UNITED STATES SECURITIES AND EXCHANGE COMMISSION
Washington, DC 20549
Form 10-K
(MARK ONE) | ||
☑ | ANNUAL REPORT PURSUANT TO SECTION 13 OR 15(d) OF THE SECURITIES EXCHANGE ACT OF 1934 | |
For the fiscal year ended October 29, 2017 | ||
OR | ||
☐ | TRANSITION REPORT PURSUANT TO SECTION 13 OR 15(d) OF THE SECURITIES EXCHANGE ACT OF 1934 | |
For the transition period from to | ||
State or Other Jurisdiction of Incorporation or Organization | Exact Name of Registrant as Specified in Its Charter Address of Principal Executive Offices Registrant’s telephone number, including area code | Commission File Number | IRS Employer Identification No. | |||
Singapore | Broadcom Limited | 001-37690 | 98-1254807 | |||
1 Yishun Avenue 7 Singapore 768923 | ||||||
(65) 6755-7888 | ||||||
Cayman Islands | Broadcom Cayman L.P. | 333-2025938 | 98-1254815 | |||
c/o/ Broadcom Limited 1 Yishun Avenue 7 Singapore 768923 | ||||||
(65) 6755-7888 | ||||||
Securities registered pursuant to Section 12(b) of the Act: | ||||||
Title of Class | Name of Each Exchange on Which Registered | |
Ordinary Shares, no par value | The NASDAQ Global Select Market | |
Securities registered pursuant to Section 12(g) of the Act: None (Title of class) | ||||||
Indicate by check mark if the registrant is a well-known seasoned issuer, as defined in Rule 405 of the Securities Act.
Broadcom Limited: Yes ☑ No ☐ Broadcom Cayman L.P.: Yes ☐ No ☑
Indicate by check mark if the registrant is not required to file reports pursuant to Section 13 or Section 15(d) of the Act.
Broadcom Limited: Yes ☐ No ☑ Broadcom Cayman L.P.: Yes ☐ No ☑
Indicate by check mark whether the registrant (1) has filed all reports required to be filed by Section 13 or 15(d) of the Securities Exchange Act of 1934 during the preceding 12 months (or for such shorter period that the registrant was required to file such reports), and (2) has been subject to such filing requirements for the past 90 days.
Broadcom Limited: Yes ☑ No ☐ Broadcom Cayman L.P.: Yes ☑ No ☐
Indicate by check mark whether the registrant has submitted electronically and posted on its corporate Web site, if any, every Interactive Data File required to be submitted and posted pursuant to Rule 405 of Regulation S-T during the preceding 12 months (or for such shorter period that the registrant was required to submit and post such files).
Broadcom Limited: Yes ☑ No ☐ Broadcom Cayman L.P.: Yes ☑ No ☐
Indicate by check mark if disclosure of delinquent filers pursuant to Item 405 of Regulation S-K is not contained herein, and will not be contained, to the best of registrant’s knowledge, in definitive proxy or information statements incorporated by reference in Part III of this Form 10-K or any amendment to this Form 10-K.
Broadcom Limited ☐ Broadcom Cayman L.P.: ☑
Indicate by check mark whether the registrant is a large accelerated filer, an accelerated filer, a non-accelerated filer, a smaller reporting company, or an emerging growth company. See the definitions of “large accelerated filer,” “accelerated filer,” “smaller reporting company,” and “emerging growth company” in Rule 12b-2 of the Exchange Act. (Check one):
Broadcom Limited: | Large accelerated filer ☑ | Accelerated filer ☐ | Non-accelerated filer ☐ | Smaller reporting company ☐ | Emerging growth company ☐ |
Broadcom Cayman L.P.: | Large accelerated filer ☐ | Accelerated filer ☐ | Non-accelerated filer ☑ | Smaller reporting company ☐ | Emerging growth company ☐ |
(Do not check if a smaller reporting company) | |||||
If an emerging growth company, indicate by check mark if the registrant has elected not to use the extended transition period for complying with any new or revised financial accounting standards provided pursuant to Section 13(a) of the Exchange Act. ☐
Indicate by check mark whether the registrant is a shell company (as defined in Rule 12b-2 of the Exchange Act).
Broadcom Limited: Yes ☐ No ☑ Broadcom Cayman L.P.: Yes ☐ No ☑
State the aggregate market value of Broadcom Limited’s voting and non-voting ordinary shares held by non-affiliates as of the last business day of the Registrant’s most recently completed second fiscal quarter: As of April 30, 2017, the last business day of our most recently completed second fiscal quarter, the aggregate market value of Broadcom Limited’s ordinary shares held by non-affiliates of Broadcom Limited (based upon the closing sale price of such shares on the Nasdaq Global Select Market on April 28, 2017, the last trading day prior to our fiscal quarter end) was approximately $89.2 billion.
As of November 24, 2017, Broadcom Limited had 409,362,475 of its ordinary shares, no par value per share, outstanding. As of November 24, 2017, Broadcom Cayman L.P. had 390,900,560 common partnership units outstanding (all of which are owned by Broadcom Limited) and 22,141,886 restricted exchangeable partnership units outstanding.
Documents Incorporated by Reference
Information required in response to Part III of this Annual Report on Form 10-K is hereby incorporated by reference from Broadcom Limited’s definitive Proxy Statement for its 2018 Annual General Meeting of Shareholders. Except as expressly incorporated by reference, Broadcom Limited’s Proxy Statement shall not be deemed to be a part of this Annual Report on Form 10-K. Broadcom Limited intends to file its definitive Proxy Statement within 120 days after its fiscal year ended October 29, 2017.
EXPLANATORY NOTE
This report combines the annual reports on Form 10-K for the fiscal year ended October 29, 2017 of Broadcom Limited and Broadcom Cayman L.P. Unless stated otherwise or the context otherwise requires, references to “Broadcom,” “we,” “our” and “us” mean Broadcom Limited and its consolidated subsidiaries, including Broadcom Cayman L.P. References to the “Partnership” mean Broadcom Cayman L.P. and its consolidated subsidiaries. Financial information and results of operations presented in the Form 10-K for the periods prior to February 1, 2016 relate to Avago Technologies Limited, our predecessor, and relate to Broadcom and the Partnership for the periods after February 1, 2016. Broadcom Corporation was indirectly acquired by Broadcom on February 1, 2016 (refer to Note 1. “Overview and Basis of Presentation” included in Part II, Item 8 of this Form 10-K for additional information).
As of October 29, 2017, Broadcom Limited owned approximately 95% of the Partnership (represented by common partnership units, or Common Units) and is the sole general partner of the Partnership, or the General Partner. The balance of the interest in the Partnership is held by the limited partners, or the Limited Partners, in the form of restricted exchangeable limited partnership units, or Partnership REUs. As the General Partner, Broadcom has the exclusive right, power and authority to manage, control, administer and operate the business and affairs and to make decisions regarding the undertaking and business of the Partnership in accordance with the amended and restated exempted limited partnership agreement, as amended from time to time, and applicable laws. There is no board of directors of the Partnership.
Shareholders’ equity, partners’ capital and the Limited Partners’ noncontrolling interest in Broadcom are the primary areas of difference between the consolidated financial statements of Broadcom and those of the Partnership. The Partnership’s capital consists of Common Units owned by Broadcom and Partnership REUs owned by the Limited Partners. The Partnership REUs are accounted for in partners’ capital in the Partnership’s financial statements and as noncontrolling interest in shareholders’ equity in Broadcom’s financial statements.
The material differences between Broadcom and the Partnership are discussed in various sections in this report, including separate financial statements (but combined footnotes), separate disclosure controls and procedures sections, separate certifications of periodic report under Section 302 of the Sarbanes-Oxley Act of 2002 and separate certifications pursuant to 18 U.S.C Section 1350 as adopted pursuant to Section 906 of the Sarbanes-Oxley Act of 2002. In the sections that combine disclosure for Broadcom and the Partnership, this report refers to actions or holdings as being actions or holdings of Broadcom.
Broadcom consolidates the Partnership for financial reporting purposes, and neither Broadcom nor the Partnership has material assets other than its interests in their subsidiaries. Therefore, while shareholders’ equity and partners’ capital differ as discussed above, the assets of Broadcom and the Partnership are materially the same on their respective financial statements.
BROADCOM LIMITED AND BROADCOM CAYMAN L.P.
2017 ANNUAL REPORT ON FORM 10-K
TABLE OF CONTENTS
Page | ||
PART I
The following discussion should be read in conjunction with the consolidated financial statements and notes thereto included elsewhere in this Annual Report on Form 10-K. This Annual Report on Form 10-K contains forward-looking statements within the meaning of the federal securities laws and particularly in Item 1: “Business,” Item 1A: “Risk Factors,” Item 3: “Legal Proceedings” and Item 7: “Management’s Discussion and Analysis of Financial Condition and Results of Operations” of this Annual Report on Form 10-K. These statements are indicated by words or phrases such as “anticipate,” “expect,” “estimate,” “seek,” “plan,” “believe,” “could,” “intend,” “will,” and similar words or phrases. These forward-looking statements may include the proposed transaction involving Broadcom and Qualcomm Incorporated, or Qualcomm, and the expected benefits of the proposed transaction; projections of financial information; statements about historical results that may suggest trends for our business; statements of the plans, strategies, and objectives of management for future operations; statements of expectation or belief regarding future events (including any acquisitions we may make), technology developments, our products, product sales, expenses, liquidity, cash flow and growth rates, or enforceability of our intellectual property rights; and the effects of seasonality on our business. Such statements are based on current expectations, estimates, forecasts and projections of our or industry performance and macroeconomic conditions, based on management’s judgment, beliefs, current trends and market conditions, and involve risks and uncertainties that may cause actual results to differ materially from those contained in the forward-looking statements. We derive most of our forward-looking statements from our operating budgets and forecasts, which are based upon many detailed assumptions. While we believe that our assumptions are reasonable, we caution that it is very difficult to predict the impact of known factors, and it is impossible for us to anticipate all factors that could affect our actual results. Accordingly, we caution you not to place undue reliance on these statements. Important factors that could cause actual results to differ materially from our expectations are disclosed under “Risk Factors” in Part I, Item 1A of this Annual Report on Form 10-K. These factors include risks associated with our proposal to acquire Qualcomm, including: (i) the ultimate outcome of any possible transaction between Broadcom and Qualcomm; (ii) uncertainties as to whether Qualcomm will cooperate with us regarding the proposed transaction; (iii) the effects of the announcement of the proposed transaction on the ability of Broadcom and Qualcomm to retain customers, to retain and hire key personnel and to maintain favorable relationships with suppliers or customers; (iv) the timing of the proposed transaction; (v) the ability to obtain regulatory approvals and satisfy other closing conditions to the completion of the proposed transaction (including shareholder approval); and (vi) other risks related to the completion of the proposed transaction and actions related thereto; any loss of our significant customers and fluctuations in the timing and volume of significant customer demand; our dependence on contract manufacturing and outsourced supply chain; our dependency on a limited number of suppliers; any acquisitions we may make, such as delays, challenges and expenses associated with receiving governmental and regulatory approvals and satisfying other closing conditions, and with integrating acquired companies with our existing businesses and our ability to achieve the growth prospects and synergies expected by such acquisitions; our ability to accurately estimate customers’ demand and adjust our manufacturing and supply chain accordingly; our significant indebtedness, including the need to generate sufficient cash flows to service and repay such debt; dependence on a small number of markets and the rate of growth in these markets; dependence on and risks associated with distributors of our products; dependence on senior management; quarterly and annual fluctuations in our operating results; global economic conditions and concerns; our proposed redomiciliation of our ultimate parent company to the United States; our competitive performance and ability to continue achieving design wins with our customers, as well as the timing of any design wins; prolonged disruptions of our or our contract manufacturers' manufacturing facilities or other significant operations; our ability to improve our manufacturing efficiency and quality; our dependence on outsourced service providers for certain key business services and their ability to execute to our requirements; our ability to maintain or improve gross margin; our overall cash tax costs, legislation that may impact our overall cash tax costs and our ability to maintain tax concessions in certain jurisdictions; our ability to protect our intellectual property and the unpredictability of any associated litigation expense; any expense or reputational damage associated with resolving customer product warranty and indemnification claims; cyclicality in the semiconductor industry or in our target markets; our ability to sell to new types of customers and to keep pace with technological advances; market acceptance of the end products into which our products are designed; and other events and trends on a national, regional and global scale, including those of a political, economic, business, competitive and regulatory nature. All of the forward-looking statements in this Annual Report on Form 10-K are qualified in their entirety by reference to the factors listed above and those discussed under the heading “Risk Factors” in Part I, Item 1A of this Annual Report on Form 10-K. We caution you that the foregoing list of important factors may not contain all of the material factors that are important to you. In addition, in light of these risks and uncertainties, the matters referred to in the forward-looking statements contained in this Annual Report on Form 10-K may not in fact occur. We undertake no intent or obligation to publicly update or revise any forward-looking statement, whether as a result of new information, future events or otherwise, except as otherwise required by law.
Unless stated otherwise or the context otherwise requires, references to “Broadcom,” “we,” “our” and “us” mean Broadcom Limited and its consolidated subsidiaries, including Broadcom Cayman L.P. References to the “Partnership” mean Broadcom Cayman L.P. and its consolidated subsidiaries. Financial information and results of operations presented for the
1
periods prior to February 1, 2016 relate to Avago Technologies Limited, our predecessor, and relate to Broadcom and the Partnership for the periods after February 1, 2016. Our fiscal year ends on the Sunday closest to October 31 in a 52-week year and the first Sunday in November in a 53-week year. We refer to our fiscal years by the calendar year in which they end. For example, the fiscal year ended October 29, 2017 is referred to as “fiscal year 2017.”
2
ITEM 1. | BUSINESS |
Overview
Broadcom Limited, or Broadcom, is the successor to Avago Technologies Limited, or Avago, as a result of the business combination between Avago and Broadcom Corporation, or BRCM, completed on February 1, 2016, or the Broadcom Transaction. We are a leading designer, developer and global supplier of a broad range of semiconductor devices with a focus on complex digital and mixed signal complementary metal oxide semiconductor, or CMOS, based devices and analog III-V based products. We have a history of innovation and offer thousands of products that are used in end products such as enterprise and data center networking, home connectivity, set-top boxes, broadband access, telecommunication equipment, mobile handsets and base stations, data center servers and storage systems, factory automation, power generation and alternative energy systems, and electronic displays. We differentiate ourselves through our high performance design and integration capabilities and focus on developing products for target markets where we believe we can earn attractive margins. We have four reportable segments: wired infrastructure, wireless communications, enterprise storage, and industrial & other, which align with our principal target markets.
The Partnership is an exempted limited partnership formed under the laws of the Cayman Islands. Broadcom is the sole General Partner and owns a majority interest (by vote and value) in the Partnership. As General Partner, Broadcom has the exclusive right, power and authority to manage, control, administer and operate the business and affairs and to make decisions regarding the undertaking and business of the Partnership in accordance with the Partnership’s amended and restated exempted partnership agreement, or the Partnership Agreement, and applicable laws. There is no board of directors of the Partnership.
Semiconductors are made by imprinting a network of electronic components onto a semiconductor wafer. These devices are designed to perform various functions such as processing, amplifying and selectively filtering electronic signals, controlling electronic system functions and processing, and transmitting and storing data. Our digital and mixed signal products are based on silicon wafers with CMOS transistors offering fast switching speeds and low power consumption, which are both critical design factors for the markets we serve. We also offer analog products, which are based on III-V semiconductor materials that have higher electrical conductivity than silicon, and thus tend to have better performance characteristics in radio frequency, or RF, and optoelectronic applications. III-V refers to elements from the 3rd and 5th groups in the periodic table of chemical elements. Examples of these materials used in our products are gallium arsenide, or GaAs, gallium nitride, and indium phosphide, or InP. Following the acquisition of Brocade Communications Systems, Inc., or Brocade, we also offer mission critical fibre channel storage area networking, or FC SAN, products in the form of modules, switches and subsystems incorporating multiple semiconductor products.
Our over 50-year history of innovation dates back to our diverse origins from Hewlett-Packard Company, AT&T, LSI Corporation, or LSI, and BRCM. Over the years, we have assembled a large team of digital, mixed signal and analog design engineers around the world. We maintain design and product development engineering resources at locations in the United States, Asia, Europe and Israel, providing us with engineering expertise worldwide. We strategically focus our research and development resources to address niche opportunities in our target markets and leverage our extensive portfolio of U.S. and other patents and other intellectual property, or IP, to integrate multiple technologies and create system-on-chip, or SoC, and component solutions that target growth opportunities. We design products that deliver high-performance and provide mission-critical functionality.
Original equipment manufacturers, or OEMs, or their contract manufacturers, and distributors typically account for the substantial majority of our sales. We have established strong relationships with leading OEM customers across multiple target markets. Many of our major customer relationships have been in place for many years and have often been built as a result of years of collaborative product development. This has enabled us to build our IP portfolio and develop critical expertise regarding our customers’ requirements, including substantial system level knowledge. This collaboration has provided us with key insights into our customers' businesses and has enabled us to be more efficient and productive and to better serve our target markets and customers. We have a direct sales force focused on supporting large OEMs. We also distribute a substantial portion of our products through our broad distribution network, and a significant amount of these sales are to large global electronic components distributors, including Avnet, Inc.
We focus on maintaining an efficient global supply chain and a variable, low-cost operating model. Accordingly, we outsource a majority of our manufacturing operations, utilizing third-party foundry and assembly and test capabilities, as well as some of our corporate infrastructure functions. We focus our internal fabrication capacity and capital expenditures on products utilizing our innovative and proprietary processes, to protect our IP and to accelerate time to market of our products, while outsourcing commodity processes such as standard CMOS. We also have a long history of operating in Asia, where approximately 38% of our employees are located and where we manufacture and source the majority of our products and materials. Our presence in Asia places us in close proximity to many of our customers’ manufacturing facilities and at the center of worldwide electronics manufacturing.
3
Recent Developments
U.S. 2017 Tax Reform Act
On December 20, 2017, the Tax Cuts and Jobs Act, or the 2017 Tax Reform Act, was approved by Congress and is pending presidential approval. In general, the 2017 Tax Reform Act reduces the U.S. corporate income tax rate from 35% to 21%, effective in 2018. The 2017 Tax Reform Act moves from worldwide business taxation to a participation exemption regime. The 2017 Tax Reform Act also imposes base-erosion prevention measures on non-U.S. earnings of U.S. entities, as well as a one-time mandatory deemed repatriation tax on accumulated non-U.S. earnings of U.S. entities. The base-erosion prevention measures will have the effect of subjecting non-U.S. earnings of U.S. entities to taxation in the United States at an effective rate that is expected to be substantially lower than 21%. The 2017 Tax Reform Act will affect the tax position and cash taxes of our U.S. entities and will have a corresponding impact on our consolidated financial results starting in the first quarter of our fiscal year 2018.
Acquisition of Brocade
On November 17, 2017, we acquired Brocade for approximately $6.1 billion. Brocade’s networking solutions help the world’s leading organizations turn their networks into platforms for business innovation. With solutions spanning public and private data centers to the network edge, Brocade is a leader in FC SAN switching. We are in the process of integrating Brocade into our enterprise storage segment. In connection with the acquisition of Brocade, or the Brocade Merger, we incurred $4.0 billion of indebtedness.
Proposed Acquisition of Qualcomm
On November 6, 2017, we announced a proposal to acquire Qualcomm Incorporated, or Qualcomm, for $70 per share, consisting of $60 in cash and $10 in Broadcom ordinary shares. We stated that the proposal stands whether Qualcomm’s pending acquisition of NXP Semiconductors N.V., or NXP, is consummated on the then-disclosed terms of $110 per NXP share or is terminated. Including the assumption of net debt and giving effect to the pending NXP acquisition, the enterprise value of the proposed transaction is approximately $130 billion.
On November 13, 2017, Qualcomm’s board of directors rejected our proposal. In response, we announced that we remained fully committed to pursuing the acquisition of Qualcomm and reiterated our proposal.
On December 4, 2017, we announced that we had provided notice to Qualcomm of our intent to nominate 11 candidates for election to the Qualcomm board of directors at Qualcomm’s 2018 annual meeting of stockholders.
On December 11, 2017, we filed preliminary proxy materials with the U.S. Securities and Exchange Commission, or the SEC, in connection with our planned solicitation of proxies to elect 11 independent, highly qualified nominees to the Qualcomm board of directors at Qualcomm’s 2018 annual meeting of stockholders, which Qualcomm has announced will be held on March 6, 2018.
We also filed a premerger notification under the Hart-Scott-Rodino Antitrust Improvements Act of 1976 with the U.S. Department of Justice and the Federal Trade Commission regarding our proposed acquisition of Qualcomm.
No agreement has been reached with Qualcomm and there can be no assurance that any transaction will result from our proposal.
Redomiciliation to the United States from Singapore
On November 2, 2017, we announced our intention to initiate a process to change the ultimate parent company of the Broadcom group from a Singapore company to a U.S. corporation. The final form and timing of the redomiciliation has not yet been finalized and may be affected by the implementation of the 2017 Tax Reform Act. In addition, the redomiciliation is subject to the approval of our shareholders. We presently expect that our overall cash tax costs will approximately double, as compared to our fiscal year 2017 results, due to the redomiciliation and taking in account our initial estimates of the expected effects of the 2017 Tax Reform Act.
Products and Markets
Our product portfolio ranges from discrete devices to complex sub-systems that include multiple device types and may also incorporate firmware for interfacing between analog and digital systems. In some cases, our products include mechanical hardware that interfaces with optoelectronic or capacitive sensors. We focus on markets that require high quality and the technology leadership and integrated performance characteristic of our products. For the fiscal year ended October 29, 2017, or fiscal year 2017, our wired infrastructure segment contributed 48%, our wireless communications segment contributed 31%, our enterprise storage segment contributed 16%, and our industrial & other segment contributed 5% of our net revenue. For the fiscal year ended October 30, 2016, or fiscal year 2016, net revenue included contributions from BRCM commencing on February 1, 2016, which are included in the wired infrastructure and wireless communications segments. For the fiscal year
4
ended November 1, 2015, or fiscal year 2015, net revenue included contributions from Emulex Corporation, or Emulex, commencing on May 6, 2015, which are included in the enterprise storage segment.
See discussion in the “Results of Operations” section included in Part II, Item 7. Management’s Discussion and Analysis of Financial Condition and Results of Operations and Note 12. “Segment Information” included in Part II, Item 8. Financial Statements and Supplementary Data, of this Annual Report on Form 10-K for additional segment information.
The table below presents the major product families and their major applications in our reportable segments.
Segment | Major Applications | Major Product Families | |
Wired Infrastructure | • Set-top Box (STB) and Broadband Access | • STB SoCs | |
• Cable, digital subscriber line (DSL) and passive optical networking (PON) central office/consumer premise equipment (CO/CPE) SoCs | |||
• Data center, Telecom, Enterprise and Small-and-Medium size Business/Remote-Office-Branch-Office (SMB)/(ROBO) Networking | • Ethernet switching and routing application specific standard product (ASSP) | ||
• Embedded processors and controllers | |||
• Serializer/Deserializer (SerDes), application specific integrated circuits (ASICs) | |||
• Optical and copper, physical layer (PHYs) | |||
• Fiber optic laser and receiver components | |||
Wireless Communications | • mobile handsets | • RF front end modules (FEMs), filters, power amplifiers | |
• Wi-Fi, Bluetooth, global positioning system/global navigation satellite system (GPS/GNSS) SoCs | |||
• Custom touch controllers | |||
Enterprise Storage | • Servers and storage systems | • Serial attached small computer system interface (SAS) and redundant array of independent disks (RAID) controllers and adapters | |
• Peripheral component interconnect express (PCIe) switches | |||
• Fibre channel host bus adapters (HBA) | |||
• Fibre channel switches (starting fiscal year 2018) | |||
• Hard disk drives (HDD); Solid state drives (SSD) | • Read channel based SoCs; Custom flash controllers | ||
• Preamplifiers | |||
Industrial & Other | • Power isolation, power conversion and renewable energy systems | • Optocouplers | |
• Factory automation, in-car infotainment and renewable energy systems | • Industrial fiber optics | ||
• Motor controls and factory automation | • Motion control encoders and subsystems | ||
• Displays and lighting | • Light emitting diode (LEDs) | ||
Wired Infrastructure Segment. We provide semiconductor solutions for enabling the STB and broadband access markets. We also provide a wide variety of semiconductor solutions which manage the movement of data in data center, telecom, enterprise and SMB/ROBO networking applications.
Set-Top Box Solutions: We offer complete SoC platform solutions for cable, satellite, Internet Protocol, over-the-top and terrestrial STBs. Our products enable global service providers to introduce new and enhanced technologies and services in STBs, including transcoding, digital video recording functionality, higher definition, increased networking capabilities, and more tuners to enable faster channel change and more simultaneous recordings. We are also enabling service providers in deploying High Efficiency Video Coding, or HEVC, a video compression format that is a successor to the H.264/MPEG-4 format. HEVC enables ultra-high definition, or Ultra HD, services by effectively doubling the capacity of existing networks to deploy new or existing content. Our families of STB solutions support the complete range of resolutions, from standard definition, to high definition, or HD, and Ultra HD.
5
Broadband Access Solutions: We offer complete SoC platform solutions for DSL, cable and fiber for both central office deployments and CPE. For CPE deployments, we support broadband modems, wireless local area network, or WLAN, routers as well as residential gateway solutions. For central office deployment, our solutions include cable modem termination systems, for cable, optical line termination, for fiber, and DSL Access Multiplexer for DSL. Our products enable global service providers to continue to deploy next generation broadband access technologies across multiple standards, including DSL, cable and fiber, to provide more bandwidth and faster speeds to consumers. Over the coming years, we expect to see global service providers moving toward new technologies, including data over cable service interface specification, 3.1 for cable modem technologies, G.Fast for DSL, and deploying more fiber-based solutions to increase speeds and bandwidth for customers.
Ethernet Switching and Routing: Ethernet is a ubiquitous interconnection technology that enables high performance and cost effective networking infrastructure. We offer a broad set of Ethernet switching and routing products that are optimized for data center implementations, service provider networks, enterprise, and SMB/ROBO. In the data center market, our high capacity, low latency, switching silicon supports advanced protocols around virtualization and multi-pathing. Our Ethernet switching fabric technologies provide the ability to build highly scalable flat networks supporting tens of thousands of servers. Our service provider switch portfolio enables carrier/service provider networks to support a large number of services in the wireless backhaul, access, aggregation and core of their networks. For enterprise and SMB/ROBO applications, we offer product families that combine multi-layer switching capabilities and support lower power modes that comply with industry standards around energy efficient Ethernet.
Embedded processors and controllers: Our embedded processors leverage our ARM central processing unit and Ethernet switching technology to deliver SoCs for high performance embedded applications in a wide range of communication products such as voice-over-internet-protocol, telephony, point-of-sale devices and enterprise and retail access points and gateways. We offer a range of knowledge-based processors to enable high-performance decision-making for packet processing in a variety of advanced devices in the enterprise, metro, access, edge and core networking spaces. We also offer a range of Ethernet controllers for servers and workstations supporting multiple generations of Ethernet technology.
SerDes ASICs: For data center and enterprise networking, and high performance compute applications, we supply high speed SerDes technology integrated into ASICs. These ASICs are custom products built to individual customers specifications. Our ASICs are designed on advanced CMOS process technologies, focused primarily on leading edge geometries.
Physical Layer Devices: These devices, also referred to as PHYs, are transceivers which enable the reception and transmission of Ethernet data packets over a physical medium such as copper wire or optical fibers. Our high performance Ethernet transceivers are built upon a proprietary digital signal processing communication architecture optimized for high-speed network connections and support the latest standards and advanced features, such as energy efficient Ethernet, data encryption and time synchronization. We also offer a range of automotive Ethernet products to meet growing consumer demand for in-vehicle connectivity.
Fiber optic components: We supply optical laser and receiver components to the Ethernet networking, storage, and access, metro- and long-haul telecommunication markets. Our optical components enable the high speed reception and transmission of data through optical fibers.
Wireless Communications Segment. We support the wireless communications industry with a broad variety of RF semiconductor devices, connectivity solutions and custom touch controllers. Devices incorporating our wireless solutions include mobile handsets and tablets.
RF Semiconductor Devices: Our RF semiconductor devices selectively filter, as well as amplify, RF signals. Filters enable modern wireless communication systems to support a large number of subscribers simultaneously by ensuring that the multiple transmissions and receptions of voice and data streams do not interfere with each other. We were among the first to deliver commercial film bulk acoustic resonator, or FBAR, filters that offer technological advantages over competing filter technologies, to allow mobile handsets to function more efficiently in today's congested RF spectrum. FBAR technology has a significant market share within the cellular handset market. As cellular carriers continue to move to 4G/long-term evolution, or LTE, and LTE-advanced standards worldwide, we believe these technological advantages will continue to benefit our business. Our RF products include FEMs that incorporate multiple die into multi-function RF devices, duplexers and multiplexers, which are a combination of two or more transmit and receive filters in a single device, using our proprietary FBAR technology, discrete filters and discrete power amplifiers.
Our expertise in FBAR technology, amplifier design, and module integration enables us to offer industry-leading performance in cellular RF transceiver applications. Our proprietary GaAs wafer manufacturing processes are critical to the production of power amplifier and low noise amplifier products.
6
Connectivity solutions: Our connectivity solutions include discrete and integrated Wi-Fi and Bluetooth solutions, location (GPS/GNSS) controllers and touch controllers.
Wi-Fi allows devices on a local area network to communicate wirelessly, adding the convenience of mobility to the utility of high-speed data networks. We offer a family of high performance, low power Wi-Fi chipsets. Bluetooth is a low power technology that enables direct connectivity between devices. We offer a complete family of Bluetooth silicon and software solutions that enable manufacturers to easily and cost-effectively add Bluetooth functionality to virtually any device. These solutions include combination chips that offer integrated Wi-Fi and Bluetooth functionality, which provides significant performance advantages over discrete solutions.
We also offer a family of GPS, assisted-GPS (A-GPS) and GNSS semiconductor products, software and data services. These products are part of a broader location platform that leverages a broad range of communications technologies, including Wi-Fi, Bluetooth and GPS, to provide more accurate location and navigation capabilities.
Custom Touch Controllers: Our touch controllers process signals from touch screens in mobile handsets and tablets.
Enterprise Storage Segment. Our enterprise storage products enable secure movement of digital data to and from host machines such as servers, personal computers and storage systems to the underlying storage devices such as HDDs and SSDs.
Fibre Channel Switch Products: The Fibre Channel switch products we acquired in connection with our acquisition of Brocade provide interconnection, bandwidth, and high-speed switching between servers and storage devices which are in a FC SAN. FC SANs are networks dedicated to mission critical storage traffic, and enable simultaneous high speed and secure connections among multiple host computers and multiple storage arrays.
SAS, RAID and PCIe Products: We provide SAS and RAID controller and adapter solutions to server and storage system OEMs. These solutions enable secure and high speed data transmission between a host computer, such as a server, and storage peripheral devices, such as HDD, SSD and optical disk drives and disk and tape-based storage systems. Some of these solutions are delivered as stand-alone semiconductors, typically as a controller. Other solutions are delivered as circuit boards, known as adapter products, which incorporate our semiconductors onto a circuit board with other features. RAID technology is a critical part of our server storage connectivity solutions as it provides protection against the loss of critical data resulting from HDD failures.
We also provide interconnect semiconductors that support the PCI and PCIe communication standards. PCIe is the primary interconnection mechanism inside computing systems today.
Fibre Channel Products: We provide Fibre Channel HBAs, which connect host computers such as servers to FC SANs.
HDD and SSD products: We provide read channel-based SoCs and preamplifiers to HDD OEMs. These are the critical chips required to read, write and protect data. An HDD SoC is an integrated circuit, or IC, that combines the functionality of a read channel, serial interface, memory and a hard disk controller in a small, high-performance, low-power and cost-effective package. Read channels convert analog signals that are generated by reading the stored data on the physical media into digital signals. In addition, we sell preamplifiers, which are used to amplify the initial signal to and from the drive disk heads so the signal can be processed by the read channel.
We also provide custom flash controllers to SSD OEMs. An SSD stores data in flash memory instead of on a hard disk, providing high speed access to the data. Flash controllers manage the underlying flash memory in SSDs, performing critical functions such as reading and writing data to and from the flash memory and performing error correction, wear leveling and bad block management.
Industrial & Other. We provide a broad variety of products for the general industrial and automotive markets. This segment also includes IP licensing revenue.
Optocouplers: We offer optical isolators, or optocouplers, which provide electrical insulation and signal isolation for signaling systems that are susceptible to electrical noise or interference. Optocouplers are used in a diverse set of applications, including industrial motors, automotive systems including those used in hybrid engines, power generation and distribution systems, switching power supplies, motion sensors, telecommunications equipment, computers and office equipment, plasma displays, and military electronics.
Industrial Fiber Optics: For industrial networking, we provide fast optical transceivers using plastic optical fiber that enable quick and interoperable networking and factory automation.
Motion Encoders: For industrial motors and robotic motion control, we supply optical encoders, as well as ICs for the controller and decoder functions.
LEDs: For electronic signs and signals, we supply LED assemblies that offer high brightness and stable light output over thousands of hours, enabling us to support traffic signals, large commercial signs and other displays.
7
Research and Development
We are committed to continuous investment in product development, with a focus on rapidly introducing new, proprietary products. Many of our products have grown out of our own research and development efforts, and have given us competitive advantages in certain target markets due to performance differentiation. However, from time to time we also seek to enhance our capabilities through the acquisition of engineers with complementary research and development skills and complementary technologies and businesses. We focus our research and development efforts on the development of innovative, sustainable and higher value product platforms. We leverage our design capabilities in markets where we believe our innovation and reputation will allow us to earn attractive margins by developing high value-add products.
We plan to continue investing in product development, both organically and through acquisition, to drive growth in our business. We also invest in process development and fabrication capabilities to optimize processes for devices that are manufactured internally. Our field application engineers and design engineers are located in many places around the world, and in many cases near our top customers. This enhances our customer reach and our visibility into new product opportunities and enables us to support our customers in each stage of their product development cycle, from early stages of production design through to volume manufacturing and future growth. By collaborating with our customers, we have opportunities to develop high value-added, customized products for them that leverage our existing technologies. Research and development expense was $3.3 billion, $2.7 billion and $1.0 billion for fiscal years 2017, 2016 and 2015, respectively. These amounts included share-based compensation expense of $636 million, $430 million and $107 million for fiscal years 2017, 2016 and 2015, respectively. We anticipate that we will continue to make significant research and development expenditures in order to maintain our competitive position, and with a continuous flow of innovative and sustainable product platforms.
Customers, Sales and Distribution
We sell our products to a wide variety of OEMs or their contract manufacturers, distributors and end customers. Certain customers require us to contract with them directly and with specified intermediaries, such as contract manufacturers, and both they and their contract manufacturers often require time-critical delivery of our products to multiple locations around the world. Historically, a relatively small number of customers have accounted for a significant portion of our net revenue. Sales to distributors accounted for 28% and 30% of our net revenue for fiscal years 2017 and 2016, respectively. Direct sales to Foxconn Technology Group companies (including Hon Hai Precision Industries), together referred to as Foxconn, accounted for 14% of our net revenue for both fiscal years 2017 and 2016. We believe our aggregate sales to our top five end customers, through all channels, accounted for more than 40% of our net revenue for fiscal year 2017 and more than 30% for fiscal year 2016. We believe aggregate sales to Apple, Inc., through all channels, accounted for more than 20% of our net revenue for fiscal year 2017 and approximately 15% for fiscal year 2016. We expect to continue to experience significant customer concentration in future periods. The loss of, or significant decrease in demand from, any of our top five end customers could have a material adverse effect on our business, results of operations and financial condition.
We sell our products through our direct sales force and a select network of distributors globally. Our direct sales force is focused on supporting our large OEM customers. Our sales force has specialized product and service knowledge that enables us to sell specific offerings at key levels throughout a customer’s organization.
We have sales offices located in various countries, with a significant presence in Asia, which is a key center of the worldwide electronics supply chain. Many of our customers design products in North America or Europe that are then manufactured in Asia. We also maintain dedicated regional customer support call centers, where we address customer issues and handle logistics and other order fulfillment requirements.
We have strategically developed distributor relationships to serve thousands of customers around the world. A significant amount of our sales are to large global electronic components distributors, including Avnet, Inc., complemented by a number of regional distributors with customer relationships based on their respective product ranges.
We believe we are well-positioned to support our customers throughout the design, technology transfer and manufacturing stages across all geographies.
Operations
The majority of our front-end wafer manufacturing operations is outsourced to external foundries, including Taiwan Semiconductor Manufacturing Company Limited, or TSMC, primarily, as well as United Microelectronics Corporation, Semiconductor Manufacturing International Corporation, GlobalFoundries Inc., TowerJazz and WIN Semiconductors Corp. We use third-party contract manufacturers for a significant majority of our assembly and test operations, including Advanced Semiconductor Engineering, Inc., Amkor Technology, Inc., Siliconware Precision Industries Co., Ltd., Inari Technology SDN BHD and Flextronics Telecom Systems, Ltd. We use our internal fabrication facilities for products utilizing our innovative and proprietary processes, to protect our IP and to accelerate time to market for our products. Examples of internally fabricated
8
semiconductors include our FBAR filters for wireless communications and our vertical-cavity surface emitting laser-based and InP-based lasers for fiber optic communications. The majority of our internal III-V semiconductor wafer fabrication is done in the United States and Singapore. Many of our products are designed to be manufactured in a specific process, typically at one particular foundry, either our own or with a particular contract manufacturer, and in some instances, we may only qualify one contract manufacturer to manufacture certain of our products.
We store the majority of our product inventory in our warehouse in Malaysia. However, for selected customers, we maintain finished goods inventory near or at customer manufacturing sites to support their just-in-time production.
Materials and Suppliers
Our manufacturing operations employ a wide variety of semiconductors, electromechanical components and assemblies and raw materials. We purchase materials from hundreds of suppliers on a global basis. These supply relationships are generally conducted on a purchase order basis. While we have not experienced any significant difficulty in obtaining the materials used in the conduct of our business and we believe that no single supplier is material, some of the parts are not readily available from alternate suppliers due to their unique design or the length of time necessary for re-design or qualification. Our long-term relationships with our suppliers allow us to proactively manage our technology development and product discontinuance plans, and to monitor our suppliers' financial health. Some suppliers may, nonetheless, extend their lead times, limit supplies, increase prices or cease to produce necessary parts for our products. If these are unique or highly specialized components, we may not be able to find a substitute quickly, or at all. To address the potential disruption in our supply chain, we may use a number of techniques, including, in some cases, qualifying more than one source of supply, redesigning products for alternative components and incremental, or in some cases "lifetime," purchases of affected parts for supply buffer.
Competition
The global semiconductor market is highly competitive. Our competitors range from large, international companies offering a wide range of products to smaller companies specializing in narrow markets. We compete with integrated device manufacturers, or IDMs, and fabless semiconductor companies, as well as the internal resources of large, integrated OEMs. The competitive landscape is changing as a result of a trend toward consolidation within the industry, as some of our competitors have merged with or been acquired by other competitors while others have begun collaborating with each other. We expect this consolidation trend to continue. We expect competition in the markets in which we participate to continue to increase as existing competitors improve or expand their product offerings and as new companies enter the market. Additionally, our ability to compete effectively depends on a number of factors, including: quality, technical performance, price, product features, product system compatibility, system-level design capability, engineering expertise, responsiveness to customers, new product innovation, product availability, delivery timing and reliability, and customer sales and technical support.
Our primary competitors in the wired infrastructure segment are Cavium Inc., Intel Corp., Finisar Corp., GlobalFoundries, HiSilicon Technologies Co. Ltd., Lumentum Operations LLC, MACOM Technology Solutions Holdings, Inc., Marvell Corp., Mediatek Inc., Mellanox Technologies, Mitsubishi Electric Corporation, NXP Semiconductors N.V., Quantenna Inc., ST Microelectronics N.V., and Sumitomo Corporation. We compete based on the strength of our high speed proprietary design expertise, our customer relationships, and broad product portfolio.
Our primary competitors in the wireless communications segment are Murata Manufacturing Co., Ltd., Qorvo, Inc., Qualcomm, Skyworks Solutions, Inc., and TDK-EPC Corporation. We compete based on our expertise in FBAR technology, amplifier design, module integration and proprietary material processes.
Our primary competitors in the enterprise storage segment include Cavium Inc., Marvell Technology Group, Ltd., Microsemi Corp., and Texas Instruments, Inc. We compete based on our expertise in multiple storage protocols and mixed-signal design. With the acquisition of Brocade, we will also compete with Cisco Systems, Inc. with respect to our Fibre Channel switch products.
Our primary competitors in the industrial & other segment are Analog Devices, Inc., Cree, Inc., Hamamatsu Photonics K.K., Heidenhain Corporation, Renesas Electronics Corporation and Toshiba Corporation. We compete based on our design expertise, broad product portfolio, reputation for quality products and large customer base.
Intellectual Property
Our success depends in part upon our ability to protect our IP. To accomplish this, we rely on a combination of IP rights, including patents, copyrights, trademarks, service marks, trade secrets and similar IP, as well as customary contractual protections with our customers, suppliers, employees and consultants, and through security measures to protect our trade secrets. We believe our current product expertise, key engineering talent and IP portfolio provide us with a strong platform from which to develop application specific products in key target markets.
9
As of October 29, 2017, we had 24,250 U.S. and other patents and 2,061 U.S. and other pending patent applications. Our research and development efforts are presently resulting in approximately 150 new patent applications per year, relating to a wide range of ASIC, isolation, encoder, LED, RF and optoelectronic components, enterprise storage products, HDD silicon, PCIe, USB and other standard I/O devices, Ethernet and Fibre-Channel connectivity and controllers, set-top box SoCs, cable modem SoCs, broadband access SoCs, wireless connectivity SoCs, switching/routing SoCs, high performance processor SoCs and associated applications. The expiration dates of our patents range from 2018 to 2036, with a small number of patents expiring in the near future, none of which are expected to be material to our IP portfolio. We are not substantially dependent on any single patent or group of related patents.
We focus our patent application program to a greater extent on those inventions and improvements that we believe are likely to be incorporated into our products, as contrasted with more basic research. However, we do not know how many of our pending patent applications will result in the issuance of patents or the extent to which the examination process could require us to narrow our claims.
We and our predecessors have also entered into a variety of IP licensing and cross-licensing arrangements that have both benefited our business and enabled some of our competitors. A portion of our revenue comes from IP licensing royalty payments and from technology claim settlements relating to such IP. We also license in third-party technologies that are incorporated into some elements of our design activities, products and manufacturing processes. Historically, licenses of the third-party technologies used by us have generally been available to us on acceptable terms.
The semiconductor industry is characterized by the existence of a large number of patents, copyrights, trademarks and trade secrets and by the vigorous pursuit, protection and enforcement of IP rights, including by patent holding companies that do not make or sell products. Many of our customer agreements require us to indemnify our customers for third-party IP infringement claims. Claims of this sort could harm our relationships with our customers and might deter future customers from doing business with us. With respect to any IP rights claims against us or our customers or distributors, we may be required to cease manufacture of the infringing product, pay damages, expend resources to develop non-infringing technology, seek a license which may not be available on commercially reasonable terms or at all, or relinquish patents or other IP rights.
Employees
As of October 29, 2017, we had approximately 14,000 employees worldwide. By geography, approximately 55% of our employees are located in North America, 38% in Asia, and 7% in Europe, the Middle East and Africa. In the United States, none of our employees are represented by a labor union. In Singapore, approximately 270 of our 829 employees are subject to a collective bargaining agreement. A small number of our employees in other countries is represented by workers' councils or labor unions.
Environmental and Other Regulation
Our research and development and manufacturing operations involve the use of hazardous substances and are regulated under international, federal, state and local laws governing health, safety and the environment. These regulations include limitations on discharge of pollutants to air, water, and soil; remediation requirements; product chemical content limitations; manufacturing chemical use and handling restrictions; pollution control requirements; waste minimization considerations; and treatment, transport, storage and disposal of solid and hazardous wastes. We are also subject to regulation by the United States Occupational Safety and Health Administration and similar health and safety laws in other jurisdictions.
We believe that our properties and operations at our facilities comply in all material respects with applicable environmental laws and worker health and safety laws. However, the risk of environmental liabilities cannot be completely eliminated and there can be no assurance that the application of environmental, health and safety laws to our business will not require us to incur significant expenditures.
We are also regulated under a number of international, federal, state and local laws regarding recycling, product packaging and product content requirements, including legislation enacted in the United States, European Union and China, among a growing number of jurisdictions, which have placed greater restrictions on the use of lead, among other chemicals, in electronic products, which affects materials composition and semiconductor packaging. These laws are becoming more stringent and may in the future cause us to incur significant expenditures.
Backlog
Our sales are generally made pursuant to short-term purchase orders. These purchase orders are made without deposits and may be, and often are, rescheduled, canceled or modified on relatively short notice, without substantial penalty. Therefore, we believe that purchase orders or backlog are not necessarily a reliable indicator of future sales.
10
Seasonality
Historically, our net revenue has typically been higher in the second half of the fiscal year than in the first half, primarily due to seasonality in our wireless communications segment. This segment has historically experienced seasonality due to launches of new mobile handsets manufactured by our OEM customers. However, from time to time, typical seasonality and industry cyclicality are overshadowed by other factors such as wider macroeconomic effects, the timing of significant product transitions and launches by large OEMs, particularly in the wireless communications segment. We have a diversified business portfolio and our wired infrastructure segment represents the largest portion of our net revenue. We believe that our overall revenue is less susceptible to seasonal variations as a result of the diversification of our business portfolio.
Financial Information about Geographic Areas
For information on the geographic concentration of our net revenue and long-lived assets, please see Note 12. “Segment Information” included in Part II, Item 8. of our consolidated financial statements, included elsewhere in the Annual Report on Form 10-K.
Other Information
Broadcom Limited was incorporated under the laws of the Republic of Singapore in March 2015 and is successor to Avago Technologies Limited, which was incorporated under the laws of the Republic of Singapore in August 2005. Our Singapore company registration number is 201505572G. The address of our registered office and our principal executive offices is 1 Yishun Avenue 7, Singapore 768923, and our telephone number there is +65-6755-7888. Our ordinary shares are listed on the Nasdaq Global Select Market under the trading symbol “AVGO”.
Broadcom Cayman, L.P. was formed under the laws of the Cayman Islands in May 2015. The address of the Partnership’s registered office is P.O. Box 309, Ugland House, Grand Cayman, KY1-104, Cayman Islands. The address of the Partnership’s principal executive offices is 1 Yishun Avenue 7, Singapore 768923, and the telephone number there is +65-6755-7888.
Broadcom Limited is subject to the information and periodic reporting requirements of the Securities Exchange Act of 1934, or Exchange Act, and, in accordance therewith, files periodic reports, proxy statements and other information with the SEC. In addition, the Partnership restricted exchangeable units, or Partnership REUs, are deemed to be registered under Section 12(b) of the Exchange Act and the Partnership is subject to the informational requirements of the Exchange Act and the rules and regulations promulgated thereunder.
Such periodic reports, proxy statements and other information is available for inspection and copying at the SEC’s Public Reference Room at 100 F Street, NE, Washington, DC 20549 or may be obtained by calling the SEC at 1–800–SEC–0330. In addition, the SEC maintains a website at http://www.sec.gov that contains reports, proxy statements and other information regarding issuers that file electronically with the SEC. We maintain a website at www.broadcom.com. You may access our annual reports on Form 10-K, quarterly reports on Form 10-Q, current reports on Form 8-K and other reports (and amendments thereto) filed or furnished pursuant to Section 13(a) or 15(d) of the Exchange Act with the SEC, as well as, proxy statements filed by Broadcom Limited, free of charge at the “Investor Center — SEC Filings” section of our website at www.broadcom.com, as soon as reasonably practicable after such material is electronically filed with, or furnished to, the SEC. The reference to our website address does not constitute incorporation by reference of the information contained on or accessible through our website.
11
ITEM 1A. | RISK FACTORS |
As noted above, Broadcom is the successor to Avago. Following the acquisition of BRCM, on February 1, 2016, Broadcom became the ultimate parent company of Avago and BRCM. Financial information and results of operations presented in this Annual Report on Form 10-K for periods prior to February 1, 2016 relate to Avago and relate to us for the periods after February 1, 2016.
Our business, operations and financial results are subject to various risks and uncertainties, including those described below, that could adversely affect our business, financial condition, results of operations, cash flows, and the trading price of our ordinary shares. The following important factors, among others, could cause our actual results to differ materially from historical results and those expressed in forward-looking statements made by us or on our behalf in filings with the SEC, press releases, communications with investors and oral statements.
Risks Related to Our Business
The majority of our sales comes from a small number of customers and a reduction in demand or loss of one or more of our significant customers may adversely affect our business.
We are dependent on a small number of end customers, OEMs, their respective contract manufacturers, and certain distributors for a majority of our business, revenue and results of operations. Sales to distributors accounted for 28% and 30% of our net revenue for fiscal years 2017 and 2016, respectively. Direct sales to Foxconn accounted for 14% of our net revenue for both fiscal years 2017 and 2016. We believe our aggregate sales to our top five end customers, through all channels, accounted for more than 40% of our net revenue for fiscal year 2017 and more than 30% for fiscal year 2016. We believe aggregates sales to Apple, Inc., through all channels, accounted for more than 20% of our net revenue for fiscal year 2017 and approximately 15% for fiscal year 2016. This customer concentration increases the risk of quarterly fluctuations in our operating results and our sensitivity to any material, adverse developments experienced by our significant customers.
In addition, our top customers’ purchasing power has, in some cases, given them the ability to make greater demands on us with regard to pricing and contractual terms in general. We expect this trend to continue, which may adversely affect our gross margin on certain products and, should we fail to comply with such terms, might also result in substantial liability that could harm our business, financial condition and results of operations.
Moreover, the terms and conditions under which we do business with most of our customers generally do not include commitments by those customers to purchase any specific quantities of products from us. Even in those instances where we enter into an arrangement under which a customer agrees to source an agreed portion of its product needs from us (provided that we are able to meet specified development, supply and quality commitments), the arrangement often includes pricing schedules or methodologies that apply regardless of volume of products purchased, and those customers may not purchase the amount of product we expect. As a result, we may not generate the amount of revenue or the level of profitability we expect under such arrangements. If we do not perform under these arrangements, we could also be liable for significant monetary damages.
The loss of, or any substantial reduction in sales to, any of our major customers could have a material adverse effect on our business, financial condition and results of operations and cash flows.
Dependence on contract manufacturing and suppliers of critical components within our supply chain may adversely affect our ability to bring products to market, damage our reputation and adversely affect our results of operations.
We operate a primarily outsourced manufacturing business model that principally utilizes third-party wafer foundry and module assembly and test capabilities, referred to as contract manufacturers. Our products require semiconductor wafer manufacturers with state-of-the-art fabrication equipment and techniques, and most of our products are designed to be manufactured in a specific process, typically at one particular fab or foundry, either our own or with a particular contract manufacturer.
We depend on our contract manufacturers to allocate sufficient manufacturing capacity to meet our needs, to produce products of acceptable quality at acceptable yields, and to deliver those products to us on a timely basis. Although we often have long-term contracts with our contract manufacturers, we do not generally have long-term capacity commitments. We obtain substantially all of our manufacturing services on a purchase order basis and our contract manufacturers have no obligation to provide us with any specified minimum quantities of product. Further, from time to time our contract manufacturers will cease to, or will become unable to, manufacture a component for us. As the lead time needed to identify, qualify and establish reliable production, at acceptable yields, with a new contract manufacturer is typically lengthy, there is often no readily available alternative source for the wafers or other contract manufacturing services we require, and there may be other constraints on our ability to change contract manufacturers. In addition, qualifying such manufacturers is often expensive, and they may not produce products as cost-effectively as our current suppliers, which would reduce our margins. In any such circumstances, we may be unable to meet our customer demand and may fail to meet our contractual obligations.
12
This could result in the payment of significant damages by us to our customers, and our net revenue could decline, adversely affecting our business, financial condition and results of operations.
We utilize TSMC to produce the substantial majority of our semiconductor wafers. TSMC manufactured approximately three-quarters of the wafers manufactured by our contract manufacturers during the fiscal year ended October 29, 2017. Our wafer requirements represent a significant portion of the total production capacity of TSMC. However, TSMC also fabricates wafers for other companies, including certain of our competitors, and could choose to prioritize capacity for other users or reduce or eliminate deliveries to us on short notice, or raise their prices to us, all of which could harm our business, results of operations and gross margin.
Any substantial disruption in TSMC’s supply of wafers to us, or in the other contract manufacturing services that we utilize, as a result of a natural disaster, political unrest, economic instability, equipment failure or other cause, could materially harm our business, customer relationships and results of operations.
We also depend on our third-party contract manufacturers to timely develop new, advanced manufacturing processes, including, in the case of wafer fabrication, transitions to smaller geometry process technologies. If these new processes are not timely developed or we do not have sufficient access to them, we may be unable to maintain or increase our manufacturing efficiency to the same extent as our competitors or deliver products to our customers, which could result in loss of revenue opportunities and damage our relationships with our customers.
We purchase a significant amount of the materials used in our products from a limited number of suppliers.
Our manufacturing processes rely on many materials, including silicon, GaAs and InP wafers, copper lead frames, precious and rare earth metals, mold compound, ceramic packages and various chemicals and gases. We purchase a significant portion of our semiconductor materials and finished goods used in our products from a few materials providers, some of which are single source suppliers. During the fiscal year ended October 29, 2017, we purchased approximately two-thirds of the materials for our manufacturing processes from five materials providers. Substantially all of our purchases are on a purchase order basis, and we do not generally have long-term contracts with our materials providers. Suppliers may extend lead times, limit supplies or increase prices due to commodity price increases, capacity constraints or other factors, which may lead to interruption of supply or increased demand in the industry. In the event that we cannot timely obtain sufficient quantities of materials or at reasonable prices, the quality of the material deteriorates or we are not able to pass on higher materials or energy costs to our customers, our business, financial condition and results of operations could be adversely impacted.
We may pursue acquisitions, investments, joint ventures and dispositions, which could adversely affect our results of operations.
Our growth strategy includes the acquisition of, and investment in, businesses that offer complementary products, services and technologies, augment our market coverage, or enhance our technological capabilities, such as our acquisition of Brocade. We may also enter into strategic alliances or joint ventures to achieve these goals. We may not be able to identify suitable acquisition, investment, alliance, or joint venture opportunities, or to consummate any such transactions. In addition, our original estimates and assumptions used in assessing any transaction that we make may be inaccurate and we may not realize the expected financial or strategic benefits of any such transaction, including our acquisition of Brocade.
Any acquisitions we may undertake involve risks and uncertainties, such as unexpected delays, challenges and related expenses, and diversion of management’s attention. For example, regulatory approvals required in connection with an acquisition, such as those from the U.S. Department of Justice or the Federal Trade Commission, may take longer than anticipated to obtain, may not be obtained at all or may contain materially burdensome conditions. If any conditions or changes to the structure of an acquisition are required to obtain these regulatory approvals, they may have the effect of jeopardizing or delaying completion of such acquisition or reducing our anticipated benefits of the transaction. If we agree to any material conditions in order to obtain any such approvals or if we fail to comply with any such conditions, our business and results of operations may be adversely affected. For example, if we do not complete our redomiciliation within one year from the closing, we agreed to initiate a process to separate and divest the Brocade SAN business. If we fail to complete an acquisition, our share price could fall to the extent the price reflects an assumption that such acquisition will be completed, and we may have incurred significant unrecoverable costs. Further, the failure to consummate an acquisition may result in negative publicity and adversely impact our relationships with our customers, vendors and employees. We may become subject to legal proceedings relating to the acquisition and the integration of acquired businesses may not be successful. The integration of an acquired business involves significant challenges, including, among others: minimizing the disruption of our business, diversion of management’s attention from daily operations and integrating the personnel of acquired businesses; incurring significant restructuring charges and amortization expense, assuming liabilities and ongoing lawsuits, potential impairment of acquired goodwill and other intangible assets, and increasing our expenses and working capital requirements; and implementing our management information systems, operating systems and internal controls over the acquired operations. These difficulties may be complicated by factors such as the size of the business or entity acquired, geographic
13
distances and cultural differences, lack of experience operating in the geographic markets or industry sectors of the acquired business, potential loss of key employees and customers, the potential for deficiencies in internal controls at the acquired or combined business, performance problems with the acquired business’ technology, exposure to unanticipated liabilities of the acquired business, insufficient revenue to offset increased expenses associated with the acquisition, adverse tax consequences and our potential inability to achieve the growth prospects or synergies expected from any such acquisition.
Failure to manage and successfully integrate the acquisitions we make, or to improve margins of the acquired businesses and products, could materially harm our business, operating results and margins.
Any future acquisitions we make may require significant additional debt or equity financing, which, in the case of debt financing, would increase our leverage and potentially negatively affect our credit ratings, and in the case of an equity or equity-linked financing, would be dilutive to our existing shareholders. Any downgrades in our credit ratings could adversely affect our ability to borrow by resulting in more restrictive borrowing terms or increased borrowing costs. As a result, we may be unable to complete acquisitions or other strategic transactions in the future to the same extent as in the past, or at all. These and other factors could harm our ability to achieve anticipated levels of profitability of acquired businesses or realize other anticipated benefits of an acquisition, and could adversely affect our business, financial condition and results of operations.
We recently made an offer to acquire all of the outstanding shares of Qualcomm. We do not yet know the outcome of this proposed acquisition. However, any such transaction will be subject to all of the risks discussed above, and we will need to incur a significant amount of indebtedness to fund the transaction.
From time to time, we may also seek to divest or wind down portions of our business that are not strategically important, both acquired or otherwise, such as the Brocade IP Networking business, or we may exit minority investments, each of which could materially affect our cash flows and results of operations. Any future dispositions we may make could involve risks and uncertainties, including our ability to sell such businesses on terms acceptable to us, or at all. In addition, any such dispositions could result in disruption to other parts of our business, potential loss of employees or customers, exposure to unanticipated liabilities or result in ongoing obligations and liabilities to us following any such dispositions. For example, in connection with such dispositions, we often enter into transition services agreements or other strategic relationships, including long-term research and development arrangements, sales arrangements or agree to provide certain indemnities to the purchaser in any such transaction, which may result in additional expense and may adversely affect our financial condition and results of operations. In addition, dispositions may include the transfer of technology and/or the licensing of certain IP rights to third-party purchasers, which could limit our ability to assert our IP rights against such third-party purchasers.
Failure to adjust our manufacturing and supply chain to accurately meet customers demand could adversely affect our results of operations.
We make significant decisions, including determining the levels of business that we will seek and accept, production schedules, levels of reliance on contract manufacturing and outsourcing, internal fabrication utilization and other resource requirements, based on our estimates of customer requirements. Factors that can impact our ability to accurately estimate future customer requirements include the short-term nature of many customers’ commitments, our customers’ ability to reschedule, cancel and modify orders with little or no notice and without significant penalty, the accuracy of our customers’ forecasts and the possibility of rapid changes in demand for our customers’ products, as well as seasonal or cyclical trends in their industries or the semiconductor industry.
To ensure availability of our products, particularly for our largest customers, we typically start manufacturing our relevant products based on our customers’ forecasts, which are not binding. As a result, we incur inventory and manufacturing costs in advance of anticipated sales that may never materialize or which may be substantially lower than expected. If actual demand for our products is lower than forecast, we may also experience higher inventory carrying and operating costs and product obsolescence. Because certain of our sales, research and development, and internal manufacturing overhead expenses are relatively fixed, a reduction in customer demand may also decrease our gross margin and operating income.
Conversely, customers often require rapid increases in production on short notice. We may be unable to secure sufficient materials or contract manufacturing capacity to meet such increases in demand. This could damage our customer relationships, reduce revenue growth and margins, subject us to additional liabilities, harm our reputation, and prevent us from taking advantage of opportunities.
We are dependent on a limited number of markets, and dynamics in these markets could negatively impact our business or results of operations.
We operate in a limited number of markets. If demand in these markets declines or grows at a significantly slower pace than expected, our results may be adversely affected. The success of our wired infrastructure segment is primarily dependent on information technology, or IT, and data center spending, which can vary dramatically from quarter to quarter, consumer
14
demand for traditional pay-TV services, capital expenditures on the installation of broadband capacity and our ability to transition our products to increasingly smaller line width geometries. Our wireless communications segment is primarily dependent on the mobile handset market, which is characterized by intense competition, rapidly evolving technologies and changing consumer preferences, and our success is dependent on the overall demand for mobile handsets and macroeconomic conditions in general, as well as the relative success of the mobile handsets into which our products are incorporated.
Similar to our wired infrastructure segment, our enterprise storage segment is dependent on data center spending, as well as HDD-related sales. In addition, the shift to cloud-based IT solutions and services, such as hyperscale computing, may adversely affect both our wired infrastructure and enterprise storage segments. We currently sell a substantial portion of our products for use in traditional enterprise data centers. As cloud-based IT solutions become more prevalent, our results of operations will suffer if we are unable to increase sales of our products to cloud-based data center providers.
We are subject to risks associated with our distributors, including product inventory levels and product sell-through.
We sell many of our products through distributors who maintain their own inventory of our products for sale to dealers and end customers. Sales to distributors accounted for 28% of our net revenue in the fiscal year ended October 29, 2017. If our distributors are unable to sell an adequate amount of their inventory of our products in a given quarter or if they decide to decrease their inventories for any reason, our sales to these distributors and our revenue may decline. We also face the risk that our distributors may increase inventory levels of our products in any particular quarter in excess of future anticipated sales. If such sales do not occur in the time frame anticipated by these distributors for any reason, these distributors may substantially decrease the amount of product they order from us in subsequent periods until their inventory levels realign with end customer demand, which would harm our business and could adversely affect our revenue in such subsequent periods. We have streamlined the number of distributors we use, making us increasingly dependent on our remaining distributors, which may exacerbate the foregoing risks and increase our related credit risk.
We do not always have a direct relationship with the end customers of our products sold through distributors. As a result, our products may be used in applications for which they were not necessarily designed or tested, including, for example, medical devices, and they may not perform as anticipated in such applications. In such event, failure of even a small number of parts could result in significant liabilities to us, damage our reputation and harm our business and results of operations.
Our business would be adversely affected by the departure of existing members of our senior management team.
Our success depends, in large part, on the continued contributions of our senior management team, and in particular, the services of Mr. Hock E. Tan, our President and Chief Executive Officer. None of our senior management is bound by written employment contracts. In addition, we do not currently maintain key person life insurance covering our senior management. The loss of any of our senior management could harm our ability to implement our business strategy and respond to the rapidly changing market conditions in which we operate.
Our operating results are subject to substantial quarterly and annual fluctuations.
Our revenue and operating results have fluctuated in the past and are likely to fluctuate in the future. These fluctuations may occur on a quarterly and annual basis and are due to a number of factors, many of which are beyond our control. These factors include, among others:
• | customer concentration and the gain or loss of significant customers; |
• | the timing of launches by our customers of new products, such as mobile handsets, in which our products are included and changes in end-user demand for the products manufactured and sold by our customers; |
• | changes in our product mix or customer mix and their effect on our gross margin; |
• | the timing of receipt, reduction or cancellation of significant orders by customers; |
• | fluctuations in the levels of component inventories held by our customers; |
• | utilization of our internal manufacturing facilities and fluctuations in manufacturing yields; |
• | our ability to successfully and timely integrate, and realize the benefits of acquisitions we may make and the timing of acquisitions or dispositions of, or making and exiting investments in, other entities, businesses or technologies; |
• | changes in our tax structure or incentive arrangements, which may adversely affect our net tax expense and our cash flow in any quarter in which such an event occurs; |
• | our ability to develop, introduce and market new products and technologies on a timely basis; |
15
• | the timing and extent of our non-product revenue, such as product development revenue and royalty and other payments from IP sales and licensing arrangements; |
• | new product announcements and introductions by us or our competitors; |
• | seasonality or other fluctuations in our markets; |
• | IP disputes and associated litigation expense; |
• | timing and amount of research and development and related new product expenditures, and the timing of receipt of any research and development grant monies; |
• | significant warranty claims, including those not covered by our suppliers or our insurers; |
• | availability and cost of raw materials and components from our suppliers; |
• | timing of any regulatory updates, particularly with respect to tax reform; |
• | fluctuations in currency exchange rates; |
• | loss of key personnel or the shortage of available skilled workers; and |
• | the effects of competitive pricing pressures, including decreases in average selling prices of our products. |
The foregoing factors are often difficult to predict, and these, as well as other factors, could materially adversely affect our quarterly or annual operating results. In addition, a significant amount of our operating expenses are relatively fixed in nature due to our significant sales, research and development and internal manufacturing overhead costs. Any failure to adjust spending quickly enough to compensate for a revenue shortfall could magnify the adverse impact of such revenue shortfall on our results of operations. As a result, we believe that quarter-to-quarter comparisons of our revenue and operating results may not be meaningful or a reliable indicator of our future performance. If our operating results in one or more future quarters fail to meet the expectations of securities analysts or investors, an immediate and significant decline in the trading price of our ordinary shares may occur.
If we are unable to attract and retain qualified personnel, especially our design and technical personnel, we may not be able to execute our business strategy effectively.
Our future success depends on our ability to retain, attract and motivate qualified personnel. We also seek to acquire talented engineering and technical personnel through acquisitions we may make from time to time or otherwise. We have historically encountered some difficulties in hiring and retaining qualified engineers, particularly in Silicon Valley and Southeast Asia where qualified engineers are in high demand. In addition, our employees, including employees whom we have retained as a result of an acquisition, may decide not to continue working for us and may leave with little or no notice. As the source of our technological and product innovations, our design and technical personnel represent a significant asset. Any inability to retain, attract or motivate such personnel could have a material adverse effect on our business, financial condition and results of operations.
Adverse global economic conditions could have a negative effect on our business, results of operations and financial condition and liquidity.
Adverse global economic conditions have from time to time caused or exacerbated significant slowdowns in the semiconductor industry generally, as well as in our target markets, which have adversely affected our business and results of operations. In recent periods, investor and customer concerns about the global economic outlook have adversely affected market and business conditions in general. Macroeconomic weakness and uncertainty also make it more difficult for us to accurately forecast revenue, gross margin and expenses. Sustained uncertainty about, or worsening of, current global economic conditions may cause our customers and consumers to reduce or delay spending, could lead to the insolvency of key suppliers and customers, and could intensify pricing pressures. Any or all of these factors could negatively affect demand for our products and our business, financial condition and result of operations.
We operate in the highly cyclical semiconductor industry, which is subject to significant downturns.
The semiconductor industry is highly cyclical and is characterized by constant and rapid technological change and price erosion, evolving technical standards, frequent new product introductions, short product life cycles (for semiconductors and for many of the end products in which they are used) and wide fluctuations in product supply and demand. From time to time, these factors, together with changes in general economic conditions, cause significant upturns and downturns in the industry in general, and in our business in particular. Periods of industry downturns have been characterized by diminished demand for end-user products, high inventory levels and periods of inventory adjustment, under-utilization of manufacturing capacity, changes in revenue mix and accelerated erosion of average selling prices, resulting in an adverse effect on our business, financial condition and results of operations. We expect our business to continue to be subject to cyclical downturns even
16
when overall economic conditions are relatively stable. If we cannot offset industry or market downturns, our net revenue may decline and our financial condition and results of operations may suffer.
Our proposed redomiciliation may adversely impact our overall cash tax costs. If we do not complete the redomiciliation within one year of the Brocade Merger, we may be required to divest our Brocade SAN business.
On November 2, 2017, we announced our intention to initiate a process to change the ultimate parent company of the Broadcom group from a Singapore company to a U.S. corporation. The final form and the timing of the redomiciliation has not yet been finalized and may be affected by the 2017 Tax Reform Act. In addition, the redomiciliation is subject to the approval of our shareholders. We presently expect our overall cash tax costs will approximately double, as compared to our fiscal year 2017 results, due to the redomiciliation and taking in account the expected effects of the 2017 Tax Reform Act.
Furthermore, in connection with the completion of the Brocade Merger, we agreed to initiate a process to separate and divest the Brocade SAN business if we do not complete this redomiciliation within one year after the Brocade Merger. Any such divestiture could materially and adversely affect our business and results of operations.
Winning business is subject to lengthy, competitive bid selection processes that often require us to incur significant expense, from which we may ultimately generate no revenue.
Our business is dependent on us winning competitive bid selection processes, known as “design wins”. These selection processes are typically lengthy and can require us to dedicate significant development expenditures and scarce engineering resources in pursuit of a single customer opportunity. Failure to obtain a particular design win may prevent us from obtaining design wins in subsequent generations of a particular product. This can result in lost revenue and could weaken our position in future competitive bid selection processes.
Winning a product design does not guarantee sales to a customer or that we will realize as much revenue as anticipated, if any. A delay or cancellation of a customer’s plans could materially and adversely affect our financial results, as we incur significant expense in the design process and may generate little or no revenue from it. In addition, the timing of design wins is unpredictable and implementing production for a major design win, or multiple design wins occurring at the same time, may strain our resources and those of our contract manufacturers. In such event, we may be forced to dedicate significant additional resources and incur additional, unanticipated costs and expenses. Often customers will only purchase limited numbers of evaluation units from us until they qualify the products and/or the manufacturing line for those products. The qualification process can take significant time and resources and we may not always be able to satisfy customers’ qualification requirements. Delays in qualification or failure to qualify our products may cause a customer to discontinue use of our products and result in a significant loss of revenue. Finally, customers could choose at any time to stop using our products or may fail to successfully market and sell their products, which could reduce demand for our products, and cause us to hold excess inventory, materially adversely affecting our business, financial condition and results of operations. These risks are exacerbated by the fact that many of our products, and the end products into which our products are incorporated, often have very short life cycles.
Competition in our industry could prevent us from growing our revenue.
The global semiconductor market is highly competitive. We expect competition in the markets in which we participate to continue to increase as existing competitors improve or expand their product offerings. Competition may further increase as companies not currently in direct competition with us may introduce competing products in the future. In addition, the competitive landscape is changing as a result of a trend toward consolidation within the industry, as some of our direct competitors have merged with or been acquired by other competitors while others have begun collaborating with each other. We expect this consolidation trend to continue.
Some of our competitors may have greater resources for manufacturing, distribution, financial, research and development or marketing resources than us. In addition, some of our competitors may also have a greater presence in key markets, a larger customer base or more comprehensive IP portfolio and patent protection than us. We compete with IDMs and fabless semiconductor companies, as well as the internal resources of large, integrated OEMs. Because our products are often building block semiconductors, providing functions that in some cases can be integrated into more complex ICs we also face competition from manufacturers of ICs, as well as customers that may develop their own IC products. Our competitors in these markets range from large, international companies offering a wide range of semiconductor products and devices to smaller companies specializing in niche markets and new technologies.
If we are unable to compete successfully, we may lose market share for our products or incur significant reduction in our gross margins, any of which could have a material adverse effect on our business and results of operations.
17
A prolonged disruption of our manufacturing facilities, research and development facilities or other significant operations, or those of our suppliers, could have a material adverse effect on our business, financial condition and results of operations.
Although we operate a primarily outsourced manufacturing business model, we also rely on our own manufacturing facilities, in particular in Fort Collins, Colorado, Singapore, and Breinigsville, Pennsylvania. We use these internal fabrication facilities for products utilizing our innovative and proprietary processes, to protect our IP, to accelerate time to market of our products and to ensure supply of certain components. Our Fort Collins and Breinigsville facilities are the sole sources for our FBAR components used in many of our wireless devices and for the InP-based wafers used in our fibre optics products, respectively. Many of our facilities, and those of our contract manufacturers and suppliers, are located in California and the Pacific Rim region, which has above average seismic activity and severe weather activity. In addition, our research and development personnel are primarily concentrated in China, India, Israel, Malaysia, Singapore, South Korea, Taiwan, Fort Collins, Colorado, San Jose, California, Southern California and Breinigsville and Allentown, Pennsylvania, with the expertise of the personnel at each such location tending to be focused on one or two specific areas.
A prolonged disruption at one or more of our manufacturing or research facilities for any reason, especially our Fort Collins, Singapore and Breinigsville facilities, or those of our contract manufacturers or suppliers, due to natural- or man-made disasters or other events outside of our control, such as equipment malfunction or widespread outbreaks of acute illness at one or more of these facilities, would limit our capacity to meet customer demands and delay new product development until a replacement facility and equipment, if necessary, were found. Any such event would likely disrupt our operations, delay production, shipments and revenue, result in us being unable to timely satisfy customer demand, expose us to claims by our customers resulting in significant expense to repair or replace our affected facilities, and in some instances could significantly curtail our research and development efforts in a particular product area or target market. As a result, we could forgo revenue opportunities, potentially lose market share, damage our customer relationships and be subject to litigation and additional liabilities, all of which could materially and adversely affect our business. Although we purchase insurance to mitigate certain losses, such insurance often carries a high deductible amount and any such uninsured losses could negatively affect our operating results. In addition, even if we were able to promptly resume production of our affected products, if our customers cannot timely resume their own manufacturing following such an event, they may cancel or scale back their orders from us and this may in turn adversely affect our results of operations. Such events could also result in increased fixed costs relative to the revenue we generate and adversely affect our results of operations.
We may be unable to maintain appropriate manufacturing capacity at our own manufacturing facilities, which could adversely affect our relationships with our customers, and our business, financial condition and results of operations.
We must maintain appropriate capacity at our own manufacturing facilities to meet anticipated customer demand for our proprietary products. From time to time, this requires us to invest in expansion or improvements of those facilities, which often involves substantial cost and other risks, such as delays in completion. Such expanded manufacturing capacity may still be insufficient, or may not come online soon enough, to meet customer demand and we may have to put customers on product allocation, forgo sales or lose customers as a result. Conversely, if we overestimate customer demand, we would experience excess capacity and fixed costs at these facilities, all of which could adversely affect our results of operations.
Any failure of our IT systems or one or more of our corporate infrastructure vendors to provide necessary services could have a material adverse effect on our business.
We depend on various IT systems, including networks, applications, internal IT systems and personnel, and outsourced services for, among other things, financial reporting and product orders and shipments. We rely on third-party vendors to provide critical corporate infrastructure services, including certain services related to accounting, billing, shipping, human resources, benefit plan administration, IT network development and network monitoring. While we may be entitled to damages if our vendors fail to perform under their agreements with us, we may be unable to collect on any award of damages and any award may be insufficient to cover the actual costs we may incur as a result of a vendor’s failure to perform under its agreement with us. Upon expiration or termination of any of our third-party vendor agreements we may not be able to timely replace the vendor on terms and conditions, including service levels and cost, that are favorable to us. In addition, a transition from one vendor to another vendor could subject us to operational delays and inefficiencies until the transition is complete.
Any failure of these internal or third-party systems and services to operate effectively could disrupt our operations and could have a material adverse effect on our business, financial condition and results of operations by harming our ability to accurately forecast sales demand, manage our supply chain and production facilities, fulfill customer orders, and report financial and other information on a timely and accurate basis.
Our gross margin is dependent on a number of factors, including our product mix, price erosion, acquisitions we may make, level of capacity utilization and commodity prices.
Our gross margin is highly dependent on product mix, which is susceptible to seasonal and other fluctuations in our markets. A shift in sales mix away from our higher margin products, as well as the timing and amount of our non-product and
18
IP-related revenue, could adversely affect our future gross margin percentages. Although our non-product revenue is generally high margin, it fluctuates significantly from quarter to quarter. In addition, increased competition and the existence of product alternatives, more complex engineering requirements, lower demand or reductions in our technological lead, compared to our competitors, and other factors may lead to further price erosion, lower revenue and lower margin for us in the future.
Our gross margin may also be adversely affected by expenses related to the acquisitions of businesses, such as amortization of intangible assets and restructuring and impairment charges. Furthermore, businesses or companies that we acquire may have different gross margin profiles than us and could, therefore, also affect our overall gross margin.
In addition, semiconductor manufacturing requires significant capital investment, leading to high fixed costs, including depreciation expense. If we are unable to utilize our owned manufacturing facilities at a high level, the fixed costs associated with these facilities, such as depreciation expense, will not be fully absorbed, resulting in higher average unit costs and a lower gross margin. Furthermore, fluctuations in commodity prices, either directly in the price of the raw materials we buy, or as a result of price increases passed on to us by our suppliers, could negatively impact our margins. We do not hedge our exposure to commodity prices, some of which (including gold and fuel prices) are very volatile, and sudden or prolonged increases in commodities prices may adversely affect our gross margin.
The enactment of legislation implementing changes in taxation of international business activities, the adoption of other corporate tax reform policies, or changes in tax legislation or policies could materially impact our financial position and results of operations.
Corporate tax reform, base-erosion efforts and tax transparency continue to be high priorities in many tax jurisdictions where we have business operations. As a result, policies regarding corporate income and other taxes in numerous jurisdictions are under heightened scrutiny and tax reform legislation is being proposed or enacted in a number of jurisdictions. For example, the 2017 Tax Reform Act, adopting broad U.S. corporate income tax reform will, among other things, reduce the U.S. corporate income tax rate, but will impose base-erosion prevention measures on non-U.S. earnings of U.S. entities as well as a one-time mandatory deemed repatriation tax on accumulated non-U.S. earnings of U.S. entities. The 2017 Tax Reform Act will affect the tax position reflected on our consolidated balance sheet and our obligations for cash taxes of our U.S. entities and will have a corresponding impact on our consolidated financial results starting in the first quarter of our fiscal year 2018.
In addition, many countries are beginning to implement legislation and other guidance to align their international tax rules with the Organisation for Economic Co-operation’s Base Erosion and Profit Shifting recommendations and action plan that aim to standardize and modernize global corporate tax policy, including changes to cross-border tax, transfer-pricing documentation rules, and nexus-based tax incentive practices. As a result of the heightened scrutiny of corporate taxation policies, prior decisions by tax authorities regarding treatments and positions of corporate income taxes could be subject to enforcement activities, and legislative investigation and inquiry, which could also result in changes in tax policies or prior tax rulings. Any such changes in policies or rulings may also result in the taxes we previously paid being subject to change.
Due to the large scale of our international business activities any substantial changes in international corporate tax policies, enforcement activities or legislative initiatives may materially and adversely affect our business, the amount of taxes we are required to pay and our financial condition and results of operations generally.
If the tax incentive or tax holiday arrangements we have negotiated in Singapore and other jurisdictions change or cease to be in effect or applicable, in part or in whole, for any reason, or if our assumptions and interpretations regarding tax laws and incentive or holiday arrangements prove to be incorrect, the amount of corporate income taxes we have to pay could significantly increase.
Our operations are currently structured to benefit from the various tax incentives and tax holidays extended to us in various jurisdictions to encourage investment or employment. For example, we have obtained tax incentives from the Singapore Economic Development Board, an agency of the Government of Singapore, which provide that qualifying income we earn in Singapore is subject to tax holiday or reduced rates of Singapore income tax. Subject to our compliance with the conditions specified in these incentives and legislative developments, the Singapore tax incentives are presently expected to expire at various dates generally between 2020 and 2021, subject in certain cases to potential extensions, which we may or may not be able to obtain, and any subsequent changes in incentive scope. Absent these tax incentives, the corporate income tax rate that would otherwise apply to our Singapore taxable income would be 17%. We also have tax holidays on our qualifying income in Malaysia, which are scheduled to expire between 2018 and 2028. The tax incentives and tax holidays that we have obtained are also subject to our compliance with various operating and other conditions and may, in some instances, be amended or terminated prior to their scheduled termination date by the relevant governmental authority. If we cannot, or elect not to, comply with the operating conditions included in any particular tax incentive, we could, in some instances, be required to refund previously realized material tax benefits, or if such tax incentive or tax holiday is terminated prior to its expiration absent a new incentive applying, we will lose the related tax benefits earlier than scheduled. Depending on the incentive at issue, we could also be required to modify our operational structure and tax strategy, which may not be as
19
beneficial to us as the benefits provided under the present arrangements. The effect of all these tax incentives and tax holidays, in the aggregate, was to reduce the overall provision for income taxes by approximately $237 million, $169 million and $207 million, for fiscal years 2017, 2016 and 2015, respectively, to increase diluted net income per share by $0.56 and $0.74 in fiscal years 2017 and 2015, respectively, and to reduce diluted net loss per share by $0.44 for fiscal year 2016.
Our interpretations and conclusions regarding the tax incentives are not binding on any taxing authority, and if our assumptions about tax and other laws are incorrect or if these tax incentives are substantially modified or rescinded we could suffer material adverse tax and other financial consequences, which would increase our expenses, reduce our profitability and adversely affect our cash flows.
Our overall cash tax costs are affected by a number of factors, including reorganizations or restructurings of our businesses or assets, jurisdictional revenue mix and changes in tax regulations or policy, and may be further impacted if our ultimate parent company redomiciles from Singapore to the U.S., all of which could materially, adversely affect financial results.
We are currently a Singapore-based multinational company subject to tax in various tax jurisdictions. Significant judgment is required in determining our worldwide provision for income taxes. In the ordinary course of our business, there are many transactions where the ultimate tax determination is uncertain. Additionally, our calculations of income taxes payable currently and on a deferred basis are based on our interpretations of applicable tax laws in the jurisdictions in which we are required to file tax returns.
Our provision for income taxes is subject to volatility and could be adversely affected by numerous factors including:
• | reorganization or restructuring of our businesses, tangible and intangible assets, outstanding indebtedness and corporate structure, including the planned redomiciliation of our ultimate parent company from Singapore to the U.S.; |
• | jurisdictional mix of our income and assets, and the resulting tax effects of differing tax rates in different countries; |
• | changes in the allocation of income and expenses, including adjustments related to changes in our corporate structure, acquisitions or tax law; |
• | changes in transfer pricing rules or methods of applying these rules; |
• | changes in tax laws, including in the U.S., changes to the taxation of earnings of foreign subsidiaries, the deductibility of expenses attributable to income and foreign tax credit rules; |
• | tax effects of increases in non-deductible employee compensation; |
• | changes in tax accounting rules or principles and in the valuation of deferred tax assets and liabilities; |
• | outcomes of income tax audits; and |
• | modifications, expiration, lapses or termination of tax credits or incentives. |
At the time we completed our acquisition of BRCM, or the Broadcom Merger, in connection with the preliminary allocation of the purchase price, we established a deferred tax liability on our balance sheet. This liability is associated with our potential tax liability arising from our planned integration of BRCM’s IP, which was completed in November 2016. This deferred tax liability was established using an assumed effective U.S. corporate income tax rate of 35%. However, the 2017 Tax Reform Act lowers this rate to 21%, which will result in a material reduction in the amount of other long-term liabilities on our balance sheet. In addition, prior to the adoption of the 2017 Tax Reform Act, this tax liability would have become payable in the U.S. as earnings resulting from this integration of IP were distributed over time. However, under the 2017 Tax Reform Act, we will be required to recognize all of these earnings in our fiscal year 2018 as a deemed repatriation of foreign earnings, subject to a one-time mandatory deemed repatriation tax. This repatriation tax, which we preliminarily estimate to be approximately $1.3 billion to $2.5 billion in the aggregate, will be payable over eight years starting in fiscal year 2018. This repatriation tax will increase the amount of our cash taxes payable by an initial amount of at least $100 million to $200 million per year, starting in fiscal year 2018. Our initial estimates of the financial impact of the 2017 Tax Reform Act may change as we refine our analysis and as additional guidance becomes available.
We have also adopted transfer pricing policies between our affiliated entities. Our policies call for the provision of services, the sale of products, the advance of financing and grant of licenses from one affiliate to another at prices that we believe are negotiated on an arm’s length basis. Our taxable income in any jurisdiction is dependent upon acceptance of our operational practices and intercompany transfer pricing by local tax authorities as being on an arm’s length basis. Due to inconsistencies in application of the arm’s length standard among taxing authorities, as well as lack of adequate treaty-based protection, transfer pricing challenges by tax authorities could, if successful, result in adjustments for prior or future years. As a result of these adjustments, we could become subject to higher taxes and our earnings and results of operations would be adversely affected in any period in which such determination is made.
20
Although we believe our tax estimates are reasonable, there is no assurance that the final determination of our income tax liability will not be materially different than what is reflected in our income tax provisions and accruals. Significant judgment is required to determine the recognition and measurement of tax liabilities prescribed in the relevant accounting guidance for uncertainty in income taxes. The accounting guidance for uncertainty in income taxes applies to all income tax positions, which, if resolved unfavorably, could adversely impact our provision for income taxes and our payment obligation with respect to any such taxes.
In addition, we are subject to, and are under, tax audit in various jurisdictions, and such jurisdictions may assess additional income tax against us. Although we believe our tax positions are reasonable, the final determination of tax audits could be materially different from our income tax provisions and accruals. The ultimate result of an audit could have a material adverse effect on our results of operations and cash flows in the period or periods for which that determination is made.
We may be involved in legal proceedings, including IP, anti-competition and securities litigation, employee-related claims and governmental investigations, which could, among other things, divert efforts of management and result in significant expense and loss of our IP rights.
We are often involved in legal proceedings, including cases involving our IP rights and those of others, anti-competition and commercial matters, merger-related suits, securities class action suits, employee-related claims and other actions. Some of these actions may seek injunctive relief, including injunctions or exclusion orders against the sale of our products and substantial monetary damages, which if granted or awarded could materially harm our business, financial condition and results of operations. From time to time, we may also be involved or required to participate in governmental investigations. Litigation or settlement of such actions, regardless of their merit, or involvement in governmental investigations, can be complex, can extend for a protracted period of time, may divert the efforts and attention of our management and technical personnel, is frequently costly and the related expenditures unpredictable. An unfavorable resolution of a governmental investigation may include, among others, fines or other orders to pay money, and/or the issuance of orders to cease certain conduct and/or modify our business practices.
The semiconductor industry is characterized by companies holding large numbers of patents, copyrights, trademarks and trade secrets and by the vigorous pursuit, protection and enforcement of IP rights, including actions by patent-holding companies that do not make or sell products. From time to time, third parties assert against us and our customers and distributors their patent, copyright, trademark, trade secret and other IP rights to technologies that are important to our business.
Many of our customer agreements, and in some cases our asset sale agreements, require us to indemnify our customers or purchasers for third-party IP infringement claims, including costs to defend those claims, and payment of damages in the case of adverse rulings. Claims of this sort could also harm our relationships with our customers and might deter future customers from doing business with us. We do not know whether we will prevail in such proceedings, given the complex technical issues and inherent uncertainties in IP litigation. If any pending or future proceedings result in an adverse outcome, we could be required to:
• | cease the manufacture, use or sale of the infringing products, processes or technology and/or make changes to our processes or products; |
• | pay substantial damages for past, present and future use of the infringing technology; |
• | expend significant resources to develop non-infringing technology; |
• | license technology from the third-party claiming infringement, which license may not be available on commercially reasonable terms, or at all; |
• | enter into cross-licenses with our competitors, which could weaken our overall IP portfolio and our ability to compete in particular product categories; |
• | indemnify our customers or distributors and/or recall, or accept the return of, infringing products; |
• | pay substantial damages to our direct or end customers to discontinue use or replace infringing technology with non-infringing technology; or |
• | relinquish IP rights associated with one or more of our patent claims, if such claims are held invalid or otherwise unenforceable. |
Any of the foregoing results could have a material adverse effect on our business, financial condition and results of operations.
In addition, we may be obligated to indemnify our current or former directors or employees, or former directors or employees of companies that we have acquired, in connection with litigation or regulatory investigations. These liabilities
21
could be substantial and may include, among other things, the cost of defending lawsuits against these individuals, as well as stockholder derivative suits; the cost of government, law enforcement or regulatory investigations; civil or criminal fines and penalties; legal and other expenses; and expenses associated with the remedial measure, if any, which may be imposed.
We utilize a significant amount of IP in our business. If we are unable or fail to protect our IP, our business could be adversely affected.
Our success depends in part upon protecting our IP. To accomplish this, we rely on a combination of IP rights, including patents, copyrights, trademarks and trade secrets, as well as customary contractual protections with our customers, suppliers, employees and consultants. We may be required to spend significant resources to monitor and protect our IP rights, and even with significant expenditures we may not be able to protect our IP rights that are valuable to our business. We are unable to predict or assure that:
• | IP rights that we presently employ in our business will not lapse or be invalidated, circumvented, challenged, or, in the case of third-party IP rights licensed to us, be licensed to others; |
• | our IP rights will provide competitive advantages to us; |
• | rights previously granted by third parties to IP rights licensed or assigned to us, including portfolio cross-licenses, will not hamper our ability to assert our IP rights against potential competitors or hinder the settlement of currently pending or future disputes; |
• | any of our pending or future patent, trademark or copyright applications will be issued or have the coverage originally sought; |
• | our IP rights will be enforced in certain jurisdictions where competition may be intense or where legal protection may be weak; or |
• | we have sufficient IP rights to protect our products or our business. |
In addition, our competitors or others may develop products or technologies that are similar or superior to our products or technologies, duplicate our products or technologies or design around our protected technologies. Effective patent, trademark, copyright and trade secret protection may be unavailable or more limited in other jurisdictions, relative to those protections available in the United States, may not be applied for or may be abandoned in one or more relevant jurisdictions. We may elect to abandon or divest patents or otherwise not pursue prosecution of certain pending patent applications, due to strategic concerns or other factors. In addition, when patents expire, we lose the protection and competitive advantages they provided to us.
We also generate some of our revenue from licensing royalty payments and from technology claim settlements relating to certain of our IP. Licensing of our IP rights, particularly exclusive licenses, may limit our ability to assert those IP rights against third parties, including the licensee of those rights. In addition, we may acquire companies with IP that is subject to licensing obligations to other third parties. These licensing obligations may extend to our own IP following any such acquisition and may limit our ability to assert our IP rights. From time to time we pursue litigation to assert our IP rights, including, in some cases, against third parties with whom we have ongoing relationships, such as customers and suppliers. Claims of this sort could also harm our relationships with our customers and might deter future customers from doing business with us. Conversely, third parties may pursue IP litigation against us, including as a result of our IP licensing business. An adverse decision in such types of legal action could limit our ability to assert our IP rights and limit the value of our technology, including the loss of opportunities to sell or license our technology to others or to collect royalty payments based upon successful protection and assertion of our IP against others. In addition, such legal actions or adverse decisions could otherwise negatively impact our business, financial condition and results of operations.
From time to time we may need to obtain additional IP licenses or renew existing license agreements. We are unable to predict whether these license agreements can be obtained or renewed on acceptable terms or at all.
We are subject to warranty claims, product recalls and product liability.
From time to time, we may be subject to warranty or product liability claims that may in the future lead to significant expense. Our customer contracts typically contain warranty and indemnification provisions, and in certain cases may also contain liquidated damages provisions, relating to product quality issues. The potential liabilities associated with such provisions are significant, and in some cases, including in agreements with some of our largest customers, are potentially unlimited. Any such liabilities may greatly exceed any revenue we receive from the relevant products. Costs, payments or damages incurred or paid by us in connection with warranty and product liability claims and product recalls could materially and adversely affect our financial condition and results of operations. We may also be exposed to such claims as a result of any acquisition we may undertake in the future.
22
Product liability insurance is subject to significant deductibles and there is no guarantee that such insurance will be available or adequate to protect against all such claims, or we may elect to self-insure with respect to certain matters. It is possible for one of our customers to recall a product containing one of our devices. In such an event, we may incur significant costs and expenses, including among others, replacement costs, contract damage claims from our customers and reputational harm. Although we maintain reserves for reasonably estimable liabilities and purchase product liability insurance, our reserves may be inadequate to cover the uninsured portion of such claims. Conversely, in some cases, amounts we reserve may ultimately exceed our actual liability for particular claims and may need to be reversed.
The complexity of our products could result in unforeseen delays or expense or undetected defects or bugs, which could adversely affect the market acceptance of new products, damage our reputation with current or prospective customers, and materially and adversely affect our operating costs.
Highly complex products, such as those we offer, may contain defects and bugs when they are first introduced or as new versions are released, or their release may be delayed due to unforeseen difficulties during product development. If any of our products, including products of companies we have acquired, or third-party components used in our products, contain defects or bugs, or have reliability, quality or compatibility problems, we may not be able to successfully design workarounds. Furthermore, if any of these problems are not found until after we have commenced commercial production of a new product, we may be required to incur additional development costs and product recall, repair or replacement costs. Consequently, our reputation may be damaged and customers may be reluctant to buy our products, which could materially and adversely affect our ability to retain existing customers and attract new customers. To resolve these problems, we may have to invest significant capital and other resources. These problems may also result in claims against us by our customers or others. For example, if a delay in the manufacture and delivery of our products causes the delay of a customer’s end-product delivery, we may be required, under the terms of our agreement with that customer, to compensate the customer for the adverse effects of such delays. In addition, these problems may divert our technical and other resources from other development efforts, and we would likely lose, or experience a delay in, market acceptance of the affected product or products. As a result, our financial results could be materially and adversely affected.
We make substantial investments in research and development to enhance existing and develop new technologies to keep pace with technological advances and to remain competitive in our business, and unsuccessful investments could materially adversely affect our business, financial condition and results of operations.
The semiconductor industry is characterized by rapid technological change, changes in customer requirements, frequent new product introductions and enhancements, short product cycles and evolving industry standards, and requires substantial investment in our research and development in order to develop and bring to market new and enhanced technologies and products. In addition, semiconductor products transition over time to increasingly smaller line width geometries. This requires us to adapt our products and manufacturing processes to these new technologies, which requires expertise in new procedures. Our failure to successfully transition to smaller geometry process technologies could impair our competitive position. In order to remain competitive, we have made, and expect to continue to make, significant investments in research and development. We expect the dollar amount of research and development expenses to increase for the foreseeable future, due to the increasing complexity and number of products we plan to develop. If we fail to develop new and enhanced products and technologies, if we focus on technologies that do not become widely adopted, or if new competitive technologies that we do not support, become widely accepted, demand for our products may be reduced. Significant investments in unsuccessful research and development efforts could materially adversely affect our business, financial condition and results of operations. In addition, increased investments in research and development could cause our cost structure to fall out of alignment with demand for our products, which would have a negative impact on our financial results.
Our business, financial condition and results of operations could be adversely affected by the political and economic conditions of the countries in which we conduct business and other factors related to our international operations.
A majority of our products are produced and sourced in Asia, including China, India, Malaysia, the Philippines, Singapore, South Korea, Taiwan and Thailand, and we sell our products throughout the world. In addition, as of October 29, 2017, approximately 38% of our employees are located in Asia. Multiple factors relating to our international operations and to particular countries in which we operate could have a material adverse effect on our business, financial condition and results of operations. These factors include:
• | changes in political, regulatory, legal or economic conditions or geopolitical turmoil, including terrorism, war or political or military coups, or civil disturbances or political instability; |
• | restrictive governmental actions, such as restrictions on the transfer or repatriation of funds and foreign investments and trade protection measures, including import/export restrictions, import/export duties and quotas, and customs duties and tariffs, all of which could increase under the current administration in the United States; |
23
• | disruptions of capital and trading markets and currency fluctuations, which may result in our products becoming too expensive for foreign customers or foreign-sourced materials and services becoming more expensive for us; |
• | difficulty in obtaining product distribution and support, and transportation delays; |
• | difficulty in conducting due diligence with respect to business partners in certain international markets; |
• | public health or safety concerns; |
• | nationalization of businesses and expropriation of assets; and |
• | changes in tax laws. |
A significant legal risk associated with conducting business internationally is compliance with the various and differing laws and regulations, including anti-corruption and anti-bribery laws and regulations, of the countries in which we do business, antitrust and competition laws, data privacy laws and export regulations. In addition, the laws in various countries are constantly evolving and may, in some cases, conflict with each other. Although our Code of Ethics and Business Conduct and other policies prohibit us, our employees and our agents from engaging in unethical business practices, there can be no assurance that all of our employees or agents will refrain from acting in violation of our related anti-corruption policies and procedures. Any such violation could have a material adverse effect on our business.
Our business is subject to various governmental regulations, and compliance with these regulations may cause us to incur significant expense. If we fail to maintain compliance with applicable regulations, we may be forced to cease the manufacture and distribution of certain products, and we could be subject to civil or criminal penalties.
Our business is subject to various international laws and other legal requirements, including packaging, product content, labor and import/export regulations, such as the U.S. Export Administration Regulations, and many of our products are regulated or sold into regulated industries. These laws and regulations are complex, change frequently, have generally become more stringent over time and may intensify under the current U.S. administration. We may be required to incur significant expense to comply with, or to remedy violations of, these regulations. In addition, if our customers fail to comply with these regulations, we may be required to suspend sales to these customers, which could negatively impact our results of operations.
In addition, the manufacture and distribution of our semiconductors must comply with various laws and adapt to changes in regulatory requirements as they occur. For example, if a country in which our products are manufactured or sold sets technical standards that are not widely shared, it may require us to stop distributing our products commercially until they comply with such new standards, lead certain of our customers to suspend imports of their products into that country, require manufacturers in that country to manufacture products with different technical standards and disrupt cross-border manufacturing relationships, any of which could have a material adverse effect on our business, financial condition and results of operations. If we fail to comply with these requirements, we could also be required to pay civil penalties or face criminal prosecution. In addition, it is expected that the current U.S. administration’s trade policy will promote U.S. manufacturing and manufacturers. It is unclear what effect this will have on us as a multinational company that conducts business world-wide, or on our suppliers, customers, contract manufacturers and OEMs.
Our products and operations are also subject to the rules of industrial standards bodies, like the International Standards Organization, as well as regulation by other agencies, such as the U.S. Federal Communications Commission. If we fail to adequately address any of these rules or regulations, our business could be harmed.
We are subject to environmental, health and safety laws, which could increase our costs, restrict our operations and require expenditures that could have a material adverse effect on our results of operations and financial condition.
We are subject to a variety of international laws and regulations relating to the use, disposal, clean-up of and human exposure to, hazardous materials. Compliance with environmental, health and safety requirements could, among other things, require us to modify our manufacturing processes, restrict our ability to expand our facilities, or require us to acquire pollution control equipment, all of which can be very costly. Any failure by us to comply with such requirements could result in the limitation or suspension of the manufacture of our products, and could result in litigation against us and the payment of significant fines and damages by us in the event of a significant adverse judgment. In addition, complying with any cleanup or remediation obligations for which we are or become responsible could be costly and have a material adverse effect on our business, financial condition and results of operations.
Changing requirements relating to the materials composition of our products, including the restrictions on lead and certain other substances in electronics that apply to specified electronics products sold in various countries, including the United States, China, Japan, and in the European Union, increase the complexity and costs of our product design and procurement operations and may require us to re-engineer our products. Such re-engineering may result in excess inventory or other additional costs and could have a material adverse effect on our results of operations. We may also experience claims
24
from employees from time to time with regard to exposure to hazardous materials or other workplace related environmental claims.
Social and environmental responsibility regulations, policies and provisions, as well as customer demand, may make our supply chain more complex and may adversely affect our relationships with customers.
There is an increasing focus on corporate social and environmental responsibility in the semiconductor industry, particularly with OEMs that manufacture consumer electronics. A number of our customers have adopted, or may adopt, procurement policies that include social and environmental responsibility provisions that their suppliers should comply with, or they seek to include such provisions in their procurement terms and conditions. An increasing number of participants in the semiconductor industry are also joining voluntary social responsibility initiatives such as the U.N. Global Compact, a voluntary initiative for businesses to develop, implement and disclose sustainability policies and practices. These social and environmental responsibility provisions and initiatives are subject to change, can be unpredictable, and may be difficult and expensive for us to comply with, given the complexity of our supply chain and our significant outsourced manufacturing. If we are unable to comply, or are unable to cause our suppliers or contract manufacturers to comply, with such policies or provisions, a customer may stop purchasing products from us, and may take legal action against us, which could harm our reputation, revenue and results of operations.
In addition, as part of their corporate social and environmental responsibility programs, an increasing number of OEMs are seeking to source products that do not contain minerals sourced from areas where proceeds from the sale of such minerals are likely to be used to fund armed conflicts, such as in the Democratic Republic of Congo. This could adversely affect the sourcing, availability and pricing of minerals used in the manufacture of semiconductor devices, including our products. Since our supply chain is complex, we are not currently able to definitively ascertain the origins of all of these minerals and metals used in our products. As a result, we may face difficulties in satisfying these customers’ demands, which may harm our sales and operating results.
The average selling prices of products in our markets have often decreased rapidly and may do so in the future, which could harm our revenue and gross profit.
The products we develop and sell are used for high volume applications. As a result, the prices of those products have often decreased rapidly. Gross profit on our products may be negatively affected by, among other things, pricing pressures from our customers. In the past, we have reduced the average selling prices of our products in anticipation of future competitive pricing pressures, new product introductions by us or our competitors and other factors. In addition, some of our customer agreements provide for volume-based pricing and product pricing roadmaps, which can also reduce the average selling prices of our products over time. Our margins and financial results will suffer if we are unable to offset any reductions in our average selling prices by increasing our sales volumes, reducing manufacturing costs, or developing new and higher value-added products on a timely basis.
A breach of our security systems may have a material adverse effect on our business.
Our security systems are designed to maintain the physical security of our facilities and protect our customers’, suppliers’ and employees’ confidential information, as well as our own proprietary information. However, we are also dependent on a number of third-party cloud-based and other service providers of critical corporate infrastructure services relating to, among other things, human resources, electronic communication services and certain finance functions, and we are, of necessity, dependent on the security systems of these providers. Accidental or willful security breaches or other unauthorized access by third parties or our employees or contractors of our facilities, our information systems or the systems of our cloud-based or other service providers, or the existence of computer viruses or malware in our or their data or software could expose us to a risk of information loss and misappropriation of proprietary and confidential information, including information relating to our products or customers and the personal information of our employees. In addition, we have, from time to time, also been subject to unauthorized network intrusions and malware on our own IT networks. Any theft or misuse of confidential, personal or proprietary information as a result of such activities could result in, among other things, unfavorable publicity, damage to our reputation, loss of our trade secrets and other competitive information, difficulty in marketing our products, allegations by our customers that we have not performed our contractual obligations, litigation by affected parties and possible financial obligations for liabilities and damages related to the theft or misuse of such information, as well as fines and other sanctions resulting from any related breaches of data privacy regulations, any of which could have a material adverse effect on our reputation, business, profitability and financial condition. Since the techniques used to obtain unauthorized access or to sabotage systems change frequently and are often not recognized until launched against a target, we may be unable to anticipate these techniques or to implement adequate preventative measures.
25
We are required to assess our internal control over financial reporting on an annual basis and any adverse findings from such assessment could result in a loss of investor confidence in our financial reports, significant expense to remediate any internal control deficiencies and ultimately have an adverse effect on our share price.
We are required to assess the effectiveness of our internal control over financial reporting annually, as required by Section 404 of the Sarbanes-Oxley Act. Even though, as of October 29, 2017, we concluded that our internal control over financial reporting was effective, we need to maintain our processes and systems and adapt them as our business grows and changes, including to reflect our integration of Brocade, as well as any future acquisitions we may undertake. This continuous process of maintaining and adapting our internal controls and complying with Section 404 is expensive, time consuming and requires significant management attention. We cannot be certain that our internal control measures will continue to provide adequate control over our financial processes and reporting and ensure compliance with Section 404. Furthermore, as we grow our business or acquire other businesses, our internal controls may become more complex and we may require significantly more resources to ensure they remain effective. Failure to implement required new or improved controls, or difficulties encountered in the implementation of such controls, either in our existing business or in businesses that we acquire, could harm our operating results or cause us to fail to meet our reporting obligations. If we or our independent registered public accounting firm identify material weaknesses in our internal controls, the disclosure of that fact, even if quickly remedied, may cause investors to lose confidence in our financial statements and the trading price of our ordinary shares may decline.
Remediation of a material weakness could require us to incur significant expenses and if we fail to remedy any material weakness, our financial statements may be inaccurate, we may be required to restate our financial statements, our ability to report our financial results on a timely and accurate basis may be adversely affected, our access to the capital markets may be restricted, the trading price of our ordinary shares may decline, and we may be subject to sanctions or investigation by regulatory authorities, including the SEC or The Nasdaq Global Select Market.
Our financial condition and results of operations could be adversely affected by employee-benefit related costs and expense.
We sponsor several defined benefit plans and post-retirement medical benefit plans. We are required to make contributions to these plans to comply with minimum funding requirements imposed by laws governing these employee benefit plans. The difference between the obligations and assets of these plans, or the funded status of these plans, is a significant factor in determining our pension expense and the ongoing funding requirements of these plans. The projected benefit obligations under these pension plans exceeded the value of the assets of those plans by approximately $82 million at the end of fiscal year 2017. We expect to have additional funding requirements in future years and we may make additional, voluntary contributions to the plans. Depending on our cash position at the time, any such funding or contributions to our pension plans could impact our operating flexibility and financial position, including adversely affecting our cash flow for the quarter in which they are made.
Furthermore, in order to reduce the expenses associated with these programs, where practicable, we are seeking to move defined benefit plans to defined contribution plans, or to cash out future retirees not yet receiving benefits, and to replace existing pension obligations with annuities. Any such changes may adversely affect our results of operations, including our profitability and cash flows. Weak economic conditions and related under-performance of asset markets could also lead to an increase in post-retirement benefit expense.
The Internal Revenue Service may not agree that Broadcom Limited should be treated as a foreign corporation for U.S. federal income tax purposes.
A corporation is generally considered a tax resident in the jurisdiction of its organization or incorporation for U.S. federal income tax purposes. Because Broadcom is currently a Singapore entity, it would generally be classified as a foreign corporation (and, therefore, not a U.S. tax resident) under these rules. Even so, the Internal Revenue Service, or IRS, may assert that we should be treated as a U.S. corporation (and, therefore, a U.S. tax resident) for U.S. federal income tax purposes pursuant to Section 7874 of the Internal Revenue Code of 1986, as amended, or the Code.
Under Section 7874 of the Code, if the former shareholders of BRCM hold 80% or more of the vote or value of the ordinary shares of Broadcom, by reason of their former holding of BRCM common shares (the percentage (by vote and value) of our ordinary shares considered to be held (for purposes of Section 7874 of the Code) by former BRCM shareholders immediately after the Broadcom Merger by reason of holding BRCM common shares is referred to in this disclosure as the “Section 7874 Percentage”), and our expanded affiliated group after the Broadcom Transaction does not have substantial business activities in Singapore relative to our worldwide business activities, Broadcom would be treated as a U.S. corporation for U.S. federal income tax purposes. If the Section 7874 Percentage were determined to be at least 60% (but less than 80%), Section 7874 of the Code would cause Broadcom to be treated as a “surrogate foreign corporation” if we did not have substantial business activities in Singapore relative to our worldwide business activities.
26
Under current law, Broadcom should not be treated as a U.S. corporation for U.S. federal income tax purposes. However, determining the Section 7874 Percentage is complex and is subject to factual and legal uncertainties, including that such determination takes into account several factors other than the ratio of ownership of our ordinary shares by former BRCM shareholders following the Broadcom Merger. While we believe the Section 7874 Percentage to be significantly less than 60% (and therefore that Section 7874 should not apply to Broadcom or BRCM), there can be no assurance that the IRS will agree with the position that the Section 7874 Percentage is less than 60%.
If the Section 7874 Percentage were determined to be at least 60% (but less than 80%), several limitations could apply to BRCM. For example, BRCM would be prohibited from using its net operating losses, foreign tax credits or other tax attributes to offset the income or gain recognized by reason of the transfer of property to a foreign related person during the 10-year period following the Broadcom Merger or any income received or accrued during such period by reason of a license of any property by BRCM to a foreign related person. In addition, the IRS has announced that it will promulgate new rules, which, in that situation, may limit the ability to restructure the non-U.S. members of the BRCM tax group or access cash earned in its non-U.S. subsidiaries. Moreover, in such case, Section 4985 of the Code and rules related thereto would impose an excise tax on the value of certain stock compensation held directly or indirectly by certain BRCM “disqualified individuals” (including former officers and directors of BRCM) at a rate equal to 15%, but only if a gain is otherwise recognized by BRCM shareholders as a result of the Broadcom Merger.
Risks Relating to Our Indebtedness
Our substantial indebtedness could adversely affect our financial health and our ability to raise additional capital to fund our operations, limit our ability to react to changes in the economy or our industry and prevent us from fulfilling our obligations under our indebtedness.
As of October 29, 2017, our total consolidated indebtedness under our senior unsecured notes that were issued and sold in January 2017, or the January 2017 Senior Notes, and our senior unsecured notes that were issued and sold in October 2017, or the October 2017 Senior Note, collectively the Senior Notes, was $17,689 million. Subject to restrictions in the indentures governing our Senior Notes, or the Indentures, we have the ability to incur a significant amount of additional indebtedness in the future.
Our substantial indebtedness could have important consequences including:
• | increasing our vulnerability to adverse general economic and industry conditions; |
• | requiring us to dedicate a substantial portion of our cash flow from operations to payments on our indebtedness, thereby reducing the availability of our cash flow to fund working capital, capital expenditures, research and development efforts, execution of our business strategy, acquisitions and other general corporate purposes; |
• | limiting our flexibility in planning for, or reacting to, changes in the economy and the semiconductor industry; |
• | placing us at a competitive disadvantage compared to our competitors with less indebtedness; and |
• | making it more difficult to borrow additional funds in the future to fund growth, acquisitions, working capital, capital expenditures and other purposes; and |
• | exposing us to interest rate risk to the extent we incur any variable rate indebtedness, and we do not typically hedge against changes in interest rates. |
The Indentures also place limitations on our ability to incur certain secured debt, enter into certain sale and lease-back transactions and consolidate, merge, sell or otherwise dispose of all or substantially all of our assets. In addition, the Indentures contain customary events of default upon the occurrence of which, after any applicable grace period, the noteholders would have the ability to immediately declare the debt due and payable. In such event, we may not have sufficient available cash to repay such debt at the time it becomes due, or be able to refinance such debt on acceptable terms or at all. Any of the foregoing could materially and adversely affect our business, financial condition and results of operations.
We receive debt ratings from the major credit rating agencies in the United States. Credit rating agencies regularly revise their ratings for companies they follow, including us. Factors that may impact our credit ratings include debt levels, planned asset purchases or sales and near-term and long-term production growth opportunities. Liquidity, asset quality, cost structure, reserve mix and commodity pricing levels could also be considered by the rating agencies. A ratings downgrade could adversely affect the trading price of our Senior Notes or the trading market for our Senior Notes. Any credit rating downgrade could adversely impact our ability to access debt markets in the future or to refinance our outstanding indebtedness at similar rates or at all, increase the cost of current or future debt and significantly harm our financial condition and results of operations.
27
Servicing our debt requires a significant amount of cash, and we may not have sufficient cash flow from our business to pay our substantial debt.
Our ability to make scheduled payments of the principal of, to pay interest on, and to refinance our debt, depends on our future performance, which is subject to economic, financial, competitive and other factors beyond our control. Our business may not continue to generate cash flow from operations in the future sufficient to satisfy our obligations under the Senior Notes and any future indebtedness we may incur and to make necessary capital expenditures. If we are unable to generate such cash flow, we may be required to adopt one or more alternatives, such as reducing or delaying investments or capital expenditures, selling assets, refinancing or obtaining additional equity capital on terms that may be onerous or highly dilutive. Our ability to refinance our outstanding indebtedness or future indebtedness will depend on the capital markets and our financial condition at such time. We may not be able to engage in any of these activities or engage in these activities on desirable terms when needed, which could result in a default on our indebtedness.
The trading prices of the Senior Notes may be volatile.
The trading prices of the Senior Notes could be subject to significant fluctuation in response to, among other factors, changes in our operating results, interest rates, the market for debt securities, general economic conditions and securities analysts’ recommendations, if any, regarding our securities.
Risks Relating to Investments in Singapore Companies
It may be difficult to enforce a judgment of U.S. courts for civil liabilities under U.S. federal securities laws against us or our directors in Singapore.
Broadcom is incorporated under the laws of the Republic of Singapore, and certain of our directors are resident outside the United States. Moreover, a majority of our consolidated assets are located outside the United States. Although Broadcom is incorporated outside the United States, we have agreed to accept service of process in the United States through our agent designated for certain purposes. Nevertheless, since a majority of the consolidated assets owned by us are located outside the United States, any judgment obtained in the United States against us may not be collectible within the United States.
There is no ratified treaty between the United States and Singapore providing for the reciprocal recognition and enforcement of judgments in civil and commercial matters. A final judgment for the payment of money rendered by any federal or state court in the United States based on civil liability, whether or not predicated solely upon the federal securities laws, would, therefore, not be automatically enforceable in Singapore. There is doubt whether a Singapore court may impose civil liability on Broadcom or our directors and officers who reside in Singapore in a suit brought in the Singapore courts against us or such persons with respect to a violation solely of the federal securities laws of the United States. Consequently, there can be no assurance as to whether Singapore courts will enter judgments in actions brought in Singapore courts based upon the civil liability provisions of the federal securities laws of the United States.
Broadcom is incorporated in Singapore and our shareholders may have more difficulty in protecting their interest than they would as shareholders of a corporation incorporated in the United States, and we may have more difficulty attracting and retaining qualified board members and executives.
Broadcom’s corporate affairs are governed by its Constitution and by the laws governing corporations incorporated in Singapore. The rights of our shareholders and the responsibilities of the members of our Board under Singapore law are different from those applicable to a corporation incorporated in the United States. Therefore, our public shareholders may have more difficulty in protecting their interest in connection with actions taken by our management or members of our Board than they would as shareholders of a corporation incorporated in the United States.
In addition, being a public company incorporated in Singapore may make it more expensive for Broadcom to obtain director and officer liability insurance, and we may be required to accept reduced coverage or incur substantially higher costs to obtain coverage. These factors could also make it more difficult for us to attract and retain qualified executive officers and members of our Board, particularly to serve on committees of our Board.
For a limited period of time, our directors have general authority to allot and issue new ordinary shares on such terms and conditions as may be determined by our Board in its sole discretion.
Under Singapore law, we may only allot and issue new ordinary shares with the prior approval of Broadcom’s shareholders in a general meeting. At our 2017 annual general meeting, Broadcom’s shareholders provided our directors with the general authority to allot and issue any number of new ordinary shares, which will continue in force until the earlier of (i) the conclusion of our annual general meeting in 2018, (ii) the expiration of the period within which the next annual general meeting is required by law to be held (i.e., within 15 months after the conclusion of the last general meeting) or (iii) the subsequent revocation or modification of such general authority by our shareholders at a duly convened general meeting. Subject to the general authority to allot and issue new ordinary shares provided by our shareholders, the provisions of the
28
Singapore Companies Act and Broadcom’s Constitution, our Board may allot and issue new ordinary shares on such terms and conditions as they may think fit to impose. Any additional issuances of new ordinary shares by our directors may adversely impact the market price of our ordinary shares and dilute your share ownership.
Risks Relating to Owning Our Ordinary Shares
At times, Broadcom’s share price has been volatile and it may fluctuate substantially in the future, which could result in substantial losses for our investors as well as class action litigation against us and our management which could cause us to incur substantial costs and divert our management’s attention and resources.
The trading price of Broadcom ordinary shares has, at times, fluctuated significantly and could be subject to wide fluctuations in response to any of the risk factors listed in this “Risk Factors” section, and others, including:
• | actual or anticipated fluctuations in our financial condition and operating results; |
• | issuance of new or updated research or reports by securities analysts; |
• | fluctuations in the valuation and results of operations of our significant customers as well as companies perceived by investors to be comparable to us; |
• | announcements of proposed acquisitions by us or our competitors; |
• | announcements of, or expectations of additional debt or equity financing efforts; |
• | share price and volume fluctuations attributable to inconsistent trading volume levels of our shares; |
• | issuance of ordinary shares upon exchange of Partnership REUs; and |
• | changes in our dividend or share repurchase policies. |
These fluctuations are often unrelated or disproportionate to our operating performance. These broad market and industry fluctuations, as well as general economic, political and market conditions such as recessions, interest rate changes or currency fluctuations, may negatively impact the market price of our ordinary shares. You may not realize any return on your investment in us and may lose some or all of your investment. In the past, companies that have experienced volatility in the market price of their stock have been subject to securities class action litigation. We may be the target of this type of litigation in the future. We are also the subject of a number of lawsuits stemming from our acquisitions of PLX Technology, Inc., or PLX, Emulex and Brocade. Securities litigation against us, including the lawsuits related to such transactions, could result in substantial costs and divert our management’s attention from other business concerns, which could seriously harm our business.
A substantial amount of our shares is held by a small number of large investors and significant sales of our ordinary shares in the public market by one or more of these holders could cause our share price to fall.
As of September 30, 2017, we believe that our two largest shareholders, Capital World Investors and Capital Research Global Investors, held approximately 17% of Broadcom outstanding ordinary shares in the aggregate. These investors may sell their shares at any time for a variety of reasons and such sales could depress the market price of our ordinary shares. In addition, any such sales of our ordinary shares by these entities could also impair our ability to raise capital through the sale of additional equity securities.
There can be no assurance that we will continue to declare cash dividends.
Our Board has adopted a dividend policy pursuant to which we currently pay a cash dividend on Broadcom ordinary shares on a quarterly basis. The declaration and payment of any dividend is subject to the approval of our Board and our dividend may be discontinued or reduced at any time. There can be no assurance that we will declare cash dividends in the future in any particular amounts, or at all. Furthermore, we may declare dividends as interim dividends, which are wholly provisional under Singapore law and may be revoked by our Board at any time prior to the payment thereof.
Future dividends, if any, and their timing and amount, may be affected by, among other factors: management’s views on potential future capital requirements for strategic transactions, including acquisitions; earnings levels; contractual restrictions; cash position and overall financial condition; and changes to our business model. The payment of cash dividends is restricted by applicable law, contractual restrictions and our corporate structure. Pursuant to Singapore law and Broadcom’s Constitution, no dividends may be paid except out of our profits or expected profits, based on Singapore accounting standards. Because we are a holding company, our ability to pay cash dividends on Broadcom ordinary shares is also limited by restrictions on our ability to obtain sufficient funds through dividends from subsidiaries.
29
Singapore corporate law may impede a takeover of our company by a third-party, which could adversely affect the value of our ordinary shares.
The Singapore Code on Take-overs and Mergers contains provisions that may delay, deter or prevent a future takeover or change in control of our company for so long as we remain a public company with more than 50 shareholders and net tangible assets of S$5 million or more. Any person acquiring an interest, whether by a series of transactions over a period of time or not, either on their own or together with parties acting in concert with such person, in 30% or more of our voting shares, or, if such person holds, either on their own or together with parties acting in concert with such person, between 30% and 50% (both inclusive) of our voting shares, and such person (or parties acting in concert with such person) acquires additional voting shares representing more than 1% of our voting shares in any six-month period, must, except with the consent of the Securities Industry Council in Singapore, extend a mandatory takeover offer for the remaining voting shares in accordance with the provisions of the Singapore Code on Take-overs and Mergers. While the Singapore Code on Take-overs and Mergers seeks to ensure equality of treatment among shareholders, its provisions may discourage or prevent certain types of transactions involving an actual or threatened change of control of our company. These legal requirements may impede or delay a takeover of our company by a third-party, which could adversely affect the value of our ordinary shares.
Our actual operating results may differ significantly from our guidance.
From time to time, we release guidance regarding our future performance that represents our management’s estimates as of the date of release. This guidance, which consists of forward-looking statements, is prepared by our management and is qualified by, and subject to, the assumptions and the other information contained or referred to in the release. Our guidance is not prepared with a view toward compliance with published guidelines of the American Institute of Certified Public Accountants, and neither any independent registered public accounting firm nor any other independent expert or outside party compiles, examines or reviews the guidance and, accordingly, no such person expresses any opinion or any other form of assurance with respect thereto.
Guidance is based upon a number of assumptions and estimates that, while presented with numerical specificity, is inherently subject to significant business, economic and competitive uncertainties and contingencies, many of which are beyond our control and are based upon specific assumptions with respect to future business decisions, some of which will change. We generally state possible outcomes as high and low ranges which are intended to provide a sensitivity analysis as variables are changed but are not intended to represent that actual results could not fall outside of these ranges. The principal reason that we release this data is to provide a basis for our management to discuss our business outlook with analysts and investors. We do not accept any responsibility for any projections or reports published by any such persons.
Guidance is necessarily speculative in nature, and it can be expected that some or all of the assumptions of the guidance furnished by us will not materialize or will vary significantly from actual results, particularly any guidance relating to the results of operations of acquired businesses or companies as our management will, necessarily, be less familiar with their business, procedures and operations. Accordingly, our guidance is only an estimate of what management believes is realizable as of the date of release. Actual results will vary from the guidance and the variations may be material. Investors should also recognize that the reliability of any forecasted financial data will diminish the farther in the future that the data are forecast. In light of the foregoing, investors are urged to put the guidance in context and not to place undue reliance on it.
Any failure to successfully implement our operating strategy or the occurrence of any of the events or circumstances set forth in this Annual Report on Form 10-K could result in the actual operating results being different than the guidance, and such differences may be adverse and material.
Risks Relating to Restricted Exchangeable Units
The exchange of the Partnership REUs into Broadcom ordinary shares is subject to significant restrictions, including the right of Broadcom in its sole discretion to cause the Partnership to repurchase such Partnership REUs for cash instead of Broadcom ordinary shares.
Holders of Partnership REUs, or Limited Partners, may, subject to compliance with the procedures set forth in the Partnership’s amended and restated exempted limited partnership agreement, as amended from time to time, or the Partnership Agreement, require the Partnership to repurchase all or any portion of such Limited Partner’s Partnership REUs in exchange for Broadcom ordinary shares, at a ratio of one Broadcom ordinary share for each Partnership REU, or the Exchange Right. However, Broadcom, in its sole discretion as General Partner, has the right to cause the Partnership to repurchase the Partnership REUs for cash (in an amount determined in accordance with the terms of the Partnership Agreement based on the market price of Broadcom ordinary shares) in lieu of Broadcom ordinary shares. Although we are currently issuing Broadcom ordinary shares upon exchange of Partnership REUs, Broadcom, in its sole discretion as General Partner, may choose to cause the Partnership to repurchase the Partnership REUs for cash at any time and without notice. The payment of cash upon exchange of Partnership REUs could result in, among other things, tax consequences that differ from those that would have resulted if the holder of such Partnership REUs had received Broadcom ordinary shares.
30
In addition, prior to February 1, 2019, following the effective time of the Broadcom Merger, it is a condition precedent to the obligation of the Partnership to repurchase such Partnership REUs, and the holder of such Partnership REUs shall not be permitted to exercise the Exchange Right, unless (i) Broadcom has received a written opinion from an independent nationally recognized law or accounting firm that the Exchange Right should not cause Broadcom to be treated as (a) a “surrogate foreign corporation” (within the meaning of Section 7874(a)(2)(B) of the Code) or (b) a “domestic corporation” (within the meaning of Section 7874(b) of the Code) and (ii) Broadcom’s independent auditor has determined that no reserve shall be required for financial accounting purposes relating to Section 7874 of the Code as a result of the exercise of such Exchange Right. Although Limited Partners are currently permitted to exercise their Exchange Rights, no assurance can be provided as to whether the above conditions precedent will be satisfied in the future.
The exchange of Partnership REUs is a U.S. taxable event.
The exchange of Partnership REUs will be treated for U.S. tax purposes as a taxable sale of the Partnership REUs by the Limited Partner making the exchange. A Limited Partner will recognize gain or loss for U.S. income tax purposes in an amount equal to the fair market value of our ordinary shares or the cash amount received in the exchange, plus the amount of the Partnership’s liabilities allocable to the Partnership REUs being exchanged, less the Limited Partner’s adjusted tax basis in the Partnership REUs exchanged. The recognition of any loss resulting from an exchange of Partnership REUs is subject to a number of limitations set forth in the Code. It is possible that the amount of gain recognized or even the tax liability resulting from the gain could exceed the value of our ordinary shares or cash amount received upon the exchange. In addition, a Limited Partner may have difficulty finding buyers for a substantial number of ordinary shares in order to raise cash to pay tax liabilities associated with the exchange of their Partnership REUs and may not receive a price for the ordinary shares equal to the value of the Partnership REUs at the time of the exchange.
An active trading market for Partnership REUs is not expected to develop.
The Partnership REUs are not listed on a national exchange in the United States or on a foreign exchange. An active trading market for the Partnership REUs is not expected to develop. In addition, although the Partnership REUs are registered under the Exchange Act, Broadcom, as General Partner, is under no obligation to continue such registration and is authorized to deregister the Partnership REUs at any time such registration is not legally required. As a result, it will be very difficult to sell the Partnership REUs at a price that is attractive, or at all.
Future sales of Broadcom ordinary shares in the public market could cause the value of Partnership REUs to fall.
Sales of a substantial number of Broadcom ordinary shares in the public market, or the perception that these sales might occur, could depress the value of the Partnership REUs because the value of the Partnership REUs is derivative of the value of Broadcom ordinary shares.
The value of the Broadcom ordinary shares received in any exchange of the Partnership REUs, or the cash amount to be paid by us in lieu thereof, may fluctuate.
The value of the Broadcom ordinary shares into which the Partnership REUs may be exchanged, or the cash amount to be paid by the Partnership in lieu thereof, may be subject to significant fluctuations for many reasons.
Consequently, due to these potential fluctuations in value of Broadcom ordinary shares, at the time that the Exchange Right is exercised, the Broadcom ordinary shares into which Partnership REUs may be exchanged, or the cash amount to be paid in lieu thereof, may have a value that differs from the value of Broadcom ordinary shares as of the effective time of the Broadcom Merger. Also see “At times, Broadcom’s share price has been volatile and it may fluctuate substantially in the future, which could result in substantial losses for our investors as well as class action litigation against us and our management which could cause us to incur substantial costs and divert our management’s attention and resources.” regarding fluctuations in the value of Broadcom ordinary shares.
There can be no assurance that the Partnership will continue to declare cash distributions.
Pursuant to the terms of the Partnership Agreement, Broadcom, as General Partner, and our Limited Partners are entitled to receive distributions from the Partnership if and when Broadcom pays dividends to holders of its ordinary shares. There can be no assurance that Broadcom will declare cash dividends in the future in any particular amounts, or at all. Also see “There can be no assurance that we will continue to declare cash dividends.” regarding factors that may affect the timing and amount of dividends paid by Broadcom.
In certain circumstances, a Limited Partner may lose its limited liability status.
The Exempted Limited Partnership Law, 2014 of the Cayman Islands, as amended and any successor to such statute, or the Cayman Islands Limited Partnerships Act, provides a limited partner with the benefits of limited liability unless, in addition to exercising rights and powers as a limited partner, such limited partner takes part in the control or conduct of the business of the limited partnership (subject to certain qualifications and exceptions). Subject to the provisions of the Cayman Islands
31
Limited Partnerships Act and of similar legislation in other jurisdictions, the liability of each limited partner for the debts, liabilities and obligations of the Partnership will be limited to the limited partner’s capital contribution, plus the limited partner’s share of any undistributed income of the Partnership. However, pursuant to the Cayman Islands Limited Partnerships Act, where a limited partner has received a payment representing the return of all or part of that limited partner’s capital contribution or is released from any outstanding obligation in respect of his commitment and, at the time that payment was made or release effected, (i) the limited partnership is insolvent; and (ii) the limited partner had actual knowledge of the insolvency of the limited partnership, then for a period of six months, but not thereafter, such limited partner would be liable to the Partnership or, where the Partnership is dissolved, to its creditors, to repay such payment or perform the released obligation with interest to the extent that such contribution or part thereof is, necessary to discharge the liabilities of the Partnership to all creditors who extended credit or whose claims otherwise arose before the return of the capital contribution.
The limitation of liability conferred under the Cayman Islands Limited Partnerships Act may be ineffective outside the Cayman Islands except to the extent it is given extra-territorial recognition or effect by the laws of other jurisdictions. There may also be requirements to be satisfied in each jurisdiction to maintain limited liability. If limited liability is lost, limited partners may be considered to be general partners (and therefore be subject to unlimited liability) in such jurisdiction by creditors and others having claims against the Partnership.
Under certain circumstances, the voting rights of the Partnership REUs will be limited.
Each holder of Partnership REUs has the benefit of a voting trust agreement dated February 1, 2016, among the Partnership, Broadcom and the voting trustee, or the Voting Trust Agreement. Pursuant to the terms of the Voting Trust Agreement, the voting trustee holds non-economic voting preference shares of Broadcom, or Special Voting Shares, that entitle the voting trustee to a number of votes equal to the number of votes that would attach to the Broadcom ordinary shares receivable upon the exchange of the Partnership REUs as of the record date of a Broadcom shareholder meeting. Holders of Partnership REUs are entitled to direct the voting trustee under the Voting Trust Agreement to vote the number of Special Voting Shares equal to the number of Partnership REUs held by such holder in substantially all votes that are presented to the holders of Broadcom ordinary shares. However, in the event that, under applicable law, any matter requires the approval of the holder of record of a Special Voting Share, voting separately as a class, the Voting Trust Agreement restricts the ability of holders of Partnership REUs to exercise such voting rights.
ITEM 1B. | UNRESOLVED STAFF COMMENTS |
None.
ITEM 2. | PROPERTIES |
We are co-headquartered in Yishun, Singapore and San Jose, California. We conduct our administration, manufacturing, research and development, sales and marketing in both owned and leased facilities. We believe that our owned and leased facilities are adequate for our present operations. We do not identify or allocate assets by operating segment.
As of October 29, 2017, our principal facilities consisted of:
(Square Feet) | Singapore | United States | Other Countries | Total | ||||||||
Owned facilities 1 | 37,352 | 1,998,866 | 493,000 | 2,529,218 | ||||||||
Leased facilities 2 | 260,843 | 1,638,362 | 1,419,474 | 3,318,679 | ||||||||
Total facilities | 298,195 | 3,637,228 | 1,912,474 | 5,847,897 | ||||||||
_______________ | ||||||||||||
1 Includes 37,352 square feet of property owned in Singapore subject to 30-year land lease with the state authority expiring in September 2029, subject to renewal at our option. Also includes 318,000 square feet and 158,000 square feet of property owned in Malaysia subject to a 60-year land lease with the state authority expiring in May 2051 and October 2077, respectively, subject to renewal at our option. | ||||||||||||
2 Building leases expire on varying dates through October 2030 and generally include renewals at our option. | ||||||||||||
ITEM 3. | LEGAL PROCEEDINGS |
The information set forth under Note 14. “Commitments and Contingencies” included in Part II, Item 8. of this Annual Report on Form 10-K, is incorporated herein by reference. For an additional discussion of certain risks associated with legal proceedings, see “Risk Factors” above.
ITEM 4. | MINE SAFETY DISCLOSURES |
None.
32
PART II
ITEM 5. | MARKET FOR THE REGISTRANT’S COMMON EQUITY, RELATED SHAREHOLDER MATTERS AND ISSUER SALE AND PURCHASES OF EQUITY SECURITIES |
Market Information
Broadcom ordinary shares are listed on The Nasdaq Global Select Market under the symbol “AVGO”. The following table sets forth, for each quarterly period presented, the high and low sales prices of our ordinary shares as reported by The Nasdaq Global Select Market:
Market Prices | |||||||
High | Low | ||||||
Fiscal Year ended October 30, 2016: | |||||||
First Quarter (ended February 1, 2016) | $ | 149.72 | $ | 115.21 | |||
Second Quarter (ended May 1, 2016) | $ | 159.65 | $ | 114.25 | |||
Third Quarter (ended July 31, 2016) | $ | 167.60 | $ | 139.18 | |||
Fourth Quarter (ended October 30, 2016) | $ | 179.42 | $ | 158.75 | |||
Fiscal Year ended October 29, 2017: | |||||||
First Quarter (ended January 29, 2017) | $ | 205.79 | $ | 160.62 | |||
Second Quarter (ended April 30, 2017) | $ | 227.75 | $ | 198.86 | |||
Third Quarter (ended July 30, 2017) | $ | 258.49 | $ | 219.91 | |||
Fourth Quarter (ended October 29, 2017) | $ | 259.36 | $ | 231.53 | |||
Holders
As of November 24, 2017, there were 301 holders of record of Broadcom ordinary shares. A substantially greater number of shareholders are “street name” or beneficial holders, whose shares are held of record by banks, brokers and other financial institutions.
As of November 24, 2017, there were 633 holders of record of the Partnership REUs.
Dividends and Distributions
In fiscal years 2017 and 2016, Broadcom declared and paid the following quarterly cash dividends, on a per share basis:
Fiscal Year | |||||||
2017 | 2016 | ||||||
First Quarter | $ | 1.02 | $ | 0.44 | |||
Second Quarter | $ | 1.02 | $ | 0.49 | |||
Third Quarter | $ | 1.02 | $ | 0.50 | |||
Fourth Quarter | $ | 1.02 | $ | 0.51 | |||
Pursuant to the Partnership Agreement, starting in the second quarter of fiscal year 2016 and onwards, a cash distribution per Partnership REU was declared and paid equal to, and simultaneously with, that of the Broadcom quarterly cash dividend per ordinary share.
On December 4, 2017, the Board declared an interim cash dividend of $1.75 per Broadcom ordinary share, payable on December 29, 2017 to shareholders of record at the close of business (Eastern Time) on December 19, 2017, or the Broadcom Dividend. Broadcom paid aggregate cash dividends and distributions of $1,745 million and $750 million in fiscal years 2017 and 2016, respectively.
The Partnership will pay a cash distribution in an amount equal to the aggregate amount of the Broadcom Dividend to Broadcom, as General Partner, and a $1.75 distribution per Partnership REU, payable on December 29, 2017, to limited partners of record at the close of business (Eastern Time) on December 19, 2017. The Partnership made aggregate distributions of $92 million and $34 million on its Partnership REUs during fiscal years 2017 and 2016, respectively.
Our Board reviews our dividend policy annually targeting a projected quarterly per share dividend amount for the full fiscal year. However, the declaration and payment of any future cash dividends (and therefore any future cash distributions) are at the discretion and approval of our Board and subject to our Board’s continuing determination that they are in our best
33
interests. Future dividend payments will also depend upon factors such as our earnings level, capital requirements, contractual restrictions, cash position, overall financial condition and any other factors deemed relevant by our Board.
The payment of cash dividends on Broadcom ordinary shares is restricted under applicable law and our corporate structure. Pursuant to Singapore law and Broadcom’s Constitution, no cash dividends may be paid except out of our profits, or expected profits. Also, because we are a holding company, our ability to pay cash dividends on Broadcom ordinary shares and cash distributions on our Partnership REUs may be limited by restrictions on our ability to obtain sufficient funds through dividends from subsidiaries, including restrictions under the terms of agreements governing our indebtedness.
Recent Sales of Unregistered Equity Securities
None.
Issuer Purchases of Equity Securities
None.
Share Performance Graph
The following graph shows a comparison of cumulative total return for our ordinary shares, the Standard & Poor’s 500 Stock Index, or S&P 500 Index, and the Philadelphia Semiconductor Index, or PHLX Semiconductor Index. The graph covers the period from October 26, 2012 (the last trading day of our fiscal year 2012) to October 27, 2017 (the last trading day of our fiscal year 2017). The total return graph and table assume that $100 was invested on October 26, 2012 in Avago Technologies Limited ordinary shares for each of the S&P 500 Index and the PHLX Semiconductor Index and assumes all dividends are reinvested. Indexes are calculated on a month-end basis.
The comparisons in the graph below are based on historical data and are not indicative of, or intended to forecast, the possible future performance of our ordinary shares.
34
Comparison of Five Year Cumulative Total Return
Among Broadcom Limited, the S&P 500 Index and the PHLX Semiconductor Index
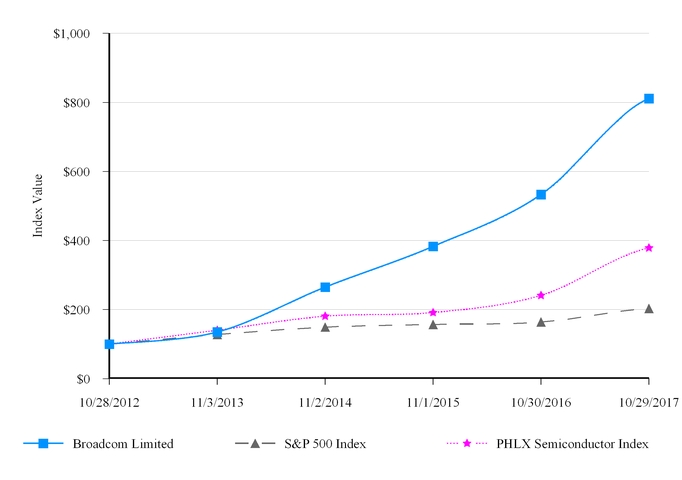
October 28, 2012 | November 3, 2013 | November 2, 2014 | November 1, 2015 | October 30, 2016 | October 29, 2017 | |||||||||||||||||||
Broadcom Limited | $ | 100.00 | $ | 135.09 | $ | 264.91 | $ | 382.93 | $ | 533.27 | $ | 811.36 | ||||||||||||
S&P 500 Index | $ | 100.00 | $ | 127.58 | $ | 149.18 | $ | 156.94 | $ | 164.03 | $ | 203.21 | ||||||||||||
PHLX Semiconductor Index | $ | 100.00 | $ | 140.10 | $ | 180.71 | $ | 191.38 | $ | 241.17 | $ | 378.46 | ||||||||||||
The graph and the table above shall not be deemed “filed” with the SEC for the purposes of Section 18 of the Exchange Act or otherwise subject to the liabilities of that section, nor shall it be deemed incorporated by reference in any filing made by us with the SEC, regardless of any general incorporation language in such filing.
Securities Authorized for Issuance Under Equity Compensation Plans
The information required by this item regarding securities authorized for issuance under equity compensation plans is incorporated herein by reference to the definitive Proxy Statement for our 2018 annual general meeting of shareholders to be filed with the SEC within 120 days after the end of fiscal year 2017.
35
ITEM 6. | SELECTED FINANCIAL DATA |
The following table sets forth the selected consolidated financial data for Broadcom and the Partnership. We report financial results on a 52-or 53-week fiscal year. Our fiscal year ends on the Sunday closest to October 31 in a 52-week year and on the first Sunday in November in a 53-week year. Our fiscal year 2013 was a 53-week fiscal year. You should read the following selected consolidated financial data together with the information included under the headings “Risk Factors” and “Management’s Discussion and Analysis of Financial Condition and Results of Operations” and our historical financial statements and related notes included elsewhere in this Annual Report on Form 10-K.
Summary of Five Year Selected Financial Data | ||||||||||||||||||||
Fiscal Year Ended | ||||||||||||||||||||
October 29, 2017 | October 30, 2016 | November 1, 2015 | November 2, 2014 | November 3, 2013 | ||||||||||||||||
(In millions, except per share amounts) | ||||||||||||||||||||
Statement of Operations Data: (1) | ||||||||||||||||||||
Net revenue | $ | 17,636 | $ | 13,240 | $ | 6,824 | $ | 4,269 | $ | 2,520 | ||||||||||
Cost of products sold: | ||||||||||||||||||||
Cost of products sold (2) | 6,593 | 5,295 | 2,750 | 1,911 | 1,251 | |||||||||||||||
Purchase accounting effect on inventory | 4 | 1,185 | 30 | 210 | 9 | |||||||||||||||
Amortization of acquisition-related intangible assets | 2,511 | 763 | 484 | 249 | 61 | |||||||||||||||
Restructuring charges (3) | 19 | 57 | 7 | 22 | 1 | |||||||||||||||
Total cost of products sold | 9,127 | 7,300 | 3,271 | 2,392 | 1,322 | |||||||||||||||
Gross margin | 8,509 | 5,940 | 3,553 | 1,877 | 1,198 | |||||||||||||||
Research and development | 3,292 | 2,674 | 1,049 | 695 | 398 | |||||||||||||||
Selling, general and administrative (2) | 787 | 806 | 486 | 407 | 222 | |||||||||||||||
Amortization of acquisition-related intangible assets | 1,764 | 1,873 | 249 | 197 | 24 | |||||||||||||||
Restructuring, impairment and disposal charges (3) | 161 | 996 | 137 | 140 | 2 | |||||||||||||||
Litigation settlements (4) | 122 | — | — | — | — | |||||||||||||||
Total operating expenses | 6,126 | 6,349 | 1,921 | 1,439 | 646 | |||||||||||||||
Operating income (loss) (5) | 2,383 | (409 | ) | 1,632 | 438 | 552 | ||||||||||||||
Interest expense (6) | (454 | ) | (585 | ) | (191 | ) | (110 | ) | (2 | ) | ||||||||||
Loss on extinguishment of debt (7) | (166 | ) | (123 | ) | (10 | ) | — | — | ||||||||||||
Other income, net | 62 | 10 | 36 | 14 | 18 | |||||||||||||||
Income (loss) from continuing operations before income taxes | 1,825 | (1,107 | ) | 1,467 | 342 | 568 | ||||||||||||||
Provision for income taxes (8) | 35 | 642 | 76 | 33 | 16 | |||||||||||||||
Income (loss) from continuing operations | 1,790 | (1,749 | ) | 1,391 | 309 | 552 | ||||||||||||||
Loss from discontinued operations, net of income taxes (9) | (6 | ) | (112 | ) | (27 | ) | (46 | ) | — | |||||||||||
Net income (loss) | 1,784 | (1,861 | ) | 1,364 | 263 | 552 | ||||||||||||||
Net income (loss) attributable to noncontrolling interest (10) | 92 | (122 | ) | — | — | — | ||||||||||||||
Net income (loss) attributable to ordinary shares | $ | 1,692 | $ | (1,739 | ) | $ | 1,364 | $ | 263 | $ | 552 | |||||||||
Income (loss) per ordinary share (diluted): | ||||||||||||||||||||
Income (loss) per share from continuing operations | $ | 4.03 | $ | (4.57 | ) | $ | 4.95 | $ | 1.16 | $ | 2.19 | |||||||||
Loss per share from discontinued operations | (0.01 | ) | (0.29 | ) | (0.10 | ) | (0.17 | ) | — | |||||||||||
Net income (loss) per share | $ | 4.02 | $ | (4.86 | ) | $ | 4.85 | $ | 0.99 | $ | 2.19 | |||||||||
Cash dividend declared and paid per ordinary share | $ | 4.08 | $ | 1.94 | $ | 1.55 | $ | 1.13 | $ | 0.80 | ||||||||||
36
October 29, 2017 | October 30, 2016 | November 1, 2015 | November 2, 2014 | November 3, 2013 | ||||||||||||||||
(In millions) | ||||||||||||||||||||
Balance Sheet Data: (1) | ||||||||||||||||||||
Cash and cash equivalents (11) | $ | 11,204 | $ | 3,097 | $ | 1,822 | $ | 1,604 | $ | 985 | ||||||||||
Total assets | $ | 54,418 | $ | 49,966 | $ | 10,515 | $ | 10,376 | $ | 3,415 | ||||||||||
Debt and capital lease obligations | $ | 17,569 | $ | 13,642 | $ | 3,872 | $ | 5,395 | $ | 2 | ||||||||||
Total shareholders' equity | $ | 23,186 | $ | 21,876 | $ | 4,714 | $ | 3,243 | $ | 2,886 | ||||||||||
Other Financial Data: | ||||||||||||||||||||
Earnings to fixed charges ratio (12) | 4.20 | — | 7.60 | 3.70 | 94.40 | |||||||||||||||
Shareholders’ equity, partners’ capital and the Limited Partners’ noncontrolling interest in Broadcom are the primary areas of difference between the consolidated financial statements of Broadcom and those of the Partnership. The following table sets forth certain Partnership data, as well as these primary differences.
Fiscal Year Ended | ||||||||||||||||||||
October 29, 2017 | October 30, 2016 | November 1, 2015 | November 2, 2014 | November 3, 2013 | ||||||||||||||||
(In millions, except per share amounts) | ||||||||||||||||||||
Partnership Data: | ||||||||||||||||||||
General Partner's interest in net income (loss) | $ | 1,692 | $ | (2,116 | ) | $ | — | $ | — | $ | — | |||||||||
Limited Partners' interest in net income (loss) | $ | 92 | $ | (122 | ) | $ | — | $ | — | $ | — | |||||||||
Net income attributable to ordinary shareholders | $ | — | $ | 377 | $ | 1,364 | $ | 263 | $ | 552 | ||||||||||
Cash distribution paid per restricted exchangeable partnership unit | $ | 4.08 | $ | 1.50 | $ | — | $ | — | $ | — | ||||||||||
Cash distribution paid to General Partner | $ | 1,756 | $ | 594 | $ | — | $ | — | $ | — | ||||||||||
Cash dividends paid per ordinary share | $ | — | $ | 0.44 | $ | 1.55 | $ | 1.13 | $ | 0.80 | ||||||||||
Total partners’ capital/shareholders’ equity | $ | 23,083 | $ | 21,876 | $ | 4,714 | $ | 3,243 | $ | 2,886 | ||||||||||
_______________________________________
(1) | On February 1, 2016, we acquired BRCM for total consideration of approximately $35.7 billion. On May 5, 2015, we acquired Emulex for total consideration of approximately $587 million. On August 12, 2014, we acquired PLX for total consideration of approximately $308 million. On May 6, 2014, we acquired LSI for total consideration of approximately $6.5 billion. On June 28, 2013, we acquired CyOptics, Inc. for total consideration of approximately $380 million. The results of operations of the acquired companies and estimated fair value of assets acquired and liabilities assumed were included in our financial statements from the respective acquisition dates. |
(2) | We incurred acquisition-related costs of $98 million, $139 million, $74 million and $74 million in fiscal years 2017, 2016, 2015 and 2014, respectively, of which $97 million, $138 million, $71 million and $67 million were presented as part of operating expenses, and the remainder was presented as part of cost of products sold. |
(3) | Fiscal years 2017, 2016, 2015 and 2014 restructuring charges primarily reflect actions taken to implement planned cost reduction and restructuring activities in connection with the acquisitions. We also incurred $56 million, $590 million and $61 million in-process research and development and other asset impairment charges in fiscal years 2017, 2016 and 2015, respectively. |
(4) | Primarily represents litigation charges associated with certain legal settlement agreements. |
(5) | Includes share-based compensation expense of $920 million, $664 million, $232 million, $153 million and $77 million for fiscal years 2017, 2016, 2015, 2014 and 2013, respectively. Share-based compensation expense includes the impact of equity awards assumed as part of the acquisitions, as well as the impact of special long-term compensation and retention equity awards. |
(6) | Interest expense in fiscal years 2017 and 2016 includes coupon and contractual interest, accretion of the original issue discount, amortization of debt issuance costs related to our outstanding debt and debt modification fees |
37
related to financing the Broadcom Merger. Interest expense in fiscal years 2015 and 2014 includes interest on the 2.0% Convertible Senior Notes due 2021.
(7) | Loss on extinguishment of debt was primarily due to the debt issuance cost write-off that resulted from repayments of certain debt. |
(8) | Our provision for income taxes for fiscal year 2017 primarily relates to income from continuing operations, partially offset by $273 million of excess tax benefits from share-based awards recognized upon adoption of an accounting standards update. Our provision for income taxes for fiscal year 2016 included $93 million of expenses related to the undistributed earnings of foreign operations that were previously considered indefinitely reinvested, partially offset by income tax benefits from losses on continuing operations and the recognition of previously unrecognized tax benefits as a result of audit settlements. For fiscal years 2015, 2014, 2013 our provision for income taxes fluctuates mainly based on changes in jurisdictional mix of income. |
(9) | During fiscal years 2016, 2015 and 2014, we sold certain businesses related to the acquisitions of BRCM, Emulex and LSI for a gain of $36 million, a loss of $14 million and a gain of $18 million, respectively. |
(10) | As a result of Broadcom’s controlling interest in the Partnership, we consolidate the financial results of the Partnership and present a noncontrolling interest for the portion of the Partnership it does not own in our consolidated financial statements. This represents the portion of net income (loss) attributable to the economic interest in the Partnership owned by the Limited Partners. |
(11) | The Partnership’s cash and cash equivalents at October 29, 2017 and October 30, 2016 were $11.0 billion and $3.0 billion, respectively. The balance differences result from the timing of capital contributions from Broadcom to the Partnership and distributions from the Partnership to Broadcom. |
(12) | Fixed charges consist of interest expense on all indebtedness plus amortization of debt issuance costs and accretion of debt discount, capitalized interest and an estimate of interest expense within rental expense. Earnings consist of income from continuing operations before income taxes plus fixed charges and amortization of capitalized interest less capitalized interest. Earnings for the fiscal year 2016 were inadequate to cover fixed charges as the coverage deficiency was $1,123 million. |
38
ITEM 7. | MANAGEMENT’S DISCUSSION AND ANALYSIS OF FINANCIAL CONDITION AND RESULTS OF OPERATIONS |
This Management’s Discussion and Analysis of Financial Condition and Results of Operations should be read in conjunction with “Selected Financial Data” and our consolidated financial statements and notes thereto which appear elsewhere in this Annual Report on Form 10-K. This discussion may contain forward-looking statements based upon current expectations that involve risks and uncertainties. Our actual results may differ materially from those anticipated in these forward-looking statements as a result of various factors, including those set forth under the caption “Risk Factors” or in other parts of this Annual Report on Form 10-K.
Overview
Broadcom Limited, or Broadcom, is the successor to Avago Technologies Limited, or Avago, as a result of its acquisition of Broadcom Corporation, or BRCM. We are a leading designer, developer and global supplier of a broad range of semiconductor devices with a focus on complex digital and mixed signal complementary metal oxide semiconductor based devices and analog III-V based products. We have a history of innovation and offer thousands of products that are used in end products such as enterprise and data center networking, home connectivity, set-top boxes, broadband access, telecommunication equipment, mobile handsets and base stations, data center servers and storage systems, factory automation, power generation and alternative energy systems, and electronic displays. We have four reportable segments: wired infrastructure, wireless communications, enterprise storage, and industrial & other, which align with our principal target markets.
Broadcom Cayman L.P., or the Partnership, is an exempted limited partnership formed under the laws of the Cayman Islands. Pursuant to the amended and restated exempted limited partnership agreement, or the Partnership Agreement, it authorized its common partnership units and restricted exchangeable limited partnership units, or Partnership REUs. The Partnership REUs are deemed to be registered under Section 12(b) of the Securities Exchange Act of 1934, as amended, or the Exchange Act, and the Partnership is subject to the informational requirements of the Exchange Act and the rules and regulations promulgated thereunder. Broadcom, its General Partner, has the exclusive right, power and authority to manage, control, administer and operate the business and affairs and to make decisions regarding the undertaking and business of the Partnership in accordance with the Partnership Agreement, and applicable laws. There is no board of directors of the Partnership.
Original equipment manufacturers, or OEMs, or their contract manufacturers, and distributors typically account for the substantial majority of our sales. We have established strong relationships with leading OEM customers across multiple target markets and we have a direct sales force focused on supporting large OEMs. We also distribute a substantial portion of our products through our broad distribution network, and a significant amount of these sales are to large global electronic components distributors, including Avnet, Inc.
The demand for our products has been affected in the past, and is likely to continue to be affected in the future, by various factors, including the following:
• | general economic and market conditions in the semiconductor industry and in our target markets; |
• | our ability to define specifications for, develop or acquire, complete, introduce and market, new products and technologies in a cost-effective and timely manner; |
• | the timing, rescheduling or cancellation of expected customer orders; |
• | the rate at which our present and future customers and end-users adopt our products and technologies in our target markets, and the rate at which our customers' products that include our technology are accepted in their markets; and |
• | the qualification, availability and pricing of competing products and technologies and the resulting effects on sales and pricing of our products. |
Uncertainty in global economic conditions poses significant risks to our business. For example, customers may defer purchases in response to tighter credit and negative financial news, which would in turn adversely affect product demand and our results of operations.
Fiscal Year Highlights
Highlights during fiscal year 2017 include the following:
• | Our cash and cash equivalents were $11,204 million at October 29, 2017, compared with $3,097 million at October 30, 2016, which primarily included the net proceeds from the issuance of the October 2017 Senior Notes (defined below). |
39
• | We generated $6,551 million of cash from operations during fiscal year 2017. |
• | Broadcom paid aggregate cash dividends on its ordinary shares of $1,653 million, and the Partnership made aggregate distributions of $92 million on its Partnership REUs during fiscal year 2017. |
• | On January 19, 2017, we completed the issuance and sale of senior unsecured notes, or the January 2017 Senior Notes, in an aggregate principal amount of $13,550 million. The net proceeds, together with cash on hand, were used to repay all of the outstanding term loans under our guaranteed, collateralized credit agreement entered into on February 1, 2016, or the 2016 Credit Agreement, in the aggregate amount of $13,555 million. In addition, on October 17, 2017, we completed the issuance and sale of senior unsecured notes, or the October 2017 Senior Notes, in an aggregate principal amount of $4,000 million. The net proceeds, together with cash on hand, were used to finance the acquisition of Brocade Communication Systems, Inc., or Brocade, as discussed in detail below. |
Recent Developments
U.S. 2017 Tax Reform Act
On December 20, 2017, the Tax Cuts and Jobs Act, or the 2017 Tax Reform Act, was approved by Congress and is pending presidential approval. In general, the 2017 Tax Reform Act reduces the U.S. corporate income tax rate from 35% to 21%, effective in 2018. The 2017 Tax Reform Act moves from worldwide business taxation to a participation exemption regime. The 2017 Tax Reform Act also imposes base-erosion prevention measures on non-U.S. earnings of U.S. entities, as well as a one-time mandatory deemed repatriation tax on accumulated non-U.S. earnings of U.S. entities. The base-erosion prevention measures will have the effect of subjecting non-U.S. earnings of U.S. entities to taxation in the United States at an effective rate that is expected to be substantially lower than 21%. The 2017 Tax Reform Act will affect the tax position and cash taxes of our U.S. entities and will have a corresponding impact on our consolidated financial results starting in the first quarter of our fiscal year 2018.
Acquisition of Brocade Communications Systems, Inc.
On November 17, 2017, pursuant to the Agreement and Plan of Merger, by and among Broadcom, BRCM, Brocade, and Bobcat Merger Sub, Inc., or Merger Sub, which BRCM subsequently assigned to LSI Corporation on December 18, 2016, Merger Sub merged with and into Brocade with Brocade as the surviving corporation, or the Brocade Merger. As a result, Brocade stockholders who did not perfect their appraisal rights with respect to the Brocade Merger received, in aggregate, approximately $5.3 billion in cash in exchange for all shares of Brocade common stock issued and outstanding immediately prior to the effective time of the Brocade Merger. We also paid $701 million to retire Brocade’s term loan. In addition, we assumed certain vested (to the extent not in-the-money) and all unvested Brocade stock options, restricted stock units, or RSUs, and performance stock units, or PSUs, held by continuing employees and service providers. All vested in-the-money Brocade stock options, after giving effect to any acceleration, and all other RSUs and PSUs were cashed out upon the Brocade Merger. As a result of the Brocade Merger, Brocade became an indirect subsidiary of the Partnership.
We financed the Brocade Merger with the net proceeds from the October 2017 Senior Notes as discussed in further detail below under “Indebtedness,” as well as cash on hand.
Divestiture of Brocade’s IP Networking Business
Following the Brocade Merger, on December 1, 2017, we sold Brocade’s IP Networking business, including the Ruckus Wireless and ICX Switch businesses, to ARRIS International plc for cash consideration of $800 million, plus unvested assumed employee stock awards.
Proposed Acquisition of Qualcomm Incorporated
On November 6, 2017, we announced a proposal to acquire Qualcomm Incorporated, or Qualcomm, for $70.00 per share, consisting of $60.00 in cash and $10.00 in Broadcom ordinary shares. We stated that the proposal stands whether Qualcomm’s pending acquisition of NXP Semiconductors N.V., or NXP, is consummated on the then-disclosed terms of $110.00 per NXP share or is terminated. Including the assumption of net debt and giving effect to the pending NXP acquisition, the enterprise value of the proposed transaction is approximately $130 billion.
On November 13, 2017, Qualcomm’s board of directors rejected our proposal. In response, we announced that we remained fully committed to pursuing the acquisition of Qualcomm and reiterated our proposal.
On December 4, 2017, we announced that we had provided notice to Qualcomm of our intent to nominate 11 candidates for election to the Qualcomm board of directors at Qualcomm’s 2018 annual meeting of stockholders.
On December 11, 2017, we filed preliminary proxy materials with the Securities and Exchange Commission, or the SEC, in connection with our planned solicitation of proxies to elect 11 independent, highly qualified nominees to the Qualcomm
40
board of directors at Qualcomm’s 2018 annual meeting of stockholders, which Qualcomm has announced will be held on March 6, 2018.
We also filed a premerger notification under the Hart-Scott-Rodino Antitrust Improvements Act of 1976 with the U.S. Department of Justice and the Federal Trade Commission regarding our proposed acquisition of Qualcomm.
No agreement has been reached with Qualcomm and there can be no assurance that any transaction will result from our proposal.
Redomiciliation to the United States from Singapore
On November 2, 2017, we announced our intention to initiate a process to change the ultimate parent company of the Broadcom group from a Singapore company to a U.S. corporation. The final form and timing of the redomiciliation has not yet been finalized and may be affected by the implementation of the 2017 Tax Reform Act. In addition, the redomiciliation is subject to the approval of our shareholders. We presently expect that our overall cash tax costs will approximately double, as compared to our fiscal year 2017 results, due to the redomiciliation and taking in account our initial estimates of the expected effects of the 2017 Tax Reform Act.
Acquisitions and Divestitures
The discussion and analysis in this section and the accompanying consolidated financial statements include the results of operations of acquired companies commencing on their respective acquisition dates.
Broadcom Corporation
On February 1, 2016, Broadcom became the successor to Avago and acquired BRCM, or the Broadcom Merger, in which, Avago shareholders exchanged their shares on a one-for-one basis for newly issued Broadcom ordinary shares and BRCM shareholders received, in aggregate, approximately $16.8 billion in cash, 112 million Broadcom ordinary shares and 23 million Partnership REUs in exchange for all shares of BRCM common stock, par value $0.0001 per share, issued and outstanding immediately prior to the effective time of the Broadcom Merger. In addition, we also paid $137 million in cash for vested BRCM equity awards. Broadcom also assumed unvested RSUs originally granted by BRCM and converted them into 6 million Broadcom RSUs.
The aggregate consideration for the Broadcom Merger was approximately $35.7 billion. We funded the cash portion of the Broadcom Merger with net proceeds from the issuance of $15.6 billion in term loans under the 2016 Credit Agreement, that we entered into at the time of closing of the Broadcom Merger, as well as cash on hand of the combined companies. The financial results provided in this Annual Report on Form 10-K include the results of operations of BRCM commencing as of February 1, 2016, or the Acquisition Date.
During fiscal year 2016, we completed the sales of certain non-core BRCM businesses for aggregate cash proceeds of $830 million and recognized an aggregate gain of $36 million from the sales.
Emulex Corporation
In fiscal year 2015, we acquired Emulex Corporation, or Emulex, a leader in network connectivity, monitoring and management, for a purchase price of $587 million.
Net Revenue
Substantially all of our net revenue is derived from sales of semiconductor devices that are incorporated into electronic products, as well as from modules, switches and subsystems. Our four reportable segments are wired infrastructure, wireless communications, enterprise storage and industrial & other, which align with our target markets. Applications for our products in these segments include enterprise and data center networking, home connectivity, set-top boxes, broadband access, telecommunication equipment, mobile handsets and base stations, data center servers and storage systems, factory automation, power generation and alternative energy systems, and electronic displays.
Our overall net revenue, as well as the percentage of total net revenue generated by sales in each of our segments, has varied from quarter to quarter, due largely to fluctuations in end-market demand, including the effects of seasonality, which are discussed in detail below under “Seasonality”.
We use distributors for a significant portion of our business and recognize revenue upon delivery of product to the distributors, which can cause our quarterly net revenue to fluctuate significantly. Such revenue is reduced for estimated returns and distributor allowances. We also sell products directly to OEMs and other end customers, many of which also purchase product from our distributors and who direct contract manufacturers to purchase product from us. Historically, a relatively small number of customers has accounted for a significant portion of our net revenue. Sales to distributors accounted for 28% and 30% of our net revenue for fiscal years 2017 and 2016, respectively. Direct sales to Foxconn Technology Group companies (including Hon Hai Precision Industries), together referred to as Foxconn, accounted for 14% of our net
41
revenue for both fiscal years 2017 and 2016. We believe our aggregate sales to our top five end customers, through all channels, accounted for more than 40% of our net revenue for fiscal year 2017 and more than 30% for fiscal year 2016. We believe aggregate sales to Apple, Inc., through all channels, accounted for more than 20% of our net revenue for fiscal year 2017 and approximately 15% for fiscal year 2016. We expect to continue to experience significant customer concentration in future periods. The loss of, or significant decrease in demand from, any of our top five end customers could have a material adverse effect on our business, results of operations and financial condition.
From time to time, some of our key customers place large orders or delay orders, causing our quarterly net revenue to fluctuate significantly. This is particularly true in our wireless communications segment as fluctuations may be magnified by the launches of, and seasonal variations in, sales of mobile handsets, as well as changes in the overall economic environment.
In recent years, approximately 50% of our net revenue has come from sales to distributors, OEMs or contract manufacturers located in China. However, the end customers for our products, or for the end products into which our products are incorporated, are frequently located in countries other than China. As a result, we believe that a substantially smaller percentage of our net revenue is ultimately dependent on sales of either our product, or our customers’ product incorporating our product, to end customers located in China.
Costs and Expenses
Total cost of products sold. Cost of products sold consists primarily of the cost of semiconductor wafers and other materials, and the cost of assembly and testing of those products. Cost of products sold also includes: personnel costs and overhead related to our manufacturing operations, including share-based compensation expense, and related occupancy, computer services and equipment costs; manufacturing quality, order fulfillment, warranty and inventory adjustments, including write-downs for inventory obsolescence; energy costs; other manufacturing expenses and acquisition-related costs. Acquisition-related costs include direct transaction costs and integration-related costs. Total cost of products sold also includes the purchase accounting effect on inventory, amortization of acquisition-related intangible assets and restructuring charges.
Although we outsource a significant portion of our manufacturing activities, we also have some proprietary semiconductor fabrication facilities. If we are unable to utilize our owned fabrication facilities at a desired level, the fixed costs associated with these facilities will not be fully absorbed, resulting in higher average unit costs and lower gross margins.
Research and development. Research and development expense consists primarily of personnel costs for our engineers engaged in the design and development of our products and technologies, including share-based compensation expense. These expenses also include project material costs, third-party fees paid to consultants, prototype development expense, allocated facilities costs and other corporate expenses and computer services costs related to supporting computer tools used in the engineering and design process.
Selling, general and administrative. Selling expense consists primarily of compensation and associated costs for sales and marketing personnel, including share-based compensation expense, sales commissions paid to our independent sales representatives, costs of advertising, trade shows, corporate marketing, promotion, travel related to our sales and marketing operations, related occupancy and equipment costs, and other marketing costs. General and administrative expense consists primarily of compensation and associated costs for executive management, finance, human resources and other administrative personnel, outside professional fees, allocated facilities costs, acquisition-related costs and other corporate expenses.
Amortization of acquisition-related intangible assets. In connection with our acquisitions, we recognized intangible assets that are being amortized over their estimated useful lives of 1 year to 25 years. We also recognized goodwill and in-process research and development, which are not amortized, in connection with acquisitions.
Restructuring, impairment and disposal charges. Restructuring, impairment and disposal charges consist primarily of compensation costs associated with employee exit programs, alignment of our global manufacturing operations, rationalizing product development program costs, in-process research and development impairment, fixed asset impairment, facility and lease abandonments and other exit costs, including curtailment of service or supply agreements.
Interest expense. Interest expense includes coupon interest, commitment fees, accretion of the original issue discount and amortization of debt issuance costs related to our outstanding debt, expenses related to debt modification and ticking fees.
Other income, net. Other income, net includes interest income, gains (losses) on foreign currency remeasurement, and other miscellaneous items.
Provision for income taxes. We have structured our operations to maximize the benefit from tax incentives extended to us in various jurisdictions to encourage investment or employment. For example, we have obtained several tax incentives from the Singapore Economic Development Board, an agency of the Government of Singapore, which provide that qualifying
42
income we earn in Singapore is subject to tax holiday or reduced rates of Singapore income tax. Subject to our compliance with the conditions specified in these incentives and legislative developments, the Singapore tax incentives are presently expected to expire at various dates generally between 2020 and 2021, subject in certain cases to potential extensions, which we may or may not be able to obtain. Absent such tax incentives, the corporate income tax rate in Singapore that would otherwise apply to us would be 17%. We also have tax holidays on our qualifying income in Malaysia, which are scheduled to expire between 2018 and 2028. The tax incentives that we have negotiated are also subject to our compliance with various operating and other conditions. If we cannot, or elect not to, comply with the operating conditions included in any particular tax incentive, we will lose the related tax benefits and we could be required to refund previously realized material tax benefits. Depending on the incentive at issue, we could also be required to modify our operational structure and tax strategy, which may not be as beneficial to us as the benefits provided under the present tax concession arrangements. For fiscal years 2017, 2016 and 2015, the effect of all these tax incentives was to reduce the overall provision for income taxes by approximately $237 million, $169 million and $207 million, respectively.
Our interpretations and conclusions regarding the tax incentives are not binding on any taxing authority, and if our assumptions about tax and other laws are incorrect or if these tax incentives are substantially modified or rescinded we could suffer material adverse tax and other financial consequences, which would increase our expenses, reduce our profitability and adversely affect our cash flows. In addition, taxable income in any jurisdiction is dependent upon acceptance of our operational practices and intercompany transfer pricing by local tax authorities as being on an arm’s length basis. Due to inconsistencies in application of the arm’s length standard among taxing authorities, as well as lack of adequate treaty-based protection, transfer pricing challenges by tax authorities could, if successful, substantially increase our income tax expense.
On November 2, 2017, we announced our intention to initiate a process to change the ultimate parent company of the Broadcom group from a Singapore company to a U.S. corporation. We would expect our overall cash tax costs to approximately double, as compared to our fiscal year 2017 results, due to the redomiciliation and taking in account our initial estimates of the effects of the 2017 Tax Reform Act.
Going forward, our overall cash tax costs will vary based on a variety of factors in addition to the impact caused by the redomiciliation of our ultimate parent company from Singapore to the U.S., including reorganizations or restructurings of our businesses or assets, overall profitability, the jurisdictional mix of income before income taxes and changes in tax regulations or policy, and discrete events, such as settlements of future audits and acquisitions we may make from time to time. Our actual effective tax costs and overall effective rate may vary from our expectations and that variance may be material. In particular, we may owe significant taxes in jurisdictions outside our country of domicile during periods when we are profitable in those jurisdictions even though we may be experiencing low operating profit or operating losses on a consolidated basis, potentially resulting in significant tax liabilities on a consolidated basis during those periods. Our historical provision for income taxes is not necessarily reflective of our future results of operations.
Critical Accounting Estimates
The preparation of financial statements in accordance with generally accepted accounting principles in the United States, or GAAP, requires us to make estimates and assumptions that affect the reported amounts of assets and liabilities and disclosure of contingent assets and liabilities at the date of the financial statements and the reported amounts of revenue and expenses during the reporting period. We base our estimates and assumptions on current facts, historical experience and various other factors that we believe to be reasonable under the circumstances, the results of which form the basis for making judgments about the carrying values of assets and liabilities and the accrual of costs and expenses that are not readily apparent from other sources. Our actual financial results may differ materially and adversely from our estimates. Our critical accounting policies are those that affect our historical financial statements materially and involve difficult, subjective or complex judgments by management. Those policies include revenue recognition, business combinations, valuation of long-lived assets, intangible assets and goodwill, inventory valuation, income taxes, retirement and post-retirement benefit plan assumptions, share-based compensation and employee bonus programs. See Note 2. “Summary of Significant Accounting Policies” included in Part II, Item 8. of this Annual Report on Form 10-K for further information on our critical accounting policies and estimates.
Revenue recognition. We recognize revenue from sales of our products to distributors upon delivery of product to the distributors. An allowance for distributor credits covering price adjustments is made based on our estimate of historical experience rates as well as considering economic conditions and contractual terms. To date, actual distributor claims activity has been materially consistent with the provisions we have made based on our historical estimates. However, because of the inherent nature of estimates, there is always a risk that there could be significant differences between actual amounts and our estimates. Different judgments or estimates could result in variances that might be significant to reported operating results. We also record reductions of revenue for rebates, in the same period that the related revenue is recorded. We accrue 100% of potential rebates at the time of sale and do not apply a breakage factor. We reverse the accrual of unclaimed rebate amounts as specific rebate programs contractually end and when we believe unclaimed rebates are no longer subject to payment and
43
will not be paid. Thus the reversal of unclaimed rebates may have a positive impact on our net revenue and net income in subsequent periods.
Business combinations. Accounting for business combinations requires our management to make significant estimates and assumptions, especially at the acquisition date, including our estimates for intangible assets, contractual obligations assumed, restructuring liabilities, pre-acquisition contingencies and contingent consideration, where applicable. Although we believe the assumptions and estimates we have made in the past have been reasonable and appropriate, they are based, in part, on historical experience and information obtained from the management of the acquired companies and are inherently uncertain. Critical estimates in valuing certain of the intangible assets we have acquired include, but are not limited to: future expected cash flows from product sales, customer contracts and acquired technologies, expected costs to develop in-process research and development into commercially viable products, estimated cash flows from the projects when completed, and discount rates. The discount rates used to discount expected future cash flows to present value are typically derived from a weighted-average cost of capital analysis and adjusted to reflect inherent risks. Unanticipated events and circumstances may occur that may affect the accuracy or validity of such assumptions, estimates or actual results.
Valuation of goodwill and long-lived assets. We perform an annual impairment review of our goodwill during the fourth fiscal quarter of each year, and more frequently if we believe indicators of impairment exist. The process of evaluating the potential impairment of goodwill is highly subjective and requires significant judgment. To review for impairment we first assess qualitative factors to determine whether events or circumstances lead to a determination that it is more likely than not that the fair value of any of our reporting units is less than its carrying amount. Our qualitative assessment of the recoverability of goodwill, whether performed annually or based on specific events or circumstances, considers various macroeconomic, industry-specific and company-specific factors. Those factors include: (i) severe adverse industry or economic trends; (ii) significant company-specific actions, including exiting an activity in conjunction with restructuring of operations; (iii) current, historical or projected deterioration of our financial performance; or (iv) a sustained decrease in our market capitalization below our net book value. After assessing the totality of events and circumstances, if we determine that it is not more likely than not that the fair value of any of our reporting units is less than its carrying amount, no further assessment is performed. If we determine that it is more likely than not that the fair value of any of our reporting units is less than its carrying amount, we calculate the fair value of that reporting unit and compare the fair value to the reporting unit’s net book value.
Determining the fair value of a reporting unit involves the use of significant estimates and assumptions. Our goodwill impairment test uses both the income approach and the market approach to estimate a reporting unit's fair value. The income approach is based on the discounted cash flow method that uses the reporting unit estimates for forecasted future financial performance including revenues, operating expenses, and taxes, as well as working capital and capital asset requirements. These estimates are developed as part of our long-term planning process based on assumed market segment growth rates and our assumed market segment share, estimated costs based on historical data and various internal estimates. Projected cash flows are then discounted to a present value employing a discount rate that properly accounts for the estimated market weighted-average cost of capital, as well as any risk unique to the subject cash flows. The market approach is based on weighting financial multiples of comparable companies and applies a control premium. A reporting unit's carrying value represents the assignment of various assets and liabilities, excluding certain corporate assets and liabilities, such as cash and debt.
We assess the impairment of long-lived assets including purchased in-process research and development, assets, property, plant and equipment, and intangible assets, whenever events or changes in circumstances indicate that the carrying value of such assets may not be recoverable. Factors we consider important which could trigger an impairment review include (i) significant under-performance relative to historical or projected future operating results, (ii) significant changes in the manner of our use of the acquired assets or the strategy for our overall business, or (iii) significant negative industry or economic trends. The process of evaluating the potential impairment of long-lived assets under the accounting guidance on property, plant and equipment and other intangible assets is also highly subjective and requires significant judgment. In order to estimate the fair value of long-lived assets, we typically make various assumptions about the future prospects about our business or the part of our business that the long-lived asset relates to, consider market factors specific to the business and estimate future cash flows to be generated by the business, which requires significant judgment as it is based on assumptions about market demand for our products over a number of future years. Based on these assumptions and estimates, we determine whether we need to take an impairment charge to reduce the value of the long-lived asset stated on our consolidated balance sheet to reflect its estimated fair value. Assumptions and estimates about future values and remaining useful lives are complex and often subjective. They can be affected by a variety of factors, including external factors, such as the real estate market, industry and economic trends, and internal factors, such as changes in our business strategy and our internal forecasts. Although we believe the assumptions and estimates we have made in the past have been reasonable and appropriate, changes in assumptions and estimates could materially impact our reported financial results.
44
Inventory valuation. We regularly review inventory quantities on hand and record a provision for excess and obsolete inventory based primarily on our forecast of product demand and production requirements. Demand for our products can fluctuate significantly from period to period. A significant decrease in demand could result in an increase in the amount of excess inventory quantities on hand. In addition, our industry is characterized by rapid technological change, frequent new product development and rapid product obsolescence that could result in an increase in the amount of obsolete inventory quantities on hand. Additionally, our estimates of future product demand may prove to be inaccurate, which may cause us to understate or overstate both the provision required for excess and obsolete inventory and cost of products sold. Therefore, although we make every effort to ensure the accuracy of our forecasts of future product demand, any significant unanticipated changes in demand or technological developments could have a significant impact on the value of our inventory and our results of operations.
Income taxes. Significant management judgment is required in developing our provision for income taxes, including the determination of deferred tax assets and liabilities and any valuation allowances that might be required against the deferred tax assets. We have considered projected future taxable income and ongoing prudent and feasible tax planning strategies in assessing the need for valuation allowances. If we determine, in the future, that a valuation allowance is required, such adjustment to the deferred tax assets would increase our tax expense in the period in which such determination is made. Conversely, if we determine, in the future, a valuation allowance exceeds our requirement, such adjustment to the deferred tax assets would decrease tax expense in the period in which such determination is made. In evaluating the exposure associated with various tax filing positions, we accrue an income tax liability when such positions do not meet the more-likely-than-not threshold for recognition.
The calculation of our tax liabilities involves dealing with uncertainties in the application of complex tax law and regulations in a multitude of jurisdictions. We recognize potential liabilities for anticipated tax audit issues in Singapore and other tax jurisdictions based on our estimate of whether, and the extent to which, additional taxes and interest will be due. If our estimate of income tax liabilities proves to be less than the actual amount ultimately assessed, a further charge to tax expense would be required. If the payment of these amounts ultimately proves to be unnecessary, the reversal of the accrued liabilities would result in tax benefits being recognized in the period when we determine the liabilities no longer exist.
Retirement and post-retirement benefit plan assumptions. Retirement and post-retirement benefit plan costs are a significant cost of doing business. They represent obligations that will ultimately be settled sometime in the future and therefore are subject to estimation. Pension accounting is intended to reflect the recognition of future retirement and post-retirement benefit plan costs over the employees' average expected future service to us, based on the terms of the plans and investment and funding decisions. To estimate the impact of these future payments and our decisions concerning funding of these obligations, we are required to make assumptions using actuarial concepts within the framework of GAAP. One critical assumption is the discount rate used to calculate the estimated costs. Other important assumptions include the expected long-term return on plan assets, the health care cost trend rate, expected future salary increases, expected future increases to benefit payments, expected retirement dates, employee turnover, retiree mortality rates, and portfolio composition. We evaluate these assumptions at least annually.
The discount rate is used to determine the present value of future benefit payments at the relevant measurement dates — October 29, 2017 and October 30, 2016, for both U.S. and non-U.S. plans, in fiscal years 2017 and 2016, respectively. For fiscal years 2017 and 2016, the U.S. discount rates were based on the results of matching expected plan benefit payments with cash flows from a hypothetical yield curve constructed with high-quality corporate bond yields. The discount rate for non-U.S. plans was based either on published rates for government bonds or use of a hypothetical yield curve constructed with high- quality corporate bond yields, depending on the availability of sufficient quantities of quality corporate bonds. Lower discount rates increase present values of the pension liabilities and subsequent year pension expense; higher discount rates decrease present values of the pension liabilities and subsequent year pension expense.
We base our salary increase assumptions on historical experience and future expectations. In developing the expected rate of return, we consider long-term compound annualized returns based on historical market data, historical and expected returns on the various categories of plan assets, and the target investment portfolio allocation among debt, equity securities and other investments.
Actuarial assumptions are based on our best estimates and judgment. Material changes may occur in retirement benefit costs in the future if these assumptions differ from actual events or experience. We performed a sensitivity analysis on the discount rate, which is the key assumption in calculating U.S. pension and post-retirement benefit obligations as of October 29, 2017. Each change of 25 basis points in the discount rate assumption would have had an estimated $41 million impact on the benefit obligations as of October 29, 2017. Each change of 25 basis points in the discount rate assumption and expected rate of return assumption would have an estimated change of $1 million and $4 million, respectively, on annual net retirement benefit costs for fiscal year 2018.
45
Share-based compensation expense. Share-based compensation expense consists of expense for share options and RSUs granted to employees and non-employees or assumed from acquisitions as well as expense associated with Broadcom employee share purchase plan, or ESPP. We recognize compensation expense for time-based options and ESPP rights based on the estimated grant-date fair value method required under the authoritative guidance using the Black-Scholes valuation model.
Certain equity awards include both time-based and market-based conditions and are accounted for as market-based awards. The fair value of these market-based awards is estimated on the date of grant using a Monte Carlo simulation model. Assumptions utilized in the Monte Carlo simulation model follow the same methodology as our time-based option awards.
Employee Bonus Programs. Our employee bonus programs, which are overseen by our Compensation Committee or our Board, in the case of our Chief Executive Officer, provide for variable compensation based on the attainment of overall corporate annual targets and functional performance metrics. In the first fiscal quarter of the year, if management determines that it is probable that the targets and metrics will be achieved and the amounts can be reasonably estimated, a variable, proportional compensation accrual is recognized based on an assumed 100% achievement of the targets and metrics. The bonus payout levels can be greater if attainment of metrics and targets is greater than 100% and a portion of the payouts may not occur if a minimum floor of performance is not achieved. In subsequent quarters, we monitor and accrue for variable compensation expense based on our actual progress toward the achievement of the annual targets and metrics. The actual achievement of target metrics at the end of the fiscal year, which is subject to approval by our Compensation Committee, may result in the actual variable compensation amounts being significantly higher or lower than the relevant estimated amounts accrued in earlier quarters, which would result in a corresponding adjustment in the fourth fiscal quarter.
Fiscal Year Presentation
We operate on a 52- or 53-week fiscal year ending on the Sunday closest to October 31 in a 52-week year and the first Sunday in November in a 53-week year. Each of fiscal years 2017, 2016 and 2015 consisted of 52 weeks.
The financial statements included in Part II, Item 8. of this Annual Report on Form 10-K are presented in accordance with GAAP and expressed in U.S. dollars.
46
Results of Operations
Fiscal Year 2017 Compared to Fiscal Year 2016
Fiscal Year Ended | ||||||||||||||
October 29, 2017 | October 30, 2016 | October 29, 2017 | October 30, 2016 | |||||||||||
(In millions) | (As a percentage of net revenue) | |||||||||||||
Statements of Operations Data: | ||||||||||||||
Net revenue | $ | 17,636 | $ | 13,240 | 100 | % | 100 | % | ||||||
Cost of products sold: | ||||||||||||||
Cost of products sold | 6,593 | 5,295 | 38 | 40 | ||||||||||
Purchase accounting effect on inventory | 4 | 1,185 | — | 9 | ||||||||||
Amortization of acquisition-related intangible assets | 2,511 | 763 | 14 | 6 | ||||||||||
Restructuring charges | 19 | 57 | — | — | ||||||||||
Total cost of products sold | 9,127 | 7,300 | 52 | 55 | ||||||||||
Gross margin | 8,509 | 5,940 | 48 | 45 | ||||||||||
Research and development | 3,292 | 2,674 | 19 | 20 | ||||||||||
Selling, general and administrative | 787 | 806 | 4 | 6 | ||||||||||
Amortization of acquisition-related intangible assets | 1,764 | 1,873 | 10 | 14 | ||||||||||
Restructuring, impairment and disposal charges | 161 | 996 | 1 | 8 | ||||||||||
Litigation settlements | 122 | — | 1 | — | ||||||||||
Total operating expenses | 6,126 | 6,349 | 35 | 48 | ||||||||||
Operating income (loss) | $ | 2,383 | $ | (409 | ) | 13 | % | (3 | )% | |||||
Net Revenue
Fiscal Year Ended | |||||||||||||||
Net Revenue by segment | October 29, 2017 | October 30, 2016 | $ Change | % Change | |||||||||||
(In millions, except for percentages) | |||||||||||||||
Wired infrastructure | $ | 8,549 | $ | 6,582 | $ | 1,967 | 30 | % | |||||||
Wireless communications | 5,404 | 3,724 | 1,680 | 45 | % | ||||||||||
Enterprise storage | 2,799 | 2,291 | 508 | 22 | % | ||||||||||
Industrial & other | 884 | 643 | 241 | 37 | % | ||||||||||
Total net revenue | $ | 17,636 | $ | 13,240 | $ | 4,396 | 33 | % | |||||||
Fiscal Year Ended | ||||||
Net Revenue by segment | October 29, 2017 | October 30, 2016 | ||||
(As a percentage of net revenue) | ||||||
Wired infrastructure | 48 | % | 50 | % | ||
Wireless communications | 31 | 28 | ||||
Enterprise storage | 16 | 17 | ||||
Industrial & other | 5 | 5 | ||||
Total net revenue | 100 | % | 100 | % | ||
Our total net revenue increased primarily due to the full year contribution from acquired BRCM products in fiscal year 2017 compared to only three quarters in fiscal year 2016, as well as due to strong organic year-over-year growth.
Net revenue from our wired infrastructure segment increased primarily due to the full year contribution from acquired BRCM products, as well as strong organic year-over-year growth. Net revenue from our wireless communications segment increased primarily due to an increase in our wireless content in handsets, as well as the full year contribution from acquired BRCM products. Net revenue from our enterprise storage segment increased primarily due to strength in demand for our hard
47
disk drive, or HDD, products, as well as increased demand for our custom solid state drive, or SSD, controller, and server storage and connectivity products. The demand for our HDD products was higher in fiscal year 2017 than in fiscal year 2016 due to shortages in the SSD supply chain during fiscal year 2017.
Gross Margin
Gross margin increased by $2,569 million in fiscal year 2017. Gross margin as a percentage of net revenue increased to 48% in fiscal year 2017 from 45% for fiscal year 2016. These increases were primarily attributable to a $1,181 million reduction in acquisition purchase accounting effect on inventory, as well as a more favorable product mix, partially offset by a $1,748 million increase in amortization of acquisition-related intangible assets resulting from the Broadcom Merger. The 33% increase in net revenue was the primary reason for the increase in gross margin dollars. We expect to incur additional amortization of acquisition-related intangible assets in future periods as a result of the Brocade Merger which closed on November 17, 2017, and any further acquisitions.
Research and Development Expense
Research and development expense increased $618 million, or 23%, in fiscal year 2017. Research and development expense remained relatively flat as a percentage of net revenue at 19% and 20% for fiscal years 2017 and 2016, respectively. The increase in research and development expense dollars for fiscal year 2017 was primarily due to a full year of expense resulting from the acquired BRCM businesses and higher share-based compensation expense, partially offset by benefits from restructuring actions that we initiated following the Broadcom Merger. Share-based compensation expense was higher in fiscal year 2017 due to equity awards granted to employees from the acquired BRCM businesses, as well as annual employee equity awards granted at higher grant-date fair values.
Selling, General and Administrative Expense
Selling, general and administrative expense decreased $19 million, or 2%, in fiscal year 2017. Selling, general and administrative expense as a percentage of net revenue was 4% and 6% for fiscal years 2017 and 2016, respectively. The decrease in selling, general and administrative expense dollars for fiscal year 2017 was primarily due to a decrease in acquisition-related costs and benefits from restructuring actions that we initiated following the Broadcom Merger, partially offset by higher share-based compensation expense. Share-based compensation expense was higher in fiscal year 2017 due to annual employee equity awards granted at higher grant-date fair values.
Amortization of Acquisition-Related Intangible Assets
Amortization of acquisition-related intangible assets recognized in operating expenses decreased $109 million, or 6%, in fiscal year 2017, due to a decrease in amortization of intangible assets acquired in the Broadcom Merger. We expect to incur additional amortization of acquisition-related intangible assets in future periods as a result of the Brocade Merger.
Restructuring, Impairment and Disposal Charges
Restructuring, impairment and disposal charges included in operating expenses decreased $835 million, or 84%, in fiscal year 2017 compared to fiscal year 2016 primarily due to a decrease in the impairment of in-process research and development projects. The decrease was also due to lower employee termination costs as the majority of restructuring activities resulting from the Broadcom Merger were undertaken in fiscal year 2016. We expect to incur additional restructuring charges in future periods as a result of the Brocade Merger.
Litigation Settlements
During fiscal year 2017, we incurred $122 million of litigation charges associated with certain legal settlement agreements.
48
Segment Operating Results
Fiscal Year Ended | |||||||||||||||
Operating Income (Loss) | October 29, 2017 | October 30, 2016 | $ Change | % Change | |||||||||||
(In millions, except for percentages) | |||||||||||||||
Wired infrastructure | $ | 3,853 | $ | 2,664 | $ | 1,189 | 45 | % | |||||||
Wireless communications | 2,155 | 1,282 | 873 | 68 | % | ||||||||||
Enterprise storage | 1,527 | 995 | 532 | 53 | % | ||||||||||
Industrial & other | 447 | 327 | 120 | 37 | % | ||||||||||
Unallocated expenses | (5,599 | ) | (5,677 | ) | 78 | (1 | )% | ||||||||
Total operating income (loss) | $ | 2,383 | $ | (409 | ) | $ | 2,792 | 683 | % | ||||||
Operating income from our wired infrastructure segment increased primarily due to a full year of revenue contributions from acquired BRCM products, as well as due to strong organic year-over-year growth, partially offset by a full year of research and development expense related to the acquired BRCM businesses. Operating income from our wireless communications segment increased primarily due to an increase in our wireless content in handsets, as well as the full year contribution from acquired BRCM products. These increases were partially offset by a full year of research and development expense related to the acquired BRCM businesses. Operating income from our enterprise storage segment increased primarily due to strength in demand for our HDD products, as well as increased demand for our custom SSD controller, and server storage connectivity products. We expect contributions from the Brocade SAN business to increase operating income in the enterprise storage segment in future periods. Operating income for the wired infrastructure, wireless communications and enterprise storage segments also benefited from lower operating expenses following our restructuring actions. Operating income from our industrial & other segment increased primarily due to an increase in revenue dollars from our optocoupler products and licensing of intellectual property, or IP, partially offset by an increase in legal expense.
Unallocated expenses include amortization of acquisition-related intangible assets, share-based compensation expense, restructuring, impairment and disposal charges, acquisition-related costs, charges for litigation settlement, and other costs that are not used in evaluating the results of, or in allocating resources to, our segments. Unallocated expenses decreased 1% in fiscal year 2017 primarily due to significant reductions in the purchase accounting effect on inventory and restructuring, impairment and disposal charges, partially offset by increases in amortization of acquisition-related intangible assets and charges for litigation settlement. Additionally, share-based compensation was higher in fiscal year 2017 due to equity awards granted to employees from the acquired BRCM businesses, as well as annual employee equity awards granted at higher grant-date fair values. We expect the factors noted above to increase as a result of the Brocade Merger.
Overall, operating income also benefited from reductions in operating expenses related to our restructuring actions following the Broadcom Merger.
Non-Operating Income and Expenses
Interest expense. Interest expense was $454 million and $585 million for fiscal years 2017 and 2016, respectively. Interest expense was higher in fiscal year 2016 due primarily to one-time debt-related expenses associated with the financing of the Broadcom Merger. We expect interest expense to increase in fiscal year 2018 due to the issuance of the October 2017 Senior Notes.
Loss on extinguishment of debt. During fiscal year 2017, we issued the January 2017 Senior Notes to refinance all of the term loans outstanding under the 2016 Credit Agreement. We terminated the 2016 Credit Agreement, and the revolving credit facility thereunder, in connection with the issuance of the October 2017 Senior Notes, the proceeds of which were used to finance the Brocade Merger. As a result, we wrote off $166 million of outstanding debt issuance costs, which were included in loss on extinguishment of debt. During fiscal year 2016, we made prepayments on our term loan borrowings under the 2016 Credit Agreement and, as a result, recognized $123 million of losses on extinguishment of debt.
Other income, net. Other income net was $62 million and $10 million in fiscal years 2017 and 2016, respectively. Other income, net for fiscal year 2017 primarily comprised a gain on disposal of assets and interest income.
Provision for income taxes. Our provisions for income taxes were $35 million and $642 million in fiscal years 2017 and 2016, respectively. The provision for income taxes in fiscal year 2017 was primarily due to an increase in profit before tax and a discrete expense of $76 million resulting from entity reorganizations, partially offset by the recognition of $273 million of excess tax benefits from share-based equity awards that vested or were exercised during fiscal year 2017 and, to a lesser extent, the recognition of previously unrecognized tax benefits primarily as a result of audit settlements.
49
The income tax provision for fiscal year 2016 was primarily the result of an increase in tax associated with our undistributed earnings, partially offset by income tax benefits from losses from continuing operations and the recognition of previously unrecognized tax benefits as a result of audit settlements.
At the time we completed the Broadcom Merger, in connection with the allocation of the purchase price, we established a deferred tax liability associated with our potential tax liability arising from our planned integration of BRCM’s IP, which was completed in November 2016. Prior to the adoption of the 2017 Tax Reform Act, this tax liability will become payable as earnings resulting from this integration of IP are distributed over time. However, under the 2017 Tax Reform Act, we will be required to recognize all of these earnings in our fiscal year 2018 as a deemed repatriation of foreign earnings, subject to a one-time mandatory deemed repatriation tax.
As a result of these events, the amount of our income taxes payable could vary materially and consume an increasing amount of our cash. In addition, our provision for income taxes in future periods is likely to change as a result of the impact of internal restructurings and reorganizations which could also affect our overall effective tax rate.
Fiscal Year 2016 Compared to Fiscal Year 2015
Fiscal Year Ended | ||||||||||||||
Statements of Operations Data: | October 30, 2016 | November 1, 2015 | October 30, 2016 | November 1, 2015 | ||||||||||
(In millions) | (As a percentage of net revenue) | |||||||||||||
Net revenue | $ | 13,240 | $ | 6,824 | 100 | % | 100 | % | ||||||
Cost of products sold: | ||||||||||||||
Cost of products sold | 5,295 | 2,750 | 40 | 41 | ||||||||||
Purchase accounting effect on inventory | 1,185 | 30 | 9 | — | ||||||||||
Amortization of acquisition-related intangible assets | 763 | 484 | 6 | 7 | ||||||||||
Restructuring charges | 57 | 7 | — | — | ||||||||||
Total cost of products sold | 7,300 | 3,271 | 55 | 48 | ||||||||||
Gross margin | 5,940 | 3,553 | 45 | 52 | ||||||||||
Research and development | 2,674 | 1,049 | 20 | 15 | ||||||||||
Selling, general and administrative | 806 | 486 | 6 | 7 | ||||||||||
Amortization of acquisition-related intangible assets | 1,873 | 249 | 14 | 4 | ||||||||||
Restructuring, impairment and disposal charges | 996 | 137 | 8 | 2 | ||||||||||
Total operating expenses | 6,349 | 1,921 | 48 | 28 | ||||||||||
Operating income (loss) | $ | (409 | ) | $ | 1,632 | (3 | )% | 24 | % | |||||
Net Revenue
Fiscal Year Ended | |||||||||||||||
Net Revenue by Segment | October 30, 2016 | November 1, 2015 | $ Change | % Change | |||||||||||
(In millions, except for percentages) | |||||||||||||||
Wired infrastructure | $ | 6,582 | $ | 1,479 | $ | 5,103 | 345 | % | |||||||
Wireless communications | 3,724 | 2,536 | 1,188 | 47 | % | ||||||||||
Enterprise storage | 2,291 | 2,180 | 111 | 5 | % | ||||||||||
Industrial & other | 643 | 629 | 14 | 2 | % | ||||||||||
Total net revenue | $ | 13,240 | $ | 6,824 | $ | 6,416 | 94 | % | |||||||
50
Fiscal Year Ended | ||||||
Net Revenue by Segment | October 30, 2016 | November 1, 2015 | ||||
(As a percentage of net revenue) | ||||||
Wired infrastructure | 50 | % | 22 | % | ||
Wireless communications | 28 | 37 | ||||
Enterprise storage | 17 | 32 | ||||
Industrial & other | 5 | 9 | ||||
Total net revenue | 100 | % | 100 | % | ||
Our overall net revenue increased in fiscal year 2016, compared to fiscal year 2015, primarily due to the contributions from acquired BRCM products since the Acquisition Date. As a result of the Broadcom Merger, our wired infrastructure segment constituted our largest segment.
Net revenue from our wired infrastructure segment increased primarily due to the contributions since the Acquisition Date from acquired BRCM products included in this segment. Net revenue from our wireless communications segment increased primarily due to revenue contributions of approximately $1.8 billion from sales of acquired BRCM wireless connectivity and related products since the Acquisition Date, partially offset by a decrease in sales of approximately $525 million in sales of our radio frequency, or RF, components due to reduced demand from a key North American mobile handset customer. Net revenue from our enterprise storage segment increased primarily due to the additional revenue resulting from a full year of contributions from the Emulex business that we acquired in May 2015, as well as strength in demand for our HDD products, partially offset by a decrease in demand for our server and storage connectivity products. Net revenue from our industrial & other segment remained essentially flat compared to fiscal year 2015. Our net revenue in fiscal year 2016 also included $450 million from development arrangements and sales and licensing of IP, compared to $313 million in fiscal year 2015, which primarily benefited our wired infrastructure and industrial & other segments.
Gross Margin
Gross margin was $5.9 billion for fiscal year 2016 compared to $3.6 billion for fiscal year 2015. The increase in gross margin was primarily due to contributions to our wired infrastructure and wireless communications segments from the BRCM businesses acquired in February 2016. As a percentage of net revenue, gross margin was 45% and 52% for fiscal years 2016 and 2015, respectively. The 7% decrease in gross margin as a percentage of net revenue was largely due to $1.2 billion of costs resulting from the step-up of inventory to fair value and the increase in amortization of acquisition-related intangible assets associated with the Broadcom Merger.
Research and Development Expense
Research and development expense increased $1.6 billion, or 155%, in fiscal year 2016. Research and development expense as a percentage of net revenue was 20% and 15% for fiscal years 2016 and 2015, respectively. The overall increase in research and development expense dollars and as a percentage of net revenue for fiscal year 2016 was primarily due to the acquisition of BRCM. Share-based compensation included in research and development expense increased due to RSUs assumed in connection with, and integration equity awards granted to employees acquired in, the Broadcom Merger, as well as annual employee equity awards granted at higher grant-date fair values.
Selling, General and Administrative Expense
Selling, general and administrative expense increased $320 million, or 66%, in fiscal year 2016. Selling, general and administrative expense as a percentage of net revenue was 6% and 7% for fiscal years 2016 and 2015, respectively. The overall increase in selling, general and administrative expense dollars for fiscal year 2016 was primarily due to the impact of the acquired BRCM businesses and the acquisition-related costs. The decrease as a percentage of revenue was due to the realization of synergies resulting from the integration of BRCM. Share-based compensation included in selling, general and administrative expense increased due to RSUs assumed in connection with, and integration equity awards granted to employees acquired in, the Broadcom Merger, as well as annual employee equity awards granted at higher grant-date fair values.
Amortization of Acquisition-Related Intangible Assets
Total amortization of acquisition-related intangible assets was $2.6 billion for fiscal year 2016, compared to $733 million for fiscal year 2015. The increase in amortization expense in fiscal year 2016 was primarily attributable to an increase in amortizable intangible assets resulting from the Broadcom Merger.
51
Restructuring, Impairment and Disposal Charges
Restructuring, impairment and disposal charges, recognized primarily in operating expenses, were $1.1 billion for fiscal year 2016 compared to $144 million in fiscal year 2015. The increase was due primarily to the Broadcom Merger, including impairment charges of $417 million for termination of in-process research and development projects and $173 million for property, plant and equipment. Restructuring charges were due primarily to employee termination costs of approximately $418 million, and lease termination and other exit costs of $29 million, primarily resulting from the Broadcom Merger.
Segment Operating Results
Fiscal Year Ended | |||||||||||||||
Operating Income (Loss) | October 30, 2016 | November 1, 2015 | $ Change | % Change | |||||||||||
(In millions, except for percentages) | |||||||||||||||
Wired infrastructure | $ | 2,664 | $ | 478 | $ | 2,186 | 457 | % | |||||||
Wireless communications | 1,282 | 1,202 | 80 | 7 | % | ||||||||||
Enterprise storage | 995 | 855 | 140 | 16 | % | ||||||||||
Industrial & other | 327 | 310 | 17 | 5 | % | ||||||||||
Unallocated expenses | (5,677 | ) | (1,213 | ) | (4,464 | ) | 368 | % | |||||||
Total operating income (loss) | $ | (409 | ) | $ | 1,632 | $ | (2,041 | ) | (125 | )% | |||||
Operating income from our wired infrastructure segment increased primarily due to contributions from the acquired BRCM wired products. Operating income from our wireless communications segment increased primarily due to contributions from the acquired BRCM wireless connectivity products, partially offset by a decrease in demand for our RF components from a key North American mobile handset customer. Operating income from our enterprise storage segment increased primarily due to a full year of contributions from the Emulex business that we acquired in May 2015, as well as strength in demand for our HDD products, partially offset by a decrease in demand for our server and storage connectivity products. Operating income from our industrial & other segment was flat.
Unallocated expenses include amortization of acquisition-related intangible assets, share-based compensation expense, restructuring, impairment and disposal charges, acquisition-related costs, including charges related to the step-up of acquired inventory to fair value, and other costs that are not used in evaluating the results of, or in allocating resources to, our segments. Unallocated expenses increased 368% in fiscal year 2016, compared to fiscal year 2015, primarily due to increases in charges related to the step-up of inventory to fair value, amortization of acquisition-related intangible assets, restructuring, impairment and disposal charges, and costs incurred in connection with the Broadcom Merger. Additionally, share-based compensation increased due to RSUs assumed in, and integration equity awards granted to employees acquired in, the Broadcom Merger.
Non-Operating Income and Expenses
Interest expense. Interest expense was $585 million and $191 million for fiscal years 2016 and 2015, respectively. The increase in interest expense in fiscal year 2016 was primarily due to interest on higher outstanding debt balances and expenses related to debt modification and ticking fees, in each case associated with the term loan indebtedness we incurred to finance the Broadcom Merger.
Loss on extinguishment of debt. During fiscal year 2016, in connection with the closing of the Broadcom Merger, we repaid in full our term loan borrowings under a collateralized credit agreement with lenders named therein entered into in fiscal year 2014, or the 2014 Credit Agreement. We subsequently repaid our €900 million Term B-1 Euro Loan (defined below) partially funded by the sale of certain acquired BRCM assets that were held for sale. We also repaid our $500 million Term B-2 Loan (defined below), partially funded with $325 million of additional Term A Loan (defined below) borrowings. These payments and the August 2016 amendments to the 2016 Credit Agreement resulted in a loss on extinguishment of debt of $123 million for fiscal year 2016. In fiscal year 2015, we made a $593 million principal prepayment on term loan borrowings under the 2014 Credit Agreement and settled the 2.0% Convertible Senior Notes due 2021, which resulted in a loss on extinguishment of debt of $10 million for fiscal year 2015.
In connection with the completion of the Broadcom Merger, three Broadcom subsidiaries entered into the 2016 Credit Agreement, which originally provided for a Term A loan facility in the aggregate principal amount of $4.4 billion, or the Term A Loan, a Term B-1 dollar loan facility in the aggregate principal amount of $9.8 billion, or the Term B-1 Loan, a Term B-1 euro loan facility in the aggregate principal amount of €900 million, equivalent to $978 million as of February 1, 2016, or the Term B-1 Euro Loan, a Term B-2 loan facility in the aggregate principal amount of $500 million, or the Term B-2 Loan, and together
52
with the Term A Loan, Term B-1 Loan, and Term B-1 Euro Loan. The 2016 Credit Agreement also provides for a revolving credit facility, or the 2016 Revolving Credit Facility, that permits us to borrow from time to time in an aggregate principal amount of up to $500 million for working capital and other corporate purposes, including swingline loans of up to $150 million in the aggregate and for the issuance of letters of credit of up to $100 million in the aggregate, which, in the case of swingline loans and letters of credit, reduce the available borrowing capacity under the 2016 Revolving Credit Facility on a dollar for dollar basis.
Provision for income taxes. For fiscal year 2016, we had a provision for income taxes of $642 million compared to $76 million for fiscal year 2015. The income tax provision for fiscal year 2016 was primarily the result of an increase in tax associated with our undistributed earnings, partially offset by income tax benefits from losses from continuing operations and the recognition of previously unrecognized tax benefits as a result of audit settlements.
During fiscal year 2016, we determined that we no longer intend to indefinitely reinvest our accumulated and current foreign earnings in our operations outside of Singapore. As a result, we made a provision for taxes on $1.9 billion of our undistributed earnings as of November 1, 2015, including projected withholding taxes that would become payable upon the distribution of those earnings, and recognized $93 million of expense in fiscal year 2016 related to the undistributed earnings of foreign operations that were previously considered indefinitely reinvested.
At the time we completed the Broadcom Merger, in connection with the preliminary allocation of the purchase price, we established a deferred tax liability that was associated with our potential tax liability arising from our planned integration of BRCM’s IP, which was completed in November 2016. This tax liability will become payable as earnings resulting from this integration of IP are distributed over time.
Seasonality
Historically, our net revenue has typically been higher in the second half of the fiscal year than in the first half, primarily due to seasonality in our wireless communications segment. This segment has historically experienced seasonality due to launches of new mobile handsets manufactured by our OEM customers. However, from time to time, typical seasonality and industry cyclicality are overshadowed by other factors such as wider macroeconomic effects, the timing of significant product transitions and launches by large OEMs, particularly in the wireless communications segment. We have a diversified business portfolio and our wired infrastructure segment represents the largest portion of our net revenue. We believe that our overall revenue is less susceptible to seasonal variations as a result of the diversification of our business portfolio.
Liquidity and Capital Resources
The following section discusses our principal liquidity and capital resources as well as our principal liquidity requirements and sources and uses of cash. Our cash and cash equivalents are maintained in highly liquid investments with remaining maturities of 90 days or less at the time of purchase. We believe our cash equivalents are liquid and accessible.
Our primary sources of liquidity as of October 29, 2017 consisted of: (i) $11,204 million in cash and cash equivalents, which included $3,980 million of net proceeds from the issuance of the October 2017 Senior Notes, all of which was used to fund the Brocade Merger on November 17, 2017, and (ii) cash we expect to generate from operations. In addition, we may also generate cash from the sale of assets from time to time.
During fiscal year 2017, we completed the issuances and sales of the January 2017 Senior Notes and October 2017 Senior Notes, collectively, the Senior Notes, in aggregate principal amounts of $13,550 million and $4,000 million, respectively.
During fiscal year 2017, we also entered into a trade accounts receivable factoring facility with a third-party financial institution to sell certain of our trade accounts receivable on a non-recourse basis for amounts of up to $100 million from time to time. Total trade accounts receivable sold under the factoring agreement were $178 million during fiscal year 2017.
Our short-term and long-term liquidity requirements primarily arise from: (i) business acquisitions and investments we may make from time to time, (ii) working capital requirements, (iii) research and development and capital expenditure needs, (iv) interim cash dividend payments by Broadcom (if and when declared by the Board), (v) cash distributions by the Partnership (if and when declared by the Partnership’s General Partner), (vi) interest and principal payments related to outstanding indebtedness, (vii) payment of income taxes, including taxes resulting from intercompany transfers of IP, and (viii) funding employee benefit plan obligations. Our ability to fund these requirements will depend, in part, on our future cash flows, which are determined by our future operating performance and, therefore, subject to prevailing global macroeconomic conditions and financial, business and other factors, some of which are beyond our control.
Our capital expenditures for fiscal year 2017 were higher than fiscal year 2016, due primarily to expenditures for construction at our Irvine and San Jose campuses, purchases of test manufacturing equipment and spending on equipment to support various research and development projects. We expect capital expenditures to be somewhat lower in fiscal year 2018 as compared to fiscal year 2017.
53
Our liquidity needs also increased as a result of completing the Brocade Merger. We financed $4,000 million of the purchase consideration with the issuance of the October 2017 Senior Notes. We believe that our cash and cash equivalents on hand and cash flows from operations will provide sufficient liquidity, after giving effect to the Brocade Merger, to operate our business and fund our current and assumed obligations for at least the next 12 months, excluding the impact of any future mergers, acquisitions and divestiture activity.
From time to time, we engage in discussions with third parties regarding potential acquisitions of, or investments in, businesses, technologies and product lines. Any such transaction, or evaluation of potential transactions, could require significant use of our cash and cash equivalents, or require us to increase our borrowings to fund such transactions. We could also reduce certain expenditures such as payment of our cash dividend. If we do not have sufficient cash to fund our operations or finance growth opportunities, including acquisitions, or unanticipated capital expenditures, our business and financial condition could suffer. In such circumstances we may also seek to obtain new debt or equity financing. However, we cannot assure you that such additional financing will be available on terms acceptable to us or at all. Our ability to service the Senior Notes and any other indebtedness we may incur, will depend on our ability to generate cash in the future.
We may also elect to sell additional debt or equity securities for reasons other than those specified above.
Summary and Highlights
Our cash and cash equivalents increased $8,107 million to $11,204 million at October 29, 2017 from $3,097 million at October 30, 2016.
The increase was largely due to the following:
• | $17,426 million of proceeds from the issuance of the Senior Notes, |
• | $6,551 million in net cash provided by operating activities, |
• | $441 million of proceeds from disposals of property, plant and equipment, |
• | $257 million from the issuance of ordinary shares upon exercises of share options and purchase rights under Broadcom’s employee share purchase plan, and |
• | $200 million of proceeds from maturities of investments. |
The increase was partially offset by the following:
• | $13,668 million for the repayment of our term loan borrowings under the 2016 Credit Agreement, |
• | $1,745 million of dividend payments by Broadcom and cash distributions by the Partnership, |
• | $1,069 million in capital expenditures, and |
• | $207 million for the purchases of investments. |
Dividends/Distributions
Dividends paid by Broadcom
Fiscal Year Ended | ||||||||||||
October 29, 2017 | October 30, 2016 | November 1, 2015 | ||||||||||
(In millions, except per share data) | ||||||||||||
Cash dividends paid per ordinary share | $ | 4.08 | $ | 1.94 | $ | 1.55 | ||||||
Cash dividends paid to ordinary shareholders | $ | 1,653 | $ | 716 | $ | 408 | ||||||
Distributions made by the Partnership
Fiscal Year Ended | ||||||||||||
October 29, 2017 | October 30, 2016 | November 1, 2015 | ||||||||||
(In millions, except per Partnership REU) | ||||||||||||
Cash distributions paid to General Partner | $ | 1,756 | $ | 594 | $ | — | ||||||
Cash distributions paid per Partnership REU | $ | 4.08 | $ | 1.50 | $ | — | ||||||
Cash distributions paid to Limited Partners | $ | 92 | $ | 34 | $ | — | ||||||
54
Cash Flows
Fiscal Year Ended | ||||||||||||
October 29, 2017 | October 30, 2016 | November 1, 2015 | ||||||||||
(In millions) | ||||||||||||
Net cash provided by operating activities | $ | 6,551 | $ | 3,411 | $ | 2,318 | ||||||
Net cash used in investing activities | (674 | ) | (9,840 | ) | (241 | ) | ||||||
Net cash provided by (used in) financing activities | 2,230 | 7,704 | (1,859 | ) | ||||||||
Net increase in cash and cash equivalents | $ | 8,107 | $ | 1,275 | $ | 218 | ||||||
Operating Activities
Cash provided by operating activities represents net income (loss) adjusted for certain non-cash items and changes in assets and liabilities. The $3,140 million increase in cash provided by operations during fiscal year 2017 compared to fiscal year 2016 was due to the impact of net income and adjustments to net income for non-cash items, partially offset by changes in assets and liabilities. The adjustments to net income for non-cash items were higher, compared to fiscal year 2016, primarily due to increased depreciation and amortization, increased share-based compensation, and an increase in the non-cash portion of the debt extinguishment loss, partially offset by a decrease in non-cash restructuring, impairment and disposal charges and a decrease in deferred taxes and other non-cash taxes.
The $1,093 million increase in cash provided by operating activities during fiscal year 2016 compared to fiscal year 2015 was due to the adjustments to net loss for non-cash items and changes in assets and liabilities, partially offset by the impact of a net loss during fiscal year 2016. The adjustments to net loss for non-cash items were higher, compared to fiscal year 2015, primarily due to depreciation and amortization, share-based compensation, non-cash restructuring, impairment and disposal charges and deferred taxes and other non-cash taxes.
Investing Activities
Cash used in investing activities consisted primarily of cash used for capital expenditures, acquisitions, and investments, partially offset by proceeds from disposals of property, plant and equipment, divestitures and maturities of investments. The $9,166 million change in investing cash flows for fiscal year 2017 compared to fiscal year 2016 was primarily due to $10,055 million paid primarily for the Broadcom Merger in fiscal year 2016 and cash receipts of $441 million from the sale of our Irvine campus in fiscal year 2017, offset in part by a decrease in proceeds from the sales of businesses and an increase in capital expenditures and investments.
The $9,599 million change in investing cash flows for fiscal year 2016 compared to fiscal year 2015 was primarily due to $10,055 million paid primarily for the Broadcom Merger and an increase in capital expenditures and investments, partially offset by an increase in proceeds from the sales of businesses and an increase in proceeds from sales and maturities of investments.
Financing Activities
Broadcom
Cash provided by (used in) financing activities consisted primarily of net proceeds and payments related to our long-term debt, payment of assumed debt, dividend payments by Broadcom, cash distributions by the Partnership, proceeds received from the issuances of ordinary shares pursuant to our employee equity incentive plans and payments of debt issuance costs. The $5,474 million decrease in financing cash flows for fiscal year 2017 compared to fiscal year 2016 was primarily due a decrease in net proceeds and payments related to our long-term debt and an increase in dividend and distribution payments, offset in part by the repayment of assumed debt in fiscal year 2016.
The $9,563 million increase in financing cash flows for fiscal year 2016 compared to fiscal year 2015 was primarily due to an increase in net proceeds and payments related to our long-term debt, partially offset by an increase in dividend and distribution payments.
The Partnership
Cash provided by (used in) financing activities for the Partnership is materially the same as for Broadcom discussed above. The differences are due to capital transactions with the General Partner, which result from capital contributions and distributions between Broadcom and the Partnership.
55
Indebtedness
See Note 8. “Borrowings” included in Part II, Item 8. of this Annual Report on Form 10-K.
Senior Notes
On January 19, 2017, we completed the issuance and sale of the January 2017 Senior Notes in an aggregate principal amount of $13,550 million. The net proceeds, together with cash on hand, were used to repay all of the outstanding term loans under the 2016 Credit Agreement in the aggregate amount of $13,555 million.
On October 17, 2017, we completed the issuance and sale of the October 2017 Senior Notes in an aggregate principal amount of $4,000 million. The net proceeds, together with cash on hand, were used to finance the Brocade Merger, which closed on November 17, 2017. In connection with the issuance of the October 2017 Senior Notes, we terminated the commitments and satisfied all outstanding obligations under the 2016 Credit Agreement.
As a result, during fiscal year 2017, we wrote-off $166 million of debt issuance costs, which were included in loss on extinguishment of debt in the consolidated statements of operations.
56
Contractual Commitments
Payments Due by Period | ||||||||||||||||||||
Total | Less than 1 year | 1-3 years | 3-5 years | More than 5 years | ||||||||||||||||
(In millions) | ||||||||||||||||||||
Debt principal and interest | $ | 21,560 | $ | 657 | $ | 3,849 | $ | 5,182 | $ | 11,872 | ||||||||||
Purchase commitments | 909 | 841 | 68 | — | — | |||||||||||||||
Other contractual commitments | 272 | 111 | 154 | 7 | — | |||||||||||||||
Operating lease obligations | 745 | 119 | 126 | 79 | 421 | |||||||||||||||
Capital lease obligations | 21 | 21 | — | — | — | |||||||||||||||
Pension plan contributions | 118 | 118 | — | — | — | |||||||||||||||
Total | $ | 23,625 | $ | 1,867 | $ | 4,197 | $ | 5,268 | $ | 12,293 | ||||||||||
Debt Principal and Interest. Represents principal and interest on borrowings under the Senior Notes and outstanding senior unsecured notes that we assumed as a result of the Broadcom Merger, or the Assumed Senior Notes.
Purchase Commitments. Represents unconditional purchase obligations that include agreements to purchase goods or services, primarily inventory, that are enforceable and legally binding on us and that specify all significant terms, including fixed or minimum quantities to be purchased, fixed, minimum or variable price provisions, and the approximate timing of the transaction. Purchase obligations exclude agreements that are cancelable without penalty. Cancellation for outstanding purchase orders for capital expenditures in connection with the internal fabrication facility expansion and construction of our new campuses is generally allowed but requires payment of all costs incurred through the date of cancellation and, therefore, cancelable purchase orders for these capital expenditures are included in the table above.
Other Contractual Commitments. Represents amounts payable pursuant to agreements related to IT, human resources, financial infrastructure outsourcing services and other service agreements.
Operating Lease Obligations. Represents real property and equipment leased from third parties under non-cancelable operating leases.
Capital Lease Obligations. Represents equipment leased from third parties under non-cancelable capital leases.
Pension Plan Contributions. Represents our planned minimum contributions to our pension plans. Although additional future contributions will be required, the amount and timing of these contributions will be affected by actuarial assumptions, the actual rate of returns on plan assets, the level of market interest rates, legislative changes and the amount of voluntary contributions to the plans. The amount shown in the table represents our planned contributions to our pension plans within a year. Because any contributions for fiscal year 2019 and later will depend on the value of the plan assets in the future and thus are uncertain, we have not included any amounts for fiscal year 2019 and beyond in the above table.
Due to the inherent uncertainty with respect to the timing of future cash outflows associated with our unrecognized tax benefits at October 29, 2017, we are unable to reliably estimate the timing of cash settlement with the respective taxing authority. Therefore, $1,011 million of unrecognized tax benefits and accrued interest classified within other long-term liabilities on our consolidated balance sheet as of October 29, 2017 have been excluded from the contractual obligations table above.
Off-Balance Sheet Arrangements
We had no material off-balance sheet arrangements at October 29, 2017 as defined in Item 303(a)(4)(ii) of Regulation S-K under the Exchange Act.
Indemnifications
See Note 14. “Commitments and Contingencies” in Part II, Item 8 of this Form 10-K.
Accounting Changes and Recent Accounting Standards
For a description of accounting changes and recent accounting standards, including the expected dates of adoption and estimated effects, if any, in our consolidated financial statements, see Note 2. “Summary of Significant Accounting Policies” included in Part II, Item 8. of this Annual Report on Form 10-K.
57
ITEM 7A. | QUANTITATIVE AND QUALITATIVE DISCLOSURES ABOUT MARKET RISK |
Foreign Currency Derivative Instruments
We use foreign exchange forward contracts to hedge a portion of our exposures to changes in currency exchange rates, which result from our global operating and financing activities. Gains and losses from foreign currency transactions, as well as derivative instruments, were not significant for any period presented in the consolidated financial statements included in this Form 10-K.
European Debt Exposures
We actively monitor our exposure to the European financial markets, including the impact of sovereign debt issues. We also seek to mitigate our risk by investing in fixed deposits with various financial institutions and we limit the amount we hold with any one institution. We do not have any direct investments in the sovereign debt of European countries. From time to time, we may have deposits with major European financial institutions. We also seek to mitigate collection risks from our customers by performing regular credit evaluations of our customers’ financial condition and require collateral, such as letters of credit and bank guarantees, in certain circumstances. As of October 29, 2017, we do not believe that we have any material direct or indirect exposure to the European financial markets.
58
ITEM 8. | FINANCIAL STATEMENTS AND SUPPLEMENTARY DATA |
BROADCOM LIMITED AND BROADCOM CAYMAN L.P.
INDEX TO CONSOLIDATED FINANCIAL STATEMENTS
Page | |
Financial Statements of Broadcom Limited | |
Financial Statements of Broadcom Cayman L.P. | |
59
REPORT OF INDEPENDENT REGISTERED PUBLIC ACCOUNTING FIRM
To the Board of Directors and Shareholders of Broadcom Limited
In our opinion, the consolidated financial statements listed in the index appearing under Item 15(a)(1) present fairly, in all material respects, the financial position of Broadcom Limited and its subsidiaries as of October 29, 2017 and October 30, 2016, and the results of their operations and their cash flows for each of the three years in the period ended October 29, 2017 in conformity with accounting principles generally accepted in the United States of America. In addition, in our opinion, the financial statement schedule listed in the index appearing under Item 15(a)(2) presents fairly, in all material respects, the information set forth therein when read in conjunction with the related consolidated financial statements. Also in our opinion, the Company maintained, in all material respects, effective internal control over financial reporting as of October 29, 2017, based on criteria established in Internal Control - Integrated Framework (2013) issued by the Committee of Sponsoring Organizations of the Treadway Commission (COSO). The Company's management is responsible for these financial statements and financial statement schedule, for maintaining effective internal control over financial reporting and for its assessment of the effectiveness of internal control over financial reporting, included in Management's Report on Internal Control over Financial Reporting appearing under Item 9A. Our responsibility is to express opinions on these financial statements, on the financial statement schedule, and on the Company's internal control over financial reporting based on our integrated audits. We conducted our audits in accordance with the standards of the Public Company Accounting Oversight Board (United States). Those standards require that we plan and perform the audits to obtain reasonable assurance about whether the financial statements are free of material misstatement and whether effective internal control over financial reporting was maintained in all material respects. Our audits of the financial statements included examining, on a test basis, evidence supporting the amounts and disclosures in the financial statements, assessing the accounting principles used and significant estimates made by management, and evaluating the overall financial statement presentation. Our audit of internal control over financial reporting included obtaining an understanding of internal control over financial reporting, assessing the risk that a material weakness exists, and testing and evaluating the design and operating effectiveness of internal control based on the assessed risk. Our audits also included performing such other procedures as we considered necessary in the circumstances. We believe that our audits provide a reasonable basis for our opinions.
As discussed in Note 2 to the consolidated financial statements, the Company changed the manner in which it accounts for certain elements of its employee share-based compensation in 2017.
A company’s internal control over financial reporting is a process designed to provide reasonable assurance regarding the reliability of financial reporting and the preparation of financial statements for external purposes in accordance with generally accepted accounting principles. A company’s internal control over financial reporting includes those policies and procedures that (i) pertain to the maintenance of records that, in reasonable detail, accurately and fairly reflect the transactions and dispositions of the assets of the company; (ii) provide reasonable assurance that transactions are recorded as necessary to permit preparation of financial statements in accordance with generally accepted accounting principles, and that receipts and expenditures of the company are being made only in accordance with authorizations of management and directors of the company; and (iii) provide reasonable assurance regarding prevention or timely detection of unauthorized acquisition, use, or disposition of the company’s assets that could have a material effect on the financial statements.
Because of its inherent limitations, internal control over financial reporting may not prevent or detect misstatements. Also, projections of any evaluation of effectiveness to future periods are subject to the risk that controls may become inadequate because of changes in conditions, or that the degree of compliance with the policies or procedures may deteriorate.
/s/ PricewaterhouseCoopers LLP
San Jose, California
December 21, 2017
60
REPORT OF INDEPENDENT REGISTERED PUBLIC ACCOUNTING FIRM
To the Board of Directors and Shareholders of Broadcom Limited, the sole general partner of Broadcom Cayman L.P.
In our opinion, the consolidated financial statements listed in the index appearing under Item 15(a)(1) present fairly, in all material respects, the financial position of Broadcom Cayman L.P. and its subsidiaries as of October 29, 2017 and October 30, 2016, and the results of their operations and their cash flows for each of the three years in the period ended October 29, 2017 in conformity with accounting principles generally accepted in the United States of America. In addition, in our opinion, the financial statement schedule listed in the index appearing under Item 15(a)(2) presents fairly, in all material respects, the information set forth therein when read in conjunction with the related consolidated financial statements. Also in our opinion, the Company maintained, in all material respects, effective internal control over financial reporting as of October 29, 2017, based on criteria established in Internal Control - Integrated Framework (2013) issued by the Committee of Sponsoring Organizations of the Treadway Commission (COSO). The management of the Company’s General Partner is responsible for these financial statements and financial statement schedule, for maintaining effective internal control over financial reporting and for its assessment of the effectiveness of internal control over financial reporting, included in Management's Report on Internal Control over Financial Reporting appearing under Item 9A. Our responsibility is to express opinions on these financial statements, on the financial statement schedule, and on the Company's internal control over financial reporting based on our integrated audits. We conducted our audits in accordance with the standards of the Public Company Accounting Oversight Board (United States). Those standards require that we plan and perform the audits to obtain reasonable assurance about whether the financial statements are free of material misstatement and whether effective internal control over financial reporting was maintained in all material respects. Our audits of the financial statements included examining, on a test basis, evidence supporting the amounts and disclosures in the financial statements, assessing the accounting principles used and significant estimates made by management, and evaluating the overall financial statement presentation. Our audit of internal control over financial reporting included obtaining an understanding of internal control over financial reporting, assessing the risk that a material weakness exists, and testing and evaluating the design and operating effectiveness of internal control based on the assessed risk. Our audits also included performing such other procedures as we considered necessary in the circumstances. We believe that our audits provide a reasonable basis for our opinions.
As discussed in Note 2 to the consolidated financial statements, the Company changed the manner in which it accounts for certain elements of its employee share-based compensation in 2017.
A company’s internal control over financial reporting is a process designed to provide reasonable assurance regarding the reliability of financial reporting and the preparation of financial statements for external purposes in accordance with generally accepted accounting principles. A company’s internal control over financial reporting includes those policies and procedures that (i) pertain to the maintenance of records that, in reasonable detail, accurately and fairly reflect the transactions and dispositions of the assets of the company; (ii) provide reasonable assurance that transactions are recorded as necessary to permit preparation of financial statements in accordance with generally accepted accounting principles, and that receipts and expenditures of the company are being made only in accordance with authorizations of management and directors of the Company’s General Partner; and (iii) provide reasonable assurance regarding prevention or timely detection of unauthorized acquisition, use, or disposition of the company’s assets that could have a material effect on the financial statements.
Because of its inherent limitations, internal control over financial reporting may not prevent or detect misstatements. Also, projections of any evaluation of effectiveness to future periods are subject to the risk that controls may become inadequate because of changes in conditions, or that the degree of compliance with the policies or procedures may deteriorate.
/s/ PricewaterhouseCoopers LLP
San Jose, California
December 21, 2017
61
BROADCOM LIMITED
CONSOLIDATED BALANCE SHEETS
October 29, 2017 | October 30, 2016 | |||||||
(In millions, except share amounts) | ||||||||
ASSETS | ||||||||
Current assets: | ||||||||
Cash and cash equivalents | $ | 11,204 | $ | 3,097 | ||||
Trade accounts receivable, net | 2,448 | 2,181 | ||||||
Inventory | 1,447 | 1,400 | ||||||
Other current assets | 724 | 447 | ||||||
Total current assets | 15,823 | 7,125 | ||||||
Long-term assets: | ||||||||
Property, plant and equipment, net | 2,599 | 2,509 | ||||||
Goodwill | 24,706 | 24,732 | ||||||
Intangible assets, net | 10,832 | 15,068 | ||||||
Other long-term assets | 458 | 532 | ||||||
Total assets | $ | 54,418 | $ | 49,966 | ||||
LIABILITIES AND SHAREHOLDERS’ EQUITY | ||||||||
Current liabilities: | ||||||||
Accounts payable | $ | 1,105 | $ | 1,261 | ||||
Employee compensation and benefits | 626 | 517 | ||||||
Current portion of long-term debt | 117 | 454 | ||||||
Other current liabilities | 681 | 846 | ||||||
Total current liabilities | 2,529 | 3,078 | ||||||
Long-term liabilities: | ||||||||
Long-term debt | 17,431 | 13,188 | ||||||
Pension and post-retirement benefit obligations | 112 | 531 | ||||||
Other long-term liabilities | 11,160 | 11,293 | ||||||
Total liabilities | 31,232 | 28,090 | ||||||
Commitments and contingencies (Note 14) | ||||||||
Shareholders’ equity: | ||||||||
Ordinary shares, no par value; 408,732,155 shares and 398,281,461 shares issued and outstanding on October 29, 2017 and October 30, 2016, respectively | 20,505 | 19,241 | ||||||
Non-economic voting preference shares, no par value; 22,145,603 shares and 22,804,591 shares issued and outstanding on October, 29, 2017 and October 30, 2016, respectively | — | — | ||||||
Accumulated deficit | (129 | ) | (215 | ) | ||||
Accumulated other comprehensive loss | (91 | ) | (134 | ) | ||||
Total Broadcom Limited shareholders’ equity | 20,285 | 18,892 | ||||||
Noncontrolling interest | 2,901 | 2,984 | ||||||
Total shareholders’ equity | 23,186 | 21,876 | ||||||
Total liabilities and shareholders’ equity | $ | 54,418 | $ | 49,966 | ||||
The accompanying notes are an integral part of these consolidated financial statements.
62
BROADCOM LIMITED
CONSOLIDATED STATEMENTS OF OPERATIONS
Fiscal Year Ended | ||||||||||||
October 29, 2017 | October 30, 2016 | November 1, 2015 | ||||||||||
(In millions, except per share data) | ||||||||||||
Net revenue | $ | 17,636 | $ | 13,240 | $ | 6,824 | ||||||
Cost of products sold: | ||||||||||||
Cost of products sold | 6,593 | 5,295 | 2,750 | |||||||||
Purchase accounting effect on inventory | 4 | 1,185 | 30 | |||||||||
Amortization of acquisition-related intangible assets | 2,511 | 763 | 484 | |||||||||
Restructuring charges | 19 | 57 | 7 | |||||||||
Total cost of products sold | 9,127 | 7,300 | 3,271 | |||||||||
Gross margin | 8,509 | 5,940 | 3,553 | |||||||||
Research and development | 3,292 | 2,674 | 1,049 | |||||||||
Selling, general and administrative | 787 | 806 | 486 | |||||||||
Amortization of acquisition-related intangible assets | 1,764 | 1,873 | 249 | |||||||||
Restructuring, impairment and disposal charges | 161 | 996 | 137 | |||||||||
Litigation settlements | 122 | — | — | |||||||||
Total operating expenses | 6,126 | 6,349 | 1,921 | |||||||||
Operating income (loss) | 2,383 | (409 | ) | 1,632 | ||||||||
Interest expense | (454 | ) | (585 | ) | (191 | ) | ||||||
Loss on extinguishment of debt | (166 | ) | (123 | ) | (10 | ) | ||||||
Other income, net | 62 | 10 | 36 | |||||||||
Income (loss) from continuing operations before income taxes | 1,825 | (1,107 | ) | 1,467 | ||||||||
Provision for income taxes | 35 | 642 | 76 | |||||||||
Income (loss) from continuing operations | 1,790 | (1,749 | ) | 1,391 | ||||||||
Loss from discontinued operations, net of income taxes | (6 | ) | (112 | ) | (27 | ) | ||||||
Net income (loss) | 1,784 | (1,861 | ) | 1,364 | ||||||||
Net income (loss) attributable to noncontrolling interest | 92 | (122 | ) | — | ||||||||
Net income (loss) attributable to ordinary shares | $ | 1,692 | $ | (1,739 | ) | $ | 1,364 | |||||
Basic income (loss) per share attributable to ordinary shares: | ||||||||||||
Income (loss) per share from continuing operations | $ | 4.19 | $ | (4.46 | ) | $ | 5.27 | |||||
Loss per share from discontinued operations | (0.01 | ) | (0.29 | ) | (0.10 | ) | ||||||
Net income (loss) per share | $ | 4.18 | $ | (4.75 | ) | $ | 5.17 | |||||
Diluted income (loss) per share attributable to ordinary shares: | ||||||||||||
Income (loss) per share from continuing operations | $ | 4.03 | $ | (4.57 | ) | $ | 4.95 | |||||
Loss per share from discontinued operations | (0.01 | ) | (0.29 | ) | (0.10 | ) | ||||||
Net income (loss) per share | $ | 4.02 | $ | (4.86 | ) | $ | 4.85 | |||||
Weighted-average shares: | ||||||||||||
Basic | 405 | 366 | 264 | |||||||||
Diluted | 421 | 383 | 281 | |||||||||
Cash dividends declared and paid per share | $ | 4.08 | $ | 1.94 | $ | 1.55 | ||||||
The accompanying notes are an integral part of these consolidated financial statements.
63
BROADCOM LIMITED
CONSOLIDATED STATEMENTS OF COMPREHENSIVE INCOME (LOSS)
Fiscal Year Ended | ||||||||||||
October 29, 2017 | October 30, 2016 | November 1, 2015 | ||||||||||
(In millions) | ||||||||||||
Net income (loss) | $ | 1,784 | $ | (1,861 | ) | $ | 1,364 | |||||
Other comprehensive income (loss), net of tax: | ||||||||||||
Unrealized gain (loss) on defined benefit pension plans and post-retirement benefit plans | 42 | (65 | ) | (24 | ) | |||||||
Reclassification to net income (loss) | 1 | 4 | 1 | |||||||||
Other comprehensive income (loss) | 43 | (61 | ) | (23 | ) | |||||||
Comprehensive income (loss) | 1,827 | (1,922 | ) | 1,341 | ||||||||
Comprehensive income (loss) attributable to noncontrolling interest | 92 | (122 | ) | — | ||||||||
Comprehensive income (loss) attributable to ordinary shares | $ | 1,735 | $ | (1,800 | ) | $ | 1,341 | |||||
The accompanying notes are an integral part of these consolidated financial statements.
64
BROADCOM LIMITED
CONSOLIDATED STATEMENTS OF CASH FLOWS
Fiscal Year Ended | ||||||||||||
October 29, 2017 | October 30, 2016 | November 1, 2015 | ||||||||||
(In millions) | ||||||||||||
Cash flows from operating activities: | ||||||||||||
Net income (loss) | $ | 1,784 | $ | (1,861 | ) | $ | 1,364 | |||||
Adjustments to reconcile net income (loss) to net cash provided by operating activities: | ||||||||||||
Depreciation and amortization | 4,737 | 3,042 | 962 | |||||||||
Share-based compensation | 921 | 679 | 232 | |||||||||
Excess tax benefits from share-based compensation | — | (89 | ) | (125 | ) | |||||||
Deferred taxes and other non-cash taxes | (173 | ) | 365 | (220 | ) | |||||||
Non-cash portion of debt extinguishment loss, net | 166 | 100 | 10 | |||||||||
Non-cash restructuring, impairment and disposal charges | 71 | 662 | 77 | |||||||||
Amortization of debt issuance costs and accretion of debt discount | 24 | 36 | 22 | |||||||||
Other | 7 | (6 | ) | 32 | ||||||||
Changes in assets and liabilities, net of acquisitions and disposals: | ||||||||||||
Trade accounts receivable, net | (267 | ) | (491 | ) | (187 | ) | ||||||
Inventory | (39 | ) | 996 | 62 | ||||||||
Accounts payable | (97 | ) | 33 | 29 | ||||||||
Employee compensation and benefits | 109 | 163 | 8 | |||||||||
Contributions to defined benefit pension plans | (361 | ) | (33 | ) | (54 | ) | ||||||
Other current assets and current liabilities | (490 | ) | (98 | ) | 12 | |||||||
Other long-term assets and long-term liabilities | 159 | (87 | ) | 94 | ||||||||
Net cash provided by operating activities | 6,551 | 3,411 | 2,318 | |||||||||
Cash flows from investing activities: | ||||||||||||
Purchases of property, plant and equipment | (1,069 | ) | (723 | ) | (593 | ) | ||||||
Proceeds from disposals of property, plant and equipment | 441 | 5 | 110 | |||||||||
Purchases of investments | (207 | ) | (58 | ) | (14 | ) | ||||||
Proceeds from sales and maturities of investments | 200 | 104 | — | |||||||||
Acquisitions of businesses, net of cash acquired | (40 | ) | (10,055 | ) | (394 | ) | ||||||
Proceeds from sales of businesses | 10 | 898 | 650 | |||||||||
Other | (9 | ) | (11 | ) | — | |||||||
Net cash used in investing activities | (674 | ) | (9,840 | ) | (241 | ) | ||||||
Cash flows from financing activities: | ||||||||||||
Proceeds from issuance of long-term debt | 17,426 | 19,510 | — | |||||||||
Repayment of debt | (13,668 | ) | (9,842 | ) | (1,639 | ) | ||||||
Payment of assumed debt | — | (1,475 | ) | (178 | ) | |||||||
Payment of debt issuance costs | (24 | ) | (123 | ) | — | |||||||
Dividend and distribution payments | (1,745 | ) | (750 | ) | (408 | ) | ||||||
Issuance of ordinary shares | 257 | 295 | 241 | |||||||||
Excess tax benefits from share-based compensation | — | 89 | 125 | |||||||||
Payment of capital lease obligations | (16 | ) | — | — | ||||||||
Net cash provided by (used in) financing activities | 2,230 | 7,704 | (1,859 | ) | ||||||||
Net change in cash and cash equivalents | 8,107 | 1,275 | 218 | |||||||||
Cash and cash equivalents at the beginning of period | 3,097 | 1,822 | 1,604 | |||||||||
Cash and cash equivalents at end of period | $ | 11,204 | $ | 3,097 | $ | 1,822 | ||||||
Supplemental disclosure of cash flow information: | ||||||||||||
Cash paid for interest | $ | 310 | $ | 448 | $ | 172 | ||||||
Cash paid for income taxes | $ | 349 | $ | 242 | $ | 138 | ||||||
The accompanying notes are an integral part of these consolidated financial statements.
65
BROADCOM LIMITED
CONSOLIDATED STATEMENTS OF SHAREHOLDERS’ EQUITY
Ordinary Shares | Non-Economic Voting Preference Shares | Retained Earnings/(Accumulated Deficit) | Accumulated Other Comprehensive Loss | Non-controlling Interest | Total Shareholders’ Equity | |||||||||||||||||||||||||
Shares | Amount | Shares | Amount | |||||||||||||||||||||||||||
(In millions) | ||||||||||||||||||||||||||||||
Balance as of November 2, 2014 | 254 | $ | 2,009 | — | $ | — | $ | 1,284 | $ | (50 | ) | $ | — | $ | 3,243 | |||||||||||||||
Issuance of ordinary shares in connection with equity incentive plans | 8 | 241 | — | — | — | — | — | 241 | ||||||||||||||||||||||
Share-based compensation | — | 237 | — | — | — | — | — | 237 | ||||||||||||||||||||||
Excess tax benefits from share-based compensation | — | 130 | — | — | — | — | — | 130 | ||||||||||||||||||||||
Cash dividends declared and paid to ordinary shareholders | — | — | — | — | (408 | ) | — | — | (408 | ) | ||||||||||||||||||||
Issuance of ordinary shares upon conversion of Convertible Notes | 14 | (75 | ) | — | — | — | — | — | (75 | ) | ||||||||||||||||||||
Fair value of partially vested equity awards assumed in connection with the acquisition of Emulex Corporation | — | 5 | — | — | — | — | — | 5 | ||||||||||||||||||||||
Changes in accumulated other comprehensive loss: | ||||||||||||||||||||||||||||||
Actuarial losses and prior service costs associated with defined benefit pension plans and post-retirement benefit plans, net of taxes | — | — | — | — | — | (23 | ) | — | (23 | ) | ||||||||||||||||||||
Net income | — | — | — | — | 1,364 | — | — | 1,364 | ||||||||||||||||||||||
Balance as of November 1, 2015 | 276 | 2,547 | — | — | 2,240 | (73 | ) | — | 4,714 | |||||||||||||||||||||
Issuance of ordinary shares upon the acquisition of Broadcom Corporation | 112 | 15,438 | — | — | — | — | — | 15,438 | ||||||||||||||||||||||
Issuance by the Partnership of restricted exchangeable partnership units upon the acquisition of Broadcom Corporation | — | — | — | — | — | — | 3,140 | 3,140 | ||||||||||||||||||||||
Issuance of non-economic voting preference shares | — | — | 23 | — | — | — | — | — | ||||||||||||||||||||||
Issuance of ordinary shares in connection with equity incentive plans | 10 | 295 | — | — | — | — | — | 295 | ||||||||||||||||||||||
Share-based compensation | — | 690 | — | — | — | — | — | 690 | ||||||||||||||||||||||
Excess tax benefits from share-based compensation | — | 89 | — | — | — | — | — | 89 | ||||||||||||||||||||||
Cash dividends declared and paid to ordinary shareholders | — | — | — | — | (716 | ) | — | — | (716 | ) | ||||||||||||||||||||
Cash distribution declared and paid by the Partnership on restricted exchangeable partnership units | — | — | — | — | — | — | (34 | ) | (34 | ) | ||||||||||||||||||||
Fair value of partially vested equity awards assumed in connection with the acquisition of Broadcom Corporation | — | 182 | — | — | — | — | — | 182 | ||||||||||||||||||||||
Changes in accumulated other comprehensive loss: | ||||||||||||||||||||||||||||||
Actuarial losses and prior service costs associated with defined benefit pension plans and post-retirement benefit plans, net of taxes | — | — | — | — | — | (61 | ) | — | (61 | ) | ||||||||||||||||||||
Net loss | — | — | — | — | (1,739 | ) | — | (122 | ) | (1,861 | ) | |||||||||||||||||||
Balance as of October 30, 2016 | 398 | 19,241 | 23 | — | (215 | ) | (134 | ) | 2,984 | 21,876 | ||||||||||||||||||||
Issuance of ordinary shares in connection with equity incentive plans | 10 | 257 | — | — | — | — | — | 257 | ||||||||||||||||||||||
Exchange of restricted exchangeable partnership units for ordinary shares | 1 | 86 | — | — | — | — | (86 | ) | — | |||||||||||||||||||||
Cancellation of non-economic voting preference shares | — | — | (1 | ) | — | — | — | — | — | |||||||||||||||||||||
Share-based compensation | — | 921 | — | — | — | — | — | 921 | ||||||||||||||||||||||
Cash dividends declared and paid to ordinary shareholders | — | — | — | — | (1,653 | ) | — | — | (1,653 | ) | ||||||||||||||||||||
Cash distribution declared and paid by the Partnership on restricted exchangeable partnership units | — | — | — | — | — | — | (92 | ) | (92 | ) | ||||||||||||||||||||
Changes in accumulated other comprehensive loss: | ||||||||||||||||||||||||||||||
Actuarial gains and prior service costs associated with defined benefit pension plans and post-retirement benefit plans, net of taxes | — | — | — | — | — | 43 | — | 43 | ||||||||||||||||||||||
Cumulative effect of accounting change | — | — | — | — | 47 | — | 3 | 50 | ||||||||||||||||||||||
Net income | — | — | — | — | 1,692 | — | 92 | 1,784 | ||||||||||||||||||||||
Balance as of October 29, 2017 | 409 | $ | 20,505 | 22 | $ | — | $ | (129 | ) | $ | (91 | ) | $ | 2,901 | $ | 23,186 | ||||||||||||||
The accompanying notes are an integral part of these consolidated financial statements.
66
BROADCOM CAYMAN L.P.
CONSOLIDATED BALANCE SHEETS
October 29, 2017 | October 30, 2016 | |||||||
(In millions, except share amounts) | ||||||||
ASSETS | ||||||||
Current assets: | ||||||||
Cash and cash equivalents | $ | 11,017 | $ | 3,044 | ||||
Trade accounts receivable, net | 2,448 | 2,181 | ||||||
Inventory | 1,447 | 1,400 | ||||||
Other current assets | 808 | 500 | ||||||
Total current assets | 15,720 | 7,125 | ||||||
Long-term assets: | ||||||||
Property, plant and equipment, net | 2,599 | 2,509 | ||||||
Goodwill | 24,706 | 24,732 | ||||||
Intangible assets, net | 10,832 | 15,068 | ||||||
Other long-term assets | 458 | 532 | ||||||
Total assets | $ | 54,315 | $ | 49,966 | ||||
LIABILITIES AND PARTNERS’ CAPITAL | ||||||||
Current liabilities: | ||||||||
Accounts payable | $ | 1,105 | $ | 1,261 | ||||
Employee compensation and benefits | 626 | 517 | ||||||
Current portion of long-term debt | 117 | 454 | ||||||
Other current liabilities | 681 | 846 | ||||||
Total current liabilities | 2,529 | 3,078 | ||||||
Long-term liabilities: | ||||||||
Long-term debt | 17,431 | 13,188 | ||||||
Pension and post-retirement benefit obligations | 112 | 531 | ||||||
Other long-term liabilities | 11,160 | 11,293 | ||||||
Total liabilities | 31,232 | 28,090 | ||||||
Commitments and contingencies (Note 14) | ||||||||
Partners’ capital: | ||||||||
Common partnership units; 390,896,843 units and 390,237,855 units issued and outstanding on October 29, 2017 and October 30, 2016, respectively | 20,273 | 19,026 | ||||||
Restricted exchangeable units; 22,145,603 units and 22,804,591 units issued and outstanding on October 29, 2017 and October 30, 2016, respectively | 2,901 | 2,984 | ||||||
Accumulated other comprehensive loss | (91 | ) | (134 | ) | ||||
Total partners’ capital | 23,083 | 21,876 | ||||||
Total liabilities and partners’ capital | $ | 54,315 | $ | 49,966 | ||||
The accompanying notes are an integral part of these consolidated financial statements.
67
BROADCOM CAYMAN L.P.
CONSOLIDATED STATEMENTS OF OPERATIONS
Fiscal Year Ended | ||||||||||||
October 29, 2017 | October 30, 2016 | November 1, 2015 | ||||||||||
(In millions, except per unit/share amounts) | ||||||||||||
Net revenue | $ | 17,636 | $ | 13,240 | $ | 6,824 | ||||||
Cost of products sold: | ||||||||||||
Cost of products sold | 6,593 | 5,295 | 2,750 | |||||||||
Purchase accounting effect on inventory | 4 | 1,185 | 30 | |||||||||
Amortization of acquisition-related intangible assets | 2,511 | 763 | 484 | |||||||||
Restructuring charges | 19 | 57 | 7 | |||||||||
Total cost of products sold | 9,127 | 7,300 | 3,271 | |||||||||
Gross margin | 8,509 | 5,940 | 3,553 | |||||||||
Research and development | 3,292 | 2,674 | 1,049 | |||||||||
Selling, general and administrative | 787 | 806 | 486 | |||||||||
Amortization of acquisition-related intangible assets | 1,764 | 1,873 | 249 | |||||||||
Restructuring, impairment and disposal charges | 161 | 996 | 137 | |||||||||
Litigation settlements | 122 | — | — | |||||||||
Total operating expenses | 6,126 | 6,349 | 1,921 | |||||||||
Operating income (loss) | 2,383 | (409 | ) | 1,632 | ||||||||
Interest expense | (454 | ) | (585 | ) | (191 | ) | ||||||
Loss on extinguishment of debt | (166 | ) | (123 | ) | (10 | ) | ||||||
Other income, net | 62 | 10 | 36 | |||||||||
Income (loss) from continuing operations before income taxes | 1,825 | (1,107 | ) | 1,467 | ||||||||
Provision for income taxes | 35 | 642 | 76 | |||||||||
Income (loss) from continuing operations | 1,790 | (1,749 | ) | 1,391 | ||||||||
Loss from discontinued operations, net of income taxes | (6 | ) | (112 | ) | (27 | ) | ||||||
Net income (loss) | $ | 1,784 | $ | (1,861 | ) | $ | 1,364 | |||||
General Partner's interest in net income (loss) | $ | 1,692 | $ | (2,116 | ) | $ | — | |||||
Limited Partners' interest in net income (loss) | $ | 92 | $ | (122 | ) | $ | — | |||||
Net income attributable to ordinary shareholders | $ | — | $ | 377 | $ | 1,364 | ||||||
Cash distributions paid per restricted exchangeable partnership unit | $ | 4.08 | $ | 1.50 | $ | — | ||||||
Cash distributions paid to General Partner | $ | 1,756 | $ | 594 | $ | — | ||||||
Cash dividends paid per ordinary share | $ | — | $ | 0.44 | $ | 1.55 | ||||||
The accompanying notes are an integral part of these consolidated financial statements.
68
BROADCOM CAYMAN L.P.
CONSOLIDATED STATEMENTS OF COMPREHENSIVE INCOME (LOSS)
Fiscal Year Ended | ||||||||||||
October 29, 2017 | October 30, 2016 | November 1, 2015 | ||||||||||
(In millions) | ||||||||||||
Net income (loss) | $ | 1,784 | $ | (1,861 | ) | $ | 1,364 | |||||
Other comprehensive income (loss), net of tax: | ||||||||||||
Unrealized gain (loss) on defined benefit pension plans and post-retirement benefit plans | 42 | (65 | ) | (24 | ) | |||||||
Reclassification to net income (loss) | 1 | 4 | 1 | |||||||||
Other comprehensive income (loss) | 43 | (61 | ) | (23 | ) | |||||||
Comprehensive income (loss) | $ | 1,827 | $ | (1,922 | ) | $ | 1,341 | |||||
The accompanying notes are an integral part of these consolidated financial statements.
69
BROADCOM CAYMAN L.P.
CONSOLIDATED STATEMENTS OF CASH FLOWS
Fiscal Year Ended | ||||||||||||
October 29, 2017 | October 30, 2016 | November 1, 2015 | ||||||||||
(In millions) | ||||||||||||
Cash flows from operating activities: | ||||||||||||
Net income (loss) | $ | 1,784 | $ | (1,861 | ) | $ | 1,364 | |||||
Adjustments to reconcile net income (loss) to net cash provided by operating activities: | ||||||||||||
Depreciation and amortization | 4,737 | 3,042 | 962 | |||||||||
Share-based compensation | 921 | 679 | 232 | |||||||||
Excess tax benefits from share-based compensation | — | (89 | ) | (125 | ) | |||||||
Deferred taxes and other non-cash taxes | (173 | ) | 365 | (220 | ) | |||||||
Non-cash portion of debt extinguishment loss, net | 166 | 100 | 10 | |||||||||
Non-cash restructuring, impairment and disposal charges | 71 | 662 | 77 | |||||||||
Amortization of debt issuance costs and accretion of debt discount | 24 | 36 | 22 | |||||||||
Other | 7 | (6 | ) | 32 | ||||||||
Changes in assets and liabilities, net of acquisitions and disposals: | ||||||||||||
Trade accounts receivable, net | (267 | ) | (491 | ) | (187 | ) | ||||||
Inventory | (39 | ) | 996 | 62 | ||||||||
Accounts payable | (97 | ) | 33 | 29 | ||||||||
Employee compensation and benefits | 109 | 163 | 8 | |||||||||
Contributions to defined benefit pension plans | (361 | ) | (33 | ) | (54 | ) | ||||||
Other current assets and current liabilities | (490 | ) | (98 | ) | 12 | |||||||
Other long-term assets and long-term liabilities | 159 | (87 | ) | 94 | ||||||||
Net cash provided by operating activities | 6,551 | 3,411 | 2,318 | |||||||||
Cash flows from investing activities: | ||||||||||||
Purchases of property, plant and equipment | (1,069 | ) | (723 | ) | (593 | ) | ||||||
Proceeds from disposals of property, plant and equipment | 441 | 5 | 110 | |||||||||
Purchases of investments | (207 | ) | (58 | ) | (14 | ) | ||||||
Proceeds from sales and maturities of investments | 200 | 104 | — | |||||||||
Acquisitions of businesses, net of cash acquired | (40 | ) | (10,055 | ) | (394 | ) | ||||||
Proceeds from sales of businesses | 10 | 898 | 650 | |||||||||
Other | (9 | ) | (11 | ) | — | |||||||
Net cash used in investing activities | (674 | ) | (9,840 | ) | (241 | ) | ||||||
Cash flows from financing activities: | ||||||||||||
Proceeds from issuance of long-term debt | 17,426 | 19,510 | — | |||||||||
Repayment of debt | (13,668 | ) | (9,842 | ) | (1,639 | ) | ||||||
Payment of assumed debt | — | (1,475 | ) | (178 | ) | |||||||
Payment of debt issuance costs | (24 | ) | (123 | ) | — | |||||||
Dividend payments to ordinary shareholders | — | (122 | ) | (408 | ) | |||||||
Distributions paid to unit holders | (1,848 | ) | (628 | ) | — | |||||||
Issuance of ordinary shares | — | 72 | 241 | |||||||||
Capital transactions with General Partner | 226 | 170 | — | |||||||||
Excess tax benefits from share-based compensation | — | 89 | 125 | |||||||||
Payment of capital lease obligations | (16 | ) | — | — | ||||||||
Net cash provided by (used in) financing activities | 2,096 | 7,651 | (1,859 | ) | ||||||||
Net change in cash and cash equivalents | 7,973 | 1,222 | 218 | |||||||||
Cash and cash equivalents at the beginning of period | 3,044 | 1,822 | 1,604 | |||||||||
Cash and cash equivalents at end of period | $ | 11,017 | $ | 3,044 | $ | 1,822 | ||||||
Supplemental disclosure of cash flow information: | ||||||||||||
Cash paid for interest | $ | 310 | $ | 448 | $ | 172 | ||||||
Cash paid for income taxes | $ | 349 | $ | 242 | $ | 138 | ||||||
The accompanying notes are an integral part of these consolidated financial statements.
70
BROADCOM CAYMAN L.P.
CONSOLIDATED STATEMENTS OF PARTNERS’ CAPITAL
Partnership REUs | Partnership Common Units | Ordinary Shares | Retained Earnings | Accumulated Other Comprehensive Loss | Total Partners’ Capital | ||||||||||||||||||||||||||||
Units | Amount | Units | Amount | Shares | Amount | ||||||||||||||||||||||||||||
(In millions) | |||||||||||||||||||||||||||||||||
Balance as of November 2, 2014 | — | $ | — | — | $ | — | 254 | $ | 2,009 | $ | 1,284 | $ | (50 | ) | $ | 3,243 | |||||||||||||||||
Issuance of ordinary shares in connection with equity incentive plans | — | — | — | — | 8 | 241 | — | — | 241 | ||||||||||||||||||||||||
Share-based compensation | — | — | — | — | — | 237 | — | — | 237 | ||||||||||||||||||||||||
Excess tax benefits from share-based compensation | — | — | — | — | — | 130 | — | — | 130 | ||||||||||||||||||||||||
Cash dividends declared and paid to ordinary shareholders | — | — | — | — | — | — | (408 | ) | — | (408 | ) | ||||||||||||||||||||||
Issuance of ordinary shares upon conversion of Convertible Notes | — | — | — | — | 14 | (75 | ) | — | — | (75 | ) | ||||||||||||||||||||||
Fair value of partially vested equity awards assumed in connection with the acquisition of Emulex Corporation | — | — | — | — | — | 5 | — | — | 5 | ||||||||||||||||||||||||
Changes in accumulated other comprehensive loss: | |||||||||||||||||||||||||||||||||
Actuarial losses and prior service costs associated with defined benefit pension plans and post-retirement benefit plans, net of taxes | — | — | — | — | — | — | — | (23 | ) | (23 | ) | ||||||||||||||||||||||
Net income | — | — | — | — | — | — | 1,364 | — | 1,364 | ||||||||||||||||||||||||
Balance as of November 1, 2015 | — | — | — | — | 276 | 2,547 | 2,240 | (73 | ) | 4,714 | |||||||||||||||||||||||
Issuance of ordinary shares in connection with equity incentive plans | — | — | — | — | 2 | 72 | — | — | 72 | ||||||||||||||||||||||||
Share-based compensation | — | — | — | 633 | — | 57 | — | — | 690 | ||||||||||||||||||||||||
Excess tax benefits from share-based compensation | — | — | — | 66 | — | 23 | — | — | 89 | ||||||||||||||||||||||||
Cash dividends declared and paid to ordinary shareholders | — | — | — | — | — | — | (122 | ) | — | (122 | ) | ||||||||||||||||||||||
Transfer to General Partner | — | — | 278 | 5,194 | (278 | ) | (2,699 | ) | (2,495 | ) | — | — | |||||||||||||||||||||
Issuance of common partnership units upon the acquisition of Broadcom Corporation | — | — | 112 | 15,438 | — | — | — | — | 15,438 | ||||||||||||||||||||||||
Issuance of restricted exchangeable partnership units upon the acquisition of Broadcom Corporation | 23 | 3,140 | — | — | — | — | — | — | 3,140 | ||||||||||||||||||||||||
Cash distribution declared and paid to unit holders | — | (34 | ) | — | (594 | ) | — | — | — | — | (628 | ) | |||||||||||||||||||||
Capital transactions with General Partner | — | — | — | 405 | — | — | — | — | 405 | ||||||||||||||||||||||||
Changes in accumulated other comprehensive loss: | |||||||||||||||||||||||||||||||||
Actuarial losses and prior service costs associated with defined benefit pension plans and post-retirement benefit plans, net of taxes | — | — | — | — | — | — | — | (61 | ) | (61 | ) | ||||||||||||||||||||||
Net income (loss) | — | (122 | ) | — | (2,116 | ) | — | — | 377 | — | (1,861 | ) | |||||||||||||||||||||
Balance as of October 30, 2016 | 23 | 2,984 | 390 | 19,026 | — | — | — | (134 | ) | 21,876 | |||||||||||||||||||||||
Exchange of restricted exchangeable partnership units for ordinary shares | (1 | ) | (86 | ) | 1 | 86 | — | — | — | — | — | ||||||||||||||||||||||
71
Partnership REUs | Partnership Common Units | Ordinary Shares | Retained Earnings | Accumulated Other Comprehensive Loss | Total Partners’ Capital | ||||||||||||||||||||||||||||
Units | Amount | Units | Amount | Shares | Amount | ||||||||||||||||||||||||||||
Share-based compensation | — | — | — | 921 | — | — | — | — | 921 | ||||||||||||||||||||||||
Cash distribution declared and paid to unit holders | — | (92 | ) | — | (1,756 | ) | — | — | — | — | (1,848 | ) | |||||||||||||||||||||
Capital transactions with General Partner | — | — | — | 257 | — | — | — | — | 257 | ||||||||||||||||||||||||
Changes in accumulated other comprehensive loss: | |||||||||||||||||||||||||||||||||
Actuarial gains and prior service costs associated with defined benefit pension plans and post-retirement benefit plans, net of taxes | — | — | — | — | — | — | — | 43 | 43 | ||||||||||||||||||||||||
Cumulative effect of accounting change | — | 3 | — | 47 | — | — | — | — | 50 | ||||||||||||||||||||||||
Net income | — | 92 | — | 1,692 | — | — | — | — | 1,784 | ||||||||||||||||||||||||
Balance as of October 29, 2017 | 22 | $ | 2,901 | 391 | $ | 20,273 | — | $ | — | $ | — | $ | (91 | ) | $ | 23,083 | |||||||||||||||||
The accompanying notes are an integral part of these consolidated financial statements.
72
BROADCOM LIMITED AND BROADCOM CAYMAN L.P.
NOTES TO CONSOLIDATED FINANCIAL STATEMENTS
1. Overview and Basis of Presentation
Overview
Broadcom Limited, or Broadcom, is a leading designer, developer and global supplier of a broad range of semiconductor devices with a focus on complex digital and mixed signal complementary metal oxide semiconductor based devices and analog III-V based products. We have a history of innovation and offer thousands of products that are used in end products such as enterprise and data center networking, home connectivity, set-top boxes, broadband access, telecommunication equipment, mobile handsets and base stations, data center servers and storage systems, factory automation, power generation and alternative energy systems, and electronic displays. We have four reportable segments: wired infrastructure, wireless communications, enterprise storage and industrial & other, which align with our principal target markets.
Broadcom, a company organized under the laws of the Republic of Singapore, is the successor to Avago Technologies Limited, or Avago. Broadcom Cayman L.P., or the Partnership, is an exempted limited partnership formed under the laws of the Cayman Islands. On February 1, 2016, pursuant to an Agreement and Plan of Merger dated as of May 28, 2015, or the Broadcom Agreement, Broadcom, Avago, the Partnership, Broadcom Corporation, a California corporation, or BRCM, and certain other parties, completed various transactions, including a scheme of arrangement under Singapore law between Avago and Broadcom, or the Avago Scheme. Pursuant to the Avago Scheme, all issued ordinary shares of Avago were exchanged on a one-for-one basis for newly issued ordinary shares of Broadcom. Immediately following the consummation of the Avago Scheme, two subsidiaries of Broadcom merged with and into BRCM with BRCM as the surviving corporation of each such merger, or the Broadcom Merger. Following the Avago Scheme and the Broadcom Merger, or the Broadcom Transaction, each of Avago and BRCM became indirect subsidiaries of Broadcom and the Partnership.
Broadcom is the Partnership’s sole General Partner and owns a majority interest (by vote and value) in the Partnership represented by common partnership units, or Common Units. The balance of the partnership units represents restricted exchangeable limited partnership units, or Partnership REUs, the holders of which are referred to as the Limited Partners. As General Partner, Broadcom has the exclusive right, power and authority to manage, control, administer and operate the business and affairs and to make decisions regarding the undertaking and business of the Partnership in accordance with the Partnership’s amended and restated exempted limited partnership agreement, or Partnership Agreement, as amended from time to time, and applicable laws.
The Avago Scheme was accounted for in all periods presented using a carryover basis, similar to a pooling-of-interests, as the transaction was premised on a non-substantive exchange in order to facilitate the acquisition of BRCM, resulting in the retention of the historical basis of accounting. Under this method of accounting, Broadcom and Avago were treated as if they had always been combined for accounting and financial reporting purposes. The Broadcom Merger is discussed in further detail in Note 3. “Acquisitions.”
The Partnership REUs are deemed to be registered under Section 12(b) of the Securities Exchange Act of 1934, as amended, or the Exchange Act, and the Partnership is subject to the informational requirements of the Exchange Act and the rules and regulations promulgated thereunder.
The consolidated financial statements and accompanying notes are being presented in a combined report being filed by two separate registrants: Broadcom and the Partnership. The differences in the consolidated financial statements relate to the noncontrolling interest that represents the outstanding Partnership REUs and transactions between Broadcom and the Partnership, which we account for as capital transactions and distributions. Refer to Note 9. “Shareholders’ Equity” and Note 10. “Partners’ Capital” for additional information.
Unless stated otherwise or the context otherwise requires, references to “Broadcom,” “we,” “our” and “us” mean Broadcom Limited and its consolidated subsidiaries, including Broadcom Cayman L.P. References to the “Partnership” mean Broadcom Cayman L.P. and its consolidated subsidiaries. Financial information and results of operations for periods prior to February 1, 2016 relate to Avago, our predecessor, and relate to Broadcom and the Partnership for periods after February 1, 2016.
Basis of Presentation
We operate on a 52- or 53-week fiscal year ending on the Sunday closest to October 31 in a 52-week year and the first Sunday in November in a 53-week year. Our fiscal year ended October 29, 2017, or fiscal year 2017, was a 52-week fiscal year. The first quarter of our fiscal year 2017 ended on January 29, 2017, the second quarter ended on April 30, 2017 and the third quarter ended on July 30, 2017. Our fiscal years ended October 30, 2016, or fiscal year 2016, and November 1, 2015, or fiscal year 2015, were also 52-week fiscal years.
73
As a result of Broadcom’s controlling interest in the Partnership, we consolidate the financial results of the Partnership and present a noncontrolling interest for the portion of the Partnership we do not own in our consolidated financial statements. Net income (loss) attributable to noncontrolling interest in the consolidated statements of operations represents the portion of income (loss) attributable to the economic interest in the Partnership owned by the Limited Partners.
The accompanying consolidated financial statements include the results of operations of BRCM and other acquisitions commencing as of their respective acquisition dates.
2. Summary of Significant Accounting Policies
Our consolidated financial statements include the accounts of Broadcom and the Partnership, respectively, and their subsidiaries. All intercompany balances and transactions have been eliminated in consolidation.
Foreign currency remeasurement. We operate in a U.S. dollar functional currency environment. As such, foreign currency assets and liabilities are remeasured into U.S. dollars at current exchange rates except for non-monetary items such as inventory and property, plant and equipment, which are remeasured at historical exchange rates. The effects of foreign currency remeasurement were not material for any period presented.
Use of estimates. The preparation of financial statements in conformity with generally accepted accounting principles in the United States, or GAAP, requires management to make estimates and assumptions that affect the reported amounts of assets and liabilities and disclosure of contingent assets and liabilities at the date of the financial statements and the reported amounts of revenues and expenses during the reporting period. Actual results could differ from those estimates, and such differences could affect the results of operations reported in future periods.
Cash and cash equivalents. We consider all highly liquid investment securities with original or remaining maturities of three months or less at the date of purchase to be cash equivalents. We determine the appropriate classification of our cash and cash equivalents at the time of purchase.
Trade accounts receivable, net. Trade accounts receivable are recognized at the invoiced amount and do not bear interest. Accounts receivable are reduced by an allowance for doubtful accounts, which is our best estimate of the amount of probable credit losses in our existing accounts receivable. We determine the allowance based on customer-specific experience and the aging of such receivables, among other factors. Allowances for doubtful accounts were not material as of October 29, 2017 and were $9 million as of October 30, 2016. Accounts receivable are also recognized net of sales returns and distributor credit allowances. These amounts are recognized when it is both probable and estimable that discounts will be granted or products will be returned. Allowances for sales returns and distributor credit allowances at October 29, 2017 and October 30, 2016 were $208 million and $283 million, respectively.
Concentrations of credit risk and significant customers. Our cash, cash equivalents and accounts receivable are potentially subject to concentration of credit risk. Cash and cash equivalents may be redeemable upon demand and are maintained with several financial institutions that management believes are of high credit quality and therefore bear minimal credit risk. We seek to mitigate our credit risks by spreading such risks across multiple counterparties and monitoring the risk profile of these counterparties. Our accounts receivable are derived from revenue earned from customers located both within and outside the U.S. We mitigate collection risks from our customers by performing regular credit evaluations of our customers’ financial conditions, and require collateral, such as letters of credit and bank guarantees, in certain circumstances.
Concentration of other risks. The semiconductor industry is characterized by rapid technological change, competitive pricing pressures and cyclical market patterns. Our financial results are affected by a wide variety of factors, including general economic conditions worldwide, economic conditions specific to the semiconductor industry, timely implementation of new manufacturing technologies, ability to safeguard patents and other intellectual property in a rapidly evolving market and reliance on assembly and test subcontractors, third-party wafer fabricators and independent distributors. In addition, the semiconductor market has historically been cyclical and subject to significant economic downturns at various times. We are exposed to the risk of obsolescence of our inventory depending on the mix of future business.
Inventory. We value our inventory at the lower of the actual cost of the inventory or the current estimated market value of the inventory, with cost being determined under the first-in, first-out method. We record a provision for excess and obsolete inventory based primarily on our forecast of product demand and production requirements. The excess and obsolete balance determined by this analysis becomes the basis for our excess and obsolete inventory charge and the written-down value of the inventory becomes its new cost basis.
Retirement benefits. Post-retirement benefit plan assets and liabilities are estimates of benefits that we expect to pay to eligible retirees. We consider various factors in determining the value of our post-retirement net assets, including the number of employees that we expect to receive benefits and other actuarial assumptions. For defined benefit pension plans, we consider various factors in determining our respective pension liabilities and net periodic benefit costs, including the number of employees that we expect to receive benefits, their salary levels and years of service, the expected return on plan assets,
74
the discount rate, the timing of the payment of benefits, and other actuarial assumptions. If the actual results and events of the retirement benefit plans differ from our current assumptions, the benefit obligations may be over- or under-valued. The key benefit plan assumptions are the discount rate and the expected rate of return on plan assets. The assumptions discussed below are for the U.S. retirement benefit plans. For the non-U.S. plans, we chose assumptions specific to each country.
The U.S. discount rates are based on the results of matching expected plan benefit payments with cash flows from a hypothetical yield curve constructed with high-quality corporate bond yields. We base the salary increase assumptions on historical experience and future expectations. In developing the expected rate of return, we consider long-term compound annualized returns based on historical market data, historical and expected returns on the various categories of plan assets, and the target investment portfolio allocation among debt, equity securities and other investments.
Derivative instruments. We are subject to foreign currency risks for transactions denominated in foreign currencies, primarily the Singapore Dollar, Israeli Shekel, Euro, Japanese Yen and Indian Rupee. Therefore, we enter into foreign exchange forward contracts to manage financial exposures resulting from the changes in the exchange rates of these foreign currencies. These contracts are designated at inception as hedges of the related foreign currency exposures, which include committed and forecasted revenue and expense transactions that are denominated in currencies other than the functional currency of the subsidiary which has the exposure. We exclude time value from the measurement of effectiveness. To achieve hedge accounting, contracts must reduce the foreign currency exchange rate risk otherwise inherent in the amount and duration of the hedged exposures and comply with established risk management policies; our hedging contracts generally mature within three months. We do not use derivative financial instruments for speculative or trading purposes.
We designate our forward contracts as either cash flow or fair value hedges. All derivatives are recognized on the consolidated balance sheets at their fair values based on Level 2 inputs as defined in the fair value hierarchy. The accounting for gains and losses resulting from changes in fair value depends on the use of the derivative and whether it is designated and qualifies for hedge accounting. For derivative instruments that are designated and qualify as fair value hedges, changes in value of the instruments are recognized in income in the current period. Such hedges are recognized in net income (loss) and are offset by the changes in fair value of the underlying assets or liabilities being hedged. For derivative instruments that are designated and qualify as cash flow hedges, changes in the value of the effective portion of the derivative instrument are recognized in accumulated other comprehensive income (loss), a component of shareholders’ equity. These amounts are then reclassified and recognized in net income (loss) when either the forecasted transaction occurs or it becomes probable the forecasted transaction will not occur. Changes in the fair value of the ineffective portion of derivative instruments are recognized in net income (loss) in the current period, which have not been material to date. Changes in the value of derivative instruments not designated as hedges are recognized in other income, net, in our consolidated statements of operations.
Property, plant and equipment. Property, plant and equipment are stated at cost less accumulated depreciation and amortization. Additions, improvements and major renewals are capitalized, and maintenance, repairs and minor renewals are expensed as incurred. Assets are held in construction in progress until placed in service, upon which date, we begin to depreciate these assets. When assets are retired or disposed of, the assets and related accumulated depreciation and amortization are removed from our property, plant and equipment balances and the resulting gain or loss is reflected in the consolidated statements of operations. Buildings and leasehold improvements are generally depreciated over 15 to 40 years, or over the lease period, whichever is shorter, and machinery and equipment are generally depreciated over three to ten years. We use the straight-line method of depreciation for all property, plant and equipment.
Fair value measurement. Fair value is defined as the price that would be received upon sale of an asset or paid to transfer a liability in an orderly transaction between market participants at the measurement date. A three level hierarchy is applied to prioritize the inputs to valuation techniques used to measure fair value. The hierarchy gives the highest priority to unadjusted quoted prices in active markets for identical assets or liabilities (Level 1 measurements) and the lowest priority to unobservable inputs (Level 3 measurements).
The three levels of the fair value hierarchy under the guidance for fair value measurements are described below:
Level 1 — Level 1 inputs are quoted prices (unadjusted) in active markets for identical assets or liabilities that the reporting entity has the ability to access at the measurement date. Our Level 1 assets include cash equivalents, banker's acceptances, trading securities investments and investment funds. We measure trading securities investments and investment funds at quoted market prices as they are traded in an active market with sufficient volume and frequency of transactions.
Level 2 — Level 2 inputs are inputs other than quoted prices included within Level 1 that are observable for the asset or liability, either directly or indirectly. If the asset or liability has a specified contractual term, a Level 2 input must be observable for substantially the full term of the asset or liability.
Level 3 — Level 3 inputs are unobservable inputs for the asset or liability in which there is little, if any, market activity for the asset or liability at the measurement date. Level 3 assets and liabilities include cost method investments, goodwill, intangible assets, and property, plant and equipment, which are measured at fair value using a discounted cash flow approach
75
when they are impaired. Quantitative information for Level 3 assets and liabilities reviewed at each reporting period includes indicators of significant deterioration in the earnings performance, credit rating, asset quality, business prospects of the investee, and financial indicators of the investee's ability to continue as a going concern.
Business combinations. We account for business combinations under the acquisition method of accounting, which requires us to recognize separately from goodwill the assets acquired and the liabilities assumed at their acquisition date fair values. While we use our best estimates and assumptions to accurately value assets acquired and liabilities assumed at the acquisition date as well as contingent consideration, where applicable, our estimates are inherently uncertain and subject to refinement. As a result, during the measurement period, which may be up to one year from the acquisition date, we record adjustments to the assets acquired and liabilities assumed with the corresponding offset to goodwill. Upon the conclusion of the measurement period or final determination of the values of assets acquired or liabilities assumed, whichever comes first, any subsequent adjustments are recognized in our consolidated statements of operations. Accounting for business combinations requires our management to make significant estimates and assumptions, especially at the acquisition date including our estimates for intangible assets, contractual obligations assumed, restructuring liabilities, pre-acquisition contingencies, and contingent consideration, where applicable. Although we believe the assumptions and estimates we have made in the past have been reasonable and appropriate, they are based, in part, on historical experience and information obtained from the management of the acquired companies and are inherently uncertain. Critical estimates in valuing certain of the intangible assets we have acquired include future expected cash flows from product sales, customer contracts and acquired technologies, expected costs to develop in-process research and development into commercially viable products, and estimated cash flows from the projects when completed and discount rates. Unanticipated events and circumstances may occur that may affect the accuracy or validity of such assumptions, estimates or actual results.
Goodwill. Goodwill represents the excess of purchase price and related costs over the value assigned to the net tangible and identifiable intangible assets of businesses acquired. Goodwill is not amortized but is reviewed annually (or more frequently if impairment indicators arise) for impairment. To review for impairment we first assess qualitative factors to determine whether events or circumstances lead to a determination that it is more likely than not that the fair value of any of our reporting units is less than its carrying amount. Our qualitative assessment of the recoverability of goodwill, whether performed annually or based on specific events or circumstances, considers various macroeconomic, industry-specific and company-specific factors. Those factors include: (i) severe adverse industry or economic trends; (ii) significant company-specific actions, including exiting an activity in conjunction with restructuring of operations; (iii) current, historical or projected deterioration of our financial performance; or (iv) a sustained decrease in our market capitalization below our net book value. After assessing the totality of events and circumstances, if we determine that it is not more likely than not that the fair value of any of our reporting units is less than its carrying amount, no further assessment is performed. If we determine that it is more likely than not that the fair value of any of our reporting units is less than its carrying amount, we calculate the fair value of that reporting unit and compare the fair value to the reporting unit’s net book value. If the fair value of the reporting unit is greater than its net book value, there is no impairment. Otherwise, we calculate the implied fair value of goodwill by deducting the fair value of all tangible and intangible assets, excluding goodwill, of the reporting unit from the fair value of the reporting unit. The implied fair value of goodwill is compared to the carrying value of goodwill. If the implied fair value of goodwill is less than the carrying value of goodwill, an impairment loss is recognized equal to the difference. Determining the fair value of a reporting unit involves the use of significant estimates and assumptions.
Long-lived assets. Purchased finite-lived intangible assets are carried at cost less accumulated amortization. Amortization is recognized over the periods during which the intangible assets are expected to contribute to our cash flows. Purchased in-process research and development, or IPR&D, projects are capitalized at fair value as an indefinite lived intangible asset and assessed for impairment thereafter. Upon completion of each underlying project, IPR&D assets are reclassified as an amortizable purchased intangible asset and amortized over their estimated useful lives. If an IPR&D project is abandoned, we recognize the carrying value of the related intangible asset in our consolidated statements of operations in the period it is abandoned. On a quarterly basis, we monitor factors and changes in circumstances that could indicate carrying amounts of long-lived assets, including purchased intangible assets, and property, plant and equipment, may not be recoverable. Factors we consider important which could trigger an impairment review include (i) significant under-performance relative to historical or projected future operating results, (ii) significant changes in the manner of our use of the acquired assets or the strategy for our overall business, and (iii) significant negative industry or economic trends. An impairment loss must be measured if the sum of the expected future cash flows (undiscounted and before interest) from the use and eventual disposition of the asset (or asset group) is less than the net book value of the asset (or asset group). The amount of the impairment loss will generally be measured as the difference between the net book value of the asset (or asset group) and the estimated fair value.
Warranty. We accrue for the estimated costs of product warranties at the time revenue is recognized. Product warranty costs are estimated based upon our historical experience and specific identification of the products requirements, which may fluctuate based on product mix. Additionally, we accrue for warranty costs associated with occasional or unanticipated product quality issues if a loss is probable and can be reasonably estimated.
76
Revenue recognition. We recognize revenue related to sales of our products, net of trade discounts and allowances, provided that (i) persuasive evidence of an arrangement exists, (ii) delivery has occurred and title and risk of loss have transferred, (iii) the price is fixed or determinable and (iv) collectibility is reasonably assured. Delivery is considered to have occurred when title and risk of loss have transferred to the customer. We consider the price to be determinable when the price is not subject to refund or adjustments or when any such adjustments can be estimated. We evaluate the creditworthiness of our customers to determine that appropriate credit limits are established prior to the acceptance of an order. Revenue, including sales to resellers and distributors, is reduced for estimated returns and distributor allowances.
We recognize revenue from sales of our products to distributors upon delivery of product to the distributors. An allowance for distributor credits covering price adjustments is made based on our estimate of historical experience rates as well as considering economic conditions and contractual terms. To date, actual distributor claims activity has been materially consistent with the provisions we have made based on our historical estimates. We also record reductions of revenue for rebates, in the same period that the related revenue is recorded. We accrue 100% of potential rebates at the time of sale and do not apply a breakage factor. We reverse the accrual of unclaimed rebate amounts as specific rebate programs contractually end and when we believe unclaimed rebates are no longer subject to payment and will not be paid. Thus, the reversal of unclaimed rebates may have a positive impact on our net revenue and results of operations in subsequent periods.
We enter into development agreements with some of our customers and recognize revenue from these agreements upon completion and acceptance by the customer of contract deliverables or as services are provided, depending on the terms of the arrangement. Revenue is deferred for any amounts billed or received prior to completion or delivery of services. As we retain the intellectual property generated from these development agreements, costs related to these arrangements are included in research and development expense.
We recognize revenue from the sales and licensing of our intellectual property when the following fundamental criteria are met: (i) persuasive evidence of an arrangement exists, (ii) delivery has occurred, (iii) the sales price is fixed or determinable, and (iv) collection of resulting receivables is reasonably assured. Revenue from upfront payments for the licensing of our patents is recognized when the arrangement is mutually signed, if there is no future delivery or future performance obligation and all other criteria are met. Revenue from guaranteed royalty streams are recognized when paid, or collection is reasonably assured and all other criteria are met. When patent licensing arrangements include royalties for future sales of the licensees’ products using our licensed patented technology, revenue is recognized when the royalty report is received from the licensee, at which time the sales price is determinable, provided that all other criteria have been met.
Research and development. Research and development expense consists primarily of personnel costs for our engineers and third parties engaged in the design and development of our products, software and technologies, including salary, bonus and share-based compensation expense, project material costs, services and depreciation. Such costs are charged to research and development expense as they are incurred.
Share-based compensation expense. We recognize compensation expense for time-based restricted share units, or RSUs, using the straight-line amortization method based on the fair value of RSUs on the date of grant. The fair value of RSUs is the closing market price of Broadcom ordinary shares on the date of grant, reduced by the present value of dividends expected to be paid on Broadcom ordinary shares prior to vesting. We recognize compensation expense for time-based share options and employee share purchase plan rights based on the estimated grant-date fair value method determined using the Black-Scholes valuation model with a straight-line amortization method.
Certain equity awards include both service and market conditions. The fair value of market-based awards is estimated on the date of grant using the Monte Carlo simulation technique. Assumptions utilized in the Monte Carlo simulation model follow the same methodology as our time-based option awards. Compensation expense for market-based awards is amortized based upon a graded vesting method over the service period.
Since the applicable authoritative guidance requires share-based compensation expense to be based on awards that are ultimately expected to vest, estimated share-based compensation expense for such awards has been reduced for estimated forfeitures. Changes in the estimated forfeiture rates can have a significant effect on share-based compensation expense since the effect of adjusting the rate is recognized in the period the forfeiture estimate is changed.
Shipping and handling costs. Our shipping and handling costs charged to customers are included in net revenue and the associated expense is included in cost of products sold in the consolidated statements of operations for all periods presented.
Advertising. Advertising costs are expensed as incurred and included within selling, general and administrative expense. Advertising costs were not material for fiscal years 2017, 2016 or 2015.
Litigation and settlement cost. We are involved in legal actions and other matters arising in our recent business acquisitions and in the normal course of business. We recognize an estimated loss contingency when the outcome is probable prior to issuance of the consolidated financial statements and we are able to reasonably estimate the amount or range of any possible loss.
77
Taxes on income. We account for income taxes under the asset and liability method, which requires the recognition of deferred tax assets and liabilities for the expected future tax consequences of events that have been included in the consolidated financial statements. Under this method, deferred tax assets and liabilities are determined based on the differences between the consolidated financial statements and tax bases of assets and liabilities using enacted tax rates in effect for the year in which the differences are expected to reverse. The effect of a change in tax rates on deferred tax assets and liabilities is recognized in income in the period that includes the enactment date.
We recognize net deferred tax assets to the extent we believe these assets will more likely than not be realized. In making such determination, we consider all available positive and negative evidence, including scheduled reversals of deferred tax liabilities, projected future taxable income, tax planning strategies and recent financial operations. If we determine that we are able to realize our deferred income tax assets in the future in excess of their net carrying values, we adjust the valuation allowance and reduce the provision for income taxes. Likewise, if we determine that we are not be able to realize all or part of our net deferred tax assets, we increase the provision for income taxes in the period such determination is made.
We account for uncertainty in income taxes in accordance with the applicable accounting guidance on income taxes. This guidance provides that a tax benefit from an uncertain tax position may be recognized when it is more likely than not that the position will be sustained upon examination, including resolutions of any related appeals or litigation processes, based on the technical merits.
Net income (loss) per share. Basic net income (loss) per share is computed by dividing net income (loss) attributable to ordinary shares by the weighted-average number of Broadcom ordinary shares outstanding during the period. Diluted net income (loss) per share is computed by dividing net income (loss) attributable to ordinary shares and, if the Partnership REUs are dilutive, net income (loss) attributable to noncontrolling interest by the weighted-average number of Broadcom ordinary shares and potentially dilutive shares outstanding during the period. Diluted shares outstanding include the dilutive effect of in-the-money share options, RSUs and employee share purchase plan rights under the Amended and Restated Broadcom Limited Employee Share Purchase Plan, or ESPP (together referred to as equity awards). Diluted shares outstanding also included Broadcom ordinary shares issuable upon exchange of the Partnership REUs (refer to Note 10. “Partners’ Capital” for additional information) for fiscal year 2016 and the 2.0% Convertible Senior Notes due 2021 issued by Avago, or the Convertible Notes, for fiscal year 2015. Potentially dilutive shares whose effect would have been antidilutive are excluded from the computation of diluted net income (loss) per share.
The dilutive effect of equity awards is calculated based on the average share price for each fiscal period, using the treasury stock method. Under the treasury stock method, the amount the employee must pay for exercising share options and to purchase shares under the ESPP and the amount of compensation cost for future service that we have not yet recognized are collectively assumed to be used to repurchase ordinary shares. For fiscal years 2016 and 2015, the amount of tax benefits that would be recognized when equity awards become deductible for income tax purposes was also assumed to be used to repurchase ordinary shares.
The dilutive effect of the Convertible Notes was calculated using the treasury stock method based on our assumption that the Convertible Notes would be settled in cash. The treasury stock method assumed that the carrying value of the Convertible Notes represented proceeds, since settlement of the Convertible Notes tendered for conversion could be settled with cash, ordinary shares or a combination of both at our option.
The dilutive effect of the Partnership REUs was calculated using the if-converted method. The if-converted method assumes that the Partnership REUs were converted at the beginning of the reporting period.
Reclassifications. Certain reclassifications have been made to the prior period consolidated statements of cash flows. These reclassifications have no impact on the previously reported net cash activities.
Recently Adopted Accounting Guidance
In the first quarter of fiscal year 2017, we early adopted an accounting standards update issued by the Financial Accounting Standards Board, or FASB, in March 2016 that simplifies the accounting for certain aspects of share-based payments to employees. The standard eliminates (i) the requirement to report excess tax benefits and certain tax deficiencies related to share-based payment transactions as additional paid-in capital and (ii) the requirement that excess tax benefits be realized before companies can recognize them. The standard requires a modified-retrospective transition method by means of a cumulative-effect adjustment as of the beginning of the period in which the guidance is adopted. As a result of adoption, we recognized a tax benefit of $273 million as a discrete item for fiscal year 2017, a $47 million cumulative-effect adjustment to reduce our accumulated deficit and a $3 million cumulative-effect adjustment to increase our noncontrolling interest for previously unrecognized excess tax benefits as of October 30, 2016. In connection with the adoption, we elected to present excess tax benefits within operating activities on the statement of cash flows prospectively and we continued our existing practice of estimating forfeitures.
78
Recent Accounting Guidance Not Yet Adopted
In October 2016, the FASB issued updated guidance related to the recognition of income tax consequences of an intra-entity transfer of an asset other than inventory. This guidance will be effective for the first quarter of our fiscal year 2019; however, early adoption is permitted. We are currently planning to early adopt this guidance in the first quarter of fiscal year 2018. The adoption of this guidance will result in a decrease in current and long-term prepaid tax expense of $67 million and $199 million, respectively, and an increase of $266 million to our accumulated deficit during the first quarter of fiscal year 2018, and will increase our income tax provision for periods in which we perform intra-entity transfers.
In August 2016, the FASB issued guidance related to the classification of certain transactions on the statement of cash flows. This guidance will be effective for the first quarter of our fiscal year 2019; however, early adoption is permitted. We will present our statements of cash flows in accordance with this guidance for the affected transactions occurring subsequent to adoption.
In February 2016, the FASB issued guidance related to the accounting for leases, which among other things, requires a lessee to recognize lease assets and lease liabilities on the balance sheet for operating leases. This guidance will be effective for the first quarter of our fiscal year 2020. The new guidance is required to be applied using a modified retrospective approach. We are evaluating the impact that this guidance will have on our consolidated financial statements.
In May 2014, the FASB issued guidance that outlines a single comprehensive model for entities to use in accounting for revenue arising from contracts with customers and supersedes most current revenue recognition guidance. In August 2015, the FASB issued an amendment to defer the effective date. The effective date of the guidance will be the first quarter of our fiscal year 2019. The new standard creates a single source of revenue guidance under GAAP, eliminating industry-specific guidance.
The underlying principle of the standard is to recognize revenue when a customer obtains control of promised goods or services at an amount that reflects the consideration that is expected to be received in exchange for those goods or services. An entity should apply a five-step approach for recognizing revenue as follows (1) identify the contract with a customer; (2) identify the performance obligations in the contract; (3) determine the transaction price; (4) allocate the transaction price to the performance obligations in the contract; and (5) recognize revenue when, or as, the entity satisfies a performance obligation. The standard also requires increased disclosures including the nature, amount, timing, and uncertainty of revenues and cash flows related to contracts with customers.
The standard allows two methods of adoption: (1) retrospectively to each prior period presented (“full retrospective method”), or (2) retrospectively with the cumulative effect recognized in retained earnings as of the date of adoption ("modified retrospective method"). We plan to adopt the new standard using the modified retrospective method at the beginning of our first quarter of fiscal year 2019. We have established a cross-functional team to assess the potential impact of the new revenue standard and are on schedule in establishing new accounting policies, processes, and internal controls necessary to support the requirements of the new standard.
While we are still finalizing our analysis to quantify the adoption impact of the provisions of the new standard, the exact impact of the new standard will be dependent on facts and circumstances at adoption and could vary from quarter to quarter.
3. Acquisitions
Acquisition of Broadcom Corporation
The Broadcom Merger closed on February 1, 2016, or the Acquisition Date, pursuant to the terms of the Broadcom Agreement. The aggregate consideration for the Broadcom Merger, which consisted of both cash and equity consideration, was approximately $28,758 million, net of cash acquired.
We funded the cash portion of the Broadcom Merger with the net proceeds from the issuance of the term loan facilities provided for under the 2016 Credit Agreement, as defined and discussed in further detail in Note 8. “Borrowings,” as well as cash on hand of the combined companies.
BRCM was a leader in semiconductor solutions for wired and wireless communications and provided a broad portfolio of highly-integrated system-on-a-chip solutions that seamlessly deliver voice, video, data and multimedia connectivity in the home, office and mobile environments. We acquired BRCM to position us as a global diversified leader in wired and wireless communication semiconductors, to deepen our broad portfolios, and to enable us to better address the evolving needs of customers across the wired and wireless end markets.
79
Purchase Consideration
(In millions) | ||||
Cash for outstanding BRCM common stock | $ | 16,798 | ||
Fair value of Broadcom ordinary shares issued for outstanding BRCM common stock | 15,438 | |||
Fair value of Partnership REUs issued for outstanding BRCM common stock | 3,140 | |||
Fair value of partially vested assumed restricted stock unit awards | 182 | |||
Cash for vested BRCM equity awards | 137 | |||
Effective settlement of pre-existing relationships | 11 | |||
Total purchase consideration | 35,706 | |||
Less: cash acquired | 6,948 | |||
Total purchase consideration, net of cash acquired | $ | 28,758 | ||
Broadcom issued 112 million ordinary shares and the Partnership issued 23 million Partnership REUs, all of which are valued and presented in the above table, to former BRCM shareholders in the Broadcom Merger. Broadcom also assumed unvested RSUs originally granted by BRCM and converted them into 6 million Broadcom RSUs. The portion of the fair value of partially vested assumed RSUs associated with prior service of BRCM employees represented a component of the total consideration, as presented above, and was valued based on Broadcom’s ordinary share price as of the Acquisition Date.
The following table presents our allocation of the total purchase price, net of cash acquired:
Fair Value | ||||
(In millions) | ||||
Trade accounts receivable | $ | 669 | ||
Inventory | 1,853 | |||
Assets held-for-sale | 833 | |||
Other current assets | 194 | |||
Property, plant and equipment | 889 | |||
Goodwill | 22,992 | |||
Intangible assets | 14,808 | |||
Other long-term assets | 121 | |||
Total assets acquired | 42,359 | |||
Accounts payable | (559 | ) | ||
Employee compensation and benefits | (104 | ) | ||
Current portion of long-term debt | (1,475 | ) | ||
Other current liabilities | (780 | ) | ||
Long-term debt | (139 | ) | ||
Other long-term liabilities | (10,544 | ) | ||
Total liabilities assumed | (13,601 | ) | ||
Fair value of net assets acquired | $ | 28,758 | ||
Goodwill was primarily attributable to the assembled workforce, anticipated synergies and economies of scale expected from the operations of the combined company. The synergies include certain cost savings, operating efficiencies, and other strategic benefits projected to be achieved as a result of the Broadcom Merger. Goodwill is not deductible for tax purposes.
The assets held-for-sale represented those BRCM businesses that were not aligned with our strategic objectives. The sales of these businesses are disclosed in Note 4. “Supplemental Financial Information.”
Our results of continuing operations for fiscal year 2016 included $6,993 million of net revenue attributable to BRCM. It is impracticable to determine the effect on net loss attributable to BRCM for fiscal year 2016 as we immediately integrated BRCM into our ongoing operations. Transaction costs of $42 million incurred related to the Broadcom Merger were included in selling, general and administrative expense in the consolidated statements of operations for fiscal year 2016.
80
Intangible Assets
Fair Value | Weighted-Average Amortization Periods | |||||
(In millions) | (In years) | |||||
Developed technology | $ | 9,010 | 6 | |||
Customer contracts and related relationships | 2,703 | 2 | ||||
Order backlog | 750 | < 1 | ||||
Trade name | 350 | 17 | ||||
Other | 45 | 16 | ||||
Total identified finite-lived intangible assets | 12,858 | |||||
IPR&D | 1,950 | N/A | ||||
Total identified intangible assets, net of assets held-for-sale | 14,808 | |||||
Intangible assets included in assets held-for-sale | 320 | |||||
Identified intangible assets | $ | 15,128 | ||||
Developed technology relates to products for wired and wireless communication applications. We valued the developed technology using the multi-period excess earnings method under the income approach. This method reflects the present value of the projected cash flows that are expected to be generated by the developed technology less charges representing the contribution of other assets to those cash flows. The economic useful life was determined based on the technology cycle related to each developed technology, as well as the cash flows over the forecast period.
Customer contracts and related relationships represent the fair value of future projected revenue that will be derived from sales of products to existing customers of BRCM. Customer contracts and related relationships were valued using the with-and-without-method under the income approach. In this method, the fair value was measured by the difference between the present values of the cash flows with and without the existing customers in place over the period of time necessary to reacquire the customers. The economic useful life was determined based on historical customer turnover rates.
Order backlog represents business under existing contractual obligations as of the Acquisition Date. The fair value of backlog was determined using the multi-period excess earnings method under the income approach based on expected operating cash flows from future contractual revenue. The economic useful life was determined based on the expected life of the backlog and the cash flows over the forecast period.
Trade name relates to the “Broadcom” trade name. The fair value was determined by applying the relief-from-royalty method under the income approach. This valuation method is based on the application of a royalty rate to forecasted revenue under the trade name. The economic useful life was determined based on the expected life of the trade name and the cash flows anticipated over the forecasted periods.
The fair value of IPR&D was determined using the multi-period excess earnings method under the income approach. This method reflects the present value of the projected cash flows that are expected to be generated by the IPR&D, less charges representing the contribution of other assets to those cash flows.
We believe the amounts of purchased intangible assets recorded above represented the fair values of, and approximated the amounts a market participant would pay for, these intangible assets as of the Acquisition Date.
The following table summarizes the details of IPR&D by category as of the Acquisition Date:
Description | IPR&D | Percentage of Completion | Estimated Cost to Complete | Expected Release Date (By Fiscal Year) | |||||||||
(Dollars in millions) | |||||||||||||
Set-top box solutions | $ | 90 | 56 | % | $ | 90 | 2016 - 2017 | ||||||
Broadband carrier access solutions | $ | 390 | 34 | % | $ | 376 | 2016 - 2018 | ||||||
Carrier switch solutions | $ | 270 | 51 | % | $ | 255 | 2016 - 2019 | ||||||
Compute and connectivity solutions | $ | 170 | 61 | % | $ | 136 | 2016 - 2018 | ||||||
Physical layer product solutions | $ | 190 | 51 | % | $ | 71 | 2016 - 2019 | ||||||
Wireless connectivity combo solutions | $ | 770 | 57 | % | $ | 364 | 2016 - 2018 | ||||||
Touch controllers | $ | 70 | 39 | % | $ | 21 | 2016 - 2017 | ||||||
81
Discount rates of 14% and 16% were applied to the projected cash flows to reflect the risk related to these wired and wireless IPR&D projects, respectively. These discount rates represent a premium of 2% over the respective wired and wireless weighted-average cost of capital to reflect the higher risk and uncertainty of the cash flows for IPR&D relative to the overall businesses.
During fiscal year 2016, we wrote off $411 million of acquired IPR&D to restructuring, impairment and disposal charges as we will no longer develop and invest in these projects. The majority of these abandoned IPR&D projects related to wireless connectivity combo and broadband carrier access solutions.
Unaudited Pro Forma Information
The following unaudited pro forma financial information presents combined results of operations for each of the periods presented, as if BRCM had been acquired as of the beginning of fiscal year 2015. The unaudited pro forma financial information for fiscal years 2016 and 2015 combined the historical results of Avago for the fiscal quarter ended January 31, 2016 and fiscal year ended November 1, 2015 and the historical results of BRCM for the three months ended December 31, 2015 and the twelve months ended September 30, 2015, representing BRCM’s previous reporting periods prior to the Acquisition Date, and the historical results of Broadcom for the fiscal quarters ended May 1, 2016, July 31, 2016 and October 30, 2016. The unaudited pro forma information includes adjustments to amortization and depreciation for intangible assets and property, plant and equipment acquired, adjustments to share-based compensation expense, the purchase accounting effect on inventory acquired, interest expense for the additional indebtedness incurred to complete the acquisition, restructuring charges related to the acquisition and transaction costs. For fiscal year 2015, non-recurring pro forma adjustments directly attributable to the Broadcom Merger included (i) the purchase accounting effect of inventory acquired of $1,185 million, (ii) the write-off of debt issuance costs of $141 million in connection with the repayment of certain borrowings, (iii) acquisition costs of $60 million and (iv) BRCM interest expense of $34 million. The unaudited pro forma information presented below is for informational purposes only and is not necessarily indicative of the consolidated results of operations of the combined business had the acquisition actually occurred at the beginning of fiscal year 2015 or of the results of future operations of the combined business.
Fiscal Year | ||||||||
2016 | 2015 | |||||||
(In millions except per share data) | ||||||||
Pro forma net revenue | $ | 15,281 | $ | 15,296 | ||||
Pro forma net loss from continuing operations | $ | (1,255 | ) | $ | (433 | ) | ||
Pro forma net loss | $ | (1,367 | ) | $ | (460 | ) | ||
Pro forma net loss attributable to ordinary shares | $ | (1,291 | ) | $ | (435 | ) | ||
Pro forma loss per share attributable to ordinary shares - basic and diluted | $ | (3.53 | ) | $ | (1.16 | ) | ||
Other Acquisitions
We completed additional acquisitions in fiscal years 2017, 2016 and 2015 to enhance our competitive position. During fiscal year 2017, we completed two immaterial acquisitions. During fiscal year 2016, in addition to BRCM, we completed three immaterial acquisitions. During fiscal year 2015, we completed the acquisition of Emulex Corporation, or Emulex, as discussed below.
Acquisition of Emulex
On May 5, 2015, we acquired Emulex, a leader in network connectivity, monitoring and management. We acquired Emulex to broaden our portfolios to better serve the enterprise storage end market. Purchase consideration for the acquisition of Emulex was $399 million, net of cash acquired.
Our results of continuing operations for fiscal year 2015 include $181 million of net revenue attributable to Emulex. It is impracticable to determine the effect on net income resulting from the acquisition of Emulex, as we immediately integrated Emulex into our ongoing operations.
4. Supplemental Financial Information
Cash and Cash Equivalents
Cash equivalents included $6,002 million and $1,022 million of time deposits as of October 29, 2017 and October 30, 2016, respectively. As of October 29, 2017, cash equivalents also included $401 million of money-market funds. For time deposits, carrying value approximates fair value due to the short-term nature of the instruments. The fair value of money-market funds, which was consistent with their carrying value, was determined using unadjusted prices in active, accessible markets for identical assets, and as such they were classified as Level 1 assets in the fair value hierarchy.
82
Accounts Receivable Factoring
During fiscal year 2017, we entered into a factoring agreement with a third-party financial institution under which we sell certain of our trade accounts receivable on a non-recourse basis. We account for these transactions as sales of receivables and present cash proceeds as cash provided by operating activities in the consolidated statements of cash flows. Total trade accounts receivable sold under the factoring agreement were $178 million during fiscal year 2017. Factoring fees for the sales of receivables were recorded in other income, net and were not material.
Inventory
October 29, 2017 | October 30, 2016 | |||||||
(In millions) | ||||||||
Finished goods | $ | 562 | $ | 431 | ||||
Work-in-process | 696 | 596 | ||||||
Raw materials | 189 | 373 | ||||||
Total inventory | $ | 1,447 | $ | 1,400 | ||||
Property, Plant and Equipment, Net
October 29, 2017 | October 30, 2016 | |||||||
(In millions) | ||||||||
Land | $ | 177 | $ | 268 | ||||
Construction in progress | 411 | 361 | ||||||
Buildings and leasehold improvements | 579 | 534 | ||||||
Machinery and equipment | 2,925 | 2,475 | ||||||
Total property, plant and equipment | 4,092 | 3,638 | ||||||
Accumulated depreciation and amortization | (1,493 | ) | (1,129 | ) | ||||
Total property, plant and equipment, net | $ | 2,599 | $ | 2,509 | ||||
Depreciation expense was $451 million, $402 million and $229 million for fiscal years 2017, 2016 and 2015, respectively.
As of October 29, 2017 and October 30, 2016, we had $122 million and $159 million, respectively, of unpaid purchases of property, plant and equipment included in accounts payable and other current liabilities. Amounts reported as unpaid purchases are presented as cash outflows from investing activities for purchases of property, plant and equipment in the consolidated statements of cash flows in the period in which they are paid.
During fiscal year 2017, as part of our campus rationalization efforts, we completed the sale of our Irvine campus for $443 million and we leased back a portion of the campus at market rental rates. There was no significant gain or loss recognized upon completion of the sale.
83
Other Current Liabilities
October 29, 2017 | October 30, 2016 | |||||||
(In millions) | ||||||||
Interest payable | $ | 136 | $ | 14 | ||||
Accrued rebates | 124 | 317 | ||||||
Tax liabilities | 123 | 117 | ||||||
Other | 298 | 398 | ||||||
Total other current liabilities | $ | 681 | $ | 846 | ||||
Accrued Rebate Activity
Fiscal Year | ||||||||
2017 | 2016 | |||||||
(In millions) | ||||||||
Beginning balance | $ | 317 | $ | 26 | ||||
Liabilities assumed in acquisitions | — | 359 | ||||||
Charged as a reduction of revenue | 244 | 461 | ||||||
Reversal of unclaimed rebates | (79 | ) | (6 | ) | ||||
Payments | (358 | ) | (523 | ) | ||||
Ending balance | $ | 124 | $ | 317 | ||||
Other Long-Term Liabilities
October 29, 2017 | October 30, 2016 | |||||||
(In millions) | ||||||||
Deferred tax liabilities | $ | 10,019 | $ | 10,287 | ||||
Unrecognized tax benefits (a) | 1,011 | 893 | ||||||
Other | 130 | 113 | ||||||
Total other long-term liabilities | $ | 11,160 | $ | 11,293 | ||||
________________________________
(a) Includes accrued interest and penalties.
Accumulated Other Comprehensive Loss
Fiscal Year | ||||||||
2017 | 2016 | |||||||
(In millions) | ||||||||
Beginning balance | $ | (134 | ) | $ | (73 | ) | ||
Changes in accumulated other comprehensive loss: | ||||||||
Other comprehensive income (loss) before reclassifications | 63 | (99 | ) | |||||
Amounts reclassified out of accumulated other comprehensive loss | 1 | 4 | ||||||
Tax effects | (21 | ) | 34 | |||||
Other comprehensive income (loss) | 43 | (61 | ) | |||||
Ending balance | $ | (91 | ) | $ | (134 | ) | ||
The change in accumulated other comprehensive loss was entirely related to defined benefit pension plans and post-retirement benefit plans.
84
Litigation Settlements
We reported an aggregate of $122 million in litigation settlement expenses with respect to matters that existed at the balance sheet date of October 29, 2017, which primarily consists of expenses that became probable and reasonably estimable prior to the issuance of these consolidated financial statements. This amount does not take into consideration the receipt of any potential indemnity or contribution amounts we may become entitled to as a result of these settlements because such amounts are not probable or reasonably estimable as of the date hereof.
Other Income, Net
Fiscal Year | ||||||||||||
2017 | 2016 | 2015 | ||||||||||
(In millions) | ||||||||||||
Other income | $ | 43 | $ | 27 | $ | 35 | ||||||
Interest income | 44 | 10 | 8 | |||||||||
Other expense | (25 | ) | (27 | ) | (7 | ) | ||||||
Other income, net | $ | 62 | $ | 10 | $ | 36 | ||||||
Other income, net includes interest income, gains (losses) on foreign currency remeasurement and other miscellaneous items.
Discontinued Operations
During fiscal year 2016, we sold certain BRCM businesses for aggregate cash proceeds of $830 million. During fiscal year 2015, we sold the Axxia networking business, which we acquired through the acquisition of LSI Corporation, or LSI, and related assets to Intel Corporation for $650 million and the Emulex network visibility product business for an immaterial amount. In connection with these sales, we provided transitional services to the buyers as short-term assistance in assuming the operations of the purchased businesses. We do not have any material continuing involvement with these businesses and have presented their results in discontinued operations. The following table summarizes the selected financial information of discontinued operations:
Fiscal Year | ||||||||||||
2017 | 2016 | 2015 | ||||||||||
(In millions) | ||||||||||||
Net revenue | $ | 15 | $ | 103 | $ | 65 | ||||||
Income (loss) from discontinued operations before gain (loss) on disposals and income taxes | $ | (6 | ) | $ | (216 | ) | $ | 1 | ||||
Gain (loss) on disposals of discontinued operations | — | 42 | (14 | ) | ||||||||
Benefit from (provision for) income taxes | — | 62 | (14 | ) | ||||||||
Loss from discontinued operations, net of income taxes | $ | (6 | ) | $ | (112 | ) | $ | (27 | ) | |||
85
5. Goodwill and Intangible Assets
Goodwill
Wired Infrastructure | Wireless Communications | Enterprise Storage | Industrial & Other | Total | ||||||||||||||||
(In millions) | ||||||||||||||||||||
Balance as of November 1, 2015 | $ | 287 | $ | 261 | $ | 990 | $ | 136 | $ | 1,674 | ||||||||||
Broadcom Merger | 17,354 | 5,670 | — | — | 23,024 | |||||||||||||||
Other acquisitions | — | 21 | 11 | 8 | 40 | |||||||||||||||
Reclassification of goodwill related to certain assets held-for-sale | — | — | (6 | ) | — | (6 | ) | |||||||||||||
Balance as of October 30, 2016 | 17,641 | 5,952 | 995 | 144 | 24,732 | |||||||||||||||
Broadcom Merger adjustments | (25 | ) | (7 | ) | — | — | (32 | ) | ||||||||||||
Other acquisitions | 6 | — | — | — | 6 | |||||||||||||||
Balance as of October 29, 2017 | $ | 17,622 | $ | 5,945 | $ | 995 | $ | 144 | $ | 24,706 | ||||||||||
During fiscal year 2017, we made two immaterial acquisitions and adjustments to certain tax balances related to the Broadcom Merger, resulting in a $26 million net decrease in goodwill. During fiscal year 2016, we made three immaterial acquisitions in addition to the Broadcom Merger.
During the fourth quarters of fiscal years 2017, 2016 and 2015, we completed our annual impairment assessments and we concluded that goodwill was not impaired in any of these years.
Intangible Assets
Gross Carrying Amount | Accumulated Amortization | Net Book Value | ||||||||||
(In millions) | ||||||||||||
As of October 29, 2017: | ||||||||||||
Purchased technology | $ | 12,724 | $ | (4,265 | ) | $ | 8,459 | |||||
Customer contracts and related relationships | 4,240 | (3,100 | ) | 1,140 | ||||||||
Trade names | 528 | (117 | ) | 411 | ||||||||
Other | 135 | (25 | ) | 110 | ||||||||
Intangible assets subject to amortization | 17,627 | (7,507 | ) | 10,120 | ||||||||
IPR&D | 712 | — | 712 | |||||||||
Total | $ | 18,339 | $ | (7,507 | ) | $ | 10,832 | |||||
As of October 30, 2016: | ||||||||||||
Purchased technology | $ | 12,182 | $ | (1,855 | ) | $ | 10,327 | |||||
Customer contracts and related relationships | 4,231 | (1,377 | ) | 2,854 | ||||||||
Trade names | 528 | (77 | ) | 451 | ||||||||
Other | 107 | (7 | ) | 100 | ||||||||
Intangible assets subject to amortization | 17,048 | (3,316 | ) | 13,732 | ||||||||
IPR&D | 1,336 | — | 1,336 | |||||||||
Total | $ | 18,384 | $ | (3,316 | ) | $ | 15,068 | |||||
86
Based on the amount of intangible assets subject to amortization at October 29, 2017, the expected amortization expense for each of the next five fiscal years and thereafter is as follows:
Fiscal Year: | Expected Amortization Expense | |||
(In millions) | ||||
2018 | $ | 2,971 | ||
2019 | 2,207 | |||
2020 | 1,835 | |||
2021 | 1,446 | |||
2022 | 1,031 | |||
Thereafter | 630 | |||
Total | $ | 10,120 | ||
The weighted-average amortization periods remaining by intangible asset category were as follows:
Amortizable intangible assets: | October 29, 2017 | October 30, 2016 | ||
(In years) | ||||
Purchased technology | 5 | 6 | ||
Customer contracts and related relationships | 4 | 3 | ||
Trade name | 13 | 14 | ||
Other | 10 | 12 | ||
6. Net Income (Loss) Per Share
Broadcom
The following is a reconciliation of the numerators and denominators of the basic and diluted net income (loss) per share computations for the periods presented:
Fiscal Year | ||||||||||||
2017 | 2016 | 2015 | ||||||||||
(In millions, except per share data) | ||||||||||||
Numerator - Basic: | ||||||||||||
Income (loss) from continuing operations | $ | 1,790 | $ | (1,749 | ) | $ | 1,391 | |||||
Less: Income (loss) from continuing operations attributable to noncontrolling interest | 92 | (116 | ) | — | ||||||||
Income (loss) from continuing operations attributable to ordinary shares | 1,698 | (1,633 | ) | 1,391 | ||||||||
Loss from discontinued operations, net of income taxes | (6 | ) | (112 | ) | (27 | ) | ||||||
Less: Loss from discontinued operations, net of income taxes, attributable to noncontrolling interest | — | (6 | ) | — | ||||||||
Loss from discontinued operations, net of income taxes, attributable to ordinary shares | (6 | ) | (106 | ) | (27 | ) | ||||||
Net income (loss) attributable to ordinary shares | $ | 1,692 | $ | (1,739 | ) | $ | 1,364 | |||||
Numerator - Diluted: | ||||||||||||
Income (loss) from continuing operations | $ | 1,698 | $ | (1,749 | ) | $ | 1,391 | |||||
Loss from discontinued operations, net of income taxes | (6 | ) | (112 | ) | (27 | ) | ||||||
Net income (loss) | $ | 1,692 | $ | (1,861 | ) | $ | 1,364 | |||||
87
Denominator: | ||||||||||||
Weighted-average ordinary shares outstanding - basic | 405 | 366 | 264 | |||||||||
Dilutive effect of equity awards | 16 | — | 9 | |||||||||
Dilutive effect of Convertible Notes | — | — | 8 | |||||||||
Exchange of noncontrolling interest for ordinary shares | — | 17 | — | |||||||||
Weighted-average ordinary shares outstanding - diluted | 421 | 383 | 281 | |||||||||
Basic income (loss) per share attributable to ordinary shares: | ||||||||||||
Income (loss) per share from continuing operations | $ | 4.19 | $ | (4.46 | ) | $ | 5.27 | |||||
Loss per share from discontinued operations, net of income taxes | (0.01 | ) | (0.29 | ) | (0.10 | ) | ||||||
Net income (loss) per share | $ | 4.18 | $ | (4.75 | ) | $ | 5.17 | |||||
Diluted income (loss) per share attributable to ordinary shares: | ||||||||||||
Income (loss) per share from continuing operations | $ | 4.03 | $ | (4.57 | ) | $ | 4.95 | |||||
Loss per share from discontinued operations, net of income taxes | (0.01 | ) | (0.29 | ) | (0.10 | ) | ||||||
Net income (loss) per share | $ | 4.02 | $ | (4.86 | ) | $ | 4.85 | |||||
During fiscal year 2015, the Convertible Notes were converted in full and settled with a combination of cash and the issuance of 13.8 million Avago ordinary shares. The incremental Avago ordinary shares attributable to the conversion were a component of diluted shares for the period prior to settlement and a component of basic weighted-average shares outstanding subsequent to the conversion.
Diluted net income (loss) per share excluded the potentially dilutive effect of the exchange of Partnership REUs for up to 22 million ordinary shares for fiscal year 2017 and weighted-average outstanding equity awards to acquire 12 million ordinary shares for fiscal year 2016, as their effect was antidilutive.
The Partnership
Income (loss) per unit for the Partnership is not required to be presented as its Common Units and Partnership REUs are not publicly traded.
7. | Retirement Plans and Post-Retirement Benefits |
Pension and Post-Retirement Benefit Plans
Defined Benefit Plans. The U.S. defined benefit pension plans include a management plan and a represented plan. Benefits under the management plan are provided under either an adjusted career-average-pay program or a cash-balance program. Benefits under the represented plan are based on a dollar-per-month formula. Benefit accruals under the management plan were frozen in 2009. Participants in the adjusted career-average-pay program no longer earn service accruals. Participants in the cash-balance program no longer earn service accruals, but continue to earn 4% interest per year on their cash-balance accounts. There are no active participants under the represented plan. We also have a non-qualified supplemental pension plan in the United States that principally provides benefits based on compensation in excess of amounts that can be considered under the management plan. We also have pension plans covering certain non-U.S. employees.
Post-Retirement Benefit Plans. Certain of our U.S. employees who were age 49 or younger on January 1, 2005 and who meet the retirement eligibility requirements as of their termination dates, may receive post-retirement medical benefits under our retiree medical account program. Eligible employees receive a medical benefit spending account of $55,000 upon retirement to pay premiums for medical coverage through the maximum age of 75 as retiree.
Our group life insurance plan offers post-retirement life insurance coverage for certain U.S. employees.
Non-U.S Retirement Benefit Plans. In addition to the defined benefit plans for certain employees in Taiwan, India, Japan, Israel, Italy and Germany, other eligible employees outside of the United States receive retirement benefits under various defined contribution retirement plans. Eligibility is generally determined based on the terms of our plans and local statutory requirements.
88
Net Periodic Benefit Income
Pension Benefits | Post-Retirement Benefits | |||||||||||||||||||||||
Fiscal Year | Fiscal Year | |||||||||||||||||||||||
2017 | 2016 | 2015 | 2017 | 2016 | 2015 | |||||||||||||||||||
(In millions) | ||||||||||||||||||||||||
Net periodic benefit income: | ||||||||||||||||||||||||
Service cost | $ | 4 | $ | 3 | $ | 3 | $ | — | $ | — | $ | — | ||||||||||||
Interest cost | 53 | 59 | 61 | 3 | 3 | 3 | ||||||||||||||||||
Expected return on plan assets | (65 | ) | (72 | ) | (77 | ) | (4 | ) | (4 | ) | (5 | ) | ||||||||||||
Net actuarial loss and prior service cost | 2 | 1 | 1 | — | — | — | ||||||||||||||||||
Curtailments | (1 | ) | — | — | — | — | — | |||||||||||||||||
Settlements | — | 3 | — | — | — | — | ||||||||||||||||||
Net periodic benefit income | $ | (7 | ) | $ | (6 | ) | $ | (12 | ) | $ | (1 | ) | $ | (1 | ) | $ | (2 | ) | ||||||
Net actuarial (income) loss | $ | (60 | ) | $ | 88 | $ | 36 | $ | (3 | ) | $ | 11 | $ | 1 | ||||||||||
We expect to recognize $2 million of net actuarial loss in net periodic benefit income in fiscal year 2018 related to our defined benefit pension plans.
Funded Status
Pension Benefits | Post-Retirement Benefits | |||||||||||||||
October 29, 2017 | October 30, 2016 | October 29, 2017 | October 30, 2016 | |||||||||||||
(In millions) | ||||||||||||||||
Change in plan assets: | ||||||||||||||||
Fair value of plan assets — beginning of period | $ | 1,050 | $ | 1,052 | $ | 78 | $ | 78 | ||||||||
Actual return on plan assets | 108 | 64 | 7 | 1 | ||||||||||||
Employer contributions | 361 | 33 | — | — | ||||||||||||
Payments from plan assets | (93 | ) | (93 | ) | (2 | ) | (1 | ) | ||||||||
Settlements | — | (11 | ) | — | — | |||||||||||
Plan assets acquired in acquisitions | — | 5 | — | — | ||||||||||||
Fair value of plan assets — end of period | 1,426 | 1,050 | 83 | 78 | ||||||||||||
Change in benefit obligations: | ||||||||||||||||
Benefit obligations — beginning of period | $ | 1,566 | $ | 1,511 | $ | 79 | $ | 69 | ||||||||
Service cost | 4 | 3 | — | — | ||||||||||||
Interest cost | 53 | 59 | 3 | 3 | ||||||||||||
Actuarial (gain) loss | (13 | ) | 80 | — | 8 | |||||||||||
Benefit payments | (93 | ) | (93 | ) | (2 | ) | (1 | ) | ||||||||
Curtailments | (4 | ) | — | — | — | |||||||||||
Settlements | (8 | ) | (11 | ) | — | — | ||||||||||
Benefit obligations assumed in acquisitions | — | 17 | — | — | ||||||||||||
Foreign currency impact | 3 | — | — | — | ||||||||||||
Benefit obligations — end of period | 1,508 | 1,566 | 80 | 79 | ||||||||||||
Overfunded (underfunded) status of benefit obligations | $ | (82 | ) | $ | (516 | ) | $ | 3 | $ | (1 | ) | |||||
89
Plans with benefit obligations in excess of plan assets:
Pension Benefits | Post-Retirement Benefits | |||||||||||||||
October 29, 2017 | October 30, 2016 | October 29, 2017 | October 30, 2016 | |||||||||||||
(In millions) | ||||||||||||||||
Projected benefit obligations | $ | 701 | $ | 1,565 | $ | — | $ | — | ||||||||
Accumulated benefit obligations | $ | 696 | $ | 1,557 | $ | 15 | $ | 16 | ||||||||
Fair value of plan assets | $ | 603 | $ | 1,048 | $ | — | $ | — | ||||||||
Plans with benefit obligations less than plan assets:
Pension Benefits | Post-Retirement Benefits | |||||||||||||||
October 29, 2017 | October 30, 2016 | October 29, 2017 | October 30, 2016 | |||||||||||||
(In millions) | ||||||||||||||||
Projected benefit obligations | $ | 807 | $ | 1 | $ | — | $ | — | ||||||||
Accumulated benefit obligations | $ | 805 | $ | 1 | $ | 65 | $ | 63 | ||||||||
Fair value of plan assets | $ | 823 | $ | 2 | $ | 83 | $ | 78 | ||||||||
The fair value of pension plan assets at October 29, 2017 and October 30, 2016 included $20 million and $21 million, respectively, of assets for our non-U.S. pension plans.
The projected benefit obligations as of October 29, 2017 and October 30, 2016 included $106 million and $118 million, respectively, of obligations related to our non-U.S. plans. The accumulated benefit obligations as of October 29, 2017 and October 30, 2016 included $100 million and $110 million, respectively, of obligations related to our non-U.S. plans.
The following table presents amounts recognized on the consolidated balance sheets:
Pension Benefits | Post-Retirement Benefits | |||||||||||||||
October 29, 2017 | October 30, 2016 | October 29, 2017 | October 30, 2016 | |||||||||||||
(In millions) | ||||||||||||||||
Other long-term assets | $ | 17 | $ | 1 | $ | 18 | $ | 15 | ||||||||
Employee compensation and benefits | $ | 1 | $ | 1 | $ | 1 | $ | 1 | ||||||||
Pension and post-retirement benefit obligations | $ | 98 | $ | 516 | $ | 14 | $ | 15 | ||||||||
Amounts recognized in accumulated other comprehensive loss, net of taxes: | ||||||||||||||||
Actuarial losses and prior service costs, net of taxes | $ | (85 | ) | $ | (126 | ) | $ | (6 | ) | $ | (8 | ) | ||||
We currently expect to make contributions of $118 million to our defined benefit pension plans in fiscal year 2018. We do not expect to make any contributions to our post-retirement medical benefit plans in fiscal year 2018.
Expected Future Benefit Payments
The following table presents expected payments from our benefit plans over the next 10 fiscal years as of October 29, 2017:
Fiscal Years: | Pension Benefits | Post-Retirement Benefits | ||||||
(In millions) | ||||||||
2018 | $ | 92 | $ | 3 | ||||
2019 | $ | 92 | $ | 3 | ||||
2020 | $ | 91 | $ | 3 | ||||
2021 | $ | 91 | $ | 3 | ||||
2022 | $ | 90 | $ | 3 | ||||
2023-2027 | $ | 451 | $ | 19 | ||||
90
Defined Benefit Plan Investment Policy
Plan assets of the funded defined benefit pension plans are invested in funds held by third-party fund managers or are deposited into government-managed accounts in which we have no active involvement in and no control over investment strategy, other than establishing broad investment guidelines and parameters. The plan assets held by third-parties consist primarily of equities and fixed income funds. As of October 30, 2016, the plan assets also included commingled funds. The fund managers monitor the fund’s asset allocation within the guidelines established by our plan’s investment committee. In line with plan investment objectives and consultation with our management, our investment committee set an allocation benchmark among equity, bond and other assets based on the relative weighting of overall non-U.S. market indices. The overall investment objectives of the plan are 1) the acquisition of suitable assets of appropriate liquidity which will generate income and capital growth to meet current and future plan benefits, 2) to limit the risk of the assets failing to meet the long-term liabilities of the plan, and 3) to minimize the long-term costs of the plan by maximizing the return on the assets. Performance is regularly evaluated by the investment committee and is based on actual returns achieved by the fund manager relative to its benchmark.
For the defined benefit pension plans, the investment strategy for the U.S. plans is to allocate assets in a manner that seeks both to maximize the safety of promised benefits and to minimize the cost of funding those benefits. We direct the overall portfolio allocation and use a third-party investment consultant that has discretion to structure portfolios and select the investment managers within those allocation parameters. Multiple investment managers are utilized, including both active and passive management approaches. The plan assets are invested using a liability-driven investment strategy intended to minimize market and interest rate risks, and those assets are periodically rebalanced toward asset allocation targets.
The target asset allocation for U.S. plans reflects a risk/return profile that we believe is appropriate relative to the liability structure and return goals for the plans. We periodically review the allocation of plan assets relative to alternative allocation models to evaluate the need for adjustments based on forecasted liabilities and plan liquidity needs. The fixed-income allocation is primarily directed toward long-term core bond investments, with smaller allocations to Treasury Inflation-Protected Securities and high-yield bonds. As of October 29, 2017, there were no material equity investments in the plans.
The following table presents our defined benefit pension plans' weighted-average asset allocations by category:
Defined Benefit Pension Plans | ||||||||||||
October 29, 2017 | October 30, 2016 | |||||||||||
Actual | Target | Actual | Target | |||||||||
Equity investments | — | % | — | % | 33 | % | 40 | % | ||||
Fixed income | 100 | 100 | 67 | 55 | ||||||||
Real estate | — | — | — | 5 | ||||||||
Total | 100 | % | 100 | % | 100 | % | 100 | % | ||||
91
Fair Value Measurement of Plan Assets
October 29, 2017 | |||||||||||||||||||
Fair Value Measurements at Reporting Date Using | |||||||||||||||||||
Level 1 | Level 2 | Level 3 | Total | ||||||||||||||||
(In millions) | |||||||||||||||||||
Cash equivalents | $ | 943 | (a) | $ | — | $ | — | $ | 943 | ||||||||||
Equity securities: | |||||||||||||||||||
Non-U.S. equity securities | 7 | (b) | — | — | 7 | ||||||||||||||
Fixed-income securities: | |||||||||||||||||||
U.S. treasuries | — | 39 | (c) | — | 39 | ||||||||||||||
Corporate bonds | — | 393 | (c) | — | 393 | ||||||||||||||
Asset-backed and mortgage-backed securities | — | 1 | (c) | — | 1 | ||||||||||||||
Municipal bonds | — | 25 | (c) | — | 25 | ||||||||||||||
Government bonds | — | 18 | (c) | — | 18 | ||||||||||||||
Total plan assets | $ | 950 | $ | 476 | $ | — | $ | 1,426 | |||||||||||
October 30, 2016 | |||||||||||||||||||
Fair Value Measurements at Reporting Date Using | |||||||||||||||||||
Level 1 | Level 2 | Level 3 | Total | ||||||||||||||||
(In millions) | |||||||||||||||||||
Cash equivalents | $ | 38 | (a) | $ | — | $ | — | $ | 38 | ||||||||||
Equity securities: | |||||||||||||||||||
U.S. equity securities | 155 | (b) | — | — | 155 | ||||||||||||||
Non-U.S. equity securities | 72 | (b) | — | — | 72 | ||||||||||||||
Fixed-income securities: | |||||||||||||||||||
U.S. treasuries | — | 39 | (c) | — | 39 | ||||||||||||||
Corporate bonds | — | 393 | (c) | — | 393 | ||||||||||||||
Asset-backed and mortgage-backed securities | — | 3 | (c) | — | 3 | ||||||||||||||
Agency-backed bonds | — | 3 | (c) | — | 3 | ||||||||||||||
Municipal bonds | — | 25 | (c) | — | 25 | ||||||||||||||
Government bonds | — | 11 | (c) | — | 11 | ||||||||||||||
Total assets measured by fair value hierarchy | $ | 265 | $ | 474 | $ | — | 739 | ||||||||||||
Assets measured at net asset value: | |||||||||||||||||||
Commingled funds - equities | 116 | (d) | |||||||||||||||||
Commingled funds - bonds | 195 | (e) | |||||||||||||||||
Total plan assets | $ | 1,050 | |||||||||||||||||
_________________________________
(a) | Cash equivalents primarily included short-term investment funds which consisted of short-term money market instruments that were valued based on quoted prices in active markets. |
(b) | These equity securities were valued based on quoted prices in active markets. |
(c) | These amounts consisted of investments that were traded less frequently than Level 1 securities and were valued using inputs that included quoted prices for similar assets in active markets and inputs other than quoted prices that were observable for the asset, such as interest rates, yield curves, prepayment speeds, collateral performance, broker/dealer quotes and indices that were observable at commonly quoted intervals. |
(d) | The amount consisted of investments in funds not registered with the U.S. Securities and Exchange Commission, or SEC, with underlying investments primarily in publicly traded U.S. and non-U.S. equity securities, including securities with small and large market capitalization. |
92
(e) | The amount consisted of investments in funds not registered with the SEC with underlying investments primarily in Treasury Inflation-Protected Securities and high-yield bonds. |
Post-Retirement Benefit Plan Investment Policy
Our overall investment strategy for the group life insurance plan is to allocate assets in a manner that seeks to both maximize the safety of promised benefits and minimize the cost of funding those benefits. The target asset allocation for plan assets reflects a risk/return profile that we believe is appropriate relative to the liability structure and return goals for the plan. We periodically review the allocation of plan assets relative to alternative allocation models to evaluate the need for adjustments based on forecasted liabilities and plan liquidity needs. We set the overall portfolio allocation and use an investment manager that directs the investment of funds consistent with that allocation. The investment manager invests the plan assets in index funds that it manages.
The following table presents the plan asset allocations by category:
October 29, 2017 | October 30, 2016 | |||||||||||
Actual | Target | Actual | Target | |||||||||
Commingled funds - U.S. equities | 20 | % | 20 | % | 20 | % | 20 | % | ||||
Commingled funds - Non-U.S. equities | 20 | 20 | 20 | 20 | ||||||||
Commingled funds - bonds | 60 | 60 | 60 | 60 | ||||||||
Total | 100 | % | 100 | % | 100 | % | 100 | % | ||||
Assumptions
The assumptions used to determine the benefit obligations and net periodic benefit income from our defined benefit and post-retirement benefit plans are presented in the table below. The expected long-term return on assets shown in the table below represents an estimate of long-term returns on investment portfolios primarily consisting of combinations of debt, equity and other investments, depending on the plan. We consider long-term rates of return, which are weighted based on the asset classes (both historical and forecasted) in which we expect the pension and post-retirement funds to be invested. Discount rates reflect the current rate at which defined benefit and post-retirement benefit obligations could be settled based on the measurement dates of the plans, which in each case is our fiscal year end. The range of assumptions that are used for defined benefit pension plans reflects the different economic environments within various countries.
Assumptions for Benefit Obligations as of | Assumptions for Net Periodic Benefit Income Fiscal Year | |||||||||
October 29, 2017 | October 30, 2016 | 2017 | 2016 | 2015 | ||||||
Defined benefit pension plans: | ||||||||||
Discount rate | 0.50%-7.00% | 0.50%-7.00% | 0.50%-7.00% | 0.75%-7.75% | 1.00%-4.10% | |||||
Average increase in compensation levels | 2.00%-11.00% | 2.00%-9.16% | 2.00%-9.15% | 2.50%-11.72% | 2.50%-6.00% | |||||
Expected long-term return on assets | N/A | N/A | 0.25%-8.00% | 1.50%-9.00% | 1.50%-7.30% | |||||
93
Assumptions for Benefit Obligations as of | Assumptions for Net Periodic Benefit Income Fiscal Year | |||||||||
October 29, 2017 | October 30, 2016 | 2017 | 2016 | 2015 | ||||||
Post-retirement benefits plan: | ||||||||||
Discount rate | 3.40%-3.80% | 3.30%-3.90% | 3.30%-3.90% | 3.90%-4.50% | 3.80%-4.40% | |||||
Average increase in compensation levels | 3.00% | 3.50% | 3.50% | 3.50% | 3.50% | |||||
Expected long-term return on assets | N/A | N/A | 4.40% | 5.10% | 5.40% | |||||
Current health care cost trend rate | 7.00% | 7.33% | 7.33% | 7.67% | 8.00% | |||||
Ultimate health care cost trend rate | 3.50% | 3.50% | 3.50% | 3.50% | 3.50% | |||||
Health care cost trend rate decreases to ultimate trend rate in year | 2031 | 2031 | 2031 | 2031 | 2031 | |||||
Changes in the assumed health care cost trend rates could have a significant effect on the amounts reported for the U.S. post-retirement medical benefit plans. A one percentage point change in the assumed health care cost trend rates for fiscal year 2017 would have the following effects:
1% Increase | 1% Decrease | |||||||
(Dollars in millions) | ||||||||
Effect on U.S. post-retirement benefit obligation | $ | 1 | $ | (1 | ) | |||
Percentage effect on U.S. post-retirement benefit obligation | 1 | % | (1 | )% | ||||
The effect of a one percentage point increase or decrease in our health care cost trend rates on the service and interest cost components of the net periodic benefit cost would have been immaterial.
401(k) Defined Contribution Plans
Our eligible U.S. employees participate in company-sponsored 401(k) plans. Under these plans, we provide matching contributions to employees up to 6% of their eligible earnings. All matching contributions vest immediately. During fiscal years 2017, 2016 and 2015, we made contributions of $61 million, $43 million and $26 million, respectively, to the 401(k) plans.
94
8. Borrowings
As of October 29, 2017: | As of October 30, 2016: | |||||||||||||
Effective Interest Rate | Aggregate Principal Amount | Effective Interest Rate | Aggregate Principal Amount | |||||||||||
(In millions, except for percentages) | ||||||||||||||
January 2017 Senior Notes | ||||||||||||||
Fixed rate 2.375% notes due January 2020 | 2.615 | % | $ | 2,750 | $ | — | ||||||||
Fixed rate 3.000% notes due January 2022 | 3.214 | % | 3,500 | — | ||||||||||
Fixed rate 3.625% notes due January 2024 | 3.744 | % | 2,500 | — | ||||||||||
Fixed rate 3.875% notes due January 2027 | 4.018 | % | 4,800 | — | ||||||||||
13,550 | — | |||||||||||||
October 2017 Senior Notes | ||||||||||||||
Fixed rate 2.200% notes due January 2021 | 2.406 | % | 750 | — | ||||||||||
Fixed rate 2.650% notes due January 2023 | 2.781 | % | 1,000 | — | ||||||||||
Fixed rate 3.125% notes due January 2025 | 3.234 | % | 1,000 | — | ||||||||||
Fixed rate 3.500% notes due January 2028 | 3.596 | % | 1,250 | — | ||||||||||
4,000 | — | |||||||||||||
2016 Term Loans | ||||||||||||||
Term A Loan due February 2021 | — | 2.52 | % | 7,090 | ||||||||||
Term B-3 Loan due February 2023 | — | 3.84 | % | 6,578 | ||||||||||
— | 13,668 | |||||||||||||
Assumed Senior Notes | ||||||||||||||
Fixed rate 2.70% notes due November 2018 | 2.70 | % | 117 | 2.70 | % | 117 | ||||||||
Fixed rate 2.50% - 4.50% notes due August 2022 - August 2034 | 2.50% - 4.50% | 22 | 2.50% - 4.50% | 22 | ||||||||||
139 | 139 | |||||||||||||
Total principal amount outstanding | 17,689 | 13,807 | ||||||||||||
Less: Unaccreted discount and unamortized debt issuance costs | (141 | ) | (165 | ) | ||||||||||
Carrying value of debt | $ | 17,548 | $ | 13,642 | ||||||||||
Senior Notes
On January 19, 2017, we completed the issuance and sale of senior unsecured notes, or the January 2017 Senior Notes, in an aggregate principal amount of $13,550 million. We used the net proceeds, plus cash on hand, to repay all of the term loans outstanding under our guaranteed, collateralized credit agreement, or the 2016 Credit Agreement, dated February 1, 2016, in the aggregate amount of $13,555 million and to pay $127 million of related fees and expenses. Our January 2017 Senior Notes are fully and unconditionally guaranteed, jointly and severally, on an unsecured, unsubordinated basis by Broadcom and the Partnership, or Parent Guarantor, collectively the Guarantors, subject to certain release conditions described in the indenture governing the January 2017 Senior Notes. Each series of January 2017 Senior Notes pays interest semi-annually in cash in arrears on January 15 and July 15 of each year, which began on July 15, 2017.
As a result of the repayment of the outstanding term loans under the 2016 Credit Agreement, during fiscal year 2017, we wrote-off $159 million of debt issuance costs, which were included in loss on extinguishment of debt in the consolidated statements of operations.
On October 17, 2017, we completed the issuance and sale of senior unsecured notes, or the October 2017 Senior Notes, in an aggregate principal amount of $4,000 million. We used the net proceeds, plus cash on hand, to finance the acquisition of Brocade Communications Systems, Inc., or Brocade, which closed on November 17, 2017. Our October 2017 Senior Notes are fully and unconditionally guaranteed, jointly and severally, on an unsecured, unsubordinated basis by the Guarantors, subject to certain release conditions described in the indenture governing the October 2017 Senior Notes. Each series of October 2017 Senior Notes pays interest semi-annually in cash in arrears on January 15 and July 15 of each year, commencing on July 15, 2018.
95
We may redeem all or a portion of our January 2017 and October 2017 Senior Notes, collectively, the Senior Notes, at any time prior to their maturity, subject to a specified make-whole premium as set forth in the January 2017 Indenture and the October 2017 Indenture, collectively, the Indentures. In the event of a change of control triggering event, each holder of our Senior Notes will have the right to require us to purchase for cash all or a portion of their Senior Notes at a redemption price of 101% of the aggregate principal amount of such Senior Notes plus accrued and unpaid interest. The Indentures also contain covenants that restrict, among other things, the ability of Broadcom and its subsidiaries to incur certain secured debt and consummate certain sale and leaseback transactions, and the ability of BRCM and Broadcom Cayman Finance Limited, or the Subsidiary Issuers, Broadcom and the Guarantors, to merge, consolidate or sell all or substantially all of their assets. We were in compliance with all of the covenants related to the Senior Notes as of October 29, 2017.
2016 Term Loans and Amendment to 2016 Credit Agreement
In connection with the completion of the Broadcom Merger, on February 1, 2016, we entered into the 2016 Credit Agreement, which originally provided for term loans: a Term A loan facility in the aggregate principal amount of $4,400 million, or the Term A Loan, a Term B-1 dollar loan facility in the aggregate principal amount of $9,750 million, or the Term B-1 Loan, a Term B-1 euro loan facility in the aggregate principal amount of €900 million, or the Term B-1 Euro Loan, equivalent to $978 million as of February 1, 2016, and a Term B-2 loan facility in the aggregate principal amount of $500 million, or the Term B-2 Loan, and together with the Term A Loan, Term B-1 Loan, and Term B-1 Euro Loan, referred to as the 2016 Term Loans. We recognized $106 million of third-party financing costs related to the 2016 Credit Agreement in interest expense immediately in connection with a modification of debt related to a previous credit agreement which we repaid in full and terminated in connection with the 2016 Credit Agreement. We also recognized a $34 million loss on extinguishment of debt.
During fiscal year 2016, we made principal prepayments totaling $610 million on the Term B-1 Loan and fully repaid the €900 million Term B-1 Euro Loan and the $500 million Term B-2 Loan. The paydown of the Term B-2 Loan was partially funded with $325 million of additional Term A Loan borrowings. As a result, during fiscal year 2016, we wrote-off $40 million of debt issuance costs, which was included in loss on extinguishment of debt in our consolidated statements of operations.
In August 2016, we amended the 2016 Credit Agreement, or the August 2016 Amendment, and refinanced all of the outstanding Term B-1 Loans into the Term B-3 dollar loan facility in the aggregate principal amount of $6,595 million, or Term B-3 Loans, and increased the amount of outstanding Term A Loans. As a result of the August 2016 Amendment, we wrote-off $49 million of debt issuance costs, which was included in loss on extinguishment of debt.
In connection with the issuance of the October 2017 Senior Notes, we terminated the 2016 Credit Agreement.
Revolving Credit Facility
The 2016 Credit Agreement also provided for a revolving credit facility, or the 2016 Revolving Credit Facility, which was also terminated in connection with the issuance of the October 2017 Senior Notes. We wrote-off $7 million of debt issuance costs, which were included in loss on extinguishment of debt in the consolidated statements of operations. Unamortized debt issuance costs related to the 2016 Revolving Credit Facility was $9 million as of October 30, 2016, and were included in other long-term assets on the consolidated balance sheets.
Assumed Senior Notes
As a result of the Broadcom Merger, we assumed $1,614 million of BRCM’s outstanding senior unsecured notes, or the Assumed Senior Notes, at fair value on the Acquisition Date. During fiscal year 2016, we tendered for and repaid $1,475 million of the Assumed Senior Notes. We were in compliance with all of the covenants described in the indentures governing the Assumed Senior Notes as of October 29, 2017.
Fair Value of Debt
As of October 29, 2017, the estimated aggregate fair value of the Senior Notes and the Assumed Senior Notes was $17,953 million. The fair value of the Senior Notes and the Assumed Senior Notes was classified as Level 2 as we used quoted prices from less active markets.
96
Future Principal Payments of Debt
The future scheduled principal payments for the outstanding Senior Notes and Assumed Senior Notes as of October 29, 2017 were as follows:
Fiscal Year: | Future Scheduled Principal Payments | |||
(In millions) | ||||
2018 | $ | 117 | ||
2019 | — | |||
2020 | 2,750 | |||
2021 | 750 | |||
2022 | 3,509 | |||
Thereafter | 10,563 | |||
Total | $ | 17,689 | ||
9. Shareholders’ Equity
Prior to the Acquisition Date of BRCM, our shareholders’ equity reflected Avago’s outstanding ordinary shares, all of which were publicly traded on the NASDAQ stock market. As a result of the Broadcom Transaction, our ownership interest changed. Pursuant to the Avago Scheme, Broadcom issued 278 million ordinary shares to holders of Avago ordinary shares and issued 112 million ordinary shares to former BRCM shareholders pursuant to the Broadcom Merger. Consequently, the number of Broadcom ordinary shares outstanding increased from 278 million Avago ordinary shares on January 31, 2016 to 390 million Broadcom ordinary shares on February 1, 2016. Both Avago and BRCM became indirect subsidiaries of Broadcom and the Partnership, and Broadcom is the sole General Partner of the Partnership. As a result, the carrying amount of equity attributable to Broadcom was adjusted to reflect the change in our ownership interest of our subsidiaries. Additionally, Broadcom reflects a noncontrolling interest in its shareholders’ equity, which represents the interest of the holders of the Limited Partners in the Partnership, as further discussed below.
In connection with the Broadcom Merger, Broadcom also issued 23 million non-economic voting preference shares, or the Special Voting Shares, which is equal to the number of issued Partnership REUs. The Special Voting Shares were issued to a voting trustee pursuant to a voting trust agreement dated February 1, 2016, among Broadcom, the Partnership and the voting trustee, or the Voting Trust Agreement.
Noncontrolling Interest
As of both October 29, 2017 and October 30, 2016, the Limited Partners held a noncontrolling interest of approximately 5% in the Partnership through their ownership of Partnership REUs.
Broadcom adjusts the net income (loss) in its consolidated statements of operations to exclude the noncontrolling interest’s proportionate share of the results. In addition, Broadcom presents the proportionate share of equity attributable to the noncontrolling interest as a separate component of shareholders’ equity within our consolidated balance sheets and statements of shareholders’ equity.
Pursuant to the terms of the Partnership Agreement, each Partnership REU is entitled to distributions from the Partnership in an amount equal to any dividends or distributions that Broadcom declares and pays with respect to Broadcom ordinary shares. In addition, each holder of a Partnership REU is entitled to vote with respect to matters on which holders of Broadcom ordinary shares are entitled to vote by directing the voting trustee to vote one Special Voting Share for each Partnership REU they hold pursuant to the Voting Trust Agreement. On January 30, 2017, Broadcom registered 23 million ordinary shares to allow for Limited Partners to exchange their Partnership REUs pursuant to the Partnership Agreement. Effective February 1, 2017, subject to certain additional requirements and potential deferrals as set forth in the Partnership Agreement, Limited Partners have the right to require the Partnership to repurchase some or all of such Limited Partner’s Partnership REUs for consideration, as determined by Broadcom in its sole discretion, of either one Broadcom ordinary share or a cash amount as determined under the Partnership Agreement for each Partnership REU submitted for repurchase.
During fiscal year 2017, the Partnership exchanged 1 million Partnership REUs, pursuant to exchange notices. In accordance with the terms of the Partnership Agreement, the exchange notices were satisfied by exchanging these Partnership REUs for the same number of newly issued Broadcom ordinary shares valued at $86 million. The exchanges represented increases in our ownership interest in the Partnership and were accounted for as equity transactions, with no gain or loss recorded in Broadcom’s consolidated statements of operations. Pursuant to the terms of the Partnership Agreement,
97
upon the exchange of Partnership REUs, each such Partnership REU was cancelled and the Partnership issued the same number of Common Units to the General Partner concurrently with the exchange.
Conversion of Convertible Notes
During fiscal year 2015, the Convertible Notes were converted in full and the resulting conversion obligation was settled by a combination of $1 billion in cash and the issuance of 13.8 million of Avago ordinary shares.
Dividends
Broadcom paid cash dividends of $4.08, $1.94 and $1.55 per ordinary share, or an aggregate of $1,653 million, $716 million and $408 million, during fiscal years 2017, 2016 and 2015, respectively.
Equity Incentive Award Plans
Share-based incentive awards are provided to employees and directors under the terms of various Broadcom equity incentive plans.
In July 2009, our Board of Directors adopted, and our shareholders approved, the Avago Technologies Limited 2009 Equity Incentive Award Plan, or the 2009 Plan, to authorize the grant of options, share appreciation rights, RSUs, dividend equivalents, performance awards, and other share-based awards. A total of 20 million ordinary shares were initially reserved for issuance under the 2009 Plan, subject to annual increases starting in fiscal year 2012. The amount of the annual increase is equal to the least of (a) 6 million shares, (b) 3% of the ordinary shares outstanding on the last day of the immediately preceding fiscal year and (c) such smaller number of ordinary shares as determined by our Board. However, no more than 90 million ordinary shares may be issued upon the exercise of equity awards issued under the 2009 Plan. The 2009 Plan became effective on July 27, 2009.
Options issued to employees under the 2009 Plan prior to March 2011 generally expire ten years following the date of grant. Since March 2011, options issued to employees under the 2009 Plan generally expire seven years after the date of grant. Options awarded to non-employees under this plan generally expire after five years. Options issued to both employees and non-employees under the 2009 Plan generally vest over a four-year period from the date of grant and are granted with an exercise price equal to the fair market value on the date of grant. Any share options cancelled or forfeited after July 27, 2009 under the equity incentive plans adopted prior to the 2009 Plan become available for issuance under the 2009 Plan.
RSU awards granted to employees under the 2009 Plan are generally time-based and vest over four years. An RSU is an equity award that is granted with an exercise price equal to zero and which represents the right to receive one of our ordinary shares immediately upon vesting. We also grant market-based RSUs with both a service condition and a market condition as part of our equity compensation programs under the 2009 Plan. During fiscal years 2017, 2016 and 2015, we granted market-based RSUs that vest over four years, subject to satisfaction of share price contingency conditions. During fiscal year 2017, we also granted market-based RSUs under which grantees may receive the number of shares ranging from 0% to 450% of the original grant at vesting based upon the total shareholder return, or TSR, on our ordinary share as compared to the TSR of an index group of companies. The market-based RSUs generally vest over four years, subject to satisfaction of market conditions.
As of October 29, 2017, 19 million ordinary shares remained available for issuance under the 2009 Plan.
In connection with the LSI acquisition, we assumed the LSI 2003 Equity Incentive Plan, or the 2003 Plan, and outstanding unvested stock options and RSUs originally granted by LSI under the 2003 Plan that were held by continuing employees. At the time of the acquisition, these awards were converted to Avago share options and RSUs, with adjustments made to the exercise price of stock options and the number of shares subject to stock options and RSU awards so that the intrinsic value of each award was approximately the same immediately before and immediately after the adjustment. These unvested options and RSUs will vest in accordance with their original terms, generally vesting in equal annual installments over a four-year period from the original grant date and expire seven years after the grant date. Under the 2003 Plan, we may grant to former employees of LSI and other employees who were not employees of Avago at the time of the acquisition restricted stock awards, RSUs, share options and share appreciation rights with an exercise price that is no less than the fair market value on the date of grant. No participant may be granted share options covering more than four million shares or more than an aggregate of one million shares of restricted stock and RSUs in any fiscal year. Equity awards granted under the 2003 Plan following the LSI acquisition are expected to be on similar terms and consistent with similar grants made pursuant to the 2009 Plan. As of October 29, 2017, four million ordinary shares remained available for issuance under the 2003 Plan.
In connection with the Broadcom Merger, we assumed the BRCM 2012 Stock Incentive Plan, or the 2012 Plan, and outstanding unvested RSUs originally granted by BRCM under the 2012 Plan that were held by continuing employees. At the time of the acquisition, these awards were converted to Broadcom RSUs, with adjustments made to the number of shares subject to RSU awards so that the intrinsic value of each award was approximately the same immediately before and immediately after the adjustment. These unvested RSUs will vest in accordance with their original terms, generally vesting in equal quarterly installments over a four-year period from the original grant date. Under the 2012 Plan, we may grant to former
98
employees of BRCM and other employees who were not employees of Avago at the time of the acquisition restricted stock awards, RSUs, share options and share appreciation rights with an exercise price that is no less than the fair market value on the date of grant. No participant may be granted share options, restricted stock or RSUs, covering more than an aggregate of four million shares in any fiscal year. Equity awards granted under the 2012 Plan following the Broadcom Merger are expected to be on similar terms and consistent with similar grants made pursuant to the 2009 Plan. As of October 29, 2017, 82 million ordinary shares remained available for issuance under the 2012 Plan. The number of shares available for issuance under the 2012 Plan is subject to an annual increase of 12 million shares.
The ESPP provides eligible employees with the opportunity to acquire an ownership interest in us through periodic payroll deductions, based on a 6-month look-back period, at a price equal to the lesser of 85% of the fair market value of the ordinary shares at either the beginning or ending of the relevant offering period. The ESPP is structured as a qualified employee stock purchase plan under Section 423 of the Internal Revenue Code of 1986. However, the ESPP is not intended to be a qualified pension, profit sharing or stock bonus plan under Section 401(a) of the Internal Revenue Code of 1986 and is not subject to the provisions of Employee Retirement Income Security Act of 1974. The ESPP will terminate on July 27, 2019 unless sooner terminated.
Share-Based Compensation Expense
Fiscal Year | ||||||||||||
2017 | 2016 | 2015 | ||||||||||
(In millions) | ||||||||||||
Cost of products sold | $ | 64 | $ | 48 | $ | 26 | ||||||
Research and development | 636 | 430 | 107 | |||||||||
Selling, general and administrative | 220 | 186 | 99 | |||||||||
Total share-based compensation expense (a) | $ | 920 | $ | 664 | $ | 232 | ||||||
_________________________________
(a) | Does not include $1 million and $15 million of share-based compensation related to discontinued operations recognized during fiscal years 2017 and 2016, respectively, which was included in loss from discontinued operations, net of income taxes in our consolidated statements of operations. |
In connection with the Broadcom Merger, we assumed RSUs originally granted by BRCM. Share-based compensation expense reported in continuing operations in fiscal years 2017 and 2016 included $179 million and $222 million, respectively, related to the assumed BRCM RSUs.
We have assumed an annualized forfeiture rate for RSUs of 5% in each of fiscal years 2017 and 2016 and 3% in fiscal year 2015. We will recognize additional expense if actual forfeitures are lower than we estimated, and will recognize a benefit if actual forfeitures are higher than we estimated.
The income tax benefits for share-based compensation expense were $273 million, $89 million and $130 million for fiscal years 2017, 2016 and 2015, respectively.
The following table summarizes the weighted-average assumptions utilized to calculate the fair value of market-based awards granted in the periods presented:
Market-Based Awards | |||||||||
Fiscal Year | |||||||||
2017 | 2016 | 2015 | |||||||
Risk-free interest rate | 1.7 | % | 1.2 | % | 1.4 | % | |||
Dividend yield | 1.8 | % | 1.3 | % | 1.2 | % | |||
Volatility | 32.3 | % | 35.0 | % | 36.3 | % | |||
Expected term (in years) | 4.0 | 3.8 | 4.4 | ||||||
The risk-free interest rate was derived from the average U.S. Treasury Strips rate during the period, which approximated the rate in effect at the time of grant.
The dividend yield was based on the historical and expected dividend payouts as of the respective award grant dates.
The expected volatility was based on Broadcom's own historical share price volatility over the period commensurate with the expected life of the awards and the implied volatility from its own traded ordinary shares with a term of 180 days measured at a specific date.
99
The expected term of market-based RSUs valued using Monte Carlo simulation techniques was commensurate with the awards’ contractual terms.
Restricted Stock Unit Awards
A summary of time- and market-based RSU activity is as follows:
Number of Shares Outstanding | Weighted-Average Grant Date Fair Value Per Share | ||||||
(In millions, except per share data) | |||||||
Balance as of November 2, 2014 | 4 | $ | 48.82 | ||||
Granted | 3 | $ | 119.30 | ||||
Vested | (1 | ) | $ | 57.29 | |||
Forfeited | (1 | ) | $ | 79.51 | |||
Balance as of November 1, 2015 | 5 | $ | 95.17 | ||||
Assumed in Broadcom Merger | 6 | $ | 135.58 | ||||
Granted | 12 | $ | 138.45 | ||||
Vested | (4 | ) | $ | 114.49 | |||
Forfeited | (2 | ) | $ | 130.30 | |||
Balance as of October 30, 2016 | 17 | $ | 130.71 | ||||
Granted | 8 | $ | 199.33 | ||||
Vested | (5 | ) | $ | 126.81 | |||
Forfeited | (2 | ) | $ | 142.78 | |||
Balance as of October 29, 2017 | 18 | $ | 163.42 | ||||
The aggregate fair value of time- and market-based RSUs that vested in fiscal years 2017, 2016 and 2015 was $1,172 million, $590 million and $179 million, respectively. As of October 29, 2017, the total unrecognized compensation cost related to unvested RSUs was $2,134 million, which is expected to be recognized over the remaining weighted-average service period of 3.0 years.
Share Option Awards
A summary of time- and market-based share option activity is as follows:
Number of Shares Outstanding | Weighted- Average Exercise Price Per Share | Weighted- Average Remaining Contractual Life (In years) | Aggregate Intrinsic Value | ||||||||||
(In millions, except years and per share data) | |||||||||||||
Balance as of November 2, 2014 | 29 | $ | 44.97 | ||||||||||
Granted | 1 | $ | 95.97 | ||||||||||
Exercised | (7 | ) | $ | 34.40 | $ | 571 | |||||||
Cancelled | (2 | ) | $ | 65.32 | |||||||||
Balance as of November 1, 2015 | 21 | $ | 47.92 | ||||||||||
Exercised | (5 | ) | $ | 44.35 | $ | 579 | |||||||
Cancelled | (1 | ) | $ | 53.56 | |||||||||
Balance as of October 30, 2016 | 15 | $ | 48.77 | ||||||||||
Exercised | (4 | ) | $ | 45.48 | $ | 682 | |||||||
Cancelled | (1 | ) | $ | 66.08 | |||||||||
Balance as of October 29, 2017 | 10 | $ | 49.54 | 2.85 | $ | 2,112 | |||||||
Fully vested as of October 29, 2017 | 9 | $ | 46.49 | 2.75 | $ | 1,847 | |||||||
Fully vested and expected to vest as of October 29, 2017 | 10 | $ | 49.54 | 2.85 | $ | 2,112 | |||||||
As of October 29, 2017, the total unrecognized compensation cost related to unvested time- and market-based share options was $17 million, which is expected to be recognized over the remaining weighted-average service period of 0.7 years.
100
Employee Share Purchase Plan
In fiscal years 2017, 2016 and 2015, under the ESPP, employees purchased 0.5 million, 0.4 million and 0.2 million ordinary shares for $78 million, $51 million and $15 million, respectively. As of October 29, 2017, the total unrecognized compensation cost related to the ESPP purchase rights was $12 million, which is expected to be recognized over the remaining four months of the current offering period under the ESPP.
10. Partners’ Capital
The partners' capital balance as of November 1, 2015 represented, and was equivalent to, the historical shareholders' equity balance of Avago. At the time of executing the Avago Scheme on February 1, 2016, the historical shareholders' equity balance of Avago belonged, and continues to belong, to Broadcom, as sole General Partner of the Partnership.
Pursuant to the terms of the Partnership Agreement, Broadcom, as the holder of the Common Units, is entitled to receive distributions from the Partnership in an amount equal to the aggregate dividends payable by Broadcom to the holders of Broadcom ordinary shares, and the Limited Partners, as holders of the Partnership REUs, are entitled to receive distributions from the Partnership in an amount per unit equal to the dividend payable by Broadcom per ordinary share. Additionally, if Broadcom proposes to redeem, repurchase, or otherwise acquire any Broadcom ordinary shares, the Partnership Agreement requires that the Partnership, immediately prior to such redemption, repurchase or acquisition, make a distribution to Broadcom on the Common Units in an amount sufficient for Broadcom to fund such redemption, repurchase or acquisition, as the case may be. Each Limited Partner is entitled to vote with respect to matters on which holders of Broadcom ordinary shares are entitled to vote by directing the voting trustee to vote one Special Voting Share for each Partnership REU held pursuant to the Voting Trust Agreement.
Effective February 1, 2017, subject to certain additional requirements and potential deferrals as set forth in the Partnership Agreement, Limited Partners have the right to require the Partnership to repurchase some or all of such Limited Partner’s Partnership REUs for consideration, as determined by Broadcom in its sole discretion, of either one Broadcom ordinary share or a cash amount as determined under the Partnership Agreement for each Partnership REU submitted for repurchase.
During fiscal year 2017, the Partnership exchanged 1 million Partnership REUs, pursuant to exchange notices. In accordance with the terms of the Partnership Agreement, the exchange notices were satisfied by exchanging these Partnership REUs for the same number of newly issued Broadcom ordinary shares valued at $86 million. The issuance of shares were accounted for as a capital contribution by Broadcom to the Partnership. The exchanges of Partnership REUs were recorded as increases to the Common Units balance and reductions to the Partnership REUs balance within the partners’ capital of the Partnership’s consolidated balance sheet and statement of partners’ capital. Pursuant to the terms of the Partnership Agreement, upon the exchange of Partnership REUs, each such Partnership REU was cancelled and the Partnership issued the same number of Common Units to the General Partner concurrently with the exchange.
Share-Based Compensation Expense
Share-based incentive awards are provided to employees and Broadcom’s non-employee directors under the terms of various Broadcom equity incentive plans. Refer to Note 9. “Shareholders’ Equity” for further details.
Capital Transactions with General Partner
During fiscal years 2017 and 2016, the Partnership had capital transactions with the General Partner of $257 million and $405 million, respectively, which consisted of capital contributions made by the General Partner to the Partnership. For fiscal year 2016, the capital transactions also included RSUs originally granted by BRCM that were assumed by Broadcom in connection with the Broadcom Merger.
Distributions
The following table summarizes distributions made by the Partnership for the periods presented.
Fiscal Year | ||||||||
2017 | 2016 | |||||||
(In millions, except per Partnership REU) | ||||||||
Cash distributions paid to General Partner | $ | 1,756 | $ | 594 | ||||
Cash distributions paid per Partnership REU | $ | 4.08 | $ | 1.50 | ||||
Cash distributions paid to Limited Partners | $ | 92 | $ | 34 | ||||
During fiscal year 2017, these distributions included a $103 million distribution to Broadcom, as General Partner, for reimbursement of expenses the General Partner incurred on behalf of the Partnership and its subsidiaries.
101
11. Income Taxes
Components of Income (Loss) from Continuing Operations Before Income Taxes
Since we are incorporated in Singapore, domestic income reflects the results of operations based in Singapore. The following table presents the components of income (loss) from continuing operations before income taxes for financial reporting purposes:
Fiscal Year | ||||||||||||
2017 | 2016 | 2015 | ||||||||||
(In millions) | ||||||||||||
Domestic income | $ | 2,102 | $ | 1,365 | $ | 1,580 | ||||||
Foreign loss | (277 | ) | (2,472 | ) | (113 | ) | ||||||
Income (loss) from continuing operations before income taxes | $ | 1,825 | $ | (1,107 | ) | $ | 1,467 | |||||
Components of Provision for Income Taxes
We have obtained several tax incentives from the Singapore Economic Development Board, an agency of the Government of Singapore, which provide that qualifying income we earn in Singapore are subject to tax holidays or reduced rates of Singapore income tax. Each such tax incentive is separate and distinct from the others, and may be granted, withheld, extended, modified, truncated, complied with or terminated independently without any effect on the other incentives. Subject to our compliance with the conditions specified in these incentives and legislative developments, the Singapore tax incentives are presently expected to expire at various dates generally between 2020 and 2021, subject in certain cases to potential extensions, which we may or may not be able to obtain.
We also have tax incentives on our qualifying income in Malaysia, which are scheduled to expire between2018 and 2028. The tax incentives that we have negotiated in Malaysia are also subject to our compliance with various operating and other conditions. If we cannot, or elect not to, comply with the conditions specified in these incentives, we will lose the related tax benefits and we could be required to refund previously realized material tax benefits.
The effect of all these tax incentives, in the aggregate, was to reduce the overall provision for income taxes by approximately $237 million, $169 million and $207 million, for fiscal years 2017, 2016 and 2015, respectively, increase diluted net income per share by $0.56 and $0.74 for fiscal years 2017 and 2015, respectively, and reduce diluted net loss per share by $0.44 for fiscal year 2016.
Significant components of the provision for income taxes are as follows:
Fiscal Year | ||||||||||||
2017 | 2016 | 2015 | ||||||||||
(In millions) | ||||||||||||
Current tax expense: | ||||||||||||
Domestic | $ | 112 | $ | 59 | $ | 59 | ||||||
Foreign | 158 | 165 | 237 | |||||||||
270 | 224 | 296 | ||||||||||
Deferred tax expense (benefit): | ||||||||||||
Domestic | (1 | ) | 9 | 4 | ||||||||
Foreign | (234 | ) | 409 | (224 | ) | |||||||
(235 | ) | 418 | (220 | ) | ||||||||
Total provision for income taxes | $ | 35 | $ | 642 | $ | 76 | ||||||
The provision for income taxes in fiscal year 2017 was primarily due to an increase in profit before tax and a discrete expense of $76 million resulting from entity reorganizations partially offset by the recognition of $273 million of excess tax benefits from share-based awards that vested or were exercised during fiscal year 2017 and, to a lesser extent, the recognition of previously unrecognized tax benefits primarily as a result of audit settlements.
The income tax provision for the fiscal year 2016 was primarily the result of an increase in tax associated with our undistributed earnings, partially offset by income tax benefits from losses from continuing operations and the recognition of previously unrecognized tax benefits as a result of audit settlements.
102
Rate Reconciliation
Fiscal Year | |||||||||
2017 | 2016 | 2015 | |||||||
Statutory tax rate in Singapore | 17.0 | % | 17.0 | % | 17.0 | % | |||
Foreign income taxed at different rates | (0.8 | ) | (89.7 | ) | 1.8 | ||||
Tax holidays and concessions | (13.0 | ) | 15.3 | (14.1 | ) | ||||
Other, net | (1.3 | ) | (0.6 | ) | 0.2 | ||||
Valuation allowance | — | — | 0.3 | ||||||
Actual tax rate on income (loss) before income taxes | 1.9 | % | (58.0 | )% | 5.2 | % | |||
Summary of Deferred Income Taxes
October 29, 2017 | October 30, 2016 | |||||||
(In millions) | ||||||||
Deferred income tax assets: | ||||||||
Depreciation and amortization | $ | 8 | $ | 15 | ||||
Inventory | 6 | 6 | ||||||
Trade accounts | 22 | 6 | ||||||
Employee benefits | 145 | 216 | ||||||
Employee share awards | 180 | 90 | ||||||
Net operating loss carryovers and credit carryovers | 2,356 | 1,773 | ||||||
Other deferred income tax assets | 42 | 172 | ||||||
Gross deferred income tax assets | 2,759 | 2,278 | ||||||
Less valuation allowance | (1,447 | ) | (1,003 | ) | ||||
Deferred income tax assets | 1,312 | 1,275 | ||||||
Deferred income tax liabilities: | ||||||||
Depreciation and amortization | 96 | 263 | ||||||
Other deferred income tax liabilities | 12 | 37 | ||||||
Foreign earnings not indefinitely reinvested | 11,202 | 10,954 | ||||||
Deferred income tax liabilities | 11,310 | 11,254 | ||||||
Net deferred income tax liabilities | $ | (9,998 | ) | $ | (9,979 | ) | ||
Deferred income taxes reflect the net effects of temporary differences between the carrying amounts of assets and liabilities for financial reporting purposes and their basis for income tax purposes and the tax effects of net operating losses and tax credit carryforwards.
The following table presents net deferred income tax assets (liabilities) as reflected on the consolidated balance sheets:
October 29, 2017 | October 30, 2016 | |||||||
(In millions) | ||||||||
Other long-term assets | $ | 21 | $ | 308 | ||||
Other long-term liabilities | (10,019 | ) | (10,287 | ) | ||||
Net long-term income tax liabilities | $ | (9,998 | ) | $ | (9,979 | ) | ||
The increase in the valuation allowance from $1,003 million in fiscal year 2016 to $1,447 million in fiscal year 2017 was primarily due to foreign losses not expected to be realized.
As of October 29, 2017, we had U.S. federal net operating loss carryforwards of $575 million, U.S. state net operating loss carryforwards of $3,067 million and other foreign net operating loss carryforwards of $1,702 million. U.S. federal and state net operating loss carryforwards begin to expire in fiscal year 2018. The other foreign net operating losses expire in
103
various fiscal years beginning 2018. As of October 29, 2017, we had $1,494 million and $1,212 million of U.S. federal and state research and development tax credits, respectively, which if not utilized, begin to expire in fiscal year 2018.
The U.S. Tax Reform Act of 1986 limits the use of net operating loss and tax credit carryforwards in the case of an “ownership change” of a corporation or separate return loss year limitations. Any ownership changes, as defined, may restrict utilization of carryforwards. As of October 29, 2017, we had approximately $575 million and $1,222 million of federal net operating loss and tax credit carryforwards, respectively, in the U.S. subject to an annual limitation. We do not expect these limitations to result in any permanent loss of our tax benefits.
During fiscal year 2017, we early adopted an accounting standards update issued by the FASB that simplifies the accounting for certain aspects of stock-based payments to employees. As a result of adoption, we recognized a tax benefit of $273 million as a discrete item for fiscal year 2017, a $47 million cumulative-effect adjustment to reduce our accumulated deficit and a $3 million cumulative-effect adjustment to increase our noncontrolling interest for previously unrecognized excess tax benefits as of October 30, 2016.
Uncertain Tax Positions
Gross unrecognized tax benefits increased by $273 million during fiscal year 2017, resulting in gross unrecognized tax benefits of $2,256 million as of October 29, 2017. The increase in gross unrecognized tax benefits was primarily a result of restructuring activities in fiscal year 2017. During fiscal year 2017, we recognized $121 million of previously unrecognized tax benefits as a result of the audit settlement with taxing authorities, and $12 million as a result of the expiration of the statute of limitations for certain audit periods. During fiscal year 2016, gross unrecognized tax benefits increased by $1,454 million resulting from the Broadcom Merger.
We recognize interest and penalties related to unrecognized tax benefits within provision for income taxes in the accompanying consolidated statements of operations. We recognized approximately $30 million of expense related to interest and penalties in fiscal year 2017. Accrued interest and penalties were included within other long-term liabilities on the consolidated balance sheets. As of October 29, 2017 and October 30, 2016, the combined amount of cumulative accrued interest and penalties was approximately $132 million and $102 million, respectively. The increase in cumulative accrued interest and penalties was primarily a result of an increase in interest accrual from various unrecognized tax benefit items .
The following table reconciles the beginning and ending balance of gross unrecognized tax benefits:
Fiscal Year | ||||||||||||
2017 | 2016 | 2015 | ||||||||||
(In millions) | ||||||||||||
Beginning balance | $ | 1,983 | $ | 578 | $ | 487 | ||||||
Lapse of statute of limitations | (12 | ) | (8 | ) | (10 | ) | ||||||
Increases in balances related to tax positions taken during prior periods (including those related to acquisitions made during the year) | 47 | 1,325 | 94 | |||||||||
Decreases in balances related to tax positions taken during prior periods | (32 | ) | (1 | ) | (40 | ) | ||||||
Increases in balances related to tax positions taken during current period | 391 | 138 | 47 | |||||||||
Decreases in balances related to settlement with taxing authorities | (121 | ) | (49 | ) | — | |||||||
Ending balance | $ | 2,256 | $ | 1,983 | $ | 578 | ||||||
A portion of our unrecognized tax benefits will affect our effective tax rate if they are recognized upon favorable resolution of the uncertain tax positions. As of October 29, 2017, approximately $2,388 million of the unrecognized tax benefits including accrued interest and penalties would affect our effective tax rate. As of October 30, 2016, approximately $2,085 million of the unrecognized tax benefits including accrued interest and penalties would have affected our effective tax rate.
We are subject to Singapore income tax examination for fiscal years 2012 and later. Certain of our acquired companies are subject to tax examinations in major jurisdictions outside Singapore for fiscal years 2010 and later. It is possible that we may recognize up to $8 million of our existing unrecognized tax benefits within the next 12 months as a result of lapses of statute of limitations for certain audit periods.
12. Segment Information
Reportable Segments
We have four reportable segments: wired infrastructure, wireless communications, enterprise storage and industrial &
104
other. These segments align with our principal target markets. The segments represent components for which separate financial information is available that is utilized on a regular basis by the Chief Executive Officer of Broadcom, who has been identified as the Chief Operating Decision Maker, or the CODM, as defined by authoritative guidance on segment reporting, in determining how to allocate resources and evaluate performance. The segments are determined based on several factors, including client base, homogeneity of products, technology, delivery channels and similar economic characteristics.
Wired Infrastructure. We provide semiconductor solutions for enabling all types of set-top boxes and the digital subscriber line, or DSL, cable and fiber broadband access markets. We also provide a wide variety of semiconductor solutions which manage the movement of data in data center, telecommunication, enterprise and Small-and-Medium size Business/Remote-Office-Branch-Office, or SMB/ROBO networking applications. We offer complete system-on-chip, or SoC, platform solutions for cable, satellite, Internet Protocol, over-the-top and terrestrial STBs and SoC platform solutions for DSL, cable and fiber for both central office deployments and consumer premise equipment and routing products that are optimized for data center implementations, service provider networks, enterprise, and SMB/ROBO. We offer a broad set of standard Ethernet switching technology to deliver SoCs for high performance compute applications, we supply high speed Serializer/Deserializer technology integrated into application specific integrated circuits, or ASICs. In addition we provide physical layer devices which are transceivers that enable the reception and transmission of Ethernet data packets over a physical medium such as copper wire or optical fibers. We also supply optical laser and receiver components to the storage, Ethernet networking, access, metro and long-haul telecommunication markets.
Wireless Communications. We support the wireless communications industry with a broad variety of radio frequency, or RF, semiconductor devices that amplify, as well as selectively filter, RF signals. In addition to RF devices, we provide a variety of optoelectronic sensors for mobile handset applications. We also provide connectivity solutions that include discrete and integrated Wi-Fi and Bluetooth solutions, location controllers and touch controllers.
Enterprise Storage. Our enterprise storage products enable secure movement of digital data to and from host machines such as servers, personal computers and storage systems to the underlying storage devices such as hard disk drives, or HDDs and solid state drives, or SSDs. We provide read channel-based SoCs and preamplifiers to HDD original equipment manufacturers, or OEMs. In addition, we sell preamplifiers, which are used to amplify the initial signal to and from the drive disk heads so the signal can be processed by the read channel. We provide custom flash controllers to SSD OEMs, and Serial attached small computer system interface and Redundant Array of Independent Disks controller and adapter solutions to server and storage system OEMs. We provide Fibre Channel Host Bus Adapters, which connect host computers such as servers to Fibre Channel Storage Area Networks, or FC SANs. FC SANs are networks dedicated to storage traffic and enable simultaneous high speed and secure connections among multiple host computers and multiple storage arrays. We also provide interconnect semiconductors that support the Peripheral Component Interconnect Express communication standards.
Industrial & Other. We provide a broad variety of products for the general industrial and automotive markets. We offer optical isolators, or optocouplers, which provide electrical insulation and signal isolation. For industrial motors and robotic motion control, we supply optical encoders, as well as integrated circuits for the controller and decoder functions. For electronic signs and signals, we supply Light Emitting Diode assemblies that offer high brightness and stable light output over thousands of hours, enabling us to support traffic signals, large commercial signs and other displays. For industrial networking, we provide faster optical transceivers using plastic optical fiber that enable quick and interoperable networking and factory automation.
Our CODM assesses the performance of each segment and allocates resources to those segments based on net revenue and operating results and does not evaluate operating segments using discrete asset information. Operating results by segment include items that are directly attributable to each segment. Operating results by segment also include shared expenses from global operations, including manufacturing support, logistics and quality control, in addition to expenses associated with selling and general administrative activities for the business, which are allocated primarily based on revenue, while facilities expenses are primarily allocated based on site-specific headcount.
Unallocated Expenses
Unallocated expenses include amortization of acquisition-related intangible assets, share-based compensation expense, restructuring, impairment and disposal charges, acquisition-related costs, including charges related to inventory step-up to fair value, litigation settlement charges, and other costs, which are not used in evaluating the results of, or in allocating resources to, our segments. Acquisition-related costs also include transaction costs and any costs directly related to the acquisition and integration of acquired businesses.
Depreciation expense directly attributable to each reportable segment is included in operating results for each segment. However, the CODM does not evaluate depreciation expense by operating segment and, therefore, it is not separately presented. There was no inter-segment revenue. The accounting policies of the segments are the same as those described in the summary of significant accounting policies.
105
Fiscal Year | ||||||||||||
2017 | 2016 | 2015 | ||||||||||
(In millions) | ||||||||||||
Net revenue: | ||||||||||||
Wired infrastructure | $ | 8,549 | $ | 6,582 | $ | 1,479 | ||||||
Wireless communications | 5,404 | 3,724 | 2,536 | |||||||||
Enterprise storage | 2,799 | 2,291 | 2,180 | |||||||||
Industrial & other | 884 | 643 | 629 | |||||||||
Total net revenue | $ | 17,636 | $ | 13,240 | $ | 6,824 | ||||||
Operating income (loss): | ||||||||||||
Wired infrastructure | $ | 3,853 | $ | 2,664 | $ | 478 | ||||||
Wireless communications | 2,155 | 1,282 | 1,202 | |||||||||
Enterprise storage | 1,527 | 995 | 855 | |||||||||
Industrial & other | 447 | 327 | 310 | |||||||||
Unallocated expenses | (5,599 | ) | (5,677 | ) | (1,213 | ) | ||||||
Total operating income (loss) | $ | 2,383 | $ | (409 | ) | $ | 1,632 | |||||
The following tables present net revenue and long-lived asset information based on geographic region. Net revenue is based on the geographic location of the distributors, OEMs or contract manufacturers who purchased our products, which may differ from the geographic location of the end customers. Long-lived assets include property, plant and equipment and are based on the physical location of the assets.
Fiscal Year | ||||||||||||
2017 | 2016 | 2015 | ||||||||||
(In millions) | ||||||||||||
Net revenue: | ||||||||||||
China | $ | 9,460 | $ | 7,184 | $ | 3,675 | ||||||
United States | 1,266 | 1,124 | 755 | |||||||||
Singapore | 323 | 250 | 208 | |||||||||
Other | 6,587 | 4,682 | 2,186 | |||||||||
$ | 17,636 | $ | 13,240 | $ | 6,824 | |||||||
October 29, 2017 | October 30, 2016 | |||||||
(In millions) | ||||||||
Long-lived assets: | ||||||||
United States | $ | 1,822 | $ | 1,917 | ||||
Taiwan | 268 | 186 | ||||||
Singapore | 79 | 78 | ||||||
Other | 430 | 328 | ||||||
$ | 2,599 | $ | 2,509 | |||||
Significant Customer Information
We sell our products through our direct sales force and a select network of distributors globally. One direct customer accounted for 17% and 18% of our net accounts receivable balance at October 29, 2017 and October 30, 2016, respectively. During fiscal years 2017 and 2016, one direct customer represented 14% of our net revenue in each period. The majority of the revenue from this customer was included in our wireless communications and wired infrastructure segments. This customer is a contract manufacturer for a number of OEMs.
106
13. Related Party Transactions
Silicon Manufacturing Partners Pte. Ltd.
We have a 51% equity interest in Silicon Manufacturing Partners Pte. Ltd., or SMP, a joint venture with GlobalFoundries. We have a take-or-pay agreement with SMP under which we have agreed to purchase 51% of the managed wafer capacity from SMP’s integrated circuit manufacturing facility and GlobalFoundries has agreed to purchase the remaining managed wafer capacity. SMP determines its managed wafer capacity each year based on forecasts provided by us and GlobalFoundries. If we fail to purchase our required commitments, we will be required to pay SMP for the fixed costs associated with the unpurchased wafers. GlobalFoundries is similarly obligated with respect to the wafers allotted to it. The agreement may be terminated by either party upon two years written notice. The agreement may also be terminated for material breach, bankruptcy or insolvency. We purchased $59 million, $41 million and $60 million of inventory from SMP for fiscal years 2017, 2016 and 2015, respectively. As of October 29, 2017, the amount payable to SMP was $7 million.
During fiscal years 2017, 2016 or 2015, in the ordinary course of business, we purchased from, or sold to, several entities, for which one of our directors also serves or served as a director or entities that are otherwise affiliated with one of our directors.
Fiscal Year | ||||||||||||
2017 | 2016 | 2015 | ||||||||||
(In millions) | ||||||||||||
Total net revenue | $ | 346 | $ | 335 | $ | 183 | ||||||
Total costs and expenses including inventory purchases | $ | 145 | $ | 81 | $ | 80 | ||||||
October 29, 2017 | October 30, 2016 | |||||||
(In millions) | ||||||||
Total receivables | $ | 31 | $ | 15 | ||||
Total payables | $ | 12 | $ | 7 | ||||
14. Commitments and Contingencies
Commitments
The following table summarizes contractual obligations and commitments as of October 29, 2017:
Fiscal Year | ||||||||||||||||||||||||||||
Total | 2018 | 2019 | 2020 | 2021 | 2022 | Thereafter | ||||||||||||||||||||||
(In millions) | ||||||||||||||||||||||||||||
Debt principal and interest | $ | 21,560 | $ | 657 | $ | 566 | $ | 3,283 | $ | 1,242 | $ | 3,940 | $ | 11,872 | ||||||||||||||
Purchase commitments | 909 | 841 | 68 | — | — | — | — | |||||||||||||||||||||
Other contractual commitments | 272 | 111 | 94 | 60 | 7 | — | — | |||||||||||||||||||||
Operating lease obligations | 745 | 119 | 75 | 51 | 42 | 37 | 421 | |||||||||||||||||||||
Capital lease obligations | 21 | 21 | — | — | — | — | — | |||||||||||||||||||||
Pension plan contributions | 118 | 118 | — | — | — | — | — | |||||||||||||||||||||
Total | $ | 23,625 | $ | 1,867 | $ | 803 | $ | 3,394 | $ | 1,291 | $ | 3,977 | $ | 12,293 | ||||||||||||||
Debt Principal and Interest. Represents principal and interest on borrowings under the Senior Notes and Assumed Senior Notes.
Purchase Commitments. Represents unconditional purchase obligations that include agreements to purchase goods or services, primarily inventory, that are enforceable and legally binding on us and that specify all significant terms, including fixed or minimum quantities to be purchased, fixed, minimum or variable price provisions, and the approximate timing of the transaction. Purchase obligations exclude agreements that are cancelable without penalty. Cancellation for outstanding purchase orders for capital expenditures in connection with internal fabrication facility expansion and construction of our new campuses is generally allowed but requires payment of all costs incurred through the date of cancellation and, therefore, cancelable purchase orders for these capital expenditures are included in the table above.
107
Other Contractual Commitments. Represents amounts payable pursuant to agreements related to information technology, or IT, human resources, financial infrastructure outsourcing services and other service agreements.
Operating Lease Obligations. Represents real property and equipment leased from third parties under non-cancelable operating leases. Rent expense was $253 million, $229 million and $77 million for fiscal years 2017, 2016 and 2015, respectively.
Capital Lease Obligations. Represents equipment leased from third parties under non-cancelable capital leases.
Pension Plan Contributions. Represents our planned contributions to our pension plans. Although additional future contributions will be required, the amount and timing of these contributions will be affected by actuarial assumptions, the actual rate of returns on plan assets, the level of market interest rates, legislative changes and the amount of voluntary contributions to the plans. The amount shown in the table represents our planned contributions to our pension plans within a year. Because any contributions for fiscal year 2019 and later will depend on the value of the plan assets in the future and thus are uncertain, we have not included any amounts for fiscal year 2019 and beyond in the above table.
Due to the inherent uncertainty with respect to the timing of future cash outflows associated with our unrecognized tax benefits at October 29, 2017, we are unable to reliably estimate the timing of cash settlement with the respective taxing authority. Therefore, $1,011 million of unrecognized tax benefits and accrued interest classified within other long-term liabilities on our consolidated balance sheet as of October 29, 2017 have been excluded from the contractual obligations table above.
Standby Letters of Credit
As of both October 29, 2017 and October 30, 2016, we had outstanding obligations relating to standby letters of credit of $12 million. Standby letters of credit are financial guarantees provided by third parties for leases, customs, taxes and certain self-insured risks. If the guarantees are called, we must reimburse the provider of the guarantees. The fair values of the letters of credit approximate the contract amounts. The standby letters of credit generally renew annually.
Contingencies
From time to time, we are involved in litigation that we believe is of the type common to companies engaged in our line of business, including commercial disputes, employment issues and disputes involving claims by third parties that our activities infringe their patent, copyright, trademark or other intellectual property rights. Legal proceedings are often complex, may require the expenditure of significant funds and other resources, and the outcome of litigation is inherently uncertain, with material adverse outcomes possible. Intellectual property claims generally involve the demand by a third-party that we cease the manufacture, use or sale of the allegedly infringing products, processes or technologies and/or pay substantial damages or royalties for past, present and future use of the allegedly infringing intellectual property. Claims that our products or processes infringe or misappropriate any third-party intellectual property rights (including claims arising through our contractual indemnification of our customers) often involve highly complex, technical issues, the outcome of which is inherently uncertain. Moreover, from time to time we pursue litigation to assert our intellectual property rights. Regardless of the merit or resolution of any such litigation, complex intellectual property litigation is generally costly and diverts the efforts and attention of our management and technical personnel.
Lawsuits Relating to the Acquisition of Brocade Communications Systems, Inc.
On December 13, 2016, December 15, 2016, December 21, 2016, January 5, 2017 and January 18, 2017, six putative class action complaints were filed in the United States District Court for the Northern District of California, or the U.S. Northern District Court, captioned Steinberg v. Brocade Communications Systems, Inc., et al., No. 3:16-cv-7081-EMC, Gross v. Brocade Communications Systems, Inc., et al., No. 3:16-cv-7173-EJD, Jha v. Brocade Communications Systems, Inc., et al., No. 3:16-cv-7270-HRL, Bragan v. Brocade Communications Systems, Inc., et al., No. 3:16-cv-7271-JSD, Chuakay v. Brocade Communications Systems, Inc., et al., No. 3:17-cv-0058-PJH, and Mathew v. Brocade Communications Systems, Inc., et al., No. 3:16-cv-7271-HSG, respectively. The Steinberg, Bragan and Mathew complaints name as defendants Brocade Communications Systems Inc., or Brocade, the members of Brocade’s board of directors, Broadcom, BRCM, and Merger Sub. The Gross, Jha and Chuakay complaints name as defendants Brocade and the members of Brocade’s board of directors. All of the complaints assert claims under Sections 14(a) and 20(a) of the Securities Exchange Act of 1934, as amended, or the Exchange Act, and Rule 14a-9 promulgated thereunder. The complaints allege, among other things, that the board of directors of Brocade failed to provide material information and/or omitted material information from the Preliminary Proxy Statement filed with the SEC on December 6, 2016 by Brocade. The complaints seek to enjoin the closing of the transaction between Brocade and Broadcom, as well as certain other equitable and declaratory relief and attorneys’ fees and costs. On January 10, 2017, January 27, 2017 and February 15, 2017, the U.S. Northern District Court granted motions to relate the cases, all of which are now related to the Steinberg action and before the Honorable Judge Edward Chen. On January 11, 2017, Plaintiff Jha filed a motion for a preliminary injunction, which was subsequently withdrawn on January 18, 2017. On February 6, 2017, Plaintiff
108
Gross voluntarily dismissed the Gross action without prejudice, which was ordered by the U.S. Northern District Court on February 15, 2017. On April 14, 2017, the U.S. Northern District Court granted the Motion for Consolidation, Appointment as Lead Plaintiff and Approval of Lead Plaintiff’s Selection of Counsel filed by Plaintiff Giulio D. Cessario, a plaintiff in the Steinberg action, which consolidated these actions under the caption In re Brocade Communications Systems, Inc. Securities Litigation, Case No. 3:16-cv-07081-EMC. The U.S. Northern District Court has set this matter for an initial hearing on January 18, 2018. We believe these claims are all entirely without merit and intend to vigorously defend these actions.
Lawsuits Relating to Tessera, Inc.
On May 23, 2016, Tessera Technologies, Inc., Tessera, Inc., or Tessera, and Invensas Corp., an affiliate of Tessera, or Invensas or collectively, the Complainants, filed a complaint to institute an investigation with the U.S. International Trade Commission, or the ITC. The Complainants allege infringement by Broadcom and our subsidiaries, BRCM, Avago and Avago Technologies U.S. Inc., or Avago U.S., or collectively, the Respondents, of three patents relating to semiconductor packaging and semiconductor manufacturing technology. The downstream respondents, which are customers of the Respondents, are Arista Networks, Inc., ARRIS International plc, ARRIS Group, Inc., ARRIS Technology, Inc., ARRIS Enterprises LLC, ARRIS Solutions, Inc., Pace Ltd., Pace Americas, LLC, Pace USA, LLC, ASUSteK Computer Inc., ASUS Computer International, Comcast Cable Communications, LLC, Comcast Cable Communications Management, LLC, Comcast Business Communications, LLC, HTC Corporation, HTC America, Inc., NETGEAR, Inc., Technicolor S.A., Technicolor USA, Inc., and Technicolor Connected Home USA LLC, or collectively, the Downstream Respondents. On July 20, 2016, the ITC instituted the investigation, or the ITC Investigation. Complainants seek the following relief: (1) a permanent limited exclusion order excluding from importation into the U.S. all of the Respondents' semiconductor devices and semiconductor device packages and Downstream Respondents’ products containing Respondents’ semiconductor devices and semiconductor device packages that infringe one or more of the three patents subject to the ITC Investigation and (2) a permanent cease and desist order prohibiting the Respondents and Downstream Respondents and related companies from importing, marketing, advertising, demonstrating, warehousing inventory for distribution, offering for sale, selling, qualifying for use in the products of others, distributing, or using the Respondents' semiconductor devices and semiconductor device packages and Downstream Respondents’ products containing Respondents’ semiconductor devices and semiconductor device packages that infringe one or more of the three patents subject to the ITC Investigation. The ITC held the hearing in March 2017. On June 30, 2017, the administrative law judge issued an initial determination finding a violation with respect to U.S. Patent No. 6,849,946 and no violation with respect to U.S. Patent Nos. 6,133,136 and 6,856,007. The administrative law judge recommended that the ITC issue limited exclusion and cease and desist orders and recommended that we post a 100% import bond during the presidential review period. Broadcom and Downstream Respondents are petitioning for ITC review of the initial determination, and the ITC announced what issues it intends to review on September 29, 2017.
On May 23, 2016, Tessera and Invensas filed a complaint against BRCM in the U.S. District Court for the District of Delaware, Case No. 1-16-cv-00379, alleging infringement of the three patents subject to the ITC Investigation. The complaint seeks compensatory damages in an unspecified amount, as well as an award of reasonable attorneys’ fees, interest, and costs.
On May 23, 2016, Tessera and Tessera Advanced Technologies, Inc. filed a complaint against BRCM in the U.S. District Court for the District of Delaware, Case No. 1-16-cv-00380, alleging infringement of four patents relating to semiconductor packaging and circuit technologies. On June 19, 2016, the complaint was amended to add three more patents relating to semiconductor packaging technologies for a total of seven patents in this matter. The complaint seeks compensatory damages in an unspecified amount, as well as an award of reasonable attorneys’ fees, interest, and costs.
On May 23, 2016, Invensas filed a Writ of Summons against Broadcom, BRCM, Broadcom Netherlands B.V. and Broadcom Communications Netherlands B.V. in the Hague District Court in the Netherlands, Case No. L1422381, alleging infringement of a single European patent that is a foreign counterpart to one of the patents subject to the ITC Investigation, or the European Patent. The named defendants also include distributors EBV Elektronik GmbH, Arrow Central Europe GmbH, and Mouser Electronics Netherlands B.V. The requested relief includes a cease-and-desist order and damages in an unspecified amount.
On May 23, 2016, Invensas also filed a complaint against each of (i) Broadcom Germany GmbH and Broadcom‘s German distributors, Case No. 7 O 97/16, and (ii) Broadcom and BRCM, Case No. 7 O 98/16, in the Mannheim District Court in Germany, alleging infringement of the European Patent. The required relief includes damages in an unspecified amount and an injunction preventing the sale of the accused products. On February 3, 2017, the Mannheim District Court held a hearing to determine infringement. On March 17, 2017, the Mannheim District Court issued its ruling. The court found infringement in both cases and granted injunctions preventing the commercialization of certain Broadcom products in Germany. Broadcom is appealing the decision. On March 27, 2017, Broadcom filed a brief with the appellate court in Germany in Case No. 7 O 98/16 seeking: (1) reversal on the merits, (2) a higher bond for enforcement of the injunction, and (3) a stay of enforcement pending the nullity action. On May 22, 2017, Broadcom filed its appeal of Case No. 7 O 97/16 seeking (1) reversal on the merits and (2) a stay of enforcement. On June 1, 2017, the German appellate court denied Broadcom’s request for a stay of enforcement in Case No. 7 O 98/16, but has not yet ruled on our appeal of the decision on the merits or the higher bond amount. In October
109
2017, the German Federal Patent Court issued a preliminary ruling that the European Patent should be found null and void. Invensas has ceased its enforcement of the injunction related to the European Patent.
On November 7, 2016, Invensas filed a complaint against Avago, Avago U.S., Emulex, LSI and PLX Technology, Inc., a subsidiary of Broadcom, or PLX, in the U.S. District Court for the District of Delaware, Case No. 1-16-cv-01033, alleging infringement of two of the patents subject to the ITC Investigation. The complaint seeks compensatory damages in an unspecified amount, as well as an award of reasonable attorneys’ fees, interest, and costs.
On November 7, 2016, Tessera and Invensas filed a complaint against Avago, Avago U.S., and Avago Technologies Wireless (U.S.A.) Manufacturing Inc. in the U.S. District Court for the District of Delaware, Case No. 1-16-cv-01034, alleging infringement of two patents relating to semiconductor packaging technology. On January 31, 2017, Tessera and Invensas amended the complaint in this matter and added three additional patents related to semiconductor packaging technology, which are also at issue in case No. 1-16-cv-00379 pending in Delaware. The complaint seeks compensatory damages in an unspecified amount, as well as an award of reasonable attorneys’ fees, interest, and costs.
On December 18, 2017, Broadcom and its subsidiaries entered into comprehensive settlement agreements and a patent license agreement with Tessera and its affiliates resolving all outstanding litigation. Pursuant to the agreements between the parties, the ITC investigation will be terminated, and all of the other litigations will be dismissed.
Lawsuits Relating to the Acquisition of BRCM
Following the announcement of the Broadcom Merger, 11 putative class action complaints were filed by and purportedly on behalf of alleged BRCM shareholders. Two putative class action complaints, or the Federal Actions, were filed in the United States District Court for the Central District of California, or the U.S. Central District Court. One putative class action complaint was filed in the Superior Court of the State of California, County of Santa Clara and eight putative class action complaints were filed in the Superior Court of the State of California, County of Orange, or the State Actions. The Federal Actions and State Actions name as defendants, among other parties, BRCM, members of BRCM’s board of directors and Avago, and allege, among other things, breaches of fiduciary duties and aiding and abetting those alleged breaches. Additionally, the Federal Actions allege violations of Sections 14(a) and 20(a) of the Exchange Act and SEC Rule 14-a9.
On January 15, 2016, lead plaintiffs in the Federal Actions filed a Second Amended Consolidated Class Action Complaint, or the Federal Consolidated Complaint, which names as defendants, among other parties, members of BRCM’s board of directors and Avago, and alleges breaches of fiduciary duties and aiding and abetting those alleged breaches, as well as violation of Sections 14(a) and 20(a) of the Exchange Act and SEC Rule 14-a9.
On September 23, 2016, the parties entered into a Stipulation and Agreement of Compromise and Settlement, or the Stipulation, which has been filed with the U.S. Central District Court. Pursuant to the Stipulation, BRCM agreed to confirm certain facts concerning the Broadcom Merger. Additionally, defendants agreed to pay or cause to be paid attorneys’ fees and expenses as may be awarded by the U.S. Central District Court to plaintiffs’ counsel for their efforts in prosecuting the litigation, as well as the costs of administering the settlement. The Stipulation includes a release of all claims against defendants relating to or arising from the litigation. On December 2, 2016, the U.S. Central District Court granted preliminary approval of the settlement. On February 27, 2017, the U.S. Central District Court granted final approval of the settlement. On March 16, 2017, the State Actions were dismissed with prejudice pursuant to the settlement. The settlement did not have an impact on our financial statements.
We believe that the claims in the litigation, including the Federal Consolidated Complaint, were without merit and that no misconduct or damages occurred. Defendants entered into the settlement to eliminate the burden, distraction, and expense of further litigation.
Lawsuits Relating to the Acquisition of Emulex
On March 3, 2015, two putative shareholder class action complaints were filed in the Court of Chancery of the State of Delaware, or the Delaware Court of Chancery, against Emulex, its directors, Avago Technologies Wireless (U.S.A.) Manufacturing Inc., or AT Wireless, and Emerald Merger Sub, Inc., or Emerald Merger Sub, captioned as follows: James Tullman v. Emulex Corporation, et al., Case No. 10743-VCL (Del. Ch.); Moshe Silver ACF/Yehudit Silver U/NY/UTMA v. Emulex Corporation, et al., Case No. 10744-VCL (Del. Ch.). On March 11, 2015, a third complaint was filed in the Delaware Court of Chancery, captioned Hoai Vu v. Emulex Corporation, et al., Case No. 10776-VCL (Del. Ch.). The complaints alleged, among other things, that Emulex’s directors breached their fiduciary duties by approving the Agreement and Plan of Merger, dated February 25, 2015, by and among AT Wireless, Emerald Merger Sub and Emulex and that AT Wireless and Emerald Merger Sub aided and abetted these alleged breaches of fiduciary duty. The complaints sought, among other things, either to enjoin the transaction or to rescind it following its completion, as well as damages, including attorneys’ and experts’ fees. The Delaware Court of Chancery has entered an order consolidating the three Delaware actions under the caption In re Emulex Corporation
110
Stockholder Litigation, Consolidated C.A. No. 10743-VCL. On May 5, 2015, we completed our acquisition of Emulex. On June 5, 2015, the Court of Chancery dismissed the consolidated action without prejudice.
On April 8, 2015, a putative class action complaint was filed in the U.S. Central District Court, entitled Gary Varjabedian, et al. v. Emulex Corporation, et al., No. 8:15-cv-554-CJC-JCG. The complaint names as defendants Emulex, its directors, AT Wireless and Emerald Merger Sub, and purported to assert claims under Sections 14(d), 14(e) and 20(a) of the Exchange Act. The complaint alleged, among other things, that the board of directors of Emulex failed to provide material information and/or omitted material information from the Solicitation/Recommendation Statement on Schedule 14D-9 filed with the SEC on April 7, 2015 by Emulex, together with the exhibits and annexes thereto. The complaint sought to enjoin the tender offer to purchase all of the outstanding shares of Emulex common stock, as well as certain other equitable relief and attorneys’ fees and costs. On July 28, 2015, the U.S. Central District Court issued an order appointing the lead plaintiff and approving lead counsel for the putative class. On September 9, 2015, plaintiff filed a first amended complaint seeking rescission of the merger, unspecified money damages, other equitable relief and attorneys’ fees and costs. On October 13, 2015, defendants moved to dismiss the first amended complaint, which the U.S. Central District Court granted with prejudice on January 13, 2016. Plaintiff filed a notice of appeal to the United States Court of Appeals for the Ninth Circuit, or the Ninth Circuit Court, on January 15, 2016. The appeal is captioned Gary Varjabedian, et al. v. Emulex Corporation, et al., No. 16-55088. On June 27, 2016, the Plaintiff-Appellant filed his opening brief, on August 17 and August 22, 2016, the Defendants-Appellees filed their answering briefs, and on October 5, 2016 Plaintiff-Appellant filed his reply brief. The Ninth Circuit Court heard oral argument on October 5, 2017. We are unable to predict the date on which the Ninth Circuit Court will issue any decision at this time.
We believe these claims are all entirely without merit and intend to vigorously defend these actions.
Lawsuits Relating to the Acquisition of PLX
In June and July 2014, four lawsuits were filed in the Superior Court for the State of California, County of Santa Clara, or the Superior Court, challenging our acquisition of PLX. On July 22, 2014, the Superior Court consolidated these California actions under the caption In re PLX Technology, Inc. S’holder Litig., Lead Case No. 1-14-CV-267079 (Cal. Super. Ct., Santa Clara) and appointed lead counsel. That same day, the Superior Court also stayed the consolidated action, pending resolution of related actions filed in the Delaware Court of Chancery, described below.
Also in June and July 2014, five similar lawsuits were filed in the Delaware Court of Chancery. On July 21, 2014, the Delaware Court of Chancery consolidated these Delaware actions under the caption In re PLX Technology, Inc. Stockholders Litigation, Consol. C.A. No. 9880-VCL (Del. Ch.), appointed lead plaintiffs and lead counsel, and designated an operative complaint for the consolidated action. On July 31, 2014, counsel for lead plaintiffs in Delaware informed the Delaware Court of Chancery that they would not seek a preliminary injunction, but intend to seek damages and pursue monetary remedies through post-closing litigation. Our acquisition of PLX closed on August 12, 2014.
On October 31, 2014, lead plaintiffs filed a consolidated amended complaint. This complaint alleges, among other things, that PLX’s directors breached their fiduciary duties to PLX’s stockholders by seeking to sell PLX for an inadequate price, pursuant to an unfair process, and by agreeing to preclusive deal protections in the merger agreement. Plaintiffs also allege that Potomac Capital Partners II, L.P., Deutsche Bank Securities, AT Wireless and Pluto Merger Sub, Inc., the acquisition subsidiary, aided and abetted the alleged fiduciary breaches. Plaintiffs also allege that PLX’s Solicitation/Recommendation statement on Schedule 14D-9, as filed with the SEC, contained false and misleading statements and/or omitted material information necessary to inform the shareholder vote. The plaintiffs seek, among other things, monetary damages and attorneys’ fees and costs. On September 3, 2015, the Delaware Court of Chancery granted motions to dismiss filed by AT Wireless, the acquisition subsidiary and two PLX directors, and denied motions to dismiss filed by several other PLX directors, Potomac Capital Partners II, L.P. and Deutsche Bank Securities.
On August 17, 2016, the five remaining PLX director-defendants and Deutsche Bank Securities entered into a stipulation of partial settlement to resolve claims against all of the former PLX directors and Deutsche Bank Securities asserted in the Delaware class action. The partial settlement also provides for a release of all potential claims against AT Wireless, Pluto Merger Sub, Avago and PLX. Defendant Potomac Capital Partners II, L.P. is not a party to the settlement. This partial settlement was approved by the Delaware Court of Chancery on December 20, 2016.
The Delaware class litigation is on-going. On November 9, 2016, the sole remaining defendant, Potomac Capital Partners II, L.P., filed cross-claims against the named individual director defendants and Deutsche Bank Securities for contribution. Under various contracts and statutes, PLX may owe indemnification to each of these parties. The cross-claims are now barred according to the terms of the approved partial settlement, although Potomac Capital Partners II, L.P. might be entitled to an offset (based on contributory fault) of any damages it might owe to the class.
Other Matters
In addition to the matters discussed above, we are currently engaged in a number of legal actions in the ordinary course
111
of our business.
We do not believe, based on currently available facts and circumstances, that the final outcome of any pending legal proceedings, taken individually or as a whole, will have a material adverse effect on our financial condition, results of operations or cash flows. However, lawsuits may involve complex questions of fact and law and may require the expenditure of significant funds and other resources to defend. The results of litigation are inherently uncertain, and material adverse outcomes are possible. From time to time, we may enter into confidential discussions regarding the potential settlement of such lawsuits. Any settlement of pending litigation could require us to incur substantial costs and other ongoing expenses, such as future royalty payments in the case of an intellectual property dispute.
During the periods presented, no material amounts have been accrued or disclosed in the accompanying consolidated financial statements with respect to loss contingencies associated with any other legal proceedings, as potential losses for such matters are not considered probable and ranges of losses are not reasonably estimable. These matters are subject to many uncertainties and the ultimate outcomes are not predictable. There can be no assurances that the actual amounts required to satisfy any liabilities arising from the matters described above will not have a material adverse effect on our results of operations, financial position or cash flows.
Other Indemnifications
As is customary in our industry and as provided for in local law in the United States and other jurisdictions, many of our standard contracts provide remedies to our customers and others with whom we enter into contracts, such as defense, settlement, or payment of judgment for intellectual property claims related to the use of our products. From time to time, we indemnify customers, as well as our suppliers, contractors, lessors, lessees, companies that purchase our businesses or assets and others with whom we enter into contracts, against combinations of loss, expense, or liability arising from various triggering events related to the sale and the use of our products, the use of their goods and services, the use of facilities and state of our owned facilities, the state of the assets and businesses that we sell and other matters covered by such contracts, usually up to a specified maximum amount. In addition, from time to time we also provide protection to these parties against claims related to undiscovered liabilities, additional product liabilities or environmental obligations. In our experience, claims made under such indemnifications are rare and the associated estimated fair value of the liability is not material.
15. Restructuring, Impairment and Disposal Charges
Restructuring Charges
The following is a summary of significant restructuring expense recognized in continuing operations, primarily operating expenses, for the periods specified below:
• | In connection with the Broadcom Merger, we began the implementation of cost reduction activities, including the elimination of a total of approximately 3,700 positions from our workforce across all business and functional areas on a global basis. During fiscal years 2017 and 2016, we recognized $86 million and $418 million of employee termination costs and $38 million and $29 million for lease and other exits costs, respectively. As of October 29, 2017, we were substantially complete with the restructuring activities related to the Broadcom Merger. |
• | In fiscal year 2015, we recognized $60 million of employee termination costs and $17 million for lease and other exit costs in connection with the Emulex and LSI acquisitions. |
112
Employee Termination Costs | Lease and Other Exit Costs | Total | ||||||||||
(In millions) | ||||||||||||
Balance as of November 2, 2014 | $ | 34 | $ | 6 | $ | 40 | ||||||
Restructuring charges (a) | 65 | 30 | 95 | |||||||||
Utilization | (86 | ) | (23 | ) | (109 | ) | ||||||
Balance as of November 1, 2015 | 13 | 13 | 26 | |||||||||
Liabilities assumed in the Broadcom Merger | 2 | 13 | 15 | |||||||||
Restructuring charges (a) | 445 | 37 | 482 | |||||||||
Utilization | (344 | ) | (28 | ) | (372 | ) | ||||||
Balance as of October 30, 2016 | 116 | 35 | 151 | |||||||||
Restructuring charges (a) | 86 | 43 | 129 | |||||||||
Utilization | (174 | ) | (61 | ) | (235 | ) | ||||||
Balance as of October 29, 2017 (b) | $ | 28 | $ | 17 | $ | 45 | ||||||
(a) | Included $5 million, $35 million and $12 million of restructuring charges related to discontinued operations recognized during fiscal years 2017, 2016 and 2015, respectively, which was included in loss from discontinued operations, net of income taxes in our consolidated statements of operations. |
(b) | The majority of the employee termination costs balance is expected to be paid by the first quarter of fiscal year 2018. The leases and other exit costs balance is expected to be paid during the remaining terms of the leases, which extend through fiscal year 2025. |
Impairment and Disposal Charges
During fiscal year 2017, we recorded impairment and disposal charges of $56 million for the impairment of property, plant and equipment and IPR&D projects.
During fiscal year 2016, we recorded $417 million of impairment charges in our wireless communications segment and wired infrastructure segment for IPR&D projects which were abandoned as a result of the integration of BRCM. In addition, we recorded impairment charges of $173 million primarily for property, plant and equipment acquired through the Broadcom Merger and a $16 million loss on disposal of these assets.
During fiscal year 2015, we realigned certain product groups within our wired infrastructure segment and agreed to sell certain fiber optics subsystem assets to a third party, resulting in a $61 million loss to write these assets down to fair value less costs to sell.
16. Condensed Consolidating Financial Information
On January 9, 2017, the Subsidiary Issuers, issued an aggregate principal amount of $13,550 million of January 2017 Senior Notes, in a private placement transaction.
On October 17, 2017, the Subsidiary Issuers issued an aggregate principal amount of $4,000 million of October 2017 Senior Notes, in a private placement transaction. The Senior Notes are discussed in further detail in Note 8. “Borrowings.”
Each series of Senior Notes is fully and unconditionally guaranteed, jointly and severally, on an unsecured, unsubordinated basis by the Guarantors, subject to certain release conditions described in the respective Indentures and below.
The guarantee by Broadcom will be automatically and unconditionally released (solely in the case of clauses (1) or (2) below) and the guarantee by the Partnership may be unconditionally released in the events of (1) sale, exchange, disposition or other transfer of all or substantially all of Guarantors’ assets, (2) the Issuers’ exercise of their legal defeasance option or covenant defeasance options or if the Issuers’ obligations under the indenture are satisfied and discharged or (3) release of obligations under the Senior Notes. The Parent Guarantor’s guarantee may also be released under other circumstances described in the Indentures.
The Subsidiary Issuers are 100% owned by the Partnership. Our other subsidiaries, collectively, the Non-Guarantor Subsidiaries, do not guarantee the Senior Notes.
Under the terms of registration rights agreements entered into in connection with the Notes, the Subsidiary Issuers, Parent Guarantor, and Broadcom agreed to file a registration statement with the SEC for an offer to exchange new senior
113
notes of the Issuers which are registered with the SEC and guaranteed by the Guarantors for the Issuers’ outstanding unregistered senior notes. This exchange is currently expected to be completed during the first half of fiscal year 2018.
The following information sets forth the consolidating financial information as of October 29, 2017 and October 30, 2016 and for the fiscal years ended October 29, 2017, October 30, 2016 and November 1, 2015 for the Parent Guarantor, Subsidiary Issuers, and Non-Guarantor Subsidiaries. Investments in subsidiaries are accounted for under the equity method; accordingly, entries necessary to consolidate the Parent Guarantor and all of our guarantor and non-guarantor subsidiaries are reflected in the eliminations column. In the opinion of management, separate complete financial statements of the Subsidiary Issuers would not provide additional material information that would be useful in assessing their financial composition.
114
Condensed Consolidating Balance Sheet | ||||||||||||||||||||
October 29, 2017 | ||||||||||||||||||||
Parent Guarantor | Subsidiary Issuers | Non-Guarantor Subsidiaries | Eliminations | Consolidated Totals | ||||||||||||||||
(in millions) | ||||||||||||||||||||
ASSETS | ||||||||||||||||||||
Current assets: | ||||||||||||||||||||
Cash and cash equivalents | $ | 7 | $ | 7,555 | $ | 3,455 | $ | — | $ | 11,017 | ||||||||||
Trade accounts receivable, net | — | — | 2,448 | — | 2,448 | |||||||||||||||
Inventory | — | — | 1,447 | — | 1,447 | |||||||||||||||
Intercompany receivable | 33 | 279 | 309 | (621 | ) | — | ||||||||||||||
Intercompany loan receivable | 28 | 1,891 | 8,849 | (10,768 | ) | — | ||||||||||||||
Other current assets | 84 | 350 | 374 | — | 808 | |||||||||||||||
Total current assets | 152 | 10,075 | 16,882 | (11,389 | ) | 15,720 | ||||||||||||||
Property, plant and equipment, net | — | 207 | 2,392 | — | 2,599 | |||||||||||||||
Goodwill | — | 1,360 | 23,346 | — | 24,706 | |||||||||||||||
Intangible assets, net | — | — | 10,832 | — | 10,832 | |||||||||||||||
Investment in subsidiaries | 23,112 | 28,049 | 43,450 | (94,611 | ) | — | ||||||||||||||
Intercompany loan receivable, long-term | — | 41,547 | — | (41,547 | ) | — | ||||||||||||||
Other long-term assets | — | 213 | 245 | — | 458 | |||||||||||||||
Total assets | $ | 23,264 | $ | 81,451 | $ | 97,147 | $ | (147,547 | ) | $ | 54,315 | |||||||||
LIABILITIES AND PARTNERS’ CAPITAL/SHAREHOLDERS’ EQUITY | ||||||||||||||||||||
Current liabilities: | ||||||||||||||||||||
Accounts payable | $ | 7 | $ | 72 | $ | 1,026 | $ | — | $ | 1,105 | ||||||||||
Employee compensation and benefits | — | 274 | 352 | — | 626 | |||||||||||||||
Current portion of long-term debt | — | 117 | — | — | 117 | |||||||||||||||
Intercompany payable | 124 | 186 | 311 | (621 | ) | — | ||||||||||||||
Intercompany loan payable | 50 | 8,799 | 1,919 | (10,768 | ) | — | ||||||||||||||
Other current liabilities | — | 254 | 427 | — | 681 | |||||||||||||||
Total current liabilities | 181 | 9,702 | 4,035 | (11,389 | ) | 2,529 | ||||||||||||||
Long-term liabilities: | ||||||||||||||||||||
Long-term debt | — | 17,431 | — | — | 17,431 | |||||||||||||||
Deferred tax liabilities | — | 10,293 | (274 | ) | — | 10,019 | ||||||||||||||
Pension and post-retirement benefit obligations | — | — | 112 | — | 112 | |||||||||||||||
Intercompany loan payable, long-term | — | — | 41,547 | (41,547 | ) | — | ||||||||||||||
Unrecognized tax benefits | — | 497 | 514 | — | 1,011 | |||||||||||||||
Other long-term liabilities | — | 76 | 54 | — | 130 | |||||||||||||||
Total liabilities | 181 | 37,999 | 45,988 | (52,936 | ) | 31,232 | ||||||||||||||
Total partners’ capital/shareholders’ equity | 23,083 | 43,452 | 51,159 | (94,611 | ) | 23,083 | ||||||||||||||
Total liabilities and partners' capital/shareholders' equity | $ | 23,264 | $ | 81,451 | $ | 97,147 | $ | (147,547 | ) | $ | 54,315 | |||||||||
115
Condensed Consolidating Balance Sheet | ||||||||||||||||||||
October 30, 2016 | ||||||||||||||||||||
Parent Guarantor | Subsidiary Issuers | Non-Guarantor Subsidiaries | Eliminations | Consolidated Totals | ||||||||||||||||
(in millions) | ||||||||||||||||||||
ASSETS | ||||||||||||||||||||
Current assets: | ||||||||||||||||||||
Cash and cash equivalents | $ | — | $ | 1,092 | $ | 1,952 | $ | — | $ | 3,044 | ||||||||||
Trade accounts receivable, net | — | 96 | 2,085 | — | 2,181 | |||||||||||||||
Inventory | — | 4 | 1,396 | — | 1,400 | |||||||||||||||
Intercompany receivable | 32 | 1,170 | 259 | (1,461 | ) | — | ||||||||||||||
Intercompany loan receivable | 410 | 1,188 | 3,034 | (4,632 | ) | — | ||||||||||||||
Other current assets | 59 | 73 | 368 | — | 500 | |||||||||||||||
Total current assets | 501 | 3,623 | 9,094 | (6,093 | ) | 7,125 | ||||||||||||||
Property, plant and equipment, net | — | 270 | 2,239 | — | 2,509 | |||||||||||||||
Goodwill | — | 1,392 | 23,340 | — | 24,732 | |||||||||||||||
Intangible assets, net | — | 606 | 14,462 | — | 15,068 | |||||||||||||||
Investment in subsidiaries | 21,886 | 69,470 | 47,534 | (138,890 | ) | — | ||||||||||||||
Intercompany loan receivable, long-term | — | 62 | 7,964 | (8,026 | ) | — | ||||||||||||||
Other long-term assets | — | 32 | 500 | — | 532 | |||||||||||||||
Total assets | $ | 22,387 | $ | 75,455 | $ | 105,133 | $ | (153,009 | ) | $ | 49,966 | |||||||||
LIABILITIES AND PARTNERS’ CAPITAL/SHAREHOLDERS’ EQUITY | ||||||||||||||||||||
Current liabilities: | ||||||||||||||||||||
Accounts payable | $ | 4 | $ | 111 | $ | 1,146 | $ | — | $ | 1,261 | ||||||||||
Employee compensation and benefits | 6 | 219 | 292 | — | 517 | |||||||||||||||
Current portion of long-term debt | — | 318 | 136 | — | 454 | |||||||||||||||
Intercompany payable | 72 | 216 | 1,173 | (1,461 | ) | — | ||||||||||||||
Intercompany loan payable | 429 | 2,748 | 1,455 | (4,632 | ) | — | ||||||||||||||
Other current liabilities | — | 267 | 579 | — | 846 | |||||||||||||||
Total current liabilities | 511 | 3,879 | 4,781 | (6,093 | ) | 3,078 | ||||||||||||||
Long-term liabilities: | ||||||||||||||||||||
Long-term debt | — | 5,470 | 7,718 | — | 13,188 | |||||||||||||||
Deferred tax liabilities | — | 10,230 | 57 | — | 10,287 | |||||||||||||||
Pension and post-retirement benefit obligations | — | — | 531 | — | 531 | |||||||||||||||
Intercompany loan payable, long-term | — | 7,964 | 62 | (8,026 | ) | — | ||||||||||||||
Unrecognized tax benefits | — | 342 | 551 | — | 893 | |||||||||||||||
Other long-term liabilities | — | 44 | 69 | — | 113 | |||||||||||||||
Total liabilities | 511 | 27,929 | 13,769 | (14,119 | ) | 28,090 | ||||||||||||||
Total partners’ capital/shareholders’ equity | 21,876 | 47,526 | 91,364 | (138,890 | ) | 21,876 | ||||||||||||||
Total liabilities and partners' capital/shareholders' equity | $ | 22,387 | $ | 75,455 | $ | 105,133 | $ | (153,009 | ) | $ | 49,966 | |||||||||
116
Condensed Consolidating Statements of Operations and Comprehensive Income | ||||||||||||||||||||
Fiscal Year Ended | ||||||||||||||||||||
October 29, 2017 | ||||||||||||||||||||
Parent Guarantor | Subsidiary Issuers | Non-Guarantor Subsidiaries | Eliminations | Consolidated Totals | ||||||||||||||||
(in millions) | ||||||||||||||||||||
Net revenue | $ | — | $ | 73 | $ | 17,563 | $ | — | $ | 17,636 | ||||||||||
Intercompany revenue | — | 2,046 | 8 | (2,054 | ) | — | ||||||||||||||
Total revenue | — | 2,119 | 17,571 | (2,054 | ) | 17,636 | ||||||||||||||
Cost of products sold: | ||||||||||||||||||||
Cost of products sold | — | 154 | 6,439 | — | 6,593 | |||||||||||||||
Intercompany cost of products sold | — | (12 | ) | 174 | (162 | ) | — | |||||||||||||
Purchase accounting effect on inventory | — | — | 4 | — | 4 | |||||||||||||||
Amortization of acquisition-related intangible assets | — | 7 | 2,504 | — | 2,511 | |||||||||||||||
Restructuring charges | — | 5 | 14 | — | 19 | |||||||||||||||
Total cost of products sold | — | 154 | 9,135 | (162 | ) | 9,127 | ||||||||||||||
Gross margin | — | 1,965 | 8,436 | (1,892 | ) | 8,509 | ||||||||||||||
Research and development | — | 1,490 | 1,802 | — | 3,292 | |||||||||||||||
Intercompany operating expense | — | (66 | ) | 1,958 | (1,892 | ) | — | |||||||||||||
Selling, general and administrative | 23 | 339 | 425 | — | 787 | |||||||||||||||
Amortization of acquisition-related intangible assets | — | 7 | 1,757 | — | 1,764 | |||||||||||||||
Restructuring, impairment and disposal charges | — | 54 | 107 | — | 161 | |||||||||||||||
Litigation settlements | — | — | 122 | — | 122 | |||||||||||||||
Total operating expenses | 23 | 1,824 | 6,171 | (1,892 | ) | 6,126 | ||||||||||||||
Operating income (loss) | (23 | ) | 141 | 2,265 | — | 2,383 | ||||||||||||||
Interest expense | — | (411 | ) | (43 | ) | — | (454 | ) | ||||||||||||
Intercompany interest expense | (12 | ) | (274 | ) | (1,420 | ) | 1,706 | — | ||||||||||||
Loss on extinguishment of debt | — | (59 | ) | (107 | ) | — | (166 | ) | ||||||||||||
Other income, net | 2 | 30 | 30 | — | 62 | |||||||||||||||
Intercompany interest income | 1 | 1,425 | 280 | (1,706 | ) | — | ||||||||||||||
Intercompany other income (expense), net | 1,390 | (589 | ) | (801 | ) | — | — | |||||||||||||
Income from continuing operations before income taxes and earnings in subsidiaries | 1,358 | 263 | 204 | — | 1,825 | |||||||||||||||
Provision for (benefit from) income taxes | — | 67 | (32 | ) | — | 35 | ||||||||||||||
Income from continuing operations before earnings in subsidiaries | 1,358 | 196 | 236 | — | 1,790 | |||||||||||||||
Earnings in (loss from) subsidiaries | 426 | (2,279 | ) | (2,097 | ) | 3,950 | — | |||||||||||||
Income (loss) from continuing operations and earnings (loss) in subsidiaries | 1,784 | (2,083 | ) | (1,861 | ) | 3,950 | 1,790 | |||||||||||||
Income (loss) from discontinued operations, net of income taxes | — | (13 | ) | 7 | — | (6 | ) | |||||||||||||
Net income (loss) | $ | 1,784 | $ | (2,096 | ) | $ | (1,854 | ) | $ | 3,950 | $ | 1,784 | ||||||||
Net income (loss) | $ | 1,784 | $ | (2,096 | ) | $ | (1,854 | ) | $ | 3,950 | $ | 1,784 | ||||||||
Other comprehensive income, net of tax: | ||||||||||||||||||||
Unrealized gain on defined benefit pension plans and post-retirement benefit plans | — | — | 42 | — | 42 | |||||||||||||||
Reclassification to net income (loss) | — | — | 1 | — | 1 | |||||||||||||||
Other comprehensive income | — | — | 43 | — | 43 | |||||||||||||||
Comprehensive income (loss) | $ | 1,784 | $ | (2,096 | ) | $ | (1,811 | ) | $ | 3,950 | $ | 1,827 | ||||||||
117
Condensed Consolidating Statements of Operations and Comprehensive Loss | ||||||||||||||||||||
Fiscal Year Ended | ||||||||||||||||||||
October 30, 2016 | ||||||||||||||||||||
Parent Guarantor | Subsidiary Issuers | Non-Guarantor Subsidiaries | Eliminations | Consolidated Totals | ||||||||||||||||
(in millions) | ||||||||||||||||||||
Net revenue | $ | — | $ | 402 | $ | 12,838 | $ | — | $ | 13,240 | ||||||||||
Intercompany revenue | — | 353 | 55 | (408 | ) | — | ||||||||||||||
Total revenue | — | 755 | 12,893 | (408 | ) | 13,240 | ||||||||||||||
Cost of products sold: | ||||||||||||||||||||
Cost of products sold | — | 237 | 5,058 | — | 5,295 | |||||||||||||||
Intercompany cost of products sold | — | (149 | ) | 557 | (408 | ) | — | |||||||||||||
Purchase accounting effect on inventory | — | 15 | 1,170 | — | 1,185 | |||||||||||||||
Amortization of acquisition-related intangible assets | — | 14 | 749 | — | 763 | |||||||||||||||
Restructuring charges | — | 36 | 21 | — | 57 | |||||||||||||||
Total cost of products sold | — | 153 | 7,555 | (408 | ) | 7,300 | ||||||||||||||
Gross margin | — | 602 | 5,338 | — | 5,940 | |||||||||||||||
Research and development | — | 1,237 | 1,437 | — | 2,674 | |||||||||||||||
Intercompany operating expense | — | (1,337 | ) | 1,337 | — | — | ||||||||||||||
Selling, general and administrative | 41 | 254 | 511 | — | 806 | |||||||||||||||
Amortization of acquisition-related intangible assets | — | 82 | 1,791 | — | 1,873 | |||||||||||||||
Restructuring, impairment and disposal charges | — | 309 | 687 | — | 996 | |||||||||||||||
Total operating expenses | 41 | 545 | 5,763 | — | 6,349 | |||||||||||||||
Operating income (loss) | (41 | ) | 57 | (425 | ) | — | (409 | ) | ||||||||||||
Interest expense | — | (312 | ) | (273 | ) | — | (585 | ) | ||||||||||||
Intercompany interest expense | (3 | ) | (262 | ) | (3 | ) | 268 | — | ||||||||||||
Loss on extinguishment of debt | — | (113 | ) | (10 | ) | — | (123 | ) | ||||||||||||
Other income (expense), net | — | (27 | ) | 37 | — | 10 | ||||||||||||||
Intercompany interest income | 1 | 2 | 265 | (268 | ) | — | ||||||||||||||
Intercompany other income (expense), net | 753 | (277 | ) | (476 | ) | — | — | |||||||||||||
Income (loss) from continuing operations before income taxes | 710 | (932 | ) | (885 | ) | — | (1,107 | ) | ||||||||||||
Provision for income taxes | — | 447 | 195 | — | 642 | |||||||||||||||
Income (loss) from continuing operations, before earnings in subsidiaries | 710 | (1,379 | ) | (1,080 | ) | — | (1,749 | ) | ||||||||||||
Loss from subsidiaries | (2,571 | ) | (3,600 | ) | (5,516 | ) | 11,687 | — | ||||||||||||
Loss from continuing operations and loss from subsidiaries | (1,861 | ) | (4,979 | ) | (6,596 | ) | 11,687 | (1,749 | ) | |||||||||||
Income (loss) from discontinued operations, net of income taxes | — | (158 | ) | 46 | — | (112 | ) | |||||||||||||
Net loss | $ | (1,861 | ) | $ | (5,137 | ) | $ | (6,550 | ) | $ | 11,687 | $ | (1,861 | ) | ||||||
Net loss | $ | (1,861 | ) | $ | (5,137 | ) | $ | (6,550 | ) | $ | 11,687 | $ | (1,861 | ) | ||||||
Other comprehensive loss, net of tax: | ||||||||||||||||||||
Unrealized loss on defined benefit pension plans and post-retirement benefit plans | — | — | (65 | ) | — | (65 | ) | |||||||||||||
Reclassification to net loss | — | — | 4 | — | 4 | |||||||||||||||
Other comprehensive loss | — | — | (61 | ) | — | (61 | ) | |||||||||||||
Comprehensive loss | $ | (1,861 | ) | $ | (5,137 | ) | $ | (6,611 | ) | $ | 11,687 | $ | (1,922 | ) | ||||||
118
Condensed Consolidating Statements of Operations and Comprehensive Income | ||||||||||||||||||||
Fiscal Year Ended | ||||||||||||||||||||
November 1, 2015 | ||||||||||||||||||||
Parent Guarantor | Subsidiary Issuers | Non-Guarantor Subsidiaries | Eliminations | Consolidated Totals | ||||||||||||||||
(in millions) | ||||||||||||||||||||
Net revenue | $ | — | $ | — | $ | 6,824 | $ | — | $ | 6,824 | ||||||||||
Cost of products sold: | ||||||||||||||||||||
Cost of products sold | — | — | 2,750 | — | 2,750 | |||||||||||||||
Purchase accounting effect on inventory | — | — | 30 | — | 30 | |||||||||||||||
Amortization of acquisition-related intangible assets | — | — | 484 | — | 484 | |||||||||||||||
Restructuring charges | — | — | 7 | — | 7 | |||||||||||||||
Total cost of products sold | — | — | 3,271 | — | 3,271 | |||||||||||||||
Gross margin | — | — | 3,553 | — | 3,553 | |||||||||||||||
Research and development | — | — | 1,049 | — | 1,049 | |||||||||||||||
Selling, general and administrative | — | — | 486 | — | 486 | |||||||||||||||
Amortization of acquisition-related intangible assets | — | — | 249 | — | 249 | |||||||||||||||
Restructuring, impairment and disposal charges | — | — | 137 | — | 137 | |||||||||||||||
Total operating expenses | — | — | 1,921 | — | 1,921 | |||||||||||||||
Operating income | — | — | 1,632 | — | 1,632 | |||||||||||||||
Interest expense | — | — | (191 | ) | — | (191 | ) | |||||||||||||
Loss on extinguishment of debt | — | — | (10 | ) | — | (10 | ) | |||||||||||||
Other income, net | — | — | 36 | — | 36 | |||||||||||||||
Income from continuing operations before income taxes | — | — | 1,467 | — | 1,467 | |||||||||||||||
Provision for income taxes | — | — | 76 | — | 76 | |||||||||||||||
Income from continuing operations | — | — | 1,391 | — | 1,391 | |||||||||||||||
Loss from discontinued operations, net of income taxes | — | — | (27 | ) | — | (27 | ) | |||||||||||||
Net income | $ | — | $ | — | $ | 1,364 | $ | — | $ | 1,364 | ||||||||||
Net income | $ | — | $ | — | $ | 1,364 | $ | — | $ | 1,364 | ||||||||||
Other comprehensive loss, net of tax: | ||||||||||||||||||||
Unrealized loss on defined benefit pension plans and post-retirement benefit plans | — | — | (24 | ) | — | (24 | ) | |||||||||||||
Reclassification to net income | — | — | 1 | — | 1 | |||||||||||||||
Other comprehensive loss | — | — | (23 | ) | — | (23 | ) | |||||||||||||
Comprehensive income | $ | — | $ | — | $ | 1,341 | $ | — | $ | 1,341 | ||||||||||
119
Condensed Consolidating Statements of Cash Flows | ||||||||||||||||||||
Fiscal Year Ended | ||||||||||||||||||||
October 29, 2017 | ||||||||||||||||||||
Parent Guarantor | Subsidiary Issuers | Non-Guarantor Subsidiaries | Eliminations | Consolidated Totals | ||||||||||||||||
(in millions) | ||||||||||||||||||||
Cash flows from operating activities: | ||||||||||||||||||||
Net income (loss) | $ | 1,784 | $ | (2,096 | ) | $ | (1,854 | ) | $ | 3,950 | $ | 1,784 | ||||||||
Adjustments to reconcile net income (loss) to net cash provided by operating activities | (1,980 | ) | 4,804 | 5,729 | (3,786 | ) | 4,767 | |||||||||||||
Net cash provided by (used in) operating activities | (196 | ) | 2,708 | 3,875 | 164 | 6,551 | ||||||||||||||
Cash flows from investing activities: | ||||||||||||||||||||
Intercompany contributions paid | (40 | ) | — | (41 | ) | 81 | — | |||||||||||||
Distributions received from subsidiaries | 1,834 | — | 1,858 | (3,692 | ) | — | ||||||||||||||
Net change in intercompany loans | 410 | (286 | ) | 5,664 | (5,788 | ) | — | |||||||||||||
Acquisitions of businesses, net of cash acquired | — | — | (40 | ) | — | (40 | ) | |||||||||||||
Proceeds from sale of businesses | — | — | 10 | — | 10 | |||||||||||||||
Purchases of property, plant and equipment | — | (254 | ) | (841 | ) | 26 | (1,069 | ) | ||||||||||||
Proceeds from disposals of property, plant and equipment | — | 25 | 442 | (26 | ) | 441 | ||||||||||||||
Purchases of investments | — | (200 | ) | (7 | ) | — | (207 | ) | ||||||||||||
Proceeds from sales and maturities of investments | — | 200 | — | — | 200 | |||||||||||||||
Other | — | — | (9 | ) | — | (9 | ) | |||||||||||||
Net cash provided by (used in) investing activities | 2,204 | (515 | ) | 7,036 | (9,399 | ) | (674 | ) | ||||||||||||
Cash flows from financing activities: | ||||||||||||||||||||
Intercompany contributions received | — | 205 | 40 | (245 | ) | — | ||||||||||||||
Dividends and distributions paid | (1,848 | ) | (1,834 | ) | (1,858 | ) | 3,692 | (1,848 | ) | |||||||||||
Net intercompany borrowings | (379 | ) | (5,797 | ) | 388 | 5,788 | — | |||||||||||||
Proceeds from issuance of long-term debt | — | 17,426 | — | — | 17,426 | |||||||||||||||
Repayment of debt | — | (5,704 | ) | (7,964 | ) | — | (13,668 | ) | ||||||||||||
Payment of debt issuance costs | — | (24 | ) | — | — | (24 | ) | |||||||||||||
Capital transactions with General Partner | 226 | — | — | — | 226 | |||||||||||||||
Payment of capital lease obligations | — | (2 | ) | (14 | ) | — | (16 | ) | ||||||||||||
Net cash provided by (used in) financing activities | (2,001 | ) | 4,270 | (9,408 | ) | 9,235 | 2,096 | |||||||||||||
Net change in cash and cash equivalents | 7 | 6,463 | 1,503 | — | 7,973 | |||||||||||||||
Cash and cash equivalents at the beginning of period | — | 1,092 | 1,952 | — | 3,044 | |||||||||||||||
Cash and cash equivalents at end of period | $ | 7 | $ | 7,555 | $ | 3,455 | $ | — | $ | 11,017 | ||||||||||
120
Condensed Consolidating Statements of Cash Flows | ||||||||||||||||||||
Fiscal Year Ended | ||||||||||||||||||||
October 30, 2016 | ||||||||||||||||||||
Parent Guarantor | Subsidiary Issuers | Non-Guarantor Subsidiaries | Eliminations | Consolidated Totals | ||||||||||||||||
(in millions) | ||||||||||||||||||||
Cash flows from operating activities: | ||||||||||||||||||||
Net loss | $ | (1,861 | ) | $ | (5,137 | ) | $ | (6,550 | ) | $ | 11,687 | $ | (1,861 | ) | ||||||
Adjustments to reconcile net loss to net cash provided by operating activities | 1,818 | 4,869 | 9,931 | (11,346 | ) | 5,272 | ||||||||||||||
Net cash provided by (used in) operating activities | (43 | ) | (268 | ) | 3,381 | 341 | 3,411 | |||||||||||||
Cash flows from investing activities: | ||||||||||||||||||||
Intercompany contributions paid | (35 | ) | (7,400 | ) | (4,970 | ) | 12,405 | — | ||||||||||||
Distributions received from subsidiaries | 250 | 356 | 250 | (856 | ) | — | ||||||||||||||
Net change in intercompany loans | — | (102 | ) | (10,587 | ) | 10,689 | — | |||||||||||||
Acquisitions of businesses, net of cash acquired | — | (10,965 | ) | 910 | — | (10,055 | ) | |||||||||||||
Proceeds from sale of businesses | — | 58 | 840 | — | 898 | |||||||||||||||
Purchases of property, plant and equipment | — | (80 | ) | (643 | ) | — | (723 | ) | ||||||||||||
Proceeds from disposals of property, plant and equipment | — | — | 5 | — | 5 | |||||||||||||||
Purchases of investments | — | — | (58 | ) | — | (58 | ) | |||||||||||||
Proceeds from sales and maturities of investments | — | 13 | 91 | — | 104 | |||||||||||||||
Other | — | (2 | ) | (9 | ) | — | (11 | ) | ||||||||||||
Net cash provided by (used in) investing activities | 215 | (18,122 | ) | (14,171 | ) | 22,238 | (9,840 | ) | ||||||||||||
Cash flows from financing activities: | ||||||||||||||||||||
Intercompany contributions received | — | 5,310 | 7,435 | (12,745 | ) | — | ||||||||||||||
Dividends and distributions paid | (628 | ) | (250 | ) | (728 | ) | 856 | (750 | ) | |||||||||||
Net intercompany borrowings | 286 | 10,301 | 103 | (10,690 | ) | — | ||||||||||||||
Proceeds from issuance of long-term debt | — | 9,551 | 9,959 | — | 19,510 | |||||||||||||||
Debt repayments | — | (3,883 | ) | (5,959 | ) | — | (9,842 | ) | ||||||||||||
Payment of assumed debt | — | (1,475 | ) | — | — | (1,475 | ) | |||||||||||||
Payment of debt issuance costs | — | (77 | ) | (46 | ) | — | (123 | ) | ||||||||||||
Issuance of ordinary shares | — | — | 72 | — | 72 | |||||||||||||||
Capital transactions with General Partner | 170 | — | — | — | 170 | |||||||||||||||
Excess tax benefits from share-based compensation | — | 5 | 84 | — | 89 | |||||||||||||||
Net cash provided by (used in) financing activities | (172 | ) | 19,482 | 10,920 | (22,579 | ) | 7,651 | |||||||||||||
Net change in cash and cash equivalents | — | 1,092 | 130 | — | 1,222 | |||||||||||||||
Cash and cash equivalents at the beginning of period | — | — | 1,822 | — | 1,822 | |||||||||||||||
Cash and cash equivalents at end of period | $ | — | $ | 1,092 | $ | 1,952 | $ | — | $ | 3,044 | ||||||||||
121
Condensed Consolidating Statements of Cash Flows | ||||||||||||||||||||
Fiscal Year Ended | ||||||||||||||||||||
November 1, 2015 | ||||||||||||||||||||
Parent Guarantor | Subsidiary Issuers | Non-Guarantor Subsidiaries | Eliminations | Consolidated Totals | ||||||||||||||||
(in millions) | ||||||||||||||||||||
Cash flows from operating activities: | ||||||||||||||||||||
Net income | $ | — | $ | — | $ | 1,364 | $ | — | $ | 1,364 | ||||||||||
Total adjustments to reconcile net income to net cash provided by operating activities | — | — | 954 | — | 954 | |||||||||||||||
Net cash provided by operating activities | — | — | 2,318 | — | 2,318 | |||||||||||||||
Cash flows from investing activities: | ||||||||||||||||||||
Acquisitions of businesses, net of cash acquired | — | — | (394 | ) | — | (394 | ) | |||||||||||||
Proceeds from sales of businesses | — | — | 650 | — | 650 | |||||||||||||||
Purchases of property, plant and equipment | — | — | (593 | ) | — | (593 | ) | |||||||||||||
Proceeds from disposals of property, plant and equipment | — | — | 110 | — | 110 | |||||||||||||||
Purchases of investments | — | — | (14 | ) | — | (14 | ) | |||||||||||||
Net cash used in investing activities | — | — | (241 | ) | — | (241 | ) | |||||||||||||
Cash flows from financing activities: | ||||||||||||||||||||
Debt repayments | — | — | (1,639 | ) | — | (1,639 | ) | |||||||||||||
Payments of assumed debt | — | — | (178 | ) | — | (178 | ) | |||||||||||||
Dividend and distribution payments | — | — | (408 | ) | — | (408 | ) | |||||||||||||
Issuance of ordinary shares | — | — | 241 | — | 241 | |||||||||||||||
Excess tax benefits from share-based compensation | — | — | 125 | — | 125 | |||||||||||||||
Net cash used in financing activities | — | — | (1,859 | ) | — | (1,859 | ) | |||||||||||||
Net change in cash and cash equivalents | — | — | 218 | — | 218 | |||||||||||||||
Cash and cash equivalents at the beginning of period | — | — | 1,604 | — | 1,604 | |||||||||||||||
Cash and cash equivalents at end of period | $ | — | $ | — | $ | 1,822 | $ | — | $ | 1,822 | ||||||||||
17. Subsequent Events
U.S. 2017 Tax Reform Act
On December 20, 2017, the Tax Cuts and Jobs Act, or the 2017 Tax Reform Act, was approved by Congress and is pending presidential approval. In general, the 2017 Tax Reform Act reduces the U.S. corporate income tax rate from 35% to 21%, effective in 2018. The 2017 Tax Reform Act moves from worldwide business taxation to a participation exemption regime. The 2017 Tax Reform Act also imposes base-erosion measures on non-U.S. earnings of U.S. entities, as well as a one-time mandatory deemed repatriation tax on accumulated non-U.S. earnings of U.S. entities. The base-erosion prevention measures will have the effect of subjecting non-U.S. earnings of U.S. entities to taxation in the United States at an effective rate that is expected to be substantially lower than 21%. The 2017 Tax Reform Act will affect the tax position and cash taxes of our U.S. entities and will have a corresponding impact on our consolidated financial results starting in the first quarter of our fiscal year 2018.
Acquisition of Brocade Communications Systems, Inc.
On November 17, 2017, or the Brocade Acquisition Date, pursuant to the Agreement and Plan of Merger, by and among Broadcom, BRCM, Brocade, and Bobcat Merger Sub, Inc., or Merger Sub, which BRCM subsequently assigned to LSI on December 18, 2016, Merger Sub merged with and into Brocade with Brocade as the surviving corporation, or the Brocade Merger. As a result of the Brocade Merger, and Brocade stockholders who did not perfect their appraisal rights with respect to the Brocade Merger received, in aggregate, approximately $5.3 billion in cash in exchange for all shares of Brocade common stock issued and outstanding immediately prior to the effective time of the Brocade Merger. We also paid $701 million to retire Brocade’s term loan. In addition, we assumed certain vested (to the extent not in-the-money) and all unvested Brocade stock options, RSUs, and performance stock units, or PSUs, held by continuing employees and service providers. All vested in-the-money Brocade stock options, after giving effect to any acceleration, and all other RSUs and PSUs were cashed out upon the Brocade Merger. As a result of the Brocade Merger, Brocade became an indirect subsidiary of the Partnership.
122
Brocade was a leading supplier of networking hardware, software and services, including FC SAN solutions and Internet Protocol Networking, or IP Networking, solutions. We acquired Brocade to enhance our position as a leading provider of enterprise storage connectivity solutions and, with a broader portfolio for enterprise storage, to increase our ability to address the evolving needs of our OEM customers.
The aggregate consideration for the Brocade Merger consisted of the following:
(In millions) | ||||
Cash for outstanding Brocade common stock | $ | 5,298 | ||
Cash paid by Broadcom to retire Brocade’s term loan | 701 | |||
Cash for vested Brocade equity awards | 28 | |||
Fair value of partially vested assumed equity awards | 23 | |||
Total purchase consideration | $ | 6,050 | ||
We financed the Brocade Merger with the net proceeds from the issuance of the October 2017 Senior Notes, as discussed in further detail in Note 8. “Borrowings,” as well as cash on hand of the combined companies.
We are currently evaluating the purchase price allocation following the consummation of the Brocade Merger. It is not practicable to disclose the preliminary purchase price allocation or unaudited pro forma combined financial information for this transaction, given the short period of time between the acquisition date and the issuance of these consolidated financial statements.
Divestiture of Brocade’s IP Networking Business
Following the Brocade Merger, on December 1, 2017, we sold Brocade’s IP Networking business, including the Ruckus Wireless and ICX Switch businesses, to ARRIS International plc for cash consideration of $800 million, plus unvested assumed employee stock awards.
Sale of Brocade’s San Jose Headquarters
On November 30, 2017, we completed the sale of Brocade’s San Jose, California headquarters for $225 million.
Proposed Acquisition of Qualcomm Incorporated
On November 6, 2017, we announced a proposal to acquire Qualcomm Incorporated, or Qualcomm, for $70 per share, consisting of $60 in cash and $10 in Broadcom ordinary shares. We stated that the proposal stands whether Qualcomm’s pending acquisition of NXP Semiconductors N.V., or NXP, is consummated on the then-disclosed terms of $110 per NXP share or is terminated. Including the assumption of net debt and giving effect to the pending NXP acquisition, the enterprise value of the proposed transaction is approximately $130 billion.
On November 13, 2017, Qualcomm’s board of directors rejected our proposal. In response, we announced that we remained fully committed to pursuing the acquisition of Qualcomm and reiterated our proposal.
On December 4, 2017, we announced that we had provided notice to Qualcomm of our intent to nominate 11 candidates for election to the Qualcomm board of directors at Qualcomm’s 2018 annual meeting of stockholders.
On December 11, 2017, we filed preliminary proxy materials with the SEC in connection with our planned solicitation of proxies to elect 11 independent, highly qualified nominees to the Qualcomm board of directors at Qualcomm’s 2018 annual meeting of stockholders, which Qualcomm has announced will be held on March 6, 2018.
We also filed a premerger notification under the Hart-Scott-Rodino Antitrust Improvements Act of 1976 with the U.S. Department of Justice Antitrust Division and the Federal Trade Commission regarding our proposed acquisition of Qualcomm.
No agreement has been reached with Qualcomm and there can be no assurance that any transaction will result from our proposal.
Redomiciliation to the United States from Singapore
On November 2, 2017, we announced our intention to initiate a process to change the parent company of the Broadcom group from a Singapore company to a U.S. corporation. The final form and timing of the redomiciliation has not yet been finalized and may be affected by the implementation of the 2017 Tax Reform Act. In addition, the redomiciliation is subject to the approval of our shareholders.
123
If we do not complete our redomiciliation within one year from the Brocade Acquisition Date, we agreed to initiate a process to separate and divest the Brocade FC SAN business.
Cash Dividends/Distribution Declared
On December 4, 2017, Broadcom’s Board of Directors declared an interim cash dividend of $1.75 per Broadcom ordinary share, payable on December 29, 2017 to shareholders of record at the close of business (Eastern Time) on December 19, 2017, or the Broadcom Dividend.
As a result of the Broadcom Dividend, and pursuant to the Partnership Agreement, the Partnership will pay a cash distribution in an amount equal to the aggregate amount of the Broadcom Dividend to Broadcom, as General Partner, and a $1.75 distribution per Partnership REU, payable on December 29, 2017, to Limited Partners of record at the close of business (Eastern Time) on December 19, 2017.
124
Supplementary Financial Data — Quarterly Data (Unaudited)
Fiscal Quarter Ended | ||||||||||||||||||||||||||||||||
October 29, 2017 (1) | July 30, 2017 (2) | April 30, 2017 (3) | January 29, 2017 (4) | October 30, 2016 (5) | July 31, 2016 (6) | May 1, 2016 (7) | January 31, 2016 | |||||||||||||||||||||||||
(In millions, except per share data) | ||||||||||||||||||||||||||||||||
Net revenue | $ | 4,844 | $ | 4,463 | $ | 4,190 | $ | 4,139 | $ | 4,136 | $ | 3,792 | $ | 3,541 | $ | 1,771 | ||||||||||||||||
Gross margin | $ | 2,383 | $ | 2,149 | $ | 1,976 | $ | 2,001 | $ | 2,171 | $ | 1,782 | $ | 1,046 | $ | 941 | ||||||||||||||||
Operating income (loss) | $ | 755 | $ | 648 | $ | 474 | $ | 506 | $ | 381 | $ | (264 | ) | $ | (1,001 | ) | $ | 475 | ||||||||||||||
Income (loss) from continuing operations | $ | 556 | $ | 509 | $ | 468 | $ | 257 | $ | (606 | ) | $ | (303 | ) | $ | (1,217 | ) | $ | 377 | |||||||||||||
Income (loss) from discontinued operations, net of income taxes | 5 | (2 | ) | (4 | ) | (5 | ) | (62 | ) | (12 | ) | (38 | ) | — | ||||||||||||||||||
Net income (loss) | 561 | 507 | 464 | 252 | (668 | ) | (315 | ) | (1,255 | ) | 377 | |||||||||||||||||||||
Net income (loss) attributable to noncontrolling interest | 29 | 26 | 24 | 13 | (36 | ) | (17 | ) | (69 | ) | — | |||||||||||||||||||||
Net income (loss) attributable to ordinary shares | $ | 532 | $ | 481 | $ | 440 | $ | 239 | $ | (632 | ) | $ | (298 | ) | $ | (1,186 | ) | $ | 377 | |||||||||||||
Diluted income (loss) per share attributable to ordinary shares: | ||||||||||||||||||||||||||||||||
Income (loss) per share from continuing operations | $ | 1.24 | $ | 1.14 | $ | 1.06 | $ | 0.58 | $ | (1.44 | ) | $ | (0.72 | ) | $ | (2.93 | ) | $ | 1.30 | |||||||||||||
Income (loss) per share from discontinued operations, net of income taxes | 0.01 | — | (0.01 | ) | (0.01 | ) | (0.15 | ) | (0.03 | ) | (0.09 | ) | — | |||||||||||||||||||
Net income (loss) per share | $ | 1.25 | $ | 1.14 | $ | 1.05 | $ | 0.57 | $ | (1.59 | ) | $ | (0.75 | ) | $ | (3.02 | ) | $ | 1.30 | |||||||||||||
Dividends declared and paid per share | $ | 1.02 | $ | 1.02 | $ | 1.02 | $ | 1.02 | $ | 0.51 | $ | 0.50 | $ | 0.49 | $ | 0.44 | ||||||||||||||||
Dividends declared and paid per share-full year | $ | 4.08 | $ | 1.94 | ||||||||||||||||||||||||||||
_________________________________
(1) | Includes amortization of acquisition-related intangible assets of $1,099 million and $110 million of litigation settlement charges. |
(2) | Includes amortization of acquisition-related intangible assets of $1,096 million. |
(3) | Includes amortization of acquisition-related intangible assets of $1,081 million. |
(4) | Includes amortization of acquisition-related intangible assets of $999 million and a loss on debt extinguishment of $159 million. |
(5) | Includes amortization of acquisition-related intangible assets of $402 million, restructuring, impairment and disposal charges of $420 million, a purchase accounting effect on inventory charge of $86 million and a loss on debt extinguishment of $49 million. |
(6) | Includes amortization of acquisition-related intangible assets of $760 million, restructuring, impairment and disposal charges of $282 million and a purchase accounting effect on inventory charge of $271 million. |
(7) | Includes the results of BRCM beginning with the fiscal quarter ended May 1, 2016 in connection with the completion of the Broadcom Merger on February 1, 2016. The results of BRCM include amortization of acquisition-related intangible assets of $749 million, a purchase accounting effect on inventory charge of $828 million, restructuring, impairment and disposal charges of $319 million and a loss on debt extinguishment of $53 million. |
125
Schedule II — Valuation and Qualifying Accounts
Balance at Beginning of Period | Additions to Allowances | Charges Utilized/ Write-offs | Balance at End of Period | |||||||||||||
(In millions) | ||||||||||||||||
Accounts receivable allowances: | ||||||||||||||||
Distributor credit allowance(1) | ||||||||||||||||
Fiscal year ended October 29, 2017 | $ | 252 | $ | 1,176 | $ | (1,251 | ) | $ | 177 | |||||||
Fiscal year ended October 30, 2016 | $ | 66 | $ | 1,216 | $ | (1,030 | ) | $ | 252 | |||||||
Fiscal year ended November 1, 2015 | $ | 58 | $ | 339 | $ | (331 | ) | $ | 66 | |||||||
Other accounts receivable allowances (2) | ||||||||||||||||
Fiscal year ended October 29, 2017 | $ | 40 | $ | 49 | $ | (58 | ) | $ | 31 | |||||||
Fiscal year ended October 30, 2016 | $ | 9 | $ | 142 | $ | (111 | ) | $ | 40 | |||||||
Fiscal year ended November 1, 2015 | $ | 7 | $ | 20 | $ | (18 | ) | $ | 9 | |||||||
Income tax valuation allowance (3) | ||||||||||||||||
Fiscal year ended October 29, 2017 | $ | 1,003 | $ | 460 | $ | (16 | ) | $ | 1,447 | |||||||
Fiscal year ended October 30, 2016 | $ | 147 | $ | 882 | $ | (26 | ) | $ | 1,003 | |||||||
Fiscal year ended November 1, 2015 | $ | 120 | $ | 28 | $ | (1 | ) | $ | 147 | |||||||
_______________________________________
(1) | Distributor credit allowance relates to price adjustments. |
(2) | Other accounts receivable allowances primarily include sales returns and allowance for doubtful accounts. |
(3) | The change in the fiscal year 2017 valuation allowance was a result of an increase in foreign deferred tax assets arising from foreign losses not expected to be realized. The change in the fiscal year 2016 valuation allowance includes $856 million as a result of the Broadcom Merger and an increase in state deferred tax assets not expected to be realized. |
ITEM 9. | CHANGES IN AND DISAGREEMENTS WITH ACCOUNTANTS ON ACCOUNTING AND FINANCIAL DISCLOSURE |
Not applicable.
ITEM 9A. | CONTROLS AND PROCEDURES |
Broadcom Limited
Evaluation of Disclosure Controls and Procedures.
Our management, with the participation of our Chief Executive Officer, or CEO, and Chief Financial Officer, or CFO, evaluated the effectiveness of Broadcom’s disclosure controls and procedures as of October 29, 2017. The term “disclosure controls and procedures,” as defined in Rules 13a-15(e) and 15d-15(e) under the Exchange Act, means controls and other procedures of a company that are designed to ensure that information required to be disclosed by a company in the reports that it files or submits under the Exchange Act is recorded, processed, summarized and reported within the time periods specified in the SEC’s rules and forms. Disclosure controls and procedures include, without limitation, controls and procedures designed to ensure that information required to be disclosed by a company in the reports that it files or submits under the Exchange Act is accumulated and communicated to our management, including its principal executive and principal financial officers, as appropriate to allow timely decisions regarding required disclosure. Management recognizes that any controls and procedures, no matter how well designed and operated, can provide only reasonable assurance of achieving their objectives and management necessarily applies its judgment in evaluating the cost-benefit relationship of possible controls and procedures. Based on the evaluation of our disclosure controls and procedures as of October 29, 2017, our CEO and CFO concluded that, as of such date, our disclosure controls and procedures were effective at the reasonable assurance level.
126
Management’s Report on Internal Control Over Financial Reporting.
Our management is responsible for establishing and maintaining adequate internal control over financial reporting for Broadcom Limited. Internal control over financial reporting is defined in Rules 13a-15(f) and 15d-15(f) promulgated under the Exchange Act as a process designed by, or under the supervision of, our principal executive and principal financial officers and effected by the Board, management and other personnel, to provide reasonable assurance regarding the reliability of financial reporting and the preparation of financial statements for external purposes in accordance with generally accepted accounting principles and includes those policies and procedures that:
• | Pertain to the maintenance of records that in reasonable detail accurately and fairly reflect the transactions and dispositions of the assets of us; |
• | Provide reasonable assurance that transactions are recorded as necessary to permit preparation of financial statements in accordance with generally accepted accounting principles, and that receipts and expenditures of us are being made only in accordance with authorizations of management and directors of us; and |
• | Provide reasonable assurance regarding prevention or timely detection of unauthorized acquisition, use or disposition of our assets that could have a material effect on the financial statements. |
Because of its inherent limitations, internal control over financial reporting may not prevent or detect misstatements. Projections of any evaluation of effectiveness to future periods are subject to the risk that controls may become inadequate because of changes in conditions, or that the degree of compliance with the policies or procedures may deteriorate.
Our management assessed the effectiveness of our internal control over financial reporting as of October 29, 2017. In making this assessment, our management used the criteria set forth by the Committee of Sponsoring Organizations of the Treadway Commission (COSO) in Internal Control-Integrated Framework (2013). Based on this assessment, our management concluded that, as of October 29, 2017, our internal control over financial reporting is effective based on those criteria.
The effectiveness of our internal control over financial reporting, as of October 29, 2017 has been audited by PricewaterhouseCoopers LLP, an independent registered public accounting firm, as stated in their report which is included in Part II, Item 8. of this Annual Report on Form 10-K.
Changes in Internal Controls over Financial Reporting.
No change in our internal control over financial reporting (as defined in Rules 13a-15(f) and 15d-15(f) under the Exchange Act) occurred during the fiscal quarter ended October 29, 2017 that has materially affected, or is reasonably likely to materially affect, our internal control over financial reporting.
Broadcom Cayman L.P.
Evaluation of Disclosure Controls and Procedures.
An evaluation was conducted under the supervision and with the participation of the management of Broadcom, as our General Partner, including the CEO and CFO of Broadcom as authorized representative in its capacity as the General Partner of the Partnership, of the effectiveness of Partnership’s disclosure controls and procedures as of October 29, 2017. The term “disclosure controls and procedures,” as defined in Rules 13a-15(e) and 15d-15(e) under the Exchange Act, means controls and other procedures of a company that are designed to ensure that information required to be disclosed by a company in the reports that it files or submits under the Exchange Act is recorded, processed, summarized and reported within the time periods specified in the SEC’s rules and forms. Disclosure controls and procedures include, without limitation, controls and procedures designed to ensure that information required to be disclosed by a company in the reports that it files or submits under the Exchange Act is accumulated and communicated to the management of Broadcom, as our General Partner, including its principal executive and principal financial officers, of Broadcom, as appropriate to allow timely decisions regarding required disclosure. Our General Partner, as our management recognizes that any controls and procedures, no matter how well designed and operated, can provide only reasonable assurance of achieving their objectives and necessarily applies its judgment in evaluating the cost-benefit relationship of possible controls and procedures. Based on the evaluation of our disclosure controls and procedures as of October 29, 2017, the management of Broadcom, as our General Partner, including the CEO and CFO concluded that, as of such date, our disclosure controls and procedures were effective at the reasonable assurance level.
127
Management’s Report on Internal Control Over Financial Reporting.
The management of our General Partner is responsible for establishing and maintaining adequate internal control over financial reporting for the Partnership. Internal control over financial reporting is defined in Rules 13a-15(f) and 15d-15(f) promulgated under the Exchange Act as a process designed by, or under the supervision of, our principal executive and principal financial officers and effected by the Board, management and other personnel, to provide reasonable assurance regarding the reliability of financial reporting and the preparation of financial statements for external purposes in accordance with generally accepted accounting principles and includes those policies and procedures that:
• | Pertain to the maintenance of records that in reasonable detail accurately and fairly reflect the transactions and dispositions of the assets of us; |
• | Provide reasonable assurance that transactions are recorded as necessary to permit preparation of financial statements in accordance with generally accepted accounting principles, and that receipts and expenditures of us are being made only in accordance with authorizations of management and directors of us; and |
• | Provide reasonable assurance regarding prevention or timely detection of unauthorized acquisition, use or disposition of our assets that could have a material effect on the financial statements. |
Because of its inherent limitations, internal control over financial reporting may not prevent or detect misstatements. Projections of any evaluation of effectiveness to future periods are subject to the risk that controls may become inadequate because of changes in conditions, or that the degree of compliance with the policies or procedures may deteriorate.
The management of our General Partner assessed the effectiveness of our internal control over financial reporting as of October 29, 2017. In making this assessment, the management of our General Partner used the criteria set forth by the Committee of Sponsoring Organizations of the Treadway Commission (COSO) in Internal Control-Integrated Framework (2013). Based on this assessment, the management of our General Partner concluded that, as of October 29, 2017, our internal control over financial reporting is effective based on those criteria.
The effectiveness of our internal control over financial reporting, as of October 29, 2017 has been audited by PricewaterhouseCoopers LLP, an independent registered public accounting firm, as stated in their report which is included in Part II, Item 8. of this Annual Report on Form 10-K.
Changes in Internal Controls over Financial Reporting.
No change in our internal control over financial reporting (as defined in Rules 13a-15(f) and 15d-15(f) under the Exchange Act) occurred during the fiscal quarter ended October 29, 2017 that has materially affected, or is reasonably likely to materially affect, our internal control over financial reporting.
128
ITEM 9B. | OTHER INFORMATION |
As previously disclosed in our periodic reports, in 2016, Tessera Technologies, Inc. and certain of its affiliates filed complaints against Broadcom and certain of its subsidiaries alleging infringement of certain patents. On December 18, 2017, the parties entered into comprehensive settlement agreements and a patent license agreement to settle and resolve all outstanding litigation.
In accordance with GAAP, we are required to reflect related settlement expenses in our financial statements for the year ended October 29, 2017 because (i) the settlement is related to litigation that existed at the balance sheet date of October 29, 2017 and (ii) the incurrence of such expenses became probable and estimable after December 6, 2017, the date on which we reported our preliminary financial results for the fiscal year, but prior to the filing this Annual Report on Form 10-K. As a result, our financial results for the quarter and year ended October 29, 2017, which were summarized in our prior earnings release, have been updated to reflect the settlement expenses. This amount does not take into consideration the receipt of any potential indemnity or contributions amounts we may become entitled to as a result of the settlement because such amounts are not probable or reasonably estimable as of the date hereof.
The settlement expenses reduced our net income and diluted net income per share for each of the fiscal quarter and year ended October 29, 2017 on a GAAP basis compared to the results reported in our December 6, 2017 earnings release. These adjustments are reflected in this Annual Report on Form 10-K.
129
PART III
ITEM 10. | DIRECTORS, EXECUTIVE OFFICERS AND CORPORATE GOVERNANCE |
The information regarding our directors, executive officers and compliance with Section 16(a) of the Exchange Act, set forth in the sections entitled “Proposal 1 — Election of Directors,” “Executive Officers,” “Corporate Governance” and “Section 16(a) Beneficial Ownership Reporting Compliance,” in Broadcom’s definitive Proxy Statement for our 2018 Annual General Meeting of Shareholders to be filed with the SEC within 120 days of the end of our 2017 fiscal year pursuant to General Instruction G(3) to Form 10-K is hereby incorporated by reference in this section.
We have adopted a written Code of Ethics and Business Conduct that applies to all of our employees and directors, including our principal executive officer, principal financial officer and principal accounting officer, or persons performing similar functions and have posted it in the “Investors Center — Governance” section of our website, which is located at www.broadcom.com. We intend to satisfy any disclosure requirement under Item 5.05 of Form 8-K regarding any amendments to, or waivers from, our Code of Ethics and Business Conduct by posting such information on our website at the internet address and location above.
ITEM 11. | EXECUTIVE COMPENSATION |
The information regarding executive compensation required by this Item 11 set forth in the sections entitled “Director Compensation”, “Compensation Discussion and Analysis,” “Executive Compensation,” “Compensation Committee Report” and “Corporate Governance — Compensation Committee Interlocks and Insider Participation" in Broadcom’s definitive Proxy Statement for our 2018 Annual General Meeting of Shareholders to be filed with the SEC within 120 days of the end of our 2017 fiscal year pursuant to General Instruction G(3) to Form 10-K is hereby incorporated by reference in this section. However, the Compensation Committee Report included in such definitive Proxy Statement shall not be deemed “filed” with the SEC for the purposes of Section 18 of the Exchange Act or otherwise subject to the liabilities of that section, nor shall it be deemed incorporated by reference in any filing made by us with the SEC, regardless of any general incorporation language in such filing.
ITEM 12. | SECURITY OWNERSHIP OF CERTAIN BENEFICIAL OWNERS AND MANAGEMENT AND RELATED STOCKHOLDER MATTERS |
The information regarding security ownership of certain beneficial owners and management and related shareholder matters required by this Item 12 set forth in the section entitled “Security Ownership of Certain Beneficial Owners, Directors and Executive Officers” and “Equity Compensation Plan Information” in Broadcom’s definitive Proxy Statement for our 2018 Annual General Meeting of Shareholders to be filed with the SEC within 120 days of the end of our 2017 fiscal year pursuant to General Instruction G(3) to Form 10-K is hereby incorporated by reference in this section.
ITEM 13. | CERTAIN RELATIONSHIPS AND RELATED TRANSACTIONS, AND DIRECTOR INDEPENDENCE |
The information regarding certain relationships, related transactions and director independence required by this Item 13 set forth in the sections entitled “Corporate Governance” and “Certain Relationships and Related Party Transactions” in Broadcom’s definitive Proxy Statement for our 2018 Annual General Meeting of Shareholders to be filed with the SEC within 120 days of the end of our 2017 fiscal year pursuant to General Instruction G(3) to Form 10-K is hereby incorporated by reference in this section.
ITEM 14. | PRINCIPAL ACCOUNTING FEES AND SERVICES |
The information regarding principal accounting fees and services required by this Item 14 set forth in the proposal relating to the re-appointment of our independent registered public accounting firm in Broadcom’s definitive Proxy Statement for our 2018 Annual General Meeting of Shareholders to be filed with the SEC within 120 days of the end of our 2017 fiscal year pursuant to General Instruction G(3) to Form 10-K is hereby incorporated by reference in this section.
130
PART IV
ITEM 15. | EXHIBITS, FINANCIAL STATEMENT SCHEDULES |
(a) The following are filed as part of this Annual Report on Form 10-K:
1. Financial Statements
The following consolidated financial statements are included in Item 8 of this Annual Report on Form 10-K:
Page | |
Financial Statements of Broadcom Limited | |
Financial Statements of Broadcom Cayman L.P. | |
2. Financial Statement Schedules
The financial statement schedule required by Item 15(a) (Schedule II, Valuation and Qualifying Accounts) is included in Item 8 of this Annual Report on Form 10-K.
Schedules not filed have been omitted because they are not applicable, are not required or the information required to be set forth therein is included in the financial statements or notes thereto.
3. Exhibits
The documents set forth below are filed herewith or incorporated by reference to the location indicated.
Exhibit No. | Incorporated by Referenced Herein | Filed Herewith | |||||
Description | Form | Filing Date | |||||
2.1# | Avago Technologies Limited Current Report on Form 8-K (Commission File No. 001-34428) | April 11, 2013 | |||||
2.2# | Avago Technologies Limited Current Report on Form 8-K/A (Commission File No. 001-34428) | December 16, 2013 | |||||
131
Exhibit No. | Incorporated by Referenced Herein | Filed Herewith | |||||
Description | Form | Filing Date | |||||
2.3# | Avago Technologies Limited Current Report on Form 8-K (Commission File No. 001-34428) | May 29, 2015 | |||||
2.4 | Avago Technologies Limited Current Report on Form 8-K (Commission File No. 001-34428) | July 31, 2015 | |||||
2.5 | Broadcom Limited Current Report on Form 8-K/A (Commission File No. 001-37690) | November 2, 2016 | |||||
3.1 | Broadcom Limited Current Report on Form 8-K12B (Commission File No. 001-37690) | February 2, 2016 | |||||
3.2 | Broadcom Limited Current Report on Form 8-K12B (Commission File No. 001-37690) | February 2, 2016 | |||||
3.3 | Broadcom Limited Current Report on Form 8-K12B (Commission File No. 001-37690) | February 2, 2016 | |||||
4.1 | Broadcom Limited Registration Statement on Form S-3 (Commission File No. 333-209923) | March 4, 2016 | |||||
4.2 | Broadcom Limited Current Report on Form 8-K (Commission File No. 001-37690) | January 20, 2017 | |||||
4.3 | Broadcom Limited Current Report on Form 8-K (Commission File No. 001-37690) | January 20, 2017 | |||||
4.4 | Broadcom Limited Current Report on Form 8-K (Commission File No. 001-37690) | January 20, 2017 | |||||
4.5 | Broadcom Limited Current Report on Form 8-K (Commission File No. 001-37690) | January 20, 2017 | |||||
4.6 | Broadcom Limited Current Report on Form 8-K (Commission File No. 001-37690) | January 20, 2017 | |||||
132
Exhibit No. | Incorporated by Referenced Herein | Filed Herewith | |||||
Description | Form | Filing Date | |||||
4.7 | Broadcom Limited Current Report on Form 8-K (Commission File No. 001-37690) | January 20, 2017 | |||||
4.8 | Broadcom Limited Current Report on Form 8-K (Commission File No. 001-37690) | October 17, 2017 | |||||
4.9 | Broadcom Limited Current Report on Form 8-K (Commission File No. 001-37690) | October 17, 2017 | |||||
4.10 | Broadcom Limited Current Report on Form 8-K (Commission File No. 001-37690) | October 17, 2017 | |||||
4.11 | Broadcom Limited Current Report on Form 8-K (Commission File No. 001-37690) | October 17, 2017 | |||||
4.12 | Broadcom Limited Current Report on Form 8-K (Commission File No. 001-37690) | October 17, 2017 | |||||
4.13 | Broadcom Limited Current Report on Form 8-K (Commission File No. 001-37690) | October 17, 2017 | |||||
10.1 | Broadcom Limited Quarterly Report on Form 10-Q (Commission File No. 001-37690) | June 9, 2016 | |||||
10.2 | Broadcom Limited Quarterly Report on Form 10-Q (Commission File No. 001-37690) | June 9, 2016 | |||||
133
Exhibit No. | Incorporated by Referenced Herein | Filed Herewith | |||||
Description | Form | Filing Date | |||||
10.3 | Broadcom Limited Current Report on Form 8-K12B (Commission File No. 001-37690) | February 2, 2016 | |||||
10.4 | Broadcom Limited Current Report on Form 8-K12B (Commission File No. 001-37690) | February 2, 2016 | |||||
10.5 | Avago Technologies Limited Quarterly Report on Form 10-Q (Commission File No. 001-34428) | September 13, 2013 | |||||
10.6 | Avago Technologies Finance Pte. Ltd. Amendment No. 1 to Annual Report on Form 20-F/A (Commission File No. 333-137664) | February 27, 2008 | |||||
10.7 | Broadcom Limited Current Report on Form 8-K (Commission File No. 001-37690) | February 2, 2016 | |||||
10.8 | Broadcom Limited Quarterly Report on Form 10-Q (Commission File No. 001-37690) | June 9, 2016 | |||||
10.9 | Broadcom Limited Current Report on Form 8-K (Commission File No. 001-37690) | August 3, 2016 | |||||
10.10 | Broadcom Limited Current Report on Form 8-K (Commission File No. 001-37690) | August 3, 2016 | |||||
10.11 | Broadcom Limited Current Report on Form 8-K (Commission File No. 001-37690) | August 3, 2016 | |||||
134
Exhibit No. | Incorporated by Referenced Herein | Filed Herewith | |||||
Description | Form | Filing Date | |||||
10.12 | Broadcom Limited Current Report on Form 8-K (Commission File No. 001-37690) | January 20, 2017 | |||||
10.13 | Avago Technologies Limited Registration Annual Report on Form 10-K (Commission File No. 001-33428) | December 15, 2010 | |||||
10.14 | Avago Technologies Limited Registration Annual Report on Form 10-K (Commission File No. 001-33428) | December 17, 2015 | |||||
10.15 | Broadcom Limited Quarterly Report on Form 10-Q (Commission File No. 001-37690) | March 10, 2016 | |||||
10.16 | Avago Technologies Finance Pte. Ltd. Registration Statement on Form F-4 (Commission File No. 333-137664) | November 15, 2006 | |||||
10.17 | Avago Technologies Finance Pte. Ltd. Registration Statement on Form F-4 (Commission File No. 333-137664) | November 15, 2006 | |||||
10.18 | Avago Technologies Finance Pte. Ltd. Registration Statement on Form F-4 (Commission File No. 333-137664) | November 15, 2006 | |||||
135
Exhibit No. | Incorporated by Referenced Herein | Filed Herewith | |||||
Description | Form | Filing Date | |||||
10.19 | Avago Technologies Finance Pte. Ltd. Registration Statement on Form F-4 (Commission File No. 333-137664) | November 15, 2006 | |||||
10.20 | Avago Technologies Limited Quarterly Report on Form 10-Q (Commission File No. 001-34428) | September 13, 2013 | |||||
10.21 | Broadcom Corporation Annual Report on Form 10-K (Commission File No. 000-23993) | March 31, 2003 | |||||
10.22 | Broadcom Corporation Annual Report on Form 10-K (Commission File No. 000-23993) | February 4, 2009 | |||||
10.23 | Broadcom Corporation Annual Report on Form 10-K (Commission File No. 000-23993) | February 2, 2011 | |||||
10.24* | Broadcom Corporation Annual Report on Form 10-K (Commission File No. 000-23993) | March 1, 2005 | |||||
10.25 | Broadcom Corporation Quarterly Report on Form 10-Q (Commission File No. 000-23993) | October 24, 2007 | |||||
10.26 | Broadcom Corporation Annual Report on Form 10-K (Commission File No. 000-23993) | January 28, 2008 | |||||
10.27 | Broadcom Corporation Annual Report on Form 10-K (Commission File No. 000-23993) | January 28, 2008 | |||||
10.28 | Broadcom Corporation Annual Report on Form 10-K (Commission File No. 000-23993) | February 1, 2012 | |||||
10.29 | X | ||||||
136
Exhibit No. | Incorporated by Referenced Herein | Filed Herewith | |||||
Description | Form | Filing Date | |||||
10.30* | Broadcom Corporation Current Report on Form 8-K/A (Commission File No. 000-23993) | July 23, 2009 | |||||
10.31+ | Avago Technologies Limited Registration Statement on Form S-1 (Commission File No. 333-153127) | July 27, 2009 | |||||
10.32+ | Broadcom Limited Current Report on Form 8-K (Commission File No. 001-37690) | February 2, 2016 | |||||
10.33+ | Avago Technologies Limited Registration Statement on Form S-8 (Commission File No. 333-195741) | May 6, 2014 | |||||
10.34+ | Broadcom Limited Annual Report on Form 10-K (Commission File No. 001-37690) | December 23, 2016 | |||||
10.35+ | Avago Technologies Limited Registration Statement on Form S-8 (Commission File No. 333-203858) | May 5, 2015 | |||||
10.36+ | Broadcom Limited Annual Report on Form 10-K (Commission File No. 001-37690) | December 23, 2016 | |||||
10.37+ | Broadcom Corporation Annual Report on Form 10-K (Commission File No. 000-23993) | January 29, 2015 | |||||
10.38+ | Broadcom Limited Annual Report on Form 10-K (Commission File No. 001-37690) | December 23, 2016 | |||||
10.39+ | Broadcom Corporation Annual Report on Form 10-K (Commission File No. 000-23993) | February 2, 2011 | |||||
10.40+ | Broadcom Limited Annual Report on Form 10-K (Commission File No. 001-37690) | December 23, 2016 | |||||
10.41+ | Brocade Communication Systems, Inc. Current Report on Form 8-K (Commission File No. 000-25601 ) | April 12, 2017 | |||||
10.42+ | Broadcom Limited Registration Statement on Form S-8 (Commission File No. 333-221654) | November 11, 2017 | |||||
10.43+ | Brocade Communication Systems, Inc. Post-Effective Amendment No. 1 to Form S-4 on Form S-8 Registration Statement (Commission File No. 333-211823) | June 3, 2016 | |||||
137
Exhibit No. | Incorporated by Referenced Herein | Filed Herewith | |||||
Description | Form | Filing Date | |||||
10.44+ | Broadcom Limited Registration Statement on Form S-8 (Commission File No. 333-221654) | November 11, 2017 | |||||
10.45+ | Broadcom Limited Annual Report on Form 10-K (Commission File No. 001-37690) | December 23, 2016 | |||||
10.46+ | Amendment No. 5 to Avago Technologies Limited Registration Statement on Form S-1 (Commission File No. 333-153127) | July 27, 2009 | |||||
10.47+ | Avago Technologies Limited Quarterly Report on Form 10-Q (Commission File No. 001-34428) | June 7, 2013 | |||||
10.48+ | Broadcom Limited Quarterly Report on Form 10-Q (Commission File No. 001-37690) | March 10, 2016 | |||||
10.49+ | X | ||||||
10.50+ | Broadcom Limited Quarterly Report on Form 10-Q (Commission File No. 001-37690) | March 9, 2017 | |||||
10.51+ | X | ||||||
10.52+ | Avago Technologies Limited Registration Statement on Form S-8 (Commission File No. 333-196438) | June 2, 2014 | |||||
10.53+ | Avago Technologies Limited Registration Statement on Form S-8 (Commission File No. 333-196438) | June 2, 2014 | |||||
10.54+ | Broadcom Limited Quarterly Report on Form 10-Q (Commission File No. 001-37690) | March 10, 2016 | |||||
10.55+ | X | ||||||
10.56+ | Broadcom Corporation Quarterly Report on Form 10-Q (Commission File No. 000-23993) | April 24, 2014 | |||||
10.57+ | Broadcom Corporation Quarterly Report on Form 10-Q (Commission File No. 000-23993) | July 30, 2015 | |||||
138
Exhibit No. | Incorporated by Referenced Herein | Filed Herewith | |||||
Description | Form | Filing Date | |||||
10.58+ | Broadcom Corporation Annual Report on Form 10-K (Commission File No. 000-23993) | January 30, 2014 | |||||
10.59+ | Broadcom Corporation Quarterly Report on Form 10-Q (Commission File No. 000-23993) | April 24, 2014 | |||||
10.60+ | Broadcom Limited Quarterly Report on Form 10-Q (Commission File No. 001-37690) | March 10, 2016 | |||||
10.61+ | X | ||||||
10.62+ | Broadcom Limited Quarterly Report on Form 10-Q (Commission File No. 001-37690) | March 9, 2017 | |||||
10.63+ | X | ||||||
10.64+ | Broadcom Limited Current Report on Form 8-K (Commission File No. 001-37690) | June 16, 2016 | |||||
10.65+ | Broadcom Limited Current Report on Form 8-K (Commission File No. 001-37690) | June 19, 2017 | |||||
10.66+ | Avago Technologies Limited Current Report on Form 10-Q (Commission File No. 001-34428) | September 10, 2015 | |||||
10.67+ | Avago Technologies Limited Quarterly Report on Form 10-Q (Commission File No. 001-34428) | March 13, 2014 | |||||
10.68+ | Broadcom Limited Annual Report on Form 10-K (Commission File No. 001-37690) | December 23, 2016 | |||||
10.69+ | Avago Technologies Limited Quarterly Report on Form 10-Q (Commission File No. 001-34428) | June 10, 2015 | |||||
10.70+ | Avago Technologies Limited Quarterly Report on Form 10-Q (Commission File No. 001-34428) | March 13, 2014 | |||||
10.71+ | X | ||||||
139
Exhibit No. | Incorporated by Referenced Herein | Filed Herewith | |||||
Description | Form | Filing Date | |||||
10.72+* | Avago Technologies Limited Annual Report on Form 10-K (Commission File No. 001-34428) | December 17, 2015 | |||||
10.73+ | Avago Technologies Limited Quarterly Report on Form 10-Q (Commission File No. 001-34428) | June 10, 2015 | |||||
10.74+ | Broadcom Limited Quarterly Report on Form 10-Q (Commission File No. 001-37690) | March 10, 2016 | |||||
12.1 | X | ||||||
21.1 | X | ||||||
23.1 | X | ||||||
24.1 | X | ||||||
31.1 | X | ||||||
31.2 | X | ||||||
31.3 | X | ||||||
31.4 | X | ||||||
32.1 | X | ||||||
32.2 | X | ||||||
32.3 | X | ||||||
140
Exhibit No. | Incorporated by Referenced Herein | Filed Herewith | |||||
Description | Form | Filing Date | |||||
32.4 | X | ||||||
101.INS | XBRL Instance Document | X | |||||
101.SCH | XBRL Schema Document | X | |||||
101.CAL | XBRL Calculation Linkbase Document | X | |||||
101.DEF | XBRL Definition Linkbase Document | X | |||||
101.LAB | XBRL Labels Linkbase Document | X | |||||
101.PRE | XBRL Presentation Linkbase Document | X | |||||
Notes:
+ | Indicates a management contract or compensatory plan or arrangement. | |
# | Schedules have been omitted pursuant to Item 601(b)(2) of Regulation S-K. Broadcom Limited hereby undertakes to furnish supplementally copies of any omitted schedules upon request by the SEC. | |
* | Certain information omitted pursuant to a request for confidential treatment filed with the SEC. | |
141
SIGNATURES
Pursuant to the requirements of Section 13 or 15(d) of the Securities Exchange Act of 1934, the Registrant has duly caused this report to be signed on its behalf by the undersigned, thereunto duly authorized.
BROADCOM LIMITED | |||
By: | /s/ Hock E. Tan | ||
Name: | Hock E. Tan | ||
Title: | President and Chief Executive Officer | ||
Date: December 21, 2017
BROADCOM CAYMAN L.P., | |||
by its General Partner, Broadcom Limited | |||
By: | /s/ Hock E. Tan | ||
Name: | Hock E. Tan | ||
Title: | President and Chief Executive Officer | ||
Date: December 21, 2017
POWER OF ATTORNEY
Each person whose individual signature appears below hereby authorizes and appoints Hock E. Tan, Thomas H. Krause, Jr., Mark D. Brazeal and Kirsten M. Spears, and each of them, with full power of substitution and resubstitution and full power to act without the other, as his or her true and lawful attorney-in-fact and agent to act in his or her name, place and stead and to execute in the name and on behalf of each person, individually and in each capacity stated below, and to file any and all amendments to this Annual Report on Form 10-K, and to file the same, with all exhibits thereto, and other documents in connection therewith, with the Securities and Exchange Commission, granting unto said attorneys-in-fact and agents, and each of them, full power and authority to do and perform each and every act and thing, ratifying and confirming all that said attorneys-in-fact and agents or any of them or their or his substitute or substitutes may lawfully do or cause to be done by virtue thereof.
142
Pursuant to the requirements of the Securities Exchange Act of 1934, this Annual Report on Form 10-K has been signed by the following persons on behalf of the Registrant in the capacities indicated and on the dates indicated.
Signature | Title | Date | ||
/s/ Hock E. Tan | President and Chief Executive Officer and Director (Principal Executive Officer) | December 21, 2017 | ||
Hock E. Tan | ||||
/s/ Thomas H. Krause, Jr. | Chief Financial Officer (Principal Financial Officer) | December 21, 2017 | ||
Thomas H. Krause, Jr. | ||||
/s/ Kirsten M. Spears | Principal Accounting Officer | December 21, 2017 | ||
Kirsten M. Spears | ||||
/s/ James Diller Sr. | Chairman of the Board of Directors | December 21, 2017 | ||
James Diller Sr. | ||||
/s/ Gayla J. Delly | Director | December 21, 2017 | ||
Gayla J. Delly | ||||
/s/ Lewis C. Eggebrecht | Director | December 21, 2017 | ||
Lewis C. Eggebrecht | ||||
/s/ Kenneth Y. Hao | Director | December 21, 2017 | ||
Kenneth Y. Hao | ||||
/s/ Eddy W. Hartenstein | Director | December 21, 2017 | ||
Eddy W. Hartenstein | ||||
/s/ Check Kian Low | Director | December 21, 2017 | ||
Check Kian Low | ||||
/s/ Donald Macleod | Director | December 21, 2017 | ||
Donald Macleod | ||||
/s/ Peter J. Marks | Director | December 21, 2017 | ||
Peter J. Marks | ||||
/s/ Henry Samueli | Director | December 21, 2017 | ||
Henry Samueli | ||||
143