UNITED STATES
SECURITIES AND EXCHANGE COMMISSION
Washington, DC 20549
FORM 10-K
Annual Report Pursuant to Section 13 or 15(d)
of the Securities Exchange Act of 1934
For the Fiscal Year Ended December 31, 2017
Commission file number: 333-205986
RIVER FINANCIAL CORPORATION
(Exact name of registrant as specified in its charter)
|
Alabama |
|
46-1422125 |
|
(State or other jurisdiction of |
|
(I.R.S. Employer |
|
incorporation or organization) |
|
Identification No.) |
|
|
|
|
|
2611 Legends Drive Prattville, AL |
|
36066 |
|
(Address of principal executive offices) |
|
(Zip Code) |
(334) 290-1012
(Registrant’s telephone number, including area code)
Securities registered pursuant to Section 12(b) of the Act:
|
Title of Each Class |
|
Name of Exchange on Which Registered |
|
None. |
|
Not applicable. |
Securities registered pursuant to Section 12(g) of the Act: None
Indicate by check mark if the registrant is a well-known seasoned issuer, as defined in Rule 405 of the Securities Act. Yes ☐ No ☒
Indicate by check mark if the registrant is not required to file reports pursuant to Section 13 or Section 15(d) of the Exchange Act. Yes ☐ No ☒
Indicate by check mark whether the registrant (1) has filed all reports required to be filed by Section 13 or 15(d) of the Securities Exchange Act of 1934 during the preceding 12 months (or for such shorter period that the registrant was required to file such reports), and (2) has been subject to such filing requirements for the past 90 days. Yes ☒ No ☐
Indicate by check mark whether the registrant has submitted electronically and posted on its corporate Web site, if any, every Interactive Data File required to be submitted and posted pursuant to Rule 405 of Regulation S-T (§232.405 of this chapter) during the preceding 12 months (or for such shorter period that the registrant was required to submit and post such files). Yes ☒ No ☐
Indicate by check mark if disclosure of delinquent filers pursuant to Item 405 of Regulation S-K is not contained herein, and will not be contained, to the best of registrant’s knowledge, in definitive proxy or information statements incorporated by reference in Part III of this Form 10-K or any amendment to this Form 10-K. ☒
Indicate by check mark whether the registrant is a large accelerated filer, an accelerated filer, a non-accelerated filer, or a smaller reporting company. See the definitions of “large accelerated filer,” “accelerated filer” and “smaller reporting company” in Rule 12b-2 of the Exchange Act.
|
Large accelerated filer |
|
☐ |
|
Accelerated filer |
|
☐ |
|
|
|
|
|
|||
|
Non-accelerated filer |
|
☐ |
|
Smaller reporting company |
|
☒ |
|
|
|
|
|
|
|
|
|
Emerging growth company |
|
☐ |
|
|
|
|
|
|
|
|
|
|
|
|
If an emerging growth company, indicate by check mark if the registrant has elected not to use the extended transition period for complying with any new or revised financial accounting standards provided pursuant to Section 13(a) of the Exchange Act.
Indicate by check mark whether the registrant is a shell company (as defined in Rule 12b-2 of the Exchange Act). Yes ☐ No ☒
✓ Indicate by check mark whether the registrant is a shell company (as defined in Rule 12b-2 of the Act). Yes ☐ No ☒
State the aggregate market value of the voting common equity held by non-affiliates of the registrant as of June 30, 2017: There is no public market for registrant’s common stock. The registrant had total revenue of less than $50 million in 2017.
Indicate the number of shares outstanding of each of the registrant’s classes of common stock, as of the latest practicable date.
|
Class of Common Stock |
|
Outstanding at March 1, 2018 |
|
Common stock, par value $1.00 per share |
|
5,119,818 shares |
FORM 10-K
INDEX
|
|
2 |
|
|
|
|
|
|
|
2 |
|
|
|
|
|
|
|
|
|
|
|
|
|
|
Item 1. |
3 |
|
|
|
|
|
|
Item 1A. |
15 |
|
|
|
|
|
|
Item 1B. |
28 |
|
|
|
|
|
|
Item 2. |
29 |
|
|
|
|
|
|
Item 3. |
29 |
|
|
|
|
|
|
Item 4. |
29 |
|
|
|
|
|
|
|
|
|
|
|
|
|
|
|
|
|
|
Item 5. |
30 |
|
|
|
|
|
|
Item 6. |
32 |
|
|
|
|
|
|
Item 7. |
Management’s Discussion and Analysis of Financial Condition and Results of Operations |
34 |
|
|
|
|
|
Item 8. |
51 |
|
|
|
|
|
|
Item 9. |
Changes in and Disagreements with Accounting and Financial Disclosures |
87 |
|
|
|
|
|
Item 9A. |
87 |
|
|
|
|
|
|
|
|
|
|
|
|
|
|
|
|
|
|
|
|
|
|
Item 10. |
88 |
|
|
|
|
|
|
Item 11. |
90 |
|
|
|
|
|
|
Item 12. |
Security Ownership of Certain Beneficial Owners and Management and Related Stockholder Matters |
95 |
|
|
|
|
|
Item 13. |
Certain Relationships and Related Transactions and Director Independence |
96 |
|
|
|
|
|
Item 14. |
96 |
|
|
|
|
|
|
Part IV. |
|
|
|
|
|
|
|
Item 15. |
97 |
|
|
|
|
|
|
98 |
||
i
Unless the context otherwise indicates or requires, in this Annual Report on Form 10-K to “River,” “RFC,” the “Company,” “we,” “us” and “our” refer to River Financial Corporation, an Alabama corporation, as well as our wholly-owned subsidiary bank, River Bank and Trust, an Alabama Banking Corporation which we may sometimes refer to as “RB&T” and the “Bank”.
On October 28, 2015, the Company’s Registration Statement on Form S-4 (File No. 333-205986) became effective, and the Company became subject to the reporting requirements of the Securities Exchange Act of 1934, as amended (the “Exchange Act”) under Section 15(d).
This Annual Report on Form 10-K contains forward-looking statements that reflect our current views with respect to, among other things, future events and financial performance, which involve substantial risks and uncertainties. Certain statements made in this Annual Report on Form 10-K are “forward-looking statements” within the meaning of Section 27A of the Securities Act of 1933, as amended (the “Securities Act”), and Section 21E of the Exchange Act. Forward-looking statements include any statement that, without limitation, may predict, forecast, indicate or imply future results, performance or achievements instead of historical or current facts and may contain words like “anticipates,” “approximately,” “believes,” “budget,” “can,” “could,” “continues,” “contemplates,” “estimates,” “expects,” “forecast,” “intends,” “may,” “might,” “objective,” “outlook,” “predicts,” “probably,” “plans,” “potential,” “project,” “seeks,” “shall,” “should,” “target,” “will,” or the negative of these terms and other words, phrases, or expressions with similar meaning.
Any forward-looking statements contained in this Annual Report on Form 10-K are based upon our historical performance and on our current plans, estimates and expectations in light of information currently available to us. The inclusion of forward-looking information should not be regarded as a representation by us that the future plans, estimates or expectations will be achieved. Such forward-looking statements are subject to various risks and uncertainties and assumptions relating to our operations, financial results, financial condition, business, prospects, growth strategy and liquidity. Forward-looking statements involve risks and uncertainties which may cause actual results to differ materially from those projected in the forward-looking statements, and the Company cannot give assurances that such statements will prove to be correct. Except as required by law, we undertake no obligation to update any forward-looking statement, whether as a result of new information or otherwise. Given these uncertainties, the reader should not place undue reliance on forward-looking statements as a prediction of actual results. Factors that could cause actual results to differ materially from those projected or estimated by us include those that are discussed herein under “Part I, Item 1A. – Risk Factors,” as well as other unknown risks and uncertainties.
2
Overview
We are a bank holding company headquartered in Prattville, Alabama. River Bank & Trust was formed as an Alabama banking corporation in March 2006. In November 2012, River Financial Corporation was formed as an Alabama corporation and all the common shares of River Bank & Trust were exchanged for common shares of River Financial Corporation and River Bank & Trust became the wholly owned subsidiary of River Financial Corporation.
We operate one subsidiary bank, River Bank & Trust. Through the Bank, we provide a broad array of financial services to businesses, business owners, and professionals. We operate ten full-service banking offices, located in Montgomery, Prattville, Millbrook, Wetumpka, Auburn, Opelika, Alexander City and Gadsden, Alabama.
As of December 31, 2017, we had total assets of $823.3 million, total loans of $547.1 million, total deposits of $699.9 million, and total shareholders’ equity of $89.0 million.
Our Products and Services
Through our Bank, we engage in the business of banking, which consists primarily of accepting deposits from the public and making loans and other investments. Our principal sources of funds for loans and investments at our Bank are demand, time, savings, and other deposits (including negotiable orders of withdrawal, or NOW accounts) and the amortization and prepayments of loans and investments. Our principal sources of income are interest and fees collected on loans, interest collected on other investments, fees earned from the origination and sale of residential mortgage loans, and service charges, as well as income from investment brokerage services. Our principal expenses are interest paid on savings and other deposits (including NOW accounts), interest paid on other borrowings, employee compensation, office expenses, and other overhead expenses.
Deposits
Our principal sources of funds are core deposits, including demand deposits, interest-bearing transaction accounts, money market accounts, savings deposits, and certificates of deposit. As of December 31, 2017, our deposit composition was as follows:
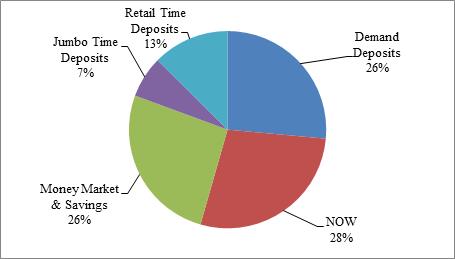
Deposit rates are reviewed weekly by senior management. Management believes that the rates that we offer are competitive with those offered by other institutions in our market areas. We also focus on customer service to attract and retain deposits.
Transaction accounts include demand deposits and NOW accounts, which customers use for cash management and which provide us with a source of fee income, as well as a low-cost source of funds. Time and savings accounts also provide a relatively stable and low-cost source of funds. Our primary source of funds is NOW accounts. Certificates of deposit in excess of $100,000 are held primarily by customers in our market areas. We utilize brokered certificates of deposit to supplement our market funding sources when funding needs or pricing warrants the use of wholesale funding.
3
We offer a range of lending services, including real estate, consumer, and commercial loans, to individuals, small businesses, and other organizations located in or conducting a substantial portion of their business in our market areas. Our total loans, net of unearned income, at December 31, 2017, were approximately $547.1 million, or approximately 66.5% of total assets. The interest rates charged on loans vary with the degree of risk, maturity, and amount of the loan and are further subject to competitive pressures, money market rates, availability of funds, and government regulations.
As of December 31, 2017, our loan portfolio composition was classified as follows: (percent of gross loans)
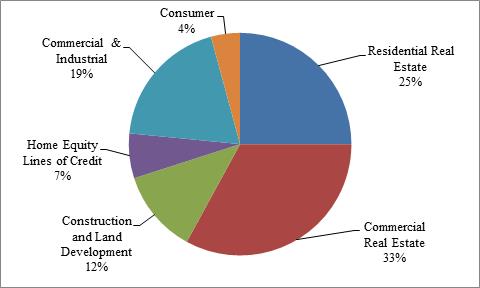
Real Estate Loans. Loans secured by real estate are the primary component of our loan portfolio, constituting approximately $385.5 million, or 70.5%, of total loans, net of unearned income, at December 31, 2017. We originate consumer and commercial loans for the purpose of acquiring real estate that are secured by such real estate (CRE). We also often take real estate as an additional source of collateral to secure commercial and industrial (C&I) loans. Such loans are classified as real estate loans rather than commercial and industrial loans if the real estate collateral is considered significant as a secondary source of repayment for the loan. Loans are typically made on a recourse basis supported by financial statements and a review of the repayment ability of the borrower(s) and/or guarantor(s). Origination fees are charged for many loans secured by real estate.
Real estate lending activities consist of the following:
|
|
• |
Commercial real estate term loans accrue at either variable or fixed rates. The variable rates approximate current market rates. Amortizations are typically no more than 25 years. |
|
|
• |
The primary type of residential mortgage loan is the single-family first mortgage, typically structured with fixed or adjustable interest rates, based on market conditions. These loans usually have fixed rates for up to 5 years, with maturities of 15 to 30 years. |
|
|
• |
Construction and land development (C&D) loans are typically made on a variable-rate basis. Loan terms usually do not exceed 24 months. |
We originate residential loans for sale into the secondary market. These loans are made in accordance with underwriting standards set by the purchaser of the loan, normally as to loan-to-value ratio, interest rate, borrower qualification, and documentation. These loans are generally made under a commitment to purchase from a loan purchaser. We generally collect from the borrower or purchaser a combination of the origination fee, discount points, and/or a service release fee.
Home Equity Lines of Credit: We originate home equity lines of credit secured by residential property. The loans are typically made on a variable rate basis with maturities up to 10 years. At December 31, 2017, home equity lines of credit constituted $35.8 million, or 6.5% of our loan portfolio.
4
Commercial and Industrial Loans. We make loans for commercial purposes in various lines of business. These loans are typically made on terms up to 7 years at fixed or variable rates. The loans are secured by various types of collateral, including accounts receivable, inventory, or, in the case of equipment loans, the financed equipment. We attempt to reduce our credit risk on commercial loans by underwriting the loan based on the borrower’s cash flow and its ability to service the debt from earnings, and by limiting the loan-to-value ratio. Historically, we have typically loaned up to 80% on loans secured by accounts receivable, up to 50% on loans secured by inventory (which are typically also secured by accounts receivable), and up to 100% on loans secured by equipment. We also make some unsecured commercial loans. Commercial and industrial loans constituted $105.8 million, or 19.3% of our loan portfolio, at December 31, 2017. Interest rates are negotiable based upon the borrower’s financial condition, credit history, management stability and collateral.
Consumer Loans. Consumer lending includes installment lending to individuals in our market areas and generally consists of loans to purchase automobiles and other consumer durable goods. Consumer loans constituted $23.2 million, or 4.2% of our loan portfolio, at December 31, 2017. Consumer loans are underwritten based on the borrower’s income, current debt level, past credit history and collateral. Consumer rates are both variable and fixed, with terms negotiable. Terms generally range from one to five years depending on the nature and condition of the collateral. Periodic amortization, generally monthly, is typically required.
Loan Approval. Certain credit risks are inherent in making loans. These include repayment risks, risks resulting from uncertainties in the future value of collateral, risks resulting from changes in economic and industry conditions, and risks inherent in dealing with individual borrowers. In particular, longer maturities increase the risk that economic conditions will change and adversely affect collectability.
We attempt to minimize loan losses through various means and the use of standardized underwriting criteria. We have established a standardized loan policy that may be modified based on local market conditions. In particular, on larger credits, we generally rely on the cash flow of a debtor as the source of repayment and secondarily on the value of the underlying collateral. In addition, we attempt to utilize shorter loan terms in order to reduce the risk of a decline in the value of such collateral.
We address repayment risks by adhering to internal credit policies and procedures. These policies and procedures include officer and customer lending limits, a loan committee approval process for larger loans, documentation examination, and follow-up procedures for loan review and any exceptions to credit policies. The point in the loan approval process at which a loan is approved depends on the size of the borrower’s credit relationship with the bank and the loan authority of the lending officer to whom the loan request is made. Each of our lending officers has the authority to approve loans up to an approved loan authority amount, as approved by the bank’s board of directors. Loans in excess of the highest loan authority amount of a particular lending officer must be approved by the bank’s loan committee, or another officer with sufficient loan authority to approve the request.
Risk Ratings. Loan officers are directly responsible for monitoring the risk in their respective portfolios. On commercial loans, risk grades are assigned by the loan officer for the probability of default following analysis of borrower characteristics and external economic factors. However, on consumer loans, risk grades are determined by a borrower’s credit score and personal debt ratio, as well as the borrower’s repayment history with the bank.
Electronic Banking
We offer electronic banking services to our customers, including commercial and retail online banking, automated bill payment, mobile banking, and remote deposit capture for certain customers.
Market Areas
We currently conduct our banking operations through our Banks’ 10 banking locations in the state of Alabama. The locations include Montgomery, Prattville, Millbrook, Wetumpka, Auburn, Opelika, Alexander City, and Gadsden. Our market areas generally include the Montgomery, Auburn-Opelika, and Gadsden Metropolitan Statistical Areas.
5
The financial services industry is highly competitive. We compete for loans, deposits, and financial services in all of our principal markets. We compete directly with other bank and nonbank institutions located within our markets, internet-based banks, out-of-market banks, and bank holding companies that advertise in or otherwise serve our markets, along with money market and mutual funds, brokerage houses, mortgage companies, and insurance companies or other commercial entities that offer financial services products. Competition involves efforts to retain current customers, obtain new loans and deposits, increase the scope and type of services offered, and offer competitive interest rates paid on deposits and charged on loans. Many of our competitors enjoy competitive advantages, including greater financial resources, a wider geographic presence, more accessible branch office locations, the ability to offer additional services, more favorable pricing alternatives, and lower origination and operating costs. Some of our competitors have been in business for a long time and have an established customer base and name recognition. We believe that our competitive pricing, personalized service, and community involvement enable us to effectively compete in the communities in which we operate.
Employees
As of December 31, 2017, we had approximately 142 full-time and 9 part-time employees. None of these employees are party to a collective bargaining agreement.
SUPERVISION AND REGULATION
General
We are extensively regulated under both federal and state law. These laws restrict permissible activities and investments and require compliance with various consumer protection provisions applicable to lending, deposit, brokerage, and fiduciary activities. They also impose capital adequacy requirements and conditions on a bank holding company’s ability to repurchase stock or to receive dividends from its subsidiary banks. We are subject to comprehensive examination and supervision by the Federal Reserve, and River Bank and Trust is subject to comprehensive examination and supervision by the Federal Deposit Insurance Corporation (FDIC) and the Alabama Banking Department. These regulatory agencies generally have broad discretion to impose restrictions and limitations on our operations. This supervisory framework could materially impact the conduct and profitability of our activities.
In December 2015, we completed a merger with Keystone, pursuant to which we acquired control of Keystone Bank. Under the terms of the merger agreement, Keystone was merged with and into RB&T, with RB&T surviving the merger.
To the extent that the following information describes statutory and regulatory provisions, it is qualified in its entirety by reference to the text of the particular statutory and regulatory provisions. Proposals to change the laws and regulations governing the banking industry are frequently raised at both the state and federal levels. The likelihood and timing of any changes in these laws and regulations, and the impact such changes may have on us, are difficult to ascertain. A change in applicable laws and regulations, or in the manner such laws or regulations are interpreted by regulatory agencies or courts, may have a material effect on our business, operations, and earnings.
Regulation of River Financial Corporation
We are registered as a bank holding company under the Bank Holding Company Act of 1956, as amended (the “BHCA”) and are subject to regulation and supervision by the Federal Reserve. The BHCA requires us to secure the prior approval of the Federal Reserve before we own or control, directly or indirectly, more than five percent (5%) of the voting shares or substantially all of the assets of any bank or thrift, or merge or consolidate with another bank or thrift holding company. Further, under the BHCA, our activities and those of any nonbank subsidiary are generally limited to: those activities that the Federal Reserve determines to be so closely related to banking as to be a proper incident thereto. Prior approval of the Federal Reserve may be required before engaging in certain activities. In making such determinations, the Federal Reserve is required to weigh the expected benefits to the public, such as greater convenience, increased competition, and gains in efficiency, against the possible adverse effects, such as undue concentration of resources, decreased or unfair competition, conflicts of interest, and unsound banking practices.
Subject to various exceptions, the BHCA and the Change in Bank Control Act, together with related regulations, require Federal Reserve approval prior to any person or company acquiring “control” of a bank holding company. Control is conclusively deemed to exist if an individual or company acquires 25% or more of any class of voting securities of the bank holding company, and a rebuttable presumption arises if a person or company acquires 10% or more, but less than 25%, of any class of voting securities and either: (i) the bank holding company has registered securities under Section 12 of the Securities Act; or (ii) no other person owns a greater percentage of that class of voting securities immediately after the transaction.
6
The BHCA was substantially amended by the Gramm-Leach-Bliley Act, or the GLBA, which, among other things, permits a “financial holding company” to engage in a broader range of non-banking activities, and to engage on less restrictive terms in certain activities than were previously permitted. These expanded activities include securities underwriting and dealing, insurance underwriting and sales, and merchant banking activities. To become a financial holding company, a bank holding company must certify that all depository institutions that it controls are both “well capitalized” and “well managed” (as defined by federal law), and have at least a “satisfactory” CRA rating. The GLBA also imposes certain privacy requirements on all financial institutions and their treatment of consumer information. At this time, we have not elected to become a financial holding company, nor do we expect to make such an election in the foreseeable future.
There are a number of restrictions imposed on us by law and regulatory policy that are designed to minimize potential loss to depositors and to the insurance fund maintained by the FDIC (as discussed in more detail below) in the event that a subsidiary depository institution should become insolvent. For example, federal law requires a bank holding company to serve as a source of financial strength to its subsidiary depository institutions and to commit resources to support such institutions in circumstances where it might not do so in the absence of such a policy. The Federal Reserve also has the authority under the BHCA to require a bank holding company to terminate any activity or to relinquish control of a non-bank subsidiary upon the Federal Reserve’s determination that such activity or control constitutes a serious risk to the financial soundness and stability of any bank subsidiary of the bank holding company.
Any capital loan by a bank holding company to a subsidiary depository institution is subordinate in right of payment to deposits and certain other indebtedness of the institution. In addition, in the event of the holding company’s bankruptcy, any commitment made by the bank holding company to a federal banking regulatory agency to maintain the capital of its subsidiary depository institution(s) will be assumed by the bankruptcy trustee and entitled to a priority of payment.
The Federal Deposit Insurance Act, or FDIA, provides that, in the event of the “liquidation or other resolution” of an insured depository institution, the claims of depositors of the institution (including the claims of the FDIC as a subrogee of insured depositors) and certain claims for administrative expenses of the FDIC as a receiver will have priority over other general unsecured claims against the institution. If an insured depository institution fails, insured and uninsured depositors, along with the FDIC, will have priority in payment ahead of unsecured, non- deposit creditors, including the institution’s holding company, with respect to any extensions of credit they have made to such insured depository institution.
Regulation of River Bank and Trust
The operations and investments of RB&T are subject to the supervision, examination, and reporting requirements of the FDIC, the Alabama Banking Department, as well as other federal banking statutes and regulations, including with respect to the level of reserves that RB&T must maintain against deposits, restrictions on the types, amount, and terms and conditions of loans it may originate, and limits on the types of other activities in which RB&T may engage and the investments that it may make. The FDIC and Alabama Banking Department also have the power to prevent the continuance or development of unsafe or unsound banking practices or other violations of law.
Transactions with Affiliates
We are subject to federal laws, such as Sections 23A and 23B of the Federal Reserve Act, that limit the size and number of the transactions that depository institutions may engage in with their affiliates. Under these provisions, transactions (such as loans or investments) by a bank with nonbank affiliates are generally limited to 10% of the bank’s capital and surplus for all covered transactions with any one affiliate, and 20% of capital and surplus for all covered transactions with all affiliates. Any extensions of credit to affiliates, with limited exceptions, must be secured by eligible collateral in specified amounts. Banks are also prohibited from purchasing any “low quality” assets from an affiliate. The Dodd-Frank Act imposes additional requirements on transactions with affiliates, including an expansion of the definition of “covered transactions” and an increase in the amount of time for which collateral requirements regarding covered transactions must be maintained.
We are also subject to restrictions on extensions of credit to our executive officers, directors, principal stockholders, and their related interests. These extensions of credit must be made on substantially the same terms, including interest rates and collateral, as those prevailing at the time for comparable transactions with third parties, and must not involve more than the normal risk of repayment or present other unfavorable features. Furthermore, we are prohibited from engaging in asset purchases or sales transactions with our officers, directors, or principal stockholders unless the transaction is on market terms and, if the transaction represents greater than 10% of the capital and surplus of the bank, a majority of the bank’s disinterested directors has approved the transaction.
7
Our earnings are and will be affected by domestic economic conditions and the monetary and fiscal policies of the United States government and its agencies. The monetary policies of the Federal Reserve have a significant effect upon the operating results of commercial banks. The Federal Reserve has a major impact upon the levels of bank loans, investments and deposits through its open market operations in United States government securities and through its regulation of, among other things, the discount rate on bank borrowings and the reserve requirements against bank deposits. It is not possible for us to predict the nature and impact of future changes in monetary and fiscal policies.
Deposit Insurance
Our deposits are insured up to applicable limits by the Deposit Insurance Fund (DIF) of the FDIC. The DIF is the successor to the Bank Insurance Fund and the Savings Association Insurance Fund, which were merged in 2006. Under the FDIC’s current risk-based assessment system, as amended by the Dodd-Frank Act and the FDIC’s final rule on assessments, dividend assessment base and large bank pricing, or the Assessment Rule, insured institutions are assigned to one of four categories based on supervisory evaluations, regulatory capital levels, and certain other factors. An institution’s assessment rate depends upon the category to which it is assigned and the applicability of certain potential adjustments established by FDIC regulations, with less risky institutions paying lower assessment rates.
The assessment base against which the assessment rate is applied to determine the total assessment due for a given period is the depository institution’s average total consolidated assets during the assessment period less average tangible equity during that assessment period. Tangible equity is defined in the Assessment Rule as Tier 1 Capital and is calculated monthly, unless the insured depository institution has less than $1 billion in assets, in which case the insured depository institution calculates Tier 1 Capital on an end-of-quarter basis.
The Dodd-Frank Act also eliminated the ceiling and increased the floor on the size of the DIF. It established a minimum designated reserve ratio, or the DRR, of 1.35 percent of the estimated insured deposits and required the FDIC to adopt a restoration plan should the reserve ratio fall below 1.35 percent. However, the assessment rate schedules used to determine assessments due from insured depository institutions become progressively lower when the reserve ratio in the DIF exceeds 1.15 percent, 2 percent, and 2.5 percent.
In addition to the assessment for deposit insurance, insured depository institutions are required to make payments on bonds issued in the late 1980s by the Financing Corporation to recapitalize a predecessor deposit insurance fund. This payment is established quarterly and, for each of the first three quarters in calendar year 2017, equaled .135 basis points on the assessment base which is equal to average total assets less average tangible equity capital. The assessment equaled .115 basis points for the fourth quarter of 2017.
The Dodd-Frank Act also raised the limit for federal deposit insurance to $250,000 and increased the cash limit of Securities Investor Protection Corporation protection from $100,000 to $250,000.
The FDIC has authority to increase insurance assessments. A significant increase in insurance assessments would likely have an adverse effect on our operating expenses and results of operations. We cannot predict what insurance assessment rates will be in the future. Furthermore, deposit insurance may be terminated by the FDIC upon a finding that the institution has engaged in unsafe or unsound practices, is in an unsafe or unsound condition to continue operations, or has violated any applicable law, regulation, rule, order, or condition imposed by the FDIC.
Dividend Restrictions
We are a legal entity separate and distinct from our Bank. Our ability to pay dividends and make other distributions depends in part upon the receipt of dividends from our subsidiary bank and is limited by federal and state law. The specific limits depend upon a number of factors, including recent earnings, recent dividends, level of capital, and regulatory status. The regulators are authorized, and under certain circumstances are required, to determine whether the payment of dividends or other distributions by a bank would be an unsafe or unsound practice and to prohibit such payment. For example, the FDIA generally prohibits a depository institution from making any capital distribution (including payment of a dividend) or paying any management fee to its parent holding company if the depository institution would thereafter be undercapitalized.
8
The bank generally may not withdraw, either in the form of a dividend or otherwise, any portion of its permanent capital and may not declare a dividend in excess of its retained net profits without prior approval of the Alabama Banking Department and FDIC. Further, the bank is also required by Alabama law to obtain prior approval of the Alabama Banking Department for its payment of dividends if the total of all dividends declared by the bank in any calendar year will exceed the total of (i) the bank’s net earnings (as defined by statute) for that year, plus (ii) its retained net earnings for the preceding two years.
The ability of a bank holding company to pay dividends and make distributions can also be limited by other laws or regulations. The Federal Reserve, which has authority to prohibit a bank holding company from paying dividends or making other distributions, has issued a Supervisory Letter stating that a bank holding company should not pay cash dividends unless its net income available to common stockholders has been sufficient to fully fund the dividends, and the prospective rate of earnings retention appears to be consistent with the holding company’s capital needs, asset quality, and overall financial condition. Accordingly, a bank holding company should not pay cash dividends that exceed its net income or that can only be funded in ways that weaken the bank holding company’s financial health, such as by borrowing. The Dodd-Frank Act, Basel III (described below), and their respective implementing regulations impose additional restrictions on the ability of banking institutions to pay dividends.
Capital Adequacy Guidelines
In December 2010, the Basel Committee on Banking Supervision released its final framework for strengthening international capital and liquidity regulation, or Basel III. Basel III requires banks to maintain a higher level of capital than previously required, with a greater emphasis on common equity. The Dodd-Frank Act imposed generally applicable capital requirements with respect to bank holding companies and their bank subsidiaries and mandated that the federal banking regulatory agencies adopt rules and regulations to implement the Basel III requirements.
Among other things, the Dodd-Frank Act requires the Federal Reserve to apply consolidated capital requirements to a bank holding company that are no less stringent than those currently applied to depository institutions. In July 2013, the federal banking agencies adopted a final rule, or the Basel III Final Rule, implementing these standards. Under the Basel III Final Rule, trust preferred securities are excluded from Tier I capital unless such securities were issued prior to May 19, 2010 by a bank holding company with less than $15 billion in assets, subject to certain limits. The Dodd-Frank Act additionally provides for countercyclical capital requirements so that the required amount of capital increases in times of economic expansion and decreases in times of economic contraction, consistent with safety and soundness. Under the Basel III Final Rule, which implements this concept, banks must maintain a capital conservation buffer consisting of additional common equity Tier 1 capital equal to 2.5% of risk-weighted assets above each of the required minimum capital levels in order to avoid limitations on paying dividends, engaging in share repurchases, and paying certain discretionary bonuses. This new capital conservation buffer requirement is currently being phased in beginning in 2016 at 0.625% of risk-weighted assets and will increase each year until fully implemented at 2.5% in January 2019.
For purposes of calculating risk-weighted assets, the federal banking agencies have promulgated risk-based capital guidelines designed to make regulatory capital requirements more sensitive to differences in risk profiles among banks, to account for off-balance sheet exposures, and to minimize disincentives for holding liquid assets. Under these guidelines, assets and off- balance sheet items are assigned to broad risk categories, each with appropriate weights. The resulting capital ratios represent capital as a percentage of total risk-weighted assets and off-balance sheet items. Bank assets are given risk-weights under the Basel III Final Rule. In addition, certain off-balance sheet items are assigned certain credit conversion factors to convert them to asset- equivalent amounts to which an appropriate risk-weighting will apply. Those computations result in the total risk-weighted assets.
Under the Basel III Final Rule, as of the years ended December 31, 2017 and 2016 , the minimum ratio of total capital to risk-weighted assets (including the capital conservation buffer) was 9.250% and 8.625%, respectively. The minimum ratio of “Tier 1 Capital” (consisting generally of equity and qualifying preferred stock, less certain goodwill items and other intangible assets) to risk- weighted assets was 7.250% and 6.625% and the minimum ratio of “Common Equity Tier 1 Capital” (which generally consists of common stock and retained earnings) to risk-weighted assets including the capital conservation buffer was 5.750% and 5.125% for the years ended December 31, 2017 and 2016. When the capital conservation buffer is fully phased in beginning January 1, 2019, the minimum ratios (including the 2.5% capital conservation buffer) will be (i) Common Equity Tier 1 ratio of 7% (ii)Tier 1 Risk-Based ratio of 8.5% and (iii) Total Risk-Based ratio of 10.5% The remainder of total capital, or “Tier 2 Capital,” may consist of (a) the allowance for loan losses of up to 1.25% of risk-weighted assets, (b) certain types of preferred stock not qualifying as Tier 1 Capital, (c) hybrid capital instruments, (d) perpetual debt, (e) mandatory convertible securities, and (f) certain subordinated debt and intermediate-term preferred stock up to 50% of Tier 1 Capital. Total Capital is the sum of Tier 1 Capital and Tier 2 Capital (which is included only to the extent of Tier 1 Capital), less reciprocal holdings of other banking organizations capital instruments, investments in unconsolidated subsidiaries, and any other deductions as determined by the appropriate regulator.
9
In addition, the federal banking agencies have established minimum leverage ratio requirements for banking organizations they supervise, calculated as the ratio of Tier 1 Capital to adjusted average consolidated assets. Prior to the effective date of the Basel III Final Rule, banks and bank holding companies meeting certain specified criteria, including having the highest regulatory rating and not experiencing significant growth or expansion, were permitted to maintain a minimum leverage ratio of Tier 1 Capital to adjusted average quarterly assets equal to 3%. Other banks and bank holding companies generally were required to maintain a minimum leverage ratio of 4%. Under the Basel III Final Rule, as of January 1, 2015, the required minimum leverage ratio for all banks is 4%. These are all minimum capital standards and the regulatory agencies expect banks and bank holding companies to maintain capital well above the minimum levels.
As an additional means of identifying problems in the financial management of depository institutions, the federal banking regulatory agencies have established certain non-capital safety and soundness standards for institutions for which they are the primary federal regulator. The standards relate generally to operations and management, asset quality, interest rate exposure, and executive compensation. The agencies are authorized to take action against institutions that fail to meet such standards.
Prompt Corrective Action
In addition to the required minimum capital levels described above, federal law establishes a system of “prompt corrective actions” that federal banking agencies are required to take, and certain actions that they have discretion to take, based upon the capital category into which a federally regulated depository institution falls. Regulations set forth detailed procedures and criteria for implementing prompt corrective action in the case of any institution which is not adequately capitalized. Under the prompt corrective action rules effective as of January 1, 2015, an institution is deemed “well capitalized” if its leverage ratio, Common Equity Tier 1 ratio, Tier 1 Capital ratio, and Total Capital ratio meet or exceed 5%, 6.5%, 8%, and 10%, respectively. An institution is deemed to be “adequately capitalized” or better if its leverage, Common Equity Tier 1, Tier 1, and Total Capital ratios meet or exceed 4.0%, 4.5%, 6.0%, and 8.0%, and “undercapitalized” if it fails to meet these minimum capital requirements. An institution is “significantly undercapitalized” if its leverage, Common Equity Tier 1, Tier 1, or Total Capital ratios fall below 3%, 3%, 4%, or 6%, respectively, and “critically undercapitalized” if the institution has a ratio of tangible equity to total assets that is equal to or less than 2%.
The prompt corrective action rules require an undercapitalized institution to file a written capital restoration plan, along with a performance guaranty by its holding company or a third party. In addition, an undercapitalized institution becomes subject to certain automatic restrictions, including a prohibition on payment of dividends and a limitation on asset growth and expansion in certain cases, a limitation on the payment of bonuses or raises to senior executive officers, and a prohibition on the payment of certain “management fees” to any “controlling person.” Institutions that are classified as undercapitalized are also subject to certain additional supervisory actions, including increased reporting burdens and regulatory monitoring; limitations on the institution’s ability to make acquisitions, open new branch offices, or engage in new lines of business; obligations to raise additional capital; restrictions on transactions with affiliates; and restrictions on interest rates paid by the institution on deposits. In certain cases, banking regulatory agencies may require replacement of senior executive officers or directors, or sale of the institution to a willing purchaser. If an institution is deemed to be “critically undercapitalized” and continues in that category for 90 days, the statute requires, with certain narrowly limited exceptions, that the institution be placed in receivership.
Community Reinvestment Act
The CRA requires the federal banking regulatory agencies to assess all financial institutions that they regulate to determine whether these institutions are meeting the credit needs of the communities they serve, including their assessment area(s) (as established for these purposes in accordance with applicable regulations based principally on the location of branch offices). Under the CRA, institutions are assigned a rating of “outstanding,” “satisfactory,” “needs to improve,” or “unsatisfactory.” An institution’s record in meeting the requirements of the CRA is made publicly available and is taken into consideration in connection with any applications it files with federal regulators to engage in certain activities, including approval of a branch or other deposit facility, mergers and acquisitions, office relocations, or expansions into non-banking activities. The Bank received a “satisfactory” rating at its most recent CRA evaluation.
USA PATRIOT Act
Under the Uniting and Strengthening America by Providing Appropriate Tools Required to Intercept and Obstruct Terrorism (USA PATRIOT) Act, which amended the U.S. Bank Secrecy Act, financial institutions are subject to prohibitions against specified financial transactions and account relationships, as well as enhanced due diligence and “know your customer” standards in their dealings with foreign financial institutions and foreign customers. The USA PATRIOT Act also mandates that financial institutions establish anti-money laundering programs meeting certain standards and requires the federal banking regulators to consider the effectiveness of a financial institution’s anti-money laundering activities when reviewing bank mergers and bank holding company acquisitions.
10
Privacy of Customer Information
The GLBA and the implementing regulations issued by federal regulatory agencies require financial institutions (including banks, insurance agencies, and broker/dealers) to adopt policies and procedures regarding the disclosure of nonpublic personal information about their customers to non-affiliated third parties. In general, financial institutions are required to explain to customers their policies and procedures regarding the disclosure of such nonpublic personal information, and, unless otherwise required or permitted by law, financial institutions are prohibited from disclosing such information except as provided in their policies and procedures. Specifically, the GLBA established certain information security guidelines that require each financial institution, under the supervision and ongoing oversight of its board of directors or an appropriate committee thereof, to develop, implement, and maintain a comprehensive written information security program designed to ensure the security and confidentiality of customer information, to protect against anticipated threats or hazards to the security or integrity of such information, and to protect against unauthorized access to or use of such information that could result in substantial harm or inconvenience to any customer.
The Consumer Financial Protection Bureau
The Dodd-Frank Act created the Consumer Financial Protection Bureau, or the CFPB, which is an independent bureau with broad authority to regulate the consumer finance industry, including regulated financial institutions, non-banks and others involved in extending credit to consumers. The CFPB has authority through rulemaking, orders, policy statements, guidance, and enforcement actions to administer and enforce federal consumer financial laws, to oversee several entities and market segments not previously under the supervision of a federal regulator, and to impose its own regulations and pursue enforcement actions when it determines that a practice is unfair, deceptive, or abusive. The federal consumer financial laws and all of the functions and responsibilities associated with them, many of which were previously enforced by other federal regulatory agencies, were transferred to the CFPB on July 21, 2011. While the CFPB has the power to interpret, administer, and enforce federal consumer financial laws, the Dodd-Frank Act provides that the federal banking regulatory agencies continue to have examination and enforcement powers over the financial institutions that they supervise relating to the matters within the jurisdiction of the CFPB if such institutions have less than $10 billion in assets. The Dodd- Frank Act also gives state attorneys general the ability to enforce federal consumer protection laws.
Mortgage Loan Origination
The Dodd-Frank Act authorizes the CFPB to establish certain minimum standards for the origination of residential mortgages, including a determination of the borrower’s ability to repay. Under the Dodd-Frank Act and the implementing final rule adopted by the CFPB, or the ATR/QM Rule, a financial institution may not make a residential mortgage loan to a consumer unless it first makes a “reasonable and good faith determination” that the consumer has a “reasonable ability” to repay the loan. In addition, the ATR/QM Rule limits prepayment penalties and permits borrowers to raise certain defenses to foreclosure if they receive any loan other than a “qualified mortgage,” as defined by the CFPB. The ATR/QM Rule specifies the types of income and assets that may be considered in the ability-to-repay determination, the permissible sources for verification, and the required methods of calculating the loan’s monthly payments. The ATR/QM Rule became effective January 10, 2014.
In addition, Section 941 of the Dodd-Frank Act amended the Exchange Act to require sponsors of asset-backed securities (ABS) to retain at least 5 percent of the credit risk of the assets underlying the securities and generally prohibits sponsors from transferring or hedging that credit risk. In October 2014, the federal banking regulatory agencies adopted a final rule to implement this requirement, or the Risk Retention Rule. Among other things, the Risk Retention Rule requires a securitizer to retain not less than 5 percent of the credit risk of any asset that the securitizer, through the issuance of an ABS, transfers, sells, or conveys to a third party; and prohibits a securitizer from directly or indirectly hedging or otherwise transferring the credit risk that the securitizer is required to retain. In certain situations, the final rule allows securitizers to allocate a portion of the risk retention requirement to the originator(s) of the securitized assets, if an originator contributes at least 20 percent of the assets in the securitization. The Risk Retention Rule also provides an exemption to the risk retention requirements for an ABS collateralized exclusively by Qualified Residential Mortgages, or QRMs, and ties the definition of a QRM to the definition of a “qualified mortgage” established by the CFPB for purposes of evaluating a consumer’s ability to repay a mortgage loan. The federal banking agencies have agreed to review the definition of QRMs in 2019, following the CFPB’s own review of its “qualified mortgage” regulation.
Mortgage Loan Servicing
On January 17, 2013, the CFPB issued a series of final rules as part of an ongoing effort to address mortgage servicing reforms and create uniform standards for the mortgage servicing industry. The rules contain additional requirements for communications with borrowers, address the maintenance of customer account records, govern procedures for responding to written borrower requests and complaints of errors, and provide guidance regarding servicing delinquent loans, foreclosure proceedings, and loss mitigation efforts, among other measures. These rules became effective on January 10, 2014 and have in general led to increased costs to service loans across the mortgage industry.
11
On December 10, 2013, five federal financial regulatory agencies, including the Federal Reserve and the FDIC, adopted final rules implementing the so-called “Volcker Rule” embodied in Section 13 of the BHCA, which was added by Section 619 of the Dodd-Frank Act. The Volcker Rule completes the process begun in October 2011, when the agencies introduced proposed implementing rules for comment. In general, the Volcker Rule prohibits banking entities from (1) engaging in short-term proprietary trading for their own accounts, and (2) having certain ownership interests in, and relationships with, hedge funds or private equity funds, or covered funds. The Volcker Rule is intended to provide greater clarity with respect to both the extent of those primary prohibitions and the related exemptions and exclusions.
The Volcker Rule also requires each regulated entity to establish an internal compliance program that is consistent with the extent to which it engages in activities covered by the Volcker Rule, which must include (for the largest entities) making regular reports about those activities to regulators. Community and small banks, like us, are afforded some relief under the Volcker Rule. If such banks are engaged only in exempted proprietary trading, such as trading in United States government, agency, state, and municipal obligations, they are exempt entirely from compliance program requirements. Moreover, even if a community or small bank engages in proprietary trading or covered fund activities under the rule, they need only incorporate references to the Volcker Rule into their existing policies and procedures.
On January 15, 2014, the federal banking agencies issued an interim final rule, or the Interim Rule, that exempts certain collateralized debt obligations backed by trust-preferred securities, also known as TruPS CDOs, from the broad restrictions of the Volcker Rule. Specifically, the Interim Rule provides that the covered fund restrictions of the Volcker Rule are inapplicable to a banking entity’s ownership interest in, or sponsorship of, any issuer of TruPS CDOs, provided that, among other things, (1) the TruPS CDOs were issued before May 19, 2010, by a holding company with $15 billion or less in total consolidated assets, and (2) the banking entity acquired the interest in the TruPS CDOs on or before December 10, 2013, or acquired the interest in the course of a merger with or acquisition of a banking entity that itself acquired the interest on or before that date.
Other Provisions of the Dodd-Frank Act
The Dodd-Frank Act, which became law on July 21, 2010, implements far-reaching changes across the financial regulatory landscape. In addition to the reforms previously mentioned, the Dodd-Frank Act also:
|
|
• |
Requires bank holding companies and banks to be both well-capitalized and well-managed in order to acquire banks located outside their home state and requires any bank holding company electing to be treated as a financial holding company to be both well-managed and well-capitalized; |
|
|
• |
Eliminates all remaining restrictions on interstate banking by authorizing national and state banks to establish de novo branches in any state that would permit a bank chartered in that state to open a branch at that location; |
|
|
• |
Repeals Regulation Q, the federal prohibition on the payment of interest on demand deposits, thereby permitting depository institutions to pay interest on business transaction and other accounts; |
|
|
• |
Enhances insider transaction limitations by strengthening loan restrictions to insiders and applying the various limits to a greater number of types of transactions, including derivative transactions, repurchase agreements, reverse repurchase agreements, and securities lending or borrowing transactions. The law also restricts certain asset sales to and from an insider to an institution, including requirements that such sales be on market terms and, in certain circumstances, approved by the institution’s board of directors; and |
|
|
• |
Strengthens the previous limits on a depository institution’s credit exposure to one borrower (whether a person or group of related persons) in an amount exceeding certain thresholds, by expanding the scope of these restrictions to include credit exposure arising from derivative transactions, repurchase agreements, and securities lending and borrowing transactions. |
Although a significant number of the rules and regulations mandated by the Dodd-Frank Act have been finalized, many of the new requirements called for have yet to be implemented and will likely be subject to implementing regulations over the course of several years. Given the uncertainty associated with the manner in which the provisions of the Dodd-Frank Act will be implemented by the various agencies, the full extent of the impact such requirements will have on financial institutions’ operations is unclear.
12
Federal Home Loan Bank Membership
River Bank and Trust is a member of the Federal Home Loan Bank of Atlanta, or the FHLBA. Each member of the FHLBA is required to maintain a minimum investment in the Class B stock of the FHLBA. The Board of Directors of the FHLBA can increase the minimum investment requirements in the event it has concluded that additional capital is required to allow it to meet its own regulatory capital requirements. Any increase in the minimum investment requirements outside of specified ranges requires the approval of the Federal Housing Finance Agency. Because the extent of any obligation to increase the level of investment in the FHLBA depends entirely upon the occurrence of a future event, we are unable to determine the extent of future required potential payments to the FHLBA at this time. Additionally, in the event that a member financial institution fails, the right of the FHLBA to seek repayment of funds loaned to that institution will take priority (a super lien) over the rights of all other creditors.
Other Laws and Regulations
Our operations are subject to several additional laws, some of which are specific to banking and others of which are applicable to commercial operations generally. For example, with respect to our lending practices, we are subject to the following laws and regulations, among several others:
|
|
• |
Truth-In-Lending Act, governing disclosures of credit terms to consumer borrowers; |
|
|
• |
Home Mortgage Disclosure Act of 1975, requiring financial institutions to provide information to enable the public and public officials to determine whether a financial institution is fulfilling its obligation to help meet the housing needs of the community it serves; |
|
|
• |
Equal Credit Opportunity Act, prohibiting discrimination on the basis of race, creed, or other prohibited factors in extending credit; |
|
|
• |
Fair Credit Reporting Act of 1978, as amended by the Fair and Accurate Credit Transactions Act, governing the use and provision of information to credit reporting agencies, certain identity theft protections, and certain credit and other disclosures; |
|
|
• |
Fair Debt Collection Practices Act, governing the manner in which consumer debts may be collected by collection agencies; |
|
|
• |
Real Estate Settlement Procedures Act, requiring certain disclosures concerning loan closing costs and escrows, and governing transfers of loan servicing and the amounts of escrows in connection with loans secured by one-to-four family residential properties; |
|
|
• |
Bank Secrecy Act, as amended by the USA PATRIOT Act, imposing requirements and limitations on specific financial transactions and account relationships, intended to guard against money laundering and terrorism financing; |
|
|
• |
Rules and regulations established by the National Flood Insurance Program; |
|
|
• |
Sections 22(g) and 22(h) of the Federal Reserve Act which set lending restrictions and limitations regarding loans and other extensions of credit made to executive officers, directors, principal stockholders, and other insiders; |
|
|
• |
Sections 23A and 23B of the Federal Reserve Act, imposing restrictions regarding loans and other extensions of credit made by a bank to one or more of its affiliates; and |
|
|
• |
Rules and regulations of the various federal agencies charged with the responsibility of implementing these federal laws. |
Our deposit operations are subject to federal laws applicable to depository accounts, including:
|
|
• |
Right to Financial Privacy Act, which imposes a duty to maintain confidentiality of consumer financial records and prescribes procedures for complying with administrative subpoenas of financial records; |
|
|
• |
Truth-In-Savings Act, requiring certain disclosures for consumer deposit accounts; |
|
|
• |
Electronic Funds Transfer Act and Regulation E of the Federal Reserve, which govern automatic deposits to and withdrawals from deposit accounts and customers’ rights and liabilities arising from the use of automated teller machines and other electronic banking services; and |
|
|
• |
Rules and regulations of the various federal agencies charged with the responsibility of implementing these federal laws. |
We are also subject to a variety of laws and regulations that are not limited to banking organizations. For example, in lending to commercial and consumer borrowers, and in owning and operating our own property, we are subject to regulations and potential liabilities under state and federal environmental laws. In addition, we must comply with privacy and data security laws and regulations at both the federal and state level.
13
We are heavily regulated by regulatory agencies at the federal and state levels. Like most of our competitors, we have faced and expect to continue to face increased regulation and regulatory and political scrutiny, which creates significant uncertainty for us, as well as for the financial services industry in general.
Enforcement Powers
The Financial Institution Reform Recovery and Enforcement Act, or FIRREA, expanded and increased the penalties available for use by the federal regulatory agencies against depository institutions and certain “institution-affiliated parties.” Institution-affiliated parties primarily include management, employees, and agents of a financial institution, as well as independent contractors and consultants, such as attorneys, accountants, and others who participate in the conduct of the financial institution’s affairs. An institution can be subject to an enforcement action due to the failure to timely file required reports, the filing of false or misleading information, or the submission of inaccurate reports, or engaging in other unsafe or unsound banking practices. Civil money penalties may be imposed at various levels but can be as high as $1,100,000 per day for such violations.
FIRREA provided regulators with greater flexibility to commence enforcement actions against institutions and institution-affiliated parties and to terminate an institution’s deposit insurance. It also expanded the power of banking regulatory agencies to issue regulatory orders. Such orders may, among other things, require affirmative action to correct any harm resulting from a violation or practice, including restitution, reimbursement, indemnification, or guarantees against loss. A financial institution may also be ordered to restrict its growth, dispose of certain assets, rescind agreements or contracts, or take other actions as determined by the ordering agency to be appropriate. The Dodd-Frank Act increases regulatory oversight, supervision and examination of banks, bank holding companies, and their respective subsidiaries by the appropriate regulatory agency.
Future Legislation and Regulation
Regulators have increased their focus on the regulation of the financial services industry in recent years, leading in many cases to greater uncertainty and compliance costs for regulated entities. For example, the provisions of the Dodd-Frank Act could require us to make material expenditures, particularly in the form of personnel training costs and additional compliance expenses. We also may be required to change certain of our business practices in order to comply with the Dodd-Frank Act and its implementing regulations, which in turn could adversely affect our ability to pursue business opportunities that we might otherwise consider pursuing, cause business disruptions, and/or have other impacts that are as of yet unknown to us. Failure to comply with these laws or regulations, even if inadvertent, could result in negative publicity, fines, or additional expenses.
Furthermore, proposals that could substantially intensify the regulation of the financial services industry may be introduced in the United States Congress, in state legislatures, and by applicable regulatory authorities. These proposals may change banking statutes and regulations and our operating environment in substantial and unpredictable ways. If enacted, these proposals could increase or decrease the cost of doing business, limit or expand permissible activities or affect the competitive balance among banks, savings associations, credit unions, and other financial institutions. We cannot predict whether any of these proposals will be enacted and, if enacted, the effect that these proposals, or any implementing regulations, would have on our business, results of operations, or financial condition.
Website Information
We maintain a website at www.riverbankandtrust.com through which we make available, free of charge under the tab “Investor Relations,” our Annual Report on Form 10-K, Quarterly Reports on Form 10-Q, Current Reports on Form 8-K and all amendments to those reports filed or furnished pursuant to Section 13(a) of the Exchange Act as soon as reasonably practicable after such material is electronically filed with the SEC. These reports are also available on the SEC’s website, www.sec.gov. We will provide paper copies of these reports to stockholders free of charge upon written request to: River Financial Corporation, Attention: Corporate Secretary, P.O. Box 680249, Alabama 36068. Information on, or accessible through, our website is not part of this Annual Report on Form 10-K. We have included our website address only as an inactive textual reference and do not intend it to be an active link to our website.
14
An investment in our common stock involves certain risks that you should carefully consider in addition to the other information set forth in this Annual Report on Form 10-K. The occurrence of any of the risks described below may have a material adverse effect on our business, prospects, financial condition or results of operations, in which case the value of your common stock could decline and you could lose all or a part of your investment. Additional risks of which we are not presently aware or that we currently believe are immaterial may also harm our business or results of operations. Further, to the extent that any of the information contained in this Annual Report on Form 10-K constitutes forward-looking statements, the risk factors set forth below also are cautionary statements identifying important factors that could cause the Company’s actual results to differ materially from those expressed in any forward-looking statements made by or on behalf of the Company.
Risks Relating to Our Business
Our business is concentrated in, and largely dependent upon, the continued growth and welfare of the general geographic markets in which we operate.
Our commercial banking operations are concentrated in Alabama. As of December 31, 2017, most of our total loans were to borrowers located in Alabama. As a result, our financial condition and results of operations and cash flows are affected by changes in the economic conditions of the state or the regions of which it is a part. Our success depends to a significant extent upon the business activity, population, income levels, deposits, and real estate activity in this market. Although our customers’ business and financial interests may extend well beyond this market area, adverse conditions that affect this market area could reduce our growth rate, affect the ability of our customers to repay their loans, affect the value of collateral underlying loans, impact our ability to attract deposits, and generally affect our financial conditions and results of operations. Because of our geographic concentration, we may be less able than other regional or national financial institutions to diversify our credit risks across multiple markets.
A return of recessionary conditions could result in increases in our level of nonperforming loans and/or reduced demand for our products and services, which could have an adverse effect on our results of operations.
Economic recession or other economic problems, including those affecting our markets and regions, but also those affecting the U.S. or world economies, could have a material adverse impact on the demand for our products and services. Since the conclusion of the last recession, economic growth has been slow and uneven, and unemployment levels remain relatively high. If economic conditions deteriorate, or if there are negative developments affecting the domestic and international credit markets, the value of our loans and investments may be harmed, which in turn would have an adverse effect on our financial performance, and our financial condition may be adversely affected. In addition, although deteriorating market conditions could adversely affect our financial condition, results of operations, and cash flows, we cannot provide any assurance that we would benefit from any market growth or favorable economic conditions, either in our primary market areas or nationally, even if they do occur.
Difficult conditions in the market for financial products and services may materially and adversely affect our business and results of operations.
Dramatic declines in the housing market during recent years, along with increasing foreclosures and unemployment, resulted in significant write-downs of asset values by financial institutions, including government-sponsored entities and major commercial and investment banks. These write-downs, initially of mortgage-backed securities but spreading to credit default swaps and other derivative securities, caused many financial institutions to seek additional capital, to merge with larger and stronger institutions, and, in some cases, to fail. This market turmoil and tightening of credit led to an increased level of commercial and consumer delinquencies, lack of consumer confidence, increased market volatility, and widespread reduction of business activity generally. Although conditions have improved, a return of these trends could have a material adverse effect on our business and operations. Negative market developments may affect consumer confidence levels and may cause adverse changes in payment patterns, causing increases in delinquencies and default rates, which may impact our charge-offs and provisions for loan and credit losses. Economic deterioration that affects household and/or corporate incomes could also result in reduced demand for credit or fee-based products and services. These conditions would have adverse effects on us and others in the financial services industry.
Our small to medium-sized business and entrepreneurial customers may have fewer financial resources than larger entities to weather a downturn in the economy, which may impair a borrower’s ability to repay a loan, and such impairment could adversely affect our financial condition and results of operations.
We focus our business development and marketing strategy primarily to serve the banking and financial services needs of small to medium-sized businesses and entrepreneurs. These small to medium-sized businesses and entrepreneurs may have fewer financial resources in terms of capital or borrowing capacity than larger entities. If economic conditions negatively impact the Alabama market generally, and small to medium-sized businesses are adversely affected, our financial condition and results of operations may be negatively affected.
15
Our financial performance will be negatively impacted if we are unable to execute our growth strategy.
Our current growth strategy is to grow organically and supplement that growth with select acquisitions. Our ability to grow organically depends primarily on generating loans and deposits of acceptable risk and expense, and we may not be successful in continuing this organic growth. Our ability to identify appropriate markets for expansion, recruit and retain qualified personnel, and fund growth at a reasonable cost depends upon prevailing economic conditions, maintenance of sufficient capital, competitive factors, and changes in banking laws, among other factors. Conversely, if we grow too quickly and are unable to control costs and maintain asset quality, such growth, whether organic or through select acquisitions, could materially and adversely affect our financial condition and results of operations.
External economic factors, such as changes in monetary policy and inflation and deflation, may have an adverse effect on our business, financial condition and results of operations.
Our financial condition and results of operations are affected by credit policies of monetary authorities, particularly the Board of Governors of the Federal Reserve System, or the Federal Reserve. Actions by monetary and fiscal authorities, including the Federal Reserve, could lead to inflation, deflation, or other economic phenomena that could adversely affect our financial performance. The primary impact of inflation on our operations most likely will be reflected in increased operating costs. Conversely, deflation generally will tend to erode collateral values and diminish loan quality. Virtually all of our assets and liabilities are monetary in nature. As a result, interest rates have a more significant impact on our performance than general levels of inflation or deflation. Interest rates do not necessarily move in the same direction or by the same magnitude as the prices of goods and services.
Our profitability is vulnerable to interest rate fluctuations.
Our profitability depends substantially upon our net interest income. Net interest income is the difference between the interest earned on assets (such as loans and securities held in our investment portfolio) and the interest paid for liabilities (such as interest paid on savings and money market accounts and time deposits).
Income associated with interest-earning assets and costs associated with interest-bearing liabilities may not be affected uniformly by fluctuations in interest rates. The magnitude and duration of changes in interest rates are events over which we have no control, and such changes may have an adverse effect on our net interest income. Prepayment and early withdrawal levels, which are also impacted by changes in interest rates, can significantly affect our assets and liabilities. For example, an increase in interest rates could, among other things, reduce the demand for loans and decrease loan repayment rates. Such an increase could also adversely affect the ability of our floating-rate borrowers to meet their higher payment obligations, which could in turn lead to an increase in non-performing assets and net charge-offs. Conversely, a decrease in the general level of interest rates could affect us by, among other things, leading to greater competition for deposits and incentivizing borrowers to prepay or refinance their loans more quickly or frequently than they otherwise would. The primary tool that management uses to measure interest rate risk is a simulation model that evaluates the impact of varying levels of prevailing interest rates and the impact on net interest income and the economic value of equity. As of December 31, 2017, this simulation analysis indicated that if prevailing interest rates immediately decreased by 300 basis points, we would expect net interest income to decrease by approximately $3.8 million, or 12.8% over the next 12 months, and an increase in the economic value of equity of $3.2 million, or 2.8%. We believe that this is unlikely based on current interest rate levels. Conversely, if prevailing interest rates immediately increased by 300 basis points, we would expect net interest income to decrease by approximately $157 thousand, or 0.5%, over the next 12 months, and a decrease in the economic value of equity of $18.0 million, or 15.6%. However, fluctuations in interest rates affect different classes of income-earning assets differently, and there can be no assurance as to the actual effect on our results of operations should such an increase or decrease occur.
Generally, the interest rates on our interest-earning assets and interest-bearing liabilities do not change at the same rate, to the same extent or on the same basis. Even assets and liabilities with similar maturities or re-pricing periods may react in different degrees to changes in market interest rates. Interest rates on certain types of assets and liabilities may fluctuate in advance of changes in general market interest rates, while interest rates on other types of assets and liabilities may lag behind changes in general market rates. Certain assets, such as fixed and adjustable rate mortgage loans, have features that limit changes in interest rates on a short-term basis and over the life of the asset. Changes in interest rates could materially and adversely affect our financial condition and results of operations.
16
Market interest rates for loans, investments, and deposits are highly sensitive to many factors beyond our control.
Generally, interest rate spreads (the difference between interest rates earned on assets and interest rates paid on liabilities) have narrowed in recent years as a result of changing market conditions, policies of various government and regulatory authorities, and competitive pricing pressures, and we cannot predict whether these rate spreads will narrow even further. This narrowing of interest rate spreads could adversely affect our financial condition and results of operations. In addition, we cannot predict whether interest rates will continue to remain at present levels. Changes in interest rates may cause significant changes, up or down, in our net interest income.
We attempt to minimize the adverse effects of changes in interest rates by structuring our asset-liability composition in order to obtain the maximum spread between interest income and interest expense. However, there can be no assurance that we will be successful in minimizing the adverse effects of changes in interest rates. Depending on our portfolio of loans and investments, our financial condition and results of operations may be adversely affected by changes in interest rates.
We could suffer losses from a decline in the credit quality of the assets that we hold.
We could sustain losses if borrowers, guarantors, and related parties fail to perform in accordance with the terms of their loans. We have adopted underwriting and credit monitoring procedures and policies that we believe are appropriate to minimize this risk, including the establishment and review of the allowance for credit losses, periodic assessment of the likelihood of nonperformance, tracking loan performance, and diversifying our credit portfolio. These policies and procedures, however, may not prevent unexpected losses that could materially adversely affect our financial condition and results of operations. In particular, we face credit quality risks presented by past, current, and potential economic and real estate market conditions.
A significant portion of our loan portfolio is secured by real estate, and events that negatively impact the real estate market could negatively impact our business.
A significant portion of our loan portfolio is secured by either residential or commercial real estate. As of December 31, 2017, we had approximately $137.7 million in residential real estate loans and $181.2 million in commercial real estate loans outstanding, representing approximately 25.2% and 33.1%, respectively, of our total loans outstanding on that date.
There are significant risks associated with real estate-based lending. Real estate collateral may deteriorate in value during the time that credit is extended, in which case we might not be able to sell such collateral for an amount necessary to satisfy a defaulting borrower’s obligation to us. In that event, there could be a material adverse effect on our financial condition and results of operations. Additionally, commercial real estate loans are subject to unique risks. These types of loans are often viewed as having more risks than residential real estate or other consumer loans, primarily because relatively large amounts are loans to a relatively small number of borrowers. Thus, the deterioration of even a small number of these loans could cause a significant increase in the loan loss allowance or loan charge-offs, which in turn could have a material adverse effect on our financial condition and results of operations. Furthermore, commercial real estate loans depend on cash flows from the property securing the debt. Cash flows may be affected significantly by general economic conditions and a downturn in a local economy in one of our markets or in occupancy rates where a property is located could increase the likelihood of default.
The foregoing risks are enhanced as a result of the limited geographic scope of our principal markets. Most of the real estate securing our loans is located in Alabama. Because the value of this collateral depends upon local real estate market conditions and is affected by, among other things, neighborhood characteristics, real estate tax rates, the cost of operating the properties, and local governmental regulation, adverse changes in any of these factors in Alabama could cause a decline in the value of the collateral securing a significant portion of our loan portfolio. Further, the concentration of real estate collateral in these two markets limits our ability to diversify the risk of such occurrences.
17
Our allowance for estimated loan losses may not be adequate to cover actual loan losses, which may require us to take a charge to earnings and adversely impact our financial condition and results of operations.
We maintain an allowance for estimated loan losses that we believe is adequate to absorb any probable losses in our loan portfolio. Management determines the amount of the allowance based upon an analysis of general market conditions, credit quality of our loan portfolio and performance of our customers relative to their financial obligations with us. We periodically evaluate the loan portfolio for risk grading, which can result in changes in our allowance. The amount of future losses is affected by changes in economic, operating, and other conditions, including changes in interest rates, which may be beyond our control, and such losses may exceed the allowance for estimated loan losses. Although we believe that our allowance for estimated loan losses is adequate to absorb any probable losses on existing loans that may become uncollectible, there can be no assurance that the allowance will prove sufficient to cover actual loan losses in the future. If actual losses exceed the estimate, the excess losses could adversely affect our net income and capital. Such excess could also lead to larger allowances for loan losses in future periods, which could in turn adversely affect new income and capital in those periods. If economic conditions differ substantially from the assumptions used in the estimate, or if the performance of our loan portfolio deteriorates, future losses may occur, and increases in the allowance may be necessary, either of which would have a negative effect on our financial condition and results of operations.
Additionally, federal banking regulators, as part of their supervisory function, periodically review the adequacy of our allowance for estimated loan losses. These agencies may require us to establish additional allowances based on their judgment of the information available at the time of their examinations. If these regulatory agencies require us to increase the allowance for estimated loan losses, it would have a negative effect on our financial condition and results of operations.
Our use of appraisals in deciding whether to make a loan secured by real property does not ensure the value of the real property collateral.
In considering whether to make a loan secured by real property, we generally require an appraisal. However, an appraisal is only an estimate of the value of the property at the time the appraisal is made. If the appraisal does not reflect the amount that may be obtained upon any sale or foreclosure of the property, we may not realize an amount equal to the indebtedness secured by the property.
Any expansion into new markets or new lines of business might not be successful.
As part of our ongoing strategic plan, we may consider expansion into new geographic markets. Such expansion might take the form of the establishment of de novo branches or the acquisition of existing banks or bank branches. There are considerable costs associated with opening new branches, and new branches generally do not generate sufficient revenues to offset costs until they have been in operation for some time. Additionally, we may consider expansion into new lines of business through the acquisition of third parties or organic growth and development. There are substantial risks associated with such efforts, including risks that (i) revenues from such activities might not be sufficient to offset the development, compliance, and other implementation costs, (ii) competing products and services and shifting market preferences might affect the profitability of such activities, and (iii) our internal controls might be inadequate to manage the risks associated with new activities. Furthermore, it is possible that our unfamiliarity with new markets or lines of business might adversely affect the success of such actions. If any such expansions into new geographic or product markets are not successful, there could be an adverse effect on our financial condition and results of operations.
Acquisitions may disrupt our business and dilute stockholder value, and integrating acquired companies may be more difficult, costly, or time-consuming than we expect.
Our business strategy focuses on both organic growth and growth through acquisitions of financial institutions located in the southeastern United States. Our pursuit of acquisitions may disrupt our business, and common stock that we issue as merger consideration may have the effect of diluting the value of your investment. In addition, we may fail to realize some or all of the anticipated benefits of completed acquisitions, including our acquisition of Keystone on December 31, 2015. We anticipate that the integration of Keystone and other businesses that we acquire in the future may be a time-consuming and expensive process, even if the integration process is effectively planned and implemented.
In addition, our acquisition activities could be material to our business and involve a number of significant risks, including the following:
|
|
• |
incurring time and expense associated with identifying and evaluating potential acquisitions and negotiating potential transactions, resulting in our attention being diverted from the operation of our existing business; |
|
|
• |
using inaccurate estimates and judgments to evaluate credit, operations, management, and market risks with respect to the target company or the assets and liabilities that we seek to acquire; |
|
|
• |
exposure to potential asset quality issues of the target company; |
18
|
|
• |
intense competition from other banking organizations and other potential acquirers, many of which have substantially greater resources than we do; |
|
|
• |
potential exposure to unknown or contingent liabilities of banks and businesses we acquire, including, without limitation, liabilities for regulatory and compliance issues; |
|
|
• |
inability to realize the expected revenue increases, cost savings, increases in geographic or product presence, and other projected benefits of the acquisition; |
|
|
• |
incurring time and expense required to integrate the operations and personnel of the combined businesses; |
|
|
• |
inconsistencies in standards, procedures, and policies that would adversely affect our ability to maintain relationships with customers and employees; |
|
|
• |
experiencing higher operating expenses relative to operating income from the new operations; |
|
|
• |
creating an adverse short-term effect on our results of operations; |
|
|
• |
losing key employees and customers; |
|
|
• |
significant problems relating to the conversion of the financial and customer data of the entity; |
|
|
• |
integration of acquired customers into our financial and customer product systems; |
|
|
• |
potential changes in banking or tax laws or regulations that may affect the target company; or |
|
|
• |
risks of impairment to goodwill or other-than-temporary impairment of investment securities. |
If difficulties arise with respect to the integration process, the economic benefits expected to result from acquisitions might not occur. As with any merger of financial institutions, there also may be business disruptions that cause us to lose customers or cause customers to move their business to other financial institutions. Failure to successfully integrate businesses that we acquire could have an adverse effect on our profitability, return on equity, return on assets, or our ability to implement our strategy, any of which in turn could have a material adverse effect on our business, financial condition, and results of operation.
Our liquidity needs might adversely affect our financial condition and results of operations.
The primary sources of funds for the Bank are customer deposits and loan repayments. Loan repayments are subject to the credit risks described above. In addition, deposit levels may be affected by a number of factors, including interest rates paid by competitors, general interest rate levels, returns available to customers on alternative investments, and general economic conditions. Therefore, RB&T may be required to rely from time to time on secondary sources of liquidity to meet withdrawal demands or otherwise fund operations or support growth. RB&T has lines of credit in place with the Federal Home Loan Bank of Atlanta and correspondent banks that we believe are adequate to meet the Banks’ liquidity needs. However, there can be no assurance that these arrangements will be sufficient to meet future liquidity needs, particularly if loan demand grows faster than anticipated.
As a bank holding company, the sources of funds available to us are limited.
Any future constraints on liquidity at the holding company level could impair our ability to declare and pay dividends on our common stock. In some instances, notice to, or approval from, the Federal Reserve may be required prior to our declaration or payment of dividends. Further, our operations are primarily conducted by our subsidiary Bank, which is subject to significant regulation. Federal and state banking laws restrict the payment of dividends by banks to their holding companies, and RB&T is subject to these restrictions in paying dividends to us. Because our ability to receive dividends or loans from RB&T is restricted, our ability to pay dividends to our stockholders is also restricted.
Additionally, the right of a bank holding company to participate in the assets of its subsidiary bank in the event of a bank-level liquidation or reorganization is subject to the claims of the bank’s creditors, including depositors, which take priority, except to the extent that the holding company may be a creditor with a recognized claim.
Our largest loan relationships currently make up a significant percentage of our total loan portfolio.
The concentration risk associated with having a small number of extremely large loan relationships is that, if one or more of these relationships were to become delinquent or suffer default, we could be at serious risk of material losses. The allowance for loan losses may not be adequate to cover losses associated with any of these relationships, and any loss or increase in the allowance would negatively affect our earnings and capital. Even if the loans are collateralized, the large increase in classified assets could harm our reputation with our regulators and inhibit our ability to execute our business plan.
19
Several of our large depositors have relationships with each other, which creates a higher risk that one customer’s withdrawal of its deposit could lead to a loss of other deposits from customers within the relationship, which, in turn, could force us to fund our business through more expensive and less stable sources.
Several of our large depositors have business, family, or other relationships with each other, which creates a risk that any one customer’s withdrawal of its deposit could lead to a loss of other deposits from customers within the relationship.
Withdrawals of deposits by any one of our largest depositors or by one of our related customer groups could force us to rely more heavily on borrowings and other sources of funding for our business and withdrawal demands, adversely affecting our net interest margin and results of operations. We may also be forced, as a result of any withdrawal of deposits, to rely more heavily on other, potentially more expensive and less stable funding sources. Consequently, the occurrence of any of these events could have a material adverse effect on our business, results of operations, financial condition, and future prospects.
We may not be able to adequately measure and limit the credit risk associated with our loan portfolio, which could adversely affect our profitability.
As a part of the products and services that we offer, we make commercial and commercial real estate loans. The principal economic risk associated with each class of loans is the creditworthiness of the borrower, which is affected by the strength of the relevant business market segment, local market conditions, and general economic conditions. Additional factors related to the credit quality of commercial loans include the quality of the management of the business and the borrower’s ability both to properly evaluate changes in the supply and demand characteristics affecting our market for products and services, and to effectively respond to those changes. Additional factors related to the credit quality of commercial real estate loans include tenant vacancy rates and the quality of management of the property. A failure to effectively measure and limit the credit risk associated with our loan portfolio could have an adverse effect on our business, financial condition, and results of operations.
We operate in a highly competitive industry and face significant competition from other financial institutions and financial services providers, which may decrease our growth or profits.
Consumer and commercial banking are highly competitive industries. Our market areas contain not only a large number of community and regional banks, but also a significant presence of the country’s largest commercial banks. We compete with other state and national financial institutions, as well as savings and loan associations, savings banks, and credit unions, for deposits and loans. In addition, we compete with financial intermediaries, such as consumer finance companies, commercial finance companies, mortgage banking companies, insurance companies, securities firms, mutual funds, and several government agencies, as well as major retailers, all actively engaged in providing various types of loans and other financial services. Some of these competitors may have a long history of successful operations in our market areas and greater ties to local businesses and more expansive banking relationships, as well as more established depositor bases, fewer regulatory constraints, and lower cost structures than we do. Competitors with greater resources may possess an advantage through their ability to maintain numerous banking locations in more convenient sites, to conduct more extensive promotional and advertising campaigns, or to operate a more developed technology platform. Due to their size, many competitors may offer a broader range of products and services, as well as better pricing for certain products and services than we can offer. For example, in the current low interest rate environment, competitors with lower costs of capital may solicit our customers to refinance their loans with a lower interest rate. Further, increased competition among financial services companies due to the recent consolidation of certain competing financial institutions may adversely affect our ability to market our products and services. Technology has lowered barriers to entry and made it possible for banks to compete in our market areas without a retail footprint by offering competitive rates, and for non-banks to offer products and services traditionally provided by banks.
The financial services industry could become even more competitive as a result of legislative, regulatory, and technological changes and continued consolidation. Banks, securities firms, and insurance companies can merge under the umbrella of a financial holding company, which can offer virtually any type of financial service, including banking, securities underwriting, insurance (both agency and underwriting), and merchant banking.
Our ability to compete successfully depends on a number of factors, including:
|
|
• |
our ability to develop, maintain, and build upon long-term customer relationships based on quality service and high ethical standards; |
|
|
• |
our ability to attract and retain qualified employees to operate our business effectively; |
|
|
• |
our ability to expand our market position; |
|
|
• |
the scope, relevance, and pricing of products and services that we offer to meet customer needs and demands; |
|
|
• |
the rate at which we introduce new products and services relative to our competitors; |
20
|
|
• |
industry and general economic trends. |
Failure to perform in any of these areas could significantly weaken our competitive position, which could adversely affect our growth and profitability, which, in turn, could harm our business, financial condition, and results of operations.
As a community bank, our ability to maintain our reputation is critical to the success of our business, and the failure to do so may materially adversely affect our performance.
We are a community bank, and our reputation is one of the most valuable components of our business. As such, we strive to conduct our business in a manner that enhances our reputation. This is done, in part, by recruiting, hiring, and retaining employees who share our core values of being an integral part of the communities we serve, delivering superior service to our customers, and caring about our customers and associates. If our reputation is negatively affected, by the actions of our employees or otherwise, our business and, therefore, our operating results may be materially adversely affected.
As a community banking institution, we have lower lending limits and different lending risks than certain of our larger, more diversified competitors.
We are a community banking institution that provides banking services to the local communities in the market areas in which we operate. Our ability to diversify our economic risks is limited by our own local markets and economies. We lend primarily to individuals and to small to medium-sized businesses, which may expose us to greater lending risks than those of banks that lend to larger, better-capitalized businesses with longer operating histories. In addition, our legally mandated lending limits are lower than those of certain of our competitors that have more capital than we do. These lower lending limits may discourage borrowers with lending needs that exceed our limits from doing business with us. We may try to serve such borrowers by selling loan participations to other financial institutions; however, this strategy may not succeed.
Our financial projections are based upon numerous assumptions about future events, and our actual financial performance may differ materially from our projections if our assumptions are inaccurate.
If the communities in which we operate do not grow, or if the prevailing economic conditions locally or nationally are less favorable than we have assumed, then our ability to reduce our non-performing loans and other real estate owned portfolios and to implement our business strategies may be adversely affected, and our actual financial performance may be materially different from our projections.
Moreover, we cannot give any assurance that we will benefit from any market growth or favorable economic conditions in our market areas even if they do occur. If our senior management team is unable to provide the effective leadership necessary to implement our strategic plan, including the successful integration of Keystone Bank and River Bank & Trust, our actual financial performance may be materially adversely different from our projections. Additionally, to the extent that any component of our strategic plan requires regulatory approval, if we are unable to obtain necessary approval, we will be unable to completely implement our strategy, which may adversely affect our actual financial results. Our inability to successfully implement our strategic plan could adversely affect the price of our common stock.
Because our business success depends significantly on key management personnel, the departure of such personnel could impair operations.
We depend heavily upon our senior management team. The loss of the services of a member of our senior management team, or an inability to attract other experienced banking personnel, could adversely affect our business. Some of these adverse effects could include the loss of personal contacts with existing or potential customers, as well as the loss of special technical knowledge, experience, and skills of such individuals who are responsible for our operations.
We may be adversely affected by the lack of soundness of other financial institutions or market utilities.
Our ability to engage in routine funding and other transactions could be adversely affected by the actions and commercial soundness of other financial institutions. Financial institutions are interrelated as a result of trading, clearing, counterparty, or other relationships. Defaults by, or even rumors or questions about, one or more financial institutions or market utilities, or the financial services industry generally, may lead to market-wide liquidity problems and losses of depositor, creditor, and counterparty confidence, and could lead to losses or defaults by us or by other institutions.
21
We depend on the accuracy and completeness of information about customers and counterparties.
In deciding whether to extend credit or enter into other transactions with customers and counterparties, we may rely on information furnished to us by or on behalf of customers and counterparties, including financial statements and other financial information. We also may rely on representations of customers and counterparties as to the accuracy and completeness of that information and, with respect to financial statements, on reports of independent auditors. In deciding whether to extend credit, we may rely upon our customers’ representations that their financial statements conform to accounting principles generally accepted in the United States of America (“GAAP”) and present fairly, in all material respects, the financial condition, results of operations, and cash flows of the customer. We also may rely on customer representations and certifications, or other audit or accountants’ reports, with respect to the business and financial condition of our clients. Our financial condition, results of operations, financial reporting, and reputation could be negatively affected if we rely on materially misleading, false, inaccurate, or fraudulent information.
We are subject to environmental risk in our lending activities.
Because a significant portion of our loan portfolio is secured by real property, we may foreclose upon and take title to such property in the ordinary course of business. If hazardous substances are found on such property, we could be liable for remediation costs, as well as for personal injury and property damage. Environmental laws might require us to incur substantial expenses, materially reduce the property’s value, or limit our ability to use or sell the property. Although management has policies requiring environmental reviews before loans secured by real property are made and before foreclosure is commenced, it is still possible that environmental risks might not be detected and that the associated costs might have a material adverse effect on our financial condition and results of operations.
We continually encounter technological change and may have fewer resources than our competitors to continue to invest in technological improvements.
The banking and financial services industries are undergoing rapid technological changes, with frequent introductions of new technology-driven products and services. In addition to enhancing the level of service provided to customers, the effective use of technology increases efficiency and enables financial institutions to reduce costs. Our future success will depend, in part, upon our ability to address the needs of our customers by using technology to provide products and services that enhance customer convenience and create additional efficiencies in operations. Many of our competitors have greater resources to invest in technological improvements, and we may not be able to effectively implement new technology-driven products and services, which could reduce our ability to effectively compete.
Our information systems may experience a failure or interruption.
We rely heavily on communications and information systems to conduct our business. Any failure or interruption in the operation of these systems could impair or prevent the effective operation of our customer relationship management, general ledger, deposit, lending, or other functions. While we have policies and procedures designed to prevent or limit the effect of a failure or interruption in the operation of our information systems, there can be no assurance that any such failures or interruptions will not occur or, if they do occur, that they will be adequately addressed. The occurrence of any failures or interruptions impacting our information systems could damage our reputation, result in a loss of customer business, and expose us to additional regulatory scrutiny, civil litigation, and possible financial liability, any of which could have a material adverse effect on our financial condition and results of operations.
22
We use information technology in our operations and offer online banking services to our customers and unauthorized access to our or our customers’ confidential or proprietary information as a result of a cyber-attack or otherwise could expose us to reputational harm and litigation and adversely affect our ability to attract and retain customers.
Information security risks for financial institutions have generally increased in recent years, in part because of the proliferation of new technologies, the use of the internet and telecommunications technologies to conduct financial transactions, and the increased sophistication and activities of organized crime, hackers, terrorists, activists, and other external parties. We are under continuous threat of loss due to hacking and cyber-attacks, especially as we continue to expand customer capabilities to utilize internet and other remote channels to transact business. Our risk and exposure to these matters remains heightened because of the evolving nature and complexity of these threats from cybercriminals and hackers, our plans to continue to provide internet banking and mobile banking channels, and our plans to develop additional remote connectivity solutions to serve our customers. Therefore, the secure processing, transmission, and storage of information in connection with our online banking services are critical elements of our operations. However, our network could be vulnerable to unauthorized access, computer viruses and other malware, phishing schemes, or other security failures. In addition, our customers may use personal smartphones, tablet PCs, or other mobile devices that are beyond our control systems in order to access our products and services. Our technologies, systems and networks, and our customers’ devices, may become the target of cyber-attacks, electronic fraud, or information security breaches that could result in the unauthorized release, gathering, monitoring, misuse, loss, or destruction of our or our customers’ confidential, proprietary, and other information, or otherwise disrupt our or our customers’ or other third parties’ business operations. As cyber threats continue to evolve, we may be required to spend significant capital and other resources to protect against these threats or to alleviate or investigate problems caused by such threats. To the extent that our activities or the activities of our customers involve the processing, storage, or transmission of confidential customer information, any breaches or unauthorized access to such information could present significant regulatory costs and expose us to litigation and other possible liabilities. Any inability to prevent these types of security threats could also cause existing customers to lose confidence in our systems and could adversely affect our reputation and ability to generate deposits. While we have not experienced any material losses relating to cyber-attacks or other information security breaches to date, we may suffer such losses in the future. The occurrence of any cyber-attack or information security breach could result in potential liability to clients, reputational damage, damage to our competitive position, and the disruption of our operations, all of which could adversely affect our financial condition or results of operations, lead to increased compliance and insurance costs and reduce shareholder value.
We are dependent upon outside third parties for the processing and handling of our records and data.
We rely on software developed by third-party vendors to process various transactions. In some cases, we have contracted with third parties to run their proprietary software on our behalf. These systems include, but are not limited to, general ledger, payroll, employee benefits, loan and deposit processing, and securities portfolio accounting. While we perform a review of controls instituted by the applicable vendors over these programs in accordance with industry standards and perform our own testing of user controls, we must rely on the continued maintenance of controls by these third-party vendors, including safeguards over the security of customer data. In addition, we maintain, or contract with third parties to maintain, daily backups of key processing outputs in the event of a failure on the part of any of these systems. Nonetheless, we may incur a temporary disruption in our ability to conduct business or process transactions, or incur damage to our reputation, if the third-party vendor fails to adequately maintain internal controls or institute necessary changes to systems. Such a disruption or breach of security may have a material adverse effect on our business.
The internal controls that we have implemented in order to mitigate risks inherent to the business of banking might fail or be circumvented.
Management regularly reviews and updates our internal controls and procedures that are designed to manage the various risks in our business, including credit risk, operational risk, and interest rate risk. No system of controls, however well-designed and operated, can provide absolute assurance that the objectives of the system will be met. If there were a failure of such a system, or if a system were circumvented, there could be a material adverse effect on our financial condition and results of operations.
Changes in accounting standards could materially impact our financial statements.
From time to time, the Financial Accounting Standards Board or the Securities and Exchange Commission, or the SEC, may change the financial accounting and reporting standards that govern the preparation of our financial statements. Such changes may result in us being subject to new or changing accounting and reporting standards. In addition, the bodies that interpret the accounting standards (such as banking regulators or outside auditors) may change their interpretations or positions on how these standards should be applied. These changes may be beyond our control, can be hard to predict, and can materially impact how we record and report our financial condition and results of operations. In some cases, we could be required to apply a new or revised standard retrospectively, or apply an existing standard differently, also retrospectively, in each case resulting in our needing to revise or restate prior period financial statements.
23
Adverse weather or manmade events could negatively affect our core markets or disrupt our operations, which could have an adverse effect upon our business and results of operations.
Our market areas are susceptible to natural disasters, such as hurricanes, tornadoes, tropical storms, other severe weather events, and related flooding and wind damage, and manmade disasters. These disasters could negatively impact regional economic conditions; cause a decline in the value or destruction of mortgaged properties and increase the risk of delinquencies, foreclosures, or loss on loans originated by us; damage our banking facilities and offices; and negatively impact our growth strategy. Such weather events could disrupt operations, result in damage to properties, and negatively affect the local economies in the markets where we operate. We cannot predict whether or to what extent damage that may be caused by future weather or manmade events will affect our operations or the economies in our current or future market areas, but such events could negatively impact economic conditions in these regions and result in a decline in local loan demand and loan originations, a decline in the value or destruction of properties securing our loans, and an increase in delinquencies, foreclosures, or loan losses. Our business or results of operations may be adversely affected by these and other negative effects of natural or manmade disasters. Further, severe weather, natural disasters, acts of war or terrorism, and other external events could adversely affect us in a number of ways, including an increase in delinquencies, bankruptcies, or defaults that could result in a higher level of non-performing assets, net charge-offs, and provision for loan losses. Such risks could also impair the value of collateral securing loans and hurt our deposit base.
We are or may become involved from time to time in suits, legal proceedings, information-gathering requests, investigations, and proceedings by governmental and self-regulatory agencies that may lead to adverse consequences.
Many aspects of our business involve substantial risk of legal liability. We are subject to being threatened to be named as defendants in lawsuits arising from our business activities, including business activities of Keystone prior to our acquisition. In addition, from time to time, we are, or may become, the subject of governmental and self-regulatory agency information-gathering requests, reviews, investigations and proceedings, and other forms of regulatory inquiry, including by bank regulatory agencies, the Securities and Exchange Commission, and law enforcement authorities. The results of such proceedings could lead to significant civil or criminal penalties, including monetary penalties, damages, adverse judgments, settlements, fines, injunctions, restrictions on the way in which we conduct our business, or reputational harm.
Risks Related to the Regulation of Our Industry
We are subject to extensive regulation in the conduct of our business, which imposes additional costs on us and adversely affects our profitability.
As a bank holding company, we are subject to federal regulation under the Bank Holding Company Act of 1956, as amended, or the BHCA, and the examination and reporting requirements of the Federal Reserve. Federal regulation of the banking industry, along with tax and accounting laws, regulations, rules, and standards, may limit our operations significantly and control the methods by which we conduct business, as they limit those of other banking organizations. Banking regulations are primarily intended to protect depositors, deposit insurance funds, and the banking system as a whole, and not stockholders or other creditors. These regulations affect lending practices, capital structure, investment practices, dividend policy, and overall growth, among other things. For example, federal and state consumer protection laws and regulations limit the manner in which we may offer and extend credit. In addition, the laws governing bankruptcy generally favor debtors, making it more expensive and more difficult to collect from customers who become subject to bankruptcy proceedings.
We also may be required to invest significant management attention and resources to evaluate and make any changes necessary to comply with applicable laws and regulations, particularly as a result of regulations adopted under the Dodd-Frank Wall Street Reform and Consumer Protection Act of 2010. This allocation of resources, as well as any failure to comply with applicable requirements, may negatively impact our financial condition and results of operations.
24
Changes in laws, government regulation, and monetary policy may have a material effect on our results of operations.
Financial institutions have been the subject of significant legislative and regulatory changes and may be the subject of further significant legislation or regulation in the future, none of which is within our control. New proposals for legislation continue to be introduced in the U.S. Congress that could further substantially increase regulation of the bank and non-bank financial services industries, impose restrictions on the operations and general ability of firms within the industry to conduct business consistent with historical practices, including in the areas of compensation, interest rates, financial product offerings, and disclosures, and have an effect on bankruptcy proceedings with respect to consumer residential real estate mortgages, among other things. Federal and state regulatory agencies also frequently adopt changes to their regulations or change the manner in which existing regulations are applied. Changes to statutes, regulations, or regulatory policies, including changes in their interpretation or implementation by regulators, could affect us in substantial and unpredictable ways. Such changes could, among other things, subject us to additional costs and lower revenues, limit the types of financial services and products that we may offer, ease restrictions on non-banks and thereby enhance their ability to offer competing financial services and products, increase compliance costs, and require a significant amount of management’s time and attention. Failure to comply with statutes, regulations, or policies could result in sanctions by regulatory agencies, civil monetary penalties, or reputational damage, each of which could have a material adverse effect on our business, financial condition, and results of operations.
Banking agencies periodically conduct examinations of our business, including compliance with laws and regulations, and our failure to comply with any supervisory actions to which we become subject as a result of such examinations could materially and adversely affect us.
The Bank is subject to supervision and regulation by banking agencies that periodically conduct examinations of our business, including compliance with laws and regulations – specifically, RB&T is subject to examination by the FDIC and the Alabama Banking Department. Accommodating such examinations may require management to reallocate resources, which would otherwise be used in the day-to-day operation of other aspects of our business. If, as a result of an examination, any such banking agency was to determine that the financial condition, capital resources, allowance for loan losses, asset quality, earnings prospects, management, liquidity, or other aspects of our operations had become unsatisfactory, or that we or our management were in violation of any law or regulation, such banking agency may take a number of different remedial actions as it deems appropriate. These actions include the power to enjoin “unsafe or unsound” practices, to require affirmative action to correct any conditions resulting from any violation or practice, to issue an administrative order that can be judicially enforced, to direct an increase in our capital, to restrict our growth, to assess civil monetary penalties against us, our officers, or directors, to remove officers and directors, and, if it is concluded that such conditions cannot be corrected or there is an imminent risk of loss to depositors, to terminate our deposit insurance. If we become subject to such a regulatory action, it could have a material adverse effect on our business, financial condition, and results of operations.
FDIC deposit insurance assessments may materially increase in the future, which would have an adverse effect on earnings.
As a member institution of the Federal Deposit Insurance Corporation, RB&T is assessed a quarterly deposit insurance premium. Failed banks nationwide have significantly depleted the insurance fund and reduced the ratio of reserves to insured deposits. The FDIC has adopted a Deposit Insurance Fund, or DIF, Restoration Plan, which requires the DIF to attain a 1.35% reserve ratio by September 30, 2020. As a result of this requirement, RB&T could be required to pay significantly higher premiums or additional special assessments that would adversely affect earnings, thereby reducing the availability of funds to pay dividends to the parent company, River Financial Corporation.
We are subject to certain capital requirements by regulators.
Applicable regulations require us to maintain specific capital standards in relation to the respective credit risks of our assets and off-balance sheet exposures. Various components of these requirements are subject to qualitative judgments by regulators. We maintain a “well capitalized” status under the current regulatory framework. Our failure to maintain a “well capitalized” status could affect our customers’ confidence in us, which could adversely affect our ability to do business. In addition, failure to maintain such status could also result in restrictions imposed by our regulators on our growth and other activities. Any such effect on customers or restrictions by our regulators could have a material adverse effect on our financial condition and results of operations.
25
We may need to raise additional capital in the future, including as a result of potential increased minimum capital thresholds established by regulators, but that capital may not be available when it is needed or may be dilutive to stockholders.
We are required by federal and state regulatory authorities to maintain adequate capital levels to support our operations. New regulations implementing minimum capital standards could require financial institutions to maintain higher minimum capital ratios and may place a greater emphasis on common equity as a component of “Tier 1 capital,” which consists generally of shareholders’ equity and qualifying preferred stock, less certain goodwill items and other intangible assets. In order to support our operations and comply with regulatory standards, we may need to raise capital in the future. Our ability to raise additional capital will depend on conditions in the capital markets at that time, which are outside of our control, on our financial performance, and on our successful integration of Keystone and the operations of RB&T. Accordingly, we cannot assure you of our ability to raise additional capital, if needed, on favorable terms. The capital and credit markets have experienced significant volatility in recent years. In some cases, the markets have produced downward pressure on stock prices and credit availability for certain issuers without regard to those issuers’ underlying financial strength. If we cannot raise additional capital when needed, our financial condition and results of operations may be adversely affected, and our banking regulators may subject us to regulatory enforcement action, including receivership. Furthermore, our issuance of additional shares of our common stock could dilute the economic ownership interest of our stockholders.
We are subject to numerous laws designed to protect consumers, including the Community Reinvestment Act and fair lending laws, and failure to comply with these laws could lead to a wide variety of sanctions.
The Community Reinvestment Act, or CRA, the Equal Credit Opportunity Act, the Fair Housing Act, and other fair lending laws and regulations impose nondiscriminatory lending requirements on financial institutions. The U.S. Department of Justice and other federal agencies are responsible for enforcing these laws and regulations. A successful regulatory challenge to an institution’s performance under the CRA or fair lending laws and regulations could result in a wide variety of sanctions, including damages and civil money penalties, injunctive relief, restrictions on mergers and acquisitions activity, restrictions on expansion, and restrictions on entering new business lines. Private parties may also have the ability to challenge an institution’s performance under fair lending laws in private class action litigation. Such actions could have a material adverse effect on our business, financial condition, results of operations, and future prospects.
We are subject to the Bank Secrecy Act and other anti-money laundering statutes and regulations, and any deemed deficiency by us with respect to these laws could result in significant liability.
The Bank Secrecy Act, the USA PATRIOT Act of 2001, and other laws and regulations require financial institutions, among other duties, to institute and maintain an effective anti- money laundering program and file suspicious activity and currency transaction reports when appropriate. In addition to other bank regulatory agencies, the federal Financial Crimes Enforcement Network of the Department of the Treasury is authorized to impose significant civil money penalties for violations of those requirements and has recently engaged in coordinated enforcement efforts with the state and federal banking regulators, as well as the U.S. Department of Justice, Consumer Financial Protection Bureau, Drug Enforcement Administration, and Internal Revenue Service. We are also subject to increased scrutiny of compliance with the rules enforced by the Office of Foreign Assets Control of the Department of the Treasury regarding, among other things, the prohibition of transacting business with, and the need to freeze assets of, certain persons and organizations identified as a threat to the national security, foreign policy, or economy of the United States. If our policies, procedures, and systems are deemed deficient, we would be subject to liability, including fines and regulatory actions, which may include restrictions on our ability to pay dividends and the necessity to obtain regulatory approvals to proceed with certain aspects of our business plan, including our acquisition plans. Failure to maintain and implement adequate programs to combat money laundering and terrorist financing could also have serious reputational consequences for us. Any of these results could have a material adverse effect on our business, financial condition, results of operations, and future prospects.
Risks Related to Our Common Stock
An active, liquid market for our common stock may not develop or be sustained, which may impair your ability to sell your shares.
There is currently no public market for our common stock. If an active trading market does not develop, you may not be able to sell your shares at the volume, prices, and times desired. To the extent there is trading in our common stock, the trading is in privately negotiated transactions at times and at prices of which we are sometimes unaware.
26
The trading price of our common stock may be subject to various influences, which may make it difficult for you to sell your shares at the volumes, prices, and times desired.
The trading price of our common stock may be volatile and subject to wide price fluctuations in response to various factors, including:
|
|
• |
actual or anticipated fluctuations in our operating results, financial condition, or asset quality; |
|
|
• |
market conditions in the broader stock market in general, or in our industry in particular; |
|
|
• |
publication of research reports about us, our competitors, or the bank and non-bank financial services industries generally, or changes in, or failure to meet, securities analysts’ estimates of our financial and operating performance, or lack of research reports by industry analysts or ceasing of coverage; |
|
|
• |
future issuances of our common stock or other securities; |
|
|
• |
significant acquisitions or business combinations, strategic partnerships, joint ventures, or capital commitments by or involving our competitors or us; |
|
|
• |
additions or departures of key personnel; |
|
|
• |
trades of large blocks of our stock; |
|
|
• |
economic and political conditions or events; |
|
|
• |
regulatory developments; and |
|
|
• |
other news, announcements, or disclosures (whether by us or others) related to us, our competitors, our core markets, or the bank and non-bank financial services industries. |
These and other factors may cause the market price and any demand for our common stock to fluctuate substantially, which may limit or prevent investors from readily selling their shares of common stock and may otherwise negatively affect the liquidity of our common stock.
We cannot guarantee that we will pay dividends to our stockholders in the future.
The holders of our common stock will receive dividends if and when declared by our board of directors out of legally available funds. Any future determination relating to the payment of dividends will be made at the discretion of our board of directors and will depend on a number of factors, including our future earnings, capital requirements, financial condition, future prospects, regulatory restrictions, and other factors that our board of directors may deem relevant.
Our principal business operations are conducted through RB&T. Cash available to pay dividends to our stockholders is derived primarily, if not entirely, from dividends paid by our Banks to us. The ability of RB&T to pay dividends to us, as well as our ability to pay dividends to our stockholders, will continue to be subject to, and limited by, certain legal and regulatory restrictions. Further, any lenders making loans to us may impose financial covenants that may be more restrictive with respect to dividend payments than the regulatory requirements.
A future issuance of stock could dilute the value of our common stock.
At a special meeting of our stockholders held on December 1, 2015, our existing stockholders approved a proposal to amend our certificate of incorporation to increase the number of shares of our common stock that we may issue to 10,000,000. As of March 1, 2018, 5,119,818 shares of our common stock were issued and outstanding. Those shares outstanding do not include the potential issuance, as of March 1, 2018, 246,625 shares of our common stock subject to issuance upon exercise of outstanding stock options and warrants, or 177,500 additional shares of our common stock that were reserved for issuance under the River Financial Corporation Incentive Stock Compensation Plans. Future issuance of any new shares could cause further dilution in the value of our outstanding shares of common stock.
27
Our directors and executive officers beneficially own a significant portion of our common stock and have substantial influence over us.
Our directors and executive officers, as a group, beneficially owned approximately 11.5% of our outstanding common stock as of March 1, 2018 . As a result of this level of ownership, our directors and executive officers have the ability, by taking coordinated action, to exercise significant influence over our affairs and policies. The interests of our directors and executive officers may not be consistent with your interests as a stockholder. This influence may also have the effect of delaying or preventing changes of control or changes in management, or limiting the ability of our other stockholders to approve transactions that they may deem to be in the best interests of our Company.
Shares of our common stock are not insured deposits and may lose value.
Shares of our common stock are not savings or deposit accounts and are not insured by the FDIC’s DIF, or any other agency or private entity. Such shares are subject to investment risk, including the possible loss of some or all of the value of your investment.
The laws that regulate our operations are designed for the protection of depositors and the public, not our stockholders.
The federal and state banking laws and regulations applicable to our operations give regulatory authorities extensive discretion in connection with their supervisory and enforcement responsibilities, and generally have been promulgated to protect depositors and the FDIC’s DIF and not for the purpose of protecting stockholders. These laws and regulations can materially affect our future business. Laws and regulations now affecting us may be changed at any time, and the interpretation of such laws and regulations by bank regulatory authorities is also subject to change.
We have the ability to incur debt and pledge our assets, including our stock in RB&T, to secure that debt.
We have the ability to incur debt and pledge our assets to secure that debt. Absent special and unusual circumstances, a holder of indebtedness for borrowed money has rights that are superior to those of holders of common stock. For example, interest must be paid to the lender before dividends can be paid to the stockholders, and loans must be paid off before any assets can be distributed to stockholders if we were to liquidate. Furthermore, we would have to make principal and interest payments on our indebtedness, which could reduce our profitability or result in net losses on a consolidated basis.
The requirements of being a public company may strain our resources and distract our management, which could make it difficult to manage our business.
Since October 28, 2015, we have been required to comply with the regulatory and reporting requirements of the SEC. Complying with these reporting and other regulatory requirements is time consuming, results in increased costs to us, and could have a material adverse effect on our business, financial condition, and results of operations.
As a public company, we are subject to the requirements of the Exchange Act and the Sarbanes-Oxley Act. These requirements may place a strain on our systems and resources. The Exchange Act requires that we file annual, quarterly and current reports with respect to our business and financial condition. The Sarbanes-Oxley Act requires that we maintain effective disclosure controls and procedures and internal controls over financial reporting. To maintain and improve the effectiveness of our disclosure controls and procedures, we must commit significant resources and management oversight. We continue to implement procedures and processes for the purpose of addressing the standards and requirements applicable to public companies. Sustaining our growth also requires us to commit additional management, operational, and financial resources to maintain appropriate operational and financial systems to adequately support expansion. These activities may divert management’s attention from other business concerns, which could have a material adverse effect on our business, financial condition, results of operations, and cash flows.
Item 1B. Unresolved Staff Comments.
Not applicable.
28
Our headquarters and the main office of RB&T is located at 2611 Legends Drive, Prattville, Alabama 36066. Including the main office, RB&T operates ten branches with drive-through and/or ATM service.
The following table summarizes pertinent details of the Company’s main and banking offices as of December 31, 2017:
|
Office Address |
|
Owned/Leased |
|
|
|
|
|
2611 Legends Drive |
|
Owned |
|
Prattville, AL 36066 |
|
|
|
|
|
|
|
612 South Memorial Drive |
|
Leased |
|
Prattville, AL 36067 |
|
|
|
|
|
|
|
7075 Halcyon Park Drive |
|
Leased |
|
Montgomery, AL 36117 |
|
|
|
|
|
|
|
309 Maxwell Boulevard |
|
Leased |
|
Montgomery, AL 36104 |
|
|
|
|
|
|
|
10 Cambridge Drive |
|
Owned |
|
Wetumpka, AL 36092 |
|
|
|
|
|
|
|
3617 U.S. Highway 280 |
|
Owned |
|
Alexander City, AL 35010 |
|
|
|
|
|
|
|
2394 East University Drive |
|
Owned |
|
Auburn, AL 36830 |
|
|
|
|
|
|
|
1804 Thomason Drive |
|
Owned |
|
Opelika, AL 36801 |
|
|
|
|
|
|
|
244 South 3rd Street |
|
Owned |
|
Gadsden, AL 35901
3111 Alabama Highway 14 Millbrook, AL 36054 |
|
Owned |
|
|
|
|
We believe that our banking offices are in good condition and are suitable to our needs.
As of March 1, 2018, we are not subject pending or threatened litigation in the ordinary course of our business.
Item 4. Mine Safety Disclosures.
Not applicable.
29
Item 5. Market For Registrant’s Common Equity, Related Stockholder Matters and Issuer Purchases of Equity Securities.
Market for Our Common Stock
There is currently no established public trading market for shares of our common stock. We do not make a market in our securities, nor do we attempt to negotiate prices for trades of such securities. When made, sales are normally undertaken in privately negotiated transactions, sometimes at prices of which we are unaware. As of March 1, 2018, there were approximately 748 registered holders of our common stock.
The last known privately negotiated trade of our common stock of which management is aware occurred on February 9, 2018 at a price of $25.50 per share. During the last year we are aware of privately negotiated trades of stock with prices ranging from $19.00 to $25.50 per share.
Securities Authorized for Issuance Under Equity Compensation Plans
The following table provides information about River Financial’s shares of common stock that may be issued upon exercise of options, warrants, and rights under all of our existing equity compensation plans as of .
|
Plan Category |
|
Number of Securities to be Issued Upon Exercise of Outstanding Options and Rights |
|
|
Weighted – Average Exercise Price of Outstanding Options and Rights |
|
|
Number of Securities Remaining Available for Future Issuance Under Equity Compensation Plans (Excluding Securities Reflected in the First Column) |
|
|||
|
Equity compensation plans approved by Security Holders(1) |
|
|
122,000 |
|
|
$ |
13.65 |
|
|
|
- |
|
|
Equity compensation plans approved by Security Holders(2) |
|
|
122,500 |
|
|
$ |
16.74 |
|
|
|
177,500 |
|
|
Equity compensation plans approved by Security Holders(3) |
|
|
2,125 |
|
|
$ |
8.40 |
|
|
|
- |
|
|
Total |
|
|
246,625 |
|
|
|
|
|
|
|
|
|
|
(1) |
These shares reserved for issuance under the 2006 Equity Incentive Compensation Plan. |
|
(2) |
These shares reserved for issuance under the 2015 Equity Incentive Compensation Plan. |
|
(3) |
These shares reserved for issuance for the incentive stock options assumed from Keystone. |
Recent Sales of Unregistered Securities
In 2017 and 2016, at year end the Company sold 12,967 and 19,008, shares for cash, respectively, to its employee stock ownership plan. The Company relied upon exemptions from registration under SEC Rule 701 and Rule 147.
Dividends
The holders of our common stock receive dividends if and when declared by our board of directors out of legally available funds. Any future determination of the payment of dividends will be made at the discretion of our board of directors and will depend on a number of factors, including our future earnings, capital requirements, financial condition, future prospects, regulatory restrictions, and other factors that our board of directors may deem relevant.
30
We are subject to the Federal Reserve’s policies restricting bank holding companies from declaring or paying cash dividends. As a general matter, the Federal Reserve has indicated that the board of directors of a bank holding company should consult with the Federal Reserve and eliminate, defer, or significantly reduce the bank holding company’s dividends if (i) its net income available to stockholders for the past four quarters, net of dividends previously paid during that period, is not sufficient to fully fund the dividends, (ii) its prospective rate of earnings retention is not consistent with its capital needs and overall current and prospective financial condition, or (iii) it will not meet, or is in danger of not meeting, its minimum regulatory capital adequacy ratios. Our failure to do so could result in the Federal Reserve finding that we are operating in an unsafe and unsound manner.
Our ability to pay dividends is dependent on the ability of our Banks to pay dividends to us. RB&T’s ability to pay dividends on its common stock to us without regulatory approval is limited by banking laws to its retained net income available to holders of its common stock to date for the then current fiscal year, plus retained net income from the prior two fiscal years.
Should the Banks be “significantly undercapitalized” under the applicable federal bank capital standards, or if the Bank is “undercapitalized” and has failed to submit an acceptable capital restoration plan or has materially failed to implement such a plan, the FDIC may choose to require us to receive prior approval for any capital distribution from the Federal Reserve. In addition, the Banks generally are prohibited from making a capital distribution if it would cause them to be “undercapitalized” under applicable federal bank capital standards.
The dividends paid per share on common stock for 2017 and 2016 were $0.25 cents per share and $0.16 cents per share respectively.
31
Item 6. Selected Financial Data.
SUMMARY CONSOLIDATED FINANCIAL DATA
|
|
Years Ended December 31, |
|
||||||
|
(Dollars in thousands, except per share information) |
|
2017 |
|
|
2016 |
|
||
|
Summary of Operations: |
|
|
|
|
|
|
|
|
|
Total interest income |
|
$ |
32,170 |
|
|
$ |
30,309 |
|
|
Total interest expense |
|
|
2,620 |
|
|
|
2,353 |
|
|
Net interest income |
|
|
29,550 |
|
|
|
27,956 |
|
|
Provision for loan losses |
|
|
1,740 |
|
|
|
878 |
|
|
Net interest income after provision for loan losses |
|
|
27,810 |
|
|
|
27,078 |
|
|
Noninterest income |
|
|
6,309 |
|
|
|
4,889 |
|
|
Noninterest expense |
|
|
21,305 |
|
|
|
20,560 |
|
|
Income before income taxes |
|
|
12,814 |
|
|
|
11,407 |
|
|
Income tax expense |
|
|
4,519 |
|
|
|
3,504 |
|
|
Net income |
|
|
8,295 |
|
|
|
7,903 |
|
|
Share and per common share data: |
|
|
|
|
|
|
|
|
|
Basic net income per share |
|
$ |
1.63 |
|
|
$ |
1.57 |
|
|
Diluted net income per share |
|
$ |
1.60 |
|
|
$ |
1.55 |
|
|
Common equity per common share outstanding |
|
$ |
17.46 |
|
|
$ |
16.10 |
|
|
Tangible common equity per common share outstanding |
|
$ |
15.18 |
|
|
$ |
13.71 |
|
|
Dividends per common share |
|
$ |
0.25 |
|
|
$ |
0.16 |
|
|
Actual common shares outstanding |
|
|
5,098,068 |
|
|
|
5,080,857 |
|
|
Weighted average common shares outstanding |
|
|
5,095,305 |
|
|
|
5,023,617 |
|
|
Diluted weighted average common shares outstanding |
|
|
5,180,102 |
|
|
|
5,087,518 |
|
|
Balance Sheet Data: |
|
|
|
|
|
|
|
|
|
Total assets |
|
$ |
823,292 |
|
|
$ |
810,417 |
|
|
Securities |
|
|
193,289 |
|
|
|
183,361 |
|
|
Loans, net of unearned income |
|
|
547,121 |
|
|
|
516,441 |
|
|
Allowance for loan losses |
|
|
4,881 |
|
|
|
4,007 |
|
|
Deposits |
|
|
699,861 |
|
|
|
704,913 |
|
|
Securities sold under agreements to repurchase |
|
|
13,865 |
|
|
|
13,034 |
|
|
Federal Home Loan Bank advances |
|
|
10,000 |
|
|
|
- |
|
|
Federal funds purchased |
|
|
1,153 |
|
|
|
- |
|
|
Note payable |
|
|
5,357 |
|
|
|
6,428 |
|
|
Total stockholders’ equity |
|
|
88,999 |
|
|
|
81,827 |
|
|
Average total assets |
|
|
804,850 |
|
|
|
746,347 |
|
|
Average loans |
|
|
517,822 |
|
|
|
495,687 |
|
|
Average interest earning assets |
|
|
738,047 |
|
|
|
680,947 |
|
|
Average deposits |
|
|
685,350 |
|
|
|
638,779 |
|
|
Average interest bearing deposits |
|
|
516,892 |
|
|
|
495,299 |
|
|
Average interest bearing liabilities |
|
|
545,852 |
|
|
|
518,399 |
|
|
Average total stockholders’ equity |
|
|
87,367 |
|
|
|
81,064 |
|
32
SUMMARY CONSOLIDATED FINANCIAL DATA (continued)
|
|
Years Ended December 31, |
|
||||||
|
|
|
2017 |
|
|
2016 |
|
||
|
Selected Financial Ratios: |
|
|
|
|
|
|
|
|
|
(ratios are annualized where applicable) |
|
|
|
|
|
|
|
|
|
Return on average assets |
|
|
1.03 |
% |
|
|
1.06 |
% |
|
Return on average equity |
|
|
9.49 |
% |
|
|
9.75 |
% |
|
Average equity to average total assets |
|
|
10.86 |
% |
|
|
10.86 |
% |
|
Dividend payout (1) |
|
|
15.33 |
% |
|
|
10.27 |
% |
|
Efficiency ratio (2) |
|
|
59.41 |
% |
|
|
62.60 |
% |
|
Net interest margin (3) |
|
|
4.00 |
% |
|
|
4.11 |
% |
|
Net interest spread (4) |
|
|
3.97 |
% |
|
|
4.10 |
% |
|
Capital Ratios: |
|
|
|
|
|
|
|
|
|
Tier 1 leverage ratio |
|
|
10.43 |
% |
|
|
9.96 |
% |
|
Common equity tier 1 (CET1) risk-based capital |
|
|
13.54 |
% |
|
|
13.01 |
% |
|
Tier 1 risk-based capital |
|
|
13.54 |
% |
|
|
13.01 |
% |
|
Total risk-based capital |
|
|
14.33 |
% |
|
|
13.68 |
% |
|
Asset Quality Ratios: |
|
|
|
|
|
|
|
|
|
(ratios are annualized where applicable) |
|
|
|
|
|
|
|
|
|
Net charge-offs to average loans |
|
|
0.17 |
% |
|
|
0.14 |
% |
|
Allowance to period end loans |
|
|
0.89 |
% |
|
|
0.78 |
% |
|
Allowance for loan losses to non-performing loans |
|
|
162.32 |
% |
|
|
90.55 |
% |
|
Non-performing assets to total assets |
|
|
0.55 |
% |
|
|
0.69 |
% |
|
Other Data: |
|
|
|
|
|
|
|
|
|
Banking locations |
|
|
10 |
|
|
|
10 |
|
|
Full-time equivalent employees |
|
|
147 |
|
|
|
130 |
|
|
(1) |
Dividend payout ratio is dividends divided by net income. |
|
(2) |
Efficiency ratio is noninterest expense divided by the sum of net interest income before the provision for loan losses plus noninterest income. |
|
(3) |
Net interest margin is net interest income divided by average interest earning assets. |
|
(4) |
Net interest spread is the difference between the weighted average yield on interest earning assets and the average effective rate paid on interest bearing liabilities. |
33
Item 7. Management’s Discussion and Analysis of Financial Condition and Results of Operations
The following discussion and analysis of our financial condition and results of operations should be read together with our consolidated financial statements and related notes thereto and other financial information appearing elsewhere in this document. In addition to historical information, this discussion and analysis contains forward-looking statements that involve risks, uncertainties and assumptions that could cause actual results to differ materially from our expectations. Factors that could cause such differences are discussed in the sections entitled “Special Note Regarding Forward-Looking Statements” and “Risk Factors.” We assume no obligation to update any of these forward-looking statements.
The following discussion pertains to our historical results, on a consolidated basis. However, because we conduct all of our material business operations through our subsidiaries, the discussion and analysis relates to activities primarily conducted at the subsidiary level.
All dollar amounts in the tables in this section are in thousands of dollars, except per share data or when specifically identified.
Our Business
We are a bank holding company headquartered in Prattville, Alabama. We operate one subsidiary bank – River Bank and Trust (“RB&T” or the “Bank”).
Through the Bank, we provide a broad array of financial services to businesses, business owners and professionals through ten full-service banking offices in Alabama.
Segments
While our chief decision makers monitor the revenue streams of the various banking products and services, operations are managed and financial performance is evaluated on a Company-wide basis. Accordingly, all of the Company’s banking operations are considered by management to be aggregated in one reportable operating segment. Because the overall banking operations comprise substantially all of the consolidated operations, no separate segment disclosures are presented in the accompanying consolidated financial statements.
Overview of 2017 Results
|
|
• |
Our net income was $8.3 million in 2017, compared with $7.9 million in 2016. The largest contributing factors leading to the increase in the 2017 net income and other highlights include the following: Average interest earning assets in 2017 were $738.0 million compared to $680.9 million in 2016. The higher level of interest earning assets led to an increase in net interest income from $28.0 million in 2016 to $29.6 million in 2017. |
|
|
• |
Average loans outstanding in 2017 were $517.8 million, approximately 4.47% higher than $495.7 million in average loans outstanding in 2016. The higher average balance for total loans outstanding was the primary reason for the increase of $1.6 million in our net interest income. |
|
|
• |
The effective yield on our loan portfolio decreased from 5.47% in 2016 to 5.39% in 2017. The decrease in the yield was mainly attributable to competitive pricing pressures and loans renewing and repricing at lower market rates. |
|
|
• |
Average total investment securities in 2017 were $200.3 million compared to $152.8 million in 2016. The increase resulted from organic growth. |
|
|
• |
Average non-interest bearing deposits grew from $143.5 million in 2016 to $168.5 million in 2017. The increase resulted from organic growth. |
|
|
• |
Our higher net interest income was offset by higher operating expenses, which grew to $21.3 million in 2017 from $20.6 million in 2016. The increase in noninterest expense came from organic growth with most of the increase in salaries and employee benefits. |
|
|
• |
Our noninterest income increased from $4.9 million in 2016 to $6.3 million in 2017. The increase resulted from death benefits received in the current year as well as significant increases in service charges and fee income and income from mortgage operations. |
34
Critical Accounting Policies and Estimates
Our consolidated financial statements are prepared based on the application of certain accounting policies, the most significant of which are described in RFC’s Notes to the Consolidated Financial Statements. Certain of these policies require numerous estimates and strategic or economic assumptions that may prove inaccurate or subject to variation and may significantly affect our reported results and financial position for the current period or future periods. The use of estimates, assumptions, and judgment is necessary when financial assets and liabilities are required to be recorded at, or adjusted to reflect fair value. Assets carried at fair value inherently result in more financial statement volatility. Fair values and information used to record valuation adjustments for certain assets and liabilities are based on quoted market prices or are provided by other independent third-party sources, when available. When such information is not available, management estimates valuation adjustments. Changes in underlying factors, assumptions or estimates in any of these areas could have a material impact on our future financial condition and results of operations.
The following briefly describes the more complex policies involving a significant amount of judgments about valuation and the application of complex accounting standards and interpretations.
Allowance for Loan Losses
We record estimated probable inherent credit losses in the loan portfolio as an allowance for loan losses. The methodologies and assumptions for determining the adequacy of the overall allowance for loan losses involve significant judgments to be made by management. Some of the more critical judgments supporting RFC’s allowance for loan losses include judgments about: creditworthiness of borrowers, estimated value of underlying collateral, assumptions about cash flow, determination of loss factors for estimated credit losses, and the impact of current events, conditions, and other factors impacting the level of inherent losses. Under different conditions or using different assumptions, the actual or estimated credit losses ultimately realized by RFC may be different than management’s estimates provided in our Consolidated Financial Statements included elsewhere in this Form 10-K. For a more complete discussion of the methodology employed to calculate the allowance for loan losses, see Note 1 to our Consolidated Financial Statements for the year ended December 31, 2017, which are included elsewhere in this document.
Investment Securities Impairment
Periodically, we assess whether there have been any events or economic circumstances to indicate that a security on which there is an unrealized loss is impaired on an other-than-temporary basis. In such instance, we would consider many factors, including the severity and duration of the impairment, our intent and ability to hold the security for a period of time sufficient for a recover in value, recent events specific to the issuer or industry, and for debt securities, external credit ratings and recent downgrades. Securities on which there is an unrealized loss that is deemed to be other-than-temporary are written down to fair value. The credit portion of the impairment, if any, is recognized as a realized loss in current earnings.
Income Taxes
Deferred income tax assets and liabilities are computed using the asset and liability method, which recognizes a liability or asset representing the tax effects, based on current tax law, of future deductible or taxable amounts attributable to events recognized in the financial statements. A valuation allowance may be established to the extent necessary to reduce the deferred tax asset to a level at which it is “more likely than not” that the tax assets or benefits will be realized. Realization of tax benefits depends on having sufficient taxable income, available tax loss carrybacks or credits, the reversing of taxable temporary differences and/or tax planning strategies within the reversal period and that current tax law allows for the realization of recorded tax benefits.
Comparison of Results of Operations for the years ended December 31, 2017 and 2016
The following is a narrative discussion and analysis of significant changes in our results of operations for the years ended December 31, 2017 and 2016.
Net Income
2017 vs. 2016
During the year ended December 31, 2017, our net income was $8.3 million, compared to $7.9 million for the year ended December 31, 2016, an increase of 4.96%. The primary reason for the increase in net income in 2017 compared to 2016 was an increase in net interest income from $28.0 million in 2016 to $29.6 million in 2017 for an increase of $1.6 million, or 5.70%. Our net interest margin saw a decrease from 4.11% in 2016 to 4.00% in 2017. The decrease in the margin resulted from a decrease in the yield on our loan portfolio from 5.47% in 2016 to 5.39% in 2017 and also because loans comprised a lower percentage of total interest earning assets at 70.2% in 2017 compared to 72.8% in 2016.
35
Noninterest income increased from $4.9 million in 2016 to $6.3 million in 2017, or 29.04%. The increase resulted from death benefits received in the current year as well as significant increases in service charges and fee income and income from mortgage operations.
Net Interest Income and Net Interest Margin Analysis
The largest component of our net income is net interest income – the difference between the income earned on interest-earning assets and the interest paid on deposits and borrowed funds used to support our assets. Net interest income divided by average earning assets represents our net interest margin. The major factors that affect net interest income and net interest margin are changes in volumes, the yield on interest-earning assets, and the cost of interest-bearing liabilities. Our margin can also be affected by economic conditions, the competitive environment, loan demand, and deposit flow. Our ability to respond to changes in these factors by using effective asset-liability management techniques is critical to maintaining the stability of the net interest margin and our primary source of earnings.
The following table shows, for the years 2017 and 2016, the average balance of each principal category of our assets and liabilities and the average yields on assets and average costs of liabilities. Such yields and costs are calculated by dividing income or expense by the average daily balances of the associated assets or liabilities.
AVERAGE BALANCE SHEETS & NET INTEREST INCOME
|
|
Year Ended December 31, 2017 |
|
|
Year Ended December 31, 2016 |
|
|||||||||||||||||||
|
|
|
Average Balance |
|
|
Interest Income/ Expense |
|
|
Average Yield/Rate |
|
|
Average Balance |
|
|
Interest Income/ Expense |
|
|
Average Yield/Rate |
|
||||||
|
Interest earning assets |
|
|
|
|
|
|
|
|
|
|
|
|
|
|
|
|
|
|
|
|
|
|
|
|
|
Loans |
|
$ |
517,822 |
|
|
$ |
27,930 |
|
|
|
5.39 |
% |
|
$ |
495,687 |
|
|
$ |
27,119 |
|
|
|
5.47 |
% |
|
Mortgage loans held for sale |
|
|
4,036 |
|
|
|
86 |
|
|
|
2.13 |
% |
|
|
4,754 |
|
|
|
155 |
|
|
|
3.26 |
% |
|
Investment securities: |
|
|
|
|
|
|
|
|
|
|
|
|
|
|
|
|
|
|
|
|
|
|
|
|
|
Taxable securities |
|
|
146,370 |
|
|
|
2,938 |
|
|
|
2.01 |
% |
|
|
96,732 |
|
|
|
1,805 |
|
|
|
1.87 |
% |
|
Tax-exempt securities |
|
|
53,951 |
|
|
|
1,712 |
|
|
|
3.17 |
% |
|
|
56,115 |
|
|
|
1,679 |
|
|
|
2.99 |
% |
|
Interest bearing balances in other banks |
|
|
15,868 |
|
|
|
211 |
|
|
|
1.33 |
% |
|
|
21,985 |
|
|
|
196 |
|
|
|
0.89 |
% |
|
Federal funds sold |
|
|
- |
|
|
|
- |
|
|
|
0.00 |
% |
|
|
5,674 |
|
|
|
30 |
|
|
|
0.53 |
% |
|
Total interest earning assets |
|
$ |
738,047 |
|
|
$ |
32,877 |
|
|
|
4.45 |
% |
|
$ |
680,947 |
|
|
$ |
30,984 |
|
|
|
4.55 |
% |
|
Interest bearing liabilities |
|
|
|
|
|
|
|
|
|
|
|
|
|
|
|
|
|
|
|
|
|
|
|
|
|
Interest bearing transaction accounts |
|
$ |
189,673 |
|
|
$ |
452 |
|
|
|
0.24 |
% |
|
$ |
176,776 |
|
|
$ |
449 |
|
|
|
0.25 |
% |
|
Savings and money market accounts |
|
|
189,438 |
|
|
|
667 |
|
|
|
0.35 |
% |
|
|
180,711 |
|
|
|
648 |
|
|
|
0.36 |
% |
|
Time deposits |
|
|
137,781 |
|
|
|
1,110 |
|
|
|
0.81 |
% |
|
|
137,812 |
|
|
|
950 |
|
|
|
0.69 |
% |
|
Securities sold under agreement to repurchase |
|
|
13,592 |
|
|
|
28 |
|
|
|
0.21 |
% |
|
|
10,378 |
|
|
|
16 |
|
|
|
0.15 |
% |
|
Federal Home Loan Bank advances |
|
|
8,712 |
|
|
|
101 |
|
|
|
1.16 |
% |
|
|
5,713 |
|
|
|
40 |
|
|
|
0.70 |
% |
|
Federal funds purchased |
|
|
721 |
|
|
|
13 |
|
|
|
1.80 |
% |
|
|
- |
|
|
|
- |
|
|
|
0.00 |
% |
|
Note payable |
|
|
5,935 |
|
|
|
249 |
|
|
|
4.20 |
% |
|
|
7,009 |
|
|
|
250 |
|
|
|
3.57 |
% |
|
Total interest bearing liabilities |
|
$ |
545,852 |
|
|
$ |
2,620 |
|
|
|
0.48 |
% |
|
$ |
518,399 |
|
|
$ |
2,353 |
|
|
|
0.45 |
% |
|
Noninterest-bearing funding of earning assets |
|
|
192,195 |
|
|
|
— |
|
|
|
0.00 |
% |
|
|
162,548 |
|
|
|
— |
|
|
|
0.00 |
% |
|
Total cost of funding earning assets |
|
$ |
738,047 |
|
|
$ |
2,620 |
|
|
|
0.35 |
% |
|
$ |
680,947 |
|
|
$ |
2,353 |
|
|
|
0.35 |
% |
|
Net interest rate spread |
|
|
|
|
|
|
|
|
|
|
3.97 |
% |
|
|
|
|
|
|
|
|
|
|
4.10 |
% |
|
Net interest income/margin (taxable equivalent) |
|
|
|
|
|
$ |
30,257 |
|
|
|
4.10 |
% |
|
|
|
|
|
$ |
28,631 |
|
|
|
4.20 |
% |
|
Tax equivalent adjustment |
|
|
|
|
|
|
(707 |
) |
|
|
|
|
|
|
|
|
|
|
(675 |
) |
|
|
|
|
|
Net interest income/margin |
|
|
|
|
|
$ |
29,550 |
|
|
|
4.00 |
% |
|
|
|
|
|
$ |
27,956 |
|
|
|
4.11 |
% |
Comparison of net interest income for the years ended December 31, 2017 and 2016
Net interest income increased $1.6 million, or 5.70%, to $29.6 million for the year ended December 31, 2017, compared to $28.0 million for 2016. The increase was due to an increase in interest income of $1.9 million, resulting from higher levels of loan volume. The increase in interest income was primarily due to a 4.47% increase in average loans outstanding during 2017 compared to 2016. The resulting net interest margin for 2017 decreased to 4.00%, from 4.11% during 2016. During 2017, non-interest bearing deposits averaged $168.5 million, compared to $143.5 million during 2016, an increase of $25.0 million, or 17.41%.
36
Interest-earning assets averaged $738.0 million for 2017, compared to $680.9 million for 2016, an increase of $57.1 million, or 8.39%. Average loans increased $22.1 million during 2017 to $517.8 million from $495.7 million in 2016. However, the mix of average earning assets in 2017 shifted slightly from loans to investment securities. As a percentage of average total earning assets, average loans decreased from 72.8% in 2016 to 70.2% in 2017. The yield on average interest-earning assets decreased 10 basis points to 4.45% during 2017, compared to 4.55% for 2016. The yield on earning assets decreased primarily due to the decrease in the effective yield on loans during 2017. During 2017, loan yields decreased 8 basis points to 5.39%. The decrease in loan yields was primarily due competitive pricing pressures and loans repricing at lower market rates.
Interest-bearing liabilities averaged $545.9 million for 2017, compared to $518.4 million for 2016, an increase of $27.5 million. The increase in average volume occurred from organic growth. The average rate paid on interest-bearing liabilities was 0.48% for 2017, compared to 0.45% for 2016. During recent years, we have benefited from the historically low interest rates and repriced time deposits at maturity at the lower current market rates, and we have also lowered rates on other deposit accounts to lower market rates where possible. However, during the current year interest rates have increased slightly. The increase in total interest expense from $2.4 million in 2016 to $2.6 million in 2017 was mainly attributable to the increase in average interest-bearing liabilities.
The following table reflects, for the years 2017 and 2016, the changes in our net interest income due to changes in the volume of earning assets and interest-bearing liabilities and the associated rates earned or paid on the assets and liabilities.
|
|
Year Ended December 31, 2017 vs. Year Ended December 31, 2016 |
|
||||||||||
|
|
|
Volume |
|
|
Variance due to Yield/Rate |
|
|
Total |
|
|||
|
Interest earning assets |
|
|
|
|
|
|
|
|
|
|
|
|
|
Loans |
|
$ |
1,211 |
|
|
$ |
(400 |
) |
|
$ |
811 |
|
|
Mortgage loans held for sale |
|
|
(23 |
) |
|
|
(46 |
) |
|
|
(69 |
) |
|
Investment securities: |
|
|
|
|
|
|
|
|
|
|
|
|
|
Taxable securities |
|
|
926 |
|
|
|
207 |
|
|
|
1,133 |
|
|
Tax-exempt securities |
|
|
(65 |
) |
|
|
98 |
|
|
|
33 |
|
|
Interest bearing balances in other banks |
|
|
(55 |
) |
|
|
70 |
|
|
|
15 |
|
|
Federal funds sold |
|
|
(30 |
) |
|
|
- |
|
|
|
(30 |
) |
|
Total interest earning assets |
|
$ |
1,964 |
|
|
$ |
(71 |
) |
|
$ |
1,893 |
|
|
Interest bearing liabilities |
|
|
|
|
|
|
|
|
|
|
|
|
|
Interest bearing transaction accounts |
|
$ |
33 |
|
|
$ |
(30 |
) |
|
$ |
3 |
|
|
Savings and money market accounts |
|
|
31 |
|
|
|
(12 |
) |
|
|
19 |
|
|
Time deposits |
|
|
- |
|
|
|
160 |
|
|
|
160 |
|
|
Securities sold under agreement to repurchase |
|
|
5 |
|
|
|
7 |
|
|
|
12 |
|
|
Federal Home Loan Bank advances |
|
|
21 |
|
|
|
40 |
|
|
|
61 |
|
|
Federal funds purchased |
|
|
- |
|
|
|
13 |
|
|
|
13 |
|
|
Note payable |
|
|
(38 |
) |
|
|
37 |
|
|
|
(1 |
) |
|
Total interest bearing liabilities |
|
$ |
52 |
|
|
$ |
215 |
|
|
$ |
267 |
|
|
Net interest income |
|
|
|
|
|
|
|
|
|
|
|
|
|
Net interest income (taxable equivalent) |
|
$ |
1,912 |
|
|
$ |
(286 |
) |
|
$ |
1,626 |
|
|
Taxable equivalent adjustment |
|
|
17 |
|
|
|
(49 |
) |
|
|
(32 |
) |
|
Net interest income |
|
$ |
1,929 |
|
|
$ |
(335 |
) |
|
$ |
1,594 |
|
Provision for Loan Losses
During the year ended December 31, 2017, we recorded a provision for loan losses of $1.7 million compared to $878 thousand during the year ended December 31, 2016. The increase in the provision for loan losses resulted from growth in loan volume. Net loan charge-offs increased from $698 thousand in 2016 to $866 thousand in 2017. The allowance for loan losses is increased by a provision for loan losses, which is a charge to earnings, and is decreased by charge-offs and increased by loan recoveries. In determining the adequacy of our allowance for loan losses, we consider our historical loan loss experience, the general economic environment, the overall portfolio composition, and other information. As these factors change, the level of loan loss provision changes. When individual loans are evaluated for impairment, and impairment is deemed necessary, the impaired portion of the loan amount is generally charged off. As of December 31, 2017 and 2016, $908 thousand and $1.3 million of our allowance was related to impaired loans, respectively.
37
In addition to net interest margin, we generate other types of recurring noninterest income from our operations. Our banking operations generate revenue from service charges and fees on deposit accounts. We have a mortgage division that generates revenue from originating and selling mortgages, and from the sale of non-deposit investment products through an arrangement with a registered broker-dealer with which we have a revenue-sharing arrangement. In addition to these types of recurring noninterest income, the Bank owns insurance on several key employees and records income on the increase in the cash surrender value of these policies.
The following table sets forth the principal components of noninterest income for the periods indicated.
|
|
|
For the Year Ended December 31, |
|
|||||
|
|
|
2017 |
|
|
2016 |
|
||
|
Service charges and fees |
|
$ |
2,949 |
|
|
$ |
2,479 |
|
|
Investment brokerage revenue |
|
|
58 |
|
|
|
221 |
|
|
Mortgage operations |
|
|
1,895 |
|
|
|
1,419 |
|
|
Bank owned life insurance income |
|
|
1,086 |
|
|
|
431 |
|
|
Net gain on sale of investment securities |
|
|
5 |
|
|
|
24 |
|
|
Other noninterest income |
|
|
316 |
|
|
|
315 |
|
|
Total noninterest income |
|
$ |
6,309 |
|
|
$ |
4,889 |
|
Noninterest income for the years ended December 31, 2017 and 2016 was $6.3 million and $4.9 million, respectively. The primary reason for the increase in noninterest income was a $655 thousand increase in bank owned life insurance income resulting from death benefits received during the year. Service charges and fees continued to be our largest source of noninterest income in 2017 with $2.9 million compared to $2.5 million in 2016. These service charges and fees are primarily generated by checking and savings accounts. Our mortgage operations produced noninterest income in 2017 of $1.9 million compared to $1.4 million in 2016.
Noninterest expense
Our total noninterest expense increase reflects our continued growth, as well as the expansion of our operational framework, employee expansion, and facility expansion, as we build the foundation to support our recent and future growth. We believe that some of our overhead costs will reduce as a percentage of our revenue as we grow and gain operating leverage by spreading these costs over a larger revenue base.
The following table presents the primary components of noninterest expense for the periods indicated.
|
|
|
For the Years Ended December 31, |
|
|||||
|
|
|
2017 |
|
|
2016 |
|
||
|
Salaries and employee benefits |
|
$ |
12,097 |
|
|
$ |
11,161 |
|
|
Occupancy expenses |
|
|
1,399 |
|
|
|
1,526 |
|
|
Equipment rentals, depreciation, and maintenance |
|
|
841 |
|
|
|
805 |
|
|
Telephone and communications |
|
|
261 |
|
|
|
207 |
|
|
Advertising and business development |
|
|
625 |
|
|
|
324 |
|
|
Data processing |
|
|
1,689 |
|
|
|
1,825 |
|
|
Foreclosed assets, net |
|
|
163 |
|
|
|
77 |
|
|
Federal deposit insurance and other regulatory assessments |
|
|
333 |
|
|
|
384 |
|
|
Legal and other professional services |
|
|
505 |
|
|
|
691 |
|
|
Other operating expense |
|
|
3,392 |
|
|
|
3,560 |
|
|
Total noninterest expense |
|
$ |
21,305 |
|
|
$ |
20,560 |
|
Noninterest expense for the years ended December 31, 2017 and 2016 was $21.3 million and $20.6 million, respectively, an increase of $745 thousand, or 3.6%. The largest component of noninterest expense was salaries and employee benefits. Salaries and benefits increased approximately $936 thousand mainly due to the addition of new employees. The increase in advertising and business development expense resulted from an increase in our advertising efforts during 2017. The decrease in most of the remaining noninterest expense categories resulted primarily from cost savings realized from the Keystone merger.
38
Income tax expense of $4.5 million and $3.5 million was recognized during the years ended December 31, 2017 and 2016, respectively. The increase in income tax expense during 2017 was due to an increase in pre-tax income. The effective tax rate for the year 2017 was 35.3% compared to 30.7% for the year 2016. The effective tax rates are affected by items of income and expense that are not subject to federal and state taxation. The increase in the effective tax rate in 2017 as compared to 2016 was primarily related to additional income tax expense that was recognized from the change in the federal income tax rate to revalue our net deferred tax assets to the new corporate rate.
Comparison of Balance Sheets at December 31, 2017 and 2016
Overview
Our total assets increased $12.9 million, or 1.6%, from $810.4 million at December 31, 2016, to $823.3 million at December 31, 2017. Loans increased by $29.8 million during 2017 and investment securities increased $9.9 million in 2017. Cash and cash equivalents decreased by $26.9 million during 2017.
Deposits at December 31, 2017 totaled $699.9 million, a decrease of $5.1 million as compared to December 31, 2016. Noninterest-bearing deposits decreased $99 thousand in 2017 and interest-bearing deposits decreased $5.0 million. Our deposits decreased during 2017 due to normal fluctuations in deposits as well as customers moving their deposits to higher yielding investments.
Loans
Loans are our largest category of earning assets and typically provide higher yields than other types of earning assets. Associated with the higher loan yields are the inherent credit and liquidity risks that we attempt to control and counterbalance. Total loans averaged $517.8 million during the year ended December 31, 2017, or 70.2% of average earning assets, as compared to $495.7 million or 72.8% of average earning assets, for the year ended December 31, 2016. At December 31, 2017, total loans, net of unearned income, were $547.1 million, compared to $516.4 million at December 31, 2016, an increase of $30.7 million, or 5.9%.
The organic, or non-acquired, growth in our loan portfolio is attributable to our ability to attract new customers from other financial institutions and overall growth in our markets. Much of our loan growth has come from moving customers from other financial institutions to RB&T. We have also been successful in building banking relationships with new customers. We have hired several new bankers in the markets that we serve, and these employees have been successful in transitioning their former clients and attracting new clients to RB&T. Our bankers are expected to be involved in their communities and to maintain business development efforts to develop relationships with clients, and our philosophy is to be responsive to customer needs by providing decisions in a timely manner. In addition to our business development efforts, many of the markets that we serve have shown signs of economic recovery over the last few years.
39
The table below provides a summary of the loan portfolio composition as of the periods indicated.
COMPOSITION OF LOAN PORTFOLIO
|
|
December 31, 2017 |
|
|
December 31, 2016 |
|
|||||||||||
|
|
|
Amount |
|
|
% of Total |
|
|
Amount |
|
|
% of Total |
|
||||
|
Residential real estate: |
|
|
|
|
|
|
|
|
|
|
|
|
|
|
|
|
|
Closed-end 1-4 family - first lien |
|
$ |
115,776 |
|
|
|
21.4 |
% |
|
$ |
113,807 |
|
|
|
22.2 |
% |
|
Closed-end 1-4 family - junior lien |
|
|
4,969 |
|
|
|
0.9 |
% |
|
|
4,791 |
|
|
|
0.9 |
% |
|
Multi-family |
|
|
16,977 |
|
|
|
3.1 |
% |
|
|
17,043 |
|
|
|
3.3 |
% |
|
Total residential real estate |
|
|
137,722 |
|
|
|
25.4 |
% |
|
|
135,641 |
|
|
|
26.5 |
% |
|
Commercial real estate: |
|
|
|
|
|
|
|
|
|
|
|
|
|
|
|
|
|
Nonfarm nonresidential |
|
|
173,443 |
|
|
|
32.0 |
% |
|
|
161,198 |
|
|
|
31.5 |
% |
|
Farmland |
|
|
7,782 |
|
|
|
1.4 |
% |
|
|
13,344 |
|
|
|
2.6 |
% |
|
Total commercial real estate |
|
|
181,225 |
|
|
|
33.4 |
% |
|
|
174,542 |
|
|
|
34.1 |
% |
|
Construction and land development: |
|
|
|
|
|
|
|
|
|
|
|
|
|
|
|
|
|
Residential |
|
|
25,830 |
|
|
|
4.8 |
% |
|
|
27,228 |
|
|
|
5.3 |
% |
|
Other |
|
|
40,734 |
|
|
|
7.5 |
% |
|
|
37,221 |
|
|
|
7.3 |
% |
|
Total construction and land development |
|
|
66,564 |
|
|
|
12.3 |
% |
|
|
64,449 |
|
|
|
12.6 |
% |
|
Home equity lines of credit |
|
|
35,833 |
|
|
|
6.6 |
% |
|
|
35,761 |
|
|
|
7.0 |
% |
|
Commercial loans: |
|
|
|
|
|
|
|
|
|
|
|
|
|
|
|
|
|
Other commercial loans |
|
|
95,896 |
|
|
|
17.7 |
% |
|
|
81,198 |
|
|
|
15.8 |
% |
|
Agricultural |
|
|
1,581 |
|
|
|
0.3 |
% |
|
|
887 |
|
|
|
0.2 |
% |
|
State, county, and municipal loans |
|
|
8,332 |
|
|
|
1.5 |
% |
|
|
8,719 |
|
|
|
1.7 |
% |
|
Total commercial loans |
|
|
105,809 |
|
|
|
19.5 |
% |
|
|
90,804 |
|
|
|
17.7 |
% |
|
Consumer loans |
|
|
23,231 |
|
|
|
4.3 |
% |
|
|
20,858 |
|
|
|
4.1 |
% |
|
Total gross loans |
|
|
550,384 |
|
|
|
101.5 |
% |
|
|
522,055 |
|
|
|
101.9 |
% |
|
Allowance for loan losses |
|
|
(4,881 |
) |
|
|
-0.9 |
% |
|
|
(4,007 |
) |
|
|
-0.8 |
% |
|
Net deferred loan fees and discounts |
|
|
(3,263 |
) |
|
|
-0.6 |
% |
|
|
(5,614 |
) |
|
|
-1.1 |
% |
|
Net loans |
|
$ |
542,240 |
|
|
|
100.0 |
% |
|
$ |
512,434 |
|
|
|
100.0 |
% |
In the context of this discussion, a “real estate mortgage loan” is defined as any loan, other than a loan for construction purposes, secured by real estate, regardless of the purpose of the loan. It is common practice for financial institutions in our market areas, and for us in particular, to obtain a security interest or lien in real estate whenever possible, in addition to any other available collateral. This collateral is taken to reinforce the likelihood of the ultimate repayment of the loan. This practice tends to increase the magnitude of the real estate loan portfolio. In many cases, we prefer real estate collateral to many other potential collateral sources, such as accounts receivable, inventory, and equipment.
The Federal regulatory agencies issued two “guidance” documents that have a significant impact on real estate related lending and, thus, on the operations of the Bank. One part of the guidance could require lenders to restrict lending secured primarily by certain categories of commercial real estate to a level of 300% of their capital or raise additional capital. This factor, combined with the current economic environment, could affect the Bank’s lending strategy away from, or to limit its expansion of, commercial real estate lending which has been a material part of River Financial Corporation’s lending strategy. This could also have a negative impact on our lending and profitability. Management actively monitors the composition of the Bank’s loan portfolio, focusing on concentrations of credit, and the results of that monitoring activity are periodically reported to the Board of Directors.
The other guidance relates to the structuring of certain types of mortgages that allows negative amortization of consumer mortgage loans. Although the Bank does not engage at present in lending using these types of instruments, the guidance could have the effect of making the Bank less competitive in consumer mortgage lending if the local market is driving the demand for such an offering.
40
The principal component of our loan portfolio is real estate mortgage loans on residential and commercial properties. At December 31, 2017, this category totaled $354.8 million and represented 65.4% of the total loan portfolio, compared to $345.9 million, or 67.5% of the total loan portfolio at year-end 2016. Residential real estate loans increased in 2017 $2.1 million, or 1.5%, and commercial real estate loans increased $6.7 million, or 3.8%. Home equity lines of credit increased $72 thousand, or 0.2%.
Real estate construction loans totaled $66.6 million at December 31, 2017, an increase $2.1 million, or 3.3%, over $64.4 million at December 31, 2016. This loan type accounted for 12.3% and 12.6% of our total loan portfolio at December 31, 2017 and December 2016, respectively.
Commercial and industrial loans totaled $105.8 million at December 31, 2017, compared to $90.8 million at December 31, 2016, an increase of $15.0 million, or 16.5% during 2017. We expect this growth trend with respect to commercial and industrial loans to continue as economic conditions improve.
The repayment of loans is a source of additional liquidity for us. The following table sets forth our loans maturing within specific intervals at December 31, 2017.
LOAN MATURITY AND SENSITIVITY TO CHANGES IN INTEREST RATES
|
|
|
|
|
|
Over one |
|
|
|
|
|
|
|
|
|
||
|
|
|
One year |
|
|
year through |
|
|
Over five |
|
|
|
|
|
|||
|
|
|
or less |
|
|
five years |
|
|
years |
|
|
Total |
|
||||
|
Residential real estate: |
|
|
|
|
|
|
|
|
|
|
|
|
|
|
|
|
|
Closed-end 1-4 family - first lien |
|
$ |
18,543 |
|
|
$ |
74,500 |
|
|
$ |
22,733 |
|
|
$ |
115,776 |
|
|
Closed-end 1-4 family - junior lien |
|
|
1,367 |
|
|
|
2,045 |
|
|
|
1,557 |
|
|
|
4,969 |
|
|
Multi-family |
|
|
1,034 |
|
|
|
9,198 |
|
|
|
6,745 |
|
|
|
16,977 |
|
|
Total residential real estate |
|
|
20,944 |
|
|
|
85,743 |
|
|
|
31,035 |
|
|
|
137,722 |
|
|
Commercial real estate: |
|
|
|
|
|
|
|
|
|
|
|
|
|
|
|
|
|
Nonfarm nonresidential |
|
|
23,433 |
|
|
|
116,126 |
|
|
|
33,884 |
|
|
|
173,443 |
|
|
Farmland |
|
|
3,086 |
|
|
|
3,959 |
|
|
|
737 |
|
|
|
7,782 |
|
|
Total commercial real estate |
|
|
26,519 |
|
|
|
120,085 |
|
|
|
34,621 |
|
|
|
181,225 |
|
|
Construction and land development: |
|
|
|
|
|
|
|
|
|
|
|
|
|
|
|
|
|
Residential |
|
|
25,228 |
|
|
|
559 |
|
|
|
43 |
|
|
|
25,830 |
|
|
Other |
|
|
11,288 |
|
|
|
25,527 |
|
|
|
3,919 |
|
|
|
40,734 |
|
|
Total construction and land development |
|
|
36,516 |
|
|
|
26,086 |
|
|
|
3,962 |
|
|
|
66,564 |
|
|
Home equity lines of credit |
|
|
1,604 |
|
|
|
7,029 |
|
|
|
27,200 |
|
|
|
35,833 |
|
|
Commercial loans: |
|
|
|
|
|
|
|
|
|
|
|
|
|
|
|
|
|
Other commercial loans |
|
|
49,394 |
|
|
|
38,871 |
|
|
|
7,631 |
|
|
|
95,896 |
|
|
Agricultural |
|
|
924 |
|
|
|
378 |
|
|
|
279 |
|
|
|
1,581 |
|
|
State, county, and municipal loans |
|
|
- |
|
|
|
5,216 |
|
|
|
3,116 |
|
|
|
8,332 |
|
|
Total commercial loans |
|
|
50,318 |
|
|
|
44,465 |
|
|
|
11,026 |
|
|
|
105,809 |
|
|
Consumer loans |
|
|
5,454 |
|
|
|
12,128 |
|
|
|
5,649 |
|
|
|
23,231 |
|
|
Total gross loans |
|
$ |
141,355 |
|
|
$ |
295,536 |
|
|
$ |
113,493 |
|
|
$ |
550,384 |
|
The information presented in the table above is based upon the contractual maturities of the individual loans, which may be subject to renewal at their contractual maturity. Renewal of such loans is subject to review and credit approval, as well as modification of terms at their maturity. Consequently, we believe that this treatment presents fairly the maturity structure of the loan portfolio.
41
We use our securities portfolio primarily to enhance our overall yield on interest-earning assets and as a source of liquidity, as a tool to manage our balance sheet sensitivity and regulatory capital ratios, and as a base upon which to pledge assets for public deposits. When our liquidity position exceeds current needs and our expected loan demand, other investments are considered as a secondary earnings alternative. As investments mature, they are used to meet current cash needs, or they are reinvested to maintain our desired liquidity position. We have designated all of our securities as available-for-sale to provide flexibility, in case an immediate need for liquidity arises, and we believe that the composition of the portfolio offers needed flexibility in managing our liquidity position and interest rate sensitivity without adversely impacting our regulatory capital levels. Securities available-for-sale are reported at fair value with unrealized gains or losses reported as a separate component of other comprehensive income, net of related deferred taxes. Purchase premiums and discounts are recognized in income using the interest method over the terms of the securities.
The following tables summarize the amortized cost and fair value of securities available-for-sale at December 31, 2017 and 2016.
INVESTMENT SECURITIES
|
|
|
December 31, 2017 |
|
|
December 31, 2016 |
|
||||||||||
|
|
|
Amortized |
|
|
Fair |
|
|
Amortized |
|
|
Fair |
|
||||
|
|
|
Cost |
|
|
Value |
|
|
Cost |
|
|
Value |
|
||||
|
Securities available for sale: |
|
|
|
|
|
|
|
|
|
|
|
|
|
|
|
|
|
Residential mortgage-backed |
|
$ |
125,768 |
|
|
$ |
122,972 |
|
|
$ |
111,611 |
|
|
$ |
108,675 |
|
|
U.S. govt. sponsored enterprises |
|
|
13,176 |
|
|
|
12,999 |
|
|
|
15,506 |
|
|
|
15,327 |
|
|
State, county, and municipal |
|
|
55,339 |
|
|
|
55,501 |
|
|
|
57,837 |
|
|
|
57,586 |
|
|
Corporate debt obligations |
|
|
1,831 |
|
|
|
1,817 |
|
|
|
1,819 |
|
|
|
1,773 |
|
|
Totals |
|
$ |
196,114 |
|
|
$ |
193,289 |
|
|
$ |
186,773 |
|
|
$ |
183,361 |
|
The following table shows the scheduled maturity and average yields of our securities at December 31, 2017.
INVESTMENT SECURITIES MATURITY DISTRIBUTION AND YIELDS
|
|
|
|
|
|
|
|
|
|
After one year but |
|
|
After five years but |
|
|
|
|
|
|
|
|
|
|
|
|
|
|
|
|
|
|||||||||||
|
|
|
Within one year |
|
|
within five years |
|
|
within ten years |
|
|
After ten years |
|
|
Other securities |
|
|||||||||||||||||||||||||
|
|
|
Amount |
|
|
Yield |
|
|
Amount |
|
|
Yield |
|
|
Amount |
|
|
Yield |
|
|
Amount |
|
|
Yield |
|
|
Amount |
|
|
Yield |
|
||||||||||
|
U.S. govt. sponsored enterprises |
|
$ |
550 |
|
|
|
1.30 |
% |
|
$ |
6,094 |
|
|
|
1.92 |
% |
|
$ |
2,657 |
|
|
|
2.43 |
% |
|
$ |
3,698 |
|
|
|
2.15 |
% |
|
$ |
- |
|
|
|
--- |
% |
|
State, county, and municipal |
|
|
5,513 |
|
|
|
1.15 |
% |
|
|
12,560 |
|
|
|
1.55 |
% |
|
|
8,232 |
|
|
|
1.97 |
% |
|
|
29,196 |
|
|
|
2.68 |
% |
|
|
- |
|
|
|
--- |
% |
|
Corporate debt obligations |
|
|
- |
|
|
|
--- |
% |
|
|
462 |
|
|
|
2.91 |
% |
|
|
1,000 |
|
|
|
2.67 |
% |
|
|
355 |
|
|
|
5.94 |
% |
|
|
- |
|
|
|
--- |
% |
|
Residential mortgage-backed |
|
|
- |
|
|
|
--- |
% |
|
|
- |
|
|
|
--- |
% |
|
|
- |
|
|
|
--- |
% |
|
|
- |
|
|
|
--- |
% |
|
|
122,972 |
|
|
|
1.95 |
% |
|
Totals |
|
$ |
6,063 |
|
|
|
1.16 |
% |
|
$ |
19,116 |
|
|
|
1.70 |
% |
|
$ |
11,889 |
|
|
|
2.13 |
% |
|
$ |
33,249 |
|
|
|
2.66 |
% |
|
$ |
122,972 |
|
|
|
--- |
% |
We invest primarily in mortgage-backed securities, municipal securities, and obligations of government-sponsored entities and agencies of the United States, though we may in some situations also invest in direct obligations of the United States or obligations guaranteed as to the principal and interest by the United States. All of our mortgage-backed securities are residential securities issued by the Federal National Mortgage Association, or FNMA, and the Federal Home Loan Mortgage Corporation, or FHLMC. During all periods presented, we have used most of our excess liquidity to invest in loans, as our loan demand has remained strong, rather than investing in investment securities.
42
Allowance for Loan Losses, Provision for Loan Losses and Asset Quality
Allowance for loan losses and provision for loan losses
Our allowance for loan losses represents our estimate of probable inherent credit losses in the loan portfolio. We determine the required allowance each quarter based on an ongoing evaluation of risk as it correlates to potential losses within the portfolio. Increases in the allowance are made by charges to the provision for loan losses. Loans deemed to be uncollectible are charged against the allowance. Recoveries of previously charged-off amounts are credited to our allowance for loan losses.
Management utilizes a review process for the loan portfolio to identify loans that are deemed to be impaired. A loan is considered impaired when it is probable that the Bank will be unable to collect the scheduled payments of principal and interest due under the contractual terms of the loan agreement or when the loan is deemed to be a troubled debt restructuring. For loans and loan relationships deemed to be impaired that are $100 thousand, or greater, management determines the estimated value of the underlying collateral, less estimated costs to acquire and sell the collateral, or the estimated net present value of the cash flows expected to be received on the loan or loan relationship. These amounts are compared to the current investment in the loan and a specific allowance for the deficiency, if any, is specifically included in the analysis of the allowance for loan losses. For loans and loan relationships less than $100 thousand that are deemed to be impaired, management applies a loss factor of 15% and includes that amount in that analysis of the allowance for loan losses rather than specifically measuring the impairment for each loan or loan relationship.
All other loans are deemed to be unimpaired and are grouped into various homogeneous risk pools utilizing regulatory reporting classifications. The Bank’s historical loss factors are calculated for each of these risk pools based on the net losses experienced as a percentage of the average loans outstanding. The time periods utilized in these historical loss factor calculations are subjective and vary according to management’s estimate of the impact of current economic cycles. As every loan has a risk of loss, minimum loss factors are estimated based on long term trends for the Bank, the banking industry, and the economy. The greater of the calculated historical loss factors or the minimum loss factors are applied to the unimpaired loan amounts currently outstanding for the risk pool and included in the analysis of the allowance for loan losses. In addition, certain qualitative adjustments may be included by management as additional loss factors applied to the unimpaired loan risk pools. These adjustments may include, among other things, changes in loan policy, loan administration, loan, geographic, or industry concentrations, loan growth rates, and experience levels of our lending officers. The loss allocations for specifically impaired loans, smaller impaired loans not specifically measured for impairment, and unimpaired loans are totaled to determine the total required allowance for loan losses. This total is compared to the current allowance on the Bank’s books and adjustments made accordingly by a charge or credit to the provision for loan losses.
Management believes the data it uses in determining the allowance for loan losses is sufficient to estimate potential losses in the loan portfolio; however, actual results could differ from management’s estimate.
43
The following table presents a summary of changes in the allowance for loan losses for the periods and dates indicated.
ALLOWANCE FOR LOAN LOSSES
|
|
Year Ended: |
|
||||||
|
|
|
December 31, |
|
|
December 31, |
|
||
|
Amounts in thousands, (except percentages) |
|
2017 |
|
|
2016 |
|
||
|
Allowance for loan losses at beginning of period |
|
$ |
4,007 |
|
|
$ |
3,827 |
|
|
Charge-offs: |
|
|
|
|
|
|
|
|
|
Mortgage loans on real estate: |
|
|
|
|
|
|
|
|
|
Residential |
|
|
32 |
|
|
|
14 |
|
|
Commercial real estate |
|
|
308 |
|
|
|
15 |
|
|
Construction and land development |
|
|
24 |
|
|
|
— |
|
|
Equity lines of credit |
|
|
100 |
|
|
|
141 |
|
|
Total mortgage loans on real estate |
|
|
464 |
|
|
|
170 |
|
|
Commercial |
|
|
466 |
|
|
|
487 |
|
|
Consumer |
|
|
109 |
|
|
|
187 |
|
|
Total charge-offs |
|
|
1,039 |
|
|
|
844 |
|
|
Recoveries: |
|
|
|
|
|
|
|
|
|
Mortgage loans on real estate: |
|
|
|
|
|
|
|
|
|
Residential |
|
|
24 |
|
|
|
5 |
|
|
Commercial real estate |
|
|
16 |
|
|
|
- |
|
|
Construction and land development |
|
|
11 |
|
|
|
26 |
|
|
Equity lines of credit |
|
|
4 |
|
|
|
17 |
|
|
Total mortgage loans on real estate |
|
|
55 |
|
|
|
48 |
|
|
Commercial |
|
|
104 |
|
|
|
40 |
|
|
Consumer |
|
|
14 |
|
|
|
58 |
|
|
Total recoveries |
|
|
173 |
|
|
|
146 |
|
|
Net Charge-offs |
|
|
866 |
|
|
|
698 |
|
|
Provision for loan losses |
|
|
1,740 |
|
|
|
878 |
|
|
Allowance for loan losses at end of period |
|
$ |
4,881 |
|
|
$ |
4,007 |
|
|
Total loans outstanding, net of deferred loan fees and discounts |
|
$ |
547,121 |
|
|
$ |
516,441 |
|
|
Average loans outstanding, net of deferred loan fees |
|
$ |
517,822 |
|
|
$ |
495,687 |
|
|
Allowance for loan losses to period end loans |
|
|
0.89 |
% |
|
|
0.78 |
% |
|
Net charge-offs to average loans (annualized) |
|
|
0.17 |
% |
|
|
0.14 |
% |
In accordance with ASC Topic 805, Business Combinations, the loans acquired in 2015 from Keystone Bank were recorded at fair value and any discount to fair value was recorded against the loans rather than as an allowance for loan losses. No portion of the discount was deemed related to credit quality. The total discount was recorded as an accretable discount and is accreted into interest income over the life of the loans using the level yield method. At December 31, 2017, Keystone’s acquired loan portfolio totaled $75.0 million and had a related accretable discount of $2.5 million. During 2017, discount accretion of $2.3 million was recognized in interest income on loans. At December 31, 2016, Keystone’s acquired loan portfolio totaled $111.8 million and had a related accretable discount of $4.8 million. During 2016, discount accretion of $2.4 million was recognized in interest income on loans.
Overall, asset quality indicators have continued to improve, and, as a result, provision expense has been minimal for the Bank’s loan portfolio. During the years ended December 31, 2017 and 2016, we recorded provision expense of $1.7 million and $878 thousand, respectively.
44
Allocation of Our Allowance for Loan Losses
While no portion of our allowance for loan losses is in any way restricted to any individual loan or group of loans and the entire allowance is available to absorb losses from any and all loans, the following table represents management’s allocation of our allowance for loan losses to specific loan categories for the periods indicated.
ALLOCATION OF ALLOWANCE FOR LOAN LOSSES
|
|
As of December 31, |
|
||||||||||||||
|
|
|
2017 |
|
|
2016 |
|
||||||||||
|
|
|
Amount |
|
|
Percent of Allowance in each Category to Total Allowance |
|
|
Amount |
|
|
Percent of Allowance in each Category to Total Allowance |
|
||||
|
Residential real estate |
|
$ |
1,167 |
|
|
|
23.9 |
% |
|
$ |
602 |
|
|
|
15.0 |
% |
|
Commercial real estate |
|
|
1,604 |
|
|
|
32.9 |
% |
|
|
1,456 |
|
|
|
36.3 |
% |
|
Construction and land development |
|
|
606 |
|
|
|
12.4 |
% |
|
|
731 |
|
|
|
18.2 |
% |
|
Home equity lines of credit |
|
|
333 |
|
|
|
6.8 |
% |
|
|
190 |
|
|
|
4.7 |
% |
|
Commercial |
|
|
954 |
|
|
|
19.5 |
% |
|
|
829 |
|
|
|
20.7 |
% |
|
Consumer |
|
|
217 |
|
|
|
4.5 |
% |
|
|
199 |
|
|
|
5.1 |
% |
|
Total |
|
$ |
4,881 |
|
|
|
100.0 |
% |
|
$ |
4,007 |
|
|
|
100.0 |
% |
Nonperforming Assets
The following table presents our nonperforming assets for the dates indicated.
NONPERFORMING ASSETS
|
|
December 31, |
|
||||||
|
|
|
2017 |
|
|
2016 |
|
||
|
Nonaccrual loans |
|
$ |
2,586 |
|
|
$ |
4,386 |
|
|
Accruing loans past due 90 days or more |
|
|
421 |
|
|
|
39 |
|
|
Total nonperforming loans |
|
|
3,007 |
|
|
|
4,425 |
|
|
Foreclosed assets |
|
|
1,546 |
|
|
|
1,151 |
|
|
Total nonperforming assets |
|
$ |
4,553 |
|
|
$ |
5,576 |
|
|
Allowance for loan losses to period end loans |
|
|
0.89 |
% |
|
|
0.78 |
% |
|
Allowance for loan losses to period end nonperforming loans |
|
|
162.32 |
% |
|
|
90.55 |
% |
|
Net charge-offs to average loans (annualized) |
|
|
0.17 |
% |
|
|
0.14 |
% |
|
Nonperforming assets to period end loans and foreclosed property |
|
|
0.83 |
% |
|
|
1.08 |
% |
|
Nonperforming loans to period end loans |
|
|
0.55 |
% |
|
|
0.86 |
% |
|
Nonperforming assets to total assets |
|
|
0.55 |
% |
|
|
0.69 |
% |
|
Period end loans |
|
|
547,121 |
|
|
|
516,441 |
|
|
Period end total assets |
|
|
823,292 |
|
|
|
810,417 |
|
|
Allowance for loan losses |
|
|
4,881 |
|
|
|
4,007 |
|
|
Average loans for the period |
|
|
517,822 |
|
|
|
495,687 |
|
|
Net charge-offs for the period |
|
|
866 |
|
|
|
698 |
|
|
Period end loans plus foreclosed property |
|
|
548,667 |
|
|
|
517,592 |
|
Accrual of interest is discontinued on a loan when management believes, after considering economic and business conditions and collection efforts, that the borrower’s financial condition is such that the collection of interest is doubtful. In addition to consideration of these factors, loans that are past due 90 days or more are generally placed on nonaccrual status. When a loan is placed on nonaccrual status, all accrued interest on the loan is reversed and deducted from earnings as a reduction of reported interest income. No additional interest is accrued on the loan balance until collection of both principal and interest becomes reasonably certain. Payments received while a loan is on nonaccrual status will generally be applied to the outstanding principal balance. When a problem loan is finally resolved, there may ultimately be an actual write-down or charge-off of the principal balance of the loan that would necessitate additional charges to the allowance for loan losses.
45
Total nonperforming assets decreased $1.0 million to $4.6 million at December 31, 2017, from $5.6 million at December 31, 2016. Total nonperforming assets as a percentage of total assets decreased 0.14% from 0.69% at December 31, 2016 to 0.55% at December 31, 2017. Improving asset quality has been and will continue to be a primary focus of management.
Deposits
Deposits, which include noninterest-bearing demand deposits, interest-bearing demand deposits, money market accounts, and savings, time, and other deposits, are the primary funding source for the Bank. We offer a variety of products designed to attract and retain customers, with primary focus on building and expanding client relationships. We continue to focus on establishing a comprehensive relationship with consumer and business borrowers, seeking deposits as well as lending relationships.
The following table details the composition of our deposit portfolio as of the dates indicated.
COMPOSITION OF DEPOSITS
|
|
December 31, 2017 |
|
|
December 31, 2016 |
|
|||||||||||
|
|
|
|
|
|
|
Percent of |
|
|
|
|
|
|
Percent of |
|
||
|
|
|
Amount |
|
|
Total |
|
|
Amount |
|
|
Total |
|
||||
|
Demand deposits, noninterest-bearing |
|
$ |
185,171 |
|
|
|
26.5 |
% |
|
$ |
185,270 |
|
|
|
26.3 |
% |
|
Demand deposits, interest-bearing |
|
|
195,792 |
|
|
|
28.0 |
% |
|
|
197,509 |
|
|
|
28.0 |
% |
|
Money market accounts |
|
|
153,732 |
|
|
|
22.0 |
% |
|
|
160,677 |
|
|
|
22.8 |
% |
|
Savings deposits |
|
|
29,441 |
|
|
|
4.2 |
% |
|
|
24,022 |
|
|
|
3.4 |
% |
|
Time certificates of $250 or more |
|
|
37,045 |
|
|
|
5.3 |
% |
|
|
32,991 |
|
|
|
4.7 |
% |
|
Other time certificates |
|
|
98,680 |
|
|
|
14.0 |
% |
|
|
104,444 |
|
|
|
14.8 |
% |
|
Totals |
|
$ |
699,861 |
|
|
|
100.0 |
% |
|
$ |
704,913 |
|
|
|
100.0 |
% |
Total deposits were $699.9 million at December 31, 2017, a decrease of $5 million, or 0.7%, from $704.9 at December 31, 2016. Noninterest-bearing demand deposits and interest-bearing demand deposits decreased a combined total of $1.8 million, or 0.5% from December 31, 2016 to December 31, 2017. These two categories of deposits are our least expensive source of funding for interest-earning assets.
The following table details the maturities of our time deposits which consist entirely of certificates of deposit.
MATURITIES OF CERTIFICATES OF DEPOSIT
|
|
|
|
|
|
|
CDs |
|
|
CDs |
|
||
|
|
|
|
|
|
|
$100 |
|
|
Less Than |
|
||
|
|
|
All CDs |
|
|
or more |
|
|
$100 |
|
|||
|
Three months or less |
|
$ |
28,631 |
|
|
$ |
18,041 |
|
|
$ |
10,590 |
|
|
Greater than three months through six months |
|
|
21,950 |
|
|
|
12,691 |
|
|
|
9,259 |
|
|
Greater than six months through one year |
|
|
32,052 |
|
|
|
19,566 |
|
|
|
12,486 |
|
|
Greater than one year through three years |
|
|
33,195 |
|
|
|
22,174 |
|
|
|
11,021 |
|
|
Greater than three years |
|
|
19,897 |
|
|
|
15,444 |
|
|
|
4,453 |
|
|
Total |
|
$ |
135,725 |
|
|
$ |
87,916 |
|
|
$ |
47,809 |
|
Deposit growth has benefited to a large extent from uncertainty in the financial markets, which has increased the liquidity of many banks as consumers and businesses look for safe places for liquidity, thereby increasing bank deposits.
Other Funding Sources
We supplement our deposit funding with wholesale funding when needed for balance sheet planning or when the terms are attractive and will not disrupt our offering rates in our markets. A source that we have used for wholesale funding is the Federal Home Loan Bank of Atlanta (“FHLB”). At December 31, 2017 the Bank had $10 million of borrowings outstanding with FHLB. We did not have any borrowings outstanding with FHLB at December 31, 2016.
46
Market and public confidence in our financial strength and financial institutions in general will largely determine our access to appropriate levels of liquidity. This confidence is significantly dependent on our ability to maintain sound asset quality and appropriate levels of capital reserves.
Liquidity is defined as the ability to meet anticipated customer demands for funds under credit commitments and deposit withdrawals at a reasonable cost and on a timely basis. We measure our liquidity position by giving consideration to both on- and off-balance sheet sources of and demands for funds on a daily, weekly, and monthly basis.
Liquidity risk involves the risk of being unable to fund assets with the appropriate duration and rate-based liabilities, as well as the risk of not being able to meet unexpected cash needs. Liquidity planning and management are necessary to ensure the ability to fund operations in a cost-effective manner and to meet current and future potential obligations such as loan commitments, lease obligations, and unexpected deposit outflows. In this process, we focus on both assets and liabilities and on the manner in which they combine to provide adequate liquidity to meet our needs.
Funds are available from a number of basic banking activity sources, including the core deposit base, the repayment and maturity of loans, and investment security cash flows. Other funding sources include federal funds purchased, brokered certificates of deposit, and borrowings from the FHLB.
Cash and cash equivalents at December 31, 2017 and 2016 were $15.6 million and $42.5 million, respectively. Based on the recorded cash and cash equivalents, our liquidity resources were sufficient at December 31, 2017 to fund loans and meet other cash needs as necessary.
Contractual Obligations
While our liquidity monitoring and management considers both present and future demands for and sources of liquidity, the following table of contractual commitments focuses only on future obligations.
|
|
|
|
|
|
Due after 1 |
|
|
Due after 3 |
|
|
|
|
|
|
|
|
|
|||
|
|
|
Due in 1 |
|
|
through |
|
|
through |
|
|
Due after |
|
|
|
|
|
||||
|
|
|
year or less |
|
|
3 years |
|
|
5 years |
|
|
5 years |
|
|
Total |
|
|||||
|
Federal Home Loan Bank advances |
|
$ |
10,000 |
|
|
$ |
- |
|
|
$ |
- |
|
|
$ |
- |
|
|
$ |
10,000 |
|
|
Federal funds purchased |
|
|
1,153 |
|
|
|
- |
|
|
|
- |
|
|
|
- |
|
|
|
1,153 |
|
|
Certificates of deposit of less than $100 |
|
|
32,335 |
|
|
|
11,021 |
|
|
|
4,453 |
|
|
|
- |
|
|
|
47,809 |
|
|
Certificates of deposit of $100 or more |
|
|
50,298 |
|
|
|
22,174 |
|
|
|
15,444 |
|
|
|
- |
|
|
|
87,916 |
|
|
Securities sold under agreements to repurchase |
|
|
13,865 |
|
|
|
- |
|
|
|
- |
|
|
|
- |
|
|
|
13,865 |
|
|
Operating leases |
|
|
528 |
|
|
|
1,041 |
|
|
|
1,026 |
|
|
|
1,495 |
|
|
|
4,090 |
|
|
Total contractual obligations |
|
$ |
108,179 |
|
|
$ |
34,236 |
|
|
$ |
20,923 |
|
|
$ |
1,495 |
|
|
$ |
164,833 |
|
Off-Balance Sheet Arrangements
We are party to credit-related financial instruments with off-balance sheet risks in the normal course of business to meet the financing needs of our customers. These financial instruments include commitments to extend credit and standby letters of credit. Such commitments involve, to varying degrees, elements of credit and interest rate risk in excess of amounts recorded on our balance sheet. Our exposure to credit loss is represented by the contractual amounts of these commitments. We follow the same credit policies in making commitments as we do for on-balance sheet instruments.
Our off-balance sheet arrangements are summarized in the following table for the periods indicated.
CREDIT EXTENSION COMMITMENTS
|
|
December 31, 2017 |
|
|
December 31, 2016 |
|
|||
|
Commitments to extend credit |
|
$ |
142,878 |
|
|
$ |
108,564 |
|
|
Stand-by and performance letters of credit |
|
|
2,268 |
|
|
|
2,219 |
|
|
Total |
|
$ |
145,146 |
|
|
$ |
110,783 |
|
47
Interest Sensitivity and Market Risk
Interest Sensitivity
We monitor and manage the pricing and maturity of our assets and liabilities in order to diminish the potential adverse impact that changes in interest rates could have on net interest income. The principal monitoring technique we employ is simulation analysis and this technique is augmented by “gap” analysis.
In simulation analysis, we review each individual asset and liability category and their projected behavior in various different interest rate environments. These projected behaviors are based upon management’s past experiences and upon current competitive environments, including the various environments in the different markets in which we compete. Using this projected behavior and differing rate scenarios as inputs, the simulation analysis generates as output projections of net interest income. We also periodically verify the validity of this approach by comparing actual results with those that were projected in previous models.
Another technique used in interest rate management, but to a lesser degree than simulation analysis, is the measurement of the interest sensitivity “gap,” which is the positive or negative dollar difference between assets and liabilities that are subject to interest rate repricing within a given period of time. Interest rate sensitivity can be managed by repricing assets and liabilities, selling securities available for sale or trading securities, replacing an asset or liability at maturity, or by adjusting the interest rate during the life of an asset or liability.
We evaluate interest rate sensitivity risk and then formulate guidelines regarding asset generation and repricing and sources and prices of off-balance sheet commitments in order to decrease interest sensitivity risk. We use computer simulations to measure the net income effect of various interest rate scenarios. The modeling reflects interest rate changes and the related impact on net income over specified periods of time.
The following table illustrates our interest rate sensitivity at December 31, 2017, assuming that the relevant assets and liabilities are collected and paid, respectively, based upon historical experience rather than their stated maturities.
INTEREST SENSITIVITY ANALYSIS
|
|
0-1 Mos |
|
|
1-3 Mos |
|
|
3-12 Mos |
|
|
1-2 Yrs |
|
|
2-3 Yrs |
|
|
>3 Yrs |
|
|
Total |
|
||||||||
|
Interest earning assets |
|
|
|
|
|
|
|
|
|
|
|
|
|
|
|
|
|
|
|
|
|
|
|
|
|
|
|
|
|
Loans |
|
$ |
126,209 |
|
|
$ |
32,797 |
|
|
$ |
114,964 |
|
|
$ |
93,397 |
|
|
$ |
69,641 |
|
|
$ |
110,113 |
|
|
$ |
547,121 |
|
|
Securities |
|
|
2,979 |
|
|
|
9,320 |
|
|
|
24,931 |
|
|
|
28,812 |
|
|
|
24,363 |
|
|
|
102,884 |
|
|
|
193,289 |
|
|
Certificates of deposit in banks |
|
|
248 |
|
|
|
999 |
|
|
|
499 |
|
|
|
469 |
|
|
|
987 |
|
|
|
2,012 |
|
|
|
5,214 |
|
|
Cash balances in banks |
|
|
889 |
|
|
|
- |
|
|
|
- |
|
|
|
- |
|
|
|
- |
|
|
|
- |
|
|
|
889 |
|
|
Total interest earning assets |
|
$ |
130,325 |
|
|
$ |
43,116 |
|
|
$ |
140,394 |
|
|
$ |
122,678 |
|
|
$ |
94,991 |
|
|
$ |
215,009 |
|
|
$ |
746,513 |
|
|
Interest bearing liabilities |
|
|
|
|
|
|
|
|
|
|
|
|
|
|
|
|
|
|
|
|
|
|
|
|
|
|
|
|
|
Interest bearing transaction accounts |
|
$ |
82,807 |
|
|
$ |
3,825 |
|
|
$ |
17,231 |
|
|
$ |
22,982 |
|
|
$ |
22,982 |
|
|
$ |
45,965 |
|
|
$ |
195,792 |
|
|
Savings and money market accounts |
|
|
102,712 |
|
|
|
3,295 |
|
|
|
14,803 |
|
|
|
19,728 |
|
|
|
19,728 |
|
|
|
22,907 |
|
|
|
183,173 |
|
|
Time deposits |
|
|
10,421 |
|
|
|
18,210 |
|
|
|
54,002 |
|
|
|
25,103 |
|
|
|
8,092 |
|
|
|
19,897 |
|
|
|
135,725 |
|
|
Securities sold under agreements to repurchase |
|
|
13,865 |
|
|
|
- |
|
|
|
- |
|
|
|
- |
|
|
|
- |
|
|
|
- |
|
|
|
13,865 |
|
|
Federal Home Loan Bank Advances |
|
|
5,000 |
|
|
|
5,000 |
|
|
|
- |
|
|
|
- |
|
|
|
- |
|
|
|
- |
|
|
|
10,000 |
|
|
Federal funds purchased |
|
|
1,153 |
|
|
|
- |
|
|
|
- |
|
|
|
- |
|
|
|
- |
|
|
|
- |
|
|
|
1,153 |
|
|
Note payable |
|
|
- |
|
|
|
268 |
|
|
|
804 |
|
|
|
1,071 |
|
|
|
1,071 |
|
|
|
2,143 |
|
|
|
5,357 |
|
|
Total interest bearing liabilities |
|
$ |
215,958 |
|
|
$ |
30,598 |
|
|
$ |
86,840 |
|
|
$ |
68,884 |
|
|
$ |
51,873 |
|
|
$ |
90,912 |
|
|
$ |
545,065 |
|
|
Interest sensitive gap |
|
|
|
|
|
|
|
|
|
|
|
|
|
|
|
|
|
|
|
|
|
|
|
|
|
|
|
|
|
Period gap |
|
$ |
(85,633 |
) |
|
$ |
12,518 |
|
|
$ |
53,554 |
|
|
$ |
53,794 |
|
|
$ |
43,118 |
|
|
$ |
124,097 |
|
|
$ |
201,448 |
|
|
Cumulative gap |
|
$ |
(85,633 |
) |
|
$ |
(73,115 |
) |
|
$ |
(19,561 |
) |
|
$ |
34,233 |
|
|
$ |
77,351 |
|
|
$ |
201,448 |
|
|
|
|
|
|
Cumulative gap - Rate Sensitive Assets/ Rate |
|
|
|
|
|
|
|
|
|
|
|
|
|
|
|
|
|
|
|
|
|
|
|
|
|
|
|
|
|
Sensitive Liabilities |
|
|
(11.5 |
)% |
|
|
(9.8 |
)% |
|
|
(2.6 |
)% |
|
|
4.6 |
% |
|
|
10.4 |
% |
|
|
27.0 |
% |
|
|
|
|
48
We generally benefit from increasing market rates of interest when we have an asset-sensitive gap (a positive number) and generally benefit from decreasing market interest rates when we are liability-sensitive (a negative number). As shown in the table above, we are slightly liability-sensitive on a cumulative basis through two years. The interest sensitivity analysis presents only a static view of the timing and repricing opportunities, without taking into consideration that changes in interest rates do not affect all assets and liabilities equally. For example, rates paid on a substantial portion of core deposits may change contractually within a relatively short time frame, but those are viewed by management as significantly less interest-sensitive than market- based rates such as those paid on non-core deposits. For this and other reasons, management relies more upon the simulation analysis (as noted above) in managing interest rate risk. Net interest income may be impacted by other significant factors in a given interest rate environment, including changes in the volume and mix of earning assets and interest-bearing liabilities.
Market Risk
Our earnings are dependent, to a large degree, on our net interest income, which is the difference between interest income earned on all earning assets, primarily loans and securities, and interest paid on all interest bearing-liabilities, primarily deposits. Market risk is the risk of loss from adverse changes in market prices and interest rates. Our market risk arises primarily from inherent interest rate risk in our lending, investing, and deposit gathering activities. We seek to reduce our exposure to market risk through actively monitoring and managing interest rate risk. Management relies upon static “gap” analysis to determine the degree of mismatch in the maturity and repricing distribution of interest-earning assets and interest-bearing liabilities which quantifies, to a large extent, the degree of market risk inherent in our balance sheet. Gap analysis is further augmented by simulation analysis to evaluate the impact of varying levels of prevailing interest rates and the sensitivity of specific earning assets and interest-bearing liabilities to changes in those prevailing rates. Simulation analysis consists of evaluating the impact on net interest income given changes from 400 basis points below the current prevailing rates to 400 basis points above the current prevailing rates. Management makes certain assumptions as to the effect that varying levels of interest rates have on certain earning assets and interest bearing-liabilities, which assumptions consider both historical experience and consensus estimates of outside sources.
The following table illustrates the results of our simulation analysis to determine the extent to which market risk would affect net interest margin for the next 12 months if prevailing interest rates increased or decreased by the specified amounts from current rates. As noted above, this model uses estimates and assumptions in asset and liability account rate reactions to changes in prevailing interest rates. However, to isolate the market risk inherent in the balance sheet, the model assumes that no growth in the balance sheet occurs during the projection period. This model also assumes an immediate and parallel shift in interest rates, which would result in no change in the shape or slope of the interest rate yield curve. Because of the inherent use of these estimates and assumptions in the simulation model to derive this market risk information, the actual results of the future impact of market risk on our net interest margin may (and most likely will) differ from that found in the table.
MARKET RISK
|
|
Impact on net interest income |
|
||||||
|
|
|
As of December 31, 2017 |
|
|
As of December 31, 2016 |
|
||
|
Change in prevailing rates: |
|
|
|
|
|
|
|
|
|
+ 400 basis points |
|
|
(1.37 |
)% |
|
|
(0.40 |
)% |
|
+ 300 basis points |
|
|
(0.53 |
)% |
|
|
0.20 |
% |
|
+ 200 basis points |
|
|
(0.02 |
)% |
|
|
0.48 |
% |
|
+ 100 basis points |
|
|
0.30 |
% |
|
|
0.38 |
% |
|
+ 0 basis points |
|
|
- |
|
|
|
- |
|
|
- 100 basis points |
|
|
(4.51 |
)% |
|
|
(3.10 |
)% |
|
- 200 basis points |
|
|
(10.54 |
)% |
|
|
(8.68 |
)% |
|
- 300 basis points |
|
|
(12.82 |
)% |
|
|
(10.50 |
)% |
|
- 400 basis points |
|
|
(13.80 |
)% |
|
|
(11.52 |
)% |
49
Total stockholders’ equity at December 31, 2017 was $89.0 million, or 10.8% of total assets. At December 31, 2016, total stockholders’ equity was $81.8 million, or 10.1% of total assets. The increase in shareholders’ equity for 2017 was mainly attributable to net income of $8.3 million.
The bank regulatory agencies have established risk-based capital requirements for banks. These guidelines are intended to provide an additional measure of a bank’s capital adequacy by assigning weighted levels of risk to asset categories. Banks are also required to systematically maintain capital against “off-balance sheet” activities such as loans sold with recourse, loan commitments, guarantees, and standby letters of credit. These guidelines are intended to strengthen the quality of capital by increasing the emphasis on common equity and restricting the amount of loan loss reserves and other forms of equity, such as preferred stock, that may be included in capital. Certain items, such as goodwill and other intangible assets, are deducted from total capital in arriving at the various regulatory capital measures such as Tier 1 capital and total risk based capital. Our objective is to maintain the Bank’s current status as a “well-capitalized institution,” as that term is defined by the Bank’s regulators. As of December 31, 2017, RB&T was “well-capitalized” under the regulatory framework for prompt corrective action.
Changes to the regulatory guidelines for bank capital levels that became effective January 1, 2015, the minimum ratio of total capital to risk-weighted assets (including certain off-balance sheet activities such as standby letters of credit) is 8%. The required ratio of “Tier 1 Capital” (consisting generally of shareholders’ equity and qualifying preferred stock, less certain goodwill items and other intangible assets) to risk-weighted assets is 6%. While there was previously no required ratio of “Common Equity Tier 1 Capital” (which generally consists of common stock, retained earnings, certain qualifying capital instruments issued by consolidated subsidiaries, and Accumulated Other Comprehensive Income, subject to adjustments) to total risk-weighted assets, a required minimum ratio of 4.5% became effective on January 1, 2015, as well. The remainder of total capital, or “Tier 2 Capital,” may consist of (a) the allowance for loan losses of up to 1.25% of risk-weighted assets, (b) preferred stock not qualifying as Tier 1 Capital, (c) hybrid capital instruments, (d) perpetual debt, (e) mandatory convertible securities, and (f) certain subordinated debt and intermediate-term preferred stock up to 50% of Tier 1 Capital. Total Capital is the sum of Tier 1 Capital and Tier 2 Capital (which is included only to the extent of Tier 1 Capital), less reciprocal holdings of other banking organizations’ capital instruments, investments in unconsolidated subsidiaries, and any other deductions as determined by the appropriate regulator.
Quantitative measures, established by regulation to ensure capital adequacy effective January 1, 2015, require River Bank & Trust to maintain minimum amounts and ratios (set forth in the table below) of total risk based capital, Common Equity Tier 1 capital, and Tier 1 capital (as defined in the regulations) to risk-weighted assets (as defined), and of Tier 1 capital (as defined) to average assets (as defined).
The following table presents the Bank’s capital amounts and ratios with the required minimum levels for capital adequacy purposes including the phase in of the capital conservation buffer under Basel III and minimum levels to be well capitalized (as defined) under the regulatory prompt corrective action regulations. The following table contains selected capital ratios at December 31, 2017 and 2016 for the Bank.
CAPITAL ADEQUACY ANALYSIS
|
As of December 31, 2017: |
|
Actual |
|
|
Required For Capital Adequacy Purposes |
|
To Be Well Capitalized Under Prompt Corrective Action Regulations |
|||||||||||||
|
|
|
Amount |
|
|
Ratio |
|
|
Amount |
|
|
Ratio |
|
Amount |
|
|
Ratio |
||||
|
Total Capital (To Risk-Weighted Assets) |
|
$ |
89,604 |
|
|
|
14.325 |
% |
|
$ |
57,859 |
|
|
>= 9.250% |
|
$ |
62,551 |
|
|
>= 10.000% |
|
Common Equity Tier 1 Capital (To Risk- weighted Assets) |
|
|
84,724 |
|
|
|
13.545 |
% |
|
|
35,967 |
|
|
>= 5.750% |
|
|
40,658 |
|
|
>= 6.500% |
|
Tier 1 Capital (To Risk-Weighted Assets) |
|
|
84,724 |
|
|
|
13.545 |
% |
|
|
45,349 |
|
|
>= 7.250% |
|
|
50,040 |
|
|
>= 8.000% |
|
Tier 1 Capital (To Average Assets) |
|
|
84,724 |
|
|
|
10.429 |
% |
|
|
32,497 |
|
|
>= 4.000% |
|
|
40,621 |
|
|
>= 5.000% |
|
As of December 31, 2016: |
|
Actual |
|
|
Required For Capital Adequacy Purposes |
|
To Be Well Capitalized Under Prompt Corrective Action Regulations |
|||||||||||||
|
|
|
Amount |
|
|
Ratio |
|
|
Amount |
|
|
Ratio |
|
Amount |
|
|
Ratio |
||||
|
Total Capital (To Risk-Weighted Assets) |
|
$ |
81,719 |
|
|
|
13.680 |
% |
|
$ |
51,522 |
|
|
>= 8.625% |
|
$ |
59,736 |
|
|
>= 10.00% |
|
Common Equity Tier 1 Capital (To Risk- weighted Assets) |
|
|
77,712 |
|
|
|
13.010 |
% |
|
|
30,613 |
|
|
>= 5.125% |
|
|
38,826 |
|
|
>= 6.50% |
|
Tier 1 Capital (To Risk-Weighted Assets) |
|
|
77,712 |
|
|
|
13.010 |
% |
|
|
39,573 |
|
|
>= 6.625% |
|
|
47,786 |
|
|
>= 8.00% |
|
Tier 1 Capital (To Average Assets) |
|
|
77,712 |
|
|
|
9.960 |
% |
|
|
31,210 |
|
|
>= 4.000% |
|
|
39,012 |
|
|
>= 5.00% |
50
The Bank’s Total Capital ratio and Tier 1 Capital (To Risk-weighted Assets) ratio increased from year-end 2016 to year-end 2017 and the ratios remain well above the levels for the Bank to be deemed well-capitalized.
Banking regulations limit the amount of dividends that a bank may pay without approval of the regulatory authorities. These restrictions are based on the bank’s level of regulatory classified assets, prior years’ net earnings and ratio of equity capital to assets. As of December 31, 2017, the maximum amount of dividend the Bank could declare payable to the Company was approximately $14.0 million.
Item 7A. Quantitative and Qualitative Disclosures about Market Risk.
Not applicable. However, see Item 8 “Interest Sensitivity and Market Risk”
Item 8. Financial Statements and Supplementary Data.
51

REPORT OF INDEPENDENT REGISTERED PUBLIC ACCOUNTING FIRM
To the Board of Directors and Stockholders
River Financial Corporation and Subsidiary
Prattville, Alabama
Opinion on the Financial Statements
We have audited the accompanying consolidated statements of financial condition of River Financial Corporation and Subsidiary (the Company) as of December 31, 2017 and 2016, and the related consolidated statements of income, comprehensive income, changes in stockholders’ equity, and cash flows for each of the years in the two-year period ended December 31, 2017, and the related notes (collectively referred to as the financial statements). In our opinion, the financial statements present fairly, in all material respects, the financial position of the Company as of December 31, 2017 and 2016, and the results of its operations and its cash flows for each of the years in the two-year period ended December 31, 2017, in conformity with accounting principles generally accepted in the United States of America.
Basis for Opinion
These financial statements are the responsibility of the Company’s management. Our responsibility is to express an opinion on the Company’s financial statements based on our audits. We are a public accounting firm registered with the Public Company Accounting Oversight Board (United States) (PCAOB) and are required to be independent with respect to the Company in accordance with the U.S. federal securities laws and the applicable rules and regulations of the Securities and Exchange Commission and the PCAOB.
We conducted our audits in accordance with the standards of the PCAOB. Those standards require that we plan and perform the audit to obtain reasonable assurance about whether the financial statements are free of material misstatement, whether due to error or fraud. The Company is not required to have, nor were we engaged to perform, an audit of its internal control over financial reporting. As part of our audits, we are required to obtain an understanding of internal control over financial reporting, but not for the purpose of expressing an opinion on the effectiveness of the Company’s internal control over financial reporting. Accordingly, we express no such opinion.
Our audits included performing procedures to assess the risks of material misstatement of the financial statements, whether due to error or fraud, and performing procedures that respond to those risks. Such procedures included examining, on a test basis, evidence regarding the amounts and disclosures in the financial statements. Our audits also included evaluating the accounting principles used and significant estimates made by management, as well as evaluating the overall presentation of the financial statements. We believe that our audits provide a reasonable basis for our opinion.
We have served as the Company’s auditor since 2016.

Birmingham, Alabama
March 20, 2018
52
Consolidated Statements of Financial Condition
(in thousands except share data)
|
Assets |
|
December 31, 2017 |
|
|
December 31, 2016 |
|
||
|
Cash and due from banks |
|
$ |
14,669 |
|
|
$ |
17,329 |
|
|
Interest-bearing deposits in banks |
|
|
889 |
|
|
|
25,170 |
|
|
Cash and cash equivalents |
|
|
15,558 |
|
|
|
42,499 |
|
|
Certificates of deposit in banks |
|
|
5,214 |
|
|
|
5,463 |
|
|
Securities available-for-sale |
|
|
193,289 |
|
|
|
183,361 |
|
|
Loans held for sale |
|
|
3,858 |
|
|
|
7,734 |
|
|
Loans, net of unearned income |
|
|
547,121 |
|
|
|
516,441 |
|
|
Less allowance for loan losses |
|
|
(4,881 |
) |
|
|
(4,007 |
) |
|
Net loans |
|
|
542,240 |
|
|
|
512,434 |
|
|
Premises and equipment, net |
|
|
21,809 |
|
|
|
21,472 |
|
|
Accrued interest receivable |
|
|
2,499 |
|
|
|
2,376 |
|
|
Bank owned life insurance |
|
|
19,991 |
|
|
|
15,161 |
|
|
Foreclosed assets |
|
|
1,546 |
|
|
|
1,151 |
|
|
Deferred income taxes |
|
|
1,977 |
|
|
|
3,352 |
|
|
Core deposit intangible |
|
|
1,560 |
|
|
|
2,119 |
|
|
Goodwill |
|
|
10,050 |
|
|
|
10,050 |
|
|
Other assets |
|
|
3,701 |
|
|
|
3,245 |
|
|
Total assets |
|
$ |
823,292 |
|
|
$ |
810,417 |
|
|
Liabilities and Stockholders' Equity |
|
|
|
|
|
|
|
|
|
Noninterest-bearing deposits |
|
$ |
185,171 |
|
|
$ |
185,270 |
|
|
Interest-bearing deposits |
|
|
514,690 |
|
|
|
519,643 |
|
|
Total deposits |
|
|
699,861 |
|
|
|
704,913 |
|
|
Securities sold under agreements to repurchase |
|
|
13,865 |
|
|
|
13,034 |
|
|
Federal Home Loan Bank advances |
|
|
10,000 |
|
|
|
- |
|
|
Federal funds purchased |
|
|
1,153 |
|
|
|
- |
|
|
Note payable |
|
|
5,357 |
|
|
|
6,428 |
|
|
Accrued interest payable and other liabilities |
|
|
3,107 |
|
|
|
3,592 |
|
|
Total liabilities |
|
|
733,343 |
|
|
|
727,967 |
|
|
Common stock related to 401(k) Employee Stock Ownership Plan |
|
|
950 |
|
|
|
623 |
|
|
Stockholders' Equity |
|
|
|
|
|
|
|
|
|
Common stock ($1 par value; 10,000,000 shares authorized; 5,113,951 and 5,090,901 shares issued; 5,098,068 and 5,080,857 shares outstanding, respectively) |
|
|
5,114 |
|
|
|
5,091 |
|
|
Additional paid in capital |
|
|
64,935 |
|
|
|
64,656 |
|
|
Retained earnings |
|
|
22,388 |
|
|
|
15,032 |
|
|
Accumulated other comprehensive loss |
|
|
(2,116 |
) |
|
|
(2,153 |
) |
|
Treasury stock at cost (15,883 and 10,044 shares, respectively) |
|
|
(372 |
) |
|
|
(176 |
) |
|
Common stock related to 401(k) Employee Stock Ownership Plan |
|
|
(950 |
) |
|
|
(623 |
) |
|
Total stockholders' equity |
|
|
88,999 |
|
|
|
81,827 |
|
|
Total equity |
|
|
89,949 |
|
|
|
82,450 |
|
|
Total liabilities and stockholders' equity |
|
$ |
823,292 |
|
|
$ |
810,417 |
|
The accompanying notes are an integral part of these financial statements.
53
Consolidated Statements of Income
(in thousands except per share data)
|
|
For the Years Ended |
|
||||||
|
|
|
December 31, |
|
|||||
|
|
|
2017 |
|
|
2016 |
|
||
|
Interest income: |
|
|
|
|
|
|
|
|
|
Loans, including fees |
|
$ |
27,891 |
|
|
$ |
27,169 |
|
|
Taxable securities |
|
|
2,938 |
|
|
|
1,805 |
|
|
Nontaxable securities |
|
|
1,130 |
|
|
|
1,109 |
|
|
Federal funds sold |
|
|
- |
|
|
|
30 |
|
|
Other interest income |
|
|
211 |
|
|
|
196 |
|
|
Total interest income |
|
|
32,170 |
|
|
|
30,309 |
|
|
Interest expense: |
|
|
|
|
|
|
|
|
|
Deposits |
|
|
2,229 |
|
|
|
2,047 |
|
|
Securities sold under agreements to repurchase |
|
|
28 |
|
|
|
16 |
|
|
Federal Home Loan Bank advances |
|
|
101 |
|
|
|
40 |
|
|
Federal funds purchased |
|
|
13 |
|
|
|
- |
|
|
Note payable |
|
|
249 |
|
|
|
250 |
|
|
Total interest expense |
|
|
2,620 |
|
|
|
2,353 |
|
|
Net interest income |
|
|
29,550 |
|
|
|
27,956 |
|
|
Provision for loan losses |
|
|
1,740 |
|
|
|
878 |
|
|
Net interest income after provision for loan losses |
|
|
27,810 |
|
|
|
27,078 |
|
|
Noninterest income: |
|
|
|
|
|
|
|
|
|
Service charges and fees |
|
|
2,949 |
|
|
|
2,479 |
|
|
Investment brokerage revenue |
|
|
58 |
|
|
|
221 |
|
|
Mortgage operations |
|
|
1,895 |
|
|
|
1,419 |
|
|
Bank owned life insurance income |
|
|
1,086 |
|
|
|
431 |
|
|
Net gain on sale of investment securities |
|
|
5 |
|
|
|
24 |
|
|
Other noninterest income |
|
|
316 |
|
|
|
315 |
|
|
Total noninterest income |
|
|
6,309 |
|
|
|
4,889 |
|
|
Noninterest expense: |
|
|
|
|
|
|
|
|
|
Salaries and employee benefits |
|
|
12,097 |
|
|
|
11,161 |
|
|
Occupancy expenses |
|
|
1,399 |
|
|
|
1,526 |
|
|
Equipment rentals, depreciation, and maintenance |
|
|
841 |
|
|
|
805 |
|
|
Telephone and communications |
|
|
261 |
|
|
|
207 |
|
|
Advertising and business development |
|
|
625 |
|
|
|
324 |
|
|
Data processing |
|
|
1,689 |
|
|
|
1,825 |
|
|
Foreclosed assets, net |
|
|
163 |
|
|
|
77 |
|
|
Federal deposit insurance and other regulatory assessments |
|
|
333 |
|
|
|
384 |
|
|
Legal and other professional services |
|
|
505 |
|
|
|
691 |
|
|
Other operating expense |
|
|
3,392 |
|
|
|
3,560 |
|
|
Total noninterest expense |
|
|
21,305 |
|
|
|
20,560 |
|
|
Income before income taxes |
|
|
12,814 |
|
|
|
11,407 |
|
|
Provision for income taxes |
|
|
4,519 |
|
|
|
3,504 |
|
|
Net income |
|
$ |
8,295 |
|
|
$ |
7,903 |
|
|
Basic net earnings per common share |
|
$ |
1.63 |
|
|
$ |
1.57 |
|
|
Diluted net earnings per common share |
|
$ |
1.60 |
|
|
$ |
1.55 |
|
The accompanying notes are an integral part of these financial statements.
54
Consolidated Statements of Comprehensive Income
(in thousands)
|
|
For the Years Ended |
|
||||||
|
|
|
December 31, |
|
|||||
|
|
|
2017 |
|
|
2016 |
|
||
|
Net income |
|
$ |
8,295 |
|
|
$ |
7,903 |
|
|
Other comprehensive income (loss), net of tax: |
|
|
|
|
|
|
|
|
|
Investment securities available-for-sale: |
|
|
|
|
|
|
|
|
|
Net unrealized gains (losses) |
|
|
592 |
|
|
|
(4,293 |
) |
|
Reclassification adjustments for net gains realized in net income |
|
|
(5 |
) |
|
|
(24 |
) |
|
Income tax effect |
|
|
(217 |
) |
|
|
1,593 |
|
|
Other comprehensive income (loss) |
|
|
370 |
|
|
|
(2,724 |
) |
|
Comprehensive income |
|
$ |
8,665 |
|
|
$ |
5,179 |
|
The accompanying notes are an integral part of these financial statements.
55
Consolidated Statements of Changes in Stockholders' Equity
(in thousands except share and per share data)
|
|
Common Stock |
|
|
Additional Paid In Capital |
|
|
Retained Earnings |
|
|
Accumulated Other Comprehensive Income (Loss) |
|
|
Treasury Stock |
|
|
Common Stock Related to ESOP |
|
|
Total Stockholders' Equity |
|
||||||||
|
Balance at December 31, 2015 |
|
$ |
4,876 |
|
|
$ |
62,493 |
|
|
$ |
7,941 |
|
|
$ |
571 |
|
|
$ |
(957 |
) |
|
$ |
(310 |
) |
|
$ |
74,614 |
|
|
Net income |
|
|
- |
|
|
|
- |
|
|
|
7,903 |
|
|
|
- |
|
|
|
- |
|
|
|
- |
|
|
|
7,903 |
|
|
Other comprehensive loss |
|
|
- |
|
|
|
- |
|
|
|
- |
|
|
|
(2,724 |
) |
|
|
- |
|
|
|
- |
|
|
|
(2,724 |
) |
|
Adjustment to Keystone merger fair values |
|
|
- |
|
|
|
640 |
|
|
|
- |
|
|
|
- |
|
|
|
- |
|
|
|
- |
|
|
|
640 |
|
|
Exercise of stock options and warrants (273,294 shares) |
|
|
207 |
|
|
|
1,342 |
|
|
|
- |
|
|
|
- |
|
|
|
957 |
|
|
|
- |
|
|
|
2,506 |
|
|
Issuance of common stock (8,013 shares) |
|
|
8 |
|
|
|
123 |
|
|
|
- |
|
|
|
- |
|
|
|
- |
|
|
|
- |
|
|
|
131 |
|
|
Purchase of treasury shares (21,039 shares) |
|
|
- |
|
|
|
- |
|
|
|
- |
|
|
|
- |
|
|
|
(363 |
) |
|
|
- |
|
|
|
(363 |
) |
|
Sale of treasury shares (10,995 shares) |
|
|
- |
|
|
|
1 |
|
|
|
- |
|
|
|
- |
|
|
|
187 |
|
|
|
- |
|
|
|
188 |
|
|
Dividends declared ($0.16 per share) |
|
|
- |
|
|
|
- |
|
|
|
(812 |
) |
|
|
- |
|
|
|
- |
|
|
|
- |
|
|
|
(812 |
) |
|
Stock compensation expense |
|
|
- |
|
|
|
57 |
|
|
|
- |
|
|
|
- |
|
|
|
- |
|
|
|
- |
|
|
|
57 |
|
|
Change for KSOP related shares |
|
|
- |
|
|
|
- |
|
|
|
- |
|
|
|
- |
|
|
|
- |
|
|
|
(313 |
) |
|
|
(313 |
) |
|
Balance at December 31, 2016 |
|
|
5,091 |
|
|
|
64,656 |
|
|
|
15,032 |
|
|
|
(2,153 |
) |
|
|
(176 |
) |
|
|
(623 |
) |
|
|
81,827 |
|
|
Net income |
|
|
- |
|
|
|
- |
|
|
|
8,295 |
|
|
|
- |
|
|
|
- |
|
|
|
- |
|
|
|
8,295 |
|
|
Other comprehensive income |
|
|
- |
|
|
|
- |
|
|
|
- |
|
|
|
370 |
|
|
|
- |
|
|
|
- |
|
|
|
370 |
|
|
Exercise of stock options and warrants (25,096 shares) |
|
|
19 |
|
|
|
136 |
|
|
|
- |
|
|
|
- |
|
|
|
108 |
|
|
|
- |
|
|
|
263 |
|
|
Issuance of common stock (4,204 shares) |
|
|
4 |
|
|
|
81 |
|
|
|
- |
|
|
|
- |
|
|
|
- |
|
|
|
- |
|
|
|
85 |
|
|
Purchase of treasury shares (25,056 shares) |
|
|
- |
|
|
|
- |
|
|
|
- |
|
|
|
- |
|
|
|
(579 |
) |
|
|
- |
|
|
|
(579 |
) |
|
Sale of treasury shares (12,967 shares) |
|
|
- |
|
|
|
6 |
|
|
|
- |
|
|
|
- |
|
|
|
275 |
|
|
|
- |
|
|
|
281 |
|
|
Remeasurement of deferred income taxes reclassified to retained earnings |
|
|
|
|
|
|
- |
|
|
|
333 |
|
|
|
(333 |
) |
|
|
- |
|
|
|
- |
|
|
|
- |
|
|
Dividends declared ($0.25 per share) |
|
|
- |
|
|
|
- |
|
|
|
(1,272 |
) |
|
|
- |
|
|
|
- |
|
|
|
- |
|
|
|
(1,272 |
) |
|
Stock compensation expense |
|
|
- |
|
|
|
56 |
|
|
|
- |
|
|
|
- |
|
|
|
- |
|
|
|
- |
|
|
|
56 |
|
|
Change for KSOP related shares |
|
|
- |
|
|
|
- |
|
|
|
- |
|
|
|
- |
|
|
|
- |
|
|
|
(327 |
) |
|
|
(327 |
) |
|
Balance at December 31, 2017 |
|
$ |
5,114 |
|
|
$ |
64,935 |
|
|
$ |
22,388 |
|
|
$ |
(2,116 |
) |
|
$ |
(372 |
) |
|
$ |
(950 |
) |
|
$ |
88,999 |
|
The accompanying notes are an integral part of these financial statements.
56
Consolidated Statements of Cash Flows
(in thousands)
|
|
For the Years Ended December 31, |
|
||||||
|
|
|
2017 |
|
|
2016 |
|
||
|
Cash Flows From (Used For) Operating Activities: |
|
|
|
|
|
|
|
|
|
Net Income |
|
$ |
8,295 |
|
|
$ |
7,903 |
|
|
Adjustments to reconcile net income to net cash provided by operating activities: |
|
|
|
|
|
|
|
|
|
Provision for loan losses |
|
|
1,740 |
|
|
|
878 |
|
|
Provision for losses on foreclosed assets |
|
|
145 |
|
|
|
180 |
|
|
Amortization of securities available-for-sale |
|
|
2,325 |
|
|
|
1,798 |
|
|
Accretion of securities available-for-sale |
|
|
(32 |
) |
|
|
(32 |
) |
|
Accretion of acquired loans |
|
|
(2,334 |
) |
|
|
(2,353 |
) |
|
Realized net gain on securities available-for-sale |
|
|
(5 |
) |
|
|
(24 |
) |
|
Amortization of deferred loan fees |
|
|
(1,054 |
) |
|
|
(987 |
) |
|
Amortization of core deposit intangible |
|
|
559 |
|
|
|
644 |
|
|
Stock compensation expense |
|
|
56 |
|
|
|
57 |
|
|
Bank owned life insurance income |
|
|
(1,086 |
) |
|
|
(431 |
) |
|
Depreciation and amortization of premises and equipment |
|
|
946 |
|
|
|
849 |
|
|
Gain on sale of foreclosed assets |
|
|
(72 |
) |
|
|
(133 |
) |
|
Deferred income tax expense |
|
|
1,159 |
|
|
|
686 |
|
|
(Increase) decrease in operating assets and (Decrease) increase in operating liabilities: |
|
|
|
|
|
|
|
|
|
Loans held-for-sale |
|
|
3,876 |
|
|
|
(4,963 |
) |
|
Accrued interest receivable |
|
|
(123 |
) |
|
|
(142 |
) |
|
Other assets |
|
|
52 |
|
|
|
134 |
|
|
Accrued interest payable and other liabilities |
|
|
(487 |
) |
|
|
(1,180 |
) |
|
Net cash from operating activities |
|
|
13,960 |
|
|
|
2,884 |
|
|
Cash Flows From (Used For) Investing Activities: |
|
|
|
|
|
|
|
|
|
Maturity of certificate of deposit |
|
|
498 |
|
|
|
607 |
|
|
Purchase of certificate of deposit |
|
|
(249 |
) |
|
|
- |
|
|
Activity in securities available-for-sale: |
|
|
|
|
|
|
|
|
|
Sales |
|
|
13,251 |
|
|
|
24,297 |
|
|
Maturities, payments, calls |
|
|
28,225 |
|
|
|
19,427 |
|
|
Purchases |
|
|
(53,105 |
) |
|
|
(88,423 |
) |
|
Loan principal originations, net |
|
|
(30,816 |
) |
|
|
(34,788 |
) |
|
Proceeds from sale of foreclosed assets |
|
|
2,190 |
|
|
|
1,055 |
|
|
Payment to Keystone shareholders |
|
|
- |
|
|
|
(7,274 |
) |
|
Purchases of premises and equipment |
|
|
(1,285 |
) |
|
|
(1,768 |
) |
|
Sale (purchases) of restricted equity securities, net |
|
|
(509 |
) |
|
|
519 |
|
|
Proceeds from bank owned life insurance |
|
|
1,260 |
|
|
|
- |
|
|
Purchase of bank owned life insurance |
|
|
(5,000 |
) |
|
|
- |
|
|
Net cash used for investing activities |
|
|
(45,540 |
) |
|
|
(86,348 |
) |
|
Cash Flows From (Used For) Financing Activities: |
|
|
|
|
|
|
|
|
|
Net increase (decrease) in deposits |
|
|
(5,052 |
) |
|
|
94,515 |
|
|
Net increase in securities sold under agreements to repurchase |
|
|
831 |
|
|
|
2,868 |
|
|
Proceeds from Federal Home Loan Bank advances |
|
|
50,000 |
|
|
|
- |
|
|
Repayment of Federal Home Loan Bank advances |
|
|
(40,000 |
) |
|
|
(10,500 |
) |
|
Proceeds from issuance of note payable |
|
|
- |
|
|
|
7,500 |
|
|
Repayment of note payable |
|
|
(1,071 |
) |
|
|
(1,072 |
) |
|
Federal funds purchased |
|
|
1,153 |
|
|
|
- |
|
|
Proceeds from issuance of common stock |
|
|
85 |
|
|
|
131 |
|
|
Proceeds from exercise of common stock options and warrants |
|
|
263 |
|
|
|
2,506 |
|
|
Purchase of treasury stock |
|
|
(579 |
) |
|
|
(363 |
) |
|
Sale of treasury stock |
|
|
281 |
|
|
|
188 |
|
|
Cash dividends |
|
|
(1,272 |
) |
|
|
(812 |
) |
|
Net cash from financing activities |
|
|
4,639 |
|
|
|
94,961 |
|
|
Net Change In Cash And Cash Equivalents |
|
|
(26,941 |
) |
|
|
11,497 |
|
|
Cash and Cash Equivalents At Beginning Of Period |
|
|
42,499 |
|
|
|
31,002 |
|
|
Cash and Cash Equivalents At End Of Period |
|
$ |
15,558 |
|
|
$ |
42,499 |
|
|
|
|
|
|
|
|
|
|
|
|
|
|
|
|
|
|
|
|
|
|
|
|
|
|
|
|
|
|
|
|
|
|
|
|
|
|
|
|
|
|
|
|
|
|
|
|
|
|
|
57
|
|
|
|
|
|
|
|
|
|
|
Cash Payments For: |
|
|
|
|
|
|
|
|
|
Interest paid to depositors |
|
$ |
2,243 |
|
|
$ |
2,048 |
|
|
Interest paid on borrowings |
|
$ |
372 |
|
|
$ |
309 |
|
|
Income taxes |
|
$ |
3,830 |
|
|
$ |
2,049 |
|
|
Non-cash investing and financing activities: |
|
|
|
|
|
|
|
|
|
Transfer of loans to foreclosed assets |
|
$ |
2,658 |
|
|
$ |
304 |
|
The accompanying notes are an integral part of these financial statements.
58
Notes to Consolidated Financial Statements
(1) Summary of Significant Accounting Policies
Basis of Presentation
The consolidated financial statements include the accounts of River Financial Corporation (the “Company”) and its wholly-owned banking subsidiary, River Bank and Trust (“RB&T”, the “Bank”). All material intercompany accounts and transactions have been eliminated in consolidation. The Bank provides a full range of commercial and consumer banking services in Alabama, including metropolitan Montgomery, Lee County, Autauga County, Elmore County, Tallapoosa County, and Etowah County in Alabama. RB&T is primarily regulated by the Federal Deposit Insurance Corporation (“FDIC”) and the Alabama Banking Department. The Bank undergoes periodic examinations by these regulatory agencies. The Company is regulated by the Federal Reserve Bank (“FRB”) and is also subject to periodic examinations.
The accounting principles followed by the Company, and the method of applying these principles, conform with accounting principles generally accepted in the United States of America (“GAAP”) and with general practices within the banking industry. In preparing financial statements in conformity with GAAP, management is required to make estimates and assumptions that affect the reported amounts in the consolidated financial statements. Actual results could differ significantly from those estimates. Material estimates common to the banking industry that are particularly susceptible to significant change in the near term include, but are not limited to, the determination of the allowance for loan losses, the valuation of real estate acquired in connection with foreclosures or in satisfaction of loans, and valuation allowances associated with the realization of deferred tax assets, which are based on future taxable income.
Cash and Cash Equivalents
Cash equivalents include amounts due from banks, interest-bearing deposits with the Federal Reserve Bank of Atlanta (“FRB”), Federal Home Loan Bank (“FHLB”), correspondent banks, and federal funds sold. Generally, federal funds are sold for one-day periods. The Company is required to maintain average reserve balances with the FRB or in cash. At December 31, 2017 and 2016, the Company’s reserve requirements were approximately $2.43 million and $2.39 million, respectively.
Investment Securities
The Company classifies its securities in one of three categories: trading, available-for-sale, or held-to-maturity. Trading securities are bought and held principally for the purpose of selling them in the near term. Held-to-maturity securities are those securities that the Company has the ability and intent to hold until maturity. All securities not included in trading or held-to- maturity are classified as available-for-sale. At December 31, 2017 and 2016, all securities are classified as available-for-sale.
Available-for-sale securities are recorded at fair value. Held-to-maturity securities are recorded at cost, adjusted for the amortization or accretion of premiums or discounts. Unrealized holding gains and losses, net of the related tax effect, on securities available-for-sale are excluded from earnings and are reported as a separate component of shareholders’ equity until realized. Transfers of securities between categories are recorded at fair value at the date of transfer.
Management evaluates investment securities for other-than-temporary impairment on a quarterly basis. A decline in the market value of any investment below cost that is deemed other- than-temporary is charged to earnings for the decline in value deemed to be credit related and a new cost basis in the security is established. The decline in value attributed to non-credit related factors is recognized in other comprehensive income.
Premiums and discounts are amortized or accreted over the life of the related securities as adjustments to the yield. Realized gains and losses are included in earnings and are derived using the specific identification method for determining the cost of securities sold.
Other Investments
Other investments include FRB stock, FHLB stock and other investments that do not have a readily determinable market value. These investments are carried at cost, which approximates fair value.
59
Loans and Allowance for Loan Losses
Loans are stated at the principal amount outstanding, net of the allowance for loan losses and unearned fees. Interest on loans is recognized as income based upon the applicable rate applied to the daily outstanding principal balance using the simple interest method. The past due or delinquency status of a loan is determined based on contractual payment terms.
Nonrefundable loan fees and costs incurred for loans are generally deferred and recognized in income over the life of the loans.
A loan is considered impaired when, based on current information and events, it is probable that all amounts due according to the contractual terms of the loan agreement will not be collected. Impaired loans are measured based on the present value of expected future cash flows discounted at the loan’s effective interest rate, at the loan’s observable market price, or at the fair value of the collateral of the loan if the loan is collateral dependent. Accrual of interest is discontinued on a loan when management believes, after considering economic and business conditions and collection efforts that the borrower’s financial condition is such that collection of interest is doubtful. When a loan is placed on nonaccrual status, previously accrued and uncollected interest is charged to interest income on loans. Generally, payments on nonaccrual loans are applied to principal. When a borrower has demonstrated the capacity to service the debt for a reasonable period of time, management may elect to resume the accrual of interest on the loan.
All other loans are deemed to be unimpaired and are grouped into various homogeneous risk pools utilizing regulatory reporting classifications. The Bank’s historical loss factors are calculated for each of these risk pools based on the net losses experienced as a percentage of the average loans outstanding. The time periods utilized in these historical loss factor calculations are subjective and vary according to management’s estimate of the impact of current economic cycles. As every loan has a risk of loss, minimum loss factors are estimated based on long term trends for the Bank, the banking industry, and the economy. The greater of the calculated historical loss factors or the minimum loss factors are applied to the unimpaired loan amounts currently outstanding for the risk pool and included in the analysis of the allowance for loan losses. In addition, certain qualitative adjustments may be included by management as additional loss factors applied to the unimpaired loan risk pools. These adjustments may include, among other things, changes in loan policy, loan administration, loan, geographic, or industry concentrations, loan growth rates, and experience levels of our lending officers. The loss allocations for specifically impaired loans, smaller impaired loans not specifically measured for impairment, and unimpaired loans are totaled to determine the total required allowance for loan losses. This total is compared to the current allowance on the Bank’s books and adjustments made accordingly by a charge or credit to the provision for loan losses.
The allowance for loan losses is established through a provision for loan losses charged to expense. Loans are charged against the allowance for loan losses when management believes that the collectibility of the principal is unlikely. The allowance represents an amount which, in management’s judgment, will be adequate to absorb probable losses on existing loans that may become uncollectible.
Management assesses the adequacy of its allowance for loan losses at the end of each calendar quarter. Management’s judgment in determining the adequacy of the allowance is based on evaluations of the collectibility of loans. These evaluations take into consideration such factors as changes in the nature and volume of the loan portfolio, current economic conditions that may affect the borrower’s ability to pay, overall portfolio quality, and review of specific problem loans.
Management believes that the allowance for loan losses is adequate. While management uses available information to recognize losses on loans, future additions to the allowance may be necessary based on changes in economic conditions. In addition, various regulatory agencies, as an integral part of their examination process, periodically review the Company’s allowance for loan losses. Such agencies may require the Company to recognize additions to the allowance based on judgments that are different than those of management.
Concentrations of Credit Risk
The Company originates primarily commercial, commercial real estate, residential real estate, and consumer loans to customers in its primary market areas in Alabama listed above. The ability of the majority of the Company’s customers to honor their contractual loan obligations is dependent on the economy in these areas. Seventy-seven percent of the Company’s loan portfolio is secured by real estate, of which the majority is secured by real estate in the Company’s market areas. The Company, according to regulatory restrictions, may not generally extend credit to any single borrower or group of related borrowers on a secured basis in excess of 20% of capital, as defined, or $17,796, or on an unsecured basis in excess of 10% of capital, as defined, or $8,898. However, the Company has established internal policies that may further limit the extension of credit to any single borrower or group of related borrowers depending on their credit worthiness.
60
Transfers of financial assets are accounted for as sales when control over the assets has been surrendered. Control over transferred assets is deemed to be surrendered when (1) the assets have been isolated from the Company, i.e. put presumptively beyond the reach of the transferor and its creditors, even in bankruptcy or other receivership, (2) the transferee obtains the right (free of conditions that constrain it from taking advantage of that right) to pledge or exchange the transferred assets, and (3) the Company does not maintain effective control over the transferred assets through an agreement to repurchase them before their maturity or the ability to unilaterally cause the holder to return specific assets.
Mortgage Loans Held-for-Sale
Mortgage loans held-for-sale are carried at the lower of aggregate cost or estimated market value. Gains and losses on loans held-for-sale are included in the determination of income for the period in which the sales occur. At December 31, 2017 and 2016, the cost of loans held-for-sale approximates the market value.
Premises and Equipment
Premises and equipment are stated at cost less accumulated depreciation. Major additions and improvements are charged to the property accounts while replacements, maintenance and repairs that do not improve or extend the life of the respective assets are expensed currently. When property is retired or otherwise disposed of, the cost and related accumulated depreciation are removed from the accounts and the resulting gain or loss, if any, is recognized. Depreciation expense is computed using the straight-line method over the following estimated useful lives. The useful estimated useful life for buildings is generally 40 years. The estimated useful life for furniture and equipment is generally 3-25 years.
Other Real Estate and Repossessed Assets
Other real estate represents properties acquired through or in lieu of loan foreclosure and is initially recorded at fair value less estimated disposal costs. Costs of improvements are capitalized, whereas costs relating to holding other real estate and valuation adjustments are expensed. Revenue and expenses from operations and changes in valuation allowance are included in net expenses from other real estate.
Goodwill and Intangible Assets
Goodwill represents the excess of cost over the fair value of the net assets purchased in business combinations. Goodwill is required to be tested annually for impairment or whenever events occur that may indicate that the recoverability of the carrying amount is not probable. In the event of impairment, the amount by which the carrying amount exceeds the fair value is charged to earnings. The Company performs its annual test for impairment in the fourth quarter of each year.
Intangible assets consist of core deposit premiums acquired in connection with business combinations and are based on the established value of acquired customer deposits. The core deposit premium is initially recognized based on a valuation performed as of the consummation date and is amortized over an estimated useful life of three to ten years. Amortization periods are reviewed annually in connection with the annual impairment testing of goodwill.
Purchased Loans
Purchased loans acquired in a business combination are recorded at estimated fair value on their purchase date. When the loans have evidence of credit deterioration since origination and it is probable at the date of acquisition that the Company will not collect all contractually required principal and interest payments, the difference between contractually required payments at acquisition and the cash flows expected to be collected at acquisition is referred to as the non-accretable difference. The Company must estimate expected cash flows at each reporting date. Subsequent decreases to the expected cash flows will generally result in a provision for loan losses. Subsequent increases in expected cash flows result in a reversal of the provision for loan losses to the extent of prior provisions and adjustment to accretable discount if no prior provisions have been made. This increase in accretable discount will have a positive impact on interest income. In addition, purchased loans without evidence of credit deterioration are also handled under this method.
Income Taxes
Income tax expense is the total of the current year income tax due or refundable and the change in deferred tax assets and liabilities. Deferred tax assets and liabilities are recognized for the future tax consequences attributable to differences between the financial statement carrying amounts of existing assets and liabilities and their respective tax bases and operating loss and tax credit carryforwards. Deferred tax assets and liabilities are measured using enacted tax rates expected to apply to taxable income in the years
61
in which those temporary differences are expected to be recovered or settled. The effect of a change in tax rates on deferred tax assets and liabilities is recognized in income in the period that includes the enactment date. Any interest and penalties incurred in connection with income taxes are recorded as a component of other operating expenses in the consolidated financial statements.
In the event the future tax consequences of differences between the financial reporting bases and the tax bases of the assets and liabilities results in deferred tax assets, an evaluation of the probability of being able to realize the future benefits indicated by such asset is required. A valuation allowance is provided for the portion of the deferred tax asset when it is more likely than not that some portion or all of the deferred tax asset will not be realized. In assessing the realizability of the deferred tax assets, management considers the scheduled reversals of deferred tax liabilities, projected future taxable income, and tax planning strategies.
The Company currently evaluates income tax positions judged to be uncertain. A loss contingency reserve is accrued if it is probable that the tax position will be challenged, it is probable that the future resolution of the challenge will confirm that a loss has been incurred, and the amount of such loss can be reasonably estimated.
Stock-Based Compensation
The Company accounts for its stock-based compensation plans using a fair value-based method of accounting, whereby compensation cost is measured at the grant date based on the value of the award and is recognized over the service period, which is usually the vesting period.
Accumulated Other Comprehensive Income
At December 31, 2017 and 2016, accumulated other comprehensive income (loss) consisted of net unrealized gains (losses) on investment securities available-for-sale.
Net Earnings per Common Share
Basic earnings per common share are computed by dividing net income by the weighted-average number of shares of common stock outstanding during the year. Diluted earnings per common share are computed by dividing net income by the effect of the issuance of potential common shares that are dilutive and by the sum of the weighted-average number of shares of common stock outstanding. Anti-dilutive potential common shares are excluded from the diluted earnings per share computation. At December 31, 2017 and 2016, there were no antidilutive potential common shares.
The reconciliation of the components of basic and diluted earnings per share is as follows (amounts in thousands, except per share amounts):
|
|
For the Year Ended December 31, |
|
||||||
|
|
|
2017 |
|
|
2016 |
|
||
|
Net income available to common shareholders |
|
$ |
8,295 |
|
|
$ |
7,903 |
|
|
Weighted average common shares outstanding |
|
|
5,095,305 |
|
|
|
5,023,617 |
|
|
Dilutive effect of stock options |
|
|
84,797 |
|
|
|
60,659 |
|
|
Dilutive effect of stock warrants |
|
|
- |
|
|
|
3,242 |
|
|
Diluted common shares |
|
|
5,180,102 |
|
|
|
5,087,518 |
|
|
Basic earnings per common share |
|
$ |
1.63 |
|
|
$ |
1.57 |
|
|
Diluted earnings per common share |
|
$ |
1.60 |
|
|
$ |
1.55 |
|
Segment Reporting
ASC Topic 280 “Segment Reporting,” provides for the identification of reportable segments on the basis of distinct business units and their financial information to the extent such units are reviewed by an entity’s chief decision maker (which can be an individual or group of management persons). ASC Topic 280 permits aggregation or combination of segments that have similar characteristics. In the Company’s operations, each bank branch is viewed by management as being a separately identifiable business or segment from the perspective of monitoring performance and allocation of financial resources. Although the branches operate independently and are managed and monitored separately, each is substantially similar in terms of business focus, type of customers, products, and services. Accordingly, the Company’s consolidated financial statements reflect the presentation of segment information on an aggregated basis in one reportable segment.
62
Certain 2016 amounts have been reclassified to conform to the presentation used in 2017. These reclassifications had no material effect on the operations, financial condition or cash flows of the Company.
The Company’s 401(k) employee stock ownership plan (KSOP) includes a "put option" for shares of the Company’s common stock distributed from the KSOP. Shares are distributed from the KSOP primarily to separate vested participants and certain eligible participants who elect to diversify their account balances. Since the Company’s common stock is not currently traded on an established securities market, if the owners of distributed shares desire to sell their shares, the Company is required to purchase the shares at fair value during two put option periods following the distribution of the shares from the KSOP. The first put option period is within sixty days following the distribution of the shares from the KSOP. The second put option period begins on the first day of the fifth month of the plan year for a sixty day period. The distributed shares subject to the put option and the shares held by the KSOP (KSOP shares) were previously recorded in permanent equity. Due to the Company’s obligation under the put option, the distributed shares and KSOP shares should be classified as temporary equity in the mezzanine section of the consolidated statements of financial condition. This change in classification resulted in the December 31, 2016 permanent equity decreasing $623 thousand and temporary equity increasing by $623 thousand from amounts previously reported. This change in classification resulted in the December 31, 2015 permanent equity decreasing $310 thousand and temporary equity increasing by $310 thousand from amounts previously reported. Based on an analysis of quantitative and qualitative factors, this change in classification was deemed immaterial for all periods previously reported.
Advertising
Advertising costs are expensed as incurred.
Recently Issued Accounting Pronouncements
In August 2015, the FASB issued ASU 2015-14, Revenue from Contracts with Customers—Deferral of the Effective Date. ASU 2015-14 defers the effective date of ASU 2014-09, Revenue from Contracts with Customers, which supersedes the revenue recognition requirements in Topic 605, Revenue Recognition, by one year. ASU 2014-09 is based on the principle that revenue is recognized to depict the transfer of promised goods or services to customers in an amount that reflects the consideration to which the entity expects to be entitled in exchange for those goods or services. ASU 2014-09 also requires additional disclosure about the nature, amount, timing and uncertainty of revenue and cash flows arising from customer contracts. Under ASU 2015-14, ASU 2014-09 is now effective for annual periods beginning after December 15, 2017 and interim periods within those years. The Company’s revenue is significantly weighted towards net interest income on financial assets and liabilities, which is explicitly excluded from the scope of the new standard, and noninterest income has not been as significant. The Company is continuing to assess its revenue streams and reviewing its contracts with customers that are potentially affected by the new guidance including fees on deposits, gains and losses on the sale of other real estate owned, credit and debit card interchange fees, and credit card revenue, to determine the potential impact the new guidance is expected to have on the Company’s consolidated financial statements. However, the Company’s revenue recognition pattern for these revenue streams is not expected to change materially from current practice. Consequently, the Company does not expect the adoption of this ASU to have a material impact on its financial statements.
In January 2016, the FASB issued ASU 2016-01 Financial Instruments-Overall (Subtopic 825-10): Recognition and Measurement of Financial Assets and Financial Liabilities. This will enhance the reporting model for financial instruments to provide users of financial statements with more decision-useful information. The ASU addresses certain aspects of recognition, measurement, presentation, and disclosure of financial instruments. Some of the amendments include the following: 1) Require equity investments (except those accounted for under the equity method of accounting or those that result in consolidation of the investee) to be measured at fair value with changes in fair value recognized in net income; 2)Simplify the impairment assessment of equity investment’s without readily determinable fair values by requiring a qualitative assessment to identify impairment; 3) Require public business entities to use exit price notion when measuring fair value of financial instruments for disclosure purposes; 4) Require an entity to present separately in other comprehensive income the portion of the total change in the fair value of a liability resulting in a change in the fair value of a liability resulting in a change in the instrument-specific credit risk when the entity has elected to measure the liability at fair value; among others. For public business entities, the amendments of this ASU are effective fiscal years beginning after December 15, 2017, including interim periods within those fiscal years. The Company does not expect the impact of this ASU to have a material effect on its consolidated financial statements.
63
In February 2016, the FASB issued ASU 2016-02, Leases (Topic 842). This will require lessees to recognize assets and liabilities that arise from leases on the balance sheet. A lessee should recognize in the statement of financial position a liability to make lease payments (the lease liability) and a right of use asset representing its right to use the underlying asset for lease term. The new guidance is effective for annual and interim reporting periods beginning after December 15, 2018. The amendment should be applied at the beginning of the earliest period presented using a modified retrospective approach with earlier application permitted as of the beginning of an interim or annual reporting period. The Company is currently evaluating the impact of the new guidance on its consolidated financial statements.
In June 2016, the FASB issued ASU 2016-13, Financial Instruments - Credit Losses (Topic 326): Measurement of Credit Losses on Financial Instruments. The new guidance will apply to most financial assets measured at amortized cost and certain other instruments including loans, debt securities held to maturity, net investments in leases and off-balance-sheet credit exposures. The guidance will replace the current incurred loss accounting model that delays recognition of a loss until it is probable a loss has been incurred with an expected loss model that reflects expected credit losses based upon a broader range of estimates including consideration of past events, current conditions and supportable forecasts. The guidance also eliminates the current accounting model for purchased credit impaired loans and debt securities. For securities available for sale, credit losses are to be recognized as allowances rather than reductions in the amortized cost of the securities, which will require re-measurement of the related allowance at each reporting period. The guidance includes enhanced disclosure requirements intended to help financial statement users better understand estimates and judgments used in estimating credit losses. The guidance is effective for fiscal years beginning after December 15, 2019, including interim periods within those fiscal years. However, entities can apply these amendments as early as fiscal years beginning after December 15, 2018. The Company is evaluating the impact to its consolidated financial statements upon adoption.
In January 2017, FASB issued ASU 2017-04, “Intangibles-Goodwill and Other (Topic 350): Simplifying the Test for Goodwill Impairment.” ASU 2017-04 simplifies the manner in which an entity is required to test goodwill for impairment by eliminating Step 2 from the goodwill impairment test. Step 2 measures a goodwill impairment loss by comparing the implied fair value of a reporting unit's goodwill with the carrying amount of that goodwill. In computing the implied fair value of goodwill under Step 2, an entity, prior to the amendments in ASU 2017-04, had to perform procedures to determine the fair value at the impairment testing date of its assets and liabilities, including unrecognized assets and liabilities, in accordance with the procedure that would be required in determining the fair value of assets acquired and liabilities assumed in a business combination. However, under the amendments in ASU 2017-04, an entity should (1) perform its annual or interim goodwill impairment test by comparing the fair value of a reporting unit with its carrying amount, and (2) recognize an impairment charge for the amount by which the carrying amount exceeds the reporting unit's fair value, with the understanding that the loss recognized should not exceed the total amount of goodwill allocated to that reporting unit. Additionally, ASU 2017-04 removes the requirements for any reporting unit with a zero or negative carrying amount to perform a qualitative assessment and, if it fails such qualitative test, to perform Step 2 of the goodwill impairment test. ASU 2017-04 is effective prospectively for annual, or any interim, goodwill impairment tests in fiscal years beginning after December 15, 2019. Early adoption is permitted. The Company adopted ASU 2017-04 in 2017 and based on the Company’s annual goodwill impairment test performed as of December 31, 2017 under ASU 2017-04, the fair value of its reporting units exceeded the carrying value and, therefore, the related goodwill was not impaired.
In March 2017, the FASB issued ASU 2017-08, Receivables – Nonrefundable Fees and Other Costs (Subtopic 310-20), Premium Amortization on Purchased Callable Debt Securities. The amendments shorten the amortization period for certain callable debt securities held at a premium. Specifically, the amendments require the premium to be amortized to the earliest call date. The amendments do not require an accounting change for securities held at a discount; the discount continues to be amortized to maturity. The amendments in this ASU are effective for public business entities for fiscal years, and interim periods within those fiscal years, beginning after December 15, 2018. Early adoption is permitted. The amendments should be applied on a modified retrospective basis, with a cumulative-effect adjustment directly to retained earnings as of the beginning of the period of adoption. The Company does not believe that this ASU will have an impact on its financial position or results of operations.
In May 2017, the FASB issued ASU No. 2017-09, Compensation - Stock Compensation (Topic 718), Scope of Modification Accounting. The amendments provide guidance on determining which changes to the terms and conditions of share-based payment awards require an entity to apply modification accounting under Topic 718. The guidance is effective for all entities for fiscal years, and interim periods within those fiscal years, beginning after December 15, 2017. Early adoption is permitted, including adoption in an interim period. The amendments in this ASU should be applied prospectively to an award modified on or after the adoption date. The Company does not expect the impact to its consolidated financial statements upon adoption to be material.
64
In February 2018, FASB issued ASU 2018-02, “Income Statement-Reporting Comprehensive Income (Topic 220): Reclassification of Certain Tax Effects from Accumulated Other Comprehensive Income.” ASU 2018-02 seeks to help entities reclassify certain stranded income tax effects in accumulated other comprehensive income resulting from the Tax Cuts and Jobs Act of 2017, enacted on December 22, 2017. ASU 2018-02 was issued in response to concerns regarding current guidance in GAAP that requires deferred tax liabilities and assets to be adjusted for the effect of a change in tax laws or rates with the effect included in income from continuing operations in the reporting period that includes the enactment date, even in situations in which the related income tax effects of items in accumulated other comprehensive income were originally recognized in other comprehensive income (loss), rather than net income, and as a result the stranded tax effects would not reflect the appropriate tax rate. The amendments of ASU 2018-02 allow an entity to make a reclassification from accumulated other comprehensive income (loss) to retained earnings for the stranded tax effects, which is the difference between the historical corporate income tax rate of 34% and the newly enacted corporate income tax rate of 21%. ASU 2018-02 is effective for fiscal years beginning after December 31, 2018; however, public business entities are allowed to early adopt the amendments of ASU 2018-02. As a result of the re-measurement of the Company’s deferred tax assets following the enactment of the Tax Reform Act, accumulated other comprehensive loss included $333 thousand of stranded tax effects at December 31, 2017. The Company early adopted the amendments of 2018-02 as of December 31, 2017 and made the election to reclassify the stranded tax effects from accumulated other comprehensive loss to retained earnings at December 31, 2017.
(2) Investment Securities
Investment securities available-for-sale at December 31, 2017 and 2016 are as follows (amounts in thousands):
|
|
|
Amortized Cost |
|
|
Gross Unrealized Gains |
|
|
Gross Unrealized Losses |
|
|
Fair Value |
|
||||
|
December 31, 2017: |
|
|
|
|
|
|
|
|
|
|
|
|
|
|
|
|
|
Securities available-for-sale: |
|
|
|
|
|
|
|
|
|
|
|
|
|
|
|
|
|
Residential mortgage-backed |
|
$ |
125,768 |
|
|
$ |
23 |
|
|
$ |
(2,819 |
) |
|
$ |
122,972 |
|
|
U.S. govt. sponsored enterprises |
|
|
13,176 |
|
|
|
8 |
|
|
|
(185 |
) |
|
|
12,999 |
|
|
State, county, and municipal |
|
|
55,339 |
|
|
|
511 |
|
|
|
(349 |
) |
|
|
55,501 |
|
|
Corporate debt obligations |
|
|
1,831 |
|
|
|
11 |
|
|
|
(25 |
) |
|
|
1,817 |
|
|
Totals |
|
$ |
196,114 |
|
|
$ |
553 |
|
|
$ |
(3,378 |
) |
|
$ |
193,289 |
|
|
|
|
Amortized Cost |
|
|
Gross Unrealized Gains |
|
|
Gross Unrealized Losses |
|
|
Fair Value |
|
||||
|
December 31, 2016: |
|
|
|
|
|
|
|
|
|
|
|
|
|
|
|
|
|
Securities available-for-sale: |
|
|
|
|
|
|
|
|
|
|
|
|
|
|
|
|
|
Residential mortgage-backed |
|
$ |
111,611 |
|
|
$ |
63 |
|
|
$ |
(2,999 |
) |
|
$ |
108,675 |
|
|
U.S. govt. sponsored enterprises |
|
|
15,506 |
|
|
|
44 |
|
|
|
(223 |
) |
|
|
15,327 |
|
|
State, county, and municipal |
|
|
57,837 |
|
|
|
562 |
|
|
|
(813 |
) |
|
|
57,586 |
|
|
Corporate debt obligations |
|
|
1,819 |
|
|
|
4 |
|
|
|
(50 |
) |
|
|
1,773 |
|
|
Totals |
|
$ |
186,773 |
|
|
$ |
673 |
|
|
$ |
(4,085 |
) |
|
$ |
183,361 |
|
Management evaluates securities for other-than-temporary impairment on a quarterly basis, and more frequently when economic or market concerns warrant such evaluation. Consideration is given to (1) the length of time and the extent to which the fair value has been less than cost, (2) the financial condition and near-term prospects of the issuer and (3) the intent and ability of the Company to retain its investment in the issuer for a period of time sufficient to allow for any anticipated recovery in fair value.
65
Details concerning investment securities with unrealized losses as of December 31, 2017 and 2016 are as follows (amounts in thousands):
|
|
Less Than 12 Months |
|
|
More Than 12 Months |
|
|
Total |
|
||||||||||||||||
|
|
|
Fair Value |
|
|
Unrealized Losses |
|
|
Fair Value |
|
|
Unrealized Losses |
|
|
Fair Value |
|
|
Unrealized Losses |
|
||||||
|
December 31, 2017: |
|
|
|
|
|
|
|
|
|
|
|
|
|
|
|
|
|
|
|
|
|
|
|
|
|
Securities available-for-sale: |
|
|
|
|
|
|
|
|
|
|
|
|
|
|
|
|
|
|
|
|
|
|
|
|
|
Residential mortgage-backed |
|
$ |
43,811 |
|
|
$ |
445 |
|
|
$ |
75,046 |
|
|
$ |
2,374 |
|
|
$ |
118,857 |
|
|
$ |
2,819 |
|
|
U.S. govt. sponsored enterprises |
|
|
8,630 |
|
|
|
60 |
|
|
|
3,698 |
|
|
|
125 |
|
|
|
12,328 |
|
|
|
185 |
|
|
State, county & municipal |
|
|
14,535 |
|
|
|
130 |
|
|
|
14,559 |
|
|
|
219 |
|
|
|
29,094 |
|
|
|
349 |
|
|
Corporate debt obligations |
|
|
1,000 |
|
|
|
- |
|
|
|
355 |
|
|
|
25 |
|
|
|
1,355 |
|
|
|
25 |
|
|
Totals |
|
$ |
67,976 |
|
|
$ |
635 |
|
|
$ |
93,658 |
|
|
$ |
2,743 |
|
|
$ |
161,634 |
|
|
$ |
3,378 |
|
|
December 31, 2016: |
|
|
|
|
|
|
|
|
|
|
|
|
|
|
|
|
|
|
|
|
|
|
|
|
|
Securities available-for-sale: |
|
|
|
|
|
|
|
|
|
|
|
|
|
|
|
|
|
|
|
|
|
|
|
|
|
Residential mortgage-backed |
|
$ |
98,033 |
|
|
$ |
2,999 |
|
|
$ |
- |
|
|
$ |
- |
|
|
$ |
98,033 |
|
|
$ |
2,999 |
|
|
U.S. govt. sponsored enterprises |
|
|
10,733 |
|
|
|
149 |
|
|
|
1,376 |
|
|
|
74 |
|
|
|
12,109 |
|
|
|
223 |
|
|
State, county & municipal |
|
|
35,062 |
|
|
|
813 |
|
|
|
- |
|
|
|
- |
|
|
|
35,062 |
|
|
|
813 |
|
|
Corporate debt obligations |
|
|
1,319 |
|
|
|
50 |
|
|
|
- |
|
|
|
- |
|
|
|
1,319 |
|
|
|
50 |
|
|
Totals |
|
$ |
145,147 |
|
|
$ |
4,011 |
|
|
$ |
1,376 |
|
|
$ |
74 |
|
|
$ |
146,523 |
|
|
$ |
4,085 |
|
At December 31, 2017, one hundred sixty-eight out of two hundred forty-three securities were in a loss position due primarily to changing interest rates. In analyzing an issuer’s financial condition, management considers whether the securities are issued by the federal government or its agencies, whether downgrades by bond rating agencies have occurred, and industry analysts’ reports. As management had the ability and intent to hold debt securities until maturity, no declines were deemed to be other than temporary as of December 31, 2017 and 2016.
The proceeds and gross gains and gross losses from sales of securities available-for-sale for the years ended December 31, 2017 and 2016 are as follows (in thousands):
|
|
|
Year ended December 31: |
|
|||||
|
|
|
2017 |
|
|
2016 |
|
||
|
Realized Gains (Losses)-Securities Sales: |
|
|
|
|
|
|
|
|
|
Gross gains |
|
$ |
63 |
|
|
$ |
95 |
|
|
Gross losses |
|
|
(58 |
) |
|
|
(71 |
) |
|
Investment securities gains, net |
|
$ |
5 |
|
|
$ |
24 |
|
|
Proceeds from sales of investment securities |
|
$ |
13,251 |
|
|
$ |
24,297 |
|
At December 31, 2017 and 2016, securities with a carrying value of approximately $28.5 million and $29.9 million, respectively, were pledged to secure public deposits as required by law. At December 31, 2017 and 2016, the carrying value of securities pledged to secure repurchase agreements was approximately $20 million and $18.4 million, respectively.
The amortized cost and estimated fair value of securities available-for-sale at December 31, 2017, by contractual maturity, are shown below (in thousands). Expected maturities will differ from contractual maturities because borrowers have the right to call or prepay obligations with or without call or prepayment penalties.
|
|
|
Amortized Cost |
|
|
Fair Value |
|
||
|
Securities available-for-sale |
|
|
|
|
|
|
|
|
|
Less than 1 year |
|
$ |
6,073 |
|
|
$ |
6,063 |
|
|
1 to 5 years |
|
|
19,243 |
|
|
|
19,116 |
|
|
5 to 10 years |
|
|
11,938 |
|
|
|
11,889 |
|
|
After 10 years |
|
|
33,092 |
|
|
|
33,249 |
|
|
|
|
|
70,346 |
|
|
|
70,317 |
|
|
Residential mortgage-backed securities |
|
|
125,768 |
|
|
|
122,972 |
|
|
Totals |
|
$ |
196,114 |
|
|
$ |
193,289 |
|
66
Major classifications of loans at December 31, 2017 and 2016 are summarized as follows (in thousands):
|
|
December 31, 2017 |
|
|
December 31, 2016 |
|
|||||||||||
|
|
|
Amount |
|
|
% of Total |
|
|
Amount |
|
|
% of Total |
|
||||
|
Residential real estate: |
|
|
|
|
|
|
|
|
|
|
|
|
|
|
|
|
|
Closed-end 1-4 family - first lien |
|
$ |
115,776 |
|
|
|
21.4 |
% |
|
$ |
113,807 |
|
|
|
22.2 |
% |
|
Closed-end 1-4 family - junior lien |
|
|
4,969 |
|
|
|
0.9 |
% |
|
|
4,791 |
|
|
|
0.9 |
% |
|
Multi-family |
|
|
16,977 |
|
|
|
3.1 |
% |
|
|
17,043 |
|
|
|
3.3 |
% |
|
Total residential real estate |
|
|
137,722 |
|
|
|
25.4 |
% |
|
|
135,641 |
|
|
|
26.5 |
% |
|
Commercial real estate: |
|
|
|
|
|
|
|
|
|
|
|
|
|
|
|
|
|
Nonfarm nonresidential |
|
|
173,443 |
|
|
|
32.0 |
% |
|
|
161,198 |
|
|
|
31.5 |
% |
|
Farmland |
|
|
7,782 |
|
|
|
1.4 |
% |
|
|
13,344 |
|
|
|
2.6 |
% |
|
Total commercial real estate |
|
|
181,225 |
|
|
|
33.4 |
% |
|
|
174,542 |
|
|
|
34.1 |
% |
|
Construction and land development: |
|
|
|
|
|
|
|
|
|
|
|
|
|
|
|
|
|
Residential |
|
|
25,830 |
|
|
|
4.8 |
% |
|
|
27,228 |
|
|
|
5.3 |
% |
|
Other |
|
|
40,734 |
|
|
|
7.5 |
% |
|
|
37,221 |
|
|
|
7.3 |
% |
|
Total construction and land development |
|
|
66,564 |
|
|
|
12.3 |
% |
|
|
64,449 |
|
|
|
12.6 |
% |
|
Home equity lines of credit |
|
|
35,833 |
|
|
|
6.6 |
% |
|
|
35,761 |
|
|
|
7.0 |
% |
|
Commercial loans: |
|
|
|
|
|
|
|
|
|
|
|
|
|
|
|
|
|
Other commercial loans |
|
|
95,896 |
|
|
|
17.7 |
% |
|
|
81,198 |
|
|
|
15.8 |
% |
|
Agricultural |
|
|
1,581 |
|
|
|
0.3 |
% |
|
|
887 |
|
|
|
0.2 |
% |
|
State, county, and municipal loans |
|
|
8,332 |
|
|
|
1.5 |
% |
|
|
8,719 |
|
|
|
1.7 |
% |
|
Total commercial loans |
|
|
105,809 |
|
|
|
19.5 |
% |
|
|
90,804 |
|
|
|
17.7 |
% |
|
Consumer loans |
|
|
23,231 |
|
|
|
4.3 |
% |
|
|
20,858 |
|
|
|
4.1 |
% |
|
Total gross loans |
|
|
550,384 |
|
|
|
101.5 |
% |
|
|
522,055 |
|
|
|
101.9 |
% |
|
Allowance for loan losses |
|
|
(4,881 |
) |
|
|
-0.9 |
% |
|
|
(4,007 |
) |
|
|
-0.8 |
% |
|
Net deferred loan fees and discounts |
|
|
(3,263 |
) |
|
|
-0.6 |
% |
|
|
(5,614 |
) |
|
|
-1.1 |
% |
|
Net loans |
|
$ |
542,240 |
|
|
|
100.0 |
% |
|
$ |
512,434 |
|
|
|
100.0 |
% |
For purposes of the disclosures required pursuant to ASC 310, the loan portfolio was disaggregated into segments and then further disaggregated into classes for certain disclosures. A portfolio segment is defined as the level at which an entity develops and documents a systematic method for determining its allowance for loan losses. There are three primary loan portfolio segments that include real estate, commercial, and consumer. A class is generally determined based on the initial measurement attribute, risk characteristic of the loan, and the Company’s method for monitoring and assessing credit risk. Classes within the real estate portfolio segment include residential real estate, commercial real estate, construction and land development and home equity lines of credit. The portfolio segments of non-real estate commercial loans and consumer loans have not been further segregated by class.
The following describe risk characteristics relevant to each of the portfolio segments:
Real estate - As discussed below, the Company offers various types of real estate loan products. All loans within this portfolio segment are particularly sensitive to the valuation of real estate:
Residential real estate and home equity lines of credit are repaid by various means such as a borrower’s income, sale of the property, or rental income derived from the property.
Commercial real estate loans include both owner-occupied commercial real estate loans and other commercial real estate loans secured by income producing properties. Owner-occupied commercial real estate loans to operating businesses are long-term financing of land and buildings. These loans are repaid by cash flow generated from the business operation. Real estate loans for income-producing properties such as office and industrial buildings, and retail shopping centers are repaid from rent income derived from the properties. Loans secured by farmland are repaid by various means such as a borrower’s income, sale of the property, or rental income derived from the property.
67
Construction and land development loans are repaid through cash flow related to the operations, sale or refinance of the underlying property. This portfolio class includes extensions of credit to real estate developers or investors where repayment is dependent on the sale of the real estate or income generated from the real estate collateral.
Commercial loans - The commercial loan portfolio segment includes commercial and industrial loans, agricultural loans and loans to state and municipalities. These loans include those loans to commercial customers for use in normal business operations to finance working capital needs, equipment purchases, or expansion projects. Loans are repaid by business cash flows or tax revenues. Collection risk in this portfolio is driven by the creditworthiness of the underlying borrower, particularly cash flows from the customers’ business operations.
Consumer loans - The consumer loan portfolio segment includes direct consumer installment loans, overdrafts and other revolving credit loans. Loans in this portfolio are sensitive to unemployment and other key consumer economic measures.
The following tables present the balance in the allowance for loan losses and the recorded investment in loans by portfolio segment and based on impairment method as of December 31, 2017 and 2016 (amounts in thousands). The acquired loans are not included in the allowance for loan losses calculation, as these loans are recorded at fair value and there has been no further indication of credit deterioration that would require an additional provision.
|
|
Real Estate Mortgage Loans |
|
|
|
|
|
|
|
|
|
|
|
|
|
|
|
|
|
||||||||||
|
Allowance for Loan Losses |
|
Residential |
|
|
Commercial |
|
|
Construction and Land Development |
|
|
Home Equity Lines Of Credit |
|
|
Commercial |
|
|
Consumer |
|
|
Total |
|
|||||||
|
Balance - December 31, 2016 |
|
$ |
602 |
|
|
$ |
1,456 |
|
|
$ |
731 |
|
|
$ |
190 |
|
|
$ |
829 |
|
|
$ |
199 |
|
|
$ |
4,007 |
|
|
Provision for loan losses |
|
|
573 |
|
|
|
440 |
|
|
|
(112 |
) |
|
|
239 |
|
|
|
487 |
|
|
|
113 |
|
|
|
1,740 |
|
|
Loan charge-offs |
|
|
(32 |
) |
|
|
(308 |
) |
|
|
(24 |
) |
|
|
(100 |
) |
|
|
(466 |
) |
|
|
(109 |
) |
|
|
(1,039 |
) |
|
Loan recoveries |
|
|
24 |
|
|
|
16 |
|
|
|
11 |
|
|
|
4 |
|
|
|
104 |
|
|
|
14 |
|
|
|
173 |
|
|
Balance - December 31, 2017 |
|
$ |
1,167 |
|
|
$ |
1,604 |
|
|
$ |
606 |
|
|
$ |
333 |
|
|
$ |
954 |
|
|
$ |
217 |
|
|
|
4,881 |
|
|
Ending balance: |
|
|
|
|
|
|
|
|
|
|
|
|
|
|
|
|
|
|
|
|
|
|
|
|
|
|
|
|
|
Individually evaluated for impairment |
|
$ |
526 |
|
|
$ |
187 |
|
|
$ |
11 |
|
|
$ |
- |
|
|
$ |
174 |
|
|
$ |
10 |
|
|
$ |
908 |
|
|
Collectively evaluated for impairment |
|
$ |
641 |
|
|
$ |
1,417 |
|
|
$ |
595 |
|
|
$ |
333 |
|
|
$ |
780 |
|
|
$ |
207 |
|
|
$ |
3,973 |
|
|
Loans: |
|
|
|
|
|
|
|
|
|
|
|
|
|
|
|
|
|
|
|
|
|
|
|
|
|
|
|
|
|
Individually evaluated for impairment |
|
$ |
2,611 |
|
|
$ |
2,295 |
|
|
$ |
168 |
|
|
$ |
100 |
|
|
$ |
301 |
|
|
$ |
87 |
|
|
$ |
5,562 |
|
|
Collectively evaluated for impairment |
|
$ |
135,111 |
|
|
$ |
178,930 |
|
|
$ |
66,396 |
|
|
$ |
35,733 |
|
|
$ |
105,508 |
|
|
$ |
23,144 |
|
|
$ |
544,822 |
|
|
Percent of loans in each category to total loans |
|
|
25.1 |
% |
|
|
32.9 |
% |
|
|
12.1 |
% |
|
|
6.5 |
% |
|
|
19.2 |
% |
|
|
4.2 |
% |
|
|
100.0 |
% |
|
|
Real Estate Mortgage Loans |
|
|
|
|
|
|
|
|
|
|
|
|
|
||||||||||||||
|
Allowance for Loan Losses |
|
Residential |
|
|
Commercial |
|
|
Construction and Land Development |
|
|
Home Equity Lines Of Credit |
|
|
Commercial |
|
|
Consumer |
|
|
Total |
|
|||||||
|
Balance - December 31, 2015 |
|
$ |
368 |
|
|
$ |
1,302 |
|
|
$ |
569 |
|
|
$ |
150 |
|
|
$ |
1,250 |
|
|
$ |
188 |
|
|
$ |
3,827 |
|
|
Provision for loan losses |
|
|
243 |
|
|
|
169 |
|
|
|
136 |
|
|
|
164 |
|
|
|
26 |
|
|
|
140 |
|
|
|
878 |
|
|
Loan charge-offs |
|
|
(14 |
) |
|
|
(15 |
) |
|
|
- |
|
|
|
(141 |
) |
|
|
(487 |
) |
|
|
(187 |
) |
|
|
(844 |
) |
|
Loan recoveries |
|
|
5 |
|
|
|
- |
|
|
|
26 |
|
|
|
17 |
|
|
|
40 |
|
|
|
58 |
|
|
|
146 |
|
|
Balance - December 31, 2016 |
|
$ |
602 |
|
|
$ |
1,456 |
|
|
$ |
731 |
|
|
$ |
190 |
|
|
$ |
829 |
|
|
$ |
199 |
|
|
$ |
4,007 |
|
|
Ending balance: |
|
|
|
|
|
|
|
|
|
|
|
|
|
|
|
|
|
|
|
|
|
|
|
|
|
|
|
|
|
Individually evaluated for impairment |
|
$ |
53 |
|
|
$ |
747 |
|
|
$ |
- |
|
|
$ |
- |
|
|
$ |
456 |
|
|
$ |
19 |
|
|
$ |
1,275 |
|
|
Collectively evaluated for impairment |
|
$ |
549 |
|
|
$ |
709 |
|
|
$ |
731 |
|
|
$ |
190 |
|
|
$ |
373 |
|
|
$ |
180 |
|
|
$ |
2,732 |
|
|
Loans: |
|
|
|
|
|
|
|
|
|
|
|
|
|
|
|
|
|
|
|
|
|
|
|
|
|
|
|
|
|
Individually evaluated for impairment |
|
$ |
1,201 |
|
|
$ |
5,375 |
|
|
$ |
31 |
|
|
$ |
200 |
|
|
$ |
685 |
|
|
$ |
39 |
|
|
$ |
7,531 |
|
|
Collectively evaluated for impairment |
|
$ |
134,440 |
|
|
$ |
169,167 |
|
|
$ |
64,418 |
|
|
$ |
35,561 |
|
|
$ |
90,119 |
|
|
$ |
20,819 |
|
|
$ |
514,524 |
|
|
Acquired loans with deteriorated credit quality |
|
$ |
- |
|
|
$ |
- |
|
|
$ |
- |
|
|
$ |
- |
|
|
$ |
- |
|
|
$ |
- |
|
|
$ |
- |
|
|
Percent of loans in each category to total loans |
|
|
26.0 |
% |
|
|
33.4 |
% |
|
|
12.3 |
% |
|
|
6.9 |
% |
|
|
17.4 |
% |
|
|
4.0 |
% |
|
|
100.0 |
% |
68
The Bank individually evaluates for impairment all loans that are on nonaccrual status. Additionally, all troubled debt restructurings are individually evaluated for impairment. A loan is considered impaired when, based on current events and circumstances, it is probable that all amounts due according to the contractual terms of the loan will not be collected. Impaired loans are measured based on the present value of expected future cash flows discounted at the loan’s effective interest rate, at the loan’s observable market price, or the fair value of the collateral if the loan is collateral-dependent. Management may also elect to apply an additional collective reserve to groups of impaired loans based on current economic or market factors. Interest payments received on impaired loans are generally applied as a reduction of the outstanding principal balance.
The following tables present impaired loans by class of loans as of December 31, 2017 and 2016 (amounts in thousands). The purchased credit-impaired loans are not included in these tables because they are carried at fair value and accordingly have no related associated allowance.
|
|
|
|
|
|
|
|
|
|
|
|
|
|
|
|
|
|
|
|
|
|
|
December 31, 2017 |
|
Unpaid Principal Balance |
|
|
Recorded Investment |
|
|
Impaired Loans With No Allowance |
|
|
Impaired Loans With Allowance |
|
|
Allowance for Loan Losses |
|
|||||
|
Nonaccruing Impaired Loans |
|
|
|
|
|
|
|
|
|
|
|
|
|
|
|
|||||
|
Mortgage loans on real estate: |
|
|
|
|
|
|
|
|
|
|
|
|
|
|
|
|
|
|
|
|
|
Residential |
|
$ |
1,767 |
|
|
$ |
1,767 |
|
|
$ |
350 |
|
|
$ |
1,417 |
|
|
$ |
526 |
|
|
Commercial real estate |
|
|
500 |
|
|
|
328 |
|
|
|
328 |
|
|
|
- |
|
|
|
- |
|
|
Construction and land development |
|
|
- |
|
|
|
- |
|
|
|
- |
|
|
|
- |
|
|
|
- |
|
|
Total mortgage loans on real estate |
|
|
2,267 |
|
|
|
2,095 |
|
|
|
678 |
|
|
|
1,417 |
|
|
|
526 |
|
|
Home equity lines of credit |
|
|
- |
|
|
|
- |
|
|
|
- |
|
|
|
- |
|
|
|
- |
|
|
Commercial loans |
|
|
- |
|
|
|
- |
|
|
|
- |
|
|
|
- |
|
|
|
- |
|
|
Consumer loans |
|
|
204 |
|
|
|
54 |
|
|
|
54 |
|
|
|
- |
|
|
|
- |
|
|
Total Loans |
|
$ |
2,471 |
|
|
$ |
2,149 |
|
|
$ |
732 |
|
|
$ |
1,417 |
|
|
$ |
526 |
|
|
|
|
|
|
|
|
|
|
|
|
|
|
|
|
|
|
|
|
|
|
|
|
|
|
Unpaid Principal Balance |
|
|
Recorded Investment |
|
|
Impaired Loans With No Allowance |
|
|
Impaired Loans With Allowance |
|
|
Allowance for Loan Losses |
|
|||||
|
Accruing Impaired Loans |
|
|
|
|
|
|
|
|
|
|
|
|
|
|
|
|||||
|
Mortgage loans on real estate: |
|
|
|
|
|
|
|
|
|
|
|
|
|
|
|
|
|
|
|
|
|
Residential |
|
$ |
844 |
|
|
$ |
844 |
|
|
$ |
844 |
|
|
$ |
- |
|
|
$ |
- |
|
|
Commercial real estate |
|
|
1,968 |
|
|
|
1,967 |
|
|
|
540 |
|
|
|
1,427 |
|
|
|
187 |
|
|
Construction and land development |
|
|
232 |
|
|
|
168 |
|
|
|
- |
|
|
|
168 |
|
|
|
11 |
|
|
Total mortgage loans on real estate |
|
|
3,044 |
|
|
|
2,979 |
|
|
|
1,384 |
|
|
|
1,595 |
|
|
|
198 |
|
|
Home equity lines of credit |
|
|
100 |
|
|
|
100 |
|
|
|
100 |
|
|
|
- |
|
|
|
- |
|
|
Commercial loans |
|
|
300 |
|
|
|
301 |
|
|
|
127 |
|
|
|
174 |
|
|
|
174 |
|
|
Consumer loans |
|
|
33 |
|
|
|
33 |
|
|
|
- |
|
|
|
33 |
|
|
|
10 |
|
|
Total Loans |
|
$ |
3,477 |
|
|
$ |
3,413 |
|
|
$ |
1,611 |
|
|
$ |
1,802 |
|
|
$ |
382 |
|
|
|
|
|
|
|
|
|
|
|
|
|
|
|
|
|
|
|
|
|
|
|
|
|
|
Unpaid Principal Balance |
|
|
Recorded Investment |
|
|
Impaired Loans With No Allowance |
|
|
Impaired Loans With Allowance |
|
|
Allowance for Loan Losses |
|
|||||
|
Total Impaired Loans |
|
|
|
|
|
|
|
|
|
|
|
|
|
|
|
|||||
|
Mortgage loans on real estate: |
|
|
|
|
|
|
|
|
|
|
|
|
|
|
|
|
|
|
|
|
|
Residential |
|
$ |
2,611 |
|
|
$ |
2,611 |
|
|
$ |
1,194 |
|
|
$ |
1,417 |
|
|
$ |
526 |
|
|
Commercial real estate |
|
|
2,468 |
|
|
|
2,295 |
|
|
|
868 |
|
|
|
1,427 |
|
|
|
187 |
|
|
Construction and land development |
|
|
232 |
|
|
|
168 |
|
|
|
- |
|
|
|
168 |
|
|
|
11 |
|
|
Total mortgage loans on real estate |
|
|
5,311 |
|
|
|
5,074 |
|
|
|
2,062 |
|
|
|
3,012 |
|
|
|
724 |
|
|
Home equity lines of credit |
|
|
100 |
|
|
|
100 |
|
|
|
100 |
|
|
|
- |
|
|
|
- |
|
|
Commercial loans |
|
|
300 |
|
|
|
301 |
|
|
|
127 |
|
|
|
174 |
|
|
|
174 |
|
|
Consumer loans |
|
|
237 |
|
|
|
87 |
|
|
|
54 |
|
|
|
33 |
|
|
|
10 |
|
|
Total Loans |
|
$ |
5,948 |
|
|
$ |
5,562 |
|
|
$ |
2,343 |
|
|
$ |
3,219 |
|
|
$ |
908 |
|
69
|
|
|
|
|
|
|
|
|
|
|
|
|
|
|
|
|
|
|
|
|
|
|
December 31, 2016 |
|
Unpaid Principal Balance |
|
|
Recorded Investment |
|
|
Impaired Loans With No Allowance |
|
|
Impaired Loans With Allowance |
|
|
Allowance for Loan Losses |
|
|||||
|
Nonaccruing Impaired Loans |
|
|
|
|
|
|
|
|
|
|
|
|
|
|
|
|||||
|
Mortgage loans on real estate: |
|
|
|
|
|
|
|
|
|
|
|
|
|
|
|
|
|
|
|
|
|
Residential |
|
$ |
223 |
|
|
$ |
223 |
|
|
$ |
96 |
|
|
$ |
127 |
|
|
$ |
53 |
|
|
Commercial real estate |
|
|
3,620 |
|
|
|
3,470 |
|
|
|
1,010 |
|
|
|
2,460 |
|
|
|
430 |
|
|
Construction and land development |
|
|
- |
|
|
|
- |
|
|
|
- |
|
|
|
- |
|
|
|
- |
|
|
Total mortgage loans on real estate |
|
|
3,843 |
|
|
|
3,693 |
|
|
|
1,106 |
|
|
|
2,587 |
|
|
|
483 |
|
|
Home equity lines of credit |
|
|
100 |
|
|
|
100 |
|
|
|
100 |
|
|
|
- |
|
|
|
- |
|
|
Commercial loans |
|
|
93 |
|
|
|
93 |
|
|
|
93 |
|
|
|
- |
|
|
|
- |
|
|
Consumer loans |
|
|
- |
|
|
|
- |
|
|
|
- |
|
|
|
- |
|
|
|
- |
|
|
Total Loans |
|
$ |
4,036 |
|
|
$ |
3,886 |
|
|
$ |
1,299 |
|
|
$ |
2,587 |
|
|
$ |
483 |
|
|
|
|
|
|
|
|
|
|
|
|
|
|
|
|
|
|
|
|
|
|
|
|
|
|
Unpaid Principal Balance |
|
|
Recorded Investment |
|
|
Impaired Loans With No Allowance |
|
|
Impaired Loans With Allowance |
|
|
Allowance for Loan Losses |
|
|||||
|
Accruing Impaired Loans |
|
|
|
|
|
|
|
|
|
|
|
|
|
|
|
|||||
|
Mortgage loans on real estate: |
|
|
|
|
|
|
|
|
|
|
|
|
|
|
|
|
|
|
|
|
|
Residential |
|
$ |
978 |
|
|
$ |
978 |
|
|
$ |
978 |
|
|
$ |
- |
|
|
$ |
- |
|
|
Commercial real estate |
|
|
1,905 |
|
|
|
1,905 |
|
|
|
589 |
|
|
|
1,316 |
|
|
|
317 |
|
|
Construction and land development |
|
|
31 |
|
|
|
31 |
|
|
|
31 |
|
|
|
- |
|
|
|
- |
|
|
Total mortgage loans on real estate |
|
|
2,914 |
|
|
|
2,914 |
|
|
|
1,598 |
|
|
|
1,316 |
|
|
|
317 |
|
|
Home equity lines of credit |
|
|
100 |
|
|
|
100 |
|
|
|
100 |
|
|
|
- |
|
|
|
- |
|
|
Commercial loans |
|
|
592 |
|
|
|
592 |
|
|
|
136 |
|
|
|
456 |
|
|
|
456 |
|
|
Consumer loans |
|
|
39 |
|
|
|
39 |
|
|
|
- |
|
|
|
39 |
|
|
|
19 |
|
|
Total Loans |
|
$ |
3,645 |
|
|
$ |
3,645 |
|
|
$ |
1,834 |
|
|
$ |
1,811 |
|
|
$ |
792 |
|
|
|
|
|
|
|
|
|
|
|
|
|
|
|
|
|
|
|
|
|
|
|
|
|
|
Unpaid Principal Balance |
|
|
Recorded Investment |
|
|
Impaired Loans With No Allowance |
|
|
Impaired Loans With Allowance |
|
|
Allowance for Loan Losses |
|
|||||
|
Total Impaired Loans |
|
|
|
|
|
|
|
|
|
|
|
|
|
|
|
|||||
|
Mortgage loans on real estate: |
|
|
|
|
|
|
|
|
|
|
|
|
|
|
|
|
|
|
|
|
|
Residential |
|
$ |
1,201 |
|
|
$ |
1,201 |
|
|
$ |
1,074 |
|
|
$ |
127 |
|
|
$ |
53 |
|
|
Commercial real estate |
|
|
5,525 |
|
|
|
5,375 |
|
|
|
1,599 |
|
|
|
3,776 |
|
|
|
747 |
|
|
Construction and land development |
|
|
31 |
|
|
|
31 |
|
|
|
31 |
|
|
|
- |
|
|
|
- |
|
|
Total mortgage loans on real estate |
|
|
6,757 |
|
|
|
6,607 |
|
|
|
2,704 |
|
|
|
3,903 |
|
|
|
800 |
|
|
Home equity lines of credit |
|
|
200 |
|
|
|
200 |
|
|
|
200 |
|
|
|
- |
|
|
|
- |
|
|
Commercial loans |
|
|
685 |
|
|
|
685 |
|
|
|
229 |
|
|
|
456 |
|
|
|
456 |
|
|
Consumer loans |
|
|
39 |
|
|
|
39 |
|
|
|
- |
|
|
|
39 |
|
|
|
19 |
|
|
Total Loans |
|
$ |
7,681 |
|
|
$ |
7,531 |
|
|
$ |
3,133 |
|
|
$ |
4,398 |
|
|
$ |
1,275 |
|
70
The following table presents the average recorded investment in impaired loans and the interest income recognized on impaired loans in the years ended December 31, 2017 and 2016 by loan category (in thousands).
|
|
Year Ended December 31, 2017 |
|
|
Year Ended December 31, 2016 |
|
|||||||||||
|
|
|
Average Recorded Investment |
|
|
Interest Income |
|
|
Average Recorded Investment |
|
|
Interest Income |
|
||||
|
Mortgage loans on real estate: |
|
|
|
|
|
|
|
|
|
|
|
|
|
|
|
|
|
Residential real estate |
|
$ |
2,209 |
|
|
$ |
50 |
|
|
$ |
1,231 |
|
|
$ |
70 |
|
|
Commercial real estate |
|
|
3,027 |
|
|
|
80 |
|
|
|
5,527 |
|
|
|
165 |
|
|
Construction and land development |
|
|
181 |
|
|
|
10 |
|
|
|
63 |
|
|
|
5 |
|
|
Total mortgage loans on real estate |
|
|
5,417 |
|
|
|
140 |
|
|
|
6,821 |
|
|
|
240 |
|
|
Home equity lines of credit |
|
|
100 |
|
|
|
6 |
|
|
|
299 |
|
|
|
13 |
|
|
Commercial loans |
|
|
498 |
|
|
|
15 |
|
|
|
706 |
|
|
|
13 |
|
|
Consumer loans |
|
|
116 |
|
|
|
1 |
|
|
|
46 |
|
|
|
2 |
|
|
Total Loans |
|
$ |
6,131 |
|
|
$ |
162 |
|
|
$ |
7,872 |
|
|
$ |
268 |
|
For the years ended December 31, 2017 and 2016, the Bank did not recognize a material amount of interest income on impaired loans.
The following tables present the aging of the recorded investment in past due loans and non-accrual loan balances as of December 31, 2017 and 2016 by class of loans (amounts in thousands).
|
|
Accruing Loans |
|
|
|
|
|
|
|
|
|
||||||||||
|
|
|
|
|
|
|
30-89 Days |
|
|
90+ Days |
|
|
Nonaccrual |
|
|
|
|
|
|||
|
As of December 31, 2017 |
|
Current |
|
|
Past Due |
|
|
Past Due |
|
|
Loans |
|
|
Total Loans |
|
|||||
|
Mortgage loans on real estate: |
|
|
|
|
|
|
|
|
|
|
|
|
|
|
|
|
|
|
|
|
|
Residential |
|
$ |
134,565 |
|
|
$ |
857 |
|
|
$ |
410 |
|
|
$ |
1,890 |
|
|
$ |
137,722 |
|
|
Commercial real estate |
|
|
180,826 |
|
|
|
- |
|
|
|
- |
|
|
|
399 |
|
|
|
181,225 |
|
|
Construction and land development |
|
|
66,275 |
|
|
|
221 |
|
|
|
- |
|
|
|
68 |
|
|
|
66,564 |
|
|
Total mortgage loans on real estate |
|
|
381,666 |
|
|
|
1,078 |
|
|
|
410 |
|
|
|
2,357 |
|
|
|
385,511 |
|
|
Home equity lines of credit |
|
|
35,591 |
|
|
|
152 |
|
|
|
10 |
|
|
|
80 |
|
|
|
35,833 |
|
|
Commercial loans |
|
|
105,081 |
|
|
|
728 |
|
|
|
- |
|
|
|
- |
|
|
|
105,809 |
|
|
Consumer loans |
|
|
22,906 |
|
|
|
175 |
|
|
|
1 |
|
|
|
149 |
|
|
|
23,231 |
|
|
Total Loans |
|
$ |
545,244 |
|
|
$ |
2,133 |
|
|
$ |
421 |
|
|
$ |
2,586 |
|
|
$ |
550,384 |
|
|
|
Accruing Loans |
|
|
|
|
|
|
|
|
|
||||||||||
|
|
|
|
|
|
|
30-89 Days |
|
|
90+ Days |
|
|
Nonaccrual |
|
|
|
|
|
|||
|
As of December 31, 2016 |
|
Current |
|
|
Past Due |
|
|
Past Due |
|
|
Loans |
|
|
Total Loans |
|
|||||
|
Mortgage loans on real estate: |
|
|
|
|
|
|
|
|
|
|
|
|
|
|
|
|
|
|
|
|
|
Residential |
|
$ |
132,603 |
|
|
$ |
2,585 |
|
|
$ |
- |
|
|
$ |
453 |
|
|
$ |
135,641 |
|
|
Commercial real estate |
|
|
170,363 |
|
|
|
708 |
|
|
|
- |
|
|
|
3,471 |
|
|
|
174,542 |
|
|
Construction and land development |
|
|
64,111 |
|
|
|
312 |
|
|
|
- |
|
|
|
26 |
|
|
|
64,449 |
|
|
Total mortgage loans on real estate |
|
|
367,077 |
|
|
|
3,605 |
|
|
|
- |
|
|
|
3,950 |
|
|
|
374,632 |
|
|
Home equity lines of credit |
|
|
35,257 |
|
|
|
320 |
|
|
|
- |
|
|
|
184 |
|
|
|
35,761 |
|
|
Commercial loans |
|
|
90,579 |
|
|
|
76 |
|
|
|
19 |
|
|
|
130 |
|
|
|
90,804 |
|
|
Consumer loans |
|
|
20,431 |
|
|
|
285 |
|
|
|
20 |
|
|
|
122 |
|
|
|
20,858 |
|
|
Total Loans |
|
$ |
513,344 |
|
|
$ |
4,286 |
|
|
$ |
39 |
|
|
$ |
4,386 |
|
|
$ |
522,055 |
|
71
The Bank categorizes loans into risk categories based on relevant information about the ability of borrowers to service their debt, such as current financial information, historical payment experience, credit documentation, public information and current economic trends, among other factors. The Bank analyzes loans individually by classifying the loans as to credit risk. This analysis is performed on a continuous basis. The Bank uses the following definitions for their risk ratings:
Accruing Loans – Special Mention: Weakness exists that could cause future impairment, including the deterioration of financial ratios, past due status and questionable management capabilities. Collateral values generally afford adequate coverage but may not be immediately marketable.
Substandard: Specific and well-defined weaknesses exist that may include poor liquidity and deterioration of financial ratios. The loan may be past due and related deposit accounts experiencing overdrafts. Immediate corrective action is necessary.
Doubtful: Specific weaknesses characterized as Substandard that are severe enough to make collection in full unlikely. There is no reliable secondary source of full repayment. Loans classified as doubtful will usually be placed on non-accrual, analyzed and fully or partially charged off based on a review of any collateral and other relevant factors.
Nonaccrual: Specific weakness characterized as Doubtful that are severe enough for the loan to be placed on nonaccrual status because collection of all contractual principal and interest payments is considered unlikely.
Loans not meeting the criteria above that are analyzed individually as part of the above described process are considered to be “Pass” rated loans. As of December 31, 2017 and 2016, and based on the most recent analyses performed, the risk category of loans by class of loans is as follows (amounts in thousands):
|
|
|
|
|
|
Special |
|
|
|
|
|
|
|
|
|
|
|
|
|
||
|
As of December 31, 2017 |
|
Pass |
|
|
Mention |
|
|
Substandard |
|
|
Doubtful |
|
|
Total |
|
|||||
|
Mortgage loans on real estate: |
|
|
|
|
|
|
|
|
|
|
|
|
|
|
|
|
|
|
|
|
|
Residential |
|
$ |
132,914 |
|
|
$ |
1,390 |
|
|
$ |
3,418 |
|
|
$ |
- |
|
|
$ |
137,722 |
|
|
Commercial real estate |
|
|
175,208 |
|
|
|
4,238 |
|
|
|
1,779 |
|
|
|
- |
|
|
|
181,225 |
|
|
Construction and land development |
|
|
65,656 |
|
|
|
750 |
|
|
|
158 |
|
|
|
- |
|
|
|
66,564 |
|
|
Total mortgage loans on real estate |
|
|
373,778 |
|
|
|
6,378 |
|
|
|
5,355 |
|
|
|
- |
|
|
|
385,511 |
|
|
Home equity lines of credit |
|
|
35,580 |
|
|
|
14 |
|
|
|
203 |
|
|
|
36 |
|
|
|
35,833 |
|
|
Commercial loans |
|
|
103,137 |
|
|
|
2,234 |
|
|
|
438 |
|
|
|
- |
|
|
|
105,809 |
|
|
Consumer loans |
|
|
22,865 |
|
|
|
58 |
|
|
|
308 |
|
|
|
- |
|
|
|
23,231 |
|
|
Total Loans |
|
$ |
535,360 |
|
|
$ |
8,684 |
|
|
$ |
6,304 |
|
|
$ |
36 |
|
|
$ |
550,384 |
|
|
|
|
|
|
|
Special |
|
|
|
|
|
|
|
|
|
|
|
|
|
||
|
As of December 31, 2016 |
|
Pass |
|
|
Mention |
|
|
Substandard |
|
|
Doubtful |
|
|
Total |
|
|||||
|
Mortgage loans on real estate: |
|
|
|
|
|
|
|
|
|
|
|
|
|
|
|
|
|
|
|
|
|
Residential |
|
$ |
125,983 |
|
|
$ |
6,272 |
|
|
$ |
3,386 |
|
|
$ |
- |
|
|
$ |
135,641 |
|
|
Commercial real estate |
|
|
165,381 |
|
|
|
3,837 |
|
|
|
5,324 |
|
|
|
- |
|
|
|
174,542 |
|
|
Construction and land development |
|
|
63,151 |
|
|
|
605 |
|
|
|
451 |
|
|
|
242 |
|
|
|
64,449 |
|
|
Total mortgage loans on real estate |
|
|
354,515 |
|
|
|
10,714 |
|
|
|
9,161 |
|
|
|
242 |
|
|
|
374,632 |
|
|
Home equity lines of credit |
|
|
35,344 |
|
|
|
109 |
|
|
|
308 |
|
|
|
- |
|
|
|
35,761 |
|
|
Commercial loans |
|
|
87,684 |
|
|
|
2,357 |
|
|
|
649 |
|
|
|
114 |
|
|
|
90,804 |
|
|
Consumer loans |
|
|
20,433 |
|
|
|
211 |
|
|
|
214 |
|
|
|
- |
|
|
|
20,858 |
|
|
Total Loans |
|
$ |
497,976 |
|
|
$ |
13,391 |
|
|
$ |
10,332 |
|
|
$ |
356 |
|
|
$ |
522,055 |
|
Troubled Debt Restructurings (TDR):
At December 31, 2017 and 2016, loans totaling $2.4 million and $3.1 million, respectively, were classified as TDR’s and impaired. The restructuring of a loan is considered a TDR if both (i) the borrower is experiencing financial difficulties and (ii) the Company has granted a concession. The Company restructured 1 loan totaling $57 thousand in 2017 and 5 loans totaling $979 thousand in 2016.
During the year ended December 31, 2017 there were no real estate loans that were modified during 2017 that were in default of their modified terms. During the year ended December 31, 2016 there were 2 real estate loans totaling $223 thousand that were modified during 2016 that were in default of their modified terms.
72
Major classifications of premises and equipment as of December 31, 2017 and 2016 are summarized as follows (amounts in thousands):
|
|
|
December 31, |
|
|||||
|
|
|
2017 |
|
|
2016 |
|
||
|
Land and improvements |
|
$ |
6,123 |
|
|
$ |
5,942 |
|
|
Buildings and improvements |
|
|
15,967 |
|
|
|
15,348 |
|
|
Leasehold improvements |
|
|
658 |
|
|
|
655 |
|
|
Furniture, equipment, and vehicle |
|
|
4,099 |
|
|
|
3,799 |
|
|
Total |
|
|
26,847 |
|
|
|
25,744 |
|
|
Accumulated depreciation |
|
|
(5,038 |
) |
|
|
(4,272 |
) |
|
Premises and equipment, net |
|
$ |
21,809 |
|
|
$ |
21,472 |
|
Depreciation expense amounted to approximately $946 thousand in 2017 and $849 thousand in 2016.
(5) Foreclosed assets
Other real estate and certain other assets acquired in foreclosure are carried at the lower of the recorded investment in the loan or fair value less estimated costs to sell the property. There was a total of approximately $323 thousand in residential real estate foreclosures for December 31, 2017 and no residential real estate foreclosures for December 31, 2016. An analysis of foreclosed properties for the years ended December 31, 2017 and 2016 follows (in thousands).
|
|
|
Year ended December 31, |
|
|||||
|
|
|
|
2017 |
|
|
|
2016 |
|
|
Balance at beginning of year |
|
$ |
1,151 |
|
|
$ |
1,949 |
|
|
Transfers from loans |
|
|
2,658 |
|
|
|
304 |
|
|
Foreclosed property sold |
|
|
(2,118 |
) |
|
|
(922 |
) |
|
Write-down of foreclosed property |
|
|
(145 |
) |
|
|
(180 |
) |
|
Balance at end of year |
|
$ |
1,546 |
|
|
$ |
1,151 |
|
Expenses applicable to foreclosed assets for the years ended December 31, 2017 and 2016 include the following (amounts in thousands).
|
|
|
Year ended December 31, |
|
|||||
|
|
|
2017 |
|
|
2016 |
|
||
|
Net gain on sales of foreclosed assets |
|
$ |
(72 |
) |
|
$ |
(133 |
) |
|
Write-down of foreclosed property |
|
|
145 |
|
|
|
180 |
|
|
Operating expenses, net of rental income |
|
|
90 |
|
|
|
30 |
|
|
Total |
|
$ |
163 |
|
|
$ |
77 |
|
73
The following table sets forth the major classifications of deposits at December 31, 2017 and 2016 (in thousands):
|
|
|
December 31, |
|
|||||
|
|
|
2017 |
|
|
2016 |
|
||
|
Demand deposits, non-interest bearing |
|
$ |
185,171 |
|
|
$ |
185,270 |
|
|
Demand deposits, interest bearing |
|
|
195,792 |
|
|
|
197,509 |
|
|
Money market accounts |
|
|
153,732 |
|
|
|
160,677 |
|
|
Savings deposits |
|
|
29,441 |
|
|
|
24,022 |
|
|
Time certificates of $250,000 or more |
|
|
37,045 |
|
|
|
32,991 |
|
|
Other time certificates |
|
|
98,680 |
|
|
|
104,444 |
|
|
Totals |
|
$ |
699,861 |
|
|
$ |
704,913 |
|
As of December 31, 2017, the scheduled maturities of certificates of deposit are as follows for certificates of deposit less than $250 and for certificates of deposit (“CDs”) of $250 or more (in thousands):
|
CDs Less Than $250,000 |
|
|||
|
2018 |
|
$ |
61,982 |
|
|
2019 |
|
|
17,830 |
|
|
2020 |
|
|
7,494 |
|
|
2021 |
|
|
4,517 |
|
|
2022 |
|
|
6,857 |
|
|
Maturing after 2022 |
|
|
- |
|
|
Total |
|
$ |
98,680 |
|
|
CDs $250,000 or more |
|
|||
|
2018 |
|
$ |
20,651 |
|
|
2019 |
|
|
7,273 |
|
|
2020 |
|
|
598 |
|
|
2021 |
|
|
3,612 |
|
|
2022 |
|
|
4,911 |
|
|
Maturing after 2022 |
|
|
- |
|
|
Total |
|
$ |
37,045 |
|
(7) Securities Sold Under Repurchase Agreements
Securities sold under repurchase agreement are sold for one business day only. Securities sold under these arrangements are held in safekeeping by the Bank’s primary correspondent bank and may not be pledged, assigned, sold, or otherwise transferred or utilized by the customer. Interest rates on securities sold under repurchase agreement are determined daily by the Bank.
Securities sold under repurchase agreements were $13.9 million and $13.0 million at December 31, 2017 and 2016, respectively. The agreements were secured by investment securities with a fair value of approximately $20.0 million and $18.4 million at December 31, 2017 and 2016, respectively. The weighted average interest rate paid on these agreements was 0.15% for the years ended December 31, 2017 and 2016.
74
(8) Federal Home Loan Bank and Other Borrowings
At December 31, 2017, the Company had outstanding advances from the FHLB that are summarized as follows (in thousands):
|
December 31, 2017: |
||||||||||
|
Advance |
|
|
Maturity |
|
Rate |
|
|
Rate Type |
||
|
$ |
5,000 |
|
|
1/22/2018 |
|
|
1.26 |
% |
|
Fixed |
|
|
5,000 |
|
|
2/12/2018 |
|
|
1.38 |
% |
|
Fixed |
|
$ |
10,000 |
|
|
|
|
|
|
|
|
|
|
|
||||||
|
|
|
|
|
|
|
|
At December 31, 2017 and 2016, the Company had outstanding unfunded standby letters of credit with the FHLB totaling approximately $1.6 million. There were no outstanding borrowings with the FHLB at December 31, 2016.
The Company had pledged under blanket floating liens approximately $203 million and $165.8 million in residential first mortgage loans, home equity lines of credit, commercial real estate loans, and loans secured by multi-family real estate as security for these advances, letters of credit, and possible future advances as of December 31, 2017 and 2016, respectively. The value of the pledged collateral, when using appropriate discount percentages as prescribed by the FHLB, equals or exceeds the advances and unfunded letters of credit outstanding. At December 31, 2017 and 2016, the Company had approximately $95.5 million and $88.1 million of additional borrowing capacity under its borrowing arrangement with the FHLB.
On December 31, 2015, the Company entered into a loan agreement with SouthPoint Bank of Birmingham, Alabama for $7.5 million. The loan proceeds were drawn and received by the Company on January 4, 2016. The loan proceeds were used to fund the payment of the cash consideration to the Keystone shareholders of $7.3 million in accordance with the merger agreement and for general corporate purposes. The loan carries a variable interest rate equal to the Wall Street Journal Prime Rate. The loan is secured by all of the common stock of the Bank. The balance at December 31, 2017 and 2016 was $5.4 million and $6.4 million, respectively. The bank will have principal payments of approximately $1.07 million for the years 2018, 2019, 2020, and 2021. The final principal payment will be paid at December 31, 2022.
The Company had available lines of credit for overnight federal funds borrowings totaling $28.5 million and $31.5 million at December 31 2017, and 2016, respectively. At December 31, 2017, the Company had an outstanding federal funds purchased balance of $1.2 million with an interest rate of 2.20% . There were no federal funds purchased at December 31, 2016.
75
The Tax Cuts and Jobs Act (the “Act”), which was enacted on December 22, 2017, made key changes to the U.S. tax law, including the reduction of the U.S. federal corporate tax rate from 34% to 21%. As ASC 740, Income Taxes, requires the effects of changes in tax rates and laws on deferred tax balances to be recognized in the period in which the legislation is enacted, the Company remeasured its deferred tax assets and liabilities based on the rates at which they are expected to reverse in the future, which is 21%. The deferred tax expense recorded related to the remeasurement of net deferred tax assets was $545 thousand. Additionally, the deferred tax effects on the unrealized holding losses for available for sale securities was also remeasured as a component of deferred income tax expense in the amount of $333 thousand.
The components of income tax expense for the years ended December 31, 2017 and 2016 are as follows (in thousands):
|
|
2017 |
|
|
2016 |
|
|||
|
Current |
|
$ |
3,360 |
|
|
$ |
2,818 |
|
|
Deferred |
|
|
281 |
|
|
|
686 |
|
|
Change in federal income tax rate |
|
|
878 |
|
|
|
|
|
|
Total income tax expense |
|
$ |
4,519 |
|
|
$ |
3,504 |
|
The difference between income tax expense and the amount computed by applying the statutory federal income tax rate to income before taxes for the years ended December 31, 2017 and 2016 is as follows (in thousands):
|
|
2017 |
|
|
2016 |
|
|||
|
Net income before taxes |
|
$ |
12,814 |
|
|
$ |
11,407 |
|
|
Statutory federal tax rate |
|
|
34 |
% |
|
|
34 |
% |
|
Tax on income at statutory federal tax rate |
|
|
4,357 |
|
|
|
3,878 |
|
|
Increase (decrease) resulting from: |
|
|
|
|
|
|
|
|
|
Federal income tax benefit of state income taxes |
|
|
(156 |
) |
|
|
(141 |
) |
|
Tax exempt income on loans |
|
|
(82 |
) |
|
|
(69 |
) |
|
Tax exempt income on investments |
|
|
(384 |
) |
|
|
(377 |
) |
|
Tax exempt income from bank-owned life insurance |
|
|
(144 |
) |
|
|
(146 |
) |
|
Tax exempt death benefits from bank-owned life insurance |
|
|
(226 |
) |
|
|
- |
|
|
Nondeductible expenses |
|
|
66 |
|
|
|
71 |
|
|
Change in federal income tax rate |
|
|
878 |
|
|
|
- |
|
|
State income tax |
|
|
460 |
|
|
|
399 |
|
|
Other |
|
|
(250 |
) |
|
|
(111 |
) |
|
Total |
|
$ |
4,519 |
|
|
$ |
3,504 |
|
The following summarizes the components of deferred taxes at December 31, 2017 and 2016 (in thousands).
|
|
2017 |
|
|
2016 |
|
|||
|
Deferred tax assets: |
|
|
|
|
|
|
|
|
|
Loans and allowance for loan losses |
|
$ |
1,517 |
|
|
$ |
2,627 |
|
|
Accrued expenses |
|
|
- |
|
|
|
329 |
|
|
Deferred compensation |
|
|
282 |
|
|
|
326 |
|
|
Unrealized losses on investment securities available- for-sale |
|
|
709 |
|
|
|
1,259 |
|
|
Other |
|
|
497 |
|
|
|
690 |
|
|
Total deferred tax assets |
|
|
3,005 |
|
|
|
5,231 |
|
|
Deferred tax liabilities: |
|
|
|
|
|
|
|
|
|
Core deposit intangible |
|
|
(391 |
) |
|
|
(782 |
) |
|
Depreciation |
|
|
(602 |
) |
|
|
(951 |
) |
|
Other |
|
|
(35 |
) |
|
|
(146 |
) |
|
Total deferred tax liabilities |
|
|
(1,028 |
) |
|
|
(1,879 |
) |
|
Net deferred income tax assets |
|
$ |
1,977 |
|
|
$ |
3,352 |
|
76
The Company is a party to financial instruments with off-balance-sheet risk in the normal course of business to meet the financing needs of its customers. These financial instruments include commitments to extend credit and standby letters of credit. Those instruments involve, to varying degrees, elements of credit risk in excess of the amount recognized in the balance sheet. The contract amounts of those instruments reflect the extent of involvement the Company has in particular classes of financial instruments.
The exposure to credit loss in the event of nonperformance by the other party to the financial instrument for commitments to extend credit and standby letters of credit is represented by the contractual amount of those instruments. The Company uses the same credit policies in making commitments and conditional obligations as it does for on-balance-sheet instruments. In most cases, the Company requires collateral or other security to support financial instruments with credit risk.
Financial instruments whose contract amount represents credit risk at December 31, 2017 and 2016 were as follows (in thousands):
|
|
2017 |
|
|
2016 |
|
|||
|
Commitments to extend credit |
|
$ |
142,878 |
|
|
$ |
108,564 |
|
|
Stand-by and performance letters of credit |
|
|
2,268 |
|
|
|
2,219 |
|
|
Total |
|
$ |
145,146 |
|
|
$ |
110,783 |
|
Commitments to extend credit are agreements to lend to a customer, as long as there is no violation of any condition established in the contract. Commitments generally have fixed expiration dates or other termination clauses and may require payment of a fee. Since many of the commitments may expire without being drawn upon, the total commitment amounts do not necessarily represent future cash requirements. The Company evaluates each customer’s creditworthiness on a case-by-case basis. The amount of collateral obtained upon an extension of credit, if deemed necessary by the Company, is based on management’s credit evaluation. The type of collateral held varies but may include unimproved and improved real estate, certificates of deposit, or personal property.
Standby and performance letters of credit are conditional commitments issued by the Company to guarantee the performance of a customer to a third party. Those guarantees are primarily issued to local businesses. The credit risk involved in issuing letters of credit is essentially the same as that involved in extending loan facilities to customers.
The Company has entered into operating lease agreements for three branch locations and various office equipment. Total rent expense for 2017 and 2016 was approximately $393 thousand and $406 thousand, respectively. Future minimum rent on operating leases as of December 31, 2017 is as follows (in thousands):
|
2018 |
|
$ |
528 |
|
|
2019 |
|
|
531 |
|
|
2020 |
|
|
510 |
|
|
2021 |
|
|
507 |
|
|
2022 |
|
|
519 |
|
|
Thereafter |
|
|
1,495 |
|
|
Total |
|
$ |
4,090 |
|
(11) Employee Benefit Plans
Equity Incentive Plan
During 2006, the Company adopted the River Financial Corporation 2006 Equity Incentive Plan (the “2006 Equity Incentive Plan”). During 2015, the Company adopted the River Financial Corporation 2015 Equity Incentive Plan (the “2015 Equity Incentive Plan”). These Equity Incentive Plans were adopted to provide a means of enhancing and encouraging the recruitment and retention of individuals on whom the success of the Company depends.
The 2006 Equity Incentive Plan provides for the grant of incentive stock options and nonqualified stock options. A total of 375,000 shares were reserved for possible issuance under the 2006 Equity Incentive Plan. The exercise price of each option grant equals the market price of the Company’s stock on the date of grant and an option’s term is ten years. This plan expired on April 3, 2016. The maximum term of options granted under the plan is ten years and the plan expired ten years after the adoption date.
The 2015 Equity Incentive Plan provides for the grant of incentive stock options, nonqualified stock options, stock appreciation rights, restricted stock unit awards, and restricted stock awards. A total of 300,000 shares were reserved for possible issuance under the 2015 Equity Incentive Plan. The maximum term of grants under the plan is ten years and the plan expires ten years after the adoption date.
77
A summary of activity in the outstanding stock options for the years ended December 31, 2017 and 2016 is presented below:
|
|
|
|
|
|
|
|
|
|
Weighted |
|
||
|
|
|
|
|
|
|
|
|
|
|
Average |
|
|
|
|
|
|
|
|
|
Weighted |
|
|
Remaining |
|
||
|
|
|
|
|
|
|
Average |
|
|
Contractual |
|
||
|
|
|
Shares |
|
|
Exercise Price |
|
|
Term (years) |
|
|||
|
Outstanding at January 1, 2017 |
|
|
267,425 |
|
|
$ |
14.11 |
|
|
|
6.27 |
|
|
Granted |
|
|
20,500 |
|
|
|
20.43 |
|
|
|
|
|
|
Exercised |
|
|
(19,550 |
) |
|
|
11.73 |
|
|
|
|
|
|
Outstanding at December 31, 2017 |
|
|
268,375 |
|
|
$ |
14.77 |
|
|
|
5.87 |
|
|
Exercisable at December 31, 2017 |
|
|
142,575 |
|
|
$ |
13.28 |
|
|
|
3.98 |
|
|
|
|
|
|
|
|
|
|
|
|
|
|
|
|
Outstanding at January 1, 2016 |
|
|
287,000 |
|
|
$ |
11.41 |
|
|
|
3.33 |
|
|
Granted |
|
|
108,000 |
|
|
|
16.00 |
|
|
|
|
|
|
Exercised |
|
|
(127,575 |
) |
|
|
9.63 |
|
|
|
|
|
|
Outstanding at December 31, 2016 |
|
|
267,425 |
|
|
$ |
14.11 |
|
|
|
6.27 |
|
|
Exercisable at December 31, 2016 |
|
|
123,325 |
|
|
$ |
12.51 |
|
|
|
3.66 |
|
The total fair value of shares underlying the options which vested during the years ended December 31, 2017 and 2016, was $951 thousand and $1.06 million, respectively. The intrinsic value of options exercised during the years ended December 31, 2017 and 2016 was $250 thousand and $1.35 million, respectively. The aggregate intrinsic value of total options outstanding and exercisable options at December 31, 2017 was $2.61 million and $1.6 million, respectively. Cash received from options exercised for the years ended December 31, 2017 was $229 thousand. There was no income tax benefit recognized for the exercise of options for the years ended December 31, 2017 and 2016 as all options exercised were incentive stock options.
As of December 31, 2016, unvested stock options totaled 144,100. During 2017, there were 20,500 stock options that were granted and 38,800 stock options that vested resulting in unvested stock options of 125,800 as of December 31, 2017.
The stock options granted in 2017 and 2016 have a weighted average calculated value of $2.22 and $1.63, respectively. The dividend yield is the estimated dividend we expect to pay over the next four or five years. The expected life is calculated as the mid-point between the weighted-average time to vesting and the contractual maturity. The expected volatility is the approximate industry average for small bank and holding companies. The risk free interest rate is the U.S. Treasury rate on the day of the option grant for a term equal to the expected life of the option. The calculated value of each grant is estimated on the date of grant using the Black-Scholes option pricing model with the following weighted average assumptions:
|
|
2017 |
|
|
2016 |
|
|
|||
|
Dividend yield (after three years) |
|
|
1.50 |
% |
|
|
1.50 |
% |
|
|
Expected life in years |
|
|
7 |
|
|
|
7 |
|
|
|
Expected volatility |
|
|
10.00 |
% |
|
|
10.00 |
% |
|
|
Risk free interest rate |
|
|
2.07 |
% |
|
|
1.77 |
% |
|
The Company recognized $56 thousand and $57 thousand in compensation expense related to performance share awards during 2017 and 2016, respectively. As of December 31, 2017, there was approximately $158 thousand of unrecorded compensation expense related to the performance share awards which is expected to be recognized over a weighted average period of 1.6 years.
Defined Contribution Plan
The Company provides a 401(k) employee stock ownership plan, which covers substantially all of the Company’s employees who are eligible, as to age and length of service. A participant may elect to make contributions up to $18,000 of the participant’s annual compensation in 2017 and 2016. The Company makes contributions up to 3% of each participant’s annual compensation and the Company matches 50% of the next 2% contributed by the employee. Contributions to the plan by Company were approximately $306 thousand and $280 thousand in 2017 and 2016, respectively. Outstanding shares of the Company’s common stock allocated to participants at December 31, 2017 and 2016 totaled 53,715 and 38,933 respectively, and there were no unallocated shares. These shares are treated as outstanding for purposes of calculating earnings per share and dividends on these shares are included in the Consolidated Statements of Stockholders’ Equity.
78
The Company’s KSOP includes a put option for shares of the Company’s common stock distributed from the KSOP. Shares are distributed from the KSOP primarily to separated vested participants and certain eligible participants who elect to diversify their account balances. Since the Company’s common stock is not currently traded on an established securities market, if the owners of distributed shares desire to sell their shares, the Company is required to purchase the shares at fair value during two put option periods following the distribution of the shares from the KSOP. The first put option period is within sixty days following the distribution of the shares from the KSOP. The second put option period begins on the first day of the fifth month of the plan year for a sixty day period. The fair value of distributed shares subject to the put option totaled $0 as of December 31, 2017 and December 31, 2016. The cost of the KSOP shares totaled $950 thousand and $623 thousand as of December 31, 2017 and December 31, 2016, respectively. Due to the Company’s obligation under the put option, the distributed shares and KSOP shares are classified as temporary equity in the mezzanine section of the consolidated statements of financial condition and totaled $950 thousand and $623 thousand as of December 31, 2017 and December 31, 2016, respectively. The fair value of the KSOP shares totaled $1.32 million and $788 thousand as of December 31, 2017 and December 31, 2016, respectively.
(12) Stock Warrants
The Company issued 325,000 stock warrants to the initial organizers of the Bank in April 2006 for their involvement in the organization of the Bank. Vesting periods are five years from the date of the grant. There were no stock warrants issued in 2017 or 2016. The warrants have an exercise price of $10.00 per share and expired on April 3, 2016. The warrants on all 135,000 shares vested and exercisable at December 31, 2015 were exercised in 2016 prior to the expiration date. There were no warrants exercised in 2017. None of the warrants have been forfeited. No compensation expense is required by accounting principles generally accepted in the United State of America to be recorded in connection with these stock warrants.
On December 31, 2015, the Company assumed the outstanding stock warrants of Keystone. These warrants were issued to the initial organizers of Keystone in 2007. At the time of the merger the warrants were converted under the terms of the merger. A total of 36,000 warrants were assumed with an exercise price of $8.00 per share. These warrants expired on March 1, 2017. During 2016, warrants for 29,750 shares were exercised. At December 31, 2016, the remaining 6,250 shares were vested and exercisable. During 2017, the remaining 6,250 warrants were exercised.
(13) Related Party Transactions
The Company conducts transactions its with directors and executive officers, including companies in which such directors and executive officers have a beneficial interest, in the normal course of business. It is the Company’s policy to comply with federal regulations that require that loan and deposit transactions with directors and executive officers be made on substantially the same terms as those prevailing at the time for comparable loans and deposits to other persons. At December 31, 2017 and 2016, deposits from directors, executive officers and their related interests aggregated approximately $4 million and $4.2 million, respectively. These deposits were taken in the normal course of business at market interest rates.
The following is a summary of activity for related party loans for 2017 (in thousands):
|
Balance at December 31, 2016 |
|
$ |
9,551 |
|
|
New loans |
|
|
15,690 |
|
|
Repayments |
|
|
16,872 |
|
|
Balance at December 31, 2017 |
|
$ |
8,369 |
|
(14) Regulatory Matters
Banking regulations limit the amount of dividends that the Banks may pay without prior approval of the regulatory authorities. These restrictions are based on the level of regulatory classified assets, the prior years’ net earnings, and the ratio of equity capital to total assets.
The Bank is subject to various regulatory capital requirements administered by federal banking agencies. Failure to meet minimum capital requirements can initiate certain mandatory and possibly additional discretionary actions by regulators that, if undertaken, could have a direct material effect on the financial statements. Under certain adequacy guidelines and the regulatory framework for prompt corrective action, specific capital guidelines that involve quantitative measures of the assets, liabilities, and certain off-balance sheet items as calculated under regulatory accounting practices must be met. The capital amounts and classifications are also subject to qualitative judgments by the regulators about components, risk weightings, and other factors.
79
In July 2013, the federal bank regulatory agencies issued final rules implementing the Basel III regulatory capital framework as required by the Dodd-Frank Wall Street Reform and Consumer Protection Act. The final rules took effect for the Bank on January 1, 2015, subject to a transition period for certain parts of the rules. The rules revise the minimum capital requirements and adjust the prompt corrective action thresholds applicable to financial institutions under the agencies’ jurisdiction. The rules revise the regulatory capital elements, add a new common equity Tier 1 capital ratio, increase the minimum Tier 1 capital ratio requirements, and implement a new capital conservation buffer. The rules also permit certain banking organizations to retain, through a one-time election, the existing treatment of accumulated other comprehensive income. The Bank has made the election to retain the existing treatment for accumulated other comprehensive income.
The rules are intended to provide an additional measure of a bank’s capital adequacy by assigning weighted levels of risk to asset categories. Banks are also required to systematically maintain capital against such “off-balance sheet” activities as loans sold with recourse, loan commitments, guarantees, and standby letters of credit. These guidelines are intended to strengthen the quality of capital by increasing the emphasis on common equity and restricting the amount of loan loss reserves and other forms of equity, such as preferred stock, that may be included in capital. Certain items, such as goodwill and other intangible assets, are deducted from capital in arriving at the various regulatory capital measures, such as common equity Tier 1 capital, Tier 1 capital, and total risk-based capital.
Quantitative measures established by regulation to ensure capital adequacy require the Bank to maintain minimum amounts and ratios (set forth in the table below) of Total and Tier 1 Capital (as defined in the regulations) to risk-weighted assets (as defined), and of Tier 1 Capital (as defined) to average assets (as defined). Management believes, as of December 31, 2017 and 2016, that the Bank meets all capital adequacy requirements to which it is subject.
As of December 31, 2017 and 2016, the most recent notification from the regulators categorized the Bank as well capitalized under the regulatory framework for prompt corrective action. To be categorized as well capitalized, the Bank must maintain minimum total risk-based, Tier 1 risk-based and Tier 1 leverage ratios as set forth in the table below. There are no conditions or events since that notification that management believes have changed the Bank’s category.
The following table presents the Bank’s capital amounts and ratios with the required minimum levels for capital adequacy purposes including the phase in of the capital conservation buffer under Basel III and minimum levels to be well capitalized (as defined) under the regulatory prompt corrective action regulations.
The Bank’s actual capital amounts (in thousands) and ratios are also presented in the table below.
|
As of December 31, 2017: |
|
Actual |
|
|
Required For Capital Adequacy Purposes |
|
To Be Well Capitalized Under Prompt Corrective Action Regulations |
|||||||||||||
|
|
|
Amount |
|
|
Ratio |
|
|
Amount |
|
|
Ratio |
|
Amount |
|
|
Ratio |
||||
|
Total Capital (To Risk-Weighted Assets) |
|
$ |
89,604 |
|
|
|
14.325 |
% |
|
$ |
57,859 |
|
|
>= 9.250% |
|
$ |
62,551 |
|
|
>= 10.000% |
|
Common Equity Tier 1 Capital (To Risk- weighted Assets) |
|
|
84,724 |
|
|
|
13.545 |
% |
|
|
35,967 |
|
|
>= 5.750% |
|
$ |
40,658 |
|
|
>= 6.500% |
|
Tier 1 Capital (To Risk-Weighted Assets) |
|
|
84,724 |
|
|
|
13.545 |
% |
|
|
45,349 |
|
|
>= 7.250% |
|
$ |
50,040 |
|
|
>= 8.000% |
|
Tier 1 Capital (To Average Assets) |
|
|
84,724 |
|
|
|
10.429 |
% |
|
|
32,497 |
|
|
>= 4.000% |
|
$ |
40,621 |
|
|
>= 5.000% |
|
As of December 31, 2016: |
|
Actual |
|
|
Required For Capital Adequacy Purposes |
|
To Be Well Capitalized Under Prompt Corrective Action Regulations |
|||||||||||||
|
|
|
Amount |
|
|
Ratio |
|
|
Amount |
|
|
Ratio |
|
Amount |
|
|
Ratio |
||||
|
Total Capital (To Risk-Weighted Assets) |
|
$ |
81,719 |
|
|
|
13.680 |
% |
|
$ |
51,522 |
|
|
>= 8.625% |
|
$ |
59,736 |
|
|
>= 10.000% |
|
Common Equity Tier 1 Capital (To Risk- weighted Assets) |
|
|
77,712 |
|
|
|
13.010 |
% |
|
|
30,613 |
|
|
>= 5.125% |
|
$ |
38,826 |
|
|
>= 6.500% |
|
Tier 1 Capital (To Risk-Weighted Assets) |
|
|
77,712 |
|
|
|
13.010 |
% |
|
|
39,573 |
|
|
>= 6.625% |
|
$ |
47,786 |
|
|
>= 8.000% |
|
Tier 1 Capital (To Average Assets) |
|
|
77,712 |
|
|
|
9.960 |
% |
|
|
31,210 |
|
|
>= 4.000% |
|
$ |
39,012 |
|
|
>= 5.000% |
80
(15) Fair Value Measurements and Disclosures
The Company utilizes fair value measurements to record fair value adjustments to certain assets and liabilities and to determine fair value disclosures. Securities available-for-sale are recorded at fair value on a recurring basis. Additionally, from time to time, the Company may be required to record at fair value other assets on a nonrecurring basis, such as impaired loans, other real estate, and repossessed assets. These nonrecurring fair value adjustments typically involve application of the lower of cost or market accounting or write-downs of individual assets.
Fair Value Hierarchy
The Company groups assets and liabilities at fair value in three levels, based on the markets in which the assets and liabilities are traded and the reliability of the assumptions used to determine fair value. These levels are:
Level 1 – Valuation is based upon quoted prices for identical instruments traded in active markets.
Level 2 – Valuation is based upon quoted prices for similar instruments in active markets, quoted prices for identical or similar instruments in markets that are not active, and model- based valuation techniques for which all significant assumptions are observable in the market.
Level 3 – Valuation is generated from model-based techniques that use at least one significant assumption not observable in the market. These unobservable assumptions reflect estimates of assumptions that market participants would use in pricing the asset or liability. Valuation techniques include use of option pricing models, discounted cash flow models and similar techniques.
Following is a description of valuation methodologies used for assets and liabilities recorded or disclosed at fair value.
Cash and Cash Equivalents
For disclosure purposes, for cash, due from banks, interest-bearing deposits, and federal funds sold, the carrying amount is a reasonable estimate of fair value.
Certificates of Deposits in Banks
For disclosure purposes, for certificates of deposits in banks, the carrying amount is a reasonable estimate of fair value.
Securities Available-for-Sale
Securities available-for-sale are recorded at fair value on a recurring basis. Fair value measurement is based upon quoted prices, if available. If quoted prices are not available, fair values are measured using independent pricing models or other model-based valuation techniques such as the present value of future cash flows, adjusted for the security’s credit rating, prepayment assumptions and other factors such as credit loss assumptions. Level 1 securities include those traded on an active exchange, such as the New York Stock Exchange and U.S. Treasury securities that are traded by dealers or brokers in active over-the-counter market funds. Level 2 securities include mortgage-backed securities issued by government sponsored enterprises and municipal bonds. Securities classified as Level 3 include asset-backed securities in less liquid markets.
Other Investments
For disclosure purposes, the carrying amount of other investments approximates their fair value.
Loans and Mortgage Loans Held-for-Sale
The Company does not record loans at fair value on a recurring basis. However, from time to time, a loan is considered impaired and an allowance for loan losses is established. Loans for which it is probable that payment of interest and principal will not be made in accordance with the contractual terms of the loan agreement are considered impaired. When a loan is identified as individually impaired, management measures impairment using one of three methods. These methods include collateral value, market value of similar debt, and discounted cash flows. Those impaired loans not requiring an allowance represent loans for which the fair value of the expected repayments or collateral exceed the recorded investments in such loans. At December 31, 2017 and 2016, impaired loans were evaluated based on the fair value of the collateral. Impaired loans where an allowance is established based on the fair value of collateral, or loans that are charged down according to the fair value of collateral, require classification in the fair value hierarchy. When the fair value of the collateral is based on an observable market price, the Company records the impaired loan as nonrecurring Level 2. When the fair value is based on an appraised value, the Company records the impaired loan as nonrecurring Level 3.
For disclosure purposes, the fair value of fixed-rate loans is estimated by discounting the future cash flows using the current rates at which similar loans would be made to borrowers with similar credit ratings. For variable rate loans, the carrying amount is a reasonable estimate of fair value. Mortgage loans held-for-sale are carried at cost, which is a reasonable estimate of fair value.
81
For disclosure purposes, the fair value of the cash surrender value of life insurance policies is equivalent to the carrying value.
Accrued Interest Receivable
For disclosure purposes, the fair value of the accrued interest on investments and loans is the carrying value.
Foreclosed Assets
Other real estate properties and miscellaneous repossessed assets are adjusted to fair value upon transfer of the loans to foreclosed assets. Subsequently, foreclosed assets are carried at the lower of carrying value or fair value. Fair value is based upon independent market prices, appraised values of the collateral or management’s estimation of the value of the collateral. When the fair value of the collateral is based on an observable market price, the Company records the foreclosed asset as nonrecurring Level 2. When fair value is based on an appraised value or management’s estimate of value, the Company records the foreclosed asset as nonrecurring Level 3.
Deposits
For disclosure purposes, the fair value of demand deposits, interest-bearing demand deposits, money market accounts, and savings accounts is the amount payable on demand at the reporting date. The fair value of fixed-rate maturity certificates of deposit is estimated by discounting the future cash flows using the rates currently offered for deposits of similar remaining maturities.
Accrued Interest Payable
For disclosure purposes, the fair value of the accrued interest payable on deposits is the carrying value.
Federal Home Loan Bank Advances
For disclosure purposes, the fair value of the FHLB advances is based on the quoted value for similar remaining maturities provided by the FHLB.
Federal Funds Purchased
For disclosure purposes, the fair value of federal funds purchased is the carrying value.
Note Payable
For disclosure purposes, the fair value of the variable rate note payable is the carrying value.
Commitments to Extend Credit and Standby Letters of Credit
Because commitments to extend credit and standby letters of credit are generally short-term and made using variable rates, the carrying value and estimated fair value associated with these instruments are immaterial.
Assets and Liabilities Recorded at Fair Value on a Recurring Basis
The table below presents the recorded amount of assets and liabilities measured at fair value on a recurring basis as of December 31, 2017 and 2016. There were no transfers between levels during 2017 or 2016 (in thousands).
|
|
|
Fair Value Measurements At Reporting Date Using: |
|
|||||||||||||
|
|
|
|
|
|
|
Quoted Prices |
|
|
|
|
|
|
|
|
|
|
|
|
|
|
|
|
|
In Active |
|
|
Significant |
|
|
|
|
|
||
|
|
|
|
|
|
|
Markets For |
|
|
Other |
|
|
Significant |
|
|||
|
|
|
|
|
|
|
Identical |
|
|
Observable |
|
|
Unobservable |
|
|||
|
|
|
|
|
|
|
Assets |
|
|
Inputs |
|
|
Inputs |
|
|||
|
December 31, 2017: |
|
Fair Value |
|
|
(Level 1) |
|
|
(Level 2) |
|
|
(Level 3) |
|
||||
|
Securities available-for-sale: |
|
|
|
|
|
|
|
|
|
|
|
|
|
|
|
|
|
Residential mortgage -backed |
|
$ |
122,972 |
|
|
$ |
- |
|
|
$ |
122,972 |
|
|
$ |
- |
|
|
U.S. government agencies |
|
|
12,999 |
|
|
|
- |
|
|
|
12,999 |
|
|
|
- |
|
|
State, county, and municipal |
|
|
55,501 |
|
|
|
- |
|
|
|
55,501 |
|
|
|
- |
|
|
Corporate obligations |
|
|
1,817 |
|
|
|
- |
|
|
|
1,817 |
|
|
|
- |
|
|
Totals |
|
$ |
193,289 |
|
|
$ |
- |
|
|
$ |
193,289 |
|
|
$ |
- |
|
82
|
|
|
Fair Value Measurements At Reporting Date Using: |
|
|||||||||||||
|
|
|
|
|
|
|
Quoted Prices |
|
|
|
|
|
|
|
|
|
|
|
|
|
|
|
|
|
In Active |
|
|
Significant |
|
|
|
|
|
||
|
|
|
|
|
|
|
Markets For |
|
|
Other |
|
|
Significant |
|
|||
|
|
|
|
|
|
|
Identical |
|
|
Observable |
|
|
Unobservable |
|
|||
|
|
|
|
|
|
|
Assets |
|
|
Inputs |
|
|
Inputs |
|
|||
|
December 31, 2016: |
|
Fair Value |
|
|
(Level 1) |
|
|
(Level 2) |
|
|
(Level 3) |
|
||||
|
Securities available-for-sale: |
|
|
|
|
|
|
|
|
|
|
|
|
|
|
|
|
|
Residential mortgage -backed |
|
$ |
108,675 |
|
|
$ |
- |
|
|
$ |
108,675 |
|
|
$ |
- |
|
|
U.S. government agencies |
|
|
15,327 |
|
|
|
- |
|
|
|
15,327 |
|
|
|
- |
|
|
State, county, and municipal |
|
|
57,586 |
|
|
|
- |
|
|
|
57,586 |
|
|
|
- |
|
|
Corporate obligations |
|
|
1,773 |
|
|
|
- |
|
|
|
1,773 |
|
|
|
- |
|
|
Totals |
|
$ |
183,361 |
|
|
$ |
- |
|
|
$ |
183,361 |
|
|
$ |
- |
|
Assets Recorded at Fair Value on a Nonrecurring Basis
The Company may be required, from time to time, to measure certain assets at fair value on a nonrecurring basis in accordance with U.S. generally accepted accounting principles. These include assets that are measured at the lower of cost or market that were recognized at fair value below cost at the end of the period. Assets measured at fair value on a nonrecurring basis are included in the table below as of December 31, 2017 and 2016 (in thousands).
|
|
Fair Value Measurements At Reporting Date Using: |
|
||||||||||||||
|
|
|
|
|
|
|
Quoted Prices |
|
|
|
|
|
|
|
|
|
|
|
|
|
|
|
|
|
In Active |
|
|
Significant |
|
|
|
|
|
||
|
|
|
|
|
|
|
Markets For |
|
|
Other |
|
|
Significant |
|
|||
|
|
|
|
|
|
|
Identical |
|
|
Observable |
|
|
Unobservable |
|
|||
|
|
|
|
|
|
|
Assets |
|
|
Inputs |
|
|
Inputs |
|
|||
|
December 31, 2017: |
|
Fair Value |
|
|
(Level 1) |
|
|
(Level 2) |
|
|
(Level 3) |
|
||||
|
Impaired loans |
|
$ |
4,654 |
|
|
$ |
- |
|
|
$ |
- |
|
|
$ |
4,654 |
|
|
Foreclosed assets |
|
|
1,546 |
|
|
|
- |
|
|
|
- |
|
|
|
1,546 |
|
|
Totals |
|
$ |
6,200 |
|
|
$ |
- |
|
|
$ |
- |
|
|
$ |
6,200 |
|
|
|
|
Fair Value Measurements At Reporting Date Using: |
|
|||||||||||||
|
|
|
|
|
|
|
Quoted Prices |
|
|
|
|
|
|
|
|
|
|
|
|
|
|
|
|
|
In Active |
|
|
Significant |
|
|
|
|
|
||
|
|
|
|
|
|
|
Markets For |
|
|
Other |
|
|
Significant |
|
|||
|
|
|
|
|
|
|
Identical |
|
|
Observable |
|
|
Unobservable |
|
|||
|
|
|
|
|
|
|
Assets |
|
|
Inputs |
|
|
Inputs |
|
|||
|
December 31, 2016: |
|
Fair Value |
|
|
(Level 1) |
|
|
(Level 2) |
|
|
(Level 3) |
|
||||
|
Impaired loans |
|
$ |
6,256 |
|
|
$ |
- |
|
|
$ |
- |
|
|
$ |
6,256 |
|
|
Foreclosed assets |
|
|
1,151 |
|
|
|
- |
|
|
|
- |
|
|
|
1,151 |
|
|
Totals |
|
$ |
7,407 |
|
|
$ |
- |
|
|
$ |
- |
|
|
$ |
7,407 |
|
The Company has estimated the fair values of these assets using Level 3 inputs, specifically the appraised value of the collateral. Impaired loan balances represent those collateral dependent impaired loans where management has estimated the credit loss by comparing the loan’s carrying value against the expected realizable fair value of the impaired loan for the amount of the credit loss. The Company had no Level 3 assets measured at fair value on a recurring basis at December 31, 2017 or 2016. For Level 3 assets measured at fair value on a non-recurring basis as of December 31, 2017 and 2016 for the valuation technique we used appraisals. For the significant unobservable input we used appraisal discounts and the weighted average of input 15-20% was used. This is for years ended December 31, 2017 and 2016.
83
The estimated fair values and related carrying values of the Company’s financial instruments at December 31, 2017 and 2016 were as follows (amounts in thousands):
|
|
|
|
|
|
Estimated Fair Value |
|
||||||||||
|
|
|
Carrying |
|
|
|
|
|
|
|
|
|
|
|
|
|
|
|
December 31, 2017: |
|
Amount |
|
|
Level 1 |
|
|
Level 2 |
|
|
Level 3 |
|
||||
|
Financial assets: |
|
|
|
|
|
|
|
|
|
|
|
|
|
|
|
|
|
Cash and cash equivalents |
|
$ |
15,558 |
|
|
$ |
15,558 |
|
|
$ |
- |
|
|
$ |
- |
|
|
Certificates of deposit in banks |
|
|
5,214 |
|
|
|
- |
|
|
|
5,214 |
|
|
|
- |
|
|
Securities available-for-sale |
|
|
193,289 |
|
|
|
- |
|
|
|
193,289 |
|
|
|
- |
|
|
Restricted equity securities |
|
|
1,259 |
|
|
|
- |
|
|
|
- |
|
|
|
1,259 |
|
|
Loans receivable |
|
|
542,240 |
|
|
|
- |
|
|
|
536,701 |
|
|
|
4,654 |
|
|
Loans held for sale |
|
|
3,858 |
|
|
|
- |
|
|
|
3,858 |
|
|
|
- |
|
|
Bank owned life insurance |
|
|
19,991 |
|
|
|
- |
|
|
|
19,991 |
|
|
|
- |
|
|
Accrued interest receivable |
|
|
2,499 |
|
|
|
- |
|
|
|
2,499 |
|
|
|
- |
|
|
Financial liabilities: |
|
|
|
|
|
|
|
|
|
|
|
|
|
|
|
|
|
Deposits |
|
|
699,861 |
|
|
|
- |
|
|
|
675,871 |
|
|
|
- |
|
|
Accrued interest payable |
|
|
121 |
|
|
|
- |
|
|
|
121 |
|
|
|
|
|
|
Securities sold under agreements to repurchase |
|
|
13,865 |
|
|
|
- |
|
|
|
13,865 |
|
|
|
- |
|
|
Federal Home Loan Bank advances |
|
|
10,000 |
|
|
|
|
|
|
|
9,997 |
|
|
|
|
|
|
Federal funds purchased |
|
|
1,153 |
|
|
|
|
|
|
|
1,153 |
|
|
|
|
|
|
Note payable |
|
|
5,357 |
|
|
|
- |
|
|
|
5,357 |
|
|
|
- |
|
|
|
|
|
|
|
Estimated Fair Value |
|
||||||||||
|
|
|
Carrying |
|
|
|
|
|
|
|
|
|
|
|
|
|
|
|
December 31, 2016: |
|
Amount |
|
|
Level 1 |
|
|
Level 2 |
|
|
Level 3 |
|
||||
|
Financial assets: |
|
|
|
|
|
|
|
|
|
|
|
|
|
|
|
|
|
Cash and cash equivalents |
|
$ |
42,499 |
|
|
$ |
42,499 |
|
|
$ |
- |
|
|
$ |
- |
|
|
Certificates of deposit in banks |
|
|
5,463 |
|
|
|
- |
|
|
|
5,463 |
|
|
|
- |
|
|
Securities available-for-sale |
|
|
183,361 |
|
|
|
- |
|
|
|
183,361 |
|
|
|
- |
|
|
Restricted equity securities |
|
|
751 |
|
|
|
- |
|
|
|
- |
|
|
|
751 |
|
|
Loans receivable |
|
|
512,434 |
|
|
|
- |
|
|
|
509,087 |
|
|
|
6,256 |
|
|
Loans held for sale |
|
|
7,734 |
|
|
|
- |
|
|
|
7,734 |
|
|
|
- |
|
|
Bank owned life insurance |
|
|
15,161 |
|
|
|
- |
|
|
|
15,161 |
|
|
|
- |
|
|
Accrued interest receivable |
|
|
2,376 |
|
|
|
- |
|
|
|
2,376 |
|
|
|
- |
|
|
Financial liabilities: |
|
|
|
|
|
|
|
|
|
|
|
|
|
|
|
|
|
Deposits |
|
|
704,913 |
|
|
|
- |
|
|
|
688,591 |
|
|
|
- |
|
|
Accrued interest payable |
|
|
130 |
|
|
|
|
|
|
|
130 |
|
|
|
|
|
|
Securities sold under agreements to repurchase |
|
|
13,034 |
|
|
|
- |
|
|
|
13,034 |
|
|
|
- |
|
|
Note payable |
|
|
6,428 |
|
|
|
|
|
|
|
6,428 |
|
|
|
|
|
Limitations
Fair value estimates are made at a specific point in time, based on relevant market information and information about the financial instrument. These estimates do not reflect any premium or discount that could result from offering for sale at one time the Company’s entire holdings of a particular financial instrument. Because no market exists for a significant portion of the Company’s financial instruments, fair value estimates are based on many judgments. These estimates are subjective in nature and involve uncertainties and matters of significant judgment and therefore cannot be determined with precision. Changes in assumptions could significantly affect the estimates.
Fair value estimates are based on existing on- and off-balance sheet financial instruments without attempting to estimate the value of anticipated future business and the value of assets and liabilities that are not considered financial instruments. Significant assets and liabilities that are not considered financial instruments include mortgage banking operations, deferred income taxes and premises and equipment. In addition, the tax ramifications related to the realization of the unrealized gains and losses can have a significant effect on fair value estimates and have not been considered in the estimates.
84
(16) River Financial Corporation (Parent Company Only) Financial Information
STATEMENTS OF FINANCIAL CONDITION
(in thousands)
|
|
December 31, |
|
||||||
|
|
|
2017 |
|
|
2016 |
|
||
|
Assets |
|
|
|
|
|
|
|
|
|
Cash |
|
$ |
1,619 |
|
|
$ |
1,865 |
|
|
Investment in River Bank & Trust |
|
|
93,593 |
|
|
|
86,880 |
|
|
Deferred income taxes |
|
|
9 |
|
|
|
16 |
|
|
Other assets |
|
|
91 |
|
|
|
117 |
|
|
Total assets |
|
$ |
95,312 |
|
|
$ |
88,878 |
|
|
Liabilities |
|
|
|
|
|
|
|
|
|
Note payable |
|
$ |
5,357 |
|
|
$ |
6,428 |
|
|
Accrued expenses |
|
|
6 |
|
|
|
- |
|
|
Total liabilities |
|
|
5,363 |
|
|
|
6,428 |
|
|
Common stock related to 401(k) Employee Stock Option Plan |
|
|
950 |
|
|
|
623 |
|
|
Stockholders' equity |
|
|
|
|
|
|
|
|
|
Common stock |
|
|
5,114 |
|
|
|
5,091 |
|
|
Additional paid in capital |
|
|
64,935 |
|
|
|
64,656 |
|
|
Retained earnings |
|
|
22,388 |
|
|
|
15,032 |
|
|
Accumulated other comprehensive loss |
|
|
(2,116 |
) |
|
|
(2,153 |
) |
|
Treasury stock, at cost |
|
|
(372 |
) |
|
|
(176 |
) |
|
Common stock related to 401(k) Employee Stock Option Plan |
|
|
(950 |
) |
|
|
(623 |
) |
|
Total stockholders' equity |
|
|
88,999 |
|
|
|
81,827 |
|
|
Total equity |
|
|
89,949 |
|
|
|
82,450 |
|
|
Total liabilities and stockholders' equity |
|
$ |
95,312 |
|
|
$ |
88,878 |
|
STATEMENTS OF INCOME
(in thousands)
|
|
Year Ended December 31, |
|
||||||
|
|
|
2017 |
|
|
2016 |
|
||
|
Cash dividends from River Bank & Trust |
|
$ |
2,250 |
|
|
$ |
1,500 |
|
|
Total income |
|
|
2,250 |
|
|
|
1,500 |
|
|
Interest expense - note payable |
|
|
249 |
|
|
|
250 |
|
|
Legal and other professional fees |
|
|
101 |
|
|
|
232 |
|
|
Data processing expense |
|
|
4 |
|
|
|
28 |
|
|
Stockholders' meeting expense |
|
|
11 |
|
|
|
10 |
|
|
Other expenses |
|
|
10 |
|
|
|
19 |
|
|
Total expenses |
|
|
375 |
|
|
|
539 |
|
|
Net income before tax benefit |
|
|
1,875 |
|
|
|
961 |
|
|
Applicable income tax benefit |
|
|
(134 |
) |
|
|
(313 |
) |
|
Net income before undistributed net income of River Bank & Trust |
|
|
2,009 |
|
|
|
1,274 |
|
|
Equity in undistributed net income of River Bank & Trust |
|
|
6,286 |
|
|
|
6,629 |
|
|
Net income |
|
$ |
8,295 |
|
|
$ |
7,903 |
|
85
(in thousands)
|
|
Year Ended December 31, |
|
||||||
|
|
|
2017 |
|
|
2016 |
|
||
|
Net income |
|
$ |
8,295 |
|
|
$ |
7,903 |
|
|
Adjustments to reconcile net income to net cash provided by operating activities: |
|
|
|
|
|
|
|
|
|
Equity in undistributed net income of River Bank & Trust |
|
|
(6,286 |
) |
|
|
(6,629 |
) |
|
Deferred income tax |
|
|
7 |
|
|
|
497 |
|
|
(Increase) decrease in operating assets and (decrease) increase in operating liabilities: |
|
|
|
|
|
|
|
|
|
Other assets |
|
|
26 |
|
|
|
207 |
|
|
Accrued expenses and other liabilities |
|
|
5 |
|
|
|
(1,840 |
) |
|
Net cash provided by operating activities |
|
|
2,047 |
|
|
|
138 |
|
|
Cash Flows used for investing activities: |
|
|
|
|
|
|
|
|
|
Payments to Keystone shareholders |
|
|
- |
|
|
|
(7,274 |
) |
|
Net cash used in investing activities |
|
|
- |
|
|
|
(7,274 |
) |
|
|
|
|
|
|
|
|
|
|
|
Cash flow from financing activities: |
|
|
|
|
|
|
|
|
|
Proceeds from note payable |
|
|
- |
|
|
|
7,500 |
|
|
Payments on note payable |
|
|
(1,071 |
) |
|
|
(1,072 |
) |
|
Proceeds from exercise of common stock options and warrants |
|
|
263 |
|
|
|
2,506 |
|
|
Proceeds from issuance of common stock |
|
|
85 |
|
|
|
131 |
|
|
Purchase of treasury stock |
|
|
(579 |
) |
|
|
(363 |
) |
|
Sale of treasury stock |
|
|
281 |
|
|
|
188 |
|
|
Cash dividends |
|
|
(1,272 |
) |
|
|
(812 |
) |
|
Net cash provided by (used in) financing activities |
|
|
(2,293 |
) |
|
|
8,078 |
|
|
Net change in cash |
|
|
(246 |
) |
|
|
942 |
|
|
Cash at beginning of year |
|
|
1,865 |
|
|
|
923 |
|
|
Cash at end of year |
|
$ |
1,619 |
|
|
$ |
1,865 |
|
(17) Goodwill and Intangible Assets
At the close of business December 31, 2015, the Company recorded goodwill of $9.41 million associated with the Keystone merger. During the year 2016, an adjustment of $640 thousand was made to increase the amount of goodwill. The adjustment was made to the value of stock options and warrants assumed in the Keystone merger. The adjustments were made following the Company’s review of additional information that existed at the time of the merger. The adjustment to goodwill increased shareholders’ equity $640 thousand. In addition to the goodwill recorded for Keystone, the Company recorded a core deposit intangible asset of approximately $2.8 million. The core deposit intangible asset is amortized using an accelerated method over eight years from the date of the merger. Amortization expense of $559 thousand and $644 thousand was recorded in 2017 and 2016, respectively.
Changes to the carrying amount of goodwill for the years ended December 31, 2017 and 2016 are provided in the following table.
|
|
2017 |
|
|
2016 |
|
|||
|
Balance at beginning of year |
|
$ |
10,050 |
|
|
$ |
9,410 |
|
|
Adjustments to goodwill |
|
|
- |
|
|
|
640 |
|
|
Balance at end of year |
|
$ |
10,050 |
|
|
$ |
10,050 |
|
A summary of core deposit intangible assets as of December 31, 2017 and 2016 is set forth below.
|
|
2017 |
|
|
2016 |
|
|||
|
Gross carrying amount |
|
$ |
2,763 |
|
|
$ |
2,763 |
|
|
Less: accumulated amortization |
|
|
(1,203 |
) |
|
|
(644 |
) |
|
Net carrying amount |
|
$ |
1,560 |
|
|
$ |
2,119 |
|
86
Item 9. Changes In and Disagreements with Accountants on Accounting and Financial Disclosure.
There were no disagreements with accountants regarding accounting and financial disclosure matters during the year ended December 31, 2017.
Item 9.A Controls and Procedures
Evaluation of Disclosure Controls and Procedures
The Company has carried out an evaluation under the supervision and with participation of management, including the Company’s Chief Executive Officer and Chief Financial Officer, of the effectiveness of the design and operation of the Company’s disclosure controls and procedures. There are inherent limitations to the effectiveness of any system of disclosure controls and procedures, including the possibility of human error and the circumvention or overriding of the controls and procedures. Accordingly, even the effective disclosure controls and procedures can only provide reasonable assurance of achieving their control objectives. Based upon this evaluation, our Chief Executive Officer and Chief Financial Officer have concluded that, as of December 31, 2017, the Company’s disclosure controls and procedures are effective in ensuring that material information relating to the Company required to be disclosed in reports that if files or submits under the Exchange Act is recorded, processed, summarized and reported within the requisite time periods and is accumulated and communicated to our management, including our Chief Executive Officer and our Chief Financial Officer, as appropriate to allow timely decisions regarding disclosure.
Management’s Annual Report on Internal Control Over Financial Reporting
Management is responsible for establishing and maintaining internal control over financial reporting (as defined in Rule 13a-15(f) under the Exchange Act). The Company’s internal control over financial reporting is a process designed to provide reasonable assurance regarding the reliability of financial reporting and the preparation of financial statements for external purposes in accordance with generally accepted accounting principles. The Company’s internal control over financial reporting includes those policies and procedures that: (i) pertain to maintenance of records that, in reasonable detail, accurately and fairly reflect the transactions and dispositions of the assets of the Company, (ii) provide reasonable assurance that transactions are recorded as necessary to permit preparation of financial statements in accordance with generally accepted accounting principles, and that receipts and expenditures of the Company are being made only in accordance with the authorizations of management and directors of the Company; and (iii) provide reasonable assurance regarding prevention or timely detection of unauthorized acquisition, use or disposition of the Company’s assets that could have a material effect on the financial statements.
Because of its inherent limitations, internal control over financial reporting may not prevent or detect misstatements. Also, projections of any evaluation of effectiveness to future periods are subject to the risk that the controls may become inadequate because of changes in conditions, or that the degree of compliance with the policies or procedures may deteriorate.
Management has assessed the effectiveness of the Company’s internal control over financial reporting as of December 31, 2017. In making this assessment, management used the criteria set forth by the Committee of Sponsoring Organizations of the Treadway Commission (COSO) in Internal Control Integrated Framework (2013). Based on its assessment and those criteria, management has concluded that the Company maintained effective internal control over financial reporting as of December 31, 2017.
87
Item 10. Directors, Executive Officers and Corporate Governance.
Our Directors and Executive Officers
The following table sets forth the name, age, and position, as of December 31, 2017 of the individuals who currently serve as our executive officers and directors.
|
Name |
|
Age |
|
|
Position |
|
Director Since |
|
|
||
|
Larry Puckett |
|
|
75 |
|
|
Director and Chairman of the Board of Directors |
|
|
2006 |
|
|
|
W. Murray Neighbors |
|
|
68 |
|
|
Director and Vice Chairman of the Board of Directors |
|
|
2015 |
|
1 |
|
James M .Stubbs |
|
|
55 |
|
|
Director and Chief Executive Officer |
|
|
2006 |
|
|
|
Gerald R. Smith, Jr |
|
|
64 |
|
|
Director and President |
|
|
2015 |
|
1 |
|
Vernon B. Taylor |
|
|
53 |
|
|
Director |
|
|
2006 |
|
|
|
Jimmy L. Ridling |
|
|
73 |
|
|
Director |
|
|
2006 |
|
|
|
John A. Freeman |
|
|
70 |
|
|
Director |
|
|
2015 |
|
1 |
|
Kenneth H. Givens |
|
|
64 |
|
|
Executive Vice President, CFO, Secretary of the Board of Directors |
|
|
2011 |
|
|
|
1 |
Service commenced on December 31, 2015 as a result of the merger between River Financial Corporation and Keystone Bancshares, Inc. and its subsidiaries. |
Below is certain information regarding our executive officers’ and directors’ individual experience, qualifications, attributes, and skills and brief statements of those aspects of our directors’ backgrounds that led us to conclude that they should serve as directors or executive officers.
Larry Puckett was one of the founding directors of River Bank & Trust in 2006, and was appointed as a Director and Chairman of the board of directors at that time. While Mr. Puckett currently remains as the Chairman of the board of directors, he is also the Dealer/Operator and President of Larry Puckett Chevrolet in Prattville, Alabama. Mr. Puckett serves on multiple business and non-profit boards, and is considered to be a valued member and successful business person in the automotive industry and his community.
W. Murray Neighbors was appointed as a Director and Vice Chairman of the board of directors in 2015 as a result of the merger effective December 31, 2015. Prior to the merger, Mr. Neighbors was one of the original Members of the Board of Directors and served as Chairman of the board of directors of Keystone Bancshares, Inc. and Keystone Bank in 2007. Mr. Neighbors is retired from the US Treasury Department, but remains an active developer of commercial and residential properties in Auburn, AL. He is managing member of WMN Properties, Member of P&T Properties (golf course and restaurant), member of ITC Capital Partners ,LLC, and member of CFS 16, LLC. Mr. Neighbors is also very active in his community as a member of the City of Auburn’s Commercial Development Authority, has served on the Business Development Committee for the Auburn Chamber of Commerce and as the Treasurer of the Lee County Rotary Club.
James M. Stubbs was one of the founding directors, President and Chief Executive Officer of River Bank & Trust in 2006. Mr. Stubbs was appointed as the Chief Executive Officer of River Financial Corporation and River Bank & Trust, effective with the merger on December 31, 2015. Mr. Stubbs has over twenty five years of commercial banking experience. Specifically, Mr. Stubbs served as a Vice President in the Consumer and Commercial Lending Departments of Aliant Bank from June 1986 through June 1997. Subsequently, he served as an Area President for Colonial Bank from June 1997 through February 2005, when he left to begin the formation of River Bank & Trust. Mr. Stubbs community involvement includes serving on numerous business and non-profit boards.
Gerald R. Smith, Jr. was appointed as a Director of the board of directors in 2015 as a result of the merger effective December 31, 2015. Mr. Smith was also appointed as President of River Financial Corporation and River Bank & Trust effective December 31, 2015. Prior to the merger, Mr. Smith was one of the founding directors of Keystone Bank in 2007, and served as Chief Executive Officer. Mr. Smith also brings 45 years of banking experience and a long history of community involvement in Gadsden, AL. Prior to forming Keystone Bank, Mr. Smith served as the Area Executive for North Alabama for The Bank with overall responsibility for offices in several cities. He also served as a Senior Banking Officer with The Bank overseeing loan operations and central loan underwriting.
Vernon B. Taylor was one of the founding directors of River Bank & Trust in 2006, and is currently serving as a Director of River Financial Corporation and River Bank & Trust. He has been in aviation for 28 years, and served as a pilot in the US Air Force. Mr. Taylor later founded and directed two aviation service companies based in the River Region. He serves on those boards and is an investor in local commercial real estate. Mr. Taylor is very active in the community while serving on several local boards.
88
Jimmy L. Ridling was one of the founding directors of River Bank & Trust in 2006, and was appointed as a Director and Vice Chairman of the board of directors at that time through 2015. While currently serving as a Director of River Financial Corporation and River Bank & Trust, Mr. Ridling has had a successful career in the insurance industry and brings a diverse background to the board while currently serving as Commissioner of the Alabama Department of Insurance. He was vice president of the U.S. operations of Firemen’s Fund Insurance, and then became President and Chief Executive Officer of Southern Guaranty. Mr. Ridling also served as Chairman of the Board of Directors for Jackson Hospital and the River Region United Way, a board member of the Montgomery Airport Authority, the Montgomery Area Chamber of Commerce, and the Central Alabama Community Foundation.
John A. Freeman was appointed as a Director of the board of directors in 2015 as a result of the merger effective December 31, 2015. Mr. Freeman is the President of Freeman Land Development, Inc, and has a long history as a community and civic leader in the Gadsden area. He also previously served as an Advisory Director of Superior Bank in Gadsden, AL.
Kenneth H. Givens has served as an Executive Vice President and Chief Financial Officer for River Bank & Trust and River Financial Corporation since 2011. Mr. Givens began his career in community bank accounting and financial management in 1974. He spent his first 8 years with First Alabama (Regions) Bank of Dothan as a Controller and the Human Resource Director, and then spent the next 29 years with Aliant Financial Corporation & Aliant Bank as the Chief Financial Officer, Executive Vice President and Director. Mr. Givens also served as an instructor at the Alabama Banking School from 1998 through the summer of 2014.
Board Size and Composition
Our registration statement filed on Form S-4 with the SEC and merger agreement approved by our shareholders, state that the board of directors will consist of 4 legacy Directors of River Financial Corporation and 3 legacy Directors of Keystone Bancshares, Inc. RB&T currently has 23 Directors total, but only 7 of those Directors serve on River Financial Corporation’s Board of Directors. Our directors are elected for a one-year term and hold office until their successors are duly elected and qualified, or until their earlier death, resignation or removal.
Director Independence
Our board of directors has determined that all of our directors are “independent directors,” as defined in NASDAQ Marketplace Rule 5605(a)(2), except Messrs. Stubbs and Smith, who are executive officers. In determining each director’s independence, our board of directors considered the services provided, and loan transactions between us or RB&T and the director or the director’s family members or businesses with which our directors or their family members are associated, and other matters that our board of directors deemed pertinent.
Audit/Compliance Committee
The Company’s board relies upon the audit committee of RB&T to perform the required duties under 12 C.F.R. § 363.5 for insured depository institutions, and the Alabama Banking Department’s policy on Audit and Risk Management Standards for Alabama, State Chartered Banks. These duties include the appointment, compensation and oversight of the independent public accountant who performs services under the FDICs Part 363, and reviewing with management and the independent public accountant the basis for the reports issued under Part 363. The current members of the Audit/Compliance Committee are Lynn Carter, Banks Herndon, Murray Neighbors, David Smith and David Thrasher. The Board of Directors of the Company and RB&T have determined that Murray Neighbors is a financial expert for purposes of the audit committee. Mr. Neighbors retired from a twenty-six year career in federal financial criminal investigations and management oversight where he served as the Director of Review and Program Evaluation for the Criminal Investigation Division of the U.S. Treasury Department. Mr. Neighbors is also an independent director.
Board of Directors’ Role in Risk Oversight
Our board of directors, as a whole and through its committees, has responsibility for the oversight of risk management. In its risk oversight role, our board of directors has the responsibility to satisfy itself that the risk management processes designed and implemented by management are adequate and functioning as designed. Our board of directors oversees an enterprise-wide approach to risk management, designed to support the achievement of organizational objectives, including strategic objectives, to improve long-term organizational performance and enhance stockholder value.
89
Additional Information Concerning Directors
Our directors serve one-year terms. With the exception of the legacy Keystone directors and executive officers, none of the directors or executive officers was selected pursuant to any arrangement or understanding, other than with our directors and executive officers acting within their capacities as such. Under the terms of our merger agreement with Keystone, our bylaws provide that the legacy Keystone directors, or persons nominated by them will serve until the fourth anniversary of the effective date of the Keystone merger. There are no family relationships among our directors and executive officers. None of our directors or executive officers serves as a director of any other company that has a class of securities registered under, or that is subject to the periodic reporting requirements of, the Exchange Act, or any investment company registered under the Investment Company Act of 1940. None of our directors or executive officers has been involved in any legal proceedings during the past 10 years that are material to an evaluation of the ability or integrity of any of our directors or executive officers or in which such director or officer had or has a material interest adverse to us or any of our subsidiaries. The principal occupation and employment during the past five years of each of our directors and executive officers was carried on, in each case except as specifically identified above, with a corporation or organization that is not a parent, subsidiary or other affiliate of us. The stock ownership with respect to each of our directors and executive officers is set forth in the table entitled “Security Ownership of Certain Beneficial Owners and Management” under Item 12 below.
Code of Business Conduct and Ethics
We have adopted a Code of Business Conduct and Ethics (“Code”) that all of the bank’s employees, officers and directors must abide by. The Code is approved on an annual basis, and a receipt of acknowledgment and understanding of the Code is required annually by the directors of the board and all bank employees. We will provide, free of charge, a copy of our code to any person upon request made in writing to Rebecca Hallman, AVP Investor Relations/HR Director, P.O. Box 680249, Prattville, Alabama 36068, or by email, rhallman@riverbankandtrust.com.
Item 11. Executive Compensation
Compensation of Executive Officers
Our executive compensation program is designed to attract, motivate, and retain high-quality leadership and incentivize our executive officers to achieve performance goals over the short- and long-term, which also aligns the interests of our executive officers with our stockholders. The following discussion relates to the compensation of our Chief Executive Officer (CEO), Jimmy Stubbs, our President, Gerald R. Smith, Jr., and our Chief Financial Officer (CFO), Kenneth H. Givens, who are collectively referred to herein as our named executive officers of River Financial Corporation. Our Executive Committee and board of directors has historically reviewed and determined the compensation of our named executive officers on an annual basis.
Elements of Executive Compensation
We do not currently have employment agreements with any of our executive officers. The compensation of our named executive officers presently consists of base salary, equity awards, non-equity incentive compensation, and certain other benefits, as further described below.
Base Salaries: Base salaries for our named executive officers are determined based on each officer’s responsibilities, experience, and contributions to our growth, individual performance, Company performance, and general industry conditions.
Equity Awards. Our named executive officers participate in the 2006 & 2015 Incentive Stock Compensation Plan. See plan details on the following page. Grants of equity to our named executive officers under the Incentive Plan have consisted of option awards. These grants provide our named executive officers with the appropriate incentives to continue in our employ and to improve our growth and profitability, serve to align the interests of our named executive officers with our stockholders, and reward our named executive officers for improved Company performance. Any grant recommendations are presented to the Stock Option Committee for approval, and then presented to the full board through an Executive Session for approval.
Non-Equity Incentive Compensation. Our named executive officers are also eligible to receive an annual cash bonus as a percentage of base salary based on our net income during the year, relative to our budgeted expectations for the year. Any bonus payout recommendations are presented to the Executive Compensation Committee for approval, and then presented to the full board through an Executive Session for approval.
90
Other Employee Benefits. We provide the following additional benefits to our named executive officers on the same basis as all other eligible employees:
|
• |
Company-sponsored healthcare plans, including coverage for medical, dental, vision and gap insurance benefits; |
|
• |
a qualified 401(k) employee stock ownership plan with a matching contribution; and |
|
• |
payment of life, accidental death and dismemberment, and long term disability insurance premiums. |
Summary Compensation Table
The following table sets forth, for the years ended December 31, 2017 and December 31, 2016, a summary of the compensation paid to or earned by our named executive officers from the Company.
|
|
|
|
|
|
|
|
|
|
|
|
|
Non-Equity |
|
|
|
|
|
|
|
|
|
|
|
|
|
|
|
|
|
|
|
Option (2) |
|
|
Incentive Plan |
|
|
All Other (3) |
|
|
|
|
|
|||
|
Name and Principal Position (1) |
|
Year |
|
Salary ($) |
|
|
Awards ($) |
|
|
Compensation ($) |
|
|
Compensation ($) |
|
|
Total ($) |
|
|||||
|
James M. Stubbs |
|
2017 |
|
$ |
258,103 |
|
|
$ |
- |
|
|
$ |
82,500 |
|
|
$ |
17,295 |
|
|
$ |
357,898 |
|
|
Chief Executive Officer |
|
2016 |
|
$ |
212,266 |
|
|
$ |
65,160 |
|
|
$ |
106,121 |
|
|
$ |
13,549 |
|
|
$ |
397,096 |
|
|
Gerald R. Smith, Jr |
|
2017 |
|
$ |
239,615 |
|
|
$ |
- |
|
|
$ |
73,500 |
|
|
$ |
18,710 |
|
|
$ |
331,825 |
|
|
President |
|
2016 |
|
$ |
221,738 |
|
|
$ |
52,128 |
|
|
$ |
90,000 |
|
|
$ |
18,909 |
|
|
$ |
382,775 |
|
|
Kenneth Givens |
|
2017 |
|
$ |
190,499 |
|
|
$ |
- |
|
|
$ |
39,000 |
|
|
$ |
20,355 |
|
|
$ |
249,854 |
|
|
Chief Financial Officer |
|
2016 |
|
$ |
178,284 |
|
|
$ |
24,435 |
|
|
$ |
71,313 |
|
|
$ |
17,939 |
|
|
$ |
291,971 |
|
|
(1) |
Post-merger effective December 31, 2015, Mr. Stubbs holds the position of Chief Executive Officer and Mr. Gerald Ray Smith, Jr. now holds the position of President for both River Bank & Trust and River Financial Corporation. Mr. Givens remains as the Chief Financial Officer for both River Bank & Trust and River Financial Corporation. |
|
(2) |
Represents the grant date fair value of options and warrants calculated in accordance with FASB Topic 718 as set forth in footnote 1 of River Financial’s financial statements. |
|
(3) |
All other compensation: |
|
|
a. |
All other compensation for Mr. Stubbs in 2017 includes life insurance / accidental death & dismemberment ($978), long term disability ($264), company vehicle ($1,887), and company match on the 401(K) ($14,166). |
|
|
b. |
All other compensation for Mr. Stubbs in 2016 includes life insurance / accidental death & dismemberment ($936), long term disability ($264), company vehicle ($1,965), and company match on the 401(K) ($10,384). |
|
|
c. |
All other compensation for Mr. Smith in 2017 includes medical insurance ($6,782), gap insurance ($1,605), life insurance/accidental death & dismemberment ($978), long term disability ($264), company vehicle ($2,275), and company match on the 401(K) ($6,806). |
|
|
d. |
All other compensation for Mr. Smith in 2016 includes medical insurance ($7,039), gap insurance ($1,143), life insurance/accidental death & dismemberment ($936), long term disability ($264), company vehicle ($692), and company match on the 401(K) ($8,835). |
|
|
e. |
All other compensation for Mr. Givens in 2017 includes medical insurance ($7,330), gap insurance ($1,308), life insurance / accidental death & dismemberment ($978), long term disability ($264), and company match on the 401(K) ($10,475). |
|
|
f. |
All other compensation for Mr. Givens in 2016 includes medical insurance ($7,039), gap insurance ($1,143), life insurance / accidental death & dismemberment ($936), long term disability ($264), and company match on the 401(K) ($8,557). |
91
2006 & 2015 Incentive Stock Compensation Plans
General. The 2015 Incentive Stock Compensation (“Incentive Plan”) Plan was approved by our stockholders at a special called meeting on December 1, 2015. The purpose of the Incentive Plan is to promote the long-term success of the Company by providing financial incentives to eligible persons who are in positions to make significant contributions toward such success. The Plan is designed to attract individuals of outstanding ability to employment with the Company, to encourage such persons to acquire a proprietary interest in the Company, and to render superior performance for the Company. The 2015 Incentive Plan provides for the grant of incentive and non-qualified stock options, stock appreciation rights, restricted and unrestricted stock awards, performance awards, and other stock-based awards to our employees, officers, and directors. The 2015 Incentive Plan reserved for issuance a total of 300,000 shares of our common stock, and the 2006 Incentive Plan reserved for issuance a total of 375,000 shares of our common stock, subject to adjustment in the event of a recapitalization, stock split or similar event. As of March 1, 2018, 246,625 shares of our common stock were subject to outstanding options under the 2006 and 2015 Incentive Plans and 177,500 additional shares of our common stock were reserved for issuance under the 2015 Incentive Plan. The 2006 Incentive Plan expired on April 3, 2016.
Administration of the Incentive Plan. The Incentive Plan provides that it will be administered by the Compensation Committee, which has the authority to grant awards under the Incentive Plan, to determine the terms of each award (which are evidenced by a written agreement describing the material terms of the award), to interpret the provisions of the Incentive Plan and to make all other determinations that it may deem necessary or advisable to administer the Incentive Plan.
Types of Awards Available Under the Incentive Plan.
|
|
• |
Options – The Incentive Plan provides for awards in the form of options to purchase shares of our common stock, either as incentive stock options qualified under Section 422 of the Code or options that are not so qualified (referred to as non-qualified stock options). The exercise price of an option may not be less than 100% of the fair market value of our common stock on the date of the grant. The exercise price may be paid in cash, or as otherwise provided in the award agreement. |
|
|
• |
Stock Appreciation Rights – The Incentive Plan provides for the grant of stock appreciation rights. The base price of a stock appreciation right may not be less than 100% of the fair market value of our common stock on the date of the grant. The consideration payable upon exercise of a stock appreciation right will be paid in cash, shares of our common stock, or a combination of cash and shares of our common stock, as determined by the Committee. |
|
|
• |
Stock Awards – The Incentive Plan provides for the grant of restricted or unrestricted stock awards, or restricted stock units (RSU). Stock awards may be issued for any lawful consideration as the Committee may determine, and the consideration may be in the form of services performed, or may be paid in cash, shares of our common stock, or a combination of cash and shares of our common stock, as determined in the sole discretion of the Committee. |
|
|
• |
Performance Awards – The Incentive Plan provides for the grant of performance awards that become payable on account of attainment of one or more performance goals established by the Committee. Performance awards may be settled in cash, shares of our common stock, or a combination of cash and our common stock, as determined in the sole discretion of the Committee. Performance goals established by the Committee may be based on our or an affiliate’s operating income or one or more other business criteria selected by the Committee that apply to an individual or group of individuals, a business unit, or us or an affiliate as a whole, over such performance period as the Committee may designate. |
Vesting. The Committee has the authority to determine the vesting schedule applicable to each award, and to accelerate the vesting or exercisability of any award.
Change in Control Transactions. In the event of any transaction resulting in a change in control, outstanding stock options and other awards under the Incentive Plan that are payable in or convertible into our common stock will terminate upon the effective time of such change in control unless provision is made in connection with the transaction for the continuation or assumption of such awards by, or for the substitution of the equivalent awards of, the surviving or successor entity or a parent thereof. In the event of such termination, the holders of such awards will be permitted, immediately before the change in control, to exercise or convert all portions of such awards that are then exercisable or convertible or that will become exercisable or convertible upon or prior to the effective time of the change in control. The Committee may take such actions as it deems appropriate to provide for the acceleration of the exercisability of any or all outstanding stock options or other awards.
Adjustments for Other Corporate Transactions. In the event of certain corporate transactions (including a stock dividend or split, spin-off, split-up, dividend, recapitalization, merger, consolidation or share exchange, or similar corporate change that is not part of a transaction resulting in a change in control of us), the Committee will appropriately adjust, if needed, (a) the maximum number and kind of shares reserved for issuance or with respect to which awards may be granted under the Incentive Plan and (b) the terms of outstanding awards, including, but not limited to, the number, kind, and price of securities subject to such awards.
92
Termination and Amendment. Our board of directors may terminate, amend, or modify the Incentive Plan or any portion thereof at any time; provided, however, that (i) any such amendment that would require shareholder approval in order to ensure compliance with any applicable rules or regulations; and (ii) any amendment that would change the maximum aggregate number of shares for which Awards may be granted under the Plan (except as required under any adjustments pursuant to Sections 1.03 and 4.01 of the Plan), shall be subject to approval of the shareholders of the Company.
Outstanding Equity Awards at 2017 Fiscal Year-End
The following table sets forth information as of December 31, 2017, concerning outstanding equity awards previously granted to our named executive officers:
|
|
|
OUTSTANDING EQUITY AWARDS AT FISCAL YEAR-END |
||||||||||||
|
|
|
Option / Warrant awards |
||||||||||||
|
Name |
|
Number of securities underlying unexercised options (#) exercisable |
|
|
Number of securities underlying unexercised options (#) unexerciseable (1) |
|
|
Option exercise price ($) |
|
|
Option expiration date |
|||
|
James Stubbs |
|
|
7,500 |
|
|
|
- |
|
|
$ |
13.00 |
|
|
1/15/2019 |
|
|
|
|
10,000 |
|
|
|
- |
|
|
$ |
13.50 |
|
|
1/15/2020 |
|
|
|
|
8,000 |
|
|
|
2,000 |
|
|
$ |
12.47 |
|
|
3/13/2023 |
|
|
|
|
4,000 |
|
|
|
6,000 |
|
|
$ |
15.00 |
|
|
1/14/2025 |
|
|
|
|
8,000 |
|
|
|
32,000 |
|
|
$ |
16.00 |
|
|
1/20/2026 |
|
|
|
|
37,500 |
|
|
|
40,000 |
|
|
|
|
|
|
|
|
|
|
|
|
|
|
|
|
|
|
|
|
|
|
|
|
Ray Smith |
|
|
6,400 |
|
|
|
25,600 |
|
|
$ |
16.00 |
|
|
1/20/2026 |
|
|
|
|
6,400 |
|
|
|
25,600 |
|
|
|
|
|
|
|
|
|
|
|
|
|
|
|
|
|
|
|
|
|
|
|
|
Kenneth Givens |
|
|
20,000 |
|
|
|
- |
|
|
$ |
13.60 |
|
|
2/1/2022 |
|
|
|
|
4,000 |
|
|
|
1,000 |
|
|
$ |
12.47 |
|
|
3/13/2023 |
|
|
|
|
2,000 |
|
|
|
3,000 |
|
|
$ |
15.00 |
|
|
1/14/2025 |
|
|
|
|
3,000 |
|
|
|
12,000 |
|
|
$ |
16.00 |
|
|
1/20/2026 |
|
|
|
|
29,000 |
|
|
|
16,000 |
|
|
|
|
|
|
|
|
|
|
|
|
|
|
|
|
|
|
|
|
|
|
|
|
(1) |
Unexerciseable options are subject to time-vesting requirements. |
Retirement Benefits
We maintain a tax-qualified 401(k) Employee Stock Ownership Plan, or the “KSOP”, in which our named executive officers participate, as well as any other eligible employees. The Plan allows participants to contribute up to 100% of their pay on a pre-tax basis into individual retirement accounts, subject to the maximum annual limits set by the IRS. However, no more than 50% of the participant’s contribution can be invested in the company stock. The Company’s matching employer contribution is in an amount equal to100% of the first 3% and 50% up to the next 2% of each plan participant’s elective deferrals. The employer’s matching contributions are currently 100% invested in company stock, and are immediately 100% vested in order to maintain “safe harbor” status.
93
Fees. River Financial Corporation Directors received a director’s fee of $11,000 in 2017 and none in 2016. The following table shows fees paid to those persons who were directors in 2017.
|
|
DIRECTOR COMPENSATION |
|
||||||||||||
|
Name |
|
Year |
|
Fees earned or paid in cash ($) |
|
|
Stock Awards ($) |
|
All Other Compensation |
|
Total ($) |
|
||
|
Larry Puckett |
|
2017 |
|
$ |
11,000 |
|
|
N/A |
|
N/A |
|
$ |
11,000 |
|
|
James M. Stubbs |
|
2017 |
|
$ |
11,000 |
|
|
N/A |
|
N/A |
|
$ |
11,000 |
|
|
Jimmy L. Ridling |
|
2017 |
|
$ |
11,000 |
|
|
N/A |
|
N/A |
|
$ |
11,000 |
|
|
Lynn M. Carter |
|
2017 |
|
$ |
11,000 |
|
|
N/A |
|
N/A |
|
$ |
11,000 |
|
|
Charles E. Herron |
|
2017 |
|
$ |
11,000 |
|
|
N/A |
|
N/A |
|
$ |
11,000 |
|
|
Jerry C. Kyser, Jr. |
|
2017 |
|
$ |
11,000 |
|
|
N/A |
|
N/A |
|
$ |
11,000 |
|
|
David R. Thrasher |
|
2017 |
|
$ |
11,000 |
|
|
N/A |
|
N/A |
|
$ |
11,000 |
|
|
R. Shepherd Morris |
|
2017 |
|
$ |
11,000 |
|
|
N/A |
|
N/A |
|
$ |
11,000 |
|
|
Bolling P. Starke, III |
|
2017 |
|
$ |
11,000 |
|
|
N/A |
|
N/A |
|
$ |
11,000 |
|
|
David B. Smith |
|
2017 |
|
$ |
11,000 |
|
|
N/A |
|
N/A |
|
$ |
11,000 |
|
|
Vernon B. Taylor |
|
2017 |
|
$ |
11,000 |
|
|
N/A |
|
N/A |
|
$ |
11,000 |
|
|
Dorothy Sanford |
|
2017 |
|
$ |
11,000 |
|
|
N/A |
|
N/A |
|
$ |
11,000 |
|
|
Adolph Weil, III |
|
2017 |
|
$ |
11,000 |
|
|
N/A |
|
N/A |
|
$ |
11,000 |
|
|
Gerald R. Smith, Jr |
|
2017 |
|
$ |
11,000 |
|
|
N/A |
|
N/A |
|
$ |
11,000 |
|
|
Banks Herndon |
|
2017 |
|
$ |
11,000 |
|
|
N/A |
|
N/A |
|
$ |
11,000 |
|
|
Boles Pegues |
|
2017 |
|
$ |
11,000 |
|
|
N/A |
|
N/A |
|
$ |
11,000 |
|
|
Howard J. Porter, Jr. |
|
2017 |
|
$ |
11,000 |
|
|
N/A |
|
N/A |
|
$ |
11,000 |
|
|
John A. Freeman |
|
2017 |
|
$ |
11,000 |
|
|
N/A |
|
N/A |
|
$ |
11,000 |
|
|
John Gittings |
|
2017 |
|
$ |
11,000 |
|
|
N/A |
|
N/A |
|
$ |
11,000 |
|
|
John Y. Reynolds |
|
2017 |
|
$ |
11,000 |
|
|
N/A |
|
N/A |
|
$ |
11,000 |
|
|
Jonathan Traylor |
|
2017 |
|
$ |
11,000 |
|
|
N/A |
|
N/A |
|
$ |
11,000 |
|
|
Lucian Newman |
|
2017 |
|
$ |
11,000 |
|
|
N/A |
|
N/A |
|
$ |
11,000 |
|
|
W. Murray Neighbors |
|
2017 |
|
$ |
11,000 |
|
|
N/A |
|
N/A |
|
$ |
11,000 |
|
Change in Control Agreements
River Bank & Trust has change in control agreements with Jimmy Stubbs, Chief Executive Officer, Gerald R. Smith, President, and Kenneth H. Givens, Executive Vice President and Chief Financial Officer, and five other executive officers of the bank. Mr. Stubbs’ and Mr. Smith’s agreements are for a term of 36 months and renew annually, and the agreements for all other executive officers are for 24 months and renew annually.
The agreements define a “change in control” as (a) a change in control as defined by the bank’s primary federal bank regulator; (b) a merger or business combination or contested election where non-employee directors cease to be a majority of directors; (c) the bank transfers all or substantially all of its assets to another entity which is not an affiliate of the bank; (d) the bank is merged with another corporation or entity and less than 60% of the equity interest in the surviving corporation is owned by former shareholders of the bank; or (3) the bank sells or transfers more than 50% of its equity interest to persons not affiliated with the bank.
Except for Mr. Stubbs and Mr.Smith, the agreements are “double trigger” agreements, which means that the employee receives benefits only if there is a change in control, and either an employee terminates employment for “good reason,” which includes a material diminution in employee’s authority, duties or responsibilities, or salary, or there is a relocation of employee’s principal place of business to a location outside a radius of 35 miles of employee’s principal place of business at the time of the change in control.
Except for Mr. Stubbs and Mr. Smith, if within two years after a change in control, an employee resigns for good reason or is terminated other than for cause, the employee will receive insurance and health benefits for 18 months plus a lump sum cash payment equal to 1.5 times employee’s base amount of compensation.
Mr. Stubbs’ and Mr. Smith’s agreements provide that upon a change in control, each person shall receive a lump sum cash payment equal to 2.99 times the base amount of compensation and if employment is terminated within three years after a change in control, each person will continue to receive health and insurance benefits for 36 months.
94
If an employee is terminated for cause, as defined in the agreements, or resigns prior to a change in control, the employee receives no compensation or benefits from the agreement.
Item 12. Security Ownership of Certain Beneficial Owners and Management and Related Stockholder Matters.
Security Ownership of Certain Beneficial Owners and Management
The following table sets forth certain information regarding the beneficial ownership of our common stock as of March 1, 2018 by:
|
|
• |
each of our directors; |
|
|
• |
our Named Executive Officers listed in the Summary Compensation Table; |
|
|
• |
all of our current directors and executive officers as a group; and |
|
|
• |
each stockholder known by us to beneficially own more than 5% of our common stock |
Beneficial ownership is determined in accordance with the rules of the SEC and includes voting or investment power with respect to the securities. Shares of common stock that may be acquired by an individual or group within 60 days of March 1, 2018, pursuant to derivative securities, such as options or RSUs, are deemed to be outstanding for the purpose of computing the percentage ownership of such individual or group, but are not deemed to be outstanding for the purpose of computing the percentage ownership of any other person shown in the table. Percentage of ownership is based on an aggregate of 5,119,818 shares of common stock outstanding as of March 1, 2018.
Except as indicated in footnotes to the this table, we believe that the stockholders named in this table have sole voting and investment power with respect to all shares of common stock shown to be beneficially owned by them, based on information provided to us by such stockholder.
|
Name of Beneficial Owner |
|
Amount and Nature of Beneficial Ownership |
|
|
|
Percentage of Outstanding Shares(1) |
|
||
|
Named Directors & Executive Officers |
|
|
|
|
|
|
|
|
|
|
Larry Puckett |
|
|
125,697 |
|
|
|
|
2.46 |
% |
|
Jim Ridling |
|
|
94,952 |
|
|
|
|
1.85 |
% |
|
Vernon B Taylor |
|
|
112,620 |
|
|
|
|
2.20 |
% |
|
James M Stubbs |
|
|
164,214 |
|
(2) |
|
|
3.21 |
% |
|
Gerald R Smith, Jr |
|
|
74,050 |
|
(3) |
|
|
1.45 |
% |
|
W. Murray Neighbors |
|
|
46,044 |
|
|
|
|
0.90 |
% |
|
John A. Freeman |
|
|
21,269 |
|
|
|
|
0.42 |
% |
|
Kenneth H. Givens |
|
|
33,000 |
|
(4) |
|
|
0.64 |
% |
|
|
|
|
|
|
|
|
|
|
|
|
Executive Officers and Directors as a Group |
|
|
671,846 |
|
|
|
|
13.12 |
% |
|
5% Stockholders known by us |
|
N/A |
|
|
|
|
|
|
|
|
(1) |
Based upon total outstanding shares as of March 1, 2018. Percentages are calculated for each person assuming the exercise of options or warrants held by such person but that no other person exercises options or warrants. For the directors and executive officers as a group, the percentage is determined by assuming that each director and executive officer exercises all options and warrants but that no other person exercises options or warrants. |
|
(2) |
James M. Stubbs’ ownership includes 47,500 vested options not yet exercised. |
|
(3) |
Gerald R. Smith, Jr.’s ownership includes 12,800 vested options not yet exercised. |
|
(4) |
Kenneth H. Givens’ ownership solely represents 25,000 vested options not yet exercised. |
95
Item 13. Certain Relationships and Related Transactions, and Director Independence
Banking Transactions
We and our subsidiaries may engage in transactions with directors, officers, employees, and other “related parties” only to the extent that such activities are permitted by, and consistent with, applicable laws and regulations. Federal and state regulations impose a number of restrictions on transactions and dealings between insured depository institutions and related parties. In general, these transactions are subject to certain quantitative limitations and are required to be on substantially the same terms and conditions as are available for transactions between the institution and unrelated parties. “Related parties” include our directors and officers, their spouses, and certain members of their immediate families, as well as other persons or entities with which we have certain relationships, as set forth in federal and state regulations.
We have had in the past, and expect to have in the future, banking transactions in the ordinary course of business with our directors, officers, and principal stockholders, and their associates, on substantially the same terms, including interest rates and collateral, as those prevailing at the same time for comparable transactions with unrelated parties. Such transactions are not expected to involve more than the normal risks of collectability nor present other unfavorable features to us. Loans to individual directors and officers must also comply with our lending policies and statutory lending limits.
Item 14. Principal Accountant Fees and Services
During the period covering the fiscal years ended December 31, 2017 and 2016, Mauldin & Jenkins, LLC performed the following professional services. The retention of Mauldin & Jenkins, LLC was approved in advance by the audit committee. In accordance with the Company’s audit committee procedures, the audit committee approved the retention of the independent accountants, the length of its engagement, and the services performed.
|
Description |
|
2017 |
|
|
2016 |
|
||
|
Audit Fees |
|
$ |
115,262 |
|
|
$ |
122,737 |
|
|
Audit-Related Fees |
|
$ |
- |
|
|
$ |
- |
|
|
Tax Fees |
|
$ |
- |
|
|
$ |
- |
|
|
All Other Fees |
|
$ |
- |
|
|
$ |
- |
|
96
The following is an index of exhibits including items incorporated by reference:
|
Exhibit Number |
|
Description of Exhibit |
|
|
|
|
|
|
||
|
|
|
|
|
|
||
|
|
|
|
|
|
||
|
|
|
|
|
4.1 |
|
Article IV and Article V of the Articles of Incorporation, as amended, included at Exhibit 3.1 above and Article II and Article VI of the bylaws, as amended, included as Exhibit 3.2 above, and incorporated herein by reference. |
|
|
|
|
|
|
||
|
|
|
|
|
|
||
|
|
|
|
|
|
||
|
|
|
|
|
|
||
|
|
|
|
|
|
||
|
|
|
|
|
|
||
|
|
|
|
|
|
||
|
|
|
|
|
|
||
|
|
|
|
|
|
||
|
|
|
|
|
|
||
|
|
|
|
|
|
||
|
|
|
|
|
|
||
|
|
|
|
|
|
||
|
|
|
|
|
|
||
|
|
|
|
|
|
||
|
|
|
|
|
|
||
|
|
|
|
|
101 |
|
Interactive Data Files |
97
Pursuant to the requirements of Section 13 or 15(d) the Securities Exchange Act of 1934 the registrant has duly caused this annual report on Form 10-K to be signed on its behalf by the undersigned, thereunto duly authorized, in the City of Prattville, State of Alabama, on March 20, 2018.
|
RIVER FINANCIAL CORPORATION |
||
|
|
|
|
|
By: |
|
/s/ James M. Stubbs |
|
|
|
James M. Stubbs |
|
|
|
Chief Executive Officer |
|
|
|
(Duly Authorized Representative) |
Pursuant to the requirements of the Securities Exchange Act of 1994, this report has been signed by the following persons on behalf of the registrant and in the capacities on the dates indicated.
|
/s/ James M. Stubbs |
|
CEO and Director |
|
* |
|
James M. Stubbs |
|
|
|
|
|
|
|
|
|
|
|
/s/ Kenneth H. Givens |
|
Chief Financial Officer |
|
* |
|
Kenneth H. Givens |
|
(Principal Financial and Accounting Officer) |
|
|
|
|
|
|
|
|
|
/s/ Larry Puckett |
|
Director and Chairman of the Board |
|
* |
|
Larry Puckett |
|
|
|
|
|
|
|
|
|
|
|
/s/ W. Murray Neighbors |
|
Director and Vice Chairman of the Board |
|
* |
|
W. Murray Neighbors |
|
|
|
|
|
|
|
|
|
|
|
/s/ Gerald R. Smith |
|
Director and President |
|
* |
|
Gerald R. Smith |
|
|
|
|
|
|
|
|
|
|
|
/s/ Vernon B. Taylor |
|
Director |
|
* |
|
Vernon B. Taylor |
|
|
|
|
|
|
|
|
|
|
|
/s/ Jimmy L. Ridling |
|
Director |
|
* |
|
Jimmy L. Ridling |
|
|
|
|
|
|
|
|
|
|
|
/s/ John A. Freeman |
|
Director |
|
* |
|
John A. Freeman |
|
|
|
|
|
|
|
|
|
|
|
|
|
|
|
|
|
* March 20, 2018 |
|
|
|
|
98