UNITED STATES SECURITIES AND EXCHANGE COMMISSION
WASHINGTON, D.C. 20549
FORM
or
For the fiscal year ended
Commission file number
(Exact name of Registrant as specified in its charter)
N/A
(Translation of Registrant’s name into English (if applicable))
(Province or other jurisdiction of incorporation or organization)
6500
(Primary Standard Industrial Classification Code Number (if applicable))
N/A
(I.R.S. Employer Identification Number (if applicable))
(Address and telephone number of Registrant’s principal executive offices)
(Name, address (including zip code) and telephone number (including area code) of agent for service in the United States)
Securities registered or to be registered pursuant to Section 12(b) of the Act:
Title of each class | Trading Symbol | Name of each exchange on which registered |
| | Toronto Stock Exchange |
Securities registered or to be registered pursuant to Section 12(g) of the Act: None
Securities for which there is a reporting obligation pursuant to Section 15(d) of the Act: None
For annual reports, indicate by check mark the information filed with this Form:
Indicate the number of outstanding shares of each of the issuer’s classes of capital or common stock as of the close of the period covered by the annual report:
Indicate by check mark whether the Registrant (1) has filed all reports required to be filed by Section 13 or 15(d) of the Exchange Act during the preceding 12 months (or for such shorter period that the Registrant was required to file such reports) and (2) has been subject to such filing requirements for the past 90 days.
☒
Indicate by check mark whether the registrant has submitted electronically every Interactive Data File required to be submitted pursuant to Rule 405 of Regulation S-T (§232.405 of this chapter) during the preceding 12 months (or for such shorter period that the Registrant was required to submit such files).
☒
Indicate by check mark whether the registrant is an emerging growth company as defined in Rule 12b-2 of the Exchange Act.
Emerging growth company
If an emerging growth company that prepares its financial statements in accordance with U.S. GAAP, indicate by check mark if the registrant has elected not to use the extended transition period for complying with any new or revised financial accounting standards provided pursuant to Section 13(a) of the Exchange Act. ☐
Indicate by check mark whether the registrant has filed a report on and attestation to its management’s assessment of the effectiveness of its internal control over financial reporting under Section 404(b) of the Sarbanes-Oxley Act (15 U.S.C. 7262(b)) by the registered public accounting firm that prepared or issued its audit report.
If securities are registered pursuant to Section 12(b) of the Act, indicate by check mark whether the financial statements of the registrant included in the filing reflect the correction of an error to previously issued financial statements.
Indicate by check mark whether any of those error corrections are restatements that required a recovery analysis of incentive-based compensation received by any of the registrant’s executive officers during the relevant recovery period pursuant to §240.10D-1(b). ☐
PRINCIPAL DOCUMENTS
The following documents have been filed as part of this Annual Report on Form 40-F:
A. Annual Information Form
For the Registrant’s Annual Information Form for the year ended December 31, 2023, see Exhibit 1 of this Annual Report on Form 40-F.
B. Audited Annual Financial Statements
For the Registrant’s audited consolidated financial statements as at December 31, 2023 and 2022 and for the years ended December 31, 2023 and 2022 and the related notes, Management's Annual Report on Internal Control over Financial Reporting and the Report of Independent Registered Public Accounting Firm, see Exhibit 2 of this Annual Report on Form 40-F.
C. Management’s Discussion and Analysis
For the Registrant’s management’s discussion and analysis for the year ended December 31, 2023, see Exhibit 3 of this Annual Report on Form 40-F.
DISCLOSURE CONTROLS AND PROCEDURES
The Registrant’s Chief Executive Officer and Chief Financial Officer have evaluated the effectiveness of the Registrant’s disclosure controls and procedures (as defined in Rules 13a-15(e) and 15d-15(e) of the Securities Exchange Act of 1934, as amended (the “Exchange Act”)) as of the end of the period covered by this annual report (the “Evaluation Date”). Based on that evaluation, the Chief Executive Officer and Chief Financial Officer have concluded that, as of the Evaluation Date, the Registrant’s disclosure controls and procedures were effective to ensure that information required to be disclosed by the Registrant in reports that it files or submits under the Exchange Act is (i) recorded, processed, summarized and reported within the time periods specified in the rules and forms of the Securities and Exchange Commission (the “SEC”) and (ii) accumulated and communicated to the Registrant’s management, including its Chief Executive Officer and Chief Financial Officer, as appropriate, to allow timely decisions regarding required disclosure.
MANAGEMENT’S ANNUAL REPORT ON INTERNAL CONTROL OVER FINANCIAL REPORTING
Management is responsible for establishing and maintaining adequate internal control over financial reporting for the Registrant. Internal control over financial reporting is a process designed to provide reasonable assurance regarding the reliability of financial reporting and the preparation of financial statements for external purposes in accordance with generally accepted accounting principles.
Due to its inherent limitations, internal control over financial reporting may not prevent or detect misstatements. Also, projections of any evaluation of its effectiveness to future periods are subject to the risk that controls may become inadequate because of changes in conditions, or that the degree of compliance with the policies or procedures may deteriorate.
Management has excluded twelve majority-owned entities acquired by the Registrant during the last fiscal period from its assessment of internal control over financial reporting as at December 31, 2023. The total assets and total revenues of the twelve majority-owned entities represent 4.8% and 2.6%, respectively, of the related consolidated financial statement amounts as at and for the year ended December 31, 2023.
Management has assessed the effectiveness of the Registrant’s internal control over financial reporting as of December 31, 2023, based on the criteria set forth in Internal Control – Integrated Framework (2013) issued by the Committee of Sponsoring Organizations of the Treadway Commission. Based on this assessment, management has concluded that the Registrant’s internal control over financial reporting was effective as of December 31, 2023.
The effectiveness of the Registrant’s internal control over financial reporting as of December 31, 2023 has been audited by PricewaterhouseCoopers LLP, the Registrant’s independent registered public accounting firm (PCAOB Firm ID: 271), as stated in their report filed in Exhibit 2 of this Annual Report on Form 40-F.
CHANGES IN INTERNAL CONTROL OVER FINANCIAL REPORTING
During the year ended December 31, 2023, there were no changes in the Registrant’s internal control over financial reporting that have materially affected, or are reasonably likely to materially affect, the Registrant’s internal control over financial reporting.
NOTICES PURSUANT TO REGULATION BTR
There were no notices required by Rule 104 of Regulation BTR that the Registrant sent during the year ended December 31, 2023 concerning any equity security subject to a blackout period under Rule 101 of Regulation BTR.
AUDIT COMMITTEE FINANCIAL EXPERT
The Registrant’s board of directors (the “Board of Directors”) has determined that it has at least one audit committee financial expert (as such term is defined in item 8(a) of General Instruction B to Form 40-F) serving on its audit committee (the “Audit Committee”). Ms. Joan Sproul has been determined by the Board of Directors to be such audit committee financial expert and is independent (as such term is defined by the NASDAQ Stock Market’s corporate governance standards applicable to the Registrant).
Ms. Sproul was most recently the Executive Vice President, Finance (CFO) & Chief Administrative Officer of the Sinai Health System in Toronto, Canada. In addition to serving more than 20 years in various finance and corporate-related roles at Mount Sinai Hospital, she previously held a number of senior financial positions in the hospitality industry. Ms. Sproul was named to the list of Canada's Most Powerful Women, Women's Executive Network, 2013. Ms. Sproul holds a Chartered Professional Accountant (CPA) designation, having qualified as a Chartered Accountant in 1981 and began her career at Ernst & Whinney. Ms. Sproul holds a Bachelor of Commerce degree from the University of Toronto.
The SEC has indicated that the designation of Ms. Joan Sproul as an audit committee financial expert does not make her an “expert” for any purpose, impose on her any duties, obligations or liability that are greater than the duties, obligations or liability imposed on her as a member of the Audit Committee and the Board of Directors in absence of such designation, or affect the duties, obligations or liability of any other member of the Audit Committee or Board of Directors.
CODE OF ETHICS
The Registrant has adopted a Code of Ethics and Conduct that applies to all directors, officers and employees of the Registrant and its subsidiaries, and a Financial Management Code of Ethics, which applies to senior management and senior financial and accounting personnel of the Registrant and its subsidiaries. A copy of the Code of Ethics and Conduct and the Financial Management Code of Ethics can be obtained, free of charge, on the Registrant’s website (www.firstservice.com) or by contacting the Registrant at (416) 960-9566.
PRINCIPAL ACCOUNTANT FEES AND SERVICES
The following table sets out the fees billed to the Registrant by PricewaterhouseCoopers LLP for professional services rendered for the fiscal period ended December 31, 2023 and 2022. During this period, PricewaterhouseCoopers LLP was the Registrant’s only external auditor.
(in thousands of US$) |
Year ended December 31, 2023 |
Year ended December 31, 2022 |
||||||
Audit fees (note 1) |
$ | 1,160 | $ | 1,065 | ||||
Audit-related fees (note 2) |
64 | 65 | ||||||
Tax fees (note 3) |
317 | 36 | ||||||
All other fees (note 4) |
150 | 104 | ||||||
$ | 1,691 | $ | 1,270 |
Notes:
1. |
Refers to the aggregate fees billed by the Registrant's external auditor for audit services relating to the audit of the Registrant and statutory audits required by subsidiaries. |
2. |
Refers to the aggregate fees billed for assurance and related services by the Registrant's external auditor that are reasonably related to the performance of the audit or review of the Registrant's financial statements and are not reported under (1) above, including professional services rendered by the Registrant's external auditor for accounting consultations on proposed transactions and consultations related to accounting and reporting standards. Such fees included amounts incurred in respect of: due diligence and other work related to the disposition and acquisition of businesses, such work being unrelated to the audit of the Registrant's financial statements; accounting consultations with respect to proposed transactions, as well as other audit-related services. |
3. |
Refers to the aggregate fees billed for professional services rendered by the Registrant's external auditor for tax compliance, tax advice and tax planning. |
4. |
Refers to fees for licensing and subscriptions to accounting and tax research tools, as well as administration and out-of-pocket expenses. |
The Registrant’s Audit Committee pre-approves all audit services and permitted non-audit services provided to the Registrant by PricewaterhouseCoopers LLP. The Audit Committee has delegated to the Chair of the Audit Committee, who is independent, the authority to act on behalf of the Audit Committee with respect to the pre-approval of all audit and permitted non-audit services provided by its external auditors from time to time. Any approvals by the Chair are reported to the full Audit Committee at its next meeting. All of the services described in footnotes 2, 3 and 4 under “Principal Accountant Fees and Services” above were approved by the Audit Committee pursuant to paragraph (c)(7)(i)(C) of Rule 2-01 of Regulation S-X.
OFF-BALANCE SHEET ARRANGEMENTS
The Registrant does not have any off-balance sheet arrangements that have, or are reasonably likely to have, a current or future material effect on the Registrant’s financial performance or financial condition.
TABULAR DISCLOSURE OF CONTRACTUAL OBLIGATIONS
The information provided in the table entitled “Contractual Obligations” under the section entitled “Liquidity and Capital Resources” in the management’s discussion and analysis included as Exhibit 3 to this Annual Report on Form 40-F, is incorporated herein by reference.
IDENTIFICATION OF THE AUDIT COMMITTEE
The Registrant has a separately designated standing Audit Committee established in accordance with section 3(a)(58)(A) of the Exchange Act. The members of the Audit Committee are Joan Sproul (Chair), Yousry Bissada, and Elizabeth Carducci.
CORPORATE GOVERNANCE
The Registrant is a “foreign private issuer” as defined in Rule 3b-4 under the Exchange Act and its Common Shares are listed on the Toronto Stock Exchange and The NASDAQ Global Select Market ("NASDAQ"). NASDAQ Marketplace Rule 5615(a)(3) permits a foreign private issuer to follow its home country practices in lieu of certain requirements in the NASDAQ Listing Rules. A foreign private issuer that follows home country practices in lieu of certain corporate governance provisions of the NASDAQ Listing Rules must disclose each NASDAQ corporate governance requirement that it does not follow and include a brief statement of the home country practice the issuer follows in lieu of the NASDAQ corporate governance requirement(s), either on its website or in its annual filings with the Commission. A description of the significant ways in which the Registrant’s corporate governance practices differ from those followed by domestic companies pursuant to the applicable NASDAQ Listing Rules is disclosed on the Registrant’s website at: http://www.firstservice.ca/social_purpose/nasdaq_canadian_corporate_governance.html .
UNDERTAKING AND CONSENT TO SERVICE OF PROCESS
A. |
Undertaking |
The Registrant undertakes to make available, in person or by telephone, representatives to respond to inquiries made by the staff of the SEC, and to furnish promptly, when requested to do so by the SEC staff, information relating to: the securities registered pursuant to Form 40-F, the securities in relation to which the obligation to file an Annual Report on Form 40-F arises, or transactions in said securities.
B. |
Consent to Service of Process |
The Registrant has previously filed with the SEC an Appointment of Agent for Service of Process and Undertaking on Form F-X in connection with its Common Shares.
SIGNATURE
Pursuant to the requirements of the Exchange Act, the Registrant certifies that it meets all of the requirements for filing on Form 40-F and has duly caused this annual report to be signed on its behalf by the undersigned, thereto duly authorized.
FIRSTSERVICE CORPORATION | |||
Date: February 22, 2024 | By: | /s/ Jeremy Rakusin | |
Name: Title: |
Jeremy Rakusin Chief Financial Officer |
EXHIBIT INDEX
No. |
Document |
Annual Information Form of the Registrant for the year ended December 31, 2023. |
Management’s discussion and analysis of the Registrant for the year ended December 31, 2023. |
101. |
Interactive Data File. |
104. |
Cover Page Interactive Data File (formatted as Inline XBRL and contained in Exhibit 101) |
Exhibit 1
FIRSTSERVICE CORPORATION
ANNUAL INFORMATION FORM
For the year ended December 31, 2023
February 22, 2024
TABLE OF CONTENTS
2 | |
2 | |
2 | |
3 | |
3 | |
4 | |
8 | |
8 | |
9 | |
9 | |
9 | |
9 | |
10 | |
10 | |
11 | |
11 | |
12 | |
12 | |
16 | |
17 | |
17 | |
19 | |
24 | |
25 | |
26 | |
27 | |
27 | |
27 | |
29 |
Exhibit “A” – Audit Committee Mandate
This is the annual information form of FirstService Corporation for the year ended December 31, 2023 (the “AIF”). In this AIF, unless otherwise specified or the context otherwise requires, reference to “we”, “us”, “our”, “Company” or “FirstService” includes reference to the subsidiaries of, and other equity interests held by, FirstService Corporation and its subsidiaries.
Certain historical information contained in this AIF has been provided by, or derived from information provided by, certain third parties. Although we have no knowledge that would indicate that any such information is untrue or incomplete, we assume no responsibility for the completeness or accuracy of such information or the failure by such third parties to disclose events which may have occurred or may affect the completeness or accuracy of such information, but which are unknown to us.
Unless otherwise specified, all dollar amounts referred to in this AIF are expressed in United States dollars and all references to “$” or “US$” are to United States dollars and all references to “C$” are to Canadian dollars. Unless otherwise indicated, all financial information included in, or incorporated by reference into, this AIF is derived from consolidated financial statements that are prepared using generally accepted accounting principles as in effect in the United States (“GAAP”) and presented as at December 31, 2023.
This AIF contains, and incorporates by reference, “forward looking statements” which reflect the current expectations, estimates, forecasts and projections of management regarding our future growth, results of operations, performance and business prospects and opportunities. Wherever possible, words such as “may,” “would,” “could,” “will,” “anticipate,” “believe,” “plan,” “expect,” “intend,” “estimate,” “aim,” “endeavour” and similar expressions have been used to identify these forward-looking statements. These statements reflect management’s current beliefs with respect to future events and are based on information currently available to management. Forward-looking statements involve significant known and unknown risks, uncertainties and assumptions. Many factors could cause our actual results, performance or achievements to be materially different from any future results, performance or achievements that may be expressed or implied by such forward-looking statements, including, without limitation, those listed in the “Risk Factors” section of this AIF. Should one or more of these risks or uncertainties materialize, or should assumptions underlying the forward-looking statements prove incorrect, actual results, performance or achievements could vary materially from those expressed or implied by the forward-looking statements contained in this AIF. These factors should be considered carefully and readers should not place undue reliance on the forward-looking statements. Although the forward-looking statements contained in, or incorporated by reference into, this AIF are based upon what management currently believes to be reasonable assumptions, we cannot assure readers that actual results, performance or achievements will be consistent with these forward-looking statements. These forward-looking statements are made as of the date of this AIF and, unless otherwise required by applicable securities laws, we do not intend, nor do we undertake any obligation, to update or revise any forward-looking statements contained in this AIF to reflect subsequent information, events, results or circumstances or otherwise.
FIRSTSERVICE CORPORATION
ANNUAL INFORMATION FORM
(February 22, 2024)
We were formed under the Business Corporations Act (Ontario) as “New FSV Corporation” pursuant to Articles of Incorporation effective on October 6, 2014. On June 1, 2015, our predecessor, FirstService Corporation (“Old FSV”), completed a plan of arrangement (the “Spin-off”) which separated Old FSV into two independent publicly traded companies – FirstService and Colliers International Group Inc. Under the Spin-off, Old FSV shareholders received one FirstService share and one Colliers International Group Inc. share of the same class as each Old FSV share previously held, Old FSV amalgamated with a wholly-owned subsidiary and changed its name to Colliers International Group Inc., and FirstService’s name was changed to “FirstService Corporation”.
On May 10, 2019, we settled the Restated Management Services Agreement, including the long-term incentive arrangement therein, between FirstService, Jay S. Hennick and Jayset Management FSV Inc. and eliminated FirstService’s dual class share structure. On that date, FirstService also effected an amendment to its articles that eliminated the multiple voting shares and the “blank cheque” preference shares as part of the authorized capital of FirstService, and re-classified its subordinate voting shares as common shares. This transaction is further described in FirstService’s management information circular dated March 25, 2019 relating to the annual and special meeting of shareholders held on May 3, 2019 under “Business of the Meeting – Approval of Transaction” and “Business of the Meeting – Approval of Amendment to the Articles”.
Our head and registered office is located at 1255 Bay Street, Suite 600, Toronto, Ontario, M5R 2A9. Our fiscal year-end is December 31.
Intercorporate Relationships
We have the following principal subsidiaries which have total assets or revenues which exceed 10% of our total consolidated assets or revenues as at and for the year ended December 31, 2023:
Name of subsidiary |
Percentage of voting securities owned |
Jurisdiction of incorporation, continuance, formation or organization |
FirstService CAM Holdings, Inc. |
100.0% |
Delaware |
FirstService Residential, Inc. |
100.0% |
Delaware |
FirstService Residential Florida, Inc. |
100.0% |
Florida |
FirstService Restoration, Inc. |
100.0% |
Delaware |
FirstService Roofing Holdings, Inc. |
90.4% |
Delaware |
Bellwether FOS Holdco, Inc. |
89.1% |
Delaware |
FirstOnSite USA Holdings, Inc. |
100.0% |
Delaware |
Interstate Restoration LLC |
100.0% |
Colorado |
FS Brands, Inc. |
97.2% |
Delaware |
Century Fire Holdings, LLC |
94.9% |
Delaware |
The voting securities of the above noted subsidiaries not controlled by FirstService are owned by operating management of each respective subsidiary. The above table does not include all of the subsidiaries of FirstService. The assets and revenues of our unnamed subsidiaries did not exceed 20% of our total consolidated assets or total consolidated revenues as at and for the year ended December 31, 2023.
General development of the business
FirstService is the North American leader in residential property management and other essential property services to residential and commercial customers. We began independent operations on June 1, 2015 following the completion of the Spin-off, which included, among other things, the transfer to us of the FirstService Residential and FirstService Brands divisions of Old FSV, and the assets and liabilities referable thereto, as operated by Old FSV prior to June 1, 2015. Prior to completion of the Spin-off, we did not carry on any active business and did not issue any shares.
History
The business lines of FirstService were part of the foundation of our predecessor company, Old FSV, originally launched in 1989 by Jay S. Hennick, our founder and Chairman, with a Toronto-based commercial swimming pool and recreational facility management business which he founded as a teenager in 1972. Over the past 30 years, the businesses of FirstService have grown their operations “one step at a time” both through internal growth and acquisitions. In addition to the Spin-off, the following chart summarizes key milestones in the evolution of the Company:
Year |
Event |
1989 |
Jay S. Hennick established Old FSV with a Toronto-based swimming pool management company Old FSV acquired College Pro Painters franchise system and established FirstService Brands |
1994 |
D. Scott Patterson joined Old FSV as Vice President, Corporate Development and soon thereafter became Chief Financial Officer |
1996 |
Old FSV established the FirstService Residential platform by acquiring two Florida-based property management firms, with follow-on acquisitions in the New York City and Northeast U.S. regions shortly thereafter |
1997 |
FirstService Brands acquired Paul Davis Restoration |
1997 |
FirstService Financial was established as part of the FirstService Residential platform service offering |
1998 |
FirstService Brands acquired California Closets |
2005 |
FirstService Brands exceeded 1,000 franchises |
2007 |
FirstService Brands exceeded $1 billion in system-wide sales |
2008 |
FirstService adopted Net Promoter System (NPS) across all of its businesses |
2009 |
FS Energy was launched to add to FirstService Residential’s comprehensive services |
2010 |
FirstService Residential expanded into Canada |
2013 |
FirstService Residential national brand was established from the rebranding of 18 regional brands |
2016 |
FirstService acquired Century Fire Protection |
2019 |
FirstService acquired Global Restoration (legally known as Bellwether FOS Holdco, Inc.) and completed a public offering of common shares for gross proceeds of approximately US$200 million |
2020 |
FirstService completed a private placement sale of common shares for gross proceeds of approximately US$150 million. |
2021 |
First Onsite Restoration national brand was established from the rebranding of Global Restoration |
2023 |
FirstService acquired Roofing Corp of America |
FirstService is a North American leader in the essential outsourced property services sector, serving its customers through two operating divisions: FirstService Residential, North America’s largest manager of residential communities, and FirstService Brands, one of North America’s largest providers of essential property services delivered through individually branded company-owned operations and franchise systems. With the acquisition of First Onsite Restoration in 2019, FirstService Brands significantly expanded its scale and capabilities in commercial and large loss property restoration in North America. See “– FirstService Brands Segment – First Onsite Restoration”. At the end of 2023, with the acquisition of Roofing Corp of America, FirstService Brands added commercial roofing services to its repair, maintenance and restoration capabilities. See “– FirstService Brands Segment – Roofing Corp of America”.
FirstService Residential and FirstService Brands both rely on the same operational foundations for success – a core competency in managing and growing market-leading, value-added outsourced essential property services businesses; a focus on client service excellence; economies of scale that are leveraged wherever possible to create more value for clients; and strong brand recognition. These pillars provide our businesses with competitive advantages that are difficult to replicate. Our two business lines also have similar highly attractive financial profiles, including a high proportion of recurring revenue streams, low capital expenditure and working capital requirements, high free cash flow generation, and significant financial strength to grow both organically and through consolidation of highly fragmented industries.
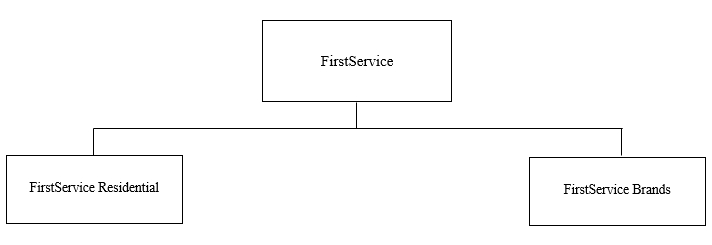
We conduct our business and report our financial performance through two operating segments as shown below:
The following charts summarize the revenues, operating earnings and adjusted EBITDA of our two operating segments over the past two fiscal years.
Revenues by operating segment |
Year ended December 31 |
|
(in thousands of US$) |
2023 |
2022 |
FirstService Residential FirstService Brands Total |
1,996,823 2,337,725 $4,334,548 |
1,772,258 1,973,577 $3,745,835 |
Operating earnings (loss) by operating segment |
Year ended December 31 |
|
(in thousands of US$) |
2023 |
2022 |
FirstService Residential FirstService Brands Corporate Total |
155,044 126,468 (36,620) $244,892 |
138,873 111,638 (31,485) $219,026 |
Adjusted EBITDA1 by operating segment |
Year ended December 31 |
|
(in thousands of US$) |
2023 |
2022 |
FirstService Residential FirstService Brands Corporate Total |
187,792 242,356 (14,420) $415,728 |
168,637 196,277 (13,182) $351,732 |
FirstService Residential Segment
FirstService Residential is North America’s largest manager of private residential communities, offering a full range of services across multiple geographies to a wide variety of clients, including condominiums (high and low-rise), co-operatives, homeowner associations, master-planned communities, active adult and lifestyle communities, and a variety of other residential developments governed by common interest or multi-unit residential community associations. Our approximately 20,000 employees in approximately 100 offices across 25 U.S. states and 3 Canadian provinces manage over 9,000 communities, representing more than 4 million residents. Our operational and client coverage footprint is extensive, with a presence in major markets that constitute over 70% of the North American population.
Typically, owners of residential units within these communities are required to pay monthly or quarterly fees to cover all expenses to operate and maintain the common areas of the communities. Resident owners elect volunteer homeowners to serve on a board of directors to oversee the operations of the community association. Historically, decision-making for the day-to-day operations of the communities was delegated to these volunteer board members, although, increasingly, these boards outsource this responsibility to professional property management companies like FirstService Residential.
There are two types of professional property management companies within the industry – traditional or full-service:
● |
Traditional property management: Traditional property managers focus principally on administrative and governance property management functions on behalf of community association clients, including advising homeowner boards on matters relating to the operation of their communities, collection of monthly maintenance fees, sourcing and payments to suppliers, financial statement preparation, and outsourcing of support services. |
● |
Full service property management: Full service property managers provide all of the traditional functions, plus a range of ancillary services including, among other things, on-site staffing (in areas such as building engineering and maintenance, full-service amenity management, security and concierge/front desk), banking and insurance products, energy conservation and management solutions, and resale processing services. |
Only a small number of industry participants have the expertise and capital to provide full-service property management services comparable to FirstService Residential. We have the scale, highly recognized brand, geographic footprint, resources, operating expertise and innovation to deliver a full-service offering. We combine our advantages of size and national presence with a local touch and dedication focusing on service excellence, which solidifies our client relationships and market-leading reputation.
As a full-service property manager, FirstService Residential provides a full range of ancillary services, including on-site staffing for building engineering and maintenance, full-service swimming pool and amenity management, security and concierge/front desk. In most markets, we also provide non-labour, higher margin fee-based ancillary products and services, including financial services (cash management, other banking transaction-related services, and specialized property insurance brokerage), energy management solutions and advisory services, and resale processing services, utilizing the scale of our operations to economically benefit clients.
________________________________________
1 |
Adjusted EBITDA is a financial measure that is not calculated in accordance with GAAP. For a reconciliation of this and other non-GAAP financial measures, see “Reconciliation of non-GAAP financial measures” in this AIF. |
We generally provide residential property management and recurring ancillary services under contract, with a fixed monthly fee. These contracts typically range in duration from one to three years, yet are generally cancellable by either party with 30 to 90 days’ notice. Historically, a significant proportion of our revenue is recurring due to the nature of our contracts, which have a mid-90% retention rate, and therefore have a long-term tenure.
FirstService Brands Segment
FirstService Brands is a leading North American operator and provider of essential property services to residential and commercial customers. The principal brands in this division include First Onsite Restoration, Paul Davis Restoration, Roofing Corp of America, Century Fire Protection, California Closets, CertaPro Painters, Floor Coverings International, and Pillar to Post Home Inspectors.
Franchised Operations
We own and operate five franchise networks as follows:
(i) |
Paul Davis Restoration is a franchisor of residential and light commercial restoration services serving the insurance industry in the United States and Canada through 353 franchises. Paul Davis provides full service water, fire and mold cleanup, construction rebuild and restoration services for property damaged by natural or man-made disasters. Royalties are earned from franchisees based on a percentage of franchisee gross revenues. |
(ii) |
CertaPro Painters is the largest provider of residential and commercial painting services in North America. CertaPro has 364 franchises operating in major markets across the United States and Canada. CertaPro Painters focuses on high-end residential and commercial painting and decorating work. CertaPro completes more than 125,000 projects in a typical year. Royalties are earned based on a percentage of franchisee gross revenues or a fixed monthly fee, plus administrative fees for various ancillary services. |
(iii) |
California Closets is North America's largest provider of custom-designed and installed closet and home storage solutions. California Closets has 87 franchises in the United States and Canada. There are currently approximately 138 branded California Closets retail showrooms in operation in North America which are used by franchisees to demonstrate and sell the product. California Closets franchise and corporate locations typically install more than 75,000 jobs annually across North America. Royalties are earned based on a percentage of franchisee gross revenues. |
(iv) |
Pillar to Post Home Inspectors is one of North America’s largest home inspection service providers. Services are provided through a network of approximately 650 home inspectors in 449 franchises. Through its proprietary inspection model, Pillar to Post Home Inspectors can assess many categories or items inside and outside the home as part of its evaluation process. Pillar to Post Home Inspectors typically inspects more than $50 billion in residential real estate each year. Royalties are earned on a percentage of franchisee gross revenues. |
(v) |
Floor Coverings International is a residential and commercial floor coverings design and installation franchise system operating in North America with 295 franchises. Royalties are earned based on a percentage of franchisee gross revenues. |
Franchise agreements are for terms of five or ten years. Royalties are reported and paid to us monthly in arrears. All franchise agreements contain renewal provisions that can be invoked by FirstService Brands at little or no cost.
The franchised property services industry is highly fragmented, consisting principally of a large number of smaller, single-service or single-concept companies. Due to the large size of the overall market for these services, dominant market share is not considered necessary for becoming a major player in the industry. However, because of the low barriers to entry in this segment, we believe that brand name recognition among consumers is a critical factor in achieving long-term success in the businesses we operate.
Franchise businesses are subject to U.S. Federal Trade Commission regulations and state and provincial laws that regulate the offering and sale of franchises. Presently, we are authorized to sell franchises in 50 U.S. states, in all Canadian provinces and in several other countries around the world. In all jurisdictions, we endeavor to have our franchises meet or exceed regulatory standards.
Company-Owned Operations
FirstService Brands owns 22 California Closets operations, 15 Paul Davis Restoration operations and two CertaPro Painters operations in major metropolitan markets in the United States and Canada. The California Closets, Paul Davis Restoration and CertaPro Painters operations were acquired from franchisees with the goal of accelerating revenue growth and realizing operating margin expansion potential.
First Onsite Restoration
First Onsite Restoration is the second largest commercial and large loss property restoration firm in North America. Headquartered in Denver, Colorado and founded in 1998, First Onsite provides integrated end-to-end solutions encompassing mitigation, restoration and reconstruction services on behalf of blue chip, national clients which include large, multi-location commercial customers, property owners and insurance companies. First Onsite employs approximately 2,700 staff operating out of approximately 110 regional offices throughout North America. First Onsite Restoration complements our Paul Davis Restoration franchised and company-owned operations, which collectively are a leading player in the residential segment of the industry.
Century Fire Protection
Century Fire Protection is one of the largest full-service fire protection companies in the Southeastern United States. Century Fire Protection adds an important service capability to FirstService’s portfolio of essential property services. Headquartered in Duluth, Georgia, Century Fire Protection provides end-to-end fire protection solutions, including design, fabrication, installation, maintenance, repair, service and inspection services for commercial, residential, industrial and institutional clients. Century Fire Protection employs approximately 1,900 staff operating out of 35 offices throughout Georgia, Alabama, Maryland, North Carolina, South Carolina, Tennessee, Texas, Florida, Missouri, Virginia, Kansas and Kentucky.
Roofing Corp of America
In December 2023, we completed the acquisition of Roofing Corp of America, the fifth largest commercial roofing firm in North America. The acquisition added a key service capability to FirstService’s portfolio of leading essential property services brands and, in particular, brought a highly complementary strategic fit to our operations at First Onsite Restoration and Paul Davis Restoration. Headquartered in Atlanta, Georgia, Roofing Corp of America delivers a wide range of end-to-end roofing services, including re-roofing, repair and maintenance, and new roof installations, to building owners, property and facility managers, homeowners’ associations, and general contractors. Roofing Corp of America operates under ten local brands from 16 regional branch locations across 11 U.S. states, spanning the Sun Belt, Mid-Atlantic, Midwest and West regions and employs more than 900 highly trained professionals.
Certain segments of the Company’s operations are subject to seasonal variations. This seasonality results in variations in quarterly revenues and operating margins. Variations can also be caused by acquisitions or dispositions, which alter the consolidated service mix.
Our trademarks are important for the advertising and brand awareness of all of our businesses and franchises. We take precautions to defend the value of our trademarks by maintaining legal registrations and by litigating against alleged infringements, if necessary.
The FirstService Residential operating division operates under the FirstService Residential trademark. This common branding creates a unified North American market presence signifying our market leadership, to showcase our commitment to service excellence and to leverage our strengths to the benefit of current and future clients. No value has been ascribed to the FirstService Residential trademark in our consolidated financial statements.
In our FirstService Brands division, our Century Fire business, Roofing Corp of America business and two franchise systems – California Closets and Paul Davis Restoration – have trademarks to which value has been ascribed in our consolidated financial statements. The value of these trademarks is derived from the recognition they enjoy among the target audiences for the respective property services. These trademarks have been in existence for many years, and their prominence among consumers has grown over time through the addition of locations and/or franchisees and the ongoing marketing programs conducted by franchisees and FirstService. No value has been ascribed to the First Onsite trademark in our consolidated financial statements.
We maintain leadership positions in the residential property management and residential and commercial property services industries, offering a full complement of services to a wide range of customers. We have an established track record of expanding our business through both organic and acquisition growth. Our growth plan involves five primary drivers: (i) capitalizing on our scale advantages to win new business; (ii) continuing to emphasize retention of our existing customer base, and leveraging referrals from past and existing customers; (iii) continuing to expand our ancillary services; (iv) realizing operational efficiencies; and (v) selectively pursuing strategic acquisitions.
We compete in the essential property services industry as one of the largest providers of such services to residential and commercial customers in North America.
FirstService Residential is the North American leader in residential property management with an estimated 6% market share. We operate in a highly fragmented market, with an estimated 9,000 local and regional management companies across North America. Only a relatively small number of our competitors are able to deliver the expertise and investment capital to compete broadly on a professional platform. Our primary competitors are smaller independent regional players. Our competitive position varies across geographies, property types, and services provided.
The essential property services industry in which FirstService Brands participates is highly fragmented and consists predominantly of small “mom & pop” businesses and, for restoration, emergency response, roofing and related services, a few national players. Each of our service lines within FirstService Brands has professionalized its business category, and has a leading position within each market served. FirstService Brands competes primarily with local, regional and family-owned and operated enterprises or franchise businesses.
We have approximately 29,000 employees.
Environmental, social and governance
Oversight
The board of directors of FirstService (the “Board”) oversees and monitors FirstService’s policies and practices related to its environmental, social and governance (“ESG”) program, including management of climate-related risks and opportunities, and alignment of the ESG strategy with FirstService’s overall business strategy. The Board satisfies itself that FirstService has developed and implemented appropriate ESG standards in the conduct of its operations. At least annually, the Board verifies FirstService’s compliance with any applicable legal and regulatory requirements related to ESG disclosure and reviews any ESG report prepared by FirstService. For more detailed information on FirstService’s ESG initiatives, please visit FirstService’s website at www.firstservice.com.
The Nominating and Corporate Governance Committee of the Board contributes to the Board’s oversight of FirstService’s ESG program through: (i) the review, on a periodic basis, of FirstService’s governance practices in relation to its ESG and climate programs, policies and practices; (ii) the review of FirstService’s public disclosure related to its ESG and climate programs, policies and practices and any ESG report prepared by FirstService; (iii) the review annually of the Board’s expertise in ESG matters and ensuring appropriate ESG education is provided to the Board members; (iv) ensuring ESG and diversity goals are considered in Board recruitment; (v) ensuring that responsibility for oversight of any specific ESG-related matters, as appropriate, are integrated into committee mandates and the Board mandate; (vi) monitoring ESG matters of interest to shareholders and other FirstService stakeholders and reviewing any shareholder proposals on ESG; and (vii) monitoring FirstService brand and FirstService social responsibility initiatives, diversity, equity and inclusion initiatives and community giving and philanthropic programs.
To ensure the Board and management have, or have access to, the competencies needed to engage on ESG and climate matters, the members of the Nominating and Corporate Governance Committee, as well as other Board members attended a substantial ESG and climate related training/workshop in January 2024 dealing with ESG trends, key climate concepts relevant for capital markets, ESG disclosure frameworks and ESG governance best practices.
ESG Materiality Assessment
As a foundation for FirstService’s ESG strategy and disclosure, in 2023 FirstService undertook its first ESG materiality assessment to identify, assess and prioritize the ESG factors considered to have the greatest potential to impact company value over the short, medium, and long term. In developing the ESG materiality assessment, FirstService considered leading ESG reporting frameworks, including the International Sustainability Standards Board (ISSB), Sustainability Accounting Standards Board (SASB) and Recommendations of the Task Force on Climate-related Financial Disclosures (TCFD).
FirstService identified the following core factors that present significant opportunities for FirstService and are a focus for its ESG approach:
● |
Human Capital Management: FirstService’s people are its greatest asset. FirstService strives to foster a strong culture that embraces diversity and inclusion, attracts those who share its values and offers opportunities to grow within the organization. |
● |
Health & Safety: Protecting FirstService team members, clients, and the communities in which FirstService operates through strong health and safety management is critical to its success. |
● |
Climate Change: As a service provider, FirstService’s exposure to climate risk is comparatively less than real estate property owners. At the same time, there are significant opportunities for FirstService to support clients seeking to enhance energy efficiency or recover from the impacts of acute weather events. |
Social Purpose Initiative
FirstService has long believed in the importance of giving back to its people, its community, and the environment. Since 2018, FirstService has put this belief into action through its Social Purpose initiative, which was launched to create greater awareness and visibility for the many ways that FirstService employees give back. Throughout the year, team members are encouraged to join FirstService’s mission to #FirstServeOthers by engaging in initiatives and activities in support of our people, our community, and our environment. The 2023 highlights from FirstService’s Social Purpose initiative are detailed on FirstService’s website at www.firstservice.com.
We own a majority interest in substantially all of our operations, while operating management of each non-wholly-owned subsidiary owns the remaining shares. This structure was designed to maintain control at FirstService while providing significant risks and rewards of equity ownership to management at the operating businesses. In almost all cases, we have the right to “call” management’s shares, usually payable at our option with any combination of common shares of FirstService (the “Common Shares”) or cash. We may also be obligated to acquire certain of these non-controlling interests in the event of death, disability or cessation of employment or if the shares are “put” by the holder, subject to annual limitations on these puts imposed by the relevant shareholder agreements. These arrangements provide significant flexibility to us in connection with management succession planning and shareholder liquidity matters.
Dividend policy
Our board of directors has adopted a dividend policy pursuant to which we intend to make quarterly cash dividends to holders of Common Shares of record at the close of business on the last business day of each calendar quarter. The current quarterly dividend rate is $0.25 per Common Share (a rate of $1.00 per annum), which has increased several times since the Spin-off in 2015 when the quarterly dividend rate was $0.10 per Common Share (a rate of $0.40 per annum). Each quarterly dividend is paid within 30 days after the applicable record date. For the purposes of the Income Tax Act (Canada) and any similar provincial legislation, all dividends on the Common Shares will be eligible dividends unless indicated otherwise.
The terms of our dividend policy remain, among other things, at the discretion of our board of directors. Future dividends on the Common Shares, if any, will depend on the results of our operations, cash requirements, financial condition, contractual restrictions, business opportunities, provisions of applicable law and other relevant factors. Under the terms of our second amended and restated credit agreement dated as of February 17, 2022 (the “Credit Agreement”), our amended and restated note and guarantee agreement (the “Senior Note Agreement”) governing our senior notes (the “Senior Notes”), our master note agreement dated as of September 29, 2022 (the “NYL Note Agreement”) with NYL Investors LLC for private placement issuances of up to US$150 million of senior unsecured notes (“NYL Notes”) and our note purchase and private shelf agreement dated as of September 29, 2022 (the “Prudential Note Agreement”) with PGIM Private Capital for private placement issuances of up to US$300 million of senior unsecured notes (“Prudential Notes”), we are not permitted to pay dividends, whether in cash or in specie, in the circumstances of an event of default thereunder occurring and continuing or an event of default occurring as a consequence thereof. See “Material contracts” and “Risk factors” below.
Dividend history
The aggregate cash dividends declared per Common Share for the years ended December 31, 2023, 2022 and 2021 were US$0.90, US$0.81 and US$0.73, respectively.
Authorized and issued capital
Our authorized capital consists of an unlimited number of Common Shares, of which, as at the date hereof, there were 44,971,389 Common Shares issued and outstanding.
Common Shares
Holders of Common Shares are entitled to receive: (i) notice of, to attend and speak at and to vote at any meeting of the shareholders of FirstService, and at such meeting holders of Common Shares have one vote for each Common Share held; (ii) dividends as may be declared thereon by our board of directors; and (iii) our remaining property and assets, in equal amounts per share on all Common Shares at the time outstanding without preference or distinction, upon our liquidation, dissolution or winding up, or other distribution of our assets among our shareholders for the purposes of winding-up our affairs. The holders of Common Shares do not have any right to vote separately upon any proposal to amend our articles to increase any maximum number of authorized shares of any class or series having rights or privileges equal or superior to the Common Shares or to create a new class of shares equal or superior to the Common Shares. The Common Shares are not redeemable nor retractable but are, subject to applicable law, able to be purchased for cancellation by FirstService in the open market, by private contract or otherwise.
Stock Option Plan
FirstService has a stock option plan (the “Option Plan”) pursuant to which options to acquire Common Shares are granted to directors, officers and full-time employees of FirstService or its subsidiaries (other than Jay S. Hennick). A summary of the terms of the Option Plan is set out in the section entitled “Executive Compensation – Incentive Award Plans of FirstService – FirstService Stock Option Plan” contained in our Management Information Circular filed in connection with our meeting of shareholders held on April 6, 2023 (the “Meeting Circular”), which section is incorporated by reference herein and is available under our SEDAR+ profile at www.sedarplus.ca. The maximum number of Common Shares subject to grants of options under the Option Plan is limited to 7,313,500, of which, as at the date hereof: (i) options exercisable for 2,700,287 Common Shares have been granted and are outstanding as at the date hereof; and (ii) options which were exercisable for 3,262,973 Common Shares have been exercised or expired as at the date hereof, leaving options available for grant for 1,350,240 Common Shares.
The outstanding Common Shares are listed and posted for trading on the Toronto Stock Exchange (“TSX”) and the NASDAQ Global Select Market (“Nasdaq”) under the symbol “FSV”. No other securities of FirstService are listed for trading on any marketplace. The following table sets forth the reported high and low trading prices and the aggregate volume of trading of the Common Shares on Nasdaq (in United States dollars) and on the TSX (in Canadian dollars) for each month during 2023:
Nasdaq |
TSX |
|||||
Month |
High Price (US$) |
Low Price (US$) |
Volume Traded |
High Price (C$) |
Low Price (C$) |
Volume Traded |
January 2023 |
$143.99 |
$121.94 |
758,023 |
192.26 |
166.25 |
1,054,053 |
February 2023 |
$148.70 |
$134.65 |
1,104,033 |
198.68 |
183.25 |
1,765,963 |
March 2023 |
$141.51 |
$131.75 |
984,188 |
190.56 |
181.42 |
1,608,658 |
April 2023 |
$150.79 |
$137.12 |
922,531 |
204.75 |
185.15 |
1,108,973 |
May 2023 |
$151.38 |
$139.68 |
1,313,360 |
204.84 |
187.00 |
1,474,730 |
June 2023 |
$156.87 |
$139.48 |
1,363,628 |
207.31 |
186.43 |
1,609,603 |
July 2023 |
$163.95 |
$151.63 |
1,587,949 |
212.04 |
201.75 |
1,123,238 |
August 2023 |
$157.68 |
$143.49 |
1,206,078 |
209.77 |
194.42 |
1,296,070 |
September 2023 |
$158.41 |
$144.74 |
1,222,106 |
213.00 |
195.00 |
1,718,852 |
October 2023 |
$149.07 |
$134.77 |
1,085,814 |
205.33 |
187.25 |
1,184,722 |
November 2023 |
$158.47 |
$140.76 |
1,153,863 |
216.18 |
195.50 |
1,145,787 |
December 2023 |
$166.27 |
$155.40 |
1,552,920 |
223.84 |
208.02 |
1,785,888 |
Transfer agents and registrars
The transfer agent and registrar for the Common Shares is TSX Trust Company, 301 – 100 Adelaide Street West, Toronto, Ontario M5H 4H1.
Directors and executive officers
Directors
Our board of directors is currently comprised of eight members. The following information is provided with respect to the directors of FirstService as at the date hereof:
Name and municipality of residence |
Age |
Present position and tenure |
Principal occupation during last five years |
Yousry Bissada1,2 Ontario, Canada |
63 |
Director since April 6, 2022 |
Yousry Bissada has more than 30 years of financial services experience focused on the mortgage industry. He is the President and Chief Executive Officer and Director of Home Trust Company, having joined in 2017. From 2017 until mid-2023, Mr. Bissada also served as President & CEO and Director of Home Trust’s parent company, Home Capital Group (HCGI) until it was acquired by Smith Financial Corp. In addition to serving on the board of Home Trust, he also currently serves on the board of FirstService, Bank and Trust Company Association and the Princess Margaret Cancer Foundation. Mr. Bissada is a CPA, GCA and Accredited Mortgage Professional (AMP) and holds an ICD.D designation from the Institute of Corporate Directors. |
Elizabeth Carducci1 Ontario, Canada |
58 |
Director since June 30, 2022 |
Ms. Carducci is recognized as a visionary leader in the customer and employee experience industry. She is currently an advisor and investor in early stage companies, having recently retired from a 21 year career at Medallia, a leading software company in the customer experience space. As a member of the founding team, Ms. Carducci joined Medallia in 2001 as employee number three and helped build the company into an industry leader with 2,000 employees and more than $500 million in annual revenue. She was part of the management team that took Medallia public in 2019, and through a subsequent $6.4 billion buyout in 2021 by private equity firm, Thoma Bravo. Ms. Carducci held numerous operational roles during her tenure at Medallia, culminating in her position as Chief Revenue Officer. Under her stewardship, Medallia became the leading provider of customer experience management solutions across a wide variety of industries, including the hospitality, retail and financial services sectors. Before Medallia, Ms. Carducci led the global contact center organization for Starwood Hotels, with prior roles at ITT Sheraton, and Deloitte. Ms. Carducci holds an MBA from Stanford University and a Bachelor of Science in Electrical Engineering from the Massachusetts Institute of Technology. |
Name and municipality of residence |
Age |
Present position and tenure |
Principal occupation during last five years |
Steve H. Grimshaw2,3 Texas, USA |
59 |
Director since May 11, 2021 |
Mr. Grimshaw is the full time Chairman of Caliber, Inc., one of the largest automotive service companies in the U.S. Since joining as CEO in 2009, Caliber has grown from 68 locations in two states to over 1,550 company owned locations in 42 states across the U.S. Caliber’s family of brands now include Caliber Collision, Caliber Auto Glass, Caliber Auto Care, and Protech Electronics. Caliber’s revenues have increased from $284 million to over $4.0+ billion during his tenure. Prior to joining Caliber, Mr. Grimshaw served as Executive Vice President & General Manager at Safety-Kleen Systems, one of the largest environmental services companies in the U.S. with additional operations in Canada, Mexico, Japan, China, and South Korea. Under Mr. Grimshaw’s inspirational leadership, Caliber’s philanthropic efforts are tightly woven into the fabric of the Caliber culture, including the annual Rhythm Restoration Food Drive with more than 20 million meals collected for children in need of nutritious meals and the Caliber Recycled Rides program which has donated more than 250 vehicles to military and first responder families in need of reliable transportation. Mr. Grimshaw received the 2016 Ernst & Young Southwest Entrepreneur of the Year Award in the services category and was a National Finalist. Mr. Grimshaw was Chair of the Board for the Dallas Division of the American Heart Association until June 2020 and currently serves on the AHA Board for the Southwest Region. Mr. Grimshaw chaired the 2016 Côtes du Coeur event with his wife raising a record $4 million to fight heart disease and stroke. Mr. Grimshaw was also appointed to the American Heart Association CEO Roundtable as one of 40 CEOs from some of America’s largest companies dedicated to disseminating evidence-based approaches to workplace health. Mr. Grimshaw also sits on the board of Premise Health, the nation’s leading direct healthcare provider based in Nashville, TN and Apple Roofing, a residential and commercial roofing company based in Southlake, TX. Mr. Grimshaw is a graduate of the University of South Carolina where he currently serves as a Trustee for the Business Partnership Foundation for the Darla Moore Business School. Previous board participation includes Mavis Discount Tire, Amegy Bank Dallas Advisory Board and 22Kill (focused on ending veteran suicide). |
Jay S. Hennick Ontario, Canada |
67 |
Director and Chairman of the Board since June 1, 2015 |
Mr. Hennick is the global Chairman, CEO and controlling shareholder of Colliers International. Jay is also the Founder, Chairman and the largest individual shareholder of FirstService and was the former CEO from 1988 to 2015. He is also the Chairman of Hennick & Company, a private family investment firm. In 1998, Mr. Hennick was awarded Canada's Entrepreneur of the Year, and in 2001 he was named Canada's CEO of the Year by Canadian Business Magazine. In 2011, Jay received an Honorary Doctorate of Laws from York University and in 2014, an Honorary Doctorate from the University of Ottawa. In 2019, Mr. Hennick was appointed as a member of the Order of Canada and received the International Horatio Alger Award. Mr. Hennick also served as Chairman of the Board of Directors of the Sinai Health System and Mount Sinai Hospital, in Toronto between 2013 and 2016. Jay and his wife Barbara are also active philanthropists establishing the Hennick Family Foundation to support important causes in healthcare, education and the arts, the largest of which include: a $50 million donation to the Royal Ontario Museum in support of their revitalization and new vision plans of one of Ontario’s most treasured institutions; a $36 million donation to name Hennick Bridgepoint Hospital, the largest complex care and rehabilitation hospital in Canada; a $10 million donation to the World Holocaust Remembrance Centre (Yad Vashem) in Jerusalem, Israel; a $8 million donation to name the “Hennick JD-MBA Program” at Osgoode Hall Law School and the Schulich School of Business at York University; a $7.5 million donation to name the “Hennick Family Wellness Gallery”, a healing and respite gallery housing the largest collection of artworks from famed Canadian artist, Sorel Etrog; and a $3.5 million donation to the University of Ottawa Law School to fund scholarship for worthy students. |
Name and municipality of residence |
Age |
Present position and tenure |
Principal occupation during last five years |
Frederick F. Reichheld3 Massachusetts, USA |
72 |
Director since June 1, 2015 |
Since 1977, Mr. Reichheld has been employed at Bain & Company, Inc., a global business consulting firm, and was elected to the partnership at Bain in 1982. Mr. Reichheld is the creator of the Net Promoter® system of management and founded Bain’s Loyalty practice, which helps clients achieve superior results through improvements in customer, employee, partner and investor loyalty and has also served in a variety of other roles, including as a member of Bain & Company’s Worldwide Management, Nominating, and Compensation Committees. In January 1999, he was elected by the firm to become the first Bain Fellow. Mr. Reichheld is a frequent speaker to major business forums and groups of CEOs and senior executives worldwide and has authored several books, including The Loyalty Effect: The Hidden Force Behind Growth, Profits, and Lasting Value (Harvard Business School Press, 1996), Loyalty Rules!: How Today’s Leaders Build Lasting Relationships (Harvard Business School Press 2003), The Ultimate Question (Harvard Business School Press, 2006), The Ultimate Question 2.0 (Harvard Business School Press 2011) and Winning on Purpose (Harvard Business Review Press 2021). Mr. Reichheld received his BA from Harvard College and his MBA from Harvard Business School. |
D. Scott Patterson Ontario, Canada |
63 |
Director and Chief Executive Officer since June 1, 2015 |
Mr. Patterson is the CEO of FirstService. Pre-spin-off, Mr. Patterson was the President and Chief Operating Officer of former FirstService Corporation from 2003 to 2015. He joined former FirstService Corporation in 1995 as Vice President Corporate Development, and was its Chief Financial Officer from February 1995 until September 2003. Prior to joining former FirstService Corporation, Mr. Patterson was an investment banker at Bankers Trust. Mr. Patterson qualified as a Chartered Accountant in 1985 and began his career at PricewaterhouseCoopers. Mr. Patterson holds a Bachelor of Arts degree in Business Administration from the University of Western Ontario. |
Joan Eloise Sproul1 Ontario, Canada |
67 |
Director since May 15, 2018 |
Ms. Sproul was most recently the Executive Vice President, Finance (CFO) & Chief Administrative Officer of the Sinai Health System in Toronto, Canada. In addition to serving more than 20 years in various finance and corporate-related roles at Mount Sinai Hospital, she previously held a number of senior financial positions in the hospitality industry. Ms. Sproul was named to the list of Canada's Most Powerful Women, Women's Executive Network, 2013. Ms. Sproul holds a Chartered Professional Accountant (CPA) designation, having qualified as a Chartered Accountant in 1981 and began her career at Ernst & Whinney. Ms. Sproul holds a Bachelor of Commerce degree from the University of Toronto. |
Erin J. Wallace2,3 Colorado, USA |
64 |
Director since October 8, 2015 |
Ms. Wallace is the former Chief Operating Officer at Great Wolf Resorts, Inc., a role she held from 2016 through 2019. In this role she was responsible for leading more than 9,000 Pack Member employees at 18 lodges throughout the United States. Great Wolf Resorts, Inc. is America’s largest family of indoor water park resorts and has over 7.0 million guests a year. Before joining Great Wolf Resorts, Inc., Ms. Wallace was the Chief Operating Officer of Learning Care Group, Inc. from February 2015 to August 2016, where she led more than 16,000 Learning Care Group employees in delivering operational excellence to the families served at more than 900 schools throughout its umbrella of 5 brands. Prior to that, Ms. Wallace’s 30 year career at the Walt Disney Company spanned many roles in Theme Parks and Resorts concluding with Executive Vice President of Operations Strategy, Planning, Revenue Management and Decision Sciences, encompassing all of Disney Parks’ domestic and international sites. After joining Disney as an industrial engineer in 1985, Ms. Wallace’s roles included Senior Vice President of Walt Disney World Operations – where she oversaw the largest and most popular resort destination in the world, Vice President of Walt Disney World’s Magic Kingdom® and general manager for Disney’s Animal Kingdom® and Disney’s All-Star Resort. Ms. Wallace graduated with honors from the University of Florida and earned her MBA from the Crummer School of Business at Rollins College. She is currently a Trustee at Rollins College and a director of Ardent Leisure Group Limited. |
Notes:
1. |
Member of Audit Committee |
2. |
Member of Executive Compensation Committee |
3. |
Member of Nominating and Corporate Governance Committee |
Each director remains in office until the following annual shareholders’ meeting of FirstService or until the election or appointment of his or her successor, unless he or she resigns, his or her office becomes vacant or he or she becomes disqualified to act as a director. All directors stand for election or re-election annually.
Further background information regarding the directors of FirstService are set out in the Meeting Circular, the relevant sections of which are incorporated by reference herein and which is available under our SEDAR+ profile at www.sedarplus.ca.
Officers
The following information is provided with respect to the executive and other key officers of FirstService as at the date hereof:
Name and municipality of residence |
Age |
Present position and tenure |
Principal occupation during last five years |
D. Scott Patterson Ontario, Canada |
63 |
Chief Executive Officer since June 2015 |
See description above under “Directors”. |
Jeremy Rakusin Ontario, Canada |
55 |
Chief Financial Officer since June 2015 |
Mr. Rakusin is the CFO of FirstService, and he is responsible for the overall financial management of FirstService, including external and internal financial reporting, budgeting, and capital market activities, including managing investor and lender relationships. Mr. Rakusin is also closely involved with all corporate communications and capital allocation decision making. Mr. Rakusin joined FirstService in September 2012 as Vice President, Strategy & Corporate Development and was responsible for sourcing and executing the company’s acquisition strategy, as well as leading other corporate strategic and growth initiatives. Prior to joining FirstService, Mr. Rakusin was Mergers & Acquisitions Head at Raymond James Ltd. with responsibility for leading the firm’s domestic and cross-border M&A practice. Mr. Rakusin’s investment banking and corporate finance experience also includes more than 10 years at Bank of America, Merrill Lynch and TD Securities. Other career experience includes positions as a portfolio manager at a Toronto-based discretionary investment firm and as a securities and corporate lawyer at Toronto-based Goodmans LLP. Mr. Rakusin earned his joint MBA and Law degrees from the University of Toronto. He also received his Chartered Financial Analyst designation. |
Douglas G. Cooke Ontario, Canada |
64 |
Senior Vice President, Corporate Controller and Corporate Secretary since June 2015 |
Mr. Cooke is the Senior Vice President, Corporate Controller and Corporate Secretary of FirstService, and he is responsible for FirstService’s external and internal corporate reporting and cash management functions. Mr. Cooke joined FirstService in 1995 as Controller, later assuming the position of Corporate Controller and Treasurer. In 2019, Mr. Cooke was appointed Senior Vice President. Prior to joining FirstService, Mr. Cooke was Senior Internal Auditor for Unilever Canada, a subsidiary of Unilever PLC, one of the world’s largest consumer product companies. Previously, Mr. Cooke has held senior financial reporting positions within the retail and financial sectors. Mr. Cooke is both a Chartered Professional Accountant and Chartered Financial Analyst, beginning his career with KPMG. |
Alex Nguyen Ontario, Canada |
41 |
Senior Vice President, Strategy and Corporate Development, since June 2015 |
Mr. Nguyen is the Senior Vice President, Strategy and Corporate Development, of FirstService. In this role, Mr. Nguyen is responsible for driving acquisition growth across all of FirstService’s business platforms. Mr. Nguyen is also closely involved in the formulation and execution of the Company’s corporate strategy and growth initiatives. In 2019, Mr. Nguyen was appointed Senior Vice President. Prior to FirstService, Mr. Nguyen worked at the Ontario Teachers’ Pension Plan, one of the largest institutional investors in the world, where he was responsible for the execution and management of private equity investments. Formerly, Mr. Nguyen worked at RBC Capital Markets and CIT. |
Name and municipality of residence |
Age |
Present position and tenure |
Principal occupation during last five years |
Steve Carpenter |
48 |
Senior Vice President, Technology and Sustainability and Information Services, since January 2022 |
Steve Carpenter joined FirstService in 2015 and has served as California Closets CIO and FirstService Brands CIO prior to moving to the FirstService Corporate team in 2022. Prior to joining FirstService, he served as Director of Hosted Operations for one of the largest global contact center companies. In that role he was responsible for hosted services provided to numerous Fortune 100 companies. Previously, Steve held multiple IT leadership positions over a ten plus year period with a North American multi-brand home services provider; where he focused on providing technology solutions that improved customer experience, employee productivity, and overall life cycle management. Steve has over twenty years of IT leadership experience in selecting, sourcing, designing, implementing, and running all aspects of information technology. Steve attended Murray State University and is a United States Army veteran, he currently resides in the Ozark Mountain area of Arkansas. |
David Diestel Florida, USA |
54 |
Chief Executive Officer, FirstService Residential, since August 2021 |
Mr. Diestel is CEO of FirstService Residential, a role he assumed in 2021 after serving as President of the company’s South Region since 2014. During his time leading the South, his focus on corporate culture and operating discipline transformed the region and led the team to deliver significant increases in revenue and profitability along with entry into new markets. Mr. Diestel joined FirstService Residential in 2005 as the company's Senior Vice President, Operations. In this role, he was responsible for launching the FirstService Residential brand and many of the foundational operational practices that today drive the company’s focus on associate and client experience as well as growth initiatives. Before joining FirstService Residential, Mr. Diestel held the position of Director of Strategy and Operations at FirstService, which he joined in 2002. Mr. Diestel earned a bachelor’s degree in Engineering from McGill University and an MBA from the Rotman School of Management at the University of Toronto. He earned his certification as a LEED AP (Leadership in Energy and Environmental Design) from the U.S. Green Building Council. |
Charlie E. Chase Pennsylvania, USA |
64 |
President and Chief Executive Officer, FirstService Brands, since 2010 |
Mr. Chase is the President and CEO of FirstService Brands. Prior to his role as CEO, Mr. Chase served as the President of the Consumer Franchises of The Franchise Company and prior to that he was CEO of CertaPro Group. Throughout his 30 years with FirstService Brands he has held numerous roles, starting as a Franchise owner in 1982 at College Pro Painters. Believing that there was an opportunity to create a successful and significant full time painting company, in 1992 he became the founding President of CertaPro Painters. |
Ownership
As of the date hereof, the directors and executive/key officers of FirstService, as a group, own, or control or direct, directly or indirectly, 5,210,933 Common Shares, which represents 11.6% of the total Common Shares outstanding.
Legal proceedings and regulatory actions
There are no legal proceedings to which FirstService is a party to, or in respect of which, any of the property of FirstService is the subject of, which is or was material to FirstService during 2023, and FirstService is not aware of any such legal proceedings that are contemplated. In the normal course of operations, FirstService is subject to routine immaterial claims and litigation incidental to its business. Litigation currently pending or threatened against FirstService includes disputes with former employees and commercial liability claims related to services provided by FirstService. FirstService believes resolution of such proceedings, combined with amounts set aside, will not have a material impact on FirstService’s financial condition or the results of operations.
During 2023, there were no penalties or sanctions imposed against FirstService by a court relating to provincial and territorial securities legislation or by a securities regulatory authority, nor were there any other penalties or sanctions imposed by a court or regulatory body against FirstService and, during 2023, FirstService did not enter into any settlement agreements before a court relating to provincial and territorial securities legislation or with a securities regulatory authority.
The following chart provides a summary of the properties occupied by FirstService and its subsidiaries as at December 31, 2023:
(square feet) |
United States (leased) |
United States (owned) |
Canada (leased) |
Canada (owned) |
International (leased) |
International (owned) |
FirstService Residential |
1,003,000 |
- |
104,000 |
– |
– |
– |
FirstService Brands |
3,166,000 |
47,000 |
549,000 |
– |
– |
– |
Corporate |
- |
- |
8,000 |
– |
– |
– |
Reconciliation of non-GAAP financial measures
In this AIF, we make reference to “adjusted EBITDA” and “adjusted EPS,” which are financial measures that are not calculated in accordance with GAAP.
Adjusted EBITDA is defined as net earnings, adjusted to exclude: (i) income tax; (ii) other expense (income); (iii) interest expense; (iv) depreciation and amortization; (v) acquisition-related items; and (vi) stock-based compensation expense. The Company uses adjusted EBITDA to evaluate its own operating performance and its ability to service debt, as well as an integral part of its planning and reporting systems. Additionally, this measure is used in conjunction with discounted cash flow models to determine the Company’s overall enterprise valuation and to evaluate acquisition targets. Adjusted EBITDA is presented as a supplemental measure because the Company believes such measure is useful to investors as a reasonable indicator of operating performance because of the low capital intensity of its service operations. The Company believes this measure is a financial metric used by many investors to compare companies, especially in the services industry. This measure is not a recognized measure of financial performance under GAAP in the United States, and should not be considered as a substitute for operating earnings, net earnings from operations or cash flow from operating activities, as determined in accordance with GAAP. The Company’s method of calculating adjusted EBITDA may differ from other issuers and accordingly, this measure may not be comparable to measures used by other issuers. A reconciliation of net earnings (loss) from operations to adjusted EBITDA appears below.
Year ended |
||||||||
(in thousands of US$) |
December 31 |
|||||||
2023 |
2022 |
|||||||
Net earnings |
$ | 147,021 | $ | 145,007 | ||||
Income tax |
56,317 | 48,974 | ||||||
Other income, net |
(5,810 | ) | (146 | ) | ||||
Interest expense, net |
47,364 | 25,191 | ||||||
Operating earnings |
244,892 | 219,026 | ||||||
Depreciation and amortization |
127,934 | 110,140 | ||||||
Acquisition-related items |
21,517 | 4,520 | ||||||
Stock-based compensation expense |
21,385 | 18,046 | ||||||
Adjusted EBITDA |
$ | 415,718 | $ | 351,732 |
A reconciliation of segment operating earnings to segment Adjusted EBITDA appears below.
(in thousands of US$) |
||||||||||||
Year ended December 31, 2023 |
FirstService |
FirstService |
||||||||||
Residential |
Brands |
Corporate(1) |
||||||||||
Operating earnings (loss) |
$ | 155,044 | $ | 126,468 | $ | (36,620 | ) | |||||
Depreciation and amortization |
33,114 | 94,729 | 91 | |||||||||
Acquisition-related items |
(366 | ) | 21,159 | 724 | ||||||||
Stock-based compensation expense |
- | - | 21,385 | |||||||||
Adjusted EBITDA |
$ | 187,792 | $ | 242,356 | $ | (14,420 | ) |
Year ended December 31, 2022 |
FirstService |
FirstService |
||||||||||
Residential |
Brands |
Corporate(1) |
||||||||||
Operating earnings (loss) |
$ | 138,873 | $ | 111,638 | $ | (31,485 | ) | |||||
Depreciation and amortization |
28,611 | 81,439 | 90 | |||||||||
Acquisition-related items |
1,153 | 3,200 | 167 | |||||||||
Stock-based compensation expense |
- | - | 18,046 | |||||||||
Adjusted EBITDA |
$ | 168,637 | $ | 196,277 | $ | (13,182 | ) |
(1) Corporate costs represent corporate overhead expenses not directly attributable to reportable segments and are therefore unallocated with segment operating earnings (loss) and Adjusted EBITDA
Adjusted EPS is defined as diluted net earnings (loss) per share, adjusted for the effect, after income tax, of: (i) the non-controlling interest redemption increment; (ii) acquisition-related items; (iii) amortization of intangible assets recognized in connection with acquisitions; and (iv) stock-based compensation expense. The Company believes this measure is useful to investors because it provides a supplemental way to understand the underlying operating performance of the Company and enhances the comparability of operating results from period to period. Adjusted EPS is not a recognized measure of financial performance under GAAP, and should not be considered as a substitute for diluted net earnings per Common Share from operations, as determined in accordance with GAAP. The Company’s method of calculating this non-GAAP measure may differ from other issuers and, accordingly, this measure may not be comparable to measures used by other issuers. A reconciliation of diluted net earnings (loss) per Common Share from operations to adjusted EPS appears below.
Year ended |
||||||||
(in US$) |
December 31 |
|||||||
2023 |
2022 |
|||||||
Diluted net earnings per share |
$ | 2.24 | $ | 2.72 | ||||
Non-controlling interest redemption increment |
0.72 | 0.33 | ||||||
Acquisition-related items |
0.47 | 0.10 | ||||||
Amortization of intangible assets, net of tax |
0.88 | 0.79 | ||||||
Stock-based compensation expense, net of tax |
0.35 | 0.30 | ||||||
Adjusted EPS |
$ | 4.66 | $ | 4.24 |
We believe that the presentation of adjusted EBITDA and adjusted EPS, which are non-GAAP financial measures, provides important supplemental information to management and investors regarding financial and business trends relating to the Company’s financial condition and results of operations. Non-GAAP financial measures do not have any standardized meaning and are therefore unlikely to be comparable to similar measures presented by other issuers. We use these non-GAAP financial measures to assist management and investors in understanding our operating performance, our ability to service debt, to assist in determining our overall enterprise valuation and to evaluate acquisition targets, and such measures are an integral part of our planning and reporting systems. We provide non-GAAP financial measures because we believe such measures are useful to investors as a reasonable indicator of our operating performance given the low capital intensity of our service operations and provide a supplemental way to understand our underlying operating performance that enhances the comparability of operating results from period to period, and such measures are commonly used by many investors to compare companies, especially in the services industry. We have also chosen to provide such measures to investors so they can analyze our operating results in the same way that management does and use such measures in their assessment of our core business and valuation. Investors are cautioned that non-GAAP financial measures should not be relied upon as a substitute for financial measures prepared in accordance with GAAP. Non-GAAP financial measures have limitations in that they do not reflect all of the costs or benefits associated with the operations of our business as determined in accordance with GAAP. As a result, investors should not consider these measures in isolation or as a substitute for analysis of our results as reported under GAAP.
Readers should carefully consider the following risks, as well as the other information contained in this AIF and our management’s discussion and analysis for the year ended December 31, 2023. If any of the following risks actually occurs, our business could be materially harmed. The risks and uncertainties described below are not the only ones we face. Additional risks and uncertainties, including those of which we are currently unaware or we currently deem immaterial, may also adversely affect our business, and past performance is no guarantee of future performance.
Risks relating to our Business
Public health crises, and its related impact on global, regional and local economic conditions, and in particular its impact on client demand for our services, our ability to deliver services and ensure the health and productivity of our employees
FirstService’s business, operations and financial condition could be materially adversely affected by the outbreak of epidemics or pandemics or other health crises beyond our control. Many governments may declare that an outbreak, or one or more waves or an outbreak, constitutes an emergency in their jurisdictions. Reactions to the spread of an outbreak, or the worsening of an outbreak from time to time, may lead to, among other things, significant restrictions on travel, business closures, quarantines, social distancing and other containment measures and a general reduction in consumer activity. While these effects may be temporary, the duration of any business disruptions and related financial impact cannot be reasonably estimated, and may be instituted, terminated and re-instituted from time to time as an outbreak worsens, waves of an outbreak occur or new variants of the virus arise from time to time.
Such public health crises can also result in volatility and disruptions in the supply and demand for various products and services (including the products and services offered by FirstService), global supply chains and financial markets, as well as declining trade and market sentiment and reduced mobility of people, all of which could affect interest rates, credit ratings, credit risk and inflation. The risks to FirstService of such public health crises also include risks to employee health and safety and a slowdown or temporary suspension of operations in geographic locations impacted by an outbreak.
Economic conditions, especially as they relate to credit conditions and consumer spending and demand for managed residential property
During periods of economic slowdown or contraction, our business is impacted directly. Consumer spending directly impacts our FirstService Brands operations businesses because as consumers spend less on property services, our revenues decline. These factors could also negatively impact the timing or the ultimate collection of accounts receivable, which would negatively impact our operating revenues, profitability and cash flow.
Residential real estate property values, resale rates and general conditions of financial liquidity for real estate transactions
We provide various services at residential properties in our FirstService Residential and FirstService Brands operating divisions. Property values and consumer confidence are strongly correlated with demand for our services, including painting, closet installation, general maintenance, collections and resale processing.
Extreme weather conditions impacting demand for our services or our ability to perform those services
Natural disasters, such as hurricanes, can have a direct impact in our FirstService Residential and FirstService Brands operations. These events damage property, which require various services that our companies offer, such as restoration and roofing. They may also harm our employees, facilities and franchisees, resulting in an inability to serve clients and generate revenues.
Economic deterioration impacting our ability to recover goodwill and other intangible assets
Expectations of future earnings drive the recoverability of goodwill and other intangible assets, which are tested, at least, on an annual basis. A future deterioration of operating performance may necessitate additional non-cash impairment charges.
A decline in our ability to generate cash from our businesses to fund future acquisitions and meet our debt obligations
We rely on our businesses to generate the necessary cash to service our financial obligations. As at December 31, 2023, we had $1,182.1 million of debt outstanding ($994.5 million net of cash) that, on December 31, 2023, was required to be refinanced or repaid over the next 3 years. We also had $155 million of available un-drawn credit at December 31, 2023. To date, we have been able to meet all of our debt obligations, however with a decline in performance in some of our businesses, surplus cash may not be available to be remitted which may result in the inability to meet a debt repayment.
An important component of our growth strategy is strategic and selective acquisitions, which we tend to complete with cash. Although we have a revolving credit facility available to us under the Credit Agreement and potential future private placement issuances of NYL Notes and/or Prudential Notes under the NYL Note Agreement and Prudential Note Agreement, respectively, as noted elsewhere in this AIF, we also rely on surplus cash on hand to fund acquisitions. If cash on hand is not available and our revolving credit facility is fully utilized, then future acquisitions may not be possible.
The effects of changes in foreign exchange rates in relation to the U.S. dollar on our Canadian dollar denominated revenues and expenses
We generate approximately 13% of our revenues outside the United States. Consequently, a portion of our consolidated results are impacted directly by fluctuations in the relative strength of the U.S. dollar versus the Canadian dollar currency. In the future, we may acquire additional international operations. In such event, the impact of foreign currency exchange rate fluctuations may increase.
Competition in the markets served by FirstService
We operate in highly competitive markets. Changes in the source and intensity of competition in the markets served by us impact the demand for our services and may result in additional pricing pressures. The relatively low capital cost of entry to certain of our businesses has led to strong competitive markets, including regional and local owner-operated companies. Regional and local competitors operating in a limited geographic area may have lower labour, benefits and overhead costs. The principal methods of competition in our businesses include name recognition, quality and speed of service, pricing, customer satisfaction and reputation. No assurance can be given that we will be able to compete successfully against current or future competitors and that the competitive pressures that we face will not result in reduced market share or negatively impact our financial performance.
Labour shortages or increases in wage and benefit costs
As a services company, our primary asset is the human capital that comprises our workforce. In particular, we rely on property managers, franchisees and other skilled staff to generate revenues. A shortage, or increase in wage and benefit costs, of this human capital could reduce our revenues and profitability.
The effects of changes in interest rates on our cost of borrowing
As at December 31, 2023, we had $1,045.5 million of debt at variable interest rates. As a result, changes in base rates such as SOFR affect our interest expense as these base rates fluctuate. On our fixed rate debt, we have from time-to-time entered into fixed-for-floating interest rate swaps, where advantageous, to convert the fixed interest payments to floating. These swaps are intended to manage interest rate sensitivity and reduce overall interest costs. The Company has two interest rate swaps in place to exchange the floating interest rate on $182.5 million of debt total under its Credit Agreement for a fixed rate.
A decline in our performance impacting our continued compliance with the financial covenants under our debt agreements, or our ability to negotiate a waiver of certain covenants with our lenders
A prolonged decline in our earnings performance could result in a non-compliance with one or more financial covenants under the Credit Agreement, Senior Note Agreement, NYL Note Agreement and/or Prudential Note Agreement. In addition, FirstService’s degree of leverage from time to time could have adverse consequences for FirstService, including: limiting our ability to obtain additional financing for working capital, capital expenditures, debt service requirements, acquisitions and associated contingent purchase consideration, and/or for general corporate purposes; restricting our flexibility and discretion to operate our business; limiting our ability to declare dividends on the Common Shares; having to dedicate a portion of our cash flows from operations to the payment of interest on our existing indebtedness and not having such cash flows available for other purposes, including operations, capital expenditures, acquisitions and other future business opportunities; exposing us to increased interest expense on borrowings; limiting our ability to adjust to changing market conditions; placing us at a competitive disadvantage compared to its competitors that have less debt; making us vulnerable in a downturn in general economic conditions; and making us unable to make capital expenditures that are important to our growth and strategies. In the event that we are unable to make principal or interest payments on our indebtedness outstanding under the Credit Agreement or our other indebtedness as required, we could be in default and such indebtedness could be accelerated, and we may not be able to repay or refinance such indebtedness. Any such default and acceleration could require us to raise additional equity capital (resulting in dilution) or take on additional indebtedness, which could have more onerous terms than our existing indebtedness, or to sell assets or take other actions that could adversely affect our business. Furthermore, a lender, if unpaid, may exercise their secured creditor rights.
Unexpected increases in operating costs, such as insurance, workers’ compensation, health care and fuel prices
As a services company, the costs of providing services to our customers can fluctuate. Certain operating expenses are based on market rates which we cannot control and, absent an offsetting price increase in our services, have a direct impact on our operating margins.
Changes in the frequency or severity of insurance incidents relative to our historical experience
Adverse changes in claims experience could increase our insurance costs and/or increase the risk of being unable to renew insurance coverage at our operations. In each of our operating segments, we effectively self-insure certain risks, with a layer of third-party insurance for catastrophic claims. An increase in the frequency or severity of claims in these areas could materially affect our financial position and results of operations. There can be no assurance that we will be able to obtain insurance coverage on favourable economic terms in the future.
A decline in our ability to make acquisitions at reasonable prices and successfully integrate acquired operations, no assurance of future performance by acquired businesses and potential liabilities associated with acquisitions
As an acquisitive organization, we actively pursue acquisitions to expand our footprint and services offerings as well as supplement existing businesses. Not only does our acquisition strategy depend on the continued availability of suitable targets, it also depends on the ability to negotiate favorable terms and conditions. Another risk with acquisitions is the ability to integrate the acquired business into an existing service line.
In addition, the historic and current performance of a business we acquire may not be indicative of success in future periods. A business we acquire may not perform as well as we anticipate or we may incur unanticipated costs and expenses relating to its operations. The future performance of a business we acquire may be influenced by unpredictable events, economic downturns, regulatory changes and other factors beyond the control of FirstService. There is no assurance that revenues generated from a business we acquire will increase in future years. As a result of any one or more of these factors, the operations and financial performance of a business we acquire may be negatively affected, which could materially and adversely affect FirstService’s financial results.
In relation to acquisitions we make, often times the liabilities of the acquired business remained with the acquired legal entity or entities. There may be liabilities that FirstService fail to discover or are unable to quantify accurately or at all in a due diligence review of an acquisition conducted prior to completing the acquisition. Although FirstService has in the past in select circumstances obtained buyer-side representation and warranty insurance in respect of an acquisition and has certain limited indemnification rights, these may be insufficient to satisfy any losses resulting from such liabilities.
Changes in laws, regulations and government policies at the federal, state/provincial or local level may adversely impact our businesses
Changes in laws and regulation at the different jurisdictional levels can have a direct effect on our operations. It is difficult to predict the future impact of a change in legislative and regulatory requirements affecting our businesses. The laws and regulations applicable to our businesses will likely change in the future and affect our operations and financial performance. In addition, if we were to fail to comply with any applicable law or regulation, we could be subject to substantial fines or damages, be involved in litigation, suffer losses to our reputation and suffer the loss of licenses or penalties that may affect how our business is operated, which, in turn, would have a material adverse effect on our business, financial condition and results of operations.
Risks related to liability for employee acts or omissions, or installation/system failure, in our fire protection businesses
The nature of the fire protection services we provide exposes us to the risks that we may be held liable for employee acts or omissions or installation/system failures. In an attempt to reduce this risk, our installation, service and/or maintenance agreements and other contracts contain provisions limiting our liability in such circumstances, and we typically maintain liability insurance to mitigate such risk. However, in the event of litigation, it is possible that contract limitations may be deemed not applicable or unenforceable, that our insurance coverage is not adequate, or that insurance carriers deny coverage of our claims. As a result, such employee acts or omissions or installation/system failures could have an adverse effect on our business, financial condition, results of operations and cash flows.
Risks arising from any regulatory review and litigation
While management is not currently aware of any formal regulatory reviews or investigations, the commencement of any such reviews or investigations may result in the diversion of significant management attention and resources and, if securities or other regulators determine that a violation of securities or other laws may have occurred, or has occurred, the Company or its officers and directors may receive notices regarding potential enforcement action or prosecution and could be subject to civil or criminal penalties or other remedies. For example, the Company or its officers could be required to pay substantial damages, fines or other penalties, the regulators could seek an injunction against the Company or seek to ban an officer or director of the Company from acting as such, any of which actions would have a material adverse effect on the Company.
Risks associated with intellectual property and other proprietary rights that are material to our business
Our ability to compete effectively depends in part on our rights to service marks, trademarks, trade names and other intellectual property rights we own or license. We have not sought to register every one of our marks in every jurisdiction in which they are used. Furthermore, because of the differences in foreign trademark, patent and other intellectual property or proprietary rights laws, we may not receive the same protection in other jurisdictions as we would in Canada or the United States. If we are unable to protect our proprietary information and brand names, we could suffer a material adverse effect on our business, financial condition or results of operations. Litigation may be necessary to enforce our intellectual property rights and protect our proprietary information, or to defend against claims by third parties that our products or services infringe their intellectual property rights. Any litigation or claims brought by or against us could result in substantial costs and diversion of our resources. A successful claim of trademark, patent or other intellectual property infringement against us, or any other successful challenge to the use of our intellectual property, could subject us to damages or prevent us from providing certain services under our recognized brand names, which could have a material adverse effect on our business, financial condition or results of operations.
Disruptions or security failures in our information technology systems
Our information technology systems facilitate our ability to monitor, operate and control our operations. While we have disaster recovery plans in place, any disruption in these plans or the failure of our information technology systems to operate as expected could, depending on the magnitude of the problem, adversely affect our operating results by limiting, among other things, our capacity to monitor, operate and control our operations effectively. In addition, because our systems contain information about individuals and businesses, our failure to maintain the security of the data we hold, whether the result of our own error or the malfeasance or errors of others, could harm our reputation or give rise to legal liabilities relating to violations of privacy laws or otherwise, which may lead to lower revenues, increased costs and other material adverse effects on our results of operations.
Political conditions, including any outbreak or escalation of terrorism or hostilities and the impact thereof on our business
Political events and situations can have an effect on the Company’s operations. Events could occur that may hamper our ability to manage operations, extract cash and implement FirstService policies in certain regions.
Risks relating to our Common Shares
Volatility of market price of the Common Shares
The market price of the Common Shares may be volatile and subject to wide fluctuations in response to numerous factors, many of which are beyond our control, including the following:
● |
actual or anticipated fluctuations in our annual or quarterly results of operations; |
● |
changes in estimates of future results of operations by us or by securities research analysts; |
● |
changes in the economic performance or market valuations of other companies that investors deem comparable to us; |
● |
the addition or departure of our executive officers or other key personnel; |
● |
litigation or regulatory action against us; |
● |
issuances or expected issuances of additional Common Shares or other forms of our securities; |
● |
changes in applicable laws and regulations, including tax laws, or changes in the manner in which those laws are applied; |
● |
significant acquisitions or business combinations, strategic partnerships, joint ventures or capital commitments by or involving us or our competitors; and |
● |
news reports relating to the conditions in the economy in general and/or trends, concerns or competitive developments, regulatory changes and other related issues in our industry. |
The volatility may affect the ability of holders of Common Shares to sell the Common Shares at an advantageous price.
Financial markets have, at times, experienced significant price and volume fluctuations that have particularly affected the market prices of securities of companies and that have, in many cases, been unrelated to the operating performance, underlying asset values or prospects of such companies. Accordingly, the market price of the Common Shares may decline even if our operating results, underlying asset values or prospects have not changed. Additionally, these factors, as well as other related factors, may cause decreases in asset values that are deemed to be other than temporary, which may result in impairment losses. As well, certain institutional investors may base their investment decisions on consideration of our environmental, governance and social practices and performance against such institutions’ respective investment guidelines and criteria, and failure to meet such criteria may result in a limited or no investment in the Common Shares by those institutions, which could adversely affect the trading price of the Common Shares. There can be no assurance that fluctuations in price and volume will not occur. If such increased levels of volatility and market turmoil occur, our operations could be adversely impacted and the trading price of the Common Shares may be adversely affected.
A decline in our performance impacting our ability to pay dividends on Common Shares
Although we intend to make cash dividends to shareholders in accordance with our existing dividend policy, these dividends are not assured. Future dividends on the Common Shares will depend on our results of operations, financial condition, capital requirements, general business conditions and other factors that our board of directors may deem relevant. Additionally, under the Credit Agreement, the Senior Note Agreement, the NYL Note Agreement and Prudential Note Agreement, we are not permitted to pay dividends, whether in cash or in specie, in the circumstances of an event of default thereunder occurring and continuing or an event of default occurring as a consequence thereof. The market value of the Common Shares may deteriorate if we are unable to pay dividends pursuant to our existing dividend policy in the future.
Potential dilution
We are authorized to issue an unlimited number of Common Shares for consideration and terms and conditions as established by our board of directors, in many cases, without any requirement for explicit shareholder approval, and shareholders have no pre-emptive rights in connection with such further issuances. We may issue additional Common Shares in share offerings (including through the sale of securities convertible into or exchangeable for Common Shares) and pursuant to the exercise of options under our Option Plan. We cannot predict the size of future issuances of Common Shares or the effect that future issuances and sales of Common Shares will have on the market price of the Common Shares. Issuances of a substantial number of additional Common Shares, or the perception that such issuances could occur, may adversely affect prevailing market prices for the Common Shares. With any additional issuance of Common Shares, holders of Common Shares will suffer dilution and we may experience dilution in our earnings per share.
Foreign private issuer
We are a “foreign private issuer”, as such term is defined in Rule 405 under the United States Securities Act of 1933, as amended, and are permitted, under a multijurisdictional disclosure system adopted by the United States and Canada, to prepare our disclosure documents filed under the United States Securities Exchange Act of 1934, as amended (“U.S. Exchange Act”), in accordance with Canadian disclosure requirements. Under the U.S. Exchange Act, we are subject to reporting obligations that, in certain respects, are less detailed and less frequent than those of U.S. domestic reporting companies. As a result, we do not file the same reports that a U.S. domestic issuer would file with the U.S. Securities and Exchange Commission (“SEC”), although we are required to file or furnish to the SEC the continuous disclosure documents that we are required to file in Canada under Canadian securities laws. In addition, our officers, directors, and principal shareholders are exempt from the reporting and short swing profit liability provisions of Section 16 of the U.S. Exchange Act. Therefore, our shareholders may not know on as timely a basis when our officers, directors and principal shareholders purchase or sell shares, as the reporting deadlines under the corresponding Canadian insider reporting requirements are generally longer.
As a foreign private issuer, we are exempt from the rules and regulations under the U.S. Exchange Act related to the furnishing and content of proxy statements. We are also exempt from Regulation FD, which prohibits issuers from making selective disclosures of material non-public information. While we will comply with the corresponding requirements relating to proxy statements and disclosure of material non-public information under Canadian securities laws, these requirements differ from those under the U.S. Exchange Act and Regulation FD, and shareholders should not expect to receive the same information at the same time as such information is provided by U.S. domestic companies.
In addition, as a foreign private issuer, we have the option to follow certain Canadian corporate governance practices, except to the extent that such laws would be contrary to U.S. securities laws, and provided that we disclose the requirements we are not following and describe the Canadian practices we follow instead. We currently rely on this exemption with respect to requirements regarding the quorum for any meeting of our shareholders, the requirement to obtain shareholder approval prior to an issuance of securities in certain circumstances and certain responsibilities of the Executive Compensation Committee of our board of directors. We may in the future elect to follow home country practices in Canada with regard to other matters. As a result, our shareholders may not have the same protections afforded to shareholders of U.S. domestic companies that are subject to all corporate governance requirements and Nasdaq corporate governance listing standards.
The determination of foreign private issuer status is made annually on the last business day of an issuer’s most recently completed second fiscal quarter. We would lose our foreign private issuer status if, for example, more than 50% of our Common Shares are directly or indirectly held by residents of the United States and we fail to meet additional requirements necessary to maintain our foreign private issuer status. If we lose our foreign private issuer status on this date, we will be required to file with the SEC periodic reports and registration statements on U.S. domestic issuer forms, which are more detailed and extensive than the forms available to a foreign private issuer. We will also have to mandatorily comply with U.S. federal proxy requirements, and our officers, directors and principal shareholders will become subject to the short-swing profit disclosure and recovery provisions of Section 16 of the U.S. Exchange Act. In addition, we will lose our ability to rely upon exemptions from certain corporate governance requirements under the Nasdaq listing rules. As a U.S. listed public company that is not a foreign private issuer, we will incur significant additional legal, accounting and other expenses that we will not incur as a foreign private issuer, and accounting, reporting and other expenses in order to maintain a listing on a U.S. securities exchange.
Interest of management and others in material transactions
Except as described below or elsewhere in this AIF, no director of FirstService, executive officer of FirstService, or person or company that beneficially owns, or controls or directs more than 10% of any class or series of voting securities of FirstService, or any associate or affiliate of any of the foregoing persons, has or has had any material interest in any transaction within the last three years, or during the current year, that has materially affected or is reasonably expected to materially affect FirstService or any of its subsidiaries.
To the knowledge of the directors and executive officers of FirstService, no person beneficially owns, or controls or directs, directly or indirectly, 10% or more of the issued and outstanding Common Shares.
The only contracts that can reasonably be regarded as material to us, other than contracts entered into in the ordinary course of business, are as follows:
(a) Credit Facility: On February 17, 2022, we entered into the Credit Agreement with a syndicate of lenders. The Credit Agreement replaced our prior credit agreement which had been in effect since June 21, 2019. The Credit Agreement provides for a committed multi-currency revolving credit facility of US$1 billion on an unsecured basis. The Credit Agreement has a term ending on February 17, 2027, bears interest at 0.20% to 2.50% over floating reference rates, depending on certain leverage ratios. The Credit Agreement replaced our previous US$450 million revolving credit facility and US$440 million term loan (drawn in a single advance) that were set to mature in January 2023 and June 2024, respectively. A portion of the revolving credit facility under the Credit Agreement was used to repay the remaining term loan balance of US$407 million under the prior credit agreement. In December 2023, we exercised the $250 million accordion feature under the credit facility to fund our commercial roofing platform acquisition. Accordingly, the second amended and restated credit agreement currently provides for a committed multi-currency revolving credit facility of US$1.25 billion on an unsecured basis. The Credit Agreement requires a commitment fee of 0.24% to 0.50% of the unused portion, depending on certain leverage ratios. The indebtedness under the Credit Agreement, the Senior Notes, the NYL Notes and the Prudential Notes rank equally in terms of seniority. We may repay amounts owing under the Credit Agreement at any time without penalty. Advances under the Credit Agreement are subject to certain conditions of drawdown, and may be made by way of US and Canadian prime rate/base rate/SOFR loans, bankers acceptances or letters of credit. The financial covenants contained in the Credit Agreement require that we maintain a total debt to consolidated EBITDA ratio of not more than 3.5 to 1.0 and, on a consolidated and rolling four quarters basis, an interest coverage ratio of greater than 2.0 to 1. To date, we have always complied with the foregoing covenants under the Credit Agreement and the prior credit agreement. All outstanding amounts under the Credit Agreement will be accelerated and must be repaid upon the occurrence of an event of default under the Credit Agreement, in certain circumstances, following written notice from the lenders to such effect. We are prohibited under the Credit Agreement from undertaking certain acquisitions and dispositions, and incurring certain indebtedness and encumbrances, without prior approval of the lenders under the Credit Agreement. The Credit Facility is utilized for working capital and general corporate purposes and to fund future tuck-under acquisitions;
(b) Senior Note Agreement: On June 1, 2015, we entered into the Senior Note Agreement pursuant to which FirstService assumed from Old FSV US$150 million of Senior Notes bearing interest at a rate of 3.84% to 4.84%, depending on leverage ratios. As of December 31, 2023, the current interest rate on the Senior Notes is 3.84%. The Senior Notes are due on January 16, 2025, with five annual equal repayments which began on January 16, 2021, and rank equally with the indebtedness under the Credit Agreement in terms of seniority. We may prepay the Senior Notes at any time in an amount of not less than $5 million at the principal amount of the notes then being repaid, plus accrued interest and a make whole payment. The financial covenants contained in the Senior Note Agreement require that we maintain a total debt to consolidated EBITDA ratio of not more than 3.5 to 1.0 and, on a consolidated and rolling four quarters basis, an interest coverage ratio of greater than 2.0 to 1. To date, we have complied with the foregoing covenants. All outstanding amounts under the Senior Notes will be accelerated and must be repaid upon the occurrence of certain events of default under the Senior Note Agreement. We are prohibited under the Senior Note Agreement from undertaking certain acquisitions and dispositions, and incurring certain indebtedness and encumbrances, without prior approval of the holders of the Senior Notes;
(c) NYL Note Agreement: On September 29, 2022, we entered into the NYL Note Agreement for potential future private placement issuances of NYL Notes with NYL Investors LLC (“New York Life”) of up to US$150 million, net of any existing Senior Notes and NYL Notes held by New York Life. We currently have no remaining capacity under the NYL Note Agreement. The NYL Note Agreement has a three-year term ending September 29, 2025. We have the ability to issue incremental NYL Note tranches under the NYL Note Agreement, subject to acceptance by New York Life, with varying maturities as determined by us, and with coupon pricing determined at the time of each NYL Note issuance. As part of entering into the NYL Note Agreement on September 29, 2022, we issued, on a private placement basis to New York Life, US$60 million of 4.53% NYL Notes due September 29, 2032. Subsequently, in January 2024, we issued, on a private placement basis to New York Life, US$50 million of 5.48% NYL Notes due January 30, 2029 and US$25 million of 5.60% NYL Notes due January 30, 2031. The NYL Notes rank equally with the indebtedness under the Credit Agreement, the Senior Note Agreement and the Prudential Note Agreement in terms of seniority. We may prepay issued NYL Notes at any time in an amount of not less than $5 million at the principal amount of the notes then being repaid, plus accrued interest and a make whole payment. The financial covenants contained in the NYL Note Agreement are the same as those contained in the Senior Note Agreement. To date, we have complied with the foregoing covenants. All outstanding amounts under issued NYL Notes will be accelerated and must be repaid upon the occurrence of certain events of default under the NYL Note Agreement. We are prohibited under the NYL Note Agreement from undertaking certain acquisitions and dispositions, and incurring certain indebtedness and encumbrances, without prior approval of the holders of the NYL Notes. The proceeds from any issued NYL Notes are intended to be utilized for working capital and general corporate purposes and to fund future tuck-under acquisitions, as well as potential repayment of amounts outstanding under the Credit Agreement; and
(d) Prudential Note Agreement: On September 29, 2022, we entered into the Prudential Note Agreement for potential future private placement issuances of Prudential Notes with PGIM Private Capital (“Prudential”) of up to US$300 million, net of any existing Senior Notes and Prudential Notes held by Prudential. We currently have US$235 million of remaining capacity under the Prudential Note Agreement. The Prudential Note Agreement has a three-year term ending September 29, 2025. We have the ability to issue incremental Prudential Note tranches under the Prudential Note Agreement, subject to acceptance by Prudential, with varying maturities as determined by us, and with coupon pricing determined at the time of each Prudential Note issuance. In January 2024, we issued, on a private placement basis to Prudential, US$50 million of 5.64% Prudential Notes due January 30, 2031. The Prudential Notes rank equally with the indebtedness under the Credit Agreement, the Senior Note Agreement and the NYL Note Agreement in terms of seniority. We may prepay issued Prudential Notes at any time in an amount of not less than $5 million at the principal amount of the notes then being repaid, plus accrued interest and a make whole payment. The financial covenants contained in the Prudential Note Agreement are the same as those contained in the Senior Note Agreement. To date, we have complied with the foregoing covenants. All outstanding amounts under issued Prudential Notes will be accelerated and must be repaid upon the occurrence of certain events of default under the Prudential Note Agreement. We are prohibited under the Prudential Note Agreement from undertaking certain acquisitions and dispositions, and incurring certain indebtedness and encumbrances, without prior approval of the holders of the Prudential Notes. The proceeds from any issued Prudential Notes are intended to be utilized for working capital and general corporate purposes and to fund future tuck-under acquisitions, as well as potential repayment of amounts outstanding under the Credit Agreement.
Copies of the above material contracts are available on FirstService’s SEDAR+ profile at www.sedarplus.ca.
Cease trade orders, bankruptcies, penalties or sanctions
To the best of the knowledge of the Company:
(1) none of the directors or executive officers of the Company is, as at the date of this AIF, or was within 10 years before the date of this AIF, a director, chief executive officer or chief financial officer of any company (including the Company) that: (i) was subject to a cease trade or similar order or an order that denied the relevant company access to any exemption under securities legislation, in each case, that was in effect for a period of more than 30 consecutive days (collectively, an “Order”) that was issued while the director or executive officer was acting in the capacity as director, chief executive officer or chief financial officer; or (ii) was subject to an Order that was issued after the director or executive officer ceased to be a director, chief executive officer or chief financial officer and which resulted from an event that occurred while that person was acting in the capacity as director, chief executive officer or chief financial officer; and
(2) none of the directors or executive officers of the Company, or a shareholder holding a sufficient number of securities of the Company to affect materially the control of the Company: (a) is, as at the date of this AIF, or has been, within 10 years before the date of this AIF, a director or executive officer of any company (including the Company) that, while that person was acting in that capacity, or within a year of that person ceasing to act in that capacity, became bankrupt, made a proposal under any legislation relating to bankruptcy or insolvency or was subject to or instituted any proceedings, arrangement or compromise with creditors or had a receiver, receiver manager or trustee appointed to hold its assets; or (b) has, within the 10 years before the date of this AIF, become bankrupt, made a proposal under any legislation relating to bankruptcy or insolvency, or become subject to or instituted any proceedings, arrangement or compromise with creditors, or had a receiver, receiver manager or trustee appointed to hold the assets of the director, executive officer or shareholder.
Certain directors and officers of the Company are engaged in and will continue to engage in activities outside the Company, and as a result, certain directors and officers of the Company may become subject to conflicts of interest. The Business Corporations Act (Ontario) provides that in the event that a director or officer has an interest in a contract or proposed contract or agreement, the director or officer shall disclose his or her interest in such contract or agreement and, in the case of directors, shall refrain from voting on any matter in respect of such contract or agreement unless otherwise provided under the Business Corporations Act (Ontario). To the extent that conflicts of interest arise, such conflicts will be resolved in accordance with the provisions of the Business Corporations Act (Ontario).
As at the date hereof, the Company is not aware of any existing or potential material conflicts of interest between the Company and a director or officer of the Company.
The Company’s independent registered public accounting firm is PricewaterhouseCoopers LLP, Chartered Professional Accountants, who have issued a Report of Independent Registered Public Accounting Firm dated February 22, 2024 in respect of the Company’s consolidated financial statements as of December 31, 2023 and 2022 and for each of the years ended December 31, 2023 and on the effectiveness of the Company’s internal control over financial reporting as at December 31, 2023. PricewaterhouseCoopers LLP has advised that they are independent with respect to the Company within the meaning of the Rules of Professional Conduct of the Chartered Professional Accountants of Ontario and the rules of the US Securities and Exchange Commission (SEC) and the Public Company Accounting Oversight Board (PCAOB) on auditor independence.
The Audit Committee is comprised of three members who are each “independent” and “financially literate” as required by Multilateral Instrument 52-110 Audit Committees (the “Audit Committee Rule”). The members of the Audit Committee are Yousry Bissada, Elizabeth Carducci and Joan Eloise Sproul (Chair). The Audit Committee has the resources and the authority to discharge its responsibilities, including the authority to engage, at the expense of FirstService, outside consultants, independent legal counsel and other advisors as it determines necessary to carry out its duties, without seeking approval of our board of directors or management. The Audit Committee also has the authority to conduct any investigation necessary and appropriate to fulfilling its responsibilities, and has direct access to communicate with the external auditors, legal counsel and officers and employees of FirstService. The Audit Committee meets at least four times annually, or more frequently as circumstances dictate.
The Audit Committee reviews the annual and interim financial statements intended for circulation among shareholders and reports upon these to our board of directors prior to their approval by the full board. The Audit Committee is also responsible for reviewing the integrity of FirstService’s financial reporting process, both internal and external, and any major issues as to the adequacy of the internal controls and any special audit procedures adopted in light of any material control deficiencies. The Audit Committee communicates directly with FirstService’s external auditors in order to discuss audit and related matters whenever appropriate. In addition, our board of directors may refer to the Audit Committee such matters and questions relating to the financial position of FirstService and its subsidiaries. All reports made to FirstService’s ethics hotline are reviewed by the Chair of the Audit Committee and then by the entire Audit Committee at its next meeting. Our board of directors has adopted an Audit Committee mandate, a copy of which is annexed as Exhibit “A” to this AIF. The Audit Committee mandate is also published on the Company’s website (www.firstservice.com).
The education and related experience of each of the members of the Audit Committee that is relevant to the performance by such members of their responsibilities on such committee is described below.
Joan Eloise Sproul (Chair) – Ms. Sproul was most recently the Executive Vice President, Finance (CFO) & Chief Administrative Officer of the Sinai Health System in Toronto, Canada. In addition to serving more than 20 years in various finance and corporate-related roles at Mount Sinai Hospital, she previously held a number of senior financial positions in the hospitality industry. Ms. Sproul was named to the list of Canada's Most Powerful Women, Women's Executive Network, 2013. Ms. Sproul holds a Chartered Professional Accountant (CPA) designation, having qualified as a Chartered Accountant in 1981 and began her career at Ernst & Whinney. Ms. Sproul holds a Bachelor of Commerce degree from the University of Toronto.
Yousry Bissada – Mr. Bissada is the President and Chief Executive Officer of Home Capital Group Inc. Mr. Bissada has more than three decades of experience in financial services and the mortgage industry. Prior to joining Home Capital Group, Mr. Bissada was President and CEO of Kanetix Ltd., an insurance and financial products company, President and CEO of Filogix, Senior Vice President, Real Estate Secured Lending Products at TD Canada Trust and CFO of Firstline Trust. Mr. Bissada has also served on the boards of companies in the mortgage and financial services industries, such as Chair of Canadiana Financial Corp. and Paradigm Quest Inc. and as a director of Propel Holdings Inc., Street Capital Financial Corp. and Equity Financial Holdings Inc. (now Haventree Bank). Mr. Bissada is a CPA, CGA and an Accredited Mortgage Professional (AMP).
Elizabeth Carducci – Ms. Carducci is recognized as a visionary leader in the customer and employee experience industry. She is currently an advisor and investor in early stage companies, having recently retired from a 21 year career at Medallia, a leading software company in the customer experience space. As a member of the founding team, Ms. Carducci joined Medallia in 2001 as employee number three and helped build the company into an industry leader with 2,000 employees and more than $500 million in annual revenue. She was part of the management team that took Medallia public in 2019, and through a subsequent $6.4 billion buyout in 2021 by private equity firm, Thoma Bravo. Ms. Carducci held numerous operational roles during her tenure at Medallia, culminating in her position as Chief Revenue Officer. Under her stewardship, Medallia became the leading provider of customer experience management solutions across a wide variety of industries, including the hospitality, retail and financial services sectors. Before Medallia, Ms. Carducci led the global contact center organization for Starwood Hotels, with prior roles at ITT Sheraton, and Deloitte. Ms. Carducci holds an MBA from Stanford University and a Bachelor of Science in Electrical Engineering from the Massachusetts Institute of Technology.
The Audit Committee Rule requires the Company to disclose whether its Audit Committee has adopted specific policies and procedures for the engagement of non-audit services and to prepare a summary of these policies and procedures. The Audit Committee is responsible for the selection, nomination, compensation, retention, termination and oversight of the work of the external auditors engaged for the purpose of issuing an auditor’s report or performing other audit, review or attest services for FirstService and, in such regard, recommend to our board of directors the external auditors to be nominated for approval by FirstService shareholders. The Audit Committee will also consider, assess and report to our board of directors with regard to the independence and performance of the external auditors. The Audit Committee has adopted a pre-approval policy pursuant to which the Company may not engage the Company’s external auditor to carry out certain non-audit services that are deemed inconsistent with the independence of auditors under U.S. and Canadian applicable laws. The Audit Committee must pre-approve all audit engagements and the provision by the external auditors of all non-audit services, including fees and terms for all audit engagements and non-audit engagements.
In addition to performing the audit of the Company’s annual consolidated financial statements, PricewaterhouseCoopers LLP provided other services to the Company and they billed the Company the following fees during 2023 and 2022:
(in thousands of US$) |
Year ended December 31, 2023 |
Year ended December 31, 2022 |
||||||
Audit fees (note 1) |
$ | 1,160 | $ | 1,065 | ||||
Audit-related fees (note 2) |
64 | 65 | ||||||
Tax fees (note 3) |
317 | 36 | ||||||
All other fees (note 4) |
150 | 104 | ||||||
$ | 1,691 | $ | 1,270 |
Notes:
1. |
Refers to the aggregate fees billed by the Company’s external auditor for audit services relating to the audit of FirstService and statutory audits required by subsidiaries. |
2. |
Refers to the aggregate fees billed for assurance and related services by the Company’s external auditor that are reasonably related to the performance of the audit or review of the Company’s financial statements and are not reported under (1) above, including professional services rendered by the Company’s external auditor for accounting consultations on proposed transactions and consultations related to accounting and reporting standards. Such fees included amounts incurred in respect of: due diligence and other work related to the disposition and acquisition of businesses, such work being unrelated to the audit of the Company’s financial statements; accounting consultations with respect to proposed transactions, as well as other audit-related services. |
3. |
Refers to the aggregate fees billed for professional services rendered by the Company’s external auditor for tax compliance, tax advice and tax planning. |
4. |
Refers to fees for licensing and subscriptions to accounting and tax research tools, as well as administration and out-of-pocket expenses. |
Additional information, including the directors’ and officers’ remuneration and indebtedness, principal holders of the Company’s securities and options to purchase securities, where applicable, is contained in the Meeting Circular.
Copies of publicly filed documents of the Company, including those incorporated herein by reference, can be found through the SEDAR+ web site at www.sedarplus.ca and also via EDGAR at www.sec.gov. Additional financial information is provided in the Company’s consolidated financial statements and management’s discussion and analysis for the year ended December 31, 2023.
AUDIT COMMITTEE MANDATE
Purpose
The Audit Committee (the “Committee”) is appointed by and shall assist the Board of Directors (the “Board”) of FirstService Corporation (the “Company”) in fulfilling its oversight responsibilities in the following principal areas: (i) accounting policies and practices, (ii) the financial reporting process, (iii) financial statements provided by the Company to the public, (iv) risk management including systems of internal accounting and financial controls, (v) appointing, overseeing and evaluating the work of the external auditors, and (vi) compliance with applicable legal and regulatory requirements.
In addition to the responsibilities specifically enumerated in this Mandate, the Board may refer to the Committee such matters and questions relating to the financial position of the Company and its subsidiaries as the Board may from time to time see fit.
Membership
The Committee shall consist of at least three directors appointed annually by the Board and shall be selected based upon the following, in accordance with applicable rules and regulations:
a. |
Independence. Each member shall be independent in accordance with applicable legal and regulatory requirements and in such regard shall have no direct or indirect material relationship with the Company which could, in the view of the Board, reasonably interfere with the exercise of a member’s independent judgment. |
b. |
Financially Literate. Each member shall be financially literate or must become financially literate within a reasonable period of time after his or her appointment to the Committee. For these purposes, an individual is financially literate if he or she has the ability to read and understand a set of financial statements that present a breadth and level of complexity of accounting issues that are generally comparable to the breadth and complexity of the issues that can reasonably be expected to be raised by the Company’s financial statements. |
c. |
Commitment. In addition to being a member of the Committee, if a member is also on the audit committee or board of directors of other public companies, the Board shall determine that such simultaneous service does not impair the ability of such member to serve effectively on the Company’s Audit Committee. |
Chair and Secretary
The Chair of the Audit Committee shall be selected by the Board. If the Chair is not present, the members of the Committee may designate a Chair for the meeting by majority vote of the members present. The Secretary of the Company shall be the Secretary of the Audit Committee, provided that if the Secretary is not present, the Chair of the meeting may appoint a secretary for the meeting with the consent of the other Committee members who are present.
Meetings
The times and locations of meetings of the Committee and the calling of such meetings, shall be determined from time to time by the Chair of the Committee, in consultation with management when necessary, provided that there shall be a minimum of four meetings per year. The Committee shall have sufficient notice in order to prepare for each meeting. Notice of each meeting shall also be given to the external auditors of the Company, and meetings shall be convened whenever requested by the external auditors or any member of the Committee in accordance with applicable law.
Meeting Agendas
Agendas for meetings of the Audit Committee shall be developed by the Chair of the Committee in consultation with management and the corporate secretary, and shall be circulated to the Committee members prior to any meetings.
Resources and Authority
The Committee shall have the resources and the authority to discharge its responsibilities, including the authority to engage, at the expense of the Company, outside consultants, independent legal counsel and other advisors as it determines necessary to carry out its duties, without seeking approval of the Board or management.
The Committee shall have the authority to conduct any investigation necessary and appropriate to fulfilling its responsibilities, and has direct access to communicate with the external auditors, legal counsel, and officers and employees of the Company.
The members of the Committee have the right, for the purpose of performing their duties, to inspect the books and records of the Company and to discuss such accounts and records and any matters relating to the financial position, risk management and internal controls of the Company with the officers and external auditors of the Company.
Responsibilities
The Company’s management is responsible for preparing the Company’s financial statements while the external auditors are responsible for auditing those financial statements. The Committee is responsible for overseeing the conduct of those activities by the Company’s management and external auditors, and overseeing the activities of any internal audit initiatives. The Company’s external auditors are accountable to the Committee as representatives of the Company’s shareholders.
It is recognized that members of the Committee are not full-time employees of the Company and do not represent themselves to be accountants or auditors by profession or experts in the fields of accounting or auditing or the preparation of financial statements. It is not the duty or responsibility of the Committee or its members to conduct “field work” or other types of auditing or accounting reviews or procedures. Each member of the Committee shall be entitled to rely on (i) the integrity of those persons and organizations within and outside the Company from whom it receives information, and (ii) the accuracy of the financial and other information provided to the Committee by such persons or organizations absent actual knowledge to the contrary.
The specific responsibilities of the Committee are as follows:
1. |
Financial Reporting Process and Financial Statements |
a. |
In consultation with the external auditors and management, review the integrity of the Company’s financial reporting process, both internal and external, and any major issues as to the adequacy of the internal controls and any special audit procedures adopted in light of any material control deficiencies; |
b. |
Review all material transactions and contracts entered into by the Company with any insider or related party of the Company, other than officer or employee compensation arrangements which are approved by the Compensation Committee; |
c. |
Review with management and the external auditors the Company’s annual audited consolidated financial statements and discuss with the external auditors all matters required to be discussed by generally accepted auditing standards (GAAS) in Canada and the United States. This would include reviewing an annual report prepared by the external auditors describing: (i) all critical accounting policies used by the Company, (ii) any material alternative accounting treatments within generally accepted accounting principles (GAAP) that have been discussed with management of the Company, including the ramifications of the use of such alternative treatments and disclosures, and (iii) any other material written communications between the external auditors and management; |
d. |
Following completion of the annual audit, review with management and the external auditors any significant issues, concerns or difficulties encountered; |
e. |
Resolve any disagreements between management and the external auditors regarding financial reporting; |
f. |
Review the interim quarterly and annual financial statements and annual and interim press releases prior to the release of earnings information including earnings guidance provided to analysts; |
g. |
Review and be satisfied that adequate procedures are in place for the review of the public disclosure of financial information by the Company and periodically assess the adequacy of those procedures; and |
h. |
Meet separately, periodically, with management and with the external auditors. |
2. |
External Auditors |
a. |
The Committee is responsible for the selection, nomination, compensation, retention, termination and oversight of the work of the external auditors engaged for the purpose of issuing an auditor’s report or performing other audit, review or attest services for the Company, and in such regard recommend to the Board the external auditors to be nominated for approval by the shareholders; |
b. |
Pre-approve all audit engagements and the provision by the external auditors of all non-audit services, including fees and terms for all audit engagements and non-audit engagements, and in such regard the Committee may establish the types of non-audit services the external auditors shall be prohibited from providing and shall establish the types of audit, audit related and non-audit services for which the Committee will retain the external auditors; |
c. |
Review and approve the Company’s policies for the hiring of partners and employees and former partners and employees of the external auditing firm; |
d. |
Consider, assess and report to the Board with regard to the independence and performance of the external auditors; and |
e. |
Request and review annually a report by the external auditors regarding the auditing firm’s internal quality-control procedures, any material issues raised by the most recent internal quality-control review of the auditing firm, or by any inquiry or investigation by governmental or professional authorities, within the past five years. |
3. |
Internal Controls and Risk Management |
a. |
Oversee management’s design, implementation and evaluation of the Company’s internal controls over financial reporting including compliance with the requirements of the Sarbanes-Oxley Act. Receive and review reports from management and the external auditors with regard to the reliability and effective operation of the Company’s accounting systems and internal controls; |
b. |
Discuss with management the Company’s approach to risk assessment and risk management and it’s assessment of the need for internal auditing. The Company’s approach includes assessing and managing the risks related with personal and sensitive data that is collected, transmitted or stored by the Company and the control environment in place to protect the privacy of such data; |
c. |
Establish policies and procedures for the confidential, anonymous submission by employees of the Company of any concerns regarding questionable accounting or other acts and for the receipt, retention and treatment of any such submissions. |
4. |
Legal and Regulatory Requirements |
a. |
Receive and review timely analysis by management of significant issues relating to public disclosure and reporting, including, prior to finalization, the Management’s Discussion and Analysis and Annual Information Form; |
b. |
Prepare the report of the Audit Committee required to be included with the Company’s periodic filings; and |
c. |
Assist the Board in the oversight of compliance with legal and regulatory matters. |
5. |
Additional Responsibilities |
a. |
Report regularly to the Board, including matters such as the quality and integrity of the Company’s financial statements, compliance with legal and regulatory requirements, the results of any internal audit initiatives including evaluation of internal controls over financial reporting for purposes of compliance with Sarbanes-Oxley, and the performance and independence of the external auditors; and |
b. |
Review and reassess annually the adequacy of the Audit Committee’s Mandate and prepare and review with the Board an annual performance evaluation of the Audit Committee. |
Exhibit 2
FIRSTSERVICE CORPORATION
CONSOLIDATED FINANCIAL STATEMENTS
Year ended
December 31, 2023
FIRSTSERVICE CORPORATION
MANAGEMENT’S REPORT
MANAGEMENT’S RESPONSIBILITY FOR FINANCIAL STATEMENTS
The accompanying consolidated financial statements and management discussion and analysis (“MD&A”) of FirstService Corporation (the “Company”) and all information in this annual report are the responsibility of management and have been approved by the Board of Directors.
The consolidated financial statements have been prepared by management in accordance with accounting principles generally accepted in the United States of America using the best estimates and judgements of management, where appropriate. The most significant of these accounting principles are set out in Note 2 to the consolidated financial statements. Management has prepared the financial information presented elsewhere in this annual report and has ensured that it is consistent with the consolidated financial statements.
The MD&A has been prepared in accordance with National Instrument 51-102 of the Canadian Securities Administrators, taking into consideration other relevant guidance, including Regulation S-K of the US Securities and Exchange Commission.
The Board of Directors of the Company has an Audit Committee consisting of three independent directors. The Audit Committee meets regularly to review with management and the independent auditors any significant accounting, internal control, auditing and financial reporting matters.
These consolidated financial statements have been audited by PricewaterhouseCoopers LLP, which have been appointed as the independent registered public accounting firm of the Company by the shareholders. Their report outlines the scope of their examination and opinion on the consolidated financial statements and the effectiveness of ICFR at December 31, 2023. As auditors, PricewaterhouseCoopers LLP have full and independent access to the Audit Committee to discuss their findings.
MANAGEMENT’S REPORT ON INTERNAL CONTROL OVER FINANCIAL REPORTING
Management is responsible for establishing and maintaining adequate internal control over financial reporting for the Company. Internal control over financial reporting is a process designed to provide reasonable assurance regarding the reliability of financial reporting and the preparation of financial statements for external purposes in accordance with generally accepted accounting principles.
Due to its inherent limitations, internal control over financial reporting may not prevent or detect misstatements. Also, projections of any evaluation of its effectiveness to future periods are subject to the risk that controls may become inadequate because of changes in conditions, or that the degree of compliance with the policies or procedures may deteriorate.
Management has excluded twelve individually insignificant entities acquired by the Company, including Roofing Corp of America, during the last fiscal period from its assessment of internal control over financial reporting as at December 31, 2023. The total assets and total revenues of the twelve majority-owned entities represent 4.8% and 2.6%, respectively, of the related consolidated financial statement amounts as at and for the year ended December 31, 2023.
Management has assessed the effectiveness of the Company’s internal control over financial reporting as at December 31, 2023, based on the criteria set forth in Internal Control – Integrated Framework (2013) issued by the Committee of Sponsoring Organizations of the Treadway Commission. Based on this assessment, management has concluded that, as at December 31, 2023, the Company’s internal control over financial reporting was effective.
The effectiveness of the Company's internal control over financial reporting as at December 31, 2023, has been audited by PricewaterhouseCoopers LLP, the Company’s independent registered public accounting firm as stated in their report which appears herein.
/s/ Scott Patterson Chief Executive Officer |
/s/ Jeremy Rakusin Chief Financial Officer |
February 22, 2024
Report of Independent Registered Public Accounting Firm
To the Shareholders and Board of Directors of FirstService Corporation
Opinions on the Financial Statements and Internal Control over Financial Reporting
We have audited the accompanying consolidated balance sheets of FirstService Corporation and its subsidiaries (together, the Company) as of December 31, 2023 and 2022, and the related consolidated statements of earnings and comprehensive earnings, shareholders' equity and cash flows for the years then ended, including the related notes (collectively referred to as the consolidated financial statements). We also have audited the Company’s internal control over financial reporting as of December 31, 2023, based on criteria established in Internal Control – Integrated Framework (2013) issued by the Committee of Sponsoring Organizations of the Treadway Commission (COSO).
In our opinion, the consolidated financial statements referred to above present fairly, in all material respects, the financial position of the Company as of December 31, 2023 and 2022, and the results of its operations and its cash flows for the years then ended in conformity with accounting principles generally accepted in the United States of America. Also in our opinion, the Company maintained, in all material respects, effective internal control over financial reporting as of December 31, 2023, based on criteria established in Internal Control – Integrated Framework (2013) issued by the COSO.
Basis for Opinions
The Company’s management is responsible for these consolidated financial statements, for maintaining effective internal control over financial reporting, and for its assessment of the effectiveness of internal control over financial reporting, included in the accompanying Management's Report on Internal Control over Financial Reporting. Our responsibility is to express opinions on the Company’s consolidated financial statements and on the Company’s internal control over financial reporting based on our audits. We are a public accounting firm registered with the Public Company Accounting Oversight Board (United States) (PCAOB) and are required to be independent with respect to the Company in accordance with the U.S. federal securities laws and the applicable rules and regulations of the Securities and Exchange Commission and the PCAOB.
We conducted our audits in accordance with the standards of the PCAOB. Those standards require that we plan and perform the audits to obtain reasonable assurance about whether the consolidated financial statements are free of material misstatement, whether due to error or fraud, and whether effective internal control over financial reporting was maintained in all material respects.
Our audits of the consolidated financial statements included performing procedures to assess the risks of material misstatement of the consolidated financial statements, whether due to error or fraud, and performing procedures that respond to those risks. Such procedures included examining, on a test basis, evidence regarding the amounts and disclosures in the consolidated financial statements. Our audits also included evaluating the accounting principles used and significant estimates made by management, as well as evaluating the overall presentation of the consolidated financial statements. Our audit of internal control over financial reporting included obtaining an understanding of internal control over financial reporting, assessing the risk that a material weakness exists, and testing and evaluating the design and operating effectiveness of internal control based on the assessed risk. Our audits also included performing such other procedures as we considered necessary in the circumstances. We believe that our audits provide a reasonable basis for our opinions.
As described in Management’s Report on Internal Control over Financial Reporting, management has excluded 12 entities, including Roofing Corp of America, from its assessment of internal control over financial reporting as of December 31, 2023 because they were acquired by the Company in purchase business combinations during 2023. We have also excluded these 12 entities from our audit of internal control over financial reporting. These entities, each of which is majority-owned, comprised, in aggregate, total assets and total revenues excluded from management’s assessment and our audit of internal control over financial reporting of approximately 4.8% and 2.6% of consolidated total assets and consolidated total revenues, respectively, as of and for the year ended December 31, 2023.
Definition and Limitations of Internal Control over Financial Reporting
A company’s internal control over financial reporting is a process designed to provide reasonable assurance regarding the reliability of financial reporting and the preparation of financial statements for external purposes in accordance with generally accepted accounting principles. A company’s internal control over financial reporting includes those policies and procedures that (i) pertain to the maintenance of records that, in reasonable detail, accurately and fairly reflect the transactions and dispositions of the assets of the company; (ii) provide reasonable assurance that transactions are recorded as necessary to permit preparation of financial statements in accordance with generally accepted accounting principles, and that receipts and expenditures of the company are being made only in accordance with authorizations of management and directors of the company; and (iii) provide reasonable assurance regarding prevention or timely detection of unauthorized acquisition, use, or disposition of the company’s assets that could have a material effect on the financial statements.
Because of its inherent limitations, internal control over financial reporting may not prevent or detect misstatements. Also, projections of any evaluation of effectiveness to future periods are subject to the risk that controls may become inadequate because of changes in conditions, or that the degree of compliance with the policies or procedures may deteriorate.
Critical Audit Matters
The critical audit matters communicated below are matters arising from the current period audit of the consolidated financial statements that were communicated or required to be communicated to the audit committee and that (i) relate to accounts or disclosures that are material to the consolidated financial statements and (ii) involved our especially challenging, subjective, or complex judgments. The communication of critical audit matters does not alter in any way our opinion on the consolidated financial statements, taken as a whole, and we are not, by communicating the critical audit matters below, providing separate opinions on the critical audit matters or on the accounts or disclosures to which they relate.
Acquisition of Roofing Corp of America – Valuation of Customer Relationships
As described in note 4 to the consolidated financial statements, on December 18, 2023, the Company completed the acquisition of Roofing Corp of America (the acquired business) for total purchase consideration of $447.2 million. Of the acquired intangible assets of $234.8 million, $212.9 million related to customer relationships. Management recorded the customer relationships acquired at fair value on the date of the acquisition, and estimated the fair value using the income approach. Management applied significant judgment in estimating the fair value of the customer relationships acquired, which included the use of assumptions with respect to future earnings before interest, taxes, depreciation and amortization (EBITDA) margins, revenue attributable to returning customers, revenue growth rates, expected attrition rates of acquired customer relationships and the discount rate.
The principal considerations for our determination that performing procedures relating to the valuation of customer relationships acquired in the acquisition of Roofing Corp of America is a critical audit matter are (i) the significant judgment by management when developing the fair value estimate of the customer relationships acquired; (ii) a high degree of auditor judgment, subjectivity and effort in performing procedures and evaluating management’s assumptions related to future EBITDA margins, revenue attributable to returning customers, revenue growth rates, expected attrition rates of acquired customer relationships and the discount rate: and (iii) the audit effort involved the use of professionals with specialized skill and knowledge.
Addressing the matter involved performing procedures and evaluating audit evidence in connection with forming our overall opinion on the consolidated financial statements. These procedures included testing the effectiveness of controls relating to the acquisition accounting, including controls over management’s valuation of the customer relationships acquired. These procedures also included, among others, (i) reading the purchase agreement; (ii) testing management’s process for developing the fair value estimate of the customer relationships acquired; (iii) evaluating the appropriateness of the income approach used by management; (iv) testing the completeness and accuracy of the data used in estimating the fair value of the customer relationships; and (v) evaluating the reasonableness of assumptions used by management related to future EBITDA margins, revenue attributable to returning customers, revenue growth rates, expected attrition rates of acquired customer relationships and the discount rate. Evaluating the reasonableness of assumptions used by management related to future EBITDA margins, revenue attributable to returning customers, revenue growth rates and expected attrition rates of acquired customer relationships involved considering (i) the current and past performance of the acquired business; (ii) the consistency with external market and industry data; (iii) the consistency with prior acquisitions made by the Company; and (iv) whether the assumptions were consistent with evidence obtained in other areas of the audit. Professionals with specialized skill and knowledge were used to assist in evaluating (i) the appropriateness of the income approach used to estimate the fair value of the customer relationships; and (ii) the reasonableness of the discount rate assumption used.
Qualitative Goodwill Impairment Assessment
As described in notes 2 and 10 to the consolidated financial statements, the Company’s goodwill balance was $1.2 billion as of December 31, 2023. Goodwill is tested for impairment annually on August 1, or more frequently if events or changes in circumstances indicate that goodwill might be impaired, in which case the carrying amount of goodwill is written down to fair value. Impairment of goodwill is performed at the reporting unit level. The Company has seven reporting units. Impairment is tested by first assessing qualitative factors to determine whether it is more likely than not that the fair value of a reporting unit is less than its carrying amount (the qualitative goodwill impairment assessment). Where it is determined to be more likely than not its fair value is greater than its carrying amount, then no further quantitative impairment testing is required. As disclosed by management, management uses significant judgment in assessing the qualitative factors to be considered in the qualitative goodwill impairment assessment, including the financial performance of a reporting unit, changes in the business or economic environment of each reporting unit and the Company overall, or declines in the market value of the Company’s own shares.
The principal considerations for our determination that performing procedures relating to the qualitative goodwill impairment assessment is a critical audit matter are the significant judgment by management in assessing the qualitative factors in the qualitative goodwill impairment assessment to determine whether it is more likely than not that the fair value of a reporting unit is less than the carrying amount; and a higher degree of auditor judgment, subjectivity and effort in performing procedures and evaluating audit evidence related to management’s qualitative impairment assessment of the financial performance of a reporting unit, changes in the business or economic environment of each reporting unit and the Company overall, or declines in the market value of the Company’s own shares.
Addressing the matter involved performing procedures and evaluating audit evidence in connection with forming our overall opinion on the consolidated financial statements. These procedures included testing the effectiveness of controls relating to management’s qualitative goodwill impairment assessment. These procedures also included, among others, evaluating the reasonableness of management’s qualitative impairment assessment related to the financial performance of each reporting unit, changes in the business or economic environment of each reporting unit and the Company overall, or declines in the market value of the Company’s own shares by (i) considering current and past performance of the reporting units; (ii) considering consistency with external market and industry data; (iii) comparing share price trends and market capitalization for the Company to historical amounts; and (iv) considering consistency with evidence obtained in other areas of the audit.
/s/
Chartered Professional Accountants, Licensed Public Accountants
February, 22, 2024
We have served as the Company’s auditor since 2014.
FIRSTSERVICE CORPORATION | ||||||||
CONSOLIDATED STATEMENTS OF EARNINGS | ||||||||
(in thousands of US dollars, except per share amounts) | ||||||||
Years ended December 31 | 2023 | 2022 | ||||||
Revenues (note 3) | $ | $ | ||||||
Cost of revenues (exclusive of depreciation and amortization shown below) | ||||||||
Selling, general and administrative expenses | ||||||||
Depreciation | ||||||||
Amortization of intangible assets | ||||||||
Acquisition-related items (note 4) | ||||||||
Operating earnings | ||||||||
Interest expense, net | ||||||||
Other income, net (note 6) | ( | ) | ( | ) | ||||
Earnings before income tax | ||||||||
Income tax (note 15) | ||||||||
Net earnings | ||||||||
Non-controlling interest share of earnings (note 12) | ||||||||
Non-controlling interest redemption increment (note 12) | ||||||||
Net earnings attributable to Company | $ | $ | ||||||
Net earnings per common share (note 16) | ||||||||
Basic | $ | $ | ||||||
Diluted | $ | $ |
The accompanying notes are an integral part of these financial statements.
FIRSTSERVICE CORPORATION | ||||||||
CONSOLIDATED STATEMENTS OF COMPREHENSIVE EARNINGS | ||||||||
(in thousands of US dollars) | ||||||||
Years ended December 31 | 2023 | 2022 | ||||||
Net earnings | $ | $ | ||||||
Foreign currency translation gain (loss) | ( | ) | ||||||
Comprehensive earnings | ||||||||
Less: Comprehensive earnings attributable to non-controlling shareholders | ||||||||
Comprehensive earnings attributable to Company | $ | $ |
The accompanying notes are an integral part of these financial statements.
FIRSTSERVICE CORPORATION | ||||||||
CONSOLIDATED BALANCE SHEETS | ||||||||
(in thousands of US dollars) | ||||||||
As at December 31 | 2023 | 2022 | ||||||
Assets | ||||||||
Current assets | ||||||||
Cash and cash equivalents | $ | $ | ||||||
Restricted cash | ||||||||
Accounts receivable, net of allowance of $ (December 31, 2022 - $ ) (note 2) | ||||||||
Income tax recoverable | ||||||||
Inventories, net (note 7) | ||||||||
Prepaid expenses and other current assets | ||||||||
Other receivables | ||||||||
Other assets | ||||||||
Deferred income tax (note 15) | ||||||||
Fixed assets (note 8) | ||||||||
Operating lease right-of-use assets (note 5) | ||||||||
Intangible assets (note 9) | ||||||||
Goodwill (note 10) | ||||||||
$ | $ | |||||||
Liabilities and shareholders' equity | ||||||||
Current liabilities | ||||||||
Accounts payable | $ | $ | ||||||
Accrued liabilities (note 7) | ||||||||
Income tax payable | ||||||||
Unearned revenues | ||||||||
Operating lease liabilities - current (note 5) | ||||||||
Long-term debt - current (note 11) | ||||||||
Contingent acquisition consideration - current (note 18) | ||||||||
Long-term debt - non-current (note 11) | ||||||||
Operating lease liabilities - non-current (note 5) | ||||||||
Contingent acquisition consideration (note 18) | ||||||||
Unearned revenues | ||||||||
Other liabilities | ||||||||
Deferred income tax (note 15) | ||||||||
Redeemable non-controlling interests (note 12) | ||||||||
Shareholders' equity | ||||||||
$ | $ |
Commitments and contingent liabilities (note 19)
The accompanying notes are an integral part of these financial statements.
On behalf of the Board of Directors,
/s/ Joan Sproul |
/s/ D. Scott Patterson | |
Director |
Director |
FIRSTSERVICE CORPORATION |
||||||||||||||||||||||||
CONSOLIDATED STATEMENTS OF SHAREHOLDERS' EQUITY |
||||||||||||||||||||||||
(in thousands of US dollars, except share information) |
||||||||||||||||||||||||
Common shares |
Accumulated |
|||||||||||||||||||||||
Issued and |
Retained |
other |
||||||||||||||||||||||
outstanding |
Contributed |
Earnings |
comprehensive |
|||||||||||||||||||||
shares |
Amount |
surplus |
(Deficit) |
earnings (loss) |
Total |
|||||||||||||||||||
Balance, December 31, 2021 |
$ | $ | $ | ( |
) | $ | $ | |||||||||||||||||
Net earnings |
- | |||||||||||||||||||||||
Other comprehensive loss |
- | ( |
) | ( |
) | |||||||||||||||||||
Subsidiaries’ equity transactions |
- | |||||||||||||||||||||||
Common Shares: |
||||||||||||||||||||||||
Stock option expense |
- | |||||||||||||||||||||||
Stock options exercised |
( |
) | ||||||||||||||||||||||
Dividends |
- | ( |
) | ( |
) | |||||||||||||||||||
Balance, December 31, 2022 |
$ | $ | $ | $ | ( |
) | $ | |||||||||||||||||
Net earnings |
- | |||||||||||||||||||||||
Other comprehensive earnings |
- | |||||||||||||||||||||||
Common Shares: |
||||||||||||||||||||||||
Stock option expense |
- | |||||||||||||||||||||||
Stock options exercised |
( |
) | ||||||||||||||||||||||
Dividends |
- | ( |
) | ( |
) | |||||||||||||||||||
Balance, December 31, 2023 |
$ | $ | $ | $ | ( |
) | $ |
The accompanying notes are an integral part of these financial statements.
FIRSTSERVICE CORPORATION |
||||||||
CONSOLIDATED STATEMENTS OF CASH FLOWS |
||||||||
(in thousands of US dollars) |
||||||||
Years ended December 31 |
2023 |
2022 |
||||||
Cash provided by (used in) |
||||||||
Operating activities |
||||||||
Net earnings |
$ | $ | ||||||
Items not affecting cash: |
||||||||
Depreciation and amortization |
||||||||
Deferred income tax |
( |
) | ||||||
Contingent acquisition consideration fair value adjustments |
( |
) | ||||||
Gain on sale of building asset |
( |
) | ||||||
Stock-based compensation and other |
||||||||
Changes in non-cash working capital: |
||||||||
Accounts receivable |
( |
) | ( |
) | ||||
Inventories |
( |
) | ||||||
Prepaid expenses and other current assets |
( |
) | ||||||
Accounts payable |
( |
) | ||||||
Accrued liabilities |
( |
) | ||||||
Income tax payable |
( |
) | ||||||
Unearned revenues |
||||||||
Other liabilities |
( |
) | ||||||
Contingent acquisition consideration paid |
( |
) | ||||||
Net cash provided by operating activities |
||||||||
Investing activities |
||||||||
Acquisitions of businesses, net of cash acquired (note 4) |
( |
) | ( |
) | ||||
Disposal of building asset (note 6) |
||||||||
Purchases of fixed assets |
( |
) | ( |
) | ||||
Other investing activities |
( |
) | ( |
) | ||||
Net cash used in investing activities |
( |
) | ( |
) | ||||
Financing activities |
||||||||
Increase in long-term debt |
||||||||
Repayment of long-term debt |
( |
) | ( |
) | ||||
Financing fees paid |
( |
) | ||||||
Purchases of non-controlling interests |
( |
) | ( |
) | ||||
Sale of interests in subsidiaries to non-controlling interests |
||||||||
Contingent acquisition consideration paid |
( |
) | ( |
) | ||||
Proceeds received on exercise of stock options |
||||||||
Dividends paid to common shareholders |
( |
) | ( |
) | ||||
Distributions paid to non-controlling interests |
( |
) | ( |
) | ||||
Net cash provided by financing activities |
||||||||
Effect of exchange rate changes on cash |
( |
) | ||||||
Increase (decrease) in cash, cash equivalents and restricted cash |
( |
) | ||||||
Cash, cash equivalents and restricted cash, beginning of year |
||||||||
Cash, cash equivalents and restricted cash, end of year |
$ | $ |
FIRSTSERVICE CORPORATION
NOTES TO CONSOLIDATED FINANCIAL STATEMENTS
(in thousands of US dollars, except share and per share amounts)
1. | Description of the business |
FirstService Corporation (the “Company”) is a North American provider of residential property management and other essential property services to residential and commercial customers. The Company’s operations are conducted in
segments: FirstService Residential and FirstService Brands. The segments are grouped with reference to the nature of services provided and the types of clients that use those services.
FirstService Residential is a full-service property manager and in many markets provides a full range of ancillary services primarily in the following areas: (i) on-site staffing, including building engineering and maintenance, full-service amenity management, security, concierge and front desk personnel; (ii) proprietary banking and insurance products; and (iii) energy conservation and management solutions.
FirstService Brands provides a range of essential property services to residential and commercial customers in North America through company-owned operations and franchise systems. The principal brands in this division include First Onsite Property Restoration, Paul Davis Restoration, Roofing Corp of America, Century Fire Protection, California Closets, CertaPro Painters, Floor Coverings International and Pillar to Post Home Inspectors.
2. | Summary of significant accounting policies |
The preparation of consolidated financial statements in accordance with accounting principles generally accepted in the United States of America (“GAAP”) requires management to make estimates and assumptions that affect the reported amounts of assets and liabilities and disclosures of contingent assets and liabilities at the date of the financial statements, and the reported amounts of revenues and expenses during the reporting period. The most significant estimates are related to the determination of fair values of assets acquired and liabilities assumed in business combinations, and recoverability of goodwill and intangible assets. Actual results could be materially different from these estimates.
Significant accounting policies are summarized as follows:
Basis of consolidation
The consolidated financial statements include the accounts of the Company and its majority-owned subsidiaries where the Company is the primary beneficiary. Inter-company transactions and accounts are eliminated on consolidation.
Cash and cash equivalents
Cash equivalents consist of short-term interest-bearing securities, which are readily convertible into cash and have original maturities at the date of purchase of three months or less.
Restricted cash
Restricted cash consists of cash over which the Company has legal ownership but is restricted as to its availability or intended use, including funds held on behalf of clients and franchisees.
The Company’s restricted cash balance consists primarily of cash related to our marketing funds in the FirstService Brands segment, cash held for certain employees’ benefit plans, and cash held for insurance broker commissions owed in our FirstService Residential segment.
Accounts Receivable
In the ordinary course of business the Company extends non-interest bearing trade credit to its customers. Accounts receivable are carried at amortized cost and reported on the face of the consolidated balance sheets, net of an allowance for credit losses. The Company maintains an allowance for credit losses to provide for the estimated amount of receivables that will not be collected. In determining the allowance for credit losses, the Company analyzes the aging of accounts receivable, historical payment experience, customer creditworthiness and current economic trends.
The allowance for credit losses is based on the Company’s assessment of the collectability of customer accounts. The measurement of expected credit losses is based on relevant information about past events, including historical experience, credit quality, the age of the accounts receivable balances, and current economic conditions that may impact a customer’s ability to pay.
Inventories
Finished goods and supplies and other inventories are carried at the lower of cost and net realizable value. Cost is determined using the weighted average method. Work-in-progress inventory relates to construction contracts and real estate project management projects in process.
Fixed assets
Fixed assets are carried at cost less accumulated depreciation. The costs of additions and improvements are capitalized, while maintenance and repairs are expensed as incurred. Fixed assets are reviewed for impairment whenever events or circumstances indicate that the carrying value of an asset group may not be recoverable. An impairment loss is recorded to the extent the carrying amount exceeds the estimated fair value of an asset group. Fixed assets are depreciated over their estimated useful lives as follows:
Buildings | |
Vehicles | |
Furniture and equipment | |
Computer equipment and software | |
Leasehold improvements | term of the lease to a maximum of |
Fair value
The Company uses the fair value measurements framework for financial assets and liabilities and for non-financial assets and liabilities that are recognized or disclosed at fair value on a non-recurring basis. The framework defines fair value, gives guidance for measurement and disclosure, and establishes a three-level hierarchy for observable and unobservable inputs used to measure fair value. The classification of an asset or liability within the hierarchy is determined based on the lowest level input that is significant to the fair value measurement. The three levels are as follows:
Level 1 – Quoted prices (unadjusted) in active markets for identical assets or liabilities
Level 2 – Observable market-based inputs other than quoted prices in active markets for identical assets or liabilities
Level 3 – Unobservable inputs for which there is little or no market data, which requires the Company to develop its own assumptions
Financing fees
Financing fees related to our second amended and restated credit agreement (the “Credit Agreement”) with a syndicate of lenders, our $
Leases
The Company has lease agreements with lease and non-lease components, and has elected to account for each lease component (e.g., fixed rent payments) separately from the non-lease components (e.g., common-area maintenance costs). The Company has also elected not to recognize the right-of-use assets and lease liabilities for short-term leases that have a lease term of 12 months or less. Leases are recognized on the balance sheet when the lease term commences, and the associated lease payments are recognized as an expense on a straight-line basis over the lease term.
At lease commencement, which is generally when the Company takes possession of the asset, the Company records a lease liability and a corresponding right-of-use asset. Lease liabilities represent the present value of minimum lease payments over the expected lease term, which includes options to extend or terminate the lease when it is reasonably certain those options will be exercised. The present value of the lease liability is determined using the Company’s incremental collateralized borrowing rate at the lease commencement.
Minimum lease payments include base rent, fixed escalation of rental payments, and rental payments that are adjusted periodically depending on a rate or index.
Right-of-use assets represent the right to control the use of the leased asset during the lease and are initially recognized in an amount equal to the lease liability. In addition, prepaid rent, initial direct costs, and adjustments for lease incentives are components of the right-of-use asset. Over the lease term the lease expense is amortized on a straight-line basis beginning on the lease commencement date. Right-of-use assets are assessed for impairment as part of the impairment of long-lived assets, which is performed whenever events or changes in circumstances indicate that the carrying amount of an asset or asset group may not be recoverable.
Goodwill and intangible assets
Goodwill represents the excess of purchase price over the fair value of assets acquired and liabilities assumed in a business combination and is not subject to amortization.
Intangible assets are recorded at fair value on the date they are acquired. They are amortized over their estimated useful lives as follows:
Customer relationships | straight-line over |
Franchise rights | by pattern of use, currently estimated at |
Trademarks and trade names | straight-line over |
Management contracts and other | straight-line over life of contract ranging from |
Backlog | straight-line over |
The Company reviews the carrying value of finite life intangible assets for impairment whenever events or changes in circumstances indicate that the carrying amount of an asset group may not be recoverable from the estimated future cash flows expected to result from their use and eventual disposition. If the sum of the undiscounted expected future cash flows is less than the carrying amount of the asset group, an impairment loss is recognized. Measurement of the impairment loss is based on the excess of the carrying amount of the asset group over the fair value calculated using an income approach.
Goodwill is tested for impairment annually, on August 1, or more frequently if events or changes in circumstances indicate the asset might be impaired, in which case the carrying amount of the asset is written down to fair value.
Impairment of goodwill is tested at the reporting unit level. The Company has
reporting units determined with reference to business segment, customer type, service delivery model and geography. Impairment is tested by first assessing qualitative factors to determine whether it is more likely than not that the fair value of a reporting unit is less than its carrying amount. Where it is determined to be more likely than not that its fair value is greater than its carrying amount, then no further testing is required. Where the qualitative analysis is not sufficient to support that the fair value exceeds the carrying amount then a goodwill impairment test is performed. The Company also has an unconditional option to bypass the qualitative assessment for any reporting unit in any period and proceed directly to performing a quantitative goodwill impairment test. The Company may resume performing the qualitative assessment in any subsequent period. A quantitative goodwill impairment test is performed by comparing the fair value of each reporting unit to its carrying value, including goodwill. Fair value is estimated using a market multiple method, which estimates market multiples of earnings before interest, taxes, depreciation and amortization (“EBITDA”) for comparable entities with similar operations and economic characteristics. Significant assumptions used in estimating the fair value of each reporting unit include the market multiples of EBITDA.
Redeemable non-controlling interests
Redeemable non-controlling interests (“RNCI”) are recorded at the greater of (i) the redemption amount or (ii) the amount initially recorded as RNCI at the date of inception of the minority equity position. This amount is recorded in the “mezzanine” section of the balance sheet, outside of shareholders’ equity. Changes in the RNCI amount are recognized immediately as they occur.
Revenue recognition and unearned revenues
The Company accounts for a contract with a customer when there is approval and commitment from both parties, the rights of the parties are identified, payment terms are identified, the contract has commercial substance and collectability of consideration is probable. The Company’s revenues are measured based on consideration specified in the contract of each customer and revenue is recognized as the performance obligations are satisfied by transferring the control of the service or product to a customer.
(a) Revenues from property and amenity management services
Property and amenity management services represent a series of distinct daily services, that in nature are substantially the same, rendered over time. The Company is compensated for these services through monthly management fees and fees associated with ancillary services. Revenue is recognized for the fees associated with the services performed.
(b) Revenues from construction contracts and service operations other than franchisor operations
Revenues are recognized at the time the service is rendered. Certain services including but not limited to restoration and construction contracts, are recognized over time based on percentage of completion, based on a ratio of actual costs to total estimated contract costs. In cases where anticipated costs to complete a project exceed the revenue to be recognized, a provision for the additional estimated losses is recorded in the period when the loss becomes apparent. Amounts received from customers in advance of services being provided are recorded as unearned revenues when received.
(c) Franchisor operations
The Company operates several franchise systems within its FirstService Brands segment. Initial franchise fees are deferred and recognized over the term of the franchise agreement. Royalty revenues are recognized based on a contracted percentage of franchisee revenues, as reported by the franchisees. Revenues from administrative and other support services, as applicable, are recognized as the services are provided.
The Company’s franchise systems operate marketing funds on behalf of franchisees. Advertising fund contributions from franchisees are reported as revenues and advertising fund expenditures are reported as expenses in our statements of earnings. To the extent that contributions received exceed advertising expenditures, the excess amount is accrued and offset as unearned revenue, whereas any expenditures in excess of contributions are expensed as incurred. As such, advertising fund contributions and the related revenues and expenses may be reported in different periods.
Stock-based compensation
For equity classified awards, compensation cost is measured at the grant date based on the estimated fair value of the award. The related stock option compensation expense is allocated using the graded attribution method.
Notional value appreciation plans
Under these plans, subsidiary employees are compensated if the notional value of the subsidiary increases. Awards under these plans generally have a term of up to
years and a vesting period of years. The increase in notional value is calculated with reference to growth in earnings relative to a fixed threshold amount plus or minus changes in indebtedness relative to a fixed opening amount. If an award is subject to a vesting condition, then graded attribution is applied to the intrinsic value. The related compensation expense is recorded in selling, general and administrative expenses, the current liability is recorded in accrued liabilities, and the non-current portion is recorded in other liabilities.
Foreign currency translation
Assets, liabilities and operations of foreign subsidiaries are recorded based on the functional currency of each entity. For certain foreign operations, the functional currency is the local currency, in which case the assets, liabilities and operations are translated at current exchange rates from the local currency to the reporting currency, the US dollar. The resulting unrealized gains or losses are reported as a component of accumulated other comprehensive earnings. Realized and unrealized foreign currency gains or losses related to any foreign dollar denominated monetary assets and liabilities are included in net earnings.
Income tax
Income tax has been provided using the asset and liability method whereby deferred income tax assets and liabilities are recognized for the expected future income tax consequences of events that have been recognized in the consolidated financial statements or income tax returns. Deferred income tax assets and liabilities are measured using enacted income tax rates expected to apply to taxable income in the years in which temporary differences are expected to reverse, be recovered or settled. The effect on deferred income tax assets and liabilities of a change in income tax rates is recognized in earnings in the period in which the change occurs. A valuation allowance is recorded unless it is more likely than not that realization of a deferred income tax asset will occur based on available evidence.
The Company recognizes uncertainty in tax positions taken or expected to be taken in a tax return by recording a liability for unrecognized tax benefits on its balance sheet. Uncertainties are quantified by applying a prescribed recognition threshold and measurement attribute.
The Company classifies interest and penalties associated with income tax positions in income tax expense.
Business combinations
All business combinations are accounted for using the purchase method of accounting. Transaction costs are expensed as incurred.
The determination of fair values of assets and liabilities assumed in business combinations requires the use of estimates and judgement by management, particularly in determining fair values of intangible assets acquired.
The fair value of the contingent consideration is classified as a financial liability and is recorded on the balance sheet at the acquisition date and is re-measured at fair value at the end of each period until the end of the contingency period, with fair value adjustments recognized in earnings.
3. | Revenue from contracts with customers |
Disaggregated revenues are as follows:
Year ended | ||||||||
December 31 | ||||||||
2023 | 2022 | |||||||
Revenues | ||||||||
FirstService Residential | $ | $ | ||||||
FirstService Brands company-owned operations | ||||||||
FirstService Brands franchisor | ||||||||
FirstService Brands franchise fee |
The Company disaggregates revenue by segment. Within the FirstService Brands segment, the Company further disaggregates its company-owned operations revenue; these businesses primarily recognize revenue over time as they perform because of continuous transfer of control to the customer. As such, revenue is recognized based on the extent of progress towards completion of the performance obligation. The Company generally uses the percentage of completion method.
We believe this disaggregation best depicts how the nature, amount, timing and uncertainty of the Company’s revenue and cash flows are affected by economic factors.
The Company’s backlog represents remaining performance obligations and is defined as contracted work yet to be performed. As at December 31, 2023, the aggregate amount of backlog was $
Within the FirstService Brands segment, franchise fee revenue recognized during the twelve months ended December 31, 2023 that was included in unearned revenues at the beginning of the period was $
The majority of current unearned revenues as at December 31, 2022 was recognized into income during 2023.
External broker costs and employee sales commissions in obtaining new franchisees are capitalized in accordance with the revenue standard and are amortized over the life of the underlying franchise agreement. Costs amortized during the twelve months ended December 31, 2023 were $
4. | Acquisitions |
2023 acquisitions:
The Company completed
acquisitions during the year, in the FirstService Residential segment and in the FirstService Brands segment. In the FirstService Residential segment, the Company acquired property management firms operating in New York City, Toronto, Canada, and San Ramon, California, respectively.
Within the FirstService Brands segment, the Company acquired
Paul Davis franchises, headquartered in Houston, Texas, Denver, Colorado, and Boise, Idaho, respectively. The Company also acquired a fire protection company, located in Houston, Texas, a California Closets franchise operating in Reno, Nevada, independent restoration companies located in Nashville, Tennessee and Cincinnati, Ohio, respectively, as well as a property services business in Orange County, California. On December 18th, the Company announced the acquisition of Roofing Corp of America, a commercial roofing company headquartered in Atlanta, Georgia and operating in 11 U.S. states spanning the Sun Belt, Mid-Atlantic, Midwest and West regions.
Details of these acquisitions are as follows:
Roofing Corp | All other | |||||||||||
of America | acquisitions | Total | ||||||||||
Accounts receivable | $ | $ | $ | |||||||||
Other current assets | ||||||||||||
Non-current assets | ||||||||||||
Accounts payable | ( | ) | ( | ) | ( | ) | ||||||
Accrued liabilities | ( | ) | ( | ) | ( | ) | ||||||
Other current liabilities | ( | ) | ( | ) | ( | ) | ||||||
Non-current liabilities | ( | ) | ( | ) | ( | ) | ||||||
Deferred tax liabilities | ( | ) | ( | ) | ( | ) | ||||||
Redeemable non-controlling interest | ( | ) | ( | ) | ( | ) | ||||||
$ | $ | ( | ) | $ | ( | ) | ||||||
Cash consideration | $ | $ | (1) | $ | ||||||||
Less: cash acquired | ( | ) | ( | ) | ( | ) | ||||||
Acquisition date fair value of contingent consideration | ||||||||||||
Total purchase consideration | $ | $ | $ | |||||||||
Acquired intangible assets | $ | (2) | $ | $ | ||||||||
Goodwill | $ | $ | $ |
(1) Included in the other amount is $
(2) Intangible assets for Roofing Corp include $
“Acquisition-related items” included both transaction costs and contingent acquisition consideration fair value adjustments. Acquisition-related transaction costs for the year ended December 31, 2023 totaled $
The purchase price allocations for certain transactions completed in the last twelve months, including Roofing Corp of America, are not yet complete, pending final determination of the fair value of assets acquired, the corresponding deferred tax liabilities, and final working capital adjustments. The acquisitions referred to above were accounted for by the purchase method of accounting for business combinations. Accordingly, the accompanying consolidated statements of earnings do not include any revenues or expenses related to these acquisitions prior to their respective closing dates. There have been no material changes to the estimated purchase price allocations determined at the time of acquisition during the year ended December 31, 2023.
The amount of revenues and earnings contributed from the date of acquisition and included in the Company’s consolidated results for the year ended December 31, 2023, and the supplemental pro forma revenues and earnings of the combined entity had the acquisition date been January 1, 2022, are as follows:
Revenues | Net earnings | |||||||
Actual from acquired entities for 2023 | $ | $ | ||||||
Supplemental pro forma for 2023 (unaudited) | ||||||||
Supplemental pro forma for 2022 (unaudited) |
Supplemental pro forma results were adjusted for non-recurring items.
2022 acquisitions:
The Company completed
acquisitions in 2022, in the FirstService Residential segment and in the FirstService Brands segment. In the FirstService Residential segment, the Company acquired a regional firm operating in New York City. In the FirstService Brands segment, the Company acquired independent restoration companies operating in Ontario, Alabama, and Louisiana. The Company also acquired Paul Davis operations located in Nebraska and Utah, as well as a California Closets franchise located in Oregon.
Details of these acquisitions are as follows:
Aggregate | ||||
Acquisitions | ||||
Accounts receivable | $ | |||
Other current assets | ||||
Non-current assets | ||||
Accounts payable | ( | ) | ||
Accrued liabilities | ( | ) | ||
Other current liabilities | ( | ) | ||
Non-current liabilities | ( | ) | ||
Deferred tax liabilities | ( | ) | ||
Redeemable non-controlling interest | ( | ) | ||
$ | ( | ) | ||
Cash consideration, net of cash acquired of $ | $ | |||
Acquisition date fair value of contingent consideration | ||||
Total purchase consideration | $ | |||
Acquired intangible assets | $ | |||
Goodwill | $ |
In all years presented, the fair values of non-controlling interests for all acquisitions were determined using an income approach with reference to a discounted cash flow model using the same assumptions implied in determining the purchase consideration.
The purchase price allocations of all acquisitions resulted in the recognition of goodwill. The primary factors contributing to goodwill are assembled workforces, synergies with existing operations and future growth prospects. For certain acquisitions completed during the year ended December 31, 2023, goodwill in the amount of $
The determination of fair values of assets acquired and liabilities assumed in business combinations required the use of estimates and judgement by management, particularly in determining fair values of intangible assets acquired. Intangible assets acquired at fair value on the date of acquisition are recorded using the income approach on an individual asset basis. The assumptions used in estimating the fair values of intangible assets include future EBITDA margins, revenue growth rates, revenue attributable to returning customers, expected attrition rates of acquired customer relationships and the discount rates.
The Company typically structures its business acquisitions to include contingent consideration. Vendors, at the time of acquisition, are entitled to receive a contingent consideration payment if the acquired businesses achieve specified earnings levels during the one- to two-year periods following the dates of acquisition. The ultimate amount of payment is determined based on a formula, the key inputs to which are (i) a contractually agreed maximum payment; (ii) a contractually specified earnings level and (iii) the actual earnings for the contingency period. If the acquired business does not achieve the specified earnings level, the maximum payment is reduced for any shortfall, potentially to nil.
The fair value of the contingent consideration liability recorded on the consolidated balance sheet as at December 31, 2023 was $
5. | Leases |
The Company has operating leases for corporate offices, copiers, and certain equipment. Its leases have remaining lease terms of
Other information related to leases was as follows (in thousands, except lease term and discount rate):
Supplemental Cash Flows Information, twelve months ended December 31 | 2023 | |||
Cash paid for amounts included in the measurement of operating lease liabilities | $ | |||
Right-of-use assets obtained in exchange for operating lease obligation | $ | |||
Weighted Average Remaining Operating Lease Term (years) | | |||
Weighted Average Discount Rate | % |
Future minimum operating lease payments under non-cancellable leases as of December 31, 2023 were as follows:
2024 | $ | |||
2025 | ||||
2026 | ||||
2027 | ||||
2028 | ||||
Thereafter | ||||
Total future minimum lease payments | ||||
Less imputed interest | ( | ) | ||
Total |
6. | Other income, net |
2023 | 2022 | |||||||
Gain on sale of building asset | ( | ) | ||||||
Other income | ( | ) | ( | ) | ||||
$ | ( | ) | $ | ( | ) |
During the second quarter, the Company sold a building in South Florida for proceeds of $
7. | Components of working capital accounts |
December 31, | December 31, | |||||||
2023 | 2022 | |||||||
Inventories | ||||||||
Work-in-progress | $ | $ | ||||||
Finished goods | ||||||||
Supplies and other | ||||||||
$ | $ | |||||||
Accrued liabilities | ||||||||
Accrued payroll and benefits | $ | $ | ||||||
Value appreciation plans(1) | ||||||||
Customer advances | ||||||||
Other | ||||||||
$ | $ |
(1) Non-current portion of value appreciation plans of $
8. | Fixed assets |
December 31, 2023 | Accumulated | |||||||||||
Cost | depreciation | Net | ||||||||||
Land | $ | $ | $ | |||||||||
Buildings | ||||||||||||
Vehicles | ||||||||||||
Furniture and equipment | ||||||||||||
Computer equipment and software | ||||||||||||
Leasehold improvements | ||||||||||||
$ | $ | $ |
December 31, 2022 | Accumulated | |||||||||||
Cost | depreciation | Net | ||||||||||
Land | $ | $ | $ | |||||||||
Buildings | ||||||||||||
Vehicles | ||||||||||||
Furniture and equipment | ||||||||||||
Computer equipment and software | ||||||||||||
Leasehold improvements | ||||||||||||
$ | $ | $ |
Included in fixed assets are vehicles, office and computer equipment under finance lease at a cost of $
9. |
Intangible assets |
|
December 31, 2023 |
Gross |
|||||||||||
carrying |
Accumulated |
|||||||||||
amount |
amortization |
Net |
||||||||||
Customer relationships |
$ | $ | $ | |||||||||
Franchise rights |
||||||||||||
Trademarks and trade names |
||||||||||||
Management contracts and other |
||||||||||||
$ | $ | $ |
Gross |
||||||||||||
December 31, 2022 |
carrying |
Accumulated |
||||||||||
amount |
amortization |
Net |
||||||||||
Customer relationships |
$ | $ | $ | |||||||||
Franchise rights |
||||||||||||
Trademarks and trade names |
||||||||||||
Management contracts and other |
||||||||||||
$ | $ | $ |
During the year ended December 31, 2023, the Company acquired the following intangible assets:
Estimated |
||||||||
weighted |
||||||||
average |
||||||||
amortization |
||||||||
Amount |
period (years) |
|||||||
Customer relationships |
$ | |||||||
Trademarks and trade names |
||||||||
Management Contracts and other |
||||||||
$ |
The following is the estimated annual amortization expense for recorded intangible assets for each of the next five years ending December 31:
2024 |
$ | |||
2025 |
||||
2026 |
||||
2027 |
||||
2028 |
10. | Goodwill |
FirstService | FirstService | |||||||||||
Residential | Brands | Consolidated | ||||||||||
Balance, December 31, 2021 | $ | $ | $ | |||||||||
Goodwill acquired during the year | ||||||||||||
Other items | ||||||||||||
Foreign exchange | ( | ) | ( | ) | ( | ) | ||||||
Balance, December 31, 2022 | ||||||||||||
Goodwill acquired during the year | ||||||||||||
Other items | ||||||||||||
Foreign exchange | ||||||||||||
Balance, December 31, 2023 | $ | $ | $ |
Goodwill represents the excess of purchase price over the value assigned to the net tangible and identifiable intangible assets of businesses acquired. A test for goodwill impairment is required to be completed annually, in the Company’s case as of August 1, or more frequently if events or changes in circumstances indicate the asset might be impaired. Based on the qualitative assessment in 2023, the Company has concluded that goodwill is
impaired. There were no triggering events since the impairment test in August.
11. | Long-term debt |
|
December 31, | December 31, | |||||||
2023 | 2022 | |||||||
Credit Agreement | $ | $ | ||||||
3.84% Senior Notes | ||||||||
4.53% Notes | ||||||||
Capital leases maturing at various dates through 2028 | ||||||||
Other long-term debt maturing at various dates up to 2023 | ||||||||
Less: current portion | ||||||||
Long-term debt - non-current | $ | $ |
The Company has $
In February 2022, the Company entered into a second amended and restated credit agreement providing for a $
The indebtedness under the Credit Agreement and the Senior Notes rank equally in terms of seniority. The Company has granted the lenders under the Credit Agreement and the holders of the Senior Notes various security, including an interest in all of our assets. The Company is prohibited under the Credit Agreement and the Senior Notes from undertaking certain acquisitions and dispositions, and incurring certain indebtedness and encumbrances, without prior approval of the lenders under the Credit Agreement and the holders of the Senior Notes.
In September 2022, the Company entered into two revolving, uncommitted financing facilities for potential future private placement issuances of senior unsecured notes (the “Notes”) aggregating $
In January 2024, the Company issued, on a private placement basis to New York Life, $
The effective interest rate on the Company’s long-term debt for the year ended December 31, 2023 was
2024 | $ | |||
2025 | ||||
2026 | ||||
2027 | ||||
2028 and thereafter |
12. | Redeemable non-controlling interests |
The minority equity positions in the Company’s subsidiaries are referred to as redeemable non-controlling interests (“RNCI”). The RNCI are considered to be redeemable securities. The following table provides a reconciliation of the beginning and ending RNCI amounts:
2023 | 2022 | |||||||
Balance, January 1 | $ | $ | ||||||
RNCI share of earnings | ||||||||
RNCI redemption increment | ||||||||
Distributions paid to RNCI | ( | ) | ( | ) | ||||
Purchases of interests from RNCI, net | ( | ) | ( | ) | ||||
RNCI recognized on business acquisitions | ||||||||
Other | ||||||||
Balance, December 31 | $ | $ |
The Company has shareholders’ agreements in place at each of its non-wholly owned subsidiaries. These agreements allow the Company to “call” the non-controlling interest at a price determined with the use of a formula price, which is usually equal to a fixed multiple of average annual net earnings before extraordinary items, income taxes, interest, depreciation, and amortization. The agreements also have redemption features which allow the owners of the RNCI to “put” their equity to the Company at the same price subject to certain limitations. The formula price is referred to as the redemption amount and may be paid in cash or in Common Shares. The redemption amount as of December 31, 2023 was $
13. |
Capital stock |
The authorized capital stock of the Company is as follows:
An unlimited number of Common Shares having one vote per share.
The following table provides a summary of total capital stock issued and outstanding:
Common Shares |
||||||||
Number |
Amount |
|||||||
Balance, December 31, 2023 |
$ |
14. | Stock-based compensation |
The Company has a stock option plan for certain officers and key full-time employees of the Company and its subsidiaries. Options are granted at the market price for the underlying shares on the date of grant. Each option vests over a
Grants under the Company’s stock option plan are equity-classified awards. Stock option activity for the year ended December 31, 2023 is as follows:
Weighted average | ||||||||||||||||
Weighted | remaining | |||||||||||||||
Number of | average | contractual life | Aggregate | |||||||||||||
options | exercise price | (years) | intrinsic value | |||||||||||||
Shares issuable under options - Beginning of period | $ | |||||||||||||||
Granted | ||||||||||||||||
Exercised | ( | ) | ||||||||||||||
Forfeited | ( | ) | ||||||||||||||
Shares issuable under options - December 31, 2023 | $ | $ | ||||||||||||||
Options exercisable - End of period | $ | $ |
The Company incurred stock-based compensation expense related to these awards of $
As at December 31, 2023, the range of option exercise prices was $
The following table summarizes information about option exercises during year ended December 31, 2023:
2023 | ||||
Number of options exercised | ||||
Aggregate fair value | $ | |||
Intrinsic value | ||||
Amount of cash received |
As at December 31, 2023, there was $
The fair value of each option grant is estimated on the date of grant using the Black-Scholes option pricing model, utilizing the following weighted average assumptions:
2023 | ||||
Risk free rate | % | |||
Expected life in years | ||||
Expected volatility | % | |||
Dividend yield | % | |||
Weighted average fair value per option granted | $ |
The risk-free interest rate is based on the implied yield of a zero-coupon US Treasury bond with a term equal to the option’s expected term. The expected life in years represents the estimated period of time until exercise and is based on historical experience. The expected volatility is based on the historical prices of the Company’s shares over the previous four years.
15. | Income tax |
Income tax differs from the amounts that would be obtained by applying the statutory rate to the respective year’s earnings before tax. Differences result from the following items:
2023 | 2022 | |||||||
Income tax expense using combined statutory rate of (2022 - ) | $ | $ | ||||||
Permanent differences | ||||||||
Adjustments to tax liabilities for prior periods | ||||||||
Non-deductible stock-based compensation | ||||||||
Foreign, state and provincial tax rate differential | ( | ) | ( | ) | ||||
Other taxes | ||||||||
Provision for income taxes as reported | $ | $ |
Earnings before income tax by jurisdiction comprise the following:
2023 | 2022 | |||||||
Canada | $ | $ | ||||||
United States | ||||||||
Total | $ | $ |
Income tax expense (recovery) comprises the following:
2023 | 2022 | |||||||
Current | ||||||||
Canada | $ | $ | ||||||
United States | ||||||||
Deferred | ||||||||
Canada | ||||||||
United States | ( | ) | ||||||
( | ) | |||||||
Total | $ | $ |
The significant components of deferred income tax are as follows:
2023 | 2022 | |||||||
Deferred income tax assets | ||||||||
Loss carry-forwards | $ | $ | ||||||
Expenses not currently deductible | ||||||||
Allowance for credit losses | ||||||||
Inventory and other reserves | ||||||||
Deferred income tax liabilities | ||||||||
Depreciation and amortization | ||||||||
Basis differences of partnerships and other entities | ||||||||
Prepaid and other expenses deducted for tax purposes | ||||||||
Net deferred income tax asset (liability) before valuation allowance | ( | ) | ( | ) | ||||
Valuation allowance | ||||||||
Net deferred income tax asset (liability) | $ | ( | ) | $ | ( | ) |
The recoverability of deferred income tax assets is dependent on generating sufficient taxable income before the
The Company has gross operating loss carry-forwards as follows:
Loss carry forward | Gross losses not recognized | Net | ||||||||||||||||||||||
2023 | 2022 | 2023 | 2022 | 2023 | 2022 | |||||||||||||||||||
Canada | $ | $ | $ | $ | $ | $ | ||||||||||||||||||
United States |
These amounts above are available to reduce future federal, state, and provincial income taxes in their respective jurisdictions. Net operating loss carry-forward balances attributable to the United States and Canada expire over the next
Cumulative unremitted earnings of US and foreign subsidiaries approximated $
The gross unrecognized tax benefits are $
The Company’s significant tax jurisdictions include the United States and Canada. The number of years with open tax audits varies depending on the tax jurisdictions. Generally, income tax returns filed with the Canada Revenue Agency and related provinces are open for
to years and income tax returns filed with the U.S. Internal Revenue Service and related states are open for to years.
The Company does not currently expect any other material impact on earnings to result from the resolution of matters related to open taxation years, other than noted above. Actual settlements may differ from the amounts accrued. The Company has, as part of its analysis, made its current estimates based on facts and circumstances known to date and cannot predict changes in facts and circumstances that may affect its current estimates.
16. |
Net earnings per common share |
The following table reconciles the denominator used to calculate earnings per common share:
2023 |
2022 |
|||||||
Shares issued and outstanding at beginning of period |
||||||||
Weighted average number of shares: |
||||||||
Issued during the period |
||||||||
Weighted average number of shares used in computing basic earnings per share |
||||||||
Assumed exercise of stock options, net of shares assumed acquired under the Treasury Stock Method |
||||||||
Number of shares used in computing diluted earnings per share |
17. |
Other supplemental information |
2023 |
2022 |
|||||||
Cash payments made during the period |
||||||||
Income taxes |
$ | $ | ||||||
Interest |
18. | Financial instruments |
Concentration of credit risk
The Company is subject to credit risk with respect to its cash and cash equivalents, accounts receivable and other receivables. Concentrations of credit risk with respect to cash and cash equivalents are limited by the use of multiple large and reputable banks. Concentrations of credit risk with respect to the receivables are limited due to the large number of entities comprising the Company’s customer base and their dispersion across many different service lines.
During the year ended December 31, 2023, there were $
Interest rate risk
The Company maintains an interest rate risk management strategy that uses interest rate hedging contracts from time to time. The Company’s specific goals are to: (i) manage interest rate sensitivity by modifying the characteristics of its debt and (ii) lower the long-term cost of its borrowed funds.
Foreign currency risk
Foreign currency risk is related to the portion of the Company’s business transactions denominated in currencies other than U.S. dollars. A portion of revenue is generated by the Company’s Canadian operations. The Company’s head office expenses are incurred in Canadian dollars which is economically hedged by Canadian dollar denominated revenue.
Fair values of financial instruments
The following table provides the financial assets and liabilities carried at fair value measured on a recurring basis as of December 31, 2023:
Carrying value at | Fair value measurements | |||||||||||||||
December 31, 2023 | Level 1 | Level 2 | Level 3 | |||||||||||||
Contingent consideration liability | $ | $ | $ | $ | ||||||||||||
Interest rate swap assets |
The Company has
2023 | 2022 | |||||||
Balance, January 1 | $ | $ | ||||||
Amounts recognized on acquisitions | ||||||||
Fair value adjustments | ( | ) | ||||||
Resolved and settled in cash | ( | ) | ( | ) | ||||
Other | ||||||||
Balance, December 31 | $ | $ | ||||||
Less: current portion | $ | $ | ||||||
Non-current portion | $ | $ |
The carrying amounts for cash and cash equivalents, restricted cash, accounts receivable, accounts payable and accrued liabilities approximate fair values due to the short maturity of these instruments, unless otherwise indicated. The inputs to the measurement of the fair value of long term debt are Level 2 inputs. The fair value measurements were made using a net present value approach; significant model inputs were expected future cash outflows and discount rates (which range from
2023 | 2022 | |||||||||||||||
Carrying | Fair | Carrying | Fair | |||||||||||||
amount | value | amount | value | |||||||||||||
Other receivables | $ | $ | $ | $ | ||||||||||||
Long-term debt |
Other receivables include notes receivable from non-controlling shareholders and other non-current receivables.
19. |
Contingencies |
In the normal course of operations, the Company is subject to routine claims and litigation incidental to its business. Litigation currently pending or threatened against the Company includes disputes with former employees and commercial liability claims related to services provided by the Company. The Company believes resolution of such proceedings, combined with amounts set aside, will not have a material impact on the Company’s financial condition or the results of operations.
20. | Related party transactions |
The Company has entered into office space rental arrangements and property management contracts with senior managers of certain subsidiaries. These senior managers are usually also minority shareholders of the subsidiaries. The business purpose of the transactions is to rent office space for the Company and to generate property management revenues for the Company. The recorded amount of the rent expense for the year ended December 31,
As at December 31, 2023, the Company had $
21. | Segmented information |
Operating segments
The Company has
reportable operating segments. The segments are grouped with reference to the nature of services provided and the types of clients that use those services. The Company assesses each segment’s performance based on operating earnings or operating earnings before depreciation and amortization. FirstService Residential provides property management and related property services to residential communities in North America. FirstService Brands provides company-owned and franchised property services to customers in North America. Corporate includes the costs of operating the Company’s corporate head office. The reportable segment information excludes intersegment transactions.
2023 | FirstService | FirstService | ||||||||||||||
Residential | Brands | Corporate | Consolidated | |||||||||||||
Revenues | $ | $ | $ | $ | ||||||||||||
Depreciation and amortization | ||||||||||||||||
Operating earnings (loss) | ( | ) | ||||||||||||||
Other income, net | ||||||||||||||||
Interest expense, net | ( | ) | ||||||||||||||
Income taxes | ( | ) | ||||||||||||||
Net earnings | $ | |||||||||||||||
Total assets | $ | $ | $ | $ | ||||||||||||
Total additions to long lived assets |
2022 | FirstService | FirstService | ||||||||||||||
Residential | Brands | Corporate | Consolidated | |||||||||||||
Revenues | $ | $ | $ | $ | ||||||||||||
Depreciation and amortization | ||||||||||||||||
Operating earnings (loss) | ( | ) | ||||||||||||||
Other income, net | ||||||||||||||||
Interest expense, net | ( | ) | ||||||||||||||
Income taxes | ( | ) | ||||||||||||||
Net earnings | $ | |||||||||||||||
Total assets | $ | $ | $ | $ | ||||||||||||
Total additions to long lived | ||||||||||||||||
assets |
Geographic information
Revenues in each geographic region are reported by customer locations.
2023 | 2022 | |||||||
United States | ||||||||
Revenues | $ | $ | ||||||
Total long-lived assets | ||||||||
Canada | ||||||||
Revenues | $ | $ | ||||||
Total long-lived assets | ||||||||
Consolidated | ||||||||
Revenues | $ | $ | ||||||
Total long-lived assets |
22. |
Impact of recently issued accounting standards |
In November 2023, the FASB issued ASU 2023-07 – Improvements to Reportable Segment Disclosures. This ASU requires incremental disclosures about a public entity’s reportable segments but does not change the definition of a segment or the guidance for determining reportable segments. The new guidance requires disclosure of significant segment expenses that are (1) regularly provided to (or easily computed from information regularly provided to) the chief operating decision maker and (2) included in the reported measure of segment profit or loss. The new standard also allows companies to disclose multiple measures of segment profit or loss if those measures are used to assess performance and allocate resources. The guidance is effective January 1, 2024 and should be adopted retrospectively unless impracticable. The Company is currently assessing the impact of this ASU on its financial disclosures.
In December 2023, the FASB issued ASU 2023-09 – Improvements to Income Tax Disclosures. This ASU requires significant additional disclosures about income taxes, primarily focused on the disclosure of income taxes paid and the rate reconciliation table. The guidance will be applied prospectively and is effective January 1, 2025. The Company is currently assessing the impact of this ASU on its financial disclosures.
Exhibit 3
FIRSTSERVICE CORPORATION
Management’s discussion and analysis for the year ended December 31, 2023
(in US dollars)
February 22, 2024
The following management’s discussion and analysis (“MD&A”) should be read together with the audited consolidated financial statements and the accompanying notes (the “Consolidated Financial Statements”) of FirstService Corporation (“we,” “us,” “our,” the “Company” or “FirstService”) for the year ended December 31, 2023. The Consolidated Financial Statements have been prepared in accordance with generally accepted accounting principles in the United States (“GAAP”). All financial information herein is presented in United States dollars.
The Company has prepared this MD&A with reference to National Instrument 51-102 – Continuous Disclosure Obligations of the Canadian Securities Administrators (the “CSA”). Under the U.S./Canada Multijurisdictional Disclosure System, the Company is permitted to prepare this MD&A in accordance with the disclosure requirements of Canada, which requirements are different from those of the United States. This MD&A provides information for the year ended December 31, 2023 and up to and including February 22, 2024.
Additional information about the Company, including the Company’s current Annual Information Form, which is included in FirstService’s Annual Report on Form 40-F, can be found on SEDAR+ at www.sedarplus.ca and on EDGAR at www.sec.gov.
This MD&A includes references to “Adjusted EBITDA” and “Adjusted EPS”, which are financial measures that are not calculated in accordance with GAAP. For a reconciliation of these non-GAAP measures to the most directly comparable GAAP financial measures, see “Reconciliation of non-GAAP financial measures.”
FirstService’s business
FirstService is a leading provider of branded essential property services comprised of two reportable operating segments: (i) FirstService Residential, the largest provider of residential property management services in North America; and (ii) FirstService Brands, a leading provider of essential property services to residential and commercial customers through both company-owned operations and franchise systems. The segments are grouped with reference to the nature of services provided and the types of clients that use those services. FirstService Residential and FirstService Brands are described in further detail in our Annual Information Form.
Consolidated review
Our consolidated revenues for the year ended December 31, 2023 were $4.33 billion, an increase of 16% over the prior year. The top-line performance included approximately 10% organic growth, and the balance from recent acquisitions, with resulting growth in Adjusted EBITDA, Operating Earnings and Adjusted EPS (see definitions and reconciliations below). Diluted earnings per share was down versus the prior year primarily due to higher acquisition-related costs, as well as increases to the non-controlling interest redemption increment, further described below.
We acquired controlling interests in twelve businesses in 2023, including three in our FirstService Residential segment and nine in our FirstService Brands segment. The total initial cash consideration for these acquisitions was $547.2 million. Our tuck-under acquisitions support the strategic growth initiatives of our service lines in both segments, which include expanding our geographic footprint into new markets, enhancing our scale in existing markets, broadening our service offerings and expanding coverage of our national client accounts. In the fourth quarter of 2023, we also completed a larger acquisition by adding Roofing Corp of America, a commercial roofing company headquartered in Atlanta and operating in 11 U.S. states spanning the Sun Belt, Mid-Atlantic, Midwest and West regions.
Results of operations – year ended December 31, 2023
Our revenues were $4.33 billion for 2023, up 16% relative to 2022. The increase included organic revenue growth of 10%, with the balance coming from recent acquisitions.
Operating earnings for the year were $244.9 million versus $219.0 million in the prior year period, with the increase attributable to growth in profitability in both divisions. Adjusted EBITDA rose 18% to $415.7 million in 2023 versus $351.7 million in the prior year. Performance in our FirstService Residential division was driven by new contract wins and growth in labour-related services revenue with our existing clients. Our FirstService Brands division was driven by broad-based organic growth, with particular strength at Century Fire and our restoration operations, together with contribution from recent tuck-under acquisitions.
Depreciation and amortization expense was $127.9 million in 2023 relative to $110.1 million in the prior year, with the increase primarily related to recently acquired company-owned operations in our FirstService Brands segment.
Acquisition-related costs were $21.5 million, relative to $4.5 million in the prior year, and included $16.4 million of contingent acquisition consideration fair value adjustments from outperformance on prior tuck-under acquisitions, with most of these adjustments in our FirstService Brands segment.
Net interest expense increased to $47.4 million in 2023, up from $25.2 million in the prior year, with the difference primarily attributable to the higher cost of debt, as well as an increase in our average outstanding debt. Our weighted average interest rate increased to 6.0% in 2023 from 3.8% in the prior year.
Other income was $5.8 million versus $0.1 million in the prior year. Other income in the current period included a pre-tax gain of $4.4 million from the sale of a building located in South Florida within the FirstService Residential segment.
Our consolidated income tax rate for the period was 28%, versus 25% in the prior year, and relative to the statutory rate of 27% in both periods.
Net earnings for the period were $147.0 million versus $145.0 million a year ago. The increase was attributable to higher profitability in both segments, partially offset by higher interest expense in the current year.
The redeemable non-controlling interest (“RNCI”) share of earnings was $14.1 million for the year, relative to $9.4 million in the prior year period, with the increase attributable to the mix of two-year average earnings of our non-wholly owned subsidiaries. The RNCI redemption increment was $32.5 million, versus $14.6 million in the prior period, and was attributable to changes in the trailing two-year average of earnings of non-wholly owned subsidiaries.
At FirstService Residential, revenues were $2.0 billion in 2023, up 13% versus the prior year, with the increase comprised of 10% organic growth and the balance from acquisitions. The strong organic growth was primarily driven by new contract wins, together with contribution from increased labour-related and ancillary services with our existing clients. Adjusted EBITDA for this segment was $187.8 million or 9.4% of revenues, relative to $168.6 million or 9.5% of revenues in the prior year. Operating earnings for 2023 were $155.0 million or 7.8% of revenues, relative to $138.9 million or 7.8% of revenues a year ago.
Our FirstService Brands operations reported revenues of $2.34 billion in 2023, an increase of 18% versus the prior year, comprised of 11% organic growth and the balance from tuck-under acquisitions. All service lines contributed to the division’s organic revenue growth, including an exceptionally strong increase over the prior year at our Century Fire Protection operations. Adjusted EBITDA for this segment was $242.4 million in 2023 or 10.4% of revenues, relative to $196.3 million or 9.9% of revenues in the prior year. Operating earnings were $126.5 million or 5.4% of revenues, versus $111.6 million or 5.7% of revenues a year ago. The segment EBITDA margin, defined as Adjusted EBITDA divided by revenue, was positively impacted by operating leverage realized from the strong top-line performance in our restoration and Century Fire businesses. The operating earnings margin, defined as operating earnings divided by revenue, was slightly down due to acquisition related items, primarily contingent acquisition consideration fair value adjustments.
Corporate costs (see definitions and reconciliations below), as presented in Adjusted EBITDA, were $14.4 million in 2023 relative to $13.2 million in the prior year. Corporate costs were $36.6 million versus $31.5 million in the prior year, with the increase primarily due to higher stock-based compensation expense.
Results of operations – year ended December 31, 2022
Our revenues were $3.75 billion for 2022, up 15% relative to 2021. The increase included organic revenue growth of 9%, with the balance coming from acquisitions in the year.
Operating earnings for 2022 were $219.0 million versus $201.6 million in 2021, with the increase attributable to growth in profitability in both segments. Adjusted EBITDA rose 7% to $351.7 million in 2022 versus $327.4 million in the prior year. Performance in our FirstService Residential segment was driven by growth in labour-related services revenue. Our FirstService Brands division was driven by broad-based organic growth, with particular strength at our home services and Century Fire Protection brands, together with contribution from recent tuck-under acquisitions.
Depreciation and amortization expense was $110.1 million in 2022 relative to $99.0 million in 2021, with the increase primarily related to recently acquired company-owned operations in our FirstService Brands segment.
Net interest expense increased to $25.2 million in 2022, up from $16.0 million in the prior year, with the difference primarily attributable to the higher cost of debt, as well as an increase in our average outstanding debt. Our weighted average interest rate increased to 3.8% in 2022 from 2.8% in the prior year.
Other income was $0.1 million in 2022 versus $23.4 million in the prior year. Other income in 2021 included a $12.5 million pre-tax gain from the divestiture of our immaterial, non-core pest control operation in the FirstService Residential segment. Also included in 2021 other income was a pre-tax gain of $7.3 million from the sale of a building located in South Florida, also in the FirstService Residential segment.
Our consolidated income tax rate for 2022 was 25%, flat versus 2021, and relative to the statutory rate of 27% in both periods.
Net earnings for 2022 were $145.0 million versus $156.1 million in 2021. The decrease was attributable to higher interest expense in the current year, as well as comparatively higher other income in 2021, partially offset by operating earnings growth in both divisions.
At FirstService Residential, revenues were $1.77 billion in 2022, up 12% versus the prior year, with the increase comprised of 8% organic growth and the balance from acquisitions. Organic growth was primarily due to increased labour-related services compared to the prior year. Adjusted EBITDA for this segment was $168.6 million or 9.5% of revenues, relative to $156.7 million or 9.9% of revenues in the prior year. Operating earnings for 2022 were $138.9 million or 7.8% of revenues, relative to $127.3 million or 8.0% of revenues in the prior year. The segment EBITDA margin, defined as Adjusted EBITDA divided by revenue, and the operating earnings margin, defined as operating earnings divided by revenue, were impacted by wage inflation, as well as higher growth of labour-driven revenues relative to higher margin ancillaries.
Our FirstService Brands operations reported revenues of $1.97 billion in 2022, an increase of 19% versus the prior year, comprised of 11% organic growth and the balance from tuck-under acquisitions. Organic revenue growth was broad-based across the division and included significant double-digit increases in our home services and Century Fire brands. Adjusted EBITDA for this segment was $196.3 million in 2022 or 9.9% of revenues, relative to $187.9 million or 11.3% of revenues in the prior year. Operating earnings were $111.6 million or 5.7% of revenues, versus $106.6 million or 6.4% of revenues in the prior year. The division margin decline was a result of cost inflationary pressures within some of the businesses in this division, in addition to the combined impact of growth-related platform investments and more tempered weather-claim activity within our restoration operations.
Corporate costs, as presented in Adjusted EBITDA, were $13.2 million in 2022 relative to $17.2 million in the prior year. The year-over-year decrease was primarily due to lower annual cash-based incentive compensation expense in 2022. Corporate costs were $31.5 million versus $32.2 million in 2021, with higher stock-based compensation expense partially offsetting the decrease in annual cash-based incentive compensation.
Selected annual information - last five years |
||||||||||||||||||||
(in thousands of US$, except share and per share amounts) |
||||||||||||||||||||
(derived from audited financial statements prepared in accordance with US GAAP) |
||||||||||||||||||||
Year ended December 31 |
||||||||||||||||||||
2023 |
2022 |
2021 |
2020 |
2019 |
||||||||||||||||
Operations |
||||||||||||||||||||
Revenues |
$ | 4,334,548 | $ | 3,745,835 | $ | 3,249,072 | $ | 2,772,415 | $ | 2,407,410 | ||||||||||
Operating earnings (loss) |
244,892 | 219,026 | 201,642 | 169,412 | (174,419 | ) | ||||||||||||||
Net earnings (loss) |
147,021 | 145,007 | 156,130 | 109,590 | (227,631 | ) | ||||||||||||||
Financial position |
||||||||||||||||||||
Total assets |
$ | 3,625,743 | $ | 2,774,514 | $ | 2,509,023 | $ | 2,196,540 | $ | 1,955,469 | ||||||||||
Long-term debt |
1,182,107 | 734,463 | 652,804 | 589,604 | 766,623 | |||||||||||||||
Redeemable non-controlling interests |
332,963 | 233,429 | 219,135 | 193,034 | 174,662 | |||||||||||||||
Shareholders' equity |
1,024,146 | 907,466 | 799,722 | 660,398 | 425,887 | |||||||||||||||
Common share data |
||||||||||||||||||||
Net earnings (loss) per common share: |
||||||||||||||||||||
Basic |
$ | 2.25 | 2.74 | 3.08 | 2.04 | (6.58 | ) | |||||||||||||
Diluted |
2.24 | 2.72 | 3.05 | 2.02 | (6.58 | ) | ||||||||||||||
Weighted average common shares outstanding (thousands) |
||||||||||||||||||||
Basic |
44,556 | 44,175 | 43,841 | 42,756 | 38,225 | |||||||||||||||
Diluted |
44,795 | 44,494 | 44,401 | 43,184 | 38,662 | |||||||||||||||
Cash dividends per common share |
$ | 0.90 | 0.81 | 0.73 | 0.66 | 0.60 | ||||||||||||||
Other data |
||||||||||||||||||||
Adjusted EBITDA |
$ | 415,728 | $ | 351,732 | $ | 327,376 | $ | 283,722 | $ | 235,182 | ||||||||||
Adjusted EPS |
4.66 | 4.24 | 4.57 | 3.46 | 3.00 |
Results of operations – fourth quarter ended December 31, 2023
Consolidated revenues for the fourth quarter ended December 31, 2023 were up 6% relative to the same period in 2022. Adjusted EBITDA was $103.3 million, up from $102.5 million in the prior year quarter. Operating Earnings were $48.1 million, relative to $67.5 million in the fourth quarter of 2022. Consolidated operating margins were lower in the quarter due to the results in the FirstService Brands segment, which are described below.
FirstService Residential revenues increased 12% during the quarter, including 9% organic growth. Growth was driven by new contract wins, with particularly strong performance at our sited labour communities. Adjusted EBITDA for the quarter was $43.5 million, compared to $38.1 million reported in the prior year quarter. Operating Earnings were $34.1 million during the quarter, versus $30.6 million for the fourth quarter of the prior year. Operating margins were relatively in-line with the prior year quarter.
Our FirstService Brands operations reported revenue growth of 1% in the fourth quarter ended December 31, 2023 compared to the prior year quarter. Revenues declined 7% on an organic basis due to milder weather patterns at our restoration operations, compared to the significant loss claims activity from hurricanes Ian and Fiona in the prior year quarter. The division top-line performance included very strong growth at Century Fire together with solid contribution from our home services brands, partially offsetting the restoration-driven headwinds. Adjusted EBITDA for the quarter was $61.1 million, compared to $67.4 million in the prior year quarter. Operating Earnings were $20.6 million, versus $44.0 million in the prior year quarter. The division EBITDA margin decline was primarily attributable to lower profitability in our restoration operations due to the reduced weather-related activity during the period. The operating earnings margin was further impacted by significant contingent acquisition consideration fair value adjustments.
Summary of quarterly results - years ended December 31, 2023 and 2022 |
||||||||||||||||||||
(in thousands of US$, except per share amounts) |
||||||||||||||||||||
Q1 |
Q2 |
Q3 |
Q4 |
Year |
||||||||||||||||
Year ended December 31, 2023 |
||||||||||||||||||||
Revenues |
$ | 1,018,445 | $ | 1,119,734 | $ | 1,117,109 | $ | 1,079,260 | $ | 4,334,548 | ||||||||||
Operating earnings |
40,950 | 82,321 | 73,559 | 48,062 | 244,892 | |||||||||||||||
Net earnings |
22,667 | 54,713 | 45,858 | 23,783 | 147,021 | |||||||||||||||
Net earnings per share: |
||||||||||||||||||||
Basic |
0.36 | 1.02 | 0.73 | 0.14 | 2.25 | |||||||||||||||
Diluted |
0.36 | 1.01 | 0.73 | 0.14 | 2.24 | |||||||||||||||
Year ended December 31, 2022 |
||||||||||||||||||||
Revenues |
$ | 834,572 | $ | 930,707 | $ | 960,455 | $ | 1,020,101 | $ | 3,745,835 | ||||||||||
Operating earnings |
29,046 | 59,813 | 62,709 | 67,458 | 219,026 | |||||||||||||||
Net earnings |
18,821 | 40,506 | 41,341 | 44,339 | 145,007 | |||||||||||||||
Net earnings per share: |
||||||||||||||||||||
Basic |
0.32 | 0.78 | 0.77 | 0.86 | 2.74 | |||||||||||||||
Diluted |
0.32 | 0.78 | 0.77 | 0.86 | 2.72 | |||||||||||||||
Other data |
||||||||||||||||||||
Adjusted EBITDA - 2023 |
$ | 82,096 | $ | 118,353 | $ | 111,936 | $ | 103,343 | $ | 415,728 | ||||||||||
Adjusted EBITDA - 2022 |
62,338 | 91,346 | 95,501 | 102,547 | 351,732 | |||||||||||||||
Adjusted EPS - 2023 |
0.85 | 1.46 | 1.25 | 1.11 | 4.66 | |||||||||||||||
Adjusted EPS - 2022 |
0.73 | 1.12 | 1.17 | 1.22 | 4.24 |
Operating outlook
We are committed to a long-term growth strategy that is primarily driven by average annual organic revenue growth in the mid-single digit range, combined with tuck-under acquisitions within each of our service platforms, resulting in targeted average annual growth in revenues of 10% or higher. We are targeting some incremental operating leverage and modestly higher growth rates for operating earnings. Economic conditions and growth-related investments in our operations will negatively or positively impact these target growth rates in any given year.
In our FirstService Residential segment, revenues are expected to increase at a mid-single digit percentage organic growth rate in 2024 primarily from new business wins. Any additional tuck-under acquisitions will augment organic growth. Operating margins for 2024 are expected to be approximately in-line with 2023.
Our FirstService Brands segment is expected to generate a mid-teens total revenue growth rate largely driven by the recent acquisition of Roofing Corp of America. Our organic growth at our restoration brands in any given year is dependent on some degree of weather-driven claims activity, which can be unpredictable given the uncertainty of weather patterns. Operating margins are expected to be approximately in-line with 2023, unless influenced by varying levels of weather-related activity at our restoration operations.
The foregoing contains forward-looking statements, and readers should refer to “Forward-looking statements and risks” below regarding our cautions relating to these forward-looking statements and the material risk factors that could cause actual results to differ materially from these forward-looking statements. The above forward-looking statements are made on the assumption that general economic conditions and the conduct of the Company’s businesses remain as they exist on the date hereof, with none of the material risk factors (as noted under “Forward-looking statements and risks” below) occurring during 2024.
Seasonality and quarterly fluctuations
Certain segments of the Company’s operations are subject to seasonal variations. The seasonality of the service lines results in variations in quarterly revenues and operating margins. Variations can also be caused by acquisitions or dispositions, which alter the consolidated service mix.
FirstService Residential generates peak revenues and earnings in the third quarter, as seasonal ancillary swimming pool management revenues are earned. FirstService Brands includes restoration operations, which are influenced by weather patterns that historically have resulted in higher revenues and earnings in any given reporting quarter, and certain franchise operations, which generate the majority of their revenues during the second and third quarters.
Liquidity and capital resources
The Company generated cash flow from operating activities of $280.4 million for the year ended December 31, 2023, up from $105.9 million in the prior year. Operating cash flow, before the impact of working capital, was favourably impacted by increased profitability at both of our segments. In the prior year, there were significant increases in non-cash working capital in our restoration businesses in the FirstService Brands segment, in response to area-wide weather events, primarily hurricanes Ian and Fiona. We believe that cash from operations and other existing resources, including our revolving credit facility described below, will continue to be adequate to satisfy the ongoing working capital needs of the Company.
We had outstanding $60 million of senior secured notes on December 31, 2023 bearing interest at a rate of 3.84% to 4.84%, depending on leverage ratios. As of December 31, 2023 and on the date hereof, the current interest rate is 3.84%. On the date hereof, we have outstanding $30 million of senior secured notes. The remaining outstanding amount of senior secured notes is due on January 16, 2025.
In February 2022, we entered into a second amended and restated credit agreement providing for a $1 billion revolving credit facility on an unsecured basis. The maturity date of the revolving credit facility is February 2027. The new revolving credit facility bears interest at 0.20% to 2.50% over floating reference rates, depending on certain leverage ratios. The current revolving credit facility replaced our previous $450 million revolving credit facility and $440 million term loan (drawn in a single advance) that were set to mature in January 2023 and June 2024, respectively. The new revolving credit facility was used to repay the remaining term loan balance of $407 million under the prior credit agreement, and will continue to be utilized for working capital and general corporate purposes and to fund future tuck-under acquisitions. In December 2023, the Company exercised the $250 million accordion feature under the credit facility to fund its commercial roofing platform acquisition. Accordingly, the second amended and restated credit agreement currently provides for a committed multi-currency revolving credit facility of US$1.25 billion on an unsecured basis.
In September 2022, the Company entered into two revolving, uncommitted financing facilities for potential future private placement issuances of senior unsecured notes (the “Notes”) aggregating $450 million with its existing lenders, NYL Investors LLC (“New York Life”) of up to $150 million and PGIM Private Capital (“Prudential”), of up to $300 million, in each case, net of any existing notes held by them. The facilities each have a three-year term ending September 29, 2025. The Company has the ability to issue incremental Note tranches under the facilities, subject to acceptance by New York Life or Prudential, with varying maturities as determined by the Company, and with coupon pricing determined at the time of each Note issuance. As part of the closing of the New York Life facility, the Company issued, on a private placement basis to New York Life, $60 million of 4.53% Notes, which are due in full on September 29, 2032, with interest payable semi-annually. In January 2024, the Company issued, on a private placement basis to New York Life, $50 million of 5.48% Notes, which are due in full on January 30, 2029, as well as $25 million of 5.60% Notes, which are due in full on January 30, 2031, both with interest payable semi-annually. Also in January 2024, the Company issued, on a private placement basis to Prudential, $50 million of 5.64% Notes, which are due in full on January 30, 2031, with interest payable semi-annually.
During 2023, we invested cash in acquisitions as follows: an aggregate of $547.2 million (net of cash acquired) in twelve new business acquisitions, $20.1 million in contingent consideration payments related to previously completed acquisitions, and $4.3 million in acquisitions of RNCI.
In relation to acquisitions completed during the past two years, we have outstanding contingent consideration, assuming all contingencies are satisfied and payment is due in full, totalling $63.5 million as at December 31, 2023 (December 31, 2022 - $34.2 million). The contingent consideration liability is recognized at fair value upon acquisition and is updated to fair value each quarter. The contingent consideration is based on achieving specified earnings levels, and is paid or payable after the end of the contingency period, which extends to November 2025. We estimate that a majority of the contingent consideration outstanding as of December 31, 2023 will ultimately be paid.
Capital expenditures for the year were $92.7 million (2022 - $77.6 million), which consisted primarily of service vehicle fleet replacements and additions in the FirstService Brands segment, as well as information technology system and hardware investments in both of our operating segments. The current year figure also included leasehold improvements and office relocations in the FirstService Residential segment.
Net indebtedness as at December 31, 2023 was $994.5 million, versus $598.2 million at December 31, 2022. Net indebtedness is calculated as the current and non-current portions of long-term debt less cash and cash equivalents. We were in compliance with the covenants contained in our credit agreement and the agreements governing our senior secured notes and the Notes as at December 31, 2023 and we expect to remain in compliance with such covenants going forward.
The Company declared common share dividends totalling $0.90 per share during 2023, with $0.8775 paid in cash during the year and $0.225 paid in January 2024. In February 2024, our Board of Directors approved an increase to our dividend such that, commencing with the quarter ended March 31, 2024, the quarterly dividend would be US$0.25 per share (a rate of US$1.00 per share per annum). The Company’s policy is to pay quarterly dividends on its common shares in the future, subject to the discretion of our Board of Directors.
During the year we distributed $7.4 million (2022 - $8.1 million) to non-controlling shareholders of subsidiaries.
The following table summarizes our contractual obligations as at December 31, 2023:
Contractual obligations |
Payments due by period |
|||||||||||||||||||
(in thousands of US$) |
Less than |
After |
||||||||||||||||||
Total |
1 year |
1-3 years |
4-5 years |
5 years |
||||||||||||||||
Long-term debt |
$ | 1,162,059 | $ | 30,000 | $ | 30,000 | $ | 1,042,059 | $ | 60,000 | ||||||||||
Interest on long term debt |
170,039 | 66,298 | 82,016 | 19,007 | 2,718 | |||||||||||||||
Capital lease obligations |
20,048 | 7,132 | 9,765 | 3,151 | - | |||||||||||||||
Contingent acquisition consideration |
63,478 | 31,604 | 31,874 | - | - | |||||||||||||||
Operating leases |
278,611 | 56,460 | 101,960 | 56,650 | 63,541 | |||||||||||||||
Total contractual obligations |
$ | 1,694,235 | $ | 191,494 | $ | 255,615 | $ | 1,120,867 | $ | 126,259 |
At December 31, 2023, we had commercial commitments totaling $19.1 million comprised of letters of credit outstanding due to expire within one year. We are required to make semi-annual payments of interest on both our senior secured and senior unsecured notes at interest rates of 3.84% and 4.53%, respectively.
To manage our insurance costs, we take on risk in the form of high deductibles on many of our coverages. We believe this step reduces overall insurance costs in the long term, but may cause fluctuations in the short term depending on the frequency and severity of insurance incidents.
In most operations where managers or employees are also non-controlling owners, the Company is party to shareholders’ agreements. These agreements allow us to “call” the minority position at a value determined with the use of a formula price, which is in most cases equal to a multiple of trailing two-year average earnings, less debt. Non-controlling owners may also “put” their interest to the Company at the same price, with certain limitations including (i) the inability to “put” more than 33% or 50% of their holdings in any twelve-month period and (ii) the inability to “put” any holdings for at least one year after the date of our initial acquisition of the business or the date the non-controlling shareholder acquired their interest, as the case may be. The total value of the RNCI (the “redemption amount”), as calculated in accordance with shareholders’ agreements, was as follows.
December 31 |
December 31 |
|||||||
(in thousands of US$) |
2023 |
2022 |
||||||
FirstService Residential |
$ | 72,140 | $ | 60,424 | ||||
FirstService Brands |
221,771 | 148,522 | ||||||
$ | 293,911 | $ | 208,946 |
The amount recorded on our balance sheet under the caption “redeemable non-controlling interests” is the greater of (i) the redemption amount (as above) or (ii) the amount initially recorded as RNCI at the date of inception of the minority equity position. As at December 31, 2023, the RNCI recorded on the balance sheet was $333.0 million. The purchase prices of the RNCI may be paid in cash or, in some cases, in common shares of FirstService. If all RNCI were redeemed in cash, the pro forma estimated accretion to net earnings per share for 2023 would be $0.75, and the accretion to Adjusted EPS would be $0.02.
Stock-based compensation expense
One of our key operating principles is for senior management to have a significant long-term equity stake in the businesses they operate. The equity owned by senior management takes the form of stock, stock options or notional value appreciation plans, the latter two of which require the recognition of compensation expense under GAAP. The amount of expense recognized with respect to stock options is determined for the Company plan by allocating the grant-date fair value of each option over the expected term of the option. The amount of expense recognized with respect to the notional value appreciation plans is re-measured quarterly.
Critical accounting estimates
Critical accounting estimates are those that management deems to be most important to the portrayal of our financial condition and results of operations, and that require management’s most difficult, subjective or complex judgments, due to the need to make estimates about the effects of matters that are inherently uncertain. We have identified two critical accounting estimates: determination of fair values of assets acquired and liabilities assumed in business combinations, and impairment testing of the carrying value of goodwill.
The determination of fair values of assets acquired and liabilities assumed in business combinations requires the use of estimates and judgment by management, particularly in determining fair values of intangible assets acquired. For example, if different assumptions were used regarding the profitability and expected attrition rates of acquired customer relationships and the discount rates, different amounts of intangible assets and related amortization could be reported. Management applied significant judgement in estimating the fair value of the customer relationships acquired, in particular in its acquisition of Roofing Corp of America, which included the use of assumptions with respect to future earnings before interest, taxes, depreciation and amortization (“EBITDA”) margins, revenue attributable to returning customers, revenue growth rates, expected attrition rates of acquired customer relationships and the discount rate.
Impairment of goodwill is tested at the reporting unit level. The Company has seven reporting units determined with reference to business segment, customer type, service delivery model and geography. Impairment is tested by first assessing qualitative factors to determine whether it is more likely than not that the fair value of a reporting unit is less than its carrying amount. Where it is determined to be more likely than not that its fair value is greater than its carrying amount, then no further testing is required. Where the qualitative analysis is not sufficient to support that the fair value exceeds the carrying amount, then a goodwill impairment test is performed. The Company also has an unconditional option to bypass the qualitative assessment for any reporting unit in any period and proceed directly to performing a quantitative goodwill impairment test. The Company may resume performing the qualitative assessment in any subsequent period. A quantitative goodwill impairment test is performed by comparing the fair value of each reporting unit to its carrying value, including goodwill. Fair value is estimated using a market multiple method, which estimates market multiples of EBITDA for comparable entities with similar operations and economic characteristics. Significant assumptions used in estimating the fair value of each reporting unit include the market multiples of EBITDA. Management uses significant judgment in assessing the qualitative factors to be considered in the qualitative goodwill impairment assessment, including the financial performance of a reporting unit, changes in the business and economic environment of each reporting unit and the Company overall, or declines in the market value of the Company’s own shares.
Reconciliation of non-GAAP financial measures
In this MD&A, we make reference to “Adjusted EBITDA” and “Adjusted EPS,” which are financial measures that are not calculated in accordance with GAAP.
Adjusted EBITDA is defined as net earnings, adjusted to exclude: (i) income tax; (ii) other expense (income); (iii) interest expense; (iv) depreciation and amortization; (v) acquisition-related items; and (vi) stock-based compensation expense. The Company uses Adjusted EBITDA to evaluate its own operating performance and its ability to service debt, as well as an integral part of its planning and reporting systems. Additionally, this measure is used in conjunction with discounted cash flow models to determine the Company’s overall enterprise valuation and to evaluate acquisition targets. Adjusted EBITDA is presented as a supplemental measure because the Company believes such measure is useful to investors as a reasonable indicator of operating performance because of the low capital intensity of its service operations. The Company believes this measure is a financial metric used by many investors to compare companies, especially in the services industry. This measure is not a recognized measure of financial performance under GAAP in the United States, and should not be considered as a substitute for operating earnings, net earnings or cash flow from operating activities, as determined in accordance with GAAP. The Company’s method of calculating Adjusted EBITDA may differ from other issuers and accordingly, this measure may not be comparable to measures used by other issuers. A reconciliation of net earnings to Adjusted EBITDA appears below.
Year ended |
||||||||
(in thousands of US$) |
December 31 |
|||||||
2023 |
2022 |
|||||||
Net earnings |
$ | 147,021 | $ | 145,007 | ||||
Income tax |
56,317 | 48,974 | ||||||
Other income |
(5,810 | ) | (146 | ) | ||||
Interest expense, net |
47,364 | 25,191 | ||||||
Operating earnings |
244,892 | 219,026 | ||||||
Depreciation and amortization |
127,934 | 110,140 | ||||||
Acquisition-related items |
21,517 | 4,520 | ||||||
Stock-based compensation expense |
21,385 | 18,046 | ||||||
Adjusted EBITDA |
$ | 415,728 | $ | 351,732 |
A reconciliation of segment operating earnings to segment Adjusted EBITDA appears below.
(in thousands of US$) |
||||||||||||
2023 |
FirstService |
FirstService |
||||||||||
Residential |
Brands |
Corporate (1) |
||||||||||
Operating earnings (loss) |
$ | 155,044 | $ | 126,468 | $ | (36,620 | ) | |||||
Depreciation and amortization |
33,114 | 94,729 | 91 | |||||||||
Acquisition-related items |
(366 | ) | 21,159 | 724 | ||||||||
Stock-based compensation expense |
- | - | 21,385 | |||||||||
Adjusted EBITDA |
$ | 187,792 | $ | 242,356 | $ | (14,420 | ) |
2022 |
FirstService |
FirstService |
||||||||||
Residential |
Brands |
Corporate (1) |
||||||||||
Operating earnings (loss) |
$ | 138,873 | $ | 111,638 | $ | (31,485 | ) | |||||
Depreciation and amortization |
28,611 | 81,439 | 90 | |||||||||
Acquisition-related items |
1,153 | 3,200 | 167 | |||||||||
Stock-based compensation expense |
- | - | 18,046 | |||||||||
Adjusted EBITDA |
$ | 168,637 | $ | 196,277 | $ | (13,182 | ) |
(1) Corporate costs represent corporate overhead expenses not directly attributable to reportable segments and are therefore unallocated within segment operating earnings (loss) and Adjusted EBITDA.
Adjusted EPS is defined as diluted net earnings per share, adjusted for the effect, after income tax, of: (i) the non-controlling interest redemption increment; (ii) acquisition-related items; (iii) amortization of intangible assets recognized in connection with acquisitions; and (iv) stock-based compensation expense. The Company believes this measure is useful to investors because it provides a supplemental way to understand the underlying operating performance of the Company and enhances the comparability of operating results from period to period. Adjusted EPS is not a recognized measure of financial performance under GAAP, and should not be considered as a substitute for diluted net earnings per common share, as determined in accordance with GAAP. The Company’s method of calculating this non-GAAP measure may differ from other issuers and, accordingly, this measure may not be comparable to measures used by other issuers. A reconciliation of diluted net earnings per common share to Adjusted EPS appears below.
Year ended |
||||||||
(in US$) |
December 31 |
|||||||
2023 |
2022 |
|||||||
Diluted net earnings per share |
$ | 2.24 | $ | 2.72 | ||||
Non-controlling interest redemption increment |
0.72 | 0.33 | ||||||
Acquisition-related items |
0.47 | 0.10 | ||||||
Amortization of intangible assets, net of tax |
0.88 | 0.79 | ||||||
Stock-based compensation expense, net of tax |
0.35 | 0.30 | ||||||
Adjusted EPS |
$ | 4.66 | $ | 4.24 |
We believe that the presentation of Adjusted EBITDA and Adjusted EPS, which are non-GAAP financial measures, provides important supplemental information to management and investors regarding financial and business trends relating to the Company’s financial condition and results of operations. We use these non-GAAP financial measures when evaluating operating performance because we believe that the inclusion or exclusion of the items described above, for which the amounts are non-cash or non-recurring in nature, provides a supplemental measure of our operating results that facilitates comparability of our operating performance from period to period, against our business model objectives, and against other companies in our industry. We have chosen to provide this information to investors so they can analyze our operating results in the same way that management does and use this information in their assessment of our core business and the valuation of the Company. Adjusted EBITDA and Adjusted EPS are not calculated in accordance with GAAP, and should be considered supplemental to, and not as a substitute for, or superior to, financial measures calculated in accordance with GAAP. Non-GAAP financial measures have limitations in that they do not reflect all of the costs or benefits associated with the operations of our business as determined in accordance with GAAP. As a result, investors should not consider these measures in isolation or as a substitute for analysis of our results as reported under GAAP.
Transactions with related parties
The Company has entered into office space rental arrangements and property management contracts with senior managers of certain subsidiaries. These senior managers are usually also minority shareholders of the subsidiaries. The business purpose of the transactions is to rent office space for the Company and to generate property management revenues for the Company. The recorded amount of the rent expense for the year ended December 31, 2023 was $4.6 million (2022 - $4.4 million). These amounts are settled monthly in cash, and are priced at market rates. The rental arrangements have fixed terms of up to 10 years.
As at December 31, 2023, the Company had $6.6 million of loans receivable from minority shareholders (December 31, 2022 - $2.4 million). The business purpose of the loans receivable was to finance the sale of non-controlling interests in subsidiaries to senior managers. The loan amounts are measured based on the formula price of the underlying non-controlling interests, and interest rates are determined based on market rates plus a spread. The loans generally have terms of 5 to 10 years, but are open for repayment without penalty at any time.
Outstanding share data
The authorized capital of the Company consists of an unlimited number of common shares. The holders of common shares are entitled to one vote in respect of each common share held at all meetings of the shareholders of the Company.
As of the date hereof, the Company has outstanding 44,971,389 common shares. In addition, as at the date hereof 2,700,287 common shares are issuable upon exercise of options granted under the Company’s stock option plan.
Canadian tax treatment of common share dividends
For the purposes of the enhanced dividend tax credit rules contained in the Income Tax Act (Canada) and any corresponding provincial and territorial tax legislation, all dividends (and deemed dividends) paid by us to Canadian residents on our common shares are designated as “eligible dividends”. Unless stated otherwise, all dividends (and deemed dividends) paid by us hereafter are designated as “eligible dividends” for the purposes of such rules.
Disclosure controls and procedures
Our Chief Executive Officer and Chief Financial Officer, with the assistance and participation of other Company management, have evaluated the effectiveness of the design and operation of the Company’s disclosure controls and procedures (as defined in Canada by National Instrument 52-109 – Certification of Disclosure in Issuers’ Annual and Interim Filings and in the United States by Rules 13a-15(e) and 15d-15(e) of the United States Securities Exchange Act of 1934, as amended (the “Exchange Act”)) as of December 31, 2023. Based on that evaluation, the Chief Executive Officer and the Chief Financial Officer have concluded that, as of December 31, 2023, the Company’s disclosure controls and procedures were effective to give reasonable assurance that information required to be disclosed by the Company in reports that it files or submits under Canadian securities legislation and the Exchange Act is: (i) recorded, processed, summarized and reported within the time periods specified therein; and (ii) accumulated and communicated to management, including the Chief Executive Officer and the Chief Financial Officer, as appropriate, to allow timely decisions regarding required disclosure.
Management’s report on internal control over financial reporting
Management is responsible for establishing and maintaining adequate internal control over financial reporting for the Company. Internal control over financial reporting is a process designed to provide reasonable assurance regarding the reliability of financial reporting and the preparation of financial statements for external purposes in accordance with GAAP.
Due to its inherent limitations, internal control over financial reporting may not prevent or detect misstatements. Also, projections of any evaluation of effectiveness to future periods are subject to the risk that controls may become inadequate because of changes in conditions, or that the degree of compliance with the policies or procedures may deteriorate.
Management has excluded twelve entities acquired by the Company in purchase business combinations during the 2023 fiscal year from our assessment of internal control over financial reporting as at December 31, 2023. The total assets and total revenues of the twelve majority-owned entities represent 4.8% and 2.6%, respectively, of the related consolidated financial statement amounts as at and for the year ended December 31, 2023.
Management has assessed the effectiveness of the Company’s internal control over financial reporting as at December 31, 2023, based on the criteria set forth in Internal Control – Integrated Framework (2013) issued by the Committee of Sponsoring Organizations of the Treadway Commission. Based on this assessment, management has concluded that, as at December 31, 2023, the Company’s internal control over financial reporting was effective.
The effectiveness of the Company's internal control over financial reporting as at December 31, 2023, has been audited by PricewaterhouseCoopers LLP, an independent registered public accounting firm, as stated in their report dated February 22, 2024 which accompanies the Company’s audited consolidated financial statements for the year ended December 31, 2023.
Changes in internal control over financial reporting
During the year ended December 31, 2023, there were no changes in our internal control over financial reporting that have materially affected, or are reasonably likely to materially affect, the Company’s internal control over financial reporting.
Legal proceedings
FirstService is involved in litigation in the normal course of its business, both as a defendant and as a plaintiff. Management reviews all of the relevant facts for each claim and applies judgment in evaluating the likelihood and, if applicable, the amount of any potential loss. Where a potential loss is considered probable and the amount is reasonably estimable, provisions for loss are made based on management’s assessment of the likely outcome. Where a range of loss can be reasonably estimated with no best estimate in the range, FirstService records the minimum amount in the range. FirstService does not provide for claims for which the outcome is not determinable or claims for which the amount of the loss cannot be reasonably estimated. Any settlements or awards under such claims are provisioned for when reasonably determinable.
As of February 22, 2024, there are no claims outstanding for which FirstService has assessed the potential loss as both probable to result and reasonably estimable, therefore no accrual has been made.
Market risk of financial instruments
FirstService is engaged in operating and financing activities that generate risk in three primary areas as set out below. See Note 18 to the Consolidated Financial Statements for additional information regarding these risks. FirstService’s overall risk management program and business practices seek to minimize any potential adverse effects on FirstService’s financial performance. Risk management is carried out by the senior management team and is reviewed by FirstService’s board of directors.
For an understanding of other potential risks, including non-financial risks, see the section entitled “Risk Factors” in the Company’s Annual Information Form for the year ended December 31, 2023 available on SEDAR+ at www.sedarplus.ca, which is also included in the Company’s Annual Report on Form 40-F available on EDGAR at www.sec.gov.
Foreign exchange
FirstService is exposed to foreign exchange risk as a result of transactions in currencies other than its functional currency, the U.S. dollar. A majority of FirstService’s revenues in fiscal 2023 were transacted in U.S. dollars. A portion of FirstService’s revenues were denominated in Canadian dollars, which results in foreign currency exposure related to fluctuations between the Canadian and U.S. dollars. FirstService’s head office expenses are incurred in Canadian dollars, which is hedged by Canadian dollar denominated revenue. As an additional part of its risk management strategy, FirstService maintains net monetary asset and/or liability balances in foreign currencies and may engage in foreign currency hedging activities using financial instruments, including currency forward contracts and currency options. FirstService does not use financial instruments for speculative purposes. As at the date of this MD&A, FirstService does not have any such financial instruments.
FirstService’s credit agreement allows FirstService to borrow under its revolving credit facility in Canadian and U.S. dollars. To mitigate any foreign exchange risk related to its Canadian dollar denominated debt, FirstService may from time to time enter into forward foreign exchange contracts to sell Canadian dollars in an amount equal to the principal amount of its Canadian dollar denominated borrowings. As at the date of this MD&A, FirstService does not have any such foreign exchange contracts.
Interest rate
FirstService has no significant interest-bearing assets. FirstService’s income and operating cash flows are substantially independent of changes in market interest rates.
FirstService’s primary interest rate risk arises from its long-term debt under its credit agreement, senior secured notes and senior unsecured notes. FirstService manages its exposure to changes in interest rates by using a combination of fixed and variable rate debt, varying lengths of terms to achieve the desired proportion of variable and fixed rate debt and, from time to time, may enter into hedging/interest rate swap contracts. Fluctuations in interest rates affect the fair value of any hedging/interest rate swap contracts as their value depends on the prevailing market interest rate. Hedging/interest rate swap contracts are monitored on a monthly basis. As of the date of this MD&A, we have two interest swaps in place to exchange the floating interest rate on $182.5 million of debt under our credit agreement for a fixed rate. An increase (or decrease) in interest rates by 1% would result in an $8.4 million increase (or decrease) in annual interest expense under the credit facility contained in FirstService’s credit agreement.
Credit risk
Credit risk refers to the risk of losses due to failure of FirstService’s customers or other counterparties to meet their payment obligations. Credit risk also arises from deposits with banks. Credit risk with respect to the customer receivables are limited due to the large number of entities comprising FirstService’s customer base and their dispersion across many different service lines. Credit risk with respect to deposits is limited by the use of multiple large and reputable banks.
Forward-looking statements and risks
This MD&A contains forward-looking statements with respect to expected financial performance, strategy and business conditions. The words “believe,” “anticipate,” “estimate,” “plan,” “expect,” “intend,” “may,” “project,” “will,” “would,” and similar expressions are intended to identify forward-looking statements, although not all forward-looking statements contain these identifying words. These statements reflect management’s current beliefs with respect to future events and are based on information currently available to management. Forward-looking statements involve significant known and unknown risk and uncertainties. Many factors could cause our actual results, performance or achievements to be materially different from any future results, performance or achievements that may be expressed or implied by such forward-looking statements. Factors which may cause such differences include, but are not limited to those set out below and those set out in detail in the “Risk Factors” section of the Company’s Annual Information Form for the year ended December 31, 2023 available on SEDAR+ at www.sedarplus.ca, which is also included in the Company’s Annual Report on Form 40-F available on EDGAR at www.sec.gov:
● |
Economic conditions, especially as they relate to credit conditions, consumer spending and demand for managed residential property, particularly in regions where our business may be concentrated. |
● |
Residential real estate property values, resale rates and general conditions of financial liquidity for real estate transactions. |
● |
Extreme weather conditions impacting demand for our services or our ability to perform those services. |
● |
Economic deterioration impacting our ability to recover goodwill and other intangible assets. |
● |
A decline in our ability to generate cash from our businesses to fund future acquisitions and meet our debt obligations. |
● |
The effects of changes in foreign exchange rates in relation to the U.S. dollar on our Canadian dollar denominated revenues and expenses. |
● |
Competition in the markets served by the Company. |
● |
Labour shortages or increases in wage and benefit costs. |
● |
The effects of changes in interest rates on our cost of borrowing. |
● |
A decline in our performance impacting our continued compliance with the financial covenants under our debt agreements, or our ability to negotiate a waiver of certain covenants with our lenders. |
● |
Unexpected increases in operating costs, such as insurance, workers’ compensation, health care and fuel prices. |
● |
Changes in the frequency or severity of insurance incidents relative to our historical experience. |
● |
A decline in our ability to make acquisitions at reasonable prices and successfully integrate acquired operations. |
● |
The performance of acquired businesses and potential liabilities acquired in connection with such acquisitions. |
● |
Changes in laws, regulations and government policies at the federal, state/provincial or local level that may adversely impact our businesses. |
● |
Risks related to liability for employee acts or omissions, or installation/system failure, in our fire protection businesses. |
● |
A decline in our performance impacting our ability to pay dividends on our common shares. |
● |
Risks arising from any regulatory review and litigation. |
● |
Risks associated with intellectual property and other proprietary rights that are material to our business. |
● |
Disruptions or security failures in our information technology systems. |
● |
Political conditions, including any outbreak or escalation of terrorism or hostilities and the impact thereof on our business. |
● |
Performance in our commercial and large loss property restoration business and roofing business. |
● |
Volatility of the market price of our common shares. |
● |
Potential future dilution to the holders of our common shares. |
● |
Risks related to our qualification as a foreign private issuer. |
● |
The outbreak of epidemics or pandemics or other health crises could result in volatility and disruptions in the supply and demand for our products and services, global supply chains and financial markets. |
We caution that the foregoing list is not exhaustive of all possible factors, as other factors could adversely affect our results, performance or achievements. The reader is cautioned against undue reliance on these forward-looking statements. Although we believe that the assumptions underlying our forward-looking statements are reasonable, any of the assumptions could prove inaccurate and, therefore, there can be no assurance that the results contemplated in such forward-looking statements will be realized. The inclusion of such forward-looking statements should not be regarded as a representation by the Company or any other person that the future events, plans or expectations contemplated by the Company will be achieved. We note that past performance in operations and share price are not necessarily predictive of future performance. All forward-looking statements in this MD&A are qualified by these cautionary statements. The forward-looking statements are made as of the date of this MD&A and, unless otherwise required by applicable securities laws, we do not intend, nor do we undertake any obligation, to update or revise any forward-looking statements contained in this MD&A to reflect subsequent information, events, results or circumstances or otherwise.
Additional information
Copies of publicly filed documents of the Company, including our Annual Information Form, can be found through the SEDAR+ website at www.sedarplus.ca and on EDGAR at www.sec.gov.
EXHIBIT 23
CONSENT OF INDEPENDENT REGISTERED PUBLIC ACCOUNTING FIRM
We hereby consent to the incorporation by reference in this Annual Report on Form 40-F for the year ended December 31, 2023 of FirstService Corporation of our report dated February 22, 2024, relating to the consolidated financial statements and the effectiveness of internal control over financial reporting, which appears in Exhibit 2 to this Annual Report on Form 40-F.
We also consent to reference to us under the heading “ Experts,” which appears in the Annual Information Form filed as Exhibit 1 to this Annual Report on Form 40-F.
/s/ PricewaterhouseCoopers LLP
Chartered Professional Accountants, Licensed Public Accountants
Toronto, Canada
February 22, 2024
EXHIBIT 31
CERTIFICATION
PURSUANT TO RULE 13a-14(a) OR 15d-14(a) OF THE SECURITIES EXCHANGE ACT OF 1934
I, D. Scott Patterson, certify that:
1. |
I have reviewed this annual report on Form 40-F of FirstService Corporation; |
2. |
Based on my knowledge, this report does not contain any untrue statement of a material fact or omit to state a material fact necessary to make the statements made, in light of the circumstances under which such statements were made, not misleading with respect to the period covered by this report; |
3. |
Based on my knowledge, the financial statements, and other financial information included in this report, fairly present in all material respects the financial condition, results of operations and cash flows of the issuer as of, and for, the periods presented in this report; |
4. |
The issuer’s other certifying officer and I are responsible for establishing and maintaining disclosure controls and procedures (as defined in Exchange Act Rules 13a-15(e) and 15d-15(e)) and internal control over financial reporting (as defined in Exchange Act Rules 13a-15(f) and 15d-15(f)) for the issuer and have: |
a. |
Designed such disclosure controls and procedures, or caused such disclosure controls and procedures to be designed under our supervision, to ensure that material information relating to the issuer, including its consolidated subsidiaries, is made known to us by others within those entities, particularly during the period in which this report is being prepared; |
|
b. |
Designed such internal control over financial reporting, or caused such internal control over financial reporting to be designed under our supervision, to provide reasonable assurance regarding the reliability of financial reporting and the preparation of financial statements for external purposes in accordance with generally accepted accounting principles; |
|
c. |
Evaluated the effectiveness of the issuer’s disclosure controls and procedures and presented in this report our conclusions about the effectiveness of the disclosure controls and procedures, as of the end of the period covered by this report based on such evaluation; and |
|
d. |
Disclosed in this report any change in the issuer’s internal control over financial reporting that occurred during the period covered by the annual report that has materially affected, or is reasonably likely to materially affect, the issuer’s internal control over financial reporting; and |
5. |
The issuer’s other certifying officer and I have disclosed, based on our most recent evaluation of internal control over financial reporting, to the issuer’s auditors and the audit committee of the issuer’s board of directors (or persons performing the equivalent functions): |
a. |
All significant deficiencies and material weaknesses in the design or operation of internal control over financial reporting which are reasonably likely to adversely affect the issuer’s ability to record, process, summarize and report financial information; and |
|
b. |
Any fraud, whether or not material, that involves management or other employees who have a significant role in the issuer’s internal control over financial reporting. |
February 22, 2024
/s/ D. Scott Patterson
D. Scott Patterson
Chief Executive Officer
CERTIFICATION
PURSUANT TO RULE 13a-14(a) OR 15d-14(a) OF THE SECURITIES EXCHANGE ACT OF 1934
I, Jeremy Rakusin, certify that:
1. |
I have reviewed this annual report on Form 40-F of FirstService Corporation; |
2. |
Based on my knowledge, this report does not contain any untrue statement of a material fact or omit to state a material fact necessary to make the statements made, in light of the circumstances under which such statements were made, not misleading with respect to the period covered by this report; |
3. |
Based on my knowledge, the financial statements, and other financial information included in this report, fairly present in all material respects the financial condition, results of operations and cash flows of the issuer as of, and for, the periods presented in this report; |
4. |
The issuer’s other certifying officer and I are responsible for establishing and maintaining disclosure controls and procedures (as defined in Exchange Act Rules 13a-15(e) and 15d-15(e)) and internal control over financial reporting (as defined in Exchange Act Rules 13a-15(f) and 15d-15(f)) for the issuer and have: |
a. |
Designed such disclosure controls and procedures, or caused such disclosure controls and procedures to be designed under our supervision, to ensure that material information relating to the issuer, including its consolidated subsidiaries, is made known to us by others within those entities, particularly during the period in which this report is being prepared; |
|
b. |
Designed such internal control over financial reporting, or caused such internal control over financial reporting to be designed under our supervision, to provide reasonable assurance regarding the reliability of financial reporting and the preparation of financial statements for external purposes in accordance with generally accepted accounting principles; |
|
c. |
Evaluated the effectiveness of the issuer’s disclosure controls and procedures and presented in this report our conclusions about the effectiveness of the disclosure controls and procedures, as of the end of the period covered by this report based on such evaluation; and |
|
d. |
Disclosed in this report any change in the issuer’s internal control over financial reporting that occurred during the period covered by the annual report that has materially affected, or is reasonably likely to materially affect, the issuer’s internal control over financial reporting; and |
5. |
The issuer’s other certifying officer and I have disclosed, based on our most recent evaluation of internal control over financial reporting, to the issuer’s auditors and the audit committee of the issuer’s board of directors (or persons performing the equivalent functions): |
a. |
All significant deficiencies and material weaknesses in the design or operation of internal control over financial reporting which are reasonably likely to adversely affect the issuer’s ability to record, process, summarize and report financial information; and |
|
b. |
Any fraud, whether or not material, that involves management or other employees who have a significant role in the issuer’s internal control over financial reporting. |
February 22, 2024
/s/ Jeremy Rakusin
Jeremy Rakusin
Chief Financial Officer
EXHIBIT 32
CERTIFICATION
PURSUANT TO 18 U.S.C. SECTION 1350, AS ADOPTED PURSUANT
TO SECTION 906 OF THE SARBANES-OXLEY ACT OF 2002
In connection with the annual report on Form 40-F of FirstService Corporation (the “Company”) for the year ended December 31, 2023 (the “Report”) filed with the United States Securities and Exchange Commission on the date hereof, I, D. Scott Patterson, Chief Executive Officer of the Company, certify, pursuant to 18 U.S.C. Section 1350, as enacted pursuant to section 906 of the Sarbanes‑Oxley Act of 2002, that, to the best of my knowledge:
1. |
The Report fully complies with the requirements of Section 13(a) or 15(d) of the Securities Exchange Act of 1934; and |
2. |
The information contained in the Report fairly presents, in all material respects, the financial condition and results of operations of the Company. |
Dated: February 22, 2024
/s/ D. Scott Patterson | |
D. Scott Patterson | |
Chief Executive Officer |
CERTIFICATION
PURSUANT TO 18 U.S.C. SECTION 1350, AS ADOPTED PURSUANT
TO SECTION 906 OF THE SARBANES-OXLEY ACT OF 2002
In connection with the annual report on Form 40-F of FirstService Corporation (the “Company”) for the year ended December 31, 2023 (the “Report”) filed with the United States Securities and Exchange Commission on the date hereof, I, Jeremy Rakusin, Chief Financial Officer of the Company, certify, pursuant to 18 U.S.C. Section 1350, as enacted pursuant to section 906 of the Sarbanes‑Oxley Act of 2002, that, to the best of my knowledge:
1. |
The Report fully complies with the requirements of Section 13(a) or 15(d) of the Securities Exchange Act of 1934; and |
2. |
The information contained in the Report fairly presents, in all material respects, the financial condition and results of operations of the Company. |
Dated: February 22, 2024
/s/ Jeremy Rakusin | |
Jeremy Rakusin | |
Chief Financial Officer |
?SPKTIC&, M4IC&,4IC&,4IC&,4IC&,4IC&,4IC&,4IE4_-00_A@8!W#O\ @-##V_K[?-9[ MW[?F]A_\9:QG+]F:AI6UHST5FCB@^13.6.G&8$1EXTYOR1149PZ93A_&(G%9]["3TJ8B!P^]:+1<[_,;@6:#(N, MQWV6(S96I*<@%;JN$,-)R-[SRFVD9!4L U^5. M>2TE2\%0:80-SLJ0L ^CC1FW7W,$-MJ(Q4\:1M.TZF?+6*OSQ(=HW)Y\PC(+ MD) .FB?83C+I+J)M2)E* =G9CHJHB!1*L !X1LEXF\P=9?9NSTN]7,+;G3E0;=)DL^0A-K"8 M4 .9)@ =RI$.N =<60E#;;: I:UJ40$I2DJ43@ FO"5 M*BP8S\R;)8AQ(K2WY,J4\W'C1V&DE;CS[[JD----I!4MQQ24(2"I1 !->Z9' M?D)RJT9Q@KAK#M^\1T$JJ@HM$UIJ8LC;K"8GB $H6OMSB\<%.H44A>K@VC$5 M.P.7R >^4C ;N%HEESN)" "@MB MU(6#SZ=+\Q.%(7$9)#@H)UJ\=^D=)^;L/2N/'UK?T;V5Z@D%U&E+>Z,I*HY; M4U*OSB% X\JN+;E>JXW<)2=S1M4Y?=7K<^^DIBD:D;JZ=U<_(NP=&;+)N;Y9 M8]4HI*DEIHA?*AVCI,3@I'0I4S^4H9NZ?O2]C911;-<%?*.).$4,5ZL ('*GW'!CU D-@(',+5G5WJ)KG4"]2:KU/<+S/45) M;9DN;;9%84K<8L*ULAN#!C9_)$99459<4LNDK,-G35RR74;.T%6[A(WA425( M)#E'_: @'WD"4Y3=_8H&["&K?H4<;]N\?=&;67VG4). MI-MBWB%L=+3FT@82LI M((S,TBYAEC!(Q::JQRBU!\@B+M Q7+;S6YRJ#H+Q M&0$6GI]/: @^ ML]?EBX;#5SK1XM.F/2 M 2K6F6-7ZQ:"T)TU8I#2TPWQD!-\NH#L6UA*N'(X3*N2<@^0V$N)O9Y<]8[3 MVG?F=.T2BSW-L) %VBLR@X42UW7GA0%,3.I9'PK6-PW4$1,RA#>F,=(R+B4; MB(9FLWUR8W9R7LQ[1N&\25E6(HH>,A"'%C5X!(YC"#>#K[ P 'X@#\V,OET_Z0Z,Z=,H7:( EW
HKN;=IP.^DB:2LJG M8=D9"59:5*;](I^ZR48"A(N+L@MK*E16XR%>C#&,[-I'CWN+D7:D*?IZC2]N MDSJID>O&Z(MX&$2.HFF9W/3S@"1L4V2\TAU!<+@L*8B9)!3MVS8TV=#ML5^= M<)<:#"C-EV1+EO-QXS#:?:6Z\ZI#;:1_N4H#.!W-:6M=JN=\N$6U6:WS;K 8FHX M500$RI;U.(W1CU9J\8NZ\BGK7;=X1!!VC4$"K(:Z@78 *A2KH&\M[:'3504_ MXQZ9O&"LB;^0NFZGO=?'QT?$L6D9%,6<9&L$$VK&/CVR#)BR:HE B+9HT;$2 M;MT$B !$T44R)D* %*4 #ME2.H_BEM\#S%JZ>QT726-S:]0SFEIMK*L[2JWP ME^C?G+3SM>DB/&"@E26IC2JZ*=%? /=[KY._]8YKECMZMC[>CK4^VN]24'"T MHN]S;+L:UMJ& Y&A^:FJ0I2%OVY]%5[<2NF;QXXL)Q]@)$EV9M-N0BBNPKBR M;+GC70=A,:IP(^?'UTA3%*9)T O9DA@.))1-)4S<+%<8RE5_U'?=4W%V[:AN MDR[7![A4B6Z5[$9)#3#8VLQF$DG9'CMM,HR=C: ?DNX'I'58%,8QGQ:_3TQC&*4QC& M*4QC&*4QC&*5_.=<.'#QPN[=N%W;MTJ==R[=+*N73E=0PF46<.%C'6764,(F M.JJ ?J]5LUVGHZKTZ F+18Y98K>-@X&/ ]$\@CT<^X*B12A27HR9R06S1YQ(Z)L_/EC+KROE MUJU%G\EVCJ>L/2&L#E,Q$U 0M=B;B=O$@;QF(M'PJCAV11$Q3R!"G[!HBUKJ MO76G:LQI>L*; TFL1Y *A%0+!)FD H >+H1UE=QP;4VJV*FJ:^7!DW5;Q+PH%$QZA7#"XCZ^!3@;RGISOYH"&,0T MIY1O*"Q:+BXR$CF41"QS&(B8ULDSCHR,:-V$>P:($!-!JS9-4TFS5NBF4")( MHID33( %(4 S[^;VZC=?\ 6>O"_ BNJTWIUS F?241+O.CIUMK)G8[^/WN,V8=ODIP=UCLQ4 M]&@E"P%-2Y*YMR0H%34MA*RT !V .P![ ?B /S8QC-$U;"F,8Q2F,8Q2F M,8Q2F,8Q2F,8Q2F,8Q2F,8Q2F,8Q2F,SKI?$:\>5P,+?C[NYP!>P&%N>N. * M(]^P&%%T<"B/81 #" B "(9(7C%UJ]0 =.4_.;14K,.Q40"=41$K@\*S;/'S=L8BCA-,Y@3R<'.,'-*MPQE M+/%+K=\=^1&SHC3%ZHU\X];(L;YI#UR/V$5FM#2\V[(/IXA26;%;*0LA(K"B MC#MI=BW^8*KD2*J0_A!2Z;!!'>E,8QD4IC&,4IC*RN674NJO%'DAI[CE,:=O M=XD]OMJ\Y96ZNR<*TA( +!9GE:3))-GX^L6,T59F>+BW]C('*4GTP'+-<4IC M&,4IC&,4K$+TD^H%Q6X6T_<\'R*K%NL$E>[-5):L*5K7\1=$FS"&C9EI($=N M)*4CSL5%%WS8R2*15"*E( PZ$^,'4LX@\N)O954XZT^V05]H>KK#?#R M-KU?7ZNS18-TCL" V>M)224<+F>+(@JR.B1)9OY@*',41(:JOX??1.EMPZ[Y M)O-JZJH&Q7<'=:"UAW5SJT/8EXQL\AK(JZ08J2C1R9JBX4014631$A5#ID,< M!$A>VB<>/&B-25;8L_J[3^N-?3 0 #AA%@Y2 M8_,WR&P[,HU8"]5(=)J+Q_'J \#MW)_ M>*56]K;EOU">I#L? K+IC)3 M0.4V)0FI02JQS:0FVS^L#NWAQ?JA+U2!U#N;5UHD2WO8.PH5 MA7Z[N#0;RB7$DP2M((1$XQ&UQTLTC2J/F"4>UE(YVU=D D@EDGB#^K-XV/ M0*"B;V/.J=P?T UW;9''V!8V. TC8;BC($.[E)*.L[-J MG$I/EGB\>K.PPQ .#GWY-*BAT1:W MSRE16EN-=SUK \=(S<=14WM 6T4/PJFFB4>15ZE7 /7)94!5@S>042RD:!W( M ' 2"H'@6FV9WI6=27D7L?DAQ]E-H1&RIVV.*1<7)$VZHQ=AL/X01]LI$]- M-'T5(KN(_P J#GF7G$EV@,TT1.T*FHFMU'H?\VM%\5ZML;0^YY*S579FQMOU M2,JL26K/Y BLFZ;%JBS-^HB(?+7,5,CY ,D'J&O+#&ZKB5V,:P"8>+PLRY:-F K6&N6:NGCC-Y-BF^5 M:OV2A#I+"=0R4D>L>,C';D9Y!X([\]_X<&E>I6CDYTI.J1N+43#9*&V./.X( MB1/&4^WMTHFI1LY(O)!FY@8B7ND4=XF>0;RJ +U]609,TF;MVN4TB0#I@61? M-?FYRNV+S)C>GMP;L-8H$[7H1D[VCMRSC'J*L#J0K:PO46;^0(NG&LH*'78" MZ<1[9:9DYIRO%)>6B4XC5)U,-M\1^:&T=!T3@!J49?:SVPN6D_:Z;03T@MG/ M,*Q2%>KYF:;5@]D%H5TV>23J9D6+1I"-53K)O5$O/,AYCF!Q^UKI7J=N'/.! M;8<3QYW+7XF<:;3H[R99+HRYJA%QC]PM)1+5P^>-H"WM%V$]'LDW4D6*79RP M-5BN4$E0 X^1(2><$'X<9SSQ2K"-%\TN;'#[FEK'A[S;OU.WE1]U_+&E'VG MBS]?%24\[=1\8[7ED462[EJ26;%CIN,F$%%(]%RS>1SE0C@X#':T=0GJ@[&Y MG\B^(7'&9KECEU+_ &&NT-5[4JZS4UE5JK(@K+S3F:<) W,@=@LE'N)"63>. M&IS(K1K91\8.WKVC===,RW<[-+ZIXMTGD7O^2A;!!7 ^XPV9*MZ/3E(%RI*2 M#Z0A[-7$Y:3AX(C5H9Z8%8Q"1 VQ@F\/XQ* ^W< 'W[ ]^V1P.44B&5D3&D(P[>6EW;6-> M)JHK.';F;K3)J B J$]I7=3SCDGR?X5[FH#5H5U:(2"4V'1A!(ZR MZ=KHZ2\PU2:I)E,=5W)QR GL [4YIMNGMP) MGJ5=@ZS"NHUP\D6+-W,2L@_\ EK1+PI*) M'YSU9Q\/5'Z:I@_LV.J" ?U>VS&HYQ79M^;=/#K =9::W3'RLE$W) MA%NY!!O%6NL0L.XD40;IB#X*W88ATWFX]F#B1;1ZS19-LHHJF52 .W&3C.#[ MR%?KQ[J5++B3R;ZC/'[F3!<.^;$8^W%2[HS1"O[IK54E)&*KK]_'/92*?25Z M80K".<1#HS!U&3#:P$0=0CST?E*^2L ]0/J/<@-STWAQM:E<<=#:5F M5H9&VSI6S2:LSQO(OHYDX=OUFSV1<.IA:-=N#13$&\;&1Y&ZBZJ[AR4#RYU_ MU8$^7/,%GQ;XR:R'8>DINOR!;MO1VG/P3JO0YX:23F9MC#/6K84V2+Y6.CH? MYN6/>2+ITMX&A 0^E0+Q_P!&\1=4 0N@^H_-[4TW,UNR/EZ+::],6>&KTD MU+(23LX27X-L))R^3G(E2,DZY+HM74<\(=VW]4DH5MZF0,YR,$8XQ\>YQ\OO M2K*]2]:S<7%.P;1X^\]ZT&R-DZUM"$)#7/7R4:V&7CR(N1='E%&X(QTFU42+ M%/X.9;-F[J0:R#DT@3S$D@*R$-,TUPBWQ9-A$XX<+.9_(*I4:=2AEM@Q>X46 M",NBZ]9\ID#,Y:KNGC,))M'KN6[)TZ4>-FH(^J2;F4(GC!"??D?PRD?H3D?* ME6(?#7_5ERH^_FN/V%:LT9[$^K^]? _]<8P? M]/Z?VI45OAX_RJ+]^CA[^M-\M(^(8_(XJ/Z5X7]3 W]5?WI5J'0/_(+C 1?TEW3_YN,8S%7<_,_>E?_]D! end
G%FQY7RI%A=:N+V
M>6/,,L8ZY#$GL%QY>6LM-(BET\*Y)Z:^)5<.@XHO?&;#+2#I4!S'QE<=S5^8
MO#72G5'Y6K]=29+:Z+9EBGDA:\2SZQ*QKZ'25F2DJX==\?-N'4R$W_7_ "HS
MBMHHT/-!F67A5 :Z?F/URH+ 0=-AX$$K--1+:/=OG*>E>MRZP::4UD1BTKKE
M8MW:$GM"1+3K*E(,GR%8>+70W\ENP]96)V0P6TNN.%-=?:^,A35.>:PFEBIO
M8MN21G%(:BC0P&]8'.K8.\%N%+;+E"P>
Consolidated Statements of Earnings - USD ($) $ in Thousands |
12 Months Ended | |
---|---|---|
Dec. 31, 2023 |
Dec. 31, 2022 |
|
Revenues (note 3) | $ 4,334,548 | $ 3,745,835 |
Cost of revenues (exclusive of depreciation and amortization shown below) | 2,947,008 | 2,565,720 |
Selling, general and administrative expenses | 993,197 | 846,429 |
Depreciation | 73,696 | 61,415 |
Amortization of intangible assets | 54,238 | 48,725 |
Acquisition-related items (note 4) | 21,517 | 4,520 |
Operating earnings | 244,892 | 219,026 |
Interest expense, net | 47,364 | 25,191 |
Other income, net (note 6) | (5,810) | (146) |
Earnings before income tax | 203,338 | 193,981 |
Income tax (note 15) | 56,317 | 48,974 |
Net earnings | 147,021 | 145,007 |
Non-controlling interest share of earnings (note 12) | 14,140 | 9,381 |
Non-controlling interest redemption increment (note 12) | 32,490 | 14,552 |
Net earnings attributable to Company | $ 100,391 | $ 121,074 |
Net earnings per common share (note 16) | ||
Basic (in dollars per share) | $ 2.25 | $ 2.74 |
Diluted (in dollars per share) | $ 2.24 | $ 2.72 |
Consolidated Statements of Comprehensive Earnings - USD ($) $ in Thousands |
12 Months Ended | |
---|---|---|
Dec. 31, 2023 |
Dec. 31, 2022 |
|
Net earnings | $ 147,021 | $ 145,007 |
Foreign currency translation gain (loss) | 1,546 | (7,882) |
Comprehensive earnings | 148,567 | 137,125 |
Less: Comprehensive earnings attributable to non-controlling shareholders | 46,630 | 23,933 |
Comprehensive earnings attributable to Company | $ 101,937 | $ 113,192 |
Consolidated Balance Sheets (Parentheticals) - USD ($) $ in Thousands |
Dec. 31, 2023 |
Dec. 31, 2022 |
---|---|---|
Accounts receivable, allowance | $ 19,563 | $ 18,247 |
Consolidated Statements of Shareholders' Equity - USD ($) $ in Thousands |
Common Stock [Member] |
Additional Paid-in Capital [Member] |
Retained Earnings [Member] |
AOCI Attributable to Parent [Member] |
Total |
---|---|---|---|---|---|
Balance (in shares) at Dec. 31, 2021 | 44,013,031 | ||||
Balance at Dec. 31, 2021 | $ 797,428 | $ 68,249 | $ (67,920) | $ 1,965 | $ 799,722 |
Net earnings (loss) | 0 | 0 | 121,074 | 0 | 121,074 |
Other comprehensive earnings (loss) | 0 | 0 | 0 | (7,882) | (7,882) |
Subsidiaries’ equity transactions | 0 | 17 | 0 | 0 | 17 |
Stock option expense | $ 0 | 18,046 | 0 | 0 | 18,046 |
Stock options exercised (in shares) | 213,462 | ||||
Stock options exercised | $ 15,601 | (3,305) | 0 | 0 | 12,296 |
Dividends | $ 0 | 0 | (35,807) | 0 | $ (35,807) |
Balance (in shares) at Dec. 31, 2022 | 44,226,493 | 44,013,031 | |||
Balance at Dec. 31, 2022 | $ 813,029 | 83,007 | 17,347 | (5,917) | $ 907,466 |
Net earnings (loss) | 0 | 0 | 100,391 | 0 | 100,391 |
Other comprehensive earnings (loss) | 0 | 0 | 0 | 1,546 | 1,546 |
Stock option expense | $ 0 | 21,385 | 0 | 0 | $ 21,385 |
Stock options exercised (in shares) | 455,934 | 455,934 | |||
Stock options exercised | $ 42,788 | (9,172) | 0 | 0 | $ 33,616 |
Dividends | $ 0 | 0 | (40,258) | 0 | $ (40,258) |
Balance (in shares) at Dec. 31, 2023 | 44,682,427 | 44,226,493 | |||
Balance at Dec. 31, 2023 | $ 855,817 | $ 95,220 | $ 77,480 | $ (4,371) | $ 1,024,146 |
Note 1 - Description of the Business |
12 Months Ended | ||
---|---|---|---|
Dec. 31, 2023 | |||
Notes to Financial Statements | |||
Business Description and Basis of Presentation [Text Block] |
FirstService Corporation (the “Company”) is a North American provider of residential property management and other essential property services to residential and commercial customers. The Company’s operations are conducted in segments: FirstService Residential and FirstService Brands. The segments are grouped with reference to the nature of services provided and the types of clients that use those services.
FirstService Residential is a full-service property manager and in many markets provides a full range of ancillary services primarily in the following areas: (i) on-site staffing, including building engineering and maintenance, full-service amenity management, security, concierge and front desk personnel; (ii) proprietary banking and insurance products; and (iii) energy conservation and management solutions.
FirstService Brands provides a range of essential property services to residential and commercial customers in North America through company-owned operations and franchise systems. The principal brands in this division include First Onsite Property Restoration, Paul Davis Restoration, Roofing Corp of America, Century Fire Protection, California Closets, CertaPro Painters, Floor Coverings International and Pillar to Post Home Inspectors. |
Note 2 - Summary of Significant Accounting Policies |
12 Months Ended | ||||||||||||||||||||||
---|---|---|---|---|---|---|---|---|---|---|---|---|---|---|---|---|---|---|---|---|---|---|---|
Dec. 31, 2023 | |||||||||||||||||||||||
Notes to Financial Statements | |||||||||||||||||||||||
Significant Accounting Policies [Text Block] |
The preparation of consolidated financial statements in accordance with accounting principles generally accepted in the United States of America (“GAAP”) requires management to make estimates and assumptions that affect the reported amounts of assets and liabilities and disclosures of contingent assets and liabilities at the date of the financial statements, and the reported amounts of revenues and expenses during the reporting period. The most significant estimates are related to the determination of fair values of assets acquired and liabilities assumed in business combinations, and recoverability of goodwill and intangible assets. Actual results could be materially different from these estimates.
Significant accounting policies are summarized as follows:
Basis of consolidation The consolidated financial statements include the accounts of the Company and its majority-owned subsidiaries where the Company is the primary beneficiary. Inter-company transactions and accounts are eliminated on consolidation.
Cash and cash equivalents Cash equivalents consist of short-term interest-bearing securities, which are readily convertible into cash and have original maturities at the date of purchase of three months or less.
Restricted cash Restricted cash consists of cash over which the Company has legal ownership but is restricted as to its availability or intended use, including funds held on behalf of clients and franchisees.
The Company’s restricted cash balance consists primarily of cash related to our marketing funds in the FirstService Brands segment, cash held for certain employees’ benefit plans, and cash held for insurance broker commissions owed in our FirstService Residential segment.
Accounts Receivable In the ordinary course of business the Company extends non-interest bearing trade credit to its customers. Accounts receivable are carried at amortized cost and reported on the face of the consolidated balance sheets, net of an allowance for credit losses. The Company maintains an allowance for credit losses to provide for the estimated amount of receivables that will not be collected. In determining the allowance for credit losses, the Company analyzes the aging of accounts receivable, historical payment experience, customer creditworthiness and current economic trends.
The allowance for credit losses is based on the Company’s assessment of the collectability of customer accounts. The measurement of expected credit losses is based on relevant information about past events, including historical experience, credit quality, the age of the accounts receivable balances, and current economic conditions that may impact a customer’s ability to pay.
Inventories Finished goods and supplies and other inventories are carried at the lower of cost and net realizable value. Cost is determined using the weighted average method. Work-in-progress inventory relates to construction contracts and real estate project management projects in process.
Fixed assets Fixed assets are carried at cost less accumulated depreciation. The costs of additions and improvements are capitalized, while maintenance and repairs are expensed as incurred. Fixed assets are reviewed for impairment whenever events or circumstances indicate that the carrying value of an asset group may not be recoverable. An impairment loss is recorded to the extent the carrying amount exceeds the estimated fair value of an asset group. Fixed assets are depreciated over their estimated useful lives as follows:
Fair value The Company uses the fair value measurements framework for financial assets and liabilities and for non-financial assets and liabilities that are recognized or disclosed at fair value on a non-recurring basis. The framework defines fair value, gives guidance for measurement and disclosure, and establishes a three-level hierarchy for observable and unobservable inputs used to measure fair value. The classification of an asset or liability within the hierarchy is determined based on the lowest level input that is significant to the fair value measurement. The three levels are as follows:
Level 1 – Quoted prices (unadjusted) in active markets for identical assets or liabilities Level 2 – Observable market-based inputs other than quoted prices in active markets for identical assets or liabilities Level 3 – Unobservable inputs for which there is little or no market data, which requires the Company to develop its own assumptions
Financing fees Financing fees related to our second amended and restated credit agreement (the “Credit Agreement”) with a syndicate of lenders, our $60,000 of senior secured notes (the “Senior Notes”), and our $60,000 of senior unsecured notes (the “Notes”) are deferred and amortized to interest expense using the effective interest method.
Leases The Company has lease agreements with lease and non-lease components, and has elected to account for each lease component (e.g., fixed rent payments) separately from the non-lease components (e.g., common-area maintenance costs). The Company has also elected not to recognize the right-of-use assets and lease liabilities for short-term leases that have a lease term of 12 months or less. Leases are recognized on the balance sheet when the lease term commences, and the associated lease payments are recognized as an expense on a straight-line basis over the lease term.
At lease commencement, which is generally when the Company takes possession of the asset, the Company records a lease liability and a corresponding right-of-use asset. Lease liabilities represent the present value of minimum lease payments over the expected lease term, which includes options to extend or terminate the lease when it is reasonably certain those options will be exercised. The present value of the lease liability is determined using the Company’s incremental collateralized borrowing rate at the lease commencement.
Minimum lease payments include base rent, fixed escalation of rental payments, and rental payments that are adjusted periodically depending on a rate or index.
Right-of-use assets represent the right to control the use of the leased asset during the lease and are initially recognized in an amount equal to the lease liability. In addition, prepaid rent, initial direct costs, and adjustments for lease incentives are components of the right-of-use asset. Over the lease term the lease expense is amortized on a straight-line basis beginning on the lease commencement date. Right-of-use assets are assessed for impairment as part of the impairment of long-lived assets, which is performed whenever events or changes in circumstances indicate that the carrying amount of an asset or asset group may not be recoverable.
Goodwill and intangible assets Goodwill represents the excess of purchase price over the fair value of assets acquired and liabilities assumed in a business combination and is not subject to amortization.
Intangible assets are recorded at fair value on the date they are acquired. They are amortized over their estimated useful lives as follows:
The Company reviews the carrying value of finite life intangible assets for impairment whenever events or changes in circumstances indicate that the carrying amount of an asset group may not be recoverable from the estimated future cash flows expected to result from their use and eventual disposition. If the sum of the undiscounted expected future cash flows is less than the carrying amount of the asset group, an impairment loss is recognized. Measurement of the impairment loss is based on the excess of the carrying amount of the asset group over the fair value calculated using an income approach.
Goodwill is tested for impairment annually, on August 1, or more frequently if events or changes in circumstances indicate the asset might be impaired, in which case the carrying amount of the asset is written down to fair value.
Impairment of goodwill is tested at the reporting unit level. The Company has reporting units determined with reference to business segment, customer type, service delivery model and geography. Impairment is tested by first assessing qualitative factors to determine whether it is more likely than not that the fair value of a reporting unit is less than its carrying amount. Where it is determined to be more likely than not that its fair value is greater than its carrying amount, then no further testing is required. Where the qualitative analysis is not sufficient to support that the fair value exceeds the carrying amount then a goodwill impairment test is performed. The Company also has an unconditional option to bypass the qualitative assessment for any reporting unit in any period and proceed directly to performing a quantitative goodwill impairment test. The Company may resume performing the qualitative assessment in any subsequent period. A quantitative goodwill impairment test is performed by comparing the fair value of each reporting unit to its carrying value, including goodwill. Fair value is estimated using a market multiple method, which estimates market multiples of earnings before interest, taxes, depreciation and amortization (“EBITDA”) for comparable entities with similar operations and economic characteristics. Significant assumptions used in estimating the fair value of each reporting unit include the market multiples of EBITDA.
Redeemable non-controlling interests Redeemable non-controlling interests (“RNCI”) are recorded at the greater of (i) the redemption amount or (ii) the amount initially recorded as RNCI at the date of inception of the minority equity position. This amount is recorded in the “mezzanine” section of the balance sheet, outside of shareholders’ equity. Changes in the RNCI amount are recognized immediately as they occur.
Revenue recognition and unearned revenues The Company accounts for a contract with a customer when there is approval and commitment from both parties, the rights of the parties are identified, payment terms are identified, the contract has commercial substance and collectability of consideration is probable. The Company’s revenues are measured based on consideration specified in the contract of each customer and revenue is recognized as the performance obligations are satisfied by transferring the control of the service or product to a customer.
(a) Revenues from property and amenity management services Property and amenity management services represent a series of distinct daily services, that in nature are substantially the same, rendered over time. The Company is compensated for these services through monthly management fees and fees associated with ancillary services. Revenue is recognized for the fees associated with the services performed.
(b) Revenues from construction contracts and service operations other than franchisor operations Revenues are recognized at the time the service is rendered. Certain services including but not limited to restoration and construction contracts, are recognized over time based on percentage of completion, based on a ratio of actual costs to total estimated contract costs. In cases where anticipated costs to complete a project exceed the revenue to be recognized, a provision for the additional estimated losses is recorded in the period when the loss becomes apparent. Amounts received from customers in advance of services being provided are recorded as unearned revenues when received.
(c) Franchisor operations The Company operates several franchise systems within its FirstService Brands segment. Initial franchise fees are deferred and recognized over the term of the franchise agreement. Royalty revenues are recognized based on a contracted percentage of franchisee revenues, as reported by the franchisees. Revenues from administrative and other support services, as applicable, are recognized as the services are provided.
The Company’s franchise systems operate marketing funds on behalf of franchisees. Advertising fund contributions from franchisees are reported as revenues and advertising fund expenditures are reported as expenses in our statements of earnings. To the extent that contributions received exceed advertising expenditures, the excess amount is accrued and offset as unearned revenue, whereas any expenditures in excess of contributions are expensed as incurred. As such, advertising fund contributions and the related revenues and expenses may be reported in different periods.
Stock-based compensation For equity classified awards, compensation cost is measured at the grant date based on the estimated fair value of the award. The related stock option compensation expense is allocated using the graded attribution method.
Notional value appreciation plans Under these plans, subsidiary employees are compensated if the notional value of the subsidiary increases. Awards under these plans generally have a term of up to years and a vesting period of years. The increase in notional value is calculated with reference to growth in earnings relative to a fixed threshold amount plus or minus changes in indebtedness relative to a fixed opening amount. If an award is subject to a vesting condition, then graded attribution is applied to the intrinsic value. The related compensation expense is recorded in selling, general and administrative expenses, the current liability is recorded in accrued liabilities, and the non-current portion is recorded in other liabilities.
Foreign currency translation Assets, liabilities and operations of foreign subsidiaries are recorded based on the functional currency of each entity. For certain foreign operations, the functional currency is the local currency, in which case the assets, liabilities and operations are translated at current exchange rates from the local currency to the reporting currency, the US dollar. The resulting unrealized gains or losses are reported as a component of accumulated other comprehensive earnings. Realized and unrealized foreign currency gains or losses related to any foreign dollar denominated monetary assets and liabilities are included in net earnings.
Income tax Income tax has been provided using the asset and liability method whereby deferred income tax assets and liabilities are recognized for the expected future income tax consequences of events that have been recognized in the consolidated financial statements or income tax returns. Deferred income tax assets and liabilities are measured using enacted income tax rates expected to apply to taxable income in the years in which temporary differences are expected to reverse, be recovered or settled. The effect on deferred income tax assets and liabilities of a change in income tax rates is recognized in earnings in the period in which the change occurs. A valuation allowance is recorded unless it is more likely than not that realization of a deferred income tax asset will occur based on available evidence.
The Company recognizes uncertainty in tax positions taken or expected to be taken in a tax return by recording a liability for unrecognized tax benefits on its balance sheet. Uncertainties are quantified by applying a prescribed recognition threshold and measurement attribute.
The Company classifies interest and penalties associated with income tax positions in income tax expense.
Business combinations All business combinations are accounted for using the purchase method of accounting. Transaction costs are expensed as incurred.
The determination of fair values of assets and liabilities assumed in business combinations requires the use of estimates and judgement by management, particularly in determining fair values of intangible assets acquired.
The fair value of the contingent consideration is classified as a financial liability and is recorded on the balance sheet at the acquisition date and is re-measured at fair value at the end of each period until the end of the contingency period, with fair value adjustments recognized in earnings. |
Note 3 - Revenue From Contracts With Customers |
12 Months Ended | ||||||||||||||||||||||||||||||||||||||||||||||||||||||||||||||||||||||||||
---|---|---|---|---|---|---|---|---|---|---|---|---|---|---|---|---|---|---|---|---|---|---|---|---|---|---|---|---|---|---|---|---|---|---|---|---|---|---|---|---|---|---|---|---|---|---|---|---|---|---|---|---|---|---|---|---|---|---|---|---|---|---|---|---|---|---|---|---|---|---|---|---|---|---|---|
Dec. 31, 2023 | |||||||||||||||||||||||||||||||||||||||||||||||||||||||||||||||||||||||||||
Notes to Financial Statements | |||||||||||||||||||||||||||||||||||||||||||||||||||||||||||||||||||||||||||
Revenue from Contract with Customer [Text Block] |
Disaggregated revenues are as follows:
The Company disaggregates revenue by segment. Within the FirstService Brands segment, the Company further disaggregates its company-owned operations revenue; these businesses primarily recognize revenue over time as they perform because of continuous transfer of control to the customer. As such, revenue is recognized based on the extent of progress towards completion of the performance obligation. The Company generally uses the percentage of completion method.
We believe this disaggregation best depicts how the nature, amount, timing and uncertainty of the Company’s revenue and cash flows are affected by economic factors.
The Company’s backlog represents remaining performance obligations and is defined as contracted work yet to be performed. As at December 31, 2023, the aggregate amount of backlog was $838,335 (2022 - $631,660). The Company expects to recognize revenue on the majority of the remaining backlog over the next 12 months.
Within the FirstService Brands segment, franchise fee revenue recognized during the twelve months ended December 31, 2023 that was included in unearned revenues at the beginning of the period was $5,752 (2022 - $4,649). These fees are recognized over the life of the underlying franchise agreement, usually between 5 - 10 years.
The majority of current unearned revenues as at December 31, 2022 was recognized into income during 2023.
External broker costs and employee sales commissions in obtaining new franchisees are capitalized in accordance with the revenue standard and are amortized over the life of the underlying franchise agreement. Costs amortized during the twelve months ended December 31, 2023 were $2,817 (2022 - $2,014). The closing amount of the capitalized costs to obtain contracts on the balance sheet as at December 31, 2023 was $11,610 (2022 - $8,802). There were no impairment losses recognized related to those assets in the year. |
Note 4 - Acquisitions |
12 Months Ended | |||||||||||||||||||||||||||||||||||||||||||||||||||||||||||||||||||||||||||||||||||||||||||||||||||||||||||||||||||||||||||||||||||||||||||||||||||||||||||||||||||||||||||||||||||||||||||||||||||||||||||||||||||||||||||||||||||||||||||||||||||||||||||||||||||||||||||||||||||||||||||||||||||||||||||||||||||||||||||||||||||||||||||||||||||||||||||||||||||||||||||||||||||||||||||||||||||||||||||||||||||||||||||||||||||||||||||||||||
---|---|---|---|---|---|---|---|---|---|---|---|---|---|---|---|---|---|---|---|---|---|---|---|---|---|---|---|---|---|---|---|---|---|---|---|---|---|---|---|---|---|---|---|---|---|---|---|---|---|---|---|---|---|---|---|---|---|---|---|---|---|---|---|---|---|---|---|---|---|---|---|---|---|---|---|---|---|---|---|---|---|---|---|---|---|---|---|---|---|---|---|---|---|---|---|---|---|---|---|---|---|---|---|---|---|---|---|---|---|---|---|---|---|---|---|---|---|---|---|---|---|---|---|---|---|---|---|---|---|---|---|---|---|---|---|---|---|---|---|---|---|---|---|---|---|---|---|---|---|---|---|---|---|---|---|---|---|---|---|---|---|---|---|---|---|---|---|---|---|---|---|---|---|---|---|---|---|---|---|---|---|---|---|---|---|---|---|---|---|---|---|---|---|---|---|---|---|---|---|---|---|---|---|---|---|---|---|---|---|---|---|---|---|---|---|---|---|---|---|---|---|---|---|---|---|---|---|---|---|---|---|---|---|---|---|---|---|---|---|---|---|---|---|---|---|---|---|---|---|---|---|---|---|---|---|---|---|---|---|---|---|---|---|---|---|---|---|---|---|---|---|---|---|---|---|---|---|---|---|---|---|---|---|---|---|---|---|---|---|---|---|---|---|---|---|---|---|---|---|---|---|---|---|---|---|---|---|---|---|---|---|---|---|---|---|---|---|---|---|---|---|---|---|---|---|---|---|---|---|---|---|---|---|---|---|---|---|---|---|---|---|---|---|---|---|---|---|---|---|---|---|---|---|---|---|---|---|---|---|---|---|---|---|---|---|---|---|---|---|---|---|---|---|---|---|---|---|---|---|---|---|---|---|---|---|---|---|---|---|---|---|---|---|---|---|---|---|---|---|---|---|---|---|---|---|---|---|---|---|---|---|---|---|---|---|---|---|---|---|---|---|---|---|---|---|---|---|---|---|---|---|---|---|---|
Dec. 31, 2023 | ||||||||||||||||||||||||||||||||||||||||||||||||||||||||||||||||||||||||||||||||||||||||||||||||||||||||||||||||||||||||||||||||||||||||||||||||||||||||||||||||||||||||||||||||||||||||||||||||||||||||||||||||||||||||||||||||||||||||||||||||||||||||||||||||||||||||||||||||||||||||||||||||||||||||||||||||||||||||||||||||||||||||||||||||||||||||||||||||||||||||||||||||||||||||||||||||||||||||||||||||||||||||||||||||||||||||||||||||||
Notes to Financial Statements | ||||||||||||||||||||||||||||||||||||||||||||||||||||||||||||||||||||||||||||||||||||||||||||||||||||||||||||||||||||||||||||||||||||||||||||||||||||||||||||||||||||||||||||||||||||||||||||||||||||||||||||||||||||||||||||||||||||||||||||||||||||||||||||||||||||||||||||||||||||||||||||||||||||||||||||||||||||||||||||||||||||||||||||||||||||||||||||||||||||||||||||||||||||||||||||||||||||||||||||||||||||||||||||||||||||||||||||||||||
Business Combination Disclosure [Text Block] |
2023 acquisitions: The Company completed acquisitions during the year, in the FirstService Residential segment and in the FirstService Brands segment. In the FirstService Residential segment, the Company acquired property management firms operating in New York City, Toronto, Canada, and San Ramon, California, respectively.
Within the FirstService Brands segment, the Company acquired Paul Davis franchises, headquartered in Houston, Texas, Denver, Colorado, and Boise, Idaho, respectively. The Company also acquired a fire protection company, located in Houston, Texas, a California Closets franchise operating in Reno, Nevada, independent restoration companies located in Nashville, Tennessee and Cincinnati, Ohio, respectively, as well as a property services business in Orange County, California. On December 18th, the Company announced the acquisition of Roofing Corp of America, a commercial roofing company headquartered in Atlanta, Georgia and operating in 11 U.S. states spanning the Sun Belt, Mid-Atlantic, Midwest and West regions.
Details of these acquisitions are as follows:
(1) Included in the other amount is $14,625 paid in escrow just prior to December 31, 2022. (2) Intangible assets for Roofing Corp include $212,890 of customer relationships and $21,880 of trademarks.
“Acquisition-related items” included both transaction costs and contingent acquisition consideration fair value adjustments. Acquisition-related transaction costs for the year ended December 31, 2023 totaled $5,151 (2022 - $5,114). Also included in acquisition-related items was an increase of $16,366 related to contingent acquisition consideration fair value adjustments (2022 – reversal of $594).
The purchase price allocations for certain transactions completed in the last twelve months, including Roofing Corp of America, are not yet complete, pending final determination of the fair value of assets acquired, the corresponding deferred tax liabilities, and final working capital adjustments. The acquisitions referred to above were accounted for by the purchase method of accounting for business combinations. Accordingly, the accompanying consolidated statements of earnings do not include any revenues or expenses related to these acquisitions prior to their respective closing dates. There have been no material changes to the estimated purchase price allocations determined at the time of acquisition during the year ended December 31, 2023.
The amount of revenues and earnings contributed from the date of acquisition and included in the Company’s consolidated results for the year ended December 31, 2023, and the supplemental pro forma revenues and earnings of the combined entity had the acquisition date been January 1, 2022, are as follows:
Supplemental pro forma results were adjusted for non-recurring items.
2022 acquisitions: The Company completed acquisitions in 2022, in the FirstService Residential segment and in the FirstService Brands segment. In the FirstService Residential segment, the Company acquired a regional firm operating in New York City. In the FirstService Brands segment, the Company acquired independent restoration companies operating in Ontario, Alabama, and Louisiana. The Company also acquired Paul Davis operations located in Nebraska and Utah, as well as a California Closets franchise located in Oregon.
Details of these acquisitions are as follows:
In all years presented, the fair values of non-controlling interests for all acquisitions were determined using an income approach with reference to a discounted cash flow model using the same assumptions implied in determining the purchase consideration.
The purchase price allocations of all acquisitions resulted in the recognition of goodwill. The primary factors contributing to goodwill are assembled workforces, synergies with existing operations and future growth prospects. For certain acquisitions completed during the year ended December 31, 2023, goodwill in the amount of $160,831 is deductible for income tax purposes (2022 - $15,797).
The determination of fair values of assets acquired and liabilities assumed in business combinations required the use of estimates and judgement by management, particularly in determining fair values of intangible assets acquired. Intangible assets acquired at fair value on the date of acquisition are recorded using the income approach on an individual asset basis. The assumptions used in estimating the fair values of intangible assets include future EBITDA margins, revenue growth rates, revenue attributable to returning customers, expected attrition rates of acquired customer relationships and the discount rates.
The Company typically structures its business acquisitions to include contingent consideration. Vendors, at the time of acquisition, are entitled to receive a contingent consideration payment if the acquired businesses achieve specified earnings levels during the one- to two-year periods following the dates of acquisition. The ultimate amount of payment is determined based on a formula, the key inputs to which are (i) a contractually agreed maximum payment; (ii) a contractually specified earnings level and (iii) the actual earnings for the contingency period. If the acquired business does not achieve the specified earnings level, the maximum payment is reduced for any shortfall, potentially to nil.
The fair value of the contingent consideration liability recorded on the consolidated balance sheet as at December 31, 2023 was $63,478 (see note 18). The estimated range of outcomes (undiscounted) for these contingent consideration arrangements is determined based on the formula price and the likelihood of achieving specified earnings levels over the contingency period, and ranges from $54,721 to a maximum of $64,378. These contingencies will expire during the period extending to November 2025. During the year ended December 31, 2023, $20,136 was paid with reference to such contingent consideration (2022 - $6,806).
|
Note 5 - Leases |
12 Months Ended | ||||||||||||||||||||||||||||||||||||||||||||||||||||||||||||||||||||||||||||||||||
---|---|---|---|---|---|---|---|---|---|---|---|---|---|---|---|---|---|---|---|---|---|---|---|---|---|---|---|---|---|---|---|---|---|---|---|---|---|---|---|---|---|---|---|---|---|---|---|---|---|---|---|---|---|---|---|---|---|---|---|---|---|---|---|---|---|---|---|---|---|---|---|---|---|---|---|---|---|---|---|---|---|---|---|
Dec. 31, 2023 | |||||||||||||||||||||||||||||||||||||||||||||||||||||||||||||||||||||||||||||||||||
Notes to Financial Statements | |||||||||||||||||||||||||||||||||||||||||||||||||||||||||||||||||||||||||||||||||||
Lessee, Operating Leases [Text Block] |
The Company has operating leases for corporate offices, copiers, and certain equipment. Its leases have remaining lease terms of 1 year to 15 years, some of which may include options to extend the leases for up to 15 years, and some of which may include options to terminate the leases within 1 year. The Company evaluates renewal terms on a lease by lease basis to determine if the renewal is reasonably certain. The amount of operating lease expense recorded in the statement of earnings for the twelve months ended December 31, 2023 was $53,906 (2022 - $49,544).
Other information related to leases was as follows (in thousands, except lease term and discount rate):
Future minimum operating lease payments under non-cancellable leases as of December 31, 2023 were as follows:
|
Note 6 - Other Income, Net |
12 Months Ended | |||||||||||||||||||||||||||||||||||||||||||||||
---|---|---|---|---|---|---|---|---|---|---|---|---|---|---|---|---|---|---|---|---|---|---|---|---|---|---|---|---|---|---|---|---|---|---|---|---|---|---|---|---|---|---|---|---|---|---|---|---|
Dec. 31, 2023 | ||||||||||||||||||||||||||||||||||||||||||||||||
Notes to Financial Statements | ||||||||||||||||||||||||||||||||||||||||||||||||
Other Income and Other Expense Disclosure [Text Block] |
During the second quarter, the Company sold a building in South Florida for proceeds of $7,350. The pre-tax gain on the sale was $4,351. The sale was in the FirstService Residential segment.
|
Note 7 - Components of Working Capital Accounts |
12 Months Ended | |||||||||||||||||||||||||||||||||||||||||||||||||||||||||||||||||||||||||||||||||||||||||||||||||||||||||||||||||||||||||||||||||||||||||||||||||||||||||||
---|---|---|---|---|---|---|---|---|---|---|---|---|---|---|---|---|---|---|---|---|---|---|---|---|---|---|---|---|---|---|---|---|---|---|---|---|---|---|---|---|---|---|---|---|---|---|---|---|---|---|---|---|---|---|---|---|---|---|---|---|---|---|---|---|---|---|---|---|---|---|---|---|---|---|---|---|---|---|---|---|---|---|---|---|---|---|---|---|---|---|---|---|---|---|---|---|---|---|---|---|---|---|---|---|---|---|---|---|---|---|---|---|---|---|---|---|---|---|---|---|---|---|---|---|---|---|---|---|---|---|---|---|---|---|---|---|---|---|---|---|---|---|---|---|---|---|---|---|---|---|---|---|---|---|---|---|
Dec. 31, 2023 | ||||||||||||||||||||||||||||||||||||||||||||||||||||||||||||||||||||||||||||||||||||||||||||||||||||||||||||||||||||||||||||||||||||||||||||||||||||||||||||
Notes to Financial Statements | ||||||||||||||||||||||||||||||||||||||||||||||||||||||||||||||||||||||||||||||||||||||||||||||||||||||||||||||||||||||||||||||||||||||||||||||||||||||||||||
Supplemental Balance Sheet Disclosures [Text Block] |
(1) Non-current portion of value appreciation plans of $62,268 is included in Other Liabilities |
Note 8 - Fixed Assets |
12 Months Ended | ||||||||||||||||||||||||||||||||||||||||||||||||||||||||||||||||||||||||||||||||||||||||||||||||||||||||||||||||||||||||||||||||||||||||||||||||||||||||||||||||||||||||||||||||||||||||||||||||||||||||||||||||||||||||||||||||||||||||||||||||||||||||||||||||||||||
---|---|---|---|---|---|---|---|---|---|---|---|---|---|---|---|---|---|---|---|---|---|---|---|---|---|---|---|---|---|---|---|---|---|---|---|---|---|---|---|---|---|---|---|---|---|---|---|---|---|---|---|---|---|---|---|---|---|---|---|---|---|---|---|---|---|---|---|---|---|---|---|---|---|---|---|---|---|---|---|---|---|---|---|---|---|---|---|---|---|---|---|---|---|---|---|---|---|---|---|---|---|---|---|---|---|---|---|---|---|---|---|---|---|---|---|---|---|---|---|---|---|---|---|---|---|---|---|---|---|---|---|---|---|---|---|---|---|---|---|---|---|---|---|---|---|---|---|---|---|---|---|---|---|---|---|---|---|---|---|---|---|---|---|---|---|---|---|---|---|---|---|---|---|---|---|---|---|---|---|---|---|---|---|---|---|---|---|---|---|---|---|---|---|---|---|---|---|---|---|---|---|---|---|---|---|---|---|---|---|---|---|---|---|---|---|---|---|---|---|---|---|---|---|---|---|---|---|---|---|---|---|---|---|---|---|---|---|---|---|---|---|---|---|---|---|---|---|---|---|---|---|---|---|---|---|---|---|---|---|---|---|---|---|
Dec. 31, 2023 | |||||||||||||||||||||||||||||||||||||||||||||||||||||||||||||||||||||||||||||||||||||||||||||||||||||||||||||||||||||||||||||||||||||||||||||||||||||||||||||||||||||||||||||||||||||||||||||||||||||||||||||||||||||||||||||||||||||||||||||||||||||||||||||||||||||||
Notes to Financial Statements | |||||||||||||||||||||||||||||||||||||||||||||||||||||||||||||||||||||||||||||||||||||||||||||||||||||||||||||||||||||||||||||||||||||||||||||||||||||||||||||||||||||||||||||||||||||||||||||||||||||||||||||||||||||||||||||||||||||||||||||||||||||||||||||||||||||||
Property, Plant and Equipment Disclosure [Text Block] |
Included in fixed assets are vehicles, office and computer equipment under finance lease at a cost of $36,915 (2022 - $32,207) and net book value of $21,298 (2022 - $12,712).
|
Note 9 - Intangible Assets |
12 Months Ended | |||||||||||||||||||||||||||||||||||||||||||||||||||||||||||||||||||||||||||||||||||||||||||||||||||||||||||||||||||||||||||||||||||||||||||||||||||||||||||||||||||||||||||||||||||||||||||||||||||||||||||||||||||||||||||||||||||||||||||||||||||||||||||||||||||||||||||||||||||||||||||||||||||||||||||||||||||||||||||||||||||||||||||||||||||||||||||||||||
---|---|---|---|---|---|---|---|---|---|---|---|---|---|---|---|---|---|---|---|---|---|---|---|---|---|---|---|---|---|---|---|---|---|---|---|---|---|---|---|---|---|---|---|---|---|---|---|---|---|---|---|---|---|---|---|---|---|---|---|---|---|---|---|---|---|---|---|---|---|---|---|---|---|---|---|---|---|---|---|---|---|---|---|---|---|---|---|---|---|---|---|---|---|---|---|---|---|---|---|---|---|---|---|---|---|---|---|---|---|---|---|---|---|---|---|---|---|---|---|---|---|---|---|---|---|---|---|---|---|---|---|---|---|---|---|---|---|---|---|---|---|---|---|---|---|---|---|---|---|---|---|---|---|---|---|---|---|---|---|---|---|---|---|---|---|---|---|---|---|---|---|---|---|---|---|---|---|---|---|---|---|---|---|---|---|---|---|---|---|---|---|---|---|---|---|---|---|---|---|---|---|---|---|---|---|---|---|---|---|---|---|---|---|---|---|---|---|---|---|---|---|---|---|---|---|---|---|---|---|---|---|---|---|---|---|---|---|---|---|---|---|---|---|---|---|---|---|---|---|---|---|---|---|---|---|---|---|---|---|---|---|---|---|---|---|---|---|---|---|---|---|---|---|---|---|---|---|---|---|---|---|---|---|---|---|---|---|---|---|---|---|---|---|---|---|---|---|---|---|---|---|---|---|---|---|---|---|---|---|---|---|---|---|---|---|---|---|---|---|---|---|---|---|---|---|---|---|---|---|---|---|---|---|---|---|---|---|---|---|---|---|---|---|---|---|---|---|---|---|---|---|---|---|---|
Dec. 31, 2023 | ||||||||||||||||||||||||||||||||||||||||||||||||||||||||||||||||||||||||||||||||||||||||||||||||||||||||||||||||||||||||||||||||||||||||||||||||||||||||||||||||||||||||||||||||||||||||||||||||||||||||||||||||||||||||||||||||||||||||||||||||||||||||||||||||||||||||||||||||||||||||||||||||||||||||||||||||||||||||||||||||||||||||||||||||||||||||||||||||||
Notes to Financial Statements | ||||||||||||||||||||||||||||||||||||||||||||||||||||||||||||||||||||||||||||||||||||||||||||||||||||||||||||||||||||||||||||||||||||||||||||||||||||||||||||||||||||||||||||||||||||||||||||||||||||||||||||||||||||||||||||||||||||||||||||||||||||||||||||||||||||||||||||||||||||||||||||||||||||||||||||||||||||||||||||||||||||||||||||||||||||||||||||||||||
Intangible Assets Disclosure [Text Block] |
During the year ended December 31, 2023, the Company acquired the following intangible assets:
The following is the estimated annual amortization expense for recorded intangible assets for each of the next five years ending December 31:
|
Note 10 - Goodwill |
12 Months Ended | ||||||||||||||||||||||||||||||||||||||||||||||||||||||||||||||||||||||||||||||||||||||||||||||||||||||||||||||||||||||||||||||||||||||||||||||||||||||||||||||
---|---|---|---|---|---|---|---|---|---|---|---|---|---|---|---|---|---|---|---|---|---|---|---|---|---|---|---|---|---|---|---|---|---|---|---|---|---|---|---|---|---|---|---|---|---|---|---|---|---|---|---|---|---|---|---|---|---|---|---|---|---|---|---|---|---|---|---|---|---|---|---|---|---|---|---|---|---|---|---|---|---|---|---|---|---|---|---|---|---|---|---|---|---|---|---|---|---|---|---|---|---|---|---|---|---|---|---|---|---|---|---|---|---|---|---|---|---|---|---|---|---|---|---|---|---|---|---|---|---|---|---|---|---|---|---|---|---|---|---|---|---|---|---|---|---|---|---|---|---|---|---|---|---|---|---|---|---|---|---|
Dec. 31, 2023 | |||||||||||||||||||||||||||||||||||||||||||||||||||||||||||||||||||||||||||||||||||||||||||||||||||||||||||||||||||||||||||||||||||||||||||||||||||||||||||||||
Notes to Financial Statements | |||||||||||||||||||||||||||||||||||||||||||||||||||||||||||||||||||||||||||||||||||||||||||||||||||||||||||||||||||||||||||||||||||||||||||||||||||||||||||||||
Goodwill Disclosure [Text Block] |
Goodwill represents the excess of purchase price over the value assigned to the net tangible and identifiable intangible assets of businesses acquired. A test for goodwill impairment is required to be completed annually, in the Company’s case as of August 1, or more frequently if events or changes in circumstances indicate the asset might be impaired. Based on the qualitative assessment in 2023, the Company has concluded that goodwill is impaired. There were no triggering events since the impairment test in August. |
Note 11 - Long-term Debt |
12 Months Ended | |||||||||||||||||||||||||||||||||||||||||||||||||||||||||||||||||||||||||||||||||||||||||||||||||||||||||||||||||||||||||||||||||||||||||
---|---|---|---|---|---|---|---|---|---|---|---|---|---|---|---|---|---|---|---|---|---|---|---|---|---|---|---|---|---|---|---|---|---|---|---|---|---|---|---|---|---|---|---|---|---|---|---|---|---|---|---|---|---|---|---|---|---|---|---|---|---|---|---|---|---|---|---|---|---|---|---|---|---|---|---|---|---|---|---|---|---|---|---|---|---|---|---|---|---|---|---|---|---|---|---|---|---|---|---|---|---|---|---|---|---|---|---|---|---|---|---|---|---|---|---|---|---|---|---|---|---|---|---|---|---|---|---|---|---|---|---|---|---|---|---|---|---|---|
Dec. 31, 2023 | ||||||||||||||||||||||||||||||||||||||||||||||||||||||||||||||||||||||||||||||||||||||||||||||||||||||||||||||||||||||||||||||||||||||||||
Notes to Financial Statements | ||||||||||||||||||||||||||||||||||||||||||||||||||||||||||||||||||||||||||||||||||||||||||||||||||||||||||||||||||||||||||||||||||||||||||
Long-Term Debt [Text Block] |
The Company has $60,000 of Senior Notes bearing interest at a rate of 3.84%. The Senior Notes are due on January 16, 2025, with five annual equal repayments which began on January 16, 2021.
In February 2022, the Company entered into a second amended and restated credit agreement providing for a $1,000,000 revolving credit facility on an unsecured basis. The maturity date of the revolving credit facility is February 2027. The revolving credit facility bears interest at 0.20% to 2.50% over floating reference rates, depending on certain leverage ratios. The weighted average interest rate for 2023 was 6.29%. The Facility had $155,450 of available un-drawn credit as at December 31, 2023. As of December 31, 2023, letters of credit in the amount of $19,050 were outstanding ($15,655 as at December 31, 2022). The current revolving credit facility replaced the Company’s previous $450,000 revolving credit facility and $440,000 term loan (drawn in a single advance) that were set to mature in January 2023 and June 2024, respectively. The new revolving credit facility was used to repay the remaining term loan balance of $407,000 under the prior credit agreement, and will continue to be utilized for working capital and general corporate purposes and to fund future tuck-under acquisitions. The Company assessed whether the repayment of the term loan balance and expansion of the revolving credit facility constituted a substantial change in the terms of the underlying debt agreements and as a result, this transaction has been treated as a debt extinguishment. In December 2023, the Company exercised the Credit Agreement’s $250,000 accordion feature to fund its acquisition of Roofing Corp of America.
The indebtedness under the Credit Agreement and the Senior Notes rank equally in terms of seniority. The Company has granted the lenders under the Credit Agreement and the holders of the Senior Notes various security, including an interest in all of our assets. The Company is prohibited under the Credit Agreement and the Senior Notes from undertaking certain acquisitions and dispositions, and incurring certain indebtedness and encumbrances, without prior approval of the lenders under the Credit Agreement and the holders of the Senior Notes.
In September 2022, the Company entered into two revolving, uncommitted financing facilities for potential future private placement issuances of senior unsecured notes (the “Notes”) aggregating $450,000 with its existing lenders, NYL Investors LLC (“New York Life”) of up to $150,000 and PGIM Private Capital (“Prudential”), of up to $300,000, in each case, net of any existing notes held by them. The facilities each have a -year term ending September 29, 2025. The Company has the ability to issue incremental Note tranches under the Facilities, subject to acceptance by New York Life or Prudential, with varying maturities as determined by the Company, and with coupon pricing determined at the time of each Note issuance. As part of the closing of the New York Life facility, the Company issued, on a private placement basis to New York Life, $60,000 of 4.53% Notes, which are due in full on September 29, 2032, with interest payable semi-annually.
In January 2024, the Company issued, on a private placement basis to New York Life, $50,000 of 5.48% Notes, which are due in full on January 30, 2029, as well as $25,000 of 5.60% Notes, which are due in full on January 30, 2031, both with interest payable semi-annually. Also in January 2024, the Company issued, on a private placement basis to Prudential, $50,000 of 5.64% Notes, which are due in full on January 30, 2031, with interest payable semi-annually.
The effective interest rate on the Company’s long-term debt for the year ended December 31, 2023 was 5.97% (2022 – 3.78%). The estimated aggregate amount of principal repayments on long-term debt required in each of the next five years ending December 31 and thereafter to meet the retirement provisions are as follows:
|
Note 12 - Redeemable Non-controlling Interests |
12 Months Ended | ||||||||||||||||||||||||||||||||||||||||||||||||||||||||||||||||||||||||||||||||||||||||||||
---|---|---|---|---|---|---|---|---|---|---|---|---|---|---|---|---|---|---|---|---|---|---|---|---|---|---|---|---|---|---|---|---|---|---|---|---|---|---|---|---|---|---|---|---|---|---|---|---|---|---|---|---|---|---|---|---|---|---|---|---|---|---|---|---|---|---|---|---|---|---|---|---|---|---|---|---|---|---|---|---|---|---|---|---|---|---|---|---|---|---|---|---|---|
Dec. 31, 2023 | |||||||||||||||||||||||||||||||||||||||||||||||||||||||||||||||||||||||||||||||||||||||||||||
Notes to Financial Statements | |||||||||||||||||||||||||||||||||||||||||||||||||||||||||||||||||||||||||||||||||||||||||||||
Noncontrolling Interest Disclosure [Text Block] |
The minority equity positions in the Company’s subsidiaries are referred to as redeemable non-controlling interests (“RNCI”). The RNCI are considered to be redeemable securities. The following table provides a reconciliation of the beginning and ending RNCI amounts:
The Company has shareholders’ agreements in place at each of its non-wholly owned subsidiaries. These agreements allow the Company to “call” the non-controlling interest at a price determined with the use of a formula price, which is usually equal to a fixed multiple of average annual net earnings before extraordinary items, income taxes, interest, depreciation, and amortization. The agreements also have redemption features which allow the owners of the RNCI to “put” their equity to the Company at the same price subject to certain limitations. The formula price is referred to as the redemption amount and may be paid in cash or in Common Shares. The redemption amount as of December 31, 2023 was $293,911 (2022 - $208,946). The redemption amount is lower than that recorded on the balance sheet as the formula price of certain RNCI are lower than the amount initially recorded at the inception of the minority equity position. If all put or call options were settled with Common Shares as at December 31, 2023, approximately 1,800,000 such shares would be issued, and would have resulted in an increase of $0.75 to earnings per share for the year ended December 31, 2023.
|
Note 13 - Capital Stock |
12 Months Ended | ||||||||||||||||||||||||||||||||||||||
---|---|---|---|---|---|---|---|---|---|---|---|---|---|---|---|---|---|---|---|---|---|---|---|---|---|---|---|---|---|---|---|---|---|---|---|---|---|---|---|
Dec. 31, 2023 | |||||||||||||||||||||||||||||||||||||||
Notes to Financial Statements | |||||||||||||||||||||||||||||||||||||||
Equity [Text Block] |
The authorized capital stock of the Company is as follows:
An unlimited number of Common Shares having one vote per share.
The following table provides a summary of total capital stock issued and outstanding:
|
Note 14 - Stock-based Compensation |
12 Months Ended | ||||||||||||||||||||||||||||||||||||||||||||||||||||||||||||||||||||||||||||||||||||||||||||||||||||||||||||||||||||||||||||||||||||||||||||||||||||||||||||||||||||||||||||||||||||||||||||||||||||||||||||||||||||||||||||||||||||||||||||||||||||||||||||||||||||||||
---|---|---|---|---|---|---|---|---|---|---|---|---|---|---|---|---|---|---|---|---|---|---|---|---|---|---|---|---|---|---|---|---|---|---|---|---|---|---|---|---|---|---|---|---|---|---|---|---|---|---|---|---|---|---|---|---|---|---|---|---|---|---|---|---|---|---|---|---|---|---|---|---|---|---|---|---|---|---|---|---|---|---|---|---|---|---|---|---|---|---|---|---|---|---|---|---|---|---|---|---|---|---|---|---|---|---|---|---|---|---|---|---|---|---|---|---|---|---|---|---|---|---|---|---|---|---|---|---|---|---|---|---|---|---|---|---|---|---|---|---|---|---|---|---|---|---|---|---|---|---|---|---|---|---|---|---|---|---|---|---|---|---|---|---|---|---|---|---|---|---|---|---|---|---|---|---|---|---|---|---|---|---|---|---|---|---|---|---|---|---|---|---|---|---|---|---|---|---|---|---|---|---|---|---|---|---|---|---|---|---|---|---|---|---|---|---|---|---|---|---|---|---|---|---|---|---|---|---|---|---|---|---|---|---|---|---|---|---|---|---|---|---|---|---|---|---|---|---|---|---|---|---|---|---|---|---|---|---|---|---|---|---|---|---|---|
Dec. 31, 2023 | |||||||||||||||||||||||||||||||||||||||||||||||||||||||||||||||||||||||||||||||||||||||||||||||||||||||||||||||||||||||||||||||||||||||||||||||||||||||||||||||||||||||||||||||||||||||||||||||||||||||||||||||||||||||||||||||||||||||||||||||||||||||||||||||||||||||||
Notes to Financial Statements | |||||||||||||||||||||||||||||||||||||||||||||||||||||||||||||||||||||||||||||||||||||||||||||||||||||||||||||||||||||||||||||||||||||||||||||||||||||||||||||||||||||||||||||||||||||||||||||||||||||||||||||||||||||||||||||||||||||||||||||||||||||||||||||||||||||||||
Share-Based Payment Arrangement [Text Block] |
The Company has a stock option plan for certain officers and key full-time employees of the Company and its subsidiaries. Options are granted at the market price for the underlying shares on the date of grant. Each option vests over a -year term, expires years from the date granted and allows for the purchase of one Common Share. All Common Shares issued are new shares. As at December 31, 2023, there were 1,918,740 options available for future grants.
Grants under the Company’s stock option plan are equity-classified awards. Stock option activity for the year ended December 31, 2023 is as follows:
The Company incurred stock-based compensation expense related to these awards of $21,385 during the year ended December 31, 2023 (2022 - $18,046).
As at December 31, 2023, the range of option exercise prices was $83.89 to $162.25 per share.
The following table summarizes information about option exercises during year ended December 31, 2023:
As at December 31, 2023, there was $21,024 of unrecognized compensation cost related to non-vested awards which is expected to be recognized over the next 4 years. During the year ended December 31, 2023, the fair value of options vested was $16,204 (2022 - $12,623).
The fair value of each option grant is estimated on the date of grant using the Black-Scholes option pricing model, utilizing the following weighted average assumptions:
The risk-free interest rate is based on the implied yield of a zero-coupon US Treasury bond with a term equal to the option’s expected term. The expected life in years represents the estimated period of time until exercise and is based on historical experience. The expected volatility is based on the historical prices of the Company’s shares over the previous four years. |
Note 15 - Income Tax |
12 Months Ended | |||||||||||||||||||||||||||||||||||||||||||||||||||||||||||||||||||||||||||||||||||||||||||||||||||||||||||||||||||||||||||||||||||||||||||||||||||||||||||||||||||||||||||||||||||||||||||||||||||||||||||||||||||||||||||||||||||||||||||||||||||||||||||||||||||||||||||||||||||||||||||||||||||||||||||||||||||||||||||||||||||||||||||||||||||||||||||||||||||||||||||||||||||||||||||||||||||||||||||||||||||||||||||||||||||||||||||||||||||||||||||||||||||||||||||||||||||||||||||||||||||||||||||||||||||||||||||||||||||||||||||||||||||||||||||||
---|---|---|---|---|---|---|---|---|---|---|---|---|---|---|---|---|---|---|---|---|---|---|---|---|---|---|---|---|---|---|---|---|---|---|---|---|---|---|---|---|---|---|---|---|---|---|---|---|---|---|---|---|---|---|---|---|---|---|---|---|---|---|---|---|---|---|---|---|---|---|---|---|---|---|---|---|---|---|---|---|---|---|---|---|---|---|---|---|---|---|---|---|---|---|---|---|---|---|---|---|---|---|---|---|---|---|---|---|---|---|---|---|---|---|---|---|---|---|---|---|---|---|---|---|---|---|---|---|---|---|---|---|---|---|---|---|---|---|---|---|---|---|---|---|---|---|---|---|---|---|---|---|---|---|---|---|---|---|---|---|---|---|---|---|---|---|---|---|---|---|---|---|---|---|---|---|---|---|---|---|---|---|---|---|---|---|---|---|---|---|---|---|---|---|---|---|---|---|---|---|---|---|---|---|---|---|---|---|---|---|---|---|---|---|---|---|---|---|---|---|---|---|---|---|---|---|---|---|---|---|---|---|---|---|---|---|---|---|---|---|---|---|---|---|---|---|---|---|---|---|---|---|---|---|---|---|---|---|---|---|---|---|---|---|---|---|---|---|---|---|---|---|---|---|---|---|---|---|---|---|---|---|---|---|---|---|---|---|---|---|---|---|---|---|---|---|---|---|---|---|---|---|---|---|---|---|---|---|---|---|---|---|---|---|---|---|---|---|---|---|---|---|---|---|---|---|---|---|---|---|---|---|---|---|---|---|---|---|---|---|---|---|---|---|---|---|---|---|---|---|---|---|---|---|---|---|---|---|---|---|---|---|---|---|---|---|---|---|---|---|---|---|---|---|---|---|---|---|---|---|---|---|---|---|---|---|---|---|---|---|---|---|---|---|---|---|---|---|---|---|---|---|---|---|---|---|---|---|---|---|---|---|---|---|---|---|---|---|---|---|---|---|---|---|---|---|---|---|---|---|---|---|---|---|---|---|---|---|---|---|---|---|---|---|---|---|---|---|---|---|---|---|---|---|---|---|---|---|---|---|---|---|---|---|---|---|---|---|---|---|---|---|---|---|---|---|---|---|---|---|---|---|---|---|---|---|---|---|---|---|---|---|---|---|---|---|---|---|---|---|---|---|---|---|---|---|---|---|---|---|---|---|---|---|---|---|---|---|---|---|---|---|---|---|---|---|---|---|---|---|---|---|---|---|---|---|---|---|---|---|---|---|
Dec. 31, 2023 | ||||||||||||||||||||||||||||||||||||||||||||||||||||||||||||||||||||||||||||||||||||||||||||||||||||||||||||||||||||||||||||||||||||||||||||||||||||||||||||||||||||||||||||||||||||||||||||||||||||||||||||||||||||||||||||||||||||||||||||||||||||||||||||||||||||||||||||||||||||||||||||||||||||||||||||||||||||||||||||||||||||||||||||||||||||||||||||||||||||||||||||||||||||||||||||||||||||||||||||||||||||||||||||||||||||||||||||||||||||||||||||||||||||||||||||||||||||||||||||||||||||||||||||||||||||||||||||||||||||||||||||||||||||||||||||||
Notes to Financial Statements | ||||||||||||||||||||||||||||||||||||||||||||||||||||||||||||||||||||||||||||||||||||||||||||||||||||||||||||||||||||||||||||||||||||||||||||||||||||||||||||||||||||||||||||||||||||||||||||||||||||||||||||||||||||||||||||||||||||||||||||||||||||||||||||||||||||||||||||||||||||||||||||||||||||||||||||||||||||||||||||||||||||||||||||||||||||||||||||||||||||||||||||||||||||||||||||||||||||||||||||||||||||||||||||||||||||||||||||||||||||||||||||||||||||||||||||||||||||||||||||||||||||||||||||||||||||||||||||||||||||||||||||||||||||||||||||||
Income Tax Disclosure [Text Block] |
Income tax differs from the amounts that would be obtained by applying the statutory rate to the respective year’s earnings before tax. Differences result from the following items:
Earnings before income tax by jurisdiction comprise the following:
Income tax expense (recovery) comprises the following:
The significant components of deferred income tax are as follows:
The recoverability of deferred income tax assets is dependent on generating sufficient taxable income before the 20 year loss carry-forward limitation. Although realization is not assured, the Company believes it is more likely than not that the deferred tax asset will be realized. The amount of the deferred tax asset considered realizable, however, could be reduced in the near term if estimates of future taxable income during the carry-forward period are reduced.
The Company has gross operating loss carry-forwards as follows:
These amounts above are available to reduce future federal, state, and provincial income taxes in their respective jurisdictions. Net operating loss carry-forward balances attributable to the United States and Canada expire over the next 9 to 20 years.
Cumulative unremitted earnings of US and foreign subsidiaries approximated $950,864 as at December 31, 2023 (2022 - $842,671). Income tax is not provided on the unremitted earnings of US and foreign subsidiaries because it has been the practice and is the intention of the Company to reinvest these earnings indefinitely in these subsidiaries.
The gross unrecognized tax benefits are $148 (2022 - $148). Of this balance, $148 (2022 - $148) would affect the Company’s effective tax rate if recognized. For the year ended December 31, 2023, there was no adjustment to interest and penalties related to provisions for income tax (2022 - ). As at December 31, 2023, the Company had accrued $38 (2022 - $38) for potential income tax related interest and penalties.
The Company’s significant tax jurisdictions include the United States and Canada. The number of years with open tax audits varies depending on the tax jurisdictions. Generally, income tax returns filed with the Canada Revenue Agency and related provinces are open for to years and income tax returns filed with the U.S. Internal Revenue Service and related states are open for to years.
The Company does not currently expect any other material impact on earnings to result from the resolution of matters related to open taxation years, other than noted above. Actual settlements may differ from the amounts accrued. The Company has, as part of its analysis, made its current estimates based on facts and circumstances known to date and cannot predict changes in facts and circumstances that may affect its current estimates.
|
Note 16 - Net Earnings Per Common Share |
12 Months Ended | ||||||||||||||||||||||||||||||||||||||||||||||||||||||||||||||||||||||||||
---|---|---|---|---|---|---|---|---|---|---|---|---|---|---|---|---|---|---|---|---|---|---|---|---|---|---|---|---|---|---|---|---|---|---|---|---|---|---|---|---|---|---|---|---|---|---|---|---|---|---|---|---|---|---|---|---|---|---|---|---|---|---|---|---|---|---|---|---|---|---|---|---|---|---|---|
Dec. 31, 2023 | |||||||||||||||||||||||||||||||||||||||||||||||||||||||||||||||||||||||||||
Notes to Financial Statements | |||||||||||||||||||||||||||||||||||||||||||||||||||||||||||||||||||||||||||
Earnings Per Share [Text Block] |
The following table reconciles the denominator used to calculate earnings per common share:
|
Note 17 - Other Supplemental Information |
12 Months Ended | |||||||||||||||||||||||||||||||||||||||||||||||
---|---|---|---|---|---|---|---|---|---|---|---|---|---|---|---|---|---|---|---|---|---|---|---|---|---|---|---|---|---|---|---|---|---|---|---|---|---|---|---|---|---|---|---|---|---|---|---|---|
Dec. 31, 2023 | ||||||||||||||||||||||||||||||||||||||||||||||||
Notes to Financial Statements | ||||||||||||||||||||||||||||||||||||||||||||||||
Additional Financial Information Disclosure [Text Block] |
|
Note 18 - Financial Instruments |
12 Months Ended | ||||||||||||||||||||||||||||||||||||||||||||||||||||||||||||||||||||||||||||||||||||||||||||||||||||||||||||||||||||||||||||||||||||||||||||||||||||||||||||||||||||||||||||||||||||||||||||||||||||||||||||||||||||||||||||||||||||||||||||||||||||||||||||||||||||||||||||||||||||||||||||||||
---|---|---|---|---|---|---|---|---|---|---|---|---|---|---|---|---|---|---|---|---|---|---|---|---|---|---|---|---|---|---|---|---|---|---|---|---|---|---|---|---|---|---|---|---|---|---|---|---|---|---|---|---|---|---|---|---|---|---|---|---|---|---|---|---|---|---|---|---|---|---|---|---|---|---|---|---|---|---|---|---|---|---|---|---|---|---|---|---|---|---|---|---|---|---|---|---|---|---|---|---|---|---|---|---|---|---|---|---|---|---|---|---|---|---|---|---|---|---|---|---|---|---|---|---|---|---|---|---|---|---|---|---|---|---|---|---|---|---|---|---|---|---|---|---|---|---|---|---|---|---|---|---|---|---|---|---|---|---|---|---|---|---|---|---|---|---|---|---|---|---|---|---|---|---|---|---|---|---|---|---|---|---|---|---|---|---|---|---|---|---|---|---|---|---|---|---|---|---|---|---|---|---|---|---|---|---|---|---|---|---|---|---|---|---|---|---|---|---|---|---|---|---|---|---|---|---|---|---|---|---|---|---|---|---|---|---|---|---|---|---|---|---|---|---|---|---|---|---|---|---|---|---|---|---|---|---|---|---|---|---|---|---|---|---|---|---|---|---|---|---|---|---|---|---|---|---|---|---|---|---|---|---|---|---|---|---|---|---|---|
Dec. 31, 2023 | |||||||||||||||||||||||||||||||||||||||||||||||||||||||||||||||||||||||||||||||||||||||||||||||||||||||||||||||||||||||||||||||||||||||||||||||||||||||||||||||||||||||||||||||||||||||||||||||||||||||||||||||||||||||||||||||||||||||||||||||||||||||||||||||||||||||||||||||||||||||||||||||||
Notes to Financial Statements | |||||||||||||||||||||||||||||||||||||||||||||||||||||||||||||||||||||||||||||||||||||||||||||||||||||||||||||||||||||||||||||||||||||||||||||||||||||||||||||||||||||||||||||||||||||||||||||||||||||||||||||||||||||||||||||||||||||||||||||||||||||||||||||||||||||||||||||||||||||||||||||||||
Financial Instruments Disclosure [Text Block] |
Concentration of credit risk The Company is subject to credit risk with respect to its cash and cash equivalents, accounts receivable and other receivables. Concentrations of credit risk with respect to cash and cash equivalents are limited by the use of multiple large and reputable banks. Concentrations of credit risk with respect to the receivables are limited due to the large number of entities comprising the Company’s customer base and their dispersion across many different service lines.
During the year ended December 31, 2023, there were $8,102 (2022 - $2,172) of write-offs from the allowance for credit losses.
Interest rate risk The Company maintains an interest rate risk management strategy that uses interest rate hedging contracts from time to time. The Company’s specific goals are to: (i) manage interest rate sensitivity by modifying the characteristics of its debt and (ii) lower the long-term cost of its borrowed funds.
Foreign currency risk Foreign currency risk is related to the portion of the Company’s business transactions denominated in currencies other than U.S. dollars. A portion of revenue is generated by the Company’s Canadian operations. The Company’s head office expenses are incurred in Canadian dollars which is economically hedged by Canadian dollar denominated revenue.
Fair values of financial instruments The following table provides the financial assets and liabilities carried at fair value measured on a recurring basis as of December 31, 2023:
The Company has interest rate swaps in place to exchange the floating interest rate on $182,500 of debt under its Credit Agreement for a fixed rate. The fair value of the interest rate swap asset was calculated through discounting future expected cash flows using the appropriate prevailing interest rate swap curve adjusted for credit risk. The inputs to the measurement of the fair value of contingent consideration related to acquisitions are Level 3 inputs using a discounted cash flow model; significant model inputs were expected future operating cash flows (determined with reference to each specific acquired business) and discount rates (which range from 8% to 10%). The range of discount rates is attributable to level of risk related to economic growth factors combined with the length of the contingent payment periods; and the dispersion was driven by unique characteristics of the businesses acquired and the respective terms for these contingent payments. Within the range of discount rates, there is a data point concentration at A 2% increase in the weighted average discount rate would not have a significant impact on the fair value of the contingent consideration balance.
The carrying amounts for cash and cash equivalents, restricted cash, accounts receivable, accounts payable and accrued liabilities approximate fair values due to the short maturity of these instruments, unless otherwise indicated. The inputs to the measurement of the fair value of long term debt are Level 2 inputs. The fair value measurements were made using a net present value approach; significant model inputs were expected future cash outflows and discount rates (which range from 4.5% to 5.0%). The following are estimates of the fair values for other financial instruments:
Other receivables include notes receivable from non-controlling shareholders and other non-current receivables. |
Note 19 - Contingencies |
12 Months Ended | ||
---|---|---|---|
Dec. 31, 2023 | |||
Notes to Financial Statements | |||
Commitments and Contingencies Disclosure [Text Block] |
In the normal course of operations, the Company is subject to routine claims and litigation incidental to its business. Litigation currently pending or threatened against the Company includes disputes with former employees and commercial liability claims related to services provided by the Company. The Company believes resolution of such proceedings, combined with amounts set aside, will not have a material impact on the Company’s financial condition or the results of operations. |
Note 20 - Related Party Transactions |
12 Months Ended | ||
---|---|---|---|
Dec. 31, 2023 | |||
Notes to Financial Statements | |||
Related Party Transactions Disclosure [Text Block] |
The Company has entered into office space rental arrangements and property management contracts with senior managers of certain subsidiaries. These senior managers are usually also minority shareholders of the subsidiaries. The business purpose of the transactions is to rent office space for the Company and to generate property management revenues for the Company. The recorded amount of the rent expense for the year ended December 31, 2023 was $4,555 (2022 - $4,350). These amounts are settled monthly in cash, and are priced at market rates. The rental arrangements have fixed terms of up to 10 years.
As at December 31, 2023, the Company had $6,554 of loans receivable from minority shareholders ( December 31, 2022 - $2,374). The business purpose of the loans receivable was to finance the sale of non-controlling interests in subsidiaries to senior managers. The loan amounts are measured based on the formula price of the underlying non-controlling interests, and interest rates are determined based on market rates plus a spread. The loans generally have terms of 5 to 10 years, but are open for repayment without penalty at any time. |
Note 21 - Segmented Information |
12 Months Ended | ||||||||||||||||||||||||||||||||||||||||||||||||||||||||||||||||||||||||||||||||||||||||||||||||||||||||||||||||||||||||||||||||||||||||||||||||||||||||||||||||||||||||||||||||||||||||||||||||||||||||||||||||||||||||||||||||||||||||||||||||||||||||||||||||||||||||||||||||||||||||||||||||||||||||||||||||||||||||||||||||||||||||||||||||||||||||||||||||||||||||||||||||||||||||||||||||||||||||||||||||||||||||||||||||||||||||||||||||||||||||||||||||||||||||||||||||||||||||||||||||||||||||||||||||||||||||||||||||||||||||||||||||||||||||||||||||||||||||||||||||||||||||||||||||||||||||||||||||||||||||||||||||||||
---|---|---|---|---|---|---|---|---|---|---|---|---|---|---|---|---|---|---|---|---|---|---|---|---|---|---|---|---|---|---|---|---|---|---|---|---|---|---|---|---|---|---|---|---|---|---|---|---|---|---|---|---|---|---|---|---|---|---|---|---|---|---|---|---|---|---|---|---|---|---|---|---|---|---|---|---|---|---|---|---|---|---|---|---|---|---|---|---|---|---|---|---|---|---|---|---|---|---|---|---|---|---|---|---|---|---|---|---|---|---|---|---|---|---|---|---|---|---|---|---|---|---|---|---|---|---|---|---|---|---|---|---|---|---|---|---|---|---|---|---|---|---|---|---|---|---|---|---|---|---|---|---|---|---|---|---|---|---|---|---|---|---|---|---|---|---|---|---|---|---|---|---|---|---|---|---|---|---|---|---|---|---|---|---|---|---|---|---|---|---|---|---|---|---|---|---|---|---|---|---|---|---|---|---|---|---|---|---|---|---|---|---|---|---|---|---|---|---|---|---|---|---|---|---|---|---|---|---|---|---|---|---|---|---|---|---|---|---|---|---|---|---|---|---|---|---|---|---|---|---|---|---|---|---|---|---|---|---|---|---|---|---|---|---|---|---|---|---|---|---|---|---|---|---|---|---|---|---|---|---|---|---|---|---|---|---|---|---|---|---|---|---|---|---|---|---|---|---|---|---|---|---|---|---|---|---|---|---|---|---|---|---|---|---|---|---|---|---|---|---|---|---|---|---|---|---|---|---|---|---|---|---|---|---|---|---|---|---|---|---|---|---|---|---|---|---|---|---|---|---|---|---|---|---|---|---|---|---|---|---|---|---|---|---|---|---|---|---|---|---|---|---|---|---|---|---|---|---|---|---|---|---|---|---|---|---|---|---|---|---|---|---|---|---|---|---|---|---|---|---|---|---|---|---|---|---|---|---|---|---|---|---|---|---|---|---|---|---|---|---|---|---|---|---|---|---|---|---|---|---|---|---|---|---|---|---|---|---|---|---|---|---|---|---|---|---|---|---|---|---|---|---|---|---|---|---|---|---|---|---|---|---|---|---|---|---|---|---|---|---|---|---|---|---|---|---|---|---|---|---|---|---|---|---|---|---|---|---|---|---|---|---|---|---|---|---|---|---|---|---|---|---|---|---|---|---|---|---|---|---|---|---|---|---|---|---|---|---|---|---|---|---|---|---|---|---|---|---|---|---|---|---|---|---|---|---|---|---|---|---|---|---|---|---|---|---|---|---|---|---|---|---|---|---|---|---|---|---|---|---|---|---|---|---|---|---|---|---|---|---|---|---|---|---|---|---|---|---|---|---|---|---|---|---|---|---|---|---|---|---|---|---|---|---|---|---|---|---|---|---|---|---|---|---|---|---|---|---|---|---|---|---|---|
Dec. 31, 2023 | |||||||||||||||||||||||||||||||||||||||||||||||||||||||||||||||||||||||||||||||||||||||||||||||||||||||||||||||||||||||||||||||||||||||||||||||||||||||||||||||||||||||||||||||||||||||||||||||||||||||||||||||||||||||||||||||||||||||||||||||||||||||||||||||||||||||||||||||||||||||||||||||||||||||||||||||||||||||||||||||||||||||||||||||||||||||||||||||||||||||||||||||||||||||||||||||||||||||||||||||||||||||||||||||||||||||||||||||||||||||||||||||||||||||||||||||||||||||||||||||||||||||||||||||||||||||||||||||||||||||||||||||||||||||||||||||||||||||||||||||||||||||||||||||||||||||||||||||||||||||||||||||||||||
Notes to Financial Statements | |||||||||||||||||||||||||||||||||||||||||||||||||||||||||||||||||||||||||||||||||||||||||||||||||||||||||||||||||||||||||||||||||||||||||||||||||||||||||||||||||||||||||||||||||||||||||||||||||||||||||||||||||||||||||||||||||||||||||||||||||||||||||||||||||||||||||||||||||||||||||||||||||||||||||||||||||||||||||||||||||||||||||||||||||||||||||||||||||||||||||||||||||||||||||||||||||||||||||||||||||||||||||||||||||||||||||||||||||||||||||||||||||||||||||||||||||||||||||||||||||||||||||||||||||||||||||||||||||||||||||||||||||||||||||||||||||||||||||||||||||||||||||||||||||||||||||||||||||||||||||||||||||||||
Segment Reporting Disclosure [Text Block] |
Operating segments The Company has reportable operating segments. The segments are grouped with reference to the nature of services provided and the types of clients that use those services. The Company assesses each segment’s performance based on operating earnings or operating earnings before depreciation and amortization. FirstService Residential provides property management and related property services to residential communities in North America. FirstService Brands provides company-owned and franchised property services to customers in North America. Corporate includes the costs of operating the Company’s corporate head office. The reportable segment information excludes intersegment transactions.
Geographic information Revenues in each geographic region are reported by customer locations.
|
Note 22 - Impact of recently issued accounting standards |
12 Months Ended | ||
---|---|---|---|
Dec. 31, 2023 | |||
Notes to Financial Statements | |||
Accounting Standards Update and Change in Accounting Principle [Text Block] |
In November 2023, the FASB issued ASU 2023-07 – Improvements to Reportable Segment Disclosures. This ASU requires incremental disclosures about a public entity’s reportable segments but does not change the definition of a segment or the guidance for determining reportable segments. The new guidance requires disclosure of significant segment expenses that are (1) regularly provided to (or easily computed from information regularly provided to) the chief operating decision maker and (2) included in the reported measure of segment profit or loss. The new standard also allows companies to disclose multiple measures of segment profit or loss if those measures are used to assess performance and allocate resources. The guidance is effective January 1, 2024 and should be adopted retrospectively unless impracticable. The Company is currently assessing the impact of this ASU on its financial disclosures.
In December 2023, the FASB issued ASU 2023-09 – Improvements to Income Tax Disclosures. This ASU requires significant additional disclosures about income taxes, primarily focused on the disclosure of income taxes paid and the rate reconciliation table. The guidance will be applied prospectively and is effective January 1, 2025. The Company is currently assessing the impact of this ASU on its financial disclosures. |
Significant Accounting Policies (Policies) |
12 Months Ended | ||||||||||
---|---|---|---|---|---|---|---|---|---|---|---|
Dec. 31, 2023 | |||||||||||
Accounting Policies [Abstract] | |||||||||||
Consolidation, Policy [Policy Text Block] | Basis of consolidation The consolidated financial statements include the accounts of the Company and its majority-owned subsidiaries where the Company is the primary beneficiary. Inter-company transactions and accounts are eliminated on consolidation.
|
||||||||||
Cash and Cash Equivalents, Policy [Policy Text Block] | Cash and cash equivalents Cash equivalents consist of short-term interest-bearing securities, which are readily convertible into cash and have original maturities at the date of purchase of three months or less.
|
||||||||||
Cash and Cash Equivalents, Restricted Cash and Cash Equivalents, Policy [Policy Text Block] | Restricted cash Restricted cash consists of cash over which the Company has legal ownership but is restricted as to its availability or intended use, including funds held on behalf of clients and franchisees.
The Company’s restricted cash balance consists primarily of cash related to our marketing funds in the FirstService Brands segment, cash held for certain employees’ benefit plans, and cash held for insurance broker commissions owed in our FirstService Residential segment.
|
||||||||||
Accounts Receivable [Policy Text Block] | Accounts Receivable In the ordinary course of business the Company extends non-interest bearing trade credit to its customers. Accounts receivable are carried at amortized cost and reported on the face of the consolidated balance sheets, net of an allowance for credit losses. The Company maintains an allowance for credit losses to provide for the estimated amount of receivables that will not be collected. In determining the allowance for credit losses, the Company analyzes the aging of accounts receivable, historical payment experience, customer creditworthiness and current economic trends.
The allowance for credit losses is based on the Company’s assessment of the collectability of customer accounts. The measurement of expected credit losses is based on relevant information about past events, including historical experience, credit quality, the age of the accounts receivable balances, and current economic conditions that may impact a customer’s ability to pay.
|
||||||||||
Inventory, Policy [Policy Text Block] | Inventories Finished goods and supplies and other inventories are carried at the lower of cost and net realizable value. Cost is determined using the weighted average method. Work-in-progress inventory relates to construction contracts and real estate project management projects in process.
|
||||||||||
Property, Plant and Equipment, Policy [Policy Text Block] | Fixed assets Fixed assets are carried at cost less accumulated depreciation. The costs of additions and improvements are capitalized, while maintenance and repairs are expensed as incurred. Fixed assets are reviewed for impairment whenever events or circumstances indicate that the carrying value of an asset group may not be recoverable. An impairment loss is recorded to the extent the carrying amount exceeds the estimated fair value of an asset group. Fixed assets are depreciated over their estimated useful lives as follows:
|
||||||||||
Fair Value Measurement, Policy [Policy Text Block] | Fair value The Company uses the fair value measurements framework for financial assets and liabilities and for non-financial assets and liabilities that are recognized or disclosed at fair value on a non-recurring basis. The framework defines fair value, gives guidance for measurement and disclosure, and establishes a three-level hierarchy for observable and unobservable inputs used to measure fair value. The classification of an asset or liability within the hierarchy is determined based on the lowest level input that is significant to the fair value measurement. The three levels are as follows:
Level 1 – Quoted prices (unadjusted) in active markets for identical assets or liabilities Level 2 – Observable market-based inputs other than quoted prices in active markets for identical assets or liabilities Level 3 – Unobservable inputs for which there is little or no market data, which requires the Company to develop its own assumptions
|
||||||||||
Deferred Charges, Policy [Policy Text Block] | Financing fees Financing fees related to our second amended and restated credit agreement (the “Credit Agreement”) with a syndicate of lenders, our $60,000 of senior secured notes (the “Senior Notes”), and our $60,000 of senior unsecured notes (the “Notes”) are deferred and amortized to interest expense using the effective interest method.
|
||||||||||
Lessee, Leases [Policy Text Block] | Leases The Company has lease agreements with lease and non-lease components, and has elected to account for each lease component (e.g., fixed rent payments) separately from the non-lease components (e.g., common-area maintenance costs). The Company has also elected not to recognize the right-of-use assets and lease liabilities for short-term leases that have a lease term of 12 months or less. Leases are recognized on the balance sheet when the lease term commences, and the associated lease payments are recognized as an expense on a straight-line basis over the lease term.
At lease commencement, which is generally when the Company takes possession of the asset, the Company records a lease liability and a corresponding right-of-use asset. Lease liabilities represent the present value of minimum lease payments over the expected lease term, which includes options to extend or terminate the lease when it is reasonably certain those options will be exercised. The present value of the lease liability is determined using the Company’s incremental collateralized borrowing rate at the lease commencement.
Minimum lease payments include base rent, fixed escalation of rental payments, and rental payments that are adjusted periodically depending on a rate or index.
Right-of-use assets represent the right to control the use of the leased asset during the lease and are initially recognized in an amount equal to the lease liability. In addition, prepaid rent, initial direct costs, and adjustments for lease incentives are components of the right-of-use asset. Over the lease term the lease expense is amortized on a straight-line basis beginning on the lease commencement date. Right-of-use assets are assessed for impairment as part of the impairment of long-lived assets, which is performed whenever events or changes in circumstances indicate that the carrying amount of an asset or asset group may not be recoverable.
|
||||||||||
Goodwill and Intangible Assets, Goodwill, Policy [Policy Text Block] | Goodwill and intangible assets Goodwill represents the excess of purchase price over the fair value of assets acquired and liabilities assumed in a business combination and is not subject to amortization.
Intangible assets are recorded at fair value on the date they are acquired. They are amortized over their estimated useful lives as follows:
The Company reviews the carrying value of finite life intangible assets for impairment whenever events or changes in circumstances indicate that the carrying amount of an asset group may not be recoverable from the estimated future cash flows expected to result from their use and eventual disposition. If the sum of the undiscounted expected future cash flows is less than the carrying amount of the asset group, an impairment loss is recognized. Measurement of the impairment loss is based on the excess of the carrying amount of the asset group over the fair value calculated using an income approach.
Goodwill is tested for impairment annually, on August 1, or more frequently if events or changes in circumstances indicate the asset might be impaired, in which case the carrying amount of the asset is written down to fair value.
Impairment of goodwill is tested at the reporting unit level. The Company has reporting units determined with reference to business segment, customer type, service delivery model and geography. Impairment is tested by first assessing qualitative factors to determine whether it is more likely than not that the fair value of a reporting unit is less than its carrying amount. Where it is determined to be more likely than not that its fair value is greater than its carrying amount, then no further testing is required. Where the qualitative analysis is not sufficient to support that the fair value exceeds the carrying amount then a goodwill impairment test is performed. The Company also has an unconditional option to bypass the qualitative assessment for any reporting unit in any period and proceed directly to performing a quantitative goodwill impairment test. The Company may resume performing the qualitative assessment in any subsequent period. A quantitative goodwill impairment test is performed by comparing the fair value of each reporting unit to its carrying value, including goodwill. Fair value is estimated using a market multiple method, which estimates market multiples of earnings before interest, taxes, depreciation and amortization (“EBITDA”) for comparable entities with similar operations and economic characteristics. Significant assumptions used in estimating the fair value of each reporting unit include the market multiples of EBITDA.
|
||||||||||
Consolidation, Subsidiaries or Other Investments, Consolidated Entities, Policy [Policy Text Block] | Redeemable non-controlling interests Redeemable non-controlling interests (“RNCI”) are recorded at the greater of (i) the redemption amount or (ii) the amount initially recorded as RNCI at the date of inception of the minority equity position. This amount is recorded in the “mezzanine” section of the balance sheet, outside of shareholders’ equity. Changes in the RNCI amount are recognized immediately as they occur.
|
||||||||||
Revenue [Policy Text Block] | Revenue recognition and unearned revenues The Company accounts for a contract with a customer when there is approval and commitment from both parties, the rights of the parties are identified, payment terms are identified, the contract has commercial substance and collectability of consideration is probable. The Company’s revenues are measured based on consideration specified in the contract of each customer and revenue is recognized as the performance obligations are satisfied by transferring the control of the service or product to a customer.
(a) Revenues from property and amenity management services Property and amenity management services represent a series of distinct daily services, that in nature are substantially the same, rendered over time. The Company is compensated for these services through monthly management fees and fees associated with ancillary services. Revenue is recognized for the fees associated with the services performed.
(b) Revenues from construction contracts and service operations other than franchisor operations Revenues are recognized at the time the service is rendered. Certain services including but not limited to restoration and construction contracts, are recognized over time based on percentage of completion, based on a ratio of actual costs to total estimated contract costs. In cases where anticipated costs to complete a project exceed the revenue to be recognized, a provision for the additional estimated losses is recorded in the period when the loss becomes apparent. Amounts received from customers in advance of services being provided are recorded as unearned revenues when received.
(c) Franchisor operations The Company operates several franchise systems within its FirstService Brands segment. Initial franchise fees are deferred and recognized over the term of the franchise agreement. Royalty revenues are recognized based on a contracted percentage of franchisee revenues, as reported by the franchisees. Revenues from administrative and other support services, as applicable, are recognized as the services are provided.
The Company’s franchise systems operate marketing funds on behalf of franchisees. Advertising fund contributions from franchisees are reported as revenues and advertising fund expenditures are reported as expenses in our statements of earnings. To the extent that contributions received exceed advertising expenditures, the excess amount is accrued and offset as unearned revenue, whereas any expenditures in excess of contributions are expensed as incurred. As such, advertising fund contributions and the related revenues and expenses may be reported in different periods.
|
||||||||||
Share-Based Payment Arrangement [Policy Text Block] | Stock-based compensation For equity classified awards, compensation cost is measured at the grant date based on the estimated fair value of the award. The related stock option compensation expense is allocated using the graded attribution method.
|
||||||||||
Notional Value Appreciation Plan [Policy Text Block] | Notional value appreciation plans Under these plans, subsidiary employees are compensated if the notional value of the subsidiary increases. Awards under these plans generally have a term of up to years and a vesting period of years. The increase in notional value is calculated with reference to growth in earnings relative to a fixed threshold amount plus or minus changes in indebtedness relative to a fixed opening amount. If an award is subject to a vesting condition, then graded attribution is applied to the intrinsic value. The related compensation expense is recorded in selling, general and administrative expenses, the current liability is recorded in accrued liabilities, and the non-current portion is recorded in other liabilities.
|
||||||||||
Foreign Currency Transactions and Translations Policy [Policy Text Block] | Foreign currency translation Assets, liabilities and operations of foreign subsidiaries are recorded based on the functional currency of each entity. For certain foreign operations, the functional currency is the local currency, in which case the assets, liabilities and operations are translated at current exchange rates from the local currency to the reporting currency, the US dollar. The resulting unrealized gains or losses are reported as a component of accumulated other comprehensive earnings. Realized and unrealized foreign currency gains or losses related to any foreign dollar denominated monetary assets and liabilities are included in net earnings.
|
||||||||||
Income Tax, Policy [Policy Text Block] | Income tax Income tax has been provided using the asset and liability method whereby deferred income tax assets and liabilities are recognized for the expected future income tax consequences of events that have been recognized in the consolidated financial statements or income tax returns. Deferred income tax assets and liabilities are measured using enacted income tax rates expected to apply to taxable income in the years in which temporary differences are expected to reverse, be recovered or settled. The effect on deferred income tax assets and liabilities of a change in income tax rates is recognized in earnings in the period in which the change occurs. A valuation allowance is recorded unless it is more likely than not that realization of a deferred income tax asset will occur based on available evidence.
The Company recognizes uncertainty in tax positions taken or expected to be taken in a tax return by recording a liability for unrecognized tax benefits on its balance sheet. Uncertainties are quantified by applying a prescribed recognition threshold and measurement attribute.
The Company classifies interest and penalties associated with income tax positions in income tax expense.
|
||||||||||
Business Combinations Policy [Policy Text Block] | Business combinations All business combinations are accounted for using the purchase method of accounting. Transaction costs are expensed as incurred.
The determination of fair values of assets and liabilities assumed in business combinations requires the use of estimates and judgement by management, particularly in determining fair values of intangible assets acquired.
The fair value of the contingent consideration is classified as a financial liability and is recorded on the balance sheet at the acquisition date and is re-measured at fair value at the end of each period until the end of the contingency period, with fair value adjustments recognized in earnings. |
Note 3 - Revenue From Contracts With Customers (Tables) |
12 Months Ended | ||||||||||||||||||||||||||||||||||||||||||||||||||||||||||||||||||||||||
---|---|---|---|---|---|---|---|---|---|---|---|---|---|---|---|---|---|---|---|---|---|---|---|---|---|---|---|---|---|---|---|---|---|---|---|---|---|---|---|---|---|---|---|---|---|---|---|---|---|---|---|---|---|---|---|---|---|---|---|---|---|---|---|---|---|---|---|---|---|---|---|---|---|
Dec. 31, 2023 | |||||||||||||||||||||||||||||||||||||||||||||||||||||||||||||||||||||||||
Notes Tables | |||||||||||||||||||||||||||||||||||||||||||||||||||||||||||||||||||||||||
Disaggregation of Revenue [Table Text Block] |
|
Note 4 - Acquisitions (Tables) |
12 Months Ended | ||||||||||||||||||||||||||||||||||||||||||||||||||||||||||||||||||||||||||||||||||||||||||||||||||||||||||||||||||||||||||||||||||||||||||||||||||||||||||||||||||||||||||||||||||||||||||||||||||||||||||||||||||||||||||||||||||||||||||||||||||||||||||||||||||||||||||||||||||||||||||||||||||||||||||||||||||||||||||||||||||||||||||||||||||||||||||||||||||||||||||||||||||||||||||||||||||
---|---|---|---|---|---|---|---|---|---|---|---|---|---|---|---|---|---|---|---|---|---|---|---|---|---|---|---|---|---|---|---|---|---|---|---|---|---|---|---|---|---|---|---|---|---|---|---|---|---|---|---|---|---|---|---|---|---|---|---|---|---|---|---|---|---|---|---|---|---|---|---|---|---|---|---|---|---|---|---|---|---|---|---|---|---|---|---|---|---|---|---|---|---|---|---|---|---|---|---|---|---|---|---|---|---|---|---|---|---|---|---|---|---|---|---|---|---|---|---|---|---|---|---|---|---|---|---|---|---|---|---|---|---|---|---|---|---|---|---|---|---|---|---|---|---|---|---|---|---|---|---|---|---|---|---|---|---|---|---|---|---|---|---|---|---|---|---|---|---|---|---|---|---|---|---|---|---|---|---|---|---|---|---|---|---|---|---|---|---|---|---|---|---|---|---|---|---|---|---|---|---|---|---|---|---|---|---|---|---|---|---|---|---|---|---|---|---|---|---|---|---|---|---|---|---|---|---|---|---|---|---|---|---|---|---|---|---|---|---|---|---|---|---|---|---|---|---|---|---|---|---|---|---|---|---|---|---|---|---|---|---|---|---|---|---|---|---|---|---|---|---|---|---|---|---|---|---|---|---|---|---|---|---|---|---|---|---|---|---|---|---|---|---|---|---|---|---|---|---|---|---|---|---|---|---|---|---|---|---|---|---|---|---|---|---|---|---|---|---|---|---|---|---|---|---|---|---|---|---|---|---|---|---|---|---|---|---|---|---|---|---|---|---|---|---|---|---|---|---|---|---|---|---|---|---|---|---|---|---|---|---|---|---|---|---|---|---|---|---|---|---|---|---|---|---|---|---|---|---|---|---|---|---|---|---|---|---|
Dec. 31, 2023 | |||||||||||||||||||||||||||||||||||||||||||||||||||||||||||||||||||||||||||||||||||||||||||||||||||||||||||||||||||||||||||||||||||||||||||||||||||||||||||||||||||||||||||||||||||||||||||||||||||||||||||||||||||||||||||||||||||||||||||||||||||||||||||||||||||||||||||||||||||||||||||||||||||||||||||||||||||||||||||||||||||||||||||||||||||||||||||||||||||||||||||||||||||||||||||||||||||
Notes Tables | |||||||||||||||||||||||||||||||||||||||||||||||||||||||||||||||||||||||||||||||||||||||||||||||||||||||||||||||||||||||||||||||||||||||||||||||||||||||||||||||||||||||||||||||||||||||||||||||||||||||||||||||||||||||||||||||||||||||||||||||||||||||||||||||||||||||||||||||||||||||||||||||||||||||||||||||||||||||||||||||||||||||||||||||||||||||||||||||||||||||||||||||||||||||||||||||||||
Schedule of Recognized Identified Assets Acquired and Liabilities Assumed [Table Text Block] |
|
||||||||||||||||||||||||||||||||||||||||||||||||||||||||||||||||||||||||||||||||||||||||||||||||||||||||||||||||||||||||||||||||||||||||||||||||||||||||||||||||||||||||||||||||||||||||||||||||||||||||||||||||||||||||||||||||||||||||||||||||||||||||||||||||||||||||||||||||||||||||||||||||||||||||||||||||||||||||||||||||||||||||||||||||||||||||||||||||||||||||||||||||||||||||||||||||||
Business Acquisition, Pro Forma Information [Table Text Block] |
|
Note 5 - Leases (Tables) |
12 Months Ended | |||||||||||||||||||||||||||||||||||||||||||||
---|---|---|---|---|---|---|---|---|---|---|---|---|---|---|---|---|---|---|---|---|---|---|---|---|---|---|---|---|---|---|---|---|---|---|---|---|---|---|---|---|---|---|---|---|---|---|
Dec. 31, 2023 | ||||||||||||||||||||||||||||||||||||||||||||||
Notes Tables | ||||||||||||||||||||||||||||||||||||||||||||||
Lessee, Operating Lease, Supplemental Cash Flows Information [Table Text Block] |
|
|||||||||||||||||||||||||||||||||||||||||||||
Lessee, Operating Lease, Liability, to be Paid, Maturity [Table Text Block] |
|
Note 6 - Other Income, Net (Tables) |
12 Months Ended | |||||||||||||||||||||||||||||||||||||||||||||
---|---|---|---|---|---|---|---|---|---|---|---|---|---|---|---|---|---|---|---|---|---|---|---|---|---|---|---|---|---|---|---|---|---|---|---|---|---|---|---|---|---|---|---|---|---|---|
Dec. 31, 2023 | ||||||||||||||||||||||||||||||||||||||||||||||
Notes Tables | ||||||||||||||||||||||||||||||||||||||||||||||
Schedule of Other Nonoperating Income (Expense) [Table Text Block] |
|
Note 7 - Components of Working Capital Accounts (Tables) |
12 Months Ended | |||||||||||||||||||||||||||||||||||||||||||||||||||||||||||||||||||||||||||||||||||||||||||||||||||||||||||||||||||||||||||||||||||||||||||||||||||||||||
---|---|---|---|---|---|---|---|---|---|---|---|---|---|---|---|---|---|---|---|---|---|---|---|---|---|---|---|---|---|---|---|---|---|---|---|---|---|---|---|---|---|---|---|---|---|---|---|---|---|---|---|---|---|---|---|---|---|---|---|---|---|---|---|---|---|---|---|---|---|---|---|---|---|---|---|---|---|---|---|---|---|---|---|---|---|---|---|---|---|---|---|---|---|---|---|---|---|---|---|---|---|---|---|---|---|---|---|---|---|---|---|---|---|---|---|---|---|---|---|---|---|---|---|---|---|---|---|---|---|---|---|---|---|---|---|---|---|---|---|---|---|---|---|---|---|---|---|---|---|---|---|---|---|---|
Dec. 31, 2023 | ||||||||||||||||||||||||||||||||||||||||||||||||||||||||||||||||||||||||||||||||||||||||||||||||||||||||||||||||||||||||||||||||||||||||||||||||||||||||||
Notes Tables | ||||||||||||||||||||||||||||||||||||||||||||||||||||||||||||||||||||||||||||||||||||||||||||||||||||||||||||||||||||||||||||||||||||||||||||||||||||||||||
Schedule of Inventory, Current [Table Text Block] |
|
Note 8 - Fixed Assets (Tables) |
12 Months Ended | ||||||||||||||||||||||||||||||||||||||||||||||||||||||||||||||||||||||||||||||||||||||||||||||||||||||||||||||||||||||||||||||||||||||||||||||||||||||||||||||||||||||||||||||||||||||||||||||||||||||||||||||||||||||||||||||||||||||||||||||||||||||||||||||||||||
---|---|---|---|---|---|---|---|---|---|---|---|---|---|---|---|---|---|---|---|---|---|---|---|---|---|---|---|---|---|---|---|---|---|---|---|---|---|---|---|---|---|---|---|---|---|---|---|---|---|---|---|---|---|---|---|---|---|---|---|---|---|---|---|---|---|---|---|---|---|---|---|---|---|---|---|---|---|---|---|---|---|---|---|---|---|---|---|---|---|---|---|---|---|---|---|---|---|---|---|---|---|---|---|---|---|---|---|---|---|---|---|---|---|---|---|---|---|---|---|---|---|---|---|---|---|---|---|---|---|---|---|---|---|---|---|---|---|---|---|---|---|---|---|---|---|---|---|---|---|---|---|---|---|---|---|---|---|---|---|---|---|---|---|---|---|---|---|---|---|---|---|---|---|---|---|---|---|---|---|---|---|---|---|---|---|---|---|---|---|---|---|---|---|---|---|---|---|---|---|---|---|---|---|---|---|---|---|---|---|---|---|---|---|---|---|---|---|---|---|---|---|---|---|---|---|---|---|---|---|---|---|---|---|---|---|---|---|---|---|---|---|---|---|---|---|---|---|---|---|---|---|---|---|---|---|---|---|---|---|---|---|
Dec. 31, 2023 | |||||||||||||||||||||||||||||||||||||||||||||||||||||||||||||||||||||||||||||||||||||||||||||||||||||||||||||||||||||||||||||||||||||||||||||||||||||||||||||||||||||||||||||||||||||||||||||||||||||||||||||||||||||||||||||||||||||||||||||||||||||||||||||||||||||
Notes Tables | |||||||||||||||||||||||||||||||||||||||||||||||||||||||||||||||||||||||||||||||||||||||||||||||||||||||||||||||||||||||||||||||||||||||||||||||||||||||||||||||||||||||||||||||||||||||||||||||||||||||||||||||||||||||||||||||||||||||||||||||||||||||||||||||||||||
Property, Plant and Equipment [Table Text Block] |
|
Note 9 - Intangible Assets (Tables) |
12 Months Ended | ||||||||||||||||||||||||||||||||||||||||||||||||||||||||||||||||||||||||||||||||||||||||||||||||||||||||||||||||||||||||||||||||||||||||||||||||||||||||||||||||||||||||||||||||||||||||||||||||||||||||||||||||||||||||||||||||||||||||||
---|---|---|---|---|---|---|---|---|---|---|---|---|---|---|---|---|---|---|---|---|---|---|---|---|---|---|---|---|---|---|---|---|---|---|---|---|---|---|---|---|---|---|---|---|---|---|---|---|---|---|---|---|---|---|---|---|---|---|---|---|---|---|---|---|---|---|---|---|---|---|---|---|---|---|---|---|---|---|---|---|---|---|---|---|---|---|---|---|---|---|---|---|---|---|---|---|---|---|---|---|---|---|---|---|---|---|---|---|---|---|---|---|---|---|---|---|---|---|---|---|---|---|---|---|---|---|---|---|---|---|---|---|---|---|---|---|---|---|---|---|---|---|---|---|---|---|---|---|---|---|---|---|---|---|---|---|---|---|---|---|---|---|---|---|---|---|---|---|---|---|---|---|---|---|---|---|---|---|---|---|---|---|---|---|---|---|---|---|---|---|---|---|---|---|---|---|---|---|---|---|---|---|---|---|---|---|---|---|---|---|---|---|---|---|---|---|---|---|---|---|---|---|---|---|---|---|---|---|---|---|---|---|---|---|---|
Dec. 31, 2023 | |||||||||||||||||||||||||||||||||||||||||||||||||||||||||||||||||||||||||||||||||||||||||||||||||||||||||||||||||||||||||||||||||||||||||||||||||||||||||||||||||||||||||||||||||||||||||||||||||||||||||||||||||||||||||||||||||||||||||||
Notes Tables | |||||||||||||||||||||||||||||||||||||||||||||||||||||||||||||||||||||||||||||||||||||||||||||||||||||||||||||||||||||||||||||||||||||||||||||||||||||||||||||||||||||||||||||||||||||||||||||||||||||||||||||||||||||||||||||||||||||||||||
Schedule of Finite-Lived Intangible Assets [Table Text Block] |
|
||||||||||||||||||||||||||||||||||||||||||||||||||||||||||||||||||||||||||||||||||||||||||||||||||||||||||||||||||||||||||||||||||||||||||||||||||||||||||||||||||||||||||||||||||||||||||||||||||||||||||||||||||||||||||||||||||||||||||
Schedule of Acquired Finite-Lived Intangible Assets by Major Class [Table Text Block] |
|
||||||||||||||||||||||||||||||||||||||||||||||||||||||||||||||||||||||||||||||||||||||||||||||||||||||||||||||||||||||||||||||||||||||||||||||||||||||||||||||||||||||||||||||||||||||||||||||||||||||||||||||||||||||||||||||||||||||||||
Schedule of Finite-Lived Intangible Assets, Future Amortization Expense [Table Text Block] |
|
Note 10 - Goodwill (Tables) |
12 Months Ended | ||||||||||||||||||||||||||||||||||||||||||||||||||||||||||||||||||||||||||||||||||||||||||||||||||||||||||||||||||||||||||||||||||||||||||||||||||||||||||||
---|---|---|---|---|---|---|---|---|---|---|---|---|---|---|---|---|---|---|---|---|---|---|---|---|---|---|---|---|---|---|---|---|---|---|---|---|---|---|---|---|---|---|---|---|---|---|---|---|---|---|---|---|---|---|---|---|---|---|---|---|---|---|---|---|---|---|---|---|---|---|---|---|---|---|---|---|---|---|---|---|---|---|---|---|---|---|---|---|---|---|---|---|---|---|---|---|---|---|---|---|---|---|---|---|---|---|---|---|---|---|---|---|---|---|---|---|---|---|---|---|---|---|---|---|---|---|---|---|---|---|---|---|---|---|---|---|---|---|---|---|---|---|---|---|---|---|---|---|---|---|---|---|---|---|---|---|---|
Dec. 31, 2023 | |||||||||||||||||||||||||||||||||||||||||||||||||||||||||||||||||||||||||||||||||||||||||||||||||||||||||||||||||||||||||||||||||||||||||||||||||||||||||||||
Notes Tables | |||||||||||||||||||||||||||||||||||||||||||||||||||||||||||||||||||||||||||||||||||||||||||||||||||||||||||||||||||||||||||||||||||||||||||||||||||||||||||||
Schedule of Goodwill [Table Text Block] |
|
Note 11 - Long-term Debt (Tables) |
12 Months Ended | ||||||||||||||||||||||||||||||||||||||||||||||||||||||||||||||||||||||||||||||||||||||||||||||||||||||||||||
---|---|---|---|---|---|---|---|---|---|---|---|---|---|---|---|---|---|---|---|---|---|---|---|---|---|---|---|---|---|---|---|---|---|---|---|---|---|---|---|---|---|---|---|---|---|---|---|---|---|---|---|---|---|---|---|---|---|---|---|---|---|---|---|---|---|---|---|---|---|---|---|---|---|---|---|---|---|---|---|---|---|---|---|---|---|---|---|---|---|---|---|---|---|---|---|---|---|---|---|---|---|---|---|---|---|---|---|---|---|
Dec. 31, 2023 | |||||||||||||||||||||||||||||||||||||||||||||||||||||||||||||||||||||||||||||||||||||||||||||||||||||||||||||
Notes Tables | |||||||||||||||||||||||||||||||||||||||||||||||||||||||||||||||||||||||||||||||||||||||||||||||||||||||||||||
Schedule of Debt [Table Text Block] |
|
||||||||||||||||||||||||||||||||||||||||||||||||||||||||||||||||||||||||||||||||||||||||||||||||||||||||||||
Schedule of Maturities of Long-Term Debt [Table Text Block] |
|
Note 12 - Redeemable Non-controlling Interests (Tables) |
12 Months Ended | ||||||||||||||||||||||||||||||||||||||||||||||||||||||||||||||||||||||||||||||||||||||||||
---|---|---|---|---|---|---|---|---|---|---|---|---|---|---|---|---|---|---|---|---|---|---|---|---|---|---|---|---|---|---|---|---|---|---|---|---|---|---|---|---|---|---|---|---|---|---|---|---|---|---|---|---|---|---|---|---|---|---|---|---|---|---|---|---|---|---|---|---|---|---|---|---|---|---|---|---|---|---|---|---|---|---|---|---|---|---|---|---|---|---|---|
Dec. 31, 2023 | |||||||||||||||||||||||||||||||||||||||||||||||||||||||||||||||||||||||||||||||||||||||||||
Notes Tables | |||||||||||||||||||||||||||||||||||||||||||||||||||||||||||||||||||||||||||||||||||||||||||
Redeemable Noncontrolling Interest [Table Text Block] |
|
Note 13 - Capital Stock (Tables) |
12 Months Ended | ||||||||||||||||||||||||||||||||||||
---|---|---|---|---|---|---|---|---|---|---|---|---|---|---|---|---|---|---|---|---|---|---|---|---|---|---|---|---|---|---|---|---|---|---|---|---|---|
Dec. 31, 2023 | |||||||||||||||||||||||||||||||||||||
Notes Tables | |||||||||||||||||||||||||||||||||||||
Schedule of Stock by Class [Table Text Block] |
|
Note 14 - Stock-based Compensation (Tables) |
12 Months Ended | |||||||||||||||||||||||||||||||||||||||||||||||||||||||||||||||||||||||||||||||||||||||||||||||||||||||||||||||||||||||||||||||||||||||||||||||||||||||||||||||||||||||||||||||||||||||||||
---|---|---|---|---|---|---|---|---|---|---|---|---|---|---|---|---|---|---|---|---|---|---|---|---|---|---|---|---|---|---|---|---|---|---|---|---|---|---|---|---|---|---|---|---|---|---|---|---|---|---|---|---|---|---|---|---|---|---|---|---|---|---|---|---|---|---|---|---|---|---|---|---|---|---|---|---|---|---|---|---|---|---|---|---|---|---|---|---|---|---|---|---|---|---|---|---|---|---|---|---|---|---|---|---|---|---|---|---|---|---|---|---|---|---|---|---|---|---|---|---|---|---|---|---|---|---|---|---|---|---|---|---|---|---|---|---|---|---|---|---|---|---|---|---|---|---|---|---|---|---|---|---|---|---|---|---|---|---|---|---|---|---|---|---|---|---|---|---|---|---|---|---|---|---|---|---|---|---|---|---|---|---|---|---|---|---|---|---|
Dec. 31, 2023 | ||||||||||||||||||||||||||||||||||||||||||||||||||||||||||||||||||||||||||||||||||||||||||||||||||||||||||||||||||||||||||||||||||||||||||||||||||||||||||||||||||||||||||||||||||||||||||||
Notes Tables | ||||||||||||||||||||||||||||||||||||||||||||||||||||||||||||||||||||||||||||||||||||||||||||||||||||||||||||||||||||||||||||||||||||||||||||||||||||||||||||||||||||||||||||||||||||||||||||
Share-Based Payment Arrangement, Option, Activity [Table Text Block] |
|
|||||||||||||||||||||||||||||||||||||||||||||||||||||||||||||||||||||||||||||||||||||||||||||||||||||||||||||||||||||||||||||||||||||||||||||||||||||||||||||||||||||||||||||||||||||||||||
Stock Options Exercised [Table Text Block] |
|
|||||||||||||||||||||||||||||||||||||||||||||||||||||||||||||||||||||||||||||||||||||||||||||||||||||||||||||||||||||||||||||||||||||||||||||||||||||||||||||||||||||||||||||||||||||||||||
Schedule of Share-Based Payment Award, Stock Options, Valuation Assumptions [Table Text Block] |
|
Note 15 - Income Tax (Tables) |
12 Months Ended | |||||||||||||||||||||||||||||||||||||||||||||||||||||||||||||||||||||||||||||||||||||||||||||||||||||||||||||||||||||||||||||||||||||||||||||||||||||||||||||||||||||||||||
---|---|---|---|---|---|---|---|---|---|---|---|---|---|---|---|---|---|---|---|---|---|---|---|---|---|---|---|---|---|---|---|---|---|---|---|---|---|---|---|---|---|---|---|---|---|---|---|---|---|---|---|---|---|---|---|---|---|---|---|---|---|---|---|---|---|---|---|---|---|---|---|---|---|---|---|---|---|---|---|---|---|---|---|---|---|---|---|---|---|---|---|---|---|---|---|---|---|---|---|---|---|---|---|---|---|---|---|---|---|---|---|---|---|---|---|---|---|---|---|---|---|---|---|---|---|---|---|---|---|---|---|---|---|---|---|---|---|---|---|---|---|---|---|---|---|---|---|---|---|---|---|---|---|---|---|---|---|---|---|---|---|---|---|---|---|---|---|---|---|---|---|---|
Dec. 31, 2023 | ||||||||||||||||||||||||||||||||||||||||||||||||||||||||||||||||||||||||||||||||||||||||||||||||||||||||||||||||||||||||||||||||||||||||||||||||||||||||||||||||||||||||||||
Notes Tables | ||||||||||||||||||||||||||||||||||||||||||||||||||||||||||||||||||||||||||||||||||||||||||||||||||||||||||||||||||||||||||||||||||||||||||||||||||||||||||||||||||||||||||||
Schedule of Effective Income Tax Rate Reconciliation [Table Text Block] |
|
|||||||||||||||||||||||||||||||||||||||||||||||||||||||||||||||||||||||||||||||||||||||||||||||||||||||||||||||||||||||||||||||||||||||||||||||||||||||||||||||||||||||||||
Schedule of Income before Income Tax, Domestic and Foreign [Table Text Block] |
|
|||||||||||||||||||||||||||||||||||||||||||||||||||||||||||||||||||||||||||||||||||||||||||||||||||||||||||||||||||||||||||||||||||||||||||||||||||||||||||||||||||||||||||
Schedule of Components of Income Tax Expense (Benefit) [Table Text Block] |
|
|||||||||||||||||||||||||||||||||||||||||||||||||||||||||||||||||||||||||||||||||||||||||||||||||||||||||||||||||||||||||||||||||||||||||||||||||||||||||||||||||||||||||||
Schedule of Deferred Tax Assets and Liabilities [Table Text Block] |
|
|||||||||||||||||||||||||||||||||||||||||||||||||||||||||||||||||||||||||||||||||||||||||||||||||||||||||||||||||||||||||||||||||||||||||||||||||||||||||||||||||||||||||||
Summary of Operating Loss Carryforwards [Table Text Block] |
|
Note 16 - Net Earnings Per Common Share (Tables) |
12 Months Ended | ||||||||||||||||||||||||||||||||||||||||||||||||||||||||||||||||||||||||
---|---|---|---|---|---|---|---|---|---|---|---|---|---|---|---|---|---|---|---|---|---|---|---|---|---|---|---|---|---|---|---|---|---|---|---|---|---|---|---|---|---|---|---|---|---|---|---|---|---|---|---|---|---|---|---|---|---|---|---|---|---|---|---|---|---|---|---|---|---|---|---|---|---|
Dec. 31, 2023 | |||||||||||||||||||||||||||||||||||||||||||||||||||||||||||||||||||||||||
Notes Tables | |||||||||||||||||||||||||||||||||||||||||||||||||||||||||||||||||||||||||
Schedule of Earnings Per Share, Basic and Diluted [Table Text Block] |
|
Note 17 - Other Supplemental Information (Tables) |
12 Months Ended | |||||||||||||||||||||||||||||||||||||||||||||
---|---|---|---|---|---|---|---|---|---|---|---|---|---|---|---|---|---|---|---|---|---|---|---|---|---|---|---|---|---|---|---|---|---|---|---|---|---|---|---|---|---|---|---|---|---|---|
Dec. 31, 2023 | ||||||||||||||||||||||||||||||||||||||||||||||
Notes Tables | ||||||||||||||||||||||||||||||||||||||||||||||
Schedule of Other Supplement Information [Table Text Block] |
|
Note 18 - Financial Instruments (Tables) |
12 Months Ended | ||||||||||||||||||||||||||||||||||||||||||||||||||||||||||||||||||||||||||||||||||||||||||||||||||||||
---|---|---|---|---|---|---|---|---|---|---|---|---|---|---|---|---|---|---|---|---|---|---|---|---|---|---|---|---|---|---|---|---|---|---|---|---|---|---|---|---|---|---|---|---|---|---|---|---|---|---|---|---|---|---|---|---|---|---|---|---|---|---|---|---|---|---|---|---|---|---|---|---|---|---|---|---|---|---|---|---|---|---|---|---|---|---|---|---|---|---|---|---|---|---|---|---|---|---|---|---|---|---|---|
Dec. 31, 2023 | |||||||||||||||||||||||||||||||||||||||||||||||||||||||||||||||||||||||||||||||||||||||||||||||||||||||
Notes Tables | |||||||||||||||||||||||||||||||||||||||||||||||||||||||||||||||||||||||||||||||||||||||||||||||||||||||
Schedule of Fair Value, Assets and Liabilities Measured on Recurring Basis [Table Text Block] |
|
||||||||||||||||||||||||||||||||||||||||||||||||||||||||||||||||||||||||||||||||||||||||||||||||||||||
Schedule of Business Acquisitions by Acquisition, Contingent Consideration [Table Text Block] |
|
||||||||||||||||||||||||||||||||||||||||||||||||||||||||||||||||||||||||||||||||||||||||||||||||||||||
Fair Value, by Balance Sheet Grouping [Table Text Block] |
|
Note 21 - Segmented Information (Tables) |
12 Months Ended | |||||||||||||||||||||||||||||||||||||||||||||||||||||||||||||||||||||||||||||||||||||||||||||||||||||||||||||||||||||||||||||||||||||||||||||||||||||||||||||||||||||||||||||||||||||||||||||||||||||||||||||||||||||||||||||||||||||||||||||||||||||||||||||||||||||||||||||||||||||||||||||||||||||||||||||||||||||||||||||||||||||||||||||||||||||||||||||||||||||||||||||||||||||||||||||||||||||||||||||||||||||||||||||||||||||||||||||||||||||||||||||||||||||||||||||||||||||||||||||||||||||||||||||
---|---|---|---|---|---|---|---|---|---|---|---|---|---|---|---|---|---|---|---|---|---|---|---|---|---|---|---|---|---|---|---|---|---|---|---|---|---|---|---|---|---|---|---|---|---|---|---|---|---|---|---|---|---|---|---|---|---|---|---|---|---|---|---|---|---|---|---|---|---|---|---|---|---|---|---|---|---|---|---|---|---|---|---|---|---|---|---|---|---|---|---|---|---|---|---|---|---|---|---|---|---|---|---|---|---|---|---|---|---|---|---|---|---|---|---|---|---|---|---|---|---|---|---|---|---|---|---|---|---|---|---|---|---|---|---|---|---|---|---|---|---|---|---|---|---|---|---|---|---|---|---|---|---|---|---|---|---|---|---|---|---|---|---|---|---|---|---|---|---|---|---|---|---|---|---|---|---|---|---|---|---|---|---|---|---|---|---|---|---|---|---|---|---|---|---|---|---|---|---|---|---|---|---|---|---|---|---|---|---|---|---|---|---|---|---|---|---|---|---|---|---|---|---|---|---|---|---|---|---|---|---|---|---|---|---|---|---|---|---|---|---|---|---|---|---|---|---|---|---|---|---|---|---|---|---|---|---|---|---|---|---|---|---|---|---|---|---|---|---|---|---|---|---|---|---|---|---|---|---|---|---|---|---|---|---|---|---|---|---|---|---|---|---|---|---|---|---|---|---|---|---|---|---|---|---|---|---|---|---|---|---|---|---|---|---|---|---|---|---|---|---|---|---|---|---|---|---|---|---|---|---|---|---|---|---|---|---|---|---|---|---|---|---|---|---|---|---|---|---|---|---|---|---|---|---|---|---|---|---|---|---|---|---|---|---|---|---|---|---|---|---|---|---|---|---|---|---|---|---|---|---|---|---|---|---|---|---|---|---|---|---|---|---|---|---|---|---|---|---|---|---|---|---|---|---|---|---|---|---|---|---|---|---|---|---|---|---|---|---|---|---|---|---|---|---|---|---|---|---|---|---|---|---|---|---|---|---|---|---|---|---|---|---|---|---|---|---|---|---|---|---|---|---|---|---|---|---|---|---|---|---|---|---|---|---|---|---|---|---|---|---|---|---|---|---|---|---|---|---|---|---|---|---|---|---|---|---|---|---|---|---|---|---|---|
Dec. 31, 2023 | ||||||||||||||||||||||||||||||||||||||||||||||||||||||||||||||||||||||||||||||||||||||||||||||||||||||||||||||||||||||||||||||||||||||||||||||||||||||||||||||||||||||||||||||||||||||||||||||||||||||||||||||||||||||||||||||||||||||||||||||||||||||||||||||||||||||||||||||||||||||||||||||||||||||||||||||||||||||||||||||||||||||||||||||||||||||||||||||||||||||||||||||||||||||||||||||||||||||||||||||||||||||||||||||||||||||||||||||||||||||||||||||||||||||||||||||||||||||||||||||||||||||||||||||
Notes Tables | ||||||||||||||||||||||||||||||||||||||||||||||||||||||||||||||||||||||||||||||||||||||||||||||||||||||||||||||||||||||||||||||||||||||||||||||||||||||||||||||||||||||||||||||||||||||||||||||||||||||||||||||||||||||||||||||||||||||||||||||||||||||||||||||||||||||||||||||||||||||||||||||||||||||||||||||||||||||||||||||||||||||||||||||||||||||||||||||||||||||||||||||||||||||||||||||||||||||||||||||||||||||||||||||||||||||||||||||||||||||||||||||||||||||||||||||||||||||||||||||||||||||||||||||
Schedule of Segment Reporting Information, by Segment [Table Text Block] |
|
|||||||||||||||||||||||||||||||||||||||||||||||||||||||||||||||||||||||||||||||||||||||||||||||||||||||||||||||||||||||||||||||||||||||||||||||||||||||||||||||||||||||||||||||||||||||||||||||||||||||||||||||||||||||||||||||||||||||||||||||||||||||||||||||||||||||||||||||||||||||||||||||||||||||||||||||||||||||||||||||||||||||||||||||||||||||||||||||||||||||||||||||||||||||||||||||||||||||||||||||||||||||||||||||||||||||||||||||||||||||||||||||||||||||||||||||||||||||||||||||||||||||||||||
Schedule of Revenue from External Customers and Long-Lived Assets, by Geographical Areas [Table Text Block] |
|
Note 1 - Description of the Business (Details Textual) |
12 Months Ended |
---|---|
Dec. 31, 2023 | |
Number of Reportable Segments | 2 |
Note 3 - Revenue From Contracts With Customers 1 (Details Textual) - USD ($) $ in Thousands |
12 Months Ended | |
---|---|---|
Dec. 31, 2023 |
Dec. 31, 2022 |
|
External Broker Costs and Employee Sales Commissions [Member] | ||
Capitalized Contract Cost, Amortization | $ 2,817 | $ 2,014 |
Capitalized Contract Cost, Net | 11,610 | 8,802 |
Capitalized Contract Cost, Impairment Loss | 0 | |
FirstService Brands Segment [Member] | ||
Contract with Customer, Liability, Revenue Recognized | $ 5,752 | $ 4,649 |
FirstService Brands Segment [Member] | Franchise [Member] | Minimum [Member] | ||
Revenue Recognized Period (Year) | 5 years | |
FirstService Brands Segment [Member] | Franchise [Member] | Maximum [Member] | ||
Revenue Recognized Period (Year) | 10 years |
Note 3 - Revenue From Contracts With Customers 2 (Details Textual) - USD ($) $ in Thousands |
Dec. 31, 2023 |
Dec. 31, 2022 |
---|---|---|
Revenue, Remaining Performance Obligation, Expected Timing of Satisfaction, Start Date [Axis]: 2023-01-01 | ||
Revenue, Remaining Performance Obligation, Amount | $ 631,660 | |
Revenue, Remaining Performance Obligation, Expected Timing of Satisfaction, Period (Month) | 12 months | |
Revenue, Remaining Performance Obligation, Expected Timing of Satisfaction, Start Date [Axis]: 2024-01-01 | ||
Revenue, Remaining Performance Obligation, Amount | $ 838,335 | |
Revenue, Remaining Performance Obligation, Expected Timing of Satisfaction, Period (Month) | 12 months |
Note 3 - Revenue From Contracts With Customers - Disaggregation of Revenue (Details) - USD ($) $ in Thousands |
12 Months Ended | |
---|---|---|
Dec. 31, 2023 |
Dec. 31, 2022 |
|
Revenues | $ 4,334,548 | $ 3,745,835 |
FirstService Residential Segment [Member] | ||
Revenues | 1,996,823 | 1,772,258 |
FirstService Brands Segment [Member] | ||
Revenues | 2,337,725 | 1,973,577 |
FirstService Brands Segment [Member] | Franchisor Owned Outlet [Member] | ||
Revenues | 2,122,691 | 1,773,446 |
FirstService Brands Segment [Member] | Franchisor [Member] | ||
Revenues | 208,704 | 195,299 |
FirstService Brands Segment [Member] | Franchise [Member] | ||
Revenues | $ 6,330 | $ 4,832 |
Note 4 - Acquisitions - Assets Acquired and Liabilities Assumed (Details) - USD ($) $ in Thousands |
12 Months Ended | ||||||
---|---|---|---|---|---|---|---|
Dec. 31, 2023 |
Dec. 31, 2022 |
Dec. 31, 2021 |
|||||
Cash consideration | $ 547,182 | $ 51,994 | |||||
Goodwill | 289,746 | 40,006 | |||||
Goodwill | 1,179,825 | 886,086 | $ 843,362 | ||||
Roofing Corp of America [Member] | |||||||
Accounts receivable | 83,943 | ||||||
Other current assets | 26,362 | ||||||
Non-current assets | 22,871 | ||||||
Accounts payable | (30,531) | ||||||
Accrued liabilities | (14,171) | ||||||
Other current liabilities | (13,364) | ||||||
Non-current liabilities | (5,491) | ||||||
Deferred tax liabilities | (5,062) | ||||||
Redeemable non-controlling interest | (46,255) | ||||||
Business acquisition total | 18,302 | ||||||
Cash consideration | 445,160 | ||||||
Less: cash acquired | (19,883) | ||||||
Acquisition date fair value of contingent consideration | 21,902 | ||||||
Total purchase consideration | 447,179 | ||||||
Business Combination, Recognized Identifiable Assets Acquired and Liabilities Assumed, Finite-Lived Intangibles | [1] | 234,770 | |||||
Goodwill | 194,107 | ||||||
All Other Acquisitions [Member] | |||||||
Accounts receivable | 27,919 | ||||||
Other current assets | 5,089 | ||||||
Non-current assets | 6,581 | ||||||
Accounts payable | (13,826) | ||||||
Accrued liabilities | (4,592) | ||||||
Other current liabilities | (5,507) | ||||||
Non-current liabilities | (3,378) | ||||||
Deferred tax liabilities | (14,243) | ||||||
Redeemable non-controlling interest | (17,604) | ||||||
Business acquisition total | (19,561) | ||||||
Cash consideration | [2] | 146,265 | |||||
Less: cash acquired | (9,735) | ||||||
Acquisition date fair value of contingent consideration | 10,669 | ||||||
Total purchase consideration | 147,199 | ||||||
Business Combination, Recognized Identifiable Assets Acquired and Liabilities Assumed, Finite-Lived Intangibles | 71,121 | ||||||
Goodwill | 95,639 | ||||||
Acquisition 2023 [Member] | |||||||
Accounts receivable | 111,862 | ||||||
Other current assets | 31,451 | ||||||
Non-current assets | 29,452 | ||||||
Accounts payable | (44,357) | ||||||
Accrued liabilities | (18,763) | ||||||
Other current liabilities | (18,871) | ||||||
Non-current liabilities | (8,869) | ||||||
Deferred tax liabilities | (19,305) | ||||||
Redeemable non-controlling interest | (63,859) | ||||||
Business acquisition total | (1,259) | ||||||
Cash consideration | 591,425 | ||||||
Less: cash acquired | (29,618) | ||||||
Acquisition date fair value of contingent consideration | 32,571 | ||||||
Total purchase consideration | 594,378 | ||||||
Business Combination, Recognized Identifiable Assets Acquired and Liabilities Assumed, Finite-Lived Intangibles | 305,891 | ||||||
Goodwill | $ 289,746 | ||||||
Acquisitions 2022 [Member] | |||||||
Accounts receivable | 11,478 | ||||||
Other current assets | 11,764 | ||||||
Non-current assets | 7,848 | ||||||
Accounts payable | (3,877) | ||||||
Accrued liabilities | (3,305) | ||||||
Other current liabilities | (7,114) | ||||||
Non-current liabilities | (3,804) | ||||||
Deferred tax liabilities | (2,008) | ||||||
Redeemable non-controlling interest | (18,262) | ||||||
Business acquisition total | (7,280) | ||||||
Cash consideration | 51,994 | ||||||
Less: cash acquired | (8,318) | ||||||
Acquisition date fair value of contingent consideration | 8,933 | ||||||
Total purchase consideration | 60,927 | ||||||
Acquired intangible assets | 28,201 | ||||||
Goodwill | $ 40,006 | ||||||
|
Note 4 - Acquisitions - Assets Acquired and Liabilities Assumed (Details) (Parentheticals) $ in Thousands |
12 Months Ended |
---|---|
Dec. 31, 2022
USD ($)
| |
Acquisitions 2022 [Member] | |
Cash acquired | $ 8,318 |
Note 4 - Acquisitions - Business Acquisitions, Pro Forma Revenue and Earnings (Details) - USD ($) $ in Thousands |
12 Months Ended | |
---|---|---|
Dec. 31, 2023 |
Dec. 31, 2022 |
|
Actual, revenues | $ 111,915 | |
Actual, net earnings | 6,820 | |
Supplemental pro forma (unaudited), revenues | 4,794,360 | $ 4,450,194 |
Supplemental pro forma (unaudited), net earnings | $ 182,933 | $ 198,381 |
Note 5 - Leases (Details Textual) - USD ($) $ in Thousands |
12 Months Ended | |
---|---|---|
Dec. 31, 2023 |
Dec. 31, 2022 |
|
Lessee, Operating Lease, Renewal Term (Year) | 15 years | |
Operating Lease, Expense | $ 53,906 | $ 49,544 |
Minimum [Member] | ||
Lessee, Operating Lease, Remaining Lease Term (Year) | 1 year | |
Maximum [Member] | ||
Lessee, Operating Lease, Remaining Lease Term (Year) | 15 years |
Note 5 - Leases - Supplemental Cash Flows Information (Details) $ in Thousands |
12 Months Ended |
---|---|
Dec. 31, 2023
USD ($)
| |
Cash paid for amounts included in the measurement of operating lease liabilities | $ 48,690 |
Right-of-use assets obtained in exchange for operating lease obligation | $ 64,240 |
Weighted Average Remaining Operating Lease Term (years) (Year) | 6 years |
Weighted Average Discount Rate | 5.40% |
Note 5 - Leases - Future Minimum Operating Lease Payments (Details) $ in Thousands |
Dec. 31, 2023
USD ($)
|
---|---|
2024 | $ 56,460 |
2025 | 55,997 |
2026 | 45,963 |
2027 | 32,554 |
2028 | 24,096 |
Thereafter | 63,541 |
Total future minimum lease payments | 278,611 |
Less imputed interest | (43,790) |
Total | $ 234,821 |
Note 6 - Other Income, Net (Details Textual) - USD ($) $ in Thousands |
3 Months Ended | 12 Months Ended | |
---|---|---|---|
Jun. 30, 2023 |
Dec. 31, 2023 |
Dec. 31, 2022 |
|
Proceeds from Sale of Property, Plant, and Equipment | $ 7,350 | $ 0 | |
Gain (Loss) on Disposition of Property Plant Equipment | 4,351 | (0) | |
Building [Member] | |||
Proceeds from Sale of Property, Plant, and Equipment | $ 7,350 | ||
Gain (Loss) on Disposition of Property Plant Equipment | $ 4,351 | $ 4,351 | $ (0) |
Note 6 - Other Income, Net - Other (Income) Expense (Details) - USD ($) $ in Thousands |
3 Months Ended | 12 Months Ended | |
---|---|---|---|
Jun. 30, 2023 |
Dec. 31, 2023 |
Dec. 31, 2022 |
|
Gain on sale of building asset | $ (4,351) | $ 0 | |
Other income | (1,459) | (146) | |
Other Nonoperating Income (Expense) | (5,810) | (146) | |
Building [Member] | |||
Gain on sale of building asset | $ (4,351) | $ (4,351) | $ 0 |
Note 7 - Components of Working Capital Accounts (Details Textual) $ in Thousands |
Dec. 31, 2023
USD ($)
|
---|---|
Other Liabilities [Member] | |
Value Appreciation Plans | $ 62,268 |
Note 7 - Components of Working Capital Accounts - Components of Working Capital Accounts (Details) - USD ($) $ in Thousands |
Dec. 31, 2023 |
Dec. 31, 2022 |
||
---|---|---|---|---|
Work-in-progress | $ 181,751 | $ 177,134 | ||
Finished goods | 26,350 | 32,340 | ||
Supplies and other | 38,091 | 32,867 | ||
Inventory, Net | 246,192 | 242,341 | ||
Accrued payroll and benefits | 176,921 | 146,852 | ||
Value appreciation plans(1) | [1] | 4,874 | 9,403 | |
Customer advances | 7,149 | 6,397 | ||
Other | 138,792 | 119,672 | ||
Accrued Liabilities, Current | $ 327,736 | $ 282,324 | ||
|
Note 8 - Fixed Assets (Details Textual) - USD ($) $ in Thousands |
Dec. 31, 2023 |
Dec. 31, 2022 |
---|---|---|
Finance Lease, Right-of-Use Asset, before Accumulated Amortization | $ 36,915 | $ 32,207 |
Finance Lease, Right-of-Use Asset, after Accumulated Amortization | $ 21,298 | $ 12,712 |
Note 8 - Fixed Assets - Components of Fixed Assets (Details) - USD ($) $ in Thousands |
Dec. 31, 2023 |
Dec. 31, 2022 |
---|---|---|
Cost | $ 613,456 | $ 525,908 |
Accumulated depreciation | 409,268 | 358,896 |
Net | 204,188 | 167,012 |
Land [Member] | ||
Cost | 26 | 1,279 |
Accumulated depreciation | 0 | 0 |
Net | 26 | 1,279 |
Building [Member] | ||
Cost | 4,554 | 9,277 |
Accumulated depreciation | 589 | 3,620 |
Net | 3,965 | 5,657 |
Vehicles [Member] | ||
Cost | 156,900 | 128,047 |
Accumulated depreciation | 94,937 | 84,041 |
Net | 61,963 | 44,006 |
Furniture and Fixtures [Member] | ||
Cost | 172,841 | 161,142 |
Accumulated depreciation | 120,980 | 104,565 |
Net | 51,861 | 56,577 |
Computer Equipment [Member] | ||
Cost | 213,309 | 175,544 |
Accumulated depreciation | 152,607 | 130,542 |
Net | 60,702 | 45,002 |
Leasehold Improvements [Member] | ||
Cost | 65,826 | 50,619 |
Accumulated depreciation | 40,155 | 36,128 |
Net | $ 25,671 | $ 14,491 |
Note 9 - Intangible Assets - Components of Intangible Assets (Details) - USD ($) $ in Thousands |
Dec. 31, 2023 |
Dec. 31, 2022 |
---|---|---|
Gross carrying amount | $ 969,103 | $ 655,431 |
Accumulated amortization | 341,092 | 286,980 |
Net | 628,011 | 368,451 |
Customer Relationships [Member] | ||
Gross carrying amount | 683,006 | 451,970 |
Accumulated amortization | 198,911 | 163,913 |
Net | 484,095 | 288,057 |
Franchise Rights [Member] | ||
Gross carrying amount | 58,363 | 53,702 |
Accumulated amortization | 42,972 | 36,919 |
Net | 15,391 | 16,783 |
Trademarks and Trade Names [Member] | ||
Gross carrying amount | 51,412 | 29,424 |
Accumulated amortization | 18,674 | 18,705 |
Net | 32,738 | 10,719 |
Other Intangible Assets [Member] | ||
Gross carrying amount | 176,322 | 120,335 |
Accumulated amortization | 80,535 | 67,443 |
Net | $ 95,787 | $ 52,892 |
Note 9 - Intangible Assets - Acquired Intangible Assets (Details) $ in Thousands |
12 Months Ended |
---|---|
Dec. 31, 2023
USD ($)
| |
Amount | $ 305,891 |
Finite-Lived Intangible Asset, Useful Life (Year) | 19 years 1 month 6 days |
Customer Relationships [Member] | |
Amount | $ 224,940 |
Finite-Lived Intangible Asset, Useful Life (Year) | 19 years 6 months |
Trademarks and Trade Names [Member] | |
Amount | $ 21,880 |
Finite-Lived Intangible Asset, Useful Life (Year) | 15 years |
Other Intangible Assets [Member] | |
Amount | $ 59,071 |
Finite-Lived Intangible Asset, Useful Life (Year) | 19 years 1 month 6 days |
Note 9 - Intangible Assets - Estimated Annual Amortization Expense for Recorded Intangible Assets (Details) $ in Thousands |
Dec. 31, 2023
USD ($)
|
---|---|
2024 | $ 61,092 |
2025 | 59,808 |
2026 | 58,134 |
2027 | 54,730 |
2028 | $ 51,969 |
Note 10 - Goodwill (Details Textual) $ in Thousands |
12 Months Ended |
---|---|
Dec. 31, 2023
USD ($)
| |
Goodwill, Impairment Loss | $ 0 |
Note 10 - Goodwill - Components of Goodwill (Details) - USD ($) $ in Thousands |
12 Months Ended | |
---|---|---|
Dec. 31, 2023 |
Dec. 31, 2022 |
|
Balance | $ 886,086 | $ 843,362 |
Goodwill | 289,746 | 40,006 |
Other items | 3,277 | 4,679 |
Foreign exchange | 716 | (1,961) |
Balance | 1,179,825 | 886,086 |
FirstService Residential Segment [Member] | ||
Balance | 259,804 | 256,435 |
Goodwill | 59,456 | 2,219 |
Other items | 555 | 2,562 |
Foreign exchange | 503 | (1,412) |
Balance | 320,318 | 259,804 |
FirstService Brands Segment [Member] | ||
Balance | 626,282 | 586,927 |
Goodwill | 230,290 | 37,787 |
Other items | 2,722 | 2,117 |
Foreign exchange | 213 | (549) |
Balance | $ 859,507 | $ 626,282 |
Note 11 - Long-term Debt (Details Textual) - USD ($) |
1 Months Ended | 12 Months Ended | ||||
---|---|---|---|---|---|---|
Sep. 30, 2022 |
Feb. 28, 2022 |
Dec. 31, 2023 |
Jan. 31, 2024 |
Dec. 31, 2022 |
Dec. 31, 2021 |
|
Senior Notes | $ 60,000,000 | $ 90,000,000 | ||||
The Term Loan [Member] | ||||||
Long-Term Debt, Total | $ 407,000,000 | $ 440,000,000 | ||||
Senior Unsecured Notes [Member] | ||||||
Senior Notes | $ 60,000,000 | |||||
Line of Credit Facility, Maximum Borrowing Capacity | $ 450,000,000 | |||||
Debt Instrument, Term (Year) | 3 years | |||||
Senior Unsecured Notes [Member] | NYL Investors LLC [Member] | ||||||
Line of Credit Facility, Maximum Borrowing Capacity | $ 150,000,000 | |||||
Senior Unsecured Notes [Member] | PGIM Private Capital [Member] | ||||||
Line of Credit Facility, Maximum Borrowing Capacity | $ 300,000,000 | |||||
Private Placement 4.53% Notes [Member] | ||||||
Debt Instrument, Interest Rate, Stated Percentage | 4.53% | |||||
Debt Instrument, Face Amount | $ 60,000,000 | |||||
Private Placement 5.48 Notes% [Member] | Subsequent Event [Member] | ||||||
Debt Instrument, Interest Rate, Stated Percentage | 5.48% | |||||
Debt Instrument, Face Amount | $ 50,000,000 | |||||
Private Placement 5.60% Notes [Member] | Subsequent Event [Member] | ||||||
Debt Instrument, Interest Rate, Stated Percentage | 5.60% | |||||
Debt Instrument, Face Amount | $ 25,000,000 | |||||
Private Placement 5.64% Notes [Member] | Subsequent Event [Member] | ||||||
Debt Instrument, Interest Rate, Stated Percentage | 5.64% | |||||
Debt Instrument, Face Amount | $ 50,000,000 | |||||
Credit Agreement and Senior Notes [Member] | ||||||
Debt Instrument, Interest Rate, Effective Percentage | 5.97% | 3.78% | ||||
Revolving Credit Facility [Member] | ||||||
Line of Credit Facility, Maximum Borrowing Capacity | $ 1,000,000 | $ 450,000,000 | ||||
Debt, Weighted Average Interest Rate | 6.29% | |||||
Line of Credit Facility, Remaining Borrowing Capacity | $ 155,450,000 | |||||
Letters of Credit Outstanding, Amount | 19,050,000 | $ 15,655,000 | ||||
Revolving Credit Facility [Member] | Credit Agreement Accordion [Member] | ||||||
Proceeds from Lines of Credit | $ 250,000,000 | |||||
Revolving Credit Facility [Member] | Minimum [Member] | ||||||
Debt Instrument, Basis Spread on Variable Rate | 0.20% | |||||
Revolving Credit Facility [Member] | Maximum [Member] | ||||||
Debt Instrument, Basis Spread on Variable Rate | 2.50% | |||||
Senior Notes [Member] | ||||||
Debt Instrument, Interest Rate, Stated Percentage | 3.84% |
Note 11 - Long-term Debt - Long-term Debt and Convertible Debentures (Details) - USD ($) $ in Thousands |
Dec. 31, 2023 |
Dec. 31, 2022 |
---|---|---|
3.84% Senior Notes | $ 60,000 | $ 90,000 |
Capital leases maturing at various dates through 2028 | 20,048 | 15,334 |
Other long-term debt maturing at various dates up to 2023 | 0 | 457 |
Long-Term Debt and Lease Obligation, Including Current Maturities | 1,182,107 | 734,463 |
Less: current portion | 37,132 | 35,665 |
Long-term debt - non-current | 1,144,975 | 698,798 |
Private Placement 4.53% Notes [Member] | ||
Debt instrument, carrying amount | 60,000 | 60,000 |
Revolving Credit Facility [Member] | ||
Debt instrument, carrying amount | $ 1,042,059 | $ 568,672 |
Note 11 - Long-term Debt - Principal Repayments on Long-term Debt (Details) $ in Thousands |
Dec. 31, 2023
USD ($)
|
---|---|
2024 | $ 37,132 |
2025 | 36,187 |
2026 | 3,578 |
2027 | 1,044,428 |
2028 and thereafter | $ 60,782 |
Note 12 - Redeemable Non-controlling Interests (Details Textual) - USD ($) $ / shares in Units, $ in Thousands |
12 Months Ended | ||
---|---|---|---|
Dec. 31, 2023 |
Dec. 31, 2022 |
Dec. 31, 2021 |
|
Redeemable Noncontrolling Interest, Equity, Carrying Amount | $ 332,963 | $ 233,429 | $ 219,135 |
Common Shares to Be Issued Upon Settlement of All Put or Call Options (in shares) | 1,800,000 | ||
Potential Increase Decrease to Dilutive Earnings Per Share Put or Call Options Settled with Common Shares (in dollars per share) | $ 0.75 | ||
Redemption Amount [Member] | |||
Redeemable Noncontrolling Interest, Equity, Carrying Amount | $ 293,911 | $ 208,946 |
Note 12 - Redeemable Non-controlling Interests - Reconciliation of the Beginning and Ending NCI Amounts (Details) - USD ($) $ in Thousands |
12 Months Ended | |
---|---|---|
Dec. 31, 2023 |
Dec. 31, 2022 |
|
Balance | $ 233,429 | $ 219,135 |
RNCI share of earnings | 14,140 | 9,381 |
RNCI redemption increment | 32,490 | 14,552 |
Distributions paid to RNCI | (7,376) | (8,061) |
Purchases of interests from RNCI, net | (4,285) | (21,451) |
RNCI recognized on business acquisitions | 63,859 | 18,262 |
Other | 706 | 1,611 |
Balance | $ 332,963 | $ 233,429 |
Note 13 - Capital Stock - Capital Stock Issued and Outstanding (Details) $ in Thousands |
Dec. 31, 2023
USD ($)
shares
|
---|---|
Capital stock issued and outstanding, shares (in shares) | shares | 44,682,427 |
Capital stock issued and outstanding, amount | $ | $ 855,817 |
Note 14 - Stock-based Compensation (Details Textual) - USD ($) $ / shares in Units, $ in Thousands |
12 Months Ended | |
---|---|---|
Dec. 31, 2023 |
Dec. 31, 2022 |
|
Share-based Compensation Arrangement by Share-based Payment Award, Award Vesting Period (Year) | 5 years | |
Share-Based Payment Arrangement, Option, Exercise Price Range, Lower Range Limit (in dollars per share) | $ 83.89 | |
Share-Based Payment Arrangement, Option, Exercise Price Range, Upper Range Limit (in dollars per share) | $ 162.25 | |
Share-Based Payment Arrangement, Nonvested Award, Cost Not yet Recognized, Amount | $ 21,024 | |
Share-based Payment Arrangement, Nonvested Award, Cost Not yet Recognized, Period for Recognition (Year) | 4 years | |
Share-Based Compensation Arrangement by Share-Based Payment Award, Options, Vested in Period, Fair Value | $ 16,204 | $ 12,623 |
Share-Based Payment Arrangement, Option [Member] | ||
Share-based Compensation Arrangement by Share-based Payment Award, Award Vesting Period (Year) | 4 years | |
Share-based Compensation Arrangement by Share-based Payment Award, Expiration Period (Year) | 5 years | |
Share-Based Compensation Arrangement by Share-Based Payment Award, Number of Shares Available for Grant (in shares) | 1,918,740 | |
Share-Based Payment Arrangement, Expense | $ 21,385 | $ 18,046 |
Note 14 - Stock-based Compensation - Stock Option Activity (Details) $ / shares in Units, $ in Thousands |
12 Months Ended |
---|---|
Dec. 31, 2023
USD ($)
$ / shares
shares
| |
Balance (in shares) | shares | 2,337,573 |
Balance (in dollars per share) | $ / shares | $ 120.06 |
Granted, number of options (in shares) | shares | 615,000 |
Granted, weighted average exercise price (in dollars per share) | $ / shares | $ 142.2 |
Exercised, number of options (in shares) | shares | (455,934) |
Exercised, weighted average exercise price (in dollars per share) | $ / shares | $ 73.73 |
Forfeited, number of options (in shares) | shares | (75,890) |
Forfeited, weighted average exercise price (in dollars per share) | $ / shares | $ 144.43 |
Balance (in shares) | shares | 2,420,749 |
Balance (in dollars per share) | $ / shares | $ 133.65 |
Shares issuable under options - end of period, weighted average remaining contractual life (Year) | 2 years 6 months |
Shares issuable under options - end of period, aggregate intrinsic value | $ | $ 68,849 |
Options exercisable - End of period, number of options (in shares) | shares | 1,044,891 |
Options exercisable - End of period, weighted average exercise price (in dollars per share) | $ / shares | $ 120.6 |
Options exercisable - End of period, weighted average remaining contractual life (Year) | 1 year 7 months 6 days |
Options exercisable - End of period, aggregate instrinsic value | $ | $ 43,351 |
Note 14 - Stock-based Compensation - Options Exercised (Details) - USD ($) $ in Thousands |
12 Months Ended | |
---|---|---|
Dec. 31, 2023 |
Dec. 31, 2022 |
|
Number of options exercised (in shares) | 455,934 | |
Aggregate fair value | $ 33,616 | $ 12,296 |
Share-Based Payment Arrangement, Option [Member] | ||
Number of options exercised (in shares) | 455,934 | |
Aggregate fair value | $ 66,499 | |
Intrinsic value | 32,883 | |
Amount of cash received | $ 33,616 |
Note 14 - Stock-based Compensation - Fair Value of Each Option Grant Assumptions Used (Details) |
12 Months Ended |
---|---|
Dec. 31, 2023
$ / shares
| |
Risk free rate | 4.00% |
Expected life in years (Year) | 4 years 2 months 12 days |
Expected volatility | 33.50% |
Dividend yield | 0.60% |
Weighted average fair value per option granted (in dollars per share) | $ 44.19 |
Note 15 - Income Tax (Details Textual) - USD ($) $ in Thousands |
12 Months Ended | |
---|---|---|
Dec. 31, 2023 |
Dec. 31, 2022 |
|
Tax Credit Carryforward Duration Limit (Year) | 20 years | |
Undistributed Earnings of Foreign Subsidiaries | $ 950,864 | $ 842,671 |
Unrecognized Tax Benefits, Ending Balance | 148 | 148 |
Unrecognized Tax Benefits that Would Impact Effective Tax Rate | 148 | 148 |
Tax Adjustments, Settlements, and Unusual Provisions | 0 | 0 |
Unrecognized Tax Benefits, Income Tax Penalties and Interest Accrued, Total | $ 38 | $ 38 |
Minimum [Member] | Foreign Tax Authority [Member] | Canada Revenue Agency [Member] | ||
Income Tax Return Examination Period (Year) | 3 years | |
Minimum [Member] | Foreign Tax Authority [Member] | Internal Revenue Service (IRS) [Member] | ||
Income Tax Return Examination Period (Year) | 3 years | |
Maximum [Member] | Foreign Tax Authority [Member] | Canada Revenue Agency [Member] | ||
Income Tax Return Examination Period (Year) | 4 years | |
Maximum [Member] | Foreign Tax Authority [Member] | Internal Revenue Service (IRS) [Member] | ||
Income Tax Return Examination Period (Year) | 5 years | |
Canada and United States [Member] | Minimum [Member] | ||
Tax Credit Carryforward Duration Limit (Year) | 9 years | |
Canada and United States [Member] | Maximum [Member] | ||
Tax Credit Carryforward Duration Limit (Year) | 20 years |
Note 15 - Income Tax - Effective Income Tax Rate Reconciliation (Details) - USD ($) $ in Thousands |
12 Months Ended | |
---|---|---|
Dec. 31, 2023 |
Dec. 31, 2022 |
|
Income tax expense using combined statutory rate of 26.5% (2022 - 26.5%) | $ 53,884 | $ 51,405 |
Permanent differences | 2,075 | 584 |
Adjustments to tax liabilities for prior periods | 111 | 230 |
Non-deductible stock-based compensation | 5,667 | 4,782 |
Foreign, state and provincial tax rate differential | (5,420) | (8,043) |
Other taxes | 0 | 16 |
Total | $ 56,317 | $ 48,974 |
Note 15 - Income Tax - Effective Income Tax Rate Reconciliation (Details) (Parentheticals) |
12 Months Ended | |
---|---|---|
Dec. 31, 2023 |
Dec. 31, 2022 |
|
Income tax expense using combined statutory rate, statutory rate | 26.50% | 26.50% |
Note 15 - Income Tax - Earning Before Income Tax by Jurisdiction (Details) - USD ($) $ in Thousands |
12 Months Ended | |
---|---|---|
Dec. 31, 2023 |
Dec. 31, 2022 |
|
Earnings before income tax | $ 203,338 | $ 193,981 |
Canada Revenue Agency [Member] | Foreign Tax Authority [Member] | ||
Earnings before income tax | 34,600 | 32,125 |
Internal Revenue Service (IRS) [Member] | Domestic Tax Authority [Member] | ||
Earnings before income tax | $ 168,738 | $ 161,856 |
Note 15 - Income Tax - Provision for (Recovery of) Income Tax (Details) - USD ($) $ in Thousands |
12 Months Ended | |
---|---|---|
Dec. 31, 2023 |
Dec. 31, 2022 |
|
Current | ||
Current income tax expense (recovery) | $ 73,761 | $ 40,986 |
Deferred | ||
Deferred income tax expense (recovery) | (17,444) | 7,988 |
Total | 56,317 | 48,974 |
Canada Revenue Agency [Member] | ||
Current | ||
Canada, current income tax expense (recovery) | 9,494 | 8,401 |
Deferred | ||
Canada, deferred income tax expense (recovery) | 375 | 431 |
Internal Revenue Service (IRS) [Member] | ||
Current | ||
United States, current income tax expense (recovery) | 64,267 | 32,585 |
Deferred | ||
United States, deferred income tax expense (recovery) | $ (17,819) | $ 7,557 |
Note 15 - Income Tax - Deferred Income Tax Components (Details) - USD ($) $ in Thousands |
Dec. 31, 2023 |
Dec. 31, 2022 |
---|---|---|
Loss carry-forwards | $ 4,943 | $ 2,251 |
Expenses not currently deductible | 37,225 | 31,353 |
Allowance for credit losses | 8,125 | 4,779 |
Inventory and other reserves | 1,836 | 3,357 |
Deferred Tax Assets, Gross | 52,129 | 41,740 |
Depreciation and amortization | 97,896 | 86,175 |
Basis differences of partnerships and other entities | 1,919 | 2,053 |
Prepaid and other expenses deducted for tax purposes | 2,186 | 1,896 |
Deferred Tax Liabilities, Gross | 102,001 | 90,124 |
Net deferred income tax asset (liability) before valuation allowance | (49,872) | (48,384) |
Valuation allowance | 1,400 | 1,017 |
Net deferred income tax asset (liability) | $ (51,272) | $ (49,401) |
Note 15 - Income Tax - Gross Operating Loss Carryforwards (Details) - USD ($) $ in Thousands |
Dec. 31, 2023 |
Dec. 31, 2022 |
---|---|---|
Loss carry forward | $ 4,943 | $ 2,251 |
Foreign Tax Authority [Member] | Canada Revenue Agency [Member] | ||
Loss carry forward | 2,048 | 2,336 |
Valuation allowance | 0 | 0 |
Net | 2,048 | 2,336 |
Domestic Tax Authority [Member] | Internal Revenue Service (IRS) [Member] | ||
Loss carry forward | 53,295 | 24,102 |
Valuation allowance | 20,360 | 18,324 |
Net | $ 32,935 | $ 5,778 |
Note 16 - Net Earnings Per Common Share - Reconciliation of the Denominator Used to Calculate Earnings Per Common Share (Details) - shares |
12 Months Ended | |
---|---|---|
Dec. 31, 2023 |
Dec. 31, 2022 |
|
Shares issued and outstanding at beginning of period (in shares) | 44,226,493 | 44,013,031 |
Issued during the period (in shares) | 329,888 | 162,076 |
Weighted average number of shares used in computing basic earnings per share (in shares) | 44,556,381 | 44,175,107 |
Assumed exercise of stock options, net of shares assumed acquired under the Treasury Stock Method (in shares) | 238,593 | 318,900 |
Number of shares used in computing diluted earnings per share (in shares) | 44,794,974 | 44,494,007 |
Note 17 - Other Supplemental Information - Summary of Other Supplemental Information (Details) - USD ($) $ in Thousands |
12 Months Ended | |
---|---|---|
Dec. 31, 2023 |
Dec. 31, 2022 |
|
Income taxes | $ 64,647 | $ 55,114 |
Interest | $ 49,717 | $ 23,687 |
Note 18 - Financial Instruments (Details Textual) $ in Thousands |
12 Months Ended | |
---|---|---|
Dec. 31, 2023
USD ($)
|
Dec. 31, 2022
USD ($)
|
|
Accounts Receivable, Allowance for Credit Loss, Writeoff | $ 8,102 | $ 2,172 |
Minimum [Member] | Measurement Input, Discount Rate [Member] | ||
Long-Term Debt, Measurement Input | 4.5 | |
Maximum [Member] | Measurement Input, Discount Rate [Member] | ||
Long-Term Debt, Measurement Input | 5 | |
Fair Value, Inputs, Level 3 [Member] | Contingent Consideration Liability [Member] | ||
Fair Value Inputs Discount Rate Data Point Concentration | 9.00% | |
Fair Value Inputs Weighted Average Discount Rate Increase | 2.00% | |
Fair Value, Inputs, Level 3 [Member] | Minimum [Member] | Measurement Input, Discount Rate [Member] | ||
Business Combination, Contingent Consideration, Liability, Measurement Input | 0.08 | |
Fair Value, Inputs, Level 3 [Member] | Maximum [Member] | Measurement Input, Discount Rate [Member] | ||
Business Combination, Contingent Consideration, Liability, Measurement Input | 0.10 | |
Interest Rate Swap [Member] | ||
Derivative, Number of Instruments Held | 2 | |
Derivative, Notional Amount | $ 182,500 |
Note 18 - Financial Instruments - Financial Assets and Liabilities Carried at Fair Value (Details) - USD ($) $ in Thousands |
Dec. 31, 2023 |
Dec. 31, 2022 |
Dec. 31, 2021 |
---|---|---|---|
Business Combination, Contingent Consideration, Liability | $ 63,478 | ||
Interest rate swap assets | 2,127 | ||
Fair Value, Inputs, Level 1 [Member] | |||
Business Combination, Contingent Consideration, Liability | 0 | ||
Interest rate swap assets | 0 | ||
Fair Value, Inputs, Level 2 [Member] | |||
Business Combination, Contingent Consideration, Liability | 0 | ||
Interest rate swap assets | 2,127 | ||
Fair Value, Inputs, Level 3 [Member] | |||
Business Combination, Contingent Consideration, Liability | 63,478 | $ 34,188 | $ 32,346 |
Interest rate swap assets | $ 0 |
Note 18 - Financial Instruments - Change in Fair Value of Contingent Consideration Liability (Details) - USD ($) $ in Thousands |
12 Months Ended | |
---|---|---|
Dec. 31, 2023 |
Dec. 31, 2022 |
|
Business Combination, Contingent Consideration Arrangements, Change in Amount of Contingent Consideration, Liability | $ 16,366 | $ (594) |
Balance | 63,478 | |
Less: current portion | 31,604 | 25,537 |
Non-current portion | 31,874 | 8,651 |
Fair Value, Inputs, Level 3 [Member] | ||
Balance | 34,188 | 32,346 |
Amounts recognized on acquisitions | 32,571 | 8,933 |
Business Combination, Contingent Consideration Arrangements, Change in Amount of Contingent Consideration, Liability | 16,366 | (594) |
Resolved and settled in cash | (20,136) | (6,806) |
Other | 489 | 309 |
Balance | 63,478 | 34,188 |
Less: current portion | 31,604 | 25,537 |
Non-current portion | $ 31,874 | $ 8,651 |
Note 18 - Financial Instruments - Estimated of Fair Values of Other Financial Instruments (Details) - USD ($) $ in Thousands |
Dec. 31, 2023 |
Dec. 31, 2022 |
---|---|---|
Reported Value Measurement [Member] | ||
Other receivables, fair value | $ 4,238 | $ 4,881 |
Long-term debt, fair value | 1,182,107 | 734,463 |
Estimate of Fair Value Measurement [Member] | ||
Other receivables, fair value | 4,238 | 4,881 |
Long-term debt, fair value | $ 1,183,854 | $ 736,818 |
Note 20 - Related Party Transactions (Details Textual) - USD ($) $ in Thousands |
12 Months Ended | |
---|---|---|
Dec. 31, 2023 |
Dec. 31, 2022 |
|
Operating Lease, Expense | $ 53,906 | $ 49,544 |
Minority Shareholders of Subsidiaries [Member] | ||
Operating Lease, Expense | $ 2,023 | 4,350 |
Lessee, Operating Lease, Term of Contract (Year) | 10 years | |
Financing Receivable, after Allowance for Credit Loss | $ 6,554 | $ 2,374 |
Minority Shareholders of Subsidiaries [Member] | Minimum [Member] | ||
Debt Instrument, Term (Year) | 5 years | |
Minority Shareholders of Subsidiaries [Member] | Maximum [Member] | ||
Debt Instrument, Term (Year) | 10 years |
Note 21 - Segmented Information (Details Textual) |
12 Months Ended |
---|---|
Dec. 31, 2023 | |
Number of Operating Segments | 2 |
Note 21 - Segmented Information - Operating Segments (Details) - USD ($) $ in Thousands |
12 Months Ended | |
---|---|---|
Dec. 31, 2023 |
Dec. 31, 2022 |
|
Revenues | $ 4,334,548 | $ 3,745,835 |
Depreciation and amortization | 127,934 | 110,140 |
Operating earnings (loss) | 244,892 | 219,026 |
Other income, net | 5,810 | 146 |
Interest expense, net | (47,364) | (25,191) |
Income taxes | 56,317 | 48,974 |
Net earnings | 147,021 | 145,007 |
Total assets | 3,625,743 | 2,774,514 |
Total additions to long lived assets | 727,942 | 211,162 |
Income taxes | (56,317) | (48,974) |
FirstService Residential Segment [Member] | ||
Revenues | 1,996,823 | 1,772,258 |
Depreciation and amortization | 33,114 | 28,611 |
Operating earnings (loss) | 155,044 | 138,873 |
Other income, net | ||
Interest expense, net | ||
Income taxes | ||
Net earnings | ||
Total assets | 939,586 | 836,691 |
Total additions to long lived assets | 139,174 | 56,354 |
Income taxes | ||
FirstService Brands Segment [Member] | ||
Revenues | 2,337,725 | 1,973,577 |
Depreciation and amortization | 94,729 | 81,439 |
Operating earnings (loss) | 126,468 | 111,638 |
Other income, net | ||
Interest expense, net | ||
Income taxes | ||
Net earnings | ||
Total assets | 2,679,848 | 1,931,847 |
Total additions to long lived assets | 588,768 | 152,960 |
Income taxes | ||
Corporate Segment [Member] | ||
Revenues | 0 | 0 |
Depreciation and amortization | 91 | 90 |
Operating earnings (loss) | (36,620) | (31,485) |
Other income, net | ||
Interest expense, net | ||
Income taxes | ||
Net earnings | ||
Total assets | 6,309 | 5,976 |
Total additions to long lived assets | 0 | 1,848 |
Income taxes |
Note 21 - Segmented Information - Revenues and Long-lived Assets by Geographic Location (Details) - USD ($) $ in Thousands |
12 Months Ended | |
---|---|---|
Dec. 31, 2023 |
Dec. 31, 2022 |
|
Revenues | $ 4,334,548 | $ 3,745,835 |
Total long-lived assets | 2,230,323 | 1,627,093 |
UNITED STATES | ||
Revenues | 3,771,219 | 3,279,533 |
Total long-lived assets | 1,827,117 | 1,290,619 |
CANADA | ||
Revenues | 563,329 | 466,302 |
Total long-lived assets | $ 403,206 | $ 336,474 |
7>&R.%7JP%XZU#^!DX3-=>)>Z@7AV*G*>DSQCXP8 LQ,R23RYP@<6 M\C +3TK[8+)SEX"<2B>)$#,I?-TJ'S#)PY@\J:1SA'F4RS%U$#.H_,)#1CZ0 MD8?)N#NX?J/#XB[R!(.&?JS1-4N@3^4>C0?/-<-H_.[3*W?QE_"(.7H1,QIE MOKP=(,G#D#RJ<>$C $>> ZXV9=D6CZ*"^J>;_E!(\8>8'*$>9YD8UPG$CD'7ZGM