Exhibit 99.1

INOVALON REPORTS FIRST QUARTER 2017 RESULTS
First Quarter 2017 Highlights
· First quarter revenue of $108.3 million
· First quarter net income of $3.6 million, resulting in diluted net income of $0.02 per share
· First quarter Non-GAAP net income of $9.7 million, resulting in Non-GAAP diluted net income of $0.07 per share
· First quarter Adjusted EBITDA of $25.0 million
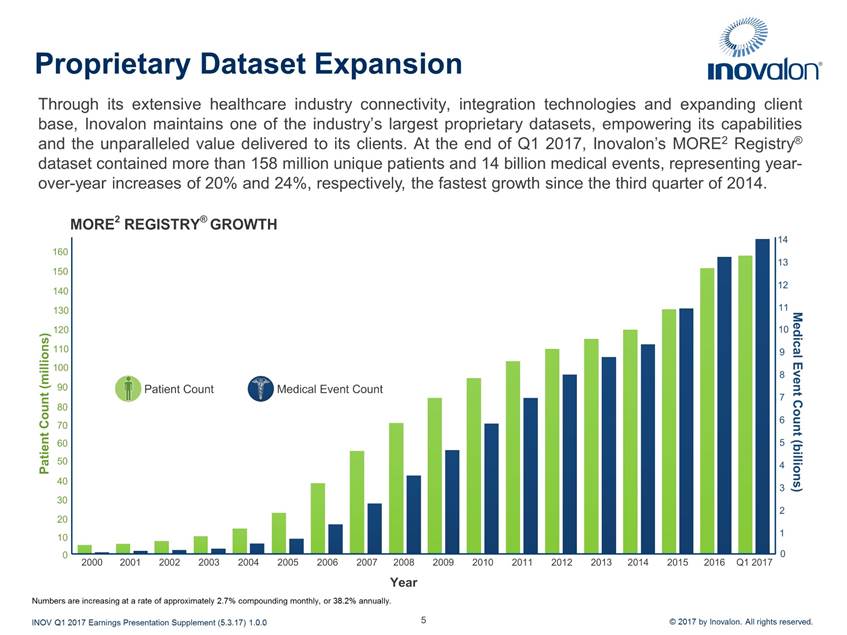
· MORE2 Registry® dataset medical event count expanded to more than 14 billion, unique patient count expanded to more than 158 million
Please refer to our First Quarter 2017 Earnings Presentation Supplement available at http://investors.inovalon.com for additional information, including slides that will be referenced during the Company’s conference call.
BOWIE, Md. — May 3, 2017 — Inovalon (Nasdaq: INOV), a leading technology company providing advanced, cloud-based platforms empowering a data-driven transformation from volume-based to value-based models across the healthcare ecosystem, today announced financial results for the first quarter of 2017.
“During the first quarter of 2017, we delivered financial results ahead of plan and continued to see a number of positive forces building in our business,” said Keith Dunleavy, M.D., Inovalon’s Chief Executive Officer and Chairman of the Board. “We continue to achieve meaningful expansion of our platform capabilities, analytical sophistication, compute scale, connectivity, and proprietary datasets. This combination is increasingly strengthening and differentiating the Company. Together with our investments in sales and marketing, this is supporting an ongoing expansion of our client base and new contract wins across a widening range of market adjacencies. Altogether, this is providing us an increasing level of confidence in our 2017 outlook.”
First Quarter 2017 Financial Results
· Revenue for the first quarter of 2017 was $108.3 million, compared with $102.7 million for the first quarter of 2016.
· Cost of revenue for the first quarter of 2017 was $38.3 million, or 35.3% of revenue, compared with 40.8% of revenue for the first quarter of 2016. This translates into gross margin for the first quarter of 2017 of 64.7% compared with 59.2% for the first quarter of 2016, an increase of 550 basis points.
· Net income for the first quarter of 2017 was $3.6 million resulting in diluted net income per share of $0.02, compared with $2.4 million and $0.02 per share, respectively, for the first quarter of 2016.
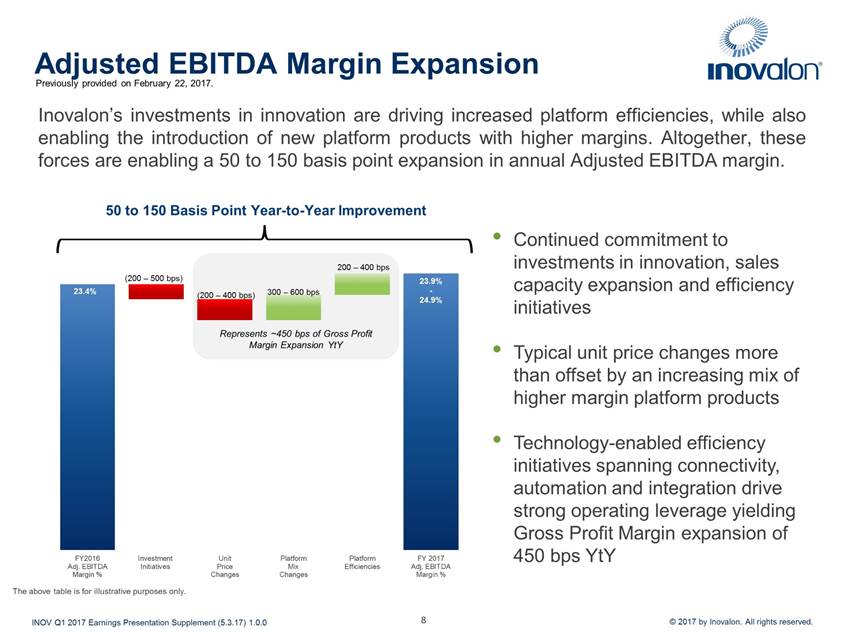
· Adjusted EBITDA was $25.0 million for the first quarter of 2017, compared with $18.5 million for the first quarter of 2016, an increase of 35%. Adjusted EBITDA margin was 23.0% in the first quarter of 2017, compared with 18.1% for the first quarter of 2016, an increase of 490 basis points.
· Non-GAAP net income was $9.7 million for the first quarter of 2017, compared with $7.5 million for the first quarter of 2016, an increase of 29%. Non-GAAP diluted net income per share for the first quarter of 2017 was $0.07, compared with $0.05 per share for the first quarter of 2016.
“Overall, we are very pleased with the Company’s execution in the first quarter,” said Chris Greiner, Chief Financial and Operating Officer of Inovalon. “Inovalon delivered revenue ahead of expectations with notable margin expansion driven by our continued investments in technology-enabled efficiency initiatives, as well as favorable platform product mix. We continue to see the factors in our business that we have previously discussed materialize as expected, and with our positive first quarter performance we remain optimistic about 2017 and our return to double-digit organic growth in the second half of the year.”
Adjusted EBITDA, Adjusted EBITDA margin and Non-GAAP net income are non-GAAP measures. Net income is the GAAP financial measure most directly comparable to Adjusted EBITDA and Non-GAAP net income. Reconciliations of net income to Adjusted EBITDA and Non-GAAP net income, identifying the differences between net income and each of these non-GAAP financial measures, are included in this press release after the consolidated financial statements.
Key Highlights
· Better Than Expected First Quarter Performance. First quarter 2017 revenue of $108.3 million was above the Company’s expected range. Approximately $2 million of the higher revenue came from work originally expected to occur in the second quarter 2017. Gross margin in the first quarter improved by 550 basis points over the prior year’s first quarter, representing operating leverage from both technology-enabled efficiency initiatives and higher-margin product platform mix. As planned, the Company’s investments in new cloud-based platforms, connectivity, product modularity, and expanding technology-enabled automation and efficiencies are generating strong returns on invested capital. Together with the 250 basis point year-over-year improvement in General & Administrative expense as a percentage of revenue (despite the addition of
incremental General & Administrative expense from the acquisition of Creehan Holding Co., Inc. on October 1, 2016), the increase in gross margin in the first quarter supported significantly higher levels of investment in innovation and sales & marketing versus the prior year, while still enabling a material year-over-year Adjusted EBITDA margin expansion of 490 basis points.
· Continuing Investments. Inovalon’s ongoing investments in innovation, product development, and sales and marketing are driving differentiation and momentum in the business. Reflecting the significant number of opportunities that the Company sees in empowering the transformation to value-based healthcare, during the first quarter of 2017, Inovalon increased its investment in innovation to $17.7 million, a 52% increase from the year ago period. These continued investments in cloud-based platform technologies, on-demand real-time transactional analytics, connectivity, data model architecture, natural language processing, machine learning, and product modularity are resulting in expanding capability differentiation, new product offerings, and increasing margin improvement. Also during the first quarter of 2017, the Company further increased its investment in sales & marketing expense to $7.6 million, a 16% increase compared to the year ago period, and a 310% increase compared to the first quarter of 2015. This significant and sustained increase in investment has dramatically expanded the sales and marketing organization resources, specifically increasing the number of FTEs performing sales from 15 in the first quarter of 2015 to 79 in the first quarter of 2017. Combined with the new capabilities enabled through the Company’s ongoing innovation and product development initiatives, the expanded sales and marketing capacity and capability was evident during the quarter in material year-over-year increases in new client count, annualized revenue associated with new statements of work, the pace of progression of opportunities through the Company’s sales pipeline, and speed to opportunity closure.
· Continued Expansion of Proprietary Datasets. Continuing the trend witnessed in the fourth quarter of 2016, Inovalon’s increasing client base, product breadth, and connectivity drove strong expansion in the Company’s proprietary datasets in the first quarter of 2017. At the end of the first quarter, Inovalon’s MORE2 Registry® dataset contained more than 158 million unique patients and over 14 billion medical events, representing year-over-year increases of 20% and 24%, respectively. These growth rates represent an acceleration from the strong growth delivered in the fourth quarter of 2016, and are the fastest growth rates for these metrics since the third quarter of 2014.
· Expansion in Value-Based & Outcomes-Based Platform Demand. Inovalon is seeing continued demand in the payor market and increasing demand from the provider, pharmaceutical, and device manufacturer market segments for cloud-based platforms supporting value-based and outcomes-based model needs. During the first quarter of 2017, the Company entered into new agreements in both the device and pharmaceutical segments. One example is the Company’s recently-announced agreement with Amgen, one of the world’s leading biotechnology companies, to better manage healthcare costs and enable access to therapeutic solutions that deliver value to patients, payors, and providers. This adds to the company’s previously disclosed engagements with Boehringer
Ingelheim Pharmaceuticals Inc. and Bristol-Myers Squibb, as well as other engagements with leading players in the pharmaceutical and specialty pharmacy markets.
Other Financial Data and Key Metrics
The following constitute other financial and key metrics which are presented quarterly.
· Growth of Datasets: At March 31, 2017, the MORE2 Registry® dataset contained more than 158.4 million unique patient counts and 14 billion medical event counts, increases of 20% and 24%, respectively, compared with March 31, 2016.
· Investment in Innovation: For the quarter ended March 31, 2017, Inovalon’s ongoing investment supporting innovations in advanced, cloud-based platforms empowering a data-driven transformation from volume-based to value-based models was $17.7 million, or 16% of revenue, an increase of $6.1 million, or 52%, compared to the year ago period.
· Analytical Process Count Growth: Inovalon’s trailing 12-month Patient Analytical Month (PAM) count, which the Company believes is indicative of the Company’s overall level of analytical activity, grew to more than 28.3 billion as of March 31, 2017, an increase of 28% as compared with March 31, 2016.
Please see the Company’s filings with the Securities and Exchange Commission (SEC) for further detail regarding the preceding other financial data and key metrics.
Shares Outstanding
During the first quarter of 2017, Inovalon continued to repurchase shares of its Class A common stock in the open market, pursuant to its previously-announced share repurchase program, repurchasing approximately 2.1 million shares of Class A common stock for a total of $25.4 million. This brings the total number of shares repurchased from the open market since the start of the repurchase program to approximately 9.7 million shares. As of March 31, 2017, approximately $68.4 million remained available to repurchase shares under the Company’s share repurchase program. As of April 28, 2017, the Company had 63,243,236 million shares of Class A common stock outstanding and 82,745,283 million shares of Class B common stock outstanding.
2017 Financial Guidance
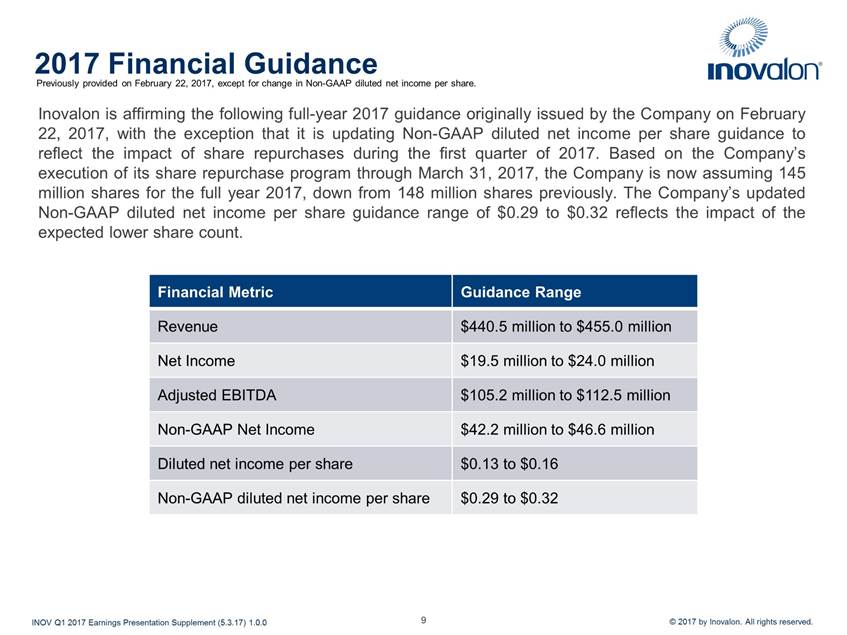
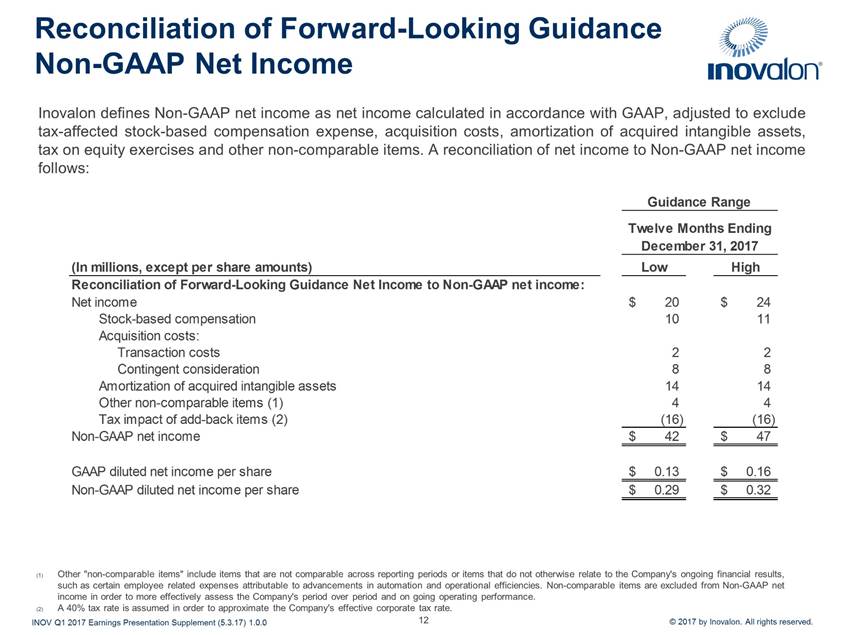
Inovalon is affirming the following full-year 2017 guidance originally issued by the Company on February 22, 2017, with the exception that it is updating Non-GAAP diluted net income per share guidance to reflect the impact of share repurchases during the first quarter of 2017:
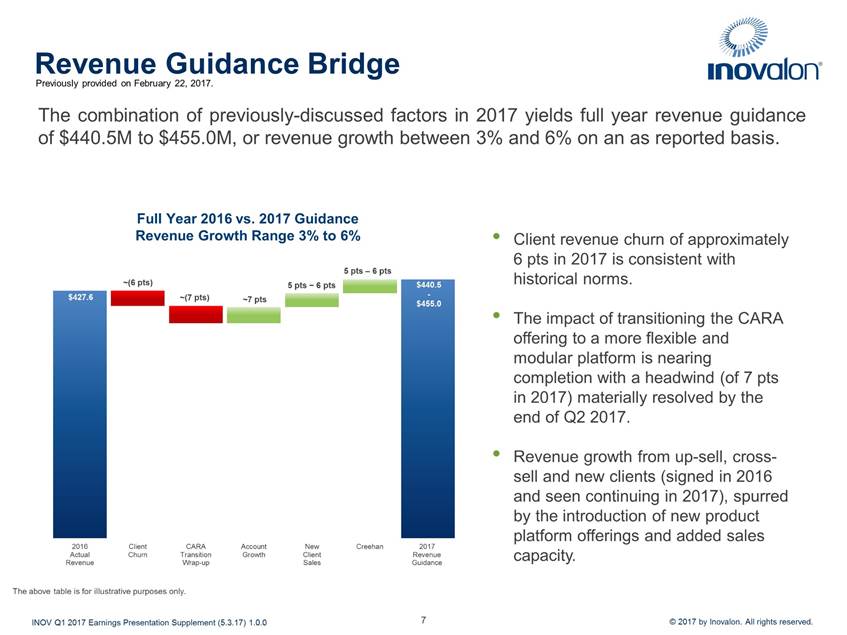
· Revenue is expected to be between $440.5 million and $455.0 million
· Net Income is expected to be between $19.5 million and $24.0 million
· Adjusted EBITDA is expected to be between $105.2 million and $112.5 million
· Non-GAAP net income is expected to be between $42.2 million and $46.6 million
· Diluted net income per share is expected to be between $0.13 and $0.16
· Non-GAAP diluted net income per share is expected to be between $0.29 and $0.32
Inovalon’s 2017 guidance excludes the impact of any acquisitions that have not yet been announced or consummated. In addition, while the Company’s sales pipeline contains a number of potentially significant strategic platform opportunities, 2017 guidance does not assume a significant contribution from these opportunities.
Reconciliations of net income, the GAAP financial measure most directly comparable to Adjusted EBITDA and Non-GAAP net income, identifying the differences between each of these non-GAAP financial measures and net income, are included in this press release after the consolidated financial statements.
While the ongoing implementation of the share repurchase program or changes in the stock price could change the fully diluted share count, under the treasury stock method, the Company is assuming 145 million shares for the full year 2017. Additionally, the Company’s guidance assumes a 40.0% effective tax rate for the full year 2017.
Conference Call
Inovalon will host a conference call to discuss its first quarter 2017 results at 5:00 pm Eastern Time today. To participate in Inovalon’s conference call, please dial (855) 783-2604, conference ID 7550980; international callers should dial (631) 485-4882 using the same conference ID. A replay will be available on Inovalon’s investor relations website (http://investors.inovalon.com).
Please refer to our First Quarter 2017 Earnings Presentation Supplement available at http://investors.inovalon.com for additional information, including slides that will be referenced during the Company’s conference call.
About Inovalon
Inovalon is a leading technology company providing cloud-based platforms empowering a data-driven transformation from volume-based to value-based models throughout the healthcare industry. Leveraging large-scale data interconnectivity capabilities, unparalleled proprietary data sets, advanced analytics, data-driven intervention systems, and industry-leading subject matter expertise, Inovalon enables the assessment and improvement of clinical and quality outcomes and financial performance across the healthcare ecosystem. From health plans and provider organizations, to pharmaceutical, medical device, and diagnostics companies, Inovalon’s unique achievement of value is delivered through the effective progression of “Turning Data into Insight, and Insight into Action®.” Providing technology that supports nearly 500 healthcare organizations, Inovalon’s platforms are informed by data pertaining to more than 856,000 physicians, 375,000 clinical facilities, and more than 158 million Americans. For more information, visit www.inovalon.com.
Forward Looking Statements
Certain statements contained in this press release constitute forward-looking statements within the meaning of, and are intended to be covered by the safe harbor provisions of, Section 27A of the Securities Act of 1933, as amended, and Section 21E of the Securities Exchange Act of 1934, as amended. All statements contained in this press release other than statements of historical fact, including but not limited to statements regarding the roll-out of any product or capability, the timing, performance characteristics and utility of any such product or capability, and the impact of any such product or capability on the healthcare industry, future results of operations and financial position, business strategy and plans, market growth, and objectives for future operations, are forward-looking statements. The words “believe,” “may,” “see,” “will,” “estimate,” “continue,” “anticipate,” “intend,” “expect,” and similar expressions are intended to identify forward-looking statements. Forward-looking statements in this press release include, but are not limited to, strategies and business plans, expectations regarding future results, plans to repurchase shares of Class A common stock, and financial guidance for the full-year 2017. Inovalon has based these forward-looking statements largely on current expectations and projections about future events and trends that may affect financial condition, results of operations, business strategy, short-term and long-term business operations and objectives, and financial needs. These forward-looking statements are subject to a number of risks, uncertainties, and assumptions, which could cause the future events and trends discussed in this press release not to occur and could cause actual results to differ materially and adversely from those anticipated or implied in the forward-looking statements.
These risks, uncertainties, and assumptions include, among others: the Company’s ability to continue and manage growth; ability to grow the client base, retain and renew the existing client base and maintain or increase the fees and activity with existing clients; the effect of the concentration of revenue among top clients; the ability to innovate new services and adapt platforms and toolsets; the ability to successfully implement growth strategies, including the ability to expand into adjacent verticals, such as direct to consumer, growing channel partnerships, expanding internationally and successfully pursuing acquisitions; the ability to successfully integrate our acquisitions and the ability of the acquired business to perform as expected; the successful implementation and adoption of new platforms and solutions, including Data Diagnostics® and INDICES® Value-Based Provider Platform; the possibility of technical, logistical or planning issues in connection with the Company’s investment in and successful deployment of the Company’s products, services and technological advancements; the ability to enter into new agreements with existing or new platforms, products and solutions in the timeframes expected, or at all; the impact of pending M&A activity in the managed care industry, including potential positive or negative impact on existing contracts or the demand for new contracts; the effects of and costs associated with compliance with regulations applicable to the Company, including regulations relating to data protection and data privacy; the ability to protect the privacy of clients’ data and prevent security breaches; the effect of competition on the business; and the efficacy of the Company’s platforms and toolsets. Additional information is also set forth in the Company’s Annual Report on Form 10-K for the year ended December 31, 2016, filed with the SEC on February 23, 2017, included under the heading Item 1A, “Risk Factors.” The Company is under no duty to, and disclaims any obligation to, update any of these
forward-looking statements after the date of this press release or conform these statements to actual results or revised expectations, except as required by law.
Use of Non-GAAP Financial Measures
In the Company’s earnings releases, prepared remarks, conference calls, slide presentations, and webcasts, there may be use or discussion of non-GAAP financial measures. The GAAP financial measure most directly comparable to each non-GAAP financial measure used or discussed, and a reconciliation of the differences between the comparable GAAP financial measure and each non-GAAP financial measure are included in this press release after the consolidated financial statements.
Inovalon Holdings, Inc.
Consolidated Statements of Income
(unaudited)
|
|
|
Three Months Ended |
| ||||
|
(In thousands, except per-share amounts) |
|
2017 |
|
2016 |
| ||
|
Revenue |
|
$ |
108,306 |
|
$ |
102,657 |
|
|
Expenses: |
|
|
|
|
| ||
|
Cost of revenue(1) |
|
38,285 |
|
41,923 |
| ||
|
Sales and marketing(1) |
|
7,587 |
|
6,559 |
| ||
|
Research and development(1) |
|
7,788 |
|
5,932 |
| ||
|
General and administrative(1) |
|
35,845 |
|
36,552 |
| ||
|
Depreciation and amortization |
|
12,485 |
|
8,394 |
| ||
|
Total operating expenses |
|
101,990 |
|
99,360 |
| ||
|
Income from operations |
|
6,316 |
|
3,297 |
| ||
|
Other income and (expenses): |
|
|
|
|
| ||
|
Realized gains (losses) on short-term investments |
|
— |
|
(4 |
) | ||
|
Gain on disposal of equipment |
|
— |
|
534 |
| ||
|
Interest income |
|
1,338 |
|
1,442 |
| ||
|
Interest expense |
|
(1,413 |
) |
(1,259 |
) | ||
|
Income before taxes |
|
6,241 |
|
4,010 |
| ||
|
Provision for income taxes |
|
2,599 |
|
1,645 |
| ||
|
Net income |
|
$ |
3,642 |
|
$ |
2,365 |
|
|
Net income attributable to common stockholders, basic and diluted |
|
$ |
3,569 |
|
$ |
2,356 |
|
|
Net income per share attributable to common stockholders, basic and diluted: |
|
|
|
|
| ||
|
Basic net income per share |
|
$ |
0.02 |
|
$ |
0.02 |
|
|
Diluted net income per share |
|
$ |
0.02 |
|
$ |
0.02 |
|
|
Weighted average shares of common stock outstanding: |
|
|
|
|
| ||
|
Basic |
|
144,729 |
|
151,282 |
| ||
|
Diluted |
|
145,165 |
|
152,355 |
| ||
|
(1) Includes stock-based compensation expense as follows: |
|
|
|
|
| ||
|
Cost of revenue |
|
$ |
305 |
|
$ |
119 |
|
|
Sales and marketing |
|
390 |
|
154 |
| ||
|
Research and development |
|
273 |
|
242 |
| ||
|
General and administrative |
|
2,629 |
|
1,577 |
| ||
|
Total stock-based compensation expense |
|
$ |
3,597 |
|
$ |
2,092 |
|
Inovalon Holdings, Inc.
Consolidated Balance Sheets
|
(In thousands) |
|
March 31, 2017 |
|
December 31, 2016 |
| ||
|
|
|
Unaudited |
|
|
| ||
|
ASSETS |
|
|
|
|
| ||
|
Current assets: |
|
|
|
|
| ||
|
Cash and cash equivalents |
|
$ |
147,888 |
|
$ |
127,683 |
|
|
Short-term investments |
|
385,422 |
|
445,315 |
| ||
|
Accounts receivable, net |
|
101,640 |
|
85,591 |
| ||
|
Prepaid expenses and other current assets |
|
12,987 |
|
12,100 |
| ||
|
Income tax receivable |
|
12,704 |
|
15,165 |
| ||
|
Total current assets |
|
660,641 |
|
685,854 |
| ||
|
Non-current assets: |
|
|
|
|
| ||
|
Property, equipment and capitalized software, net |
|
78,826 |
|
76,420 |
| ||
|
Goodwill |
|
184,557 |
|
184,557 |
| ||
|
Intangible assets, net |
|
99,776 |
|
103,549 |
| ||
|
Other assets |
|
3,854 |
|
2,964 |
| ||
|
Total assets |
|
$ |
1,027,654 |
|
$ |
1,053,344 |
|
|
LIABILITIES AND STOCKHOLDERS’ EQUITY |
|
|
|
|
| ||
|
Current liabilities: |
|
|
|
|
| ||
|
Accounts payable |
|
$ |
17,672 |
|
$ |
16,474 |
|
|
Accrued compensation |
|
10,072 |
|
15,211 |
| ||
|
Other current liabilities |
|
14,443 |
|
9,468 |
| ||
|
Deferred revenue |
|
16,851 |
|
11,850 |
| ||
|
Deferred rent |
|
1,065 |
|
1,016 |
| ||
|
Credit facilities |
|
33,750 |
|
30,000 |
| ||
|
Capital lease obligation |
|
117 |
|
115 |
| ||
|
Total current liabilities |
|
93,970 |
|
84,134 |
| ||
|
Non-current liabilities: |
|
|
|
|
| ||
|
Credit facilities, less current portion |
|
225,000 |
|
236,250 |
| ||
|
Capital lease obligation, less current portion |
|
187 |
|
215 |
| ||
|
Deferred rent |
|
1,194 |
|
1,457 |
| ||
|
Other liabilities |
|
7,403 |
|
13,158 |
| ||
|
Deferred income taxes |
|
34,497 |
|
34,553 |
| ||
|
Total liabilities |
|
362,251 |
|
369,767 |
| ||
|
Stockholders’ equity: |
|
|
|
|
| ||
|
Class A common stock |
|
— |
|
— |
| ||
|
Class B common stock |
|
1 |
|
1 |
| ||
|
Additional paid-in-capital |
|
519,691 |
|
516,300 |
| ||
|
Retained earnings |
|
277,729 |
|
274,087 |
| ||
|
Treasury stock |
|
(131,614 |
) |
(106,231 |
) | ||
|
Other comprehensive loss |
|
(404 |
) |
(580 |
) | ||
|
Total stockholders’ equity |
|
665,403 |
|
683,577 |
| ||
|
Total liabilities and stockholders’ equity |
|
$ |
1,027,654 |
|
$ |
1,053,344 |
|
Inovalon Holdings, Inc.
Consolidated Statements of Cash Flows
(unaudited)
|
|
|
Three Months Ended March 31, |
| ||||
|
(In thousands) |
|
2017 |
|
2016 |
| ||
|
Cash flows from operating activities: |
|
|
|
|
| ||
|
Net income |
|
$ |
3,642 |
|
$ |
2,365 |
|
|
Adjustments to reconcile net income to net cash provided by operating activities: |
|
|
|
|
| ||
|
Stock-based compensation expense |
|
3,597 |
|
2,092 |
| ||
|
Depreciation |
|
8,874 |
|
6,567 |
| ||
|
Amortization of intangibles |
|
3,611 |
|
1,827 |
| ||
|
Amortization of premiums on short-term investments |
|
591 |
|
871 |
| ||
|
Realized (gains) losses on short-term investments |
|
— |
|
4 |
| ||
|
Tax payments for equity award issuances |
|
— |
|
88 |
| ||
|
Deferred income taxes |
|
(113 |
) |
(1,252 |
) | ||
|
Excess tax benefits from stock-based compensation |
|
— |
|
(911 |
) | ||
|
Gain on disposal of equipment |
|
— |
|
(534 |
) | ||
|
Changes in assets and liabilities: |
|
|
|
|
| ||
|
Accounts receivable |
|
(16,049 |
) |
8,128 |
| ||
|
Prepaid expenses and other current assets |
|
(886 |
) |
(5,054 |
) | ||
|
Income taxes receivable |
|
2,381 |
|
2,037 |
| ||
|
Other assets |
|
(890 |
) |
78 |
| ||
|
Accounts payable |
|
69 |
|
(2,194 |
) | ||
|
Accrued compensation |
|
(6,467 |
) |
(3,877 |
) | ||
|
Other liabilities |
|
(816 |
) |
2,676 |
| ||
|
Deferred rent |
|
(214 |
) |
(149 |
) | ||
|
Deferred revenue |
|
5,001 |
|
1,537 |
| ||
|
Net cash provided by operating activities |
|
2,331 |
|
14,299 |
| ||
|
Cash flows from investing activities: |
|
|
|
|
| ||
|
Purchases of short-term investments |
|
— |
|
(80,065 |
) | ||
|
Sales and maturities of short-term investments |
|
59,615 |
|
84,671 |
| ||
|
Purchases of property and equipment |
|
(2,965 |
) |
(4,053 |
) | ||
|
Investment in capitalized software |
|
(5,605 |
) |
(2,790 |
) | ||
|
Net cash provided by (used in) investing activities |
|
51,045 |
|
(2,237 |
) | ||
|
Cash flows from financing activities: |
|
|
|
|
| ||
|
Repurchase of common stock |
|
(25,383 |
) |
— |
| ||
|
Repayment of credit facility borrowings |
|
(7,500 |
) |
(3,750 |
) | ||
|
Proceeds from exercise of stock options |
|
25 |
|
3,841 |
| ||
|
Capital lease obligations paid |
|
(116 |
) |
(31 |
) | ||
|
Tax payments for equity award issuances |
|
(197 |
) |
(182 |
) | ||
|
Excess tax benefits from stock-based compensation |
|
— |
|
911 |
| ||
|
Net cash provided by (used in) financing activities |
|
(33,171 |
) |
789 |
| ||
|
Increase in cash and cash equivalents |
|
20,205 |
|
12,851 |
| ||
|
Cash and cash equivalents, beginning of period |
|
127,683 |
|
114,034 |
| ||
|
Cash and cash equivalents, end of period |
|
$ |
147,888 |
|
$ |
126,885 |
|
Inovalon Holdings, Inc.
Adjusted Earnings Before Interest, Taxes, Depreciation and Amortization
(unaudited)
Inovalon defines Adjusted Earnings Before Interest, Taxes, Depreciation and Amortization (Adjusted EBITDA) as net income calculated in accordance with GAAP, adjusted for the impact of depreciation and amortization, realized losses on short-term investments, gain on disposal of equipment, interest expense, interest income, provision for income taxes, stock-based compensation, acquisition costs, tax on equity exercises, and other non-comparable items. Adjusted EBITDA margin is defined as Adjusted EBITDA as a percentage of revenue. A reconciliation of net income to Adjusted EBITDA follows:
|
|
|
Three Months Ended March 31, |
| ||||
|
(In thousands, except percentages) |
|
2017 |
|
2016 |
| ||
|
Reconciliation of Net Income to Adjusted EBITDA: |
|
|
|
|
| ||
|
Net income |
|
$ |
3,642 |
|
$ |
2,365 |
|
|
Depreciation and amortization |
|
12,485 |
|
8,394 |
| ||
|
Realized (gains) losses on short-term investments |
|
— |
|
4 |
| ||
|
Gain on disposal of equipment |
|
— |
|
(534 |
) | ||
|
Interest expense |
|
1,413 |
|
1,259 |
| ||
|
Interest income |
|
(1,338 |
) |
(1,442 |
) | ||
|
Provision for income taxes |
|
2,599 |
|
1,645 |
| ||
|
EBITDA |
|
18,801 |
|
11,691 |
| ||
|
Stock-based compensation |
|
3,597 |
|
2,092 |
| ||
|
Acquisition costs: |
|
|
|
|
| ||
|
Transaction costs |
|
100 |
|
615 |
| ||
|
Integration costs |
|
713 |
|
— |
| ||
|
Contingent consideration |
|
930 |
|
3,218 |
| ||
|
Tax on equity exercises |
|
32 |
|
88 |
| ||
|
Other non-comparable items(1) |
|
780 |
|
832 |
| ||
|
Adjusted EBITDA |
|
$ |
24,953 |
|
$ |
18,536 |
|
|
Adjusted EBITDA margin |
|
23.0 |
% |
18.1 |
% | ||
(1) Other “non-comparable items” include items that are not comparable across reporting periods or items that do not otherwise relate to the Company’s ongoing financial results, such as certain employee related expenses attributable to advancements in automation and operational efficiencies. Non-comparable items are excluded from Adjusted EBITDA in order to more effectively assess the Company’s period over period and on going operating performance.
Inovalon Holdings, Inc.
Non-GAAP net income
(unaudited)
Inovalon defines Non-GAAP net income as net income calculated in accordance with GAAP, adjusted to exclude tax-affected stock-based compensation expense, acquisition costs, amortization of acquired intangible assets, tax on equity exercises and other non-comparable items. A reconciliation of net income to Non-GAAP net income follows:
|
|
|
Three Months Ended March 31, |
| ||||
|
(In thousands, except per share amounts) |
|
2017 |
|
2016 |
| ||
|
Reconciliation of Net Income to Non-GAAP net income: |
|
|
|
|
| ||
|
Net income |
|
$ |
3,642 |
|
$ |
2,365 |
|
|
Stock-based compensation |
|
3,597 |
|
2,092 |
| ||
|
Acquisition costs: |
|
|
|
|
| ||
|
Transaction costs |
|
100 |
|
615 |
| ||
|
Integration costs |
|
713 |
|
— |
| ||
|
Contingent consideration |
|
930 |
|
3,218 |
| ||
|
Amortization of acquired intangible assets |
|
3,774 |
|
1,827 |
| ||
|
Tax on equity exercises |
|
32 |
|
88 |
| ||
|
Other non-comparable items(1) |
|
780 |
|
832 |
| ||
|
Tax impact of add-back items |
|
(3,890 |
) |
(3,557 |
) | ||
|
Non-GAAP net income |
|
$ |
9,678 |
|
$ |
7,480 |
|
|
GAAP basic net income per share |
|
$ |
0.02 |
|
$ |
0.02 |
|
|
GAAP diluted net income per share |
|
$ |
0.02 |
|
$ |
0.02 |
|
|
Non-GAAP basic net income per share |
|
$ |
0.07 |
|
$ |
0.05 |
|
|
Non-GAAP diluted net income per share |
|
$ |
0.07 |
|
$ |
0.05 |
|
(1) Other “non-comparable items” include items that are not comparable across reporting periods or items that do not otherwise relate to the Company’s ongoing financial results, such as certain employee related expenses attributable to advancements in automation and operational efficiencies. Non-comparable items are excluded from Non-GAAP Net Income in order to more effectively assess the Company’s period over period and on going operating performance.
Inovalon Holdings, Inc.
Key Metrics
(unaudited)
The Company believes the key metrics illustrated in the tables below are indicative of its overall level of analytical activity and its underlying growth in the business.
|
|
|
As of March 31, |
| ||
|
(In thousands) |
|
2017 |
|
2016 |
|
|
MORE2 Registry® dataset metrics: |
|
|
|
|
|
|
Unique patient count(1) |
|
158,482 |
|
132,361 |
|
|
Medical event count(2) |
|
14,016,628 |
|
11,300,216 |
|
|
Trailing 12 month Patient Analytics Months (PAM)(3) |
|
28,303,430 |
|
22,125,006 |
|
(1) Unique patient count is defined as each unique, longitudinally matched, de-identified natural person represented in the MORE2 Registry® as of the end of the period presented.
(2) Medical event count is defined as the total number of discrete medical events as of the end of the period presented (for example, a discrete medical event typically results from the presentation of a patient to a physician for the diagnosis of diabetes and congestive heart failure in a single visit, the presentation of a patient to an emergency department for chest pain, etc.).
(3) Patient Analytics Months, or PAM, is defined as the sum of the analytical processes performed on each respective patient within patient populations covered by clients under contract. As used in the metric, an “analytical process” is a distinct set of data calculations undertaken by the Company which is initiated and completed by the Company’s analytical platform to examine a specific question such as whether a patient is believed to have a condition such as diabetes, or worsening of the disease, during a specific time period.
Inovalon Holdings, Inc.
Investment in Innovation
(unaudited)
The Company’s business model is based upon the ability to deliver value to clients through the combination of advanced, cloud-based data analytics and data-driven intervention platforms focused on the achievement of meaningful and measureable improvements in clinical quality outcomes and financial performance in healthcare. The Company’s ability to deliver this value is dependent in part on the ability to continue to innovate, design new capabilities, and bring these capabilities to market in an enterprise scale. The Company’s continued ability to innovate the platform and bring differentiated capabilities to market is an important aspect of the Company’s business success. The Company’s investment in innovation includes costs for research and development, capitalized software development, and expenditures related to hardware and software platforms on which data analytics and data-driven interventions capabilities are deployed as summarized below.
|
|
|
Three Months Ended March 31, |
| ||||
|
(In thousands, except percentages) |
|
2017 |
|
2016 |
| ||
|
Investment in Innovation |
|
|
|
|
| ||
|
Research and development(1) |
|
$ |
7,788 |
|
$ |
5,932 |
|
|
Capitalized software development(2) |
|
6,140 |
|
5,300 |
| ||
|
Research and development infrastructure investments(3) |
|
3,758 |
|
379 |
| ||
|
Total investment in innovation |
|
$ |
17,686 |
|
$ |
11,611 |
|
|
As a percentage of revenue |
|
|
|
|
| ||
|
Research and development(1) |
|
7 |
% |
6 |
% | ||
|
Capitalized software development(2) |
|
6 |
% |
5 |
% | ||
|
Research and development infrastructure investments(3) |
|
3 |
% |
0 |
% | ||
|
Total investment in innovation |
|
16 |
% |
11 |
% | ||
(1) Research and development primarily includes employee costs related to the development and enhancement of the Company’s service offerings.
(2) Capitalized software development includes capitalized costs incurred to develop and enhance functionality for the Company’s data analytics and data-driven intervention platforms.
(3) Research and development infrastructure investments include strategic expenditures related to hardware and software platforms under development or enhancement.
Inovalon Holdings, Inc.
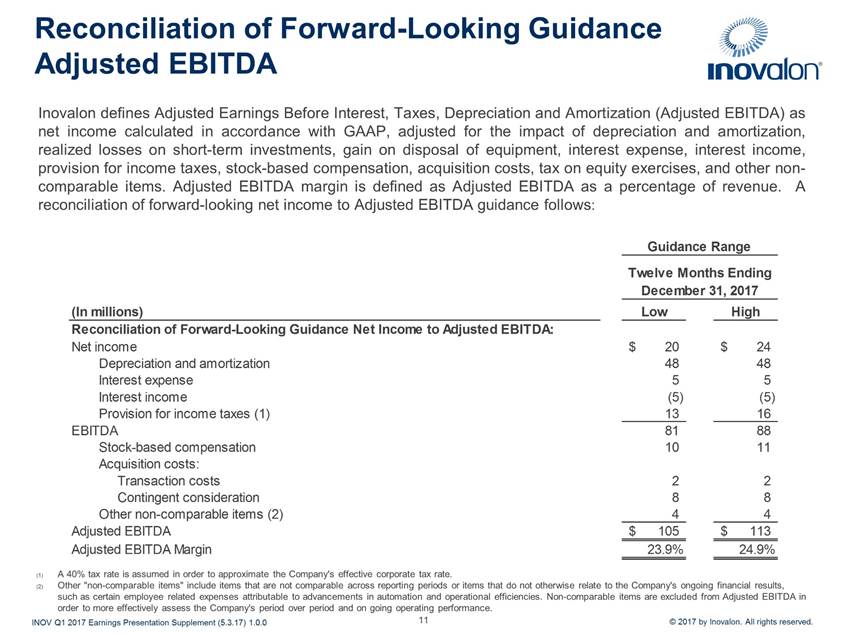
Forward-Looking Guidance Adjusted EBITDA
(Unaudited)
|
|
|
Guidance Range |
| ||||
|
|
|
Year Ending |
| ||||
|
(In millions) |
|
Low |
|
High |
| ||
|
Reconciliation of Forward-Looking Guidance Net Income to Adjusted EBITDA: |
|
|
|
|
| ||
|
|
|
|
|
|
| ||
|
Net income |
|
$ |
20 |
|
$ |
24 |
|
|
Depreciation and amortization |
|
48 |
|
48 |
| ||
|
Interest expense |
|
5 |
|
5 |
| ||
|
Interest income |
|
(5 |
) |
(5 |
) | ||
|
Provision for income taxes (1) |
|
13 |
|
16 |
| ||
|
EBITDA |
|
81 |
|
88 |
| ||
|
Stock-based compensation |
|
10 |
|
11 |
| ||
|
Acquisition costs: |
|
|
|
|
| ||
|
Transaction costs |
|
2 |
|
2 |
| ||
|
Contingent consideration |
|
8 |
|
8 |
| ||
|
Other non-comparable items (2) |
|
4 |
|
4 |
| ||
|
Adjusted EBITDA |
|
$ |
105 |
|
$ |
113 |
|
(1) A 40% tax rate is assumed in order to approximate the Company’s effective statutory corporate tax rate.
(2) Other “non-comparable items” include items that are not comparable across reporting periods or items that do not otherwise relate to the Company’s ongoing financial results, such as certain employee related expenses attributable to advancements in automation and operational efficiencies. Non-comparable items are excluded from Adjusted EBITDA in order to more effectively assess the Company’s period over period and on going operating performance.
Inovalon Holdings, Inc.
Forward-Looking Guidance Non-GAAP net income
(Unaudited)
|
|
|
Guidance Range |
| ||||
|
|
|
Year Ending |
| ||||
|
(In millions, except per share amounts) |
|
Low |
|
High |
| ||
|
Reconciliation of Forward-Looking Guidance Net Income to Non-GAAP net income: |
|
|
|
|
| ||
|
Net income |
|
$ |
20 |
|
$ |
24 |
|
|
Stock-based compensation |
|
10 |
|
11 |
| ||
|
Acquisition costs: |
|
|
|
|
| ||
|
Transaction costs |
|
2 |
|
2 |
| ||
|
Contingent consideration |
|
8 |
|
8 |
| ||
|
Amortization of acquired intangible assets |
|
14 |
|
14 |
| ||
|
Other non-comparable items (1) |
|
4 |
|
4 |
| ||
|
Tax impact of add-back items (2) |
|
(16 |
) |
(16 |
) | ||
|
Non-GAAP net income |
|
$ |
42 |
|
$ |
47 |
|
|
|
|
|
|
|
| ||
|
GAAP diluted net income per share |
|
$ |
0.13 |
|
$ |
0.16 |
|
|
Non-GAAP diluted net income per share |
|
$ |
0.29 |
|
$ |
0.32 |
|
|
Weighted average shares of common stock outstanding - diluted |
|
145,000 |
|
145,000 |
| ||
(1) Other “non-comparable items” include items that are not comparable across reporting periods or items that do not otherwise relate to the Company’s ongoing financial results, such as certain employee related expenses attributable to advancements in automation and operational efficiencies. Non-comparable items are excluded from non-GAAP net income in order to more effectively assess the Company’s period over period and on going operating performance.
(2) A 40% tax rate is assumed in order to approximate the Company’s effective statutory corporate tax rate.
Non-GAAP Financial Measures
Inovalon provides the measures Adjusted EBITDA, Adjusted EBITDA margin, and Non-GAAP net income as additional information for evaluating the Company’s operating results. These measures are not prepared in accordance with, or as an alternative for, GAAP accounting and may be different from non-GAAP measures used by other companies.
Investors frequently have requested information from management regarding depreciation, amortization and other non-cash charges, such as stock-based compensation, as well as the impact of non-comparable items and management believes, based on discussions with investors, that these non-GAAP measures enhance investors’ ability to assess Inovalon’s historical and projected future financial performance. While management believes these non-GAAP financial measures provide useful supplemental information to investors, there are limitations associated with the use of non-GAAP financial measures. For example, one limitation of Adjusted EBITDA is that it excludes depreciation and amortization, which represents the periodic costs of certain capitalized tangible and intangible assets used in generating revenues in our business. Inovalon compensates for these limitations by using these non-GAAP financial measures as supplements to GAAP financial measures and by reconciling the non-GAAP financial measures to their most comparable GAAP financial measures. Investors are encouraged to review the reconciliations of these non-GAAP financial measures to the comparable GAAP measures that are provided above.
These non-GAAP measures include financial information that is prepared in accordance with GAAP and presented in our consolidated financial statements and are used to evaluate our business, measure our performance, develop financial forecasts and make strategic decisions and as an important factor in determining variable compensation.
Adjusted EBITDA and Adjusted EBITDA Margin
The Company defines Adjusted EBITDA as net income calculated in accordance with GAAP, adjusted for the impact of depreciation and amortization, realized losses on short-term investments, gain on disposal of equipment, interest expense, interest income, provision for income taxes, stock-based compensation, acquisition costs, tax on equity exercises, and other non-comparable items. A reconciliation of net income, which is the most directly comparable GAAP financial measure, to Adjusted EBITDA is provided above.
Adjusted EBITDA margin is the Company’s calculation of Adjusted EBITDA, divided by revenue calculated in accordance with GAAP.
The Company uses Adjusted EBITDA and Adjusted EBITDA margin as supplemental measures of performance to gain insight into operating effectiveness. The Company uses Adjusted EBITDA and Adjusted EBITDA margin as key metrics to assess its ability to increase revenues while controlling expense growth and the scalability of the Company’s business model. The Company believes that the exclusion of the expenses eliminated in calculating Adjusted EBITDA and Adjusted EBITDA margin provides management and investors a useful measure for period-to-period comparisons of the Company’s core business and operating results by excluding items that are not comparable across reporting periods or that do not otherwise relate to the Company’s ongoing operating results. Accordingly, the Company believes that Adjusted
EBITDA and Adjusted EBITDA margin provide useful information to investors and others in understanding and evaluating the Company’s operating results. However, use of Adjusted EBITDA and Adjusted EBITDA margin as analytical tools has limitations, and investors and others should not consider them in isolation or as substitutes for analysis of our financial results as reported under GAAP. In addition, other companies, including companies in Inovalon’s industry, might calculate Adjusted EBITDA and Adjusted EBITDA margin or similarly titled measures differently, which may reduce their usefulness as comparative measures.
Non-GAAP net income
The Company defines Non-GAAP net income as net income calculated in accordance with GAAP, adjusted to exclude tax-affected stock-based compensation expense, acquisition costs, amortization of acquired intangible assets, tax on equity exercises, and other non-comparable items.
The Company uses Non-GAAP net income as a supplemental measure of performance to gain insight into financial effectiveness. The Company uses Non-GAAP net income as a key metric to assess its ability to increase revenues while controlling expense growth and the scalability of its business model. The Company believes that the exclusion of the expenses eliminated in calculating Non-GAAP net income provides management and investors a useful measure for period to period comparisons of the Company’s core business and financial results by excluding items that are not comparable across reporting periods or that do not otherwise relate to its ongoing financial results. Accordingly, the Company believes that Non-GAAP net income provides useful information to investors and others in understanding and evaluating the Company’s performance. However, use of Non-GAAP net income as an analytical tool has limitations, and investors and others should not consider this measure in isolation or as a substitute for analysis of the Company’s financial results as reported under GAAP. In addition, other companies, including companies in Inovalon’s industry, might calculate Non-GAAP net income or similarly titled measures differently, which may reduce their usefulness as comparative measures.
Contacts:
Inovalon
George Price (Investors)
Phone: 301-809-4000 x1190
gprice@inovalon.com
Inovalon
Kim E. Collins (Communications)
Phone: 301-809-4000 x1473
kcollins@inovalon.com
