EX-99.1
Great Western Bancorp, Inc. Announces Fiscal Year 2014 Fourth
Quarter and Full-Year Financial Results
Financial Highlights
| |
• |
|
Fourth quarter net income rose 6% to $27.9 million, or $0.48 per share, compared to the same quarter in fiscal year 2013 |
| |
• |
|
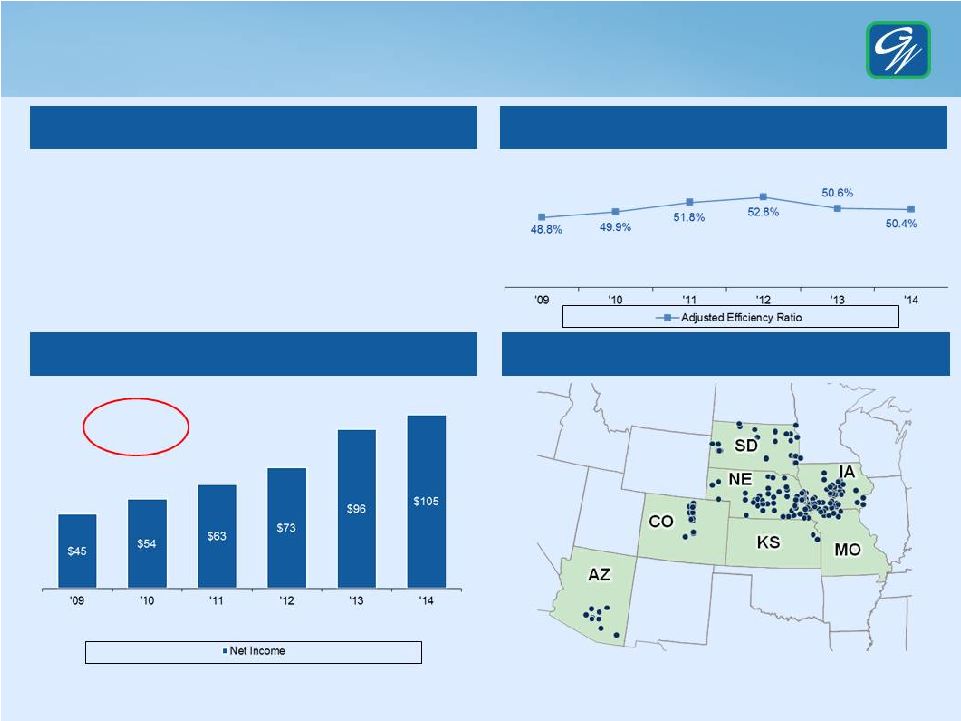
Noninterest expense management drove an adjusted efficiency ratio1 of 49.0% for the quarter |
| |
• |
|
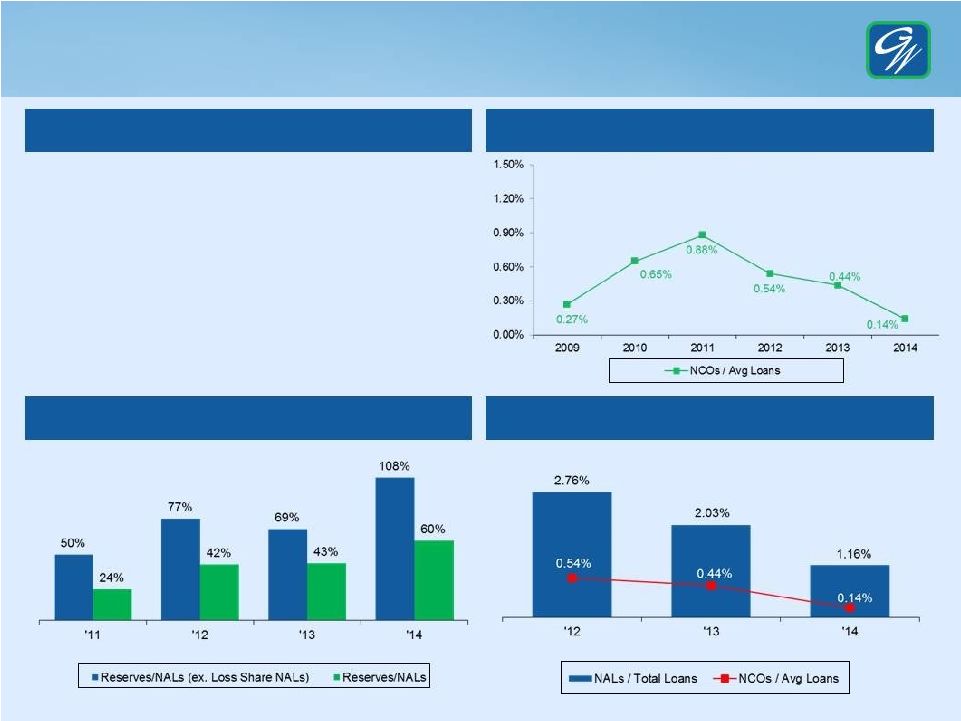
Asset quality continued to improve, with a $50.1 million reduction in nonperforming loans to $78.9 million and OREO down $7.8 million to $49.6 million over the last 12 months |
| |
• |
|
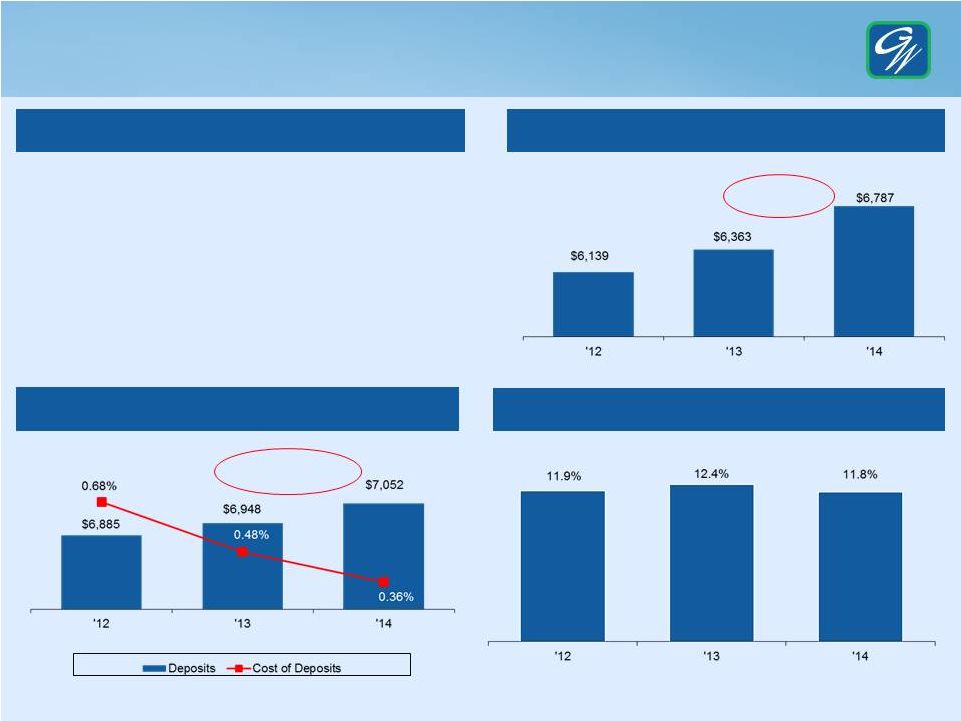
Total loans grew 6.7% to $6.79 billion over the last 12 months targeted within the business and agribusiness segments of the portfolio |
| |
• |
|
Full-year net income increased 9% to $105.0 million, or $1.81 per share, compared to fiscal year 2013 |
Great
Western Bancorp, Inc. (NYSE: GWB) today reported net income of $27.9 million, or $0.48 per share, for the quarter ended September 30, 2014, an improvement of 6% from $26.3 million, or $0.46 per share, in the same quarter of fiscal year 2013.
The higher net income was primarily due to targeted management of noninterest expense and improved net interest income, partially offset by provisions for loan losses and lower noninterest income.
“We are pleased with this strong finish to a successful fiscal year 2014. During the quarter, we preserved the momentum we carried throughout the fiscal
year,” said Ken Karels, President and Chief Executive Officer of Great Western Bancorp, Inc. “The impact of our strategies drove positive results in fiscal year 2014. Asset quality continued to improve. The aggregate growth in our loan
portfolio reflected our diversification and strengths in C&I, commercial real estate and agribusiness lending. We made additional progress managing our deposit portfolio toward the goal of lowering our cost of funds. We took important steps in
fiscal year 2014 to further optimize our footprint, rationalizing our branch network in Nebraska and developing important growth markets such as Colorado and Arizona. Our brand promise of ‘big-bank capability with small-bank service,’ our
commitment to efficiency and our disciplined focus on specific markets is ideally suited to our customers and creating a strong platform for long-term growth.”
Fiscal Year 2014 Results
For fiscal year 2014, net
income rose 9% to $105.0 million, or $1.81 per share, from $96.2 million, or $1.66 per share, during fiscal year 2013. The increase was driven by a management’s focus on noninterest expenses, other than expenses related to the fair value of
derivatives, and continued improvements in overall asset quality. This led to a $5.3 million decline in adjusted noninterest expenses1 (total noninterest expenses were up 26% driven by changes in
the fair value of derivative contracts fully offset in interest income) and a $10.9 million year-over-year reduction in provision for loan losses, partially offset by a significant decrease in noninterest income reflecting slower home mortgage
originations.
| 1 |
This is a non-GAAP measure management believes is helpful to understanding trends in the business that may not be fully apparent based only on the most comparable GAAP measure. Further information on this measure and a
reconciliation to the most comparable GAAP measure is provided at the end of this document. |
1
Net Interest Income and Net Interest Margin
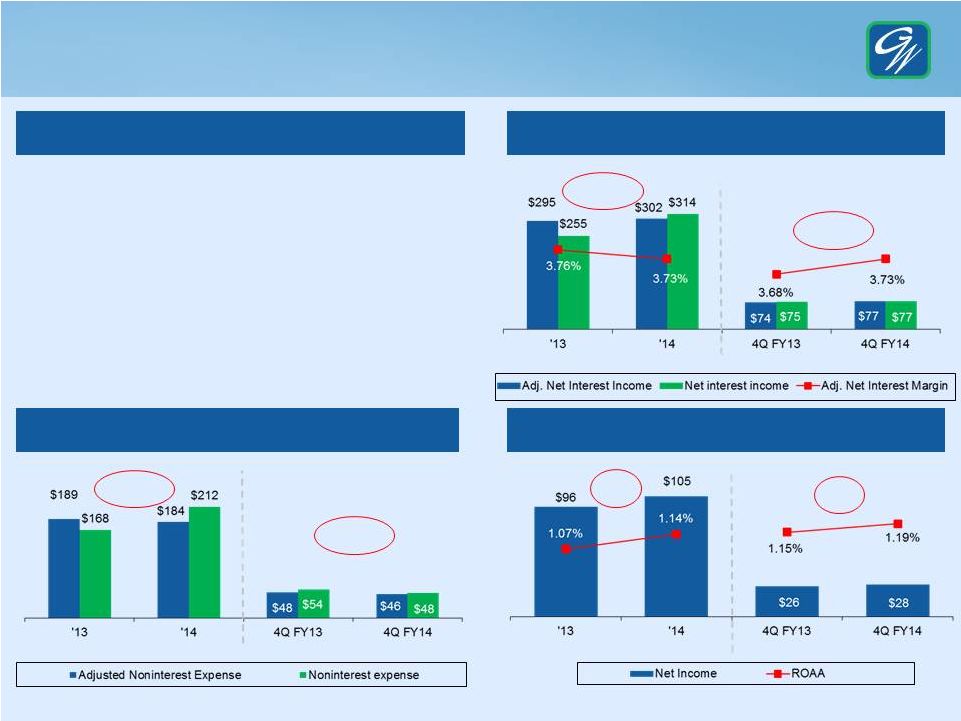
Net interest income increased $1.8 million, or 2%, from $74.9 million for the fourth quarter of fiscal year 2013 to $76.6 million for the fourth quarter of
fiscal year 2014. Over the same period, adjusted net interest income1 increased $3.3 million, or 4%. Net interest income rose $59.0 million, or 23%, from $255.1 million for fiscal year 2013 to
$314.1 million for fiscal year 2014. Over the same period, adjusted net interest income1 improved $6.8 million, or 2%. The difference between adjusted net interest income and net interest income
reflects the amount of fair value adjustment related to interest rates on loans for which we have elected the fair value option, which is offset by corresponding changes in the fair value of the related interest rate swaps in noninterest expense.
The increases in quarterly and annual adjusted net interest income were driven by loan portfolio growth through fiscal year 2014 and a reduction in total funding cost, primarily related to transition in the deposit portfolio away from time deposits
toward more cost-effective transaction accounts, partially offset by reduced asset yields.
Adjusted net interest margin1 was 3.73%, 3.77% and 3.68%, respectively, for the quarters ended September 30, 2014, June 30, 2014, and September 30, 2013, while net interest margin fluctuated at 3.72%, 4.43%
and 3.75%, respectively, for the same periods, again with volatility due to fair value changes. Loan yields continue to be pressured by pricing competition for high-quality credits. However, adjusted net interest margin has remained stable due to a
six basis point reduction in cost of deposits between the fourth quarter of fiscal year 2013 and the fourth quarter of fiscal year 2014 and a change in asset mix. Adjusted net interest margin1 was
3.73% and 3.76%, respectively, for fiscal year 2014 and fiscal year 2013, while net interest margin was 3.88% and 3.24%, respectively.
Loan growth for
the fiscal year ended September 30, 2014 was $424.8 million, or 6.7%, compared to September 30, 2013 and $109.0 million compared to June 30, 2014. The majority of the growth for the fiscal year occurred in targeted commercial real
estate, commercial non-real estate (or C&I) and agribusiness segments of the portfolio, consistent with strategy. Deposits grew 1% compared to September 30, 2013, with certificates of deposit comprising 25% of average deposit balances for
the fourth quarter of fiscal year 2014 compared to 32% for the fourth quarter of fiscal year 2013.
Provision for Loan Losses and Asset Quality
Provision for loan losses was $2.7 million for the quarter ended September 30, 2014 compared to a release of $2.5 million of provision for loan
losses for the same quarter of fiscal year 2013. However, provision for loan losses was $0.7 million for fiscal year 2014, a decrease of 94% compared to $11.6 million for fiscal year 2013. The lower provision was driven by continued improvements in
asset quality.
At September 30, 2014, nonperforming loans were $78.9 million compared to $129.0 million at September 30, 2013, a 39%
improvement, with $35.0 million of the balance at September 30, 2014 covered by FDIC loss-sharing arrangements. OREO balances improved by approximately 14%, declining from $57.4 million at September 30, 2013 to $49.6 million at
September 30, 2014, with $10.6 million of this balance covered by FDIC loss-sharing arrangements. Net charge-offs were $2.3 million for the fourth quarter of fiscal year 2014 compared to $11.9 million for the fourth quarter of fiscal year 2013
translating to net charge-offs to average loans of 0.14% for fiscal year 2014 compared to 0.44% for fiscal year 2013.
Noninterest Income
Noninterest income was $14.9 million for the quarter ended September 30, 2014, a 15% decrease compared to the same quarter in fiscal year 2013, reflecting
lower mortgage volumes. Noninterest income was $58.1 million for fiscal year 2014 compared to $74.9 million during fiscal year 2013, again reflecting lower mortgage volumes (primarily lower refinance volumes) and a reduction in recoveries realized
on acquired assets shared with the FDIC under loss-sharing arrangements, consistent with the run-off of that portion of the portfolio.
2
Noninterest Expense
Total noninterest expense was $48.1 million for the quarter ended September 30, 2014, a reduction of 11% compared to $54.3 million for the same quarter in
fiscal year 2013. Adjusted noninterest expense1 was $45.6 million for the fourth quarter of fiscal year 2014 compared to $48.3 million for the fourth quarter of fiscal year 2013, a reduction of
6%. In each case, the reduction was driven by lower salaries and employee benefits, occupancy expenses and professional fees, leading to an adjusted efficiency ratio1 of 49.0% for the quarter
ended September 30, 2014, compared to 52.4% for the same quarter in fiscal year 2013.
Total noninterest expense for the fiscal year was $212.1
million, an increase of 26% compared to fiscal year 2013. Adjusted for changes in fair value of interest rate swaps offset in net interest income and amortization of intangible assets, adjusted noninterest expense1 for the full fiscal year was $184.0 million, a 3% decrease compared to $189.3 million for fiscal year 2013, driven primarily by a 6% reduction in salaries and employee benefits related to
streamlining the retail management structure and right-sizing the branch footprint.
Capital
Great Western Bancorporation, Inc., the predecessor of Great Western Bancorp, Inc., declared and paid a dividend of $34.0 million to a subsidiary of National
Australia Bank in September 2014 related to earnings for fiscal year 2014.
Tier 1 and total capital ratios were 11.8% and 12.9%, respectively, at
September 30, 2014, compared to 12.4% and 13.8%, respectively, at September 30, 2013. In each case, the change reflects the timing of the dividend noted previously which was accelerated to be completed prior to the initial public offering
on October 20, 2014.
Business Outlook
“The current business environment presents both opportunities and challenges as we move into fiscal year 2015,” added Karels. “Persistent lower
interest rates continue to drive fierce competition for lending growth, and we expect the outstanding balance of our total loans to be relatively flat in the first quarter of fiscal year 2015. We also recorded a $0.9 million reversal of provision
for loan losses in the first quarter of fiscal year 2014 and do not expect a similar reversal in the first quarter of fiscal year 2015. However, longer-term our loan portfolio diversification will be key to our strategy going forward and we believe
we have the right exposure to the right sectors, supported by the right approach to serving customers, to create solid long-term growth opportunity. Our focus remains on efficiency, managing our cost of funds and optimizing our footprint for
growth.”
Conference Call
Great Western
Bancorp, Inc. will host a conference call to discuss its financial results for the fourth quarter and full-year fiscal year 2014 on Thursday, November 20, 2014 at 7:30 AM (CT). The call can be accessed by dialing (888) 317-6016
approximately 10 minutes prior to the start time. Please ask to be joined into the Great Western Bancorp, Inc. (GWB) call. International callers should dial (412) 317-6016. The call will also be broadcast live over the Internet and can be
accessed in the Investor Relations section of Great Western’s website at www.greatwesternbank.com. A replay will be available beginning one hour following the conference call and ending on December 03, 2014. To access the replay,
dial (877) 344-7529 (U.S) and use conference ID #10055627. International callers should dial (412) 317-0088 and enter the same conference ID number.
3
About Great Western Bancorp, Inc.
Great Western Bancorp, Inc. is the holding company for Great Western Bank, a full-service regional bank focused on relationship-based business and agribusiness
banking. Great Western Bank offers small and mid-sized businesses a focused suite of financial products and a range of deposit and loan products to retail customers through several channels, including the branch network, online banking system,
mobile banking applications and customer care centers. The bank services its customers through 162 branches in seven states: South Dakota, Iowa, Nebraska, Colorado, Arizona, Kansas and Missouri. To learn more about Great Western Bank visit
www.greatwesternbank.com.
Forward-Looking Statements
This press release contains forward-looking statements within the meaning of the Private Securities Litigation Reform Act of 1995. Statements about Great
Western’s expectations, beliefs, plans, predictions, forecasts, objectives, assumptions or future events or performance are not historical facts and may be forward-looking. These statements are often, but not always, made through the use of
words or phrases such as “anticipates,” “believes,” “can,” “could,” “may,” “predicts,” “potential,” “should,” “will,” “estimate,” “plans,”
“projects,” “continuing,” “ongoing,” “expects,” “intends” and similar words or phrases. In particular, the statements included in this press release concerning Great Western’s expected
performance and strategy, and the interest rate environment, in fiscal year 2015 are not historical facts and are forward-looking. Accordingly, the forward-looking statements in this press release are only predictions and involve estimates, known
and unknown risks, assumptions and uncertainties that could cause actual results to differ materially from those expressed. All forward-looking statements are necessarily only estimates of future results, and there can be no assurance that actual
results will not differ materially from expectations, and, therefore, you are cautioned not to place undue reliance on such statements. Any forward-looking statements are qualified in their entirety by reference to the factors discussed in the
section titled “Risk Factors” in Great Western’s Prospectus, dated October 14, 2014, included as part of the Registration Statement on Form S-1 filed in connection with Great Western’s initial public offering. Further, any
forward-looking statement speaks only as of the date on which it is made, and Great Western undertakes no obligation to update any forward-looking statement to reflect events or circumstances after the date on which the statement is made or to
reflect the occurrence of unanticipated events.
4
GREAT WESTERN BANCORP, INC.
CONSOLIDATED FINANCIAL DATA
(Unaudited)
|
|
|
|
|
|
|
|
|
|
|
|
|
|
|
|
|
|
|
|
|
| |
|
At and for the three months ended |
|
|
At and for the fiscal year ended |
|
| |
|
Sept. 30,
2014 |
|
|
June 30,
2014 |
|
|
Sept. 30,
2013 |
|
|
Sept. 30,
2014 |
|
|
Sept. 30,
2013 |
|
| |
|
(dollars in thousands except per share amounts) |
|
| Operating Data: |
|
|
|
|
|
|
|
|
|
|
|
|
|
|
|
|
|
|
|
|
| Interest and dividend income |
|
$ |
84,361 |
|
|
$ |
97,164 |
|
|
$ |
83,698 |
|
|
$ |
346,125 |
|
|
$ |
294,257 |
|
| Interest expense |
|
|
7,715 |
|
|
|
7,778 |
|
|
|
8,812 |
|
|
|
32,052 |
|
|
|
39,161 |
|
| Noninterest income |
|
|
14,884 |
|
|
|
14,225 |
|
|
|
17,526 |
|
|
|
58,054 |
|
|
|
74,904 |
|
| Noninterest expense |
|
|
48,121 |
|
|
|
67,476 |
|
|
|
54,333 |
|
|
|
212,144 |
|
|
|
168,285 |
|
| Provision for loan losses |
|
|
2,749 |
|
|
|
1,500 |
|
|
|
(2,460 |
) |
|
|
684 |
|
|
|
11,574 |
|
| Net income |
|
|
27,875 |
|
|
|
22,503 |
|
|
|
26,323 |
|
|
|
104,952 |
|
|
|
96,243 |
|
| EPS |
|
$ |
0.48 |
|
|
$ |
0.39 |
|
|
$ |
0.46 |
|
|
$ |
1.81 |
|
|
$ |
1.66 |
|
|
|
|
|
|
|
| Performance Ratios: |
|
|
|
|
|
|
|
|
|
|
|
|
|
|
|
|
|
|
|
|
| Net interest margin |
|
|
3.72 |
% |
|
|
4.43 |
% |
|
|
3.75 |
% |
|
|
3.88 |
% |
|
|
3.24 |
% |
| Adjusted net interest margin(1) |
|
|
3.73 |
% |
|
|
3.77 |
% |
|
|
3.68 |
% |
|
|
3.73 |
% |
|
|
3.76 |
% |
| Return on average total assets |
|
|
1.19 |
% |
|
|
0.98 |
% |
|
|
1.15 |
% |
|
|
1.14 |
% |
|
|
1.07 |
% |
| Return on average common equity |
|
|
7.69 |
% |
|
|
6.25 |
% |
|
|
7.46 |
% |
|
|
7.34 |
% |
|
|
6.97 |
% |
| Return on average tangible common equity(1) |
|
|
16.3 |
% |
|
|
14.2 |
% |
|
|
17.9 |
% |
|
|
16.6 |
% |
|
|
17.5 |
% |
| Adjusted efficiency ratio(1) |
|
|
49.0 |
% |
|
|
54.8 |
% |
|
|
52.4 |
% |
|
|
50.4 |
% |
|
|
50.6 |
% |
|
|
|
|
|
|
| Capital: |
|
|
|
|
|
|
|
|
|
|
|
|
|
|
|
|
|
|
|
|
| Tier 1 capital ratio |
|
|
11.8 |
% |
|
|
12.1 |
% |
|
|
12.4 |
% |
|
|
11.8 |
% |
|
|
12.4 |
% |
| Total capital ratio |
|
|
12.9 |
% |
|
|
13.1 |
% |
|
|
13.8 |
% |
|
|
12.9 |
% |
|
|
13.8 |
% |
| Tier 1 leverage ratio |
|
|
9.1 |
% |
|
|
9.3 |
% |
|
|
9.2 |
% |
|
|
9.1 |
% |
|
|
9.2 |
% |
| Tangible common equity / tangible assets(1) |
|
|
8.2 |
% |
|
|
8.3 |
% |
|
|
8.2 |
% |
|
|
8.2 |
% |
|
|
8.2 |
% |
|
|
|
|
|
|
| Asset Quality: |
|
|
|
|
|
|
|
|
|
|
|
|
|
|
|
|
|
|
|
|
| Nonperforming loans |
|
|
78,905 |
|
|
|
80,838 |
|
|
|
129,000 |
|
|
|
78,905 |
|
|
|
129,000 |
|
| OREO |
|
|
49,580 |
|
|
|
54,190 |
|
|
|
57,422 |
|
|
|
49,580 |
|
|
|
57,422 |
|
| Nonperforming loans / total loans |
|
|
1.16 |
% |
|
|
1.21 |
% |
|
|
2.03 |
% |
|
|
1.16 |
% |
|
|
2.03 |
% |
| Net charge-offs |
|
|
2,269 |
|
|
|
1,615 |
|
|
|
11,927 |
|
|
|
9,030 |
|
|
|
27,588 |
|
| Net charge-offs / average total loans |
|
|
0.13 |
% |
|
|
0.10 |
% |
|
|
0.76 |
% |
|
|
0.14 |
% |
|
|
0.44 |
% |
| Allowance for loan losses / total loans |
|
|
0.70 |
% |
|
|
0.70 |
% |
|
|
0.88 |
% |
|
|
0.70 |
% |
|
|
0.88 |
% |
| (1) |
This is a non-GAAP financial measure we believe is helpful to interpreting our financial results. See the table at the end of this document for the calculation of the
measure and reconciliation to the most comparable GAAP measure. |
5
GREAT WESTERN BANCORP, INC.
CONSOLIDATED FINANCIAL DATA
(Unaudited)
|
|
|
|
|
|
|
|
|
|
|
|
|
|
|
|
|
|
|
|
|
| |
|
At and for the three months ended |
|
|
At and for the fiscal year ended |
|
| |
|
Sept. 30,
2014 |
|
|
June 30,
2014 |
|
|
Sept. 30,
2013 |
|
|
Sept. 30,
2014 |
|
|
Sept. 30,
2013 |
|
| |
|
(dollars in thousands) |
|
| Income Statement |
|
|
|
|
| Interest and dividend income |
|
$ |
84,361 |
|
|
$ |
97,164 |
|
|
$ |
83,698 |
|
|
$ |
346,125 |
|
|
$ |
294,257 |
|
| Interest expense |
|
|
7,715 |
|
|
|
7,778 |
|
|
|
8,812 |
|
|
|
32,052 |
|
|
|
39,161 |
|
|
|
|
|
|
|
|
|
|
|
|
|
|
|
|
|
|
|
|
|
|
| Net interest income |
|
|
76,646 |
|
|
|
89,386 |
|
|
|
74,886 |
|
|
|
314,073 |
|
|
|
255,096 |
|
| Provision for loan losses |
|
|
2,749 |
|
|
|
1,500 |
|
|
|
(2,460 |
) |
|
|
684 |
|
|
|
11,574 |
|
|
|
|
|
|
|
|
|
|
|
|
|
|
|
|
|
|
|
|
|
|
| Net interest income after provision for loan losses |
|
|
73,897 |
|
|
|
87,886 |
|
|
|
77,346 |
|
|
|
313,389 |
|
|
|
243,522 |
|
|
|
|
|
|
|
|
|
|
|
|
|
|
|
|
|
|
|
|
|
|
| Noninterest income |
|
|
|
|
|
|
|
|
|
|
|
|
|
|
|
|
|
|
|
|
| Service charges and other fees |
|
|
10,477 |
|
|
|
9,695 |
|
|
|
10,765 |
|
|
|
40,204 |
|
|
|
41,692 |
|
| Net gain on sale of loans |
|
|
1,653 |
|
|
|
1,323 |
|
|
|
2,616 |
|
|
|
5,539 |
|
|
|
13,724 |
|
| Casualty insurance commissions |
|
|
196 |
|
|
|
321 |
|
|
|
472 |
|
|
|
1,073 |
|
|
|
1,426 |
|
| Investment center income |
|
|
660 |
|
|
|
577 |
|
|
|
1,087 |
|
|
|
2,417 |
|
|
|
3,137 |
|
| Net gain on sale of securities |
|
|
84 |
|
|
|
— |
|
|
|
(824 |
) |
|
|
90 |
|
|
|
917 |
|
| Trust department income |
|
|
891 |
|
|
|
942 |
|
|
|
944 |
|
|
|
3,738 |
|
|
|
3,545 |
|
| Other |
|
|
923 |
|
|
|
1,367 |
|
|
|
2,466 |
|
|
|
4,993 |
|
|
|
10,463 |
|
|
|
|
|
|
|
|
|
|
|
|
|
|
|
|
|
|
|
|
|
|
| Total noninterest income |
|
|
14,884 |
|
|
|
14,225 |
|
|
|
17,526 |
|
|
|
58,054 |
|
|
|
74,904 |
|
| Noninterest expense |
|
|
|
|
|
|
|
|
|
|
|
|
|
|
|
|
|
|
|
|
| Salaries and employee benefits |
|
$ |
23,928 |
|
|
$ |
24,126 |
|
|
$ |
24,536 |
|
|
$ |
95,105 |
|
|
$ |
100,660 |
|
| Occupancy expenses, net |
|
|
3,913 |
|
|
|
4,894 |
|
|
|
4,613 |
|
|
|
17,526 |
|
|
|
18,532 |
|
| Data processing |
|
|
5,442 |
|
|
|
4,354 |
|
|
|
5,231 |
|
|
|
19,548 |
|
|
|
18,980 |
|
| Equipment expenses |
|
|
1,251 |
|
|
|
1,077 |
|
|
|
1,158 |
|
|
|
4,350 |
|
|
|
4,518 |
|
| Advertising |
|
|
1,360 |
|
|
|
1,213 |
|
|
|
1,584 |
|
|
|
4,746 |
|
|
|
6,267 |
|
| Communication expenses |
|
|
1,108 |
|
|
|
1,046 |
|
|
|
1,024 |
|
|
|
4,510 |
|
|
|
4,609 |
|
| Professional fees |
|
|
2,609 |
|
|
|
3,620 |
|
|
|
3,692 |
|
|
|
12,233 |
|
|
|
12,547 |
|
| Derivatives, net (gain) loss |
|
|
(197 |
) |
|
|
13,197 |
|
|
|
1,330 |
|
|
|
11,922 |
|
|
|
(40,305 |
) |
| Net (gain) loss from sale of repossessed property and other assets |
|
|
(37 |
) |
|
|
(1,564 |
) |
|
|
(553 |
) |
|
|
(2,451 |
) |
|
|
(2,788 |
) |
| Amortization of core deposits and other intangibles |
|
|
2,768 |
|
|
|
4,069 |
|
|
|
4,690 |
|
|
|
16,216 |
|
|
|
19,290 |
|
| Other |
|
|
5,976 |
|
|
|
11,444 |
|
|
|
7,028 |
|
|
|
28,439 |
|
|
|
25,975 |
|
|
|
|
|
|
|
|
|
|
|
|
|
|
|
|
|
|
|
|
|
|
| Total noninterest expense |
|
|
48,121 |
|
|
|
67,476 |
|
|
|
54,333 |
|
|
|
212,144 |
|
|
|
168,285 |
|
|
|
|
|
|
|
|
|
|
|
|
|
|
|
|
|
|
|
|
|
|
| Income before income taxes |
|
|
40,660 |
|
|
|
34,635 |
|
|
|
40,539 |
|
|
|
159,299 |
|
|
|
150,141 |
|
| Provision for income taxes |
|
|
12,785 |
|
|
|
12,132 |
|
|
|
14,216 |
|
|
|
54,347 |
|
|
|
53,898 |
|
|
|
|
|
|
|
|
|
|
|
|
|
|
|
|
|
|
|
|
|
|
| Net income |
|
$ |
27,875 |
|
|
$ |
22,503 |
|
|
$ |
26,323 |
|
|
$ |
104,952 |
|
|
$ |
96,243 |
|
|
|
|
|
|
|
|
|
|
|
|
|
|
|
|
|
|
|
|
|
|
6
GREAT WESTERN BANCORP, INC.
CONSOLIDATED FINANCIAL DATA
(Unaudited)
Summarized Balance Sheet
|
|
|
|
|
|
|
|
|
|
|
|
|
| |
|
Sept. 30, 2014 |
|
|
June 30, 2014 |
|
|
Sept. 30, 2013 |
|
| |
|
(dollars in thousands) |
|
| Assets |
|
|
|
|
|
|
|
|
|
|
|
|
| Cash and due from banks |
|
$ |
256,639 |
|
|
$ |
235,077 |
|
|
$ |
282,157 |
|
| Securities |
|
|
1,341,242 |
|
|
|
1,395,768 |
|
|
|
1,480,449 |
|
| Total loans |
|
|
6,787,467 |
|
|
|
6,678,501 |
|
|
|
6,362,673 |
|
| Allowance for loan losses |
|
|
(47,518 |
) |
|
|
(47,038 |
) |
|
|
(55,864 |
) |
|
|
|
|
|
|
|
|
|
|
|
|
|
| Loans, net |
|
|
6,739,949 |
|
|
|
6,631,463 |
|
|
|
6,306,809 |
|
| Goodwill and other intangible assets |
|
|
712,036 |
|
|
|
714,803 |
|
|
|
728,251 |
|
| Other assets |
|
|
321,563 |
|
|
|
315,172 |
|
|
|
336,592 |
|
|
|
|
|
|
|
|
|
|
|
|
|
|
| Total assets |
|
$ |
9,371,429 |
|
|
$ |
9,292,283 |
|
|
$ |
9,134,258 |
|
|
|
|
|
|
|
|
|
|
|
|
|
|
| Liabilities and stockholder’s equity |
|
|
|
|
|
|
|
|
|
|
|
|
| Noninterest-bearing deposits |
|
$ |
1,303,015 |
|
|
$ |
1,294,131 |
|
|
$ |
1,199,427 |
|
| Interest-bearing deposits |
|
|
5,749,165 |
|
|
|
5,772,981 |
|
|
|
5,748,781 |
|
|
|
|
|
|
|
|
|
|
|
|
|
|
| Total deposits |
|
|
7,052,180 |
|
|
|
7,067,112 |
|
|
|
6,948,208 |
|
| Securities sold under agreements to repurchase |
|
|
161,687 |
|
|
|
185,620 |
|
|
|
217,562 |
|
| FHLB advances and other borrowings |
|
|
575,094 |
|
|
|
435,097 |
|
|
|
390,607 |
|
| Other liabilities |
|
|
161,378 |
|
|
|
173,490 |
|
|
|
160,667 |
|
|
|
|
|
|
|
|
|
|
|
|
|
|
| Total liabilities |
|
|
7,950,339 |
|
|
|
7,861,319 |
|
|
|
7,717,044 |
|
| Stockholder’s equity |
|
|
1,421,090 |
|
|
|
1,430,964 |
|
|
|
1,417,214 |
|
|
|
|
|
|
|
|
|
|
|
|
|
|
| Total liabilities and stockholder’s equity |
|
$ |
9,371,429 |
|
|
$ |
9,292,283 |
|
|
$ |
9,134,258 |
|
|
|
|
|
|
|
|
|
|
|
|
|
|
GREAT WESTERN BANCORP, INC.
CONSOLIDATED FINANCIAL DATA (Unaudited)
|
|
|
|
|
|
|
|
|
|
|
|
|
|
|
|
|
| |
|
Sept. 30,
2014 |
|
|
Sept. 30,
2013 |
|
|
Change
($) |
|
|
Change
(%) |
|
| |
|
(dollars in thousands) |
|
| Loan Portfolio Summary |
|
|
|
|
|
|
|
|
|
|
|
|
|
|
|
|
| Commercial non-real estate |
|
$ |
1,571,122 |
|
|
$ |
1,481,756 |
|
|
$ |
89,366 |
|
|
|
6.0 |
% |
| Agriculture |
|
|
1,681,209 |
|
|
|
1,587,248 |
|
|
|
93,961 |
|
|
|
5.9 |
% |
| Construction and development |
|
|
314,000 |
|
|
|
294,314 |
|
|
|
19,686 |
|
|
|
6.7 |
% |
| Owner-occupied CRE |
|
|
1,151,868 |
|
|
|
1,010,159 |
|
|
|
141,709 |
|
|
|
14.0 |
% |
| Non-owner-occupied CRE |
|
|
922,395 |
|
|
|
820,916 |
|
|
|
101,479 |
|
|
|
12.4 |
% |
| Multifamily residential real estate |
|
|
152,931 |
|
|
|
186,585 |
|
|
|
(33,654 |
) |
|
|
18.0 |
% |
|
|
|
|
|
|
|
|
|
|
|
|
|
|
|
|
|
| Commercial real estate |
|
|
2,541,194 |
|
|
|
2,311,974 |
|
|
|
229,220 |
|
|
|
9.9 |
% |
| Residential real estate |
|
|
902,918 |
|
|
|
906,469 |
|
|
|
(3,551 |
) |
|
|
(0.4 |
%) |
| Consumer |
|
|
90,086 |
|
|
|
101,477 |
|
|
|
(11,391 |
) |
|
|
(11.2 |
%) |
| Other(1) |
|
|
33,448 |
|
|
|
24,711 |
|
|
|
8,737 |
|
|
|
35.4 |
% |
|
|
|
|
|
|
|
|
|
|
|
|
|
|
|
|
|
| Total unpaid principal balance |
|
$ |
6,819,977 |
|
|
$ |
6,413,635 |
|
|
$ |
406,342 |
|
|
|
6.3 |
% |
|
|
|
|
|
| Less: Unamortized discount on acquired loans and unearned net deferred fees and costs and loans in process |
|
|
(32,510 |
) |
|
|
(50,962 |
) |
|
|
18,452 |
|
|
|
(35.2 |
)% |
|
|
|
|
|
|
|
|
|
|
|
|
|
|
|
|
|
| Total unpaid principal balance |
|
$ |
6,787,467 |
|
|
$ |
6,362,673 |
|
|
$ |
424,794 |
|
|
|
6.7 |
% |
|
|
|
|
|
|
|
|
|
|
|
|
|
|
|
|
|
| (1) |
Other loans primarily include consumer and commercial credit cards and customer deposit account overdrafts. |
7
GREAT WESTERN BANCORP, INC.
CONSOLIDATED FINANCIAL DATA
(Unaudited)
|
|
|
|
|
|
|
|
|
|
|
|
|
|
|
|
|
|
|
|
|
|
|
|
|
|
|
|
|
|
|
|
|
|
|
|
|
| |
|
For the three months ended |
|
| |
|
September 30, 2014 |
|
|
June 30, 2014 |
|
|
September 30, 2013 |
|
| Net Interest Margin (dollars in thousands) |
|
Average
Balance |
|
|
Interest |
|
|
Yields
/Rates |
|
|
Average
Balance |
|
|
Interest |
|
|
Yields
/Rates |
|
|
Average
Balance |
|
|
Interest |
|
|
Yields
/Rates |
|
| Assets: |
|
|
|
|
|
|
|
|
|
|
|
|
|
|
|
|
|
|
|
|
|
|
|
|
|
|
|
|
|
|
|
|
|
|
|
|
| Cash and due from banks |
|
$ |
80,815 |
|
|
$ |
56 |
|
|
|
0.27 |
% |
|
$ |
119,970 |
|
|
$ |
99 |
|
|
|
0.33 |
% |
|
$ |
75,073 |
|
|
$ |
74 |
|
|
|
0.39 |
% |
| Investment securities |
|
|
1,403,371 |
|
|
|
6,408 |
|
|
|
1.81 |
% |
|
|
1,428,407 |
|
|
|
6,982 |
|
|
|
1.96 |
% |
|
|
1,589,761 |
|
|
|
7,957 |
|
|
|
1.99 |
% |
| Loans, other than acquired with deteriorated credit quality, net |
|
|
6,527,721 |
|
|
|
76,388 |
|
|
|
4.64 |
% |
|
|
6,362,850 |
|
|
|
88,531 |
|
|
|
5.58 |
% |
|
|
6,024,403 |
|
|
|
74,453 |
|
|
|
4.90 |
% |
| Loans acquired with deteriorated credit quality, net |
|
|
169,287 |
|
|
|
1,509 |
|
|
|
3.54 |
% |
|
|
186,825 |
|
|
|
1,552 |
|
|
|
3.33 |
% |
|
|
241,630 |
|
|
|
1,214 |
|
|
|
1.99 |
% |
|
|
|
|
|
|
|
|
|
|
|
|
|
|
|
|
|
|
|
|
|
|
|
|
|
|
|
|
|
|
|
|
|
|
|
|
|
| Loans, net |
|
|
6,697,008 |
|
|
|
77,897 |
|
|
|
4.61 |
% |
|
|
6,549,675 |
|
|
|
90,083 |
|
|
|
5.52 |
% |
|
|
6,266,033 |
|
|
|
75,667 |
|
|
|
4.79 |
% |
|
|
|
|
|
|
|
|
|
|
|
|
|
|
|
|
|
|
|
|
|
|
|
|
|
|
|
|
|
|
|
|
|
|
|
|
|
| Total interest-earning assets |
|
|
8,181,194 |
|
|
|
84,361 |
|
|
|
4.09 |
% |
|
|
8,098,052 |
|
|
|
97,164 |
|
|
|
4.81 |
% |
|
|
7,930,867 |
|
|
|
83,698 |
|
|
|
4.19 |
% |
| Other noninterest-earning assets |
|
|
1,125,205 |
|
|
|
|
|
|
|
|
|
|
|
1,146,314 |
|
|
|
|
|
|
|
|
|
|
|
1,171,020 |
|
|
|
|
|
|
|
|
|
|
|
|
|
|
|
|
|
|
|
|
|
|
|
|
|
|
|
|
|
|
|
|
|
|
|
|
|
|
|
|
|
|
|
|
|
|
| Total Assets |
|
$ |
9,306,399 |
|
|
$ |
84,361 |
|
|
|
3.60 |
% |
|
$ |
9,244,366 |
|
|
$ |
97,164 |
|
|
|
4.22 |
% |
|
$ |
9,101,887 |
|
|
$ |
83,698 |
|
|
|
3.65 |
% |
|
|
|
|
|
|
|
|
|
|
|
|
|
|
|
|
|
|
|
|
|
|
|
|
|
|
|
|
|
|
|
|
|
|
|
|
|
| Liabilities and Equity: |
|
|
|
|
|
|
|
|
|
|
|
|
|
|
|
|
|
|
|
|
|
|
|
|
|
|
|
|
|
|
|
|
|
|
|
|
| Non-interest demand deposits |
|
$ |
1,270,967 |
|
|
|
|
|
|
|
|
|
|
$ |
1,232,316 |
|
|
|
|
|
|
|
|
|
|
$ |
1,172,690 |
|
|
|
|
|
|
|
|
|
| NOW, MMDA and savings deposits |
|
|
3,980,578 |
|
|
$ |
2,387 |
|
|
|
0.24 |
% |
|
|
4,048,428 |
|
|
$ |
2,376 |
|
|
|
0.24 |
% |
|
|
3,494,212 |
|
|
$ |
1,825 |
|
|
|
0.21 |
% |
| CDs |
|
|
1,779,503 |
|
|
|
3,749 |
|
|
|
0.84 |
% |
|
|
1,860,094 |
|
|
|
3,943 |
|
|
|
0.85 |
% |
|
|
2,211,758 |
|
|
|
5,317 |
|
|
|
0.95 |
% |
|
|
|
|
|
|
|
|
|
|
|
|
|
|
|
|
|
|
|
|
|
|
|
|
|
|
|
|
|
|
|
|
|
|
|
|
|
| Total deposits |
|
|
7,031,048 |
|
|
|
6,136 |
|
|
|
0.35 |
% |
|
|
7,140,838 |
|
|
|
6,319 |
|
|
|
0.35 |
% |
|
|
6,878,660 |
|
|
|
7,142 |
|
|
|
0.41 |
% |
|
|
|
|
|
|
|
|
|
|
|
|
|
|
|
|
|
|
|
|
|
|
|
|
|
|
|
|
|
|
|
|
|
|
|
|
|
| Securities sold under agreements to repurchase |
|
$ |
186,477 |
|
|
$ |
158 |
|
|
|
0.34 |
% |
|
$ |
192,579 |
|
|
$ |
153 |
|
|
|
0.32 |
% |
|
$ |
231,476 |
|
|
$ |
155 |
|
|
|
0.27 |
% |
| FHLB advances and other borrowings |
|
|
490,360 |
|
|
|
860 |
|
|
|
0.70 |
% |
|
|
311,430 |
|
|
|
752 |
|
|
|
0.97 |
% |
|
|
427,028 |
|
|
|
946 |
|
|
|
0.88 |
% |
| Related party notes payable |
|
|
41,295 |
|
|
|
231 |
|
|
|
2.22 |
% |
|
|
41,295 |
|
|
|
229 |
|
|
|
2.22 |
% |
|
|
41,295 |
|
|
|
236 |
|
|
|
2.27 |
% |
| Subordinated debentures and other |
|
|
56,083 |
|
|
|
330 |
|
|
|
2.33 |
% |
|
|
56,083 |
|
|
|
325 |
|
|
|
2.32 |
% |
|
|
56,083 |
|
|
|
333 |
|
|
|
2.36 |
% |
|
|
|
|
|
|
|
|
|
|
|
|
|
|
|
|
|
|
|
|
|
|
|
|
|
|
|
|
|
|
|
|
|
|
|
|
|
| Total borrowings |
|
|
774,215 |
|
|
|
1,579 |
|
|
|
0.81 |
% |
|
|
601,387 |
|
|
|
1,459 |
|
|
|
0.97 |
% |
|
|
755,882 |
|
|
|
1,670 |
|
|
|
0.88 |
% |
|
|
|
|
|
|
|
|
|
|
|
|
|
|
|
|
|
|
|
|
|
|
|
|
|
|
|
|
|
|
|
|
|
|
|
|
|
| Total interest-bearing liabilities |
|
|
7,805,263 |
|
|
|
7,715 |
|
|
|
0.39 |
% |
|
|
7,742,225 |
|
|
|
7,778 |
|
|
|
0.40 |
% |
|
|
7,634,542 |
|
|
|
8,812 |
|
|
|
0.46 |
% |
|
|
|
|
|
|
|
|
|
|
|
|
|
|
|
|
|
|
|
|
|
|
|
|
|
|
|
|
|
|
|
|
|
|
|
|
|
| Noninterest-bearing other liabilities |
|
|
62,174 |
|
|
|
|
|
|
|
|
|
|
|
57,044 |
|
|
|
|
|
|
|
|
|
|
|
66,710 |
|
|
|
|
|
|
|
|
|
| Equity |
|
|
1,438,962 |
|
|
|
|
|
|
|
|
|
|
|
1,445,097 |
|
|
|
|
|
|
|
|
|
|
|
1,400,635 |
|
|
|
|
|
|
|
|
|
|
|
|
|
|
|
|
|
|
|
|
|
|
|
|
|
|
|
|
|
|
|
|
|
|
|
|
|
|
|
|
|
|
|
|
|
|
| Total Liabilities and Equity |
|
$ |
9,306,399 |
|
|
|
|
|
|
|
|
|
|
$ |
9,244,366 |
|
|
|
|
|
|
|
|
|
|
$ |
9,101,887 |
|
|
|
|
|
|
|
|
|
|
|
|
|
|
|
|
|
|
|
|
|
|
|
|
|
|
|
|
|
|
|
|
|
|
|
|
|
|
|
|
|
|
|
|
|
|
| Net interest spread |
|
|
|
|
|
|
|
|
|
|
3.20 |
% |
|
|
|
|
|
|
|
|
|
|
3.81 |
% |
|
|
|
|
|
|
|
|
|
|
3.19 |
% |
| Net interest income and net interest margin |
|
|
|
|
|
$ |
76,646 |
|
|
|
3.72 |
% |
|
|
|
|
|
$ |
89,386 |
|
|
|
4.43 |
% |
|
|
|
|
|
$ |
74,886 |
|
|
|
3.75 |
% |
|
|
|
|
|
|
|
|
|
|
|
|
|
|
|
|
|
|
|
|
|
|
|
|
|
|
|
|
|
|
|
|
|
|
|
|
|
| Adjusted net interest income and adjusted net interest margin(1) |
|
|
|
|
|
$ |
76,843 |
|
|
|
3.73 |
% |
|
|
|
|
|
$ |
76,189 |
|
|
|
3.77 |
% |
|
|
|
|
|
$ |
73,556 |
|
|
|
3.68 |
% |
|
|
|
|
|
|
|
|
|
|
|
|
|
|
|
|
|
|
|
|
|
|
|
|
|
|
|
|
|
|
|
|
|
|
|
|
|
| Adjusted interest income and adjusted yield on loans, other than acquired with deteriorated credit
quality, net(1) |
|
|
|
|
|
$ |
76,585 |
|
|
|
4.65 |
% |
|
|
|
|
|
$ |
75,334 |
|
|
|
4.75 |
% |
|
|
|
|
|
$ |
73,123 |
|
|
|
4.82 |
% |
|
|
|
|
|
|
|
|
|
|
|
|
|
|
|
|
|
|
|
|
|
|
|
|
|
|
|
|
|
|
|
|
|
|
|
|
|
| (1) |
These are non-GAAP financial measures we believe are helpful to interpreting our financial results. See the table at the end of this document for the calculation of
the measures and reconciliation to the most comparable GAAP measures. |
8
GREAT WESTERN BANCORP, INC.
CONSOLIDATED FINANCIAL DATA
(Unaudited)
|
|
|
|
|
|
|
|
|
|
|
|
|
|
|
|
|
|
|
|
|
|
|
|
|
| |
|
Fiscal year ended September 30, |
|
| |
|
2014 |
|
|
2013 |
|
| Net Interest Margin (dollars in thousands) |
|
Average
Balance |
|
|
Interest |
|
|
Yields/
Rates |
|
|
Average
Balance |
|
|
Interest |
|
|
Yields/
Rates |
|
| Assets: |
|
|
|
|
|
|
|
|
|
|
|
|
|
|
|
|
|
|
|
|
|
|
|
|
| Cash and due from banks |
|
$ |
167,982 |
|
|
$ |
455 |
|
|
|
0.27 |
% |
|
$ |
132,517 |
|
|
$ |
336 |
|
|
|
0.25 |
% |
| Investment securities |
|
|
1,419,354 |
|
|
|
27,411 |
|
|
|
1.93 |
% |
|
|
1,575,343 |
|
|
|
29,588 |
|
|
|
1.88 |
% |
| Loans, other than acquired with deteriorated credit quality, net |
|
|
6,311,857 |
|
|
|
312,424 |
|
|
|
4.95 |
% |
|
|
5,876,116 |
|
|
|
249,527 |
|
|
|
4.25 |
% |
| Loans acquired with deteriorated credit quality, net |
|
|
194,668 |
|
|
|
5,835 |
|
|
|
3.00 |
% |
|
|
278,884 |
|
|
|
14,806 |
|
|
|
5.31 |
% |
|
|
|
|
|
|
|
|
|
|
|
|
|
|
|
|
|
|
|
|
|
|
|
|
|
| Loans, net |
|
|
6,506,525 |
|
|
|
318,259 |
|
|
|
4.89 |
% |
|
|
6,155,000 |
|
|
|
264,333 |
|
|
|
4.29 |
% |
|
|
|
|
|
|
|
|
|
|
|
|
|
|
|
|
|
|
|
|
|
|
|
|
|
| Total interest-earning assets |
|
|
8,093,861 |
|
|
|
346,125 |
|
|
|
4.28 |
% |
|
|
7,862,860 |
|
|
|
294,257 |
|
|
|
3.74 |
% |
| Other noninterest-earning assets |
|
|
1,149,957 |
|
|
|
|
|
|
|
|
|
|
|
1,158,231 |
|
|
|
|
|
|
|
|
|
|
|
|
|
|
|
|
|
|
|
|
|
|
|
|
|
|
|
|
|
|
|
|
|
|
| Total Assets |
|
$ |
9,243,818 |
|
|
$ |
346,125 |
|
|
|
3.74 |
% |
|
$ |
9,021,091 |
|
|
$ |
294,257 |
|
|
|
3.26 |
% |
|
|
|
|
|
|
|
|
|
|
|
|
|
|
|
|
|
|
|
|
|
|
|
|
|
| Liabilities and Equity: |
|
|
|
|
|
|
|
|
|
|
|
|
|
|
|
|
|
|
|
|
|
|
|
|
| Non-interest demand deposits |
|
$ |
1,242,097 |
|
|
|
|
|
|
|
|
|
|
$ |
1,159,581 |
|
|
|
|
|
|
|
|
|
| NOW, MMDA and savings deposits |
|
|
3,952,765 |
|
|
$ |
9,329 |
|
|
|
0.24 |
% |
|
|
3,296,745 |
|
|
$ |
6,921 |
|
|
|
0.21 |
% |
| CDs |
|
|
1,909,269 |
|
|
|
16,435 |
|
|
|
0.86 |
% |
|
|
2,447,553 |
|
|
|
26,196 |
|
|
|
1.07 |
% |
|
|
|
|
|
|
|
|
|
|
|
|
|
|
|
|
|
|
|
|
|
|
|
|
|
| Total deposits |
|
|
7,104,131 |
|
|
|
25,764 |
|
|
|
0.36 |
% |
|
|
6,903,879 |
|
|
|
33,117 |
|
|
|
0.48 |
% |
|
|
|
|
|
|
|
|
|
|
|
|
|
|
|
|
|
|
|
|
|
|
|
|
|
| Securities sold under agreements to repurchase |
|
|
193,901 |
|
|
|
600 |
|
|
|
0.31 |
% |
|
|
230,516 |
|
|
|
644 |
|
|
|
0.28 |
% |
| FHLB advances and other borrowings |
|
|
356,915 |
|
|
|
3,452 |
|
|
|
0.97 |
% |
|
|
328,976 |
|
|
|
3,103 |
|
|
|
0.94 |
% |
| Related party notes payable |
|
|
41,295 |
|
|
|
921 |
|
|
|
2.23 |
% |
|
|
41,295 |
|
|
|
950 |
|
|
|
2.30 |
% |
| Subordinated debentures and other |
|
|
56,083 |
|
|
|
1,315 |
|
|
|
2.34 |
% |
|
|
56,083 |
|
|
|
1,347 |
|
|
|
2.40 |
% |
|
|
|
|
|
|
|
|
|
|
|
|
|
|
|
|
|
|
|
|
|
|
|
|
|
| Total borrowings |
|
|
648,194 |
|
|
|
6,288 |
|
|
|
0.97 |
% |
|
|
656,870 |
|
|
|
6,044 |
|
|
|
0.92 |
% |
|
|
|
|
|
|
|
|
|
|
|
|
|
|
|
|
|
|
|
|
|
|
|
|
|
| Total interest-bearing liabilities |
|
|
7,752,325 |
|
|
|
32,052 |
|
|
|
0.41 |
% |
|
|
7,560,749 |
|
|
|
39,161 |
|
|
|
0.52 |
% |
|
|
|
|
|
|
|
|
|
|
|
|
|
|
|
|
|
|
|
|
|
|
|
|
|
| Noninterest-bearing other liabilities |
|
|
60,721 |
|
|
|
|
|
|
|
|
|
|
|
80,047 |
|
|
|
|
|
|
|
|
|
| Equity |
|
|
1,430,772 |
|
|
|
|
|
|
|
|
|
|
|
1,380,295 |
|
|
|
|
|
|
|
|
|
|
|
|
|
|
|
|
|
|
|
|
|
|
|
|
|
|
|
|
|
|
|
|
|
|
| Total Liabilities and Equity |
|
$ |
9,243,818 |
|
|
|
|
|
|
|
|
|
|
$ |
9,021,091 |
|
|
|
|
|
|
|
|
|
|
|
|
|
|
|
|
|
|
|
|
|
|
|
|
|
|
|
|
|
|
|
|
|
|
| Net interest spread |
|
|
|
|
|
|
|
|
|
|
3.33 |
% |
|
|
|
|
|
|
|
|
|
|
2.74 |
% |
| Net interest income and net interest margin |
|
|
|
|
|
$ |
314,073 |
|
|
|
3.88 |
% |
|
|
|
|
|
$ |
255,096 |
|
|
|
3.24 |
% |
|
|
|
|
|
|
|
|
|
|
|
|
|
|
|
|
|
|
|
|
|
|
|
|
|
| Adjusted net interest income and adjusted net interest margin(1) |
|
|
|
|
|
$ |
302,151 |
|
|
|
3.73 |
% |
|
|
|
|
|
$ |
295,401 |
|
|
|
3.76 |
% |
|
|
|
|
|
|
|
|
|
|
|
|
|
|
|
|
|
|
|
|
|
|
|
|
|
| Adjusted interest income and adjusted yield on loans, other than acquired with deteriorated credit quality, net(1) |
|
|
|
|
|
$ |
300,502 |
|
|
|
4.76 |
% |
|
|
|
|
|
$ |
289,832 |
|
|
|
4.93 |
% |
|
|
|
|
|
|
|
|
|
|
|
|
|
|
|
|
|
|
|
|
|
|
|
|
|
| (1) |
These are non-GAAP financial measures we believe are helpful to interpreting our financial results. See the table at the end of this document for the calculation of
the measures and reconciliation to the most comparable GAAP measures. |
9
Non-GAAP Measures and Reconciliation
We rely on certain non-GAAP measures in making financial and operational decisions about our business which exclude certain items that we do not consider
reflective of our business performance. We believe that each of the non-GAAP measures presented is helpful in highlighting trends in our business, financial condition and results of operations which might not otherwise be apparent when relying
solely on our financial results calculated in accordance with U.S. generally accepted accounting principles, or GAAP.
In particular, we evaluate our
profitability and performance based on our cash net income and return on average tangible common equity, each of which excludes the effects of amortization expense relating to intangible assets and related tax effects from the acquisition of us by
National Australia Bank Limited and our acquisitions of other institutions. We believe these measures help highlight trends associated with our financial condition and results of operations by providing net income and return information based on our
cash payments and receipts during the applicable period.
We also evaluate our profitability and performance based on our adjusted net interest income,
adjusted interest income on loans other than acquired with deteriorated credit quality, adjusted noninterest expense, adjusted net interest margin and adjusted yield on loans other than acquired with deteriorated credit quality. Each of these
measures excludes changes in fair value related to interest rates associated with certain of our fixed-rate loans measured at fair value and the matching fixed-to-floating interest rate swaps. We believe that these measures help highlight trends
associated with our financial condition and results of operations by eliminating these matching and offsetting changes in fair value which, on a net basis, have no effect on our GAAP net income. Similarly, we evaluate our operational efficiency
based on our adjusted efficiency ratio, which excludes the effects of changes in fair value discussed above as well as adjusted to exclude the effect of amortization of core deposit and other intangibles (a non-cash expense item) and to include the
tax benefit associated with our tax-advantaged loans and investments.
We evaluate our financial condition based on the ratio of our tangible common
equity to our tangible assets. Our calculation of this ratio excludes the effect of our goodwill and other intangible assets. We believe this measure is helpful in highlighting the common equity component of our capital and because of its focus by
federal bank regulators when reviewing the health and strength of financial institutions in recent years and when considering regulatory approvals for certain actions, including capital actions.
Reconciliations for each of these non-GAAP financial measures to the closest GAAP financial measures are included in the tables below. Each of the non-GAAP
measures presented should be considered in context with our GAAP financial results included in this release.
10
GREAT WESTERN BANCORP, INC.
CONSOLIDATED FINANCIAL DATA (Unaudited)
|
|
|
|
|
|
|
|
|
|
|
|
|
|
|
|
|
|
|
|
|
| |
|
At and for the three months ended |
|
|
At and for the fiscal year ended |
|
| |
|
Sept. 30,
2014 |
|
|
June 30,
2014 |
|
|
Sept. 30,
2013 |
|
|
Sept. 30,
2014 |
|
|
Sept. 30,
2013 |
|
| |
|
(dollars in thousands) |
|
| Reconciliation of Non-GAAP Measures |
|
|
|
|
|
|
|
|
|
|
|
|
|
|
|
|
|
|
|
|
|
|
|
|
| Cash net income and return on average tangible common equity: |
|
|
|
|
|
|
|
|
|
|
|
|
| Net income |
|
$ |
27,875 |
|
|
$ |
22,503 |
|
|
$ |
26,323 |
|
|
$ |
952 |
|
|
$ |
96,243 |
|
|
|
|
|
|
|
| Add: Amortization of intangible assets |
|
|
2,768 |
|
|
|
4,069 |
|
|
|
4,690 |
|
|
|
16,216 |
|
|
|
19,290 |
|
|
|
|
|
|
|
| Add: Tax on amortization of intangible assets |
|
|
(811 |
) |
|
|
(811 |
) |
|
|
(811 |
) |
|
|
(3,244 |
) |
|
|
(3,244 |
) |
|
|
|
|
|
|
|
|
|
|
|
|
|
|
|
|
|
|
|
|
|
| Cash net income |
|
$ |
29,832 |
|
|
$ |
25,761 |
|
|
$ |
30,202 |
|
|
$ |
117,924 |
|
|
$ |
112,289 |
|
|
|
|
|
|
|
|
|
|
|
|
|
|
|
|
|
|
|
|
|
|
| Average common equity |
|
$ |
1,438,962 |
|
|
$ |
1,445,097 |
|
|
$ |
1,400,635 |
|
|
$ |
1,430,772 |
|
|
$ |
1,380,295 |
|
| Less: Average goodwill and other intangible assets |
|
|
713,462 |
|
|
|
717,104 |
|
|
|
730,893 |
|
|
|
719,573 |
|
|
|
738,140 |
|
|
|
|
|
|
|
|
|
|
|
|
|
|
|
|
|
|
|
|
|
|
| Average tangible common equity |
|
$ |
725,500 |
|
|
$ |
727,993 |
|
|
$ |
669,742 |
|
|
$ |
711,199 |
|
|
$ |
642,155 |
|
|
|
|
|
|
|
|
|
|
|
|
|
|
|
|
|
|
|
|
|
|
| Return on average common equity |
|
|
7.69 |
% |
|
|
6.25 |
% |
|
|
7.46 |
% |
|
|
7.34 |
% |
|
|
6.97 |
% |
|
|
|
|
|
|
| Return on average tangible common equity * |
|
|
16.3 |
% |
|
|
14.2 |
% |
|
|
17.9 |
% |
|
|
16.6 |
% |
|
|
17.5 |
% |
|
| * Calculated as cash net income divided by
average tangible common equity. Annualized for quarterly periods. |
|
| Adjusted net interest income and adjusted net interest margin: |
|
|
|
|
|
|
|
|
|
|
|
|
|
|
|
|
|
|
|
|
|
|
|
|
|
|
| Net interest income |
|
$ |
76,646 |
|
|
$ |
89,386 |
|
|
$ |
74,886 |
|
|
$ |
314,073 |
|
|
$ |
255,096 |
|
|
|
|
|
|
|
| Less: Loan FV adjustment related to interest rates |
|
|
(197 |
) |
|
|
13,197 |
|
|
|
1,330 |
|
|
|
11,922 |
|
|
|
(40,305 |
) |
|
|
|
|
|
|
|
|
|
|
|
|
|
|
|
|
|
|
|
|
|
| Adjusted net interest income |
|
$ |
76,843 |
|
|
$ |
76,189 |
|
|
$ |
73,556 |
|
|
$ |
302,151 |
|
|
$ |
295,401 |
|
|
|
|
|
|
|
|
|
|
|
|
|
|
|
|
|
|
|
|
|
|
| Average interest-earning assets |
|
$ |
8,181,194 |
|
|
$ |
8,098,052 |
|
|
$ |
7,930,867 |
|
|
$ |
8,093,861 |
|
|
$ |
7,862,860 |
|
|
|
|
|
|
|
| Net interest margin |
|
|
3.72 |
% |
|
|
4.43 |
% |
|
|
3.75 |
% |
|
|
3.88 |
% |
|
|
3.24 |
% |
|
|
|
|
|
|
| Adjusted net interest margin * |
|
|
3.73 |
% |
|
|
3.77 |
% |
|
|
3.68 |
% |
|
|
3.73 |
% |
|
|
3.76 |
% |
|
|
| * Adjusted net interest margin is calculated
as adjusted net interest income divided by average interest earning assets. Annualized for quarterly periods. |
|
|
|
|
|
| Adjusted interest income and adjusted yield on Loans, other than acquired with deteriorated credit quality, net: |
|
|
|
|
|
|
|
|
|
|
|
|
|
|
|
|
|
|
|
|
|
|
|
|
|
|
| Interest income |
|
$ |
76,388 |
|
|
$ |
88,531 |
|
|
$ |
74,453 |
|
|
$ |
312,424 |
|
|
$ |
249,527 |
|
|
|
|
|
|
|
| Less: Loan FV adjustment related to interest rates |
|
|
(197 |
) |
|
|
13,197 |
|
|
|
1,330 |
|
|
|
11,922 |
|
|
|
(40,305 |
) |
|
|
|
|
|
|
|
|
|
|
|
|
|
|
|
|
|
|
|
|
|
| Adjusted interest income |
|
$ |
76,585 |
|
|
$ |
75,334 |
|
|
$ |
73,123 |
|
|
$ |
300,502 |
|
|
$ |
289,832 |
|
|
|
|
|
|
|
|
|
|
|
|
|
|
|
|
|
|
|
|
|
|
| Average Loans, other than acquired with deteriorated credit quality, net |
|
$ |
6,527,721 |
|
|
$ |
6,362,850 |
|
|
$ |
6,024,403 |
|
|
$ |
6,311,857 |
|
|
$ |
5,876,116 |
|
|
|
|
|
|
|
| Yield |
|
|
4.64 |
% |
|
|
5.58 |
% |
|
|
4.90 |
% |
|
|
4.95 |
% |
|
|
4.25 |
% |
|
|
|
|
|
|
| Adjusted yield * |
|
|
4.65 |
% |
|
|
4.75 |
% |
|
|
4.82 |
% |
|
|
4.76 |
% |
|
|
4.93 |
% |
|
| * Adjusted yield is calculated as adjusted
interest income divided by average balance. Annualized for quarterly periods. |
|
| Adjusted noninterest expense and adjusted efficiency ratio: |
|
|
|
|
|
|
|
|
|
|
|
|
|
|
|
|
|
|
|
|
|
|
|
|
|
|
| Total revenue |
|
$ |
91,530 |
|
|
$ |
103,611 |
|
|
$ |
92,412 |
|
|
$ |
372,127 |
|
|
$ |
330,000 |
|
|
|
|
|
|
|
| Plus: Tax equivalent adjustment |
|
|
1,324 |
|
|
|
1,199 |
|
|
|
1,092 |
|
|
|
4,663 |
|
|
|
3,541 |
|
|
|
|
|
|
|
| Total revenue (fully tax-equivalent basis) |
|
|
92,854 |
|
|
|
104,810 |
|
|
|
93,504 |
|
|
|
376,790 |
|
|
|
333,541 |
|
|
|
|
|
|
|
| Less: Loan FV adjustment related to interest rates |
|
|
(197 |
) |
|
|
13,197 |
|
|
|
1,330 |
|
|
|
11,922 |
|
|
|
(40,305 |
) |
|
|
|
|
|
|
|
|
|
|
|
|
|
|
|
|
|
|
|
|
|
| Adjusted revenue |
|
$ |
93,051 |
|
|
$ |
91,613 |
|
|
$ |
92,174 |
|
|
$ |
364,868 |
|
|
$ |
373,846 |
|
|
|
|
|
|
|
|
|
|
|
|
|
|
|
|
|
|
|
|
|
|
| Noninterest expense |
|
$ |
48,121 |
|
|
$ |
67,476 |
|
|
$ |
54,333 |
|
|
$ |
212,144 |
|
|
$ |
168,285 |
|
|
|
|
|
|
|
| Less: Amortization of core deposit and other intangibles |
|
|
2,768 |
|
|
|
4,069 |
|
|
|
4,690 |
|
|
|
16,216 |
|
|
|
19,290 |
|
| Tangible noninterest expense |
|
|
45,353 |
|
|
|
63,407 |
|
|
|
49,643 |
|
|
|
195,928 |
|
|
|
148,995 |
|
|
|
|
|
|
|
|
|
|
|
|
|
|
|
|
|
|
|
|
|
|
| Less: Derivatives, net (gain) loss |
|
|
(197 |
) |
|
|
13,197 |
|
|
|
1,330 |
|
|
|
11,922 |
|
|
|
(40,305 |
) |
|
|
|
|
|
|
|
|
|
|
|
|
|
|
|
|
|
|
|
|
|
| Adjusted noninterest expense |
|
$ |
45,550 |
|
|
$ |
50,210 |
|
|
$ |
48,313 |
|
|
$ |
184,006 |
|
|
$ |
189,300 |
|
|
|
|
|
|
|
|
|
|
|
|
|
|
|
|
|
|
|
|
|
|
| Adjusted efficiency ratio* |
|
|
49.0 |
% |
|
|
54.8 |
% |
|
|
52.4 |
% |
|
|
50.4 |
% |
|
|
50.6 |
% |
| Unadjusted efficiency ratio ** |
|
|
48.8 |
% |
|
|
60.5 |
% |
|
|
53.1 |
% |
|
|
52.0 |
% |
|
|
44.7 |
% |
|
|
| * Calculated as ratio of adjusted noninterest
expense to adjusted revenue. ** Calculated as ratio of tangible noninterest expense
to total revenue (fully tax-equivalent basis). |
|
|
|
|
|
| Tangible common equity and tangible common equity to tangible assets: |
|
|
|
|
|
|
|
|
|
|
|
|
|
|
|
|
|
|
|
|
|
|
|
|
|
|
| Total stockholder’s equity |
|
$ |
1,421,090 |
|
|
$ |
1,430,964 |
|
|
$ |
1,417,214 |
|
|
$ |
1,421,090 |
|
|
$ |
1,417,214 |
|
|
|
|
|
|
|
| Less: Goodwill, core deposits and other intangibles |
|
|
712,036 |
|
|
|
714,803 |
|
|
|
728,251 |
|
|
|
712,036 |
|
|
|
728,251 |
|
|
|
|
|
|
|
|
|
|
|
|
|
|
|
|
|
|
|
|
|
|
| Tangible common equity |
|
$ |
709,054 |
|
|
$ |
716,161 |
|
|
$ |
688,963 |
|
|
$ |
709,054 |
|
|
$ |
6,888,963 |
|
|
|
|
|
|
|
|
|
|
|
|
|
|
|
|
|
|
|
|
|
|
| Total assets |
|
$ |
9,371,429 |
|
|
$ |
9,292,283 |
|
|
$ |
9,134,258 |
|
|
$ |
9,371,429 |
|
|
$ |
9,134,258 |
|
|
|
|
|
|
|
| Less: Goodwill, core deposits and other intangibles |
|
|
712,036 |
|
|
|
714,803 |
|
|
|
728,251 |
|
|
|
712,036 |
|
|
|
728,251 |
|
|
|
|
|
|
|
|
|
|
|
|
|
|
|
|
|
|
|
|
|
|
| Tangible assets |
|
$ |
8,659,393 |
|
|
$ |
8,577,480 |
|
|
$ |
8,406,007 |
|
|
$ |
8,659,393 |
|
|
$ |
8,406,007 |
|
|
|
|
|
|
|
|
|
|
|
|
|
|
|
|
|
|
|
|
|
|
| Tangible common equity to tangible assets |
|
|
8.2 |
% |
|
|
8.3 |
% |
|
|
8.2 |
% |
|
|
8.2 |
% |
|
|
8.2 |
% |
11