Ascendis Algorithm for Product Innovation
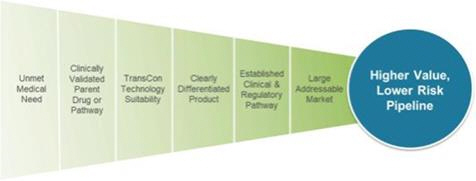
Through our approach, we may benefit from established clinical safety and efficacy data, which we believe increases the probability of success. As presented above, our algorithm for product innovation focuses on identifying indications that have an unmet medical need, have a clinically-validated parent drug or pathway, are suitable to our TransCon technologies, have potential for creating a clearly differentiated product, have an established development pathway and have a large potentially addressable market.
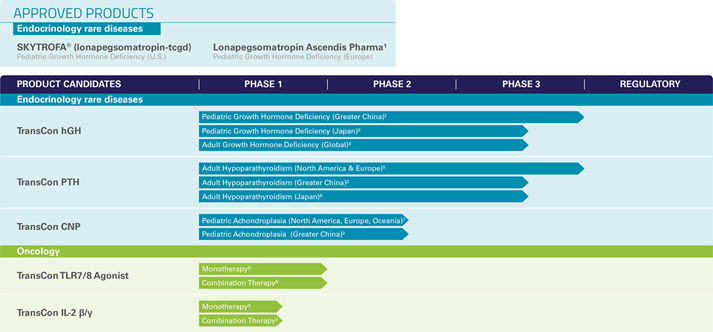
We currently have one marketed product and a diversified portfolio of five product candidates in clinical development in the areas of endocrinology rare diseases and oncology. We are also evaluating additional therapeutic areas and indications.
| • | First Approved Product – Our first marketed product is SKYTROFA ® (lonapegsomatropin-tcgd), developed as TransCon Growth Hormone (“TransCon hGH”), which has received regulatory approval in the United States (“U.S.”) for the treatment of pediatric patients one year and older who weigh at least 11.5 kg and have growth failure due to inadequate secretion of endogenous growth hormone, also known as growth hormone deficiency (“GHD”) and which is now commercially available for prescription in the U.S. TransCon hGH is also approved in the European Union (“EU”) under the name Lonapegsomatropin Ascendis Pharma for the treatment of children and adolescents aged from 3 years up to 18 years with growth failure due to insufficient endogenous growth hormone secretion. |
| • | Endocrinology Rare Disease Pipeline – We are developing three product candidates in our endocrinology rare disease portfolio spanning seven different clinical programs. These include TransCon hGH for pediatric GHD in Japan; TransCon hGH for adults with GHD; TransCon PTH for adults with hypoparathyroidism; the last classical hormone deficiency for which complete hormone replacement has been elusive; and TransCon CNP for achondroplasia, the most common form of dwarfism. VISEN Pharmaceuticals (“VISEN”), to which we have licensed rights to TransCon hGH, TransCon PTH, and TransCon CNP, and under certain conditions, has a First Right of Negotiation for other Endocrine product candidates for the Chinese market in case Ascendis decides to out-license such territory, is developing TransCon hGH, TransCon PTH and TransCon CNP in China. In addition, we are planning new trials in other endocrinology rare disease indications, including TransCon hGH for Turner Syndrome; TransCon PTH for children with hypoparathyroidism; and TransCon CNP for infants (age 0-2 years) with achondroplasia. |
| • | Oncology Pipeline – In oncology, we are leveraging our TransCon technologies in effort to enhance anti-tumor effects of clinically-validated parent drugs and pathways and to provide sustained modulation of tumor microenvironments and activate cytotoxic immune cells. We have initiated clinical development of two product candidates: TransCon TLR7/8 Agonist, an investigational, long-acting prodrug of resiquimod, a small molecule agonist of Toll like receptors (“TLR”) 7 and 8 for intratumoral delivery and TransCon IL-2 ß/g for systemic delivery, which is designed for prolonged exposure to an IL-2 variant that selectively activates the IL-2Rß/ g , with minimal binding to IL-2Rα. Our clinical development program for these product candidates also includes evaluation of them as a potential combination therapy. |
3