REGISTRATION STATEMENT PURSUANT TO SECTION 12(b) OR 12(g) OF THE SECURITIES EXCHANGE ACT OF 1934 |
ANNUAL REPORT PURSUANT TO SECTION 13 OR 15(d) OF THE SECURITIES EXCHANGE ACT OF 1934 |
TRANSITION REPORT PURSUANT TO SECTION 13 OR 15(d) OF THE SECURITIES EXCHANGE ACT OF 1934 |
SHELL COMPANY REPORT PURSUANT TO SECTION 13 OR 15(d) OF THE SECURITIES EXCHANGE ACT OF 1934 |
Title of Each Class |
Trading Symbol(s) |
Name of Each Exchange on Which Registered | ||
The (The Nasdaq Global Select Market) | ||||
The (The Nasdaq Global Select Market) |
* | |
☒ | Accelerated filer | ☐ | ||||
Non-accelerated filer |
☐ | Emerging growth company |
† |
The term “new or revised financial accounting standard” refers to any update issued by the Financial Accounting Standards Board to its Accounting Standards Codification after April 5, 2012. |
International Financial Reporting Standards as issued by the International Accounting Standards Board ☐ |
Other ☐ |
1 |
||||||
1 |
||||||
2 |
||||||
Item 1. |
2 |
|||||
Item 2. |
2 |
|||||
Item 3. |
2 |
|||||
Item 4. |
40 |
|||||
Item 4A. |
65 |
|||||
Item 5. |
66 |
|||||
Item 6. |
90 |
|||||
Item 7. |
100 |
|||||
Item 8. |
103 |
|||||
Item 9. |
104 |
|||||
Item 10. |
105 |
|||||
Item 11. |
119 |
|||||
Item 12. |
120 |
|||||
121 |
||||||
Item 13. |
121 |
|||||
Item 14. |
121 |
|||||
Item 15. |
121 |
|||||
Item 16A. |
123 |
|||||
Item 16B. |
123 |
|||||
Item 16C. |
123 |
|||||
Item 16D. |
124 |
|||||
Item 16E. |
124 |
|||||
Item 16F. |
124 |
|||||
Item 16G. |
124 |
|||||
Item 16H. |
125 |
|||||
125 |
||||||
Item 17. |
125 |
|||||
Item 18. |
125 |
|||||
Item 19. |
125 |
|||||
132 |
• | “$,” “dollars,” “US$” or “U.S. dollars” refers to the legal currency of the United States; |
• | “ADSs” refers to our American depositary shares, each representing two Class A ordinary shares, par value US$0.0001 per share; |
• | “China” or the “PRC” refers to the People’s Republic of China, and solely for the purpose of this annual report, excludes Hong Kong, Macau and Taiwan; |
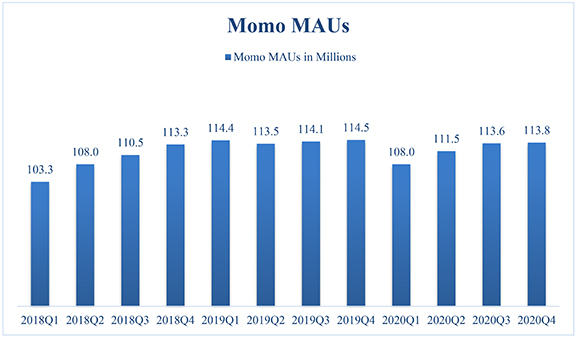
• | “MAUs” refers to monthly active users. We define Momo MAUs during a given calendar month as Momo users who were daily active users for at least one day during the 30-day period counting back from the last day of such calendar month. Momo daily active users are users who accessed our platform through mobile devices and utilized any of the functions on our platform on a given day. |
• | “Momo Inc.,” “we,” “us,” “our company,” or “our” refers to our holding company Momo Inc., its subsidiaries and its consolidated affiliated entities and their subsidiaries; |
• | “ordinary shares” refers to our Class A and Class B ordinary shares, par value US$0.0001 per share; and |
• | “RMB” or “Renminbi” refers to the legal currency of China. |
• | our goals and strategies; |
• | our future business development, financial condition and results of operations; |
• | the expected growth of mobile social networking platforms, live video services, mobile marketing services, mobile games and online entertainment services in China; |
• | our expectations regarding demand for and market acceptance of our services; |
• | our expectations regarding our user base and level of user engagement; |
• | our monetization strategies; |
• | our plans to invest in our technology infrastructure; |
• | competition in our industry; and |
• | relevant government policies and regulations relating to our industry. |
Item 1. |
Identity of Directors, Senior Management and Advisers |
Item 2. |
Offer Statistics and Expected Timetable |
Item 3. |
Key Information |
A. |
Selected Financial Data |
Year Ended December 31, |
||||||||||||||||||||||||
2016 RMB |
2017 RMB |
2018 RMB |
2019 RMB |
2020 RMB |
2020 US$ |
|||||||||||||||||||
(in thousands, except share and share-related data) |
||||||||||||||||||||||||
Selected Data of Consolidated Statements of Operations |
||||||||||||||||||||||||
Net Revenues (1) |
3,707,358 | 8,886,390 | 13,408,421 | 17,015,089 | 15,024,188 | 2,302,558 | ||||||||||||||||||
Cost and expenses (2) |
||||||||||||||||||||||||
Cost of revenues |
(1,619,327 | ) | (4,373,377 | ) | (7,182,897 | ) | (8,492,096 | ) | (7,976,781 | ) | (1,222,495 | ) | ||||||||||||
Research and development expenses |
(208,647 | ) | (346,144 | ) | (760,644 | ) | (1,095,031 | ) | (1,167,677 | ) | (178,954 | ) | ||||||||||||
Sales and marketing expenses |
(647,238 | ) | (1,467,376 | ) | (1,812,262 | ) | (2,690,824 | ) | (2,813,922 | ) | (431,252 | ) | ||||||||||||
General and administrative expenses |
(259,712 | ) | (422,005 | ) | (640,023 | ) | (1,527,282 | ) | (763,150 | ) | (116,958 | ) | ||||||||||||
|
|
|
|
|
|
|
|
|
|
|
|
|||||||||||||
Total cost and expenses |
(2,734,924 | ) | (6,608,902 | ) | (10,395,826 | ) | (13,805,233 | ) | (12,721,530 | ) | (1,949,659 | ) | ||||||||||||
|
|
|
|
|
|
|
|
|
|
|
|
|||||||||||||
Other operating income |
2,659 | 156,764 | 253,697 | 344,843 | 228,777 | 35,062 | ||||||||||||||||||
Income from operations |
975,093 | 2,434,252 | 3,266,292 | 3,554,699 | 2,531,435 | 387,961 | ||||||||||||||||||
Interest income |
54,603 | 145,568 | 272,946 | 407,542 | 444,471 | 68,118 | ||||||||||||||||||
Interest expense |
— | — | (56,503 | ) | (78,611 | ) | (78,872 | ) | (12,088 | ) | ||||||||||||||
Other gain or loss, net |
(39,283 | ) | (30,085 | ) | (43,200 | ) | (15,711 | ) | 1,500 | 230 | ||||||||||||||
|
|
|
|
|
|
|
|
|
|
|
|
|||||||||||||
Income before income tax and share of income on equity method investments |
990,413 | 2,549,735 | 3,439,535 | 3,867,919 | 2,898,534 | 444,221 |
Year Ended December 31, |
||||||||||||||||||||||||
2016 RMB |
2017 RMB |
2018 RMB |
2019 RMB |
2020 RMB |
2020 US$ |
|||||||||||||||||||
(in thousands, except share and share-related data) |
||||||||||||||||||||||||
Income tax expens |
(34,638 | ) | (445,001 | ) | (699,648 | ) | (883,801 | ) | (755,620 | ) | (115,804 | ) | ||||||||||||
|
|
|
|
|
|
|
|
|
|
|
|
|||||||||||||
Income before share of income on equity method investments |
955,775 | 2,104,734 | 2,739,887 | 2,984,118 | 2,142,914 | 328,417 | ||||||||||||||||||
Share of income (loss) on equity method investments |
23,194 | 39,729 | 48,660 | (23,350 | ) | (42,522 | ) | (6,517 | ) | |||||||||||||||
Net income |
978,969 | 2,144,463 | 2,788,547 | 2,960,768 | 2,100,392 | 321,900 | ||||||||||||||||||
Less: net loss attributable to non-controlling interest |
— | (3,635 | ) | (27,228 | ) | (10,122 | ) | (3,092 | ) | (474 | ) | |||||||||||||
|
|
|
|
|
|
|
|
|
|
|
|
|||||||||||||
Net income attributable to Momo Inc. |
978,969 | 2,148,098 | 2,815,775 | 2,970,890 | 2,103,484 | 322,374 | ||||||||||||||||||
|
|
|
|
|
|
|
|
|
|
|
|
|||||||||||||
Net income attributable to ordinary shareholders |
978,969 | 2,148,098 | 2,815,775 | 2,970,890 | 2,103,484 | 322,374 | ||||||||||||||||||
|
|
|
|
|
|
|
|
|
|
|
|
|||||||||||||
Net income per share attributable to ordinary shareholders |
||||||||||||||||||||||||
Basic |
2.54 | 5.44 | 6.92 | 7.15 | 5.05 | 0.77 | ||||||||||||||||||
Diluted |
2.41 | 5.17 | 6.59 | 6.76 | 4.83 | 0.74 | ||||||||||||||||||
Weighted average shares used in computing net income per ordinary share |
||||||||||||||||||||||||
Basic |
377,335,923 | 394,549,323 | 407,009,875 | 415,316,627 | 416,914,898 | 416,914,898 | ||||||||||||||||||
Diluted |
407,041,165 | 415,265,078 | 433,083,643 | 451,206,091 | 452,081,642 | 452,081,642 |
Year Ended December 31, |
||||||||||||||||||||
2016 US$ |
2017 US$ |
2018 US$ |
2019 US$ |
2020 US$ |
||||||||||||||||
Cash dividends per ordinary share (3) |
— | — | — | 0.31 | 0.38 |
(1) | Components of our net revenues are presented in the following table: |
Year Ended December 31, |
||||||||||||||||||||||||
2016 RMB |
2017 RMB |
2018 RMB |
2019 RMB |
2020 RMB |
2020 US$ |
|||||||||||||||||||
(in thousands) |
||||||||||||||||||||||||
Live video service |
2,534,604 | 7,429,906 | 10,709,491 | 12,448,131 | 9,637,579 | 1,477,024 | ||||||||||||||||||
Value-added service |
449,781 | 695,798 | 1,883,150 | 4,105,963 | 5,112,182 | 783,476 | ||||||||||||||||||
Mobile marketing |
441,644 | 514,279 | 500,321 | 331,822 | 198,197 | 30,375 | ||||||||||||||||||
Mobile games |
236,238 | 241,388 | 130,392 | 92,451 | 39,564 | 6,063 | ||||||||||||||||||
Other services |
45,091 | 5,019 | 185,067 | 36,722 | 36,666 | 5,620 | ||||||||||||||||||
|
|
|
|
|
|
|
|
|
|
|
|
|||||||||||||
Total |
3,707,358 | 8,886,390 | 13,408,421 | 17,015,089 | 15,024,188 | 2,302,558 | ||||||||||||||||||
|
|
|
|
|
|
|
|
|
|
|
|
(2) | Share-based compensation expenses were allocated in cost and expenses as follows: |
Year Ended December 31, |
||||||||||||||||||||||||
2016 RMB |
2017 RMB |
2018 RMB |
2019 RMB |
2020 RMB |
2020 US$ |
|||||||||||||||||||
(in thousands) |
||||||||||||||||||||||||
Cost of revenues |
18,521 | 13,547 | 21,661 | 23,972 | 18,449 | 2,827 | ||||||||||||||||||
Research and development expenses |
37,455 | 59,190 | 152,806 | 175,053 | 175,870 | 26,953 | ||||||||||||||||||
Sales and marketing expenses |
39,139 | 79,032 | 142,927 | 196,311 | 158,902 | 24,353 | ||||||||||||||||||
General and administrative expenses |
115,724 | 183,204 | 263,419 | 1,012,896 | 325,465 | 49,880 | ||||||||||||||||||
|
|
|
|
|
|
|
|
|
|
|
|
|||||||||||||
Total |
210,839 | 334,973 | 580,813 | 1,408,232 | 678,686 | 104,013 | ||||||||||||||||||
|
|
|
|
|
|
|
|
|
|
|
|
As of December 31, |
||||||||||||||||||||||||
2016 RMB |
2017 RMB |
2018 RMB |
2019 RMB |
2020 RMB |
2020 US$ |
|||||||||||||||||||
(in thousands) |
||||||||||||||||||||||||
Selected Consolidated Balance Sheet Data: |
||||||||||||||||||||||||
Cash and cash equivalents |
1,788,268 | 4,462,194 | 2,468,034 | 2,612,743 | 3,363,942 | 515,547 | ||||||||||||||||||
Total assets |
5,344,283 | 8,471,188 | 18,965,538 | 22,483,681 | 23,220,556 | 3,558,706 | ||||||||||||||||||
Total liabilities |
942,289 | 1,719,088 | 7,942,679 | 8,764,899 | 8,385,227 | 1,285,092 | ||||||||||||||||||
Total equity |
4,401,994 | 6,752,100 | 11,022,859 | 13,718,782 | 14,835,329 | 2,273,614 |
(3) | Total cash dividends for the years ended December 31, 2019 and 2020 were US$128.6 million and US$158.6 million. |
B. |
Capitalization and Indebtedness |
C. |
Reasons for the Offer and Use of Proceeds |
D. |
Risk Factors |
• | we are unable to attract new users to our platform or retain existing ones; |
• | we fail to introduce new and improved services, or if we introduce services that are not favorably received by users; |
• | we are unable to combat spam on or inappropriate or abusive use of our platform, which may lead to negative public perception of us and our brand; |
• | technical or other problems prevent us from delivering our services in a rapid and reliable manner or otherwise adversely affect the user experience; |
• | we suffer from negative publicity, fail to maintain our brand or if our reputation is damaged; |
• | we fail to address user concerns related to privacy and communication, safety, security or other factors; |
• | there are adverse changes in our services that are mandated by, or that we elect to make to address, legislation, regulations or government policies; and |
• | the growth of the number of smartphone users in China stalls. |
• | expand our paying user base for the various services offered by our platform, including live video service, value-added service, mobile games and others; |
• | develop and deploy diversified and distinguishable features and services for our users, customers and platform partners; |
• | convince customers of the benefits of our marketing services compared to alternative forms of marketing, and continue to increase the efficiency of our mobile marketing solutions and expand our network of marketers; |
• | develop or implement strategic initiatives to monetize our platform; |
• | develop beneficial relationship with key strategic partners, talented broadcasters and talent agencies for our live video service; |
• | develop a reliable, scalable, secure, high-performance technology infrastructure that can efficiently handle increased usage; |
• | successfully compete with other companies, some of which have substantially greater resources and market power than us, that are currently in, or may in the future enter, our industry, or duplicate the features of our services; |
• | attract, retain and motivate talented employees; and |
• | defend ourselves against litigation, regulatory, intellectual property, privacy or other claims. |
• | the difficulty in retaining Tantan’s users following the acquisition; |
• | the need to integrate certain operations, systems, technologies, and personnel of Tantan, the inefficiencies that may result if such integration is delayed or not implemented as expected, and unforeseen difficulties and expenditures that may arise in connection with such integration; |
• | the difficulty in successfully evaluating and utilizing Tantan’s technology and features; |
• | the difficulty in integrating potentially contrasting corporate cultures and management philosophies; |
• | diversion of our management’s and personnel’s attention from our existing businesses and initiatives; |
• | the difficulty in retaining employees following the acquisition; |
• | the difficulties relating to achieving the expected synergies of the transaction; |
• | the incurrence of unforeseen obligations or liabilities, which may entail significant expense; and |
• | the difficulty in integrating Tantan’s financial reporting, which may affect our ability to maintain effective controls and procedures over our consolidated financial reporting. |
• | the popularity, usefulness, ease of use, performance and reliability of our services compared to those of our competitors, and the research and development abilities of us and our competitors; |
• | changes mandated by, or that we elect to make to address, legislation, regulations or government policies, some of which may have a disproportionate effect on us; |
• | acquisitions or consolidation within our industry, which may result in more formidable competitors; |
• | our ability to monetize our services; |
• | our ability to attract, retain, and motivate talented employees; |
• | our ability to manage and grow our operations cost-effectively; and |
• | our reputation and brand strength relative to our competitors. |
• | our technology, system, networks and our users’ devices have been subject to, and may continue to be the target of, cyber-attacks, computer viruses, malicious code, phishing attacks or information security breaches that could result in an unauthorized release, gathering, monitoring, misuse, loss or destruction of confidential, proprietary and other information of ours, our employees or sensitive information provided by our users, or otherwise disrupt our, our users’ or other third parties’ business operations; |
• | we periodically encounter attempts to create false accounts or use our platform to send targeted and untargeted spam messages to our users, or take other actions on our platform for purposes such as spamming or spreading misinformation, and we may not be able to repel spamming attacks; |
• | the use of encryption and other security measures intended to protect our systems and confidential data may not provide absolute security, and losses or unauthorized access to or releases of confidential information may still occur; |
• | our security measures may be breached due to employee error, malfeasance or unauthorized access to sensitive information by our employees, who may be induced by outside third parties, and we may not be able to anticipate any breach of our security or to implement adequate preventative measures; and |
• | we may be subject to information technology system failures or network disruptions caused by natural disasters, accidents, power disruptions, telecommunications failures, acts of terrorism or war, computer viruses, physical or electronic break-ins, or other events or disruptions. |
• | revoke our business and operating licenses; |
• | require us to discontinue or restrict operations; |
• | restrict our right to collect revenues; |
• | block our websites; |
• | require us to restructure the operations in such a way as to compel us to establish a new enterprise, re-apply for the necessary licenses or relocate our businesses, staff and assets; |
• | impose additional conditions or requirements with which we may not be able to comply; or |
• | take other regulatory or enforcement actions against us that could be harmful to our business. |
• | variations in our revenues, earnings, cash flow and data related to our user base or user engagement; |
• | announcements of new investments, acquisitions, strategic partnerships or joint ventures by us or our competitors; |
• | announcements of new products, services and expansions by us or our competitors; |
• | changes in financial estimates by securities analysts; |
• | detrimental adverse publicity about us, our services or our industry; |
• | additions or departures of key personnel; |
• | release of lock-up or other transfer restrictions on our outstanding equity securities or sales of additional equity securities; and |
• | potential litigation or regulatory investigations. |
• | the rules under the Exchange Act requiring the filing of quarterly reports on Form 10-Q or current reports on Form 8-K with the SEC; |
• | the sections of the Exchange Act regulating the solicitation of proxies, consents, or authorizations in respect of a security registered under the Exchange Act; |
• | the sections of the Exchange Act requiring insiders to file public reports of their stock ownership and trading activities and liability for insiders who profit from trades made in a short period of time; and |
• | the selective disclosure rules by issuers of material nonpublic information under Regulation FD. |
• | we have failed to timely provide the depositary with notice of meeting and related voting materials; |
• | we have instructed the depositary that we do not wish a discretionary proxy to be given; |
• | we have informed the depositary that there is substantial opposition as to a matter to be voted on at the meeting; |
• | a matter to be voted on at the meeting would have a material adverse impact on shareholders; or |
• | the voting at the meeting is to be made on a show of hands. |
Item 4. |
Information on the Company |
A. |
History and Development of the Company |
• | In March 2017, we acquired 100% equity interest of Zhejiang Shengdian Digital Network Technology Co., Ltd., or Zhejiang Shengdian, upon which it became a subsidiary of Beijing Momo. Zhejiang Shengdian now holds our internet audio/video program transmission license. |
• | In July 2017, we established Loudi Momo Technology Co., Ltd., or Loudi Momo, as a wholly-owned subsidiary of Beijing Momo. |
• | In September 2017, we established Changsha Heer Network Technology Co., Ltd., or Changsha Heer, as a wholly-owned subsidiary of Beijing Momo. Changsha Heer changed its name to Changsha Deep Fusion Network Technology Co., Ltd. on July 19, 2019. |
• | In February 2018, we established QOOL Media Hong Kong Limited, or QOOL Media HK, a company which was initially 70% owned by Momo Technology HK Company Limited. In August 2018, the shareholders of QOOL Media HK transferred all their equity interests in QOOL Media HK to QOOL Media Inc., or QOOL Media Cayman. |
• | In March 2018, we established Hainan Momo Pictures Co., Ltd., or Hainan Momo Pictures, as a wholly-owned subsidiary of Momo Pictures Co., Ltd., or Momo Pictures. |
• | In May 2018, we successfully completed our acquisition of Tantan and acquired a 100% fully diluted equity stake in Tantan for a combination of share consideration and cash, including approximately 5.3 million newly issued Class A ordinary shares of our company and US$613.2 million in cash. |
• | In April 2018, we established Hainan Miaoka Network Technology Co., Ltd., or Hainan Miaoka, and Hainan Yilingliuer Network Technology Co., Ltd., or Hainan Yilingliuer, as our consolidated affiliated entities. |
• | In May 2018, we established Beijing Yiliulinger Information Technology Co., Ltd., or Beijing Yiliulinger, as a wholly-owned subsidiary of Beijing Momo Information Technology Co., Ltd., or Beijing Momo IT. |
• | In July 2018, we established QOOL Media Cayman, a company which is 79.6% owned by us. |
• | In July 2018, we issued US$725 million principal amount of convertible senior notes due 2025. The notes will bear interest at a rate of 1.25% per year, payable semiannually on January 1 and July 1 of each year. Holders of the notes have the right to convert their notes into our ADSs based on an initial conversion rate of 15.4776 of our ADSs per $1,000 principal amount of notes (which is equivalent to an initial conversion price of approximately US$64.61 per ADS). The conversion rate for the notes is subject to adjustment upon the occurrence of certain events. In 2019, the conversion rate was adjusted to 15.7172 of our ADSs per US$1,000 principal amount of notes (which is equivalent to a conversion price of approximately US$63.62 per ADS) due to the special cash dividend paid on April 30, 2019. In 2020, the conversion rate was adjusted to 16.2937 of our ADSs per US$1,000 principal amount of notes (which is equivalent to a conversion price of approximately US$61.37 per ADS) due to the special cash dividend paid on April 30, 2020. We will not have the right to redeem the notes prior to maturity, except in the event of certain changes to the laws or their application or interpretation. Holders of the notes will have the right to require us to repurchase all or part of their notes in cash on July 1, 2023, or in the event of certain fundamental changes. The notes will mature on July 1, 2025, unless previously repurchased, redeemed or converted in accordance with their terms prior to such date. |
• | In December 2018, we established QOOL Media Technology (Tianjin) Co., Ltd., or QOOL Media Technology, as a wholly-owned subsidiary of QOOL Media HK. |
• | In March 2019, we established Beijing Fancy Reader Technology Co., Ltd., or Beijing Fancy Reader, as our consolidated affiliated entity. |
• | In March 2019, we established Hainan Heer Network Technology Co., Ltd., or Hainan Heer, as a wholly-owned subsidiary of Beijing Momo. |
• | In April 2019, we established Beijing Perfect Match Technology Co., Ltd., or Beijing Perfect Match, as our consolidated affiliated entity. |
• | In July 2019, we established Tianjin LaiFu Culture Development Co., Ltd., or Tianjin Laifu, and Tianjin Apollo Exploration Culture Co., Ltd., or Tianjin Apollo as wholly-owned subsidiaries of Tantan Culture Development (Beijing) Co., Ltd, or Tantan Culture. |
• | In August 2019, we established SpaceCape Inc. in Cayman Islands, or SpaceCape Cayman, a company which is 100% owned by us. |
• | In August 2019, we established SpaceCape Technology Pte. Ltd. in Singapore, or SpaceCape Singapore, as a wholly-owned subsidiary of SpaceCape Cayman. |
• | In November 2019, we established Beijing DBD Reader Technology Co., Ltd., or Beijing DBD Reader, as a wholly-owned subsidiary of Beijing Fancy Reader. |
• | In December 2019, we established Beijing SpaceCape Information Technology Co. Ltd., or Beijing SpaceCape, as a wholly-owned subsidiary of SpaceCape Singapore. |
• | In December 2019, we established MatchUp UK Limited in Hong Kong, as a wholly-owned subsidiary of Tantan Limited. |
• | In December 2019, we established Chengdu Ketanjuan Tech Co., Ltd, or Chengdu Ketanjuan, as a wholly-owned subsidiary of Tantan Culture. |
• | In February 2020, we established DeepMatch Inc. in Cayman Islands, or DeepMatch Cayman, a company which is 100% owned by us. |
• | In March 2020, we established DeepMatch Technology Pte. Ltd. in Singapore, or SpaceCape Singapore, as a wholly-owned subsidiary of DeepMatch Cayman. |
• | In March 2020, we established Mana Games Inc. in Cayman Islands, or Mana Games Cayman, a company which is 100% owned by us. |
• | In March 2020, we established Mana Games HK Limited in Hong Kong, or Mana Games HK, as a wholly-owned subsidiary of Mana Games Inc. |
• | In March 2020, we established Tianjin Qianchuan Media Co., Ltd., or Tianjin Qianchuan, as a wholly-owned subsidiary of Beijing Momo. |
• | In March 2020, we established Tianjin Xiaomofanshi Tech Co., Ltd., or Tianjin Xiaomofanshi, as a wholly-owned subsidiary of Beijing Momo. |
• | In June 2020, we established Gannan XiaomoGantian Tech Co., Ltd, or Xiaomo Gantian, as a wholly-owned subsidiary of Tianjin Xiaomofanshi. |
• | In September 2020, we established SpaceTime (Beijing) Technology Co., Ltd, or SpaceTime Beijing, as a wholly-owned subsidiary of Beijing Momo. |
• | In November 2020, we established Laiqianshou (Chengdu) Technology Co., Ltd, or Laiqianshou, as a wholly-owned subsidiary of Tantan Culture. |
• | In March 2021, we changed the name of Beijing Fancy Reader to Beijing Top Maker Culture Co., Ltd., or Beijing Top Maker, and changed the name of its subsidiary, Beijing DBD Reader, to Beijing All For One Culture Co., Ltd. |
• | From May 2018 to April 2019, we entered into a series of contractual arrangements with Tantan Culture, Hainan Miaoka, Hainan Yilingliuer, Beijing Fancy Reader and QOOL Media (Tianjin) Co., Ltd., or Tianjin QOOL Media, and their respective shareholders, through which we exert control over these entities and their subsidiaries and consolidate their operating results in our financial statements. |
B. |
Business Overview |
C. |
Organizational Structure |
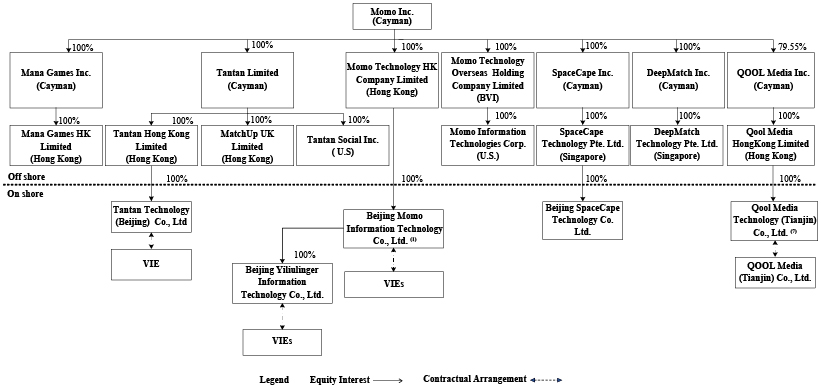
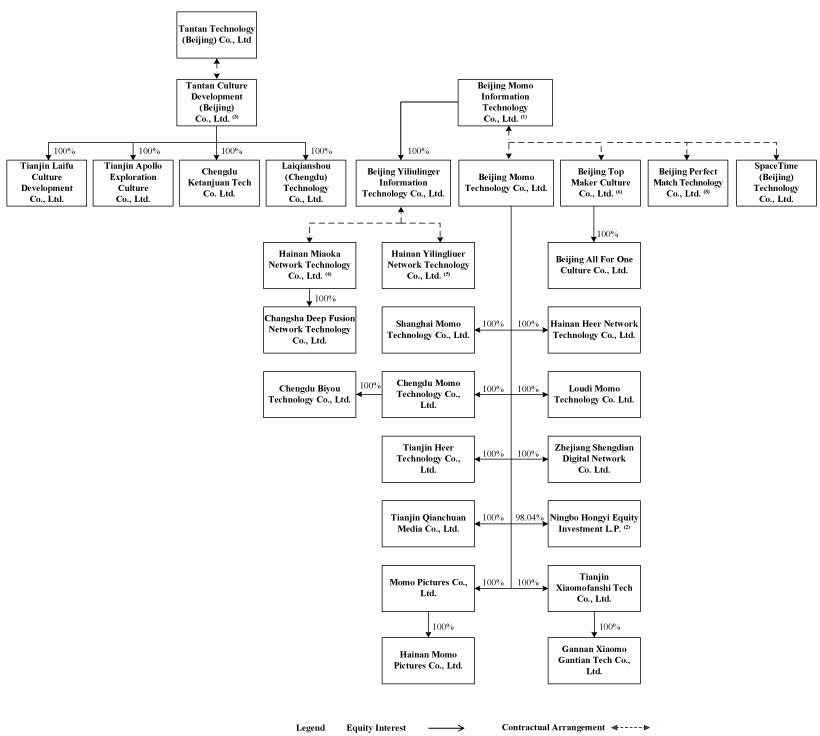
(1) | We exercise effective control over Beijing Momo through contractual arrangements among Beijing Momo IT, Beijing Momo and Messrs. Yan Tang, Yong Li, Xiaoliang Lei and Zhiwei Li, each of whom holds 72.0%, 16.0%, 6.4% and 5.6% of the equity interest in Beijing Momo, respectively. Except for Zhiwei Li and Xiaoliang Lei, the shareholders of Beijing Momo are our shareholders and directors. |
(2) | Ningbo Hongyi Equity Investment L.P. is a limited partnership organized in September 2015. We invested in it and became a limited partner starting from February 2018. |
(3) | We exercise effective control over Tantan Culture through contractual arrangements among Tantan Technology (Beijing) Co., Ltd., or Tantan Technology, Tantan Culture and Beijing Momo. |
(4) | We exercise effective control over Hainan Miaoka through contractual arrangements among Beijing Yiliulinger, Hainan Miaoka and Messrs. Xiaoliang Lei and Li Wang, each of whom holds 50% and 50% of the equity interest in Hainan Miaoka, respectively. The shareholders of Hainan Miaoka are our directors or officers. |
(5) | We exercise effective control over Hainan Yilingliuer, through contractual arrangements among Beijing Yiliulinger, Hainan Yilingliuer and Messrs. Xiaoliang Lei and Li Wang, each of whom holds 50% and 50% of the equity interest in Hainan Yilingliuer, respectively. The shareholders of Hainan Yilingliuer are our directors or officers. |
(6) | Beijing Top Maker was established in March 2019, and changed to its current name in March 2021. We exercise effective control over Beijing Top Maker through contractual arrangements among Beijing Top Maker, Beijing Momo Information Technology Co., Ltd, and Messrs. Kuan He and Luyu Fan, each of whom holds 99% and 1% of the equity interest in Beijing Top Maker ,respectively. |
(7) | QOOL Media (Tianjin) Co., Ltd. was established in November 2016. We exercise effective control over Tianjin QOOL Media through contractual arrangements among Tianjin QOOL Media, QOOL Media Technology (Tianjin) Co., Ltd., Beijing Momo and Tianjin Mingqiao Media Partnership (Limited Partner), or Tianjin Mingqiao, each of which holds 70% and 30% of the equity interest in Tianjin QOOL Media, respectively. Mr. Chen Feng and Mr. Ridan Da are two partners of Tianjin Mingqiao. |
(8) | Beijing Perfect Match Technology Co., Ltd. was established in April 2019. We exercise effective control over Beijing Perfect Match through contractual arrangements among Beijing Perfect March, Beijing Momo IT, and Mr. Yu Dong and Ms. Min Liu, each of whom holds 99% and 1% of the equity interest in Beijing Perfect Match, respectively. |
• | exercise effective control over our consolidated affiliated entities; |
• | receive substantially all of the economic benefits of our consolidated affiliated entities; and |
• | have an option to purchase all or part of the equity interests in our consolidated affiliated entities when and to the extent permitted by PRC law. |
• | the ownership structures of Beijing Momo IT and Beijing Momo will not result in any violation of PRC laws or regulations currently in effect; and |
• | the contractual arrangements among Beijing Momo IT, Beijing Momo and the shareholders of Beijing Momo governed by PRC law are valid, binding and enforceable, and do not and will not result in any violation of PRC laws or regulations currently in effect. |
D. |
Property, Plant and Equipment |
Item 4A. |
Unresolved Staff Comments |
Item 5. |
Operating and Financial Review and Prospects |
A. |
Operating Results |
Year Ended December 31, |
||||||||||||||||||||||||
2018 |
2019 |
2020 |
||||||||||||||||||||||
RMB |
% |
RMB |
% |
RMB |
% |
|||||||||||||||||||
(in thousands, except for percentages) |
||||||||||||||||||||||||
Net revenues |
13,408,421 | 100.0 | 17,015,089 | 100.0 | 15,024,188 | 100.0 | ||||||||||||||||||
Live video service |
10,709,491 | 79.9 | 12,448,131 | 73.2 | 9,637,579 | 64.1 | ||||||||||||||||||
Value-added service |
1,883,150 | 14.0 | 4,105,963 | 24.1 | 5,112,182 | 34.0 | ||||||||||||||||||
Mobile marketing services |
500,321 | 3.7 | 331,822 | 2.0 | 198,197 | 1.4 | ||||||||||||||||||
Mobile games |
130,392 | 1.0 | 92,451 | 0.5 | 39,564 | 0.3 | ||||||||||||||||||
Other services |
185,067 | 1.4 | 36,722 | 0.2 | 36,666 | 0.2 | ||||||||||||||||||
Cost and expenses |
||||||||||||||||||||||||
Cost of revenues |
(7,182,897 | ) | (53.6 | ) | (8,492,096 | ) | (49.9 | ) | (7,976,781 | ) | (53.1 | ) | ||||||||||||
Research and development expenses |
(760,644 | ) | (5.7 | ) | (1,095,031 | ) | (6.4 | ) | (1,167,677 | ) | (7.8 | ) | ||||||||||||
Sales and marketing expenses |
(1,812,262 | ) | (13.5 | ) | (2,690,824 | ) | (15.8 | ) | (2,813,922 | ) | (18.7 | ) | ||||||||||||
General and administrative expenses |
(640,023 | ) | (4.8 | ) | (1,527,282 | ) | (9.0 | ) | (763,150 | ) | (5.1 | ) | ||||||||||||
|
|
|
|
|
|
|
|
|
|
|
|
|||||||||||||
Total cost and expenses |
(10,395,826 | ) | (77.6 | ) | (13,805,233 | ) | (81.1 | ) | (12,721,530 | ) | (84.7 | ) | ||||||||||||
|
|
|
|
|
|
|
|
|
|
|
|
|||||||||||||
Other operating income |
253,697 | 1.9 | 344,843 | 2.0 | 228,777 | 1.5 | ||||||||||||||||||
Income from operations |
3,266,292 | 24.4 | 3,554,699 | 20.9 | 2,531,435 | 16.8 | ||||||||||||||||||
Interest income |
272,946 | 2.0 | 407,542 | 2.4 | 444,471 | 3.0 | ||||||||||||||||||
Interest expense |
(56,503 | ) | (0.4 | ) | (78,611 | ) | (0.5 | ) | (78,872 | ) | (0.5 | ) | ||||||||||||
Other gain or loss, net |
(43,200 | ) | (0.3 | ) | (15,711 | ) | (0.1 | ) | 1,500 | 0.0 | ||||||||||||||
|
|
|
|
|
|
|
|
|
|
|
|
|||||||||||||
Income before income tax and share of income on equity method investments |
3,439,535 | 25.7 | 3,867,919 | 22.7 | 2,898,534 | 19.3 | ||||||||||||||||||
Income tax expense |
(699,648 | ) | (5.2 | ) | (883,801 | ) | (5.2 | ) | (755,620 | ) | (5.0 | ) | ||||||||||||
|
|
|
|
|
|
|
|
|
|
|
|
|||||||||||||
Income before share of income on equity method investments |
2,739,887 | 20.4 | 2,984,118 | 17.5 | 2,142,914 | 14.3 | ||||||||||||||||||
Share of income (loss) on equity method investments |
48,660 | 0.4 | (23,350 | ) | (0.1 | ) | (42,522 | ) | (0.3 | ) | ||||||||||||||
|
|
|
|
|
|
|
|
|
|
|
|
|||||||||||||
Net income |
2,788,547 | 20.9 | 2,960,768 | 17.4 | 2,100,392 | 14.0 | ||||||||||||||||||
|
|
|
|
|
|
|
|
|
|
|
|
Year Ended December 31, |
||||||||||||||||||||||||
2018 |
2019 |
2020 |
||||||||||||||||||||||
RMB |
% |
RMB |
% |
RMB |
% |
|||||||||||||||||||
(in thousands, except for percentages) |
||||||||||||||||||||||||
Cost of revenues: |
||||||||||||||||||||||||
Revenue sharing |
5,701,563 | 79.4 | 7,153,655 | 84.2 | 6,630,538 | 83.1 | ||||||||||||||||||
Commission fees |
278,528 | 3.9 | 369,549 | 4.4 | 362,831 | 4.6 | ||||||||||||||||||
Bandwidth costs |
303,507 | 4.2 | 364,695 | 4.3 | 308,664 | 3.9 | ||||||||||||||||||
Production cost in connection with television content |
429,215 | 6.0 | — | — | — | — | ||||||||||||||||||
Labor costs |
176,461 | 2.5 | 244,182 | 2.9 | 306,577 | 3.8 | ||||||||||||||||||
Depreciation and amortization |
140,621 | 2.0 | 209,388 | 2.5 | 211,779 | 2.7 | ||||||||||||||||||
Other costs |
153,002 | 2.0 | 150,627 | 1.7 | 156,392 | 1.9 | ||||||||||||||||||
|
|
|
|
|
|
|
|
|
|
|
|
|||||||||||||
Total cost of revenues |
7,182,897 | 100.0 | 8,492,096 | 100.0 | 7,976,781 | 100.0 | ||||||||||||||||||
|
|
|
|
|
|
|
|
|
|
|
|
Year ended December 31, |
||||||||||||||||||||||||||||
2018 |
2019 |
2020 |
||||||||||||||||||||||||||
RMB |
YoY% |
RMB |
YoY% |
RMB |
US$ |
YoY% |
||||||||||||||||||||||
(in thousands, except percentages) |
||||||||||||||||||||||||||||
Revenues: |
||||||||||||||||||||||||||||
Momo |
12,812,421 | 44 | 15,740,815 | 23 | 12,631,119 | 1,935,804 | (20 | ) | ||||||||||||||||||||
Tantan |
417,998 | N/A | 1,259,906 | not comparable | (1) |
2,368,314 | 362,960 | 88 | ||||||||||||||||||||
QOOL |
178,002 | 11,259 | 14,368 | (92 | ) | 24,755 | 3,794 | 72 |
(1) | After our acquisition of Tantan in May 2018, we consolidated its financial information into ours. As such, the revenue for 2018 only includes seven months of operations. |
Year ended December 31, |
||||||||||||||||||||||||||||
2018 |
2019 |
2020 |
||||||||||||||||||||||||||
RMB |
YoY% |
RMB |
YoY% |
RMB |
US$ |
YoY% |
||||||||||||||||||||||
(in thousands, except percentages) |
||||||||||||||||||||||||||||
Cost and Expenses: |
||||||||||||||||||||||||||||
Momo |
8,928,568 | 35 | 11,025,551 | 23 | 9,829,243 | 1,506,397 | (11 | ) | ||||||||||||||||||||
Tantan |
963,486 | N/A | 2,727,259 | not comparable | (1) |
2,844,395 | 435,923 | 4 | ||||||||||||||||||||
QOOL |
503,772 | 3,536 | 52,423 | (90 | ) | 47,892 | 7,339 | (9 | ) |
(1) | After our acquisition of Tantan in May 2018, we consolidated its financial information into ours. As such, the costs and expenses for 2018 only includes seven months of operations. |
• | Exclusive cooperation agreements, as supplemented; |
• | Equity interest pledge agreements; |
• | Business operation agreements; |
• | Exclusive call option agreements; |
• | Powers of attorney; and |
• | Spousal consent letters. |
B. |
Liquidity and Capital Resources |
Year Ended December 31, |
||||||||||||
2018 |
2019 |
2020 |
||||||||||
(in RMB thousands) |
||||||||||||
Net cash provided by operating activities |
3,327,718 | 5,448,886 | 3,080,889 | |||||||||
Net cash used in investing activities |
(10,034,004 | ) | (4,029,919 | ) | (748,466 | ) | ||||||
Net cash provided by (used in) financing activities |
4,687,951 | (1,273,780 | ) | (1,498,150 | ) | |||||||
Effect of exchange rate changes |
24,175 | (478 | ) | (80,944 | ) | |||||||
Net (decrease) increase in cash and cash equivalents |
(1,994,160 | ) | 144,709 | 753,329 | ||||||||
Cash and cash equivalents at beginning of period |
4,462,194 | 2,468,034 | 2,612,743 | |||||||||
Cash and cash equivalents and restricted cash at end of period |
2,468,034 | 2,612,743 | 3,366,072 |
C. |
Research and Development |
D. |
Trend Information |
E. |
Off-Balance Sheet Arrangements |
F. |
Contractual Obligations |
|
Years ending December 31, |
|||||||||||||||
Total |
2021 |
2022 |
2023 and thereafter |
|||||||||||||
(RMB in thousands) |
||||||||||||||||
Convertible senior note obligations (1) |
4,996,723 | 59,133 | 59,133 | 4,878,457 | ||||||||||||
Operating lease obligations (2) |
281,162 | 135,107 | 101,646 | 44,409 | ||||||||||||
|
|
|
|
|
|
|
|
(1) | Including estimated interest payments of RMB266.1 million in total (RMB59.1 million, RMB59.1 million and RMB147.9 million over the periods of less than one year, one to two years, and more than two years from December 31, 2020, respectively) and principal payments of RMB4,730.6 million, with the principal of the convertible senior note to be due in 2025. Please see “Convertible Senior Notes” under Note 10 to our audited consolidated financial statements included in this annual report beginning on page F-1. |
(2) | Operating lease obligations represent our obligations for leasing internet data center facilities and office spaces, which include all future cash outflows under ASC Topic 842, Leases. Please see “Leases” under Note 11 to our audited consolidated financial statements included in this annual report beginning on page F-1. |
G. |
Safe Harbor |
Item 6. |
Directors, Senior Management and Employees |
A. |
Directors and Senior Management |
Directors and Executive Officers |
Age |
Position/Title | ||
Yan Tang | 42 | Executive Chairman | ||
Li Wang | 37 | Director, President and Chief Executive Officer | ||
Yong Li | 46 | Independent Director | ||
David Ying Zhang | 47 | Director | ||
Benson Bing Chung Tam | 57 | Independent Director | ||
Dave Daqing Qi | 57 | Independent Director | ||
Yongming Wu | 46 | Independent Director | ||
Jonathan Xiaosong Zhang | 57 | Chief Financial Officer | ||
Chunlai Wang | 34 | Chief Technology Officer |
B. |
Compensation |
Name |
Class A Ordinary Shares Underlying Outstanding Options |
Exercise Price (US$/Share) |
Date of Grant |
Date of Expiration |
||||||||||||
Yan Tang |
* | 0.1404 | October 10, 2013 | October 9, 2023 | ||||||||||||
* | 0.0002 | October 29, 2014 | October 28, 2024 | |||||||||||||
* | 0.0002 | April 22, 2015 | April 21, 2025 | |||||||||||||
* | 0.0002 | March 31, 2016 | March 30, 2026 | |||||||||||||
* | 0.0002 | December 30, 2016 | December 29, 2026 | |||||||||||||
* | 0.0002 | March 7, 2017 | March 6, 2027 | |||||||||||||
* | 0.0002 | May 2, 2018 | May 1, 2028 | |||||||||||||
* | 0.0002 | April 15,2019 | April 14,2029 | |||||||||||||
* | 0.0002 | April 15,2020 | April 14,2030 | |||||||||||||
Li Wang |
* | 0.0002 | October 29, 2014 | October 28, 2024 | ||||||||||||
* | 0.0002 | April 22, 2015 | April 21, 2025 | |||||||||||||
* | 0.0002 | March 31, 2016 | March 30, 2026 | |||||||||||||
* | 0.0002 | December 30, 2016 | December 29, 2026 | |||||||||||||
* | 0.0002 | March 7, 2017 | March 6, 2027 | |||||||||||||
* | 0.0002 | May 2, 2018 | May 1, 2028 | |||||||||||||
* | 0.0002 | April 15,2019 | April 14,2029 | |||||||||||||
* | 0.0002 | April 15,2020 | April 14,2030 | |||||||||||||
David Ying Zhang |
* | 0.1404 | October 10, 2013 | October 9, 2023 | ||||||||||||
Jonathan Xiaosong Zhang |
* | 0.0002 | October 29, 2014 | October 28, 2024 | ||||||||||||
* | 0.0002 | April 22, 2015 | April 21, 2025 | |||||||||||||
* | 0.0002 | March 31, 2016 | March 30, 2026 | |||||||||||||
* | 0.0002 | December 30, 2016 | December 29, 2026 | |||||||||||||
* | 0.0002 | March 7, 2017 | March 6, 2027 | |||||||||||||
* | 0.0002 | May 2, 2018 | May 1, 2028 | |||||||||||||
* | 0.0002 | April 15,2019 | April 14,2029 | |||||||||||||
* | 0.0002 | April 15,2020 | April 14,2030 | |||||||||||||
Chunlai Wang |
* | 0.0327 | November 1, 2012 | October 31, 2022 | ||||||||||||
* | 0.1404 | October 10, 2013 | October 9, 2023 | |||||||||||||
* | 0.0002 | October 29, 2014 | October 28, 2024 | |||||||||||||
* | 0.0002 | April 22, 2015 | April 21, 2025 | |||||||||||||
* | 0.0002 | June 16, 2016 | June 15, 2026 | |||||||||||||
* | 0.0002 | May 17, 2017 | May 16, 2027 | |||||||||||||
* | 0.0002 | September 1, 2017 | August 31, 2027 | |||||||||||||
* | 0.0002 | May 2, 2018 | May 1, 2028 | |||||||||||||
* | 0.0002 | April 15,2019 | April 14,2029 | |||||||||||||
* | 0.0002 | April 15,2020 | April 14,2030 | |||||||||||||
Other individuals as a group |
* | 0.0327 | November 1, 2012 | October 31, 2022 | ||||||||||||
* | 0.1404 | October 10, 2013 | October 9, 2023 | |||||||||||||
* | 0.1404 | March 1, 2014 | February 28, 2024 |
Name |
Class A Ordinary Shares Underlying Outstanding Options |
Exercise Price (US$/Share) |
Date of Grant |
Date of Expiration |
||||||||||||
* | 0.0002 | October 29, 2014 | October 28, 2024 | |||||||||||||
* | 0.0002 | April 22, 2015 | April 21, 2025 | |||||||||||||
* | 0.0002 | May 4, 2015 | May 3, 2025 | |||||||||||||
* | 0.0002 | August 13, 2015 | August 12, 2025 | |||||||||||||
* | 0.0002 | October 15, 2015 | October 14, 2025 | |||||||||||||
* | 0.0002 | November 13, 2015 | November 12, 2025 | |||||||||||||
* | 0.0002 | March 31, 2016 | March 30, 2026 | |||||||||||||
* | 0.0002 | June 16, 2016 | June 15, 2026 | |||||||||||||
* | 0.0002 | July 6, 2016 | July 5, 2026 | |||||||||||||
* | 0.0002 | October 15, 2016 | October 14, 2026 | |||||||||||||
* | 0.0002 | December 30, 2016 | December 29, 2026 | |||||||||||||
* | 0.0002 | January 3, 2017 | January 2, 2027 | |||||||||||||
* | 0.0002 | April 13, 2017 | April 12, 2027 | |||||||||||||
* | 0.0002 | May 17, 2017 | May 16, 2027 | |||||||||||||
* | 0.0002 | July 13, 2017 | July 12, 2027 | |||||||||||||
* | 0.0002 | September 1, 2017 | August 31, 2027 | |||||||||||||
* | 0.0002 | October 13, 2017 | October 12, 2027 | |||||||||||||
* | 0.0002 | December 5, 2017 | December 4, 2027 | |||||||||||||
* | 0.0002 | December 29, 2017 | December 28, 2027 | |||||||||||||
* | 0.0002 | April 13, 2018 | April 12, 2028 | |||||||||||||
* | 0.0002 | May 2, 2018 | May 1, 2028 | |||||||||||||
* | 0.0002 | July 13, 2018 | July 12, 2028 | |||||||||||||
* | 0.0002 | October 15, 2018 | October 14, 2028 | |||||||||||||
* | 0.0002 | December 29, 2018 | December 28, 2028 | |||||||||||||
195,000 | 0.0002 | April 15,2019 | April 14, 2029 | |||||||||||||
2,161,000 | 0.0002 | May 17, 2019 | May 16, 2029 | |||||||||||||
50,000 | 0.0002 | July 12,2019 | July 11, 2029 | |||||||||||||
137,000 | 0.0002 | October 15,2019 | October 14, 2029 | |||||||||||||
181,000 | 0.0002 | December 26,2019 | December 25, 2029 | |||||||||||||
86,000 | 0.0002 | April 15,2020 | April 14, 2030 | |||||||||||||
2,567,000 | 0.0002 | May 28,2020 | May 27, 2030 | |||||||||||||
84,000 | 0.0002 | July 8,2020 | July 7, 2030 | |||||||||||||
217,000 | 0.0002 | October 15,2020 | October 14, 2030 | |||||||||||||
534,500 | 0.0002 | December 30,2020 | December 29, 2030 | |||||||||||||
Total |
27,674,129 | |||||||||||||||
|
|
* | Aggregate number of shares represented by all outstanding options granted to the person account for less than 1% of our total outstanding ordinary shares on an as-converted basis. |
Name |
Restricted Share Units for Class A Ordinary Shares |
Date of Grant |
||||||
Benson Bing Chung Tam |
* | May 17, 2016 | ||||||
* | March 7, 2017 | |||||||
* | May 2, 2018 | |||||||
* | April 15,2019 | |||||||
* | April 15,2020 | |||||||
Dave Daqing Qi |
* | May 17, 2016 | ||||||
* | March 7, 2017 | |||||||
* |
May 2, 2018 | |||||||
* | April 15,2019 | |||||||
* |
April 15,2020 | |||||||
Yongming Wu |
* | April 15,2019 | ||||||
* |
April 15,2020 | |||||||
Total |
234,375 | |||||||
|
|
* | Aggregate number of shares represented by all restricted share units granted to the person account for less than 1% of our total outstanding ordinary shares on an as-converted basis. |
C. |
Board Practices |
• | appointing the independent auditors and pre-approving all auditing and non-auditing services permitted to be performed by the independent auditors; |
• | reviewing with the independent auditors any audit problems or difficulties and management’s response; |
• | discussing the annual audited financial statements with management and the independent auditors; |
• | reviewing the adequacy and effectiveness of our accounting and internal control policies and procedures and any steps taken to monitor and control major financial risk exposures; |
• | reviewing and approving all proposed related party transactions; |
• | meeting separately and periodically with management and the independent auditors; and |
• | monitoring compliance with our code of business conduct and ethics, including reviewing the adequacy and effectiveness of our procedures to ensure proper compliance. |
• | reviewing and approving, or recommending to the board for its approval, the compensation for our chief executive officer and other executive officers; |
• | reviewing and recommending to the board for determination with respect to the compensation of our non-employee directors; |
• | reviewing periodically and approving any incentive compensation or equity plans, programs or similar arrangements; and |
• | selecting compensation consultant, legal counsel or other adviser only after taking into consideration all factors relevant to that person’s independence from management. |
• | selecting and recommending to the board nominees for election by the shareholders or appointment by the board; |
• | reviewing annually with the board the current composition of the board with regards to characteristics such as independence, knowledge, skills, experience and diversity; |
• | making recommendations on the frequency and structure of board meetings and monitoring the functioning of the committees of the board; and |
• | advising the board periodically with regards to significant developments in the law and practice of corporate governance as well as our compliance with applicable laws and regulations, and making recommendations to the board on all matters of corporate governance and on any remedial action to be taken. |
• | convening shareholders’ annual general meetings and reporting its work to shareholders at such meetings; |
• | declaring dividends and distributions; |
• | appointing officers and determining the term of office of the officers; |
• | exercising the borrowing powers of our company and mortgaging the property of our company; and |
• | approving the transfer of shares in our company, including the registration of such shares in our share register. |
D. |
Employees |
As of December 31, 2020 |
||||
Function: |
||||
Research and development |
1,367 | |||
Customer service, sales and marketing |
393 | |||
Operations and cost |
360 | |||
General administration |
274 | |||
|
|
|||
Total |
2,394 | |||
|
|
E. |
Share Ownership |
Item 7. |
Major Shareholders and Related Party Transactions |
A. |
Major Shareholders |
• | each of our current directors and executive officers; and |
• | each person known to us to own beneficially 5% or more of our total outstanding ordinary shares. |
Shares Beneficially Owned |
Ordinary Shares Beneficially Owned |
Voting Power |
||||||||||||||
Directors and executive officers**: |
Class A Ordinary Shares |
Class B Ordinary Shares |
||||||||||||||
% (1) |
% (2) |
|||||||||||||||
Yan Tang (3) |
6,376,644 | 80,364,466 | 20.7 | 71.0 | ||||||||||||
Li Wang (4) |
* | — | * | * | ||||||||||||
Yong Li (5) |
8,046,899 | — | 2.0 | * | ||||||||||||
David Ying Zhang (6) |
* | — | * | * | ||||||||||||
Benson Bing Chung Tam (7) |
* | — | * | * | ||||||||||||
Dave Daqing Qi (8) |
* | — | * | * | ||||||||||||
Jonathan Xiaosong Zhang (9) |
* | — | * | * | ||||||||||||
Yongming Wu (10) |
* | — | * | * | ||||||||||||
Chunlai Wang (11) |
* | — | * | * | ||||||||||||
All directors and executive officers as a group |
19,632,226 | 80,364,466 | 23.6 | 71.8 | ||||||||||||
Principal Shareholders: |
||||||||||||||||
Gallant Future Holdings Limited (12) |
— | 72,364,466 | 17.6 | 63.7 | ||||||||||||
J O Hambro Capital Management Limited (13) |
23,260,894 | — | 5.6 | 2.0 |
* | Less than 1% of our total outstanding Class A and Class B ordinary shares. |
** | Except for Messrs. Yong Li, David Ying Zhang, Mr. Benson Bing Chung Tam, Mr. Dave Daqing Qi and Mr. Yongming Wu, the business address for our executive officers and directors is 20th Floor, Block B, Tower 2, Wangjing SOHO, No. 1 Futongdong Street, Chaoyang District, Beijing 100102, People’s Republic of China. |
(1) | Percentage ownership is calculated by dividing the number of Class A and Class B ordinary shares beneficially owned by a given person or group by the sum of (i) 412,260,535 ordinary shares and (ii) and the number of shares such person or group has the right to acquire upon exercise of option, warrant or other right within 60 days after March 31, 2021. Our Class B ordinary shares are convertible at any time by the holder thereof into Class A ordinary shares on a one-for-one |
(2) | For each person and group included in this column, percentage of voting power is calculated by dividing the voting power beneficially owned by such person or group by the voting power of all of our Class A and Class B ordinary shares as a single class. Each holder of Class A ordinary shares is entitled to one vote per share and each holder of our Class B ordinary shares is entitled to ten votes per share on all matters submitted to them for vote. |
(3) | Represent (i) 72,364,466 Class B ordinary shares held by Gallant Future Holdings Limited, (ii) 8,000,000 Class B ordinary shares held by New Heritage Global Limited, (iii) 6,099,144 Class A ordinary shares that Mr. Tang is entitled to acquire within 60 days from March 31, 2021 upon exercise of share options held by him under our share incentive plans, and (iv) 277,500 Class A ordinary shares that Mr. Tang’s spouse is entitled to acquire within 60 days from March 31, 2021 upon exercise of share options held by her under our share incentive plans. Gallant Future Holdings Limited is incorporated in the British Virgin Islands and is wholly owned by a family trust controlled by Mr. Tang. New Heritage Global Limited is a limited company incorporated in the British Virgin Islands and is wholly beneficially owned by Mr. Tang through a family trust. |
(4) | Represents Class A ordinary shares that Mr. Wang is entitled to acquire within 60 days from March 31, 2021 upon exercise of share options held by him under our share incentive plans. |
(5) | Represents 8,046,899 Class A ordinary shares held by Joyous Harvest Holdings Limited, a company incorporated in the British Virgin Islands and wholly owned by a family trust controlled by Mr. Li. The business address of Mr. Li is 5/F, Block A, Lingxinghang Center, No. 8, Guangshun South Avenue, Chaoyang District, Beijing. |
(6) | Represents (i) 1 Class A ordinary share held by Matrix Partners China II Hong Kong Limited, as reported on the Amendment No. 8 to Schedule 13D filed by Matrix Partners China II Hong Kong Limited, among others, on March 21, 2018, and (ii) Class A ordinary shares represented by ADSs beneficially owned by Mr. Zhang. Matrix Partners China II Hong Kong Limited is a limited company incorporated in Hong Kong. Matrix Partners China II Hong Kong Limited is controlled and 90%-owned by Matrix Partners China II, L.P., and the remaining 10% shares is held by Matrix Partners China II-A, L.P. The general partner of Matrix Partners China II, L.P. and Matrix Partners China II-A, L.P. is Matrix China II GP, Ltd. The directors of Matrix China II GP, Ltd. are David Ying Zhang, Timothy A. Barrows, David Su and Yibo Shao. The business address of Mr. Zhang is Suite 2601, Taikang Financial Tower, No. 38 Yard East 3rd Ring Road North, Chaoyang District, Beijing 100026, People’s Republic of China. |
(7) | Represents Class A ordinary shares held by Mr. Tam and Class A ordinary shares that Mr. Tam is entitled to acquire within 60 days from March 31, 2021 upon the exercise of share options held by Mr. Tam under our share incentive plans. The business address of Mr. Tam is Room 1-4-2503, No. 2 East Xibahe, Chaoyang District, Beijing, China. |
(8) | Represents Class A ordinary shares and ADSs held by Mr. Qi and Class A ordinary shares that Mr. Qi is entitled to acquire within 60 days from March 31, 2021 upon the exercise of share options held by Mr. Qi under our share incentive plans. The business address of Dr. Qi is Room 332, Tower E3, Oriental Plaza, 1 East Chang An Avenue, Dong Cheng District, Beijing 100738, China. |
(9) | Represents Class A ordinary shares that Mr. Zhang is entitled to acquire within 60 days from March 31, 2021 upon exercise of share options held by him under our share incentive plans and Class A ordinary shares represented by ADSs beneficially owned by Mr. Zhang. |
(10) | Represents Class A ordinary shares that Mr. Wu is entitled to acquire within 60 days from March 31, 2021 upon exercise of share options held by him under our share incentive plans. The business address of Mr. Wu is 8 Shenton Way, AXA Tower, #45-01, Singapore 068811. |
(11) | Represents Class A ordinary shares that Mr. Wang is entitled to acquire within 60 days from March 31, 2021 upon exercise of share options held by him under our share incentive plans. |
(12) | Represents 72,364,466 Class B ordinary shares held by Gallant Future Holdings Limited. Gallant Future Holdings Limited is a company incorporated in the British Virgin Islands and wholly owned by a family trust controlled by Mr. Yan Tang. Mr. Tang has sole power to direct the voting and disposition of shares of our company directly or indirectly held by Gallant Future Holdings Limited. The registered address of Gallant Future Holdings Limited is Sertus Chambers, P.O. Box 905, Quasticky Building, Road Town, Tortola, British Virgin Islands. |
(13) | Represents 23,260,894 Class A ordinary shares represented by American depositary receipts held by J O Hambro Capital Management Limited, a company incorporated in England and Wales with its business address at Level 3, 1 St James’s Market, London SW1Y 4AH, United Kingdom, based on a Schedule 13G filed by J O Hambro Capital Management Limited on February 11, 2020. |
B. |
Related Party Transactions |
C. |
Interests of Experts and Counsel |
Item 8. |
Financial Information |
A. |
Consolidated Statements and Other Financial Information |
B. |
Significant Changes |
Item 9. |
The Offer and Listing |
A. |
Offering and Listing Details |
B. |
Plan of Distribution |
C. |
Markets |
D. |
Selling Shareholders |
E. |
Dilution |
F. |
Expenses of the Issue |
Item 10. |
Additional Information |
A. |
Share Capital |
B. |
Memorandum and Articles of Association |
• | the instrument of transfer is lodged with us, accompanied by the certificate for the ordinary shares to which it relates and such other evidence as our board of directors may reasonably require to show the right of the transferor to make the transfer; |
• | the instrument of transfer is in respect of only one class of ordinary shares; |
• | the instrument of transfer is properly stamped, if required; |
• | in the case of a transfer to joint holders, the number of joint holders to whom the ordinary share is to be transferred does not exceed four; and |
• | a fee of such maximum sum as the Nasdaq Global Select Market may determine to be payable or such lesser sum as our directors may from time to time require is paid to us in respect thereof. |
• | the designation of the series; |
• | the number of shares of the series; |
• | the dividend rights, dividend rates, conversion rights, voting rights; and |
• | the rights and terms of redemption and liquidation preferences. |
• | authorize our board of directors to issue preferred shares in one or more series and to designate the price, rights, preferences, privileges and restrictions of such preferred shares without any further vote or action by our shareholders; and |
• | limit the ability of shareholders to requisition and convene general meetings of shareholders. |
• | does not have to file an annual return of its shareholders with the Registrar of Companies; |
• | is not required to open its register of members for inspection; |
• | does not have to hold an annual general meeting; |
• | may issue negotiable or bearer shares or shares with no par value; |
• | may obtain an undertaking against the imposition of any future taxation (such undertakings are usually given for 20 years in the first instance); |
• | may register by way of continuation in another jurisdiction and be deregistered in the Cayman Islands; |
• | may register as a limited duration company; and |
• | may register as a segregated portfolio company. |
• | the names and addresses of our members, together with a statement of the shares held by each member, and such statement shall confirm (i) the amount paid or agreed to be considered as paid, on the shares of each member, (ii) the number and category of shares held by each member, and (iii) whether each relevant category of shares held by a member carries voting rights under the articles of association of the company, and if so, whether such voting rights are conditional; |
• | the date on which the name of any person was entered on the register as a member; and |
• | the date on which any person ceased to be a member. |
• | the statutory provisions as to the required majority vote have been met; |
• | the shareholders have been fairly represented at the meeting in question and the statutory majority are acting bona fide without coercion of the minority to promote interests adverse to those of the class; |
• | the arrangement is such that may be reasonably approved by an intelligent and honest man of that class acting in respect of his interest; and |
• | the arrangement is not one that would more properly be sanctioned under some other provision of the Companies Act. |
• | a company acts or proposes to act illegally or ultra vires (and is therefore incapable of ratification by the shareholders); |
• | the act complained of, although not ultra vires, could only be effected duly if authorized by more than a simple majority vote that has not been obtained; and |
• | those who control the company are perpetrating a “fraud on the minority.” |
C. |
Material Contracts |
D. |
Exchange Controls |
E. |
Taxation |
• | the excess distribution or gain will be allocated ratably over the U.S. Holder’s holding period for the ADSs or ordinary shares; |
• | the amount allocated to the current taxable year and any taxable years in the U.S. Holder’s holding period prior to the first taxable year in which we are classified as a PFIC (each, a “pre-PFIC year”), will be taxable as ordinary income; |
• | the amount allocated to each prior taxable year, other than a pre-PFIC year, will be subject to tax at the highest tax rate in effect applicable to the U.S. Holder for that year; and |
• | an additional tax equal to the interest charge generally applicable to underpayments of tax will be imposed on the tax attributable to each prior taxable year, other than a pre-PFIC year. |
F. |
Dividends and Paying Agents |
G. |
Statement by Experts |
H. |
Documents on Display |
I. |
Subsidiary Information |
Item 11. |
Quantitative and Qualitative Disclosures about Market Risk |
Item 12. |
Description of Securities Other than Equity Securities |
A. |
Debt Securities |
B. |
Warrants and Rights |
C. |
Other Securities |
D. |
American Depositary Shares |
Service |
Fees | |
• To any person to which ADSs are issued or to any person to which a distribution is made in respect of ADS distributions pursuant to stock dividends or other free distributions of stock, bonus distributions, stock splits or other distributions (except where converted to cash) |
Up to US$0.05 per ADS issued | |
• Cancelation of ADSs, including termination of the deposit agreement |
Up to US$0.05 per ADS canceled | |
• Distribution of cash dividends |
Up to US$0.05 per ADS held | |
• Distribution of cash entitlements (other than cash dividends) and/or cash proceeds, including proceeds from the sale of rights, securities and other entitlements |
Up to US$0.05 per ADS held | |
• Distribution of ADSs pursuant to exercise of rights. |
Up to US$0.05 per ADS held | |
• Depositary services |
Up to US$0.05 per ADS held on the applicable record date(s)established by the depositary bank |
Item 13. |
Defaults, Dividend Arrearages and Delinquencies |
Item 14. |
Material Modifications to the Rights of Security Holders and Use of Proceeds |
Item 15. |
Controls and Procedures |
Item 16A. |
Audit Committee Financial Expert |
Item 16B. |
Code of Ethics |
Item 16C. |
Principal Accountant Fees and Services |
2019 |
2020 |
|||||||
(in RMB thousands) |
||||||||
Audit fees (1) |
16,721 | 17,034 | ||||||
Tax and other service fees (2) |
1,621 | 1,654 |
(1) | “Audit fees” represents the aggregate fees billed for each of the fiscal years listed for professional services rendered by our principal accounting firm for the audit of our annual financial statements or services that are normally provided by the auditors in connection with statutory and regulatory filings or engagements. |
(2) | “Tax and other service fees” represents the aggregate fees billed for professional services rendered by our principal accounting firm for tax compliance, tax advice, tax planning, assurance and related services. |
Item 16D. |
Exemptions from the Listing Standards for Audit Committees |
Item 16E. |
Purchases of Equity Securities by the Issuer and Affiliated Purchasers |
Item 16F. |
Change in Registrant’s Certifying Accountant |
Item 16G. |
Corporate Governance |
Item 16H. |
Mine Safety Disclosure |
Item 17. |
Financial Statements |
Item 18. |
Financial Statements |
Item 19. |
Exhibits |
13.1** | Certification by Principal Executive Officer Pursuant to Section 906 of the Sarbanes-Oxley Act of 2002 | |
13.2** | Certification by Principal Financial Officer Pursuant to Section 906 of the Sarbanes-Oxley Act of 2002 | |
15.1* | Consent of Maples and Calder (Hong Kong) LLP | |
15.2* | Consent of Han Kun Law Offices | |
15.3* | Consent of Deloitte Touche Tohmatsu Certified Public Accountants LLP, an independent registered public accounting firm | |
101.INS* | Inline XBRL Instance Document — the instance document does not appear in the Interactive Data File because its XBRL tags are embedded within the Inline XBRL document | |
101.SCH* | Inline XBRL Taxonomy Extension Schema Document | |
101.CAL* | Inline XBRL Taxonomy Extension Calculation Linkbase Document | |
101.DEF* | Inline XBRL Taxonomy Extension Definition Linkbase Document | |
101.LAB* | Inline XBRL Taxonomy Extension Label Linkbase Document | |
101.PRE* | Inline XBRL Taxonomy Extension Presentation Linkbase Document | |
104.* | Cover Page Interactive Data File — the cover page XBRL tags are embedded within the Exhibit 101 Inline XBRL document set |
* | Filed herewith |
** | Furnished herewith |
Momo Inc. | ||
By: | /s/ Li Wang | |
Name: Li Wang | ||
Title: Chief Executive Officer |
CONTENTS |
Pages | |||
F - 2 - F - 3 | ||||
F - 4 | ||||
F - 5 | ||||
F - 6 | ||||
F - 7 | ||||
F - 8 | ||||
F - 9 - F -56 |
• | We tested the effectiveness of controls over management’s goodwill impairment evaluation, including those over the determination of the fair value of the Tantan Reporting Unit, such as controls related to management’s selection of the discount rate and forecasts of future revenue and operating margin. |
• | We evaluated management’s ability to accurately forecast future revenues and operating margins by comparing actual results to management’s historical forecasts. |
• | We evaluated the reasonableness of management’s revenue and operating margin forecasts by comparing the forecasts to: |
— | Historical revenues and operating margins. |
— | Internal communications to management and the Board of Directors. |
• | With the assistance of our fair value specialists, we evaluated the reasonableness of the (1) valuation methodology and (2) discount rate by: |
— | Testing the source information underlying the determination of the discount rate and the mathematical accuracy of the calculation. |
— | Developing a range of independent estimates and comparing those to the discount rate selected by management. |
As of December 31, | |||||||||||||
2019 | 2020 | 2020 | |||||||||||
RMB | RMB | US$ | |||||||||||
Assets |
|||||||||||||
Current assets |
|||||||||||||
Cash and cash equivalents |
|||||||||||||
Short-term deposits |
|||||||||||||
Restricted cash |
— | ||||||||||||
Accounts receivable, net of allowance for doubtful accounts of RMB |
|||||||||||||
Amount due from a related party |
— | — | |||||||||||
Prepaid expenses and other current assets |
|||||||||||||
Total current assets |
|||||||||||||
Long-term deposits |
|||||||||||||
Right-of-use |
|||||||||||||
Property and equipment, net |
|||||||||||||
Intangible assets, |
|||||||||||||
Rental deposits |
|||||||||||||
Long-term investments |
|||||||||||||
Other non-current assets |
|||||||||||||
Deferred tax assets |
|||||||||||||
Goodwill |
|||||||||||||
Total assets |
|||||||||||||
Liabilities and equity |
|||||||||||||
Current liabilities |
|||||||||||||
Accounts payable (including accounts payable of the consolidated VIEs without recourse to the Company of RMB |
|||||||||||||
Deferred revenue (including deferred revenue of the consolidated VIEs without recourse to the Company of RMB |
|||||||||||||
Accrued exp enses and other current liabilities (including accrued expenses and other current liabilities of the consolidated VIEs without recourse to the Company of RMB |
|||||||||||||
Amount due to related parties (including amount due to related parties of the consolidated VIEs without recourse to the Company of RMB |
|||||||||||||
Lease liabilities due within one year (including lease liabilities due within one year of the consolidated VIEs without recourse to the Company of RMB |
|||||||||||||
Income tax payable (including income tax payable of the consolidated VIEs without recourse to the Company of RMB |
|||||||||||||
Deferred consideration in connection with business acquisitions (including deferred consideration in connection with business acquisitions of the consolidated VIEs without recourse to the Company of RMB |
|||||||||||||
|
|
|
|
|
|
||||||||
Total current liabilities |
|||||||||||||
Deferred tax liabilities |
|||||||||||||
Convertible senior notes |
|||||||||||||
Share-based compensation liability |
|||||||||||||
Lease liabilities |
|||||||||||||
Other non-current liabilities |
|||||||||||||
|
|
|
|
|
|
||||||||
Total liabilities |
|||||||||||||
|
|
|
|
|
|
|
|
|
|
|
|
| |
Commitments and contingencies (Note 18) |
|||||||||||||
Equity |
|||||||||||||
Class A ordinary shares ($ |
|||||||||||||
Class B ordinary shares ($ |
|||||||||||||
Treasury stock |
( |
) | ( |
) | ( |
) | |||||||
Additional paid-in capital |
|||||||||||||
Retained earnings |
|||||||||||||
Accumulated other comprehensive income |
|||||||||||||
Non-controlling interest |
|||||||||||||
|
|
|
|
|
|
||||||||
Total equity |
|||||||||||||
|
|
|
|
|
|
||||||||
Total liabilities and equity |
|||||||||||||
|
|
|
|
|
|
For the years ended December 31, | ||||||||||||||||
2018 | 2019 | 2020 | 2020 | |||||||||||||
RMB | RMB | RMB | US$ | |||||||||||||
Net revenues |
||||||||||||||||
Cost and expenses: |
||||||||||||||||
Cost of revenues (including share-based compensation of RMB |
( |
) | ( |
) | ( |
) | ( |
) | ||||||||
Research and development (including share-based compensation of RMB |
( |
) | ( |
) | ( |
) | ( |
) | ||||||||
Sales and marketing (including share-based compensation of RMB |
( |
) | ( |
) | ( |
) | ( |
) | ||||||||
General and administrative (including share-based compensation of RMB |
( |
) | ( |
) | ( |
) | ( |
) | ||||||||
Total cost and expenses |
( |
) | ( |
) | ( |
) | ( |
) | ||||||||
Other operating income |
||||||||||||||||
Income from operations |
||||||||||||||||
Interest income |
||||||||||||||||
Interest expense |
( |
) | ( |
) | ( |
) | ( |
) | ||||||||
Other gain or loss, net |
( |
) | ( |
) | ||||||||||||
Income before income tax and share of income on equity method investments |
||||||||||||||||
Income tax expense |
( |
) | ( |
) | ( |
) | ( |
) | ||||||||
Income before share of income on equity method investments |
||||||||||||||||
Share of income (loss) on equity method investments |
( |
) | ( |
) | ( |
) | ||||||||||
Net income |
||||||||||||||||
|
|
|
|
|
|
|
|
|
|
|
|
|
|
|
|
|
Less: net loss attributable to non-controlling interest |
( |
) | ( |
) | ( |
) | ( |
) | ||||||||
Net income attributable to the shareholders of Momo Inc. |
||||||||||||||||
|
|
|
|
|
|
|
|
|
|
|
|
|
|
|
|
|
Net income per share attributable to ordinary shareholders |
||||||||||||||||
Basic |
||||||||||||||||
Diluted |
||||||||||||||||
Weighted average shares used in calculating net income per ordinary share |
||||||||||||||||
Basic |
||||||||||||||||
Diluted |
For the years ended December 31, | ||||||||||||||||
2018 | 2019 | 2020 | 2020 | |||||||||||||
RMB | RMB | RMB | US$ | |||||||||||||
Net income |
||||||||||||||||
Other comprehensive income (loss), net of tax: |
||||||||||||||||
Foreign currency translation adjustment |
( |
) | ( |
) | ( |
) | ||||||||||
|
|
|
|
|
|
|
|
|||||||||
Comprehensive income |
||||||||||||||||
Less: comprehensive loss attributed to the non-controlling interest |
( |
) | ( |
) | ( |
) | ( |
) | ||||||||
|
|
|
|
|
|
|
|
|||||||||
Comprehensive income attributable to Momo Inc. |
||||||||||||||||
|
|
|
|
|
|
|
|
Additional paid-in capital |
Treasury stock |
(Accumulated deficit)/ Retained earning |
Accumulated other comprehensive income |
Non-controlling interests |
Total shareholders’ equity |
|||||||||||||||||||||||||||
Ordinary shares | ||||||||||||||||||||||||||||||||
Shares | Amount | |||||||||||||||||||||||||||||||
RMB | RMB | RMB | RMB | RMB | RMB | RMB | ||||||||||||||||||||||||||
Balance as of January 1, 2018 |
( |
) | ||||||||||||||||||||||||||||||
Net income |
— | — | — | — | — | ( |
) | |||||||||||||||||||||||||
Share-based compensation |
— | — | — | — | — | |||||||||||||||||||||||||||
Capital injection from non-controlling interest shareholder of Ninbo Hongyi Equity Investment L.P |
— | — | — | — | — | — | ||||||||||||||||||||||||||
Issuance of ordinary shares in connection with exercise of options and vesting of restricted share units |
— | — | — | — | ||||||||||||||||||||||||||||
Transfer of non-controlling interest of QOOL HK |
— | — | ( |
) | — | — | — | — | ||||||||||||||||||||||||
Share issued connection with the acquisition of Tantan Limited |
— | — | — | — | ||||||||||||||||||||||||||||
Foreign currency translation adjustment |
— | — | — | — | — | |||||||||||||||||||||||||||
|
|
|
|
|
|
|
|
|
|
|
|
|
|
|
|
|||||||||||||||||
Balance as of December 31, 2018 |
( |
) | ||||||||||||||||||||||||||||||
Net income |
— | — | — | — | — | ( |
) | |||||||||||||||||||||||||
Share-based compensation |
— | — | — | — | — | |||||||||||||||||||||||||||
Issuance of ordinary shares in connection with exercise of options and vesting of restricted share units |
— | — | — | — | ||||||||||||||||||||||||||||
Cash Dividends |
— | — | — | — | ( |
) | — | — | ( |
) | ||||||||||||||||||||||
Foreign currency translation adjustment |
— | — | — | — | — | ( |
) | ( |
) | |||||||||||||||||||||||
|
|
|
|
|
|
|
|
|
|
|
|
|
|
|
|
|||||||||||||||||
Balance as of December 31, 2019 |
( |
) | ||||||||||||||||||||||||||||||
Net income |
— | — | — | — | — | ( |
) | |||||||||||||||||||||||||
Repurchase of shares |
— | — | — | ( |
) | — | — | — | ( |
) | ||||||||||||||||||||||
Share-based compensation |
— | — | — | — | — | |||||||||||||||||||||||||||
Issuance of ordinary shares in connection with exercise of options and vesting of restricted share units |
— | — | — | — | ||||||||||||||||||||||||||||
Cash Dividends |
— | — | — | — | ( |
) | — | — | ( |
) | ||||||||||||||||||||||
Foreign currency translation adjustment |
— | — | — | — | — | ( |
) | ( |
) | ( |
) | |||||||||||||||||||||
|
|
|
|
|
|
|
|
|
|
|
|
|
|
|
|
|||||||||||||||||
Balance as of December 31, 2020 |
( |
) | ||||||||||||||||||||||||||||||
|
|
|
|
|
|
|
|
|
|
|
|
|
|
|
|
For the years ended December 31, | ||||||||||||||||||
2018 | 2019 | 2020 | 2020 | |||||||||||||||
RMB | RMB | RMB | US$ | |||||||||||||||
Cash flows from operating activities |
||||||||||||||||||
Net income |
||||||||||||||||||
Adjustments to reconcile net income to net cash provided by operating activities |
||||||||||||||||||
Depreciation of property and equipment |
||||||||||||||||||
Amortization of intangible assets |
||||||||||||||||||
Share-based compensation |
||||||||||||||||||
Share of (income) loss on equity method investments |
( |
) | ||||||||||||||||
Gain or loss on long-term investments |
( |
) | ( |
) | ||||||||||||||
Gain on subsidiary deconsolidation |
— | — | ( |
) | ( |
) | ||||||||||||
Gain on disposal of property and equipment |
( |
) | ( |
) | ( |
) | ( |
) | ||||||||||
Provision of losses on receivable and other assets |
( |
) | ||||||||||||||||
Cash received on investment income distribution |
— | — | ||||||||||||||||
Changes in operating assets and liabilities |
||||||||||||||||||
Accounts receivable |
( |
) | ||||||||||||||||
Prepaid expenses and other current assets |
( |
) | ( |
) | ( |
) | ||||||||||||
Amount due from a related party |
( |
) | ||||||||||||||||
Deferred tax assets |
( |
) | ||||||||||||||||
Rental deposits |
( |
) | ( |
) | ( |
) | ( |
) | ||||||||||
Other non-current assets |
( |
) | ( |
) | ( |
) | ( |
) | ||||||||||
Accounts payable |
( |
) | ( |
) | ||||||||||||||
Income tax payable |
( |
) | ||||||||||||||||
Deferred revenue |
( |
) | ||||||||||||||||
Accrued expenses and other current liabilities |
( |
) | ( |
) | ||||||||||||||
Amount due to related parties |
( |
) | ( |
) | ( |
) | ||||||||||||
Deferred tax liabilities |
( |
) | ( |
) | ( |
) | ( |
) | ||||||||||
Other non-current liabilities |
( |
) | ||||||||||||||||
|
|
|
|
|
|
|
|
|||||||||||
Net cash provided by operating activities |
||||||||||||||||||
|
|
|
|
|
|
|
|
|||||||||||
Cash flows from investing activities |
||||||||||||||||||
Purchase of property and equipment |
( |
) | ( |
) | ( |
) | ( |
) | ||||||||||
Payment for long-term investments |
( |
) | ( |
) | ( |
) | ( |
) | ||||||||||
Prepayment for long-term investments |
( |
) | ( |
) | — | — | ||||||||||||
Payment for business acquisition, net of cash acquired |
( |
) | — | — | — | |||||||||||||
Purchase of short-term deposits |
( |
) | ( |
) | ( |
) | ( |
) | ||||||||||
Cash received on maturity of short-term deposits |
||||||||||||||||||
Purchase of long-term deposits |
— | ( |
) | ( |
) | ( |
) | |||||||||||
Payment for short-term investments |
( |
) | ( |
) | ( |
) | ( |
) | ||||||||||
Cash received from sales of short-term investment |
||||||||||||||||||
Cash received from sales of long -term investment |
— | — | ||||||||||||||||
Other investing activities |
( |
) | ( |
) | ||||||||||||||
|
|
|
|
|
|
|
|
|||||||||||
Net cash used in investing activities |
( |
) | ( |
) | ( |
) | ( |
) | ||||||||||
|
|
|
|
|
|
|
|
|||||||||||
Cash flows from financing activities |
||||||||||||||||||
Deferred payment for business acquisition |
— | ( |
) | ( |
) | ( |
) | |||||||||||
Proceeds from exercise of share options |
||||||||||||||||||
Repurchase of ordinary shares |
— | — | ( |
) | ( |
) | ||||||||||||
Repurchase of subsidiary’s share options |
— | — | ( |
) | ( |
) | ||||||||||||
Dividends payment |
— | ( |
) | ( |
) | ( |
) | |||||||||||
Deferred payment of purchase of property and equipment |
( |
) | ( |
) | — | — | ||||||||||||
Proceeds from bank loan |
— | — | — | |||||||||||||||
Repayment of bank loan |
( |
) | — | — | — | |||||||||||||
Proceeds from issuance of convertible notes, net of issuance cost of RMB |
— | — | — | |||||||||||||||
Capital contribution from non-controlling interest shareholder |
— | — |
— |
|||||||||||||||
|
|
|
|
|
|
|
|
|||||||||||
Net cash provided by (used in) financing activities |
( |
) | ( |
) | ( |
) | ||||||||||||
|
|
|
|
|
|
|
|
|||||||||||
Effect of exchange rate changes |
( |
) | ( |
) | ( |
) | ||||||||||||
|
|
|
|
|
|
|
|
|||||||||||
Net (decrease) increase in cash, cash equivalent and restricted cash |
( |
) | ||||||||||||||||
Cash and cash equivalents at the beginning of year |
||||||||||||||||||
|
|
|
|
|
|
|
|
|||||||||||
Cash, cash equivalent and restricted cash at the end of year |
||||||||||||||||||
|
|
|
|
|
|
|
|
|||||||||||
Non-cash investing and financing activities |
||||||||||||||||||
Payable for purchase of property and equipment |
||||||||||||||||||
Payable for repurchase of ordinary shares |
— | — | — | |||||||||||||||
Deferred consideration in connection with business acquisition |
||||||||||||||||||
Ordinary shares issued for the acquisition of Tantan Limited |
— | — | — | |||||||||||||||
Right-of-use |
— |
1. |
ORGANIZATION AND PRINCIPAL ACTIVITIES |
Major subsidiaries |
Momo Technology HK Company Limited (“Momo HK”) |
Beijing Momo Information Technology Co., Ltd. (“Beijing Momo IT”) |
Qool Media HongKong Limited (“QOOL HK”) |
Tantan Limited (“Tantan”) |
Tantan Hong Kong Limited (“Tantan HK”) |
Tantan Technology (Beijing) Co., Ltd. (“Tantan Technology”) |
QOOL Media Inc. (“QOOL Inc.”) |
QOOL Media Technology (Tianjin) Co., Ltd. (“QOOL Media”) |
SpaceCape Inc. (“SpaceCape Inc.”) |
SpaceCape Technology Pte.Ltd. (“SpaceCape Singapore”) |
MatchUp UK Limited (“Tantan MatchUp”) |
Major VIEs |
Beijing Momo Technology Co., Ltd. (“Beijing Momo”) * |
QOOL Media (Tianjin) Co., Ltd. (“QOOL Tianjin”) * |
Tantan Culture Development (Beijing) Co., Ltd. (“Tantan Culture”) * |
Hainan Miaoka Network Technology Co., Ltd. (“Miaoka”) * |
Major VIEs’ subsidiaries |
Chengdu Momo Technology Co., Ltd. (“Chengdu Momo”) * |
Tianjin Heer Technology Co., Ltd. (“Tianjin Heer”) * |
Loudi Momo Technology Co., Ltd. (“Loudi Momo”) * |
Momo Pictures Co., Ltd. (“Momo Pictures”) * |
Tianjin Laifu Culture Development Co., Ltd. (“Tantan Laifu”) * |
Tianjin Apollo Exploration Culture Co., Ltd. (“Tantan Apollo”) * |
* | These entities are controlled by the Company pursuant to the contractual arrangements disclosed below. |
1. |
ORGANIZATION AND PRINCIPAL ACTIVITIES - |
(1) | Power of Attorneys |
1. |
ORGANIZATION AND PRINCIPAL ACTIVITIES - |
(2) |
Exclusive Call Option Agreements |
(3) | Spousal Consent Letters |
(1) | Exclusive Cooperation Agreements |
1. |
ORGANIZATION AND PRINCIPAL ACTIVITIES - |
(2) | Equity Interest Pledge Agreements |
(3) | Business Operations Agreements |
1. |
ORGANIZATION AND PRINCIPAL ACTIVITIES - |
• | revoke the Group’s business and operating licenses; |
• | require the Group to discontinue or restrict operations; |
• | restrict the Group’s right to collect revenues; |
• | block the Group’s websites; |
• | require the Group to restructure the operations in such a way as to compel the Group to establish a new enterprise, re-apply for the necessary licenses or relocate our businesses, staff and assets; |
• | impose additional conditions or requirements with which the Group may not be able to comply; or |
• | take other regulatory or enforcement actions against the Group that could be harmful to the Group’s business. |
1. |
ORGANIZATION AND PRINCIPAL ACTIVITIES - |
As of December 31, | ||||||||
2019 | 2020 | |||||||
RMB | RMB | |||||||
Cash and cash equivalents |
||||||||
Short-term deposits |
||||||||
Other current assets |
|
|
|
|
|
|
|
|
Total current assets |
||||||||
Long-term deposits |
— | |||||||
Long-term investments |
||||||||
Other non-current assets |
|
|
|
|
|
|
|
|
Total assets |
||||||||
Accounts payable |
||||||||
Deferred revenue |
||||||||
Other current liabilities |
|
|
|
|
|
|
|
|
Total current liabilities |
||||||||
Other non-current liabilities |
|
|
|
|
|
|
|
|
Total liabilitie s |
1. |
ORGANIZATION AND PRINCIPAL ACTIVITIES - |
For the years ended December 31, | ||||||||||||
2018 | 2019 | 2020 | ||||||||||
RMB | RMB | RMB | ||||||||||
Net revenues |
||||||||||||
Net income |
6,734,471 | |||||||||||
Net cash provided by operating activities |
||||||||||||
Net cash used in investing activities |
( |
) | ( |
) | ( |
) | ||||||
Net cash provided by financing activities |
— | — |
2. |
SIGNIFICANT ACCOUNTING POLICIES |
2. |
SIGNIFICANT ACCOUNTING POLICIES - |
2. |
SIGNIFICANT ACCOUNTING POLICIES - |
As of December 31, | ||||||||
2019 | 2020 | |||||||
A |
% | % | ||||||
B |
% | % |
As of December 31, | ||||||||
2019 | 2020 | |||||||
C |
% | % |
2. |
SIGNIFICANT ACCOUNTING POLICIES - |
2. |
SIGNIFICANT ACCOUNTING POLICIES - |
Office equipment |
||
Computer equipment |
||
Vehicles |
||
Leasehold improvement |
or estimated useful lives |
Copyright |
||
License |
||
Technology |
||
User base |
||
Trade name |
2. |
SIGNIFICANT ACCOUNTING POLICIES - |
2. |
SIGNIFICANT ACCOUNTING POLICIES - |
2. |
SIGNIFICANT ACCOUNTING POLICIES |
For the year ended December 31, 2020 | ||||||||||||
Momo | Tantan | QOOL | ||||||||||
RMB | RMB | RMB | ||||||||||
Live video service |
— | |||||||||||
Value-added services |
— | |||||||||||
Mobile marketing |
— | — | ||||||||||
Mobile games |
— | — | ||||||||||
Other services |
— | |||||||||||
Total |
||||||||||||
For the year ended December 31, 2019 | ||||||||||||
Momo | Tantan | QOOL | ||||||||||
RMB | RMB | RMB | ||||||||||
Live video service |
— | — | ||||||||||
Value-added services |
— | |||||||||||
Mobile marketing |
— | — | ||||||||||
Mobile games |
— | — | ||||||||||
Other services |
— | |||||||||||
Total |
||||||||||||
For the year ended December 31, 2018 | ||||||||||||
Momo | Tantan | QOOL | ||||||||||
RMB | RMB | RMB | ||||||||||
Live video service |
— | — | ||||||||||
Value-added services |
— | |||||||||||
Mobile marketing |
— | — | ||||||||||
Mobile games |
— | — | ||||||||||
Other services |
— | |||||||||||
Total |
||||||||||||
2. |
SIGNIFICANT ACCOUNTING POLICIES |
(a) | Live video service |
2. |
SIGNIFICANT ACCOUNTING POLICIES |
(b) | Value-added services |
(c) | Mobile marketing |
2. |
SIGNIFICANT ACCOUNTING POLICIES |
(c) | Mobile marketing - continued |
(d) | Mobile games |
(e) | Other services |
2. |
SIGNIFICANT ACCOUNTING POLICIES |
2. |
SIGNIFICANT ACCOUNTING POLICIES |
2. |
SIGNIFICANT ACCOUNTING POLICIES |
2. |
SIGNIFICANT ACCOUNTING POLICIES |
2. |
SIGNIFICANT ACCOUNTING POLICIES |
2. |
SIGNIFICANT ACCOUNTING POLICIES |
3. |
ACQUISITIONS |
Cash consideration |
||||
Fair value of ordinary shares issued |
||||
Total consideration |
Indicated Value | Estimated useful lives | |||||||
RMB | ||||||||
Net tangible assets: |
||||||||
Cash and cash equivalents and short term investment |
||||||||
Accounts receivable |
||||||||
Other current asset |
||||||||
Property and equipment, net |
||||||||
Other non-current asset |
||||||||
Intangible assets |
||||||||
Trade name |
||||||||
Technology |
||||||||
User base |
||||||||
Total assets |
||||||||
Accounts payable |
( |
) | ||||||
Other current liabilities |
( |
) | ||||||
Deferred tax liabilities |
( |
) | ||||||
Goodwill |
||||||||
Total consideration |
3. |
ACQUISITIONS - |
Year ended December 31, 2018 | ||||
RMB | ||||
Net revenue |
||||
Net loss |
Year ended December 31, 2018 | ||||
(Unaudited) | ||||
RMB | ||||
Pro forma net revenue |
||||
Pro forma net income attributable to ordinary shareholders of Momo Inc. |
||||
Pro forma net income per ordinary share - basic |
||||
Pro forma net income per ordinary share - diluted |
4. |
PREPAID EXPENSES AND OTHER CURRENT ASSETS |
As of December 31, | ||||||||
2019 | 2020 | |||||||
RMB | RMB | |||||||
Deposits with third-party payment channels (i) |
||||||||
Interest receivable |
||||||||
Deposits at third party broker (ii) |
— | |||||||
Input VAT (iii) |
||||||||
Advance to suppliers (iv) |
||||||||
Deferred platform commission cost |
||||||||
Prepaid income tax and other expenses |
||||||||
Corporate lending receivable (v) |
— | |||||||
Others |
||||||||
4. |
PREPAID EXPENSES AND OTHER CURRENT ASSETS - |
(i) | Deposits with third-party payment channels are mainly the cash deposited in certain third-party payment channels by the Group for the broadcasters and the gift recipients who received the virtual items in the value-added service to withdraw their revenue sharing and the customer payment to the Group’s account through the third-party payment channels. |
(ii) | On September 7, 2020, the Company engaged Credit Suisse Securities(USA) LLC (“Credit Suisse”) as agent to facilitate the share repurchase program. During the year ended December 31, 2020, the Company deposited US$ |
(iii) | Input VAT mainly occurred from the purchasing of goods or other services, property and equipment and advertising activities. It is subject to verification by related tax authorities before offsetting the VAT output. |
(iv) | Advance to suppliers were primarily for advertising fees and related service fees. |
(v) | Corporate lending receivable was a loan to a third-party entity during 2018, which matured in . The annual interest rate is amounting to RMB |
5. |
LONG-TERM INVESTMENTS |
As of December 31, | ||||||||
2019 | 2020 | |||||||
RMB | RMB | |||||||
Equity method investments |
||||||||
Jingwei Chuangteng (Hangzhou) L.P. (i) |
||||||||
Hangzhou Aqua Ventures Investment Management L.P. (ii) |
||||||||
Chengdu Tianfu Qianshi Equity Investment Partnership L.P. (i ii ) |
||||||||
Others (v) |
||||||||
Equity securities without readily determinable fair values |
||||||||
Hunan Qindao Cultural Spread Ltd. ( iv ) |
||||||||
Hangzhou Faceunity Technology Limited ( iv ) |
||||||||
Haining Yijiayi Culture Co., Ltd. ( iv ) |
||||||||
Others (v) |
||||||||
(i) | On January 9, 2015, the Group entered into a partnership agreement to subscribe partnership interest, as a limited partner, in Jingwei Chuangteng (Hangzhou) L.P. (“Jingwei”). According to the partnership agreement, the Group committed to subscribe |
5. |
LONG-TERM INVESTMENTS - |
(ii) | On August 18, 2015, the Group entered into a partnership agreement to subscribe partnership interest, as a limited partner, in Hangzhou Aqua Ventures Investment Management L.P. (“Aqua”). According to the partnership agreement, the Group committed to subscribe |
(i ii ) |
On September 12, 2018, the Group entered into a partnership agreement to subscribe partnership interest, as a limited partner, in Chengdu Tianfu Qianshi Equity Investment Partnership L.P. (“Tianfu”). According to the partnership agreement, the Group committed to subscribe |
( i v) |
The Group invested in certain preferred shares of private companies. As these investments were neither debt security nor in-substance common stock, they were accounted as an equity securities without readily determinable fair values and measured at fair value using the measurement alternative. There has been no orderly transactions for the identical or a similar investment of the same issuer noted for the years ended December 31, 2018, 2019 and 2020. |
(v) | Others represent equity method investments or equity securities without readily determinable fair values that are individually insignificant. |
6. |
PROPERTY AND EQUIPMENT, NET |
As of December 31, | ||||||||
2019 | 2020 | |||||||
RMB | RMB | |||||||
Computer equipment |
||||||||
Office equipment |
||||||||
Vehicles |
||||||||
Leasehold improvement |
||||||||
Less: accumulated depreciation |
( |
) | ( |
) | ||||
Exchange difference |
( |
) | ( |
) | ||||
7. |
INTANGIBLE ASSETS, NET |
As of December 31, | ||||||||
2019 | 2020 | |||||||
RMB | RMB | |||||||
Trade name |
||||||||
Active user |
||||||||
Technology |
||||||||
License |
||||||||
Game copyright |
||||||||
Less: accumulated amortization and impairment |
( |
) | ( |
) | ||||
Exchange difference |
( |
) | ||||||
|
|
|
|
|||||
Net book value |
||||||||
|
|
|
|
For the year ended December 31, |
Amounts | |||
2021 |
||||
2022 |
||||
2023 |
||||
2024 |
||||
2025 |
||||
Thereafter |
||||
|
|
|||
Total |
||||
|
|
8. |
GOODWILL |
As of December 31, 2020 | ||||||||||||
Momo | Tantan | Total | ||||||||||
RMB | RMB | RMB | ||||||||||
Balance, as of January 1, 2019 |
||||||||||||
Foreign exchange differences |
— | |||||||||||
Balance, as of December 31, 2019 |
||||||||||||
Foreign exchange differences |
— | ( |
) | ( |
) | |||||||
|
|
|
|
|
|
|||||||
Balance, as of December 31, 2020 |
||||||||||||
|
|
|
|
|
|
8. |
GOODWILL |
9. |
ACCRUED EXPENSES AND OTHER CURRENT LIABILITIES |
As of December 31, | ||||||||
2019 | 2020 | |||||||
RMB | RMB | |||||||
Accrued payroll and welfare |
||||||||
Payable for advertisement |
||||||||
Balance of users’ virtual accounts |
||||||||
Other tax payables |
||||||||
Accrued professional services and related service fee |
||||||||
VAT payable |
||||||||
Others |
||||||||
|
|
|
|
|||||
Total |
||||||||
|
|
|
|
10. |
CONVERTIBLE SENIOR NOTES |
10. |
CONVERTIBLE SENIOR NOTES |
11. |
LEASES |
For the years ended December 31 | ||||||||
2019 | 2020 | |||||||
RMB | RMB | |||||||
Cash paid for amounts included in the measurement of lease liabilities: |
||||||||
Operating cash flows from operating leases |
||||||||
Non-cash right-of-use |
||||||||
Operating leases |
||||||||
Weighted average remaining lease term |
||||||||
Operating leases |
||||||||
Weighted average discount rate |
||||||||
Operating leases |
% | % |
11. |
LEASES |
Amounts | ||||
RMB | ||||
2021 |
||||
2022 |
||||
2023 and thereafter |
||||
Less imputed interest |
||||
Total |
||||
12. |
FAIR VALUE |
Fair Value Measured as of December 31, | ||||||||||||||||
Description |
2019 | Quoted Prices in Active Market for Identical Assets |
Significant Other Observable Inputs |
Significant Unobservable Inputs |
||||||||||||
RMB | (Level 1) | (Level 2) | (Level 3) | |||||||||||||
Cash and cash equivalents |
— | — | ||||||||||||||
Total |
— | — | ||||||||||||||
Fair Value Measured as of December 31, | ||||||||||||||||
Description |
2020 | Quoted Prices in Active Market for Identical Assets |
Significant Other Observable Inputs |
Significant Unobservable Inputs |
||||||||||||
RMB | (Level 1) | (Level 2) | (Level 3) | |||||||||||||
Cash and cash equivalents |
— | — | ||||||||||||||
Total |
— | — | ||||||||||||||
12. |
FAIR VALUE |
13. |
INCOME TAXES |
13. |
INCOME TAXES |
13. |
INCOME TAXES |
As of December 31, | ||||||||
2019 | 2020 | |||||||
RMB | RMB | |||||||
Deferred tax assets: |
||||||||
Advertising expense |
||||||||
Net operating loss carry-forward |
||||||||
Accrued expenses |
||||||||
Impairment on long-term investments and game copyright |
||||||||
Less: valuation allowance |
( |
) | ( |
) | ||||
|
|
|
|
|||||
Deferred tax assets, net |
||||||||
|
|
|
|
|||||
Deferred tax liabilities: |
||||||||
Intangible assets acquired |
||||||||
|
|
|
|
|||||
Deferred tax liabilities, net |
||||||||
|
|
|
|
13. |
INCOME TAXES |
For the year ended December 31, | ||||||||||||
2018 | 2019 | 2020 | ||||||||||
RMB | RMB | RMB | ||||||||||
Net income before provision for income tax |
||||||||||||
PRC statutory tax rate |
% | % | % | |||||||||
Income tax expense at statutory tax rate |
||||||||||||
Permanent differences and Research and development super-deduction |
( |
) | ||||||||||
Change in valuation allowance |
||||||||||||
Effect of income tax rate difference in other jurisdictions |
||||||||||||
Effect of tax holidays and preferential tax rates |
( |
) | ( |
) | ( |
) | ||||||
Effect of the preferential tax rate adjustment of prior year’s EIT |
— | — | ( |
) | ||||||||
Effect of PRC withholding tax |
— | — | ||||||||||
|
|
|
|
|
|
|||||||
Provision for income tax |
||||||||||||
|
|
|
|
|
|
For the year ended December 31, | ||||||||||||
2018 | 2019 | 2020 | ||||||||||
RMB | RMB | RMB | ||||||||||
Increase in income tax expenses |
||||||||||||
Net income per ordinary share attributable to Momo Inc. - basic |
||||||||||||
Net income per ordinary share attributable to Momo Inc. - diluted |
14. |
ORDINARY SHARES |
15. |
DISTRIBUTION TO SHAREHOLDERS |
16. |
SHARE-BASED COMPENSATION |
16. |
SHARE-BASED COMPENSATION |
Number of options |
Weighted average exercise price per option (US$) |
Weighted average remaining contractual life (years) |
Aggregated intrinsic Value (US$) |
|||||||||||||
Outstanding as of December 31, 2019 |
||||||||||||||||
|
|
|
|
|
|
|
|
|||||||||
Granted |
||||||||||||||||
Exercised |
( |
) | ||||||||||||||
Forfeited |
( |
) | ||||||||||||||
|
|
|
|
|
|
|
|
|||||||||
Outstanding as of December 31, 2020 |
||||||||||||||||
|
|
|
|
|
|
|
|
|||||||||
Exercisable as of December 31, 2020 |
Risk-free interest rate of return |
Expected term | Volatility | Dividend yield | Exercise price (US$) |
||||||||||||||||
2018 |
||||||||||||||||||||
2019 |
||||||||||||||||||||
2020 |
(1) | Risk-free interest rate |
(2) | Expected term |
16. |
SHARE-BASED COMPENSATION - |
(3) | Volatility |
(4) | Dividend yield |
(5) | Exercise price |
(6) | Fair value of underlying ordinary shares |
16. |
SHARE-BASED COMPENSATION - |
Number of options |
Weighted average exercise price per option (US$) |
Weighted average remaining contractual life (years) |
Aggregated intrinsic Value (US$) |
|||||||||||||
Outstanding as of December 31, 2019 |
||||||||||||||||
|
|
|
|
|
|
|
|
|||||||||
Granted |
||||||||||||||||
Redeemed |
( |
) | ||||||||||||||
Forfeited |
( |
) | ||||||||||||||
|
|
|
|
|
|
|
|
|||||||||
Outstanding as of December 31, 2020 |
||||||||||||||||
|
|
|
|
|
|
|
|
|||||||||
Exercisable as of December 31, 2020 |
16. |
SHARE-BASED COMPENSATION - |
Risk-free interest rate of return |
Contractual term | Volatility | Dividend yield | Exercise price (US$) |
||||||||||||||||
2018 |
% | % | ||||||||||||||||||
2019 |
% | % | ||||||||||||||||||
2020 |
% | % |
(1) | Risk-free interest rate |
(2) | Contractual term |
(3) | Volatility |
(4) | Dividend yield |
(5) | Exercise price |
16. |
SHARE-BASED COMPENSATION - |
(6) | Fair value of underlying ordinary shares |
Risk-free interest rate of return |
Contractual term | Volatility | Dividend yield | Exercise price (US$) |
||||||||||||||||
2018 |
% | % | ||||||||||||||||||
2019 |
% | % | ||||||||||||||||||
2020 |
% | % |
16. |
SHARE-BASED COMPENSATION - |
(1) | Risk-free interest rate |
(2) | Contractual term |
(3) | Volatility |
(4) | Dividend yield |
(5) | Exercise price |
(6) | Fair value of underlying ordinary shares |
17. |
NET INCOME PER SHARE |
For the year ended December 31, | ||||||||||||
2018 | 2019 | 2020 | ||||||||||
RMB | RMB | RMB | ||||||||||
Numerator: |
||||||||||||
Net income attributed to ordinary shareholders for computing net income per ordinary share-basic and diluted |
||||||||||||
Denominator: |
||||||||||||
Denominator for computing net income per share-basic: |
||||||||||||
Weighted average ordinary shares outstanding used in computing net income per ordinary share-basic |
||||||||||||
Denominator for computing net income per share-diluted: |
||||||||||||
Weighted average shares outstanding used in computing net income per ordinary share-diluted |
(i) | |||||||||||
Net income per ordinary share attributable to Momo Inc. - basic |
||||||||||||
Net income per ordinary share attributable to Momo Inc. - diluted |
||||||||||||
For the year ended December 31, |
||||||||||||
2018 |
2019 |
2020 |
||||||||||
RMB |
RMB |
RMB |
||||||||||
Share issuable upon exercise of share options |
||||||||||||
Share issuable upon exercise of RSUs |
— |
(i) | The calculation of the weighted average number of ordinary shares for the purpose of diluted net income per share has considered the effect of certain potentially dilutive securities. For the year ended December 31, 2018, an incremental weighted average number of |
18. |
COMMITMENTS AND CONTINGENCIES |
19. |
RELATED PARTY BALANCES AND TRANSACTIONS |
Major related parties |
Relationship with the Group | |
Hunan Qindao Network Media Technology Co., Ltd. | Affiliate of a long-term investee | |
Hunan Qindao Cultural Spread Ltd. | Long-term investee | |
Beijing Shiyue Haofeng Media Co., Ltd. | Long-term investee | |
Beijing Santi Cloud Union Technology Co., Ltd. (i) | Long-term investee | |
Beijing Santi Cloud Time Technology Co., Ltd. (i) | Affiliate of a long-term investee |
(i) | The Company deconsolidated Beijing Santi Cloud Union Technology Co., Ltd. and its subsidiary, Beijing Santi Cloud Time Technology Co., Ltd. on March 31, 2020, and returned a remaining equity investment accounted as equity securities without determinable fair value that investment was further sold in November 2020. |
(1) | Amount due from a related party-current |
As of December 31, | ||||||||
2019 | 2020 | |||||||
RMB | RMB | |||||||
Hunan Qindao Network Media Technology Co., Ltd. (ii) |
||||||||
|
|
|
|
|||||
Total |
||||||||
|
|
|
|
(ii) | The amount of RMB |
(2) | Amount due to related parties – current |
As of December 31, | ||||||||
2019 | 2020 | |||||||
RMB | RMB | |||||||
Hunan Qindao Network Media Technology Co., Ltd. (iii) |
||||||||
Others |
||||||||
|
|
|
|
|||||
Total |
||||||||
|
|
|
|
(iii) | The amount of RMB |
19. |
RELATED PARTY BALANCES AND TRANSACTIONS - |
(3) | Sales to a related party |
For the year ended December 31, |
||||||||||||
2018 | 2019 | 2020 | ||||||||||
RMB | RMB | RMB | ||||||||||
Hunan Qindao Network Media Technology Co., Ltd. (vi) |
— | |||||||||||
|
|
|
|
|
|
|||||||
Total |
||||||||||||
|
|
|
|
|
|
(vi) | The sales to Hunan Qindao Network Media Technology Co., Ltd. represented mobile marketing services provided. |
(4) | Purchase from related parties |
For the year ended December 31, |
||||||||||||
2018 | 2019 | 2020 | ||||||||||
RMB | RMB | RMB | ||||||||||
Hunan Qindao Network Media Technology Co., Ltd. (v) |
||||||||||||
Beijing Santi Cloud Union Technology Co., Ltd. (vi) |
— | — | ||||||||||
Beijing Santi Cloud Time Technology Co., Ltd. (vi) |
— | — | ||||||||||
Beijing Shiyue Haofeng Media Co., Ltd. (v) |
||||||||||||
|
|
|
|
|
|
|||||||
Total |
||||||||||||
|
|
|
|
|
|
(v) | The purchases from Hunan Qindao Network Media Technology Co., Ltd. and Beijing Shiyue Haofeng Media Co., Ltd. mainly represent the Revenue Sharing. |
(vi) | The purchase from Beijing Santi Cloud Union Technology Co., Ltd. and Beijing Santi Cloud Time Technology Co., Ltd. is mainly related to its bandwidth services. |
20. |
SEGMENT INFORMATION |
20. |
SEGMENT INFORMATION - |
For the year ended December 31,2018 | ||||||||||||||||
Momo | Tantan | QOOL | Consolidated | |||||||||||||
RMB | RMB | RMB | RMB | |||||||||||||
Net revenues: |
||||||||||||||||
Cost and expenses: |
||||||||||||||||
Cost of revenues |
( |
) | ( |
) | ( |
) | ( |
) | ||||||||
Research and development |
( |
) | ( |
) | ( |
) | ||||||||||
Sales and marketing |
( |
) | ( |
) | ( |
) | ( |
) | ||||||||
General and administrative |
( |
) | ( |
) | ( |
) | ( |
) | ||||||||
Total cost and expenses |
( |
) | ( |
) | ( |
) | ( |
) | ||||||||
Other operating income |
||||||||||||||||
Income (loss) from operations |
( |
) | ( |
) | ||||||||||||
Interest income |
||||||||||||||||
Interest expense |
( |
) | ( |
) | ||||||||||||
Other gain or loss, net |
( |
) | ( |
) | ||||||||||||
Income tax (expenses) benefits |
( |
) | ( |
) | ( |
) | ||||||||||
Share of income on equity method investments |
||||||||||||||||
|
|
|
|
|
|
|
|
|||||||||
Net income (loss) |
( |
) | ( |
) | ||||||||||||
|
|
|
|
|
|
|
|
|||||||||
For the year ended December 31,2019 | ||||||||||||||||
Momo | Tantan | QOOL | Consolidated | |||||||||||||
RMB | RMB | RMB | RMB | |||||||||||||
Net revenues: |
||||||||||||||||
Cost and expenses: |
||||||||||||||||
Cost of revenues |
( |
) | ( |
) | ( |
) | ( |
) | ||||||||
Research and development |
( |
) | ( |
) | ( |
) | ||||||||||
Sales and marketing |
( |
) | ( |
) | ( |
) | ( |
) | ||||||||
General and administrative |
( |
) | ( |
) | ( |
) | ( |
) | ||||||||
Total cost and expenses |
( |
) | ( |
) | ( |
) | ( |
) | ||||||||
Other operating income |
||||||||||||||||
Income (loss) from operations |
( |
) | ( |
) | ||||||||||||
Interest income |
||||||||||||||||
Interest expense |
( |
) | ( |
) | ||||||||||||
Other gain or loss, net |
( |
) | ( |
) | ||||||||||||
Income tax (expenses) benefits |
( |
) | ( |
) | ||||||||||||
Share of income on equity method investments |
( |
) | ( |
) | ||||||||||||
|
|
|
|
|
|
|
|
|||||||||
Net income (loss) |
( |
) | ( |
) | ||||||||||||
|
|
|
|
|
|
|
|
20. |
SEGMENT INFORMATION - |
For the year ended December 31,2020 | ||||||||||||||||
Momo | Tantan | QOOL | Consolidated | |||||||||||||
RMB | RMB | RMB | RMB | |||||||||||||
Net revenues: |
||||||||||||||||
Cost and expenses: |
||||||||||||||||
Cost of revenues |
( |
) | ( |
) | ( |
) | ( |
) | ||||||||
Research and development |
( |
) | ( |
) | — | ( |
) | |||||||||
Sales and marketing |
( |
) | ( |
) | ( |
) | ( |
) | ||||||||
General and administrative |
( |
) | ( |
) | ( |
) | ( |
) | ||||||||
Total cost and expenses |
( |
) | ( |
) | ( |
) | ( |
) | ||||||||
Other operating income |
||||||||||||||||
Income (loss) from operations |
( |
) | ( |
) | ||||||||||||
Interest income |
||||||||||||||||
Interest expense |
( |
) | — | — | ( |
) | ||||||||||
Other gain or loss, net |
— | — | ||||||||||||||
Income tax (expenses) benefits |
( |
) | ( |
) | ||||||||||||
Share of income on equity method investments |
( |
) | — | — | ( |
) | ||||||||||
|
|
|
|
|
|
|
|
|||||||||
Net income (loss) |
( |
) | ( |
) | ||||||||||||
|
|
|
|
|
|
|
|
21. |
EMPLOYEE BENEFIT PLAN |
22. |
STATUTORY RESERVES AND RESTRICTED NET ASSETS |
22. |
STATUTORY RESERVES AND RESTRICTED NET ASSETS - |
23. |
SUBSEQUENT EVENTS |