| 0 Offering everyone a piece of the American spirit—one handshake at a time. Supplemental Financial Presentation May 2023 |
| 1 Important Information Forward-Looking Statements This presentation contains forward-looking statements that are subject to risks and uncertainties. All statements other than statements of historical fact included in this presentation are forward-looking statements. You can identify forward-looking statements by the fact that they generally include words such as "anticipate," "estimate," "expect," "project," "plan,“ "intend," "believe," “outlook” and other words of similar meaning in connection with any discussion of the timing or nature of future operating or financial performance or other events but not all forward-looking statements contain these identifying words. These forward-looking statements are based on assumptions that the Company’s management has made in light of their industry experience and on their perceptions of historical trends, current conditions, expected future developments and other factors they believe are appropriate under the circumstances. As you consider this presentation, you should understand that these statements are not guarantees of performance or results. They involve risks, uncertainties (some of which are beyond the Company’s control) and assumptions. These risks, uncertainties and assumptions include, but are not limited to, the following: decreases in consumer spending due to declines in consumer confidence, local economic conditions or changes in consumer preferences; the Company’s ability to effectively execute on its growth strategy; the Company’s failure to maintain and enhance its strong brand image, to compete effectively, to maintain good relationships with its key suppliers, and to improve and expand its exclusive product offerings; and the effect of COVID-19 on our business. The Company discusses the foregoing risks and other risks in greater detail under the heading “Risk factors” in the periodic reports filed by the Company with the Securities and Exchange Commission. Although the Company believes that these forward-looking statements are based on reasonable assumptions, you should be aware that many factors could affect the Company’s actual financial results and cause them to differ materially from those anticipated in the forward-looking statements. Because of these factors, the Company cautions that you should not place undue reliance on any of these forward-looking statements. New risks and uncertainties arise from time to time, and it is impossible for the Company to predict those events or how they may affect the Company. Further, any forward-looking statement speaks only as of the date on which it is made. Except as required by law, the Company does not intend to update or revise the forward-looking statements in this presentation after the date of this presentation. Industry and Market Information Statements in this presentation concerning our industry and the markets in which we operate, including our general expectations and competitive position, business opportunity and market size, growth and share, are based on information from independent industry organizations and other third-party sources, data from our internal research and management estimates. Management estimates are derived from publicly available information and the information and data referred to above and are based on assumptions and calculations made by us based upon our interpretation of such information and data. The information and data referred to above are imprecise and may prove to be inaccurate because the information cannot always be verified with complete certainty due to the limitations on the availability and reliability of raw data, the voluntary nature of the data gathering process and other limitations and uncertainties. As a result, please be aware that the data and statistical information in this presentation may differ from information provided by our competitors or from information found in current or future studies conducted by market research institutes, consultancy firms or independent sources. Recent Developments Our business and opportunities for growth depend on consumer discretionary spending, and as such, our results are particularly sensitive to economic conditions and consumer confidence. Inflation (which has occurred over the past twelve months and is continuing) and other challenges affecting the global economy could impact our operations and will depend on future developments, which are uncertain. These and other effects make it more challenging for us to estimate the future performance of our business, particularly over the near-to-medium term. For further discussion of the uncertainties and business risks affecting the Company, see Item 1A, Risk Factors, of our Fiscal 2023 10-K. |
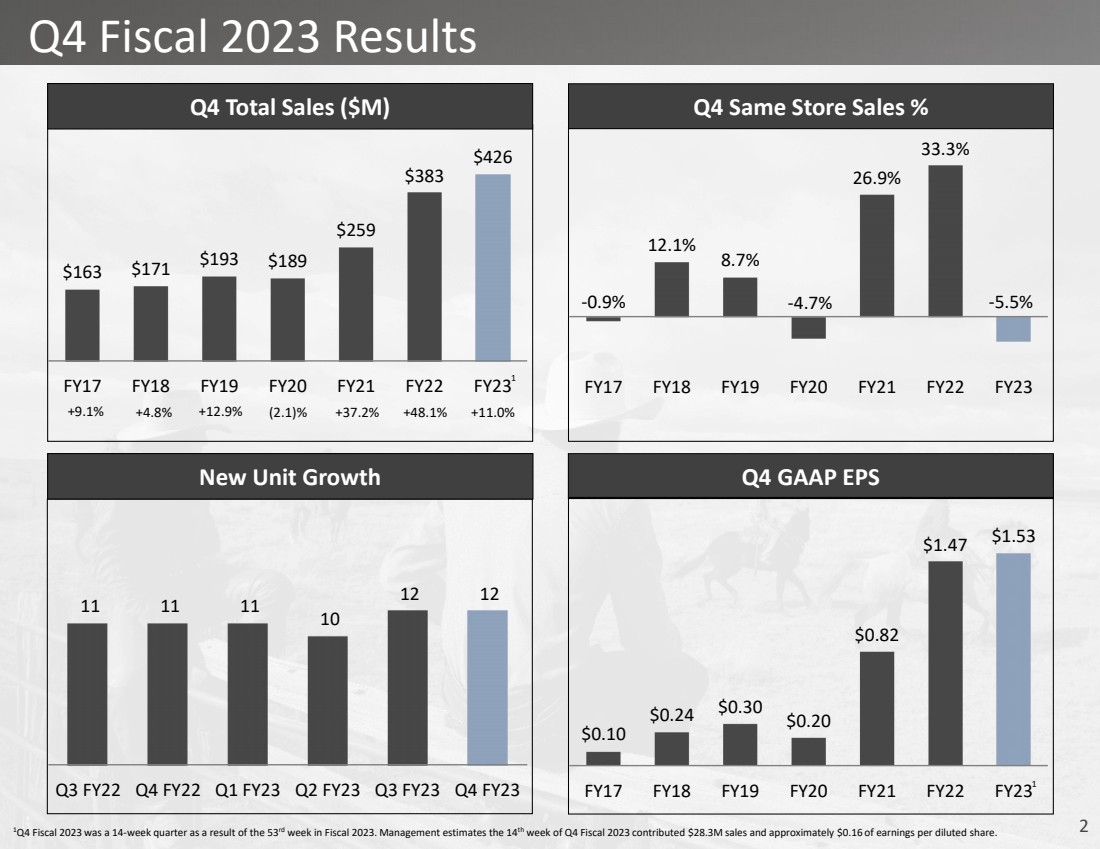
| 2 $163 $171 $193 $189 $259 $383 $426 FY17 FY18 FY19 FY20 FY21 FY22 FY23 Q4 Fiscal 2023 Results 11 11 11 10 12 12 Q3 FY22 Q4 FY22 Q1 FY23 Q2 FY23 Q3 FY23 Q4 FY23 New Unit Growth -0.9% 12.1% 8.7% -4.7% 26.9% 33.3% -5.5% FY17 FY18 FY19 FY20 FY21 FY22 FY23 Q4 Total Sales ($M) (2.1)% +37.2% +48.1% +11.0% Q4 Same Store Sales % Q4 GAAP EPS +9.1% +4.8% +12.9% $0.10 $0.24 $0.30 $0.20 $0.82 $1.47 $1.53 FY17 FY18 FY19 FY20 FY21 FY22 FY23 1Q4 Fiscal 2023 was a 14-week quarter as a result of the 53rd week in Fiscal 2023. Management estimates the 14th week of Q4 Fiscal 2023 contributed $28.3M sales and approximately $0.16 of earnings per diluted share. 1 1 |
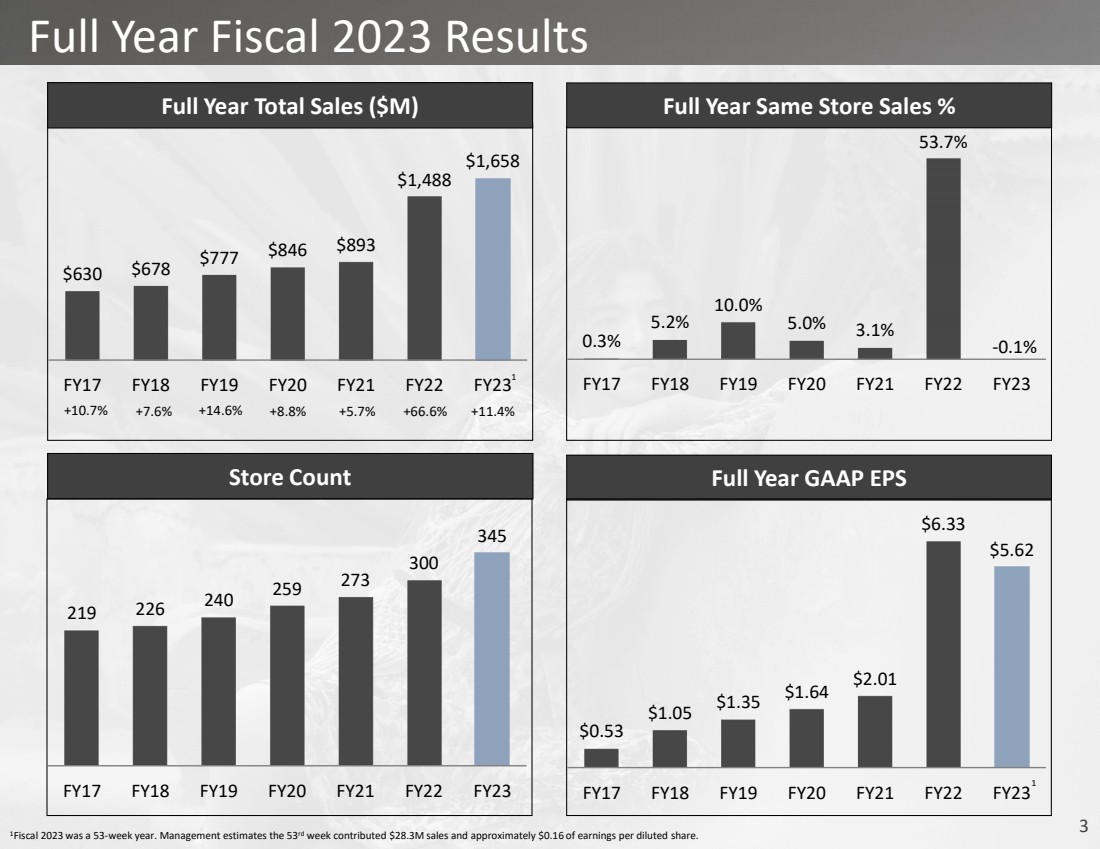
| 3 $630 $678 $777 $846 $893 $1,488 $1,658 FY17 FY18 FY19 FY20 FY21 FY22 FY23 Full Year Fiscal 2023 Results Store Count 0.3% 5.2% 10.0% 5.0% 3.1% 53.7% -0.1% FY17 FY18 FY19 FY20 FY21 FY22 FY23 Full Year Total Sales ($M) +8.8% +5.7% +66.6% +11.4% Full Year Same Store Sales % Full Year GAAP EPS +10.7% +7.6% +14.6% $0.53 $1.05 $1.35 $1.64 $2.01 $6.33 $5.62 FY17 FY18 FY19 FY20 FY21 FY22 FY23 219 226 240 259 273 300 345 FY17 FY18 FY19 FY20 FY21 FY22 FY23 1Fiscal 2023 was a 53-week year. Management estimates the 53rd week contributed $28.3M sales and approximately $0.16 of earnings per diluted share. 1 1 |
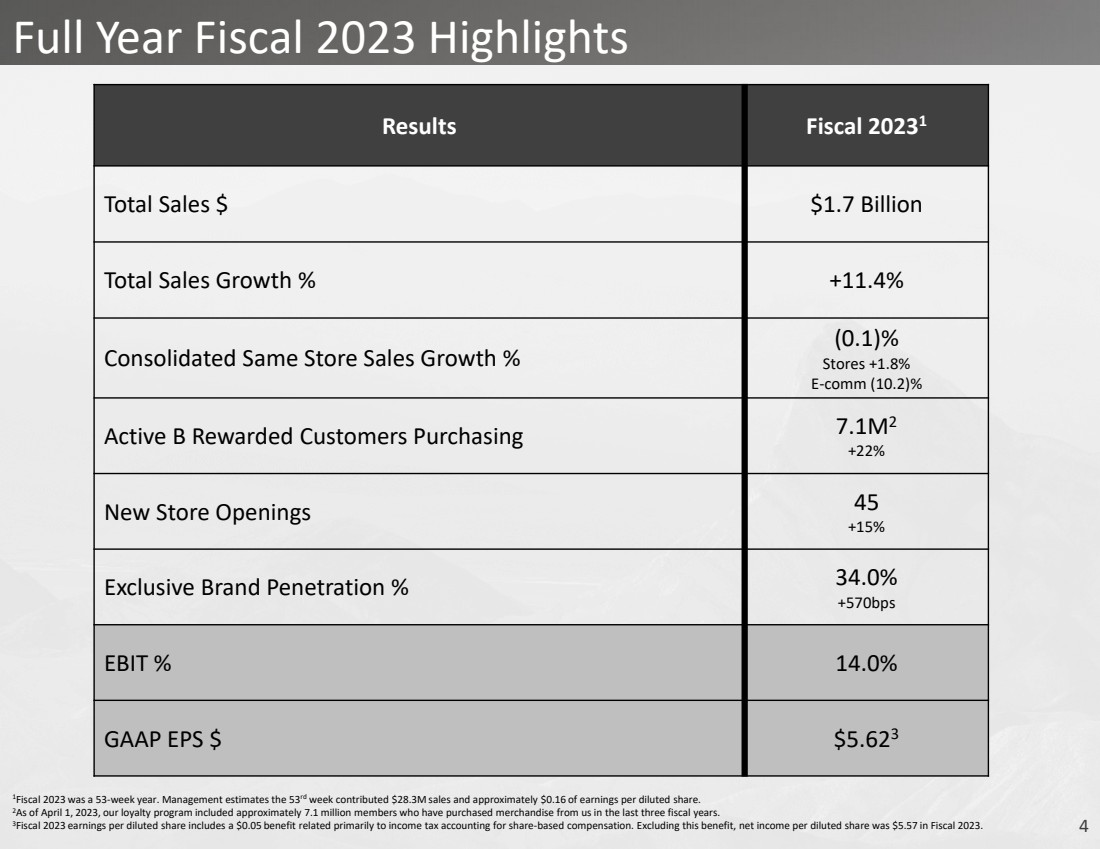
| 4 Full Year Fiscal 2023 Highlights Results Fiscal 20231 Total Sales $ $1.7 Billion Total Sales Growth % +11.4% Consolidated Same Store Sales Growth % (0.1)% Stores +1.8% E-comm (10.2)% Active B Rewarded Customers Purchasing 7.1M2 +22% New Store Openings 45 +15% Exclusive Brand Penetration % 34.0% +570bps EBIT % 14.0% GAAP EPS $ $5.623 1Fiscal 2023 was a 53-week year. Management estimates the 53rd week contributed $28.3M sales and approximately $0.16 of earnings per diluted share. 2As of April 1, 2023, our loyalty program included approximately 7.1 million members who have purchased merchandise from us in the last three fiscal years. 3Fiscal 2023 earnings per diluted share includes a $0.05 benefit related primarily to income tax accounting for share-based compensation. Excluding this benefit, net income per diluted share was $5.57 in Fiscal 2023. |
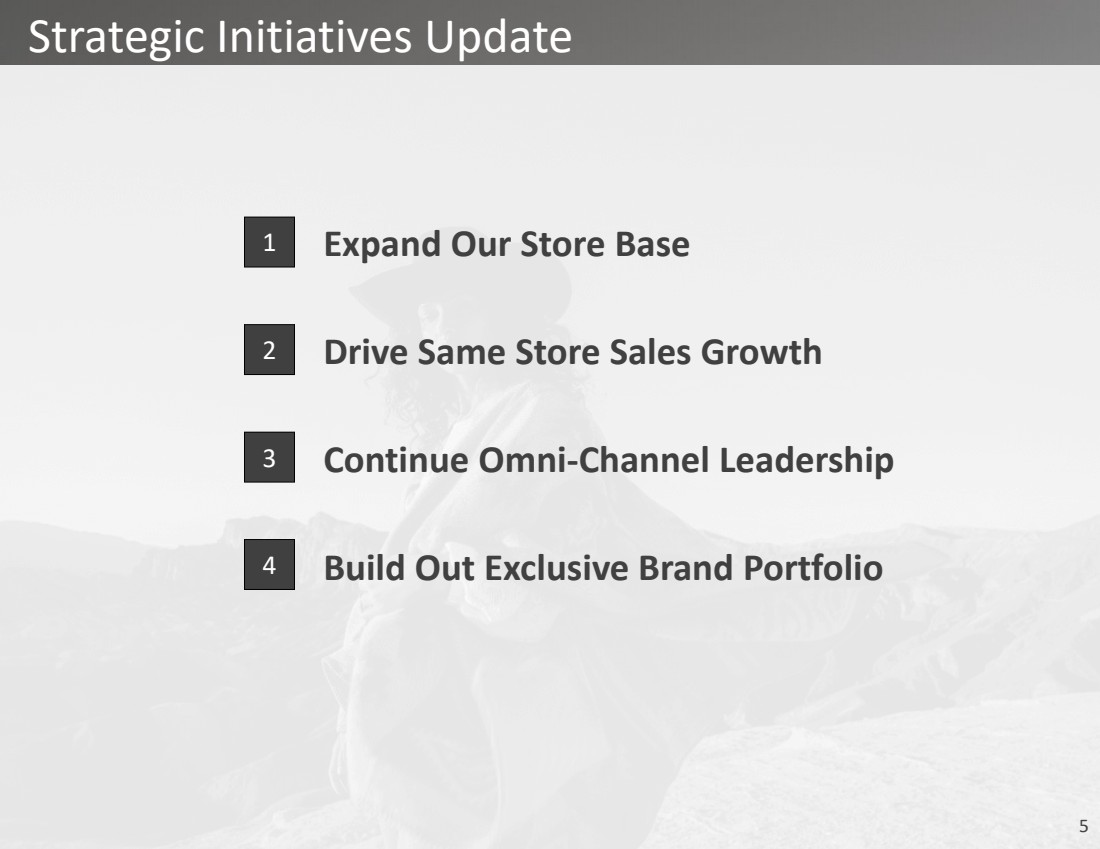
| 5 Strategic Initiatives Update 1 2 3 4 Expand Our Store Base Drive Same Store Sales Growth Continue Omni-Channel Leadership Build Out Exclusive Brand Portfolio |
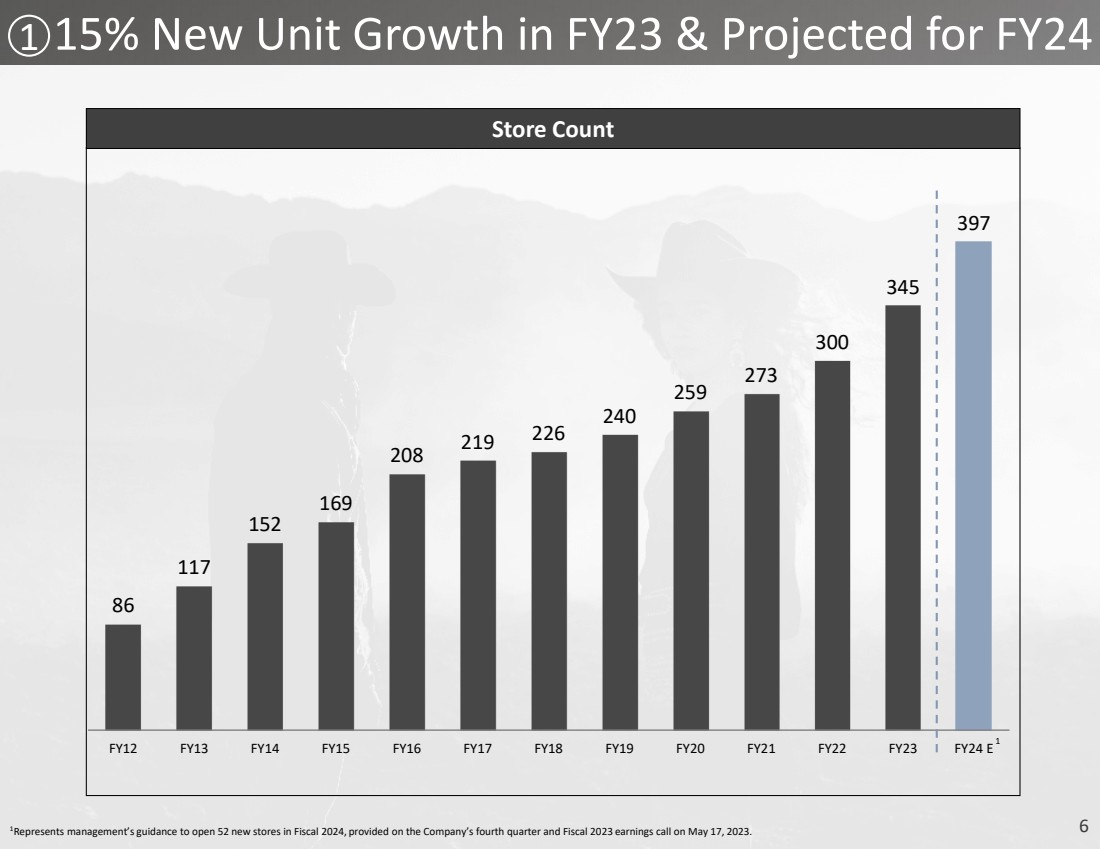
| 6 15% New Unit Growth in FY23 & Projected for FY24 86 117 152 169 208 219 226 240 259 273 300 345 397 FY12 FY13 FY14 FY15 FY16 FY17 FY18 FY19 FY20 FY21 FY22 FY23 FY24 E Store Count 1 1Represents management’s guidance to open 52 new stores in Fiscal 2024, provided on the Company’s fourth quarter and Fiscal 2023 earnings call on May 17, 2023. 1 |
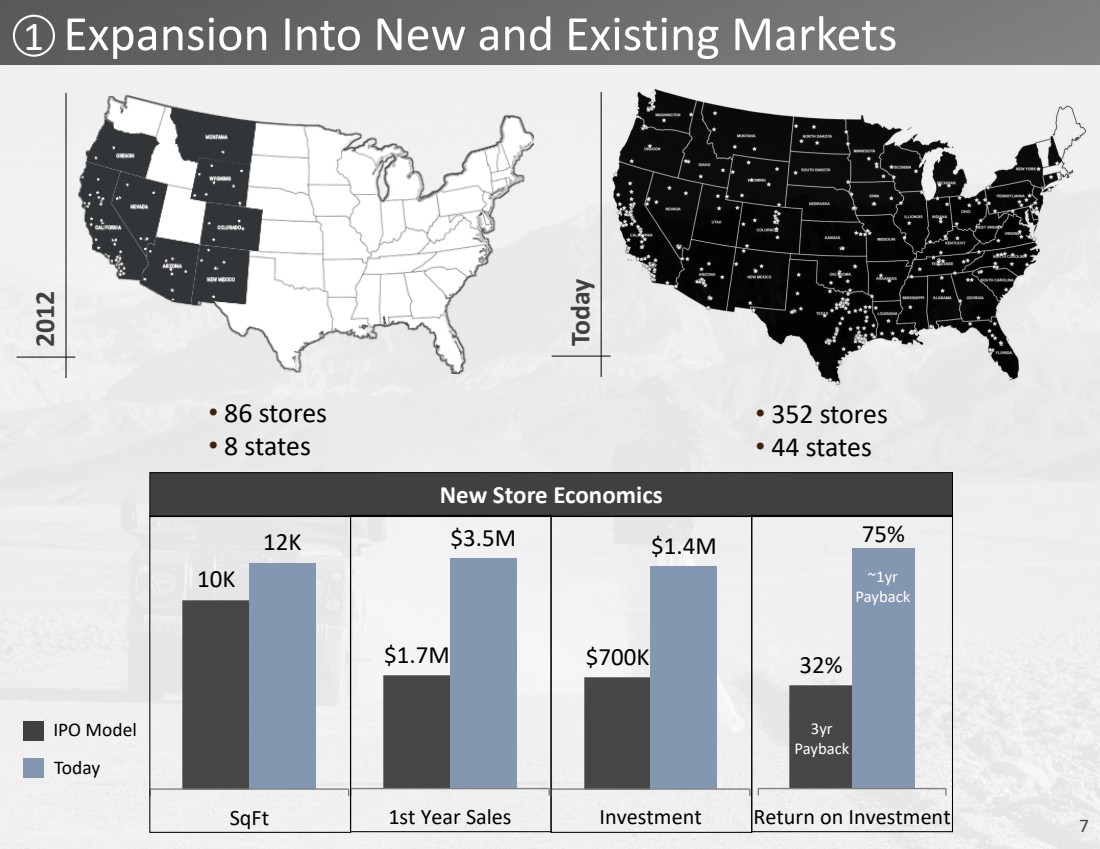
| 7 1 Expansion Into New and Existing Markets • 352 stores • 44 states • 86 stores • 8 states 2012 Today New Store Economics 10K 12K SqFt $1.7M $3.5M 1st Year Sales $700K $1.4M Investment 32% 75% Return on Investment IPO Model Today 3yr Payback ~1yr Payback |
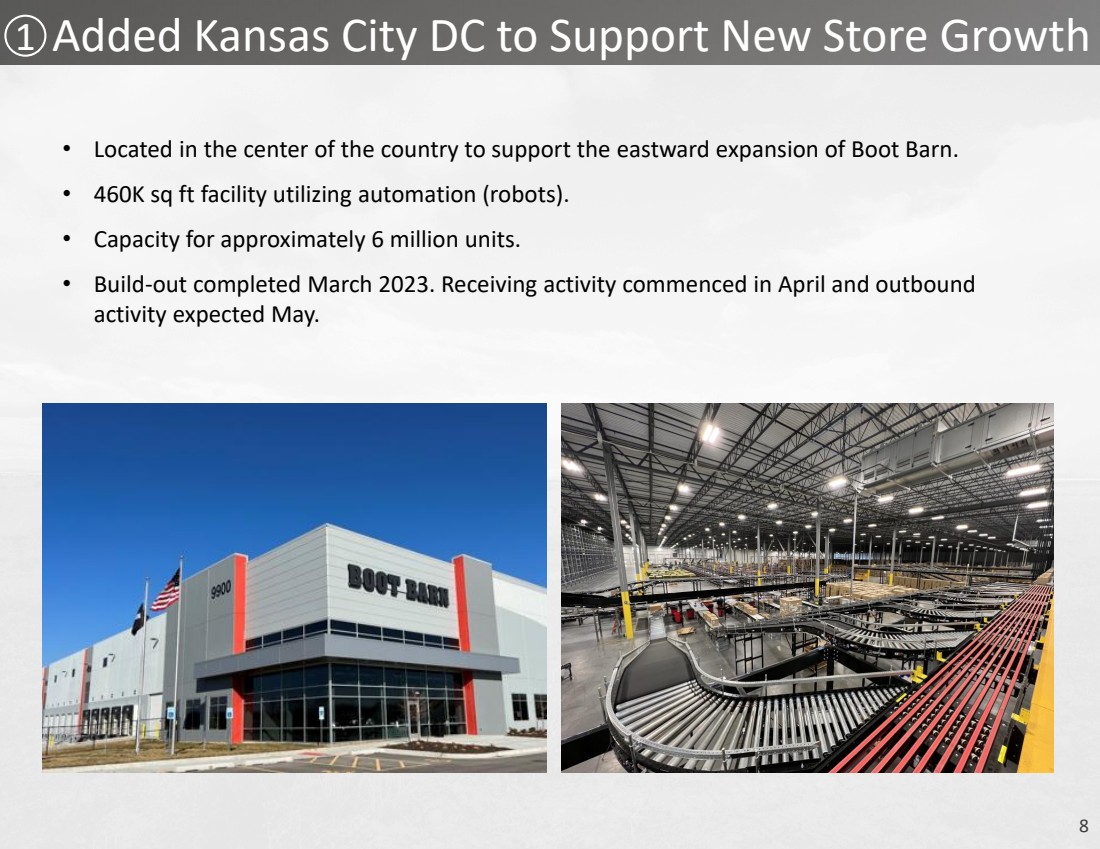
| 8 1 Added Kansas City DC to Support New Store Growth • Located in the center of the country to support the eastward expansion of Boot Barn. • 460K sq ft facility utilizing automation (robots). • Capacity for approximately 6 million units. • Build-out completed March 2023. Receiving activity commenced in April and outbound activity expected May. |
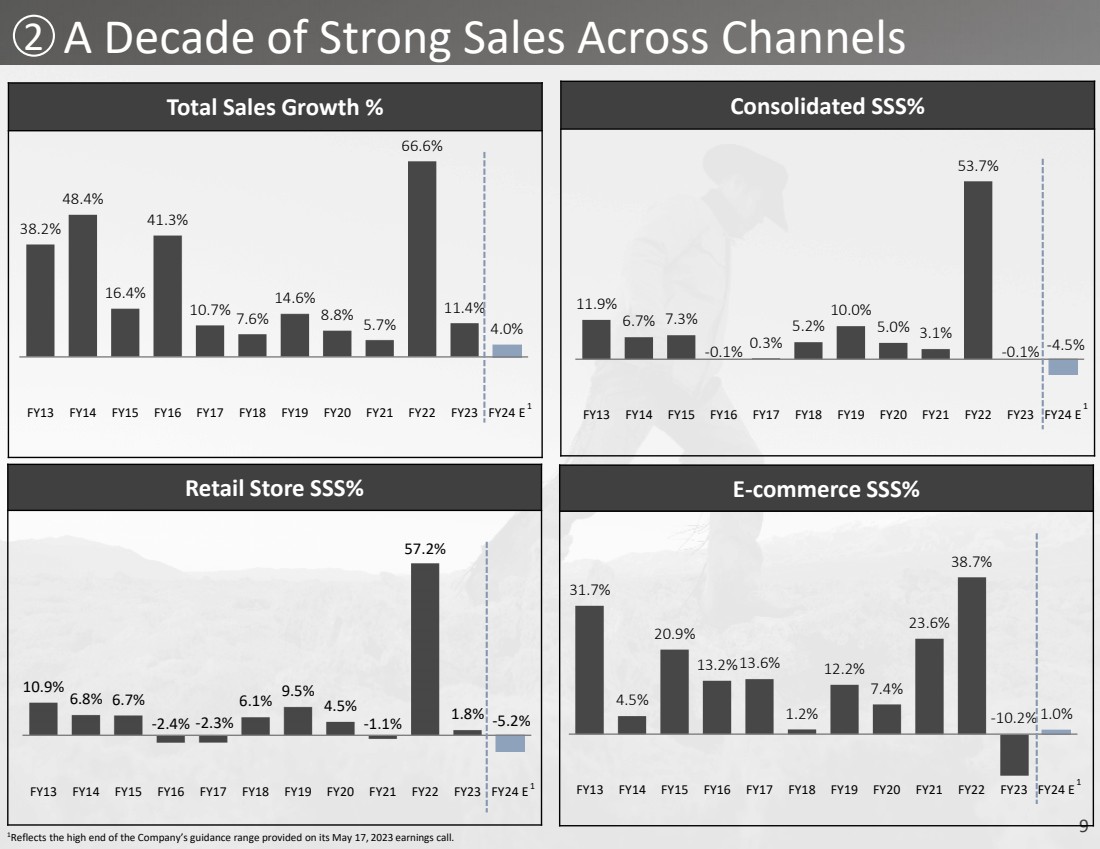
| 9 2 A Decade of Strong Sales Across Channels Total Sales Growth % 38.2% 48.4% 16.4% 41.3% 10.7% 7.6% 14.6% 8.8% 5.7% 66.6% 11.4% 4.0% FY13 FY14 FY15 FY16 FY17 FY18 FY19 FY20 FY21 FY22 FY23 FY24 E Consolidated SSS% 11.9% 6.7% 7.3% -0.1% 0.3% 5.2% 10.0% 5.0% 3.1% 53.7% -0.1% -4.5% FY13 FY14 FY15 FY16 FY17 FY18 FY19 FY20 FY21 FY22 FY23 FY24 E Retail Store SSS% 10.9% 6.8% 6.7% -2.4% -2.3% 6.1% 9.5% 4.5% -1.1% 57.2% 1.8% -5.2% FY13 FY14 FY15 FY16 FY17 FY18 FY19 FY20 FY21 FY22 FY23 FY24 E E-commerce SSS% 31.7% 4.5% 20.9% 13.2%13.6% 1.2% 12.2% 7.4% 23.6% 38.7% -10.2% 1.0% FY13 FY14 FY15 FY16 FY17 FY18 FY19 FY20 FY21 FY22 FY23 FY24 E 1Reflects the high end of the Company’s guidance range provided on its May 17, 2023 earnings call. 1 1 1 1 |
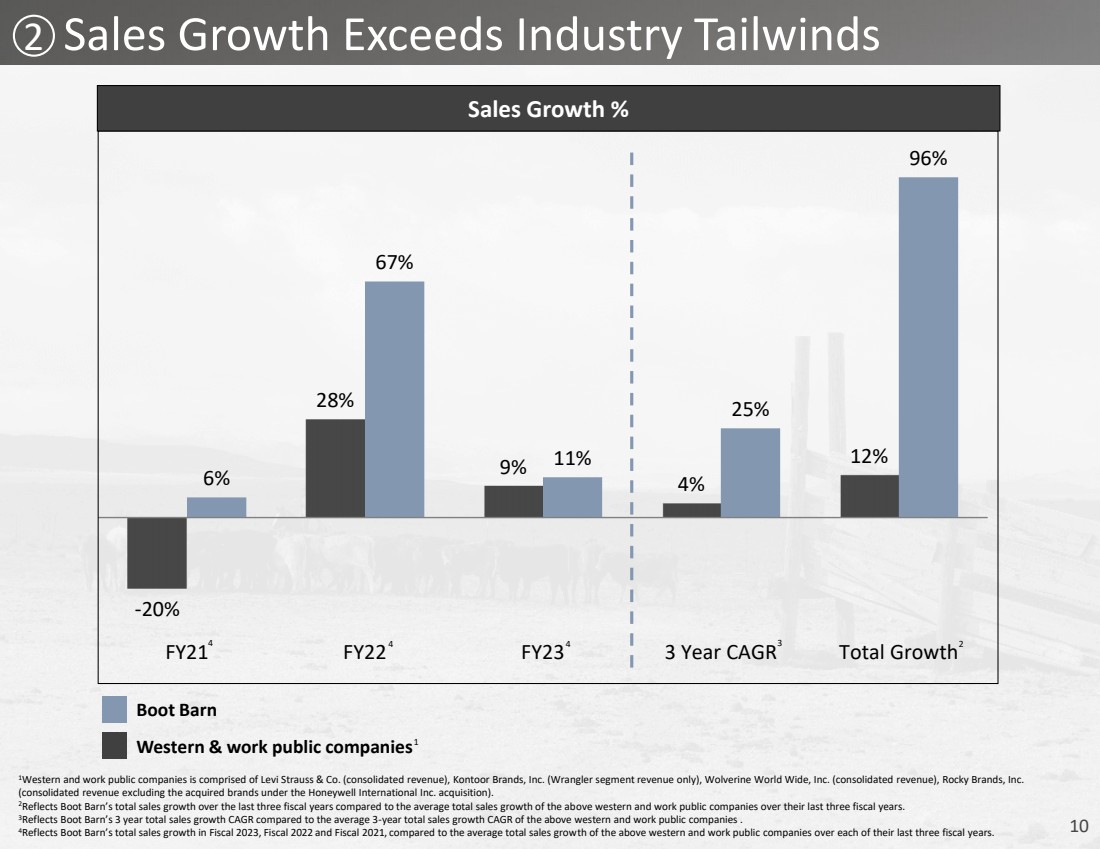
| 10 2 Sales Growth Exceeds Industry Tailwinds -20% 28% 9% 4% 12% 6% 67% 11% 25% 96% FY21 FY22 FY23 3 Year CAGR Total Growth Sales Growth % Boot Barn Western & work public companies1 1Western and work public companies is comprised of Levi Strauss & Co. (consolidated revenue), Kontoor Brands, Inc. (Wrangler segment revenue only), Wolverine World Wide, Inc. (consolidated revenue), Rocky Brands, Inc. (consolidated revenue excluding the acquired brands under the Honeywell International Inc. acquisition). 2Reflects Boot Barn’s total sales growth over the last three fiscal years compared to the average total sales growth of the above western and work public companies over their last three fiscal years. 3Reflects Boot Barn’s 3 year total sales growth CAGR compared to the average 3-year total sales growth CAGR of the above western and work public companies . 4Reflects Boot Barn’s total sales growth in Fiscal 2023, Fiscal 2022 and Fiscal 2021, compared to the average total sales growth of the above western and work public companies over each of their last three fiscal years. 4 4 4 3 2 |
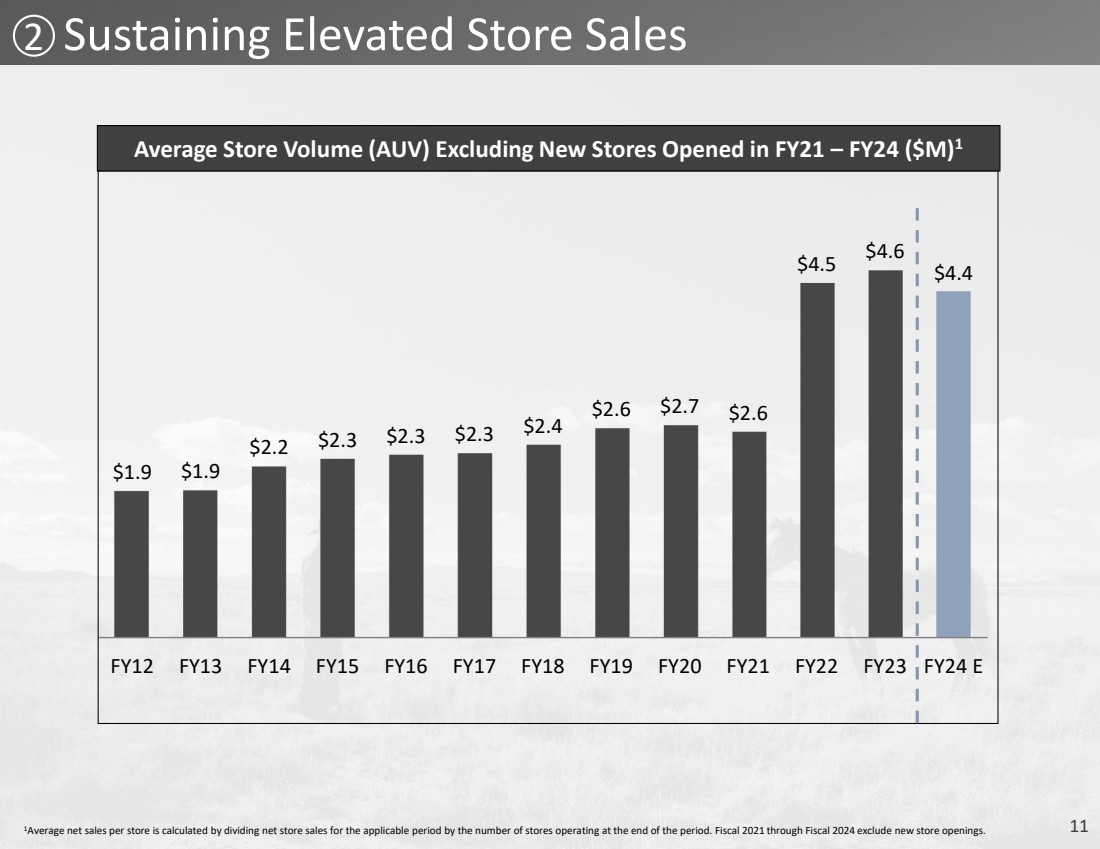
| 11 2 Sustaining Elevated Store Sales $1.9 $1.9 $2.2 $2.3 $2.3 $2.3 $2.4 $2.6 $2.7 $2.6 $4.5 $4.6 $4.4 FY12 FY13 FY14 FY15 FY16 FY17 FY18 FY19 FY20 FY21 FY22 FY23 FY24 E Average Store Volume (AUV) Excluding New Stores Opened in FY21 – FY24 ($M)1 1Average net sales per store is calculated by dividing net store sales for the applicable period by the number of stores operating at the end of the period. Fiscal 2021 through Fiscal 2024 exclude new store openings. |
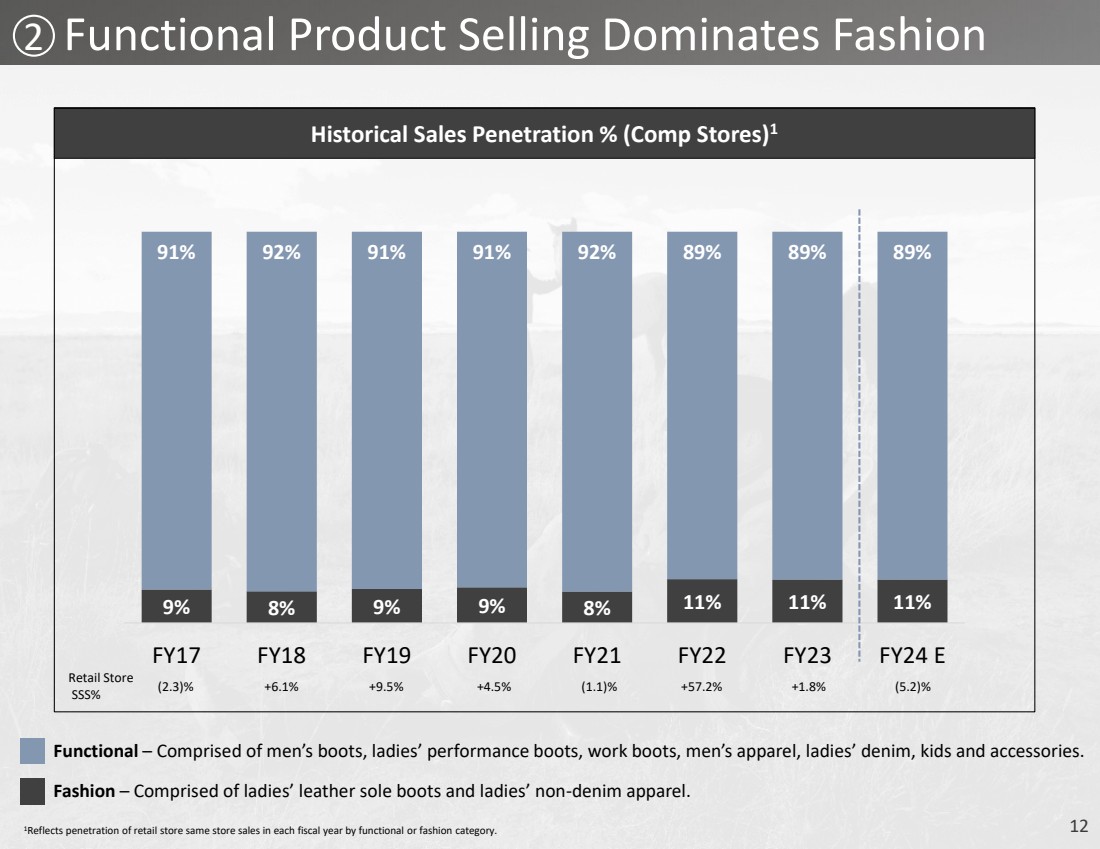
| 12 9% 8% 9% 9% 8% 11% 11% 11% 91% 92% 91% 91% 92% 89% 89% 89% FY17 FY18 FY19 FY20 FY21 FY22 FY23 FY24 E 2 Functional Product Selling Dominates Fashion Historical Sales Penetration % (Comp Stores)1 Functional – Comprised of men’s boots, ladies’ performance boots, work boots, men’s apparel, ladies’ denim, kids and accessories. Fashion – Comprised of ladies’ leather sole boots and ladies’ non-denim apparel. Retail Store SSS% (2.3)% +6.1% +9.5% +4.5% (1.1)% +57.2% +1.8% (5.2)% 1Reflects penetration of retail store same store sales in each fiscal year by functional or fashion category. |
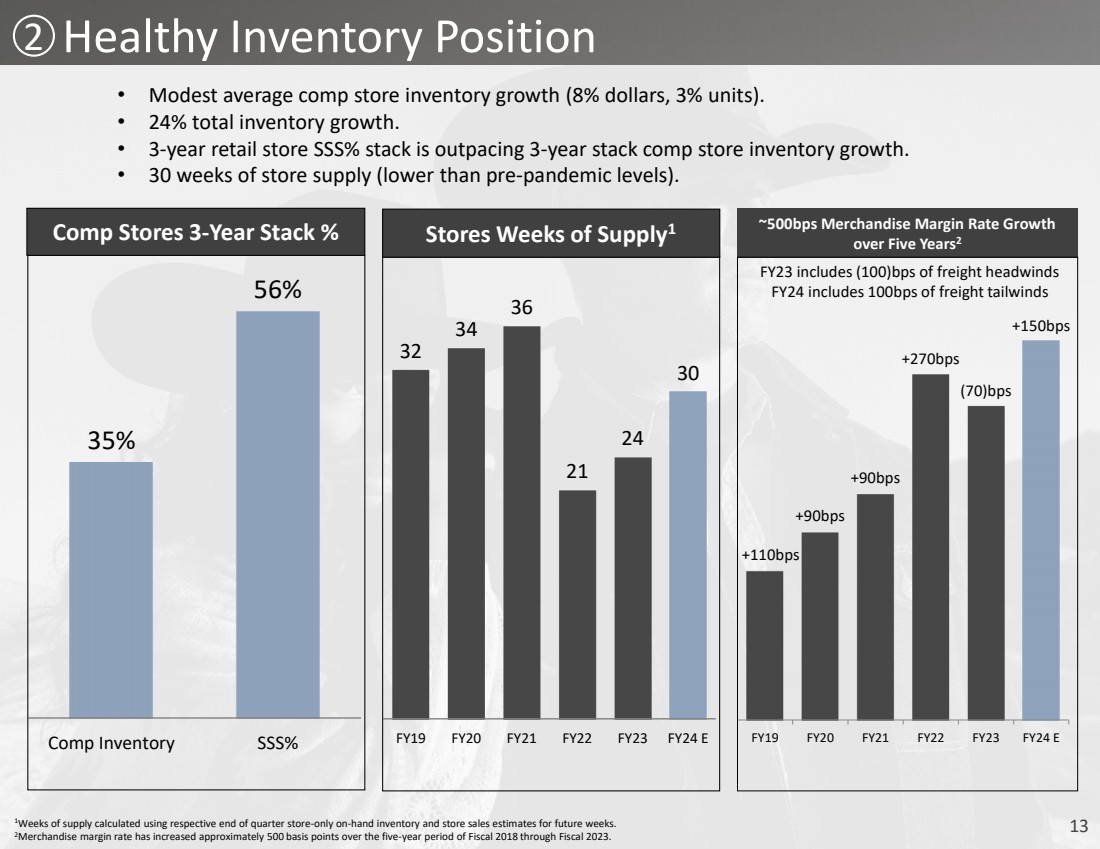
| 13 ~500bps Merchandise Margin Rate Growth over Five Years2 Healthy Inventory Position 32 34 36 21 24 30 FY19 FY20 FY21 FY22 FY23 FY24 E Stores Weeks of Supply1 • Modest average comp store inventory growth (8% dollars, 3% units). • 24% total inventory growth. • 3-year retail store SSS% stack is outpacing 3-year stack comp store inventory growth. • 30 weeks of store supply (lower than pre-pandemic levels). 35% 56% Comp Inventory SSS% Comp Stores 3-Year Stack % 2 1Weeks of supply calculated using respective end of quarter store-only on-hand inventory and store sales estimates for future weeks. 2Merchandise margin rate has increased approximately 500 basis points over the five-year period of Fiscal 2018 through Fiscal 2023. +110bps +90bps +90bps +270bps (70)bps +150bps FY19 FY20 FY21 FY22 FY23 FY24 E FY23 includes (100)bps of freight headwinds FY24 includes 100bps of freight tailwinds |
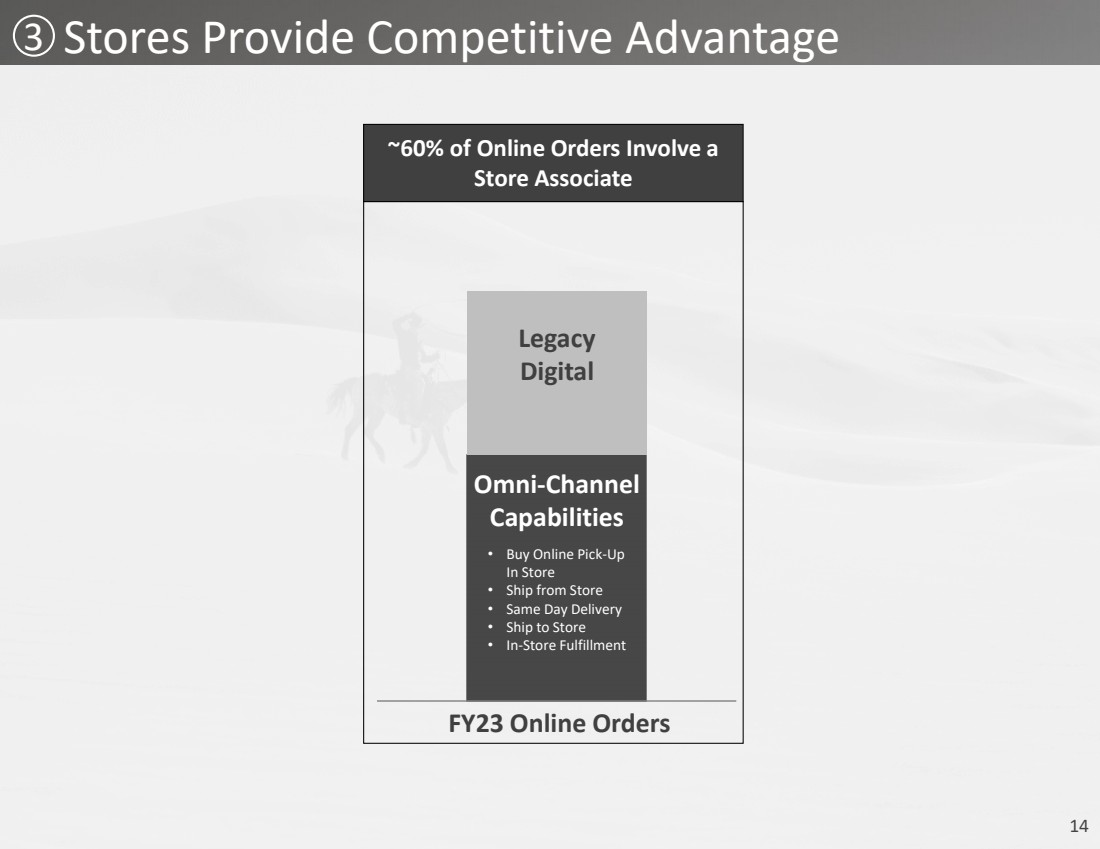
| 14 3 Stores Provide Competitive Advantage Legacy Digital Omni-Channel Capabilities ~60% of Online Orders Involve a Store Associate FY23 Online Orders • Buy Online Pick-Up In Store • Ship from Store • Same Day Delivery • Ship to Store • In-Store Fulfillment |
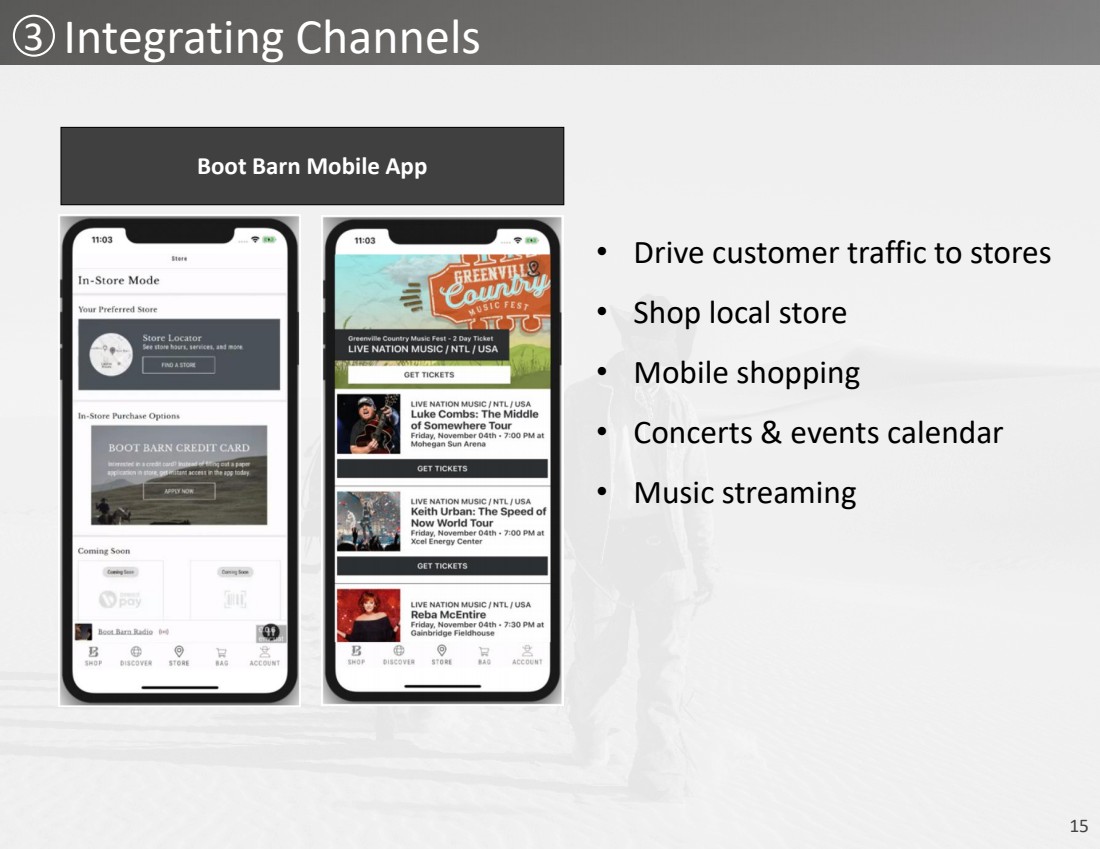
| 15 3 Integrating Channels Boot Barn Mobile App • Drive customer traffic to stores • Shop local store • Mobile shopping • Concerts & events calendar • Music streaming |
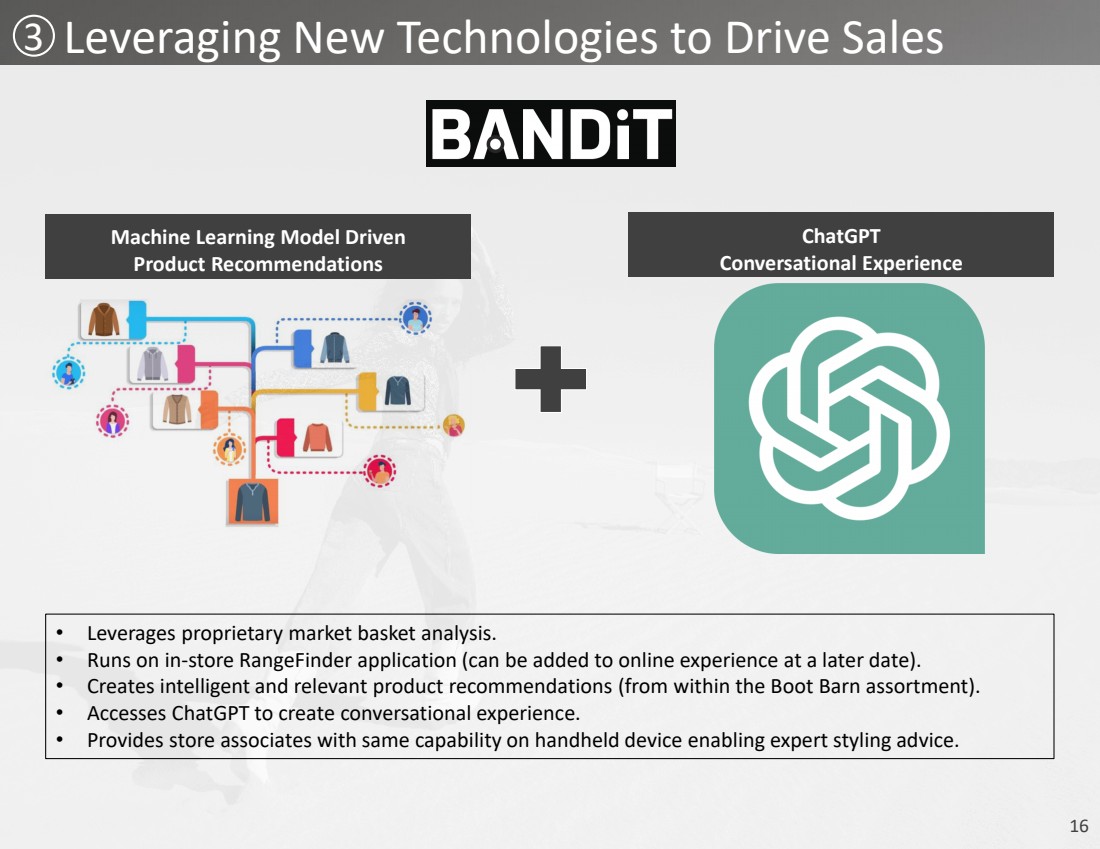
| 16 Machine Learning Model Driven Product Recommendations ChatGPT Conversational Experience 3 Leveraging New Technologies to Drive Sales • Leverages proprietary market basket analysis. • Runs on in-store RangeFinder application (can be added to online experience at a later date). • Creates intelligent and relevant product recommendations (from within the Boot Barn assortment). • Accesses ChatGPT to create conversational experience. • Provides store associates with same capability on handheld device enabling expert styling advice. |
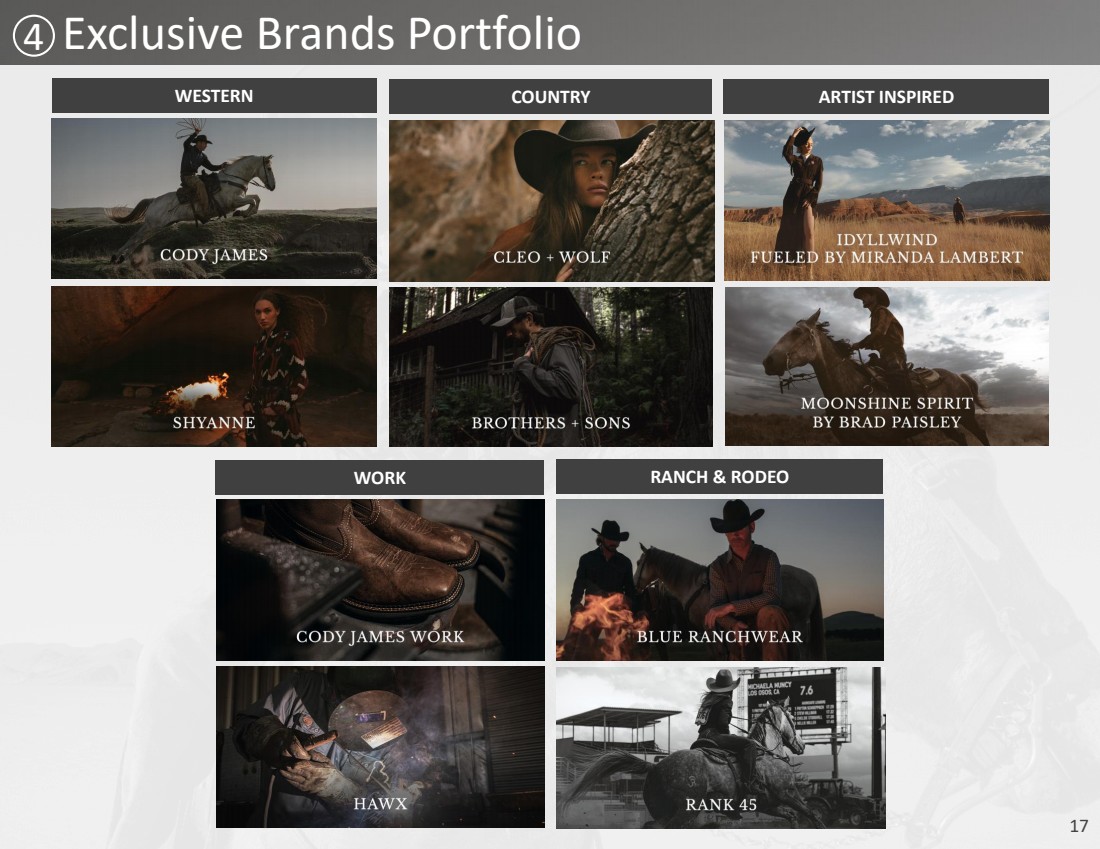
| 17 WESTERN COUNTRY ARTIST INSPIRED Exclusive Brands Portfolio WORK RANCH & RODEO 4 |
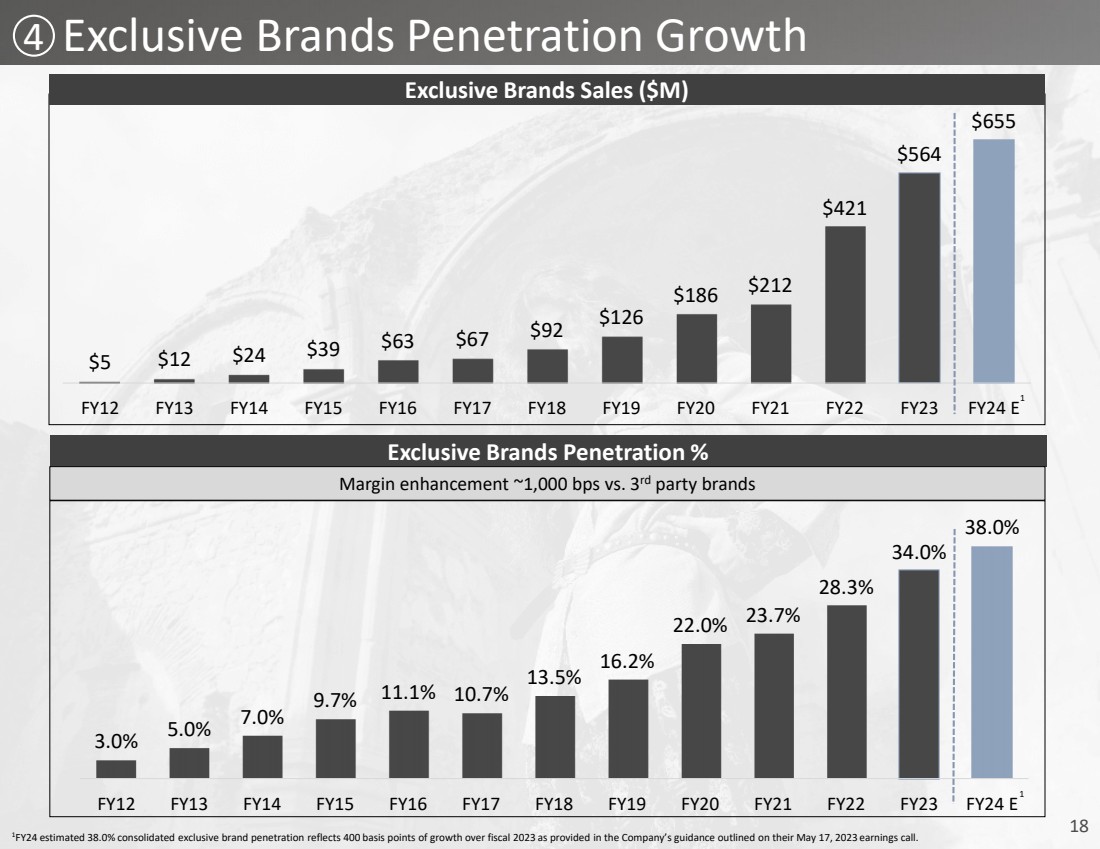
| 18 Exclusive Brands Penetration Growth 3.0% 5.0% 7.0% 9.7% 11.1% 10.7% 13.5% 16.2% 22.0% 23.7% 28.3% 34.0% 38.0% FY12 FY13 FY14 FY15 FY16 FY17 FY18 FY19 FY20 FY21 FY22 FY23 FY24 E Exclusive Brands Penetration % Margin enhancement ~1,000 bps vs. 3rd party brands $5 $12 $24 $39 $63 $67 $92 $126 $186 $212 $421 $564 $655 FY12 FY13 FY14 FY15 FY16 FY17 FY18 FY19 FY20 FY21 FY22 FY23 FY24 E Exclusive Brands Sales ($M) 4 1FY24 estimated 38.0% consolidated exclusive brand penetration reflects 400 basis points of growth over fiscal 2023 as provided in the Company’s guidance outlined on their May 17, 2023 earnings call. 1 1 |
| 19 FY24 Guidance |

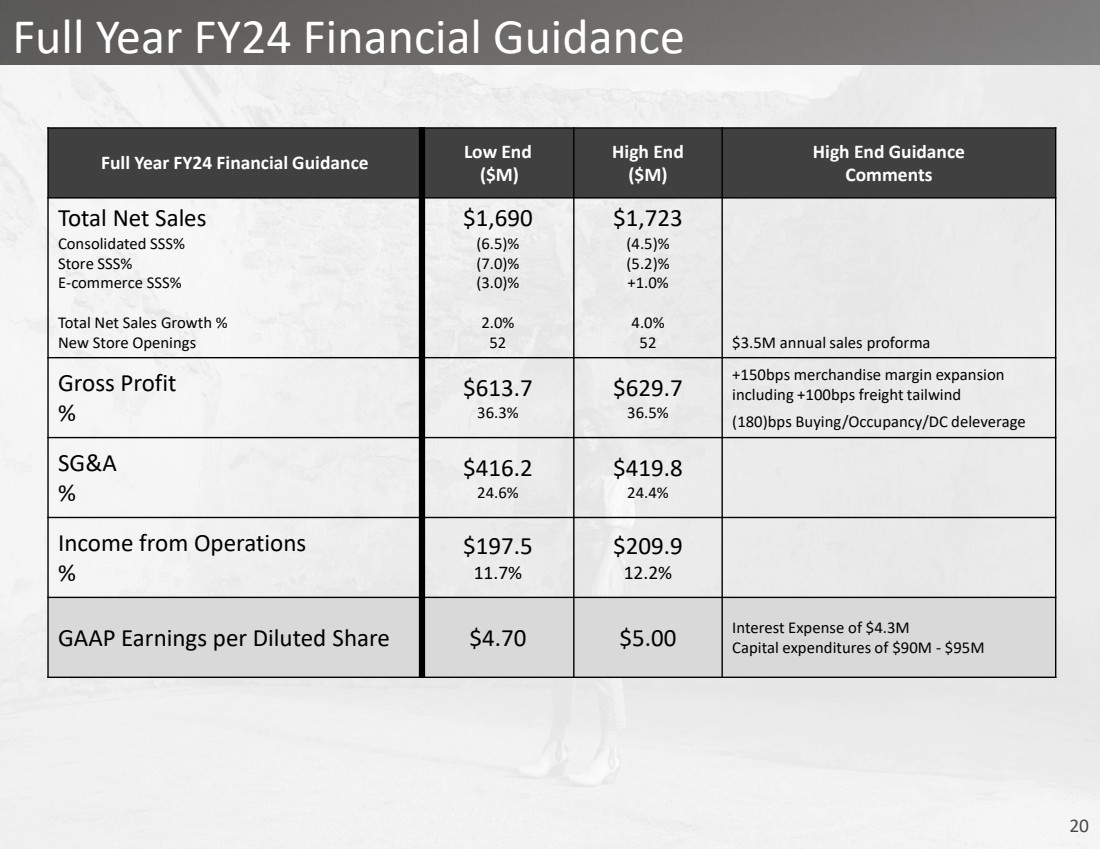
| 20 Full Year FY24 Financial Guidance Full Year FY24 Financial Guidance Low End ($M) High End ($M) High End Guidance Comments Total Net Sales Consolidated SSS% Store SSS% E-commerce SSS% Total Net Sales Growth % New Store Openings $1,690 (6.5)% (7.0)% (3.0)% 2.0% 52 $1,723 (4.5)% (5.2)% +1.0% 4.0% 52 $3.5M annual sales proforma Gross Profit % $613.7 36.3% $629.7 36.5% +150bps merchandise margin expansion including +100bps freight tailwind (180)bps Buying/Occupancy/DC deleverage SG&A % $416.2 24.6% $419.8 24.4% Income from Operations % $197.5 11.7% $209.9 12.2% GAAP Earnings per Diluted Share $4.70 $5.00 Interest Expense of $4.3M Capital expenditures of $90M - $95M |
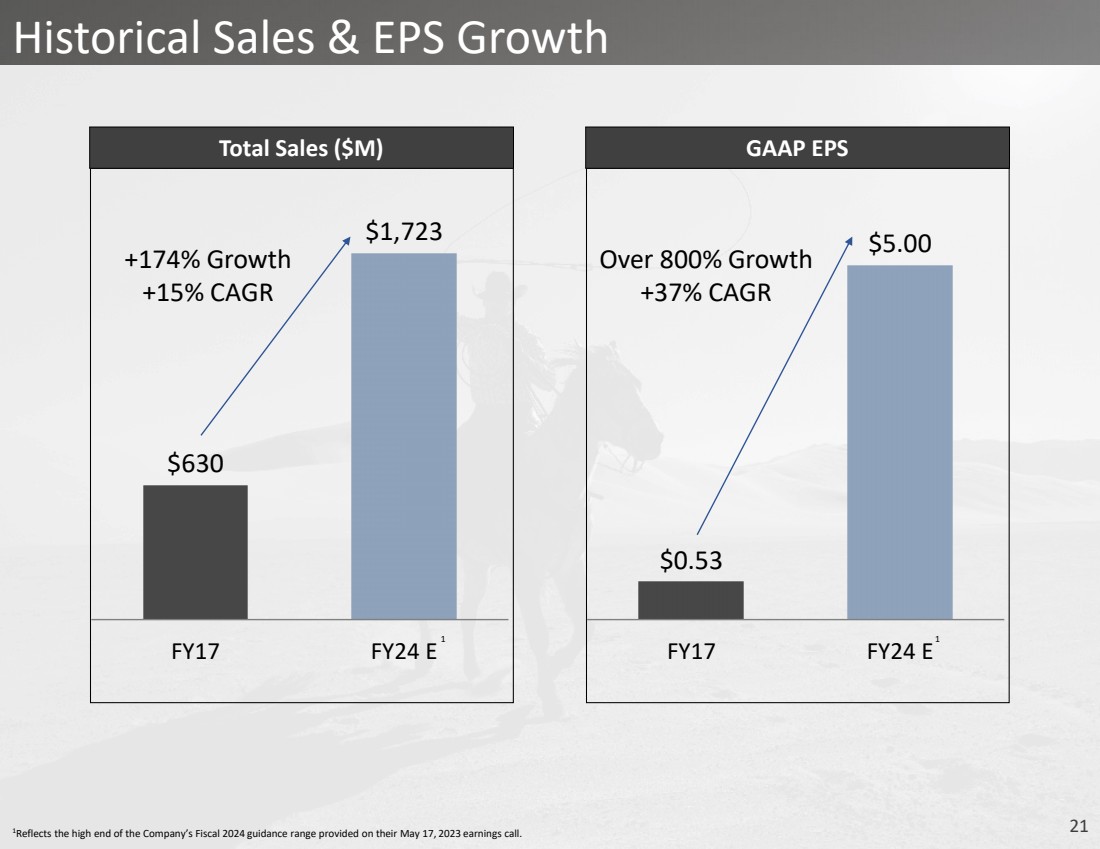
| 1Reflects the high end of the Company’s Fiscal 2024 guidance range provided on their May 17, 2023 earnings call. 21 $0.53 $5.00 FY17 FY24 E GAAP EPS $630 $1,723 FY17 FY24 E Total Sales ($M) +174% Growth +15% CAGR Over 800% Growth +37% CAGR Historical Sales & EPS Growth 1 1 |
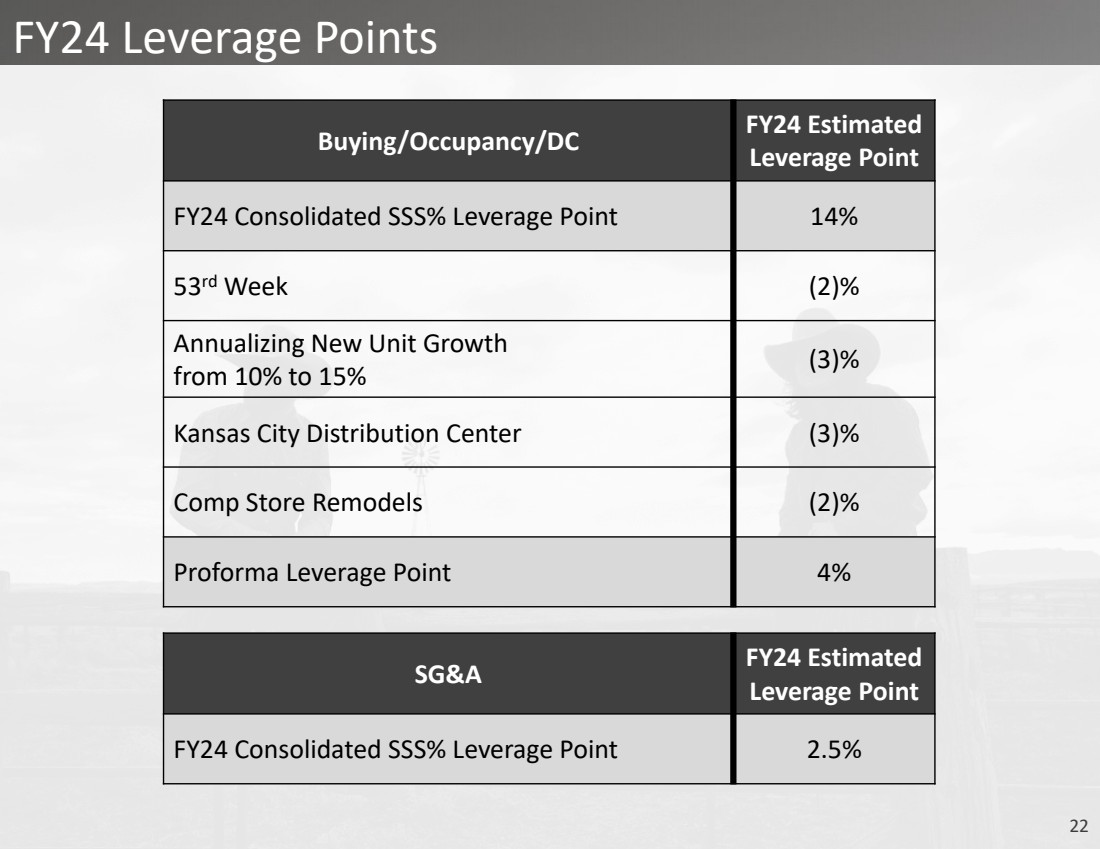
| 22 FY24 Leverage Points Buying/Occupancy/DC FY24 Estimated Leverage Point FY24 Consolidated SSS% Leverage Point 14% 53rd Week (2)% Annualizing New Unit Growth from 10% to 15% (3)% Kansas City Distribution Center (3)% Comp Store Remodels (2)% Proforma Leverage Point 4% SG&A FY24 Estimated Leverage Point FY24 Consolidated SSS% Leverage Point 2.5% |
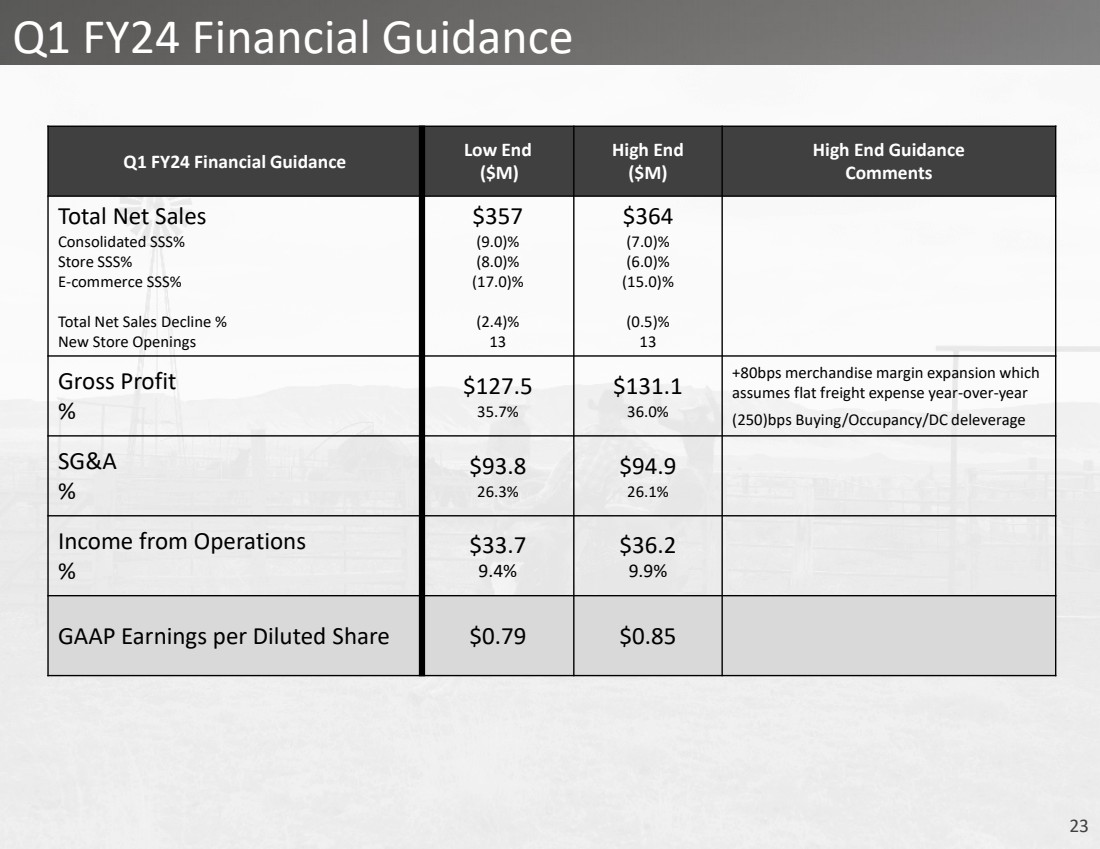
| 23 Q1 FY24 Financial Guidance Q1 FY24 Financial Guidance Low End ($M) High End ($M) High End Guidance Comments Total Net Sales Consolidated SSS% Store SSS% E-commerce SSS% Total Net Sales Decline % New Store Openings $357 (9.0)% (8.0)% (17.0)% (2.4)% 13 $364 (7.0)% (6.0)% (15.0)% (0.5)% 13 Gross Profit % $127.5 35.7% $131.1 36.0% +80bps merchandise margin expansion which assumes flat freight expense year-over-year (250)bps Buying/Occupancy/DC deleverage SG&A % $93.8 26.3% $94.9 26.1% Income from Operations % $33.7 9.4% $36.2 9.9% GAAP Earnings per Diluted Share $0.79 $0.85 |
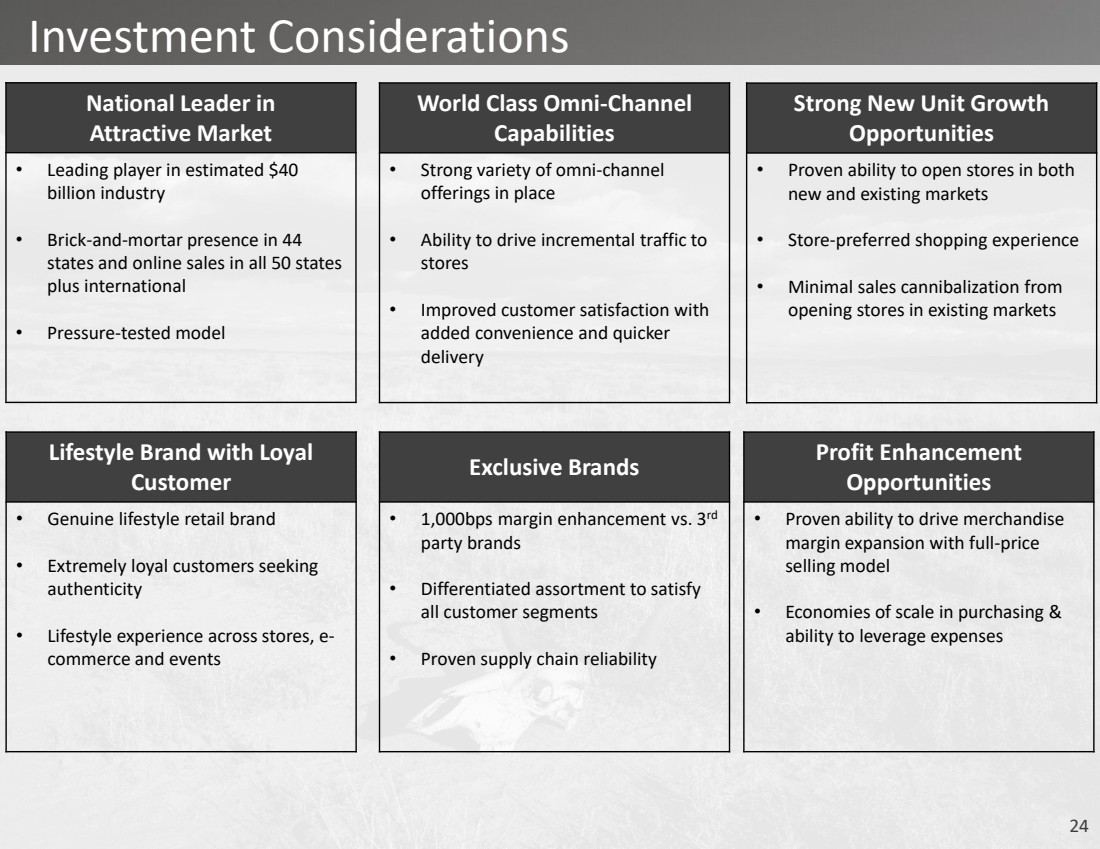
| 24 National Leader in Attractive Market • Leading player in estimated $40 billion industry • Brick-and-mortar presence in 44 states and online sales in all 50 states plus international • Pressure-tested model World Class Omni-Channel Capabilities • Strong variety of omni-channel offerings in place • Ability to drive incremental traffic to stores • Improved customer satisfaction with added convenience and quicker delivery Strong New Unit Growth Opportunities • Proven ability to open stores in both new and existing markets • Store-preferred shopping experience • Minimal sales cannibalization from opening stores in existing markets Lifestyle Brand with Loyal Customer • Genuine lifestyle retail brand • Extremely loyal customers seeking authenticity • Lifestyle experience across stores, e-commerce and events Profit Enhancement Opportunities • Proven ability to drive merchandise margin expansion with full-price selling model • Economies of scale in purchasing & ability to leverage expenses Investment Considerations Exclusive Brands • 1,000bps margin enhancement vs. 3rd party brands • Differentiated assortment to satisfy all customer segments • Proven supply chain reliability |
| 25 investor.bootbarn.com |