Exhibit
Exhibit 99.1
KIMBALL ELECTRONICS, INC. REPORTS FIRST QUARTER FISCAL YEAR 2019 RESULTS
| |
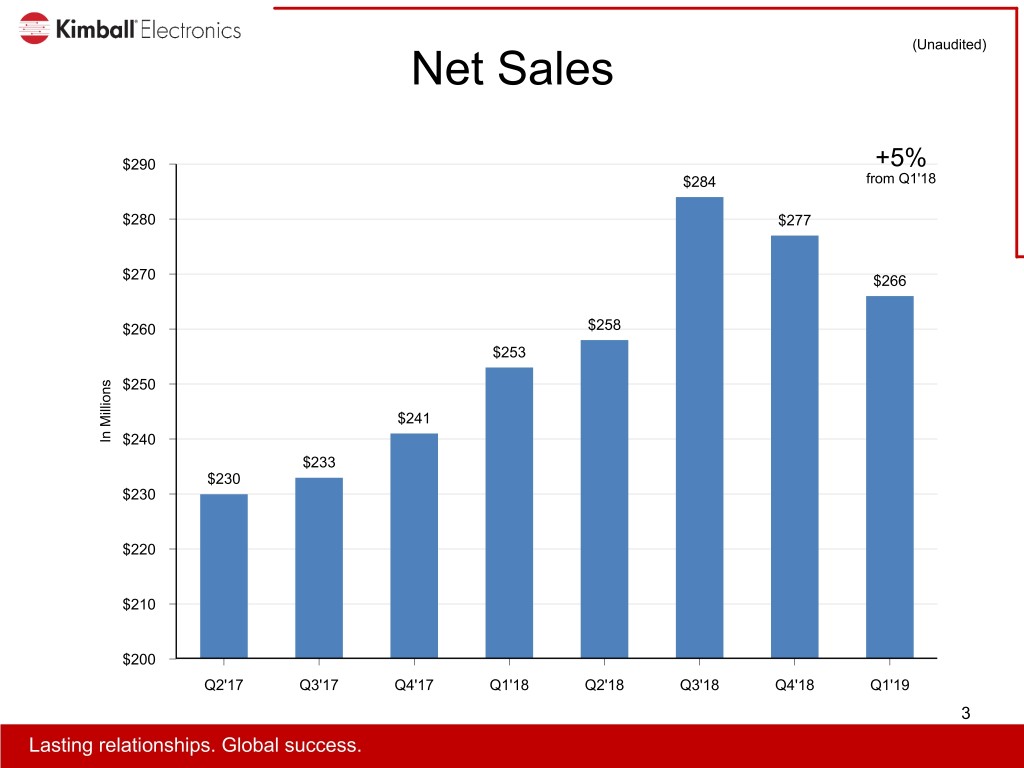
• | First quarter net sales were $266 million, up 5% from the prior year first quarter |
| |
• | Net income of $5.1 million and diluted earnings per share of $0.19 |
| |
• | Returned $5.4 million to Share Owners in stock repurchases during the quarter |
JASPER, IN (November 6, 2018) - Kimball Electronics, Inc. (Nasdaq: KE), a leading global electronics manufacturing services provider of high-quality, durable electronic products, today announced financial results for its first quarter ended September 30, 2018.
|
| | | | | | | | |
| | Three Months Ended |
| | September 30, |
(Amounts in Thousands, except EPS) | | 2018 (1) | | 2017 |
Net Sales | | $ | 265,620 |
| | $ | 253,204 |
|
Operating Income (2) | | $ | 7,032 |
| | $ | 9,523 |
|
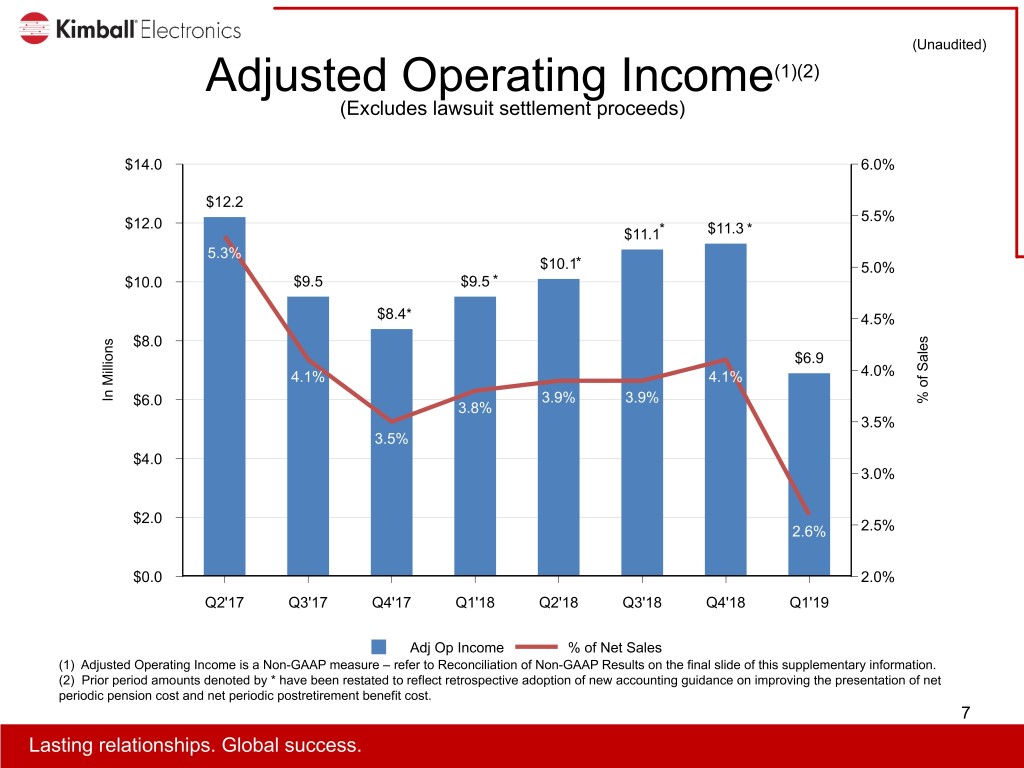
Adjusted Operating Income (non-GAAP) (2) (3) | | $ | 6,940 |
| | $ | 9,523 |
|
Operating Income % | | 2.6 | % | | 3.8 | % |
Net Income | | $ | 5,069 |
| | $ | 8,480 |
|
Adjusted Net Income (non-GAAP) (3) | | $ | 4,999 |
| | $ | 8,480 |
|
Diluted EPS | | $ | 0.19 |
| | $ | 0.31 |
|
(1) During the three months ended September 30, 2018, the Company adopted the new accounting standard on Revenue from Contracts with Customers on a modified retrospective basis. The adoption was not material to the Condensed Consolidated Statement of Income for the three months ended September 30, 2018. The prior period was not restated.
(2) Prior period amounts have been restated to reflect the retrospective adoption of new accounting guidance on improving the presentation of net periodic pension cost and net periodic postretirement benefit cost.
(3) A reconciliation of GAAP and non-GAAP financial measures is included below.
Donald D. Charron, Chairman and Chief Executive Officer, stated, “We achieved solid year-over-year organic growth in three of our four end market verticals as the ramp-up of new program launches helped to more than offset softness in certain mature programs.”
Mr. Charron continued, “While this was a challenging quarter for us, we are cautiously optimistic that our goals of 8% organic sales growth and 4.5% operating income remain within our reach for fiscal year 2019.”
First Quarter Fiscal Year 2019 Overview:
| |
• | Consolidated net sales increased 5% organically compared to the first quarter of fiscal year 2018. |
| |
• | The current quarter includes non-operating expense of $0.7 million related to pre-tax net losses from foreign currency movements, which compares to pre-tax net gains of $1.1 million recognized in non-operating income in the same quarter of the prior year related to foreign currency movements. |
| |
• | The Romania facility continues to progress in its ramp-up and improved its impact to the consolidated operating income percent by 30 basis points compared to the prior year first quarter. |
| |
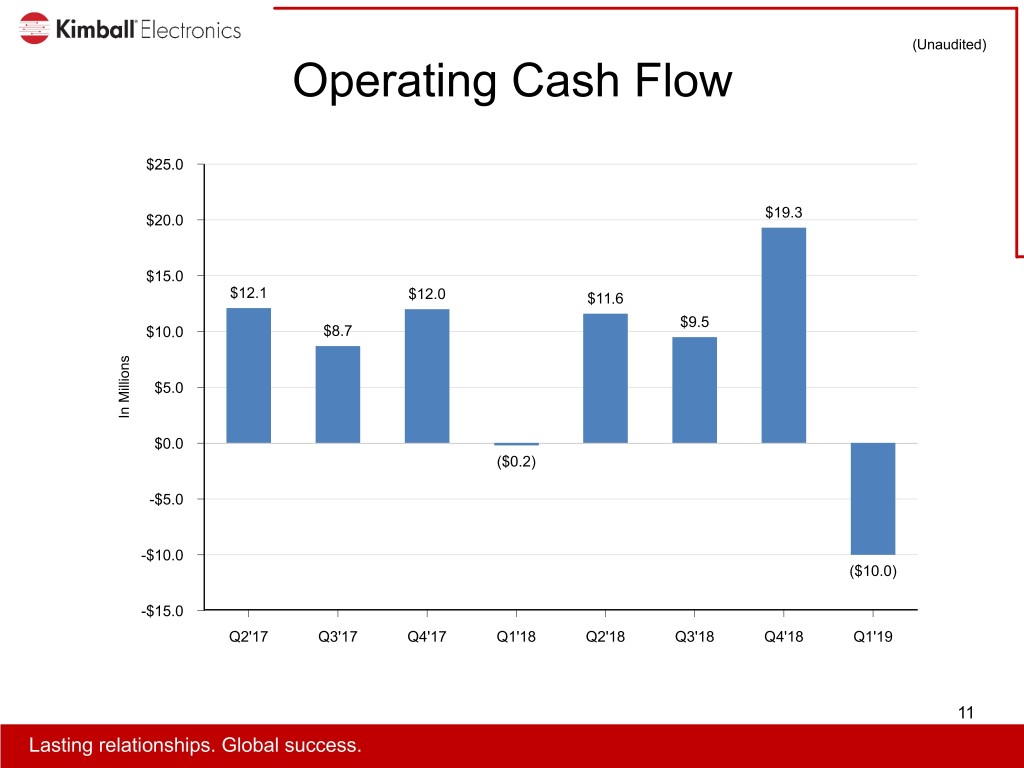
• | Operating activities used cash of $10.0 million during the quarter, which compares to cash used by operating activities of $0.2 million in the first quarter of fiscal year 2018. |
| |
• | Cash conversion days (“CCD”) for the quarter ended September 30, 2018 were 68 days, up from 59 days in the same quarter last year. CCD is calculated as the sum of days sales outstanding plus contract asset days plus production days supply on hand less accounts payable days. |
| |
• | $5.4 million was returned to Share Owners during the quarter in the form of common stock repurchases. |
| |
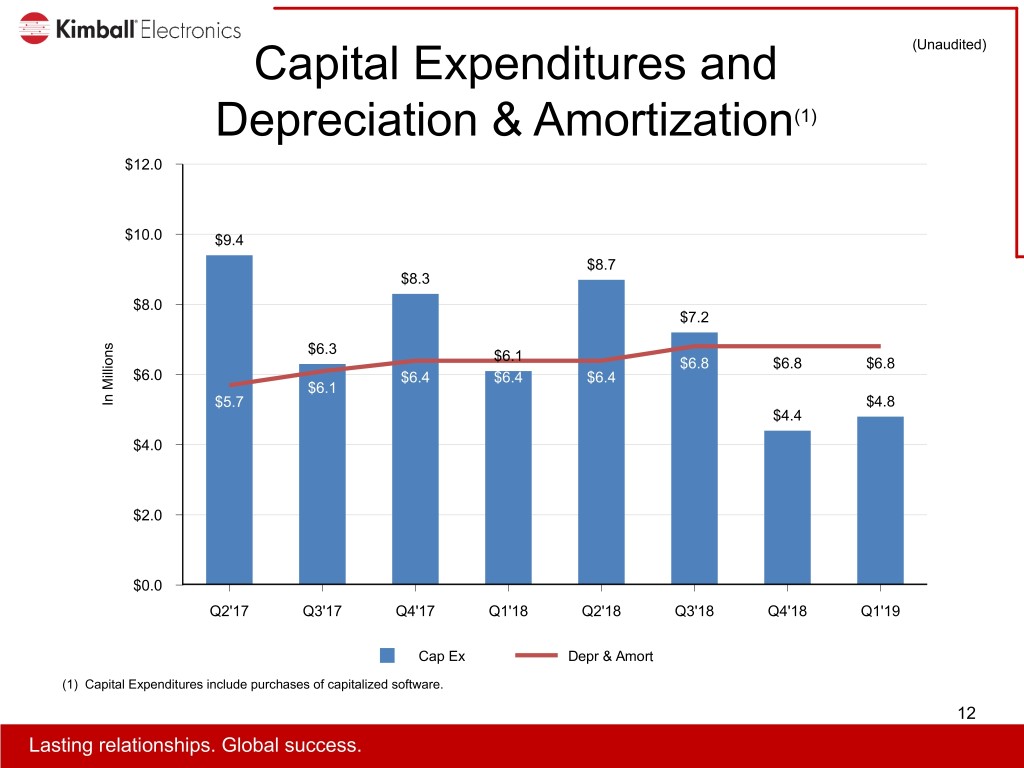
• | Investments in capital expenditures were $4.8 million during the quarter. |
| |
• | Cash and cash equivalents were $75.0 million and borrowings outstanding on credit facilities were $59.3 million at September 30, 2018. |
| |
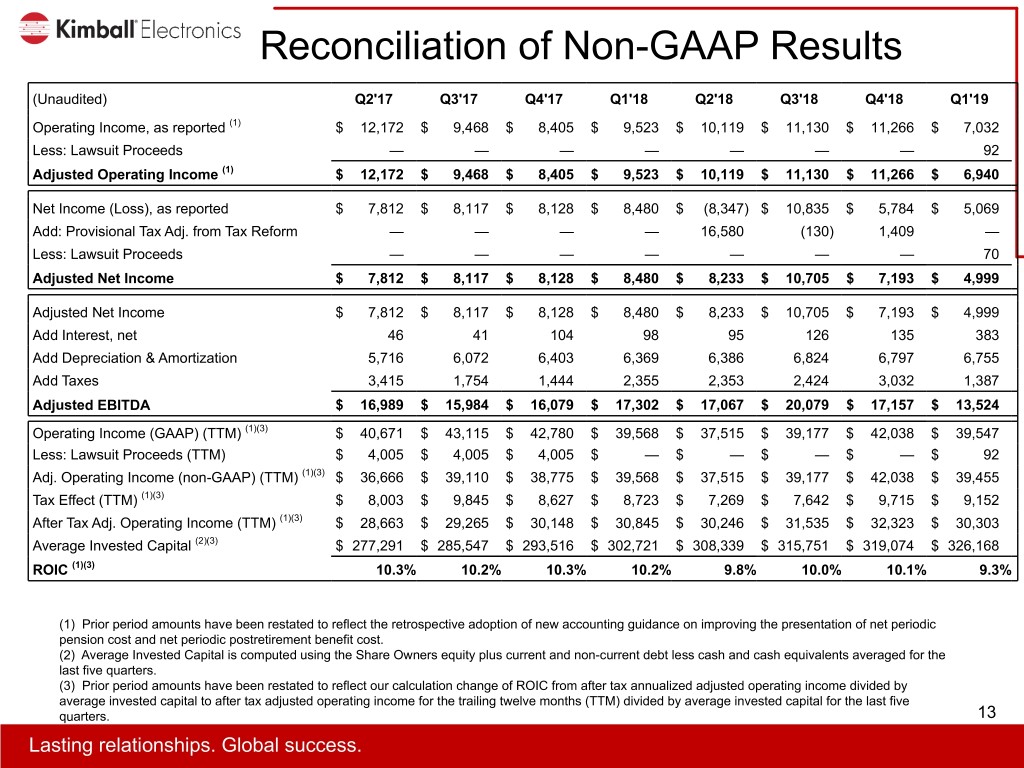
• | Return on invested capital (“ROIC”), calculated for the trailing twelve months, was 9.3% and 10.2% for the twelve months ended September 30, 2018 and 2017, respectively (see reconciliation of non-GAAP financial measures for ROIC calculation). |
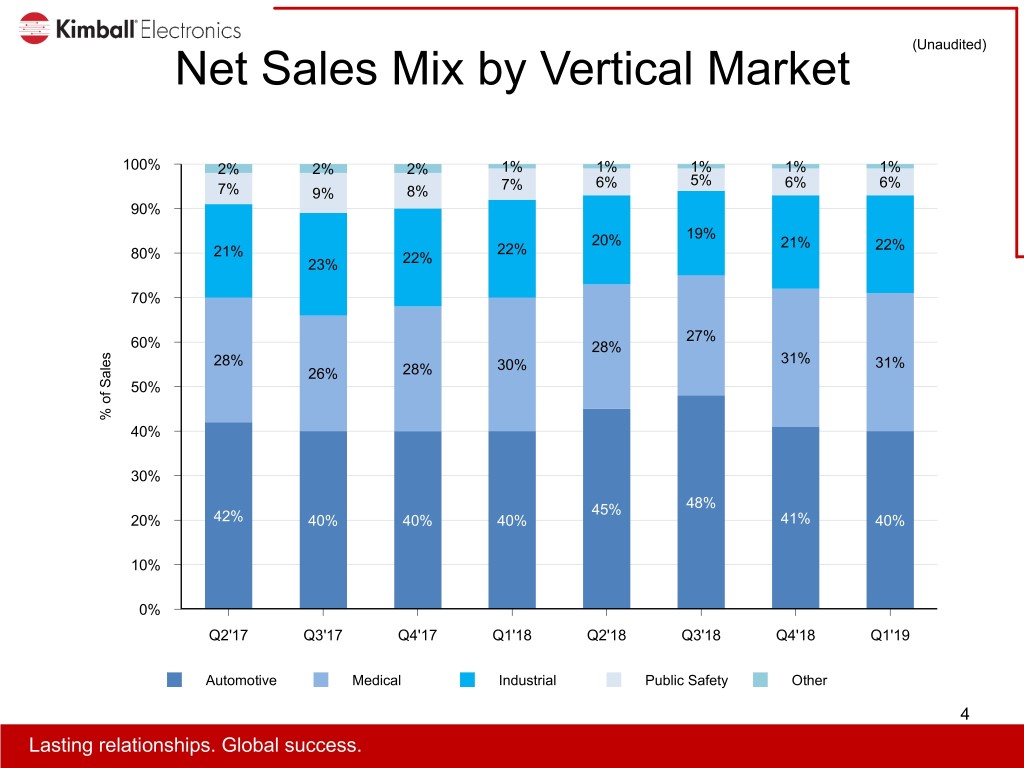
Net Sales by Vertical Market:
|
| | | | | | | | | | |
| Three Months Ended | | |
| September 30, | | |
(Amounts in Millions) | 2018 | | 2017 | | Percent Change |
Automotive | $ | 105.9 |
| | $ | 102.0 |
| | 4 | % |
Medical | 82.2 |
| | 76.2 |
| | 8 | % |
Industrial | 57.4 |
| | 54.8 |
| | 5 | % |
Public Safety | 17.1 |
| | 17.2 |
| | — | % |
Other | 3.0 |
| | 3.0 |
| | — | % |
Total Net Sales | $ | 265.6 |
| | $ | 253.2 |
| | 5 | % |
Forward-Looking Statements
Certain statements contained within this release are considered forward-looking under the Private Securities Litigation Reform Act of 1995 and are subject to risks and uncertainties including, but not limited to, successful integration of acquisitions and new operations, global economic conditions, geopolitical environment, significant volume reductions from key contract customers, loss of key customers or suppliers, financial stability of key customers and suppliers, availability or cost of raw materials, impact related to tariffs and other trade barriers, and increased competitive pricing pressures reflecting excess industry capacities. Additional cautionary statements regarding other risk factors that could have an effect on the future performance of the Company are contained in its Annual Report on Form 10-K for the year ended June 30, 2018.
Non-GAAP Financial Measures
This press release contains non-GAAP financial measures. A non-GAAP financial measure is a numerical measure of a company’s financial performance that excludes or includes amounts so as to be different than the most directly comparable measure calculated and presented in accordance with Generally Accepted Accounting Principles (“GAAP”) in the United States in the statement of income, statement of comprehensive income, balance sheet, statement of cash flows, or statement of equity of the Company. The non-GAAP financial measures contained herein include adjusted operating income, adjusted net income, and ROIC. These measures include adjustments in the three months ended September 30, 2018 for proceeds from a lawsuit settlement. Reconciliations of the reported GAAP numbers to these non-GAAP financial measures are included in the financial highlights table below. Management believes it is useful for investors to understand how its core operations performed without the effects of the proceeds from the lawsuit settlement. Excluding this amount allows investors to meaningfully trend, analyze, and benchmark the performance of the Company’s core operations. Many of the Company’s internal performance measures that management uses to make certain operating decisions excludes this item to enable meaningful trending of core operating metrics.
|
| | |
Conference Call / Webcast |
| | |
Date: | | November 7, 2018 |
Time: | | 10:00 AM Eastern Time |
Dial-In #: | | 800-992-4934 (International Calls - 937-502-2251) |
Conference ID: | | 7129658 |
The live webcast of the conference call can be accessed at investors.kimballelectronics.com. For those unable to participate in the live webcast, the call will be archived at investors.kimballelectronics.com.
About Kimball Electronics, Inc.
WHO WE ARE Kimball Electronics is a leading contract manufacturer of durable electronics serving a variety of industries on a global scale. The customer is the focus of everything we do and our touch is felt throughout daily life via the markets we serve: Automotive, Industrial, Medical, and Public Safety. Recognized for a reputation of excellence, we are committed to a high-performance culture that values personal and organizational commitment to quality, reliability, value, speed, and ethical behavior. Our employees know they are part of a company culture that is
committed to doing the right thing. We build lasting relationships and global success for customers while enabling employees to share in the Company’s success through personal, professional, and financial growth.
WHAT WE DO Kimball Electronics trades under the symbol “KE” on The NASDAQ Stock Market. Kimball Electronics is a preeminent Electronics Manufacturing Services (“EMS”) provider serving customers around the world. Additionally, Kimball Electronics offers diversified contract manufacturing services (“DCMS”) for non-electronic components, medical disposables, and plastics. GES, a Kimball Electronics Company, specializes in design, production and servicing of automation, test, and inspection equipment for the semiconductor, electronics, and life sciences industries. From our operations in the United States, China, India, Japan, Mexico, Poland, Romania, Thailand, and Vietnam, our teams are proud to provide manufacturing services for a variety of industries globally. Kimball Electronics is headquartered in Jasper, Indiana.
To learn more about Kimball Electronics, visit: www.kimballelectronics.com.
Lasting relationships. Global success.
Financial highlights for the first quarter ended September 30, 2018 are as follows:
|
| | | | | | | | | | | | | |
Condensed Consolidated Statements of Income | | | | | | |
(Unaudited) | Three Months Ended |
(Amounts in Thousands, except Per Share Data) | September 30, 2018 (1) | | September 30, 2017 |
Net Sales | $ | 265,620 |
| | 100.0 | % | | $ | 253,204 |
| | 100.0 | % |
Cost of Sales (2) | 247,434 |
| | 93.2 | % | | 233,751 |
| | 92.3 | % |
Gross Profit (2) | 18,186 |
| | 6.8 | % | | 19,453 |
| | 7.7 | % |
Selling and Administrative Expenses (2) | 11,246 |
| | 4.2 | % | | 9,930 |
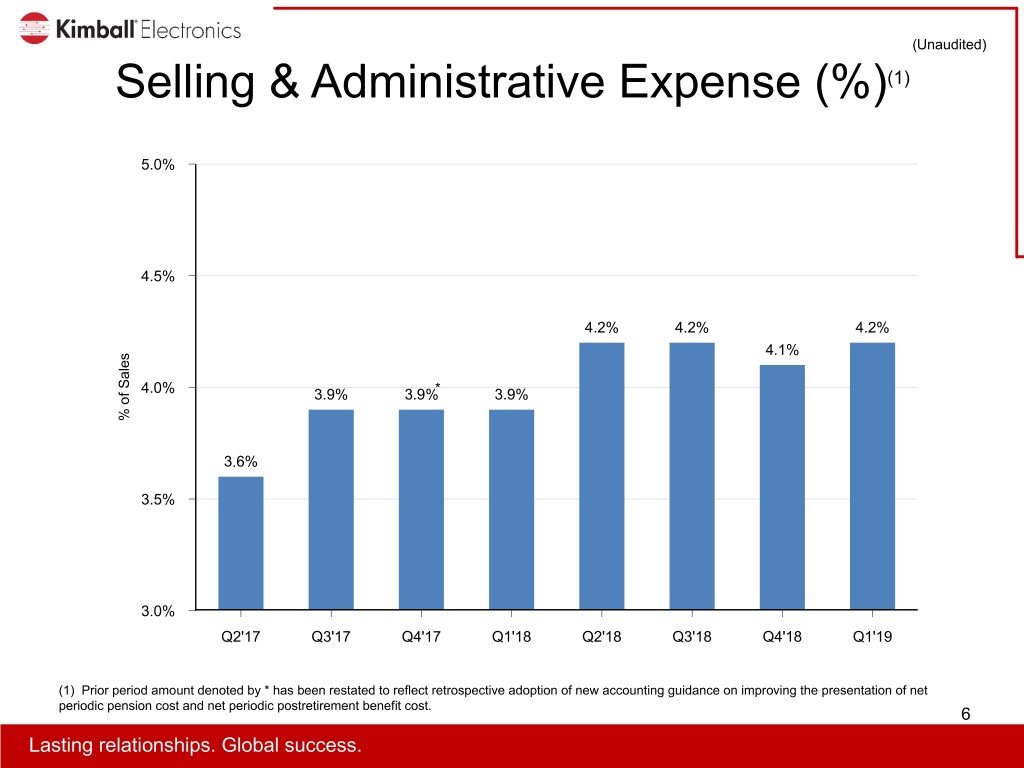
| | 3.9 | % |
Other General Income | (92 | ) | | — | % | | — |
| | — | % |
Operating Income (2) | 7,032 |
| | 2.6 | % | | 9,523 |
| | 3.8 | % |
Other Income (Expense), net (2) | (554 | ) | | (0.2 | )% | | 1,312 |
| | 0.5 | % |
Income Before Taxes on Income | 6,478 |
| | 2.4 | % | | 10,835 |
| | 4.3 | % |
Provision for Income Taxes | 1,409 |
| | 0.5 | % | | 2,355 |
| | 1.0 | % |
Net Income | $ | 5,069 |
| | 1.9 | % | | $ | 8,480 |
| | 3.3 | % |
| | | | | | | |
Earnings Per Share of Common Stock: | | | | | | | |
Basic | $ | 0.19 |
| | | | $ | 0.32 |
| | |
Diluted | $ | 0.19 |
| | | | $ | 0.31 |
| | |
| | | | | | | |
Average Number of Shares Outstanding: | | | | | | | |
Basic | 26,507 |
| | | | 26,859 |
| | |
Diluted | 26,628 |
| | | | 27,028 |
| | |
(1) During the three months ended September 30, 2018, the Company adopted the new accounting standard on Revenue from Contracts with Customers on a modified retrospective basis. The adoption was not material to the Condensed Consolidated Statement of Income for the three months ended September 30, 2018. The prior period was not restated.
(2) The Condensed Consolidated Statement of Income for the three months ended September 30, 2017 has been retrospectively restated for the adoption of new accounting guidance on improving the presentation of net periodic pension cost and net periodic postretirement benefit cost.
|
| | | | | | | |
Condensed Consolidated Statements of Cash Flows | Three Months Ended |
(Unaudited) | September 30, |
(Amounts in Thousands) | 2018 | | 2017 |
Net Cash Flow used for Operating Activities | $ | (10,013 | ) | | $ | (169 | ) |
Net Cash Flow used for Investing Activities | (4,646 | ) | | (6,066 | ) |
Net Cash Flow provided by (used for) Financing Activities | 43,714 |
| | (948 | ) |
Effect of Exchange Rate Change on Cash and Cash Equivalents | (514 | ) | | 944 |
|
Net Increase (Decrease) in Cash and Cash Equivalents | 28,541 |
| | (6,239 | ) |
Cash and Cash Equivalents at Beginning of Period | 46,428 |
| | 44,555 |
|
Cash and Cash Equivalents at End of Period | $ | 74,969 |
| | $ | 38,316 |
|
|
| | | | | | | |
| (Unaudited) | | |
Condensed Consolidated Balance Sheets | September 30,
2018 | | June 30,
2018 |
(Amounts in Thousands) |
ASSETS | | | |
Cash and cash equivalents | $ | 74,969 |
| | $ | 46,428 |
|
Receivables, net | 169,630 |
| | 173,559 |
|
Contract assets * | 43,619 |
| | — |
|
Inventories * | 188,572 |
| | 201,596 |
|
Prepaid expenses and other current assets | 15,587 |
| | 15,405 |
|
Property and Equipment, net | 134,831 |
| | 137,210 |
|
Goodwill | 6,191 |
| | 6,191 |
|
Other Intangible Assets, net | 4,713 |
| | 4,375 |
|
Other Assets * | 24,764 |
| | 23,994 |
|
Total Assets | $ | 662,876 |
| | $ | 608,758 |
|
| | | |
LIABILITIES AND SHARE OWNERS’ EQUITY | | | |
Borrowings under credit facilities | $ | 59,271 |
| | $ | 8,337 |
|
Accounts payable | 192,657 |
| | 187,788 |
|
Accrued expenses * | 28,134 |
| | 32,446 |
|
Long-term income taxes payable | 11,286 |
| | 12,361 |
|
Other | 12,644 |
| | 12,299 |
|
Share Owners’ Equity * | 358,884 |
| | 355,527 |
|
Total Liabilities and Share Owners’ Equity | $ | 662,876 |
| | $ | 608,758 |
|
* The Company adopted new accounting guidance for the recognition of revenue from contracts with customers on a modified retrospective basis as of July 1, 2018. As a result of the adoption of this new guidance, on July 1, 2018, the Company recognized Contract assets of $43.2 million, reduced Inventories by $39.2 million, reduced Other Assets by $0.9 million, increased Accrued expenses by $0.2 million, and increased retained earnings in Share Owners’ Equity by $3.1 million.
|
| | | | | | | | |
Reconciliation of Non-GAAP Financial Measures | | | | |
(Unaudited) | | | | |
(Amounts in Thousands, except Per Share Data) | | | | |
| | | | |
Operating Income excluding Lawsuit Proceeds |
| | Three Months Ended |
| | September 30, |
| | 2018 | | 2017 |
Operating Income, as reported (1) | | $ | 7,032 |
| | $ | 9,523 |
|
Less: Pre-tax Settlement Proceeds from Lawsuit | | 92 |
| | — |
|
Adjusted Operating Income (1) | | $ | 6,940 |
| | $ | 9,523 |
|
| | | | |
| | | | |
Net Income excluding Lawsuit Proceeds |
| | Three Months Ended |
| | September 30, |
| | 2018 | | 2017 |
Net Income, as reported | | $ | 5,069 |
| | $ | 8,480 |
|
Less: After-tax Settlement Proceeds from Lawsuit | | 70 |
| | — |
|
Adjusted Net Income | | $ | 4,999 |
| | $ | 8,480 |
|
| | | | |
| | | | |
Return on Invested Capital (ROIC) | | | | |
| | Twelve Months Ended |
| | September 30, |
| | 2018 | | 2017 |
Operating Income (GAAP) (1) | | $ | 39,547 |
| | $ | 39,568 |
|
Less: Pre-tax Settlement Proceeds from Lawsuit | | $ | 92 |
| | $ | — |
|
Adjusted Operating Income (non-GAAP) (1) | | $ | 39,455 |
| | $ | 39,568 |
|
Tax Effect (2) | | $ | 9,152 |
| | $ | 8,723 |
|
After Tax Adjusted Operating Income | | $ | 30,303 |
| | $ | 30,845 |
|
Average Invested Capital (3) | | $ | 326,168 |
| | $ | 302,721 |
|
ROIC | | 9.3 | % | | 10.2 | % |
(1) Prior period Operating Income has been retrospectively restated for the adoption of new accounting guidance on improving the presentation of net periodic pension cost and net periodic postretirement benefit cost.
(2) Accumulated tax effect utilizing the applicable quarterly effective tax rates, excludes provisional tax adjustments related to the U.S. Tax Cuts and Jobs Act.
(3) Average Invested Capital is computed using Share Owners’ equity plus current and non-current debt less cash and cash equivalents averaged for the last five quarters.

