UNITED STATES
SECURITIES AND EXCHANGE COMMISSION
Washington, D.C. 20549
FORM 6-K
REPORT OF FOREIGN PRIVATE ISSUER
PURSUANT TO RULE 13a-16 OR 15d-16
UNDER THE SECURITIES EXCHANGE ACT OF 1934
For the month of March, 2018
Commission File Number 001-36487
Atlantica Yield plc
(Exact name of Registrant as Specified in its Charter)
Not Applicable
(Translation of Registrant's name into English)
Great West House, GW1, 17th floor
Great West Road
Brentford, TW8 9DF
United Kingdom
Tel.: +44 20 7098 4384
Indicate by check mark whether the registrant files or will file annual reports under cover of Form 20-F or Form 40-F:
☒ Form 20-F ☐ Form 40-F
Indicate by check mark if the registrant is submitting the Form 6-K in paper as permitted by Regulation S-T Rule 101(b)(1): ☐
Indicate by check mark if the registrant is submitting the Form 6-K in paper as permitted by Regulation S-T Rule 101(b)(7): ☐
Full Year 2017 Earnings PresentationMarch 7, 2018
This presentation contains forward-looking statements. These forward-looking statements include, but are not limited to, all statements other than statements of historical facts contained in this presentation, including, without limitation, those regarding our future financial position and results of operations, our strategy, plans, objectives, goals and targets, future developments in the markets in which we operate or are seeking to operate or anticipated regulatory changes in the markets in which we operate or intend to operate. In some cases, you can identify forward-looking statements by terminology such as “aim,” “anticipate,” “believe,” “continue,” “could,” “estimate,” “expect,” “forecast,” “guidance,” “intend,” “is likely to,” “may,” “plan,” “potential,” “predict,” “projected,” “should” or “will” or the negative of such terms or other similar expressions or terminology. By their nature, forward-looking statements involve risks and uncertainties because they relate to events and depend on circumstances that may or may not occur in the future. Forward-looking statements speak only as of the date of this presentation and are not guarantees of future performance and are based on numerous assumptions. Our actual results of operations, financial condition and the development of events may differ materially from (and be more negative than) those made in, or suggested by, the forward-looking statements.The purchase of Atlantica shares by Algonquin from Abengoa is subject to a number of condition which have been satisfied, though the share sale has not yet occured. Atlantica cannot make any representation regarding an agreement reached by two third parties. There is no guarantee that the AAGES ROFO and other agreements become effective, or that any assets will be purchased by Atlantica from Algonquin, AAGES or Abengoa.Many factors could cause the actual results, performance or achievements of the Company to be materially different from any future results, performance or achievements that may be expressed or implied by such forward-looking statements, including, among others: difficult conditions in the global economy and in the global market and uncertainties in emerging markets where we have international operations; changes in government regulations providing incentives and subsidies for renewable energy, including reduction of our revenues in Spain, which are mainly defined by regulation through parameters that could be reviewed at the end of each regulatory period; our ability to acquire solar projects due to the potential increase of the cost of solar panels; political, social and macroeconomic risks relating to the United Kingdom’s exit from the European Union; changes in general economic, political, governmental and business conditions globally and in the countries in which we do business; decreases in government expenditure budgets, reductions in government subsidies or adverse changes in laws and regulations affecting our businesses and growth plan; challenges in achieving growth and making acquisitions due to our dividend policy; inability to identify and/or consummate future acquisitions, under the AAGES ROFO Agreement, the Abengoa ROFO Agreement, or otherwise, on favorable terms or at all; our ability to identify and reach an agreement with new partners similar to the AAGES ROFO Agreement or Abengoa ROFO Agreement; our ability to identify and/or consumate future acquisitions from third parties or from potential new partners, including as a result of not being able to find acquisition opportunities at attractive prices; legal challenges to regulations, subsidies and incentives that support renewable energy sources; extensive governmental regulation in a number of different jurisdictions, including stringent environmental regulation; increases in the cost of energy and gas, which could increase our operating costs; counterparty credit risk and failure of counterparties to our offtake agreements to fulfill their obligations; inability to replace expiring or terminated offtake agreements with similar agreements; new technology or changes in industry standards; inability to manage exposure to credit, interest rates, foreign currency exchange rates, supply and commodity price risks; reliance on third-party contractors and suppliers; risks associated with acquisitions and investments; deviations from our investment criteria for future acquisitions and investments; failure to maintain safe work environments; effects of catastrophes, natural disasters, adverse weather conditions, climate change, unexpected geological or other physical conditions, criminal or terrorist acts or cyber-attacks at one or more of our plants; insufficient insurance coverage and increases in insurance cost; litigation and other legal proceedings including claims due to Abengoa’s restructuring process; reputational risk, including damage caused to us by Abengoa’s reputation; the loss of one or more of our executive officers; failure of information technology on which we rely to run our business; revocation or termination of our concession agreements or power purchase agreements; lowering of revenues in Spain that are mainly defined by regulation; inability to adjust regulated tariffs or fixed-rate arrangements as a result of fluctuations in prices of raw materials, exchange rates, labor and subcontractor costs; exposure to market electricity can impact revenue from our renewable energy and efficient natural gas facilities (previously named “conventional generation”); changes to national and international law and policies that support renewable energy resources; lack of electric transmission capacity and potential upgrade costs to the electric transmission grid; disruptions in our operations as a result of our not owning the land on which our assets are located; risks associated with maintenance, expansion and refurbishment of electric generation facilities; failure of our assets to perform as expected, including Solana and Kaxu; failure to receive dividends from all project and investments, including Solana and Kaxu; variations in meteorological conditions; disruption of the fuel supplies necessary to generate power at our efficient natural gas facilities (previously named “conventional generation”); deterioration in Abengoa’s financial condition; Abengoa’s ability to meet its obligations under our agreements with Abengoa, including operation and maintenance agreements, to comply with past representations, commitments and potential liabilities linked to the time when Abengoa owned the assets, potential clawback of transactions with Abengoa, and other risks related to Abengoa; failure to meet certain covenants under our financing arrangements; failure to obtain pending waivers in relation to the minimum ownership by Abengoa and the cross-default provisions contained in some of our project financing agreements; failure of Abengoa to maintain existing guarantees and letters of credit under the Financial Support Agreement or failure by us to maintain guarantees; failure of Abengoa to maintain its obligations and production guarantees, pursuant to EPC contracts; our ability to consummate future acquisitions from AAGES, Algonquin, Abengoa or others; our ability to close acquisitions under our ROFO agreements with AAGES, Algonquin, Abengoa and others, due to, among other things, not being offered assets that fit in our portfolio or not reaching agreements on prices; our ability to use U.S. NOLs to offset future income may be limited, including as the result of experiencing an ownership change under section 382 of the Internal Revenue Code of 1986, as amended (“IRC”); conflicts of interests which may be resolved in a manner that is not in our best interests or the best interest of our minority shareholders, potentially caused by our ownership structure and certain service agreements in place with our current largest shareholder; the share sale may not be completed; the divergence of interest between us and Abengoa, due to Abengoa’s sale of our shares; potential negative implications from a potential change of control; negative implications of U.S. federal income tax reform; impact on our stock price due to the sale by Abengoa of its stake in us and potential negative effects of a potential sale by Abengoa of its stake in us or of a potential change of control or of a potential delay or failure of a sale process; technical failure, design errors or faulty operation of our assets not covered by guarantees or insurance; and failure to collect insurance proceeds in the expected amounts; failure to reach an agreement on the extension of the production guarantee period at Solana and Kaxu. Furthermore, any dividends are subject to available capital, market conditions, and compliance with associated laws and regulations. These factors should be considered in connection with information regarding risks and uncertainties that may affect Atlantica Yield’s future results included in Atlantica Yield’s filings with the U.S. Securities and Exchange Commission at www.sec.gov. Atlantica Yield undertakes no obligation to update or revise any forward-looking statements, whether as a result of new information, future events or developments or otherwise.Should one or more of these risks or uncertainties materialize, or should underlying assumptions prove incorrect, actual results may vary materially from those described herein as anticipated, believed, estimated, expected or targeted.This presentation includes certain non-GAAP (Generally Accepted Accounting Principles) financial measures which have not been subject to a financial audit for any period. We present non-GAAP financial measures because we believe that they and other similar measures are widely used by certain investors, securities analysts and other interested parties as supplemental measures of performance and liquidity.The non-GAAP financial measures may not be comparable to other similarly titled measures of other companies and have limitations as analytical tools and should not be considered in isolation or as a substitute for analysis of our operating results as reported under IFRS as issued by the IASB. Non-GAAP financial measures and ratios are not measurements of our performance or liquidity under IFRS as issued by the IASB and should not be considered as alternatives to operating profit or profit for the year or any other performance measures derived in accordance with IFRS as issued by the IASB or any other generally accepted accounting principles or as alternatives to cash flow from operating, investing or financing activities.The CAFD and other guidance included in this presentation are estimates as of March 7, 2017. These estimates are based on assumptions believed to be reasonable as of that date. Atlantica Yield plc. disclaims any current intention to update such guidance, except as required by law. DISCLAIMER
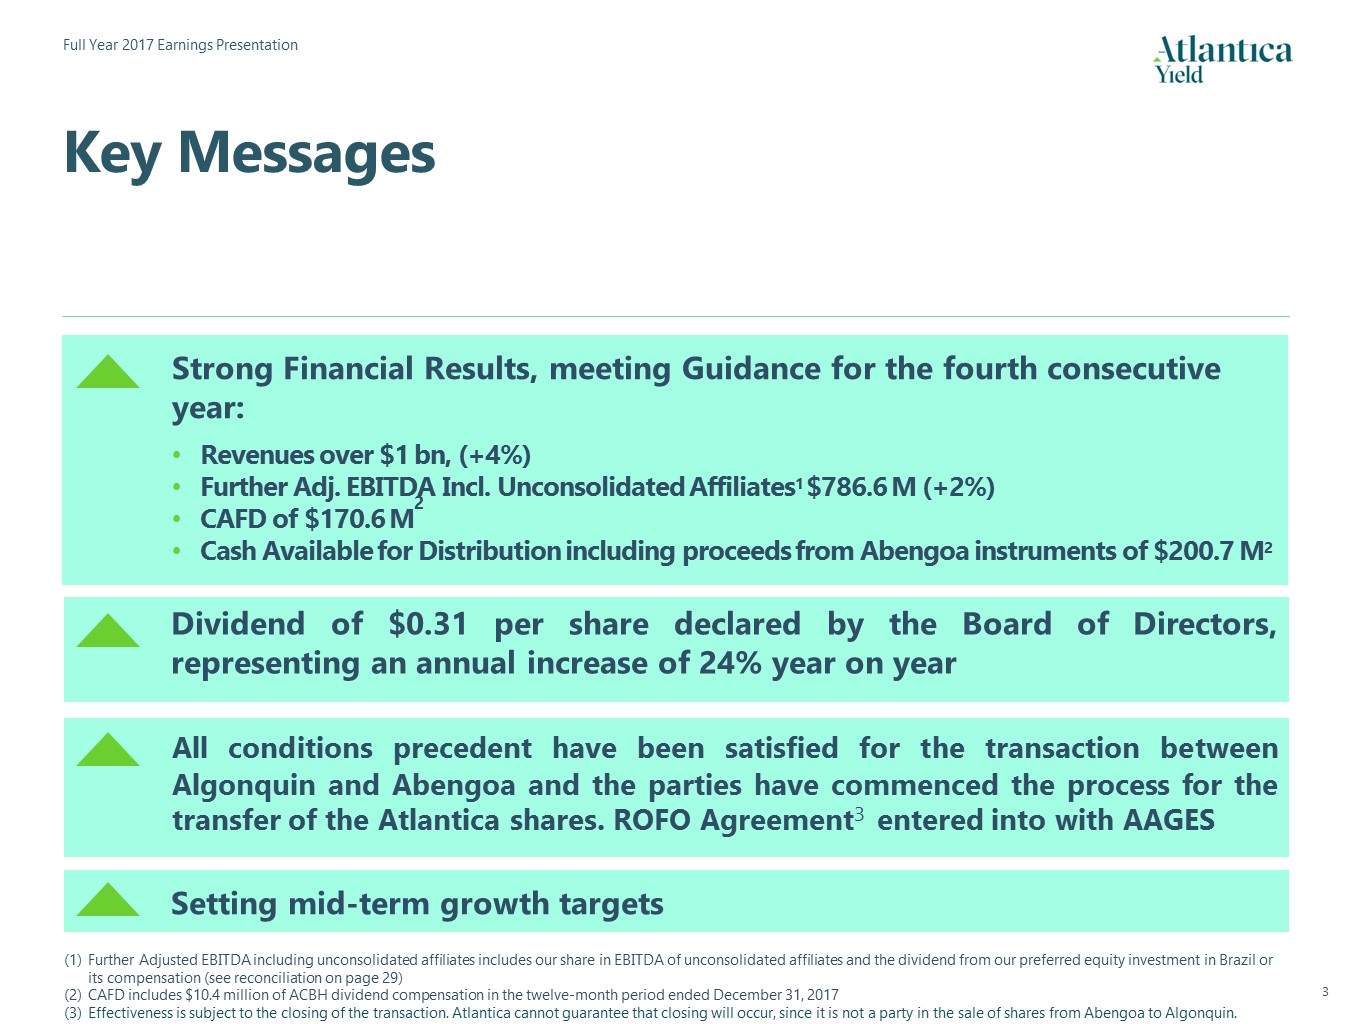
Key Messages Strong Financial Results, meeting Guidance for the fourth consecutive year:Revenues over $1 bn, (+4%)Further Adj. EBITDA Incl. Unconsolidated Affiliates1 $786.6 M (+2%)CAFD of $170.6 M2Cash Available for Distribution including proceeds from Abengoa instruments of $200.7 M2 Dividend of $0.31 per share declared by the Board of Directors, representing an annual increase of 24% year on year All conditions precedent have been satisfied for the transaction between Algonquin and Abengoa and the parties have commenced the process for the transfer of the Atlantica shares. ROFO Agreement3 entered into with AAGES Setting mid-term growth targets Further Adjusted EBITDA including unconsolidated affiliates includes our share in EBITDA of unconsolidated affiliates and the dividend from our preferred equity investment in Brazil or its compensation (see reconciliation on page 29)CAFD includes $10.4 million of ACBH dividend compensation in the twelve-month period ended December 31, 2017Effectiveness is subject to the closing of the transaction. Atlantica cannot guarantee that closing will occur, since it is not a party in the sale of shares from Abengoa to Algonquin.

1. Financial Results 2. Strategic Update AGENDA 3. Q&A Appendix
1. Financial Results
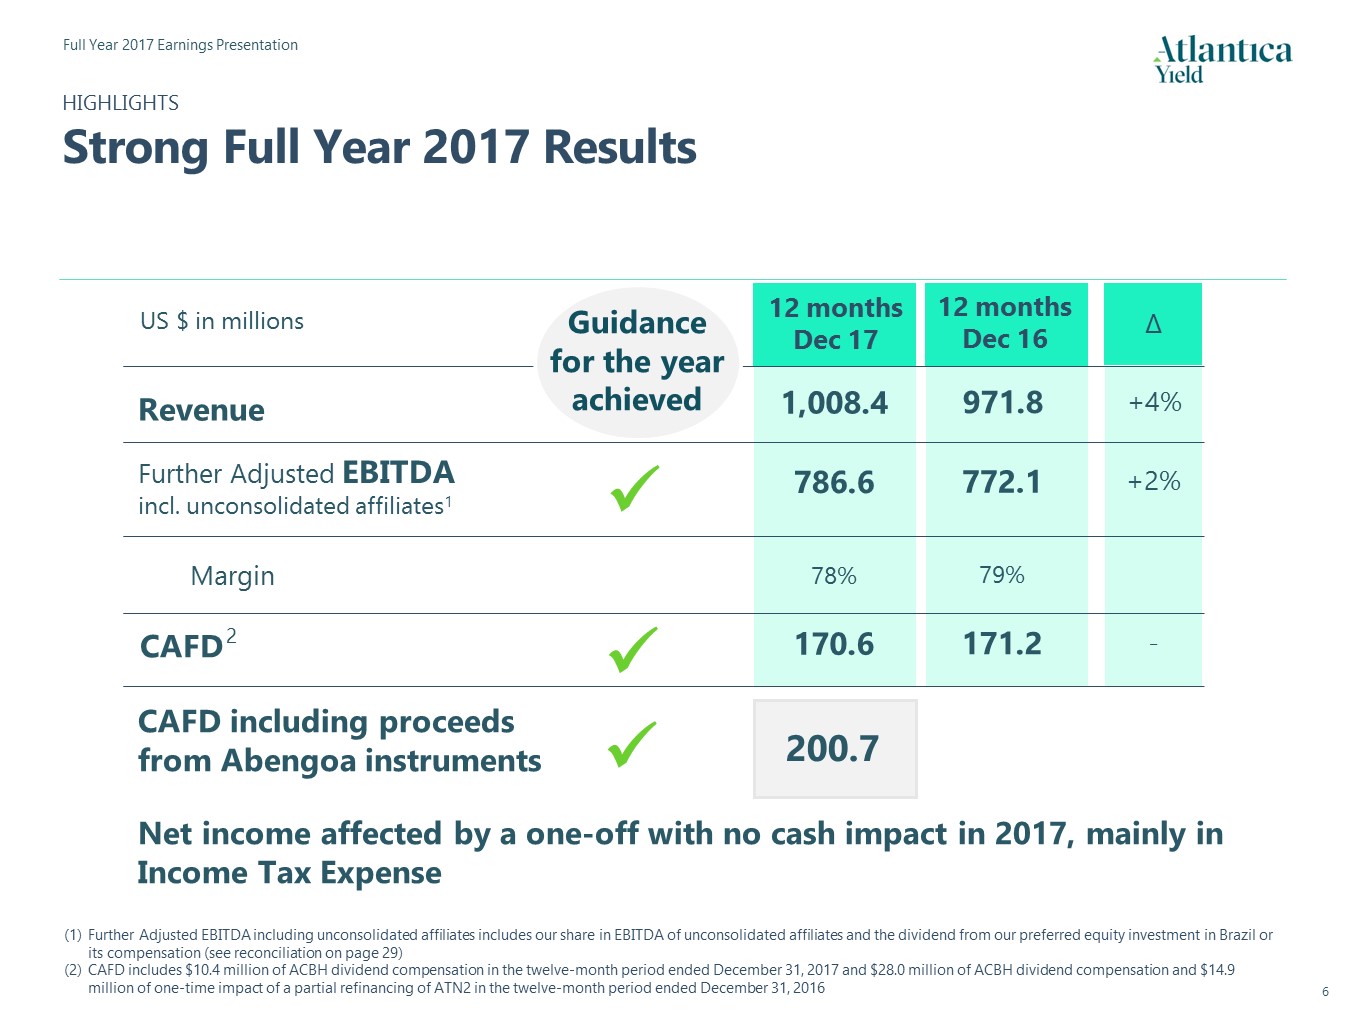
12 monthsDec 16 ∆ +4% +2% HIGHLIGHTSStrong Full Year 2017 Results Revenue Further Adjusted EBITDA incl. unconsolidated affiliates1 Margin 12 monthsDec 17 1,008.4 786.6 78% - CAFD 170.6 US $ in millions Guidance for the year achieved 971.8 772.1 79% 171.2 Further Adjusted EBITDA including unconsolidated affiliates includes our share in EBITDA of unconsolidated affiliates and the dividend from our preferred equity investment in Brazil or its compensation (see reconciliation on page 29)CAFD includes $10.4 million of ACBH dividend compensation in the twelve-month period ended December 31, 2017 and $28.0 million of ACBH dividend compensation and $14.9 million of one-time impact of a partial refinancing of ATN2 in the twelve-month period ended December 31, 2016 CAFD including proceeds from Abengoa instruments 200.7 Net income affected by a one-off with no cash impact in 2017, mainly in Income Tax Expense 2
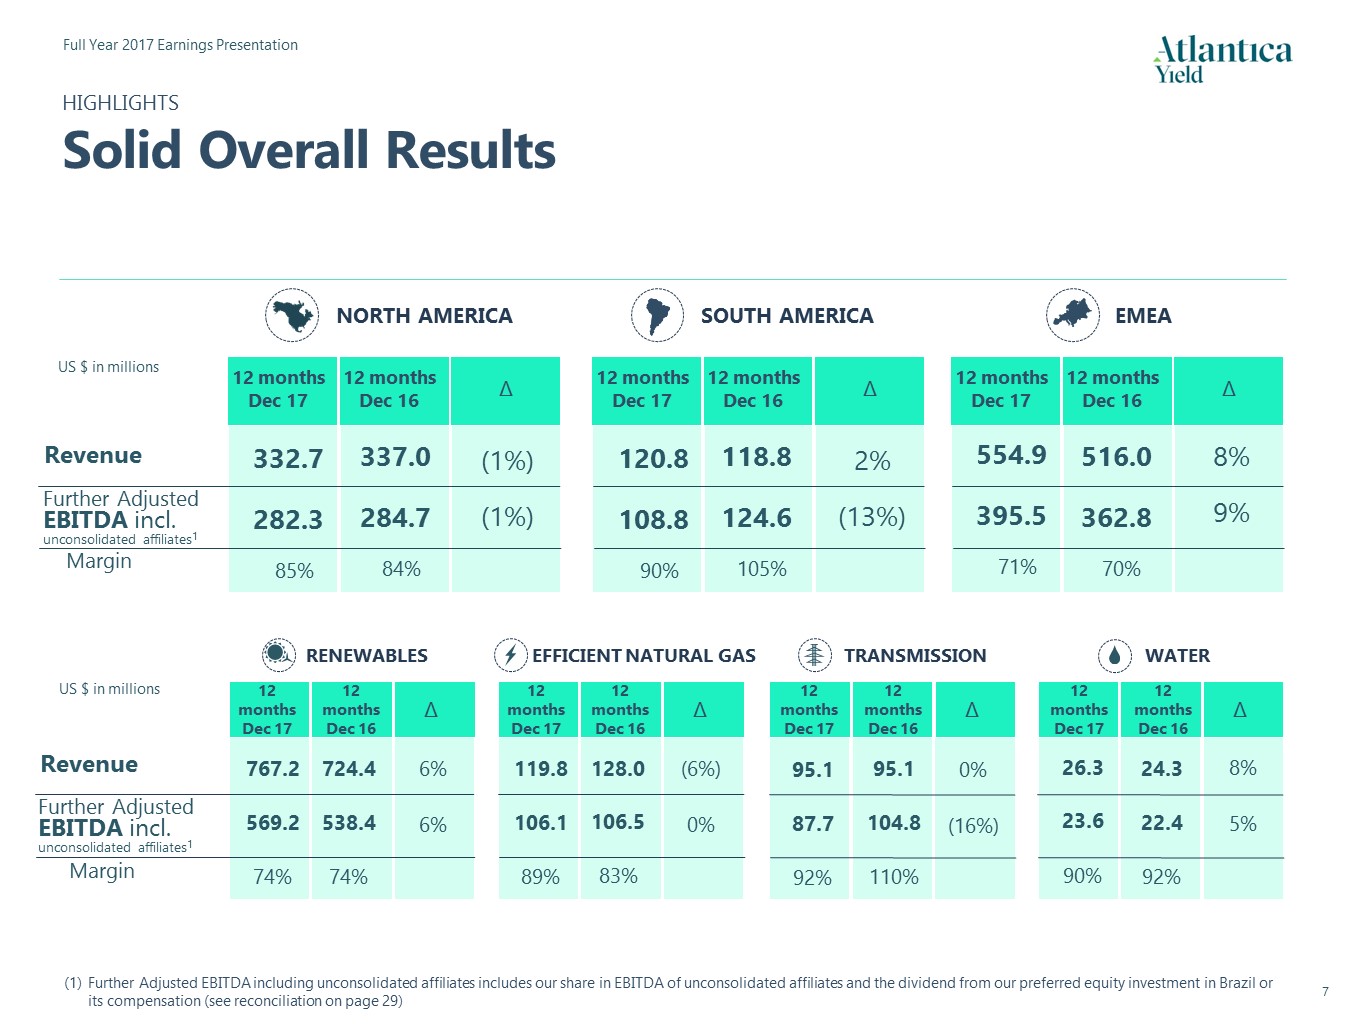
HIGHLIGHTSSolid Overall Results US $ in millions Revenue Further Adjusted EBITDA incl. unconsolidated affiliates1 12 months Dec 17 12 months Dec 16 ∆ Revenue 12 months Dec 17 12 months Dec 16 ∆ SOUTH AMERICA 12 months Dec 17 12 months Dec 16 ∆ 12 months Dec 17 12 months Dec 16 ∆ ∆ ∆ ∆ EMEA NORTH AMERICA RENEWABLES EFFICIENT NATURAL GAS TRANSMISSION WATER Further Adjusted EBITDA incl. unconsolidated affiliates1 Margin Margin US $ in millions Further Adjusted EBITDA including unconsolidated affiliates includes our share in EBITDA of unconsolidated affiliates and the dividend from our preferred equity investment in Brazil or its compensation (see reconciliation on page 29) 12 months Dec 17 12 months Dec 16 12 months Dec 17 12 months Dec 16 12 months Dec 17 12 months Dec 16 337.0 284.7 84% 118.8 124.6 105% 516.0 362.8 70% 724.4 538.4 74% 128.0 106.5 83% 95.1 104.8 110% 24.3 22.4 92% 332.7 282.3 85% (1%) (1%) 120.8 108.8 90% 2% (13%) 554.9 395.5 71% 8% 9% 767.2 569.2 74% 6% 6% 119.8 106.1 89% (6%) 0% 95.1 87.7 92% 0% (16%) 26.3 23.6 90% 8% 5%

KEY OPERATIONAL METRICSRobust and Steady Overall Performance GWh produced GWh produced Electric availability Availability Availability RENEWABLES TRANSMISSION WATER EFFICIENT NATURAL GAS MW in operation Mft3 in operation Miles in operation MW in operation Includes curtailment in wind assets for which we received compensation in the twelve-month period ended December 31, 2017Represents total installed capacity in assets owned at the end of the period, regardless of our percentage of ownership in each of the assetsElectric availability refers to operational MW over contracted MW with PemexAvailability refers to actual availability divided by contracted availability 1 4 4 3 2 12 months Dec 17 12 months Dec 16 12 months Dec 17 12 months Dec 16 12 months Dec 17 12 months Dec 16 12 months Dec 17 12 months Dec 16 2 3,087 1,442 100.0% 1,099 2,416 99.1% 300 101.8% 10.5 3,167 1,442 2,372 300 10.5 1,099 100.5% 97.9% 101.8%
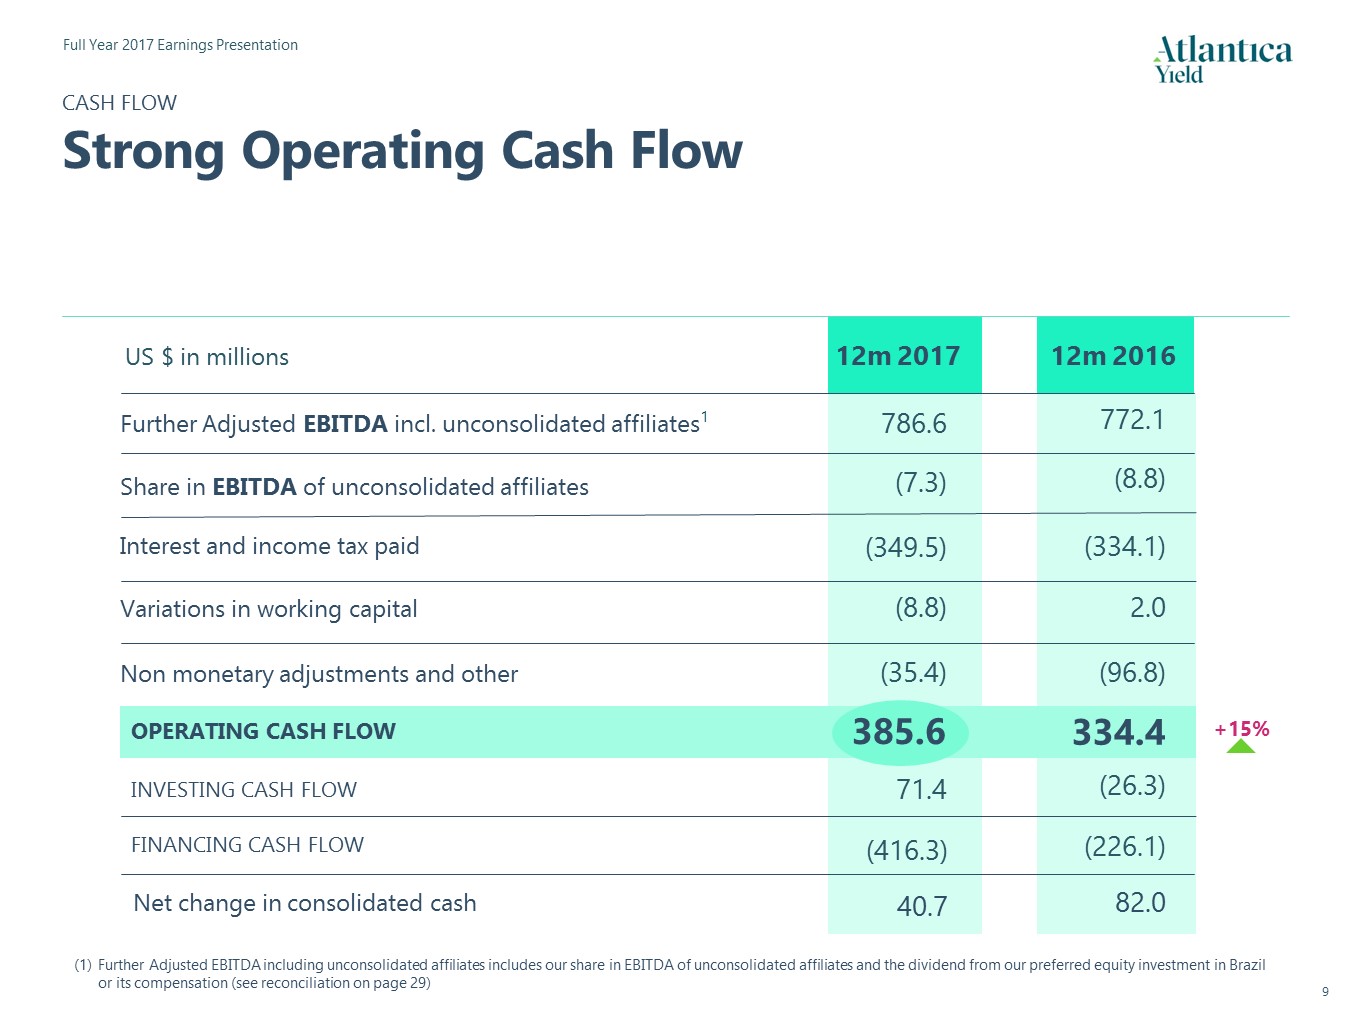
OPERATING CASH FLOW CASH FLOWStrong Operating Cash Flow Net change in consolidated cash US $ in millions 12m 2017 12m 2016 Further Adjusted EBITDA incl. unconsolidated affiliates1 Share in EBITDA of unconsolidated affiliates Interest and income tax paid Variations in working capital Non monetary adjustments and other INVESTING CASH FLOW FINANCING CASH FLOW Further Adjusted EBITDA including unconsolidated affiliates includes our share in EBITDA of unconsolidated affiliates and the dividend from our preferred equity investment in Brazil or its compensation (see reconciliation on page 29) +15% (8.8) 772.1 (334.1) (96.8) (26.3) (226.1) 82.0 2.0 334.4 (7.3) 786.6 (349.5) (8.8) 385.6 (35.4) 71.4 (416.3) 40.7
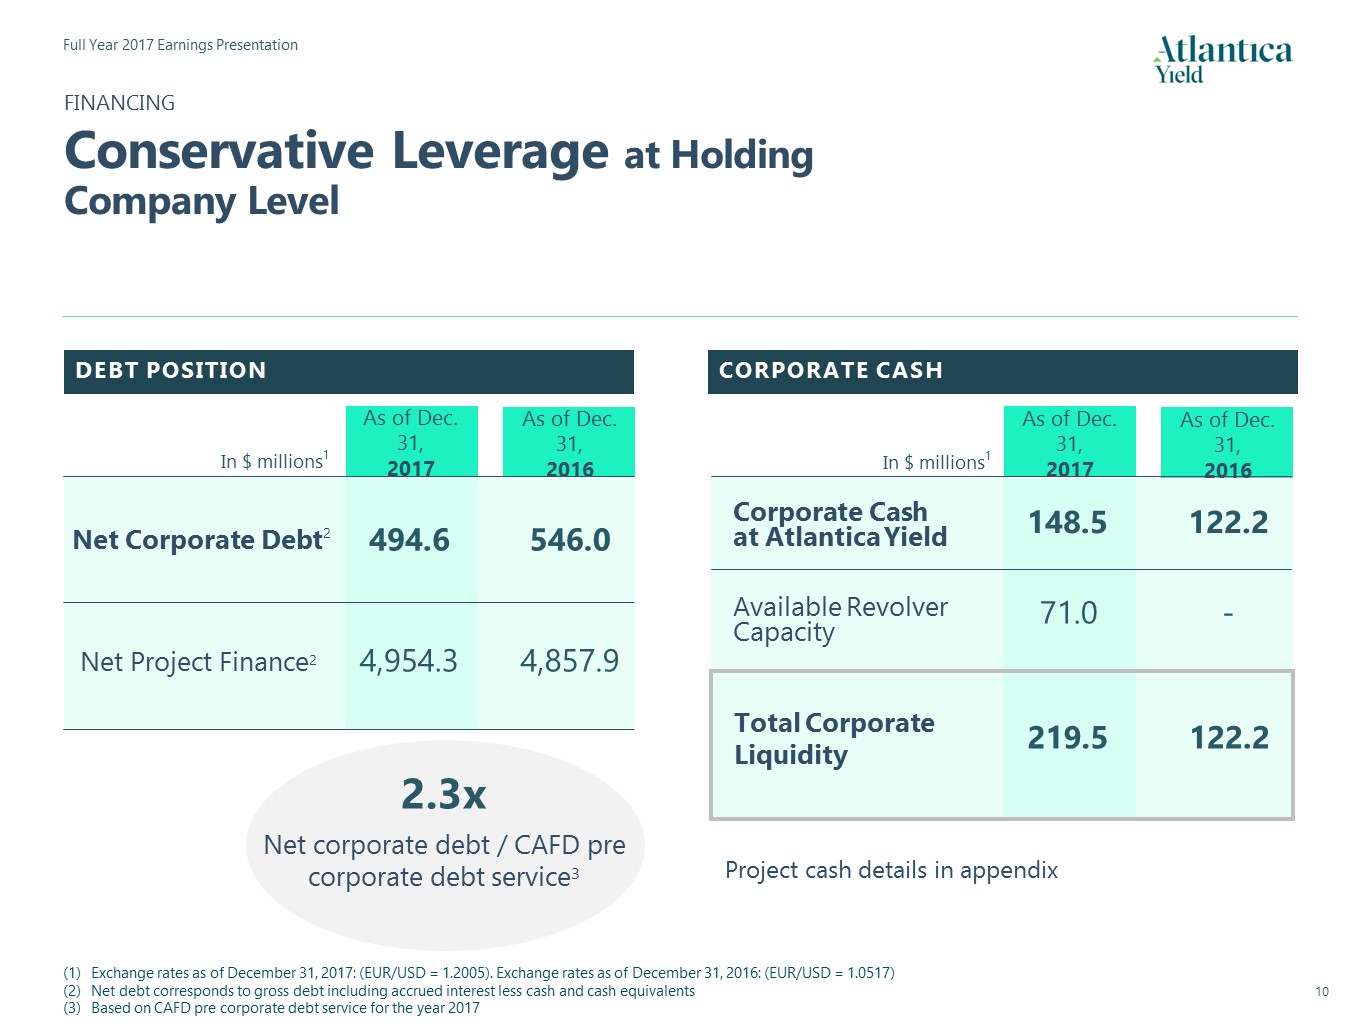
As of Dec. 31,2016 As of Dec. 31,2017 148.5 71.0 122.2 - As of Dec. 31,2016 FINANCINGConservative Leverage at Holding Company Level Net corporate debt / CAFD pre corporate debt service3 2.3x Exchange rates as of December 31, 2017: (EUR/USD = 1.2005). Exchange rates as of December 31, 2016: (EUR/USD = 1.0517)Net debt corresponds to gross debt including accrued interest less cash and cash equivalentsBased on CAFD pre corporate debt service for the year 2017 As of Dec. 31,2017 In $ millions1 494.6 Net Project Finance2 4,954.3 DEBT POSITION Net Corporate Debt2 546.0 4,857.9 CORPORATE CASH Corporate Cash at Atlantica Yield Available Revolver Capacity Total Corporate Liquidity 219.5 122.2 Project cash details in appendix In $ millions1
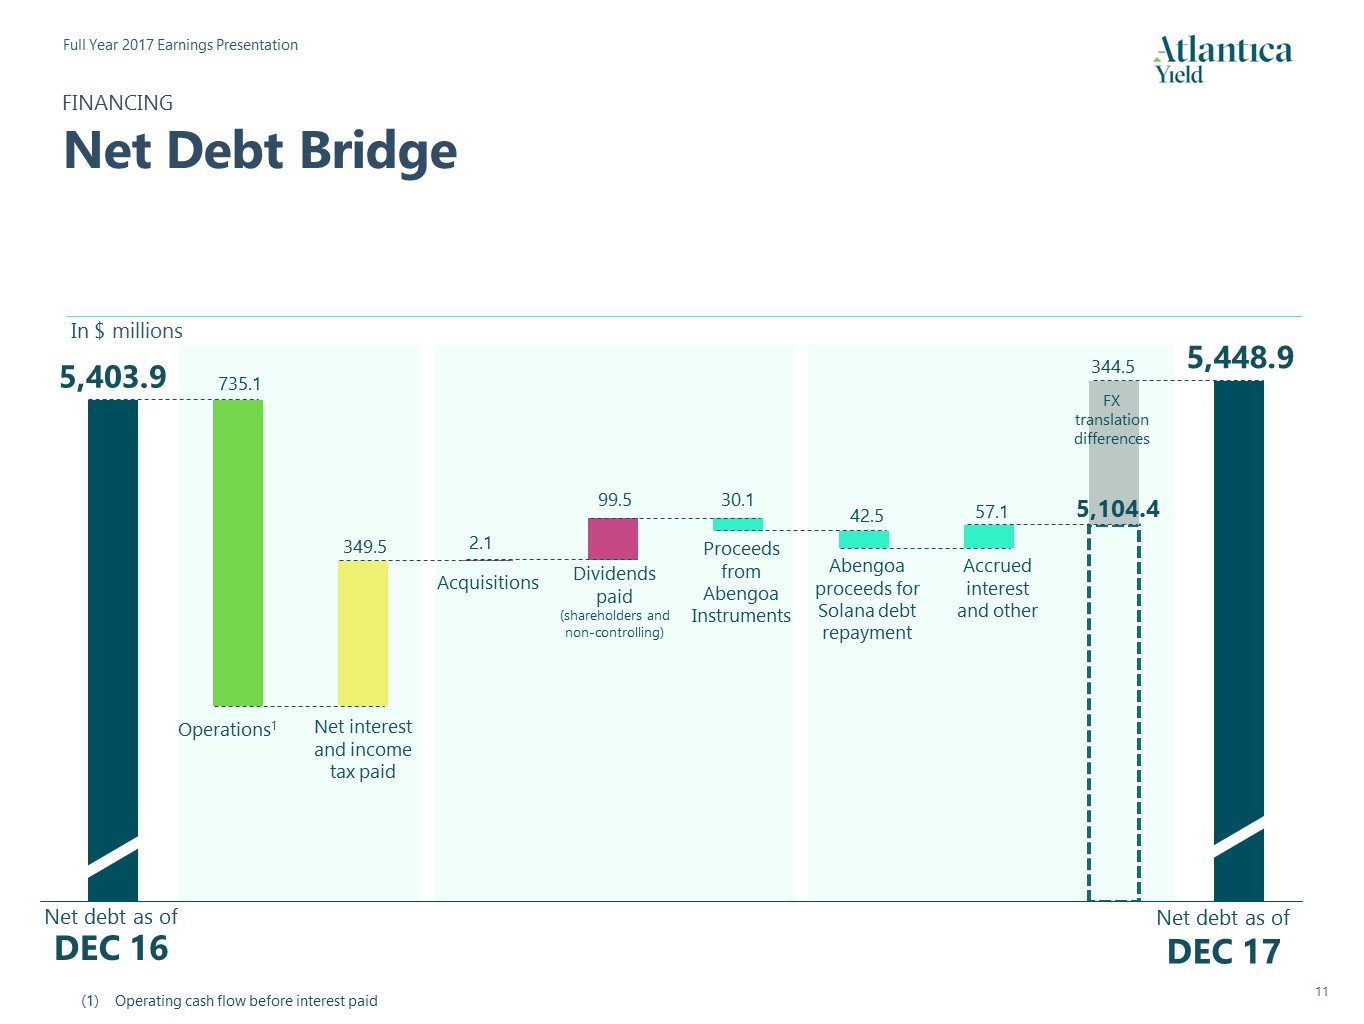
FINANCINGNet Debt Bridge Operating cash flow before interest paid 5,403.9 735.1 349.5 Net interest and income tax paid Operations1 In $ millions DEC 17 DEC 16 Acquisitions Dividends paid (shareholders and non-controlling) FX translation differences Accrued interest and other Abengoa proceeds for Solana debt repayment 2.1 99.5 30.1 5,448.9 344.5 57.1 Net debt as of Net debt as of 42.5 Proceeds from Abengoa Instruments 5,104.4
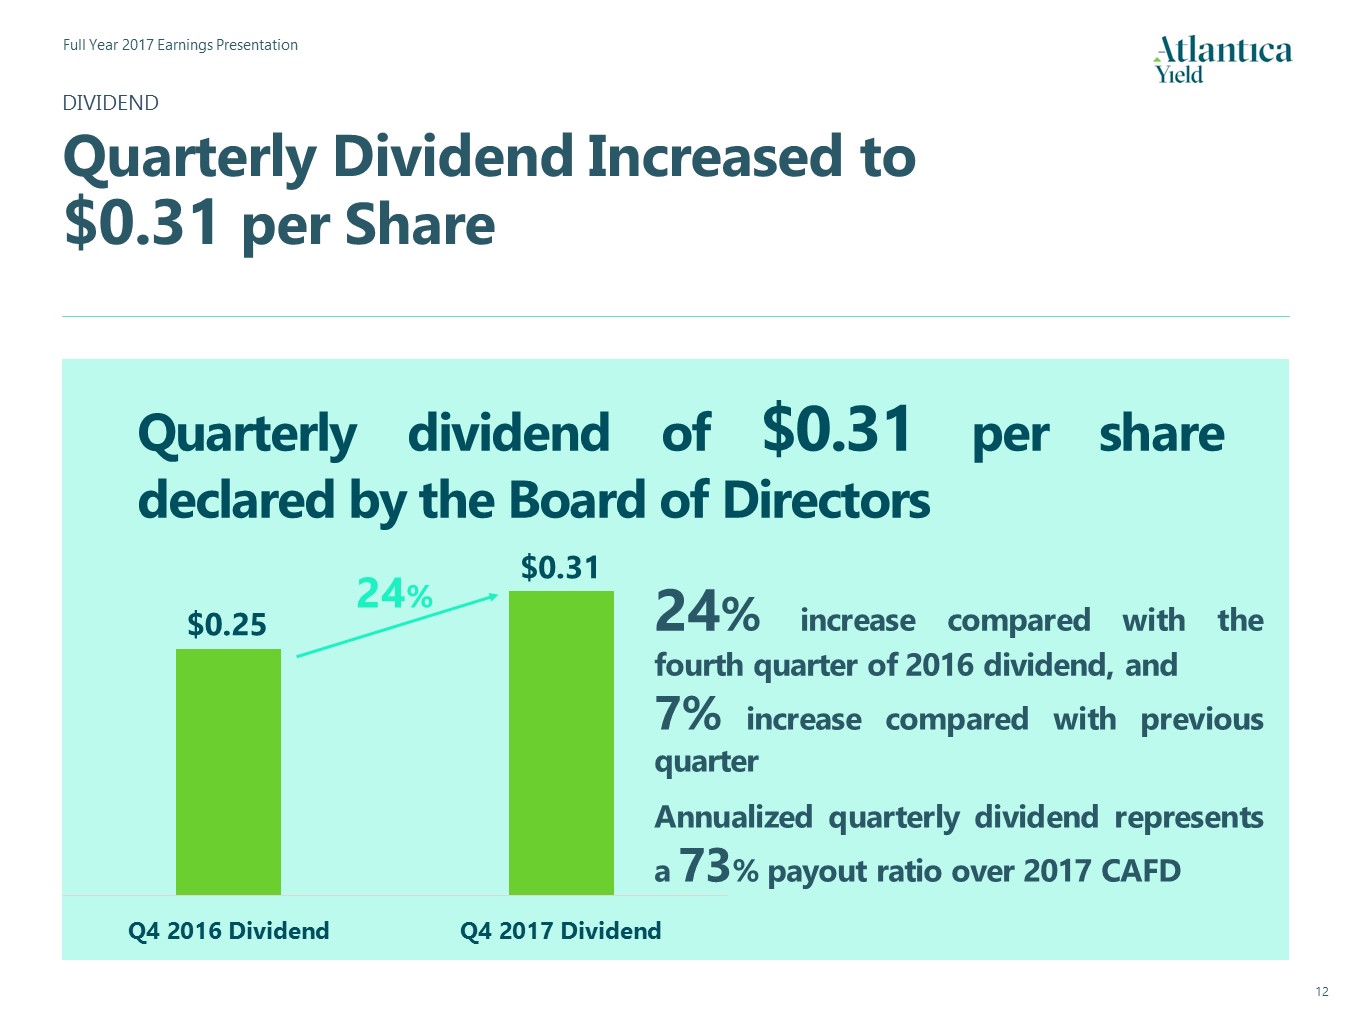
DIVIDENDQuarterly Dividend Increased to $0.31 per Share Quarterly dividend of $0.31 per share declared by the Board of Directors 24% 24% increase compared with the fourth quarter of 2016 dividend, and7% increase compared with previous quarterAnnualized quarterly dividend represents a 73% payout ratio over 2017 CAFD $0.31 $0.25
2. Strategic Update
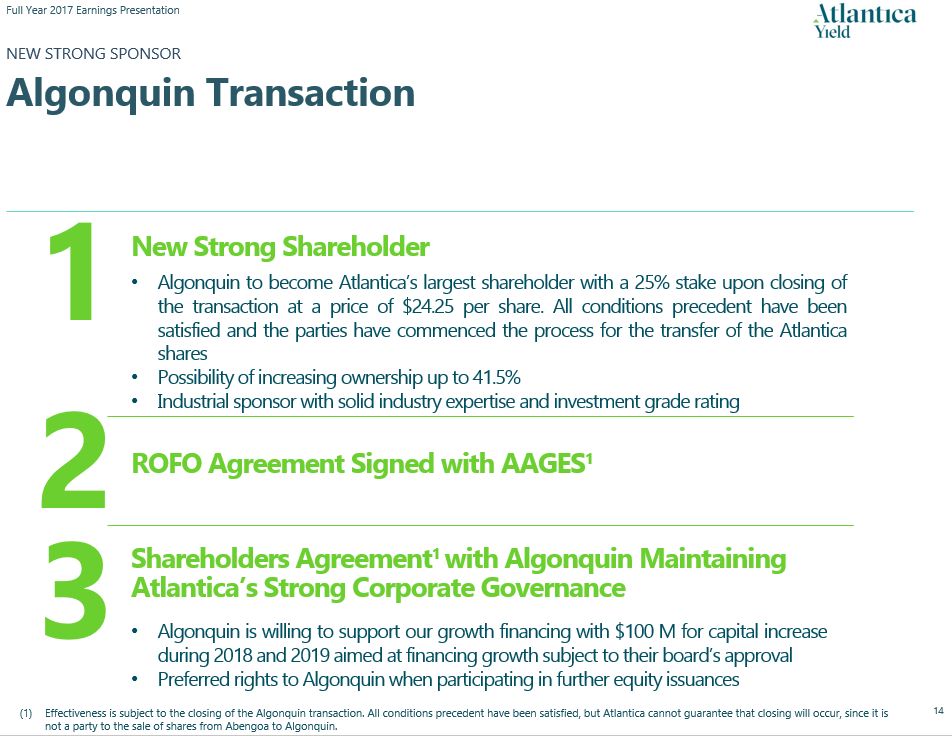
NEW STRONG SPONSORAlgonquin Transaction New Strong Shareholder ROFO Agreement Signed with AAGES1 Shareholders Agreement1 with Algonquin Maintaining Atlantica’s Strong Corporate Governance 1 2 3 Algonquin to become Atlantica’s largest shareholder with a 25% stake upon closing of the transaction. All conditions precedent have satisfied and the parties have commenced the process for the transfer of the Atlantica sharesPossibility of increasing ownership up to 41.5%Industrial sponsor with solid industry expertise and investment grade rating Algonquin is willing to support our growth financing with $100 M for capital increase aimed at financing growth subject to their board’s approvalPreferred rights to Algonquin when participating in further equity issuances Effectiveness is subject to the closing of the Algonquin transaction. All conditions precedent have been satisfied, but Atlantica cannot guarantee that closing will occur, since it is not a party to the sale of shares from Abengoa to Algonquin.
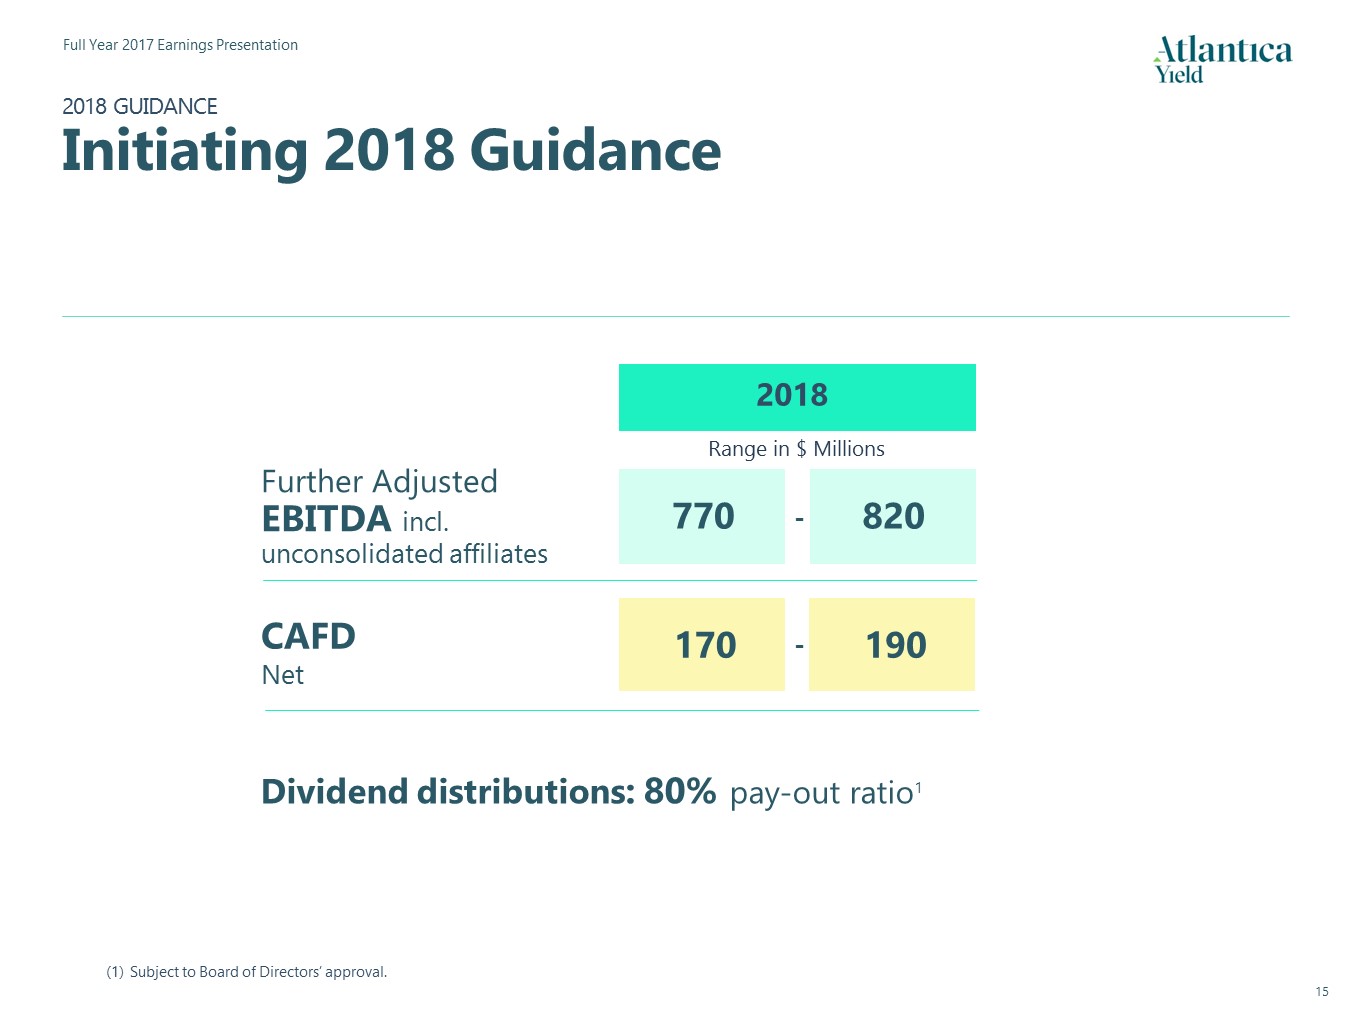
2018 770 Range in $ Millions CAFD Net 170 820 190 Further Adjusted EBITDA incl. unconsolidated affiliates Dividend distributions: 80% pay-out ratio1 - - Subject to Board of Directors’ approval. 2018 GUIDANCEInitiating 2018 Guidance
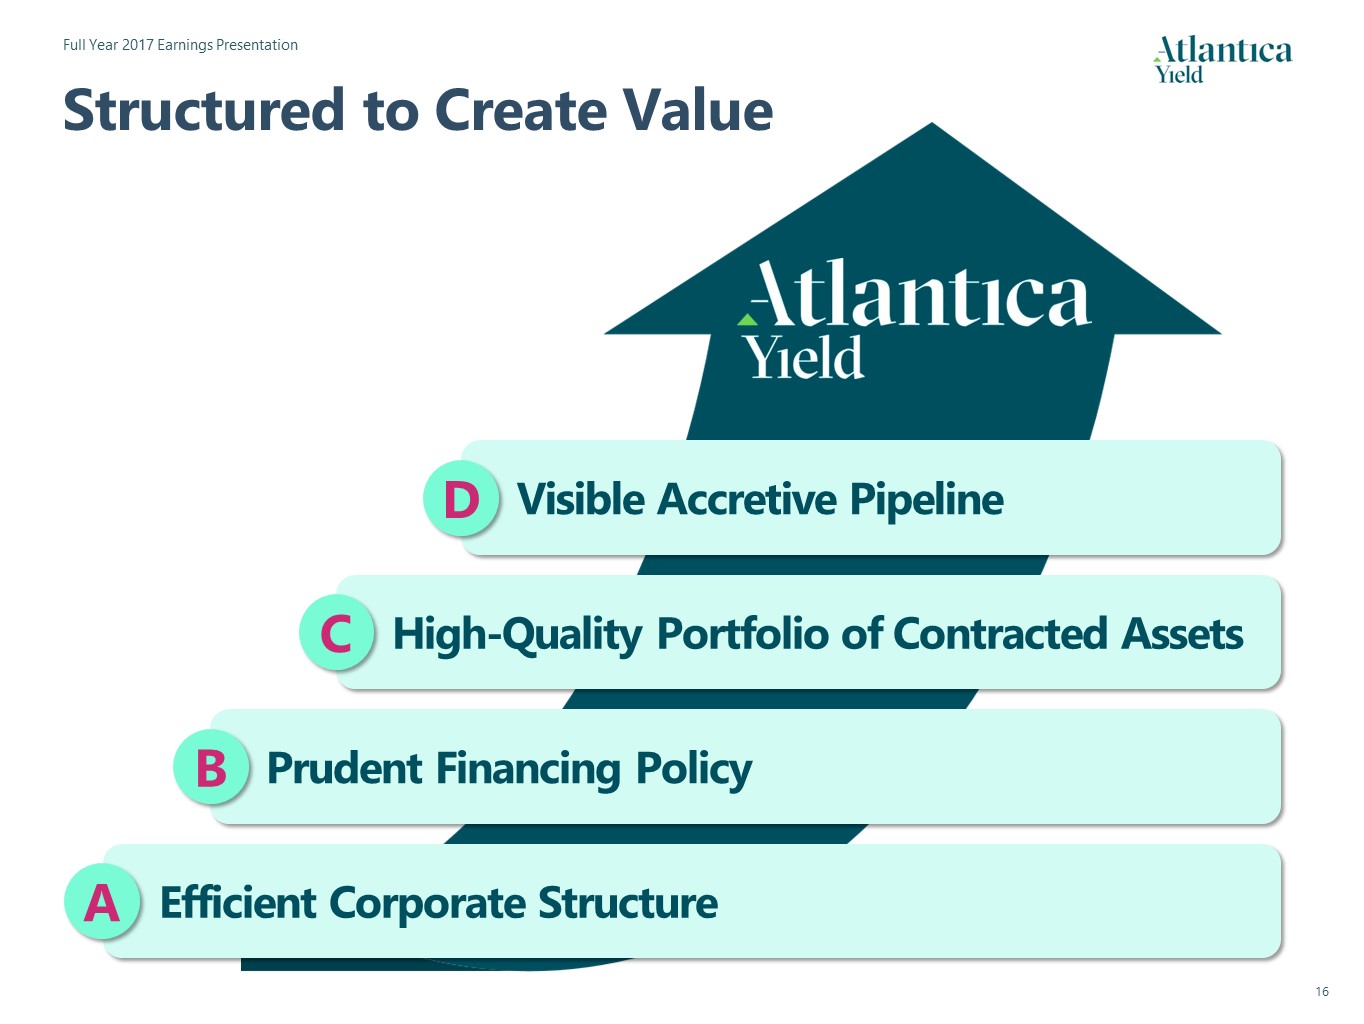
Structured to Create Value Efficient Corporate Structure Prudent Financing Policy High-Quality Portfolio of Contracted Assets Visible Accretive Pipeline D C B A
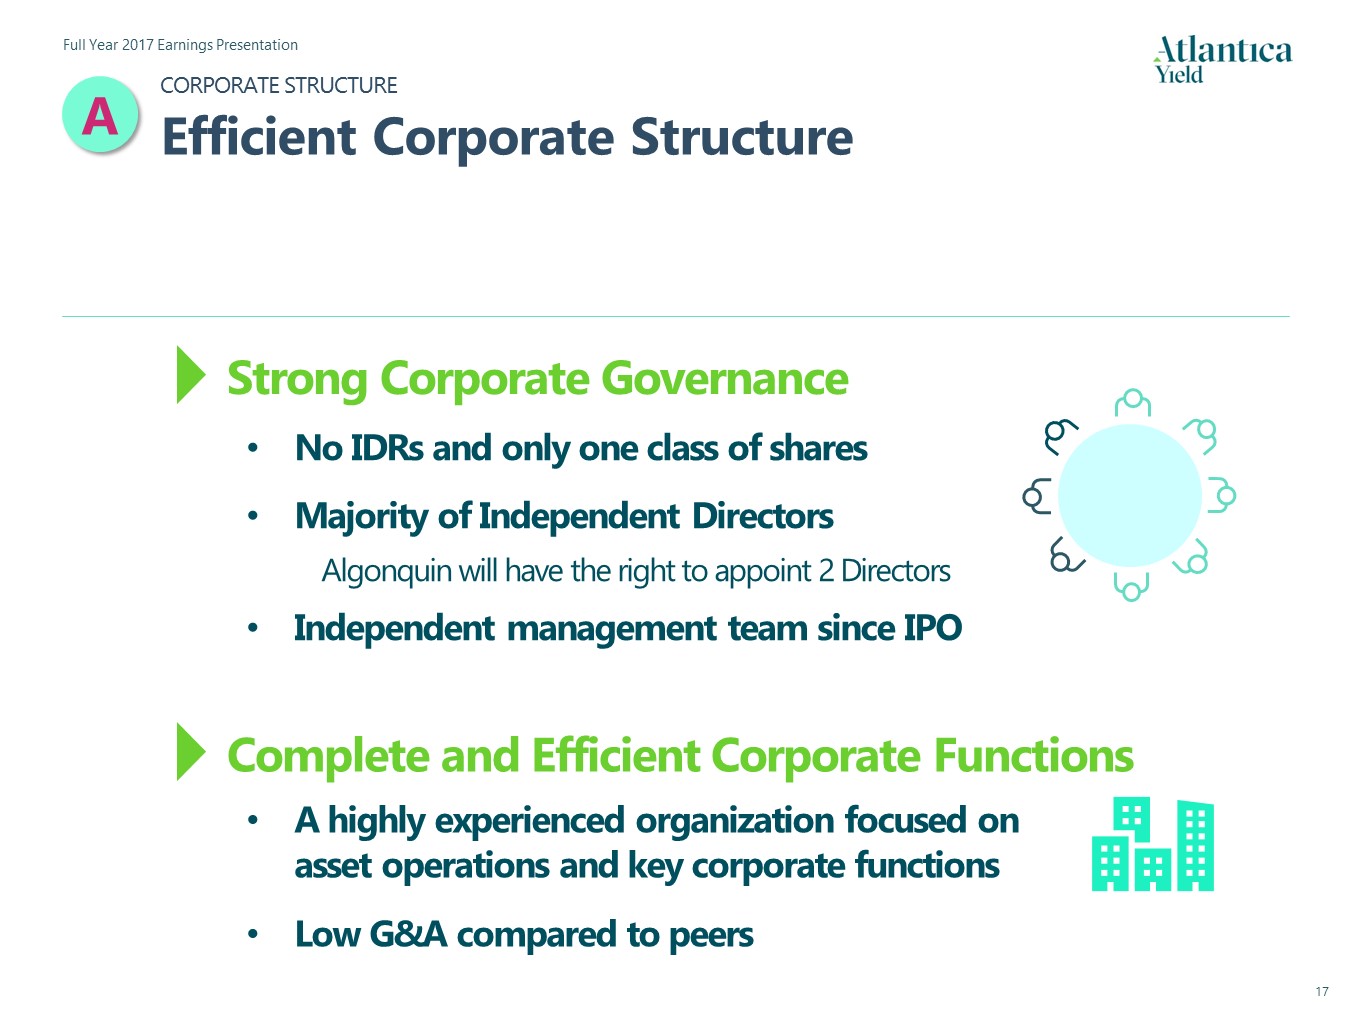
Strong Corporate Governance No IDRs and only one class of sharesMajority of Independent Directors Algonquin will have the right to appoint 2 DirectorsIndependent management team since IPO A highly experienced organization focused on asset operations and key corporate functionsLow G&A compared to peers Complete and Efficient Corporate Functions A CORPORATE STRUCTUREEfficient Corporate Structure
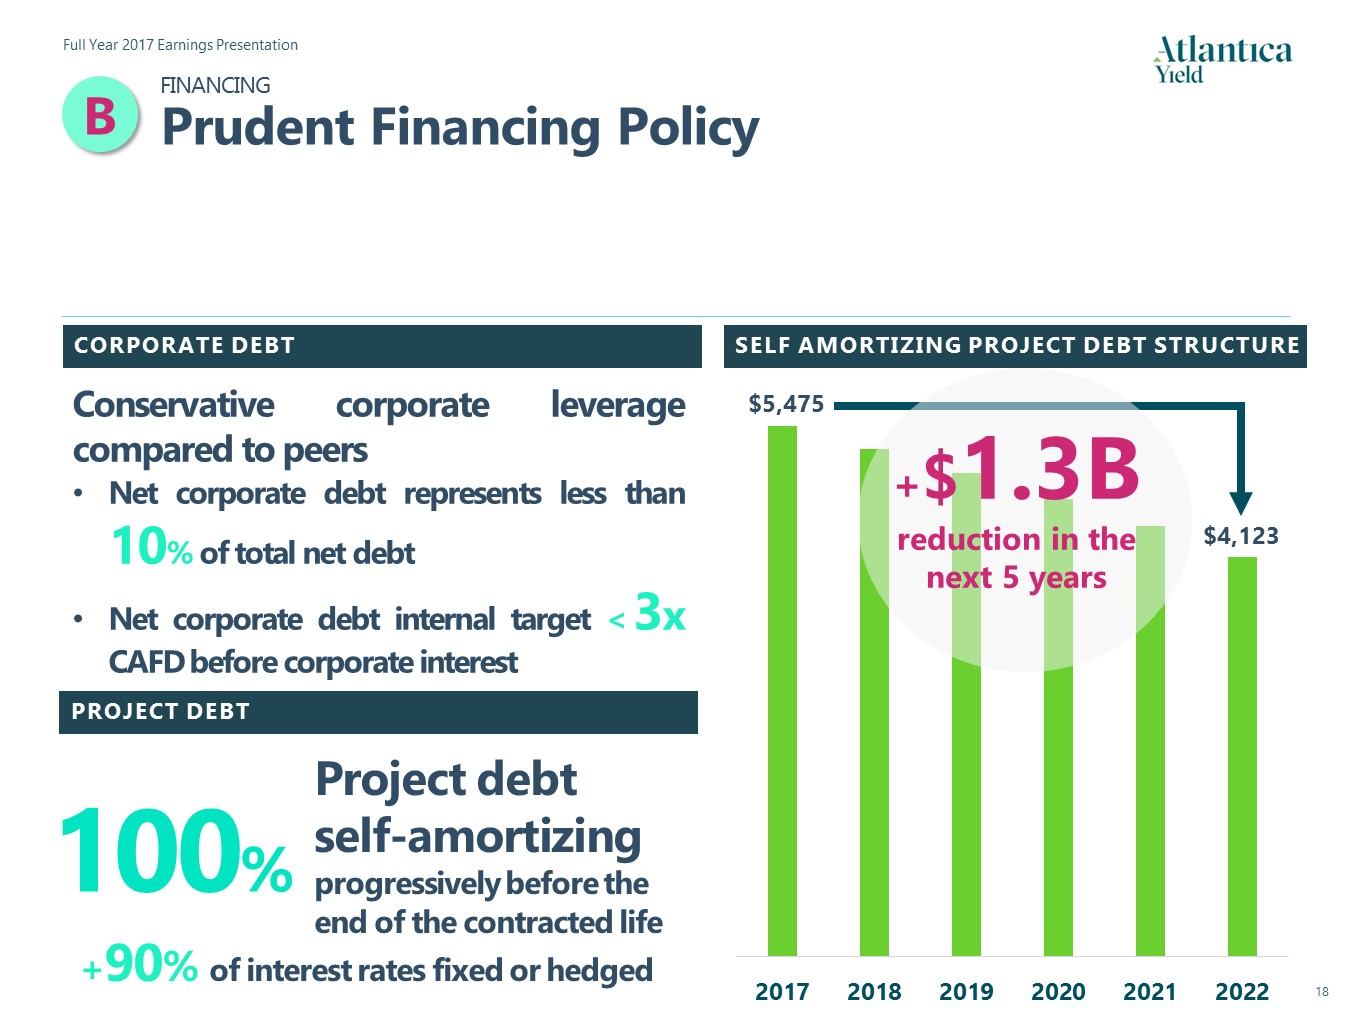
SELF AMORTIZING PROJECT DEBT STRUCTURE PROJECT DEBT Project debt self-amortizing progressively before the end of the contracted life 100% +90% of interest rates fixed or hedged $5,475 $4,123 +$1.3B reduction in the next 5 years CORPORATE DEBT Conservative corporate leverage compared to peersNet corporate debt represents less than 10% of total net debtNet corporate debt internal target < 3x CAFD before corporate interest B FINANCINGPrudent Financing Policy

HIGH-QUALITY PORTFOLIOStrong Portfolio of Assets C LONG-TERM HIGH QUALITY CONTRACTS 19years Weighted average contracted life remaining 1 Represents weighted average years remaining as of December 31, 2017. Regulated in the case of the Spanish assets. DIVERSIFIED PORTFOLIO Risks balanced across geographies and technologiesAccess to growth opportunities in high growth sectors and geographies 100% contracted revenues 2Investment grade offtakers 3Minimal commodity risk OVER 25 YEARS OF CASH FLOWS VISIBILITY Possibility to extend contracted life Strong long-term cash-flows (3) Offtakers for Quadra 1&2, Honaine, Skikda and ATN2 are unrated.(4) Based on CAFD estimations for the next three years and assumes no acquisitions. 40% Solar or Wind 60% Zero natural resource dependency Low dependence on natural resources4 Tails in most assets once debt is already amortized CAFD profile of existing portfolio assuming no re-contracting
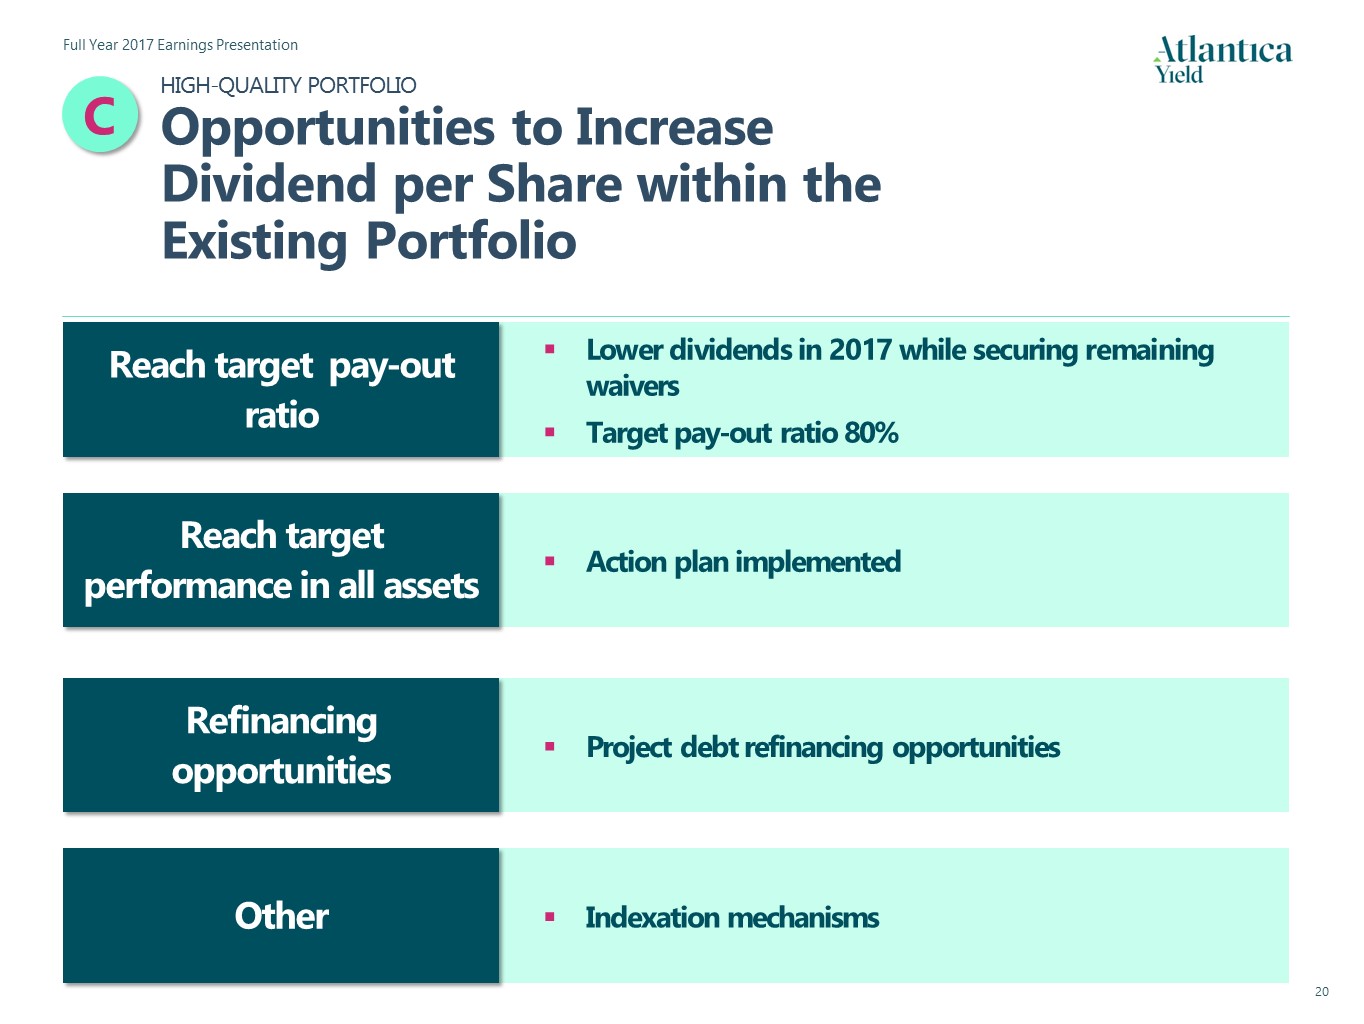
Reach target performance in all assets Action plan implemented Other Indexation mechanisms Refinancing opportunities Project debt refinancing opportunities Reach target pay-out ratio Lower dividends in 2017 while securing remaining waiversTarget pay-out ratio 80% C HIGH-QUALITY PORTFOLIOOpportunities to Increase Dividend per Share within the Existing Portfolio
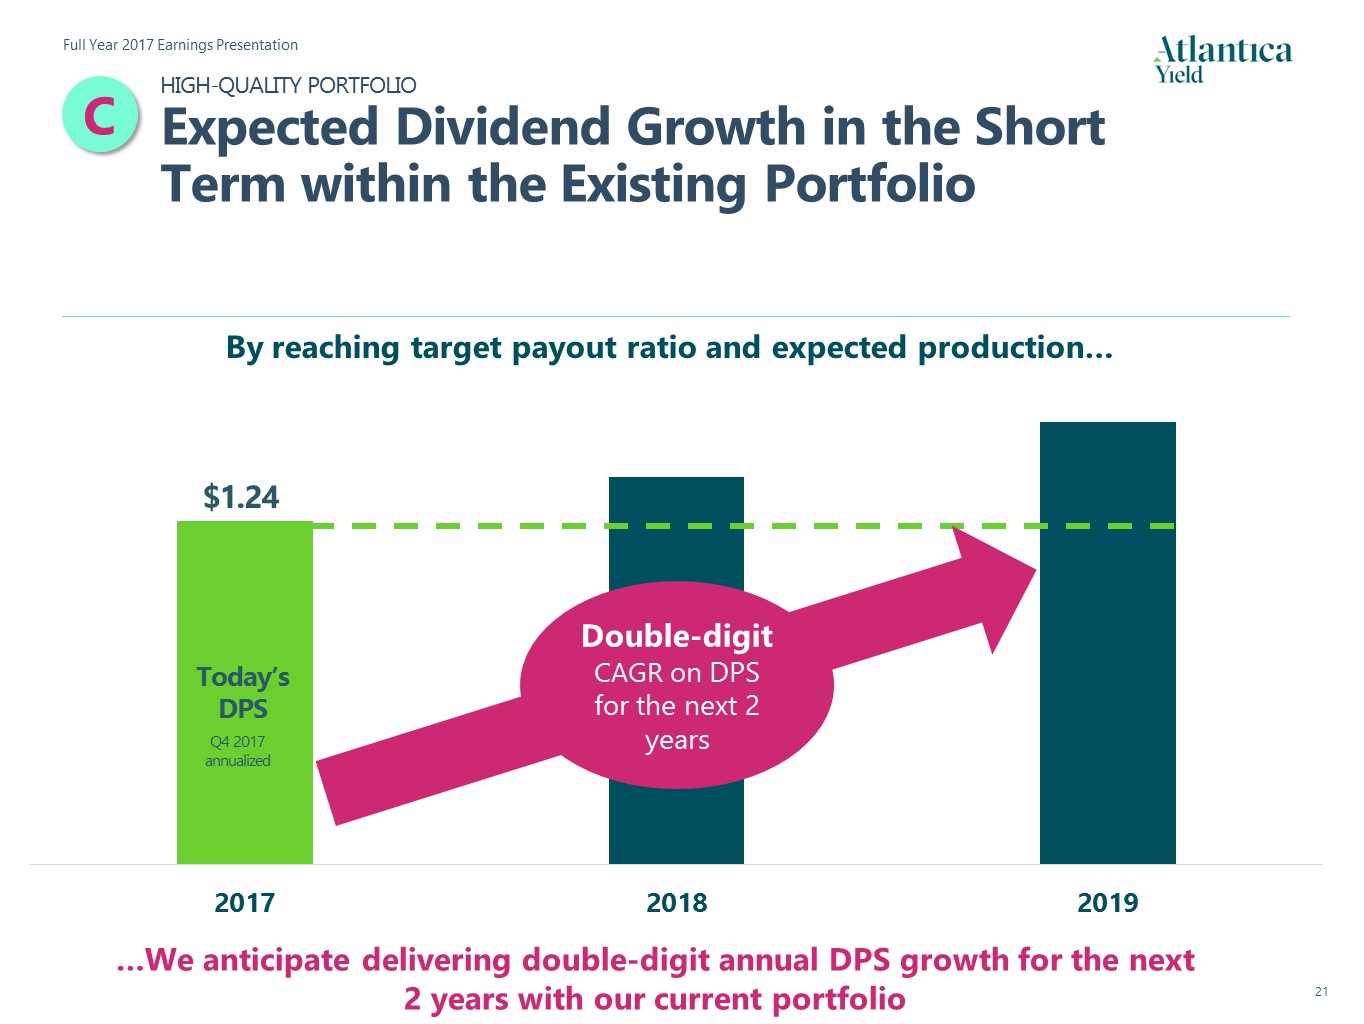
By reaching target payout ratio and expected production… $1.24 Q4 2017 annualized Double-digit CAGR on DPS for the next 2 years Today’s DPS …We anticipate delivering double-digit annual DPS growth for the next 2 years with our current portfolio C HIGH-QUALITY PORTFOLIOExpected Dividend Growth in the Short Term within the Existing Portfolio
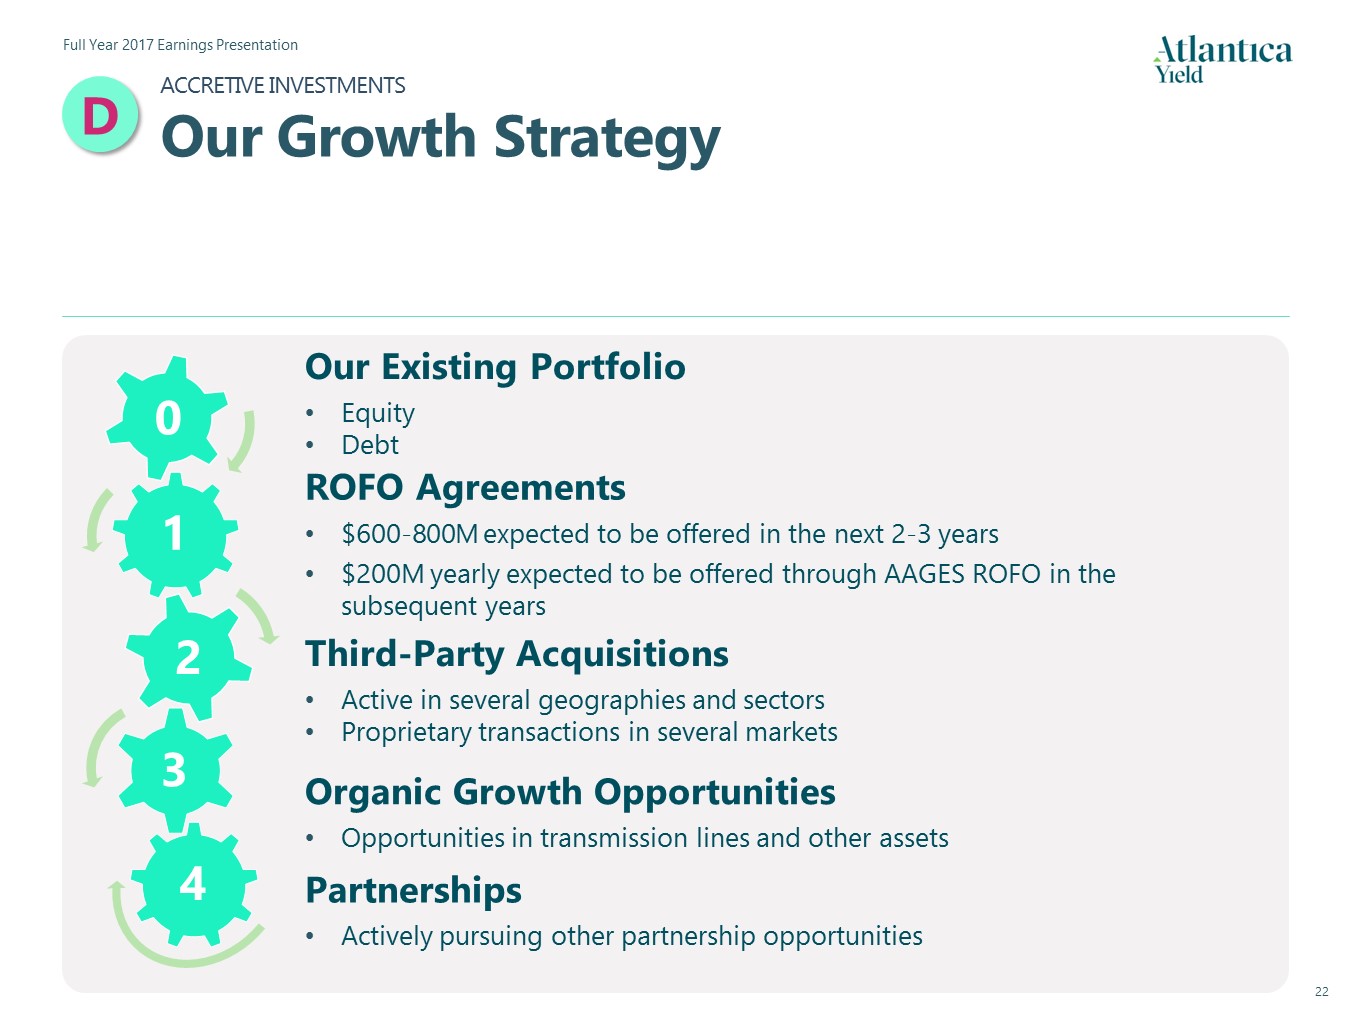
ROFO Agreements$600-800M expected to be offered in the next 2-3 years$200M yearly expected to be offered through AAGES ROFO in the subsequent years PartnershipsActively pursuing other partnership opportunities Third-Party AcquisitionsActive in several geographies and sectorsProprietary transactions in several markets 1 Organic Growth Opportunities Opportunities in transmission lines and other assets D ACCRETIVE INVESTMENTSOur Growth Strategy 0 Our Existing PortfolioEquityDebt
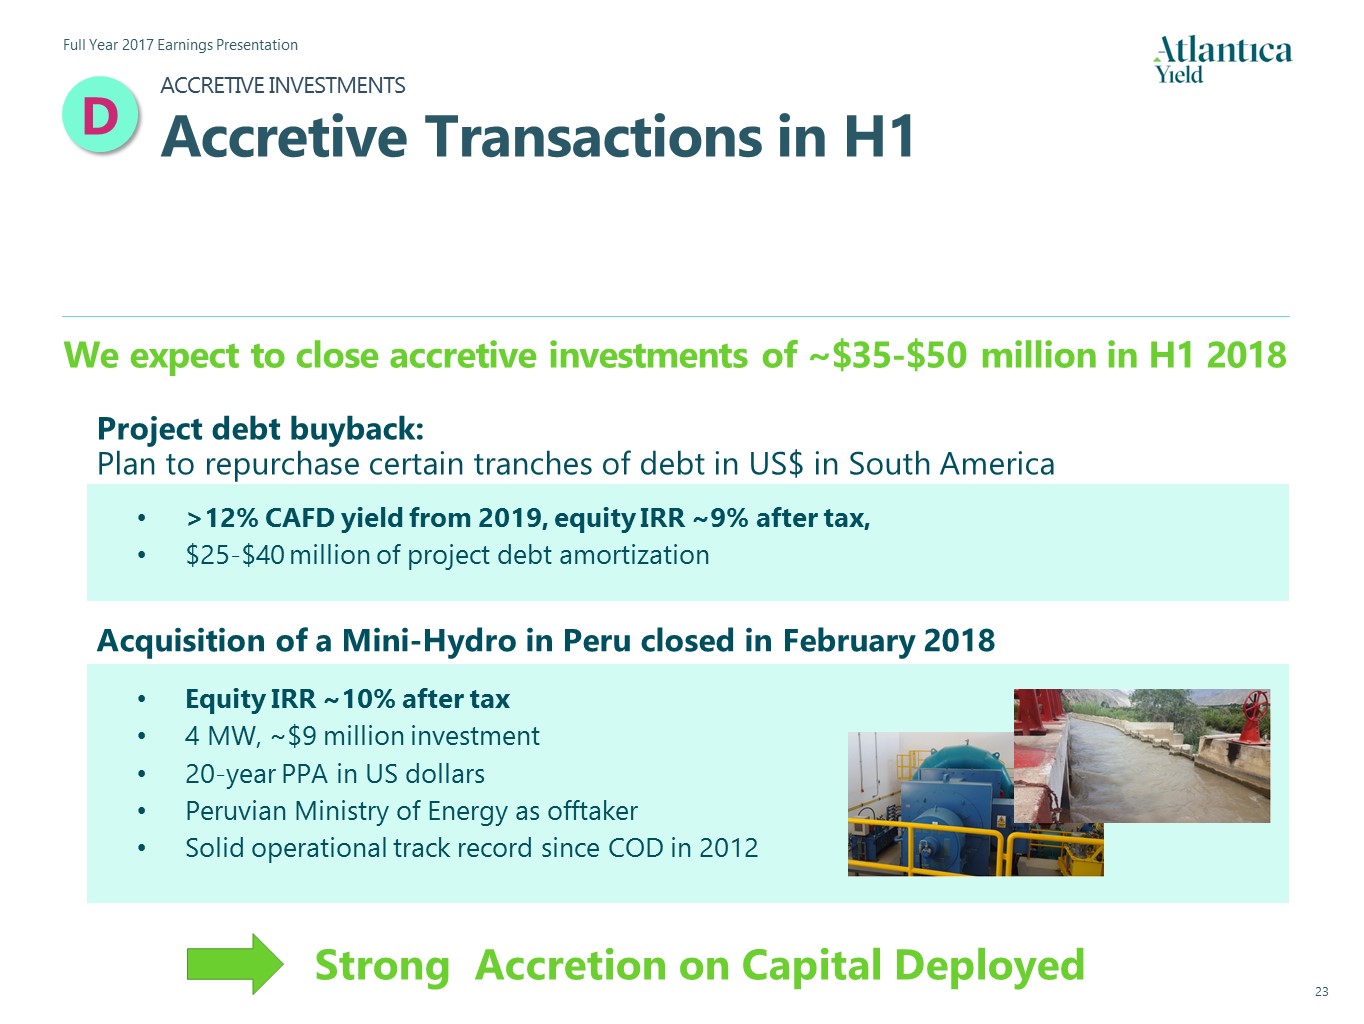
Acquisition of a Mini-Hydro in Peru closed in February 2018 Project debt buyback: Plan to repurchase certain tranches of debt in US$ in South America Equity IRR ~10% after tax4 MW, ~$9 million investment20-year PPA in US dollarsPeruvian Ministry of Energy as offtakerSolid operational track record since COD in 2012 >12% CAFD yield from 2019, equity IRR ~9% after tax, $25-$40 million of project debt amortization Strong Accretion on Capital Deployed D ACCRETIVE INVESTMENTSAccretive Transactions in H1 We expect to close accretive investments of ~$35-$50 million in H1 2018

We cannot assure you that AAGES, Algonquin or Abengoa Will offer us assets under the ROFO Agreements that fit within our portfolio of assets or contribute to our growth strategy on favorable terms or at allCurrently owned by EIG Total equity value expected to be offered by AAGES of $200 million per year ROFO Pipeline 2018-20201 Onwards D ACCRETIVE INVESTMENTSROFO Pipeline Project Potential stake Country Technology Capacity Estimated COD Vista Ridge (SAWS) 20% USA Water Transportation 50,000 acre-feet/year 2020 A3T 100% Mexico Cogeneration 220 MW 2019 ATN3 100% Peru 220 kV Transmission Line 221 miles 2020 Cerro Dominador (Atacama)2 100% Chile Solar 210 MW 2019 Xina 40% South Africa Solar 100 MW In operation Khi 51% South Africa Solar 50 MW In operation

D ACCRETIVE INVESTMENTSAccretive Investments Are Expected to Deliver Sustainable DPS Growth in the Next 5 Years Q4 2017 annualized 2022 DPS target Existing portfolio growth 2017 2022 Accretive Investments 8 -10%CAGR Capital available for investmentsCurrent liquidity on hand20% of yearly CAFDPossibility to use of corporate debt and/or capital increases while maintaining always the internal corporate leverage ratio of <3x times Accretive investments opportunitiesROFO pipeline and other growth opportunitiesOur existing portfolio $1.24 Today’s DPS

3. Q&A
Appendix
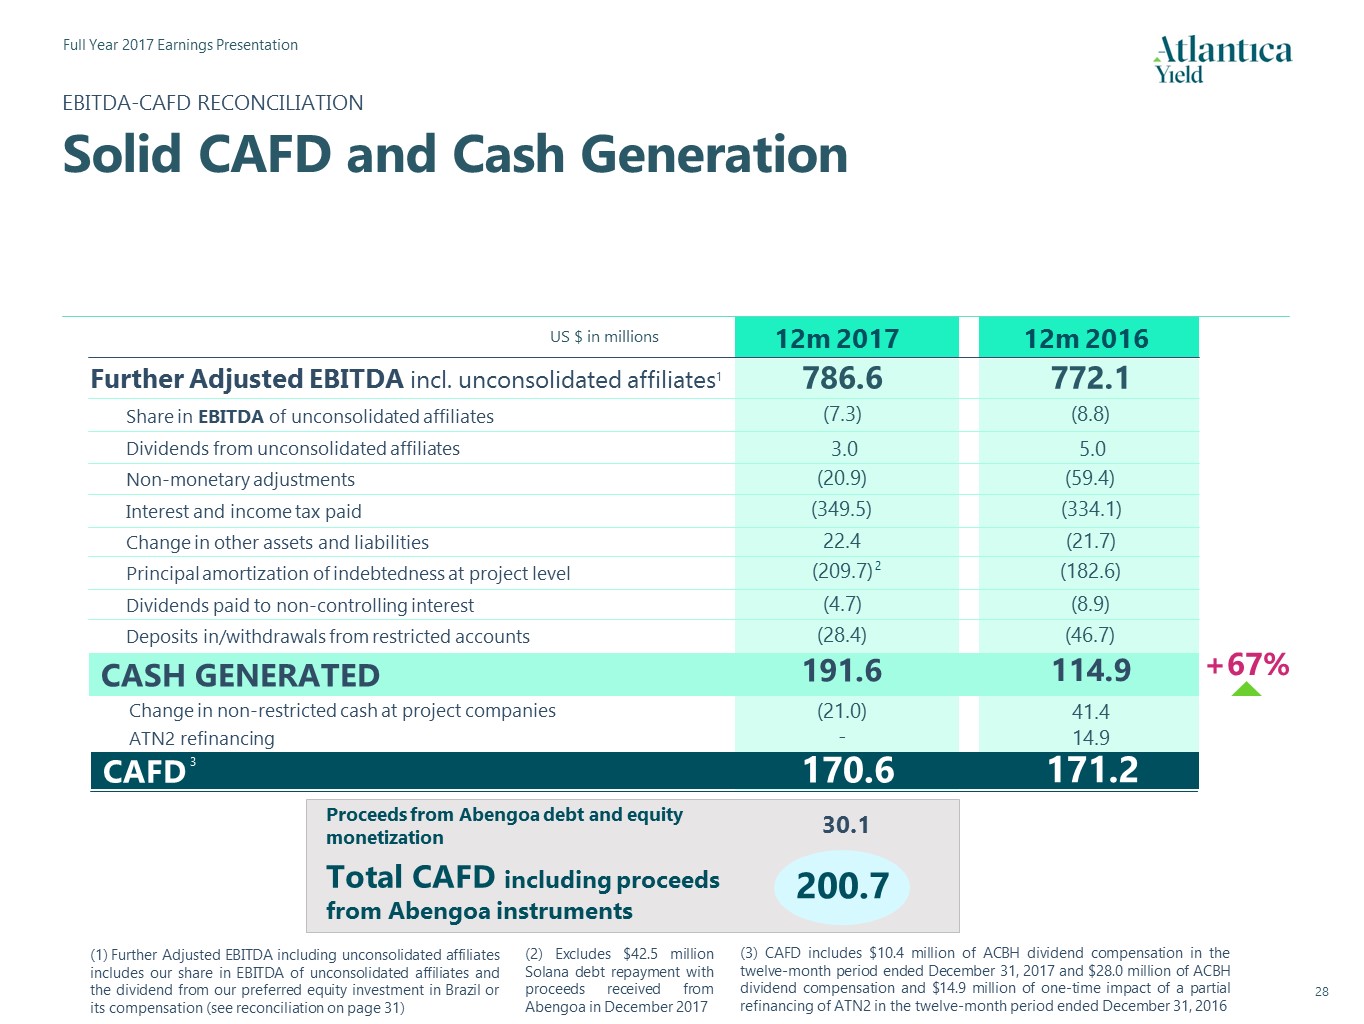
EBITDA-CAFD RECONCILIATIONSolid CAFD and Cash Generation ATN2 refinancing CASH GENERATED US $ in millions 12m 2017 12m 2016 (8.8) (7.3) Share in EBITDA of unconsolidated affiliates Interest and income tax paid Change in other assets and liabilities Principal amortization of indebtedness at project level Further Adjusted EBITDA incl. unconsolidated affiliates1 772.1 786.6 (334.1) (349.5) (21.7) 22.4 (182.6) (209.7) 114.9 191.6 14.9 - Dividends paid to non-controlling interest (8.9) (4.7) (59.4) (20.9) Non-monetary adjustments Change in non-restricted cash at project companies 41.4 (21.0) CAFD 171.2 170.6 Further Adjusted EBITDA including unconsolidated affiliates includes our share in EBITDA of unconsolidated affiliates and the dividend from our preferred equity investment in Brazil or its compensation (see reconciliation on page 31) (3) CAFD includes $10.4 million of ACBH dividend compensation in the twelve-month period ended December 31, 2017 and $28.0 million of ACBH dividend compensation and $14.9 million of one-time impact of a partial refinancing of ATN2 in the twelve-month period ended December 31, 2016 3 5.0 3.0 Dividends from unconsolidated affiliates Deposits in/withdrawals from restricted accounts (46.7) (28.4) 200.7 Total CAFD including proceeds from Abengoa instruments 30.1 Proceeds from Abengoa debt and equity monetization +67% 2 (2) Excludes $42.5 million Solana debt repayment with proceeds received from Abengoa in December 2017

12m 2017 12m 2016 6.5 6.9 (4.9) (111.8) 1.7 119.8 (6.6) 405.7 448.4 332.9 310.9 8.8 7.3 (5.3) Q4 2017 RECONCILIATIONReconciliation of Further Adjusted EBITDA including unconsolidated affiliates to Profit/(loss) for the period US $ in millions Profit/(loss) for the period attributable to the Company Profit/(loss) attributable to non-controlling interest Income tax Share of loss/(profit) of associates carried under the equity method Financial expense, net 786.6 772.1 Further Adjusted EBITDAincl. unconsolidated affiliates 402.4 458.0 Operating Profit Depreciation, amortization, and impairment charges Atlantica Yield’s pro-rata share of EBITDA from unconsolidated affiliates Further Adjusted EBITDA 763.3 779.3 27.9 10.4 Dividend from exchangeable preferred equity investment in ACBH or its compensation

HISTORICAL FINANCIAL REVIEWKey Financials by Quarter FY 2015 1Q16 2Q16 3Q16 4Q16 FY 2016 1Q17 2Q17 3Q17 4Q17 FY 2017 Revenues 790,881 206,376 261,302 295,272 208,847 971,797 198,146 285,069 291,964 233,202 1,008,381 F.A. EBITDA margin (%) 80.5% 75.0% 79.5% 89.5% 69.6% 79.5% 83.3% 79.9% 80.9% 67.5% 78.0% Further Adj. EBITDA incl. unconsolidated affiliates 636,510 154,879 207,645 264,262 145,326 772,112 165,049 227,841 236,252 157,433 786,575 Atlantica Yield’s pro-rata share of EBITDA from unconsolidated affiliates (12,291) (2,332) (2,193) (2,157) (2,120) (8,802) (1,100) (2,064) (2,052) (2,049) (7,265) Further Adjusted EBITDA 624,219 152,547 205,452 262,105 143,206 763,310 163,949 225,777 234,200 155,384 779,310 Dividends from unconsolidated affiliates 4,417 - 4,984 - - 4,984 - - 2,454 549 3,003 Non-monetary items (91,410) (18,356) (12,563) (11,508) (16,948) (59,375) (12,025) (10.758) (13,005) 14,906 (20,882) Interest and income tax paid (310,234) (27,613) (137,371) (27,183) (141,890) (334,057) (26,610) (143,081) (28,976) (150,866) (349,533) Principal amortization of indebtedness net of new indebtedness at project level (175,389) (14,254) (53,851) (18,792) (95,739) (182,636) (21,522) (54,528) (20,330) (113,362)* (209,742) * Deposits into/withdrawals from debt service accounts (16,837) (34,155) 12,291 (43,027) 18,186 (46,705) 7,557 (8,157) (26,581) (1,205) (28,386) Change in non-restricted cash at project companies 72,217 (41,089) 59,969 (90,385) 112,918 41,413 (27,293) 66,886 (143,982) 83,397 (20,992) Dividends paid to non-controlling interests (8,307) - (5,479) (3,473) - (8,952) - (1,801) (2,837) - (4,638) Changes in other assets and liabilities 79,821 (13,237) (33,824) (13,957) 39,325 (21,694) (23,184) (39,756) 35,747 49,621 22,428 Asset refinancing - 14,893 - - - 14,893 - - - - - Cash Available For Distribution (CAFD) 178,496 18,736. . 39,607 53,780 . 59,058 171,181 60,872 34,582 36,690 38,424 170,568 Dividends declared1 117,254 - 29,063 16,335 25,054 70,452 25,054 26,056 29,063 31,067 111,241 # of shares at the end of the period 100,217,260 100,217,260 100,217,260 100,217,260 100,217,260 100,217,260 100,217,260 100,217,260 100,217,260 100,217,260 100,217,260 DPS (in $ per share) 1.170 - 0.290 0.163 0.250 0.703 0.250 0.260 0.290 0.310 1.110 Project debt 5,470.7 5,666.8 5,512.1 5,612.9 5,330.5 5,330.5 5,410.3 5,474.1 5,579.5 5,475.2 5,475.2 Project cash (469.2) (529.4) (469.7) (587.6) (472.6) (472.6) (487.4) (435.4) (597.0) (520.9) (520.9) Net project debt 5,001.5 5,137.4 5,042.4 5,025.3 4,857.9 4,857.9 4,922.9 5,038.7 4,982.5 4,954.3 4,954.3 Corporate debt 664.5 669.9 666.3 671.6 668.2 668.2 667.9 684.6 700.9 643.1 643.1 Corporate cash (45.5) (45.4) (84.9) (85.8) (122.2) (122.2) (102.0) (178.9) (197.1) (148.5) (148.5) Net corporate debt 619.0 624.5 581.4 585.8 546.0 546.0 565.9 505.7 503.8 494.6 494.6 Total net debt 5,620.5 5,761.9 5,623.8 5,611.2 5,403.8 5,403.8 5,488.8 5,544.4 5,486.3 5,448.9 5,448.9 Net Corporate Debt/CAFD pre corporate interests2 2.9x 2.9x 2.7x 2.7x 2.7x 2.7x 2.6x 2.3x 2.3x 2.3x 2.3x Dividends are paid to shareholders in the quarter after they are declaredRatios presented are the ratios shown on each earnings presentationsIncludes the impact of a one-time partial refinancing of ATN2 Debt details Key Financials US $ in thousands US $ in millions (3) Dividend declared on August 3 2016 is the sum of $0.145 per share corresponding to the first quarter of 2016 and $0.145 per share corresponding to the second quarter of 2016 (4) (5) (5) (5) (5) Includes compensation from our preferred equity investment in Brazil ($21.2M in Q3 2016, $6.8M in Q4 2016 and $10.4M in Q1 2017)(6) Excludes $42.5 million Solana debt repayment with proceeds received from Abengoa in December 2017 (6) (6)
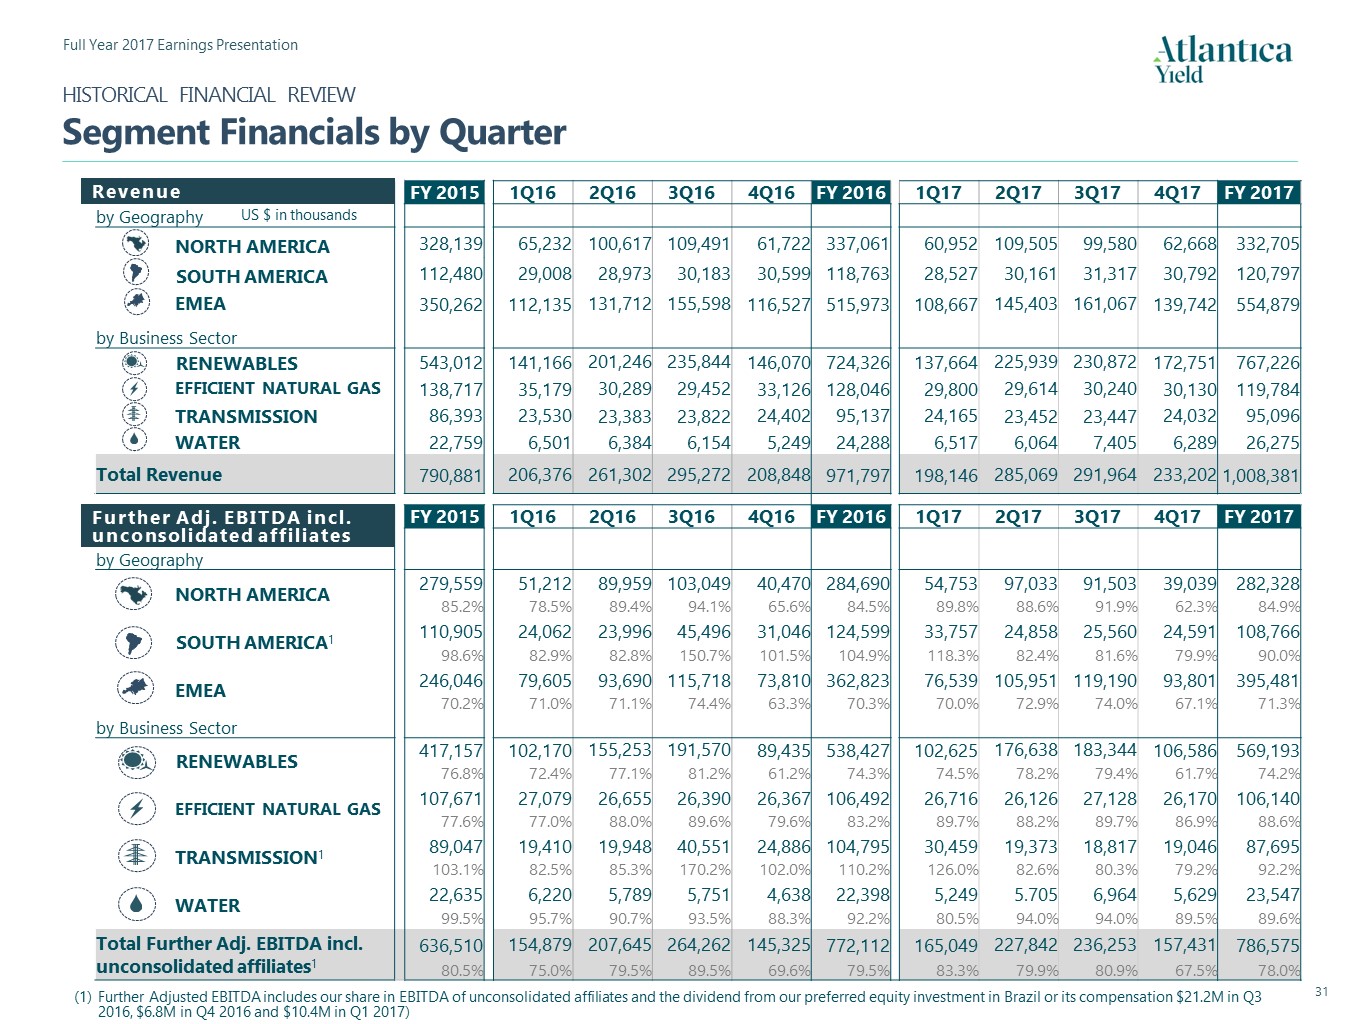
HISTORICAL FINANCIAL REVIEWSegment Financials by Quarter FY 2015 1Q16 2Q16 3Q16 4Q16 FY 2016 1Q17 2Q17 3Q17 4Q17 FY 2017 by Geography NORTH AMERICA 328,139 65,232 100,617 109,491 61,722 337,061 60,952 109,505 99,580 62,668 332,705 SOUTH AMERICA 112,480 29,008 28,973 30,183 30,599 118,763 28,527 30,161 31,317 30,792 120,797 EMEA 350,262 112,135 131,712 155,598 116,527 515,973 108,667 145,403 161,067 139,742 554,879 by Business Sector RENEWABLES 543,012 141,166 201,246 235,844 146,070 724,326 137,664 225,939 230,872 172,751 767,226 EFFICIENT NATURAL GAS 138,717 35,179 30,289 29,452 33,126 128,046 29,800 29,614 30,240 30,130 119,784 TRANSMISSION 86,393 23,530 23,383 23,822 24,402 95,137 24,165 23,452 23,447 24,032 95,096 WATER 22,759 6,501 6,384 6,154 5,249 24,288 6,517 6,064 7,405 6,289 26,275 Total Revenue 790,881 206,376 261,302 295,272 208,848 971,797 198,146 285,069 291,964 233,202 1,008,381 FY 2015 1Q16 2Q16 3Q16 4Q16 FY 2016 1Q17 2Q17 3Q17 4Q17 FY 2017 by Geography NORTH AMERICA 279,559 51,212 89,959 103,049 40,470 284,690 54,753 97,033 91,503 39,039 282,328 85.2% 78.5% 89.4% 94.1% 65.6% 84.5% 89.8% 88.6% 91.9% 62.3% 84.9% SOUTH AMERICA1 110,905 24,062 23,996 45,496 31,046 124,599 33,757 24,858 25,560 24,591 108,766 98.6% 82.9% 82.8% 150.7% 101.5% 104.9% 118.3% 82.4% 81.6% 79.9% 90.0% EMEA 246,046 79,605 93,690 115,718 73,810 362,823 76,539 105,951 119,190 93,801 395,481 70.2% 71.0% 71.1% 74.4% 63.3% 70.3% 70.0% 72.9% 74.0% 67.1% 71.3% by Business Sector RENEWABLES 417,157 102,170 155,253 191,570 89,435 538,427 102,625 176,638 183,344 106,586 569,193 76.8% 72.4% 77.1% 81.2% 61.2% 74.3% 74.5% 78.2% 79.4% 61.7% 74.2% EFFICIENT NATURAL GAS 107,671 27,079 26,655 26,390 26,367 106,492 26,716 26,126 27,128 26,170 106,140 77.6% 77.0% 88.0% 89.6% 79.6% 83.2% 89.7% 88.2% 89.7% 86.9% 88.6% TRANSMISSION1 89,047 19,410 19,948 40,551 24,886 104,795 30,459 19,373 18,817 19,046 87,695 103.1% 82.5% 85.3% 170.2% 102.0% 110.2% 126.0% 82.6% 80.3% 79.2% 92.2% WATER 22,635 6,220 5,789 5,751 4,638 22,398 5,249 5.705 6,964 5,629 23,547 99.5% 95.7% 90.7% 93.5% 88.3% 92.2% 80.5% 94.0% 94.0% 89.5% 89.6% Total Further Adj. EBITDA incl. unconsolidated affiliates1 636,510 154,879 207,645 264,262 145,325 772,112 165,049 227,842 236,253 157,431 786,575 80.5% 75.0% 79.5% 89.5% 69.6% 79.5% 83.3% 79.9% 80.9% 67.5% 78.0% US $ in thousands Revenue Further Adj. EBITDA incl. unconsolidated affiliates Further Adjusted EBITDA includes our share in EBITDA of unconsolidated affiliates and the dividend from our preferred equity investment in Brazil or its compensation $21.2M in Q3 2016, $6.8M in Q4 2016 and $10.4M in Q1 2017)
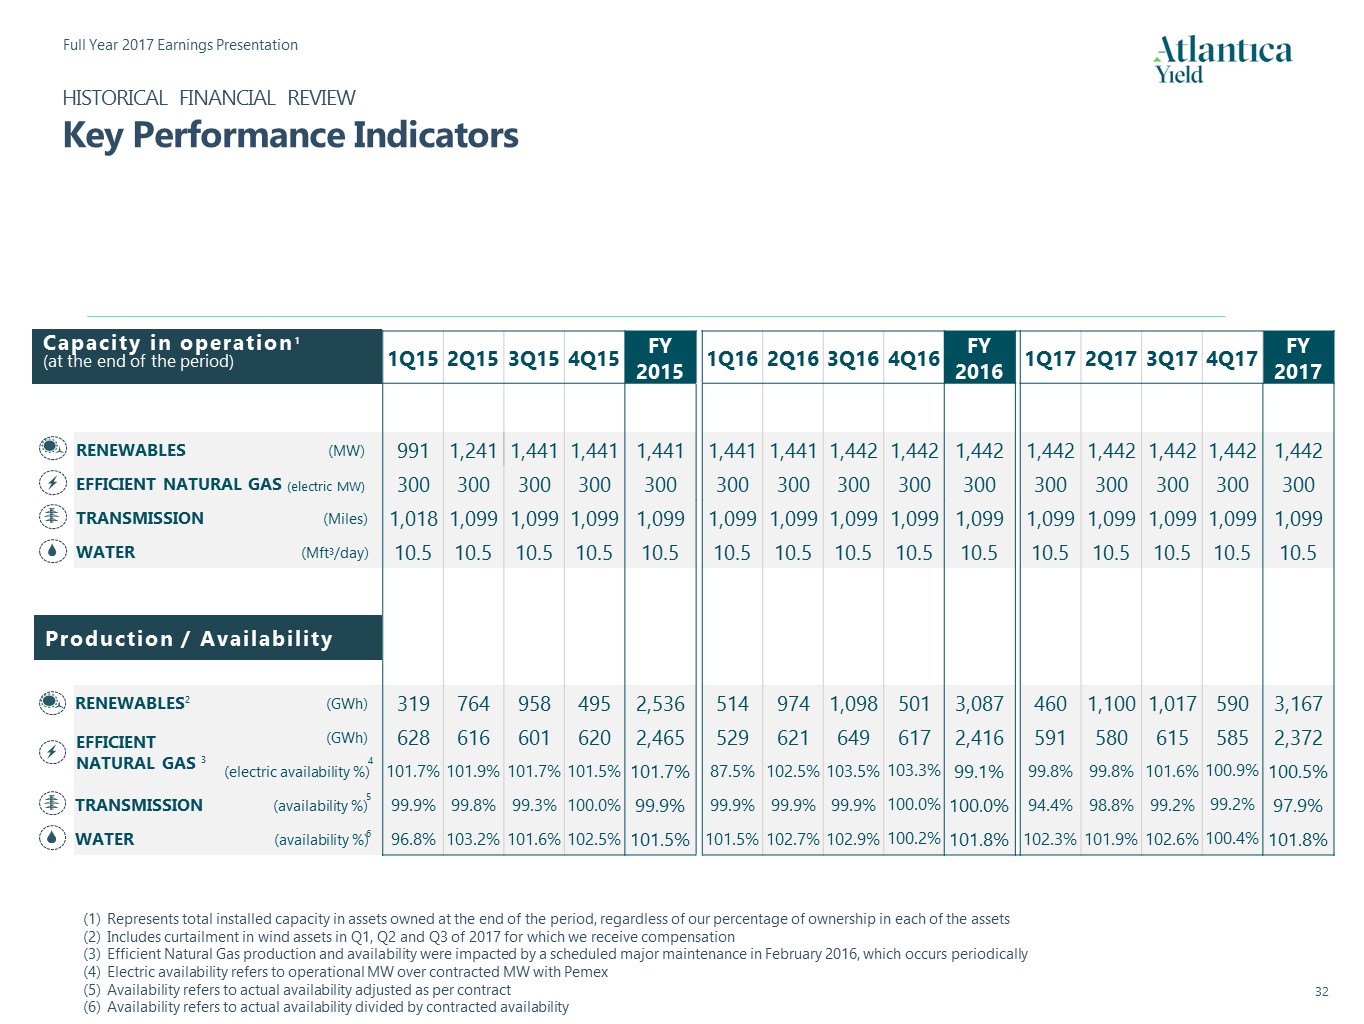
1Q15 2Q15 3Q15 4Q15 FY 2015 1Q16 2Q16 3Q16 4Q16 FY 2016 1Q17 2Q17 3Q17 4Q17 FY 2017 RENEWABLES (MW) 991 1,241 1,441 1,441 1,441 1,441 1,441 1,442 1,442 1,442 1,442 1,442 1,442 1,442 1,442 EFFICIENT NATURAL GAS (electric MW) 300 300 300 300 300 300 300 300 300 300 300 300 300 300 300 TRANSMISSION (Miles) 1,018 1,099 1,099 1,099 1,099 1,099 1,099 1,099 1,099 1,099 1,099 1,099 1,099 1,099 1,099 WATER (Mft3/day) 10.5 10.5 10.5 10.5 10.5 10.5 10.5 10.5 10.5 10.5 10.5 10.5 10.5 10.5 10.5 RENEWABLES2 (GWh) 319 764 958 495 2,536 514 974 1,098 501 3,087 460 1,100 1,017 590 3,167 (GWh) 628 616 601 620 2,465 529 621 649 617 2,416 591 580 615 585 2,372 (electric availability %) 101.7% 101.9% 101.7% 101.5% 101.7% 87.5% 102.5% 103.5% 103.3% 99.1% 99.8% 99.8% 101.6% 100.9% 100.5% TRANSMISSION (availability %) 99.9% 99.8% 99.3% 100.0% 99.9% 99.9% 99.9% 99.9% 100.0% 100.0% 94.4% 98.8% 99.2% 99.2% 97.9% WATER (availability %) 96.8% 103.2% 101.6% 102.5% 101.5% 101.5% 102.7% 102.9% 100.2% 101.8% 102.3% 101.9% 102.6% 100.4% 101.8% EFFICIENT NATURAL GAS 3 Capacity in operation1(at the end of the period) Production / Availability HISTORICAL FINANCIAL REVIEWKey Performance Indicators 4 5 6 Represents total installed capacity in assets owned at the end of the period, regardless of our percentage of ownership in each of the assetsIncludes curtailment in wind assets in Q1, Q2 and Q3 of 2017 for which we receive compensationEfficient Natural Gas production and availability were impacted by a scheduled major maintenance in February 2016, which occurs periodicallyElectric availability refers to operational MW over contracted MW with PemexAvailability refers to actual availability adjusted as per contractAvailability refers to actual availability divided by contracted availability

1Q15 2Q15 3Q15 4Q15 FY 2015 1Q16 2Q16 3Q16 4Q16 FY 2016 1Q17 2Q17 3Q17 4Q17 FY 2017 US 14.3% 33.7% 34.5% 17.1% 24.9% 17.3% 36.4% 33.5% 16.0% 25.8% 18.1% 41.9% 29.5% 18.2% 27.0% Spain 15.1% 30.6% 31.3% 8.6% 21.0% 9.5% 27.0% 35.4% 9.9% 20.4% 10.0% 31.0% 33.4% 12.6% 21.8% Kaxu 26.0% 31.1% 29.3%2 42.2% 25.8% 33.2% 34.3% 33.9% 15.9% 20.9% 21.4% 41.1% 24.9% WIND3 Uruguay 27.3% 34.4% 41.9% 39.3% 35.8% 31.6% 32.2% 35.9% 34.9% 33.7% 27.8% 36.1% 46.1% 37.7% 37.0% SOLAR Historical Capacity Factors1 HISTORICAL FINANCIAL REVIEWCapacity Factors Historical Capacity Factors calculated from the date of entry into operation or the acquisition of each asset. Some capacity factors are not indicative of a full period of operationsAverage capacity factor in Kaxu for 2015 calculated from August 1, 2015 Includes curtailment production in wind assets for which we receive compensation
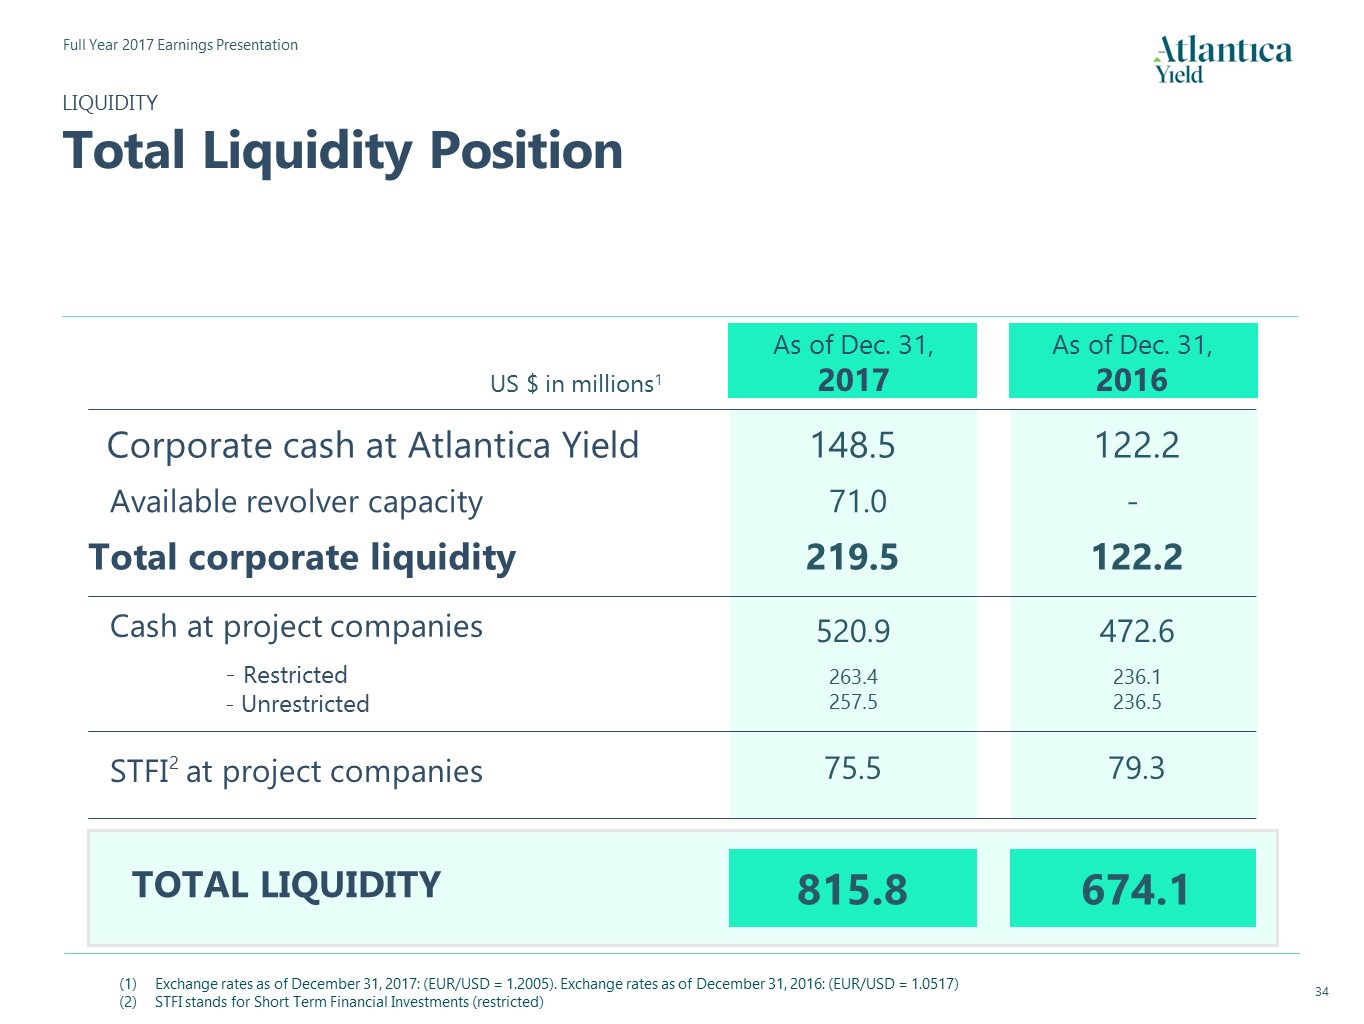
LIQUIDITYTotal Liquidity Position US $ in millions1 Cash at project companies - Restricted - Unrestricted STFI2 at project companies 520.9 263.4257.5 As of Dec. 31,2017 75.5 TOTAL LIQUIDITY 472.6 236.1236.5 As of Dec. 31,2016 79.3 815.8 674.1 Corporate cash at Atlantica Yield 148.5 122.2 71.0 - Available revolver capacity Total corporate liquidity 219.5 122.2 Exchange rates as of December 31, 2017: (EUR/USD = 1.2005). Exchange rates as of December 31, 2016: (EUR/USD = 1.0517)STFI stands for Short Term Financial Investments (restricted)
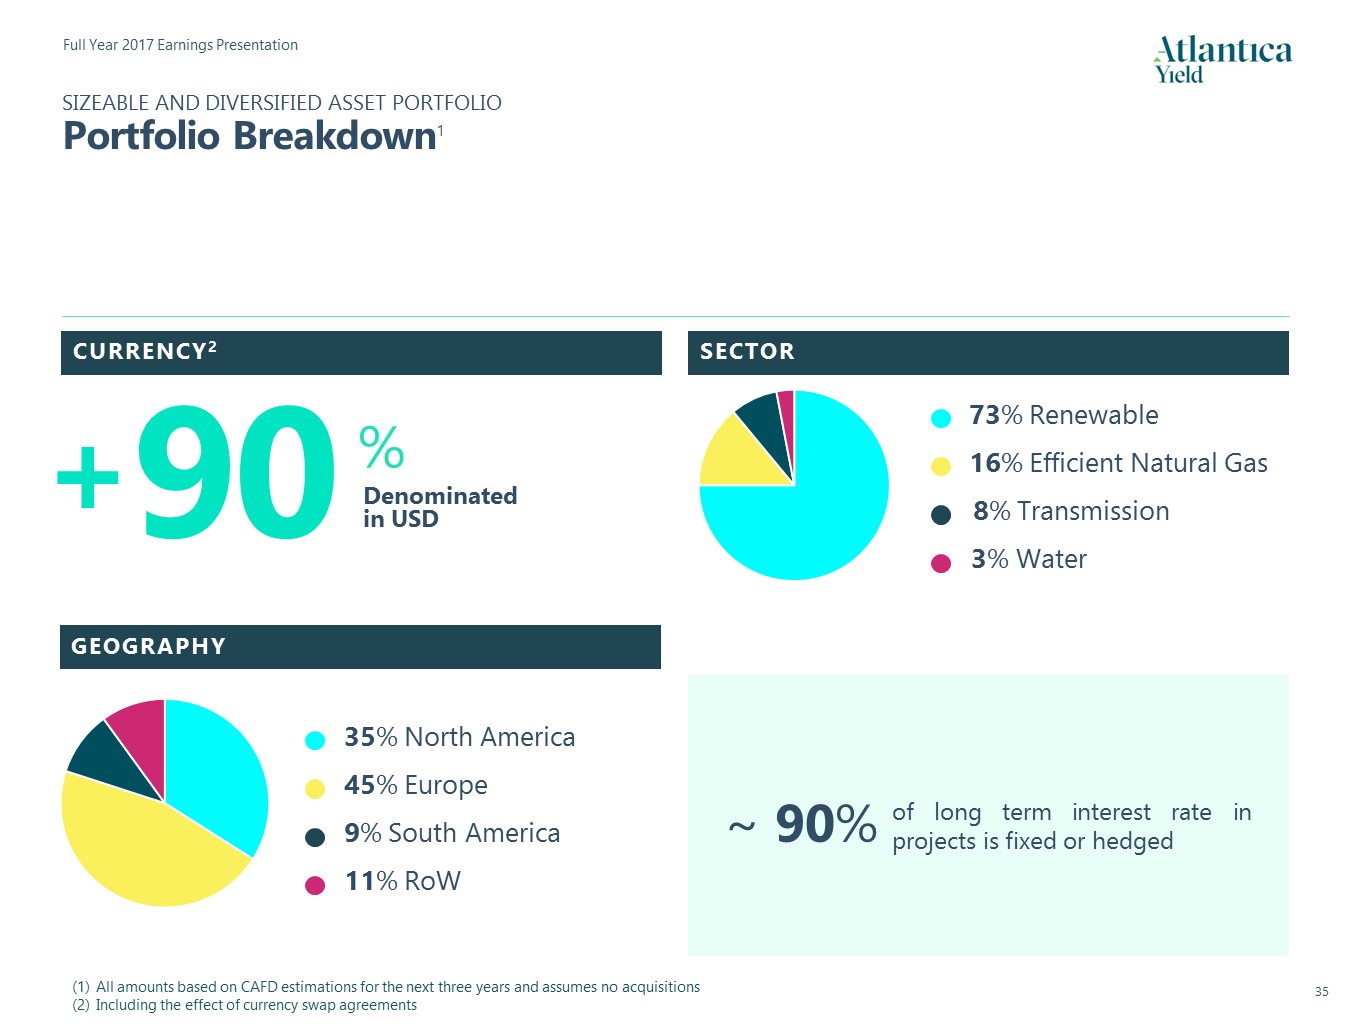
SIZEABLE AND DIVERSIFIED ASSET PORTFOLIOPortfolio Breakdown1 CURRENCY2 SECTOR GEOGRAPHY All amounts based on CAFD estimations for the next three years and assumes no acquisitions Including the effect of currency swap agreements of long term interest rate in projects is fixed or hedged ~ 90% 90 Denominatedin USD % 35% North America45% Europe9% South America11% RoW 73% Renewable16% Efficient Natural Gas 8% Transmission 3% Water +
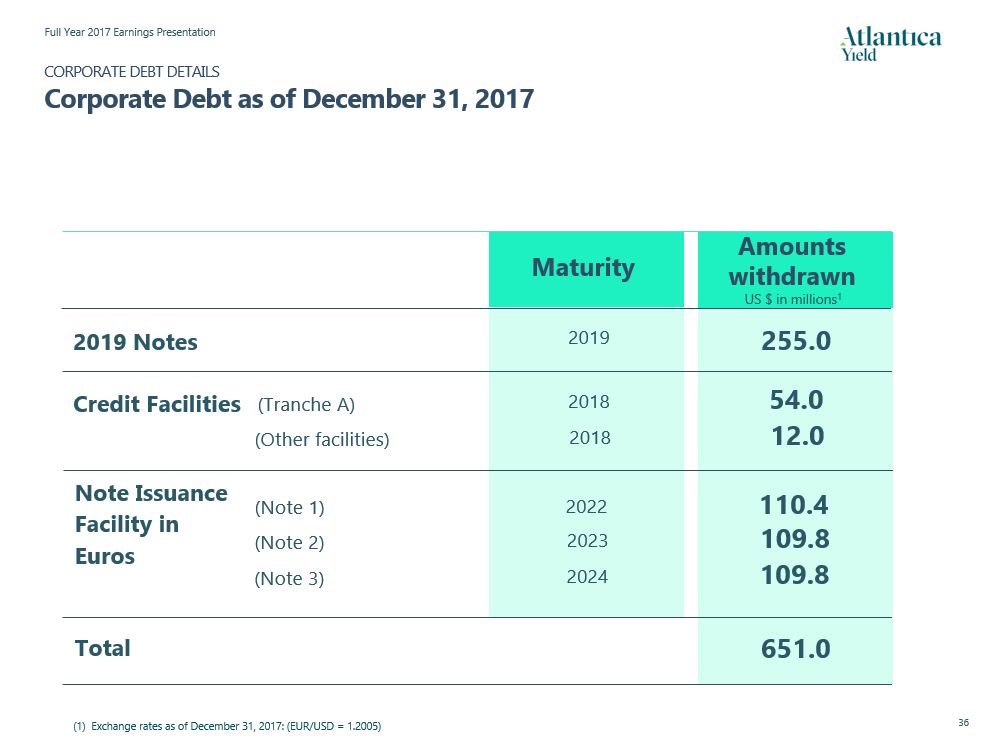
US $ in millions1 2019 Notes Credit Facilities Maturity 2019 Amounts withdrawn 255.0 Total 706.9 2018 57.0 CORPORATE DEBT DETAILSCorporate Debt as of December 31, 2017 Note Issuance Facility in Euros (Note 1) (Note 2) (Note 3) 2022 108.7 2023 108.1 2024 108.1 (1) Exchange rates as of December 31, 2017: (EUR/USD = 1.2005) 2018 12.0 (Other facilities) (Tranche A)
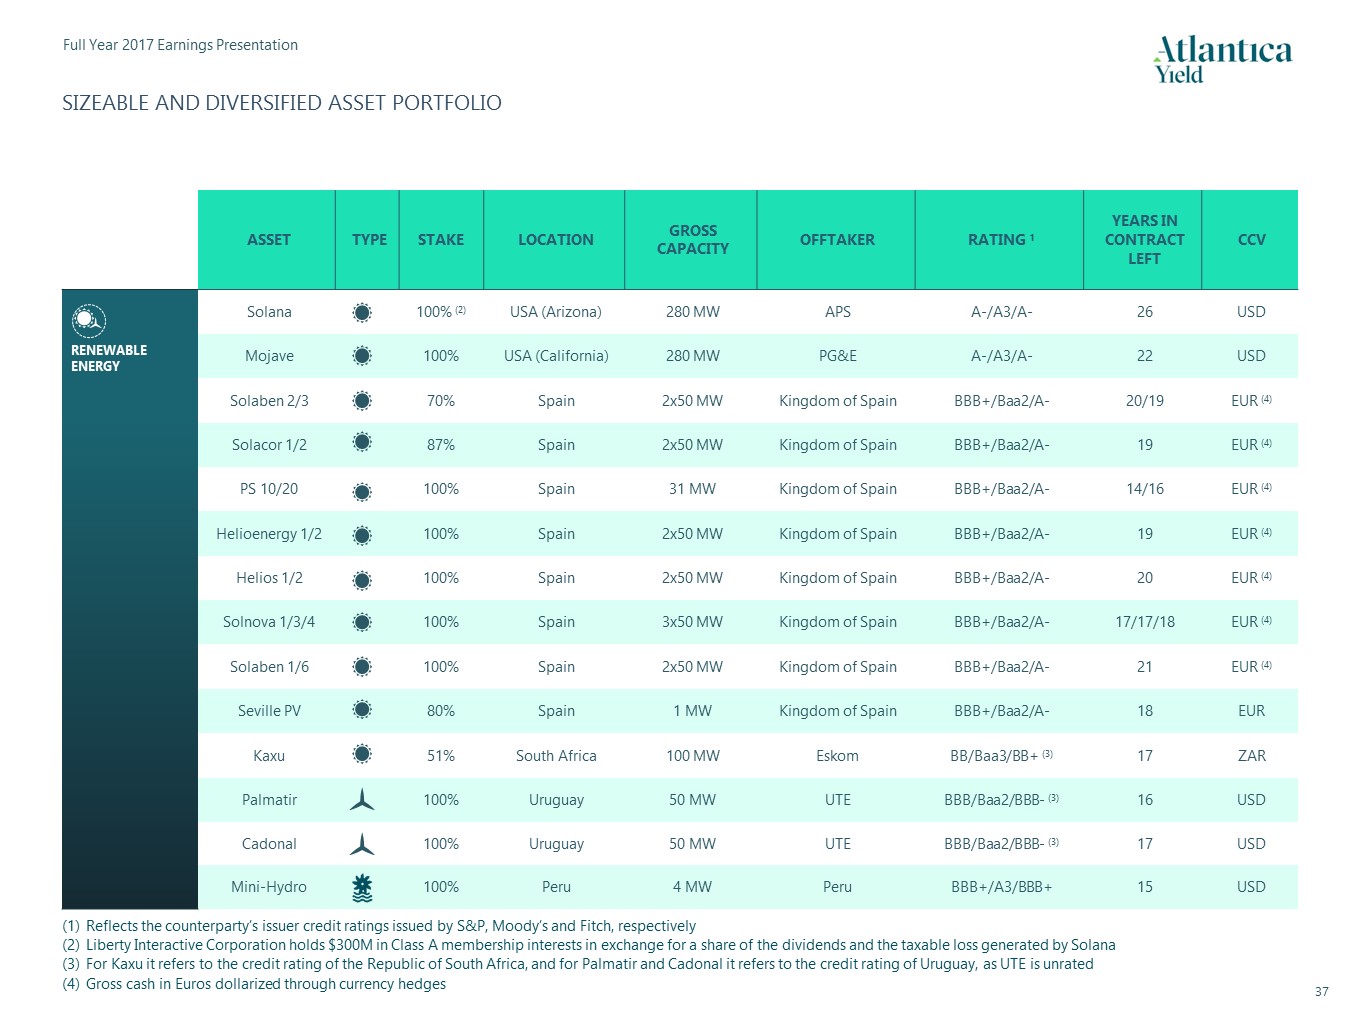
SIZEABLE AND DIVERSIFIED ASSET PORTFOLIO ASSET TYPE STAKE LOCATION GROSSCAPACITY OFFTAKER RATING 1 YEARS INCONTRACT LEFT CCV RENEWABLE ENERGY Solana 100% (2) USA (Arizona) 280 MW APS A-/A3/A- 26 USD Mojave 100% USA (California) 280 MW PG&E A-/A3/A- 22 USD Solaben 2/3 70% Spain 2x50 MW Kingdom of Spain BBB+/Baa2/A- 20/19 EUR (4) Solacor 1/2 87% Spain 2x50 MW Kingdom of Spain BBB+/Baa2/A- 19 EUR (4) PS 10/20 100% Spain 31 MW Kingdom of Spain BBB+/Baa2/A- 14/16 EUR (4) Helioenergy 1/2 100% Spain 2x50 MW Kingdom of Spain BBB+/Baa2/A- 19 EUR (4) Helios 1/2 100% Spain 2x50 MW Kingdom of Spain BBB+/Baa2/A- 20 EUR (4) Solnova 1/3/4 100% Spain 3x50 MW Kingdom of Spain BBB+/Baa2/A- 17/17/18 EUR (4) Solaben 1/6 100% Spain 2x50 MW Kingdom of Spain BBB+/Baa2/A- 21 EUR (4) Seville PV 80% Spain 1 MW Kingdom of Spain BBB+/Baa2/A- 18 EUR Kaxu 51% South Africa 100 MW Eskom BB/Baa3/BB+ (3) 17 ZAR Palmatir 100% Uruguay 50 MW UTE BBB/Baa2/BBB- (3) 16 USD Cadonal 100% Uruguay 50 MW UTE BBB/Baa2/BBB- (3) 17 USD Mini-Hydro 100% Peru 4 MW Peru BBB+/A3/BBB+ 15 USD Reflects the counterparty’s issuer credit ratings issued by S&P, Moody’s and Fitch, respectivelyLiberty Interactive Corporation holds $300M in Class A membership interests in exchange for a share of the dividends and the taxable loss generated by SolanaFor Kaxu it refers to the credit rating of the Republic of South Africa, and for Palmatir and Cadonal it refers to the credit rating of Uruguay, as UTE is unratedGross cash in Euros dollarized through currency hedges
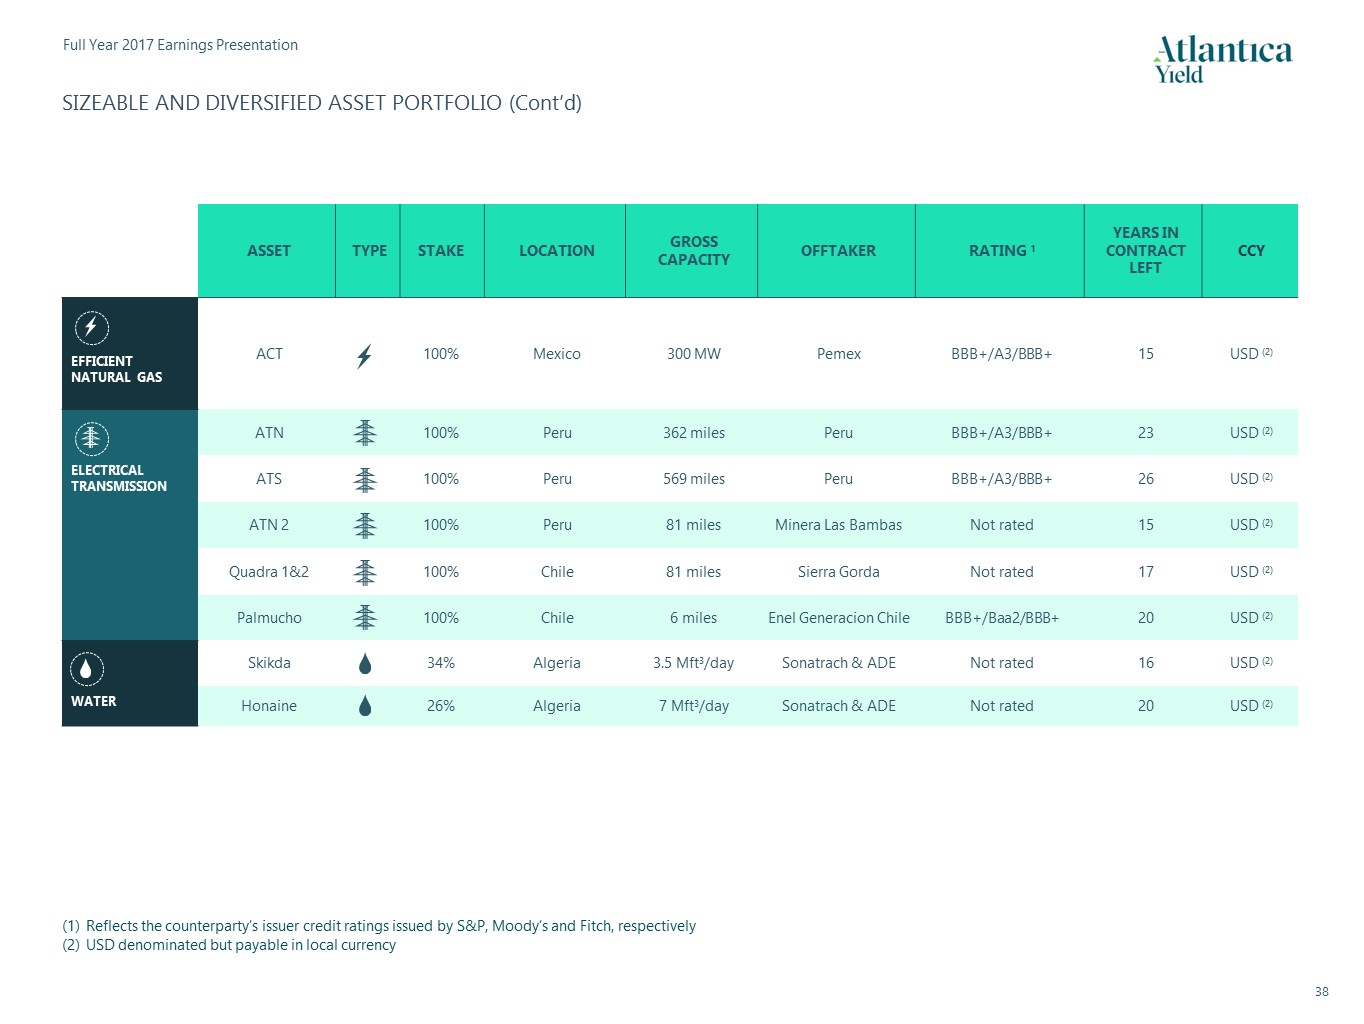
SIZEABLE AND DIVERSIFIED ASSET PORTFOLIO (Cont’d) ASSET TYPE STAKE LOCATION GROSSCAPACITY OFFTAKER RATING 1 YEARS INCONTRACT LEFT CCY EFFICIENT NATURAL GAS ACT 100% Mexico 300 MW Pemex BBB+/A3/BBB+ 15 USD (2) ELECTRICAL TRANSMISSION ATN 100% Peru 362 miles Peru BBB+/A3/BBB+ 23 USD (2) ATS 100% Peru 569 miles Peru BBB+/A3/BBB+ 26 USD (2) ATN 2 100% Peru 81 miles Minera Las Bambas Not rated 15 USD (2) Quadra 1&2 100% Chile 81 miles Sierra Gorda Not rated 17 USD (2) Palmucho 100% Chile 6 miles Enel Generacion Chile BBB+/Baa2/BBB+ 20 USD (2) WATER Skikda 34% Algeria 3.5 Mft3/day Sonatrach & ADE Not rated 16 USD (2) Honaine 26% Algeria 7 Mft3/day Sonatrach & ADE Not rated 20 USD (2) Reflects the counterparty’s issuer credit ratings issued by S&P, Moody’s and Fitch, respectivelyUSD denominated but payable in local currency

Great West House, GW1, 17th Floor,Great West RoadBrentford TW8 9DFLondon (United Kingdom)
SIGNATURES
Pursuant to the requirements of the Securities Exchange Act of 1934, the Registrant has duly caused this report to be signed on its behalf by the undersigned, thereunto duly authorized.
|
|
ATLANTICA YIELD PLC
|
||
|
|
|
|
|
|
/s/ Santiago Seage
|
|||
|
|
|
Name:
|
Santiago Seage
|
|
|
|
Title:
|
Chief Executive Officer
|
Date: March 7, 2018