Preliminary and Confidential – Subject to Further Review and Revision Citigroup Global Markets Inc. | Global Energy Group September 2018 Discussion Project Francis Materials
Preliminary and Confidential – Subject to Further Review and Revision Table of Contents A. AMGP Acquires AM - Additional Materials 1 B. AM GP / IDR Buy-In - Additional Materials 5 C. AM Acquires AMGP - Additional Materials 11
Preliminary and Confidential – Subject to Further Review and Revision A. AMGP Acquires AM - Additional Materials
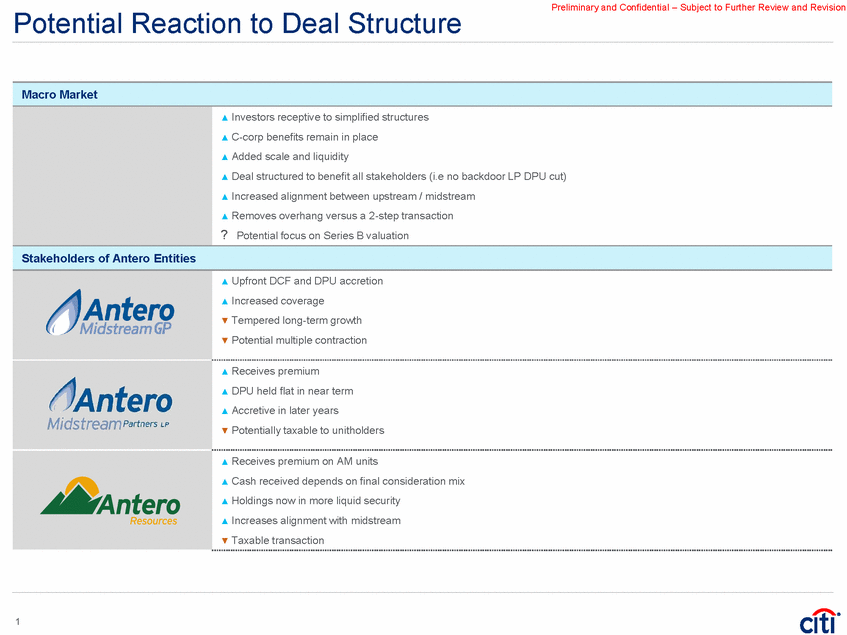
Preliminary and Confidential – Subject to Further Review and Revision Potential Reaction to Deal Structure 1 Macro Market Investors receptive to simplified structures C-corp benefits remain in place Added scale and liquidity Deal structured to benefit all stakeholders (i.e no backdoor LP DPU cut) Increased alignment between upstream / midstream Removes overhang versus a 2-step transaction ? Potential focus on Series B valuation Stakeholders of Antero Entities Upfront DCF and DPU accretion Increased coverage Tempered long-term growth Potential multiple contraction Receives premium DPU held flat in near term Accretive in later years Potentially taxable to unitholders Receives premium on AM units Cash received depends on final consideration mix Holdings now in more liquid security Increases alignment with midstream Taxable transaction
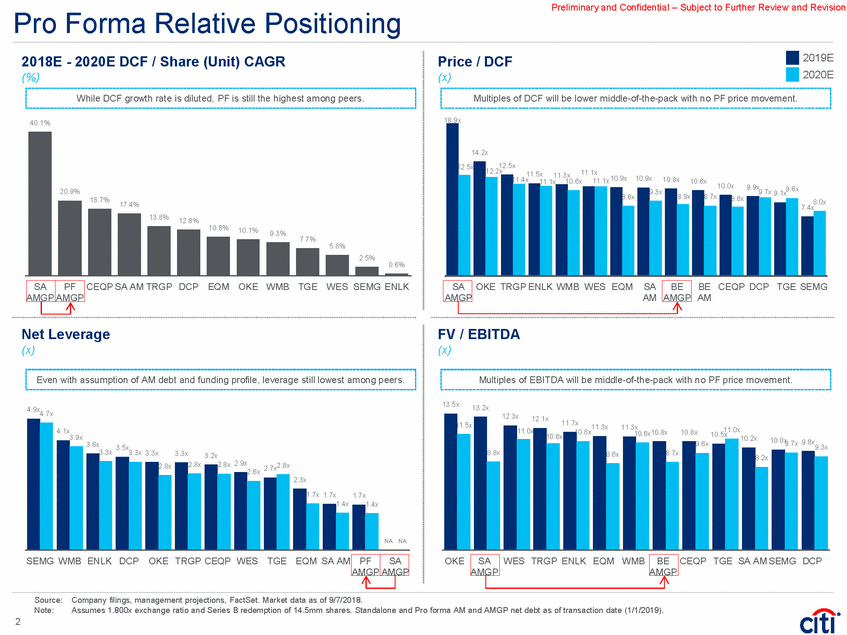
Preliminary and Confidential – Subject to Further Review and Revision Pro Forma Relative Positioning 2019E 2020E 2018E - 2020E DCF / Share (Unit) CAGR (%) Price / DCF (x) 18.9x 40.1% .5x 12.2x 11.1x 11.5x 11.3x 10.9x 10.9x 10.0x 9.9x 9.6x 20.9% 9.7x 9.1x 8.7x 18.7% 17.4% 7.4x 13.8% 12.8% 10.8% 10.1% 9.3% 7.7% 5.8% 2.5% 0.6% CEQP SA AM TRGP DCP EQM OKE WMB TGE WES SEMG ENLK AM AM Net Leverage (x) FV / EBITDA (x) 13.5x 13.2x 4.9x 4.7x 12.3x 12.1x 11.7x 11.3x11.3x 11.0x 4.1x 0.8x 10.6x10.8x 10.8x 10.5x 3.9x 10.2x 10.0x 9.8x 9.3x 9.7x 3.6x 3.5x 3.3x 3.3x 3.3x 3.3x 3.2x 2.9x 2.8x 2.7x2.8x 2.6x 2.3x 1.7x 1.7x 1.7x 1.4x 1.4x 0N.0Ax0N.0Ax SEMG WMB ENLK DCP OKE TRGP CEQP WES TGE EQM SA AM OKE WES TRGP ENLK EQM WMB CEQP TGE SA AM SEMG DCP Source: Company filings, management projections, FactSet. Market data as of 9/7/2018. Note: Assumes 1.800x exchange ratio and Series B redemption of 14.5mm shares. Standalone and Pro forma AM and AMGP net debt as of transaction date (1/1/2019). 2 PF AMGP SA AMGP BE AMGP SA AMGP 2.8x 2.8x 1 1.5x 8.8x 11.0x 10.6x 1 8.6x 8.7x 9.6x 8.2x Multiples of EBITDA will be middle-of-the-pack with no PF price movement. Even with assumption of AM debt and funding profile, leverage still lowest among peers. SA AMGP PF AMGP 14.2x 12 12.5x 11.4x 11.1x 10.6x 11.1x10.8x 10.6x 8.6x 9.3x 8.9x 8.6x 8.0x OKE TRGP ENLK WMB WES EQM SA BE CEQP DCP TGE SEMG SA AMGP BE AMGP Multiples of DCF will be lower middle-of-the-pack with no PF price movement. While DCF growth rate is diluted, PF is still the highest among peers.
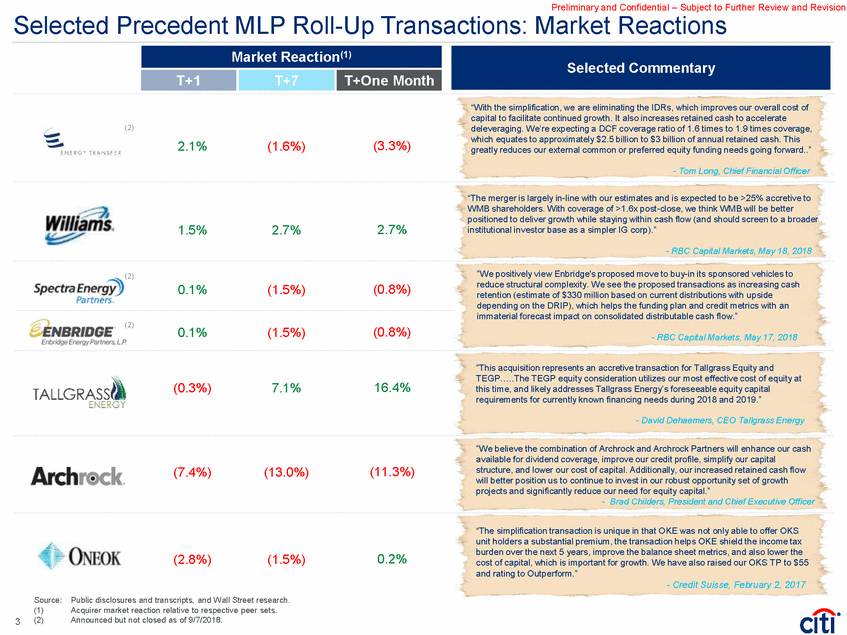
Preliminary and Confidential – Subject to Further Review and Revision MLP Roll-Up Transactions: Market Reactions Selected Precedent “With the simplification, we are eliminating the IDRs, which improves our overall cost of capital to facilitate continued growth. It also increases retained cash to accelerate deleveraging. We’re expecting a DCF coverage ratio of 1.6 times to 1.9 times coverage, which equates to approximately $2.5 billion to $3 billion of annual retained cash. This greatly reduces our external common or preferred equity funding needs going forward..” (2) 2.1% (1.6%) (3.3%) - Tom Long, Chief Financial Officer “The merger is largely in-line with our estimates and is expected to be >25% accretive to WMB shareholders. With coverage of >1.6x post-close, we think WMB will be better positioned to deliver growth while staying within cash flow (and should screen to a broader institutional investor base as a simpler IG corp).” 2.7% 1.5% 2.7% - RBC Capital Markets, May 18, 2018 “We positively view Enbridge's proposed move to buy-in its sponsored vehicles to reduce structural complexity. We see the proposed transactions as increasing cash retention (estimate of $330 million based on current distributions with upside depending on the DRIP), which helps the funding plan and credit metrics with an immaterial forecast impact on consolidated distributable cash flow.” (2) 0.1% (1.5%) (0.8%) (2) (0.8%) 0.1% (1.5%) - RBC Capital Markets, May 17, 2018 “This acquisition represents an accretive transaction for Tallgrass Equity and TEGP…..The TEGP equity consideration utilizes our most effective cost of equity at this time, and likely addresses Tallgrass Energy’s foreseeable equity capital requirements for currently known financing needs during 2018 and 2019.” 16.4% (0.3%) 7.1% - David Dehaemers, CEO Tallgrass Energy “We believe the combination of Archrock and Archrock Partners will enhance our cash available for dividend coverage, improve our credit profile, simplify our capital structure, and lower our cost of capital. Additionally, our increased retained cash flow will better position us to continue to invest in our robust opportunity set of growth projects and significantly reduce our need for equity capital.” - Brad Childers, President and Chief Executive Officer (7.4%) (13.0%) (11.3%) “The simplification transaction is unique in that OKE was not only able to offer OKS unit holders a substantial premium, the transaction helps OKE shield the income tax burden over the next 5 years, improve the balance sheet metrics, and also lower the cost of capital, which is important for growth. We have also raised our OKS TP to $55 0.2% (2.8%) (1.5%) and rating to Outperform.” . - Credit Suisse, February 2, 2017 Source: (1) (2) Public disclosures and transcripts, and Wall Street research. Acquirer market reaction relative to respective peer sets. Announced but not closed as of 9/7/2018. 3 Selected Commentary Market Reaction(1) T+1 T+7 T+One Month
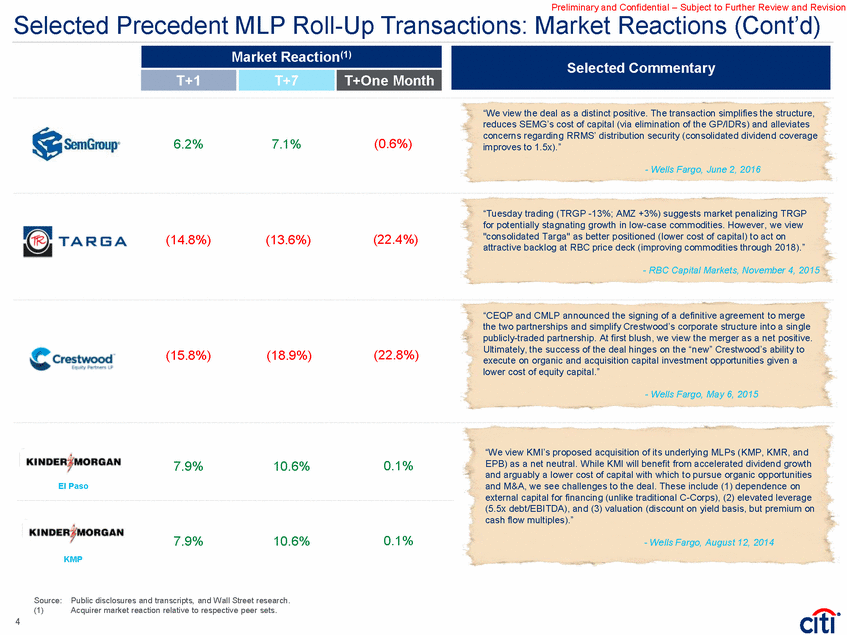
Preliminary and Confidential – Subject to Further Review and Revision MLP Roll-Up Transactions: Market Reactions (Cont’d) Selected Precedent “We view the deal as a distinct positive. The transaction simplifies the structure, reduces SEMG’s cost of capital (via elimination of the GP/IDRs) and alleviates concerns regarding RRMS’ distribution security (consolidated dividend coverage improves to 1.5x).” 6.2% 7.1% (0.6%) - Wells Fargo, June 2, 2016 “Tuesday trading (TRGP -13%; AMZ +3%) suggests market penalizing TRGP for potentially stagnating growth in low-case commodities. However, we view "consolidated Targa" as better positioned (lower cost of capital) to act on attractive backlog at RBC price deck (improving commodities through 2018).” (22.4%) (14.8%) (13.6%) - RBC Capital Markets, November 4, 2015 “CEQP and CMLP announced the signing of a definitive agreement to merge the two partnerships and simplify Crestwood’s corporate structure into a single publicly-traded partnership. At first blush, we view the merger as a net positive. Ultimately, the success of the deal hinges on the “new” Crestwood’s ability to execute on organic and acquisition capital investment opportunities given a lower cost of equity capital.” (15.8%) (18.9%) (22.8%) - Wells Fargo, May 6, 2015 “We view KMI’s proposed acquisition of its underlying MLPs (KMP, KMR, and EPB) as a net neutral. While KMI will benefit from accelerated dividend growth and arguably a lower cost of capital with which to pursue organic opportunities and M&A, we see challenges to the deal. These include (1) dependence on external capital for financing (unlike traditional C-Corps), (2) elevated leverage (5.5x debt/EBITDA), and (3) valuation (discount on yield basis, but premium on cash flow multiples).” 7.9% 10.6% 0.1% El Paso 7.9% 10.6% 0.1% - Wells Fargo, August 12, 2014 KMP Source: Public disclosures and transcripts, and Wall Street research. (1) Acquirer market reaction relative to respective peer sets. 4 Selected Commentary Market Reaction(1) T+1 T+7 T+One Month
Preliminary and Confidential – Subject to Further Review and Revision B. AM GP / IDR Buy-In - Additional Materials

Preliminary and Confidential – Subject to Further Review and Revision Transaction Overview Transaction Steps Standalone Transaction Structure(1) • • Effective transaction date of 1/1/2019 AM acquires AMGP IDRs at 17.3x 2019E post-tax GP Cash Flow – Transaction funded with 100% equity AMGP remains a publicly traded C-corp – Sole asset is AM LP units Transaction triggers Series B conversion at AMGP transaction price (market) Assumes no synergies No basis step-up Pro forma AM targets standalone AM DPUs Growth capex funded according to standalone forecast Public Shareholders Sponsors • 58.0% Interest 42.0% Interest • • • • • AMGP AR Public Unitholders % IDR Interest 47.4% LP Interest AM Sources & Uses Pro Forma Transaction Structure(1) Public Shareholders Sponsors New AM Equity Issued f or GP/IDRs AM Cash $3,104 5 58.0% Interest 42.0% Interest AMGP AR Public Unitholders Purchase Price Paid f or GP/IDRs Transaction Fees and Expenses $3,104 5 9% LP Interest 30.4% LP Interest AM Source: Note: (1) Company filings, management projections, FactSet. Market data as of 9/7/2018. PF ownership assumes no cash election. Ownership percentages at effective transaction date of 1/1/2019. 5 33.7% LP Interest 52.6% LP Interest 35. Total Trans action Us e s$3,109 AM Us e s ($m m ) Total Trans action Source s$3,109 AM Source s ($m m ) 100
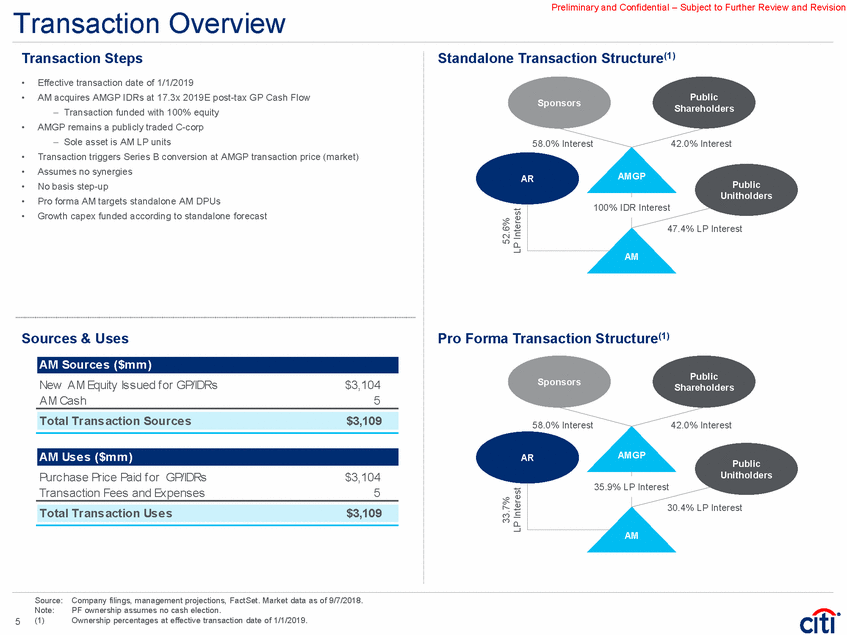
Preliminary and Confidential – Subject to Further Review and Revision AM Accretion / (Dilution) – GP / IDR Buy-In Accretion / (Dilution) at 17.3x 2019E Post-Tax GP/IDR Cash Flow 2019E 2020E Trans action Adjus tm e nts 2021E Trans action Adjus tm e nts Standalone AM Trans action Adjus tm e nts Pro Form a AM Standalone AM Pro Form a AM Standalone AM Pro Form a AM ($mm) Total EBITDA (-) Interest Expense (-) Maintenance Capex (-) Income Taxes (-) Other $988.6 (111.2) (39.4) (6.0) 0.0 $0.0 0.0 0.0 0.0 0.0 $988.6 (111.2) (39.4) (6.0) 0.0 $1,222.2 (140.1) (63.1) (6.0) 0.0 $0.0 0.4 0.0 0.0 0.0 $1,222.2 (139.7) (63.1) (6.0) 0.0 $1,413.5 (150.5) (43.9) (6.0) 0.0 $0.0 3.5 0.0 0.0 0.0 $1,413.5 (147.0) (43.9) (6.0) 0.0 Total Coverage Ratio (x) Total Cash Coverage ($mm) Total Distributions LP Distributions GP/IDR Distributions Average Units Outstanding (mm) 1.28x $183.2 648.8 413.4 235.4 187.045 1.29x $186.1 645.8 645.8 0.0 292.219 1.14x $124.8 888.2 533.1 355.1 187.045 1.22x $180.6 832.8 832.8 0.0 292.219 1.10x $111.7 1,101.4 639.7 461.8 187.045 1.22x $217.2 999.4 999.4 0.0 292.219 $3.0 $55.8 $105.6 105.173 105.173 105.173 Source: Company filings, management projections, FactSet. Market data as of 9/7/2018. 6 AM AM DCF pe r Unit ($) $2.70 $2.85 $3.18 $3.47 $3.72 $4.16 Accre tion / (Dilution) - ($) 0.15 0.28 0.44 Accre tion / (Dilution) - (%) 5.5% 8.9% 12.0% AM Dis tributions pe r Unit ($) $2.21 $2.21 $2.85 $2.85 $3.42 $3.42 Accre tion / (Dilution) - ($) 0.00 0.00 0.00 Accre tion / (Dilution) - (%) 0.0% 0.0% 0.0% YoY Grow th Rate - (%) 28.9% 29.0% 20.0% Total Cons olidate d De bt $2,411.6 $2,411.6 $2,980.0 $2,968.1 $3,249.7 $3,090.3 Cons olidate d Le ve rage (x) 2.4x 2.4x 2.4x 2.4x 2.3x 2.2x Dis tributable Cas h Flow $832.0 $832.0 $1,013.0 $1,013.5 $1,213.1 $1,216.6
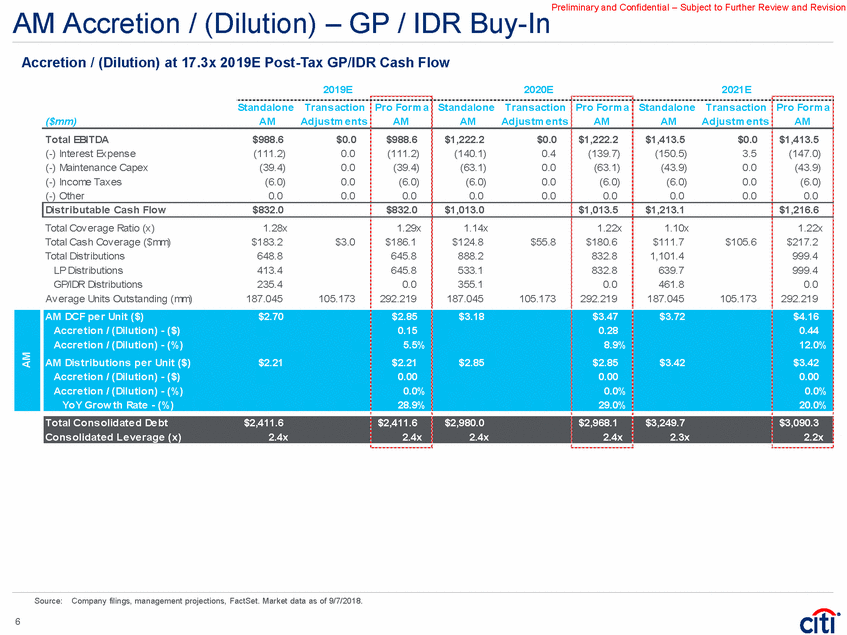
Preliminary and Confidential – Subject to Further Review and Revision AMGP Accretion / (Dilution) – GP / IDR Buy-In Accretion / (Dilution) at 17.3x 2019E Post-Tax GP/IDR Cash Flow 2019E 2020E 2021E Standalone Trans action Standalone Trans action Pro Form a AM GP Standalone Trans action Pro Form a AM GP Pro Form a AM GP ($mm) AM GP Adjus tm e nts AM GP Adjus tm e nts AM GP Adjus tm e nts Asset EBITDA (+) LP Distributions (+) GP / IDR Distributions $0.0 0.0 235.4 $0.0 232.4 (235.4) $0.0 232.4 0.0 $0.0 0.0 355.1 $0.0 299.7 (355.1) $0.0 299.7 0.0 $0.0 0.0 461.8 $0.0 359.7 (461.8) $0.0 359.7 0.0 (-) Interest Expense (-) Maintenance Capex (-) Series B Pref erred Distributions (-) Income Taxes (-) Other 0.0 0.0 (12.3) (56.0) (2.0) 0.0 0.0 12.3 27.0 0.0 0.0 0.0 0.0 (29.1) (2.0) 0.0 0.0 (19.5) (84.5) (2.0) 0.0 0.0 19.5 47.1 0.0 0.0 0.0 0.0 (37.5) (2.0) 0.0 0.0 (25.9) (109.9) (2.0) 0.0 0.0 25.9 65.0 0.0 0.0 0.0 0.0 (45.0) (2.0) Total Coverage Ratio (x) Total Cash Coverage ($mm) Total Dividends Average Shares Outstanding (mm) 1.00x ($0.1) 165.2 186.209 1.00x $0.0 201.4 190.209 1.00x ($0.2) 249.3 186.209 1.00x $0.0 260.3 190.209 1.00x ($0.3) 324.2 186.209 1.00x $0.0 312.7 190.209 $0.1 $0.2 $0.3 4.000 4.000 4.000 Source: Company filings, management projections, FactSet. Market data as of 9/7/2018. Note: Assumes 50% tax shield on LP distributions; subject to further diligence. Assumes 25% Tax Rate. 7 AMGP AM GP CAFD pe r Share ($) $0.89 $1.06 $1.34 $1.37 $1.74 $1.64 Accre tion / (Dilution) - ($) 0.17 0.03 (0.10) Accre tion / (Dilution) - (%) 19.4% 2.3% (5.5%) AM GP Divide nd pe r Share ($) $0.89 $1.06 $1.34 $1.37 $1.74 $1.64 Accre tion / (Dilution) - ($) 0.17 0.03 (0.10) Accre tion / (Dilution) - (%) 19.3% 2.2% (5.6%) YoY Grow th Rate - (%) 64.7% 96.5% 50.9% 29.2% 30.0% 20.2% Total De cons olidate d De bt $0.0 $0.0 $0.0 $0.0 $0.0 $0.0 De cons olidate d Le ve rage (x) 0.0x 0.0x 0.0x 0.0x 0.0x 0.0x Total Cons olidate d De bt $2,411.6 $2,411.6 $2,980.0 $2,968.1 $3,249.7 $3,090.3 Cons olidate d Le ve rage (x) 2.4x 2.4x 2.4x 2.4x 2.3x 2.2x Cas h Available for Divide nds $165.1 $201.4 $249.1 $260.3 $323.9 $312.7 Total EBITDA $235.4 ($3.0) $232.4 $355.1 ($55.4) $299.7 $461.8 ($102.1) $359.7
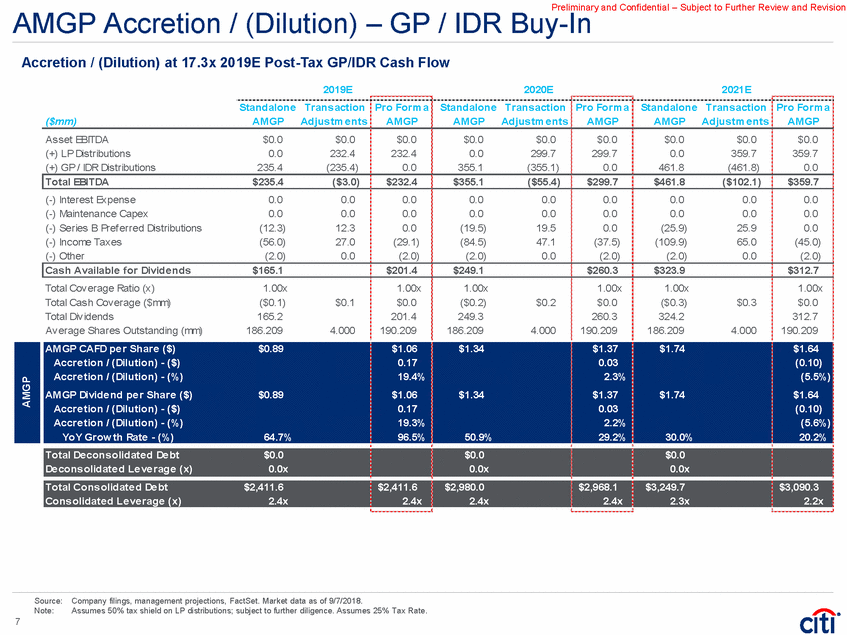
Preliminary and Confidential – Subject to Further Review and Revision AMGP Pro Forma Tax Sensitivity CAFD per Share Sensitivity AM GP Tax Shie ld 35.0% 40.0% 45.0% 50.0% 55.0% 60.0% SA AMGP CAFD per Share ($) PF AMGP CAFD per Share ($) $0.89 1.01 $0.89 1.03 $0.89 1.04 $0.89 1.06 $0.89 1.07 $0.89 1.09 Prop. Accretion / (Dilution)(1) - (%) 47.3% 49.6% 51.8% 54.0% 56.2% 58.4% 35.0% 40.0% 45.0% 50.0% 55.0% 60.0% SA AMGP CAFD per Share ($) PF AMGP CAFD per Share ($) $1.34 1.31 $1.34 1.33 $1.34 1.35 $1.34 1.37 $1.34 1.39 $1.34 1.41 Prop. Accretion / (Dilution)(1) - (%) 18.1% 19.8% 21.6% 23.4% 25.2% 26.9% 35.0% 40.0% 45.0% 50.0% 55.0% 60.0% SA AMGP CAFD per Share ($) PF AMGP CAFD per Share ($) $1.74 1.57 $1.74 1.60 $1.74 1.62 $1.74 1.64 $1.74 1.67 $1.74 1.69 Prop. Accretion / (Dilution)(1) - (%) 8.3% 10.0% 11.6% 13.2% 14.8% 16.5% CAFD per Share Accretion / (Dilution) Summary 22.9% 21.1% 19.4% 17.7% 16.0% 14.3% 5.2% 3.8% 2.3% 0.8% (0.7%) (2.1%) (2.8%) (4.1%) (5.5%) (6.8%) (8.2%) (9.6%) 2019 2020 2021 Tax Shield: 35.0% 40.0% 45.0% 50.0% 55.0% 60.0% Source: Note: (1) Company filings, management projections, FactSet. Market data as of 9/7/2018. Assumes 25% Tax Rate. AMGP proportionate share of AM DCF reflects AMGP CAFD / share multiplied by AM units held by AMGP. 8 2021 2020 2019 Accre tion / (Dilution) - (%) (9.6%) (8.2%) (6.8%) (5.5%) (4.1%) (2.8%) Accre tion / (Dilution) - (%) (2.1%) (0.7%) 0.8% 2.3% 3.8% 5.2% Accre tion / (Dilution) - (%) 14.3% 16.0% 17.7% 19.4% 21.1% 22.9%
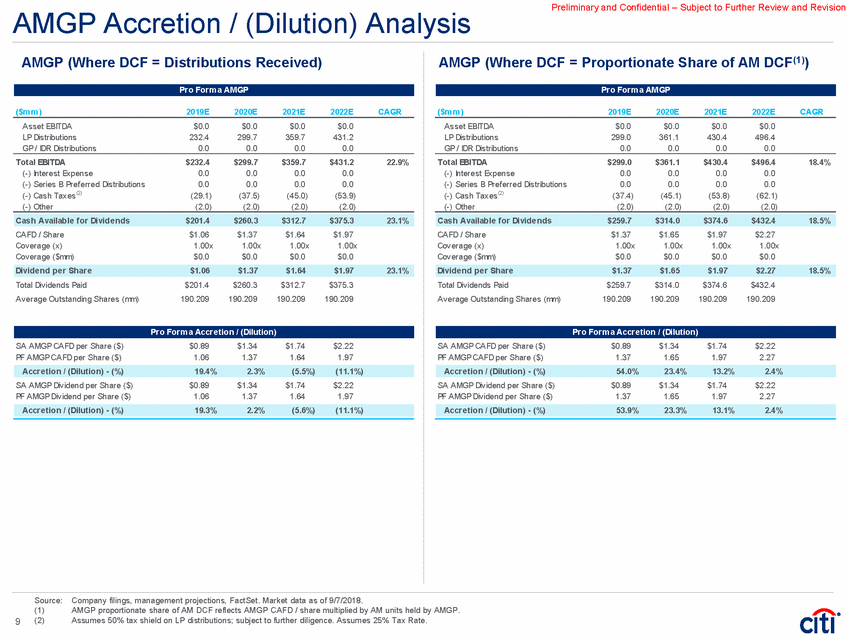
Preliminary and Confidential – Subject to Further Review and Revision AMGP Accretion / (Dilution) Analysis AMGP (Where DCF = Proportionate Share of AM DCF(1)) AMGP (Where DCF = Distributions Received) ($m m ) 2019E 2020E 2021E 2022E CAGR ($m m ) 2019E 2020E 2021E 2022E CAGR Asset EBITDA LP Distributions GP / IDR Distributions $0.0 232.4 0.0 $0.0 299.7 0.0 $0.0 359.7 0.0 $0.0 431.2 0.0 Asset EBITDA LP Distributions GP / IDR Distributions $0.0 299.0 0.0 $0.0 361.1 0.0 $0.0 430.4 0.0 $0.0 496.4 0.0 Total EBITDA (-) Interest Expense (-) Series B Pref erred Distributions (-) Cash Taxes(2) (-) Other $232.4 0.0 0.0 (29.1) (2.0) $299.7 0.0 0.0 (37.5) (2.0) $359.7 0.0 0.0 (45.0) (2.0) $431.2 0.0 0.0 (53.9) (2.0) 22.9% Total EBITDA (-) Interest Expense (-) Series B Pref erred Distributions (-) Cash Taxes(2) (-) Other $299.0 0.0 0.0 (37.4) (2.0) $361.1 0.0 0.0 (45.1) (2.0) $430.4 0.0 0.0 (53.8) (2.0) $496.4 0.0 0.0 (62.1) (2.0) 18.4% CAFD / Share Coverage (x) Coverage ($mm) $1.06 1.00x $0.0 $1.37 1.00x $0.0 $1.64 1.00x $0.0 $1.97 1.00x $0.0 CAFD / Share Coverage (x) Coverage ($mm) $1.37 1.00x $0.0 $1.65 1.00x $0.0 $1.97 1.00x $0.0 $2.27 1.00x $0.0 Total Dividends Paid Average Outstanding Shares (mm) $201.4 190.209 $260.3 190.209 $312.7 190.209 $375.3 190.209 Total Dividends Paid Average Outstanding Shares (mm) $259.7 190.209 $314.0 190.209 $374.6 190.209 $432.4 190.209 SA AMGP CAFD per Share ($) PF AMGP CAFD per Share ($) $0.89 1.06 $1.34 1.37 $1.74 1.64 $2.22 1.97 SA AMGP CAFD per Share ($) PF AMGP CAFD per Share ($) $0.89 1.37 $1.34 1.65 $1.74 1.97 $2.22 2.27 SA AMGP Dividend per Share ($) PF AMGP Dividend per Share ($) $0.89 1.06 $1.34 1.37 $1.74 1.64 $2.22 1.97 SA AMGP Dividend per Share ($) PF AMGP Dividend per Share ($) $0.89 1.37 $1.34 1.65 $1.74 1.97 $2.22 2.27 Source: (1) (2) Company filings, management projections, FactSet. Market data as of 9/7/2018. AMGP proportionate share of AM DCF reflects AMGP CAFD / share multiplied by AM units held by AMGP. Assumes 50% tax shield on LP distributions; subject to further diligence. Assumes 25% Tax Rate. 9 Accre tion / (Dilution) - (%)53.9%23.3%13.1%2.4% Accre tion / (Dilution) - (%)19.3%2.2%(5.6%)(11.1%) Accre tion / (Dilution) - (%)54.0%23.4%13.2%2.4% Accre tion / (Dilution) - (%)19.4%2.3%(5.5%)(11.1%) Pro Form a Accre tion / (Dilution) Pro Form a Accre tion / (Dilution) Divide nd pe r Share$1.37$1.65$1.97$2.2718.5% Divide nd pe r Share$1.06$1.37$1.64$1.9723.1% Cas h Available for Divide nds$259.7$314.0$374.6$432.418.5% Cas h Available for Divide nds$201.4$260.3$312.7$375.323.1% Pro Form a AM GP Pro Form a AM GP
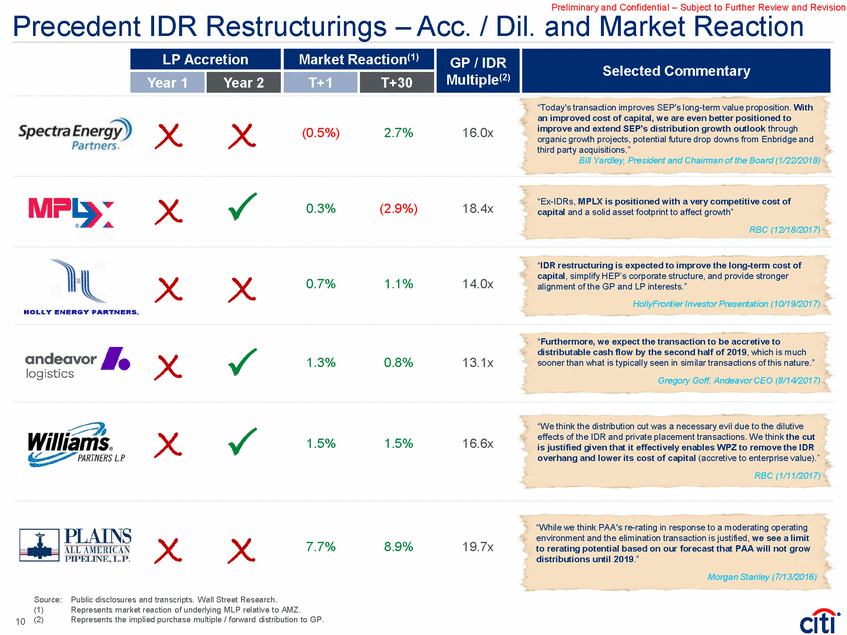
Preliminary and Confidential – Subject to Further Review and Revision Precedent IDR Restructurings – Acc. / Dil. and Market Reaction “Today's transaction improves SEP's long-term value proposition. With an improved cost of capital, we are even better positioned to improve and extend SEP's distribution growth outlook through organic growth projects, potential future drop downs from Enbridge and third party acquisitions.” Bill Yardley, President and Chairman of the Board (1/22/2018) X X (0.5%) 2.7% 16.0x P X “Ex-IDRs, MPLX is positioned with a very competitive cost of capital and a solid asset footprint to affect growth” RBC (12/18/2017) 0.3% (2.9%) 18.4x “IDR restructuring is expected to improve the long-term cost of capital, simplify HEP’s corporate structure, and provide stronger alignment of the GP and LP interests.” HollyFrontier Investor Presentation (10/19/2017) X X 0.7% 1.1% 14.0x “Furthermore, we expect the transaction to be accretive to distributable cash flow by the second half of 2019, which is much sooner than what is typically seen in similar transactions of this nature.” Gregory Goff, Andeavor CEO (8/14/2017) P X 1.3% 0.8% 13.1x “We think the distribution cut was a necessary evil due to the dilutive effects of the IDR and private placement transactions. We think the cut is justified given that it effectively enables WPZ to remove the IDR overhang and lower its cost of capital (accretive to enterprise value).” RBC (1/11/2017) X P 1.5% 1.5% 16.6x “While we think PAA's re-rating in response to a moderating operating environment and the elimination transaction is justified, we see a limit to rerating potential based on our forecast that PAA will not grow distributions until 2019.” Morgan Stanley (7/13/2016) X X 7.7% 8.9% 19.7x Source: (1) (2) Public disclosures and transcripts. Wall Street Research. Represents market reaction of underlying MLP relative to AMZ. Represents the implied purchase multiple / forward distribution to GP. 10 LP Accretion Market Reaction(1) GP / IDR Multiple(2) Selected Commentary Year 1 Year 2 T+1 T+30
Preliminary and Confidential – Subject to Further Review and Revision C. AM Acquires AMGP - Additional Materials
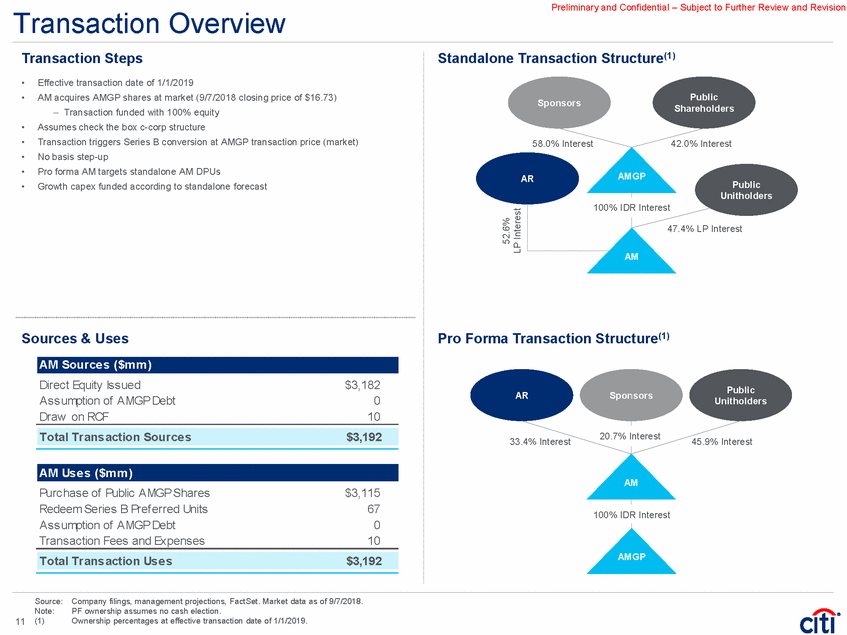
Preliminary and Confidential – Subject to Further Review and Revision Transaction Overview Transaction Steps Standalone Transaction Structure(1) • • Effective transaction date of 1/1/2019 AM acquires AMGP shares at market (9/7/2018 closing price of $16.73) – Transaction funded with 100% equity Assumes check the box c-corp structure Transaction triggers Series B conversion at AMGP transaction price (market) No basis step-up Pro forma AM targets standalone AM DPUs Growth capex funded according to standalone forecast Public Shareholders Sponsors • • • • • 58.0% Interest 42.0% Interest AMGP AR Public Unitholders % IDR Interest 47.4% LP Interest AM Sources & Uses Pro Forma Transaction Structure(1) Direct Equity Issued Assumption of AMGP Debt Draw on RCF $3,182 0 10 Public Unitholders AR Sponsors 20.7% Interest 33.4% Interest 45.9% Interest AM Purchase of Public AMGP Shares Redeem Series B Pref erred Units Assumption of AMGP Debt Transaction Fees and Expenses $3,115 67 0 10 100% IDR Interest AMGP Source: Note: (1) Company filings, management projections, FactSet. Market data as of 9/7/2018. PF ownership assumes no cash election. Ownership percentages at effective transaction date of 1/1/2019. 11 52.6% LP Interest Total Trans action Us e s$3,192 AM Us e s ($m m ) Total Trans action Source s$3,192 AM Source s ($m m ) 100
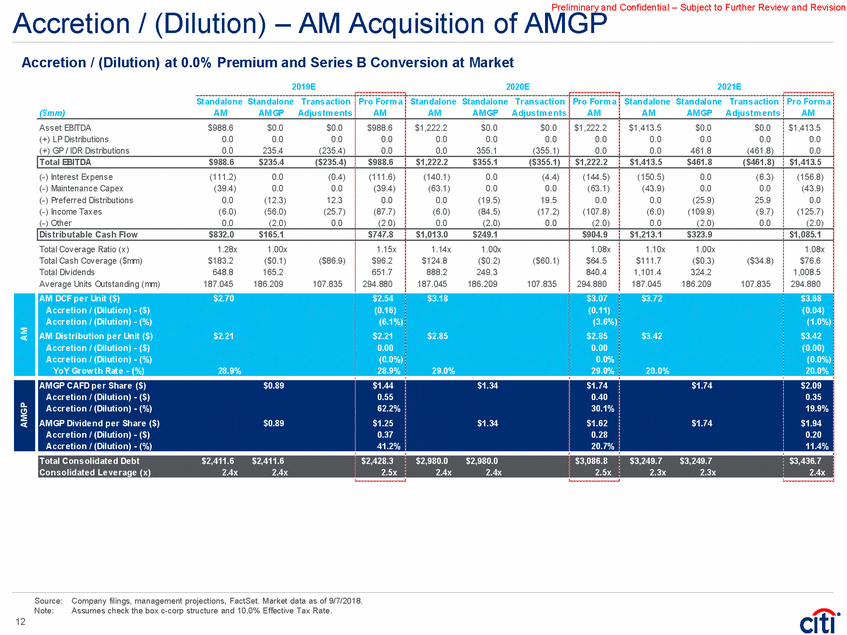
Preliminary and Confidential – Subject to Further Review and Revision Accretion / (Dilution) – AM Acquisition of AMGP Accretion / (Dilution) at 0.0% Premium and Series B Conversion at Market 2019E Standalone Standalone Trans action 2020E Standalone Standalone Trans action 2021E Standalone Standalone Trans action Pro Form a AM Pro Form a AM Pro Form a AM ($mm) AM AM GP Adjus tm e nts AM AM GP Adjus tm e nts AM AM GP Adjus tm e nts Asset EBITDA (+) LP Distributions (+) GP / IDR Distributions $988.6 0.0 0.0 $0.0 0.0 235.4 $0.0 0.0 (235.4) $988.6 0.0 0.0 $1,222.2 0.0 0.0 $0.0 0.0 355.1 $0.0 0.0 (355.1) $1,222.2 0.0 0.0 $1,413.5 0.0 0.0 $0.0 0.0 461.8 $0.0 0.0 (461.8) $1,413.5 0.0 0.0 (-) Interest Expense (-) Maintenance Capex (-) Pref erred Distributions (-) Income Taxes (-) Other (111.2) (39.4) 0.0 (6.0) 0.0 0.0 0.0 (12.3) (56.0) (2.0) (0.4) 0.0 12.3 (25.7) 0.0 (111.6) (39.4) 0.0 (87.7) (2.0) (140.1) (63.1) 0.0 (6.0) 0.0 0.0 0.0 (19.5) (84.5) (2.0) (4.4) 0.0 19.5 (17.2) 0.0 (144.5) (63.1) 0.0 (107.8) (2.0) (150.5) (43.9) 0.0 (6.0) 0.0 0.0 0.0 (25.9) (109.9) (2.0) (6.3) 0.0 25.9 (9.7) 0.0 (156.8) (43.9) 0.0 (125.7) (2.0) Total Coverage Ratio (x) Total Cash Coverage ($mm) Total Dividends Average Units Outstanding (mm) 1.28x $183.2 648.8 187.045 1.00x ($0.1) 165.2 186.209 1.15x $96.2 651.7 294.880 1.14x $124.8 888.2 187.045 1.00x ($0.2) 249.3 186.209 1.08x $64.5 840.4 294.880 1.10x $111.7 1,101.4 187.045 1.00x ($0.3) 324.2 186.209 1.08x $76.6 1,008.5 294.880 ($86.9) ($60.1) ($34.8) 107.835 107.835 107.835 Source: Company filings, management projections, FactSet. Market data as of 9/7/2018. Note: Assumes check the box c-corp structure and 10.0% Effective Tax Rate. 12 AM AM DCF pe r Unit ($) $2.70 $2.54 $3.18 $3.07 $3.72 $3.68 Accre tion / (Dilution) - ($) (0.16) (0.11) (0.04) Accre tion / (Dilution) - (%) (6.1%) (3.6%) (1.0%) AM Dis tribution pe r Unit ($) $2.21 $2.21 $2.85 $2.85 $3.42 $3.42 Accre tion / (Dilution) - ($) 0.00 0.00 (0.00) Accre tion / (Dilution) - (%) (0.0%) 0.0% (0.0%) YoY Grow th Rate - (%) 28.9% 28.9% 29.0% 29.0% 20.0% 20.0% AMGP AM GP CAFD pe r Share ($) $0.89 $1.44 $1.34 $1.74 $1.74 $2.09 Accre tion / (Dilution) - ($) 0.55 0.40 0.35 Accre tion / (Dilution) - (%) 62.2% 30.1% 19.9% AM GP Divide nd pe r Share ($) $0.89 $1.25 $1.34 $1.62 $1.74 $1.94 Accre tion / (Dilution) - ($) 0.37 0.28 0.20 Accre tion / (Dilution) - (%) 41.2% 20.7% 11.4% Total Cons olidate d De bt $2,411.6 $2,411.6 $2,428.3 $2,980.0 $2,980.0 $3,086.8 $3,249.7 $3,249.7 $3,436.7 Cons olidate d Le ve rage (x) 2.4x 2.4x 2.5x 2.4x 2.4x 2.5x 2.3x 2.3x 2.4x Dis tributable Cas h Flow $832.0 $165.1 $747.8 $1,013.0 $249.1 $904.9 $1,213.1 $323.9 $1,085.1 Total EBITDA $988.6 $235.4 ($235.4) $988.6 $1,222.2 $355.1 ($355.1) $1,222.2 $1,413.5 $461.8 ($461.8) $1,413.5
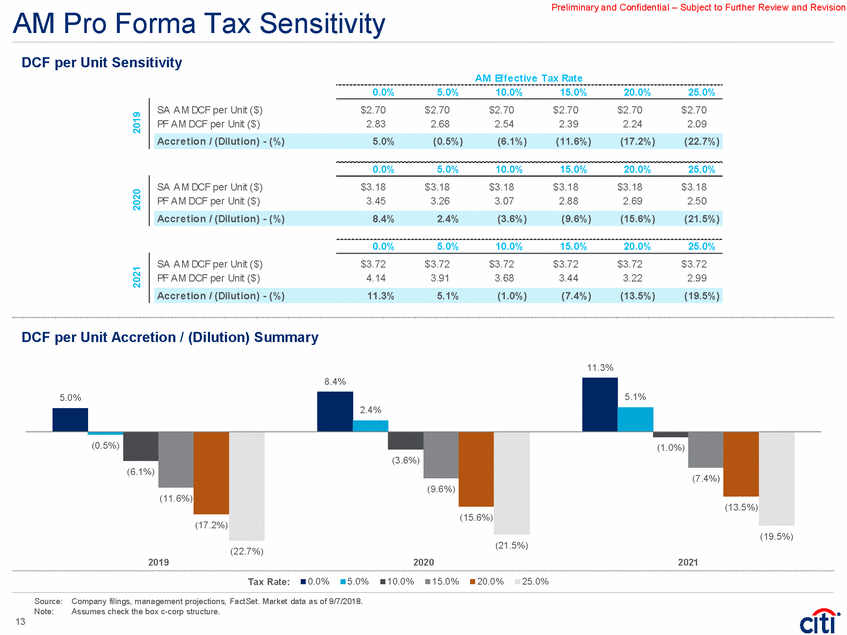
Preliminary and Confidential – Subject to Further Review and Revision AM Pro Forma Tax Sensitivity DCF per Unit Sensitivity AM Effe ctive Tax Rate 0.0% 5.0% 10.0% 15.0% 20.0% 25.0% SA AM DCF per Unit ($) PF AM DCF per Unit ($) $2.70 2.83 $2.70 2.68 $2.70 2.54 $2.70 2.39 $2.70 2.24 $2.70 2.09 0.0% 5.0% 10.0% 15.0% 20.0% 25.0% SA AM DCF per Unit ($) PF AM DCF per Unit ($) $3.18 3.45 $3.18 3.26 $3.18 3.07 $3.18 2.88 $3.18 2.69 $3.18 2.50 0.0% 5.0% 10.0% 15.0% 20.0% 25.0% SA AM DCF per Unit ($) PF AM DCF per Unit ($) $3.72 4.14 $3.72 3.91 $3.72 3.68 $3.72 3.44 $3.72 3.22 $3.72 2.99 DCF per Unit Accretion / (Dilution) Summary 11.3% 5.1% (3.6%) (6.1%) (7.4%) (9.6%) (11.6%) (13.5%) (15.6%) (17.2%) (19.5%) (21.5%) (22.7%) 2019 2020 2021 Tax Rate: 0.0% 5.0% 10.0% 15.0% 20.0% 25.0% Source: Company filings, management projections, FactSet. Market data as of 9/7/2018. Note: Assumes check the box c-corp structure. 13 2021 2020 2019 8.4% 5.0% 2.4% (0.5%) (1.0%) Accre tion / (Dilution) - (%) 11.3% 5.1% (1.0%) (7.4%) (13.5%) (19.5%) Accre tion / (Dilution) - (%) 8.4% 2.4% (3.6%) (9.6%) (15.6%) (21.5%) Accre tion / (Dilution) - (%) 5.0% (0.5%) (6.1%) (11.6%) (17.2%) (22.7%)
Preliminary and Confidential – Subject to Further Review and Revision AMGP Pro Forma Tax Sensitivity CAFD per Share Sensitivity AM Effe ctive Tax Rate 0.0% 5.0% 10.0% 15.0% 20.0% 25.0% SA AMGP CAFD per Share ($) PF AMGP CAFD per Share ($) $0.89 1.61 $0.89 1.52 $0.89 1.44 $0.89 1.35 $0.89 1.27 $0.89 1.18 0.0% 5.0% 10.0% 15.0% 20.0% 25.0% SA AMGP CAFD per Share ($) PF AMGP CAFD per Share ($) $1.34 1.96 $1.34 1.85 $1.34 1.74 $1.34 1.63 $1.34 1.52 $1.34 1.42 0.0% 5.0% 10.0% 15.0% 20.0% 25.0% SA AMGP CAFD per Share ($) PF AMGP CAFD per Share ($) $1.74 2.35 $1.74 2.22 $1.74 2.09 $1.74 1.95 $1.74 1.82 $1.74 1.70 CAFD per Share Accretion / (Dilution) Summary 81.2% 71.7% 62.2% 52.5% 46.2% 43.0% 38.2% 34.9% 30.1% 27.4% 19.9% 12.2% 4.8% (2.5%) 2019 2020 2021 Tax Rate: 0.0% 5.0% 10.0% 15.0% 20.0% 25.0% Source: Company filings, management projections, FactSet. Market data as of 9/7/2018. Note: Assumes check the box c-corp structure. 14 2021 2020 2019 33.5% 21.9% 13.9% 6.0% Accre tion / (Dilution) - (%) 34.9% 27.4% 19.9% 12.2% 4.8% (2.5%) Accre tion / (Dilution) - (%) 46.2% 38.2% 30.1% 21.9% 13.9% 6.0% Accre tion / (Dilution) - (%) 81.2% 71.7% 62.2% 52.5% 43.0% 33.5%

Preliminary and Confidential – Subject to Further Review and Revision Conversion Considerations Alternative C-Corp Structure: Up-C 1) AMGP contributes IDRs to AM for LP units Public Shareholders Sponsors 2) AM forms an Up-C 3) AMGP merges into AM Up-C for AM Up-C shares (3) AMGP AR 4) AM public unitholders exchange units for AM Up-C shares tax-deferred Public Unitholders (1) (5) 5) AR retains its ownership in the partnership (private) and receives the right to convert into AM Up-C shares 1:1 AM (4) Legacy AM Public Legacy AMGP Public Sponsors Transaction expected to be tax deferred to all parties Achieves a simplified, single public 1099 security Governance is restructured and Series B is converted at market price No step-up, and AR's share of the taxable income is not taxed at the partnership – No double taxation to AR AR ability to convert into AM Up-C shares provides liquidity, if desired – Step-up upon conversion Class C voting shares(1) AR AM (1) AR has the right to convert into AM Up-C shares 1:1. 15 AM Up-C Pro Forma Structure Key Considerations (2)AM Up-C Structure Steps (Up-C Conversion)

Preliminary and Confidential – Subject to Further Review and Revision IRS Circular 230 Disclosure: Citigroup Inc. and its affiliates do not provide tax or legal advice. Any discussion of tax matters in these materials (i) is not intended or written to be used, and cannot be used or relied upon, by you for the purpose of avoiding any tax penalties and (ii) may have been written in connection with the "promotion or marketing" of any transaction contemplated hereby ("Transaction"). Accordingly, you should seek advice based on your particular circumstances from an independent tax advisor. In any instance where distribution of this communication is subject to the rules of the US Commodity Futures Trading Commission (“CFTC”), this communication constitutes an invitation to consider entering into a derivatives transaction under U.S. CFTC Regulations §§ 1.71 and 23.605, where applicable, but is not a binding offer to buy/sell any financial instrument. Any terms set forth herein are intended for discussion purposes only and are subject to the final terms as set forth in separate definitive written agreements. This presentation is not a commitment to lend, syndicate a financing, underwrite or purchase securities, or commit capital nor does it obligate us to enter into such a commitment, nor are we acting as a fiduciary to you. By accepting this presentation, subject to applicable law or regulation, you agree to keep confidential the information contained herein and the existence of and proposed terms for any Transaction. Prior to entering into any Transaction, you should determine, without reliance upon us or our affiliates, the economic risks and merits (and independently determine that you are able to assume these risks) as well as the legal, tax and accounting characterizations and consequences of any such Transaction. In this regard, by accepting this presentation, you acknowledge that (a) we are not in the business of providing (and you are not relying on us for) legal, tax or accounting advice, (b) there may be legal, tax or accounting risks associated with any Transaction, (c) you should receive (and rely on) separate and qualified legal, tax and accounting advice and (d) you should apprise senior management in your organization as to such legal, tax and accounting advice (and any risks associated with any Transaction) and our disclaimer as to these matters. By acceptance of these materials, you and we hereby agree that from the commencement of discussions with respect to any Transaction, and notwithstanding any other provision in this presentation, we hereby confirm that no participant in any Transaction shall be limited from disclosing the U.S. tax treatment or U.S. tax structure of such Transaction. We are required to obtain, verify and record certain information that identifies each entity that enters into a formal business relationship with us. We will ask for your complete name, street address, and taxpayer ID number. We may also request corporate formation documents, or other forms of identification, to verify information provided. Any prices or levels contained herein are preliminary and indicative only and do not represent bids or offers. These indications are provided solely for your information and consideration, are subject to change at any time without notice and are not intended as a solicitation with respect to the purchase or sale of any instrument. The information contained in this presentation may include results of analyses from a quantitative model which represent potential future events that may or may not be realized, and is not a complete analysis of every material fact representing any product. Any estimates included herein constitute our judgment as of the date hereof and are subject to change without any notice. We and/or our affiliates may make a market in these instruments for our customers and for our own account. Accordingly, we may have a position in any such instrument at any time. Although this material may contain publicly available information about Citi corporate bond research, fixed income strategy or economic and market analysis, Citi policy (i) prohibits employees from offering, directly or indirectly, a favorable or negative research opinion or offering to change an opinion as consideration or inducement for the receipt of business or for compensation; and (ii) prohibits analysts from being compensated for specific recommendations or views contained in research reports. So as to reduce the potential for conflicts of interest, as well as to reduce any appearance of conflicts of interest, Citi has enacted policies and procedures designed to limit communications between its investment banking and research personnel to specifically prescribed circumstances. © 2018 Citigroup Inc. All rights reserved. Citi and Citi and Arc Design are trademarks and service marks of Citigroup Inc. or its affiliates and are used and registered throughout the world. Citi believes that sustainability is good business practice. We work closely with our clients, peer financial institutions, NGOs and other partners to finance solutions to climate change, develop industry standards, reduce our own environmental footprint, and engage with stakeholders to advance shared learning and solutions. Highlights of Citi’s unique role in promoting sustainability include: (a) releasing in 2007 a Climate Change Position Statement, the first US financial institution to do so; (b) targeting $50 billion over 10 years to address global climate change: includes significant increases in investment and financing of renewable energy, clean technology, and other carbon-emission reduction activities; (c) committing to an absolute reduction in GHG emissions of all Citi owned and leased properties around the world by 10% by 2011; (d) purchasing more than 234,000 MWh of carbon neutral power for our operations over the last three years; (e) establishing in 2008 the Carbon Principles; a framework for banks and their U.S. power clients to evaluate and address carbon risks in the financing of electric power projects; (f) producing equity research related to climate issues that helps to inform investors on risks and opportunities associated with the issue; and (g) engaging with a broad range of stakeholders on the issue of climate change to help advance understanding and solutions. Citi works with its clients in greenhouse gas intensive industries to evaluate emerging risks from climate change and, where appropriate, to mitigate those risks. efficiency, renewable energy and mitigation 16
