UNITED STATES
SECURITIES AND EXCHANGE COMMISSION
Washington, D.C. 20549
FORM 8-K
CURRENT REPORT
Pursuant to Section 13 or 15(d)
of the Securities Exchange Act of 1934
Date of report (Date of earliest event reported): March 19, 2020
CASPER SLEEP INC.
(Exact name of registrant as specified in its charter)
Delaware | 001-39214 | 46-3987647 | ||
(State or other jurisdiction of incorporation or organization)
|
(Commission File Number)
|
(I.R.S. Employer Identification No.)
|
Three World Trade Center
175 Greenwich Street, Floor 39
New York, NY 10007
(Address of principal executive offices) (Zip Code)
(347) 941-1871
(Registrant’s telephone number, include area code)
N/A
(Former Name or Former Address, if Changed Since Last Report)
Check the appropriate box below if the Form 8-K filing is intended to simultaneously satisfy the filing obligation of the registrant under any of the following provisions:
¨ | Written communications pursuant to Rule 425 under the Securities Act (17 CFR 230.425) |
¨ | Soliciting material pursuant to Rule 14a-12 under the Exchange Act (17 CFR 240.14a-12) |
¨ | Pre-commencement communications pursuant to Rule 14d-2(b) under the Exchange Act (17 CFR 240.14d-2(b)) |
¨ | Pre-commencement communications pursuant to Rule 13e-4(c) under the Exchange Act (17 CFR 240.13e-4(c)) |
Securities registered pursuant to Section 12(b) of the Act:
Title of each class | Trading Symbol(s) | Name of each exchange on which registered |
Common Stock, $0.000001 par value per share |
CSPR | The New York Stock Exchange |
Indicate by check mark whether the registrant is an emerging growth company as defined in Rule 405 of the Securities Act of 1933 (§230.405 of this chapter) or Rule 12b-2 of the Securities Exchange Act of 1934 (§240.12b-2 of this chapter).
Emerging growth company x
If an emerging growth company, indicate by check mark if the registrant has elected not to use the extended transition period for complying with any new or revised financial accounting standards provided pursuant to Section 13(a) of the Exchange Act. ¨
Item 2.02. Results of Operations and Financial Condition.
On March 19, 2020, Casper Sleep Inc. announced its financial results for the quarter and year ended December 31, 2019. The full text of the press release and the letter to shareholders issued in connection with the announcement are furnished as Exhibit 99.1 and Exhibit 99.2 to this Current Report on Form 8-K, respectively.
The information contained in Item 2.02 of this Form 8-K (including Exhibit 99.1 and Exhibit 99.2 attached hereto) shall not be deemed “filed” for purposes of Section 18 of the Securities Exchange Act of 1934, as amended (the “Exchange Act”), or otherwise subject to the liabilities of that section, nor shall it be deemed incorporated by reference in any filing under the Securities Act of 1933, as amended, or the Exchange Act, except as expressly provided by specific reference in such a filing.
Item 9.01. Financial Statements and Exhibits.
(d) Exhibits
The following exhibits relating to Item 2.02 shall be deemed to be furnished, and not filed:
Exhibit No. |
Description | |
99.1 | Press Release issued on March 19, 2020 | |
99.2 | Letter to Shareholders dated March 19, 2020 |
SIGNATURES
Pursuant to the requirements of the Securities Exchange Act of 1934, the registrant has duly caused this report to be signed on its behalf by the undersigned hereunto duly authorized.
CASPER SLEEP INC. | ||
Date: March 19, 2020 | By: |
/s/ Gregory Macfarlane |
Gregory Macfarlane | ||
Chief Financial Officer and Chief Operating Officer |
Exhibit 99.1
Casper Reports Fourth Quarter and Full Year 2019 Results
Fourth Quarter 2019 Revenue Increased 29%
Full Year 2019 Revenue Increased 23%
Strong Gross Margin Performance
Company Expects to Achieve Positive EBITDA by Midyear 2021
NEW YORK - March 19, 2020 - Casper Sleep Inc. (the “Company”) (NYSE: CSPR), the global Sleep Company, today announced financial results for the fourth quarter (“fourth quarter 2019”) and full year (“full year 2019”) ended on December 31, 2019. Casper posted strong full year and quarterly operating performance, which underscores the potential of the company’s omnichannel approach to commercializing sleep, as detailed in its shareholder letter, available on the Casper Investor Relations website at https://ir.casper.com/files/doc_financials/2019/q4/Q4-2019-Shareholder-Letter.pdf.
Fourth Quarter 2019 Financial Summary (as compared to the fourth quarter ended December 31, 2018)
· | Net Revenue increased 29.3% to $126.9 million; |
· | Direct-to-Consumer Revenues increased 13.2% to $92.0 million, and the Company opened 12 new stores during the fourth quarter 2019; |
· | Retail Partnership Revenues increased 106.1% to $35.0 million, and the Company launched with 3 new partners during the fourth quarter 2019; and |
· | Gross Profit Margin was 47.6%, a 520 basis point improvement. |
Full Year 2019 Financial Summary (as compared to the full year ended December 31, 2018)
· | Net Revenue increased 22.7% to $439.3 million; |
· | Direct-to-Consumer Revenues increased 13.0% to $350.5 million, and the Company opened 37 net new stores during 2019, increasing the total store fleet count to 60; |
· | Retail Partnership Revenues increased 86.0% to $88.8 million, and the Company launched with 7 new partners during 2019, to end year with 18; and |
· | Gross Profit Margin was 49.0%, a 500 basis point improvement. |
Philip Krim, Chief Executive Officer, commented: “Casper had a strong fourth quarter and a strong year. Thanks to the recent process of going public, we have had a chance to meet directly with many investors, leading to a shared understanding of the power and uniqueness of our brand, the utility of our multi-channel approach and in particular our strength in e-commerce and digital. We continue to see a broader opportunity in serving the Sleep Economy, driving improving results on our margins through outsourced manufacturing, operational leverage, and disciplined spending, with a goal of achieving positive EBITDA in 2021.
We are committed to creating durable, long-term value, and our investment thesis and overall strategy remains intact. Due to the evolving COVID-19 situation, we are in a dynamic environment. However, with our IPO behind us, we now have a strong balance sheet and cash position, and we have the ability to monitor changes and quickly adapt to the evolving landscape.
We believe that our successes will continue into 2020 and beyond.”
Fourth Quarter 2019 Review (all comparisons to the fourth quarter ended December 31, 2018)
Revenue, net was $126.9 million, an increase of $28.7 million, or 29.3%, compared to $98.2 million. Revenue, net increased as a result of increased sales through our direct-to-consumer and retail partnership channels and the introduction of new products. Direct-to-consumer sales increased 13.2% as we continued to gain market share and expand our retail presence to 60 stores, with 12 net new stores opened during the fourth quarter 2019. Sales to retail partners increased 106.1% period-over-period, driven by growth of sales activity by existing partners, the introduction of new partners and the expansion of our product offerings.
Gross profit was $60.4 million, an increase of $18.8 million, or 45.2%, compared to $41.6 million. Cost of goods sold was $66.5 million, an increase of $9.9 million, or 17.5%, compared to $56.6 million. Gross margin was 47.6% compared to 42.4%. The increase in gross margin was largely driven by implementing supply chain initiatives designed to reduce product unit costs and introducing new higher margin products, which has had a favorable impact on our cost of goods sold.
Sales and marketing expenses were $40.6 million, an increase of $7.1, or 21.2%, compared to $33.5 million. Sales and marketing expenses increased as we continued to invest in driving traffic to our e-commerce website, marketing our products to consumers and building our brand. Sales and marketing expenses as a percentage of revenue, net decreased from 34.1% to 32.0%, reflecting continued efficiency even as sales and marketing expenses increased.
General and administrative expenses were $43.4 million, an increase of $8.1 million, or 22.9%, compared to $35.4 million. General and administrative expenses increased as we invested to support our growing business, particularly in retail stores and product development. We believe innovation is a key differentiator and invest significant resources in research and development to drive product innovation to improve sleep quality. General and administrative expenses as a percentage of revenue, net decreased from 36.0% to 34.2%, reflecting slowing growth in general and administrative expenses relative to growth in revenue, net.
Net loss was ($25.6) million, an improvement of $2.2 million, or 8.0%, compared to ($27.9) million. The improvement in the net loss is due to improvements in gross margin, sales and marketing as a percentage of net revenue, and general and administrative expenses as a percentage of net revenue, which offset an increase in interest expense.
Adjusted EBITDA was ($16.9) million, an improvement of $8.1 million, or 32.3%, compared to ($24.9) million. The improvement in Adjusted EBITDA is primarily due to increases in certain adjustments to arrive at Adjusted EBITDA, including interest expense, depreciation, stock-based compensation, reorganization costs and transaction costs. See below for a reconciliation of Adjusted EBITDA to the most directly comparable measure calculated in accordance with GAAP, net loss.
Full Year 2019 Review (all comparisons to the full year ended December 31, 2018)
Revenue, net was $439.3 million, an increase of $81.4 million, or 22.7%, compared to $357.9 million. Revenue, net increased as a result of increased sales through our direct-to-consumer and retail partnership channels and the introduction of new products. Direct-to-consumer sales increased 13.0% as we continued to gain market share and expand our retail presence to 60 stores, with 37 net new stores opened at various points throughout 2019. Sales to retail partners increased 86.0%, driven by growth of sales activity by existing partners, the introduction of new partners and the expansion of our product offerings.
Gross profit was $215.4 million, an increase of $57.7 million, or 36.6%, compared to $157.8 million. Cost of goods sold was $223.8 million, an increase of $23.7 million, or 11.8%, compared to $200.1 million. Gross margin was 49.0% compared to 44.1%. The increase in gross margin was largely driven by implementing supply chain initiatives designed to reduce product unit costs and introducing new higher margin products, which has had a favorable impact on our cost of goods sold.
Sales and marketing expenses were $154.6 million, an increase of $28.4, or 22.5%, compared to $126.2 million. Sales and marketing expenses increased as we continued to invest in driving traffic to our e-commerce website, marketing our products to consumers and building our brand. Sales and marketing expenses as a percentage of revenue, net decreased from 35.3% to 35.2%, reflective of our ability to maintain efficiency even as overall investment in sales and marketing increased.
General and administrative expenses were $149.6 million, an increase of $26.0 million, or 21.1%, compared to $123.5 million. General and administrative expenses increased as we invested to support our growing business, particularly in retail stores and product development. We believe innovation is a key differentiator and invest significant resources in research and development to drive product innovation to improve sleep quality. General and administrative expenses as a percentage of revenue, net decreased from 34.5% to 34.1% reflecting the slowing growth in general and administrative expenses relative to growth in revenue, net.
Net loss was ($93.0) million, an increase of $0.9 million, or 1.0%, compared to ($92.1) million. The increase in the net loss is due to an increase in interest expense, offset by improvements in gross margin, sales and marketing as a percentage of net revenue, and general and administrative expenses as a percentage of net revenue.
Adjusted EBITDA was ($70.7) million, an improvement of $11.7 million, or 14.2%, compared to ($82.4) million. The improvement in Adjusted EBITDA is primarily due to increases in certain adjustments to arrive at Adjusted EBITDA, including interest expense, depreciation, stock-based compensation, reorganization costs and transaction costs. See below for a reconciliation of Adjusted EBITDA to the most directly comparable measure calculated in accordance with GAAP, net loss.
Balance Sheet
As of December 31, 2019, the Company had cash and cash equivalents of $67.4 million compared to $26.9 million as of December 31, 2018. The increase was driven by $133.9 million in cash from financing activities, including $82.6 million from the issuance of equity and exercise of stock options and $51.3 million proceeds from borrowings under our senior secured facility and our subordinated facility, partially offset by ($44.3) million of cash used in operating activities.
COVID-19 and Outlook
Casper is closely monitoring how the spread of COVID-19 is affecting its employees, customers and business operations. We have developed preparedness plans to help protect the safety of our employees and retail customers, while safely continuing business operations. Due to the spread of the outbreak in New York, California, and elsewhere where we have corporate offices, we have temporarily restricted access to our offices until at least March 27, 2020 and implemented a mandatory remote work policy during this period. In addition, over the past several weeks, we have worked with our manufacturing, logistics and other supply chain partners to build communication and monitoring processes for all aspects of our product and delivery supply chain. To date, we have not seen a material impact on our supply chain, inventory availability or delivery capacity.
In addition, as of the date of this release, the outbreak has caused us to temporarily close our retail stores located in North America through March 27, 2020. As a result, we expect that the COVID-19 outbreak will impact our revenues, results of operations and financial condition. We are, however, carefully monitoring shifts by customers from our physical retail to our online platform. Moreover, we have not, to date, experienced a material impact due to the COVID-19 outbreak on sales with our retail partners. We are, however, continuing to work closely with our retail partners to monitor the situation. At this time, there is significant uncertainty relating to the trajectory of the COVID-19 outbreak and impact of related responses. The continued spread of the outbreak may have further impact on our business, financial condition or results of operations.
While there is still uncertainty about the evolving landscape and the quarter is not yet complete, we are providing a first quarter estimate for net revenue of between $108 million and $112 million and for Adjusted EBITDA of between $(30) million to $(27) million. As a reminder, the first quarter has historically been the seasonally slowest quarter and we expect quarterly losses to be lower throughout the rest of the year.
Conference Call & Webcast Information
Casper will host a live conference call to discuss its earnings at 8:00 a.m. Eastern Time on March 19, 2020. Interested parties are invited to listen to the conference call which can be accessed live over the phone by dialing (866) 209-2825 (international callers please dial (825) 312-2362) prior to the scheduled conference call time and provide the following passcode: 9241819. A live audio webcast of the conference call will also be available online at ir.casper.com. Please go to the website at least ten (10) minutes prior to the call to register and to test your system’s audio. A taped replay of the conference call will be available within two hours of the conclusion of the call at ir.casper.com. The replay will be available until March 19, 2021.
Casper periodically provides information for investors on its corporate website, casper.com, and its investor relations website, ir.casper.com. This includes press releases and other information about financial performance, reports filed or furnished with the SEC and information on corporate governance.
About Casper
Casper is a global Sleep Company. The Company has a full portfolio of obsessively engineered sleep products—including mattresses, pillows, bedding, and furniture—designed in-house by the Company’s award-winning R&D team at Casper Labs in San Francisco. In addition to its global ecommerce business, Casper owns and operates 60 Sleep Shops across North America and its products are available at a growing list of retailers.
Forward-Looking Statements
This press release contains forward-looking statements within the meaning of the Private Securities Litigation Reform Act of 1995. All statements contained in this press release that do not relate to matters of historical fact should be considered forward-looking statements, including without limitation statements regarding our expectations surrounding the impact of novel coronavirus and the related effect on our employees, customers and business operations; our future results of operations and financial position; our expectation to achieve positive EBITDA by midyear 2021; our business strategy and plans, and objectives of management for future operations and creating long-term value. These statements are neither promises nor guarantees, but involve known and unknown risks, uncertainties and other important factors that may cause our actual results, performance or achievements to be materially different from any future results, performance or achievements expressed or implied by the forward-looking statements, including, but not limited to, the following: the novel coronavirus outbreak could adversely impact our business, financial condition and results of operations; our ability to compete successfully in the highly competitive industries in which we operate; our ability to maintain and enhance our brand; the success of our retail store expansion plans; our ability to successfully implement our growth strategies related to launching new products; the effectiveness and efficiency of our marketing programs; our ability to manage our current operations and to manage future growth effectively; our past results may not be indicative of our future operating performance; our ability to attract new customers or retain existing customers; the growth of the market for sleep as a retail category and our ability to become a leader or maintain our leadership in the category; the impact of social media and influencers on our reputation; our ability to protect and maintain our intellectual property; our exclusive reliance on third-party contract manufacturers whose efforts we are unable to fully control; our ability to effectively implement strategic initiatives; our ability to transfer our supply chain and other business processes to a global scale; risks relating to our international operations and expansion; we are dependent on our retail partners; general economic and business conditions; we could be subject to system failures or interruptions and security breaches; risks relating to changing legal and regulatory requirements, and any failure to comply with applicable laws and regulations; we may be subject to product liability claims and other litigation; we may experience fluctuations in our quarterly operating results; we have and expect to continue to incur significant losses; risks relating to our indebtedness; our need for additional funding, which may not be available; risks relating to taxes; future sales by us our stockholders may cause the market price of our stock to decline; and risks and additional costs relating to our status as a new public company. These and other important factors discussed under the caption “Risk Factors” in our Annual Report on Form 10-K for the year ended December 31, 2019 and our other filings with the Securities and Exchange Commission could cause actual results to differ materially from those indicated by the forward-looking statements made in this press release. Any such forward-looking statements represent management’s estimates as of the date of this press release. While we may elect to update such forward-looking statements at some point in the future, we disclaim any obligation to do so, even if subsequent events cause our views to change.
Non-GAAP Financial Measures
Adjusted EBITDA is a supplemental measure of our performance that is not required by, or presented in accordance with, GAAP. Adjusted EBITDA is not a measurement of our financial performance under GAAP and should not be considered as an alternative to net income or any other performance measure derived in accordance with GAAP.
We define Adjusted EBITDA as net loss before interest (income) expense, income tax expense and depreciation and amortization as further adjusted to exclude the impact of stock based compensation expense, restructuring costs, costs associated with legal settlements, and expenses incurred in connection with our initial public offering. We caution investors that amounts presented in accordance with our definition of Adjusted EBITDA may not be comparable to similar measures disclosed by our competitors, because not all companies and analysts calculate Adjusted EBITDA in the same manner. We present Adjusted EBITDA because we consider them to be important supplemental measures of our performance and believe it is frequently used by securities analysts, investors, and other interested parties in the evaluation of companies in our industry. Management believes that investors’ understanding of our performance is enhanced by including this non-GAAP financial measure as a reasonable basis for comparing our ongoing results of operations.
Management uses Adjusted EBITDA:
· | as a measurement of operating performance because it assists us in comparing the operating performance of our business on a consistent basis, as it removes the impact of items not directly resulting from our core operations; |
· | for planning purposes, including the preparation of our internal annual operating budget and financial projections; |
· | to evaluate the performance and effectiveness of our operational strategies; and |
· | to evaluate our capacity to expand our business. |
By providing this non-GAAP financial measure, together with the reconciliation, we believe we are enhancing investors’ understanding of our business and our results of operations, as well as assisting investors in evaluating how well we are executing our strategic initiatives. Adjusted EBITDA has limitations as an analytical tool, and should not be considered in isolation, or as an alternative to, or a substitute for net income or other financial statement data presented in our consolidated financial statements as indicators of financial performance. Some of the limitations are:
· | such measures do not reflect our cash expenditures; |
· | such measures do not reflect changes in, or cash requirements for, our working capital needs; |
· | although depreciation and amortization are non-cash charges, the assets being depreciated and amortized will often have to be replaced in the future and such measures do not reflect any cash requirements for such replacements; and |
· | other companies in our industry may calculate such measures differently than we do, limiting their usefulness as comparative measures. |
Due to these limitations, Adjusted EBITDA should not be considered as measures of discretionary cash available to us to invest in the growth of our business. We compensate for these limitations by relying primarily on our GAAP results and using these non-GAAP measures only supplementally. As noted in the Reconciliation of Non-GAAP metrics table elsewhere in this press release, Adjusted EBITDA includes adjustments to exclude the impact of stock-based compensation expense and material infrequent items, including but not limited to the costs of our initial public offering, restructuring costs, costs associated with legal settlements, and acquisitions or divestitures, among other items. It is reasonable to expect that these items will occur in future periods. However, we believe these adjustments are appropriate because the amounts recognized can vary significantly from period to period, do not directly relate to the ongoing operations of our business and may complicate comparisons of our internal operating results and operating results of other companies over time. In addition, Adjusted EBITDA includes adjustments for other items that we do not expect to regularly record following our initial public offering. Each of the normal recurring adjustments and other adjustments described in this paragraph and in the Reconciliation of Non-GAAP metrics table elsewhere in this press release help management with a measure of our core operating performance over time by removing items that are not related to day-to-day operations.
Press Contact
Emma Frane
emma.frane@casper.com
Investor Relations Contact
IR@casper.com
Casper Sleep Inc. and Subsidiaries
Consolidated Balance Sheets
(In thousands, except per share amounts)
As of December 31, | ||||||||
2019 | 2018 | |||||||
Assets | ||||||||
Current assets: | ||||||||
Cash and cash equivalents | $ | 67,407 | $ | 26,880 | ||||
Restricted cash | 171 | 1,475 | ||||||
Accounts receivable | 31,059 | 23,106 | ||||||
Prepaid expenses and other current assets | 23,924 | 7,739 | ||||||
Inventory, net | 39,358 | 32,703 | ||||||
Total current assets | 161,919 | 91,903 | ||||||
Property and equipment, net | 66,262 | 18,812 | ||||||
Other assets | 2,137 | 5,823 | ||||||
Total assets | $ | 230,318 | $ | 116,538 | ||||
Liabilities, Convertible Preferred Stock and Stockholders’ Deficit | ||||||||
Current liabilities: | ||||||||
Accounts payable | 30,734 | 27,704 | ||||||
Accrued expenses | 73,130 | 37,358 | ||||||
Deferred revenue | 9,673 | 8,822 | ||||||
Other current liabilities | 34,422 | 26,855 | ||||||
Total current liabilities | 147,959 | 100,739 | ||||||
Other liabilities | 69,492 | 886 | ||||||
Total liabilities | 217,451 | 101,625 | ||||||
Convertible preferred stock, $0.000001 par value —19,213 and 16,524 shares authorized; 19,181 and 16,524 issued and outstanding as of December 31, 2019 and December 31, 2018, respectively | 319,961 | 238,802 | ||||||
Stockholders’ deficit: | ||||||||
Convertible Class A Common stock, $0.000001 par value —19,044 and 19,920 shares authorized; 9,191 and 9,110 issued and outstanding as of December 31, 2019 and December 31, 2018, respectively | — | — | ||||||
Class B Common stock, $0.000001 par value —37,000 and 34,475 shares authorized; 1,466 and 1,288 issued and outstanding as of December 31, 2019 and December 31, 2018, respectively | — | — | ||||||
Additional paid-in capital | 18,097 | 8,750 | ||||||
Accumulated other comprehensive (loss) income | 69 | (419 | ) | |||||
Accumulated deficit | (325,260 | ) | (232,220 | ) | ||||
Total stockholders’ deficit | (307,094 | ) | (223,889 | ) | ||||
Total liabilities, convertible preferred stock and stockholders’ deficit | $ | 230,318 | $ | 116,538 |
Casper Sleep Inc. and Subsidiaries
Consolidated Statements of Operations and Comprehensive Loss
(In thousands, except per share amounts)
Year Ended December 31, | ||||||||
2019 | 2018 | |||||||
Revenue, net | $ | 439,258 | $ | 357,891 | ||||
Cost of goods sold | 223,847 | 200,139 | ||||||
Gross profit | 215,411 | 157,752 | ||||||
Operating expenses | ||||||||
Sales and marketing expenses | 154,589 | 126,189 | ||||||
General and administrative expense | 149,568 | 123,523 | ||||||
Total operating expenses | 304,157 | 249,712 | ||||||
Loss from operations | (88,746 | ) | (91,960 | ) | ||||
Other (income) expense | ||||||||
Interest (income) expense | 3,188 | (248 | ) | |||||
Other expense, net | 1,019 | 341 | ||||||
Total other expense, net | 4,207 | 93 | ||||||
Loss before income taxes | (92,953 | ) | (92,053 | ) | ||||
Income tax expense | 87 | 39 | ||||||
Net loss | (93,040 | ) | (92,092 | ) | ||||
Other comprehensive income (loss) | ||||||||
Currency translation adjustment | 488 | (1,077 | ) | |||||
Total comprehensive loss | $ | (92,552 | ) | $ | (93,169 | ) | ||
Net loss per share attributable to common stockholders, basic and diluted | (8.86 | ) | (8.91 | ) | ||||
Weighted-average number of shares used in computing net loss per share attributable to common stockholders, basic and diluted | 10,501 | 10,336 |
Casper Sleep Inc. and Subsidiaries
Consolidated Statements of Operations and Comprehensive Loss (unaudited)
(In thousands, except per share amounts)
Quarter Ended December 31, | ||||||||
2019 | 2018 | |||||||
Revenue, net | $ | 126,939 | $ | 98,204 | ||||
Cost of goods sold | 66,505 | 56,583 | ||||||
Gross profit | 60,434 | 41,621 | ||||||
Operating expenses | ||||||||
Sales and marketing expenses | 40,596 | 33,484 | ||||||
General and administrative expense | 43,442 | 35,357 | ||||||
Total operating expenses | 84,038 | 68,841 | ||||||
Loss from operations | (23,604 | ) | (27,220 | ) | ||||
Other (income) expense | ||||||||
Interest (income) expense | 1,833 | 255 | ||||||
Other expense, net | 178 | 392 | ||||||
Total other expense, net | 2,011 | 647 | ||||||
Loss before income taxes | (25,615 | ) | (27,867 | ) | ||||
Income tax expense | 27 | (6 | ) | |||||
Net loss | (25,642 | ) | (27,861 | ) | ||||
Other comprehensive income (loss) | ||||||||
Currency translation adjustment | 413 | 211 | ||||||
Total comprehensive loss | $ | (25,229 | ) | $ | (27,650 | ) |
Casper Sleep Inc. and Subsidiaries
Consolidated Statement of Cash Flows
(In thousands, except per share amounts)
Year ended December 31, | ||||||||
2019 | 2018 | |||||||
Cash flows used in operating activities: | ||||||||
Net loss | $ | (93,040 | ) | $ | (92,092 | ) | ||
Adjustments to reconcile net loss to net cash used in operating activities: | ||||||||
Depreciation and amortization | 7,753 | 3,426 | ||||||
Stock based compensation expense | 7,933 | 5,716 | ||||||
Other | 5,938 | (118 | ) | |||||
Changes in assets and liabilities: | ||||||||
Accounts receivable | (7,953 | ) | (10,450 | ) | ||||
Prepaid expenses and other current assets | (16,185 | ) | 880 | |||||
Inventory | (6,655 | ) | (8,688 | ) | ||||
Other assets | (314 | ) | 1,860 | |||||
Accounts payable | 2,842 | 10,205 | ||||||
Accrued expenses | 35,772 | 8,378 | ||||||
Deferred revenue | 851 | 6,438 | ||||||
Other liabilities | 18,730 | 2,190 | ||||||
Net cash used in operating activities | (44,328 | ) | (72,255 | ) | ||||
Cash flows used in investing activities: | ||||||||
Purchases of property and equipment | (54,813 | ) | (13,035 | ) | ||||
Note receivable | 4,000 | 1,000 | ||||||
Net cash used in investing activities | (50,813 | ) | (12,035 | ) | ||||
Cash flows from financing activities: | ||||||||
Exercise of stock options | 1,414 | 275 | ||||||
Proceeds from Fundraising | 81,159 | — | ||||||
Proceeds from borrowings | 54,225 | 15,000 | ||||||
Repayment on borrowings | (2,922 | ) | (435 | ) | ||||
Net cash provided by financing activities | 133,876 | 14,840 | ||||||
Effect of exchange rate changes | 488 | (1,077 | ) | |||||
Net change in cash and cash equivalents | 39,223 | (70,527 | ) | |||||
Cash, cash equivalents and restricted cash at beginning of period | 28,355 | 98,882 | ||||||
Cash, cash equivalents and restricted cash at end of the period | $ | 67,578 | $ | 28,355 | ||||
Supplemental reconciliation of cash, cash equivalents and restricted cash reported within the consolidated balance sheets | ||||||||
Cash and cash equivalents | 67,407 | 26,880 | ||||||
Restricted cash | 171 | 1,475 | ||||||
Total cash, cash equivalents and restricted cash | $ | 67,578 | $ | 28,355 | ||||
Supplemental disclosure of cash paid for: | ||||||||
Interest paid | (2,578 | ) | (182 | ) |
Casper Sleep Inc. and Subsidiaries
Consolidated Statement of Cash Flows (unaudited)
(In thousands, except per share amounts)
Quarter ended December 31, | ||||||||
2019 | 2018 | |||||||
Cash flows used in operating activities: | ||||||||
Net loss | $ | (25,641 | ) | $ | (27,861 | ) | ||
Adjustments to reconcile net loss to net cash used in operating activities: | ||||||||
Depreciation and amortization | 2,949 | 1,032 | ||||||
Stock based compensation expense | 2,285 | 1,143 | ||||||
Deferred rent | 1,647 | (364 | ) | |||||
Deferred income taxes | 4 | (14 | ) | |||||
Changes in assets and liabilities: | ||||||||
Accounts receivable | (6,681 | ) | (7,844 | ) | ||||
Prepaid expenses and other current assets | 562 | 5,004 | ||||||
Inventory | (12,240 | ) | (4,287 | ) | ||||
Other assets | (366 | ) | 1,617 | |||||
Accounts payable | (131 | ) | 858 | |||||
Accrued expenses | 22,509 | 4,248 | ||||||
Deferred revenue | 4,070 | 3,203 | ||||||
Other liabilities | (3,590 | ) | (4,056 | ) | ||||
Net cash used in operating activities | (14,623 | ) | (27,321 | ) | ||||
Cash flows used in investing activities: | ||||||||
Purchases of property and equipment | (11,181 | ) | (5,786 | ) | ||||
Note receivable | — | 1,000 | ||||||
Net cash used in investing activities | (11,181 | ) | (4,786 | ) | ||||
Cash flows from financing activities: | ||||||||
Exercise of stock options | 96 | 92 | ||||||
Proceeds from Fundraising | 12,972 | — | ||||||
Proceeds from borrowings | 25,000 | 15,000 | ||||||
Repayment on borrowings | — | (435 | ) | |||||
Net cash provided by financing activities | 38,068 | 14,657 | ||||||
Effect of exchange rate changes | 413 | 211 | ||||||
Net change in cash and cash equivalents | 12,677 | (17,239 | ) | |||||
Cash, cash equivalents and restricted cash at beginning of period | 54,901 | 45,594 | ||||||
Cash, cash equivalents and restricted cash at end of the period | $ | 67,578 | $ | 28,355 | ||||
Supplemental reconciliation of cash, cash equivalents and restricted cash reported within the consolidated balance sheets | ||||||||
Cash and cash equivalents | 67,407 | 26,880 | ||||||
Restricted cash | 171 | 1,475 | ||||||
Total cash, cash equivalents and restricted cash | $ | 67,578 | $ | 28,355 |
Casper Sleep Inc. and Subsidiaries
Reconciliation of Non-GAAP METRICS (unaudited)
(In thousands)
Year ended December 31, | ||||||||
2019 | 2018 | |||||||
Reconciliation of Adjusted EBITDA: | ||||||||
Net Loss | $ | (93,040 | ) | $ | (92,092 | ) | ||
Income Tax Expense | 87 | 39 | ||||||
Interest (income) expense: | 3,188 | (248 | ) | |||||
Depreciation and amortization | 7,753 | 3,426 | ||||||
Stock based compensation expense | 7,933 | 5,716 | ||||||
Reorganization | 1,223 | 490 | ||||||
Legal Settlement | 826 | 270 | ||||||
Transaction Costs | 1,346 | — | ||||||
Adjusted EBITDA | $ | (70,684 | ) | $ | (82,399 | ) |
Quarter Ended December 31, | ||||||||
2019 | 2018 | |||||||
Reconciliation of Adjusted EBITDA: | ||||||||
Net Loss | $ | (25,642 | ) | $ | (27,861 | ) | ||
Income Tax Expense | 27 | (6 | ) | |||||
Interest (income) expense: | 1,833 | 255 | ||||||
Depreciation and amortization | 2,949 | 1,032 | ||||||
Stock based compensation expense | 2,285 | 1,143 | ||||||
Reorganization | 542 | 490 | ||||||
Legal Settlement | 688 | 5 | ||||||
Transaction Costs | 441 | — | ||||||
Adjusted EBITDA | $ | (16,876 | ) | $ | (24,941 | ) |
Exhibit 99.2
Page 1 of 15 Shareholder Letter Q4 2019 |
Shareholder Letter Q4 2019Thursday, March 19th, 2020 To Our Shareholders and the Investment Community: Today, we are reporting our financial results for the fourth quarter and full year, which ended on December 31, 2019, providing an update on how COVID-19 is impacting our business, and discussing guidance. 2019 Results Before we get into our results, I would like to address a topic that is on all of our minds, COVID-19, and how it is impacting all of us. The health and safety of our employees and customers is our top priority. We are continuing to monitor developments and will provide more details later in this letter on how we are adapting our business in this challenging environment. Moving to 2019 results, we are pleased to report that 2019 was a good year for sleep and a strong year and fourth quarter for Casper. Our results were within the ranges provided as preliminary estimates for 2019 results in our IPO registration statement. In the fourth quarter and full year 2019, we saw positive progress on each of the levers driving our path to profitability: continued top-line revenue growth, improving gross margins, disciplined marketing with natural leverage, and scalable general and administrative infrastructure. Fourth Quarter 2019 Highlights Overall net revenue was $126.9 million for the fourth quarter, our highest revenue quarter ever. This represented period-over-period growth of 29.3% for this quarter, marking a continued reacceleration of growth. Our direct-to-consumer revenues were up 13.2% period-over-period in the fourth quarter, at $92.0 million, and we opened 12 new retail stores in the quarter. Our retail partnership revenues were up 106.1% period-over-period in the fourth quarter, at $35.0 million, and we launched with three new retail partners. This marked our highest ever retail partner revenue quarter. Gross profit margin in the fourth quarter was 47.6%, a 520 basis point period-over-period improvement. Highlights Strong Q4 sales performance Progress on all levers to drive profitability Expect to achieve positive EBITDA profitability by midyear 2021 COVID-19 update |
Net losses improved by 8% to $25.6 million for the fourth quarter of 2019 compared to the prior year period. Full Year 2019 Highlights Net revenue was $439.3 million for 2019, representing 22.7% growth from the prior year. Our direct-to-consumer revenues were up 13.0% year-on-year in 2019, at $350.5 million, and we opened 37 net new stores in the year, bringing our total store fleet count to 60 at year-end. Our Retail Partnership revenues were up 86.0% in 2019, at $88.8 million, and we launched with 7 new partners, to end the year with 18 total partners. Gross profit margin for 2019 was 49.0%, a 500 basis point year-over-year improvement, driven by supply chain initiatives to reduce product unit costs and the introduction of new higher margin products, which had a favorable impact on our cost of goods sold. We held our net loss for the year nearly flat, with a 1% increase to $93.0 million for the full year relative to 2018. Our products continue to shine: the Casper Glow was named one of TIME’s best inventions of 2019, and Consumer Reports recently named the original Casper Mattress as one of the decade’s most influential products. COVID-19 Update The COVID-19 situation is rapidly evolving and, while there is still a great deal of uncertainty on the overall impact across the globe, we’d like to provide an update on our observations of our business to date and the actions we’ve taken. First, our top priority is the health and safety of our employees and customers. Starting last week we shifted to optional remote work for employees at our headquarters, and over the weekend we updated our policy to mandatory remote work from March 16th through March 27th. Over the past weekend we reduced the operating hours of our retail stores and on Monday of this week we announced the temporary closure of all of our Casper Sleep Shops from March 17th through March 27th. Second, we do not currently have any material issues with respect to our supply chain. We manage a diverse global supply chain and this provides not only cost and infrastructure advantages, but also flexibility should we need it. Over the past several weeks, we have worked with our manufacturing and logistics partners to build communication and monitoring processes for all aspects of our product and delivery supply chain. This work includes: a full inventory assessment of all commodities, sub components, work in process and finished goods; monitoring |
shift level labor and output rates for key vendors; daily tracking of shipping, rail and truck logistics and receiving flows. At this point we are not seeing any specific issues with inventory availability and delivery. Third, while the quarter started off strong in January and into February, we have seen consumer caution in recent weeks impacting our retail stores, with a measurable slowdown in retail traffic. Like many other retailers, we announced earlier this week the closure of our retail stores from March 17th through March 27th. As a result, we expect to see an impact on our retail store sales for the first quarter. In terms of e-commerce, we also began seeing shifting performance on casper.com, with an initial slow down over the past few weeks, but a pick-up in performance over the weekend and into this week. We are carefully monitoring shifts by customers from retail to our online sales channel. We believe our multi-channel platform and the strength of our brand leave us well-positioned to capture market share if demand shifts online. We have not seen a material impact on our retail partnerships to date, but we will continue to work closely with our partners as conditions evolve. As we continue to monitor the developing situation, we are managing the business with a focus on cash management. We finished 2019 with approximately $68 million in cash and then successfully raised an additional $88 million in net proceeds from our IPO earlier this year. We would like to reaffirm that the business is fully capitalized and that we will manage the business with a focus on working towards EBITDA breakeven by midyear 2021. We are a fast-moving and flexible organization with extensive data and analytics capabilities and a mostly variable cost structure, both of which enable us to quickly and thoughtfully react to changing circumstances. To date, we have already taken action in a number of areas including labor management, marketing investment, pricing and promotions, company travel, and inventory levels, and we have shifted our resource focus towards cost and cash management activities. We will continue to monitor the business closely and adjust accordingly. While there is still uncertainty about the evolving landscape and we have not yet completed the quarter, we want to share that our first quarter estimate for net revenue is between $108 million and $112 million and for Adjusted EBITDA is between $(30) million to $(27) million. As a reminder, the first quarter has historically been our seasonally slowest quarter and we expect quarterly losses to be lower throughout the rest of the year. This is a complicated situation for all of us, which is evolving daily. We continue to follow the latest guidance from public health authorities and state and local authorities, and adapt our business accordingly. We plan to provide a full-year update and 2020 guidance on our first quarter 2020 earnings call, which we expect to be in early May. |
Our Multi-channel Strategy We have developed our multi-channel strategy to support the consumers’ path to purchase across a range of Sleep products, which typically includes multiple touchpoints across both physical and online sales channels. Our sales channels consist of direct-to-consumer, which includes online sales and sales in our owned retail locations, and retail partnerships which includes online and in-store sales through our best-in-class retail partners. We believe both channels are an integral part of the consumer experience. Net Revenue - Direct-to-Consumer: In the fourth quarter of 2019, our stores, combined with our online presence, drove a direct-to-consumer sales increase of 13.2% year-over-year to $92.0 million. We had a strong Black Friday & Cyber Monday shopping window, and we were excited to offer seasonally curated jpgting products both online and in our retail stores, which grew transactions in the quarter. We opened 12 new Casper retail locations in the fourth quarter, on time and on budget, ending the year with a total store count of 60 and expanding our footprint with a number of new-to-Casper cities like Calgary, Charlotte, Cincinnati, and Kansas City. $310 $92 $81 Direct to Consumer Revenue +13.0% $mm, % Growth $351 +13.2% 4Q18 4Q19 2018 2019 Net Revenue - Retail Partnerships: The continued growth and strength of our retail partnerships drove a 106.1% period-over-period growth in revenue to $35.0 million in the fourth quarter of 2019. Retail partnership revenue accounted for 28% of fourth quarter revenue in 2019, compared to 17% of total revenue in the fourth quarter of 2018. The growth of this channel is important, as our Retail Partners require less marketing and general and administrative spend than direct-to-consumer, which drives operating leverage. |
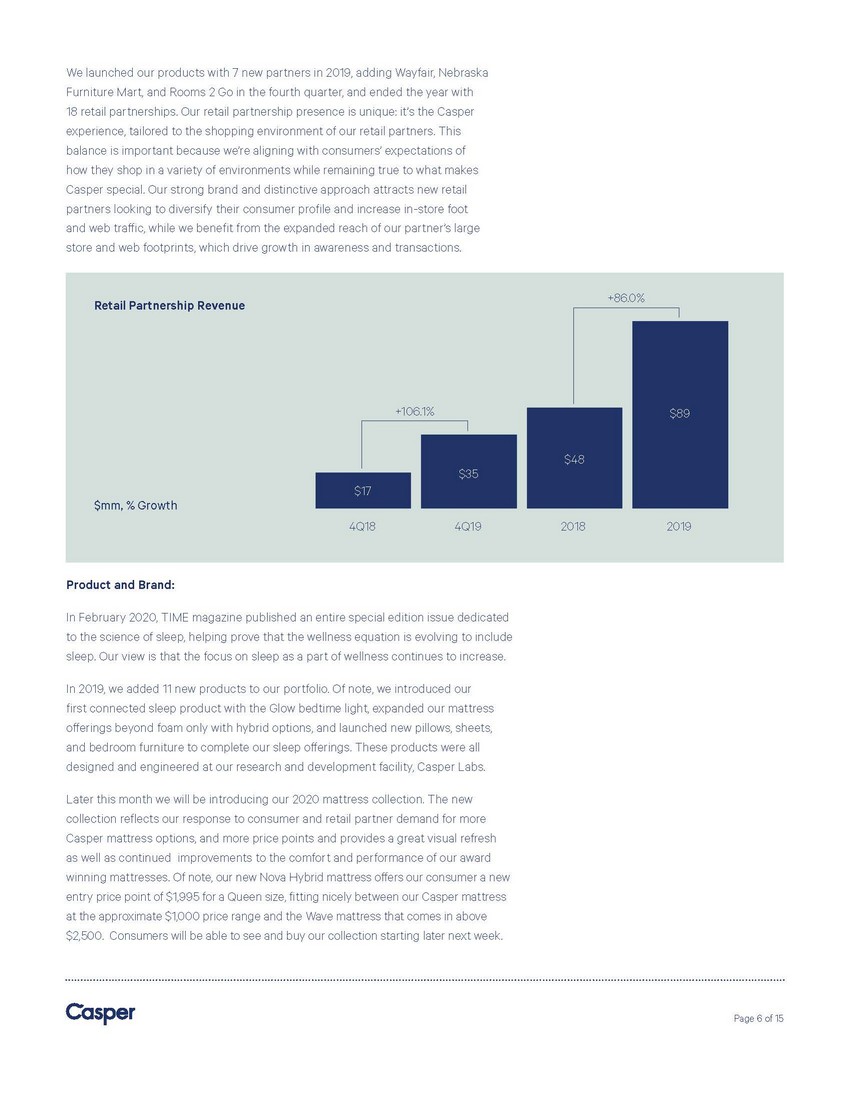
We launched our products with 7 new partners in 2019, adding Wayfair, Nebraska Furniture Mart, and Rooms 2 Go in the fourth quarter, and ended the year with 18 retail partnerships. Our retail partnership presence is unique: it’s the Casper experience, tailored to the shopping environment of our retail partners. This balance is important because we’re aligning with consumers’ expectations of how they shop in a variety of environments while remaining true to what makes Casper special. Our strong brand and distinctive approach attracts new retail partners looking to diversify their consumer profile and increase in-store foot and web traffic, while we benefit from the expanded reach of our partner’s large store and web footprints, which drive growth in awareness and transactions. $48 $17 Retail Partnership Revenue +86.0% +106.1% $89 $35 $mm, % Growth 4Q18 4Q19 2018 2019 Product and Brand: In February 2020, TIME magazine published an entire special edition issue dedicated to the science of sleep, helping prove that the wellness equation is evolving to include sleep. Our view is that the focus on sleep as a part of wellness continues to increase. In 2019, we added 11 new products to our portfolio. Of note, we introduced our first connected sleep product with the Glow bedtime light, expanded our mattress offerings beyond foam only with hybrid options, and launched new pillows, sheets, and bedroom furniture to complete our sleep offerings. These products were all designed and engineered at our research and development facility, Casper Labs. Later this month we will be introducing our 2020 mattress collection. The new collection reflects our response to consumer and retail partner demand for more Casper mattress options, and more price points and provides a great visual refresh as well as continued improvements to the comfort and performance of our award winning mattresses. Of note, our new Nova Hybrid mattress offers our consumer a new entry price point of $1,995 for a Queen size, fitting nicely between our Casper mattress at the approximate $1,000 price range and the Wave mattress that comes in above $2,500. Consumers will be able to see and buy our collection starting later next week. |
Gross Margins: We believe a key measure of our performance is our success in continuing to deliver margin expansion across our business. We have invested significant leadership effort into product and material re-engineering to take cost out of the underlying products, driving improvements in gross margin in 2019. The decision to utilize third-party manufacturers is a strategic one that has allowed us to grow the business quickly, expand into new products easily and avoid large fixed cost investments typical in the bedding industry. We have built internal expertise through the entire bill of material, sub-components and raw material costs, and manufacturing techniques, and we have shown measurable ability to reduce costs in our cost of goods sold. We made excellent progress in qualifying new suppliers, increasing sourcing capabilities, completing a large number of productivity programs that benefitted 2019 and set 2020 up for further expected savings. Casper earned $60.4 million in gross profits in the fourth quarter of 2019, an increase of 45.2% from last year’s fourth quarter, and $215.4 million in gross profits in 2019, an increase of 36.6% from the prior year. Gross margins were 49.0% in 2019, a +496 basis point improvement year-over-year and 47.6% in the fourth quarter, a +523 basis point improvement year-over-year. Importantly, we have been able to improve our overall company gross margins, even as retail partnerships with lower margins increased from 17% of total revenue in the fourth quarter of 2018 to 28% in the fourth quarter of 2019. Gross margin percentage in the fourth quarter was impacted by year-end accounting adjustments for our annual inventory count and valuation adjustments. Though these entries were booked in the fourth quarter, they apply to the full year. These adjustments resulted in a fourth quarter gross margin percentage that was slightly lower than our third quarter margin of 50.7%. The fourth quarter margin does not represent any differences in underlying gross margin performance and we remain confident in our gross margin profile moving into 2020. |
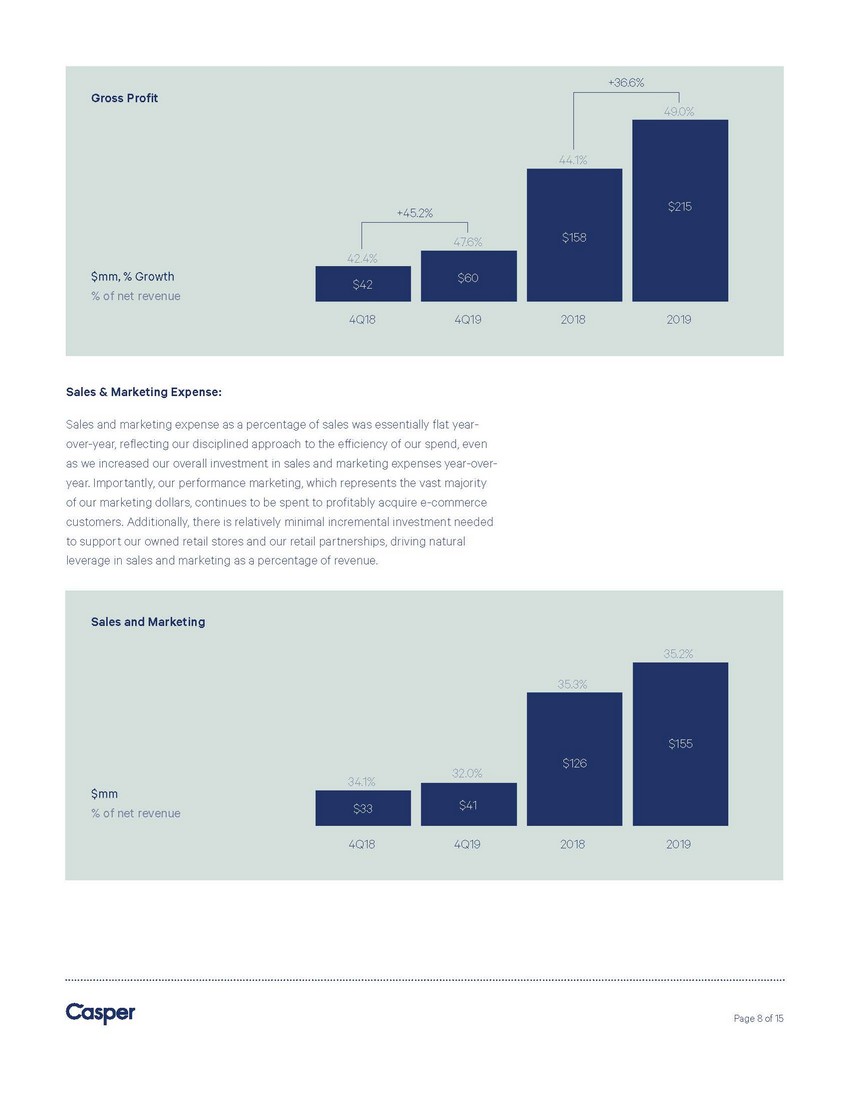
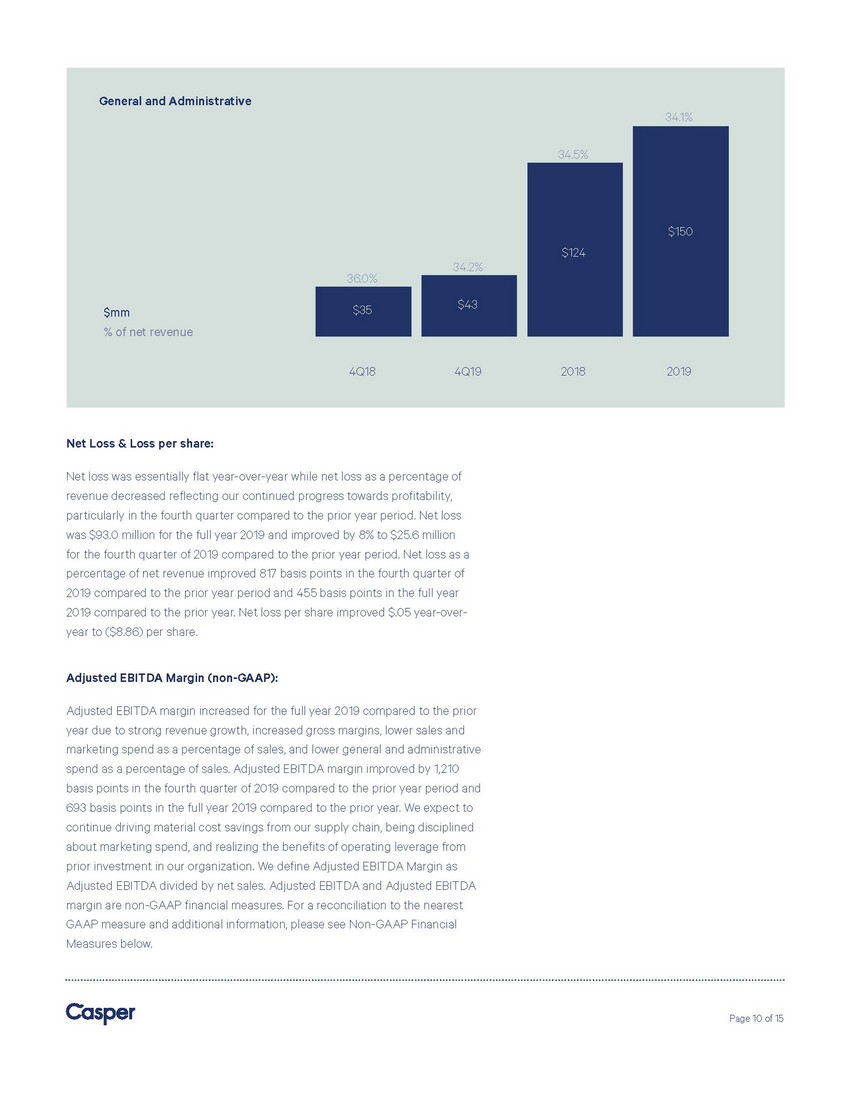
$158 $60 $42 +36.6% Gross Profit 49.0% 44.1% +45.2% $215 47.6% 42.4% $mm, % Growth % of net revenue 4Q18 4Q19 2018 2019 Sales & Marketing Expense: Sales and marketing expense as a percentage of sales was essentially flat year-over-year, reflecting our disciplined approach to the efficiency of our spend, even as we increased our overall investment in sales and marketing expenses year-over-year. Importantly, our performance marketing, which represents the vast majority of our marketing dollars, continues to be spent to profitably acquire e-commerce customers. Additionally, there is relatively minimal incremental investment needed to support our owned retail stores and our retail partnerships, driving natural leverage in sales and marketing as a percentage of revenue. $155 $126 $33 Sales and Marketing 35.2% 35.3% 34.1% 32.0% $mm % of net revenue $41 4Q18 4Q19 2018 2019 |
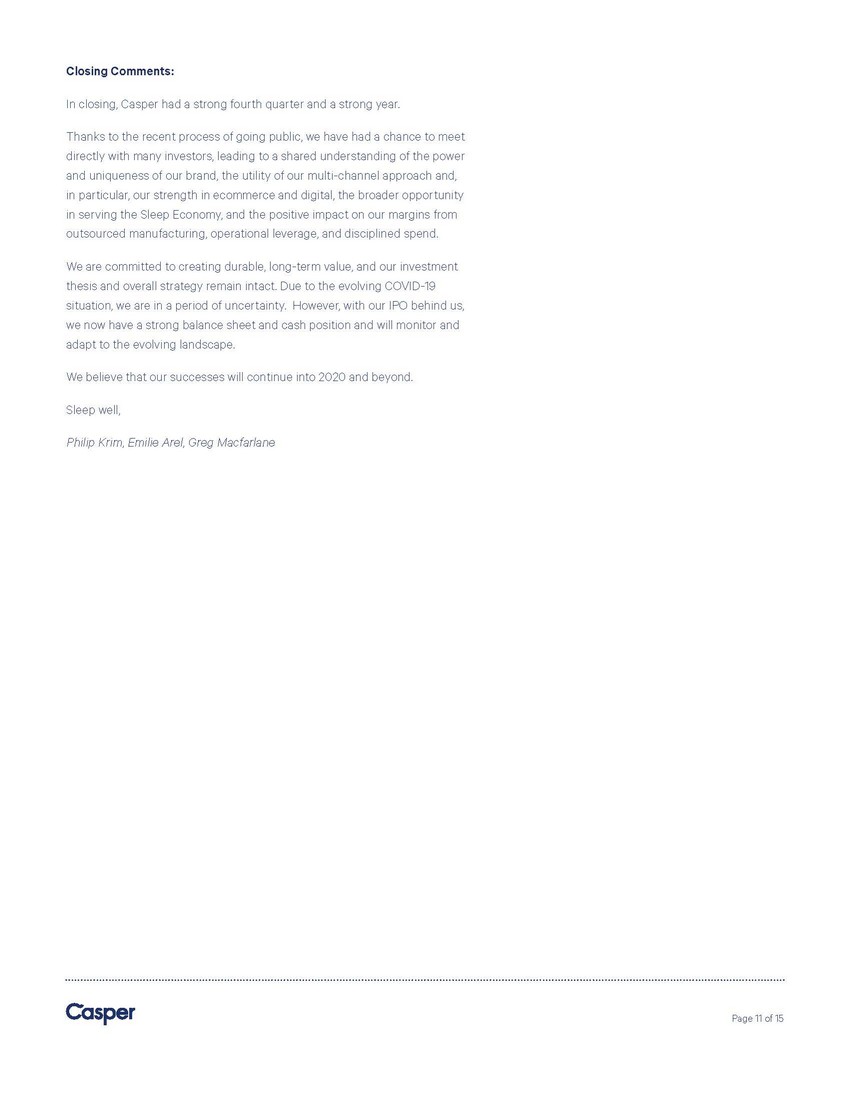
Contribution Margin (non-GAAP): Contribution margin is a metric we use to evaluate the business and is defined as gross profit less sales and marketing expense and is effectively the profit after we acquire a customer and sell a product. Contribution margin dollars increased 143.8% in the fourth quarter of 2019 and 92.7% for the full year 2019, driven by improved gross margins and disciplined marketing spend. Contribution Margin as a percentage of net revenue increased 734 basis points in the fourth quarter of 2019 compared with the prior year and 503 basis points for full year 2019 compared to the prior year. Contribution margin and contribution margin as a percentage of net revenue are non-GAAP financial measures. For a reconciliation to the nearest GAAP measure and additional information, please see “Non-GAAP Financial Measures below”. Contribution Margin +92.7% 13.8% +143.8% 8.8% $61 15.6% $32 $mm, % Growth % of net revenue 8.3% $8 $20 4Q18 4Q19 2018 2019 General & Administrative Expense: General & administrative expense for 2019 was $149.6 million and for the fourth quarter of 2019 was $43.4 million. In 2019 we continued to invest in key areas that drive growth, particularly retail and product development. We introduced 11 new products including our award winning Glow light, our Hybrid mattresses and our Down and Foam pillows. We built our business to scale, investing ahead of growth, and we believe the majority of our overhead infrastructure is largely in place. This drives operating leverage as we continue to grow, as demonstrated by the improvements in general & administrative spend as a percentage of net revenue, which was down by 46 basis points year-over-year in 2019 and 178 basis points in the fourth quarter of 2019 compared to the prior year period. |
$150 $124 $43 $35 General and Administrative 34.1% 34.5% 34.2% 36.0% $mm % of net revenue 4Q18 4Q19 2018 2019 Net Loss & Loss per share: Net loss was essentially flat year-over-year while net loss as a percentage of revenue decreased reflecting our continued progress towards profitability, particularly in the fourth quarter compared to the prior year period. Net loss was $93.0 million for the full year 2019 and improved by 8% to $25.6 million for the fourth quarter of 2019 compared to the prior year period. Net loss as a percentage of net revenue improved 817 basis points in the fourth quarter of 2019 compared to the prior year period and 455 basis points in the full year 2019 compared to the prior year. Net loss per share improved $.05 year-over-year to ($8.86) per share. Adjusted EBITDA Margin (non-GAAP): Adjusted EBITDA margin increased for the full year 2019 compared to the prior year due to strong revenue growth, increased gross margins, lower sales and marketing spend as a percentage of sales, and lower general and administrative spend as a percentage of sales. Adjusted EBITDA margin improved by 1,210 basis points in the fourth quarter of 2019 compared to the prior year period and 693 basis points in the full year 2019 compared to the prior year. We expect to continue driving material cost savings from our supply chain, being disciplined about marketing spend, and realizing the benefits of operating leverage from prior investment in our organization. We define Adjusted EBITDA Margin as Adjusted EBITDA divided by net sales. Adjusted EBITDA and Adjusted EBITDA margin are non-GAAP financial measures. For a reconciliation to the nearest GAAP measure and additional information, please see Non-GAAP Financial Measures below. |
Closing Comments: In closing, Casper had a strong fourth quarter and a strong year. Thanks to the recent process of going public, we have had a chance to meet directly with many investors, leading to a shared understanding of the power and uniqueness of our brand, the utility of our multi-channel approach and, in particular, our strength in ecommerce and digital, the broader opportunity in serving the Sleep Economy, and the positive impact on our margins from outsourced manufacturing, operational leverage, and disciplined spend. We are committed to creating durable, long-term value, and our investment thesis and overall strategy remain intact. Due to the evolving COVID-19 situation, we are in a period of uncertainty. However, with our IPO behind us, we now have a strong balance sheet and cash position and will monitor and adapt to the evolving landscape. We believe that our successes will continue into 2020 and beyond. Sleep well, Philip Krim, Emilie Arel, Greg Macfarlane |
Forward-Looking Statements This shareholder letter contains forward-looking statements within the meaning of the Private Securities Litigation Reform Act of 1995. All statements contained in this letter that do not relate to matters of historical fact should be considered forward-looking statements, including without limitation statements regarding our expectations surrounding the impact of novel coronavirus and the related effect on our employees, customers and business operations; the timing of our earnings release and conference call for the first quarter of 2020; the launch of our 2020 mattress collection; our future results of operations and financial position; our expectation to achieve positive EBITDA by mid-year 2021; our business strategy and plans, and objectives of management for future operations. These statements are neither promises nor guarantees, but involve known and unknown risks, uncertainties and other important factors that may cause our actual results, performance or achievements to be materially different from any future results, performance or achievements expressed or implied by the forward-looking statements, including, but not limited to, the following: the novel coronavirus outbreak could adversely impact our business, financial condition and results of operations; our ability to compete successfully in the highly competitive industries in which we operate; our ability to maintain and enhance our brand; the success of our retail store expansion plans; our ability to successfully implement our growth strategies related to launching new products; the effectiveness and efficiency of our marketing programs; our ability to manage our current operations and to manage future growth effectively; our past results may not be indicative of our future operating performance; our ability to attract new customers or retain existing customers; the growth of the market for sleep as a retail category and our ability to become a leader or maintain our leadership in the category; the impact of social media and influencers on our reputation; our ability to protect and maintain our intellectual property; our exclusive reliance on third-party contract manufacturers whose efforts we are unable to fully control; our ability to effectively implement strategic initiatives; our ability to transfer our supply chain and other business processes to a global scale; risks relating to our international operations and expansion; we are dependent on our retail partners; general economic and business conditions; we could be subject to system failures or interruptions and security breaches; risks relating to changing legal and regulatory requirements, and any failure to comply with applicable laws and regulations; we may be subject to product liability claims and other litigation; we may experience fluctuations in our quarterly operating results; we have and expect to continue to incur significant losses; risks relating to our indebtedness; our need for additional funding, which may not be available; risks relating to taxes; future sales by us our stockholders may cause the market price of our stock to decline; and risks and additional costs relating to our status as a new public company. These and other important factors discussed under the caption “Risk Factors” in our Annual Report on Form 10-K for the year ended December 31, 2019 and our other filings with the Securities |
and Exchange Commission could cause actual results to differ materially from those indicated by the forward-looking statements made in this letter. Any such forward-looking statements represent management’s estimates as of the date of this letter. While we may elect to update such forward-looking statements at some point in the future, we disclaim any obligation to do so, even if subsequent events cause our views to change. Non-GAAP Financial Measures Adjusted EBITDA, Adjusted EBITDA margin and Contribution Margin are supplemental measures of our performance that are not required by, or presented in accordance with, GAAP. Adjusted EBITDA, Adjusted EBITDA margin and Contribution Margin are not measurements of our financial performance under GAAP and should not be considered as alternatives to net income, gross profit or any other performance measure derived in accordance with GAAP. We define Adjusted EBITDA as net loss before interest (income) expense, income tax expense and depreciation and amortization as further adjusted to exclude the impact of stock-based compensation expense, restructuring costs, costs associated with legal settlements, and expenses incurred in connection with our initial public offering. We define Adjusted EBITDA margin as Adjusted EBITDA divided by net sales. We define Contribution Margin as gross profit less sales and marketing expense. We caution investors that amounts presented in accordance with our definition of Adjusted EBITDA, Adjusted EBITDA margin and Contribution Margin may not be comparable to similar measures disclosed by our competitors, because not all companies and analysts calculate Adjusted EBITDA, Adjusted EBITDA margin or Contribution Margin in the same manner. We present Adjusted EBITDA, Adjusted EBITDA margin and Contribution Margin because we consider them to be important supplemental measures of our performance and believe they are frequently used by securities analysts, investors, and other interested parties in the evaluation of companies in our industry. Management believes that investors’ understanding of our performance is enhanced by including these non-GAAP financial measure as a reasonable basis for comparing our ongoing results of operations. Management uses Adjusted EBITDA and Adjusted EBITDA margin: as a measurement of operating performance because it assists us in comparing the operating performance of our business on a consistent basis, as it removes the impact of items not directly resulting from our core operations; for planning purposes, including the preparation of our internal annual operating budget and financial projections; to evaluate the performance and effectiveness of our operational strategies; and |
to evaluate our capacity to expand our business. Management uses Contribution Margin to evaluate the performance of the Company’s business and profitability. By providing these non-GAAP financial measures, together with the reconciliations, we believe we are enhancing investors’ understanding of our business and our results of operations, as well as assisting investors in evaluating how well we are executing our strategic initiatives. Adjusted EBITDA, Adjusted EBITDA margin and Contribution Margin have limitations as analytical tools, and should not be considered in isolation, or as an alternative to, or a substitute for net income, gross profit or other financial statement data presented in our consolidated financial statements as indicators of financial performance. Some of the limitations are: such measures do not reflect our cash expenditures; such measures do not reflect changes in, or cash requirements for, our working capital needs; although depreciation and amortization are non cash charges, the assets being depreciated and amortized will often have to be replaced in the future and such measures do not reflect any cash requirements for such replacements; and other companies in our industry may calculate such measures differently than we do, limiting their usefulness as comparative measures. Due to these limitations, Adjusted EBITDA, Adjusted EBITDA margin and Contribution Margin should not be considered as measures of discretionary cash available to us to invest in the growth of our business. We compensate for these limitations by relying primarily on our GAAP results and using these non-GAAP measures only supplementally. Adjusted EBITDA includes adjustments to exclude the impact of stock-based compensation expense and material infrequent items, including but not limited to the costs of our initial public offering, restructuring costs, costs associated with legal settlements, and acquisitions or divestitures, among other items. It is reasonable to expect that these items will occur in future periods. However, we believe these adjustments are appropriate because the amounts recognized can vary significantly from period to period, do not directly relate to the ongoing operations of our business and may complicate comparisons of our internal operating results and operating results of other companies over time. In addition, Adjusted EBITDA includes adjustments for other items that we do not expect to regularly record following our initial public offering. Each of the normal recurring adjustments and other adjustments described in this paragraph and in the reconciliation table in the Appendix to this letter help management with a measure of our core operating performance over time by removing items that are not related to day-to-day operations. |
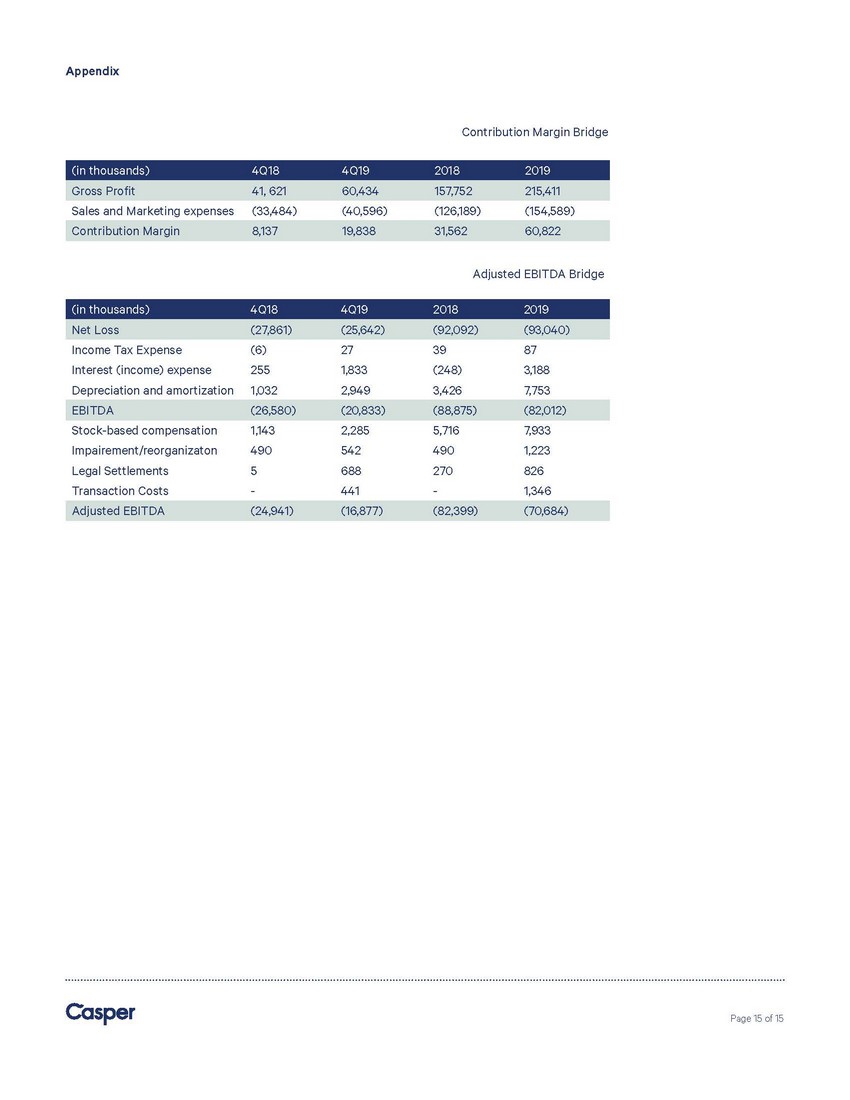
Appendix Contribution Margin Bridge Adjusted EBITDA Bridge |
D!
M\@'Z @,"# (4 AT")@(O C@"00)+ E0"70)G G$">@*$ HX"F *B JP"M@+!
M LL"U0+@ NL"]0, PL#%@,A RT#. -# T\#6@-F W(#?@.* Y8#H@.N [H#
MQP/3 ^ #[ /Y! 8$$P0@!"T$.P1(!%4$8P1Q!'X$C 2:!*@$M@3$!-,$X03P
M!/X%#044%]@8&!A8&)P8W!D@&
M609J!GL&C :=!J\&P ;1!N,&]0<'!QD'*P<]!T\'80=T!X8'F0>L![\'T@?E
M!_@("P@?"#((1@A:"&X(@@B6"*H(O@C2".<(^PD0"24).@E/"60)>0F/":0)
MN@G/">4)^PH1"B<*/0I4"FH*@0J8"JX*Q0K<"O,+"PLB"SD+40MI"X +F NP
M"\@+X0OY#!(,*@Q##%P,=0R.#*<,P S9#/,-#0TF#4 -6@UT#8X-J0W##=X-
M^ X3#BX.20YD#G\.FPZV#M(.[@\)#R4/00]>#WH/E@^S#\\/[! )$"800Q!A
M$'X0FQ"Y$-<0]1$3$3$13Q%M$8P1JA')$>@2!Q(F$D429!*$$J,2PQ+C$P,3
M(Q-#$V,3@Q.D$\43Y10&%"<4211J%(L4K13.%/ 5$A4T%585>!6;%;T5X!8#
M%B86219L%H\6LA;6%OH7'1=!%V47B1>N%](7]Q@;&$ 891B*&*\8U1CZ&2 9
M11EK&9$9MQG=&@0:*AI1&G<:GAK%&NP;%!L[&V,;BANR&]H< APJ'%(<>QRC
M',P<]1T>'4<=:AZ4'KX>Z1\3'SX?:1^4'[\?ZB 5($$@
M;""8(,0@\"$<(4@A=2&A( &YXS'DJ>8EYYWI&
M>J5[!'MC>\)\(7R!?.%]07VA?@%^8G["?R-_A'_E@$> J($*@6N!S8(P@I*"
M](-7@[J$'82 A..%1X6KA@Z&WZ;4/!I^L
M.I.:Y;:29M_AVFM$^*UIX^M_6;QQ/Z5B/G"OPL_1G2SL_4'J5K\%,FLRYIVC
M;,MO,XL=(B=1:L?IWVM2O/[4GXYGFX_B%>[S=^AM='IET7K
(XAN;%^*WO\;']/+Z>;9?>>8_U
M%=RRQIICB.9^GV3?GY_Z_P!O[M 8M/ZJ^^CU=OD_A[MO%<'%KV_T^@VO2]\S
M6.>)[*=UIXC[K7G_ ,4\RT:>=;2_/4VVI'KZ=4+QAF-L<=9:1K/A7ET/Z=_"
M=T=]NK;>_4;4_GYB)O7:]LQUPT\1S6)R6FUO//GQXX\
(F?%FP]8[KI\./%BS8:4QYLF
M;'$:;%]GU/\ F4CFO_+O_P!5/Y9^..'SZKJ'7:O%J<5KX\>GU%,6*VGPX:X\
M5:8[3>E:5B.*1%IF>(^9F>>>3ADW]>CW>O:%NK\0J1\#2@
M$_ 3\ [!?AV?3GVH=+_3F\_ZC7]_?QQW_FLO=V\?]//QSY
[UZ9^D'N'II]XW':>F>MOI
M4K7'N&*^//>*<6[:_4QVYFOFW$3/'SX?CI/4#T>] +[-T5H-PV#IK+KM572Z
M79]OM2+3EF>)MDBO,U^/-\DQ\?/Z.)..9P\_3F=\]D]O/]^/EYFE;=_-8G
MOGFW,?S?W_=S/D\S'&
D!
M\@'Z @,"# (4 AT")@(O C@"00)+ E0"70)G G$">@*$ HX"F *B JP"M@+!
M LL"U0+@ NL"]0, PL#%@,A RT#. -# T\#6@-F W(#?@.* Y8#H@.N [H#
MQP/3 ^ #[ /Y! 8$$P0@!"T$.P1(!%4$8P1Q!'X$C 2:!*@$M@3$!-,$X03P
M!/X%#044%]@8&!A8&)P8W!D@&
M609J!GL&C :=!J\&P ;1!N,&]0<'!QD'*P<]!T\'80=T!X8'F0>L![\'T@?E
M!_@("P@?"#((1@A:"&X(@@B6"*H(O@C2".<(^PD0"24).@E/"60)>0F/":0)
MN@G/">4)^PH1"B<*/0I4"FH*@0J8"JX*Q0K<"O,+"PLB"SD+40MI"X +F NP
M"\@+X0OY#!(,*@Q##%P,=0R.#*<,P S9#/,-#0TF#4 -6@UT#8X-J0W##=X-
M^ X3#BX.20YD#G\.FPZV#M(.[@\)#R4/00]>#WH/E@^S#\\/[! )$"800Q!A
M$'X0FQ"Y$-<0]1$3$3$13Q%M$8P1JA')$>@2!Q(F$D429!*$$J,2PQ+C$P,3
M(Q-#$V,3@Q.D$\43Y10&%"<4211J%(L4K13.%/ 5$A4T%585>!6;%;T5X!8#
M%B86219L%H\6LA;6%OH7'1=!%V47B1>N%](7]Q@;&$ 891B*&*\8U1CZ&2 9
M11EK&9$9MQG=&@0:*AI1&G<:GAK%&NP;%!L[&V,;BANR&]H< APJ'%(<>QRC
M',P<]1T>'4<=:AZ4'KX>Z1\3'SX?:1^4'[\?ZB 5($$@
M;""8(,0@\"$<(4@A=2&A( &YXS'DJ>8EYYWI&
M>J5[!'MC>\)\(7R!?.%]07VA?@%^8G["?R-_A'_E@$> J($*@6N!S8(P@I*"
M](-7@[J$'82 A..%1X6KA@Z& WW7\]
MO5CJ_JGKOU^.6ZVPT6 ZJ=?H5\A1BK.KALD9B9R+'$D%P =[D'?CPOV'_BUC
M_P!E>F'_ .U9+_\ L@7KS]-I1ZK1^,?*.8[='''4S]O/GHXFW\;'XC/4S#5L
M?TW/>GGQ_P UZ_T[A!-/*7N>6=SC&YL8#?E#0T;X$DD^W[VH_B!@],/PJ]+^
MHG7]B>S?FPU)\\?;$<]N[)&-1AF@&O<[>_ #=.)T 56_\.'&5*?X6,!9@K10
M6+EV])9EC: Z9S;+V-<\^[B&L:T;]@T! C_
M %!.W..EGBK6 ,KCVB GMO<.7S<@#ING%O@D$MT"-7;S2VZ7#99,Y[6N:7,(
M#@#L@ZWY^W@KUVN0F2[BLUU/E*>:DECKY#'0&+A$YEKG'7B>Z5P;LDAWCAP
M(^OL/)_5^2M=4&HR_:?2R$E^E&^%D$<<1ACD+3&TN=,)&]O3C(.+B20&CB#-
MJ6[&7 #9.@FUR[#9"6EZ18"Q%DGY&8Q8X/LV#'*]W %NA&7.AC=Q>(?#O$;=\1&Z/1?YV7?,1U[_ )0@
M*;EIQ7)=3.S)>*N7GKTZN*J&W(]MAD7=[SA)%(]@Y1G0 >\?,P:Y:!\X@>_X
MC#Y: WSEABLI4QLEFQ/,R6?NQ.B8PD 2M(Y%AD;RS%;,\37' _VEZ=>AO4.7]/J\%NNWIZ6_Z>'
MQ3'Q/1L2SS2<>.@]C0R1F_ /C1 (T/T_'G*4IKM;9KEUB(SP@3-/=C&B7MT?
MF:.0\CQY'W7IC )XZ:1^U:B'$9F'
MK]WD0.BO,^$,=.P[CCFM8#&).8A:SCL.;KEST>+CQ*FWZENS-L]78:?J>? M'@PM;(\=MSM>6M!V?Z0OPWZ"'?XX.G//\ ^&=K_P"BSKGZ/V]*=?#"(F,>
M;\QXGZ-:D993A.4U,OV#T7ZU^NF2_!]UUU7DJF09ZCT,K'!BX7=/\)70%U8$
MMK=L9!-P>0.(+'@@M=KP ?8[7]B(XFQ,:QC0UC0 &@: 'V 42P1SQ
MNCD8V2-PTYC@""/Y'U6M'UD:&MEJ881MGBOH9Z._",9GF'Y'_!9^(;JW\44/
M7+>L\;0J8NI5J05X*%:2**83"<3.YO<2[D&M&@=#Z>Z_'G6'07J1^ 3UHDZC
MP%.2?IP/D@HY*6$RU+U)VC\/8XG<9&F@@EIVP.:=>W]>XH(X(VQQL;'&T::Q
MH '\!)8(YF.9(QKV.&G-< 01_(^J:?K(T]3*<<(V9=<4RT=V,1,\QW?R Z\
M_%?ZT_BKNXKIS 4+%&2&7NBAT4+$CH@$D:45O67I*U6@GCS,+HIXJ,\;NW)\T=R0QU7?L]GN!'\?U<0K
MMQ_DIQ_DJ\)4J-_XT=)?K Y=C70RW8'M?#*TA]-O*R-%G]#='?LX$<>2^G>L
MO2;9(H_S=ADELTZD;6PRN+I;3.==OAG];?FW[ ?N+5=^/]TXA3@J5'L>L_2-
M6I-9ES,+8(8+MJ1_;D(;%4E$5A_[/(8\AOCR=[&QY62/5;IHY2?'_F31;AR,
M.)>SLR:%J6+NQQ!W#B26>=@D#V)!\*W\?Y*<4X2I4!_KET4S&NR'YU&:@IMO
M]QL,Q)@=/V \-#-G *.>9YB8SX*J
M]W!G@;+W/)=Y.R?/N%JC8JX[J$XZM-#D'29$SNQ%JH?BX'O?R=9CEV-QMV7[
M(/R_*'@AK%U/2<0$LIQ+!,N],](X04[67=\3TL;$Q:XSO9,P56L6/R06Q68Y:['5W\1S:3#)"':#6M
M =S(UMS23=I;MC'!S01O1&QXTOK87(Z^#LML3Y4PW'91F:Q\,4LCY7%M9T5-
ML[6M)T&'=1SZ/S3#R>()]E9O7*QF<%ZI9JPW
MJK/=5]&=+X>E\%!T9UNVED\%"R!G^IL0RCC:?)_U.?S!W@D^X7[7R/X3;+
M^G6.Z"N]'XRUTEC7
0&V[T5E0=.T*UJ6S#3JQ69B3+,R!H?(2 "7.UL[T/=+@I
MRC']69^[EF8,Y*U5D??IM?;LLJ2V!%-!8>YK.R71@;@!:X@D;.PX ;^LSG\E
MT]U!U2ZMDKMLSY2C5%?N5^-.-]>,E\8DX@;.FCFXMV\'1/@]0H=*8G% BECJ
M50&3NGX>LR/Y_/S?*!\WS.\^_D_=>T^ HV9I)I:M>6:2/LOD?"USGQ^_ DC9
M;_!\)NB2G/G;MQ]&W*68ZI'=DKPL@:T\GN&IG2N#G,(:0!".32"222UJZ37PU:
MHRNR&"&&.NSMPLBB:UL3?'RM _:/ \#[!>>5Z
7N$G'D71L[8\%F_G/RKJN7P5?-15
MHK /:@GCL!C?
>
MF?2[,T/4O&.'2+AF0Z1]*.GIH,%6P-VMT_F8>H+37,B=()98INS/*S9
[8_P#:S#,9=,/R#D93QUHQ@^P(,Q])E,_*:C_=+.K'9_3 .'CS[^R^E^(_
M47UBRG1OJ9T$VCZCY7J'I&UC,QMET]4L;5#SJ)TA)\!^QK6R-_,&J5*3-+30
MQ\&-K1UJT4=>O$T,CAAC#&, ^C6CP OF/&00F/A&QAC:6L+6 <6D@D#[ D#Q
M_ 53?ZFXVC/)"^.Y
&. O[AB9$UK>7+D7: UOEYW]_*^ZF'IT;-BQ!5KPV+!#II8XFM=*1
M]7$#;C_=8G3_ %+!GX[7"&>I/5D[4]:TP,EB<6APY $CRT@C1/@_W"TCO53#
M1U+%J5EV&M'''-%(^J[_ %43WMC;)"T;+V\GM'L#\S3K1!,J2Z6-V$J.R#;_
M ,/!\
CL"]QVHY9I(@X=Q@!FY^GF=^"A9FEM
M05;,-2\2Z/A&Z">:-[6
37-(T01]002O6.)L4
M;6-:&L:.(:!H ?9
ON2?JM7GNL:^"D;$ZI