
fa
UNITED STATES
SECURITIES AND EXCHANGE COMMISSION
WASHINGTON, D.C. 20549
FORM
For the quarterly period ended
OR
For the transition period from to
Commission file number:
(Exact name of registrant as specified in its charter)
|
||
(State or other jurisdiction of incorporation or organization) |
|
(I.R.S. Employer Identification No.) |
|
|
|
|
||
(Address of principal executive offices) |
|
(Zip Code) |
(Registrant’s telephone number, including area code)
Securities registered pursuant to Section 12(b) of the Securities Exchange Act of 1934:
Title of each class |
|
Trading symbol |
|
Name of exchange in which registered |
|
|
Indicate by check mark whether the registrant (1) has filed all reports required to be filed by Section 13 or 15(d) of the Securities Exchange Act of 1934 during the preceding 12 months (or for such shorter period that the registrant was required to file such reports), and (2) has been subject to such filing requirements for the past 90 days.
Indicate by check mark whether the registrant has submitted electronically every Interactive Data File required to be submitted pursuant to Rule 405 of Regulation S-T during the preceding 12 months (or for such shorter period that the registrant was required to submit such files).
Indicate by check mark whether the registrant is a large accelerated filer, an accelerated filer, a non-accelerated filer, or a smaller reporting company. See the definitions of “large accelerated filer,” “accelerated filer” and “smaller reporting company” in Rule 12b-2 of the Exchange Act.
|
☒ |
|
|
Accelerated filer |
☐ |
|
|
|
|
|
|
|
|
Non-accelerated filer |
|
☐ |
|
|
Smaller reporting company |
|
|
|
|
|
|
|
|
|
|
|
|
|
Emerging growth company |
If an emerging growth company, indicate by check mark if the registrant has elected not to use the extended transition period for complying with any new or revised financial reporting accounting standards provided pursuant to Section 13(a) of the Exchange Act. ☐
Indicate by check mark whether the registrant is a shell company (as defined in Rule 12b-2 of the Exchange Act). Yes
Indicate the number of shares outstanding of each of the issuer’s classes of common stock, as of the latest practicable date.
Class |
|
Outstanding at July 31, 2024 |
Common Shares, without par value |
|
Metallus Inc.
Table of Contents
|
|
Page |
3 |
||
3 |
||
|
3 |
|
|
Consolidated Statements of Comprehensive Income (Loss) (Unaudited) |
4 |
|
5 |
|
|
6 |
|
|
7 |
|
|
8 |
|
Management’s Discussion and Analysis of Financial Condition and Results of Operations |
19 |
|
34 |
||
34 |
||
35 |
||
35 |
||
35 |
||
35 |
||
36 |
||
37 |
||
|
38 |
|
2
Part I. Financial Information
Item 1. Financial Statements
Metallus Inc.
Consolidated Statements of Operations (Unaudited)
|
|
Three Months Ended June 30, |
|
|
Six Months Ended June 30, |
|
||||||||||
|
|
2024 |
|
|
2023 |
|
|
2024 |
|
|
2023 |
|
||||
(Dollars in millions, except per share data) |
|
|
|
|
|
|
|
|
|
|
|
|
||||
Net sales |
|
$ |
|
|
$ |
|
|
$ |
|
|
$ |
|
||||
Cost of products sold |
|
|
|
|
|
|
|
|
|
|
|
|
||||
Gross Profit |
|
|
|
|
|
|
|
|
|
|
|
|
||||
|
|
|
|
|
|
|
|
|
|
|
|
|
||||
Selling, general and administrative expenses |
|
|
|
|
|
|
|
|
|
|
|
|
||||
Loss (gain) on sale or disposal of assets, net |
|
|
|
|
|
( |
) |
|
|
|
|
|
( |
) |
||
Interest (income) expense, net |
|
|
( |
) |
|
|
( |
) |
|
|
( |
) |
|
|
( |
) |
Loss on extinguishment of debt |
|
|
|
|
|
|
|
|
|
|
|
|
||||
Other (income) expense, net |
|
|
( |
) |
|
|
( |
) |
|
|
( |
) |
|
|
( |
) |
Income (Loss) Before Income Taxes |
|
|
|
|
|
|
|
|
|
|
|
|
||||
Provision (benefit) for income taxes |
|
|
|
|
|
|
|
|
|
|
|
|
||||
Net Income (Loss) |
|
$ |
|
|
$ |
|
|
$ |
|
|
$ |
|
||||
|
|
|
|
|
|
|
|
|
|
|
|
|
||||
Per Share Data: |
|
|
|
|
|
|
|
|
|
|
|
|
||||
Basic earnings (loss) per share |
|
$ |
|
|
$ |
|
|
$ |
|
|
$ |
|
||||
Diluted earnings (loss) per share |
|
$ |
|
|
$ |
|
|
$ |
|
|
$ |
|
||||
See accompanying Notes to the unaudited Consolidated Financial Statements.
3
Metallus Inc.
Consolidated Statement of Comprehensive Income (Loss) (Unaudited)
|
|
Three Months Ended June 30, |
|
|
Six Months Ended June 30, |
|
||||||||||
|
|
2024 |
|
|
2023 |
|
|
2024 |
|
|
2023 |
|
||||
(Dollars in millions) |
|
|
|
|
|
|
|
|
|
|
|
|
||||
Net income (loss) |
|
$ |
|
|
$ |
|
|
$ |
|
|
$ |
|
||||
Other comprehensive income (loss), net of benefit (provision) for income taxes of |
|
|
|
|
|
|
|
|
|
|
|
|
||||
Foreign currency translation adjustments |
|
|
( |
) |
|
|
|
|
|
( |
) |
|
|
|
||
Pension and postretirement liability adjustments |
|
|
( |
) |
|
|
( |
) |
|
|
( |
) |
|
|
( |
) |
Other comprehensive income (loss), net of tax |
|
|
( |
) |
|
|
( |
) |
|
|
( |
) |
|
|
( |
) |
Comprehensive Income (Loss), net of tax |
|
$ |
|
|
$ |
|
|
$ |
|
|
$ |
|
||||
See accompanying Notes to the unaudited Consolidated Financial Statements.
4
Metallus Inc.
Consolidated Balance Sheets (Unaudited)
|
|
June 30, |
|
|
December 31, |
|
||
(Dollars in millions) |
|
|
|
|
|
|
||
ASSETS |
|
|
|
|
|
|
||
Current Assets |
|
|
|
|
|
|
||
Cash and cash equivalents |
|
$ |
|
|
$ |
|
||
Accounts receivable, net of allowances (2024 - $ |
|
|
|
|
|
|
||
Inventories, net |
|
|
|
|
|
|
||
Deferred charges and prepaid expenses |
|
|
|
|
|
|
||
Other current assets |
|
|
|
|
|
|
||
Total Current Assets |
|
|
|
|
|
|
||
|
|
|
|
|
|
|
||
Property, plant and equipment, net |
|
|
|
|
|
|
||
Operating lease right-of-use assets |
|
|
|
|
|
|
||
Pension assets |
|
|
|
|
|
|
||
Intangible assets, net |
|
|
|
|
|
|
||
Other non-current assets |
|
|
|
|
|
|
||
Total Assets |
|
$ |
|
|
$ |
|
||
|
|
|
|
|
|
|
||
LIABILITIES AND SHAREHOLDERS’ EQUITY |
|
|
|
|
|
|
||
Current Liabilities |
|
|
|
|
|
|
||
Accounts payable |
|
$ |
|
|
$ |
|
||
Salaries, wages and benefits |
|
|
|
|
|
|
||
Accrued pension and postretirement costs |
|
|
|
|
|
|
||
Current operating lease liabilities |
|
|
|
|
|
|
||
Current convertible notes, net |
|
|
|
|
|
|
||
Government funding liabilities |
|
|
|
|
|
|
||
Other current liabilities |
|
|
|
|
|
|
||
Total Current Liabilities |
|
|
|
|
|
|
||
|
|
|
|
|
|
|
||
Credit Agreement |
|
|
|
|
|
|
||
Non-current operating lease liabilities |
|
|
|
|
|
|
||
Accrued pension and postretirement costs |
|
|
|
|
|
|
||
Deferred income taxes |
|
|
|
|
|
|
||
Other non-current liabilities |
|
|
|
|
|
|
||
Total Liabilities |
|
|
|
|
|
|
||
|
|
|
|
|
|
|
||
Shareholders’ Equity |
|
|
|
|
|
|
||
Preferred shares, without par value; authorized |
|
|
|
|
|
|
||
Common shares, without par value; authorized |
|
|
|
|
|
|
||
Additional paid-in capital |
|
|
|
|
|
|
||
Retained deficit |
|
|
( |
) |
|
|
( |
) |
Treasury shares - 2024 - |
|
|
( |
) |
|
|
( |
) |
Accumulated other comprehensive income (loss) |
|
|
|
|
|
|
||
Total Shareholders’ Equity |
|
|
|
|
|
|
||
Total Liabilities and Shareholders’ Equity |
|
$ |
|
|
$ |
|
||
See accompanying Notes to the unaudited Consolidated Financial Statements.
5
Metallus Inc.
(Dollars in millions) |
|
Common |
|
|
Additional |
|
|
Retained |
|
|
Treasury |
|
|
Accumulated |
|
|
Total |
|
||||||
Balance As of December 31, 2023 |
|
|
|
|
$ |
|
|
$ |
( |
) |
|
$ |
( |
) |
|
$ |
|
|
$ |
|
||||
Net income (loss) |
|
|
— |
|
|
|
— |
|
|
|
|
|
|
— |
|
|
|
— |
|
|
|
|
||
Other comprehensive income (loss) |
|
|
— |
|
|
|
— |
|
|
|
— |
|
|
|
— |
|
|
|
( |
) |
|
|
( |
) |
Stock-based compensation expense |
|
|
— |
|
|
|
|
|
|
— |
|
|
|
— |
|
|
|
— |
|
|
|
|
||
Stock option activity |
|
|
|
|
|
|
|
|
— |
|
|
|
— |
|
|
|
— |
|
|
|
|
|||
Purchase of treasury shares, including excise tax |
|
|
( |
) |
|
|
— |
|
|
|
— |
|
|
|
( |
) |
|
|
— |
|
|
|
( |
) |
Issuance of treasury shares |
|
|
|
|
|
( |
) |
|
|
— |
|
|
|
|
|
|
— |
|
|
|
— |
|
||
Shares surrendered for taxes |
|
|
( |
) |
|
|
— |
|
|
|
— |
|
|
|
( |
) |
|
|
— |
|
|
|
( |
) |
Balance As of March 31, 2024 |
|
|
|
|
$ |
|
|
$ |
( |
) |
|
$ |
( |
) |
|
$ |
|
|
$ |
|
||||
Net income (loss) |
|
|
— |
|
|
|
— |
|
|
|
|
|
|
— |
|
|
|
— |
|
|
|
|
||
Other comprehensive income (loss) |
|
|
— |
|
|
|
— |
|
|
|
— |
|
|
|
— |
|
|
|
( |
) |
|
|
( |
) |
Stock-based compensation expense |
|
|
— |
|
|
|
|
|
|
— |
|
|
|
— |
|
|
|
— |
|
|
|
|
||
Stock option activity |
|
|
|
|
|
|
|
|
— |
|
|
|
— |
|
|
|
— |
|
|
|
|
|||
Purchase of treasury shares, including excise tax |
|
|
( |
) |
|
|
— |
|
|
|
— |
|
|
|
( |
) |
|
|
— |
|
|
|
( |
) |
Issuance of treasury shares |
|
|
|
|
|
( |
) |
|
|
— |
|
|
|
|
|
|
— |
|
|
|
— |
|
||
Shares surrendered for taxes |
|
|
( |
) |
|
|
— |
|
|
|
— |
|
|
|
— |
|
|
|
— |
|
|
|
— |
|
Balance at June 30, 2024 |
|
|
|
|
$ |
|
|
$ |
( |
) |
|
$ |
( |
) |
|
$ |
|
|
$ |
|
||||
(Dollars in millions) |
|
Common |
|
|
Additional |
|
|
Retained |
|
|
Treasury |
|
|
Accumulated |
|
|
Total |
|
||||||
Balance at December 31, 2022 |
|
|
|
|
$ |
|
|
$ |
( |
) |
|
$ |
( |
) |
|
$ |
|
|
$ |
|
||||
Net income (loss) |
|
|
— |
|
|
|
— |
|
|
|
|
|
|
— |
|
|
|
— |
|
|
|
|
||
Other comprehensive income (loss) |
|
|
— |
|
|
|
— |
|
|
|
— |
|
|
|
— |
|
|
|
( |
) |
|
|
( |
) |
Stock-based compensation expense |
|
|
— |
|
|
|
|
|
|
— |
|
|
|
— |
|
|
|
— |
|
|
|
|
||
Stock option activity |
|
|
|
|
|
|
|
|
— |
|
|
|
— |
|
|
|
— |
|
|
|
|
|||
Purchase of treasury shares, including excise tax |
|
|
( |
) |
|
|
— |
|
|
|
— |
|
|
|
( |
) |
|
|
— |
|
|
|
( |
) |
Issuance of treasury shares |
|
|
|
|
|
( |
) |
|
|
— |
|
|
|
|
|
|
— |
|
|
|
— |
|
||
Shares surrendered for taxes |
|
|
( |
) |
|
|
— |
|
|
|
— |
|
|
|
( |
) |
|
|
— |
|
|
|
( |
) |
Balance at March 31, 2023 |
|
|
|
|
$ |
|
|
$ |
( |
) |
|
$ |
( |
) |
|
$ |
|
|
$ |
|
||||
Net income (loss) |
|
|
— |
|
|
|
— |
|
|
|
|
|
|
— |
|
|
|
— |
|
|
|
|
||
Other comprehensive income (loss) |
|
|
— |
|
|
|
— |
|
|
|
— |
|
|
|
— |
|
|
|
( |
) |
|
|
( |
) |
Stock-based compensation expense |
|
|
— |
|
|
|
|
|
|
— |
|
|
|
— |
|
|
|
— |
|
|
|
|
||
Stock option activity |
|
|
|
|
|
|
|
|
— |
|
|
|
— |
|
|
|
— |
|
|
|
|
|||
Purchase of treasury shares, including excise tax |
|
|
( |
) |
|
|
— |
|
|
|
— |
|
|
|
( |
) |
|
|
— |
|
|
|
( |
) |
Issuance of treasury shares |
|
|
|
|
|
( |
) |
|
|
— |
|
|
|
|
|
|
— |
|
|
|
— |
|
||
Balance at June 30, 2023 |
|
|
|
|
$ |
|
|
$ |
( |
) |
|
$ |
( |
) |
|
$ |
|
|
$ |
|
||||
See accompanying Notes to the unaudited Consolidated Financial Statements.
6
Metallus Inc.
Consolidated Statements of Cash Flows (Unaudited)
|
|
Six Months Ended June 30, |
|
|||||
|
|
2024 |
|
|
2023 |
|
||
(Dollars in millions) |
|
|
|
|
|
|
||
CASH PROVIDED (USED) |
|
|
|
|
|
|
||
Operating Activities |
|
|
|
|
|
|
||
Net income (loss) |
|
$ |
|
|
$ |
|
||
Adjustments to reconcile net income (loss) to net cash provided (used) by operating activities: |
|
|
|
|
|
|
||
Depreciation and amortization |
|
|
|
|
|
|
||
Amortization of deferred financing fees |
|
|
|
|
|
|
||
Loss on extinguishment of debt |
|
|
|
|
|
|
||
Loss (gain) on sale or disposal of assets, net |
|
|
|
|
|
( |
) |
|
Deferred income taxes |
|
|
|
|
|
|
||
Stock-based compensation expense |
|
|
|
|
|
|
||
Pension and postretirement (benefit) expense, net |
|
|
|
|
|
|
||
Changes in operating assets and liabilities: |
|
|
|
|
|
|
||
Accounts receivable, net |
|
|
|
|
|
( |
) |
|
Inventories, net |
|
|
|
|
|
( |
) |
|
Accounts payable |
|
|
( |
) |
|
|
|
|
Other accrued expenses |
|
|
( |
) |
|
|
( |
) |
Pension and postretirement contributions and payments |
|
|
( |
) |
|
|
( |
) |
Deferred charges and prepaid expenses |
|
|
( |
) |
|
|
|
|
Other, net |
|
|
|
|
|
|
||
Net Cash Provided (Used) by Operating Activities |
|
|
|
|
|
|
||
|
|
|
|
|
|
|
||
Investing Activities |
|
|
|
|
|
|
||
Capital expenditures |
|
|
( |
) |
|
|
( |
) |
Proceeds from government funding |
|
|
|
|
|
|
||
Proceeds from disposals of property, plant and equipment |
|
|
|
|
|
|
||
Net Cash Provided (Used) by Investing Activities |
|
|
( |
) |
|
|
( |
) |
|
|
|
|
|
|
|
||
Financing Activities |
|
|
|
|
|
|
||
Purchase of treasury shares |
|
|
( |
) |
|
|
( |
) |
Proceeds from exercise of stock options |
|
|
|
|
|
|
||
Shares surrendered for employee taxes on stock compensation |
|
|
( |
) |
|
|
( |
) |
Repayments on convertible notes |
|
|
|
|
|
( |
) |
|
Net Cash Provided (Used) by Financing Activities |
|
|
( |
) |
|
|
( |
) |
Increase (Decrease) in Cash, Cash Equivalents, and Restricted Cash |
|
|
( |
) |
|
|
( |
) |
Cash, cash equivalents, and restricted cash at beginning of period |
|
|
|
|
|
|
||
Cash, Cash Equivalents, and Restricted Cash at End of Period |
|
$ |
|
|
$ |
|
||
|
|
|
|
|
|
|
||
The following table provides a reconciliation of cash, cash equivalents, and restricted cash reported within the Consolidated Balance Sheets that sum to the total of the same such amounts shown in the Consolidated Statements of Cash Flows: |
|
|||||||
|
|
|
|
|
|
|
||
Cash and cash equivalents |
|
$ |
|
|
$ |
|
||
Restricted cash reported in other current assets |
|
|
|
|
|
|
||
Total cash, cash equivalents, and restricted cash shown in the Consolidated Statements of Cash Flows |
|
$ |
|
|
$ |
|
||
See accompanying Notes to the unaudited Consolidated Financial Statements.
7
Metallus Inc.
Notes to Unaudited Consolidated Financial Statements
(dollars in millions, except per share data)
Note 1 - Basis of Presentation
The accompanying unaudited Consolidated Financial Statements have been prepared by Metallus Inc. (the “Company” or “Metallus”) in accordance with generally accepted accounting principles in the United States (“U.S. GAAP”) for interim financial information. Accordingly, they do not include all of the information and footnotes required by U.S. GAAP for complete financial statements. In the opinion of management, all adjustments (consisting of normal recurring accruals) and disclosures considered necessary for a fair presentation have been included. For further information, refer to Metallus' audited Consolidated Financial Statements and Notes included in its Annual Report on Form 10-K for the year ended December 31, 2023.
Note 2 - Recent Accounting Pronouncements
In November 2021, the Financial Accounting Standards Board ("FASB") issued Accounting Standards Update ("ASU") 2021-10, "Government Assistance (Topic 832), Disclosures by Business Entities about Government Assistance", which requires business entities to provide disclosures on material government assistance transactions for annual reporting periods. The disclosures include information around (1) the nature of the assistance, (2) the related accounting policies used to account for government assistance, (3) the effect of government assistance on the entity’s financial statements, and (4) any significant terms and conditions of the agreements, including commitments and contingencies. The Company prospectively applied the guidance in conjunction with the agreement with United States entered into during the first quarter of 2024.
During the second quarter of 2024, the Company received $
There are no other current ASUs issued, but not adopted, that are expected to have a material impact on the Company.
Note 3 - Revenue Recognition
The following table provides the major sources of revenue by end-market sector for the three and six months ended June 30, 2024 and 2023:
|
|
Three Months Ended June 30, |
|
|
Six Months Ended June 30, |
|
||||||||||
|
|
2024 |
|
|
2023 |
|
|
2024 |
|
|
2023 |
|
||||
Industrial |
|
$ |
|
|
$ |
|
|
$ |
|
|
$ |
|
||||
Automotive |
|
|
|
|
|
|
|
|
|
|
|
|
||||
Aerospace & Defense (1) |
|
|
|
|
|
|
|
|
|
|
|
|
||||
Energy |
|
|
|
|
|
|
|
|
|
|
|
|
||||
Other (2) |
|
|
|
|
|
|
|
|
|
|
|
|
||||
Total Net Sales |
|
|
|
|
|
|
|
|
|
|
$ |
|
||||
(1) “Aerospace & Defense” sales by end-market were previously included in "Industrial".
(2) “Other” sales by end-market sector relates to the Company’s scrap sales.
8
The following table provides the major sources of revenue by product type for the three and six months ended June 30, 2024 and 2023:
|
|
Three Months Ended June 30, |
|
|
Six Months Ended June 30, |
|
||||||||||
|
|
2024 |
|
|
2023 |
|
|
2024 |
|
|
2023 |
|
||||
Bar |
|
$ |
|
|
$ |
|
|
$ |
|
|
$ |
|
||||
Tube |
|
|
|
|
|
|
|
|
|
|
|
|
||||
Manufactured components |
|
|
|
|
|
|
|
|
|
|
|
|
||||
Other (3) |
|
|
|
|
|
|
|
|
|
|
|
|
||||
Total Net Sales |
|
$ |
|
|
$ |
|
|
$ |
|
|
$ |
|
||||
(3) “Other” sales by product type relates to the Company’s scrap sales.
Contract liabilities are recognized when the Company has received consideration from a customer to transfer goods at a future point in time. Contract liabilities are primarily related to deferred revenue resulting from any cash payments received in advance from customers and are included in other current liabilities on the Consolidated Balance Sheets. Contract liabilities totaled $
Note 4 – Other (Income) Expense, net
The following table provides the components of other (income) expense, net for the three and six months ended June 30, 2024 and 2023:
|
|
Three Months Ended June 30, |
|
|
Six Months Ended June 30, |
|
||||||||||
|
|
2024 |
|
|
2023 |
|
|
2024 |
|
|
2023 |
|
||||
Pension and postretirement non-service benefit (income) loss |
|
$ |
( |
) |
|
$ |
( |
) |
|
$ |
( |
) |
|
$ |
( |
) |
Loss (gain) from remeasurement of benefit plans |
|
|
|
|
|
|
|
|
|
|
|
|
||||
Insurance recoveries |
|
|
|
|
|
( |
) |
|
|
|
|
|
( |
) |
||
Foreign currency exchange (gain) loss |
|
|
( |
) |
|
|
( |
) |
|
|
( |
) |
|
|
( |
) |
Miscellaneous (income) expense |
|
|
|
|
|
|
|
|
|
|
|
|
||||
Total other (income) expense, net |
|
$ |
( |
) |
|
$ |
( |
) |
|
$ |
( |
) |
|
$ |
( |
) |
Non-service related pension and other postretirement benefit income, for all years, consists primarily of the interest cost, expected return on plan assets and amortization components of net periodic cost.
The Company's Bargaining Unit Pension Plan ("Bargaining Plan"), the Retirement Plan (“Salaried Plan”), and the Supplemental Pension Plan ("Supplemental Plan") each have a provision that permits employees to elect to receive their pension benefits in a lump sum upon retirement. In the first quarter of 2024, the cumulative cost of all lump sum payments was expected to exceed the sum of the service cost and interest cost components of net periodic pension cost for the Salaried Plan. As a result, the Company completed a full remeasurement of its pension obligations and plan assets associated with the Salaried Plan during the first quarter of 2024.
In the second quarter of 2024, the Company entered into an agreement to purchase a group annuity contract from The Prudential Insurance Company of America (“Prudential”) in connection with the annuitization of the Salaried Plan. The Company remeasured the Salaried Plan upon annuitization on May 15, 2024. A loss of $
A loss of $
9
investment losses on plan assets, partially offset by a $
For more details on the aforementioned remeasurements, refer to “Note 9 - Retirement and Postretirement Plans.”
During 2023, the Company recognized insurance recoveries of $
Note 5 - Income Tax Provision
Metallus’ provision for income taxes in interim periods is computed by applying the appropriate estimated annual effective tax rates to income or loss before income taxes for the period. In addition, non-recurring or discrete items, including interest on prior-year tax liabilities, are recorded during the periods in which they occur.
|
|
Three Months Ended June 30, |
|
|
Six Months Ended June 30, |
|
||||||||||
|
|
2024 |
|
|
2023 |
|
|
2024 |
|
|
2023 |
|
||||
Provision (benefit) for incomes taxes |
|
$ |
|
|
$ |
|
|
$ |
|
|
$ |
|
||||
Effective tax rate |
|
|
% |
|
|
% |
|
|
% |
|
|
% |
||||
Income tax expense for the three months ended June 30, 2024 was calculated using forecasted multi-jurisdictional annual effective tax rates to determine a blended annual effective tax rate. The effective tax rate for the three and six months ended June 30, 2024 was
For the six months ended June 30, 2024, Metallus made $
Note 6 - Earnings (Loss) Per Share
Basic earnings (loss) per share is computed based upon the weighted average number of common shares outstanding. Diluted earnings (loss) per share is computed based upon the weighted average number of common shares outstanding plus the dilutive effect of common share equivalents calculated using the treasury stock method or if-converted method. For the Convertible Notes, the Company utilizes the if-converted method to calculate diluted earnings (loss) per share. Under the if-converted method, the Company adjusts net earnings to add back interest expense (including amortization of debt issuance costs) recognized on the Convertible Notes and includes the number of shares potentially issuable related to the Convertible Notes in the weighted average shares outstanding. Treasury shares are excluded from the denominator in calculating both basic and diluted earnings (loss) per share.
Equity-based Awards
Common share equivalents for shares issuable for equity-based awards amounted to
10
three and six months ended June 30, 2024, respectively, were included in the denominator of the diluted earnings (loss) per share calculation.
Common share equivalents for shares issuable for equity-based awards amounted to
Convertible Notes
Common share equivalents for shares issuable upon the conversion of outstanding Convertible Notes were included in the computation of diluted earnings (loss) per share for the three and six months ended June 30, 2024 and 2023 as these shares would be dilutive.
The reduction in the dilutive effect on convertible notes is attributable to the repurchase of outstanding Convertible Notes that occurred in the first quarter of 2023. For additional details regarding the Convertible Notes please refer to “Note 14 - Financing Arrangements” in the Company’s Annual Report on Form 10-K for the year ended December 31, 2023.
The following table sets forth the reconciliation of the numerator and the denominator of basic and diluted earnings (loss) per share for the three and six months ended June 30, 2024 and 2023:
|
|
Three Months Ended June 30, |
|
|
Six Months Ended June 30, |
|
||||||||||
|
|
2024 |
|
|
2023 |
|
|
2024 |
|
|
2023 |
|
||||
Numerator: |
|
|
|
|
|
|
|
|
|
|
|
|
||||
Net income (loss), basic |
|
$ |
|
|
$ |
|
|
$ |
|
|
$ |
|
||||
Add convertible notes interest |
|
|
|
|
|
|
|
|
|
|
|
|
||||
Net income (loss), diluted |
|
$ |
|
|
$ |
|
|
$ |
|
|
$ |
|
||||
|
|
|
|
|
|
|
|
|
|
|
|
|
||||
Denominator: |
|
|
|
|
|
|
|
|
|
|
|
|
||||
Weighted average shares outstanding, basic |
|
|
|
|
|
|
|
|
|
|
|
|
||||
Dilutive effect of stock-based awards |
|
|
|
|
|
|
|
|
|
|
|
|
||||
Dilutive effect of convertible notes |
|
|
|
|
|
|
|
|
|
|
|
|
||||
Weighted average shares outstanding, diluted |
|
|
|
|
|
|
|
|
|
|
|
|
||||
|
|
|
|
|
|
|
|
|
|
|
|
|
||||
Basic earnings (loss) per share |
|
$ |
|
|
$ |
|
|
$ |
|
|
$ |
|
||||
Diluted earnings (loss) per share |
|
$ |
|
|
$ |
|
|
$ |
|
|
$ |
|
||||
Note 7 - Inventories
The components of inventories, net of reserves as of June 30, 2024 and December 31, 2023 were as follows:
|
|
June 30, |
|
|
December 31, |
|
||
Manufacturing supplies |
|
$ |
|
|
$ |
|
||
Raw materials |
|
|
|
|
|
|
||
Work in process |
|
|
|
|
|
|
||
Finished products |
|
|
|
|
|
|
||
Gross inventory |
|
|
|
|
|
|
||
Allowance for inventory reserves |
|
|
( |
) |
|
|
( |
) |
Total inventories, net |
|
$ |
|
|
$ |
|
||
11
Note 8 - Financing Arrangements
For a detailed discussion of the Company's long-term debt and credit arrangements, refer to “Note 14 - Financing Arrangements” in the Company’s Annual Report on Form 10-K for the year ended December 31, 2023.
The following table summarizes the current and non-current debt as of June 30, 2024 and December 31, 2023:
|
|
June 30, |
|
|
December 31, |
|
||
Credit Agreement |
|
$ |
|
|
$ |
|
||
Convertible Senior Notes due 2025 |
|
|
|
|
|
|
||
Total debt |
|
$ |
|
|
$ |
|
||
Less current portion of debt |
|
|
|
|
|
|
||
Total non-current portion of debt |
|
$ |
|
|
$ |
|
||
Amended Credit Agreement
On September 30, 2022, the Company, as borrower, and certain domestic subsidiaries of the Company, as subsidiary guarantors (the “Subsidiary Guarantors”), entered into a Fourth Amended and Restated Credit Agreement (the “Amended Credit Agreement”), with JPMorgan Chase Bank, N.A., as administrative agent (the “Administrative Agent”), and the lenders party thereto (collectively, the “Lenders”), which further amended and restated the Company’s existing secured Third Amended and Restated Credit Agreement, dated as of October 15, 2019.
As of June 30, 2024, the amount available under the Amended Credit Agreement was $
Convertible Senior Notes due 2025
The principal amount of the Convertible Senior Notes due 2025 upon issuance was $
The Indenture for the Convertible Senior Notes due 2025 provides that notes will become convertible during a quarter when the share price for
For details regarding all conversion mechanics and methods of settlement, refer to the Indenture for the Convertible Senior Notes due 2025 filed as an exhibit to a Form 8-K on December 15, 2020 and incorporated by reference in our most recent 10-K filing.
In the first quarter of 2023, the Company repurchased a total of $
12
The components of the Convertible Senior Notes due 2025 as of June 30, 2024 and December 31, 2023 were as follows:
|
|
June 30, |
|
|
December 31, |
|
||
Principal |
|
$ |
|
|
$ |
|
||
Less: Debt issuance costs, net of amortization |
|
|
( |
) |
|
|
( |
) |
Convertible Senior Notes due 2025, net |
|
$ |
|
|
$ |
|
||
The following table sets forth total interest expense recognized related to the Convertible Notes:
|
|
Three Months Ended June 30, |
|
|
Six Months Ended June 30, |
|
||||||||||
|
|
2024 |
|
|
2023 |
|
|
2024 |
|
|
2023 |
|
||||
Contractual interest expense |
|
$ |
|
|
$ |
|
|
$ |
|
|
$ |
|
||||
Amortization of debt issuance costs |
|
|
|
|
|
|
|
|
|
|
|
|
||||
Total |
|
$ |
|
|
$ |
|
|
$ |
|
|
$ |
|
||||
The total cash interest paid for the six months ended June 30, 2024 and 2023 was $
Fair Value Measurement
The fair value of the Convertible Senior Notes due 2025 was approximately $
Metallus’ Credit Facility is variable-rate debt. As such, any outstanding carrying value is a reasonable estimate of fair value as interest rates on these borrowings approximate current market rates. This valuation falls within Level 2 of the fair value hierarchy and is based on quoted prices for similar assets and liabilities in active markets that are observable either directly or indirectly. There were
Interest (Income) Expense, net
The following table provides the components of interest expense, net for the three and six months ended June 30, 2024 and 2023:
|
|
Three Months Ended June 30, |
|
|
Six Months Ended June 30, |
|
||||||||||
|
|
2024 |
|
|
2023 |
|
|
2024 |
|
|
2023 |
|
||||
Interest expense |
|
$ |
|
|
$ |
|
|
$ |
|
|
$ |
|
||||
Interest income |
|
|
( |
) |
|
|
( |
) |
|
|
( |
) |
|
|
( |
) |
Interest (income) expense, net |
|
$ |
( |
) |
|
$ |
( |
) |
|
$ |
( |
) |
|
$ |
( |
) |
Interest income primarily relates to interest earned on cash invested in a money market fund and deposits with financial institutions. As of June 30, 2024, the carrying value of the Company's money market investment was $
Treasury Shares
On December 20, 2021 Metallus announced that its Board of Directors authorized a share repurchase program under which the Company may repurchase up to $
13
offsetting dilution from annual equity compensation awards. The share repurchase program does not require the Company to acquire any dollar amount or number of shares and may be modified, suspended, extended or terminated by the Company at any time without prior notice. These authorizations reflect the continued confidence of the Board and senior leadership in the Company’s ability to generate sustainable through-cycle profitability while maintaining a strong balance sheet and cash flow.
For the three months ended June 30, 2024, the Company repurchased approximately
For the three months ended June 30, 2023, the Company repurchased approximately
In July 2024, the Company repurchased approximately
Note 9 - Retirement and Postretirement Plans
Plan Amendments and Updates
Bargaining Plan
On October 29, 2021, the United Steelworkers ("USW") Local 1123 voted to ratify a new
In the first half of 2024, the Company contributed a total of $
Salaried Plan
During the fourth quarter of 2021, termination of the Salaried Plan was approved by the Company's Board of Directors. Participants were notified in January 2022 and the plan was terminated effective
14
Pension Net Periodic Benefit Cost (Income)
The components of net periodic benefit cost (income) for the three months ended June 30, 2024 were as follows:
|
|
Pension |
|
|
|
|
|
|
|
|||||||||||||||||||
|
|
United States of America |
|
|
United Kingdom |
|
|
Mexico |
|
|
|
|
|
|
|
|||||||||||||
|
|
Bargaining |
|
|
Salaried |
|
|
Supplemental |
|
|
Pension |
|
|
Pension |
|
|
Total |
|
|
Postretirement |
|
|||||||
Service cost |
|
$ |
|
|
$ |
|
|
$ |
— |
|
|
$ |
— |
|
|
$ |
— |
|
|
$ |
|
|
$ |
|
||||
Interest cost |
|
|
|
|
|
|
|
|
|
|
|
|
|
|
— |
|
|
|
|
|
|
|
||||||
Expected return on plan assets |
|
|
( |
) |
|
|
( |
) |
|
|
— |
|
|
|
( |
) |
|
|
— |
|
|
|
( |
) |
|
|
( |
) |
Amortization of prior service cost |
|
|
|
|
|
— |
|
|
|
— |
|
|
|
— |
|
|
|
— |
|
|
|
|
|
|
( |
) |
||
Net remeasurement losses (gains) |
|
|
— |
|
|
|
|
|
|
— |
|
|
|
— |
|
|
|
— |
|
|
|
|
|
|
— |
|
||
Net Periodic Benefit Cost (Income) |
|
$ |
|
|
$ |
|
|
$ |
|
|
$ |
( |
) |
|
$ |
— |
|
|
$ |
|
|
$ |
( |
) |
||||
The components of net periodic benefit cost (income) for the three months ended June 30, 2023 were as follows:
|
|
Pension |
|
|
|
|
|
|
|
|||||||||||||||||||
|
|
United States of America |
|
|
United Kingdom |
|
|
Mexico |
|
|
|
|
|
|
|
|||||||||||||
|
|
Bargaining |
|
|
Salaried |
|
|
Supplemental |
|
|
Pension |
|
|
Pension |
|
|
Total |
|
|
Postretirement |
|
|||||||
Service cost |
|
$ |
|
|
$ |
|
|
$ |
— |
|
|
$ |
— |
|
|
$ |
— |
|
|
$ |
|
|
$ |
|
||||
Interest cost |
|
|
|
|
|
|
|
|
|
|
|
|
|
|
— |
|
|
|
|
|
|
|
||||||
Expected return on plan assets |
|
|
( |
) |
|
|
( |
) |
|
|
— |
|
|
|
( |
) |
|
|
— |
|
|
|
( |
) |
|
|
( |
) |
Amortization of prior service cost |
|
|
|
|
|
— |
|
|
|
— |
|
|
|
— |
|
|
|
— |
|
|
|
|
|
|
( |
) |
||
Net remeasurement losses (gains) |
|
|
— |
|
|
|
|
|
|
— |
|
|
|
— |
|
|
|
— |
|
|
|
|
|
|
— |
|
||
Net Periodic Benefit Cost (Income) |
|
$ |
|
|
$ |
|
|
$ |
|
|
$ |
( |
) |
|
$ |
— |
|
|
$ |
|
|
$ |
( |
) |
||||
The components of net periodic benefit cost (income) for the six months ended June 30, 2024 were as follows:
|
|
Pension |
|
|
|
|
|
|
|
|||||||||||||||||||
|
|
United States of America |
|
|
United Kingdom |
|
|
Mexico |
|
|
|
|
|
|
|
|||||||||||||
|
|
Bargaining |
|
|
Salaried |
|
|
Supplemental |
|
|
Pension |
|
|
Pension |
|
|
Total |
|
|
Postretirement |
|
|||||||
Service cost |
|
$ |
|
|
$ |
|
|
$ |
— |
|
|
$ |
— |
|
|
$ |
— |
|
|
$ |
|
|
$ |
|
||||
Interest cost |
|
|
|
|
|
|
|
|
|
|
|
|
|
|
— |
|
|
|
|
|
|
|
||||||
Expected return on plan assets |
|
|
( |
) |
|
|
( |
) |
|
|
— |
|
|
|
( |
) |
|
|
— |
|
|
|
( |
) |
|
|
( |
) |
Amortization of prior service cost |
|
|
|
|
|
— |
|
|
|
— |
|
|
|
— |
|
|
|
— |
|
|
|
|
|
|
( |
) |
||
Net remeasurement losses (gains) |
|
|
— |
|
|
|
|
|
|
— |
|
|
|
— |
|
|
|
— |
|
|
|
|
|
|
— |
|
||
Net Periodic Benefit Cost (Income) |
|
$ |
|
|
$ |
|
|
$ |
|
|
$ |
( |
) |
|
$ |
— |
|
|
$ |
|
|
$ |
( |
) |
||||
15
The components of net periodic benefit cost (income) for the six months ended June 30, 2023 were as follows:
|
|
Pension |
|
|
|
|
|
|
|
|||||||||||||||||||
|
|
United States of America |
|
|
United Kingdom |
|
|
Mexico |
|
|
|
|
|
|
|
|||||||||||||
|
|
Bargaining |
|
|
Salaried |
|
|
Supplemental |
|
|
Pension |
|
|
Pension |
|
|
Total |
|
|
Postretirement |
|
|||||||
Service cost |
|
$ |
|
|
$ |
|
|
$ |
— |
|
|
$ |
— |
|
|
$ |
— |
|
|
$ |
|
|
$ |
|
||||
Interest cost |
|
|
|
|
|
|
|
|
|
|
|
|
|
|
— |
|
|
|
|
|
|
|
||||||
Expected return on plan assets |
|
|
( |
) |
|
|
( |
) |
|
|
— |
|
|
|
( |
) |
|
|
— |
|
|
|
( |
) |
|
|
( |
) |
Amortization of prior service cost |
|
|
|
|
|
— |
|
|
|
— |
|
|
|
— |
|
|
|
— |
|
|
|
|
|
|
( |
) |
||
Net remeasurement losses (gains) |
|
|
— |
|
|
|
|
|
|
— |
|
|
|
— |
|
|
|
— |
|
|
|
|
|
|
— |
|
||
Net Periodic Benefit Cost (Income) |
|
$ |
|
|
$ |
|
|
$ |
|
|
$ |
( |
) |
|
$ |
— |
|
|
$ |
|
|
$ |
( |
) |
||||
The Bargaining Plan, Salaried Plan, and Supplemental Plan have a provision that permits employees to elect to receive their pension benefits in a lump sum upon retirement. The Company's accounting policy is to recognize settlements during the quarter in which it is projected that the costs of all settlements during the year will be greater than the sum of the service cost and interest cost components.
In the first quarter of 2024, the cumulative cost of all lump sum payments was expected to exceed the sum of the service cost and interest cost components of net periodic pension cost for the Salaried Plan. As a result, the Company completed a full remeasurement of its pension obligations and plan assets associated with the Salaried Plan during the first quarter of 2024. On May 1, 2024, in advance of the annuitization of the Salaried plan and upon the election of certain participants, the Company made $
In the first quarter of 2023, in anticipation of receiving the regulatory approval to move forward with the plan termination process, the cumulative costs of all lump sum payments and other settlements were projected to exceed this threshold during 2023 for the Salaried Plan. Ultimately, these costs did not exceed this threshold for the Salaried Plan during 2023. The Salaried Plan's pension obligations and plan assets were remeasured during each quarter of 2023.
Note 10 – Stock-Based Compensation
During the six months ended June 30, 2024 the Board of Directors granted
Time-based restricted stock units are issued with the fair value equal to the closing market price of Metallus common shares on the date of grant. These restricted stock units do not have any performance conditions for vesting. Expense is recognized over the service period, adjusted for any forfeitures that occur during the vesting period. The weighted average fair value of the restricted stock units granted during the six months ended June 30, 2024 was $
Performance-based restricted stock units issued in 2024 vest based on achievement of a total shareholder return (“TSR”) metric. The TSR metric is considered a market condition, which requires Metallus to reflect it in the fair value on grant date using an advanced option-pricing model. The fair value of each performance share was therefore determined using a Monte Carlo valuation model, a generally accepted lattice pricing model under ASC 718 – Stock-based Compensation. The Monte Carlo valuation model, among other factors, uses commonly-accepted economic theory underlying all valuation models, estimates fair value using simulations of future share prices based on stock price behavior and considers the correlation of peer company returns in determining fair value. The fair value of the performance-based restricted stock units granted during the six months ended June 30, 2024 was $
In the fourth quarter of 2023, the Board approved and authorized a performance-based Transformation Incentive Grant program (the “Transformation Incentive Grant Program”). Under the Transformation Incentive Grant Program, certain employees were granted performance-based restricted stock unit awards designed to be earned based upon the closing price performance of the Company's common shares during a performance period running from December 1, 2023 through December 31, 2026. Similar to the annual performance-based restricted stock units, the fair value of each share is determined using a Monte Carlo valuation
16
model, a generally accepted lattice pricing model. There were no additional grants under the Transformation Incentive Grant Program in the first half of 2024. For further information, refer to Metallus' Stock Based Compensation note included in its Annual Report on Form 10-K for the year ended December 31, 2023.
Note 11 - Accumulated Other Comprehensive Income (Loss)
Changes in accumulated other comprehensive income (loss) for the six months ended June 30, 2024 and 2023 by component were as follows:
|
|
Foreign Currency |
|
|
Pension and |
|
|
Total |
|
|||
Balance as of December 31, 2023 |
|
$ |
( |
) |
|
$ |
|
|
$ |
|
||
Other comprehensive income (loss) before reclassifications, before income tax |
|
|
( |
) |
|
|
|
|
|
( |
) |
|
Amounts reclassified from accumulated other comprehensive income (loss), before income tax |
|
|
|
|
|
( |
) |
|
|
( |
) |
|
Amounts deferred to accumulated other comprehensive income (loss), before income tax |
|
|
|
|
|
|
|
|
|
|||
Tax effect |
|
|
|
|
|
|
|
|
|
|||
Net current period other comprehensive income (loss), net of income taxes |
|
|
( |
) |
|
|
( |
) |
|
|
( |
) |
Balance as of June 30, 2024 |
|
$ |
( |
) |
|
$ |
|
|
$ |
|
||
|
|
|
|
|
|
|
|
|
|
|||
|
|
Foreign Currency |
|
|
Pension and |
|
|
Total |
|
|||
Balance as of December 31, 2022 |
|
$ |
( |
) |
|
$ |
|
|
$ |
|
||
Other comprehensive income (loss) before reclassifications, before income tax |
|
|
|
|
|
|
|
|
|
|||
Amounts reclassified from accumulated other comprehensive income (loss), before income tax |
|
|
|
|
|
( |
) |
|
|
( |
) |
|
Amounts deferred to accumulated other comprehensive income (loss), before income tax |
|
|
|
|
|
|
|
|
|
|||
Tax effect |
|
|
|
|
|
( |
) |
|
|
( |
) |
|
Net current period other comprehensive income (loss), net of income taxes |
|
|
|
|
|
( |
) |
|
|
( |
) |
|
Balance as of June 30, 2023 |
|
$ |
( |
) |
|
$ |
|
|
$ |
|
||
The amount reclassified from accumulated other comprehensive income (loss) in the six months ended June 30, 2024 and 2023 for the pension and postretirement liability adjustment was included in other (income) expense, net in the unaudited Consolidated Statements of Operations.
17
Note 12 – Contingencies
Metallus has a number of loss exposures incurred in the ordinary course of business, such as environmental claims, product warranty claims, employee-related matters, and other litigation. Establishing loss reserves for these matters requires management’s estimate and judgment regarding risk exposure and ultimate liability or realization. These loss reserves are reviewed periodically and adjustments are made to reflect the most recent facts and circumstances. Accruals related to environmental claims represent management’s best estimate of the fees and costs associated with these claims. Although it is not possible to predict with certainty the outcome of such claims, management believes that their ultimate dispositions should not have a material adverse effect on our financial position, cash flows or results of operations. As of June 30, 2024 and December 31, 2023, Metallus had a $
18
Item 2. Management’s Discussion and Analysis of Financial Condition and Results of Operations
(dollars in millions, except per share data)
This Management’s Discussion and Analysis of Financial Condition and Results of Operations (“MD&A”) is intended to help investors understand our results of operations, financial condition and current business environment. The MD&A is provided as a supplement to, and should be read in conjunction with, our unaudited consolidated financial statements and related notes included elsewhere in this Quarterly Report on Form 10-Q for the three and six months ended June 30, 2024.
The MD&A is organized as follows:
Overview
Business Overview
We manufacture alloy steel, as well as carbon and micro-alloy steel, using electric arc furnace ("EAF") technology. Our portfolio includes special bar quality (“SBQ”) bars, seamless mechanical tubing (“tubes”), manufactured components such as precision steel components, and billets. Our products and solutions are used in a diverse range of demanding applications in the following end-markets: industrial, automotive, aerospace & defense, and energy.
We conduct our business activities and report financial results as one business segment. The presentation of financial results as one reportable segment is consistent with the way we operate our business and is consistent with the manner in which the Chief Operating Decision Maker ("CODM") evaluates performance and makes resource and operating decisions for the business as described above. Furthermore, the Company notes that monitoring financial results as one reportable segment helps the CODM manage costs on a consolidated basis, consistent with the integrated nature of our operations.
Business Highlights
The following items represent key trends and events during the three and six months ended June 30, 2024:
19
(1) Please see discussion of non-GAAP financial measures in Form 10-Q – Net Sales Adjusted to Exclude Surcharges
20
Results of Operations
Net Sales
The charts below present net sales and shipments for the three months ended June 30, 2024 and 2023.
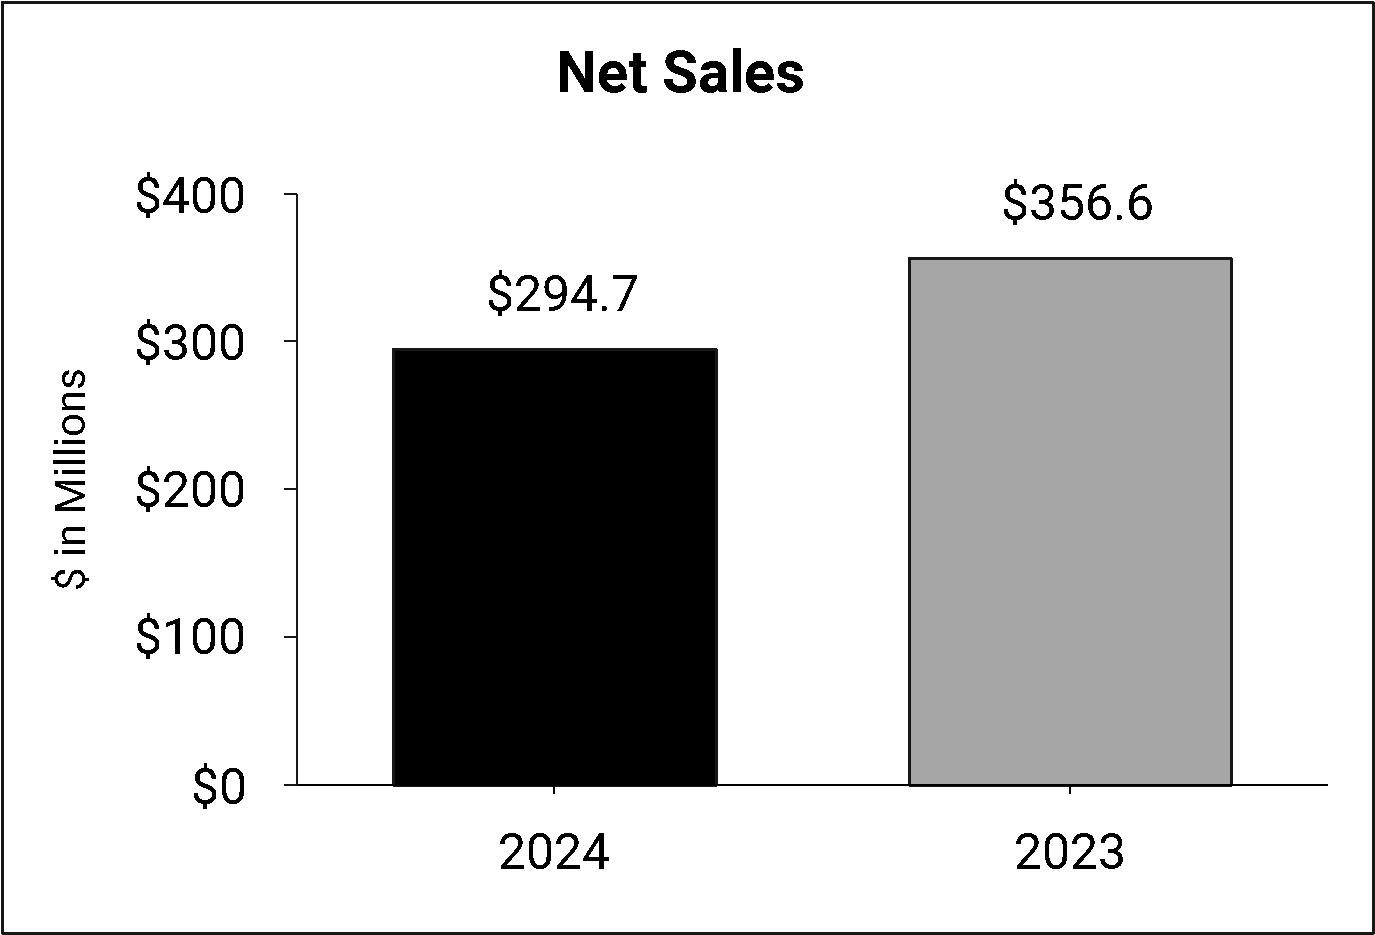
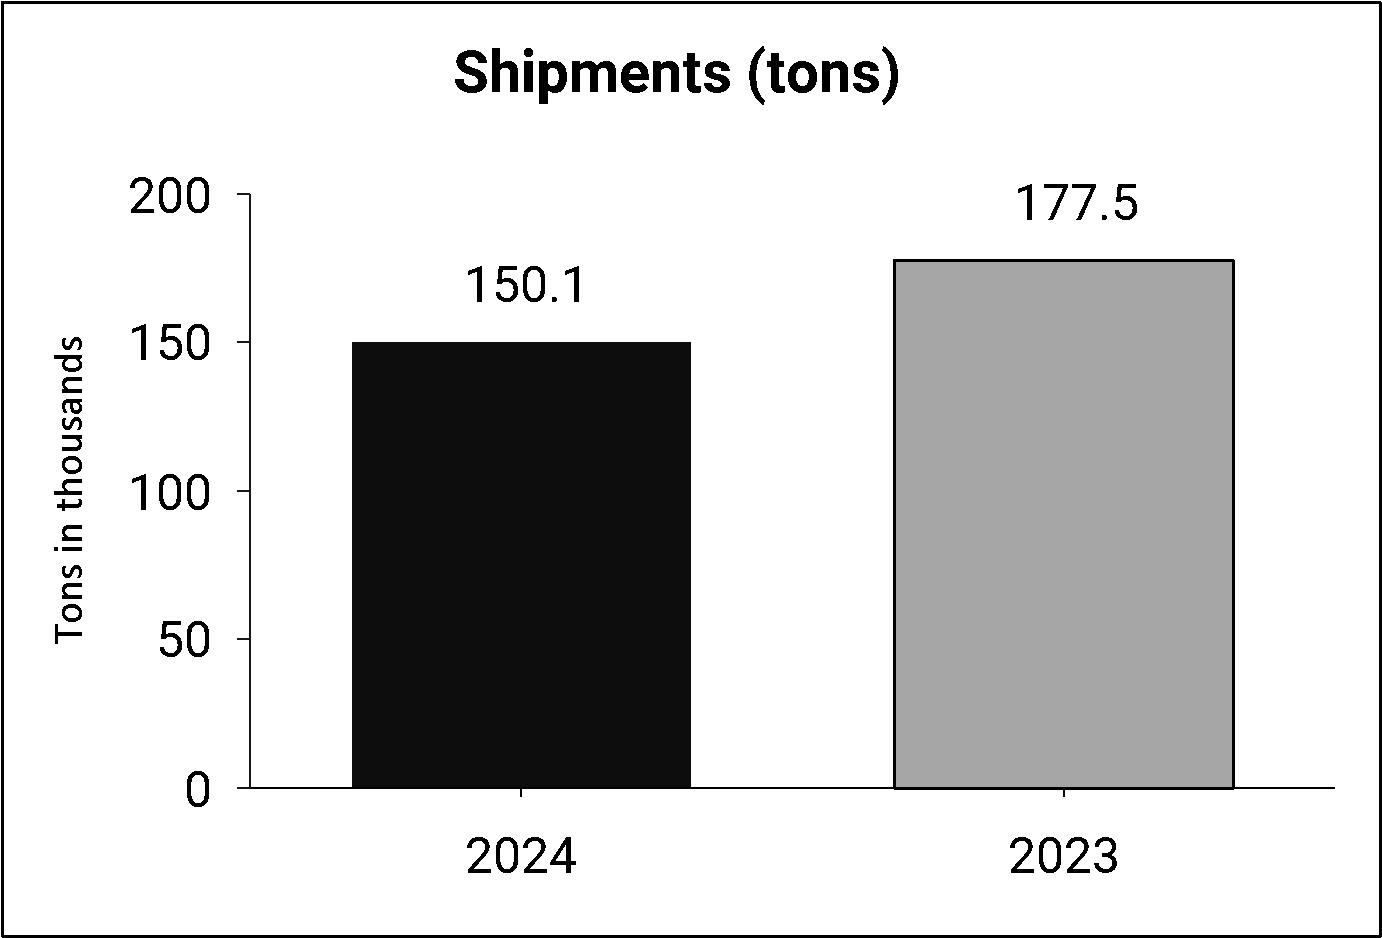
Net sales for the three months ended June 30, 2024 were $294.7 million, a decrease of $61.9 million, or 17.4% compared with the three months ended June 30, 2023. The decrease in net sales was driven by unfavorable surcharges and lower shipments, partially offset by favorable price/mix. Lower market prices for scrap and alloy drove the unfavorable surcharges of $44.8 million. Lower volume of 27.4 thousand ship tons resulted in a net sales decrease of $39.0 million. Favorable price/mix of $21.9 million was primarily due to higher base prices across automotive, energy and aerospace & defense end-market sectors. Excluding surcharges, net sales decreased $17.1 million or 6.8%.
The charts below present net sales and shipments for the six months ended June 30, 2024 and 2023.
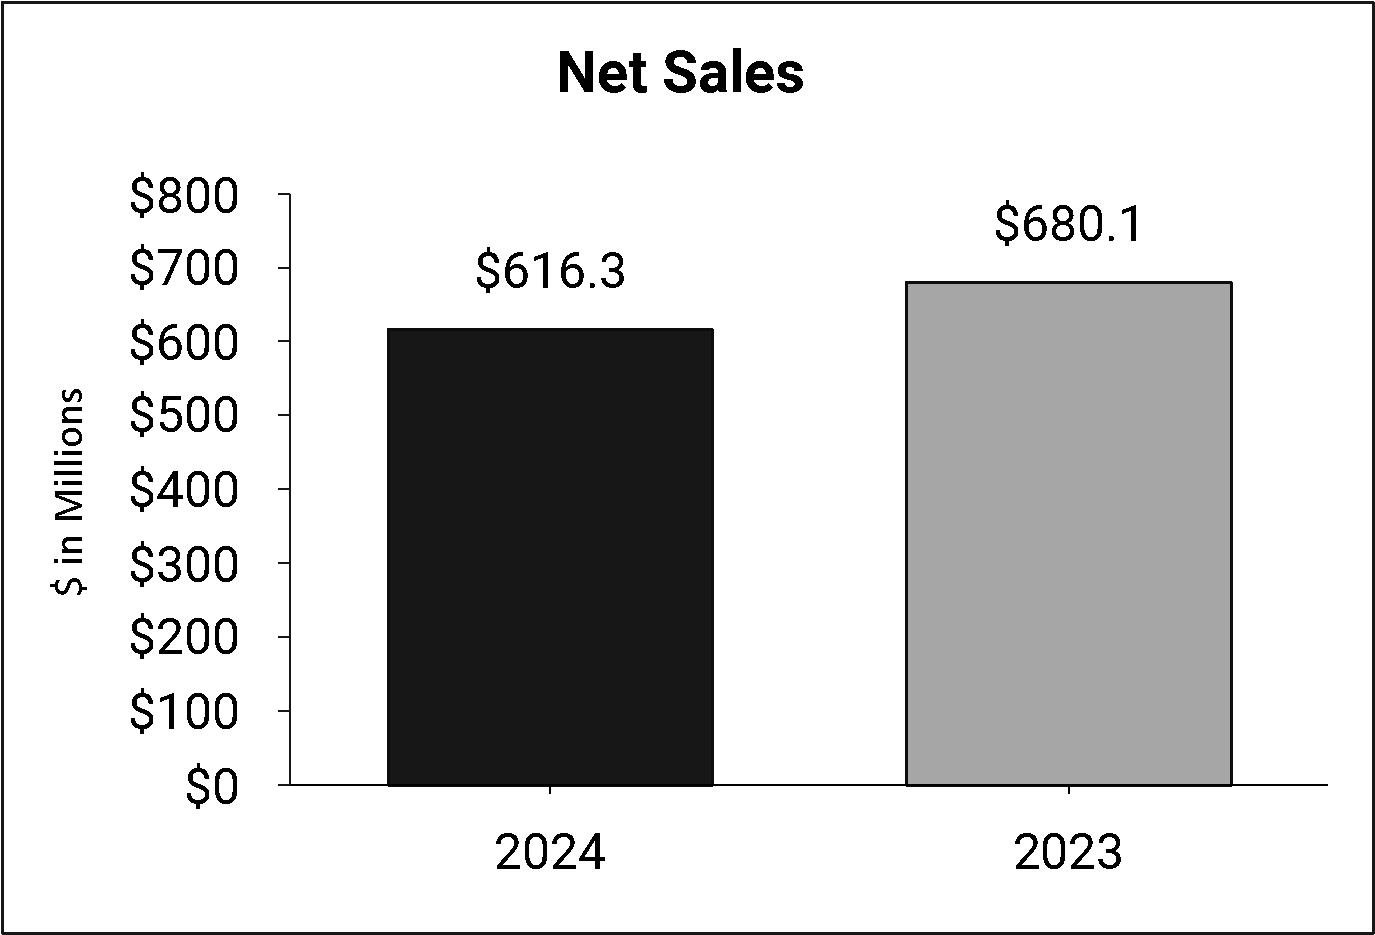
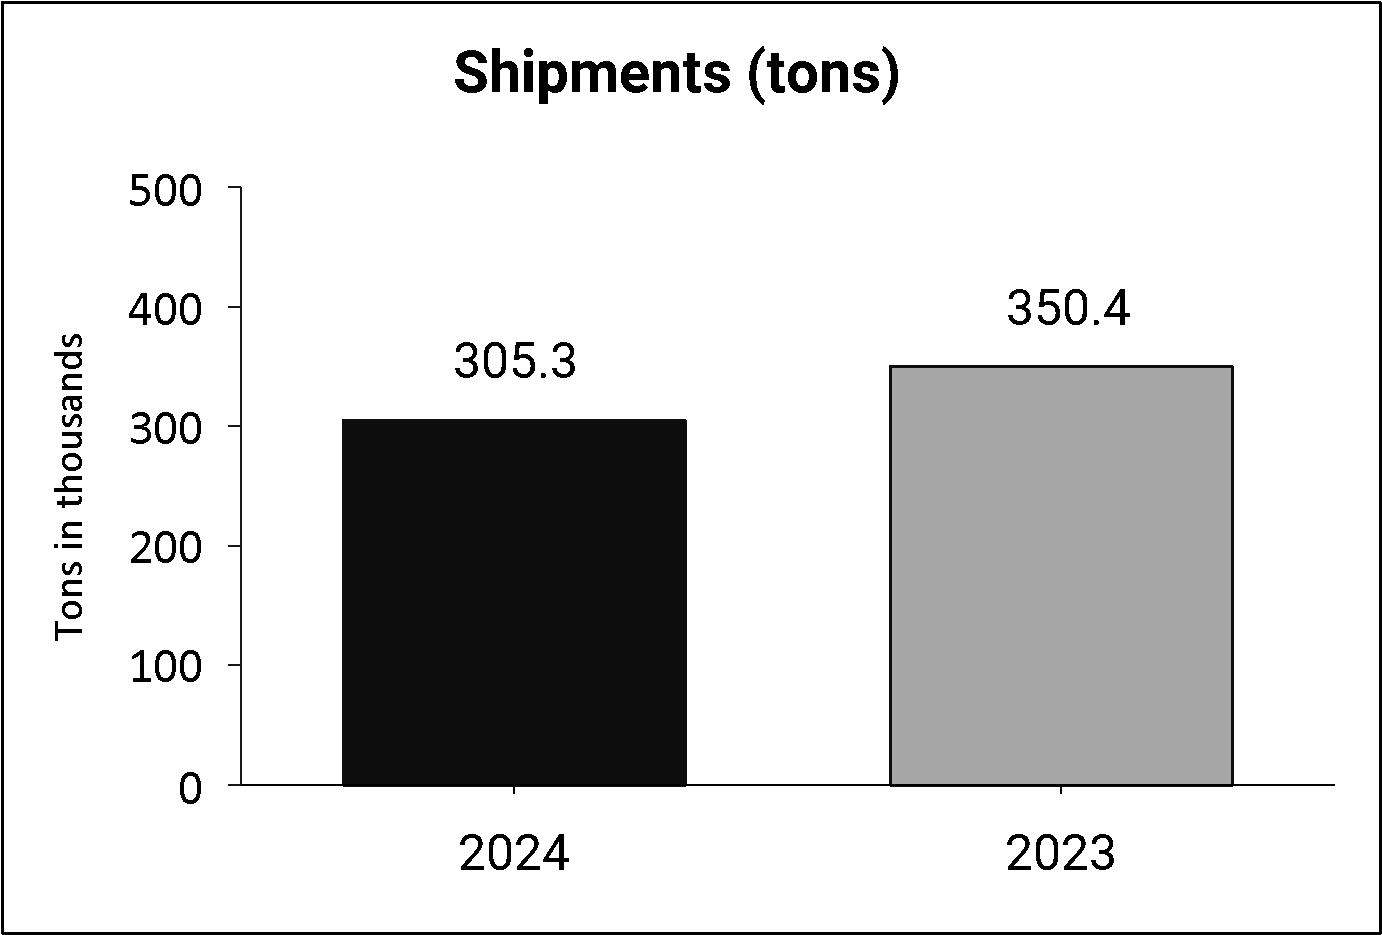
Net sales for the six months ended June 30, 2024 were $616.3 million, a decrease of $63.8 million, or 9.4% compared with the six months ended June 30, 2023. The decrease in net sales was driven by lower volumes and surcharges, partially offset by favorable price/mix. Lower volume of 45.1 thousand ship tons, and lower alloy surcharge per ton, resulted in a net sales decrease of $122.3 million. Favorable price/mix of $58.5 million was primarily due to higher base prices across all end-market sectors. Excluding surcharges, net sales decreased $5.9 million or 1.2%.
21
Gross Profit
The chart below presents the drivers of the gross profit variance from the three months ended June 30, 2024 as compared to the three months ended June 30, 2023.
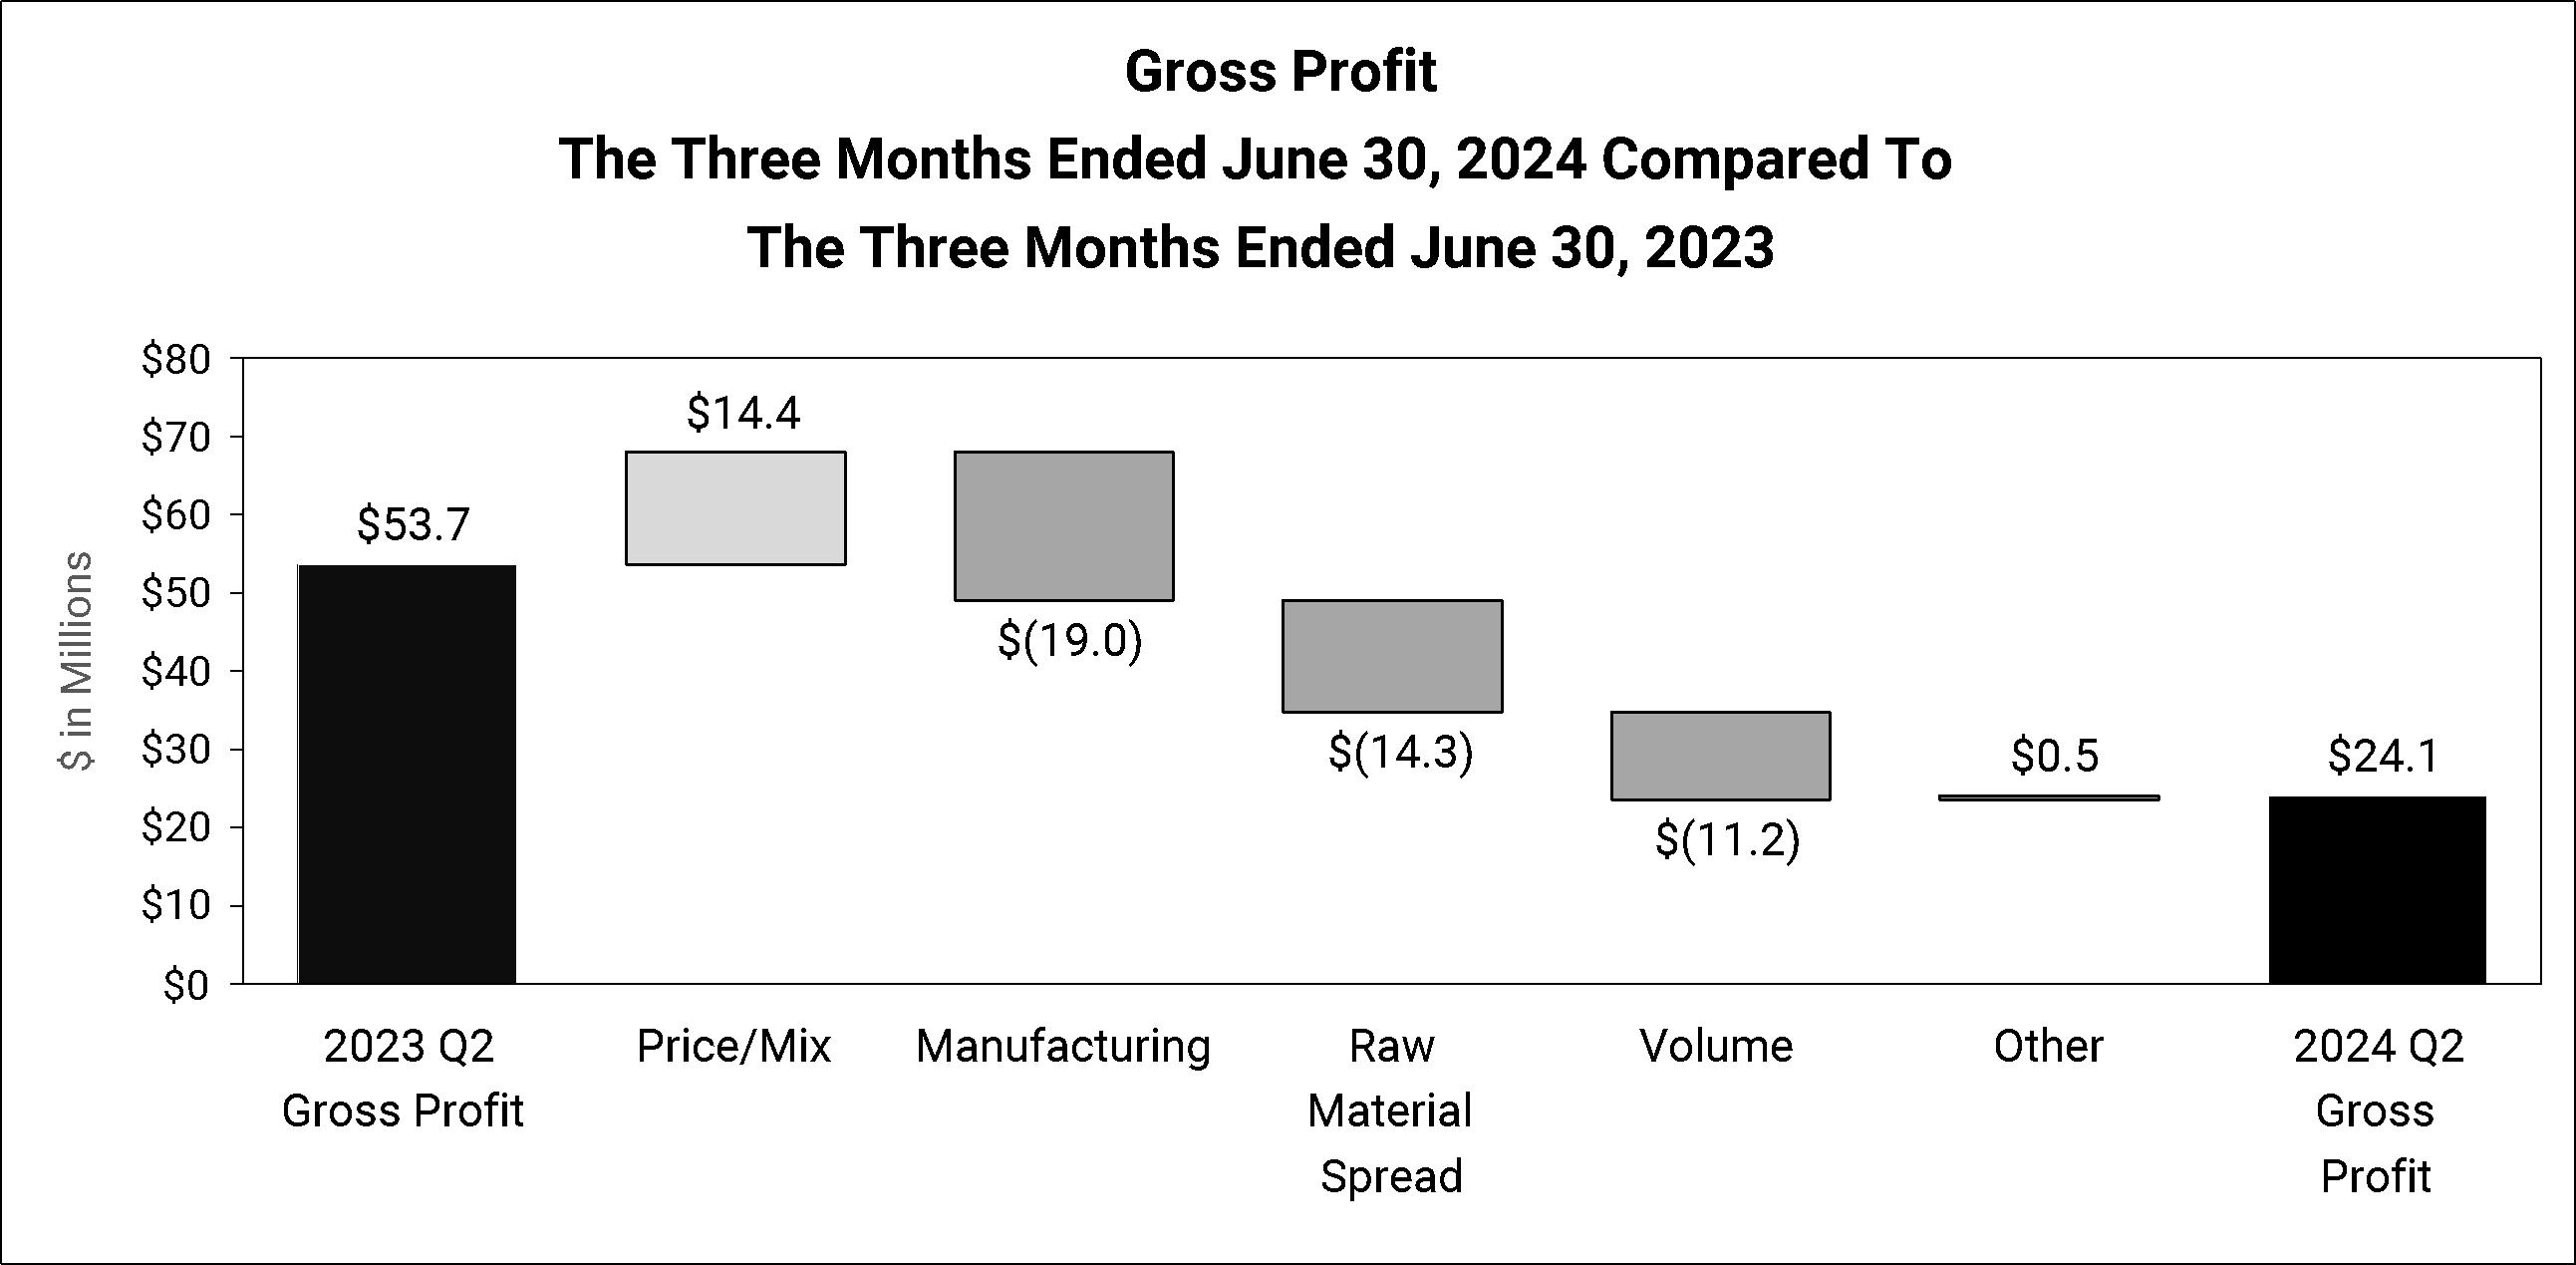
Gross profit for the three months ended June 30, 2024 decreased $29.6 million, or 55.1% compared with the three months ended June 30, 2023. The decrease was driven by higher manufacturing costs, unfavorable raw material spread and lower volume, partially offset by favorable price/mix. Higher manufacturing costs were primarily due to lower fixed cost leverage on decreased production levels. Raw material spread was unfavorable due to lower scrap and alloy prices. All end-market sectors except aerospace & defense were unfavorably impacted by lower volume.
22
The chart below presents the drivers of the gross profit variance from the six months ended June 30, 2024 as compared to the six months ended June 30, 2023.
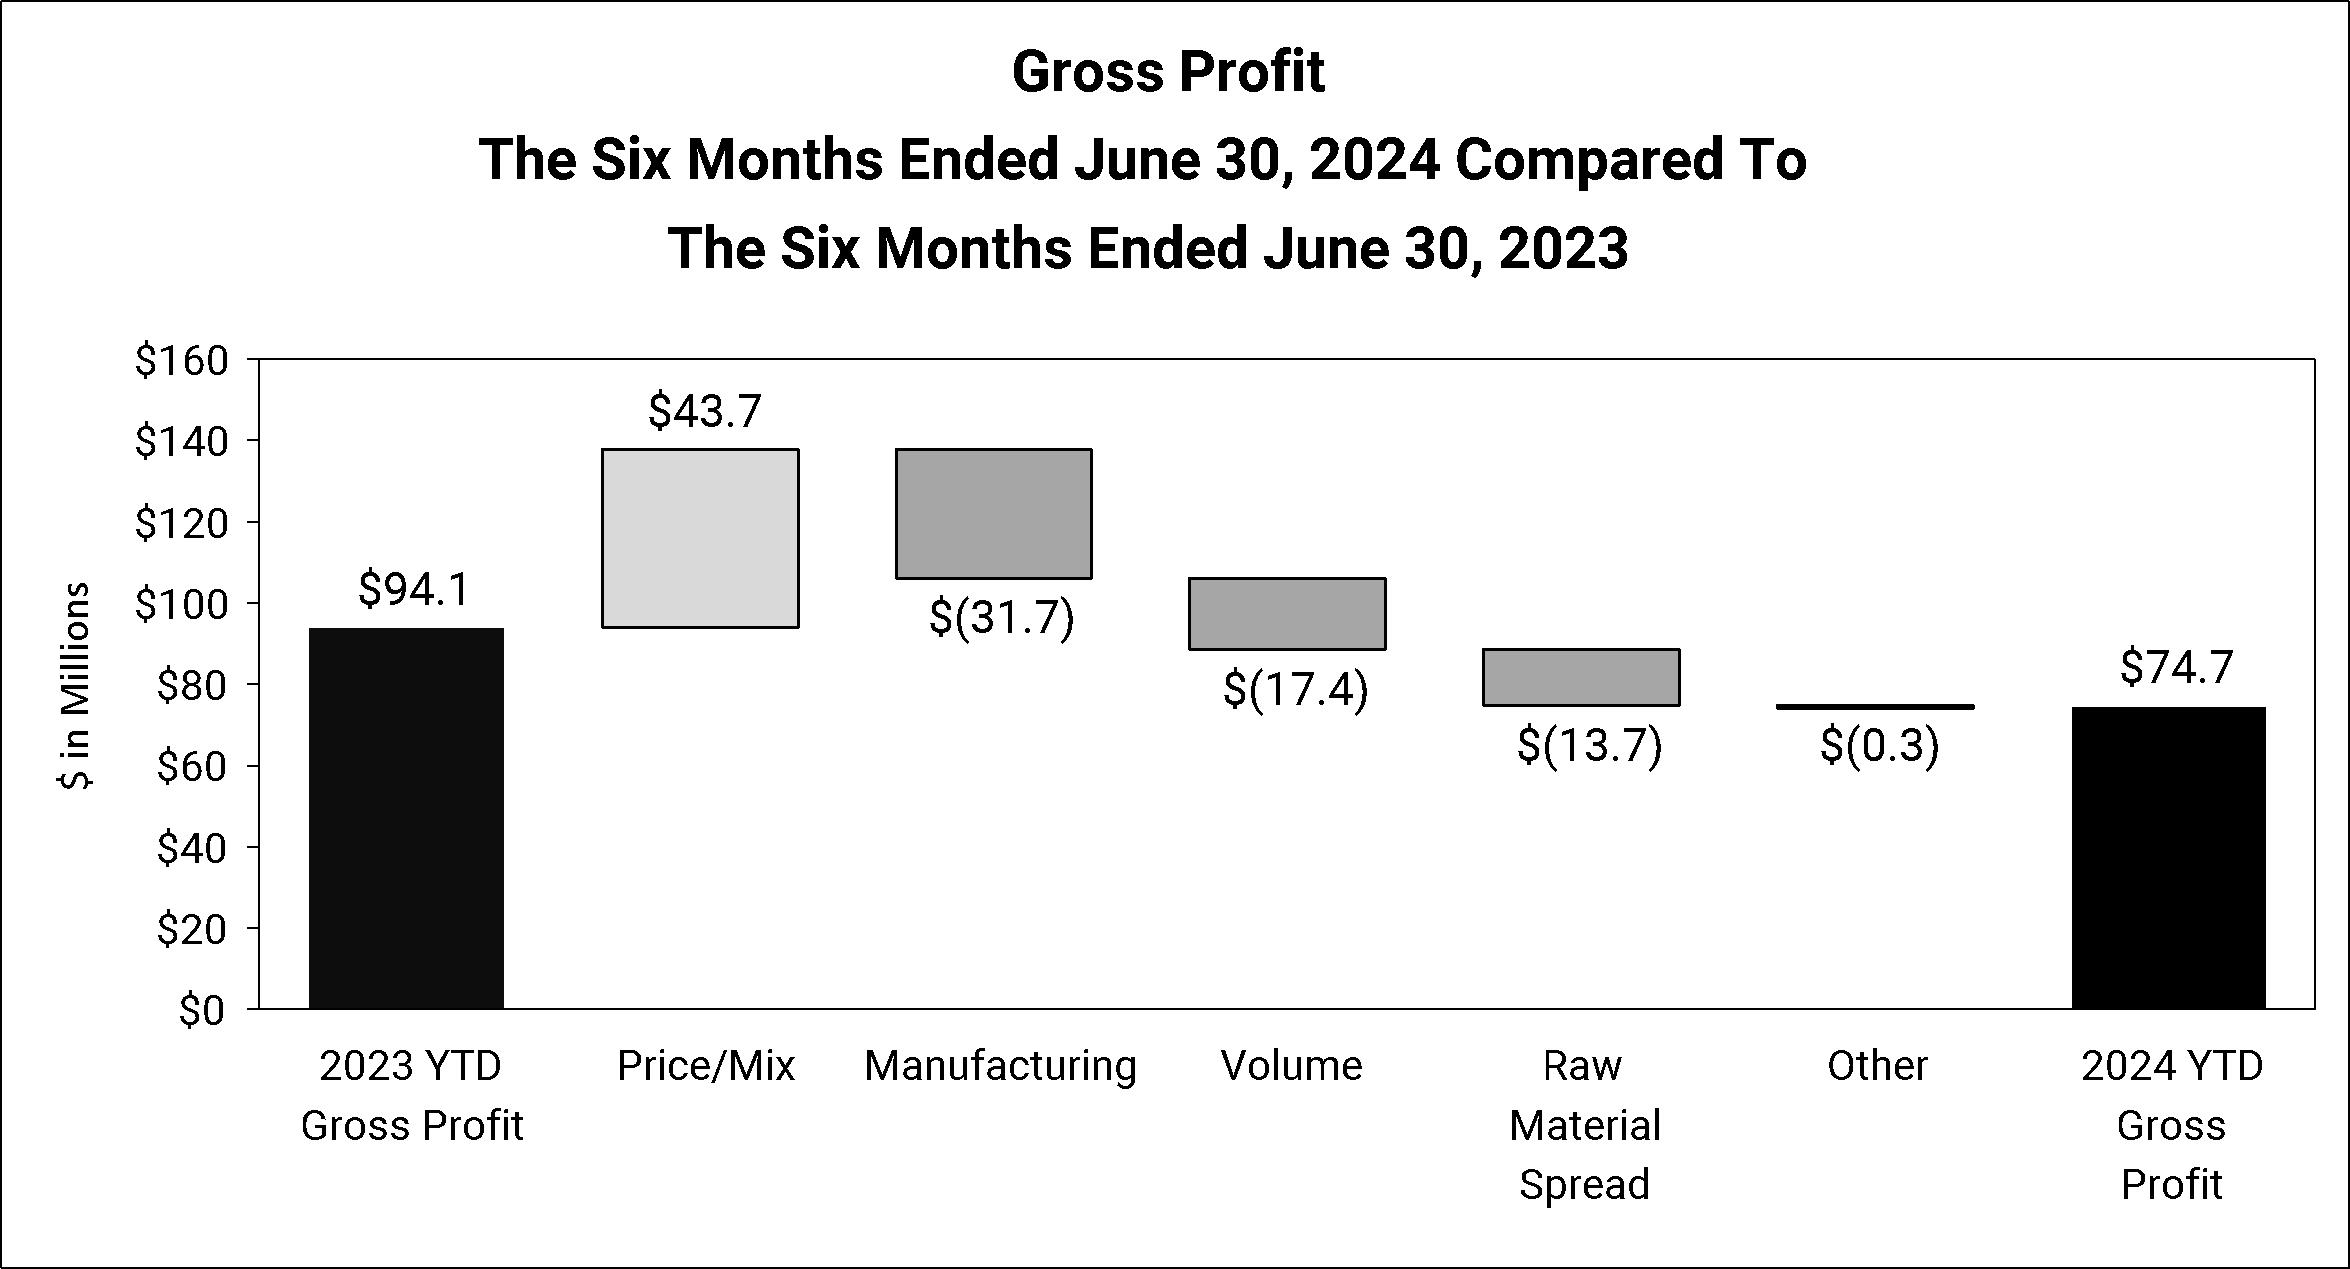
Gross profit for the six months ended June 30, 2024 decreased $19.4 million, or 20.6% compared with the six months ended June 30, 2023. The decrease was driven by higher manufacturing costs, lower volume and unfavorable raw material spread, partially offset by favorable price/mix. Lower fixed cost leverage on decreased production resulted in unfavorable manufacturing costs. Raw material spread was unfavorable due to lower shipments. The industrial, automotive and energy end-market sectors were unfavorably impacted by lower volume.
23
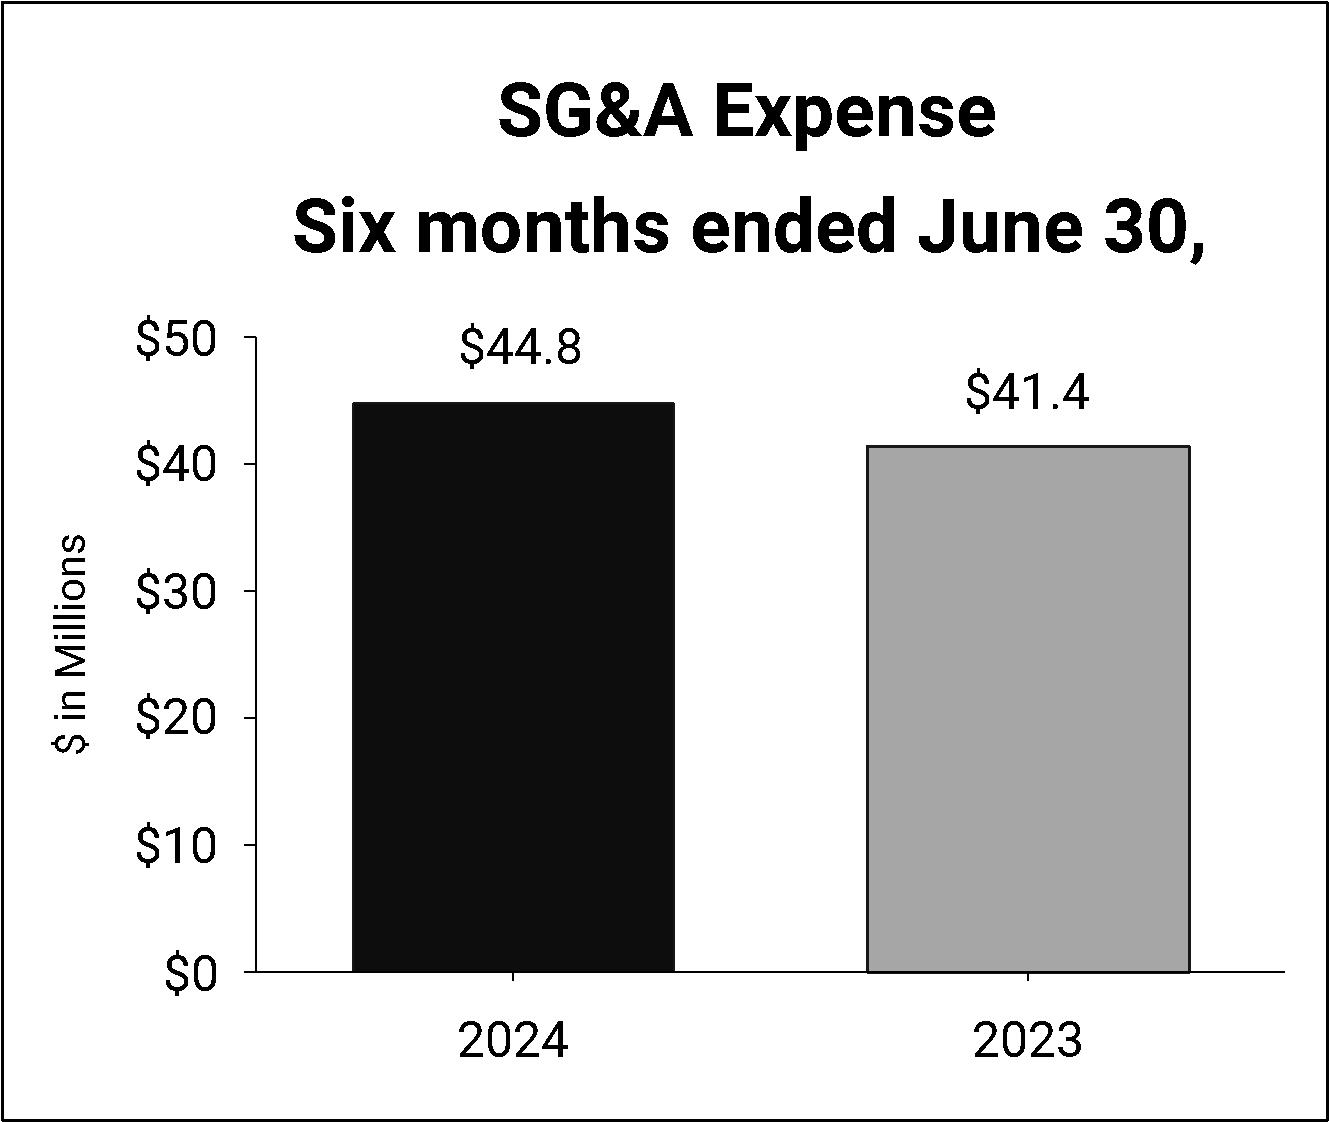
Selling, General and Administrative Expenses
The charts below present selling, general and administrative (“SG&A”) expense for the three and six months ended June 30, 2024 and 2023.
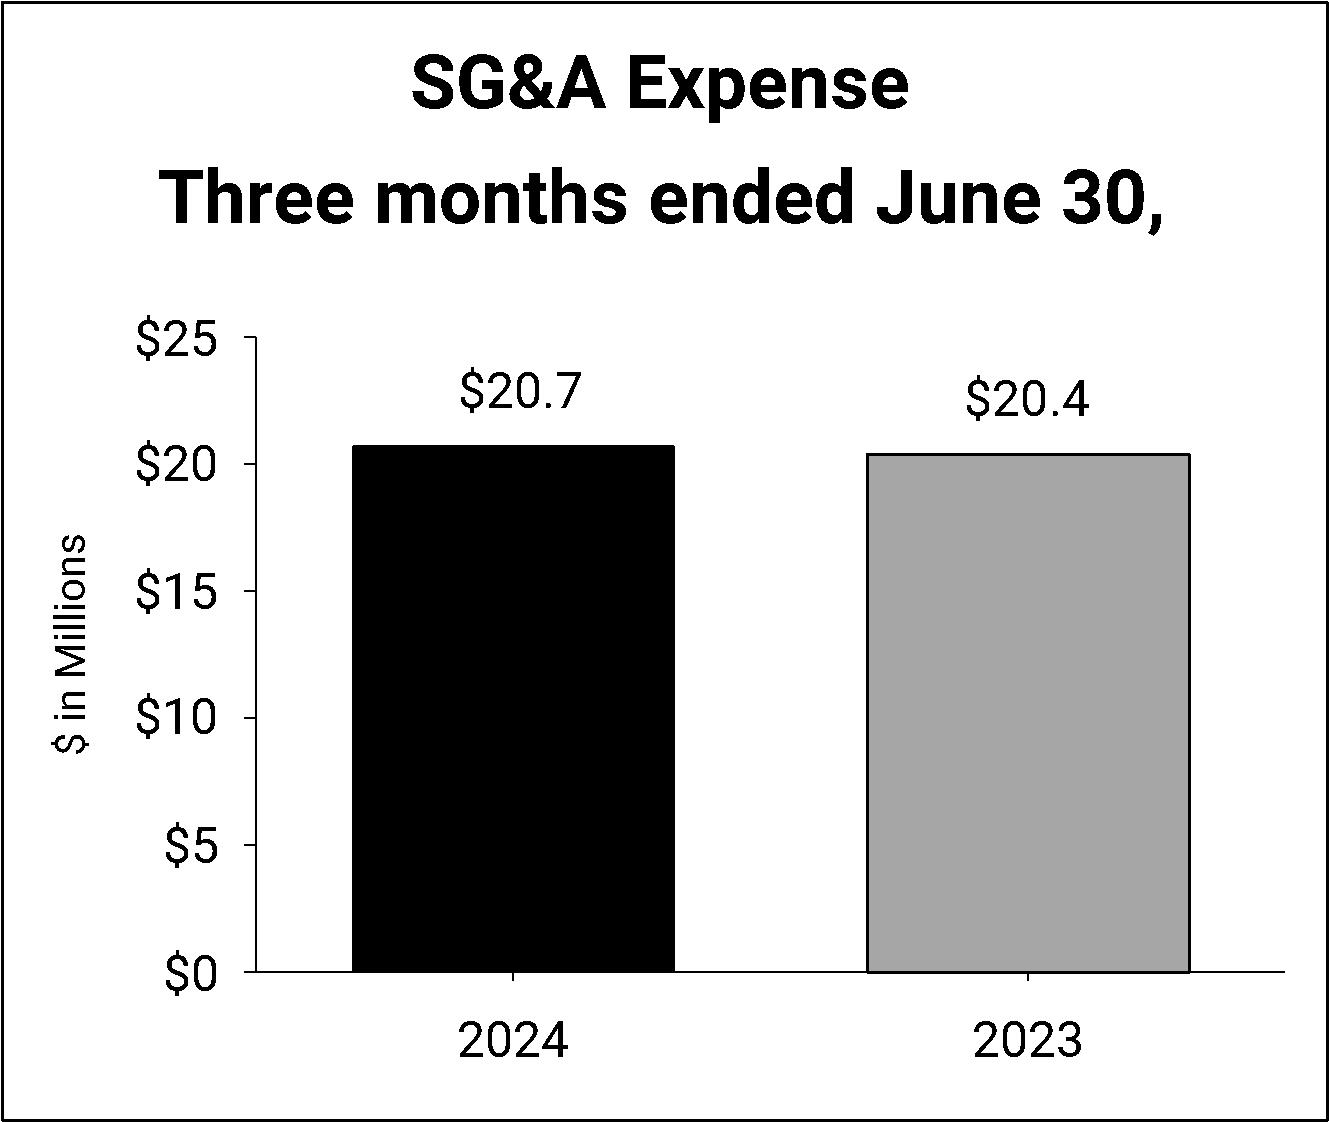
SG&A expense for the three months ended June 30, 2024 increased by $0.3 million, or 1.5% compared with the three months ended June 30, 2023. The increase was primarily due to higher salary and benefits and stock-based compensation, partially offset by lower variable pay.
SG&A expense for the six months ended June 30, 2024 increased by $3.4 million, or 8.2% compared with the six months ended June 30, 2023. The increase was primarily due to higher salary and benefits, stock-based compensation and professional services, primarily driven by the ongoing information technology transformation project, partially offset by lower variable pay.
24
Interest (Income) Expense, net
Net interest income for the three and six months ended June 30, 2024 was $2.4 million and $5.2 million, respectively, compared with net interest income of $1.7 million and $3.2 million for the three and six months ended June 30, 2023, respectively. The change was due to interest earned on greater cash invested in a money market fund and in other accounts which generate interest income at a rate similar to the money market fund during 2024. Refer to “Note 8 - Financing Arrangements” in the Notes to the unaudited Consolidated Financial Statements for additional information.
Other (Income) Expense, net
|
|
Three Months Ended June 30, |
|
|||||||||
|
|
2024 |
|
|
2023 |
|
|
$ Change |
|
|||
Pension and postretirement non-service benefit (income) loss |
|
$ |
(1.4 |
) |
|
$ |
(1.3 |
) |
|
$ |
(0.1 |
) |
Loss (gain) from remeasurement benefit plans |
|
|
1.0 |
|
|
|
0.5 |
|
|
|
0.5 |
|
Insurance recoveries |
|
|
— |
|
|
|
(1.5 |
) |
|
|
1.5 |
|
Foreign currency exchange (gain) loss |
|
|
(0.1 |
) |
|
|
(0.1 |
) |
|
|
— |
|
Miscellaneous (income) expense |
|
|
— |
|
|
|
0.1 |
|
|
|
(0.1 |
) |
Total other (income) expense, net |
|
$ |
(0.5 |
) |
|
$ |
(2.3 |
) |
|
$ |
1.8 |
|
|
|
Six Months Ended June 30, |
|
|||||||||
|
|
2024 |
|
|
2023 |
|
|
$ Change |
|
|||
Pension and postretirement non-service benefit (income) loss |
|
$ |
(2.8 |
) |
|
$ |
(2.5 |
) |
|
$ |
(0.3 |
) |
Loss (gain) from remeasurement of benefit plans |
|
|
1.8 |
|
|
|
2.7 |
|
|
|
(0.9 |
) |
Insurance recoveries |
|
|
— |
|
|
|
(11.3 |
) |
|
|
11.3 |
|
Foreign currency exchange (gain) loss |
|
|
(0.3 |
) |
|
|
(0.1 |
) |
|
|
(0.2 |
) |
Miscellaneous (income) expense |
|
|
— |
|
|
|
0.1 |
|
|
|
(0.1 |
) |
Total other (income) expense, net |
|
$ |
(1.3 |
) |
|
$ |
(11.1 |
) |
|
$ |
9.8 |
|
Non-service related pension and other postretirement benefit income, for all years, consists primarily of the interest cost, expected return on plan assets and amortization components of net periodic cost.
The Company's Bargaining Unit Pension Plan ("Bargaining Plan"), Retirement Plan (“Salaried Plan”), and the Supplemental Pension Plan ("Supplemental Plan") each have a provision that permits employees to elect to receive their pension benefits in a lump sum upon retirement. In the first quarter of 2024, the cumulative cost of all lump sum payments was expected to exceed the sum of the service cost and interest cost components of net periodic pension cost for the Salaried Plan. As a result, the Company completed a full remeasurement of its pension obligations and plan assets associated with the Salaried Plan during the first quarter of 2024.
In the second quarter of 2024, the Company entered into an agreement to purchase a group annuity contract from The Prudential Insurance Company of America (“Prudential”) in connection with the annuitization of the Salaried Plan. The Company remeasured the Salaried Plan ahead of the annuitization on May 15, 2024. A loss of $1.0 million and $1.8 million from the remeasurement of the Salaried Plan was recognized for the three and six months ended June 30, 2024, respectively. For the three and six months ended June 30, 2024, the loss was primarily due to investment losses on plan assets of $1.8 million and $3.3 million, respectively, partially offset by a decrease in the liability due to an increase in the discount rate of $0.7 million and $1.4 million, respectively. In addition, the three months ended June 30, 2024 included a $0.1 million gain as a result of the completion of the Salaried Plan annuitization.
A loss of $0.5 million and $2.7 million from the remeasurement of the Salaried Plan was recognized for the three and six months ended June 30, 2023, respectively. For the three months ended June 30, 2023, the loss was primarily due to $2.6 million of investment losses on plan assets, partially offset by a $2.1 million decrease in the liability driven by an increase in the discount rate. For the six months ended June 30, 2023, the loss was due to a $2.6 million increase in the liability driven by changes in the discount rate and lump sum basis losses, plus $0.1 million due to investment losses on plan assets.
For more details on the aforementioned remeasurements, refer to “Note 9 - Retirement and Postretirement Plans."
25
During 2023, the Company recognized insurance recoveries of $31.3 million related to the 2022 Faircrest melt shop unplanned downtime. In the first quarter of 2023, the Company recognized recoveries of $9.8 million, of which $0.8 million was received during the first quarter and $9.0 million was received in the second quarter of 2023. In the second quarter of 2023, a $1.5 million insurance recovery was received, and the remaining $20.0 million was received in the first quarter of 2024. The 2022 insurance claims were closed in the first quarter of 2024. Refer to “Note 4 - Other (Income) Expense, net” in the Notes to the Consolidated Financial Statements for additional information. For further information related to previous insurance recoveries, refer to "Note 7 - Other (Income) Expense, net" in the Company’s Annual Report on Form 10-K for the year ended December 31, 2023.
Provision for Income Taxes
|
|
Three Months Ended June 30, |
|
|||||||||
|
|
2024 |
|
|
2023 |
|
|
$ Change |
|
|||
Provision (benefit) for income taxes |
|
$ |
1.5 |
|
|
$ |
11.0 |
|
|
$ |
(9.5 |
) |
Effective tax rate |
|
|
24.6 |
% |
|
|
27.4 |
% |
|
|
(2.8 |
)% |
|
|
Six Months Ended June 30, |
|
|||||||||
|
|
2024 |
|
|
2023 |
|
|
$ Change |
|
|||
Provision (benefit) for income taxes |
|
$ |
7.5 |
|
|
$ |
14.8 |
|
|
$ |
(7.3 |
) |
Effective tax rate |
|
|
20.8 |
% |
|
|
25.4 |
% |
|
|
(4.6 |
)% |
The provision for income taxes for the quarter ended June 30, 2024 was $1.5 million compared to a provision for income taxes of $11.0 million in 2023. The change in the effective tax rate is primarily related to lower net income for the three and six months ended June 30, 2024. In addition to lower net income, the decrease for the six months ended June 30, 2024 compared to the six months ended June 30, 2023 is also impacted by the deductibility of the loss on extinguishment of debt on the Convertible Senior Notes due 2025 and a state net operating loss discrete adjustment that both impacted 2023.
26
Non-GAAP Financial Measures
Net Sales, Excluding Surcharges
The tables below present net sales by end-markets, adjusted to exclude surcharges, which represents a financial measure that has not been determined in accordance with accounting principles generally accepted in the United States (“U.S. GAAP”). We believe presenting net sales by end-markets, both on a gross basis and on a per ton basis, adjusted to exclude raw material and energy surcharges, provides additional insight into key drivers of net sales such as base price and product mix. Due to the fact that the surcharge mechanism can introduce volatility to our net sales, net sales adjusted to exclude surcharges provides management and investors clarity of our core pricing and results. Presenting net sales by end-markets, adjusted to exclude surcharges including on a per ton basis, allows management and investors to better analyze key market indicators and trends and allows for enhanced comparison between our end-markets.
When surcharges are included in a customer agreement and are applicable (i.e., reach the threshold amount), based on the terms outlined in the respective agreement, surcharges are then included as separate line items on a customer’s invoice. These additional surcharge line items adjust base prices to match cost fluctuations due to market conditions. Each month, the Company will post on the surcharges page of its external website, as well as our customer portal, the scrap, alloy, and energy surcharges that will be applied (as a separate line item) to invoices dated in the following month (based upon shipment volumes in the following month). All surcharges invoiced are included in GAAP net sales.
(dollars in millions, ship tons in thousands) |
|
|
|
|
|
|
|
|
|
|
|
|
|
|
|
|
||||||||
|
|
Three Months Ended June 30, 2024 |
|
|||||||||||||||||||||
|
|
Industrial |
|
|
Automotive |
|
|
Aerospace & Defense |
|
|
Energy |
|
|
Other |
|
|
Total |
|
||||||
Ship Tons |
|
|
56.4 |
|
|
|
67.8 |
|
|
|
16.4 |
|
|
|
9.5 |
|
|
|
— |
|
|
|
150.1 |
|
|
|
|
|
|
|
|
|
|
|
|
|
|
|
|
|
|
|
|
||||||
Net Sales |
|
$ |
103.0 |
|
|
$ |
122.3 |
|
|
$ |
43.7 |
|
|
$ |
20.9 |
|
|
$ |
4.8 |
|
|
$ |
294.7 |
|
Less: Surcharges |
|
|
24.6 |
|
|
|
24.7 |
|
|
|
5.3 |
|
|
|
4.7 |
|
|
|
— |
|
|
|
59.3 |
|
Base Sales |
|
$ |
78.4 |
|
|
$ |
97.6 |
|
|
$ |
38.4 |
|
|
$ |
16.2 |
|
|
$ |
4.8 |
|
|
$ |
235.4 |
|
|
|
|
|
|
|
|
|
|
|
|
|
|
|
|
|
|
|
|
||||||
Net Sales / Ton |
|
$ |
1,826 |
|
|
$ |
1,804 |
|
|
$ |
2,665 |
|
|
$ |
2,200 |
|
|
$ |
— |
|
|
$ |
1,963 |
|
Surcharges / Ton |
|
$ |
436 |
|
|
$ |
364 |
|
|
$ |
323 |
|
|
$ |
495 |
|
|
$ |
— |
|
|
$ |
395 |
|
Base Sales / Ton |
|
$ |
1,390 |
|
|
$ |
1,440 |
|
|
$ |
2,342 |
|
|
$ |
1,705 |
|
|
$ |
— |
|
|
$ |
1,568 |
|
|
|
|
|
|
|
|
|
|
|
|
|
|
|
|
|
|
|
|
||||||
|
|
Three Months Ended June 30, 2023 |
|
|||||||||||||||||||||
|
|
Industrial |
|
|
Automotive |
|
|
Aerospace & Defense |
|
|
Energy |
|
|
Other |
|
|
|
|
||||||
Ship Tons |
|
|
70.2 |
|
|
|
79.5 |
|
|
|
8.2 |
|
|
|
19.6 |
|
|
|
— |
|
|
|
177.5 |
|
|
|
|
|
|
|
|
|
|
|
|
|
|
|
|
|
|
|
|
||||||
Net Sales |
|
$ |
146.0 |
|
|
$ |
136.9 |
|
|
$ |
22.8 |
|
|
$ |
45.9 |
|
|
$ |
5.0 |
|
|
$ |
356.6 |
|
Less: Surcharges |
|
|
46.7 |
|
|
|
37.6 |
|
|
|
4.3 |
|
|
|
15.5 |
|
|
|
— |
|
|
|
104.1 |
|
Base Sales |
|
$ |
99.3 |
|
|
$ |
99.3 |
|
|
$ |
18.5 |
|
|
$ |
30.4 |
|
|
$ |
5.0 |
|
|
$ |
252.5 |
|
|
|
|
|
|
|
|
|
|
|
|
|
|
|
|
|
|
|
|
||||||
Net Sales / Ton |
|
$ |
2,080 |
|
|
$ |
1,722 |
|
|
$ |
2,780 |
|
|
$ |
2,342 |
|
|
$ |
— |
|
|
$ |
2,009 |
|
Surcharges / Ton |
|
$ |
665 |
|
|
$ |
472 |
|
|
$ |
524 |
|
|
$ |
792 |
|
|
$ |
— |
|
|
$ |
586 |
|
Base Sales / Ton |
|
$ |
1,415 |
|
|
$ |
1,250 |
|
|
$ |
2,256 |
|
|
$ |
1,550 |
|
|
$ |
— |
|
|
$ |
1,423 |
|
27
(dollars in millions, ship tons in thousands) |
|
|
|
|
|
|
|
|
|
|
|
|
|
|
|
|
||||||||
|
|
Six Months Ended June 30, 2024 |
|
|||||||||||||||||||||
|
|
Industrial |
|
|
Automotive |
|
|
Aerospace & Defense |
|
|
Energy |
|
|
Other |
|
|
Total |
|
||||||
Ship Tons |
|
|
117.2 |
|
|
|
134.3 |
|
|
|
32.9 |
|
|
|
20.9 |
|
|
|
— |
|
|
|
305.3 |
|
|
|
|
|
|
|
|
|
|
|
|
|
|
|
|
|
|
|
|
||||||
Net Sales |
|
$ |
221.9 |
|
|
$ |
245.2 |
|
|
$ |
90.0 |
|
|
$ |
48.9 |
|
|
$ |
10.3 |
|
|
$ |
616.3 |
|
Less: Surcharges |
|
|
54.7 |
|
|
|
51.2 |
|
|
|
11.8 |
|
|
|
11.3 |
|
|
|
— |
|
|
|
129.0 |
|
Base Sales |
|
$ |
167.2 |
|
|
$ |
194.0 |
|
|
$ |
78.2 |
|
|
$ |
37.6 |
|
|
$ |
10.3 |
|
|
$ |
487.3 |
|
|
|
|
|
|
|
|
|
|
|
|
|
|
|
|
|
|
|
|
||||||
Net Sales / Ton |
|
$ |
1,893 |
|
|
$ |
1,826 |
|
|
$ |
2,736 |
|
|
$ |
2,340 |
|
|
$ |
— |
|
|
$ |
2,019 |
|
Surcharges / Ton |
|
$ |
467 |
|
|
$ |
381 |
|
|
$ |
359 |
|
|
$ |
541 |
|
|
$ |
— |
|
|
$ |
423 |
|
Base Sales / Ton |
|
$ |
1,426 |
|
|
$ |
1,445 |
|
|
$ |
2,377 |
|
|
$ |
1,799 |
|
|
$ |
— |
|
|
$ |
1,596 |
|
|
|
|
|
|
|
|
|
|
|
|
|
|
|
|
|
|
|
|
||||||
|
|
Six Months Ended June 30, 2023 |
|
|||||||||||||||||||||
|
|
Industrial |
|
|
Automotive |
|
|
Aerospace & Defense |
|
|
Energy |
|
|
Other |
|
|
Total |
|
||||||
Ship Tons |
|
|
135.4 |
|
|
|
159.9 |
|
|
|
15.2 |
|
|
|
39.9 |
|
|
|
— |
|
|
|
350.4 |
|
|
|
|
|
|
|
|
|
|
|
|
|
|
|
|
|
|
|
|
||||||
Net Sales |
|
$ |
272.3 |
|
|
$ |
264.7 |
|
|
$ |
40.2 |
|
|
$ |
92.1 |
|
|
$ |
10.8 |
|
|
$ |
680.1 |
|
Less: Surcharges |
|
|
81.2 |
|
|
|
69.3 |
|
|
|
7.8 |
|
|
|
28.6 |
|
|
|
— |
|
|
|
186.9 |
|
Base Sales |
|
$ |
191.1 |
|
|
$ |
195.4 |
|
|
$ |
32.4 |
|
|
$ |
63.5 |
|
|
$ |
10.8 |
|
|
$ |
493.2 |
|
|
|
|
|
|
|
|
|
|
|
|
|
|
|
|
|
|
|
|
||||||
Net Sales / Ton |
|
$ |
2,011 |
|
|
$ |
1,655 |
|
|
$ |
2,645 |
|
|
$ |
2,308 |
|
|
$ |
— |
|
|
$ |
1,941 |
|
Surcharges / Ton |
|
$ |
600 |
|
|
$ |
433 |
|
|
$ |
513 |
|
|
$ |
717 |
|
|
$ |
— |
|
|
$ |
533 |
|
Base Sales / Ton |
|
$ |
1,411 |
|
|
$ |
1,222 |
|
|
$ |
2,132 |
|
|
$ |
1,591 |
|
|
$ |
— |
|
|
$ |
1,408 |
|
28
Liquidity and Capital Resources
Amended Credit Agreement
On September 30, 2023, the Company, as borrower, and certain domestic subsidiaries of the Company, as subsidiary guarantors (the “Subsidiary Guarantors”), entered into a Fourth Amended and Restated Credit Agreement (the “Amended Credit Agreement”), with JPMorgan Chase Bank, N.A., as administrative agent (the “Administrative Agent”), and the lenders party thereto (collectively, the “Lenders”), which further amended and restated the Company’s existing secured Third Amended and Restated Credit Agreement, dated as of October 15, 2019.
The Amended Credit Agreement extended the maturity date of the asset-based revolving credit facility (the “Credit Facility”) from October 2024 to September 2027. Following the amendment, Credit Facility capacity remained at $400.0 million. Pursuant to the terms of the Amended Credit Agreement, the interest rate to be paid on any borrowings under the Credit Facility is now based on a two-tiered schedule rather than a three-tiered schedule with applicable rates decreasing by 25 basis points, references to LIBOR rates were updated with references to SOFR rates, the advance rate on investment-grade eligible accounts receivable was increased from 85% to 90%, and there was an improvement in the springing fixed charge coverage ratio from 1.1x to 1.0x. The Credit Facility remains undrawn at this time.
Refer to “Note 8 - Financing Arrangements” in the Notes to the unaudited Consolidated Financial Statements for additional information.
Convertible Notes
In May 2016, the Company issued $75.0 million aggregate principal amount of Convertible Senior Notes due 2021, plus an additional $11.3 million principal amount to cover over-allotments.
In December 2020, the Company entered into separate, privately negotiated exchange agreements with a limited number of holders of the Company’s then outstanding Convertible Senior Notes due 2021. Pursuant to the exchange agreements, the Company exchanged $46.0 million aggregate principal amount of Convertible Senior Notes due 2021 for $46.0 million aggregate principal amount of its new Convertible Senior Notes due 2025. The net amount of this exchange was $44.5 million, after deducting the initial underwriters’ fees and paying other transaction costs. The Company did not receive any cash proceeds from the issuance of the Convertible Senior Notes due 2025.
The Convertible Senior Notes due 2025 bear cash interest at a rate of 6.0% per year, payable semiannually on June 1 and December 1, beginning on June 1, 2021. The Convertible Senior Notes due 2025 will mature on December 1, 2025, unless earlier repurchased or converted. The Convertible Senior Notes due 2025 are convertible at the option of holders in certain circumstances and during certain periods into the Company’s common shares, cash, or a combination thereof, at the Company’s election. The Indenture for the Convertible Senior Notes due 2025 provides that notes will become convertible during a quarter when the share price for 20 trading days during the final 30 trading days of the immediately preceding quarter was greater than 130% of the conversion price. This criterion was met during the second quarter of 2024 and as such the notes can be converted at the option of the holders beginning July 1 through September 30, 2024. Whether the notes will be convertible following such period will depend on if this criterion, or another conversion condition, is met in the future. To date, no holders have elected to convert their notes during any optional conversion periods. For additional details regarding the Convertible Notes please refer to “Note 14 - Financing Arrangements” in the Company’s Annual Report on Form 10-K for the year ended December 31, 2023.
29
Additional Liquidity Considerations
The following represents a summary of key liquidity measures under the Amended Credit Agreement as of June 30, 2024 and December 31, 2023:
|
|
June 30, |
|
|
December 31, |
|
||
Cash and cash equivalents |
|
$ |
272.8 |
|
|
$ |
280.6 |
|
|
|
|
|
|
|
|
||
Credit Agreement: |
|
|
|
|
|
|
||
Maximum availability |
|
$ |
400.0 |
|
|
$ |
400.0 |
|
Suppressed availability(1) |
|
|
(155.3 |
) |
|
|
(135.8 |
) |
Availability |
|
|
244.7 |
|
|
|
264.2 |
|
Amount borrowed |
|
|
— |
|
|
|
— |
|
Letter of credit obligations |
|
|
(5.4 |
) |
|
|
(5.4 |
) |
Availability not borrowed |
|
$ |
239.3 |
|
|
$ |
258.8 |
|
|
|
|
|
|
|
|
||
Total liquidity |
|
$ |
512.1 |
|
|
$ |
539.4 |
|
(1) As of June 30, 2024, and December 31, 2023, Metallus had less than $400.0 million in collateral assets to borrow against.
Our principal sources of liquidity are cash and cash equivalents, cash flows from operations and available borrowing capacity under our Amended Credit Agreement. As of June 30, 2024, taking into account our view of industrial, automotive, aerospace & defense and energy market demand for our products, and our 2024 operating and long-range plan, we believe that our cash balance as of June 30, 2024, projected cash generated from operations, and borrowings available under the Amended Credit Agreement, will be sufficient to satisfy our working capital needs, capital expenditures and other liquidity requirements associated with our operations, including servicing our debt and pension and postretirement benefit obligations, for at least the next twelve months. We expect capital expenditures to be approximately $55 million in 2024.
In the first half of 2024, the Company contributed a total of $34.3 million in pension contributions, most of which related to the Bargaining Plan. In July 2024, the Company contributed an additional $3.2 million to the Bargaining Plan and anticipates additional contributions of approximately $5.3 million to the Bargaining Plan throughout the remainder of 2024.
To the extent our liquidity needs prove to be greater than expected or cash generated from operations is less than anticipated, and cash on hand or credit availability is insufficient, we would seek additional financing to provide additional liquidity. We regularly evaluate our potential access to the equity and debt capital markets as sources of liquidity and we believe additional financing would likely be available if necessary, although we can make no assurance as to the form or terms of any such financing.
We continue to evaluate the best use of our liquidity which would allow us to invest in profitable growth, maintain a strong balance sheet, and return capital to shareholders.
In the first half of 2023, we repurchased a total of $7.5 million aggregate principal amount of our Convertible Senior Notes Due 2025. In addition to reducing outstanding debt and generating interest savings of $0.5 million, the repurchases of convertible notes reduced weighted average diluted shares outstanding for the year ended December 31, 2023 by 0.7 million shares and, on a go-forward basis reduced diluted shares outstanding by 1.0 million shares.
For the three months ended June 30, 2024, the Company repurchased approximately 0.4 million common shares in the open market at an aggregate cost of $9.6 million, which equates to an average repurchase price of $21.88 per share. For the six months ended June 30, 2024, the Company repurchased approximately 0.7 million common shares in the open market at an aggregate cost of $14.0 million, which equates to an average repurchase price of $21.55 per share. As of June 30, 2024, the Company had a balance of $126.4 million remaining on its authorized share repurchase program.
In July 2024, the Company repurchased approximately 0.2 million common shares at an aggregate cost of $3.9 million, which equates to an average repurchase price of $21.00 per share. As of July 31, 2024, the Company had a balance of $122.5 million remaining under its authorized share repurchase program.
30
Cash Flows
The following table reflects the major categories of cash flows for the six months ended June 30, 2024 and 2023. For additional details, please refer to the unaudited Consolidated Statements of Cash Flows included in this quarterly report.
|
|
Six Months Ended June 30, |
|
|||||
|
|
2024 |
|
|
2023 |
|
||
Net cash provided (used) by operating activities |
|
$ |
41.7 |
|
|
$ |
23.1 |
|
Net cash provided (used) by investing activities |
|
|
(21.5 |
) |
|
|
(17.0 |
) |
Net cash provided (used) by financing activities |
|
|
(28.1 |
) |
|
|
(41.1 |
) |
Increase (Decrease) in Cash and Cash Equivalents |
|
$ |
(7.9 |
) |
|
$ |
(35.0 |
) |
Operating activities
Net cash provided by operating activities for the six months ended June 30, 2024 was $41.7 million compared to net cash provided of $23.1 million for the six months ended June 30, 2023. The change was primarily driven by a decrease in the use of cash for working capital, partially offset by pension contributions and lower profitability during the first half of 2024 compared to the first half of 2023.
Investing activities
Net cash used by investing activities for the six months ended June 30, 2024 was $21.5 million compared to net cash used of $17.0 million for the six months ended June 30, 2023. The change was due to higher capital expenditures in the first half of 2024 compared to the first half of 2023, partially offset by proceeds from government funding.
Financing activities
Net cash used by financing activities for the six months ended June 30, 2024 was $28.1 million compared to net cash used of $41.1 million for the six months ended June 30, 2023. The change was primarily due to lower repurchases of Convertible Notes and common shares in 2024, partially offset by higher shares surrendered for taxes in 2024 compared to the same period in 2023. Refer to “Note 8 - Financing Arrangements” for more detail related to the Convertible Senior Notes due in 2025 and the share repurchase program.
31
Critical Accounting Policies and Estimates
Our financial statements are prepared in accordance with U.S. GAAP. The preparation of these financial statements requires management to make estimates and assumptions that affect the reported amounts of assets and liabilities at the date of the financial statements and the reported amounts of revenues and expenses during the periods presented. We review our critical accounting policies throughout the year.
New Accounting Guidance
See “Note 2 - Recent Accounting Pronouncements” in the Notes to the unaudited Consolidated Financial Statements.
Forward-Looking Statements
Certain statements set forth in this Quarterly Report on Form 10-Q (including our forecasts, beliefs and expectations) that are not historical in nature are “forward-looking” statements within the meaning of the Private Securities Litigation Reform Act of 1995. In particular, Management’s Discussion and Analysis of Financial Condition and Results of Operations contains numerous forward-looking statements. Forward-looking statements generally will be accompanied by words such as “anticipate,” “aspire,” “believe,” “could,” “estimate,” “expect,” “forecast,” “outlook,” “intend,” “may,” “plan,” “possible,” “potential,” “predict,” “project,” “seek,” “should,” “strategic direction,” “strategy,” “target,” “will,” “would,” or other similar words, phrases or expressions that convey the uncertainty of future events or outcomes. You are cautioned not to place undue reliance on forward-looking statements, which speak only as of the date of this Form 10-Q. We caution readers that actual results may differ materially from those expressed or implied in forward-looking statements made by or on behalf of us due to a variety of factors, such as:
32
You are cautioned that it is not possible to predict or identify all of the risks, uncertainties and other factors that may affect future results, and that the above list should not be considered to be a complete list. Except as required by the federal securities laws, we undertake no obligation to publicly update or revise any forward-looking statement, whether as a result of new information, future events or otherwise. Further, this report includes our current policy and intent and is not intended to create legal rights or obligations. Certain standards of measurement and performance contained in this report are developing and based on assumptions, and no assurance can be given that any plan, objective, initiative, projection, goal, mission, commitment, expectation, or prospect set forth in this report can or will be achieved. Inclusion of information in this report is not an indication that the subject or information is material to our business or operating results.
33
Item 3. Quantitative and Qualitative Disclosures About Market Risk
Interest Rate Risk
Our borrowings include both fixed and variable-rate debt. The variable debt consists principally of borrowings under our Credit Agreement. We are exposed to the risk of rising interest rates to the extent we fund our operations with these variable-rate borrowings. As of June 30, 2024, we have $13.2 million of aggregate debt outstanding. None of our outstanding debt as of June 30, 2024 has variable interest rates, thus a rise in interest rates would not impact our interest expense at this point in time.
Foreign Currency Exchange Rate Risk
Fluctuations in the value of the U.S. dollar compared to foreign currencies may impact our earnings. Geographically, our sales are primarily made to customers in the United States. Currency fluctuations could impact us to the extent they impact the currency or the price of raw materials in foreign countries in which our competitors operate or have significant sales.
Commodity Price Risk
In the ordinary course of business, we are exposed to market risk with respect to commodity price fluctuations, primarily related to our purchases of raw materials and energy, principally scrap steel, other ferrous and non-ferrous metals and alloys. Additionally, the current and potential future global conflicts could also exacerbate inflationary pressures throughout the global economy and lead to potential market disruptions, such as significant volatility in commodity prices and supply chain disruptions. Although our business has not been materially impacted by current conflicts to date, it is difficult to predict the extent to which our operations, or those of our suppliers, will be impacted in the future.
Whenever possible, we manage our exposure to commodity risks primarily through the use of supplier pricing agreements that enable us to establish the purchase prices for certain inputs that are used in our manufacturing business. We utilize a raw material surcharge as a component of pricing steel to pass through the cost increases of scrap, alloys and other raw materials, as well as energy. From time to time, we may use financial instruments to hedge a portion of our exposure to commodity price risk. In periods of stable demand for our products, the surcharge mechanism has worked effectively to reduce the normal time lag in passing through higher raw material costs so that we can maintain our gross margins. When demand and cost of raw materials are lower, however, the surcharge impacts sales prices to a lesser extent.
Item 4. Controls and Procedures
(a) Disclosure Controls and Procedures
As of the end of the period covered by this quarterly report, we carried out an evaluation, under the supervision and with the participation of our management, including our principal executive officer and principal financial officer, of the effectiveness of the design and operation of our disclosure controls and procedures (as defined in Exchange Act Rule 13a-15(e)). Based upon that evaluation, the principal executive officer and principal financial officer concluded that our disclosure controls and procedures were effective as of the end of the period covered by this quarterly report.
(b) Changes in Internal Control Over Financial Reporting
During the Company’s most recent fiscal quarter, there have been no changes in the Company’s internal control over financial reporting that have materially affected, or are reasonably likely to materially affect, the Company’s internal control over financial reporting.
34
Part II. Other Information
Item 1. Legal Proceedings
We are involved in various claims and legal actions arising in the ordinary course of business. In the opinion of our management, the ultimate disposition of these matters will not have a material adverse effect on our consolidated financial position, results of operations or cash flows.
Item 1A. Risk Factors
We are subject to various risks and uncertainties in the course of our business. The discussion of such risks and uncertainties may be found under Risk Factors in our Annual Report on Form 10-K for the year ended December 31, 2023 filed with the SEC.
Item 2. Unregistered Sales of Equity Securities and Use of Proceeds
The table below provides information concerning our repurchase of common shares for the three months ended June 30, 2024.
(Dollars in millions, except per share data) |
|
Total number of shares purchased (1) |
|
|
Average price paid per share (2) |
|
|
Total number of shares purchased as part of publicly announced plans or programs (1) |
|
|
Maximum dollar value of shares that may yet be purchased under the plans or programs (3) |
|
||||
Beginning shares available |
|
|
|
|
|
|
|
|
|
|
$ |
36.0 |
|
|||
April, 2024 |
|
|
150,312 |
|
|
$ |
21.82 |
|
|
|
150,312 |
|
|
$ |
32.7 |
|
May, 2024 |
|
|
154,322 |
|
|
$ |
22.29 |
|
|
|
154,322 |
|
|
$ |
129.3 |
|
June, 2024 |
|
|
134,397 |
|
|
$ |
21.88 |
|
|
|
134,397 |
|
|
$ |
126.4 |
|
Quarter-to-date |
|
|
439,031 |
|
|
$ |
21.88 |
|
|
|
439,031 |
|
|
$ |
126.4 |
|
In July 2024, the Company repurchased approximately 0.2 million common shares at an aggregate cost of $3.9 million, which equates to an average repurchase price of $21.00 per share. As of July 31, 2024, the Company had a balance of $122.5 million remaining under its authorized share repurchase program.
(1) The Company may utilize various methods to repurchase shares, which could include open market repurchases, including repurchases through Rule 10b5-1 plans, privately-negotiated transactions or by other means. The actual timing, number and value of shares repurchased under the program will depend on a number of factors, including the price of the Company's shares, general market and economic conditions, capital needs and other factors.
(2) The average price paid per share excludes any broker commissions.
(3) On December 20, 2021, the Company announced that its Board of Directors authorized a share repurchase program under which the Company may repurchase up to $50.0 million of its outstanding common shares. On November 2, 2022, the Board of Directors authorized an additional $75.0 million share repurchase program. On May 6, 2024, the Board of Directors again authorized an additional $100.0 million share repurchase program. The share repurchase program does not require the Company to acquire any dollar amount or number of shares and does not have an expiration date.
35
Item 5. Other Information
During the quarter ended June 30, 2024, an officer (as defined in Exchange Act Rule 16a-1(f)) of the Company adopted a written plan for the sale of the Company’s common shares intended to satisfy the affirmative defense conditions of Exchange Act Rule 10b5-1(c) (“Rule 10b5-1 trading arrangements”) as follows:
On
The above-named officer is currently and is expected to remain in compliance with his share ownership guidelines following the sale of any common shares pursuant to his 10b5-1 trading arrangement.
36
Item 6. Exhibits
Exhibit Number |
|
Exhibit Description |
|
|
|
31.1* |
|
|
|
|
|
31.2* |
|
|
|
|
|
32.1** |
|
|
|
|
|
101.INS* |
|
Inline XBRL Instance Document. |
|
|
|
101.SCH* |
|
Inline XBRL Taxonomy Extension Schema Document. |
|
|
|
101.PRE* |
|
Inline XBRL Taxonomy Extension Presentation Linkbase Document. |
|
|
|
101.CAL* |
|
Inline XBRL Taxonomy Extension Calculation Linkbase Document. |
|
|
|
101.LAB* |
|
Inline XBRL Taxonomy Extension Label Linkbase Document. |
|
|
|
101.DEF* |
|
Inline XBRL Taxonomy Extension Definition Linkbase Document. |
104 |
|
Cover Page Interactive Data File (formatted as Inline XBRL and contained in Exhibit 101). |
* Filed herewith.
** Furnished herewith.
37
Signatures
Pursuant to the requirements of the Securities Exchange Act of 1934, the registrant has duly caused this report to be signed on its behalf by the undersigned thereunto duly authorized.
|
|
METALLUS INC. |
|
|
|
|
|
|
Date: |
August 8, 2024 |
/s/Kristopher R. Westbrooks |
|
|
Kristopher R. Westbrooks Executive Vice President and Chief Financial Officer (Principal Financial Officer) |
38