UNITED STATES
SECURITIES AND EXCHANGE COMMISSION
Washington, D.C. 20549
FORM N-CSRS
CERTIFIED SHAREHOLDER REPORT OF REGISTERED MANAGEMENT
INVESTMENT COMPANIES
Investment Company Act File Number 811-22920
The Advisors’ Inner Circle Fund III
(Exact name of registrant as specified in charter)
SEI Investments
One Freedom Valley Drive
Oaks, PA 19456
(Address of principal executive offices) (Zip code)
SEI Investments
One Freedom Valley Drive
Oaks, PA 19456
(Name and address of agent for service)
Registrant’s telephone number, including
area code: (877) 446-3863
Date of fiscal year end: December 31, 2024
Date of reporting period: June 30, 2024
Item 1. Reports to Stockholders.
(a) A copy of the report transmitted to stockholders pursuant to Rule
30e-1 under the Investment Company Act of 1940, as amended (the “Act”) (17 CFR § 270.30e-1), is attached hereto.
0001593547falseN-CSRSAdvisors' Inner Circle Fund IIIN-1A2024-06-300001593547adic:C000234546Member2024-01-012024-06-3000015935472024-01-012024-06-300001593547adic:C000234546Member2024-06-300001593547adic:C000234545Member2024-01-012024-06-300001593547adic:C000234545Member2024-06-300001593547adic:C000234729Member2024-01-012024-06-300001593547adic:C000234729Member2024-06-300001593547adic:C000234729Memberadic:BarclaysBankVersorMTN8076892CTIMember2024-06-300001593547adic:C000234729Memberadic:GSXAT01CINDEX8076917CTIMember2024-06-300001593547adic:C000234729Memberadic:JPQFMOW1INDEX8076920CTIMember2024-06-300001593547adic:C000234729Memberadic:BNPXDITUINDEX8076905CTIMember2024-06-300001593547adic:C000234729Memberadic:MQIS311INDEX8076927CTIMember2024-06-300001593547adic:C000234729Memberadic:GSGUSEquity8076935CTIMember2024-06-300001593547adic:C000234729Memberadic:BNPXDITUINDEX8076938CTIMember2024-06-300001593547adic:C000234729Memberadic:DBTIDUS5INDEX8076941CTIMember2024-06-300001593547adic:C000234729Memberadic:DBVSCVP8INDEX8076944CTIMember2024-06-300001593547adic:C000234729Memberadic:JPQFMOW1INDEX8076947CTIMember2024-06-300001593547adic:C000234730Member2024-01-012024-06-300001593547adic:C000234730Member2024-06-300001593547adic:C000234730Memberadic:BarclaysBankVersorMTN8076892CTIMember2024-06-300001593547adic:C000234730Memberadic:GSXAT01CINDEX8076917CTIMember2024-06-300001593547adic:C000234730Memberadic:JPQFMOW1INDEX8076920CTIMember2024-06-300001593547adic:C000234730Memberadic:BNPXDITUINDEX8076905CTIMember2024-06-300001593547adic:C000234730Memberadic:MQIS311INDEX8076927CTIMember2024-06-300001593547adic:C000234730Memberadic:GSGUSEquity8076935CTIMember2024-06-300001593547adic:C000234730Memberadic:BNPXDITUINDEX8076938CTIMember2024-06-300001593547adic:C000234730Memberadic:DBTIDUS5INDEX8076941CTIMember2024-06-300001593547adic:C000234730Memberadic:DBVSCVP8INDEX8076944CTIMember2024-06-300001593547adic:C000234730Memberadic:JPQFMOW1INDEX8076947CTIMember2024-06-300001593547adic:C000234544Member2024-01-012024-06-300001593547adic:C000234544Member2024-06-300001593547adic:C000234544Memberadic:TencentHoldings8077165CTIMember2024-06-300001593547adic:C000234544Memberadic:MetaPlatforms8077079CTIMember2024-06-300001593547adic:C000234544Memberadic:Apple8076996CTIMember2024-06-300001593547adic:C000234544Memberadic:ServiceNow8077105CTIMember2024-06-300001593547adic:C000234544Memberadic:Microsoft8077082CTIMember2024-06-300001593547adic:C000234544Memberadic:Amazoncom8076991CTIMember2024-06-300001593547adic:C000234544Memberadic:NVIDIA8077096CTIMember2024-06-300001593547adic:C000234544Memberadic:RegeneronPharmaceuticals8077104CTIMember2024-06-300001593547adic:C000234544Memberadic:PDDHoldings8077185CTIMember2024-06-300001593547adic:C000234544Memberadic:BarrickGold8076999CTIMember2024-06-300001593547adic:C000234543Member2024-01-012024-06-300001593547adic:C000234543Member2024-06-300001593547adic:C000234543Memberadic:TencentHoldings8077165CTIMember2024-06-300001593547adic:C000234543Memberadic:MetaPlatforms8077079CTIMember2024-06-300001593547adic:C000234543Memberadic:Apple8076996CTIMember2024-06-300001593547adic:C000234543Memberadic:ServiceNow8077105CTIMember2024-06-300001593547adic:C000234543Memberadic:Microsoft8077082CTIMember2024-06-300001593547adic:C000234543Memberadic:Amazoncom8076991CTIMember2024-06-300001593547adic:C000234543Memberadic:NVIDIA8077096CTIMember2024-06-300001593547adic:C000234543Memberadic:RegeneronPharmaceuticals8077104CTIMember2024-06-300001593547adic:C000234543Memberadic:PDDHoldings8077185CTIMember2024-06-300001593547adic:C000234543Memberadic:BarrickGold8076999CTIMember2024-06-30iso4217:USDxbrli:sharesiso4217:USDxbrli:sharesxbrli:pureutr:Dadic:Holding
The Advisors' Inner Circle Fund III
FS Multi-Strategy Alternatives Fund
Semi-Annual Shareholder Report - June 30, 2024
This semi-annual shareholder report contains important information about Class A Shares of the FS Multi-Strategy Alternatives Fund (the "Fund") for the period from January 1, 2024 to June 30, 2024. You can find additional information about the Fund at https://fsinvestments.com/investments/all-investments/fsmmx. You can also request this information by contacting us at 877-924-4766.
What were the Fund costs for the last six months?
(based on a hypothetical $10,000 investment)
Fund Name | Costs of a $10,000 investment | Costs paid as a percentage of a $10,000 investment |
|---|
FS Multi-Strategy Alternatives Fund, Class A Shares | $99 | 1.96% |
Key Fund Statistics as of June 30, 2024
| Total Net Assets (000's) | Number of Holdings | Total Advisory Fees Paid (000's) | Portfolio Turnover |
|---|
| $1,839,714 | 659 | $10,836 | 392% |
What did the Fund invest in?
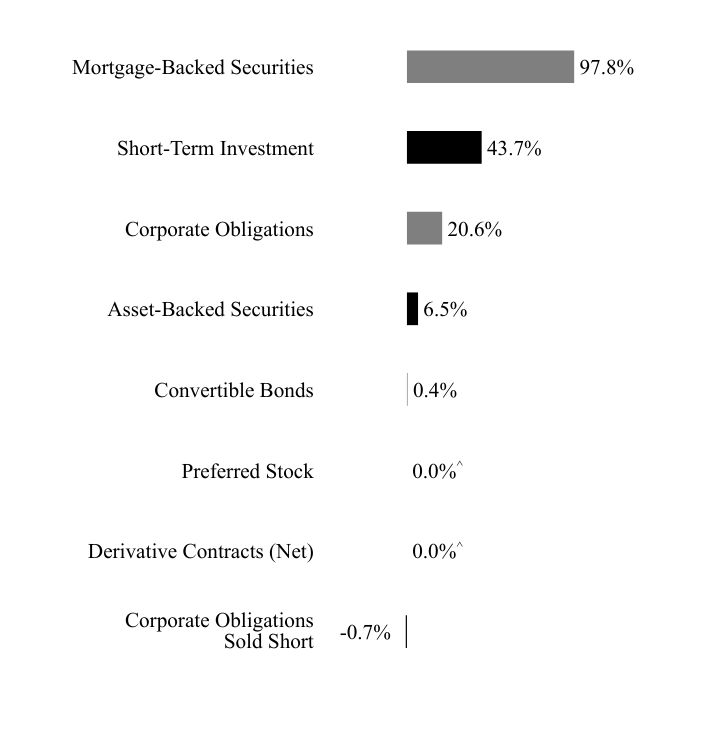
Asset WeightingsFootnote Reference*
Value | Value |
|---|
Corporate Obligations
Sold Short | -0.7% |
Derivative Contracts (Net) | 0.0%Footnote Reference^ |
Preferred Stock | 0.0%Footnote Reference^ |
Convertible Bonds | 0.4% |
Asset-Backed Securities | 6.5% |
Corporate Obligations | 20.6% |
Short-Term Investment | 43.7% |
Mortgage-Backed Securities | 97.8% |
| Footnote | Description |
Footnote* | Percentages are calculated based on total net assets. |
Footnote^ | Value shown as 0.0% as a result of rounding. |
Holding Name | Percentage of Total Net Assets |
|---|
Long Securities | |
FNMA or FHLMC TBA, 6.50%, 7/1/2032 | 32.5% |
FNMA or FHLMC TBA, 5.50%, 7/15/2054 | 26.7% |
FNMA or FHLMC TBA, 5.00%, 7/15/2038 | 12.6% |
FNMA or FHLMC TBA, 6.00%, 7/15/2054 | 5.5% |
Barclays Bank Versor MTN | 4.4% |
Short Securities | |
U.S. 10-Year Treasury Note | -0.2% |
Newell Brands | -0.1% |
Fiesta Purchaser | -0.1% |
Cleveland-Cliffs | -0.1% |
Organon | -0.1% |
There were no material changes during the reporting period.
Changes in and Disagreements with Accountants
There were no changes in or disagreements with accountants during the reporting period.
For additional information about the Fund; including its prospectus, financial information, and holdings, visit or call:
Rule 30e-1 of the Investment Company Act of 1940 permits funds to transmit only one copy of a proxy statement, annual report or semi-annual report to shareholders (who need not be related) with the same residential, commercial or electronic address, provided that the shareholders have consented in writing and the reports are addressed either to each shareholder individually or to the shareholders as a group. This process is known as “householding” and is designed to reduce the duplicate copies of materials that shareholders receive and to lower printing and mailing costs for funds.
The Advisors' Inner Circle Fund III
FS Multi-Strategy Alternatives Fund / Class A Shares - FSMMX
Semi-Annual Shareholder Report - June 30, 2024
CHI-SA-TSR-2024-5
The Advisors' Inner Circle Fund III
FS Multi-Strategy Alternatives Fund
Semi-Annual Shareholder Report - June 30, 2024
This semi-annual shareholder report contains important information about Class I Shares of the FS Multi-Strategy Alternatives Fund (the "Fund") for the period from January 1, 2024 to June 30, 2024. You can find additional information about the Fund at https://fsinvestments.com/investments/all-investments/fsmsx. You can also request this information by contacting us at 877-924-4766.
What were the Fund costs for the last six months?
(based on a hypothetical $10,000 investment)
Fund Name | Costs of a $10,000 investment | Costs paid as a percentage of a $10,000 investment |
|---|
FS Multi-Strategy Alternatives Fund, Class I Shares | $86 | 1.71% |
Key Fund Statistics as of June 30, 2024
| Total Net Assets (000's) | Number of Holdings | Total Advisory Fees Paid (000's) | Portfolio Turnover |
|---|
| $1,839,714 | 659 | $10,836 | 392% |
What did the Fund invest in?
Asset WeightingsFootnote Reference*
Value | Value |
|---|
Corporate Obligations
Sold Short | -0.7% |
Derivative Contracts (Net) | 0.0%Footnote Reference^ |
Preferred Stock | 0.0%Footnote Reference^ |
Convertible Bonds | 0.4% |
Asset-Backed Securities | 6.5% |
Corporate Obligations | 20.6% |
Short-Term Investment | 43.7% |
Mortgage-Backed Securities | 97.8% |
| Footnote | Description |
Footnote* | Percentages are calculated based on total net assets. |
Footnote^ | Value shown as 0.0% as a result of rounding. |
Holding Name | Percentage of Total Net Assets |
|---|
Long Securities | |
FNMA or FHLMC TBA, 6.50%, 7/1/2032 | 32.5% |
FNMA or FHLMC TBA, 5.50%, 7/15/2054 | 26.7% |
FNMA or FHLMC TBA, 5.00%, 7/15/2038 | 12.6% |
FNMA or FHLMC TBA, 6.00%, 7/15/2054 | 5.5% |
Barclays Bank Versor MTN | 4.4% |
Short Securities | |
U.S. 10-Year Treasury Note | -0.2% |
Newell Brands | -0.1% |
Fiesta Purchaser | -0.1% |
Cleveland-Cliffs | -0.1% |
Organon | -0.1% |
There were no material changes during the reporting period.
Changes in and Disagreements with Accountants
There were no changes in or disagreements with accountants during the reporting period.
For additional information about the Fund; including its prospectus, financial information, and holdings, visit or call:
Rule 30e-1 of the Investment Company Act of 1940 permits funds to transmit only one copy of a proxy statement, annual report or semi-annual report to shareholders (who need not be related) with the same residential, commercial or electronic address, provided that the shareholders have consented in writing and the reports are addressed either to each shareholder individually or to the shareholders as a group. This process is known as “householding” and is designed to reduce the duplicate copies of materials that shareholders receive and to lower printing and mailing costs for funds.
The Advisors' Inner Circle Fund III
FS Multi-Strategy Alternatives Fund / Class I Shares - FSMSX
Semi-Annual Shareholder Report - June 30, 2024
CHI-SA-TSR-2024-6
The Advisors' Inner Circle Fund III
Semi-Annual Shareholder Report - June 30, 2024
This semi-annual shareholder report contains important information about Class A Shares of the FS Managed Futures Fund (the "Fund") for the period from January 1, 2024 to June 30, 2024. You can find additional information about the Fund at https://fsinvestments.com/investments/mutual-fund-reports. You can also request this information by contacting us at 877-924-4766.
What were the Fund costs for the last six months?
(based on a hypothetical $10,000 investment)
Fund Name | Costs of a $10,000 investment | Costs paid as a percentage of a $10,000 investment |
|---|
FS Managed Futures Fund, Class A Shares | $26 | 0.50% |
Key Fund Statistics as of June 30, 2024
| Total Net Assets (000's) | Number of Holdings | Total Advisory Fees Paid (000's) | Portfolio Turnover |
|---|
| $2,005 | 13 | $0 | 0% |
What did the Fund invest in?
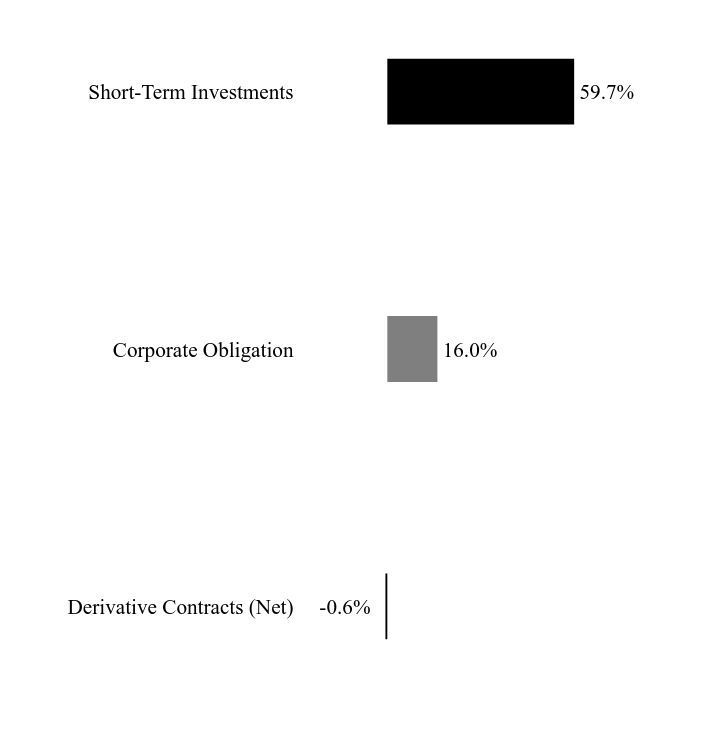
Asset WeightingsFootnote Reference*
Value | Value |
|---|
Derivative Contracts (Net) | -0.6% |
Corporate Obligation | 16.0% |
Short-Term Investments | 59.7% |
| Footnote | Description |
Footnote* | Percentages are calculated based on total net assets. |
Holding Name | | | Percentage of
Total Net Assets |
|---|
Barclays Bank Versor MTN | | | 16.0% |
GSXAT01C Index | | | 0.5% |
JPQFMOW1 Index | | | 0.1% |
BNPXDITU Index | | | 0.0% |
MQIS311 Index | | | 0.0% |
GSG US Equity | | | 0.0% |
BNPXDITU Index | | | 0.0% |
DBTIDUS5 Index | | | 0.0% |
DBVSCVP8 Index | | | 0.0% |
JPQFMOW1 Index | | | 0.0% |
There were no material changes during the reporting period.
Changes in and Disagreements with Accountants
There were no changes in or disagreements with accountants during the reporting period.
For additional information about the Fund; including its prospectus, financial information, and holdings, visit or call:
Rule 30e-1 of the Investment Company Act of 1940 permits funds to transmit only one copy of a proxy statement, annual report or semi-annual report to shareholders (who need not be related) with the same residential, commercial or electronic address, provided that the shareholders have consented in writing and the reports are addressed either to each shareholder individually or to the shareholders as a group. This process is known as “householding” and is designed to reduce the duplicate copies of materials that shareholders receive and to lower printing and mailing costs for funds.
The Advisors' Inner Circle Fund III
FS Managed Futures Fund / Class A Shares - FMFFX
Semi-Annual Shareholder Report - June 30, 2024
CHI-SA-TSR-2024-3
The Advisors' Inner Circle Fund III
Semi-Annual Shareholder Report - June 30, 2024
This semi-annual shareholder report contains important information about Class I Shares of the FS Managed Futures Fund (the "Fund") for the period from January 1, 2024 to June 30, 2024. You can find additional information about the Fund at https://fsinvestments.com/investments/mutual-fund-reports. You can also request this information by contacting us at 877-924-4766.
What were the Fund costs for the last six months?
(based on a hypothetical $10,000 investment)
Fund Name | Costs of a $10,000 investment | Costs paid as a percentage of a $10,000 investment |
|---|
FS Managed Futures Fund, Class I Shares | $13 | 0.25% |
Key Fund Statistics as of June 30, 2024
| Total Net Assets (000's) | Number of Holdings | Total Advisory Fees Paid (000's) | Portfolio Turnover |
|---|
| $2,005 | 13 | $0 | 0% |
What did the Fund invest in?
Asset WeightingsFootnote Reference*
Value | Value |
|---|
Derivative Contracts (Net) | -0.6% |
Corporate Obligation | 16.0% |
Short-Term Investments | 59.7% |
| Footnote | Description |
Footnote* | Percentages are calculated based on total net assets. |
Holding Name | | | Percentage of
Total Net Assets |
|---|
Barclays Bank Versor MTN | | | 16.0% |
GSXAT01C Index | | | 0.5% |
JPQFMOW1 Index | | | 0.1% |
BNPXDITU Index | | | 0.0% |
MQIS311 Index | | | 0.0% |
GSG US Equity | | | 0.0% |
BNPXDITU Index | | | 0.0% |
DBTIDUS5 Index | | | 0.0% |
DBVSCVP8 Index | | | 0.0% |
JPQFMOW1 Index | | | 0.0% |
There were no material changes during the reporting period.
Changes in and Disagreements with Accountants
There were no changes in or disagreements with accountants during the reporting period.
For additional information about the Fund; including its prospectus, financial information, and holdings, visit or call:
Rule 30e-1 of the Investment Company Act of 1940 permits funds to transmit only one copy of a proxy statement, annual report or semi-annual report to shareholders (who need not be related) with the same residential, commercial or electronic address, provided that the shareholders have consented in writing and the reports are addressed either to each shareholder individually or to the shareholders as a group. This process is known as “householding” and is designed to reduce the duplicate copies of materials that shareholders receive and to lower printing and mailing costs for funds.
The Advisors' Inner Circle Fund III
FS Managed Futures Fund / Class I Shares - FMGFX
Semi-Annual Shareholder Report - June 30, 2024
CHI-SA-TSR-2024-4
The Advisors' Inner Circle Fund III
FS Chiron Real Development Fund
Semi-Annual Shareholder Report - June 30, 2024
This semi-annual shareholder report contains important information about Class A Shares of the FS Chiron Real Development Fund (the "Fund") for the period from January 1, 2024 to June 30, 2024. You can find additional information about the Fund at https://fsinvestments.com/investments/all-investments/farlx. You can also request this information by contacting us at 877-924-4766.
What were the Fund costs for the last six months?
(based on a hypothetical $10,000 investment)
Fund Name | Costs of a $10,000 investment | Costs paid as a percentage of a $10,000 investment |
|---|
FS Chiron Real Development Fund, Class A Shares | $76 | 1.45% |
Key Fund Statistics as of June 30, 2024
| Total Net Assets (000's) | Number of Holdings | Total Advisory Fees Paid (000's) | Portfolio Turnover |
|---|
| $73,219 | 87 | $249 | 196% |
What did the Fund invest in?
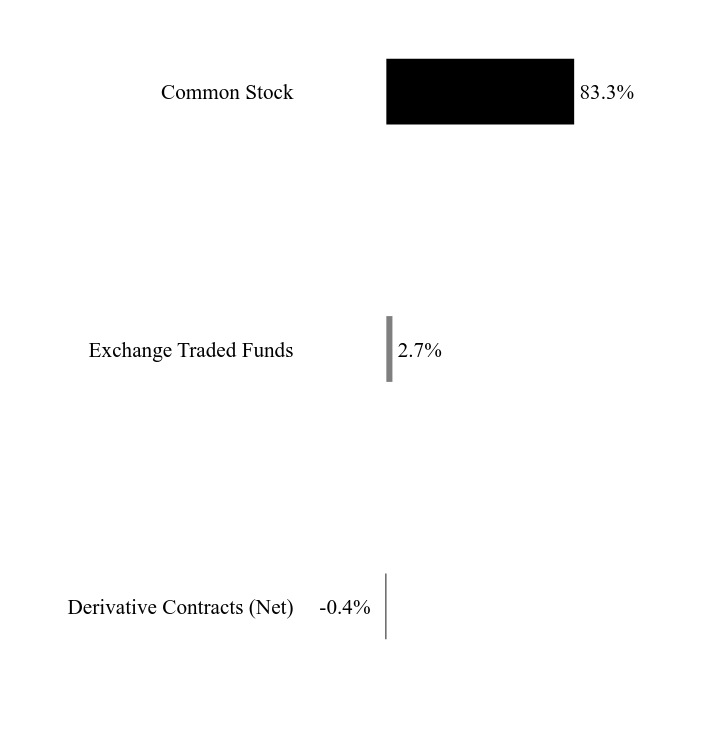
Asset WeightingsFootnote Reference*
Value | Value |
|---|
Derivative Contracts (Net) | -0.4% |
Exchange Traded Funds | 2.7% |
Common Stock | 83.3% |
| Footnote | Description |
Footnote* | Percentages are calculated based on total net assets. |
Holding Name | | | Percentage of
Total Net Assets |
|---|
Tencent Holdings | | | 4.9% |
Meta Platforms, Class A | | | 4.1% |
Apple | | | 4.0% |
ServiceNow | | | 3.6% |
Microsoft | | | 3.5% |
Amazon.com | | | 3.5% |
NVIDIA | | | 3.5% |
Regeneron Pharmaceuticals | | | 2.9% |
PDD Holdings | | | 2.5% |
Barrick Gold | | | 2.2% |
There were no material changes during the reporting period.
Changes in and Disagreements with Accountants
There were no changes in or disagreements with accountants during the reporting period.
For additional information about the Fund; including its prospectus, financial information, and holdings, visit or call:
Rule 30e-1 of the Investment Company Act of 1940 permits funds to transmit only one copy of a proxy statement, annual report or semi-annual report to shareholders (who need not be related) with the same residential, commercial or electronic address, provided that the shareholders have consented in writing and the reports are addressed either to each shareholder individually or to the shareholders as a group. This process is known as “householding” and is designed to reduce the duplicate copies of materials that shareholders receive and to lower printing and mailing costs for funds.
The Advisors' Inner Circle Fund III
FS Chiron Real Development Fund / Class A Shares - FARLX
Semi-Annual Shareholder Report - June 30, 2024
CHI-SA-TSR-2024-2
The Advisors' Inner Circle Fund III
FS Chiron Real Development Fund
Semi-Annual Shareholder Report - June 30, 2024
This semi-annual shareholder report contains important information about Class I Shares of the FS Chiron Real Development Fund (the "Fund") for the period from January 1, 2024 to June 30, 2024. You can find additional information about the Fund at https://fsinvestments.com/investments/all-investments/fsrlx/investments/fsrlx. You can also request this information by contacting us at 877-924-4766.
What were the Fund costs for the last six months?
(based on a hypothetical $10,000 investment)
Fund Name | Costs of a $10,000 investment | Costs paid as a percentage of a $10,000 investment |
|---|
FS Chiron Real Development Fund, Class I Shares | $63 | 1.20% |
Key Fund Statistics as of June 30, 2024
| Total Net Assets (000's) | Number of Holdings | Total Advisory Fees Paid (000's) | Portfolio Turnover |
|---|
| $73,219 | 87 | $249 | 196% |
What did the Fund invest in?
Asset WeightingsFootnote Reference*
Value | Value |
|---|
Derivative Contracts (Net) | -0.4% |
Exchange Traded Funds | 2.7% |
Common Stock | 83.3% |
| Footnote | Description |
Footnote* | Percentages are calculated based on total net assets. |
Holding Name | | | Percentage of
Total Net Assets |
|---|
Tencent Holdings | | | 4.9% |
Meta Platforms, Class A | | | 4.1% |
Apple | | | 4.0% |
ServiceNow | | | 3.6% |
Microsoft | | | 3.5% |
Amazon.com | | | 3.5% |
NVIDIA | | | 3.5% |
Regeneron Pharmaceuticals | | | 2.9% |
PDD Holdings | | | 2.5% |
Barrick Gold | | | 2.2% |
There were no material changes during the reporting period.
Changes in and Disagreements with Accountants
There were no changes in or disagreements with accountants during the reporting period.
For additional information about the Fund; including its prospectus, financial information, and holdings, visit or call:
Rule 30e-1 of the Investment Company Act of 1940 permits funds to transmit only one copy of a proxy statement, annual report or semi-annual report to shareholders (who need not be related) with the same residential, commercial or electronic address, provided that the shareholders have consented in writing and the reports are addressed either to each shareholder individually or to the shareholders as a group. This process is known as “householding” and is designed to reduce the duplicate copies of materials that shareholders receive and to lower printing and mailing costs for funds.
The Advisors' Inner Circle Fund III
FS Chiron Real Development Fund / Class I Shares - FSRLX
Semi-Annual Shareholder Report - June 30, 2024
CHI-SA-TSR-2024-1
(b) Not applicable.
Item 2. Code
of Ethics.
Not applicable for semi-annual report.
Item 3. Audit
Committee Financial Expert.
Not applicable for semi-annual report.
Item 4. Principal Accountant Fees and Services.
Not applicable for semi-annual report.
Item 5. Audit Committee of Listed Registrants.
Not applicable to open-end management investment companies.
Item 6. Schedule of Investments.
(a) The Schedules of Investments are included as part of the Financial Statements
and Other Information filed under Item 7 of this form.
(b) Not applicable.
Item 7. Financial Statements and Financial Highlights for Open-End
Management Investment Companies.
Financial Statements and Financial Highlights are filed herein.
The
Advisors’ Inner Circle Fund III

FS
Multi-Strategy Alternatives Fund
FS
Managed Futures Fund
FS
Chiron Real Development Fund
|
Semi-Annual
Financial Statements and Other Information |
JUNE
30, 2024 |
|
THE
ADVISORS’ INNER CIRCLE FUND III |
FS
INVESTMENTS
JUNE
30, 2024 |
TABLE
OF CONTENTS
|
Financial Statements
(Form N-CSRS Item 7) |
|
|
Consolidated Schedules
of Investments |
1 |
|
Glossary |
77 |
|
Consolidated Statements
of Assets and Liabilties |
78 |
|
Consolidated Statements
of Operations |
82 |
|
Consolidated Statements
of Changes in Net Assets |
85 |
|
Consolidated Financial
Highlights |
91 |
|
Notes to Consolidated
Financial Statements |
101 |
|
Board of Trustees
Considerations in Approving the Sub-Advisory Agreement (Form N-CSRS Item 11) |
136 |
The Funds file
their complete schedule of portfolio holdings with the Securities and Exchange Commission for the first and third quarters of each fiscal
year as an exhibit to its reports on Form N-PORT. The Funds’ Form N-PORT is available on the Funds’ website at https://fsinvestments.com/investments/mutual-fund-reports.
A description
of the policies and procedures that the Funds use to determine how to vote proxies relating to fund securities, as well as information
relating to how a Fund voted proxies relating to fund securities during the most recent 12-month period ended June 30, will be available
after August 30 (i) without charge, upon request, by calling 1-877-924-4766; and (ii) on the Funds’ website at https://fsinvestments.com/investments/mutual-fund-reports.
|
THE
ADVISORS’ INNER CIRCLE FUND III |
FS
MULTI-STRATEGY
ALTERNATIVES
FUND
JUNE
30, 2024
(Unaudited) |
|
CONSOLIDATED
SCHEDULE OF INVESTMENTS |
|
(Percentages
are based on Net Assets of $1,839,714 (000)) |
|
MORTGAGE-BACKED
SECURITIES — 97.8% |
| |
|
Face Amount (000) |
|
|
Fair Value (000) |
|
|
CAYMAN
ISLANDS — 0.1% |
|
ACREC, Ser 2021-FL1,
Cl E |
|
|
|
|
|
|
|
|
|
Callable 07/16/24
@ $100 |
|
|
|
|
|
|
|
|
|
8.446%, TSFR1M
+ 3.114%, 10/16/36(A) (B) |
|
$ |
1,030 |
|
|
$ |
979 |
|
|
Arbor Realty
Commercial Real Estate Notes, Ser 2022-FL2, Cl E |
|
|
|
|
|
|
|
|
|
Callable 07/15/24
@ $100 |
|
|
|
|
|
|
|
|
|
10.329%, TSFR1M
+ 5.000%, 05/15/37(A) (B) |
|
|
100 |
|
|
|
96 |
|
|
AREIT Trust,
Ser 2022-CRE6, Cl D |
|
|
|
|
|
|
|
|
|
Callable 02/15/25
@ $100 |
|
|
|
|
|
|
|
|
|
8.183%, SOFR30A
+ 2.850%, 01/20/37(A) (B) |
|
|
270 |
|
|
|
262 |
|
|
AREIT Trust,
Ser 2022-CRE6, Cl E |
|
|
|
|
|
|
|
|
|
Callable 02/15/25
@ $100 |
|
|
|
|
|
|
|
|
|
8.733%, SOFR30A
+ 3.400%, 01/20/37(A) (B) |
|
|
200 |
|
|
|
189 |
|
|
MF1, Ser 2021-FL6,
Cl E |
|
|
|
|
|
|
|
|
|
Callable 07/16/24
@ $100 |
|
|
|
|
|
|
|
|
|
8.396%, TSFR1M
+ 3.064%, 07/16/36(A) (B) |
|
|
440 |
|
|
|
401 |
|
|
MF1, Ser 2021-FL7,
Cl E |
|
|
|
|
|
|
|
|
|
Callable 07/16/24
@ $100 |
|
|
|
|
|
|
|
|
|
8.246%, TSFR1M
+ 2.914%, 10/16/36(A) (B) |
|
|
370 |
|
|
|
333 |
|
| |
|
|
|
|
|
|
|
|
| |
|
|
|
|
|
|
2,260 |
|
| |
|
|
|
|
|
|
|
|
|
UNITED
STATES — 97.7% |
|
245 Park Avenue
Trust, Ser 2017-245P, Cl E |
|
|
|
|
|
|
|
|
|
3.779%, 06/05/37(A)
(B) |
|
|
240 |
|
|
|
198 |
|
|
A&D Mortgage
Trust, Ser 2024-NQM1, Cl B1 |
|
|
|
|
|
|
|
|
|
Callable 01/25/27
@ $100 |
|
|
|
|
|
|
|
|
|
8.582%, 02/25/69(A)
(B) |
|
|
1,000 |
|
|
|
1,016 |
|
|
Arbor Realty
Commercial Real Estate Notes, Ser 2021-FL1, Cl D |
|
|
|
|
|
|
|
|
|
Callable 07/15/24
@ $100 |
|
|
|
|
|
|
|
|
|
8.393%, TSFR1M
+ 3.064%, 12/15/35(A) (B) |
|
|
1,572 |
|
|
|
1,518 |
|
|
Arbor Realty
Commercial Real Estate Notes, Ser 2021-FL1, Cl E |
|
|
|
|
|
|
|
|
|
Callable 07/15/24
@ $100 |
|
|
|
|
|
|
|
|
|
8.843%, TSFR1M
+ 3.514%, 12/15/35(A) (B) |
|
|
130 |
|
|
|
122 |
|
The
accompanying notes are an integral part of the consolidated financial statements.
1
|
THE
ADVISORS’ INNER CIRCLE FUND III |
FS
MULTI-STRATEGY
ALTERNATIVES
FUND
JUNE
30, 2024
(Unaudited) |
|
MORTGAGE-BACKED
SECURITIES — continued |
|
|
|
Face Amount (000) |
|
|
Fair Value (000) |
|
|
UNITED
STATES — (continued) |
|
Arbor Realty
Commercial Real Estate Notes, Ser 2021-FL3, Cl D |
|
|
|
|
|
|
|
|
|
Callable 07/15/24
@ $100 |
|
|
|
|
|
|
|
|
|
7.643%, TSFR1M
+ 2.314%, 08/15/34(A) (B) |
|
$ |
200 |
|
|
$ |
197 |
|
|
Arbor Realty
Commercial Real Estate Notes, Ser 2021-FL3, Cl E |
|
|
|
|
|
|
|
|
|
Callable 07/15/24
@ $100 |
|
|
|
|
|
|
|
|
|
7.993%, TSFR1M
+ 2.664%, 08/15/34(A) (B) |
|
|
640 |
|
|
|
617 |
|
|
Arbor Realty
Commercial Real Estate Notes, Ser 2021-FL4, Cl E |
|
|
|
|
|
|
|
|
|
Callable 07/15/24
@ $100 |
|
|
|
|
|
|
|
|
|
8.843%, TSFR1M
+ 3.514%, 11/15/36(A) (B) |
|
|
1,830 |
|
|
|
1,738 |
|
|
Arbor Realty
Commercial Real Estate Notes, Ser 2022-FL1, Cl D |
|
|
|
|
|
|
|
|
|
Callable 08/15/24
@ $100 |
|
|
|
|
|
|
|
|
|
8.333%, SOFR30A
+ 3.000%, 01/15/37(A) (B) |
|
|
1,580 |
|
|
|
1,525 |
|
|
AREIT Trust,
Ser 2022-CRE7, Cl E |
|
|
|
|
|
|
|
|
|
10.520%, TSFR1M
+ 5.191%, 06/17/39(A) (B) |
|
|
110 |
|
|
|
109 |
|
|
Ashford Hospitality
Trust, Ser 2018-ASHF, Cl D |
|
|
|
|
|
|
|
|
|
7.601%, TSFR1M
+ 2.272%, 04/15/35(A) (B) |
|
|
1,760 |
|
|
|
1,715 |
|
|
Atrium Hotel
Portfolio Trust, Ser 2018-ATRM, Cl F |
|
|
|
|
|
|
|
|
|
9.626%, TSFR1M
+ 4.297%, 06/15/35(A) (B) |
|
|
410 |
|
|
|
402 |
|
|
BBCMS Trust,
Ser 2018-BXH, Cl F |
|
|
|
|
|
|
|
|
|
Callable 10/15/25
@ $100 |
|
|
|
|
|
|
|
|
|
8.451%, TSFR1M
+ 3.122%, 10/15/37(A) (B) |
|
|
690 |
|
|
|
681 |
|
|
BF Mortgage Trust,
Ser 2019-NYT, Cl C |
|
|
|
|
|
|
|
|
|
7.326%, TSFR1M
+ 1.997%, 12/15/35(A) (B) |
|
|
100 |
|
|
|
90 |
|
|
BRAVO Residential
Funding Trust, Ser 2023-NQM3, Cl M1 |
|
|
|
|
|
|
|
|
|
Callable 04/25/26
@ $100 |
|
|
|
|
|
|
|
|
|
4.944%, 09/25/62(A)
(B) |
|
|
1,570 |
|
|
|
1,430 |
|
|
BRAVO Residential
Funding Trust, Ser 2023-NQM7, Cl B2 |
|
|
|
|
|
|
|
|
|
Callable 10/25/26
@ $100 |
|
|
|
|
|
|
|
|
|
8.003%, 09/25/63(A)
(B) |
|
|
170 |
|
|
|
166 |
|
|
BRAVO Residential
Funding Trust, Ser 2024-NQM1, Cl B2 |
|
|
|
|
|
|
|
|
|
Callable 01/25/27
@ $100 |
|
|
|
|
|
|
|
|
|
8.226%, 12/01/63(A)
(B) |
|
|
100 |
|
|
|
98 |
|
The
accompanying notes are an integral part of the consolidated financial statements.
2
|
THE
ADVISORS’ INNER CIRCLE FUND III |
FS
MULTI-STRATEGY
ALTERNATIVES
FUND
JUNE
30, 2024
(Unaudited) |
|
MORTGAGE-BACKED
SECURITIES — continued |
|
|
|
Face Amount (000) |
|
|
Fair Value (000) |
|
|
UNITED
STATES — (continued) |
|
BRAVO Residential
Funding Trust, Ser 2024-NQM3, Cl B2 |
|
|
|
|
|
|
|
|
|
Callable 03/25/27
@ $100 |
|
|
|
|
|
|
|
|
|
8.407%, 03/25/64(A)
(B) |
|
$ |
100 |
|
|
$ |
98 |
|
|
BX Trust, Ser
2018-GW, Cl G |
|
|
|
|
|
|
|
|
|
8.546%, TSFR1M
+ 3.217%, 05/15/35(A) (B) |
|
|
2,227 |
|
|
|
2,214 |
|
|
BX Trust, Ser
2018-GWMZ, Cl MC |
|
|
|
|
|
|
|
|
|
11.114%, TSFR1M
+ 5.785%, 05/15/37(A) (B) |
|
|
1,580 |
|
|
|
1,571 |
|
|
BX Trust, Ser
2021-SDMF, Cl F |
|
|
|
|
|
|
|
|
|
7.381%, TSFR1M
+ 2.051%, 09/15/34(A) (B) |
|
|
1,919 |
|
|
|
1,842 |
|
|
CAFL Issuer,
Ser 2021-RTL1, Cl A2 |
|
|
|
|
|
|
|
|
|
Callable 07/28/24
@ $100 |
|
|
|
|
|
|
|
|
|
3.104%, 03/28/29(A)
(C) |
|
|
498 |
|
|
|
484 |
|
|
Cascade Funding
Mortgage Trust, Ser 2021-FRR1, Cl CK98 |
|
|
|
|
|
|
|
|
|
08/29/29(A)
(D) |
|
|
260 |
|
|
|
159 |
|
|
Chase Home Lending
Mortgage Trust, Ser 2024-4, Cl AX1, IO |
|
|
|
|
|
|
|
|
|
Callable 12/25/36
@ $100 |
|
|
|
|
|
|
|
|
|
0.238%, 03/25/55(A)
(B) |
|
|
10,779 |
|
|
|
51 |
|
|
Chase Home Lending
Mortgage Trust, Ser 2024-5, Cl AX1, IO |
|
|
|
|
|
|
|
|
|
Callable 01/25/37
@ $100 |
|
|
|
|
|
|
|
|
|
0.301%, 04/25/55(A)
(B) |
|
|
14,460 |
|
|
|
91 |
|
|
Citigroup Commercial
Mortgage Trust, Ser 2013-375P, Cl B |
|
|
|
|
|
|
|
|
|
3.635%, 05/10/35(A)
(B) |
|
|
1,500 |
|
|
|
1,440 |
|
|
Citigroup Commercial
Mortgage Trust, Ser 2013-375P, Cl D |
|
|
|
|
|
|
|
|
|
3.635%, 05/10/35(A)
(B) |
|
|
210 |
|
|
|
196 |
|
|
CLNY Trust, Ser
2019-IKPR, Cl D |
|
|
|
|
|
|
|
|
|
7.468%, TSFR1M
+ 2.139%, 11/15/38(A) (B) |
|
|
260 |
|
|
|
246 |
|
|
COLT Mortgage
Loan Trust, Ser 2022-7, Cl B2 |
|
|
|
|
|
|
|
|
|
Callable 07/25/25
@ $100 |
|
|
|
|
|
|
|
|
|
6.285%, 04/25/67(A)
(B) |
|
|
180 |
|
|
|
168 |
|
|
COLT Mortgage
Loan Trust, Ser 2023-1, Cl B2 |
|
|
|
|
|
|
|
|
|
Callable 04/25/26
@ $100 |
|
|
|
|
|
|
|
|
|
8.079%, 04/25/68(A)
(B) |
|
|
140 |
|
|
|
136 |
|
|
COLT Mortgage
Loan Trust, Ser 2024-2, Cl B2 |
|
|
|
|
|
|
|
|
|
Callable 03/25/27
@ $100 |
|
|
|
|
|
|
|
|
The
accompanying notes are an integral part of the consolidated financial statements.
3
|
THE
ADVISORS’ INNER CIRCLE FUND III |
FS
MULTI-STRATEGY
ALTERNATIVES
FUND
JUNE
30, 2024
(Unaudited) |
|
MORTGAGE-BACKED
SECURITIES — continued |
|
|
|
Face Amount (000) |
|
|
Fair Value (000) |
|
|
UNITED
STATES — (continued) |
|
8.443%, 04/25/69(A)
(B) |
|
$ |
100 |
|
|
$ |
98 |
|
|
COLT Mortgage
Loan Trust, Ser 2024-INV1, Cl B1 |
|
|
|
|
|
|
|
|
|
Callable 01/25/27
@ $100 |
|
|
|
|
|
|
|
|
|
8.161%, 12/25/68(A)
(B) |
|
|
100 |
|
|
|
100 |
|
|
COLT Mortgage
Loan Trust, Ser 2024-INV2, Cl B1 |
|
|
|
|
|
|
|
|
|
Callable 04/25/27
@ $100 |
|
|
|
|
|
|
|
|
|
8.188%, 05/25/69(A)
(B) |
|
|
140 |
|
|
|
140 |
|
|
COMM Mortgage
Trust, Ser 2013-CR8, Cl D |
|
|
|
|
|
|
|
|
|
Callable 05/10/25
@ $100 |
|
|
|
|
|
|
|
|
|
3.659%, 06/10/46(A)
(B) |
|
|
170 |
|
|
|
162 |
|
|
COMM Mortgage
Trust, Ser 2013-CR8, Cl E |
|
|
|
|
|
|
|
|
|
Callable 05/10/25
@ $100 |
|
|
|
|
|
|
|
|
|
4.000%, 06/10/46(A)
(B) |
|
|
150 |
|
|
|
141 |
|
|
COMM Mortgage
Trust, Ser 2013-CR8, Cl F |
|
|
|
|
|
|
|
|
|
Callable 05/10/25
@ $100 |
|
|
|
|
|
|
|
|
|
4.000%, 06/10/46(A)
(B) |
|
|
330 |
|
|
|
304 |
|
|
COMM Mortgage
Trust, Ser 2014-LC15, Cl D |
|
|
|
|
|
|
|
|
|
Callable 02/10/25
@ $100 |
|
|
|
|
|
|
|
|
|
4.948%, 04/10/47(A)
(B) |
|
|
309 |
|
|
|
287 |
|
|
COMM Mortgage
Trust, Ser 2015-PC1, Cl C |
|
|
|
|
|
|
|
|
|
Callable 06/10/25
@ $100 |
|
|
|
|
|
|
|
|
|
4.423%, 07/10/50(B) |
|
|
1,710 |
|
|
|
1,512 |
|
|
COMM Mortgage
Trust, Ser 2019-521F, Cl B |
|
|
|
|
|
|
|
|
|
6.576%, TSFR1M
+ 1.247%, 06/15/34(A) (B) |
|
|
510 |
|
|
|
459 |
|
|
COMM Mortgage
Trust, Ser 2024-WCL1, Cl D |
|
|
|
|
|
|
|
|
|
8.589%, TSFR1M
+ 3.289%, 06/15/41(A) (B) |
|
|
1,000 |
|
|
|
997 |
|
|
Connecticut Avenue
Securities Trust, Ser 2024-R01, Cl 1B2 |
|
|
|
|
|
|
|
|
|
Callable 01/25/29
@ $100 |
|
|
|
|
|
|
|
|
|
9.335%, SOFR30A
+ 4.000%, 01/25/44(A) (B) |
|
|
150 |
|
|
|
155 |
|
|
Connecticut Avenue
Securities Trust, Ser 2024-R02, Cl 1B2 |
|
|
|
|
|
|
|
|
|
Callable 02/25/29
@ $100 |
|
|
|
|
|
|
|
|
|
9.035%, SOFR30A
+ 3.700%, 02/25/44(A) (B) |
|
|
350 |
|
|
|
358 |
|
|
CORE Mortgage
Trust, Ser 2019-CORE, Cl E |
|
|
|
|
|
|
|
|
|
7.276%, TSFR1M
+ 1.947%, 12/15/31(A) (B) |
|
|
1,604 |
|
|
|
1,435 |
|
|
Cross Mortgage
Trust, Ser 2023-H2, Cl B1 |
|
|
|
|
|
|
|
|
|
Callable 10/25/26
@ $100 |
|
|
|
|
|
|
|
|
The
accompanying notes are an integral part of the consolidated financial statements.
4
|
THE
ADVISORS’ INNER CIRCLE FUND III |
FS
MULTI-STRATEGY
ALTERNATIVES
FUND
JUNE
30, 2024
(Unaudited) |
|
MORTGAGE-BACKED
SECURITIES — continued |
|
|
|
Face Amount (000) |
|
|
Fair Value (000) |
|
|
UNITED
STATES — (continued) |
|
8.451%, 11/25/68(A)
(B) |
|
$ |
760 |
|
|
$ |
769 |
|
|
CSMC Trust, Ser
2017-CHOP, Cl H |
|
|
|
|
|
|
|
|
|
12.794%, PRIME
+ 4.294%, 07/15/32(A) (B) |
|
|
690 |
|
|
|
621 |
|
|
CSMC Trust, Ser
2017-PFHP, Cl A |
|
|
|
|
|
|
|
|
|
6.326%, TSFR1M
+ 0.997%, 12/15/30(A) (B) |
|
|
150 |
|
|
|
145 |
|
|
CSMC Trust, Ser
2021-GATE, Cl C |
|
|
|
|
|
|
|
|
|
8.150%, TSFR1M
+ 2.821%, 12/15/36(A) (B) |
|
|
300 |
|
|
|
282 |
|
|
CSMC Trust, Ser
2021-GATE, Cl D |
|
|
|
|
|
|
|
|
|
9.000%, TSFR1M
+ 3.671%, 12/15/36(A) (B) |
|
|
480 |
|
|
|
442 |
|
|
CSMC Trust, Ser
2022-ATH3, Cl B1 |
|
|
|
|
|
|
|
|
|
Callable 08/25/25
@ $100 |
|
|
|
|
|
|
|
|
|
7.100%, 08/25/67(A)
(B) |
|
|
730 |
|
|
|
709 |
|
|
CyrusOne Data
Centers Issuer I, Ser 2024-3A, Cl A2 |
|
|
|
|
|
|
|
|
|
4.650%, 05/20/49(A) |
|
|
120 |
|
|
|
109 |
|
|
Ellington Financial
Mortgage Trust, Ser 2022-3, Cl M1 |
|
|
|
|
|
|
|
|
|
Callable 07/25/25
@ $100 |
|
|
|
|
|
|
|
|
|
5.007%, 08/25/67(A)
(B) |
|
|
200 |
|
|
|
175 |
|
|
FHLMC Multifamily
Structured Credit Risk, Ser 2021-MN1, Cl B1 |
|
|
|
|
|
|
|
|
|
Callable 09/25/32
@ $100 |
|
|
|
|
|
|
|
|
|
13.085%, SOFR30A
+ 7.750%, 01/25/51(A) (B) |
|
|
130 |
|
|
|
141 |
|
|
FHLMC Multifamily
Structured Credit Risk, Ser 2021-MN3, Cl M2 |
|
|
|
|
|
|
|
|
|
Callable 09/25/36
@ $100 |
|
|
|
|
|
|
|
|
|
9.335%, SOFR30A
+ 4.000%, 11/25/51(A) (B) |
|
|
40 |
|
|
|
40 |
|
|
FHLMC Multifamily
Structured Credit Risk, Ser 2022-MN4, Cl B1 |
|
|
|
|
|
|
|
|
|
Callable 08/25/37
@ $100 |
|
|
|
|
|
|
|
|
|
14.835%, SOFR30A
+ 9.500%, 05/25/52(A) (B) |
|
|
130 |
|
|
|
145 |
|
|
FHLMC Multifamily
Structured Credit Risk, Ser 2022-MN4, Cl M2 |
|
|
|
|
|
|
|
|
|
Callable 08/25/37
@ $100 |
|
|
|
|
|
|
|
|
|
11.835%, SOFR30A
+ 6.500%, 05/25/52(A) (B) |
|
|
867 |
|
|
|
962 |
|
|
FHLMC Multifamily
Structured Credit Risk, Ser 2023-MN7, Cl B1 |
|
|
|
|
|
|
|
|
|
Callable 09/25/31
@ $100 |
|
|
|
|
|
|
|
|
The
accompanying notes are an integral part of the consolidated financial statements.
5
|
THE
ADVISORS’ INNER CIRCLE FUND III |
FS
MULTI-STRATEGY
ALTERNATIVES
FUND
JUNE
30, 2024
(Unaudited) |
|
MORTGAGE-BACKED
SECURITIES — continued |
|
|
|
Face Amount (000) |
|
|
Fair Value (000) |
|
|
UNITED
STATES — (continued) |
|
14.185%, SOFR30A
+ 8.850%, 09/25/43(A) (B) |
|
$ |
180 |
|
|
$ |
194 |
|
|
FHLMC Multifamily
Structured Credit Risk, Ser 2023-MN7, Cl M2 |
|
|
|
|
|
|
|
|
|
Callable 09/25/31
@ $100 |
|
|
|
|
|
|
|
|
|
11.035%, SOFR30A
+ 5.700%, 09/25/43(A) (B) |
|
|
500 |
|
|
|
542 |
|
|
FHLMC, Ser 2017-356,
Cl S5, IO |
|
|
|
|
|
|
|
|
|
0.553%, 09/15/47(B) |
|
|
21,222 |
|
|
|
2,278 |
|
|
FHLMC, Ser 2017-357,
IO |
|
|
|
|
|
|
|
|
|
4.500%, 09/15/47 |
|
|
13,481 |
|
|
|
2,910 |
|
|
FHLMC, Ser 2019-4927,
IO |
|
|
|
|
|
|
|
|
|
5.000%, 11/25/49 |
|
|
8,874 |
|
|
|
2,084 |
|
|
FHLMC, Ser 2020-4973,
Cl BI, IO |
|
|
|
|
|
|
|
|
|
4.500%, 05/25/50 |
|
|
21,058 |
|
|
|
4,810 |
|
|
FHLMC, Ser 2020-4973,
Cl IK, IO |
|
|
|
|
|
|
|
|
|
5.000%, 05/25/50 |
|
|
9,121 |
|
|
|
1,757 |
|
|
FHLMC, Ser 2020-4986,
IO |
|
|
|
|
|
|
|
|
|
4.500%, 06/25/50 |
|
|
16,212 |
|
|
|
3,618 |
|
|
FHLMC, Ser 2020-4989,
Cl EI, IO |
|
|
|
|
|
|
|
|
|
4.000%, 07/25/50 |
|
|
14,504 |
|
|
|
2,928 |
|
|
FHLMC, Ser 2020-4998,
Cl KI, IO |
|
|
|
|
|
|
|
|
|
4.000%, 08/25/50 |
|
|
17,308 |
|
|
|
3,613 |
|
|
FHLMC, Ser 2020-5003,
Cl LI, IO |
|
|
|
|
|
|
|
|
|
2.500%, 08/25/50 |
|
|
16,242 |
|
|
|
1,838 |
|
|
FHLMC, Ser 2020-5015,
Cl BI, IO |
|
|
|
|
|
|
|
|
|
4.000%, 09/25/50 |
|
|
15,875 |
|
|
|
3,189 |
|
|
FHLMC, Ser 2020-5019,
Cl MI, IO |
|
|
|
|
|
|
|
|
|
4.000%, 10/25/50 |
|
|
21,819 |
|
|
|
4,645 |
|
|
FHLMC, Ser 2020-5038,
Cl HI, IO |
|
|
|
|
|
|
|
|
|
4.000%, 11/25/50 |
|
|
24,482 |
|
|
|
5,239 |
|
|
FHLMC, Ser 2021-5093,
Cl GI, IO |
|
|
|
|
|
|
|
|
|
3.000%, 03/25/51 |
|
|
15,079 |
|
|
|
2,583 |
|
|
FHLMC, Ser 2021-5104,
Cl GI, IO |
|
|
|
|
|
|
|
|
|
3.500%, 06/25/49 |
|
|
17,650 |
|
|
|
3,146 |
|
|
FHLMC, Ser 2021-5112,
Cl KI, IO |
|
|
|
|
|
|
|
|
|
3.500%, 06/25/51 |
|
|
20,425 |
|
|
|
3,787 |
|
|
FHLMC, Ser 2021-5134,
Cl BI, IO |
|
|
|
|
|
|
|
|
|
4.500%, 08/25/51 |
|
|
21,039 |
|
|
|
4,661 |
|
The
accompanying notes are an integral part of the consolidated financial statements.
6
|
THE
ADVISORS’ INNER CIRCLE FUND III |
FS
MULTI-STRATEGY
ALTERNATIVES
FUND
JUNE
30, 2024
(Unaudited) |
|
MORTGAGE-BACKED
SECURITIES — continued |
|
|
|
Face Amount (000) |
|
|
Fair Value (000) |
|
|
UNITED
STATES — (continued) |
|
FHLMC, Ser 2021-5152,
Cl YI, IO |
|
|
|
|
|
|
|
|
|
4.000%, 10/25/49 |
|
$ |
13,311 |
|
|
$ |
2,755 |
|
|
FHLMC, Ser 2021-5154,
Cl GI, IO |
|
|
|
|
|
|
|
|
|
2.000%, 03/25/42 |
|
|
24,259 |
|
|
|
1,376 |
|
|
FHLMC, Ser 2021-5163,
Cl JI, IO |
|
|
|
|
|
|
|
|
|
4.000%, 09/25/51 |
|
|
19,653 |
|
|
|
3,927 |
|
|
FHLMC, Ser 2021-5163,
Cl NI, IO |
|
|
|
|
|
|
|
|
|
4.500%, 11/25/51 |
|
|
8,844 |
|
|
|
1,937 |
|
|
FHLMC, Ser 2021-5182,
IO |
|
|
|
|
|
|
|
|
|
4.000%, 04/25/51 |
|
|
13,116 |
|
|
|
2,789 |
|
|
FHLMC, Ser 2021-5184,
IO |
|
|
|
|
|
|
|
|
|
4.000%, 01/25/52 |
|
|
18,386 |
|
|
|
3,722 |
|
|
FHLMC, Ser 2022-5191,
Cl NI, IO |
|
|
|
|
|
|
|
|
|
4.000%, 06/15/42 |
|
|
13,264 |
|
|
|
2,427 |
|
|
FHLMC, Ser 2022-5250,
Cl SA, IO |
|
|
|
|
|
|
|
|
|
08/25/52(B)
(D) |
|
|
44,235 |
|
|
|
2,744 |
|
|
FHLMC, Ser 2022-5252,
Cl SP, IO |
|
|
|
|
|
|
|
|
|
0.015%, 09/25/52(B) |
|
|
30,968 |
|
|
|
1,585 |
|
|
FHLMC, Ser 2022-5270,
Cl IB, IO |
|
|
|
|
|
|
|
|
|
4.500%, 09/25/50 |
|
|
11,018 |
|
|
|
2,276 |
|
|
FHLMC, Ser 2022-5279,
Cl IM, IO |
|
|
|
|
|
|
|
|
|
4.000%, 11/25/51 |
|
|
10,032 |
|
|
|
1,992 |
|
|
FHLMC, Ser 2023-406,
Cl S43, IO |
|
|
|
|
|
|
|
|
|
1.865%, 10/25/53(B) |
|
|
45,291 |
|
|
|
3,775 |
|
|
FHLMC, Ser 2023-406,
Cl S44, IO |
|
|
|
|
|
|
|
|
|
1.665%, 10/25/53(B) |
|
|
88,545 |
|
|
|
6,891 |
|
|
FHLMC, Ser 2023-406,
Cl S5, IO |
|
|
|
|
|
|
|
|
|
0.715%, 10/25/53(B) |
|
|
69,671 |
|
|
|
3,440 |
|
|
FHLMC, Ser 2023-5290,
Cl TS, IO |
|
|
|
|
|
|
|
|
|
0.915%, 12/25/52(B) |
|
|
48,914 |
|
|
|
3,287 |
|
|
FHLMC, Ser 2023-5296,
Cl ST, IO |
|
|
|
|
|
|
|
|
|
0.915%, 11/25/52(B) |
|
|
48,280 |
|
|
|
3,996 |
|
|
FHLMC, Ser 2023-5336,
Cl SA, IO |
|
|
|
|
|
|
|
|
|
0.465%, 09/25/53(B) |
|
|
67,069 |
|
|
|
2,771 |
|
|
FHLMC, Ser 2023-5344,
Cl SA, IO |
|
|
|
|
|
|
|
|
|
0.315%, 10/25/53(B) |
|
|
68,909 |
|
|
|
2,740 |
|
|
FHLMC, Ser 2023-5354,
Cl SL, IO |
|
|
|
|
|
|
|
|
|
1.515%, 11/25/53(B) |
|
|
46,270 |
|
|
|
3,386 |
|
|
FHLMC, Ser 2024-5412,
Cl MI, IO |
|
|
|
|
|
|
|
|
|
5.000%, 01/25/49 |
|
|
16,562 |
|
|
|
2,732 |
|
The
accompanying notes are an integral part of the consolidated financial statements.
7
|
THE
ADVISORS’ INNER CIRCLE FUND III |
FS
MULTI-STRATEGY
ALTERNATIVES
FUND
JUNE
30, 2024
(Unaudited) |
|
MORTGAGE-BACKED
SECURITIES — continued |
|
|
|
Face Amount (000) |
|
|
Fair Value (000) |
|
|
UNITED
STATES — (continued) |
|
FNMA or FHLMC
TBA |
|
|
|
|
|
|
|
|
|
6.500%, 07/01/32 |
|
$ |
588,000 |
|
|
$ |
598,428 |
|
|
6.000%, 07/15/54 |
|
|
100,000 |
|
|
|
100,277 |
|
|
5.500%, 07/15/54 |
|
|
499,000 |
|
|
|
492,119 |
|
|
5.000%, 07/15/38 |
|
|
240,000 |
|
|
|
231,938 |
|
|
FNMA, Ser 2012-75,
Cl DS, IO |
|
|
|
|
|
|
|
|
|
0.500%, 07/25/42(B) |
|
|
9,137 |
|
|
|
951 |
|
|
FNMA, Ser 2018-73,
Cl SC, IO |
|
|
|
|
|
|
|
|
|
0.750%, 10/25/48(B) |
|
|
20,193 |
|
|
|
1,978 |
|
|
FNMA, Ser 2019-49,
Cl IC, IO |
|
|
|
|
|
|
|
|
|
4.500%, 05/25/44 |
|
|
9,169 |
|
|
|
1,020 |
|
|
FNMA, Ser 2020-41,
Cl IP, IO |
|
|
|
|
|
|
|
|
|
4.000%, 09/25/49 |
|
|
12,194 |
|
|
|
2,377 |
|
|
FNMA, Ser 2020-57,
Cl IB, IO |
|
|
|
|
|
|
|
|
|
4.500%, 08/25/50 |
|
|
31,739 |
|
|
|
6,755 |
|
|
FNMA, Ser 2020-76,
Cl MI, IO |
|
|
|
|
|
|
|
|
|
5.500%, 11/25/50 |
|
|
12,418 |
|
|
|
3,158 |
|
|
FNMA, Ser 2020-77,
Cl HI, IO |
|
|
|
|
|
|
|
|
|
4.000%, 11/25/50 |
|
|
17,994 |
|
|
|
3,681 |
|
|
FNMA, Ser 2020-89,
Cl KI, IO |
|
|
|
|
|
|
|
|
|
4.000%, 12/25/50 |
|
|
23,260 |
|
|
|
4,565 |
|
|
FNMA, Ser 2021-27,
Cl EI, IO |
|
|
|
|
|
|
|
|
|
4.500%, 05/25/51 |
|
|
24,293 |
|
|
|
5,445 |
|
|
FNMA, Ser 2021-4,
Cl IV, IO |
|
|
|
|
|
|
|
|
|
4.500%, 06/25/50 |
|
|
12,956 |
|
|
|
2,899 |
|
|
FNMA, Ser 2021-62,
Cl DI, IO |
|
|
|
|
|
|
|
|
|
4.500%, 09/25/48 |
|
|
9,742 |
|
|
|
2,182 |
|
|
FNMA, Ser 2021-62,
Cl HI, IO |
|
|
|
|
|
|
|
|
|
2.500%, 08/25/51 |
|
|
13,498 |
|
|
|
1,850 |
|
|
FNMA, Ser 2021-87,
Cl GI, IO |
|
|
|
|
|
|
|
|
|
3.500%, 12/25/51 |
|
|
27,556 |
|
|
|
5,202 |
|
|
FNMA, Ser 2021-91,
Cl NI, IO |
|
|
|
|
|
|
|
|
|
3.500%, 01/25/52 |
|
|
20,892 |
|
|
|
3,921 |
|
|
FNMA, Ser 2022-16,
Cl QI, IO |
|
|
|
|
|
|
|
|
|
3.500%, 04/25/52 |
|
|
27,197 |
|
|
|
3,157 |
|
|
FNMA, Ser 2022-74,
Cl SA, IO |
|
|
|
|
|
|
|
|
|
10/25/52(B)
(D) |
|
|
56,602 |
|
|
|
1,835 |
|
|
FNMA, Ser 2022-74,
Cl US, IO |
|
|
|
|
|
|
|
|
|
11/25/52(B)
(D) |
|
|
66,889 |
|
|
|
2,363 |
|
The
accompanying notes are an integral part of the consolidated financial statements.
8
|
THE
ADVISORS’ INNER CIRCLE FUND III |
FS
MULTI-STRATEGY
ALTERNATIVES
FUND
JUNE
30, 2024
(Unaudited) |
|
MORTGAGE-BACKED
SECURITIES — continued |
|
|
|
Face Amount (000) |
|
|
Fair Value (000) |
|
|
UNITED
STATES — (continued) |
|
FNMA, Ser 2022-90,
Cl CI, IO |
|
|
|
|
|
|
|
|
|
4.500%, 05/25/50 |
|
$ |
22,386 |
|
|
$ |
4,639 |
|
|
FNMA, Ser 2023-11,
Cl HS, IO |
|
|
|
|
|
|
|
|
|
0.840%, 04/25/53(B) |
|
|
128,169 |
|
|
|
5,652 |
|
|
FNMA, Ser 2023-11,
Cl SA, IO |
|
|
|
|
|
|
|
|
|
0.915%, 04/25/53(B) |
|
|
60,964 |
|
|
|
3,529 |
|
|
FNMA, Ser 2023-19,
Cl SB, IO |
|
|
|
|
|
|
|
|
|
1.515%, 05/25/53(B) |
|
|
20,388 |
|
|
|
1,505 |
|
|
FNMA, Ser 2023-431,
Cl C35, IO |
|
|
|
|
|
|
|
|
|
2.000%, 07/25/37 |
|
|
64,839 |
|
|
|
4,549 |
|
|
FNMA, Ser 2024-11,
Cl IK, IO |
|
|
|
|
|
|
|
|
|
6.500%, 03/25/54 |
|
|
12,146 |
|
|
|
2,662 |
|
|
FNMA, Ser 2024-12,
Cl DS, IO |
|
|
|
|
|
|
|
|
|
0.715%, 03/25/54(B) |
|
|
47,509 |
|
|
|
2,573 |
|
|
FNMA, Ser 2024-22,
Cl SA, IO |
|
|
|
|
|
|
|
|
|
0.765%, 05/25/54(B) |
|
|
81,101 |
|
|
|
4,741 |
|
|
FNMA, Ser 2024-24,
Cl SB, IO |
|
|
|
|
|
|
|
|
|
1.265%, 09/25/53(B) |
|
|
48,764 |
|
|
|
3,281 |
|
|
Fontainebleau
Miami Beach Trust, Ser 2019-FBLU, Cl F |
|
|
|
|
|
|
|
|
|
4.095%, 12/10/36(A)
(B) |
|
|
1,500 |
|
|
|
1,448 |
|
|
GCAT Trust, Ser
2024-NQM2, Cl B1 |
|
|
|
|
|
|
|
|
|
Callable 06/25/27
@ $100 |
|
|
|
|
|
|
|
|
|
7.860%, 06/25/59(A)
(B) |
|
|
1,000 |
|
|
|
1,000 |
|
|
GCAT Trust, Ser
2024-NQM2, Cl B2 |
|
|
|
|
|
|
|
|
|
Callable 06/25/27
@ $100 |
|
|
|
|
|
|
|
|
|
8.136%, 06/25/59(A)
(B) |
|
|
210 |
|
|
|
203 |
|
|
GNMA, Ser 2010-35,
Cl AS, IO |
|
|
|
|
|
|
|
|
|
0.297%, 03/20/40(B) |
|
|
10,889 |
|
|
|
776 |
|
|
GNMA, Ser 2010-37,
Cl SG, IO |
|
|
|
|
|
|
|
|
|
0.247%, 03/20/40(B) |
|
|
8,571 |
|
|
|
598 |
|
|
GNMA, Ser 2011-70,
Cl WI, IO |
|
|
|
|
|
|
|
|
|
12/20/40(B)
(D) |
|
|
17,143 |
|
|
|
614 |
|
|
GNMA, Ser 2015-123,
Cl SE, IO |
|
|
|
|
|
|
|
|
|
0.267%, 09/20/45(B) |
|
|
10,051 |
|
|
|
990 |
|
|
GNMA, Ser 2016-77,
Cl SC, IO |
|
|
|
|
|
|
|
|
|
0.647%, 10/20/45(B) |
|
|
13,717 |
|
|
|
1,512 |
|
|
GNMA, Ser 2017-179,
Cl TI, IO |
|
|
|
|
|
|
|
|
|
4.500%, 12/20/47 |
|
|
12,248 |
|
|
|
2,646 |
|
The
accompanying notes are an integral part of the consolidated financial statements.
9
|
THE
ADVISORS’ INNER CIRCLE FUND III |
FS
MULTI-STRATEGY
ALTERNATIVES
FUND
JUNE
30, 2024
(Unaudited) |
|
MORTGAGE-BACKED
SECURITIES — continued |
|
|
|
Face Amount (000) |
|
|
Fair Value (000) |
|
|
UNITED
STATES — (continued) |
|
GNMA, Ser 2018-100,
Cl S, IO |
|
|
|
|
|
|
|
|
|
0.747%, 07/20/48(B) |
|
$ |
10,626 |
|
|
$ |
1,112 |
|
|
GNMA, Ser 2018-21,
Cl PI, IO |
|
|
|
|
|
|
|
|
|
4.500%, 02/20/48 |
|
|
25,109 |
|
|
|
5,372 |
|
|
GNMA, Ser 2018-89,
Cl LS, IO |
|
|
|
|
|
|
|
|
|
0.747%, 06/20/48(B) |
|
|
17,187 |
|
|
|
1,841 |
|
|
GNMA, Ser 2018-91,
Cl SH, IO |
|
|
|
|
|
|
|
|
|
0.797%, 07/20/48(B) |
|
|
10,598 |
|
|
|
1,068 |
|
|
GNMA, Ser 2018-91,
Cl SJ, IO |
|
|
|
|
|
|
|
|
|
0.797%, 07/20/48(B) |
|
|
11,326 |
|
|
|
1,156 |
|
|
GNMA, Ser 2019-133,
Cl EI, IO |
|
|
|
|
|
|
|
|
|
4.500%, 04/20/49 |
|
|
9,473 |
|
|
|
2,043 |
|
|
GNMA, Ser 2020-127,
Cl IY, IO |
|
|
|
|
|
|
|
|
|
4.000%, 08/20/50 |
|
|
14,555 |
|
|
|
2,884 |
|
|
GNMA, Ser 2020-148,
Cl IP, IO |
|
|
|
|
|
|
|
|
|
4.500%, 02/20/48 |
|
|
21,779 |
|
|
|
4,660 |
|
|
GNMA, Ser 2020-4,
IO |
|
|
|
|
|
|
|
|
|
5.000%, 01/20/50 |
|
|
17,082 |
|
|
|
3,296 |
|
|
GNMA, Ser 2020-53,
Cl QI, IO |
|
|
|
|
|
|
|
|
|
4.500%, 08/20/49 |
|
|
11,334 |
|
|
|
2,323 |
|
|
GNMA, Ser 2020-61,
IO |
|
|
|
|
|
|
|
|
|
4.500%, 05/20/50 |
|
|
17,318 |
|
|
|
3,437 |
|
|
GNMA, Ser 2021-139,
Cl WI, IO |
|
|
|
|
|
|
|
|
|
4.048%, 11/20/45(B) |
|
|
13,587 |
|
|
|
2,223 |
|
|
GNMA, Ser 2021-158,
Cl JI, IO |
|
|
|
|
|
|
|
|
|
5.000%, 02/20/50 |
|
|
10,400 |
|
|
|
2,385 |
|
|
GNMA, Ser 2021-215,
Cl SB, IO |
|
|
|
|
|
|
|
|
|
1.000%, 12/20/51(B) |
|
|
16,664 |
|
|
|
768 |
|
|
GNMA, Ser 2021-216,
Cl IC, IO |
|
|
|
|
|
|
|
|
|
3.000%, 12/20/51 |
|
|
29,888 |
|
|
|
3,752 |
|
|
GNMA, Ser 2021-78,
Cl IC, IO |
|
|
|
|
|
|
|
|
|
4.000%, 05/20/51 |
|
|
28,545 |
|
|
|
5,070 |
|
|
GNMA, Ser 2022-148,
Cl SJ, IO |
|
|
|
|
|
|
|
|
|
0.667%, 08/20/52(B) |
|
|
39,832 |
|
|
|
2,528 |
|
|
GNMA, Ser 2022-153,
Cl SG, IO |
|
|
|
|
|
|
|
|
|
0.117%, 09/20/52(B) |
|
|
39,079 |
|
|
|
1,376 |
|
|
GNMA, Ser 2022-188,
Cl IE, IO |
|
|
|
|
|
|
|
|
|
4.500%, 01/20/50 |
|
|
14,174 |
|
|
|
2,674 |
|
|
GNMA, Ser 2022-193,
Cl SA, IO |
|
|
|
|
|
|
|
|
|
11/20/52(B)
(D) |
|
|
80,070 |
|
|
|
1,691 |
|
The
accompanying notes are an integral part of the consolidated financial statements.
10
|
THE
ADVISORS’ INNER CIRCLE FUND III |
FS
MULTI-STRATEGY
ALTERNATIVES
FUND
JUNE
30, 2024
(Unaudited) |
|
MORTGAGE-BACKED
SECURITIES — continued |
|
|
|
Face Amount (000) |
|
|
Fair Value (000) |
|
|
UNITED
STATES — (continued) |
|
GNMA, Ser 2022-212,
Cl SA, IO |
|
|
|
|
|
|
|
|
|
0.817%, 12/20/52(B) |
|
$ |
33,209 |
|
|
$ |
1,485 |
|
|
GNMA, Ser 2022-213,
Cl TS, IO |
|
|
|
|
|
|
|
|
|
1.517%, 12/20/52(B) |
|
|
17,066 |
|
|
|
1,087 |
|
|
GNMA, Ser 2022-23,
Cl WI, IO |
|
|
|
|
|
|
|
|
|
4.500%, 02/20/52 |
|
|
9,252 |
|
|
|
1,901 |
|
|
GNMA, Ser 2022-30,
Cl IG, IO |
|
|
|
|
|
|
|
|
|
3.000%, 02/20/52 |
|
|
25,621 |
|
|
|
3,724 |
|
|
GNMA, Ser 2022-34,
Cl IT, IO |
|
|
|
|
|
|
|
|
|
4.000%, 01/20/51 |
|
|
15,885 |
|
|
|
3,234 |
|
|
GNMA, Ser 2022-5,
Cl NI, IO |
|
|
|
|
|
|
|
|
|
3.000%, 01/20/52 |
|
|
25,574 |
|
|
|
3,549 |
|
|
GNMA, Ser 2023-4,
Cl SG, IO |
|
|
|
|
|
|
|
|
|
0.917%, 01/20/53(B) |
|
|
85,159 |
|
|
|
5,672 |
|
|
GNMA, Ser 2023-5,
Cl SC, IO |
|
|
|
|
|
|
|
|
|
0.867%, 01/20/53(B) |
|
|
66,173 |
|
|
|
3,074 |
|
|
GNMA, Ser 2023-82,
Cl US, IO |
|
|
|
|
|
|
|
|
|
1.417%, 06/20/53(B) |
|
|
32,084 |
|
|
|
1,471 |
|
|
GNMA, Ser 2024-65,
Cl SU, IO |
|
|
|
|
|
|
|
|
|
0.817%, 05/20/53(B) |
|
|
72,724 |
|
|
|
3,701 |
|
|
GS Mortgage Securities
Trust, Ser 2017-SLP, Cl G |
|
|
|
|
|
|
|
|
|
4.744%, 10/10/32(A)
(B) |
|
|
1,790 |
|
|
|
1,645 |
|
|
GS Mortgage-Backed
Securities Trust, Ser 2021-PJ4, Cl AIOS, IO |
|
|
|
|
|
|
|
|
|
Callable 12/25/44
@ $100 |
|
|
|
|
|
|
|
|
|
0.220%, 09/25/51(A)
(B) |
|
|
2,764 |
|
|
|
34 |
|
|
GS Mortgage-Backed
Securities Trust, Ser 2021-PJ6, Cl AIOS, IO |
|
|
|
|
|
|
|
|
|
Callable 03/25/45
@ $100 |
|
|
|
|
|
|
|
|
|
0.150%, 11/25/51(A)
(B) |
|
|
6,027 |
|
|
|
48 |
|
|
GS Mortgage-Backed
Securities Trust, Ser 2021-PJ7, Cl AIOS, IO |
|
|
|
|
|
|
|
|
|
Callable 05/25/45
@ $100 |
|
|
|
|
|
|
|
|
|
0.150%, 01/25/52(A)
(B) |
|
|
7,534 |
|
|
|
63 |
|
|
GS Mortgage-Backed
Securities Trust, Ser 2023-CCM1, Cl B2 |
|
|
|
|
|
|
|
|
|
Callable 02/25/26
@ $100 |
|
|
|
|
|
|
|
|
|
7.496%, 08/25/53(A)
(B) |
|
|
630 |
|
|
|
597 |
|
|
GSMS Trust, Ser
2024-FAIR, Cl D |
|
|
|
|
|
|
|
|
|
8.214%, 07/15/29(A)
(B) |
|
|
2,750 |
|
|
|
2,726 |
|
The
accompanying notes are an integral part of the consolidated financial statements.
11
|
THE
ADVISORS’ INNER CIRCLE FUND III |
FS
MULTI-STRATEGY
ALTERNATIVES
FUND
JUNE
30, 2024
(Unaudited) |
|
MORTGAGE-BACKED
SECURITIES — continued |
|
|
|
Face Amount (000) |
|
|
Fair Value (000) |
|
|
UNITED
STATES — (continued) |
|
HPLY Trust, Ser
2019-HIT, Cl F |
|
|
|
|
|
|
|
|
|
8.593%, TSFR1M
+ 3.264%, 11/15/36(A) (B) |
|
$ |
967 |
|
|
$ |
952 |
|
|
Hudsons Bay Simon
JV Trust, Ser 2015-HB7, Cl A7 |
|
|
|
|
|
|
|
|
|
Callable 08/05/24
@ $100 |
|
|
|
|
|
|
|
|
|
3.914%, 08/05/34(A) |
|
|
1,251 |
|
|
|
1,233 |
|
|
Imperial Fund
Mortgage Trust, Ser 2020-NQM1, Cl B2 |
|
|
|
|
|
|
|
|
|
Callable 07/25/24
@ $100 |
|
|
|
|
|
|
|
|
|
5.163%, 10/25/55(A)
(B) |
|
|
742 |
|
|
|
694 |
|
|
Imperial Fund
Mortgage Trust, Ser 2022-NQM4, Cl M1 |
|
|
|
|
|
|
|
|
|
Callable 05/25/25
@ $100 |
|
|
|
|
|
|
|
|
|
5.040%, 06/25/67(A)
(C) |
|
|
700 |
|
|
|
676 |
|
|
J.P. Morgan Chase
Commercial Mortgage Securities Trust, Ser 2022-NLP, Cl B |
|
|
|
|
|
|
|
|
|
6.436%, TSFR1M
+ 1.107%, 04/15/37(A) (B) |
|
|
2,470 |
|
|
|
2,350 |
|
|
J.P. Morgan Chase
Commercial Mortgage Securities Trust, Ser 2022-NLP, Cl D |
|
|
|
|
|
|
|
|
|
7.495%, TSFR1M
+ 2.166%, 04/15/37(A) (B) |
|
|
195 |
|
|
|
172 |
|
|
J.P. Morgan Mortgage
Trust, Ser 2023-4, Cl B4 |
|
|
|
|
|
|
|
|
|
Callable 10/25/45
@ $100 |
|
|
|
|
|
|
|
|
|
6.311%, 11/25/53(A)
(B) |
|
|
256 |
|
|
|
235 |
|
|
J.P. Morgan Mortgage
Trust, Ser 2024-2, Cl AX3, IO |
|
|
|
|
|
|
|
|
|
Callable 09/25/36
@ $100 |
|
|
|
|
|
|
|
|
|
0.438%, 08/25/54(A)
(B) |
|
|
5,012 |
|
|
|
32 |
|
|
J.P. Morgan Mortgage
Trust, Ser 2024-4, Cl AX3, IO |
|
|
|
|
|
|
|
|
|
Callable 02/25/37
@ $100 |
|
|
|
|
|
|
|
|
|
0.215%, 10/25/54(A)
(B) |
|
|
4,818 |
|
|
|
16 |
|
|
JPMBB Commercial
Mortgage Securities Trust, Ser 2014-C19, Cl F |
|
|
|
|
|
|
|
|
|
Callable 01/15/25
@ $100 |
|
|
|
|
|
|
|
|
|
3.750%, 04/15/47(A)
(B) |
|
|
710 |
|
|
|
639 |
|
|
JPMBB Commercial
Mortgage Securities Trust, Ser 2015-C33, Cl D1 |
|
|
|
|
|
|
|
|
|
Callable 11/15/25
@ $100 |
|
|
|
|
|
|
|
|
|
4.290%, 12/15/48(A)
(B) |
|
|
490 |
|
|
|
428 |
|
|
LAQ Mortgage
Trust, Ser 2023-LAQ, Cl F |
|
|
|
|
|
|
|
|
|
Callable 03/15/25
@ $100 |
|
|
|
|
|
|
|
|
|
12.263%, TSFR1M
+ 6.934%, 03/15/36(A) (B) |
|
|
1,125 |
|
|
|
1,115 |
|
The
accompanying notes are an integral part of the consolidated financial statements.
12
|
THE
ADVISORS’ INNER CIRCLE FUND III |
FS
MULTI-STRATEGY
ALTERNATIVES
FUND
JUNE
30, 2024
(Unaudited) |
|
MORTGAGE-BACKED
SECURITIES — continued |
|
|
|
Face Amount (000) |
|
|
Fair Value (000) |
|
|
UNITED
STATES — (continued) |
|
LAQ Mortgage
Trust, Ser 2023-LAQ, Cl G |
|
|
|
|
|
|
|
|
|
Callable 03/15/25
@ $100 |
|
|
|
|
|
|
|
|
|
13.761%, TSFR1M
+ 8.432%, 03/15/36(A) (B) |
|
$ |
405 |
|
|
$ |
401 |
|
|
MAD Mortgage
Trust, Ser 2017-330M, Cl B |
|
|
|
|
|
|
|
|
|
3.478%, 08/15/34(A)
(B) |
|
|
100 |
|
|
|
90 |
|
|
MAD Mortgage
Trust, Ser 2017-330M, Cl D |
|
|
|
|
|
|
|
|
|
4.108%, 08/15/34(A)
(B) |
|
|
100 |
|
|
|
85 |
|
|
MCR Mortgage
Trust, Ser 2024-HTL, Cl F |
|
|
|
|
|
|
|
|
|
10.982%, TSFR1M
+ 5.653%, 02/15/37(A) (B) |
|
|
337 |
|
|
|
340 |
|
|
MF1, Ser 2020-FL4,
Cl D |
|
|
|
|
|
|
|
|
|
Callable 07/15/24
@ $100 |
|
|
|
|
|
|
|
|
|
9.543%, TSFR1M
+ 4.214%, 11/15/35(A) (B) |
|
|
300 |
|
|
|
294 |
|
|
MFA Trust, Ser
2022-RTL1, Cl A2 |
|
|
|
|
|
|
|
|
|
6.413%, 04/26/27(A)
(C) |
|
|
312 |
|
|
|
299 |
|
|
Morgan Stanley
Bank of America Merrill Lynch Trust, Ser 2014-C17, Cl D |
|
|
|
|
|
|
|
|
|
Callable 07/15/24
@ $100 |
|
|
|
|
|
|
|
|
|
4.816%, 08/15/47(A)
(B) |
|
|
200 |
|
|
|
197 |
|
|
Morgan Stanley
Bank of America Merrill Lynch Trust, Ser 2015-C23, Cl D |
|
|
|
|
|
|
|
|
|
Callable 06/15/25
@ $100 |
|
|
|
|
|
|
|
|
|
4.275%, 07/15/50(A)
(B) |
|
|
1,160 |
|
|
|
1,077 |
|
|
Morgan Stanley
Bank of America Merrill Lynch Trust, Ser 2015-C24, Cl E |
|
|
|
|
|
|
|
|
|
Callable 08/15/25
@ $100 |
|
|
|
|
|
|
|
|
|
4.466%, 05/15/48(A)
(B) |
|
|
170 |
|
|
|
141 |
|
|
Morgan Stanley
Capital I Trust, Ser 2015-420, Cl A |
|
|
|
|
|
|
|
|
|
Callable 10/12/24
@ $100 |
|
|
|
|
|
|
|
|
|
3.727%, 10/12/50(A) |
|
|
893 |
|
|
|
854 |
|
|
Morgan Stanley
Capital I Trust, Ser 2018-SUN, Cl F |
|
|
|
|
|
|
|
|
|
Callable 07/15/24
@ $100 |
|
|
|
|
|
|
|
|
|
8.178%, TSFR1M
+ 2.851%, 07/15/35(A) (B) |
|
|
1,000 |
|
|
|
997 |
|
|
Morgan Stanley
Capital I Trust, Ser 2019-MEAD, Cl D |
|
|
|
|
|
|
|
|
|
Callable 11/10/24
@ $100 |
|
|
|
|
|
|
|
|
|
3.283%, 11/10/36(A)
(B) |
|
|
330 |
|
|
|
301 |
|
|
Morgan Stanley
Capital I, Ser 2024-BPR2, Cl E |
|
|
|
|
|
|
|
|
|
9.044%, 05/05/29(A)
(B) |
|
|
160 |
|
|
|
147 |
|
The
accompanying notes are an integral part of the consolidated financial statements.
13
|
THE
ADVISORS’ INNER CIRCLE FUND III |
FS
MULTI-STRATEGY
ALTERNATIVES
FUND
JUNE
30, 2024
(Unaudited) |
|
MORTGAGE-BACKED
SECURITIES — continued |
|
|
|
Face Amount (000) |
|
|
Fair Value (000) |
|
|
UNITED
STATES — (continued) |
|
Morgan Stanley
Capital I, Ser 2024-BPR2, Cl X, IO |
|
|
|
|
|
|
|
|
|
1.073%, 05/05/29(A)
(B) |
|
$ |
2,289 |
|
|
$ |
85 |
|
|
Morgan Stanley
Residential Mortgage Loan Trust, Ser 2024-INV2, Cl B4 |
|
|
|
|
|
|
|
|
|
Callable 01/25/37
@ $100 |
|
|
|
|
|
|
|
|
|
7.560%, 02/25/54(A)
(B) |
|
|
130 |
|
|
|
129 |
|
|
Morgan Stanley
Residential Mortgage Loan Trust, Ser 2024-INV2, Cl B5 |
|
|
|
|
|
|
|
|
|
Callable 01/25/37
@ $100 |
|
|
|
|
|
|
|
|
|
7.560%, 02/25/54(A)
(B) |
|
|
100 |
|
|
|
92 |
|
|
Morgan Stanley
Residential Mortgage Loan Trust, Ser 2024-INV2, Cl B6 |
|
|
|
|
|
|
|
|
|
Callable 01/25/37
@ $100 |
|
|
|
|
|
|
|
|
|
7.560%, 02/25/54(A)
(B) |
|
|
120 |
|
|
|
90 |
|
|
MSWF Commercial
Mortgage Trust, Ser 2023-2, Cl E |
|
|
|
|
|
|
|
|
|
Callable 12/15/33
@ $100 |
|
|
|
|
|
|
|
|
|
4.000%, 12/15/56(A) |
|
|
100 |
|
|
|
67 |
|
|
MSWF Commercial
Mortgage Trust, Ser 2023-2, Cl XD, IO |
|
|
|
|
|
|
|
|
|
Callable 09/15/33
@ $100 |
|
|
|
|
|
|
|
|
|
3.252%, 12/15/56(A)
(B) |
|
|
1,000 |
|
|
|
201 |
|
|
Multifamily Connecticut
Avenue Securities Trust, Ser 2023-01, Cl M10 |
|
|
|
|
|
|
|
|
|
Callable 10/25/30
@ $100 |
|
|
|
|
|
|
|
|
|
11.835%, SOFR30A
+ 6.500%, 11/25/53(A) (B) |
|
|
990 |
|
|
|
1,109 |
|
|
Natixis Commercial
Mortgage Securities Trust, Ser 2022-RRI, Cl E |
|
|
|
|
|
|
|
|
|
10.522%, TSFR1M
+ 5.193%, 03/15/35(A) (B) |
|
|
1,125 |
|
|
|
1,122 |
|
|
New Residential
Mortgage Loan Trust, Ser 2024-NQM1, Cl B1 |
|
|
|
|
|
|
|
|
|
Callable 02/25/27
@ $100 |
|
|
|
|
|
|
|
|
|
7.912%, 03/25/64(A)
(B) |
|
|
2,000 |
|
|
|
1,991 |
|
|
New Residential
Mortgage Loan Trust, Ser 2024-NQM1, Cl B2 |
|
|
|
|
|
|
|
|
|
Callable 02/25/27
@ $100 |
|
|
|
|
|
|
|
|
|
8.114%, 03/25/64(A)
(B) |
|
|
190 |
|
|
|
184 |
|
|
NLT Trust, Ser
2023-1, Cl B1 |
|
|
|
|
|
|
|
|
|
Callable 04/25/44
@ $100 |
|
|
|
|
|
|
|
|
The
accompanying notes are an integral part of the consolidated financial statements.
14
|
THE
ADVISORS’ INNER CIRCLE FUND III |
FS
MULTI-STRATEGY
ALTERNATIVES
FUND
JUNE
30, 2024
(Unaudited) |
|
MORTGAGE-BACKED
SECURITIES — continued |
|
|
|
Face Amount (000) |
|
|
Fair Value (000) |
|
|
UNITED
STATES — (continued) |
|
3.723%, 10/25/62(A)
(B) |
|
$ |
270 |
|
|
$ |
162 |
|
|
NLT Trust, Ser
2023-1, Cl B2 |
|
|
|
|
|
|
|
|
|
Callable 04/25/44
@ $100 |
|
|
|
|
|
|
|
|
|
3.723%, 10/25/62(A)
(B) |
|
|
230 |
|
|
|
120 |
|
|
NLT Trust, Ser
2023-1, Cl B3 |
|
|
|
|
|
|
|
|
|
Callable 04/25/44
@ $100 |
|
|
|
|
|
|
|
|
|
3.723%, 10/25/62(A)
(B) |
|
|
400 |
|
|
|
184 |
|
|
NYO Commercial
Mortgage Trust, Ser 2021-1290, Cl C |
|
|
|
|
|
|
|
|
|
7.439%, TSFR1M
+ 2.109%, 11/15/38(A) (B) |
|
|
140 |
|
|
|
131 |
|
|
OBX Trust, Ser
2021-INV2, Cl AIO1, IO |
|
|
|
|
|
|
|
|
|
Callable 11/25/47
@ $100 |
|
|
|
|
|
|
|
|
|
0.210%, 10/25/51(A)
(B) |
|
|
3,955 |
|
|
|
46 |
|
|
Olympic Tower
Mortgage Trust, Ser 2017-OT, Cl D |
|
|
|
|
|
|
|
|
|
4.077%, 05/10/39(A)
(B) |
|
|
150 |
|
|
|
107 |
|
|
PRKCM Trust,
Ser 2023-AFC1, Cl B2 |
|
|
|
|
|
|
|
|
|
Callable 02/25/26
@ $100 |
|
|
|
|
|
|
|
|
|
7.555%, 02/25/58(A)
(B) |
|
|
430 |
|
|
|
411 |
|
|
PRKCM Trust,
Ser 2023-AFC3, Cl B1 |
|
|
|
|
|
|
|
|
|
Callable 08/25/26
@ $100 |
|
|
|
|
|
|
|
|
|
7.861%, 09/25/58(A)
(B) |
|
|
120 |
|
|
|
119 |
|
|
PRKCM Trust,
Ser 2023-AFC3, Cl B2 |
|
|
|
|
|
|
|
|
|
Callable 08/25/26
@ $100 |
|
|
|
|
|
|
|
|
|
7.861%, 09/25/58(A)
(B) |
|
|
110 |
|
|
|
106 |
|
|
PRKCM Trust,
Ser 2024-AFC1, Cl B2 |
|
|
|
|
|
|
|
|
|
Callable 02/25/27
@ $100 |
|
|
|
|
|
|
|
|
|
8.500%, 03/25/59(A)
(B) |
|
|
180 |
|
|
|
177 |
|
|
PRKCM Trust,
Ser 2024-HOME1, Cl B1 |
|
|
|
|
|
|
|
|
|
Callable 05/25/27
@ $100 |
|
|
|
|
|
|
|
|
|
7.736%, 05/25/59(A)
(B) |
|
|
150 |
|
|
|
149 |
|
|
PRKCM Trust,
Ser 2024-HOME1, Cl B2 |
|
|
|
|
|
|
|
|
|
Callable 05/25/27
@ $100 |
|
|
|
|
|
|
|
|
|
7.736%, 05/25/59(A)
(B) |
|
|
150 |
|
|
|
143 |
|
|
PRPM Trust, Ser
2023-NQM2, Cl B1 |
|
|
|
|
|
|
|
|
|
Callable 09/25/26
@ $100 |
|
|
|
|
|
|
|
|
|
7.026%, 08/25/68(A)
(B) |
|
|
290 |
|
|
|
281 |
|
|
PRPM Trust, Ser
2023-NQM2, Cl B2 |
|
|
|
|
|
|
|
|
|
Callable 09/25/26
@ $100 |
|
|
|
|
|
|
|
|
|
7.026%, 08/25/68(A)
(B) |
|
|
290 |
|
|
|
269 |
|
The
accompanying notes are an integral part of the consolidated financial statements.
15
|
THE
ADVISORS’ INNER CIRCLE FUND III |
FS
MULTI-STRATEGY
ALTERNATIVES
FUND
JUNE
30, 2024
(Unaudited) |
|
MORTGAGE-BACKED
SECURITIES — continued |
|
|
|
Face Amount (000) |
|
|
Fair Value (000) |
|
|
UNITED
STATES — (continued) |
|
PRPM Trust, Ser
2023-NQM3, Cl B1 |
|
|
|
|
|
|
|
|
|
Callable 01/25/27
@ $100 |
|
|
|
|
|
|
|
|
|
7.498%, 11/25/68(A)
(B) |
|
$ |
160 |
|
|
$ |
157 |
|
|
PRPM Trust, Ser
2023-NQM3, Cl B2 |
|
|
|
|
|
|
|
|
|
Callable 01/25/27
@ $100 |
|
|
|
|
|
|
|
|
|
7.498%, 11/25/68(A)
(B) |
|
|
310 |
|
|
|
292 |
|
|
PRPM Trust, Ser
2024-NQM1, Cl B1 |
|
|
|
|
|
|
|
|
|
Callable 03/25/27
@ $100 |
|
|
|
|
|
|
|
|
|
7.557%, 12/25/68(A)
(B) |
|
|
170 |
|
|
|
166 |
|
|
PRPM Trust, Ser
2024-RCF3, Cl M2 |
|
|
|
|
|
|
|
|
|
Callable 05/25/26
@ $100 |
|
|
|
|
|
|
|
|
|
4.000%, 05/25/54(A)
(C) |
|
|
310 |
|
|
|
247 |
|
|
Rate Mortgage
Trust, Ser 2021-J3, Cl AX1, IO |
|
|
|
|
|
|
|
|
|
Callable 10/25/45
@ $100 |
|
|
|
|
|
|
|
|
|
0.214%, 10/25/51(A)
(B) |
|
|
2,105 |
|
|
|
25 |
|
|
RCKT Mortgage
Trust, Ser 2021-4, Cl AX1, IO |
|
|
|
|
|
|
|
|
|
Callable 07/25/47
@ $100 |
|
|
|
|
|
|
|
|
|
0.507%, 09/25/51(A)
(B) |
|
|
9,603 |
|
|
|
254 |
|
|
Saluda Grade
Alternative Mortgage Trust, Ser 2024-RTL4, Cl A2 |
|
|
|
|
|
|
|
|
|
Callable 07/25/26
@ $100 |
|
|
|
|
|
|
|
|
|
7.500%, 02/25/30(A)
(C) |
|
|
350 |
|
|
|
332 |
|
|
Santander Bank
Mortgage Credit-Linked Notes Series, Ser 2023-MTG1, Cl M2 |
|
|
|
|
|
|
|
|
|
Callable 09/25/40
@ $100 |
|
|
|
|
|
|
|
|
|
10.235%, SOFR30A
+ 4.900%, 02/26/52(A) (B) |
|
|
217 |
|
|
|
239 |
|
|
Santander Bank
Mortgage Credit-Linked Notes Series, Ser 2023-MTG1, Cl M3 |
|
|
|
|
|
|
|
|
|
Callable 09/25/40
@ $100 |
|
|
|
|
|
|
|
|
|
11.185%, SOFR30A
+ 5.850%, 02/26/52(A) (B) |
|
|
317 |
|
|
|
357 |
|
|
SCG Mortgage
Trust, Ser 2024-MSP, Cl E |
|
|
|
|
|
|
|
|
|
10.266%, TSFR1M
+ 4.937%, 04/15/41(A) (B) |
|
|
1,630 |
|
|
|
1,623 |
|
|
THPT Mortgage
Trust, Ser 2023-THL, Cl E |
|
|
|
|
|
|
|
|
|
10.745%, 12/10/34(A)
(B) |
|
|
1,500 |
|
|
|
1,511 |
|
|
THPT Mortgage
Trust, Ser 2023-THL, Cl F |
|
|
|
|
|
|
|
|
|
7.428%, 12/10/34(A)
(B) |
|
|
170 |
|
|
|
154 |
|
|
UBS-BAMLL Trust,
Ser 2012-WRM, Cl A |
|
|
|
|
|
|
|
|
|
Callable 07/10/24
@ $100 |
|
|
|
|
|
|
|
|
The
accompanying notes are an integral part of the consolidated financial statements.
16
|
THE
ADVISORS’ INNER CIRCLE FUND III |
FS
MULTI-STRATEGY
ALTERNATIVES
FUND
JUNE
30, 2024
(Unaudited) |
|
MORTGAGE-BACKED
SECURITIES — continued |
|
|
|
Face Amount (000) |
|
|
Fair Value (000) |
|
|
UNITED
STATES — (continued) |
|
3.663%, 06/10/30(A) |
|
$ |
3 |
|
|
$ |
3 |
|
|
UBS-BAMLL Trust,
Ser 2012-WRM, Cl C |
|
|
|
|
|
|
|
|
|
Callable 07/10/24
@ $100 |
|
|
|
|
|
|
|
|
|
4.379%, 06/10/30(A)
(B) |
|
|
240 |
|
|
|
214 |
|
|
Velocity Commercial
Capital Loan Trust, Ser 2023-RTL1, Cl A2 |
|
|
|
|
|
|
|
|
|
Callable 01/25/25
@ $100 |
|
|
|
|
|
|
|
|
|
9.500%, 07/25/28(A)
(C) |
|
|
990 |
|
|
|
1,000 |
|
|
Verus Securitization
Trust, Ser 2019-INV2, Cl B1 |
|
|
|
|
|
|
|
|
|
Callable 07/25/24
@ $100 |
|
|
|
|
|
|
|
|
|
4.452%, 07/25/59(A)
(B) |
|
|
140 |
|
|
|
132 |
|
|
Verus Securitization
Trust, Ser 2022-4, Cl B2 |
|
|
|
|
|
|
|
|
|
Callable 04/25/25
@ $100 |
|
|
|
|
|
|
|
|
|
4.782%, 04/25/67(A)
(B) |
|
|
160 |
|
|
|
130 |
|
|
Verus Securitization
Trust, Ser 2022-6, Cl B2 |
|
|
|
|
|
|
|
|
|
Callable 06/25/25
@ $100 |
|
|
|
|
|
|
|
|
|
4.929%, 06/25/67(A)
(B) |
|
|
400 |
|
|
|
327 |
|
|
Verus Securitization
Trust, Ser 2022-INV1, Cl B2 |
|
|
|
|
|
|
|
|
|
Callable 08/25/25
@ $100 |
|
|
|
|
|
|
|
|
|
5.834%, 08/25/67(A)
(B) |
|
|
510 |
|
|
|
466 |
|
|
Verus Securitization
Trust, Ser 2023-3, Cl B2 |
|
|
|
|
|
|
|
|
|
Callable 04/25/26
@ $100 |
|
|
|
|
|
|
|
|
|
7.883%, 03/25/68(A)
(B) |
|
|
100 |
|
|
|
97 |
|
|
Verus Securitization
Trust, Ser 2023-5, Cl B2 |
|
|
|
|
|
|
|
|
|
Callable 06/25/26
@ $100 |
|
|
|
|
|
|
|
|
|
8.094%, 06/25/68(A)
(B) |
|
|
173 |
|
|
|
170 |
|
|
Verus Securitization
Trust, Ser 2023-6, Cl B2 |
|
|
|
|
|
|
|
|
|
Callable 09/25/26
@ $100 |
|
|
|
|
|
|
|
|
|
7.826%, 09/25/68(A)
(B) |
|
|
190 |
|
|
|
183 |
|
|
Verus Securitization
Trust, Ser 2023-8, Cl B1 |
|
|
|
|
|
|
|
|
|
Callable 12/25/26
@ $100 |
|
|
|
|
|
|
|
|
|
8.138%, 12/25/68(A)
(B) |
|
|
1,500 |
|
|
|
1,500 |
|
|
Verus Securitization
Trust, Ser 2023-8, Cl B2 |
|
|
|
|
|
|
|
|
|
Callable 12/25/26
@ $100 |
|
|
|
|
|
|
|
|
|
8.138%, 12/25/68(A)
(B) |
|
|
100 |
|
|
|
98 |
|
|
Verus Securitization
Trust, Ser 2023-INV1, Cl B2 |
|
|
|
|
|
|
|
|
|
Callable 02/25/26
@ $100 |
|
|
|
|
|
|
|
|
|
7.558%, 02/25/68(A)
(B) |
|
|
890 |
|
|
|
863 |
|
|
Verus Securitization
Trust, Ser 2023-INV2, Cl B2 |
|
|
|
|
|
|
|
|
|
Callable 07/25/26
@ $100 |
|
|
|
|
|
|
|
|
The
accompanying notes are an integral part of the consolidated financial statements.
17
|
THE
ADVISORS’ INNER CIRCLE FUND III |
FS
MULTI-STRATEGY
ALTERNATIVES
FUND
JUNE
30, 2024
(Unaudited) |
|
MORTGAGE-BACKED
SECURITIES — continued |
|
|
|
Face Amount (000) |
|
|
Fair Value (000) |
|
|
UNITED
STATES — (continued) |
|
8.135%, 08/25/68(A)
(B) |
|
$ |
220 |
|
|
$ |
215 |
|
|
Verus Securitization
Trust, Ser 2023-INV3, Cl B1 |
|
|
|
|
|
|
|
|
|
Callable 11/25/26
@ $100 |
|
|
|
|
|
|
|
|
|
8.257%, 11/25/68(A)
(B) |
|
|
180 |
|
|
|
180 |
|
|
Verus Securitization
Trust, Ser 2023-INV3, Cl B2 |
|
|
|
|
|
|
|
|
|
Callable 11/25/26
@ $100 |
|
|
|
|
|
|
|
|
|
8.257%, 11/25/68(A)
(B) |
|
|
250 |
|
|
|
245 |
|
|
Verus Securitization
Trust, Ser 2024-1, Cl B1 |
|
|
|
|
|
|
|
|
|
Callable 01/25/27
@ $100 |
|
|
|
|
|
|
|
|
|
7.909%, 01/25/69(A)
(B) |
|
|
2,000 |
|
|
|
1,989 |
|
|
Verus Securitization
Trust, Ser 2024-1, Cl B2 |
|
|
|
|
|
|
|
|
|
Callable 01/25/27
@ $100 |
|
|
|
|
|
|
|
|
|
8.324%, 01/25/69(A)
(B) |
|
|
160 |
|
|
|
157 |
|
|
Verus Securitization
Trust, Ser 2024-2, Cl B1 |
|
|
|
|
|
|
|
|
|
Callable 02/25/27
@ $100 |
|
|
|
|
|
|
|
|
|
7.864%, 02/25/69(A)
(B) |
|
|
1,500 |
|
|
|
1,490 |
|
|
Verus Securitization
Trust, Ser 2024-3, Cl B1 |
|
|
|
|
|
|
|
|
|
Callable 04/25/27
@ $100 |
|
|
|
|
|
|
|
|
|
8.028%, 04/25/69(A)
(B) |
|
|
2,000 |
|
|
|
2,010 |
|
|
Verus Securitization
Trust, Ser 2024-3, Cl B2 |
|
|
|
|
|
|
|
|
|
Callable 04/25/27
@ $100 |
|
|
|
|
|
|
|
|
|
8.437%, 04/25/69(A)
(B) |
|
|
220 |
|
|
|
217 |
|
|
Verus Securitization
Trust, Ser 2024-4, Cl B1 |
|
|
|
|
|
|
|
|
|
Callable 05/25/27
@ $100 |
|
|
|
|
|
|
|
|
|
7.643%, 06/25/69(A)
(B) |
|
|
1,000 |
|
|
|
999 |
|
|
Verus Securitization
Trust, Ser 2024-4, Cl B2 |
|
|
|
|
|
|
|
|
|
Callable 05/25/27
@ $100 |
|
|
|
|
|
|
|
|
|
8.066%, 06/25/69(A)
(B) |
|
|
100 |
|
|
|
97 |
|
|
Verus Securitization
Trust, Ser 2024-5, Cl B1 |
|
|
|
|
|
|
|
|
|
Callable 06/25/27
@ $100 |
|
|
|
|
|
|
|
|
|
7.793%, 06/25/69(A)
(B) |
|
|
1,500 |
|
|
|
1,507 |
|
|
Verus Securitization
Trust, Ser 2024-5, Cl B2 |
|
|
|
|
|
|
|
|
|
Callable 06/25/27
@ $100 |
|
|
|
|
|
|
|
|
|
7.842%, 06/25/69(A)
(B) |
|
|
400 |
|
|
|
384 |
|
|
Verus Securitization
Trust, Ser 2024-INV1, Cl B2 |
|
|
|
|
|
|
|
|
|
Callable 03/25/27
@ $100 |
|
|
|
|
|
|
|
|
|
8.507%, 03/25/69(A)
(B) |
|
|
130 |
|
|
|
128 |
|
|
Visio Trust,
Ser 2023-1, Cl B2 |
|
|
|
|
|
|
|
|
|
Callable 03/25/26
@ $100 |
|
|
|
|
|
|
|
|
|
7.858%, 03/25/58(A)
(B) |
|
|
450 |
|
|
|
434 |
|
The
accompanying notes are an integral part of the consolidated financial statements.
18
|
THE
ADVISORS’ INNER CIRCLE FUND III |
FS
MULTI-STRATEGY
ALTERNATIVES
FUND
JUNE
30, 2024
(Unaudited) |
|
MORTGAGE-BACKED
SECURITIES — continued |
|
|
|
Face Amount (000) |
|
|
Fair Value (000) |
|
|
UNITED
STATES — (continued) |
|
Visio Trust,
Ser 2023-2, Cl B1 |
|
|
|
|
|
|
|
|
|
Callable 08/25/26
@ $100 |
|
|
|
|
|
|
|
|
|
7.774%, 10/25/58(A)
(B) |
|
$ |
560 |
|
|
$ |
552 |
|
|
Visio Trust,
Ser 2023-2, Cl B2 |
|
|
|
|
|
|
|
|
|
Callable 08/25/26
@ $100 |
|
|
|
|
|
|
|
|
|
7.774%, 10/25/58(A)
(B) |
|
|
460 |
|
|
|
442 |
|
|
VMC Finance,
Ser 2021-FL4, Cl C |
|
|
|
|
|
|
|
|
|
Callable 07/18/25
@ $100 |
|
|
|
|
|
|
|
|
|
7.696%, TSFR1M
+ 2.364%, 06/16/36(A) (B) |
|
|
350 |
|
|
|
334 |
|
|
VMC Finance,
Ser 2021-HT1, Cl B |
|
|
|
|
|
|
|
|
|
9.946%, TSFR1M
+ 4.614%, 01/18/37(A) (B) |
|
|
1,600 |
|
|
|
1,538 |
|
|
Wells Fargo Commercial
Mortgage Trust, Ser 2015-C26, Cl D |
|
|
|
|
|
|
|
|
|
Callable 02/15/25
@ $100 |
|
|
|
|
|
|
|
|
|
3.586%, 02/15/48(A) |
|
|
310 |
|
|
|
296 |
|
|
Wells Fargo Commercial
Mortgage Trust, Ser 2015-C26, Cl E |
|
|
|
|
|
|
|
|
|
Callable 02/15/25
@ $100 |
|
|
|
|
|
|
|
|
|
3.250%, 02/15/48(A) |
|
|
540 |
|
|
|
509 |
|
|
Wells Fargo Commercial
Mortgage Trust, Ser 2015-NXS3, Cl D |
|
|
|
|
|
|
|
|
|
Callable 10/15/25
@ $100 |
|
|
|
|
|
|
|
|
|
3.153%, 09/15/57(A) |
|
|
540 |
|
|
|
491 |
|
|
Wells Fargo Mortgage
Backed Securities Trust, Ser 2021-INV2, Cl B4 |
|
|
|
|
|
|
|
|
|
Callable 09/25/45
@ $100 |
|
|
|
|
|
|
|
|
|
3.645%, 09/25/51(A)
(B) |
|
|
95 |
|
|
|
74 |
|
|
Wells Fargo Mortgage
Backed Securities Trust, Ser 2021-RR1, Cl AIO1, IO |
|
|
|
|
|
|
|
|
|
Callable 03/25/46
@ $100 |
|
|
|
|
|
|
|
|
|
0.490%, 12/25/50(A)
(B) |
|
|
3,913 |
|
|
|
106 |
|
| |
|
|
|
|
|
|
|
|
| |
|
|
|
|
|
|
1,796,239 |
|
| |
|
|
|
|
|
|
|
|
|
TOTAL MORTGAGE-BACKED
SECURITIES |
|
|
|
|
|
|
|
|
|
(Cost $1,775,410)
(000) |
|
|
|
|
|
|
1,798,499 |
|
The
accompanying notes are an integral part of the consolidated financial statements.
19
|
THE
ADVISORS’ INNER CIRCLE FUND III |
FS
MULTI-STRATEGY
ALTERNATIVES
FUND
JUNE
30, 2024
(Unaudited) |
|
CORPORATE
OBLIGATIONS — 20.6% |
| |
|
Face Amount (000) |
|
|
Fair Value (000) |
|
|
CANADA —
1.0% |
|
|
|
|
|
Bombardier |
|
|
|
|
|
|
|
|
|
Callable 08/02/24
@ $100.000 |
|
|
|
|
|
|
|
|
|
7.875%, 04/15/27(A) |
|
$ |
6,270 |
|
|
$ |
6,286 |
|
|
Husky Injection
Molding Systems |
|
|
|
|
|
|
|
|
|
Callable 02/15/26
@ $104.500 |
|
|
|
|
|
|
|
|
|
9.000%, 02/15/29(A) |
|
|
628 |
|
|
|
650 |
|
|
Kronos Acquisition
Holdings |
|
|
|
|
|
|
|
|
|
Callable 06/30/27
@ $104.125 |
|
|
|
|
|
|
|
|
|
8.250%, 06/30/31(A) |
|
|
1,040 |
|
|
|
1,041 |
|
|
Callable 08/02/24
@ $102.500 |
|
|
|
|
|
|
|
|
|
5.000%, 12/31/26(A) |
|
|
7,384 |
|
|
|
7,557 |
|
|
Methanex |
|
|
|
|
|
|
|
|
|
Callable 09/01/24
@ $100.000 |
|
|
|
|
|
|
|
|
|
4.250%, 12/01/24 |
|
|
2,215 |
|
|
|
2,196 |
|
| |
|
|
|
|
|
|
|
|
| |
|
|
|
|
|
|
17,730 |
|
|
CHILE — 0.1% |
|
|
|
|
|
Sable International
Finance |
|
|
|
|
|
|
|
|
|
Callable 08/02/24
@ $101.438 |
|
|
|
|
|
|
|
|
|
5.750%, 09/07/27(A) |
|
|
1,390 |
|
|
|
1,334 |
|
| |
|
|
|
|
|
|
|
|
|
GERMANY —
0.0% |
|
|
|
|
|
Cerdia Finanz
GmbH |
|
|
|
|
|
|
|
|
|
Callable 08/02/24
@ $105.250 |
|
|
|
|
|
|
|
|
|
10.500%, 02/15/27(A) |
|
|
1,038 |
|
|
|
1,075 |
|
| |
|
|
|
|
|
|
|
|
|
NETHERLANDS —
0.2% |
|
|
|
|
|
Trivium Packaging
Finance |
|
|
|
|
|
|
|
|
|
Callable 08/02/24
@ $101.375 |
|
|
|
|
|
|
|
|
|
5.500%, 08/15/26(A) |
|
|
3,107 |
|
|
|
3,044 |
|
| |
|
|
|
|
|
|
|
|
|
SWITZERLAND —
0.1% |
|
|
|
|
|
VistaJet Malta
Finance |
|
|
|
|
|
|
|
|
|
Callable 08/02/24
@ $103.938 |
|
|
|
|
|
|
|
|
|
7.875%, 05/01/27(A) |
|
|
1,416 |
|
|
|
1,250 |
|
The
accompanying notes are an integral part of the consolidated financial statements.
20
|
THE
ADVISORS’ INNER CIRCLE FUND III |
FS
MULTI-STRATEGY
ALTERNATIVES
FUND
JUNE
30, 2024
(Unaudited) |
|
CORPORATE
OBLIGATIONS — continued |
|
|
|
Face Amount (000) |
|
|
Fair Value (000) |
|
|
SWITZERLAND —
(continued) |
|
|
|
|
|
Callable 02/01/25
@ $103.188 |
|
|
|
|
|
|
|
|
|
6.375%, 02/01/30(A) |
|
$ |
880 |
|
|
$ |
692 |
|
| |
|
|
|
|
|
|
|
|
| |
|
|
|
|
|
|
1,942 |
|
|
UNITED KINGDOM
— 4.4% |
|
|
|
|
|
Barclays Bank
Versor MTN |
|
|
|
|
|
|
|
|
|
0.000%, 12/27/24(A)(E) |
|
|
82,511 |
|
|
|
80,441 |
|
|
eG Global Finance |
|
|
|
|
|
|
|
|
|
Callable 05/30/26
@ $106.000 |
|
|
|
|
|
|
|
|
|
12.000%, 11/30/28(A) |
|
|
796 |
|
|
|
848 |
|
| |
|
|
|
|
|
|
|
|
| |
|
|
|
|
|
|
81,289 |
|
|
UNITED STATES —
14.8% |
|
|
|
|
|
Acrisure |
|
|
|
|
|
|
|
|
|
Callable 06/15/26
@ $104.250 |
|
|
|
|
|
|
|
|
|
8.500%, 06/15/29(A) |
|
|
990 |
|
|
|
1,000 |
|
|
AdaptHealth |
|
|
|
|
|
|
|
|
|
Callable 07/15/24
@ $103.063 |
|
|
|
|
|
|
|
|
|
6.125%, 08/01/28(A) |
|
|
2,310 |
|
|
|
2,206 |
|
|
AECOM |
|
|
|
|
|
|
|
|
|
Callable 12/15/26
@ $100.000 |
|
|
|
|
|
|
|
|
|
5.125%, 03/15/27 |
|
|
1,350 |
|
|
|
1,327 |
|
|
Albertsons |
|
|
|
|
|
|
|
|
|
Callable 08/02/24
@ $101.875 |
|
|
|
|
|
|
|
|
|
7.500%, 03/15/26(A) |
|
|
1,323 |
|
|
|
1,342 |
|
|
American Airlines |
|
|
|
|
|
|
|
|
|
5.500%, 04/20/26(A) |
|
|
619 |
|
|
|
613 |
|
|
AmeriTex HoldCo
Intermediate |
|
|
|
|
|
|
|
|
|
Callable 10/15/25
@ $105.125 |
|
|
|
|
|
|
|
|
|
10.250%, 10/15/28(A) |
|
|
1,703 |
|
|
|
1,793 |
|
|
ANGI Group |
|
|
|
|
|
|
|
|
|
Callable 07/15/24
@ $101.938 |
|
|
|
|
|
|
|
|
|
3.875%, 08/15/28(A) |
|
|
1,000 |
|
|
|
859 |
|
|
Anywhere Real
Estate Group |
|
|
|
|
|
|
|
|
|
Callable 04/15/25
@ $102.625 |
|
|
|
|
|
|
|
|
|
7.000%, 04/15/30(A) |
|
|
231 |
|
|
|
189 |
|
The
accompanying notes are an integral part of the consolidated financial statements.
21
|
THE
ADVISORS’ INNER CIRCLE FUND III |
FS
MULTI-STRATEGY
ALTERNATIVES
FUND
JUNE
30, 2024
(Unaudited) |
|
CORPORATE
OBLIGATIONS — continued |
|
|
|
Face Amount (000) |
|
|
Fair Value (000) |
|
|
UNITED STATES —
(continued) |
|
|
|
|
|
Arcosa |
|
|
|
|
|
|
|
|
|
Callable 08/02/24
@ $102.188 |
|
|
|
|
|
|
|
|
|
4.375%, 04/15/29(A) |
|
$ |
471 |
|
|
$ |
437 |
|
|
Ares Capital |
|
|
|
|
|
|
|
|
|
7.000%, 01/15/27 |
|
|
1,022 |
|
|
|
1,039 |
|
|
Callable 02/01/29
@ $100.000 |
|
|
|
|
|
|
|
|
|
5.875%, 03/01/29 |
|
|
1,565 |
|
|
|
1,542 |
|
|
Callable 04/15/28
@ $100.000 |
|
|
|
|
|
|
|
|
|
2.875%, 06/15/28 |
|
|
397 |
|
|
|
352 |
|
|
Blackstone Mortgage
Trust |
|
|
|
|
|
|
|
|
|
Callable 10/15/26
@ $100.000 |
|
|
|
|
|
|
|
|
|
3.750%, 01/15/27(A) |
|
|
235 |
|
|
|
212 |
|
|
Boxer Parent |
|
|
|
|
|
|
|
|
|
Callable 07/15/24
@ $100.000 |
|
|
|
|
|
|
|
|
|
9.125%, 03/01/26(A) |
|
|
2,930 |
|
|
|
2,932 |
|
|
Callable 08/02/24
@ $100.000 |
|
|
|
|
|
|
|
|
|
7.125%, 10/02/25(A) |
|
|
3,920 |
|
|
|
3,923 |
|
|
Bread Financial
Holdings |
|
|
|
|
|
|
|
|
|
Callable 03/15/26
@ $104.875 |
|
|
|
|
|
|
|
|
|
9.750%, 03/15/29(A) |
|
|
4,588 |
|
|
|
4,820 |
|
|
Callable 08/02/24
@ $101.750 |
|
|
|
|
|
|
|
|
|
7.000%, 01/15/26(A) |
|
|
679 |
|
|
|
678 |
|
|
Brink's |
|
|
|
|
|
|
|
|
|
Callable 06/15/26
@ $103.250 |
|
|
|
|
|
|
|
|
|
6.500%, 06/15/29(A) |
|
|
500 |
|
|
|
505 |
|
|
Brundage-Bone
Concrete Pumping Holdings |
|
|
|
|
|
|
|
|
|
Callable 08/02/24
@ $101.500 |
|
|
|
|
|
|
|
|
|
6.000%, 02/01/26(A) |
|
|
2,771 |
|
|
|
2,740 |
|
|
Buckeye Partners |
|
|
|
|
|
|
|
|
|
Callable 02/01/25
@ $100.000 |
|
|
|
|
|
|
|
|
|
4.125%, 03/01/25(A) |
|
|
429 |
|
|
|
423 |
|
|
Carnival |
|
|
|
|
|
|
|
|
|
7.875%, 06/01/27 |
|
|
1,565 |
|
|
|
1,638 |
|
|
Catalent Pharma
Solutions |
|
|
|
|
|
|
|
|
|
Callable 08/02/24
@ $100.000 |
|
|
|
|
|
|
|
|
|
5.000%, 07/15/27(A) |
|
|
818 |
|
|
|
802 |
|
|
CCO Holdings |
|
|
|
|
|
|
|
|
|
Callable 07/01/25
@ $102.125 |
|
|
|
|
|
|
|
|
|
4.250%, 02/01/31(A) |
|
|
500 |
|
|
|
408 |
|
The
accompanying notes are an integral part of the consolidated financial statements.
22
|
THE
ADVISORS’ INNER CIRCLE FUND III |
FS
MULTI-STRATEGY
ALTERNATIVES
FUND
JUNE
30, 2024
(Unaudited) |
|
CORPORATE
OBLIGATIONS — continued |
|
|
|
Face Amount (000) |
|
|
Fair Value (000) |
|
|
UNITED STATES —
(continued) |
|
|
|
|
|
CD&R Smokey
Buyer |
|
|
|
|
|
|
|
|
|
Callable 08/02/24
@ $100.000 |
|
|
|
|
|
|
|
|
|
6.750%, 07/15/25(A) |
|
$ |
1,151 |
|
|
$ |
1,144 |
|
|
Central Parent |
|
|
|
|
|
|
|
|
|
Callable 06/15/25
@ $104.000 |
|
|
|
|
|
|
|
|
|
8.000%, 06/15/29(A) |
|
|
699 |
|
|
|
710 |
|
|
Charter Communications
Operating |
|
|
|
|
|
|
|
|
|
Callable 05/01/29
@ $100.000 |
|
|
|
|
|
|
|
|
|
6.100%, 06/01/29 |
|
|
924 |
|
|
|
927 |
|
|
CITGO Petroleum |
|
|
|
|
|
|
|
|
|
Callable 08/02/24
@ $100.000 |
|
|
|
|
|
|
|
|
|
7.000%, 06/15/25(A) |
|
|
6,572 |
|
|
|
6,570 |
|
|
Clarios Global |
|
|
|
|
|
|
|
|
|
Callable 08/02/24
@ $100.000 |
|
|
|
|
|
|
|
|
|
8.500%, 05/15/27(A) |
|
|
9,084 |
|
|
|
9,135 |
|
|
Callable 08/02/24
@ $100.000 |
|
|
|
|
|
|
|
|
|
6.750%, 05/15/25(A) |
|
|
1,500 |
|
|
|
1,500 |
|
|
Callable 08/02/24
@ $100.000 |
|
|
|
|
|
|
|
|
|
6.250%, 05/15/26(A) |
|
|
500 |
|
|
|
500 |
|
|
Cloud Software
Group |
|
|
|
|
|
|
|
|
|
Callable 06/30/27
@ $104.125 |
|
|
|
|
|
|
|
|
|
8.250%, 06/30/32(A) |
|
|
924 |
|
|
|
942 |
|
|
Concentra Escrow
Issuer |
|
|
|
|
|
|
|
|
|
Callable 07/15/27
@ $103.438 |
|
|
|
|
|
|
|
|
|
6.875%, 07/15/32(A) |
|
|
371 |
|
|
|
376 |
|
|
CoreCivic |
|
|
|
|
|
|
|
|
|
Callable 07/15/27
@ $100.000 |
|
|
|
|
|
|
|
|
|
4.750%, 10/15/27 |
|
|
2,266 |
|
|
|
2,131 |
|
|
Cornerstone Building
Brands |
|
|
|
|
|
|
|
|
|
Callable 08/02/24
@ $103.063 |
|
|
|
|
|
|
|
|
|
6.125%, 01/15/29(A) |
|
|
1,500 |
|
|
|
1,234 |
|
|
Cougar JV Subsidiary |
|
|
|
|
|
|
|
|
|
Callable 05/15/27
@ $104.000 |
|
|
|
|
|
|
|
|
|
8.000%, 05/15/32(A) |
|
|
133 |
|
|
|
138 |
|
|
CVS Health |
|
|
|
|
|
|
|
|
|
6.250%, 06/01/27 |
|
|
725 |
|
|
|
744 |
|
|
Callable 12/25/27
@ $100.000 |
|
|
|
|
|
|
|
|
|
4.300%, 03/25/28 |
|
|
3,349 |
|
|
|
3,234 |
|
The
accompanying notes are an integral part of the consolidated financial statements.
23
|
THE
ADVISORS’ INNER CIRCLE FUND III |
FS
MULTI-STRATEGY
ALTERNATIVES
FUND
JUNE
30, 2024
(Unaudited) |
|
CORPORATE
OBLIGATIONS — continued |
|
|
|
Face Amount (000) |
|
|
Fair Value (000) |
|
|
UNITED STATES —
(continued) |
|
|
|
|
|
Dealer Tire |
|
|
|
|
|
|
|
|
|
Callable 08/02/24
@ $102.000 |
|
|
|
|
|
|
|
|
|
8.000%, 02/01/28(A) |
|
$ |
1,912 |
|
|
$ |
1,845 |
|
|
Dell International |
|
|
|
|
|
|
|
|
|
Callable 08/01/26
@ $100.000 |
|
|
|
|
|
|
|
|
|
4.900%, 10/01/26 |
|
|
4,256 |
|
|
|
4,214 |
|
|
Encore Capital
Group |
|
|
|
|
|
|
|
|
|
Callable 08/01/24
@ $102.125 |
|
|
|
|
|
|
|
|
|
4.250%, 06/01/28(A) |
|
GBP |
460 |
|
|
|
503 |
|
|
Enova International |
|
|
|
|
|
|
|
|
|
Callable 12/15/25
@ $105.625 |
|
|
|
|
|
|
|
|
|
11.250%, 12/15/28(A) |
|
$ |
335 |
|
|
|
358 |
|
|
Callable 08/02/24
@ $100.000 |
|
|
|
|
|
|
|
|
|
8.500%, 09/15/25(A) |
|
|
850 |
|
|
|
851 |
|
|
Fiserv |
|
|
|
|
|
|
|
|
|
Callable 07/21/28
@ $100.000 |
|
|
|
|
|
|
|
|
|
5.375%, 08/21/28 |
|
|
3,954 |
|
|
|
3,982 |
|
|
Ford Motor Credit |
|
|
|
|
|
|
|
|
|
Callable 05/16/25
@ $100.000 |
|
|
|
|
|
|
|
|
|
5.125%, 06/16/25 |
|
|
4,720 |
|
|
|
4,684 |
|
|
Freedom Mortgage |
|
|
|
|
|
|
|
|
|
Callable 10/01/25
@ $106.000 |
|
|
|
|
|
|
|
|
|
12.000%, 10/01/28(A) |
|
|
1,738 |
|
|
|
1,866 |
|
|
Callable 08/02/24
@ $103.313 |
|
|
|
|
|
|
|
|
|
6.625%, 01/15/27(A) |
|
|
1,787 |
|
|
|
1,726 |
|
|
Freedom Mortgage
Holdings |
|
|
|
|
|
|
|
|
|
Callable 02/01/26
@ $104.625 |
|
|
|
|
|
|
|
|
|
9.250%, 02/01/29(A) |
|
|
1,122 |
|
|
|
1,121 |
|
|
Callable 05/15/27
@ $104.563 |
|
|
|
|
|
|
|
|
|
9.125%, 05/15/31(A) |
|
|
164 |
|
|
|
160 |
|
|
Full House Resorts |
|
|
|
|
|
|
|
|
|
Callable 07/18/24
@ $104.125 |
|
|
|
|
|
|
|
|
|
8.250%, 02/15/28(A) |
|
|
990 |
|
|
|
949 |
|
|
GE HealthCare
Technologies |
|
|
|
|
|
|
|
|
|
Callable 10/15/27
@ $100.000 |
|
|
|
|
|
|
|
|
|
5.650%, 11/15/27 |
|
|
3,974 |
|
|
|
4,026 |
|
|
Genesis Energy |
|
|
|
|
|
|
|
|
|
Callable 08/02/24
@ $104.000 |
|
|
|
|
|
|
|
|
|
8.000%, 01/15/27 |
|
|
2,000 |
|
|
|
2,045 |
|
The
accompanying notes are an integral part of the consolidated financial statements.
24
|
THE
ADVISORS’ INNER CIRCLE FUND III |
FS
MULTI-STRATEGY
ALTERNATIVES
FUND
JUNE
30, 2024
(Unaudited) |
|
CORPORATE
OBLIGATIONS — continued |
|
|
|
Face Amount (000) |
|
|
Fair Value (000) |
|
|
UNITED STATES —
(continued) |
|
|
|
|
|
Genworth Holdings |
|
|
|
|
|
|
|
|
|
Callable 07/18/24
@ $100.000 |
|
|
|
|
|
|
|
|
|
7.587%, SOFR
+ 2.003%, 11/15/36(B) |
|
$ |
1,751 |
|
|
$ |
1,437 |
|
|
GEO Group |
|
|
|
|
|
|
|
|
|
Callable 04/15/27
@ $105.125 |
|
|
|
|
|
|
|
|
|
10.250%, 04/15/31(A) |
|
|
899 |
|
|
|
941 |
|
|
Callable 04/15/26
@ $104.313 |
|
|
|
|
|
|
|
|
|
8.625%, 04/15/29(A) |
|
|
1,587 |
|
|
|
1,625 |
|
|
Getty Images |
|
|
|
|
|
|
|
|
|
Callable 07/18/24
@ $100.000 |
|
|
|
|
|
|
|
|
|
9.750%, 03/01/27(A) |
|
|
6,399 |
|
|
|
6,412 |
|
|
GFL Environmental |
|
|
|
|
|
|
|
|
|
Callable 08/02/24
@ $101.281 |
|
|
|
|
|
|
|
|
|
5.125%, 12/15/26(A) |
|
|
3,000 |
|
|
|
2,971 |
|
|
GN Bondco |
|
|
|
|
|
|
|
|
|
Callable 10/15/26
@ $104.750 |
|
|
|
|
|
|
|
|
|
9.500%, 10/15/31(A) |
|
|
1,000 |
|
|
|
932 |
|
|
Go Daddy Operating |
|
|
|
|
|
|
|
|
|
Callable 08/02/24
@ $100.875 |
|
|
|
|
|
|
|
|
|
5.250%, 12/01/27(A) |
|
|
2,000 |
|
|
|
1,958 |
|
|
Goodyear Tire
& Rubber |
|
|
|
|
|
|
|
|
|
Callable 07/18/24
@ $100.000 |
|
|
|
|
|
|
|
|
|
9.500%, 05/31/25 |
|
|
11,653 |
|
|
|
11,664 |
|
|
GTCR AP Finance |
|
|
|
|
|
|
|
|
|
Callable 08/02/24
@ $100.000 |
|
|
|
|
|
|
|
|
|
8.000%, 05/15/27(A) |
|
|
165 |
|
|
|
165 |
|
|
HCA |
|
|
|
|
|
|
|
|
|
Callable 03/01/26
@ $100.000 |
|
|
|
|
|
|
|
|
|
5.375%, 09/01/26 |
|
|
4,005 |
|
|
|
3,995 |
|
|
Heartland Dental |
|
|
|
|
|
|
|
|
|
Callable 05/15/25
@ $105.250 |
|
|
|
|
|
|
|
|
|
10.500%, 04/30/28(A) |
|
|
880 |
|
|
|
934 |
|
|
Herc Holdings |
|
|
|
|
|
|
|
|
|
Callable 06/15/26
@ $103.313 |
|
|
|
|
|
|
|
|
|
6.625%, 06/15/29(A) |
|
|
2,000 |
|
|
|
2,028 |
|
|
H-Food Holdings |
|
|
|
|
|
|
|
|
|
Callable 07/15/24
@ $100.000 |
|
|
|
|
|
|
|
|
|
8.500%, 06/01/26(A) |
|
|
1,080 |
|
|
|
76 |
|
The
accompanying notes are an integral part of the consolidated financial statements.
25
|
THE
ADVISORS’ INNER CIRCLE FUND III |
FS
MULTI-STRATEGY
ALTERNATIVES
FUND
JUNE
30, 2024
(Unaudited) |
|
CORPORATE
OBLIGATIONS — continued |
|
|
|
Face Amount (000) |
|
|
Fair Value (000) |
|
|
UNITED STATES —
(continued) |
|
|
|
|
|
HP |
|
|
|
|
|
|
|
|
|
Callable 12/15/27
@ $100.000 |
|
|
|
|
|
|
|
|
|
4.750%, 01/15/28 |
|
$ |
4,232 |
|
|
$ |
4,187 |
|
|
Hudson Pacific
Properties |
|
|
|
|
|
|
|
|
|
Callable 01/15/28
@ $100.000 |
|
|
|
|
|
|
|
|
|
5.950%, 02/15/28 |
|
|
600 |
|
|
|
510 |
|
|
Callable 08/01/27
@ $100.000 |
|
|
|
|
|
|
|
|
|
3.950%, 11/01/27 |
|
|
30 |
|
|
|
25 |
|
|
ILFC E-Capital
Trust II |
|
|
|
|
|
|
|
|
|
Callable 08/02/24
@ $100.000 |
|
|
|
|
|
|
|
|
|
7.409%, TSFR3M
+ 2.062%, 12/21/65(A) (B) |
|
|
1,700 |
|
|
|
1,409 |
|
|
Illuminate Buyer |
|
|
|
|
|
|
|
|
|
Callable 08/02/24
@ $102.250 |
|
|
|
|
|
|
|
|
|
9.000%, 07/01/28(A) |
|
|
3,704 |
|
|
|
3,733 |
|
|
IRB Holding |
|
|
|
|
|
|
|
|
|
Callable 08/02/24
@ $100.000 |
|
|
|
|
|
|
|
|
|
7.000%, 06/15/25(A) |
|
|
2,000 |
|
|
|
2,000 |
|
|
KeHE Distributors |
|
|
|
|
|
|
|
|
|
Callable 02/15/26
@ $104.500 |
|
|
|
|
|
|
|
|
|
9.000%, 02/15/29(A) |
|
|
1,791 |
|
|
|
1,836 |
|
|
Kennedy-Wilson |
|
|
|
|
|
|
|
|
|
Callable 03/01/26
@ $102.500 |
|
|
|
|
|
|
|
|
|
5.000%, 03/01/31 |
|
|
278 |
|
|
|
227 |
|
|
Callable 09/01/24
@ $102.375 |
|
|
|
|
|
|
|
|
|
4.750%, 02/01/30 |
|
|
282 |
|
|
|
234 |
|
|
Ladder Capital
Finance Holdings |
|
|
|
|
|
|
|
|
|
Callable 07/15/27
@ $103.500 |
|
|
|
|
|
|
|
|
|
7.000%, 07/15/31(A) |
|
|
563 |
|
|
|
568 |
|
|
Callable 07/18/24
@ $100.000 |
|
|
|
|
|
|
|
|
|
5.250%, 10/01/25(A) |
|
|
4,816 |
|
|
|
4,774 |
|
|
Callable 08/02/24
@ $101.063 |
|
|
|
|
|
|
|
|
|
4.250%, 02/01/27(A) |
|
|
2,757 |
|
|
|
2,611 |
|
|
LD Holdings Group |
|
|
|
|
|
|
|
|
|
Callable 11/01/25
@ $104.125 |
|
|
|
|
|
|
|
|
|
8.750%, 11/01/27(A) |
|
|
554 |
|
|
|
490 |
|
|
Callable 07/15/24
@ $103.063 |
|
|
|
|
|
|
|
|
|
6.125%, 04/01/28(A) |
|
|
489 |
|
|
|
367 |
|
|
Level 3 Financing |
|
|
|
|
|
|
|
|
|
Callable 05/15/26
@ $105.250 |
|
|
|
|
|
|
|
|
|
10.500%, 05/15/30(A) |
|
|
717 |
|
|
|
710 |
|
The
accompanying notes are an integral part of the consolidated financial statements.
26
|
THE
ADVISORS’ INNER CIRCLE FUND III |
FS
MULTI-STRATEGY
ALTERNATIVES
FUND
JUNE
30, 2024
(Unaudited) |
|
CORPORATE
OBLIGATIONS — continued |
|
|
|
Face Amount (000) |
|
|
Fair Value (000) |
|
|
UNITED STATES —
(continued) |
|
|
|
|
|
LFS Topco |
|
|
|
|
|
|
|
|
|
Callable 08/02/24
@ $102.938 |
|
|
|
|
|
|
|
|
|
5.875%, 10/15/26(A) |
|
$ |
142 |
|
|
$ |
131 |
|
|
Madison IAQ |
|
|
|
|
|
|
|
|
|
Callable 08/02/24
@ $102.938 |
|
|
|
|
|
|
|
|
|
5.875%, 06/30/29(A) |
|
|
1,000 |
|
|
|
930 |
|
|
Maxim Crane Works
Holdings Capital |
|
|
|
|
|
|
|
|
|
Callable 09/01/25
@ $105.750 |
|
|
|
|
|
|
|
|
|
11.500%, 09/01/28(A) |
|
|
4,501 |
|
|
|
4,641 |
|
|
Midcap Financial
Issuer Trust |
|
|
|
|
|
|
|
|
|
Callable 07/18/24
@ $103.250 |
|
|
|
|
|
|
|
|
|
6.500%, 05/01/28(A) |
|
|
1,887 |
|
|
|
1,785 |
|
|
Mohegan Tribal
Gaming Authority |
|
|
|
|
|
|
|
|
|
Callable 08/02/24
@ $102.000 |
|
|
|
|
|
|
|
|
|
8.000%, 02/01/26(A) |
|
|
6,787 |
|
|
|
6,434 |
|
|
MPT Operating
Partnership |
|
|
|
|
|
|
|
|
|
Callable 08/02/24
@ $100.000 |
|
|
|
|
|
|
|
|
|
5.250%, 08/01/26 |
|
|
1,403 |
|
|
|
1,275 |
|
|
Nationstar Mortgage
Holdings |
|
|
|
|
|
|
|
|
|
Callable 08/02/24
@ $101.250 |
|
|
|
|
|
|
|
|
|
5.000%, 02/01/26(A) |
|
|
2,097 |
|
|
|
2,053 |
|
|
New Enterprise
Stone & Lime |
|
|
|
|
|
|
|
|
|
Callable 08/02/24
@ $102.438 |
|
|
|
|
|
|
|
|
|
9.750%, 07/15/28(A) |
|
|
1,690 |
|
|
|
1,718 |
|
|
New Home |
|
|
|
|
|
|
|
|
|
Callable 10/01/26
@ $104.625 |
|
|
|
|
|
|
|
|
|
9.250%, 10/01/29(A) |
|
|
1,388 |
|
|
|
1,391 |
|
|
NuStar Logistics |
|
|
|
|
|
|
|
|
|
Callable 03/01/26
@ $100.000 |
|
|
|
|
|
|
|
|
|
6.000%, 06/01/26 |
|
|
1,677 |
|
|
|
1,675 |
|
|
Callable 01/28/27
@ $100.000 |
|
|
|
|
|
|
|
|
|
5.625%, 04/28/27 |
|
|
1,174 |
|
|
|
1,164 |
|
|
Olympus Water
US Holding |
|
|
|
|
|
|
|
|
|
Callable 06/01/25
@ $104.875 |
|
|
|
|
|
|
|
|
|
9.750%, 11/15/28(A) |
|
|
915 |
|
|
|
968 |
|
|
Callable 10/01/24
@ $103.563 |
|
|
|
|
|
|
|
|
|
7.125%, 10/01/27(A) |
|
|
1,463 |
|
|
|
1,469 |
|
|
OneMain Finance |
|
|
|
|
|
|
|
|
|
7.125%, 03/15/26 |
|
|
2,284 |
|
|
|
2,321 |
|
The
accompanying notes are an integral part of the consolidated financial statements.
27
|
THE
ADVISORS’ INNER CIRCLE FUND III |
FS
MULTI-STRATEGY
ALTERNATIVES
FUND
JUNE
30, 2024
(Unaudited) |
|
CORPORATE
OBLIGATIONS — continued |
|
|
|
Face Amount (000) |
|
|
Fair Value (000) |
|
|
UNITED STATES —
(continued) |
|
|
|
|
|
Oracle |
|
|
|
|
|
|
|
|
|
Callable 04/06/28
@ $100.000 |
|
|
|
|
|
|
|
|
|
4.500%, 05/06/28 |
|
$ |
4,518 |
|
|
$ |
4,437 |
|
|
Pactiv |
|
|
|
|
|
|
|
|
|
8.375%, 04/15/27 |
|
|
1,029 |
|
|
|
1,072 |
|
|
7.950%, 12/15/25 |
|
|
777 |
|
|
|
798 |
|
|
PHH Mortgage |
|
|
|
|
|
|
|
|
|
Callable 08/02/24
@ $101.969 |
|
|
|
|
|
|
|
|
|
7.875%, 03/15/26(A) |
|
|
416 |
|
|
|
406 |
|
|
PRA Group |
|
|
|
|
|
|
|
|
|
Callable 06/01/26
@ $104.438 |
|
|
|
|
|
|
|
|
|
8.875%, 01/31/30(A) |
|
|
455 |
|
|
|
454 |
|
|
Callable 10/01/24
@ $102.500 |
|
|
|
|
|
|
|
|
|
5.000%, 10/01/29(A) |
|
|
247 |
|
|
|
212 |
|
|
Prime Security
Services Borrower |
|
|
|
|
|
|
|
|
|
5.750%, 04/15/26(A) |
|
|
2,721 |
|
|
|
2,700 |
|
|
Callable 08/31/26
@ $100.000 |
|
|
|
|
|
|
|
|
|
3.375%, 08/31/27(A) |
|
|
783 |
|
|
|
724 |
|
|
Raptor Acquisition |
|
|
|
|
|
|
|
|
|
Callable 07/15/24
@ $101.219 |
|
|
|
|
|
|
|
|
|
4.875%, 11/01/26(A) |
|
|
2,835 |
|
|
|
2,743 |
|
|
Regal Rexnord |
|
|
|
|
|
|
|
|
|
Callable 03/15/28
@ $100.000 |
|
|
|
|
|
|
|
|
|
6.050%, 04/15/28 |
|
|
5,198 |
|
|
|
5,261 |
|
|
Rithm Capital |
|
|
|
|
|
|
|
|
|
Callable 04/01/26
@ $104.000 |
|
|
|
|
|
|
|
|
|
8.000%, 04/01/29(A) |
|
|
4,496 |
|
|
|
4,364 |
|
|
Callable 08/02/24
@ $101.563 |
|
|
|
|
|
|
|
|
|
6.250%, 10/15/25(A) |
|
|
1,308 |
|
|
|
1,299 |
|
|
RLJ Lodging Trust |
|
|
|
|
|
|
|
|
|
Callable 08/02/24
@ $100.938 |
|
|
|
|
|
|
|
|
|
3.750%, 07/01/26(A) |
|
|
793 |
|
|
|
754 |
|
|
Select Medical |
|
|
|
|
|
|
|
|
|
Callable 08/02/24
@ $102.083 |
|
|
|
|
|
|
|
|
|
6.250%, 08/15/26(A) |
|
|
8,504 |
|
|
|
8,546 |
|
|
Service Properties
Trust |
|
|
|
|
|
|
|
|
|
Callable 06/15/27
@ $104.438 |
|
|
|
|
|
|
|
|
|
8.875%, 06/15/32 |
|
|
150 |
|
|
|
140 |
|
|
Callable 08/15/25
@ $100.000 |
|
|
|
|
|
|
|
|
|
5.250%, 02/15/26 |
|
|
7,978 |
|
|
|
7,725 |
|
The
accompanying notes are an integral part of the consolidated financial statements.
28
|
THE
ADVISORS’ INNER CIRCLE FUND III |
FS
MULTI-STRATEGY
ALTERNATIVES
FUND
JUNE
30, 2024
(Unaudited) |
|
CORPORATE
OBLIGATIONS — continued |
|
|
|
Face Amount (000) |
|
|
Fair Value (000) |
|
|
UNITED STATES —
(continued) |
|
|
|
|
|
Callable 08/15/26
@ $100.000 |
|
|
|
|
|
|
|
|
|
4.950%, 02/15/27 |
|
$ |
1,650 |
|
|
$ |
1,500 |
|
|
Callable 08/01/26
@ $100.000 |
|
|
|
|
|
|
|
|
|
4.750%, 10/01/26 |
|
|
1,650 |
|
|
|
1,546 |
|
|
Callable 08/15/29
@ $100.000 |
|
|
|
|
|
|
|
|
|
4.375%, 02/15/30 |
|
|
101 |
|
|
|
71 |
|
|
Six Flags Theme
Parks |
|
|
|
|
|
|
|
|
|
Callable 08/02/24
@ $100.000 |
|
|
|
|
|
|
|
|
|
7.000%, 07/01/25(A) |
|
|
2,662 |
|
|
|
2,670 |
|
|
Southwestern
Energy |
|
|
|
|
|
|
|
|
|
Callable 07/18/24
@ $104.188 |
|
|
|
|
|
|
|
|
|
8.375%, 09/15/28 |
|
|
1,126 |
|
|
|
1,164 |
|
|
Starwood Property
Trust |
|
|
|
|
|
|
|
|
|
Callable 10/01/28
@ $100.000 |
|
|
|
|
|
|
|
|
|
7.250%, 04/01/29(A) |
|
|
1,788 |
|
|
|
1,807 |
|
|
Callable 09/30/24
@ $100.000 |
|
|
|
|
|
|
|
|
|
3.750%, 12/31/24(A) |
|
|
2,337 |
|
|
|
2,302 |
|
|
Callable 01/15/26
@ $100.000 |
|
|
|
|
|
|
|
|
|
3.625%, 07/15/26(A) |
|
|
1,311 |
|
|
|
1,233 |
|
|
Sunoco |
|
|
|
|
|
|
|
|
|
Callable 08/02/24
@ $101.000 |
|
|
|
|
|
|
|
|
|
6.000%, 04/15/27 |
|
|
1,726 |
|
|
|
1,724 |
|
|
Surgery Center
Holdings |
|
|
|
|
|
|
|
|
|
Callable 04/15/27
@ $103.625 |
|
|
|
|
|
|
|
|
|
7.250%, 04/15/32(A) |
|
|
500 |
|
|
|
505 |
|
|
SWF Escrow Issuer |
|
|
|
|
|
|
|
|
|
Callable 10/01/24
@ $103.250 |
|
|
|
|
|
|
|
|
|
6.500%, 10/01/29(A) |
|
|
1,001 |
|
|
|
539 |
|
|
Tempo Acquisition |
|
|
|
|
|
|
|
|
|
Callable 07/15/24
@ $100.000 |
|
|
|
|
|
|
|
|
|
5.750%, 06/01/25(A) |
|
|
4,406 |
|
|
|
4,400 |
|
|
Tenet Healthcare |
|
|
|
|
|
|
|
|
|
Callable 07/18/24
@ $100.000 |
|
|
|
|
|
|
|
|
|
6.250%, 02/01/27 |
|
|
1,324 |
|
|
|
1,323 |
|
|
TKC Holdings |
|
|
|
|
|
|
|
|
|
Callable 08/02/24
@ $103.438 |
|
|
|
|
|
|
|
|
|
6.875%, 05/15/28(A) |
|
|
2,989 |
|
|
|
2,898 |
|
|
T-Mobile USA |
|
|
|
|
|
|
|
|
|
Callable 02/15/28
@ $100.000 |
|
|
|
|
|
|
|
|
|
4.950%, 03/15/28 |
|
|
5,724 |
|
|
|
5,686 |
|
The
accompanying notes are an integral part of the consolidated financial statements.
29
|
THE
ADVISORS’ INNER CIRCLE FUND III |
FS
MULTI-STRATEGY
ALTERNATIVES
FUND
JUNE
30, 2024
(Unaudited) |
|
CORPORATE
OBLIGATIONS — continued |
|
|
|
Face Amount (000) |
|
|
Fair Value (000) |
|
|
UNITED STATES —
(continued) |
|
|
|
|
|
TMS International |
|
|
|
|
|
|
|
|
|
Callable 07/15/24
@ $103.125 |
|
|
|
|
|
|
|
|
|
6.250%, 04/15/29(A) |
|
$ |
1,012 |
|
|
$ |
924 |
|
|
Townsquare Media |
|
|
|
|
|
|
|
|
|
Callable 08/02/24
@ $101.719 |
|
|
|
|
|
|
|
|
|
6.875%, 02/01/26(A) |
|
|
2,139 |
|
|
|
2,106 |
|
|
US Acute Care
Solutions |
|
|
|
|
|
|
|
|
|
Callable 05/15/26
@ $104.875 |
|
|
|
|
|
|
|
|
|
9.750%, 05/15/29(A) |
|
|
1,957 |
|
|
|
1,927 |
|
|
Valley National
Bancorp |
|
|
|
|
|
|
|
|
|
Callable 06/15/25
@ $100.000 |
|
|
|
|
|
|
|
|
|
5.250%, TSFR3M
+ 5.140%, 06/15/30(B) |
|
|
90 |
|
|
|
77 |
|
|
Callable 06/15/26
@ $100.000 |
|
|
|
|
|
|
|
|
|
3.000%, TSFR3M
+ 2.360%, 06/15/31(B) |
|
|
447 |
|
|
|
349 |
|
|
Vector Group |
|
|
|
|
|
|
|
|
|
Callable 08/02/24
@ $100.000 |
|
|
|
|
|
|
|
|
|
10.500%, 11/01/26(A) |
|
|
8,594 |
|
|
|
8,680 |
|
|
Callable 08/02/24
@ $102.875 |
|
|
|
|
|
|
|
|
|
5.750%, 02/01/29(A) |
|
|
995 |
|
|
|
932 |
|
|
WASH Multifamily
Acquisition |
|
|
|
|
|
|
|
|
|
Callable 08/02/24
@ $101.438 |
|
|
|
|
|
|
|
|
|
5.750%, 04/15/26(A) |
|
|
6,915 |
|
|
|
6,760 |
|
|
White Capital
Parent |
|
|
|
|
|
|
|
|
|
Callable 08/02/24
@ $100.000 |
|
|
|
|
|
|
|
|
|
8.250% cash/0%
PIK, 03/15/26(A) |
|
|
1,804 |
|
|
|
1,804 |
|
|
Williams Scotsman |
|
|
|
|
|
|
|
|
|
Callable 07/18/24
@ $100.000 |
|
|
|
|
|
|
|
|
|
6.125%, 06/15/25(A) |
|
|
1,127 |
|
|
|
1,125 |
|
|
XHR |
|
|
|
|
|
|
|
|
|
Callable 07/15/24
@ $101.594 |
|
|
|
|
|
|
|
|
|
6.375%, 08/15/25(A) |
|
|
675 |
|
|
|
674 |
|
| |
|
|
|
|
|
|
|
|
| |
|
|
|
|
|
|
272,530 |
|
|
TOTAL CORPORATE
OBLIGATIONS |
|
|
|
|
|
|
|
|
|
(Cost $382,608)
(000) |
|
|
|
|
|
|
378,944 |
|
| |
|
|
|
|
|
|
|
|
The
accompanying notes are an integral part of the consolidated financial statements.
30
|
THE
ADVISORS’ INNER CIRCLE FUND III |
FS
MULTI-STRATEGY
ALTERNATIVES
FUND
JUNE
30, 2024
(Unaudited) |
|
ASSET-BACKED
SECURITIES — 6.5% |
| |
|
Face Amount (000) |
|
|
Fair Value (000) |
|
|
BERMUDA
— 0.0% |
|
Rad CLO, Ser
2023-20A, Cl E |
|
|
|
|
|
|
|
|
|
Callable 07/20/25
@ $100 |
|
|
|
|
|
|
|
|
|
13.405%, TSFR3M
+ 8.080%, 07/20/36(A) (B) |
|
$ |
250 |
|
|
$ |
258 |
|
| |
|
|
|
|
|
|
|
|
| |
|
|
|
|
|
|
|
|
|
CAYMAN
ISLANDS — 3.3% |
|
AB BSL CLO 2,
Ser 2021-2A, Cl E |
|
|
|
|
|
|
|
|
|
Callable 07/15/24
@ $100 |
|
|
|
|
|
|
|
|
|
12.300%, TSFR3M
+ 6.972%, 04/15/34(A) (B) |
|
|
250 |
|
|
|
245 |
|
|
Allegro CLO VI,
Ser 2018-2A, Cl D |
|
|
|
|
|
|
|
|
|
Callable 07/17/24
@ $100 |
|
|
|
|
|
|
|
|
|
8.329%, TSFR3M
+ 3.012%, 01/17/31(A) (B) |
|
|
2,000 |
|
|
|
1,996 |
|
|
Anchorage Capital
CLO, Ser 2018-10A, Cl E |
|
|
|
|
|
|
|
|
|
Callable 07/15/24
@ $100 |
|
|
|
|
|
|
|
|
|
11.340%, TSFR3M
+ 6.012%, 10/15/31(A) (B) |
|
|
1,500 |
|
|
|
1,489 |
|
|
Anchorage Capital
CLO, Ser 2024-28A, Cl E |
|
|
|
|
|
|
|
|
|
Callable 01/20/26
@ $100 |
|
|
|
|
|
|
|
|
|
12.235%, TSFR3M
+ 6.950%, 04/20/37(A) (B) |
|
|
1,420 |
|
|
|
1,458 |
|
|
Anchorage Capital
CLO, Ser 2024-29A, Cl E |
|
|
|
|
|
|
|
|
|
Callable 07/20/26
@ $100 |
|
|
|
|
|
|
|
|
|
12.161%, TSFR3M
+ 6.840%, 07/20/37(A) (B) |
|
|
1,500 |
|
|
|
1,491 |
|
|
Apidos CLO XV,
Ser 2018-15A, Cl ERR |
|
|
|
|
|
|
|
|
|
Callable 07/20/24
@ $100 |
|
|
|
|
|
|
|
|
|
11.286%, TSFR3M
+ 5.962%, 04/20/31(A) (B) |
|
|
1,000 |
|
|
|
993 |
|
|
Apidos CLO XX,
Ser 2018-20A, Cl DR |
|
|
|
|
|
|
|
|
|
Callable 07/16/24
@ $100 |
|
|
|
|
|
|
|
|
|
11.289%, TSFR3M
+ 5.962%, 07/16/31(A) (B) |
|
|
250 |
|
|
|
248 |
|
|
Apidos CLO XXII,
Ser 2020-22A, Cl DR |
|
|
|
|
|
|
|
|
|
Callable 07/20/24
@ $100 |
|
|
|
|
|
|
|
|
|
12.336%, TSFR3M
+ 7.012%, 04/20/31(A) (B) |
|
|
1,000 |
|
|
|
993 |
|
|
Apidos CLO XXX,
Ser 2018-XXXA, Cl D |
|
|
|
|
|
|
|
|
|
Callable 07/18/24
@ $100 |
|
|
|
|
|
|
|
|
|
11.189%, TSFR3M
+ 5.862%, 10/18/31(A) (B) |
|
|
1,000 |
|
|
|
998 |
|
The
accompanying notes are an integral part of the consolidated financial statements.
31
|
THE
ADVISORS’ INNER CIRCLE FUND III |
FS
MULTI-STRATEGY
ALTERNATIVES
FUND
JUNE
30, 2024
(Unaudited) |
|
ASSET-BACKED
SECURITIES — continued |
|
|
|
Face Amount (000) |
|
|
Fair Value (000) |
|
|
CAYMAN
ISLANDS — (continued) |
|
Bain Capital
Credit CLO, Ser 2021-2A, Cl ER |
|
|
|
|
|
|
|
|
|
Callable 07/19/24
@ $100 |
|
|
|
|
|
|
|
|
|
12.198%, TSFR3M
+ 6.872%, 07/19/34(A) (B) |
|
$ |
360 |
|
|
$ |
356 |
|
|
Callable 07/17/24
@ $100 |
|
|
|
|
|
|
|
|
|
11.899%, TSFR3M
+ 6.582%, 10/17/32(A) (B) |
|
|
250 |
|
|
|
246 |
|
|
Bain Capital
Credit CLO, Ser 2021-3A, Cl ER |
|
|
|
|
|
|
|
|
|
Callable 07/21/24
@ $100 |
|
|
|
|
|
|
|
|
|
12.686%, TSFR3M
+ 7.362%, 10/21/34(A) (B) |
|
|
700 |
|
|
|
677 |
|
|
Benefit Street
Partners CLO IX, Ser 2018-9A, Cl ER |
|
|
|
|
|
|
|
|
|
Callable 07/20/24
@ $100 |
|
|
|
|
|
|
|
|
|
11.286%, TSFR3M
+ 5.962%, 07/20/31(A) (B) |
|
|
500 |
|
|
|
492 |
|
|
Carlyle US CLO,
Ser 2021-2A, Cl DR |
|
|
|
|
|
|
|
|
|
Callable 07/15/24
@ $100 |
|
|
|
|
|
|
|
|
|
12.090%, TSFR3M
+ 6.762%, 07/15/32(A) (B) |
|
|
500 |
|
|
|
502 |
|
|
Carlyle US CLO,
Ser 2023-3A, Cl E |
|
|
|
|
|
|
|
|
|
Callable 10/15/25
@ $100 |
|
|
|
|
|
|
|
|
|
13.729%, TSFR3M
+ 8.400%, 10/15/36(A) (B) |
|
|
410 |
|
|
|
424 |
|
|
CFG Investments,
Ser 2023-1, Cl B |
|
|
|
|
|
|
|
|
|
Callable 02/25/25
@ $100 |
|
|
|
|
|
|
|
|
|
10.050%, 07/25/34(A) |
|
|
210 |
|
|
|
214 |
|
|
CIFC Funding,
Ser 2015-3A, Cl ER |
|
|
|
|
|
|
|
|
|
Callable 07/19/24
@ $100 |
|
|
|
|
|
|
|
|
|
10.538%, TSFR3M
+ 5.212%, 04/19/29(A) (B) |
|
|
250 |
|
|
|
249 |
|
|
CIFC Funding,
Ser 2017-2A, Cl E |
|
|
|
|
|
|
|
|
|
Callable 07/20/24
@ $100 |
|
|
|
|
|
|
|
|
|
11.536%, TSFR3M
+ 6.212%, 04/20/30(A) (B) |
|
|
500 |
|
|
|
496 |
|
|
CIFC Funding,
Ser 2017-4A, Cl D |
|
|
|
|
|
|
|
|
|
Callable 07/24/24
@ $100 |
|
|
|
|
|
|
|
|
|
11.685%, TSFR3M
+ 6.362%, 10/24/30(A) (B) |
|
|
700 |
|
|
|
697 |
|
|
Dryden 60 CLO,
Ser 2018-60A, Cl D |
|
|
|
|
|
|
|
|
|
Callable 07/15/24
@ $100 |
|
|
|
|
|
|
|
|
|
8.590%, TSFR3M
+ 3.262%, 07/15/31(A) (B) |
|
|
300 |
|
|
|
297 |
|
The
accompanying notes are an integral part of the consolidated financial statements.
32
|
THE
ADVISORS’ INNER CIRCLE FUND III |
FS
MULTI-STRATEGY
ALTERNATIVES
FUND
JUNE
30, 2024
(Unaudited) |
|
ASSET-BACKED
SECURITIES — continued |
|
|
|
Face Amount (000) |
|
|
Fair Value (000) |
|
|
CAYMAN
ISLANDS — (continued) |
|
Eaton Vance CLO,
Ser 2021-1A, Cl D3R |
|
|
|
|
|
|
|
|
|
Callable 07/15/24
@ $100 |
|
|
|
|
|
|
|
|
|
12.390%, TSFR3M
+ 7.062%, 01/15/34(A) (B) |
|
$ |
1,500 |
|
|
$ |
1,498 |
|
|
Empower CLO,
Ser 2022-1A, Cl E |
|
|
|
|
|
|
|
|
|
Callable 10/20/24
@ $100 |
|
|
|
|
|
|
|
|
|
13.875%, TSFR3M
+ 8.550%, 10/20/34(A) (B) |
|
|
400 |
|
|
|
404 |
|
|
Empower CLO,
Ser 2023-2A, Cl E |
|
|
|
|
|
|
|
|
|
Callable 10/15/25
@ $100 |
|
|
|
|
|
|
|
|
|
13.579%, TSFR3M
+ 8.250%, 07/15/36(A) (B) |
|
|
1,530 |
|
|
|
1,583 |
|
|
Empower CLO,
Ser 2024-1A, Cl D2 |
|
|
|
|
|
|
|
|
|
Callable 04/25/26
@ $100 |
|
|
|
|
|
|
|
|
|
9.250%, 04/25/37(A) |
|
|
250 |
|
|
|
256 |
|
|
Empower CLO,
Ser 2024-1A, Cl E |
|
|
|
|
|
|
|
|
|
Callable 04/25/26
@ $100 |
|
|
|
|
|
|
|
|
|
11.811%, TSFR3M
+ 6.500%, 04/25/37(A) (B) |
|
|
250 |
|
|
|
253 |
|
|
Fillmore Park
CLO, Ser 2018-1A, Cl E |
|
|
|
|
|
|
|
|
|
Callable 07/15/24
@ $100 |
|
|
|
|
|
|
|
|
|
10.990%, TSFR3M
+ 5.662%, 07/15/30(A) (B) |
|
|
788 |
|
|
|
782 |
|
|
Fortress Credit
BSL III, Ser 2018-1A, Cl ER |
|
|
|
|
|
|
|
|
|
Callable 07/18/24
@ $100 |
|
|
|
|
|
|
|
|
|
11.779%, TSFR3M
+ 6.452%, 04/18/31(A) (B) |
|
|
1,000 |
|
|
|
987 |
|
|
Fortress Credit
BSL VII, Ser 2019-1A, Cl E |
|
|
|
|
|
|
|
|
|
Callable 07/23/24
@ $100 |
|
|
|
|
|
|
|
|
|
12.528%, TSFR3M
+ 7.202%, 07/23/32(A) (B) |
|
|
1,600 |
|
|
|
1,600 |
|
|
Fortress Credit
BSL VIII, Ser 2019-2A, Cl E |
|
|
|
|
|
|
|
|
|
Callable 07/20/24
@ $100 |
|
|
|
|
|
|
|
|
|
12.596%, TSFR3M
+ 7.272%, 10/20/32(A) (B) |
|
|
1,000 |
|
|
|
975 |
|
|
Galaxy XXVI CLO,
Ser 2018-26A, Cl E |
|
|
|
|
|
|
|
|
|
Callable 11/22/24
@ $100 |
|
|
|
|
|
|
|
|
|
11.438%, TSFR3M
+ 6.112%, 11/22/31(A) (B) |
|
|
1,500 |
|
|
|
1,494 |
|
|
Generate CLO,
Ser 2017-2A, Cl ER |
|
|
|
|
|
|
|
|
|
Callable 07/22/24
@ $100 |
|
|
|
|
|
|
|
|
The
accompanying notes are an integral part of the consolidated financial statements.
33
|
THE
ADVISORS’ INNER CIRCLE FUND III |
FS
MULTI-STRATEGY
ALTERNATIVES
FUND
JUNE
30, 2024
(Unaudited) |
|
ASSET-BACKED
SECURITIES — continued |
|
|
|
Face Amount (000) |
|
|
Fair Value (000) |
|
|
CAYMAN
ISLANDS — (continued) |
|
11.236%, TSFR3M
+ 5.912%, 01/22/31(A) (B) |
|
$ |
750 |
|
|
$ |
748 |
|
|
Generate CLO,
Ser 2023-3A, Cl E2R |
|
|
|
|
|
|
|
|
|
Callable 01/20/26
@ $100 |
|
|
|
|
|
|
|
|
|
13.155%, TSFR3M
+ 7.830%, 10/20/36(A) (B) |
|
|
1,250 |
|
|
|
1,292 |
|
|
Generate CLO,
Ser 2024-14A, Cl E |
|
|
|
|
|
|
|
|
|
Callable 04/22/26
@ $100 |
|
|
|
|
|
|
|
|
|
12.075%, TSFR3M
+ 6.750%, 04/22/37(A) (B) |
|
|
1,780 |
|
|
|
1,833 |
|
|
Gilbert Park
CLO, Ser 2017-1A, Cl E |
|
|
|
|
|
|
|
|
|
Callable 07/15/24
@ $100 |
|
|
|
|
|
|
|
|
|
11.990%, TSFR3M
+ 6.662%, 10/15/30(A) (B) |
|
|
250 |
|
|
|
247 |
|
|
Goldentree Loan
Management US CLO 5, Ser 2019-5A, Cl E |
|
|
|
|
|
|
|
|
|
Callable 07/20/24
@ $100 |
|
|
|
|
|
|
|
|
|
10.436%, TSFR3M
+ 5.112%, 10/20/32(A) (B) |
|
|
520 |
|
|
|
517 |
|
|
Greywolf CLO
IV, Ser 2021-1A, Cl DR |
|
|
|
|
|
|
|
|
|
Callable 07/17/24
@ $100 |
|
|
|
|
|
|
|
|
|
12.437%, TSFR3M
+ 7.120%, 04/17/34(A) (B) |
|
|
1,500 |
|
|
|
1,485 |
|
|
HPS Loan Management,
Ser 2018-2016, Cl DR |
|
|
|
|
|
|
|
|
|
Callable 07/20/24
@ $100 |
|
|
|
|
|
|
|
|
|
8.486%, TSFR3M
+ 3.162%, 07/20/30(A) (B) |
|
|
1,180 |
|
|
|
1,167 |
|
|
Ivy Hill Middle
Market Credit Fund XXI, Ser 2023-21A, Cl E |
|
|
|
|
|
|
|
|
|
13.847%, TSFR3M
+ 8.520%, 07/18/35(A) (B) |
|
|
450 |
|
|
|
447 |
|
|
Jamestown CLO
XII, Ser 2019-1A, Cl D |
|
|
|
|
|
|
|
|
|
Callable 10/20/24
@ $100 |
|
|
|
|
|
|
|
|
|
12.586%, TSFR3M
+ 7.262%, 04/20/32(A) (B) |
|
|
250 |
|
|
|
247 |
|
|
KKR CLO 23, Ser
2018-23, Cl E |
|
|
|
|
|
|
|
|
|
Callable 07/20/24
@ $100 |
|
|
|
|
|
|
|
|
|
11.586%, TSFR3M
+ 6.262%, 10/20/31(A) (B) |
|
|
1,000 |
|
|
|
991 |
|
|
LCM XIII, Ser
2016-13A, Cl ER |
|
|
|
|
|
|
|
|
|
Callable 07/19/24
@ $100 |
|
|
|
|
|
|
|
|
The
accompanying notes are an integral part of the consolidated financial statements.
34
|
THE
ADVISORS’ INNER CIRCLE FUND III |
FS
MULTI-STRATEGY
ALTERNATIVES
FUND
JUNE
30, 2024
(Unaudited) |
|
ASSET-BACKED
SECURITIES — continued |
|
|
|
Face Amount (000) |
|
|
Fair Value (000) |
|
|
CAYMAN
ISLANDS — (continued) |
|
12.888%, TSFR3M
+ 7.562%, 07/19/27(A) (B) |
|
$ |
400 |
|
|
$ |
388 |
|
|
Madison Park
Funding LI, Ser 2021-51A, Cl E |
|
|
|
|
|
|
|
|
|
Callable 07/19/24
@ $100 |
|
|
|
|
|
|
|
|
|
11.858%, TSFR3M
+ 6.532%, 07/19/34(A) (B) |
|
|
1,250 |
|
|
|
1,250 |
|
|
Madison Park
Funding XIV, Ser 2018-14A, Cl ER |
|
|
|
|
|
|
|
|
|
Callable 10/22/24
@ $100 |
|
|
|
|
|
|
|
|
|
11.386%, TSFR3M
+ 6.062%, 10/22/30(A) (B) |
|
|
1,000 |
|
|
|
991 |
|
|
Madison Park
Funding XXVII, Ser 2018-27A, Cl C |
|
|
|
|
|
|
|
|
|
Callable 07/20/24
@ $100 |
|
|
|
|
|
|
|
|
|
8.186%, TSFR3M
+ 2.862%, 04/20/30(A) (B) |
|
|
250 |
|
|
|
249 |
|
|
Madison Park
Funding XXX, Ser 2018-30A, Cl E |
|
|
|
|
|
|
|
|
|
Callable 07/15/24
@ $100 |
|
|
|
|
|
|
|
|
|
10.540%, TSFR3M
+ 5.212%, 04/15/29(A) (B) |
|
|
680 |
|
|
|
677 |
|
|
Marble Point
CLO XV, Ser 2021-1A, Cl DR |
|
|
|
|
|
|
|
|
|
Callable 07/23/24
@ $100 |
|
|
|
|
|
|
|
|
|
9.188%, TSFR3M
+ 3.862%, 07/23/32(A) (B) |
|
|
1,000 |
|
|
|
991 |
|
|
Neuberger Berman
Loan Advisers CLO 30, Ser 2021-30A, Cl ER |
|
|
|
|
|
|
|
|
|
Callable 07/20/24
@ $100 |
|
|
|
|
|
|
|
|
|
11.786%, TSFR3M
+ 6.462%, 01/20/31(A) (B) |
|
|
1,250 |
|
|
|
1,239 |
|
|
Northwoods Capital
XVIII, Ser 2019-18A, Cl E |
|
|
|
|
|
|
|
|
|
Callable 08/20/24
@ $100 |
|
|
|
|
|
|
|
|
|
12.167%, TSFR3M
+ 6.842%, 05/20/32(A) (B) |
|
|
270 |
|
|
|
262 |
|
|
Oaktree CLO,
Ser 2019-1A, Cl D |
|
|
|
|
|
|
|
|
|
Callable 07/22/24
@ $100 |
|
|
|
|
|
|
|
|
|
9.386%, TSFR3M
+ 4.062%, 04/22/30(A) (B) |
|
|
1,040 |
|
|
|
1,034 |
|
|
Oaktree CLO,
Ser 2019-2A, Cl C |
|
|
|
|
|
|
|
|
|
Callable 07/15/24
@ $100 |
|
|
|
|
|
|
|
|
|
9.550%, TSFR3M
+ 4.222%, 04/15/31(A) (B) |
|
|
1,890 |
|
|
|
1,884 |
|
|
Oaktree CLO,
Ser 2021-3A, Cl ER |
|
|
|
|
|
|
|
|
|
Callable 07/20/24
@ $100 |
|
|
|
|
|
|
|
|
|
12.366%, TSFR3M
+ 7.042%, 10/20/34(A) (B) |
|
|
1,500 |
|
|
|
1,499 |
|
|
Oaktree CLO,
Ser 2022-1A, Cl E |
|
|
|
|
|
|
|
|
|
Callable 08/15/24
@ $100 |
|
|
|
|
|
|
|
|
The
accompanying notes are an integral part of the consolidated financial statements.
35
|
THE
ADVISORS’ INNER CIRCLE FUND III |
FS
MULTI-STRATEGY
ALTERNATIVES
FUND
JUNE
30, 2024
(Unaudited) |
|
ASSET-BACKED
SECURITIES — continued |
|
|
|
Face Amount (000) |
|
|
Fair Value (000) |
|
|
CAYMAN
ISLANDS — (continued) |
|
13.082%, TSFR3M
+ 7.760%, 05/15/33(A) (B) |
|
$ |
1,250 |
|
|
$ |
1,242 |
|
|
Oaktree CLO,
Ser 2023-2A, Cl E |
|
|
|
|
|
|
|
|
|
Callable 07/20/25
@ $100 |
|
|
|
|
|
|
|
|
|
13.975%, TSFR3M
+ 8.650%, 07/20/36(A) (B) |
|
|
250 |
|
|
|
260 |
|
|
Octagon Investment
Partners 45, Ser 2022-1A, Cl ER |
|
|
|
|
|
|
|
|
|
Callable 07/15/24
@ $100 |
|
|
|
|
|
|
|
|
|
12.149%, TSFR3M
+ 6.820%, 04/15/35(A) (B) |
|
|
500 |
|
|
|
478 |
|
|
OHA Credit Partners
VII, Ser 2021-7A, Cl ER3 |
|
|
|
|
|
|
|
|
|
Callable 08/20/24
@ $100 |
|
|
|
|
|
|
|
|
|
11.837%, TSFR3M
+ 6.512%, 02/20/34(A) (B) |
|
|
250 |
|
|
|
249 |
|
|
OZLM Funding
II, Ser 2018-2A, Cl DR2 |
|
|
|
|
|
|
|
|
|
Callable 10/30/24
@ $100 |
|
|
|
|
|
|
|
|
|
11.491%, TSFR3M
+ 6.162%, 07/30/31(A) (B) |
|
|
640 |
|
|
|
633 |
|
|
OZLM IX, Ser
2018-9A, Cl DRR |
|
|
|
|
|
|
|
|
|
Callable 10/20/24
@ $100 |
|
|
|
|
|
|
|
|
|
11.706%, TSFR3M
+ 6.382%, 10/20/31(A) (B) |
|
|
480 |
|
|
|
473 |
|
|
OZLM VIII, Ser
2018-8A, Cl DRR |
|
|
|
|
|
|
|
|
|
Callable 07/17/24
@ $100 |
|
|
|
|
|
|
|
|
|
11.659%, TSFR3M
+ 6.342%, 10/17/29(A) (B) |
|
|
1,590 |
|
|
|
1,588 |
|
|
OZLM XVII, Ser
2017-17A, Cl D |
|
|
|
|
|
|
|
|
|
Callable 10/20/24
@ $100 |
|
|
|
|
|
|
|
|
|
11.576%, TSFR3M
+ 6.252%, 07/20/30(A) (B) |
|
|
360 |
|
|
|
353 |
|
|
OZLM XXIII, Ser
2021-23A, Cl ER |
|
|
|
|
|
|
|
|
|
Callable 07/15/24
@ $100 |
|
|
|
|
|
|
|
|
|
12.870%, TSFR3M
+ 7.542%, 04/15/34(A) (B) |
|
|
1,640 |
|
|
|
1,603 |
|
|
Park Avenue Institutional
Advisers CLO, Ser 2018-1A, Cl C |
|
|
|
|
|
|
|
|
|
Callable 07/20/24
@ $100 |
|
|
|
|
|
|
|
|
|
8.916%, TSFR3M
+ 3.592%, 10/20/31(A) (B) |
|
|
1,000 |
|
|
|
995 |
|
|
Rad CLO, Ser
2024-7A, Cl FR |
|
|
|
|
|
|
|
|
|
Callable 04/17/25
@ $100 |
|
|
|
|
|
|
|
|
The
accompanying notes are an integral part of the consolidated financial statements.
36
|
THE
ADVISORS’ INNER CIRCLE FUND III |
FS
MULTI-STRATEGY
ALTERNATIVES
FUND
JUNE
30, 2024
(Unaudited) |
|
ASSET-BACKED
SECURITIES — continued |
|
|
|
Face Amount (000) |
|
|
Fair Value (000) |
|
|
CAYMAN
ISLANDS — (continued) |
|
12.447%, TSFR3M
+ 7.130%, 04/17/36(A) (B) |
|
$ |
320 |
|
|
$ |
316 |
|
|
Regatta XIV Funding,
Ser 2018-3A, Cl E |
|
|
|
|
|
|
|
|
|
Callable 01/25/25
@ $100 |
|
|
|
|
|
|
|
|
|
11.535%, TSFR3M
+ 6.212%, 10/25/31(A) (B) |
|
|
1,250 |
|
|
|
1,234 |
|
|
Regatta XIX Funding,
Ser 2022-1A, Cl E |
|
|
|
|
|
|
|
|
|
Callable 07/20/24
@ $100 |
|
|
|
|
|
|
|
|
|
12.205%, TSFR3M
+ 6.880%, 04/20/35(A) (B) |
|
|
250 |
|
|
|
252 |
|
|
Sculptor CLO
XXVII, Ser 2021-27A, Cl E |
|
|
|
|
|
|
|
|
|
Callable 07/20/24
@ $100 |
|
|
|
|
|
|
|
|
|
12.636%, TSFR3M
+ 7.312%, 07/20/34(A) (B) |
|
|
3,000 |
|
|
|
2,982 |
|
|
Sycamore Tree
CLO, Ser 2024-2A, Cl ER |
|
|
|
|
|
|
|
|
|
Callable 01/20/26
@ $100 |
|
|
|
|
|
|
|
|
|
13.005%, TSFR3M
+ 7.680%, 01/20/37(A) (B) |
|
|
1,000 |
|
|
|
1,003 |
|
|
Symphony CLO
XX, Ser 2019-20A, Cl E |
|
|
|
|
|
|
|
|
|
Callable 01/16/25
@ $100 |
|
|
|
|
|
|
|
|
|
11.879%, TSFR3M
+ 6.552%, 01/16/32(A) (B) |
|
|
250 |
|
|
|
244 |
|
|
TIAA CLO I, Ser
2018-1A, Cl DR |
|
|
|
|
|
|
|
|
|
Callable 01/20/25
@ $100 |
|
|
|
|
|
|
|
|
|
9.086%, TSFR3M
+ 3.762%, 07/20/31(A) (B) |
|
|
500 |
|
|
|
486 |
|
|
TICP CLO VII,
Ser 2020-7A, Cl ER |
|
|
|
|
|
|
|
|
|
Callable 04/15/25
@ $100 |
|
|
|
|
|
|
|
|
|
12.640%, TSFR3M
+ 7.312%, 04/15/33(A) (B) |
|
|
1,830 |
|
|
|
1,815 |
|
|
Voya CLO, Ser
2017-1A, Cl DR |
|
|
|
|
|
|
|
|
|
Callable 07/18/24
@ $100 |
|
|
|
|
|
|
|
|
|
11.239%, TSFR3M
+ 5.912%, 01/18/29(A) (B) |
|
|
250 |
|
|
|
249 |
|
| |
|
|
|
|
|
|
|
|
| |
|
|
|
|
|
|
60,286 |
|
| |
|
|
|
|
|
|
|
|
|
JERSEY
— 0.3% |
|
Benefit Street
Partners CLO XXX, Ser 2023-30A, Cl D |
|
|
|
|
|
|
|
|
|
Callable 04/25/25
@ $100 |
|
|
|
|
|
|
|
|
|
10.924%, TSFR3M
+ 5.600%, 04/25/36(A) (B) |
|
|
1,375 |
|
|
|
1,402 |
|
The
accompanying notes are an integral part of the consolidated financial statements.
37
|
THE
ADVISORS’ INNER CIRCLE FUND III |
FS
MULTI-STRATEGY
ALTERNATIVES
FUND
JUNE
30, 2024
(Unaudited) |
|
ASSET-BACKED
SECURITIES — continued |
|
|
|
Face Amount (000) |
|
|
Fair Value (000) |
|
|
JERSEY
— (continued) |
|
Boyce Park CLO,
Ser 2022-1A, Cl E |
|
|
|
|
|
|
|
|
|
Callable 07/21/24
@ $100 |
|
|
|
|
|
|
|
|
|
11.575%, TSFR3M
+ 6.250%, 04/21/35(A) (B) |
|
$ |
1,000 |
|
|
$ |
995 |
|
|
Deerpath Capital
CLO, Ser 2023-1A, Cl DR |
|
|
|
|
|
|
|
|
|
11.707%, TSFR3M
+ 6.390%, 04/17/34(A) (B) |
|
|
250 |
|
|
|
251 |
|
|
Dryden 107 CLO,
Ser 2023-107A, Cl E |
|
|
|
|
|
|
|
|
|
Callable 08/15/25
@ $100 |
|
|
|
|
|
|
|
|
|
13.052%, TSFR3M
+ 7.730%, 08/15/35(A) (B) |
|
|
576 |
|
|
|
589 |
|
|
Halseypoint CLO,
Ser 2023-7A, Cl E |
|
|
|
|
|
|
|
|
|
Callable 07/20/25
@ $100 |
|
|
|
|
|
|
|
|
|
14.105%, TSFR3M
+ 8.780%, 07/20/36(A) (B) |
|
|
360 |
|
|
|
373 |
|
|
ICG US CLO, Ser
2023-1A, Cl E |
|
|
|
|
|
|
|
|
|
Callable 01/18/25
@ $100 |
|
|
|
|
|
|
|
|
|
14.137%, TSFR3M
+ 8.810%, 07/18/36(A) (B) |
|
|
740 |
|
|
|
767 |
|
|
OCP CLO, Ser
2024-31A, Cl E |
|
|
|
|
|
|
|
|
|
Callable 04/20/26
@ $100 |
|
|
|
|
|
|
|
|
|
12.193%, TSFR3M
+ 6.900%, 04/20/37(A) (B) |
|
|
1,440 |
|
|
|
1,461 |
|
| |
|
|
|
|
|
|
|
|
| |
|
|
|
|
|
|
5,838 |
|
| |
|
|
|
|
|
|
|
|
|
UNITED
KINGDOM — 0.1% |
|
Newday Funding
Master Issuer, Ser 2024-2A, Cl E |
|
|
|
|
|
|
|
|
|
Callable 07/15/27
@ $100 |
|
|
|
|
|
|
|
|
|
07/15/32(A)
(B) (D) |
|
GBP |
1,800 |
|
|
|
2,275 |
|
| |
|
|
|
|
|
|
|
|
| |
|
|
|
|
|
|
|
|
|
UNITED
STATES — 2.8% |
|
ACHV ABS TRUST,
Ser 2023-3PL, Cl D |
|
|
|
|
|
|
|
|
|
Callable 05/18/26
@ $100 |
|
|
|
|
|
|
|
|
|
8.360%, 08/19/30(A) |
|
$ |
1,000 |
|
|
|
1,022 |
|
|
ACHV ABS TRUST,
Ser 2023-4CP, Cl E |
|
|
|
|
|
|
|
|
|
Callable 06/25/26
@ $100 |
|
|
|
|
|
|
|
|
|
10.500%, 11/25/30(A) |
|
|
500 |
|
|
|
506 |
|
|
Affirm Asset
Securitization Trust, Ser 2023-X1, Cl D |
|
|
|
|
|
|
|
|
|
Callable 07/15/25
@ $100 |
|
|
|
|
|
|
|
|
|
9.550%, 11/15/28(A) |
|
|
110 |
|
|
|
113 |
|
The
accompanying notes are an integral part of the consolidated financial statements.
38
|
THE
ADVISORS’ INNER CIRCLE FUND III |
FS
MULTI-STRATEGY
ALTERNATIVES
FUND
JUNE
30, 2024
(Unaudited) |
|
ASSET-BACKED
SECURITIES — continued |
|
|
|
Face Amount (000) |
|
|
Fair Value (000) |
|
|
UNITED
STATES — (continued) |
|
Affirm Asset
Securitization Trust, Ser 2024-A, Cl 1E |
|
|
|
|
|
|
|
|
|
Callable 02/15/26
@ $100 |
|
|
|
|
|
|
|
|
|
9.170%, 02/15/29(A) |
|
$ |
1,500 |
|
|
$ |
1,503 |
|
|
Ally Bank Auto
Credit-Linked Notes, Ser 2024-A, Cl G |
|
|
|
|
|
|
|
|
|
Callable 02/15/28
@ $100 |
|
|
|
|
|
|
|
|
|
12.748%, 05/17/32(A) |
|
|
600 |
|
|
|
600 |
|
|
AMSR Trust, Ser
2023-SFR2, Cl F1 |
|
|
|
|
|
|
|
|
|
3.950%, 06/17/40(A) |
|
|
210 |
|
|
|
177 |
|
|
AMSR Trust, Ser
2023-SFR2, Cl F2 |
|
|
|
|
|
|
|
|
|
3.950%, 06/17/40(A) |
|
|
640 |
|
|
|
520 |
|
|
Ascent Education
Funding Trust, Ser 2024-A, Cl C |
|
|
|
|
|
|
|
|
|
Callable 05/25/34
@ $100 |
|
|
|
|
|
|
|
|
|
8.010%, 10/25/50(A) |
|
|
130 |
|
|
|
129 |
|
|
Brex Commercial
Charge Card Master Trust, Ser 2024-1, Cl B |
|
|
|
|
|
|
|
|
|
11.590%, 07/15/27(A) |
|
|
500 |
|
|
|
500 |
|
|
Carlyle Global
Market Strategies CLO, Ser 2017-1A, Cl CR |
|
|
|
|
|
|
|
|
|
Callable 08/14/24
@ $100 |
|
|
|
|
|
|
|
|
|
8.934%, TSFR3M
+ 3.612%, 08/14/30(A) (B) |
|
|
750 |
|
|
|
748 |
|
|
Carvana Auto
Receivables Trust, Ser 2021-N3, Cl XS |
|
|
|
|
|
|
|
|
|
Callable 04/10/27
@ $100 |
|
|
|
|
|
|
|
|
|
06/12/28(A)
(D) |
|
|
22 |
|
|
|
— |
|
|
Catskill Park
CLO, Ser 2017-1A, Cl D |
|
|
|
|
|
|
|
|
|
Callable 07/20/24
@ $100 |
|
|
|
|
|
|
|
|
|
11.586%, TSFR3M
+ 6.262%, 04/20/29(A) (B) |
|
|
140 |
|
|
|
138 |
|
|
ClickLease Equipment
Receivables Trust, Ser 2024-1, Cl C |
|
|
|
|
|
|
|
|
|
Callable 05/15/27
@ $100 |
|
|
|
|
|
|
|
|
|
8.400%, 02/15/30(A) |
|
|
230 |
|
|
|
230 |
|
|
ClickLease Equipment
Receivables Trust, Ser 2024-1, Cl D |
|
|
|
|
|
|
|
|
|
Callable 05/15/27
@ $100 |
|
|
|
|
|
|
|
|
|
11.410%, 02/15/30(A) |
|
|
770 |
|
|
|
770 |
|
|
CPS Auto Receivables
Trust, Ser 2023-D, Cl E |
|
|
|
|
|
|
|
|
|
Callable 05/15/28
@ $100 |
|
|
|
|
|
|
|
|
|
10.130%, 05/15/31(A) |
|
|
1,630 |
|
|
|
1,734 |
|
|
CPS Auto Receivables
Trust, Ser 2024-B, Cl E |
|
|
|
|
|
|
|
|
|
Callable 06/15/29
@ $100 |
|
|
|
|
|
|
|
|
The
accompanying notes are an integral part of the consolidated financial statements.
39
|
THE
ADVISORS’ INNER CIRCLE FUND III |
FS
MULTI-STRATEGY
ALTERNATIVES
FUND
JUNE
30, 2024
(Unaudited) |
|
ASSET-BACKED
SECURITIES — continued |
|
|
|
Face Amount (000) |
|
|
Fair Value (000) |
|
|
UNITED
STATES — (continued) |
|
8.360%, 11/17/31(A) |
|
$ |
700 |
|
|
$ |
708 |
|
|
Dewolf Park CLO,
Ser 2017-1A, Cl E |
|
|
|
|
|
|
|
|
|
Callable 07/15/24
@ $100 |
|
|
|
|
|
|
|
|
|
11.790%, TSFR3M
+ 6.462%, 10/15/30(A) (B) |
|
|
300 |
|
|
|
297 |
|
|
Ent Auto Receivables
Trust, Ser 2023-1A, Cl D |
|
|
|
|
|
|
|
|
|
Callable 03/15/28
@ $100 |
|
|
|
|
|
|
|
|
|
7.700%, 03/17/31(A) |
|
|
1,560 |
|
|
|
1,597 |
|
|
Exeter Automobile
Receivables Trust, Ser 2023-3A, Cl E |
|
|
|
|
|
|
|
|
|
Callable 08/15/27
@ $100 |
|
|
|
|
|
|
|
|
|
9.980%, 01/15/31(A) |
|
|
1,130 |
|
|
|
1,202 |
|
|
Exeter Automobile
Receivables Trust, Ser 2023-4A, Cl E |
|
|
|
|
|
|
|
|
|
Callable 10/15/27
@ $100 |
|
|
|
|
|
|
|
|
|
9.570%, 02/18/31(A) |
|
|
1,960 |
|
|
|
2,044 |
|
|
FHF Issuer Trust,
Ser 2024-1A, Cl C |
|
|
|
|
|
|
|
|
|
Callable 01/15/28
@ $100 |
|
|
|
|
|
|
|
|
|
7.420%, 05/15/31(A) |
|
|
900 |
|
|
|
916 |
|
|
Frontier Issuer,
Ser 2024-1, Cl C |
|
|
|
|
|
|
|
|
|
Callable 05/20/28
@ $100 |
|
|
|
|
|
|
|
|
|
11.160%, 06/20/54(A) |
|
|
2,740 |
|
|
|
2,744 |
|
|
Goodleap Sustainable
Home Solutions Trust, Ser 2023-3C, Cl B |
|
|
|
|
|
|
|
|
|
Callable 12/20/39
@ $100 |
|
|
|
|
|
|
|
|
|
7.800%, 07/20/55(A) |
|
|
1,570 |
|
|
|
1,555 |
|
|
Hertz Vehicle
Financing III, Ser 2021-2A, Cl D |
|
|
|
|
|
|
|
|
|
4.340%, 12/27/27(A) |
|
|
490 |
|
|
|
438 |
|
|
Hertz Vehicle
Financing III, Ser 2023-1A, Cl 1D |
|
|
|
|
|
|
|
|
|
9.130%, 06/25/27(A) |
|
|
470 |
|
|
|
469 |
|
|
Hertz Vehicle
Financing III, Ser 2023-2A, Cl D |
|
|
|
|
|
|
|
|
|
9.400%, 09/25/29(A) |
|
|
250 |
|
|
|
248 |
|
|
Hertz Vehicle
Financing, Ser 2021-1A, Cl D |
|
|
|
|
|
|
|
|
|
3.980%, 12/26/25(A) |
|
|
1,000 |
|
|
|
987 |
|
|
Hertz Vehicle
Financing, Ser 2022-2A, Cl D |
|
|
|
|
|
|
|
|
|
Callable 06/25/27
@ $100 |
|
|
|
|
|
|
|
|
|
5.160%, 06/26/28(A) |
|
|
250 |
|
|
|
224 |
|
|
Hertz Vehicle
Financing, Ser 2022-4A, Cl D |
|
|
|
|
|
|
|
|
|
Callable 09/25/25
@ $100 |
|
|
|
|
|
|
|
|
|
6.560%, 09/25/26(A) |
|
|
250 |
|
|
|
243 |
|
The
accompanying notes are an integral part of the consolidated financial statements.
40
|
THE
ADVISORS’ INNER CIRCLE FUND III |
FS
MULTI-STRATEGY
ALTERNATIVES
FUND
JUNE
30, 2024
(Unaudited) |
|
ASSET-BACKED
SECURITIES — continued |
|
|
|
Face Amount (000) |
|
|
Fair Value (000) |
|
|
UNITED
STATES — (continued) |
|
Hertz Vehicle
Financing, Ser 2022-5A, Cl D |
|
|
|
|
|
|
|
|
|
Callable 09/25/27
@ $100 |
|
|
|
|
|
|
|
|
|
6.780%, 09/25/28(A) |
|
$ |
1,370 |
|
|
$ |
1,275 |
|
|
Hotwire Funding,
Ser 2024-1A, Cl C |
|
|
|
|
|
|
|
|
|
9.188%, 06/20/54(A) |
|
|
140 |
|
|
|
142 |
|
|
Laurel Road Prime
Student Loan Trust, Ser 2017-B, Cl R |
|
|
|
|
|
|
|
|
|
Callable 07/25/24
@ $100 |
|
|
|
|
|
|
|
|
|
08/25/42(A)
(D) |
|
|
— |
^ |
|
|
25 |
|
|
Marlette Funding
Trust, Ser 2022-3A, Cl D |
|
|
|
|
|
|
|
|
|
Callable 11/15/26
@ $100 |
|
|
|
|
|
|
|
|
|
7.800%, 11/15/32(A) |
|
|
170 |
|
|
|
168 |
|
|
Marlette Funding
Trust, Ser 2023-2A, Cl D |
|
|
|
|
|
|
|
|
|
Callable 06/15/27
@ $100 |
|
|
|
|
|
|
|
|
|
7.920%, 06/15/33(A) |
|
|
1,670 |
|
|
|
1,660 |
|
|
Marlette Funding
Trust, Ser 2023-3A, Cl D |
|
|
|
|
|
|
|
|
|
Callable 10/15/27
@ $100 |
|
|
|
|
|
|
|
|
|
8.040%, 09/15/33(A) |
|
|
1,520 |
|
|
|
1,569 |
|
|
Marlette Funding
Trust, Ser 2024-1A, Cl D |
|
|
|
|
|
|
|
|
|
Callable 10/15/28
@ $100 |
|
|
|
|
|
|
|
|
|
6.930%, 07/17/34(A) |
|
|
1,760 |
|
|
|
1,779 |
|
|
Mercury Financial
Credit Card Master Trust, Ser 2024-2A, Cl B |
|
|
|
|
|
|
|
|
|
7.430%, 07/20/29(A) |
|
|
2,100 |
|
|
|
2,111 |
|
|
Mission Lane
Credit Card Master Trust, Ser 2024-A, Cl C |
|
|
|
|
|
|
|
|
|
7.320%, 08/15/29(A) |
|
|
1,360 |
|
|
|
1,359 |
|
|
OnDeck Asset
Securitization Trust IV, Ser 2023-1A, Cl C |
|
|
|
|
|
|
|
|
|
9.930%, 08/19/30(A) |
|
|
600 |
|
|
|
617 |
|
|
OnDeck Asset
Securitization Trust IV, Ser 2024-1A, Cl C |
|
|
|
|
|
|
|
|
|
Callable 06/17/26
@ $100 |
|
|
|
|
|
|
|
|
|
8.990%, 06/17/31(A) |
|
|
100 |
|
|
|
102 |
|
|
OneMain Financial
Issuance Trust, Ser 2023-2A, Cl D |
|
|
|
|
|
|
|
|
|
Callable 09/14/26
@ $100 |
|
|
|
|
|
|
|
|
|
7.520%, 09/15/36(A) |
|
|
1,560 |
|
|
|
1,607 |
|
|
Progress Residential
Trust, Ser 2024-SFR2, Cl F |
|
|
|
|
|
|
|
|
|
3.650%, 04/17/41(A)
(B) |
|
|
690 |
|
|
|
546 |
|
The
accompanying notes are an integral part of the consolidated financial statements.
41
|
THE
ADVISORS’ INNER CIRCLE FUND III |
FS
MULTI-STRATEGY
ALTERNATIVES
FUND
JUNE
30, 2024
(Unaudited) |
|
ASSET-BACKED
SECURITIES — continued |
|
|
|
Face Amount (000) |
|
|
Fair Value (000) |
|
|
UNITED
STATES — (continued) |
|
Progress Residential
Trust, Ser 2024-SFR3, Cl E2 |
|
|
|
|
|
|
|
|
|
4.000%, 06/17/41(A) |
|
$ |
2,000 |
|
|
$ |
1,743 |
|
|
Progress Residential
Trust, Ser 2024-SFR4, Cl F1 |
|
|
|
|
|
|
|
|
|
3.400%, 07/09/29(A)
(B) |
|
|
140 |
|
|
|
108 |
|
|
Purchasing Power
Funding, Ser 2024-A, Cl D |
|
|
|
|
|
|
|
|
|
7.260%, 08/15/28(A) |
|
|
450 |
|
|
|
451 |
|
|
Reach ABS Trust,
Ser 2023-1A, Cl C |
|
|
|
|
|
|
|
|
|
Callable 03/15/27
@ $100 |
|
|
|
|
|
|
|
|
|
8.450%, 02/18/31(A) |
|
|
1,500 |
|
|
|
1,537 |
|
|
Reach ABS Trust,
Ser 2024-1A, Cl D |
|
|
|
|
|
|
|
|
|
Callable 03/15/28
@ $100 |
|
|
|
|
|
|
|
|
|
10.640%, 02/18/31(A) |
|
|
270 |
|
|
|
269 |
|
|
Regional Management
Issuance Trust, Ser 2022-1, Cl D |
|
|
|
|
|
|
|
|
|
Callable 03/15/25
@ $100 |
|
|
|
|
|
|
|
|
|
6.720%, 03/15/32(A) |
|
|
250 |
|
|
|
237 |
|
|
Regional Management
Issuance Trust, Ser 2024-1, Cl D |
|
|
|
|
|
|
|
|
|
Callable 05/15/29
@ $100 |
|
|
|
|
|
|
|
|
|
7.460%, 07/15/36(A) |
|
|
2,500 |
|
|
|
2,513 |
|
|
Upstart Securitization
Trust, Ser 2023-2, Cl C |
|
|
|
|
|
|
|
|
|
Callable 06/20/27
@ $100 |
|
|
|
|
|
|
|
|
|
11.870%, 06/20/33(A) |
|
|
1,134 |
|
|
|
1,126 |
|
|
Upstart Securitization
Trust, Ser 2023-3, Cl B |
|
|
|
|
|
|
|
|
|
Callable 07/20/27
@ $100 |
|
|
|
|
|
|
|
|
|
8.250%, 10/20/33(A) |
|
|
1,204 |
|
|
|
1,236 |
|
|
US Bank, Ser
2023-1, Cl C |
|
|
|
|
|
|
|
|
|
Callable 07/25/26
@ $100 |
|
|
|
|
|
|
|
|
|
9.785%, 08/25/32(A) |
|
|
362 |
|
|
|
365 |
|
|
US Bank, Ser
2023-1, Cl D |
|
|
|
|
|
|
|
|
|
Callable 07/25/26
@ $100 |
|
|
|
|
|
|
|
|
|
13.597%, 08/25/32(A) |
|
|
547 |
|
|
|
549 |
|
|
VB-S1 Issuer,
Ser 2024-1A, Cl F |
|
|
|
|
|
|
|
|
|
8.871%, 05/15/54(A) |
|
|
130 |
|
|
|
132 |
|
|
Verdant Receivables,
Ser 2024-1A, Cl D |
|
|
|
|
|
|
|
|
|
Callable 08/12/28
@ $100 |
|
|
|
|
|
|
|
|
|
7.230%, 12/12/31(A) |
|
|
570 |
|
|
|
571 |
|
|
Vista Point Securitization
Trust, Ser 2024-CES1, Cl B1 |
|
|
|
|
|
|
|
|
|
Callable 05/25/27
@ $100 |
|
|
|
|
|
|
|
|
The
accompanying notes are an integral part of the consolidated financial statements.
42
|
THE
ADVISORS’ INNER CIRCLE FUND III |
FS
MULTI-STRATEGY
ALTERNATIVES
FUND
JUNE
30, 2024
(Unaudited) |
|
ASSET-BACKED
SECURITIES — continued |
|
|
|
Face Amount (000) |
|
|
Fair Value (000) |
|
|
UNITED
STATES — (continued) |
|
8.867%, 05/25/54(A)
(B) |
|
$ |
130 |
|
|
$ |
130 |
|
|
VStrong Auto
Receivables Trust, Ser 2023-A, Cl D |
|
|
|
|
|
|
|
|
|
Callable 09/15/28
@ $100 |
|
|
|
|
|
|
|
|
|
9.310%, 02/15/30(A) |
|
|
1,255 |
|
|
|
1,368 |
|
|
VStrong Auto
Receivables Trust, Ser 2023-A, Cl E |
|
|
|
|
|
|
|
|
|
Callable 09/15/28
@ $100 |
|
|
|
|
|
|
|
|
|
9.990%, 12/16/30(A) |
|
|
1,080 |
|
|
|
1,084 |
|
|
Westgate Resorts,
Ser 2023-1A, Cl D |
|
|
|
|
|
|
|
|
|
Callable 04/20/27
@ $100 |
|
|
|
|
|
|
|
|
|
10.140%, 12/20/37(A) |
|
|
338 |
|
|
|
343 |
|
|
Westgate Resorts,
Ser 2024-1A, Cl D |
|
|
|
|
|
|
|
|
|
Callable 11/20/27
@ $100 |
|
|
|
|
|
|
|
|
|
9.260%, 01/20/38(A) |
|
|
1,500 |
|
|
|
1,498 |
|
| |
|
|
|
|
|
|
|
|
| |
|
|
|
|
|
|
50,582 |
|
| |
|
|
|
|
|
|
|
|
|
TOTAL ASSET-BACKED
SECURITIES |
|
|
|
|
|
|
|
|
|
(Cost $116,693)
(000) |
|
|
|
|
|
|
119,239 |
|
|
CONVERTIBLE
BONDS — 0.4% |
| |
|
|
|
|
|
|
|
|
|
UNITED STATES —
0.4% |
|
|
|
|
|
Arbor Realty
Trust |
|
|
|
|
|
|
|
|
|
7.50%, 08/01/25 |
|
|
178 |
|
|
|
178 |
|
|
DigitalOcean
Holdings |
|
|
|
|
|
|
|
|
|
0.00%, 12/01/26(E) |
|
|
1,414 |
|
|
|
1,191 |
|
|
JetBlue Airways |
|
|
|
|
|
|
|
|
|
0.50%, 04/01/26 |
|
|
1,357 |
|
|
|
1,190 |
|
|
Opendoor Technologies |
|
|
|
|
|
|
|
|
|
0.25%, 08/15/26(A) |
|
|
1,664 |
|
|
|
1,335 |
|
|
PennyMac |
|
|
|
|
|
|
|
|
|
8.50%, 06/01/29(A) |
|
|
30 |
|
|
|
29 |
|
|
5.50%, 03/15/26 |
|
|
344 |
|
|
|
327 |
|
|
Redwood Trust |
|
|
|
|
|
|
|
|
|
7.75%, 06/15/27 |
|
|
2,770 |
|
|
|
2,678 |
|
|
RWT Holdings |
|
|
|
|
|
|
|
|
|
5.75%, 10/01/25 |
|
|
338 |
|
|
|
328 |
|
|
Two Harbors Investment |
|
|
|
|
|
|
|
|
|
6.25%, 01/15/26 |
|
|
611 |
|
|
|
584 |
|
| |
|
|
|
|
|
|
|
|
|
TOTAL CONVERTIBLE
BONDS |
|
|
|
|
|
|
|
|
|
(Cost $7,688) (000) |
|
|
|
|
|
|
7,840 |
|
| |
|
|
|
|
|
|
|
|
| |
|
|
|
|
|
|
|
|
The
accompanying notes are an integral part of the consolidated financial statements.
43
|
THE
ADVISORS’ INNER CIRCLE FUND III |
FS
MULTI-STRATEGY
ALTERNATIVES
FUND
JUNE
30, 2024
(Unaudited) |
|
PURCHASED
OPTIONS — 0.1% |
| |
|
Contracts |
|
|
Fair Value (000) |
|
|
PURCHASED
OPTIONS |
|
|
|
|
|
|
|
|
|
Total Purchased
Options(F)
(Cost $1,968) (000) |
|
|
321 |
|
|
$ |
1,787 |
|
| |
|
|
|
|
|
|
|
|
|
PREFERRED
STOCK — 0.0% |
| |
|
Shares
|
|
|
|
|
|
|
UNITED STATES —
0.0% |
|
|
|
|
|
Arbor Realty
Trust, 6.250% |
|
|
900 |
|
|
$ |
18 |
|
|
Brookfield Property
Partners, 6.250% |
|
|
14,575 |
|
|
|
214 |
|
|
MFA Financial,
6.500% |
|
|
2,275 |
|
|
|
53 |
|
|
New York Mortgage
Trust, 7.875% |
|
|
925 |
|
|
|
22 |
|
|
Rithm Capital,
6.375% |
|
|
575 |
|
|
|
14 |
|
|
TPG RE Finance
Trust, 6.250% |
|
|
26,000 |
|
|
|
428 |
|
| |
|
|
|
|
|
|
|
|
|
TOTAL PREFERRED
STOCK |
|
|
|
|
|
|
|
|
|
(Cost $650) (000) |
|
|
|
|
|
|
749 |
|
| |
|
|
|
|
|
|
|
|
|
SHORT-TERM
INVESTMENT — 43.7% |
| |
|
|
|
|
|
|
|
|
|
BlackRock Cash
Funds Treasury Fund - Institutional Shares |
|
|
|
|
|
|
|
|
|
5.480%(G) |
|
|
803,534,246 |
|
|
|
803,534 |
|
| |
|
|
|
|
|
|
|
|
|
TOTAL SHORT-TERM
INVESTMENT |
|
|
|
|
|
|
|
|
|
(Cost $803,534)
(000) |
|
|
|
|
|
|
803,534 |
|
| |
|
|
|
|
|
|
|
|
| |
|
|
|
|
|
|
|
|
|
TOTAL INVESTMENTS
— 169.1% |
|
|
|
|
|
|
|
|
|
(Cost $3,088,551)
(000) |
|
|
|
|
|
$ |
3,110,592 |
|
| |
|
|
|
|
|
|
|
|
| |
|
|
|
|
|
|
|
|
|
SECURITIES
SOLD SHORT |
|
CORPORATE
OBLIGATIONS — (0.7)% |
| |
|
Face Amount (000) |
|
|
Fair Value (000) |
|
|
UNITED STATES —
(0.7)% |
|
|
|
|
|
Cleveland-Cliffs |
|
|
|
|
|
|
|
|
|
6.750%, 04/15/30
(A) |
|
$ |
(1,881 |
) |
|
|
(1,861 |
) |
|
DaVita |
|
|
|
|
|
|
|
|
|
4.625%, 06/01/30
(A) |
|
|
(1,369 |
) |
|
|
(1,237 |
) |
|
Embecta |
|
|
|
|
|
|
|
|
|
5.000%, 02/15/30
(A) |
|
|
(914 |
) |
|
|
(753 |
) |
|
Fiesta Purchaser |
|
|
|
|
|
|
|
|
|
7.875%, 03/01/31
(A) |
|
|
(1,881 |
) |
|
|
(1,944 |
) |
|
Fortress Intermediate
3 |
|
|
|
|
|
|
|
|
|
7.500%, 06/01/31
(A) |
|
|
(924 |
) |
|
|
(947 |
) |
The
accompanying notes are an integral part of the consolidated financial statements.
44
|
THE
ADVISORS’ INNER CIRCLE FUND III |
FS
MULTI-STRATEGY
ALTERNATIVES
FUND
JUNE
30, 2024
(Unaudited) |
|
CORPORATE
OBLIGATIONS — continued |
|
|
|
Face Amount (000) |
|
|
Fair Value (000) |
|
|
UNITED STATES —
(continued) |
|
|
|
|
|
Guitar Center |
|
|
|
|
|
|
|
|
|
8.500%, 01/15/26
(A) |
|
$ |
(1,288 |
) |
|
$ |
(1,158 |
) |
|
HUB International |
|
|
|
|
|
|
|
|
|
5.625%, 12/01/29
(A) |
|
|
(669 |
) |
|
|
(633 |
) |
|
Newell Brands |
|
|
|
|
|
|
|
|
|
6.625%, 09/15/29
|
|
|
(2,205 |
) |
|
|
(2,162 |
) |
|
Organon |
|
|
|
|
|
|
|
|
|
5.125%, 04/30/31
(A) |
|
|
(1,826 |
) |
|
|
(1,640 |
) |
|
Park-Ohio Industries |
|
|
|
|
|
|
|
|
|
6.625%, 04/15/27
|
|
|
(927 |
) |
|
|
(892 |
) |
|
Zayo Group Holdings |
|
|
|
|
|
|
|
|
|
4.000%, 03/01/27
(A) |
|
|
(924 |
) |
|
|
(739 |
) |
| |
|
|
|
|
|
|
|
|
| |
|
|
|
|
|
|
(13,966 |
) |
|
TOTAL CORPORATE
OBLIGATIONS |
|
|
|
|
|
|
|
|
|
(Proceeds $(13,799))
(000) |
|
|
|
|
|
|
(13,966 |
) |
| |
|
|
|
|
|
|
|
|
|
TOTAL SECURITIES
SOLD SHORT — (0.7)% |
|
|
|
|
|
|
|
|
|
(Proceeds $(13,799))
(000) |
|
|
|
|
|
$ |
(13,966 |
) |
| |
|
|
|
|
|
|
|
|
| |
|
|
|
|
|
|
|
|
|
^ |
Amount
rounds to less than $1(000). |
|
(A) |
Securities
sold within terms of a private placement memorandum, exempt from registration under Section 144A of the Securities Act of 1933, as amended,
and may be sold only to dealers in that program or other "accredited investors." On June 30, 2024, the value of these securities amounted
$479,394 (000) and represented 26.1% of net assets. |
|
(B) |
Variable
or floating rate security. The rate shown is the effective interest rate as of period end. The rates on certain securities are not based
on published reference rates and spreads and are either determined by the issuer or agent based on current market conditions; by using
a formula based on the rates of underlying loans; or by adjusting periodically based on prevailing interest rates. |
|
(C) |
Step
Bonds - The rate reflected on the Schedule of Investments is the effective yield on June 30, 2024. The coupon on a step bond changes on
a specified date. |
|
(D) |
No
rate available. |
|
(E) |
Zero
Coupon Security. |
|
(F) |
Refer
to table below for details on Options Contracts. |
|
(G) |
Rate
shown is the 7-day effective yield as of June 30, 2024. The BlackRock Cash Funds Treasury Fund's financial statements are available on
the SEC's website at https://www.sec.gov. |
The
accompanying notes are an integral part of the consolidated financial statements.
45
|
THE
ADVISORS’ INNER CIRCLE FUND III |
FS
MULTI-STRATEGY
ALTERNATIVES
FUND
JUNE
30, 2024
(Unaudited) |
Open exchange
traded options contracts held by the Fund at June 30, 2024 are as follows:
|
PURCHASED OPTION
— 0.0% |
|
|
|
|
|
|
|
|
|
| |
|
Number of Contracts |
|
|
Notional Amount
(000) |
|
|
Strike Price |
|
|
Expiration Date |
|
|
Fair Value
(000) |
|
|
PUT OPTIONS |
|
|
|
|
|
|
|
|
|
|
|
|
|
|
|
|
|
|
|
|
|
UNITED STATES
— 0.0% |
|
|
|
|
|
|
|
|
|
|
|
|
|
iShares Russell
2000 ETF |
|
|
320 |
|
|
$ |
6,492 |
|
|
$ |
185.00 |
|
|
|
07/20/24 |
|
|
$ |
5 |
|
| |
|
|
|
|
|
|
|
|
|
|
|
|
|
|
|
|
|
|
|
|
|
Total Purchased
Options |
|
|
5 |
|
Open OTC options
contracts held by the Fund at June 30, 2024 are as follows:
|
PURCHASED OPTION — 0.1% |
|
|
|
|
|
|
|
|
|
|
|
|
| |
|
Counterparty |
|
|
Number of Contracts |
|
|
Notional Amount
(000) |
|
|
Strike Price |
|
|
Expiration Date |
|
|
Fair Value (000) |
|
|
CALL OPTIONS |
|
|
|
|
|
|
|
|
|
|
|
|
|
|
|
|
|
|
|
|
|
|
|
|
|
UNITED STATES
— 0.1% |
|
|
|
|
|
|
|
|
|
|
|
|
|
|
|
|
|
Palladium Dispersion
Basket Option, Strike Price 18%(1) |
|
|
UBS |
|
|
|
1 |
|
|
$ |
50,000 |
|
|
$ |
18 |
% |
|
|
03/14/25 |
|
|
$ |
1,782 |
|
|
Total Purchased
Options |
|
$ |
1,782 |
|
(1)
This option contract is written on the average absolute dispersion between a basket of the top 25 names in the S&P 500 at contract
initiation and the individual components of the basket. Payoff is computed as the average absolute deviation of each component versus
the basket performance above the strike over the life of the contract, strike is set at 18% average dispersion.
The
accompanying notes are an integral part of the consolidated financial statements.
46
|
THE
ADVISORS’ INNER CIRCLE FUND III |
FS
MULTI-STRATEGY
ALTERNATIVES
FUND
JUNE
30, 2024
(Unaudited) |
Open futures
contracts held by the Fund at June 30, 2024 are as follows:
|
Type of Contract |
|
Number of
Contracts |
|
|
Expiration
Date |
|
|
Notional Amount
(000) |
|
|
Value (000) |
|
|
Unrealized Appreciation/
(Depreciation) (000) |
|
|
Long Contracts |
|
|
|
|
|
|
|
|
|
|
|
|
|
|
|
|
|
|
|
|
|
S&P 500 Annual
Dividend Index |
|
|
1,982 |
|
|
|
Dec-2024 |
|
|
$ |
30,325 |
|
|
$ |
36,915 |
|
|
$ |
6,590 |
|
|
S&P 500 Annual
Dividend Index |
|
|
1,605 |
|
|
|
Dec-2026 |
|
|
|
29,994 |
|
|
|
31,117 |
|
|
|
1,123 |
|
| |
|
|
|
|
|
|
|
|
|
|
60,319 |
|
|
|
68,032 |
|
|
|
7,713 |
|
|
Short Contracts |
|
|
|
|
|
|
|
|
|
|
|
|
|
|
|
|
|
|
|
|
|
U.S. 2-Year Treasury
Note |
|
|
(3,334) |
|
|
|
Sep-2024 |
|
|
$ |
(679,250 |
) |
|
$ |
(680,865 |
) |
|
$ |
(1,615 |
) |
|
U.S. 10-Year
Treasury Note |
|
|
(7,072) |
|
|
|
Sep-2024 |
|
|
|
(773,501 |
) |
|
|
(777,809 |
) |
|
|
(4,308 |
) |
|
U.S. Ultra Long
Treasury Bond |
|
|
(45) |
|
|
|
Sep-2024 |
|
|
|
(5,573 |
) |
|
|
(5,640 |
) |
|
|
(67 |
) |
| |
|
|
|
|
|
|
|
|
|
|
(1,458,324 |
) |
|
|
(1,464,314 |
) |
|
|
(5,990 |
) |
| |
|
|
|
|
|
|
|
|
|
$ |
(1,398,005 |
) |
|
$ |
(1,396,282 |
) |
|
$ |
1,723 |
|
Open forward
foreign currency contract held by the Fund at June 30, 2024 is as follows:
|
Counterparty |
|
Settlement Date |
|
|
Currency to Deliver
(000) |
|
|
Currency to Receive
(000) |
|
|
Unrealized Depreciation
(000) |
|
|
JPMorgan Chase |
|
|
07/19/24 |
|
|
|
GBP |
|
|
|
399 |
|
|
|
USD |
|
|
|
501 |
|
|
$ |
(3 |
) |
| |
|
|
|
|
|
|
|
|
|
|
|
|
|
|
|
|
|
|
|
|
|
$ |
(3 |
) |
Open centrally
cleared swap contracts held by the Fund at June 30, 2024 are as follows:
|
Interest
Rate Swaps |
|
Fund Pays |
|
Fund Receives |
|
|
Payment Frequency |
|
|
Termination Date |
|
|
Currency |
|
|
Notional Amount
(000) |
|
|
Value
(000) |
|
|
|
Upfront Payments/ Receipts (000) |
|
|
Net Unrealized
Depreciation
(000) |
|
|
4.746% |
|
|
SOFR INDEX |
|
|
|
Annually |
|
|
|
05/08/2026 |
|
|
|
USD |
|
|
$ |
5,891 |
|
|
$ |
(6 |
) |
|
$ |
– |
|
|
$ |
(6 |
) |
|
4.498% |
|
|
SOFR INDEX |
|
|
|
Annually |
|
|
|
05/08/2027 |
|
|
|
USD |
|
|
|
14,072 |
|
|
|
(39 |
) |
|
|
5 |
|
|
|
(44 |
) |
|
4.341% |
|
|
SOFR INDEX |
|
|
|
Annually |
|
|
|
05/08/2028 |
|
|
|
USD |
|
|
|
23,008 |
|
|
|
(101 |
) |
|
|
7 |
|
|
|
(108 |
) |
|
4.246% |
|
|
SOFR INDEX |
|
|
|
Annually |
|
|
|
05/08/2029 |
|
|
|
USD |
|
|
|
15,271 |
|
|
|
(92 |
) |
|
|
5 |
|
|
|
(97 |
) |
|
4.191% |
|
|
SOFR INDEX |
|
|
|
Annually |
|
|
|
05/08/2030 |
|
|
|
USD |
|
|
|
4,494 |
|
|
|
(34 |
) |
|
|
– |
|
|
|
(34 |
) |
|
4.156% |
|
|
SOFR INDEX |
|
|
|
Annually |
|
|
|
05/08/2031 |
|
|
|
USD |
|
|
|
1,910 |
|
|
|
(18 |
) |
|
|
2 |
|
|
|
(20 |
) |
|
4.132% |
|
|
SOFR INDEX |
|
|
|
Annually |
|
|
|
05/08/2032 |
|
|
|
USD |
|
|
|
302 |
|
|
|
(3 |
) |
|
|
– |
|
|
|
(3 |
) |
|
4.107% |
|
|
SOFR INDEX |
|
|
|
Annually |
|
|
|
05/08/2034 |
|
|
|
USD |
|
|
|
243 |
|
|
|
(3 |
) |
|
|
– |
|
|
|
(3 |
) |
|
4.104% |
|
|
SOFR INDEX |
|
|
|
Annually |
|
|
|
05/08/2036 |
|
|
|
USD |
|
|
|
753 |
|
|
|
(11 |
) |
|
|
– |
|
|
|
(11 |
) |
|
4.102% |
|
|
SOFR INDEX |
|
|
|
Annually |
|
|
|
05/08/2039 |
|
|
|
USD |
|
|
|
1,460 |
|
|
|
(26 |
) |
|
|
– |
|
|
|
(26 |
) |
|
4.067% |
|
|
SOFR INDEX |
|
|
|
Annually |
|
|
|
05/08/2044 |
|
|
|
USD |
|
|
|
255 |
|
|
|
(6 |
) |
|
|
– |
|
|
|
(6 |
) |
|
3.971% |
|
|
SOFR INDEX |
|
|
|
Annually |
|
|
|
05/08/2049 |
|
|
|
USD |
|
|
|
267 |
|
|
|
(6 |
) |
|
|
– |
|
|
|
(6 |
) |
| |
|
|
|
|
|
|
|
|
|
|
|
|
|
|
|
|
|
|
|
|
|
$ |
(345 |
) |
|
$ |
19 |
|
|
$ |
(364 |
) |
The
accompanying notes are an integral part of the consolidated financial statements.
47
|
THE
ADVISORS’ INNER CIRCLE FUND III |
FS
MULTI-STRATEGY
ALTERNATIVES
FUND
JUNE
30, 2024
(Unaudited) |
Open OTC swap
contracts held by the Fund at June 30, 2024 are as follows:
|
Credit Default
Swap |
|
Counterparty |
|
Reference Entity/
Obligation |
|
|
Buy/Sell Protection |
|
|
(Pays)/Receives
Rate |
|
|
Payment Frequency |
|
|
Termination Date |
|
|
Notional Amount
(000) |
|
|
Value
(000) |
|
|
|
Upfront Payments/ Receipts (000) |
|
|
Net Unrealized
Appreciation
(000) |
|
|
JPMorgan Chase |
|
|
Cleveland-Cliffs |
|
|
|
Buy |
|
|
|
5.00 |
% |
|
|
Quarterly |
|
|
|
06/20/2029 |
|
|
$ |
990 |
|
|
$ |
40 |
|
|
$ |
(124 |
) |
|
$ |
164 |
|
.
|
Total Return
Swaps |
|
Counterparty |
|
Reference Entity/
Obligation |
|
|
Fund
Pays |
|
|
Fund
Receives |
|
|
Payment
Frequency |
|
|
Termination Date |
|
|
Currency |
|
|
Notional
Amount (000)^ |
|
|
Fair Value (000) |
|
|
|
Upfront Payments/
Receipts (000) |
|
|
Net Unrealized
Appreciation
(Depreciation) (000) |
|
|
Bank of America |
|
|
BABXRPFB INDEX |
** |
|
|
0.00 |
% |
|
|
TOTAL RETURN |
|
|
|
Quarterly |
|
|
|
01/06/25 |
|
|
|
USD |
|
|
|
118,006 |
|
|
$ |
(809 |
) |
|
$ |
– |
|
|
$ |
(809 |
) |
|
Bank of America |
|
|
BABXRPVB INDEX |
** |
|
|
0.00 |
% |
|
|
TOTAL RETURN |
|
|
|
Quarterly |
|
|
|
01/21/25 |
|
|
|
USD |
|
|
|
48,343 |
|
|
|
352 |
|
|
|
– |
|
|
|
352 |
|
|
Bank of America |
|
|
BAEIESPR INDEX |
** |
|
|
0.15 |
% |
|
|
TOTAL RETURN |
|
|
|
Quarterly |
|
|
|
04/04/25 |
|
|
|
USD |
|
|
|
53,569 |
|
|
|
135 |
|
|
|
– |
|
|
|
135 |
|
|
Bank of America |
|
|
BAFXCAVE INDEX |
** |
|
|
0.00 |
% |
|
|
TOTAL RETURN |
|
|
|
Quarterly |
|
|
|
09/20/24 |
|
|
|
USD |
|
|
|
90,459 |
|
|
|
(2,106 |
) |
|
|
– |
|
|
|
(2,106 |
) |
|
Barclays |
|
|
BXIIVFR1 INDEX |
** |
|
|
0.40 |
% |
|
|
TOTAL RETURN |
|
|
|
Quarterly |
|
|
|
05/20/25 |
|
|
|
USD |
|
|
|
42,702 |
|
|
|
65 |
|
|
|
– |
|
|
|
65 |
|
|
BNP Paribas |
|
|
BNPUMFRL INDEX |
** |
|
|
SOFR +0.60 |
% |
|
|
TOTAL RETURN |
|
|
|
Quarterly |
|
|
|
05/06/25 |
|
|
|
USD |
|
|
|
113,161 |
|
|
|
(3,455 |
) |
|
|
– |
|
|
|
(3,455 |
) |
|
BNP Paribas |
|
|
BNPUMFRS INDEX |
** |
|
|
TOTAL RETURN |
|
|
|
SOFR +0.05 |
% |
|
|
Quarterly |
|
|
|
05/06/25 |
|
|
|
USD |
|
|
|
97,137 |
|
|
|
2,355 |
|
|
|
– |
|
|
|
2,355 |
|
|
BNP Paribas |
|
|
BNPXDITU INDEX |
** |
|
|
0.20 |
% |
|
|
TOTAL RETURN |
|
|
|
Quarterly |
|
|
|
04/21/25 |
|
|
|
USD |
|
|
|
60,586 |
|
|
|
539 |
|
|
|
– |
|
|
|
539 |
|
|
Deutsche Bank |
|
|
DBGNLASU INDEX |
** |
|
|
0.00 |
% |
|
|
TOTAL RETURN |
|
|
|
Quarterly |
|
|
|
01/27/25 |
|
|
|
USD |
|
|
|
46,435 |
|
|
|
1,325 |
|
|
|
– |
|
|
|
1,325 |
|
|
Deutsche Bank |
|
|
DBTIDUS5 INDEX |
** |
|
|
0.00 |
% |
|
|
TOTAL RETURN |
|
|
|
Quarterly |
|
|
|
04/21/25 |
|
|
|
USD |
|
|
|
71,715 |
|
|
|
(148 |
) |
|
|
– |
|
|
|
(148 |
) |
|
Goldman Sachs |
|
|
GSCBEJFB INDEX |
** |
|
|
0.35 |
% |
|
|
TOTAL RETURN |
|
|
|
Quarterly |
|
|
|
08/09/24 |
|
|
|
USD |
|
|
|
97,724 |
|
|
|
(37 |
) |
|
|
– |
|
|
|
(37 |
) |
|
Goldman Sachs |
|
|
GSCBFBL2 INDEX |
** |
|
|
FED FUNDS +0.25 |
% |
|
|
TOTAL RETURN |
|
|
|
Quarterly |
|
|
|
01/17/25 |
|
|
|
USD |
|
|
|
139,423 |
|
|
|
(1,394 |
) |
|
|
– |
|
|
|
(1,394 |
) |
|
Goldman Sachs |
|
|
GSCBFBS2 INDEX |
** |
|
|
TOTAL RETURN |
|
|
|
FED FUNDS -0.10 |
% |
|
|
Quarterly |
|
|
|
01/17/25 |
|
|
|
USD |
|
|
|
135,908 |
|
|
|
(1,186 |
) |
|
|
– |
|
|
|
(1,186 |
) |
|
Goldman Sachs |
|
|
GSXAF11F INDEX |
** |
|
|
-0.30 |
% |
|
|
TOTAL RETURN |
|
|
|
Quarterly |
|
|
|
03/14/25 |
|
|
|
USD |
|
|
|
65,468 |
|
|
|
341 |
|
|
|
– |
|
|
|
341 |
|
|
Goldman Sachs |
|
|
RCXTMGT3 INDEX |
** |
|
|
0.00 |
% |
|
|
TOTAL RETURN |
|
|
|
Quarterly |
|
|
|
10/11/24 |
|
|
|
USD |
|
|
|
42,443 |
|
|
|
(176 |
) |
|
|
– |
|
|
|
(176 |
) |
|
Goldman Sachs |
|
|
SPSIRBKT INDEX |
** |
|
|
TOTAL RETURN |
|
|
|
-0.20 |
% |
|
|
Quarterly |
|
|
|
08/09/24 |
|
|
|
USD |
|
|
|
83,124 |
|
|
|
– |
|
|
|
– |
|
|
|
– |
|
|
JPMorgan Chase |
|
|
JMABNPMF INDEX |
** |
|
|
0.20 |
% |
|
|
TOTAL RETURN |
|
|
|
Quarterly |
|
|
|
03/31/25 |
|
|
|
USD |
|
|
|
53,913 |
|
|
|
436 |
|
|
|
– |
|
|
|
436 |
|
|
JPMorgan Chase |
|
|
JPUS1MMC INDEX |
** |
|
|
0.20 |
% |
|
|
TOTAL RETURN |
|
|
|
Quarterly |
|
|
|
09/26/24 |
|
|
|
USD |
|
|
|
50,369 |
|
|
|
(1,112 |
) |
|
|
– |
|
|
|
(1,112 |
) |
|
JPMorgan Chase |
|
|
IBOXHY INDEX |
|
|
|
TOTAL RETURN |
|
|
|
SOFR |
|
|
|
Quarterly |
|
|
|
09/20/24 |
|
|
|
USD |
|
|
|
12,200 |
|
|
|
(256 |
) |
|
|
– |
|
|
|
(256 |
) |
|
JPMorgan Chase |
|
|
IBOXHY INDEX |
|
|
|
TOTAL RETURN |
|
|
|
SOFR |
|
|
|
Quarterly |
|
|
|
12/20/24 |
|
|
|
USD |
|
|
|
12,200 |
|
|
|
(202 |
) |
|
|
– |
|
|
|
(202 |
) |
|
JPMorgan Chase |
|
|
IBOXHY INDEX |
|
|
|
TOTAL RETURN |
|
|
|
SOFR |
|
|
|
Quarterly |
|
|
|
03/20/25 |
|
|
|
USD |
|
|
|
12,200 |
|
|
|
(87 |
) |
|
|
143 |
|
|
|
(230 |
) |
|
JPMorgan Chase |
|
|
IBXXLLTR INDEX |
|
|
|
SOFR |
|
|
|
TOTAL RETURN |
|
|
|
Quarterly |
|
|
|
12/20/24 |
|
|
|
USD |
|
|
|
4,880 |
|
|
|
(1 |
) |
|
|
(61 |
) |
|
|
60 |
|
|
Macquarie Bank
Limited |
|
|
MQCP388E INDEX |
** |
|
|
0.43 |
% |
|
|
TOTAL RETURN |
|
|
|
Quarterly |
|
|
|
06/06/25 |
|
|
|
USD |
|
|
|
41,491 |
|
|
|
(499 |
) |
|
|
– |
|
|
|
(499 |
) |
The
accompanying notes are an integral part of the consolidated financial statements.
48
|
THE
ADVISORS’ INNER CIRCLE FUND III |
FS
MULTI-STRATEGY
ALTERNATIVES
FUND
JUNE
30, 2024
(Unaudited) |
|
Counterparty |
|
Reference Entity/
Obligation |
|
|
Fund
Pays |
|
|
Fund
Receives |
|
|
Payment
Frequency |
|
|
Termination Date |
|
|
Currency |
|
|
Notional
Amount (000)^ |
|
|
Fair Value (000) |
|
|
|
Upfront
Payments/
Receipts (000) |
|
|
Net Unrealized
Appreciation
(Depreciation) (000) |
|
|
Macquarie Bank
Limited |
|
|
MQIS311 INDEX |
** |
|
|
0.25 |
% |
|
|
TOTAL RETURN |
|
|
|
Quarterly |
|
|
|
03/25/25 |
|
|
|
USD |
|
|
|
107,117 |
|
|
$ |
470 |
|
|
$ |
– |
|
|
$ |
470 |
|
|
Nomura |
|
|
NMSY2RNU INDEX |
** |
|
|
0.15 |
% |
|
|
TOTAL RETURN |
|
|
|
Quarterly |
|
|
|
08/01/24 |
|
|
|
USD |
|
|
|
107,180 |
|
|
|
(2 |
) |
|
|
– |
|
|
|
(2 |
) |
|
Societe Generale |
|
|
SGIPULSU INDEX |
** |
|
|
0.25 |
% |
|
|
TOTAL RETURN |
|
|
|
Quarterly |
|
|
|
01/29/25 |
|
|
|
USD |
|
|
|
34,555 |
|
|
|
70 |
|
|
|
– |
|
|
|
70 |
|
|
Societe Generale |
|
|
SGIXFVET INDEX |
** |
|
|
SOFR +0.20 |
% |
|
|
TOTAL RETURN |
|
|
|
Quarterly |
|
|
|
08/06/24 |
|
|
|
USD |
|
|
|
45,765 |
|
|
|
150 |
|
|
|
– |
|
|
|
150 |
|
|
Societe Generale |
|
|
SGIXUSGC INDEX |
** |
|
|
0.15 |
% |
|
|
TOTAL RETURN |
|
|
|
Quarterly |
|
|
|
01/25/25 |
|
|
|
USD |
|
|
|
62,581 |
|
|
|
(950 |
) |
|
|
– |
|
|
|
(950 |
) |
|
Societe Generale |
|
|
SGIXVR2U INDEX |
** |
|
|
SOFR |
|
|
|
TOTAL RETURN |
|
|
|
N/A |
|
|
|
04/04/25 |
|
|
|
USD |
|
|
|
49,384 |
|
|
|
1,412 |
|
|
|
– |
|
|
|
1,412 |
|
|
UBS |
|
|
UBCSBSB2 INDEX |
** |
|
|
0.00 |
% |
|
|
TOTAL RETURN |
|
|
|
Monthly |
|
|
|
08/27/24 |
|
|
|
USD |
|
|
|
319,981 |
|
|
|
308 |
|
|
|
– |
|
|
|
308 |
|
| |
|
|
|
|
|
|
|
|
|
|
|
|
|
|
|
|
|
|
|
|
|
|
|
|
|
|
2,220,019 |
|
|
$ |
(4,462 |
) |
|
$ |
82 |
|
|
$ |
(4,544 |
) |
^ Notional
amounts for OTC swaps are listed in their local currency.
** The following
tables represent the individual underlying components comprising the Index Basket Swaps at June 30, 2024.
|
**BABXRPFB Index:
A commodity multi-factor basket of eight strategies targeting four factors: Carry, Liquidity, Relative Value, and Value |
|
|
|
| |
|
|
|
|
|
|
|
|
|
| |
Top
Underlying Components |
|
|
Notional |
|
|
|
Percentage of
Notional |
|
|
Future |
Gold 100 oz Futures
August 24 |
|
$ |
(17,930,421 |
) |
|
|
-15.30 |
% |
| |
Soybean Futures
November 24 |
|
|
(16,714,926 |
) |
|
|
-14.26 |
% |
| |
WTI Crude Futures
September 24 |
|
|
(16,561,043 |
) |
|
|
-14.13 |
% |
| |
Natural Gas Futures
November 24 |
|
|
(14,611,083 |
) |
|
|
-12.47 |
% |
| |
Gold 100 oz Futures
December 24 |
|
|
13,415,950 |
|
|
|
11.45 |
% |
| |
Soybean Futures
January 25 |
|
|
11,209,978 |
|
|
|
9.57 |
% |
| |
Brent Crude Futures
September 24 |
|
|
10,024,083 |
|
|
|
8.55 |
% |
| |
WTI Crude Futures
October 24 |
|
|
8,873,430 |
|
|
|
7.57 |
% |
| |
Live Cattle Futures
October 24 |
|
|
(8,052,318 |
) |
|
|
-6.87 |
% |
| |
LME PRI Alum Futures
October 24 |
|
|
7,874,896 |
|
|
|
6.72 |
% |
| |
Corn Futures September
24 |
|
|
(7,165,497 |
) |
|
|
-6.11 |
% |
| |
LME Copper Futures
October 24 |
|
|
6,939,151 |
|
|
|
5.92 |
% |
| |
LME Copper Futures
September 24 |
|
|
(6,870,742 |
) |
|
|
-5.86 |
% |
| |
Gasoline RBOB Futures
August 24 |
|
|
(6,774,642 |
) |
|
|
-5.78 |
% |
| |
WTI Crude Futures
November 24 |
|
|
6,417,858 |
|
|
|
5.48 |
% |
| |
Soybean Meal Futures
January 25 |
|
|
6,349,474 |
|
|
|
5.42 |
% |
| |
Brent Crude Futures
January 25 |
|
|
(6,322,129 |
) |
|
|
-5.39 |
% |
| |
WTI Crude Futures
January 25 |
|
|
6,089,954 |
|
|
|
5.20 |
% |
| |
Soybean Oil Futures
January 25 |
|
|
6,030,152 |
|
|
|
5.15 |
% |
| |
Corn Futures December
24 |
|
|
5,860,629 |
|
|
|
5.00 |
% |
| |
Natural Gas Futures
January 25 |
|
|
5,802,695 |
|
|
|
4.95 |
% |
| |
LME PRI Alum Futures
September 24 |
|
|
(5,177,999 |
) |
|
|
-4.42 |
% |
| |
Low SU Gasoil G
October 24 |
|
|
4,859,714 |
|
|
|
4.15 |
% |
| |
LME Zinc Futures
October 24 |
|
|
4,850,197 |
|
|
|
4.14 |
% |
| |
Natural Gas Futures
March 25 |
|
|
4,848,865 |
|
|
|
4.14 |
% |
| |
Brent Crude Futures
February 25 |
|
|
(4,714,674 |
) |
|
|
-4.02 |
% |
| |
Lean Hogs Futures
August 24 |
|
|
(4,712,811 |
) |
|
|
-4.02 |
% |
| |
WTI Crude Futures
May 25 |
|
|
(4,602,360 |
) |
|
|
-3.93 |
% |
| |
Live Cattle Futures
December 24 |
|
|
4,455,370 |
|
|
|
3.80 |
% |
| |
Gasoline RBOB Futures
September 24 |
|
|
(4,218,760 |
) |
|
|
-3.60 |
% |
The
accompanying notes are an integral part of the consolidated financial statements.
49
|
THE
ADVISORS’ INNER CIRCLE FUND III |
FS
MULTI-STRATEGY
ALTERNATIVES
FUND
JUNE
30, 2024
(Unaudited) |
|
|
Top
Underlying Components |
|
|
Notional |
|
|
|
Percentage of
Notional |
|
| |
Gasoline RBOB Futures
October 24 |
|
$ |
4,210,614 |
|
|
|
3.59 |
% |
| |
LME PRI Alum Futures
November 24 |
|
|
(3,838,433 |
) |
|
|
-3.28 |
% |
| |
LME PRI Alum Futures
January 25 |
|
|
3,837,751 |
|
|
|
3.27 |
% |
| |
Soybean Meal Futures
December 24 |
|
|
(3,741,790 |
) |
|
|
-3.19 |
% |
| |
Brent Crude Futures
December 24 |
|
|
3,634,452 |
|
|
|
3.10 |
% |
| |
WTI Crude Futures
December 24 |
|
|
3,578,182 |
|
|
|
3.05 |
% |
| |
Copper Futures
December 24 |
|
|
(3,534,314 |
) |
|
|
-3.02 |
% |
| |
Low SU Gasoil G
August 24 |
|
|
3,519,202 |
|
|
|
3.00 |
% |
| |
Sugar #11 (World)
March 25 |
|
|
3,366,675 |
|
|
|
2.87 |
% |
| |
LME Nickel Futures
September 24 |
|
|
(3,229,816 |
) |
|
|
-2.76 |
% |
| |
LME Zinc Futures
September 24 |
|
|
(3,209,687 |
) |
|
|
-2.74 |
% |
| |
Low SU Gasoil G
September 24 |
|
|
(3,103,545 |
) |
|
|
-2.65 |
% |
| |
Soybean Futures
August 24 |
|
|
2,994,869 |
|
|
|
2.56 |
% |
| |
Natural Gas Futures
December 24 |
|
|
2,889,667 |
|
|
|
2.47 |
% |
| |
Brent Crude Futures
November 24 |
|
|
2,816,335 |
|
|
|
2.40 |
% |
| |
Live Cattle Futures
August 24 |
|
|
2,771,163 |
|
|
|
2.36 |
% |
| |
LME PRI Alum Futures
August 24 |
|
|
(2,624,521 |
) |
|
|
-2.24 |
% |
| |
LME Nickel Futures
January 25 |
|
|
2,468,466 |
|
|
|
2.11 |
% |
| |
LME Nickel Futures
November 24 |
|
|
(2,466,661 |
) |
|
|
-2.10 |
% |
| |
LME Zinc Futures
January 25 |
|
|
2,429,659 |
|
|
|
2.07 |
% |
| |
LME Zinc Futures
November 24 |
|
|
(2,429,657 |
) |
|
|
-2.07 |
% |
| |
Wheat Futures (CBT)
December 24 |
|
|
2,416,356 |
|
|
|
2.06 |
% |
| |
Cotton No.2 Futures
March 25 |
|
|
2,408,127 |
|
|
|
2.05 |
% |
| |
KC HRW Wheat Futures
September 24 |
|
|
(2,337,747 |
) |
|
|
-1.99 |
% |
| |
NY Harb ULSD Futures
October 24 |
|
|
2,322,945 |
|
|
|
1.98 |
% |
| |
NY Harb ULSD Futures
August 24 |
|
|
2,297,740 |
|
|
|
1.96 |
% |
| |
NY Harb ULSD Futures
September 24 |
|
|
(2,254,117 |
) |
|
|
-1.92 |
% |
| |
Cocoa Futures September
24 |
|
|
2,178,554 |
|
|
|
1.86 |
% |
| |
LME Copper Futures
August 24 |
|
|
2,178,554 |
|
|
|
1.86 |
% |
| |
Cattle Feeder Futures
August 24 |
|
|
(2,178,554 |
) |
|
|
-1.86 |
% |
| |
Cocoa Futures -
IC September 24 |
|
|
(2,178,554 |
) |
|
|
-1.86 |
% |
| |
Low SU Gasoil G
November 24 |
|
|
(2,153,995 |
) |
|
|
-1.84 |
% |
| |
Low SU Gasoil G
January 25 |
|
|
2,152,183 |
|
|
|
1.84 |
% |
| |
Lean Hogs Futures
October 24 |
|
|
2,124,076 |
|
|
|
1.81 |
% |
| |
Gasoline RBOB Futures
November 24 |
|
|
(1,959,263 |
) |
|
|
-1.67 |
% |
| |
Gasoline RBOB Futures
January 25 |
|
|
1,946,902 |
|
|
|
1.66 |
% |
| |
Coffee 'C' Futures
December 24 |
|
|
1,928,821 |
|
|
|
1.65 |
% |
| |
Soybean Meal Futures
August 24 |
|
|
1,891,118 |
|
|
|
1.61 |
% |
| |
WTI Crude Futures
August 24 |
|
|
(1,834,957 |
) |
|
|
-1.57 |
% |
| |
Soybean Oil Futures
August 24 |
|
|
(1,752,644 |
) |
|
|
-1.50 |
% |
| |
Cotton No.2 Futures
December 24 |
|
|
(1,709,938 |
) |
|
|
-1.46 |
% |
| |
LME Copper Futures
December 24 |
|
|
(1,686,711 |
) |
|
|
-1.44 |
% |
| |
LME Nickel Futures
October 24 |
|
|
1,659,831 |
|
|
|
1.42 |
% |
| |
LME Zinc Futures
August 24 |
|
|
(1,606,494 |
) |
|
|
-1.37 |
% |
| |
LME Nickel Futures
August 24 |
|
|
1,588,847 |
|
|
|
1.36 |
% |
| |
LME Lead Futures
October 24 |
|
|
1,576,241 |
|
|
|
1.34 |
% |
| |
Silver Futures
December 24 |
|
|
(1,570,640 |
) |
|
|
-1.34 |
% |
| |
Corn Futures March
25 |
|
|
1,564,355 |
|
|
|
1.33 |
% |
| |
NY Harb ULSD Futures
January 25 |
|
|
1,554,101 |
|
|
|
1.33 |
% |
| |
Rapeseed Euro August
24 |
|
|
(1,532,529 |
) |
|
|
-1.31 |
% |
| |
Wheat Futures (CBT)
March 25 |
|
|
1,516,636 |
|
|
|
1.29 |
% |
| |
Canola Futures
(WCE) November 24 |
|
|
1,505,933 |
|
|
|
1.28 |
% |
| |
White Sugar(ICE)
October 24 |
|
|
(1,432,334 |
) |
|
|
-1.22 |
% |
| |
Soybean Oil Futures
December 24 |
|
|
(1,429,978 |
) |
|
|
-1.22 |
% |
| |
Lean Hogs Futures
December 24 |
|
|
1,360,014 |
|
|
|
1.16 |
% |
The
accompanying notes are an integral part of the consolidated financial statements.
50
|
THE
ADVISORS’ INNER CIRCLE FUND III |
FS
MULTI-STRATEGY
ALTERNATIVES
FUND
JUNE
30, 2024
(Unaudited) |
|
|
Top
Underlying Components |
|
|
Notional |
|
|
|
Percentage of
Notional |
|
| |
Copper Futures
September 24 |
|
$ |
1,354,639 |
|
|
|
1.16 |
% |
| |
LME PRI Alum Futures
December 24 |
|
|
(1,252,074 |
) |
|
|
-1.07 |
% |
| |
Sugar #11 (World)
October 24 |
|
|
(1,199,708 |
) |
|
|
-1.02 |
% |
|
Currency |
Euro Spot |
|
|
(2,403,951 |
) |
|
|
-2.05 |
% |
| |
British Pound Spot
|
|
|
(2,178,554 |
) |
|
|
-1.86 |
% |
| |
Canadian Dollar
Spot |
|
|
1,505,933 |
|
|
|
1.28 |
% |
|
|
|
|
|
|
|
|
|
|
|
|
**BABXRPVB Index:
A commodity volatility multi-factor basket of five commodity strategies targeting three factors: Vol Carry, Vol Hedging, and Relative
Value Vol |
|
|
|
|
| |
|
|
|
|
|
|
|
|
|
| |
Top
Underlying Components |
|
|
Notional |
|
|
|
Percentage of
Notional |
|
|
Future |
Corn Futures September
24 |
|
$ |
(12,782,431 |
) |
|
|
-26.25 |
% |
| |
Wheat Futures (CBT)
September 24 |
|
|
8,432,558 |
|
|
|
17.32 |
% |
| |
Brent Crude Futures
November 24 |
|
|
8,220,601 |
|
|
|
16.88 |
% |
| |
WTI Crude Futures
October 24 |
|
|
(7,861,170 |
) |
|
|
-16.14 |
% |
| |
Brent Crude Futures
October 24 |
|
|
5,254,795 |
|
|
|
10.79 |
% |
| |
LME Copper Futures
July 24 |
|
|
3,910,369 |
|
|
|
8.03 |
% |
| |
WTI Crude Futures
August 24 |
|
|
(3,634,975 |
) |
|
|
-7.46 |
% |
| |
LME Copper Futures
September 24 |
|
|
(3,056,262 |
) |
|
|
-6.28 |
% |
| |
WTI Crude Futures
September 24 |
|
|
(2,788,305 |
) |
|
|
-5.73 |
% |
| |
WTI Crude Futures
November 24 |
|
|
(1,833,439 |
) |
|
|
-3.77 |
% |
| |
Brent Crude Futures
September 24 |
|
|
(1,739,379 |
) |
|
|
-3.57 |
% |
| |
Corn Futures December
24 |
|
|
(1,243,896 |
) |
|
|
-2.55 |
% |
| |
LME Copper Futures
August 24 |
|
|
862,591 |
|
|
|
1.77 |
% |
| |
LME Copper Futures
October 24 |
|
|
(743,443 |
) |
|
|
-1.53 |
% |
| |
Brent Crude Futures
December 24 |
|
|
683,732 |
|
|
|
1.40 |
% |
| |
Natural Gas Futures
August 24 |
|
|
(166,243 |
) |
|
|
-0.34 |
% |
| |
Gold 100 oz Futures
August 24 |
|
|
128,875 |
|
|
|
0.26 |
% |
|
Options |
Put Options on
Corn Futures September 24 |
|
|
(2,735,730 |
) |
|
|
-5.62 |
% |
| |
Put Options on
Wheat Futures(CBT) September 24 |
|
|
2,280,081 |
|
|
|
4.68 |
% |
| |
Call Options on
Brent Crude Futures November 24 |
|
|
(1,908,765 |
) |
|
|
-3.92 |
% |
| |
Call Options on
WTI Crude Futures October 24 |
|
|
1,632,961 |
|
|
|
3.35 |
% |
| |
Call Options on
Brent Crude Futures October 24 |
|
|
(1,430,701 |
) |
|
|
-2.94 |
% |
| |
Call Options on
WTI Crude Futures September 24 |
|
|
925,730 |
|
|
|
1.90 |
% |
| |
Put Options on
Brent Crude Futures October 24 |
|
|
(907,625 |
) |
|
|
-1.86 |
% |
| |
Put Options on
Brent Crude Futures September 24 |
|
|
(856,079 |
) |
|
|
-1.76 |
% |
| |
Call Options on
WTI Crude Futures November 24 |
|
|
841,195 |
|
|
|
1.73 |
% |
| |
Put Options on
Brent Crude Futures November 24 |
|
|
(816,159 |
) |
|
|
-1.68 |
% |
| |
Put Options on
WTI Crude Futures September 24 |
|
|
689,736 |
|
|
|
1.42 |
% |
| |
Call Options on
WTI Crude Futures August 24 |
|
|
669,449 |
|
|
|
1.37 |
% |
| |
Put Options on
WTI Crude Futures November 24 |
|
|
651,040 |
|
|
|
1.34 |
% |
| |
Call Options on
Brent Crude Futures September 24 |
|
|
(648,462 |
) |
|
|
-1.33 |
% |
| |
Put Options on
WTI Crude Futures October 24 |
|
|
589,342 |
|
|
|
1.21 |
% |
| |
Put Options on
LME Copper Futures September 24 |
|
|
(536,573 |
) |
|
|
-1.10 |
% |
| |
Call Options on
Brent Crude Futures December24 |
|
|
(505,724 |
) |
|
|
-1.04 |
% |
| |
Put Options on
Brent Crude Futures December24 |
|
|
(464,992 |
) |
|
|
-0.95 |
% |
| |
Put Options on
Corn Futures December24 |
|
|
(431,650 |
) |
|
|
-0.89 |
% |
| |
Put Options on
WTI Crude Futures August 24 |
|
|
424,200 |
|
|
|
0.87 |
% |
| |
Put Options on
LME Copper Futures October 24 |
|
|
(340,011 |
) |
|
|
-0.70 |
% |
| |
Call Options on
LME Copper Futures July 24 |
|
|
(292,920 |
) |
|
|
-0.60 |
% |
| |
Put Options on
Wheat Futures(CBT) December24 |
|
|
231,054 |
|
|
|
0.47 |
% |
| |
Call Options on
LME Copper Futures August 24 |
|
|
(200,032 |
) |
|
|
-0.41 |
% |
| |
Call Options on
LME Copper Futures October 24 |
|
|
(196,435 |
) |
|
|
-0.40 |
% |
| |
Call Options on
Wheat Futures(CBT) December24 |
|
|
190,279 |
|
|
|
0.39 |
% |
| |
Call Options on
Corn Futures September 24 |
|
|
(169,744 |
) |
|
|
-0.35 |
% |
The
accompanying notes are an integral part of the consolidated financial statements.
51
|
THE
ADVISORS’ INNER CIRCLE FUND III |
FS
MULTI-STRATEGY
ALTERNATIVES
FUND
JUNE
30, 2024
(Unaudited) |
|
|
Top
Underlying Components |
|
|
Notional |
|
|
|
Percentage of
Notional |
|
| |
Call Options on
Wheat Futures(CBT) September 24 |
|
$ |
166,306 |
|
|
|
0.34 |
% |
| |
Put Options on
Gold 100 oz Futures December24 |
|
|
(156,735 |
) |
|
|
-0.32 |
% |
| |
Call Options on
Corn Futures December24 |
|
|
(138,974 |
) |
|
|
-0.29 |
% |
| |
Put Options on
Gold 100 oz Futures August 24 |
|
|
(136,343 |
) |
|
|
-0.28 |
% |
| |
Put Options on
LME Copper Futures August 24 |
|
|
(135,880 |
) |
|
|
-0.28 |
% |
| |
Call Options on
Gold 100 oz Futures December24 |
|
|
(133,216 |
) |
|
|
-0.27 |
% |
|
|
|
|
|
|
|
|
|
|
|
|
**BAEIESPR Index:
A strategy that sells ultra-short options to buy midterm length options to profit from a US equity market that slowly trades lower as
opposed to falls quickly. |
|
|
|
|
| |
|
|
|
|
|
|
|
|
|
| |
Top
Underlying Components |
|
|
Notional |
|
|
|
Percentage of
Notional |
|
|
Future |
S&P 500 E-Mini
Futures September 24 |
|
$ |
64,085,164 |
|
|
|
119.33 |
% |
|
Currency |
US Dollar Spot |
|
|
(10,644,894 |
) |
|
|
-19.82 |
% |
|
Option |
July 24 Puts on
SPX |
|
|
264,384 |
|
|
|
0.49 |
% |
|
|
|
|
|
|
|
|
|
|
|
|
**BAFXCAVE Index:
An FX multi-factor basket of 4 equally weighted FX strategies: Cross-Sectional Carry EM, Defensive Carry, PPP Value G10 and PPP Value
EM. |
|
|
|
|
| |
|
|
|
|
|
|
|
|
|
| |
Top
Underlying Components |
|
|
Notional |
|
|
|
Percentage of
Notional |
|
|
Currency |
CNH Fwd Points
2 Month |
|
$ |
(12,407,082 |
) |
|
|
-14.04 |
% |
| |
IDR Non-Deliverable
Forward Points 2 Month |
|
|
11,374,531 |
|
|
|
12.87 |
% |
| |
Singapore Dollar
2 Month |
|
|
(10,623,059 |
) |
|
|
-12.02 |
% |
| |
Norwegian Krone
2 Month |
|
|
(9,829,459 |
) |
|
|
-11.13 |
% |
| |
IDR Non-Deliverable
Forward Points 2 Month |
|
|
9,737,246 |
|
|
|
11.02 |
% |
| |
PHP Onshore Points
2 Month |
|
|
9,656,128 |
|
|
|
10.93 |
% |
| |
Swiss Franc 2 Month
|
|
|
(9,619,949 |
) |
|
|
-10.89 |
% |
| |
Japanese Yen 2
Month |
|
|
9,519,968 |
|
|
|
10.78 |
% |
| |
Australian Dollar
2 Month |
|
|
(9,087,219 |
) |
|
|
-10.29 |
% |
| |
KRW Onshore Points
2 Month |
|
|
(6,959,285 |
) |
|
|
-7.88 |
% |
| |
Thai Baht 2 Month
|
|
|
6,469,573 |
|
|
|
7.32 |
% |
| |
INR Non-Deliverable
Forward Points 2 Month |
|
|
5,212,795 |
|
|
|
5.90 |
% |
| |
Czech Koruna 2
Month |
|
|
(5,169,467 |
) |
|
|
-5.85 |
% |
| |
COP Ndf Points
2 Month |
|
|
4,252,568 |
|
|
|
4.81 |
% |
| |
British Pound 2
Month |
|
|
3,519,388 |
|
|
|
3.98 |
% |
| |
S. African Rand
2 Month |
|
|
3,438,641 |
|
|
|
3.89 |
% |
| |
Swedish Krona 2
Month |
|
|
3,116,155 |
|
|
|
3.53 |
% |
| |
Mexican Peso 2
Month |
|
|
2,448,260 |
|
|
|
2.77 |
% |
| |
Euro 2 Month |
|
|
2,355,416 |
|
|
|
2.67 |
% |
| |
Polish Zloty 2
Month |
|
|
(1,869,249 |
) |
|
|
-2.12 |
% |
| |
Israeli Shekel
2 Month |
|
|
(1,818,330 |
) |
|
|
-2.06 |
% |
| |
CLP Ndf Points
2 Month |
|
|
(1,759,523 |
) |
|
|
-1.99 |
% |
| |
Taiwan Dollar 2
Month |
|
|
769,621 |
|
|
|
0.87 |
% |
| |
BRL Fwd Points
2 Month |
|
|
(764,430 |
) |
|
|
-0.87 |
% |
| |
Canadian Dollar
2 Month |
|
|
(693,605 |
) |
|
|
-0.79 |
% |
| |
New Romanian Leu
2 Month |
|
|
662,745 |
|
|
|
0.75 |
% |
| |
PEN Fwd Points
2 Month |
|
|
(506,503 |
) |
|
|
-0.57 |
% |
| |
Hungarian Forint
2 Month |
|
|
(496,419 |
) |
|
|
-0.56 |
% |
| |
New Zealand Dollar
2 Month |
|
|
81,306 |
|
|
|
0.09 |
% |
|
|
|
|
|
|
|
|
|
|
|
|
**BXIIVFR1 Index:
Systematic strategy that replicates the payoff of a long VIX upside call structure, which is more cost-effective than owning the options |
|
|
|
|
| |
|
|
|
|
|
|
|
|
|
| |
Top
Underlying Components |
|
|
Notional |
|
|
|
Percentage of
Notional |
|
|
Index |
S&P 500 VIX
Short-Term Future Index Total Return |
|
$ |
(1,458,363 |
) |
|
|
-3.41 |
% |
The
accompanying notes are an integral part of the consolidated financial statements.
52
|
THE
ADVISORS’ INNER CIRCLE FUND III |
FS
MULTI-STRATEGY
ALTERNATIVES
FUND
JUNE
30, 2024
(Unaudited) |
|
|
|
|
|
|
|
|
|
|
|
|
**BNPUMFRL Index:
An alpha oriented strategy using a propriety model to take long positions based on value, quality, and momentum factors. |
|
|
|
|
| |
|
|
|
|
|
|
|
|
|
| |
Top
Underlying Components |
|
|
Notional |
|
|
|
Percentage of
Notional |
|
|
Equity |
Orange County Bancorp
Inc |
|
$ |
444,050 |
|
|
|
0.40 |
% |
| |
Chemung Financial
Corp |
|
|
442,572 |
|
|
|
0.40 |
% |
| |
Independent Bank
Corp |
|
|
438,264 |
|
|
|
0.40 |
% |
| |
FS Bancorp Inc
|
|
|
428,793 |
|
|
|
0.39 |
% |
| |
Bank of Marin Bancorp
|
|
|
428,073 |
|
|
|
0.39 |
% |
| |
Pacific Premier
Bancorp Inc |
|
|
427,443 |
|
|
|
0.39 |
% |
| |
Republic Bancorp
Inc/KY |
|
|
426,613 |
|
|
|
0.39 |
% |
| |
Amalgamated Financial
Corp |
|
|
426,024 |
|
|
|
0.38 |
% |
| |
Civista Bancshares
Inc |
|
|
425,831 |
|
|
|
0.38 |
% |
| |
Primis Financial
Corp |
|
|
425,366 |
|
|
|
0.38 |
% |
| |
Carisma Therapeutics
Inc |
|
|
424,728 |
|
|
|
0.38 |
% |
| |
Heritage Commerce
Corp |
|
|
424,722 |
|
|
|
0.38 |
% |
| |
HBT Financial Inc
|
|
|
423,952 |
|
|
|
0.38 |
% |
| |
ChoiceOne Financial
Services Inc |
|
|
423,059 |
|
|
|
0.38 |
% |
| |
Shore Bancshares
Inc |
|
|
422,690 |
|
|
|
0.38 |
% |
| |
Hanmi Financial
Corporation |
|
|
421,940 |
|
|
|
0.38 |
% |
| |
Third Coast Bancshares
Inc |
|
|
421,938 |
|
|
|
0.38 |
% |
| |
Mid Penn Bancorp
Inc |
|
|
421,618 |
|
|
|
0.38 |
% |
| |
Orrstown Financial
Services Inc |
|
|
421,012 |
|
|
|
0.38 |
% |
| |
First Bancshares
Inc/The |
|
|
420,475 |
|
|
|
0.38 |
% |
| |
Oak Valley Bancorp
|
|
|
418,635 |
|
|
|
0.38 |
% |
| |
Metropolitan Bank
Holding Corp |
|
|
418,438 |
|
|
|
0.38 |
% |
| |
Columbia Banking
System Inc |
|
|
418,327 |
|
|
|
0.38 |
% |
| |
Enterprise Bancorp
Inc |
|
|
418,213 |
|
|
|
0.38 |
% |
| |
TrustCo Bank Corp
|
|
|
418,141 |
|
|
|
0.38 |
% |
| |
SmartFinancial
Inc |
|
|
417,233 |
|
|
|
0.38 |
% |
| |
OceanFirst Financial
Corp |
|
|
416,449 |
|
|
|
0.38 |
% |
| |
CNB Financial Corp
|
|
|
416,166 |
|
|
|
0.38 |
% |
| |
Sierra Bancorp
|
|
|
415,665 |
|
|
|
0.38 |
% |
| |
BCB Bancorp Inc
|
|
|
415,363 |
|
|
|
0.38 |
% |
| |
Banner Corp |
|
|
414,686 |
|
|
|
0.37 |
% |
| |
Baycom Corp |
|
|
413,854 |
|
|
|
0.37 |
% |
| |
Renasant Corp |
|
|
413,334 |
|
|
|
0.37 |
% |
| |
First Bank |
|
|
413,245 |
|
|
|
0.37 |
% |
| |
Enterprise Financial
Services Corp |
|
|
412,634 |
|
|
|
0.37 |
% |
| |
Valley National
Bancorp |
|
|
411,183 |
|
|
|
0.37 |
% |
| |
Capital City Bank
Group Inc |
|
|
410,574 |
|
|
|
0.37 |
% |
| |
First Financial
Corp |
|
|
410,316 |
|
|
|
0.37 |
% |
| |
Bank OZK |
|
|
410,021 |
|
|
|
0.37 |
% |
| |
Northrim Bancorp
Inc |
|
|
409,351 |
|
|
|
0.37 |
% |
| |
Central Pacific
Financial Corp |
|
|
409,239 |
|
|
|
0.37 |
% |
| |
Northeast Community
Bancorp Inc |
|
|
407,755 |
|
|
|
0.37 |
% |
| |
Ocwen Financial
Corp |
|
|
403,259 |
|
|
|
0.36 |
% |
| |
Pathward Financial
Inc |
|
|
402,859 |
|
|
|
0.36 |
% |
| |
Westamerica BanCorp
|
|
|
402,550 |
|
|
|
0.36 |
% |
| |
Timberland Bancorp
Inc |
|
|
400,175 |
|
|
|
0.36 |
% |
| |
MVB Financial Corp
|
|
|
399,405 |
|
|
|
0.36 |
% |
| |
Red River Bancshares
Inc |
|
|
393,690 |
|
|
|
0.36 |
% |
| |
C & F Financial
Corp |
|
|
391,027 |
|
|
|
0.35 |
% |
| |
Bioxcel Therapeutics
Inc |
|
|
320,016 |
|
|
|
0.29 |
% |
The
accompanying notes are an integral part of the consolidated financial statements.
53
|
THE
ADVISORS’ INNER CIRCLE FUND III |
FS
MULTI-STRATEGY
ALTERNATIVES
FUND
JUNE
30, 2024
(Unaudited) |
|
|
|
|
|
|
|
|
|
|
|
|
**BNPUMFRS Index:
An alpha oriented strategy using a propriety model to take short positions based on value, quality, and momentum factors. |
|
|
|
|
| |
|
|
|
|
|
|
|
|
|
| |
Top
Underlying Components |
|
|
Notional |
|
|
|
Percentage of
Notional |
|
|
Equity |
Eagle Bancorp Inc |
|
$ |
(356,369 |
) |
|
|
0.37 |
% |
| |
Bancorp Inc |
|
|
(348,861 |
) |
|
|
0.36 |
% |
| |
Northeast Bank
|
|
|
(347,766 |
) |
|
|
0.36 |
% |
| |
Sterling Bancorp
Inc |
|
|
(345,355 |
) |
|
|
0.36 |
% |
| |
Washington Federal
Inc |
|
|
(345,348 |
) |
|
|
0.36 |
% |
| |
Hingham Institution
For Savings |
|
|
(345,034 |
) |
|
|
0.36 |
% |
| |
Blue Foundry Bancorp
|
|
|
(344,488 |
) |
|
|
0.36 |
% |
| |
HarborOne Bancorp
Inc |
|
|
(343,595 |
) |
|
|
0.36 |
% |
| |
Greene County Bancorp
Inc |
|
|
(343,226 |
) |
|
|
0.36 |
% |
| |
ServisFirst Bancshares
Inc |
|
|
(342,393 |
) |
|
|
0.36 |
% |
| |
Berkshire Hills
Bancorp Inc |
|
|
(341,819 |
) |
|
|
0.36 |
% |
| |
Washington Trust
Bancorp Inc |
|
|
(341,318 |
) |
|
|
0.36 |
% |
| |
FB Financial Corp
|
|
|
(341,090 |
) |
|
|
0.36 |
% |
| |
Triumph Financial
Inc |
|
|
(340,971 |
) |
|
|
0.36 |
% |
| |
Coastal Financial
Corp |
|
|
(340,020 |
) |
|
|
0.36 |
% |
| |
West BanCorp Inc
|
|
|
(339,929 |
) |
|
|
0.36 |
% |
| |
Metrocity Bankshares
Inc |
|
|
(339,363 |
) |
|
|
0.35 |
% |
| |
Provident Financial
Services Inc |
|
|
(338,571 |
) |
|
|
0.35 |
% |
| |
First Financial
Bankshares Inc |
|
|
(335,672 |
) |
|
|
0.35 |
% |
| |
Burke & Herbert
Financial Services Corp |
|
|
(335,524 |
) |
|
|
0.35 |
% |
| |
Live Oak Bancshares
Inc |
|
|
(335,304 |
) |
|
|
0.35 |
% |
| |
Columbia Financial
Inc |
|
|
(335,303 |
) |
|
|
0.35 |
% |
| |
New York Community
Bancorp Inc |
|
|
(334,923 |
) |
|
|
0.35 |
% |
| |
NU Holdings Ltd
|
|
|
(334,910 |
) |
|
|
0.35 |
% |
| |
Glacier Bancorp
Inc |
|
|
(334,504 |
) |
|
|
0.35 |
% |
| |
Park National Corp
|
|
|
(333,977 |
) |
|
|
0.35 |
% |
| |
Waterstone Financial
Inc |
|
|
(333,673 |
) |
|
|
0.35 |
% |
| |
Bankwell Financial
Group Inc |
|
|
(333,669 |
) |
|
|
0.35 |
% |
| |
Texas Capital Bancshares
Inc |
|
|
(333,271 |
) |
|
|
0.35 |
% |
| |
BancFirst Corp
|
|
|
(333,174 |
) |
|
|
0.35 |
% |
| |
ESSA Bancorp Inc
|
|
|
(332,851 |
) |
|
|
0.35 |
% |
| |
KeyCorp |
|
|
(332,557 |
) |
|
|
0.35 |
% |
| |
Farmers & Merchants
Bancorp Inc |
|
|
(332,007 |
) |
|
|
0.35 |
% |
| |
Homestreet Inc
|
|
|
(331,058 |
) |
|
|
0.35 |
% |
| |
Lakeland Financial
Corp |
|
|
(330,922 |
) |
|
|
0.35 |
% |
| |
BOK Financial Corp
|
|
|
(330,695 |
) |
|
|
0.35 |
% |
| |
Capitol Federal
Financial Inc |
|
|
(330,314 |
) |
|
|
0.35 |
% |
| |
Ponce Financial
Group Inc |
|
|
(328,710 |
) |
|
|
0.34 |
% |
| |
JPMorgan Chase
& Co |
|
|
(327,944 |
) |
|
|
0.34 |
% |
| |
Banco Latinoamericano
de Comercio Exterior S.A. |
|
|
(327,782 |
) |
|
|
0.34 |
% |
| |
City Holding Co
|
|
|
(327,528 |
) |
|
|
0.34 |
% |
| |
M&T Bank Corp
|
|
|
(326,587 |
) |
|
|
0.34 |
% |
| |
Wells Fargo &
Co |
|
|
(325,348 |
) |
|
|
0.34 |
% |
| |
Merchants Bancorp
|
|
|
(325,097 |
) |
|
|
0.34 |
% |
| |
TFS Financial Corp
|
|
|
(324,976 |
) |
|
|
0.34 |
% |
| |
Bank of New York
Mellon Corp |
|
|
(324,071 |
) |
|
|
0.34 |
% |
| |
Orchestra Biomed
Holdings Inc |
|
|
(324,032 |
) |
|
|
0.34 |
% |
| |
First Western Financial
Inc |
|
|
(323,805 |
) |
|
|
0.34 |
% |
| |
PNC Financial Services
Group Inc |
|
|
(323,018 |
) |
|
|
0.34 |
% |
| |
Northern Trust
Corp |
|
|
(322,973 |
) |
|
|
0.34 |
% |
The
accompanying notes are an integral part of the consolidated financial statements.
54
|
THE
ADVISORS’ INNER CIRCLE FUND III |
FS
MULTI-STRATEGY
ALTERNATIVES
FUND
JUNE
30, 2024
(Unaudited) |
|
|
|
|
|
|
|
|
|
|
|
|
**BNPXDITU Index:
Seeks to capture intraday momentum in US equity markets by leveraging market dynamics observed throughout the day. |
|
|
|
|
| |
|
|
|
|
|
|
|
|
|
| |
Top
Underlying Components |
|
|
Notional |
|
|
|
Percentage of
Notional |
|
|
Index |
BNP Paribas Dynamic
Intraday Trend US Index |
|
$ |
61,149,990 |
|
|
|
100.00 |
% |
|
|
|
|
|
|
|
|
|
|
|
| |
|
|
|
|
|
**DBGNLASU Index:
A dynamic multi-factor, multi-style portfolio that is updated monthly to optimize the best 1 month forward return by using machine learning
to select from over 100 factors in a beta, sector, and region neutral format. |
|
|
|
|
| |
|
|
|
|
| |
|
|
|
|
|
|
|
|
|
| |
Top
Underlying Components |
|
|
Notional |
|
|
|
Percentage of
Notional |
|
|
Currency |
US Dollar Spot |
|
$ |
43,111,790 |
|
|
|
90.26 |
% |
| |
US Dollar Spot
|
|
|
(8,695,857 |
) |
|
|
-18.21 |
% |
|
Index |
JPY Overnight Rate
(Mid) Index |
|
|
(4,549,538 |
) |
|
|
-9.53 |
% |
| |
Deutsche Bank Fed
Funds Effective Rate Total Return Index |
|
|
(4,231,141 |
) |
|
|
-8.86 |
% |
| |
Deutsche Bank Australia
Overnight Money Market TR Index |
|
|
(269,405 |
) |
|
|
-0.56 |
% |
|
Equity |
MicroStrategy Inc |
|
|
(468,243 |
) |
|
|
-0.98 |
% |
| |
Computershare Ltd
|
|
|
368,183 |
|
|
|
0.77 |
% |
| |
Coinbase Global
Inc |
|
|
(367,247 |
) |
|
|
-0.77 |
% |
| |
Ivanhoe Mines Ltd
|
|
|
(359,660 |
) |
|
|
-0.75 |
% |
| |
Osaka Gas Co Ltd
|
|
|
347,480 |
|
|
|
0.73 |
% |
| |
Block Inc |
|
|
(341,233 |
) |
|
|
-0.71 |
% |
| |
Carnival Corp |
|
|
(338,397 |
) |
|
|
-0.71 |
% |
| |
Archer-Daniels-Midland
Co |
|
|
334,990 |
|
|
|
0.70 |
% |
| |
Cummins Inc |
|
|
326,997 |
|
|
|
0.68 |
% |
| |
Confluent Inc |
|
|
(326,103 |
) |
|
|
-0.68 |
% |
| |
Cigna Group/The
|
|
|
323,841 |
|
|
|
0.68 |
% |
| |
Colgate-Palmolive
Co |
|
|
322,934 |
|
|
|
0.68 |
% |
| |
Nintendo Co Ltd
|
|
|
310,601 |
|
|
|
0.65 |
% |
| |
Subaru Corp |
|
|
310,298 |
|
|
|
0.65 |
% |
| |
Merck & Co
Inc |
|
|
310,181 |
|
|
|
0.65 |
% |
| |
Rivian Automotive
Inc |
|
|
(310,180 |
) |
|
|
-0.65 |
% |
| |
Ono Pharmaceutical
Co Ltd |
|
|
308,602 |
|
|
|
0.65 |
% |
| |
Tokyo Gas Co Ltd
|
|
|
306,093 |
|
|
|
0.64 |
% |
| |
Lockheed Martin
Corp |
|
|
305,501 |
|
|
|
0.64 |
% |
| |
Meta Platforms
Inc |
|
|
305,148 |
|
|
|
0.64 |
% |
| |
QUALCOMM Inc |
|
|
302,602 |
|
|
|
0.63 |
% |
| |
Caterpillar Inc
|
|
|
297,136 |
|
|
|
0.62 |
% |
| |
Aisin Corp |
|
|
296,880 |
|
|
|
0.62 |
% |
| |
AGC Inc |
|
|
296,403 |
|
|
|
0.62 |
% |
| |
HF Sinclair Corp
|
|
|
294,322 |
|
|
|
0.62 |
% |
| |
Kao Corp |
|
|
293,874 |
|
|
|
0.62 |
% |
| |
Sumitomo Electric
Industries Ltd |
|
|
290,849 |
|
|
|
0.61 |
% |
| |
Techtronic Industries
Co Ltd |
|
|
285,925 |
|
|
|
0.60 |
% |
| |
Marathon Petroleum
Corp |
|
|
283,846 |
|
|
|
0.59 |
% |
| |
Adyen NV |
|
|
(282,843 |
) |
|
|
-0.59 |
% |
| |
Caesars Entertainment
Inc |
|
|
(282,130 |
) |
|
|
-0.59 |
% |
| |
Garmin Ltd |
|
|
280,883 |
|
|
|
0.59 |
% |
| |
Cameco Corp |
|
|
(279,714 |
) |
|
|
-0.59 |
% |
| |
Brambles Ltd |
|
|
278,875 |
|
|
|
0.58 |
% |
| |
Alphabet Inc |
|
|
277,783 |
|
|
|
0.58 |
% |
| |
Siemens Energy
AG |
|
|
(274,476 |
) |
|
|
-0.57 |
% |
| |
Inpex Corp |
|
|
274,312 |
|
|
|
0.57 |
% |
| |
Kimberly-Clark
Corp |
|
|
273,736 |
|
|
|
0.57 |
% |
| |
Johnson & Johnson
|
|
|
271,948 |
|
|
|
0.57 |
% |
| |
Kirin Holdings
Co Ltd |
|
|
270,952 |
|
|
|
0.57 |
% |
| |
Recruit Holdings
Co Ltd |
|
|
270,671 |
|
|
|
0.57 |
% |
The
accompanying notes are an integral part of the consolidated financial statements.
55
|
THE
ADVISORS’ INNER CIRCLE FUND III |
FS
MULTI-STRATEGY
ALTERNATIVES
FUND
JUNE
30, 2024
(Unaudited) |
|
|
Top
Underlying Components |
|
|
Notional |
|
|
|
Percentage of
Notional |
|
| |
Boeing Co/The |
|
$ |
(270,049 |
) |
|
|
-0.57 |
% |
| |
Tyson Foods Inc
|
|
|
268,881 |
|
|
|
0.56 |
% |
| |
Toast Inc |
|
|
(268,635 |
) |
|
|
-0.56 |
% |
| |
Nutrien Ltd |
|
|
267,722 |
|
|
|
0.56 |
% |
|
|
|
|
|
|
|
|
|
|
|
|
**DBTIDUS5 Index:
Seeks to capture intraday momentum in US equity markets by reacting rapidly to market volatility. |
|
|
|
|
| |
|
|
|
|
|
|
|
|
|
| |
Top
Underlying Components |
|
|
Notional |
|
|
|
Percentage of
Notional |
|
|
Index |
Deutsche Bank US
Equity Dynamic Intraday Trend Index |
|
$ |
71,567,047 |
|
|
|
100.00 |
% |
| |
|
|
|
|
|
**GSCBEJFB Index:
A long basket of small to medium sized banks that are attractive M&A targets in order to take advantage of the impending consolidation
cycle as well as select positions in specialty finance and fintech companies. |
|
|
|
|
| |
|
|
|
|
| |
|
|
|
|
|
|
|
|
|
| |
Top
Underlying Components |
|
|
Notional |
|
|
|
Percentage of
Notional |
|
|
Equity |
First Horizon Corp |
|
$ |
7,277,733 |
|
|
|
7.45 |
% |
| |
NB Bancorp Inc
|
|
|
4,865,779 |
|
|
|
4.98 |
% |
| |
Sandy Spring Bancorp
Inc |
|
|
4,759,380 |
|
|
|
4.87 |
% |
| |
First Citizens
BancShares Inc |
|
|
4,716,997 |
|
|
|
4.83 |
% |
| |
Wintrust Financial
Corp |
|
|
4,712,929 |
|
|
|
4.82 |
% |
| |
Pinnacle Financial
Partners Inc |
|
|
4,642,572 |
|
|
|
4.75 |
% |
| |
Axos Financial
Inc |
|
|
4,625,343 |
|
|
|
4.73 |
% |
| |
First Bancshares
Inc/The |
|
|
4,499,672 |
|
|
|
4.61 |
% |
| |
Merchants Bancorp
|
|
|
4,181,580 |
|
|
|
4.28 |
% |
| |
TriCo Bancshares
|
|
|
4,115,841 |
|
|
|
4.21 |
% |
| |
National Bank Holdings
Corp |
|
|
3,948,031 |
|
|
|
4.04 |
% |
| |
First Bancorp/Southern
Pines NC |
|
|
3,920,779 |
|
|
|
4.01 |
% |
| |
Ameris Bancorp
|
|
|
3,910,707 |
|
|
|
4.00 |
% |
| |
Pacific Premier
Bancorp Inc |
|
|
3,834,095 |
|
|
|
3.92 |
% |
| |
Rithm Capital Corp
|
|
|
3,724,275 |
|
|
|
3.81 |
% |
| |
Stellar Bancorp
Inc |
|
|
3,418,455 |
|
|
|
3.50 |
% |
| |
Premier Financial
Corp |
|
|
3,333,944 |
|
|
|
3.41 |
% |
| |
ConnectOne Bancorp
Inc |
|
|
3,243,727 |
|
|
|
3.32 |
% |
| |
Independent Bank
Group Inc |
|
|
3,225,312 |
|
|
|
3.30 |
% |
| |
Old Second Bancorp
Inc |
|
|
3,011,999 |
|
|
|
3.08 |
% |
| |
Heritage Commerce
Corp |
|
|
3,008,778 |
|
|
|
3.08 |
% |
| |
Flushing Financial
Corp |
|
|
2,597,952 |
|
|
|
2.66 |
% |
| |
First Interstate
BancSystem Inc |
|
|
2,441,077 |
|
|
|
2.50 |
% |
| |
First Mid Bancshares
Inc |
|
|
1,963,607 |
|
|
|
2.01 |
% |
| |
Carter Bankshares
Inc |
|
|
1,119,306 |
|
|
|
1.15 |
% |
| |
HomeTrust Bancshares
Inc |
|
|
1,080,427 |
|
|
|
1.11 |
% |
| |
Third Coast Bancshares
Inc |
|
|
765,257 |
|
|
|
0.78 |
% |
| |
Evans Bancorp Inc
|
|
|
741,326 |
|
|
|
0.76 |
% |
| |
|
|
|
|
|
**GSCBFBL2 Index:
Long basket of small and mid-cap Cyclical GARP stocks that are positioned well to benefit from economic expansion in a soft landing scenario |
|
|
|
|
| |
|
|
|
|
| |
|
|
|
|
|
|
|
|
|
| |
Top
Underlying Components |
|
|
Notional |
|
|
|
Percentage of
Notional |
|
|
Equity |
Alpha & Omega
Semiconductor |
|
$ |
1,273,208 |
|
|
|
0.92 |
% |
| |
Axcelis Technologies
Inc |
|
|
1,221,685 |
|
|
|
0.88 |
% |
| |
Extreme Networks
Inc |
|
|
1,118,568 |
|
|
|
0.81 |
% |
| |
SMART Global Holdings
Inc |
|
|
1,072,921 |
|
|
|
0.77 |
% |
| |
Applied Materials
Inc |
|
|
1,065,865 |
|
|
|
0.77 |
% |
| |
Marcus Corp/The
|
|
|
1,048,881 |
|
|
|
0.76 |
% |
| |
Murphy USA Inc
|
|
|
1,040,203 |
|
|
|
0.75 |
% |
| |
United Therapeutics
Corp |
|
|
1,018,220 |
|
|
|
0.73 |
% |
| |
Adtalem Global
Education Inc |
|
|
1,004,759 |
|
|
|
0.73 |
% |
The
accompanying notes are an integral part of the consolidated financial statements.
56
|
THE
ADVISORS’ INNER CIRCLE FUND III |
FS
MULTI-STRATEGY
ALTERNATIVES
FUND
JUNE
30, 2024
(Unaudited) |
|
|
Top
Underlying Components |
|
|
Notional |
|
|
|
Percentage of
Notional |
|
| |
Knife River Corp
|
|
$ |
999,166 |
|
|
|
0.72 |
% |
| |
Ichor Holdings
Ltd |
|
|
997,714 |
|
|
|
0.72 |
% |
| |
Jones Lang LaSalle
Inc |
|
|
995,226 |
|
|
|
0.72 |
% |
| |
Enova International
Inc |
|
|
991,938 |
|
|
|
0.72 |
% |
| |
Edgewell Personal
Care Co |
|
|
982,871 |
|
|
|
0.71 |
% |
| |
Apogee Enterprises
Inc |
|
|
978,937 |
|
|
|
0.71 |
% |
| |
ABM Industries
Inc |
|
|
970,347 |
|
|
|
0.70 |
% |
| |
Sanmina Corp |
|
|
970,135 |
|
|
|
0.70 |
% |
| |
Scholastic Corp
|
|
|
966,755 |
|
|
|
0.70 |
% |
| |
Flowserve Corp
|
|
|
960,207 |
|
|
|
0.69 |
% |
| |
Tenet Healthcare
Corp |
|
|
958,963 |
|
|
|
0.69 |
% |
| |
IDEXX Laboratories
Inc |
|
|
956,430 |
|
|
|
0.69 |
% |
| |
Emcor Group Inc
|
|
|
956,233 |
|
|
|
0.69 |
% |
| |
Esab Corp |
|
|
950,243 |
|
|
|
0.69 |
% |
| |
Calix Inc |
|
|
948,851 |
|
|
|
0.68 |
% |
| |
Addus HomeCare
Corp |
|
|
943,118 |
|
|
|
0.68 |
% |
| |
UniFirst Corp/MA
|
|
|
942,793 |
|
|
|
0.68 |
% |
| |
Minerals Technologies
Inc |
|
|
942,168 |
|
|
|
0.68 |
% |
| |
Toll Brothers Inc
|
|
|
939,000 |
|
|
|
0.68 |
% |
| |
Urban Outfitters
Inc |
|
|
937,792 |
|
|
|
0.68 |
% |
| |
Match Group Inc
|
|
|
934,779 |
|
|
|
0.67 |
% |
| |
Allegro MicroSystems
Inc |
|
|
933,288 |
|
|
|
0.67 |
% |
| |
Digi International
Inc |
|
|
929,691 |
|
|
|
0.67 |
% |
| |
Pilgrim's Pride
Corp |
|
|
929,075 |
|
|
|
0.67 |
% |
| |
NMI Holdings Inc
|
|
|
921,868 |
|
|
|
0.67 |
% |
| |
Sonic Automotive
Inc |
|
|
920,858 |
|
|
|
0.66 |
% |
| |
Mercury General
Corp |
|
|
919,256 |
|
|
|
0.66 |
% |
| |
TEGNA Inc |
|
|
916,340 |
|
|
|
0.66 |
% |
| |
Post Holdings Inc
|
|
|
913,848 |
|
|
|
0.66 |
% |
| |
Benchmark Electronics
Inc |
|
|
912,268 |
|
|
|
0.66 |
% |
| |
Cheesecake Factory
Inc/The |
|
|
911,474 |
|
|
|
0.66 |
% |
| |
Arlo Technologies
Inc |
|
|
910,757 |
|
|
|
0.66 |
% |
| |
HCI Group Inc |
|
|
908,825 |
|
|
|
0.66 |
% |
| |
Performance Food
Group Co |
|
|
908,181 |
|
|
|
0.66 |
% |
| |
EchoStar Corp |
|
|
907,916 |
|
|
|
0.66 |
% |
| |
Corcept Therapeutics
Inc |
|
|
903,317 |
|
|
|
0.65 |
% |
| |
Exelixis Inc |
|
|
902,486 |
|
|
|
0.65 |
% |
| |
Itron Inc |
|
|
901,211 |
|
|
|
0.65 |
% |
| |
Tyson Foods Inc
|
|
|
900,588 |
|
|
|
0.65 |
% |
| |
Clearwater Paper
Corp |
|
|
900,333 |
|
|
|
0.65 |
% |
| |
Scansource Inc
|
|
|
898,696 |
|
|
|
0.65 |
% |
|
|
|
|
|
|
|
|
|
|
|
|
**GSCBFBS2 Index:
Short basket of mega-cap stocks meant to reduce beta and take advantage of a rotation out of defensive proxies in a soft landing scenario |
|
|
|
|
| |
|
|
|
|
| |
|
|
|
|
|
|
|
|
|
| |
Top
Underlying Components |
|
|
Notional |
|
|
|
Percentage of
Notional |
|
|
Equity |
Adobe Inc |
|
$ |
(2,131,125 |
) |
|
|
1.55 |
% |
| |
Broadcom Inc |
|
|
(2,002,151 |
) |
|
|
1.46 |
% |
| |
Intuit Inc |
|
|
(1,972,020 |
) |
|
|
1.43 |
% |
| |
Eli Lilly &
Co |
|
|
(1,868,476 |
) |
|
|
1.36 |
% |
| |
Microsoft Corp
|
|
|
(1,849,192 |
) |
|
|
1.34 |
% |
| |
Amazon.com Inc
|
|
|
(1,847,181 |
) |
|
|
1.34 |
% |
| |
Charter Communications
Inc |
|
|
(1,817,700 |
) |
|
|
1.32 |
% |
| |
Meta Platforms
Inc |
|
|
(1,809,493 |
) |
|
|
1.32 |
% |
| |
Accenture PLC |
|
|
(1,806,675 |
) |
|
|
1.31 |
% |
The
accompanying notes are an integral part of the consolidated financial statements.
57
|
THE
ADVISORS’ INNER CIRCLE FUND III |
FS
MULTI-STRATEGY
ALTERNATIVES
FUND
JUNE
30, 2024
(Unaudited) |
|
|
Top
Underlying Components |
|
|
Notional |
|
|
|
Percentage of
Notional |
|
| |
Alphabet Inc |
|
$ |
(1,806,074 |
) |
|
|
1.31 |
% |
| |
AT&T Inc |
|
|
(1,793,583 |
) |
|
|
1.30 |
% |
| |
Home Depot Inc
|
|
|
(1,792,418 |
) |
|
|
1.30 |
% |
| |
Ford Motor Co |
|
|
(1,792,109 |
) |
|
|
1.30 |
% |
| |
3M Co |
|
|
(1,781,242 |
) |
|
|
1.29 |
% |
| |
Citigroup Inc |
|
|
(1,776,738 |
) |
|
|
1.29 |
% |
| |
Capital One Financial
Corp |
|
|
(1,766,735 |
) |
|
|
1.28 |
% |
| |
Exxon Mobil Corp
|
|
|
(1,766,049 |
) |
|
|
1.28 |
% |
| |
General Motors
Co |
|
|
(1,764,940 |
) |
|
|
1.28 |
% |
| |
Charles Schwab
Corp |
|
|
(1,753,714 |
) |
|
|
1.27 |
% |
| |
ConocoPhillips
|
|
|
(1,749,673 |
) |
|
|
1.27 |
% |
| |
US Bancorp |
|
|
(1,746,564 |
) |
|
|
1.27 |
% |
| |
Bank of New York
Mellon Corp |
|
|
(1,746,262 |
) |
|
|
1.27 |
% |
| |
Walmart Inc |
|
|
(1,746,097 |
) |
|
|
1.27 |
% |
| |
JPMorgan Chase
& Co |
|
|
(1,744,361 |
) |
|
|
1.27 |
% |
| |
Lowe's Cos Inc
|
|
|
(1,739,257 |
) |
|
|
1.26 |
% |
| |
Wells Fargo &
Co |
|
|
(1,736,689 |
) |
|
|
1.26 |
% |
| |
UnitedHealth Group
Inc |
|
|
(1,728,052 |
) |
|
|
1.26 |
% |
| |
Morgan Stanley
|
|
|
(1,725,630 |
) |
|
|
1.25 |
% |
| |
Chevron Corp |
|
|
(1,725,120 |
) |
|
|
1.25 |
% |
| |
Blackrock Inc |
|
|
(1,720,117 |
) |
|
|
1.25 |
% |
| |
Bank of America
Corp |
|
|
(1,719,695 |
) |
|
|
1.25 |
% |
| |
MetLife Inc |
|
|
(1,718,054 |
) |
|
|
1.25 |
% |
| |
Cisco Systems Inc
|
|
|
(1,712,913 |
) |
|
|
1.24 |
% |
| |
Berkshire Hathaway
Inc |
|
|
(1,709,335 |
) |
|
|
1.24 |
% |
| |
Verizon Communications
Inc |
|
|
(1,706,948 |
) |
|
|
1.24 |
% |
| |
Mastercard Inc
|
|
|
(1,705,004 |
) |
|
|
1.24 |
% |
| |
General Electric
Co |
|
|
(1,699,087 |
) |
|
|
1.23 |
% |
| |
Procter & Gamble
Co |
|
|
(1,698,366 |
) |
|
|
1.23 |
% |
| |
Comcast Corp |
|
|
(1,692,649 |
) |
|
|
1.23 |
% |
| |
CVS Health Corp
|
|
|
(1,682,033 |
) |
|
|
1.22 |
% |
| |
American Express
Co |
|
|
(1,672,721 |
) |
|
|
1.22 |
% |
| |
McDonald's Corp
|
|
|
(1,665,963 |
) |
|
|
1.21 |
% |
| |
American International
Group Inc |
|
|
(1,658,782 |
) |
|
|
1.21 |
% |
| |
Visa Inc |
|
|
(1,651,841 |
) |
|
|
1.20 |
% |
| |
Dow Inc |
|
|
(1,643,939 |
) |
|
|
1.19 |
% |
| |
Danaher Corp |
|
|
(1,624,607 |
) |
|
|
1.18 |
% |
| |
RTX Corp |
|
|
(1,591,558 |
) |
|
|
1.16 |
% |
| |
PayPal Holdings
Inc |
|
|
(1,568,160 |
) |
|
|
1.14 |
% |
| |
Colgate-Palmolive
Co |
|
|
(1,430,658 |
) |
|
|
1.04 |
% |
| |
Booking Holdings
Inc |
|
|
(1,335,362 |
) |
|
|
0.97 |
% |
|
|
|
|
|
|
|
|
|
|
|
|
**GSXAF11F Index:
A basket of Trend, Tail Reversion, and Carry strategies across Commodity, Credit, Equity, FX, and Rates exposures |
|
|
|
|
| |
|
|
|
|
| |
|
|
|
|
|
|
|
|
|
| |
Top
Underlying Components |
|
|
Notional |
|
|
|
Percentage of
Notional |
|
|
Future |
Euro-Schatz Futures
September 24 |
|
$ |
(31,382,518 |
) |
|
|
-47.68 |
% |
| |
US 2 Year Note
(CBT) September 24 |
|
|
(31,160,386 |
) |
|
|
-47.34 |
% |
| |
JPN 10 Year Bond
(OSE) September 24 |
|
|
(12,875,537 |
) |
|
|
-19.56 |
% |
| |
3 Month Euro EURIBOR
December 25 |
|
|
(11,592,937 |
) |
|
|
-17.61 |
% |
| |
3 Month Euro EURIBOR
September 25 |
|
|
(11,582,339 |
) |
|
|
-17.60 |
% |
| |
3 Month Euro EURIBOR
June 25 |
|
|
(11,569,686 |
) |
|
|
-17.58 |
% |
| |
3 Month Euro EURIBOR
March 25 |
|
|
(11,554,095 |
) |
|
|
-17.55 |
% |
| |
3 Month Euro EURIBOR
December 24 |
|
|
(11,533,345 |
) |
|
|
-17.52 |
% |
| |
3 Month SOFR Futures
December 25 |
|
|
(9,896,557 |
) |
|
|
-15.04 |
% |
| |
3 Month SOFR Futures
September 25 |
|
|
(9,882,189 |
) |
|
|
-15.01 |
% |
The
accompanying notes are an integral part of the consolidated financial statements.
58
|
THE
ADVISORS’ INNER CIRCLE FUND III |
FS
MULTI-STRATEGY
ALTERNATIVES
FUND
JUNE
30, 2024
(Unaudited) |
|
|
Top
Underlying Components |
|
|
Notional |
|
|
|
Percentage of
Notional |
|
| |
3 Month SOFR Futures
June 25 |
|
$ |
(9,864,473 |
) |
|
|
-14.99 |
% |
| |
3 Month SOFR Futures
March 25 |
|
|
(9,841,676 |
) |
|
|
-14.95 |
% |
| |
3 Month SOFR Futures
December 24 |
|
|
(9,816,213 |
) |
|
|
-14.91 |
% |
| |
Euro-Bund Futures
September 24 |
|
|
(9,447,852 |
) |
|
|
-14.35 |
% |
| |
Euro-BTP Futures
September 24 |
|
|
8,116,858 |
|
|
|
12.33 |
% |
| |
Euro-BOBL Futures
September 24 |
|
|
(8,023,157 |
) |
|
|
-12.19 |
% |
| |
US Long Bond (CBT)
September 24 |
|
|
6,531,880 |
|
|
|
9.92 |
% |
| |
ICE 3 Month SONIA
Futures December 25 |
|
|
(6,047,935 |
) |
|
|
-9.19 |
% |
| |
ICE 3 Month SONIA
Futures September 25 |
|
|
(6,040,644 |
) |
|
|
-9.18 |
% |
| |
ICE 3 Month SONIA
Futures June 25 |
|
|
(6,031,948 |
) |
|
|
-9.16 |
% |
| |
ICE 3 Month SONIA
Futures March 25 |
|
|
(6,021,960 |
) |
|
|
-9.15 |
% |
| |
ICE 3 Month SONIA
Futures December 24 |
|
|
(6,010,758 |
) |
|
|
-9.13 |
% |
| |
SPI 200 Futures
July 24 |
|
|
4,997,840 |
|
|
|
7.59 |
% |
| |
Corn Futures September
24 |
|
|
(4,739,389 |
) |
|
|
-7.20 |
% |
| |
AUST 10Y Bond Futures
September 24 |
|
|
4,482,637 |
|
|
|
6.81 |
% |
| |
Long Gilt Futures
September 24 |
|
|
4,327,060 |
|
|
|
6.57 |
% |
| |
Swiss Market Index
Futures September 24 |
|
|
3,964,973 |
|
|
|
6.02 |
% |
| |
S&P 500 E-Mini
Futures September 24 |
|
|
3,922,393 |
|
|
|
5.96 |
% |
| |
Euro-OAT Futures
September 24 |
|
|
(3,793,007 |
) |
|
|
-5.76 |
% |
| |
US 5 Year Note
(CBT) September 24 |
|
|
(3,699,986 |
) |
|
|
-5.62 |
% |
| |
FTSE/MIB Index
Futures September 24 |
|
|
3,518,928 |
|
|
|
5.35 |
% |
| |
MSCI Emerging Markets
September 24 |
|
|
3,479,675 |
|
|
|
5.29 |
% |
| |
DAX Index Futures
September 24 |
|
|
3,246,390 |
|
|
|
4.93 |
% |
| |
NASDAQ 100 E-Mini
September 24 |
|
|
3,196,327 |
|
|
|
4.86 |
% |
| |
S&P/TSX 60
IX Futures September 24 |
|
|
3,184,274 |
|
|
|
4.84 |
% |
| |
Soybean Futures
November 24 |
|
|
(3,142,499 |
) |
|
|
-4.77 |
% |
| |
SET50 Futures September
24 |
|
|
(2,961,667 |
) |
|
|
-4.50 |
% |
| |
TOPIX Index Futures
September 24 |
|
|
2,808,906 |
|
|
|
4.27 |
% |
| |
Wheat Futures (CBT)
September 24 |
|
|
(2,705,490 |
) |
|
|
-4.11 |
% |
| |
Gold 100 oz Futures
August 24 |
|
|
2,456,015 |
|
|
|
3.73 |
% |
| |
Gold 100 oz Futures
December 24 |
|
|
2,456,015 |
|
|
|
3.73 |
% |
| |
Cotton No.2 Futures
December 24 |
|
|
(2,404,853 |
) |
|
|
-3.65 |
% |
| |
Cocoa Futures September
24 |
|
|
2,145,822 |
|
|
|
3.26 |
% |
| |
CAN 10 Year Bond
Futures September 24 |
|
|
(2,066,398 |
) |
|
|
-3.14 |
% |
| |
FTSE 100 Index
Futures September 24 |
|
|
1,916,012 |
|
|
|
2.91 |
% |
| |
IBEX 35 Index Futures
July 24 |
|
|
1,889,530 |
|
|
|
2.87 |
% |
| |
Coffee 'C' Futures
September 24 |
|
|
1,879,921 |
|
|
|
2.86 |
% |
| |
WTI Crude Futures
September 24 |
|
|
1,868,913 |
|
|
|
2.84 |
% |
| |
Brent Crude Futures
October 24 |
|
|
1,802,136 |
|
|
|
2.74 |
% |
| |
Euro STOXX 50 September
24 |
|
|
1,739,411 |
|
|
|
2.64 |
% |
| |
Gasoline RBOB Futures
September 24 |
|
|
1,610,449 |
|
|
|
2.45 |
% |
| |
Soybean Meal Futures
December 24 |
|
|
1,395,776 |
|
|
|
2.12 |
% |
| |
Silver Futures
September 24 |
|
|
1,319,354 |
|
|
|
2.00 |
% |
| |
Sugar #11 (World)
October 24 |
|
|
(1,282,327 |
) |
|
|
-1.95 |
% |
| |
CAC 40 10 Euro
Futures July 24 |
|
|
1,228,483 |
|
|
|
1.87 |
% |
| |
Natural Gas Futures
September 24 |
|
|
(1,172,295 |
) |
|
|
-1.78 |
% |
| |
KOSPI 200 Index
Futures September 24 |
|
|
1,090,381 |
|
|
|
1.66 |
% |
| |
LME PRI Alum Futures
September 24 |
|
|
(1,085,087 |
) |
|
|
-1.65 |
% |
| |
OMXS30 Index Futures
July 24 |
|
|
1,083,761 |
|
|
|
1.65 |
% |
| |
WTI Crude Futures
August 24 |
|
|
1,075,532 |
|
|
|
1.63 |
% |
| |
Low SU Gasoil G
September 24 |
|
|
1,043,737 |
|
|
|
1.59 |
% |
| |
KC HRW Wheat Futures
September 24 |
|
|
1,009,125 |
|
|
|
1.53 |
% |
| |
Gasoline RBOB Futures
August 24 |
|
|
1,002,999 |
|
|
|
1.52 |
% |
| |
LME Nickel Futures
September 24 |
|
|
(985,821 |
) |
|
|
-1.50 |
% |
| |
Brent Crude Futures
September 24 |
|
|
959,684 |
|
|
|
1.46 |
% |
The
accompanying notes are an integral part of the consolidated financial statements.
59
|
THE
ADVISORS’ INNER CIRCLE FUND III |
FS
MULTI-STRATEGY
ALTERNATIVES
FUND
JUNE
30, 2024
(Unaudited) |
|
|
Top
Underlying Components |
|
|
Notional |
|
|
|
Percentage of
Notional |
|
| |
LME Copper Futures
August 24 |
|
$ |
876,447 |
|
|
|
1.33 |
% |
| |
LME Nickel Futures
August 24 |
|
|
(868,538 |
) |
|
|
-1.32 |
% |
| |
FTSE/JSE Top 40
September 24 |
|
|
(852,466 |
) |
|
|
-1.30 |
% |
| |
Natural Gas Futures
August 24 |
|
|
(770,025 |
) |
|
|
-1.17 |
% |
| |
E-Mini Russel 2000
September 24 |
|
|
761,716 |
|
|
|
1.16 |
% |
| |
Low SU Gasoil G
August 24 |
|
|
698,567 |
|
|
|
1.06 |
% |
| |
Hang Seng Index
Futures July 24 |
|
|
661,779 |
|
|
|
1.01 |
% |
| |
HSCEI Futures July
24 |
|
|
660,197 |
|
|
|
1.00 |
% |
|
CDX |
MARKIT CDX.NA.IG.42
06/29 |
|
|
(23,237,914 |
) |
|
|
-35.31 |
% |
| |
MARKIT ITRX EUROPE
06/29 |
|
|
(21,693,727 |
) |
|
|
-32.96 |
% |
| |
MARKIT CDX.NA.HY.42
06/29 |
|
|
(6,494,564 |
) |
|
|
-9.87 |
% |
| |
MARKIT ITRX EUR
XOVER 06/29 |
|
|
(5,226,403 |
) |
|
|
-7.94 |
% |
|
FX Contract |
USD/CNH July 2024 |
|
|
(17,659,310 |
) |
|
|
-26.83 |
% |
| |
USD/JPY July 2024
|
|
|
(11,985,291 |
) |
|
|
-18.21 |
% |
| |
USD/SGD July 2024
|
|
|
(11,747,326 |
) |
|
|
-17.85 |
% |
| |
USD/EUR July 2024
|
|
|
(10,452,082 |
) |
|
|
-15.88 |
% |
| |
USD/KRW July 2024
|
|
|
(9,500,120 |
) |
|
|
-14.43 |
% |
| |
USD/NOK July 2024
|
|
|
(6,918,811 |
) |
|
|
-10.51 |
% |
| |
USD/NZD July 2024
|
|
|
6,429,965 |
|
|
|
9.77 |
% |
| |
USD/CHF July 2024
|
|
|
(5,699,728 |
) |
|
|
-8.66 |
% |
| |
USD/GBP July 2024
|
|
|
5,649,005 |
|
|
|
8.58 |
% |
| |
USD/ILS July 2024
|
|
|
(4,846,068 |
) |
|
|
-7.36 |
% |
| |
USD/PLN July 2024
|
|
|
4,760,994 |
|
|
|
7.23 |
% |
| |
USD/IDR July 2024
|
|
|
4,741,654 |
|
|
|
7.20 |
% |
| |
USD/SEK July 2024
|
|
|
(3,932,893 |
) |
|
|
-5.98 |
% |
| |
USD/INR July 2024
|
|
|
(3,716,746 |
) |
|
|
-5.65 |
% |
| |
USD/CAD July 2024
|
|
|
(3,527,170 |
) |
|
|
-5.36 |
% |
| |
USD/ZAR July 2024
|
|
|
3,467,081 |
|
|
|
5.27 |
% |
| |
USD/MXN July 2024
|
|
|
3,270,232 |
|
|
|
4.97 |
% |
| |
USD/AUD July 2024
|
|
|
2,593,140 |
|
|
|
3.94 |
% |
| |
USD/BRL July 2024
|
|
|
(2,143,683 |
) |
|
|
-3.26 |
% |
| |
USD/PHP July 2024
|
|
|
2,107,169 |
|
|
|
3.20 |
% |
| |
USD/CZK July 2024
|
|
|
(1,987,381 |
) |
|
|
-3.02 |
% |
| |
USD/HUF July 2024
|
|
|
1,915,724 |
|
|
|
2.91 |
% |
| |
USD/TWD July 2024
|
|
|
(1,558,880 |
) |
|
|
-2.37 |
% |
|
Currency |
US Dollar Spot |
|
|
6,501,770 |
|
|
|
9.88 |
% |
| |
Swiss Franc Spot
|
|
|
3,964,973 |
|
|
|
6.02 |
% |
| |
Japanese Yen Spot
|
|
|
2,808,906 |
|
|
|
4.27 |
% |
| |
British Pound Spot
|
|
|
1,916,012 |
|
|
|
2.91 |
% |
| |
Euro Spot |
|
|
953,500 |
|
|
|
1.45 |
% |
|
|
|
|
|
|
|
|
|
|
|
|
**RCXTMGT3 Index:
A strategy designed to capture the premium paid by banks to hedge their structured product risk. |
|
|
|
|
| |
|
|
|
|
| |
|
|
|
|
|
|
|
|
|
| |
Top
Underlying Components |
|
|
Notional |
|
|
|
Percentage of
Notional |
|
|
Future |
Euro STOXX 50 March
24 |
|
$ |
15,744,577 |
|
|
|
37.25 |
% |
| |
Tokyo Price Index
Futures March 24 |
|
|
9,184,689 |
|
|
|
21.73 |
% |
| |
S&P 500 E-mini
Futures March 24 |
|
|
1,035,549 |
|
|
|
2.45 |
% |
|
|
|
|
|
|
|
|
|
|
|
|
**JMABNPMF Index:
Alpha oriented strategy seeking to provide access to carry, value, and mean reversion risk factors by expressing long and short views
in related commodity pairs |
|
|
|
|
| |
|
|
|
|
| |
|
|
|
|
|
|
|
|
|
| |
Top
Underlying Components |
|
|
Notional |
|
|
|
Percentage of
Notional |
|
|
Future |
WTI Crude Futures
August 24 |
|
$ |
(12,581,778 |
) |
|
|
-23.15 |
% |
| |
Gasoline RBOB Futures
August 24 |
|
|
8,364,571 |
|
|
|
15.39 |
% |
| |
Gold 100 oz Futures
August 24 |
|
|
8,238,504 |
|
|
|
15.16 |
% |
| |
Copper Futures
September 24 |
|
|
(8,085,891 |
) |
|
|
-14.88 |
% |
The
accompanying notes are an integral part of the consolidated financial statements.
60
|
THE
ADVISORS’ INNER CIRCLE FUND III |
FS
MULTI-STRATEGY
ALTERNATIVES
FUND
JUNE
30, 2024
(Unaudited) |
|
|
Top
Underlying Components |
|
|
Notional |
|
|
|
Percentage of
Notional |
|
| |
LME PRI Alum Futures
August 24 |
|
$ |
5,235,025 |
|
|
|
9.63 |
% |
| |
Silver Futures
September 24 |
|
|
(4,106,082 |
) |
|
|
-7.56 |
% |
| |
NY Harb ULSD Futures
August 24 |
|
|
3,796,444 |
|
|
|
6.99 |
% |
| |
LME Copper Futures
August 24 |
|
|
3,325,761 |
|
|
|
6.12 |
% |
| |
Soybean Futures
November 24 |
|
|
2,215,584 |
|
|
|
4.08 |
% |
| |
Wheat Futures (CBT)
September 24 |
|
|
(1,883,317 |
) |
|
|
-3.47 |
% |
| |
LME Lead Futures
August 24 |
|
|
1,673,687 |
|
|
|
3.08 |
% |
| |
Live Cattle Futures
August 24 |
|
|
1,666,217 |
|
|
|
3.07 |
% |
| |
Soybean Oil Futures
December 24 |
|
|
(1,627,048 |
) |
|
|
-2.99 |
% |
| |
KC HRW Wheat Futures
September 24 |
|
|
1,520,751 |
|
|
|
2.80 |
% |
| |
Cattle Feeder Futures
August 24 |
|
|
(1,422,222 |
) |
|
|
-2.62 |
% |
| |
LME Zinc Futures
August 24 |
|
|
(1,196,981 |
) |
|
|
-2.20 |
% |
| |
Corn Futures September
24 |
|
|
1,065,860 |
|
|
|
1.96 |
% |
| |
Soybean Meal Futures
December 24 |
|
|
(982,903 |
) |
|
|
-1.81 |
% |
| |
White Sugar(ICE)
August 24 |
|
|
(852,569 |
) |
|
|
-1.57 |
% |
| |
Coffee Robusta
10tn September 24 |
|
|
(803,319 |
) |
|
|
-1.48 |
% |
| |
Coffee 'C' Futures
September 24 |
|
|
793,255 |
|
|
|
1.46 |
% |
| |
Red Wheat Futures
MGE September 24 |
|
|
763,180 |
|
|
|
1.40 |
% |
| |
Sugar #11 (World)
October 24 |
|
|
704,337 |
|
|
|
1.30 |
% |
| |
Brent Crude Futures
September 24 |
|
|
164,436 |
|
|
|
0.30 |
% |
|
|
|
|
|
|
|
|
|
|
|
|
**JPUS1MMC Index:
Seeks to monetize the tendency for the equity market to mean revert over short periods of time. |
|
|
|
|
| |
|
|
|
|
| |
|
|
|
|
|
|
|
|
|
| |
Top
Underlying Components |
|
|
Notional |
|
|
|
Percentage of
Notional |
|
|
Index |
S&P 500 Total
Return Index |
|
$ |
4,915,982 |
|
|
|
9.98 |
% |
|
|
|
|
|
|
|
|
|
|
|
|
**MQCP388E Index:
A commodity multi-factor basket seeking enhanced exposure relative to traditional commodity indices by utilizing off benchmark commodities,
deferred curve placement, dynamic selection, position indicators, and dynamic beta exposure. |
|
|
|
|
| |
|
|
|
|
| |
|
|
|
|
|
|
|
|
|
| |
Top
Underlying Components |
|
|
Notional |
|
|
|
Percentage of
Notional |
|
|
Future |
Brent Crude Futures
December 24 |
|
$ |
4,323,799 |
|
|
|
10.51 |
% |
| |
WTI Crude Futures
December 24 |
|
|
4,244,347 |
|
|
|
10.31 |
% |
| |
Gold 100 oz Futures
August 24 |
|
|
3,140,172 |
|
|
|
7.63 |
% |
| |
Platinum Futures
October 24 |
|
|
2,750,509 |
|
|
|
6.68 |
% |
| |
Palladium Futures
September 24 |
|
|
2,687,542 |
|
|
|
6.53 |
% |
| |
Copper Futures
March 25 |
|
|
2,676,360 |
|
|
|
6.50 |
% |
| |
Soybean Futures
March 25 |
|
|
2,417,923 |
|
|
|
5.87 |
% |
| |
Coffee 'C' Futures
March 25 |
|
|
1,680,295 |
|
|
|
4.08 |
% |
| |
Natural Gas Futures
December 24 |
|
|
1,612,796 |
|
|
|
3.92 |
% |
| |
Low SU Gasoil G
December 24 |
|
|
1,511,836 |
|
|
|
3.67 |
% |
| |
Soybean Meal Futures
March 25 |
|
|
1,494,620 |
|
|
|
3.63 |
% |
| |
Gasoline RBOB Futures
December24 |
|
|
1,380,750 |
|
|
|
3.35 |
% |
| |
LME Zinc Futures
March 25 |
|
|
1,243,347 |
|
|
|
3.02 |
% |
| |
Sugar #11 (World)
March 25 |
|
|
1,229,923 |
|
|
|
2.99 |
% |
| |
LME Copper Futures
March 25 |
|
|
1,207,203 |
|
|
|
2.93 |
% |
| |
Lean Hogs Futures
February 25 |
|
|
1,206,377 |
|
|
|
2.93 |
% |
| |
Silver Futures
September 24 |
|
|
1,076,871 |
|
|
|
2.62 |
% |
| |
Corn Futures March
25 |
|
|
832,419 |
|
|
|
2.02 |
% |
| |
LME PRI Alum Futures
March 25 |
|
|
723,917 |
|
|
|
1.76 |
% |
| |
Cattle Feeder Futures
March 25 |
|
|
693,927 |
|
|
|
1.69 |
% |
| |
White Sugar (ICE)
October 24 |
|
|
685,312 |
|
|
|
1.67 |
% |
| |
Live Cattle Futures
February 25 |
|
|
634,645 |
|
|
|
1.54 |
% |
| |
Coffee Robusta
10tn September 24 |
|
|
626,059 |
|
|
|
1.52 |
% |
| |
SGX Iron Ore 62%
August 24 |
|
|
581,217 |
|
|
|
1.41 |
% |
| |
Cocoa Futures -
IC September 24 |
|
|
576,357 |
|
|
|
1.40 |
% |
| |
Mill Wheat Euro
September 24 |
|
|
540,256 |
|
|
|
1.31 |
% |
The
accompanying notes are an integral part of the consolidated financial statements.
61
|
THE
ADVISORS’ INNER CIRCLE FUND III |
FS
MULTI-STRATEGY
ALTERNATIVES
FUND
JUNE
30, 2024
(Unaudited) |
|
|
Top
Underlying Components |
|
|
Notional |
|
|
|
Percentage of
Notional |
|
| |
Cocoa Futures March
25 |
|
$ |
535,755 |
|
|
|
1.30 |
% |
| |
Soybean Oil Futures
March 25 |
|
|
507,519 |
|
|
|
1.23 |
% |
| |
LME Nickel Futures
March 25 |
|
|
433,771 |
|
|
|
1.05 |
% |
| |
Wheat Futures (CBT)
March 25 |
|
|
432,121 |
|
|
|
1.05 |
% |
| |
NY Harb ULSD Futures
December 24 |
|
|
427,909 |
|
|
|
1.04 |
% |
| |
Rapeseed Euro August
24 |
|
|
362,866 |
|
|
|
0.88 |
% |
| |
KC HRW Wheat Futures
March 25 |
|
|
280,823 |
|
|
|
0.68 |
% |
| |
Rapeseed Euro November
24 |
|
|
246,346 |
|
|
|
0.60 |
% |
| |
Cotton No.2 Futures
March 25 |
|
|
241,742 |
|
|
|
0.59 |
% |
| |
LME Lead Futures
March 25 |
|
|
222,509 |
|
|
|
0.54 |
% |
| |
ECX Carbon Emmisions
Futures December 24 |
|
|
208,530 |
|
|
|
0.51 |
% |
|
|
|
|
|
|
|
|
|
|
|
|
**MQIS311 Index:
An intra-day equity trading strategy that adjusts its exposure based on changes in the level of realized market volatility. |
|
|
|
|
| |
|
|
|
|
| |
|
|
|
|
|
|
|
|
|
| |
Top
Underlying Components |
|
|
Notional |
|
|
|
Percentage of
Notional |
|
|
Index |
Macquarie QIS Index
311 |
|
$ |
107,590,368 |
|
|
|
100.00 |
% |
|
|
|
|
|
|
|
|
|
|
|
|
**NMSY2RNU Index:
Currency selection strategy using mean reversion signals. |
|
|
|
|
| |
|
|
|
|
| |
|
|
|
|
|
|
|
|
|
| |
Top
Underlying Components |
|
|
Notional |
|
|
|
Percentage of
Notional |
|
|
Currency |
Japanese Yen Spot |
|
$ |
24,026,079 |
|
|
|
22.41 |
% |
| |
Australian Dollar
Spot |
|
|
(11,408,889 |
) |
|
|
-10.64 |
% |
| |
Canadian Dollar
Spot |
|
|
(5,734,867 |
) |
|
|
-5.35 |
% |
| |
Swiss Franc Spot
|
|
|
(4,244,780 |
) |
|
|
-3.96 |
% |
| |
Euro Spot |
|
|
3,747,100 |
|
|
|
3.49 |
% |
| |
Norwegian Krone
Spot |
|
|
(2,091,449 |
) |
|
|
-1.95 |
% |
| |
New Zealand Dollar
Spot |
|
|
1,343,518 |
|
|
|
1.25 |
% |
| |
British Pound Spot
|
|
|
1,095,600 |
|
|
|
1.02 |
% |
| |
Swedish Krona Spot
|
|
|
(742,030 |
) |
|
|
-0.69 |
% |
|
|
|
|
|
|
|
|
|
|
|
|
**SGIPULSU Index:
Systematic strategy that only buys volatility in deeper market corrections |
|
|
|
|
| |
|
|
|
|
| |
|
|
|
|
|
|
|
|
|
| |
Top
Underlying Components |
|
|
Notional |
|
|
|
Percentage of
Notional |
|
|
Option |
September 24 Puts
on SPX |
|
$ |
86,688 |
|
|
|
0.25 |
% |
| |
August 24 Puts
on SPX |
|
|
(71,966 |
) |
|
|
-0.21 |
% |
| |
July 24 Puts on
SPX |
|
|
(26,691 |
) |
|
|
-0.08 |
% |
| |
October 24 Puts
on SPX |
|
|
15,803 |
|
|
|
0.05 |
% |
|
|
|
|
|
|
|
|
|
|
|
|
**SGIXFVET Index:
A strategy that seeks to replicate a rolling 1y1y Forward Volatility Agreement (FVA) using vanilla options to approximate the pure volatility
exposure of an FVA. |
|
|
|
|
| |
|
|
|
|
| |
|
|
|
|
|
|
|
|
|
| |
Top
Underlying Components |
|
|
Notional |
|
|
|
Percentage of
Notional |
|
|
Option |
July 2024 EURUSD
Straddle |
|
$ |
575,541 |
|
|
|
1.24 |
% |
| |
August 2024 EURUSD
Straddle |
|
|
447,595 |
|
|
|
0.97 |
% |
| |
September 2024
EURUSD Straddle |
|
|
402,233 |
|
|
|
0.87 |
% |
| |
September 2025
EURUSD Straddle |
|
|
(362,856 |
) |
|
|
-0.78 |
% |
| |
October 2025 EURUSD
Straddle |
|
|
(335,233 |
) |
|
|
-0.72 |
% |
| |
December 2024 EURUSD
Straddle |
|
|
293,675 |
|
|
|
0.63 |
% |
| |
October 2024 EURUSD
Straddle |
|
|
292,439 |
|
|
|
0.63 |
% |
| |
August 2025 EURUSD
Straddle |
|
|
(273,643 |
) |
|
|
-0.59 |
% |
| |
November 2024 EURUSD
Straddle |
|
|
247,893 |
|
|
|
0.54 |
% |
| |
January 2025 EURUSD
Straddle |
|
|
184,897 |
|
|
|
0.40 |
% |
| |
November 2025 EURUSD
Straddle |
|
|
(163,888 |
) |
|
|
-0.35 |
% |
| |
July 2025 EURUSD
Straddle |
|
|
(155,895 |
) |
|
|
-0.34 |
% |
| |
December 2025 EURUSD
Straddle |
|
|
(147,777 |
) |
|
|
-0.32 |
% |
The
accompanying notes are an integral part of the consolidated financial statements.
62
|
THE
ADVISORS’ INNER CIRCLE FUND III |
FS
MULTI-STRATEGY
ALTERNATIVES
FUND
JUNE
30, 2024
(Unaudited) |
|
|
Top
Underlying Components |
|
|
Notional |
|
|
|
Percentage of
Notional |
|
| |
February 2025 EURUSD
Straddle |
|
$ |
124,177 |
|
|
|
0.27 |
% |
| |
January 2026 EURUSD
Straddle |
|
|
(110,283 |
) |
|
|
-0.24 |
% |
| |
March 2025 EURUSD
Straddle |
|
|
92,052 |
|
|
|
0.20 |
% |
| |
February 2026 EURUSD
Straddle |
|
|
(79,338 |
) |
|
|
-0.17 |
% |
| |
June 2025 EURUSD
Straddle |
|
|
(62,283 |
) |
|
|
-0.13 |
% |
| |
May 2026 EURUSD
Straddle |
|
|
54,803 |
|
|
|
0.12 |
% |
| |
April 2025 EURUSD
Straddle |
|
|
45,345 |
|
|
|
0.10 |
% |
| |
March 2026 EURUSD
Straddle |
|
|
26,878 |
|
|
|
0.06 |
% |
| |
May 2025 EURUSD
Straddle |
|
|
9,629 |
|
|
|
0.02 |
% |
| |
June 2026 EURUSD
Straddle |
|
|
7,254 |
|
|
|
0.02 |
% |
| |
April 2026 EURUSD
Straddle |
|
|
(6,304 |
) |
|
|
-0.01 |
% |
|
|
|
|
|
|
|
|
|
|
|
|
**SGIXUSGC Index:
Seeks to monetize the tendency for the equity market to mean revert over short periods of time |
|
|
|
|
| |
|
|
|
|
| |
|
|
|
|
|
|
|
|
|
| |
Top
Underlying Components |
|
|
Notional |
|
|
|
Percentage of
Notional |
|
|
Index |
S&P 500 INDEX |
|
$ |
23,192,985 |
|
|
|
37.62 |
% |
|
|
|
|
|
|
|
|
|
|
|
|
**SGIXVR2U Index:
Systematic strategy that takes advantage of the volatility curve to generate positive carry. |
|
|
|
|
| |
|
|
|
|
| |
|
|
|
|
|
|
|
|
|
| |
Top
Underlying Components |
|
|
Notional |
|
|
|
Percentage of
Notional |
|
|
Swap |
1y Forward 7y20y
Straddle |
|
$ |
17,795,120 |
|
|
|
34.62 |
% |
| |
1y Forward 2y20y
Straddle |
|
|
7,414,633 |
|
|
|
14.42 |
% |
| |
1y Forward 10y20y
Straddle |
|
|
7,414,633 |
|
|
|
14.42 |
% |
| |
1y Forward 1y20y
Straddle |
|
|
5,931,707 |
|
|
|
11.54 |
% |
| |
1y Forward 3y20y
Straddle |
|
|
4,448,780 |
|
|
|
8.65 |
% |
| |
1y Forward 5y20y
Straddle |
|
|
3,460,162 |
|
|
|
6.73 |
% |
| |
1y Forward 1y5y
Straddle |
|
|
1,977,236 |
|
|
|
3.85 |
% |
| |
1y Forward 15y10y
Straddle |
|
|
1,977,236 |
|
|
|
3.85 |
% |
| |
1y Forward 2y10y
Straddle |
|
|
494,309 |
|
|
|
0.96 |
% |
| |
1y Forward 2y5y
Straddle |
|
|
494,309 |
|
|
|
0.96 |
% |
|
|
|
|
|
|
|
|
|
|
|
|
**UBCSBSB2 Index:
Equal weighted basket comprised of 4 interest rate swap steepener indices that are long the 10y and short the 30y across USD, EUR, GBP
and CAD. |
|
|
|
|
| |
|
|
|
|
| |
|
|
|
|
|
|
|
|
|
| |
Top
Underlying Components |
|
|
Notional |
|
|
|
Percentage of
Notional |
|
|
Index |
UBS Rolling Receiver
Interest Rate Swap Index - USD SOFR 10Y |
|
$ |
132,739,973 |
|
|
|
41.44 |
% |
| |
UBS Rolling Receiver
Interest Rate Swap Index - EUR 10Y |
|
|
123,691,262 |
|
|
|
38.62 |
% |
| |
UBS Rolling Receiver
Interest Rate Swap Index - USD SOFR 30Y |
|
|
(60,366,514 |
) |
|
|
-18.85 |
% |
| |
UBS Rolling Receiver
Interest Rate Swap Index - CAD 30Y |
|
|
(56,429,228 |
) |
|
|
-17.62 |
% |
| |
UBS Rolling Receiver
Interest Rate Swap Index - EUR 30Y |
|
|
(51,008,959 |
) |
|
|
-15.93 |
% |
|
|
|
|
|
|
|
|
|
|
|
The tables below
set forth information about the Level within the fair value hierarchy at which the Fund’s investments and other financial instruments
are measured at June 30, 2024:
|
Investments in
Securities |
|
Level 1 (000) |
|
|
Level 2 (000) |
|
|
Level 3 (000) |
|
|
Total (000) |
|
|
Mortgage-Backed
Securities |
|
$ |
— |
|
|
$ |
1,798,499 |
|
|
$ |
— |
|
|
$ |
1,798,499 |
|
|
Corporate Obligations |
|
|
— |
|
|
|
378,944 |
|
|
|
— |
|
|
|
378,944 |
|
|
Asset-Backed
Securities |
|
|
— |
|
|
|
119,239 |
|
|
|
— |
|
|
|
119,239 |
|
The
accompanying notes are an integral part of the consolidated financial statements.
63
|
THE
ADVISORS’ INNER CIRCLE FUND III |
FS
MULTI-STRATEGY
ALTERNATIVES
FUND
JUNE
30, 2024
(Unaudited) |
|
Investments in
Securities |
|
Level 1 (000) |
|
|
Level 2 (000) |
|
|
Level 3 (000) |
|
|
Total (000) |
|
|
Convertible Bonds |
|
$ |
— |
|
|
$ |
7,840 |
|
|
$ |
— |
|
|
$ |
7,840 |
|
|
Preferred Stock |
|
|
— |
|
|
|
749 |
|
|
|
— |
|
|
|
749 |
|
|
Short-Term Investment |
|
|
803,534 |
|
|
|
— |
|
|
|
— |
|
|
|
803,534 |
|
|
Centrally Cleared
Purchased Options |
|
|
5 |
|
|
|
— |
|
|
|
— |
|
|
|
5 |
|
|
OTC Purchased
Options |
|
|
— |
|
|
|
1,782 |
|
|
|
— |
|
|
|
1,782 |
|
|
Total Investments
in Securities |
|
$ |
803,539 |
|
|
$ |
2,307,053 |
|
|
$ |
— |
|
|
$ |
3,110,592 |
|
|
Securities Sold
Short, Not Yet Purchased |
|
Level 1 (000) |
|
|
Level 2 (000) |
|
|
Level 3 (000) |
|
|
Total (000) |
|
|
Corporate Obligation |
|
$ |
— |
|
|
$ |
(13,966 |
) |
|
$ |
— |
|
|
$ |
(13,966 |
) |
|
Total Securities
Sold Short, Not Yet Purchased |
|
$ |
— |
|
|
$ |
(13,966 |
) |
|
$ |
— |
|
|
$ |
(13,966 |
) |
The
accompanying notes are an integral part of the consolidated financial statements.
64
|
THE
ADVISORS’ INNER CIRCLE FUND III |
FS
MULTI-STRATEGY
ALTERNATIVES
FUND
JUNE
30, 2024
(Unaudited) |
|
Other Financial
Instruments |
|
Level 1 (000) |
|
|
Level 2 (000) |
|
|
Level 3 (000) |
|
|
Total (000) |
|
|
Futures Contracts* |
|
|
|
|
|
|
|
|
|
|
|
|
|
|
|
|
|
Unrealized Appreciation |
|
$ |
7,713 |
|
|
$ |
— |
|
|
$ |
— |
|
|
$ |
7,713 |
|
|
Unrealized Depreciation |
|
|
(5,990 |
) |
|
|
— |
|
|
|
— |
|
|
|
(5,990 |
) |
|
Forwards Contracts* |
|
|
|
|
|
|
|
|
|
|
|
|
|
|
|
|
|
Unrealized Depreciation |
|
|
— |
|
|
|
(3 |
) |
|
|
— |
|
|
|
(3 |
) |
|
OTC Swaps |
|
|
|
|
|
|
|
|
|
|
|
|
|
|
|
|
|
Credit Default
Swaps* |
|
|
|
|
|
|
|
|
|
|
|
|
|
|
|
|
|
Unrealized Appreciation |
|
|
— |
|
|
|
164 |
|
|
|
— |
|
|
|
164 |
|
|
Centrally Cleared
Swaps |
|
|
|
|
|
|
|
|
|
|
|
|
|
|
|
|
|
Interest Rate Swaps* |
|
|
|
|
|
|
|
|
|
|
|
|
|
|
|
|
|
Unrealized Depreciation |
|
|
— |
|
|
|
(364 |
) |
|
|
— |
|
|
|
(364 |
) |
|
OTC Swaps |
|
|
|
|
|
|
|
|
|
|
|
|
|
|
|
|
|
Total Return
Swaps* |
|
|
|
|
|
|
|
|
|
|
|
|
|
|
|
|
|
Unrealized Appreciation |
|
|
— |
|
|
|
8,018 |
|
|
|
— |
|
|
|
8,018 |
|
|
Unrealized Depreciation |
|
|
— |
|
|
|
(12,562 |
) |
|
|
— |
|
|
|
(12,562 |
) |
|
Total Other Financial
|
|
|
|
|
|
|
|
|
|
|
|
|
|
|
|
|
|
Instruments |
|
$ |
1,723 |
|
|
$ |
(4,747 |
) |
|
$ |
— |
|
|
$ |
(3,024 |
) |
|
* |
Futures contracts, forward contracts and swap contracts
are valued at the unrealized appreciation (depreciation) on the instrument. |
Amounts designated
as “—“ are either $0 or have been rounded to $0.
For more information
on valuation inputs, see Note 2 – Significant Accounting Policies in the Notes to Consolidated Financial Statements.
See “Glossary”
for abbreviations.
The
accompanying notes are an integral part of the consolidated financial statements.
65
|
THE
ADVISORS’ INNER CIRCLE FUND III |
FS
MANAGED
FUTURES
FUND
JUNE
30, 2024
(Unaudited) |
|
CONSOLIDATED
SCHEDULE OF INVESTMENTS |
|
(Percentages
are based on Net Assets of $2,005 (000)) |
|
CORPORATE
OBLIGATION — 16.0% |
| |
|
Face Amount (000) |
|
|
Fair Value (000) |
|
|
UNITED KINGDOM
— 16.0% |
|
|
|
|
|
Barclays Bank
Versor MTN |
|
|
|
|
|
|
|
|
|
0.000%, 12/27/24(A)(B) |
|
$ |
330 |
|
|
$ |
322 |
|
| |
|
|
|
|
|
|
|
|
|
TOTAL CORPORATE
OBLIGATIONS |
|
|
|
|
|
|
|
|
|
(Cost $326) (000) |
|
|
|
|
|
|
322 |
|
| |
|
|
|
|
|
|
|
|
|
SHORT-TERM
INVESTMENTS — 59.7% |
| |
|
Shares
|
|
|
|
|
|
|
BlackRock Cash
Funds Treasury Fund - Institutional Shares |
|
|
|
|
|
|
|
|
|
5.480%(C) |
|
|
1,192,119 |
|
|
|
1,192 |
|
|
State Street
Institutional Liquid Reserves Fund - Premier Class |
|
|
|
|
|
|
|
|
|
5.360%(D) |
|
|
3,793 |
|
|
|
4 |
|
| |
|
|
|
|
|
|
|
|
|
TOTAL SHORT-TERM
INVESTMENTS |
|
|
|
|
|
|
|
|
|
(Cost $1,196) (000) |
|
|
|
|
|
|
1,196 |
|
| |
|
|
|
|
|
|
|
|
| |
|
|
|
|
|
|
|
|
|
TOTAL INVESTMENTS
— 75.7% |
|
|
|
|
|
|
|
|
|
(Cost $1,522)
(000) |
|
|
|
|
|
$ |
1,518 |
|
| |
|
|
|
|
|
|
|
|
| |
|
|
|
|
|
|
|
|
|
(A) |
Securities
sold within terms of a private placement memorandum, exempt from registration under Section 144A of the Securities Act of 1933, as amended,
and may be sold only to dealers in that program or other "accredited investors." On June 30, 2024, the value of these securities amounted
$322 (000) and represented 16.0% of net assets. |
|
(B) |
Zero
Coupon Security. |
|
(C) |
Rate
shown is the 7-day effective yield as of June 30, 2024. The BlackRock Cash Funds Treasury Fund's financial statements are available on
the SEC's website at https://www.sec.gov. |
|
(D) |
Rate
shown is the 7-day effective yield as of June 30, 2024. The State Street Institutional Liquid Reserves Fund's financial statements are
available on the SEC's website at https://www.sec.gov. |
The
accompanying notes are an integral part of the consolidated financial statements.
66
|
THE
ADVISORS’ INNER CIRCLE FUND III |
FS
MANAGED
FUTURES
FUND
JUNE
30, 2024
(Unaudited) |
Open OTC swap
contracts held by the Fund at June 30, 2024 are as follows:
|
Total Return
Swaps |
|
Counterparty |
|
Reference Entity/
Obligation |
|
|
Fund
Pays |
|
|
Fund
Receives |
|
|
Payment
Frequency |
|
|
Termination Date |
|
|
Currency |
|
|
Notional
Amount (000)^ |
|
|
Fair Value (000) |
|
|
|
Upfront Payments/
Receipts (000) |
|
|
Net Unrealized
Appreciation
(Depreciation) (000) |
|
|
Bank of America |
|
|
GSG US Equity |
|
|
|
SOFR +0.55 |
% |
|
|
TOTAL RETURN |
|
|
|
N/A |
|
|
|
06/20/25 |
|
|
|
USD |
|
|
|
256 |
|
|
$ |
(6 |
) |
|
$ |
– |
|
|
$ |
(6 |
) |
|
BNP Paribas |
|
|
BNPXDITU INDEX |
** |
|
|
0.20 |
% |
|
|
TOTAL RETURN |
|
|
|
N/A |
|
|
|
07/03/25 |
|
|
|
USD |
|
|
|
185 |
|
|
|
1 |
|
|
|
– |
|
|
|
1 |
|
|
Deutsche Bank |
|
|
DBTIDUS5 INDEX |
** |
|
|
0.00 |
% |
|
|
TOTAL RETURN |
|
|
|
N/A |
|
|
|
07/07/25 |
|
|
|
USD |
|
|
|
196 |
|
|
|
– |
|
|
|
– |
|
|
|
– |
|
|
Deutsche Bank |
|
|
DBVSCVP8 INDEX |
** |
|
|
0.00 |
% |
|
|
TOTAL RETURN |
|
|
|
N/A |
|
|
|
09/09/24 |
|
|
|
USD |
|
|
|
449 |
|
|
|
(1 |
) |
|
|
– |
|
|
|
(1 |
) |
|
Goldman Sachs |
|
|
GSXAT01C INDEX |
** |
|
|
0.15 |
% |
|
|
TOTAL RETURN |
|
|
|
N/A |
|
|
|
10/07/24 |
|
|
|
USD |
|
|
|
1,182 |
|
|
|
9 |
|
|
|
– |
|
|
|
9 |
|
|
JPMorgan Chase |
|
|
JPQFMOW1 INDEX |
** |
|
|
0.00 |
% |
|
|
TOTAL RETURN |
|
|
|
N/A |
|
|
|
06/24/25 |
|
|
|
USD |
|
|
|
509 |
|
|
|
2 |
|
|
|
– |
|
|
|
2 |
|
|
JPMorgan Chase |
|
|
JPUS1MMC INDEX |
** |
|
|
0.20 |
% |
|
|
TOTAL RETURN |
|
|
|
N/A |
|
|
|
04/08/25 |
|
|
|
USD |
|
|
|
512 |
|
|
|
(16 |
) |
|
|
– |
|
|
|
(16 |
) |
|
Macquarie Bank
Limited |
|
|
MQIS311 INDEX |
** |
|
|
0.25 |
% |
|
|
TOTAL RETURN |
|
|
|
N/A |
|
|
|
07/07/25 |
|
|
|
USD |
|
|
|
375 |
|
|
|
– |
|
|
|
– |
|
|
|
– |
|
|
Macquarie Bank
Limited |
|
|
MQIS331 INDEX |
** |
|
|
0.25 |
% |
|
|
TOTAL RETURN |
|
|
|
N/A |
|
|
|
06/10/25 |
|
|
|
USD |
|
|
|
198 |
|
|
|
– |
|
|
|
– |
|
|
|
– |
|
|
Nomura |
|
|
NMSY2RNU INDEX |
** |
|
|
0.15 |
% |
|
|
TOTAL RETURN |
|
|
|
N/A |
|
|
|
03/06/25 |
|
|
|
USD |
|
|
|
310 |
|
|
|
(1 |
) |
|
|
– |
|
|
|
(1 |
) |
| |
|
|
|
|
|
|
|
|
|
|
|
|
|
|
|
|
|
|
|
|
|
|
|
|
|
|
4,172 |
|
|
$ |
(12 |
) |
|
$ |
– |
|
|
$ |
(12 |
) |
^ Notional
amounts for OTC swaps are listed in their local currency.
** The following
tables represent the individual underlying components comprising the Index Basket Swaps at June 30, 2024.
|
**BNPXDITU Index:
Seeks to capture intraday momentum in US equity markets by leveraging market dynamics observed throughout the day. |
|
|
|
| |
|
|
|
|
|
|
|
|
|
| |
Top
Underlying Components |
|
|
Notional |
|
|
|
Percentage of
Notional |
|
|
Index |
BNP Paribas Dynamic
Intraday Trend US Index |
|
$ |
185,363 |
|
|
|
100.00 |
% |
|
|
|
|
|
|
|
|
|
|
|
|
**DBTIDUS5 Index:
Seeks to capture intraday momentum in US equity markets by reacting rapidly to market volatility. |
|
|
|
|
| |
|
|
|
|
| |
|
|
|
|
|
|
|
|
|
| |
Top
Underlying Components |
|
|
Notional |
|
|
|
Percentage of
Notional |
|
|
Index |
Deutsche Bank US
Equity Dynamic Intraday Trend Index |
|
$ |
196,010 |
|
|
|
100.00 |
% |
|
|
|
|
|
|
|
|
|
|
|
|
**DBVSCVP8 Index:
Seeks to monetize short-term interest rate momentum by taking long or short positions in US and European rates markets. |
|
|
|
|
| |
|
|
|
|
| |
|
|
|
|
|
|
|
|
|
| |
Top
Underlying Components |
|
|
Notional |
|
|
|
Percentage of
Notional |
|
|
Index |
1yr Floating/10yr
Fixed USD OIS Swap |
|
$ |
82,134 |
|
|
|
18.31 |
% |
| |
6m Floating/10y
Fixed EUR IRS Swap |
|
|
(16,567 |
) |
|
|
-3.69 |
% |
|
|
|
|
|
|
|
|
|
|
|
|
**GSXAT01C Index:
Future and forward based liquid and fully transparent strategy that is composed of Goldman Sachs' proprietary strategies across three
asset classes - FX Trend, Rates & Bonds Trend, and Equity Trend. |
|
|
|
|
| |
|
|
|
|
| |
|
|
|
|
|
|
|
|
|
| |
Top
Underlying Components |
|
|
Notional |
|
|
|
Percentage of
Notional |
|
|
CDX |
MARKIT CDX.NA.IG.42
06/29 |
|
$ |
(1,213,763 |
) |
|
|
-101.89 |
% |
| |
MARKIT ITRX EUROPE
06/29 |
|
|
(798,160 |
) |
|
|
-67.00 |
% |
| |
MARKIT CDX.NA.HY.42
06/29 |
|
|
(394,800 |
) |
|
|
-33.14 |
% |
The
accompanying notes are an integral part of the consolidated financial statements.
67
|
THE
ADVISORS’ INNER CIRCLE FUND III |
FS
MANAGED
FUTURES
FUND
JUNE
30, 2024
(Unaudited) |
|
|
Top
Underlying Components |
|
|
Notional |
|
|
|
Percentage of
Notional |
|
| |
MARKIT ITRX EUR
XOVER 06/29 |
|
$ |
(187,407 |
) |
|
|
-15.73 |
% |
|
Future |
US 2 Year Note
(CBT) September 24 |
|
|
(1,210,840 |
) |
|
|
-101.64 |
% |
| |
Euro-Schatz Futures
September 24 |
|
|
(1,127,429 |
) |
|
|
-94.64 |
% |
| |
3 Month Euro EURIBOR
December 25 |
|
|
(439,909 |
) |
|
|
-36.93 |
% |
| |
3 Month Euro EURIBOR
September 25 |
|
|
(439,507 |
) |
|
|
-36.89 |
% |
| |
3 Month Euro EURIBOR
June 25 |
|
|
(439,027 |
) |
|
|
-36.85 |
% |
| |
3 Month Euro EURIBOR
March 25 |
|
|
(438,435 |
) |
|
|
-36.80 |
% |
| |
3 Month Euro EURIBOR
December 24 |
|
|
(437,648 |
) |
|
|
-36.74 |
% |
| |
3 Month SOFR Futures
December 25 |
|
|
(395,366 |
) |
|
|
-33.19 |
% |
| |
3 Month SOFR Futures
September 25 |
|
|
(394,792 |
) |
|
|
-33.14 |
% |
| |
3 Month SOFR Futures
June 25 |
|
|
(394,084 |
) |
|
|
-33.08 |
% |
| |
3 Month SOFR Futures
March 25 |
|
|
(393,173 |
) |
|
|
-33.01 |
% |
| |
3 Month SOFR Futures
December 24 |
|
|
(392,156 |
) |
|
|
-32.92 |
% |
| |
JPN 10 Year Bond
(OSE) September 24 |
|
|
(270,327 |
) |
|
|
-22.69 |
% |
| |
ICE 3 Month SONIA
Futures December 25 |
|
|
(242,700 |
) |
|
|
-20.37 |
% |
| |
ICE 3 Month SONIA
Futures September 25 |
|
|
(242,408 |
) |
|
|
-20.35 |
% |
| |
ICE 3 Month SONIA
Futures June 25 |
|
|
(242,059 |
) |
|
|
-20.32 |
% |
| |
ICE 3 Month SONIA
Futures March 25 |
|
|
(241,658 |
) |
|
|
-20.29 |
% |
| |
ICE 3 Month SONIA
Futures December 24 |
|
|
(241,208 |
) |
|
|
-20.25 |
% |
| |
US 5 Year Note
(CBT) September 24 |
|
|
(237,636 |
) |
|
|
-19.95 |
% |
| |
Euro-BOBL Futures
September 24 |
|
|
(194,677 |
) |
|
|
-16.34 |
% |
| |
Euro-OAT Futures
September 24 |
|
|
(180,778 |
) |
|
|
-15.18 |
% |
| |
CAN 10 Year Bond
Futures September 24 |
|
|
154,831 |
|
|
|
13.00 |
% |
| |
S&P 500 E-Mini
Futures September 24 |
|
|
150,482 |
|
|
|
12.63 |
% |
| |
Euro-BTP Futures
September 24 |
|
|
116,108 |
|
|
|
9.75 |
% |
| |
TOPIX Index Futures
September 24 |
|
|
113,778 |
|
|
|
9.55 |
% |
| |
SPI 200 Futures
July 24 |
|
|
112,602 |
|
|
|
9.45 |
% |
| |
NASDAQ 100 E-Mini
September 24 |
|
|
112,415 |
|
|
|
9.44 |
% |
| |
MSCI Emerging Markets
September 24 |
|
|
104,929 |
|
|
|
8.81 |
% |
| |
FTSE 100 Index
Futures September 24 |
|
|
100,997 |
|
|
|
8.48 |
% |
| |
US Long Bond (CBT)
September 24 |
|
|
99,276 |
|
|
|
8.33 |
% |
| |
KOSPI 200 Index
Futures September 24 |
|
|
99,150 |
|
|
|
8.32 |
% |
| |
Amsterdam Index
Futures July 24 |
|
|
96,306 |
|
|
|
8.08 |
% |
| |
US 10 Year Note
(CBT) September 24 |
|
|
(95,639 |
) |
|
|
-8.03 |
% |
| |
Swiss Market Index
Futures September 24 |
|
|
94,772 |
|
|
|
7.96 |
% |
| |
OMXS30 Index Futures
July 24 |
|
|
87,409 |
|
|
|
7.34 |
% |
| |
S&P/TSX 60
IX Futures September 24 |
|
|
81,795 |
|
|
|
6.87 |
% |
| |
Euro STOXX 50 September
24 |
|
|
79,584 |
|
|
|
6.68 |
% |
| |
Long Gilt Futures
September 24 |
|
|
73,873 |
|
|
|
6.20 |
% |
| |
DAX Index Futures
September 24 |
|
|
71,568 |
|
|
|
6.01 |
% |
| |
SET50 Futures September
24 |
|
|
(71,159 |
) |
|
|
-5.97 |
% |
| |
IBEX 35 Index Futures
July 24 |
|
|
70,106 |
|
|
|
5.89 |
% |
| |
FTSE/MIB Index
Futures September 24 |
|
|
68,972 |
|
|
|
5.79 |
% |
| |
AUST 10Y Bond Futures
September 24 |
|
|
(59,962 |
) |
|
|
-5.03 |
% |
| |
FTSE/JSE Top 40
September 24 |
|
|
54,583 |
|
|
|
4.58 |
% |
| |
E-Mini Russel 2000
September 24 |
|
|
51,291 |
|
|
|
4.31 |
% |
| |
Euro-Bund Futures
September 24 |
|
|
(45,435 |
) |
|
|
-3.81 |
% |
| |
HSCEI Futures July
24 |
|
|
39,769 |
|
|
|
3.34 |
% |
| |
Hang Seng Index
Futures July 24 |
|
|
37,520 |
|
|
|
3.15 |
% |
| |
CAC 40 10 Euro
Futures July 24 |
|
|
(23,648 |
) |
|
|
-1.99 |
% |
|
FX Contract |
USD/CNH July 2024 |
|
|
(508,145 |
) |
|
|
-42.66 |
% |
| |
USD/INR July 2024
|
|
|
(356,250 |
) |
|
|
-29.91 |
% |
| |
USD/SGD July 2024
|
|
|
(339,717 |
) |
|
|
-28.52 |
% |
| |
USD/CAD July 2024
|
|
|
(313,077 |
) |
|
|
-26.28 |
% |
| |
USD/EUR July 2024
|
|
|
(272,632 |
) |
|
|
-22.89 |
% |
The
accompanying notes are an integral part of the consolidated financial statements.
68
|
THE
ADVISORS’ INNER CIRCLE FUND III |
FS
MANAGED
FUTURES
FUND
JUNE
30, 2024
(Unaudited) |
|
|
Top
Underlying Components |
|
|
Notional |
|
|
|
Percentage of
Notional |
|
| |
USD/JPY July 2024
|
|
$ |
(242,321 |
) |
|
|
-20.34 |
% |
| |
USD/KRW July 2024
|
|
|
(239,440 |
) |
|
|
-20.10 |
% |
| |
USD/GBP July 2024
|
|
|
216,431 |
|
|
|
18.17 |
% |
| |
USD/BRL July 2024
|
|
|
(192,701 |
) |
|
|
-16.18 |
% |
| |
USD/CHF July 2024
|
|
|
(150,845 |
) |
|
|
-12.66 |
% |
| |
USD/CZK July 2024
|
|
|
(123,610 |
) |
|
|
-10.38 |
% |
| |
USD/AUD July 2024
|
|
|
118,153 |
|
|
|
9.92 |
% |
| |
USD/ZAR July 2024
|
|
|
116,777 |
|
|
|
9.80 |
% |
| |
USD/ILS July 2024
|
|
|
(115,176 |
) |
|
|
-9.67 |
% |
| |
USD/NZD July 2024
|
|
|
113,039 |
|
|
|
9.49 |
% |
| |
USD/MXN July 2024
|
|
|
(94,486 |
) |
|
|
-7.93 |
% |
| |
USD/HUF July 2024
|
|
|
(83,701 |
) |
|
|
-7.03 |
% |
| |
USD/PLN July 2024
|
|
|
82,308 |
|
|
|
6.91 |
% |
| |
USD/IDR July 2024
|
|
|
(81,330 |
) |
|
|
-6.83 |
% |
| |
USD/CLP July 2024
|
|
|
(68,311 |
) |
|
|
-5.73 |
% |
| |
USD/SEK July 2024
|
|
|
(27,405 |
) |
|
|
-2.30 |
% |
| |
USD/NOK July 2024
|
|
|
(22,610 |
) |
|
|
-1.90 |
% |
|
Currency |
US Dollar Spot |
|
|
204,833 |
|
|
|
17.19 |
% |
| |
Japanese Yen Spot
|
|
|
113,778 |
|
|
|
9.55 |
% |
| |
British Pound Spot
|
|
|
100,997 |
|
|
|
8.48 |
% |
| |
Swiss Franc Spot
|
|
|
94,772 |
|
|
|
7.96 |
% |
| |
Euro Spot |
|
|
51,037 |
|
|
|
4.28 |
% |
|
|
|
|
|
|
|
|
|
|
|
|
**JPQFMOW1 Index:
Market neutral strategy that seeks to provide exposure to Momentum risk premium. |
|
|
|
|
| |
|
|
|
|
| |
|
|
|
|
|
|
|
|
|
| |
Top
Underlying Components |
|
|
Notional |
|
|
|
Percentage of
Notional |
|
|
Equity |
Alnylam Pharmaceuticals
Inc |
|
$ |
(3,942 |
) |
|
|
-0.77 |
% |
| |
Adobe Inc |
|
|
(3,047 |
) |
|
|
-0.60 |
% |
| |
Autodesk Inc |
|
|
(2,969 |
) |
|
|
-0.58 |
% |
| |
Mitsubishi Heavy
Industries Ltd |
|
|
2,967 |
|
|
|
0.58 |
% |
| |
Intuit Inc |
|
|
2,948 |
|
|
|
0.58 |
% |
| |
Tesla Inc |
|
|
(2,943 |
) |
|
|
-0.58 |
% |
| |
United Therapeutics
Corp |
|
|
2,937 |
|
|
|
0.57 |
% |
| |
Arista Networks
Inc |
|
|
2,923 |
|
|
|
0.57 |
% |
| |
Confluent Inc |
|
|
(2,898 |
) |
|
|
-0.57 |
% |
| |
Oracle Corp |
|
|
(2,893 |
) |
|
|
-0.57 |
% |
| |
Samsara Inc |
|
|
2,889 |
|
|
|
0.56 |
% |
| |
Fair Isaac Corp
|
|
|
2,877 |
|
|
|
0.56 |
% |
| |
MongoDB Inc |
|
|
(2,834 |
) |
|
|
-0.55 |
% |
| |
Qorvo Inc |
|
|
(2,830 |
) |
|
|
-0.55 |
% |
| |
Skyworks Solutions
Inc |
|
|
(2,811 |
) |
|
|
-0.55 |
% |
| |
ServiceNow Inc
|
|
|
2,809 |
|
|
|
0.55 |
% |
| |
Rentokil Initial
PLC |
|
|
(2,803 |
) |
|
|
-0.55 |
% |
| |
Broadcom Inc |
|
|
2,794 |
|
|
|
0.55 |
% |
| |
Atlassian Corp
|
|
|
(2,751 |
) |
|
|
-0.54 |
% |
| |
SAP SE |
|
|
2,745 |
|
|
|
0.54 |
% |
| |
Charter Communications
Inc |
|
|
(2,741 |
) |
|
|
-0.54 |
% |
| |
Rockwell Automation
Inc |
|
|
(2,739 |
) |
|
|
-0.54 |
% |
| |
AppLovin Corp |
|
|
2,735 |
|
|
|
0.53 |
% |
| |
Discover Financial
Services |
|
|
(2,727 |
) |
|
|
-0.53 |
% |
| |
UiPath Inc |
|
|
(2,725 |
) |
|
|
-0.53 |
% |
| |
Super Micro Computer
Inc |
|
|
2,714 |
|
|
|
0.53 |
% |
| |
Lam Research Corp
|
|
|
2,708 |
|
|
|
0.53 |
% |
| |
Snap Inc |
|
|
2,707 |
|
|
|
0.53 |
% |
| |
Targa Resources
Corp |
|
|
2,703 |
|
|
|
0.53 |
% |
The
accompanying notes are an integral part of the consolidated financial statements.
69
|
THE
ADVISORS’ INNER CIRCLE FUND III |
FS
MANAGED
FUTURES
FUND
JUNE
30, 2024
(Unaudited) |
|
|
Top
Underlying Components |
|
|
Notional |
|
|
|
Percentage of
Notional |
|
| |
Intuitive Surgical
Inc |
|
$ |
2,700 |
|
|
|
0.53 |
% |
| |
Palantir Technologies
Inc |
|
|
2,700 |
|
|
|
0.53 |
% |
| |
First Quantum Minerals
Ltd |
|
|
(2,700 |
) |
|
|
-0.53 |
% |
| |
Citizens Financial
Group |
|
|
2,696 |
|
|
|
0.53 |
% |
| |
Humana Inc |
|
|
(2,696 |
) |
|
|
-0.53 |
% |
| |
Hilton Worldwide
Holdings Inc |
|
|
2,694 |
|
|
|
0.53 |
% |
| |
Open Text Corp
|
|
|
(2,694 |
) |
|
|
-0.53 |
% |
| |
KeyCorp |
|
|
2,692 |
|
|
|
0.53 |
% |
| |
REA Group Ltd |
|
|
2,692 |
|
|
|
0.53 |
% |
| |
Lennox International
Inc |
|
|
2,691 |
|
|
|
0.53 |
% |
| |
Kering S.A. |
|
|
(2,689 |
) |
|
|
-0.53 |
% |
| |
EPAM Systems Inc
|
|
|
(2,684 |
) |
|
|
-0.52 |
% |
| |
Kinross Gold Corp
|
|
|
2,683 |
|
|
|
0.52 |
% |
| |
Gilead Sciences
Inc |
|
|
(2,683 |
) |
|
|
-0.52 |
% |
| |
Palo Alto Networks
Inc |
|
|
(2,676 |
) |
|
|
-0.52 |
% |
| |
MS&AD Insurance
Group Holdings Inc |
|
|
2,672 |
|
|
|
0.52 |
% |
| |
SoftBank Group
Corp |
|
|
2,672 |
|
|
|
0.52 |
% |
| |
Okta Inc |
|
|
2,670 |
|
|
|
0.52 |
% |
| |
Snowflake Inc |
|
|
(2,668 |
) |
|
|
-0.52 |
% |
| |
Insulet Corp |
|
|
(2,665 |
) |
|
|
-0.52 |
% |
| |
Monolithic Power
Systems Inc |
|
|
2,664 |
|
|
|
0.52 |
% |
|
|
|
|
|
|
|
|
|
|
|
|
**JPUS1MMC Index:
Seeks to monetize the tendency for the equity market to mean revert over short periods of time. |
|
|
|
|
| |
|
|
|
|
| |
|
|
|
|
|
|
|
|
|
| |
Top
Underlying Components |
|
|
Notional |
|
|
|
Percentage of
Notional |
|
|
Index |
S&P 500 Total
Return Index |
|
$ |
49,523 |
|
|
|
9.98 |
% |
|
|
|
|
|
|
|
|
|
|
|
|
**MQIS311 Index:
An intra-day equity trading strategy that adjusts its exposure based on changes in the level of realized market volatility. |
|
|
|
|
| |
|
|
|
|
| |
|
|
|
|
|
|
|
|
|
| |
Top
Underlying Components |
|
|
Notional |
|
|
|
Percentage of
Notional |
|
|
Index |
Macquarie QIS Index
311 |
|
$ |
374,568 |
|
|
|
100.00 |
% |
|
|
|
|
|
|
|
|
|
|
|
|
**MQIS331 Index:
Seeks to monetize the tendency for the equity market to mean revert over short periods of time. |
|
|
|
|
| |
|
|
|
|
| |
|
|
|
|
|
|
|
|
|
| |
Top
Underlying Components |
|
|
Notional |
|
|
|
Percentage of
Notional |
|
|
Future |
S&P 500 E-Mini
Futures June 24 |
|
$ |
0 |
|
|
|
0.00 |
% |
|
|
|
|
|
|
|
|
|
|
|
|
**NMSY2RNU Index:
Currency selection strategy using mean reversion signals. |
|
|
|
|
| |
|
|
|
|
| |
|
|
|
|
|
|
|
|
|
| |
Top
Underlying Components |
|
|
Notional |
|
|
|
Percentage of
Notional |
|
|
Currency |
Japanese Yen Spot |
|
$ |
69,279 |
|
|
|
22.41 |
% |
| |
Australian Dollar
Spot |
|
|
(32,897 |
) |
|
|
-10.64 |
% |
| |
Canadian Dollar
Spot |
|
|
(16,536 |
) |
|
|
-5.35 |
% |
| |
Swiss Franc Spot
|
|
|
(12,240 |
) |
|
|
-3.96 |
% |
| |
Euro Spot |
|
|
10,805 |
|
|
|
3.49 |
% |
| |
Norwegian Krone
Spot |
|
|
(6,031 |
) |
|
|
-1.95 |
% |
| |
New Zealand Dollar
Spot |
|
|
3,874 |
|
|
|
1.25 |
% |
| |
British Pound Spot
|
|
|
3,159 |
|
|
|
1.02 |
% |
| |
Swedish Krona Spot
|
|
|
(2,140 |
) |
|
|
-0.69 |
% |
|
|
|
|
|
|
|
|
|
|
|
The
accompanying notes are an integral part of the consolidated financial statements.
70
|
THE
ADVISORS’ INNER CIRCLE FUND III |
FS
MANAGED
FUTURES
FUND
JUNE
30, 2024
(Unaudited) |
The tables below
set forth information about the Level within the fair value hierarchy at which the Fund’s investments and other financial instruments
are measured at June 30, 2024:
|
Investments in
Securities |
|
Level 1 (000) |
|
|
Level 2 (000) |
|
|
Level 3 (000) |
|
|
Total (000) |
|
|
Corporate Obligation |
|
$ |
— |
|
|
$ |
322 |
|
|
$ |
— |
|
|
$ |
322 |
|
|
Short-Term Investments |
|
|
1,196 |
|
|
|
— |
|
|
|
— |
|
|
|
1,196 |
|
|
Total Investments
in Securities |
|
$ |
1,196 |
|
|
$ |
322 |
|
|
$ |
— |
|
|
$ |
1,518 |
|
|
Other Financial
Instruments |
|
Level 1 (000) |
|
|
Level 2 (000) |
|
|
Level 3 (000) |
|
|
Total (000) |
|
|
OTC Swaps |
|
|
|
|
|
|
|
|
|
|
|
|
|
|
|
|
|
Total Return
Swaps* |
|
|
|
|
|
|
|
|
|
|
|
|
|
|
|
|
|
Unrealized Appreciation |
|
$ |
— |
|
|
$ |
12 |
|
|
$ |
— |
|
|
$ |
12 |
|
|
Unrealized Depreciation |
|
|
— |
|
|
|
(24 |
) |
|
|
— |
|
|
|
(24 |
) |
|
Total Other Financial
|
|
|
|
|
|
|
|
|
|
|
|
|
|
|
|
|
|
Instruments |
|
$ |
— |
|
|
$ |
(12 |
) |
|
$ |
— |
|
|
$ |
(12 |
) |
* Swap contracts
are valued at the unrealized appreciation (depreciation) on the instrument.
Amounts designated
as “—“ are either $0 or have been rounded to $0.
For more information
on valuation inputs, see Note 2 – Significant Accounting Policies in the Notes to Consolidated Financial Statements.
See “Glossary”
for abbreviations.
The
accompanying notes are an integral part of the consolidated financial statements.
71
|
THE
ADVISORS’ INNER CIRCLE FUND III |
FS
CHIRON
REAL
DEVELOPMENT FUND
JUNE
30, 2024
(Unaudited) |
|
CONSOLIDATED
SCHEDULE OF INVESTMENTS |
|
(Percentages
are based on Net Assets of $73,219 (000)) |
|
COMMON
STOCK — 83.3% |
| |
|
Shares |
|
|
Fair Value (000) |
|
|
AUSTRALIA —
1.6% |
|
|
|
|
|
Aristocrat Leisure |
|
|
11,150 |
|
|
$ |
370 |
|
|
Glencore |
|
|
146,759 |
|
|
|
837 |
|
| |
|
|
|
|
|
|
|
|
| |
|
|
|
|
|
|
1,207 |
|
|
BRAZIL —
1.2% |
|
|
|
|
|
MercadoLibre* |
|
|
546 |
|
|
|
897 |
|
| |
|
|
|
|
|
|
|
|
|
CANADA —
2.2% |
|
|
|
|
|
Barrick Gold |
|
|
95,062 |
|
|
|
1,586 |
|
| |
|
|
|
|
|
|
|
|
|
CHINA — 10.9% |
|
|
|
|
|
Beijing Jingneng
Clean Energy, Cl H |
|
|
1,338,000 |
|
|
|
319 |
|
|
China Cinda Asset
Management, Cl H |
|
|
1,157,000 |
|
|
|
96 |
|
|
China Pacific
Insurance Group, Cl H |
|
|
148,200 |
|
|
|
362 |
|
|
China Yangtze
Power, Cl A |
|
|
66,200 |
|
|
|
263 |
|
|
Contemporary
Amperex Technology, Cl A |
|
|
5,600 |
|
|
|
139 |
|
|
Hygon Information
Technology, Cl A |
|
|
37,445 |
|
|
|
362 |
|
|
Jinduicheng Molybdenum,
Cl A |
|
|
43,900 |
|
|
|
63 |
|
|
PDD Holdings
ADR* |
|
|
13,711 |
|
|
|
1,823 |
|
|
PetroChina, Cl
H |
|
|
176,000 |
|
|
|
178 |
|
|
Tencent Holdings |
|
|
74,800 |
|
|
|
3,567 |
|
|
Trip.com Group
ADR* |
|
|
15,293 |
|
|
|
719 |
|
|
Yintai Gold,
Cl A |
|
|
28,000 |
|
|
|
63 |
|
| |
|
|
|
|
|
|
|
|
| |
|
|
|
|
|
|
7,954 |
|
|
DENMARK —
2.1% |
|
|
|
|
|
Novo Nordisk,
Cl B |
|
|
10,517 |
|
|
|
1,519 |
|
| |
|
|
|
|
|
|
|
|
|
ITALY — 1.1% |
|
|
|
|
|
Ferrari |
|
|
1,964 |
|
|
|
801 |
|
| |
|
|
|
|
|
|
|
|
|
LUXEMBOURG —
0.5% |
|
|
|
|
|
Tenaris |
|
|
23,323 |
|
|
|
358 |
|
| |
|
|
|
|
|
|
|
|
|
MEXICO —
0.8% |
|
|
|
|
|
Southern Copper |
|
|
5,588 |
|
|
|
602 |
|
| |
|
|
|
|
|
|
|
|
|
NETHERLANDS —
1.9% |
|
|
|
|
|
ASML Holding |
|
|
758 |
|
|
|
783 |
|
The
accompanying notes are an integral part of the consolidated financial statements.
72
|
THE
ADVISORS’ INNER CIRCLE FUND III |
FS
CHIRON
REAL
DEVELOPMENT FUND
JUNE
30, 2024
(Unaudited) |
|
COMMON
STOCK — continued |
|
|
|
Shares |
|
|
Fair Value (000) |
|
|
NETHERLANDS —
(continued) |
|
|
|
|
|
Koninklijke KPN |
|
|
154,859 |
|
|
$ |
594 |
|
| |
|
|
|
|
|
|
|
|
| |
|
|
|
|
|
|
1,377 |
|
|
NORWAY —
0.2% |
|
|
|
|
|
Telenor |
|
|
12,735 |
|
|
|
145 |
|
| |
|
|
|
|
|
|
|
|
|
SOUTH KOREA —
0.3% |
|
|
|
|
|
SK Hynix |
|
|
1,142 |
|
|
|
196 |
|
| |
|
|
|
|
|
|
|
|
|
TAIWAN —
0.2% |
|
|
|
|
|
Taiwan Semiconductor
Manufacturing ADR |
|
|
1,065 |
|
|
|
185 |
|
| |
|
|
|
|
|
|
|
|
|
UNITED KINGDOM
— 3.1% |
|
|
|
|
|
BAE Systems |
|
|
43,195 |
|
|
|
721 |
|
|
Centrica |
|
|
208,685 |
|
|
|
356 |
|
|
RELX |
|
|
17,461 |
|
|
|
803 |
|
|
SSE |
|
|
16,066 |
|
|
|
363 |
|
| |
|
|
|
|
|
|
|
|
| |
|
|
|
|
|
|
2,243 |
|
|
UNITED STATES —
57.2% |
|
|
|
|
|
Advanced Micro
Devices* |
|
|
2,334 |
|
|
|
379 |
|
|
Airbnb, Cl A* |
|
|
4,868 |
|
|
|
738 |
|
|
Alphabet, Cl
C |
|
|
5,211 |
|
|
|
956 |
|
|
Amazon.com* |
|
|
13,281 |
|
|
|
2,567 |
|
|
Antero Midstream |
|
|
2,089 |
|
|
|
31 |
|
|
Apple |
|
|
13,980 |
|
|
|
2,944 |
|
|
Booking Holdings |
|
|
192 |
|
|
|
761 |
|
|
Broadcom |
|
|
227 |
|
|
|
364 |
|
|
Cadence Design
Systems* |
|
|
1,816 |
|
|
|
559 |
|
|
Cheniere Energy |
|
|
1,853 |
|
|
|
324 |
|
|
Chesapeake Energy |
|
|
803 |
|
|
|
66 |
|
|
CONSOL Energy |
|
|
5,588 |
|
|
|
570 |
|
|
Corpay* |
|
|
1,404 |
|
|
|
374 |
|
|
Coterra Energy |
|
|
8,089 |
|
|
|
216 |
|
|
Crowdstrike Holdings,
Cl A* |
|
|
1,911 |
|
|
|
732 |
|
|
Digital Realty
Trust |
|
|
4,871 |
|
|
|
741 |
|
|
Elevance Health |
|
|
714 |
|
|
|
387 |
|
|
Enphase Energy* |
|
|
3,542 |
|
|
|
353 |
|
|
EOG Resources |
|
|
8,327 |
|
|
|
1,048 |
|
|
Equinix |
|
|
1,193 |
|
|
|
902 |
|
The
accompanying notes are an integral part of the consolidated financial statements.
73
|
THE
ADVISORS’ INNER CIRCLE FUND III |
FS
CHIRON
REAL
DEVELOPMENT FUND
JUNE
30, 2024
(Unaudited) |
|
COMMON
STOCK — continued |
|
|
|
Shares |
|
|
Fair Value (000) |
|
|
UNITED STATES —
(continued) |
|
|
|
|
|
Equitable Holdings |
|
|
8,136 |
|
|
$ |
332 |
|
|
Equities |
|
|
7,754 |
|
|
|
287 |
|
|
Euronet Worldwide* |
|
|
7,090 |
|
|
|
734 |
|
|
Evercore, Cl
A |
|
|
1,557 |
|
|
|
325 |
|
|
Freeport-McMoRan |
|
|
12,063 |
|
|
|
586 |
|
|
Halozyme Therapeutics* |
|
|
19,011 |
|
|
|
995 |
|
|
Hess Midstream,
Cl A |
|
|
6,252 |
|
|
|
228 |
|
|
InterDigital |
|
|
953 |
|
|
|
111 |
|
|
Intuitive Surgical* |
|
|
854 |
|
|
|
380 |
|
|
KLA |
|
|
229 |
|
|
|
189 |
|
|
LPL Financial
Holdings |
|
|
3,150 |
|
|
|
880 |
|
|
Magnolia Oil
& Gas, Cl A |
|
|
9,223 |
|
|
|
234 |
|
|
Manhattan Associates* |
|
|
1,519 |
|
|
|
375 |
|
|
Marathon Oil |
|
|
8,055 |
|
|
|
231 |
|
|
Marathon Petroleum |
|
|
1,788 |
|
|
|
310 |
|
|
Meta Platforms,
Cl A |
|
|
5,902 |
|
|
|
2,976 |
|
|
Microsoft |
|
|
5,786 |
|
|
|
2,586 |
|
|
Motorola Solutions |
|
|
1,903 |
|
|
|
735 |
|
|
NetApp |
|
|
5,749 |
|
|
|
740 |
|
|
Newmont |
|
|
37,257 |
|
|
|
1,560 |
|
|
Nexstar Media
Group, Cl A |
|
|
2,154 |
|
|
|
357 |
|
|
NVIDIA |
|
|
20,597 |
|
|
|
2,545 |
|
|
Peabody Energy |
|
|
38,127 |
|
|
|
843 |
|
|
Range Resources |
|
|
4,278 |
|
|
|
143 |
|
|
Regeneron Pharmaceuticals* |
|
|
1,993 |
|
|
|
2,095 |
|
|
Schneider Electric |
|
|
1,502 |
|
|
|
361 |
|
|
ServiceNow* |
|
|
3,379 |
|
|
|
2,658 |
|
|
Tesla* |
|
|
3,741 |
|
|
|
740 |
|
|
TKO Group Holdings,
Cl A |
|
|
10,494 |
|
|
|
1,133 |
|
|
Visa, Cl A |
|
|
4,108 |
|
|
|
1,078 |
|
|
Vistra |
|
|
1,919 |
|
|
|
165 |
|
| |
|
|
|
|
|
|
|
|
| |
|
|
|
|
|
|
41,924 |
|
|
TOTAL COMMON STOCK
|
|
|
|
|
|
|
|
|
|
(Cost $56,768)
(000) |
|
|
|
|
|
|
60,994 |
|
| |
|
|
|
|
|
|
|
|
|
EXCHANGE
TRADED FUNDS — 2.7% |
| |
|
|
|
|
|
|
|
|
|
CANADA —
1.5% |
|
|
|
|
|
Sprott Physical
Uranium Trust * |
|
|
59,005 |
|
|
|
1,094 |
|
|
UNITED STATES —
1.2% |
|
|
|
|
The
accompanying notes are an integral part of the consolidated financial statements.
74
|
THE
ADVISORS’ INNER CIRCLE FUND III |
FS
CHIRON
REAL
DEVELOPMENT FUND
JUNE
30, 2024
(Unaudited) |
|
EXCHANGE
TRADED FUNDS — continued |
|
|
|
Shares |
|
|
Fair Value (000) |
|
|
iShares Bitcoin
Trust * |
|
|
26,134 |
|
|
$ |
892 |
|
|
TOTAL EXCHANGE
TRADED FUNDS |
|
|
|
|
|
|
|
|
|
(Cost $2,179) (000) |
|
|
|
|
|
|
1,986 |
|
| |
|
|
|
|
|
|
|
|
|
TOTAL INVESTMENTS
— 86.0% |
|
|
|
|
|
|
|
|
|
(Cost $58,947)
(000) |
|
|
|
|
|
$ |
62,980 |
|
| |
|
|
|
|
|
|
|
|
| |
|
|
|
|
|
|
|
|
|
* |
Non-income
producing security. |
Open futures
contracts held by the Fund at June 30, 2024 are as follows:
|
Type of Contract |
|
Number of
Contracts |
|
|
Expiration
Date |
|
|
Notional Amount
(000) |
|
|
Value (000) |
|
|
Unrealized Appreciation/
(Depreciation)(000) |
|
|
Long Contracts |
|
|
|
|
|
|
|
|
|
|
|
|
|
|
|
|
|
|
|
|
|
Copper |
|
|
11 |
|
|
|
Sep-2024 |
|
|
$ |
1,243 |
|
|
$ |
1,208 |
|
|
$ |
(35 |
) |
|
Gold |
|
|
33 |
|
|
|
Aug-2024 |
|
|
|
7,816 |
|
|
|
7,721 |
|
|
|
(96 |
) |
|
Natural Gas |
|
|
13 |
|
|
|
Aug-2024 |
|
|
|
376 |
|
|
|
338 |
|
|
|
(38 |
) |
|
Silver |
|
|
25 |
|
|
|
Sep-2024 |
|
|
|
3,862 |
|
|
|
3,695 |
|
|
|
(167 |
) |
|
WTI Crude Oil |
|
|
11 |
|
|
|
Aug-2024 |
|
|
|
860 |
|
|
|
897 |
|
|
|
37 |
|
| |
|
|
|
|
|
|
|
|
|
$ |
14,157 |
|
|
$ |
13,859 |
|
|
$ |
(299 |
) |
The
accompanying notes are an integral part of the consolidated financial statements.
75
|
THE
ADVISORS’ INNER CIRCLE FUND III |
FS
CHIRON
REAL
DEVELOPMENT FUND
JUNE
30, 2024
(Unaudited) |
The tables below
set forth information about the Level within the fair value hierarchy at which the Fund’s investments and other financial instruments
are measured at June 30, 2024:
|
Investments in
Securities |
|
Level 1 (000) |
|
|
Level 2 (000) |
|
|
Level 3 (000) |
|
|
Total (000) |
|
|
Common Stock |
|
$ |
60,994 |
|
|
$ |
— |
|
|
$ |
— |
|
|
$ |
60,994 |
|
|
Exchange Traded
Funds |
|
|
1,986 |
|
|
|
— |
|
|
|
— |
|
|
|
1,986 |
|
|
Total Investments
in Securities |
|
$ |
62,980 |
|
|
$ |
— |
|
|
$ |
— |
|
|
$ |
62,980 |
|
|
Other Financial
Instruments |
|
Level 1 (000) |
|
|
Level 2 (000) |
|
|
Level 3 (000) |
|
|
Total (000) |
|
|
Futures Contracts* |
|
|
|
|
|
|
|
|
|
|
|
|
|
|
|
|
|
Unrealized Appreciation |
|
$ |
37 |
|
|
$ |
— |
|
|
$ |
— |
|
|
$ |
37 |
|
|
Unrealized Depreciation |
|
|
(336 |
) |
|
|
— |
|
|
|
— |
|
|
|
(336 |
) |
|
Total Other Financial
|
|
|
|
|
|
|
|
|
|
|
|
|
|
|
|
|
|
Instruments |
|
$ |
(299 |
) |
|
$ |
— |
|
|
$ |
— |
|
|
$ |
(299 |
) |
|
* |
Futures contracts
are valued at the unrealized appreciation (depreciation) on the instrument. |
Amounts
designated as “—“ are either $0 or have been rounded to $0.
For more information
on valuation inputs, see Note 2 – Significant Accounting Policies in the Notes to Consolidated Financial Statements.
See “Glossary”
for abbreviations.
The
accompanying notes are an integral part of the consolidated financial statements.
76
|
THE
ADVISORS’ INNER CIRCLE FUND III |
FS
INVESTMENTS
JUNE
30, 2024
(Unaudited) |
Glossary
|
Currency
Abbreviations
AUD — Australian
Dollar
BRL — Brazilian
Real
CAD — Canadian
Dollar
CHF — Swiss
Franc
CLP — Chilean
Peso
CNH — Chinese
Yuan Offshore
COP — Colombian
Peso
CZK — Czech
Koruna
EUR — Euro
GBP — British
Pound Sterling
HUF — Hungarian
Forint
IDR — Indonesian
Rupiah
ILS — Israeli
New Sheckels
INR — Indian
Rupee
JPY — Japanese
Yen
KRW — Korean
Won
MXN— Mexican
Peso
NOK — Norwegian
Krone
NZD — New
Zealand Dollar
PEN — Peruvian
Sol
PHP — Philippine
Peso
PLN — Polish
Zloty
SEK — Swedish
Krona
SGD — Singapore
Dollar
TWD — Taiwan
Dollar
USD — U.S.
Dollar
ZAR — South
African Rand |
Portfolio
Abbreviations
ADR — American
Depositary Receipt
Cl — Class
CLO — Collateralized
Loan Obligation
ETF — Exchange-Traded
Fund
EURIBOR —
Euro London Interbank Offered Rate
FED FUNDS —
Federal Funds Effective Rate
IO — Interest
Only
IRS — Interest
Rate Swap
MTN — Medium
Term Note
OIS — Overnight
Indexed Swap
OTC — Over
the Counter
PIK — Payment-in-Kind
PPP — Purchasing
Power Parity
PRIME — Prime
Interest Rate
Ser — Series
SOFR — Secured
Overnight Financing Rate
SOFR30A —
Secured Overnight Financing Rate 30-Day Average
SONIA — Sterling
Overnight Index Average
TBA — To
Be Announced
TSFR1M —
1 Month CME Term Secured Overnight Financing Rate
TSFR3M —
3 Month CME Term Secured Overnight Financing Rate |
77
|
THE
ADVISORS’ INNER CIRCLE FUND III |
FS
INVESTMENTS
JUNE
30, 2024
(Unaudited) |
| |
|
FS Multi-Strategy
Alternatives Fund |
|
|
FS Managed Futures
Fund |
|
|
|
|
|
|
|
|
|
|
|
|
CONSOLIDATED
STATEMENTS OF ASSETS AND LIABILITIES ($ Thousands) |
|
|
|
|
|
|
|
|
|
Assets: |
|
|
|
|
|
|
|
|
|
Investments,
at Fair Value (Cost $3,088,551 and $1,522) |
|
$ |
3,110,592 |
|
|
$ |
1,518 |
|
|
Foreign Currency,
at Fair Value (Cost $330 and $–) |
|
|
333 |
|
|
|
– |
|
|
OTC Swap Contracts,
at Fair Value (Premiums Paid $42 and $–) |
|
|
8,024 |
|
|
|
12 |
|
|
Receivable for
Investments Sold |
|
|
325,024 |
|
|
|
– |
|
|
Cash Pledged
as Collateral for Swap Contracts |
|
|
90,570 |
|
|
|
310 |
|
|
Cash |
|
|
61,890 |
|
|
|
215 |
|
|
Cash Pledged
as Collateral for Futures Contracts |
|
|
30,171 |
|
|
|
– |
|
|
Dividend and
Interest Receivable |
|
|
14,664 |
|
|
|
6 |
|
|
Receivable for
Capital Shares Sold |
|
|
4,884 |
|
|
|
– |
|
|
Variation Margin
Receivable for Centrally Cleared Swap Contracts |
|
|
3,123 |
|
|
|
– |
|
|
Variation Margin
Receivable for Futures Contracts |
|
|
1,723 |
|
|
|
– |
|
|
Reclaim Receivable |
|
|
2 |
|
|
|
– |
|
|
Reimbursement
from Adviser |
|
|
– |
|
|
|
9 |
|
|
Prepaid Expenses |
|
|
115 |
|
|
|
– |
|
|
Total
Assets |
|
|
3,651,115 |
|
|
|
2,070 |
|
|
Liabilities: |
|
|
|
|
|
|
|
|
|
Payable for
Investment Securities Purchased |
|
$ |
1,764,822 |
|
|
$ |
– |
|
|
Securities Sold
Short, at value (Proceeds $13,799 and $–) |
|
|
13,966 |
|
|
|
– |
|
|
OTC Swap Contracts,
at Fair Value (Premiums Received $– and $–) |
|
|
12,446 |
|
|
|
24 |
|
|
Variation Margin
Payable for Futures Contracts |
|
|
10,625 |
|
|
|
– |
|
|
Payable for
Capital Shares Redeemed |
|
|
3,761 |
|
|
|
– |
|
|
Variation Margin
Payable for Centrally Cleared Swap Contracts |
|
|
3,173 |
|
|
|
– |
|
|
Payable Due
to Adviser |
|
|
1,990 |
|
|
|
– |
|
|
Payable Due
to Administrator |
|
|
105 |
|
|
|
– |
|
|
Payable for
Printing Fees |
|
|
83 |
|
|
|
5 |
|
|
Payable for
Transfer Agent Fees |
|
|
70 |
|
|
|
7 |
|
|
Payable for
Audit Fees |
|
|
61 |
|
|
|
24 |
|
|
Interest payable |
|
|
11 |
|
|
|
– |
|
|
Chief Compliance
Officer Fees Payable |
|
|
5 |
|
|
|
– |
|
|
Unrealized Depreciation
on Forward Foreign Currency Contracts |
|
|
3 |
|
|
|
– |
|
|
Distribution
Fees Payable (Class A) |
|
|
11 |
|
|
|
– |
|
|
Other payables |
|
|
191 |
|
|
|
– |
|
|
Other Accrued
Expenses and Other Payables |
|
|
78 |
|
|
|
5 |
|
|
Total
Liabilities |
|
|
1,811,401 |
|
|
|
65 |
|
|
Commitments
and Contingencies† |
|
|
|
|
|
|
|
|
|
Net
Assets |
|
$ |
1,839,714 |
|
|
$ |
2,005 |
|
| † | See Note 8 in the Notes
to Consolidated Financial Statements. |
| | Amounts designated as “—“
are $0. |
The
accompanying notes are an integral part of the financial statements.
78
|
THE
ADVISORS’ INNER CIRCLE FUND III |
FS
INVESTMENTS
JUNE
30, 2024
(Unaudited) |
| |
|
FS Multi-Strategy
Alternatives Fund |
|
|
FS Managed Futures
Fund |
|
|
|
|
|
|
|
|
|
|
|
|
CONSOLIDATED
STATEMENTS OF ASSETS AND LIABILITIES ($ Thousands) (1) |
|
|
|
|
|
|
|
|
|
Net
Assets Consist of: |
|
|
|
|
|
|
|
|
|
Paid-in Capital |
|
$ |
1,800,056 |
|
|
$ |
1,940 |
|
|
Total Distributable
Earnings |
|
|
39,658 |
|
|
|
65 |
|
|
Net
Assets |
|
$ |
1,839,714 |
|
|
$ |
2,005 |
|
|
Class
A Shares: |
|
|
|
|
|
|
|
|
|
Net Assets |
|
$ |
56,586 |
|
|
$ |
25 |
|
|
Outstanding
Shares of Beneficial Interest (Unlimited Authorization - No Par Value) |
|
|
5,072,110 |
|
|
|
2,500 |
|
|
Net Asset Value,
Offering and Redemption Price Per Share |
|
$ |
11.16 |
‡ |
|
$ |
9.98 |
‡ |
|
Maximum Offering
Price Per Share
($11.16/95.00%,$9.98/95.00%) |
|
|
11.75 |
|
|
|
10.51 |
|
|
Class
I Shares: |
|
|
|
|
|
|
|
|
|
Net Assets |
|
$ |
1,783,128 |
|
|
$ |
1,980 |
|
|
Outstanding
Shares of Beneficial Interest (Unlimited Authorization - No Par Value) |
|
|
158,839,793 |
|
|
|
197,500 |
|
|
Net Asset Value,
Offering and Redemption Price Per Share |
|
$ |
11.23 |
‡ |
|
$ |
10.02 |
‡ |
(1) |
|
Amounts
shown In Thousands with the exception of Outstanding Shares of Beneficial Interest and Net
Asset Value, Offering and Redemption Price Per Share. |
|
|
‡ |
|
Net
Assets divided by Shares do not calculate to the stated NAV due to Net Assets and Shares being rounded. |
|
The
accompanying notes are an integral part of the financial statements.
79
|
THE
ADVISORS’ INNER CIRCLE FUND III |
FS
INVESTMENTS
JUNE
30, 2024
(Unaudited) |
| |
|
FS Chiron Real
Development Fund |
|
|
|
|
|
|
|
|
CONSOLIDATED
STATEMENTS OF ASSETS AND LIABILITIES ($ Thousands) |
|
|
|
|
|
Assets: |
|
|
|
|
|
Investments,
at Fair Value (Cost $58,947) |
|
$ |
62,980 |
|
|
Foreign Currency,
at Fair Value (Cost $424) |
|
|
425 |
|
|
Cash |
|
|
7,835 |
|
|
Cash Pledged
as Collateral for Swap Contracts |
|
|
1,305 |
|
|
Receivable for
Investments Sold |
|
|
1,077 |
|
|
Dividend and
Interest Receivable |
|
|
95 |
|
|
Variation Margin
Receivable for Futures Contracts |
|
|
60 |
|
|
Reclaim Receivable |
|
|
20 |
|
|
Receivable for
Capital Shares Sold |
|
|
11 |
|
|
Prepaid Expenses |
|
|
4 |
|
|
Total
Assets |
|
|
73,812 |
|
|
Liabilities: |
|
|
|
|
|
Payable for
Investment Securities Purchased |
|
$ |
466 |
|
|
Payable Due
to Adviser |
|
|
52 |
|
|
Payable for
Audit Fees |
|
|
23 |
|
|
Variation Margin
Payable for Futures Contracts |
|
|
13 |
|
|
Payable for
Printing Fees |
|
|
9 |
|
|
Payable Due
to Administrator |
|
|
5 |
|
|
Payable for
Capital Shares Redeemed |
|
|
2 |
|
|
Unrealized Depreciation
on Foreign Spot Currency Contracts |
|
|
1 |
|
|
Other Accrued
Expenses and Other Payables |
|
|
22 |
|
|
Total
Liabilities |
|
|
593 |
|
|
Commitments
and Contingencies† |
|
|
|
|
|
Net
Assets |
|
$ |
73,219 |
|
| † | See Note 8 in the Notes
to Consolidated Financial Statements. |
The
accompanying notes are an integral part of the financial statements.
80
|
THE
ADVISORS’ INNER CIRCLE FUND III |
FS
INVESTMENTS
JUNE
30, 2024
(Unaudited) |
| |
|
FS Chiron Real
Development Fund |
|
|
|
|
|
|
|
|
CONSOLIDATED
STATEMENTS OF ASSETS AND LIABILITIES ($ Thousands) (1) |
|
|
|
|
|
Net
Assets Consist of: |
|
|
|
|
|
Paid-in Capital |
|
$ |
66,470 |
|
|
Total Distributable
Earnings |
|
|
6,749 |
|
|
Net
Assets |
|
$ |
73,219 |
|
|
Class
A Shares: |
|
|
|
|
|
Net Assets |
|
$ |
50 |
|
|
Outstanding
Shares of Beneficial Interest (Unlimited Authorization - No Par Value) |
|
|
4,004 |
|
|
Net Asset Value,
Offering and Redemption Price Per Share |
|
$ |
12.51 |
‡ |
|
Maximum Offering
Price Per Share
($12.51/95.00%) |
|
|
13.17 |
|
|
Class
I Shares: |
|
|
|
|
|
Net Assets |
|
$ |
73,169 |
|
|
Outstanding
Shares of Beneficial Interest (Unlimited Authorization - No Par Value) |
|
|
5,839,899 |
|
|
Net Asset Value,
Offering and Redemption Price Per Share |
|
$ |
12.53 |
‡ |
|
(1) |
|
Amounts shown In
Thousands with the exception of Outstanding Shares of Beneficial Interest and Net Asset Value, Offering and Redemption Price Per Share. |
|
|
‡ |
|
Net Assets divided
by Shares do not calculate to the stated NAV due to Net Assets and Shares being rounded. |
|
The
accompanying notes are an integral part of the financial statements.
81
|
THE
ADVISORS’ INNER CIRCLE FUND III |
FS
INVESTMENTS
FOR THE SIX MONTHS ENDED
JUNE
30, 2024
(Unaudited) |
| |
|
FS Multi-Strategy
Alternatives Fund |
|
|
FS Managed Futures
Fund |
|
|
|
|
|
|
|
|
|
|
|
|
CONSOLIDATED
STATEMENTS OF OPERATIONS ($ Thousands) |
|
|
|
|
|
|
|
|
|
Investment
Income: |
|
|
|
|
|
|
|
|
|
Dividends |
|
$ |
16 |
|
|
$ |
— |
|
|
Interest |
|
|
44,012 |
|
|
|
39 |
|
|
Less: Foreign Taxes
Withheld |
|
|
(524 |
) |
|
|
— |
|
|
Total
Investment Income |
|
|
43,504 |
|
|
|
39 |
|
|
Expenses: |
|
|
|
|
|
|
|
|
|
Investment Advisory
Fees |
|
|
10,299 |
|
|
|
11 |
|
|
Administration
Fees |
|
|
578 |
|
|
|
1 |
|
|
Distribution Fees
(Class A) |
|
|
68 |
|
|
|
— |
|
|
Trustees' Fees
(Form N-CSRS Item 10) |
|
|
23 |
|
|
|
— |
|
|
Chief Compliance
Officer Fees |
|
|
11 |
|
|
|
— |
|
|
Dividend and Interest
Expense on Securities Sold Short |
|
|
1,684 |
|
|
|
— |
|
|
Transfer Agent
Fees |
|
|
278 |
|
|
|
20 |
|
|
Registration and
Filing Fees |
|
|
181 |
|
|
|
— |
|
|
Printing Fees |
|
|
120 |
|
|
|
2 |
|
|
Legal Fees |
|
|
94 |
|
|
|
1 |
|
|
Custodian Fees |
|
|
89 |
|
|
|
1 |
|
|
Pricing Fees |
|
|
81 |
|
|
|
— |
|
|
Audit Fees |
|
|
61 |
|
|
|
24 |
|
|
Other Expenses |
|
|
21 |
|
|
|
8 |
|
|
Recovery of Investment
Advisory Fees Previously Waived |
|
|
537 |
|
|
|
– |
|
|
Total
Expenses |
|
|
14,125 |
|
|
|
68 |
|
|
Less: |
|
|
|
|
|
|
|
|
|
Investment Advisory
Fee Waiver |
|
|
— |
|
|
|
(11 |
) |
|
Reimbursement from
Adviser |
|
|
— |
|
|
|
(54 |
) |
|
Net
Expenses |
|
|
14,125 |
|
|
|
3 |
|
|
Net
Investment Income |
|
|
29,379 |
|
|
|
36 |
|
|
Net
Realized Gain (Loss) on: |
|
|
|
|
|
|
|
|
|
Investments |
|
|
6,192 |
|
|
|
— |
|
|
Purchased Options |
|
|
(4,256 |
) |
|
|
— |
|
|
Written Options |
|
|
(3,373 |
) |
|
|
— |
|
|
Securities Sold
Short |
|
|
(462 |
) |
|
|
— |
|
|
Futures Contracts |
|
|
10,010 |
|
|
|
— |
|
|
Swap Contracts |
|
|
2,172 |
|
|
|
74 |
|
|
Foreign Currency
Transactions |
|
|
5 |
|
|
|
— |
|
|
Net
Realized Gain |
|
|
10,288 |
|
|
|
74 |
|
|
Net
Change in Unrealized Appreciation (Depreciation) on: |
|
|
|
|
|
|
|
|
|
Investments |
|
|
(6,572 |
) |
|
|
(5 |
) |
|
Purchased Options |
|
|
806 |
|
|
|
— |
|
|
Written Options |
|
|
(319 |
) |
|
|
— |
|
|
Securities Sold
Short |
|
|
477 |
|
|
|
— |
|
|
Futures Contracts |
|
|
10,948 |
|
|
|
— |
|
|
Swap Contracts |
|
|
1,606 |
|
|
|
19 |
|
|
Foreign Currency
Translation |
|
|
(1,554 |
) |
|
|
— |
|
The
accompanying notes are an integral part of the financial statements.
82
|
THE
ADVISORS’ INNER CIRCLE FUND III |
FS
INVESTMENTS
FOR THE SIX MONTHS ENDED
JUNE
30, 2024
(Unaudited) |
|
|
|
FS Multi-Strategy
Alternatives Fund |
|
|
FS Managed Futures
Fund |
|
|
|
|
|
|
|
|
|
|
|
|
CONSOLIDATED
STATEMENTS OF OPERATIONS ($ Thousands) |
|
|
|
|
|
|
|
|
|
Forward Currency
Exchange Contracts |
|
|
(3 |
) |
|
|
— |
|
|
Net
Change in Unrealized Appreciation |
|
|
5,389 |
|
|
|
14 |
|
|
Net
Realized and Unrealized Gain on Investments |
|
|
15,677 |
|
|
|
88 |
|
|
Net
Increase in Net Assets Resulting from Operations |
|
$ |
45,056 |
|
|
$ |
124 |
|
Amounts designated
as “—“ are $0.
The
accompanying notes are an integral part of the financial statements.
83
|
THE
ADVISORS’ INNER CIRCLE FUND III |
FS
INVESTMENTS
FOR THE SIX MONTHS ENDED
JUNE
30, 2024
(Unaudited) |
| |
|
FS Chiron Real
Development Fund |
|
|
|
|
|
|
|
|
CONSOLIDATED
STATEMENTS OF OPERATIONS ($ Thousands) |
|
|
|
|
|
Investment
Income: |
|
|
|
|
|
Dividends |
|
$ |
336 |
|
|
Interest |
|
|
340 |
|
|
Less: Foreign Taxes
Withheld |
|
|
(20 |
) |
|
Total
Investment Income |
|
|
656 |
|
|
Expenses: |
|
|
|
|
|
Investment Advisory
Fees |
|
|
293 |
|
|
Administration
Fees |
|
|
26 |
|
|
Trustees' Fees
(Form N-CSR Item 10) |
|
|
1 |
|
|
Audit Fees |
|
|
23 |
|
|
Custodian Fees |
|
|
19 |
|
|
Transfer Agent
Fees |
|
|
15 |
|
|
Registration and
Filing Fees |
|
|
14 |
|
|
Printing Fees |
|
|
6 |
|
|
Legal Fees |
|
|
3 |
|
|
Pricing Fees |
|
|
2 |
|
|
Other Expenses |
|
|
12 |
|
|
Total
Expenses |
|
|
414 |
|
|
Less: |
|
|
|
|
|
Investment Advisory
Fee Waiver |
|
|
(44 |
) |
|
Net
Expenses |
|
|
370 |
|
|
Net
Investment Income |
|
|
286 |
|
|
Net
Realized Gain (Loss) on: |
|
|
|
|
|
Investments |
|
|
5,217 |
|
|
Futures Contracts |
|
|
487 |
|
|
Swap Contracts |
|
|
(45 |
) |
|
Foreign Currency
Transactions |
|
|
(27 |
) |
|
Forward Currency
Exchange Contracts |
|
|
1 |
|
|
Net
Realized Gain |
|
|
5,633 |
|
|
Net
Change in Unrealized Appreciation (Depreciation) on: |
|
|
|
|
|
Investments |
|
|
1,017 |
|
|
Futures Contracts |
|
|
(301 |
) |
|
Swap Contracts |
|
|
(25 |
) |
|
Foreign Currency
Translation |
|
|
(57 |
) |
|
Net
Change in Unrealized Appreciation |
|
|
634 |
|
|
Net
Realized and Unrealized Gain on Investments |
|
|
6,267 |
|
|
Net
Increase in Net Assets Resulting from Operations |
|
$ |
6,553 |
|
The
accompanying notes are an integral part of the financial statements.
84
|
THE
ADVISORS’ INNER CIRCLE FUND III |
FS
MULTI-STRATEGY
ALTERNATIVES
FUND |
|
CONSOLIDATED STATEMENTS
OF CHANGES IN NET ASSETS ($ Thousands) |
| |
|
Six Months Ended
June 30, 2024 (Unaudited) |
|
|
Year
Ended
December 31, 2023 |
|
|
Operations: |
|
|
|
|
|
|
|
|
|
Net Investment
Income |
|
$ |
29,379 |
|
|
$ |
35,630 |
|
|
Net Realized
Gain |
|
|
10,288 |
|
|
|
4,370 |
|
|
Net Change in
Unrealized Appreciation |
|
|
5,389 |
|
|
|
14,418 |
|
|
Net
Increase in Net Assets Resulting from Operations |
|
|
45,056 |
|
|
|
54,418 |
|
|
Distributions: |
|
|
|
|
|
|
|
|
|
Class A Shares |
|
|
– |
|
|
|
(1,444 |
) |
|
Class I Shares |
|
|
– |
|
|
|
(46,899 |
) |
|
Total
Distributions |
|
|
– |
|
|
|
(48,343 |
) |
|
Capital
Share Transactions: |
|
|
|
|
|
|
|
|
|
Class A Shares |
|
|
|
|
|
|
|
|
|
Issued |
|
|
14,844 |
|
|
|
35,558 |
|
|
Reinvestment of
Dividends |
|
|
– |
|
|
|
1,405 |
|
|
Redeemed |
|
|
(8,894 |
) |
|
|
(17,160 |
) |
|
Net
Increase in Net Assets from Class A Share Transactions |
|
|
5,950 |
|
|
|
19,803 |
|
|
Class I Shares |
|
|
|
|
|
|
|
|
|
Issued |
|
|
612,434 |
|
|
|
1,116,133 |
|
|
Reinvestment of
Dividends |
|
|
– |
|
|
|
43,541 |
|
|
Redeemed |
|
|
(305,317 |
) |
|
|
(419,895 |
) |
|
Net
Increase in Net Assets from Class I Share Transactions |
|
|
307,117 |
|
|
|
739,779 |
|
|
Net
Increase in Net Assets from Capital Share Transactions |
|
|
313,067 |
|
|
|
759,582 |
|
|
Total
Increase in Net Assets |
|
|
358,123 |
|
|
|
765,657 |
|
|
Net
Assets: |
|
|
|
|
|
|
|
|
|
Beginning of Year/Period |
|
|
1,481,591 |
|
|
|
715,934 |
|
|
End of Year/Period |
|
$ |
1,839,714 |
|
|
$ |
1,481,591 |
|
|
Amounts designated
as “—“ are $0. |
|
|
|
|
|
|
|
|
The
accompanying notes are an integral part of the financial statements.
85
|
THE
ADVISORS’ INNER CIRCLE FUND III |
FS
MULTI-STRATEGY
ALTERNATIVES
FUND |
|
STATEMENTS OF CHANGES
IN NET ASSETS |
| |
|
Six Months
Ended
June 30, 2024 (Unaudited) |
|
|
Year
Ended
December 31, 2023 |
|
|
Share
Transactions: |
|
|
|
|
|
|
|
|
|
Class A Shares |
|
|
|
|
|
|
|
|
|
Issued |
|
|
1,347,233 |
|
|
|
3,250,898 |
|
|
Reinvestment of
Distributions |
|
|
– |
|
|
|
129,381 |
|
|
Redeemed |
|
|
(803,986 |
) |
|
|
(1,573,638 |
) |
|
Net
Increase in Shares Outstanding from Class A Share Transactions |
|
|
543,247 |
|
|
|
1,806,641 |
|
|
Share
Transactions: |
|
|
|
|
|
|
|
|
|
Class I Shares |
|
|
|
|
|
|
|
|
|
Issued |
|
|
55,048,113 |
|
|
|
101,424,112 |
|
|
Reinvestment of
Distributions |
|
|
– |
|
|
|
3,987,284 |
|
|
Redeemed |
|
|
(27,474,776 |
) |
|
|
(38,196,901 |
) |
|
Net
Increase in Shares Outstanding from Class I Share Transactions |
|
|
27,573,337 |
|
|
|
67,214,495 |
|
| |
|
|
|
|
|
|
|
|
|
Amounts designated
as “—“ are 0. |
|
|
|
|
|
|
|
|
The
accompanying notes are an integral part of the financial statements.
86
|
THE
ADVISORS’ INNER CIRCLE FUND III |
FS
MANAGED
FUTURES
FUND |
|
CONSOLIDATED STATEMENTS
OF CHANGES IN NET ASSETS ($ Thousands) |
| |
|
Six Months
Ended
June 30, 2024 (Unaudited) |
|
|
Year
Ended
December 31, 2023 |
|
|
Operations: |
|
|
|
|
|
|
|
|
|
Net Investment
Income |
|
$ |
36 |
|
|
$ |
69 |
|
|
Net Realized
Gain (Loss) |
|
|
74 |
|
|
|
(32 |
) |
|
Net Change in
Unrealized Appreciation (Depreciation) |
|
|
14 |
|
|
|
(75 |
) |
|
Net
Increase (Decrease) in Net Assets Resulting from Operations |
|
|
124 |
|
|
|
(38 |
) |
|
Distributions: |
|
|
|
|
|
|
|
|
|
Class A Shares |
|
|
– |
|
|
|
– |
|
|
Class I Shares |
|
|
– |
|
|
|
– |
|
|
Total
Distributions |
|
|
– |
|
|
|
– |
|
|
Capital
Share Transactions: |
|
|
|
|
|
|
|
|
|
Class A Shares |
|
|
|
|
|
|
|
|
|
Issued |
|
|
– |
|
|
|
– |
|
|
Reinvestment of
Dividends |
|
|
– |
|
|
|
– |
|
|
Redeemed |
|
|
– |
|
|
|
– |
|
|
Net
Increase in Net Assets from Class A Share Transactions |
|
|
– |
|
|
|
– |
|
|
Class I Shares |
|
|
|
|
|
|
|
|
|
Issued |
|
|
– |
|
|
|
– |
|
|
Reinvestment of
Dividends |
|
|
– |
|
|
|
– |
|
|
Redeemed |
|
|
– |
|
|
|
– |
|
|
Net
Increase in Net Assets from Class I Share Transactions |
|
|
– |
|
|
|
– |
|
|
Net
Increase in Net Assets from Capital Share Transactions |
|
|
– |
|
|
|
– |
|
|
Total
Increase/(Decrease) in Net Assets |
|
|
124 |
|
|
|
(38 |
) |
|
Net
Assets: |
|
|
|
|
|
|
|
|
|
Beginning of Year/Period |
|
|
1,881 |
|
|
|
1,919 |
|
|
End of Year/Period |
|
$ |
2,005 |
|
|
$ |
1,881 |
|
|
Amounts designated
as “—“ are $0. |
|
|
|
|
|
|
|
|
The
accompanying notes are an integral part of the financial statements.
87
|
THE
ADVISORS’ INNER CIRCLE FUND III |
FS
MANAGED
FUTURES
FUND |
|
STATEMENTS OF CHANGES
IN NET ASSETS |
| |
|
Six Months
Ended
June 30, 2024 (Unaudited) |
|
|
Year
Ended
December 31, 2023 |
|
|
Share
Transactions: |
|
|
|
|
|
|
|
|
|
Class A Shares |
|
|
|
|
|
|
|
|
|
Issued |
|
|
– |
|
|
|
– |
|
|
Reinvestment of
Distributions |
|
|
– |
|
|
|
– |
|
|
Redeemed |
|
|
– |
|
|
|
– |
|
|
Net
Increase in Shares Outstanding from Class A Share Transactions |
|
|
– |
|
|
|
– |
|
|
Share
Transactions: |
|
|
|
|
|
|
|
|
|
Class I Shares |
|
|
|
|
|
|
|
|
|
Issued |
|
|
– |
|
|
|
– |
|
|
Reinvestment of
Distributions |
|
|
– |
|
|
|
– |
|
|
Redeemed |
|
|
– |
|
|
|
– |
|
|
Net
Increase in Shares Outstanding from Class I Share Transactions |
|
|
– |
|
|
|
– |
|
| |
|
|
|
|
|
|
|
|
|
Amounts designated
as “—“ are 0. |
|
|
|
|
|
|
|
|
The
accompanying notes are an integral part of the financial statements.
88
|
THE
ADVISORS’ INNER CIRCLE FUND III |
FS
CHIRON
REAL
DEVELOPMENT FUND |
|
CONSOLIDATED STATEMENTS
OF CHANGES IN NET ASSETS ($ Thousands) |
| |
|
Six Months
Ended
June 30, 2024 (Unaudited) |
|
|
Year
Ended
December 31, 2023 |
|
|
Operations: |
|
|
|
|
|
|
|
|
|
Net Investment
Income |
|
$ |
286 |
|
|
$ |
1,227 |
|
|
Net Realized
Gain (Loss) |
|
|
5,633 |
|
|
|
(1,292 |
) |
|
Net Change in
Unrealized Appreciation |
|
|
634 |
|
|
|
2,914 |
|
|
Net
Increase in Net Assets Resulting from Operations |
|
|
6,553 |
|
|
|
2,849 |
|
|
Distributions: |
|
|
|
|
|
|
|
|
|
Class A Shares |
|
|
– |
|
|
|
(1 |
) |
|
Class I Shares |
|
|
– |
|
|
|
(801 |
) |
|
Total
Distributions |
|
|
– |
|
|
|
(802 |
) |
|
Capital
Share Transactions: |
|
|
|
|
|
|
|
|
|
Class A Shares |
|
|
|
|
|
|
|
|
|
Issued |
|
|
– |
|
|
|
16 |
|
|
Reinvestment of
Dividends |
|
|
– |
|
|
|
– |
|
|
Redeemed |
|
|
(5 |
) |
|
|
– |
|
|
Net
Increase (Decrease) in Net Assets from Class A Share Transactions |
|
|
(5 |
) |
|
|
16 |
|
|
Class I Shares |
|
|
|
|
|
|
|
|
|
Issued |
|
|
14,726 |
|
|
|
23,065 |
|
|
Reinvestment of
Dividends |
|
|
– |
|
|
|
260 |
|
|
Redeemed |
|
|
(3,305 |
) |
|
|
(6,418 |
) |
|
Net
Increase in Net Assets from Class I Share Transactions |
|
|
11,421 |
|
|
|
16,907 |
|
|
Net
Increase in Net Assets from Capital Share Transactions |
|
|
11,416 |
|
|
|
16,923 |
|
|
Total
Increase in Net Assets |
|
|
17,969 |
|
|
|
18,970 |
|
|
Net
Assets: |
|
|
|
|
|
|
|
|
|
Beginning of Year/Period |
|
|
55,250 |
|
|
|
36,280 |
|
|
End of Year/Period |
|
$ |
73,219 |
|
|
$ |
55,250 |
|
|
Amounts designated
as “—“ are $0. |
|
|
|
|
|
|
|
|
The
accompanying notes are an integral part of the financial statements.
89
|
THE
ADVISORS’ INNER CIRCLE FUND III |
FS
CHIRON
REAL
DEVELOPMENT FUND |
|
STATEMENTS OF CHANGES
IN NET ASSETS |
| |
|
Six Months
Ended
June 30, 2024 (Unaudited) |
|
|
Year
Ended
December 31, 2023 |
|
|
Share
Transactions: |
|
|
|
|
|
|
|
|
|
Class A Shares |
|
|
|
|
|
|
|
|
|
Issued |
|
|
– |
|
|
|
1,493 |
|
|
Reinvestment of
Distributions |
|
|
– |
|
|
|
23 |
|
|
Redeemed |
|
|
(446 |
) |
|
|
(7 |
) |
|
Net
Increase/(Decrease) in Shares Outstanding from Class A Share Transactions |
|
|
(446 |
) |
|
|
1,509 |
|
|
Share
Transactions: |
|
|
|
|
|
|
|
|
|
Class I Shares |
|
|
|
|
|
|
|
|
|
Issued |
|
|
1,219,751 |
|
|
|
2,120,716 |
|
|
Reinvestment of
Distributions |
|
|
– |
|
|
|
22,996 |
|
|
Redeemed |
|
|
(281,846 |
) |
|
|
(588,848 |
) |
|
Net
Increase in Shares Outstanding from Class I Share Transactions |
|
|
937,905 |
|
|
|
1,554,864 |
|
| |
|
|
|
|
|
|
|
|
|
Amounts designated
as “—“ are 0. |
|
|
|
|
|
|
|
|
The
accompanying notes are an integral part of the financial statements.
90
|
THE
ADVISORS’ INNER CIRCLE FUND III |
FS
MULTI-STRATEGY
ALTERNATIVES
FUND |
CONSOLIDATED
FINANCIAL HIGHLIGHTS
Selected
Per Share Data & Ratios
For
a Share Outstanding Throughout Each Year/Period
Class
A Shares
| |
|
Six Months Ended
June 30, 2024 (Unaudited) |
|
|
Year Ended December
31, 2023 |
|
|
Year Ended December
31, 2022 |
|
|
Year Ended December
31, 2021 |
|
|
Year Ended December
31, 2020 |
|
|
Year Ended December
31, 2019 |
|
|
Net Asset Value,
Beginning of Year/Period |
|
$ |
10.86 |
|
|
$ |
10.68 |
|
|
$ |
10.78 |
|
|
$ |
9.77 |
|
|
$ |
10.22 |
|
|
$ |
9.68 |
|
|
Income from Investment
Operations: |
|
|
|
|
|
|
|
|
|
|
|
|
|
|
|
|
|
|
|
|
|
|
|
|
|
Net Investment
Income (Loss)** |
|
|
0.19 |
|
|
|
0.38 |
|
|
|
0.19 |
|
|
|
(0.07 |
) |
|
|
0.02 |
|
|
|
0.15 |
|
|
Net Realized and
Unrealized Gain (Loss) |
|
|
0.11 |
|
|
|
0.17 |
|
|
|
0.13 |
|
|
|
1.40 |
|
|
|
(0.43 |
) |
|
|
0.59 |
|
|
Total from Investment
Operations |
|
|
0.30 |
|
|
|
0.55 |
|
|
|
0.32 |
|
|
|
1.33 |
|
|
|
(0.41 |
) |
|
|
0.74 |
|
|
Dividends and
Distributions: |
|
|
|
|
|
|
|
|
|
|
|
|
|
|
|
|
|
|
|
|
|
|
|
|
|
Net Investment
Income |
|
|
– |
|
|
|
(0.37 |
) |
|
|
(0.30 |
) |
|
|
(0.32 |
) |
|
|
(0.04 |
) |
|
|
(0.20 |
) |
|
Capital Gains |
|
|
– |
|
|
|
– |
|
|
|
(0.12 |
) |
|
|
– |
|
|
|
– |
|
|
|
– |
|
|
Total Dividends
and Distributions |
|
|
– |
|
|
|
(0.37 |
) |
|
|
(0.42 |
) |
|
|
(0.32 |
) |
|
|
(0.04 |
) |
|
|
(0.20 |
) |
|
Net Asset Value,
End of Year/Period |
|
$ |
11.16 |
|
|
$ |
10.86 |
|
|
$ |
10.68 |
|
|
$ |
10.78 |
|
|
$ |
9.77 |
|
|
$ |
10.22 |
|
|
Total
Return‡ |
|
|
2.76 |
%† |
|
|
5.16 |
% |
|
|
3.01 |
% |
|
|
13.62 |
% |
|
|
(3.99 |
)% |
|
|
7.68 |
% |
|
Ratios
and Supplemental Data |
|
|
|
|
|
|
|
|
|
|
|
|
|
|
|
|
|
|
|
|
|
|
|
|
|
Net Assets, End
of Year/Period (Thousands) |
|
$ |
56,586 |
|
|
$ |
49,176 |
|
|
$ |
29,069 |
|
|
$ |
7,891 |
|
|
$ |
7,036 |
|
|
$ |
10,973 |
|
| |
|
|
|
|
|
|
|
|
|
|
|
|
|
|
|
|
|
|
|
|
|
|
|
|
|
Ratio of Expenses
to Average Net Assets |
|
|
1.96 |
%††(1) |
|
|
1.94 |
%(1) |
|
|
2.14 |
%(1) |
|
|
2.17 |
% |
|
|
2.41 |
% |
|
|
1.81 |
% |
|
Ratio of Expenses
to Average Net Assets (Excluding Waivers) |
|
|
1.89 |
%†† |
|
|
1.96 |
% |
|
|
2.31 |
% |
|
|
3.49 |
% |
|
|
3.42 |
% |
|
|
3.55 |
% |
|
Ratio of Net Investment
Income (Loss) to Average Net Assets |
|
|
3.54 |
%†† |
|
|
3.46 |
% |
|
|
1.70 |
% |
|
|
(0.66 |
)% |
|
|
0.22 |
% |
|
|
1.46 |
% |
|
Portfolio Turnover
Rate |
|
|
392 |
%† |
|
|
768 |
% |
|
|
216 |
% |
|
|
183 |
% |
|
|
244 |
% |
|
|
178 |
% |
The
accompanying notes are an integral part of the consolidated financial statements.
91
|
THE
ADVISORS’ INNER CIRCLE FUND III |
FS
MULTI-STRATEGY
ALTERNATIVES
FUND |
|
** |
Per
share calculations were performed using average shares for the period. |
|
‡ |
Returns
shown do not reflect the deductions of taxes that a shareholder would pay on Fund distributions or the redemption of Fund Shares, assumes
reinvestments of dividends, and does not reflect the applicable sales charges, if applicable. |
|
† |
Total
Return and Portfolio Turnover Rate are for the period indicated and have not been annualized. |
|
†† |
Annualized. |
|
(1) |
The
Fund incurred dividend and interest expense on securities sold short. If these expenses and fees had not been incurred, the ratios of
operating expenses to average net assets for the period ended June 30, 2024 and years ended December 31, 2023 and December 31, 2022 would
have been 1.75%, 1.75% and 1.78%, respectively. |
Amounts designated
as “—“ are 0.
The
accompanying notes are an integral part of the consolidated financial statements.
92
|
THE
ADVISORS’ INNER CIRCLE FUND III |
FS
MULTI-STRATEGY
ALTERNATIVES
FUND |
Selected
Per Share Data & Ratios
For
a Share Outstanding Throughout Each Year/Period
Class
I Shares
| |
|
Six Months Ended
June 30, 2024 (Unaudited) |
|
|
Year Ended December
31, 2023 |
|
|
Year Ended December
31, 2022 |
|
|
Year Ended December
31, 2021 |
|
|
Year Ended December
31, 2020 |
|
|
Year Ended December
31, 2019 |
|
|
Net Asset Value,
Beginning of Year/Period |
|
$ |
10.91 |
|
|
$ |
10.72 |
|
|
$ |
10.82 |
|
|
$ |
9.80 |
|
|
$ |
10.25 |
|
|
$ |
9.72 |
|
|
Income from Investment
Operations: |
|
|
|
|
|
|
|
|
|
|
|
|
|
|
|
|
|
|
|
|
|
|
|
|
|
Net Investment
Income (Loss)** |
|
|
0.20 |
|
|
|
0.39 |
|
|
|
0.18 |
|
|
|
(0.05 |
) |
|
|
0.04 |
|
|
|
0.17 |
|
|
Net Realized and
Unrealized Gain (Loss) |
|
|
0.12 |
|
|
|
0.19 |
|
|
|
0.16 |
|
|
|
1.42 |
|
|
|
(0.41 |
) |
|
|
0.59 |
|
|
Total from Investment
Operations |
|
|
0.32 |
|
|
|
0.58 |
|
|
|
0.34 |
|
|
|
1.37 |
|
|
|
(0.37 |
) |
|
|
0.76 |
|
|
Dividends and
Distributions: |
|
|
|
|
|
|
|
|
|
|
|
|
|
|
|
|
|
|
|
|
|
|
|
|
|
Net Investment
Income |
|
|
– |
|
|
|
(0.39 |
) |
|
|
(0.32 |
) |
|
|
(0.35 |
) |
|
|
(0.08 |
) |
|
|
(0.23 |
) |
|
Capital Gains |
|
|
– |
|
|
|
– |
|
|
|
(0.12 |
) |
|
|
– |
|
|
|
– |
|
|
|
– |
|
|
Total Dividends
and Distributions |
|
|
– |
|
|
|
(0.39 |
) |
|
|
(0.44 |
) |
|
|
(0.35 |
) |
|
|
(0.08 |
) |
|
|
(0.23 |
) |
|
Net Asset Value,
End of Year/Period |
|
$ |
11.23 |
|
|
$ |
10.91 |
|
|
$ |
10.72 |
|
|
$ |
10.82 |
|
|
$ |
9.80 |
|
|
$ |
10.25 |
|
|
Total
Return‡ |
|
|
2.93 |
%† |
|
|
5.44 |
% |
|
|
3.16 |
% |
|
|
13.96 |
% |
|
|
(3.65 |
)% |
|
|
7.77 |
% |
|
Ratios
and Supplemental Data |
|
|
|
|
|
|
|
|
|
|
|
|
|
|
|
|
|
|
|
|
|
|
|
|
|
Net Assets, End
of Year/Period (Thousands) |
|
$ |
1,783,128 |
|
|
$ |
1,432,415 |
|
|
$ |
686,865 |
|
|
$ |
155,191 |
|
|
$ |
121,667 |
|
|
$ |
184,543 |
|
|
Ratio of Expenses
to Average Net Assets |
|
|
1.71 |
%††(1) |
|
|
1.69 |
%(1) |
|
|
1.89 |
%(1) |
|
|
1.94 |
% |
|
|
2.16 |
% |
|
|
1.59 |
% |
|
Ratio of Expenses
to Average Net Assets (Excluding Waivers) |
|
|
1.64 |
%†† |
|
|
1.71 |
% |
|
|
2.07 |
% |
|
|
3.26 |
% |
|
|
3.17 |
% |
|
|
3.28 |
% |
|
Ratio of Net Investment
Income (Loss) to Average Net Assets |
|
|
3.57 |
%†† |
|
|
3.52 |
% |
|
|
1.69 |
% |
|
|
(0.43 |
)% |
|
|
0.46 |
% |
|
|
1.65 |
% |
|
Portfolio Turnover
Rate |
|
|
392 |
%† |
|
|
768 |
% |
|
|
216 |
% |
|
|
183 |
% |
|
|
244 |
% |
|
|
178 |
% |
The
accompanying notes are an integral part of the consolidated financial statements.
93
|
THE
ADVISORS’ INNER CIRCLE FUND III |
FS
MULTI-STRATEGY
ALTERNATIVES
FUND |
|
** |
Per
share calculations were performed using average shares for the period. |
|
‡ |
Returns
shown do not reflect the deductions of taxes that a shareholder would pay on Fund distributions or the redemption of Fund Shares, assumes
reinvestments of dividends, and does not reflect the applicable sales charges, if applicable. |
|
† |
Total
Return and Portfolio Turnover Rate are for the period indicated and have not been annualized. |
|
†† |
Annualized. |
|
(1) |
The
Fund incurred dividend and interest expense on securities sold short. If these expenses and fees had not been incurred, the ratios of
operating expenses to average net assets for the period ended June 30, 2024 and years ended December 31, 2023 and December 31, 2022 would
have been 1.50%, 1.50% and 1.53%, respectively. |
Amounts designated
as “—“ are 0.
The
accompanying notes are an integral part of the consolidated financial statements.
94
|
THE
ADVISORS’ INNER CIRCLE FUND III |
FS
MANAGED
FUTURES
FUND |
CONSOLIDATED
FINANCIAL HIGHLIGHTS
Selected
Per Share Data & Ratios
For
a Share Outstanding Throughout Each Year/Period
Class
A Shares
| |
|
Six Months Ended
June 30, 2024 (Unaudited) |
|
|
Year Ended December
31, 2023 |
|
|
Year Ended December
31, 2022 |
|
|
Year Ended December
31, 2021 |
|
|
Year Ended December
31, 2020 |
|
|
Year Ended December
31, 2019 |
|
|
Net Asset Value,
Beginning of Year/Period |
|
$ |
9.38 |
|
|
$ |
9.59 |
|
|
$ |
10.29 |
|
|
$ |
10.33 |
|
|
$ |
9.96 |
|
|
$ |
10.00 |
|
|
Income from Investment
Operations: |
|
|
|
|
|
|
|
|
|
|
|
|
|
|
|
|
|
|
|
|
|
|
|
|
|
Net Investment
Income (Loss)** |
|
|
0.17 |
|
|
|
0.32 |
|
|
|
0.11 |
|
|
|
(0.06 |
) |
|
|
0.00 |
^ |
|
|
0.18 |
|
|
Net Realized and
Unrealized Gain (Loss) |
|
|
0.43 |
|
|
|
(0.53 |
) |
|
|
1.45 |
|
|
|
0.39 |
|
|
|
1.02 |
|
|
|
(0.19 |
) |
|
Total from Investment
Operations |
|
|
0.60 |
|
|
|
(0.21 |
) |
|
|
1.56 |
|
|
|
0.33 |
|
|
|
1.02 |
|
|
|
(0.01 |
) |
|
Dividends and
Distributions: |
|
|
|
|
|
|
|
|
|
|
|
|
|
|
|
|
|
|
|
|
|
|
|
|
|
Net Investment
Income |
|
|
– |
|
|
|
– |
|
|
|
(0.78 |
) |
|
|
(0.37 |
) |
|
|
(0.65 |
) |
|
|
(0.03 |
) |
|
Capital Gains |
|
|
– |
|
|
|
– |
|
|
|
(1.48 |
) |
|
|
– |
|
|
|
– |
|
|
|
– |
|
|
Total Dividends
and Distributions |
|
|
– |
|
|
|
– |
|
|
|
(2.26 |
) |
|
|
(0.37 |
) |
|
|
(0.65 |
) |
|
|
(0.03 |
) |
|
Net Asset Value,
End of Year/Period |
|
$ |
9.98 |
|
|
$ |
9.38 |
|
|
$ |
9.59 |
|
|
$ |
10.29 |
|
|
$ |
10.33 |
|
|
$ |
9.96 |
|
|
Total
Return‡ |
|
|
6.40 |
%† |
|
|
(2.19 |
)% |
|
|
15.91 |
% |
|
|
3.22 |
% |
|
|
10.55 |
% |
|
|
(0.15 |
)% |
|
Ratios
and Supplemental Data |
|
|
|
|
|
|
|
|
|
|
|
|
|
|
|
|
|
|
|
|
|
|
|
|
|
Net Assets, End
of Year/Period (Thousands) |
|
$ |
25 |
|
|
$ |
24 |
|
|
$ |
24 |
|
|
$ |
26 |
|
|
$ |
26 |
|
|
$ |
25 |
|
|
Ratio of Expenses
to Average Net Assets |
|
|
0.50 |
%†† |
|
|
0.50 |
% |
|
|
0.51 |
% |
|
|
0.62 |
% |
|
|
0.50 |
% |
|
|
0.50 |
% |
|
Ratio of Expenses
to Average Net Assets (Excluding Waivers) |
|
|
9.08 |
%†† |
|
|
5.16 |
% |
|
|
7.82 |
% |
|
|
12.40 |
% |
|
|
13.13 |
% |
|
|
10.14 |
% |
|
Ratio of Net Investment
Income (Loss) to Average Net Assets |
|
|
3.43 |
%†† |
|
|
3.35 |
% |
|
|
1.00 |
% |
|
|
(0.57 |
)% |
|
|
(0.03 |
)% |
|
|
1.77 |
% |
|
Portfolio Turnover
Rate |
|
|
– |
%† |
|
|
– |
% |
|
|
– |
% |
|
|
– |
% |
|
|
– |
% |
|
|
– |
% |
The
accompanying notes are an integral part of the consolidated financial statements.
95
|
THE
ADVISORS’ INNER CIRCLE FUND III |
FS
MANAGED
FUTURES
FUND |
|
** |
Per
share calculations were performed using average shares for the period. |
|
^ |
The
amount shown is less than $0.005. |
|
‡ |
Returns
shown do not reflect the deductions of taxes that a shareholder would pay on Fund distributions or the redemption of Fund Shares, assumes
reinvestments of dividends, and does not reflect the applicable sales charges, if applicable. |
|
† |
Total
Return and Portfolio Turnover Rate are for the period indicated and have not been annualized. |
|
†† |
Annualized. |
Amounts designated
as “—“ are 0.
The
accompanying notes are an integral part of the consolidated financial statements.
96
|
THE
ADVISORS’ INNER CIRCLE FUND III |
FS
MANAGED
FUTURES
FUND |
Selected
Per Share Data & Ratios
For
a Share Outstanding Throughout Each Year/Period
Class
I Shares
| |
|
Six Months Ended
June 30, 2024 (Unaudited) |
|
|
Year Ended December
31, 2023 |
|
|
Year Ended December
31, 2022 |
|
|
Year Ended December
31, 2021 |
|
|
Year Ended December
31, 2020 |
|
|
Year Ended December
31, 2019 |
|
|
Net Asset Value,
Beginning of Year/Period |
|
$ |
9.40 |
|
|
$ |
9.59 |
|
|
$ |
10.29 |
|
|
$ |
10.33 |
|
|
$ |
9.96 |
|
|
$ |
10.00 |
|
|
Income from Investment
Operations: |
|
|
|
|
|
|
|
|
|
|
|
|
|
|
|
|
|
|
|
|
|
|
|
|
|
Net Investment
Income (Loss)** |
|
|
0.18 |
|
|
|
0.34 |
|
|
|
0.13 |
|
|
|
(0.03 |
) |
|
|
0.02 |
|
|
|
0.20 |
|
|
Net Realized and
Unrealized Gain (Loss) |
|
|
0.44 |
|
|
|
(0.53 |
) |
|
|
1.46 |
|
|
|
0.39 |
|
|
|
1.03 |
|
|
|
(0.18 |
) |
|
Total from Investment
Operations |
|
|
0.62 |
|
|
|
(0.19 |
) |
|
|
1.59 |
|
|
|
0.36 |
|
|
|
1.05 |
|
|
|
0.02 |
|
|
Dividends and
Distributions: |
|
|
|
|
|
|
|
|
|
|
|
|
|
|
|
|
|
|
|
|
|
|
|
|
|
Net Investment
Income |
|
|
– |
|
|
|
– |
|
|
|
(0.81 |
) |
|
|
(0.40 |
) |
|
|
(0.68 |
) |
|
|
(0.06 |
) |
|
Capital Gains |
|
|
– |
|
|
|
– |
|
|
|
(1.48 |
) |
|
|
– |
|
|
|
– |
|
|
|
– |
|
|
Total Dividends
and Distributions |
|
|
– |
|
|
|
– |
|
|
|
(2.29 |
) |
|
|
(0.40 |
) |
|
|
(0.68 |
) |
|
|
(0.06 |
) |
|
Net Asset Value,
End of Year/Period |
|
$ |
10.02 |
|
|
$ |
9.40 |
|
|
$ |
9.59 |
|
|
$ |
10.29 |
|
|
$ |
10.33 |
|
|
$ |
9.96 |
|
|
Total
Return‡ |
|
|
6.60 |
%† |
|
|
(1.98 |
)% |
|
|
16.18 |
% |
|
|
3.48 |
% |
|
|
10.83 |
% |
|
|
0.10 |
% |
|
Ratios
and Supplemental Data |
|
|
|
|
|
|
|
|
|
|
|
|
|
|
|
|
|
|
|
|
|
|
|
|
|
Net Assets, End
of Year/Period (Thousands) |
|
$ |
1,980 |
|
|
$ |
1,857 |
|
|
$ |
1,895 |
|
|
$ |
2,044 |
|
|
$ |
2,052 |
|
|
$ |
1,977 |
|
|
Ratio of Expenses
to Average Net Assets |
|
|
0.25 |
%†† |
|
|
0.25 |
% |
|
|
0.32 |
% |
|
|
0.37 |
% |
|
|
0.25 |
% |
|
|
0.25 |
% |
|
Ratio of Expenses
to Average Net Assets (Excluding Waivers) |
|
|
8.83 |
%†† |
|
|
4.91 |
% |
|
|
7.63 |
% |
|
|
12.15 |
% |
|
|
12.88 |
% |
|
|
9.89 |
% |
|
Ratio of Net Investment
Income (Loss) to Average Net Assets |
|
|
3.68 |
%†† |
|
|
3.60 |
% |
|
|
1.19 |
% |
|
|
(0.32 |
)% |
|
|
0.23 |
% |
|
|
2.02 |
% |
|
Portfolio Turnover
Rate |
|
|
– |
%† |
|
|
– |
% |
|
|
– |
% |
|
|
– |
% |
|
|
– |
% |
|
|
– |
% |
|
** |
Per
share calculations were performed using average shares for the period. |
|
‡ |
Returns
shown do not reflect the deductions of taxes that a shareholder would pay on Fund distributions or the redemption of Fund Shares, assumes
reinvestments of dividends, and does not reflect the applicable sales charges, if applicable. |
|
† |
Total
Return and Portfolio Turnover Rate are for the period indicated and have not been annualized. |
|
†† |
Annualized. |
Amounts designated
as “—“ are 0.
The
accompanying notes are an integral part of the consolidated financial statements.
97
|
THE
ADVISORS’ INNER CIRCLE FUND III |
FS
CHIRON
REAL
DEVELOPMENT FUND |
CONSOLIDATED
FINANCIAL HIGHLIGHTS
Selected
Per Share Data & Ratios
For
a Share Outstanding Throughout Each Year/Period
Class
A Shares
| |
|
Six Months Ended
June 30, 2024 (Unaudited) |
|
|
Year Ended December
31, 2023 |
|
|
Year Ended December
31, 2022 |
|
|
Year Ended December
31, 2021 |
|
|
Year Ended December
31, 2020 |
|
|
Year Ended December
31, 2019 |
|
|
Net Asset Value,
Beginning of Year/Period |
|
$ |
11.26 |
|
|
$ |
10.83 |
|
|
$ |
12.18 |
|
|
$ |
10.72 |
|
|
$ |
10.26 |
|
|
$ |
10.00 |
|
|
Income from Investment
Operations: |
|
|
|
|
|
|
|
|
|
|
|
|
|
|
|
|
|
|
|
|
|
|
|
|
|
Net Investment
Income (Loss)** |
|
|
0.04 |
|
|
|
0.27 |
|
|
|
0.13 |
|
|
|
(0.01 |
) |
|
|
(0.01 |
) |
|
|
0.18 |
|
|
Net Realized and
Unrealized Gain (Loss) |
|
|
1.21 |
|
|
|
0.30 |
|
|
|
(1.42 |
) |
|
|
1.91 |
|
|
|
0.77 |
|
|
|
0.79 |
|
|
Total from Investment
Operations |
|
|
1.25 |
|
|
|
0.57 |
|
|
|
(1.29 |
) |
|
|
1.90 |
|
|
|
0.76 |
|
|
|
0.97 |
|
|
Dividends and
Distributions: |
|
|
|
|
|
|
|
|
|
|
|
|
|
|
|
|
|
|
|
|
|
|
|
|
|
Net Investment
Income |
|
|
– |
|
|
|
(0.14 |
) |
|
|
(0.05 |
) |
|
|
(0.44 |
) |
|
|
(0.30 |
) |
|
|
(0.71 |
) |
|
Capital Gains |
|
|
– |
|
|
|
– |
|
|
|
(0.01 |
) |
|
|
– |
|
|
|
– |
|
|
|
– |
|
|
Total Dividends
and Distributions |
|
|
– |
|
|
|
(0.14 |
) |
|
|
(0.06 |
) |
|
|
(0.44 |
) |
|
|
(0.30 |
) |
|
|
(0.71 |
) |
|
Net Asset Value,
End of Year/Period |
|
$ |
12.51 |
|
|
$ |
11.26 |
|
|
$ |
10.83 |
|
|
$ |
12.18 |
|
|
$ |
10.72 |
|
|
$ |
10.26 |
|
|
Total
Return‡ |
|
|
11.10 |
%† |
|
|
5.24 |
% |
|
|
(10.64 |
)% |
|
|
17.93 |
% |
|
|
7.69 |
% |
|
|
9.87 |
% |
|
Ratios
and Supplemental Data |
|
|
|
|
|
|
|
|
|
|
|
|
|
|
|
|
|
|
|
|
|
|
|
|
|
Net Assets, End
of Year/Period (Thousands) |
|
$ |
50 |
|
|
$ |
50 |
|
|
$ |
32 |
|
|
$ |
30 |
|
|
$ |
27 |
|
|
$ |
26 |
|
|
Ratio of Expenses
to Average Net Assets |
|
|
1.45 |
%†† |
|
|
1.45 |
% |
|
|
1.50 |
% |
|
|
0.76 |
% |
|
|
0.50 |
% |
|
|
0.50 |
% |
|
Ratio of Expenses
to Average Net Assets (Excluding Waivers) |
|
|
1.60 |
%†† |
|
|
1.67 |
% |
|
|
3.16 |
% |
|
|
8.14 |
% |
|
|
11.21 |
% |
|
|
8.95 |
% |
|
Ratio of Net Investment
Income (Loss) to Average Net Assets |
|
|
0.65 |
%†† |
|
|
2.50 |
% |
|
|
1.10 |
% |
|
|
(0.11 |
)% |
|
|
(0.06 |
)% |
|
|
1.72 |
% |
|
Portfolio Turnover
Rate |
|
|
196 |
%† |
|
|
188 |
% |
|
|
996 |
% |
|
|
651 |
% |
|
|
– |
% |
|
|
– |
% |
The
accompanying notes are an integral part of the consolidated financial statements.
98
|
THE
ADVISORS’ INNER CIRCLE FUND III |
FS
CHIRON
REAL
DEVELOPMENT FUND |
|
** |
Per
share calculations were performed using average shares for the period. |
|
‡ |
Returns
shown do not reflect the deductions of taxes that a shareholder would pay on Fund distributions or the redemption of Fund Shares, assumes
reinvestments of dividends, and does not reflect the applicable sales charges, if applicable. |
|
† |
Total
Return and Portfolio Turnover Rate are for the period indicated and have not been annualized. |
|
†† |
Annualized. |
Amounts designated
as “—“ are 0.
The
accompanying notes are an integral part of the consolidated financial statements.
99
|
THE
ADVISORS’ INNER CIRCLE FUND III |
FS
CHIRON
REAL
DEVELOPMENT FUND |
Selected
Per Share Data & Ratios
For
a Share Outstanding Throughout Each Year/Period
Class
I Shares
| |
|
Six Months Ended
June 30, 2024 (Unaudited) |
|
|
Year Ended December
31, 2023 |
|
|
Year Ended December
31, 2022 |
|
|
Year Ended December
31, 2021 |
|
|
Year Ended December
31, 2020 |
|
|
Year Ended December
31, 2019 |
|
|
Net Asset Value,
Beginning of Year/Period |
|
$ |
11.26 |
|
|
$ |
10.83 |
|
|
$ |
12.18 |
|
|
$ |
10.72 |
|
|
$ |
10.26 |
|
|
$ |
10.00 |
|
|
Income from Investment
Operations: |
|
|
|
|
|
|
|
|
|
|
|
|
|
|
|
|
|
|
|
|
|
|
|
|
|
Net Investment
Income** |
|
|
0.06 |
|
|
|
0.29 |
|
|
|
0.16 |
|
|
|
0.09 |
|
|
|
0.02 |
|
|
|
0.21 |
|
|
Net Realized and
Unrealized Gain (Loss) |
|
|
1.21 |
|
|
|
0.30 |
|
|
|
(1.43 |
) |
|
|
1.84 |
|
|
|
0.76 |
|
|
|
0.79 |
|
|
Total from Investment
Operations |
|
|
1.27 |
|
|
|
0.59 |
|
|
|
(1.27 |
) |
|
|
1.93 |
|
|
|
0.78 |
|
|
|
1.00 |
|
|
Dividends and
Distributions: |
|
|
|
|
|
|
|
|
|
|
|
|
|
|
|
|
|
|
|
|
|
|
|
|
|
Net Investment
Income |
|
|
– |
|
|
|
(0.16 |
) |
|
|
(0.07 |
) |
|
|
(0.47 |
) |
|
|
(0.32 |
) |
|
|
(0.74 |
) |
|
Capital Gains |
|
|
– |
|
|
|
– |
|
|
|
(0.01 |
) |
|
|
– |
|
|
|
– |
|
|
|
– |
|
|
Total Dividends
and Distributions |
|
|
– |
|
|
|
(0.16 |
) |
|
|
(0.08 |
) |
|
|
(0.47 |
) |
|
|
(0.32 |
) |
|
|
(0.74 |
) |
|
Net Asset Value,
End of Year/Period |
|
$ |
12.53 |
|
|
$ |
11.26 |
|
|
$ |
10.83 |
|
|
$ |
12.18 |
|
|
$ |
10.72 |
|
|
$ |
10.26 |
|
|
Total
Return‡ |
|
|
11.28 |
%† |
|
|
5.48 |
% |
|
|
(10.47 |
)% |
|
|
18.12 |
% |
|
|
8.07 |
% |
|
|
10.14 |
% |
|
Ratios
and Supplemental Data |
|
|
|
|
|
|
|
|
|
|
|
|
|
|
|
|
|
|
|
|
|
|
|
|
|
Net Assets, End
of Year/Period (Thousands) |
|
$ |
73,169 |
|
|
$ |
55,200 |
|
|
$ |
36,248 |
|
|
$ |
25,804 |
|
|
$ |
2,167 |
|
|
$ |
3,076 |
|
|
Ratio of Expenses
to Average Net Assets |
|
|
1.20 |
%†† |
|
|
1.20 |
% |
|
|
1.25 |
% |
|
|
0.97 |
% |
|
|
0.25 |
% |
|
|
0.25 |
% |
|
Ratio of Expenses
to Average Net Assets (Excluding Waivers) |
|
|
1.34 |
%†† |
|
|
1.40 |
% |
|
|
2.94 |
% |
|
|
7.95 |
% |
|
|
10.95 |
% |
|
|
8.71 |
% |
|
Ratio of Net Investment
Income to Average Net Assets |
|
|
0.93 |
%†† |
|
|
2.65 |
% |
|
|
1.42 |
% |
|
|
0.75 |
% |
|
|
0.22 |
% |
|
|
1.97 |
% |
|
Portfolio Turnover
Rate |
|
|
196 |
%† |
|
|
188 |
% |
|
|
996 |
% |
|
|
651 |
% |
|
|
– |
% |
|
|
– |
% |
|
** |
Per
share calculations were performed using average shares for the period. |
|
‡ |
Returns
shown do not reflect the deductions of taxes that a shareholder would pay on Fund distributions or the redemption of Fund Shares, assumes
reinvestments of dividends, and does not reflect the applicable sales charges, if applicable. |
|
† |
Total
Return and Portfolio Turnover Rate are for the period indicated and have not been annualized. |
|
†† |
Annualized. |
Amounts designated
as “—“ are 0.
The
accompanying notes are an integral part of the consolidated financial statements.
100
|
THE
ADVISORS’ INNER CIRCLE FUND III |
FS
INVESTMENTS
JUNE
30, 2024
(Unaudited) |
NOTES
TO CONSOLIDATED FINANCIAL STATEMENTS
1.
Organization:
The Advisors’
Inner Circle Fund III (the “Trust”) is organized as a Delaware statutory trust under a Declaration of Trust dated December
4, 2013. The Trust is registered under the Investment Company Act of 1940, as amended (the “1940 Act”), as an open-end management
investment company with 58 funds. The financial statements herein are those of the FS Multi-Strategy Alternatives Fund (“Multi-Strategy
Alternatives”), the FS Managed Futures Fund (“Managed Futures”) and the FS Chiron Real Development Fund (“Real
Development”) (each a “Fund” and collectively the “Funds”). Each Fund represents two classes of shares of
beneficial interest of the Trust in a separate portfolio of securities and other assets with their own investment objective and policies.
Multi-Strategy Alternatives seeks to provide shareholders with positive absolute returns over a complete market cycle. Managed Futures
seeks to provide positive absolute returns with low correlation to traditional investments. Real Development seeks to provide total returns
consisting of capital appreciation and income. Each Fund is classified as a non-diversified, open-end management investment company registered
under the 1940 Act. The financial statements of the remaining funds of the Trust are presented separately. The assets of each fund are
segregated, and a shareholder’s interest is limited to the fund in which shares are held. Multi-Strategy Alternatives commenced
investment operations on May 16, 2017. Managed Futures and Real Development commenced investment operations on December 31, 2018 and had
no activity other than investing their cash in a money market fund.
As of June 30,
2024, Multi-Strategy Alternatives had one wholly-owned subsidiary, FS Alternatives Fund (Cayman), Managed Futures had one wholly-owned
subsidiary, FS Managed Futures Fund (Cayman), and Real Development had one wholly-owned subsidiary FS Chiron Real Development Fund (Cayman)
(collectively, the “Subsidiaries”), through which each of the Funds may gain exposure to commodities. The audited consolidated
financial statements include both the Funds’ accounts and the accounts of the Subsidiaries. All intercompany balances have been
eliminated in consolidation.
2.
Significant Accounting Policies:
The accompanying
financial statements have been prepared in conformity with U.S. generally accepted accounting principles (“U.S. GAAP”) and
are presented in U.S. dollars which is the functional currency of the Funds. The Funds are investment companies and therefore applies
the accounting and reporting guidance issued by the U.S. Financial Accounting Standards Board (“FASB”) in Accounting Standards
Codification (“ASC”) Topic 946, Financial Services — Investment Companies. The following are significant accounting
policies which are consistently followed in the preparation of the financial statements.
Use
of Estimates —The preparation of financial statements requires management to make estimates and assumptions that affect the
fair value of assets and
101
|
THE
ADVISORS’ INNER CIRCLE FUND III |
FS
INVESTMENTS
JUNE
30, 2024
(Unaudited) |
liabilities
and disclosure of contingent assets and liabilities at the date of the financial statements and the reported amounts of revenues and expenses
during the reporting period. Actual results could differ from those estimates and such differences could be material.
Security
Valuation — Securities listed on a securities exchange, market or automated quotation system for which quotations are readily
available (except for securities traded on NASDAQ), including securities traded over the counter, are valued at the last quoted sale price
on an exchange or market (foreign or domestic) on which they are traded on valuation date (or at approximately 4:00 pm Eastern Standard
Time if a security’s primary exchange is normally open at that time), or, if there is no such reported sale on the valuation date,
at the most independent, third-party pricing agents. Such values generally reflect the last reported sales price if the security is actively
traded. The third-party pricing agents may also value debt securities at an evaluated bid price by employing methodologies that utilize
actual market transactions, broker-supplied valuations, or other methodologies designed to identify the market value for such securities.
Such methodologies generally consider such factors as security prices, yields, maturities, call features, ratings and developments relating
to specific securities in arriving at valuations. On the first day a new debt security purchase is recorded, if a price is not available
on the automated pricing feeds from our primary and secondary pricing vendors nor is it available from an independent broker, the security
may be valued at its purchase price. Each day thereafter, the debt security will be valued according to the Trust’s Fair Value Procedures
until an independent source can be secured. Debt obligations with remaining maturities of sixty days or less may be valued at their amortized
cost, which approximates market value provided that it is determined the amortized cost continues to approximate fair value. Should existing
credit, liquidity or interest rate conditions in the relevant markets and issuer specific circumstances suggest that amortized cost does
not approximate fair value, then the amortized cost method may not be used. The prices for foreign securities are reported in local currency
and converted to U.S. dollars using currency exchange rates.
Securities
for which market prices are not “readily available” are valued in accordance with fair value procedures (the "Fair Value Procedures")
established by the Adviser and approved by the Trust's Board of Trustees (the “Board”). Pursuant to Rule 2a-5 under the 1940
Act, the Board has designated the Adviser as the "valuation designee" to determine the fair value of securities and other instruments
for which no readily available market quotations are available. The Fair Value Procedures are implemented through a Fair Value Committee
(the “Committee”) of the Adviser.
Options for
which the primary market is a national securities exchange are valued at the last bid price on the exchange on which they are traded,
or, in the absence of any sale, at the closing bid price for long positions and at the
102
|
THE
ADVISORS’ INNER CIRCLE FUND III |
FS
INVESTMENTS
JUNE
30, 2024
(Unaudited) |
closing ask
price for written options. Options not traded on a national securities exchange are valued at the last quoted bid price.
Swaps are marked-to-market
daily based upon quotations from market makers and the resulting changes in market values, are recorded as an unrealized gain or loss
in the Consolidated Statements of Operations.
Futures contracts
that are traded on an exchange are valued at their last reported sales price as of the valuation date.
For securities
that principally trade on a foreign market or exchange, a significant gap in time can exist between the time of a particular security’s
last trade and the time at which the Funds calculate their net asset value. The closing prices of such securities may no longer reflect
their market value at the time the Funds calculate their net asset value if an event that could materially affect the value of those securities
(a “Significant Event”) has occurred between the time of the security’s last close and the time that the Fund calculates
net asset value. A Significant Event may relate to a single issuer or to an entire market sector. If FS Fund Advisor, LLC (the “Adviser”)
becomes aware of a Significant Event that has occurred with respect to a security or group of securities after the closing of the exchange
or market on which the security or securities principally trade, but before the time at which the Fund calculates its net asset value,
it may request that a Committee meeting be called.
If a local
market in which the Funds own securities is closed for one or more days, the Funds shall value all securities held in that corresponding
currency based on the fair value prices determined by the Committee.
In accordance
with the authoritative guidance on fair value measurements and disclosure under U.S. GAAP, the Funds disclose fair value of its investments
in a hierarchy that prioritizes the inputs to valuation techniques used to measure the fair value. The objective of a fair value measurement
is to determine the price that would be received to sell an asset or paid to transfer a liability in an orderly transaction between market
participants at the measurement date (an exit price). Accordingly, the fair value hierarchy gives the highest priority to quoted prices
(unadjusted) in active markets for identical assets or liabilities (Level 1) and the lowest priority to unobservable inputs (Level 3).
The three levels of the fair value hierarchy are described below:
| |
● |
Level 1 — Unadjusted quoted prices in active
markets for identical, unrestricted assets or liabilities that the Funds have the ability to access at the measurement date; |
| |
● |
Level 2 – Other significant observable inputs
(includes quoted prices for similar securities, interest rates, prepayment speeds, credit risk, referenced indices, quoted prices in inactive
markets, adjusted quoted prices in active |
103
|
THE
ADVISORS’ INNER CIRCLE FUND III |
FS
INVESTMENTS
JUNE
30, 2024
(Unaudited) |
| |
|
markets, adjusted quoted prices on foreign equity
securities that were adjusted in accordance with the Adviser’s pricing procedures, etc.); and |
| |
● |
Level 3 — Prices, inputs or exotic modeling
techniques which are both significant to the fair value measurement and unobservable (supported by little or no market activity).
|
Investments
are classified within the level of the lowest significant input considered in determining fair value. Investments classified within Level
3 whose fair value measurement considers several inputs may include Level 1 or Level 2 inputs as components of the overall fair value
measurement.
For the six
months ended June 30, 2024, there have been no significant changes to the Funds’ fair valuation methodology.
Federal
Income Taxes — It is each Fund’s intention to continue to qualify as a regulated investment
company for Federal income tax purposes by complying with the appropriate provisions of Subchapter M of the Internal Revenue Code of 1986,
as amended. Accordingly, no provisions for Federal income taxes have been made in the financial statements.
The Funds evaluate
tax positions taken or expected to be taken in the course of preparing the Funds’ tax returns to determine whether it is “more-likely-than-not”
(i.e., greater than 50-percent) that each tax position will be sustained upon examination by a taxing authority based on the technical
merits of the position. Tax positions deemed to meet the more-likely-than-not threshold are recorded as a tax benefit or expense in the
current period. The Funds did not record any tax provision in the current period. However, management’s conclusions regarding tax
positions taken may be subject to review and adjustment at a later date based on factors including, but not limited to, examination by
tax authorities (i.e., from commencement of operations, as applicable), on-going analysis of and changes to tax laws, regulations and
interpretations thereof.
As of and during
the six months ended June 30, 2024, the Funds did not have any unrecognized tax benefits or liabilities. The Funds recognize interest
and penalties, if any, related to unrecognized tax benefits as income tax expense in the Consolidated Statements of Operations. During
the six months ended June 30, 2024, the Funds did not incur any interest or penalties.
Withholding
taxes on foreign dividends have been provided for in accordance with the Funds’ understanding of the applicable country’s
tax rules and rates. The Funds or their agent files withholding tax reclaims in certain jurisdictions to recover certain amounts previously
withheld. The Funds may record a reclaim receivable based on collectability, which includes factors such as the jurisdiction’s applicable
laws, payment history and market convention. Professional fees paid to those that provide assistance in receiving the tax reclaims, which
generally are contingent upon successful receipt of reclaimed amounts, are recorded
104
|
THE
ADVISORS’ INNER CIRCLE FUND III |
FS
INVESTMENTS
JUNE
30, 2024
(Unaudited) |
in Professional
Fees on the Consolidated Statements of Operations once the amounts are due. The professional fees related to pursuing these tax reclaims
are not subject to the Adviser’s expense limitation agreement.
Security
Transactions and Investment Income — Security transactions are accounted for on trade date.
Costs used in determining realized gains and losses on the sale of investment securities are based on the specific identification method.
Dividend income is recorded on the ex-dividend date, interest income is recognized on the accrual basis from settlement date and includes
the amortization of premiums and the accretion of discount. Discounts and premiums on securities purchased are accreted and amortized
using the scientific interest method, which approximates the effective interest method. Certain dividends from foreign securities will
be recorded as soon as the Fund is informed of the dividend if such information is obtained subsequent to the ex-dividend date. Realized
gains (losses) on paydowns of mortgage-backed and asset-backed securities are recorded as an adjustment to interest income.
Foreign
Currency Translation — The books and records of the Funds are maintained in U.S. dollars.
Investment securities and other assets and liabilities denominated in a foreign currency are translated into U.S. dollars on the date
of valuation. The Funds do not isolate that portion of realized or unrealized gains and losses resulting from changes in the foreign exchange
rate from fluctuations arising from changes in the market prices of the securities. These gains and losses are included in net realized
and unrealized gains and losses on investments on the Consolidated Statements of Operations. Net realized and unrealized gains and losses
on foreign currency transactions represent net foreign exchange gains or losses from foreign currency exchange contracts, disposition
of foreign currencies, currency gains or losses realized between trade and settlement dates on securities transactions and the difference
between the amount of the investment income and foreign withholding taxes recorded on the Funds’ books and the U.S. dollar equivalent
of the amounts actually received or paid.
Forward
Foreign Currency Exchange Contracts — The Funds may enter into forward foreign currency exchange contracts to protect the value
of securities held and related receivables and payables against changes in future foreign exchange rates. A forward currency contract
is an agreement between two parties to buy and sell currency at a set price on a future date. The market value of the contract will fluctuate
with changes in currency exchange rates. The contract is marked-to-market daily using the current forward rate and the change in market
value is recorded by the Funds as unrealized gain or loss. The Funds recognize realized gains or losses when the contract is closed, equal
to the difference between the value of the contract at the time it was opened and the value at the time it was closed. Any realized or
unrealized appreciation (depreciation) during the period is presented on the Consolidated Statements of Operations. Risks may arise from
unanticipated movements in the value of a foreign currency relative to
105
|
THE
ADVISORS’ INNER CIRCLE FUND III |
FS
INVESTMENTS
JUNE
30, 2024
(Unaudited) |
the U.S. dollar.
Risks may also arise upon entering into these contracts from the potential inability of counterparties to meet the terms of their contracts
and are generally limited to the amount of unrealized gain on the contracts at the date of default. Refer to the Multi-Strategy Alternatives
Schedule of Investments for details regarding open forward foreign currency contracts as of June 30, 2024. There were no forward foreign
currency contracts held by Managed Futures and Real Development as of June 30, 2024.
Futures
Contracts — The Funds utilized futures contracts during the six months ended June 30, 2024. To the extent consistent with its
investment objective and strategies, the Funds may use futures contracts for tactical hedging purposes as well as to enhance the Funds’
returns. Initial margin deposits of cash or securities are made upon entering into futures contracts. Futures are collateralized by cash
deposits with Bank of America, Goldman Sachs and Deutsche Bank. Futures contracts are valued at the settlement price established each
day by the board of exchange on which they are traded. The futures contracts may be marked-to-market daily and the resulting changes in
value are accounted for as unrealized gains and losses. Variation margin payments are paid or received, depending upon whether unrealized
gains or losses are incurred. When the futures contract is closed, the Fund records a realized gain or loss equal to the difference between
the proceeds from (or cost of) the closing transaction and the amount invested in the futures contract.
Risks of entering
into futures contracts include the possibility that there will be an imperfect price correlation between the futures and the underlying
securities. Second, it is possible that a lack of liquidity for futures contracts could exist in the secondary market, resulting in an
inability to close a position prior to its maturity date. Third, the futures contract involves the risk that a Fund could lose more than
the original margin deposit required to initiate a futures transaction.
Finally, the
risk exists that losses could exceed amounts disclosed on the Consolidated Statements of Assets and Liabilities.
Swap
Contracts — The Funds are authorized to enter into swap contracts, including total return swaps, interest rate swaps, equity
swap contracts and credit default swaps. To the extent consistent with its investment objective and strategies, the Funds use swap contracts
for tactical hedging purposes as well as to enhance the Funds’ returns. Swaps are a two-party contract in which the seller (buyer)
will pay to the buyer (seller) the difference between the current value of a security and its value at the time the contract was entered.
In a typical
equity swap, one party agrees to pay another party the return on a stock, stock index or basket of stocks in return for a specified interest
rate. By entering into an equity index swap, for example, the index receiver can gain exposure to stocks making up the index of securities
without actually purchasing those stocks. Equity index swaps involve not only the risk associated with
106
|
THE
ADVISORS’ INNER CIRCLE FUND III |
FS
INVESTMENTS
JUNE
30, 2024
(Unaudited) |
investment
in the securities represented in the index, but also the risk that the performance of such securities, including dividends, will not exceed
the return on the interest rate that the Fund will be committed to pay.
Interest rate
swaps involve the exchange by a Fund with another party of their respective commitments to pay or receive interest (e.g., an exchange
of floating rate payments for fixed rate payments) with respect to a notional amount of principal to manage a Fund’s exposure to
interest rates. Payments received or made are recorded as realized gains or loss. As of June 30, 2024, Multi-Strategies Alternatives has
entered into interest rate swap contracts as shown on the Consolidated Schedules of Investments.
Total return
swaps are contracts in which one party agrees to make payments of the total return from a reference instrument—which may be a single
asset, a pool of assets or an index of assets—during a specified period, in return for payments equal to a fixed or floating rate
of interest or the total return from another underlying reference instrument. The total return includes appreciation or depreciation on
the underlying asset, plus any interest or dividend payments. Payments under the swap are based upon an agreed upon principal amount but,
since the principal amount is not exchanged, it represents neither an asset nor a liability to either counterparty, and is referred to
as notional. Total return swaps are marked-to-market daily using different sources, including quotations from counterparties, pricing
services, brokers or market makers. The unrealized appreciation or depreciation related to the change in the valuation of the notional
amount of the swap is combined with the amount due to the Fund at termination or settlement. The primary risks associated with total return
swaps are credit risks (if the counterparty fails to meet its obligations) and market risk (if there is no liquid market for the swap
or unfavorable changes occur to the underlying reference instrument).
Periodic payments
made or received are recorded as realized gains or losses. At year end, the Consolidated Statements of Assets and Liabilities reflect,
if any, unrealized appreciation or depreciation and accrued periodic payments for swap contracts the Fund may have open at year end. Entering
into swap contracts involve, to varying degrees, elements of credit, interest rate and market risk in excess of the amounts recognized
on the Consolidated Statements of Assets and Liabilities. Such risks involve the possibility that there will be no liquid market for these
contracts, that the counterparty to the contract may default on its obligation to perform and that there may be unfavorable changes in
market conditions or fluctuations in interest rates. Swap contracts outstanding at period end, if any, are listed on the Consolidated
Schedules of Investments. In connection with swap contracts, cash or securities may be segregated as collateral by the Funds’ custodian.
As of June 30, 2024, the Funds have entered into total return swap contracts as shown on the Consolidated Schedules of Investments.
107
|
THE
ADVISORS’ INNER CIRCLE FUND III |
FS
INVESTMENTS
JUNE
30, 2024
(Unaudited) |
There is the
risk that the counterparty refuses to continue to enter into swap agreements with the Funds in the future, or requires increased fees,
which could impair the Funds’ ability to achieve its investment objective. A counterparty may also increase its collateral requirements,
which may limit the Funds’ ability to use leverage and reduce investment returns. In addition, if the Funds cannot locate a counterparty
willing to enter into transactions with the Funds, it will not be able to implement its investment strategy.
Centrally cleared
swaps are valued at the settlement price established each day by the board of exchange on which they are traded. The daily settlement
prices for centrally cleared swaps are provided by an independent source. Net payments of interest are recorded as realized gains or losses.
Upfront premiums are recorded as realized gains or losses on the Consolidated Statements of Operations upon termination or maturity of
the swap. A liquidation payment received or made at the termination of the swap is recorded as realized gain or loss on the Consolidated
Statements of Operations. Net periodic payments received or paid by a Fund are included as part of realized gains or losses on the Consolidated
Statements of Operations. Daily changes in valuation of Centrally Cleared swaps are recorded as a receivable or payable for the change
in value as appropriate (“variation margin”) on the Consolidated Statements of Assets and Liabilities.
Options
Written/Purchased — The Funds may purchase and write put and call options on indices and enter into related closing transactions.
To the extent consistent with its investment objective and strategies, the Funds use options for tactical hedging purposes as well as
to enhance the Funds’ returns. Additionally, the Funds use options to create long or short equity exposure without investing directly
in equity securities. A put option on a security gives the purchaser of the option the right to sell, and the writer of the option the
obligation to buy, the underlying security at any time during the option period for American options and only at the expiration date for
European options. A call option on a security gives the purchaser of the option the right to buy, and the writer of the option the obligation
to sell, the underlying security at any time during the option period for American options and only at the expiration date for European
options. The premium paid to the writer is the consideration for undertaking the obligations under the option contract. The market value
of an option generally reflects the market price of an underlying security. Other principal factors affecting market value include supply
and demand, interest rates, the pricing volatility of the underlying security and the time remaining until the expiration date. Premiums
received or paid from writing or purchasing options which expire unexercised are treated by the Funds on the expiration date as realized
gains or losses. The difference between the premium and the amount paid or received on effecting a closing purchase or sale transaction,
including brokerage commissions, is also treated as a realized gain or loss. If an option is exercised, the premium paid
108
|
THE
ADVISORS’ INNER CIRCLE FUND III |
FS
INVESTMENTS
JUNE
30, 2024
(Unaudited) |
or received
is added to the cost of the purchase or proceeds from the sale in determining whether a Funds has realized a gain or a loss. Any realized
or unrealized gains (loss) during the period are presented on the Consolidated Statements of Operations. Risks associated with options
transactions include: (i) the success of a hedging strategy may depend on an ability to predict movements in the prices of individual
securities, fluctuations in markets and movements in interest rates; (ii) there may be an imperfect correlation between the movement in
prices of options and the securities underlying them; (iii) there may not be a liquid secondary market for options; and (iv) while a Fund
will receive a premium when it writes covered call options, it may not participate fully in a rise in the market value of the underlying
security.
The Multi-Strategy
Alternatives held written/purchased options contracts as of and during the six months ended June 30, 2024.
The Managed
Futures and Real Development did not hold any written/purchased options contracts as of and during the six months ended June 30, 2024.
Mortgage-Backed
To-Be-Announced Securities — The Fund may enter into mortgage-backed to-be-announced securities (“TBAs”). These
financial instruments are subject to varying degrees of market and credit risk. TBAs provide for the delayed delivery of the underlying
instrument. The contractual or notional amounts related to these financial instruments adjusted for unrealized market valuation gains
or losses are recorded on a trade date basis. The credit risk related to settlements is limited to the unrealized market valuation gains
or losses recorded in the Consolidated Statement of Operations. Market risk is substantially dependent upon the value of the underlying
financial instruments and is affected by market forces such as volatility and changes in interest rates.
Classes
— Class specific expenses, such as distribution fees, are borne by that class of shares. Income, realized and unrealized gains/losses
and non-class specific expenses are allocated to the respective class on the basis of relative net assets.
Cash
— Idle cash may be swept into various time deposit accounts and is classified as cash on the Consolidated Statements of Assets and
Liabilities. The Funds maintain cash in bank deposit accounts which, at times, may exceed United States federally insured limits. Amounts
invested are available on the same business day.
Expenses
— Most expenses of the Trust can be directly attributed to a particular fund. Expenses which cannot be directly attributed to a
particular fund are apportioned among the funds of the Trust based on the number of funds and/or relative net assets.
109
|
THE
ADVISORS’ INNER CIRCLE FUND III |
FS
INVESTMENTS
JUNE
30, 2024
(Unaudited) |
Dividends
and Distributions to Shareholders — Each Fund intends to distribute substantially all of its net investment income and net realized
capital gains, if any, annually. All distributions are recorded on ex-dividend date.
3.
Credit Derivatives:
The Funds may
use credit default swaps to reduce risk where the Funds have exposure to the issuer, or to take an active long or short position with
respect to the likelihood of an event of default. The reference obligation of the swap can be a single issuer, a “basket”
of issuers, or an index.
The buyer of
a credit default swap is generally obligated to pay the seller a periodic stream of payments over the term of the contract in return for
a contingent payment upon the occurrence of a credit event with respect to an underlying reference obligation. Generally, a credit event
for corporate or sovereign reference obligations means bankruptcy, failure to pay, obligation acceleration, repudiation/moratorium or
restructuring. For credit default swaps on asset-backed securities, a credit event may be triggered by events such as failure to pay principal,
maturity extension, rating downgrade or write-down.
If the Fund
is a seller of protection, and a credit event occurs, as defined under the terms of that particular swap agreement, the Fund will generally
either (i) pay to the buyer an amount equal to the notional amount of the swap and take delivery of the referenced obligation, other deliverable
obligations, or underlying securities comprising a referenced index or (ii) pay a net settlement amount in the form of cash or securities
equal to the notional amount of the swap less the recovery value of the referenced obligation or underlying securities comprising a referenced
index.
If the Fund
is a buyer of protection and a credit event occurs, as defined under the terms of that particular swap agreement, the Fund will either
(i) receive from the seller of protection an amount equal to the notional amount of the swap and deliver the referenced obligation, other
deliverable obligations or underlying securities comprising the referenced index or (ii) receive a net settlement amount in the form of
cash or securities equal to the notional amount of the swap less the recovery value of the referenced obligation or underlying securities
comprising the referenced index.
Recovery values
are assumed by market makers considering either industry standard recovery rates or entity specific factors and considerations until a
credit event occurs. If a credit event has occurred, the recovery value is determined by a facilitated auction whereby a minimum number
of allowable broker bids, together with a specified valuation method, are used to calculate the settlement value.
110
|
THE
ADVISORS’ INNER CIRCLE FUND III |
FS
INVESTMENTS
JUNE
30, 2024
(Unaudited) |
4.
Derivative Transactions:
The following
tables include the Funds’ exposure by type of risk on derivatives held throughout the period.
The fair value
of derivative instruments as of June 30, 2024, is as follows ($ Thousands):
| |
Asset Derivatives |
|
|
|
Liability Derivatives |
|
|
|
| |
Consolidated
Statements of Assets and Liabilities Location |
|
Fair Value |
|
Consolidated
Statements of Assets and Liabilities Location |
|
Fair Value |
|
|
Multi-Strategy
Alternatives |
|
|
|
|
|
|
|
|
|
|
Interest rate contracts |
Unrealized appreciation
on swap contracts |
|
$ |
709 |
† |
Unrealized depreciation
on swap contracts |
|
$ |
1,052 |
† |
|
Commodity Contracts |
Unrealized appreciation
on swap contracts |
|
|
788 |
† |
Unrealized depreciation
on swap contracts |
|
|
1,308 |
† |
|
Equity Contracts |
Unrealized appreciation
on futures contracts |
|
|
7,713 |
† |
Unrealized depreciation
on futures contracts |
|
|
5,990 |
† |
| |
Unrealized appreciation
on swap contracts |
|
|
3,634 |
† |
Unrealized depreciation
on swap contracts |
|
|
8,458 |
† |
| |
Options purchased,
at value |
|
|
1,787 |
|
Options written,
at value |
|
|
– |
|
|
Credit Contracts |
Unrealized appreciation
on swap contracts |
|
|
164 |
† |
Unrealized depreciation
on swap contracts |
|
|
– |
|
|
Foreign exchange
contracts |
Unrealized appreciation
on forward
foreign currency
contracts |
|
|
– |
|
Unrealized depreciation
on forward foreign currency contracts |
|
|
3 |
|
| |
Unrealized appreciation
on swap contracts |
|
|
2,887 |
† |
Unrealized depreciation
on swap contracts |
|
|
2,108 |
† |
|
Total derivatives
not accounted for as hedging instruments |
|
|
$ |
17,682 |
|
|
|
$ |
18,919 |
|
| |
|
|
|
|
|
|
|
|
|
|
|
Managed
Futures |
|
|
|
|
|
|
|
|
|
|
|
Interest rate
contracts |
Unrealized appreciation
on swap contracts |
|
$ |
– |
|
Unrealized depreciation
on swap contracts |
|
$ |
1 |
† |
|
Equity Contracts |
Unrealized appreciation
on swap contracts |
|
|
3 |
† |
Unrealized depreciation
on swap contracts |
|
|
22 |
† |
|
Credit Contracts |
Unrealized appreciation
on swap contracts |
|
|
9 |
† |
Unrealized depreciation
on swap contracts |
|
|
– |
|
|
Foreign exchange
contracts |
Unrealized appreciation
on swap contracts |
|
|
– |
|
Unrealized depreciation
on swap contracts |
|
|
1 |
† |
|
Total derivatives
not accounted for as hedging instruments |
|
|
$ |
12 |
|
|
|
$ |
24 |
|
| |
|
|
|
|
|
|
|
|
|
|
|
Real
Development |
|
|
|
|
|
|
|
|
|
|
|
Commodity Contracts |
Unrealized appreciation
on futures contracts |
|
$ |
37 |
† |
Unrealized depreciation
on futures contracts |
|
$ |
336 |
† |
|
Total derivatives
not accounted for as hedging instruments |
|
|
$ |
37 |
|
|
|
$ |
336 |
|
†
Includes cumulative appreciation (depreciation) of futures contracts and swap contracts as reported in the Consolidated Schedules of Investments.
Market Value is reported within the Consolidated Statements of Assets and Liabilities for swap contracts that have paid premiums. Current
day’s variation margin, if any, is reported within the Consolidated Statements of Assets and Liabilities.
111
|
THE
ADVISORS’ INNER CIRCLE FUND III |
FS
INVESTMENTS
JUNE
30, 2024
(Unaudited) |
The effect of
derivative instruments on the Consolidated Statements of Operations for the six months ended June 30, 2024, was as follows:
The amount of
realized gain (loss) on derivatives recognized in income ($ Thousands):
|
Multi-Strategy
Alternatives |
|
Futures
Contracts |
|
|
Forward
Foreign
Currency
Contracts |
|
|
Swap
Contracts |
|
|
Purchased
Options |
|
|
Written
Options |
|
|
Total |
|
|
Interest Rates |
|
$ |
6,166 |
|
|
$ |
— |
|
|
$ |
(2,143 |
) |
|
$ |
— |
|
|
$ |
— |
|
|
$ |
4,023 |
|
|
Foreign exchange
contracts |
|
|
— |
|
|
|
— |
|
|
|
1,841 |
|
|
|
— |
|
|
|
— |
|
|
|
1,841 |
|
|
Credit contracts |
|
|
— |
|
|
|
— |
|
|
|
193 |
|
|
|
— |
|
|
|
— |
|
|
|
193 |
|
|
Equity contracts |
|
|
3,843 |
|
|
|
— |
|
|
|
1,361 |
|
|
|
(4,256 |
) |
|
|
(3,373 |
) |
|
|
(2,425 |
) |
|
Commodity contracts |
|
|
1 |
|
|
|
— |
|
|
|
920 |
|
|
|
— |
|
|
|
— |
|
|
|
921 |
|
|
Total |
|
$ |
10,010 |
|
|
$ |
— |
|
|
$ |
2,172 |
|
|
$ |
(4,256 |
) |
|
$ |
(3,373 |
) |
|
$ |
4,553 |
|
|
|
|
Managed
Futures |
|
Futures
Contracts |
|
|
Forward
Foreign
Currency
Contracts |
|
|
Swap
Contracts |
|
|
Purchased
Options |
|
|
Written
Options |
|
|
Total |
|
|
Interest Rates |
|
$ |
— |
|
|
$ |
— |
|
|
$ |
3 |
|
|
$ |
— |
|
|
$ |
— |
|
|
$ |
3 |
|
|
Foreign exchange
contracts |
|
|
— |
|
|
|
— |
|
|
|
(1 |
) |
|
|
— |
|
|
|
— |
|
|
|
(1 |
) |
|
Equity contracts |
|
|
— |
|
|
|
— |
|
|
|
72 |
|
|
|
— |
|
|
|
— |
|
|
|
72 |
|
|
Total |
|
$ |
— |
|
|
$ |
— |
|
|
$ |
74 |
|
|
$ |
— |
|
|
$ |
— |
|
|
$ |
74 |
|
|
|
|
Real
Development |
|
Futures
Contracts |
|
|
Forward
Foreign
Currency
Contracts |
|
|
Swap
Contracts |
|
|
Purchased
Options |
|
|
Written
Options |
|
|
Total |
|
|
Interest Rates |
|
$ |
(12 |
) |
|
$ |
— |
|
|
$ |
— |
|
|
$ |
— |
|
|
$ |
— |
|
|
$ |
(12 |
) |
|
Foreign exchange
contracts |
|
|
(26 |
) |
|
|
1 |
|
|
|
— |
|
|
|
— |
|
|
|
— |
|
|
|
(25 |
) |
|
Equity contracts |
|
|
(51 |
) |
|
|
— |
|
|
|
(43 |
) |
|
|
— |
|
|
|
— |
|
|
|
(94 |
) |
|
Commodity contracts |
|
|
576 |
|
|
|
— |
|
|
|
(2 |
) |
|
|
— |
|
|
|
— |
|
|
|
574 |
|
|
Total |
|
$ |
487 |
|
|
$ |
1 |
|
|
$ |
(45 |
) |
|
$ |
— |
|
|
$ |
— |
|
|
$ |
443 |
|
|
|
112
|
THE
ADVISORS’ INNER CIRCLE FUND III |
FS
INVESTMENTS
JUNE
30, 2024
(Unaudited) |
Change in unrealized
appreciation (depreciation) on derivatives recognized in income ($ Thousands):
|
Multi-Strategy
Alternatives |
|
Futures
Contracts |
|
|
Forward
Foreign
Currency
Contracts |
|
|
Swap
Contracts |
|
|
Purchased
Options |
|
|
Written
Options |
|
|
Total |
|
|
Interest Rates |
|
$ |
8,314 |
|
|
$ |
— |
|
|
$ |
2,394 |
|
|
$ |
— |
|
|
$ |
— |
|
|
$ |
10,708 |
|
|
Foreign exchange
contracts |
|
|
— |
|
|
|
(3 |
) |
|
|
1,052 |
|
|
|
— |
|
|
|
— |
|
|
|
1,049 |
|
|
Credit contracts |
|
|
— |
|
|
|
— |
|
|
|
(1 |
) |
|
|
— |
|
|
|
— |
|
|
|
(1 |
) |
|
Equity contracts |
|
|
2,634 |
|
|
|
— |
|
|
|
(902 |
) |
|
|
806 |
|
|
|
(319 |
) |
|
|
2,219 |
|
|
Commodity contracts |
|
|
— |
|
|
|
— |
|
|
|
(937 |
) |
|
|
— |
|
|
|
— |
|
|
|
(937 |
) |
|
Total |
|
$ |
10,948 |
|
|
$ |
(3 |
) |
|
$ |
1,606 |
|
|
$ |
806 |
|
|
$ |
(319 |
) |
|
$ |
13,038 |
|
|
|
|
Managed
Futures |
|
Futures
Contracts |
|
|
Forward
Foreign
Currency
Contracts |
|
|
Swap
Contracts |
|
|
Purchased
Options |
|
|
Written
Options |
|
|
Total |
|
|
Interest Rates |
|
$ |
— |
|
|
$ |
— |
|
|
$ |
(14 |
) |
|
$ |
— |
|
|
$ |
— |
|
|
$ |
(14 |
) |
|
Foreign exchange
contracts |
|
|
— |
|
|
|
— |
|
|
|
(1 |
) |
|
|
— |
|
|
|
— |
|
|
|
(1 |
) |
|
Credit contracts |
|
|
— |
|
|
|
— |
|
|
|
9 |
|
|
|
— |
|
|
|
— |
|
|
|
9 |
|
|
Equity contracts |
|
|
— |
|
|
|
— |
|
|
|
25 |
|
|
|
— |
|
|
|
— |
|
|
|
25 |
|
|
Total |
|
$ |
— |
|
|
$ |
— |
|
|
$ |
19 |
|
|
$ |
— |
|
|
$ |
— |
|
|
$ |
19 |
|
|
|
|
Real
Development |
|
Futures
Contracts |
|
|
Forward
Foreign
Currency
Contracts |
|
|
Swap
Contracts |
|
|
Purchased
Options |
|
|
Written
Options |
|
|
Total |
|
|
Equity contracts |
|
$ |
(5 |
) |
|
$ |
— |
|
|
$ |
(49 |
) |
|
$ |
— |
|
|
$ |
— |
|
|
$ |
(54 |
) |
|
Commodity contracts |
|
|
(296 |
) |
|
|
— |
|
|
|
24 |
|
|
|
— |
|
|
|
— |
|
|
|
(272 |
) |
|
Total |
|
$ |
(301 |
) |
|
$ |
— |
|
|
$ |
(25 |
) |
|
$ |
— |
|
|
$ |
— |
|
|
$ |
(326 |
) |
|
|
The following
discloses the volume of the Fund’s forward foreign currency contracts, futures contracts, swap contracts and options contracts activity
during the six months ended June 30, 2024.
113
|
THE
ADVISORS’ INNER CIRCLE FUND III |
FS
INVESTMENTS
JUNE
30, 2024
(Unaudited) |
For the six
months ended June 30, 2024, the average market value amount of forward foreign currency contracts was as follows ($ Thousands):
|
Multi-Strategy
Alternatives |
|
|
|
|
Average Quarterly
Market Value Balance Long |
|
$ |
— |
|
|
Average Quarterly
Market Value Balance Short |
|
|
252 |
|
|
Real
Development |
|
|
|
|
Average Quarterly
Market Value Balance Long |
|
$ |
195 |
|
|
Average Quarterly
Market Value Balance Short |
|
|
344 |
|
For the six
months ended June 30, 2024, the average market value amount of futures contracts was as follows ($ Thousands):
|
Multi-Strategy
Alternatives |
|
|
|
|
Average Quarterly
Market Value Balance Long |
|
$ |
91,534 |
|
|
Average Quarterly
Market Value Balance Short |
|
|
1,131,273 |
|
|
Real
Development |
|
|
|
|
Average Quarterly
Market Value Balance Long |
|
$ |
9,568 |
|
|
Average Quarterly
Market Value Balance Short |
|
|
— |
|
For the six
months ended June 30, 2024, the average market value amount of interest rate swap contracts was as follows ($ Thousands):
|
Multi-Strategy
Alternatives |
|
|
|
|
Average Quarterly
Market Value Balance Long |
|
$ |
635 |
|
|
Average Quarterly
Market Value Balance Short |
|
|
— |
|
For the six
months ended June 30, 2024, the average market value amount of credit default swap contracts was as follows ($ Thousands):
|
Multi-Strategy
Alternatives |
|
|
|
|
Average Quarterly
Market Value Balance Long |
|
$ |
— |
|
|
Average Quarterly
Market Value Balance Short |
|
|
25 |
|
114
|
THE
ADVISORS’ INNER CIRCLE FUND III |
FS
INVESTMENTS
JUNE
30, 2024
(Unaudited) |
For the six
months ended June 30, 2024, the average market value amount of total return swap contracts held by the Funds were as follows ($ Thousands):
|
Multi-Strategy
Alternatives |
|
|
|
|
Average Quarterly
Market Value Balance Long |
|
$ |
1,743,352 |
|
|
Average Quarterly
Market Value Balance Short |
|
|
286 |
|
|
Managed
Futures |
|
|
|
|
Average Quarterly
Market Value Balance Long |
|
$ |
4,231 |
|
|
Average Quarterly
Market Value Balance Short |
|
|
— |
|
|
Real
Development |
|
|
|
|
Average Quarterly
Market Value Balance Long |
|
$ |
1,486 |
|
|
Average Quarterly
Market Value Balance Short |
|
|
— |
|
For the six
months ended June 30, 2024, the average market value amount of options contracts was as follows ($ Thousands):
|
Multi-Strategy
Alternatives |
|
|
|
|
Average Quarterly
Market Value Balance Long |
|
$ |
2,663 |
|
|
Average Quarterly
Market Value Balance Short |
|
|
865 |
|
5.
Offsetting Assets and Liabilities:
Each Fund is
subject to various netting arrangements with select counterparties (“Master Agreements”). Master Agreements govern the terms
of certain transactions, and reduce the counterparty risk associated with relevant transactions by specifying credit protection mechanisms
and providing standardization that improves legal certainty.
Since different
types of transactions have different mechanics and are sometimes traded out of different legal entities of a particular counterparty organization,
each type of transaction may be covered by a different Master Agreement, resulting in the need for multiple agreements with a single counterparty.
As the Master Agreements are specific to unique operations of different asset types, they allow a Fund to close out and net its total
exposure to a specific counterparty entity in the event of a default with respect to all the transactions governed under a single agreement
with a specific counterparty entity.
Master Agreements
can also help limit counterparty risk by specifying collateral posting arrangements at pre-arranged exposure levels. Under the Master
Agreements, collateral is routinely transferred if the total net exposure to certain transactions (net of existing collateral already
in place) governed under the relevant Master Agreement with a counterparty in a given account exceeds a specified threshold, which typically
ranges from zero to $250,000 depending on the counterparty and the type of Master Agreement. United States Treasury Securities and U.S.
dollar cash are generally the
115
|
THE
ADVISORS’ INNER CIRCLE FUND III |
FS
INVESTMENTS
JUNE
30, 2024
(Unaudited) |
preferred forms
of collateral. Securities and cash pledged as collateral are reflected as assets on the Consolidated Statements of Assets and Liabilities
as either a component of investments at value (securities) or cash pledged as collateral for futures contracts and swap contracts (cash).
The market value of any securities received as collateral is not reflected as a component of net asset value. A Fund’s overall exposure
to counterparty risk can change substantially within a short period, as it is affected by each transaction subject to the relevant Master
Agreement.
International
Swaps and Derivatives Association, Inc. Master Agreements and Credit Support Annexes (“ISDA Master Agreements”) govern OTC
financial derivative transactions entered into by a Fund and select counterparties. ISDA Master Agreements maintain provisions for general
obligations, representations, agreements, collateral and events of default or termination. Events of termination include conditions that
may entitle counterparties to elect to terminate early and cause settlement of all outstanding transactions under the applicable ISDA
Master Agreement. Any election to terminate early could be material to the financial statements. In limited circumstances, the ISDA Master
Agreement may contain additional provisions that add additional counterparty protection beyond coverage of existing daily exposure if
the counterparty has a decline in credit quality below a predefined level. These amounts, if any, may be segregated with a third party
custodian.
The following
is a summary by counterparty of the value of over the counter (“OTC”) financial derivative instruments and collateral (received)/pledged
by counterparty of the Funds as of June 30, 2024 ($ Thousands):
|
Multi-Strategy
Alternatives |
|
Gross Assets-
Recognized in the Consolidated Statements of Assets and Liabilities |
|
|
Gross Liabilities-
Recognized in the Consolidated Statements of Assets and Liabilities |
|
|
Net Amount Available
to be
Offset |
|
|
Cash
Collateral
Pledged or Received
† |
|
|
Net
Amount ‡ |
|
|
Counterparty |
|
|
|
|
|
|
|
|
|
|
|
|
|
|
|
|
|
|
|
|
|
Bank of America |
|
$ |
487 |
|
|
$ |
(2,915 |
) |
|
$ |
(2,428 |
) |
|
$ |
2,428 |
|
|
$ |
– |
|
|
Barclays |
|
|
65 |
|
|
|
– |
|
|
|
65 |
|
|
|
– |
|
|
|
65 |
|
|
BNP Paribas |
|
|
2,894 |
|
|
|
(3,455 |
) |
|
|
(561 |
) |
|
|
561 |
|
|
|
– |
|
|
Deutsche Bank |
|
|
1,325 |
|
|
|
(148 |
) |
|
|
1,177 |
|
|
|
– |
|
|
|
1,177 |
|
|
Goldman Sachs |
|
|
341 |
|
|
|
(2,793 |
) |
|
|
(2,452 |
) |
|
|
2,452 |
|
|
|
– |
|
|
JPMorgan Chase |
|
|
496 |
|
|
|
(1,803 |
) |
|
|
(1,307 |
) |
|
|
1,307 |
|
|
|
– |
|
|
Macquarie Bank
Limited |
|
|
470 |
|
|
|
(499 |
) |
|
|
(29 |
) |
|
|
29 |
|
|
|
– |
|
|
Nomura |
|
|
– |
|
|
|
(2 |
) |
|
|
(2 |
) |
|
|
2 |
|
|
|
– |
|
|
Societe Generale |
|
|
1,632 |
|
|
|
(950 |
) |
|
|
682 |
|
|
|
– |
|
|
|
682 |
|
|
UBS |
|
|
2,090 |
|
|
|
– |
|
|
|
2,090 |
|
|
|
– |
|
|
|
2,090 |
|
|
Total |
|
$ |
9,800 |
|
|
$ |
(12,565 |
) |
|
$ |
(2,765 |
) |
|
$ |
6,779 |
|
|
$ |
4,014 |
|
116
|
THE
ADVISORS’ INNER CIRCLE FUND III |
FS
INVESTMENTS
JUNE
30, 2024
(Unaudited) |
|
Managed
Futures |
|
Gross Assets-
Recognized in the Consolidated Statements of Assets and Liabilities |
|
|
Gross Liabilities-
Recognized in the Consolidated Statements of Assets and Liabilities |
|
|
Net Amount Available
to be
Offset |
|
|
Cash
Collateral
Pledged or Received
† |
|
|
Net
Amount ‡ |
|
|
Counterparty |
|
|
|
|
|
|
|
|
|
|
|
|
|
|
|
|
|
|
|
|
|
Bank of America |
|
$ |
– |
|
|
$ |
(6 |
) |
|
$ |
(6 |
) |
|
$ |
6 |
|
|
$ |
– |
|
|
BNP Paribas |
|
|
1 |
|
|
|
– |
|
|
|
1 |
|
|
|
– |
|
|
|
1 |
|
|
Deutsche Bank |
|
|
– |
|
|
|
(1 |
) |
|
|
(1 |
) |
|
|
– |
|
|
|
(1 |
) |
|
Goldman Sachs |
|
|
9 |
|
|
|
– |
|
|
|
9 |
|
|
|
– |
|
|
|
9 |
|
|
JPMorgan Chase |
|
|
2 |
|
|
|
(16 |
) |
|
|
(14 |
) |
|
|
– |
|
|
|
(14 |
) |
|
Macquarie Bank
Limited |
|
|
– |
|
|
|
– |
|
|
|
– |
|
|
|
– |
|
|
|
– |
|
|
Nomura |
|
|
– |
|
|
|
(1 |
) |
|
|
(1 |
) |
|
|
– |
|
|
|
(1 |
) |
|
Total |
|
$ |
12 |
|
|
$ |
(24 |
) |
|
$ |
(12 |
) |
|
$ |
6 |
|
|
$ |
(6 |
) |
†
Collateral pledged is limited to the net outstanding amount due to/from the counterparty. The actual collateral amounts pledged may exceed
these amounts and may fluctuate in value.
‡
Represents receivable from/payable to counterparty in the event of default.
6.
Transactions with Affiliates:
Certain officers
of the Trust are also employees of SEI Investments Global Funds Services (the “Administrator”), a wholly owned subsidiary
of SEI Investments Company, and/or SEI Investments Distribution Co. (the “Distributor”). Such officers are paid no fees by
the Trust, other than the Chief Compliance Officer (“CCO”) as described below, for serving as officers of the Trust.
The services
provided by the CCO and his staff are paid for by the Trust as incurred. The services include regulatory oversight of the Trust’s
Advisors and service providers as required by SEC regulations. The CCO’s services and fees have been approved by and are reviewed
by the Board.
7.
Administration, Distribution, Custodian and Transfer Agent Agreements:
The Funds and
the Administrator are parties to an Administration Agreement, under which the Administrator provides management and administrative services
to the Funds. For these services, the Administrator is paid an asset-based fee, subject to certain minimums, which will vary depending
on the number of share classes and the average daily net assets of the Funds. For the six months ended June 30, 2024, Multi-Strategy Alternatives,
Managed Futures and Real Development paid the Administrator ($ Thousands) $578, $1 and $26, respectively, for these services.
The Trust and
the Distributor are parties to a Distribution Agreement. The Distributor receives no fees under the Agreement.
Brown Brothers
Harriman & Co. acts as custodian (the “Custodian”) for the Funds. The Custodian plays no role in determining the investment
policies of the Funds or which securities are to be purchased or sold by the Funds.
117
|
THE
ADVISORS’ INNER CIRCLE FUND III |
FS
INVESTMENTS
JUNE
30, 2024
(Unaudited) |
SS&C Global
Investor & Distribution Solutions, Inc. serves as the transfer agent and dividend disbursing agent for the Funds under a transfer
agency agreement with the Trust.
Pursuant to
the Amended and Restated Distribution and Service Plan, each Fund’s Class A Shares bear 12b-1 fees at an annual rate of 0.25% of
the average daily net assets of such Fund attributable to Class A Shares. Payments of the 12b-1 fee may be made without regard to expenses
actually incurred. The Funds Class I shares are not subject to 12b-1 fees.
8.
Investment Advisory Agreement, Co-Investment Management Agreement, and Investment Sub-Advisory Agreements:
Under the terms
of an investment advisory agreement, the Adviser provides investment advisory services to the Funds. The Adviser is entitled to a fee,
which is calculated daily and paid monthly, at the following annual rates based on average daily net assets of each Fund:
| |
|
Advisory Fee
Rate |
|
| |
|
|
|
|
|
Multi-Strategy
Alternatives |
|
|
1.25 |
% |
|
Managed Futures |
|
|
1.15 |
% |
|
Real Development |
|
|
0.95 |
% |
|
|
|
|
|
|
|
|
|
|
The Adviser
has contractually agreed to reduce fees and/or reimburse expenses to the extent necessary to keep total annual Fund operating expenses
(excluding interest, taxes, brokerage commissions, acquired fund fees and expenses, and extraordinary expenses (collectively, “excluded
expenses”)) from exceeding 0.25% of each Fund’s average daily net assets until April 30, 2025. Refer to waiver of investment
advisory fees and reimbursement from Adviser on the Consolidated Statement of Operations for fees waived for the six months ended June
30, 2024. The Adviser may recover all or a portion of its fee reductions or expense limitations within a three-year period from the year
in which it reduced its fee or reimbursed expenses if each Fund’s total annual Fund operating expenses are below the expense limitation.
This agreement may be terminated: (i) by the Board for any reason at any time, or (ii) by the Adviser, upon ninety (90) days prior written
notice to the Trust, effective as of the close of business on April 30, 2025.
If at any point
total annual Fund operating expenses (not including excluded expenses) are below the levels as set forth above, the Adviser may receive
from the Fund the difference between the total annual Fund operating expenses (not including excluded expenses) and the levels set forth
above to recover all or a portion of its prior fee reductions or expense reimbursements made during the preceding three-year period up
to the expense cap in place at the time the expenses were waived, during which this agreement was in place.
For the six
months ended June 30, 2024, the Adviser recaptured previously waived fees of ($ Thousands) $537 for the Multi-Strategy Alternatives
Fund.
118
|
THE
ADVISORS’ INNER CIRCLE FUND III |
FS
INVESTMENTS
JUNE
30, 2024
(Unaudited) |
The following
table describes the amounts accrued pursuant to the Expense Limitation Agreement that FS Investments has agreed to pay for the six months
ended June 30, 2024. These amounts may be subject to conditional repayment by the Fund as described below ($ Thousands):
| |
|
Expiring
Years Ended December 31 |
|
| |
|
|
2024 |
|
|
|
2025 |
|
|
|
2026 |
|
|
|
2027 |
|
|
Multi-Strategy
Alternatives |
|
$ |
752 |
|
|
$ |
872 |
|
|
$ |
354 |
|
|
$ |
– |
|
|
Managed Futures |
|
|
92 |
|
|
|
210 |
|
|
|
89 |
|
|
|
65 |
|
|
Real Development |
|
|
460 |
|
|
|
489 |
|
|
|
91 |
|
|
|
44 |
|
Chiron Investment
Management, LLC (“Chiron”) serves as investment co-adviser to Real Development. As compensation for its co-advisory services
to the Fund, FS Fund Advisor, LLC pays Chiron a co-advisory fee that is accrued daily and payable quarterly. The co-advisory fee is calculated
at an annual rate of 0.475% of the average daily net assets of the portion of the Fund allocated to Chiron.
Multi-Strategy
Alternative seeks to achieve its investment objective through a multi-manager approach by which the Adviser allocates the assets of such
Fund among a number of Underlying Managers and Alternative Beta Providers that employ a variety of alternative investment strategies.
The Underlying Managers each serve as sub-advisers to Multi-Strategy Alternative. The Alternative Beta Providers provide Multi-Strategy
Alternative with exposure to Alternative Investment Strategies but are not sub-advisers to Multi-Strategy Alternative.
The Adviser
engages the following entities as Underlying Managers to provide investment management services to Multi-Strategy Alternatives: MidOcean
Credit Fund Management, L.P., Mariner Investment Group LLC, Electron Capital Partners, LLC and Waterfall Asset Management, LLC.
9.
Investment Transactions:
The cost of
security purchases and the proceeds from security sales, other than short-term investments, for the six months ended June 30, 2024, were
as follows ($ Thousands):
| |
|
|
Multi-Strategy
Alternatives |
|
|
Managed
Futures |
|
|
|
Real Development |
|
|
Purchases |
|
|
|
|
|
|
|
|
|
|
|
|
|
U.S. Government |
|
$ |
6,386,026 |
|
|
$ |
– |
|
|
$ |
– |
|
|
Other |
|
|
183,283 |
|
|
|
– |
|
|
|
108,520 |
|
|
Sales |
|
|
|
|
|
|
|
|
|
|
|
|
|
U.S. Government |
|
$ |
5,728,323 |
|
|
$ |
– |
|
|
$ |
– |
|
|
Other |
|
|
93,112 |
|
|
|
– |
|
|
|
96,171 |
|
119
|
THE
ADVISORS’ INNER CIRCLE FUND III |
FS
INVESTMENTS
JUNE
30, 2024
(Unaudited) |
10.
Federal Tax Information:
The amount and
character of income and capital gain distributions to be paid, if any, are determined in accordance with Federal income tax regulations,
which may differ from U.S. GAAP. As a result, net investment income (loss) and net realized gain (loss) on investment transactions for
a reporting period may differ significantly from distributions during such period. These book/tax differences may be temporary or permanent.
To the extent these differences are permanent in nature, they are charged or credited to Distributable Earnings/(Loss) and Paid-in Capital,
as appropriate, in the period that the differences arise.
The tax character
of distributions declared during the years ended December 31, 2023 and 2022, were as follows ($ Thousands):
| |
|
Ordinary Income |
|
|
Long-Term Capital
Gain |
|
|
Total |
|
|
Multi-Strategy
Alternatives |
|
|
|
|
|
2023 |
|
$ |
48,343 |
|
|
$ |
— |
|
|
$ |
48,343 |
|
|
2022 |
|
|
26,234 |
|
|
|
368 |
|
|
|
26,602 |
|
|
Managed
Futures |
|
2023 |
|
|
— |
|
|
|
— |
|
|
|
— |
|
|
2022 |
|
|
275 |
|
|
|
183 |
|
|
|
458 |
|
|
Real
Development |
|
|
|
|
|
2023 |
|
|
802 |
|
|
|
— |
|
|
|
802 |
|
|
2022 |
|
|
247 |
|
|
|
2 |
|
|
|
249 |
|
As of December
31, 2023, the components of distributable earnings on a tax basis were as follows ($ Thousands):
| |
|
|
Multi-Strategy
Alternatives |
|
|
Managed
Futures
|
|
|
|
Real Development |
|
|
Undistributed
Ordinary Income |
|
$ |
— |
|
|
$ |
— |
|
|
$ |
226 |
|
|
Capital Loss Carryforwards
|
|
|
(17,486 |
) |
|
|
(32 |
) |
|
|
(2,877 |
) |
|
Post October Capital
and Specified Losses |
|
|
(7,681 |
) |
|
|
— |
|
|
|
— |
|
|
Other Temporary
Differences |
|
|
(6,382 |
) |
|
|
2 |
|
|
|
(131 |
) |
|
Unrealized Appreciation
(Depreciation) |
|
|
26,151 |
|
|
|
(29 |
) |
|
|
2,978 |
|
|
Total Distributable
Earnings (Accumulated Losses) |
|
$ |
(5,398 |
) |
|
$ |
(59 |
) |
|
$ |
196 |
|
Post-October
capital and specified losses are losses realized on investment transactions from November 1, 2023 through December 31, 2023, that in accordance
with Federal income tax regulations, the fund defers and treats as having arisen in the following fiscal year.
120
|
THE
ADVISORS’ INNER CIRCLE FUND III |
FS
INVESTMENTS
JUNE
30, 2024
(Unaudited) |
As of December
31, 2023, the following Funds have capital losses carried forward as follows ($ Thousands):
| |
|
Short-Term
Loss |
|
|
Long-Term
Loss |
|
|
Total |
|
|
Multi-Strategy
Alternatives |
|
$ |
17,486 |
|
|
$ |
– |
|
|
$ |
17,486 |
|
|
Managed Futures |
|
|
8 |
|
|
|
24 |
|
|
|
32 |
|
|
Real Development |
|
|
2,877 |
|
|
|
– |
|
|
|
2,877 |
|
For Federal
income tax purposes the difference between Federal tax cost and book cost primarily relates to losses from wash sales, premium amortization
on callable bonds, constructive sales gain adjustments, investments in passive foreign investment companies and investments in partnerships
which cannot be used for Federal income tax purposes in the current year and have been deferred for use in future years. The Federal tax
cost and aggregate gross unrealized appreciation and depreciation for the investments held by the Funds at June 30, 2024, were as follows
($ Thousands):
| |
|
Federal
Tax Cost |
|
|
Aggregate
Gross Unrealized Appreciation |
|
|
Aggregate
Gross Unrealized Depreciation |
|
|
Net
Unrealized Appreciation (Depreciation) |
|
|
Multi-Strategy
Alternatives |
|
$ |
3,088,551 |
|
|
$ |
37,217 |
|
|
$ |
(15,176 |
) |
|
$ |
22,041 |
|
|
Managed Futures |
|
|
1,522 |
|
|
|
— |
|
|
|
(4 |
) |
|
|
(4 |
) |
|
Real Development |
|
|
58,947 |
|
|
|
4,976 |
|
|
|
(943 |
) |
|
|
4,033 |
|
11.
Concentration of Risks:
Unless otherwise
specified, references below to investments by a Fund refer to direct investments made or held by a Fund and/or indirect investments to
which a Fund may have exposure through an Alternative Beta Strategy (i.e., a strategy that offers a Fund exposure to the “beta”
portion -- or market-related portion -- of the returns of particular investment strategies).
Derivatives
Risk (All Funds) — The Fund may invest in Financial Instruments,
including swap agreements, futures contracts, forwards and other derivative instruments, that may involve risks different from, or greater
than, those associated with more traditional investments. Due to leverage, small changes in the value of the Financial Instruments’
reference assets, rates, or indexes may produce disproportionate losses to the Fund. The value of Financial Instruments may not move as
expected relative to the value of the reference assets, rates or indexes. Financial Instruments used for hedging purposes may not hedge
risks as expected, and Financial Instruments used for non-hedging purposes may not provide the anticipated investment exposure. Financial
Instruments may be highly illiquid, and the Fund may not be able to close out or sell a Financial Instrument position at a particular
time or at an anticipated price. Various legislative and regulatory initiatives may impact the availability, liquidity and cost of derivatives.
Financial Instruments also may be subject to interest rate risk, currency risk and counterparty risk.
121
|
THE
ADVISORS’ INNER CIRCLE FUND III |
FS
INVESTMENTS
JUNE
30, 2024
(Unaudited) |
Equity
Risk (Real Development Fund) — The prices of equity securities in which the Fund holds long
and short positions may rise and fall daily. A variety of factors can negatively impact the value of equity securities, including factors
affecting individual companies, industries, securities markets or economies.
Market
Risk (All Funds) — Investments in securities, in general, are subject to market risks, including
increased volatility, illiquidity, or other potentially adverse effects in response to changing market conditions, inflation, changes
in interest rates, market disruptions caused by local or regional events such as war, acts of terrorism, the spread of infectious illness
(including epidemics and pandemics) or other public health issues, recessions or other events or adverse investor sentiment that may cause
their prices to fluctuate over time. An investment in the Fund may lose money.
Interest
Rate Risk (Multi-Strategy Alternatives Fund and Managed Futures Funds) — Interest rate risk
is the risk that prices of fixed income securities generally increase when interest rates decline and decrease when interest rates increase.
The Fund may lose money if short-term or long-term interest rates rise sharply or otherwise change in a manner not anticipated by the
Adviser or Wilshire. Changing interest rates may have unpredictable effects on the markets and may affect the value and liquidity of instruments
held by the Fund.
Credit/Default
Risk (Multi-Strategy Alternatives Fund) — An issuer or guarantor of fixed income securities or instruments held by the Fund
may default on its obligation to pay interest and principal when due or default on any other obligation, which may impair the liquidity
and value of the Fund’s investment. In addition, the Fund may incur expenses in an effort to protect the Fund’s interests
or enforce its rights against an issuer, guarantor or counterparty or may be hindered or delayed in exercising these rights.
Foreign
Investments and Emerging Markets Risk (All Funds) — The Fund may invest in the securities
of non-U.S. issuers, including those located in developing countries, which securities involve risks beyond those associated with investments
in U.S. securities. These risks may relate to foreign political, social and economic matters, less developed markets, political immobility
and less developed legal and accounting practices.
Multi-Manager
and Allocation Risk (All Funds) — The success of the Fund’s investment strategy depends
on, among other things, the Adviser’s ability, based on recommendations from Wilshire, to select Underlying Managers, Alternative
Beta Providers and Alternative Investment Strategies to implement the Fund’s investment objective and the Adviser’s success
in allocating assets, based on recommendations from Wilshire, to those Underlying Managers and Alternative Beta Providers. The Fund’s
Underlying Managers and/or Alternative Beta Strategies may underperform the market generally or underperform other investment managers
that could have been selected for the Fund. In addition, some Underlying Managers may have little or no experience managing assets for
an open-end fund, which is different from
122
|
THE
ADVISORS’ INNER CIRCLE FUND III |
FS
INVESTMENTS
JUNE
30, 2024
(Unaudited) |
the hedge funds
and similar vehicles with which most Underlying Managers have expertise. Mutual funds, unlike hedge funds (with which the Underlying Managers
are experienced), are subject to daily inflows and outflows of securities and cash and are subject to certain legal and tax-related restrictions
on their investments and operations, including, for example, restrictions on illiquid investments and leverage. Accordingly, an Underlying
Manager may not be able to achieve the level of returns for the Fund that the Underlying Manager would be able to achieve if it were managing
the same strategy in a hedge fund or similar investment vehicle.
Loans
and Other Direct Indebtedness Risk (All Funds) — Investments in loans (through both assignments
and participations) are generally subject to the same risks as investments in other types of debt instruments, including, in many cases,
investments in high yield bonds. There may be limited public information available regarding loans and loans may be difficult to value.
If the Fund holds a loan through another financial institution, or relies on a financial institution to administer the loan, its receipt
of principal and interest on the loan may be subject to the credit risk of that financial institution. It is possible that collateral
securing a loan, if any, may be insufficient or unavailable to the Fund, and that the Fund’s rights to collateral may be limited
by bankruptcy or insolvency laws. In addition, the secondary market for loans may be subject to irregular trading activity and wide bid/ask
spreads, which may cause the Fund to be unable to realize the full value of its investment in a loan. Loans may have extended settlement
periods that exceed seven days and, accordingly, may be considered illiquid. Purchases and sales of loans in the secondary market generally
are subject to contractual restrictions that may delay the Fund’s ability to make timely redemptions.
Loans may not
be considered “securities,” and purchasers, such as the Fund, therefore may not be entitled to rely on the anti-fraud protections
of the federal securities laws.
Non-Investment
Grade Fixed Income Securities Risk (All Funds) — Non-investment grade fixed income securities and unrated securities of comparable
credit quality (commonly known as “junk bonds”) are considered speculative and are subject to the increased risk of an issuer’s
inability to meet principal and interest payment obligations, increased risk of price volatility, increased risk of illiquidity and other
risks.
Commodities
Risk (All Funds) — To the extent that the Fund gains exposure to the commodities markets, such exposure may subject the Fund
to greater volatility than investments in traditional securities. The value of commodity-linked investments may be affected by changes
in overall market movements, commodity index volatility, changes in interest rates, or sectors affecting a particular industry or commodity,
such as drought, floods, weather, embargoes, tariffs and international economic, political and regulatory developments. The prices of
certain commodities may fluctuate widely due to factors such as changes in value, supply and demand and governmental regulatory policies.
Some commodity-linked investments are issued by companies in
123
|
THE
ADVISORS’ INNER CIRCLE FUND III |
FS
INVESTMENTS
JUNE
30, 2024
(Unaudited) |
the financial
services sector, including the banking, brokerage and insurance sectors. As a result, events affecting issuers in the financial services
sector may cause the Fund’s share value to fluctuate.
Currency
Risk (All Funds) — The Fund’s returns may be adversely impacted by changes in currency
exchange rates.
Structured
Products and Structured Notes Risk (All Funds) — A structured product may decline in value
due to changes in the underlying instruments on which the product is based. The cash flow or rate of return on the underlying investments
may be apportioned among the newly issued securities to create different investment characteristics, such as varying maturities, credit
quality, payment priorities and interest rate provisions. The cash flow or rate of return on a structured investment may be determined
by applying a multiplier to the rate of total return on the underlying investments or referenced indicator. Application of a multiplier
is comparable to the use of financial leverage, a speculative technique.
Holders of structured
products indirectly bear risks associated with the underlying investments, index or reference obligation, and are subject to counterparty
risk. Structured products are generally privately offered and sold, and thus, are not registered under the securities laws. Certain structured
products may be thinly traded or have a limited trading market and may have the effect of increasing the Fund’s illiquidity to the
extent that the Fund, at a particular point in time, may be unable to find qualified buyers for these securities. Structured notes are
derivative securities for which the amount of principal repayment and/or interest payments is based on the movement of one or more “factors.”
Investments in structured notes involve risks including interest rate risk, credit risk and market risk. Where the Fund’s investments
in structured notes are based upon the movement of one or more factors, depending on the factor used and the use of multipliers or deflators,
changes in interest rates and movement of the factor may cause significant price fluctuations.
Fixed
Income Risk (Multi-Strategy Alternatives Fund and Real Development Fund) — The price of fixed-income
securities responds to economic developments, particularly interest rate changes, as well as to perceptions about the credit risk of individual
issuers. Rising interest rates generally will cause the price of bonds and other fixed-income debt securities to fall. Falling interest
rates may cause an issuer to redeem, call or refinance a security before its stated maturity, which may result in the Fund having to reinvest
the proceeds in lower yielding securities. Bonds and other fixed-income debt securities are subject to credit risk, which is the possibility
that the credit strength of an issuer will weaken and/or an issuer of a fixed-income security will fail to make timely payments of principal
or interest and the security will go into default. Loans and other direct indebtedness involve the risk that the Fund will not receive
payment of principal, interest and other amounts due in connection with these investments, which depend primarily on the financial condition
of the borrower.
124
|
THE
ADVISORS’ INNER CIRCLE FUND III |
FS
INVESTMENTS
JUNE
30, 2024
(Unaudited) |
Mortgage-Backed
and Other Asset-Backed Securities Risk (Multi-Strategy Alternatives Fund) — MBS and other
ABS are subject to Credit/Default Risk, Interest Rate Risk, and Prepayment Risk, which are discussed elsewhere in this “Principal
Risks” section, as well as the risk of declining values of underlying collateral assets. Small movements in interest rates may dramatically
affect the value of certain mortgage- and asset-backed securities. The following provides additional information on certain of these and
other risks associated with investments in MBS and ABS.
General
MBS Risk. MBS may experience significantly greater price and yield volatility than traditional debt securities. In some cases, price
and yield volatility in MBS can be substantial, including the potential for a complete loss of expected future cashflow based on the prepayment
behavior of underlying borrowers. The price and yield sensitivity of IO and principal-only securities may be much greater than that of
the underlying pass-through security with respect to unanticipated changes in prepayments, interest rates and other factors.
Prepayment
rates for underlying borrowers are a key determinant of the cash flow behavior of MBS generally, and for IO bonds in particular, and are
influenced by changes in current interest rates and a variety of other factors including but not limited to economic, geographic, social,
and other factors, which cannot be predicted with certainty. Both adjustable-rate mortgage loans and fixed rate mortgage loans may be
subject to a greater rate of principal prepayments in a declining interest rate environment and to a lower rate of principal prepayments
in an increasing interest rate environment. Changes in prepayment behavior of underlying borrowers is often to the detriment of MBS. Prepayment
volatility is an important risk factor for holders of MBS, and may materially impact the performance of the Fund including the potential
for a complete loss of expected future cashflows on IO investments
Agency
MBS Risk. Agency MBS are subject to all risks generally applicable to MBS, but protection from credit losses is generally subject
to a guarantee from the issuing or guaranteeing U.S. government agency. There is no guarantee that such credit support will exist in the
future. Further, this guarantee is not intended to protect against non-credit related investment losses, including but not limited to
the impact of loan prepayment behavior, interest rate movements, reduction in interest proceeds, changes in the timing of principal repayment
and other factors not explicitly related to a credit loss. No agency guarantee should be viewed as a complete protection against capital
depreciation.
Non-Agency
Residential MBS/Commercial MBS/ABS (“Non-Agency Assets”) Risk. Non-Agency Assets are not issued by U.S. government agencies
or instrumentalities, but by private entities such as banks, savings and loans, mortgage bankers, securitization vehicles and other nongovernmental
issuers, and are not guaranteed by the U.S. government or any agency. Accordingly,
125
|
THE
ADVISORS’ INNER CIRCLE FUND III |
FS
INVESTMENTS
JUNE
30, 2024
(Unaudited) |
Non-Agency
Assets are subject to heightened risk of loss, including but not limited to the loss of principal or credit risk.
Swap
Agreements Risk (All Funds) — In a typical swap transaction, two parties agree to exchange
the return earned on a specified underlying reference for a fixed return or the return from another underlying reference during a specified
period of time. Swaps may be difficult to value and may be illiquid. Swaps could result in Fund losses if the underlying asset or reference
does not perform as anticipated. Swaps create significant investment leverage such that a relatively small price movement in a swap may
result in immediate and substantial losses to the Fund. The Fund may only close out a swap with its particular counterparty, and may only
transfer a position with the consent of that counterparty. Certain swaps, such as short swap transactions and total return swaps, have
the potential for unlimited losses, regardless of the size of the initial investment. Swaps can increase the Fund’s risk exposure
to underlying references and their attendant risks, such as credit risk, market risk, foreign currency risk and interest rate risk, while
also exposing the Fund to correlation risk, counterparty risk, hedging risk, inflation risk, leverage risk, liquidity risk, pricing risk
and volatility risk.
Prepayment
Risk (Multi-Strategy Alternatives Fund) The Fund faces prepayment risk with respect to certain fixed-income investments. When interest
rates fall, certain fixed income obligations will be paid off by the obligor more quickly than originally anticipated, and the Fund may
have to invest the proceeds in securities with lower yields, potentially reducing overall Fund returns.
Model
and Technology Risk (All Funds) — The Adviser, Underlying Managers, and Alternative Beta Providers may use investment programs
that are fundamentally dependent on proprietary or licensed technology through such manager’s use of, among other things, certain
hardware, software, model-based strategies, data gathering systems, order execution, and trade allocation systems, and/or risk management
systems. These strategies may not be successful on an ongoing basis or could contain errors, omissions, imperfections, or malfunctions.
These errors may result in, among other things, execution and allocation failures and failures to properly gather and organize large amounts
of data from third parties and other external source.
Event-Driven
Trading Risk (Multi-Strategy Alternatives Fund) — The Fund may seek to profit from the occurrence of specific corporate or other
events. A delay in the timing of these events, or the failure of these events to occur at all, may have a significant negative effect
on the Fund’s performance.
Arbitrage
Strategies Risk (Multi-Strategy Alternatives Fund) — The Fund may purchase securities at prices only slightly below the anticipated
value to be paid or exchanged for such securities in a merger, exchange offer or cash tender offer, and substantially above the prices
at which such securities traded immediately prior to announcement of the transaction. If there is a perception that the proposed transaction
will not be consummated or will be delayed, the market price of the security may decline sharply.
126
|
THE
ADVISORS’ INNER CIRCLE FUND III |
FS
INVESTMENTS
JUNE
30, 2024
(Unaudited) |
The Fund may
also employ convertible arbitrage investing strategies, which involve investing in convertible securities that appear incorrectly valued
relative to their theoretical value. Convertible arbitrage strategies generally involve spreads between two or more positions. To the
extent the price relationships between such positions remain constant, no gain or loss on the position will occur. Such positions do,
however, entail a substantial risk that the price differential could change unfavorably, causing a loss. The success of convertible arbitrage
investing activities will depend on the Adviser’s and/or an Underlying Manager’s ability to identify and exploit price discrepancies
in the market. Identification and exploitation of market opportunities involve uncertainty. No assurance can be given that the Adviser
and/or an Underlying Manager will be able to locate investment opportunities or to correctly exploit price discrepancies.
High
Portfolio Turnover Risk (All Funds) — Active and frequent trading of the Fund’s portfolio securities may result in increased
transaction costs to the Fund, including brokerage commissions, dealer mark-ups and other transaction costs, which could reduce the Fund’s
return.
Convertible
Securities Risk (Multi-Strategy Alternatives Fund and Real Development Fund) — If market interest rates rise, the value of a
convertible security usually falls. In addition, convertible securities are subject to the risk that the issuer will not be able to pay
interest or dividends when due, and their market value may change based on changes in the issuer’s credit rating or the market’s
perception of the issuer’s creditworthiness. Since it derives a portion of its value from the common stock into which it may be
converted, a convertible security is also subject to the same types of market and issuer risks that apply to the underlying common stock.
“Mandatory” convertible bonds, which must be converted into common stock by a certain date, may be more exposed to the risks
of the underlying common stock.
Volatility
Risk (All Funds) — The Fund may have investments that appreciate or decrease significantly in value over short periods of time.
This may cause the Fund’s net asset value (“NAV”) per share to experience significant increases or declines in value
over short periods of time, however, all investments long- or short-term are subject to risk of loss.
Counterparty
Risk (All Funds) — The stability and liquidity of many derivative transactions depends in large part on the creditworthiness
of the parties to the transactions. If a counterparty to such a transaction defaults, exercising contractual rights may involve delays
or costs for the Fund. Furthermore, there is a risk that a counterparty could become the subject of insolvency proceedings, and that the
recovery of securities and other assets from such counterparty will be delayed or be of a value less than the value of the securities
or assets originally entrusted to such counterparty.
Market
Capitalization Risk (Small-, Mid- and Large-Cap Stocks Risk) (Real Development Fund) — To the extent the Fund emphasizes small-,
mid-, or large-cap stocks, it takes
127
|
THE
ADVISORS’ INNER CIRCLE FUND III |
FS
INVESTMENTS
JUNE
30, 2024
(Unaudited) |
on the associated
risks. At any given time, any of these market capitalizations may be out of favor with investors. Small- or mid-cap capitalization stocks
may be more volatile and more affected by sector or market events than larger-capitalization stocks.
Short
Sales Risk (Multi-Strategy Alternatives Fund) — A short sale of a security involves the theoretical risk of unlimited loss because
of increases in the market price of the security sold short. The Fund’s use of short sales, in certain circumstances, can result
in significant losses.
Hedging
Transactions Risk (All Funds) — The Fund may invest in securities and utilize financial instruments for a variety of hedging
purposes. Hedging transactions may limit the opportunity for gain if the value of the portfolio position should increase. There can be
no assurance that the Fund will engage in hedging transactions at any given time, even under volatile market conditions, or that any hedging
transactions the Fund engages in will be successful. Moreover, it may not be possible for the Fund to enter into a hedging transaction
at a price sufficient to protect its assets. The Fund may not anticipate a particular risk so as to hedge against it.
Investment
Style Risk (All Funds) — Different investment styles (e.g., “growth”, “value” or “quantitative”)
tend to shift in and out of favor depending upon market and economic conditions and investor sentiment. The Fund employs various non-traditional
and alternative investment styles, and may outperform or underperform other funds that invest in similar asset classes but employ different
investment styles. Risks also exist that Underlying Managers may fail to fully adhere to stated or agreed-upon investment strategies and
goals. An Underlying Manager may make certain changes to the strategies that the manager has previously used, may not use such strategies
at all, may use additional strategies or may lose a license permitting the use of a proprietary model. Such changes may not be fully disclosed
to the Fund’s Board of Trustees or the Adviser. As a result, the Fund’s portfolio could correlate with broader securities
markets more closely than anticipated, or may otherwise fail to achieve desired performance.
Alternative
Beta Strategies seek to generate returns through exposure to portfolios of risky assets that are selected based on non-traditional criteria.
These strategies may involve elevated risk insofar as they may not involve detailed, issuer-specific fundamental analysis. Alternative
Beta Strategies may give the Fund exposure to individual issuers that face significant operational, financial, regulatory or other challenges.
Rule
144A and Other Exempted Securities Risk (Multi-Strategy Alternatives Fund and Real Development Fund) — The Fund may invest in
privately placed and other securities or instruments exempt from Securities and Exchange Commission (“SEC”) registration (collectively
“private placements”), subject to liquidity and other regulatory restrictions. In the U.S. market, private placements are
typically sold only to qualified institutional buyers, or qualified purchasers, as applicable. An insufficient number of buyers interested
in purchasing private placements at a particular time could affect
128
|
THE
ADVISORS’ INNER CIRCLE FUND III |
FS
INVESTMENTS
JUNE
30, 2024
(Unaudited) |
adversely the
marketability of such investments and the Fund might be unable to dispose of them promptly or at reasonable prices, subjecting the Fund
to liquidity risk.
Valuation
Risk (All Funds) — The sales price the Fund could receive for any particular portfolio investment may differ from the Fund’s
valuation of the investment, particularly for securities that trade in thin or volatile markets or that are valued using a fair value
methodology. Investors who purchase or redeem Fund shares on days when the Fund is holding fair-valued securities may receive fewer or
more shares or lower or higher redemption proceeds than they would have received if the Fund had not fair-valued the security or had used
a different valuation methodology.
Leverage
Risk (All Funds) — Leverage occurs when the Fund directly or indirectly increases its assets available for investment using
borrowings, short sales, Financial Instruments, or similar instruments or techniques. The use of leverage may make any change in the Fund’s
NAV greater than it otherwise would be and thus result in increased volatility of returns and the risk that the Fund will lose more than
it has invested or the margin it supplies to its counterparty on the instrument. Leverage can also create interest or other transactional
expenses that may lower the Fund’s overall returns. The use of leverage may cause the Fund to liquidate portfolio positions at disadvantageous
times in order to satisfy its obligations or to meet any asset segregation or position coverage requirements.
Cyber
Security and Operational Risk (All Funds) — The Fund and its service providers may experience disruptions that arise from breaches
in cyber security, human error, processing and communications errors, counterparty or third-party errors, technology or systems failures,
any of which may have an adverse impact on the Fund. Failures or breaches of the electronic systems of the Fund, the Fund’s adviser,
distributor, and other service providers, or the issuers of securities in which the Fund invests have the ability to cause disruptions
and negatively impact the Fund’s operations, potentially resulting in financial losses to the Fund and its shareholders.
Issuer
Risk (All Funds) — An issuer in which the Fund invests or to which it has exposure may perform poorly, and the value of its
loans or securities may therefore decline, which would negatively affect the Fund’s performance. Poor performance may be caused
by poor management decisions, competitive pressures, breakthroughs in technology, reliance on suppliers, labor problems or shortages,
corporate restructurings, fraudulent disclosures, natural disasters, the spread of infectious illness (including epidemics and pandemics)
or other events, conditions or factors.
Liquidity
Risk (All Funds) — Although the Fund will invest primarily in liquid, publicly traded securities, the Fund may make investments
that may be illiquid or that may become less liquid in response to market developments or adverse investor perceptions. Illiquid investments
may be more difficult to value and more difficult to sell in response to redemption requests than liquid investments. If the Fund must
sell illiquid or less liquid assets to meet redemption requests or other cash needs, it may be forced to sell at a loss.
129
|
THE
ADVISORS’ INNER CIRCLE FUND III |
FS
INVESTMENTS
JUNE
30, 2024
(Unaudited) |
Regulatory
Risk (All Funds) — Legal, tax, and regulatory developments may adversely affect the Fund. The regulatory environment for the
Fund is evolving, and changes in the regulation of investment funds, their managers, and their trading activities and capital markets,
or a regulator’s disagreement with the Fund’s interpretation of the application of certain regulations, may adversely affect
the ability of the Fund to pursue its investment strategy, its ability to obtain leverage and financing, and the value of investments
held by the Fund.
Tax
Risk (All Funds) — To comply with its asset diversification test applicable to a RIC, the Fund will limit its investments in
the Subsidiary to 25% of the Fund’s total assets at the end of each quarter. The Fund intends to invest in complex derivatives for
which there is not clear guidance from the Internal Revenue Service (“IRS”) as to the calculation of such investments under
the asset diversification test applicable to RICs. There are no assurances that the IRS will agree with the Fund’s calculation under
the asset diversification test which could cause the Fund to fail to qualify as a RIC.
The tax treatment
of certain commodity investments and derivative instruments in which the Fund may invest may be affected by future regulatory or legislative
changes that could affect the character, timing and/or amount of the Fund’s taxable income or gains and distributions. If the Fund
did not qualify as a RIC for any taxable year and certain relief provisions were not available, the Fund’s taxable income would
be subject to tax at the Fund level and to a further tax at the shareholder level when such income is distributed. Failure to comply with
the requirements for qualification as a RIC could cause the Fund to become subject to federal income tax, thereby diminishing the returns
for shareholders.
Investment
in Other Investment Companies Risk (Multi-Strategy Alternatives Fund and Real Development Fund) — As with other investments,
investments in other investment companies, including ETFs, are subject to market and manager risk. In addition, if the Fund acquires shares
of investment companies, shareholders bear both their proportionate share of expenses in the Fund (including management and advisory fees)
and, indirectly, the expenses of the investment companies. The Fund may invest in money market mutual funds. An investment in a money
market mutual fund is not insured or guaranteed by the Federal Deposit Insurance Corporation or any other government agency. Although
money market mutual funds that invest in U.S. government securities seek to preserve the value of the Fund’s investment at $1.00
per share, it is possible to lose money by investing in a stable NAV money market mutual fund. Moreover, SEC rules require prime money
market mutual funds to use floating NAVs that do not preserve the value of the Fund’s investment at $1.00 per share.
Custody
Risk (All Funds) — The Fund invests in securities markets that are less developed than those in the U.S., which may expose the
Fund to risks in the process of clearing and settling trades and the holding of securities by local banks, agents and depositories. The
less developed a country’s securities market is, the greater the likelihood of custody problems.
130
|
THE
ADVISORS’ INNER CIRCLE FUND III |
FS
INVESTMENTS
JUNE
30, 2024
(Unaudited) |
Subsidiary
Risk (All Funds) — By investing in a Subsidiary, the Fund is indirectly exposed to the risks associated with the Subsidiary’s
investments. The derivatives and other investments held by the Subsidiary are generally similar to those that are permitted to be held
by the Fund and are subject to the same risks that apply to similar investments if held directly by the Fund. The Subsidiary is not registered
under the 1940 Act, and unless otherwise noted in this prospectus, is not subject to all the investor protections of the 1940 Act. Changes
in the laws of the United States and/or the Cayman Islands could result in the inability of the Fund and/or Subsidiary to continue to
operate as it does currently and could adversely affect the Fund.
Non-U.S.
Government Securities Risk (Multi-Strategy Alternatives Fund and Real Development Fund) — Foreign sovereign debt securities
are subject to the risks that: (i) the governmental entity that controls the repayment of sovereign debt may not be willing or able to
repay the principal and/or interest when it becomes due, due to factors such as debt service burden, political constraints, cash flow
problems and other national economic factors; (ii) governments may default on their debt securities, which may require holders of such
securities to participate in debt rescheduling or additional lending to defaulting governments; and (iii) there is no bankruptcy proceeding
by which defaulted sovereign debt may be collected in whole or in part.
Real
Estate-Related Investment Risk (Real Development Fund) — Investments in REITs and in securities of other companies (wherever
organized) principally engaged in the real estate industry subject the Fund to, among other things, risks similar to those of direct investments
in real estate and the real estate industry in general. These include risks related to general and local economic conditions, possible
lack of availability of financing and changes in interest rates or property values. REITs are entities that either own properties or make
construction or mortgage loans, and also may include operating or finance companies. The value of interests in a REIT may be affected
by, among other factors, changes in the value of the underlying properties owned by the REIT, changes in the prospect for earnings and/or
cash flow growth of the REIT itself, defaults by borrowers or tenants, market saturation, decreases in market rates for rents, and other
economic, political, or regulatory matters affecting the real estate industry, including REITs. REITs and similar non-U.S. entities depend
upon specialized management skills, may have limited financial resources, may have less trading volume in their securities, and may be
subject to more abrupt or erratic price movements than the overall securities markets. U.S. REITs are also subject to the risk of failing
to qualify for favorable tax treatment under the Code. Some REITs (especially mortgage REITs) are affected by risks similar to those associated
with investments in debt securities including changes in interest rates and the quality of credit extended.
Highly
Leveraged Transactions Risk (Multi-Strategy Alternatives Fund and Real Development Fund) — The loans or other debt instruments
in which the Fund invests may include highly leveraged transactions whereby the borrower assumes large amounts of debt in order to have
the financial resources to attempt to achieve its business objectives. Loans or other debt instruments that are part of highly leveraged
131
|
THE
ADVISORS’ INNER CIRCLE FUND III |
FS
INVESTMENTS
JUNE
30, 2024
(Unaudited) |
transactions
involve a greater risk (including default and bankruptcy) than other investments.
Non-Diversification
Risk (All Funds) — The Fund is classified as a “non-diversified” investment company, which means that the percentage
of its assets that may be invested in the securities of a single issuer is not limited by the 1940 Act. As a result, the Fund’s
investment portfolio may be subject to greater risk and volatility than if investments had been made in the securities of a broad range
of issuers.
Activist
Strategies Risk (All Funds) — The Fund may purchase securities of companies that are the subject of proxy contests or which
activist investors are attempting to influence, in the expectation that new management or a change in business strategies will cause the
price of such company’s securities to increase. There is a risk that the market price of the company’s securities will fall
if the proxy contest, or the new management, is not successful.
Exchange-Traded
Product Risk (Real Development Fund) — The Fund may invest in long (or short) positions in ETFs, ETVs and ETNs (collectively
with ETFs and ETVs, “ETPs”). Through its positions in ETPs, the Fund will be subject to the risks associated with such vehicles’
investments, including the possibility that the value of the securities or instruments held by an ETP could decrease (or increase), and
will bear its proportionate share of the ETP’s fees and expenses. In addition, certain of the ETPs may hold common portfolio positions,
thereby reducing any diversification benefits.
Limited
Capacity Risk (Multi-Strategy Alternatives Fund) — Alternative investment strategies utilized by the Fund may have limited capacity,
and the Adviser may not be able to allocate as much of the Fund’s assets to one or more alternative investment strategies as it
desires. This capacity limitation may negatively impact the performance and portfolio composition of the Fund.
Preferred
Stock Risk (Multi-Strategy Alternatives Fund and Real Development Fund) — Preferred stock is a type of stock that generally
pays dividends at a specified rate and that has preference over common stock in the payment of dividends and the liquidation of assets.
Preferred stock does not ordinarily carry voting rights. The price of a preferred stock is generally determined by earnings, type of products
or services, projected growth rates, experience of management, liquidity, and general market conditions of the markets on which the stock
trades. The most significant risks associated with investments in preferred stock include issuer risk, market risk and interest rate risk
(i.e., the risk of losses attributable to changes in interest rates).
U.S.
Government Securities Risk (Multi-Strategy Alternatives Fund) —
The U.S. government may not provide financial support to U.S. government agencies, instrumentalities or sponsored enterprises that
have issued debt securities that may be held by the Fund. Such issuers may not have the funds to meet their payment obligations in the
future.
132
|
THE
ADVISORS’ INNER CIRCLE FUND III |
FS
INVESTMENTS
JUNE
30, 2024
(Unaudited) |
Contracts
for Differences Risk (All Funds) — As is the case with owning any financial instrument, there is the risk of loss associated
with buying a CFD. There may be liquidity risk if the underlying instrument is illiquid because the liquidity of a CFD is based on the
liquidity of the underlying instrument. Adverse movements in the underlying security will require the buyer to post additional margin.
CFDs also carry counterparty risk, i.e., the risk that the counterparty to the CFD transaction may be unable or unwilling to make payments
or to otherwise honor its financial obligations under the terms of the contract. If the counterparty were to do so, the value of the contract
may be reduced. To the extent that there is an imperfect correlation between the return on the Fund’s obligation to its counterparty
under the CFDs and the return on related assets in its portfolio, the CFD transaction may increase the Fund’s financial risk.
Depositary
Receipts Risk (Multi-Strategy Alternatives Fund and Real Development Fund) — Depositary receipts are certificates evidencing
ownership of shares of a foreign issuer that are issued by depositary banks and generally trade on an established market. Depositary receipts
are subject to many of the risks associated with investing directly in foreign securities, including, among other things, political, social
and economic developments abroad, currency movements, and different legal, regulatory and tax environments.
Municipal
Securities Risk (Multi-Strategy Alternatives Fund) — Municipal securities, like other fixed income securities, rise and fall
in value in response to economic and market factors, primarily changes in interest rates, and actual or perceived credit quality. Rising
interest rates will generally cause municipal securities to decline in value. Longer-term securities respond more sharply to interest
rate changes than do shorter-term securities. A municipal security will also lose value if, due to rating downgrades or other factors,
there are concerns about the issuer’s current or future ability to make principal or interest payments. State and local governments
rely on taxes and, to some extent, revenues from private projects financed by municipal securities, to pay interest and principal on municipal
debt. Poor statewide or local economic results or changing political sentiments may reduce tax revenues and increase the expenses of municipal
issuers, making it more difficult for them to meet their obligations. Actual or perceived erosion of the creditworthiness of municipal
issuers may reduce the value of the Fund’s holdings. As a result, the Fund will be more susceptible to factors that adversely affect
issuers of municipal obligations than a mutual fund that does not have as great a concentration in municipal obligations.
Unregistered
Fund Risk (All Funds) — Unlike the Fund, unregistered funds are not subject to the investor protections provided under the 1940
Act. Accordingly, (i) the relationship between the unregistered fund and its adviser will not be regulated by the 1940 Act; (ii) unregistered
funds are not required to have a majority of disinterested directors; (iii) unregistered funds are not subject to the various custody
and safekeeping provisions under the 1940 Act designed to protect fund assets; and (iv) unregistered funds are not subject to the various
investment limitations under the
133
|
THE
ADVISORS’ INNER CIRCLE FUND III |
FS
INVESTMENTS
JUNE
30, 2024
(Unaudited) |
1940 Act. The
Fund’s performance is subject to the risks associated with the securities and other investments held by an unregistered fund in
which the Fund may invest. The ability of the Fund to achieve its investment objective may depend upon the ability of an unregistered
fund to achieve its investment objectives. When the Fund invests in an unregistered fund, in addition to directly bearing the expenses
associated with its own operations, it will bear a pro rata portion of the unregistered fund’s expenses.
As part of the
Fund’s investments in unregistered funds, the Fund may invest in limited partnership interests. There may be fewer protections afforded
to investors in a limited partnership than investors in a corporation. In addition, limited partnerships may be subject to state taxation
in certain jurisdictions which may reduce the amount of income paid by the limited partnership to its investors. In addition, investments
in limited partnerships may be illiquid and may not have daily pricing information available for their investors, which will require a
Fund to employ fair value procedures to value its holdings in such investments.
Warrants
and Rights Risk — Warrants and rights do not carry with them the right to dividends or voting rights with respect to the securities
that they entitle the holder to purchase, and they do not represent any rights in the assets of the issuer. As a result, warrants and
rights may be considered more speculative than certain other types of equity-like securities. In addition, the values of warrants and
rights do not necessarily change with the values of the underlying securities or commodities and these instruments cease to have value
if they are not exercised prior to their expiration dates.
12.
Concentration of Shareholders:
At June 30,
2024, the percentage of total shares outstanding held by shareholders for each Fund, which are comprised of affiliated omnibus accounts,
unless otherwise indicated, that are held on behalf of various individual shareholders, was as follows:
| |
|
No.
of Shareholders |
|
|
|
% Ownership |
|
|
Multi-Strategy
Alternatives |
|
|
|
|
|
|
|
|
|
Class A |
|
|
2 |
|
|
|
76 |
% |
|
Class I |
|
|
3 |
|
|
|
57 |
% |
|
Managed
Futures |
|
|
|
|
|
|
|
|
|
Class A |
|
|
1 |
|
|
|
100 |
% |
|
Class I |
|
|
1 |
|
|
|
100 |
% |
|
Real
Development |
|
|
|
|
|
|
|
|
|
Class A |
|
|
2 |
|
|
|
100 |
% |
|
Class I |
|
|
1 |
|
|
|
36 |
% |
| |
|
|
|
|
|
|
|
|
| |
|
|
|
|
|
|
|
|
13.
Indemnifications:
In the normal
course of business, the Fund enters into contracts that provide general indemnifications. The Fund’s maximum exposure under these
arrangements is dependent on future claims that may be made against the Fund and, therefore, cannot
134
|
THE
ADVISORS’ INNER CIRCLE FUND III |
FS
INVESTMENTS
JUNE
30, 2024
(Unaudited) |
be established;
however, based on experience, the risk of loss from such claim is considered remote.
14.
Subsequent Events:
The Funds have
evaluated the need for additional disclosures (other than what is disclosed in the preceding paragraphs) and/or adjustments resulting
from subsequent events through the date the financial statements were issued. Based on this evaluation, no additional disclosures and/or
adjustments were required to the financial statements as of June 30, 2024.
135
|
THE
ADVISORS’ INNER CIRCLE FUND III |
FS
INVESTMENTS
JUNE
30, 2024
(Unaudited) |
BOARD
OF TRUSTEES CONSIDERATIONS IN APPROVING THE SUB-ADVISORY AGREEMENT (FORM N-CSRS ITEM 11)
|
FS
Multi-Strategy Alternatives Fund |
| |
| |
Pursuant to
Section 15 of the Investment Company Act of 1940 (the “1940 Act”), the Fund’s sub-advisory agreement must be approved
by the vote of a majority of the members of the Board of Trustees (the “Board” or the “Trustees”) of The Advisors’
Inner Circle Fund III (the “Trust”) who are not parties to the agreement or “interested persons” of any party
thereto, as defined in the 1940 Act (the “Independent Trustees”), cast in person at a meeting called for the purpose of voting
on such approval.
A Board meeting
was held on June 17-18, 2024 to decide whether to approve the following agreement (the “New Sub-Advisory Agreement”) for an
initial two-year term:
| |
● |
the Sub-Advisory Agreement between the Adviser and
Magnetar Asset Management LLC (“Magnetar”) on behalf of the FS Multi-Strategy Alternatives Fund. |
In preparation
for the Meeting, the Trustees requested that the Adviser and Magnetar furnish information necessary to evaluate the terms of the New Sub-Advisory
Agreement. The Trustees used this information, as well as other information that the Adviser, Magnetar and other service providers of
the Fund presented or submitted to the Board at the Meeting, to help them decide whether to approve the New Sub-Advisory Agreement for
an initial two-year term..
Specifically,
the Board requested and received written materials from the Adviser, Magnetar and other service providers of the Fund regarding, among
other things: (i) the nature, extent and quality of the services to be provided by Magnetar; (ii) Magnetar’s investment management
personnel; (iii) Magnetar’s operations and financial condition; (iv) the proposed sub-advisory fee to be paid to Magnetar; (v) Magnetar’s
compliance program, including a description of any material compliance matters; (vi) Magnetar’s policies on and compliance procedures
for personal securities transactions; (vii) Magnetar’s investment experience; and (viii) the Adviser’s rationale for recommending
Magnetar.
Representatives
from the Adviser and Magnetar, along with other Fund service providers, presented additional information and participated in question-and-answer
sessions at the Meeting to help the Trustees evaluate Magnetar’s services, fee and other aspects of the New Sub-Advisory Agreement.
Based on their evaluation of the information provided by the Adviser and Magnetar, the Trustees, including all of the Trustees who are
not parties to the New Sub-Advisory Agreement nor are considered “interested persons” (as such term is defined in the 1940
Act) of any party to the
136
|
THE
ADVISORS’ INNER CIRCLE FUND III |
FS
INVESTMENTS
JUNE
30, 2024
(Unaudited) |
New Sub-Advisory
Agreement (the “Independent Trustees”) received advice from independent counsel and met in executive session outside the presence
of Fund management, the Adviser, and Magnetar.
At the Meeting,
the Board, including a majority of the Independent Trustees, voting separately, approved the New Sub-Advisory Agreement. In considering
the approval of the New Sub-Advisory Agreement, the Board considered various factors that it determined were relevant, including: (i)
the nature, extent and quality of the services to be provided by Magnetar; and (ii) the fee to be paid to Magnetar, as discussed in further
detail below.
Nature,
Extent and Quality of Services to be Provided by Magnetar
In considering
the nature, extent and quality of the services to be provided by Magnetar, the Board reviewed the portfolio management services to be
provided by Magnetar to the Fund, including the quality and continuity of Magnetar’s portfolio management personnel, the resources
of Magnetar and Magnetar’s compliance history and compliance program. The Trustees reviewed the terms of the proposed New Sub-Advisory
Agreement. The Trustees also reviewed Magnetar’s proposed investment and risk management approaches for the Fund. The Trustees considered
that the Adviser would supervise and monitor the performance of Magnetar. The most recent investment adviser registration form (“Form
ADV”) for Magnetar was available to the Board, as was the response of Magnetar to a detailed series of questions which included,
among other things, information about the investment sub-advisory services to be provided by Magnetar to the Fund.
The Trustees
also considered other services to be provided to the Fund by Magnetar such as monitoring adherence to the Fund’s investment restrictions,
and monitoring compliance with various Fund policies and procedures. Based on the factors above, as well as those discussed below, the
Board concluded, within the context of its full deliberations, that the nature, extent and quality of the services to be provided to the
Fund by Magnetar would be satisfactory.
Costs
of Advisory Services
In considering
the sub-advisory fee payable by the Adviser to Magnetar, the Trustees reviewed, among other things, the proposed sub-advisory fee to be
paid to Magnetar. The Trustees also considered that the Adviser, not the Fund, would pay Magnetar pursuant to the New Sub-Advisory Agreement,
that the sub-advisory fee payable to Magnetar would thus not increase the overall management fee payable by the Fund, and that the fee
payable to Magnetar would reflect an arms-length negotiation between the Adviser and Magnetar. The Board concluded, within the context
of its full deliberations, that the sub-advisory fee was reasonable in light of the nature and quality of the services expected to be
rendered by Magnetar.
137
|
THE
ADVISORS’ INNER CIRCLE FUND III |
FS
INVESTMENTS
JUNE
30, 2024
(Unaudited) |
Investment
Performance, Profitability and Economies of Scale
Because Magnetar
is new to the Fund, it did not yet have an investment performance record with respect to the Fund and it was not possible to determine
the profitability that Magnetar might achieve with respect to the Fund or the extent to which economies of scale would be realized by
Magnetar as the assets of the Fund grow. Accordingly, the Trustees did not make any conclusions regarding Magnetar’s investment
performance with respect to the Fund, Magnetar’s profitability, or the extent to which economies of scale would be realized by Magnetar
as the assets of the Fund grow, but will do so during future considerations of the New Sub-Advisory Agreement.
Approval
of the New Sub-Advisory Agreement
Based on the
Board’s deliberations and its evaluation of the information described above and other factors and information it believed relevant
in the exercise of its reasonable business judgment, the Board, including all of the Independent Trustees, with the assistance of Fund
counsel and Independent Trustees’ counsel, unanimously concluded that the terms of the New Sub-Advisory Agreement, including the
fee to be paid thereunder, were fair and reasonable and agreed to approve the New Sub-Advisory Agreement for an initial term of two years.
In its deliberations, the Board did not identify any absence of information as material to its decision, or any particular factor (or
conclusion with respect thereto) or single piece of information that was all-important, controlling or determinative of its decision,
but considered all of the factors together, and each Trustee may have attributed different weights to the various factors (and conclusions
with respect thereto) and information.
138
(This page intentionally
left blank)
(This page intentionally
left blank)
(This page intentionally
left blank)
FS
Investments
P.O. Box 588
Portland, ME
04112
1-877-924-4766
Adviser:
FS Fund Advisor,
LLC
206 Rouse Boulevard
Philadelphia,
PA 19112
Distributor:
SEI Investments
Distribution Co.
1 Freedom Valley
Drive
Oaks, PA 19456
Administrator:
SEI Investments
Global Funds Services
1 Freedom Valley
Drive
Oaks, PA 19456
Legal
Counsel:
Morgan, Lewis
& Bockius LLP
2222 Market Street
Philadelphia,
PA 19103
This information
must be preceded or accompanied by a current prospectus for the Funds described.
CHI-SA-002-0300
Item 8. Changes in and Disagreements with Accountants
for Open-End Management Investment Companies.
There were no changes in or disagreements with accountants on accounting and
financial disclosure during the period covered by the report.
Item 9. Proxy Disclosures for Open-End Management
Investment Companies.
There were no matters submitted to a vote of shareholders during the period
covered by this report.
Item 10. Remuneration Paid to Directors, Officers,
and Others of Open-End Management Investment Companies.
No remuneration was paid by the company during the period covered by the report to any Officers of the Trust, other than as disclosed as part of the financial statements included above in Item 7.
Item 11. Statement Regarding Basis for Approval of Investment Advisory
Contract.
The disclosure regarding the Approval of Advisory Agreement, if applicable,
is included as part of the financial statements included above in Item 7.
Item 12. Disclosure of Proxy Voting Policies
and Procedures for Closed-End Management Investment Companies.
Not applicable to open-end management investment companies.
Item 13. Portfolio Managers of Closed-End Management
Investment Companies.
Not applicable to open-end management investment companies.
Item 14. Purchases of Equity Securities by Closed-End
Management Company and Affiliated Purchasers.
Not applicable to open-end management investment companies.
Item 15. Submission of Matters to a Vote of
Security Holders.
There have been no changes to the procedures by which shareholders may recommend
nominees to the Registrant’s Board of Trustees during the period covered by this report.
Item 16. Controls and Procedures.
(a) The Registrant's principal executive and principal financial officers,
or persons performing similar functions, have concluded that the Registrant's disclosure controls and procedures, as defined in Rule 30a-3(c)
under the Act (17 CFR § 270.30a-3(c)), as of a date within 90 days of the filing date of the report, are effective based on the evaluation
of these controls and procedures required by Rule 30a-3(b) under the Act (17 CFR § 270.30a-3(b)) and Rule 13a-15(b) or Rule 15d-15(b)
under the Securities Exchange Act of 1934, as amended (17 CFR § 240.13a-15(b) or 240.15d-15(b)).
(b) There has been no change in the Registrant's internal control over financial
reporting (as defined in Rule 30a-3(d) under the Act (17 CFR § 270.30a-3(d)) that occurred during the period covered by this report
that has materially affected, or is reasonably likely to materially affect, the Registrant's internal control over financial reporting.
Item 17. Disclosure of Securities Lending Activities
for Closed-End Management Investment Companies.
Not applicable to open-end management investment companies.
Item 18. Recovery of Erroneously Awarded Compensation.
(a) Not applicable.
(b) Not applicable.
Item 19. Exhibits.
(a)(1) Not applicable for semi-annual reports.
(a)(2) Not applicable.
(a)(3) A separate
certification for the principal executive officer and the principal financial officer of the Registrant, as required by Rule 30a-2(a)
under the Act (17 CFR § 270.30a-2(a)), are filed herewith.
(a)(4) Not applicable.
(b) Officer
certifications, as required by Rule 30a-2(b) under the Act (17 CFR § 270.30a-2(b)), also accompany this filing as exhibits.
SIGNATURES
Pursuant to the requirements of the Securities Exchange Act of 1934 and the
Investment Company Act of 1940, the Registrant has duly caused this report to be signed on its behalf by the undersigned, thereunto duly
authorized.
| (Registrant) |
The Advisors’ Inner Circle Fund III |
|
| |
|
|
| By (Signature and Title) |
/s/ Michael Beattie |
|
| |
Michael Beattie |
|
| |
Principal Executive Officer |
|
Date: September 6, 2024
Pursuant to the requirements of the Securities Exchange Act of 1934 and the
Investment Company Act of 1940, this report has been signed below by the following persons on behalf of the Registrant and in the capacities
and on the dates indicated.
| By (Signature and Title) |
/s/ Michael Beattie |
|
| |
Michael Beattie |
|
| |
Principal Executive Officer |
|
Date: September 6, 2024
| By (Signature and Title) |
/s/ Andrew Metzger |
|
| |
Andrew Metzger |
|
| |
Principal Financial Officer |
|
Date: September 6, 2024