0001590976false2023FYP4YP5Y500http://fasb.org/us-gaap/2023#OtherAssetsNoncurrenthttp://fasb.org/us-gaap/2023#OtherAssetsNoncurrenthttp://fasb.org/us-gaap/2023#AccruedLiabilitiesCurrenthttp://fasb.org/us-gaap/2023#AccruedLiabilitiesCurrenthttp://fasb.org/us-gaap/2023#OtherLiabilitiesNoncurrenthttp://fasb.org/us-gaap/2023#OtherLiabilitiesNoncurrent00015909762022-07-012023-06-3000015909762022-12-31iso4217:USD0001590976us-gaap:CommonClassAMember2023-08-24xbrli:shares0001590976us-gaap:CommonClassBMember2023-08-2400015909762021-07-012022-06-3000015909762020-07-012021-06-30iso4217:USDxbrli:shares00015909762023-06-3000015909762022-06-300001590976us-gaap:CommonClassAMember2023-06-300001590976us-gaap:CommonClassAMember2022-06-300001590976us-gaap:CommonClassBMember2022-06-300001590976us-gaap:CommonClassBMember2023-06-300001590976us-gaap:CommonClassAMemberus-gaap:CommonStockMember2020-06-300001590976us-gaap:CommonStockMemberus-gaap:CommonClassBMember2020-06-300001590976us-gaap:AdditionalPaidInCapitalMember2020-06-300001590976us-gaap:AccumulatedOtherComprehensiveIncomeMember2020-06-300001590976us-gaap:RetainedEarningsMember2020-06-300001590976us-gaap:NoncontrollingInterestMember2020-06-3000015909762020-06-300001590976us-gaap:RetainedEarningsMember2020-07-012021-06-300001590976us-gaap:NoncontrollingInterestMember2020-07-012021-06-300001590976us-gaap:CommonClassAMemberus-gaap:CommonStockMember2020-07-012021-06-300001590976us-gaap:AdditionalPaidInCapitalMember2020-07-012021-06-300001590976us-gaap:CommonStockMemberus-gaap:CommonClassBMember2020-07-012021-06-300001590976us-gaap:AccumulatedOtherComprehensiveIncomeMember2020-07-012021-06-300001590976us-gaap:CommonClassAMemberus-gaap:CommonStockMember2021-06-300001590976us-gaap:CommonStockMemberus-gaap:CommonClassBMember2021-06-300001590976us-gaap:AdditionalPaidInCapitalMember2021-06-300001590976us-gaap:AccumulatedOtherComprehensiveIncomeMember2021-06-300001590976us-gaap:RetainedEarningsMember2021-06-300001590976us-gaap:NoncontrollingInterestMember2021-06-3000015909762021-06-300001590976us-gaap:RetainedEarningsMember2021-07-012022-06-300001590976us-gaap:NoncontrollingInterestMember2021-07-012022-06-300001590976us-gaap:CommonClassAMemberus-gaap:CommonStockMember2021-07-012022-06-300001590976us-gaap:AdditionalPaidInCapitalMember2021-07-012022-06-300001590976us-gaap:AccumulatedOtherComprehensiveIncomeMember2021-07-012022-06-300001590976us-gaap:CommonClassAMemberus-gaap:CommonStockMember2022-06-300001590976us-gaap:CommonStockMemberus-gaap:CommonClassBMember2022-06-300001590976us-gaap:AdditionalPaidInCapitalMember2022-06-300001590976us-gaap:AccumulatedOtherComprehensiveIncomeMember2022-06-300001590976us-gaap:RetainedEarningsMember2022-06-300001590976us-gaap:NoncontrollingInterestMember2022-06-300001590976us-gaap:RetainedEarningsMember2022-07-012023-06-300001590976us-gaap:NoncontrollingInterestMember2022-07-012023-06-300001590976us-gaap:CommonClassAMemberus-gaap:CommonStockMember2022-07-012023-06-300001590976us-gaap:AdditionalPaidInCapitalMember2022-07-012023-06-300001590976us-gaap:CommonStockMemberus-gaap:CommonClassBMember2022-07-012023-06-300001590976us-gaap:AccumulatedOtherComprehensiveIncomeMember2022-07-012023-06-300001590976us-gaap:CommonClassAMemberus-gaap:CommonStockMember2023-06-300001590976us-gaap:CommonStockMemberus-gaap:CommonClassBMember2023-06-300001590976us-gaap:AdditionalPaidInCapitalMember2023-06-300001590976us-gaap:AccumulatedOtherComprehensiveIncomeMember2023-06-300001590976us-gaap:RetainedEarningsMember2023-06-300001590976us-gaap:NoncontrollingInterestMember2023-06-30mbuu:brandmbuu:segment00015909762019-07-012020-06-300001590976mbuu:PursuitAndMaverickBoatGroupIncMember2022-07-012023-06-300001590976mbuu:TopTenDealersMemberus-gaap:CustomerConcentrationRiskMemberus-gaap:SalesRevenueNetMember2022-07-012023-06-30xbrli:pure0001590976mbuu:TopTenDealersMemberus-gaap:CustomerConcentrationRiskMemberus-gaap:SalesRevenueNetMember2021-07-012022-06-300001590976mbuu:TopTenDealersMemberus-gaap:CustomerConcentrationRiskMemberus-gaap:SalesRevenueNetMember2020-07-012021-06-300001590976us-gaap:CustomerConcentrationRiskMembermbuu:OneWaterMarineIncMemberus-gaap:SalesRevenueNetMember2022-07-012023-06-300001590976us-gaap:CustomerConcentrationRiskMembermbuu:OneWaterMarineIncMemberus-gaap:SalesRevenueNetMember2021-07-012022-06-300001590976us-gaap:CustomerConcentrationRiskMembermbuu:OneWaterMarineIncMemberus-gaap:SalesRevenueNetMember2020-07-012021-06-300001590976us-gaap:CustomerConcentrationRiskMembermbuu:TommysBoatsMemberus-gaap:SalesRevenueNetMember2022-07-012023-06-300001590976us-gaap:CustomerConcentrationRiskMembermbuu:TommysBoatsMemberus-gaap:SalesRevenueNetMember2021-07-012022-06-300001590976us-gaap:CustomerConcentrationRiskMembermbuu:TommysBoatsMemberus-gaap:SalesRevenueNetMember2020-07-012021-06-30mbuu:financialInstitution0001590976srt:MinimumMember2023-06-300001590976srt:MaximumMember2023-06-300001590976us-gaap:NoncompeteAgreementsMember2023-06-300001590976mbuu:BoatandTrailerSalesMembermbuu:MalibuMember2022-07-012023-06-300001590976mbuu:BoatandTrailerSalesMembermbuu:SaltwaterFinishingMember2022-07-012023-06-300001590976mbuu:BoatandTrailerSalesMembermbuu:CobaltMember2022-07-012023-06-300001590976mbuu:BoatandTrailerSalesMember2022-07-012023-06-300001590976mbuu:MalibuMembermbuu:PartAndOtherSalesMember2022-07-012023-06-300001590976mbuu:SaltwaterFinishingMembermbuu:PartAndOtherSalesMember2022-07-012023-06-300001590976mbuu:CobaltMembermbuu:PartAndOtherSalesMember2022-07-012023-06-300001590976mbuu:PartAndOtherSalesMember2022-07-012023-06-300001590976mbuu:MalibuMember2022-07-012023-06-300001590976mbuu:SaltwaterFinishingMember2022-07-012023-06-300001590976mbuu:CobaltMember2022-07-012023-06-300001590976mbuu:MalibuMembersrt:NorthAmericaMember2022-07-012023-06-300001590976mbuu:SaltwaterFinishingMembersrt:NorthAmericaMember2022-07-012023-06-300001590976mbuu:CobaltMembersrt:NorthAmericaMember2022-07-012023-06-300001590976srt:NorthAmericaMember2022-07-012023-06-300001590976mbuu:InternationalMembermbuu:MalibuMember2022-07-012023-06-300001590976mbuu:SaltwaterFinishingMembermbuu:InternationalMember2022-07-012023-06-300001590976mbuu:CobaltMembermbuu:InternationalMember2022-07-012023-06-300001590976mbuu:InternationalMember2022-07-012023-06-300001590976mbuu:BoatandTrailerSalesMembermbuu:MalibuMember2021-07-012022-06-300001590976mbuu:BoatandTrailerSalesMembermbuu:SaltwaterFinishingMember2021-07-012022-06-300001590976mbuu:BoatandTrailerSalesMembermbuu:CobaltMember2021-07-012022-06-300001590976mbuu:BoatandTrailerSalesMember2021-07-012022-06-300001590976mbuu:MalibuMembermbuu:PartAndOtherSalesMember2021-07-012022-06-300001590976mbuu:SaltwaterFinishingMembermbuu:PartAndOtherSalesMember2021-07-012022-06-300001590976mbuu:CobaltMembermbuu:PartAndOtherSalesMember2021-07-012022-06-300001590976mbuu:PartAndOtherSalesMember2021-07-012022-06-300001590976mbuu:MalibuMember2021-07-012022-06-300001590976mbuu:SaltwaterFinishingMember2021-07-012022-06-300001590976mbuu:CobaltMember2021-07-012022-06-300001590976mbuu:MalibuMembersrt:NorthAmericaMember2021-07-012022-06-300001590976mbuu:SaltwaterFinishingMembersrt:NorthAmericaMember2021-07-012022-06-300001590976mbuu:CobaltMembersrt:NorthAmericaMember2021-07-012022-06-300001590976srt:NorthAmericaMember2021-07-012022-06-300001590976mbuu:InternationalMembermbuu:MalibuMember2021-07-012022-06-300001590976mbuu:SaltwaterFinishingMembermbuu:InternationalMember2021-07-012022-06-300001590976mbuu:CobaltMembermbuu:InternationalMember2021-07-012022-06-300001590976mbuu:InternationalMember2021-07-012022-06-300001590976mbuu:BoatandTrailerSalesMembermbuu:MalibuMember2020-07-012021-06-300001590976mbuu:BoatandTrailerSalesMembermbuu:SaltwaterFinishingMember2020-07-012021-06-300001590976mbuu:BoatandTrailerSalesMembermbuu:CobaltMember2020-07-012021-06-300001590976mbuu:BoatandTrailerSalesMember2020-07-012021-06-300001590976mbuu:MalibuMembermbuu:PartAndOtherSalesMember2020-07-012021-06-300001590976mbuu:SaltwaterFinishingMembermbuu:PartAndOtherSalesMember2020-07-012021-06-300001590976mbuu:CobaltMembermbuu:PartAndOtherSalesMember2020-07-012021-06-300001590976mbuu:PartAndOtherSalesMember2020-07-012021-06-300001590976mbuu:MalibuMember2020-07-012021-06-300001590976mbuu:SaltwaterFinishingMember2020-07-012021-06-300001590976mbuu:CobaltMember2020-07-012021-06-300001590976mbuu:MalibuMembersrt:NorthAmericaMember2020-07-012021-06-300001590976mbuu:SaltwaterFinishingMembersrt:NorthAmericaMember2020-07-012021-06-300001590976mbuu:CobaltMembersrt:NorthAmericaMember2020-07-012021-06-300001590976srt:NorthAmericaMember2020-07-012021-06-300001590976mbuu:InternationalMembermbuu:MalibuMember2020-07-012021-06-300001590976mbuu:SaltwaterFinishingMembermbuu:InternationalMember2020-07-012021-06-300001590976mbuu:CobaltMembermbuu:InternationalMember2020-07-012021-06-300001590976mbuu:InternationalMember2020-07-012021-06-300001590976mbuu:MalibuBoatsHoldingsLLCMemberus-gaap:NoncontrollingInterestMember2023-06-300001590976mbuu:MalibuBoatsHoldingsLLCMemberus-gaap:NoncontrollingInterestMember2022-06-300001590976mbuu:MalibuBoatsHoldingsLLCMemberus-gaap:ParentMember2023-06-300001590976mbuu:MalibuBoatsHoldingsLLCMemberus-gaap:ParentMember2022-06-300001590976mbuu:MalibuBoatsHoldingsLLCMember2023-06-300001590976mbuu:MalibuBoatsHoldingsLLCMember2022-06-300001590976us-gaap:CommonClassAMember2022-07-012023-06-300001590976us-gaap:RepurchaseAgreementsMember2022-07-012023-06-300001590976mbuu:MaverickBoatGroupIncMember2020-12-312020-12-310001590976mbuu:MaverickBoatGroupIncMember2020-12-310001590976mbuu:DealerRelationshipMembermbuu:MaverickBoatGroupIncMember2020-12-312020-12-310001590976us-gaap:TradeNamesMembermbuu:MaverickBoatGroupIncMember2020-12-312020-12-310001590976mbuu:DealerRelationshipMembermbuu:MaverickBoatGroupIncMember2020-12-310001590976mbuu:MaverickBoatGroupIncMember2020-07-012021-06-300001590976mbuu:MaverickBoatGroupIncMember2022-07-012023-06-300001590976mbuu:MaverickBoatGroupIncMember2021-07-012022-06-300001590976us-gaap:BuildingMember2023-06-300001590976us-gaap:MachineryAndEquipmentMembersrt:MinimumMember2023-06-300001590976us-gaap:MachineryAndEquipmentMembersrt:MaximumMember2023-06-300001590976us-gaap:FurnitureAndFixturesMembersrt:MinimumMember2023-06-300001590976srt:MaximumMemberus-gaap:FurnitureAndFixturesMember2023-06-300001590976us-gaap:LandMember2023-06-300001590976us-gaap:LandMember2022-06-300001590976mbuu:BuildingandLeaseholdImprovementsMember2023-06-300001590976mbuu:BuildingandLeaseholdImprovementsMember2022-06-300001590976us-gaap:MachineryAndEquipmentMember2023-06-300001590976us-gaap:MachineryAndEquipmentMember2022-06-300001590976us-gaap:FurnitureAndFixturesMember2023-06-300001590976us-gaap:FurnitureAndFixturesMember2022-06-300001590976us-gaap:ConstructionInProgressMember2023-06-300001590976us-gaap:ConstructionInProgressMember2022-06-300001590976mbuu:MalibuMember2021-06-300001590976mbuu:SaltwaterFishingMember2021-06-300001590976mbuu:CobaltMember2021-06-300001590976mbuu:SaltwaterFishingMember2021-07-012022-06-300001590976mbuu:MalibuMember2022-06-300001590976mbuu:SaltwaterFishingMember2022-06-300001590976mbuu:CobaltMember2022-06-300001590976mbuu:SaltwaterFishingMember2022-07-012023-06-300001590976mbuu:MalibuMember2023-06-300001590976mbuu:SaltwaterFishingMember2023-06-300001590976mbuu:CobaltMember2023-06-300001590976us-gaap:CustomerRelationshipsMember2023-06-300001590976us-gaap:CustomerRelationshipsMember2022-06-300001590976us-gaap:CustomerRelationshipsMembersrt:MinimumMember2023-06-300001590976srt:MaximumMemberus-gaap:CustomerRelationshipsMember2023-06-300001590976us-gaap:PatentsMember2023-06-300001590976us-gaap:PatentsMember2022-06-300001590976us-gaap:PatentsMembersrt:MaximumMember2023-06-300001590976us-gaap:TradeNamesMember2023-06-300001590976us-gaap:TradeNamesMember2022-06-300001590976us-gaap:NoncompeteAgreementsMember2022-06-300001590976us-gaap:TradeNamesMember2023-06-300001590976us-gaap:TradeNamesMember2022-06-300001590976us-gaap:SettledLitigationMembermbuu:ProductLiabilityCasesMember2023-06-300001590976mbuu:MalibuandAxisBrandBoatsMembersrt:MaximumMember2022-07-012023-06-300001590976mbuu:CobaltMembersrt:MaximumMembermbuu:StructuralWarrantyMember2022-07-012023-06-300001590976mbuu:CobaltMembermbuu:StructuralWarrantyMember2022-07-012023-06-300001590976mbuu:CobaltMembersrt:MaximumMembermbuu:GelcoatMember2022-07-012023-06-300001590976mbuu:MalibuandAxisBrandBoatsMembermbuu:GelcoatMember2022-07-012023-06-300001590976srt:MaximumMembermbuu:SaltwaterFishingMembermbuu:StructuralWarrantyAndGelcoatMember2022-07-012023-06-300001590976mbuu:SaltwaterFishingMembermbuu:BowToSternMember2022-07-012023-06-300001590976srt:MaximumMembermbuu:MaverickPathfinderAndHewesBrandBoatsMembermbuu:StructuralWarrantyAndGelcoatMember2022-07-012023-06-300001590976mbuu:MaverickPathfinderAndHewesBrandBoatsMembermbuu:BowToSternMember2022-07-012023-06-300001590976mbuu:CobiaMembersrt:MaximumMembermbuu:StructuralWarrantyAndGelcoatMember2022-07-012023-06-300001590976mbuu:CobiaMembermbuu:BowToSternMember2022-07-012023-06-300001590976mbuu:MalibuandAxisBrandBoatsMembermbuu:EnginesMembersrt:MaximumMember2022-07-012023-06-300001590976mbuu:MalibuBrandBoatsMember2014-07-012015-06-300001590976mbuu:MalibuBrandBoatsMember2015-07-012016-06-300001590976mbuu:AxisBoatsMember2014-07-012015-06-300001590976mbuu:AxisBoatsMember2015-07-012016-06-300001590976mbuu:CobaltMembermbuu:BowToSternMember2016-07-012017-06-300001590976mbuu:CobaltMembermbuu:BowToSternMember2017-07-012018-06-300001590976mbuu:MalibuandAxisBrandBoatsMembermbuu:EnginesMember2022-07-012023-06-30mbuu:hour0001590976us-gaap:LongTermDebtMembermbuu:CreditAgreementMember2023-06-300001590976us-gaap:LongTermDebtMembermbuu:CreditAgreementMember2022-06-300001590976us-gaap:RevolvingCreditFacilityMemberus-gaap:LineOfCreditMembermbuu:CreditAgreementMember2023-06-300001590976us-gaap:RevolvingCreditFacilityMemberus-gaap:LineOfCreditMembermbuu:CreditAgreementMember2022-06-300001590976mbuu:CreditAgreementMember2023-06-300001590976us-gaap:RevolvingCreditFacilityMembermbuu:CreditAgreementMember2023-06-300001590976us-gaap:RevolvingCreditFacilityMember2020-12-310001590976us-gaap:RevolvingCreditFacilityMember2022-07-080001590976mbuu:IncrementalTermLoansMember2022-07-080001590976us-gaap:RevolvingCreditFacilityMemberus-gaap:FederalFundsEffectiveSwapRateMember2022-07-082022-07-080001590976us-gaap:RevolvingCreditFacilityMemberus-gaap:BaseRateMember2022-07-082022-07-080001590976us-gaap:RevolvingCreditFacilityMembersrt:MinimumMemberus-gaap:SecuredOvernightFinancingRateSofrOvernightIndexSwapRateMember2022-07-082022-07-080001590976us-gaap:RevolvingCreditFacilityMembersrt:MaximumMemberus-gaap:SecuredOvernightFinancingRateSofrOvernightIndexSwapRateMember2022-07-082022-07-080001590976us-gaap:RevolvingCreditFacilityMemberus-gaap:BaseRateMembersrt:MinimumMember2022-07-082022-07-080001590976us-gaap:RevolvingCreditFacilityMemberus-gaap:BaseRateMembersrt:MaximumMember2022-07-082022-07-080001590976us-gaap:RevolvingCreditFacilityMembersrt:MinimumMember2022-07-082022-07-080001590976us-gaap:RevolvingCreditFacilityMembersrt:MaximumMember2022-07-082022-07-0800015909762022-07-082022-07-080001590976us-gaap:CostOfSalesMember2022-07-012023-06-300001590976us-gaap:CostOfSalesMember2021-07-012022-06-300001590976us-gaap:CostOfSalesMember2020-07-012021-06-300001590976us-gaap:SellingGeneralAndAdministrativeExpensesMember2022-07-012023-06-300001590976us-gaap:SellingGeneralAndAdministrativeExpensesMember2021-07-012022-06-300001590976us-gaap:SellingGeneralAndAdministrativeExpensesMember2020-07-012021-06-300001590976us-gaap:OtherOperatingIncomeExpenseMember2022-07-012023-06-300001590976us-gaap:OtherOperatingIncomeExpenseMember2021-07-012022-06-300001590976us-gaap:OtherOperatingIncomeExpenseMember2020-07-012021-06-300001590976us-gaap:ForeignCountryMember2023-06-300001590976us-gaap:ForeignCountryMember2022-06-300001590976us-gaap:StateAndLocalJurisdictionMember2022-07-012023-06-300001590976us-gaap:CommonClassAMember2020-07-012021-06-30mbuu:numberOfUnitHolder0001590976us-gaap:CommonClassBMember2020-07-012021-06-300001590976us-gaap:CommonClassBMember2021-06-300001590976us-gaap:CommonClassAMember2021-07-012022-06-300001590976us-gaap:CommonClassBMember2021-07-012022-06-300001590976us-gaap:CommonClassBMember2022-07-012023-06-30mbuu:entity0001590976mbuu:Fiscal2021RepurchaseProgramMemberus-gaap:CommonClassAMember2020-08-270001590976mbuu:Fiscal2021RepurchaseProgramMemberus-gaap:CommonClassAMember2020-08-272020-08-270001590976us-gaap:CommonClassAMembermbuu:Fiscal2022RepurchaseProgramMember2021-11-030001590976us-gaap:CommonClassAMembermbuu:Fiscal2022RepurchaseProgramMember2022-07-012023-06-300001590976us-gaap:CommonClassAMembermbuu:Fiscal2023RepurchaseProgramMember2022-11-030001590976us-gaap:CommonClassAMembermbuu:Fiscal2023RepurchaseProgramMember2023-06-30mbuu:vote0001590976mbuu:LongTermIncentivePlanMember2014-01-060001590976mbuu:LongTermIncentivePlanMember2023-06-300001590976us-gaap:RestrictedStockMembermbuu:LongTermIncentivePlanMember2023-05-122023-05-120001590976us-gaap:RestrictedStockUnitsRSUMembermbuu:LongTermIncentivePlanMember2020-11-032020-11-030001590976us-gaap:RestrictedStockMembermbuu:LongTermIncentivePlanMember2020-11-032020-11-030001590976mbuu:RestrictedStockUnitandRestrictedStockAwardMembermbuu:LongTermIncentivePlanMember2020-11-032020-11-030001590976mbuu:RestrictedStockUnitandRestrictedStockAwardMembermbuu:LongTermIncentivePlanMember2020-11-030001590976mbuu:RestrictedStockUnitandRestrictedStockAwardMemberus-gaap:ShareBasedCompensationAwardTrancheOneMembermbuu:LongTermIncentivePlanMember2020-11-032020-11-030001590976mbuu:RestrictedStockUnitandRestrictedStockAwardMemberus-gaap:ShareBasedCompensationAwardTrancheTwoMembermbuu:LongTermIncentivePlanMember2020-11-032020-11-030001590976us-gaap:PerformanceSharesMembermbuu:LongTermIncentivePlanMember2020-11-032020-11-030001590976us-gaap:PerformanceSharesMembermbuu:LongTermIncentivePlanMember2020-11-030001590976mbuu:StockAwardsWithMarketConditionMembermbuu:LongTermIncentivePlanMember2020-11-032020-11-030001590976mbuu:StockAwardsWithMarketConditionMembermbuu:LongTermIncentivePlanMember2020-11-030001590976us-gaap:RestrictedStockUnitsRSUMembermbuu:LongTermIncentivePlanMember2021-11-032021-11-030001590976us-gaap:RestrictedStockMembermbuu:LongTermIncentivePlanMember2021-11-032021-11-030001590976mbuu:RestrictedStockUnitandRestrictedStockAwardMembermbuu:LongTermIncentivePlanMember2021-11-032021-11-030001590976mbuu:RestrictedStockUnitandRestrictedStockAwardMembermbuu:LongTermIncentivePlanMember2021-11-030001590976mbuu:RestrictedStockUnitandRestrictedStockAwardMemberus-gaap:ShareBasedCompensationAwardTrancheOneMembermbuu:LongTermIncentivePlanMember2021-11-032021-11-030001590976mbuu:RestrictedStockUnitandRestrictedStockAwardMemberus-gaap:ShareBasedCompensationAwardTrancheTwoMembermbuu:LongTermIncentivePlanMember2021-11-032021-11-030001590976us-gaap:PerformanceSharesMembermbuu:LongTermIncentivePlanMember2021-11-032021-11-030001590976us-gaap:PerformanceSharesMembermbuu:LongTermIncentivePlanMember2021-11-030001590976mbuu:StockAwardsWithMarketConditionMembermbuu:LongTermIncentivePlanMember2021-11-032021-11-030001590976mbuu:StockAwardsWithMarketConditionMembermbuu:LongTermIncentivePlanMember2021-11-030001590976us-gaap:RestrictedStockUnitsRSUMembermbuu:LongTermIncentivePlanMember2022-05-062022-05-060001590976us-gaap:RestrictedStockUnitsRSUMembermbuu:LongTermIncentivePlanMember2022-05-060001590976us-gaap:RestrictedStockUnitsRSUMembermbuu:LongTermIncentivePlanMember2022-11-032022-11-030001590976us-gaap:RestrictedStockMembermbuu:LongTermIncentivePlanMember2022-11-032022-11-030001590976mbuu:RestrictedStockUnitandRestrictedStockAwardMembermbuu:LongTermIncentivePlanMember2022-11-032022-11-030001590976mbuu:RestrictedStockUnitandRestrictedStockAwardMembermbuu:LongTermIncentivePlanMember2022-11-030001590976mbuu:RestrictedStockUnitandRestrictedStockAwardMemberus-gaap:ShareBasedCompensationAwardTrancheOneMembermbuu:LongTermIncentivePlanMember2022-11-032022-11-030001590976mbuu:RestrictedStockUnitandRestrictedStockAwardMemberus-gaap:ShareBasedCompensationAwardTrancheTwoMembermbuu:LongTermIncentivePlanMember2022-11-032022-11-030001590976us-gaap:PerformanceSharesMembermbuu:LongTermIncentivePlanMember2022-11-032022-11-030001590976us-gaap:PerformanceSharesMembermbuu:LongTermIncentivePlanMember2022-11-030001590976mbuu:StockAwardsWithMarketConditionMembermbuu:LongTermIncentivePlanMember2022-11-032022-11-030001590976mbuu:StockAwardsWithMarketConditionMembermbuu:LongTermIncentivePlanMember2022-11-030001590976mbuu:LongTermIncentivePlanMember2022-07-012023-06-300001590976mbuu:LongTermIncentivePlanMember2021-07-012022-06-300001590976mbuu:LongTermIncentivePlanMember2020-07-012021-06-300001590976us-gaap:CommonClassAMemberus-gaap:CommonStockMembermbuu:LongTermIncentivePlanMember2022-07-012023-06-300001590976us-gaap:RestrictedStockUnitsRSUMembermbuu:LongTermIncentivePlanMember2022-07-012023-06-300001590976us-gaap:CommonClassAMemberus-gaap:CommonStockMembermbuu:LongTermIncentivePlanMember2021-07-012022-06-300001590976us-gaap:RestrictedStockUnitsRSUMembermbuu:LongTermIncentivePlanMember2021-07-012022-06-300001590976us-gaap:CommonClassAMemberus-gaap:CommonStockMembermbuu:LongTermIncentivePlanMember2020-07-012021-06-300001590976us-gaap:RestrictedStockUnitsRSUMembermbuu:LongTermIncentivePlanMember2020-07-012021-06-300001590976mbuu:RestrictedStockUnitandRestrictedStockAwardMember2022-06-300001590976mbuu:RestrictedStockUnitandRestrictedStockAwardMember2021-06-300001590976mbuu:RestrictedStockUnitandRestrictedStockAwardMember2020-06-300001590976mbuu:RestrictedStockUnitandRestrictedStockAwardMember2022-07-012023-06-300001590976mbuu:RestrictedStockUnitandRestrictedStockAwardMember2021-07-012022-06-300001590976mbuu:RestrictedStockUnitandRestrictedStockAwardMember2020-07-012021-06-300001590976mbuu:RestrictedStockUnitandRestrictedStockAwardMember2023-06-300001590976mbuu:RestrictedStockUnitandRestrictedStockAwardMembermbuu:LongTermIncentivePlanMember2023-06-300001590976mbuu:RestrictedStockUnitandRestrictedStockAwardMembermbuu:LongTermIncentivePlanMember2022-07-012023-06-300001590976us-gaap:EmployeeStockOptionMembermbuu:LongTermIncentivePlanMember2022-07-012023-06-300001590976us-gaap:EmployeeStockOptionMembermbuu:LongTermIncentivePlanMember2021-07-012022-06-300001590976us-gaap:EmployeeStockOptionMembermbuu:LongTermIncentivePlanMember2020-07-012021-06-300001590976us-gaap:RestrictedStockUnitsRSUMember2022-07-012023-06-300001590976us-gaap:RestrictedStockUnitsRSUMember2021-07-012022-06-300001590976us-gaap:RestrictedStockUnitsRSUMember2020-07-012021-06-300001590976us-gaap:EmployeeStockOptionMember2022-07-012023-06-300001590976us-gaap:EmployeeStockOptionMember2021-07-012022-06-300001590976us-gaap:EmployeeStockOptionMember2020-07-012021-06-300001590976us-gaap:PerformanceSharesMember2022-07-012023-06-300001590976us-gaap:PerformanceSharesMember2021-07-012022-06-300001590976us-gaap:PerformanceSharesMember2020-07-012021-06-30mbuu:unit00015909762023-03-282023-03-280001590976us-gaap:SubsequentEventMember2023-07-252023-07-250001590976us-gaap:SubsequentEventMember2023-07-250001590976mbuu:BatchelderEtAlVMalibuBoatsLLCMember2021-08-282021-08-280001590976mbuu:CompensatoryDamagesMembermbuu:BatchelderEtAlVMalibuBoatsLLCMember2021-08-282021-08-280001590976mbuu:MalibuBoatsWestIncMembermbuu:BatchelderEtAlVMalibuBoatsLLCMember2021-08-282021-08-280001590976mbuu:PunitiveDamagesMembermbuu:BatchelderEtAlVMalibuBoatsLLCMember2021-08-282021-08-280001590976mbuu:BatchelderEtAlVMalibuBoatsLLCMember2021-08-2800015909762021-08-280001590976us-gaap:PendingLitigationMembermbuu:BatchelderEtAlVMalibuBoatsLLCMember2021-08-282021-08-280001590976us-gaap:SubsequentEventMembermbuu:BatchelderEtAlVMalibuBoatsLLCMember2023-07-012023-07-310001590976us-gaap:SubsequentEventMembermbuu:BatchelderPlaintiffsMembermbuu:BatchelderEtAlVMalibuBoatsLLCMember2023-07-012023-07-310001590976us-gaap:SubsequentEventMembermbuu:BatchelderEtAlVMalibuBoatsLLCMember2023-07-310001590976mbuu:ShareholderMember2023-06-30mbuu:member0001590976mbuu:ShareholderMember2022-07-012023-06-300001590976mbuu:ShareholderMember2021-07-012022-06-300001590976mbuu:ShareholderMember2020-07-012021-06-300001590976mbuu:ShareholderMember2021-06-300001590976mbuu:MalibuUSMember2022-07-012023-06-300001590976mbuu:MalibuUSMember2023-06-300001590976mbuu:MalibuUSMember2021-07-012022-06-300001590976mbuu:MalibuUSMember2022-06-300001590976mbuu:MalibuUSMember2020-07-012021-06-300001590976mbuu:SaltwaterFishingMember2020-07-012021-06-300001590976mbuu:MalibuUSMember2021-06-3000015909762023-04-012023-06-3000015909762023-01-012023-03-3100015909762022-10-012022-12-3100015909762022-07-012022-09-3000015909762022-04-012022-06-3000015909762022-01-012022-03-3100015909762021-10-012021-12-3100015909762021-07-012021-09-300001590976us-gaap:SubsequentEventMember2023-07-012023-07-310001590976us-gaap:SubsequentEventMember2023-08-242023-08-240001590976us-gaap:RevolvingCreditFacilityMemberus-gaap:SubsequentEventMember2023-07-072023-07-070001590976us-gaap:RevolvingCreditFacilityMemberus-gaap:SubsequentEventMember2023-07-070001590976us-gaap:RevolvingCreditFacilityMemberus-gaap:SubsequentEventMember2023-08-24
UNITED STATES
SECURITIES AND EXCHANGE COMMISSION
Washington, D.C. 20549
FORM 10-K
| | | | | | | | | | | | | | |
| (Mark One) | | | | |
| ☑ | ANNUAL REPORT PURSUANT TO SECTION 13 OR 15(d) OF THE SECURITIES EXCHANGE ACT OF 1934 |
For the fiscal year ended June 30, 2023
OR
| | | | | | | | | | | | | | |
| ☐ | TRANSITION REPORT PURSUANT TO SECTION 13 OR 15(d) OF THE SECURITIES EXCHANGE ACT OF 1934 |
For the transition period to
Commission file number: 001-36290
MALIBU BOATS, INC.
(Exact Name of Registrant as specified in its charter)
| | | | | | | | | | | | | | | | | | | | | | | |
| Delaware | | 5075 Kimberly Way, Loudon, Tennessee 37774 | | 46-4024640 |
(State or other jurisdiction of
incorporation or organization) | | (Address of principal executive offices,
including zip code) | | (I.R.S. Employer
Identification No.) |
| | | | | | | |
| | (865) 458-5478 | | |
| | (Registrant’s telephone number,
including area code) | | |
Securities registered pursuant to Section 12(b) of the Act:
| | | | | | | | |
| Title of each class | Trading Symbol(s) | Name of each exchange on which registered |
| Class A Common Stock, par value $0.01 | MBUU | Nasdaq Global Select Market |
Indicate by check mark if the registrant is a well-known seasoned issuer, as defined in Rule 405 of the Securities Act. Yes þ No ¨
Indicate by check mark if the registrant is not required to file reports pursuant to Section 13 or Section 15(d) of the Act. Yes ¨ No þ
Indicate by check mark whether the registrant (1) has filed all reports required to be filed by Section 13 or 15(d) of the Securities Exchange Act of 1934 during the preceding 12 months (or for such shorter period that the registrant was required to file such reports), and (2) has been subject to such filing requirements for the past 90 days. Yes þ No ¨
Indicate by check mark whether the registrant has submitted electronically every Interactive Data File required to be submitted pursuant to Rule 405 of Regulation S-T (§232.405 of this chapter) during the preceding 12 months (or for such shorter period that the registrant was required to submit such files). Yes þ No ¨
Indicate by check mark whether the registrant is a large accelerated filer, an accelerated filer, a non-accelerated filer, smaller reporting company or an emerging growth company. See the definitions of “large accelerated filer,” “accelerated filer,” “smaller reporting company” and “emerging growth company” in Rule 12b-2 of the Exchange Act:
| | | | | | | | | | | | | | | | | | | | |
| Large accelerated filer | | ☑ | | Accelerated filer | | ☐ |
| | | |
| Non-accelerated filer | | ☐ | | Smaller reporting company | | ☐ |
| | | | | | |
| Emerging growth company | | ☐ | | | | |
| | | | | | |
If an emerging growth company, indicate by check mark if the registrant has elected not to use the extended transition period for complying with any new or revised financial accounting standards provided pursuant to Section 13(a) of the Exchange Act. ¨ |
| | | | | |
| Indicate by a check mark whether the registrant has filed a report on and attestation to its management's assessment of the effectiveness of its internal control over financial reporting under Section 404(b) of the Sarbanes-Oxley Act (15 U.S.C. 7262(b)) by the registered public accounting firm that prepared or issued its audit report. | ☑ |
| |
| If securities are registered pursuant to Section 12(b) of the Act, indicate by check mark whether the financial statements of the registrant included in the filing reflect the correction of an error to previously issued financial statements. | ☐ |
| |
| Indicate by check mark whether any of those error corrections are restatements that required a recovery analysis of incentive-based compensation received by any of the registrant’s executive officers during the relevant recovery period pursuant to § 240.10D-1(b). | ☐ |
| | | | | | | | | | | | | | |
| Indicate by check mark whether the registrant is a shell company (as defined in Rule 12b-2 of the Exchange Act). | Yes | ☐ | No | ☑ |
As of December 31, 2022, the last business day of the registrant’s most recently completed second fiscal quarter, the aggregate value of the registrant’s common stock held by non-affiliates was approximately $1,067.0 million, based on the number of shares of Class A common stock held by non-affiliates as of December 31, 2022 and the closing price of the registrant’s Class A common stock on the Nasdaq Global Select Market on December 31, 2022. Shares held by each executive officer, director and by each person who owns 10% or more of the outstanding Class A common stock have been excluded in that such persons may be deemed to be affiliates. This determination of affiliate status is not necessarily a conclusive determination for other purposes. The number of outstanding shares of the registrant’s Class A common stock, par value $0.01 per share, and Class B common stock, par value $0.01, as of August 24, 2023 was 20,603,689 and 12, respectively.
DOCUMENTS INCORPORATED BY REFERENCE
Portions of the registrant’s Proxy Statement for the 2023 Annual Meeting of Stockholders are incorporated into Part III of this Annual Report on Form 10-K where indicated. Such proxy statement will be filed with the Securities and Exchange Commission within 120 days of the registrant’s fiscal year ended June 30, 2023.
TABLE OF CONTENTS
SPECIAL NOTE REGARDING FORWARD-LOOKING STATEMENTS
This Annual Report on Form 10-K contains forward-looking statements. All statements other than statements of historical facts contained in this Form 10-K are forward-looking statements, including statements regarding demand for our products and expected industry trends, our business strategy and plans, our prospective products or products under development, our vertical integration initiatives, our acquisition strategy and management’s objectives for future operations. In particular, many of the statements under the headings “Item 1A. Risk Factors,” “Item 7. Management’s Discussion and Analysis of Financial Condition and Results of Operations” and “Item 1. Business” constitute forward-looking statements. In some cases, you can identify forward-looking statements by terminology such as “may,” “will,” “should,” “expects,” “plans,” “anticipates,” “believes,” “estimates,” “predicts,” “potential,” “continue,” the negative of these terms, or by other similar expressions that convey uncertainty of future events or outcomes to identify these forward-looking statements. These statements are only predictions, involving known and unknown risks, uncertainties and other factors that may cause our or our industry’s actual results, levels of activity, performance or achievements to be materially different from any future results, levels of activity, performance or achievements expressed or implied by these forward-looking statements. Such factors include, but are not limited to: general industry, economic and business conditions; our ability to execute our manufacturing strategy; our large fixed cost base; increases in the cost of, or unavailability of, raw materials, component parts and transportation costs; disruptions in our suppliers’ operations; our reliance on third-party suppliers for raw materials and components and any interruption of our informal supply arrangements; our reliance on certain suppliers for our engines and outboard motors; our ability to meet our manufacturing workforce needs; exposure to workers' compensation claims and other workplace liabilities; our ability to grow our business through acquisitions and integrate such acquisitions to fully realize their expected benefits; our growth strategy which may require us to secure significant additional capital; our ability to protect our intellectual property; disruptions to our network and information systems; our success at developing and implementing a new enterprise resource planning system; risks inherent in operating in foreign jurisdictions; a natural disaster, global pandemic or other disruption at our manufacturing facilities; increases in income tax rates or changes in income tax laws; our dependence on key personnel; our ability to enhance existing products and market new or enhanced products; the continued strength of our brands; the seasonality of our business; intense competition within our industry; increased consumer preference for used boats or the supply of new boats by competitors in excess of demand; competition with other activities for consumers’ scarce leisure time; changes in currency exchange rates; inflation and increases in interest rates; an increase in energy and fuel costs; our reliance on our network of independent dealers and increasing competition for dealers; the financial health of our dealers and their continued access to financing; our obligation to repurchase inventory of certain dealers; our exposure to claims for product liability and warranty claims; changes to U.S. trade policy, tariffs and import/export regulations; any failure to comply with laws and regulations including environmental, workplace safety and other regulatory requirements; our holding company structure; covenants in our credit agreement governing our revolving credit facility which may limit our operating flexibility; our variable rate indebtedness which subjects us to interest rate risk; our obligation to make certain payments under a tax receivables agreement; and any failure to maintain effective internal control over financial reporting or disclosure controls or procedures.
We discuss many of these factors, risks and uncertainties in greater detail under the heading “Item 1A. Risk Factors” and elsewhere in this Form 10-K. These factors expressly qualify as forward-looking statements attributable to us or persons acting on our behalf.
You should not rely on forward-looking statements as predictions of future events. Although we believe that the expectations reflected in the forward-looking statements are reasonable, we cannot guarantee future results, levels of activity, performance or achievements. Actual results may differ materially from those suggested by the forward-looking statements for various reasons, including those discussed under “Item 1A. Risk Factors” in this Form 10-K. Except as required by law, we assume no obligation to update forward-looking statements for any reason after the date of this Form 10-K to conform these statements to actual results or to changes in our expectations.
PART I.
Item 1. Business
Unless otherwise expressly indicated or the context otherwise requires, in this Annual Report on Form 10-K:
•we use the terms “Malibu Boats,” the “Company,” “we,” “us,” “our” or similar references to refer (1) prior to the consummation of our initial public offering, or "IPO" on February 5, 2014, to Malibu Boats Holdings, LLC, or the LLC, and its consolidated subsidiaries and (2) after our IPO, to Malibu Boats, Inc. and its consolidated subsidiaries;
•we refer to the owners of membership interests in the LLC immediately prior to the consummation of the IPO, collectively, as our “pre-IPO owners”;
•we refer to owners of membership interests in the LLC (the "LLC Units"), collectively, as our “LLC members”;
•references to “fiscal year” refer to the fiscal year of Malibu Boats, which ends on June 30 of each year;
•we refer to our Malibu branded boats as "Malibu", our Axis Wake Research branded boats as "Axis", our Pursuit branded boats as "Pursuit", our Maverick, Cobia, Pathfinder and Hewes branded boats as "Maverick Boat Group", and our Cobalt branded boats as "Cobalt";
•we use the term “recreational powerboat industry” to refer to our industry group, which includes performance sport boats, sterndrive and outboard boats;
•we use the term “performance sport boat category” to refer to the industry category, consisting primarily of fiberglass boats equipped with inboard propulsion and ranging from 19 feet to 26 feet in length, which we believe most closely corresponds to (1) the inboard ski/wakeboard category, as defined and tracked by the National Marine Manufacturers Association, or NMMA, and (2) the inboard ski boat category, as defined and tracked by Statistical Surveys, Inc., or SSI;
•we use the terms “sterndrive” and “outboard” to refer to the industry category, consisting primarily of sterndrive and outboard boats ranging from 20 feet to 40 feet, which most closely corresponds to the sterndrive and outboard categories, as defined and tracked by NMMA, and the sterndrive and outboard propulsion categories, as defined and tracked by SSI; in some instances, we provide market information based on specific boat lengths or boat types within the sterndrive or outboard categories to reflect our performance in those specific markets in which we offer products; and
•references to certain market and industry data presented in this Form 10-K are determined as follows: (1) U.S. boat sales and unit volume for the overall powerboat industry and any powerboat category during any calendar year are based on retail boat market data from the NMMA; (2) U.S. market share and unit volume for the overall powerboat industry and any powerboat category during any fiscal year ended June 30 or any calendar year ended December 31 are based on comparable same-state retail boat registration data from SSI, as reported by the 50 states for which data was available as of the date of this Form 10-K; and (3) market share among U.S. manufacturers of exports to international markets of boats in any powerboat category for any period is based on data from the Port Import Export Reporting Service, available through March 31, 2023, and excludes such data for Australia and New Zealand.
This Annual Report on Form 10-K includes our trademarks, such as “ Monsoon,” “Surf Gate,” “Wakesetter,” “Surf Band,” and “Swim Step,” which are protected under applicable intellectual property laws and are the property of Malibu Boats, Inc. This Form 10-K also contains trademarks, service marks, trade names and copyrights of other companies, which are the property of their respective owners. Solely for convenience, trademarks and trade names referred to in this Form 10-K may appear without the ® or TM symbols, but such references are not intended to indicate, in any way, that we will not assert, to the fullest extent under applicable law, our rights or the right of the applicable licensor to these trademarks and trade names.
Our Company
We are a leading designer, manufacturer and marketer of a diverse range of recreational powerboats, including performance sport boats, sterndrive and outboard boats under eight brands—Malibu, Axis, Pursuit, Maverick, Cobia, Pathfinder, Hewes and Cobalt. We have the #1 market share position in the United States in the performance sport boat category through our Malibu and Axis brands and the #1 market share position in the United States in the 24’—29’ segment of the sterndrive category through our Cobalt brand, and we are among the leading market share positions in the fiberglass outboard fishing boat market with our Pursuit and Maverick Boat Group brands. Our product portfolio of premium brands are used for a broad range of recreational boating activities including, among others, water sports such as water skiing,
wakeboarding and wake surfing, as well as general recreational boating and fishing. Our passion for consistent innovation, which has led to propriety technology such as Surf Gate, has allowed us to expand the market for our products by introducing consumers to new and exciting recreational activities. We design products that appeal to an expanding range of recreational boaters and water sports enthusiasts whose passion for boating and water sports is a key aspect of their lifestyle and provide consumers with a better customer-inspired experience. With performance, quality, value and multi-purpose features, our product portfolio has us well positioned to broaden our addressable market and achieve our goal of increasing our market share in the expanding recreational boating industry.
Our flagship Malibu boats are designed for consumers seeking a premium performance sport boat experience and offer our latest innovations in performance, comfort and convenience. Our Axis boats appeal to consumers who desire a more affordable performance sport boat product but still demand high performance, functional simplicity and the option to upgrade key features. Our Pursuit boats expand our product offerings into the saltwater outboard fishing market and include center console, dual console and offshore models. Our Maverick Boat Group family of boats, including Maverick, Cobia, Pathfinder and Hewes, are highly complementary to Pursuit and its saltwater outboard offerings with a focus in length segments under 30 feet. Our Cobalt boats consist of mid to large-sized luxury cruisers and bowriders that we believe offer the ultimate experience in comfort, performance and quality.
Our boats are constructed of fiberglass, available in a range of sizes, hull designs and propulsion systems (i.e., inboard, sterndrive and outboard). We employ experienced product development and engineering teams that enable us to offer a range of models across each of our brands while consistently introducing innovative features in our product offerings. Our engineering teams closely collaborate with our manufacturing personnel in order to improve product quality and process efficiencies. The results of this collaboration are reflected in our receipt of numerous industry awards.
We sell our boats through a dealer network that we believe is the strongest in the recreational powerboat industry. As of June 30, 2023, our distribution channel consisted of over 400 dealer locations globally. Our dealer base is an important part of our consumers’ experience, our marketing efforts and our brands. We devote significant time and resources to find, develop and improve the performance of our dealers and believe our dealer network gives us a distinct competitive advantage.
Market and Competitive Position
The recreational powerboat industry, including the performance sport boat, sterndrive and outboard categories, is highly competitive for consumers and dealers. Competition affects our ability to succeed in the markets we currently serve and new markets that we may enter in the future. We compete with several large manufacturers that may have greater financial, marketing and other resources than we do. We compete with large manufacturers who are represented by dealers in the markets in which we now operate and into which we plan to expand. We also compete with a wide variety of small, independent manufacturers. Competition in our industry is based primarily on brand name, price and product performance.
During calendar year 2022, retail sales of new recreational powerboats in the United States totaled $16.0 billion. Of the recreational powerboat categories defined and tracked by the NMMA, we serve three of the top four categories consisting of outboard, sterndrive and performance sport boat representing an addressable market of nearly $13.2 billion in retail sales through our Malibu, Axis, Pursuit, Maverick Boat Group brands and Cobalt brands. The following table illustrates the size of our addressable market in units and retail sales for calendar year 2022:
| | | | | | | | | | | | | | |
| Recreational Powerboat Category | | Unit Sales | | Retail Sales |
| | | | (Dollars in millions) |
| Outboard | | 160,850 | | | $ | 10,419 | |
| Performance sport boat | | 12,200 | | | $ | 1,893 | |
| Sterndrive | | 6,900 | | | $ | 887 | |
| Jet boat | | 8,000 | | | $ | 495 | |
| Cruisers | | 1,600 | | | $ | 2,283 | |
| Total addressable market | | 189,550 | | | $ | 15,977 | |
We maintain a leading market share position in a number of recreational boating categories with our various brands. According to SSI, in 2022 we held the number one market share position in the United States for performance sport boats with our Malibu and Axis brands, the number one market share position in the United States for the 24’—29’ segment of the sterndrive boat category through our Cobalt brand, and we are among the leading market share positions in the outboard fiberglass fishing market that our Pursuit and Maverick Boat Group brands serve, in each case based on unit volume. We have grown our U.S. market share in the performance sports boat category from 24.5% in 2010 to 28.8% in 2022 and we have
expanded our market share in the 24’-29’ segment of the sterndrive boat category from 14.2% in 2010 to 35.9% in 2022. Our Pursuit brand has gained share within its market since our acquisition of Pursuit and we are positioned to gain a broader share of the overall outboard fiberglass fishing market with our Maverick Boat Group brands.
Our Products and Brands
We design, manufacture and sell recreational powerboats, including performance sport boats, sterndrive and outboard boats across eight brands: Malibu, Axis, Pursuit, Maverick, Cobia, Pathfinder, Hewes, and Cobalt. We believe that we deliver superior performance for general recreational purposes with a significant focus on water sports, including wakeboarding, water skiing and wake surfing as well as general recreational boating and fishing. In addition, we also offer various accessories and aftermarket parts. The following table provides an overview of our product offerings by brand as of June 30, 2023:
| | | | | | | | | | | | | | | | | |
| Reportable Segment | Brand | Number of
Models | Lengths | Retail Price
Range
(In thousands) | Description |
| Malibu | Malibu | 11 | 20'-26' | $80-$300 | Malibu targets consumers seeking a premium boating experience with our latest innovations in performance, comfort and convenience. Across our three product lines, we offer a variety of products to customers from our Response Series tailored for high-performance water ski to highly customizable options in our Wakesetter series to our ultra premium models in the M Series. |
| Axis | 6 | 20’-25’ | $80-$175 | Axis was formed to target a younger demographic by providing a more affordably priced, high quality, entry-level boat with high performance, functional simplicity and the option to upgrade key features such as Surf Gate. |
| | | | | |
| Saltwater Fishing | Pursuit | 18 | 24'-46' | $130-$1,400 | Pursuit is a premium brand of saltwater outboard fishing boats available in three product lines including our sports center consoles, dual consoles and our offshore series to provide customers with options for ideal fishing as well as casual cruising and luxury entertainment. |
| Cobia | 11 | 21'-34' | $60-$500 | Cobia models consist of center console and dual console vessels that are designed to promote ease of boating and fishing for all levels of anglers and boaters. |
| Pathfinder | 8 | 22'-27' | $60-$250 | Pathfinder provides the most versatile inshore fishing boat. The product of bay boats provides for dedicated anglers to fish and do so with comfort, safety and proven technology. |
| Maverick and Hewes | 6 | 16'-21' | $45-$125 | Maverick and Hewes have been designed to tailor to shallow inshore flats anglers. These boats, with vacuum infused (VARIS) construction and enhanced performance, provide a legacy of dependability, unmatched ride, and exceptional craftsmanship. |
| | | | | |
| Cobalt | Cobalt | 18 | 22’-36’ | $75-$625 | Cobalt is a premium luxury sterndrive and outboard boat manufacturer available in five product lines. Our products tailor sterndrive from entry level to premium with options to expand some models with the patented Surf Gate, as well as our outboard series for increased saltwater use. |
Innovative Features
In addition to the standard features included on all of our boats, we offer consumers a full selection of innovative optional features designed to enhance performance, functionality and the overall boating experience. We believe our innovative features drive our high average selling prices. Among our most successful and most innovative has been Surf Gate. Introduced in July 2012 and initially patented in September 2013, Surf Gate is available as an optional feature on all Malibu, Axis and certain Cobalt models. Surf Gate has revolutionized the increasingly popular sport of wake surfing. Prior to Surf Gate, boaters needed to empty ballast tanks on one side of the boat and shift passengers around to lean the boat to create a larger, more pronounced surf-quality wake. By employing precisely engineered and electronically controlled panels, Surf Gate alleviates this time-consuming and cumbersome process, allowing boaters to easily surf behind an evenly weighted boat without the need to wait for ballast changes. We have also developed our patented Surf Band technology that allows the rider to remotely control the surf wave, shape, size and side. Some of our other notable innovations include Power Wedge III, G5 and the power actuated G10+ Tower, Electronic Dashboard Controls, Flip Down Swim Step, Tower Mister, Splash and Stow and Cobalt's TruWave Technology. Pursuit also has introduced the industry first Electric Sliding Entertainment Center and sliding second row center console seating. Maverick Boat Group has introduced first of its kind "Hybrid" and "Open" Bay Boat designs in recent years.
We won the Boating Industry Magazine's "Top Product" award for the Pursuit S 358 Sport in 2022. Malibu Trailers took the coveted NMMA Innovation Award at the Miami International Boat Show in 2022. The Malibu Wakesetter 23 LSV has won Wakeworld “Readers Choice” Wakeboard and Wakesurf Boat of the Year three years running in 2022, 2021 and 2020.
We also offer an array of less technological, but nonetheless value-added boat features such as gelcoat upgrades, upholstery upgrades, engine drivetrain enhancements (such as silent exhaust tips, propeller upgrades and closed cooling engine configuration), sound system upgrades, bimini tops, boat covers and trailers which further increase the level of customization afforded to consumers.
Our Dealer Network
We rely on independent dealers to sell our products. We establish performance criteria that our dealers must meet as part of their dealer agreements to ensure our dealer network remains the strongest in the industry. As a member of our network, dealers may qualify for floor plan financing programs, rebates, seasonal discounts and other allowances. We believe our dealer network is the most extensive in the market.
North America
As of June 30, 2023, our dealer network consisted of over 300 dealer locations servicing the performance sport boat, sterndrive, and outboard markets strategically located throughout the U.S. and Canada. Approximately 50% of our dealer locations have been with us, or with Pursuit, Maverick Boat Group or Cobalt, prior to our acquisition of them, for over ten years. Our top ten dealers represented 41.1%, 39.9% and 38.7%, of our net sales for fiscal year 2023, 2022 and 2021, respectively. The top ten dealers for each of the Malibu, Saltwater Fishing and Cobalt segments represented approximately 53.3%, 56.8% and 53.1%, respectively, of net sales in fiscal year 2023. The top ten dealers for each segment are not the same across all segments. Sales to our dealers under common control of OneWater Marine, Inc. represented approximately 17.2%, 16.8% and 16.3% of consolidated net sales in fiscal years 2023, 2022 and 2021, respectively, including approximately 6.5%, 29.5% and 20.7% of consolidated sales in fiscal year 2023 for Malibu, Saltwater Fishing and Cobalt, respectively. Sales to our dealers under common control of Tommy's Boats represented approximately 10.7%, 9.4% and 7.3% of our consolidated net sales in the fiscal years ended June 30, 2023, 2022 and 2021 respectively, including approximately 23.3%, 0.0% and 0.9% of consolidated sales in fiscal year 2023 for Malibu, Saltwater Fishing and Cobalt, respectively.
We consistently review our distribution network to identify opportunities to expand our geographic footprint and improve our coverage of the market. We believe that our diverse product offering and strong market position in each region of the United States helped us capitalize on growth opportunities as our industry recovered from the economic downturn. We have the ability to opportunistically add new dealers and new dealer locations to previously underserved markets and use data and performance metrics to monitor dealer performance. We believe our outstanding dealer network allows us to distribute our products more efficiently than our competitors.
International
We have an extensive international distribution network for our Malibu, Axis, Pursuit, Maverick Boat Group and Cobalt brands. As of June 30, 2023, our dealer network consisted of over 100 dealer locations throughout Europe, Asia, Middle East, South America, South Africa, and Australia/New Zealand.
Dealer Management
Our relationships with our dealers are governed by dealer agreements. Each dealer agreement has a finite term lasting between one and three years. Our dealer agreements also are typically terminable without cause by the dealer with 60 days’ prior notice and by us for a dealer failing to meet performance criteria. We may also generally terminate these agreements immediately for cause upon certain events. Pursuant to our dealer agreements, the dealers typically agree to, among other things:
•represent our products at specified boat shows;
•market our products only to retail end users in a specific geographic territory;
•promote and demonstrate our products to consumers;
•place a specified minimum number of orders of our products during the term of the agreement in exchange for rebate or discount eligibility that varies according to the level of volume they commit to purchase;
•provide us with regular updates regarding the number and type of our products in their inventory;
•maintain a service department to service our products, and perform all appropriate warranty service and repairs; and
•indemnify us for certain claims.
Our dealer network, including all additions, renewals, non-renewals or terminations, is managed by our sales personnel. Our sales teams operate using a semi-annual dealer review process involving our senior management team. Each individual dealer is reviewed semi-annually with a broad assessment across multiple key elements, including the dealer’s geographic region, market share and customer service ratings, to identify underperforming dealers for remediation and to manage the transition process when non-renewal or termination is a necessary step.
We have developed a system of financial incentives for our dealers based on customer satisfaction and achievement of best practices. Our brands employ dealer incentive programs that have been refined through decades of experience at each brand and may, from time to time, include the following elements:
•Rebates. Our domestic dealers agree to volume commitments that are used to determine applicable rebates. The structure of the dealer incentive depends on the brand represented. If a dealer meets its volume commitments as well as other terms of the dealer performance program, the dealer is entitled to the specified amounts subject to full compliance with our programs. Failure to meet the commitment volume or other terms of the program may result in partial or complete forfeiture of the dealer’s rebate.
•Free flooring. Our dealers that take delivery of current model year boats in the offseason, typically July through April, are entitled to have us pay the interest to floor the boat until the earlier of (1) the retail sale of the unit or (2) a date near the end of the current model year. This program is an additional incentive to encourage dealers to order in the offseason and helps us balance our seasonal production.
Our dealer incentive programs are structured to promote more evenly distributed ordering throughout the fiscal year, which allows us to achieve better level-loading of our production and thereby generate plant operating efficiencies. In addition, these programs may offer further rewards for dealers who are exclusive to our brands.
Floor Plan Financing
Our North American dealers often purchase boats through floor plan financing programs with third-party floor plan financing providers. During fiscal year 2023, approximately 75% of our North American shipments were made pursuant to floor plan financing programs which our dealers participate in. These programs allow dealers across our brands to establish lines of credit with third-party lenders to purchase inventory. Under these programs, a dealer draws on the floor plan facility upon the purchase of our boats and the lender pays the invoice price of the boats. As is typical in our industry, we have entered into repurchase agreements with certain floor plan financing providers to our dealers. Under the terms of these arrangements, in the event a lender repossesses a boat from a dealer that has defaulted on its floor financing arrangement and is able to deliver the repossessed boat to us, we are obligated to repurchase the boat from the lender. Our obligation to repurchase such repossessed products for the unpaid balance of our original invoice price for the boat is subject to reduction or limitation based on the age and condition of the boat at the time of repurchase, and in certain cases by an aggregate cap on repurchase obligations associated with a particular floor financing program.
Our exposure under repurchase agreements with third-party lenders is mitigated by our ability to reposition inventory with a new dealer in the event that a repurchase event occurs. The primary cost to us of a repurchase event is any margin loss on the resale of a repurchased unit. Historically, we have been able to resell repurchased boats at an amount that exceeds our cost. In addition, the historical margin loss on the resale of repurchased units has often been below 10% of the repurchased amount. For fiscal years 2023, 2022 and 2021, we did not repurchase any boats under our repurchase agreements.
Marketing and Sales
We believe that providing a high level of service to our dealers and end consumers is essential to maintaining our reputation. Our sales personnel receive training on the latest Malibu, Axis, Pursuit, Maverick Boat Group and Cobalt products and technologies, as well as training on our competitors’ products and technologies, and attend trade shows to increase their market knowledge. This training is then passed along to our dealers to ensure a consistent marketing message and leverage our marketing expenditures. Malibu, Axis, Pursuit, Maverick Boat Group and Cobalt enjoy strong brand awareness, as evidenced by our substantial market share in their respective categories.
Our marketing strategy focuses on building brand awareness and loyalty in the inboard towboat market with Malibu and Axis brands and the outboard and sterndrive markets with Pursuit, Maverick Boat Group and Cobalt brands. Activating the marketing strategy involves creating custom content to be utilized in outbound marketing campaigns and social media to engage
owners and prospects. In addition to retail websites developed for each of those brands and their unique consumers, the brands also manage all other aspects of marketing including traditional print advertising and trade shows.
Product Development and Engineering
We are strategically and financially committed to innovation, as reflected in our dedicated product development and engineering teams located in Tennessee, Kansas, California, and Florida and evidenced by our track record of new product introduction. As of June 30, 2023, our product development and engineering team consisted of nearly 60 professionals. These individuals bring to our product development efforts significant expertise across core disciplines, including boat design, trailer design, computer-aided design, electrical engineering and mechanical engineering. They are responsible for execution of all facets of our new product strategy, including designing new and refreshed boat models and new features, engineering these designs for manufacturing and integrating new features into our boats. In addition, our Chief Executive Officer and Chief Operating Officer are actively involved in the product development process and integration into manufacturing.
Our product development strategy consists of a two-pronged approach. First, we seek to introduce new boat models to target unaddressed or underserved segments of the recreational powerboat industry, while also updating and refreshing our existing boat models regularly. Second, we seek to develop and integrate innovative new or enhanced optional feature offerings into our boats. We intend to release new products and features multiple times during a year, which we believe enhances our reputation as a leading innovator in boat manufacturing and provides us with a competitive advantage.
We take a disciplined approach to the management of our product development strategy. We use a formalized phase gate process, overseen by a dedicated project manager, to develop, evaluate and implement new product ideas for both boat models and innovative features. Application of the phase gate process requires management to establish an overall timeline that is sub-divided into milestones, or “gates,” for product development. Setting milestones at certain intervals in the product development process ensures that each phase of development occurs in an organized manner and enables management to become aware of and address any issues in a timely fashion, which facilitates on-time, on-target release of new products with expected return on investment. Extensive testing and coordination with our manufacturing group are important elements of our product development process, which we believe enable us to minimize the risk associated with the release of new products. Our phase gate process also facilitates our introduction of new boat models and features throughout the year, which we believe provides us with a competitive advantage in the marketplace. Finally, in addition to our process for managing new product introductions in a given fiscal year, we also engage in longer-term product life cycle and product portfolio planning.
Manufacturing
We have eight manufacturing facilities located in five U.S. states and Australia. We produce performance sport boats through our Malibu and Axis brands at our Tennessee and Australia manufacturing facilities; we produce sterndrive and outboard boats through our Cobalt brand at our Kansas manufacturing facility; and we produce saltwater outboard boats under our Pursuit and Maverick Boat Group brands, as well as tooling parts, in Fort Pierce, Florida. We completed expansion projects at one of our Florida facilities (Maverick Boat Group) in fiscal year 2022 and at our other Florida facility (Pursuit Tooling) in fiscal year 2023. We also recently purchased a 260,000 square foot manufacturing facility near our Tennessee campus that we expect to fully finish constructing in fiscal year 2024. For our Malibu and Axis brands, we manufacture towers, tower accessories and stainless steel and aluminum billet at our California facility and engines and trailers at our Tennessee facility. For our Malibu, Axis and Cobalt brands, we produce wiring harnesses at our Alabama facility.
Our boats are built through a continuous flow manufacturing process that encompasses fabrication, assembly, quality management and testing. Each boat is produced on an established cycle depending on model that includes the fabrication of the hull and deck through gelcoat application and fiberglass lamination, grinding and hole cutting, installation of components, rigging, finishing, detailing and on-the-water testing. Production of cruisers occurs on a dedicated line that allows for the increased time needed to add the additional content required for production of larger boats.
We have vertically integrated key components of our manufacturing process, including the manufacturing of our own engines, boat trailers, towers and tower accessories, machined and billet parts, soft grip flooring, and most recently, wiring harnesses. We began including our engines, branded as Malibu Monsoon engines, in our Malibu and Axis boats for model year 2019, and in fiscal year 2024 we plan to begin offering Monsoon sterndrive engines to our Cobalt dealers and customers. We believe our engine marinization initiative will reduce our reliance on our previous engine suppliers for our Malibu, Axis and Cobalt brands while reducing the risk that a change in cost or production from any engine supplier for such brands could adversely affect our business. Our trailers are produced in a continuous flow manufacturing process involving cutting and bending of the main frame from raw top grade carbon steel, painting using our state-of-the-art system and installation of components. Our tower-related manufacturing in California uses multiple computer-controlled machines to cut all of the aluminum parts required for tower assembly. We are the only performance sport boat company that manufactures towers in-house. In fiscal year 2022, we acquired a facility to begin manufacturing our own wiring harnesses. As a result of this
acquisition, we reduced the risk of production delays due to delays in receipt of wiring harnesses from third-party suppliers. Vertical integration of key components of our boats also gives us the ability to increase incremental margin per boat sold by reducing our cost base and improving the efficiency of our manufacturing process. Additionally, it allows us to have greater control over design, consumer customization options, construction quality, and our supply chain. We continually review our manufacturing process to identify opportunities for additional vertical integration investments across our portfolio of premium brands. We procure other components, such as electronic controls, from third-party vendors and install them on the boat.
Suppliers
We purchase a wide variety of raw materials from our supplier base, including resins, fiberglass, hydrocarbon feedstocks and steel, as well as product parts and components, such as engines and electronic controls, through a purchase order process. The most significant component used in manufacturing our boats, based on cost, are engines. Through our vertical integration initiative to marinize our own engines, we entered into an engine supply agreement with General Motors LLC (“General Motors”) in November 2016 for the supply of engine blocks to use in our Malibu and Axis brand boats which began in our model year 2019 and continued through model year 2023. In April 2023, we signed a new supply agreement with General Motors that will continue through model year 2026. We adopted this strategy to more directly control product path (design, innovation, calibration and integration) of our largest dollar procured part, to differentiate our product from our competitors, and to increase our ability to respond to ongoing changes in the marketplace.
Pursuant to our engine supply agreement with General Motors, General Motors will deliver engines to us as we submit purchase orders. No minimum amount of engines is required to be ordered by us. The engine supply agreement will expire at the end of production of model year 2026, unless terminated earlier by either party as permitted under the terms of the agreement, including by General Motors due to market conditions with at least eighteen (18) months’ advanced written notice.
We had joint marketing agreements with Yamaha Motor Corporation, U.S.A., or Yamaha, that required us to supply a significant percentage of our Pursuit, Cobalt and Maverick Boat Group branded boats that are pre-rigged for outboard motors with Yamaha outboard motors in exchange for certain incentives. Those agreements expired on June 30, 2023. We are currently in discussions with Yamaha and expect to extend our agreement with Yamaha to supply outboard motors to a significant percentage of our Pursuit, Cobalt and Maverick Boat Group branded boats that are pre-rigged for outboard motors. Yamaha has continued to supply outboard motors to us since our prior agreements expired.
We experienced supply chain disruptions during fiscal year 2022 that we believe were driven by numerous factors, including labor shortages, ongoing domestic logistical constraints, West Coast port challenges and rising prices for our suppliers, in part due to inflationary pressures that continued into fiscal year 2023 and that we expect to continue into fiscal year 2024. With the exception of inflationary pressures, we believe that the systemic supply chain disruptions that we have experienced over the past several years have been largely rectified.
Insurance and Product Warranties
We carry various insurance policies, including policies to cover general products liability, workers’ compensation and other casualty and property risks, to protect against certain risks of loss consistent with the exposures associated with the nature and scope of our operations. Our policies are generally based on our safety record as well as market trends in the insurance industry and are subject to certain deductibles, limits and policy terms and conditions.
Our Malibu and Axis brand boats have a limited warranty for a period up to five years. Our Cobalt brand boats have (1) a structural warranty of up to ten years which covers the hull, deck joints, bulkheads, floor, transom, stringers, and motor mount, and (2) a five year bow-to-stern warranty on all components manufactured or purchased (excluding hull and deck structural components), including canvas and upholstery. Gelcoat is covered up to three years for Cobalt and one year for Malibu and Axis. Pursuit brand boats have a (1) limited warranty for a period of up to five years on structural components such as the hull, deck and defects in the gelcoat surface of the hull bottom, and (2) a bow-to-stern warranty of two years (excluding hull and deck structural components). Maverick, Pathfinder and Hewes brand boats have (1) a limited warranty for a period of up to five years on structural components such as the hull, deck and defects in the gelcoat surface of the hull bottom and (2) a bow-to-stern warranty of one year (excluding hull and deck structural components). Cobia brand boats have (1) a limited warranty for a period of up to ten years on structural components such as the hull, deck and defects in the gelcoat surface of the hull bottom and (2) a bow-to-stern warranty of three years (excluding hull and deck structural components). For each boat brand, there are certain materials, components or parts of the boat that are not covered by our warranty and certain components or parts that are separately warranted by the manufacturer or supplier (such as the engine). Our Malibu Monsoon engines that we manufacture for Malibu and Axis models have a limited warranty of up to five years or five-hundred hours.
Strategic Acquisitions
One of our growth strategies is to drive growth in our business through targeted acquisitions that add value while considering our existing brands and product portfolio. We acquired Maverick Boat Group in December 2020, Pursuit in October 2018 and Cobalt in July 2017. The primary objectives of our acquisitions are to expand our presence in new or adjacent categories, to expand into other product lines that may benefit from our operating strengths, and to increase the size of our addressable market. When we identify potential acquisitions, we attempt to target companies with a leading market share, strong cash flows, and an experienced management team and workforce that provide a fit with our existing operations. After completing an acquisition, we focus on integrating the company with our existing business to provide additional value to the combined entity through cost savings and revenue synergies, such as the optimization of manufacturing operations, improved processes around product development, enhancement of our existing dealer distribution network, accelerated innovation, administrative cost savings, shared procurement, vertical integration and cross-selling opportunities.
Intellectual Property
We rely on a combination of patent, trademark and copyright protection, trade secret laws, confidentiality procedures and contractual provisions to protect our rights in our brand, products and proprietary technology. This is an important part of our business and we intend to continue protecting our intellectual property. By law, our patent rights have limited lives and expire periodically. Our boat patent rights relate to boat design, features and components that we feel are important to our competitive position in our business. Some of our well-known patents include our Surf Gate and Swim Step for our Malibu and Cobalt segments and Power Wedge for our Malibu segment.
Our trademarks which are registered in the U.S. and various countries around the world, generally may endure in perpetuity on a country-by-country basis, provided that we comply with all statutory maintenance requirements, including continued use of each trademark in each such country. Some of our well-known trademarks include: (i) for our Malibu segment, Malibu, Axis, Monsoon, Power Wedge, Surf Band, Surf Gate, and Wakesetter; (ii) for our Saltwater Fishing Segment, Pursuit, Cobia, Maverick, and Redfisher; and (iii) for our Cobalt segment, Cobalt and Splash & Stow.
Seasonality
Our dealers experience seasonality in their business. Retail demand for boats is seasonal, with a significant majority of sales occurring during peak boating season, which coincides with our first and fourth fiscal quarters. In order to minimize the impact of this seasonality on our business, we manage our manufacturing processes and structure dealer incentives to tie our annual volume rebates program to consistent ordering patterns, encouraging dealers to purchase our products throughout the year. In this regard, we may offer free flooring incentives to dealers from the beginning of our model year through April 30 of each year. Further, in the event that a dealer does not consistently order units throughout the year, such dealer’s rebate is materially reduced. We may offer off-season retail promotions to our dealers in seasonally slow months, during and ahead of boat shows, to encourage retail demand.
Safety and Regulatory Matters
Our operations and products are subject to extensive environmental and health and safety regulation under various federal, commonwealth, state, and local statutes, ordinances, rules and regulations in the United States and Australia where we manufacture our boats, and in other foreign jurisdictions where we sell our products. We believe we are in material compliance with those requirements. However, we cannot be certain that costs and expenses required for us to comply with such requirements in the future, including for any new or modified regulatory requirements, or to address newly discovered environmental conditions, will not have a material adverse effect on our business, financial condition, operating results, or cash flow. The regulatory programs to which we are subject include the following:
Hazardous Materials and Waste
Certain materials used in our manufacturing, including the resins used in production of our boats, are toxic, flammable, corrosive, or reactive and are classified as hazardous materials by the national, state and local governments in those jurisdictions where we manufacture our products. The handling, storage, release, treatment, and recycling or disposal of these substances and wastes from our operations are regulated in the United States by the United States Environmental Protection Agency (“EPA”), and state and local environmental agencies. In the United States, handling, storage, release, treatment, and recycling or disposal of hazardous materials is regulated under Subtitle C of the Resource Conservation and Recovery Act (“RCRA”). The EPA works with state regulatory agencies to implement a compliance monitoring program with the goal of evaluating compliance with companies’ RCRA obligation. Our manufacturing facilities can be subject to on-site compliance evaluation inspections (CEIs) or targeted enforcement actions. The handling, storage, release, treatment and recycling or disposal of these substances and wastes from our operations are regulated in Australia by the Australian Department of Climate Change, Energy, the Environment and Water, the New South Wales Environmental Protection Authority and other state and
local authorities. Failure by us to properly handle, store, release, treat, recycle or dispose of our hazardous materials and wastes could result in liability for us, including fines, penalties, or obligations to investigate and remediate any contamination originating from our operations or facilities. We are not aware of any material contamination at our current or former facilities for which we could be liable under environmental laws or regulations, and we currently are not undertaking any remediation or investigation activities in connection with any contamination. Future spills or accidents or the discovery of currently unknown conditions or non-compliance could, however, give rise to investigation and remediation obligations or related liabilities.
Air Quality
In the United States, the federal Clean Air Act (“CAA”) and corresponding state and local laws and rules regulate emissions of air pollutants. Because our manufacturing operations involve molding and coating of fiberglass materials, which involves the emission of certain volatile organic compounds, hazardous air pollutants, and particulate matter, we are required to maintain and comply with a CAA operating permit requirements under Title V of the CAA (“Part 70 Permits”) for our Tennessee, Kansas and Florida facilities and local air permits for our California facilities. Our air permits generally require us to monitor our emissions and periodically certify that our emissions are within specified limits. To date, we have not had material difficulty complying with those limits.
The EPA and the California Air Resources Board (“CARB”) have, under the CAA, adopted regulations stipulating that many marine propulsion engines and watercraft meet certain air emission standards. Some of these standards require fitting a catalytic converter to the engine. These regulations also require, among other things, that engine manufacturers provide a warranty that their engines meet EPA and CARB emission standards. The engines used in our products are subject to these regulations. CARB has adopted an evaporative emissions regulation that applies to all spark-ignition marine watercraft with permanently installed fuel tanks sold in California (the Spark-Ignition Marine Watercraft Program). This regulation requires subject boat manufacturers to use specific CARB-certified components for the fuel systems in their boats, or to certify the boat meets a related performance standard. While we believe that our boats meet all applicable emission standards, the USEPA and CARB emissions regulations have increased the cost to manufacture our products.
OSHA
In the United States, the Occupational Safety and Health Administration (“OSHA”) standards address workplace safety generally, and limit the amount of emissions to which an employee may be exposed without the need for respiratory protection or upgraded plant ventilation. Our facilities are regularly inspected by OSHA and by state and local inspection agencies and departments. Our California facilities are also subject to California indoor air quality regulations, overseen by California’s Division of Occupational Safety and Health. We believe that our facilities comply in all material aspects with these regulations. Although capital expenditures related to compliance with environmental and safety laws are expected to increase, we do not currently anticipate any material expenditure will be required to continue to comply with existing OSHA environmental or safety regulations in connection with our existing manufacturing facilities.
At our New South Wales, Australia (“NSW”) facility, employee health and safety is regulated by SafeWork NSW, which also has requirements that limit the amount of certain emissions to which an employee may be exposed without the need for respiratory protection or upgraded plant ventilation. In addition, SafeWork NSW provides licensing and registration for potentially dangerous work, investigates workplace incidents, and enforces work health and safety laws in NSW. Our NSW facilities can be routinely inspected by SafeWork NSW. We believe that our facilities comply in all material aspects with these requirements.
Boat Design and Manufacturing Standards
In the United States, the U.S. Coast Guard promulgates regulations related to the minimum construction and safety requirements for recreational boats. In addition, boats manufactured for sale in the European Community must be certified to meet the requirements of the applicable laws and standards, including Directive 2013/53/EU on recreational craft and personal watercraft. These certifications specify standards for the design and construction of powerboats. We believe that all of our boats meet these standards. In addition, safety of recreational boats in the United States is subject to federal regulation under the Boat Safety Act of 1971, which requires boat manufacturers to recall products for replacement of parts or components that have demonstrated defects affecting safety. We have instituted recalls for defective component parts produced by certain of our third-party suppliers, including recalls on third party supplied steering columns during fiscal year 2023 and fuel pumps during fiscal year 2019. None of our recalls have had a material adverse impact on us.
Human Capital Management
Employee Profile
As of June 30, 2023, we had approximately 3,095 employees worldwide.
None of our team members are party to a collective bargaining agreement. We believe in working diligently to establish ourselves as an employer of choice.
Talent Retention and Development
We recognize employees are the heart of our organization and support them by offering a range of competitive pay, recognition and benefit programs. We provide market-competitive pay and benefits to encourage performance that creates sustainable and long-term employment. Additionally, we have numerous initiatives to support employee development, including annual performance evaluations and supervisor training programs, along with training programs for new employees (and those who are internally promoted) to learn new skills in boat production, such as gel coat application and fiberglass repair. We believe in internal promotion where possible and are committed to developing our current team members to become the next generation of leaders throughout the organization. Approximately 84% of our production leaders are internal promotions. We provide tuition assistance programs and take advantage of leadership development where possible. We partner with several colleges and universities to hire students from across the country in our Engineering Internship Program and many come to work for us after attaining their degree.
Employee Well-Being
Safety is a core value of our organization and we are committed to fostering a culture where safety is a number one priority. The success of our business depends, in part, upon the prevention of accidents, the reduction and/or prevention of occupational injuries and illnesses, and compliance with established safety and health policies and requirements. Dependent upon job tasks, some personnel will be required to have OSHA training and/or documentation to satisfy job requirements. Workplace safety is a fundamental organization-wide value, and we are committed to running an efficient program. We remain focused on building a safer workplace for our employees and will continue to work toward an injury-free workplace through the implementation of training and other safety initiatives.
Culture and Values
Our mission statement is a formal summary of our core purpose and focus and clearly communicates who we are. Our mission is to create the ultimate on-the-water lifestyle. Our core values are the guiding principles that dictate how we make decisions and interact with each other daily. We are committed to our core values of Safety, Integrity, People, Quality, Innovation, Customer Focus, and Continuous Improvement. We design products that appeal to an expanding range of recreational boaters, fisherman and water sports enthusiasts whose passion for boating is a key component of their active lifestyle. With our many awards and honors, we cultivate a culture of excellence and premier boat building.
We conducted our first annual engagement survey of all employees in 2023 as an opportunity to gather feedback from employees on their experience and overall satisfaction to identify areas for organizational improvement. Outside of formal surveys, we allow employees to continuously share any comments, questions or concerns with our leadership team, which are addressed as needed by our executive team.
Diversity and Inclusion
We are committed to maintaining an employee-first culture. We are dedicated to protecting the well-being of our employees and creating a culture that promotes inclusivity, acceptance, equality and diversity. Our employees bring a blend of diverse backgrounds, and we promote an inclusive workforce and the opportunity for career growth for all employees. We seek to hire the best-qualified individuals and do not discriminate on the basis of race, creed, color, religion, national origin, citizenship status, age, disability, marital status, sexual orientation, gender, gender identity and similar classification. We continually evaluate our internal processes and programs to further build on our diverse, equitable and inclusive culture. We value our team and are committed to treating all employees with dignity and respect.
Community Involvement
We continually strive to make an impact on our local communities and serve them with gratitude. Each year, we partner with community organizations where our facilities are located and support local schools. In Tennessee, we partner with Toys for Tots and Angel Tree each holiday season. Our corporate sponsorship with the local Kiwanis Club has allowed us to give back to children with disabilities while also helping students prepare for the upcoming school year. We partner with the local
Family Resources center each year to assist local students with cold-weather clothing fund and participate in additional local school initiatives to promote manufacturing trade jobs. In Kansas, we support our community through recreational leagues as well as donations to local libraries, events and school fundraisers, among other initiatives. In Florida, we give back to our local communities through the Treasure Coast Food Bank, Pet Food Drive for the Humane Society, Ready to Work Boot Camp, and the Everglades Foundation, Recreational Fishing Alliance and Coastal Conservation Association. Additionally, we are proud participants in and sponsors of the Making Strides Against Breast Cancer walk every year. We are proud of our partnerships with these outstanding organizations, and of the funds raised by our employees for children and families in the communities within which we operate.
Organizational Structure
Malibu Boats, Inc. was incorporated as a Delaware corporation on November 1, 2013 in anticipation of our IPO to serve as a holding company that owns only an interest in Malibu Boats Holdings, LLC. Immediately after the completion of our IPO and the recapitalization we completed in connection with our IPO, Malibu Boats, Inc. held approximately 49.3% of the economic interest in the LLC, which has since increased to approximately 97.8% of the economic interest in the LLC as of June 30, 2023.
The certificate of incorporation of Malibu Boats, Inc. authorizes two classes of common stock, Class A Common Stock and Class B Common Stock. Holders of our Class A Common Stock and our Class B Common Stock have voting power over Malibu Boats, Inc., the sole managing member of the LLC, at a level that is consistent with their overall equity ownership of our business. In connection with our IPO and the recapitalization we completed in connection with our IPO, Malibu Boats, Inc. issued to each pre-IPO owner, for nominal consideration, one share of Class B Common Stock of Malibu Boats, Inc., each of which provides its owner with no economic rights but entitles the holder to one vote on matters presented to stockholders of Malibu Boats, Inc. for each LLC Unit held by such holder. Pursuant to our certificate of incorporation and bylaws, each share of Class A Common Stock entitles the holder to one vote with respect to each matter presented to our stockholders on which the holders of Class A Common Stock are entitled to vote. Each holder of Class B Common Stock is entitled to the number of votes equal to the total number of LLC units held by such holder multiplied by the exchange rate specified in the exchange agreement with respect to each matter presented to our stockholders on which the holders of Class B Common Stock are entitled to vote. Accordingly, the holders of LLC Units collectively have a number of votes that is equal to the aggregate number of LLC Units that they hold. As the LLC members sell LLC Units to us or subsequently exchange LLC Units for shares of Class A Common Stock of Malibu Boats, Inc. pursuant to the exchange agreement described below, the voting power afforded to them by their shares of Class B Common Stock is automatically and correspondingly reduced. Subject to any rights that may be applicable to any then outstanding preferred stock, our Class A and Class B Common Stock vote as a single class on all matters presented to our stockholders for their vote or approval, except as otherwise provided in our certificate of incorporation or bylaws or required by applicable law. In addition, subject to preferences that may apply to any shares of preferred stock outstanding at the time, the holders of our Class A Common Stock are entitled to share equally, identically and ratably in any dividends or distributions (including in the event of any voluntary or involuntary liquidation, dissolution or winding up of our affairs) that our board of directors may determine to issue from time to time, while holders of our Class B Common Stock do not have any right to receive dividends or other distributions.
As noted above, Malibu Boats, Inc. is a holding company with a controlling equity interest in the LLC. Malibu Boats, Inc., as sole managing member of the LLC, operates and controls all of the business and affairs and consolidates the financial results of the LLC. The limited liability company agreement of the LLC provides that it may be amended, supplemented, waived or modified by the written consent of Malibu Boats, Inc., as managing member of the LLC, in its sole discretion without the approval of any other holder of LLC Units, except that no amendment may materially and adversely affect the rights of a holder of LLC Units, other than on a pro rata basis with other holders of LLC Units, without the consent of such holder (unless more than one holder is so affected, then the consent of a majority of such affected holders is required). Pursuant to the limited liability company agreement of the LLC, Malibu Boats, Inc. has the right to determine when distributions (other than tax distributions) will be made to the members of the LLC and the amount of any such distributions. If Malibu Boats, Inc. authorizes a distribution, such distribution will be made to the members of the LLC (including Malibu Boats, Inc.) pro rata in accordance with the percentages of their respective LLC Units.
The diagram below depicts our current organizational structure, as of June 30, 2023:
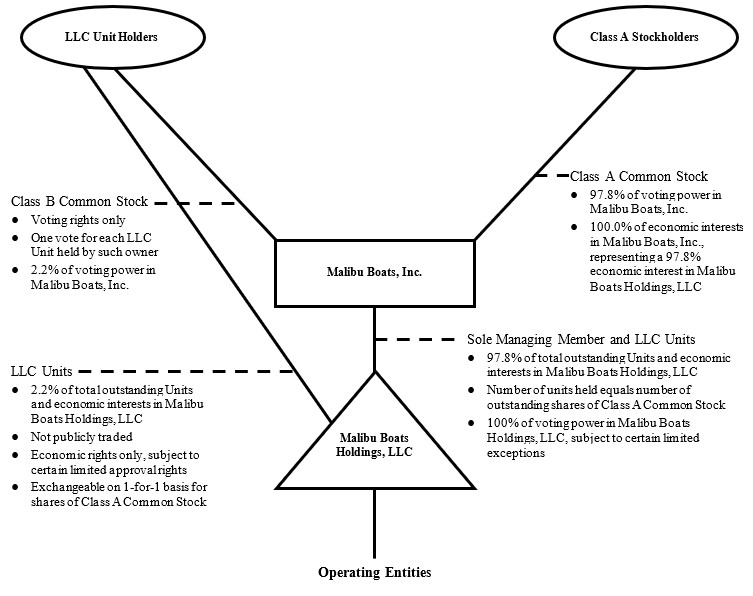
Our organizational structure allows the LLC members to retain their equity ownership in the LLC, an entity that is classified as a partnership for U.S. federal income tax purposes, in the form of LLC Units. Holders of Class A Common Stock, by contrast, hold their equity ownership in Malibu Boats, Inc., a Delaware corporation that is a domestic corporation for U.S. federal income tax purposes, in the form of shares of Class A Common Stock. The holders of LLC Units, including Malibu Boats, Inc., will incur U.S. federal, state and local income taxes on their proportionate share of any taxable income of the LLC. Net profits and net losses of the LLC will generally be allocated to the LLC’s members (including Malibu Boats, Inc.) pro rata in accordance with the percentages of their respective limited liability company interests. The limited liability company agreement provides for cash distributions to the holders of LLC Units if Malibu Boats, Inc. determines that the taxable income of the LLC will give rise to taxable income for its members. In accordance with the limited liability company agreement, we intend to cause the LLC to make cash distributions to the holders of LLC Units for purposes of funding their tax obligations in respect of the income of the LLC that is allocated to them. Generally, these tax distributions will be computed based on our estimate of the taxable income of the LLC allocable to such holder of LLC Units multiplied by an assumed tax rate equal to the highest effective marginal combined U.S. federal, state and local income tax rate prescribed for an individual or corporate resident in Los Angeles, California (taking into account the nondeductibility of certain expenses and the character of our income). For purposes of determining the taxable income of the LLC, such determination will be made by generally disregarding any adjustment to the taxable income of any member of the LLC that arises under the tax basis adjustment rules of the Internal Revenue Code of 1986, as amended, or the Code and is attributable to the acquisition by such member of an interest in the LLC in a sale or exchange transaction.
Exchanges and Other Transactions with Holders of LLC Units
In connection with our IPO and the recapitalization we completed in connection with our IPO, we entered into an exchange agreement with the pre-IPO owners of the LLC under which (subject to the terms of the exchange agreement) each pre-IPO owner (or its permitted transferee) has the right to exchange its LLC Units for shares of our Class A Common Stock on a one-
for-one basis, subject to customary conversion rate adjustments for stock splits, stock dividends and reclassifications, or, at our option, except in the event of a change in control, for a cash payment equal to the market value of the Class A Common Stock. The exchange agreement provides, however, that such exchanges must be for a minimum of the lesser of 1,000 LLC Units, all of the LLC Units held by the holder, or such amount as we determine to be acceptable. The exchange agreement also provides that an LLC member will not have the right to exchange LLC Units if Malibu Boats, Inc. determines that such exchange would be prohibited by law or regulation or would violate other agreements with Malibu Boats, Inc. to which the LLC member may be subject or any of our written policies related to unlawful or insider trading. The exchange agreement also provides that Malibu Boats, Inc. may impose additional restrictions on exchanges that it determines to be necessary or advisable so that the LLC is not treated as a “publicly traded partnership” for U.S. federal income tax purposes. In addition, pursuant to the limited liability company agreement of the LLC, Malibu Boats, Inc., as managing member of the LLC, has the right to require all members of the LLC to exchange their LLC Units for Class A Common Stock in accordance with the terms of the exchange agreement, subject to the consent of the holders of a majority of outstanding LLC Units other than those held by Malibu Boats, Inc.
As a result of exchanges of LLC Units into Class A Common Stock and purchases by Malibu Boats, Inc. of LLC Units from holders of LLC Units, Malibu Boats, Inc. will become entitled to a proportionate share of the existing tax basis of the assets of the LLC at the time of such exchanges or purchases. In addition, such exchanges and purchases of LLC Units are expected to result in increases in the tax basis of the assets of the LLC that otherwise would not have been available. These increases in tax basis may reduce the amount of tax that Malibu Boats, Inc. would otherwise be required to pay in the future. These increases in tax basis may also decrease gains (or increase losses) on future dispositions of certain capital assets to the extent tax basis is allocated to those capital assets. We have entered into a tax receivable agreement with the pre-IPO owners (or their permitted assignees) that provides for the payment by Malibu Boats, Inc. to the pre-IPO owners (or their permitted assignees) of 85% of the amount of the benefits, if any, that Malibu Boats, Inc. is deemed to realize as a result of (1) increases in tax basis and (2) certain other tax benefits related to our entering into the tax receivable agreement, including tax benefits attributable to payments under the tax receivable agreement. These payment obligations are obligations of Malibu Boats, Inc. and not of the LLC.
Available Information
Our Annual Report on Form 10-K, Quarterly Reports on Form 10-Q, Current Reports on Form 8-K and amendments to reports filed or furnished pursuant to Sections 13(a) and 15(d) of the Securities Exchange Act of 1934, as amended, or the Exchange Act are available on our web site at www.malibuboats.com, free of charge, as soon as reasonably practicable after the electronic filing of these reports with, or furnishing of these reports to, the Securities and Exchange Commission, or the SEC. In addition, the SEC maintains a web site at www.sec.gov that contains reports, proxy and information statements, and other information regarding issuers that file electronically with the SEC, including us.
Item 1A. Risk Factors
The following describes the risks and uncertainties that could cause our actual results to differ materially from those presented in our forward-looking statements. The risks and uncertainties described below are not the only ones we face but do represent those risks and uncertainties that we believe are material to us. Additional risks and uncertainties not presently known to us or that we currently deem immaterial may also harm our business.
Risks Related to our Business and Operations
We may not be able to execute our manufacturing strategy successfully, which could cause the profitability of our products to suffer.
Our manufacturing strategy is designed to improve product quality and increase productivity, while reducing costs and increasing flexibility to respond to ongoing changes in the marketplace. To implement this strategy, we must be successful in our continuous improvement efforts, which depend on the involvement of management, production employees and suppliers. Any inability to achieve our objectives under our manufacturing strategy could adversely impact the profitability of our products and our ability to deliver desirable products to our consumers.
We have a large fixed cost base that will affect our profitability if our sales decrease.
The fixed cost levels of operating a recreational powerboat manufacturer can put pressure on profit margins when sales and production decline. Our profitability depends, in part, on our ability to spread fixed costs over a sufficiently large number of products sold and shipped, and if we make a decision to reduce our rate of production, gross or net margins could be negatively affected. Consequently, decreased demand or the need to reduce production can lower our ability to absorb fixed costs and materially impact our financial condition or results of operations.
Our financial results may be adversely affected by our third-party suppliers’ increased costs or inability to meet required production levels due to changing demand or global supply chain disruptions.
We rely on a global supply chain of third parties to supply raw materials used in our manufacturing process, including resins, fiberglass, and vinyl, as well as parts and components. The prices for these raw materials, parts, and components fluctuate depending on market conditions and, in some instances, commodity prices or trade policies, including tariffs. Substantial increases in the prices of raw materials, parts, and components would increase our operating costs, and could reduce our profitability if we are unable to recoup the increased costs through higher product prices or improved operating efficiencies. Our profitability in recent years has been, and in the future may be, affected by significant fluctuations in the prices of the raw materials and commodities that we use in our products and in the cost of freight and shipping of source materials, commodities, and other component parts necessary to assemble our products.
Our ability to maintain production is dependent upon our suppliers delivering sufficient amounts of components, raw materials and parts on time to manufacture our products and meet our production schedules. Supply chain disruptions could occur for any number of factors, including facility closures due to labor disruptions, weather events, cyber intrusions, the occurrence of a contagious disease or illness, such as COVID-19, contractual or other disputes, unfavorable economic or industry conditions, political instability, delivery delays, performance problems, or financial difficulties of suppliers. These events could disrupt our suppliers’ operations and lead to uncertainty in our supply chain or cause supply disruptions for us, which could, in turn, disrupt our operations. For example, we have experienced supply chain disruptions beginning in fiscal year 2020 related to numerous factors, including COVID-19, severe weather events, labor shortages, ongoing domestic logistical constraints, West Coast port challenges and rising prices for our suppliers, in part due to inflationary pressures.
In some instances, we purchase components, raw materials and parts that are ultimately derived from a single source or geographic area or a limited number of suppliers and we may therefore be at an increased risk for supply disruptions. It may be difficult to find a replacement supplier for a limited or sole source raw material, part, or component without significant delay or on commercially reasonable terms, and as a result, an exclusive supplier of a key component could potentially exert significant bargaining power over price, quality, warranty claims, or other terms. Some components used in our manufacturing processes, including engines, boat windshields, certain electrical components and gel coats are available from a sole supplier or a limited number of suppliers. We currently purchase engines from General Motors LLC, or General Motors, that we then prepare for marine use for certain Malibu, Axis and Cobalt boats, and we purchase outboard engines from Yamaha Motor Corporation, U.S.A., or Yamaha, for a significant percentage of our Cobalt, Pursuit and Maverick Boats Group branded boats that are pre-rigged for outboard motors. We had agreements with Yamaha for the supply of outboard motors that expired on June 30, 2023. We are in discussions with Yamaha to extend those agreements and Yamaha has continued to supply outboard motors to us since those agreements expired. If we are required to replace either General Motors or Yamaha as an engine supplier for any reason, it could cause a decrease in boats available for sale or an increase in our cost of sales, either of which could adversely
affect our business, financial condition and results of operations. In fiscal year 2020 we experienced interruption to our engine supply as a result of the United Auto Workers’ strike against General Motors. During the UAW strike, General Motors suspended delivery of engine blocks to us and we incurred $2.6 million in costs by entering into purchase agreements with two suppliers for additional engines to supplement our inventory of engine blocks for Malibu and Axis boats.
Termination or interruption of informal supply arrangements could have a material adverse effect on our business or results of operations.
Historically, we have not entered into long-term agreements with suppliers of our raw materials and components other than for our engines and outboard motors. Instead, we have informal supply arrangements with many of our suppliers of components, raw materials and parts. In the event of a termination of the supply arrangement, there can be no assurance that alternate supply arrangements will be made on satisfactory terms. If we need to enter into supply arrangements on unsatisfactory terms, or if there are any delays to our supply arrangements, it could adversely affect our business and operating results.
Our ability to meet our manufacturing workforce’s needs is crucial to our results of operations and future sales and profitability.
We rely on the existence of an available hourly workforce to manufacture our boats. We cannot assure you that we will be able to attract and retain qualified employees to meet current or future manufacturing needs at a reasonable cost, or at all. For instance, even when there are high unemployment rates in the regions where we have manufacturing facilities, we have had difficulty retaining skilled employees and could experience such difficulties in the future. Although none of our employees are currently covered by collective bargaining agreements, we cannot assure you that our employees will not elect to be represented by labor unions in the future. Additionally, competition for qualified employees could require us to pay higher wages to attract a sufficient number of employees. Significant increases in manufacturing workforce costs could materially adversely affect our business, financial condition or results of operations.
The nature of our business exposes us to workers' compensation claims and other workplace liabilities.
Certain materials that we use require our employees to handle potentially hazardous or toxic substances. While our employees who handle these and other potentially hazardous or toxic materials receive specialized training and wear protective clothing, there is still a risk that they, or others, may be exposed to these substances. Exposure to these substances could result in significant injury to our employees and damage to our property or the property of others, including natural resource damage. Our personnel are also at risk for other workplace-related injuries. We have in the past been, and may in the future be, subject to fines, penalties, and other liabilities in connection with any such injury or damage. While we have implemented safety precautions at our facilities to mitigate contagious diseases, such as a pandemic, we may also be subject to possible lawsuits or regulatory actions or suffer from reputational risk if we experience spread in our workplace. We may be unable to maintain insurance for these potential liabilities on acceptable terms or such insurance may not provide adequate protection against potential liabilities.
We have grown our business through acquisitions; however we may not be successful in completing future acquisitions or integrating future acquisitions in a way that fully realizes their expected benefits to our business.
A key part of our growth strategy, as shown by our acquisition of Maverick Boat Group in 2020, Pursuit in 2018, Cobalt in 2017 and our Australian licensee in 2014, has been to acquire other companies that expand our consumer base, enter new product categories or obtain other competitive advantages. We expect to continue to acquire companies as an element of our growth strategy; however, we may not be able to identify future acquisition candidates or strategic partners as part of our growth strategy that are suitable to our business, or we may not be able to obtain financing on satisfactory terms to complete such acquisitions.
Acquisitions include a number of risks, including our ability to project and evaluate market demand, realize potential synergies and cost savings, and make accurate accounting estimates, as well as diversion of management attention. Uncertainties exist in assessing the value, risks, profitability, and liabilities associated with certain companies or assets, negotiating acceptable terms, obtaining financing on acceptable terms, and receiving any necessary regulatory approvals. As we continue to grow, in part, through acquisitions, our success depends on our ability to anticipate and effectively manage these risks. Our failure to successfully do so could have a material adverse effect on our financial condition and results of operations.
Further, our inability to successfully integrate future acquisitions within the intended time frames or at all could impede us from realizing all of the benefits of those acquisitions and could severely weaken our business operations. The integration process with any acquisition may disrupt our business and, if implemented ineffectively, may preclude realization of the full benefits expected by us and could harm our results of operations. In addition, the overall integration of the combining
companies may result in unanticipated problems, expenses, liabilities and competitive responses and may cause our stock price to decline. Even if the operations of an acquisition are integrated successfully, we may not realize the full benefits of the acquisition, including the synergies, cost savings or growth opportunities that we expect.
Our growth strategy may require us to secure significant additional capital, the amount of which will depend upon the size, timing, and structure of future acquisitions or vertical integrations and our working capital and general corporate needs.
Our growth strategy includes the possible acquisition of other businesses, such as our acquisitions of Cobalt, Pursuit and Maverick Boat Group, and the potential integration of new product lines or related products to our boats, such as our initiatives to integrate the production of engines and trailers for our Malibu and Axis models, our Monsoon engines into some of our Cobalt models and our new Tooling Design Center. These actions may require us to secure significant additional capital through the borrowing of money or the issuance of equity. Any borrowings made to finance future strategic initiatives could make us more vulnerable to a downturn in our operating results, a downturn in economic conditions, or increases in interest rates on borrowings that are subject to interest rate fluctuations. If our cash flow from operations is insufficient to meet our debt service requirements, we could then be required to sell additional equity securities, refinance our obligations or dispose of assets in order to meet our debt service requirements. Adequate financing may not be available if and when we need it or may not be available on terms acceptable to us. The failure to obtain sufficient financing on favorable terms and conditions could have a material adverse effect on our growth prospects.
Further, we could choose to finance acquisitions or other strategic initiatives, in whole or in part through the issuance of our Class A Common Stock or securities convertible into or exercisable for our Class A Common Stock. If we do so, existing stockholders will experience dilution in the voting power of their Class A Common Stock and earnings per share could be negatively impacted. The extent to which we will be able and willing to use our Class A Common Stock for acquisitions and other strategic initiatives will depend on the market value of our Class A Common Stock and the willingness of potential third parties to accept our Class A Common Stock as full or partial consideration. Our inability to use our Class A Common Stock as consideration, to generate cash from operations, or to obtain additional funding through debt or equity financings in order to pursue our strategic initiatives could materially limit our growth.
Our reliance upon patents, trademark laws and contractual provisions to protect our proprietary rights may not be sufficient to protect our intellectual property from others who may sell similar products and may lead to costly litigation. We have in the past, and may be in the future, party to lawsuits and other intellectual property rights claims that are expensive and time-consuming.
We hold patents and trademarks relating to various aspects of our products and believe that proprietary technical know- how is important to our business. Proprietary rights relating to our products are protected from unauthorized use by third parties only to the extent that they are covered by valid and enforceable patents or trademarks or are maintained in confidence as trade secrets. We cannot be certain that we will be issued any patents from any pending or future patent applications owned by or licensed to us or that the claims allowed under any issued patents will be sufficiently broad to protect our technology. In the absence of enforceable patent or trademark protection, we may be vulnerable to competitors who attempt to copy our products, gain access to our trade secrets and know-how or diminish our brand through unauthorized use of our trademarks, all of which could adversely affect our business. Accordingly, we may need to engage in future litigation to enforce intellectual property rights, to protect trade secrets or to determine the validity and scope of proprietary rights of others.
We also rely on unpatented proprietary technology. It is possible that others will independently develop the same or similar technology or otherwise obtain access to our unpatented technology. To protect our trade secrets and other proprietary information, we require employees, consultants, advisors and collaborators to enter into confidentiality agreements. We cannot assure you that these agreements will provide meaningful protection for our trade secrets, know-how, or other proprietary information in the event of any unauthorized use, misappropriation, or disclosure of such trade secrets, know-how, or other proprietary information. If we are unable to maintain the proprietary nature of our technologies, we could be materially adversely affected.
In addition, others may initiate litigation or other proceedings to challenge the validity of our patents, or allege that we infringe their patents, or they may use their resources to design comparable products that do not infringe our patents. We may incur substantial costs if our competitors initiate litigation to challenge the validity of our patents, or allege that we infringe their patents, or if we initiate any proceedings to protect our proprietary rights. If the outcome of any litigation challenging our patents is unfavorable to us, our business, financial condition and results of operations could be adversely affected.
We are subject to stringent and evolving U.S. and foreign laws, regulations, rules, contractual obligations, policies and other obligations related to data privacy and security. Our actual or perceived failure to comply with such obligations could lead to
regulatory investigations or actions; litigation (including class claims) and mass arbitration demands; fines and penalties; disruptions of our business operations; reputational harm; loss of revenue or profits; and other adverse business consequences.
In the ordinary course of business, we process personal data and other sensitive information. Our data processing activities subject us to numerous data privacy and security obligations, which arise out of various laws, regulations, guidance, industry standards, representations made in privacy and security policies, marketing materials and other statements, contractual requirements, and other obligations relating to data privacy and security. In the United States, federal, state, and local governments have enacted numerous data privacy and security laws that are quickly changing, becoming increasingly stringent, and creating regulatory uncertainty, including data breach notification laws, personal data privacy laws, consumer protection laws (e.g., Section 5 of the Federal Trade Commission Act), and other similar laws (e.g., wiretapping laws). For example, the California Consumer Privacy Act of 2018, as amended by the California Privacy Rights Act of 2020 (collectively, “CCPA”), applies to personal information of consumers, business representatives, and employees who are California residents, and requires businesses to provide specific disclosures in privacy notices and honor requests of such individuals to exercise certain privacy rights. The CCPA provides for administrative fines of up to $7,500 per violation and allows private litigants affected by certain data breaches to recover significant statutory damages. Other states have also passed comprehensive privacy laws, and similar laws are being considered in several other jurisdictions. Outside the United States, an increasing number of laws, regulations, and industry standards may govern data privacy and security. For example, under European Union’s General Data Protection Regulation (“EU GDPR”), companies may face temporary or definitive bans on data processing and other corrective actions; fines of up to 20 million Euros under the EU GDPR or 4% of annual global revenue, whichever is greater.
We may at times fail (or be perceived to have failed) in our efforts to comply with our data privacy and security obligations. Moreover, despite our efforts, our personnel or third parties on whom we rely may fail to comply with such obligations, which could negatively impact our business operations and we could face significant consequences, including but not limited to: government enforcement actions (e.g., investigations, fines, penalties, audits, inspections, and similar); litigation (including class-action claims) and mass arbitration demands; additional reporting requirements and/or oversight; bans on processing personal data; and orders to destroy or not use personal data. In particular, plaintiffs have become increasingly more active in bringing privacy-related claims against companies, including class claims and mass arbitration demands. Some of these claims allow for the recovery of statutory damages on a per violation basis, and, if viable, carry the potential for monumental statutory damages, depending on the volume of data and the number of violations. Any of these events could have a material adverse effect on our reputation, business, or financial condition, including but not limited to: loss of customers; inability to process personal data or to operate in certain jurisdictions; limited ability to develop or commercialize our products; expenditure of time and resources to defend any claim or inquiry; adverse publicity; or substantial changes to our business model or operations.
Our business operations could be negatively impacted by an outage or breach of our information technology systems or operational technology systems (or those of the third parties upon which we rely), our sensitive data, or a cybersecurity event.
We manage our business operations through a variety of information technology (IT) and operational technology systems (“IT Systems”). We depend on these systems for commercial transactions, customer interactions, manufacturing, branding, employee tracking, processing sensitive data and other applications. New system implementations, across the enterprise also pose risks including without limitation those in connection with future or past business transactions, to our IT systems, including risks of outages or disruptions, which could affect our suppliers, commercial operations, and customers. We continue to upgrade, streamline, and integrate these systems but, like those of other companies, our systems and data, and those of the third parties we rely on, are susceptible to outages due to natural disasters, power loss, computer viruses, and worms, malware, personnel misconduct or error, ransomware attacks, supply-chain attacks, security breaches, hardware or software vulnerabilities, disruptions, and similar events. In particular, severe ransomware attacks are becoming increasingly prevalent and can lead to significant interruptions in our operations (including without limitation, our manufacturing, marketing and financial operations), loss of sensitive data, revenue and income loss, reputational harm and loss of customers, and diversion of funds. Extortion payments may alleviate the negative impact of a ransomware attack, but we may be unwilling or unable to make such payments due to, for example, applicable laws or regulations prohibiting such payments. We exchange information with many trading partners across all aspects of our commercial operations through our IT systems. A breakdown, outage, malicious intrusion, breach, random attack, or other disruption of communications could result in erroneous or fraudulent transactions, disclosure of confidential or other sensitive information, loss of reputation and confidence, and may also result in legal claims or proceedings, penalties, and remediation costs. We have experienced cyber-attacks, but to our knowledge, we have not experienced any material disruptions or breaches of our information technology systems or connected products. While we have implemented security measures designed to protect against security incidents, there can be no assurance that these measures will be effective. We take steps to detect and remediate vulnerabilities, but we may not be able to detect and remediate all vulnerabilities because the threats and techniques used to exploit the vulnerability change frequently and are often sophisticated in nature. Therefore, such vulnerabilities could be exploited but may not be detected until after a security incident
has occurred. These vulnerabilities pose material risks to our business. Further, we may experience delays in developing and deploying remedial measures designed to address any such identified vulnerabilities.
Threats of system-related events and security breaches are prevalent and continue to rise, are increasingly difficult to detect, and come from a variety of sources, including traditional computer “hackers,” threat actors, “hacktivists,” organized criminal threat actors, personnel (such as through theft or misuse), sophisticated nation states, and nation-state-supported actors. If our security measures are breached or fail, unauthorized persons may be able to obtain access to or acquire personal or other confidential data, or we may need to temporarily suspend production or operations in order to restore security. Depending on the nature of the information compromised, we may also have obligations to notify consumers and/or employees about the incident, and we may need to provide some form of remedy, such as a subscription to a credit monitoring service, for the individuals affected by the incident. This could negatively affect our relationships with customers or trading partners, lead to potential claims against us, and damage our image and reputation. Moreover, the amount and scope of insurance we maintain against losses resulting from any such events or security breaches may not be sufficient to cover our losses or otherwise adequately compensate us for any disruptions to our businesses that may result, and the occurrence of any such events or security breaches could have a material adverse effect on our business and results of operations. Additionally, our contracts may not contain limitations of liability, and even where they do, there can be no assurance that limitations of liability in our contracts are sufficient to protect us from liabilities, damages, or claims related to our data privacy and security obligations
We have started the design and implementation of a new enterprise resource planning (ERP) system and if we are not able to successfully develop and manage that implementation, it could adversely affect our business or results of operations.
We have begun the process of designing and implementing a new ERP system. This project will require significant capital and human resources, the re-engineering of many processes of our business, and the attention of our management and other personnel who would otherwise be focused on other aspects of our business. The implementation may be more expensive and take longer to fully implement than we originally plan, resulting in increased capital investment, higher fees and expenses of third parties, delayed deployment scheduling, and more on-going maintenance expense once implemented, and, as such, it will be difficult for us to estimate the ultimate costs and schedules. If for any reason portions of the implementation are not successful, we could be required to expense rather than capitalize related amounts.
Our operations and sales in international markets require significant management attention, expose us to difficulties presented by international economic, political, legal and business factors, and may not be successful or produce desired levels of sales and profitability.
We currently sell our products throughout the world and we manufacture boats internationally in Australia. Several factors, including weakened international economic conditions and the strength of the U.S. dollar, could adversely affect our international growth. Expansion in our existing international operations and entry into new international markets require significant management attention. Some of the countries in which we market and our distributors sell our products are, to some degree, subject to political, economic or social instability. Our international operations expose us and our representatives, agents and distributors to risks inherent in operating in foreign jurisdictions.
Doing business on a worldwide basis also requires us to comply with the laws and regulations of various foreign jurisdictions. These laws and regulations place restrictions on our operations, trade practices, partners and investment decisions. In particular, our operations are subject to U.S. and foreign anti-corruption and trade control laws and regulations, such as the FCPA, export controls and economic sanctions programs, including those administered by the U.S. Treasury Department’s Office of Foreign Assets Control, or the OFAC. As a result of doing business in foreign countries and with foreign partners, we are exposed to a heightened risk of violating anti-corruption and trade control laws and sanctions regulations.
Catastrophic events, including natural or environmental disasters, pandemics, such as the COVID-19 pandemic or other disruptions at our facilities could adversely affect our business, financial condition and results of operations.
We rely on the continuous operation of our facilities in Tennessee, Florida, Kansas, California, Alabama, and Australia. Any natural or environmental disaster, pandemic or other serious disruption to our facilities due to fire, flood, earthquake, acts of terrorism, civil insurrection or social unrest or any other unforeseen circumstances could adversely affect our business, financial condition and results of operations. For example, as a result of the COVID-19 pandemic, we experienced a temporary shutdown of our facilities, which negatively impacted our net sales and production levels and created supply chain disruptions, which led to lower inventory levels at our dealers for a period of time. If there is a disruption in our business it could result in a reduction of production and cause delays in our ability to meet consumer demand or receive supplies from our vendors. We cannot assure you that we will not have to suspend our operations again, whether voluntarily or as a result of federal, state or local mandates, and such closures could extend for a longer term than the prior shutdown of our facilities relating to COVID-19.
Changes in climate could also adversely affect our operations by limiting or increasing the costs associated with equipment or fuel supplies. In addition, adverse weather conditions, such as increased frequency and/or severity of storms, or floods could impair our ability to operate by damaging our facilities and equipment or restricting product delivery to customers. The occurrence of any disruption at our facilities, even for a short period of time, may have an adverse effect on our productivity and profitability, during and after the period of the disruption. These disruptions may also cause personal injury and loss of life, severe damage to or destruction of property and equipment and environmental damage. Although we maintain property, casualty and business interruption insurance of the types and in the amounts that we believe are customary for the industry, we are not fully insured against all potential natural disasters or other disruptions to our facilities.
Increases in income tax rates or changes in income tax laws or enforcement could have a material adverse impact on our financial results.
Changes in domestic and international tax legislation could expose us to additional tax liability and could impact the amount of our tax receivable agreement liability. For example, in August 2022, the U.S. Congress passed the Inflation Reduction Act of 2022. The key tax provisions applicable to us include a 1% excise tax on stock repurchases effective January 1, 2023. We currently do not expect these changes to have a material impact on our financial position; however, we will continue to evaluate the impact as further information becomes available. Although we monitor changes in tax laws and work to mitigate the impact of proposed changes, such changes may negatively impact our financial results. Expected changes in current tax law beyond fiscal 2023 could impact our financial results in a material way. In addition, any increase in individual income tax rates would negatively affect our potential consumers’ discretionary income and could decrease the demand for our products.
We depend on key personnel and we may not be able to retain them or to attract, assimilate, and retain highly qualified employees in the future.
Our future success will depend in significant part upon the continued service of our senior management and our continuing ability to attract, assimilate, and retain highly qualified and skilled managerial, product development, manufacturing, and marketing and other personnel. The loss of services of any members of our senior management or key personnel or the inability to hire or retain qualified personnel in the future could adversely affect our business, financial condition, and results of operations. For instance, we are currently conducting a search process to identify and appoint a new permanent Chief Financial Officer. If we are unable to attract and retain a qualified candidate to become our Chief Financial Officer, it could have an adverse impact on our business, including impacting our ability to meet financial and operation goals and implementing our strategic plans.
Risks Related to Our Markets and the Recreational Powerboat Industry
Weak general economic conditions, particularly in the United States, can negatively impact our industry, demand for our products, and our business and results of operations.
Demand for new recreational powerboats can be negatively influenced by weak economic conditions, low consumer confidence and high unemployment, especially in the United States, and by increased market volatility worldwide. In times of economic uncertainty and contraction, consumers tend to have less discretionary income and defer or avoid expenditures for discretionary items, such as boats. Sales of our products are highly sensitive to personal discretionary spending levels, and our success depends on general economic conditions and overall consumer confidence and personal income levels, especially in the United States and in the specific regional markets where we sell our products. Any deterioration in general economic conditions that diminishes consumer confidence or discretionary income is likely to reduce our sales and adversely affect our business, financial condition and results of operations.
In addition, fiscal and monetary policy could have a material adverse impact on worldwide economic conditions, the financial markets, and availability of credit and, consequently, may negatively affect our industry, businesses, and overall financial condition. Consumers often finance purchases of our boats, and as interest rates rise, the cost of financing the purchase also increases. If credit conditions worsen, and adversely affect the ability of consumers to finance potential purchases at acceptable terms and interest rates, it could result in a decrease in sales or delay improvement in sales of our products.
If we are unable to continue to enhance existing products and develop and market new or enhanced products that respond to customer needs and preferences, we may experience a decrease in demand for our products and our business could suffer.
Market acceptance of our products depends on our technological innovation and our ability to implement technology in our boats. Our failure to introduce new technologies and product offerings that our markets desire could adversely affect our business, financial condition and results of operations. Also, we believe we have been able to achieve higher margins in part as
a result of the introduction of new features or enhancements to our existing boat models. If we fail to introduce new features or those we introduce fail to gain market acceptance, our margins may suffer.
In addition, some of our direct competitors and indirect competitors may have significantly more resources to develop and patent new technologies. It is possible that our competitors will develop and patent equivalent or superior technologies and other products that compete with ours. We cannot be certain that our products or technologies have not infringed or will not infringe on the proprietary rights of others, including our competitors. They may assert these patents against us and we may be required to license these patents on unfavorable terms or cease using the technology covered by these patents, either of which would harm our competitive position and may materially adversely affect our business.
Our continued success is dependent on the positive perception of our brands, which, if impaired, could adversely affect our sales.
We believe that our brands are significant contributors to the success of our business and that maintaining and enhancing our brands are important to expanding our consumer and dealer base. The value of our brands is based in large part on perceptions and opinions, and broad access to social media makes it easy for anyone to provide public feedback that can influence perceptions of our company. It may be difficult to control negative publicity, regardless of whether it is accurate. Negative incidents, such as quality and safety concerns, product recalls, severe incidents or injuries related to our products or actions, or statements or actions of our employees or dealers or the athletes associated with our products, could lead to tangible adverse effects on our business, including lost sales or employee retention and recruiting difficulties. Also, public concerns about the environmental impact of our products could result in diminished public perception of our brands. If the popularity of the sports and activities for which we design, manufacture and sell our boats were to decrease as a result of these risks or any negative publicity, sales of our products could decrease, which could have an adverse effect on our net revenue, profitability and operating results.
Our sales may be adversely impacted by increased consumer preference for used boats or the supply of new boats by competitors in excess of demand.
In the past, we have observed a shift in consumer demand toward purchasing more used boats during economic downturns, primarily because prices for used boats are typically lower than retail prices for new boats. If consumer demand shifts toward purchasing more used boats, it could have the effect of reducing demand among retail purchasers for our new boats. Also, while we have taken steps designed to balance production volumes for our boats with demand, our competitors could choose to reduce the price of their products, which could have the effect of reducing demand for our new boats. Reduced demand for new boats could lead to reduced sales by us, which could adversely affect our business, results of operations or financial condition.
An increase in energy and fuel costs may adversely affect our business, financial condition and results of operations.
Higher energy costs result in increases in operating expenses at our manufacturing facility and in the expense of shipping products to our dealers. In addition, increases in energy costs may adversely affect the pricing and availability of petroleum based raw materials, such as resins and foams, that are used in our products. Higher fuel prices may also have an adverse effect on demand for our boats, as they increase the cost of boat ownership and possibly affect product use.
Retail demand for our boats is seasonal and unfavorable weather conditions just before and during spring and summer can have a negative effect on our revenues.
Adverse weather conditions in any year in any particular geographic region may adversely affect sales in that region, especially during the peak boating season. Sales of our products are generally stronger just before and during spring and summer, which represent the peak boating months in most of our markets, and favorable weather during these months generally has a positive effect on consumer demand. Conversely, unseasonably cool weather, excessive rainfall, reduced rainfall levels, or drought conditions during these periods may close area boating locations or render boating dangerous or inconvenient, thereby generally reducing consumer demand for our products. Our annual results would be materially and adversely affected if our net sales were to fall below expected seasonal levels during these periods. We may also experience more pronounced seasonal fluctuation in net sales in the future as we continue to expand our businesses. Additionally, to the extent that unfavorable weather conditions are exacerbated by global climate change or otherwise, our sales may be affected to a greater degree than we have previously experienced. There can be no assurance that weather conditions will not have a material effect on the sales of any of our products.
Our industry is characterized by intense competition, which affects our sales and profits.
The recreational powerboat industry, and in particular the performance sport boat category, is highly competitive for consumers and dealers. Competition affects our ability to succeed in the markets we currently serve, including the saltwater
outboard fishing boat market that we recently entered with our acquisitions of Pursuit and Maverick Boat Group, and new markets that we may enter in the future. Competition is based primarily on brand name, price, product selection and product performance. We compete with several large manufacturers that may have greater financial, marketing and other resources than we do and who are represented by dealers in the markets in which we now operate and into which we plan to expand. We also compete with a variety of small, independent manufacturers. We cannot assure you that we will not face greater competition from existing large or small manufacturers or that we will be able to compete successfully with new competitors. Our failure to compete effectively with our current and future competitors would adversely affect our business, financial condition and results of operations.
We compete with a variety of other activities for consumers’ scarce leisure time.
Our boats are used for recreational and sport purposes, and demand for our boats may be adversely affected by competition from other activities that occupy consumers’ leisure time and by changes in consumer life style, usage pattern or taste. Similarly, an overall decrease in consumer leisure time may reduce consumers’ willingness to purchase and enjoy our products.
Changes in currency exchange rates can adversely affect our results.
A portion of our sales are denominated in a currency other than the U.S. dollar. Consequently, a strong U.S. dollar may adversely affect reported revenues and, with the recent strengthening of the U.S. dollar, we have experienced a corresponding negative impact on our financial results with respect to our foreign operations. We also maintain a portion of our manufacturing operations in Australia which partially mitigates the impact of a strengthening U.S. dollar in that country. A portion of our selling, general and administrative costs are transacted in Australian dollars as a result. We also sell U.S. manufactured products into certain international markets in U.S. dollars, including the sale of products into Canada, Europe and Latin America. Demand for our products in these markets may also be adversely affected by a strengthening U.S. dollar. We do not currently use hedging or other derivative instruments to mitigate our foreign currency risks.
Inflation could adversely affect our financial results.
The market prices of certain materials and components used in manufacturing our products, especially resins that are made with hydrocarbon, feedstocks, copper, aluminum and stainless steel, can be volatile. While, historically, inflation has not had a material effect on our results of operations, significant increases in inflation, particularly those related to wages and increases in the cost of raw materials, recently have had, and may continue to have, an adverse impact on our business, financial condition, and results of operations.
In addition, new boat buyers often finance their purchases. Inflation typically results in higher interest rates that could translate into an increased cost of boat ownership. Should inflation and increased interest rates occur, prospective consumers may choose to forego or delay their purchases or buy a less expensive boat in the event credit is not available to finance their boat purchases.
Risks Related to our Dealers
We depend on our network of independent dealers, face increasing competition for dealers and have little control over their activities.
Substantially all of our sales are derived from our network of independent dealers. Our top ten dealers represented 41.1%, 39.9% and 38.7% of our net sales for fiscal year 2023, 2022 and 2021, respectively. Sales to our dealers under common control of OneWater Marine, Inc. represented approximately 17.2%, 16.8% and 16.3% of consolidated net sales in fiscal years 2023, 2022 and 2021, respectively. Sales to our dealers under common control of Tommy's Boats represented approximately 10.7%, 9.4% and 7.3% of our consolidated net sales in the fiscal years ended June 30, 2023, 2022 and 2021 respectively. The loss of a significant number of these dealers could have a material adverse effect on our financial condition and results of operations. We have agreements with the dealers in our network that typically provide for one-year terms, although some agreements have a term of up to three years.
The number of dealers supporting our products and the quality of their marketing and servicing efforts are essential to our ability to generate sales. Competition for dealers among recreational powerboat manufacturers continues to increase based on the quality, price, value and availability of the manufacturers’ products, the manufacturers’ attention to customer service and the marketing support that the manufacturer provides to the dealers. We face competition from other manufacturers in attracting and retaining independent boat dealers. In addition, independent dealers in the recreational powerboat industry have experienced significant consolidation in recent years, which could result in the loss of one or more of our dealers in the future if the surviving entity in any such consolidation purchases similar products from a competitor. A significant deterioration in the
number or effectiveness of our dealers could have a material adverse effect on our business, financial condition and results of operations.
Our success depends, in part, upon the financial health of our dealers and their continued access to financing.
Because we sell nearly all of our products through dealers, the financial health of our dealers is critical to our success. Our business, financial condition and results of operations may be adversely affected if the financial health of the dealers that sell our products suffers. Their financial health may suffer for a variety of reasons, including a downturn in general economic conditions, rising interest rates, higher rents, increased labor costs and taxes, compliance with regulations and personal financial issues.
Our dealers also require adequate liquidity to finance their operations, including purchases of our boats. Dealers are subject to numerous risks and uncertainties that could unfavorably affect their liquidity positions, including, among other things, continued access to adequate financing sources on a timely basis on reasonable terms. These sources of financing are vital to our ability to sell products through our distribution network. Access to floor plan financing generally facilitates our dealers’ ability to purchase boats from us, and their financed purchases reduce our working capital requirements. If floor plan financing were not available to our dealers, our sales and our working capital levels would be adversely affected.
We may be required to repurchase inventory of certain dealers.
Many of our dealers have floor plan financing arrangements with third-party finance companies that enable the dealers to purchase our products. In connection with these agreements, we may have an obligation to repurchase our products from a finance company under certain circumstances, and we may not have any control over the timing or amount of any repurchase obligation nor have access to capital on terms acceptable to us to satisfy any repurchase obligation. This obligation is triggered if a dealer defaults on its debt obligations to a finance company, the finance company repossesses the boat and the boat is returned to us. Our obligation to repurchase a repossessed boat for the unpaid balance of our original invoice price for the boat is subject to reduction or limitation based on the age and condition of the boat at the time of repurchase, and in certain cases by an aggregate cap on repurchase obligations associated with a particular floor plan financing program. If boats are returned to us, it would have an adverse impact on our net sales and could result in downward pressure on pricing of our boats. Since fiscal year 2020, we have repurchased a total of two units from lenders to former dealers and those units were subsequently resold above their cost and at a minimal margin loss.
One or more dealers may default on the terms of a credit line in the future. In addition, applicable laws regulating dealer relations may also require us to repurchase our products from our dealers under certain circumstances, and we may not have any control over the timing or amount of any repurchase obligation nor have access to capital on terms acceptable to us to satisfy any repurchase obligation. If we are required to repurchase a significant number of units under any repurchase agreement or under applicable dealer laws, our business, operating results and financial condition could be adversely affected.
Risks Related to our Regulatory, Accounting, Legal and Tax Environment
The manufacture and sale of boats exposes us to product liability risks and a significant adverse determination in any material claim against us could adversely affect our operating results or financial condition.
The manufacture and sale of our boats expose us to significant risks associated with product liability, economic loss, and other claims. If our products are found to be defective or used incorrectly by our customers, bodily injury, property damage or other injury, including death, may result and this could give rise to additional product liability or economic loss claims against us and adversely affect our brand image or reputation. For instance, we recently settled certain product liability matters for $100.0 million after a jury found that our subsidiary, Malibu Boats, LLC, and another entity that was the manufacturer of the boat at issue, Malibu Boats West, Inc., negligently failed to warn of a hazard posed by the boat and that such failure was a proximate cause of the death of a passenger in the boat. Malibu Boats West, Inc. is not, and has never been, a subsidiary of ours but was a separate legal entity whose assets were purchased by Malibu Boats, LLC in 2006. See Note 17 of our audited consolidated financial statements included elsewhere in this Annual Report on Form 10-K for additional information.
As noted, we maintain product and general liability insurance policies, including excess insurance coverage for product liability claims. However, we are not fully insured against all potential claims and we may experience legal claims in excess of our insurance coverage or claims that are not covered by insurance, either of which could adversely affect our business, financial condition and results of operations. Any losses that we may suffer from any such claims, including any unanticipated adverse determination of a material product liability claim or other material claim (particularly an uninsured matter), could materially and adversely affect our financial condition, and the effect that any such liability may have upon the reputation and marketability of our products may have a negative impact on our business and operating results.
Significant product repair and/or replacement costs due to product warranty claims or product recalls could have a material adverse impact on our results of operations.
We provide limited warranties for our boats. Although we employ quality control procedures, sometimes a product is distributed that needs repair or replacement. Our standard warranties require us, through our dealer network, to repair or replace defective products during such warranty periods. In addition, if any of our products are, or are alleged to be, defective, we may be required to participate in a recall of that product if the defect or alleged defect relates to safety. For example, in fiscal year 2019 we announced a recall on fuel pumps supplied to us by a third-party vendor and used in certain Malibu and Axis boats. While this recall did not have a material impact on our business, the repair and replacement costs we could incur in connection with a recall could materially and adversely affect our business and could cause consumers to question the safety or reliability of our products.
Changes to U.S. trade policy, tariffs, and import/export regulations may have a material adverse effect on our business, financial condition, and results of operations.
Changes in laws and policies governing foreign trade could adversely affect our business and trigger retaliatory actions by affected countries. There is significant uncertainty with respect to future trade regulations, including the imposition by the U.S. of tariffs and penalties on products manufactured outside the U.S., and existing international trade agreements, as shown by Brexit in Europe. The institution of global trade tariffs, trade sanctions, new or onerous trade restrictions, embargoes and other stringent government controls have the potential to adversely impact the U.S. economy, our industry, our suppliers, and global demand for our products and, as a result, could have a material adverse effect on our business, financial condition, and results of operations.
We must comply with environmental laws and regulations as a boat manufacturer that could increase the costs of our products and reduce consumer demand.
As with boat construction in general, our manufacturing processes involve the use, handling, storage and contracting for recycling or disposal of hazardous substances and wastes. The failure to manage or dispose of such hazardous substances and wastes properly could expose us to material liability or fines, including liability for personal injury or property damage due to exposure to hazardous substances, damages to natural resources, or for the investigation and remediation of environmental conditions. Under certain environmental laws, we may be liable for remediation of contamination at sites where our hazardous wastes have been disposed or at our current or former facilities, regardless of whether such facilities are owned or leased or whether we caused the condition of contamination. We have not been notified of and are otherwise currently not aware of any contamination at our current or former facilities, or at any other location, for which we could have any material liability under environmental laws or regulations, and we currently are not undertaking any remediation or investigation activities in connection with any contamination. Also, the components in our boats may become subject to more stringent environmental regulations. For example, boat engines and other emission producing components may become subject to more stringent emissions standards, which could increase the cost of our engines, components and products, which, in turn, may reduce consumer demand for our products.
Our customers use our boats for recreational water and fishing activities. Environmental regulations, permitting and zoning requirements and other commercial policies and practices that limit access to water, including availability of slip locations and/or the ability to transfer boats among different waterways, access to fisheries, or the ability to fish in some areas could negatively affect demand for our boats. Future licensing requirements, including any licenses imposed on recreational boating, may also deter potential customers, thereby reducing our sales. Furthermore, regulations allowing the sale of fuel containing higher levels of ethanol for automobiles, which is not appropriate or intended for use in marine engines, may nonetheless result in increased warranty, service costs, customer dissatisfaction with products, and other claims against us if boaters mistakenly use this fuel in marine engines, causing damage to and the degradation of components in their marine engines.
In addition to environmental regulations, we must also comply with product safety, workforce and other laws and regulations that may increase our costs and could result in harm to our reputation if we fail to comply with such regulations.
We are subject to federal, state, local, and foreign laws and regulations, including product safety, workforce, and other regulations. For instance, we are subject to laws governing our relationships with employees, including, but not limited to, employment obligations such as employee wage, hour, and benefits issues. The Occupational Safety and Health Administration (OSHA) also imposes standards of conduct for and regulates workplace safety, including physical safety and limits on the amount of emissions to which an employee may be exposed without the need for respiratory protection or upgraded plant ventilation. Our facilities are also regularly inspected by OSHA and by state and local inspection agencies and departments.
Any of these laws, rules, or regulations may cause us to incur significant expenses to achieve or maintain compliance, require us to modify our products, or modify our approach to our workforce, adversely affecting the price of or demand for
some of our products, and ultimately affect the way we conduct our operations. Failure to comply with any of these laws, rules, or regulations could result in harm to our reputation and/or could lead to fines and other penalties, including restrictions on the importation of our products into, and the sale of our products in, one or more jurisdictions until compliance is achieved. In addition, legal requirements are constantly evolving, and changes in laws, regulations or policies, or changes in interpretations of the foregoing, could result in compliance shortfalls, require additional product development investment, increase consumer pricing, and increase our costs or create liabilities where none exists today.
Risks Related to our Capital Structure
The only material asset of Malibu Boats, Inc. is our interest in the LLC, and therefore Malibu Boats, Inc. is dependent upon distributions from the LLC for any cash obligations of Malibu Boats, Inc.
Malibu Boats, Inc. is a holding company and has no material assets other than its ownership of LLC Units in the LLC. Malibu Boats, Inc. has no independent means of generating revenue. We intend to cause the LLC to make distributions to its unit holders in an amount sufficient to cover all applicable taxes at assumed tax rates and payments under the tax receivable agreement. To the extent that Malibu Boats, Inc. need funds, and the LLC is restricted from making such distributions under applicable law or regulation or under the terms of its financing arrangements, or is otherwise unable to provide such funds, it could materially adversely affect our liquidity and financial condition. For example, our credit agreement generally prohibits the LLC, Malibu Boats, LLC, Malibu Australian Acquisition Corp., Cobalt Boats, LLC, PB Holdco, LLC, MBG Holdco, Inc. and Maverick Boat Group, Inc. from paying dividends or making distributions to Malibu Boats, Inc. However, our credit agreement permits (i) distributions to members of the LLC, including Malibu Boats, Inc., based on the member’s allocated taxable income, (ii) distributions to fund payments that are required under the our tax receivable agreement, (iii) purchases of stock or stock options of the LLC from former officers, directors or employees of loan parties under the credit agreement or payments pursuant to stock option and other benefit plans up to $5.0 million in any fiscal year, and (iv) repurchases of the outstanding stock and LLC units of Malibu Boats, Inc.. In addition, the LLC may make dividends and distributions, subject to compliance with other financial covenants.
The credit agreement governing our revolving credit facility contains restrictive covenants which may limit our operating flexibility and may impair our ability to access sufficient capital to operate our business.
We rely on our revolving credit facility to provide us with adequate liquidity to operate our business. The credit agreement governing our revolving credit facility contains restrictive covenants regarding indebtedness, liens, fundamental changes, investments, share repurchases, dividends and distributions, disposition of assets, transactions with affiliates, negative pledges, hedging transactions, certain prepayments of indebtedness, accounting changes and governmental regulation. The credit agreement also requires compliance with financial covenants consisting of a minimum ratio of EBITDA to interest expense and a maximum ratio of total debt to EBITDA. We have the option to request that lenders increase the amount available under the revolving credit facility by, or obtain incremental term loans of, up to $200.0 million, subject to the terms of the credit agreement and only if existing or new lenders choose to provide additional term or revolving commitments. Any incremental revolving commitments or term loan facility established under the credit agreement will also be subject to these same covenants and restrictions.
These covenants may affect our ability to operate and finance our business as we deem appropriate. Violation of these covenants could constitute an event of default under the credit agreement governing our revolving credit facility. If there were an event of default under the credit agreement, our lenders could reduce or terminate our access to amounts under our credit facilities or declare all of the indebtedness outstanding under our revolving credit facility immediately due and payable. We may not have sufficient funds available, or we may not have access to sufficient capital from other sources, to continue funding our operations or to repay any accelerated debt. Even if we could obtain additional financing, the terms of the financing may not be favorable to us. In addition, substantially all of our assets are subject to liens securing our revolving credit facility. If amounts outstanding under the revolving credit facility were accelerated, our lenders could foreclose on these liens and we could lose substantially all of our assets. Any event of default under the credit agreement governing our revolving credit facility could have a material adverse effect on our business, financial condition and results of operations.
Our variable rate indebtedness subjects us to interest rate risk, which could cause our debt service obligations to increase significantly.
Borrowings under our revolving credit facility are at variable rates of interest and expose us to interest rate risk. During the past year, interest rates have been increasing, which results in increased debt service obligations under our revolving credit facility even if our amount borrowed remains the same. Borrowings under our revolving credit facility bear interest at a variable rate equal to either, at our option, (i) the highest of the prime rate, the Federal Funds Rate plus 0.5%, or one-month Term SOFR plus 1% (the “Base Rate”) or (ii) SOFR, in each case plus an applicable margin ranging from 1.25% to 2.00% with respect to
SOFR borrowings and 0.25% to 1.00% with respect to Base Rate borrowings. The applicable margin will be based upon the consolidated leverage ratio of the LLC and its subsidiaries.
As of August 24, 2023, we had $65.0 million outstanding under our revolving credit facility. If the rate used to calculate interest on our outstanding floating rate debt under our revolving credit facility Credit Agreement were to increase by 1.0%, we would expect to incur additional interest expense on such indebtedness as of August 24, 2023 of approximately $0.7 million on an annualized basis.
We will be required to pay the pre-IPO owners (or any permitted assignee) for certain tax benefits pursuant to our tax receivable agreement with them, and the amounts we may pay could be significant.
We entered into a tax receivable agreement with the pre-IPO owners (or their permitted assignees) that provides for the payment by us to the pre-IPO owners (or any permitted assignee) of 85% of the tax benefits, if any, that we are deemed to realize as a result of (1) the increases in tax basis resulting from our purchases or exchanges of LLC Units and (2) certain other tax benefits related to our entering into the tax receivable agreement, including tax benefits attributable to payments under the tax receivable agreement. These payment obligations are the obligations of Malibu Boats, Inc. and not of the LLC. For purposes of the agreement, the benefit deemed realized by Malibu Boats, Inc. will be computed by comparing its actual income tax liability (calculated with certain assumptions) to the amount of such taxes that it would have been required to pay had there been no increase to the tax basis of the assets of the LLC as a result of the purchases or exchanges, and had we not entered into the tax receivable agreement.
Estimating the amount of payments that may be made under the tax receivable agreement is by its nature imprecise, insofar as the calculation of amounts payable depends on a variety of factors. The actual increase in tax basis, as well as the amount and timing of any payments under the agreement, will vary depending upon a number of factors, including:
•the timing of purchases or exchanges - for instance, the increase in any tax deductions will vary depending on the fair value, which may fluctuate over time, of the depreciable or amortizable assets of the LLC at the time of each purchase or exchange;
•the price of shares of our Class A Common Stock at the time of the purchase or exchange - the increase in any tax deductions, as well as the tax basis increase in other assets, of the LLC is directly related to the price of shares of our Class A Common Stock at the time of the purchase or exchange;
•the extent to which such purchases or exchanges are taxable - if an exchange or purchase is not taxable for any reason, increased deductions will not be available; and
•the amount and timing of our income - Malibu Boats, Inc. will be required to pay 85% of the deemed benefits as and when deemed realized. If we do not have taxable income, we generally will not be required (absent a change of control or other circumstances requiring an early termination payment) to make payments under the tax receivable agreement for that taxable year because no benefit will have been realized. However, any tax benefits that do not result in realized benefits in a given tax year will likely generate tax attributes that may be utilized to generate benefits in previous or future tax years. The utilization of such tax attributes will result in payments under the tax receivable agreement.
We expect that the payments that Malibu Boats, Inc. may make under the tax receivable agreement may be substantial. Assuming no material changes in the relevant tax law, and that we earn sufficient taxable income to realize all tax benefits that are subject to the agreement, we expect that future payments under the tax receivable agreement relating to the purchases by Malibu Boats, Inc. of LLC Units will be approximately $43.5 million over the next sixteen (16) years. Future payments to pre-IPO owners (or their permitted assignees) in respect of subsequent exchanges or purchases would be in addition to these amounts and are expected to be substantial. The foregoing numbers are estimates and the actual payments could differ materially. It is possible that future transactions or events, such as changes in tax legislation, could increase or decrease the actual tax benefits realized and the corresponding tax receivable agreement payments.
Further, there may be a material negative effect on our liquidity if distributions to Malibu Boats, Inc. by the LLC are not sufficient to permit Malibu Boats, Inc. to make payments under the tax receivable agreement after it has paid taxes. For example, Malibu Boats, Inc. may have an obligation to make tax receivable agreement payments for a certain amount while receiving distributions from the LLC in a lesser amount, which would negatively affect our liquidity. The payments under the tax receivable agreement are not conditioned upon the pre-IPO owners’ (or any permitted assignees’) continued ownership of us.
Malibu Boats, Inc. is required to make a good faith effort to ensure that it has sufficient cash available to make any required payments under the tax receivable agreement. The limited liability company agreement of the LLC requires the LLC to make
“tax distributions” which, in the ordinary course, will be sufficient to pay the actual tax liability of Malibu Boats, Inc. and to fund required payments under the tax receivable agreement. If for any reason the LLC is not able to make a tax distribution in an amount that is sufficient to make any required payment under the tax receivable agreement or we otherwise lack sufficient funds, interest would accrue on any unpaid amounts at LIBOR, plus 500 basis points until they are paid. Recent actions taken by the Chief Executive of the U.K. Financial Conduct Authority (the “FCA”), which regulates LIBOR, discontinued U.S. LIBOR after June 30, 2023. Our tax receivable agreement does not provide for an alternative reference rate to LIBOR. Therefore, pursuant to the Adjustable Interest Rate (LIBOR) Act (the “LIBOR Act”), 12 U.S.C. §§ 5801-5807, and the regulations promulgated to carry out the LIBOR Act, 12 C.F.R. Part 253, on July 1, 2023 we believe LIBOR with respect to the tax receivables agreement was automatically replaced by operation of law with the SOFR plus a spread adjustment. We do not currently anticipate failing to pay any amounts owed under our tax receivable agreement.
In certain cases, payments under the tax receivable agreement to the pre-IPO owners (or any permitted assignees) of LLC Units may be accelerated or significantly exceed the actual benefits we realize in respect of the tax attributes subject to the tax receivable agreement.
The tax receivable agreement provides that, in the event that we exercise our right to early termination of the tax receivable agreement, or in the event of a change in control or a material breach by us of our obligations under the tax receivable agreement, the tax receivable agreement will terminate, and Malibu Boats, Inc. will be required to make a lump-sum payment equal to the present value of all forecasted future payments that would have otherwise been made under the tax receivable agreement, which lump-sum payment would be based on certain assumptions, including those relating to our future taxable income. The change in control payment and termination payments to the pre-IPO owners (or any permitted assignees) could be substantial and could exceed the actual tax benefits that Malibu Boats, Inc. receives as a result of acquiring the LLC Units because the amounts of such payments would be calculated assuming that we would have been able to use the potential tax benefits each year for the remainder of the amortization periods applicable to the basis increases, and that tax rates applicable to us would be the same as they were in the year of the termination. In these situations, our obligations under the tax receivable agreement could have a substantial negative impact on our liquidity. There can be no assurance that we will be able to finance our obligations under the tax receivable agreement.
Payments under the tax receivable agreement will be based on the tax reporting positions that we determine. Although we are not aware of any issue that would cause the Internal Revenue Service, or the IRS, to challenge a tax basis increase, Malibu Boats, Inc. will not be reimbursed for any payments previously made under the tax receivable agreement. As a result, in certain circumstances, payments could be made under the tax receivable agreement in excess of the benefits that Malibu Boats, Inc. actually realizes in respect of (1) the increases in tax basis resulting from our purchases or exchanges of LLC Units and (2) certain other tax benefits related to our entering into the tax receivable agreement, including tax benefits attributable to payments under the tax receivable agreement.
Risks Related to our Common Stock
Our stock price may be volatile and stockholders may be unable to sell shares at or above the price at which they purchased them.
Our closing stock price ranged from $46.96 per share to $70.49 per share during fiscal year 2023. The market price of our Class A Common Stock could be subject to wide fluctuations in response to the risk factors listed in this section and others beyond our control. Further, stock markets may experience extreme price and volume fluctuations that can affect the market prices of equity securities. These fluctuations can be unrelated or disproportionate to the operating performance of those companies. These broad market and industry fluctuations, as well as general economic, political and market conditions such as recessions, interest rate changes or international currency fluctuations, could harm the market price of our Class A Common Stock.
Future sales of our Class A Common Stock in the public market could cause our share price to fall; furthermore, you may be diluted by future issuances of Class A Common Stock in connection with our incentive plans, acquisitions or otherwise.
Sales of a substantial number of shares of our Class A Common Stock in the public market, in particular sales by our directors, officers or other affiliates, or the perception that these sales might occur, could depress the market price of our Class A Common Stock and could impair our ability to raise capital through the sale of additional equity securities. Furthermore, any Class A Common Stock that we issue in connection with our Long-Term Incentive Plan or other equity incentive plans that we may adopt in the future, our acquisitions or otherwise would dilute the percentage ownership of holders of our Class A Common Stock.
Our governing documents and Delaware law could prevent a takeover that stockholders consider favorable and could also reduce the market price of our stock.
Our certificate of incorporation and bylaws contain certain provisions that could delay or prevent a change in control. These provisions could also make it more difficult for stockholders to elect directors and take other corporate actions. These provisions include, without limitation:
•a classified board structure;
•a requirement that stockholders must provide advance notice to propose nominations or have other business considered at a meeting of stockholders;
•supermajority stockholder approval to amend our bylaws or certain provisions in our certificate of incorporation; and
•authorization of blank check preferred stock.
In addition, we are subject to the provisions of Section 203 of the Delaware General Corporation Law. These provisions may prohibit large stockholders, in particular those owning 15% or more of our outstanding Class A Common Stock, from engaging in certain business combinations without the approval of substantially all of our stockholders for a certain period of time.
These and other provisions in our certificate of incorporation, bylaws and under Delaware law could discourage potential takeover attempts, reduce the price that investors might be willing to pay for shares of our Class A Common Stock in the future and result in the market price being lower than it would be without these provisions.
Item 1B. Unresolved Staff Comments
None.
Item 2. Properties
Tennessee
Our Malibu and Axis boats are manufactured in Loudon, Tennessee. We lease the property where we have our 197,000 square-foot facility that is used to manufacture Malibu and Axis boats. This property also includes warehouses and office space. The property is leased pursuant to a lease agreement that has a term through March 31, 2028, with the option to extend for three additional terms of ten years each. We also lease the property where we have our 23,500 square-foot facility that is used to store our warranty parts. This property also includes warehouses and office space. The property is leased pursuant to a lease agreement that has a term through December 31, 2024.
We also own 165,000 square-feet of space neighboring our manufacturing facility in Loudon, Tennessee that we use for trailer production, engine production, shipping and office space, respectively. Our Loudon facilities are used in our Malibu segment.
On July 25, 2023, we completed the purchase of a 260,000 square-foot facility in Lenoir City, Tennessee. This new facility provides for the opportunity to expand production of boats and provides more opportunities for vertical integration initiatives.
Kansas
Our Cobalt boats are manufactured in Neodesha, Kansas. We own the property in Neodesha, where we have four manufacturing facilities aggregating to 493,000 square feet of manufacturing space. Our Neodesha facilities are used in our Cobalt segment.
Florida
Our Pursuit boats are manufactured in Fort Pierce, Florida. We own the property where our Pursuit facilities are located which consist of six manufacturing facilities aggregating to 398,000 square feet of manufacturing space.
On March 1, 2023, we launched our new 116,000 square foot Tooling Design Center located on our Pursuit property. The new facility is a vertical integration initiative that will first focus on the tooling needs of our Pursuit brand, with the goal to build the majority of tooling across all of our brands at this site.
Our Maverick Boat Group boats are manufactured at a separate location in Fort Pierce, Florida. We own the property where our Maverick Boat Group facilities are located. Our two manufacturing facilities for Maverick Boat Group aggregate to 330,000 square feet of manufacturing space.
Our Fort Pierce facilities for Pursuit and the Maverick Boat Group are used in our Saltwater Fishing segment.
California
We lease a 172,500 square-foot facility in Merced, California pursuant to a lease agreement that has a term through March 31, 2028, with the option to extend for three additional terms of ten years each. Our Merced site houses both our product development team that focuses on design innovations as well as our tower and tower accessory manufacturing operations. The components assembled at this site are delivered to our facilities in Tennessee, Kansas and our Australian subsidiary. Our Merced site is used to develop and design boats, towers and tower accessories primarily for our Malibu segment and to a lesser extent for our Cobalt segment.
Alabama
We own a 130,000 square-foot facility in Alexander City, Alabama that focuses on the design and manufacturing of our wiring harnesses operations that are used in our Malibu, Axis and some Cobalt models. The components assembled at this site are delivered to our facilities in Tennessee and Kansas.
Australia
We manufacture and test boats at two facilities in Albury, Australia with combined square-footage of 68,200. Each facility is leased pursuant to a lease agreement and each with a term through October 22, 2024, with two five-year options to extend lease term. Our Albury facilities are used in our Malibu segment.
Item 3. Legal Proceedings
The discussion of legal matters under the section entitled "Legal Proceedings" is incorporated by reference from Note 17 of our audited consolidated financial statements included elsewhere in this Annual Report on Form 10-K.
Item 4. Mine Safety Disclosures
Not Applicable.
PART II.
Item 5. Market for Registrant's Common Equity, Related Stockholder Matters and Issuer Purchases of Equity Securities
Market Information
Our Class A Common Stock is listed on the Nasdaq Global Select Market under the symbol "MBUU".
On August 24, 2023, the last reported sale price on the Nasdaq Global Select Market of our Class A Common Stock was $53.31 per share. As of August 24, 2023, we had approximately four holders of record of our Class A Common Stock and 12 holders of record of our Class B Common Stock. The actual number of holders of Class A Common Stock is greater than this number of record holders, and includes stockholders who are beneficial owners, but whose shares of Class A Common Stock are held in street name by brokers and other nominees.
Dividends
Malibu Boats, Inc. has never declared or paid any cash dividends on its capital stock. We currently anticipate that we will retain all of our future earnings for use in the expansion and operation of our business and do not anticipate paying any cash dividends in the foreseeable future. Any future determination to declare cash dividends will be made at the discretion of our board of directors, subject to applicable law and will depend on our financial condition, results of operations, capital requirements, general business conditions and other factors that our board of directors may deem relevant.
Stock Performance Graph
The stock price performance graph below shall not be deemed soliciting material or to be filed with the SEC or subject to Regulation 14A or 14C under the Exchange Act or to the liabilities of Section 18 of the Exchange Act, nor shall it be incorporated by reference into any past or future filing under the Securities Act of 1933, as amended, or the Securities Act or the Exchange Act, except to the extent we specifically request that it be treated as soliciting material or specifically incorporate it by reference into a filing under the Securities Act or the Exchange Act.
The following graph shows the cumulative total stockholder return of an investment of $100 in cash at market close at the end of each of the years within the five-year period ended June 30, 2023 for (i) our Class A Common Stock, (ii) the Russell 2000 Index and (iii) the Dow Jones Recreational Product Index. Pursuant to applicable SEC rules, all values assume reinvestment of the full amount of all dividends, however no dividends have been declared on our Class A Common Stock to date. The stockholder return shown on the graph below is not necessarily indicative of future performance, and we do not make or endorse any predictions as to future stockholder returns.
Issuer Purchases of Equity Securities
On November 3, 2021, our Board of Directors authorized a stock repurchase program to allow for the repurchase of up to $70.0 million of our Class A Common Stock and the LLC's LLC Units (the “2021 Repurchase Program”) for the period from November 8, 2021 to November 8, 2022. During the fiscal year ended June 30, 2023, we repurchased 143,759 shares of Class A Common Stock for $7.9 million in cash including related fees and expenses under the 2021 Repurchase Program. On
November 3, 2022, our Board of Directors authorized a new stock repurchase program to allow for the repurchase of up to $100.0 million of our Class A Common Stock and the LLC's LLC Units (the “2022 Repurchase Program”) for the period from November 8, 2022 to November 8, 2023. As of June 30, 2023, $100.0 million was available to repurchase shares of Class A Common Stock and LLC Units under the 2022 Repurchase Program.
Unregistered Sales of Equity Securities
Not Applicable.
Equity Compensation Plan Information
Equity compensation plan information required by this Item 5 will be included in our definitive proxy statement for our annual meeting of stockholders, which will be filed with the SEC no later than 120 days after the end of our fiscal year ended June 30, 2023 (the "Proxy Statement"), and is incorporated herein by reference.
Item 6. [RESERVED]
Item 7. Management's Discussion and Analysis of Financial Condition and Results of Operations
Overview
We are a leading designer, manufacturer and marketer of a diverse range of recreational powerboats, including performance sport boats, sterndrive and outboard boats. Our product portfolio of premium brands are used for a broad range of recreational boating activities including, among others, water sports, general recreational boating and fishing. Our passion for consistent innovation, which has led to propriety technology such as Surf Gate, has allowed us to expand the market for our products by introducing consumers to new and exciting recreational activities. We design products that appeal to an expanding range of recreational boaters and water sports enthusiasts whose passion for boating and water sports is a key component of their active lifestyle and provide consumers with a better customer-inspired experience. With performance, quality, value and multi-purpose features, our product portfolio has us well positioned to broaden our addressable market and achieve our goal of increasing our market share in the expanding recreational boating industry.
We currently sell our boats under eight brands as shown in the table below, and we report our results of operations under three reportable segments, Malibu, Saltwater Fishing and Cobalt. We revised our segment reporting effective December 31, 2020 to account for our acquisition of Maverick Boat Group and to conform to changes in our internal management reporting based on our boat manufacturing operations. Prior to December 31, 2020, we had three reportable segments, Malibu, Pursuit and Cobalt. All segment information in the accompanying consolidated financial statements has been revised to conform to our current reporting segments for comparison purposes. Additional segment information is contained in Note 19 - Segment Reporting, in the notes to our consolidated financial statements included elsewhere in this Annual Report on Form 10-K.
| | | | | | | | | | | | | | |
| | % of Total Revenues |
| | Fiscal Year Ended June 30, |
| Segment | Brands | 2023 | 2022 | 2021 |
| Malibu | Malibu | 45.8% | 50.0% | 52.2% |
| Axis |
| | | | |
| Saltwater Fishing | Pursuit | 32.4% | 28.1% | 26.2% |
| Maverick |
| Cobia |
| Pathfinder |
| Hewes |
| | | | |
| Cobalt | Cobalt | 21.8% | 21.9% | 21.6% |
Our Malibu segment participates in the manufacturing, distribution, marketing and sale throughout the world of Malibu and Axis performance sports boats. Our flagship Malibu boats offer our latest innovations in performance, comfort and convenience, and are designed for consumers seeking a premium performance sport boat experience. We are the market leader in the United States in the performance sport boat category through our Malibu and Axis boat brands. Our Axis boats appeal to consumers who desire a more affordable performance sport boat product but still demand high performance, functional simplicity and the option to upgrade key features. Retail prices of our Malibu and Axis boats typically range from $80,000 to $300,000.
Our Saltwater Fishing segment participates in the manufacturing, distribution, marketing and sale throughout the world of Pursuit boats and the Maverick Boat Group family of boats (Maverick, Cobia, Pathfinder and Hewes). Our Pursuit boats expand our product offerings into the saltwater outboard fishing market and include center console, dual console and offshore models. In December 2020, we acquired Maverick Boat Group and added Maverick, Cobia, Pathfinder and Hewes to our brands. Our Maverick Boat Group family of boats are highly complementary to Pursuit, expanding our saltwater outboard offerings with a strong focus in length segments under 30 feet. We are among the market leaders in the fiberglass outboard fishing boat category with the brands in our Saltwater Fishing segment. Retail prices for our Saltwater Fishing boats typically range from $45,000 to $1,400,000.
Our Cobalt segment participates in the manufacturing, distribution, marketing and sale throughout the world of Cobalt boats. Our Cobalt boats consist of mid to large-sized luxury cruisers and bowriders that we believe offer the ultimate experience in comfort, performance and quality. We are the market leader in the United States in the 20’ - 40’ segment of the sterndrive boat category through our Cobalt brand. Retail prices for our Cobalt boats typically range from $75,000 to $625,000.
We sell our boats through a dealer network that we believe is the strongest in the recreational powerboat category. As of June 30, 2023, our worldwide distribution channel consisted of over 400 dealer locations globally. Our dealer base is an important part of our consumers’ experience, our marketing efforts and our brands. We devote significant time and resources to find, develop and improve the performance of our dealers and believe our dealer network gives us a distinct competitive advantage.
We achieved fiscal year 2023 net sales, net income and adjusted EBITDA of $1,388.4 million, $107.9 million and $284.0 million, respectively, compared to $1,214.9 million, $163.4 million and $246.5 million, respectively, for fiscal year 2022. For the definition of adjusted EBITDA and a reconciliation to net income, see “GAAP Reconciliation of Non-GAAP Financial Measures.”
Outlook
During the COVID-19 pandemic, domestic retail demand for recreational powerboats increased to the highest levels seen by the industry in decades as consumers turned to boating as a form of outdoor, socially-distanced, recreation. Retail registration activity in the recreational powerboat market, however, began declining meaningfully in the second half of calendar year 2021 as a result of limited available inventory due to the strong sales activity during the pandemic and supply chain disruptions that began impacting production levels. During calendar year 2022, retail registration activity continued to decline at a lower year-over-year rate than the second half of calendar year 2021. The declines in retail registration activity in the recreational powerboat market during calendar year 2022 were also impacted by the increased retail demand in calendar year 2021, resulting in an abnormally high comparative period.
We and our dealers have experienced similar impacts in retail demand, supply chain disruption and resulting low inventory levels as the industry. The combination of strong retail market activity in calendar years 2020 and 2021 along with supply chain disruptions in calendar year 2021 that continued through calendar year 2022 depleted inventory levels at our dealers in calendar year 2022 below pre-COVID levels. Some of the operational challenges and supply chain disruptions we experienced included labor shortages, domestic logistical constraints, West Coast port challenges and rising prices for our suppliers, in part due to inflationary pressures. These operational challenges and supply chain constraints delayed our ability to add to depleted inventory levels throughout fiscal year 2022. While retail activity at our dealers was strong during much of fiscal year 2022, it may have been higher but for a lack of inventory.
Current inventory levels at our Malibu and Cobalt dealers have returned to pre-pandemic levels and at our Saltwater Fishing dealers are continuing to normalize to pre-pandemic levels. While retail activity at our dealers trended lower during fiscal year 2023, given low inventory levels at the beginning of the fiscal year, we continued to experience strong wholesale demand throughout the first three quarters of fiscal year 2023. As channel inventory becomes more normalized, we believe wholesale demand will become more directly dependent on the underlying retail activity for our products. As a result, we believe our wholesale demand in the upcoming quarters will largely be driven by the retail activity for our products into the first half of fiscal year 2024.
We aim to increase our market share across the boating categories in which we compete through new product development, improved distribution, new models, and innovative features. Our industry, however, is highly competitive, and our competitors have become more aggressive in their product introductions, expanded their distribution capabilities, and launched surf systems competitive with our patented Surf Gate system. Further, our ability to maintain inventory levels at our dealers will be important to sustain and grow our market share across our brands. We believe our new product pipeline, strong dealer network and ability to increase production will allow us to maintain, and potentially expand, our leading market position in performance sports boats. We also believe that our track record of expanding our market share with our Malibu and Axis brands is directly transferable to our Cobalt, Pursuit and Maverick Boat Group brands.
As discussed above, our financial results and operations have been, and could continue to be, impacted by events outside of our control, including COVID-19 and supply chain disruptions that we believe were driven by numerous factors, such as labor shortages, ongoing domestic logistical constraints, West Coast port challenges and rising prices for our suppliers, in part due to inflationary pressures. Numerous other variables also have the potential to impact our volumes, both positively and negatively. For instance, elevated interest rates, which we are currently experiencing, could reduce retail consumer appetite for our product or reduce the appetite or availability for credit for our dealers and retail consumers.
Factors Affecting Our Results of Operations
We believe that our results of operations and our growth prospects are affected by a number of factors, which we discuss below.
Economic Environment and Consumer Demand
Our product sales are impacted by general economic conditions, which affect the demand for our products, the demand for optional features, the availability of credit for our dealers and retail consumers, and overall consumer confidence. Consumer spending, especially purchases of discretionary items, tends to decline during recessionary periods and tends to increase during expansionary periods. While there is still some uncertainty surrounding current macroeconomic conditions, and rising prices to our suppliers, in part due to inflationary pressures, we believe we are well positioned strategically in the recreational powerboat market with brands that are market leaders in their segments.
Inflation has impacted the prices of our materials and our labor costs, which has had a negative impact on our gross margin and our operations. In particular, the market prices of certain materials and components used in manufacturing our products, especially resins that are made with hydrocarbon, feedstocks, copper, aluminum and stainless steel, are increasing. To combat this, we implemented a surcharge across all brands effective December 1, 2021. These surcharges could have negatively impacted retail demand, but we do not believe they impacted our wholesale shipments in fiscal year 2022. Further, new boat buyers often finance their purchases. Efforts to stop or limit inflation are resulting in higher interest rates that translate into an increased cost of boat ownership. We have seen increased interest rates for our customers throughout calendar year 2022 and the first half of calendar year 2023. Should inflation and increased interest rates continue at elevated rates, we may experience less retail demand because prospective consumers may choose to forgo or delay their purchases or buy a less expensive or used boat. We intend to minimize the effect of inflation through selective price increases, cost reductions and improved productivity.
New Product Development and Innovation
Our long-term revenue prospects are based in part on our ability to develop new products and technological enhancements that meet the demands of existing and new consumers. Developing and introducing new boat models and features that deliver improved performance and convenience are essential to leveraging the value of our brands. By introducing new boat models, we are able to appeal to a new and broader range of consumers and focus on underserved or adjacent segments of the broader powerboat category. To keep product fresh and at the forefront of technological innovation in the boating industry, we aim to introduce a number of new boat models per year. We also believe we are able to capture additional value from the sale of each boat through the introduction of new features, which results in increased average selling prices and improved margins. We allocate most of our product development costs to new model and feature designs, usually with a specific consumer base and market in mind. We use industry data to analyze our markets and evaluate revenue potential from each major project we undertake. Our product development cycle, or the time from initial concept to volume production, can be up to two years. As a result, our development costs, which may be significant, may not be offset by corresponding new sales during the same periods. Once new designs and technologies become available to our consumers, we typically realize revenue from these products from one year up to 15 years. We may not, however, realize our revenue expectations from each innovation. We believe our close communication with our consumers, dealers and sponsored athletes regarding their future product desires enhances the efficiency of our product development expenditures.
Product Mix
Leveraging our robust product offering and features to enhance our sales growth and gross margins. Our product mix, as it relates to our brands, types of boats and features, not only makes our offerings attractive to consumers but also helps drive higher sales and margins. Historically, we have been able to realize higher sales and margins when we sell larger boats compared to our smaller boats, our premium brands compared to our entry-level brands and our boats that are fully-equipped with optional features. We intend to continue to develop new features and models and maintain an attractive product mix that optimizes sales growth and margins.
Ability to Manage Manufacturing Costs, Sales Cycles and Inventory Levels
Our results of operations are affected by our ability to manage our manufacturing costs effectively and to respond to changing sales cycles. Our product costs vary based on the costs of supplies and raw materials, as well as labor costs. We have implemented various initiatives to reduce our cost base and improve the efficiency of our manufacturing process. We are continuously monitoring and reviewing our manufacturing processes to identify improvements and create additional efficiencies.
Our ability to maintain production is dependent upon our suppliers delivering sufficient amounts of components, raw materials and parts to manufacture our products and on time to meet our production schedules. Historically, we have not entered into long-term agreements with suppliers of our raw materials and components other than for our engines and outboard motors. Any number of factors, including labor disruptions, weather events, the occurrence of a contagious disease or illness, contractual or other disputes, unfavorable economic or industry conditions, delivery delays or other performance problems or financial difficulties or solvency problems, could disrupt our suppliers’ operations and lead to uncertainty in our supply chain or cause supply disruptions for us, which could, in turn, disrupt our operations. We have experienced supply chain disruptions since fiscal year 2020 related to numerous factors, including COVID-19, severe weather events, labor shortages, ongoing domestic logistical constraints, West Coast port challenges and rising prices for our suppliers, in part due to inflationary pressures. If we were to further experience supply disruptions or they intensify, we may not be able to develop alternate sourcing quickly or at all. Any material disruption of our production schedule caused by an unexpected shortage of components, raw materials or parts could cause us not to be able to meet customer demand, to alter production schedules or suspend production entirely, which could cause a loss of revenues, which could materially and adversely affect our results of operations.
We completed the build-out of our new Tooling Design Center at our Pursuit facility in Florida in March 2023. The Tooling Design Center is a vertical integration initiative that will first focus on the tooling needs for our Pursuit boats, with the goal to build the majority of tooling across all of our brands at this site. This vertical integration initiative is part of a multi-year plan to bring our product tooling in-house, which has the potential to help us better control capital expenditures, improve tooling quality, and increase volumes.
On July 25, 2023, we completed the purchase of a 260,000 square-foot facility in Lenoir City, Tennessee. This new facility provides for the opportunity to expand production of boats and provides additional opportunities for vertical integration initiatives.
Dealer Network, Dealer Financing and Incentives
We rely on our dealer network to distribute and sell our products. We believe we have developed the strongest distribution network in the performance sport boat category. To improve and expand our network and compete effectively for dealers, we regularly monitor and assess the performance of our dealers and evaluate dealer locations and geographic coverage in order to identify potential market opportunities. Our acquisitions of Cobalt, Pursuit and Maverick Boat Group has allowed us to expand into each of their strong dealer networks as well. We intend to continue to add dealers in new territories in the United States as well as internationally, which we believe will result in increased unit sales.
Our dealers are exposed to seasonal variations in consumer demand for boats. We address anticipated demand for our products and manage our manufacturing in order to mitigate seasonal variations. We also use our dealer incentive programs to encourage dealers to order in the off-season by providing floor plan financing relief, which typically permits dealers to take delivery of current model year boats between July 1 and April 30 on an interest-free basis for a specified period. We also offer our dealers other incentives, including rebates, seasonal discounts and other allowances. We facilitate floor plan financing programs for many of our dealers by entering into repurchase agreements with certain third-party lenders, which enable our dealers, under certain circumstances, to establish lines of credit with the third-party lenders to purchase inventory. Under these floor plan financing programs, a dealer draws on the floor plan facility upon the purchase of our boats and the lender pays the invoice price of the boats. We will continue to review and refine our dealer incentive offerings and monitor any exposures arising under these arrangements.
Vertical Integration
We have vertically integrated a number of key components of our manufacturing process, including the manufacturing of our Monsoon engines, boat trailers, towers and tower accessories, machined and billet parts, soft grip flooring, wiring harnesses and most recently, certain tooling for our Pursuit brand. We began producing our own engines, branded as Malibu Monsoon engines, in our Malibu and Axis boats for model year 2019. Starting in fiscal year 2024, we plan to begin offering Monsoon sterndrive engines to our Cobalt dealers and customers. As we move into the second half of fiscal year 2024, we plan to continue the roll out of our Monsoon engines into Cobalt’s surf boats. We believe our vertical integration initiatives will reduce our reliance on third-party suppliers while reducing the risk that a change in cost or production from any third-party supplier
could adversely affect our business. In fiscal year 2022, we acquired a facility to begin manufacturing our own wiring harnesses. As a result of this acquisition, we reduced the risk of production delays due to delays in receipt of wiring harnesses from third-party suppliers. In March 2023, we launched our new Tooling Design Center located on our Pursuit campus. The Tooling Design Center has potential to help us better control capital expenditures, improve tooling quality, and increase volumes.
Vertical integration of key components of our boats gives us the ability to increase incremental margin per boat sold by reducing our cost base and improving the efficiency of our manufacturing process. Additionally, it allows us to have greater control over design, consumer customization options, construction quality, and our supply chain. We continually review our manufacturing process to identify opportunities for additional vertical integration investments across our portfolio of premium brands.
Components of Results of Operations
Net Sales
We generate revenue from the sale of boats to our dealers. The substantial majority of our net sales are derived from the sale of boats, including optional features included at the time of the initial wholesale purchase of the boat. Net sales consists of the following:
•Gross sales from:
•Boat and trailer sales—consists of sales of boats and trailers to our dealer network. Nearly all of our boat sales include optional feature upgrades purchased by the consumer, which increase the average selling price of our boats; and
•Parts and other sales—consists of sales of replacement and aftermarket boat parts and accessories to our dealer network; and consists of royalty income earned from license agreements with various boat manufacturers, including Nautique, Chaparral, Mastercraft, and Tige related to the use of our intellectual property.
•Net sales are net of:
•Sales returns—consists primarily of contractual repurchases of boats either repossessed by the floor plan financing provider from the dealer or returned by the dealer under our warranty program; and
•Rebates and free flooring —consists of incentives, rebates and free flooring, we provide to our dealers based on sales of eligible products. For our Malibu and Cobalt segments, if a domestic dealer meets its monthly or quarterly commitment volume, as well as other terms of the dealer performance program, the dealer is entitled to a specified rebate. For our Saltwater Fishing segment, if a dealer meets its quarterly or annual retail volume goals, the dealer is entitled to a specific rebate applied to their wholesale volume purchased. For Malibu, Cobalt and select Saltwater Fishing models, our dealers that take delivery of current model year boats in the offseason, typically July through April in the U.S., are also entitled to have us pay the interest to floor the boat until the earlier of (1) the sale of the unit or (2) a date near the end of the current model year, which incentive we refer to as “free flooring.” From time to time, we may extend the flooring program to eligible models beyond the offseason period. For more information, see "Item 1. Business - Dealer Management."
Cost of Sales
Our cost of sales includes all of the costs to manufacture our products, including raw materials, components, supplies, direct labor and factory overhead. For components and accessories manufactured by third-party vendors, such costs represent the amounts invoiced by the vendors. Shipping costs and depreciation expense related to manufacturing equipment and facilities are also included in cost of sales. Warranty costs associated with the repair or replacement of our boats under warranty are also included in cost of sales.
Operating Expenses
Our operating expenses include selling and marketing, general and administrative costs and amortization costs. Each of these items includes personnel and related expenses, supplies, non-manufacturing overhead, third-party professional fees and various other operating expenses. Further, selling and marketing expenditures include the cost of advertising and various promotional sales incentive programs. General and administrative expenses include, among other things, salaries, benefits and other personnel related expenses for employees engaged in product development, engineering, finance, information technology, human resources and executive management. Other costs include outside legal and accounting fees, investor relations, risk
management (insurance) and other administrative costs. General and administrative expenses also include product development expenses associated with our vertical integration initiative and acquisition or integration related expenses. Amortization expenses are associated with the amortization of intangibles.
Other Expense (Income), Net
Other expense (income), net consists of interest expense and other income or expense, net. Interest expense consists of interest charged under our outstanding debt and amortization of deferred financing costs on our credit facilities. Other income or expense includes adjustments to our tax receivable agreement liability and sublease income.
Income Taxes
Malibu Boats, Inc. is subject to U.S. federal and state income tax in multiple jurisdictions with respect to our allocable share of any net taxable income of the LLC. The LLC is a pass-through entity for federal purposes but incurs income tax in certain state jurisdictions. Maverick Boat Group is separately subject to U.S. federal and state income tax with respect to its net taxable income.
Net Income Attributable to Non-controlling Interest
As of each of June 30, 2023 and 2022, we had a 97.8% and 97.2%, respectively, controlling economic interest and 100% voting interest in the LLC and, therefore, we consolidate the LLC's operating results for financial statement purposes. Net income attributable to non-controlling interest represents the portion of net income attributable to the non-controlling LLC members.
Results of Operations
The table below sets forth our consolidated results of operations, expressed in thousands (except unit volume and net sales per unit) and as a percentage of net sales, for the periods presented. Our consolidated financial results for these periods are not necessarily indicative of the consolidated financial results that we will achieve in future periods. Certain totals for the table below will not sum to exactly 100% due to rounding.
| | | | | | | | | | | | | | | | | | | | | | | | | | | | | | | | | | | | | | |
| | Fiscal Year Ended June 30, |
| | 2023 | | 2022 | | 2021 |
| | $ | | % Revenue | | $ | | % Revenue | | $ | | % Revenue |
| Net sales | | 1,388,365 | | | 100.0 | % | | 1,214,877 | | | 100.0 | % | | 926,515 | | | 100.0 | % |
| Cost of sales | | 1,037,070 | | | 74.7 | % | | 904,826 | | | 74.5 | % | | 690,030 | | | 74.5 | % |
| Gross profit | | 351,295 | | | 25.3 | % | | 310,051 | | | 25.5 | % | | 236,485 | | | 25.4 | % |
| Operating expenses: | | | | | | | | | | | | |
| Selling and marketing | | 24,009 | | | 1.7 | % | | 22,900 | | | 1.9 | % | | 17,540 | | | 1.9 | % |
| General and administrative | | 175,694 | | | 12.7 | % | | 66,371 | | | 5.4 | % | | 61,915 | | | 6.6 | % |
| Amortization | | 6,808 | | | 0.5 | % | | 6,957 | | | 0.6 | % | | 7,255 | | | 0.8 | % |
| Operating income | | 144,784 | | | 10.4 | % | | 213,823 | | | 17.6 | % | | 149,775 | | | 16.2 | % |
| Other expense (income), net: | | | | | | | | | | | | |
| Other expense (income), net | | 331 | | | — | % | | 983 | | | 0.1 | % | | (1,015) | | | (0.1) | % |
| Interest expense | | 2,962 | | | 0.2 | % | | 2,875 | | | 0.2 | % | | 2,529 | | | 0.3 | % |
| Other expense (income), net | | 3,293 | | | 0.2 | % | | 3,858 | | | 0.3 | % | | 1,514 | | | 0.2 | % |
| Income before provision for income taxes | | 141,491 | | | 10.2 | % | | 209,965 | | | 17.3 | % | | 148,261 | | | 16.0 | % |
| Provision for income taxes | | 33,581 | | | 2.4 | % | | 46,535 | | | 3.8 | % | | 33,979 | | | 3.7 | % |
| Net income | | 107,910 | | | 7.8 | % | | 163,430 | | | 13.5 | % | | 114,282 | | | 12.3 | % |
| Net income attributable to non-controlling interest | | 3,397 | | | 0.3 | % | | 5,798 | | | 0.5 | % | | 4,441 | | | 0.5 | % |
| Net income attributable to Malibu Boats, Inc. | | 104,513 | | | 7.5 | % | | 157,632 | | | 13.0 | % | | 109,841 | | | 11.8 | % |
| | | | | | | | | | | | |
| | Fiscal Year Ended June 30, |
| | 2023 | | 2022 | | 2021 |
| | Unit Volumes | | % Total | | Unit Volumes | | % Total | | Unit Volumes | | % Total |
| Volume by Segment | | | | | | | | | | | | |
| Malibu | | 5,127 | | | 52.0 | % | | 5,173 | | | 55.9 | % | | 4,841 | | | 59.1 | % |
Saltwater Fishing 1 | | 2,585 | | | 26.2 | % | | 2,035 | | | 22.0 | % | | 1,428 | | | 17.5 | % |
| Cobalt | | 2,151 | | | 21.8 | % | | 2,047 | | | 22.1 | % | | 1,916 | | | 23.4 | % |
| Total Units | | 9,863 | | | | | 9,255 | | | | | 8,185 | | | |
| | | | | | | | | | | | |
| Net sales per unit | | $ | 140,765 | | | | | $ | 131,267 | | | | | $ | 113,197 | | | |
(1) We acquired all of the outstanding stock of Maverick Boat Group on December 31, 2020.
Comparison of the Fiscal Year Ended June 30, 2023 to the Fiscal Year Ended June 30, 2022
Net Sales
Net sales for fiscal year 2023 increased $173.5 million, or 14.3%, to $1,388.4 million, compared to fiscal year 2022. The increase in net sales was driven primarily by increased unit volumes in our Saltwater Fishing and Cobalt segments, a favorable model mix across all segments and inflation-driven year-over-year price increases across all segments, partially offset by lower unit volumes in the Malibu segment and increased dealer flooring program costs across all segments resulting from higher interest rates and increased inventory levels. Unit volume for fiscal year 2023 increased 608 units, or 6.6%, to 9,863 units compared to fiscal year 2022. Our unit volume increased primarily due to strong wholesale restocking demand across our Cobalt and Saltwater Fishing segments, partially offset by reduced wholesale restocking demand at our Malibu segment.
Net sales attributable to our Malibu segment increased $28.7 million, or 4.7%, to $636.2 million for fiscal year 2023 compared to fiscal year 2022. Unit volumes attributable to our Malibu segment decreased 46 units for fiscal year 2023 compared to fiscal year 2022. The increase in net sales was driven by inflation-driven year-over-year price increases and a favorable model mix, partially offset by lower unit volumes and increased dealer flooring program costs.
Net sales attributable to our Saltwater Fishing segment increased $107.2 million, or 31.4%, to $449.2 million for fiscal year 2023 compared to fiscal year 2022. Unit volumes increased 550 units for fiscal year 2023 compared to fiscal year 2022. The increase in net sales was driven by increased volume, inflation-driven year-over-year price increases and a favorable model mix, partially offset by increased dealer flooring program costs.
Net sales attributable to our Cobalt segment increased $37.6 million, or 14.2%, to $303.0 million for fiscal year 2023 compared to fiscal year 2022. Unit volumes attributable to Cobalt increased 104 units for fiscal year 2023 compared to fiscal year 2022. The increase in net sales was driven by increased volume, inflation-driven year-over-year price increases and a favorable model mix, partially offset by increased dealer flooring program costs.
Overall consolidated net sales per unit increased 7.2% to $140,765 per unit for fiscal year 2023 compared to fiscal year 2022. Net sales per unit for our Malibu segment increased 5.7% to $124,097 per unit for fiscal year 2023 compared to fiscal year 2022, driven by inflation-driven year-over-year price increases and a favorable model mix, partially offset by increased dealer flooring program costs. Net sales per unit for our Saltwater Fishing segment increased 3.4% to $173,755 per unit for fiscal year 2023 compared to fiscal year 2022, driven by inflation-driven year-over-year price increases, partially offset by increased dealer flooring program costs and a unfavorable model mix. Net sales per unit for our Cobalt segment increased 8.6% to $140,847 per unit for fiscal year 2023 compared to fiscal year 2022, driven by inflation-driven year-over-year price increases and a favorable model mix, partially offset by increased dealer flooring program costs.
Cost of Sales
Cost of sales for fiscal year 2023 increased $132.2 million, or 14.6%, to $1,037.1 million compared to fiscal year 2022. The increase in cost of sales was primarily driven by a 6.6% increase in volumes and increased prices due to inflationary pressures that have impacted prices on parts and components. In the Malibu segment, higher per unit material and labor costs contributed $19.1 million to the increase in cost of sales and were driven by increased prices due to inflationary pressures. In the Saltwater Fishing segment, higher per unit material and labor costs contributed $2.2 million to the increase in cost of sales and were driven by increased prices due to inflationary pressures and an increased mix of larger models that corresponded with higher net sales per unit. In the Cobalt segment, higher per unit material and labor costs contributed $19.7 million to the increase in cost of sales and were driven by increased prices due to inflationary pressures and an increased mix of larger models that corresponded with higher net sales per unit.
Gross Profit
Gross profit for fiscal year 2023 increased $41.2 million, or 13.3%, compared to fiscal year 2022. The increase in gross profit was driven primarily by higher sales revenue partially offset by the increased cost of sales for the reasons noted above. Gross margin for fiscal year 2023 decreased 0.2% from 25.5% to 25.3% driven primarily by an increased mix of the Saltwater Fishing segment and increased dealer flooring program costs and partially offset by better year-over-year performance in our Saltwater Fishing segment.
Operating Expenses
Selling and marketing expense for fiscal year 2023 increased $1.1 million, or 4.8% to $24.0 million compared to fiscal year 2022. The increase was driven primarily by increased promotional events. As a percentage of sales, selling and marketing expense decreased 0.2% to 1.7% for fiscal year 2023 compared to 1.9% for fiscal year 2022. General and administrative expense for fiscal year 2023 increased $109.3 million, or 164.7%, to $175.7 million compared to fiscal year 2022. The increase in general and administrative expenses was driven primarily by the settlement of product liability cases for $100.0 million in June 2023. See Note 17 of our audited consolidated financial statements included elsewhere in this Annual Report on Form 10-K for more information. The remaining increase in general and administrative expenses was driven by an increase in compensation and personnel-related expenses, an increase in legal and professional fees and an increase in travel related expenses. As a percentage of sales, general and administrative expenses increased 7.3% to 12.7% for fiscal year 2023 compared to 5.4% for fiscal year 2022. Amortization expense for fiscal year 2023 decreased $0.1 million, or 2.1%, to $6.8 million compared to fiscal year 2022 due to a decrease of amortization expense related to fully amortized intangibles.
Other Expense (Income), Net
Other expense, net for fiscal year 2023 decreased by $0.6 million, or 14.6% to $3.3 million as compared to fiscal year 2022. In fiscal year 2023, we increased our tax receivable agreement liability by $0.2 million that resulted in a corresponding amount being recognized as other expense during the same period, compared to fiscal year 2022 when we increased our tax receivable agreement liability by $1.0 million. Our interest expense increased by $0.1 million during fiscal year 2023 compared to fiscal year 2022 due to higher average interest rates on outstanding debt, offset by lower average outstanding debt.
Provision for Income Taxes
Our provision for income taxes for fiscal year 2023 decreased $13.0 million, or 27.8% to $33.6 million compared to fiscal year 2022. This decrease was primarily driven by lower pre-tax earnings. For fiscal year 2023, our effective tax rate of 23.7% differed from the statutory federal income tax rate of 21% primarily due to the impact of U.S. state taxes. This increase in the effective tax rate was partially offset by the benefit of the research and development tax credit as well as the impact of non-controlling interests in the LLC. For fiscal year 2022, our effective tax rate of 22.2% differed from the statutory federal income tax rate of 21% primarily due to the impact of U.S. state taxes. This increase in the effective tax rate was partially offset by a windfall benefit generated by certain stock-based compensation, as well as the benefits of the research and development tax credit, and the impact of non-controlling interests in the LLC.
Non-controlling interest
Non-controlling interest represents the ownership interests of the members of the LLC other than us and the amount recorded as non-controlling interest in our consolidated statements of operations and comprehensive income is computed by multiplying pre-tax income for the applicable fiscal year by the percentage ownership in the LLC not directly attributable to us. For fiscal years 2023 and 2022, the weighted average non-controlling interest attributable to ownership interests in the LLC not directly attributable to us was 2.6% and 2.8%, respectively.
Comparison of the Fiscal Year Ended June 30, 2022 to the Fiscal Year Ended June 30, 2021
Net Sales
Net sales for fiscal year 2022 increased $288.4 million, or 31.1%, to $1,214.9 million, compared to fiscal year 2021. The increase in net sales was driven primarily by increased unit volumes across all three segments, year-over-year price increases and a favorable model mix. We recognized an increase in net sales and volumes across all three segments during fiscal year 2022. Unit volume for fiscal year 2022 increased 1,070 units, or 13.1%, to 9,255 units compared to fiscal year 2021.
Net sales attributable to our Malibu segment increased $124.0 million, or 25.6%, to $607.6 million for fiscal year 2022 compared to fiscal year 2021. Unit volumes attributable to our Malibu segment increased 332 units for fiscal year 2022 compared to fiscal year 2021. The increase in net sales was driven by year-over-year price increases, a favorable model mix and increased volume resulting from strong demand for our Malibu and Axis model boats.
Net sales from our Saltwater Fishing segment increased $99.0 million, or 40.8%, to $341.9 million for fiscal year 2022 compared to fiscal year 2021. Unit volumes increased 607 units for fiscal year 2022 compared to fiscal year 2021. The increase in net sales was driven primarily by the acquisition of Maverick Boat Group on December 31, 2020, year-over-year price increases and a favorable model mix. The increase in unit volumes resulted primarily from our addition of the Maverick Boat Group.
Net sales from our Cobalt segment increased $65.4 million, or 32.7%, to $265.4 million for fiscal year 2022 compared to fiscal year 2021. Unit volumes attributable to Cobalt increased 131 units for fiscal year 2022 compared to fiscal year 2021. The increase in net sales was driven primarily by a favorable model mix, year-over-year price increases and increased volume. We experienced increased volume at Cobalt as a result of our prior year investments in the Cobalt facilities to optimize efficiency and expand capacity.
Our overall net sales per unit increased 16.0% to $131,267 per unit for fiscal year 2022 compared to fiscal year 2021. Net sales per unit for our Malibu segment increased 17.6% to $117,445 per unit for fiscal year 2022 compared to fiscal year 2021, primarily driven by year-over-year price increases and a favorable model mix. Net sales per unit for our Saltwater Fishing segment decreased 1.2% to $168,025 per unit for fiscal year 2022 compared to fiscal year 2021, primarily driven by mix of models due mostly to the inclusion of lower priced models from our acquisition of Maverick Boat Group on December 31, 2020. Net sales per unit for our Cobalt segment increased 24.2% to $129,655 per unit for fiscal year 2022 compared to fiscal year 2021, driven primarily by a favorable model mix and year-over-year price increases.
Cost of Sales
Cost of sales for fiscal year 2022 increased $214.8 million, or 31.1%, to $904.8 million compared to fiscal year 2021. The increase in cost of sales was driven by higher costs related to higher net sales in all our segments and increased prices due to supply chain disruptions and inflationary pressures that have impacted prices on parts and components. In the Malibu segment, higher per unit material and labor costs contributed $66.7 million to the increase in cost of sales and were driven by an increased mix of larger products that corresponded with higher net sales per unit. Within our Saltwater Fishing segment, higher per unit material and labor costs contributed $87.3 million to the increase in cost of sales and were driven by the acquisition of Maverick Boat Group on December 31, 2020 and an increased mix of larger products that corresponded with higher net sales
per unit. In the Cobalt segment, higher per unit material and labor costs contributed $44.8 million to the increase in cost of sales and were driven by an increased mix of larger products that corresponded with higher net sales per unit.
Gross Profit
Gross profit for fiscal year 2022 increased $73.6 million, or 31.1%, compared to fiscal year 2021. The increase in gross profit was driven primarily by higher sales revenue with a more favorable product mix and the contribution of Maverick Boat Group partially offset by the increased cost of sales for the reasons noted above. Gross margin remained flat at 25.5% in fiscal year 2022.
Operating Expenses
Selling and marketing expense for fiscal year 2022 increased $5.4 million, or 30.6% to $22.9 million compared to fiscal year 2021. The increase was driven primarily by incremental selling and marketing expenses from the acquisition of Maverick Boat Group, increased compensation and personnel-related expenses, increased travel and promotional events that resumed in fiscal year 2022 after being suspended for COVID-19 during the early portion of fiscal year 2021. As a percentage of sales, selling and marketing expense remained flat at 1.9% for fiscal year 2022. General and administrative expense for fiscal year 2022 increased $4.5 million, or 7.2%, to $66.4 million compared to fiscal year 2021. The increase in general and administrative expenses was driven primarily by an increase in compensation and personnel-related expenses, travel related expenses, information technology infrastructure expenses, incremental general and administrative expenses due to the acquisition of Maverick Boat Group, facility maintenance expenses and insurance expenses partially offset by lower professional fees and a decrease in acquisition expenses related to the acquisition of Maverick Boat Group on December 31, 2020. As a percentage of sales, general and administrative expenses decreased 120 basis points to 5.4% for fiscal year 2022 compared to 6.6% for fiscal year 2021. Amortization expense for fiscal year 2022 decreased $0.3 million, or 4.1%, to $7.0 million compared to fiscal year 2021, due to a decrease of amortization expense related to fully amortized intangibles.
Other Expense (Income), Net
Other expense, net for fiscal year 2022 increased by $2.3 million, or 154.8% to $3.9 million as compared to fiscal year 2021. In fiscal year 2022, we increased our tax receivable agreement liability by $1.0 million that resulted in a corresponding amount being recognized as other expense during the same period, compared to fiscal year 2021, when we reduced our tax receivable agreement liability by $0.1 million that resulted in a corresponding amount being recognized as other income during fiscal year 2021. Our interest expense increased by $0.3 million during fiscal year 2022 compared to fiscal year 2021 due to higher average interest rates on outstanding debt.
Provision for Income Taxes
Our provision for income taxes for fiscal year 2022 increased $12.6 million, or 37.0% to $46.5 million compared to fiscal year 2021. This increase was primarily driven by higher pre-tax earnings and increased U.S. state taxes. For fiscal year 2022, our effective tax rate of 22.2% differed from the statutory federal income tax rate of 21% primarily due to the impact of U.S. state taxes. This increase in the effective tax rate was partially offset by a windfall benefit generated by certain stock-based compensation, as well as the benefits of the research and development tax credit, and the impact of non-controlling interests in the LLC. For fiscal year 2021, our effective tax rate of 22.9% differed from the statutory federal income tax rate of 21% primarily due to the impact of U.S. state taxes, and partially offset by the impact of non-controlling interests in the LLC.
Non-controlling interest
Non-controlling interest represents the ownership interests of the members of the LLC other than us and the amount recorded as non-controlling interest in our consolidated statements of operations and comprehensive income is computed by multiplying pre-tax income for the applicable fiscal year by the percentage ownership in the LLC not directly attributable to us. For fiscal years 2022 and 2021, the weighted average non-controlling interest attributable to ownership interests in the LLC not directly attributable to us was 2.8% and 3.1%, respectively.
GAAP Reconciliation of Non-GAAP Financial Measures
Adjusted EBITDA
Adjusted EBITDA and adjusted EBITDA margin are non-GAAP financial measures that are used by management as well as by investors, commercial bankers, industry analysts and other users of our financial statements.
We define adjusted EBITDA as net income before interest expense, income taxes, depreciation, amortization and non-cash, non-recurring or non-operating expenses, including settlement of litigation claims, certain professional fees, acquisition and integration-related expenses, non- cash compensation expense and adjustments to our tax receivable agreement liability. We define adjusted EBITDA margin as adjusted EBITDA divided by net sales. Adjusted EBITDA and adjusted EBITDA margin are not measures of net income as determined by GAAP. Management believes adjusted EBITDA and adjusted EBITDA margin allow investors to evaluate the Company’s operating performance and compare our results of operations from period to period on a consistent basis by excluding items that management does not believe are indicative of our core operating performance. Management uses adjusted EBITDA to assist in highlighting trends in our operating results without regard to our financing methods, capital structure and non-recurring or non-operating expenses.
We exclude the items listed above from net income in arriving at adjusted EBITDA because these amounts can vary substantially from company to company within our industry depending upon accounting methods and book values of assets, capital structures, the methods by which assets were acquired and other factors. Adjusted EBITDA has limitations as an analytical tool and should not be considered as an alternative to, or more meaningful than, net income as determined in accordance with GAAP or as an indicator of our liquidity. Certain items excluded from adjusted EBITDA are significant components in understanding and assessing a company’s financial performance, such as a company’s cost of capital and tax structure, as well as the historical costs of depreciable assets. Our presentation of adjusted EBITDA and adjusted EBITDA margin should not be construed as an inference that our results will be unaffected by unusual or non-recurring items. Our computations of adjusted EBITDA and adjusted EBITDA margin may not be comparable to other similarly titled measures of other companies.
The following table sets forth a reconciliation of net income as determined in accordance with GAAP to adjusted EBITDA and presentation of net income margin and adjusted EBITDA margin for the periods indicated (dollars in thousands):
| | | | | | | | | | | | | | | | | | | | |
| | Fiscal Year Ended June 30, |
| | 2023 | | 2022 | | 2021 |
| Net income | | $ | 107,910 | | | $ | 163,430 | | | $ | 114,282 | |
| Provision for income taxes | | 33,581 | | | 46,535 | | | 33,979 | |
| Interest expense | | 2,962 | | | 2,875 | | | 2,529 | |
| Depreciation | | 21,912 | | | 19,365 | | | 15,636 | |
| Amortization | | 6,808 | | | 6,957 | | | 7,255 | |
Litigation settlement 1 | | 100,000 | | | — | | | — | |
Professional fees 2 | | 4,781 | | | — | | | 5,817 | |
Acquisition and integration related expenses 3 | | — | | | — | | | 5,112 | |
Stock-based compensation expense 4 | | 5,894 | | | 6,342 | | | 5,581 | |
| | | | | | |
Adjustment to tax receivable agreement liability 5 | | 188 | | | 1,025 | | | (88) | |
| Adjusted EBITDA | | $ | 284,036 | | | $ | 246,529 | | | $ | 190,103 | |
| Net Sales | | $ | 1,388,365 | | | $ | 1,214,877 | | | $ | 926,515 | |
Net Income Margin 6 | | 7.8 | % | | 13.5 | % | | 12.3 | % |
Adjusted EBITDA Margin 6 | | 20.5 | % | | 20.3 | % | | 20.5 | % |
| | | | | |
| (1) | Represents settlement of product liability cases in June 2023 for $100.0 million. For more information, refer to Note 17 of our consolidated financial statements included elsewhere in this Annual Report. |
| (2) | For fiscal year 2023, represents legal and advisory fees related to product liability cases that were settled for $100.0 million in June 2023. For fiscal year 2021, represents legal and advisory fees related to our litigation with Skier's Choice, Inc. For more information, refer to Note 17 of our consolidated financial statements included elsewhere in this Annual Report. |
| (3) | For fiscal year ended 2021, represents legal and advisory fees incurred in connection with our acquisition of Maverick Boat Group on December 31, 2020. Integration related expenses for fiscal year 2021 include post-acquisition adjustments to cost of goods sold of $0.9 million for the fair value step up of inventory acquired from Maverick Boat Group, which was sold during the third quarter of fiscal year 2021. |
| (4) | Represents equity-based incentives awarded to certain of our employees under the Malibu Boats, Inc. Long-Term Incentive Plan and profit interests issued under the previously existing limited liability company agreement of the LLC. For more information, refer to Note 15 of our consolidated financial statements included elsewhere in this Annual Report. |
| |
| (5) | For fiscal year 2023, we recognized other expense from an adjustment in our tax receivable agreement liability mainly derived by future benefits from Tennessee net operating losses at Malibu Boats, Inc. For fiscal year 2022, we recognized other expense from an adjustment in our tax receivable agreement liability due to an increase in the state tax rate used in computing our future tax obligations and in turn, an increase in the future benefit we expect to pay under our tax receivable agreement with pre-IPO owners. For fiscal year 2021, we recognized other income from an adjustment in our tax receivable agreement liability as a result of a decrease in the estimated tax rate used in computing our future tax obligations and in turn, a decrease in the future tax benefit we expect to pay under our tax receivable agreement with pre-IPO owners. For more information, refer to Note 12 of our consolidated financial statements included elsewhere in this Annual Report. |
| (6) | We calculate net income margin as net income divided by net sales and we define adjusted EBITDA margin as adjusted EBITDA divided by net sales. |
Adjusted Fully Distributed Net Income
We define Adjusted Fully Distributed Net Income as net income attributable to Malibu Boats, Inc. (i) excluding income tax expense, (ii) excluding the effect of non-recurring or non-cash items, (iii) assuming the exchange of all LLC units into shares of Class A Common Stock, which results in the elimination of non-controlling interest in the LLC, and (iv) reflecting an adjustment for income tax expense on fully distributed net income before income taxes at our estimated effective income tax rate. Adjusted Fully Distributed Net Income is a non-GAAP financial measure because it represents net income attributable to Malibu Boats, Inc., before non-recurring or non-cash items and the effects of non-controlling interests in the LLC.
We use Adjusted Fully Distributed Net Income to facilitate a comparison of our operating performance on a consistent basis from period to period that, when viewed in combination with our results prepared in accordance with GAAP, provides a more complete understanding of factors and trends affecting our business than GAAP measures alone.
We believe Adjusted Fully Distributed Net Income assists our board of directors, management and investors in comparing our net income on a consistent basis from period to period because it removes non-cash or non-recurring items, and eliminates the variability of non-controlling interest as a result of member owner exchanges of LLC Units into shares of Class A Common Stock.
In addition, because Adjusted Fully Distributed Net Income is susceptible to varying calculations, the Adjusted Fully Distributed Net Income measures, as presented in this Annual Report, may differ from and may, therefore, not be comparable to similarly titled measures used by other companies.
The following table shows the reconciliation of the numerator and denominator for net income available to Class A Common Stock per share to Adjusted Fully Distributed Net Income per Share of Class A Common Stock for the periods presented (in thousands except share and per share data):
| | | | | | | | | | | | | | | | | | | | |
| | Fiscal Year Ended June 30, |
| | 2023 | | 2022 | | 2021 |
| Reconciliation of numerator for net income available to Class A Common Stock per share to Adjusted Fully Distributed Net Income per Share of Class A Common Stock: | | | | | | |
| Net income attributable to Malibu Boats, Inc. | | $ | 104,513 | | | $ | 157,632 | | | $ | 109,841 | |
| Provision for income taxes | | 33,581 | | | 46,535 | | | 33,979 | |
Litigation settlement 1 | | 100,000 | | | — | | | — | |
Professional fees 2 | | 4,781 | | | — | | | 5,817 | |
Acquisition and integration related expenses 3 | | 6,654 | | | 6,653 | | | 10,558 | |
| | | | | | |
Stock-based compensation expense 4 | | 5,894 | | | 6,342 | | | 5,581 | |
| | | | | | |
Adjustment to tax receivable agreement liability 5 | | 188 | | | 1,025 | | | (88) | |
Net income attributable to non-controlling interest 6 | | 3,397 | | | 5,798 | | | 4,441 | |
| Fully distributed net income before income taxes | | 259,008 | | | 223,985 | | | 170,129 | |
Income tax expense on fully distributed income before income taxes 7 | | 62,939 | | | 53,308 | | | 40,150 | |
| Adjusted Fully Distributed Net Income | | $ | 196,069 | | | $ | 170,677 | | | $ | 129,979 | |
| | | | | | | | | | | | | | | | | | | | |
| | Fiscal Year Ended June 30, |
| | 2023 | | 2022 | | 2021 |
| Reconciliation of denominator for net income available to Class A Common Stock per share to Adjusted Fully Distributed Net Income per Share of Class A Common Stock: | | | | | | |
| Weighted average shares outstanding of Class A Common Stock used for basic net income per share: | | 20,501,844 | | | 20,749,237 | | | 20,752,652 | |
| Adjustments to weighted average shares of Class A Common Stock: | | | | | | |
Weighted-average LLC units held by non-controlling unit holders 8 | | 543,909 | | | 600,919 | | | 665,217 | |
Weighted-average unvested restricted stock awards issued to management 9 | | 272,116 | | | 252,135 | | | 212,579 | |
| Adjusted weighted average shares of Class A Common Stock outstanding used in computing Adjusted Fully Distributed Net Income per Share of Class A Common Stock: | | 21,317,869 | | | 21,602,291 | | | 21,630,448 | |
The following table shows the reconciliation of net income available to Class A Common Stock per share to Adjusted Fully Distributed Net Income per Share of Class A Common Stock for the periods presented:
| | | | | | | | | | | | | | | | | | | | |
| | Fiscal Year Ended June 30, |
| | 2023 | | 2022 | | 2021 |
| Net income available to Class A Common Stock per share | | $ | 5.10 | | | $ | 7.60 | | | $ | 5.29 | |
| Impact of adjustments: | | | | | | |
| Provision for income taxes | | 1.64 | | | 2.24 | | | 1.64 | |
Litigation settlement 1 | | 4.88 | | | — | | | — | |
Professional fees 2 | | 0.23 | | | — | | | 0.28 | |
Acquisition and integration related expenses 3 | | 0.32 | | | 0.32 | | | 0.51 | |
| | | | | | |
Stock-based compensation expense 4 | | 0.29 | | | 0.31 | | | 0.27 | |
| | | | | | |
Adjustment to tax receivable agreement liability 5 | | 0.01 | | | 0.05 | | | — | |
Net income attributable to non-controlling interest 6 | | 0.17 | | | 0.28 | | | 0.21 | |
| Fully distributed net income per share before income taxes | | 12.64 | | | 10.80 | | | 8.20 | |
Impact of income tax expense on fully distributed income before income taxes 8 | | (3.07) | | | (2.57) | | | (1.93) | |
Impact of increased share count 10 | | (0.38) | | | (0.32) | | | (0.26) | |
| Adjusted Fully Distributed Net Income per Share of Class A Common Stock | | $ | 9.19 | | | $ | 7.91 | | | $ | 6.01 | |
| | | | | |
| |
| |
| (1) | Represents settlement of product liability cases in June 2023 for $100.0 million. For more information, refer to Note 17 of our consolidated financial statements included elsewhere in this Annual Report. |
| (2) | For fiscal year 2023, represents legal and advisory fees related to our product liability cases that were settled in June 2023 for $100.0 million. For fiscal year 2021, represents legal and advisory fees related to our litigation with Skier's Choice, Inc. For more information, refer to Note 17 of our consolidated financial statements included elsewhere in this Annual Report. |
| (3) | For fiscal years 2023 and 2022, represents amortization of intangibles acquired in connection with the acquisition of Maverick Boat Group, Pursuit and Cobalt. For fiscal year 2021, represents legal and advisory fees incurred in connection with the acquisition of Maverick Boat Group and amortization of intangibles acquired in connection with the acquisition of Maverick Boat Group, Pursuit and Cobalt. Integration related expenses for fiscal year 2021 include post-acquisition adjustments to cost of goods sold of $0.9 million for the fair value step up of inventory acquired from Maverick Boat Group, which was sold during the third quarter of fiscal 2021. |
| (4) | Represents equity-based incentives awarded to certain of our employees under the Malibu Boats, Inc. Long-Term Incentive Plan and profit interests issued under the previously existing limited liability company agreement of the LLC. For more information, refer to Note 15 of our consolidated financial statements included elsewhere in this Annual Report. |
| (5) | For fiscal year 2023, we recognized other expense from an adjustment in our tax receivable agreement liability mainly derived by future benefits from Tennessee net operating losses at Malibu Boats, Inc.. For fiscal year 2022, we recognized other expense from an adjustment in our tax receivable agreement liability due to an increase in the state tax rate used in computing our future tax obligations and in turn, an increase in the future benefit we expect to pay under our tax receivable agreement with pre-IPO owners. For fiscal year 2021, we recognized other income from an adjustment in our tax receivable agreement liability as a result of a decrease in the estimated tax rate used in computing our future tax obligations and in turn, a decrease in the future tax benefit we expect to pay under our tax receivable agreement with pre-IPO owners. For more information, refer to Note 12 of our consolidated financial statements included elsewhere in this Annual Report. |
| (6) | Reflects the elimination of the non-controlling interest in the LLC as if all LLC members had fully exchanged their LLC Units for shares of Class A Common Stock. |
| (7) | Reflects income tax expense at an estimated normalized annual effective income tax rate of 24.3% of income before taxes for fiscal year 2023, 23.8% of income before taxes for fiscal year 2022 and 23.6% of income before taxes for fiscal year 2021, in each case assuming the conversion of all LLC Units into shares of Class A Common Stock. The estimated normalized annual effective income tax rate for fiscal years 2023, 2022 and 2021 is based on the federal statutory rate plus a blended state rate adjusted for the research and development tax credit, the foreign derived intangible income deduction, and foreign income taxes attributable to our Australian subsidiary. |
| (8) | Represents the weighted average shares outstanding of LLC Units held by non-controlling interests assuming they were exchanged into Class A Common Stock on a one-for-one basis. |
| (9) | Represents the weighted average unvested restricted stock awards included in outstanding shares during the applicable period that were convertible into Class A Common Stock and granted to members of management. |
| (10) | Reflects impact of increased share counts assuming the exchange of all weighted average shares outstanding of LLC Units into shares of Class A Common Stock and the conversion of all weighted average unvested restricted stock awards included in outstanding shares granted to members of management. |
Liquidity and Capital Resources
Overview and Primary Sources of Cash
Our primary uses of cash have been for funding working capital and capital investments, repayments under our debt arrangements, acquisitions, cash distributions to members of the LLC, cash payments under our tax receivable agreement and stock repurchases under our stock repurchase program. For both the short-term and the long-term, our sources of cash to meet these needs have primarily been operating cash flows, borrowings under our revolving credit facility and short and long-term debt financings from banks and financial institutions. We believe that our cash on hand, cash generated by operating activities and funds available under our revolving credit facility will be sufficient to finance our operating activities for at least the next twelve months and beyond.
Material Cash Requirements
Capital Expenditures. For fiscal year 2023, we incurred approximately $54.8 million in capital expenditures related to the completion of our Tooling Design Center as well as new models, capacity enhancements and vertical integration initiatives. We expect capital expenditures between $70.0 million and $80.0 million for fiscal year 2024 primarily for the outfitting of our Roane County property and investments in new models, capacity enhancements and vertical integration initiatives. Other investment opportunities, such as potential strategic acquisitions, may require additional funding.
Roane County Property Purchase and Related Improvements. On March 28, 2023, we entered into a Purchase and Sale Agreement (the “Purchase Agreement”) to purchase certain real property, improvements and other assets from the seller for a cash purchase price of approximately $33.3 million. As of June 30, 2023, we had deposited approximately $7.8 million in escrow pursuant to the Purchase Agreement. On July 25, 2023, the transaction closed and we paid the $25.5 million balance of the purchase price. We expect to incur additional capital expenditures of approximately $15.0 million to make changes to the facility to meet our operational needs.
Settlement of Batchelder Matters. On June 30, 2023, Malibu Boats, Inc. and Boats LLC entered into a Confidential General Release and Settlement Agreement (the “Settlement Agreement”) with the Batchelder I Plaintiffs and the Batchelder II Plaintiffs in settlement of each of the Batchelder Matters. Pursuant to the Settlement Agreement, among other things, Malibu Boats, Inc. or Boats LLC, as the case may be, paid (or caused to be paid) to the Batchelder Plaintiffs and their agents a total of $100.0 million, of which (a) $40.0 million was paid to the Batchelder Plaintiffs and their agents promptly following the execution of the Settlement Agreement and (b) $60.0 million was placed in an escrow account and held by the Escrow Agent pursuant to the terms of an Escrow Agreement. All conditions for releasing the $60.0 million placed in the escrow account have now been satisfied. We expect that all amounts paid under the Settlement Agreement should be tax deductible for federal and state income tax purposes.
We maintain liability insurance applicable to the Batchelder Matters with coverage up to $26.0 million. As of August 24, 2023, we had received approximately $21.0 million in insurance coverage proceeds, subject in certain cases to reservation of rights by the insurance carriers. We contend that the insurance carriers are responsible for the entirety of the $100.0 million settlement amount and related expenses, and therefore the insurers’ payments to date are well below what they should have tendered to Boats LLC. Accordingly, on July 3, 2023, Boats LLC filed a complaint against Federal Insurance Company and Starr Indemnity & Liability Company alleging that the insurers unreasonably failed to comply with their obligations by refusing, negligently and in bad faith, to settle covered claims within their available policy limits prior to trial. We intend to vigorously pursue our claims against our insurers to recover the full $100.0 million settlement amount and expenses (less any monies already tendered without reservation by the carriers). However, we cannot predict the outcome of such litigation.
Principal and Interest Payments. On July 8, 2022, we entered into a Third Amended and Restated Credit Agreement (the “Credit Agreement”). The Credit Agreement provides us with a revolving credit facility in an aggregate principal amount of up to $350.0 million. As of June 30, 2023, we had no outstanding balance under our revolving credit facility and $1.6 million in outstanding letters of credit, with $348.4 million available for borrowing. On July 7, 2023, in connection with the settlement of the Batchelder Matters, we borrowed $75.0 million under the revolving credit facility, with $273.4 million remaining available for borrowing. The revolving credit facility matures on July 8, 2027. Assuming no additional repayments or borrowings on our revolving credit facility with an outstanding balance of $65.0 million after August 24, 2023, our interest payments would be approximately $4.4 million within the next 12 months based on the interest rate at August 24, 2023 of 6.70%. See below under “Revolving Credit Facility” for additional information regarding our revolving credit facility, including the interest rate applicable to any borrowing under such facility.
Tax Receivable Agreement. We entered into a tax receivable agreement with our pre-IPO owners at the time of our initial public offering. Under the tax receivables agreement, we pay the pre-IPO owners (or any permitted assignees) 85% of the amount of cash savings, if any, in U.S. federal, state and local income tax or franchise tax that we actually realize, or in some
circumstances are deemed to realize, as a result of an expected increase in our share of tax basis in LLC’s tangible and intangible assets, including increases attributable to payments made under the tax receivable agreement. These obligations will not be paid if we do not realize cash tax savings. We estimate that approximately $4.1 million will be due under the tax receivable agreement within the next 12 months. In accordance with the tax receivable agreement, the next payment is anticipated to occur approximately 75 days after filing the federal tax return which is due on April 15, 2024.
Operating Lease Obligations. Lease commitments consist principally of leases for our manufacturing facilities. For fiscal year 2024, our expected operating lease payments will be $2.6 million and our total committed lease payments are $11.0 million as of June 30, 2023. Additional information regarding our operating leases is available in Note 11, Leases, of the Notes to Consolidated Financial Statements included in Item 8, Financial Statements and Supplementary Data, of this Annual Report on Form 10-K.
Purchase Obligations. In the ordinary course of business, we enter into purchase orders from a variety of suppliers, primarily for raw materials, in order to manage our various operating needs. The orders are expected to be purchased throughout fiscal year 2024. We or the vendor can generally terminate the purchase orders at any time. These purchase orders do not contain any termination payments or other penalties if cancelled. As of June 30, 2023, we had purchase orders in the amount of $97.1 million due within the next 12 months.
Stock Repurchase Program. During the fiscal year ended June 30, 2023, we repurchased 143,759 shares of Class A Common Stock for $7.9 million in cash including related fees and expenses under our prior repurchase program which expired on November 8, 2022. On November 3, 2022, our Board of Directors authorized a stock repurchase program to allow for the repurchase of up to $100.0 million of our Class A Common Stock and the LLC's LLC Units (the “2022 Repurchase Program”) for the period from November 8, 2022 to November 8, 2023. As of June 30, 2023, $100.0 million was available to repurchase shares of Class A Common Stock and LLC Units under the 2022 Repurchase Program. We may repurchase shares of our common stock at any time or from time to time, without prior notice, subject to market conditions and other considerations. We have no obligation to repurchase any shares of our common stock under the share repurchase program. We intend to fund repurchases under the 2022 Repurchase Program from cash on hand.
Our future capital requirements beyond the next 12 months will depend on many factors, including the general economic environment in which we operate and our ability to generate cash flow from operations, which are more uncertain as a result of inflation, increasing interest rates and fluctuating fuel prices. Our liquidity needs during this uncertain time will depend on multiple factors, including our ability to continue operations and production of boats, the performance of our dealers and suppliers, the impact of the general economy on our dealers, suppliers and retail customers, the availability of sufficient amounts of financing, and our operating performance.
The following table summarizes the cash flows from operating, investing and financing activities (dollars in thousands):
| | | | | | | | | | | | | | | | | |
| | Fiscal Year Ended June 30, |
| | 2023 | | 2022 | | 2021 |
| Total cash provided by (used in): | | | | | |
| Operating activities | $ | 184,733 | | | $ | 164,846 | | | $ | 131,314 | |
| Investing activities | (54,638) | | | (61,621) | | | (181,095) | |
| Financing activities | (134,574) | | | (60,380) | | | 57,346 | |
| Impact of currency exchange rates on cash balances | (328) | | | (580) | | | 127 | |
| (Decrease) increase in cash | $ | (4,807) | | | $ | 42,265 | | | $ | 7,692 | |
Cash Flows From Operating Activities
Net cash provided by operating activities was $184.7 million for fiscal year 2023, compared to $164.8 million for the same period in 2022, an increase of $19.9 million. The increase in cash provided by operating activities primarily resulted from a net increase in operating assets and liabilities of $94.8 million related to the timing of collections of accounts receivables, payments for accruals and payables, and purchases of inventory, and partially offset by a decrease of $74.9 million in net income (after consideration of non-cash items included in net income, primarily related to depreciation, amortization, deferred tax assets and non-cash compensation). Net cash provided by operating activities was $164.8 million for fiscal year 2022, compared to $131.3 million for the same period in 2021, an increase of $33.5 million. The increase in cash provided by operating activities primarily resulted from an increase of $51.7 million in net income (after consideration of non-cash items included in net income, primarily related to depreciation, amortization, deferred tax assets and non-cash compensation) and a net decrease in
operating assets and liabilities of $18.2 million related to the timing of collections of accounts receivables, payments for accruals and payables, and purchases of inventory.
Cash Flows From Investing Activities
Net cash used in investing activities was $54.6 million for fiscal year 2023 compared to $61.6 million for the same period in 2022, a decrease of cash used in investing activities of $7.0 million. The decrease in cash used in investing activities was primarily related to the acquisition of certain assets of AmTech, LLC and BTR, LLC in fiscal year 2022 for $6.6 million. Net cash used in investing activities was $61.6 million for fiscal year 2022 compared to $181.1 million for the same period in 2021, a decrease of cash used in investing activities of $119.5 million. The decrease in cash used in investing activities was primarily related to the acquisition of Maverick Boat Group on December 31, 2020, partially offset by an increase in capital expenditures and capital outlays related to our expansion activities at our Maverick facility in fiscal year 2022 compared to the capital expenditures in fiscal year 2021.
Cash Flows From Financing Activities
Net cash used in financing activities was $134.6 million for fiscal year 2023 compared to net cash used in financing activities of $60.4 million for fiscal year 2022, a change of $74.2 million. During fiscal year, 2023, we repaid $23.1 million on our term loans, repaid $97.0 million, net of borrowings under our revolving credit facility and repurchased $7.9 million of our Class A Common Stock under our prior stock repurchase program. We also paid $3.1 million on taxes for shares withheld upon the vesting of restricted stock awards, paid $3.4 million in distributions to LLC Unit holders and paid $1.4 million in deferred financing costs. During fiscal year 2023, we received proceeds of $1.3 million from the exercise of stock options.
Net cash used in financing activities was $60.4 million for fiscal year 2022 compared to net cash provided by financing activities of $57.3 million for fiscal year 2021, a change of $117.7 million. During fiscal year, 2022, we received proceeds of $72.0 million from additional borrowings under our revolving credit facility to fully repay the $72.0 million of outstanding term loans that matured on July 1, 2022. Also during fiscal year 2022, we repaid $20.0 million of borrowings under our revolving credit facility, we repaid a total of $76.3 million on our term loans, repurchased $34.6 million of our Class A Common Stock under our previously announced stock repurchase program, paid $2.1 million on taxes for shares withheld upon the vesting of restricted stock awards, paid $2.7 million in distributions to LLC unit holders and received $3.3 million in proceeds from the exercise of stock options. During fiscal year, 2021, we received proceeds of $25.0 million from a new incremental term loan and $65.0 million from additional borrowings under our revolving credit facility to fund the acquisition of Maverick Boat Group. During fiscal year 2021, we also repaid $28.8 million of borrowings under our revolving credit facility, we repaid $0.6 million on our term loan, paid $1.2 million on taxes for shares withheld upon the vesting of restricted stock awards, paid $0.6 million in deferred financing costs, paid $1.8 million in distributions to LLC unit holders and received $0.3 million in proceeds from the exercise of stock options.
Revolving Credit Facility
We have a revolving credit facility in an aggregate principal amount of up to $350.0 million with a maturity date of July 8, 2027. As of June 30, 2023, we had no outstanding balance under our revolving credit facility and $1.6 million in outstanding letters of credit, with $348.4 million available for borrowing. On July 7, 2023, we borrowed $75.0 million under the revolving credit facility, with $273.4 million remaining available for borrowing. We have the option to request that lenders increase the amount available under the revolving credit facility by, or obtain incremental term loans of, up to $200.0 million, subject to the terms of the Credit Agreement and only if existing or new lenders choose to provide additional term or revolving commitments.
Our indirect subsidiary, Malibu Boats, LLC is the borrower under the Credit Agreement and its obligations are guaranteed by the LLC and, subject to certain exceptions, the present and future domestic subsidiaries of Malibu Boats, LLC, and all such obligations are secured by substantially all of the assets of the LLC, Malibu Boats, LLC and such subsidiary guarantors. Malibu Boats, Inc. is not a party to the Credit Agreement.
All borrowings under the Credit Agreement bear interest at a rate equal to either, at our option, (i) the highest of the prime rate, the Federal Funds Rate plus 0.5%, or one-month Term SOFR plus 1% (the “Base Rate”) or (ii) SOFR, in each case plus an applicable margin ranging from 1.25% to 2.00% with respect to SOFR borrowings and 0.25% to 1.00% with respect to Base Rate borrowings. The applicable margin will be based upon the consolidated leverage ratio of the LLC and its subsidiaries. We are required to pay a commitment fee for the unused portion of the revolving credit facility, which will range from 0.15% to 0.30% per annum, depending on the LLC’s and its subsidiaries’ consolidated leverage ratio.
The Credit Agreement contains certain customary representations and warranties, and notice requirements for the occurrence of specific events such as the occurrence of any event of default or pending or threatened litigation. The Credit Agreement also requires compliance with certain customary financial covenants consisting of a minimum ratio of EBITDA to
interest expense and a maximum ratio of total debt to EBITDA. The Credit Agreement contains restrictive covenants regarding indebtedness, liens, fundamental changes, investments, share repurchases, dividends and distributions, disposition of assets, transactions with affiliates, negative pledges, hedging transactions, certain prepayments of indebtedness, accounting changes and governmental regulation.
The Credit Agreement also contains customary events of default. If an event of default has occurred and continues beyond any applicable cure period, the administrative agent may (i) accelerate all outstanding obligations under the Credit Agreement or (ii) terminate the commitments, amongst other remedies. Additionally, the lenders are not obligated to fund any new borrowing under the Credit Agreement while an event of default is continuing.
Repurchase Commitments
Our dealers have arrangements with certain finance companies to provide secured floor plan financing for the purchase of our boats. These arrangements indirectly provide liquidity to us by financing dealer purchases of our products, thereby minimizing the use of our working capital in the form of accounts receivable. A majority of our sales are financed under similar arrangements, pursuant to which we receive payment within a few days of shipment of the product. We have agreed to repurchase products repossessed by the finance companies if a dealer defaults on its debt obligations to a finance company and the boat is returned to us, subject to certain limitations. Our financial exposure under these agreements is limited to the difference between the amounts unpaid by the dealer with respect to the repossessed product plus costs of repossession and the amount received on the resale of the repossessed product. For fiscal years 2023, 2022 and 2021, we did not repurchase any boats under our repurchase agreements, respectively. An adverse change in retail sales could require us to repurchase repossessed units upon an event of default by any of our dealers, subject to the annual limitation. Refer to Note 17 to the audited consolidated financial statements included elsewhere in this Annual Report for further information on repurchase commitments.
Critical Accounting Policies and Critical Accounting Estimates
Our discussion and analysis of our financial condition and results of operations are based upon our consolidated financial statements, which have been prepared in accordance with GAAP. These principles require us to make estimates and judgments that affect the reported amounts of assets, liabilities, expenses and cash flows, and related disclosure of contingent assets and liabilities. Our estimates include those related to business combinations, revenue recognition, income taxes, tax receivable agreement liability, and warranty claims. We base our estimates on historical experience and on various other assumptions that we believe to be reasonable under the circumstances. Actual results may differ from these estimates. To the extent that there are material differences between these estimates and our actual results, our future financial statements will be affected.
We believe that of our significant accounting policies, which are described in the notes to our audited consolidated financial statements appearing elsewhere in this Annual Report, the accounting policies listed below involve a greater degree of judgment and complexity. Accordingly, we believe these are the most critical to understand and evaluate fully our financial condition and results of operations.
Business Combinations
We account for business acquisitions under ASC 805, Business Combinations. The total purchase consideration for an acquisition is measured as the fair value of the assets given, equity instruments issued and liabilities assumed at the acquisition date. Costs that are directly attributable to the acquisition are expensed as incurred. Identifiable assets (including intangible assets) and liabilities assumed in an acquisition are measured initially at their fair values at the acquisition date. We recognize goodwill if the fair value of the total purchase consideration and any noncontrolling interests is in excess of the net fair value of the identifiable assets acquired and the liabilities assumed. We include the results of operations of the acquired business in the consolidated financial statements beginning on the acquisition date. We recognized goodwill of $49.2 million as a result of our acquisition of Maverick Boat Group in December 2020 and goodwill of $0.3 million as a result of our acquisition of AmTech, LLC in February 2022. We had goodwill outstanding of $100.6 million as of June 30, 2023.
When determining such fair values, we make significant estimates and assumptions, especially with respect to intangible assets. Critical estimates in valuing certain intangible assets include but are not limited to projected future cash flows, dealer attrition and discount rates. Our estimates of fair value are based upon assumptions believed to be reasonable, but which are inherently uncertain and unpredictable and, as a result, actual results may differ from estimates and changes could be significant. Furthermore, our estimates might change as additional information becomes available.
Revenue Recognition
Revenue is recognized as performance obligations under the terms of contracts with customers are satisfied; this occurs when control of promised goods (boats, parts, or other) is transferred to the customer. Revenue is measured as the amount of consideration we expect to receive in exchange for transferring goods or providing services. We generally manufacture products based on specific orders from dealers and often ship completed products only after receiving credit approval from financial institutions. The amount of consideration we receive and revenue we recognize varies with changes in marketing incentives and rebates we offer to our dealers and their customers.
Dealers generally have no rights to return unsold boats. From time to time, however, we may accept returns in limited circumstances and at our discretion under our warranty policy, which generally limits returns to instances of manufacturing defects. We may be obligated, in the event of default by a dealer, to accept returns of unsold boats under our repurchase commitment to floor financing providers, who are able to obtain such boats through foreclosure. We accrue returns when a repurchase and return, due to the default of one of our dealers, is determined to be probable and the return is reasonably estimable. Historically, product returns resulting from repurchases made under the floorplan financing program have not been material and the returned boats have been subsequently resold above their cost. Our financial exposure is limited to the difference between the amount paid to the finance companies and the amount received on the resale of the repossessed product. Refer to Note 9 and Note 17 related to our product warranty and repurchase commitment obligations, respectively.
Revenue from boat part sales is recorded as the product is shipped from our location, which is free on board shipping point. Revenue associated with sales of materials, parts, boats or engine products sold under our exclusive manufacturing and distribution agreement with our Australian subsidiary are eliminated in consolidation. Revenue associated with sales to the independent representative responsible for international sales is recognized in accordance with free on board shipping point terms, the point at which the risks of ownership and loss pass to the representative. A fixed percentage discount is earned by the independent representative at the time of shipment to the representative as a reduction in the price of the boat and is recorded in our consolidated statements of operations and comprehensive income as a reduction in sales.
We earn royalties on boats shipped with our proprietary wake surfing technology under licensing agreements with various marine manufacturers. Royalty income is recognized when products are used or sold with our patented technology by these other boat manufacturers and industry suppliers. The usage of our technology satisfies the performance obligation in the contract.
Product Warranties
Our standard warranties require us or our dealers to repair or replace defective products during the warranty period at no cost to the consumer. We estimate warranty costs we expect to incur and record a liability for such costs at the time the product revenue is recognized. We utilize historical claims trends and analytical tools to develop the estimate of our warranty obligation on a per boat basis, by brand and warranty year. Factors that affect our warranty liability include the number of units sold, historical and anticipated rates of warranty claims and cost per claim. We assess the adequacy of our recorded warranty liabilities and adjust the amounts as necessary. Beginning with model year 2016, we increased the term of our limited warranty for Malibu brand boats from three years to five years and for Axis brand boats from two years to five years. Beginning in model year 2018, we increased the term of our bow-to-stern warranty for Cobalt brand boats from three years to five years. Accordingly, we have less historical claims experience for warranty year five, and as such, these estimates give rise to a higher level of estimation uncertainty. Future warranty claims may differ from our estimate of the warranty liability, which could lead to changes in the Company’s warranty liability in future periods. A hypothetical change of a 10% increase or decrease to our estimate of the warranty liability as of June 30, 2023 would have affected net income for the fiscal year ended June 30, 2023 by approximately $4.2 million. Refer to Note 9 to the audited consolidated financial statements included elsewhere in this Annual Report for further information on warranties.
New Accounting Pronouncements
See "Part II, Item 8. Financial Statements and Supplementary Data—Note 1—Organization, Basis of Presentation, and Summary of Significant Accounting Policies—New Accounting Pronouncements.”
Item 7A. Quantitative and Qualitative Disclosures About Market Risk
Market risk represents the risk of loss that may impact our financial condition through adverse changes in financial market prices and rates and inflation. Changes in these factors could cause fluctuations in our results of operations and cash flows. In the ordinary course of business, we are primarily exposed to foreign exchange rate and interest rate risks. We manage our exposure to these market risks through regular operating and financing activities. In the past, we have also attempted to reduce our market risks through hedging instruments such as interest rate swaps.
Foreign Exchange Rate Risk
We have operations both within the United States and Australia, and we are exposed to market risks in the ordinary course of our business. These risks primarily include foreign exchange rate and inflation risks. Our Australian operations purchase key components from our U.S. operations, as well as other U.S. based suppliers, and pay for these purchases in U.S. dollars. Fluctuations in the foreign exchange rate of the U.S. dollar against the Australian dollar resulted in immaterial gains in foreign currency translation in the fiscal year ended June 30, 2023. We had a loss of $0.1 million in foreign currency translation for fiscal year 2022 and a gain of $0.2 million in foreign currency translation for fiscal year 2021. We are also subject to risks relating to changes in the general economic conditions in the countries where we conduct business. To reduce certain of these risks to our Australian operations, we monitor, on a regular basis, the financial condition and position of the subsidiary. We do not use derivative instruments to mitigate the impact of our foreign exchange rate risk exposures.
Additionally, the assets and liabilities of our Australian subsidiary are translated at the foreign exchange rate in effect at the balance sheet date. Translation gains and losses are reflected as a component of accumulated other comprehensive loss in the stockholders’ equity section of the accompanying consolidated balance sheets. Revenues and expenses of our foreign subsidiary are translated at the average foreign exchange rate in effect for each month of the year. Certain assets and liabilities related to intercompany positions reported on our consolidated balance sheets that are denominated in a currency other than the functional currency are translated at the foreign exchange rates at the balance sheet date and the associated gains and losses are included in net income.
Interest Rate Risk
We are subject to interest rate risk in connection with borrowings under our revolving credit facility, which bear interest at variable rates. At June 30, 2023, we had no outstanding debt under our revolving credit facility. As of June 30, 2023, the undrawn borrowing amount under our revolving credit facility was $348.4 million.
At August 24, 2023, the interest rate on our revolving credit facility was 6.70% under the terms of the Credit Agreement. Based on a sensitivity analysis at August 24, 2023, a 100 basis point increase in interest rates would increase our annual interest expense by approximately $0.7 million.
If interest rates continue to increase, as they did throughout fiscal year 2023, we will be obligated to make higher interest payments to our lenders.
Item 8. Financial Statements and Supplementary Data
INDEX TO FINANCIAL STATEMENTS
MALIBU BOATS, INC. AND SUBSIDIARIES
Report of Management on Internal Control Over Financial Reporting
Malibu Boats, Inc.'s (the "Company") management is responsible for establishing and maintaining adequate internal control over financial reporting as defined in Rule 13a-15(f) under the Securities Exchange Act of 1934, as amended. Internal control over financial reporting is a process to provide reasonable assurance regarding the reliability of the Company's financial reporting for external purposes in accordance with U.S. generally accepted accounting principles. Because of its inherent limitations, internal control over financial reporting may not prevent or detect misstatements. Projections of any evaluation of effectiveness to future periods are subject to the risk that controls may become inadequate because of changes in conditions, or that the degree of compliance with the policies or procedures may deteriorate.
The Company's management, including its chief executive officer and interim chief financial officer, assessed the effectiveness of the Company's internal control over financial reporting as of June 30, 2023. In making this assessment, the Company used the criteria set forth by the Committee of Sponsoring Organizations of the Treadway Commission ("COSO") in Internal Control-Integrated Framework (2013).
Based on such assessment the Company's management has concluded that, as of June 30, 2023, its internal control over financial reporting is effective based on those criteria.
The effectiveness of internal control over financial reporting as of June 30, 2023 has been audited by KPMG LLP, an independent registered public accounting firm, as stated in its attestation report, which is included herein.
Malibu Boats, Inc.
Loudon, Tennessee
August 29, 2023
Report of Independent Registered Public Accounting Firm
To the Stockholders and Board of Directors
Malibu Boats, Inc.:
Opinion on Internal Control Over Financial Reporting
We have audited Malibu Boats, Inc. and subsidiaries' (the Company) internal control over financial reporting as of June 30, 2023, based on criteria established in Internal Control – Integrated Framework (2013) issued by the Committee of Sponsoring Organizations of the Treadway Commission. In our opinion, the Company maintained, in all material respects, effective internal control over financial reporting as of June 30, 2023, based on criteria established in Internal Control – Integrated Framework (2013) issued by the Committee of Sponsoring Organizations of the Treadway Commission.
We also have audited, in accordance with the standards of the Public Company Accounting Oversight Board (United States) (PCAOB), the consolidated balance sheets of the Company as of June 30, 2023 and 2022, the related consolidated statements of operations and comprehensive income, stockholders’ equity, and cash flows for each of the years in the three-year period ended June 30, 2023, and the related notes (collectively, the consolidated financial statements), and our report dated August 29, 2023 expressed an unqualified opinion on those consolidated financial statements.
Basis for Opinion
The Company’s management is responsible for maintaining effective internal control over financial reporting and for its assessment of the effectiveness of internal control over financial reporting, included in the accompanying Report of Management on Internal Control Over Financial Reporting. Our responsibility is to express an opinion on the Company’s internal control over financial reporting based on our audit. We are a public accounting firm registered with the PCAOB and are required to be independent with respect to the Company in accordance with the U.S. federal securities laws and the applicable rules and regulations of the Securities and Exchange Commission and the PCAOB.
We conducted our audit in accordance with the standards of the PCAOB. Those standards require that we plan and perform the audit to obtain reasonable assurance about whether effective internal control over financial reporting was maintained in all material respects. Our audit of internal control over financial reporting included obtaining an understanding of internal control over financial reporting, assessing the risk that a material weakness exists, and testing and evaluating the design and operating effectiveness of internal control based on the assessed risk. Our audit also included performing such other procedures as we considered necessary in the circumstances. We believe that our audit provides a reasonable basis for our opinion.
Definition and Limitations of Internal Control Over Financial Reporting
A company’s internal control over financial reporting is a process designed to provide reasonable assurance regarding the reliability of financial reporting and the preparation of financial statements for external purposes in accordance with generally accepted accounting principles. A company’s internal control over financial reporting includes those policies and procedures that (1) pertain to the maintenance of records that, in reasonable detail, accurately and fairly reflect the transactions and dispositions of the assets of the company; (2) provide reasonable assurance that transactions are recorded as necessary to permit preparation of financial statements in accordance with generally accepted accounting principles, and that receipts and expenditures of the company are being made only in accordance with authorizations of management and directors of the company; and (3) provide reasonable assurance regarding prevention or timely detection of unauthorized acquisition, use, or disposition of the company’s assets that could have a material effect on the financial statements.
Because of its inherent limitations, internal control over financial reporting may not prevent or detect misstatements. Also, projections of any evaluation of effectiveness to future periods are subject to the risk that controls may become inadequate because of changes in conditions, or that the degree of compliance with the policies or procedures may deteriorate.
/s/ KPMG LLP
Knoxville, Tennessee
August 29, 2023
Report of Independent Registered Public Accounting Firm
To the Stockholders and Board of Directors
Malibu Boats, Inc.:
Opinion on the Consolidated Financial Statements
We have audited the accompanying consolidated balance sheets of Malibu Boats, Inc. and subsidiaries (the Company) as of June 30, 2023 and 2022, the related consolidated statements of operations and comprehensive income, stockholders’ equity, and cash flows for each of the years in the three-year period ended June 30, 2023, and the related notes (collectively, the consolidated financial statements). In our opinion, the consolidated financial statements present fairly, in all material respects, the financial position of the Company as of June 30, 2023 and 2022, and the results of its operations and its cash flows for each of the years in the three-year period ended June 30, 2023, in conformity with U.S. generally accepted accounting principles.
We also have audited, in accordance with the standards of the Public Company Accounting Oversight Board (United States) (PCAOB), the Company’s internal control over financial reporting as of June 30, 2023, based on criteria established in Internal Control – Integrated Framework (2013) issued by the Committee of Sponsoring Organizations of the Treadway Commission, and our report dated August 29, 2023 expressed an unqualified opinion on the effectiveness of the Company’s internal control over financial reporting.
Basis for Opinion
These consolidated financial statements are the responsibility of the Company’s management. Our responsibility is to express an opinion on these consolidated financial statements based on our audits. We are a public accounting firm registered with the PCAOB and are required to be independent with respect to the Company in accordance with the U.S. federal securities laws and the applicable rules and regulations of the Securities and Exchange Commission and the PCAOB.
We conducted our audits in accordance with the standards of the PCAOB. Those standards require that we plan and perform the audit to obtain reasonable assurance about whether the consolidated financial statements are free of material misstatement, whether due to error or fraud. Our audits included performing procedures to assess the risks of material misstatement of the consolidated financial statements, whether due to error or fraud, and performing procedures that respond to those risks. Such procedures included examining, on a test basis, evidence regarding the amounts and disclosures in the consolidated financial statements. Our audits also included evaluating the accounting principles used and significant estimates made by management, as well as evaluating the overall presentation of the consolidated financial statements. We believe that our audits provide a reasonable basis for our opinion.
Critical Audit Matter
The critical audit matter communicated below is a matter arising from the current period audit of the consolidated financial statements that was communicated or required to be communicated to the audit committee and that: (1) relates to accounts or disclosures that are material to the consolidated financial statements and (2) involved our especially challenging, subjective, or complex judgments. The communication of a critical audit matter does not alter in any way our opinion on the consolidated financial statements, taken as a whole, and we are not, by communicating the critical audit matter below, providing a separate opinion on the critical audit matter or on the accounts or disclosures to which it relates.
Evaluation of certain assumptions underlying the product warranty liability for certain brands
As discussed in Note 9 to the consolidated financial statements, the Company’s product warranty liability as of June 30, 2023 was $41.7 million. The product warranty liability represents estimated future costs to repair or replace defective products during the warranty period for each boat sold. The Company’s estimated future costs to repair or replace defective products includes assumptions regarding the anticipated warranty costs per boat by brand.
We identified the evaluation of the anticipated warranty costs per boat that are used to estimate the product warranty liability for Malibu and Axis branded boats as a critical audit matter. A higher degree of subjective auditor judgment was required to evaluate the Company’s estimate of the anticipated warranty costs per boat, due to the nature of the audit evidence. Specifically, for Axis and Malibu model years prior to 2016, historical claims experience only exists for a warranty term of two and three years, respectively. This historical claim experience is shorter in duration than the five-year warranty term associated with the Company’s current warranty program.
The following are the primary procedures we performed to address this critical audit matter. We evaluated the design and tested the operating effectiveness of certain internal controls over the Company’s warranty accrual process. This included controls over the development of the assumptions used to estimate the warranty cost per boat for warranty year five, for which less claims experience exists. We performed sensitivity analyses to assess the potential for possible changes to these assumptions on the product warranty liability. We assessed the Company’s historical claims experience and the relationship between the historical warranty costs per boat incurred by warranty year. We further assessed the Company’s assumptions underlying the anticipated warranty costs per boat for warranty year five by considering warranty claims received after year-end but before the consolidated financial statements were issued, to identify trends not considered by the Company when it developed its assumptions. We also compared the Company’s prior year product warranty liability related to claims expected to be incurred in the current year to actual claims received in the current year to evaluate the historical accuracy of the Company’s estimate.
/s/ KPMG LLP
We have served as the Company’s auditor since 2015.
Knoxville, Tennessee
August 29, 2023
MALIBU BOATS, INC. AND SUBSIDIARIES
Consolidated Statements of Operations and Comprehensive Income
(In thousands, except share and per share data)
| | | | | | | | | | | | | | | | | | | | |
| | | Fiscal Year Ended June 30, |
| | | 2023 | | 2022 | | 2021 |
| Net sales | | $ | 1,388,365 | | | $ | 1,214,877 | | | $ | 926,515 | |
| Cost of sales | | 1,037,070 | | | 904,826 | | | 690,030 | |
| Gross profit | | 351,295 | | | 310,051 | | | 236,485 | |
| Operating expenses: | | | | | | |
| Selling and marketing | | 24,009 | | | 22,900 | | | 17,540 | |
| General and administrative | | 175,694 | | | 66,371 | | | 61,915 | |
| Amortization | | 6,808 | | | 6,957 | | | 7,255 | |
| Operating income | | 144,784 | | | 213,823 | | | 149,775 | |
| Other expense (income), net: | | | | | | |
| Other expense (income), net | | 331 | | | 983 | | | (1,015) | |
| Interest expense | | 2,962 | | | 2,875 | | | 2,529 | |
| Other expense (income), net | | 3,293 | | | 3,858 | | | 1,514 | |
| Income before provision for income taxes | | 141,491 | | | 209,965 | | | 148,261 | |
| Provision for income taxes | | 33,581 | | | 46,535 | | | 33,979 | |
| Net income | | 107,910 | | | 163,430 | | | 114,282 | |
| Net income attributable to non-controlling interest | | 3,397 | | | 5,798 | | | 4,441 | |
| Net income attributable to Malibu Boats, Inc. | | $ | 104,513 | | | $ | 157,632 | | | $ | 109,841 | |
| | | | | | |
| Comprehensive income: |
| Net income | | $ | 107,910 | | | $ | 163,430 | | | $ | 114,282 | |
| Other comprehensive (loss) income | | | | | | |
| Change in cumulative translation adjustment | | (833) | | | (1,868) | | | 1,493 | |
| Other comprehensive (loss) income | | (833) | | | (1,868) | | | 1,493 | |
| Comprehensive income | | 107,077 | | | 161,562 | | | 115,775 | |
| Less: comprehensive income attributable to non-controlling interest, net of tax | | 3,371 | | | 5,731 | | | 4,507 | |
| Comprehensive income attributable to Malibu Boats, Inc., net of tax | | $ | 103,706 | | | $ | 155,831 | | | $ | 111,268 | |
| | | | | | |
| | | | | | |
| | | | | | |
| | | | | | |
| | | | | | |
| Weighted average shares outstanding used in computing net income per share: | | |
| Basic | | 20,501,844 | | | 20,749,237 | | | 20,752,652 | |
| Diluted | | 20,641,173 | | | 20,986,256 | | | 21,011,087 | |
| Net income available to Class A Common Stock per share: | | |
| Basic | | $ | 5.10 | | | $ | 7.60 | | | $ | 5.29 | |
| Diluted | | $ | 5.06 | | | $ | 7.51 | | | $ | 5.23 | |
The accompanying notes are an integral part of these Consolidated Financial Statements.
MALIBU BOATS, INC. AND SUBSIDIARIES
Consolidated Balance Sheets
(In thousands, except share and per share data)
| | | | | | | | | | | |
| June 30, 2023 | | June 30, 2022 |
| Assets | | | |
| Current assets | | | |
| Cash | $ | 78,937 | | | $ | 83,744 | |
| Trade receivables, net | 68,381 | | | 51,598 | |
| Inventories, net | 171,189 | | | 157,002 | |
| | | |
| Prepaid expenses and other current assets | 7,827 | | | 6,155 | |
| | | |
| Total current assets | 326,334 | | | 298,499 | |
| Property, plant and equipment, net | 204,792 | | | 170,718 | |
| Goodwill | 100,577 | | | 100,804 | |
| Other intangible assets, net | 221,458 | | | 228,304 | |
| Deferred tax assets | 62,573 | | | 42,314 | |
| Other assets | 10,190 | | | 10,687 | |
| Total assets | $ | 925,924 | | | $ | 851,326 | |
| Liabilities | | | |
| Current liabilities | | | |
| Current maturities of long-term debt | $ | — | | | $ | 1,563 | |
| Accounts payable | 40,402 | | | 44,368 | |
| Accrued expenses | 187,078 | | | 87,742 | |
| | | |
| | | |
| | | |
| | | |
| | | |
| | | |
| | | |
| Income tax and distribution payable | 847 | | | 1,670 | |
| Payable pursuant to tax receivable agreement, current portion | 4,111 | | | 3,958 | |
| | | |
| Total current liabilities | 232,438 | | | 139,301 | |
| Deferred tax liabilities | 28,453 | | | 26,965 | |
| Other liabilities | 9,926 | | | 11,855 | |
| Payable pursuant to tax receivable agreement, less current portion | 39,354 | | | 41,583 | |
| Long-term debt | — | | | 118,054 | |
| Total liabilities | 310,171 | | | 337,758 | |
| Commitments and contingencies (See Note 17) | | | |
| Stockholders' Equity | | | |
Class A Common Stock, par value $0.01 per share, 100,000,000 shares authorized; 20,603,822 shares issued and outstanding as of June 30, 2023; 20,501,081 shares issued and outstanding as of June 30, 2022 | 204 | | | 203 | |
Class B Common Stock, par value $0.01 per share, 25,000,000 shares authorized; 12 shares issued and outstanding as of June 30, 2023; 10 shares issued and outstanding as of June 30, 2022 | — | | | — | |
Preferred Stock, par value $0.01 per share; 25,000,000 shares authorized; no shares issued and outstanding as of June 30, 2023; no shares issued and outstanding as of June 30, 2022 | — | | | — | |
| | | |
| | | |
| | | |
| Additional paid in capital | 86,321 | | | 85,294 | |
| Accumulated other comprehensive loss, net of tax | (4,340) | | | (3,507) | |
| Accumulated earnings | 525,697 | | | 421,184 | |
| Total stockholders' equity attributable to Malibu Boats, Inc. | 607,882 | | | 503,174 | |
| Non-controlling interest | 7,871 | | | 10,394 | |
| Total stockholders’ equity | 615,753 | | | 513,568 | |
| Total liabilities and stockholders' equity | $ | 925,924 | | | $ | 851,326 | |
The accompanying notes are an integral part of these Consolidated Financial Statements.
MALIBU BOATS, INC. AND SUBSIDIARIES
Consolidated Statements of Stockholders' Equity
(In thousands, except number of Class B shares)
| | | | | | | | | | | | | | | | | | | | | | | | | | | | | | | | | | | | | | | | | | | | | | | |
| | | Additional Paid In Capital | | Accumulated Other Comprehensive Loss, net of tax | | Accumulated Earnings | | Non-controlling Interest in LLC | | Total Stockholders' Equity |
| Class A Common Stock | | Class B Common Stock | | | | | |
| Shares | Amount | | Shares | Amount | | | | | |
| Balance at June 30, 2020 | 20,596 | | $ | 204 | | | 15 | | $ | — | | | $ | 103,797 | | | $ | (3,132) | | | $ | 153,711 | | | $ | 6,947 | | | $ | 261,527 | |
| Net income | — | | — | | | — | | — | | | — | | | — | | | 109,841 | | | 4,441 | | | 114,282 | |
| Stock based compensation, net of withholding taxes on vested equity awards | 109 | | 2 | | | — | | — | | | 4,316 | | | — | | | — | | | — | | | 4,318 | |
| Issuances of equity for services | 1 | | — | | | — | | — | | | 834 | | | — | | | — | | | — | | | 834 | |
| Issuance of equity for exercise of options | 11 | | — | | | — | | — | | | 375 | | | — | | | — | | | — | | | 375 | |
| | | | | | | | | | | | | | | |
| | | | | | | | | | | | | | | |
| Increase in payable pursuant to the tax receivable agreement | — | | — | | | — | | — | | | (2,142) | | | — | | | — | | | — | | | (2,142) | |
| Increase in deferred tax asset from step-up in tax basis | — | | — | | | — | | — | | | 2,755 | | | — | | | — | | | — | | | 2,755 | |
| Exchange of LLC Units for Class A Common Stock | 130 | | 1 | | | — | | — | | | 1,373 | | | — | | | — | | | (1,373) | | | 1 | |
| Cancellation of Class B Common Stock for Exchange of LLC Units | — | | — | | | (5) | | — | | | — | | | — | | | — | | | — | | | — | |
| Distributions to LLC Unit holders | — | | — | | | — | | — | | | — | | | — | | | — | | | (2,341) | | | (2,341) | |
| Foreign currency translation adjustment | — | | — | | | — | | — | | | — | | | 1,493 | | | — | | | 52 | | | 1,545 | |
| Balance at June 30, 2021 | 20,847 | | 207 | | | 10 | | — | | | 111,308 | | | (1,639) | | | 263,552 | | | 7,726 | | | 381,154 | |
| Net income | — | | — | | | — | | — | | | — | | | — | | | 157,632 | | | 5,798 | | | 163,430 | |
| Stock based compensation, net of withholding taxes on vested equity awards | 95 | | 1 | | | — | | — | | | 4,196 | | | — | | | — | | | — | | | 4,197 | |
| Issuances of equity for services | 1 | | — | | | — | | — | | | 1,140 | | | — | | | — | | | — | | | 1,140 | |
| Issuance of equity for exercise of options | 113 | | 1 | | | — | | — | | | 3,286 | | | — | | | — | | | — | | | 3,287 | |
| Repurchase and retirement of common stock | (555) | | (6) | | | — | | — | | | (34,636) | | | — | | | — | | | — | | | (34,642) | |
| | | | | | | | | | | | | | | |
| | | | | | | | | | | | | | | |
| | | | | | | | | | | | | | | |
| Distributions to LLC Unit holders | — | | — | | | — | | — | | | — | | | — | | | — | | | (3,076) | | | (3,076) | |
| Foreign currency translation adjustment | — | | — | | | — | | — | | | — | | | (1,868) | | | — | | | (54) | | | (1,922) | |
| | | | | | | | | | | | | | | | | | | | | | | | | | | | | | | | | | | | | | | | | | | | | | | |
| Balance at June 30, 2022 | 20,501 | | 203 | | | 10 | | — | | | 85,294 | | | (3,507) | | | 421,184 | | | 10,394 | | | 513,568 | |
| Net income | — | | — | | | — | | — | | | — | | | — | | | 104,513 | | | 3,397 | | | 107,910 | |
| Stock based compensation, net of withholding taxes on vested equity awards | 68 | | 1 | | | — | | — | | | 2,709 | | | — | | | — | | | — | | | 2,710 | |
| Issuances of equity for services | 2 | | — | | | — | | — | | | 1,194 | | | — | | | — | | | — | | | 1,194 | |
| Issuance of equity for exercise of options | 31 | | — | | | — | | — | | | 1,317 | | | — | | | — | | | — | | | 1,317 | |
| Repurchase and retirement of common stock | (144) | | (1) | | | — | | — | | | (7,867) | | | — | | | — | | | — | | | (7,868) | |
| Increase in payable pursuant to the tax receivable agreement | — | | — | | | — | | — | | | (1,710) | | | — | | | — | | | — | | | (1,710) | |
| Increase in deferred tax asset from step-up in tax basis | — | | — | | | — | | — | | | 2,619 | | | — | | | — | | | — | | | 2,619 | |
| Exchange of LLC Units for Class A Common Stock | 145 | | 1 | | | — | | — | | | 2,765 | | | — | | | — | | | (2,765) | | | 1 | |
| Issuance of Class B Common Stock | — | | — | | | 2 | | — | | | — | | | — | | | — | | | — | | | — | |
| Distributions to LLC Unit holders | — | | — | | | — | | — | | | — | | | | | — | | | (3,131) | | | (3,131) | |
| Foreign currency translation adjustment | — | | — | | | — | | — | | | — | | | (833) | | | — | | | (24) | | | (857) | |
| Balance at June 30, 2023 | 20,603 | | $ | 204 | | | 12 | | $ | — | | | $ | 86,321 | | | $ | (4,340) | | | $ | 525,697 | | | $ | 7,871 | | | $ | 615,753 | |
The accompanying notes are an integral part of these Consolidated Financial Statements.
MALIBU BOATS, INC. AND SUBSIDIARIES
Consolidated Statements of Cash Flows
(In thousands)
| | | | | | | | | | | | | | | | | | | | |
| | | Fiscal Year Ended June 30, |
| | | 2023 | | 2022 | | 2021 |
| Operating activities: | | | | | | |
| Net income | | $ | 107,910 | | | $ | 163,430 | | | $ | 114,282 | |
| Adjustments to reconcile net income to net cash provided by operating activities: | | | | | | |
| Non-cash compensation expense | | 5,894 | | | 6,342 | | | 5,581 | |
| Non-cash compensation to directors | | 1,136 | | | 1,054 | | | 834 | |
| | | | | | |
| Depreciation | | 21,912 | | | 19,365 | | | 15,636 | |
| Amortization | | 6,808 | | | 6,957 | | | 7,255 | |
| Deferred income taxes | | (16,158) | | | 4,793 | | | 6,992 | |
| Adjustment to tax receivable agreement liability | | 188 | | | 1,025 | | | (88) | |
| Other items, net | | 1,680 | | | 1,350 | | | 2,075 | |
| Change in operating assets and liabilities (excluding effects of acquisition): | | | | | | |
| Trade receivables | | (16,804) | | | (1,777) | | | (32,860) | |
| Inventories | | (14,362) | | | (38,050) | | | (35,555) | |
| Prepaid expenses and other assets | | (1,705) | | | (1,303) | | | 3,038 | |
| Accounts payable | | (5,148) | | | (287) | | | 24,459 | |
| Income taxes receivable and payable | | 6 | | | (794) | | | 3,539 | |
| Accrued expenses | | 99,326 | | | 10,579 | | | 24,894 | |
| Other liabilities | | (1,976) | | | (4,140) | | | (5,263) | |
| Payment pursuant to tax receivable agreement | | (3,974) | | | (3,698) | | | (3,505) | |
| | | | | | |
| Net cash provided by operating activities | | 184,733 | | | 164,846 | | | 131,314 | |
| Investing activities: | | | | | | |
| Purchases of property and equipment | | (54,840) | | | (55,064) | | | (30,677) | |
| Proceeds from sale of property and equipment | | 202 | | | 9 | | | 9 | |
| Payment for acquisition, net of cash acquired | | — | | | (6,566) | | | (150,427) | |
| Net cash used in investing activities | | (54,638) | | | (61,621) | | | (181,095) | |
| Financing activities: | | | | | | |
| Proceeds from revolving credit facility | | 241,700 | | | 72,000 | | | 65,000 | |
| Proceeds from long-term borrowings | | — | | | — | | | 25,000 | |
| Payments on revolving credit facility | | (338,700) | | | (20,000) | | | (28,800) | |
| Principal payments on long-term borrowings | | (23,125) | | | (76,250) | | | (625) | |
| Payment of deferred financing costs | | (1,362) | | | — | | | (638) | |
| Proceeds received from exercise of stock options | | 1,317 | | | 3,287 | | | 375 | |
| Cash paid for tax withholdings | | (3,135) | | | (2,058) | | | (1,208) | |
| Distributions to non-controlling LLC Unit holders | | (3,401) | | | (2,717) | | | (1,758) | |
| Repurchase and retirement of Class A Common Stock | | (7,868) | | | (34,642) | | | — | |
| | | | | | |
| | | | | | |
| Net cash (used in) provided by financing activities | | (134,574) | | | (60,380) | | | 57,346 | |
| Effect of exchange rate changes on cash | | (328) | | | (580) | | | 127 | |
| Changes in cash | | (4,807) | | | 42,265 | | | 7,692 | |
| Cash—Beginning of period | | 83,744 | | | 41,479 | | | 33,787 | |
| Cash—End of period | | $ | 78,937 | | | $ | 83,744 | | | $ | 41,479 | |
| Supplemental cash flow information: | | | | | | |
| Cash paid for interest | | $ | 3,061 | | | $ | 2,294 | | | $ | 2,021 | |
| Cash paid for income taxes | | 50,515 | | | 42,064 | | | 23,469 | |
| Non-cash operating, investing and financing activities: | | | | | | |
| | | | | | |
| Establishment of deferred tax assets from step-up in tax basis | | 2,619 | | | — | | | 2,755 | |
| Establishment of amounts payable under tax receivable agreements | | 1,710 | | | — | | | 2,142 | |
| | | | | | |
| Exchange of LLC Units for Class A Common Stock | 2,765 | | | — | | | 1,373 | |
| Tax distributions payable to non-controlling LLC Unit holders | | 776 | | | 1,045 | | | 687 | |
| | | | | | |
| Capital expenditures in accounts payable | | 2,207 | | | 1,032 | | | 2,419 | |
| | | | | | |
The accompanying notes are an integral part of these Consolidated Financial Statements.
MALIBU BOATS, INC. AND SUBSIDIARIES
Notes to Consolidated Financial Statements
(Dollars in thousands, except per unit and share and per share data)
1. Organization, Basis of Presentation, and Summary of Significant Accounting Policies
Organization
Malibu Boats, Inc. (“MBI”, and together with its subsidiaries, the “Company” or "Malibu"), a Delaware corporation formed on November 1, 2013, is the sole managing member of Malibu Boats Holdings, LLC, a Delaware limited liability company (the "LLC"). The Company operates and controls all of the LLC's business and affairs and, therefore, pursuant to Financial Accounting Standards Board ("FASB") Accounting Standards Codification (“ASC”) Topic 810, Consolidation, consolidates the financial results of the LLC and its subsidiaries, and records a non-controlling interest for the economic interest in the Company held by the non-controlling holders of units in the LLC ("LLC Units"). The LLC was formed in 2006. The LLC, through its wholly owned subsidiary, Malibu Boats, LLC, (“Boats LLC”), is engaged in the design, engineering, manufacturing and marketing of innovative, high-quality, recreational powerboats that are sold through a world-wide network of independent dealers. The Company sells its boats under eight brands -- Malibu, Axis, Pursuit, Maverick, Cobia, Pathfinder, Hewes and Cobalt brands. The Company reports its results of operations under three reportable segments -- Malibu, Saltwater Fishing and Cobalt.
Basis of Presentation
The accompanying consolidated financial statements of the Company have been prepared in accordance with U.S. generally accepted accounting principles ("GAAP"). Units and shares are presented as whole numbers while all dollar amounts are presented in thousands, unless otherwise noted.
Principles of Consolidation
The accompanying consolidated financial statements include the operations and accounts of the Company and all subsidiaries thereof. All intercompany balances and transactions have been eliminated upon consolidation.
Segment Reporting
The Company has three reportable segments, Malibu, Saltwater Fishing and Cobalt. The Malibu segment participates in the manufacturing, distribution, marketing and sale of Malibu and Axis performance sports boats throughout the world. The Saltwater Fishing segment participates in the manufacturing, distribution, marketing and sale throughout the world of Pursuit boats and the Maverick Boat Group boats (Maverick, Cobia, Pathfinder and Hewes). The Cobalt segment participates in the manufacturing, distribution, marketing and sale of Cobalt boats throughout the world.
The Company revised its segment reporting effective December 31, 2020, to account for its acquisition of Maverick Boat Group and to conform to changes in its internal management reporting based on the Company’s boat manufacturing operations. Prior to this change in reporting segments, the Company had three reportable segments, Malibu, Pursuit and Cobalt. The Company now aggregates Pursuit and Maverick Boat Group into one reportable segment as they have similar economic characteristics and qualitative factors. As a result, the Company continues to have three reportable segments, Malibu, Saltwater Fishing and Cobalt. Additional segment information is contained in Note 19.
Use of Estimates
The preparation of financial statements in conformity with GAAP requires management to make estimates and assumptions that affect the reported amounts of assets and liabilities and disclosure of contingent assets and liabilities as of the date of the financial statements and the reported amounts of revenues and expenses during the reporting period. Actual results could differ from those estimates, and such differences could be material.
Certain Significant Risks and Uncertainties
The Company is subject to those risks common in manufacturing-driven markets, including, but not limited to, competitive forces, dependence on key personnel, consumer demand for its products, the successful protection of its proprietary technologies, compliance with government regulations and the possibility of not being able to obtain additional financing if and when needed.
Concentration of Credit and Business Risk
A majority of the Company’s sales are made pursuant to floor plan financing programs in which the Company participates on behalf of its dealers through a contingent repurchase agreement with various third-party financing institutions. Under these arrangements, a dealer establishes a line of credit with one or more of these third-party lenders for the purchase of dealer boat inventory. When a dealer purchases and takes delivery of a boat pursuant to a floor plan financing arrangement, it draws against its line of credit and the lender pays the invoice cost of the boat directly to the Company within approximately two weeks. For dealers that use local floor plan financing programs or pay cash, the Company may extend credit without collateral under the dealer agreement based on the Company’s evaluation of the dealer’s credit risk and past payment history. The Company maintains allowances for potential credit losses that it believes are adequate. See Trade Accounts Receivable section within this footnote for more information.
The Company’s top ten dealers represented 41.1%, 39.9% and 38.7%, of the Company’s net sales for the fiscal years ended June 30, 2023, 2022 and 2021, respectively. Sales to the Company's dealers under common control of OneWater Marine, Inc. represented approximately 17.2%, 16.8% and 16.3% of the Company's consolidated net sales in the fiscal years ended June 30, 2023, 2022, and 2021 respectively. Sales to the Company's dealers under common control of Tommy's Boats represented approximately 10.7%, 9.4% and 7.3% of the Company's consolidated net sales in the fiscal years ended June 30, 2023, 2022, and 2021 respectively.
Cash
The Company considers all highly liquid investments purchased with an original maturity of 90 days or less to be cash equivalents. Cash equivalents are stated at cost, which approximates fair value. As of June 30, 2023 and 2022, no highly liquid investments were held and the entire balance consists of cash.
At June 30, 2023 and 2022, substantially all cash on hand was held by two financial institutions. This cash on deposit may be, at times, in excess of insurance limits provided by the FDIC.
Trade Accounts Receivable
Trade receivables are carried at original invoice amount less an estimate made for doubtful receivables based on a review of all outstanding amounts on a monthly basis. As of June 30, 2023 and 2022, the allowance for doubtful receivables was $0. Management determines the allowance for doubtful accounts by identifying troubled accounts and by using historical experience applied to an aging of accounts. Trade receivables are written off when deemed uncollectible. Recoveries of trade receivables previously written off are recorded when received. A trade receivable is considered to be past due if any portion of the receivable balance is outstanding beyond customer terms.
Goodwill
Goodwill is an asset representing the future economic benefits arising from other assets acquired in a business combination that are not individually identified and separately recognized. Goodwill amounts are not amortized, but rather are evaluated for potential impairment on an annual basis, as of June 30, in accordance with the provisions of ASC Topic 350, Intangibles—Goodwill and Other. Under the guidance, the Company may assess qualitative factors to determine whether it is more likely than not that the fair value of a reporting unit is less than its carrying amount. If this assessment indicates the possibility of impairment, the income approach to test for goodwill impairment would be used. Under the income approach, management calculates the fair value of its reporting units based on the present value of estimated future cash flows. If the fair value of an individual reporting unit exceeds the carrying value of the net assets including goodwill assigned to that unit, goodwill is not impaired. If the carrying value of the reporting unit’s net assets including goodwill exceeds the fair value of the reporting unit, then management determines the implied fair value of the reporting unit’s goodwill. If the carrying value of the reporting unit’s goodwill exceeds its implied fair value, then the Company would record an impairment loss equal to the difference. For the fiscal year ended June 30, 2023, the Company performed a quantitative assessment on the Maverick Boat Group reporting unit which indicated that the fair value of its reporting unit more likely than not exceeded its carrying amount. For the fiscal year ended June 30, 2023, the Company performed a qualitative assessment on the remaining reporting units which indicated that the fair value of its reporting units more likely than not exceeded their respective carrying amounts. For the fiscal year ended June 30, 2022, the Company performed a qualitative assessment which indicated that the fair value of its reporting units more likely than not exceeded their respective carrying amounts. The Company did not recognize any goodwill impairment charges in the fiscal years ended June 30, 2023, 2022 and 2021.
Intangible Assets
Intangible assets consist primarily of relationships, product trade names, legal and contractual rights surrounding a patent and a non-compete agreement. These assets are recorded at their estimated fair values at the acquisition dates using the income approach. Definite lived intangible assets are being amortized using the straight-line method based on their estimated useful lives ranging from 5 to 20 years. The estimated useful lives of dealer relationships consider the average length of dealer relationships at the time of acquisition, historical rates of dealer attrition and retention, the Company’s history of renewal and extension of dealer relationships, as well as competitive and economic factors resulting in a range of useful lives. The estimated useful lives of the Company’s trade names are based on a number of factors including technological obsolescence and the competitive environment. The estimated useful lives of legal and contractual rights are estimated based on the benefits that the patent provides for its remaining terms unless competitive, technological obsolescence or other factors indicate a shorter life. The useful life of the non-compete agreement is based on a ten-year agreement entered into by the Company and former owner of the Licensee as part of the acquisition. In addition, the Company has indefinite lived intangible assets for acquired trade names.
Management, assisted by third-party valuation specialists, determined the estimated fair values of separately identifiable intangible assets at the date of acquisition under the income approach. Significant data and assumptions used in the valuations included cost, market and income comparisons, discount rates, royalty rates and management forecasts. Discount rates for each intangible asset were selected based on judgment of relative risk and approximate rates of returns investors in the subject assets might require. The royalty rates were based on historical and projected sales and profits of products sold and management’s assessment of the intangibles’ importance to the sales and profitability of the product. Management provided forecasts of financial data pertaining to assets, liabilities and income statement balances to be utilized in the valuations. While management believes the assumptions, estimates, appraisal methods and ensuing results are appropriate and represent the best evidence of fair value in the circumstances, modification or use of other assumptions or methods could have yielded different results.
The carrying amount of definite lived intangible assets are reviewed whenever circumstances arise that indicate the carrying amount of an asset may not be recoverable. The carrying value of these assets is compared to the undiscounted future cash flows the assets are expected to generate. If the asset is considered to be impaired, the carrying value is compared to the fair value and this difference is recognized as an impairment loss. Intangible assets not subject to amortization are assessed for impairment at least annually and whenever events or changes in circumstances indicate that it is more likely than not that an asset may be impaired. The impairment test for indefinite-lived intangible assets consists of a comparison of the fair value of the intangible asset with its carrying amount. An impairment loss is recognized for the amount by which the carrying value exceeds the fair value of the asset. There was no impairment loss recognized on intangible assets for the fiscal years ended June 30, 2023, 2022 and 2021.
Dealer Incentives
The Company provides for various structured dealer rebate and sales promotions incentives, which are recognized as a component of sales in measuring the amount of consideration the Company expects to receive in exchange for transferring goods, at the time of sale to the dealer. Examples of such programs include rebates, seasonal discounts and other allowances. Dealer rebates and sales promotion expenses are estimated based on current programs and historical achievement and/or usage rates. Actual results may differ from these estimates if market conditions dictate the need to enhance or reduce sales promotion and incentive programs or if dealer achievement or other items vary from historical trends.
Free floor financing incentives include payments to the lenders providing floor plan financing to the dealers or directly to the dealers themselves. Free floor financing incentives are estimated at the time of sale to the dealer based on the expected expense to the Company over the term of the free flooring period and are recognized as a reduction in sales. The Company accounts for both incentive payments directly to dealers and payment to third party lenders in this manner. Dealer incentives are included in accrued expenses on the Company's consolidated balance sheets.
Changes in the Company’s accrual for dealer rebates were as follows:
| | | | | | | | | | | | | | | | | |
| | Fiscal Year Ended June 30, |
| | 2023 | | 2022 | | 2021 |
| Balance at beginning of year | $ | 15,852 | | | $ | 11,666 | | | $ | 6,865 | |
| Add: Dealer rebate incentives | 32,953 | | | 35,210 | | | 28,629 | |
| Additions for acquisitions | — | | | — | | | 219 | |
| Less: Dealer rebates paid | (35,090) | | | (31,024) | | | (24,047) | |
| Balance at end of year | $ | 13,715 | | | $ | 15,852 | | | $ | 11,666 | |
Changes in the Company’s accrual for floor financing were as follows:
| | | | | | | | | | | | | | | | | |
| | Fiscal Year Ended June 30, |
| | 2023 | | 2022 | | 2021 |
| Balance at beginning of year | $ | 187 | | | $ | 121 | | | $ | 719 | |
| Add: Flooring incentives | 13,926 | | | 3,717 | | | 4,157 | |
| Additions for acquisitions | — | | | — | | | 30 | |
| Less: Flooring paid | (12,979) | | | (3,651) | | | (4,785) | |
| Balance at end of year | $ | 1,134 | | | $ | 187 | | | $ | 121 | |
Tax Receivable Agreement
As a result of exchanges of LLC Units into Class A Common Stock and purchases by the Company of LLC Units from holders of LLC Units, the Company will become entitled to a proportionate share of the existing tax basis of the assets of the LLC at the time of such exchanges or purchases. In addition, such exchanges or purchases of LLC Units are expected to result in increases in the tax basis of the assets of the LLC that otherwise would not have been available. These increases in tax basis may reduce the amount of tax that the Company would otherwise be required to pay in the future. These increases in tax basis may also decrease gains (or increase losses) on future dispositions of certain capital assets to the extent tax basis is allocated to those capital assets.
In connection with the recapitalization the Company completed in connection with its IPO, the Company entered into a tax receivable agreement with the pre-IPO owners of the LLC that provides for the payment by the Company to the pre-IPO owners (or any permitted assignees) of 85% of the amount of the benefits, if any, that the Company deems to realize as a result of (i) increases in tax basis and (ii) certain other tax benefits, including those attributable to payments, under the tax receivable agreement. These contractual payment obligations are the Company's obligations and are not obligations of the LLC, and are accounted for in accordance with ASC 450, Contingencies, since the obligations were deemed to be probable and reasonably estimable. For purposes of the tax receivable agreement, the benefit deemed realized by the Company will be computed by comparing its actual income tax liability (calculated with certain assumptions) to the amount of such taxes that it would have been required to pay had there been no increase to the tax basis of the assets of the LLC as a result of the purchases or exchanges, and had the Company not entered into the tax receivable agreement.
The timing and/or amount of aggregate payments due under the tax receivable agreement may vary based on a number of factors, including the amount and timing of the taxable income the Company generates in the future and the tax rate then applicable and amortizable basis.
The term of the tax receivable agreement will continue until all such tax benefits have been utilized or expired, unless the Company exercises its right to terminate the tax receivable agreement for an amount based on the agreed payments remaining to be made under the agreement. In certain mergers, asset sales or other forms of business combinations or other changes of control, the Company (or its successor) would owe to the pre-IPO owners of the LLC (or any permitted assignees) a lump-sum payment equal to the present value of all forecasted future payments that would have otherwise been made under the tax receivable agreement that would be based on certain assumptions, including a deemed exchange of all LLC Units and that the Company would have had sufficient taxable income to fully utilize the deductions arising from the increased tax basis and other tax benefits related to entering into the tax receivable agreement.
Income Taxes
Malibu Boats, Inc. is taxed as a C corporation for U.S. income tax purposes and is therefore subject to both federal and state taxation at a corporate level. Following the IPO, the LLC continues to operate in the United States as a partnership for U.S. federal income tax purposes. Maverick Boat Group is taxed as a C corporation for U.S. income tax purposes and is separately subject to both federal and state taxation at a corporate level.
The Company files various federal and state tax returns, including some returns that are consolidated with subsidiaries. The Company accounts for the current and deferred tax effects of such returns using the asset and liability method. Significant judgments and estimates are required in determining the Company's current and deferred tax assets and liabilities, which reflect management's best assessment of the estimated future taxes it will pay. These estimates are updated throughout the year to consider income tax return filings, its geographic mix of earnings, legislative changes and other relevant items.
The Company recognizes deferred tax assets and liabilities based on the differences between the financial statement carrying amounts of assets and liabilities and the amounts applicable for income tax purposes. Deferred tax assets represent items to be realized as a tax deduction or credit in future tax returns. Realization of the deferred tax assets ultimately depends on the existence of sufficient taxable income of the appropriate character in either the carryback or carryforward period.
Each quarter the Company analyzes the likelihood that its deferred tax assets will be realized. A valuation allowance is recorded if, based on the weight of all available positive and negative evidence, it is more likely than not (a likelihood of more than 50%) that some portion, or all, of a deferred tax asset will not be realized (see Note 13).
On an annual basis, the Company performs a comprehensive analysis of all forms of positive and negative evidence based on year end results. During each interim period, the Company updates its annual analysis for significant changes in the positive and negative evidence.
If the Company later determines that realization is more likely than not for deferred tax assets with a valuation allowance, the related valuation allowance will be reduced. Conversely, if the Company determines that it is more likely than not that the Company will not be able to realize a portion of its deferred tax assets, the Company will increase the valuation allowance.
The Company recognizes a tax benefit associated with an uncertain tax position when, in its judgment, it is more likely than not that the position will be sustained based upon the technical merits of the position. For a tax position that meets the more-likely-than-not recognition threshold, the Company initially and subsequently measures the income tax benefit as the largest amount that it judges to have a greater than 50% likelihood of being realized. The liability associated with unrecognized tax benefits is adjusted periodically due to changing circumstances, such as the progress of tax audits, case law developments and new or emerging legislation. Such adjustments are recognized entirely in the period in which they are identified. The Company's income tax provision includes the net impact of changes in the liability for unrecognized tax benefits.
The Company has filed federal and state income tax returns that remain open to examination for fiscal years 2020 through 2022, while its subsidiaries, Malibu Boats Holdings, LLC and Malibu Boats Pty Ltd., remain open to examination for years 2019 through 2022.
The Company considers an issue to be resolved at the earlier of the issue being “effectively settled,” settlement of an examination, or the expiration of the statute of limitations. Upon resolution, unrecognized tax benefits will be reversed as a discrete event.
The Company's liability for unrecognized tax benefits is generally presented as noncurrent. However, if it anticipates paying cash within one year to settle an uncertain tax position, the liability is presented as current. The Company classifies interest and penalties recognized on the liability for unrecognized tax benefits as income tax expense.
Revenue Recognition
Revenue is recognized as performance obligations under the terms of contracts with customers are satisfied; this occurs when control of promised goods (boats, parts, or other) is transferred to the customer, which is upon shipment. Revenue is measured as the amount of consideration the Company expects to receive in exchange for transferring goods or providing services. The Company generally manufactures products based on specific orders from dealers and often ships completed products only after receiving credit approval from financial institutions. The amount of consideration the Company receives and revenue it recognizes varies with changes in marketing incentives and rebates it offers to its dealers and their customers.
Dealers generally have no rights to return unsold boats. From time to time, however, the Company may accept returns in limited circumstances and at the Company’s discretion under its warranty policy, which generally limits returns to instances of manufacturing defects. The Company may be obligated, in the event of default by a dealer, to accept returns of unsold boats
under its repurchase commitment to floor financing providers, who are able to obtain such boats through foreclosure. The Company accrues returns when a repurchase and return, due to the default of one of its dealers, is determined to be probable and the amount of the return is reasonably estimable. Historically, product returns, resulting from repurchases made under the floorplan financing program, have not been material and the returned boats have been subsequently resold above their cost. Refer to Note 9 and Note 17 related to the Company’s product warranty and repurchase commitment obligations, respectively.
Revenue associated with sales of materials, parts, boats or engine products sold under the Company’s exclusive manufacturing and distribution agreement with its Australian subsidiary are eliminated in consolidation.
The Company earns royalties on boats shipped with the Company's proprietary wake surfing technology under licensing agreements with various marine manufacturers. Royalty income is recognized when products are used or sold with the Company's patented technology by other boat manufacturers and industry suppliers. The usage of the Company's technology satisfies the performance obligation in the contract.
See Note 2 for more information.
Delivery Costs
Shipping and freight costs are included in cost of sales in the accompanying consolidated statements of operations and comprehensive income.
Advertising Costs
Advertising costs are expensed as incurred. Advertising expenses are included in selling and marketing expenses and were not material for the fiscal years ended June 30, 2023, 2022, and 2021.
Fair Value of Financial Instruments
Financial instruments for which the Company did not elect the fair value option include accounts receivable, prepaid expenses and other current assets, credit facilities, accounts payable, accrued expenses and other current liabilities. The carrying amounts of these financial instruments approximate their fair values as a result of their short-term nature or variable interest rates.
Fair Value Measurements
The Company applies the provisions of ASC Topic 820, Fair Value Measurement, for fair value measurements of financial assets and financial liabilities, and for fair value measurements of nonfinancial items that are recognized or disclosed at fair value in the consolidated financial statements on a recurring basis. ASC Topic 820 defines fair value as the price that would be received to sell an asset or paid to transfer a liability in an orderly transaction between market participants at the measurement date. ASC Topic 820 also establishes a framework for measuring fair value and expands disclosures about fair value measurements. In addition to the financial assets and liabilities measured on a recurring basis, certain nonfinancial assets and liabilities are to be measured at fair value on a nonrecurring basis in accordance with applicable GAAP. This includes items such as nonfinancial assets and liabilities initially measured at fair value in a business combination (but not measured at fair value in subsequent periods) and nonfinancial long-lived asset groups measured at fair value for an impairment assessment. In general, non-financial assets including goodwill, other intangible assets and property and equipment are measured at fair value when there is an indication of impairment and are recorded at fair value only when any impairment is recognized.
Equity-Based Compensation
The Company expenses employee share-based awards under ASC Topic 718, Compensation—Stock Compensation, which requires compensation cost for the grant-date fair value of share-based awards to be recognized over the requisite service period. Stock options granted to executives January 14, 2019 were valued using the Black-Scholes option pricing model. Stock awards granted on November 3, 2022, November 3, 2021 and November 3, 2020 based on total shareholder return were valued using a Monte Carlo simulation. The fair value of restricted stock unit awards granted under the Company's Long Term Incentive Plan ("Incentive Plan") are measured based on the market price of the Company’s stock on the grant date. See Note 15 for more information.
Foreign Currency Translation
The functional currency for the Company's consolidated foreign subsidiary is the applicable local currency. The assets and liabilities are translated at the foreign exchange rate in effect at the applicable reporting date, and the consolidated statements of operations and comprehensive income and cash flows are translated at the average exchange rate in effect during the applicable
period. Exchange rate fluctuations on translating the foreign currency financial statements into U.S. dollars that result in unrealized gains or losses are referred to as translation adjustments. Cumulative translation adjustments are reflected as a component of "Accumulated other comprehensive loss, net of tax," in the stockholders' equity section of the accompanying consolidated balance sheets and periodic changes are included in comprehensive income.
Comprehensive Income
Components of comprehensive income include net income and foreign currency translation adjustments. The Company has chosen to disclose comprehensive income in a single continuous consolidated statement of operations and comprehensive income.
Recent Accounting Pronouncements
In June 2016, the FASB issued Accounting Standards Update ("ASU") 2016-13, Financial Instruments - Credit Losses (Topic 326): Measurement of Credit Losses on Financial Instruments, and in November 2018 issued a subsequent amendment, ASU 2018-19, Codification Improvements to Topic 326, Financial Instruments - Credit Losses. ASU 2016-13 significantly changes how entities will measure credit losses for most financial assets and certain other instruments that are not measured at fair value through net income. ASU 2016-13 will replace today’s “incurred loss” approach with an “expected loss” model for instruments measured at amortized cost. ASU 2018-19 will affect loans, debt securities, trade receivables, net investments in leases, off balance sheet credit exposures, reinsurance receivables, and any other financial assets not excluded from the scope of this amendment that have the contractual right to receive cash. On July 1, 2020, the Company adopted this standard and the adoption did not have a material impact on the Company’s consolidated financial position, results of operations, equity or cash flows.
In March 2020, the FASB issued ASU 2020-04, Reference Rate Reform (Topic 848): Facilitation of Effects of Reference Rate Reform on Financial Reporting, which provides practical expedients and exceptions for applying GAAP to contracts, hedging relationships, and other transactions affected by reference rate reform if certain criteria are met. The elective amendments provide expedients to contract modification, affected by reference rate reform if certain criteria are met. The expedients and exceptions provided by this guidance apply only to contracts, hedging relationships, and other transactions that reference the London interbank offered rate (“LIBOR”) or another reference rate expected to be discontinued as a result of reference rate reform. Per ASU 2022-06, Reference Rate Reform (Topic 848): Deferral of the Sunset Date of Topic 848, this guidance is not applicable to contract modifications made and hedging relationships entered into or evaluated after December 31, 2024. The guidance can be applied immediately through December 31, 2024. The Company will adopt this standard when LIBOR is discontinued and does not expect a material impact to its financial condition, results of operations or disclosures based on the current debt portfolio and capital structure.
There are no other new accounting pronouncements that are expected to have a significant impact on the Company's consolidated financial statements and related disclosures.
2. Revenue Recognition
The following table disaggregates the Company's revenue by major product type and geography:
| | | | | | | | | | | | | | | | | | | | | | | |
| Fiscal Year Ended June 30, 2023 |
| Malibu | | Saltwater Fishing | | Cobalt | | Consolidated |
| Revenue by product: | | | | | | | |
| Boat and trailer sales | $ | 618,001 | | | $ | 447,587 | | | $ | 299,028 | | | $ | 1,364,616 | |
| Part and other sales | 18,246 | | | 1,569 | | | 3,934 | | | 23,749 | |
| Net sales | $ | 636,247 | | | $ | 449,156 | | | $ | 302,962 | | | $ | 1,388,365 | |
| | | | | | | |
| Revenue by geography: | | | | | | | |
| North America | $ | 582,092 | | | $ | 440,449 | | | $ | 292,335 | | | $ | 1,314,876 | |
| International | 54,155 | | | 8,707 | | | 10,627 | | | 73,489 | |
| Net sales | $ | 636,247 | | | $ | 449,156 | | | $ | 302,962 | | | $ | 1,388,365 | |
| | | | | | | | | | | | | | | | | | | | | | | |
| Fiscal Year Ended June 30, 2022 |
| Malibu | | Saltwater Fishing | | Cobalt | | Consolidated |
| Revenue by product: | | | | | | | |
| Boat and trailer sales | $ | 590,059 | | | $ | 340,725 | | | $ | 262,679 | | | $ | 1,193,463 | |
| Part and other sales | 17,484 | | | 1,205 | | | 2,725 | | | 21,414 | |
| Net sales | $ | 607,543 | | | $ | 341,930 | | | $ | 265,404 | | | $ | 1,214,877 | |
| | | | | | | |
| Revenue by geography: | | | | | | | |
| North America | $ | 548,826 | | | $ | 336,816 | | | $ | 253,812 | | | $ | 1,139,454 | |
| International | 58,717 | | | 5,114 | | | 11,592 | | | 75,423 | |
| Net sales | $ | 607,543 | | | $ | 341,930 | | | $ | 265,404 | | | $ | 1,214,877 | |
| | | | | | | | | | | | | | | | | | | | | | | |
| Fiscal Year Ended June 30, 2021 |
| Malibu | | Saltwater Fishing | | Cobalt | | Consolidated |
| Revenue by product: | | | | | | | |
| Boat and trailer sales | $ | 464,738 | | | $ | 241,750 | | | $ | 196,654 | | | $ | 903,142 | |
| Part and other sales | 18,787 | | | 1,164 | | | 3,422 | | | 23,373 | |
| Net sales | $ | 483,525 | | | $ | 242,914 | | | $ | 200,076 | | | $ | 926,515 | |
| | | | | | | |
| Revenue by geography: | | | | | | | |
| North America | $ | 434,660 | | | $ | 234,680 | | | $ | 191,477 | | | $ | 860,817 | |
| International | 48,865 | | | 8,234 | | | 8,599 | | | 65,698 | |
| Net sales | $ | 483,525 | | | $ | 242,914 | | | $ | 200,076 | | | $ | 926,515 | |
Boat and Trailer Sales
Consists of sales of boats and trailers to the Company's dealer network, net of sales returns, discounts, rebates and free flooring incentives. Boat and trailer sales also includes optional boat features. Sales returns consist of boats returned by dealers under the Company's warranty program. Rebates, free flooring and discounts are incentives that the Company provides to its dealers based on sales of eligible products.
Part and Other Sales
Consists primarily of parts and accessories sales, royalty income and clothing sales. Parts and accessories sales include replacement and aftermarket boat parts and accessories sold to the Company's dealer network. Royalty income is earned from license agreements with various boat manufacturers, including Nautique, Chaparral, Mastercraft, and Tige related to the use of the Company's intellectual property.
3. Non-controlling Interest
The non-controlling interest on the consolidated statements of operations and comprehensive income represents the portion of earnings or loss attributable to the economic interest in the Company's subsidiary, the LLC, held by the non-controlling LLC Unit holders. Non-controlling interest on the consolidated balance sheets represents the portion of net assets of the Company attributable to the non-controlling LLC Unit holders, based on the portion of the LLC Units owned by such Unit holders. The ownership of the LLC is summarized as follows:
| | | | | | | | | | | | | | | | | | | | | | | |
| As of June 30, 2023 | | As of June 30, 2022 |
| Units | | Ownership % | | Units | | Ownership % |
| Non-controlling LLC unit holders ownership in Malibu Boats Holdings, LLC | 455,919 | | 2.2 | % | | 600,919 | | 2.8 | % |
| Malibu Boats, Inc. ownership in Malibu Boats Holdings, LLC | 20,603,822 | | 97.8 | % | | 20,501,081 | | 97.2 | % |
| 21,059,741 | | 100.0 | % | | 21,102,000 | | 100.0 | % |
| | | | | | | | |
Balance of non-controlling interest as of June 30, 2021 | | $ | 7,726 | |
| Allocation of income to non-controlling LLC Unit holders for period | | 5,798 | |
| Distributions paid and payable to non-controlling LLC Unit holders for period | | (3,076) | |
| Reallocation of non-controlling interest | | (54) | |
Balance of non-controlling interest as of June 30, 2022 | | 10,394 | |
| Allocation of income to non-controlling LLC Unit holders for period | | 3,397 | |
| Distributions paid and payable to non-controlling LLC Unit holders for period | | (3,131) | |
| Reallocation of non-controlling interest | | (2,789) | |
Balance of non-controlling interest as of June 30, 2023 | | $ | 7,871 | |
Issuance of Additional LLC Units
Under the first amended and restated limited liability company agreement of the LLC, as amended (the “LLC Agreement”), the Company is required to cause the LLC to issue additional LLC Units to the Company when the Company issues additional shares of Class A Common Stock. Other than in connection with the issuance of Class A Common Stock in connection with an equity incentive program, the Company must contribute to the LLC net proceeds and property, if any, received by the Company with respect to the issuance of such additional shares of Class A Common Stock. The Company must cause the LLC to issue a number of LLC Units equal to the number of shares of Class A Common Stock issued such that, at all times, the number of LLC Units held by the Company equals the number of outstanding shares of Class A Common Stock. During the fiscal year ended June 30, 2023, the Company caused the LLC to issue a total of 346,370 LLC Units to the Company in connection with (i) the Company's issuance of Class A Common Stock to a non-employee director for her services, (ii) the issuance of Class A Common Stock for the vesting of awards granted under the Malibu Boats, Inc. Long-Term Incentive Plan (the "Incentive Plan") and (iii) the issuance of restricted Class A Common Stock granted under the Incentive Plan, (iv) the issuance of Class A Common Stock to LLC Unit holders in exchange of their LLC Units and (v) the issuance of Class A Common Stock for the exercise of options granted under the Incentive Plan. During fiscal year 2023, 38,598 LLC Units were canceled in connection with the vesting of share-based equity awards to satisfy employee tax withholding requirements, 3,406 LLC Units were canceled in connection with the vesting of stock awards with a market condition that were deemed to not be achieved and 57,866 LLC Units were canceled in connection with the forfeiture of stock awards. In connection with the cancellation of LLC units described above, an equivalent 99,870 treasury shares were retired in accordance with the LLC Agreement. Also during fiscal year 2023, 143,759 LLC Units were redeemed and canceled by the LLC in connection with the purchase and retirement of 143,759 treasury shares under the Company's stock repurchase program.
Distributions and Other Payments to Non-controlling Unit Holders
Distributions for Taxes
As a limited liability company (treated as a partnership for income tax purposes), the LLC does not incur significant federal, state or local income taxes, as these taxes are primarily the obligations of its members. As authorized by the LLC Agreement, the LLC is required to distribute cash, to the extent that the LLC has cash available, on a pro rata basis, to its members to the extent necessary to cover the members’ tax liabilities, if any, with respect to their share of LLC earnings. The LLC makes such tax distributions to its members based on an estimated tax rate and projections of taxable income. If the actual taxable income of the LLC multiplied by the estimated tax rate exceeds the tax distributions made in a calendar year, the LLC may make true-up distributions to its members, if cash or borrowings are available for such purposes. As of June 30, 2023 and 2022, tax distributions payable to non-controlling LLC Unit holders were $776 and $1,045, respectively. During the fiscal years ended June 30, 2023, 2022, and 2021, tax distributions paid to the non-controlling LLC Unit holders were $3,401, $2,717, and $1,758, respectively.
Other Distributions
Pursuant to the LLC Agreement, the Company has the right to determine when distributions will be made to LLC members and the amount of any such distributions. If the Company authorizes a distribution, such distribution will be made to the members of the LLC (including the Company) pro rata in accordance with the percentages of their respective LLC Units.
4. Acquisitions
Acquisition of Certain Assets of AmTech, LLC and BTR, LLC
On February 1, 2022, Malibu Electronics, LLC, a newly-formed, wholly-owned, direct subsidiary of Boats LLC, entered into an asset purchase agreement to acquire certain assets of AmTech, LLC, an Alabama limited liability company, and real property of BTR, LLC, an Alabama limited liability company. Boats LLC acquired the assets related to the manufacturing and distribution of wiring harnesses that had previously been sold by Amtech, LLC to Boats LLC and its subsidiaries. The acquisition continues the vertical integration strategy of the Company by acquiring its primary supplier of wiring harnesses for Malibu and Axis boats. The Company accounted for the transaction in accordance with ASC Topic 805, Business Combinations.
Maverick Boat Group
On December 31, 2020, the Company completed its acquisition of all the outstanding stock of Maverick Boat Group. The aggregate purchase price for the transaction was $150,675, funded with cash and borrowings under the Company's credit facilities. The aggregate purchase price was subject to certain adjustments, including customary adjustments for the amount of cash, indebtedness and working capital in the business at the closing date and subject to adjustment for certain capital expenditures made by Maverick Boat Group prior to closing at the Company’s request. The Company accounted for the transaction in accordance with ASC Topic 805, Business Combinations.
The total consideration given to the stockholders of Maverick Boat Group has been allocated to the assets acquired and liabilities assumed based on estimates of fair value as of the date of the acquisition. The measurements of fair value were determined based upon estimates utilizing the assistance of third party valuation specialists.
The following table summarizes the purchase price allocation based on the estimated fair values of the assets acquired and liabilities assumed at the acquisition date:
| | | | | |
| Consideration: | |
| Cash consideration paid | $ | 150,675 | |
| |
| Recognized amounts of identifiable assets acquired and (liabilities assumed), at fair value: | |
| Cash | $ | 248 | |
| Accounts receivable | 3,204 | |
| Inventories | 7,756 | |
| Other current assets | 194 | |
| Property, plant and equipment | 22,618 | |
| Identifiable intangible assets | 102,600 | |
| Other assets | 4,410 | |
| Current liabilities | (6,611) | |
| Deferred tax liabilities | (28,528) | |
| Other liabilities | (4,405) | |
| Fair value of assets acquired and liabilities assumed | 101,486 | |
| Goodwill | 49,189 | |
| Total purchase price | $ | 150,675 | |
The fair value estimates for the Company's identifiable intangible assets acquired as part of the acquisition are as follows:
| | | | | | | | | | | |
| Estimates of Fair Value | | Estimated Useful Life (in years) |
| Definite-lived intangibles: | | | |
| Dealer relationships | $ | 47,900 | | | 20 |
| Total definite-lived intangibles | 47,900 | | | |
| Indefinite-lived intangible: | | | |
| Trade name | 54,700 | | | |
| Total other intangible assets | $ | 102,600 | | | |
The value allocated to inventories reflects the estimated fair value of the acquired inventory based on the expected sales price of the inventory, less an estimated cost to complete and a reasonable profit margin. The fair value of the identifiable intangible assets were determined based on the following approaches:
Dealer Relationships - The value associated with Maverick Boat Group's dealer relationships is attributed to its long standing dealer distribution network. The estimate of fair value assigned to this asset was determined using the income approach, which requires an estimate or forecast of the expected future cash flows from the dealer relationships through the application of the multi-period excess earnings approach. The estimated remaining useful life of dealer relationships is approximately 17.5 years.
Trade Name - The value attributed to Maverick Boat Group's trade names was determined using a variation of the income approach called the relief from royalty method, which requires an estimate or forecast of the expected future cash flows. The trade name has an indefinite life.
The fair value of the definite-lived intangible assets are being amortized using the straight-line method to amortization expenses over their estimated useful lives. Indefinite-lived intangible assets are not amortized, but instead are evaluated for potential impairment on an annual basis in accordance with the provisions of ASC Topic 350, Intangibles—Goodwill and Other. The weighted average useful life of identifiable definite-lived intangible assets acquired was 20 years. Goodwill of $49,189 arising from the acquisition consists of expected synergies and cost savings as well as intangible assets that do not qualify for separate recognition.
Acquisition-related costs of $2,648, which were incurred by the Company in the fiscal year ended June 30, 2021 related to the Maverick Boat Group acquisition, were expensed in the period incurred, and are included in general and administrative expenses in the consolidated statement of operations and comprehensive income.
Pro Forma Financial Information (unaudited):
The following unaudited pro forma consolidated results of operations for the fiscal years ended June 30, 2023, 2022 and 2021, assumes that the acquisition of Maverick Boat Group occurred as of July 1, 2020. The unaudited pro forma financial information combines historical results of Malibu and Maverick Boat Group, with adjustments for interest on debt financing, depreciation and amortization attributable to fair value estimates on acquired tangible and intangible assets for the respective periods. Non-recurring pro forma adjustments associated with the fair value step up of inventory were included in the reported pro forma cost of sales and earnings. The unaudited pro forma financial information is presented for informational purposes only and is not indicative of the results of operations that would have been achieved if the acquisition had taken place at the beginning of fiscal year 2021 or the results that may occur in the future:
| | | | | | | | | | | | | | | | | |
| Fiscal Year Ended June 30, |
| 2023 | | 2022 | | 2021 |
| Net sales | $ | 1,388,365 | | | $ | 1,214,877 | | | $ | 982,535 | |
| Net income | 107,910 | | | 163,430 | | | 116,598 | |
| Net income attributable to Malibu Boats, Inc. | 104,513 | | | 157,632 | | | 112,104 | |
| Basic earnings per share | $ | 5.10 | | | $ | 7.60 | | | $ | 5.40 | |
| Diluted earnings per share | $ | 5.06 | | | $ | 7.51 | | | $ | 5.34 | |
5. Inventories, net
Inventories are stated at the lower of cost or net realizable value, determined on the first in, first out (“FIFO”) basis. Manufacturing cost includes materials, labor and manufacturing overhead. Unallocated overhead and abnormal costs are expensed as incurred. Inventories consisted of the following:
| | | | | | | | | | | |
| | As of June 30, |
| 2023 | | 2022 |
| Raw materials | $ | 142,948 | | | $ | 129,233 | |
| Work in progress | 19,222 | | | 20,929 | |
| Finished goods | 9,019 | | | 6,840 | |
| Total inventories | $ | 171,189 | | | $ | 157,002 | |
6. Property, Plant, and Equipment, net
Property, plant, and equipment acquired outside of acquisition are stated at cost. When property, plant, and equipment is retired or otherwise disposed of, the related cost and accumulated depreciation is removed from the accounts and any resulting gain or loss is accounted for in the consolidated statement of operations and comprehensive income. Major additions are capitalized; maintenance, repairs and minor improvements are charged to operating expenses as incurred if they do not increase the life or productivity of the related capitalized asset. Depreciation on leasehold improvements is computed using the straight-line method based on the lesser of the remaining lease term or the estimated useful life and depreciation of equipment is computed using the straight-line method over the estimated useful life as follows:
| | | | | | | | |
| | Years |
| Building | | 20 |
| Leasehold improvements | | Shorter of useful life or lease term |
| Machinery and equipment | | 3-5 |
| Furniture and fixtures | | 3-5 |
The Company accounts for the impairment and disposition of long-lived assets in accordance with ASC Topic 360, Property, Plant, and Equipment. In accordance with ASC Topic 360, long-lived assets to be held are reviewed for events or changes in circumstances that indicate that their carrying value may not be recoverable. The Company periodically reviews for
indicators and, if indicators are present, tests the carrying value of long-lived assets, assessing their net realizable values based on estimated undiscounted cash flows over their remaining estimated useful lives. If the carrying amount of an asset exceeds its estimated undiscounted future cash flows, an impairment charge is measured as the amount by which the carrying amount of the asset exceeds the fair value of the asset, based on discounted cash flows. No impairment charges were recorded for the fiscal years ended June 30, 2023, 2022 and 2021 in the Company’s consolidated financial statements.
Property, plant, and equipment, net consisted of the following:
| | | | | | | | | | | |
| As of June 30, |
| | 2023 | | 2022 |
| Land | $ | 4,905 | | | $ | 4,905 | |
| Building and leasehold improvements | 119,324 | | | 81,030 | |
| Machinery and equipment | 103,362 | | | 82,469 | |
| Furniture and fixtures | 12,672 | | | 10,805 | |
| Construction in process | 47,482 | | | 52,852 | |
| 287,745 | | | 232,061 | |
| Less accumulated depreciation | (82,953) | | | (61,343) | |
| $ | 204,792 | | | $ | 170,718 | |
Depreciation expense was $21,912, $19,365 and $15,636 for the fiscal years ended June 30, 2023, 2022 and 2021, respectively, substantially all of which was recorded in cost of sales.
7. Goodwill and Other Intangible Assets, net
The changes in the carrying amount of goodwill for the fiscal years ended June 30, 2023 and 2022 were as follows:
| | | | | | | | | | | | | | | | | | | | | | | |
| Malibu | | Saltwater Fishing | | Cobalt | | Consolidated |
Goodwill as of June 30, 2021 | $ | 12,528 | | | $ | 68,714 | | | $ | 19,791 | | | $ | 101,033 | |
| Addition related to the acquisition of Malibu Electronics | 329 | | | — | | | — | | | 329 | |
Effect of foreign currency changes on goodwill | (558) | | | — | | | — | | | (558) | |
Goodwill as of June 30, 2022 | 12,299 | | | 68,714 | | | 19,791 | | | 100,804 | |
| | | | | | | |
| | | | | | | |
Effect of foreign currency changes on goodwill | (227) | | | — | | | — | | | (227) | |
Goodwill as of June 30, 2023 | $ | 12,072 | | | $ | 68,714 | | | $ | 19,791 | | | $ | 100,577 | |
The components of other intangible assets were as follows:
| | | | | | | | | | | | | | | | | | | | | | | |
| As of June 30, | | Estimated Useful Life (in years) | | Weighted Average Remaining Useful Life (in years) |
| | 2023 | | 2022 | | |
| Definite-lived intangibles: | | | | | | | |
| | | | | | | |
| Dealer relationships | $ | 131,725 | | | $ | 131,806 | | | 15-20 | | 15.6 |
| Patent | 2,600 | | | 2,600 | | | 15 | | 9.0 |
| Trade name | 100 | | | 100 | | | 15 | | 7.0 |
| Non-compete agreement | 46 | | | 48 | | | 10 | | 1.3 |
| | | | | | | |
| Total | 134,471 | | | 134,554 | | | | | |
| Less: Accumulated amortization | (31,213) | | | (24,450) | | | | | |
| Total definite-lived intangible assets, net | 103,258 | | | 110,104 | | | | | |
| Indefinite-lived intangible: | | | | | | | |
| Trade names | 118,200 | | | 118,200 | | | | | |
| Total other intangible assets | $ | 221,458 | | | $ | 228,304 | | | | | |
Amortization expense recognized on all amortizable intangibles was $6,808, $6,957 and $7,255 for the fiscal years ended June 30, 2023, 2022 and 2021, respectively.
Estimated future amortization expenses as of June 30, 2023 are as follows:
| | | | | | | | |
| Fiscal Year | | As of June 30, 2023 |
| 2024 | | $ | 6,806 | |
| 2025 | | 6,803 | |
| 2026 | | 6,802 | |
| 2027 | | 6,802 | |
| 2028 | | 6,802 | |
| 2029 and thereafter | | 69,243 | |
| | $ | 103,258 | |
8. Accrued Expenses
Accrued expenses consisted of the following:
| | | | | | | | | | | |
| As of June 30, |
| | 2023 | | 2022 |
| Warranties | $ | 41,709 | | | $ | 38,673 | |
| Dealer incentives | 14,996 | | | 16,357 | |
| Accrued compensation | 19,671 | | | 21,076 | |
| Current operating lease liabilities | 2,324 | | | 2,121 | |
| Litigation settlement | 100,000 | | | — | |
| Accrued legal and professional fees | 1,899 | | | 1,939 | |
| Customer deposits | 4,054 | | | 4,851 | |
| Other accrued expenses | 2,425 | | | 2,725 | |
| Total accrued expenses | $ | 187,078 | | | $ | 87,742 | |
Litigation settlement represents settlement of product liability cases in June 2023 for $100.0 million. For more information, refer to Note 17 of our consolidated financial statements included elsewhere in this Annual Report.
9. Product Warranties
The Company's Malibu and Axis brand boats have a limited warranty for a period up to five years. The Company's Cobalt brand boats have (1) a structural warranty of up to ten years which covers the hull, deck joints, bulkheads, floor, transom, stringers, and motor mount, and (2) a five year bow-to-stern warranty on all components manufactured or purchased (excluding hull and deck structural components), including canvas and upholstery. Gelcoat is covered up to three years for Cobalt and one year for Malibu and Axis. Pursuit brand boats have (1) a limited warranty for a period of up to five years on structural components such as the hull, deck and defects in the gelcoat surface of the hull bottom and (2) a bow-to-stern warranty of two years (excluding hull and deck structural components). Maverick, Pathfinder and Hewes brand boats have (1) a limited warranty for a period of up to five years on structural components such as the hull, deck and defects in the gelcoat surface of the hull bottom and (2) a bow-to-stern warranty of one year (excluding hull and deck structural components). Cobia brand boats have (1) a limited warranty for a period of up to ten years on structural components such as the hull, deck and defects in the gelcoat surface of the hull bottom and (2) a bow-to-stern warranty of three years (excluding hull and deck structural components). For each boat brand, there are certain materials, components or parts of the boat that are not covered by the Company's warranty and certain components or parts that are separately warranted by the manufacturer or supplier (such as the engine). Engines that the Company manufactures for Malibu and Axis models have a limited warranty of up to five years or five-hundred hours.
The Company’s standard warranties require it or its dealers to repair or replace defective products during the warranty period at no cost to the consumer. The Company estimates warranty costs it expects to incur and records a liability for such costs at the time the product revenue is recognized. The Company utilizes historical claims trends and analytical tools to develop the estimate of its warranty obligation on a per boat basis, by brand and warranty year. Factors that affect the Company’s warranty liability include the number of units sold, historical and anticipated rates of warranty claims and cost per claim. The Company assesses the adequacy of its recorded warranty liabilities and adjusts the amounts as necessary. Beginning in model year 2016, the Company increased the term of its limited warranty for Malibu brand boats from three years to five years and for Axis brand boats from two years to five years. Beginning in model year 2018, the Company increased the term of its bow-to-stern warranty for Cobalt brand boats from three years to five years. Accordingly, the Company has less historical claims experience for warranty years four and five, and as such, these estimates give rise to a higher level of estimation uncertainty. Future warranty claims may differ from the Company's estimate of the warranty liability, which could lead to changes in the Company’s warranty liability in future periods.
Changes in the Company’s product warranty liability, which are included in accrued expenses in the accompanying consolidated balance sheets, were as follows:
| | | | | | | | | | | | | | | | | | | | |
| | | Fiscal Year Ended June 30, |
| | 2023 | | 2022 | | 2021 |
| Beginning balance | | $ | 38,673 | | | $ | 35,035 | | | $ | 27,500 | |
| Add: Warranty Expense | | 24,812 | | | 21,280 | | | 21,973 | |
| | | | | | |
| Additions for Maverick Boat Group acquisition | | — | | | — | | | 883 | |
| Less: Warranty claims paid | | (21,776) | | | (17,642) | | | (15,321) | |
| Ending balance | | $ | 41,709 | | | $ | 38,673 | | | $ | 35,035 | |
10. Financing
Outstanding debt consisted of the following:
| | | | | | | | | | | | | | | |
| | | As of June 30, |
| | | | 2023 | | 2022 |
| | | | | |
| Term loan | | | $ | — | | | $ | 23,125 | |
| Revolving credit loan | | | — | | | 97,000 | |
| Less unamortized debt issuance costs | | | — | | | (508) | |
| Total debt | | | — | | | 119,617 | |
| Less current maturities | | | — | | | 1,563 | |
| Long term debt less current maturities | | | $ | — | | | $ | 118,054 | |
Long-Term Debt
As of June 30, 2023, the Company had a revolving credit facility with borrowing capacity of up to $350,000. As of
June 30, 2023, the Company had $0 outstanding under its revolving credit facility and $1,578 in outstanding letters of credit with $348,422 available for borrowing. The revolving credit facility matures on July 8, 2027. As of June 30, 2023, the Company reclassified unamortized debt issuance costs into Other assets.
On July 8, 2022, Boats LLC entered into a Third Amended and Restated Credit Agreement (the “Credit Agreement”) that amended and restated its second amended and restated credit agreement dated as of June 28, 2017. The Credit Agreement increased the borrowing capacity of the revolving credit facility from $170,000 to $350,000. Boats LLC has the option to request that lenders increase the amount available under the revolving credit facility by, or obtain incremental term loans of, up to $200,000, subject to the terms of the Credit Agreement and only if existing or new lenders choose to provide additional term or revolving commitments.
The obligations of Boats LLC under the Credit Agreement are guaranteed by the LLC, and, subject to certain exceptions, the present and future domestic subsidiaries of Boats LLC, and all such obligations are secured by substantially all of the assets of the LLC, Boats LLC and such subsidiary guarantors. Malibu Boats, Inc. is not a party to the Credit Agreement.
Borrowings under the Credit Agreement bear interest at a rate equal to either, at the Company's option, (i) the highest of the prime rate, the Federal Funds Rate (as defined in the Credit Agreement) plus 0.5%, or one-month Term SOFR (as defined in the Credit Agreement) plus 1% (the “Base Rate”) or (ii) SOFR (as defined in the Credit Agreement), in each case plus an applicable margin ranging from 1.25% to 2.00% with respect to SOFR borrowings and 0.25% to 1.00% with respect to Base Rate borrowings. The applicable margin will be based upon the consolidated leverage ratio of the LLC and its subsidiaries. As of June 30, 2023, the interest rate on the Company’s term loans and revolving credit facility was 6.56%. The Company is required to pay a commitment fee for any unused portion of the revolving credit facility which will range from 0.15% to 0.30% per annum, depending on the LLC’s and its subsidiaries’ consolidated leverage ratio.
The Credit Agreement contains certain customary representations and warranties, and notice requirements for the occurrence of specific events such as the occurrence of any event of default or pending or threatened litigation. The Credit Agreement also requires compliance with certain customary financial covenants consisting of a minimum ratio of EBITDA to interest expense and a maximum ratio of total debt to EBITDA. The Credit Agreement contains certain customary restrictive covenants regarding indebtedness, liens, fundamental changes, investments, share repurchases, dividends and distributions, disposition of assets, transactions with affiliates, negative pledges, hedging transactions, certain prepayments of indebtedness, accounting changes and governmental regulation. For example, the Credit Agreement generally prohibits the LLC, Boats LLC and the subsidiary guarantors from paying dividends or making distributions, including to the Company. The credit facility permits, however, (i) distributions based on a member’s allocated taxable income, (ii) distributions to fund payments that are required under the LLC’s tax receivable agreement, (iii) purchase of stock or stock options of the LLC from former officers, directors or employees of loan parties or payments pursuant to stock option and other benefit plans up to $5,000 in any fiscal year, and (iv) repurchases of the Company's outstanding stock and LLC Units. In addition, the LLC may make unlimited dividends and distributions if its consolidated leverage ratio is 2.75 or less and certain other conditions are met, subject to compliance with certain financial covenants.
The Credit Agreement also contains customary events of default. If an event of default has occurred and continues beyond any applicable cure period, the administrative agent may (i) accelerate all outstanding obligations under the Credit Agreement or (ii) terminate the commitments, amongst other remedies. Additionally, the lenders are not obligated to fund any new borrowing under the Credit Agreement while an event of default is continuing.
Covenant Compliance
As of June 30, 2023 and 2022, the Company was in compliance with the financial covenants contained in the Credit Agreement.
11. Leases
The Company leases certain manufacturing facilities, warehouses, office space, land, and equipment. The Company determines if a contract is a lease or contains an embedded lease at the inception of the agreement. Leases with an initial term of 12 months or less are not recorded on the consolidated balance sheets. The Company does not separate non-lease components from the lease components to which they relate, and instead accounts for each separate lease and non-lease component associated with that lease component as a single lease component for all underlying asset classes. The Company's lease liabilities do not include future lease payments related to options to extend or terminate lease agreements as it is not reasonably certain those options will be exercised.
Other information concerning the Company's operating leases accounted for under ASC Topic 842, Leases is as follows:
| | | | | | | | | | | | | | | | | | | | |
| | | | As of June 30, |
| Classification | | 2023 | | 2022 |
| Assets | | | | | | |
| Right-of-use assets | | Other assets | | $ | 8,808 | | | $ | 10,659 | |
| | | | | | |
| Liabilities | | | | | | |
| Current operating lease liabilities | | Accrued expenses | | $ | 2,324 | | | $ | 2,121 | |
| Long-term operating lease liabilities | | Other liabilities | | 7,843 | | | 10,062 | |
| Total lease liabilities | | | | $ | 10,167 | | | $ | 12,183 | |
| | | | | | | | | | | | | | | | | | | | | | | | | | |
| | | | Fiscal Year Ended June 30, |
| Classification | | 2023 | | 2022 | | 2021 |
Operating lease costs (1) | | Cost of sales | | $ | 2,686 | | | $ | 2,611 | | | $ | 2,170 | |
| | Selling and marketing, and general and administrative | | 878 | | | 857 | | | 854 | |
| | | | | | | | |
| Sublease income | | Other expense (income), net | | (38) | | | (38) | | | (38) | |
| | | | | | | | |
| Cash paid for amounts included in the measurement of operating lease liabilities | | Cash flows from operating activities | | 2,555 | | | 2,517 | | | 2,617 | |
(1) Includes short-term leases, which are insignificant, and are not included in the lease liability.
The lease liability for operating leases that contain variable escalating rental payments with scheduled increases that are based on the lesser of a stated percentage increase or the cumulative increase in an index, are determined using the stated percentage increase.
The weighted average remaining lease term for the fiscal year ended June 30, 2023 and 2022 was 4.60 years and 5.53 years, respectively. As of June 30, 2023 and 2022, the weighted average discount rate determined based on the Company's incremental borrowing rate is 3.67% and 3.63%, respectively.
Future annual minimum lease payments for the following fiscal years as of June 30, 2023 are as follows:
| | | | | | | | |
| | | Amount |
| 2024 | | $ | 2,649 | |
| 2025 | | 2,347 | |
| 2026 | | 2,255 | |
| 2027 | | 2,255 | |
| 2028 | | 1,504 | |
| 2029 and thereafter | | — | |
| Total | | 11,010 | |
| Less imputed interest | | (843) | |
| Present value of lease liabilities | | $ | 10,167 | |
12. Tax Receivable Agreement Liability
The Company has a Tax Receivable Agreement with the pre-IPO owners of the LLC that provides for the payment by the Company to the pre-IPO owners (or their permitted assignees) of 85% of the amount of the benefits, if any, that the Company is deemed to realize as a result of (i) increases in tax basis and (ii) certain other tax benefits related to the Company entering into the Tax Receivable Agreement, including those attributable to payments under the Tax Receivable Agreement. These
contractual payment obligations are obligations of the Company and not of the LLC. The Company's Tax Receivable Agreement liability was determined on an undiscounted basis in accordance with ASC 450, Contingencies, since the contractual payment obligations were deemed to be probable and reasonably estimable.
For purposes of the Tax Receivable Agreement, the benefit deemed realized by the Company is computed by comparing the actual income tax liability of the Company (calculated with certain assumptions) to the amount of such taxes that the Company would have been required to pay had there been no increase to the tax basis of the assets of the LLC as a result of the purchases or exchanges, and had the Company not entered into the Tax Receivable Agreement.
The following table reflects the changes to the Company's Tax Receivable Agreement liability:
| | | | | | | | | | | |
| As of June 30, |
| 2023 | | 2022 |
| Beginning balance | $ | 45,541 | | | $ | 48,214 | |
| Additions (reductions) to tax receivable agreement: | | | |
| | | |
| Exchange of LLC Units for Class A Common Stock | 1,710 | | | — | |
| Adjustment for change in estimated state tax rate or benefits | 188 | | | 1,025 | |
| Payment under tax receivable agreement | (3,974) | | | (3,698) | |
| 43,465 | | | 45,541 | |
| Less current portion under tax receivable agreement | (4,111) | | | (3,958) | |
| Ending balance | $ | 39,354 | | | $ | 41,583 | |
The Tax Receivable Agreement further provides that, upon certain mergers, asset sales or other forms of business combinations or other changes of control, the Company (or its successor) would owe to the pre-IPO owners of the LLC a lump-sum payment equal to the present value of all forecasted future payments that would have otherwise been made under the Tax Receivable Agreement that would be based on certain assumptions, including a deemed exchange of LLC Units and that the Company would have sufficient taxable income to fully utilize the deductions arising from the increased tax basis and other tax benefits related to entering into the Tax Receivable Agreement. The Company also is entitled to terminate the Tax Receivable Agreement, which, if terminated, would obligate the Company to make early termination payments to the pre-IPO owners of the LLC. In addition, a pre-IPO owner may elect to unilaterally terminate the Tax Receivable Agreement with respect to such pre-IPO owner, which would obligate the Company to pay to such existing owner certain payments for tax benefits received through the taxable year of the election.
When estimating the expected tax rate to use in order to determine the tax benefit expected to be recognized from the Company’s increased tax basis as a result of exchanges of LLC Units by the pre-IPO owners of the LLC, the Company continuously monitors changes in its overall tax posture, including changes resulting from new legislation and changes as a result of new jurisdictions in which the Company is subject to tax.
As of June 30, 2023 and 2022, the Company recorded deferred tax assets of $118,148 and $115,952, respectively, associated with basis differences in assets upon acquiring an interest in the LLC and pursuant to making an election under Section 754 of the Internal Revenue Code of 1986 (the "Internal Revenue Code"), as amended. These basis differences are included in the overall partnership basis differences disclosed in Note 13. The aggregate Tax Receivable Agreement liability represents 85% of the tax benefits that the Company expects to receive in connection with the Section 754 election. In accordance with the Tax Receivable Agreement, the next annual payment is anticipated approximately 75 days after filing the federal tax return due by April 15, 2024.
13. Income Taxes
Malibu Boats, Inc. is taxed as a C corporation for U.S. income tax purposes and is therefore subject to both federal and state taxation at a corporate level. The LLC continues to operate in the United States as a partnership for U.S. federal income tax purposes. Maverick Boat Group is separately subject to U.S. federal and state income tax with respect to its net taxable income.
Income taxes are computed in accordance with ASC Topic 740, Income Taxes, and reflect the net tax effects of temporary differences between the financial reporting carrying amounts of assets and liabilities and the corresponding income tax amounts. The Company has deferred tax assets and liabilities and maintains valuation allowances where it is more likely than not that all or a portion of deferred tax assets will not be realized. To the extent the Company determines that it will not realize
the benefit of some or all of its deferred tax assets, such deferred tax assets will be adjusted through the Company’s provision for income taxes in the period in which this determination is made.
On August 16, 2022, the Inflation Reduction Act of 2022 (the “Inflation Reduction Act”) was signed into law. The Inflation Reduction Act contains significant business tax provisions, including an excise tax on stock buybacks (1% for transactions beginning January 1, 2023), increased funding for IRS tax enforcement, expanded energy incentives promoting clean energy investment, and a 15% corporate minimum tax on certain large corporations. The effects of the new legislation were recognized upon enactment. The Company did not recognize any significant impact to income tax expense for the fiscal year ended June 30, 2023 relating to the Inflation Reduction Act.
The components of provision for income taxes are as follows:
| | | | | | | | | | | | | | | | | |
| Fiscal Year Ended June 30, |
| 2023 | | 2022 | | 2021 |
| Current tax expense: | | | | | |
| Federal | $ | 39,462 | | | $ | 33,689 | | | $ | 21,737 | |
| State | 9,071 | | | 6,632 | | | 4,014 | |
| Foreign | 1,331 | | | 1,532 | | | 1,284 | |
| Total current | 49,864 | | | 41,853 | | | 27,035 | |
| Deferred tax expense: | | | | | |
| Federal | (14,230) | | | 4,661 | | | 6,147 | |
| State | (2,019) | | | 94 | | | 899 | |
| Foreign | (34) | | | (73) | | | (102) | |
| Total deferred | (16,283) | | | 4,682 | | | 6,944 | |
| Income tax expense | $ | 33,581 | | | $ | 46,535 | | | $ | 33,979 | |
The income tax expense differs from the amount computed by applying the federal statutory income tax rate to income from continuing operations before income taxes. The sources and tax effects of the differences are as follows:
| | | | | | | | | | | | | | | | | |
| Fiscal Year Ended June 30, |
| 2023 | | 2022 | | 2021 |
| Federal tax provision at statutory rate | 21.0 | % | | 21.0 | % | | 21.0 | % |
| | | | | |
| State income taxes, net of federal benefit | 3.5 | | | 2.8 | | | 2.9 | |
| Permanent differences attributable to partnership investment | (0.5) | | | (1.0) | | | (0.3) | |
| | | | | |
| Non-controlling interest | (0.5) | | | (0.6) | | | (0.7) | |
| | | | | |
| Other, net | 0.2 | | | — | | | — | |
| Total income tax expense on continuing operations | 23.7 | % | | 22.2 | % | | 22.9 | % |
The Company’s effective tax rate includes a rate benefit attributable to the fact that the Company’s subsidiary operated as a limited liability company which was not subject to federal income tax. Accordingly, the portion of the Company’s subsidiary earnings attributable to the non-controlling interest are subject to tax when reported as a component of the non-controlling interests’ taxable income.
The components of the Company's net deferred income tax assets and liabilities at June 30, 2023 and 2022 are as follows:
| | | | | | | | | | | |
| As of June 30, |
| 2023 | | 2022 |
| Deferred tax assets: | | | |
| | | |
| Partnership basis differences | $ | 69,193 | | | $ | 49,740 | |
| | | |
| Accrued liabilities and reserves | 1,436 | | | 955 | |
| State tax credits and NOLs | 8,922 | | | 7,178 | |
| Foreign tax credits | 580 | | | 580 | |
| | | |
| Other | 381 | | | 336 | |
| Less valuation allowance | (16,876) | | | (15,633) | |
| Total deferred tax assets | 63,636 | | | 43,156 | |
| Deferred tax liabilities: | | | |
| | | |
| Fixed assets and intangibles | 29,495 | | | 27,754 | |
| Other | 21 | | | 53 | |
| Total deferred tax liabilities | 29,516 | | | 27,807 | |
| Total net deferred tax assets | $ | 34,120 | | | $ | 15,349 | |
On an annual basis, the Company performs a comprehensive analysis of all forms of positive and negative evidence to determine whether realizability of deferred tax assets is more likely than not. During each interim period, the Company updates its annual analysis for significant changes in the positive and negative evidence. At June 30, 2023 and 2022, the Company concluded that $16,876 and $15,633, respectively, of valuation allowance against deferred tax assets was necessary. The Company continues to record the valuation allowance against the deferred tax asset generated by the state impact of the 743(b) amortization and on state net operating losses generated by current and future amortization deductions (with respect to the Section 754 election) that are reported in the Tennessee corporate tax return without offsetting income, which is taxable at the LLC. These net operating losses have a 15 year carryover and will expire, if unused, between 2030 and 2038. This also includes a valuation allowance in the amount of $580 related to foreign tax credit carryforward that is not expected to be utilized in the future.
Unrecognized tax benefits are discussed in the Company's accounting policy for income taxes (Refer to Note 1 on Income Taxes for more information). The Company has filed federal and state income tax returns that remain open to examination for fiscal years 2020 through 2022, while its subsidiaries, the LLC and Malibu Boats Pty Ltd., remain open to examination for fiscal years 2019 through 2022.
A reconciliation of changes in the amount of unrecognized tax benefits for the fiscal years ended June 30, 2023, 2022 and 2021 is as follows:
| | | | | | | | | | | | | | | | | |
| Fiscal Year Ended June 30, |
| 2023 | | 2022 | | 2021 |
| Balance as of July 1 | $ | 1,472 | | | $ | 1,452 | | | $ | 1,445 | |
| Additions based on tax positions taken during the current period | 363 | | | 314 | | | 304 | |
| Reductions for settlements with taxing authorities | — | | | — | | | (250) | |
| Reductions due to statute settlements | (156) | | | (286) | | | (50) | |
| Additions (reductions) for tax positions of prior years | 39 | | | (8) | | | 3 | |
| Balance as of June 30 | $ | 1,718 | | | $ | 1,472 | | | $ | 1,452 | |
In fiscal year 2023, the Company reduced its uncertain tax positions by $156 as a result of statute settlements, and recorded $363 in connection with its current year state filing positions. As of June 30, 2023, it is reasonably possible that $130 of the total unrecognized tax benefits recorded will reverse within the next twelve months. Of the total unrecognized tax benefits recorded on the consolidated balance sheets, $1,423 would impact the effective tax rate once settled.
As discussed in Note 1 to the Consolidated Financial Statements, the Company's policy is to accrue interest related to potential underpayment of income taxes within the provision for income taxes. At June 30, 2023, the Company had $324 of accrued interest related to unrecognized tax benefits.
The Company did not provide for U.S. federal, state income taxes or foreign withholding taxes in fiscal year 2023 on the outside basis difference of its non-U.S. subsidiary, as such foreign earnings are considered to be permanently reinvested. The estimated income and withholding tax liability associated with the remittance of these earnings is nominal.
14. Stockholders' Equity
The Company is authorized to issue 150,000,000 shares of capital stock, consisting of 100,000,000 shares of Class A Common Stock, 25,000,000 shares of Class B Common Stock, and 25,000,000 shares of Preferred Stock, par value $0.01 per share.
Exchange of LLC Units for Class A Common Stock and Issuance of Class B Common Stock
During fiscal year 2021, nine non-controlling LLC Unit holders exchanged LLC Units for the issuance of Class A Common Stock. In connection with the exchange, five shares of Class B Common Stock were automatically transferred to the Company and retired. As of June 30, 2021, the Company had a total of 10 shares of its Class B Common Stock issued and outstanding.
During fiscal year 2022, no non-controlling LLC Unit holders exchanged LLC Units for the issuance of Class A Common Stock. As there were no exchanges, no shares of Class B Common Stock were automatically transferred to the Company and retired. As of June 30, 2022, the Company had a total of 10 shares of its Class B Common Stock issued and outstanding.
During fiscal year 2023, two non-controlling LLC Unit holders exchanged LLC Units for the issuance of Class A Common Stock. In connection with the exchange, no shares of Class B Common Stock were automatically transferred to the Company and retired. In addition, during fiscal year 2023 one non-controlling LLC Unit holder transferred LLC Units to two new entities (the “New LLC Members”) for no consideration, and the Company issued a total of two shares of Class B Common Stock to the New LLC Members for nominal consideration. As of June 30, 2023, the Company had a total of 12 shares of its Class B Common Stock issued and outstanding.
Stock Repurchase Program
On August 27, 2020, the board of directors of the Company authorized a stock repurchase program for the repurchase of up to $50,000 of Class A Common Stock and the LLC Units for the period from September 2, 2020 to July 1, 2021 (the “Fiscal 2021 Repurchase Program”). No shares were repurchased under the Fiscal 2021 Repurchase Program. The Fiscal 2021 Repurchase Program expired on July 1, 2021.
On November 3, 2021, the board of directors of the Company authorized a stock repurchase program for the repurchase of up to $70,000 of Class A Common Stock and the LLC Units for the period from November 8, 2021 to November 8, 2022 (the “Fiscal 2022 Repurchase Program”). During fiscal year 2023, under the Fiscal 2022 Repurchase Program, the Company repurchased 143,759 shares of Class A Common Stock for $7,868 in cash including related fees and expenses. The Fiscal 2022 Repurchase Program expired on November 8, 2022.
On November 3, 2022, the board of directors of the Company authorized a stock repurchase program for the repurchase of up to $100,000 of Class A Common Stock and the LLC Units for the period from November 8, 2022 to November 8, 2023 (the “Fiscal 2023 Repurchase Program”). As of June 30, 2023, $100,000 was available to repurchase shares of Class A Common Stock and LLC Units under the Fiscal 2023 Repurchase Program. The Fiscal 2023 Repurchase Program expires on November 8, 2023.
Class A Common Stock and Class B Common Stock
Voting Rights
Holders of Class A Common Stock and Class B Common Stock will have voting power over Malibu Boats, Inc., the sole managing member of the LLC, at a level that is consistent with their overall equity ownership of the Company's business. Pursuant to the Company's certificate of incorporation and bylaws, each share of Class A Common Stock entitles the holder to one vote with respect to each matter presented to the Company's stockholders on which the holders of Class A Common Stock are entitled to vote. Each holder of Class B Common Stock shall be entitled to the number of votes equal to the total number of LLC Units held by such holder multiplied by the exchange rate specified in the Exchange Agreement with respect to each matter presented to the Company's stockholders on which the holders of Class B Common Stock are entitled to vote. Accordingly, the holders of LLC Units collectively have a number of votes that is equal to the aggregate number of LLC Units that they hold. Subject to any rights that may be applicable to any then outstanding preferred stock, the Company's Class A and Class B Common Stock vote as a single class on all matters presented to the Company's stockholders for their vote or approval, except as otherwise provided in the Company's certificate of incorporation or bylaws or required by applicable law. Holders of
the Company's Class A and Class B Common Stock do not have cumulative voting rights. Except in respect of matters relating to the election and removal of directors on the Company's board of directors and as otherwise provided in the Company's certificate of incorporation, the Company's bylaws, or as required by law, all matters to be voted on by the Company's stockholders must be approved by a majority of the shares present in person or by proxy at the meeting and entitled to vote on the subject matter.
Dividends
Subject to preferences that may apply to any shares of preferred stock outstanding at the time, the holders of the Company's Class A Common Stock will be entitled to share equally, identically and ratably in any dividends that the board of directors may determine to issue from time to time. Holders of the Company's Class B Common Stock do not have any right to receive dividends.
Liquidation Rights
In the event of any voluntary or involuntary liquidation, dissolution or winding up of the Company's affairs, holders of the Company's Class A Common Stock would be entitled to share ratably in the Company's assets that are legally available for distribution to stockholders after payment of its debts and other liabilities. If the Company has any preferred stock outstanding at such time, holders of the preferred stock may be entitled to distribution and/or liquidation preferences. In either such case, the Company must pay the applicable distribution to the holders of its preferred stock before it may pay distributions to the holders of its Class A Common Stock. Holders of the Company Class B Common Stock do not have any right to receive a distribution upon a voluntary or involuntary liquidation, dissolution or winding up of the Company's affairs.
Other Rights
Holders of the Company's Class A Common Stock will have no preemptive, conversion or other rights to subscribe for additional shares. The rights, preferences and privileges of the holders of the Company's Class A Common Stock will be subject to, and may be adversely affected by, the rights of the holders of shares of any series of the Company's preferred stock that the Company may designate and issue in the future.
Preferred Stock
Though the Company currently has no plans to issue any shares of preferred stock, its board of directors has the authority, without further action by the Company's stockholders, to designate and issue up to 25,000,000 shares of preferred stock in one or more series. The Company's board of directors may also designate the rights, preferences and privileges of the holders of each such series of preferred stock, any or all of which may be greater than or senior to those granted to the holders of common stock. Though the actual effect of any such issuance on the rights of the holders of common stock will not be known until the Company's board of directors determines the specific rights of the holders of preferred stock, the potential effects of such an issuance include:
•diluting the voting power of the holders of common stock;
•reducing the likelihood that holders of common stock will receive dividend payments;
•reducing the likelihood that holders of common stock will receive payments in the event of the Company's liquidation, dissolution, or winding up; and
•delaying, deterring or preventing a change-in-control or other corporate takeover.
LLC Units
In connection with the recapitalization the Company completed in connection with the Company's IPO, the LLC Agreement was amended and restated to, among other things; modify its capital structure by replacing the different classes of interests previously held by the LLC unit holders to a single new class of units called “LLC Units.” As a result of the Company's IPO and the recapitalization the Company completed in connection with the Company's IPO, the Company holds LLC Units in the LLC and is the sole managing member of the LLC. Holders of LLC Units do not have voting rights under the LLC Agreement.
Further, the LLC and the pre-IPO owners entered into the Exchange Agreement under which (subject to the terms of the Exchange Agreement) they have the right to exchange their LLC Units for shares of the Company's Class A Common Stock on a one-for-one basis, subject to customary conversion rate adjustments for stock splits, stock dividends and reclassifications, or at the Company's option, except in the event of a change in control, for a cash payment equal to the market value of the Class A
Common Stock. As of June 30, 2023, the Company held 20,603,822 LLC Units, representing a 97.8% economic interest in the LLC, while non-controlling LLC Unit holders held 455,919 LLC Units, representing a 2.2% interest in the LLC. Refer to Note 3 for additional information on non-controlling interest.
As discussed in Note 3, net profits and net losses of the LLC will generally be allocated to the LLC’s members (including the Company) pro rata in accordance with the percentages of their respective limited liability company interests. The LLC Agreement provides for cash distributions to the holders of LLC Units if the Company determines that the taxable income of the LLC will give rise to taxable income for its members. In accordance with the LLC Agreement, the Company intends to cause the LLC to make cash distributions to holders of LLC Units for purposes of funding their tax obligations in respect of the income of the LLC that is allocated to them.
15. Stock-Based Compensation
Equity Awards Issued Under the Malibu Boats, Inc. Long-Term Incentive Plan
On January 6, 2014, the Company’s board of directors adopted the Malibu Boats, Inc. Incentive Plan. The Incentive Plan, which became effective on January 1, 2014, reserves for issuance up to 1,700,000 shares of Malibu Boats, Inc. Class A Common Stock for the Company’s employees, consultants, members of its board of directors and other independent contractors at the discretion of the compensation committee. Incentive stock awards authorized under the Incentive Plan include unrestricted shares of Class A Common Stock, stock options, stock appreciation rights, restricted stock, restricted stock units, dividend equivalent awards and performance awards. As of June 30, 2023, there were 400,825 shares available for future issuance under the Incentive Plan.
On April 14, 2023, Wayne Wilson notified the Company of his resignation from his position as Chief Financial Officer and Secretary of the Company and from all other positions held with the Company and each of its subsidiaries. Mr. Wilson’s resignation as Chief Financial Officer and Secretary was effective April 19, 2023, and Mr. Wilson served in an advisory role through May 12, 2023. In connection with Mr. Wilson’s resignation, he forfeited 57,866 shares of the Company’s Class A Common Stock underlying unvested restricted stock awards and performance awards previously granted to Mr. Wilson.
On November 3, 2020, under the Incentive Plan, the Company granted approximately 33,000 restricted service based stock units and 25,000 restricted service based stock awards to key employees under the Incentive Plan. The grant date fair value of these awards was $3,145 based on a stock price of $54.47 per share on the date of grant. Approximately 58% of the awards vest ratably over three years and approximately 42% of the awards vest ratably over four years. Stock-based compensation expense attributable to the service based units and awards is amortized on a straight-line basis over the requisite service period.
On November 3, 2020, under the Incentive Plan, the Company granted to key employees a target amount of approximately 18,000 restricted stock awards with a performance condition. The number of shares that will ultimately be issued, if any, is based on the attainment of a specified amount of earnings during the fiscal year ending June 30, 2023. The maximum number of shares that can be issued if an elevated earnings target is met, adjusted to reflect the forfeiture of shares in connection with the resignation of the Company’s former Chief Financial Officer, is approximately 21,000. The original grant date fair value of the awards was estimated to be $1,002, based on a stock price of $54.47. Compensation costs associated with the performance awards are recognized over the requisite service period based on probability of achievement in accordance with ASC Topic 718, Compensation—Stock Compensation.
On November 3, 2020, under the Incentive Plan, the Company granted to key employees a target amount of approximately 18,000 stock awards with a market condition. The number of shares that will ultimately be issued, if any, is based on a total shareholder return ("TSR") computation that involves comparing the movement in the Company's stock price to movement in a market index from the grant date through November 3, 2023. The maximum number of shares that can be issued if an elevated TSR target is met, adjusted to reflect the forfeiture of shares in connection with the resignation of the Company’s former Chief Financial Officer, is approximately 28,000. The original grant date fair value of the awards was estimated to be $1,293, which was estimated using a Monte Carlo simulation. The Monte Carlo simulation model utilizes multiple input variables that determine the probability of satisfying the market condition stipulated in the award grant and calculates the fair market value for the stock award. Compensation costs are recognized over the requisite service period based on probability of achievement in accordance with ASC Topic 718, Compensation—Stock Compensation.
On November 3, 2021, under the Incentive Plan, the Company granted approximately 32,000 restricted service-based stock units and 23,000 restricted service-based stock awards to key employees under the Incentive Plan. The grant date fair value of these awards was $4,149 based on a stock price of $74.25 per share on the date of grant. Approximately 58% of the awards vest ratably over three years and approximately 42% of the awards vest ratably over four years. Stock-based compensation expense attributable to the service-based units and awards is amortized on a straight-line basis over the requisite service period.
On November 3, 2021, under the Incentive Plan, the Company granted to key employees a target amount of approximately 18,000 restricted stock awards with a performance condition. The number of shares that will ultimately be issued, if any, is based on the attainment of a specified amount of earnings during the fiscal year ending June 30, 2024. The maximum number of shares that can be issued if an elevated earnings target is met, adjusted to reflect the forfeiture of shares in connection with the resignation of the Company’s former Chief Financial Officer, is approximately 22,000. The original grant date fair value of the awards was estimated to be $1,305, based on a stock price of $74.25. Compensation costs associated with the performance awards are recognized over the requisite service period based on probability of achievement in accordance with ASC Topic 718, Compensation—Stock Compensation.
On November 3, 2021, under the Incentive Plan, the Company granted to key employees a target amount of approximately 18,000 stock awards with a market condition. The number of shares that will ultimately be issued, if any, is based on a total shareholder return ("TSR") computation that involves comparing the movement in the Company's stock price to movement in a market index from the grant date through November 3, 2024. The maximum number of shares that can be issued if an elevated TSR target is met, adjusted to reflect the forfeiture of shares in connection with the resignation of the Company’s former Chief Financial Officer, is approximately 29,000. The original grant date fair value of the awards was estimated to be $1,688, which was estimated using a Monte Carlo simulation. The Monte Carlo simulation model utilizes multiple input variables that determine the probability of satisfying the market condition stipulated in the award grant and calculates the fair market value for the stock award. Compensation costs are recognized over the requisite service period based on probability of achievement in accordance with ASC Topic 718, Compensation—Stock Compensation.
On May 6, 2022, under the Incentive Plan, the Company granted approximately 27,000 restricted service-based stock units to key employees under the Incentive Plan. The grant date fair value of these awards was $1,376 based on a stock price of $51.89 per share on the date of grant. The grant vests ratably over three years on a bi-annual basis. Stock-based compensation expense attributable to the service-based units and awards is amortized on a straight-line basis over the requisite service period.
On November 3, 2022, under the Incentive Plan, the Company granted approximately 61,000 restricted service based stock units and 35,000 restricted service based stock awards to key employees under the Incentive Plan. The grant date fair value of these awards was $5,028 based on a stock price of $52.25 per share on the date of grant. Approximately 64% of the awards vest ratably over three years and approximately 36% of the awards vest ratably over four years. Stock-based compensation expense attributable to the service based units and awards is amortized on a straight-line basis over the requisite service period.
On November 3, 2022, under the Incentive Plan, the Company granted to key employees a target amount of approximately 26,000 restricted stock awards with a performance condition. The number of shares that will ultimately be issued, if any, is based on the attainment of a specified amount of earnings during the fiscal year ending June 30, 2025. The maximum number of shares that can be issued if an elevated earnings target is met, adjusted to reflect the forfeiture of shares in connection with the resignation of the Company’s former Chief Financial Officer, is approximately 32,000. The original grant date fair value of the awards was estimated to be $1,380, based on a stock price of $52.25. Compensation costs associated with the performance awards are recognized over the requisite service period based on probability of achievement in accordance with ASC Topic 718, Compensation—Stock Compensation.
On November 3, 2022, under the Incentive Plan, the Company granted to key employees a target amount of approximately 26,000 stock awards with a market condition. The number of shares that will ultimately be issued, if any, is based on a total shareholder return ("TSR") computation that involves comparing the movement in the Company's stock price to movement in a market index from the grant date through November 3, 2025. The maximum number of shares that can be issued if an elevated TSR target is met, adjusted to reflect the forfeiture of shares in connection with the resignation of the Company’s former Chief Financial Officer, is approximately 43,000. The original grant date fair value of the awards was estimated to be $1,808, which was estimated using a Monte Carlo simulation. The Monte Carlo simulation model utilizes multiple input variables that determine the probability of satisfying the market condition stipulated in the award grant and calculates the fair market value for the stock award. Compensation costs are recognized over the requisite service period based on probability of achievement in accordance with ASC Topic 718, Compensation—Stock Compensation.
The following table presents the number, grant date stock price per share, and weighted-average exercise price per share of the Company’s employee option awards:
| | | | | | | | | | | | | | | | | | | | | | | | | | | | | | | | | | | | | | | | | | | | |
| | Fiscal Year Ended June 30, |
| | 2023 | | 2022 | | 2021 |
| | Shares | | | | Weighted Average Exercise Price/Share | | Shares | | | | Weighted Average Exercise Price/Share | | Shares | | | | Weighted Average Exercise Price/Share |
| Total outstanding Options at beginning of year | | 49,223 | | | | | $ | 40.46 | | | 161,723 | | | | | $ | 32.64 | | | 173,348 | | | | | $ | 32.61 | |
| Options granted | | — | | | | | — | | | — | | | | | — | | | — | | | | | — | |
| Options exercised | | (31,250) | | | | | 42.13 | | | (112,500) | | | | | 29.22 | | | (11,625) | | | | | 32.24 | |
| | | | | | | | | | | | | | | | | | |
| Outstanding options at end of year | | 17,973 | | | | | $ | 37.55 | | | 49,223 | | | | | $ | 40.46 | | | 161,723 | | | | | $ | 32.64 | |
| Exercisable at end of year | | 17,973 | | | | | $ | 37.55 | | | 31,730 | | | | | $ | 40.26 | | | 111,737 | | | | | $ | 30.32 | |
| | | | | | | | | | | | | | | | | | |
The weighted average remaining contractual life of options outstanding and options outstanding and exercisable as of June 30, 2023 was 1.54 years, respectively. The total intrinsic value of options exercised during the years ended June 30, 2023, 2022 and 2021 was $557, $3,751 and $322, respectively. The total intrinsic value of options outstanding and options outstanding and exercisable at June 30, 2023 was $379, respectively. The total intrinsic values are based on the Company’s closing stock price on the last trading day of the applicable year for in-the-money options.
The Company's non-employee directors receive an annual retainer for their services as directors consisting of both a cash retainer and equity awards in the form of Class A Common Stock or restricted stock units. Directors may elect that their cash annual retainer be converted into either fully vested shares of Class A Common Stock or restricted stock units paid on a deferral basis. Equity awards issued to directors are fully vested at the date of grant. Directors receiving restricted stock units as compensation for services have no rights as a stockholder of the Company, no dividend rights (except with respect to dividend equivalent rights), and no voting rights until Class A Common Stock is actually issued to them upon separation from service or change in control as defined in the Incentive Plan. If dividends are paid by the Company to its stockholders, directors would be entitled to receive an equal number of restricted stock units based on their proportional interest.
For the fiscal year ended June 30, 2023, the Company issued 2,105 shares of Class A Common Stock and 20,643 restricted stock units with a weighted-average grant date fair value of $52.45 to its non-employee directors for their services as directors pursuant to the Incentive Plan. For the fiscal year ended June 30, 2022, the Company issued 1,481 shares of Class A Common Stock and 14,258 restricted stock units with a weighted-average grant date fair value of $72.42 to its non-employee directors for their services as directors pursuant to the Incentive Plan. For the fiscal year ended June 30, 2021, the Company issued 1,376 shares of Class A Common Stock and 13,624 restricted stock units with a weighted-average grant date fair value of $55.61 to its non-employee directors for their services as directors pursuant to the Incentive Plan.
The following table presents the number and weighted-average grant date fair value of the Company’s director and employee restricted stock units and restricted stock awards:
| | | | | | | | | | | | | | | | | | | | | | | | | | | | | | | | | | | |
| Fiscal Year Ended June 30, |
| 2023 | | 2022 | | 2021 |
| Number of Restricted Stock Units and Restricted Stock Awards Outstanding | | Weighted Average Grant Date Fair Value | | Number of Restricted Stock Units and Restricted Stock Awards Outstanding | | Weighted Average Grant Date Fair Value | | Number of Restricted Stock Units and Restricted Stock Awards Outstanding | | Weighted Average Grant Date Fair Value |
| Total Non-vested Restricted Stock Units and Restricted Stock Awards at beginning of year | 369,649 | | | $ | 55.75 | | | 314,916 | | | $ | 44.46 | | | 277,696 | | | $ | 35.43 | |
| Granted | 214,172 | | | 52.30 | | | 164,290 | | | 70.74 | | | 141,642 | | | 54.96 | |
| Vested | (180,898) | | | 46.49 | | | (100,441) | | | 44.82 | | | (93,492) | | | 32.88 | |
| Forfeited | (78,099) | | | 58.45 | | | (9,116) | | | 56.41 | | | (10,930) | | | 50.24 | |
| Total Non-vested Restricted Stock Units and Restricted Stock Awards at end of year | 324,824 | | | $ | 57.98 | | | 369,649 | | | $ | 55.75 | | | 314,916 | | | $ | 44.46 | |
As of June 30, 2023, the total unrecognized compensation cost related to nonvested, share-based compensation was $10,107, which the Company expects to recognize over a weighted-average period of 2.1 years.
Stock compensation expense attributable to all of the Company's equity awards was $5,894, $6,342 and $5,581 for fiscal years 2023, 2022 and 2021, respectively, is included in general and administrative expense in the Company's consolidated statements of operations and comprehensive income. The cash flow effects resulting from all equity awards were reflected as noncash operating activities. During fiscal years 2023, 2022 and 2021, the Company withheld 54,909, 27,420 and 21,081 shares at an aggregate cost of $3,135, $2,058 and $1,208, respectively, as permitted by the applicable equity award agreements, to satisfy employee tax withholding requirements for employee share-based equity awards that have vested.
16. Net Earnings Per Share
Basic net income per share of Class A Common Stock is computed by dividing net income attributable to the Company's earnings by the weighted average number of shares of Class A Common Stock outstanding during the period. The weighted average number of shares of Class A Common Stock outstanding used in computing basic net income per share includes fully vested restricted stock units awarded to directors that are entitled to participate in distributions to common shareholders through receipt of additional units of equivalent value to the dividends paid to Class A Common Stock holders.
Diluted net income per share of Class A Common Stock is computed similarly to basic net income per share except the weighted average shares outstanding are increased to include additional shares from the assumed exercise of any common stock equivalents using the treasury method, if dilutive. The Company’s LLC Units and non-qualified stock options are considered common stock equivalents for this purpose. The number of additional shares of Class A Common Stock related to these common stock equivalents and stock options are calculated using the treasury stock method.
Stock awards with a performance condition that are based on the attainment of a specified amount of earnings are only included in the computation of diluted earnings per share to the extent that the performance condition would be achieved based on the current amount of earnings, and only if the effect would be dilutive.
Stock awards with a market condition that are based on the performance of the Company's stock price in relation to a market index over a specified time period are only included in the computation of diluted earnings per share to the extent that the shares would be issued based on the current market price of the Company's stock in relation to the market index, and only if the effect would be dilutive.
Basic and diluted net income per share of Class A Common Stock has been computed as follows (in thousands, except share and per share amounts):
| | | | | | | | | | | | | | | | | |
| Fiscal Year Ended June 30, |
| 2023 | | 2022 | | 2021 |
| Basic: | | | | | |
| Net income attributable to Malibu Boats, Inc. | $ | 104,513 | | | $ | 157,632 | | | $ | 109,841 | |
| Shares used in computing basic net income per share: | | | | | |
| Weighted-average Class A Common Stock | 20,245,980 | | | 20,511,571 | | | 20,528,723 | |
| Weighted-average participating restricted stock units convertible into Class A Common Stock | 255,864 | | | 237,666 | | | 223,929 | |
| Basic weighted-average shares outstanding | 20,501,844 | | | 20,749,237 | | | 20,752,652 | |
| Basic net income per share | $ | 5.10 | | | $ | 7.60 | | | $ | 5.29 | |
| | | | | |
| Diluted: | | | | | |
| Net income attributable to Malibu Boats, Inc. | $ | 104,513 | | | $ | 157,632 | | | $ | 109,841 | |
| Shares used in computing diluted net income per share: | | | | | |
| Basic weighted-average shares outstanding | 20,501,844 | | | 20,749,237 | | | 20,752,652 | |
| Restricted stock units granted to employees | 66,954 | | | 116,874 | | | 123,179 | |
| Weighted-average stock options convertible into Class A Common Stock | 12,707 | | | 47,525 | | | 76,844 | |
| Weighted-average market performance awards convertible into Class A Common Stock | 59,668 | | | 72,620 | | | 58,412 | |
Diluted weighted-average shares outstanding 1 | 20,641,173 | | | 20,986,256 | | | 21,011,087 | |
| Diluted net income per share | $ | 5.06 | | | $ | 7.51 | | | $ | 5.23 | |
1 The Company excluded 516,205, 686,178, and 685,271 potentially dilutive shares from the calculation of diluted net income per share for the fiscal year ended June 30, 2023, 2022, and 2021, respectively, as these units would have been antidilutive.
The shares of Class B Common Stock do not share in the earnings or losses of Malibu Boats, Inc. and are therefore not included in the calculation. Accordingly, basic and diluted net income per share of Class B Common Stock has not been presented.
17. Commitments and Contingencies
Repurchase Commitments
In connection with its dealers’ wholesale floor-plan financing of boats, the Company has entered into repurchase agreements with various lending institutions. The reserve methodology used to record an estimated expense and loss reserve in each accounting period is based upon an analysis of likely repurchases based on current field inventory and likelihood of repurchase. Subsequent to the inception of the repurchase commitment, the Company evaluates the likelihood of repurchase and adjusts the estimated loss reserve accordingly. When a potential loss reserve is recorded it is presented in accrued liabilities in the accompanying consolidated balance sheets. If the Company were obligated to repurchase a significant number of units under any repurchase agreement, its business, operating results and financial condition could be adversely affected. The total amount financed under the floor financing programs with repurchase obligations was $385,448 and $183,953 as of June 30, 2023 and 2022, respectively.
Repurchases and subsequent sales are recorded as a revenue transaction. The net difference between the repurchase price and the resale price is recorded against the loss reserve and presented in cost of sales in the accompanying consolidated statements of operations and comprehensive income. For fiscal year 2023, 2022 and 2021, the Company did not repurchase any units under its repurchase agreements. Accordingly, the Company did not carry a reserve for repurchases as of June 30, 2023 and 2022, respectively.
The Company has collateralized receivables financing arrangements with a third-party floor plan financing provider for European dealers. Under terms of these arrangements, the Company transfers the right to collect a trade receivable to the financing provider in exchange for cash but agrees to repurchase the receivable if the dealer defaults. Since the transfer of the
receivable to the financing provider does not meet the conditions for a sale under ASC Topic 860, Transfers and Servicing, the Company continues to report the transferred trade receivable in other current assets with an offsetting balance recorded as a secured obligation in accrued expenses in the Company's consolidated balance sheets. As of June 30, 2023 and 2022, the Company had no financing receivables recorded in other current assets and accrued expenses related to these arrangements.
Roane County Property Purchase
On March 28, 2023, the Company entered into a Purchase and Sale Agreement (the “Purchase Agreement”) to purchase certain real property, improvements and other assets from the seller for a cash purchase price of approximately $33,300. As of June 30, 2023, the Company had deposited approximately $7,800 in escrow pursuant to the Purchase Agreement. On July 25, 2023, the transaction closed and the Company paid the remaining $25,500 balance of the purchase price. The Company expects to incur additional capital expenditures of approximately $15,000 to make changes to the facility to meet its operational needs.
Contingencies
Product Liability
The Company is engaged in a business that exposes it to claims for product liability and warranty claims in the event the Company’s products actually or allegedly fail to perform as expected or the use of the Company’s products results, or is alleged to result, in property damage, personal injury or death. Although the Company maintains product and general liability insurance of the types and in the amounts that the Company believes are customary for the industry, the Company is not fully insured against all such potential claims. The Company may have the ability to refer claims to its suppliers and their insurers to pay the costs associated with any claims arising from the suppliers’ products. The Company’s insurance covers such claims that are not adequately covered by a supplier’s insurance and provides for excess secondary coverage above the limits provided by the Company’s suppliers.
The Company may experience legal claims in excess of its insurance coverage or claims that are not covered by insurance, either of which could adversely affect its business, financial condition and results of operations. Adverse determination of material product liability and warranty claims made against the Company could have a material adverse effect on its financial condition and harm its reputation. In addition, if any of the Company's products are, or are alleged to be, defective, the Company may be required to participate in a recall of that product if the defect or alleged defect relates to safety. These and other claims that the Company faces could be costly to the Company and require substantial management attention. Refer to Note 9 for discussion of warranty claims. The Company insures against product liability claims and, except as disclosed below, believes there are no material product liability claims as of June 30, 2023 that will have a material adverse impact on the Company's results of operations, financial condition or cash flows.
Litigation
Certain conditions may exist which could result in a loss, but which will only be resolved when future events occur. The Company, in consultation with its legal counsel, assesses such contingent liabilities, and such assessments inherently involve an exercise of judgment. If the assessment of a contingency indicates that it is probable that a loss has been incurred, the Company accrues for such contingent loss when it can be reasonably estimated. If the assessment indicates that a potentially material loss contingency is not probable but reasonably estimable, or is probable but cannot be estimated, the nature of the contingent liability, together with an estimate of the range of possible loss if determinable and material, is disclosed. If the assessment of a contingency deemed to be both probable and reasonably estimable involves a range of possible losses, the amount within the range that appears at the time to be a better estimate than any other amount within the range would be accrued. When no amount within the range is a better estimate than any other amount, the minimum amount in the range is accrued even though the minimum amount in the range is not necessarily the amount of loss that will be ultimately determined. Estimates of potential legal fees and other directly related costs associated with contingencies are not accrued but rather are expensed as incurred. Except as disclosed below, management does not believe there are any pending claims (asserted or unasserted) at June 30, 2023 or June 30, 2022 that will have a material adverse impact on the Company’s financial condition, results of operations or cash flows.
Legal Proceedings
Batchelder Matters
MBI and its indirect subsidiary Boats LLC were defendants in the product liability case Batchelder et al. v. Malibu Boats, LLC, f/k/a Malibu Boats, Inc.; Malibu Boats West, Inc., et. al., Superior Court of Rabun County, Georgia, Civil Action Case No. 2016-CV-0114-C (the "Batchelder I Matter"), brought by, among others, Stephan Paul Batchelder and Margaret Mary Batchelder as Administrators of the Estate of Ryan Paul Batchelder, deceased (“Batchelder I Plaintiffs”). The Batchelder I
Plaintiffs also sued the manufacturer of the boat at issue in the case, Malibu Boats West, Inc. (“West”). West is not, and has never been, a subsidiary of MBI or Boats LLC but was a separate legal entity whose assets were purchased by Boats LLC in 2006. The case involved a personal injury accident in 2014 involving a 2000 model year boat that was manufactured by West. On August 28, 2021, the jury rejected the Batchelder I Plaintiffs’ design defect claims and found that the driver of the boat was 75% at fault for the accident. Notwithstanding those findings, the jury found that Boats LLC and West negligently failed to warn of a hazard posed by the boat and that such failure was a proximate cause of the death of the decedent. The jury also found that Boats LLC is a legal successor of, and responsible for the liabilities of, West. The jury awarded compensatory damages of $80,000 and apportioned 15% of such damages to Boats LLC and 10% of such damages to West. In addition, the jury awarded $80,000 of punitive damages against Boats LLC and $40,000 of punitive damages against West. Based on the jury’s finding of successor liability, the trial court entered judgment for the full amount of the verdict against Boats LLC, with a potential maximum liability to Boats LLC of $140,000, plus post-judgment interest at a rate of 6.25% per annum.
The Batchelder I Plaintiffs also filed motions, after the judgment, seeking orders requiring Boats LLC to pay pre-judgment interest and a portion of their attorney fees. The Batchelder I Plaintiffs claimed they are owed attorneys' fees of approximately $56,000. The Company opposed both motions. The trial court denied the Batchelder I Plaintiffs’ motion for prejudgment interest and held that ruling on the Batchelder I Plaintiffs’ motion for attorneys’ fees would be premature, indicating that it would decide whether the Batchelder I Plaintiffs have the right to attorneys’ fees, and if so what amount is reasonable, if still necessary upon the resolution of Boats LLC’s post-trial motions and any related appeals. The Batchelder I Plaintiffs appealed the trial court’s order denying their motion for prejudgment interest.
On July 17, 2022, the trial court denied Boats LLC’s post-trial motions, and Boats LLC filed a notice of appeal. Pending resolution of the appeals process, the payment of any damages was stayed.
Boats LLC was also a defendant in a related product liability case, Stephan Paul Batchelder and Margaret Mary Batchelder, as Natural Guardians of Josh Patrick Batchelder, a minor; Darin Batchelder, individually, and as Natural Guardian of Zach Batchelder, a minor; and Kayla Batchelder (the “Batchelder II Plaintiffs” and, together with the Batchelder I Plaintiffs, the “Batchelder Plaintiffs”) v. Malibu Boats, LLC v. Dennis Michael Ficarra; Superior Court of Rabun County, Civil Action File No. 2022-CV-0034 (the “Batchelder II Matter” and, together with the Batchelder I Matter, the “Batchelder Matters”). The complaint was filed on February 9, 2022 as a purported renewal of earlier claims by the Batchelder II Plaintiffs that were dismissed without prejudice. The case involved claims by the Batchelder II Plaintiffs of their own alleged bodily injury and emotional distress stemming from the same accident involving the alleged swamping of the boat manufactured and sold by West that is the subject of the Batchelder I Matter. As noted above, West is not, and has never been, a subsidiary of MBI or Boats LLC but was a separate legal entity whose assets were purchased by Boats LLC in 2006. Four Batchelder II Plaintiffs sought damages for personal injury and punitive damages, alleging that the accident was caused by a design defect and a failure to warn. The Batchelder II Plaintiffs' claims were dismissed without prejudice from the Batchelder I Matter shortly before the trial for the Batchelder I Matter, however, and thus the new complaint was a renewal action of the original complaint.
On June 30, 2023, Malibu Boats, Inc. and Boats LLC entered into a Confidential General Release and Settlement Agreement (the “Settlement Agreement”) with the Batchelder I Plaintiffs and the Batchelder II Plaintiffs in settlement of each of the Batchelder Matters. Pursuant to the Settlement Agreement, among other things, Malibu Boats, Inc., or Boats LLC, as the case may be, paid (or caused to be paid) to the Batchelder Plaintiffs and their agents a total of $100,000, of which (a) $40,000 was paid to the Batchelder Plaintiffs and their agents promptly following the execution of the Settlement Agreement and (b) $60,000 was placed in an escrow account and held by the Escrow Agent pursuant to the terms of an Escrow Agreement. All conditions for releasing the $60,000 placed in the escrow account have been satisfied.
18. Related Party Transactions
As of June 30, 2023, there were two non-employee members of the Company's board of directors that are also original shareholders of the Company and receive an annual retainer as compensation for services rendered. For the fiscal years ended June 30, 2023, 2022 and 2021, $409, $385 and $315, respectively, was paid to these directors in both cash and equity for their services. Of the amount paid, $74 and $74 was a prepayment for services through the 2023 and 2022 annual meetings for both of the years ended June 30, 2023 and 2022, respectively.
19. Segment Reporting
The Company has three reportable segments, Malibu, Saltwater Fishing and Cobalt. The Malibu segment participates in the manufacturing, distribution, marketing and sale of Malibu and Axis performance sports boats throughout the world. The Saltwater Fishing segment participates in the manufacturing, distribution, marketing and sale throughout the world of Pursuit boats and the Maverick Boat Group brand boats (Maverick, Cobia, Pathfinder and Hewes). The Cobalt segment participates in the manufacturing, distribution, marketing and sale of Cobalt boats throughout the world.
There is no country outside of the United States from which the Company (a) derived net sales equal to 10% of total net sales, or (b) attributed assets equal to 10% of total assets. Net sales are attributed to countries based on the location of the dealer.
The following table presents financial information for the Company’s reportable segments for the fiscal years ended June 30, 2023, 2022, and 2021.
| | | | | | | | | | | | | | | | | | | | | | | |
| Fiscal Year Ended June 30, 2023 | | | | | | | |
| Malibu | | Saltwater Fishing | | Cobalt | | Total |
| Net sales | $ | 636,247 | | | $ | 449,156 | | | $ | 302,962 | | | $ | 1,388,365 | |
| Depreciation and amortization | 8,974 | | | 11,918 | | | 7,828 | | | 28,720 | |
| Net income before provision for income taxes | 40,157 | | | 57,748 | | | 43,586 | | | 141,491 | |
| Capital expenditures | 27,660 | | | 22,027 | | | 5,153 | | | 54,840 | |
| Long-lived assets | 88,060 | | | 317,514 | | | 121,253 | | | 526,827 | |
| Total assets | $ | 249,447 | | | $ | 432,806 | | | $ | 243,671 | | | $ | 925,924 | |
| | | | | | | |
| Fiscal Year Ended June 30, 2022 | | | | | | | |
| Malibu | | Saltwater Fishing | | Cobalt | | Total |
| Net sales | $ | 607,543 | | | $ | 341,930 | | | $ | 265,404 | | | $ | 1,214,877 | |
| Depreciation and amortization | 8,398 | | | 10,880 | | | 7,044 | | | 26,322 | |
| Net income before provision for income taxes | 137,133 | | | 34,049 | | | 38,783 | | | 209,965 | |
| Capital expenditures | 22,072 | | | 26,806 | | | 6,186 | | | 55,064 | |
| Long-lived assets | 68,739 | | | 307,057 | | | 124,030 | | | 499,826 | |
| Total assets | $ | 264,551 | | | $ | 384,684 | | | $ | 202,091 | | | $ | 851,326 | |
| | | | | | | |
| Fiscal Year Ended June 30, 2021 | | | | | | | |
| Malibu | | Saltwater Fishing 1 | | Cobalt | | Total |
| Net sales | $ | 483,525 | | | $ | 242,914 | | | $ | 200,076 | | | $ | 926,515 | |
| Depreciation and amortization | 9,397 | | | 7,682 | | | 5,812 | | | 22,891 | |
| Net income before provision for income taxes | 88,511 | | | 35,079 | | | 24,671 | | | 148,261 | |
| Capital expenditures | 11,269 | | | 9,962 | | | 9,446 | | | 30,677 | |
| Long-lived assets | 52,533 | | | 291,960 | | | 124,816 | | | 469,309 | |
| Total assets | $ | 211,510 | | | $ | 360,481 | | | $ | 170,793 | | | $ | 742,784 | |
| | | | | | | |
| | | | | | | |
| | | | | | | |
| | | | | | | |
| | | | | | | |
| | | | | | | |
| | | | | | | |
1 Represents the results of Maverick Boat Group since the acquisition on December 31, 2020.
20. Quarterly Financial Reporting (Unaudited)
| | | | | | | | | | | | | | | | | | | | | | | | | | | | | | | | |
| | Quarter Ended | | Fiscal Year Ended
June 30, 2023 |
| | June 30, 2023 | | March 31, 2023 | | December 31, 2022 | | September 30, 2022 | |
| Net sales | | $ | 372,303 | | | $ | 375,119 | | | $ | 338,732 | | | $ | 302,211 | | | $ | 1,388,365 | |
| Gross profit | | 102,462 | | | 98,574 | | | 75,654 | | | 74,605 | | | 351,295 | |
| Operating (loss) income | | (22,646) | | | 70,263 | | | 48,684 | | | 48,483 | | | 144,784 | |
| Net (loss) income | | (18,043) | | | 53,452 | | | 36,396 | | | 36,105 | | | 107,910 | |
| Net (loss) income attributable to non-controlling interest | | (623) | | | 1,564 | | | 1,234 | | | 1,222 | | | 3,397 | |
| Net (loss) income attributable to Malibu Boats, Inc. | | $ | (17,420) | | | $ | 51,888 | | | $ | 35,162 | | | $ | 34,883 | | | $ | 104,513 | |
| Basic net (loss) income per share | | $ | (0.86) | | | $ | 2.53 | | | $ | 1.73 | | | $ | 1.70 | | | $ | 5.10 | |
| Diluted net (loss) income per share | | $ | (0.86) | | | $ | 2.51 | | | $ | 1.72 | | | $ | 1.69 | | | $ | 5.06 | |
| | | | | | | | | | |
| | Quarter Ended | | Fiscal Year Ended
June 30, 2022 |
| | June 30, 2022 | | March 31, 2022 | | December 31, 2021 | | September 30, 2021 | |
| Net sales | | $ | 353,206 | | | $ | 344,287 | | | $ | 263,887 | | | $ | 253,497 | | | $ | 1,214,877 | |
| Gross profit | | 89,627 | | | 97,121 | | | 63,551 | | | 59,752 | | | 310,051 | |
| Operating income | | 65,411 | | | 71,537 | | | 40,187 | | | 36,688 | | | 213,823 | |
| Net income | | 49,685 | | | 54,833 | | | 30,979 | | | 27,933 | | | 163,430 | |
| Net income income attributable to non-controlling interest | | 1,766 | | | 1,955 | | | 1,088 | | | 989 | | | 5,798 | |
| Net income attributable to Malibu Boats, Inc. | | $ | 47,919 | | | $ | 52,878 | | | $ | 29,891 | | | $ | 26,944 | | | $ | 157,632 | |
| Basic net income per share | | $ | 2.34 | | | $ | 2.54 | | | $ | 1.43 | | | $ | 1.29 | | | $ | 7.60 | |
| Diluted net income per share | | $ | 2.31 | | | $ | 2.51 | | | $ | 1.41 | | | $ | 1.28 | | | $ | 7.51 | |
21. Subsequent Event
Batchelder Payments
As discussed above, in connection with the settlement of the Batchelder Matters, in July 2023, Malibu Boats, Inc., or Boats LLC, as the case may be, paid (or caused to be paid) to the Batchelder Plaintiffs and their agents a total of $100,000, of which (a) $40,000 was paid to the Batchelder Plaintiffs and their agents promptly following the execution of the Settlement Agreement and (b) $60,000 was placed in an escrow account and held by the Escrow Agent pursuant to the terms of an Escrow Agreement. All conditions for releasing the $60,000 placed in the escrow account have been satisfied.
Insurance Litigation
Malibu Boats, Inc. and its subsidiaries, including Boats LLC, maintain liability insurance applicable to the Batchelder Matters described above with coverage up to $26,000. As of August 24, 2023, the Company had received approximately $21,000 in insurance coverage proceeds, subject in certain cases to reservations of rights by the insurance carriers. The Company contends that the insurance carriers are responsible for the entirety of the $100,000 settlement amount and related expenses, and therefore, the insurers’ payments to date are well below what they should have tendered to Boats LLC. Accordingly, on July 3, 2023, Boats LLC filed a complaint against Federal Insurance Company and Starr Indemnity & Liability Company alleging that the insurers unreasonably failed to comply with their obligations by refusing, negligently, and in bad faith, to settle covered claims within their available policy limits prior to trial. The Company intends to vigorously pursue its claims against its insurers to recover the full $100,000 settlement amount and expenses (less any monies already tendered without reservation by the carriers). However, the Company cannot predict the outcome of such litigation.
Borrowing under Revolving Credit Facility
On July 7, 2023, the Company borrowed $75,000 under the revolving credit facility, with $273,422 remaining available for borrowing. The Company utilized certain of the funds borrowed under the revolving credit facility to make payments relating to the Batchelder Matters, as described herein. As of August 24, 2023, the Company had $65,000 outstanding under its revolving credit facility.
Item 9. Changes in and Disagreements with Accountants on Accounting and Financial Disclosure
None.
Item 9A. Controls and Procedures
Evaluation of Disclosure Controls and Procedures
We maintain disclosure controls and procedures (as defined in Rule 13a-15(e) of the Exchange Act) that are designed to ensure that information required to be disclosed by us in the reports that we file or submit under the Exchange Act is recorded, processed, summarized and reported within the time periods specified in the SEC's rules and forms, and that such information is accumulated and communicated to our management, including our chief executive officer and interim chief financial officer, as appropriate, to allow timely decisions regarding required disclosures. Any controls and procedures, no matter how well designed and operated, can provide only reasonable assurance of achieving the desired control objectives.
As of the end of the period covered by this Form 10-K Annual Report, we carried out an evaluation under the supervision and with the participation of our management, including our chief executive officer and interim chief financial officer, of the effectiveness of our disclosure controls and procedures. Based upon this evaluation, our chief executive officer and interim chief financial officer have concluded that our disclosure controls and procedures were effective at a reasonable assurance level as of June 30, 2023.
Report of Management on Internal Control Over Financial Reporting
Pursuant to Section 404 of the Sarbanes-Oxley Act of 2002, the Company included a report of management's assessment of the effectiveness of its internal control over financial reporting as part of this Annual Report on Form 10-K for the fiscal year ended June 30, 2023. Management's report is included in the Company's 2023 Financial Statements under the captions entitled “Report of Management on Internal Control Over Financial Reporting” and is incorporated herein by reference.
Report of Independent Registered Public Accounting Firm
KPMG LLP, the independent registered public accounting firm that audited the fiscal year 2023 consolidated financial statements included in this Annual Report on Form 10-K, has issued an attestation report on the effectiveness of our internal control over financial reporting as of June 30, 2023, which is included herein.
Changes in Internal Control Over Financial Reporting
There have been no changes in our internal control over financial reporting during the fourth quarter ended June 30, 2023 that have materially affected, or are reasonably likely to materially affect, our internal control over financial reporting.
Item 9B. Other Information
None.
Item 9C. Disclosure Regarding Foreign Jurisdictions That Prevent Inspections
Not applicable.
PART III.
Item 10. Directors, Executive Officers and Corporate Governance
The Company has adopted a Code of Business Conduct applicable to our employees, directors, and officers and a Code of Ethics. This Code of Ethics is applicable to our principal executive officer, principal financial officer, principal accounting officer and controller, or persons performing similar functions. The codes are available on the Company’s website at www.malibuboatsinc.com. To the extent required by rules adopted by the SEC and Nasdaq, we intend to promptly disclose future amendments to certain provisions of the codes or waivers of such provisions granted to executive officers and directors on our website at www.malibuboatsinc.com.
The remaining information required by this Item 10 will be included the Proxy Statement and is incorporated herein by reference.
Item 11. Executive Compensation
The information required by this Item 11 will be included in the Proxy Statement and is incorporated herein by reference.
Item 12. Security Ownership of Certain Beneficial Owners and Management and Related Stockholder Matters
The information required by this Item 12 will be included in the Proxy Statement and is incorporated herein by reference.
Item 13. Certain Relationships and Related Transactions, and Director Independence
The information required by this Item 13 will be included in the Proxy Statement and is incorporated herein by reference.
Item 14. Principal Accountant Fees and Services
Our independent registered public accounting firm is KPMG LLP, Knoxville, TN, Auditor Firm ID: 185.
The information required by this Item 14 will be included in the Proxy Statement and is incorporated herein by reference.
PART IV.
Item 15. Exhibits, Financial Statement Schedules
The following documents are filed as part of this Annual Report on Form 10-K:
1. Consolidated Financial Statements
The following financial statements are included in Part II, Item 8 of this Annual Report on Form 10-K:
•Consolidated Statements of Operations and Comprehensive Income for the fiscal years ended June 30, 2023, 2022, and 2021.
•Consolidated Balance Sheets as of June 30, 2023 and 2022.
•Consolidated Statements of Stockholders’ Equity for the fiscal years ended June 30, 2023, 2022, and 2021.
•Consolidated Statements of Cash Flows for the fiscal years ended June 30, 2023, 2022, and 2021.
•Notes to Consolidated Financial Statements.
•Reports of Independent Registered Public Accounting Firm.
2. Financial Statement Schedules
Separate financial statement schedules have been omitted because such information is inapplicable or is included in the financial statements or notes described above.
3. Exhibits
The exhibits filed as part of this Annual Report are listed in the exhibit index immediately preceding such exhibits, which exhibit index is incorporated herein by reference.
| | | | | | | | |
| Exhibit No. | | Description |
| | Stock Purchase Agreement dated December 31, 2020 among Malibu Boats, LLC, MBG Holdco, Inc., Maverick Boat Group, Inc., and the other parties named therein. 10 |
| | Certificate of Incorporation of Malibu Boats, Inc. 2 |
| | Bylaws of Malibu Boats, Inc. 13 |
| | Certificate of Formation of Malibu Boats Holdings, LLC 2 |
| | First Amended and Restated Limited Liability Company Agreement of Malibu Boats Holdings, LLC, dated as of February 5, 2014 3 |
| | First Amendment, dated as of February 5, 2014, to First Amended and Restated Limited Liability Company Agreement of Malibu Boats Holdings, LLC 4 |
| | Second Amendment, dated as of June 27, 2014, to First Amended and Restated Limited Liability Company Agreement of Malibu Boats Holdings, LLC 5 |
| | Description of Class A Common Stock 11 |
| | Form of Class A Common Stock Certificate 2 |
| | Form of Class B Common Stock Certificate 2 |
| | Exchange Agreement, dated as of February 5, 2014, by and among Malibu Boats, Inc. and Affiliates of Black Canyon Capital LLC and Horizon Holdings, LLC 3 |
| | Exchange Agreement, dated as of February 5, 2014, by and among Malibu Boats, Inc. and the Members of Malibu Boats Holdings, LLC 3 |
| | Tax Receivable Agreement, dated as of February 5, 2014, by and among Malibu Boats, Inc., Malibu Boats Holdings, LLC and the Other Members of Malibu Boats Holdings, LLC 3 |
| | Third Amended and Restated Credit Agreement, dated July 8, 2022, by and among Malibu Boats, LLC, Malibu Boats Holdings, LLC, the other guarantors party thereto, the lenders party thereto, and Truist Bank, as administrative agent, as issuing bank and as swingline lender 1 |
| | Third Amended and Restated Security Agreement, dated July 8, 2022, by and among Malibu Boats, LLC, Malibu Boats Holdings, LLC, the other debtors party thereto, and Truist Bank, as administrative agent 1 |
| | | | | | | | |
| | Employment Agreement by and between Malibu Boats, Inc. and Ritchie Anderson, dated February 5, 2014 3 |
| | Employment Agreement by and between Malibu Boats, Inc. and Jack Springer, dated February 5, 2014 3 |
| | Employment Agreement by and between Malibu Boats, Inc. and Wayne Wilson, dated February 5, 2014 3 |
| | Long-Term Incentive Plan 2 |
| | Amendment Number One, dated as of June 24, 2014, to the Long Term Incentive Plan 5 |
| | Form of Stock Option Agreement for Long-Term Incentive Plan 8 |
| | Form of Restricted Stock Agreement for Long-Term Incentive Plan 8 |
| | Form of Restricted Stock Unit Award Agreement for Long-Term Incentive Plan (executive) 8 |
| | Form of Restricted Stock Unit Award Agreement for Long-Term Incentive Plan (non-executive) 8 |
| | Form of Indemnification Agreement 6 |
| | Director Compensation Policy 12 |
| | Form of Time and Performance Based Restricted Stock Award Agreement (executive) 9 |
| | Purchase and Sale Agreement, dated March 28, 2023 14 |
| | Confidential General Release and Settlement Agreement, dated June 30, 2023, by and among the Batchelder Plaintiffs, Malibu Boats, Inc. and Malibu Boats, LLC 15 |
| | Subsidiaries of Malibu Boats, Inc. |
| | Consent of KPMG LLP, independent registered public accounting firm for Malibu Boats, Inc. |
| | Certificate of the Chief Executive Officer of Malibu Boats, Inc. pursuant to Rule 13a-14 or 15d-14 of the Securities Exchange Act of 1934, as amended, as adopted pursuant to Section 302 of the Sarbanes-Oxley Act of 2002 |
| | Certificate of the Interim Chief Financial Officer of Malibu Boats, Inc. pursuant to Rule 13a-14 or 15d-14 of the Securities Exchange Act of 1934, as amended, as adopted pursuant to Section 302 of the Sarbanes-Oxley Act of 2002 |
| | Certification of the Chief Executive Officer and Interim Chief Financial Officer of Malibu Boats, Inc. pursuant to 18 U.S.C. Section 1350, as adopted pursuant to Section 906 of the Sarbanes-Oxley Act of 2002 |
| 101 | | The following financial statements from the Company’s Annual Report on Form 10-K for the fiscal year ended June 30, 2023 were formatted in Inline XBRL: (i) Consolidated Statements of Operations and Comprehensive Income, (ii) Consolidated Balance Sheets, (iii) Consolidated Statements of Stockholders’ Equity, (iv) Consolidated Statements of Cash Flows, and (v) the Notes to Consolidated Financial Statements, tagged as blocks of text and including detailed tags. |
| 104 | | The cover page from the Company’s Annual Report on Form 10-K for the fiscal year ended June 30, 2023, formatted in Inline XBRL (Included as Exhibit 101). |
* Management contract or compensatory plan or arrangement.
+ Portions of this exhibit have been omitted pursuant to a confidential treatment request. Omitted information has been filed separately with the SEC.
(1) Filed as an exhibit to the Company's Current Report on Form 8-K (File No. 001-36290) filed on July 12, 2022.
(2) Filed as an exhibit to Amendment No. 1 to the Company’s registration statement on Form S-1 (Registration No. 333-192862) filed on January 8, 2014.
(3) Filed as an exhibit to the Company’s Current Report on Form 8-K (File No. 001-36290) filed on February 6, 2014.
(4) Filed as an exhibit to the Company's Quarterly Report on Form 10-Q/A (File No. 001-36290) filed on May 13, 2014.
(5) Filed as an exhibit to the Company's Current Report on Form 8-K (File No. 001-36290) filed on June 27, 2014.
(6) Filed as an exhibit to the Company’s registration statement on Form S-1 (File No. 333-192862) filed on December 13, 2013.
(7) Filed as an exhibit to the Company’s Quarterly Report on Form 10-Q (File No. 001-36290) filed on February 1, 2017.
(8) Filed as an exhibit to the Company's Annual Report on Form 10-K (File No. 001-36290) filed on September 8, 2017.
(9) Filed as an exhibit to the Company’s Quarterly Report on Form 10-Q (File No. 001-36290) filed on February 6, 2020.
(10) Filed as an exhibit to the Company’s Current Report on Form 8-K (File No. 001-36290) filed on January 5, 2021.
(11) Filed as an exhibit to the Company's Annual Report on Form 10-K (File No. 001-36290) filed on August 26, 2021.
(12) Filed as an exhibit to the Company's Annual Report on Form 10-K (File No. 001-36290) filed on August 25, 2022.
(13) Filed as an exhibit to the Company's Quarterly Report on Form 10-Q (File No. 001-36290) filed on February 7, 2023.
(14) Filed as an exhibit to the Company's Current Report on Form 8-K (File No. 001-36290) filed on April 3, 2023.
(15) Filed as an exhibit to the Company's Current Report on Form 8-K (File No. 001-36290) filed on July 3, 2023.
Item 16. Form 10-K Summary
None.
SIGNATURE
Pursuant to the requirements of the Securities Exchange Act of 1934, the registrant has duly caused this report to be signed on its behalf by the undersigned thereunto duly authorized.
| | | | | |
| MALIBU BOATS, INC. |
| |
| August 29, 2023 | /s/ Jack D. Springer |
| Jack D. Springer |
| Chief Executive Officer (Principal Executive Officer) |
| |
| August 29, 2023 | /s/ David S. Black |
| David S. Black |
| Interim Chief Financial Officer (Principal Financial and Accounting Officer) |
Pursuant to the requirements of the Securities Exchange Act of 1934, this report has been signed below by the following persons on behalf of the registrant and in the capacities and on the dates indicated:
| | | | | | | | | | | | | | |
| Signature | | Title | | Date |
| | | | |
| /s/ Jack D. Springer | | | | August 29, 2023 |
Jack D. Springer | | Chief Executive Officer and Director (Principal Executive Officer) | | |
/s/ David S. Black | | | | August 29, 2023 |
David S. Black | | Interim Chief Financial Officer
(Principal Financial and Accounting Officer) | | |
/s/ Michael K. Hooks | | | | August 29, 2023 |
Michael K. Hooks | | Chairman of the Board and Director | | |
/s/ James R. Buch | | | | August 29, 2023 |
James R. Buch | | Director | | |
/s/ Ivar S. Chhina | | | | August 29, 2023 |
Ivar S. Chhina | | Director | | |
/s/ Michael J. Connolly | | | | August 29, 2023 |
Michael J. Connolly | | Director | | |
/s/ Mark W. Lanigan | | | | August 29, 2023 |
Mark W. Lanigan | | Director | | |
/s/ Joan M. Lewis | | | | August 29, 2023 |
Joan M. Lewis | | Director | | |
/s/ Peter E. Murphy | | | | August 29, 2023 |
Peter E. Murphy | | Director | | |
/s/ John E. Stokely | | | | August 29, 2023 |
John E. Stokely
| | Director | | |
| /s/ Nancy M. Taylor | | | | August 29, 2023 |
Nancy M. Taylor
| | Director | | |