U. S. Securities and Exchange Commission
Washington, D. C. 20549
FORM 10-Q
|
|
[X] QUARTERLY REPORT UNDER SECTION 13 OR 15(d) OF THE SECURITIES EXCHANGE ACT OF 1934
|
|
|
For the quarterly period ended September 30, 2016
|
|
|
[ ] TRANSITION REPORT UNDER SECTION 13 OR 15(d) OF THE SECURITIES EXCHANGE ACT OF 1934
|
| For the transition period from _____ to _____ |
Commission File No. 333-191063
|
|
|
|
WINHA INTERNATIONAL GROUP LIMITED
(Name of Registrant in its Charter)
|
|
|
Nevada
|
47-2450462
|
|
(State of Other Jurisdiction of incorporation or organization)
|
(I.R.S. Employer I.D. No.)
|
|
|
|
|
3rd Floor, No. 19 Changyi Road, Changmingshui Village
Wuguishan Town, Zhongshan City, P.R. China 528458
|
|
|
(Address of Principal Executive Offices)
|
|
Issuer's Telephone Number: 86-760-8896-3655
|
Yile Center, 5 Xinzhong Avenue, Suite 918
Shiqi District, Zhongshan, P.R. China 528400
|
|
(Former Address, if Changed Since Last Report)
|
Indicate by check mark whether the Registrant (1) has filed all reports required to be filed by Sections 13 or 15(d) of the Securities Exchange Act of 1934 during the preceding 12 months (or for such shorter period that the Registrant was required to file such reports), and (2) has been subject to such filing requirements for the past 90 days. Yes ☒ No ☐
Indicate by check mark whether the registrant has submitted electronically and posted on its corporate Web site, if any, every Interactive Data File required to be submitted and posted pursuant to Rule 405 of Regulation S-T (§232.405 of this chapter) during the preceding 12 months (or for such shorter period that the registrant was required to submit and post such files.) Yes ☒ No ☐
Indicate by check mark whether the registrant is a shell company (as defined in Rule 12b-2 of the Exchange Act) Yes ☐ No ☒
Indicate by check mark whether the registrant is a large accelerated filer, an accelerated filer, a non-accelerated filer, or a smaller reporting company. See the definitions of "large accelerated filer," "accelerated filer" and "smaller reporting company" in Rule 12b-2 of the Exchange Act. (Check One)
|
Large accelerated filer ☐
|
Accelerated filer ☐
|
Non-accelerated filer☐
|
Smaller reporting company ☒
|
APPLICABLE ONLY TO CORPORATE ISSUERS: Indicate the number of shares outstanding of each of the Registrant's classes of common stock, as of the latest practicable date:
November 21, 2016
Common Voting Stock: 49,989,500
WINHA INTERNATIONAL GROUP LIMITED
QUARTERLY REPORT ON FORM 10-Q
FOR THE FISCAL QUARTER ENDED SEPTEMBER 30, 2016
TABLE OF CONTENTS
|
|
Page No
|
|
|
Part I
|
Financial Information
|
|
|
Item 1.
|
Financial Statements (unaudited):
|
|
|
Consolidated Balance Sheets (Unaudited) – September 30, 2016 and March 31, 2016
|
1
|
|
|
Consolidated Statements of Income and Other Comprehensive Income (Unaudited) - for the Three and Six Months Ended September 30, 2016 and 2015
|
3
|
|
|
Consolidated Statement of Changes in Stockholders Equity (Unaudited) for the Six Months Ended September 30, 2016
|
5
|
|
|
Consolidated Statements of Cash Flows (Unaudited) – for the Six Months Ended September 30, 2016 and 2015
|
6
|
|
|
Notes to Consolidated Financial Statements (Unaudited)
|
8
|
|
|
Item 2.
|
Management's Discussion and Analysis of Financial Condition and Results of Operations
|
35
|
|
Item 3
|
Quantitative and Qualitative Disclosures about Market Risk
|
41
|
|
Item 4.
|
Controls and Procedures
|
41
|
|
Part II
|
Other Information
|
|
|
Item 1.
|
Legal Proceedings
|
42
|
|
Items 1A.
|
Risk Factors
|
42
|
|
Item 2.
|
Unregistered Sales of Equity Securities and Use of Proceeds
|
42
|
|
Item 3.
|
Defaults upon Senior Securities
|
42
|
|
Item 4.
|
Mine Safety Disclosures
|
43
|
|
Item 5.
|
Other Information
|
43
|
|
Item 6.
|
Exhibits
|
43
|
|
Signatures
|
44
|
WINHA INTERNATIONAL GROUP LIMITED AND SUBSIDIARIES
CONSOLIDATED BALANCE SHEETS (IN U.S. $)
|
ASSETS
|
September 30,
2016
|
March 31,
2016
|
||||||
|
(Unaudited)
|
||||||||
|
Current assets:
|
||||||||
|
Cash and cash equivalents
|
$
|
6,563,778
|
$
|
21,548,630
|
||||
|
Accounts receivable
|
3,878,510
|
1,417,860
|
||||||
|
Inventories
|
581,307
|
1,523,959
|
||||||
|
Advances to suppliers
|
81,282
|
151,230
|
||||||
|
Prepaid expenses
|
2,705,771
|
174,010
|
||||||
|
Deferred tax assets
|
6,541
|
32,810
|
||||||
|
Total current assets
|
13,817,189
|
24,848,499
|
||||||
|
Property, plant and equipment, net
|
11,844,443
|
1,847,977
|
||||||
|
Website - net
|
-
|
45,676
|
||||||
|
Prepaid expenses - noncurrent
|
2,993,597
|
-
|
||||||
|
Deferred registration costs
|
-
|
212,312
|
||||||
|
TOTAL ASSETS
|
$
|
28,655,229
|
$
|
26,954,464
|
||||
See accompanying notes to the consolidated financial statements.
1
WINHA INTERNATIONAL GROUP LIMITED AND SUBSIDIARIES
CONSOLIDATED BALANCE SHEETS (IN U.S. $) (CONTINUED)
|
LIABILITIES AND STOCKHOLDERS' EQUITY
|
September 30,
2016
|
March 31,
2016
|
||||||
|
(Unaudited)
|
||||||||
|
Current liabilities:
|
||||||||
|
Accounts payable
|
$
|
200,758
|
$
|
208,866
|
||||
|
Convertible debt
|
-
|
5,435,466
|
||||||
|
Advances from customers
|
30,632
|
769,814
|
||||||
|
Taxes payable
|
1,641,182
|
1,683,909
|
||||||
|
Accrued expenses
|
141,511
|
246,387
|
||||||
|
Loan from stockholder
|
907,804
|
477,199
|
||||||
|
Total current liabilities
|
2,921,887
|
8,821,641
|
||||||
|
Stockholders' equity:
|
||||||||
|
Common stock, $0.001 par value per share, 200,000,000 shares authorized; 49,989,500 shares issued and outstanding as of September 30, 2016 and March 31, 2016
|
49,990
|
49,990
|
||||||
|
Additional paid-in capital
|
21,626,775
|
21,626,775
|
||||||
|
Statutory reserve
|
803,908
|
497,443
|
||||||
|
Accumulated (deficit)
|
(6,420,927
|
)
|
(11,096,421
|
)
|
||||
|
Other comprehensive (loss)
|
(652,232
|
)
|
(230,584
|
)
|
||||
|
Sub-total
|
15,407,514
|
10,847,203
|
||||||
|
Noncontrolling interests
|
10,325,828
|
7,285,620
|
||||||
|
Total stockholders' equity
|
25,733,342
|
18,132,823
|
||||||
|
TOTAL LIABILITIES AND STOCKHOLDERS' EQUITY
|
$
|
28,655,229
|
$
|
26,954,464
|
See accompanying notes to the consolidated financial statements.
|
Three Months Ended
September 30,
|
Six Months Ended
September 30,
|
|||||||||||||||
|
|
2016
|
2015
|
2016
|
2015
|
||||||||||||
|
Revenues
|
$
|
14,866,148
|
$
|
9,756,224
|
$
|
28,783,982
|
$
|
15,397,117
|
||||||||
|
Cost of revenues
|
8,570,699
|
4,124,953
|
14,993,435
|
7,137,807
|
||||||||||||
|
Gross profit
|
6,295,449
|
5,631,271
|
13,790,547
|
8,259,310
|
||||||||||||
|
Operating expenses:
|
||||||||||||||||
|
Selling and marketing
|
431,058
|
214,027
|
991,670
|
413,735
|
||||||||||||
|
General and administrative
|
557,733
|
263,179
|
1,080,076
|
621,417
|
||||||||||||
|
Financial expenses
|
6,689
|
6,558
|
16,232
|
7,108
|
||||||||||||
|
Total operating expenses
|
995,480
|
483,764
|
2,087,978
|
1,042,260
|
||||||||||||
|
Income from operations
|
5,299,969
|
5,147,507
|
11,702,569
|
7,217,050
|
||||||||||||
|
Other non-operating income
|
975
|
-
|
5,057
|
1,085
|
||||||||||||
|
Other non-operating (expenses)
|
(456,365
|
)
|
(328
|
)
|
(456,365
|
)
|
-
|
|||||||||
|
Total non-operating (expense) income
|
(455,390
|
)
|
(328
|
)
|
(451,308
|
)
|
1,085
|
|||||||||
|
Income before provision for income taxes
|
4,844,579
|
5,147,179
|
11,251,261
|
7,218,135
|
||||||||||||
|
Provision for income taxes
|
1,416,852
|
1,261,690
|
2,947,995
|
1,817,227
|
||||||||||||
See accompanying notes to the consolidated financial statements.
|
Three Months Ended
September 30,
|
Six Months Ended
September 30,
|
|||||||||||||||
|
|
2016
|
2015
|
2016
|
2015
|
||||||||||||
|
Net income before noncontrolling interest
|
3,427,727
|
3,885,489
|
8,303,266
|
5,400,908
|
||||||||||||
|
Noncontrolling interest
|
1,371,091
|
-
|
3,321,307
|
-
|
||||||||||||
|
Net income attributable to common stockholders
|
$
|
2,056,636
|
$
|
3,885,489
|
$
|
4,981,959
|
$
|
5,400,908
|
||||||||
|
Earnings per common share, basic and diluted
|
$
|
0.04
|
$
|
0.08
|
$
|
0.10
|
$
|
0.11
|
||||||||
|
Weighted average shares outstanding, basic and diluted
|
49,989,500
|
49,989,500
|
49,989,500
|
49,989,500
|
||||||||||||
|
Other Comprehensive income:
|
||||||||||||||||
|
Net income
|
$
|
3,427,727
|
$
|
3,885,489
|
$
|
8,303,266
|
$
|
5,400,908
|
||||||||
|
Foreign currency translation adjustment
|
(76,011
|
)
|
(346,926
|
)
|
(702,747
|
)
|
(246,844
|
)
|
||||||||
|
Comprehensive income
|
3,351,716
|
3,538,563
|
7,600,519
|
5,154,064
|
||||||||||||
|
Comprehensive income attributable to noncontrolling
|
||||||||||||||||
|
Interest
|
1,340,403
|
-
|
3,040,207
|
-
|
||||||||||||
|
Comprehensive income attributable to commonstockholders
|
$
|
2,011,313
|
$
|
3,538,563
|
$
|
4,560,312
|
$
|
5,154,064
|
||||||||
See accompanying notes to the consolidated financial statements.
CONSOLIDATED STATEMENTS OF CHANGES IN STOCKHOLDERS' EQUITY
FOR THE SIX MONTHS ENDED SEPTEMBER 30, 2016 (IN U.S. $)
|
Common
Stock
|
Additional
Paid-in
Capital
|
Accumulated
(Deficit)
|
Other
Comprehensive Income
(Loss)
|
Statutory
Reserve
Fund
|
Non-
controlling
Interests
|
Total
|
||||||||||||||||||||||
|
Balance, March 31, 2016
|
$
|
49,990
|
$
|
21,626,775
|
$
|
(11,096,421
|
)
|
$
|
(230,584
|
)
|
$
|
497,443
|
$
|
7,285,620
|
$
|
18,132,823
|
||||||||||||
|
Net income
|
-
|
-
|
4,981,959
|
-
|
-
|
3,321,307
|
8,303,266
|
|||||||||||||||||||||
|
Appropriation of statutory reserve
|
-
|
-
|
(306,465
|
)
|
-
|
306,465
|
-
|
-
|
||||||||||||||||||||
|
Other comprehensive (loss)
|
-
|
-
|
-
|
(421,648
|
)
|
-
|
(281,099
|
)
|
(702,747
|
)
|
||||||||||||||||||
|
Balance, September 30, 2016
|
$
|
49,990
|
$
|
21,626,775
|
$
|
(6,420,927
|
)
|
$
|
(652,232
|
)
|
$
|
803,908
|
$
|
10,325,828
|
$
|
25,733,342
|
||||||||||||
See accompanying notes to the consolidated financial statements
|
Six Months Ended
September 30,
|
||||||||
|
2016
|
2015
|
|||||||
|
Cash flows from operating activities:
|
||||||||
|
Net income
|
$
|
8,303,266
|
$
|
5,400,908
|
||||
|
Adjustments to reconcile net income to net cash provided by operating activities:
|
||||||||
|
Write off deferred registration costs
|
212,312
|
- | ||||||
|
Write off the website
|
46,167
|
-
|
||||||
|
Decrease in deferred tax assets
|
26,552
|
-
|
||||||
|
Depreciation and amortization
|
231,303
|
73,809
|
||||||
|
Changes in operating assets and liabilities:
|
||||||||
|
(Increase) in accounts receivable
|
(2,460,650
|
)
|
(56,176
|
)
|
||||
|
Decrease in inventories
|
942,652
|
830,599
|
||||||
|
Decrease in advances to suppliers
|
69,948
|
72,016
|
||||||
|
(Increase) decrease in prepaid expenses
|
(5,525,358
|
)
|
71,420
|
|||||
|
(Decrease) increase in accounts payable
|
(8,108
|
)
|
84,663
|
|||||
|
(Decrease) in advances from customers
|
(739,182
|
)
|
(168,799
|
)
|
||||
|
(Decrease) increase in taxes payable
|
(42,727
|
)
|
1,222,709
|
|||||
|
(Decrease) increase in accrued expenses
|
(104,875
|
)
|
4,350
|
|||||
|
Net cash provided by operating activities
|
951,300
|
7,535,499
|
||||||
|
Cash flows from investing activities:
|
||||||||
|
Payments for website expansion
|
-
|
(9,827
|
)
|
|||||
|
Purchase of fixed assets
|
(10,397,016
|
)
|
(326,482
|
)
|
||||
|
Net cash (used in) investing activities
|
(10,397,016
|
)
|
(336,309
|
)
|
||||
See accompanying notes to the consolidated financial statements.
CONSOLIDATED STATEMENTS OF CASH FLOWS
FOR THE SIX MONTHS ENDED SEPTEMBER 30, 2016 AND 2015 (IN U.S. $) (UNAUDITED) (CONTINUED)
|
Six Months Ended
September 30,
|
||||||||
|
2016
|
2015
|
|||||||
|
Cash flows from financing activities:
|
||||||||
|
Additional capital contribution
|
-
|
816,001
|
||||||
|
Proceeds from redeemable convertible notes
|
-
|
564,200
|
||||||
|
Repayment of redeemable convertible notes
|
(5,435,466
|
)
|
-
|
|||||
|
Proceeds from stockholder loan-net
|
370,605
|
26,345
|
||||||
|
Net cash (used in) provided by financing activities
|
(5,064,861
|
)
|
1,406,546
|
|||||
|
Effect of exchange rate changes on cash
|
(474,275
|
)
|
(240,257
|
)
|
||||
|
Net change in cash
|
(14,984,852
|
)
|
8,365,479
|
|||||
|
Cash, beginning of period
|
21,548,630
|
1,103,726
|
||||||
|
Cash, end of period
|
$
|
6,563,778
|
$
|
9,469,205
|
||||
|
Supplemental disclosure of cash flow information:
|
||||||||
|
Cash paid for interest
|
$
|
191,844
|
$
|
-
|
||||
|
Cash paid for income taxes
|
$
|
2,921,604
|
$
|
558,410
|
||||
|
Noncash financing activities:
|
||||||||
|
Payment of accrued expenses and other payables by shareholder in the form of a loan
|
$
|
60,000
|
$
|
26,345
|
||||
See accompanying notes to the consolidated financial statements.
7
NOTES TO THE CONSOLIDATED FINANCIAL STATEMENTS
FOR THE THREE AND SIX MONTHS ENDED SEPTEMBER 30, 2016 AND 2015
(IN U.S. $) (UNAUDITED)
1. ORGANIZATION AND BUSINESS
Winha International Group Limited ("Winha International") was incorporated in Nevada on April 15, 2013. The subsidiaries of the Company and their principal activities are described as follows
Winha International and its subsidiaries are collectively referred to as the "Company". The Company retails local specialty products through its seven self-operated physical stores. The store are supplemented by two restaurants, the first of which the Company opened in April 2015. In addition, the Company has granted 44 franchises to use the Company's tradename, store style and its other resources. The Company plans to open additional restaurants and add additional franchisees during fiscal 2017. During the three months ended September 30, 2016, the Company entered into agreements with six individials to assume the operations of six of its retail stores located in Sanshui, Shunde, Chancheng, Xiaolan, Dongguan and Guangzhou. The stores continue to operate under the Company's trade name. The Company derives revenues from wholesaling its products to these six stores.
Until November 27, 2015, the Company operated its business through a variable interest entity, Zhongshan Winha Electronic Commerce Company Limited ("Zhongshan Winha"), which has two wholly owned limited liability subsidiaries, Zhongshan Supermarket Limited ("Zhongshan Supermarket") and Zhongshan Winha Catering Management Co., Ltd. ("Winha Catering"), as well as three incorporated branches. The Company had the controlling interest in Zhongshan Winha via its wholly owned subsidiary Shenzhen Winha Information Technologies Company Ltd. ("Shenzhen Winha") through a series of contractual arrangements. On November 27, 2015, the shareholders of Zhongshan Winha transferred their stock to Shenzhen Winha upon the exercise of its option to purchase all of the registered equity. The purchase price was Renminbi (RMB) 1, approximately US $0.16. Zhongshan Winha, therefore, is now a wholly owned subsidiary of Shenzhen Winha.
In May 2015, C&V International Company Limited ("C&V"), a wholly owned subsidiary of Winha International, set up a wholly owned subsidiary, Australia Winha Commerce and Trade Limited ("Australian Winha"). In February 2016, Sanmei International Investment Co., Ltd ("Sanmei Investment"), a company incorporated in Anguilla on April 23, 2013, transferred 100% of its shares to Winha International. Subsequently, Winha International transferred the shares of C&V to Sanmei Investment, and C&V transferred the shares of Australian Winha to Sanmei Investment.
8
NOTES TO THE CONSOLIDATED FINANCIAL STATEMENTS
FOR THE THREE AND SIX MONTHS ENDED SEPTEMBER 30, 2016 AND 2015
(IN U.S. $) (UNAUDITED)
1. ORGANIZATION AND BUSINESS ORGANIZATION AND BUSINESS (CONTINUED)
In March 2016, 40% of the 72,000,000 shares of Australian Winha were transferred from the sole shareholder of Sanmei Investment to the following individuals and entities, which have direct or indirect relationships with the major shareholder or are consultants of the Company:
|
Percentage
of
Shares
|
Shares
issued
|
|||||||
|
Zhuowei Zhong
|
7
|
%
|
5,040,000
|
|||||
|
Beijing Ruihua Future Investment Management Co. Ltd.
|
5
|
%
|
3,600,000
|
|||||
|
Donghe Group Limited
|
5
|
%
|
3,600,000
|
|||||
|
Xinxi Zhong.
|
5
|
%
|
3,600,000
|
|||||
|
Zhifei Huang
|
4
|
%
|
2,880,000
|
|||||
|
Chun Yan Winne Lam
|
3
|
%
|
2,160,000
|
|||||
|
Sub Total
|
29
|
%
|
20,880,000
|
|||||
|
Individual Suppliers
|
11
|
%
|
7,920,000
|
|||||
|
Total
|
40
|
%
|
28,800,000
|
|||||
The effect of this transaction was to reduce the interest of the Company in its Australian subsidiary by 40%. The Company used the Australian Winha offering price for its initial public offering in Australia to approximate the fair value of the 40% stock issued. The Company recognized stock compensation expense of $21,882,816 during the year ended March 31, 2016.
9
NOTES TO THE CONSOLIDATED FINANCIAL STATEMENTS
FOR THE THREE AND SIX MONTHS ENDED SEPTEMBER 30, 2016 AND 2015
(IN U.S. $) (UNAUDITED)
| 1. |
ORGANIZATION AND BUSINESS (CONTINUED)
|
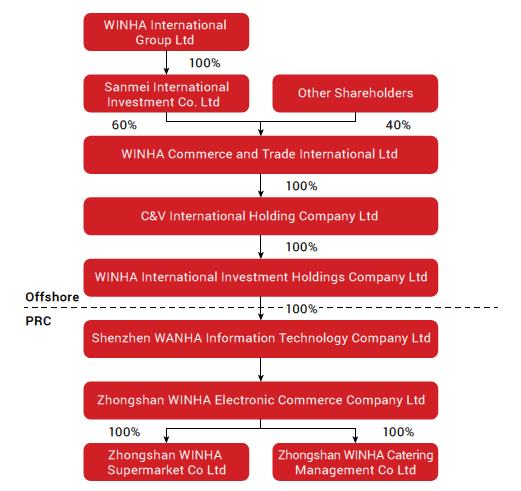
The following chart illustrates the Company's current corporate structure.
10
NOTES TO THE CONSOLIDATED FINANCIAL STATEMENTS
FOR THE THREE AND SIX MONTHS ENDED SEPTEMBER 30, 2016 AND 2015
(IN U.S. $) (UNAUDITED)
2. SUMMARY OF SIGNIFICANT ACCOUNTING POLICIES
Basis of Accounting and Presentation
The accompanying consolidated financial statements of the Company have been prepared on the accrual basis.
Until November 27, 2015, the consolidated financial statements include the accounts of the Company, its wholly owned subsidiaries and Zhongshan Winha, its VIE, for which it was deemed the primary beneficiary. On November 27, 2015, the VIE structure was terminated upon Shenzhen Winha exercising its option to purchase all of the registered equity of Zhongshan Winha. Shenzhen Winha became the sole owner of Zhongshan Winha. All significant inter-company accounts and transactions have been eliminated in consolidation.
All consolidated financial statements and notes to the consolidated financial statements are presented in United States dollars ("US Dollar" or "US$" or "$").
Foreign Currency Translation
Almost all Company assets and operations are located in the PRC. The functional currency for the majority of the Company's operations is the Renminbi ("RMB"). For Winha International Investment Holdings Company, the functional currency is the Hong Kong Dollar ("HKD"). For Australian Winha, the functional currency is the Australian Dollar ("AUD"). The Company uses the United States Dollar ("US Dollar" or "US$" or "$") for financial reporting purposes. The financial statements of the Company have been translated into US dollars in accordance with Financial Accounting Standards Board ("FASB") Accounting Standards Codification ("ASC") 830, Foreign Currency Matters.
All asset and liability accounts have been translated using the exchange rate in effect at the balance sheet date. Equity accounts have been translated at their historical exchange rates when the capital transactions occurred. Statements of operations, changes in stockholders' equity and cash flow amounts have been translated using the average exchange rate for the periods presented. Adjustments resulting from the translation of the Company's financial statements are recorded as other comprehensive income (loss).
2. SUMMARY OF SIGNIFICANT ACCOUNTING POLICIES (CONTINUED)
Foreign Currency Translation (continued)
The exchange rates used to translate amounts in RMB into US dollars for the purposes of preparing the financial statements are as follows:
|
September 30,
2016
|
March 31,
2016
|
|||||||
|
Balance sheet items, except for stockholders' equity, as of period end
|
$
|
0.1499
|
$
|
0.1550
|
||||
|
For the three months ended
September 30,
|
||||||||
|
2016
|
2015
|
|||||||
|
Amounts included in the statements of operations and changes in stockholders' equity
|
$
|
0.1500
|
$
|
0.1593
|
||||
|
For the six months ended
September 30,
|
||||||||
|
2016
|
2015
|
|||||||
|
Amounts included in the statements of operations and changes in stockholders' equity
|
$
|
0.1515
|
$
|
0.1612
|
||||
12
NOTES TO THE CONSOLIDATED FINANCIAL STATEMENTS
FOR THE THREE AND SIX MONTHS ENDED SEPTEMBER 30, 2016 AND 2015
(IN U.S. $) (UNAUDITED)
2. SUMMARY OF SIGNIFICANT ACCOUNTING POLICIES (CONTINUED)
Foreign Currency Translation (continued)
The exchange rates used to translate amounts in AUD into US dollars for the purposes of preparing the consolidated financial statements are as follows:
|
September 30,
2016
|
March 31,
2016
|
|||||||
|
Balance sheet items, except for stockholders' equity, as of period end
|
$
|
0.7634
|
$
|
0.7668
|
||||
|
For the three months ended
September 30,
|
||||||||
|
2016
|
2015
|
|||||||
|
Amounts included in the statements of operations and changes in stockholders' equity
|
$
|
0.7577
|
N/A
|
|||||
|
For the six months ended
September 30,
|
||||||||
|
2016
|
2015
|
|||||||
|
Amounts included in the statements of operations and changes in stockholders' equity
|
$
|
0.7517
|
N/A
|
|||||
2. SUMMARY OF SIGNIFICANT ACCOUNTING POLICIES (CONTINUED)
Foreign Currency Translation (continued)
For the three and six months ended September 30, 2016 and 2015, foreign currency translation adjustments of $(79,829) and $(346,926), respectively, $(706,565) and $(246,844), respectively have been reported as other comprehensive (loss) income. Other comprehensive (loss) income of the Company consists entirely of foreign currency translation adjustments. Pursuant to ASC 740-30-25-17, "Exceptions to Comprehensive Recognition of Deferred Income Taxes", the Company does not recognize deferred U.S. taxes related to the undistributed earnings of its foreign subsidiaries and, accordingly, recognizes no income tax expense or benefit from foreign currency translation adjustments.
Although government regulations now allow convertibility of the RMB for current account transactions, significant restrictions still remain. Hence, such translations should not be construed as representations that the RMB could be converted into US dollars at that rate or any other rate.
The value of the RMB against the US dollar and other currencies may fluctuate and is affected by, among other things, changes in the PRC's political and economic conditions. Any significant revaluation of the RMB may materially affect the Company's financial condition in terms of US dollar reporting. The PRC has devalued the RMB by approximately 2.9 % subsequent to March 31, 2016. Further devaluations could occur in the future.
Vulnerability Due To Operations in PRC
The Company's operations may be adversely affected by significant political, economic and social uncertainties in the PRC. Although the PRC government has been pursuing economic reform policies for more than twenty years, no assurance can be given that the PRC government will continue to pursue such policies or that such policies may not be significantly altered, especially in the event of a change in leadership, social or political disruption or unforeseen circumstances affecting the PRC's political, economic and social conditions. There is also no guarantee that the PRC government's pursuit of economic reforms will be consistent, effective or will continue.
14
NOTES TO THE CONSOLIDATED FINANCIAL STATEMENTS
FOR THE THREE AND SIX MONTHS ENDED SEPTEMBER 30, 2016 AND 2015
(IN U.S. $) (UNAUDITED)
2. SUMMARY OF SIGNIFICANT ACCOUNTING POLICIES (CONTINUED)
Use of Estimates
The preparation of financial statements in conformity with accounting principles generally accepted in the United States of America requires management to make estimates and assumptions that affect certain reported amounts of assets and liabilities and disclosure of contingent assets and liabilities at the date of the financial statements and the reported amounts of revenues and expenses during the reporting periods. Actual results could differ from those estimates.
Prepaid Expenses
Prepaid expenses as of September 30, 2016 mainly represent the prepayments of approximately $5,699,000 for the land lease and crop planting expenses. Prepaid expenses as of March 31, 2016 mainly represent the prepayment of approximately $174,000 for prepaid decoration expenses of the Company's new stores. The non-current portion of prepaid expense of approximately $2,993,000 is for the land lease.
Advances from Customers
Advances from customers represents prepaid cards purchased by customers at our retail locations. Advances from customers was $30,632 and $769,814 as of September 30, 2016 and March 31, 2016, respectively. These cards are no longer being issued.
Website Development Costs
The Company accounts for website development costs in accordance with ASC 350-50, Accounting for Website Development Costs, wherein website development costs are segregated into three activities:
|
1.
|
Initial stage (planning), whereby the related costs are expensed.
|
|
2.
|
Development stage (web application, infrastructure, graphics), whereby the related costs are capitalized and amortized once the website is ready for use. Costs for development of content for the website may be expensed or capitalized depending on the circumstances of the expenditures.
|
|
3.
|
Operating stage, whereby the related costs are expensed as incurred. Upgrades are usually expensed, unless they add additional functionality.
|
15
NOTES TO THE CONSOLIDATED FINANCIAL STATEMENTS
FOR THE THREE AND SIX MONTHS ENDED SEPTEMBER 30, 2016 AND 2015
(IN U.S. $) (UNAUDITED)
2. SUMMARY OF SIGNIFICANT ACCOUNTING POLICIES (CONTINUED)
Website Development Costs (continued)
The Company had website costs of $45,676 as of March 31, 2016, respectively. The Company wrote off the balance of website and development cost due to the discontinuance of the website during the three months ended September 30, 2016. Amortization expense was $199 and $403, respectively, for the three and six months ended September 30, 2015. Amortization expense was $0 and $1,403 for the three and six months ended September 30, 2016.
Revenue Recognition
The Company's revenue recognition policies comply with FASB ASC 605 "Revenue Recognition." The Company recognizes product revenue when the following fundamental criteria are met: (i) persuasive evidence of an arrangement exists, (ii) delivery has occurred, (iii) the price paid by the customer is fixed or determinable and (iv) collection of the resulting account receivable is reasonably assured. The Company recognizes revenue from the following channels:
|
a)
|
Retail stores - The Company recognizes sales revenue from its seven retail stores, net of sales taxes and estimated sales returns at the time it sells merchandise to the customer. Customer purchases of shopping cards are not recognized as revenue until the card is redeemed when the customer purchases merchandise by using the shopping card. During the three months ended September 30, 2016, the Company transferred control of the retail stores in Sanshui, Shunde, Chancheng, Xiaolan, Dongguan and Guangzhou to six independent individuals.
|
|
b)
|
Custom-made sales - The Company started "Custom-made" sales in August 2014. The target customers are commercial customers who can order online or in the Company's local stores and make full payment on site. All orders are forwarded to Zhongshan Winha immediately, which arranges the delivery. Revenue from the sale of products is recognized upon delivery to customers provided that there are no uncertainties regarding customer acceptance, there is persuasive evidence of an arrangement, and the sales price is fixed and determinable. Revenue generated from custom-made sales was $9,880,153 and $6,191,296, $19,696,330 and $10,799,960, respectively, for three and six months ended September 30, 2016 and 2015, respectively.
|
16
NOTES TO THE CONSOLIDATED FINANCIAL STATEMENTS
FOR THE THREE AND SIX MONTHS ENDED SEPTEMBER 30, 2016 AND 2015
(IN U.S. $) (UNAUDITED)
2. SUMMARY OF SIGNIFICANT ACCOUNTING POLICIES (CONTINUED)
Revenue Recognition (continued)
|
c)
|
Franchise and management fees - During the three months ended September 30, 2015, the Company commenced franchising the use of the Company's trademark, name identification and other business resources. The franchisee is required to pay franchise fees and management fees to Zhongshan Winha. Franchise fee revenue from franchise sales is recognized only when all material services or conditions relating to the sale have been substantially performed or satisfied by the Company. The franchise and management fees recognized by the Company were $1,792,979 and $517,452, $3,285,710 and $517,452, respectively, for the three and six months ended September 30, 2016 and 2015, and are included in revenue.
|
|
d)
|
Wholesale - During the three months ended September 30, 2016, the Company entered into agreements with six individuals to assume the operations of the retail stores located in Sanshui, Shunde, Chancheng, Xiaolan, Dongguan and Guangzhou. Revenues are derived from the sale of food products to these six stores. The Company recognizes revenue for product sales upon transfer of title to the six stores. Stores purchase orders and/or contracts are generally used to determine the existence of an arrangement. Shipping documents and the completion of any store acceptance requirements, when applicable, are used to verify product delivery. The Company assesses whether a price is fixed or determinable based upon the payment terms associated with the transaction and whether the sales price is subject to refund or adjustment.
|
| During the three and six months ended September 30, 2016, wholesale revenue of $1,867,379 was generated from these six stores. |
17
NOTES TO THE CONSOLIDATED FINANCIAL STATEMENTS
FOR THE THREE AND SIX MONTHS ENDED SEPTEMBER 30, 2016 AND 2015
(IN U.S. $) (UNAUDITED)
2. SUMMARY OF SIGNIFICANT ACCOUNTING POLICIES (CONTINUED)
Revenue Recognition (continued)
Zhongshan Winha grants certain commercial customers limited rights to return products and provides price protection for inventories held by resellers at the time of published price reductions. Zhongshan Winha establishes an estimated allowance for future product returns based upon historical return experience when the related revenue is recorded and provides for appropriate price protection reserves when pricing adjustments are approved.
Zhongshan Winha's return policy allows customers to return their merchandise in the original box and/or packaging within 7 days of purchase. The Company has not experienced material returns.
Fair Value of Financial Instruments
FASB ASC 820, Fair Value Measurement, specifies a hierarchy of valuation techniques based upon whether the inputs to those valuation techniques reflect assumptions other market participants would use based upon market data obtained from independent sources (observable inputs). In accordance with ASC 820, the following summarizes the fair value hierarchy:
|
Level 1 Inputs –
|
Unadjusted quoted market prices for identical assets and liabilities in an active market that the Company has the ability to access.
|
|
Level 2 Inputs –
|
Inputs other than the quoted prices in active markets that are observable either directly or indirectly.
|
|
Level 3 Inputs –
|
Inputs based on prices or valuation techniques that are both unobservable and significant to the overall fair value measurements.
|
18
NOTES TO THE CONSOLIDATED FINANCIAL STATEMENTS
FOR THE THREE AND SIX MONTHS ENDED SEPTEMBER 30, 2016 AND 2015
(IN U.S. $) (UNAUDITED)
2. SUMMARY OF SIGNIFICANT ACCOUNTING POLICIES (CONTINUED)
Fair Value of Financial Instruments (continued)
ASC 820 requires the use of observable market data, when available, in making fair value measurements. When inputs used to measure fair value fall within different levels of the hierarchy, the level within which the fair value measurement is categorized is based on the lowest level input that is significant to the fair value measurement. Valuation techniques used need to maximize the use of observable inputs and minimize the use of unobservable inputs. As of September 30, 2016 and March 31, 2016, none of the Company's assets and liabilities were required to be reported at fair value on a recurring basis. Carrying values of non-derivative financial instruments, including cash, accounts receivable, inventory, prepaid expenses, advances to suppliers, accounts payable, accrued expenses, and advances from customers approximate their fair values due to the short term nature of these financial instruments. There were no changes in methods or assumptions during the periods presented.
Cash and Cash Equivalents
The Company considers all demand and time deposits and all highly liquid investments with an original maturity of three months or less to be cash equivalents.
Accounts Receivable
Accounts receivable is stated at cost, net of an allowance for doubtful accounts, if required. Receivables outstanding longer than the payment terms are considered past due. The Company maintains an allowance for doubtful accounts for estimated losses when necessary resulting from the failure of customers to make required payments. The Company reviews the accounts receivable on a periodic basis and makes allowances where there is doubt as to the collectability of individual balances.
In evaluating the collectability of individual receivable balances, the Company considers many factors, including the age of the balance, the customer's payment history, its current credit-worthiness and current economic trends. The Company considers all accounts receivable at September 30, 2016 and March 31, 2016 to be fully collectible and, therefore, did not provide an allowance for doubtful accounts. For the periods presented, the Company did not write off any accounts receivable as bad debts.
19
NOTES TO THE CONSOLIDATED FINANCIAL STATEMENTS
FOR THE THREE AND SIX MONTHS ENDED SEPTEMBER 30, 2016 AND 2015
(IN U.S. $) (UNAUDITED)
2. SUMMARY OF SIGNIFICANT ACCOUNTING POLICIES (CONTINUED)
Inventories
Inventories, comprised of merchandise and food products, is stated at the lower of cost or market. The value of inventory is determined using the weighted average cost method. Inventories also include approximately $92,000 of the costs for growing crops on the leased farmland.
The Company estimates an allowance for excessive or unusable inventories. Inventory is reported net of such allowances, if any. There was no allowance for excessive or unusable inventories as of September 30, 2016 and March 31, 2016.
Property, Plant and Equipment
Property, plant and equipment are recorded at cost, less accumulated depreciation. Cost includes the price paid to acquire the asset, and any expenditure that substantially increases the asset's value or extends the useful life of an existing asset. Depreciation is computed using the straight-line method over the estimated useful lives of the assets. Major repairs and betterments that significantly extend original useful lives or improve productivity are capitalized and depreciated over the periods benefited. Maintenance and repairs are generally expensed as incurred.
During the three months ended September 30, 2016, the Company acquired various fruit orchards for $9,425,559. The fruit orchards consist of 41 different kinds of fruits in various areas in China. The book value of the orchards includes costs related to saplings, fertilizer, pesticide, water, electricity, labor and land leasing. The planting costs are capitalized. The Company also capitalized $453,134 for ten greenhouses utilized for the cultivation of vegetables.
The estimated useful lives for property, plant and equipment categories are as follows:
|
Furniture, fixtures and equipment
|
3 to 5 years
|
|
Leasehold improvements
|
Over the shorter of the remaining lease term or estimated useful life of the improvements.
|
|
Motor vehicles
|
5 years
|
|
Greenhouses
|
3 years
|
|
Fruit orchards
|
Not yet producing
|
20
NOTES TO THE CONSOLIDATED FINANCIAL STATEMENTS
FOR THE THREE AND SIX MONTHS ENDED SEPTEMBER 30, 2016 AND 2015
(IN U.S. $) (UNAUDITED)
2. SUMMARY OF SIGNIFICANT ACCOUNTING POLICIES (CONTINUED)
Impairment of Long-Lived Assets
The Company follows FASB ASC 360, "Accounting for the Impairment and Disposal of Long-Lived Assets", which addresses the financial accounting and reporting for the recognition and measurement of impairment losses for long-lived assets. In accordance with ASC 360, long-lived assets are reviewed for impairment whenever events or changes in circumstances indicate that the carrying amount of an asset may not be recoverable. The Company may recognize the impairment of long-lived assets in the event the net book value of such assets exceeds the future undiscounted cash flows attributable to those assets. The Company wrote off its website development costs during the three months ended September 30, 2016.
Income Taxes
The Company accounts for income taxes in accordance with FASB ASC 740, Income Taxes, ("ASC 740") which requires the recognition of deferred income taxes for differences between the basis of assets and liabilities for financial statement and income tax purposes. Deferred tax assets and liabilities represent the future tax consequences for those differences, which will either be taxable or deductible when the assets and liabilities are recovered or settled. Deferred taxes are also recognized for operating losses that are available to offset future taxable income. A valuation allowance is established when necessary to reduce deferred tax assets to the amount expected to be realized. ASC 740 addresses the determination of whether tax benefits claimed or expected to be claimed on a tax return should be recorded in the financial statements.
Under ASC 740, the Company may recognize the tax benefit from an uncertain tax position only if it is more likely than not that the tax position will be sustained on examination by the taxing authorities, based on the technical merits of the position. The tax benefits recognized in the financial statements from such a position would be measured based on the largest benefit that has a greater than 50% likelihood of being realized upon ultimate settlement. ASC 740 also provides guidance on the de-recognition of income tax assets and liabilities, classification of current and deferred income tax assets and liabilities, and accounting for interest and penalties associated with these tax positions. As of September 30, 2016 and March 31, 2016, the Company did not record any liabilities for unrecognized income tax benefits.
21
NOTES TO THE CONSOLIDATED FINANCIAL STATEMENTS
FOR THE THREE AND SIX MONTHS ENDED SEPTEMBER 30, 2016 AND 2015
(IN U.S. $) (UNAUDITED)
2. SUMMARY OF SIGNIFICANT ACCOUNTING POLICIES (CONTINUED)
Income Taxes (continued)
The income tax laws of various jurisdictions in which the Company and its subsidiaries operate are summarized as follows:
United States
The Company is subject to United States tax at graduated rates from 15% to 35%. No provision for income tax in the United States has been made as the Company had no U.S. taxable income for the three and six months ended September 30, 2016 and 2015.
Anguilla
Sanmei International Investment Co, Ltd is incorporated in Anguilla and is governed by the income tax laws of Anguilla. According to current Anguilla income tax law, the applicable income tax rate for the Company is 0%.
Australia
Winha Commerce and Trade Limited is incorporated in Australia. Pursuant to the income tax laws of Australia, the Company is not subject to tax on non-Australian source income.
Cayman Islands
C&V International Holdings Company Limited is incorporated in the Cayman Islands and is governed by the income tax laws of the Cayman Islands. According to current Cayman Islands income tax laws, the applicable income tax rate for the Company is 0%.
Hong Kong
Winha International Investment Holdings Company Limited is incorporated in Hong Kong. Pursuant to the income tax laws of Hong Kong, the Company is not subject to tax on non-Hong Kong source income.
PRC
Shenzhen Winha and Zhongshan Winha Electronic Commerce Company Limited, together with Zhongshan Winha Catering Management Company Limited and Zhongshan Supermarket Limited are subject to an Enterprise Income Tax at 25% and each files its own tax return.
22
NOTES TO THE CONSOLIDATED FINANCIAL STATEMENTS
FOR THE THREE AND SIX MONTHS ENDED SEPTEMBER 30, 2016 AND 2015
(IN U.S. $) (UNAUDITED)
2. SUMMARY OF SIGNIFICANT ACCOUNTING POLICIES (CONTINUED)
Net Income (Loss) Per Common Share
The Company computes net income (loss) per common share in accordance with FASB ASC 260, Earnings Per Share ("ASC 260"). Under the provisions of ASC 260, basic net income (loss) per common share is computed by dividing the net income (loss) by the weighted average number of shares of common stock outstanding during the period. Diluted income per common share is computed by dividing the net income by the weighted average number of shares of common stock outstanding plus the effect of any potential dilutive shares outstanding during the period. There were no dilutive shares outstanding during the three and six months ended September 30, 2016 and 2015. Accordingly, the number of weighted average shares outstanding as well as the amount of net income per share are presented for basic and diluted per share calculations for the period reflected in the accompanying consolidated statement of income and other comprehensive income.
Statutory Reserve
The Company's China-based subsidiaries and related entities are required to make appropriations of retained earnings for certain non-distributable reserve funds.
Pursuant to the China Foreign Investment Enterprises laws, the Company's China-based subsidiaries, are required to make appropriations from their after-tax profit as determined under generally accepted accounting principles in the PRC (the "after-tax-profit under PRC GAAP") to a general non-distributable reserve fund. Each year, at least 10% of each entities after-tax-profit under PRC GAAP is required to be set aside as a general reserve fund until the fund equals 50% of the registered capital of the applicable entity.
The statutory reserve fund is restricted as to use and can only be used to set-off against losses, expansion of production and operations and increasing registered capital of the respective company. The fund is not allowed to be transferred to the Company in terms of cash dividends, loans or advances, nor is it allowed for distribution except under liquidation.
The required transfer to the statutory reserve fund was $306,465 and $547,381, respectively, for the six months ended September 30, 2016 and 2015, respectively.
23
NOTES TO THE CONSOLIDATED FINANCIAL STATEMENTS
FOR THE THREE AND SIX MONTHS ENDED SEPTEMBER 30, 2016 AND 2015
(IN U.S. $) (UNAUDITED)
3. RECENTLY ISSUED ACCOUNTING STANDARDS
In August 2016, the Financial Accounting Standards Board ("FASB") issued Accounting Standards Update ("ASU") 2016-15, Statement of Cash Flows (Topic 230): Classification of Certain Cash Receipts and Cash Payments. This ASU addresses the classification of certain specific cash flow issues including debt prepayment or extinguishment costs, settlement of certain debt instruments, contingent consideration payments made after a business combination, proceeds from the settlement of certain insurance claims and distributions received from equity method investees. This ASU is effective for fiscal years beginning after December 15, 2017, and interim periods within those fiscal years, with early adoption permitted. An entity that elects early adoption must adopt all of the amendments in the same period. The Company is currently evaluating the effect this ASU will have on its consolidated statement of cash flows.
In June 2016, the FASB issued ASU No. 2016-13, Financial Instruments—Credit Losses (Topic 326): Measurement of Credit Losses on Financial Instruments. The new standard requires financial assets measured at amortized cost be presented at the net amount expected to be collected, through an allowance for credit losses that is deducted from the amortized cost basis. The standard will be effective for the Company beginning January 1, 2020, with early application permitted. The Company is evaluating the impact of adopting this new accounting guidance on its consolidated financial statements.
In May, 2016, the FASB issued ASU No. 2016-10, Revenue with Contracts with Customers: Narrow-scope Improvements and Practical Expedients, which is an amendment to ASU No. 2014-09 that clarifies the objective of the collectability criterion, to allow entities to exclude amounts collected from customers from all sales taxes from the transaction price, to specify the measurement date for noncash consideration is contract inception, variable consideration guidance applies only to variability resulting from reasons other than the form of the consideration, and clarification on contract modifications at transition. The implementation guidelines follow ASU No. 2014-09.
In April 2016, the FASB issued Accounting Standards Update No. 2016-12, Revenue from Contracts with Customers. In May 2014, the FASB issued ASU No. 2014-09, Revenue from Contracts with Customers (Topic 606). This guidance supersedes current guidance on revenue recognition in Topic 605, Revenue Recognition. In addition, there are disclosure requirements related to the nature, amount, timing, and uncertainty of revenue recognition. In August 2015, the FASB issued ASU No.2015-14 to defer the effective date of ASU No. 2014-09 for all entities by one year. For public business entities that follow U.S. GAAP, the deferral results in the new revenue standard being effective for fiscal years, and interim periods within those fiscal years, beginning after December 15, 2017, with early adoption permitted for interim and annual periods beginning after December 15, 2016. The Company is currently evaluating the impact of adopting this standard on its consolidated financial statements.
24
NOTES TO THE CONSOLIDATED FINANCIAL STATEMENTS
FOR THE THREE AND SIX MONTHS ENDED SEPTEMBER 30, 2016 AND 2015
(IN U.S. $) (UNAUDITED)
3. RECENTLY ISSUED ACCOUNTING STANDARDS (CONTINUED)
In February 2016, the FASB issued Accounting Standards Update No. 2016-02, Leases. The new standard establishes a right-of-use ("ROU") model that requires a lessee to record a ROU asset and a lease liability on the balance sheet for all leases with terms longer than 12 months. Leases will be classified as either finance or operating, with classification affecting the pattern of expense recognition in the income statement. The new standard is effective for fiscal years beginning after December 15, 2018, including interim periods within those fiscal years. A modified retrospective transition approach is required for lessees for capital and operating leases existing at, or entered into after, the beginning of the earliest comparative period presented in the financial statements, with certain practical expedients available. We are currently evaluating the impact of our pending adoption of the new standard on our consolidated financial statements.
In November 2015, the FASB issued Accounting Standards Update No. 2015-17, Income Taxes (Topic 740): Balance Sheet Classification of Deferred Taxes (ASU 2015-17), which simplifies the presentation of deferred income taxes by requiring deferred tax assets and liabilities be classified as noncurrent on the balance sheet. This accounting standard update is not expected to have a material impact on the Company's consolidated financial statements.
In August 2015, the FASB issued ASU No. 2015-14, Revenue from Contracts with Customers (Topic 606): Deferral of the Effective Date. The amendment in this ASU defers the effective date of ASU No. 2014-09 for all entities for one year. Public business entities, certain not-for-profit entities, and certain employee benefit plans should apply the guidance in ASU 2014-09 to annual reporting periods beginning December 15, 2017, including interim reporting periods within that reporting period. Earlier application is permitted only as of annual reporting periods beginning after December 31, 2016, including interim reporting periods within that reporting period. This accounting standard update is not expected to have a material impact on the Company's consolidated financial statements.
25
WINHA INTERNATIONAL GROUP LIMITED AND SUBSIDIARIES
NOTES TO THE CONSOLIDATED FINANCIAL STATEMENTS
FOR THE THREE AND SIX MONTHS ENDED SEPTEMBER 30, 2016 AND 2015
(IN U.S. $) (UNAUDITED)
4. PROPERTY, PLANT AND EQUIPMENT
Property, plant and equipment are summarized as follows:
|
September 30,
2016
|
March 31,
2016
|
|||||||
|
(Unaudited)
|
||||||||
|
Furniture, fixtures and equipment
|
$
|
1,095,990
|
$
|
1,131,124
|
||||
|
Leasehold improvements
|
591,360
|
629,536
|
||||||
|
Motor vehicles
|
350,014
|
361,967
|
||||||
|
Greenhouses
|
453,137
|
-
|
||||||
|
Fruit orchards
|
9,848,364
|
-
|
||||||
|
12,338,865
|
2,122,627
|
|||||||
|
Less: accumulated depreciation
|
(494,422
|
)
|
(274,650
|
)
|
||||
|
$
|
11,844,443
|
$
|
1,847,977
|
|||||
For the three and six months ended September 30, 2016 and 2015, depreciation expense was $124,362 and $38,312, $231,303 and $68,445, respectively.
5. LEASES
The Company leases its offices, warehouse and stores under operating leases expiring in various years through 2023.
During the three months ended September 30, 2016, the Company leased ten parcels of farmland, totaling 132,000 square meters, to plant vegetables for a one year period. The annual lease was $21,774 and was fully paid during the three months ended September 30, 2016.
During the three months ended September 30, 2016, the Company entered into 41 operating lease agreements with 41 independent local farmers to lease a total of 4,760,024 square meters of farmland to plant fruit trees for a ten year period. The leases required the Company to prepay rent in advance, ranging from two to four years. During the three months ended September 30, 2016, the Company made payments of $4,773,571, of which $4,536,128 is included in the prepaid expenses in the consolidated balance sheet as of September 30, 2016.
26
NOTES TO THE CONSOLIDATED FINANCIAL STATEMENTS
FOR THE THREE AND SIX MONTHS ENDED SEPTEMBER 30, 2016 AND 2015
(IN U.S. $) (UNAUDITED)
5. LEASES (Continued)
The total future minimum lease payments as of September 30, 2016 are as follows:
|
Year Ending March 31,
|
Amount
|
|||
|
2017
|
$
|
123,888
|
||
|
2018
|
255,559
|
|||
|
2019
|
253,822
|
|||
|
2020
|
1,247,282
|
|||
|
Thereafter
|
10,071,204
|
|||
|
Total
|
$
|
11,951,755
|
||
Rent expense was $67,603, $59,303, $160,632 and $126,958, for the three and six months ended September 30, 2016 and 2015, respectively.
6. CONVERTIBLE NOTES
In May 2015, C&V International Company Limited, a wholly owned subsidiary of Winha International Group Limited, set up a wholly owned subsidiary, Australia Winha Commerce and Trade Limited ("Australian Winha").
On September 1, 2015, Australia Winha borrowed $542,570 (AUD$750,000) in the form of a twelve month convertible promissory note with interest at 6% per annum. The note was convertible into 750,000 shares of Australia Winha at $0.70401 per share (AUD$1.00) and was convertible at the option of the Company.
On December 17, 2015, Australia Winha borrowed another $4,892,896 (AUD$6,750,000) in the form of a twelve month convertible promissory note with interest at 6% per annum. The note was convertible into 6,750,000 shares of Australia Winha at $0.71012 per share (AUD$1.00) and was convertible at the option of the Company.
Australia Winha repaid the above notes on July 13, 2016. Interest expense was $37,548 and $16,685, for the three months ended September 31, 2016 and 2015, respectively, and $117,011 and $16,685 for the six months ended September 30, 2016 and 2015, respectively, and recorded under non-operating expenses.
27
NOTES TO THE CONSOLIDATED FINANCIAL STATEMENTS
FOR THE THREE AND SIX MONTHS ENDED SEPTEMBER 30, 2016 AND 2015
(IN U.S. $) (UNAUDITED)
7. RELATED PARTY TRANSACTIONS
The Company obtained demand loans from the chairman of the board, which are non-interest bearing. The loans of $907,804 and $477,199 as of September 30, 2016 and March 31, 2016, respectively, are recorded as loan from stockholder in the consolidated balance sheets.
8. INCOME TAXES
The Company is required to file income tax returns in both the United States and the PRC. Its operations in the United States have been insignificant and no income taxes have been accrued.
The provision for income taxes consisted of the following for three and six months ended September 30:
|
Three Months Ended
September 30,
|
||||||||
|
2016
|
2015
|
|||||||
|
(Unaudited)
|
(Unaudited)
|
|||||||
|
Current
|
$
|
1,430,329
|
$
|
1,261,690
|
||||
|
Deferred
|
(13,477
|
)
|
-
|
|||||
|
$
|
1,416,852
|
$
|
1,261,690
|
|||||
|
Six Months Ended
September 30,
|
||||||||
|
2016
|
2015
|
|||||||
|
(Unaudited)
|
(Unaudited)
|
|||||||
|
Current
|
$
|
2,974,547
|
$
|
1,817,227
|
||||
|
Deferred
|
(26,552
|
)
|
-
|
|||||
|
$
|
2,947,995
|
$
|
1,817,227
|
|||||
28
NOTES TO THE CONSOLIDATED FINANCIAL STATEMENTS
FOR THE THREE AND SIX MONTHS ENDED SEPTEMBER 30, 2016 AND 2015
(IN U.S. $) (UNAUDITED)
8. INCOME TAXES (CONTINUED)
The following table reconciles the effective income tax rates with the statutory rates:
|
For the three months ended
September 30,
|
For the six months ended
September 30,
|
|||||||||||||||
|
2016
|
2015
|
2016
|
2015
|
|||||||||||||
|
Statutory rate - PRC
|
25.0
|
%
|
25.0
|
%
|
25.0
|
%
|
25.0
|
%
|
||||||||
|
Change in valuation allowance
|
4.3
|
%
|
0.4
|
%
|
1.2
|
%
|
0.5
|
%
|
||||||||
|
Other
|
0.5
|
%
|
(0.9
|
%)
|
0.2
|
%
|
(0.3
|
%)
|
||||||||
|
Effective income tax rate
|
29.8
|
%
|
24.5
|
%
|
26.4
|
%
|
25.2
|
%
|
||||||||
Deferred tax assets and liabilities are recognized for expected future tax consequences of differences between the carrying amounts of assets and liabilities and their respective tax bases using enacted tax rates in effect for the year in which the differences are expected to reverse. The laws of China permit the carry-forward of net operating losses for a period of five years. U.S. federal net operating losses can generally be carried forward twenty years.
Deferred tax assets are comprised of the following:
|
September 30,
|
March 31,
|
|||||||
|
2016
|
2016
|
|||||||
|
(Unaudited)
|
||||||||
|
Net operating loss carryforwards
|
$
|
6,492,763
|
$
|
6,333,864
|
||||
|
Inventory intercompany profit
|
6,541
|
2,596
|
||||||
|
Less: valuation allowance
|
(6,492,763
|
) |
(6,303,650
|
) | ||||
|
Net deferred tax asset
|
$
|
6,541
|
$
|
32,810
|
||||
At September 30, 2016 and March 31, 2016, the Company had unused operating loss carry-forwards of approximately $16,770,502 and $16,214,870 respectively, expiring in various years through 2019. The Company has established a valuation allowance of $6,492,763 and $6,303,650 against the deferred tax asset related to net operating loss carry-forwards at September 30, 2016 and March 31, 2016, respectively, due to the uncertainty of realizing the benefit. The carryforwards are principally in the United States.
29
NOTES TO THE CONSOLIDATED FINANCIAL STATEMENTS
FOR THE THREE AND SIX MONTHS ENDED SEPTEMBER 30, 2016 AND 2015
(IN U.S. $) (UNAUDITED)
8. INCOME TAXES (CONTINUED)
The Company's tax filings are subject to examination by the tax authorities. The tax years for 2015, 2014 and 2013 remain open to examination by the tax authorities in the PRC. The Company's U.S. tax returns for the years ended March 31, 2016, 2015, 2014 and 2013 are subject to examination by the tax authorities.
9. CONCENTRATION OF CREDIT RISK
Substantially all of the Company's bank accounts are located in The People's Republic of China and are not covered by protection similar to that provided by the FDIC on funds held in United States banks.
30
NOTES TO THE CONSOLIDATED FINANCIAL STATEMENTS
FOR THE THREE AND SIX MONTHS ENDED SEPTEMBER 30, 2016 AND 2015
(IN U.S. $) (UNAUDITED)
10. PARENT COMPANY ONLY CONDENSED FINANCIAL INFORMATION
The following is the condensed financial information of Winha International Group Limited only, the US parent, balance sheet as of March 31, 2016 and the related statements of operations and cash flows for the twelve months ended March 31, 2016:
Condensed Balance Sheet
|
ASSETS
|
March 31,
2016
|
|||
|
Investment in subsidiaries
|
$
|
11,050,554
|
||
|
TOTAL ASSETS
|
$
|
11,050,554
|
||
|
LIABILITIES AND STOCKHOLDERS' EQUITY
|
March 31,
2016
|
|||
|
Accrued Expenses
|
$
|
45,000
|
||
|
Stockholder loans
|
158,351
|
|||
|
Total Liabilities
|
$
|
203,351
|
||
|
Stockholders' equity
|
||||
|
Common stock, $0.0001 par value; 200,000,000 shares authorized; 49,989,500 shares issued and outstanding as of March 31, 2016
|
49,990
|
|||
|
Additional paid-in capital
|
21,626,775
|
|||
|
Statutory reserve
|
497,443
|
|||
|
Accumulated (deficit)
|
(11,096,421
|
)
|
||
|
Other comprehensive (loss)
|
(230,584
|
)
|
||
|
Total stockholders' equity
|
10,847,203
|
|||
|
TOTAL LIABILITIES AND STOCKHOLDERS' EQUITY
|
$
|
11,050,554
|
31
NOTES TO THE CONSOLIDATED FINANCIAL STATEMENTS
FOR THE THREE AND SIX MONTHS ENDED SEPTEMBER 30, 2016 AND 2015
(IN U.S. $) (UNAUDITED)
10. PARENT COMPANY ONLY CONDENSED FINANCIAL INFORMATION (CONTINUED)
Condensed Statement of Operations
|
Year Ended
|
||||
|
March 31,
2016
|
||||
|
Revenues
|
||||
|
Share of earnings from investment in subsidiaries
|
$
|
7,761,602
|
||
|
Operating expenses
|
||||
|
Stock compensation
|
(15,865,042
|
)
|
||
|
General and administrative
|
(161,732
|
)
|
||
|
Net (loss)
|
$
|
(8,265,172
|
)
|
|
Condensed Statement of Cash Flows
|
Year Ended
March 31,
2016
|
||||
|
Cash flows from operating activities
|
||||
|
Net (loss)
|
$
|
(8,265,172
|
)
|
|
|
Adjustments to reconcile net income to net cash provided by (used in) operating activities
|
||||
|
Share of earnings from investment in subsidiaries
|
(7,761,602
|
)
|
||
|
Stock compensation
|
15,865,042
|
|||
|
Increase in accrued expenses and other payables
|
161,732
|
|||
|
Net cash provided by (used in) operating activities
|
-
|
|||
|
Net change in cash
|
-
|
|||
|
Cash, beginning of period
|
-
|
|||
|
Cash, end of period
|
$
|
-
|
||
|
Noncash financing activities:
|
||||
|
Payment of accrued expenses and other payables by shareholder
|
$
|
161,732
|
||
32
NOTES TO THE CONSOLIDATED FINANCIAL STATEMENTS
FOR THE THREE AND SIX MONTHS ENDED SEPTEMBER 30, 2016 AND 2015
(IN U.S. $) (UNAUDITED)
10. PARENT COMPANY ONLY CONDENSED FINANCIAL INFORMATION (CONTINUED)
Basis of Presentation
The Company records its investment in its subsidiaries under the equity method of accounting. Such investments are presented as "Investment in subsidiaries" on the condensed balance sheet and the subsidiaries' profits are presented as "Share of earnings from investment in subsidiaries" in the condensed statement of operations.
Certain information and footnote disclosures normally included in financial statements prepared in conformity with accounting principles generally accepted in the United States of America have been condensed or omitted. The parent only financial information has been derived from the Company's consolidated financial statements and should be read in conjunction with the Company's consolidated financial statements.
There were no cash transactions in the US parent company during the three and six months ended September 30, 2016.
Restricted Net Assets
Under PRC laws and regulations, the Company's PRC subsidiaries are restricted in their ability to transfer certain of their net assets to the Company in the form of dividend payments, loans or advances. The restricted net assets of the Company's PRC subsidiaries amounted to approximately $26,396,888 as of March 31, 2016.
The Company's operations and revenues are conducted and generated in the PRC, and all of the Company's revenues being earned and currency received are denominated in RMB. RMB is subject to the foreign exchange control regulations in China, and, as a result, the Company may be unable to distribute any dividends outside of China due to PRC foreign exchange control regulations that restrict the Company's ability to convert RMB into US Dollars.
33
NOTES TO THE CONSOLIDATED FINANCIAL STATEMENTS
FOR THE THREE AND SIX MONTHS ENDED SEPTEMBER 30, 2016 AND 2015
(IN U.S. $) (UNAUDITED)
11. SUBSEQUENT EVENT
The Company's 60% owned subsidiary, Australian Winha, entered into a series of contractual agreements (the "Acquisition Agreements") dated November 7, 2016 among Australian Winha, Flavours Fruit & Veg Pty Ltd ("Flavours"), an Australia company, World of Flavours Pty Ltd ("World") and Select Providor Pty Ltd ("Select") (collectively "Flavours Shareholders"), to acquire the shares of Flavours. The Acquisition Agreements include (i) a Share Sale Agreement, (ii) a Share Subscription Agreement, (iii) a Subscription Agreement for Convertible Notes, and (iv), a Call Option Agreement,
Share Sale Agreement: Pursuant to the Share Sale Agreement, Australian Winha acquired 49 shares from each of the Flavours Shareholders, for a total of 98 shares, representing 16.1% of the currently outstanding shares, in exchange for a total of AUD$600,000 (approximately US$458,000).
Share Subscription Agreement: Pursuant to the Share Subscription Agreement, which expires on June 30, 2017, Flavours agrees to sell an additional 229 shares to Australian Winha for AUD$1,400,000 (approximately US$1,069,000). The agreement is dependent upon Australian Winha gaining approval to list its shares on the Australian Securities Exchange ("ASX").
Subscription Agreement for Convertible Notes: Pursuant to the Convertible Note Agreement, Australian Winha will loan to Flavours, in the form of a secured convertible note and guaranteed by the current directors' of Flavours, AUD$1,000,000 (approximately US$763,000) convertible into 163 shares of Flavours stock. The note will bear interest at 10% per annum, payable monthly. The note expires twenty four months from the date of issuance. The note is convertible upon Australian Winha gaining approval to list its shares on the ASX. Should Australian Winha not give notice of conversion of the note within 30 days of meeting the ASX listing conditions, Flavours can elect to convert the note for up to the 163 shares.
Call Option Agreement: Australian Winha also has a Call Option Agreement to purchase the remaining 255 shares from each of the Flavours Shareholders, a total of 510 shares, at a price equal to eight times Flavour's March 31, 2019 year end net profit after tax, under Australian generally accepted accounting principles, which may be satisfied by a cash payment, the issue of fully paid ordinary shares in Australian Winha, or a combination of both.
34
ITEM 2. MANAGEMENT'S DISCUSSION AND ANALYSIS OF FINANCIAL CONDITIONS AND RESULTS OF OPERATIONS
The following management's discussion and analysis of financial condition and results of operations provides information which management believes is relevant to an assessment and understanding of our results of operations and financial condition. The discussion should be read along with our financial statements and notes thereto. This section includes a number of forward-looking statements that reflect our current views with respect to future events and financial performance. Forward-looking statements are often identified by words like believe, expect, estimate, anticipate, intend, project and similar expressions, or words which, by their nature, refer to future events. You should not place undue certainty on these forward-looking statements. These forward-looking statements are subject to certain risks and uncertainties that could cause actual results to differ materially from our predictions.
Events Affecting Consolidation
We operate our business in China through Zhongshan Winha. We expect that virtually all of our revenue will be derived from Zhongshan Winha. On August 1, 2013, our subsidiary, Shenzhen Winha, entered into a set of contractual agreements with Zhongshan Winha and its equity owners, including an exclusive business cooperation agreement, exclusive option agreement, loan agreement, share pledge agreement, power of attorney and spousal consents. Shenzhen Winha, through these arrangements, assumed operational control of Zhongshan Winha and became the primary beneficiary of those operations. As a result, Zhongshan Winha was considered a variable interest entity with respect to Shenzhen Winha and, as a result, from August 1, 2013 through November 27, 2015, the financial statements of Zhongshan Winha were consolidated with our Company's financial statements.
The control of our operations through these contractual arrangements created risks for our business. If Zhongshan Winha and its shareholders failed to perform their obligations under the contractual arrangements, or if we suffered significant delay or other obstacles in the process of enforcing these contractual arrangements, or if legal remedies under PRC laws that we relied on were not available or effective, our business and operations could have been severely disrupted, which could have materially and adversely affected our results of operations and our ability to generate revenue in the PRC and could have damaged our reputation. To avoid such risk, on November 27, 2015, Shenzhen Winha exercised its option to purchase the registered equity of Zhongshan Winha from the shareholders of Zhongshan Winha. Upon the exercise of the purchase option, Zhongshan Winha became a wholly owned subsidiary of Shenzhen Winha. The financial statements of Zhongshan Winha remain consolidated with our Company's financial statements, but now as a subsidiary.
In May 2015, C&V International Company Limited ("C&V"), a wholly owned subsidiary of Winha International, set up a wholly owned subsidiary in Australia, Australia Winha Commerce and Trade Limited ("Australian Winha"). In February 2016, 100% of the outstanding shares of Sanmei International Investment Co., Ltd ("Sanmei Investment"), a company incorporated in Anguilla on April 23, 2013, were transferred to Winha International Group Limited. Winha International Group Limited then transferred the shares of its wholly owned subsidiary, C&V, to Sanmei Investment.
In March 2016, C&V transferred the shares of Australian Winha to Sanmei Investment. Subsequently, Sanmei Investment transferred 29% of the outstanding shares of Australian Winha to persons and entities who were either affiliates of, or consultants to, the Company (5% to Beijing Ruihua Future, 5% to Donghe Group, 7% to Zhuowei Zhong, 5% to Xinxi Zhong, 4% to Zhifei Huang and 3% to Chun Yan Winne Lam), and transferred 11% of the shares of Australian Winha to persons who are suppliers to Zhongshan Winha. The effect of above transaction reduced the interest of the Company in its Australian subsidiary, and indirectly in Zhongshan Winha, by 40%.
35
Results of Operations
The following tables set forth key components of our results of operations during the three and six months ended September 30, 2016 and 2015, and the percentage changes between 2016 and 2015.
For the three months ended September 30, 2016 and 2015:
|
|
%
|
|||||||||||
|
|
2016
|
2015
|
Change
|
|||||||||
|
Revenue
|
$
|
14,866,148
|
$
|
9,756,224
|
52
|
%
|
||||||
|
Cost of Goods Sold
|
(8,570,699
|
)
|
(4,124,953
|
)
|
108
|
%
|
||||||
|
Gross profit
|
6,295,449
|
5,631,271
|
12
|
%
|
||||||||
|
Total operating expenses
|
995,480
|
483,764
|
106
|
%
|
||||||||
|
Income from operations
|
5,299,969
|
5,147,507
|
3
|
%
|
||||||||
|
Income before provision for income taxes
|
4,844,579
|
5,147,179
|
(6
|
%)
|
||||||||
|
Provision for income taxes
|
1,416,852
|
1,261,690
|
12
|
%
|
||||||||
|
Net income
|
3,427,727
|
3,885,489
|
(12
|
%)
|
||||||||
|
Earnings per share
|
0.04
|
0.08
|
(50
|
%)
|
||||||||
For the six months ended September 30, 2016 and 2015:
|
|
%
|
|||||||||||
|
|
2016
|
2015
|
Change
|
|||||||||
|
Revenue
|
$
|
28,783,982
|
$
|
15,397,117
|
87
|
%
|
||||||
|
Cost of Goods Sold
|
(14,993,435
|
)
|
(7,137,807
|
)
|
110
|
%
|
||||||
|
Gross profit
|
13,790,547
|
8,259,310
|
67
|
%
|
||||||||
|
Total operating expenses
|
2,087,978
|
1,042,260
|
100
|
%
|
||||||||
|
Income from operations
|
11,702,569
|
7,217,050
|
62
|
%
|
||||||||
|
Income before provision for income taxes
|
11,251,261
|
7,218,135
|
56
|
%
|
||||||||
|
Provision for income taxes
|
2,947,995
|
1,817,227
|
62
|
%
|
||||||||
|
Net income
|
8,303,266
|
5,400,908
|
54
|
%
|
||||||||
|
Earnings per share
|
0.10
|
0.11
|
(9
|
%)
|
||||||||
Revenue
We commenced operations during the quarter ended June 30, 2014. During the year ended March 31, 2015, our revenue increased to $9,023,642 due to the opening of new retail stores and the initiation of custom-made sales. Our revenue continued to grow during fiscal year 2016, as recognition of our brand developed and we introduced additional revenue streams. During the year ended March 31, 2016, our total revenue increased to $42,442,485. In addition to the continuing expansion of our retail store operations and custom-made sales, two new channels for product distribution contributed to revenue during six months ended September 30, 2016:
36
|
·
|
During the year ended March 31, 2016 we initiated franchising operations, and sold 26 franchises, which were supplemented by an additional 18 franchises during the six months ended September 30, 2016. Franchise operations contributed $3,285,710 to revenue during the six months ended September 30, 2016, consisting of upfront franchise fees of $1,408,223 and monthly administrative fees.
|
|
·
|
During the three months ended September 30, 2016, we stopped leasing our retail stores in Sanshui, Shunde, Chancheng, Xiaolan, Dongguan and Guangzhou, outsourced them to six independent individuals. We continued marketing of our products to these stores, which contributed $1,867,379 to our revenues for the three and six months ended September 30, 2016.
|
During the three and six months ended September 30, 2016, we had total revenue of $14,866,148 and $28,783,982, respectively, representing an increase of 52% and 87%, respectively, when compared with the three and six months ended September 30, 2015. The following table shows the components of revenue:
For the three months ended September 30, 2016 and 2015:
|
|
2016
|
2015
|
||||||
|
Retail stores
|
$
|
1,325,637
|
$
|
3,121,628
|
||||
|
Custom-made
|
9,880,153
|
6,191,296
|
||||||
|
Franchises
|
1,792,979
|
443,300
|
||||||
|
Wholesale
|
1,867,379
|
- | ||||||
|
Total
|
$ |
14,866,148
|
$ |
9,756,224
|
||||
For the six months ended September 30, 2016 and 2015:
|
|
September 30,
|
September 30,
|
||||||
|
|
2016
|
2015
|
||||||
|
Retail stores
|
$
|
3,934,563
|
$
|
4,079,705
|
||||
|
Custom-made
|
19,696,330
|
10,799,960
|
||||||
|
Franchises
|
3,285,710
|
517,452
|
||||||
|
Wholesale
|
1,867,379
|
- | ||||||
|
Total
|
$ |
28,783,982
|
$ |
15,397,117
|
||||
Gross profit
Gross profit for the three and six months ended September 30, 2016 increased to $6,295,449 and $13,790,547, respectively, due to the dramatic increase in revenue. Our gross margin decreased to 42% and 48%, respectively, as compared to the 58% and 54% gross margin, respectively, that we realized during the three and six months ended September 30, 2015. However, gross profit, excluding franchise-related revenue, was only 34% and 41%, respectively, for the three and six months ended September 30, 2016. The reduction reflected the increased portion of our revenue attributable to our retail stores and wholesale marketing, which have lower margins than our custom-made sales. We expect our gross margin to change as additional revenue streams are added, although the direction will depend on the relative volume of high-margin revenue sources (e.g. custom made sales, franchising, and online) versus lower margin sources (e.g. retail stores).
37
Operating Expenses
Selling Expenses
Selling expenses represent the labor cost for our marketing department and retail stores, as well as expenses directly related to our marketing efforts. Selling expense for the three and six months ended September 30, 2016 was $431,058 and 991,670, respectively, an increase of 101% and 140%, respectively, over the three and six months ended September 30, 2015. Selling expenses increased primarily due to the addition of a second restaurant in fiscal year 2016. We expect our selling expenses to increase in proportion to the number of additional restaurants that we open.
General and Administrative Expenses
General and administrative expenses for the three and six months ended September 30, 2016 totaled $557,733 and $1,080,076, respectively, representing an increase of 112% and 74%, respectively, from three and six months ended September 30, 2015. The increase was primarily due to the expansion of our overall operations, including the introduction of franchise operations and a second restaurant. In addition, our 60%-owned Australian subsidiary incurred significant expenses in connection with its preparation for listing on the Australian Stock Exchange ("ASX"), which were recorded as G&A expenses as well. As we expand our operations, particularly as we initiate our multi-faceted marketing program, we expect general and administrative expenses to increase, reflecting the staffing requirements of more complex and expanded operations.
Net Income
After taking into account insignificant amounts of other income (loss), we recorded pre-tax net income of $4,844,579 and $5,147,179, respectively, $11,251,261 and $7,218,135, respectively, for the three and six months ended September 30, 2016 and 2015. Corporate income in China is subject to income tax at a rate of 25%. Our provision for income taxes was $1,416,852 and $1,261,690, respectively, $2,947,995 and $1,817,227, respectively, for the three and six months ended September 30, 2016 and 2015, primarily representing the enterprise income tax on the income of our Chinese operating entity. After deducting the income tax, we had a net income before non-controlling interests of $3,427,727 and $3,885,489, respectively, $8,303,266 and $5,400,908, respectively, during the three and six months ended September 30, 2016 and 2015. However, because we transferred 40% of Australian Winha to related parties and suppliers in March 2016, we are required to allocate 40% of the net income (loss) realized after that date by Australian Winha and its subsidiaries to the non-controlling interest. As a result, net income attributed to the non-controlling interests was $1,371,091 and $0, respectively, $3,321,307 and $0, respectively, for the three and six months ended September 30, 2016 and 2015, respectively. Our net income attributable to the common stockholders of the Company (i.e. after the allocation to the non-controlling interest) was $2,056,636 and $3,885,489, respectively, representing $0.04 per share and $0.08 per share, respectively, and $4,981,959 and $5,400,908, respectively, representing $0.10 per share and $0.11per share, respectively, for the three and six months ended September 30, 2016 and 2015.
38
Foreign Currency Translation Adjustment
Our reporting currency is the U.S. dollar. Our principal local currency, Renminbi, is our functional currency. All asset and liability accounts have been translated using the exchange rate in effect at the balance sheet date. Equity accounts have been translated at their historical exchange rates when the capital transactions occurred. Statements of income and other comprehensive income and cash flows have been translated using the average exchange rate for the periods presented. Adjustments resulting from the translation of our consolidated financial statements are recorded as other comprehensive income (loss). Transaction gains and losses that arise from exchange rate fluctuations on transactions denominated in a currency other than the functional currency are included in the results of operations as incurred. For the three and six months ended September 30, 2016 and 2015, foreign currency translation adjustments of $(76,011) and $(346,926), respectively, $(702,747) and $(246,844), respectively, have been reported as other comprehensive income (loss) in the consolidated statements of income and other comprehensive income (loss), respectively. The significant increase in the translation adjustments was due to the PRC's devaluation of its currency. Further devaluation could occur.
Liquidity and Capital Resources
As of September 30, 2016, the Company had cash and cash equivalents of $6,563,778, compared to $21,548,630 as of March 31, 2016. The following table summarizes our cash flows for the six months ended September 30, 2016 and 2015:
|
|
Six months
ended
September 30,
2016
|
Six months
ended
September 30,
2015
|
||||||
|
Net cash provided by operating activities
|
$
|
951,300
|
$
|
7,535,499
|
||||
|
Net cash (used in) investing activities
|
$
|
(10,397,016
|
)
|
$
|
(336,309
|
)
|
||
|
Net cash (used in) provided by financing activities
|
$
|
(5,064,861
|
)
|
$
|
1,406,546
|
|||
During the six months ended September 30, 2016, our operations yielded $8,303,266 in net income but only provided cash totaling $951,300. The discrepancy between net income and cash was primarily due to our pre-payment of $5,525,358 to lease farm land over the next several years. In addition, our accounts receivable increased by $2,460,650 during that period, and the balance of advances from customers decreased by $739,182, all of which was partially offset by a reduction of $942,652 in our inventory. During the six months ended September 30, 2015, our operations yielded $5,400,908 in net income and provided cash totaling $7,535,499. The difference was primarily caused by an increase in taxes payable of $1,222,709 and a decrease in inventory of $830,599.
We received loans of $370,605 from a stockholder who paid our professional fees in the United States and in Australia during the six months ended September 30, 2016, , which is classified as a financing activity for the six months ended September 30, 2016. With a portion of these loans, we paid expenses of $304,452 related to listing on the ASX. During the six months ended September 30, 2016, we also satisfied convertible debt issued by our Australian subsidiary to the three independent individuals by payment of $5,435,466. As a result, net cash used in financing activities for the six months ended September 30, 2016 was $5,064,861. For the six months ended September 30, 2015, a capital contribution to our Chinese operating company of $816,001, the sale by our Australian subsidiary of convertible debt for $564,200, and a stockholder loan of $26,345, resulted in net cash provided by financing activities of $1,406,546.39
With the cash from operations and financing activities, we used $10,397,016 to purchase fixed assets during the six months ended September 30, 2016, which was classified as cash used in investing activities. This purchase primarily consisted of the fruit orchard located on the farmland that we leased during the same period. During the six months ended September 30, 2015, we purchased fixed assets for $326,482 and spent $9,827 to further develop our website, resulting in total cash used in investing activities of $336,309.
We had working capital of approximately $11,000,000 as of September 30, 2016, a decrease of approximately $5,000,000 compared to March 31, 2016. The decrease was principally the result of the cash used by investing and financing activities.
Our debt obligations at September 30, 2016 consisted of $907,804 in stockholder loans payable on demand. Since our cash balance far exceeds our debt obligations, we believe that our capital resources will be adequate to fund our Company's operations for at least the next 12 months.
Transfer of Cash
According to PRC laws and regulations, in the event that we need to finance our PRC operations in the future, we are allowed to provide funding by means of capital contributions and/or loans to Zhongshan Winha. The loans would be subject to applicable government registration and approval requirements. We may not be able to complete the registration or obtain these government approvals on a timely basis. If we fail to complete such registration or receive such approvals, our ability to finance our PRC operations may be negatively affected, which could adversely affect our liquidity and our ability to fund and expand our business.
Current PRC regulations permit our PRC subsidiaries to pay dividends to us. However, payment of dividends is subject to applicable regulatory requirements. Furthermore, cash transfers from our PRC subsidiaries to their parent companies outside of China are subject to PRC government control of currency conversion. We receive substantially all of our revenues in RMB. Under our current corporate structure, our income is primarily derived by our PRC subsidiaries. Under existing PRC foreign exchange regulations, payments of current account items, including profit distributions, interest payments and expenditures from trade-related transactions can be made in foreign currencies without prior approval from the State Administration of Foreign Exchange ("SAFE") by complying with certain procedural requirements. As profits and dividends are current account items, any revenue generated in the PRC may be paid to shareholders outside of the PRC as profit or dividends without prior approval from SAFE so long as we comply with certain procedural requirements. However, the PRC government may also, at its discretion, restrict access in the future to foreign currencies for current account transactions. If the foreign exchange control system prevents us from obtaining sufficient foreign currency to satisfy our currency demands, we may not be able to pay dividends in foreign currencies to our shareholders. Our inability to obtain the requisite approvals for converting RMB into foreign currencies, any delays in receiving such approvals or any future restrictions on currency exchanges may restrict the ability of our PRC subsidiary to remit sufficient foreign currency to pay dividends or other payments to us, or otherwise satisfy its foreign currency denominated obligations.
The Company currently intends to reinvest its earnings in expanding its operations and currently has no plans to pay any dividends.
40
Critical Accounting Policies and Estimates
In preparing our financial statements we are required to formulate working policies regarding valuation of our assets and liabilities and to develop estimates of those values. In our preparation of the financial statements for the six months ended September 30, 2016, there were no estimates made which were (a) subject to a high degree of uncertainty and (b) material to our results.
Impact of Accounting Pronouncements
There were no recent accounting pronouncements that have or will have a material effect on the Company's financial position or results of operations.
Off Balance Sheet Transactions
We do not currently have any off-balance sheet arrangements.
ITEM 3. QUANTITATIVE AND QUALITATIVE DISCLOSURES ABOUT MARKET RISK
Not applicable.
ITEM 4. CONTROLS AND PROCEDURES
Disclosure Controls and Procedures
Evaluation of Disclosure Controls and Procedures. Our Chief Executive Officer and Chief Financial Officer carried out an evaluation of the effectiveness of the Company's disclosure controls and procedures (as defined in Rule13a-15(e) promulgated by the Securities and Exchange Commission) as of September 30, 2016. The evaluation revealed that there are material weaknesses in our disclosure controls, specifically:
|
·
|
We have not achieved the desired level of corporate governance with regard to identifying and measuring the risk of material misstatement. Because of our limited internal resources, we lack key monitoring mechanisms such as independent directors and audit committee to oversee and monitor the Company's risk management, business strategies and financial reporting procedures.
|
|
·
|
We have not designed and implemented controls to maintain appropriate segregation of duties in our manual and computer-based business processes which could affect the Company's purchasing controls, the limits on the delegation of authority for expenditures, and the proper review of manual journal entries.
|
|
·
|
Our accounting department personnel have limited knowledge and experience in US GAAP and reports with the Securities and Exchange Commission (the "SEC"). To remediate the material weakness, the management has hired an external consultant with extensive experience in US GAAP and reports to the SEC, who is responsible for assisting the Company with (i) the preparation of its financial statements in accordance with US GAAP and (ii) its periodic reports with the SEC.
|
Based on their evaluation, our Chief Executive Officer and Chief Financial Officer concluded that the Company's system of disclosure controls and procedures was not effective as of September 30, 2016.
41
Changes in Internal Control over Financial Reporting
There have been no changes in our internal control over financial reporting during the period covered by this report that has materially affected, or is reasonably likely to materially affect, our internal control over financial reporting.
PART II - OTHER INFORMATION
|
Item 1.
|
Legal Proceedings
|
|
|
None.
|
|
|
|
|
Item 1A
|
Risk Factors
|
|
|
There have been no material changes from the risk factors included in the Annual Report on Form 10-K for the year ended March 31, 2016.
|
|
|
|
|
Item 2
|
Unregistered Sale of Securities and Use of Proceeds
|
|
|
|
|
|
(a) Unregistered sales of equity securities
|
|
|
The Company did not effect any unregistered sale of securities during the second quarter of fiscal year 2017.
|
|
|
|
|
|
(c) Purchases of equity securities
|
|
|
The Company did not repurchase any of its equity securities that were registered under Section 12 of the Securities Exchange Act during the second quarter of fiscal year 2017.
|
|
|
|
|
Item 3.
|
Defaults Upon Senior Securities.
|
|
|
None.
|
42
|
Item 4.
|
Mine Safety Disclosures.
|
|
|
Not Applicable.
|
|
Item 5.
|
Other Information.
|
|
|
None.
|
|
Item 6.
|
Exhibits
|
|
31
|
Rule 13a-14(a) Certification - CEO and CFO
|
|
32
|
Rule 13a-14(b) Certification
|
|
101.INS
|
XBRL Instance
|
|
101.SCH
|
XBRL Schema XBRL Schema
|
|
101.CAL
|
XBRL Calculation
|
|
101.DEF
|
XBRL Definition
|
|
101.LAB
|
XBRL Label
|
|
101.PRE
|
XBRL Presentation
|
43
SIGNATURES
Pursuant to the requirements of the Securities Exchange Act of 1934, the Registrant has duly caused this Report to be signed on its behalf by the undersigned thereunto duly authorized.
|
|
WINHA INTERNATIONAL GROUP LIMITED.
|
|
||||
|
|
|
|
|
|||
|
Date: November 21, 2016
|
By:
|
/s/ Chung Yan Winnie Lan
|
|
|||
|
|
|
Chung Yan Winnie Lan, Chief Executive Officer, Chief Financial and Accounting Officer
|
|
|||
44