FORM 10-K
UNITED STATES SECURITIES AND EXCHANGE COMMISSION
Washington, D.C. 20549
(Mark One)
þ | ANNUAL REPORT PURSUANT TO SECTION 13 OR 15(d) OF THE SECURITIES EXCHANGE ACT OF 1934 |
For the fiscal year ended December 31, 2015
OR
o | TRANSITION REPORT PURSUANT TO SECTION 13 OR 15(d) OF THE SECURITIES EXCHANGE ACT OF 1934 |
For the transition period from _______________ to _______________ | |
Commission file number 1-36232
VALERO ENERGY PARTNERS LP
(Exact name of registrant as specified in its charter)
Delaware | 90-1006559 |
(State or other jurisdiction of | (I.R.S. Employer |
incorporation or organization) | Identification No.) |
One Valero Way | |||
San Antonio, Texas | 78249 | ||
(Address of principal executive offices) | (Zip Code) | ||
Registrant’s telephone number, including area code: (210) 345-2000 | |||
Securities registered pursuant to Section 12(b) of the Act: Common units representing limited partnership interests listed on the New York Stock Exchange.
Securities registered pursuant to Section 12(g) of the Act: None.
Indicate by check mark if the registrant is a well-known seasoned issuer, as defined in Rule 405 of the Securities Act.
Yes þ No o
Indicate by check mark if the registrant is not required to file reports pursuant to Section 13 or Section 15(d) of the Act.
Yes o No þ
Indicate by check mark whether the registrant (1) has filed all reports required to be filed by Section 13 or 15(d) of the Securities Exchange Act of 1934 during the preceding 12 months (or for such shorter period that the registrant was required to file such reports), and (2) has been subject to such filing requirements for the past 90 days. Yes þ No o
Indicate by check mark whether the registrant has submitted electronically and posted on its corporate Web site, if any, every Interactive Data File required to be submitted and posted pursuant to Rule 405 of Regulation S-T (§232.405 of this chapter) during the preceding 12 months (or for such shorter period that the registrant was required to submit and post such files). Yes þ No o
Indicate by check mark if disclosure of delinquent filers pursuant to Item 405 of Regulation S-K (§229.405 of this chapter) is not contained herein, and will not be contained, to the best of registrant’s knowledge, in definitive proxy or information statements incorporated by reference in Part III of this Form 10-K or any amendment to this Form 10-K. þ
Indicate by check mark whether the registrant is a large accelerated filer, an accelerated filer, a non-accelerated filer, or a smaller reporting company. See the definitions of “large accelerated filer,” “accelerated filer,” and “smaller reporting company” in Rule12b-2 of the Exchange Act.
Large accelerated filer þ | Accelerated filer o | Non-accelerated filer o | Smaller reporting company o |
Indicate by check mark whether the registrant is a shell company (as defined in Rule 12b-2 of the Exchange Act). Yes o No þ
The aggregate market value of the voting and non-voting common units held by non-affiliates was approximately $881.6 million based on the last sales price quoted as of June 30, 2015 on the New York Stock Exchange, the last business day of the registrant’s most recently completed second fiscal quarter.
The registrant had 36,534,211 common units, 28,789,989 subordinated units and 1,332,829 general partner units outstanding at February 1, 2016.
DOCUMENTS INCORPORATED BY REFERENCE
None
CONTENTS
PAGE | ||
i
References in this report to “Partnership,” “we,” “our,” “us,” or similar terms refer to Valero Energy Partners LP, one or more of its subsidiaries, or all of them taken as a whole. References to “our general partner” refer to Valero Energy Partners GP LLC, an indirect wholly owned subsidiary of Valero Energy Corporation. References to “Valero” refer to Valero Energy Corporation, one or more of its subsidiaries (other than Valero Energy Partners LP or Valero Energy Partners GP LLC), or all of them taken as a whole.
PART I
ITEMS 1 & 2. BUSINESS and PROPERTIES
BUSINESS
Overview
Valero Energy Partners LP is a Delaware limited partnership formed in July 2013. On December 16, 2013, we completed our initial public offering (the IPO) of 17,250,000 common units representing limited partner interests. Our common units are listed on the New York Stock Exchange (NYSE) under the symbol “VLP.” See Note 11 of Notes to Consolidated Financial Statements for further discussion of the IPO. Our company offices are located at One Valero Way, San Antonio, Texas 78249.
Our website address is www.valeroenergypartners.com. Information on our website is not part of this report. Our annual reports on Form 10-K, quarterly reports on Form 10-Q, current reports on Form 8-K, and amendments to those reports filed with or furnished to the United States (U.S.) Securities and Exchange Commission (SEC) are available, free of charge, on our website (under Reports & SEC Filings), soon after we file or furnish such material.
We are a master limited partnership formed by Valero to own, operate, develop, and acquire crude oil and refined petroleum products pipelines, terminals, and other transportation and logistics assets. Our assets include crude oil and refined petroleum products pipeline and terminal systems in the U.S. Gulf Coast and U.S. Mid-Continent regions that are integral to the operations of the following Valero refineries:
• | Port Arthur Refinery–Port Arthur, Texas; |
• | McKee Refinery–Sunray, Texas; |
• | Three Rivers Refinery–Three Rivers, Texas; |
• | Memphis Refinery–Memphis, Tennessee; |
• | Ardmore Refinery–Ardmore, Oklahoma; |
• | St. Charles Refinery–Norco, Louisiana; |
• | Houston Refinery–Houston, Texas; and |
• | Corpus Christi East and West Refineries–Corpus Christi, Texas. |
We generate revenues by charging tariffs and fees for transporting crude oil and refined petroleum products through our pipelines and terminals. All of our revenues are derived from transactions with Valero. We expect Valero to serve as a critical source of our future growth by providing us opportunities to purchase additional transportation and logistics assets that Valero currently owns or may acquire or develop in the future. Our agreements with Valero are discussed more fully in other sections of this report.
1
Acquisitions in 2015
Effective March 1, 2015, we acquired two subsidiaries from Valero that own and operate crude oil, intermediates, and refined petroleum products terminals supporting Valero’s Houston and St. Charles Refineries (the Houston and St. Charles Terminal Services Business) for total consideration of $671.2 million.
Effective October 1, 2015, we acquired subsidiaries from Valero that own and operate crude oil, intermediates, and refined petroleum products terminals supporting Valero’s Corpus Christi East and Corpus Christi West Refineries (collectively, the Corpus Christi Terminal Services Business) for total consideration of $465.0 million.
In connection with these acquisitions, we issued common units and general partner units to Valero and entered into various agreements with Valero. These transactions and agreements are described further in Note 3 and Note 4 of Notes to Consolidated Financial Statements. The descriptions of these acquisitions and the related agreements in Notes 3 and 4 of Notes to Consolidated Financial Statements are incorporated herein by reference.
Other Developments
In November 2015, we amended and restated our senior unsecured revolving credit facility agreement (the Revolver) to, among other things, extend the maturity from December 2018 to November 2020 and increase the total commitment from $300.0 million to $750.0 million. See Note 7 of Notes to Consolidated Financial Statements for a summary of the terms of the Revolver.
During 2015, we entered into two subordinated credit agreements with Valero (the Loan Agreements) under which we borrowed $160.0 million and $395.0 million (collectively, the loans) to finance a portion of the acquisitions of the Houston and St. Charles Terminal Services Business and the Corpus Christi Terminal Services Business, respectively, as described in Note 3. The loans mature on March 1 and October 1, 2020, respectively, and may be prepaid at any time without penalty. See Note 7 of Notes to Consolidated Financial Statements for a summary of the terms of the Loan Agreements.
In November 2015, we completed a public offering (the 2015 Offering) of 4,250,000 common units at a price of $46.25 per unit and received gross proceeds of $196.6 million. After deducting the underwriting discount and other offering costs totaling $7.7 million, our net proceeds from the offering were $188.9 million. Concurrent with the offering, our general partner contributed $4.0 million in exchange for 86,735 general partner units to maintain its 2.0 percent general partner interest in the Partnership. In December 2015, we used $185.0 million of these proceeds to pay down one of our Loan Agreements as further described in Note 7 of Notes to Consolidated Financial Statements.
2
Organizational Structure
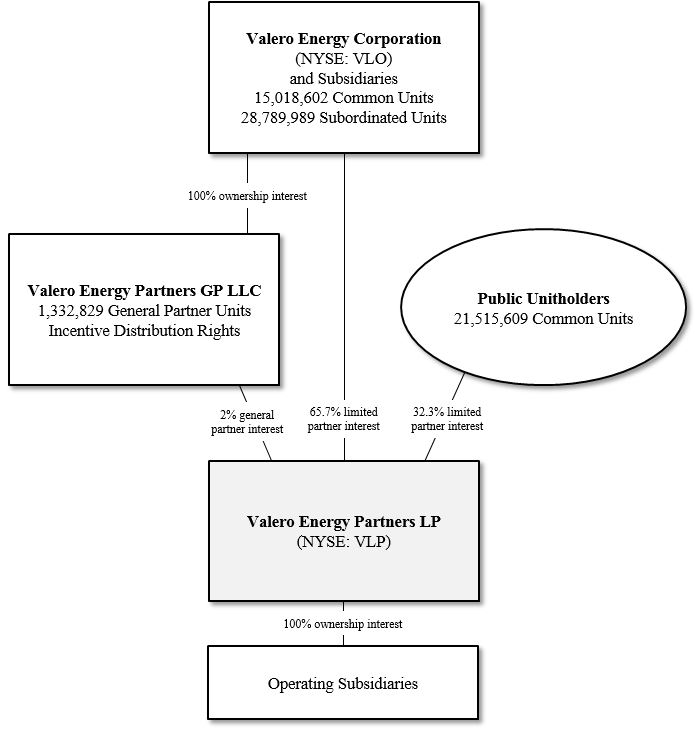
The following simplified diagram depicts our organizational structure as of February 1, 2016.
Segments
Our operations consist of one reportable segment and are conducted solely in the U.S. All of our assets are located in the U.S. See Item 8., “Financial Statements and Supplementary Data” for financial information about our operations and assets.
3
Our Assets and Operations
The following sections describe our assets and the related services that we provide.
Port Arthur Logistics System
Our Port Arthur logistics system includes our Lucas crude system and our Port Arthur products system.
Lucas Crude System. Our Lucas crude system supports diverse and flexible crude oil supply options for Valero’s Port Arthur Refinery. Our Lucas crude system comprises the following assets:
• | Lucas Terminal. Our Lucas terminal is located 12 miles from Valero’s Port Arthur Refinery on 495 acres. The facility consists of seven storage tanks with an aggregate of 1.9 million barrels of storage capacity. The Lucas terminal receives crude oil through our Nederland pipeline, which connects to the Sunoco Logistics Partners L.P. marine terminal in Nederland, Texas, as well as through connections to the Cameron Highway crude oil pipeline and Enterprise’s Beaumont marine terminal. The terminal connects to TransCanada’s Cushing MarketLink pipeline via our TransCanada connection and to the Seaway crude oil pipeline via our Seaway connection. The Lucas terminal delivers crude oil to Valero’s Port Arthur Refinery through our Lucas pipeline. |
• | Lucas Pipeline. Our Lucas pipeline is a 12-mile, 30-inch pipeline with 400,000 barrels per day of capacity that delivers crude oil from our Lucas terminal to Valero’s Port Arthur Refinery. |
• | Nederland Pipeline. Our Nederland pipeline is a five-mile, 32-inch pipeline with 600,000 barrels per day of capacity that delivers crude oil to our Lucas terminal from the Sunoco Logistics Nederland marine terminal. |
• | TransCanada Connection. Our TransCanada connection has 400,000 barrels per day of capacity and connects our Lucas terminal to TransCanada’s Cushing MarketLink pipeline. |
• | Seaway Connection. Our Seaway connection has 750,000 barrels per day of capacity and connects our Lucas terminal to the Seaway crude oil pipeline. |
Port Arthur Products System. Our Port Arthur products system transports refined petroleum products from Valero’s Port Arthur Refinery to major third-party pipeline systems, including the Explorer, Colonial, Sunoco Logistics MagTex and Enterprise TE Products refined petroleum products pipeline systems, for delivery to various marketing outlets, and to Enterprise’s Beaumont marine terminal for exports.
Our Port Arthur products system comprises the following assets:
• | Port Arthur Products Pipelines (PAPS – El Vista). Our Port Arthur products pipelines consist of a four-mile, 20-inch pipeline with 144,000 barrels per day of capacity that delivers gasoline from Valero’s Port Arthur Refinery to our El Vista terminal and a three-mile, 20-inch pipeline with 216,000 barrels per day of capacity that delivers diesel from Valero’s Port Arthur Refinery to our Port Arthur Products Station (PAPS) terminal. |
• | 12-10 Pipeline. Our 12-10 pipeline consists of 13 miles of 12-inch and 10-inch pipeline with 60,000 barrels per day of capacity that delivers refined petroleum products from Valero’s Port Arthur Refinery to the Enterprise TE Products pipeline connection, the Sunoco Logistics MagTex pipeline connection, and Enterprise’s Beaumont marine terminal. |
4
• | PAPS and El Vista Terminals. Our PAPS terminal consists of eight tanks with 821,000 barrels of diesel storage capacity, and our El Vista terminal consists of eight tanks with 1.2 million barrels of gasoline storage capacity. Our PAPS terminal also contains storage tanks owned by Colonial, which serves as the operator of our PAPS terminal. Each party owns its own tanks at the PAPS terminal and its own external pipelines connecting to the terminal, but certain equipment and improvements located at and serving the terminal are jointly owned. We own all of the El Vista terminal assets. |
McKee Logistics System
Our McKee logistics system is a crude oil and refined petroleum products pipeline and terminal system supporting Valero’s McKee Refinery. Our McKee logistics system includes our McKee crude system and McKee products system.
McKee Crude System. Our McKee crude system supplies crude oil to Valero’s McKee Refinery. The system has a throughput capacity of approximately 72,000 barrels per day and consists of 145 miles of pipelines located in the Texas panhandle and western Oklahoma, 20 crude oil truck unloading sites with lease automatic custody transfer units, and approximately 240,000 barrels of storage capacity.
McKee Products System. Our McKee products system transports refined petroleum products from Valero’s McKee Refinery to our refined petroleum products terminal in El Paso, Texas and on to Kinder Morgan’s SFPP system for marketing in the southwest U.S. We own a 33⅓ percent undivided interest in the system. Capacity on the McKee products system is allocated between the other interest owner and us according to our respective ownership interests.
Our McKee products system comprises the following assets:
• | McKee to El Paso Pipeline. Our McKee to El Paso pipeline consists of 408 miles of 10-inch pipeline that delivers diesel and gasoline produced at Valero’s McKee Refinery to our El Paso terminal. The pipeline has a total capacity of 63,000 barrels per day (of which 21,000 barrels per day of capacity are allocable to our 33⅓ percent undivided interest). |
• | SFPP Pipeline Connection. Our SFPP pipeline connection consists of 12 miles of 16- and 8-inch pipelines that deliver diesel and gasoline from our El Paso terminal to Kinder Morgan’s SFPP system. The SFPP pipeline connection has 98,400 barrels per day of capacity (of which 33,000 barrels per day of capacity are allocable to our 33⅓ percent undivided interest). |
• | El Paso Terminal. Our El Paso terminal is located on 117 acres and consists of 10 storage tanks with 499,000 barrels of storage capacity (of which 166,000 barrels of capacity are allocable to our 33⅓ percent undivided interest). The El Paso terminal receives refined petroleum products delivered to the terminal through our McKee to El Paso pipeline and delivers refined petroleum products to our four-bay truck rack at our El Paso terminal and to Kinder Morgan’s SFPP system through our SFPP pipeline connection. Our El Paso terminal truck rack has 30,000 barrels per day of capacity (of which 10,000 barrels per day of capacity are allocable to our 33⅓ percent undivided interest). |
5
Memphis Logistics System
Our Memphis logistics system includes our Collierville crude system and our Memphis products system.
Collierville Crude System. Our Collierville crude system is the primary crude oil supply source for Valero’s Memphis Refinery, delivering crude oil from the Capline pipeline.
Our Collierville crude system comprises the following assets:
• | Collierville Pipeline System. Our Collierville pipeline system consists of 52 miles of 10- to 20-inch pipelines with 210,000 barrels per day of capacity that deliver crude oil to Valero’s Memphis Refinery. We lease an approximate 13 mile portion of this pipeline, which runs from the Mississippi state line to the Memphis Refinery, from Memphis Light, Gas and Water (MLGW). The initial term of the lease, along with renewal periods available at our option, extend through 2046. |
• | Collierville Terminal. Our Collierville terminal is located in Byhalia, Mississippi on 60 acres. The facility consists of three storage tanks with 975,000 barrels of storage capacity. The Collierville terminal receives crude oil delivered to the terminal through the Capline pipeline. |
• | St. James Crude Tank. We own a 330,000 barrel crude oil storage tank in St. James, Louisiana located on land we lease from Shell. The tank is used to aggregate crude oil volumes to batch deliveries through the Capline pipeline to our Collierville terminal. |
Memphis Products System. Our Memphis products system is the primary outlet for refined petroleum products produced at Valero’s Memphis Refinery. Distribution of these products occurs through our Memphis truck rack and our terminal in West Memphis, Arkansas, for further distribution via truck and barge to marketing outlets along the central Mississippi River, to Exxon’s Memphis refined petroleum products terminal, and to the Memphis International Airport.
Our Memphis products system comprises the following assets:
• | Shorthorn Pipeline System. Our Shorthorn pipeline system consists of seven miles of 14-inch pipeline that delivers diesel and gasoline produced at Valero’s Memphis Refinery to our West Memphis terminal and two miles of 12-inch pipeline that delivers diesel and gasoline from our West Memphis terminal and Valero’s Memphis Refinery to Exxon’s Memphis refined petroleum products terminal. We lease the 14-inch pipeline from MLGW. The initial term of the lease, along with renewal periods available at our option, extend through 2046. The Shorthorn pipeline system has a total capacity of 120,000 barrels per day. |
• | Memphis Airport Pipeline System. Our Memphis Airport pipeline system consists of a nine-mile, six-inch pipeline that delivers jet fuel produced at Valero’s Memphis Refinery to the Swissport Fueling, Inc. terminal located at the Memphis International Airport and a two-mile, six-inch pipeline that delivers jet fuel from Valero’s Memphis Refinery to the FedEx jet fuel terminal located at the Memphis International Airport. The Memphis Airport pipeline system has a total capacity of 20,000 barrels per day. Both six-inch pipelines are owned by MLGW and we have an agreement with MLGW under which we are the exclusive operator of both pipelines. Our agreement with MLGW automatically renews and MLGW does not have a right to terminate. |
6
• | West Memphis Terminal. Our West Memphis terminal is located in West Memphis, Arkansas on 75 acres. The facility consists of 18 storage tanks with over one million barrels of storage capacity, a truck rack, and a barge dock on the Mississippi River. Our West Memphis terminal receives refined petroleum products through our Shorthorn pipeline system and through a biodiesel truck unloading rack located at the terminal. The terminal delivers refined petroleum products to the five-bay, 50,000 barrels per day truck rack at the terminal, our two-berth, 4,000 barrels per hour barge dock on the Mississippi River, and our Shorthorn pipeline system for deliveries to Exxon’s Memphis terminal. |
• | Memphis Truck Rack. Our Memphis truck rack is located on five acres of land adjacent to Valero’s Memphis Refinery. The facility consists of a high-capacity seven-bay truck rack and five biodiesel storage tanks with 8,000 barrels of storage capacity. The truck rack has a capacity of 110,000 barrels per day. |
Three Rivers Crude System
Our Three Rivers crude system supports Valero’s Three Rivers Refinery and is located in the Eagle Ford shale region in South Texas. The system consists of 11 crude oil truck unloading sites with lease automatic custody transfer units and three 1-mile, 12-inch pipelines with a capacity of 110,000 barrels per day. The system delivers crude oil received from the truck unloading sites and pipeline connections to tanks at Valero’s Three Rivers Refinery. The system also receives locally produced crude oil via connections to the Harvest Arrowhead pipeline system and the Plains Gardendale pipeline for processing at the Three Rivers Refinery or for shipment through third-party pipelines to Valero’s refineries in Corpus Christi, Texas. The system has a connection to the EOG Eagle Ford West Pipeline and supporting pipeline infrastructure, which segregate and connect Eagle Ford crude oil production to Valero’s Three Rivers Refinery.
Wynnewood Products System
The Wynnewood products system is the primary distribution outlet for refined petroleum products from Valero’s Ardmore Refinery. The system consists of a 30-mile, 12-inch refined petroleum products pipeline with 90,000 barrels per day of capacity and two tanks with a total of 180,000 barrels of storage capacity. The system connects Valero’s Ardmore Refinery to the Magellan refined products pipeline system.
Houston Terminal
Our Houston terminal is a crude oil, intermediates, and refined petroleum products terminal that supports Valero’s Houston Refinery. The terminal is located on the Houston ship channel and has storage tanks with 3.6 million barrels of storage capacity. The terminal receives waterborne crude oil via the refinery’s docks and the terminal’s connection to Houston Fuel Oil Terminal Company (HFOTCO), and receives pipeline crude oil through the Magellan and Seaway systems. The terminal can distribute refined petroleum products across the refinery’s docks and into the Magellan South Pipeline system. Also, the terminal can access the Colonial, TEPPCO, and Explorer pipeline systems via the Kinder Morgan Pasadena terminal.
St. Charles Terminal
Our St. Charles terminal is a crude oil, intermediates, and refined petroleum products terminal that supports Valero’s St. Charles Refinery. The terminal is located on the Mississippi River and has storage tanks with 10 million barrels of storage capacity. The terminal receives crude oil via the refinery’s docks and from Louisiana Offshore Oil Port (LOOP) via the Clovelly pipeline. The terminal can distribute refined petroleum products across the refinery’s docks and into the Plantation (via Parkway) and Colonial (via Bengal) pipeline systems.
7
Corpus Christi Terminals
Our Corpus Christi terminals are engaged in the business of terminaling crude oil, intermediates, and refined petroleum products in Corpus Christi, Texas.
• | Corpus Christi East Terminal. Our Corpus Christi East terminal supports Valero’s Corpus Christi East Refinery. The Corpus Christi East terminal is located on the Corpus Christi ship channel and has storage tanks with 6.2 million barrels of storage capacity. |
• | Corpus Christi West Terminal. Our Corpus Christi West terminal supports Valero’s Corpus Christi West Refinery. The Corpus Christi West terminal is located on the Corpus Christi ship channel and has storage tanks with 3.8 million barrels of storage capacity. |
Our Corpus Christi terminals are connected via pipeline. The terminals can receive crude oil via the refineries’ docks, the Eagle Ford Pipeline LLC pipeline, the North Beach terminal owned by NuStar Logistics, L.P. (NuStar), and NuStar’s Eagle Ford pipelines. The terminals can distribute products across their docks and through NuStar’s South Texas pipeline network.
8
Pipelines
The following table summarizes information with respect to our pipelines described above:
Pipeline | Diameter (inches) | Length (miles) | Throughput Capacity (thousand barrels per day) | Commodity | Associated Valero Refinery | Significant Third-party System Connections | ||||||
Port Arthur logistics system | ||||||||||||
Lucas crude system | ||||||||||||
Lucas pipeline | 30 | 12 | 400 | crude oil | Port Arthur | Sunoco Logistics Nederland; Enterprise Beaumont; Cameron Highway; TransCanada Cushing MarketLink | ||||||
Nederland pipeline | 32 | 5 | 600 | crude oil | Port Arthur | Sunoco Logistics Nederland | ||||||
Port Arthur products system | ||||||||||||
20-inch gasoline pipeline | 20 | 4 | 144 | gasoline | Port Arthur | Explorer; Colonial | ||||||
20-inch diesel pipeline | 20 | 3 | 216 | diesel | Port Arthur | Explorer; Colonial | ||||||
12-10 pipeline | 12, 10 | 13 | 60 | refined petroleum products | Port Arthur | Sunoco Logistics MagTex; Enterprise TE Products; Enterprise Beaumont | ||||||
McKee logistics system | ||||||||||||
McKee crude system | multiple segments | 145 | 72 | crude oil | McKee | — | ||||||
McKee products system | ||||||||||||
McKee to El Paso pipeline | 10 | 408 | 21(1) | refined petroleum products | McKee | — | ||||||
SFPP pipeline connection | 16, 8 | 12 | 33(2) | refined petroleum products | McKee | Kinder Morgan's SFPP System | ||||||
Memphis logistics system(3) | ||||||||||||
Collierville crude system | ||||||||||||
Collierville pipeline | 10-20 | 52 | 210 | crude oil | Memphis | Capline | ||||||
Memphis products system | ||||||||||||
Shorthorn pipeline system | 14, 12 | 9 | 120 | refined petroleum products | Memphis | Exxon Memphis | ||||||
Memphis Airport pipeline system | 6 | 11 | 20 | jet fuel | Memphis | Memphis International Airport | ||||||
Three Rivers crude system | ||||||||||||
Three Rivers crude system | 12 | 3 | 110 | crude oil | Three Rivers | Harvest Arrowhead, Plains Gardendale, and EOG Eagle Ford West | ||||||
Wynnewood products system | ||||||||||||
Wynnewood refined products pipeline | 12 | 30 | 90 | refined petroleum products | Ardmore | Magellan | ||||||
_____________
(1) | Capacity shown represents our 33⅓ percent undivided interest in the pipeline. Total capacity for the pipeline is 63,000 barrels per day. |
(2) | Capacity shown represents our 33⅓ percent undivided interest in the pipeline connection. Total capacity for the pipeline connection is 98,400 barrels per day. |
(3) | Portions of our Memphis logistics system pipelines are owned by MLGW, but they are operated and maintained exclusively by us under long-term arrangements with MLGW. |
9
Terminals
The following table summarizes information with respect to our terminals described above:
Terminal | Tank Storage Capacity (thousands of barrels) | Throughput Capacity (thousand barrels per day) | Commodity | Associated Valero Refinery | Significant Third-party System Connections | |||||
Port Arthur logistics system | ||||||||||
Lucas crude system | ||||||||||
Lucas terminal | 1,915 | — | crude oil | Port Arthur | Sunoco Logistics Nederland; Enterprise Beaumont; Cameron Highway; TransCanada Cushing MarketLink; Seaway | |||||
TransCanada connection | — | 400 | crude oil | Port Arthur | TransCanada Cushing MarketLink | |||||
Seaway connection | — | 750 | crude oil | Port Arthur | Seaway | |||||
Port Arthur products system | ||||||||||
PAPS terminal | 821 | — | diesel | Port Arthur | Explorer; Colonial | |||||
El Vista terminal | 1,210 | — | gasoline | Port Arthur | Explorer; Colonial | |||||
McKee logistics system | ||||||||||
McKee crude system | ||||||||||
Various terminals | 240 | — | crude oil | McKee | — | |||||
McKee products system | ||||||||||
El Paso terminal | 166 (1) | — | refined petroleum products | McKee | Kinder Morgan SFPP System | |||||
El Paso terminal truck rack | — | 10 (2) | refined petroleum products | McKee | — | |||||
Memphis logistics system | ||||||||||
Collierville crude system | ||||||||||
Collierville terminal | 975 | — | crude oil | Memphis | Capline | |||||
St. James crude tank | 330 | — | crude oil | Memphis | Capline | |||||
Memphis products system | ||||||||||
West Memphis terminal | 1,080 | — | refined petroleum products | Memphis | Exxon Memphis; Enterprise TE Products | |||||
West Memphis terminal truck rack | — | 50 | refined petroleum products | Memphis | — | |||||
West Memphis terminal dock | — | 4 (3) | refined petroleum products | Memphis | — | |||||
Memphis truck rack | 8 | 110 | refined petroleum products | Memphis | — | |||||
Wynnewood products system | ||||||||||
Wynnewood terminal | 180 | — | refined petroleum products | Ardmore | Magellan | |||||
Houston terminal | 3,642 | — | crude oil and refined petroleum products | Houston | HFOTCO, Magellan, Seaway | |||||
St. Charles terminal | 10,004 | — | crude oil and refined petroleum products | St. Charles | LOOP, Plantation, Colonial | |||||
10
Terminal | Tank Storage Capacity (thousands of barrels) | Throughput Capacity (thousand barrels per day) | Commodity | Associated Valero Refinery | Significant Third-party System Connections | |||||
Corpus Christi terminals | ||||||||||
Corpus Christi East terminal | 6,241 | — | crude oil and refined petroleum products | Corpus Christi East | Eagle Ford Pipeline LLC; NuStar North Beach terminal, Eagle Ford pipelines, and South Texas pipeline network | |||||
Corpus Christi West terminal | 3,835 | — | crude oil and refined petroleum products | Corpus Christi West | (same as Corpus Christi East terminal) | |||||
_____________
(1) | Capacity shown represents our 33⅓ percent undivided interest in the terminal. Total storage capacity is 499,000 barrels. |
(2) | Capacity shown represents our 33⅓ percent undivided interest in the truck rack. Total capacity is 30,000 barrels per day. |
(3) | Dock throughput is reflected in thousands of barrels per hour. |
Our Commercial Agreements with Valero
General
We have a master transportation services agreement with Valero with respect to our pipelines and a master terminal services agreement with Valero with respect to our terminals. Each of our pipelines and terminals is covered by a services schedule under these agreements. The services schedules prescribe rates, commitments, and other terms and conditions applicable to the respective pipelines and terminals. Under these agreements and schedules, we provide transportation and terminaling services to Valero, and Valero pays us for minimum quarterly throughput volumes of crude oil and refined petroleum products, regardless of whether such volumes are physically delivered by Valero in any given quarter. These services schedules have initial 10-year terms from inception, and, with the exception of certain assets, Valero has the option to renew the agreements for one additional five-year term.
Minimum Quarterly Throughput Commitments and Tariff Rates—Pipelines
Under our master transportation services agreement, Valero is obligated to transport minimum volumes of crude oil and refined petroleum products on our pipeline systems and pay a tariff rate with respect to such volumes. Tariff rates with respect to our pipeline systems may be adjusted annually at our discretion in accordance with the Federal Energy Regulatory Commission’s (FERC) indexing methodology. For any pipelines that may be subject to a jurisdictional tariff, we and Valero have agreed not to commence or support any tariff filing, application, protest, complaint, petition, motion, or other proceeding before FERC for the purpose of requesting that FERC accept or set tariff rates that would be inconsistent with the terms of the master transportation services agreement, provided that Valero will continue to have the right under FERC regulations to challenge any proposed changes in our base tariff rates to the extent the changes are inconsistent with FERC’s indexing methodology or other rate changing methodologies, or to the extent the challenge is in response to any proceeding brought against us by a third party that could affect our ability to provide transportation services to Valero under our master transportation services agreement or the applicable tariff.
Minimum Quarterly Throughput Commitments and Fees—Terminals
Under the master terminal services agreement relating to our terminals, Valero is obligated to throughput minimum volumes of crude oil and refined petroleum products and pay us throughput fees, as well as fees for providing related ancillary services such as ethanol, biodiesel and renewable diesel blending, and additive injection (except at the Wynnewood terminal, where Valero agrees to pay us a monthly fee as a base storage charge whether or not Valero actually uses any of the storage or other services made available by us at the
11
terminal). Valero provides and pays for its own inventory of ethanol, biodiesel and renewable diesel blending, and additives to be blended or injected at the terminals, where applicable. Throughput fees with respect to our terminals (or the base storage charge, with respect to our Wynnewood terminal) will be increased on July 1 of each year during the term of the applicable terminal service schedule, and other fees with respect to our terminals may be increased annually at our discretion, in each case by a percentage not to exceed the corresponding percentage change in the applicable inflation index during the 12-month period ending on March 31 of such year. If such index decreases during any period, we are not required to reduce our fees, but any subsequent increases in fees based on an increase in the index will be limited to the amount by which such increase exceeds the aggregate amount of cumulative decreases during the intervening periods.
Quarterly Deficiency Payments
If Valero fails to meet its minimum quarterly throughput commitments under our commercial agreements in any given quarter, it is obligated to pay a deficiency payment equal to the volume deficiency multiplied by the applicable tariff and/or fee with respect to such asset. We refer to this payment as a “quarterly deficiency payment.” Quarterly deficiency payments may be applied as a credit for amounts owed on throughput volumes in excess of Valero’s minimum quarterly throughput commitment with respect to such asset during any of the following four quarters, after which time any unused credits will expire. Upon the expiration of our commercial agreements, Valero may apply any such remaining credit amounts with respect to such asset until the completion of any such four-quarter period against any throughput volumes on such asset in excess of the minimum quarterly throughput commitment that was in place during the term of the agreement with respect to such asset.
Minimum Capacity
Under each of our commercial agreements, we are obligated to provide Valero access to capacity of at least the minimum quarterly throughput commitment for our assets. If the minimum capacity of any of our assets falls below the level of Valero’s minimum quarterly throughput commitment at any time due to events affecting such assets (whether planned or unplanned) or if capacity on any of our assets is required to be allocated among users because volume nominations exceed available capacity, Valero’s minimum quarterly throughput commitments with respect to such assets may be proportionately reduced during the period for which capacity is less than Valero’s minimum quarterly throughput commitment.
Product Gains and Losses
Under each of our commercial agreements, other than those commercial agreements covering assets that may be subject to a jurisdictional tariff or are operated by a third party and such tariff or third-party operating agreement specifically provides otherwise, we have no liability for physical losses except to the extent such losses result from our gross negligence or willful misconduct. In the event a terminal or pipeline asset is equipped to measure volume gains and losses through the installation of custody transfer meters and we begin to accept third-party volumes for throughput, we are required to negotiate provisions regarding loss allowance and allocate gains and losses among us and our customers in accordance with standard industry practices.
Termination and Suspension
Valero is permitted under our commercial agreements to suspend, reduce, or terminate its obligations under certain circumstances. If Valero determines to totally or partially suspend refining operations at a refinery that is supported by our assets for a period of at least 12 consecutive months, we and Valero are required to negotiate in good faith to agree upon a reduction of Valero’s minimum quarterly throughput commitments under the applicable commercial agreement(s), and if we are unable to agree to an appropriate reduction,
12
then after Valero has made a public announcement of such suspension, Valero may terminate the applicable agreement(s) upon 12 months’ notice to us (unless in the interim Valero publicly announces its intent to resume operations at the refinery, in which case its termination notice is deemed revoked). If a force majeure event with respect to our assets prevents us from performing any of our obligations under a commercial agreement, Valero’s obligations with respect to the affected assets under the applicable commercial agreement, including its minimum quarterly throughput commitments, will be suspended to the extent we cannot perform our obligations. In addition, if a force majeure event prevents Valero from fulfilling any of its obligations under our commercial agreements for more than 60 days, Valero’s applicable obligations with respect to the affected assets, including its minimum quarterly throughput commitments, under our commercial agreements will be suspended for the remainder of the force majeure event.
Turnarounds or other planned outages at a refinery are not force majeure events. If a force majeure event prevents any party from performing its obligations under a commercial agreement for a period of more than 12 consecutive months, then either party may terminate the agreement with respect to the affected assets. If Valero elects to terminate or suspend any of our commercial agreements, our financial condition, results of operations, cash flows, and ability to make distributions to our unitholders may be materially and adversely affected. We cannot assure you that Valero will continue to use our assets or that we will be able to generate additional revenues from third parties.
Reimbursements of Capital Expenditures
Our commercial agreements provide that, if we agree to make any capital expenditures at Valero’s request, Valero is required to reimburse us for the expenditures; the reimbursements may be recovered through tariff and/or fee increases in certain cases.
Effects of New Laws or Regulations
If new laws or regulations are enacted or promulgated or if existing laws or their interpretations are materially changed, and if such new or changed laws or regulations will have a material adverse economic impact on either us or Valero, then either of us, acting in good faith, may request to renegotiate the relevant provisions of the affected commercial agreement(s) relating to the parties’ future performance. In such event, we and Valero are required to negotiate in good faith amendments to the affected agreement(s) to conform them to the new or changed laws or regulations while preserving our economic, operational, commercial, and competitive arrangements in accordance with the understandings set forth in the applicable agreement(s).
Alternative Arrangements
Under our commercial agreements, if Valero restructures its operations at a refinery that is supported by our assets in such a manner that materially and adversely affects the economics of Valero’s performance under the applicable commercial agreement, we and Valero are required to negotiate in good faith an alternative arrangement that is no worse economically for us, and that may include a substitution of new minimum quarterly throughput commitments for Valero on other assets owned or to be acquired or constructed by us.
Our Relationship with Valero
Valero is an international manufacturer and marketer of transportation fuels, other petrochemical products, and power. Valero’s assets include 15 petroleum refineries located in the U.S., Canada, and the United Kingdom, with a combined total throughput capacity of approximately 3.0 million barrels per day. Valero also has a substantial portfolio of transportation and logistics assets.
13
We are dependent upon Valero as our only customer and the loss of Valero as a customer would have a material and adverse effect on us. For the years ended December 31, 2015, 2014, and 2013, Valero accounted for all of our revenues. We expect to continue to derive substantially all of our revenues from Valero for the foreseeable future.
Valero owns 100 percent of our general partner, a 65.7 percent limited partner interest in us, and all of our incentive distribution rights. We believe Valero will promote and support the successful execution of our business strategies given its significant ownership in us, the importance of our assets to Valero’s refining and marketing operations, and its stated intention to use us as its primary vehicle to expand the transportation and logistics assets supporting its business.
In addition to our commercial agreements with Valero, we entered into several agreements with Valero in connection with the IPO, many of which we have amended in connection with subsequent acquisitions. These agreements include an amended and restated omnibus agreement, an amended and restated services and secondment agreement, a tax sharing agreement, and several lease and access agreements. These agreements are described in Note 4 of Notes to Consolidated Financial Statements, and the descriptions of these agreements in Note 4 are incorporated herein by reference.
Pipeline Control Operations
Our pipeline systems, other than the El Paso pipeline operated by NuStar, are operated from a central control room located in San Antonio, Texas. The control center operates with a supervisory control and data acquisition system equipped with computer systems designed to monitor operational data continuously. Monitored data includes pressures, temperatures, gravities, flow rates, and alarm conditions. The control center operates remote pumps, motors, and valves associated with the receipt and delivery of crude oil and refined petroleum products, and provides for the remote-controlled shutdown of pump stations on the pipeline system. A fully functional back-up operations center is also maintained and routinely operated throughout the year to ensure safe and reliable operations.
Seasonality
The volumes of crude oil and refined petroleum products transported in our pipelines and stored in our terminals are directly affected by the levels of supply and demand for crude oil and refined petroleum products in the markets served directly or indirectly by our assets. Demand for gasoline is generally higher during the summer months than during the winter months due to seasonal increases in motor vehicle traffic. As a result, Valero’s operating results are generally lower for the first and fourth quarters of each year. Unfavorable weather conditions during the spring and summer months and a resulting lack of the expected seasonal upswings in traffic and sales could adversely affect Valero’s business, financial condition, and results of operations, which may adversely affect our business, financial condition, and results of operations. However, many effects of seasonality on our revenues will be substantially mitigated through the use of our fee-based commercial agreements with Valero that include minimum quarterly throughput commitments.
Competition
As a result of our contractual relationship with Valero under our commercial agreements and our direct connections to nine of Valero’s refineries, we believe that our pipelines and terminals will not face significant competition from other pipelines and terminals for Valero’s crude oil or refined petroleum products transportation requirements to and from the refineries we support.
If Valero’s customers reduce their purchases of refined petroleum products from Valero due to the increased availability of less expensive products from other suppliers or for other reasons, Valero may ship only the
14
minimum volumes through our pipelines (or pay the shortfall payment if it does not ship the minimum volumes), which would cause a decrease in our revenues. Valero competes with integrated petroleum companies, which have their own crude oil supplies and distribution and marketing systems, as well as with independent refiners, many of which also have their own distribution and marketing systems. Valero also competes with other suppliers that purchase refined petroleum products for resale. Competition in any particular geographic area is affected significantly by the volume of products produced by refineries in that area and by the availability of products and the cost of transportation to that area from distant refineries.
Environmental Matters
Our operations are subject to extensive environmental regulations by governmental authorities relating to the discharge and remediation of materials in the environment, greenhouse gas emissions, waste management, pollution prevention, species and habitat preservation, pipeline integrity, and other safety-related regulations, and characteristics and composition of fuels. Because environmental laws and regulations are becoming more complex and stringent and new environmental laws and regulations are continuously being enacted or proposed, the level of future expenditures required for environmental matters could increase in the future. In addition, any major upgrades in any of our operating facilities could require material additional expenditures to comply with environmental laws and regulations.
There are existing remedial obligations at some of our assets including our West Memphis terminal and our Lucas terminal. These existing environmental conditions are retained obligations of the prior operators of these facilities and Valero has agreed to indemnify us with respect to such conditions under the terms of our omnibus agreement. For additional information regarding our environmental matters, please see Note 6 of Notes to Consolidated Financial Statements.
Rate and Other Regulations
FERC and Common Carrier Regulations
We own pipeline assets in Texas, New Mexico, Tennessee, Mississippi, Arkansas, and Oklahoma, and we provide both interstate and intrastate transportation services. Our common carrier pipeline systems are subject to regulation by various federal, state, and local agencies.
FERC regulates interstate transportation on our common carrier pipeline systems under the Interstate Commerce Act (ICA), the Energy Policy Act (EPAct), and the rules and regulations promulgated under those laws. FERC regulations require that rates for interstate service pipelines that transport crude oil and refined petroleum products (collectively referred to as petroleum pipelines) and certain other liquids, be just and reasonable and must not be unduly discriminatory or confer any undue preference upon any shipper. FERC’s regulations also require interstate common carrier petroleum pipelines to file with FERC and publicly post tariffs stating their interstate transportation rates and terms and conditions of service. Under the ICA, FERC or interested persons may challenge existing or changed rates or services. FERC is authorized to investigate such charges and may suspend the effectiveness of a new rate for up to seven months. A successful rate challenge could result in a common carrier paying refunds together with interest for the period that the rate was in effect. FERC may also order a pipeline to change its rates, and may require a common carrier to pay shippers reparations for damages sustained for a period up to two years prior to the filing of a complaint.
Intrastate services provided by certain of our pipeline systems are subject to regulation by state regulatory authorities, such as the Texas Railroad Commission (TRRC), which currently regulates our portion of the McKee to El Paso pipeline. The TRRC uses a complaint-based system of regulation, both as to matters involving rates and priority of access. FERC and state regulatory commissions generally have not investigated
15
rates, unless the rates are the subject of a protest or a complaint. However, FERC or a state commission could investigate our rates on its own initiative or at the urging of a third party.
If our rate levels were investigated by FERC or a state commission, the inquiry could result in a comparison of our rates to those charged by others or to an investigation of our costs. We do not anticipate any complaints against our rates or any investigation by FERC or a state regulatory commission related to our rates or terms of service. Valero has agreed not to contest our tariff rates or terms of service for the term of our transportation services agreements, provided that our tariff changes and rate increases are consistent with the terms of the transportation services agreements. Even so, FERC or a state commission could order us to change our rates or terms of service or require us to pay shippers reparations, together with interest and subject to the applicable statute of limitations, if it were determined that an established rate or terms of service were unjust or unreasonable.
Pipeline Safety
Our assets are subject to increasingly strict safety laws and regulations. The transportation and storage of crude oil and refined petroleum products involve a risk that hazardous liquids may be released into the environment, potentially causing harm to the public or the environment. In turn, such incidents may result in substantial expenditures for response actions, significant government penalties, liability to government agencies for natural resources damages, and significant business interruption. The Department of Transportation (DOT) and Pipeline and Hazardous Materials Safety Administration have adopted safety regulations with respect to the design, construction, operation, maintenance, inspection, and management of our assets. These regulations contain requirements for the development and implementation of pipeline integrity management programs, which include the inspection and testing of pipelines and necessary maintenance or repairs. These regulations also require that pipeline operation and maintenance personnel meet certain qualifications and that pipeline operators develop comprehensive spill response plans.
Product Quality Standards
Refined petroleum products that we transport are generally sold by Valero for consumption by the public. Various federal, state, and local agencies have the authority to prescribe product quality specifications for products. Changes in product quality specifications or blending requirements could reduce our throughput volumes, require us to incur additional handling costs, or require capital expenditures. For example, different product specifications for different markets affect the fungibility of the products in our system and could require the construction of additional storage. If we are unable to recover these costs through increased revenues, our cash flows and ability to make distributions could be adversely affected. In addition, changes in the product quality of the products we receive on our product pipeline systems or at our terminals could reduce or eliminate our ability to blend products.
Security
We are also subject to Department of Homeland Security Chemical Facility Anti-Terrorism Standards, which are designed to regulate the security of high-risk chemical facilities, and to the Transportation Security Administration’s Pipeline Security Guidelines. We have an internal program of inspection designed to monitor and enforce compliance with all of these requirements. We believe that we are in material compliance with all applicable laws and regulations regarding the security of our facilities.
While we are not currently subject to governmental standards for the protection of computer-based systems and technology from cyber threats and attacks, proposals to establish such standards are being considered by the U.S. Congress and by U.S. Executive Branch departments and agencies, including the Department of Homeland Security, and we may become subject to such standards in the future. We are currently
16
implementing our own cybersecurity programs and protocols; however, we cannot guarantee their effectiveness. A significant cyber-attack could have a material effect on our operations and those of our customer.
Employees
Neither we nor our general partner has any employees. We are managed by the board of directors and executive officers of our general partner. All of the personnel that conduct our business are employed by Valero, and their services are provided to us pursuant to our omnibus agreement and services and secondment agreement with Valero.
PROPERTIES
The location and general character of our pipeline and terminal systems and other principal properties are described above under “Our Assets and Operations” and are incorporated herein by reference. We believe that our properties and facilities are generally adequate for our operations and that our facilities are maintained in a good state of repair. As of December 31, 2015, we were the lessee under a number of cancelable and noncancelable leases for certain properties. Our leases are discussed more fully in Notes 4, 7, and 8 of Notes to Consolidated Financial Statements.
Utilization of Our Facilities
Operating highlights for our pipelines and terminals–including pipeline transportation revenues, pipeline transportation throughput volumes, terminaling revenues, terminaling throughput volumes, and storage revenues–for the years ended December 31, 2015, 2014, and 2013 are described in Item 7, “Management’s Discussion and Analysis of Financial Condition and Results of Operations—Results of Operations—2015 Compared to 2014” and “—2014 Compared to 2013,” and are incorporated herein by reference.
Title to Properties and Permits
Substantially all of our pipelines are constructed on rights-of-way granted by the apparent record owners of the property and in some instances these rights-of-way are revocable at the election of the grantor. In many instances, lands over which rights-of-way have been obtained are subject to prior liens that have not been subordinated to the right-of-way grants. We have obtained permits from public authorities to cross over or under, or to lay facilities in or along, watercourses, county roads, municipal streets, and state highways and, in some instances, these permits are revocable at the election of the grantor. We have also obtained permits from railroad companies to cross over or under lands or rights-of-way, many of which are also revocable at the grantor’s election. In some states and under some circumstances, we have the right of eminent domain to acquire rights-of-way and lands necessary for our common carrier pipelines.
Under our omnibus agreement, Valero will indemnify us for certain title defects and for failures to obtain certain consents and permits necessary to conduct our business. Although title to these properties is subject to encumbrances in some cases, such as customary interests generally retained in connection with acquisition of real property, liens that can be imposed in some jurisdictions for government-initiated action to clean up environmental contamination, liens for current taxes and other burdens, and easements, restrictions, and other encumbrances to which the underlying properties were subject at the time of acquisition, we believe that none of these burdens should materially detract from the value of these properties or from our interest in these properties or should materially interfere with their use in the operation of our business.
17
Item 1A. RISK FACTORS
You should carefully consider each of the following risks and all of the other information contained in this Annual Report on Form 10-K in evaluating us and our common units. Some of these risks relate principally to our business and the industry in which we operate, while others relate principally to the business and operations of Valero, tax matters, ownership of our common units, and securities markets generally.
Our financial condition, results of operations, and cash flows and our ability to make distributions to our unitholders could be materially and adversely affected by these risks, and, as a result, the trading price of our common units could decline.
Risks Related to Our Business
Valero accounts for all of our revenues. Therefore, we are subject to the business risks associated with Valero’s business. Furthermore, if Valero changes its business strategy, is unable for any reason, including financial or other limitations, to satisfy its obligations under our commercial agreements or significantly reduces the volumes transported through our pipelines or terminals, our revenues would decline and our financial condition, results of operations, cash flows, and ability to make distributions to our unitholders would be materially and adversely affected.
For the years ended December 31, 2015, 2014, and 2013, Valero accounted for all of our revenues. We expect to continue to derive a substantial amount of our revenues from Valero for the foreseeable future, and as a result, any event, whether in our areas of operation or elsewhere, that materially and adversely affects Valero’s business may adversely affect our financial condition, results of operations, and cash flows and our ability to make distributions to our unitholders. Accordingly, we are indirectly subject to the operational and business risks of Valero, the most significant of which include the following:
• | disruption of Valero’s ability to obtain crude oil; |
• | interruptions at Valero’s refineries and other facilities; |
• | any decision by Valero to temporarily or permanently curtail or shut down operations at one or more of its refineries or other facilities and reduce or terminate its obligations under our commercial agreements; |
• | competitors that produce their own supply of feedstocks, have more extensive retail outlets, or have greater financial resources may have a competitive advantage over Valero; |
• | the ability to obtain credit and financing on acceptable terms, which could also adversely affect the financial strength of business partners; |
• | the costs to comply with environmental laws and regulations; |
• | significant losses resulting from the hazards and risks of operations may not be fully covered by insurance, and could adversely affect Valero’s operations and financial results; |
• | large capital projects can take many years to complete, and market conditions could deteriorate significantly between the project approval date and the project startup date, negatively impacting project returns; |
• | interruptions of supply and increased costs as a result of Valero’s reliance on third-party transportation of crude oil and refined petroleum products; |
18
• | potential losses from Valero’s derivative transactions; and |
• | the effects of changing commodity and refined product prices. |
The volumes of crude oil and refined petroleum products that we transport and terminal depend substantially on Valero’s refining margins. Refining margins are dependent both upon the price of crude oil or other refinery feedstocks and refined petroleum products. These prices are affected by numerous factors beyond our or Valero’s control, including the global supply and demand for crude oil, gasoline and other refined petroleum products, competition from alternative energy sources, and the impact of new and more stringent regulations affecting the energy industry. A material decrease in the refining margins at Valero’s refineries supported by our assets could cause Valero to reduce the volumes we transport and terminal for Valero, which could materially and adversely affect our financial condition, results of operations, and ability to make distributions to our unitholders.
We may not have sufficient distributable cash flow following the establishment of cash reserves and payment of fees and expenses, including cost reimbursements to our general partner and its affiliates, to enable us to pay minimum quarterly distributions to our unitholders.
We may not generate sufficient cash flows each quarter to enable us to pay minimum quarterly distributions. The amount of cash we can distribute on our units principally depends upon the amount of cash we generate from our operations, which will fluctuate from quarter to quarter based on, among other things, our throughput volumes, tariff rates and fees, and prevailing economic conditions. In addition, the actual amount of cash flows we generate will also depend on other factors, some of which are beyond our control, including:
• | the amount of our operating expenses and general and administrative expenses, including reimbursements to Valero, which are not subject to any caps or other limits, in respect of those expenses; |
• | the amount and timing of capital expenditures and acquisitions we make; |
• | our debt service requirements and other liabilities, and restrictions contained in our revolving credit facility; |
• | fluctuations in our working capital needs; and |
• | the amount of cash reserves established by our general partner. |
If we are unable to obtain needed capital or financing on satisfactory terms to fund expansions of our asset base, our ability to make quarterly distributions may be diminished or our financial leverage could increase. We do not have any commitment with any of our affiliates to provide any direct or indirect financial assistance to us.
If we do not make sufficient or effective expansion capital expenditures, we will be unable to expand our business operations and may be unable to maintain or raise the level of our quarterly distributions. We will be required to use cash from our operations, incur borrowings or access the capital markets in order to fund our expansion capital expenditures. Our ability to incur indebtedness or access the capital markets may be limited by our financial condition at such time as well as the covenants in our debt agreements, general economic conditions and contingencies, and uncertainties that are beyond our control. The terms of any such financing could also limit our ability to make distributions to our common unitholders. Incurring additional debt may significantly increase our interest expense and financial leverage, and issuing additional limited partner interests may result in significant common unitholder dilution and increase the aggregate amount of cash required to maintain the then-current distribution rate, which could materially decrease our ability to pay distributions at the then-current distribution rate.
19
If Valero satisfies only its minimum quarterly throughput commitments under, or if Valero terminates or we are unable to renew or extend, our commercial agreements with Valero, our ability to make distributions to our unitholders will be reduced.
Valero is not obligated to use our services with respect to volumes of crude oil or refined petroleum products in excess of the minimum quarterly throughput commitments under our commercial agreements. During refinery turnarounds, which typically last 30 to 60 days and are performed every four to five years, we expect that Valero will satisfy only its minimum quarterly throughput commitments under our commercial agreements. Our commercial agreements with Valero generally have initial terms of 10 years from the date of acquisition of the related asset (the earliest of which begin to expire in 2023), and with the exception of certain assets, Valero has the option to renew the agreements for one additional five-year term. If Valero fails to use our facilities and services after expiration of those agreements and we are unable to generate additional revenues from third parties, our ability to make distributions to our unitholders will be reduced.
Further, Valero may suspend, reduce or terminate its obligations under our commercial agreements if certain events occur, such as Valero’s determination to totally or partially suspend refining operations at one of its refineries that our assets support for a period that will continue for at least 12 months, or a force majeure event that impacts one of Valero’s refineries for more than 60 days. Any such reduction, suspension, or termination of Valero’s obligations would have a material and adverse effect on our financial condition, results of operations, and cash flows and our ability to make distributions to our unitholders.
We may not be able to obtain third-party revenues due to competition and other factors, which could limit our ability to grow and may extend our dependence on Valero.
Since our initial public offering, we have not generated any revenues from third parties. Our ability to obtain third-party revenues is subject to numerous factors beyond our control, including competition from third parties and the extent to which we have available capacity when third-party shippers require it. We can provide no assurance that we will be able to attract material third-party revenues. Our efforts to establish our reputation and attract new unaffiliated customers may be adversely affected by our relationship with Valero and our desire to provide services pursuant to fee-based contracts. Our potential customers may prefer to obtain services under contracts through which we could be required to assume direct commodity exposure.
Our ability to acquire transportation and logistics assets from Valero is subject to risks and uncertainty, and ultimately we may not further acquire any assets from Valero.
Our present growth strategy depends significantly on acquiring assets from Valero. The consummation and timing of any future acquisitions will depend upon, among other things, Valero’s willingness to offer assets for sale, our ability to negotiate acceptable purchase agreements and commercial agreements with respect to such assets, and our ability to obtain financing on acceptable terms. We have no control over Valero’s decision to offer us the ability to acquire any of its assets. We can provide no assurance that we will be able to successfully consummate any future acquisitions from Valero, and Valero is under no obligation to accept any offer that we may choose to make. In addition, we may decide not to acquire additional assets from Valero, and any such decision will not be subject to unitholder approval. In addition, our right of first offer with respect to certain of Valero’s assets under our omnibus agreement may be terminated by Valero at any time in the event that it no longer controls our general partner.
20
If we are unable to make acquisitions on economically acceptable terms from Valero or third parties, our future growth would be limited, and any acquisitions we may make may reduce, rather than increase, our cash flows and ability to make distributions to unitholders.
Our strategy to grow our business and increase distributions to unitholders is dependent in part on our ability to make acquisitions that result in an increase in distributable cash flow per unit. Our growth strategy is based in part on our expectation of ongoing divestitures by industry participants, including our right of first offer from Valero. The consummation and timing of any future acquisitions will depend upon, among other things, whether:
• | we are able to identify attractive acquisition candidates; |
• | we are able to negotiate acceptable purchase agreements; |
• | we are able to obtain financing for these acquisitions on economically acceptable terms; and |
• | we are outbid by competitors. |
We can provide no assurance that we will be able to consummate any future acquisitions, whether from Valero or any third parties. If we are unable to make future acquisitions, our future growth and ability to increase distributions will be limited. Furthermore, even if we do consummate acquisitions that we believe will be accretive, they may in fact result in a decrease in distributable cash flow per unit as a result of incorrect assumptions in our evaluation of such acquisitions, unforeseen consequences, or other external events beyond our control. Acquisitions involve numerous risks, including difficulties in integrating acquired businesses, inefficiencies, and unexpected costs and liabilities.
Our ability to expand may be limited if Valero does not grow its business.
Our growth strategy depends in part on the growth of Valero’s business. We believe our growth will be driven in part by identifying and executing organic expansion projects that will result in increased throughput volumes from Valero and third parties. If Valero focuses on other growth areas or does not make capital expenditures to fund the growth of its business, we may not be able to fully execute our growth strategy.
Our and Valero’s operations are subject to many risks and operational hazards. If a significant accident or event occurs that results in a business interruption or shutdown for which we are not adequately insured, our financial condition, results of operations, and cash flows and our ability to sustain or increase distributions to our unitholders could be materially and adversely affected.
Our operations are subject to all of the risks and operational hazards inherent in transporting, terminaling, and storing crude oil and refined petroleum products, including:
• | damages to facilities, equipment, and surrounding properties caused by third parties, severe weather, natural disasters, and acts of terrorism; |
• | maintenance, repairs, mechanical or structural failures at our or Valero’s facilities or at third-party facilities on which our or Valero’s operations are dependent, including electrical shortages, power disruptions, and power grid failures; |
• | damages to and loss of availability of interconnecting third-party pipelines, terminals, and other means of delivering crude oil, feedstocks, and refined petroleum products; |
• | disruption or failure of information technology systems and network infrastructure due to various causes, including unauthorized access or attack; |
21
• | curtailments of operations due to severe seasonal weather; and |
• | riots, work stoppages, slowdowns or strikes, as well as other industrial disturbances. |
These risks could result in substantial losses due to personal injury and/or loss of life, severe damage to and destruction of property and equipment, and pollution or other environmental damage, as well as business interruptions or shutdowns of our facilities. Any such event or unplanned shutdown could have a material and adverse effect on our financial condition, results of operations, and cash flows and our ability to make distributions to our unitholders. In addition, Valero’s refining operations supported by our assets, on which our operations are substantially dependent and over which we have no control, are subject to similar operational hazards and risks inherent in refining crude oil.
Our insurance policies do not cover all losses, costs, or liabilities that we may experience, and insurance companies that currently insure companies in the energy industry may cease to do so or substantially increase premiums.
We do not maintain insurance coverage against all potential losses and could suffer losses for uninsurable or uninsured risks or in amounts in excess of existing insurance coverage. We maintain insurance policies for certain property damage, business interruption, and third-party liabilities, which includes pollution liabilities, and are subject to policy limits under these policies. The occurrence of an event that is not fully covered by insurance or failure by one or more insurers to honor its coverage commitments for an insured event could have a material and adverse effect on our financial condition, results of operations, and cash flows and our ability to make distributions to our unitholders. Insurance companies may reduce the insurance capacity they are willing to offer or may demand significantly higher premiums or deductibles to cover these facilities. If significant changes in the number or financial solvency of insurance underwriters for the energy industry occur, we may be unable to obtain and maintain adequate insurance at a reasonable cost. We cannot provide assurance that our insurers will renew our insurance coverage on acceptable terms, if at all, or that we will be able to arrange for adequate alternative coverage in the event of non-renewal. The unavailability of full insurance coverage to cover events in which we suffer significant losses could have a material and adverse effect on our financial condition, results of operations, and cash flows and our ability to make distributions to our unitholders.
We are exposed to the credit risks, and certain other risks, of our customers, and any material nonpayment or nonperformance by our customers could reduce our ability to make distributions to our unitholders.
We may in the future grow our customer base beyond Valero. We are subject to the risks of loss resulting from nonpayment or nonperformance by our customers, including Valero. If Valero or any other significant customer defaults on its obligations to us, our financial results could be adversely affected. Our customers may be highly leveraged and subject to their own operating and regulatory risks. Any material nonpayment or nonperformance by our customers could reduce our financial condition, results of operations, and cash flows and our ability to make distributions to our unitholders.
Our expansion of existing assets and construction of new assets may not result in revenue increases and will be subject to regulatory, environmental, political, legal, and economic risks, which could adversely affect our operations and financial condition.
In order to optimize our existing asset base, we intend to evaluate and capitalize on organic opportunities for expansion projects in order to increase revenues on our pipelines and terminals. The expansion of existing pipelines or terminals, such as by adding horsepower, pump stations, or loading racks, or the construction or expansion of new transportation and logistics assets, involves numerous regulatory, environmental, political, and legal uncertainties, most of which are beyond our control. If we undertake these projects, they
22
may not be completed on schedule or at all or at the budgeted cost. Moreover, we may not receive sufficient long-term contractual commitments from customers to provide the revenues needed to support such projects and we may be unable to negotiate acceptable interconnection agreements with third-party pipelines to provide destinations for increased throughput. Even if we receive such commitments or make such interconnections, we may not realize an increase in revenues for an extended period of time. As a result, new facilities may not be able to attract enough throughput to achieve our expected investment return, which could materially and adversely affect our financial condition, results of operations, and cash flows and our ability in the future to make distributions to our unitholders.
We do not own all of the land on which our assets are located, which could result in disruptions to our operations.
We do not own all of the land on which our assets are located, and we are, therefore, subject to the possibility of more onerous terms and increased costs to retain necessary land use if we do not have valid leases or rights-of-way or if such rights-of-way lapse or terminate. We obtain the rights to construct and operate our assets on land owned by third parties and governmental agencies, and some of our agreements may grant us those rights for only a specific period of time. Our loss of these rights, through our inability to renew leases, right-of-way contracts or otherwise, could have a material and adverse effect on our financial condition, results of operations, and cash flows and our ability to make distributions to our unitholders.
We are dependent upon third parties to operate some of our facilities.
Our McKee products system is operated by NuStar, which owns a 66⅔ percent undivided interest in the system. If NuStar fails to operate any portion of the McKee products system in accordance with the terms of our operating agreement with them, such failure could result in our inability to meet our commitments to Valero, which in turn could result in a reduction in our revenues, or in us becoming liable to Valero for any losses it may sustain by reason of our failure to comply, which losses may not be recoverable by us from NuStar. Similarly, our PAPS terminal is operated by Colonial, and any failure by Colonial or any successor-operator to comply with the terms of our operating agreement could result in our inability to meet our commitments to Valero with respect to our Port Arthur products system, which in turn could result in a reduction in our revenues, or in us becoming liable to Valero for any losses it may sustain by reason of our failure to comply, which losses may not be recoverable by us from the operator.
Restrictions in our revolving credit facility and subordinated credit agreements with Valero could adversely affect our business, financial condition, results of operations, ability to make distributions to our unitholders, and the value of our units.
We are dependent upon the earnings and cash flows generated by our operations in order to meet any debt service obligations and to allow us to make distributions to our unitholders. Restrictions in our revolving credit facility, subordinated credit agreements with Valero, and any future financing agreements could restrict our ability to finance our future operations or capital needs or to expand or pursue our business activities, which may, in turn, limit our ability to make distributions to our unitholders. For example, our revolving credit facility and subordinated credit agreements contain covenants that require us to maintain a ratio of total debt to earnings before interest, taxes, depreciation, and amortization (EBITDA) for the prior four fiscal quarters of not greater than 5.0 to 1.0 as of the last day of each fiscal quarter (or 5.5 to 1.0 during specified periods following certain acquisitions).
The restrictions in our revolving credit facility and subordinated credit agreements could affect our ability to obtain future financing and pursue attractive business opportunities and our flexibility in planning for, and reacting to, changes in business conditions. In addition, a failure to comply with the provisions of our
23
revolving credit facility and subordinated credit agreements could result in an event of default, which would enable our lenders to declare the outstanding principal of that debt, together with accrued interest, to be immediately due and payable. If the payment of our debt is accelerated, defaults under our other debt instruments, if any, may be triggered, and our assets may be insufficient to repay such debt in full, and the holders of our units could experience a partial or total loss of their investment. Please read “Management’s Discussion and Analysis of Financial Condition and Results of Operations—Capital Resources and Liquidity” for additional information about our revolving credit facility and subordinated credit agreements.
Increases in interest rates could adversely impact the price of our common units, our ability to issue equity, or incur debt for acquisitions or other purposes and our ability to make distributions at our intended levels.
Interest rates on future credit facilities and debt offerings could be higher than current levels, causing our financing costs to increase accordingly. As with other yield-oriented securities, our unit price is impacted by our level of distributions and implied distribution yield. The distribution yield is often used by investors to compare and rank yield-oriented securities for investment decision-making purposes. Therefore, changes in interest rates, either positive or negative, may affect the yield requirements of investors who invest in our units, and a rising interest rate environment could have an adverse impact on the price of our common units, our ability to issue equity or incur debt for acquisitions or other purposes, and our ability to make distributions at our intended levels.
Compliance with and changes in environmental and pipeline integrity and safety laws could adversely affect our performance.
The principal environmental risks associated with our operations are emissions into the air and releases into the soil, surface water, or groundwater. Our operations are subject to extensive environmental laws and regulations, including those relating to the discharge and remediation of materials in the environment, greenhouse gas emissions, waste management, species and habitat preservation, pollution prevention, pipeline integrity and other safety-related regulations, and characteristics and composition of fuels. Certain of these laws and regulations could impose obligations to conduct assessment or remediation efforts at our facilities or third-party sites where we take wastes for disposal or where our wastes migrated. Environmental laws and regulations also may impose liability on us for the conduct of third parties or for actions that complied with applicable requirements when taken, regardless of negligence or fault. If we violate or fail to comply with these laws and regulations, it could lead to administrative, civil, or criminal penalties or liability and imposition of injunctions, operating restrictions, or the loss of permits.
Because environmental laws and regulations are becoming more stringent and new environmental laws and regulations are continuously being enacted or proposed, the level of expenditures required for environmental matters could increase in the future. Current and future legislative action and regulatory initiatives could result in changes to operating permits, material changes in operations, increased capital expenditures and operating costs, increased costs of the goods we transport, and decreased demand for products we handle that cannot be assessed with certainty at this time. We may be required to make expenditures to modify operations or install pollution control equipment or release prevention and containment systems that could materially and adversely affect our business, financial condition, results of operations, and liquidity if these expenditures, as with all costs, are not ultimately reflected in the tariffs and other fees we receive for our services.
For example, the U.S. Environmental Protection Agency (EPA) has, in recent years, adopted final rules making more stringent the National Ambient Air Quality Standards (NAAQS) for ozone, sulfur dioxide, and nitrogen dioxide, and the U.S. EPA is considering further revisions to the NAAQS. Emerging rules and
24
permitting requirements implementing these revised standards may require us to install more stringent controls at our facilities, which may result in increased capital expenditures. Governmental restrictions on greenhouse gas emissions—including so-called “cap-and-trade” programs targeted at reducing carbon dioxide emissions—could also result in material increased compliance costs, additional operating restrictions or permitting delays for our business, and an increase in the cost of, and reduction in demand for, the products we produce, which could have a material adverse effect on our financial position, results of operations, and liquidity. In addition, in 2015, the U.S. participated in the United Nations Conference on Climate Change, which led to the creation of the Paris Agreement. The Paris Agreement will be open for signing on April 22, 2016, and will require countries to review and “represent a progression” in their intended nationally determined contributions, which set greenhouse gas emission reduction goals, every five years beginning in 2020. Restrictions on emissions of methane or carbon dioxide that have been or may be imposed in various states or at the federal level could adversely affect the oil and gas industry. Finally, some scientists have concluded that increasing concentrations of greenhouse gas emissions in the Earth’s atmosphere may produce climate changes that have significant physical effects, such as increased frequency and severity of storms, droughts and floods and other climatic events. If any such effects were to occur, it is uncertain if they would have an adverse effect on our financial condition and operations.
Further, certain of our pipeline facilities may be subject to the pipeline integrity and safety regulations of various federal and state regulatory agencies. In recent years, increased regulatory focus on pipeline integrity and safety has resulted in various proposed or adopted regulations. The implementation of these regulations, and the adoption of future regulations, could require us to make additional capital expenditures, including to install new or modified safety measures, or to conduct new or more extensive maintenance programs at our pipeline facilities.
We may be unable to obtain or renew permits necessary for our operations, which could inhibit our ability to do business.
Our facilities operate under a number of federal and state permits, licenses, and approvals with terms and conditions containing a significant number of prescriptive limits and performance standards in order to operate. These permits, licenses, approval limits, and standards require a significant amount of monitoring, record keeping, and reporting in order to demonstrate compliance with the underlying permit, license, approval limit, or standard. Noncompliance or incomplete documentation of our compliance status may result in the imposition of fines, penalties, and injunctive relief. A decision by a government agency to deny or delay issuing a new or renewed permit or approval, or to revoke or substantially modify an existing permit or approval, could have a material and adverse effect on our ability to continue operations and on our financial condition, results of operations, and cash flows and our ability to make distributions to our unitholders.
Many of our assets have been in service for many years and, as a result, our maintenance or repair costs may increase in the future. In addition, there could be service interruptions due to unknown events or conditions or increased downtime associated with our pipelines that could have a material and adverse effect on our financial condition, results of operations, and cash flows and our ability to make distributions to our unitholders.
Our pipelines and terminals are generally long-lived assets, and many of them have been in service for many years. The age and condition of our assets could result in increased maintenance or repair expenditures in the future. Any significant increase in these expenditures could adversely affect our results of operations, financial position, or cash flows, as well as our ability to make distributions to our unitholders.
25
The tariff rates of our regulated assets are subject to review and possible adjustment by federal and state regulators, which could adversely affect our revenues and our ability to make distributions to our unitholders.
We own pipeline assets in Texas, New Mexico, Tennessee, Mississippi, Arkansas, and Oklahoma, and we provide both interstate and intrastate transportation services for refined petroleum products and crude oil. Many of our pipelines are common carriers and may be required to provide service to any shipper that requests transportation services on our pipelines.
Our Port Arthur logistics system pipelines, Shorthorn pipeline, and Collierville pipeline provide interstate transportation services that are subject to regulation by FERC under the ICA. FERC uses prescribed rate methodologies for developing and changing regulated rates for interstate pipelines. Shippers may protest (and FERC may investigate) the lawfulness of existing, new, or changed tariff rates. FERC can suspend new or changed tariff rates for up to seven months and can allow new rates to be implemented subject to refund of amounts collected in excess of the rate ultimately found to be just and reasonable. If FERC finds a rate to be unjust and unreasonable, it may order payment of reparations for up to two years prior to the filing of a complaint or investigation, and FERC may prescribe new rates prospectively.
State agencies may regulate the rates, terms, and conditions of service for our pipelines offering intrastate transportation services, and such agencies could limit our ability to increase our rates or order us to reduce our rates and pay refunds to shippers. State agencies have generally not been aggressive in regulating common carrier pipelines, have generally not investigated the rates, terms, and conditions of service of intrastate pipelines in the absence of shipper complaints, and generally resolve complaints informally.
Under our commercial agreements, we and Valero have agreed to the base tariff rates for all of our pipelines and a mechanism to modify those rates during the term of the agreements. Valero has also agreed not to challenge the base tariff rates or changes to those rates during the term of the agreements, except to the extent such changes are inconsistent with the agreements. These agreements do not, however, prevent any other new or prospective shipper, FERC, or a state agency from challenging our tariff rates or our terms and conditions of service, and due to the complexity of rate making, the lawfulness of any rate is never assured. A successful challenge of any of our rates, or any changes to FERC’s approved rate or index methodologies, could adversely affect our revenues and our ability to make distributions to our unitholders. Similarly, if state agencies in the states in which we offer intrastate transportation services change their policies or aggressively regulate our rates or terms and conditions of service, it could also materially and adversely affect our financial condition, results of operations, and cash flows and our ability to make distributions to our unitholders.
In addition, there is not always a clear boundary between interstate and intrastate pipeline transportation services, and such determinations are fact-dependent and made on a case-by-case basis. Our undivided interest in the McKee to El Paso pipeline currently provides transportation services pursuant to an intrastate tariff that is subject to regulation by the TRRC. Because a portion of this pipeline crosses New Mexico and our transportation services may be interstate in nature, we applied for a waiver of the tariff filing and reporting requirements of the ICA for our portion of the pipeline, which the FERC conditionally granted. The FERC’s conditions for granting the waiver include that we maintain all books and records in a manner consistent with the Uniform System of Accounts and that we immediately report any change in the circumstances on which the waiver was granted.
26
If Valero fails to provide the personnel necessary to conduct our operations, our ability to manage our business and continue our growth could be negatively impacted.
Valero is responsible for providing the personnel necessary to conduct our operations, including the executive officers of our general partner. We depend on the services of these individuals. If their services are unavailable to us for any reason, we may be required to hire other personnel to manage and operate our company. We cannot assure our unitholders that we would be able to locate or employ such qualified personnel on acceptable terms or at all.
Terrorist or cyber-attacks and threats, or escalation of military activity in response to these attacks, could have a material and adverse effect on our financial condition, results of operations, and cash flows and our ability to make distributions to our unitholders.
Terrorist attacks and threats, cyber-attacks, or escalation of military activity in response to these attacks, may have significant effects on general economic conditions, fluctuations in consumer confidence and spending, and market liquidity, each of which could materially and adversely affect our business. Strategic targets, such as energy-related assets and transportation assets, may be at greater risk of future terrorist or cyber-attacks than other targets in the U.S. We do not maintain specialized insurance for possible liability or loss resulting from a cyber-attack on our assets that may shut down all or part of our business. Instability in the financial markets as a result of terrorism or war could also affect our ability to raise capital including our ability to repay or refinance debt. It is possible that any of these occurrences, or a combination of them, could have a material and adverse effect on our financial condition, results of operations, and cash flows and our ability to make distributions to our unitholders.
A significant interruption related to our information technology systems could adversely affect our business.
Our information technology systems and network infrastructure may be subject to unauthorized access or attack, which could result in a loss of sensitive business information, systems interruption, or the disruption of our business operations. There can be no assurance that our infrastructure protection technologies and disaster recovery plans can prevent a technology systems breach or systems failure, which could have a material adverse effect on our financial position or results of operations.
Our customer’s operating results are seasonal and generally lower in the first and fourth quarters of the year. Our customer depends on favorable weather conditions in the spring and summer months.
Demand for gasoline is generally higher during the summer months than during the winter months due to seasonal increases in motor vehicle traffic. As a result, our customer’s operating results are generally lower for the first and fourth quarters of each year. Unfavorable weather conditions during the spring and summer months and a resulting lack of the expected seasonal upswings in traffic and sales could adversely affect our customer’s business, financial condition, and results of operations, which may adversely affect our business, financial conditions, and results of operations.
The level and terms of Valero’s indebtedness and its credit ratings could adversely affect our ability to grow our business and our ability to make distributions to our unitholders and our credit ratings and profile.
If the level of Valero’s indebtedness increases significantly in the future, it would increase the risk that Valero may default on its obligations to us under our commercial agreements. The terms of Valero’s indebtedness may limit its ability to borrow additional funds and may impact our operations in a similar manner. If Valero were to default under its debt obligations, Valero’s creditors could attempt to assert claims against our assets
27
during the litigation of their claims against Valero. The defense of any such claims could be costly and could materially impact our financial condition, even absent any adverse determination. If these claims were successful, our ability to meet our obligations to our creditors, make distributions, and finance our operations could be materially and adversely affected. If one or more credit rating agencies were to downgrade Valero’s credit rating, we could experience an increase in our borrowing costs or difficulty accessing the capital markets. Such a development could adversely affect our ability to grow our business and to make distributions to our unitholders.
Risks Inherent in an Investment in Us
Our general partner and its affiliates, including Valero, have conflicts of interest with us and limited duties to us and our unitholders, and they may favor their own interests to the detriment of us and our unitholders. Additionally, we have no control over the business decisions and operations of Valero, and Valero is under no obligation to adopt a business strategy that favors us.
As of February 1, 2016, Valero owned a 65.7 percent limited partner interest in us and owns and controls our general partner. Although our general partner has a duty to manage us in a manner that is not adverse to the best interests of us and our unitholders, because it is a wholly owned subsidiary of Valero, the directors and officers of our general partner also have a duty to manage our general partner in a manner that is beneficial to Valero. Conflicts of interest may arise between Valero and its affiliates, including our general partner, on the one hand, and us and our unitholders, on the other hand. In resolving these conflicts, the general partner may favor its own interests and the interests of its affiliates, including Valero, over the interests of our common unitholders. These conflicts include, among others, the following situations:
• | neither our partnership agreement nor any other agreement requires Valero to pursue a business strategy that favors us or utilizes our assets, which could involve decisions by Valero to increase or decrease refinery production, shut down or reconfigure a refinery, shift the focus of its investment and growth to areas not served by our assets, or undertake acquisition opportunities for itself; |
• | Valero, as our only customer, has an economic incentive to cause us to not seek higher rates and fees, even if such higher rates and fees would reflect those that could be obtained in arm’s-length, third-party transactions; |
• | Valero’s directors and officers have a fiduciary duty to make decisions beneficial to the stockholders of Valero, which may be contrary to our interests; in addition, many of the officers and directors of our general partner are also officers and/or directors of Valero and will owe fiduciary duties to Valero and its stockholders; |
• | Valero may be constrained by the terms of its debt instruments from taking actions, or refraining from taking actions, that may be in our best interests; |
• | our partnership agreement replaces the fiduciary duties that would otherwise be owed by our general partner with contractual standards governing its duties, limiting our general partner’s liabilities, and restricting the remedies available to our unitholders for actions that, without the limitations, might constitute breaches of fiduciary duty; |
• | except in limited circumstances, our general partner has the power and authority to conduct our business without unitholder approval; |
• | disputes may arise under our commercial agreements with Valero; |
28
• | our general partner will determine the amount and timing of asset purchases and sales, borrowings, issuance of additional partnership securities and the creation, reduction or increase of cash reserves, each of which can affect the amount of cash that is distributed to our unitholders; |
• | our general partner will determine the amount and timing of many of our capital expenditures and whether a capital expenditure is classified as an expansion capital expenditure, which would not reduce operating surplus, or a maintenance capital expenditure, which would reduce our operating surplus. This determination can affect the amount of cash that is distributed to our unitholders and the ability of the subordinated units to convert into common units; |
• | our general partner will determine which costs incurred by it are reimbursable by us; |
• | our general partner may cause us to borrow funds in order to permit the payment of distributions, even if the purpose or effect of the borrowing is to make a distribution on the subordinated units, to make incentive distributions, or to accelerate expiration of the subordination period; |
• | our partnership agreement permits us to classify up to $50 million as operating surplus, even if it is generated from asset sales, non-working capital borrowings, or other sources that would otherwise constitute capital surplus. This cash may be used to fund distributions on our subordinated units or to our general partner in respect of the general partner units or the incentive distribution rights; |
• | our partnership agreement does not restrict our general partner from causing us to pay it or its affiliates for any services rendered to us or entering into additional contractual arrangements with any of these entities on our behalf; |
• | our general partner intends to limit its liability regarding our contractual and other obligations; |
• | our general partner may exercise its right to call and purchase all of the common units not owned by it and its affiliates if it and its affiliates own more than 80 percent of the common units. As of February 1, 2016, Valero owned 41.1 percent of our common units, and, as a result, Valero did not have the ability to exercise the limited call right; |
• | our general partner controls the enforcement of obligations owed to us by our general partner and its affiliates, including under the omnibus agreement and our commercial agreements with Valero; |
• | our general partner decides whether to retain separate counsel, accountants, or others to perform services for us; and |
• | our general partner may elect to cause us to issue common units to it in connection with a resetting of the target distribution levels related to our general partner’s incentive distribution rights without the approval of the conflicts committee of the board of directors of our general partner, which we refer to as our conflicts committee, or our unitholders. This election may result in lower distributions to our common unitholders in certain situations. |
Under the terms of our partnership agreement, the doctrine of corporate opportunity, or any analogous doctrine, does not apply to our general partner or any of its affiliates, including its executive officers, directors, and owners. Any such person or entity that becomes aware of a potential transaction, agreement, arrangement, or other matter that may be an opportunity for us will not have any duty to communicate or offer such opportunity to us. Any such person or entity will not be liable to us or to any limited partner for breach of any fiduciary duty or other duty by reason of the fact that such person or entity pursues or acquires such opportunity for itself, directs such opportunity to another person or entity, or does not communicate such opportunity or information to us. This may create actual and potential conflicts of interest between us and affiliates of our general partner and result in less than favorable treatment of us and our unitholders.
29
Our partnership agreement requires that we distribute all of our available cash, which could limit our ability to grow and make acquisitions.
Our partnership agreement requires that we distribute all of our available cash to our unitholders and we will rely primarily upon external financing sources, including commercial bank borrowings and the issuance of debt and equity securities, to fund our acquisitions and expansion capital expenditures. As a result, to the extent we are unable to finance growth externally, our cash distribution policy will significantly impair our ability to grow.
In addition, because we intend to distribute all of our available cash, our growth may not be as fast as that of businesses that reinvest their available cash to expand ongoing operations. To the extent we issue additional units in connection with any acquisitions or expansion capital expenditures, the payment of distributions on those additional units may increase the risk that we will be unable to maintain or increase our per unit distribution level. There are no limitations in our partnership agreement or our revolving credit facility on our ability to issue additional units, including units ranking senior to the common units. The incurrence of additional commercial borrowings or other debt to finance our growth strategy would result in increased interest expense, which in turn may impact the available cash that we have to distribute to our unitholders.
The fees and reimbursements due to our general partner and its affiliates, including Valero, for services provided to us or on our behalf will reduce our distributable cash flow. In certain cases, the amount and timing of such reimbursements will be determined by our general partner and its affiliates, including Valero.
Pursuant to our partnership agreement, we reimburse our general partner and its affiliates, including Valero, for expenses they incur and payments they make on our behalf. Our partnership agreement provides that our general partner will determine in good faith the expenses that are allocable to us. Pursuant to the amended and restated omnibus agreement, as amended, we pay an annual fee of $11.2 million to Valero for general and administrative services and reimburse Valero for any out-of-pocket costs and expenses incurred by Valero in providing these services to us. In the event we acquire additional assets from Valero in the future, we may agree to increase such annual fee. In addition, we are required to reimburse our general partner for its payments to Valero pursuant to the services and secondment agreement for the wages, benefits, and other costs of Valero employees seconded to our general partner to perform operational and maintenance services at certain of our pipeline and terminal systems. Each of these payments will be made prior to making any distributions on our common units. The reimbursement of expenses and payment of fees, if any, to our general partner and its affiliates reduces our cash flows, and, as a result, reduces our ability to make distributions to our unitholders. There is no limit on the fees and expense reimbursements that we may be required to pay to our general partner and its affiliates.
Our partnership agreement restricts the remedies available to holders of our common and subordinated units for actions taken by our general partner that might otherwise constitute breaches of fiduciary duty.
Our partnership agreement contains provisions that restrict the remedies available to unitholders for actions taken by our general partner that might otherwise constitute breaches of fiduciary duty under state fiduciary duty law. For example, our partnership agreement provides that:
• | whenever our general partner (acting in its capacity as our general partner), the board of directors of our general partner, or any committee thereof (including the conflicts committee) makes a determination or takes, or declines to take, any other action in their respective capacities, our general partner, the board of directors of our general partner, and any committee thereof (including the conflicts committee), as applicable, is required to make such determination, or take or decline to take such other action, in good faith, meaning that it subjectively believed that the decision was not |
30
adverse to our best interests, and, except as specifically provided by our partnership agreement, will not be subject to any other or different standard imposed by our partnership agreement, Delaware law, or any other law, rule or regulation, or at equity;
• | our general partner is not liable to us or our unitholders for decisions made in its capacity as a general partner so long as such decisions are made in good faith; |
• | our general partner and its officers and directors are not liable to us or our limited partners for monetary damages resulting from any act or omission unless there has been a final and non-appealable judgment entered by a court of competent jurisdiction determining that our general partner or its officers and directors, as the case may be, acted in bad faith or engaged in fraud or willful misconduct or, in the case of a criminal matter, acted with knowledge that the conduct was criminal; and |
• | our general partner is not in breach of its obligations under the partnership agreement (including any duties to us or our unitholders) if a transaction with an affiliate or the resolution of a conflict of interest is: |
◦ | approved by the conflicts committee of the board of directors of our general partner, although our general partner is not obligated to seek such approval; |
◦ | approved by the vote of a majority of our outstanding common units, excluding any common units owned by our general partner and its affiliates; |
◦ | determined by the board of directors of our general partner to be on terms no less favorable to us than those generally being provided to or available from unrelated third parties; or |
◦ | determined by the board of directors of our general partner to be fair and reasonable to us, taking into account the totality of the relationships among the parties involved, including other transactions that may be particularly favorable or advantageous to us. |
In connection with a situation involving a transaction with an affiliate or a conflict of interest, any determination by our general partner or the conflicts committee must be made in good faith. If an affiliate transaction or the resolution of a conflict of interest is not approved by our common unitholders or the conflicts committee and the board of directors of our general partner determines that the resolution or course of action taken with respect to the affiliate transaction or conflict of interest satisfies either of the standards set forth in the third and fourth subbullet points above, then it will be presumed that, in making its decision, the board of directors of our general partner acted in good faith, and in any proceeding brought by or on behalf of any limited partner or the partnership challenging such determination, the person bringing or prosecuting such proceeding will have the burden of overcoming such presumption.
If a unitholder is not an Eligible Holder, the unitholder’s common units may be subject to redemption.
Our partnership agreement includes certain requirements regarding those investors who may own our common and subordinated units. Eligible Holders are limited partners whose (a) federal income tax status is not reasonably likely to have a material and adverse effect on the rates that can be charged by us on assets that are subject to regulation by FERC or an analogous regulatory body and (b) nationality, citizenship, or other related status would not create a substantial risk of cancellation or forfeiture of any property in which we have an interest, in each case as determined by our general partner with the advice of counsel. If the unitholder is not an Eligible Holder, in certain circumstances as set forth in our partnership agreement, the unitholder’s units may be redeemed by us at the then-current market price. The redemption price will be paid in cash or by delivery of a promissory note, as determined by our general partner.
31
Our partnership agreement restricts the voting rights of unitholders owning 20 percent or more of our common units.
Unitholders’ voting rights are further restricted by a provision of our partnership agreement providing that any units held by a person that owns 20 percent or more of any class of units then outstanding, other than our general partner, its affiliates, their transferees and persons who acquired such units with the prior approval of the board of directors of our general partner, cannot be used to vote on any matter.
Holders of our common units have limited voting rights and are not entitled to elect our general partner or its directors.
Unlike the holders of common stock in a corporation, unitholders have only limited voting rights on matters affecting our business and, therefore, limited ability to influence management’s decisions regarding our business. For example, unlike a holder of stock in a public corporation, our unitholders do not have “say on pay” advisory voting rights. Unitholders did not elect our general partner or the board of directors of our general partner and will have no right to elect our general partner or the board of directors of our general partner on an annual or other continuing basis. The board of directors of our general partner is chosen by the sole member of our general partner, which is a wholly owned subsidiary of Valero. Furthermore, if the unitholders are dissatisfied with the performance of our general partner, they will have little ability to remove our general partner. As a result of these limitations, the price at which our common units will trade could be diminished because of the absence or reduction of a takeover premium in the trading price.
Even if holders of our common units are dissatisfied, they cannot remove our general partner without its consent.
Our unitholders are not able to remove our general partner without its consent because our general partner and its affiliates own sufficient units to be able to prevent its removal. The vote of the holders of at least 66⅔ percent of all outstanding common and subordinated units voting together as a single class is required to remove our general partner. As of January 31, 2016, our general partner and its affiliates owned 41.1 percent of our common units and all of our subordinated units, representing an aggregate 67.1 percent of our outstanding common and subordinated units (excluding common units held by officers and directors of our general partner and Valero). If our general partner is removed without cause during the subordination period and units held by our general partner and its affiliates are not voted in favor of that removal, all remaining subordinated units will automatically convert into common units and any existing arrearages on our common units will be extinguished, thereby eliminating the distribution and liquidation preference of common units. “Cause” is narrowly defined to mean that a court of competent jurisdiction has entered a final, non-appealable judgment finding our general partner liable to us or any limited partner for actual fraud or willful misconduct in its capacity as our general partner. “Cause” does not include most cases of charges of poor management of the business, so the removal of our general partner because of unitholder dissatisfaction with the performance of our general partner in managing our partnership will most likely result in the termination of the subordination period and conversion of all subordinated units to common units.
Our partnership agreement also contains provisions limiting the ability of unitholders to call meetings or to acquire information about our operations, as well as other provisions limiting the unitholders’ ability to influence the manner or direction of management.
Our general partner interest or the control of our general partner may be transferred to a third party without unitholder consent.
Our general partner may transfer its general partner interest in us without a vote of our unitholders to an affiliate or another person in connection with its merger or consolidation with or into, or sale of all or
32
substantially all of its assets to, such person. Furthermore, our partnership agreement does not restrict the ability of Valero to transfer all or a portion of its ownership interest in our general partner to a third party. The new owner of our general partner would then be in a position to replace the board of directors and officers of our general partner with its own designees and thereby exert significant control over the decisions made by the board of directors and officers.
The incentive distribution rights of our general partner may be transferred to a third party without unitholder consent.
Our general partner may transfer its incentive distribution rights to a third party at any time without the consent of our unitholders. If our general partner transfers its incentive distribution rights to a third party, it will have less incentive to grow our partnership and increase distributions. A transfer of incentive distribution rights by our general partner could reduce the likelihood of Valero selling or contributing additional assets to us, which in turn would impact our ability to grow our asset base.
We may issue additional units without unitholder approval, which would dilute unitholder interests.
At any time, we may issue an unlimited number of limited partner interests of any type without the approval of our unitholders and our unitholders will have no preemptive or other rights (solely as a result of their status as unitholders) to purchase any such limited partner interests. Further, there are no limitations in our partnership agreement on our ability to issue equity securities that rank equal or senior to our common units as to distributions or in liquidation or that have special voting rights and other rights. The issuance by us of additional common units or other equity securities of equal or senior rank will have the following effects:
• | our existing unitholders’ proportionate ownership interest in us will decrease; |
• | the amount of cash we have available to distribute on each unit may decrease; |
• | because a lower percentage of total outstanding units will be subordinated units, the risk that a shortfall in the payment of minimum quarterly distributions will be borne by our common unitholders will increase; |
• | because the amount payable to holders of incentive distribution rights is based on a percentage of total available cash, the distributions to holders of incentive distribution rights will increase even if the per unit distribution on common units remains the same; |
• | the ratio of taxable income to distributions may increase; |
• | the relative voting strength of each previously outstanding unit may be diminished; and |
• | the market price of our common units may decline. |
Valero may sell units in the public or private markets, and such sales could have an adverse impact on the trading price of the common units.
As of February 1, 2016, Valero held 15,018,602 of our common units and 28,789,989 of our subordinated units. All of the subordinated units will convert into common units at the end of the subordination period and may convert earlier under certain circumstances. Additionally, we have agreed to provide Valero with certain registration rights under applicable securities laws. The sale of these units in the public or private markets could have an adverse impact on the price of the common units or on any trading market that may develop.
33
Our general partner’s discretion in establishing cash reserves may reduce the amount of cash we have available to distribute to unitholders.
Our partnership agreement requires our general partner to deduct from operating surplus the cash reserves that it determines are necessary to fund our future operating expenditures. In addition, our partnership agreement permits the general partner to reduce available cash by establishing cash reserves for the proper conduct of our business, to comply with applicable law or agreements to which we are a party, or to provide funds for future distributions to partners. These cash reserves will affect the amount of our distribution to unitholders.
Our general partner has a limited call right that may require the unitholders to sell common units at an undesirable time or price.
If at any time our general partner and its affiliates own more than 80 percent of our then-outstanding common units, our general partner will have the right, but not the obligation, which it may assign to any of its affiliates or to us, to acquire all, but not less than all, of the common units held by unaffiliated persons at a price not less than their then-current market price, as calculated pursuant to the terms of our partnership agreement. As a result, unitholders may be required to sell their common units at an undesirable time or price and may not receive any return on their investment. Unitholders may also incur a tax liability upon a sale of their units. As of February 1, 2016, our general partner and its affiliates owned 41.1 percent of our common units (excluding common units held by officers and directors of our general partner and Valero). At the end of the subordination period, assuming no additional issuances of common units by us (other than upon the conversion of the subordinated units), our general partner and its affiliates will own 67.1 percent of our outstanding common units (excluding common units held by officers and directors of our general partner and Valero) and therefore would not be able to exercise the call right at that time. In the future, we may engage in transactions with Valero pursuant to which we may issue additional common units to Valero.
Our general partner, or any transferee holding a majority of the incentive distribution rights, may elect to cause us to issue common units to it in connection with a resetting of the target distribution levels related to the incentive distribution rights, without the approval of the conflicts committee of our general partner or our unitholders. This election may result in lower distributions to our common unitholders in certain situations.
Our general partner has the right, at any time when there are no subordinated units outstanding and the holders have received incentive distributions at the highest level to which they are entitled (48 percent) for each of the prior four consecutive fiscal quarters (and the amount of each such distribution did not exceed adjusted operating surplus for each such quarter), to reset the minimum quarterly distribution and the initial target distribution levels at higher levels based on our cash distribution at the time of the exercise of the reset election. Following a reset election, the minimum quarterly distribution will be reset to an amount equal to the average cash distribution per unit for the two fiscal quarters immediately preceding the reset election (such amount is referred to as the “reset minimum quarterly distribution”), and the target distribution levels will be reset to correspondingly higher levels based on percentage increases above the reset minimum quarterly distribution. Our general partner has the right to transfer the incentive distribution rights at any time, in whole or in part, and any transferee holding a majority of the incentive distribution rights shall have the same rights as our general partner with respect to resetting target distributions.
In the event of a reset of the minimum quarterly distribution and the target distribution levels, the holders of the incentive distribution rights will be entitled to receive, in the aggregate, the number of common units equal to that number of common units that would have entitled the holders to an average aggregate quarterly cash distribution in the prior two quarters equal to the average of the distributions on the incentive distribution
34
rights in the prior two quarters. Our general partner will also be issued the number of general partner units necessary to maintain the same percentage general partner interest in us that existed immediately prior to the reset election. We anticipate that our general partner would exercise this reset right in order to facilitate acquisitions or internal expansion projects that would not otherwise be sufficiently accretive to distributions per common unit. It is possible, however, that our general partner or a transferee could exercise this reset election at a time when it is experiencing, or expects to experience, declines in the distributions it receives related to its incentive distribution rights and may therefore desire to be issued common units rather than retain the right to receive incentive distribution payments based on target distribution levels that are less certain to be achieved in the then-current business environment. This risk could be elevated if our incentive distribution rights have been transferred to a third party. As a result, a reset election may cause our common unitholders to experience dilution in the amount of distributions that they would have otherwise received had we not issued common units to our general partner in connection with resetting the target distribution levels.
Our general partner intends to limit its liability regarding our obligations.
Our general partner intends to limit its liability under contractual arrangements so that the counterparties to such arrangements have recourse only against our assets, and not against our general partner or its assets. Our general partner may therefore cause us to incur indebtedness or other obligations that are nonrecourse to our general partner. Our partnership agreement permits our general partner to limit its liability, even if we could have obtained more favorable terms without the limitation on liability. In addition, we are obligated to reimburse or indemnify our general partner to the extent that it incurs obligations on our behalf. Any such reimbursement or indemnification payments would reduce the amount of cash otherwise available for distribution to our unitholders.
Our partnership agreement replaces our general partner’s fiduciary duties to holders of our common units with contractual standards governing its duties.
Our partnership agreement contains provisions that eliminate the fiduciary standards to which our general partner would otherwise be held by state fiduciary duty law and replace those duties with several different contractual standards. For example, our partnership agreement permits our general partner to make a number of decisions in its individual capacity, as opposed to in its capacity as our general partner, free of any duties to us and our unitholders other than the implied contractual covenant of good faith and fair dealing, which means that a court will enforce the reasonable expectations of the partners where the language in the partnership agreement does not provide for a clear course of action. This provision entitles our general partner to consider only the interests and factors that it desires and relieves it of any duty or obligation to give any consideration to any interest of, or factors affecting, us, our affiliates or our limited partners. Examples of decisions that our general partner may make in its individual capacity include:
• | how to allocate corporate opportunities among us and its other affiliates; |
• | whether to exercise its limited call right; |
• | whether to seek approval of the resolution of a conflict of interest by the conflicts committee of the board of directors of our general partner; |
• | how to exercise its voting rights with respect to the units it owns; |
• | whether to exercise its registration rights; |
• | whether to elect to reset target distribution levels; |
• | whether to transfer the incentive distribution rights to a third party; and |
35
• | whether or not to consent to any merger or consolidation of the partnership or amendment to the partnership agreement. |
By purchasing a common unit, a common unitholder agrees to become bound by the provisions in our partnership agreement, including the provisions discussed above.
If we fail to maintain an effective system of internal controls, we may not be able to report our financial results accurately or prevent fraud, which could have a material and adverse impact on our financial condition, results of operations, and cash flows and our ability to make distributions to our unitholders.
We are required to disclose material changes made in our internal control over financial reporting on a quarterly basis and we are required to assess the effectiveness of our controls annually. Effective internal controls are necessary for us to provide reliable and timely financial reports, to prevent fraud, and to operate successfully as a publicly traded limited partnership. We may be unable to maintain effective controls over our financial processes and reporting in the future or to comply with our obligations under Section 404 of the Sarbanes-Oxley Act of 2002. For example, Section 404 requires us, among other things, annually to review and report on the effectiveness of our internal control over financial reporting. Any failure to develop, implement, or maintain effective internal controls or to improve our internal controls could harm our operating results or cause us to fail to meet our reporting obligations.
Given the difficulties inherent in the design and operation of internal controls over financial reporting, we can provide no assurance as to our, or our independent registered public accounting firm’s, future conclusions about the effectiveness of our internal controls, and we may incur significant costs in our efforts to comply with Section 404. Any failure to maintain effective internal controls over financial reporting will subject us to regulatory scrutiny and a loss of confidence in our reported financial information, which could have a material and adverse effect on our financial condition, results of operations, and cash flows and our ability to make distributions to our unitholders.
A unitholder’s liability may not be limited if a court finds that unitholder action constitutes control of our business.
A general partner of a partnership generally has unlimited liability for the obligations of the partnership, except for those contractual obligations of the partnership that are expressly made without recourse to the general partner. Our partnership is organized under Delaware law, and we conduct business in a number of other states. The limitations on the liability of holders of limited partner interests for the obligations of a limited partnership have not been clearly established in some of the other states in which we do business. A unitholder could be liable for any and all of our obligations as if a unitholder were a general partner if a court or government agency were to determine that (i) we were conducting business in a state but had not complied with that particular state’s partnership statute; or (ii) a unitholder’s right to act with other unitholders to remove or replace our general partner, to approve some amendments to our partnership agreement, or to take other actions under our partnership agreement constitute “control” of our business.
Our unitholders may have to repay distributions that were wrongfully distributed to them.
Under certain circumstances, unitholders may have to repay amounts wrongfully distributed to them. Under Section 17-607 of the Delaware Revised Uniform Limited Partnership Act, we may not make a distribution to unitholders if the distribution would cause our liabilities to exceed the fair value of our assets. Delaware law provides that for a period of three years from the date of the impermissible distribution, limited partners who received the distribution and who knew at the time of the distribution that it violated Delaware law will be liable to the limited partnership for the distribution amount. Transferees of common units are liable both for the obligations of the transferor to make contributions to the partnership that are known to the transferee
36
at the time of the transfer and for unknown obligations if the liabilities could be determined from our partnership agreement. Liabilities to partners on account of their partnership interest and liabilities that are nonrecourse to the partnership are not counted for purposes of determining whether a distribution is permitted.
The NYSE does not require a publicly traded limited partnership like us to comply with certain of its corporate governance requirements.
Because we are a publicly traded limited partnership, the NYSE does not require us to have, and we do not have or intend to have, a majority of independent directors on our general partner’s board of directors or to establish a compensation committee or a nominating and corporate governance committee. Additionally, any future issuance of additional common units or other securities, including to affiliates, will not be subject to the NYSE’s shareholder approval rules that apply to a corporation. Accordingly, unitholders will not have the same protections afforded to certain corporations that are subject to all of the NYSE corporate governance requirements.
Tax Risks
Our tax treatment depends on our status as a partnership for federal income tax purposes. If the Internal Revenue Service (IRS) were to treat us as a corporation for federal income tax purposes, which would subject us to entity-level taxation, or if we were otherwise subjected to a material amount of additional entity-level taxation, then our distributable cash flow would be substantially reduced.
The anticipated after-tax economic benefit of an investment in the common units depends largely on our being treated as a partnership for federal income tax purposes.
Despite the fact that we are a limited partnership under Delaware law, it is possible in certain circumstances for a partnership such as ours to be treated as a corporation for federal income tax purposes. A change in our business or a change in current law could cause us to be treated as a corporation for federal income tax purposes or otherwise subject us to taxation as an entity.
If we were treated as a corporation for federal income tax purposes, we would pay federal income tax on our taxable income at the corporate tax rate, which is currently a maximum of 35 percent, and would likely pay state and local income tax at varying rates. Distributions generally would be taxed again to our unitholders as corporate dividends (to the extent of our current and accumulated earnings and profits), and no income, gains, losses, deductions, or credits would flow through to our unitholders. Because a tax would be imposed upon us as a corporation, our distributable cash flow would be substantially reduced. In addition, changes in current state law may subject us to additional entity-level taxation by individual states.
Our partnership agreement provides that, if a law is enacted or existing law is modified or interpreted in a manner that subjects us to taxation as a corporation or otherwise subjects us to entity-level taxation for federal, state, or local income tax purposes, the minimum quarterly distribution amount and the target distribution levels may be adjusted to reflect the impact of that law on us.
The present federal income tax treatment of publicly traded limited partnerships, including us, or an investment in our common units may be modified by administrative or judicial interpretation, or legislative change, at any time, and potentially retroactively. We are unable to predict whether any such modifications will ultimately occur.
37
Our unitholders’ share of our income will be taxable to them for federal income tax purposes even if they do not receive any distributions from us.
Because a unitholder will be treated as a partner to whom we will allocate taxable income that could be different in amount than the cash we distribute, a unitholder will be required to pay federal income taxes and, in some cases, state and local income taxes, on the unitholder’s share of our taxable income even if it receives no distributions from us. Our unitholders may not receive distributions from us equal to their share of our taxable income or even equal to the actual tax liability that results from that income.
If the IRS contests the federal income tax positions we take, the market for our common units may be adversely impacted and the cost of any IRS contest will reduce our distributable cash flow. Recently enacted legislation alters the procedures for assessing and collecting taxes due for taxable years beginning after December 31, 2017 in a manner that could substantially reduce cash available for distribution.
The IRS or a court may reach conclusions that differ from the positions we take. Any contest with the IRS, and the outcome of any IRS contest, may have a materially adverse impact on the market for our common units and the price at which our common units trade. In addition, our costs of any contest with the IRS will be borne indirectly by our unitholders and our general partner because the costs will reduce our distributable cash flow. Recently enacted legislation, applicable to us for taxable years beginning after December 31, 2017, alters the procedures for auditing large partnerships and also alters the procedures for assessing and collecting taxes due (including applicable penalties and interest) as a result of an audit. Under the new rules, unless we are eligible to, and do, elect to issue revised Schedules K-1 to our partners with respect to an audited and adjusted return, the IRS may assess and collect taxes (including any applicable penalties and interest) directly from us in the year in which the audit is completed. If we are required to pay taxes, penalties and interest as the result of audit adjustments, cash available for distribution to our unitholders may be substantially reduced. In addition, because payment would be due for the taxable year in which the audit is completed, unitholders during that taxable year would bear the expense of the adjustment even if they were not unitholders during the audited taxable year.
Tax gain or loss on the disposition of our common units could be more or less than expected.
Unitholders who sell common units will recognize gain or loss for federal income tax purposes equal to the difference between the amount realized and their tax basis in those common units. Because distributions in excess of a unitholder’s allocable share of our net taxable income decrease the unitholder’s tax basis in its common units, the amount, if any, of such prior excess distributions with respect to the common units a unitholder sells will, in effect, become taxable income to the unitholder if it sells such common units at a price greater than its tax basis in those common units, even if the price received is less than its original cost. In addition, because the amount realized includes a unitholder’s share of our nonrecourse liabilities, a unitholder that sells common units may incur a tax liability in excess of the amount of cash received from the sale. Furthermore, a substantial portion of the amount realized, whether or not representing gain, may be taxed as ordinary income to the unitholder due to potential recapture items, including depreciation recapture.
Tax-exempt entities and non-U.S. persons face unique tax issues from owning our common units that may result in adverse tax consequences to them.
Investment in common units by tax-exempt entities, such as employee benefit plans and individual retirement accounts (known as IRAs), and non-U.S. persons, raises issues unique to them. For example, virtually all of our income allocated to organizations that are exempt from federal income tax, including IRAs and other retirement plans, will be unrelated business taxable income and will be taxable to them. Distributions to non-U.S. persons will be reduced by withholding taxes at the highest applicable effective tax rate, and non-U.S.
38
persons will be required to file federal income tax returns and pay tax on their share of our taxable income. Any tax-exempt entity or non-U.S. person should consult a tax advisor before investing in our common units.
We treat each purchaser of common units as having the same tax benefits without regard to the actual common units purchased. The IRS may challenge this treatment, which could adversely affect the value of the common units.
Because we cannot match transferors and transferees of common units and because of other reasons, we will adopt depreciation and amortization positions that may not conform to all aspects of existing Treasury Regulations. A successful IRS challenge to those positions could adversely affect the amount of tax benefits available to our unitholders. It also could affect the timing of these tax benefits or the amount of gain from the sale of common units and could have a negative impact on the value of our common units or result in audit adjustments to our unitholders’ tax returns.
We prorate our items of income, gain, loss, and deduction for federal income tax purposes between transferors and transferees of our units each month based upon the ownership of our units on the first day of each month, instead of on the basis of the date a particular unit is transferred. The IRS may challenge this treatment, which could change the allocation of items of income, gain, loss, and deduction among our unitholders.
We prorate our items of income, gain, loss, and deduction for federal income tax purposes between transferors and transferees of our units each month based upon the ownership of our units on the first day of each month, instead of on the basis of the date a particular unit is transferred. Although simplifying conventions are contemplated by the Code and most publicly traded partnerships use similar simplifying conventions, the use of this proration method may not be permitted under existing or proposed Treasury Regulations. The U.S. Department of the Treasury recently adopted final Treasury Regulations allowing a similar monthly simplifying convention for taxable years beginning on or after August 3, 2015. However, such regulations do not specifically authorize the use of the proration method we have currently adopted. If the IRS were to challenge this method or new Treasury Regulations were issued, we may be required to change the allocation of items of income, gain, loss, and deduction among our unitholders.
A unitholder whose common units are loaned to a “short seller” to effect a short sale of common units may be considered as having disposed of those common units. If so, the unitholder would no longer be treated for federal income tax purposes as a partner with respect to those common units during the period of the loan and may recognize gain or loss from the disposition.
Because a unitholder whose common units are loaned to a “short seller” to effect a short sale of common units may be considered as having disposed of the loaned common units, the unitholder may no longer be treated for federal income tax purposes as a partner with respect to those common units during the period of the loan to the short seller and the unitholder may recognize gain or loss from such disposition. Moreover, during the period of the loan to the short seller, any of our income, gain, loss, or deduction with respect to those common units may not be reportable by the unitholder and any distributions received by the unitholder as to those common units could be fully taxable as ordinary income.
We have adopted certain valuation methodologies and monthly conventions for federal income tax purposes that may result in a shift of income, gain, loss, and deduction between our general partner and our unitholders. The IRS may challenge this treatment, which could adversely affect the value of the common units.
When we issue additional units or engage in certain other transactions, we will determine the fair market value of our assets and allocate any unrealized gain or loss attributable to our assets to the capital accounts
39
of our unitholders and our general partner. Our methodology may be viewed as understating the value of our assets. In that case, there may be a shift of income, gain, loss, and deduction between certain unitholders and our general partner, which may be unfavorable to such unitholders. The IRS may challenge our valuation methods and allocations of taxable income, gain, loss, and deduction between our general partner and certain of our unitholders.
A successful IRS challenge to these methods or allocations could adversely affect the amount of taxable income or loss being allocated to our unitholders. It also could affect the amount of taxable gain from our unitholders’ sale of common units and could have a negative impact on the value of the common units or result in audit adjustments to our unitholders’ tax returns without the benefit of additional deductions.
The sale or exchange of 50 percent or more of our capital and profits interests during any 12-month period will result in the termination of our partnership for federal income tax purposes.
We will be considered to have technically terminated our existing partnership and having formed a new partnership for federal income tax purposes if there is a sale or exchange of 50 percent or more of the total interests in our capital and profits within a 12-month period. Our technical termination would, among other things, result in the closing of our taxable year for all unitholders, which would result in us filing two tax returns (and our unitholders could receive two Schedules K-1 if certain relief were unavailable) for one fiscal year, and could result in a deferral of depreciation deductions allowable in computing our taxable income. In the case of a unitholder reporting on a taxable year other than a fiscal year ending December 31, the closing of our taxable year may also result in more than 12 months of our taxable income or loss being includable in the unitholder’s taxable income for the year of termination. If treated as a new partnership, we must make new tax elections and could be subject to penalties if we are unable to determine that a termination occurred. The IRS has announced a relief procedure whereby if a publicly traded partnership that has technically terminated requests and the IRS grants special relief, among other things, the partnership may be permitted to provide only a single Schedule K-1 to unitholders for the two short tax periods included in the year in which the termination occurs.
As a result of investing in our common units, a unitholder may become subject to state and local taxes and return filing requirements in jurisdictions where we operate or own or acquire properties.
In addition to federal income taxes, our unitholders will likely be subject to other taxes, including state and local taxes, unincorporated business taxes, and estate, inheritance or intangible taxes that are imposed by the various jurisdictions in which we conduct business or control property now or in the future, even if the unitholders do not live in any of those jurisdictions. Our unitholders will likely be required to file state and local income tax returns and pay state and local income taxes in some or all of these various jurisdictions. We conduct business and/or control assets in Arkansas, Louisiana, Mississippi, New Mexico, Oklahoma, Tennessee, and Texas. Except for Texas, all of these states currently impose a personal income tax on individuals. As we make acquisitions or expand our business, we may control assets or conduct business in additional states that impose a personal income tax. It is each unitholder’s responsibility to file all federal, state, and local tax returns. Unitholders should consult their own tax advisors regarding such matters. Under the tax laws of some states where we conduct business, we may be required to withhold a percentage from amounts to be distributed to a unitholder who is not a resident of that state.
The tax treatment of publicly traded partnerships or an investment in our common units could be subject to potential legislative, judicial, or administrative changes and differing interpretations, possibly on a retroactive basis.
The present federal income tax treatment of publicly traded partnerships, including us, or an investment in our common units, may be modified by administrative, legislative, or judicial interpretation at any time. For
40
example, the Fiscal Year 2016 Budget proposed by the President recommends that certain publicly traded partnerships earning income from activities related to fossil fuels be taxed as corporations beginning in 2021. From time to time, members of Congress propose and consider such substantive changes to the existing U.S. federal income tax laws that affect publicly traded partnerships. If successful, the Obama administration’s proposal or other similar proposals could eliminate the qualifying income exception to the treatment of all publicly-traded partnerships as corporations upon which we rely for our treatment as a partnership for U.S. federal income tax purposes.
In addition, the IRS has issued proposed regulations concerning which activities give rise to qualifying income within the meaning of Section 7704 of the Internal Revenue Code. We do not believe the proposed regulations affect our ability to qualify as a publicly traded partnership. However, finalized regulations could modify the amount of our gross income that we are able to treat as qualifying income for the purposes of the qualifying income requirement.
Any modification to the federal income tax laws and interpretations thereof may or may not be applied retroactively. Moreover, any such modification could make it more difficult or impossible for us to meet the exception that allows publicly traded partnerships that generate qualifying income to be treated as partnerships (rather than corporations) for U.S. federal income tax purposes, affect or cause us to change our business activities, or affect the tax consequences of an investment in our common units. For example, members of Congress have been considering substantive changes to the definition of qualifying income and the treatment of certain types of income earned from profits interests in partnerships. While these specific proposals would not appear to affect our treatment as a partnership, we are unable to predict whether any of these changes, or other proposals, will ultimately be enacted. Any such changes could negatively impact the value of an investment in our common units.
Compliance with and changes in tax law could adversely affect our performance.
We are subject to extensive tax laws and regulations, including federal and state income tax laws and transactional taxes such as excise, sales/use, franchise and ad valorem taxes. New tax laws and regulations and changes in existing tax laws and regulations are continuously being enacted that could result in increased tax expenditures in the future. Many of these tax liabilities are subject to audits by the respective taxing authority. These audits may result in additional taxes as well as interest and penalties.
ITEM 1B. UNRESOLVED STAFF COMMENTS
None.
ITEM 3. LEGAL PROCEEDINGS
We incorporate by reference into this Item our disclosures made in Part II, Item 8 of this report included in Note 8 of Notes to Consolidated Financial Statements under the caption “Litigation Matters.”
ITEM 4. MINE SAFETY DISCLOSURES
Not applicable.
41
PART II
ITEM 5. MARKET FOR REGISTRANT'S COMMON EQUITY, RELATED STOCKHOLDER MATTERS AND ISSUER PURCHASES OF EQUITY SECURITIES
Unit Price and Cash Distributions
Our common units are listed on the NYSE under the symbol “VLP.” As of January 31, 2016, there were eight holders of record of our common units and Valero owned all of our subordinated units and general partner units, for which there is no established trading market. Our common units represent limited partner interests in us that entitle the holders to the rights and privileges specified in our partnership agreement.
The following table sets forth the range of the daily high and low sales prices per common unit and cash distributions to common unitholders for each quarter of 2015 and 2014.
Quarter Ended | High Sale Price | Low Sale Price | Quarterly Cash Distribution per Unit | Record Date | Distribution Date | |||||||||||
2015: | ||||||||||||||||
December 31 | $ | 53.25 | $ | 40.64 | $ | 0.3200 | February 4, 2016 | February 11, 2016 | ||||||||
September 30 | 54.50 | 37.96 | 0.3075 | November 2, 2015 | November 10, 2015 | |||||||||||
June 30 | 54.87 | 48.13 | 0.2925 | August 3, 2015 | August 11, 2015 | |||||||||||
March 31 | 55.00 | 38.53 | 0.2775 | May 1, 2015 | May 12, 2015 | |||||||||||
2014: | ||||||||||||||||
December 31 | 52.65 | 35.96 | 0.2660 | February 5, 2015 | February 12, 2015 | |||||||||||
September 30 | 56.89 | 43.33 | 0.2400 | October 31, 2014 | November 12, 2014 | |||||||||||
June 30 | 50.98 | 38.01 | 0.2225 | August 1, 2014 | August 13, 2014 | |||||||||||
March 31 | 40.60 | 31.30 | 0.2125 | May 1, 2014 | May 14, 2014 | |||||||||||
Distributions of Available Cash
Our partnership agreement requires that, within 45 days after the end of each quarter, we distribute all of our available cash to unitholders of record on the applicable record date.
Definition of Available Cash
Available cash generally means, for any quarter, all cash and cash equivalents on hand at the end of that quarter:
• | less, the amount of cash reserves established by our general partner to: |
◦ | provide for the proper conduct of our business (including reserves for our future capital expenditures and anticipated future credit needs requirements and refunds of collected rates reasonably likely to be refunded as a result of a settlement or hearing related to FERC rate proceedings or rate proceedings under applicable law subsequent to that quarter); |
◦ | comply with applicable law, any of our or our subsidiaries’ debt instruments or other agreements; or |
42
◦ | provide funds for distributions to our unitholders and to our general partner for any one or more of the next four quarters (provided that our general partner may not establish cash reserves for distributions if the effect of the establishment of such reserves will prevent us from paying the minimum quarterly distribution on all common units and any cumulative arrearages on such common units for the current quarter); |
• | plus, if our general partner so determines, all or any portion of the cash on hand on the date of determination of available cash for the quarter resulting from working capital borrowings made subsequent to the end of such quarter. |
The effect of the last bullet point above is to allow our general partner, if it so decides, to use cash from working capital borrowings made after the end of the quarter but on or before the date of determination of available cash for that quarter to pay distributions to unitholders. Under our partnership agreement, working capital borrowings are generally borrowings that are made under a credit facility, commercial paper facility or similar financing arrangement, and in all cases are used solely for working capital purposes or to pay distributions to partners, and with the intent of the borrower to repay such borrowings within 12 months with funds other than from additional working capital borrowings.
Intent to Distribute the Minimum Quarterly Distribution
We intend to make at least the minimum quarterly distribution to holders of our common and subordinated units of $0.2125 per unit, or $0.85 per unit on an annualized basis, to the extent we have sufficient available cash after the establishment of cash reserves and the payment of costs and expenses, including reimbursements of expenses to our general partner. However, there is no guarantee that we will pay the minimum quarterly distribution on our units in any quarter. Even if our cash distribution policy is not modified or revoked, the amount of distributions we pay and the decision to make any distribution is determined by our general partner, taking into consideration the terms of our partnership agreement.
General Partner Interest and Incentive Distribution Rights
Our general partner is currently entitled to 2.0 percent of all quarterly distributions that we make prior to our liquidation. This general partner interest is represented by 1,332,829 general partner units. Our general partner has the right, but not the obligation, to contribute up to a proportionate amount of capital to us to maintain its current general partner interest. The general partner’s initial 2.0 percent interest in these distributions will be reduced if we issue additional units in the future and our general partner does not contribute a proportionate amount of capital to us to maintain its 2.0 percent general partner interest.
Our general partner also currently holds incentive distribution rights that entitle it to receive increasing percentages, up to a maximum of 48 percent, of the cash we distribute from operating surplus (as defined in our partnership agreement) in excess of $0.244375 per unit per quarter. The maximum distribution of 48 percent does not include any distributions that our general partner or its affiliates may receive on common, subordinated, or general partner units that they own.
Percentage Allocations of Available Cash from Operating Surplus
The following table illustrates the percentage allocations of available cash from operating surplus between the unitholders and our general partner based on the specified target distribution levels. The amounts set forth under “Marginal Percentage Interest in Distributions” are the percentage interests of our general partner and the unitholders in any available cash from operating surplus we distribute up to and including the corresponding amount in the column “Target Quarterly Distribution per Unit Target Amount.” The percentage interests shown for our unitholders and our general partner for the minimum quarterly distribution are also
43
applicable to quarterly distribution amounts that are less than the minimum quarterly distribution. The percentage interests set forth below for our general partner include its 2.0 percent general partner interest and assume that our general partner has contributed any additional capital necessary to maintain its 2.0 percent general partner interest, our general partner has not transferred its incentive distribution rights, and that there are no arrearages on common units.
Total Quarterly Distribution per Unit Target Amount | Marginal Percentage Interest in Distributions | |||||
Unitholders | General Partner | |||||
Minimum Quarterly Distribution | $0.2125 | 98% | 2% | |||
First Target Distribution | above $0.2125 up to $0.244375 | 98% | 2% | |||
Second Target Distribution | above $0.244375 up to $0.265625 | 85% | 15% | |||
Third Target Distribution | above $0.265625 up to $0.31875 | 75% | 25% | |||
Thereafter | $0.31875 | 50% | 50% | |||
Subordination Period
General
Our partnership agreement provides that, during the subordination period (which we define below), our common units will have the right to receive distributions of available cash from operating surplus each quarter in an amount equal to $0.2125 per common unit, which amount is defined in our partnership agreement as the minimum quarterly distribution, plus any arrearages in the payment of the minimum quarterly distribution on the common units from prior quarters, before any distributions of available cash from operating surplus may be made on the subordinated units. These units are deemed “subordinated” because for a period of time, referred to as the subordination period, the subordinated units will not be entitled to receive any distributions until the common units have received the minimum quarterly distribution plus any arrearages from prior quarters. Furthermore, no arrearages will be paid on the subordinated units. The practical effect of the subordinated units is to increase the likelihood that during the subordination period there will be available cash to be distributed on the common units.
Subordination Period
Except as described below, the subordination period began on the closing date of the IPO and will extend until the first business day following the distribution of available cash in respect of any quarter beginning with the quarter ending December 31, 2016, that each of the following tests are met:
• | distributions of available cash from operating surplus on each of the outstanding common units, subordinated units and general partner units equaled or exceeded $0.2125 per unit per quarter, for each of the three consecutive, non-overlapping four-quarter periods immediately preceding that date; |
• | the adjusted operating surplus (as defined in our partnership agreement) generated during each of the three consecutive, non-overlapping four-quarter periods immediately preceding that date equaled or exceeded the sum of $0.85 (the annualized minimum quarterly distribution) on all of the outstanding common units, subordinated units and general partner units during those periods on a fully diluted basis; and |
• | there are no arrearages in payment of the minimum quarterly distribution on the common units. |
44
Early Termination of Subordination Period
Notwithstanding the foregoing, the subordination period will automatically terminate on the first business day following the distribution of available cash in respect of any quarter beginning with the quarter ended December 31, 2014, that each of the following tests are met:
• | distributions of available cash from operating surplus on each of the outstanding common units, subordinated units, and general partner units equaled or exceeded $1.275 (150 percent of the annualized minimum quarterly distribution), for the four-consecutive-quarter period immediately preceding that date; |
• | the adjusted operating surplus (as defined in our partnership agreement) generated during the four-quarter period immediately preceding that date equaled or exceeded the sum of (i) $1.275 per unit (150 percent of the annualized minimum quarterly distribution) on all of the outstanding common units, subordinated units, and general partner units during that period on a fully diluted basis and (ii) the corresponding distributions on the incentive distribution rights; and |
• | there are no arrearages in payment of the minimum quarterly distributions on the common units. |
Expiration Upon Removal of the General Partner
In addition, if the unitholders remove our general partner other than for cause:
• | the subordinated units held by any person will immediately and automatically convert into common units on a one-for-one basis, provided that (i) neither such person nor any of its affiliates voted any of its units in favor of the removal and (ii) such person is not an affiliate of the successor general partner; |
• | if all of the subordinated units convert pursuant to the foregoing, all cumulative common unit arrearages on the common units will be extinguished and the subordination period will end; and |
• | our general partner will have the right to convert its general partner interest and its incentive distribution rights into common units or to receive cash in exchange for those interests. |
Expiration of the Subordination Period
When the subordination period ends, each outstanding subordinated unit will convert into one common unit and will thereafter participate pro rata with the other common units in distributions of available cash.
Securities Authorized for Issuance Under Equity Compensation Plans
The information appearing in Item 12., “Security Ownership of Certain Beneficial Owners and Management and Related Stockholder Matters—Securities Authorized for Issuance Under Equity Compensation Plans,” is incorporated herein by reference.
45
ITEM 6. SELECTED FINANCIAL DATA
The selected financial data shown in the table below was derived from the consolidated financial statements of the Partnership and from the combined financial statements of our Predecessor (defined below). The Partnership completed its IPO of 17,250,000 common units representing limited partner interests on December 16, 2013. We acquired from Valero the Texas Crude Systems Business on July 1, 2014, the Houston and St. Charles Terminal Services Business on March 1, 2015, and the Corpus Christi Terminal Services Business on October 1, 2015. These acquisitions from Valero were accounted for as transfers of businesses between entities under common control. Accordingly, this financial data has been retrospectively adjusted to include the historical results of these acquisitions for all periods presented prior to the effective dates of each acquisition. We refer to the historical results prior to the IPO and the effective dates of each acquisition from Valero as those of our “Predecessor.” See Note 3 in Notes to Consolidated Financial Statements for further discussion of our acquisitions from Valero.
The following table should be read together with Item 7., “Management’s Discussion and Analysis of Financial Condition and Results of Operations” and our consolidated financial statements and accompanying notes in Item 8., “Financial Statements and Supplementary Data.” The amounts below are presented in thousands, except per unit amounts. Net income per unit is only calculated after the IPO, as no units were outstanding prior to December 16, 2013.
Year Ended December 31, | ||||||||||||||||||||
2015 | 2014 | 2013 | 2012 | 2011 | ||||||||||||||||
Operating revenues – related party | $ | 243,624 | $ | 129,180 | $ | 124,985 | $ | 115,889 | $ | 90,933 | ||||||||||
Net income (loss) | 101,841 | (1,955 | ) | 2,989 | (8,497 | ) | (24,830 | ) | ||||||||||||
Net income attributable to partners | 131,878 | 59,281 | 2,041 | — | — | |||||||||||||||
Limited partners’ interest in net income | 125,809 | 57,902 | 2,000 | — | — | |||||||||||||||
Net income per limited partner unit – (basic and diluted): | ||||||||||||||||||||
Common units | 2.12 | 1.01 | 0.03 | n/a | n/a | |||||||||||||||
Subordinated units | 2.07 | 1.01 | 0.03 | n/a | n/a | |||||||||||||||
Cash distribution declared per unit | 1.1975 | 0.9410 | 0.0370 | n/a | n/a | |||||||||||||||
Cash and cash equivalents | 80,783 | 236,579 | 375,118 | — | — | |||||||||||||||
Total assets | 850,107 | 975,953 | 1,032,895 | 557,052 | 521,815 | |||||||||||||||
Debt and capital lease obligations, net of current portion | 175,246 | 1,519 | 3,079 | 5,405 | 6,952 | |||||||||||||||
Notes payable to related party | 370,000 | — | — | — | — | |||||||||||||||
46
ITEM 7. MANAGEMENT’S DISCUSSION AND ANALYSIS OF FINANCIAL CONDITION AND RESULTS OF OPERATIONS
Management’s Discussion and Analysis of Financial Condition and Results of Operations should be read in conjunction with Items 1 and 2., “Business and Properties,” Item 1A., “Risk Factors,” and Item 8., “Financial Statements and Supplementary Data,” included in this report.
CAUTIONARY STATEMENT FOR THE PURPOSE OF SAFE HARBOR PROVISIONS OF THE
PRIVATE SECURITIES LITIGATION REFORM ACT OF 1995
This report, including without limitation our disclosures below under the heading “OUTLOOK,” includes forward-looking statements within the meaning of Section 27A of the Securities Act of 1933 and Section 21E of the Securities Exchange Act of 1934. You can identify our forward-looking statements by the words “anticipate,” “believe,” “expect,” “plan,” “intend,” “estimate,” “project,” “projection,” “predict,” “budget,” “forecast,” “goal,” “guidance,” “target,” “could,” “should,” “may,” and similar expressions.
Although we believe the assumptions upon which these forward-looking statements are based are reasonable, any of these assumptions could prove to be inaccurate and the forward-looking statements based on these assumptions could be incorrect. The matters discussed in these forward-looking statements are subject to risks, uncertainties, and other factors that could cause actual results and trends to differ materially from those made, projected, or implied in or by the forward-looking statements depending on a variety of uncertainties or other factors including, but not limited to:
• | the suspension, reduction, or termination of Valero’s obligation under our commercial agreements and our services and secondment agreement; |
• | changes in global economic conditions and the effects of the global economic downturn on Valero’s business and the business of its suppliers, customers, business partners, and credit lenders; |
• | a material decrease in Valero’s profitability; |
• | disruptions due to equipment interruption or failure at our facilities, Valero’s facilities, or third-party facilities on which our business or Valero’s business is dependent; |
• | the risk of contract cancellation, non-renewal, or failure to perform by Valero’s customers, and Valero’s inability to replace such contracts and/or customers; |
• | Valero’s ability to remain in compliance with the terms of its outstanding indebtedness; |
• | the timing and extent of changes in commodity prices and demand for Valero’s refined petroleum products; |
• | our ability to obtain credit and financing on acceptable terms in light of uncertainty and illiquidity in credit and capital markets; |
• | actions of customers and competitors; |
• | changes in our cash flows from operations; |
• | state and federal environmental, economic, health and safety, energy, and other policies and regulations, including those related to climate change and any changes therein, and any legal or regulatory investigations, delays, or other factors beyond our control; |
• | operational hazards inherent in refining operations and in transporting and storing crude oil and refined petroleum products; |
• | earthquakes or other natural disasters affecting operations; |
• | changes in capital requirements or in execution of planned capital projects; |
• | the availability and costs of crude oil, other refinery feedstocks, and refined petroleum products; |
47
• | changes in the cost or availability of third-party vessels, pipelines, and other means of delivering and transporting crude oil, feedstocks, and refined petroleum products; |
• | direct or indirect effects on our business resulting from actual or threatened terrorist incidents or acts of war; |
• | weather conditions affecting our or Valero’s operations or the areas in which Valero markets its refined petroleum products; |
• | seasonal variations in demand for refined petroleum products; |
• | adverse rulings, judgments, or settlements in litigation or other legal or tax matters, including unexpected environmental remediation costs in excess of any accruals, which affect us or Valero; |
• | risks related to labor relations and workplace safety; |
• | changes in insurance markets impacting costs and the level and types of coverage available; and |
• | political developments. |
Any one of these factors, or a combination of these factors, could materially affect our future results of operations and affect whether any forward-looking statements ultimately prove to be accurate. Our forward-looking statements are not guarantees of future performance, and actual results and future performance may differ materially from those suggested in any forward-looking statements. We do not intend to update these statements unless we are required by the securities laws to do so.
All subsequent written and oral forward-looking statements attributable to us or persons acting on our behalf are expressly qualified in their entirety by the foregoing. We undertake no obligation to publicly release any revisions to any such forward-looking statements that may be made to reflect events or circumstances after the date of this report or to reflect the occurrence of unanticipated events.
OVERVIEW
We are a fee-based master limited partnership formed by Valero in July 2013 to own, operate, develop, and acquire crude oil and refined petroleum products pipelines, terminals, and other transportation and logistics assets. As of December 31, 2015, our assets consisted of crude oil and refined petroleum products pipeline and terminal systems in the U.S. Gulf Coast and U.S. Mid-Continent regions that are integral to the operations of nine of Valero’s refineries.
On December 16, 2013, we completed the IPO of 17,250,000 of our common units at a price of $23.00 per unit and received gross proceeds of $396.8 million. After deducting the underwriting discount and other offering costs totaling $27.6 million, our net proceeds were $369.2 million. On November 24, 2015, we completed the 2015 Offering of 4,250,000 of our common units at a price to the public of $46.25 per unit and received gross proceeds of $196.6 million. After deducting the underwriting discount and other offering costs totaling $7.7 million (of which $102,000 had not been paid as of December 31, 2015), our net proceeds were $188.9 million. In connection with the 2015 Offering, our general partner contributed $4.0 million in exchange for 86,735 general partner units to maintain its 2.0 percent general partner interest in the Partnership.
Since our formation, we have acquired the following businesses from Valero, which are further described in Note 3 of Notes to Consolidated Financial Statements, and began receiving fees for services provided by these businesses commencing on each respective acquisition date:
• | On July 1, 2014, we acquired the Texas Crude Systems Business for total cash consideration of $154.0 million. |
48
• | On March 1, 2015, we acquired the Houston and St. Charles Terminal Services Business for total consideration of $671.2 million. |
• | On October 1, 2015, we acquired the Corpus Christi Terminal Services Business for total consideration of $465.0 million. |
These acquisitions were each accounted for as transfers of businesses between entities under the common control of Valero. Accordingly, the Partnership’s financial statements have been retrospectively adjusted to include the historical results of the acquired businesses for all periods presented prior to the effective date of each acquisition. We refer to the historical results of the acquired businesses prior to their respective acquisition dates as those of our “Predecessor.” See Notes 1 and 3 of Notes to Consolidated Financial Statements for a discussion of the basis of this presentation.
Operating revenues include amounts attributable to our Predecessor. In connection with the IPO and the acquisitions, we entered into new commercial agreements with Valero as more fully described in Item 1, “Business—Our Commercial Agreements with Valero” and Note 4 of Notes to Consolidated Financial Statements. Under these new agreements, certain storage capacity lease arrangements were replaced with terminaling throughput fees. In addition, we recognized terminaling revenues for certain terminals for which we did not historically charge a fee, and we revised the rates charged for transportation services provided by certain of our pipelines. Because of these new agreements, our results of operations subsequent to the IPO and the acquisitions may not be comparable to our historical results of operations.
For the year ended December 31, 2015, we reported net income of $101.8 million, net income attributable to partners of $131.9 million, and net income per common unit of $2.12. This compares to a net loss of $2.0 million, net income attributable to partners of $59.3 million, and net income per common unit of $1.01 for the year ended December 31, 2014.
• | The increase in net income of $103.8 million in 2015 compared to 2014 was due primarily to $111.3 million of revenues generated by our Houston, St. Charles, and Corpus Christi terminals from the date of their respective acquisitions. The Houston and St. Charles Terminal Services Business and the Corpus Christi Terminal Services Business did not charge Valero for services provided and therefore, did not generate revenues prior to our acquisition of those businesses on March 1, 2015 and October 1, 2015, respectively. |
• | Net income attributable to partners represents our results of operations and only includes those of an acquired business for the period subsequent to the effective date of its acquisition. Therefore, the increase in net income attributable to partners of $72.6 million in 2015 compared to 2014 was due primarily to the comparable periods reflecting the results of operations of the Texas Crude Systems Business, the Houston and St. Charles Terminal Services Business, and the Corpus Christi Terminal Services Business from the date of their respective acquisition. |
Additional analysis of the changes in the components of net income is provided below under “RESULTS OF OPERATIONS.”
49
OUTLOOK
Because our operating revenues are generated from fee-based arrangements with Valero, the amount of operating revenues we generate primarily depends on the volumes of crude oil and refined petroleum products that we transport through our pipelines and handle at our terminals. These volumes are primarily affected by refinery reliability and the supply of, and demand for, crude oil and refined petroleum products in the markets served by our assets. We expect that Valero will ship volumes in excess of its minimum throughput commitments on our pipeline systems and will throughput volumes in excess of its minimum throughput commitments at our terminals for the full year of 2016.
50
RESULTS OF OPERATIONS
The following tables highlight our results of operations and our operating performance. The financial results for the periods prior to December 16, 2013 (the date of the IPO) reflect the combined results of operations of our Predecessor, adjusted for the acquisitions. The financial results from December 16, 2013 through December 31, 2013 and for the years ended December 31, 2014 and 2015 represent our consolidated results of operations, adjusted for the acquisitions for the periods presented prior to the effective date of each acquisition. See Notes 1 and 3 of Notes to Consolidated Financial Statements for a discussion of the basis of this presentation. The narrative following these tables provides an analysis of our results of operations.
2015 Compared to 2014
Results of Operations
(in thousands, except per unit amounts)
Year Ended December 31, | ||||||||||||
2015 | 2014 | Change | ||||||||||
Operating revenues – related party | $ | 243,624 | $ | 129,180 | $ | 114,444 | ||||||
Costs and expenses: | ||||||||||||
Operating expenses | 83,681 | 88,200 | (4,519 | ) | ||||||||
General and administrative expenses | 13,758 | 12,921 | 837 | |||||||||
Depreciation expense | 38,203 | 30,098 | 8,105 | |||||||||
Total costs and expenses | 135,642 | 131,219 | 4,423 | |||||||||
Operating income (loss) | 107,982 | (2,039 | ) | 110,021 | ||||||||
Other income, net | 223 | 1,504 | (1,281 | ) | ||||||||
Interest expense | (6,113 | ) | (872 | ) | (5,241 | ) | ||||||
Income (loss) before income taxes | 102,092 | (1,407 | ) | 103,499 | ||||||||
Income tax expense | 251 | 548 | (297 | ) | ||||||||
Net income (loss) | 101,841 | (1,955 | ) | 103,796 | ||||||||
Less: Net loss attributable to Predecessor | (30,037 | ) | (61,236 | ) | 31,199 | |||||||
Net income attributable to partners | 131,878 | 59,281 | 72,597 | |||||||||
Less: General partner’s interest in net income | 6,069 | 1,379 | 4,690 | |||||||||
Limited partners’ interest in net income | $ | 125,809 | $ | 57,902 | $ | 67,907 | ||||||
Net income per limited partner unit (basic and diluted): | ||||||||||||
Common units | $ | 2.12 | $ | 1.01 | ||||||||
Subordinated units | $ | 2.07 | $ | 1.01 | ||||||||
Weighted average number of limited partner units outstanding: | ||||||||||||
Common units – basic | 31,222 | 28,790 | ||||||||||
Common units – diluted | 31,222 | 28,791 | ||||||||||
Subordinated units – basic and diluted | 28,790 | 28,790 | ||||||||||
51
Operating Highlights and Other Financial Information
(in thousands, except throughput, per barrel, and per unit amounts)
Year Ended December 31, | ||||||||||||
2015 | 2014 | Change | ||||||||||
Operating highlights: | ||||||||||||
Pipeline transportation: | ||||||||||||
Pipeline transportation revenues | $ | 81,435 | $ | 72,737 | $ | 8,698 | ||||||
Pipeline transportation throughput (BPD) (a) | 949,884 | 908,095 | 41,789 | |||||||||
Average pipeline transportation revenue per barrel (b) | $ | 0.23 | $ | 0.22 | $ | 0.01 | ||||||
Terminaling: | ||||||||||||
Terminaling revenues | $ | 161,649 | $ | 55,495 | $ | 106,154 | ||||||
Terminaling throughput (BPD) | 1,340,407 | 545,135 | 795,272 | |||||||||
Average terminaling revenue per barrel (b) | $ | 0.33 | $ | 0.28 | $ | 0.05 | ||||||
Storage revenues | $ | 540 | $ | 948 | $ | (408 | ) | |||||
Total operating revenues – related party | $ | 243,624 | $ | 129,180 | $ | 114,444 | ||||||
Capital expenditures: | ||||||||||||
Maintenance | $ | 9,490 | $ | 28,315 | $ | (18,825 | ) | |||||
Expansion | 21,479 | 75,637 | (54,158 | ) | ||||||||
Total capital expenditures | $ | 30,969 | $ | 103,952 | $ | (72,983 | ) | |||||
Other financial information: | ||||||||||||
Quarterly cash distribution declared per unit | $ | 1.1975 | $ | 0.9410 | ||||||||
Distribution declared: | ||||||||||||
Limited partner units – public | $ | 22,028 | $ | 16,238 | ||||||||
Limited partner units – Valero | 51,566 | 37,950 | ||||||||||
General partner units – Valero | 5,003 | 1,304 | ||||||||||
Total distribution declared | $ | 78,597 | $ | 55,492 | ||||||||
______________
(a) | Represents the sum of volumes transported through each separately tariffed pipeline segment. |
(b) | Average revenue per barrel is calculated as revenue divided by throughput for the period. Throughput is derived by multiplying the throughput barrels per day (BPD) by the number of days in the period. |
52
Operating revenues increased $114.4 million, or 89 percent, in 2015 compared to 2014. The increase was due primarily to revenues of $111.3 million generated by the Houston, St. Charles, and Corpus Christi terminals for the period from the dates of their acquisitions through December 31, 2015. Prior to being acquired by us, the Houston and St. Charles Terminal Services Business and the Corpus Christi Terminal Services Business did not charge Valero for services provided and, therefore, did not generate revenues. Effective with the acquisition dates, we entered into additional schedules to our commercial agreements with Valero with respect to the services we provide to Valero using the assets of the acquired businesses and began generating revenues with respect to these assets.
Operating expenses decreased $4.5 million, or 5 percent, in 2015 compared to 2014. The decrease was due primarily to lower maintenance expense of $7.9 million driven primarily by activity at our St. Charles and Houston terminals and our Lucas crude system. The decrease in maintenance expense was partially offset by an increase in insurance expense of $2.7 million as a result of the acquired assets being covered under our own insurance policies. Prior to the acquisitions, our Predecessor was allocated a portion of Valero’s insurance costs. Additionally, salaries, wages, benefits, and incentive compensation for seconded employees increased $941,000 during 2015 due to the annual merit increase.
General and administrative expenses increased $837,000, or 6 percent, in 2015 compared to 2014 due primarily to incremental costs of $620,000 related to the management fee charged to us by Valero as a result of additional administrative services provided to us in connection with our acquisitions of the Houston and St. Charles Terminal Services Business and the Corpus Christi Terminal Services Business, and higher transaction costs of $527,000 associated with the acquisition of businesses from Valero. In 2015, we incurred transaction costs of $546,000 in connection with the March 1, 2015 acquisition of the Houston and St. Charles Terminal Services Business and $438,000 in connection with the October 1, 2015 acquisition of the Corpus Christi Terminal Services Business. In 2014, we incurred $457,000 in connection with the July 1, 2014 acquisition of the Texas Crude Systems Business. These increases were offset by a decrease of $313,000 in costs related to being a separate publicly traded limited partnership.
Depreciation expense increased $8.1 million, or 27 percent, in 2015 compared to 2014 due primarily to $2.8 million in accelerated depreciation related to the retirement of certain assets in the McKee Crude System in 2015, as well as depreciation expense associated with assets placed into service during the latter part of 2014 and beginning of 2015, including the expansion of our Houston, St. Charles, and Corpus Christi terminals.
“Other income, net” decreased $1.3 million, or 85 percent, in 2015 compared to 2014 due primarily to a decrease in interest income (net of bank fees) of $651,000 attributable to a reduced cash balance during 2015. In addition, scrap metal sales decreased $436,000 and right-of-way fees decreased $141,000.
Interest expense increased $5.2 million in 2015 compared to 2014 due primarily to interest expense incurred on borrowings under our revolving credit facility and under the subordinated credit agreements with Valero associated with our acquisitions. See Notes 3 and 7 of Notes to Consolidated Financial Statements. Interest expense on this indebtedness was $5.5 million in 2015.
Our income tax expense is associated with the Texas margin tax. During 2015, we reduced our deferred income tax liabilities due to a reduction in the relative amount of revenue we generate in Texas compared to our total revenue. This reduction was a result of the acquisition of the Houston and St. Charles Terminal Services Business (which includes operations in Louisiana). In addition, in June 2015, the Texas margin tax rate was reduced from 1 percent to 0.75 percent.
The variation in the customary relationship between income tax expense and income before income taxes for the year ended December 31, 2014 was due to the impact of retrospectively adjusting our results of
53
operations to include the $61 million net loss attributable to the acquired businesses for periods prior to their dates of acquisition.
2014 Compared to 2013
Results of Operations
(in thousands, except per unit amounts)
Year Ended December 31, | ||||||||||||
2014 | 2013 | Change | ||||||||||
Operating revenues – related party | $ | 129,180 | $ | 124,985 | $ | 4,195 | ||||||
Costs and expenses: | ||||||||||||
Operating expenses | 88,200 | 84,728 | 3,472 | |||||||||
General and administrative expenses | 12,921 | 7,778 | 5,143 | |||||||||
Depreciation expense | 30,098 | 28,167 | 1,931 | |||||||||
Total costs and expenses | 131,219 | 120,673 | 10,546 | |||||||||
Operating income (loss) | (2,039 | ) | 4,312 | (6,351 | ) | |||||||
Other income, net | 1,504 | 309 | 1,195 | |||||||||
Interest expense | (872 | ) | (198 | ) | (674 | ) | ||||||
Income (loss) before income taxes | (1,407 | ) | 4,423 | (5,830 | ) | |||||||
Income tax expense | 548 | 1,434 | (886 | ) | ||||||||
Net income (loss) | (1,955 | ) | 2,989 | (4,944 | ) | |||||||
Less: Net income (loss) attributable to Predecessor | (61,236 | ) | 948 | (62,184 | ) | |||||||
Net income attributable to partners | 59,281 | 2,041 | 57,240 | |||||||||
Less: General partner’s interest in net income | 1,379 | 41 | 1,338 | |||||||||
Limited partners’ interest in net income | $ | 57,902 | $ | 2,000 | $ | 55,902 | ||||||
Net income per limited partner unit (basic and diluted): | ||||||||||||
Common units | $ | 1.01 | $ | 0.03 | ||||||||
Subordinated units | $ | 1.01 | $ | 0.03 | ||||||||
Weighted average number of limited partner units outstanding: | ||||||||||||
Common units – basic | 28,790 | 28,790 | ||||||||||
Common units – diluted | 28,791 | 28,790 | ||||||||||
Subordinated units – basic and diluted | 28,790 | 28,790 | ||||||||||
54
Operating Highlights and Other Financial Information
(in thousands, except throughput, per barrel, and per unit amounts)
Year Ended December 31, | ||||||||||||
2014 | 2013 | Change | ||||||||||
Operating highlights: | ||||||||||||
Pipeline transportation: | ||||||||||||
Pipeline transportation revenues | $ | 72,737 | $ | 75,908 | $ | (3,171 | ) | |||||
Pipeline transportation throughput (BPD) (a) | 908,095 | 814,103 | 93,992 | |||||||||
Average pipeline transportation revenue per barrel (b) | $ | 0.22 | $ | 0.26 | $ | (0.04 | ) | |||||
Terminaling: | ||||||||||||
Terminaling revenues | $ | 55,495 | $ | 29,642 | $ | 25,853 | ||||||
Terminaling throughput (BPD) | 545,135 | 260,704 | 284,431 | |||||||||
Average terminaling revenue per barrel (b) | $ | 0.28 | $ | 0.31 | $ | (0.03 | ) | |||||
Storage revenues (c) | $ | 948 | $ | 19,435 | $ | (18,487 | ) | |||||
Total operating revenues – related party | $ | 129,180 | $ | 124,985 | $ | 4,195 | ||||||
Capital expenditures: | ||||||||||||
Maintenance | $ | 28,315 | $ | 39,358 | $ | (11,043 | ) | |||||
Expansion | 75,637 | 81,139 | (5,502 | ) | ||||||||
Total capital expenditures | $ | 103,952 | $ | 120,497 | $ | (16,545 | ) | |||||
Other financial information: | ||||||||||||
Quarterly cash distribution declared per unit (d) | $ | 0.9410 | $ | 0.0370 | ||||||||
Distribution declared: | ||||||||||||
Limited partner units – public | $ | 16,238 | $ | 638 | ||||||||
Limited partner units – Valero | 37,950 | 1,492 | ||||||||||
General partner units – Valero | 1,304 | 44 | ||||||||||
Total distribution declared | $ | 55,492 | $ | 2,174 | ||||||||
______________
(a) | Represents the sum of volumes transported through each separately tariffed pipeline segment. |
(b) | Average revenue per barrel is calculated as revenue divided by throughput for the period. Throughput is derived by multiplying the throughput barrels per day by the number of days in the period. |
(c) | Prior to the IPO, our Predecessor leased some of our refined petroleum products and crude oil storage capacity to Valero. Subsequent to the IPO, under our commercial agreements with Valero, certain of these storage capacity lease agreements were replaced with terminaling fees. |
(d) | The quarterly cash distribution for the year ended December 31, 2013 was calculated as the minimum quarterly distribution of $0.2125 per unit prorated for the period from the date of the IPO (December 16, 2013) to December 31, 2013. |
55
Revenues increased $4.2 million, or 3 percent, in 2014 compared to 2013. The increase was due primarily to an increase of $4.1 million at our Port Arthur logistics system driven by higher utilization of the Lucas crude system resulting from higher throughput of domestic crude oil at Valero’s Port Arthur Refinery. Also contributing to the increase in revenues was the interconnection of the Lucas crude system with TransCanada’s Cushing MarketLink pipeline, which began service in June 2014.
Operating expenses increased $3.5 million, or 4 percent, in 2014 compared to 2013. The increase was due to higher maintenance expense of $3.6 million, which was driven primarily by an increase of $5.5 million in costs primarily associated with tank inspections at our St. Charles terminal, partially offset by a decrease of $3.0 million in maintenance expense at our Memphis and Port Arthur logistics systems and Houston terminal. Also, insurance expense increased $2.5 million as a result of us acquiring our own insurance policies. Prior to the IPO and the acquisitions, our Predecessor was allocated a portion of Valero’s insurance costs. These increases were partially offset by a decrease in waste handling costs of $1.9 million at the St. Charles terminal.
General and administrative expenses increased $5.1 million, or 66 percent, in 2014 compared to 2013 due to incremental costs of $2.4 million related to the management fee charged to us by Valero as a result of additional administrative services provided to us following the IPO, and $2.3 million in additional incremental costs of being a separate publicly traded limited partnership. During 2014, we also incurred $457,000 in costs related to the acquisition of the Texas Crude Systems Business.
Depreciation expense increased $1.9 million, or 7 percent, in 2014 compared to 2013 due primarily to the effect of assets placed in service during 2014, including new tanks and improvements to tanks and other terminal assets at the St. Charles terminal.
“Other income, net” increased $1.2 million in 2014 compared to 2013 due primarily to interest income (net of bank fees) of $870,000 earned on our cash and cash equivalents and income from right-of-way fees and the sale of scrap metal of $357,000 earned during 2014. Prior to the IPO, our Predecessor participated in Valero’s centralized cash management system; therefore, it held no cash or cash equivalents, and no interest income was allocated to our Predecessor by Valero.
Interest expense increased $674,000 in 2014 compared to 2013 due to commitment fees of $515,000 and amortization of deferred debt issuance costs of $314,000, both related to our revolving credit facility, which we entered into in connection with the IPO, partially offset by a $155,000 decrease in net interest expense on capital leases.
Our income tax expense is associated with the Texas margin tax. During the second quarter of 2013, deferred tax expense was recorded in connection with the initial recognition of a deferred tax liability associated with a change in the law with respect to the Texas margin tax.
56
LIQUIDITY AND CAPITAL RESOURCES
We expect our ongoing sources of liquidity to include cash generated from operations, borrowings under our revolving credit facility, and issuances of additional debt and equity securities. We may also enter into financing transactions with Valero in connection with acquisitions. We believe that cash generated from these sources will be sufficient to meet our short-term working capital requirements and long-term capital expenditure requirements, and to make quarterly cash distributions.
Distributions
On January 25, 2016, the board of directors of our general partner declared a distribution of $0.3200 per unit applicable to the fourth quarter of 2015, which equates to $22.7 million in total distributions to unitholders of record as of February 4, 2016. This quarterly distribution per unit is more than the minimum quarterly distribution of $0.2125 per unit.
Our distributions are declared subsequent to quarter end. The table below summarizes information related to our quarterly cash distributions:
Quarterly Period Ended | Total Quarterly Distribution (Per Unit) | Total Cash Distribution (In Thousands) | Declaration Date | Record Date | Distribution Date | ||||||||||
December 31, 2015 | $ | 0.3200 | $ | 22,711 | January 25, 2016 | February 4, 2016 | February 11, 2016 | ||||||||
September 30, 2015 | 0.3075 | 20,164 | October 15, 2015 | November 2, 2015 | November 10, 2015 | ||||||||||
June 30, 2015 | 0.2925 | 18,456 | July 24, 2015 | August 3, 2015 | August 11, 2015 | ||||||||||
March 31, 2015 | 0.2775 | 17,266 | April 21, 2015 | May 1, 2015 | May 12, 2015 | ||||||||||
December 31, 2014 | 0.2660 | 15,829 | January 26, 2015 | February 5, 2015 | February 12, 2015 | ||||||||||
September 30, 2014 | 0.2400 | 14,102 | October 14, 2014 | October 31, 2014 | November 12, 2014 | ||||||||||
June 30, 2014 | 0.2225 | 13,074 | July 15, 2014 | August 1, 2014 | August 13, 2014 | ||||||||||
March 31, 2014 | 0.2125 | 12,487 | April 17, 2014 | May 1, 2014 | May 14, 2014 | ||||||||||
December 31, 2013 (a) | 0.0370 | 2,174 | January 20, 2014 | January 31, 2014 | February 12, 2014 | ||||||||||
______________
(a) This quarterly distribution reflects the pro rata portion of the minimum quarterly distribution rate of $0.2125 for the partial quarter beginning December 16, 2013 and ending December 31, 2013.
Revolving Credit Facility
We have a total commitment of $750.0 million on the Revolver, which matures in November 2020. The Revolver includes sub-facilities for letters of credit. As of December 31, 2015, we had $175.0 million of borrowings outstanding under the Revolver. See Note 7 of Notes to Consolidated Financial Statements for a description of the Revolver.
57
Subordinated Credit Agreements
During 2015, we entered into the Loan Agreements under which we borrowed $160.0 million and $395.0 million to finance a portion of the acquisitions of the Houston and St. Charles Terminal Services Business and the Corpus Christi Terminal Services Business, respectively, as described in Note 3 of Notes to Consolidated Financial Statements.
On December 1, 2015, we repaid $185.0 million of this borrowing. As of December 31, 2015, we had $370.0 million outstanding under the Loan Agreements. See Note 7 of Notes to Consolidated Financial Statements for a description of the Loan Agreements.
Cash Flows Summary
Components of our cash flows are set forth below (in thousands):
Year Ended December 31, | |||||||||||||
2015 | 2014 (a) | 2013 (a) | |||||||||||
Cash flows provided by (used in): | |||||||||||||
Operating activities | $ | 131,430 | $ | 26,834 | $ | 28,729 | |||||||
Investing activities | (421,031 | ) | (184,014 | ) | (120,489 | ) | |||||||
Financing activities | 133,805 | 18,641 | 466,878 | ||||||||||
Net increase (decrease) in cash and cash equivalents | $ | (155,796 | ) | $ | (138,539 | ) | $ | 375,118 | |||||
(a) Prior period financial information has been retrospectively adjusted for the acquisition of the Corpus Christi Terminal Services Business. | |||||||||||||
Operating Activities
Net cash provided by operating activities in 2015 was $131.4 million, which included net income of $101.8 million plus noncash adjustments (primarily for depreciation expense) of $38.6 million, partially offset by unfavorable changes in working capital of $9.0 million. See “RESULTS OF OPERATIONS” for further discussion of our operations. The change in working capital was composed primarily of an increase in receivables from related party of $9.6 million, as shown in Note 15 of Notes to Consolidated Financial Statements. The increase in receivables from related party was attributable primarily to our newly acquired Houston, St. Charles, and Corpus Christi terminals.
Net cash provided by operating activities in 2014 was $26.8 million, which included a net loss of $2.0 million plus noncash adjustments (primarily for depreciation expense) of $30.2 million, partially offset by unfavorable changes in working capital of $1.3 million. See “RESULTS OF OPERATIONS” for further discussion of our operations. The changes in working capital were composed primarily of a decrease in accounts payable of $4.8 million, partially offset by a decrease in receivables from related party of $2.9 million as shown in Note 15 of Notes to Consolidated Financial Statements. The decrease in accounts payable was due primarily to the timing of project expenditures. The decrease in receivables from related party was due to the timing of payments received on outstanding receivables.
Net cash provided by operating activities in 2013 was $28.7 million, which included net income of $3.0 million plus noncash adjustments (primarily for depreciation expense) of $28.7 million, partially offset by unfavorable changes in working capital of $2.9 million. See “RESULTS OF OPERATIONS” for further discussion of our operations. The changes in working capital were composed primarily of an increase in
58
receivables from related party of $6.3 million, partially offset by an increase in accounts payable of $2.4 million as shown in Note 15 of Notes to Consolidated Financial Statements. The increases in receivables from related party and accounts payable were due to the use of cash for working capital after the IPO.
Investing Activities
Cash used for investing activities in 2015 was $421.0 million, which was primarily the result of the acquisitions of the Houston and St. Charles Terminal Services Business and the Corpus Christi Terminal Services Business effective March 1, 2015 and October 1, 2015, respectively. In connection with the acquisitions, we paid $966.2 million in cash to Valero, and of this amount, $390.1 million represented Valero’s carrying value in the net assets transferred to us, which was reflected as an investing activity. The remaining cash paid of $576.1 million represented the excess purchase price paid over the carrying value and was reflected as a financing activity as described below.
Cash used for investing activities in 2014 was $184.0 million, which was primarily the result of the acquisition of the Texas Crude Systems Business effective July 1, 2014. In connection with that acquisition, we paid $154.0 million in cash to Valero, and of this amount $80.1 million represented Valero’s carrying value in the net assets transferred to us, which was reflected as an investing activity. The remaining cash paid of $73.9 million represented the excess purchase price paid over the carrying value, which was reflected as a financing activity as described below.
In addition, we and our Predecessor incurred capital expenditures of $31.0 million, $104.0 million, and $120.5 million in 2015, 2014, and 2013, respectively. See “Capital Expenditures” below for a discussion of the various maintenance and expansion projects.
Financing Activities
Cash provided by financing activities for 2015 of $133.8 million consisted primarily of the $555.0 million of proceeds from the Loan Agreements with Valero in connection with the acquisitions of the Houston and St. Charles Terminal Services Business and the Corpus Christi Terminal Services Business, $200.0 million of borrowings under the Revolver, $189.7 million in cash proceeds (net of the underwriting discount) received in connection with the 2015 Offering, and $4.0 million in cash proceeds from the issuance of general partner units. These cash inflows were offset by the $576.1 million of excess purchase price paid over the carrying value for the acquired businesses as described above under “Investing Activities;” $211.2 million in repayments of borrowings under the Revolver, the Loan Agreements, and capital lease obligations; $71.7 million in cash distributions to limited partners and our general partner; and $2.3 million of debt issuance costs related to the Revolver. Further, we reflected a net transfer from Valero of $47.1 million related to the cash flows associated with our Predecessor.
Our financing activities provided cash of $18.6 million in 2014, which consisted primarily of the $73.9 million of excess purchase price paid for the acquisition of the Texas Crude Systems Business over the carrying value of the assets as described above under “Investing Activities.” In addition, we paid $41.8 million in cash distributions to limited partners and our general partner, $3.2 million of offering costs related to the IPO, and $1.1 million of debt issuance costs related to the Revolver. These cash outflows were offset by a net transfer from Valero of $139.7 million related to the 2014 cash activity for the assets acquired on July 1, 2014, March 1, 2015, and October 1, 2015.
In 2013, our financing activities provided cash of $466.9 million, which was primarily from the net cash proceeds of $372.4 million in cash proceeds (net of the underwriting discount) received in connection with the IPO and the net transfers from Valero of $92.6 million.
59
Capital Expenditures
Our operations can be capital intensive, requiring investments to expand, upgrade, or enhance existing operations and to meet environmental and operational regulations. Our capital requirements consist of maintenance capital expenditures and expansion capital expenditures as those terms are defined in our partnership agreement. Examples of maintenance capital expenditures are those made to replace partially or fully depreciated assets, to maintain the existing operating capacity of our assets and to extend their useful lives, or other capital expenditures that are incurred in maintaining existing system volumes and related cash flows. In contrast, examples of expansion capital expenditures include those made to expand and upgrade our systems and facilities and to construct or acquire new systems or facilities to grow our business.
Our capital expenditures for the past three years were as follows (in thousands):
Years Ended December 31, | |||||||||||||
2015 | 2014 (a) | 2013 (a) | |||||||||||
Maintenance | $ | 9,490 | $ | 28,315 | $ | 39,358 | |||||||
Expansion (b) | 21,479 | 75,637 | 81,139 | ||||||||||
Total capital expenditures | $ | 30,969 | $ | 103,952 | $ | 120,497 | |||||||
(a) Prior period financial information has been retrospectively adjusted for the acquisition of the Corpus Christi Terminal Services Business. | |||||||||||||
(b) This table excludes amounts paid to Valero for the acquired businesses. See Note 3 in Notes to Consolidated Financial Statements for further discussion of our acquisitions. | |||||||||||||
Our capital expenditures in 2015 were primarily directed toward the following activities:
• | the expansion and improvement of assets at our Corpus Christi terminals; |
• | the construction of a connection to receive crude oil from the Seaway pipeline into our Lucas crude system; and |
• | the improvement of assets at our St. Charles terminal that will extend the useful lives of the tanks. |
Our capital expenditures in 2014 were primarily directed toward the following activities:
• | new tanks and improvements to tanks and other terminal assets at our St. Charles and Houston terminals; |
• | the expansion and improvement of assets at our Corpus Christi terminals; and |
• | expansion of the Three Rivers crude system. |
60
Our capital expenditures in 2013 were primarily directed toward the following activities:
• | new tanks and improvements to tanks and other terminal assets at our St. Charles and Houston terminals; |
• | the expansion and improvement of assets at our Corpus Christi terminals; |
• | interconnection with TransCanada’s Cushing MarketLink pipeline; and |
• | expansion of the McKee crude system. |
For the full year of 2016, we expect our capital expenditures to be approximately $16.0 million. Our estimate consists of approximately $11.0 million for maintenance capital expenditures and approximately $5.0 million for expansion capital expenditures. We continuously evaluate our capital budget and make changes as conditions warrant. We anticipate that these capital expenditures will be funded from cash flows from operations. The foregoing capital expenditure estimate does not include any amounts related to strategic business acquisitions.
In addition to the above-mentioned capital expenditures, $27.4 million of capital projects were funded by Valero primarily related to the Houston, St. Charles, and Corpus Christi terminals. Valero agreed to fund these projects as part of our acquisitions of the Houston and St. Charles Terminal Services Business and Corpus Christi Terminal Services Business. See Note 15 of Notes to Consolidated Financial Statements for further description of these noncash activities.
Off-Balance Sheet Arrangements
We do not have any off-balance sheet arrangements.
Contractual Obligations
A summary of our contractual obligations as of December 31, 2015 is shown in the table below (in thousands):
Payments Due by Period | ||||||||||||||||||||||||||||
2016 | 2017 | 2018 | 2019 | 2020 | Thereafter | Total | ||||||||||||||||||||||
Debt and capital lease obligations (including interest on capital lease obligations) | $ | 963 | $ | — | $ | — | $ | — | $ | 545,000 | $ | — | $ | 545,963 | ||||||||||||||
Operating lease obligations | 8,229 | 8,229 | 8,186 | 8,186 | 8,186 | 35,588 | 76,604 | |||||||||||||||||||||
Other long-term liabilities | — | — | — | — | — | 1,116 | 1,116 | |||||||||||||||||||||
Total | $ | 9,192 | $ | 8,229 | $ | 8,186 | $ | 8,186 | $ | 553,186 | $ | 36,704 | $ | 623,683 | ||||||||||||||
61
Debt and Capital Lease Obligations
During 2015, we borrowed $200.0 million under the Revolver and $555.0 million under the Loan Agreements with Valero in connection with the acquisitions of the Houston and St. Charles Terminal Services Business and the Corpus Christi Terminal Services Business. In July 2015, we repaid $25.0 million of the outstanding balance under the Revolver, and in December 2015, we repaid $185.0 million of the outstanding balance under the Loan Agreements.
As of December 31, 2015, we had $175.0 million and $370.0 million of borrowings outstanding under the Revolver and the Loan Agreements, respectively.
Our capital lease agreements have remaining terms that expire during 2016 and have automatic renewal terms for 30 years. Upon renewal, we may terminate these agreements at our option by providing five-years written notice of cancellation until August 2031 upon which time we are only required to provide one-year written notice of cancellation. We expect that in the normal course of business, these leases will be renewed or replaced by other leases.
Our debt and capital lease agreements are described in Note 7 of Notes to Consolidated Financial Statements.
Operating Lease Obligations
In connection with the acquisitions, we entered into lease and access agreements with Valero with respect to the land on which each terminal is located (see Note 4 of Notes to Consolidated Financial Statements for a full description of these agreements). Additionally, we have long-term operating lease commitments with third parties for land used in the storage and transportation of crude oil and refined petroleum products. Operating lease obligations include all operating leases that have initial or remaining noncancelable terms in excess of one year.
Other Long-term Liabilities
Our other long-term liabilities are described in Note 6 of Notes to Consolidated Financial Statements. For purposes of reflecting amounts for other long-term liabilities in the table above, we made our best estimate of expected payments for each type of liability based on information available as of December 31, 2015.
Regulatory Matters
Rate and Other Regulations
Our interstate common carrier crude oil and refined petroleum products pipeline operations are subject to rate regulation by the FERC under the ICA and EPAct. Our pipelines and terminal operations are also subject to safety regulations adopted by the DOT, as well as to state regulations. For more information on federal and state regulations affecting our business, please read Item 1., “Business—Rate and Other Regulations—FERC and Common Carrier Regulations.”
Environmental Matters and Compliance Costs
We are subject to extensive federal, state, and local environmental laws and regulations. These laws, which change frequently, regulate the discharge of materials into the environment or otherwise relate to protection of the environment. Compliance with these laws and regulations may require us to remediate environmental damage from any discharge of petroleum or chemical substances from our facilities or require us to install additional pollution control equipment on our equipment and facilities. Our failure to comply with these or any other environmental or safety-related regulations could result in the assessment of administrative, civil,
62
or criminal penalties, the imposition of investigatory and remedial liabilities, and the issuance of injunctions that may subject us to additional operational constraints.
Future expenditures may be required to comply with federal, state, and local laws and regulations for our various sites, including our pipeline and terminal systems. The impact of these legislative and regulatory developments, if enacted or adopted, could result in increased compliance costs and additional operating restrictions on our business, each of which could have an adverse impact on our financial position, results of operations, and liquidity. For a further description about future expenditures that may be required to comply with these requirements, please read Item 1., “Business—Environmental Matters.”
If these expenditures, as with all costs, are not ultimately reflected in the tariffs and other fees we receive for our services, our operating results will be adversely affected. We believe that substantially all of our competitors must comply with similar environmental laws and regulations. However, the specific impact on each competitor may vary depending on a number of factors, including, but not limited to, the age and location of its operating facilities.
We accrue for environmental remediation activities when the responsibility to remediate is probable and the amount of associated costs can be reasonably estimated. As environmental remediation matters proceed toward ultimate resolution or as additional remediation obligations arise, charges in excess of those previously accrued may be required. New or expanded environmental requirements, which could increase our environmental costs, may arise in the future. We believe we comply with all legal requirements regarding the environment, but since not all of them are fixed or presently determinable (even under existing legislation) and may be affected by future legislation or regulations, it is not possible to predict all of the ultimate costs of compliance, including remediation costs that may be incurred and penalties that may be imposed. For additional information, please read Note 6 of Notes to Consolidated Financial Statements.
NEW ACCOUNTING PRONOUNCEMENTS
As discussed in Note 2 of Notes to Consolidated Financial Statements, certain new financial accounting pronouncements will become effective for our financial statements in the future. Except as disclosed in Note 2, the adoption of these pronouncements is not expected to have a material effect on our financial statements.
CRITICAL ACCOUNTING ESTIMATES
The preparation of financial statements in conformity with U.S. generally accepted accounting principles requires us to make estimates and assumptions that affect the amounts reported in the financial statements and accompanying notes. Actual results could differ from those estimates. The following summary provides further information about our critical accounting policies that involve critical accounting estimates, and should be read in conjunction with Note 2 of Notes to Consolidated Financial Statements, which summarizes our significant accounting policies. The following accounting policies involve estimates that are considered critical due to the level of subjectivity and judgment involved, as well as the impact on our financial position and results of operations. We believe that all of our estimates are reasonable.
Depreciation
We calculate depreciation expense on a straight-line basis over the estimated useful lives of the related property and equipment. Leasehold improvements are amortized on a straight-line basis over the shorter of the lease term or the estimated useful life of the related asset. Assets acquired under capital leases are amortized on a straight-line basis over (i) the lease term if transfer of ownership does not occur at the end of the lease term or (ii) the estimated useful life of the asset if transfer of ownership occurs at the end of the
63
lease term. Changes in the estimated useful lives of the property and equipment could have a material adverse effect on our results of operations.
Asset Retirement Obligations
We have asset retirement obligations with respect to certain of our pipelines and terminals that we are required to perform under law or contract once the asset is retired from service, and we have recognized obligations to restore certain leased properties to substantially the same condition as when such property was delivered to us or to its improved condition as prescribed by the lease agreements. Estimating the future asset removal costs necessary for this accounting calculation is difficult. Most of these removal obligations are years in the future and the contracts often have vague descriptions of what removal practices and criteria must be met when the removal event actually occurs. Asset removal technologies and costs, regulatory, and other compliance considerations, expenditure timing, and other inputs into valuation of the obligation, including discount and inflation rates, are also subject to change.
64
ITEM 7A. QUANTITATIVE AND QUALITATIVE DISCLOSURES ABOUT MARKET RISK
Market risk is the risk of loss arising from adverse changes in market rates and prices. Because we do not take ownership of or receive any payments based on the value of the crude oil or refined petroleum products that we handle and do not engage in the trading of any commodities, we have no direct exposure to commodity price fluctuations.
Our commercial agreements with Valero are indexed to inflation to mitigate our exposure to increases in the cost of labor and materials used in our business.
Any debt that we incur under our Revolver and the Loan Agreements will bear interest at a variable rate and will expose us to interest rate risk. Unless interest rates increase significantly in the future, our exposure to interest rate risk should be minimal. As of December 31, 2015, we had $545.0 million of aggregate borrowings outstanding under our Revolver and notes payable to related party with a weighted-average interest rate of 1.5 percent and expected maturity in 2020. The fair value of our debt and notes payable to related party approximate their carrying values as our borrowings bear interest based upon short-term floating market interest rates.
65
ITEM 8. FINANCIAL STATEMENTS AND SUPPLEMENTARY DATA
MANAGEMENT’S REPORT ON INTERNAL CONTROL OVER FINANCIAL REPORTING
Our management is responsible for establishing and maintaining adequate “internal control over financial reporting” (as defined in Rule 13a-15(f) under the Securities Exchange Act of 1934) for Valero Energy Partners LP. Our management evaluated the effectiveness of Valero Energy Partners LP’s internal control over financial reporting as of December 31, 2015. In its evaluation, management used the criteria established in Internal Control – Integrated Framework (2013) issued by the Committee of Sponsoring Organizations of the Treadway Commission (COSO). Management believes that as of December 31, 2015, our internal control over financial reporting was effective based on those criteria.
Our independent registered public accounting firm has issued an attestation report on the effectiveness of our internal control over financial reporting, which begins on page 68 of this report.
66
REPORT OF INDEPENDENT REGISTERED PUBLIC ACCOUNTING FIRM
The Unitholders of Valero Energy Partners LP and
the Board of Directors of Valero Energy Partners GP LLC
We have audited the accompanying consolidated balance sheets of Valero Energy Partners LP and its subsidiaries (the Partnership) as of December 31, 2015 and 2014, and the related consolidated statements of income, partners’ capital, and cash flows for each of the years in the three-year period ended December 31, 2015. These consolidated financial statements are the responsibility of the Partnership’s management. Our responsibility is to express an opinion on these consolidated financial statements based on our audits.
We conducted our audits in accordance with the standards of the Public Company Accounting Oversight Board (United States) (the PCAOB). Those standards require that we plan and perform the audit to obtain reasonable assurance about whether the financial statements are free of material misstatement. An audit includes examining, on a test basis, evidence supporting the amounts and disclosures in the financial statements. An audit also includes assessing the accounting principles used and significant estimates made by management, as well as evaluating the overall financial statement presentation. We believe that our audits provide a reasonable basis for our opinion.
In our opinion, the consolidated financial statements referred to above present fairly, in all material respects, the financial position of Valero Energy Partners LP and its subsidiaries as of December 31, 2015 and 2014, and the results of their operations and their cash flows for each of the years in the three-year period ended December 31, 2015, in conformity with U.S. generally accepted accounting principles.
We also have audited, in accordance with the standards of the PCAOB, the Partnership’s internal control over financial reporting as of December 31, 2015, based on criteria established in Internal Control – Integrated Framework (2013) issued by the Committee of Sponsoring Organizations of the Treadway Commission, and our report dated February 26, 2016 expressed an unqualified opinion on the effectiveness of the Partnership’s internal control over financial reporting.
/s/ KPMG LLP
San Antonio, Texas
February 26, 2016
67
REPORT OF INDEPENDENT REGISTERED PUBLIC ACCOUNTING FIRM
The Unitholders of Valero Energy Partners LP and
the Board of Directors of Valero Energy Partners GP LLC
We have audited Valero Energy Partners LP (the Partnership’s) internal control over financial reporting as of December 31, 2015, based on criteria established in Internal Control – Integrated Framework (2013) issued by the Committee of Sponsoring Organizations of the Treadway Commission (COSO). The Partnership’s management is responsible for maintaining effective internal control over financial reporting and for its assessment of the effectiveness of internal control over financial reporting, included in the accompanying Management’s Report on Internal Control over Financial Reporting. Our responsibility is to express an opinion on the Partnership’s internal control over financial reporting based on our audit.
We conducted our audit in accordance with the standards of the Public Company Accounting Oversight Board (United States) (the PCAOB). Those standards require that we plan and perform the audit to obtain reasonable assurance about whether effective internal control over financial reporting was maintained in all material respects. Our audit included obtaining an understanding of internal control over financial reporting, assessing the risk that a material weakness exists, and testing and evaluating the design and operating effectiveness of internal control based on the assessed risk. Our audit also included performing such other procedures as we considered necessary in the circumstances. We believe that our audit provides a reasonable basis for our opinion.
A company’s internal control over financial reporting is a process designed to provide reasonable assurance regarding the reliability of financial reporting and the preparation of financial statements for external purposes in accordance with generally accepted accounting principles. A company’s internal control over financial reporting includes those policies and procedures that (1) pertain to the maintenance of records that, in reasonable detail, accurately and fairly reflect the transactions and dispositions of the assets of the company; (2) provide reasonable assurance that transactions are recorded as necessary to permit preparation of financial statements in accordance with generally accepted accounting principles, and that receipts and expenditures of the company are being made only in accordance with authorizations of management and directors of the company; and (3) provide reasonable assurance regarding prevention or timely detection of unauthorized acquisition, use, or disposition of the company’s assets that could have a material effect on the financial statements.
Because of its inherent limitations, internal control over financial reporting may not prevent or detect misstatements. Also, projections of any evaluation of effectiveness to future periods are subject to the risk that controls may become inadequate because of changes in conditions, or that the degree of compliance with the policies or procedures may deteriorate.
In our opinion, Valero Energy Partners LP maintained, in all material respects, effective internal control over financial reporting as of December 31, 2015, based on criteria established in Internal Control – Integrated Framework (2013) issued by COSO.
68
We also have audited, in accordance with the standards of the PCAOB, the consolidated balance sheets of Valero Energy Partners LP and subsidiaries as of December 31, 2015 and 2014, and the related consolidated statements of income, partners’ capital, and cash flows for each of the years in the three-year period ended December 31, 2015, and our report dated February 26, 2016 expressed an unqualified opinion on those consolidated financial statements.
/s/ KPMG LLP
San Antonio, Texas
February 26, 2016
69
VALERO ENERGY PARTNERS LP
CONSOLIDATED BALANCE SHEETS
(In Thousands)
December 31, | |||||||||
2015 | 2014 (a) | ||||||||
ASSETS | |||||||||
Current assets: | |||||||||
Cash and cash equivalents | $ | 80,783 | $ | 236,579 | |||||
Receivables from related party | 18,088 | 8,499 | |||||||
Prepaid expenses and other | 632 | 727 | |||||||
Total current assets | 99,503 | 245,805 | |||||||
Property and equipment, at cost | 1,010,881 | 959,659 | |||||||
Accumulated depreciation | (263,599 | ) | (230,896 | ) | |||||
Property and equipment, net | 747,282 | 728,763 | |||||||
Deferred charges and other assets, net | 3,322 | 1,385 | |||||||
Total assets | $ | 850,107 | $ | 975,953 | |||||
LIABILITIES AND PARTNERS’ CAPITAL | |||||||||
Current liabilities: | |||||||||
Current portion of debt and capital lease obligations | $ | 913 | $ | 1,200 | |||||
Accounts payable | 9,264 | 4,297 | |||||||
Accrued liabilities | 1,690 | 1,054 | |||||||
Taxes other than income taxes | 1,276 | 765 | |||||||
Deferred revenue from related party | 129 | 124 | |||||||
Total current liabilities | 13,272 | 7,440 | |||||||
Debt and capital lease obligations, net of current portion | 175,246 | 1,519 | |||||||
Notes payable to related party | 370,000 | — | |||||||
Deferred income taxes | 320 | 830 | |||||||
Other long-term liabilities | 1,116 | 1,065 | |||||||
Commitments and contingencies | |||||||||
Partners’ capital: | |||||||||
Common unitholders – public (21,509,651 and 17,255,208 units outstanding) | 581,489 | 374,954 | |||||||
Common unitholder – Valero (15,018,602 and 11,539,989 units outstanding) | 28,430 | 58,844 | |||||||
Subordinated unitholder – Valero (28,789,989 and 28,789,989 units outstanding) | (313,961 | ) | 146,804 | ||||||
General partner – Valero (1,332,829 and 1,175,102 units outstanding) | (5,805 | ) | 4,617 | ||||||
Net investment | — | 379,880 | |||||||
Total partners’ capital | 290,153 | 965,099 | |||||||
Total liabilities and partners’ capital | $ | 850,107 | $ | 975,953 | |||||
(a) Financial information has been retrospectively adjusted for the acquisition of the Corpus Christi Terminal Services Business from Valero Energy Corporation. See Notes 1 and 3. | |||||||||
See Notes to Consolidated Financial Statements.
70
VALERO ENERGY PARTNERS LP
CONSOLIDATED STATEMENTS OF INCOME
(In Thousands, Except Per Unit Amounts)
Year Ended December 31, | |||||||||||||
2015 | 2014 (a) | 2013 (a) | |||||||||||
Operating revenues – related party | $ | 243,624 | $ | 129,180 | $ | 124,985 | |||||||
Costs and expenses: | |||||||||||||
Operating expenses (b) | 83,681 | 88,200 | 84,728 | ||||||||||
General and administrative expenses (c) | 13,758 | 12,921 | 7,778 | ||||||||||
Depreciation expense | 38,203 | 30,098 | 28,167 | ||||||||||
Total costs and expenses | 135,642 | 131,219 | 120,673 | ||||||||||
Operating income (loss) | 107,982 | (2,039 | ) | 4,312 | |||||||||
Other income, net | 223 | 1,504 | 309 | ||||||||||
Interest and debt expense, net of capitalized interest (d) | (6,113 | ) | (872 | ) | (198 | ) | |||||||
Income (loss) before income taxes | 102,092 | (1,407 | ) | 4,423 | |||||||||
Income tax expense | 251 | 548 | 1,434 | ||||||||||
Net income (loss) | 101,841 | (1,955 | ) | 2,989 | |||||||||
Less: Net income (loss) attributable to Predecessor | (30,037 | ) | (61,236 | ) | 948 | ||||||||
Net income attributable to partners | 131,878 | 59,281 | 2,041 | ||||||||||
Less: General partner’s interest in net income | 6,069 | 1,379 | 41 | ||||||||||
Limited partners’ interest in net income | $ | 125,809 | $ | 57,902 | $ | 2,000 | |||||||
Net income per limited partner unit – basic and diluted: | |||||||||||||
Common units | $ | 2.12 | $ | 1.01 | $ | 0.03 | |||||||
Subordinated units | $ | 2.07 | $ | 1.01 | $ | 0.03 | |||||||
Weighted-average limited partner units outstanding: | |||||||||||||
Common units – basic | 31,222 | 28,790 | 28,790 | ||||||||||
Common units – diluted | 31,222 | 28,791 | 28,790 | ||||||||||
Subordinated units – basic and diluted | 28,790 | 28,790 | 28,790 | ||||||||||
Cash distribution declared per unit | $ | 1.1975 | $ | 0.9410 | $ | 0.0370 | |||||||
(a) Financial information has been retrospectively adjusted for the acquisition of the Corpus Christi Terminal Services Business from Valero Energy Corporation. See Notes 1 and 3. | |||||||||||||
Supplemental information – each income statement line item reflected below includes expenses incurred for services or financing provided by related party as follows: | |||||||||||||
(b) Operating expenses – related party | $ | 38,161 | $ | 34,226 | $ | 31,759 | |||||||
(c) General and administrative expenses – related party | $ | 10,933 | $ | 10,460 | $ | 7,697 | |||||||
(d) Interest and debt expense – related party | $ | 3,190 | $ | — | $ | — | |||||||
See Notes to Consolidated Financial Statements.
71
VALERO ENERGY PARTNERS LP
CONSOLIDATED STATEMENTS OF PARTNERS’ CAPITAL
(In Thousands)
Partnership | ||||||||||||||||||||||||
Common Unitholders Public | Common Unitholder Valero | Subordinated Unitholder Valero | General Partner Valero | Net Investment | Total | |||||||||||||||||||
Balance as of December 31, 2012 (a) | $ | — | $ | — | $ | — | $ | — | $ | 549,469 | $ | 549,469 | ||||||||||||
Net income: | ||||||||||||||||||||||||
Attributable to Predecessor (a) | — | — | — | — | 948 | 948 | ||||||||||||||||||
Attributable to partners | 599 | 401 | 1,000 | 41 | — | 2,041 | ||||||||||||||||||
Net transfers from Valero Energy Corporation (a) | — | — | — | — | 92,285 | 92,285 | ||||||||||||||||||
Prefunding of capital projects by Valero Energy Corporation | — | — | — | — | 3,500 | 3,500 | ||||||||||||||||||
Allocation of net investment to unitholders | — | 75,597 | 188,601 | 6,126 | (270,324 | ) | — | |||||||||||||||||
Proceeds from initial public offering, net of offering costs | 369,226 | — | — | — | — | 369,226 | ||||||||||||||||||
Balance as of December 31, 2013 (a) | 369,825 | 75,998 | 189,601 | 6,167 | 375,878 | 1,017,469 | ||||||||||||||||||
Net income (loss): | ||||||||||||||||||||||||
Attributable to Predecessor (a) | — | — | — | — | (61,236 | ) | (61,236 | ) | ||||||||||||||||
Attributable to partners | 17,346 | 11,605 | 28,951 | 1,379 | — | 59,281 | ||||||||||||||||||
Net transfers from Valero Energy Corporation (a) | — | — | — | — | 145,354 | 145,354 | ||||||||||||||||||
Allocation of Valero Energy Corporation’s net investment in the Texas Crude Systems Business | — | 22,276 | 55,572 | 2,268 | (80,116 | ) | — | |||||||||||||||||
Consideration paid to Valero Energy Corporation for the Texas Crude Systems Business | — | (42,818 | ) | (106,822 | ) | (4,360 | ) | — | (154,000 | ) | ||||||||||||||
Cash distributions to unitholders | (12,281 | ) | (8,217 | ) | (20,498 | ) | (837 | ) | — | (41,833 | ) | |||||||||||||
Distribution equivalent right payments | (4 | ) | — | — | — | — | (4 | ) | ||||||||||||||||
Unit-based compensation | 68 | — | — | — | — | 68 | ||||||||||||||||||
Balance as of December 31, 2014 (a) | 374,954 | 58,844 | 146,804 | 4,617 | 379,880 | 965,099 | ||||||||||||||||||
Net income (loss): | ||||||||||||||||||||||||
Attributable to Predecessor | — | — | — | — | (30,037 | ) | (30,037 | ) | ||||||||||||||||
Attributable to partners | 37,183 | 28,548 | 60,078 | 6,069 | — | 131,878 | ||||||||||||||||||
Net transfers from Valero Energy Corporation | — | — | — | — | 40,301 | 40,301 | ||||||||||||||||||
Allocation of Valero Energy Corporation’s net investment in acquisitions | — | 111,433 | 267,700 | 11,011 | (390,144 | ) | — | |||||||||||||||||
Consideration paid to Valero Energy Corporation for acquisitions | — | (330,539 | ) | (773,685 | ) | (31,996 | ) | — | (1,136,220 | ) | ||||||||||||||
Units issued to Valero Energy Corporation in connection with acquisitions | — | 166,600 | — | 3,400 | — | 170,000 | ||||||||||||||||||
Units issued in public offering, net of offering costs | 188,915 | — | — | 4,011 | — | 192,926 | ||||||||||||||||||
Noncash capital contributions from Valero Energy Corporation | — | 8,898 | 18,063 | 787 | — | 27,748 | ||||||||||||||||||
Cash distributions to unitholders | (19,725 | ) | (15,354 | ) | (32,921 | ) | (3,704 | ) | — | (71,704 | ) | |||||||||||||
Distribution equivalent right payments | (11 | ) | — | — | — | — | (11 | ) | ||||||||||||||||
Unit-based compensation | 173 | — | — | — | — | 173 | ||||||||||||||||||
Balance as of December 31, 2015 | $ | 581,489 | $ | 28,430 | $ | (313,961 | ) | $ | (5,805 | ) | $ | — | $ | 290,153 | ||||||||||
(a) Financial information has been retrospectively adjusted for the acquisition of the Corpus Christi Terminal Services Business from Valero Energy Corporation. See Notes 1 and 3. | ||||||||||||||||||||||||
See Notes to Consolidated Financial Statements.
72
VALERO ENERGY PARTNERS LP
CONSOLIDATED STATEMENTS OF CASH FLOWS
(In Thousands)
Year Ended December 31, | |||||||||||||
2015 | 2014 (a) | 2013 (a) | |||||||||||
Cash flows from operating activities: | |||||||||||||
Net income (loss) | $ | 101,841 | $ | (1,955 | ) | $ | 2,989 | ||||||
Adjustments to reconcile net income (loss) to net cash provided by operating activities: | |||||||||||||
Depreciation expense | 38,203 | 30,098 | 28,167 | ||||||||||
Deferred income tax expense (benefit) | (228 | ) | 43 | 941 | |||||||||
Changes in current assets and current liabilities | (8,973 | ) | (1,318 | ) | (2,947 | ) | |||||||
Changes in deferred charges and credits and other operating activities, net | 587 | (34 | ) | (421 | ) | ||||||||
Net cash provided by operating activities | 131,430 | 26,834 | 28,729 | ||||||||||
Cash flows from investing activities: | |||||||||||||
Capital expenditures | (30,969 | ) | (103,952 | ) | (120,497 | ) | |||||||
Acquisitions from Valero Energy Corporation | (390,144 | ) | (80,116 | ) | — | ||||||||
Proceeds from dispositions of property and equipment | 82 | 54 | 8 | ||||||||||
Net cash used in investing activities | (421,031 | ) | (184,014 | ) | (120,489 | ) | |||||||
Cash flows from financing activities: | |||||||||||||
Proceeds from debt borrowings | 200,000 | — | — | ||||||||||
Proceeds from notes payable to related party | 555,000 | — | — | ||||||||||
Repayments of debt and capital lease obligations | (26,200 | ) | (1,048 | ) | (1,059 | ) | |||||||
Repayment of note payable to related party | (185,000 | ) | — | — | |||||||||
Payment of debt issuance costs | (2,322 | ) | (1,071 | ) | (572 | ) | |||||||
Prefunding of capital projects by Valero Energy Corporation | — | — | 3,500 | ||||||||||
Proceeds from issuance of common units, net of discount | 189,683 | — | 372,449 | ||||||||||
Proceeds from issuance of general partner units | 4,011 | — | — | ||||||||||
Payment of offering costs | (666 | ) | (3,223 | ) | — | ||||||||
Excess purchase price paid to Valero Energy Corporation over the carrying value of acquired assets | (576,076 | ) | (73,884 | ) | — | ||||||||
Cash distributions to unitholders and distribution equivalent right payments | (71,715 | ) | (41,837 | ) | — | ||||||||
Net transfers from Valero Energy Corporation | 47,090 | 139,704 | 92,560 | ||||||||||
Net cash provided by financing activities | 133,805 | 18,641 | 466,878 | ||||||||||
Net increase (decrease) in cash and cash equivalents | (155,796 | ) | (138,539 | ) | 375,118 | ||||||||
Cash and cash equivalents at beginning of year | 236,579 | 375,118 | — | ||||||||||
Cash and cash equivalents at end of year | $ | 80,783 | $ | 236,579 | $ | 375,118 | |||||||
(a) Financial information has been retrospectively adjusted for the acquisition of the Corpus Christi Terminal Services Business from Valero Energy Corporation. See Notes 1 and 3. | |||||||||||||
See Notes to Consolidated Financial Statements.
73
VALERO ENERGY PARTNERS LP
NOTES TO CONSOLIDATED FINANCIAL STATEMENTS
1. | BUSINESS AND BASIS OF PRESENTATION |
Business
Valero Energy Partners LP (the Partnership) is a fee-based, master limited partnership formed by Valero (defined below) in July 2013 to own, operate, develop, and acquire crude oil and refined petroleum products pipelines, terminals, and other transportation and logistics assets.
References in this report to “Partnership,” “we,” “us,” or “our” refer to Valero Energy Partners LP, one or more of its subsidiaries, or all of them taken as a whole. References in this report to “Valero” refer collectively to Valero Energy Corporation and its subsidiaries, other than Valero Energy Partners LP, any of its subsidiaries, or its general partner.
On December 16, 2013, the Partnership completed its initial public offering (the IPO) of 17,250,000 common units representing limited partner interests as further described in Note 11. Immediately following the IPO, the Partnership included the assets, liabilities, and results of operations of certain crude oil and refined petroleum products pipelines, terminals, and other logistics assets previously owned and operated by Valero, which are referred to as the Contributed Assets. We acquired from Valero the Texas Crude Systems Business on July 1, 2014, the Houston and St. Charles Terminal Services Business on March 1, 2015, and the Corpus Christi Terminal Services Business on October 1, 2015 (collectively, the Acquisitions). See Note 3 for further discussion of these Acquisitions from Valero. As of December 31, 2015, our assets consisted of crude oil and refined petroleum products pipeline and terminal systems in the United States (U.S.) Gulf Coast and U.S. Mid-Continent regions that are integral to the operations of nine of Valero’s refineries.
We generate operating revenues by providing fee-based transportation and terminaling services to Valero and, prior to the IPO, our Predecessor (defined below) leased certain crude oil and refined petroleum products storage capacity to Valero.
Basis of Presentation
Our consolidated financial statements include the accounts of the Partnership as well as our Predecessor (defined below). All intercompany accounts and transactions have been eliminated.
The Contributed Assets and the Acquisitions were accounted for as transfers of businesses between entities under the common control of Valero. As entities under the common control of Valero, we recorded the Contributed Assets and the Acquisitions on our balance sheet at Valero’s carrying value rather than fair value. Transfers between entities under common control are accounted for as though the transfer occurred as of the beginning of the period of transfer, and prior period financial statements and financial information are retrospectively adjusted to furnish comparative information. Accordingly, the Partnership’s financial statements and related notes have been retrospectively adjusted to include the historical results of the Acquisitions for all periods presented prior to the effective dates of each acquisition. We refer to the historical results of the Contributed Assets prior to the IPO and the Acquisitions prior to their respective acquisition dates as those of our “Predecessor.”
The combined financial statements of our Predecessor were derived from the consolidated financial statements and accounting records of Valero and reflect the combined historical financial position, results of operations, and cash flows of our Predecessor as if the Contributed Assets and the Acquisitions had been combined for periods prior to the IPO and the effective dates of each acquisition.
74
There were no transactions between the operations of our Predecessor; therefore, there were no intercompany transactions or accounts to be eliminated in connection with the combination of those operations. In addition, our Predecessor’s statements of income include direct charges for the management and operation of our assets and certain expenses allocated by Valero for general corporate services, such as treasury, accounting, and legal services. These expenses were charged, or allocated, to our Predecessor based on the nature of the expenses. Prior to the IPO and the Acquisitions, our Predecessor transferred cash to Valero daily and Valero funded our Predecessor’s operating and investing activities as needed. Therefore, transfers of cash to and from Valero’s cash management system are reflected as a component of net investment and are reflected as a financing activity in our statements of cash flows. In addition, interest expense was not included on the net cash transfers from Valero.
The financial information presented for the periods after the IPO for the Contributed Assets and after the effective dates of the Acquisitions represents the consolidated financial position, results of operations, and cash flows of the Partnership.
2. | SUMMARY OF SIGNIFICANT ACCOUNTING POLICIES |
Principles of Consolidation
Our consolidated financial statements include the accounts of the Partnership as well as our Predecessor. All intercompany accounts and transactions have been eliminated.
Use of Estimates
The preparation of financial statements in conformity with U.S. generally accepted accounting principles (GAAP) requires management to make estimates and assumptions that affect the amounts reported in the financial statements and accompanying notes. Actual results could differ from these estimates. On an ongoing basis, we review our estimates based on currently available information. Changes in facts and circumstances may result in revised estimates.
Cash and Cash Equivalents
Our cash equivalents are highly liquid investments that have a maturity of three months or less when acquired.
Receivables from Related Party
All of our receivables from related party are due from Valero and include trade receivables and nontrade receivables, net of payables to Valero for services under various agreements as more fully described in Note 4. Under these various agreements with Valero, we have the right to offset payables due to Valero against receivables from Valero.
Property and Equipment
The cost of property and equipment purchased or constructed, including betterments of property assets, is capitalized. However, the cost of repairs and normal maintenance of property and equipment is expensed when incurred. Betterments of property and equipment are those that extend the useful lives of the property and equipment or improve the safety of our operations. The cost of property and equipment constructed
75
includes interest and certain overhead costs allocable to the construction activities. Property and equipment also includes our 33⅓ percent undivided interest in certain assets.
When property and equipment are retired or replaced, the cost and related accumulated depreciation are eliminated, with any gain or loss reflected in depreciation expense, unless such amounts are reported separately due to materiality.
Depreciation of property and equipment is recorded on a straight-line basis over the estimated useful lives of the related assets. Leasehold improvements are amortized on a straight-line basis over the shorter of the lease term or the estimated useful life of the related asset. Assets acquired under capital lease agreements are amortized on a straight-line basis over (i) the lease term if transfer of ownership does not occur at the end of the lease term or (ii) the estimated useful life of the asset if transfer of ownership occurs at the end of the lease term.
Impairment of Assets
Long-lived assets are tested for recoverability whenever events or changes in circumstances indicate that the carrying amount of the asset may not be recoverable. A long-lived asset is not recoverable if its carrying amount exceeds the sum of the undiscounted cash flows expected to result from its use and eventual disposition. If a long-lived asset is not recoverable, an impairment loss is recognized for the amount by which the carrying amount of the long-lived asset exceeds its fair value, with fair value determined based on discounted estimated net cash flows or other appropriate methods.
Asset Retirement Obligations
We record a liability, which is referred to as an asset retirement obligation, at fair value for the estimated cost to retire a tangible long-lived asset at the time we incur that liability, which is generally when the asset is purchased, constructed, or leased. We record the liability when we have a legal obligation to incur costs to retire the asset and when a reasonable estimate of the fair value of the liability can be made. If a reasonable estimate cannot be made at the time the liability is incurred, we record the liability when sufficient information is available to estimate the liability’s fair value.
Environmental Matters
Liabilities for future remediation costs are recorded when environmental assessments and/or remedial efforts are probable and the costs can be reasonably estimated. Other than for assessments, the timing and magnitude of these accruals generally are based on the completion of investigations or other studies or a commitment to a formal plan of action. Amounts recorded for environmental liabilities have not been reduced by possible recoveries from third parties and have not been measured on a discounted basis.
Net Investment
Net investment represents Valero’s historical investment in our Predecessor, its accumulated net earnings after taxes, and the net effect of transactions and allocations between our Predecessor and Valero. There were no terms of settlement or interest charges associated with the net investment balance.
76
Revenue Recognition
Revenues are recognized for the transportation of crude oil and refined petroleum products upon delivery of actual volumes transported at contractual tariff rates. Revenues are recognized for terminaling crude oil and refined petroleum products as terminaling services are performed based on contractual rates.
As further described in Note 4, our commercial agreements (defined in Note 4) with Valero contain minimum volume commitment requirements. Under these agreements, if Valero fails to transport its minimum throughput volumes during any quarter, then Valero will pay us a deficiency payment equal to the volume of the deficiency multiplied by the tariff rate then in effect. Valero may apply the amount of any such deficiency payments as a credit for volumes transported on the applicable pipeline and terminal systems in excess of its minimum volume commitment during the following four quarters under the terms of the applicable commercial agreement. The deficiency payments are initially recorded as deferred revenue from related party. We recognize revenues for the deficiency payments at the earlier of when credits are used for volumes transported in excess of minimum volume commitments or upon the expiration of the applicable four-quarter period. The use or expiration of the credits is a reduction to deferred revenue from related party.
Certain of our commercial agreements with Valero are considered operating leases under U.S. GAAP. Lease revenue is recognized over the lease term and contingent lease revenue is recognized after minimum monthly volume commitment requirements on these leases have been met.
Prior to the IPO, our Predecessor recognized revenues under various operating leases with Valero for crude oil and refined petroleum products storage capacity.
Income Taxes
Our operations are treated as a partnership for federal and state income tax purposes, with each partner being separately taxed on its share of taxable income. Therefore, we have excluded income taxes from these financial statements, except for state taxes that apply to partnerships, specifically the margin tax in Texas. Our Predecessor’s taxable income was included in the consolidated U.S. federal income tax returns of Valero and in certain consolidated state income tax returns.
Income taxes are accounted for under the asset and liability method, as if we were a separate taxpayer rather than a member of Valero’s consolidated tax return. Under this method, deferred tax assets and liabilities are recognized for the future tax consequences attributable to differences between the financial statement carrying amounts of existing assets and liabilities and their respective tax bases. Deferred amounts are measured using enacted tax rates expected to apply to taxable income in the year those temporary differences are expected to be recovered or settled.
We classify any interest expense and penalties related to the underpayment of income taxes in income tax expense.
Net Income per Limited Partner Unit
Basic and diluted net income per limited partner unit is determined pursuant to the two-class method for master limited partnerships as further described in Note 10.
77
Comprehensive Income
We have not reported comprehensive income due to the absence of items of other comprehensive income in the years presented.
Segment Reporting
Our operations consist of one reportable segment and all of our operations are conducted, and all of our assets are located, in the U.S.
New Accounting Pronouncements
In May 2014, the Accounting Standards Codification (ASC) was amended and a new accounting standard, ASC Topic 606, “Revenue from Contracts with Customers,” was issued to clarify the principles for recognizing revenue. The core principle of the new standard is that an entity should recognize revenue to depict the transfer of promised goods or services to customers in an amount that reflects the consideration to which the entity expects to be entitled in exchange for those goods and services. The standard also requires improved interim and annual disclosures that enable the users of financial statements to better understand the nature, amount, timing, and uncertainty of revenues and cash flows arising from contracts with customers. In July 2015, the effective date of the new standard was deferred by one year. As a result, the standard is effective for annual reporting periods beginning after December 15, 2017, including interim reporting periods within those reporting periods, and can be adopted either retrospectively to each prior reporting period presented using a practical expedient, as allowed by the new standard, or retrospectively with a cumulative-effect adjustment to partners’ capital as of the date of initial application. Early adoption is permitted, but not before the original effective date, which was for annual reporting periods beginning after December 15, 2016, including interim reporting periods within those reporting periods. We are currently evaluating the effect that adopting this new standard will have on our financial statements and related disclosures.
In February 2015, the provisions of ASC Topic 810, “Consolidation,” were amended to improve consolidation guidance for certain types of legal entities. The guidance modifies the evaluation of whether limited partnerships and similar legal entities are variable interest entities (VIEs) or voting interest entities, eliminates the presumption that a general partner should consolidate a limited partnership, affects the consolidation analysis of reporting entities that are involved with VIEs, particularly those that have fee arrangements and related party relationships, and provides a scope exception from consolidation guidance for certain money market funds. These provisions are effective for annual reporting periods beginning after December 15, 2015, and interim periods within those annual periods, with early adoption permitted. These provisions may also be adopted retrospectively in previously issued financial statements for one or more years with a cumulative-effect adjustment to partners’ capital as of the beginning of the first year restated. The adoption of this guidance effective January 1, 2016 will not affect our financial position or results of operations.
In April 2015, the provisions of ASC Subtopic 835-30, “Interest–Imputation of Interest,” were amended to simplify the presentation of debt issuance costs. The guidance requires that debt issuance costs related to a note be reported in the balance sheet as a direct deduction from the face amount of that note, consistent with debt discounts, and that amortization of debt issuance costs be reported as interest expense. In August 2015, these provisions were further amended with guidance from the Securities and Exchange Commission staff that they would not object to an entity deferring and presenting debt issuance costs related to line-of-credit
78
arrangements as an asset and subsequently amortizing the deferred debt issuance costs ratably over the term of the line-of-credit arrangement, regardless of whether there are any outstanding borrowings on the line-of-credit arrangement. These provisions are to be applied retrospectively and are effective for annual reporting periods beginning after December 15, 2015, and interim periods within those annual periods, with early adoption permitted. The adoption of this guidance effective January 1, 2016 will not affect our financial position or results of operations as our debt issuance costs are associated with our revolving credit facility as further discussed in Note 7.
Also in April 2015, the provisions of ASC Topic 260, “Earnings Per Share,” were amended to provide guidance on how master limited partnerships apply the two-class method of calculating earnings per unit for historical periods when they receive net assets in a dropdown transaction that is accounted for as a transaction between entities under common control as required under Subtopic 805-50, “Business Combinations–Related Issues.” The amendments specify that for purposes of calculating earnings per unit under the two-class method for periods before the date of a dropdown transaction, earnings or losses of a transferred business should be allocated entirely to the general partner. Qualitative disclosures are also required to describe how the rights to earnings or losses differ before and after the dropdown transaction for purposes of computing earnings per unit under the two-class method. These provisions are effective for annual reporting periods beginning after December 15, 2015, and interim periods within those annual periods, with early adoption permitted, and should be applied retrospectively for all financial statements presented. We have historically calculated our net income per unit after a dropdown transaction as prescribed by these provisions; therefore, the adoption of this guidance effective January 1, 2016 will not affect our net income per unit for periods prior to January 1, 2016, but will result in additional disclosures.
In September 2015, the provisions of ASC Topic 805, “Business Combinations,” were amended to simplify the accounting and reporting of adjustments made to provisional amounts recognized in a business combination. The amendment requires that an acquirer (i) record, in the same period’s financial statements, the effect on earnings of changes in depreciation, amortization, or other income effects, if any, as a result of the change to the provisional amounts, calculated as if the accounting had been completed at the acquisition date and (ii) present separately on the statement of income or disclose in the notes the portion of the amount recorded in current-period earnings by line item that would have been recorded in previous reporting periods if the adjustment to the provisional amounts had been recognized as of the acquisition date. These provisions are effective for annual reporting periods beginning after December 15, 2015, and interim periods within those annual periods, and should be applied prospectively to adjustments made to provisional amounts that occur after the effective date. Earlier application is permitted for financial statements that have not yet been issued. The adoption of this guidance effective January 1, 2016 will not affect our financial position or results of operations; however, it may result in changes to the manner in which adjustments to provisional amounts recognized in a future business combination, if any, are presented in our financial statements.
In November 2015, the provisions of ASC Topic 740, “Income Taxes,” were amended to simplify the presentation of deferred income taxes. The amendments require that deferred tax liabilities and assets be classified as noncurrent in a classified balance sheet. The amendments are effective for financial statements for annual periods beginning after December 15, 2016, and interim periods within those annual periods, with early adoption permitted as of the beginning of any interim or annual period. The amendments may be applied either prospectively to all deferred tax liabilities and assets or retrospectively to all periods presented. Entities applying the guidance retrospectively shall disclose in the first interim and first annual period of adoption the nature of and reason for the change in accounting principle and quantitative information about the effects
79
of the accounting change on prior periods. We have elected to adopt this guidance effective January 1, 2016 on a retrospective basis, and such adoption will not affect our financial position as our deferred income tax assets and liabilities are already classified as noncurrent in our balance sheets.
In January 2016, the provisions of ASC Subtopic 825-10, “Financial Instruments–Overall,” were amended to enhance the reporting model for financial instruments regarding certain aspects of recognition, measurement, presentation, and disclosure. The amendment (i) requires equity investments (except those accounted for under the equity method or that are consolidated) to be measured at fair value with changes in fair value recognized in net income; (ii) simplifies the impairment assessment of equity investments without readily determinable fair values by requiring a qualitative assessment to identify impairment; (iii) eliminates the requirement for an entity to disclose the methods and significant assumptions used to estimate the fair value of financial instruments measured at amortized cost; (iv) requires an entity to use the exit price notion when measuring the fair value of financial instruments for disclosure purposes; and (v) requires separate presentation of financial assets and financial liabilities by measurement category and form of financial asset on the balance sheet or in the accompanying notes to the financial statements. These provisions are effective for annual reporting periods beginning after December 15, 2017, and interim periods within those annual periods. The standard is to be applied using a cumulative-effect adjustment to the balance sheet as of the beginning of the fiscal year of adoption. We are currently evaluating the effect that adopting this standard will have on our financial statements and related disclosures.
In February 2016, the ASC was amended and a new accounting standard, ASC Topic 842, “Leases,” was issued to increase the transparency and comparability among organizations by recognizing lease assets and lease liabilities on the balance sheet and disclosing key information about leasing arrangements. In order to meet that objective, the new standard requires recognition of the assets and liabilities that arise from leases. Accordingly, a lessee will recognize a right-of-use (ROU) asset for its right to use the underlying asset and a lease liability for the corresponding lease obligation. Both the ROU asset and lease liability will initially be measured at the present value of the future minimum lease payments over the lease term. Subsequent measurement, including the presentation of expenses and cash flows, will depend on the classification of the lease as either a finance or an operating lease. Initial costs directly attributable to negotiating and arranging the lease will be included in the ROU asset. Lessees can make an accounting policy election by class of underlying asset not to recognize a ROU asset and corresponding lease liability for leases with a term of 12 months or less. Accounting by lessors will remain largely unchanged from current U.S. GAAP. In transition, lessees and lessors are required to recognize and measure leases at the beginning of the earliest period presented using a modified retrospective approach. The modified retrospective approach includes a number of optional practical expedients that companies may elect to apply. These practical expedients relate to the identification and classification of leases that commenced before the effective date, initial direct costs for leases that commenced before the effective date, and the ability to use hindsight in evaluating lessee options to extend or terminate a lease or to purchase the underlying asset. The transition guidance also provides specific guidance for sale and leaseback transactions, build-to-suit leases, leveraged leases, and amounts previously recognized in accordance with the business combinations guidance for leases. The new standard is effective for public companies for fiscal years beginning after December 15, 2018, and interim periods within those years, with early adoption permitted. We are currently evaluating the effect that adopting this standard will have on our financial statements and related disclosures.
80
3. | ACQUISITIONS |
In connection with the Acquisitions, we entered into various agreements with Valero related to the acquisition agreements, including an amended and restated omnibus agreement, an amended and restated services and secondment agreement, lease agreements, and additional schedules to our commercial agreements. See Note 4 for a summary of the terms of these agreements.
Acquisition of the Texas Crude Systems Business
On July 1, 2014, we acquired the Texas Crude Systems Business from Valero for total cash consideration of $154.0 million. The Texas Crude Systems Business is engaged in the business of transporting, terminaling, and storing crude oil and refined petroleum products through various pipeline and terminal systems that compose the McKee Crude System (supporting Valero’s McKee Refinery), the Three Rivers Crude System (supporting Valero’s Three Rivers Refinery), and the Wynnewood Products System (supporting Valero’s Ardmore Refinery).
Acquisition of the Houston and St. Charles Terminals Services Business
Effective March 1, 2015, we acquired two subsidiaries from Valero that own and operate crude oil, intermediates, and refined petroleum products terminals supporting Valero’s Houston Refinery (in Houston, Texas) and St. Charles Refinery (in Norco, Louisiana) for total consideration of $671.2 million, which consisted of (i) a cash distribution of $571.2 million and (ii) the issuance of 1,908,100 common units and 38,941 general partner units having an aggregate value of $100.0 million. We funded the cash distribution to Valero with $211.2 million of our cash on hand, $200.0 million of borrowings under our revolving credit facility, and $160.0 million of proceeds from a subordinated credit agreement with Valero. See Note 7 for further discussion of the borrowings under our revolving credit facility and subordinated credit agreement.
Acquisition of the Corpus Christi Terminal Services Business
Effective October 1, 2015, we acquired Valero’s Corpus Christi East Terminal and Corpus Christi West Terminal (collectively, the Corpus Christi Terminal Services Business) for total consideration of $465.0 million, which consisted of (i) a cash distribution of $395.0 million and (ii) the issuance of 1,570,513 common units and 32,051 general partner units having an aggregate value of $70.0 million. We funded the cash distribution to Valero with $395.0 million of proceeds from a subordinated credit agreement with Valero. The Corpus Christi Terminal Services Business is engaged in the business of terminaling crude oil, intermediates, and refined petroleum products at terminals in Corpus Christi, Texas and supports Valero’s Corpus Christi East and West Refineries. See Note 7 for further discussion of the borrowings under our subordinated credit agreement.
81
Presentation of Reported Financial Information
The following table presents our previously reported balance sheet as of December 31, 2014 retrospectively adjusted for the acquisition of the Corpus Christi Terminal Services Business (in thousands). The assets and liabilities of the Texas Crude Systems Business and the Houston and St. Charles Terminal Services Business are included in our previously reported balance sheet as of December 31, 2014.
Valero Energy Partners LP (Previously Reported) | Corpus Christi Terminal Services Business | Valero Energy Partners LP (Currently Reported) | ||||||||||
ASSETS | ||||||||||||
Current assets: | ||||||||||||
Cash and cash equivalents | $ | 236,579 | $ | — | $ | 236,579 | ||||||
Receivables from related party | 8,499 | — | 8,499 | |||||||||
Prepaid expenses and other | 727 | — | 727 | |||||||||
Total current assets | 245,805 | — | 245,805 | |||||||||
Property and equipment, at cost | 819,104 | 140,555 | 959,659 | |||||||||
Accumulated depreciation | (174,530 | ) | (56,366 | ) | (230,896 | ) | ||||||
Property and equipment, net | 644,574 | 84,189 | 728,763 | |||||||||
Deferred charges and other assets, net | 1,385 | — | 1,385 | |||||||||
Total assets | $ | 891,764 | $ | 84,189 | $ | 975,953 | ||||||
LIABILITIES AND PARTNERS’ CAPITAL | ||||||||||||
Current liabilities: | ||||||||||||
Current portion of debt and capital lease obligations | $ | 1,200 | $ | — | $ | 1,200 | ||||||
Accounts payable | 4,297 | — | 4,297 | |||||||||
Accrued liabilities | 1,054 | — | 1,054 | |||||||||
Taxes other than income taxes | 765 | — | 765 | |||||||||
Deferred revenue from related party | 124 | — | 124 | |||||||||
Total current liabilities | 7,440 | — | 7,440 | |||||||||
Debt and capital lease obligations, net of current portion | 1,519 | — | 1,519 | |||||||||
Deferred income taxes | 830 | — | 830 | |||||||||
Other long-term liabilities | 1,065 | — | 1,065 | |||||||||
Partners’ capital: | ||||||||||||
Common unitholders – public | 374,954 | — | 374,954 | |||||||||
Common unitholder – Valero | 58,844 | — | 58,844 | |||||||||
Subordinated unitholder – Valero | 146,804 | — | 146,804 | |||||||||
General partner – Valero | 4,617 | — | 4,617 | |||||||||
Net investment | 295,691 | 84,189 | 379,880 | |||||||||
Total partners’ capital | 880,910 | 84,189 | 965,099 | |||||||||
Total liabilities and partners’ capital | $ | 891,764 | $ | 84,189 | $ | 975,953 | ||||||
82
The following tables present our previously reported statements of income for the years ended December 31, 2014 and 2013 retrospectively adjusted for the acquisition of the Corpus Christi Terminal Services Business (in thousands). The results of operations of the Texas Crude Systems Business and the Houston and St. Charles Terminal Services Business are included in our previously reported statements of income for the years ended December 31, 2014 and 2013.
Year Ended December 31, 2014 | ||||||||||||
Valero Energy Partners LP (Previously Reported) | Corpus Christi Terminal Services Business | Valero Energy Partners LP (Currently Reported) | ||||||||||
Operating revenues – related party | $ | 129,180 | $ | — | $ | 129,180 | ||||||
Costs and expenses: | ||||||||||||
Operating expenses | 70,507 | 17,693 | 88,200 | |||||||||
General and administrative expenses | 12,597 | 324 | 12,921 | |||||||||
Depreciation expense | 26,953 | 3,145 | 30,098 | |||||||||
Total costs and expenses | 110,057 | 21,162 | 131,219 | |||||||||
Operating income (loss) | 19,123 | (21,162 | ) | (2,039 | ) | |||||||
Other income, net | 1,504 | — | 1,504 | |||||||||
Interest and debt expense, net of capitalized interest | (872 | ) | — | (872 | ) | |||||||
Income (loss) before income taxes | 19,755 | (21,162 | ) | (1,407 | ) | |||||||
Income tax expense | 548 | — | 548 | |||||||||
Net income (loss) | 19,207 | (21,162 | ) | (1,955 | ) | |||||||
Less: Net loss attributable to Predecessor | (40,074 | ) | (21,162 | ) | (61,236 | ) | ||||||
Net income attributable to partners | $ | 59,281 | $ | — | $ | 59,281 | ||||||
83
Year Ended December 31, 2013 | ||||||||||||
Valero Energy Partners LP (Previously Reported) | Corpus Christi Terminal Services Business | Valero Energy Partners LP (Currently Reported) | ||||||||||
Operating revenues – related party | $ | 124,985 | $ | — | $ | 124,985 | ||||||
Costs and expenses: | ||||||||||||
Operating expenses | 68,529 | 16,199 | 84,728 | |||||||||
General and administrative expenses | 7,456 | 322 | 7,778 | |||||||||
Depreciation expense | 25,162 | 3,005 | 28,167 | |||||||||
Total costs and expenses | 101,147 | 19,526 | 120,673 | |||||||||
Operating income (loss) | 23,838 | (19,526 | ) | 4,312 | ||||||||
Other income, net | 309 | — | 309 | |||||||||
Interest and debt expense, net of capitalized interest | (198 | ) | — | (198 | ) | |||||||
Income (loss) before income taxes | 23,949 | (19,526 | ) | 4,423 | ||||||||
Income tax expense | 1,434 | — | 1,434 | |||||||||
Net income (loss) | 22,515 | (19,526 | ) | 2,989 | ||||||||
Less: Net income (loss) attributable to Predecessor | 20,474 | (19,526 | ) | 948 | ||||||||
Net income attributable to partners | $ | 2,041 | $ | — | $ | 2,041 | ||||||
84
The following tables present our previously reported statements of cash flows for the years ended December 31, 2014 and 2013 retrospectively adjusted for the acquisition of the Corpus Christi Terminal Services Business (in thousands). The cash flows of the Texas Crude Systems Business and the Houston and St. Charles Terminal Services Business are included in our previously reported statements of cash flows for the years ended December 31, 2014 and 2013.
Year Ended December 31, 2014 | ||||||||||||
Valero Energy Partners LP (Previously Reported) | Corpus Christi Terminal Services Business | Valero Energy Partners LP (Currently Reported) | ||||||||||
Cash flows from operating activities: | ||||||||||||
Net income (loss) | $ | 19,207 | $ | (21,162 | ) | $ | (1,955 | ) | ||||
Adjustments to reconcile net income (loss) to net cash provided by (used in) operating activities: | ||||||||||||
Depreciation expense | 26,953 | 3,145 | 30,098 | |||||||||
Deferred income tax expense | 43 | — | 43 | |||||||||
Changes in current assets and current liabilities | (1,318 | ) | — | (1,318 | ) | |||||||
Changes in deferred charges and credits and other operating activities, net | (34 | ) | — | (34 | ) | |||||||
Net cash provided by (used in) operating activities | 44,851 | (18,017 | ) | 26,834 | ||||||||
Cash flows from investing activities: | ||||||||||||
Capital expenditures | (69,928 | ) | (34,024 | ) | (103,952 | ) | ||||||
Acquisition of the Texas Crude Systems Business from Valero Energy Corporation | (80,116 | ) | — | (80,116 | ) | |||||||
Proceeds from dispositions of property and equipment | 54 | — | 54 | |||||||||
Net cash used in investing activities | (149,990 | ) | (34,024 | ) | (184,014 | ) | ||||||
Cash flows from financing activities: | ||||||||||||
Repayments of debt and capital lease obligations | (1,048 | ) | — | (1,048 | ) | |||||||
Payment of debt issuance costs | (1,071 | ) | — | (1,071 | ) | |||||||
Payment of offering costs | (3,223 | ) | — | (3,223 | ) | |||||||
Excess purchase price paid to Valero Energy Corporation over the carrying value of the Texas Crude Systems Business | (73,884 | ) | — | (73,884 | ) | |||||||
Cash distributions to unitholders and distribution equivalent right payments | (41,837 | ) | — | (41,837 | ) | |||||||
Net transfers from Valero Energy Corporation | 87,663 | 52,041 | 139,704 | |||||||||
Net cash provided by (used in) financing activities | (33,400 | ) | 52,041 | 18,641 | ||||||||
Net decrease in cash and cash equivalents | (138,539 | ) | — | (138,539 | ) | |||||||
Cash and cash equivalents at beginning of year | 375,118 | — | 375,118 | |||||||||
Cash and cash equivalents at end of year | $ | 236,579 | $ | — | $ | 236,579 | ||||||
85
Year Ended December 31, 2013 | ||||||||||||
Valero Energy Partners LP (Previously Reported) | Corpus Christi Terminal Services Business | Valero Energy Partners LP (Currently Reported) | ||||||||||
Cash flows from operating activities: | ||||||||||||
Net income (loss) | $ | 22,515 | $ | (19,526 | ) | $ | 2,989 | |||||
Adjustments to reconcile net income (loss) to net cash provided by (used in) operating activities: | ||||||||||||
Depreciation expense | 25,162 | 3,005 | 28,167 | |||||||||
Deferred income tax expense | 941 | — | 941 | |||||||||
Changes in current assets and current liabilities | (2,947 | ) | — | (2,947 | ) | |||||||
Changes in deferred charges and credits and other operating activities, net | (421 | ) | — | (421 | ) | |||||||
Net cash provided by (used in) operating activities | 45,250 | (16,521 | ) | 28,729 | ||||||||
Cash flows from investing activities: | ||||||||||||
Capital expenditures | (109,812 | ) | (10,685 | ) | (120,497 | ) | ||||||
Proceeds from dispositions of property and equipment | 8 | — | 8 | |||||||||
Net cash used in investing activities | (109,804 | ) | (10,685 | ) | (120,489 | ) | ||||||
Cash flows from financing activities: | ||||||||||||
Repayments of debt and capital lease obligations | (1,059 | ) | — | (1,059 | ) | |||||||
Prefunding of capital projects by Valero | 3,500 | — | 3,500 | |||||||||
Proceeds from issuance of common units, net of discount | 372,449 | — | 372,449 | |||||||||
Payment of debt issuance costs | (572 | ) | — | (572 | ) | |||||||
Net transfers from Valero Energy Corporation | 65,354 | 27,206 | 92,560 | |||||||||
Net cash provided by financing activities | 439,672 | 27,206 | 466,878 | |||||||||
Net increase in cash and cash equivalents | 375,118 | — | 375,118 | |||||||||
Cash and cash equivalents at beginning of year | — | — | — | |||||||||
Cash and cash equivalents at end of year | $ | 375,118 | $ | — | $ | 375,118 | ||||||
86
4. | RELATED-PARTY AGREEMENTS AND TRANSACTIONS |
Predecessor Transactions
Our Predecessor was part of the consolidated operations of Valero and all of our revenues were derived from transactions with Valero. The crude oil and refined petroleum products pipeline transportation and terminaling services we provided to Valero were settled through net parent investment, and payables and receivables related to these transactions were included as a component of net investment.
Prior to the IPO and the Acquisitions, our operating and general and administrative expenses included charges to our Predecessor for the management of our operations and the allocation of certain overhead and shared services expenses by Valero. These charges and allocations included such items as management oversight, information technology, legal, human resources, and other financial and administrative services. These allocations do not fully reflect the expenses that would have been incurred had we been a stand-alone limited partnership. Our management believes the charges allocated to our Predecessor were a reasonable reflection of the utilization of services provided, but they cannot be presumed to be carried out on an arm’s-length basis as the requisite conditions of competitive, free-market dealings may not have existed.
Agreements with Valero
The following agreements became effective with the IPO on December 16, 2013, and with the Acquisitions, coinciding with the effective dates of each acquisition.
Commercial Agreements
In connection with the IPO, we entered into a master transportation services agreement and a master terminal services agreement (collectively, the commercial agreements) with Valero. Under these commercial agreements, we provide transportation and terminaling services to Valero and Valero pays us for minimum quarterly throughput volumes of crude oil and refined petroleum products, regardless of whether such volumes are physically delivered by Valero in any given quarter. We entered into schedules under these commercial agreements in connection with the IPO. Each schedule has an initial term through December 16, 2023 and, with the exception of our El Paso truck rack and Memphis truck rack, Valero has the option to renew the agreements with respect to each asset for one additional five-year term.
In connection with the acquisition of the Texas Crude Systems Business, we entered into additional schedules under these commercial agreements with respect to each system acquired. Each schedule has an initial term through July 1, 2024 with one five-year renewal at Valero’s option and contains minimum throughput requirements and inflation escalators.
In connection with the acquisition of the Houston and St. Charles Terminal Services Business, we entered into additional schedules under our master terminal services agreement with respect to each terminal acquired. Each schedule contains minimum throughput requirements and inflation escalators, has an initial term through March 1, 2025 and, in the case of the Houston Terminal, provides Valero an option to renew for one additional five-year term, and, in the case of the St. Charles Terminal, provides Valero an option to renew through January 31, 2030.
In connection with the acquisition of the Corpus Christi Terminal Services Business, we entered into an additional schedule under our master terminal services agreement. This schedule has an initial term through
87
October 1, 2025, provides Valero an option to renew for one additional five-year term, and contains minimum throughput requirements and inflation escalators.
Amended and Restated Omnibus Agreement
In connection with the IPO, we entered into an omnibus agreement with Valero, certain of its subsidiaries, and our general partner. In connection with the Acquisitions, we entered into an amended and restated omnibus agreement with Valero, including its amended and restated schedules. The amended and restated agreement addresses the following matters:
• | our payment of an annual administrative fee (payable in equal monthly installments) for the management of our operations and general corporate services by Valero. The fee was increased from $9.2 million in 2014 to $10.4 million in connection with the acquisition of the Houston and St. Charles Terminal Services Business in March 2015. The fee was increased again in October 2015 to $11.2 million per year in connection with the acquisition of the Corpus Christi Terminal Services Business. Each increase in 2015 was prorated based on the number of days from the effective dates of each acquisition to December 31, 2015; |
• | our obligation to reimburse Valero for certain direct or allocated costs and expenses incurred by Valero on our behalf; |
• | our right of first offer to acquire certain of Valero’s transportation and logistics assets through December 2018; |
• | Valero’s obligation to indemnify us for certain environmental and other liabilities and our obligation to indemnify Valero for certain environmental and other liabilities related to our assets to the extent Valero is not required to indemnify us; |
• | Valero’s right of first refusal to acquire certain of our assets; |
• | the granting of a license from Valero to us with respect to use of certain Valero trademarks and tradenames; and |
• | the prefunding of $3.5 million in 2013 by Valero for certain capital projects. |
So long as Valero controls our general partner, the amended and restated omnibus agreement will remain in full force and effect. If Valero ceases to control our general partner, either party may terminate the amended and restated omnibus agreement, provided that the indemnification obligations will remain in full force and effect in accordance with their terms.
Amended and Restated Services and Secondment Agreement
In connection with the IPO, our general partner entered into a services and secondment agreement with Valero under which employees of Valero are seconded to our general partner to provide operational and maintenance services for certain of our pipelines and terminals, and we reimburse our general partner for these costs. During their period of secondment, the seconded employees are under the management and supervision of our general partner.
88
In connection with the Acquisitions, our general partner entered into an amended and restated services and secondment agreement with Valero, including its amended and restated exhibits, to provide for the secondment of employees to our general partner for the provision of services with respect to the assets acquired in the Acquisitions.
This agreement will continue for an initial term of ten years from the Service Date (as described in the agreement) with respect to each asset and will automatically extend for successive renewal terms of one year each, unless terminated by either party upon at least 30 days’ prior written notice before the end of the initial term or any renewal term. In addition, our general partner may terminate the agreement or reduce the level of services under the agreement at any time upon 30 days’ prior written notice.
Tax Sharing Agreement
Under our tax sharing agreement with Valero, we are required to reimburse Valero for our share of state and local income and other taxes incurred by Valero as a result of our tax items and attributes being included in a combined or consolidated state tax return filed by Valero with respect to taxable periods including or beginning on the closing date of the IPO. The amount of any such reimbursement will be limited to any entity-level tax that we would have paid directly had we not been included in a combined group with Valero. While Valero may use its tax attributes to cause its combined or consolidated group, of which we may be a member for this purpose, to owe no tax, we are nevertheless required to reimburse Valero for the tax we would have owed had the attributes not been available or used for our benefit, even though Valero had no cash expense for that period.
Ground Lease Agreement
We entered into a ground lease agreement with Valero with respect to the land on which our Memphis truck rack is located. The ground lease agreement terminates on November 30, 2033, with no renewal periods. Initially, our base rent under the lease is $35,000 per year. Commencing on January 1, 2016 and annually thereafter, base rent will increase by a factor of 1.015 times. We are also required to pay Valero a customary expense reimbursement for taxes, utilities, and similar costs incurred by Valero related to the leased premises.
Lease and Access Agreements
We entered into two lease and access agreements with Valero with respect to the land on which the Houston and St. Charles terminals are located. Each agreement has an initial term through March 1, 2025 with four automatic successive renewal periods of five years each, provided that the final renewal period for the St. Charles terminal agreement will end on December 31, 2044. Either party may terminate the lease after the initial term by providing written notice. Initially, our base rent under the Houston and St. Charles terminal agreements totals $6.4 million per year and each agreement is subject to annual inflation escalators. We are also required to pay Valero a customary expense reimbursement for taxes, utilities, and similar costs incurred by Valero related to the leased premises.
We entered into two lease and access agreements with Valero with respect to the land on which the Corpus Christi East and West terminals are located. Each agreement has an initial term through October 1, 2025 with four automatic successive renewal periods of five years each. Either party may terminate the lease after the initial term by providing written notice. Initially, our base rent under the Corpus Christi East and West terminal agreements totals $1.7 million per year and each agreement is subject to annual inflation escalators.
89
We are also required to pay Valero a customary expense reimbursement for taxes, utilities, and similar costs incurred by Valero related to the leased premises.
Subordinated Credit Agreements
We have subordinated credit agreements with Valero as further described in Note 7.
Summary of Transactions
Receivables from related party consist of the following (in thousands):
December 31, | ||||||||
2015 | 2014 | |||||||
Trade receivables – related party | $ | 26,103 | $ | 10,515 | ||||
Due to related party | (8,015 | ) | (2,016 | ) | ||||
Receivables from related party | $ | 18,088 | $ | 8,499 | ||||
The amounts shown in our balance sheets as “deferred revenue from related party” represent the unearned revenues from Valero associated with Valero’s quarterly deficiency payment, which is the result of Valero not meeting its minimum quarterly throughput commitments under our commercial agreements described above.
All of our operating revenues are generated by providing services to Valero under our commercial agreements with Valero. The cost of services provided to us by Valero, including the cost of financing provided to us by Valero in connection with certain of the Acquisitions as more fully described in Notes 3 and 7, are reflected in the supplemental information disclosure on our statements of income.
Net Investment
The following is a reconciliation of the amounts presented as net transfers from Valero on our statements of partners’ capital and statements of cash flows (in thousands).
Year Ended December 31, | |||||||||||||
2015 | 2014 (a) | 2013 (a) | |||||||||||
Net transfers from Valero per statements of partners’ capital | $ | 40,301 | $ | 145,354 | $ | 92,285 | |||||||
Less: Noncash transfers from (to) Valero | (6,789 | ) | 5,650 | (275 | ) | ||||||||
Net transfers from Valero per statements of cash flows | $ | 47,090 | $ | 139,704 | $ | 92,560 | |||||||
(a) Financial information has been retrospectively adjusted for the acquisition of the Corpus Christi Terminal Services Business. | |||||||||||||
See Note 15 for additional information related to our noncash transfers from (to) Valero.
90
Concentration Risk
All of our operating revenues were derived from transactions with Valero and all of our receivables were due from Valero. Therefore, we are subject to the business risks associated with Valero’s business.
Leases
Prior to the IPO, our Predecessor leased some of our crude oil and refined petroleum products storage capacity to Valero. There were no minimum lease requirements under these Predecessor agreements. After the IPO and the Acquisitions, certain of our system’s schedules under our commercial agreements with Valero are considered operating leases under U.S. GAAP. These agreements contain minimum throughput requirements and escalation clauses to adjust transportation tariffs and terminaling and storage fees to reflect changes in price indices. Revenues from all lease agreements are recorded within “operating revenues –related party” in our statements of income.
The amounts shown in our statements of income as “operating revenues – related party” included revenues from our current lease arrangements as follows (in thousands):
Year Ended December 31, | |||||||||||||
2015 | 2014 | 2013 | |||||||||||
Minimum rental revenues | $ | 128,468 | $ | 16,806 | $ | 206 | |||||||
Contingent rental revenues | 22,949 | 5,520 | 18,318 | ||||||||||
Total lease revenues | $ | 151,417 | $ | 22,326 | $ | 18,524 | |||||||
As of December 31, 2015, future minimum rentals to be received related to these noncancelable lease agreements were as follows (in thousands):
2016 | $ | 194,078 | |
2017 | 193,550 | ||
2018 | 193,550 | ||
2019 | 193,550 | ||
2020 | 194,078 | ||
Thereafter | 821,539 | ||
Total minimum rental payments | $ | 1,790,345 | |
91
5. | PROPERTY AND EQUIPMENT |
Major classes of property and equipment consisted of the following (in thousands):
December 31, 2015 | |||||||||||||
Non-Leased Assets | Assets Under Operating Leases (a) | Total | |||||||||||
Pipelines and related assets | $ | 228,586 | $ | 46,739 | $ | 275,325 | |||||||
Terminals and related assets | 110,758 | 580,194 | 690,952 | ||||||||||
Other | 9,352 | — | 9,352 | ||||||||||
Land | 4,672 | — | 4,672 | ||||||||||
Construction-in-progress | 30,580 | — | 30,580 | ||||||||||
Property and equipment, at cost | 383,948 | 626,933 | 1,010,881 | ||||||||||
Accumulated depreciation | (118,580 | ) | (145,019 | ) | (263,599 | ) | |||||||
Property and equipment, net | $ | 265,368 | $ | 481,914 | $ | 747,282 | |||||||
December 31, 2014 (b) | ||||||||||||||
Non-Leased Assets | Assets Under Operating Leases (a) | Total | ||||||||||||
Pipelines and related assets | $ | 227,780 | $ | 45,695 | $ | 273,475 | ||||||||
Terminals and related assets | 535,464 | 72,326 | 607,790 | |||||||||||
Other | 9,439 | — | 9,439 | |||||||||||
Land | 4,672 | — | 4,672 | |||||||||||
Construction-in-progress | 64,283 | — | 64,283 | |||||||||||
Property and equipment, at cost | 841,638 | 118,021 | 959,659 | |||||||||||
Accumulated depreciation | (211,877 | ) | (19,019 | ) | (230,896 | ) | ||||||||
Property and equipment, net | $ | 629,761 | $ | 99,002 | $ | 728,763 | ||||||||
(a) Represents assets owned by us for which we are the lessor (see Note 4). Certain assets acquired in the acquisitions of the Houston and St. Charles Terminal Services Business and the Corpus Christi Terminal Services Business were reflected as assets under operating leases subsequent to the acquisitions on March 1, 2015 and October 1, 2015, respectively. | ||||||||||||||
(b) Financial information has been retrospectively adjusted for the acquisition of the Corpus Christi Terminal Services Business. | ||||||||||||||
We have certain pipeline assets under capital lease agreements totaling $14.9 million as of December 31, 2015 and 2014. Accumulated amortization on assets under capital leases was $14.1 million and $13.0 million as of December 31, 2015 and 2014, respectively.
92
6. | ASSET RETIREMENT OBLIGATIONS |
We have asset retirement obligations with respect to certain of our pipelines and terminals that we are required to perform under law or contract once the asset is retired from service, and we have recognized obligations to restore certain leased properties to substantially the same condition as when such property was delivered to us or to its improved condition as prescribed by the lease agreements. With respect to all other property and equipment, it is our practice and current intent to maintain these assets and continue to make improvements to these assets as warranted. As a result, we believe that these assets have indeterminate lives for purposes of estimating asset retirement obligations because dates or ranges of dates upon which we would retire these assets cannot reasonably be estimated at this time; therefore, no asset retirement obligations have been recorded for these assets as of December 31, 2015 and 2014. We will recognize a liability at such time when sufficient information exists to estimate a range of potential settlement dates that is needed to employ a present value technique to estimate fair value.
Changes in our asset retirement obligations were as follows (in thousands):
December 31, | |||||||||||||
2015 | 2014 | 2013 | |||||||||||
Balance as of beginning of year | $ | 975 | $ | 931 | $ | 889 | |||||||
Accretion expense | 46 | 44 | 42 | ||||||||||
Balance as of end of year | $ | 1,021 | $ | 975 | $ | 931 | |||||||
We do not expect any short-term spending and, as a result, there is no current liability reported for asset retirement obligations as of December 31, 2015 and 2014. Accretion expense is reflected in depreciation expense.
There are no assets that are legally restricted for purposes of settling our asset retirement obligations.
93
7. | DEBT AND CAPITAL LEASE OBLIGATIONS |
Revolving Credit Facility
In November 2015, we amended and restated our senior unsecured revolving credit facility agreement (the Revolver) to, among other things, extend the maturity date from December 2018 to November 2020 and increase the total commitment from $300.0 million to $750.0 million. We incurred $2.3 million of debt issuance costs in connection with this amendment. We have the option to increase the aggregate commitments under the Revolver to $1.0 billion and we may request two additional one-year extensions of the maturity date, subject to certain conditions. The Revolver includes a letter of credit sub-facility of up to $100.0 million. Our obligations under the Revolver are jointly and severally guaranteed by our directly owned subsidiary, Valero Partners Operating Co. LLC.
Outstanding borrowings under the Revolver bear interest, at our option, at either (a) the adjusted LIBO rate (as described in the Revolver) for the applicable interest period in effect from time to time plus the applicable margin or (b) the alternate base rate (as described in the Revolver) plus the applicable margin. The Revolver also requires payments for customary fees, including commitment fees, letter of credit participation fees, and administrative agent fees.
The Revolver contains certain restrictive covenants, including a covenant that requires us to maintain a ratio of total debt to EBITDA (as defined in the Revolver) for the prior four fiscal quarters of not greater than 5.0 to 1.0 as of the last day of each fiscal quarter (5.5 to 1.0 during the specified period following certain acquisitions). The Revolver contains representations and warranties, affirmative and negative covenants, and events of default that are usual and customary for an agreement of this type that could, among other things, limit our ability to pay distributions to our unitholders.
In connection with the acquisition of the Houston and St. Charles Terminal Services Business as described in Note 3, we borrowed $200.0 million under the Revolver in March 2015. In July 2015, we repaid $25.0 million on the Revolver. There were no borrowings or repayments under the Revolver during the years ended December 31, 2014 and 2013. Our borrowing under the Revolver bears interest at a variable rate, which was 1.5 percent as of December 31, 2015. Accrued interest is payable in arrears on each Interest Payment Date (as defined in the Revolver) and on the maturity date. As of December 31, 2015, we had $175.0 million of borrowings and no letters of credit outstanding under the Revolver. As of December 31, 2014, we had no borrowings and no letters of credit outstanding under the Revolver.
Subordinated Credit Agreements
During 2015, we entered into two subordinated credit agreements with Valero (the Loan Agreements) under which we borrowed $160.0 million and $395.0 million (collectively, the loans) to finance a portion of the acquisitions of the Houston and St. Charles Terminal Services Business and the Corpus Christi Terminal Services Business, respectively, as described in Note 3. The loans mature on March 1 and October 1, 2020, respectively, and may be prepaid at any time without penalty. We are not permitted to reborrow amounts. The loans bear interest at the LIBO Rate (as defined in the Loan Agreements) plus the applicable margin. Accrued interest is payable in arrears on each Interest Payment Date (as defined in the Loan Agreements) and on each maturity date. As of December 31, 2015, the interest rate on each of the loans was 1.494 percent.
The payment of amounts owing under the Loan Agreements are subordinated to our obligations under our Revolver with third-party lenders. The Loan Agreements contain customary terms regarding covenants,
94
representations, default, and remedies, including covenants that limit the creation of liens, the incurrence of debt by us or our subsidiaries, the payment of distributions, and the entry into securitization transactions, sale/leaseback transactions, certain restrictive agreements, consolidations, mergers, and the sale of all or substantially all of our assets. The Loan Agreements also include covenants that require, as of the last day of each fiscal quarter, the ratio of Consolidated Total Debt (as defined in the Loan Agreements) to Consolidated EBITDA (as defined in the Loan Agreements) for the four-quarter period ending on such day not to exceed 5.0 to 1.0 (or 5.5 to 1.0 during a specified acquisition period).
In November 2015, we amended certain terms of the Loan Agreements to synchronize certain terms thereof with the November 2015 amendment of the Revolver. In December 2015, we paid down $185.0 million under one of our Loan Agreements. As of December 31, 2015, we had $370.0 million outstanding under the Loan Agreements and we were in compliance with the ratio of Consolidated Total Debt to Consolidated EBITDA.
Other Debt Disclosures
As of December 31, 2015, we had debt obligations under our Revolver and the Loan Agreements that totaled $545.0 million, all of which will mature in 2020.
Capitalized Interest
Capitalized interest was $31,000 for the year ended December 31, 2015. We had no capitalized interest for the years ended December 31, 2014 and 2013.
Capital Lease Obligations
We have certain pipeline assets that we acquired under capital lease agreements. These capital lease agreements have remaining terms that expire during 2016 and have automatic renewal terms for 30 years with renewal rentals adjusted for inflation. Upon renewal, we may terminate these agreements at our option by providing five-years written notice of cancellation until August 2031 upon which time we are only required to provide one-year written notice of cancellation. We expect that in the normal course of business, these leases will be renewed or replaced by other leases. As of December 31, 2015, our future minimum rentals on capital lease obligations were as follows (in thousands):
2016 | $ | 963 | |
Less interest expense | (50 | ) | |
Unamortized fair value adjustment | 246 | ||
Capital lease obligations | $ | 1,159 | |
The unamortized fair value adjustment related to our capital lease obligations is the remaining balance as of December 31, 2015 of a fair value adjustment recorded in connection with capital leases acquired by our Predecessor as part of a business acquisition in September 2005.
95
8. | COMMITMENTS AND CONTINGENCIES |
Operating Leases
We have long-term operating lease commitments for land used in the terminaling and transportation of crude oil and refined petroleum products. Certain leases contain escalation clauses and renewal options that allow for the same rental payment over the lease term or a revised rental payment based on fair rental value or negotiated value. Currently, our ground lease with Valero does not contain a renewal option. We expect that, in the normal course of business, our leases will be renewed or replaced by other leases.
As of December 31, 2015, our future minimum rentals for leases having initial or remaining noncancelable lease terms in excess of one year were as follows (in thousands):
2016 | $ | 8,229 | |
2017 | 8,229 | ||
2018 | 8,186 | ||
2019 | 8,186 | ||
2020 | 8,186 | ||
Thereafter | 35,588 | ||
Total minimum rental payments | $ | 76,604 | |
Rental expense for all operating leases was $6.7 million, $1.3 million, and $1.4 million for the years ended December 31, 2015, 2014, and 2013, respectively. Previously reported amounts of rental expense have been retrospectively adjusted for the acquisition of the Corpus Christi Terminal Services Business.
Litigation Matters
From time to time, we may be party to claims and legal proceedings arising in the ordinary course of business. We also may be required by existing laws and regulations to report the release of hazardous substances and begin a remediation study. We have not recorded a loss contingency liability as there are no matters for which a loss has been incurred. We re-evaluate and update our loss contingency liabilities as matters progress over time, and we believe that any changes to the recorded liabilities will not be material to our financial position, results of operations, or liquidity.
96
9. | CASH DISTRIBUTIONS |
Our partnership agreement prescribes the amount and priority of cash distributions that the common and subordinated unitholders and general partner will receive. Our distributions are declared subsequent to quarter end. The table below summarizes information related to our quarterly cash distributions:
Quarterly Period Ended | Total Quarterly Distribution (Per Unit) | Total Cash Distribution (In Thousands) | Declaration Date | Record Date | Distribution Date | ||||||||||
December 31, 2015 | $ | 0.3200 | $ | 22,711 | January 25, 2016 | February 4, 2016 | February 11, 2016 | ||||||||
September 30, 2015 | 0.3075 | 20,164 | October 15, 2015 | November 2, 2015 | November 10, 2015 | ||||||||||
June 30, 2015 | 0.2925 | 18,456 | July 24, 2015 | August 3, 2015 | August 11, 2015 | ||||||||||
March 31, 2015 | 0.2775 | 17,266 | April 21, 2015 | May 1, 2015 | May 12, 2015 | ||||||||||
December 31, 2014 | 0.2660 | 15,829 | January 26, 2015 | February 5, 2015 | February 12, 2015 | ||||||||||
September 30, 2014 | 0.2400 | 14,102 | October 14, 2014 | October 31, 2014 | November 12, 2014 | ||||||||||
June 30, 2014 | 0.2225 | 13,074 | July 15, 2014 | August 1, 2014 | August 13, 2014 | ||||||||||
March 31, 2014 | 0.2125 | 12,487 | April 17, 2014 | May 1, 2014 | May 14, 2014 | ||||||||||
December 31, 2013 | 0.0370 | 2,174 | January 20, 2014 | January 31, 2014 | February 12, 2014 | ||||||||||
The following table reflects the allocation of total cash distributions to the general and limited partners and distribution equivalent right (DER) payments (see Notes 10 and 12 for a description of DERs) applicable to the period in which the distributions and DERs were earned (in thousands):
Year Ended December 31, | December 16, 2013 through December 31, 2013 | ||||||||||||
2015 | 2014 | ||||||||||||
General partner’s distributions: | |||||||||||||
General partner’s distributions | $ | 1,572 | $ | 1,110 | $ | 44 | |||||||
General partner’s incentive distribution rights (IDRs) | 3,431 | 194 | — | ||||||||||
Total general partner’s distributions | 5,003 | 1,304 | 44 | ||||||||||
Limited partners’ distributions: | |||||||||||||
Common – public | 22,016 | 16,232 | 638 | ||||||||||
Common – Valero | 17,090 | 10,859 | 427 | ||||||||||
Subordinated – Valero | 34,476 | 27,091 | 1,065 | ||||||||||
Total limited partners’ distributions | 73,582 | 54,182 | 2,130 | ||||||||||
DERs | 12 | 6 | — | ||||||||||
Total cash distributions, including DERs | $ | 78,597 | $ | 55,492 | $ | 2,174 | |||||||
97
10. | NET INCOME PER LIMITED PARTNER UNIT |
Net income per limited partner unit is calculated only for the periods subsequent to the IPO as no units were outstanding prior to the IPO. Payments made to our unitholders are determined in relation to actual distributions declared and are not based on the net income allocations used in the calculation of net income per limited partner unit.
We calculate net income available to limited partners based on the distributions pertaining to each period’s net income. After considering the appropriate period’s distributions, the remaining undistributed earnings or excess distributions over earnings, if any, are allocated to the general partner, limited partners, and other participating securities in accordance with the contractual terms of our partnership agreement and as prescribed under the two-class method. Participating securities include IDRs and awards under our 2013 ICP (defined in Note 12) that receive DERs, as further discussed in Note 12. However, the terms of our partnership agreement limit the general partner’s incentive distribution to the amount of available cash, which, as defined in our partnership agreement, is net of reserves deemed appropriate. As such, IDRs are not allocated undistributed earnings or distributions in excess of earnings in the calculation of net income per limited partner unit.
Basic net income per limited partner unit is determined pursuant to the two-class method for master limited partnerships. The two-class method is an earnings allocation formula that is used to determine earnings to our general partner, common unitholders, and participating securities according to (i) distributions pertaining to each period’s net income and (ii) participation rights in undistributed earnings.
Diluted net income per limited partner unit is also determined using the two-class method, unless the treasury stock method is more dilutive. For the year ended December 31, 2015, we used the two-class method to determine diluted net income per limited partner unit. We did not have any potentially dilutive instruments outstanding during year ended December 31, 2015.
98
Net income per unit was computed as follows (in thousands, except per unit amounts):
Year Ended December 31, 2015 | ||||||||||||||||||||
Limited Partners | ||||||||||||||||||||
General Partner | Common Units | Subordinated Units | Restricted Units | Total | ||||||||||||||||
Allocation of net income to determine net income available to limited partners: | ||||||||||||||||||||
Distributions, excluding general partner’s IDRs | $ | 1,572 | $ | 39,106 | $ | 34,476 | $ | — | $ | 75,154 | ||||||||||
General partner’s IDRs | 3,431 | — | — | — | 3,431 | |||||||||||||||
DERs | — | — | — | 12 | 12 | |||||||||||||||
Distributions and DERs declared | 5,003 | 39,106 | 34,476 | 12 | 78,597 | |||||||||||||||
Undistributed earnings | 1,066 | 27,162 | 25,045 | 8 | 53,281 | |||||||||||||||
Net income available to limited partners – basic and diluted | $ | 6,069 | $ | 66,268 | $ | 59,521 | $ | 20 | $ | 131,878 | ||||||||||
Net income per limited partner unit – basic and diluted: | ||||||||||||||||||||
Weighted-average units outstanding | 31,222 | 28,790 | ||||||||||||||||||
Net income per limited partner unit – basic and diluted | $ | 2.12 | $ | 2.07 | ||||||||||||||||
99
Year Ended December 31, 2014 | ||||||||||||||||||||
Limited Partners | ||||||||||||||||||||
General Partner | Common Units | Subordinated Units | Restricted Units | Total | ||||||||||||||||
Allocation of net income to determine net income available to limited partners: | ||||||||||||||||||||
Distributions, excluding general partner’s IDRs | $ | 1,110 | $ | 27,091 | $ | 27,091 | $ | — | $ | 55,292 | ||||||||||
General partner’s IDRs | 194 | — | — | — | 194 | |||||||||||||||
DERs | — | — | — | 6 | 6 | |||||||||||||||
Distributions and DERs declared | 1,304 | 27,091 | 27,091 | 6 | 55,492 | |||||||||||||||
Undistributed earnings | 75 | 1,857 | 1,857 | — | 3,789 | |||||||||||||||
Net income available to limited partners – basic | $ | 1,379 | 28,948 | 28,948 | $ | 6 | $ | 59,281 | ||||||||||||
Add: DERs | 6 | — | ||||||||||||||||||
Net income available to limited partners – diluted | $ | 28,954 | $ | 28,948 | ||||||||||||||||
Net income per limited partner unit – basic: | ||||||||||||||||||||
Weighted-average units outstanding | 28,790 | 28,790 | ||||||||||||||||||
Net income per limited partner unit – basic | $ | 1.01 | $ | 1.01 | ||||||||||||||||
Net income per limited partner unit – diluted: | ||||||||||||||||||||
Weighted-average units outstanding | 28,790 | 28,790 | ||||||||||||||||||
Common equivalent units for restricted units | 1 | — | ||||||||||||||||||
Weighted-average units outstanding – diluted | 28,791 | 28,790 | ||||||||||||||||||
Net income per limited partner unit – diluted | $ | 1.01 | $ | 1.01 | ||||||||||||||||
100
December 16, 2013 through December 31, 2013 | ||||||||||||||||
Limited Partners | ||||||||||||||||
General Partner | Common Units | Subordinated Units | Total | |||||||||||||
Allocation of net income to determine net income available to limited partners: | ||||||||||||||||
Distributions | $ | 44 | $ | 1,065 | $ | 1,065 | $ | 2,174 | ||||||||
Excess distributions over earnings | (3 | ) | (65 | ) | (65 | ) | (133 | ) | ||||||||
Net income available to limited partners – basic and diluted | $ | 41 | $ | 1,000 | $ | 1,000 | $ | 2,041 | ||||||||
Net income per limited partner unit – basic and diluted: | ||||||||||||||||
Weighted-average units outstanding | 28,790 | 28,790 | ||||||||||||||
Net income per limited partner unit – basic and diluted | $ | 0.03 | $ | 0.03 | ||||||||||||
101
11. | UNIT ACTIVITY |
Activity in the number of units was as follows:
Common | General Partner | |||||||||||||||
Public | Valero | Subordinated | Total | |||||||||||||
Balance as of December 31, 2012 | — | — | — | — | — | |||||||||||
Units issued to Valero Energy Corporation in connection with Contributed Assets | — | 11,539,989 | 28,789,989 | 1,175,102 | 41,505,080 | |||||||||||
Units issued in initial public offering (a) | 17,250,000 | — | — | — | 17,250,000 | |||||||||||
Balance as of December 31, 2013 | 17,250,000 | 11,539,989 | 28,789,989 | 1,175,102 | 58,755,080 | |||||||||||
Unit-based compensation | 5,208 | — | — | — | 5,208 | |||||||||||
Balance as of December 31, 2014 | 17,255,208 | 11,539,989 | 28,789,989 | 1,175,102 | 58,760,288 | |||||||||||
Unit-based compensation | 4,443 | — | — | — | 4,443 | |||||||||||
Units issued in connection with the Acquisitions (see Note 3) | — | 3,478,613 | — | 70,992 | 3,549,605 | |||||||||||
Units issued in public offering (b) | 4,250,000 | — | — | — | 4,250,000 | |||||||||||
General partner units issued to maintain 2% interest (c) | — | — | — | 86,735 | 86,735 | |||||||||||
Balance as of December 31, 2015 | 21,509,651 | 15,018,602 | 28,789,989 | 1,332,829 | 66,651,071 | |||||||||||
(a) On December 16, 2013, we completed the IPO of 17,250,000 common units at a price of $23.00 per unit and received gross proceeds of $396.8 million. After deducting the underwriting discount, structuring fees, and other offering costs of $27.6 million, our net proceeds were $369.2 million.
(b) On November 24, 2015, we completed a public offering (the 2015 Offering) of 4,250,000 common units at a price of $46.25 per unit and received gross proceeds of $196.6 million. After deducting the underwriting discount and other offering costs totaling $7.7 million, our net proceeds were $188.9 million.
(c) Concurrent with the 2015 Offering, our general partner contributed $4.0 million in exchange for 86,735 general partner units to maintain its 2.0 percent general partner interest in the Partnership.
12. | UNIT-BASED COMPENSATION |
Our general partner maintains the Valero Energy Partners LP 2013 Incentive Compensation Plan (2013 ICP) under which various unit and unit-based awards may be granted to employees and non-employee directors. Awards under the 2013 ICP may include, but are not limited to, options to purchase common units, performance awards that vest upon the achievement of an objective performance goal, unit appreciation rights, and restricted units that vest over a period determined by the plan. The 2013 ICP was approved by the board of directors and the sole member of our general partner on November 26, 2013. In September 2015, the board of directors approved an increase to the annual cash and unit-based compensation received by certain of our independent directors. As of December 31, 2015, 2,990,349 common units were available to be awarded under the 2013 ICP.
102
Restricted Units
Restricted units vest in accordance with individual written agreements between the participants and us, at which time, each participant will be entitled to receive an equal number of unrestricted common units of the Partnership. The DERs entitle the participant to a cash payment equal to the cash distribution per unit paid on our outstanding common units and is paid to the participant in cash as of each record payment date during the period the restricted units are outstanding.
On January 20, 2014, a grant of 1,736 restricted units was made to each of our three independent directors, for a total of 5,208 restricted units, in tandem with an equal number of DERs. These restricted units are scheduled to vest on January 20, 2017.
On January 8, 2015, a grant of 1,481 restricted units was made to each of our three independent directors for a total of 4,443 restricted units, in tandem with an equal number of DERs. These restricted units are scheduled to vest annually in equal one-third increments on each anniversary of the restricted units’ grant date.
A summary of the status of our restricted units is presented in the table below:
Number of Units | Weighted- Average Grant-Date Fair Value Per Unit | |||||
Nonvested units as of January 1, 2015 | 5,208 | $ | 34.575 | |||
Granted | 4,443 | 40.535 | ||||
Nonvested units as of December 31, 2015 | 9,651 | 37.319 | ||||
Compensation expense associated with these restricted units was $173,000 and $68,000 for the years ended December 31, 2015 and 2014, respectively. As of December 31, 2015, there was $256,000 of unrecognized compensation cost related to outstanding unvested restricted units that is expected to be recognized over a weighted-average period of approximately two years.
On January 14, 2016, a grant of 1,986 restricted units was made under the 2013 ICP to each of our three independent directors for a total of 5,958 restricted units, in tandem with an equal number of DERs. The weighted-average grant-date fair value was $45.34 per unit. These restricted units will vest annually in equal one-third increments on each anniversary of the restricted units’ grant date.
103
13. | INCOME TAXES |
Components of income tax expense were as follows (in thousands):
Year Ended December 31, | |||||||||||||
2015 | 2014 | 2013 | |||||||||||
Current U.S. state | $ | 479 | $ | 505 | $ | 493 | |||||||
Deferred U.S. state | (228 | ) | 43 | 941 | |||||||||
Income tax expense | $ | 251 | $ | 548 | $ | 1,434 | |||||||
We are not a taxable entity for U.S. federal income tax purposes or for the majority of states that impose an income tax. Taxes on our net income generally are borne by our partners through the allocation of taxable income. Our income tax expense results from state laws that apply to entities organized as partnerships, specifically in the state of Texas. The difference between income tax expense recorded by us and income taxes computed by applying the statutory federal income tax rate (35 percent for all years presented) to income before income tax expense is due to the fact that the majority of our income is not subject to federal income tax at the entity level as described above.
Deferred income tax liabilities relate to the tax effects of significant temporary differences in property and equipment resulting from a change in the Texas margin tax law during the second quarter of 2013. This change in the tax law allows certain pipeline entities to take a depreciation deduction for purposes of computing the Texas margin tax.
As of December 31, 2015 and 2014, we had no liability reported for unrecognized tax benefits. We did not have any interest or penalties related to income taxes during the years ended December 31, 2015, 2014, and 2013.
14. | EMPLOYEE BENEFIT PLANS |
Employees of Valero who directly or indirectly support our operations participate in the pension, postretirement, health and life insurance, and defined contribution benefit plans sponsored by Valero. Valero charges us for these costs associated with its employees who provide direct services to us for the operation of our pipeline and terminal systems under our amended services and secondment agreement, but we are not separately charged for these costs associated with Valero’s employees who provide indirect support to us for the management of our operations and general corporate services under our omnibus agreement, as we pay an annual fee to Valero under that agreement. Costs associated with these benefit plans were included in the costs allocated to our Predecessor from Valero.
104
Our share of pension and postretirement costs and defined contribution plan costs was as follows (in thousands):
Year Ended December 31, | |||||||||||||
2015 | 2014 (a) | 2013 (a) | |||||||||||
Pension and postretirement costs | $ | 15 | $ | 96 | $ | 993 | |||||||
Defined contribution plan costs | 13 | 84 | 368 | ||||||||||
(a) Financial information has been retrospectively adjusted for the acquisition of the Corpus Christi Terminal Services Business. | |||||||||||||
15. | SUPPLEMENTAL CASH FLOW INFORMATION |
In order to determine net cash provided by operating activities, net income is adjusted by, among other things, changes in current assets and current liabilities as follows (in thousands):
Year Ended December 31, | ||||||||||||
2015 | 2014 | 2013 | ||||||||||
Decrease (increase) in current assets: | ||||||||||||
Receivables from related party | $ | (9,589 | ) | $ | 2,945 | $ | (6,318 | ) | ||||
Prepaid expenses and other | 95 | (451 | ) | (9 | ) | |||||||
Increase (decrease) in current liabilities: | ||||||||||||
Accounts payable | (631 | ) | (4,778 | ) | 2,403 | |||||||
Accrued liabilities | 636 | 896 | 158 | |||||||||
Taxes other than income taxes | 511 | 31 | 734 | |||||||||
Deferred revenue from related party | 5 | 39 | 85 | |||||||||
Changes in current assets and current liabilities | $ | (8,973 | ) | $ | (1,318 | ) | $ | (2,947 | ) | |||
The above changes in current assets and current liabilities differ from changes between amounts reflected in the applicable balance sheets for the respective periods for the following reasons:
• | amounts accrued for capital expenditures are reflected in investing activities when such amounts are paid, and |
• | amounts accrued for offering costs and debt issuance costs are reflected in financing activities when paid. |
We attributed $80.1 million of the total $154.0 million cash consideration paid for the acquisition of the Texas Crude Systems Business to the historical carrying value of this acquisition (an investing cash outflow). The remaining $73.9 million of cash consideration paid represents the excess purchase price paid over carrying value of this acquisition (a financing cash outflow).
We attributed $296.1 million of the total $571.2 million cash consideration paid for the acquisition of the Houston and St. Charles Terminal Services Business to the historical carrying value of this acquisition (an
105
investing cash outflow). The remaining $275.1 million of cash consideration represents the excess purchase price paid over the carrying value of this acquisition (a financing cash outflow).
We attributed $94.0 million of the total $395.0 million cash consideration paid for the acquisition of the Corpus Christi Terminal Services Business to the historical carrying value of this acquisition (an investing cash outflow). The remaining $301.0 million of cash consideration represents the excess purchase price paid over the carrying value of this acquisition (a financing cash outflow).
Noncash activities for the years ended December 31, 2015, 2014, and 2013 were as follows (in thousands):
Year Ended December 31, | |||||||||||||
2015 | 2014 (a) | 2013 (a) | |||||||||||
Receivables from related party: | |||||||||||||
Debt issuance costs owed to related party | $ | — | $ | — | $ | 1,071 | |||||||
Offering costs owed to related party | — | — | 3,223 | ||||||||||
Amounts due from related party | — | — | (5,126 | ) | |||||||||
Transfer (from) to Valero for: | |||||||||||||
Indemnification of environmental costs | — | — | (85 | ) | |||||||||
Deferred income taxes | (282 | ) | (154 | ) | — | ||||||||
Property and equipment, net | — | — | 764 | ||||||||||
Change in accrued capital expenditures | 7,071 | (5,496 | ) | (404 | ) | ||||||||
Capital expenditures included in accounts payable | (5,496 | ) | (786 | ) | (761 | ) | |||||||
Reduction to property and equipment, net due to capital lease obligation modification | — | — | 913 | ||||||||||
Noncash capital contributions from Valero Energy Corporation | 27,748 | — | — | ||||||||||
Units issued to Valero Energy Corporation in connection with acquisitions | 170,000 | — | — | ||||||||||
(a) Financial information has been retrospectively adjusted for the acquisition of the Corpus Christi Terminal Services Business. | |||||||||||||
Noncash financing activities for the year ended December 31, 2015 included capital contributions of $27.7 million for projects that were funded by Valero related primarily to the Houston, St. Charles, and Corpus Christi terminals. Valero agreed to fund these projects as part of the acquisitions of the Houston and St. Charles Terminal Services Business and Corpus Christi Terminal Services Business.
Cash flows related to interest and income taxes paid were as follows (in thousands):
Year Ended December 31, | |||||||||||||
2015 | 2014 | 2013 | |||||||||||
Interest paid | $ | 5,367 | $ | 899 | $ | 602 | |||||||
Income taxes paid | 441 | 74 | 493 | ||||||||||
106
16. | FAIR VALUE OF FINANCIAL INSTRUMENTS |
The fair value of cash and cash equivalents approximates the carrying value due to the low level of credit risk of these assets combined with their market interest rates. The fair value measurement for cash and cash equivalents is categorized as Level 1 in the fair value hierarchy. Fair values determined by Level 1 inputs utilize unadjusted quoted prices in active markets for identical assets.
The fair values of our debt and notes payable to related party approximate their carrying values as our borrowings bear interest based upon short-term floating market interest rates. The fair value measurement for these liabilities is categorized as Level 2 in the fair value hierarchy. Fair values determined by Level 2 utilize inputs that are observable for the asset or liability, either directly or indirectly. These include quoted prices for similar assets or liabilities in active markets and quoted prices for identical or similar assets or liabilities in markets that are not active.
107
17. | QUARTERLY FINANCIAL DATA (UNAUDITED) |
The following tables summarize quarterly financial data for the years ended December 31, 2015 and 2014 (in thousands, except per unit amounts) as retrospectively adjusted for the acquisition of the Corpus Christi Terminal Services Business.
2015 Quarter Ended | ||||||||||||||||
March 31 (a) | June 30 (a) | September 30 (a) | December 31 | |||||||||||||
Operating revenues – related party | $ | 41,886 | $ | 60,245 | $ | 62,037 | $ | 79,456 | ||||||||
Operating income | 7,300 | 27,712 | 25,299 | 47,671 | ||||||||||||
Net income | 6,936 | 26,378 | 23,860 | 44,667 | ||||||||||||
Net income attributable to partners | 22,121 | 33,662 | 31,428 | 44,667 | ||||||||||||
Limited partners’ interest in net income | 21,269 | 32,305 | 29,816 | 42,419 | ||||||||||||
Net income per limited partner unit – | ||||||||||||||||
basic and diluted: | ||||||||||||||||
Common units | 0.37 | 0.54 | 0.51 | 0.69 | ||||||||||||
Subordinated units | 0.36 | 0.54 | 0.49 | 0.66 | ||||||||||||
2014 Quarter Ended (a) | |||||||||||||||||
March 31 | June 30 | September 30 | December 31 | ||||||||||||||
Operating revenues – related party | $ | 29,489 | $ | 31,843 | $ | 33,666 | $ | 34,182 | |||||||||
Operating income (loss) | (717 | ) | 921 | 532 | (2,775 | ) | |||||||||||
Net income (loss) | (436 | ) | 1,043 | 345 | (2,907 | ) | |||||||||||
Net income attributable to partners | 10,482 | 12,200 | 17,543 | 19,056 | |||||||||||||
Limited partners’ interest in net income | 10,272 | 11,956 | 17,192 | 18,482 | |||||||||||||
Net income per limited partner unit – | |||||||||||||||||
basic and diluted: | |||||||||||||||||
Common units | 0.18 | 0.21 | 0.30 | 0.32 | |||||||||||||
Subordinated units | 0.18 | 0.21 | 0.30 | 0.32 | |||||||||||||
(a) Financial information has been retrospectively adjusted for the acquisition of the Corpus Christi Terminal Services Business. | |||||||||||||||||
108
The following table presents our previously reported quarterly financial data retrospectively adjusted for the acquisition of the Corpus Christi Terminal Services Business (in thousands):
Previously Reported | Corpus Christi Terminal Services Business | Currently Reported | ||||||||||
Quarter ended March 31, 2015: | ||||||||||||
Operating income (loss) | $ | 12,969 | $ | (5,669 | ) | $ | 7,300 | |||||
Net income (loss) | 12,605 | (5,669 | ) | 6,936 | ||||||||
Quarter ended June 30, 2015: | |||||||||
Operating income (loss) | 34,996 | (7,284 | ) | 27,712 | |||||
Net income (loss) | 33,662 | (7,284 | ) | 26,378 | |||||
Quarter ended September 30, 2015: | |||||||||
Operating income (loss) | 32,867 | (7,568 | ) | 25,299 | |||||
Net income (loss) | 31,428 | (7,568 | ) | 23,860 | |||||
Quarter ended March 31, 2014: | |||||||||
Operating income (loss) | 4,239 | (4,956 | ) | (717 | ) | ||||
Net income (loss) | 4,520 | (4,956 | ) | (436 | ) | ||||
Quarter ended June 30, 2014: | |||||||||
Operating income (loss) | 6,035 | (5,114 | ) | 921 | |||||
Net income (loss) | 6,157 | (5,114 | ) | 1,043 | |||||
Quarter ended September 30, 2014: | |||||||||
Operating income (loss) | 5,845 | (5,313 | ) | 532 | |||||
Net income (loss) | 5,658 | (5,313 | ) | 345 | |||||
Quarter ended December 31, 2014: | |||||||||
Operating income (loss) | 3,004 | (5,779 | ) | (2,775 | ) | ||||
Net income (loss) | 2,872 | (5,779 | ) | (2,907 | ) | ||||
109
ITEM 9. CHANGES IN AND DISAGREEMENTS WITH ACCOUNTANTS ON ACCOUNTING AND FINANCIAL DISCLOSURE
None.
ITEM 9A. CONTROLS AND PROCEDURES
Disclosure Controls and Procedures
Our management has evaluated, with the participation of our principal executive officer and principal financial officer, the effectiveness of our disclosure controls and procedures (as defined in Rule 13a-15(e) under the Securities Exchange Act of 1934) as of the end of the period covered by this report, and has concluded that our disclosure controls and procedures were effective as of December 31, 2015.
Internal Control over Financial Reporting
(a) Management’s Report on Internal Control over Financial Reporting
The management report on the Partnership’s internal control over financial reporting required by Item 9A appears in Item 8 on page 61 of this report, and is incorporated herein by reference.
(b) Attestation Report of the Independent Registered Public Accounting Firm
KPMG LLP’s report on the Partnership’s internal control over financial reporting appears in Item 8 beginning on page 68 of this report, and is incorporated herein by reference.
(c) Changes in Internal Control over Financial Reporting
There has been no change in our internal control over financial reporting that occurred during our last fiscal quarter that has materially affected, or is reasonably likely to materially affect, our internal control over financial reporting.
ITEM 9B. OTHER INFORMATION
None.
110
PART III
ITEM 10. DIRECTORS, EXECUTIVE OFFICERS AND CORPORATE GOVERNANCE
Management of Valero Energy Partners LP
We are managed by our general partner, Valero Energy Partners GP LLC. Our general partner is not elected by our unitholders and will not be subject to re-election by our unitholders in the future. Valero indirectly owns all of the membership interests in our general partner. Our general partner has a board of directors (the Board); our unitholders are not entitled to elect the directors or participate in our management or operations.
We do not have any employees. Our general partner and our subsidiaries do not have any employees. All of the personnel who conduct our business are employed by Valero, and their services are provided to us pursuant to our omnibus agreement and services and secondment agreement with Valero.
Directors and Executive Officers of Valero Energy Partners GP LLC
Our directors are elected by the sole member of our general partner and hold office until their successors have been elected or qualified or until their earlier death, resignation, removal or disqualification. Our executive officers are appointed by, and serve at the discretion of, the Board. The directors and executive officers of our general partner are listed below.
Name | Age * | Position with Valero Energy Partners GP LLC | ||
Joseph W. Gorder | 58 | Chairman of the Board and Chief Executive Officer | ||
Richard F. Lashway | 52 | Director, President and Chief Operating Officer | ||
Donna M. Titzman | 52 | Director, Senior Vice President, Chief Financial Officer and Treasurer | ||
Jay D. Browning | 57 | Executive Vice President and General Counsel | ||
Robert S. Beadle | 66 | Director | ||
Timothy J. Fretthold | 66 | Director | ||
Randall J. Larson | 58 | Director | ||
R. Lane Riggs | 50 | Director | ||
* as of December 31, 2015
Joseph W. Gorder. Mr. Gorder is Chairman of the Board and Chief Executive Officer of our general partner. Mr. Gorder was elected Chairman on April 17, 2014. He has served as a Director and as Chief Executive Officer since September 2013. Mr. Gorder has 27 years of service with Valero (including with Ultramar Diamond Shamrock Corporation prior to its merger with Valero in 2001) (UDS) and serves as Chairman of the Board, President and Chief Executive Officer of Valero. He became Valero’s Chief Executive Officer on May 1, 2014, and Valero’s Chairman of the Board on December 31, 2014. He formerly served as Valero’s Chief Operating Officer and earlier led Valero’s European operations from its London office. Mr. Gorder also has served as Valero’s Executive Vice President–Marketing and Supply following his tenure as Senior Vice President for Corporate Development and Strategic Planning. Prior to that, he held several positions with Valero and UDS with responsibilities for corporate development and marketing. Mr. Gorder also serves on the board of directors of Anadarko Petroleum Corporation. We believe that Mr. Gorder is a suitable member of the Board because of his extensive industry experience, particularly his experience in overseeing transportation and logistics assets during his tenure at Valero.
111
Richard F. Lashway. Mr. Lashway was appointed Director, President and Chief Operating Officer of our general partner in September 2013. Mr. Lashway has nearly 20 years of service with Valero (including with UDS) and serves as Senior Vice President of Commercial Development and Logistics Operations for the Valero family of companies where he is responsible for developing and managing logistics projects. Mr. Lashway has held critical leadership positions in the commercial and corporate development groups and has been an integral part of key transportation and logistics projects, including the initial public offering of Shamrock Logistics L.P., the predecessor to NuStar Energy L.P., and its acquisition of Kaneb Pipe Line Partners L.P. We believe that Mr. Lashway is a suitable member of the Board because of his extensive operational experience with transportation and logistics assets including his executive oversight and leadership of these assets at Valero.
Donna M. Titzman. Ms. Titzman was appointed Director, Senior Vice President, Chief Financial Officer and Treasurer of our general partner in September 2013. Ms. Titzman serves as Senior Vice President and Treasurer of Valero where she has responsibility for banking, cash management, customer credit, and investment management. Ms. Titzman joined Valero in 1986 and held various leadership positions before being appointed Vice President and Treasurer in 1999. Ms. Titzman is a Certified Public Accountant. We believe that Ms. Titzman is a suitable member of the Board because of her extensive industry experience and the knowledge of industry financial practices that she has gained as Treasurer of Valero.
Jay D. Browning. Mr. Browning was elected Executive Vice President and General Counsel of our general partner on February 26, 2016; he was elected Senior Vice President and General Counsel in September 2013. Mr. Browning has 22 years of service with Valero. He was elected Executive Vice President and General Counsel of Valero in 2014, and is responsible for Valero’s legal department, corporate governance, environment and safety, and government relations. He was elected Senior Vice President and General Counsel of Valero in November 2012, and previously served as Senior Vice President–Corporate Law and Secretary from 2006 to 2012. Mr. Browning was first elected as a Vice President of Valero in 2002.
Robert S. Beadle. Mr. Beadle became a member of the Board on December 19, 2013; he serves as Lead Director of the Board’s independent directors. Mr. Beadle retired from Valero in 2006 as a Senior Vice President in charge of crude oil and feedstock supply and trading. He joined Diamond Shamrock Corporation in 1976, and served in various sales, marketing and business management positions, as well as in strategic planning and development. In 1987, he was elected Vice President of Diamond Shamrock Inc., and held other executive responsibilities there and at successor companies. He joined Valero effective December 31, 2001, with its acquisition of UDS. We believe that Mr. Beadle is a suitable member of the Board because of his extensive knowledge, experience, and management skills in the refining and related logistics businesses.
Timothy J. Fretthold. Mr. Fretthold became a member of the Board on December 19, 2013; he chairs the Board’s conflicts committee. He previously served as Executive Vice President/Chief Administrative & Legal Officer of UDS from 1997 until December 31, 2001, when Valero acquired UDS. He had served as Senior Vice President/Group Executive & General Counsel of Diamond Shamrock Inc., from 1987 to 1996. We believe that Mr. Fretthold is a suitable member of the Board because of his extensive knowledge, experience, and management skills in the refining and related logistics businesses.
Randall J. Larson. Mr. Larson joined the Board on December 10, 2013, and chairs the Board’s audit committee. Mr. Larson also serves on the board of directors of ONEOK, Inc. (the general partner of ONEOK Partners, L.P.) where he serves on the audit and corporate governance committees. Mr. Larson previously served as a director of the general partner of MarkWest Energy Partners, L.P. (“MarkWest”) from July 2011 through the date of the merger of MarkWest with and into MPLX LP on December 4, 2015, and served as a director of the general partner of Oiltanking Partners, L.P. from August 2011 to February 2014. Mr. Larson was Chief Executive Officer of the general partner of TransMontaigne Partners L.P. from September 2006
112
until August 2009, and its Chief Financial Officer from January 2003 until September 2006, and Controller from May 2002 to January 2003. From July 1994 to May 2002, Mr. Larson was a partner with KPMG LLP in its Silicon Valley and National (New York City) offices. From July 1992 to July 1994, Mr. Larson served as a Professional Accounting Fellow in the Office of Chief Accountant of the Securities and Exchange Commission. We believe that Mr. Larson is a suitable member of the Board because of his extensive expertise in financial, accounting, and governance matters relating to master limited partnerships.
R. Lane Riggs. Mr. Riggs joined the Board on April 14, 2014. Since May 1, 2014, he has served as Valero’s Executive Vice President–Refining Operations and Engineering. From 2011 to 2014, Mr. Riggs was Senior Vice President-Refining Operations of Valero. Prior to that, he was an officer of various Valero subsidiary companies having responsibilities for process engineering, refining operations, feedstock supply, and optimization. We believe that Mr. Riggs is a suitable member of the Board because of his extensive knowledge, experience, and management skills in the refining and related logistics businesses.
Director Independence
Because we are a limited partnership, we rely on an exemption from the provisions of Section 303A.01 of the NYSE Listed Company Manual that would otherwise require our Board to be composed of a majority of independent directors. We are not required to have a compensation committee or a nominating and governance committee. We are, however, required to have an audit committee of at least three members who meet the independence and experience tests established by the NYSE and the Exchange Act. Our board has determined that Messrs. Beadle, Fretthold, and Larson are independent under the independence standards of the NYSE.
Committees of the Board of Directors
The Board has an audit committee and a conflicts committee, and may have such other committees as the Board may determine from time to time. The audit committee and the conflicts committee are composed entirely of independent directors.
Audit Committee
Messrs. Larson, Beadle, and Fretthold are members of our audit committee, and Mr. Larson serves as chair. Based on the attributes, education, and experience requirements set forth in the rules of the SEC, the Board has determined that Mr. Larson is an “audit committee financial expert” (as defined by the SEC). Each of the members of the audit committee is independent as independence is defined in the Exchange Act, as well as the general independence requirements of the NYSE.
Our audit committee assists the board in its oversight of the integrity of our financial statements and our compliance with legal and regulatory requirements and corporate policies and controls. Our audit committee has the sole authority to retain and terminate our independent registered public accounting firm and approve all auditing services and related fees and the terms thereof.
Our audit committee has a written charter adopted by the Board, which is available on our website at www.valeroenergypartners.com > About > Governance > Audit Committee charter.
Conflicts Committee
Messrs. Fretthold, Beadle, and Larson are members of our conflicts committee, and Mr. Fretthold serves as chair. The conflicts committee, upon request by our general partner, determines the resolution of certain transactions that may be deemed conflicts of interest. Our partnership agreement does not require the Board to seek approval from the conflicts committee to determine the resolution of any conflict of interest between
113
us and Valero or any other person. Members of the conflicts committee (i) may not be officers or employees of our general partner or directors, officers, or employees of its affiliates, (ii) may not hold an ownership interest in the general partner or its affiliates other than common units or awards under any long-term incentive plan, equity compensation plan, or similar plan implemented by the general partner or the partnership, and (iii) must meet the independence and experience standards of the NYSE and the SEC to serve on an audit committee of a board of directors.
Lead Director and Meetings of Non-Management Directors
The Board has appointed Robert S. Beadle to preside at executive sessions of the non-management and independent directors of the Board. The Lead Director, working with the committee chairs, sets agendas and leads the discussion of regular meetings of directors outside the presence of management, provides feedback regarding these meetings to the Chairman of the Board, and otherwise serves as liaison between the independent directors and the Chairman. At least annually, all of the independent directors of our general partner meet in executive session without management participation or participation by non-independent directors.
Communications with the Board of Directors of Our General Partner
Unitholders or other interested parties may communicate with our Board, our independent directors, any Board committee, or the Chairman of the Board by submitting a communication in care of the Secretary of our general partner (at Valero Energy Partners LP, One Valero Way, San Antonio, Texas 78249). The envelope should be clearly marked to identify the intended recipient of the communication. The Secretary of our general partner will forward to the directors all communications that, in the Secretary’s judgment, are appropriate for consideration by the directors. Examples of communications that would not be considered appropriate include commercial solicitations.
Codes of Ethics
We adopted a Code of Ethics for Senior Financial Officers that applies to our principal executive officer, principal financial officer and controller. The code charges these officers with responsibilities regarding honest and ethical conduct, the preparation and quality of the disclosures in documents and reports we file with the SEC, and compliance with applicable laws, rules, and regulations. We also adopted a Code of Business Conduct and Ethics that applies to all of our employees and directors.
Website Availability of Our Governance Documents
We post the following governance documents on our website at www.valeroenergypartners.com > About > Governance. A printed copy of any of these documents is available to any unitholder upon request. Requests for documents must be in writing and directed to Valero Energy Partners LP, Attn: Secretary, One Valero Way, San Antonio, Texas, 78249.
• | Governance Guidelines, |
• | Code of Business Conduct and Ethics, |
• | Code of Ethics for Senior Financial Officers, and |
• | Audit Committee charter. |
114
Section 16 Beneficial Ownership Reporting Compliance
Section 16(a) of the Exchange Act requires the directors and executive officers of our general partner and persons who own more than 10 percent of a registered class of our equity securities, to file reports of beneficial ownership on Form 3 and changes in beneficial ownership on Forms 4 or 5 with the SEC. Based on our review of the reporting forms and written representations provided to us from the persons required to file reports, we believe that each of the directors and executive officers of our general partner and persons who own more than 10 percent of a registered class of our equity securities has complied with the Section 16 reporting requirements for transactions in our securities during the fiscal year ended December 31, 2015.
ITEM 11. EXECUTIVE COMPENSATION
COMPENSATION DISCUSSION AND ANALYSIS
We do not have any employees, and our general partner and our subsidiaries do not have any employees. Valero is responsible for providing and compensating the personnel necessary to conduct our operations, including the executive officers of our general partner. Under our amended and restated omnibus agreement with Valero, we pay to Valero a fixed fee of $11.2 million per year to cover, among other things, the services provided to us by the executive officers of our general partner. The omnibus agreement is more fully described in Note 3 of Notes to Consolidated Financial Statements.
Named Executive Officer Compensation
Our “named executive officers” or “NEOs” are the following executive officers of our general partner:
• | Joseph W. Gorder, Chief Executive Officer, |
• | Richard F. Lashway, President and Chief Operating Officer, |
• | Jay D. Browning, Executive Vice President and General Counsel, and |
• | Donna M. Titzman, Senior Vice President, Chief Financial Officer and Treasurer. |
Mr. Gorder, Mr. Lashway, Mr. Browning, and Ms. Titzman devote the majority of their time to their roles at Valero, and also spend a portion of their time, as needed, managing our business and affairs. They do not receive any additional compensation for their services to our businesses or as executive officers of our general partner. Except for the fixed fee we pay to Valero under the omnibus agreement, we do not otherwise pay or reimburse any compensation amounts to or for our NEOs. Each is eligible to receive grants of unit-based awards under our incentive compensation plan, but none has to date received any awards under the plan. (Our incentive compensation plan is discussed below under “—Our Incentive Compensation Plan”).
The responsibility and authority for compensation-related decisions for our NEOs remain with the compensation committee of Valero’s board of directors (the “Valero Compensation Committee”). Those compensation determinations are not subject to approval by us, our Board, or any committees thereof. Other than awards granted under our incentive compensation plan (under which the Board can grant unit-based awards), Valero has the ultimate decision-making authority with respect to the compensation of its and its subsidiaries’ executive officers and employees, including our named executive officers.
Summary Compensation Table
Except for the fixed management fee we paid to Valero under the omnibus agreement, we did not pay or reimburse any compensation amounts to or for our named executive officers in 2015.
115
Compensation by Valero
Valero provides compensation to its executives in the form of base salaries, annual cash incentive awards, long-term equity incentive awards, and participation in various employee benefits plans and arrangements, including broad-based and supplemental defined contribution and defined benefit retirement plans. Our NEOs do not have employment agreements with Valero. In the future, Valero may provide different or additional compensation components, benefits, or perquisites to our NEOs.
The following sets forth a more detailed explanation of the elements of Valero’s executive compensation program.
Base Compensation
Our named executive officers earn a base salary for their services to Valero and its subsidiaries; these amounts are paid by Valero or its affiliates other than us. We incur only a fixed expense per month under the omnibus agreement with respect to the compensation paid by Valero to each of our NEOs.
Annual Cash Bonus Payments
Our NEOs are eligible to earn a cash payment from Valero under Valero’s annual incentive bonus program. Any bonus payments earned by the NEOs will be paid by Valero and will determined solely by Valero without input from us or our general partner or our Board. The amount of any bonus payments made by Valero will not result in changes to the contractually fixed fee for executive management services that we pay to Valero under the omnibus agreement.
Long-Term Equity-Based Incentive Compensation
Valero maintains a long-term incentive program pursuant to which it grants equity-based awards in Valero to its executives and key employees. Our NEOs may receive awards under Valero’s equity incentive plan from time to time as may be determined by the Valero Compensation Committee. The amount of any long-term incentive compensation made by Valero will not result in changes to the contractually fixed fee for executive management services that we will pay to Valero under the omnibus agreement.
Retirement, Health, Welfare and Additional Benefits
Our NEOs are eligible to participate in the employee benefit plans and programs that Valero offers to its employees, subject to the terms and eligibility requirements of those plans. Our NEOs are also eligible to participate in Valero’s tax-qualified defined contribution and defined benefit retirement plans to the same extent as all other Valero employees. Valero also has certain supplemental retirement plans in which its executives and key employees participate. When our NEOs participate in these programs, Valero is responsible for providing 100 percent of the benefits under these plans and programs to our NEOs.
Severance Arrangements
Valero has entered into change-of-control severance agreements with certain executives, including Mr. Gorder, Mr. Browning, and Ms. Titzman. The agreements are intended to assure the continued objectivity and availability of the officers in the event of any merger or acquisition activity that may threaten the job security of Valero executives. If a change of control occurs during the term of an agreement, then the agreement becomes operative for a fixed three-year period. The agreements provide generally that the named executive officers’ terms and conditions of employment will not be adversely changed during the three-year period after a change of control. In addition, outstanding stock options and shares of restricted stock will vest upon the effective date of the change of control. Under the agreements, if an officer’s employment is terminated
116
for “cause,” the officer will not receive any benefits or compensation other than any accrued salary or vacation pay that remained unpaid through the date of termination.
Our Incentive Compensation Plan
Our general partner adopted the Valero Energy Partners LP 2013 Incentive Compensation Plan (ICP) for directors and officers of our general partner or its affiliates and certain others who may perform services for us. The ICP has been approved by the sole member of our general partner. Our general partner may grant long-term unit-based awards to participants under the ICP. Awards under the plan are intended to compensate participants based on the performance of our common units and to align the participants’ long-term interests with those of our unit holders. We are responsible for the cost of awards granted under the ICP. All determinations with respect to awards to be made under the ICP will be made by the Board or any committee thereof established for such purpose. No awards under the ICP were made to our NEOs in 2015. Grants of restricted common units were made to our independent directors in 2015 (as described below under the caption, “Compensation of Our Directors”).
DIRECTOR COMPENSATION
This table summarizes compensation paid to our directors during the year ended December 31, 2015.
Fees Earned or Paid in Cash | Unit Awards (1) | Other Income (3) | Total | |||||||||||||
Robert S. Beadle | $ | 71,250 | $ | 60,032 | $ | — | $ | 131,282 | ||||||||
Timothy J. Fretthold | 71,250 | 60,032 | 11,769 | 143,051 | ||||||||||||
Joseph W. Gorder | — | — | — | (2 | ) | |||||||||||
Randall J. Larson | 71,250 | 60,032 | — | 131,282 | ||||||||||||
Richard F. Lashway | — | — | — | (2 | ) | |||||||||||
R. Lane Riggs | — | — | — | (2 | ) | |||||||||||
Donna M. Titzman | — | — | — | (2 | ) | |||||||||||
Footnotes to Director Compensation table:
(1) | The amounts shown represent the grant date fair value of awards granted in 2015, computed in accordance with Financial Accounting Standards Board Accounting Standards Codification Topic 718, Compensation–Stock Compensation (FASB ASC Topic 718). In 2015, each of our independent directors who was serving on the Board on January 8, 2015, received a grant of 1,481 restricted common units. The following table presents the number of unvested restricted common units held by each independent director as of December 31, 2015. |
Name | Unvested Restricted Units | ||
Robert S. Beadle | 3,217 | ||
Timothy J. Fretthold | 3,217 | ||
Randall J. Larson | 3,217 | ||
(2) | Mr. Gorder, Mr. Lashway, Mr. Riggs, and Ms. Titzman do not receive any compensation as directors of our general partner, and did not receive any compensation as directors of our general partner in 2015. |
(3) | The amount presented for Mr. Fretthold represents Valero’s payment in 2015 to Mr. Fretthold under a severance agreement for prior service with a predecessor of Valero. This arrangement is described in Item 13., “Certain Relationships and Related Transactions, and Director Independence—Supplemental Death Benefit Agreements and Severance Agreement.” |
117
Compensation of Our Directors
Officers of our general partner or of Valero who serve as directors of our general partner do not receive compensation from us for their service as a director of our general partner. Directors of our general partner who are not officers or employees of our general partner or of Valero (our “independent directors”) receive the compensation described below. In addition, our independent directors are reimbursed for out-of-pocket expenses incurred for attending board and committee meetings. Each director is indemnified for actions associated with being a director to the fullest extent permitted under Delaware law.
Under our current independent director compensation program, each of our independent directors receives an annual compensation package that consists of $60,000 in annual cash compensation and $90,000 in annual unit-based compensation (increased to $90,000 for 2016 from $60,000 for 2015). The independent directors who chair the audit and conflicts committees receive an additional $15,000 in cash compensation, and the independent director designated as the Lead Director receives an additional $15,000 in cash compensation. On January 8, 2015, each of Messrs. Beadle, Fretthold, and Larson received a grant of 1,481 restricted common units under the ICP, having an aggregate grant date fair value of $60,000. On January 14, 2016, each of Messrs. Beadle, Fretthold, and Larson received a grant of 1,986 restricted common units under the ICP, having an aggregate grant date fair value of $90,000. The restricted units were granted in tandem with distribution equivalent rights and are scheduled to vest in annual one-third increments over the three-year restriction period.
The following Compensation Committee Report is not “soliciting material,” is not deemed filed with the SEC, and is not to be incorporated by reference into any of Valero’s filings under the Securities Act of 1933, as amended (the “Securities Act”), or the Exchange Act, respectively, whether made before or after the date of this proxy statement and irrespective of any general incorporation language therein.
COMPENSATION COMMITTEE REPORT *
The members of the board of directors of our general partner have reviewed and discussed the Compensation Discussion and Analysis included in this Annual Report on Form 10-K with management and, based on such review and discussions and such other matters the board deemed relevant and appropriate, the board has approved the inclusion of the Compensation Discussion and Analysis in this Annual Report on Form 10-K.
Members of the board of directors:
Joseph W. Gorder | Richard F. Lashway | |
Robert S. Beadle | R. Lane Riggs | |
Timothy J. Fretthold | Donna M. Titzman | |
Randall J. Larson | ||
* | We do not have a Compensation Committee. Accordingly, the Compensation Committee Report required by Item 407(e)(5) of Regulation S-K is given by the board of directors of our general partner. |
118
ITEM 12. SECURITY OWNERSHIP OF CERTAIN BENEFICIAL OWNERS AND MANAGEMENT AND RELATED STOCKHOLDER MATTERS
Beneficial Ownership of Valero Energy Partners LP Units
The following table presents the beneficial ownership of units of Valero Energy Partners LP known as of February 10, 2016, to be held by beneficial owners of five percent or more of the units, by each director and named executive officer of our general partner, and by the directors and executive officers of our general partner as a group. The percentage of units is based on 36,534,211 common units, 28,789,989 subordinated units, and 1,332,829 general partner units outstanding as of February 1, 2016. None of the units are pledged as security.
Name of Beneficial Owner (1) | Common Units | Subordinated Units | General Partner Units | Total Partnership Interests | |||||||||||||||||
Number | Percent | Number | Percent | Number | Percent | Percent | |||||||||||||||
Valero Energy Corporation (2) | 15,018,602 | 41.11 | % | 28,789,989 | 100.00 | % | 1,332,829 | 100.00 | % | 67.72 | % | ||||||||||
Tortoise Capital Advisors, L.L.C. (3) | 4,413,762 | 12.08 | % | — | — | — | — | 6.62 | % | ||||||||||||
Goldman Sachs Asset Management (4) | 3,789,733 | 10.37 | % | — | — | — | — | 5.69 | % | ||||||||||||
Directors & Named Executive Officers | |||||||||||||||||||||
Robert S. Beadle | 15,203 | * | — | — | — | — | * | ||||||||||||||
Jay D. Browning | 5,500 | * | — | — | — | — | * | ||||||||||||||
Timothy J. Fretthold | 15,203 | * | — | — | — | — | * | ||||||||||||||
Joseph W. Gorder | 50,000 | * | — | — | — | — | * | ||||||||||||||
Randall J. Larson | 20,203 | * | — | — | — | — | * | ||||||||||||||
Richard F. Lashway | 10,000 | * | — | — | — | — | * | ||||||||||||||
R. Lane Riggs | 5,500 | * | — | — | — | — | * | ||||||||||||||
Donna M. Titzman | 11,000 | * | — | — | — | — | * | ||||||||||||||
Directors and executive officers as a group (8 persons) | 132,609 | * | — | — | — | — | * | ||||||||||||||
__________
* | Less than 1 percent. |
(1) | The address for the beneficial owners listed in this table is One Valero Way, San Antonio, Texas 78249. |
(2) | Valero Energy Corporation directly or indirectly owns the following entities, which own the units listed below. Valero Energy Corporation may be deemed to beneficially own the units and interests held by each of the entities. |
Name of Entity | Common Units | Subordinated Units | General Partner Units | ||||||
Valero Energy Partners GP LLC | — | — | 1,332,829 | ||||||
Valero Terminaling and Distribution Company | 15,018,602 | 28,789,989 | — | ||||||
Total Valero subsidiaries | 15,018,602 | 28,789,989 | 1,332,829 | ||||||
(3) | Tortoise Capital Advisors, L.L.C., 11550 Ash Street, Suite 300, Leawood, Kansas 66211, filed an amended Schedule 13G with the SEC on February 10, 2016, reporting that it or certain of its affiliates beneficially owned in the aggregate 4,413,762 Common Units, that it had sole voting and sole dispositive power over 55,147 of our Common Units, shared voting power over 3,982,016 of our Common Units, and shared dispositive power over 4,358,615 of our Common Units. |
119
(4) | Goldman Sachs Asset Management, 200 West Street, New York, NY 10282, filed an amended Schedule 13G with the SEC on February 5, 2016, reporting that it or certain of its affiliates beneficially owned in the aggregate 3,789,733 Common Units, and that it had shared voting and dispositive power over 3,789,733 of our Common Units. |
Beneficial Ownership of Valero Energy Corporation Common Stock
The following table sets forth the number of shares of Valero common stock beneficially owned as of February 1, 2016, by each director and named executive officer of our general partner, and by the directors and executive officers of our general partner as a group. The percentage of shares beneficially owned is based on a total of 470,392,772 shares outstanding as of February 1, 2016.
Name of Beneficial Owner (1) | Shares Held (2) | Shares Under Options (3) | Total Shares of Valero Common Stock | Percent of Class | |||||||
Robert S. Beadle | — | — | — | * | |||||||
Jay D. Browning | 184,451 | 27,345 | 211,796 | * | |||||||
Timothy J. Fretthold | — | — | — | * | |||||||
Joseph W. Gorder | 359,129 | 208,993 | 568,122 | * | |||||||
Randall J. Larson | — | — | — | * | |||||||
Richard F. Lashway | 33,007 | 1,166 | 34,173 | * | |||||||
R. Lane Riggs | 111,147 | 35,205 | 146,352 | * | |||||||
Donna M. Titzman | 180,383 | 69,003 | 249,386 | * | |||||||
All directors and executive officers as a group (8 persons) | 868,117 | 341,712 | 1,209,829 | * | |||||||
__________
* | Less than 1 percent. |
(1) | The address for all beneficial owners in this table is One Valero Way, San Antonio, Texas 78249. |
(2) | Includes shares allocated under Valero’s thrift plan and shares of restricted stock (and for Mr. Browning, shares owned by his spouse). |
(3) | Represents shares of Valero’s common stock that may be acquired under stock options. Stock options that may be exercised only in the event of a change of control of Valero Energy Corporation are excluded. |
Securities Authorized for Issuance Under Equity Compensation Plans
The following table provides information as of December 31, 2015 with respect to common units that may be issued under the ICP:
Plan category | Number of securities to be issued upon exercise of outstanding options, warrants and rights | Weighted average exercise price of outstanding options, warrants and rights | Number of securities remaining available for future issuance under equity compensation plans | ||||
Equity compensation plans approved by security holders: | |||||||
Valero Energy Partners LP 2013 Incentive Compensation Plan | 9,651 | n/a | 2,990,349 | ||||
120
ITEM 13. CERTAIN RELATIONSHIPS AND RELATED TRANSACTIONS, AND DIRECTOR INDEPENDENCE
As of February 1, 2016, our general partner and its affiliates, including Valero, owned 15,018,602 common units and 28,789,989 subordinated units, representing a 65.7 percent limited partner interest in us (excluding common units held by the directors and officers of Valero and our general partner). In addition, our general partner owns 1,332,829 general partner units representing an approximate 2.0 percent general partner interest in us. Transactions with our general partner and its affiliates, including Valero, are considered to be related party transactions because our general partner and its affiliates own more than five percent of our equity interests. In addition, Mr. Gorder and Mr. Browning serve as executive officers of both Valero and our general partner, and Mr. Riggs is an executive officer of Valero.
Distributions and Payments to our General Partner and its Affiliates
We will generally make cash distributions of 98.0 percent to the unitholders pro rata, including Valero (as holder of an aggregate of 15,018,602 common units and all of our subordinated units), and 2.0 percent to our general partner. In addition, if distributions exceed the established minimum quarterly distribution and target distribution levels, the incentive distribution rights held by our general partner will entitle our general partner to increasing percentages of the distributions, up to 48.0 percent of the distributions above the highest target distribution level.
In 2015, we paid $52.0 million of distributions in the aggregate to our general partner and its affiliates (representing our distribution for the quarter ended December 31, 2014, and distributions for the first three quarters of 2015). On February 11, 2016, we paid $15.8 million of distributions in the aggregate to our general partner and its affiliates (representing our distribution for the quarter ended December 31, 2015).
Under our partnership agreement, we reimburse our general partner and its affiliates, including Valero, for costs and expenses they incur and payments they make on our behalf. Under our omnibus agreement with Valero, we make monthly payments on an annual fee to Valero for general and administrative services, and we reimburse Valero for any out-of-pocket costs and expenses incurred by Valero in providing these services to us. In addition, we reimburse our general partner for payments to Valero under the services and secondment agreement for the wages, benefits, and other costs of Valero employees seconded to our general partner to perform operational and maintenance services at certain of our facilities. Each of these payments are made prior to making any distributions on our common units.
Agreements with Valero
2015 Acquisition Agreements
Effective March 1, 2015, we entered into a contribution agreement with Valero for our acquisition of the Houston and St. Charles Terminals Service Business. Effective October 1, 2015, we entered into a transaction agreement with Valero for our acquisition of the Corpus Christi Terminal Services Business. These acquisitions are further described in Note 3 of Notes to Consolidated Financial Statements, and the descriptions of these transactions in Note 3 are incorporated herein by reference.
121
Commercial Agreements with Valero
We have entered into commercial agreements with Valero in connection with the assets that we acquired in the IPO and the Acquisitions. Under these commercial agreements, we provide transportation and terminaling services to Valero, and Valero has committed to pay us for minimum quarterly throughput volumes of crude oil and refined petroleum products. These commercial agreements are further described in Item 1., “Busi-ness—Our Commercial Agreements with Valero,” and the description of these agreements in Item 1. is incorporated herein by reference.
Other Related Party Agreements with Valero
In connection with the IPO and the Acquisitions, we entered into several agreements with Valero, many of which we have amended in connection with subsequent Acquisitions. These agreements include an amended and restated omnibus agreement, an amended and restated services and secondment agreement, a tax sharing agreement, and several lease and access agreements. These agreements are described in Note 4 of Notes to Consolidated Financial Statements, and the descriptions of these agreements in Note 4 are incorporated herein by reference.
In connection with our March 1, 2015 acquisition of the Houston and St. Charles Terminals Service Business, and our October 1, 2015 acquisition of the Corpus Christi Terminal Services Business, we entered into subordinated credit agreements with Valero to finance a portion of these acquisitions. These agreements are described in Note 7 of Notes to Consolidated Financial Statements, and the descriptions of these agreements in Note 7 are incorporated herein by reference.
Supplemental Death Benefit Agreements and Severance Agreement
Valero succeeded to the obligations of Diamond Shamrock R&M, Inc. under its supplemental death benefit agreements with Messrs. Fretthold and Beadle. Each is a director of our general partner. The agreements obligate Valero to pay $1,075,000 to Mr. Fretthold’s beneficiary upon his death, and $910,000 to Mr. Beadle’s beneficiary upon his death. These agreements were assumed by Valero in the merger of Ultramar Diamond Shamrock Corporation (UDS) with and into Valero Energy Corporation on December 31, 2001 (the UDS Merger). Valero has insured most of these death benefit obligations under a group term life (GTL) policy, resulting in imputed income annually for Messrs. Fretthold and Beadle for GTL coverage in excess of $50,000. Under a severance agreement entered into between UDS and Mr. Fretthold in the UDS Merger (to which Valero has succeeded), Valero provides to Mr. Fretthold a tax gross up benefit such that Valero pays cash to Mr. Fretthold in an amount necessary to cover the tax obligation associated with his imputed income for GTL coverage in excess of $50,000. In 2015, Valero paid to Mr. Fretthold $11,769 under the terms of the severance agreement to cover his tax obligation for imputed income from GTL coverage in excess of $50,000.
Procedure for Review, Approval and Ratification of Related Person Transactions
The Board adopted a related party transactions policy. The policy provides that the board (or its authorized committee) will review all related person transactions that are required to be disclosed under SEC rules and, when appropriate, authorize or ratify all such transactions. In the event that the board or its authorized committee considers ratification of a related person transaction and determines not to so ratify, the related party transactions policy will provide that our management will make all reasonable efforts to cancel or annul the transaction.
The related party transactions policy provides that, in determining whether or not to recommend the approval or ratification of a proposed related person transaction, the Board (or its authorized committee) should consider all of the relevant facts and circumstances available, including but not limited to: (i) whether there
122
is an appropriate business justification for the transaction; (ii) the benefits that accrue to us as a result of the transaction; (iii) the terms available to unrelated third parties entering into similar transactions; (iv) the impact of the transaction on a director’s independence (in the event the related person is a director, an immediate family member of a director or an entity in which a director or an immediate family member of a director is a partner, shareholder, member or executive officer); (v) the availability of other sources for comparable products or services; (vi) whether it is a single transaction or a series of ongoing, related transactions; and (vii) whether entering into the transaction would be consistent with our code of business conduct and ethics.
Director Independence
Our disclosures in Item 10., “Directors, Executive Officers and Corporate Governance—Director Independence,” are incorporated herein by reference.
ITEM 14. PRINCIPAL ACCOUNTANT FEES AND SERVICES
Audit Fees
Fees for professional services rendered by KPMG LLP, our independent auditor, for 2015 and 2014 are presented in the following table (in thousands).
Category | 2015 | 2014 | ||||||
Audit fees (1) | $ | 1,325 | $ | 840 | ||||
Audit-related fees | — | — | ||||||
Tax fees | — | — | ||||||
All other fees | — | — | ||||||
Total | $ | 1,325 | $ | 840 | ||||
(1) | Represents fees for professional services rendered for the audit of the annual financial statements included in our annual reports on Form 10-K, review of our interim financial statements included in our quarterly reports on Form 10-Q, the audit of the effectiveness of our internal control over financial reporting, audits of acquired businesses, and services that are normally provided by the principal auditor (e.g., comfort letters, statutory audits, attest services, consents, and assistance with and review of documents filed with the SEC). |
The Audit Committee has adopted a pre-approval policy for the pre-approval of certain services rendered to us by KPMG LLP. That policy appears in Exhibit 99.01 to this report. None of the services provided by KPMG LLP were approved by the Audit Committee under the pre-approval waiver provisions of paragraph (c)(7)(i)(C) of Rule 2-01 of SEC Regulation S-K.
Auditor Independence
The Audit Committee of the Board has considered whether KPMG LLP is independent for purposes of providing external audit services to us, and the Audit Committee has determined that KPMG LLP is independent.
123
PART IV
ITEM 15. EXHIBITS AND FINANCIAL STATEMENT SCHEDULES
(a) 1. Financial Statements.
Page | |
Management’s report on internal control over financial reporting | |
Report of independent registered public accounting firm | |
Consolidated balance sheets as of December 31, 2015 and 2014 | |
Consolidated statements of income for the years ended December 31, 2015, 2014, and 2013 | |
Consolidated statements of partners’ capital for the years ended December 31, 2015, 2014, and 2013 | |
Consolidated statements of cash flows for the years ended December 31, 2015, 2014, and 2013 | |
Notes to consolidated financial statements | |
2. Financial Statement Schedules and Other Financial Information. No financial statement schedules are submitted because either they are inapplicable or because the required information is included in the consolidated financial statements or notes thereto.
3. Exhibits. Filed as part of this Form 10-K are the following exhibits:
3.01 | -- | Certificate of Limited Partnership of Valero Energy Partners LP–incorporated by reference to Exhibit 3.1 to the Partnership’s Registration Statement on Form S-1 filed September 19, 2013 (SEC File No. 333-191259). | |
3.02 | -- | First Amended and Restated Agreement of Limited Partnership of Valero Energy Partners LP dated December 16, 2013–incorporated by reference to Exhibit 3.1 to the Partnership’s Current Report on Form 8-K dated December 16, 2013, and filed December 20, 2013 (SEC File No.1-36232). | |
3.03 | -- | Certificate of Formation of Valero Energy Partners GP LLC–incorporated by reference to Exhibit 3.3 to the Partnership’s Registration Statement on Form S-1 filed September 19, 2013 (SEC File No. 333-191259). | |
3.04 | -- | First Amended and Restated Limited Liability Company Agreement of Valero Energy Partners GP LLC dated December 16, 2013–incorporated by reference to Exhibit 3.2 to the Partnership’s Current Report on Form 8-K dated December 16, 2013, and filed December 20, 2013 (SEC File No. 1-36232). | |
10.01 | -- | Amended and Restated Omnibus Agreement dated July 1, 2014, by and among Valero Energy Corporation, Valero Marketing and Supply Company, Valero Terminaling and Distribution Company, The Premcor Refining Group Inc., The Premcor Pipeline Co., Valero Energy Partners LP, Valero Energy Partners GP LLC, Valero Partners Operating Co. LLC, Valero Partners EP, LLC, Valero Partners Lucas, LLC, Valero Partners Memphis, LLC, Valero Partners North Texas, LLC, Valero Partners South Texas, LLC, and Valero Partners Wynnewood, LLC–incorporated by reference to Exhibit 10.2 to the Partnership’s Current Report on Form 8-K dated July 1, 2014, and filed July 1, 2014 (SEC File No. 1-36232). | |
10.02 | -- | Amendment and Restatement of Schedules to Amended and Restated Omnibus Agreement, dated October 1, 2015, by and among Valero Energy Corporation, Valero Marketing and Supply Company, Valero Partners Memphis, LLC, Valero Terminaling and Distribution Company, The Premcor Refining Group Inc., The Premcor Pipeline Co., Valero Energy Partners LP, Valero Energy Partners GP LLC, Valero Partners Operating Co. LLC, Valero Partners EP, LLC, Valero Partners Lucas, LLC, Valero Partners North Texas, LLC, Valero Partners South Texas, LLC, Valero Partners Wynnewood, LLC, Valero Partners Houston, LLC, Valero Partners Louisiana, LLC, Valero Partners CCTS, LLC, Valero Partners Corpus East, LLC and Valero Partners Corpus West, LLC–incorporated by reference to Exhibit 10.03 to the Partnership’s Current Report on Form 8-K dated and filed October 1, 2015 (SEC File No. 1-36232). | |
124
10.03 | -- | Amended and Restated Services and Secondment Agreement, dated March 1, 2015, by and among Valero Services, Inc., Valero Refining Company-Tennessee, L.L.C., Valero Refining-Texas, L.P., and Valero Energy Partners GP LLC–incorporated by reference to Exhibit 10.04 to the Partnership’s Current Report on Form 8-K dated March 1, 2015, and filed March 5, 2015 (SEC File No. 1-36232). | |
10.04 | -- | Amendment and Restatement of Exhibits to Amended and Restated Services and Secondment Agreement, dated October 1, 2015, by and among Valero Services, Inc., Valero Refining Company-Tennessee, L.L.C., Valero Refining-Texas, L.P., and Valero Energy Partners GP LLC–incorporated by reference to Exhibit 10.05 to the Partnership’s Current Report on Form 8-K dated and filed October 1, 2015 (SEC File No. 1-36232). | |
10.05 | -- | Tax Sharing Agreement dated December 16, 2013 by and between Valero Energy Partners LP and Valero Energy Corporation–incorporated by reference to Exhibit 10.3 to the Partnership’s Current Report on Form 8-K dated December 16, 2013, and filed December 20, 2013 (SEC File No. 1-36232). | |
10.06 | -- | Master Transportation Services Agreement dated December 16, 2013 by and between Valero Partners Operating Co. LLC and Valero Marketing and Supply Company (with Transportation Services Schedules for (i) Collierville Pipeline System, (ii) El Paso Pipeline, (iii) Lucas Pipeline System, (iv) Memphis Airport Pipeline System, (v) PAPS-El Vista Pipeline System, (vi) SFPP Pipeline Connection, and (vii) Shorthorn Pipeline System)–incorporated by reference to Exhibit 10.6 to the Partnership’s Current Report on Form 8-K dated December 16, 2013, and filed December 20, 2013 (SEC File No. 1-36232). | |
10.07 | -- | Transportation Services Schedule (McKee Crude System), dated July 1, 2014, by and between Valero Partners Operating Co. LLC and Valero Marketing and Supply Company–incorporated by reference to Exhibit 10.6 to the Partnership’s Current Report on Form 8-K dated July 1, 2014, and filed July 1, 2014 (SEC File No. 1-36232). | |
10.08 | -- | Amended and Restated Transportation Services Schedule (Three Rivers Crude System), dated October 8, 2014, by and between Valero Partners Operating Co. LLC and Valero Marketing and Supply Company–incorporated by reference to Exhibit 10.08 to the Partnership’s Annual Report on Form 10-K for the year ended December 31, 2014 (SEC File No. 1-36232). | |
10.09 | -- | Transportation Services Schedule (Wynnewood Products System), dated July 1, 2014, by and between Valero Partners Operating Co. LLC and Valero Marketing and Supply Company–incorporated by reference to Exhibit 10.9 to the Partnership’s Current Report on Form 8-K dated July 1, 2014, and filed July 1, 2014 (SEC File No. 1-36232). | |
10.10 | -- | Master Terminal Services Agreement dated December 16, 2013 by and between Valero Partners Operating Co. LLC and Valero Marketing and Supply Company (with Terminal Services Schedules for (i) El Paso Terminal, (ii) Lucas Terminal, (iii) Memphis Refinery Truck Rack, (iv) PAPS and El Vista Terminals, and (v) West Memphis Terminal)–incorporated by reference to Exhibit 10.7 to the Partnership’s Current Report on Form 8-K dated December 16, 2013, and filed December 20, 2013 (SEC File No. 1-36232). | |
10.11 | -- | Terminal Services Schedule (Wynnewood Products System), dated July 1, 2014, by and between Valero Partners Operating Co. LLC and Valero Marketing and Supply Company–incorporated by reference to Exhibit 10.8 to the Partnership’s Current Report on Form 8-K dated July 1, 2014, and filed July 1, 2014 (SEC File No. 1-36232). | |
10.12 | -- | Terminal Services Schedule (Houston Terminal), dated March 1, 2015, by and between Valero Partners Operating Co. LLC and Valero Marketing and Supply Company–incorporated by reference to Exhibit 10.06 to the Partnership’s Current Report on Form 8-K dated March 1, 2015, and filed March 5, 2015 (SEC File No. 1-36232). | |
10.13 | -- | Terminal Services Schedule (St. Charles Terminal), dated March 1, 2015, by and between Valero Partners Operating Co. LLC and Valero Marketing and Supply Company–incorporated by reference to Exhibit 10.07 to the Partnership’s Current Report on Form 8-K dated March 1, 2015, and filed March 5, 2015 (SEC File No. 1-36232). | |
10.14 | -- | Terminal Services Schedule (Corpus East and West Terminals), dated October 1, 2015, by and between Valero Partners Operating Co. LLC and Valero Marketing and Supply Company–incorporated by reference to Exhibit 10.07 to the Partnership’s Current Report on Form 8-K dated and filed October 1, 2015 (SEC File No. 1-36232). | |
125
10.15 | -- | Contribution, Conveyance and Assumption Agreement dated December 16, 2013 by and among Valero Energy Partners LP, Valero Energy Partners GP LLC, Valero Partners Operating Co. LLC, Valero Energy Corporation, Valero Terminaling and Distribution Company, The Premcor Pipeline Co., The Premcor Refining Group Inc. and Valero Refining Company-Tennessee, L.L.C.–incorporated by reference to Exhibit 10.8 to the Partnership’s Current Report on Form 8-K dated December 16, 2013, and filed December 20, 2013 (SEC File No. 1-36232). | |
10.16 | -- | Purchase and Sale Agreement, dated as of July 1, 2014, between The Shamrock Pipe Line Corporation, Valero Plains Company LLC and Valero Terminaling and Distribution Company, as Sellers, and Valero Partners North Texas, LLC, Valero Partners South Texas, LLC and Valero Partners Operating Co. LLC, as Buyers–incorporated by reference to Exhibit 10.1 to the Partnership’s Current Report on Form 8-K dated July 1, 2014, and filed July 1, 2014 (SEC File No. 1-36232). | |
10.17 | -- | Contribution Agreement, dated March 1, 2015, by and among Valero Refining-New Orleans, L.L.C., Valero Terminaling and Distribution Company, and Valero Energy Partners LP–incorporated by reference to Exhibit 10.01 to the Partnership’s Current Report on Form 8-K dated March 1, 2015, and filed March 5, 2015 (SEC File No. 1-36232). | |
10.18 | -- | Transaction Agreement, dated October 1, 2015, by and among Valero Terminaling and Distribution Company and Valero Energy Partners LP–incorporated by reference to Exhibit 10.01 to the Partnership’s Current Report on Form 8-K dated and filed October 1, 2015 (SEC File No. 1-36232). | |
10.19 | -- | Ground Lease Agreement dated December 16, 2013 by and between Valero Refining Company-Tennessee, L.L.C. and Valero Partners Memphis, LLC–incorporated by reference to Exhibit 10.4 to the Partnership’s Current Report on Form 8-K dated December 16, 2013, and filed December 20, 2013 (SEC File No. 1-36232). | |
10.20 | -- | Lease and Access Agreement dated as of March 1, between Valero Refining-Texas, L.P. and Valero Partners Houston, LLC–incorporated by reference to Exhibit 10.08 to the Partnership’s Current Report on Form 8-K dated March 1, 2015, and filed March 5, 2015 (SEC File No. 1-36232). | |
10.21 | -- | Lease and Access Agreement dated as of March 1, 2015, between Valero Refining-New Orleans, L.L.C. and Valero Partners Louisiana, LLC–incorporated by reference to Exhibit 10.09 to the Partnership’s Current Report on Form 8-K dated March 1, 2015, and filed March 5, 2015 (SEC File No. 1-36232). | |
10.22 | -- | Lease and Access Agreement dated October 1, 2015, between Valero Refining-Texas, L.P. and Valero Partners Corpus East, LLC–incorporated by reference to Exhibit 10.08 to the Partnership’s Current Report on Form 8-K dated and filed October 1, 2015 (SEC File No. 1-36232). | |
10.23 | -- | Lease and Access Agreement dated October 1, 2015, between Valero Refining-Texas, L.P. and Valero Partners Corpus West, LLC–incorporated by reference to Exhibit 10.09 to the Partnership’s Current Report on Form 8-K dated and filed October 1, 2015 (SEC File No. 1-36232). | |
+10.24 | -- | Valero Energy Partners LP 2013 Incentive Compensation Plan–incorporated by reference to Exhibit 10.5 to the Partnership’s Current Report on Form 8-K dated December 16, 2013, and filed December 20, 2013 (SEC File No. 1-36232). | |
+10.25 | -- | Form of Restricted Unit Award Agreement (for independent directors) (2014 grant) under the Valero Energy Partners LP 2013 Incentive Compensation Plan–incorporated by reference to Exhibit 10.09 to the Partnership’s Annual Report on Form 10-K for the year ended December 31, 2013 (SEC File No. 1-36232). | |
+10.26 | -- | Form of Restricted Unit Award Agreement (for independent directors) (2015 grant) under the Valero Energy Partners LP 2013 Incentive Compensation Plan–incorporated by reference to Exhibit 10.16 to the Partnership’s Annual Report on Form 10-K for the year ended December 31, 2014 (SEC File No. 1-36232). | |
*+10.27 | -- | Form of Restricted Unit Award Agreement (for independent directors) (2016 grant) under the Valero Energy Partners LP 2013 Incentive Compensation Plan. | |
126
10.28 | -- | Amended and Restated Credit Agreement, dated as of November 12, 2015, among Valero Energy Partners LP as Borrower; JPMorgan Chase Bank, N.A. as Administrative Agent; and the lenders named therein–incorporated by reference to Exhibit 10.1 to the Partnership’s Current Report on Form 8-K dated November 12, 2015, and filed November 13, 2015 (SEC File No. 1-36232). | |
*10.29 | -- | Amended and Restated Subordinated Credit Agreement, dated as of November 12, 2015, by and between Valero Energy Partners LP and Valero Energy Corporation and the parties named therein (amending and restating that certain $160 million Subordinated Credit Agreement dated March 2, 2015). | |
*10.30 | -- | Amended and Restated Subordinated Credit Agreement, dated as of November 12, 2015, by and between Valero Energy Partners LP and Valero Energy Corporation and the parties named therein (amending and restating that certain $395 million Subordinated Credit Agreement dated October 1, 2015). | |
14.01 | -- | Code of Ethics for Senior Financial Officers–incorporated by reference to Exhibit 14.01 to the Partnership’s Annual Report on Form 10-K for the year ended December 31, 2013 (SEC File No. 1-36232). | |
*21.01 | -- | List of Subsidiaries of Valero Energy Partners LP. | |
*23.01 | -- | Consent of KPMG LLP. | |
*24.01 | -- | Power of Attorney dated February 26, 2016 (on the signature page of this Form 10-K). | |
*31.01 | -- | Rule 13a-14(a) Certification (under Section 302 of the Sarbanes-Oxley Act of 2002) of principal executive officer. | |
*31.02 | -- | Rule 13a-14(a) Certification (under Section 302 of the Sarbanes-Oxley Act of 2002) of principal financial officer. | |
**32.01 | -- | Section 1350 Certifications (under Section 906 of the Sarbanes-Oxley Act of 2002). | |
*99.01 | -- | Audit Committee Pre-Approval Policy. | |
***101 | -- | Interactive Data Files | |
______________
* | Filed herewith. |
** | Furnished herewith. |
*** | Submitted electronically herewith. |
+ | Identifies management contracts or compensatory plans or arrangements required to be filed as an exhibit hereto. |
127
SIGNATURE
Pursuant to the requirements of Section 13 or 15(d) of the Securities Exchange Act of 1934, the registrant has duly caused this report to be signed on its behalf by the undersigned, thereunto duly authorized.
VALERO ENERGY PARTNERS LP | ||
(Registrant) | ||
by: | Valero Energy Partners GP LLC | |
its general partner | ||
by: | /s/ Joseph W. Gorder | |
Joseph W. Gorder | ||
Chief Executive Officer | ||
Date: February 26, 2016
128
POWER OF ATTORNEY
KNOW ALL PERSONS BY THESE PRESENTS, that each person whose signature appears below hereby constitutes and appoints Joseph W. Gorder, Donna M. Titzman, and Jay D. Browning, or any of them, each with power to act without the other, his true and lawful attorney-in-fact and agent, with full power of substitution and resubstitution, for him and in his name, place and stead, in any and all capacities, to sign any or all subsequent amendments and supplements to this Annual Report on Form 10-K, and to file the same, or cause to be filed the same, with all exhibits thereto, and other documents in connection therewith, with the Securities and Exchange Commission, granting unto each said attorney-in-fact and agent full power to do and perform each and every act and thing requisite and necessary to be done in and about the premises, as fully to all intents and purposes as he might or could do in person, hereby qualifying and confirming all that said attorney-in-fact and agent or his substitute or substitutes may lawfully do or cause to be done by virtue hereof.
Pursuant to the requirements of the Securities Exchange Act of 1934, this report has been signed below by the following persons on behalf of the registrant and in the capacities and on the dates indicated.
Signature | Title | Date | ||
/s/ Joseph W. Gorder | Chairman of the Board and Chief Executive Officer (Principal Executive Officer) | February 26, 2016 | ||
(Joseph W. Gorder) | ||||
/s/ Donna M. Titzman | Senior Vice President, Chief Financial Officer, Treasurer and Director (Principal Financial and Accounting Officer) | February 26, 2016 | ||
(Donna M. Titzman) | ||||
/s/ Richard F. Lashway | President, Chief Operating Officer and Director | February 26, 2016 | ||
(Richard F. Lashway) | ||||
/s/ Robert S. Beadle | Director | February 26, 2016 | ||
(Robert S. Beadle) | ||||
/s/ Timothy J. Fretthold | Director | February 26, 2016 | ||
(Timothy J. Fretthold) | ||||
/s/ Randall J. Larson | Director | February 26, 2016 | ||
(Randall J. Larson) | ||||
/s/ R. Lane Riggs | Director | February 26, 2016 | ||
(R. Lane Riggs) | ||||
129