
Investor Presentation April 2017 Exhibit 99.01
Safe Harbor Statement This presentation contains forward-looking statements within the meaning of federal securities laws. These statements discuss future expectations, contain projections of results of operations or of financial condition or state other forward-looking information. You can identify forward-looking statements by words such as “anticipate,” “believe,” “estimate,” “expect,” “forecast,” “project,” “could,” “may,” “should,” “would,” “will” or other similar expressions that convey the uncertainty of future events or outcomes. These forward-looking statements are not guarantees of future performance and are subject to risks, uncertainties and other factors, some of which are beyond the Partnership’s control and are difficult to predict. These statements are often based upon various assumptions, many of which are based, in turn, upon further assumptions, including examination of historical operating trends made by the management of the Partnership. Although the Partnership believes that these assumptions were reasonable when made, because assumptions are inherently subject to significant uncertainties and contingencies, which are difficult or impossible to predict and are beyond its control, the Partnership cannot give assurance that it will achieve or accomplish these expectations, beliefs or intentions. When considering these forward-looking statements, you should keep in mind the risk factors and other cautionary statements contained in the Partnership’s filings with the SEC, including the Partnership’s annual reports on Form 10-K and quarterly reports on Form 10-Q available on the Partnership’s website at www.valeroenergypartners.com. These risks could cause the Partnership’s actual results to differ materially from those contained in any forward-looking statement.
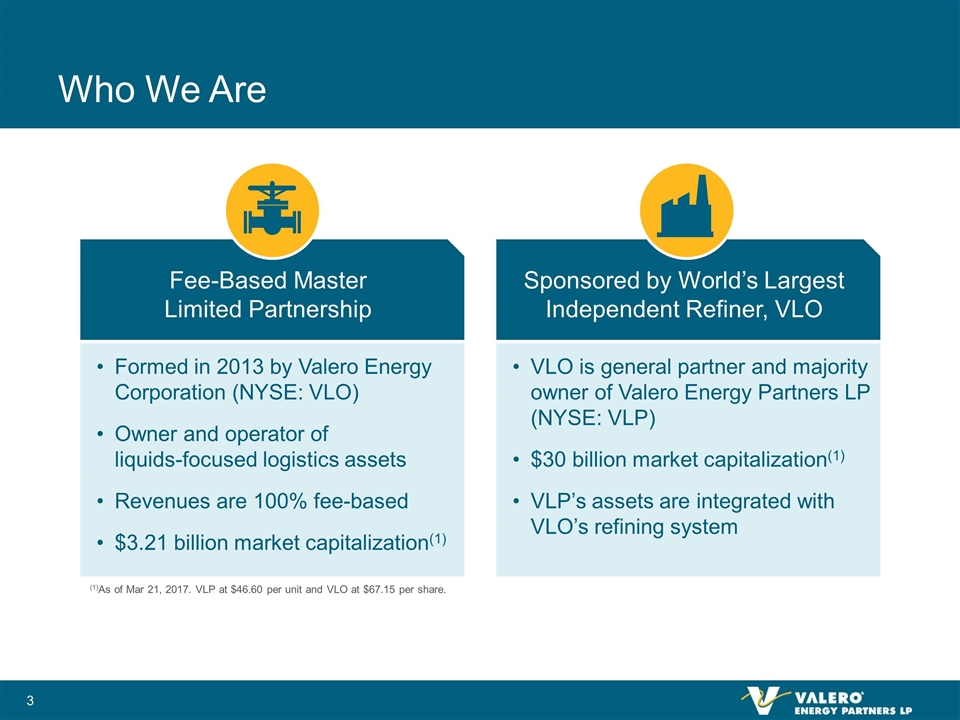
Who We Are Sponsored by World’s Largest Independent Refiner, VLO VLO is general partner and majority owner of Valero Energy Partners LP (NYSE: VLP) $30 billion market capitalization(1) VLP’s assets are integrated with VLO’s refining system Fee-Based Master Limited Partnership Formed in 2013 by Valero Energy Corporation (NYSE: VLO) Owner and operator of liquids-focused logistics assets Revenues are 100% fee-based $3.21 billion market capitalization(1) (1)As of Mar 21, 2017. VLP at $46.60 per unit and VLO at $67.15 per share.
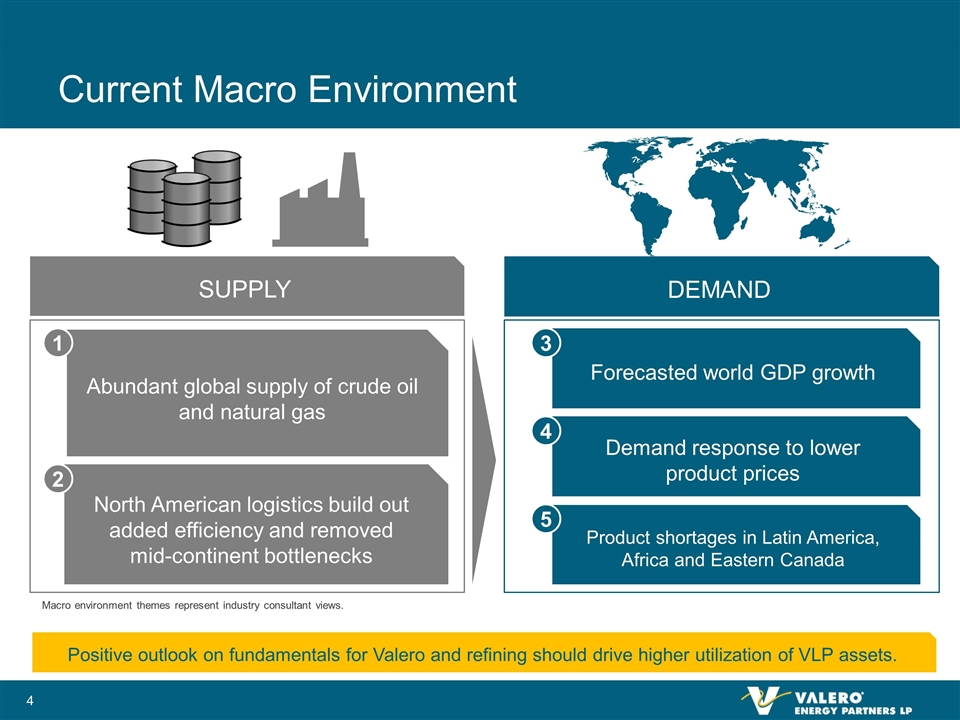
Current Macro Environment Abundant global supply of crude oil and natural gas Forecasted world GDP growth Product shortages in Latin America, Africa and Eastern Canada Demand response to lower product prices SUPPLY DEMAND North American logistics build out added efficiency and removed mid-continent bottlenecks 2 Macro environment themes represent industry consultant views. Positive outlook on fundamentals for Valero and refining should drive higher utilization of VLP assets. 1 3 4 5
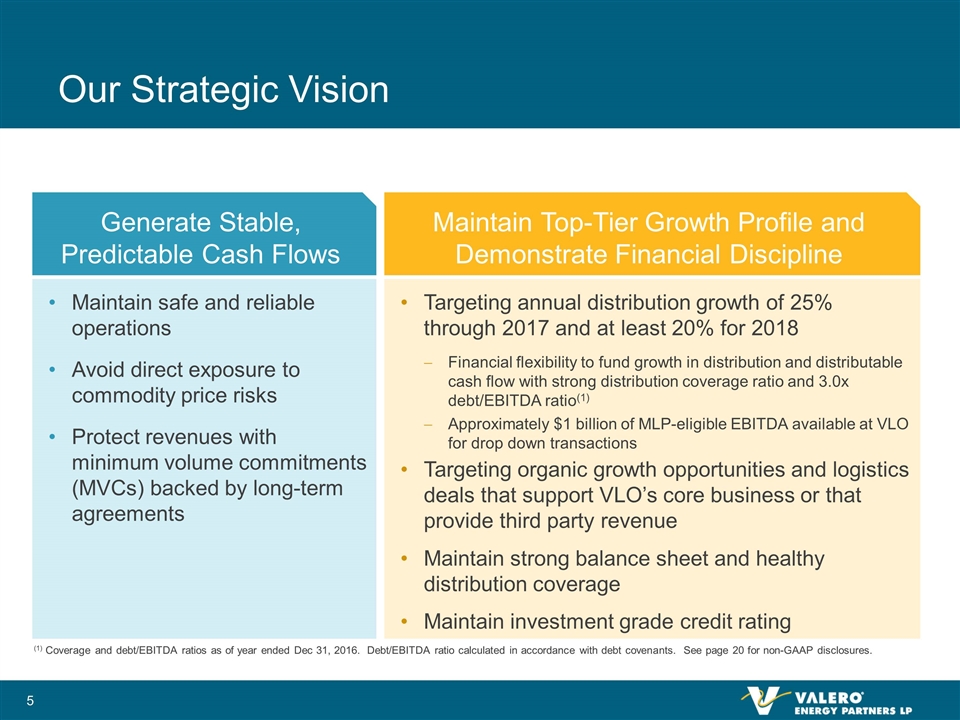
Our Strategic Vision Generate Stable, Predictable Cash Flows Maintain safe and reliable operations Avoid direct exposure to commodity price risks Protect revenues with minimum volume commitments (MVCs) backed by long-term agreements Maintain Top-Tier Growth Profile and Demonstrate Financial Discipline Targeting annual distribution growth of 25% through 2017 and at least 20% for 2018 Financial flexibility to fund growth in distribution and distributable cash flow with strong distribution coverage ratio and 3.0x debt/EBITDA ratio(1) Approximately $1 billion of MLP-eligible EBITDA available at VLO for drop down transactions Targeting organic growth opportunities and logistics deals that support VLO’s core business or that provide third party revenue Maintain strong balance sheet and healthy distribution coverage Maintain investment grade credit rating (1) Coverage and debt/EBITDA ratios as of year ended Dec 31, 2016. Debt/EBITDA ratio calculated in accordance with debt covenants. See page 20 for non-GAAP disclosures.
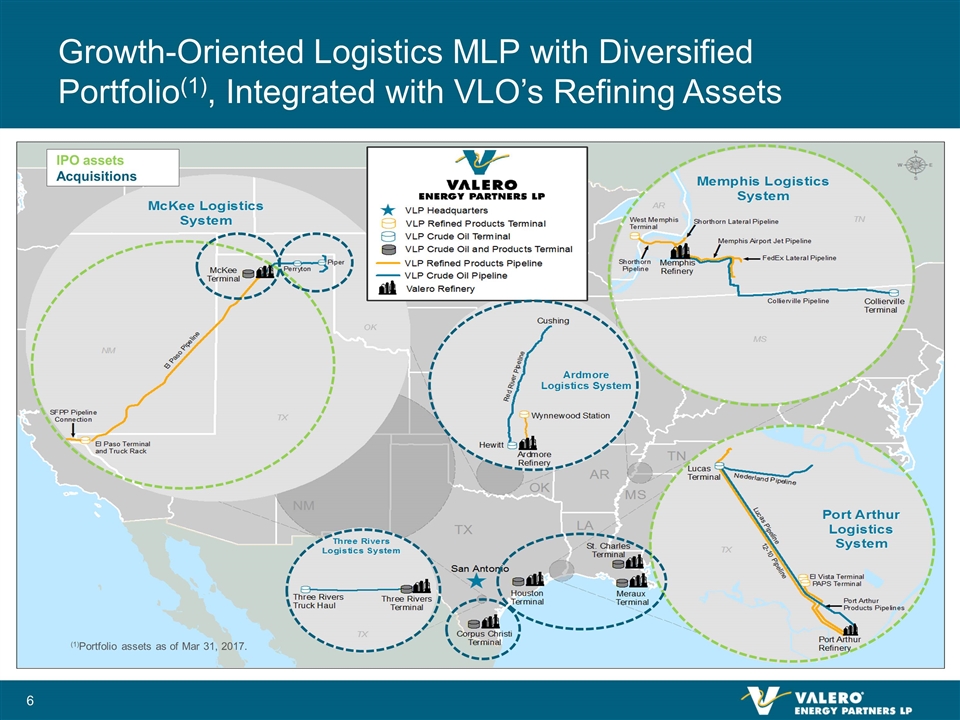
Growth-Oriented Logistics MLP with Diversified Portfolio(1), Integrated with VLO’s Refining Assets IPO assets Acquisitions (1)Portfolio assets as of Mar 31, 2017.
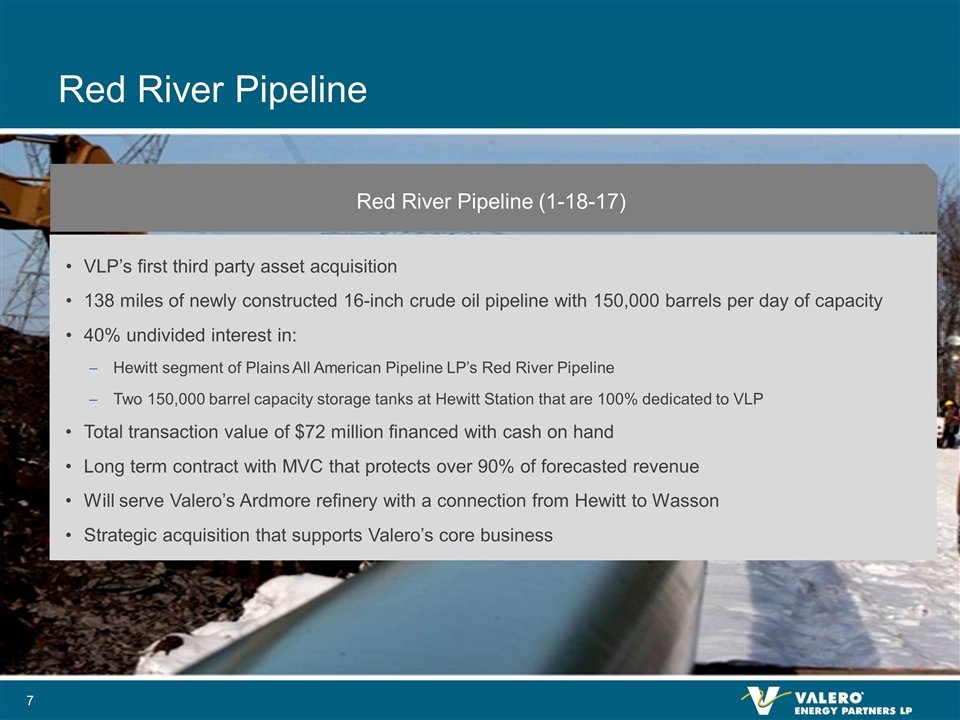
Red River Pipeline (1) See page 19 for non-GAAP reconciliations. Red River Pipeline (1-18-17) VLP’s first third party asset acquisition 138 miles of newly constructed 16-inch crude oil pipeline with 150,000 barrels per day of capacity 40% undivided interest in: Hewitt segment of Plains All American Pipeline LP’s Red River Pipeline Two 150,000 barrel capacity storage tanks at Hewitt Station that are 100% dedicated to VLP Total transaction value of $72 million financed with cash on hand Long term contract with MVC that protects over 90% of forecasted revenue Will serve Valero’s Ardmore refinery with a connection from Hewitt to Wasson Strategic acquisition that supports Valero’s core business
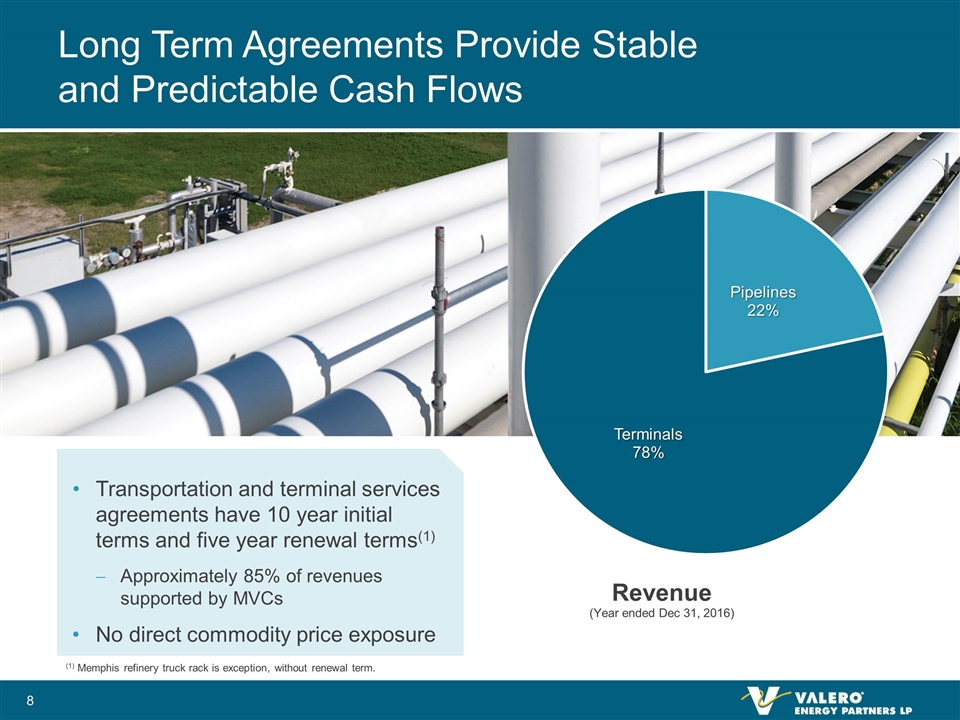
Long Term Agreements Provide Stable and Predictable Cash Flows Transportation and terminal services agreements have 10 year initial terms and five year renewal terms(1) Approximately 85% of revenues supported by MVCs No direct commodity price exposure (1) Memphis refinery truck rack is exception, without renewal term.
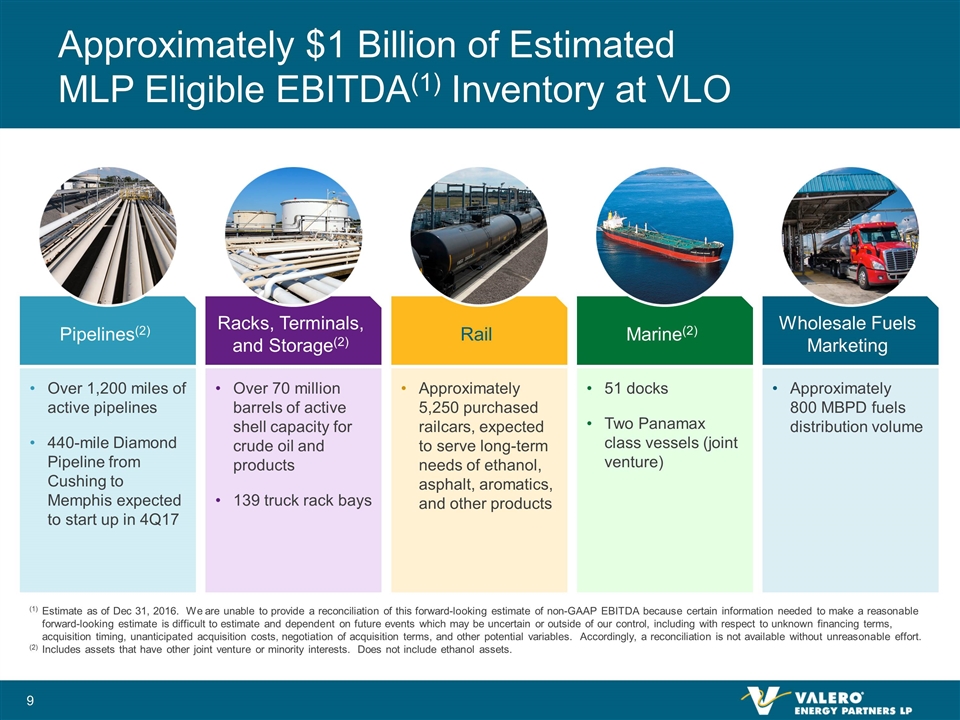
Approximately $1 Billion of Estimated MLP Eligible EBITDA(1) Inventory at VLO Racks, Terminals, and Storage(2) Over 70 million barrels of active shell capacity for crude oil and products 139 truck rack bays Rail Approximately 5,250 purchased railcars, expected to serve long-term needs of ethanol, asphalt, aromatics, and other products Pipelines(2) Over 1,200 miles of active pipelines 440-mile Diamond Pipeline from Cushing to Memphis expected to start up in 4Q17 Marine(2) 51 docks Two Panamax class vessels (joint venture) Wholesale Fuels Marketing Approximately 800 MBPD fuels distribution volume (1)Estimate as of Dec 31, 2016. We are unable to provide a reconciliation of this forward-looking estimate of non-GAAP EBITDA because certain information needed to make a reasonable forward-looking estimate is difficult to estimate and dependent on future events which may be uncertain or outside of our control, including with respect to unknown financing terms, acquisition timing, unanticipated acquisition costs, negotiation of acquisition terms, and other potential variables. Accordingly, a reconciliation is not available without unreasonable effort. (2) Includes assets that have other joint venture or minority interests. Does not include ethanol assets.
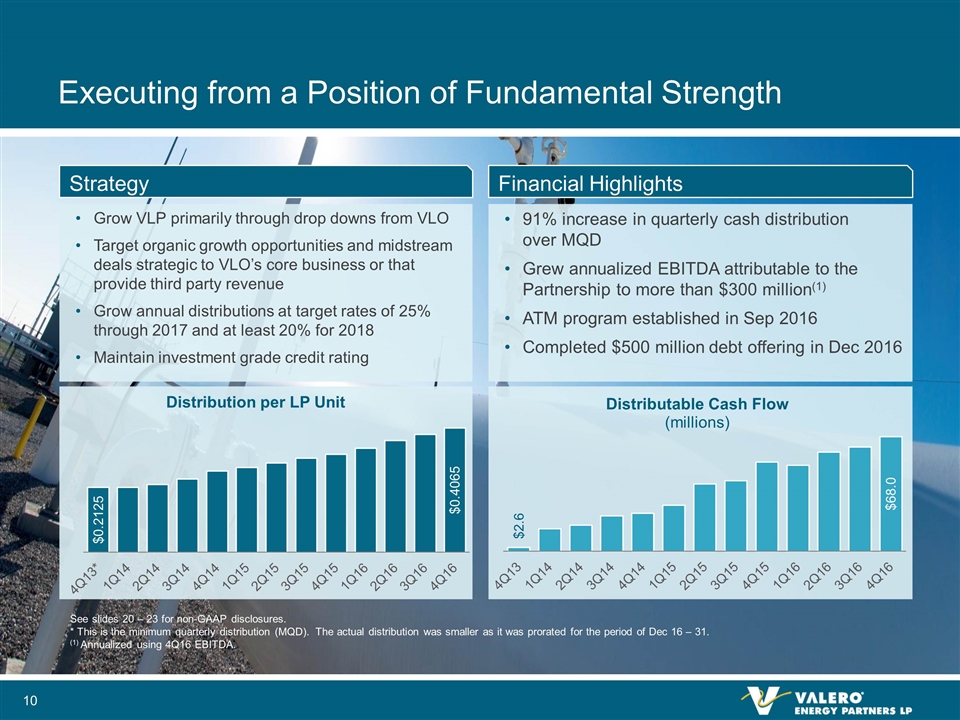
Grow VLP primarily through drop downs from VLO Target organic growth opportunities and midstream deals strategic to VLO’s core business or that provide third party revenue Grow annual distributions at target rates of 25% through 2017 and at least 20% for 2018 Maintain investment grade credit rating Executing from a Position of Fundamental Strength Strategy See slides 20 – 23 for non-GAAP disclosures. * This is the minimum quarterly distribution (MQD). The actual distribution was smaller as it was prorated for the period of Dec 16 – 31. (1) Annualized using 4Q16 EBITDA. 91% increase in quarterly cash distribution over MQD Grew annualized EBITDA attributable to the Partnership to more than $300 million(1) ATM program established in Sep 2016 Completed $500 million debt offering in Dec 2016 Financial Highlights
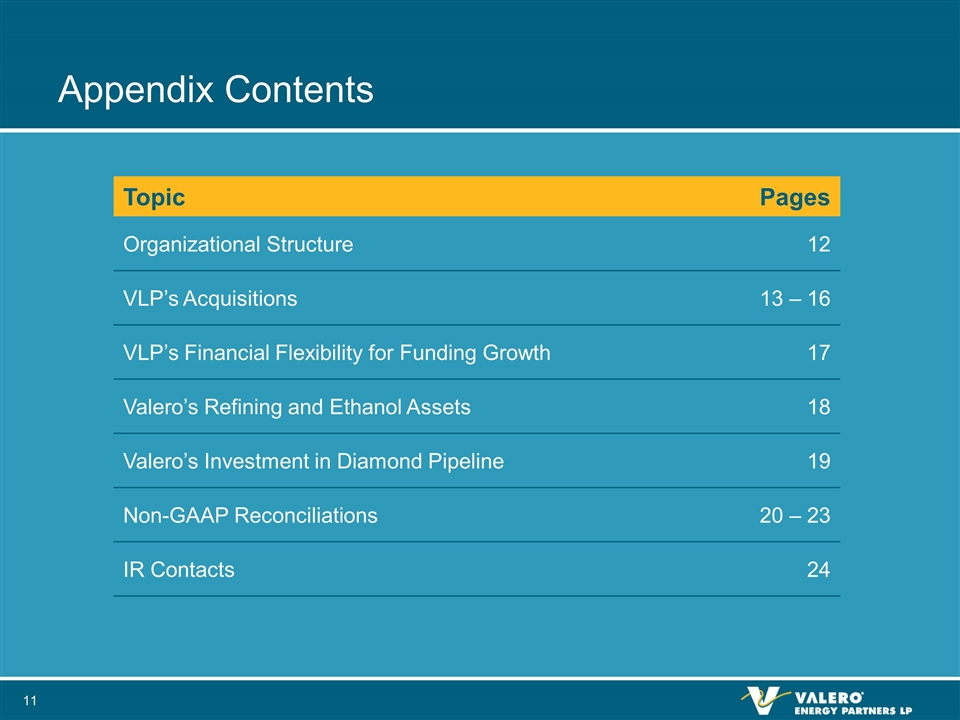
Appendix Contents Topic Pages Organizational Structure 12 VLP’s Acquisitions 13 – 16 VLP’s Financial Flexibility for Funding Growth 17 Valero’s Refining and Ethanol Assets 18 Valero’s Investment in Diamond Pipeline 19 Non-GAAP Reconciliations 20 – 23 IR Contacts 24
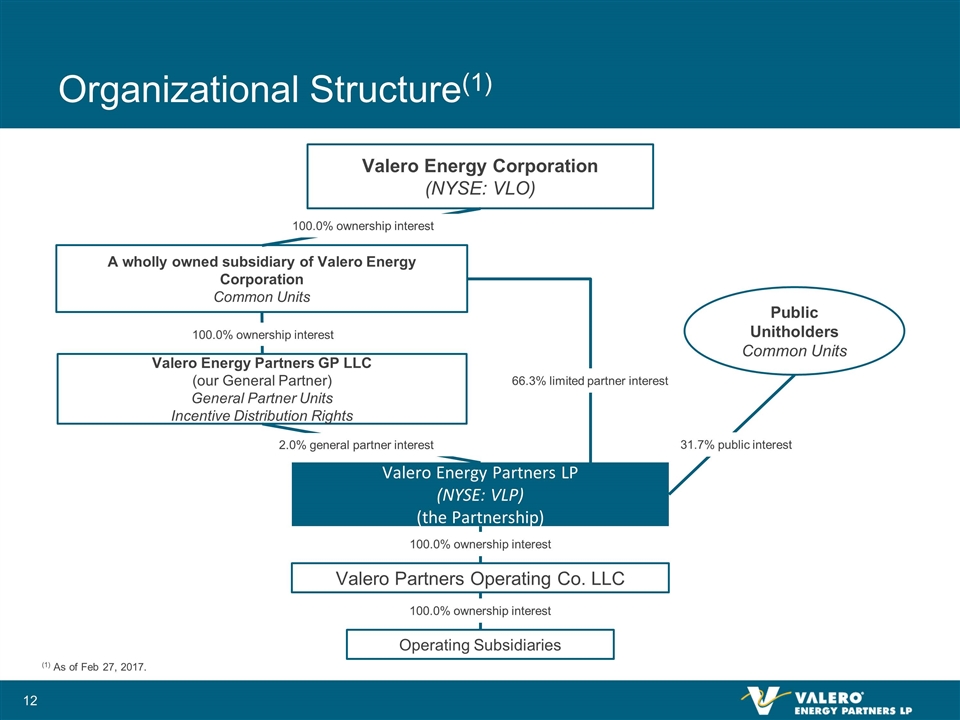
Organizational Structure(1) Valero Energy Corporation (NYSE: VLO) A wholly owned subsidiary of Valero Energy Corporation Common Units Valero Energy Partners GP LLC (our General Partner) General Partner Units Incentive Distribution Rights Valero Energy Partners LP (NYSE: VLP) (the Partnership) Valero Partners Operating Co. LLC 66.3% limited partner interest 100.0% ownership interest 100.0% ownership interest 2.0% general partner interest Public Unitholders Common Units 100.0% ownership interest Operating Subsidiaries 31.7% public interest 100.0% ownership interest (1) As of Feb 27, 2017.

IPO Assets and Texas Crude Systems Business Texas Crude Systems Business (7-1-14) Pipelines, truck unloading sites, and storage supporting VLO’s McKee, Three Rivers, and Ardmore refineries McKee system includes 72 MBPD of throughput capacity and 240,000 barrels of storage for crude oil Three Rivers system includes 11 truck unloading sites and three 110 MBPD crude oil pipelines Wynnewood system includes 90 MBPD of throughput capacity and 180,000 barrels of storage for products Assets contributing as expected IPO Assets (12-16-13) Port Arthur systems Lucas crude with 1.9 million barrels of storage and two crude oil pipelines Port Arthur products with 2.0 million barrels of storage and three products pipelines McKee products 33 ⅓% undivided interest in El Paso pipeline and terminal Allocable capacities of 21 MBPD for pipeline and 169,000 barrels for storage Memphis systems Collierville crude with 1.3 million barrels storage and 210 MBPD pipeline Memphis products with two pipelines, refinery truck rack, and West Memphis terminal (1.1 million barrels storage) Assets contributing as expected
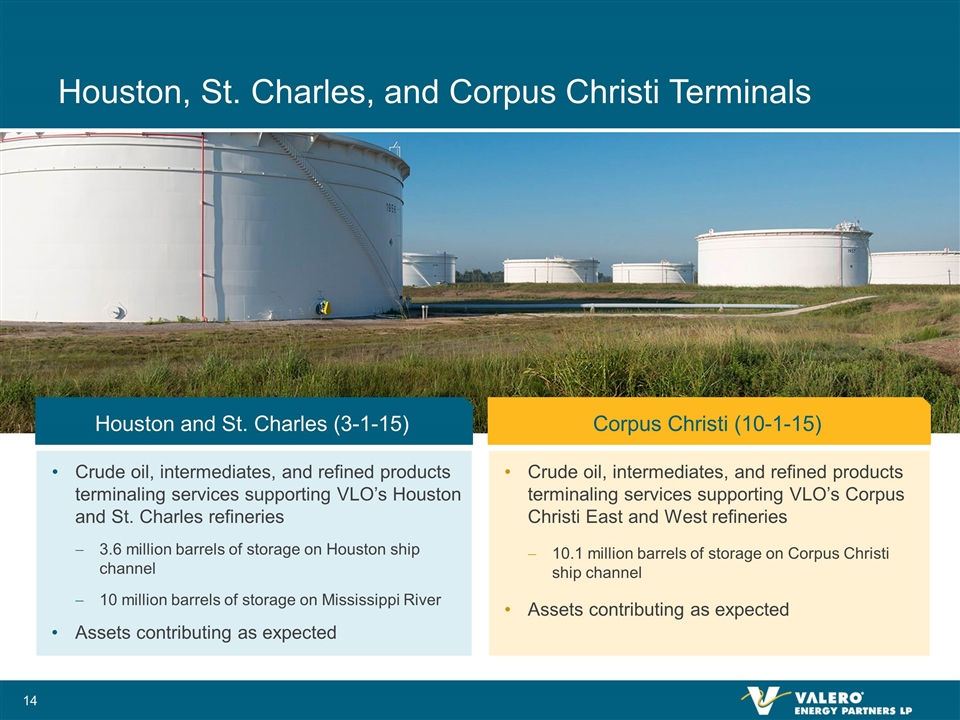
Houston, St. Charles, and Corpus Christi Terminals Corpus Christi (10-1-15) Crude oil, intermediates, and refined products terminaling services supporting VLO’s Corpus Christi East and West refineries 10.1 million barrels of storage on Corpus Christi ship channel Assets contributing as expected Houston and St. Charles (3-1-15) Crude oil, intermediates, and refined products terminaling services supporting VLO’s Houston and St. Charles refineries 3.6 million barrels of storage on Houston ship channel 10 million barrels of storage on Mississippi River Assets contributing as expected
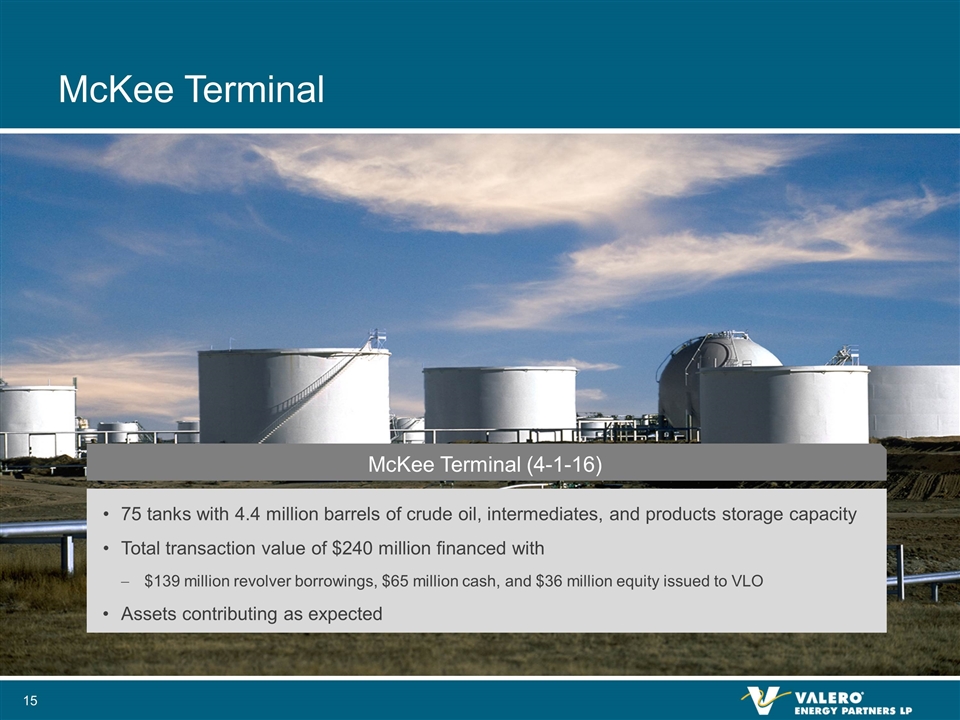
McKee Terminal McKee Terminal (4-1-16) 75 tanks with 4.4 million barrels of crude oil, intermediates, and products storage capacity Total transaction value of $240 million financed with $139 million revolver borrowings, $65 million cash, and $36 million equity issued to VLO Assets contributing as expected
Meraux and Three Rivers Terminals Meraux and Three Rivers Terminals (9-1-16) 86 tanks with 6.2 million barrels of crude oil, intermediates, and products storage capacity Total transaction value of $325 million financed with $210 million revolver borrowings, $66 million cash, and $49 million equity issued to VLO Long term contract with MVC that protects 85% of expected revenues Assets contributing as expected
Retained distributable cash flow (DCF) Available to fund growth through acquisitions and organic projects Strong coverage allows for distribution growth without acquisitions through 2017 Sponsor support $555 MM of subordinated loans $255 MM of equity issued Debt and equity markets ATM program, approximately $340 MM of capacity remained at Dec 31, 2016 Private placement, as well as public offerings, could be considered Investment grade credit ratings VLP’s Strong Financial Position Provides Flexibility for Growth Flexible Funding Options for Growth
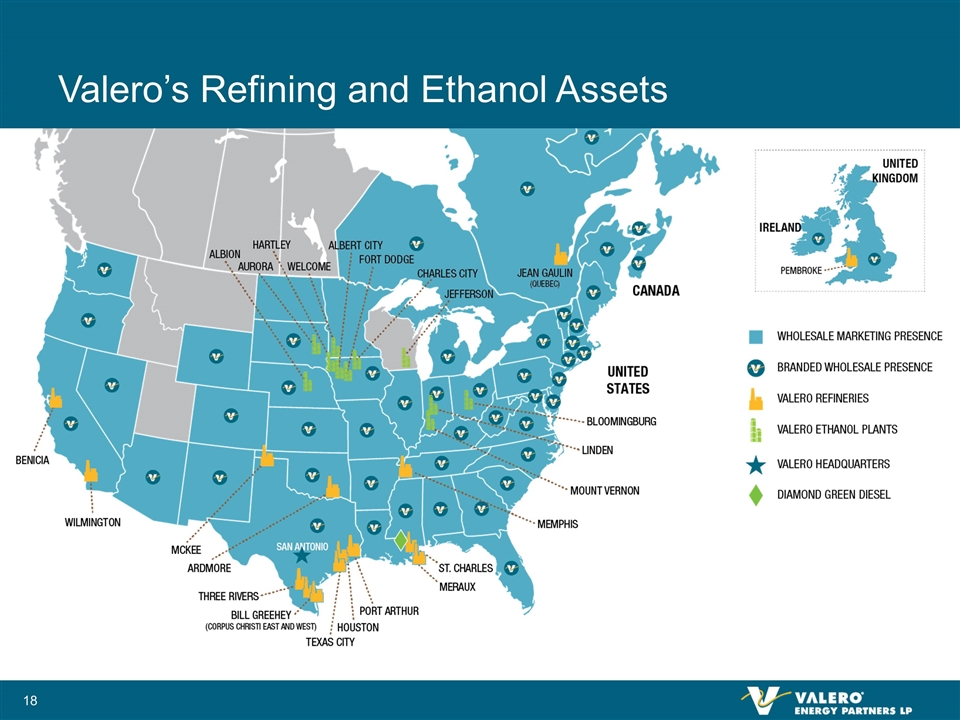
Valero’s Refining and Ethanol Assets
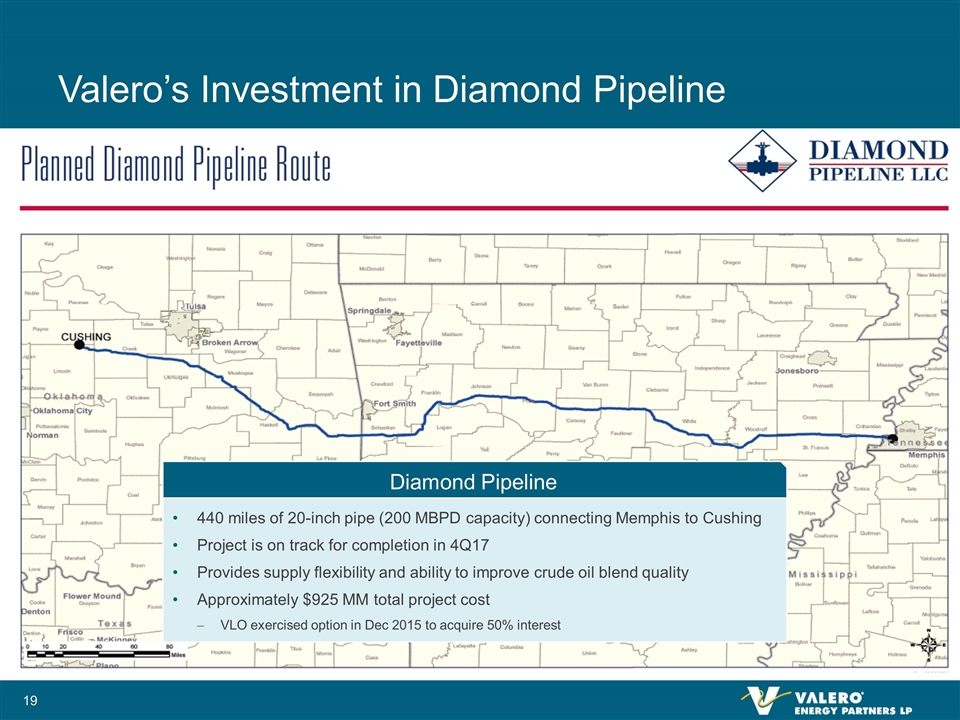
Valero’s Investment in Diamond Pipeline Diamond Pipeline 440 miles of 20-inch pipe (200 MBPD capacity) connecting Memphis to Cushing Project is on track for completion in 4Q17 Provides supply flexibility and ability to improve crude oil blend quality Approximately $925 MM total project cost VLO exercised option in Dec 2015 to acquire 50% interest
VLP Non-GAAP Disclosures: EBITDA, Distributable Cash Flow, and Debt-to-EBITDA VLP defines EBITDA as net income before income tax expense, interest expense, and depreciation expense. VLP defines distributable cash flow as EBITDA less (i) EBITDA attributable to its Predecessor and cash payments during the period for interest, income taxes, and maintenance capital expenditures; plus (ii) adjustments related to minimum throughput commitments, capital projects prefunded by Valero, and certain other items. VLP defines coverage ratio as the ratio of distributable cash flow to the total distribution declared. EBITDA, distributable cash flow, and coverage ratio are supplemental financial measures that are not defined under GAAP. They may be used by management and external users of our financial statements, such as industry analysts, investors, lenders, and rating agencies, to: describe VLP’s expectation of forecasted earnings; assess VLP’s operating performance as compared to other publicly traded limited partnerships in the transportation and logistics industry, without regard to historical cost basis or, in the case of EBITDA, financing methods; assess the ability of VLP’s business to generate sufficient cash to support its decision to make distributions to its unitholders; assess VLP’s ability to incur and service debt and fund capital expenditures; and assess the viability of acquisitions and other capital expenditure projects and the returns on investment of various investment opportunities. VLP believes that the presentation of EBITDA provides useful information to investors in assessing its financial condition and results of operations. The GAAP measures most directly comparable to EBITDA are net income and net cash provided by operating activities. EBITDA should not be considered an alternative to net income or net cash provided by operating activities presented in accordance with GAAP. EBITDA has important limitations as an analytical tool because it excludes some, but not all, items that affect net income or net cash provided by operating activities. EBITDA should not be considered in isolation or as a substitute for analysis of our results as reported under GAAP. Additionally, because EBITDA may be defined differently by other companies in our industry, VLP’s definition of EBITDA may not be comparable to similarly titled measures of other companies, thereby diminishing its utility.
VLP Non-GAAP Disclosures: EBITDA, Distributable Cash Flow, and Debt-to-EBITDA (continued) VLP uses distributable cash flow to measure whether it has generated from its operations, or “earned,” an amount of cash sufficient to support the payment of the minimum quarterly distributions. VLP’s partnership agreement contains the concept of “operating surplus” to determine whether VLP’s operations are generating sufficient cash to support the distributions that it is paying, as opposed to returning capital to VLP’s partners. Because operating surplus is a cumulative concept (measured from VLP’s IPO date and compared to cumulative distributions from the IPO date), VLP uses the term distributable cash flow to approximate operating surplus on a quarterly or annual, rather than a cumulative, basis. As a result, distributable cash flow is not necessarily indicative of the actual cash VLP has on hand to distribute or that it is required to distribute. VLP uses the distribution coverage ratio to reflect the relationship between its distributable cash flow and the total distribution declared. The debt-to-EBITDA ratio as defined in accordance with VLP’s debt covenants is the total debt and capital lease obligations divided by adjusted pro forma EBITDA for the trailing 12 month period. VLP believes that the presentation of net debt-to-EBITDA provides useful information to investors to assess its ability to incur and service debt.
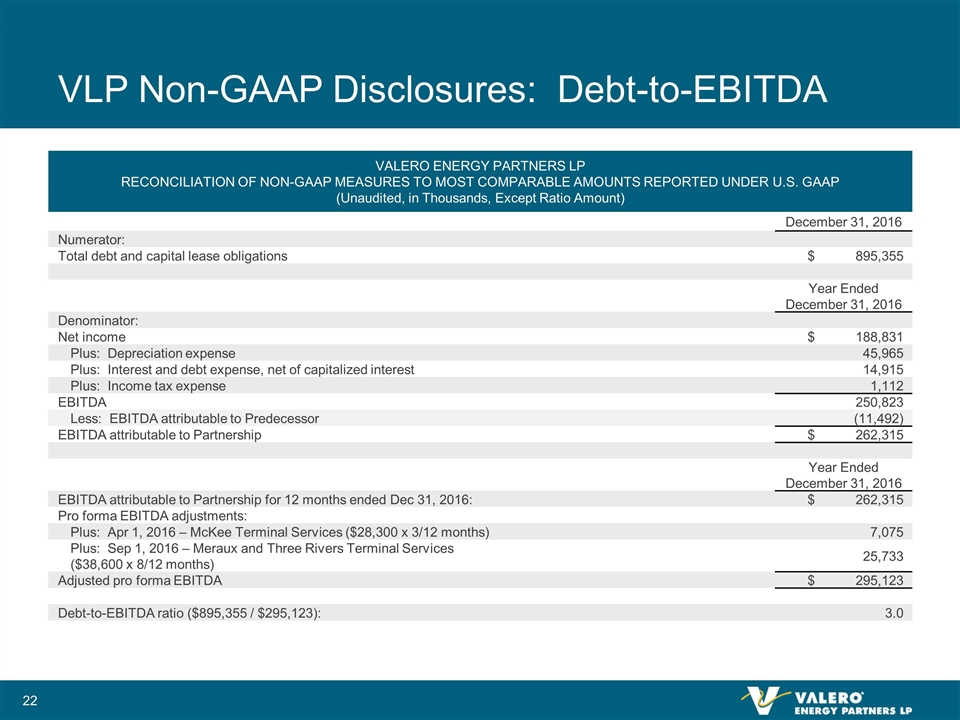
VLP Non-GAAP Disclosures: Debt-to-EBITDA VALERO ENERGY PARTNERS LP RECONCILIATION OF NON-GAAP MEASURES TO MOST COMPARABLE AMOUNTS REPORTED UNDER U.S. GAAP (Unaudited, in Thousands, Except Ratio Amount) December 31, 2016 Numerator: Total debt and capital lease obligations $ 895,355 Year Ended December 31, 2016 Denominator: Net income $188,831 Plus: Depreciation expense 45,965 Plus: Interest and debt expense, net of capitalized interest 14,915 Plus: Income tax expense 1,112 EBITDA 250,823 Less: EBITDA attributable to Predecessor (11,492) EBITDA attributable to Partnership $262,315 Year Ended December 31, 2016 EBITDA attributable to Partnership for 12 months ended Dec 31, 2016: $262,315 Pro forma EBITDA adjustments: Plus: Apr 1, 2016 – McKee Terminal Services ($28,300 x 3/12 months) 7,075 Plus: Sep 1, 2016 – Meraux and Three Rivers Terminal Services ($38,600 x 8/12 months) 25,733 Adjusted pro forma EBITDA $295,123 Debt-to-EBITDA ratio ($895,355 / $295,123): 3.0
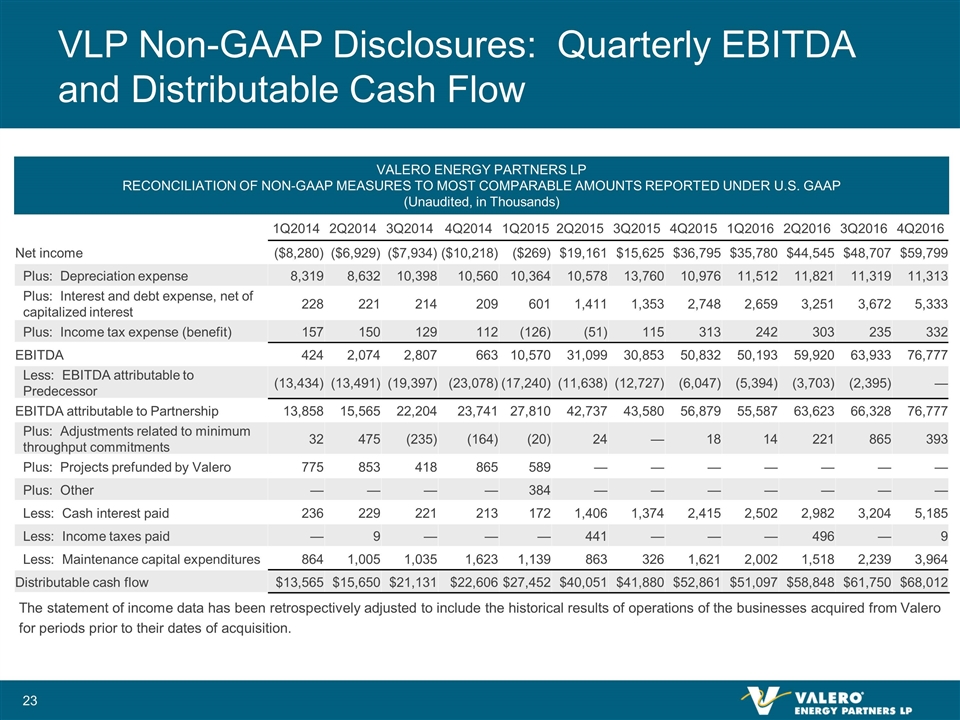
1Q2014 2Q2014 3Q2014 4Q2014 1Q2015 2Q2015 3Q2015 4Q2015 1Q2016 2Q2016 3Q2016 4Q2016 Net income ($8,280) ($6,929) ($7,934) ($10,218) ($269) $19,161 $15,625 $36,795 $35,780 $44,545 $48,707 $59,799 Plus: Depreciation expense 8,319 8,632 10,398 10,560 10,364 10,578 13,760 10,976 11,512 11,821 11,319 11,313 Plus: Interest and debt expense, net of capitalized interest 228 221 214 209 601 1,411 1,353 2,748 2,659 3,251 3,672 5,333 Plus: Income tax expense (benefit) 157 150 129 112 (126) (51) 115 313 242 303 235 332 EBITDA 424 2,074 2,807 663 10,570 31,099 30,853 50,832 50,193 59,920 63,933 76,777 Less: EBITDA attributable to Predecessor (13,434) (13,491) (19,397) (23,078) (17,240) (11,638) (12,727) (6,047) (5,394) (3,703) (2,395) — EBITDA attributable to Partnership 13,858 15,565 22,204 23,741 27,810 42,737 43,580 56,879 55,587 63,623 66,328 76,777 Plus: Adjustments related to minimum throughput commitments 32 475 (235) (164) (20) 24 — 18 14 221 865 393 Plus: Projects prefunded by Valero 775 853 418 865 589 — — — — — — — Plus: Other — — — — 384 — — — — — — — Less: Cash interest paid 236 229 221 213 172 1,406 1,374 2,415 2,502 2,982 3,204 5,185 Less: Income taxes paid — 9 — — — 441 — — — 496 — 9 Less: Maintenance capital expenditures 864 1,005 1,035 1,623 1,139 863 326 1,621 2,002 1,518 2,239 3,964 Distributable cash flow $13,565 $15,650 $21,131 $22,606 $27,452 $40,051 $41,880 $52,861 $51,097 $58,848 $61,750 $68,012 VLP Non-GAAP Disclosures: Quarterly EBITDA and Distributable Cash Flow VALERO ENERGY PARTNERS LP RECONCILIATION OF NON-GAAP MEASURES TO MOST COMPARABLE AMOUNTS REPORTED UNDER U.S. GAAP (Unaudited, in Thousands) The statement of income data has been retrospectively adjusted to include the historical results of operations of the businesses acquired from Valero for periods prior to their dates of acquisition.
IR Contacts For more information, please contact: John Locke Vice President, Investor Relations 210.345.3077 john.locke@valero.com Karen Ngo Senior Manager, Investor Relations 210.345.4574 karen.ngo@valero.com Tom Mahrer Manager, Investor Relations 210.345.1953 tom.mahrer@valero.com