ANNUAL REPORT PURSUANT TO SECTION 13 OR 15(d) OF THE SECURITIES EXCHANGE |
TRANSITION REPORT PURSUANT TO SECTION 13 OR 15(d) OF THE SECURITIES |
(State or other jurisdiction of incorporation or organization) |
(I.R.S. Employer Identification No.) | |
(Address of principal executive offices) |
(Zip Code) |
Title of each class |
Trading Symbol(s) |
Name of each exchange on which registered | ||
☒ |
Accelerated filer |
☐ | ||||
Non-accelerated filer |
☐ |
Smaller reporting company |
||||
Emerging growth company |
PART I |
||||||
Item 1. |
1 |
|||||
Item 1A. |
10 |
|||||
Item 1B. |
27 |
|||||
Item 2. |
28 |
|||||
Item 3. |
28 |
|||||
Item 4. |
28 |
|||||
PART II |
||||||
Item 5. |
29 |
|||||
Item 6. |
31 |
|||||
Item 7. |
32 |
|||||
Item 7A. |
47 |
|||||
Item 8. |
47 |
|||||
Item 9. |
87 |
|||||
Item 9A. |
87 |
|||||
Item 9B. |
88 |
|||||
PART III |
||||||
Item 10. |
91 |
|||||
Item 11. |
91 |
|||||
Item 12. |
91 |
|||||
Item 13. |
91 |
|||||
Item 14. |
91 |
|||||
PART IV |
||||||
92 |
||||||
95 |
||||||
96 |
• |
our dependence on the economy, the housing market, the level of new residential and commercial construction activity and the credit markets; |
• |
the cyclical and seasonal nature of our business; |
• |
declines in the economy or slowing of the housing market recovery that could lead to significant impairment charges; |
• |
our exposure to severe weather conditions; |
• |
the highly fragmented and competitive nature of our industry; |
• |
product shortages or the loss of key suppliers; |
• |
changes in the costs and availability of products; |
• |
inability to continue to successfully expand into new products or geographic markets; |
• |
inability to successfully acquire and integrate other businesses; |
• |
inability to successfully expand into the commercial construction market; |
• |
our exposure to claims arising from our operations; |
• |
our reliance on key personnel; |
• |
our ability to attract, train and retain qualified employees while controlling labor costs; |
• |
changes in employment and/or immigration laws; |
• |
our exposure to product liability, workmanship warranty, casualty, construction defect and other claims and legal proceedings; |
• |
changes in, or failure to comply with, federal, state, local and other regulations; |
• |
disruptions in our information technology systems, including cybersecurity incidents; |
• |
our ability to implement and maintain effective internal control over financial reporting; and |
• |
additional factors discussed under Item 1, Business; Item 1A, Risk Factors; and Item 7, Management’s Discussion and Analysis of Financial Condition and Results of Operations, of this Form 10-K. |
Item 1. |
Business |
• | Fiberglass and Cellulose Insulation – Fiberglass insulation is made of fibrous glass that is held together by a thermoset resin creating insulating air pockets. It typically contains an average of 50% recycled content. It is primarily available in two forms: batts (also referred to as blankets) and loosefill (also referred to as blown in). Fiberglass is the most widely used residential insulation material in the United States. Cellulose insulation is made primarily of paper and cardboard and has a very high recycled content. Cellulose is only available in loosefill form and is blown into the structure with specialized equipment. Fiberglass and cellulose insulation accounted for approximately 85% of our insulation sales for the year ended December 31, 2019. |
• | Spray Foam Insulation – Spray foam insulation, which is generally a polyurethane foam, is applied at a job site by mixing two chemical components together in specialized application equipment. While typically having the highest insulating value per inch and sealing effectiveness of all insulation materials that we offer, spray foam is also typically the most expensive on an installed basis. Spray foam insulation accounted for approximately 15% of our insulation sales for the year ended December 31, 2019. |
• | Basement and Crawl Space – These spaces often account for the second most energy loss in a residential structure. |
• | Building Envelope – We insulate the exterior walls of both residential and commercial structures by applying insulation on the wall or between the studs. |
• | Attic – We insulate the attics of new and existing residential structures. The attic is the area where the most energy may be lost in a home. |
• | Acoustical – Many builder or architect specifications call for acoustical insulation for sound reduction purposes in both residential and commercial structures. This product is generally installed in the interior walls to minimize sound transmission. |
• | In each of these applications, we typically use fiberglass batts, except in attic installations where we typically install loosefill fiberglass or cellulose. |
• | We also install a wide variety of advanced caulk and sealant products that control air infiltration in residential and commercial buildings to enhance energy efficiency, improve comfort and meet increasingly stringent energy code requirements. |
• | capitalize on the new residential and commercial construction markets; |
• | continue to strengthen our market share position by working with the best customers. We seek to work with the most profitable and efficient builders and commercial general contractors in our markets; |
• | recruit, develop and retain an exceptional workforce by investing in our employees and our communities and promoting a family-oriented culture; |
• | capitalize on our ability to cross-sell products through existing markets as well as new markets entered as a result of organic expansion and acquisitions. In addition to insulation and air infiltration products, we install garage doors, rain gutters, mirrors and shower doors, waterproofing, window blinds and various other products; |
• | enhance profitability from our operating leverage and national scale; |
• | continue organic expansion in the multibillion-dollar commercial end market. Our commercial strategy includes adding more locations to serve the large commercial market and increasing commercial sales at our existing new residential locations; |
• | pursue value enhancing acquisitions by continuing our disciplined approach to valuations and pricing. We will continue to be selective in identifying acquisition targets at attractive multiples. We target profitable markets and companies with strong reputations and customer bases. As part of our acquisition strategy, we seek to maintain the management teams of the companies we acquire as well as retain their local branding, which further reduces associated risk. We are very experienced in acquiring and integrating companies and have an experienced team that integrates acquisitions quickly and efficiently; and |
• | we integrate new acquisitions quickly and seamlessly into our corporate infrastructure, including our accounting and employee systems. In addition, we utilize our internal software technology, jobCORE, to integrate acquired operations and provide in-depth branch-level operational and financial performance data. We realize near term margin enhancement and revenue growth at acquired branches by applying our national buying power and leveraging relationships with large national homebuilders. |
• | Margin enhancement by leveraging branch costs across multiple products |
• | Diversified end-market exposure |
• | A more diverse customer base |
• | Stronger established local relationships |
• | Reduced cyclicality |
Item 1A. |
Risk Factors |
• | the number of new home and commercial building construction starts; |
• | short- and long-term interest rates; |
• | inflation; |
• | employment levels and job and personal income growth; |
• | housing demand from population growth, household formation and other demographic changes; |
• | housing affordability; |
• | rental housing demand; |
• | availability and cost of labor; |
• | availability and cost of land; |
• | changes in material prices; |
• | local zoning and permitting processes, including the length of building cycles from permit to completion, based on local economic or environmental factors; |
• | federal, state and local energy efficiency programs, regulations, codes and standards; |
• | availability and pricing of mortgage financing for homebuyers and commercial financing for developers of multi-family homes and commercial projects; |
• | foreclosure rates; |
• | consumer confidence generally and the confidence of potential homebuyers in particular; |
• | U.S. and global financial system and credit market stability; |
• | federal government economic, trade, and spending laws and policies; |
• | private party and government mortgage loan programs and federal and state regulation, oversight and legal action regarding lending, appraisal, foreclosure and short sale practices; |
• | federal and state personal income tax rates and provisions, including provisions for the deduction of mortgage loan interest payments, state and local income and real estate taxes and other expenses; |
• | general economic conditions, including in the markets in which we compete; and |
• | natural disasters, war, acts of terrorism and response to these events. |
• | our inability to manage acquired businesses or control integration costs and other costs relating to acquisitions; |
• | potential adverse short-term effects on operating results from increased costs, business disruption or otherwise; |
• | diversion of management’s attention; |
• | loss of suppliers, customers or other significant business partners of the acquired business; |
• | failure to retain existing key personnel of the acquired business and recruit qualified new employees at the location; |
• | failure to successfully implement infrastructure, logistics and systems integration; |
• | potential impairment of goodwill and other intangible assets; |
• | risks associated with the internal controls of acquired businesses; |
• | exposure to legal claims for activities of the acquired business prior to acquisition and inability to realize on any indemnification claims, including with respect to environmental and immigration claims; |
• | the risks inherent in the systems of the acquired business and risks associated with unanticipated events or liabilities; and |
• | our inability to obtain financing necessary to complete acquisitions on attractive terms or at all. |
• | employee classification as exempt or non-exempt for overtime and other purposes; |
• | workers’ compensation rates; |
• | immigration status; |
• | mandatory health benefits; |
• | tax reporting; and |
• | other wage and benefit requirements. |
• | our leverage may place us at a competitive disadvantage as compared with our less leveraged competitors and make us more vulnerable in the event of a downturn in general economic conditions or in any of our businesses; |
• | our flexibility in planning for, or reacting to, changes in our businesses and the industries in which we operate may be limited; |
• | a substantial portion of our cash flow from operations will be dedicated to the payment of interest and principal on our indebtedness, thereby reducing the funds available to us for operations, capital expenditures, acquisitions, future business opportunities or obligations to pay rent in respect of our operating leases; and |
• | incur or guarantee additional debt and issue preferred stock; |
• | make distributions or dividends on or redeem or repurchase shares of common stock; |
• | make certain investments and acquisitions; |
• | make capital expenditures; |
• | incur certain liens or permit them to exist; |
• | enter into certain types of transactions with affiliates; |
• | acquire, merge or consolidate with another company; or |
• | transfer, sell or otherwise dispose of all or substantially all of our assets. |
• | market conditions affecting the residential construction, commercial construction and building products industries; |
• | quarterly variations in our results of operations; |
• | changes in government regulations; |
• | the announcement of acquisitions by us or our competitors; |
• | changes in general economic and political conditions; |
• | volatility in the financial markets; |
• | results of our operations and the operations of others in our industry; |
• | changes in interest rates; |
• | threatened or actual litigation and government investigations; |
• | the addition or departure of key personnel; |
• | actions taken by our stockholders, including the sale or disposition of their shares of our common stock; and |
• | differences between our actual financial and operating results and those expected by investors and analysts and changes in analysts’ recommendations or projections. |
• | a classified board of directors with three-year staggered terms; |
• | no cumulative voting in the election of directors, which limits the ability of minority stockholders to elect director candidates; |
• | the exclusive right of our board of directors to fill a vacancy created by the expansion of the board of directors or the resignation, death or removal of a director, which prevents stockholders from being able to fill vacancies on our board of directors; |
• | the ability of our board of directors to authorize the issuance of shares of preferred stock and to determine the price and other terms of those shares, including preferences and voting rights, without stockholder approval, which could be used to significantly dilute the ownership of the holders of our stock or a hostile acquirer; |
• | a prohibition on stockholder action by written consent, which forces stockholder action to be taken at an annual or special meeting of our stockholders; |
• | a requirement that a special meeting of stockholders may be called only by a resolution duly adopted by our board of directors; and |
• | advance notice procedures that stockholders must comply with in order to nominate candidates to our board of directors or to propose matters to be acted upon at a stockholders’ meeting, which may discourage or deter a potential acquirer from conducting a solicitation of proxies to elect the acquirer’s own slate of directors or otherwise attempting to obtain control of us. |
Item 1B. |
Unresolved Staff Comments |
Item 2. |
Properties |
Item 3. |
Legal Proceedings |
Item 4. |
Mine Safety Disclosures |
Item 5. |
Market for Registrant’s Common Equity, Related Stockholder Matters and Issuer Purchases of Equity Securities |
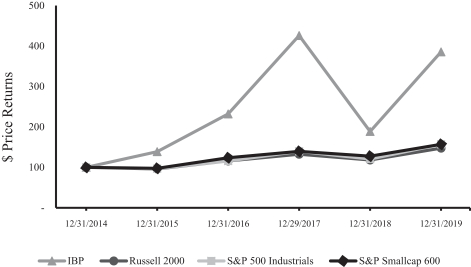
12/31/2014 |
12/31/2015 |
12/31/2016 |
12/29/2017 |
12/31/2018 |
12/31/2019 |
|||||||||||||||||||
IBP |
100 |
139 |
232 |
426 |
189 |
386 |
||||||||||||||||||
Russell 2000 |
100 |
96 |
116 |
133 |
118 |
148 |
||||||||||||||||||
S&P 500 Industrials |
100 |
97 |
116 |
140 |
121 |
157 |
||||||||||||||||||
S&P Smallcap 600 |
100 |
98 |
124 |
140 |
128 |
157 |
Total Number of Shares Purchased |
Average Price Paid Per Share |
Total Number of Shares Purchased as Part of Publicly Announced Plans or Programs |
Approximate Dollar Value of Shares that May Yet Be Purchased under the Plans or Programs (1) |
|||||||||||||
October 1—31, 2019 |
— |
$ | — |
— |
— |
|||||||||||
November 1—30, 2019 |
— |
— |
— |
— |
||||||||||||
December 1—31, 2019 |
— |
— |
— |
— |
||||||||||||
— |
$ | — |
— |
$ | 60.6 million |
|||||||||||
(1) | On February 26, 2018, our board of directors authorized a $50 million stock repurchase program effective March 2, 2018 and on October 31, 2018, our board of directors approved an additional stock repurchase program, effective November 6, 2018, pursuant to which we may purchase up to an additional $100 million of our outstanding common stock. In February 2020, our board of directors approved extending the current stock repurchase program to March 1, 2021. During the year ended December 31, 2019, we did not repurchase any shares under our stock repurchase program. |
Item 6. |
Selected Financial Data |
Years ended December 31, |
||||||||||||||||||||
2019 (1) |
2018 (2) |
2017 |
2016 |
2015 |
||||||||||||||||
Statement of operations (in thousands, except per share amounts): |
||||||||||||||||||||
Net revenue |
$ | 1,511,629 |
$ | 1,336,432 |
$ | 1,132,927 |
$ | 862,980 |
$ | 662,719 |
||||||||||
Cost of sales |
1,076,809 |
964,841 |
808,901 |
610,532 |
474,426 |
|||||||||||||||
Gross profit |
434,820 |
371,591 |
324,026 |
252,448 |
188,293 |
|||||||||||||||
Operating expenses |
||||||||||||||||||||
Selling |
75,016 |
67,105 |
58,450 |
49,667 |
37,702 |
|||||||||||||||
Administrative and other |
238,644 |
211,269 |
191,310 |
136,731 |
105,639 |
|||||||||||||||
Operating income |
121,160 |
93,217 |
74,266 |
66,050 |
44,952 |
|||||||||||||||
Other expense |
28,555 |
21,031 |
18,446 |
6,440 |
3,022 |
|||||||||||||||
Income before income taxes |
92,605 |
72,186 |
55,820 |
59,610 |
41,930 |
|||||||||||||||
Income tax provision |
24,446 |
17,438 |
14,680 |
21,174 |
15,413 |
|||||||||||||||
Net income |
68,159 |
54,748 |
41,140 |
38,436 |
26,517 |
|||||||||||||||
Basic net income per share |
$ | 2.29 |
$ | 1.76 |
$ | 1.30 |
$ | 1.23 |
$ | 0.85 |
||||||||||
Diluted net income per share |
$ | 2.28 |
$ | 1.75 |
$ | 1.30 |
$ | 1.23 |
$ | 0.85 |
||||||||||
Cash flow data (in thousands): |
||||||||||||||||||||
Net cash provided by operating activities |
$ | 123,067 |
$ | 96,633 |
$ | 68,772 |
$ | 73,266 |
$ | 34,547 |
||||||||||
Net cash used in investing activities |
$ | (131,733 |
) | $ | (74,069 |
) | $ | (200,443 |
) | $ | (79,597 |
) | $ | (111,365 |
) | |||||
Net cash provided by financing activities |
$ | 96,113 |
$ | 5,368 |
$ | 179,699 |
$ | 13,995 |
$ | 72,875 |
||||||||||
Balance sheet data (in thousands): |
||||||||||||||||||||
Cash |
$ | 177,889 |
$ | 90,442 |
$ | 62,510 |
$ | 14,482 |
$ | 6,818 |
||||||||||
Total current assets |
$ | 581,949 |
$ | 411,545 |
$ | 354,942 |
$ | 192,391 |
$ | 150,232 |
||||||||||
Property and equipment, net |
$ | 106,410 |
$ | 90,117 |
$ | 81,075 |
$ | 67,788 |
$ | 57,592 |
||||||||||
Total assets |
$ | 1,099,479 |
$ | 834,658 |
$ | 738,746 |
$ | 462,095 |
$ | 373,572 |
||||||||||
Total debt (3) |
$ | 575,539 |
$ | 463,454 |
$ | 359,722 |
$ | 166,720 |
$ | 143,677 |
||||||||||
Total stockholders’ equity |
$ | 250,031 |
$ | 182,498 |
$ | 210,528 |
$ | 153,977 |
$ | 114,483 |
(1) | Amounts prior to 2019 do not reflect the impact of the adoption of Accounting Standards Update (“ASU”) 2016-02, Leases (Topic 842), in the first quarter of 2019. See Note 8, Leases, within Item 8 of this Form 10-K for additional information. |
(2) | Amounts prior to 2018 do not reflect the impact of the adoption of ASU 2014-09, Revenue from Contracts with Customers (Topic 606), in the first quarter of 2018. See Note 2, Significant Accounting Policies, within Item 8 of this Form 10-K for additional information. |
(3) | Total debt consists of current and long-term portions of long-term debt, finance lease obligations and vehicle financing arrangements. For the year ended December 31, 2016, we adopted ASU 2015-03 which resulted in a retrospective reclassification of $0.5 million of debt issuance costs related to our long-term debt from other non-current assets to long-term debt as of December 31, 2015. |
Item 7. |
Management’s Discussion and Analysis of Financial Condition and Results of Operations |
2019 |
Change |
2018 |
Change |
2017 |
||||||||||||||||
Net revenue |
$ | 1,511,629 |
13.1% |
$ | 1,336,432 |
18.0% |
$ | 1,132,927 |
||||||||||||
Cost of sales |
1,076,809 |
11.6% |
964,841 |
19.3% |
808,901 |
|||||||||||||||
Gross profit |
$ | 434,820 |
17.0% |
$ | 371,591 |
14.7% |
$ | 324,026 |
||||||||||||
Gross profit percentage |
28.8% |
27.8% |
28.6% |
Twelve months ended December 31, |
||||||||||||
2019 |
2018 |
2017 |
||||||||||
Period-over-period Growth |
||||||||||||
Sales Growth |
13.1 |
% | 18.0 |
% | 31.3 |
% | ||||||
Same Branch Sales Growth (1) |
8.6 |
% | 11.5 |
% | 9.8 |
% | ||||||
Single-Family Sales Growth (2) |
10.5 |
% | 20.0 |
% | 17.6 |
% | ||||||
Single-Family Same Branch Sales Growth (1)(2) |
4.8 |
% | 12.1 |
% | 7.9 |
% | ||||||
Residential Sales Growth (3) |
10.9 |
% | 18.4 |
% | 24.6 |
% | ||||||
Residential Same Branch Sales Growth (1)(3) |
5.9 |
% | 11.4 |
% | 11.3 |
% | ||||||
Same Branch Sales Growth |
||||||||||||
Volume Growth (1)(4) |
2.6 |
% | 6.1 |
% | 5.8 |
% | ||||||
Price/Mix Growth (1)(5) |
5.4 |
% | 5.4 |
% | 4.0 |
% | ||||||
Large Commercial Sales Growth (1) |
14.3 |
% | 11.5 |
% | N/A |
|||||||
U.S. Housing Market |
||||||||||||
Total Completions Growth |
6.0 |
% | 2.8 |
% | 8.8 |
% | ||||||
Single-Family Completions Growth (2) |
7.6 |
% | 5.6 |
% | 7.7 |
% |
(1) | Same-branch basis represents period-over-period growth for branch locations owned greater than 12 months as of each financial statement date. |
(2) | Calculated based on period-over-period growth in the single-family subset of the residential new construction end market. |
(3) | Calculated based on period-over-period growth in the residential new construction end market. |
(4) | Excludes the large commercial end market; calculated as period-over-period change in the number of completed same-branch residential new construction and repair and remodel jobs. |
(5) | Excludes the large commercial end market; defined as change in the mix of products sold and related pricing changes and calculated as the change in period-over-period average selling price per same-branch residential new construction and repair and remodel jobs multiplied by total current year jobs. The mix of end customer and product would have an impact on the year-over-year price per job. |
(6) | U.S. Census Bureau data, as revised. |
2019 |
Change |
2018 |
Change |
2017 |
||||||||||||||||
Selling |
$ | 75,016 |
11.8% |
$ | 67,105 |
14.8% |
$ | 58,450 |
||||||||||||
Percentage of total net revenue |
5.0% |
5.0% |
5.2% |
|||||||||||||||||
Administrative |
$ | 214,134 |
15.2% |
$ | 185,850 |
13.0% |
$ | 164,453 |
||||||||||||
Percentage of total net revenue |
14.2% |
13.9% |
14.5% |
|||||||||||||||||
Amortization |
$ | 24,510 |
-3.6% |
$ | 25,419 |
-5.4% |
$ | 26,857 |
||||||||||||
Percentage of total net revenue |
1.6% |
1.9% |
2.4% |
2019 |
Change |
2018 |
Change |
2017 |
||||||||||||||||
Interest expense, net |
$ | 28,104 |
37.1% |
$ | 20,496 |
17.9% |
$ | 17,381 |
||||||||||||
Other |
451 |
-15.7% |
535 |
-49.8% |
1,065 |
|||||||||||||||
Total other expense |
$ | 28,555 |
35.8% |
$ | 21,031 |
14.0% |
$ | 18,446 |
||||||||||||
2019 |
2018 |
2017 |
||||||||||
Income tax provision |
$ | 24,446 |
$ | 17,438 |
$ | 14,680 |
||||||
Effective tax rate |
26.4% |
24.2% |
26.3% |
2019 |
2018 |
2017 |
||||||||||
Unrealized (loss) gain on cash flow hedge, net of taxes |
$ | (6,712) |
$ | (1,050) |
$ | 507 |
2019 |
2018 |
|||||||
Cash and cash equivalents |
$ | 177,889 |
$ | 90,442 |
||||
Short-term investments |
37,961 |
10,060 |
||||||
ABL Revolver |
200,000 |
150,000 |
||||||
Less: outstanding letters of credit and cash collateral |
(38,672 |
) | (28,887 |
) | ||||
Total liquidity (1) |
$ | 377,178 |
$ | 221,615 |
||||
(1) | Total liquidity reflects full borrowing base capacity under our asset-based lending credit facility (as defined below) and may be limited by certain cash collateral limitations depending upon the status of our borrowing base availability. These potential deductions would lower our available cash and cash equivalents balance shown in the table above. As of December 31, 2019, total liquidity would be reduced by $31.9 million due to these cash collateral limitations. In addition, total liquidity is further reduced by $10.0 million within cash and cash equivalents above which was deposited into a trust to serve as additional collateral for our workers’ compensation and general liability policies. This amount can be converted to a letter of credit at our discretion and would reduce the availability on our asset-based lending credit facility (as defined below) included in the table above. |
As of December 31, 2019 |
||||
Performance bonds |
$ | 59,816 |
||
Insurance letters of credit and cash collateral |
49,712 |
|||
Permit and license bonds |
7,156 |
|||
Total bonds and letters of credit |
$ | 116,684 |
||
Payments due by period |
||||||||||||||||||||||||||||
(in thousands) |
Total |
2020 |
2021 |
2022 |
2023 |
2024 |
Thereafter |
|||||||||||||||||||||
Long-term debt obligations (1) |
$ | 764,694 |
$ | 52,368 |
$ | 46,588 |
$ | 42,025 |
$ | 36,142 |
$ | 30,014 |
$ | 557,557 |
||||||||||||||
Finance lease obligations (2) |
7,023 |
3,081 |
1,973 |
1,037 |
673 |
259 |
— |
|||||||||||||||||||||
Operating lease obligations (3) |
50,407 |
17,047 |
12,247 |
7,438 |
4,207 |
2,643 |
6,825 |
|||||||||||||||||||||
Purchase obligations (4) |
35,132 |
21,132 |
14,000 |
— |
— |
— |
— |
(1) | Long-term debt obligations include interest payments on our Senior Notes, Term Loan, our notes payable to sellers of acquisitions, and vehicles purchased under the Master Loan and Security Agreement, the Master Equipment Agreement and the Master Loan Agreements. Long-term debt obligations do not include commitment fees on the unused portion of the ABL Revolver since those fees are subject to change based on the factors described in the ABL Credit Agreement. Interest on seller obligations maturing through March 2025 is estimated using current market rates. For additional information, see Note 7, Long-Term Debt, to our audited consolidated financial statements included in this Form 10-K. |
(2) | We maintain certain production vehicles under a finance lease structure. The leases expire on various dates through December 2024. Finance lease obligations, as disclosed above, include estimated interest expense payments. In determining expected interest expense payments, we utilize the rates embedded in the lease documentation. |
(3) | We lease certain locations, vehicles and equipment under operating lease agreements, including, but not limited to, corporate offices, branch locations and various office and operating equipment. In some instances, these lease agreements exist with related parties. For additional information, see Note 14, Related Party Transactions, to our audited consolidated financial statements included in this Form 10-K. |
(4) | As of December 31, 2019, we had a product supply agreement extending through December 31, 2021. For additional information, see Note 15, Commitments and Contingencies, to our audited consolidated financial statements included in this Form 10-K. |
Item 7A. |
Quantitative and Qualitative Disclosures about Market Risk |
Item 8. |
Financial Statements and Supplementary Data |
• | We tested the effectiveness of the Company’s controls over the determination of uncompleted contract revenue, including those over estimated total costs and revenues recognized through performance obligations. |
• | We inquired of project managers, observed selected projects, and evaluated the reasonableness of management’s ability to accurately estimate costs by comparing incurred contract costs on uncompleted contracts to management’s projections. |
• | We compared accounting records to executed contracts and change orders to verify accuracy of contract values in the Company’s estimates. |
• | We considered the impact of change orders and other related contract costs that may impact the determination of revenue and estimated costs to completion. |
• | We tested the mathematical accuracy of the Company’s calculation of revenue recognized over time. |
• | We selected a sample of contract costs incurred as of December 31, 2019, agreed the costs to supplier invoices or other supporting documents, and evaluated whether the costs were properly allocated to the contracts included in management’s calculation of revenue recognized over time. |
• | We developed an expectation of revenue for uncompleted contracts with remaining performance obligations as of December 31, 2019 based on (1) consideration of incurred contract costs and (2) results realized by the Company on completed contracts. We compared this expectation to the Company’s revenue recognized on uncompleted contracts at December 31, 2019. |
As of December 31, |
||||||||
2019 |
2018 |
|||||||
ASSETS |
||||||||
Current assets |
||||||||
Cash and cash equivalents |
$ | |
$ | |
||||
Investments |
|
|
||||||
Accounts receivable (less allowance for doubtful accounts of $ 2018, respectively) |
|
|
||||||
Inventories |
|
|
||||||
Other current assets |
|
|
||||||
Total current assets |
|
|
||||||
Property and equipment, net |
|
|
||||||
Operating lease right-of-use assets |
|
— |
||||||
Goodwill |
|
|
||||||
Intangibles, net |
|
|
||||||
Other non-current assets |
|
|
||||||
Total assets |
$ | |
$ | |
||||
LIABILITIES AND STOCKHOLDERS’ EQUITY |
||||||||
Current liabilities |
||||||||
Current maturities of long-term debt |
$ | |
$ | |
||||
Current maturities of operating lease obligations |
|
— |
||||||
Current maturities of finance lease obligations |
|
|
||||||
Accounts payable |
|
|
||||||
Accrued compensation |
|
|
||||||
Other current liabilities |
|
|
||||||
Total current liabilities |
|
|
||||||
Long-term debt |
|
|
||||||
Operating lease obligations |
|
— |
||||||
Finance lease obligations |
|
|
||||||
Deferred income taxes |
|
|
||||||
Other long-term liabilities |
|
|
||||||
Total liabilities |
|
|
||||||
Commitments and contingencies (Note 15) |
||||||||
Stockholders’ equity |
||||||||
Preferred Stock; $ 2019 and 2018, respectively |
|
— |
||||||
Common stock; $ and and |
|
|
||||||
Additional paid in capital |
|
|
||||||
Retained earnings |
|
|
||||||
Treasury stock; at cost: and |
( |
) | ( |
) | ||||
Accumulated other comprehensive loss |
( |
) | ( |
) | ||||
Total stockholders’ equity |
|
|
||||||
Total liabilities and stockholders’ equity |
$ | |
$ | |
||||
Years ended December 31, |
||||||||||||
2019 |
2018 |
2017 |
||||||||||
Net revenue |
$ | |
$ | |
$ | |
||||||
Cost of sales |
|
|
|
|||||||||
Gross profit |
|
|
|
|||||||||
Operating expenses |
||||||||||||
Selling |
|
|
|
|||||||||
Administrative |
|
|
|
|||||||||
Amortization |
|
|
|
|||||||||
Operating income |
|
|
|
|||||||||
Other expense |
||||||||||||
Interest expense, net |
|
|
|
|||||||||
Other |
|
|
|
|||||||||
Income before income taxes |
|
|
|
|||||||||
Income tax provision |
|
|
|
|||||||||
Net income |
$ | |
$ | |
$ | |
||||||
Other comprehensive (loss) income, net of tax: |
||||||||||||
Unrealized (loss) gain on cash flow hedge, net of tax benefit (provision) of $ , $ |
( |
) | ( |
) | |
|||||||
Comprehensive income |
$ | |
$ | |
$ | |
||||||
Basic net income per share |
$ |
|
$ | |
$ | |
||||||
Diluted net income per share |
$ |
|
$ | |
$ | |
||||||
Weighted average shares outstanding: |
||||||||||||
Basic |
|
|
|
|||||||||
Diluted |
|
|
|
|
|
|
Common Stock |
|
|
Additional Paid In |
|
|
|
Retained |
|
|
|
Treasury Stock |
|
|
|
Accumulated Other Comprehensive |
|
|
Stockholders’ |
| ||||||||||
|
|
|
Shares |
|
|
|
Amount |
|
|
Capital |
|
|
|
Earnings |
|
|
|
Shares |
|
|
|
Amount |
|
|
|
Income (Loss) |
|
|
Equity |
| ||
BALANCE—January 1, 2017 |
|
$ | |
$ | |
$ | |
( |
) | $ | ( |
) | $ | |
$ | |
||||||||||||||||
Net income |
|
|
||||||||||||||||||||||||||||||
Purchase of remaining interest in subsidiary |
( |
) | ( |
) | ||||||||||||||||||||||||||||
Issuance of common stock for acquisition |
|
|
|
|
||||||||||||||||||||||||||||
Issuance of common stock awards to employees |
|
|
( |
) | |
|||||||||||||||||||||||||||
Surrender of common stock awards by employees |
( |
) | ( |
) | ( |
) | ||||||||||||||||||||||||||
Share-based compensation expense |
|
|
||||||||||||||||||||||||||||||
Share-based compensation issued to directors |
|
|
|
|||||||||||||||||||||||||||||
Other comprehensive income, net of tax |
|
|
||||||||||||||||||||||||||||||
BALANCE—January 1, 2018 |
|
$ | |
$ | |
$ | |
( |
) | $ | ( |
) | $ | |
$ | |
||||||||||||||||
Net income |
|
|
||||||||||||||||||||||||||||||
Cumulative effect of accounting changes, net of tax |
|
|
|
|||||||||||||||||||||||||||||
Issuance of common stock awards to employees |
|
|
( |
) | |
|||||||||||||||||||||||||||
Surrender of common stock awards by employees |
( |
) | ( |
) | ( |
) | ||||||||||||||||||||||||||
Share-based compensation expense |
|
|
|
|||||||||||||||||||||||||||||
Share-based compensation issued to directors |
|
|
|
|||||||||||||||||||||||||||||
Common stock repurchase |
( |
) | ( |
) | ( |
) | ||||||||||||||||||||||||||
Other comprehensive loss, net of tax |
( |
) | ( |
) | ||||||||||||||||||||||||||||
BALANCE—January 1, 2019 |
|
$ |
|
$ |
|
$ |
|
( |
) | $ |
( |
) | $ |
( |
) | $ |
|
|||||||||||||||
Net income |
|
|
||||||||||||||||||||||||||||||
Issuance of common stock awards to employees |
|
|
( |
) | |
|||||||||||||||||||||||||||
Surrender of common stock awards by employees |
( |
) | ( |
) | ( |
) | ||||||||||||||||||||||||||
Share-based compensation expense |
|
|
||||||||||||||||||||||||||||||
Share-based compensation issued to directors |
|
|
|
|||||||||||||||||||||||||||||
Other comprehensive loss, net of tax |
( |
) | ( |
) | ||||||||||||||||||||||||||||
BALANCE—December 31, 2019 |
|
$ |
|
$ |
|
$ |
|
( |
) | $ |
( |
) | $ |
( |
) | $ |
|
|||||||||||||||
Years ended December 31, |
||||||||||||
2019 |
2018 |
2017 |
||||||||||
Cash flows from operating activities |
||||||||||||
Net income |
$ | $ | $ | |||||||||
Adjustments to reconcile net income to net cash provided by operating activities |
||||||||||||
Depreciation and amortization of property and equipment |
||||||||||||
Amortization of operating lease right-of-use assets |
— |
— |
||||||||||
Amortization of intangibles |
||||||||||||
Amortization of deferred financing costs and debt discount |
||||||||||||
Provision for doubtful accounts |
||||||||||||
Write-off of debt issuance costs |
||||||||||||
Gain on sale of property and equipment |
( |
) | ( |
) | ( |
) | ||||||
Noncash stock compensation |
||||||||||||
Deferred income taxes |
( |
) | ||||||||||
Changes in assets and liabilities, excluding effects of acquisitions |
||||||||||||
Accounts receivable |
( |
) | ( |
) | ( |
) | ||||||
Inventories |
( |
) | ( |
) | ( |
) | ||||||
Other assets |
( |
) | ( |
) | ( |
) | ||||||
Accounts payable |
||||||||||||
Income taxes receivable/payable |
( |
) | ( |
) | ||||||||
Other liabilities |
||||||||||||
Net cash provided by operating activities |
||||||||||||
Cash flows from investing activities |
||||||||||||
Purchases of investments |
( |
) | ( |
) | ( |
) | ||||||
Maturities of short term investments |
— |
|||||||||||
Purchases of property and equipment |
( |
) | ( |
) | ( |
) | ||||||
Acquisitions of businesses, net of cash acquired of $ |
( |
) | ( |
) | ( |
) | ||||||
Proceeds from sale of property and equipment |
||||||||||||
Other |
( |
) | ( |
) | ( |
) | ||||||
Net cash used in investing activities |
( |
) | ( |
) | ( |
) | ||||||
Cash flows from financing activities |
||||||||||||
Proceeds from senior notes (Note 7) |
— |
— |
||||||||||
Proceeds from term loan (Note 7) |
— |
|||||||||||
Payments on term loan (Note 7) |
( |
) | ( |
) | ( |
) | ||||||
Proceeds from delayed draw term loan |
— |
— |
||||||||||
Payments on delayed draw term loan |
— |
— |
( |
) | ||||||||
Proceeds from vehicle and equipment notes payable |
||||||||||||
Debt issuance costs |
( |
) | ( |
) | ( |
) | ||||||
Principal payments on long-term debt |
( |
) | ( |
) | ( |
) | ||||||
Principal payments on finance lease obligations |
( |
) | ( |
) | ( |
) | ||||||
Acquisition-related obligations |
( |
) | ( |
) | ( |
) | ||||||
Repurchase of common stock |
— |
( |
) | — |
||||||||
Surrender of common stock awards by employees |
( |
) | ( |
) | ( |
) | ||||||
Purchase of remaining interest in subsidiary |
— |
— |
( |
) | ||||||||
Net cash provided by financing activities |
||||||||||||
Net change in cash and cash equivalents |
||||||||||||
Cash and cash equivalents at beginning of period |
||||||||||||
Cash and cash equivalents at end of period |
$ | $ | $ | |||||||||
Supplemental disclosures of cash flow information |
||||||||||||
Net cash paid during the period for: |
||||||||||||
Interest |
$ | $ | $ | |||||||||
Income taxes, net of refunds |
||||||||||||
Supplemental disclosure of noncash activities |
||||||||||||
Common stock issued for acquisition of business |
— |
— |
||||||||||
Right-of-use assets obtained in exchange for operating lease obligations |
— |
— |
||||||||||
Termination of operating lease obligations and right-of-use assets |
( |
) | — |
— |
||||||||
Property and equipment obtained in exchange for finance lease obligations |
||||||||||||
Seller obligations in connection with acquisition of businesses |
||||||||||||
Unpaid purchases of property and equipment included in accounts payable |
January 1, 2017 |
$ | |||
Charged to costs and expenses |
||||
Charged to other accounts (1) |
||||
Deductions (2) |
( |
) | ||
December 31, 2017 |
$ | |||
Charged to costs and expenses |
||||
Charged to other accounts (1) |
||||
Deductions (2) |
( |
) | ||
December 31, 2018 |
$ | |||
Charged to costs and expenses |
||||
Charged to other accounts (1) |
||||
Deductions (2) |
( |
) | ||
December 31, 2019 |
$ | |||
(1) | Recovery of receivables previously written off as bad debt and other. |
(2) | Write-off of uncollectible accounts receivable. |
Standard |
Effective Date |
Adoption | ||||
ASU 2016-02, Leases (Topic 842) |
January 1, 2019 |
This Accounting Standards Update (“ASU”) requires substantially all leases, with the exception of leases with a term of one year or less, to be recorded on the balance sheet as a lease liability measured as the present value of the future lease payments with a corresponding right-of-use asset. This ASU also requires disclosures designed to give financial statement users information on the amount, timing and uncertainty of cash flows. See Note 8, Leases, for further information regarding the effects of adopting this standard. |
Standard |
Description |
Effective Date |
Effect on the financial statements or other significant matters | |||
ASU 2016-13, Financial Instruments-Credit Losses (Topic 326) |
This pronouncement and subsequently-issued amendments change the accounting for credit losses on available-for-sale debt securities and purchased financial assets with credit deterioration. In addition, these amendments require the measurement of all expected credit losses for financial assets, including trade accounts receivable, held at the reporting date based on historical experience, current conditions and reasonable and supportable forecasts. |
Annual periods beginning after December 15, 2019, including interim periods therein. Early adoption is permitted. |
Upon adoption of this pronouncement, we expect the accounts receivable balance and the contract assets balance included in other current assets on our Condensed Consolidated Balance Sheets to be affected, with an offsetting amount recorded to retained earnings in the period of adoption. We are still quantifying the impact of the ASU and its related amendments on our consolidated financial statements, but do not expect it to be material. |
Standard |
Description |
Effective Date |
Effect on the financial statements or other significant matters | |||
ASU 2017-04, Intangibles—Goodwill and Other (Topic 350): Simplifying the Test for Goodwill Impairment |
To address concerns over the cost and complexity of the two-step goodwill impairment test, this pronouncement removes the second step of the goodwill impairment test. Going forward, an entity will apply a one-step quantitative test and record the amount of goodwill impairment as the excess of a reporting unit’s carrying amount over its fair value, not to exceed the total amount of goodwill allocated to the reporting unit. |
Annual or interim goodwill impairment tests in fiscal years beginning after December 15, 2019, including interim periods therein. Early adoption is permitted. |
We anticipate the adoption of this ASU will not have a material impact on our consolidated financial statements or disclosures. | |||
ASU 2018-13, Fair Value Measurement (Topic 820): Disclosure Framework—Changes to the Disclosure Requirements for Fair Value Measurement |
This pronouncement amends Topic 820 to eliminate, add and modify certain disclosure requirements for fair value measurements. |
Annual periods beginning after December 15, 2019, including interim periods therein. Early adoption is permitted. |
We will modify our disclosures to conform to the new requirements beginning with filings covering periods subsequent to the adoption date. |
ASU 2019-12, Income Taxes (Topic 740), Simplifying the Accounting for Income Taxes |
This pronouncement simplifies the accounting for income taxes by removing certain exceptions to the general principles of Topic 740 and improves the consistent application of GAAP by clarifying and amending existing guidance. |
Annual periods beginning after December 15, 2020, including interim periods therein. Early adoption is permitted. |
We are currently assessing the impact of adoption on our consolidated financial statements. |
Year ended December 31, |
||||||||||||||||
2019 |
2018 |
|||||||||||||||
Residential new construction |
$ | % |
$ | % | ||||||||||||
Repair and remodel |
% |
% | ||||||||||||||
Commercial |
% |
% | ||||||||||||||
Net revenues |
$ | % |
$ | % | ||||||||||||
Year ended December 31, |
||||||||||||||||
2019 |
2018 |
|||||||||||||||
Insulation |
$ | % |
$ | % | ||||||||||||
Waterproofing |
% |
% | ||||||||||||||
Shower doors, shelving and mirrors |
% |
% | ||||||||||||||
Garage doors |
% |
% | ||||||||||||||
Rain gutters |
% |
% | ||||||||||||||
Window blinds |
% |
% | ||||||||||||||
Other building products |
% |
% | ||||||||||||||
Net revenues |
$ | % |
$ | % | ||||||||||||
As of December 31, |
||||||||
2019 |
2018 |
|||||||
Contract assets |
$ | $ | ||||||
Contract liabilities |
( |
) | ( |
) |
As of December 31, |
||||||||
2019 |
2018 |
|||||||
Costs incurred on uncompleted contracts |
$ | $ | ||||||
Estimated earnings |
||||||||
Total |
||||||||
Less: Billings to date |
||||||||
Net under billings |
$ | $ | ||||||
As of December 31, |
||||||||
2019 |
2018 |
|||||||
Costs and estimated earnings in excess of billings on uncompleted contracts (contract assets) |
$ | $ | ||||||
Billings in excess of costs and estimated earnings on uncompleted contracts (contract liabilities) |
( |
) | ( |
) | ||||
Net under billings |
$ | $ | ||||||
As of December 31, |
||||||||
2019 |
2018 |
|||||||
Land |
$ | $ | — |
|||||
Buildings |
— |
|||||||
Leasehold improvements |
||||||||
Furniture, fixtures and equipment |
||||||||
Vehicles and equipment |
||||||||
Less: accumulated depreciation and amortization |
( |
) | ( |
) | ||||
$ | $ | |||||||
As of December 31, |
||||||||||||
2019 |
2018 |
2017 |
||||||||||
Cost of sales |
$ | $ | $ | |||||||||
Administrative |
Goodwill (Gross) |
Accumulated Impairment Losses |
Goodwill (Net) |
||||||||||
January 1, 2018 |
$ | |
$ | ( |
) | $ | |
|||||
Business combinations |
|
|
|
|||||||||
Other |
|
|
|
|||||||||
December 31, 2018 |
|
( |
) | |
||||||||
Business combinations |
|
|
|
|||||||||
Other |
|
|
|
|||||||||
December 31, 2019 |
$ | |
$ | ( |
) | $ | |
|||||
As of December 31, |
||||||||||||||||||||||||
2019 |
2018 |
|||||||||||||||||||||||
Gross Carrying Amount |
Accumulated Amortization |
Net Book Value |
Gross Carrying Amount |
Accumulated Amortization |
Net Book Value |
|||||||||||||||||||
Amortized intangibles: |
||||||||||||||||||||||||
Customer relationships |
$ | |
$ | |
$ | |
$ | |
$ | |
$ | |
||||||||||||
Covenants not-to-compete |
|
|
|
|
|
|
||||||||||||||||||
Trademarks and tradenames |
|
|
|
|
|
|
||||||||||||||||||
Backlog |
|
|
|
|
|
|
||||||||||||||||||
$ | |
$ | |
$ | |
$ | |
$ | |
$ | |
|||||||||||||
2020 |
$ | |
||
2021 |
|
|||
2022 |
|
|||
2023 |
|
|||
2024 |
|
|||
Thereafter |
|
As of December 31, |
||||||||
2019 |
2018 |
|||||||
Senior Notes due 2028, net of unamortized debt issuance costs of $ |
$ | |
$ | — |
||||
Term loan, net of unamortized debt issuance costs of $ $ |
|
|
||||||
Vehicle and equipment notes, maturing through |
|
|
||||||
Various notes payable, maturing through |
|
|
||||||
|
|
|||||||
Less: current maturities |
( |
) | ( |
) | ||||
Long-term debt, less current maturities |
$ | |
$ | |
||||
2020 |
$ |
|
||
2021 |
|
|||
2022 |
|
|||
2023 |
|
|||
2024 |
|
|||
Thereafter |
|
(in thousands) |
Classification |
As of December 31, 2019 |
||||
Assets |
||||||
Non-Current |
||||||
Operating |
Operating lease right-of-use assets |
$ | ||||
Finance |
Property and equipment, net |
|||||
Total lease assets |
$ | |||||
Liabilities |
||||||
Current |
||||||
Operating |
Current maturities of operating lease obligations |
$ | ||||
Financing |
Current maturities of finance lease obligations |
|||||
Non-Current |
||||||
Operating |
Operating lease obligations |
|||||
Financing |
Finance lease obligations |
|||||
Total lease liabilities |
$ | |||||
Weighted-average remaining lease term |
||||
Operating leases |
| |||
Finance leases |
||||
Weighted-average discount rate (1) |
||||
Operating leases |
% |
|||
Finance leases |
% |
(1) | Upon adoption of the new lease standard, discount rates used for existing leases were established at January 1, 2019. |
(in thousands) |
Classification |
As of December 31, 2019 |
||||
Operating lease cost (1) |
Administrative |
$ |
||||
Finance lease cost |
||||||
Amortization of leased assets (2) |
Cost of sales |
|||||
Interest on finance lease obligations |
Interest expense, net |
|||||
Total lease costs |
$ |
|||||
(1) | Includes variable lease costs of $ |
(2) | Includes variable lease costs of $ |
As of December 31, 2019 |
||||
Cash paid for amounts included in the measurement of lease liabilities: |
||||
Operating cash flows for operating leases |
$ | |||
Operating cash flows for finance leases |
||||
Financing cash flows for finance leases |
Finance Leases |
Operating Leases |
|||||||||||||||
Related |
Other |
Total |
||||||||||||||
2020 |
$ | $ | $ | $ | ||||||||||||
2021 |
||||||||||||||||
2022 |
||||||||||||||||
2023 |
||||||||||||||||
2024 |
||||||||||||||||
Thereafter |
||||||||||||||||
Total minimum lease payments |
$ | $ | ||||||||||||||
Less: Amounts representing executory costs |
( |
) | ||||||||||||||
Less: Amounts representing interest |
( |
) | ( |
) | ||||||||||||
Present value of future minimum lease payments |
||||||||||||||||
Less: Current obligation under leases |
( |
) | ( |
) | ||||||||||||
Long-term lease obligations |
$ | $ | ||||||||||||||
Capital Leases |
Operating Leases |
|||||||||||||||
Related |
Other |
Total |
||||||||||||||
2019 |
$ | |
$ | |
$ | |
$ | |
||||||||
2020 |
|
|
|
|
||||||||||||
2021 |
|
|
|
|
||||||||||||
2022 |
|
|
|
|
||||||||||||
2023 |
|
|
|
|
||||||||||||
Thereafter |
|
|
|
|
||||||||||||
|
$ | |
$ | |
$ | |
||||||||||
Less: Amounts representing executory costs |
( |
) | ||||||||||||||
Less: Amounts representing interest |
( |
) | ||||||||||||||
Total obligation under capital leases |
|
|||||||||||||||
Less: Current portion of capital leases |
( |
) | ||||||||||||||
Long-term capital lease obligation |
$ | |
||||||||||||||
As of December 31, 2019 |
As of December 31, 2018 |
|||||||||||||||||||||||||||||||
Total |
Level 1 |
Level 2 |
Level 3 |
Total |
Level 1 |
Level 2 |
Level 3 |
|||||||||||||||||||||||||
Financial assets: |
||||||||||||||||||||||||||||||||
Cash equivalents |
$ | |
$ | |
$ | — |
$ | — |
$ | |
$ | |
$ | — |
$ | — |
||||||||||||||||
Derivative financial instruments |
— |
— |
— |
— |
|
— |
|
— |
||||||||||||||||||||||||
Total financial assets |
$ | |
$ | |
$ | — |
$ | — |
$ | |
$ | |
$ | |
$ | — |
||||||||||||||||
|
|
|
|
|
|
|
|
|
|
|
|
|
|
|
|
|
|
|
|
|
|
|
|
| ||||||||
Financial liabilities: |
||||||||||||||||||||||||||||||||
Derivative financial instruments |
$ | |
$ | — |
$ | |
$ | — |
$ | |
$ | — |
$ | |
$ | — |
||||||||||||||||
Contingent consideration |
|
— |
— |
|
|
— |
— |
|
||||||||||||||||||||||||
Total financial liabilities |
$ | |
$ | — |
$ | |
$ | |
$ | |
$ | — |
$ | |
$ | |
||||||||||||||||
Contingent consideration liability—January 1, 2019 |
$ | |
||
Preliminary purchase price |
|
|||
Fair value adjustments |
( |
) | ||
Accretion in valu e |
|
|||
Amounts cancelled |
|
|
( |
) |
Amounts paid to sellers |
( |
) | ||
Contingent consideration liability—December 31, 2019 |
$ | |
||
As of December 31, 2019 |
As of December 31, 2018 |
|||||||||||||||
Carrying Value |
Fair Value |
Carrying Value |
Fair Value |
|||||||||||||
Investments |
$ | $ | $ | $ | ||||||||||||
Senior Notes (1) |
— |
— |
(1) | Excludes the impact of unamortized debt issuance costs. |
As of December 31, |
||||||||
2019 |
2018 |
|||||||
Included in other current liabilities |
$ | |
$ | |
||||
Included in other long-term liabilities |
|
|
||||||
$ | |
$ |
|
|||||
As of December 31, |
||||||||
2019 |
2018 |
|||||||
Included in other non-current assets |
$ |
|
$ |
|
Common Stock Awards |
Performance-Based Stock Awards |
Performance-Based Restricted Stock Units |
||||||||||||||||||||||
Awards |
Weighted Average Grant Date Fair Value Per |
Awards |
Weighted Average Grant Date Fair Value Per |
Units |
Weighted Average Grant Date Fair Value Per |
|||||||||||||||||||
Nonvested awards/units at December 31, 2018 |
$ | $ | $ | |||||||||||||||||||||
Granted |
||||||||||||||||||||||||
Vested |
( |
) | ( |
) | ( |
) | ||||||||||||||||||
Forfeited/Cancelled |
( |
) | ( |
) | ( |
) | ||||||||||||||||||
Nonvested awards/units at December 31, 2019 |
$ | $ | $ | |||||||||||||||||||||
2019 |
2018 |
2017 |
||||||||||
Cost of sales |
$ | $ | $ | |||||||||
Selling |
||||||||||||
Administrative |
||||||||||||
$ | $ | $ | ||||||||||
Years ended December 31, |
||||||||||||
2019 |
2018 |
2017 |
||||||||||
Current: |
||||||||||||
Federal |
$ | $ | $ | |||||||||
State |
||||||||||||
Deferred: |
||||||||||||
Federal |
( |
) | ||||||||||
State |
( |
) | ||||||||||
( |
) | |||||||||||
Total tax expense |
$ | $ | $ | |||||||||
Years ended December 31, |
||||||||||||||||||||||||
2019 |
2018 |
2017 |
||||||||||||||||||||||
Income tax at federal statutory rate |
$ | % | $ | % | $ | % | ||||||||||||||||||
Stock compensation |
( |
) | ( |
% ) |
( |
) | ( |
%) | ( |
) | ( |
%) | ||||||||||||
Qualified Production Activity Deduction |
— |
% | — |
% | ( |
) | ( |
%) | ||||||||||||||||
Other permanent items |
% | ( |
) | ( |
%) | % | ||||||||||||||||||
Change in valuation allowance |
% | % | % | |||||||||||||||||||||
Change in uncertain tax positions |
% | % | ( |
) | ( |
%) | ||||||||||||||||||
State income taxes, net of federal benefit |
% | % | % | |||||||||||||||||||||
Rate impact of the Tax Act |
— |
% | ( |
) | ( |
%) | ( |
) | ( |
%) | ||||||||||||||
Total tax expense |
$ | % | $ | % | $ | % | ||||||||||||||||||
As of December 31, |
||||||||
2019 |
2018 |
|||||||
Deferred Tax Assets |
||||||||
Long-term |
||||||||
Accrued reserves and allowances |
$ | $ | ||||||
Allowance for doubtful accounts |
||||||||
Inventories |
||||||||
Property and equipment |
— |
|||||||
Intangibles |
||||||||
Net operating loss carryforwards |
||||||||
Other |
||||||||
Long-term deferred tax assets |
||||||||
Less: Valuation allowance |
( |
) | ( |
) | ||||
Net deferred tax assets |
||||||||
Deferred Tax Liabilities |
||||||||
Long-term |
||||||||
Accrued reserves and allowances |
( |
) | ( |
) | ||||
Property and equipment |
( |
) | ( |
) | ||||
Intangibles |
( |
) | ( |
) | ||||
Investment in partnership |
( |
) | ( |
) | ||||
Other |
( |
) | ( |
) | ||||
Long-term deferred tax liabilities |
( |
) | ( |
) | ||||
Net deferred tax liabilities |
$ | ( |
) | $ | ( |
) | ||
Unrecognized tax benefit, January 1, 2017 |
$ | |
||
Increase as a result of tax positions taken during the period |
|
|||
Decrease as a result of tax positions taken during the period |
( |
) | ||
Decrease as a result of expiring statutes |
( |
) | ||
Unrecognized tax benefit, December 31, 2017 |
$ | |
||
|
|
|
|
|
Increase as a result of tax positions taken during the period |
|
|||
Decrease as a result of tax positions taken during the period |
( |
) | ||
Decrease as a result of expiring statutes |
( |
) | ||
Unrecognized tax benefit, December 31, 2018 |
$ | |
||
|
|
|
|
|
Increase as a result of tax positions taken during the perio d |
|
|||
Decrease as a result of tax positions taken during the period |
( |
) | ||
Decrease as a result of expiring statutes |
( |
) | ||
Unrecognized tax benefit, December 31, 2019 |
$ | |
||
Years ended December 31, |
||||||||||||
2019 |
2018 |
2017 |
||||||||||
Sales |
$ | |
$ | |
$ | |
||||||
Purchases |
|
|
|
|||||||||
Rent |
|
|
|
As of December 31, |
||||||||
2019 |
2018 |
|||||||
Included in other current liabilities |
$ | |
$ | |
||||
Included in other long-term liabilities |
|
|
||||||
$ | |
$ | |
|||||
As of December 31, |
||||||||
2019 |
2018 |
|||||||
Insurance receivables and indemnification assets for claims under fully insured policies |
$ | |
$ | |
||||
Insurance receivables for claims that exceeded the stop loss limit |
|
|
||||||
Total insurance receivables and indemnificatoin assets included in other non-current |
$ | |
$ | |
||||
2019 Acquisitions |
Date |
Acquisition Type |
Cash Paid |
Seller Obligations |
Total Purchase Price |
Revenue |
Net ( Loss ) |
|||||||||||||||||||||
1st State Insulation |
|
|
$ | |
$ | |
$ | |
$ | |
$ | |
||||||||||||||||
Expert Insulation |
|
|
|
|
|
|
|
|||||||||||||||||||||
Premier |
|
|
|
|
|
|
|
|
|
|
|
|
|
|
|
|
|
|
|
|
|
( |
) | |||||
Other |
Various |
|
|
|
|
|
|
|||||||||||||||||||||
Total |
$ | |
$ | |
$ | |
$ | |
$ | |
||||||||||||||||||
Name |
Date |
Acquisition Type |
Cash Paid |
Seller Obligations |
Total Purchase Price |
Revenue |
Net (Loss) |
|||||||||||||||||
CDG |
|
|
$ | |
$ | |
$ | |
$ | |
$ | |
||||||||||||
AFT |
|
|
|
|
|
|
( |
) | ||||||||||||||||
Other |
Various |
|
|
|
|
|
|
|||||||||||||||||
Total |
$ | |
$ | |
$ | |
$ | |
$ | |
||||||||||||||
Name |
Date |
Acquisition Type |
Cash Paid |
Seller Obligations |
Fair Common Stock |
Total Purchase Price |
Revenue |
Net Income |
|||||||||||||||||||||||
Alpha (1) |
|
|
$ | |
$ | |
$ | |
$ | |
$ | |
$ | ( |
) | ||||||||||||||||
Columbia |
|
|
|
|
— |
|
|
|
|||||||||||||||||||||||
Astro |
|
|
|
|
— |
|
|
|
|||||||||||||||||||||||
Other |
Various |
|
|
|
— |
|
|
|
|||||||||||||||||||||||
Total |
$ | |
$ | |
$ | |
$ | |
$ | |
$ | ( |
) | ||||||||||||||||||
(1) | The cash paid included $ EBITDA from 2015 and a customary holdback. These payments were based on fair value of each contingent payment at the time of acquisition and subsequently adjusted during the measurement period. We issued |
2019 |
||||||||||||||||||||
1st State |
Expert |
Premier |
Other |
Total |
||||||||||||||||
Estimated fair values: |
||||||||||||||||||||
Cash |
$ |
— |
$ |
— |
$ |
$ |
— |
$ |
||||||||||||
Accounts receivable |
— |
|||||||||||||||||||
Inventories |
||||||||||||||||||||
Other current assets |
— |
— |
— |
|||||||||||||||||
Property and equipment |
||||||||||||||||||||
Intangibles |
||||||||||||||||||||
Goodwill |
||||||||||||||||||||
Other non-current assets |
— |
|||||||||||||||||||
Accounts payable and other current liabilities |
( |
) | ( |
) | ( |
) |
( |
) | ( |
) | ||||||||||
Fair value of assets acquired and purchase price |
||||||||||||||||||||
Less seller obligations |
||||||||||||||||||||
Cash paid |
$ | $ | $ |
$ | $ | |||||||||||||||
2018 |
||||||||||||||||
CDG |
AFT |
Other |
Total |
|||||||||||||
Estimated fair values: |
||||||||||||||||
Accounts receivable |
$ |
$ |
— |
$ |
$ |
|||||||||||
Inventories |
||||||||||||||||
Other current assets |
— |
|||||||||||||||
Property and equipment |
||||||||||||||||
Intangibles |
||||||||||||||||
Goodwill |
||||||||||||||||
Other non-current assets |
||||||||||||||||
Accounts payable and other current liabilities |
( |
) | ( |
) | ( |
) | ( |
) | ||||||||
Fair value of assets acquired and purchase price |
||||||||||||||||
Less fair value of common stock issued |
— |
— |
— |
— |
||||||||||||
Less seller obligations |
||||||||||||||||
Cash paid |
$ | $ | $ | $ | ||||||||||||
2017 |
||||||||||||||||||||
Alpha |
Columbia |
Astro |
Other |
Total |
||||||||||||||||
Estimated fair values: |
||||||||||||||||||||
Cash |
$ | $ | — |
$ | — |
$ | — |
$ | ||||||||||||
Accounts receivable |
||||||||||||||||||||
Inventories |
||||||||||||||||||||
Other current assets |
||||||||||||||||||||
Property and equipment |
||||||||||||||||||||
Intangibles |
||||||||||||||||||||
Goodwill |
||||||||||||||||||||
Other non-current assets |
— |
|||||||||||||||||||
Accounts payable and other current liabilities |
( |
) | ( |
) | ( |
) | ( |
) | ( |
) | ||||||||||
Fair value of assets acquired |
||||||||||||||||||||
Less fair value of common stock issued |
— |
— |
— |
|||||||||||||||||
Less seller obligations |
||||||||||||||||||||
Cash paid |
$ | $ | $ | $ | $ | |||||||||||||||
2019 |
2018 |
2017 |
||||||||||||||||||||||
Acquired intangibles assets |
Estimated Fair Value |
Weighted Average Estimated Useful Life (yrs) |
Estimated Fair Value |
Weighted Average Estimated Useful Life (yrs) |
Estimated Fair Value |
Weighted Average Estimated Useful Life (yrs) |
||||||||||||||||||
Customer relationships |
$ | |
|
$ |
|
|
$ | |
|
|||||||||||||||
Trademarks and trade names |
|
|
|
|
|
|
||||||||||||||||||
Non-competition agreements |
|
|
|
|
|
|
||||||||||||||||||
Backlog |
— |
— |
|
|
|
|
Unaudited Pro Forma for the years ended |
||||||||||||
2019 |
2018 |
2017 |
||||||||||
Net revenue |
$ | |
$ | |
$ | |
||||||
Net income |
|
|
|
|||||||||
Basic net income per share |
|
|
|
|||||||||
Diluted net income per share |
|
|
|
2019 |
Three months ended |
|||||||||||||||||||
March 31 |
June 30 |
September 30 |
December 31 |
Total Year |
||||||||||||||||
Net revenue |
$ | |
$ | |
$ | |
$ | |
$ | |
||||||||||
Gross profit |
|
|
|
|
|
|||||||||||||||
Net income |
|
|
|
|
|
|||||||||||||||
Basic net income per share |
|
|
|
|
|
|||||||||||||||
Diluted net income per share |
|
|
|
|
|
|||||||||||||||
2018 |
Three months ended |
|||||||||||||||||||
March 31 |
June 30 |
September 30 |
December 31 |
Total Year |
||||||||||||||||
Net revenue |
$ | |
$ | |
$ | |
$ | |
$ | |
||||||||||
Gross profit |
|
|
|
|
|
|||||||||||||||
Net income |
|
|
|
|
|
|||||||||||||||
Basic net income per share |
|
|
|
|
|
|||||||||||||||
Diluted net income per share |
|
|
|
|
|
Item 9. |
Changes in and Disagreements with Accountants on Accounting and Financial Disclosure |
Item 9A. |
Controls and Procedures |
Subsidiary |
Acquisition Date |
Percentage of Total Assets |
Percent of Net Revenue |
|||||||||
1st State Insulation |
March 18, 2019 |
0.6 |
% | 0.7 |
% | |||||||
Expert Insulation |
June 24, 2019 |
1.7 |
% | 0.4 |
% | |||||||
Therm-Con/Foamtech |
August 19, 2019 |
0.2 |
% | 0.2 |
% | |||||||
Northeast Spray Insulation |
September 23, 2019 |
0.2 |
% | 0.0 |
% | |||||||
Premier Building Supply |
November 18, 2019 |
2.5 |
% | 0.1 |
% | |||||||
Gulf Coast Insulation |
December 9, 2019 |
0.3 |
% | 0.0 |
% |
Item 9B. |
Other Information |
Subsidiary |
Acquisition Date |
Percentage of Total Assets |
Percent of Net Revenue |
|||||||||
1st State Insulation |
March 18, 2019 |
0.6% |
0.7% |
|||||||||
Expert Insulation |
June 24, 2019 |
1.7% |
0.4% |
|||||||||
Therm-Con/Foamtech |
August 19, 2019 |
0.2% |
0.2% |
|||||||||
Northeast Spray Insulation |
September 23, 2019 |
0.2% |
0.0% |
|||||||||
Premier Building Supply |
November 18, 2019 |
2.5% |
0.1% |
|||||||||
Gulf Coast Insulation |
December 9, 2019 |
0.3% |
0.0% |
Item 10. |
Directors, Executive Officers and Corporate Governance |
Item 11. |
Executive Compensation |
Item 12. |
Security Ownership of Certain Beneficial Owners and Management and Related Stockholder Matters |
Item 13. |
Certain Relationships and Related Transactions, and Director Independence |
Item 14. |
Principal Accounting Fees and Services |
Item 15. |
Exhibits, Financial Statement Schedules |
1. | Financial Statements: The Consolidated Financial Statements, the Notes to Consolidated Financial Statements and the Report of Independent Registered Public Accounting Firm for Installed Building Products, Inc. are presented in Item 8, Financial Statements and Supplementary Data, of Part II of this Form 10-K. |
2. | Financial Schedules: All financial statement schedules have been omitted because they are inapplicable, not required, or shown in the consolidated financial statements and notes in Item 8, Financial Statements and Supplementary Data, of Part II of this Form 10-K. |
Exhibit Number |
Description | |||
2.1† |
||||
3.1 |
||||
3.2 |
||||
4.1 |
||||
4.2 |
||||
4.3* |
||||
10.1# |
Form of Indemnification Agreement for directors and officers, incorporated by reference to Exhibit 10.1 to the Company’s Registration Statement on Form S-1/A filed on January 27, 2014. | |||
10.2# |
||||
10.3# |
||||
10.4#* |
||||
10.5# |
Exhibit Number |
Description | |||
10.31# |
||||
10.32# |
||||
10.33# |
||||
21.1* |
||||
23.1* |
||||
31.1* |
||||
31.2* |
||||
32.1* |
||||
32.2* |
||||
101.INS** |
XBRL Instance Document — the instance document does not appear in the interactive date file because its XBRL tags are embedded within the Inline XBRL document | |||
101.SCH** |
Inline XBRL Taxonomy Extension Schema Document | |||
101. CAL** |
Inline XBRL Taxonomy Extension Calculation Linkbase Document | |||
101. LAB** |
Inline XBRL Taxonomy Extension Label Linkbase Document | |||
101. PRE** |
Inline XBRL Taxonomy Extension Presentation Linkbase Document | |||
101. DEF** |
Inline XBRL Taxonomy Extension Definition Linkbase Document | |||
104** |
Cover Page Interactive Data File (formatted in Inline XBRL and contained in Exhibit 101) |
* Filed | herewith. |
** | Submitted electronically with the report. |
# | Indicates management contract or compensatory plan. |
† | Schedules have been omitted pursuant to Item 601(a)(5) of Regulation S-K. |
Item 16. |
Form 10-K Summary |
INSTALLED BUILDING PRODUCTS, INC. | ||
/s/ Jeffrey W. Edwards | ||
By: |
Jeffrey W. Edwards | |
President and Chief Executive Officer |
Signature |
Title |
Date | ||
/s/ Jeffrey W. Edwards Jeffrey W. Edwards |
President, Chief Executive Officer and Chairman of the Board of Directors (Principal Executive Officer) |
February 27, 2020 | ||
/s/ Michael T. Miller Michael T. Miller |
Executive Vice President, Chief Financial Officer and Director (Principal Financial Officer) |
February 27, 2020 | ||
/s/ Todd R. Fry Todd R. Fry |
Chief Accounting Officer and Treasurer (Principal Accounting Officer) |
February 27, 2020 | ||
/s/ Margot L. Carter Margot L. Carter |
Director |
February 27, 2020 | ||
/s/ Lawrence A. Hilsheimer Lawrence A. Hilsheimer |
Director |
February 27, 2020 | ||
/s/ Janet E. Jackson Janet E. Jackson |
Director |
February 27, 2020 | ||
/s/ Robert H. Schottenstein Robert H. Schottenstein |
Director |
February 27, 2020 | ||
/s/ Michael H. Thomas Michael H. Thomas |
Director |
February 27, 2020 | ||
/s/ Vikas Verma Vikas Verma |
Director |
February 27, 2020 |