
Emerald Holding, Inc. First Quarter 2024 May 7, 2024 Exhibit 99.2
Notes Forward-Looking Statements The information provided in this presentation is for general informational purposes only. This document contains certain forward-looking statements regarding Emerald Holding, Inc. and its subsidiaries (the “Company”), including, without limitation, the Company’s ability to continue staging live events and scale its business beyond pre-COVID levels; expectations regarding interest rates and economic conditions and the Company’s 2024 financial guidance expectations. These statements are based on management’s current expectations as well as estimates and assumptions prepared by management as of the date hereof, and although they are believed to be reasonable, they are inherently uncertain and not guaranteed. These statements involve risks and uncertainties outside of the Company’s control that may cause actual results, performance, or achievements, to differ materially and there can be no assurance that the projected results and forward-looking statements in this presentation will prove to be accurate. Forward looking statements include all statements that are not historical facts and can be identified by terms such as “anticipate,” “believes, “could,” “estimate,” “expect,” “intend,” “may,” “might,” “objective,” “ongoing,” “plan,” “potential,” “predict,” “project,” “should,” “target,” “will,” or “would” or similar expressions and the negatives of those terms. In particular, statements regarding the post-pandemic recovery for live events, expected free cash flow generation, and the multiple avenues to return to organic growth are each forward-looking statements among others. See “Risk Factors” and “Cautionary Note Regarding Forward-Looking Statements” in the Company’s most recently filed annual report on Form 10-K. The Company disclaims any obligation to update or revise any of the forward-looking statements contained herein, whether as a result of new information, future events or otherwise. Past results are not indicative of future performance.
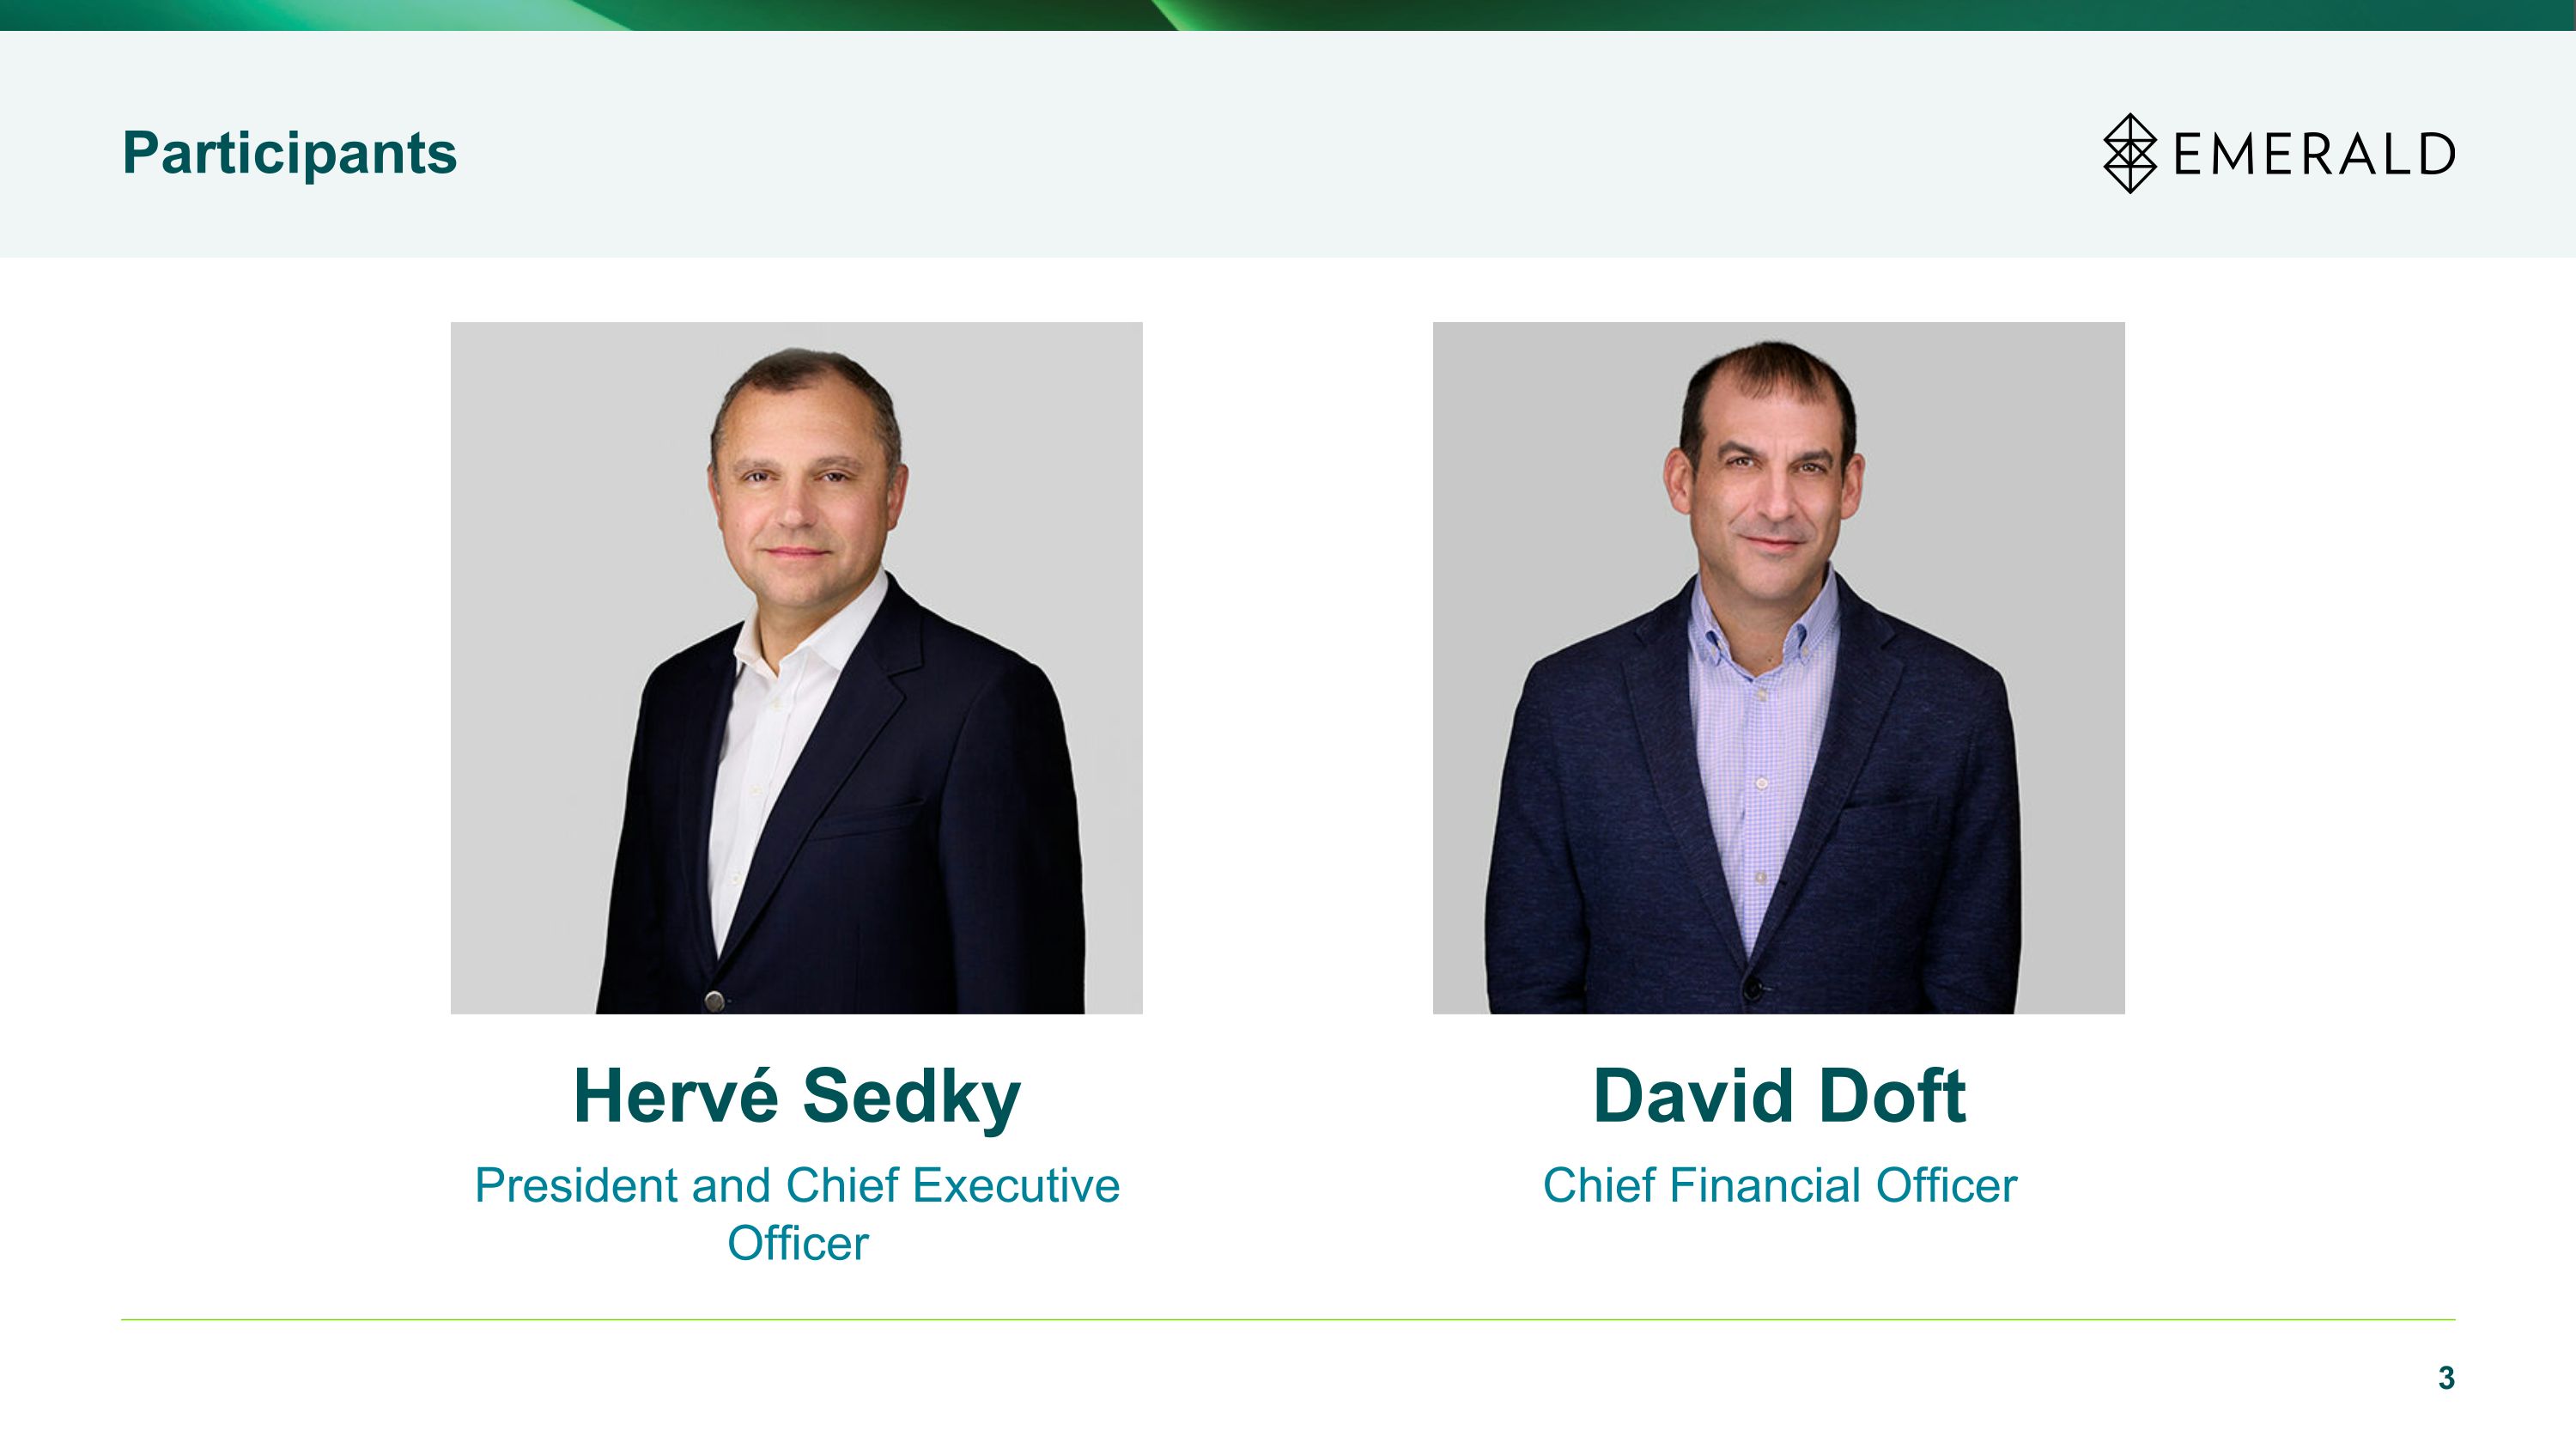
Participants Hervé Sedky President and Chief Executive Officer David Doft Chief Financial Officer
Key Q1 2024 Takeaways Continued year-over-year growth supported by positive trends in exhibitor and attendee counts, square footage, and pricing. Strong re-booking trends provide forward visibility and support reiterated outlook of $415 to 425 million in Revenue and $110 to 115 million in Adjusted EBITDA in FY 2024 Target to expand Adj. EBITDA margins from ~27% implied in 2024 guidance to historical levels over time Subsequent to quarter-end, completed the conversion of all outstanding preferred shares to common stock, resulting in a simpler capital structure Emerald continues to launch and acquire new products and services that are complementary to its core business to better support customers year-round Diversified portfolio across multiple sectors with countercyclical benefits Continue to generate positive free cash flow, supported by low-CAPEX requirements and working capital dynamics of events business where cash is collected in advance of an event staging
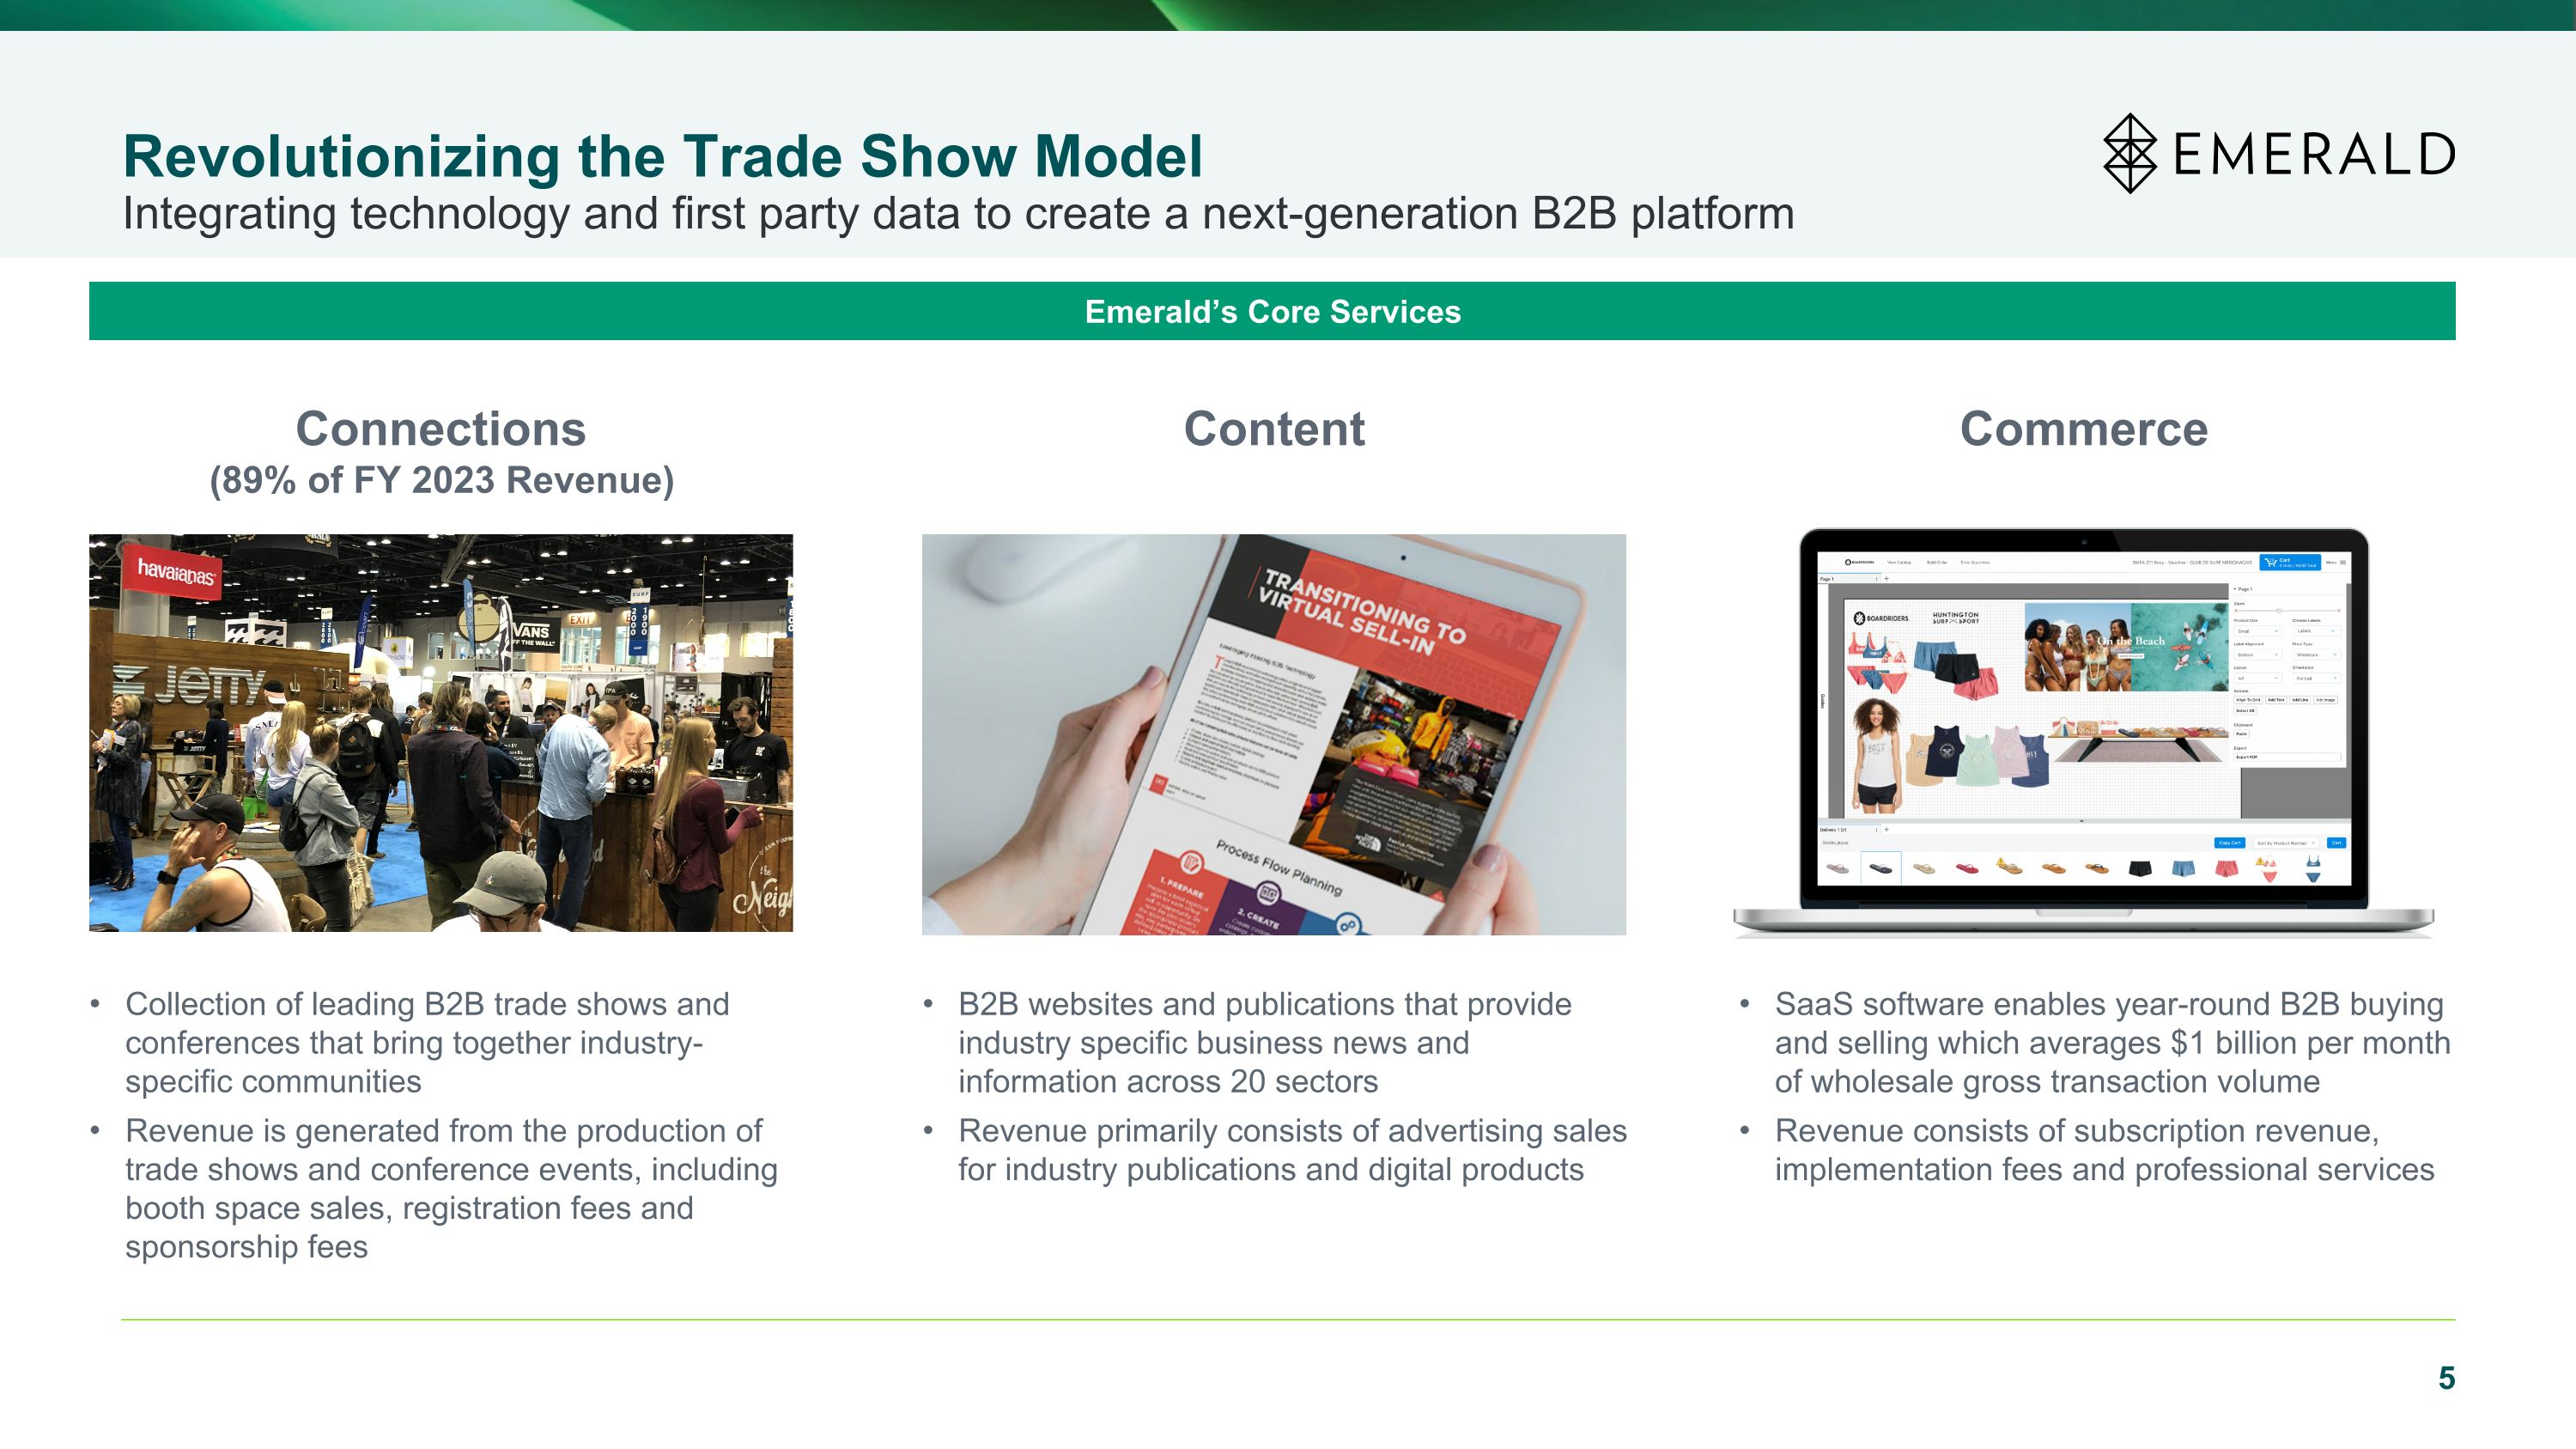
Revolutionizing the Trade Show Model Integrating technology and first party data to create a next-generation B2B platform Collection of leading B2B trade shows and conferences that bring together industry-specific communities Revenue is generated from the production of trade shows and conference events, including booth space sales, registration fees and sponsorship fees Emerald’s Core Services B2B websites and publications that provide industry specific business news and information across 20 sectors Revenue primarily consists of advertising sales for industry publications and digital products SaaS software enables year-round B2B buying and selling which averages $1 billion per month of wholesale gross transaction volume Revenue consists of subscription revenue, implementation fees and professional services Connections (89% of FY 2023 Revenue) Content Commerce
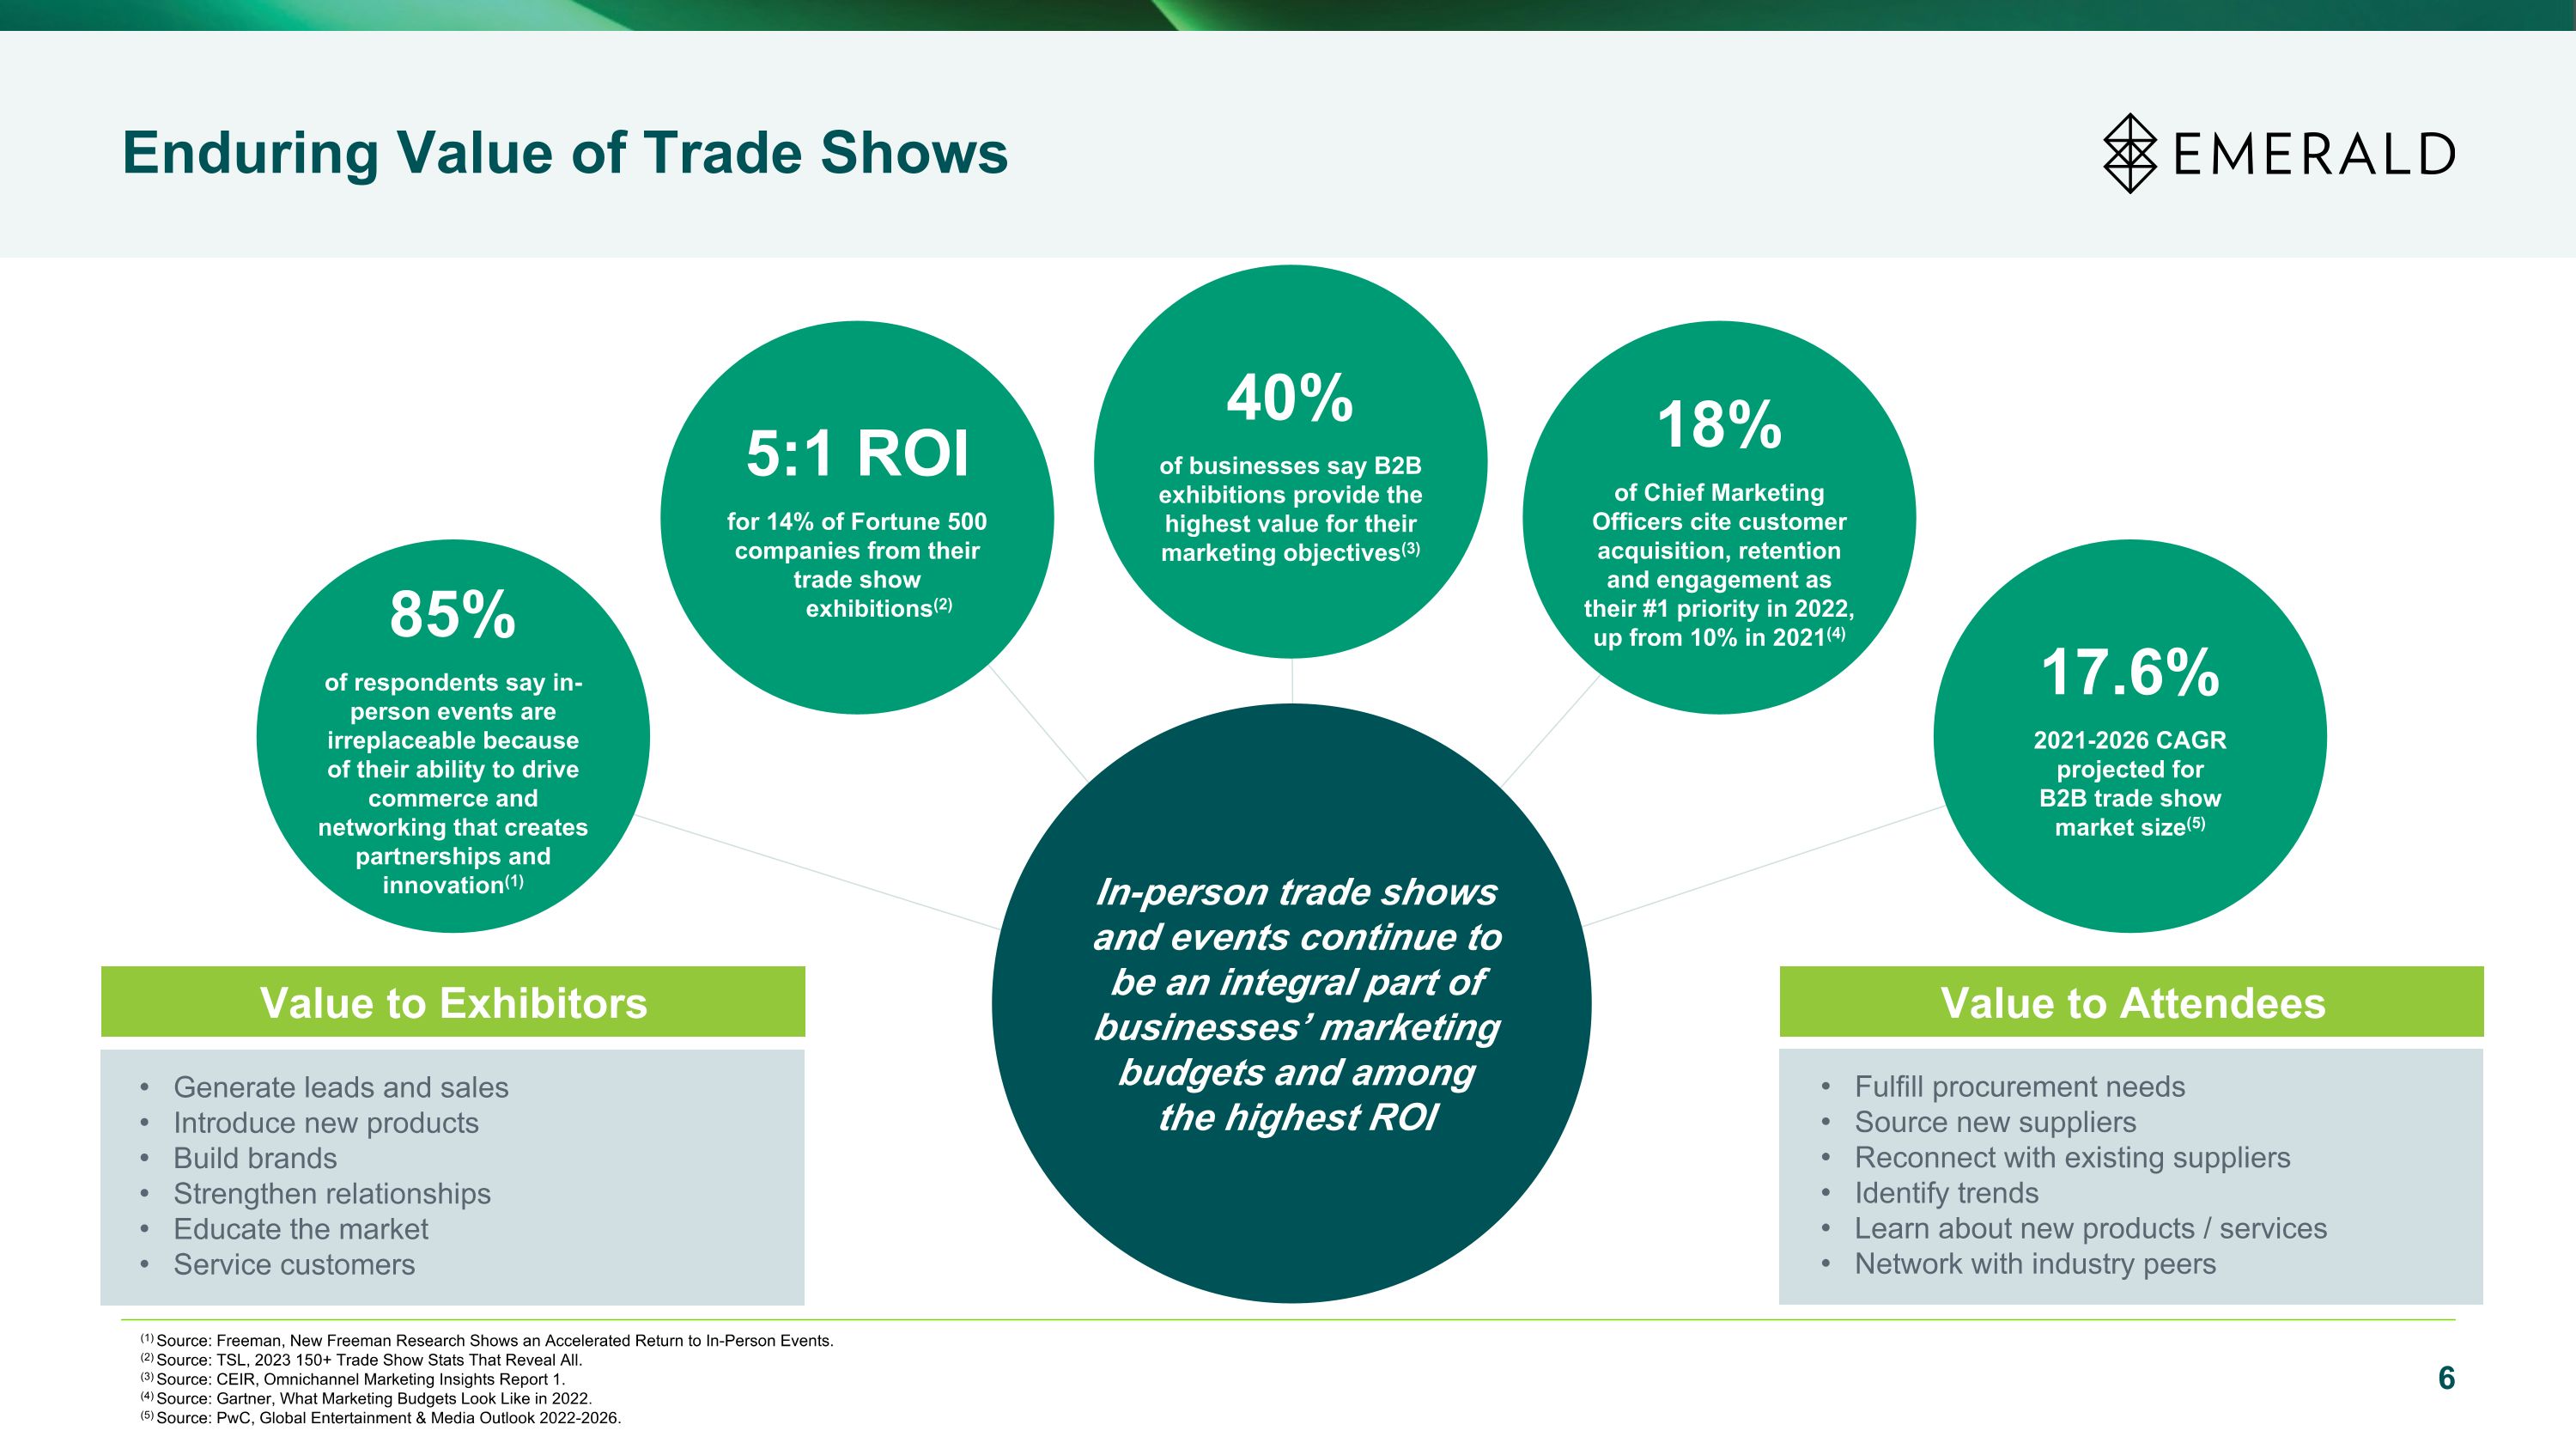
Enduring Value of Trade Shows (1) Source: Freeman, New Freeman Research Shows an Accelerated Return to In-Person Events. (2) Source: TSL, 2023 150+ Trade Show Stats That Reveal All. (3) Source: CEIR, Omnichannel Marketing Insights Report 1. (4) Source: Gartner, What Marketing Budgets Look Like in 2022. (5) Source: PwC, Global Entertainment & Media Outlook 2022-2026. In-person trade shows and events continue to be an integral part of businesses’ marketing budgets and among the highest ROI Generate leads and sales Introduce new products Build brands Strengthen relationships Educate the market Service customers Fulfill procurement needs Source new suppliers Reconnect with existing suppliers Identify trends Learn about new products / services Network with industry peers Value to Exhibitors Value to Attendees 85% of respondents say in-person events are irreplaceable because of their ability to drive commerce and networking that creates partnerships and innovation(1) 5:1 ROI for 14% of Fortune 500 companies from their trade show exhibitions(2) 40% of businesses say B2B exhibitions provide the highest value for their marketing objectives(3) 18% of Chief Marketing Officers cite customer acquisition, retention and engagement as their #1 priority in 2022, up from 10% in 2021(4) 17.6% 2021-2026 CAGR projected for B2B trade show market size(5)
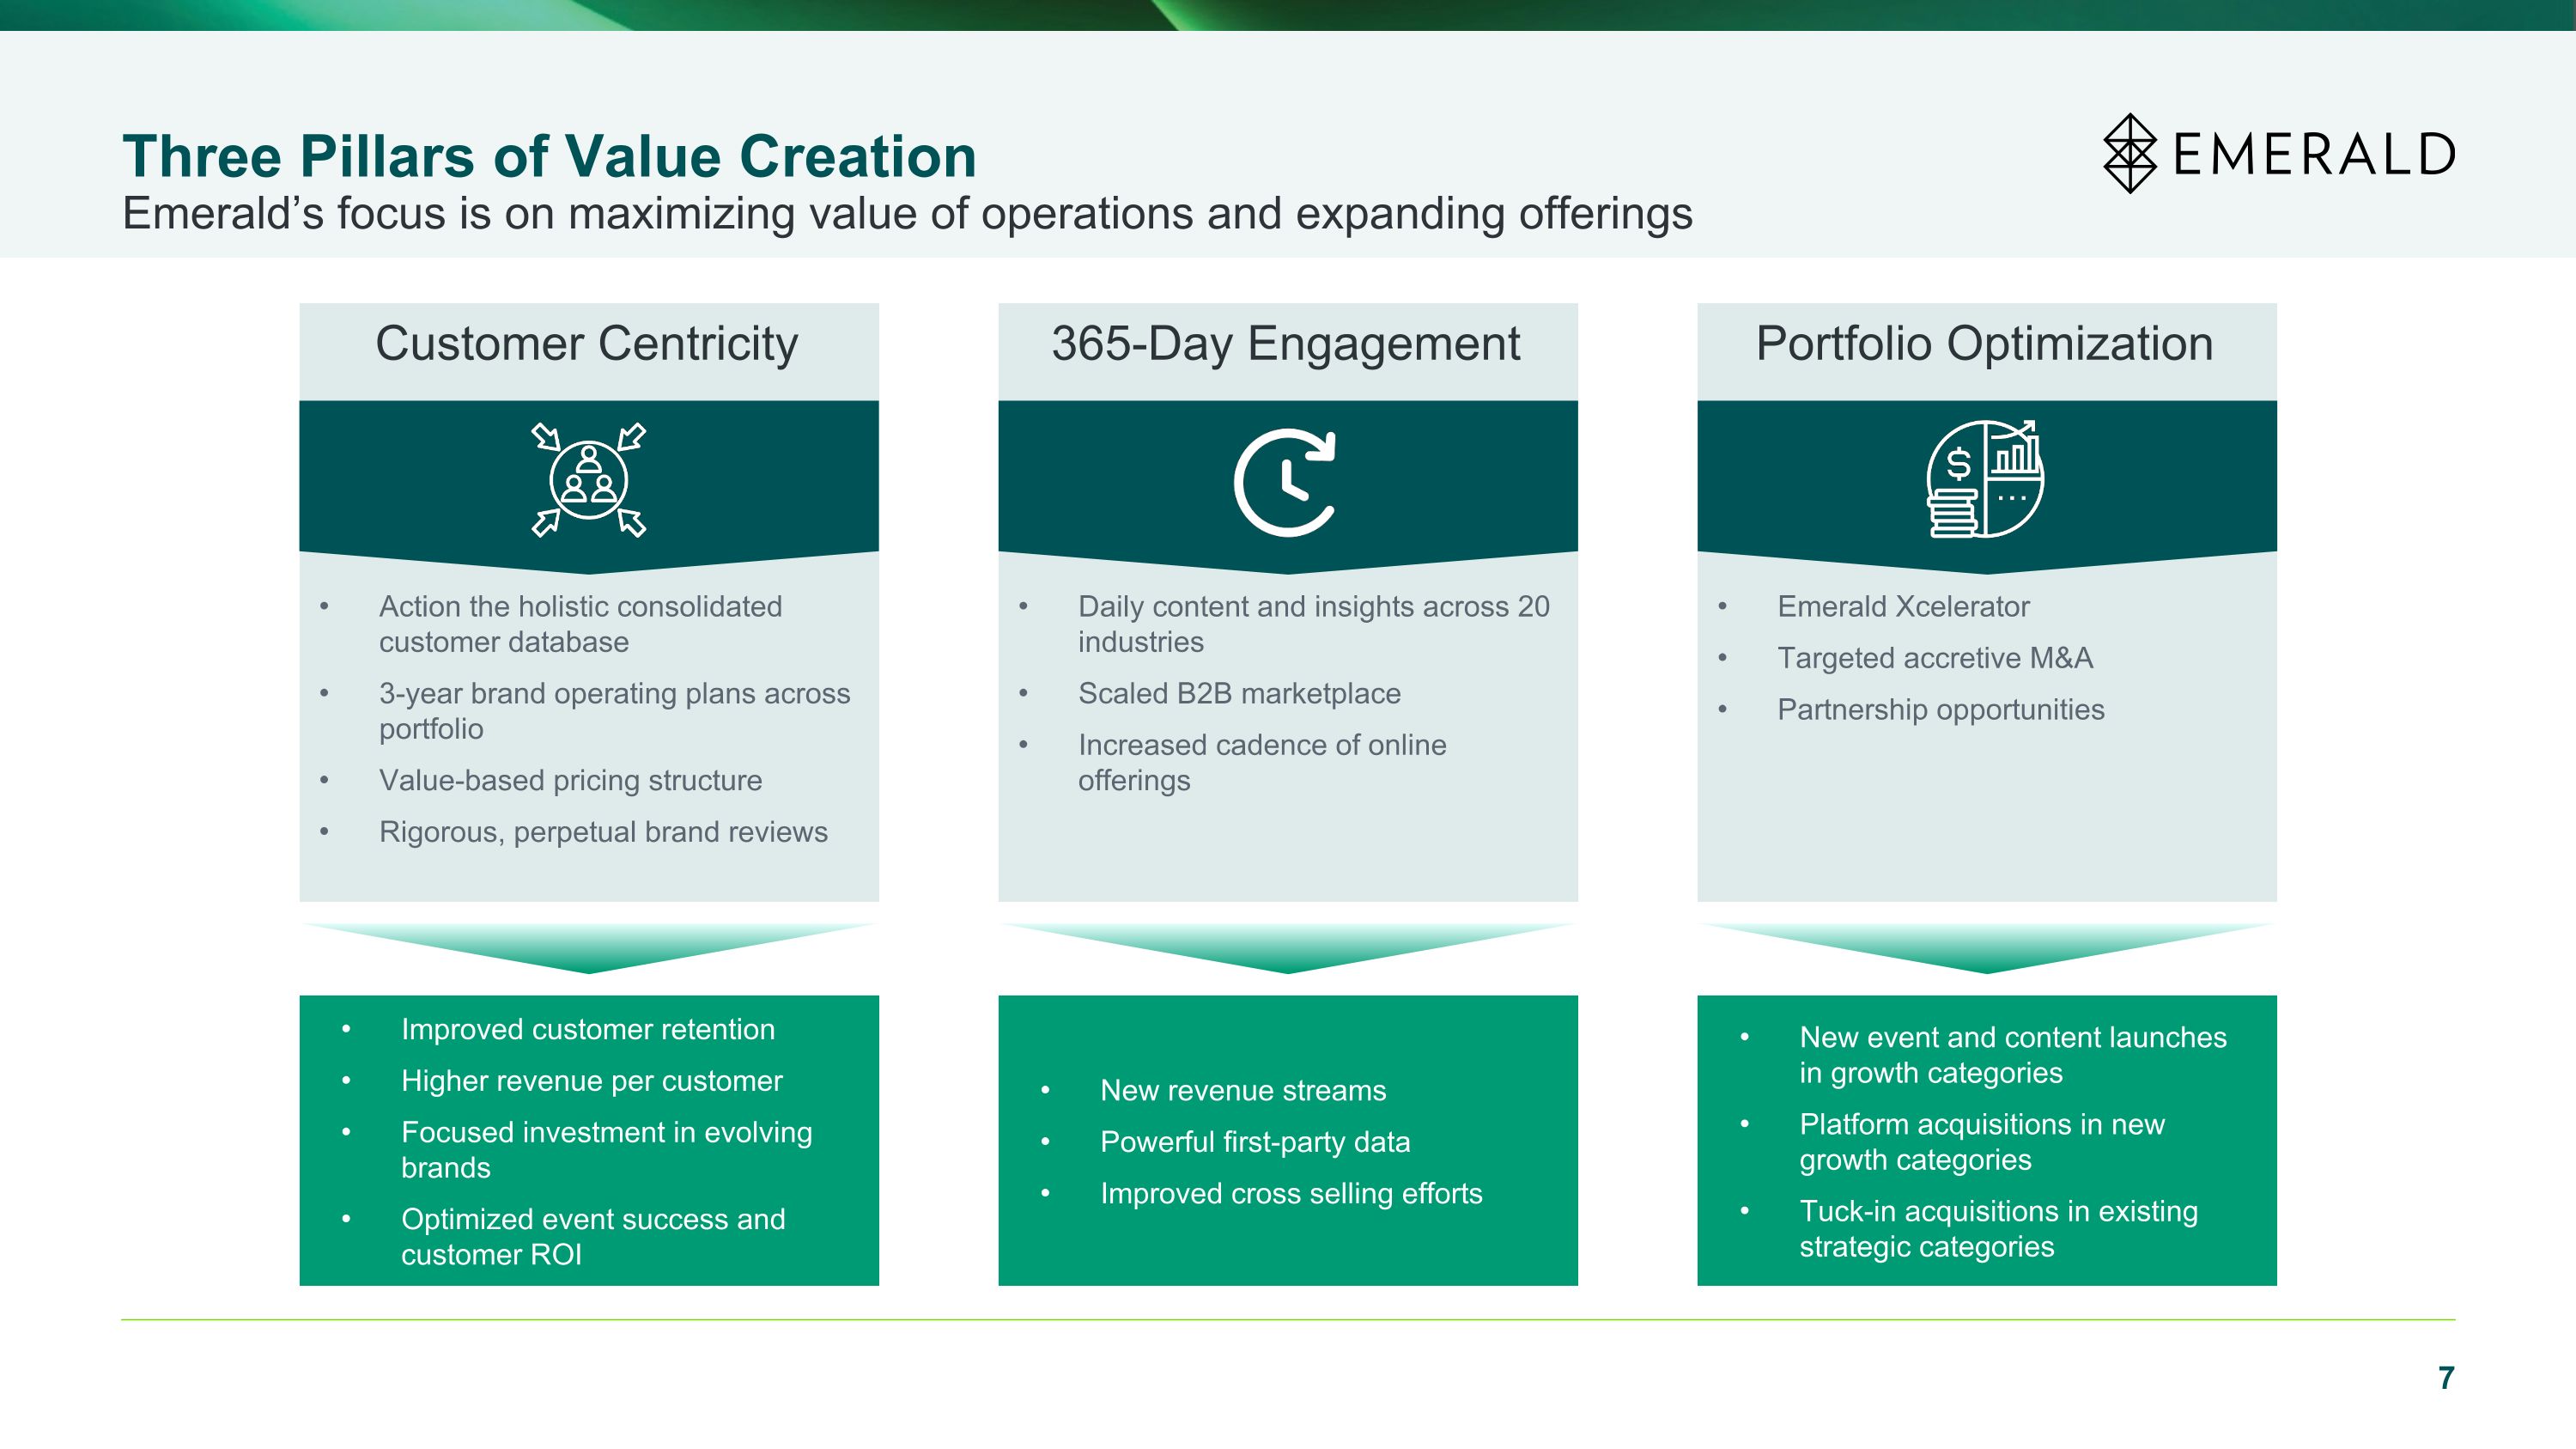
Three Pillars of Value Creation Emerald’s focus is on maximizing value of operations and expanding offerings Action the holistic consolidated customer database 3-year brand operating plans across portfolio Value-based pricing structure Rigorous, perpetual brand reviews Improved customer retention Higher revenue per customer Focused investment in evolving brands Optimized event success and customer ROI Customer Centricity Emerald Xcelerator Targeted accretive M&A Partnership opportunities New event and content launches in growth categories Platform acquisitions in new growth categories Tuck-in acquisitions in existing strategic categories Portfolio Optimization Daily content and insights across 20 industries Scaled B2B marketplace Increased cadence of online offerings New revenue streams Powerful first-party data Improved cross selling efforts 365-Day Engagement
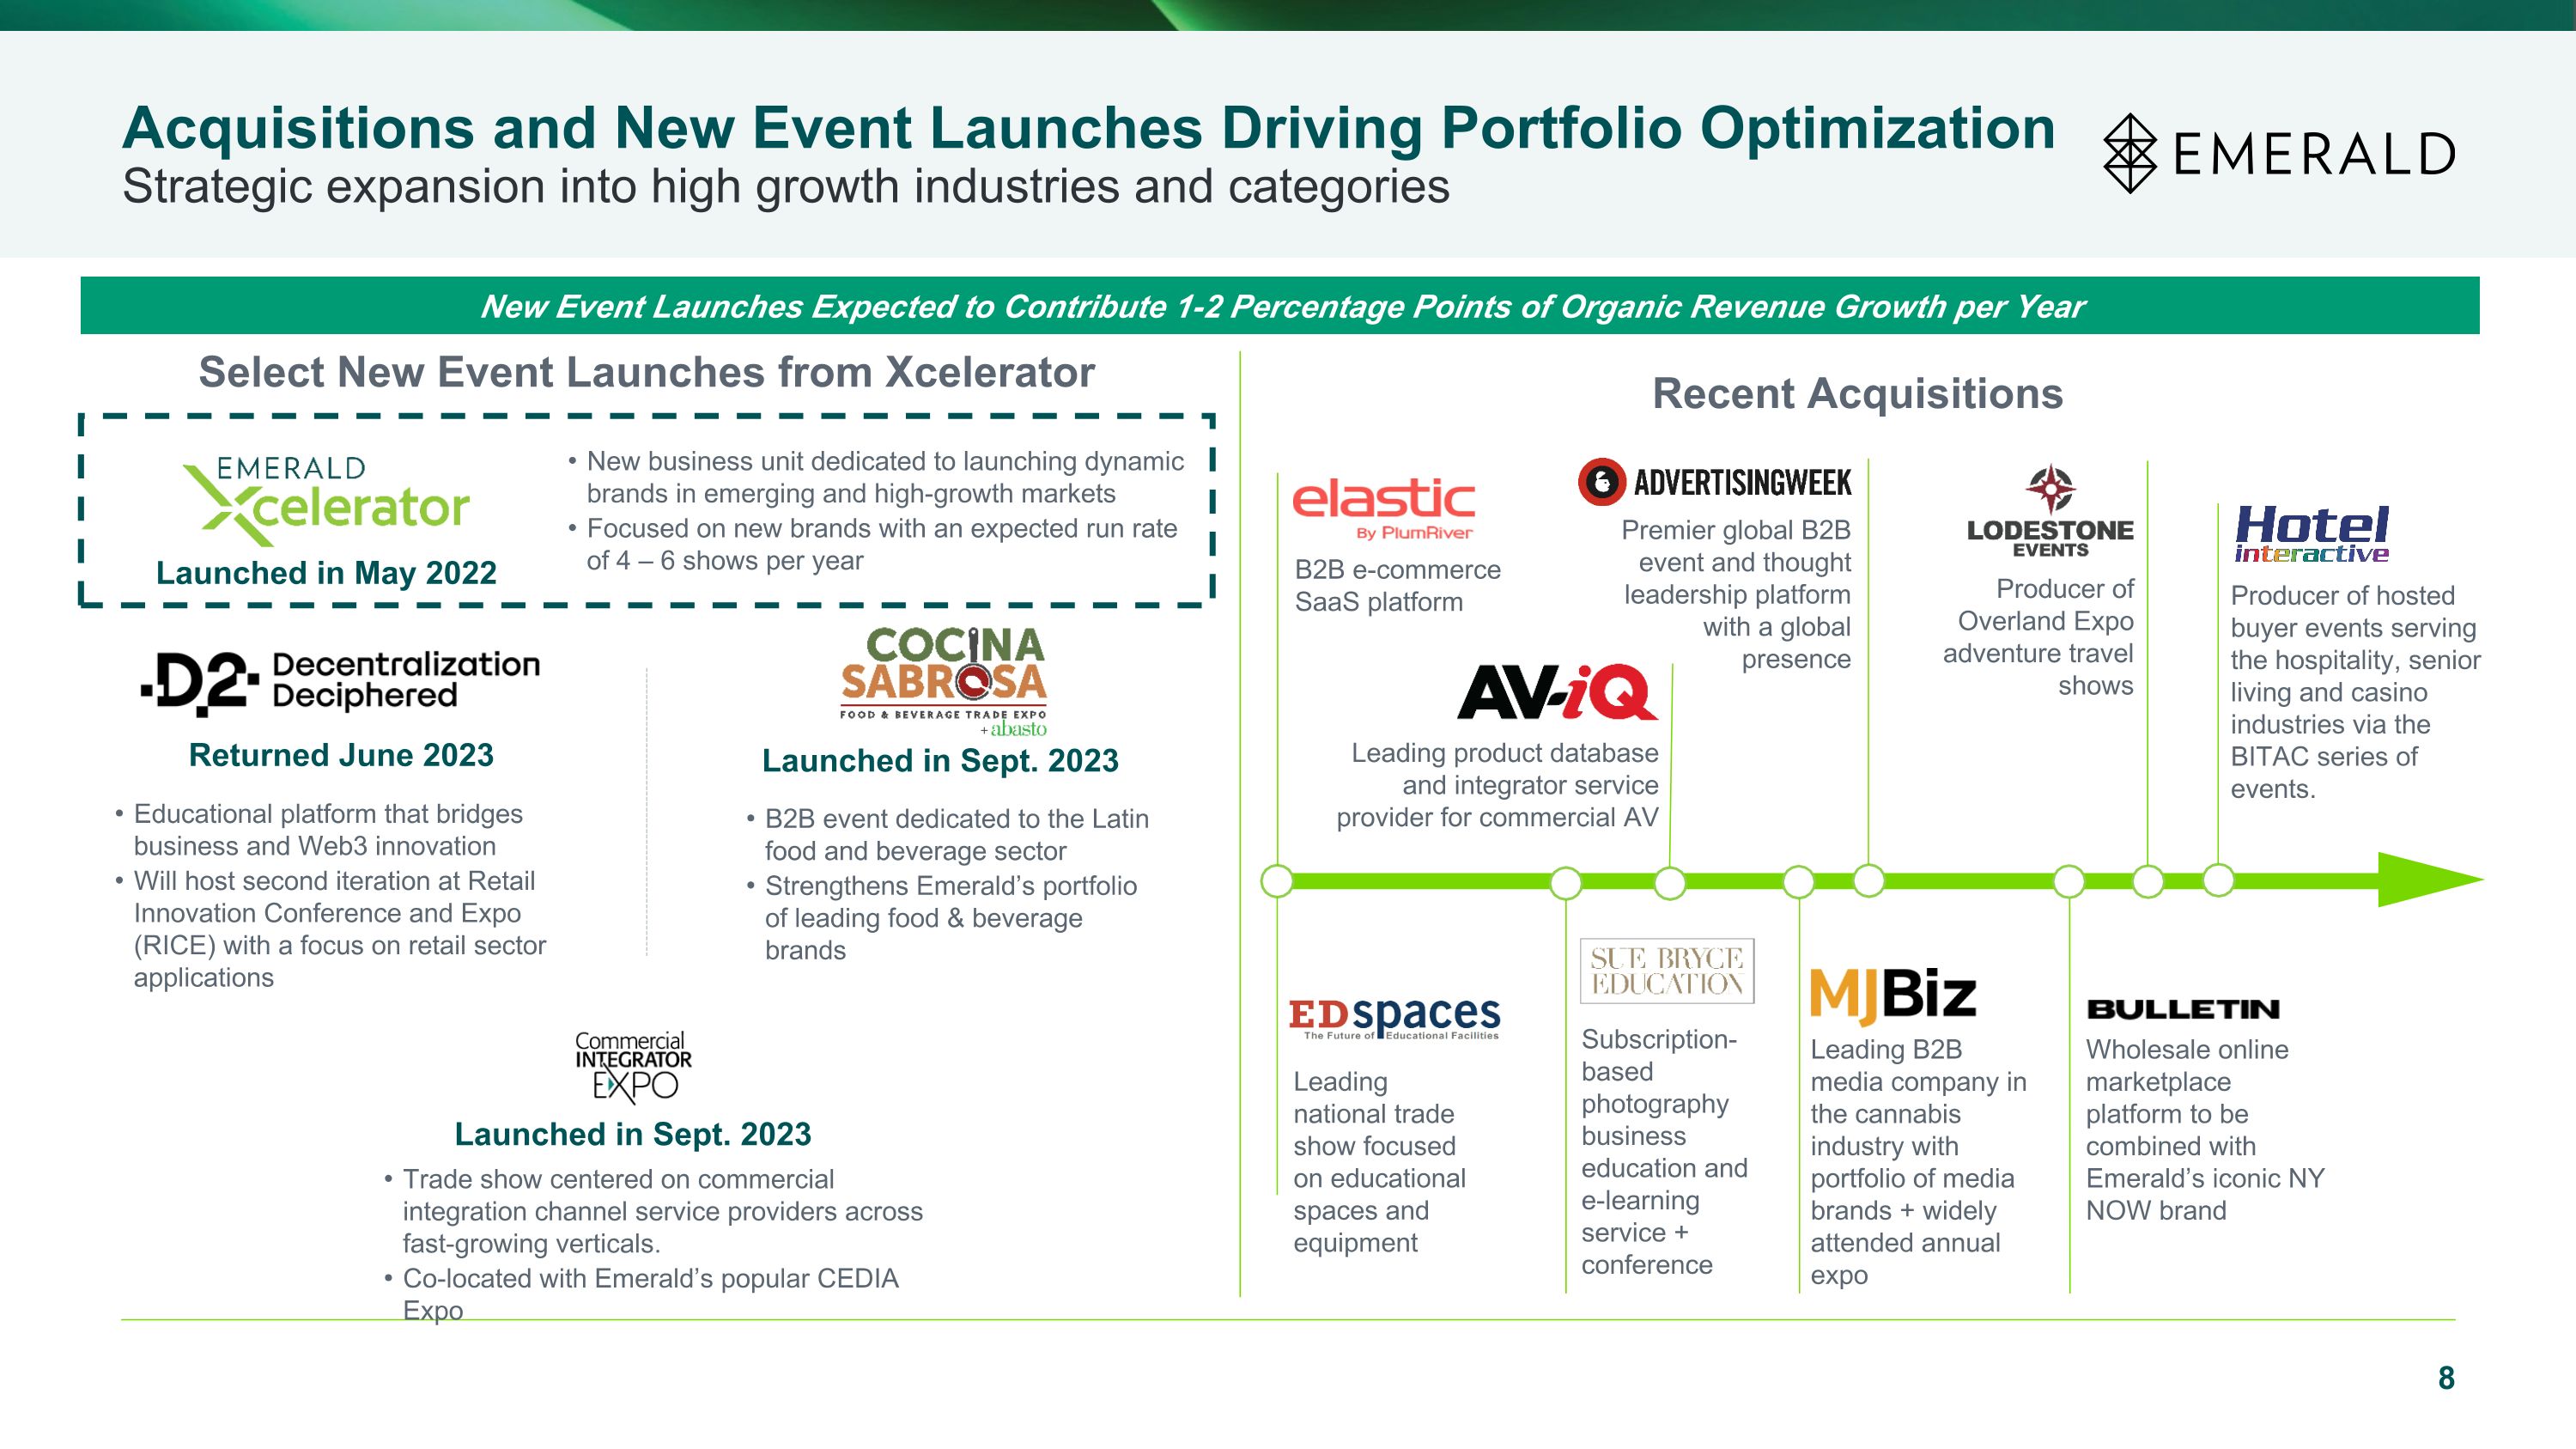
Acquisitions and New Event Launches Driving Portfolio Optimization Strategic expansion into high growth industries and categories Select New Event Launches from Xcelerator New Event Launches Expected to Contribute 1-2 Percentage Points of Organic Revenue Growth per Year Educational platform that bridges business and Web3 innovation Will host second iteration at Retail Innovation Conference and Expo (RICE) with a focus on retail sector applications Returned June 2023 B2B event dedicated to the Latin food and beverage sector Strengthens Emerald’s portfolio of leading food & beverage brands Launched in Sept. 2023 Social 3rd Party Digital Recent Acquisitions Leading B2B media company in the cannabis industry with portfolio of media brands + widely attended annual expo B2B e-commerce SaaS platform Premier global B2B event and thought leadership platform with a global presence Leading product database and integrator service provider for commercial AV Leading national trade show focused on educational spaces and equipment Subscription-based photography business education and e-learning service + conference Wholesale online marketplace platform to be combined with Emerald’s iconic NY NOW brand Producer of Overland Expo adventure travel shows Launched in May 2022 New business unit dedicated to launching dynamic brands in emerging and high-growth markets Focused on new brands with an expected run rate of 4 – 6 shows per year Producer of hosted buyer events serving the hospitality, senior living and casino industries via the BITAC series of events. Launched in Sept. 2023 Trade show centered on commercial integration channel service providers across fast-growing verticals. Co-located with Emerald’s popular CEDIA Expo
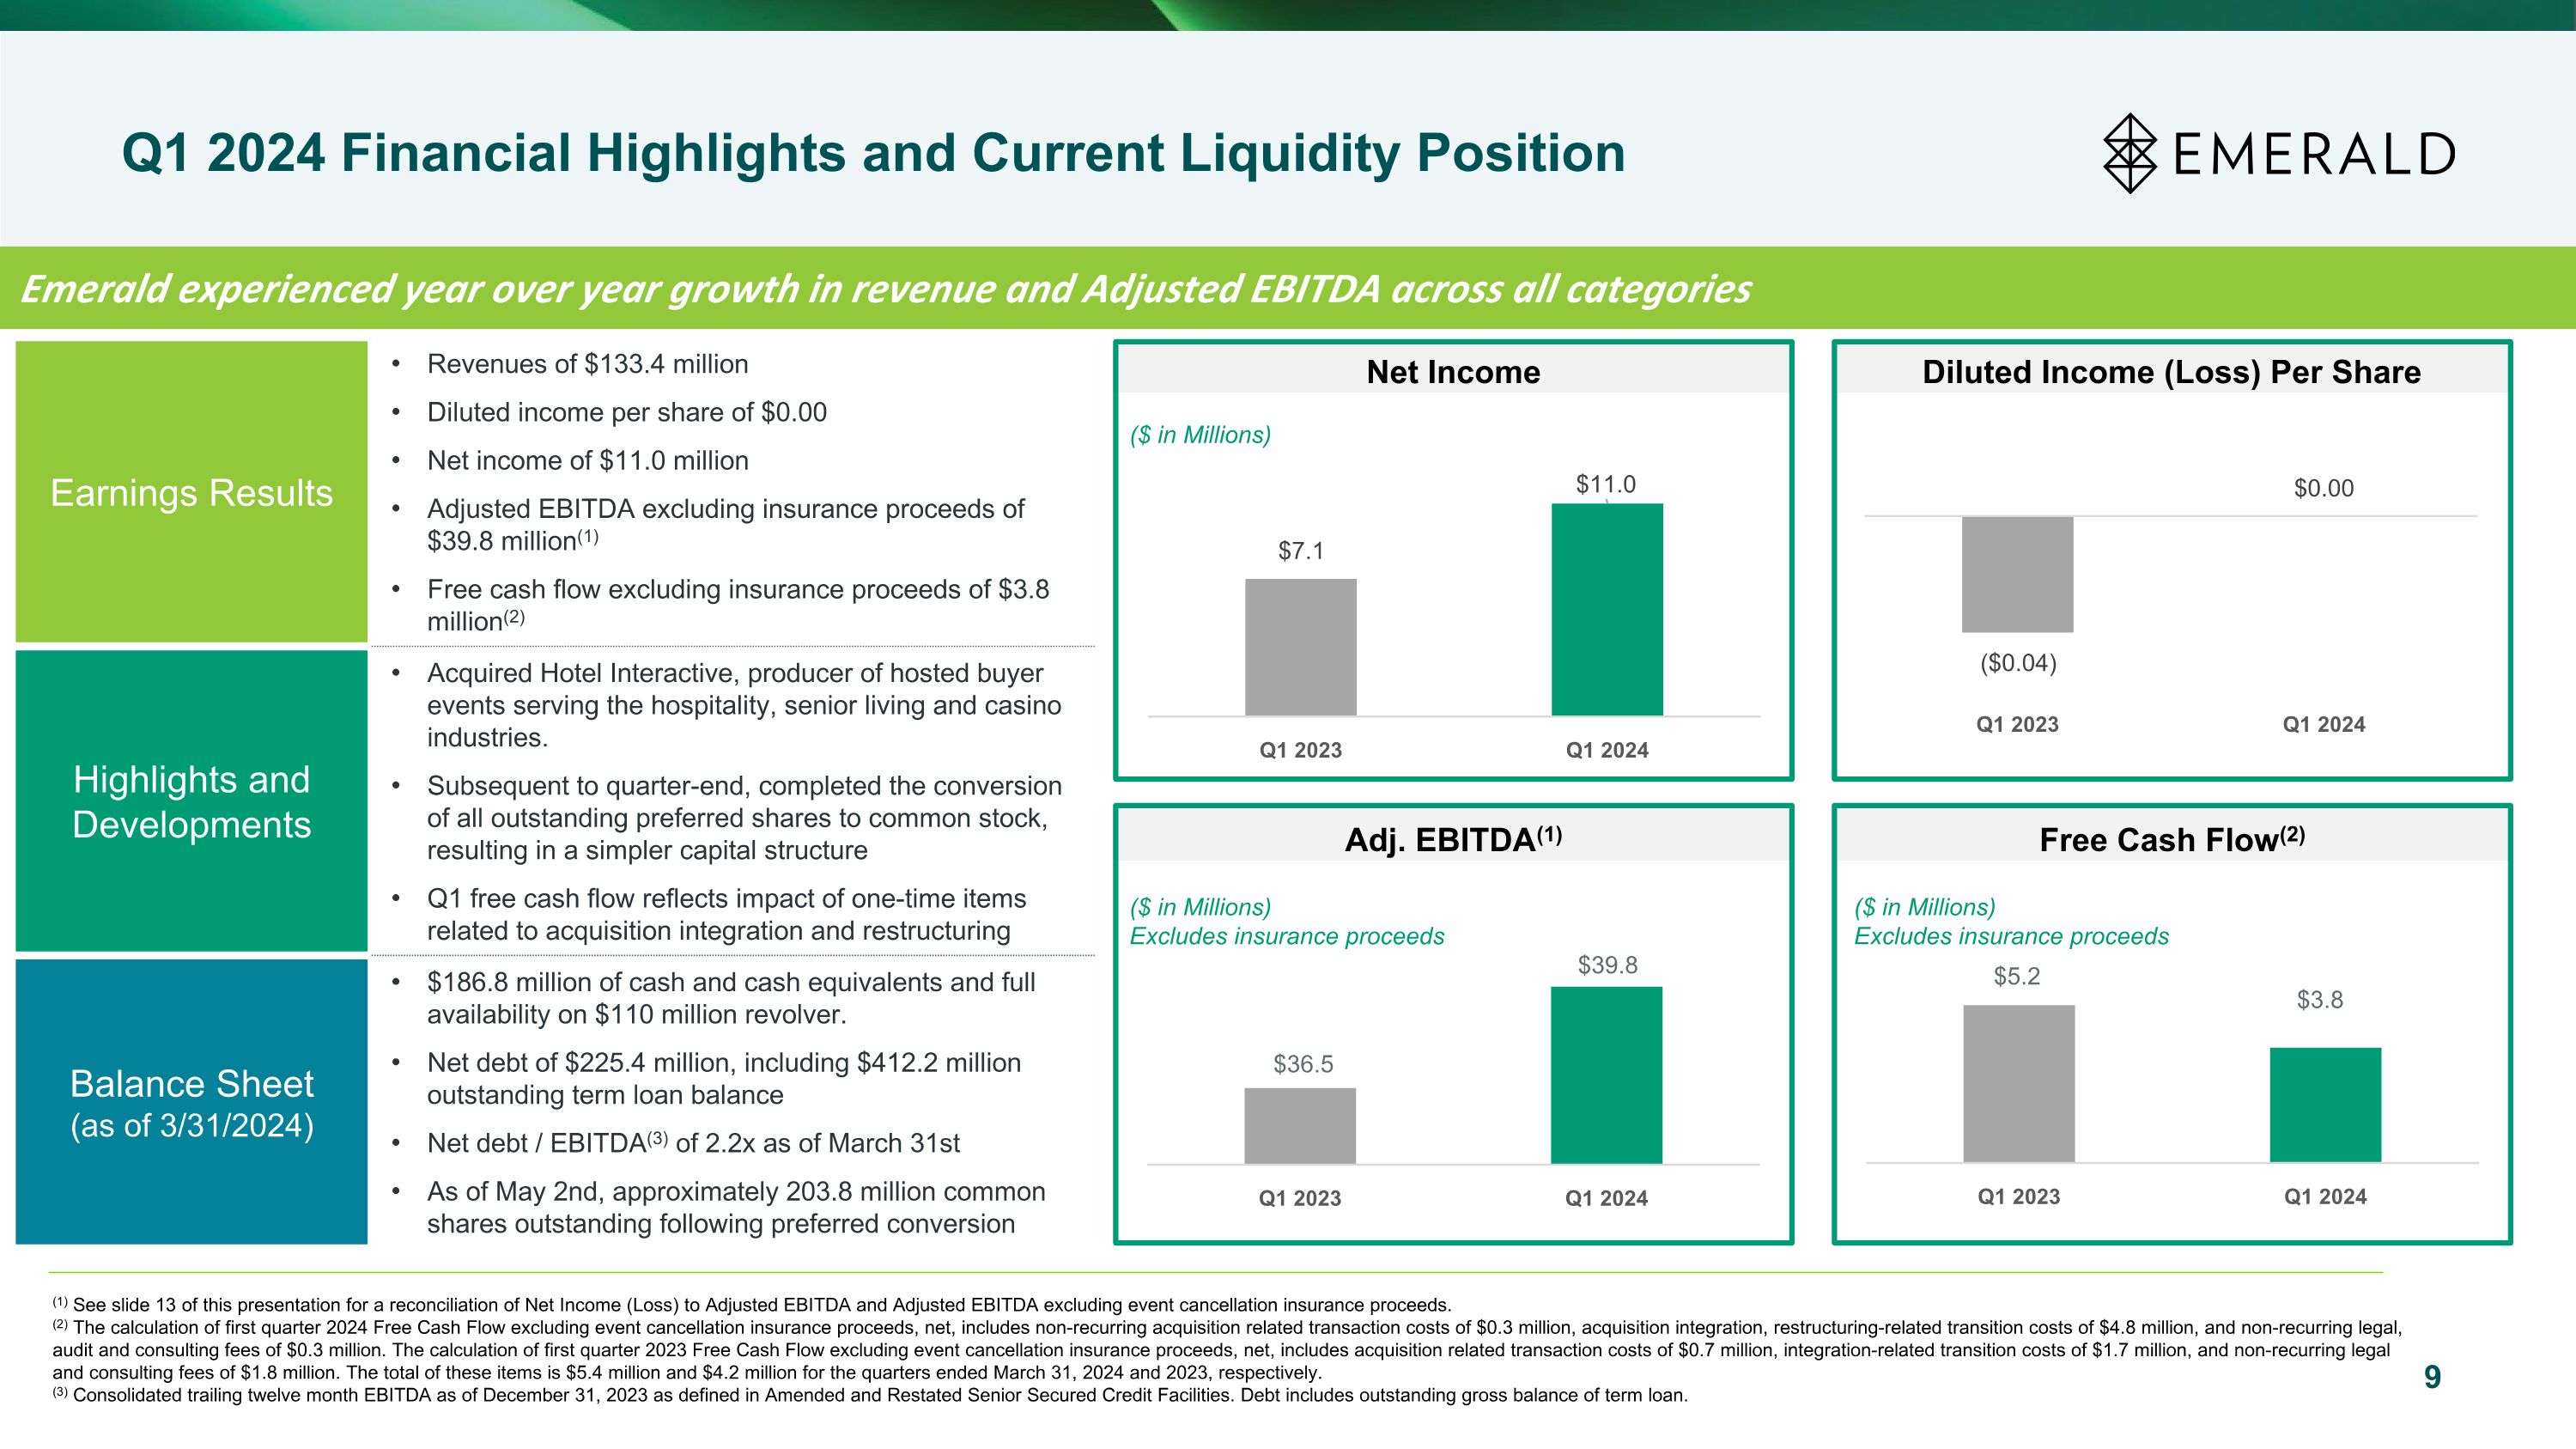
9 Adj. EBITDA(1) Free Cash Flow(2) Net Income Diluted Income (Loss) Per Share ($ in Millions) ($ in Millions) Excludes insurance proceeds (1) See slide 13 of this presentation for a reconciliation of Net Income (Loss) to Adjusted EBITDA and Adjusted EBITDA excluding event cancellation insurance proceeds. (2) The calculation of first quarter 2024 Free Cash Flow excluding event cancellation insurance proceeds, net, includes non-recurring acquisition related transaction costs of $0.3 million, acquisition integration, restructuring-related transition costs of $4.8 million, and non-recurring legal, audit and consulting fees of $0.3 million. The calculation of first quarter 2023 Free Cash Flow excluding event cancellation insurance proceeds, net, includes acquisition related transaction costs of $0.7 million, integration-related transition costs of $1.7 million, and non-recurring legal and consulting fees of $1.8 million. The total of these items is $5.4 million and $4.2 million for the quarters ended March 31, 2024 and 2023, respectively. (3) Consolidated trailing twelve month EBITDA as of December 31, 2023 as defined in Amended and Restated Senior Secured Credit Facilities. Debt includes outstanding gross balance of term loan. Earnings Results Revenues of $133.4 million Diluted income per share of $0.00 Net income of $11.0 million Adjusted EBITDA excluding insurance proceeds of $39.8 million(1) Free cash flow excluding insurance proceeds of $3.8 million(2) Highlights and Developments Acquired Hotel Interactive, producer of hosted buyer events serving the hospitality, senior living and casino industries. Subsequent to quarter-end, completed the conversion of all outstanding preferred shares to common stock, resulting in a simpler capital structure Q1 free cash flow reflects impact of one-time items related to acquisition integration and restructuring Balance Sheet (as of 3/31/2024) $186.8 million of cash and cash equivalents and full availability on $110 million revolver. Net debt of $225.4 million, including $412.2 million outstanding term loan balance Net debt / EBITDA(3) of 2.2x as of March 31st As of May 2nd, approximately 203.8 million common shares outstanding following preferred conversion Emerald experienced year over year growth in revenue and Adjusted EBITDA across all categories ($ in Millions) Excludes insurance proceeds Q1 2024 Financial Highlights and Current Liquidity Position ($0.78)
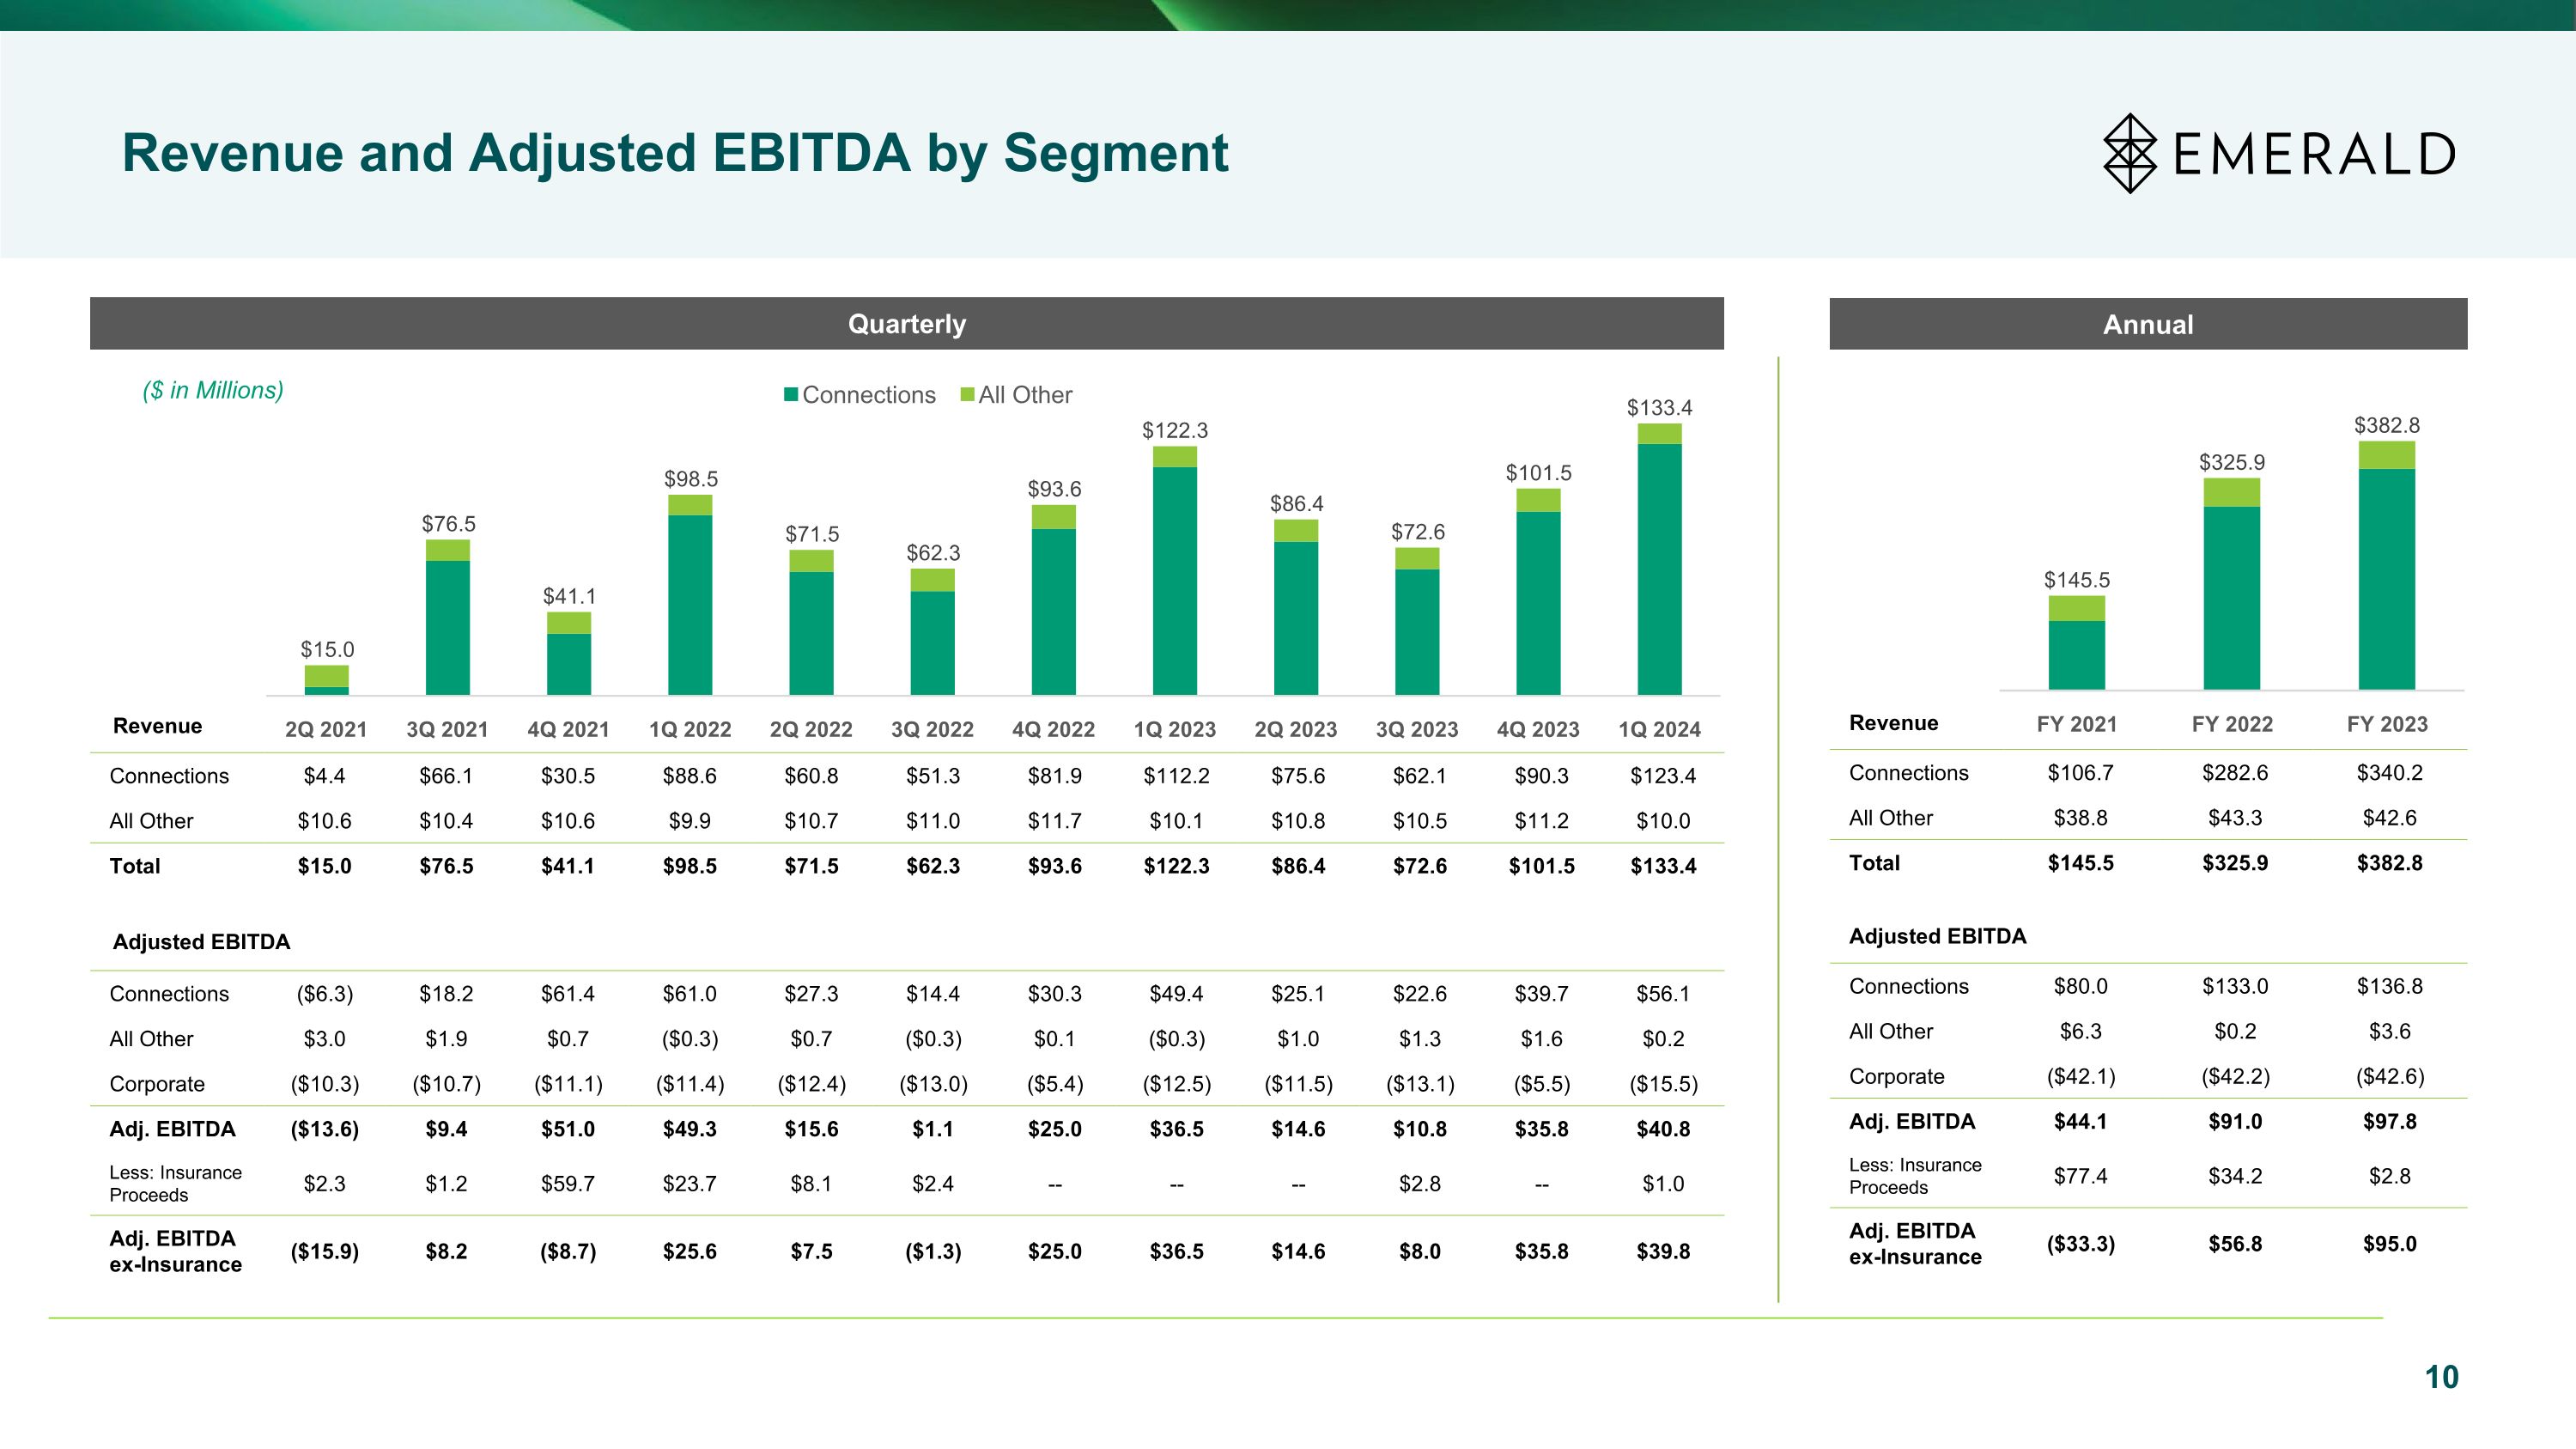
10 ($ in Millions) Revenue and Adjusted EBITDA by Segment Quarterly Connections $4.4 $66.1 $30.5 $88.6 $60.8 $51.3 $81.9 $112.2 $75.6 $62.1 $90.3 $123.4 All Other $10.6 $10.4 $10.6 $9.9 $10.7 $11.0 $11.7 $10.1 $10.8 $10.5 $11.2 $10.0 Total $15.0 $76.5 $41.1 $98.5 $71.5 $62.3 $93.6 $122.3 $86.4 $72.6 $101.5 $133.4 Connections $106.7 $282.6 $340.2 All Other $38.8 $43.3 $42.6 Total $145.5 $325.9 $382.8 Annual Connections ($6.3) $18.2 $61.4 $61.0 $27.3 $14.4 $30.3 $49.4 $25.1 $22.6 $39.7 $56.1 All Other $3.0 $1.9 $0.7 ($0.3) $0.7 ($0.3) $0.1 ($0.3) $1.0 $1.3 $1.6 $0.2 Corporate ($10.3) ($10.7) ($11.1) ($11.4) ($12.4) ($13.0) ($5.4) ($12.5) ($11.5) ($13.1) ($5.5) ($15.5) Adj. EBITDA ($13.6) $9.4 $51.0 $49.3 $15.6 $1.1 $25.0 $36.5 $14.6 $10.8 $35.8 $40.8 Less: Insurance Proceeds $2.3 $1.2 $59.7 $23.7 $8.1 $2.4 -- -- -- $2.8 -- $1.0 Adj. EBITDA ex-Insurance ($15.9) $8.2 ($8.7) $25.6 $7.5 ($1.3) $25.0 $36.5 $14.6 $8.0 $35.8 $39.8 Revenue Adjusted EBITDA Connections $80.0 $133.0 $136.8 All Other $6.3 $0.2 $3.6 Corporate ($42.1) ($42.2) ($42.6) Adj. EBITDA $44.1 $91.0 $97.8 Less: Insurance Proceeds $77.4 $34.2 $2.8 Adj. EBITDA ex-Insurance ($33.3) $56.8 $95.0 Adjusted EBITDA Revenue
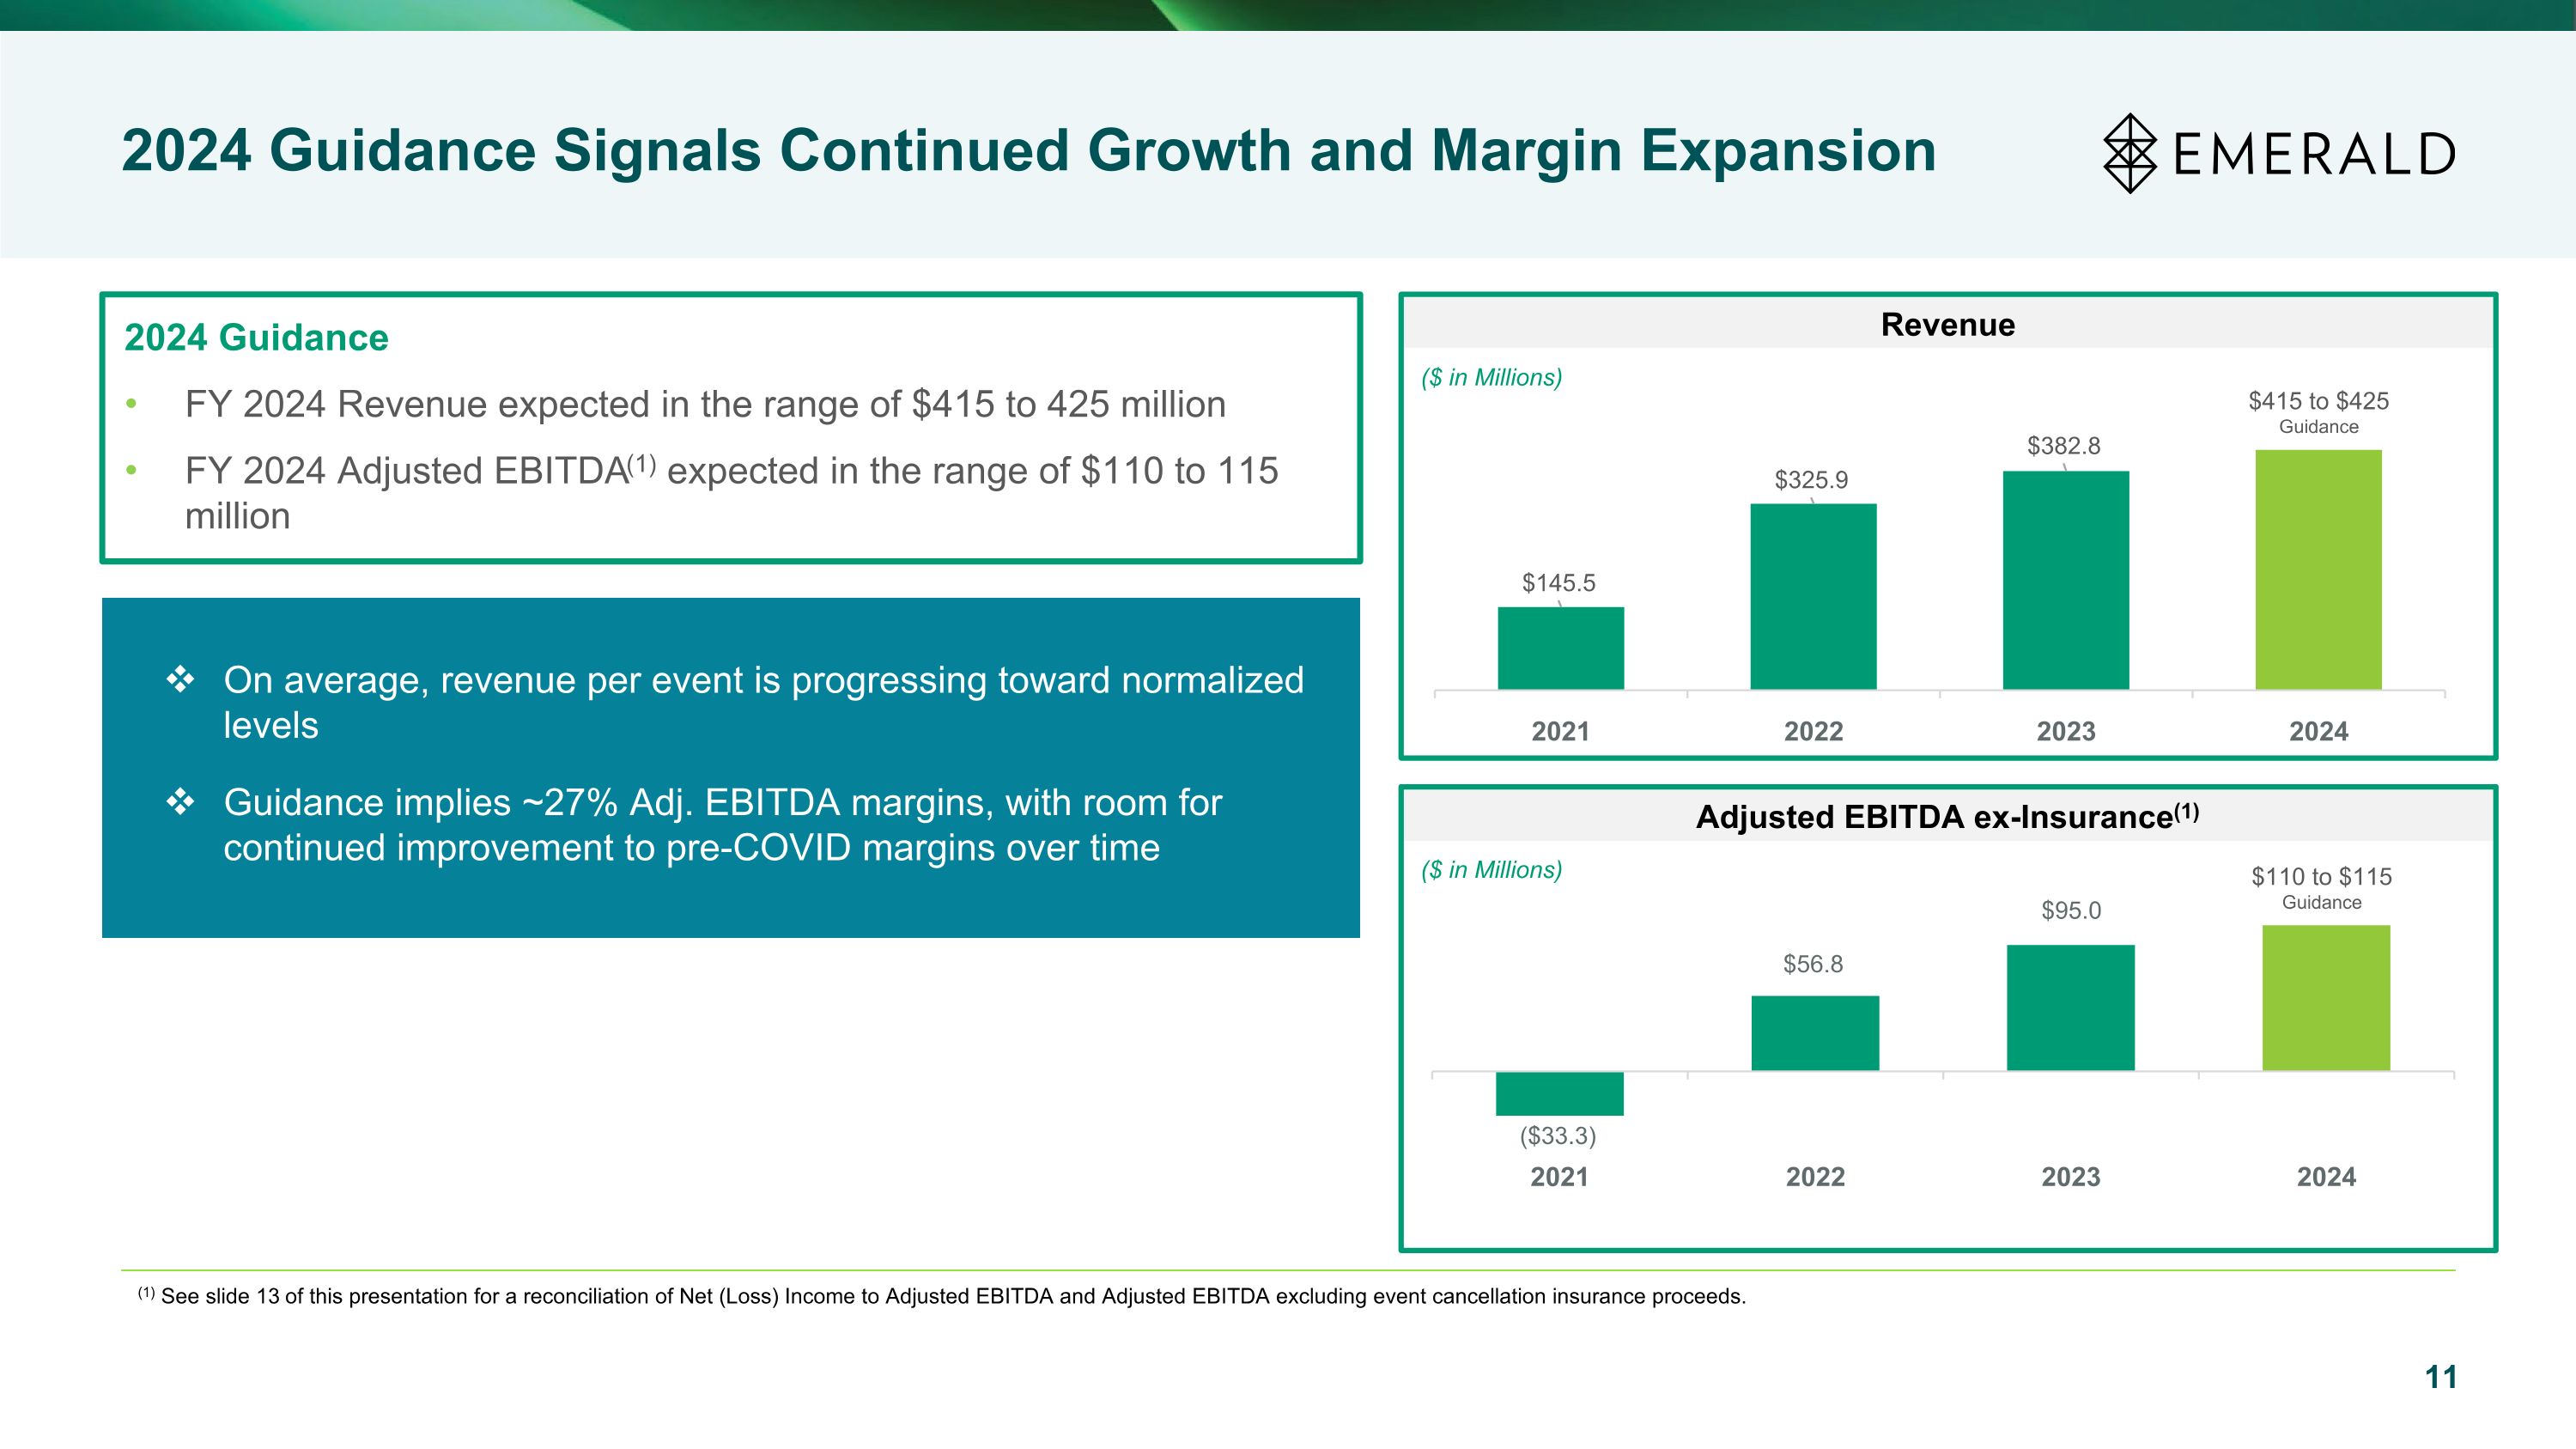
11 2024 Guidance Signals Continued Growth and Margin Expansion Revenue ($ in Millions) Adjusted EBITDA ex-Insurance(1) ($ in Millions) $415 to $425 Guidance On average, revenue per event is progressing toward normalized levels Guidance implies ~27% Adj. EBITDA margins, with room for continued improvement to pre-COVID margins over time 2024 Guidance FY 2024 Revenue expected in the range of $415 to 425 million FY 2024 Adjusted EBITDA(1) expected in the range of $110 to 115 million (1) See slide 13 of this presentation for a reconciliation of Net (Loss) Income to Adjusted EBITDA and Adjusted EBITDA excluding event cancellation insurance proceeds. $110 to $115 Guidance

Appendix
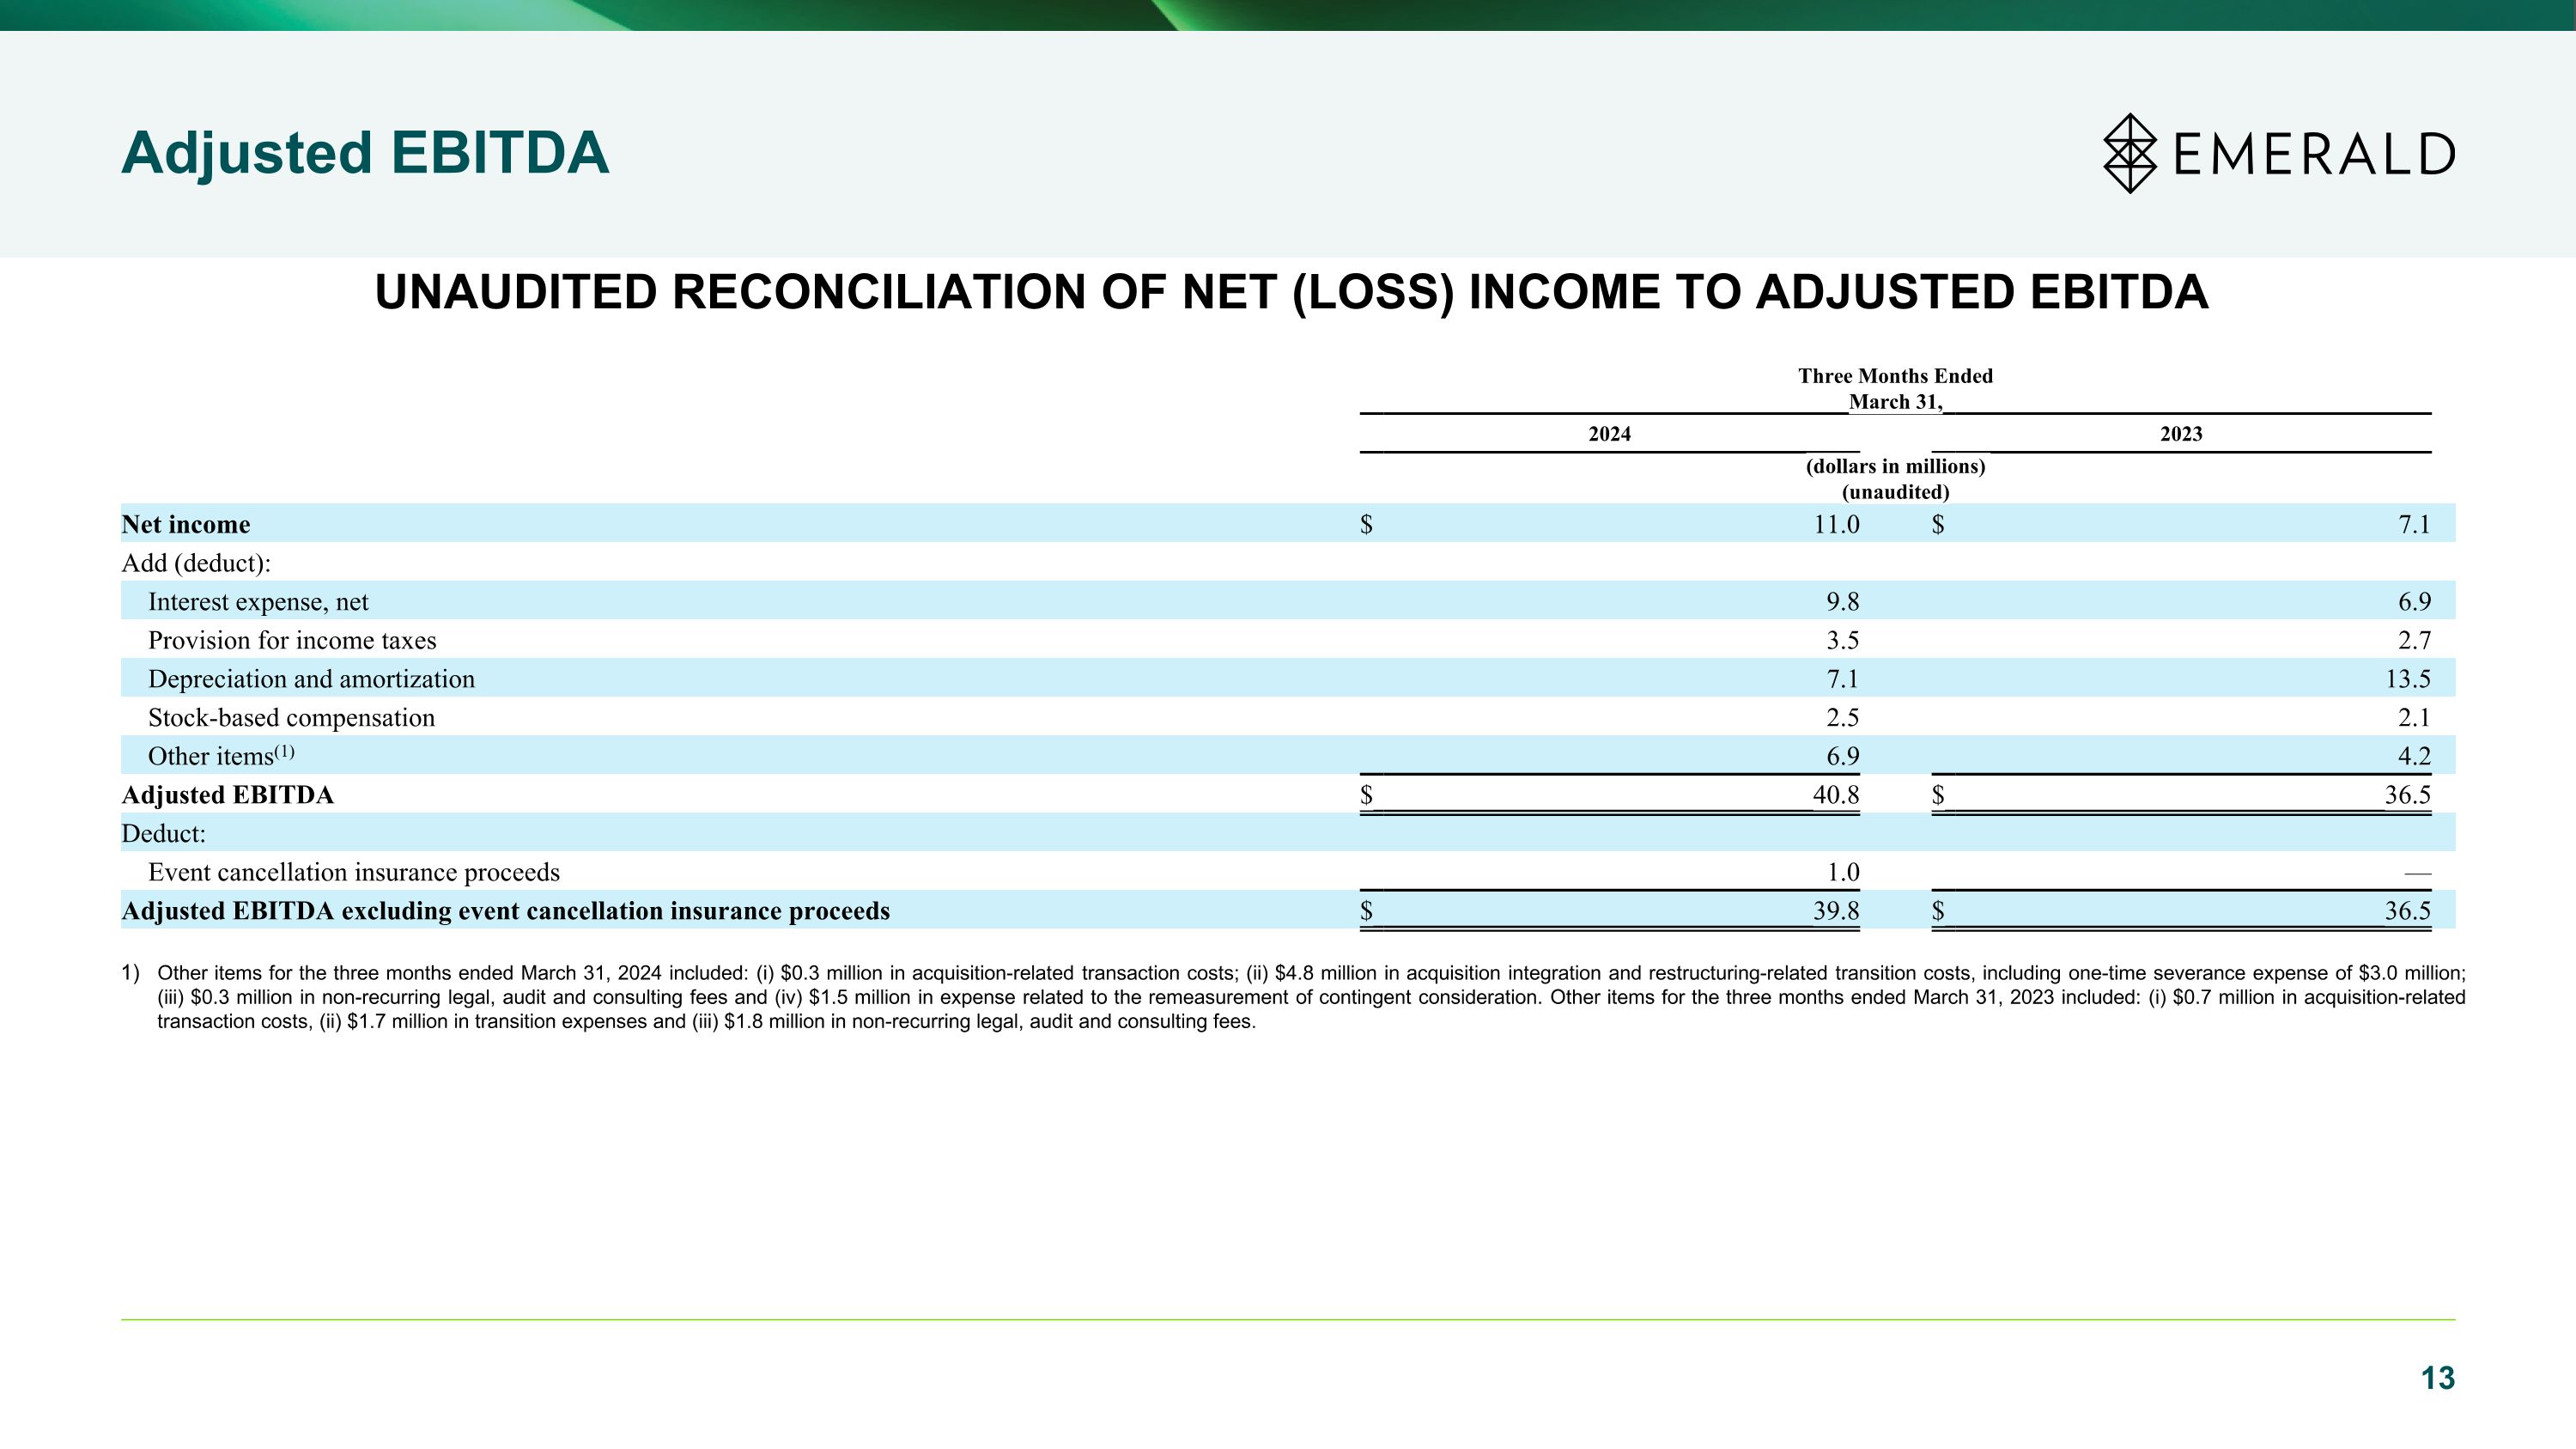
Adjusted EBITDA UNAUDITED RECONCILIATION OF NET (LOSS) INCOME TO ADJUSTED EBITDA Other items for the three months ended March 31, 2024 included: (i) $0.3 million in acquisition-related transaction costs; (ii) $4.8 million in acquisition integration and restructuring-related transition costs, including one-time severance expense of $3.0 million; (iii) $0.3 million in non-recurring legal, audit and consulting fees and (iv) $1.5 million in expense related to the remeasurement of contingent consideration. Other items for the three months ended March 31, 2023 included: (i) $0.7 million in acquisition-related transaction costs, (ii) $1.7 million in transition expenses and (iii) $1.8 million in non-recurring legal, audit and consulting fees. Three Months Ended March 31, 2024 2023 (dollars in millions) (unaudited) Net income $ 11.0 $ 7.1 Add (deduct): Interest expense, net 9.8 6.9 Provision for income taxes 3.5 2.7 Depreciation and amortization 7.1 13.5 Stock-based compensation 2.5 2.1 Other items(1) 6.9 4.2 Adjusted EBITDA $ 40.8 $ 36.5 Deduct: Event cancellation insurance proceeds 1.0 — Adjusted EBITDA excluding event cancellation insurance proceeds $ 39.8 $ 36.5
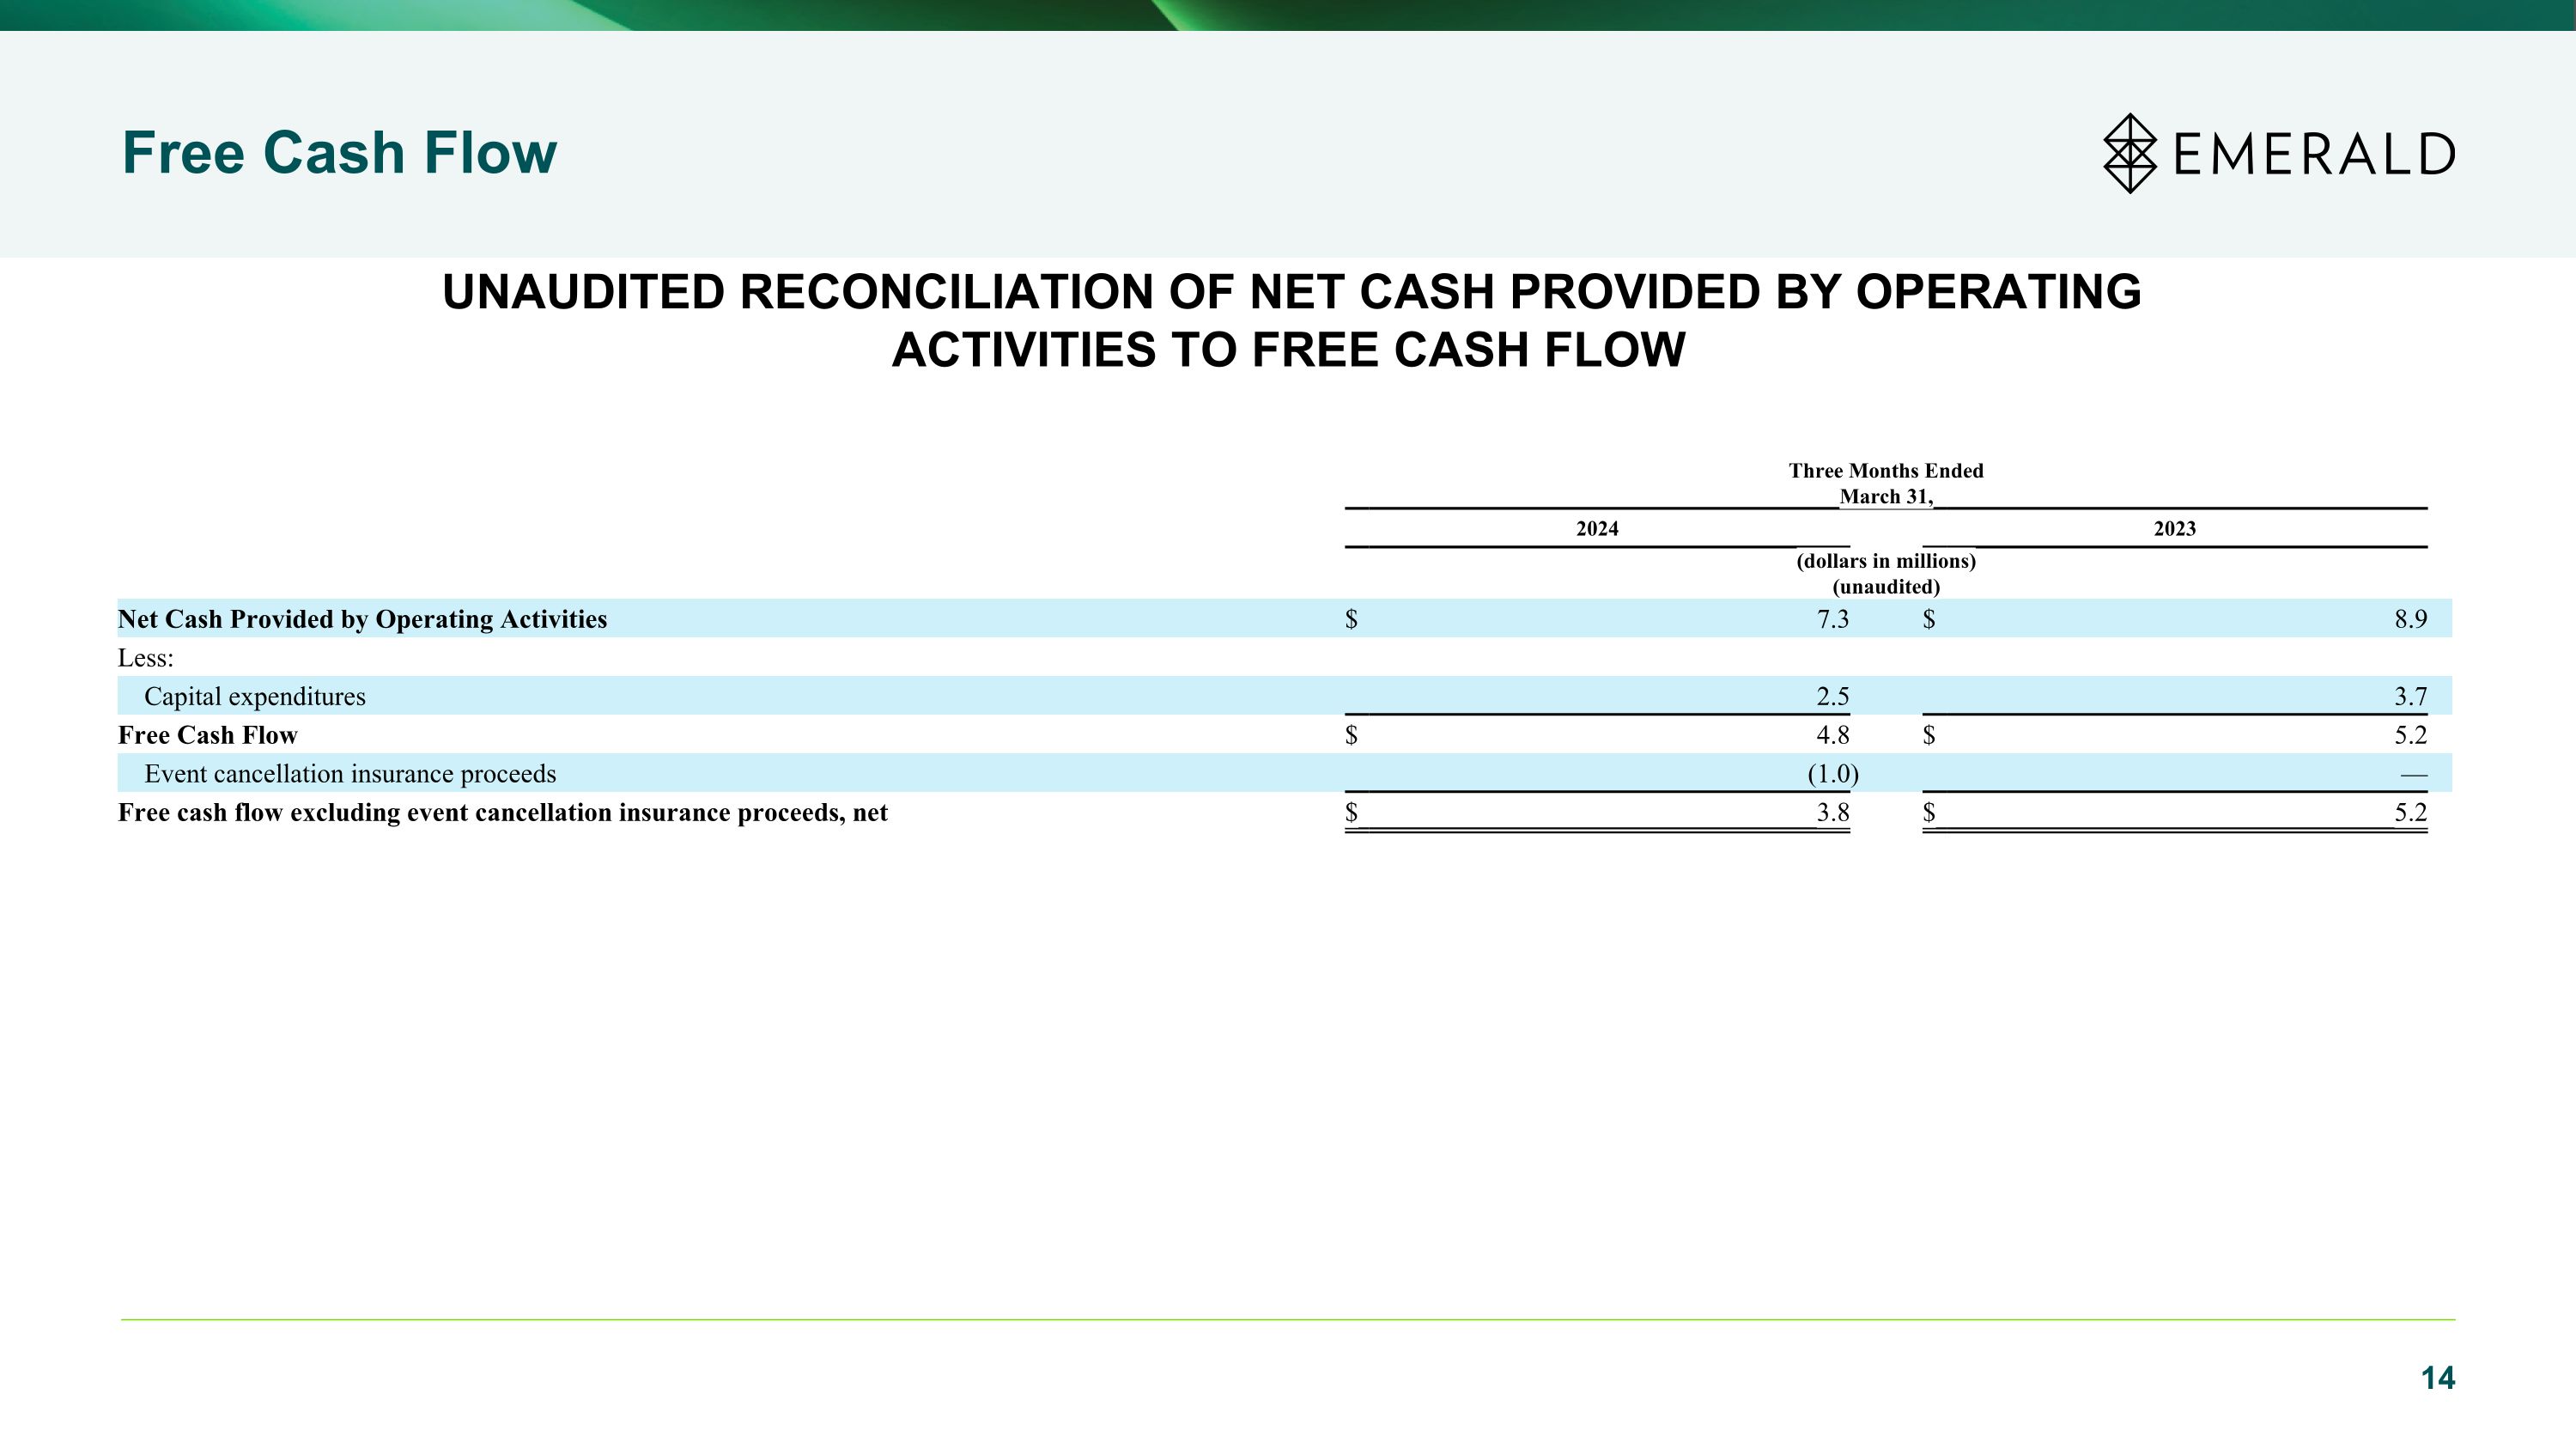
Free Cash Flow UNAUDITED RECONCILIATION OF NET CASH PROVIDED BY OPERATING ACTIVITIES TO FREE CASH FLOW Three Months Ended March 31, 2024 2023 (dollars in millions) (unaudited) Net Cash Provided by Operating Activities $ 7.3 $ 8.9 Less: Capital expenditures 2.5 3.7 Free Cash Flow $ 4.8 $ 5.2 Event cancellation insurance proceeds (1.0 ) — Free cash flow excluding event cancellation insurance proceeds, net $ 3.8 $ 5.2
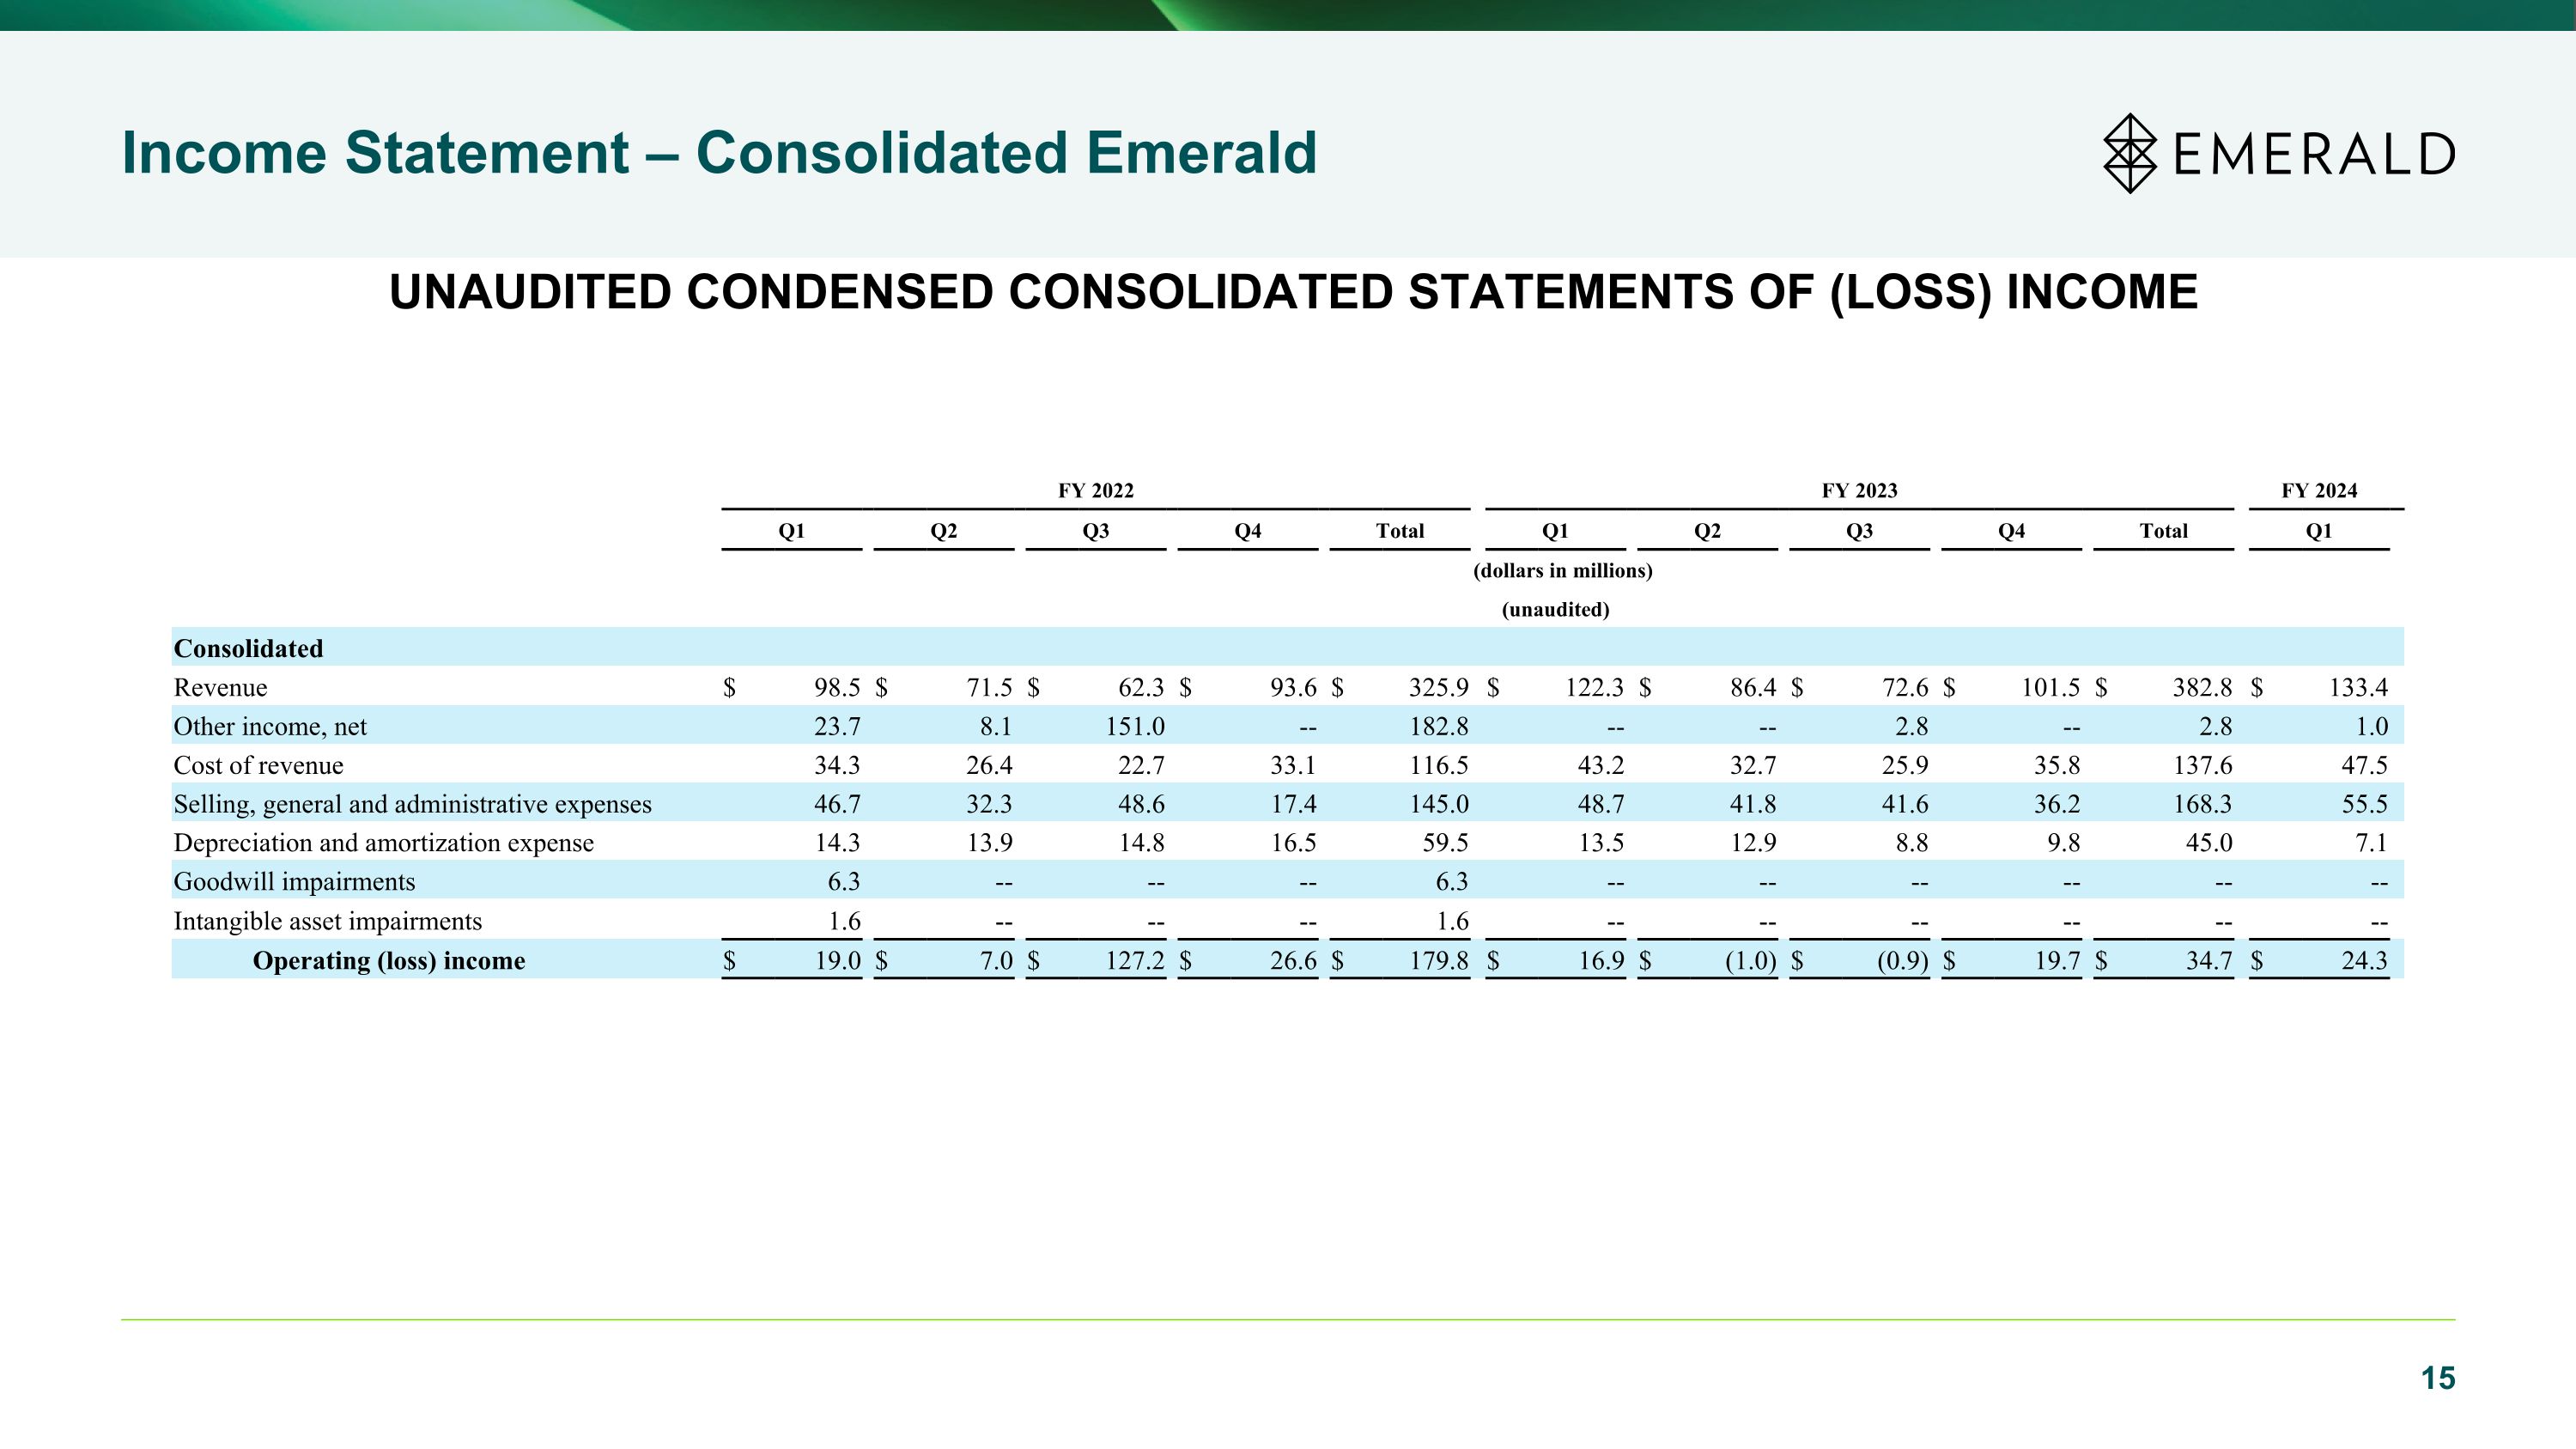
Income Statement – Consolidated Emerald UNAUDITED CONDENSED CONSOLIDATED STATEMENTS OF (LOSS) INCOME FY 2022 FY 2023 FY 2024 Q1 Q2 Q3 Q4 Total Q1 Q2 Q3 Q4 Total Q1 (dollars in millions) (unaudited) Consolidated Revenue $ 98.5 $ 71.5 $ 62.3 $ 93.6 $ 325.9 $ 122.3 $ 86.4 $ 72.6 $ 101.5 $ 382.8 $ 133.4 Other income, net 23.7 8.1 151.0 -- 182.8 -- -- 2.8 -- 2.8 1.0 Cost of revenue 34.3 26.4 22.7 33.1 116.5 43.2 32.7 25.9 35.8 137.6 47.5 Selling, general and administrative expenses 46.7 32.3 48.6 17.4 145.0 48.7 41.8 41.6 36.2 168.3 55.5 Depreciation and amortization expense 14.3 13.9 14.8 16.5 59.5 13.5 12.9 8.8 9.8 45.0 7.1 Goodwill impairments 6.3 -- -- -- 6.3 -- -- -- -- -- -- Intangible asset impairments 1.6 -- -- -- 1.6 -- -- -- -- -- -- Operating (loss) income $ 19.0 $ 7.0 $ 127.2 $ 26.6 $ 179.8 $ 16.9 $ (1.0) $ (0.9) $ 19.7 $ 34.7 $ 24.3
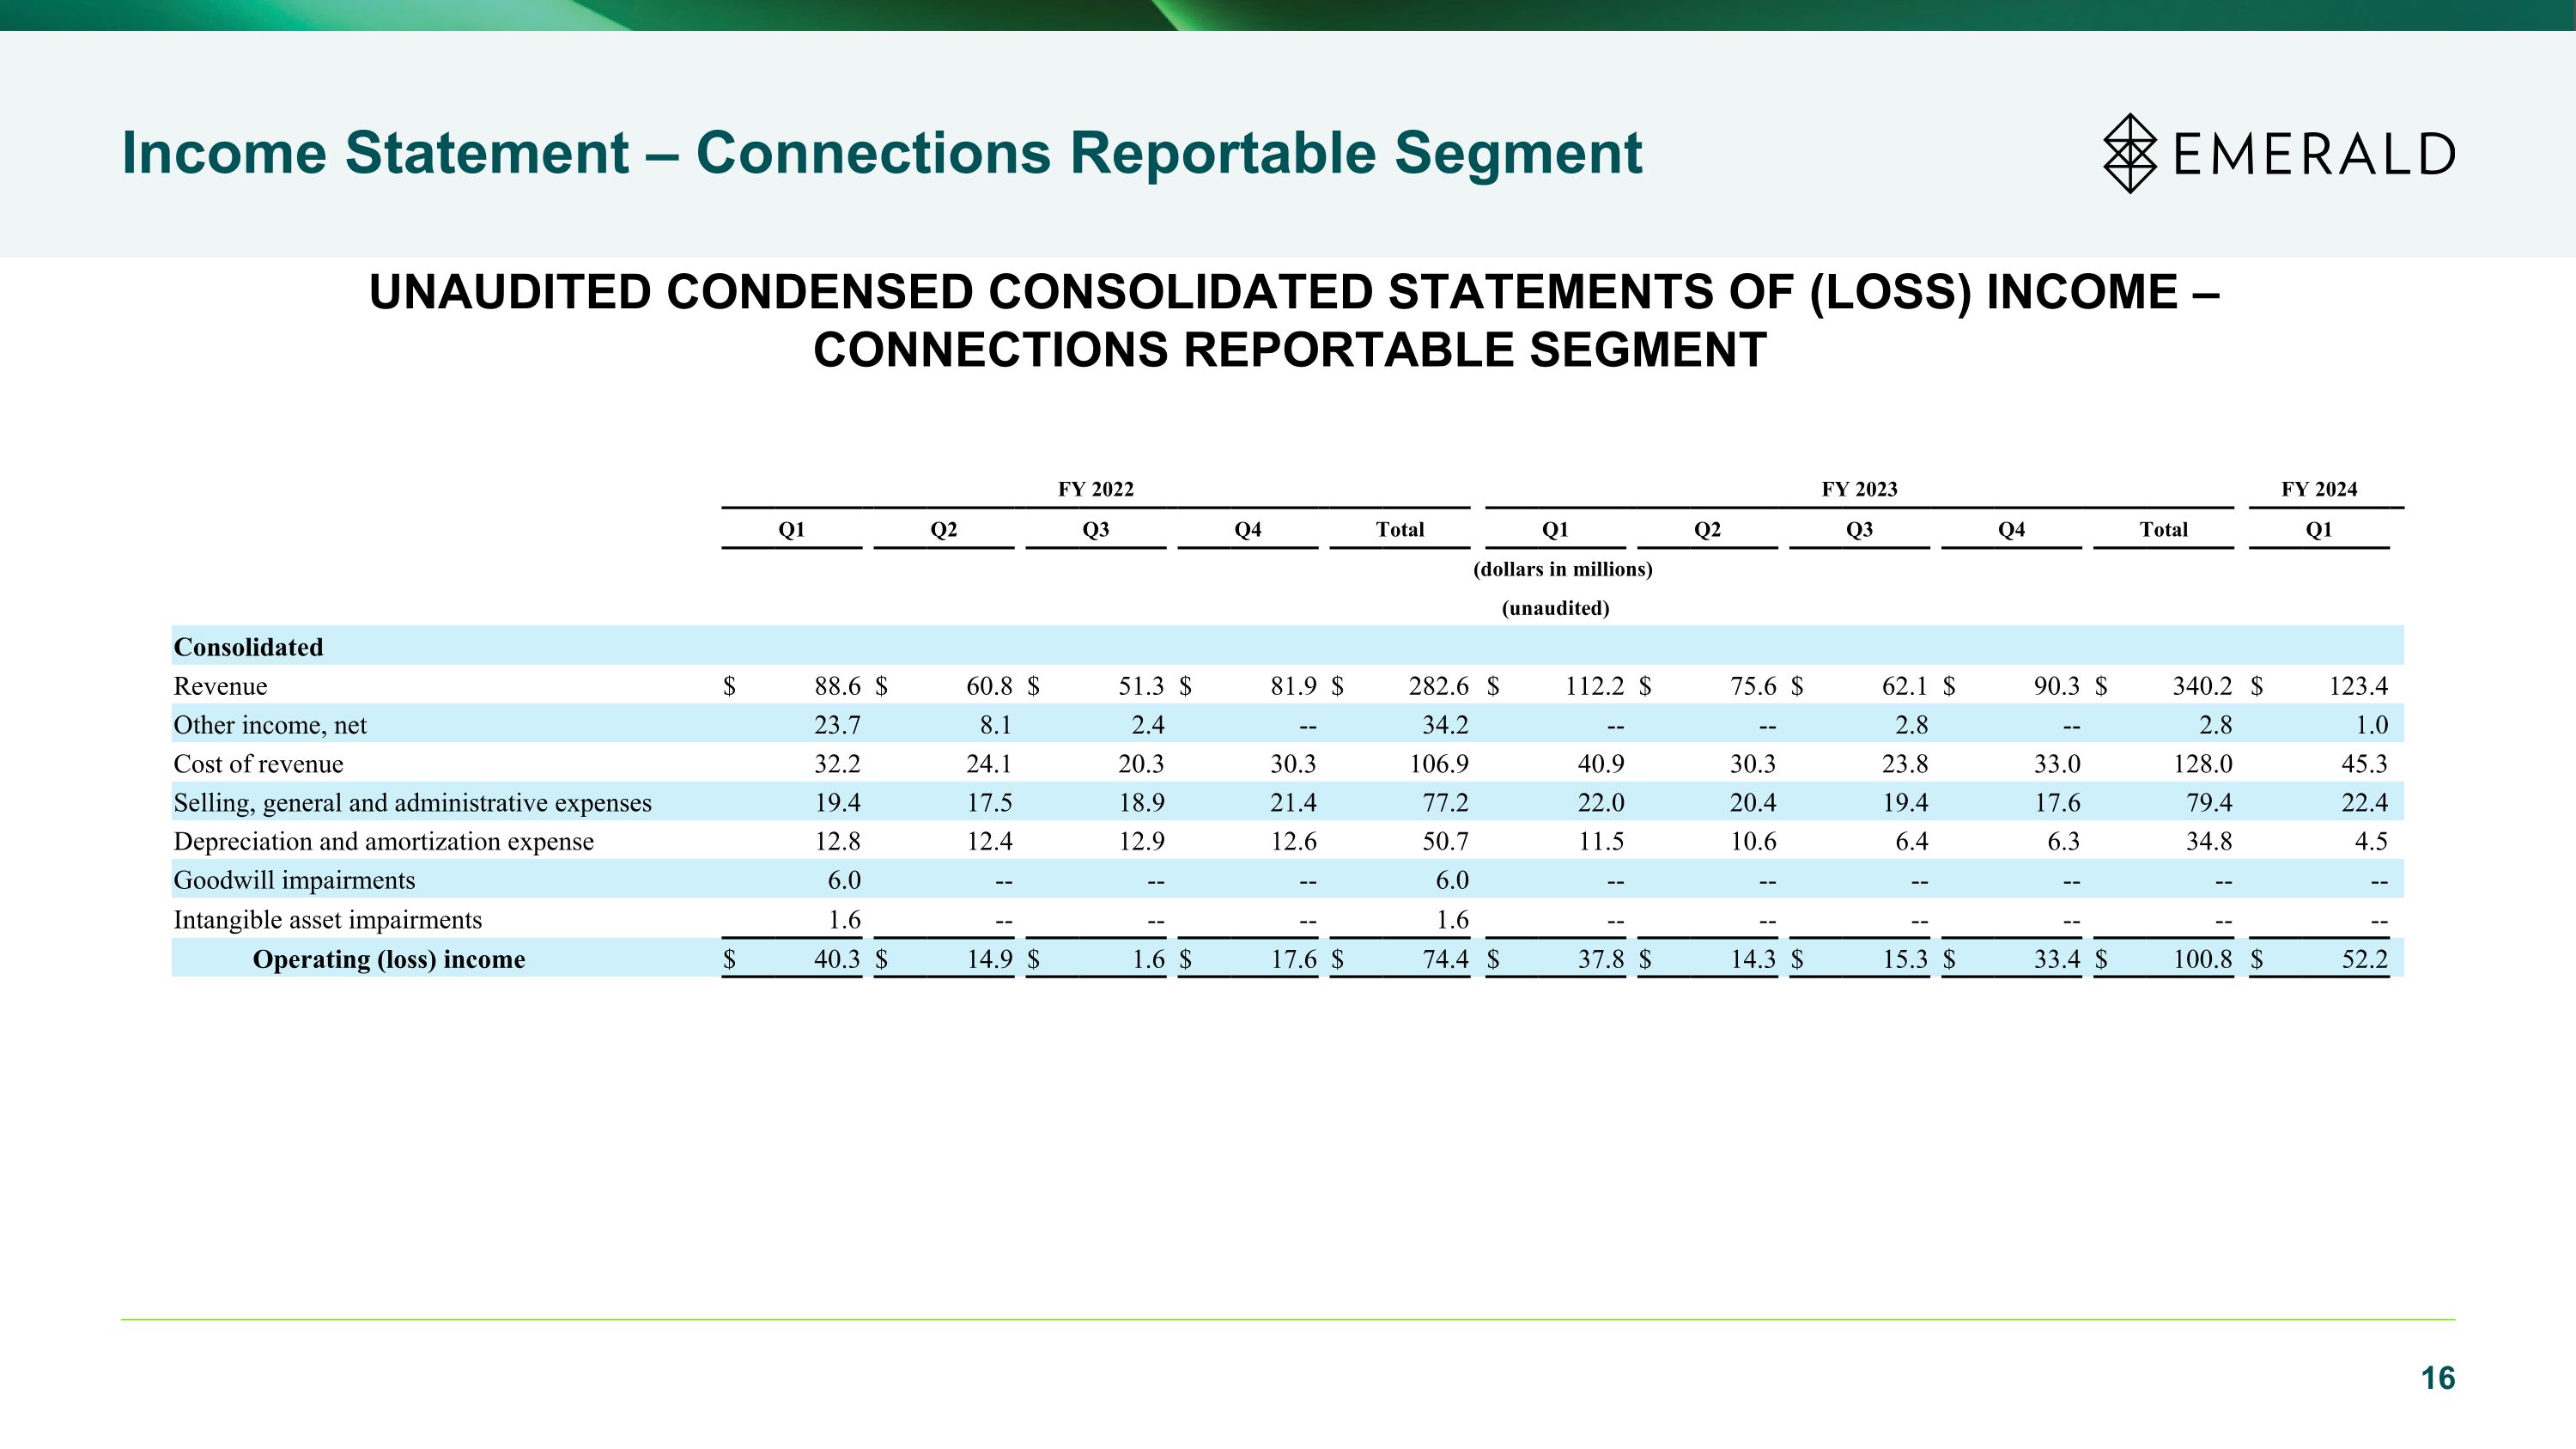
Income Statement – Connections Reportable Segment UNAUDITED CONDENSED CONSOLIDATED STATEMENTS OF (LOSS) INCOME – CONNECTIONS REPORTABLE SEGMENT FY 2022 FY 2023 FY 2024 Q1 Q2 Q3 Q4 Total Q1 Q2 Q3 Q4 Total Q1 (dollars in millions) (unaudited) Consolidated Revenue $ 88.6 $ 60.8 $ 51.3 $ 81.9 $ 282.6 $ 112.2 $ 75.6 $ 62.1 $ 90.3 $ 340.2 $ 123.4 Other income, net 23.7 8.1 2.4 -- 34.2 -- -- 2.8 -- 2.8 1.0 Cost of revenue 32.2 24.1 20.3 30.3 106.9 40.9 30.3 23.8 33.0 128.0 45.3 Selling, general and administrative expenses 19.4 17.5 18.9 21.4 77.2 22.0 20.4 19.4 17.6 79.4 22.4 Depreciation and amortization expense 12.8 12.4 12.9 12.6 50.7 11.5 10.6 6.4 6.3 34.8 4.5 Goodwill impairments 6.0 -- -- -- 6.0 -- -- -- -- -- -- Intangible asset impairments 1.6 -- -- -- 1.6 -- -- -- -- -- -- Operating (loss) income $ 40.3 $ 14.9 $ 1.6 $ 17.6 $ 74.4 $ 37.8 $ 14.3 $ 15.3 $ 33.4 $ 100.8 $ 52.2
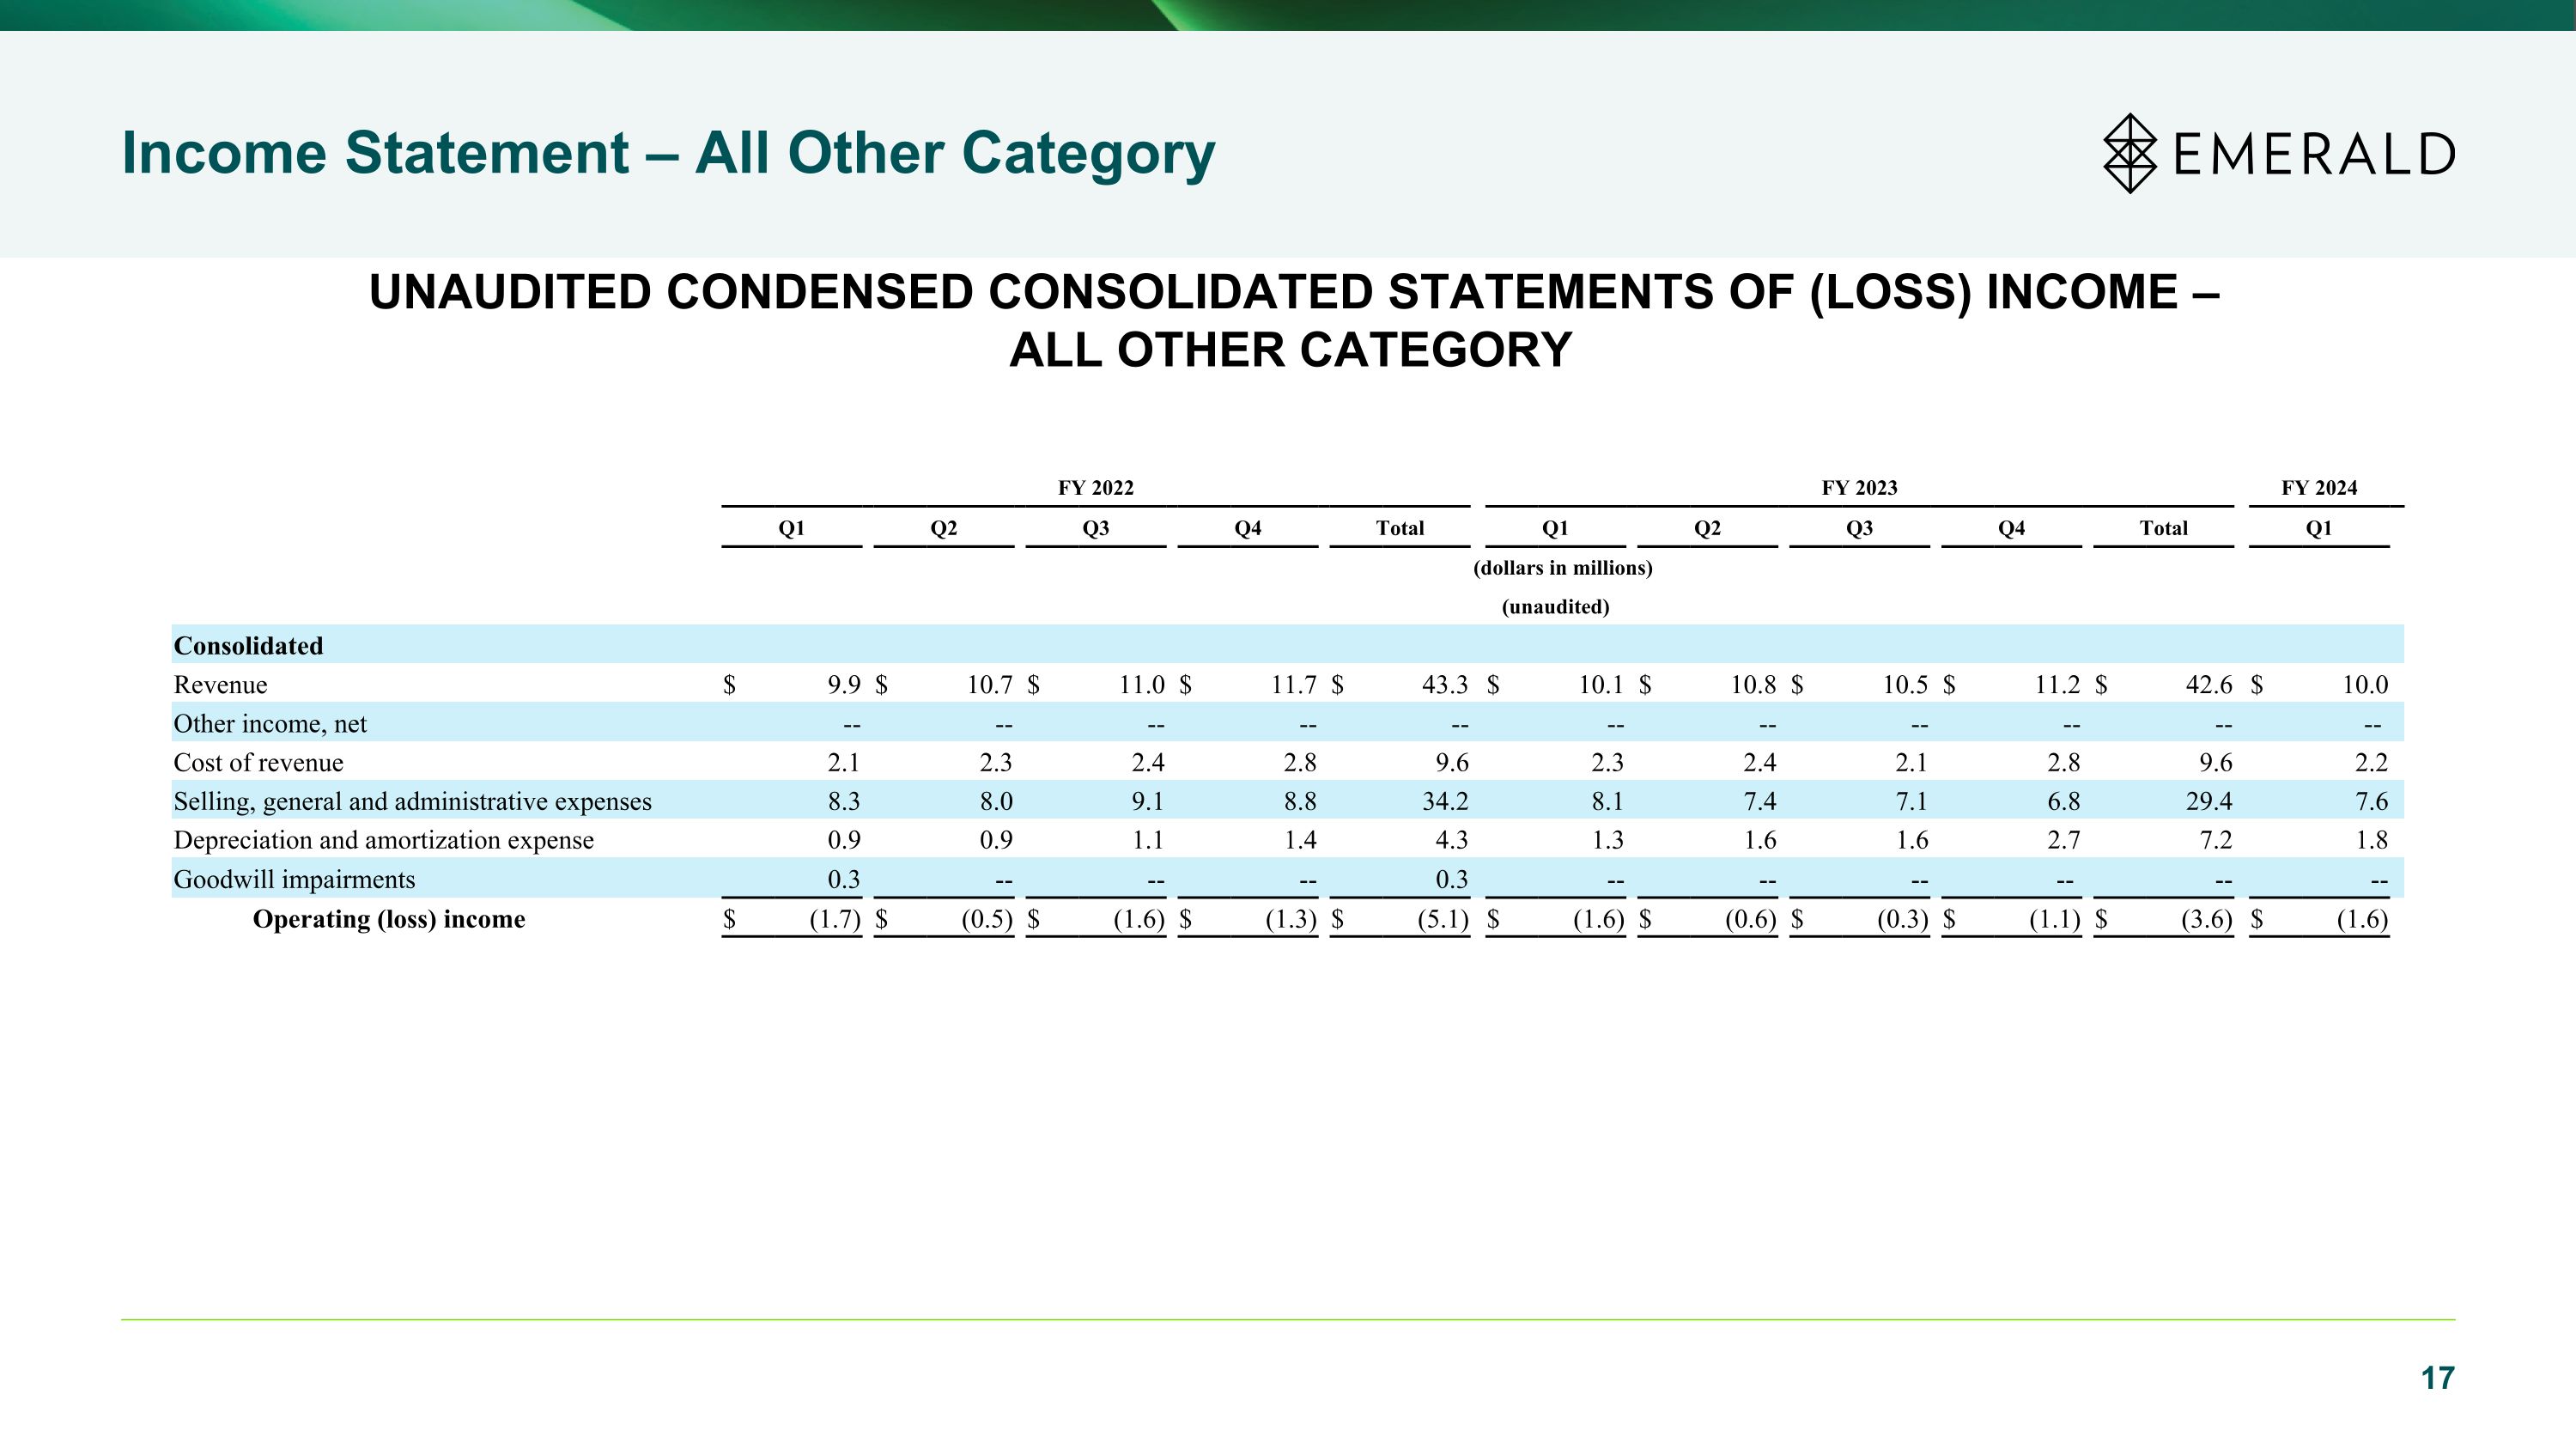
Income Statement – All Other Category UNAUDITED CONDENSED CONSOLIDATED STATEMENTS OF (LOSS) INCOME – ALL OTHER CATEGORY FY 2022 FY 2023 FY 2024 Q1 Q2 Q3 Q4 Total Q1 Q2 Q3 Q4 Total Q1 (dollars in millions) (unaudited) Consolidated Revenue $ 9.9 $ 10.7 $ 11.0 $ 11.7 $ 43.3 $ 10.1 $ 10.8 $ 10.5 $ 11.2 $ 42.6 $ 10.0 Other income, net -- -- -- -- -- -- -- -- -- -- -- Cost of revenue 2.1 2.3 2.4 2.8 9.6 2.3 2.4 2.1 2.8 9.6 2.2 Selling, general and administrative expenses 8.3 8.0 9.1 8.8 34.2 8.1 7.4 7.1 6.8 29.4 7.6 Depreciation and amortization expense 0.9 0.9 1.1 1.4 4.3 1.3 1.6 1.6 2.7 7.2 1.8 Goodwill impairments 0.3 -- -- -- 0.3 -- -- -- -- -- -- Operating (loss) income $ (1.7) $ (0.5) $ (1.6) $ (1.3) $ (5.1) $ (1.6) $ (0.6) $ (0.3) $ (1.1) $ (3.6) $ (1.6)
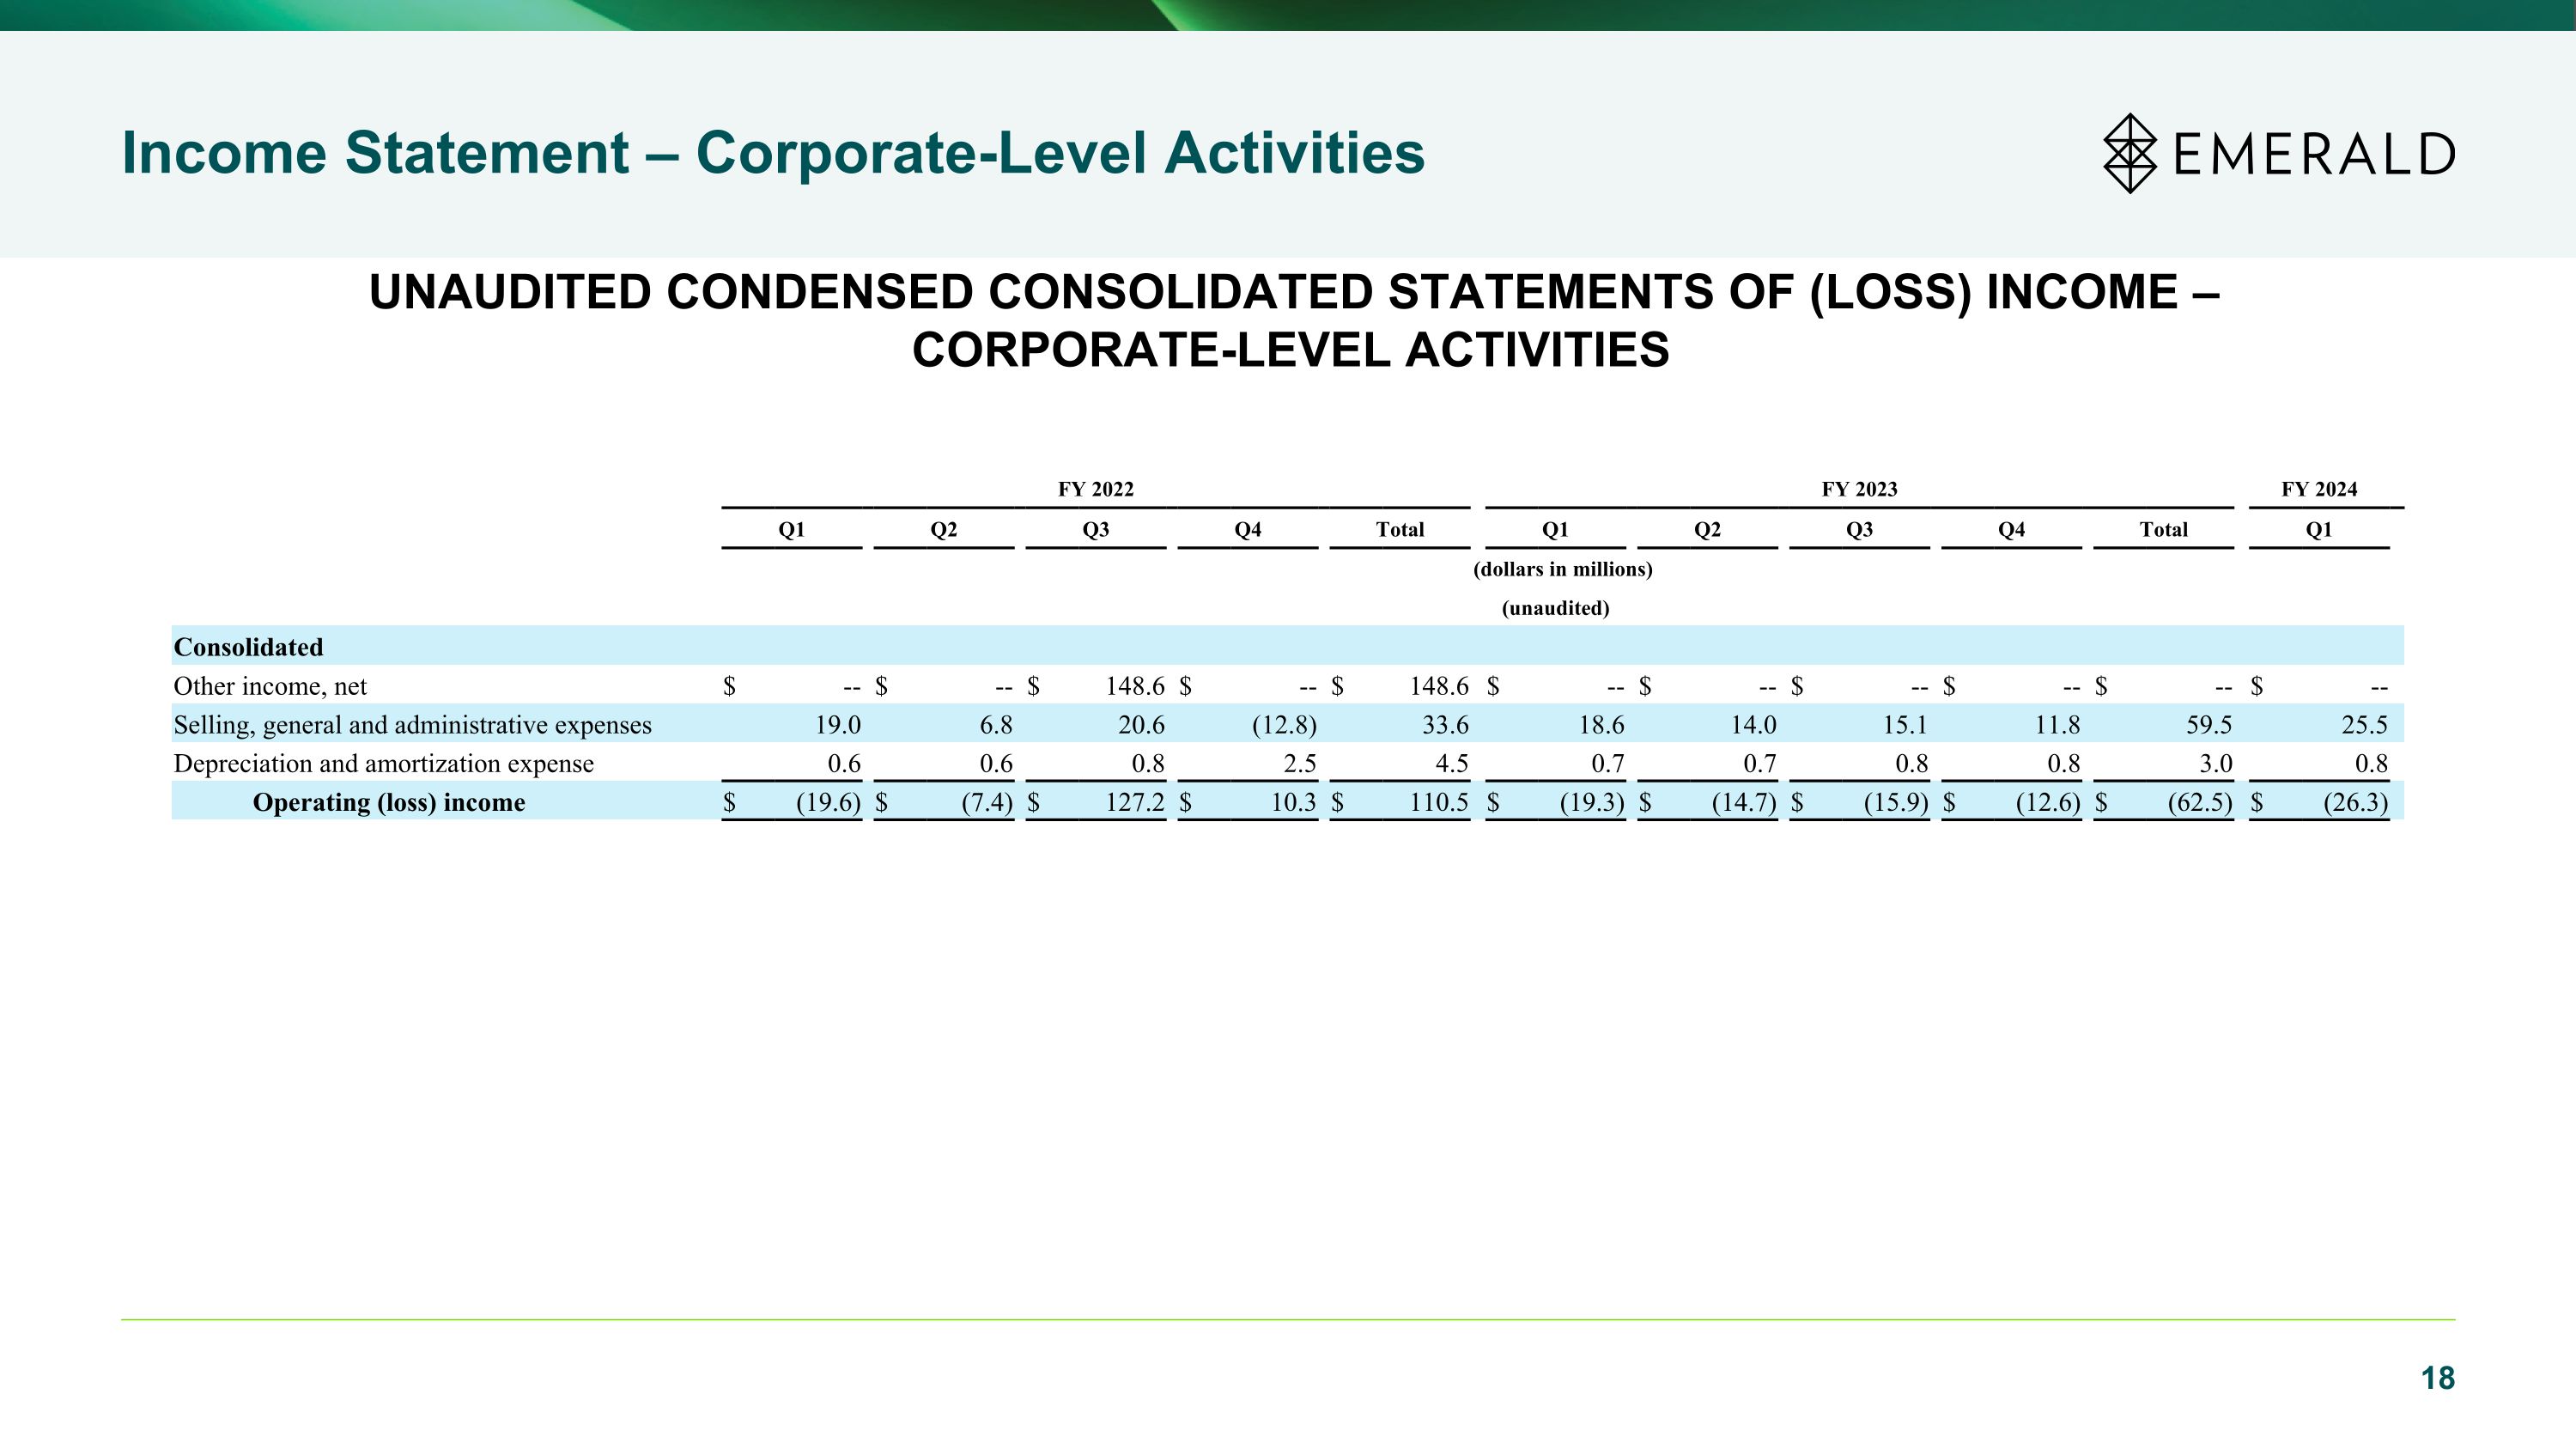
Income Statement – Corporate-Level Activities UNAUDITED CONDENSED CONSOLIDATED STATEMENTS OF (LOSS) INCOME – CORPORATE-LEVEL ACTIVITIES FY 2022 FY 2023 FY 2024 Q1 Q2 Q3 Q4 Total Q1 Q2 Q3 Q4 Total Q1 (dollars in millions) (unaudited) Consolidated Other income, net $ -- $ -- $ 148.6 $ -- $ 148.6 $ -- $ -- $ -- $ -- $ -- $ -- Selling, general and administrative expenses 19.0 6.8 20.6 (12.8) 33.6 18.6 14.0 15.1 11.8 59.5 25.5 Depreciation and amortization expense 0.6 0.6 0.8 2.5 4.5 0.7 0.7 0.8 0.8 3.0 0.8 Operating (loss) income $ (19.6) $ (7.4) $ 127.2 $ 10.3 $ 110.5 $ (19.3) $ (14.7) $ (15.9) $ (12.6) $ (62.5) $ (26.3)