UNITED STATES
SECURITIES AND EXCHANGE COMMISSION
Washington, D.C. 20549
Form 10-K
|
☒ |
ANNUAL REPORT PURSUANT TO SECTION 13 OR 15(d) OF THE SECURITIES EXCHANGE ACT OF 1934 |
For the fiscal year ended December 31, 2016
OR
|
☐ |
TRANSITION REPORT PURSUANT TO SECTION 13 OR 15(d) OF THE SECURITIES EXCHANGE ACT OF 1934 |
For the transition period from to
|
Commission File Number |
|
|
Exact name of registrant as specified in its charter, principal office and address and telephone number
|
|
State of incorporation or organization
|
|
I.R.S. Employer Identification No.
|
|
001-36867 |
|
|
Allergan plc Clonshaugh Business and Technology Park Coolock, Dublin, D17 E400, Ireland (862) 261-7000 |
|
Ireland |
|
98-1114402 |
|
|
|
|
|
|
|
|
|
|
001-36887 |
|
|
Warner Chilcott Limited Cannon’s Court 22 Victoria Street Hamilton HM 12 Bermuda (441) 295-2244 |
|
Bermuda |
|
98-0496358 |
Securities registered pursuant to Section 12(b) of the Act:
|
Title of Each Class |
Name of Each Exchange on Which Registered |
|
Allergan plc Ordinary Shares, $0.0001 par value |
New York Stock Exchange |
|
Allergan plc 5.500% Mandatory Convertible Preferred Shares, Series A, par value of $0.0001 |
New York Stock Exchange |
Securities registered pursuant to Section 12(g) of the Act:
None
Indicate by check mark if the registrant is a well-known seasoned issuer, as defined in Rule 405 of the Securities Act.
|
Allergan plc |
|
Yes ☒ |
|
No ☐ |
|
Warner Chilcott Limited |
|
Yes ☒ |
|
No ☐ |
Indicate by check mark if the registrant is not required to file reports pursuant to Section 13 or Section 15(d) of the Act.
|
Allergan plc |
|
Yes ☐ |
|
No ☒ |
|
Warner Chilcott Limited |
|
Yes ☐ |
|
No ☒ |
Indicate by check mark whether the registrant (1) has filed all reports required to be filed by Section 13 or 15(d) of the Securities Exchange Act of 1934 during the preceding 12 months (or for such shorter period that the registrant was required to file such reports), and (2) has been subject to such filing requirements for the past 90 days:
|
Allergan plc |
|
Yes ☒ |
|
No ☐ |
|
Warner Chilcott Limited |
|
Yes ☒ |
|
No ☐ |
Indicate by check mark whether the registrant has submitted electronically and posted on its corporate Web site, if any, every Interactive Data File required to be submitted and posted pursuant to Rule 405 of Regulation S-T (§ 232.405 of this chapter) during the preceding 12 months (or for such shorter period that the registrant was required to submit and post such files).
|
Allergan plc |
|
Yes ☒ |
|
No ☐ |
|
Warner Chilcott Limited |
|
Yes ☒ |
|
No ☐ |
Indicate by check mark if disclosure of delinquent filers pursuant to Item 405 of Regulation S-K (§ 229.405 of this chapter) is not contained herein, and will not be contained, to the best of registrant’s knowledge, in definitive proxy or information statements incorporated by reference in Part III of this Form 10-K or any amendment to this Form 10-K.
|
Allergan plc |
|
☐ |
|
|
|
Warner Chilcott Limited |
|
☒ |
|
|
Indicate by check mark whether the registrant is a large accelerated filer, an accelerated filer, a non-accelerated filer, or a smaller reporting company. See the definitions of “large accelerated filer,” “accelerated filer” and “smaller reporting company” in Rule 12b-2 of the Exchange Act. (Check one):
|
Allergan plc |
Large accelerated filer |
☒ |
Accelerated filer |
☐ |
|
|
Non-accelerated filer (Do not check if a smaller reporting company) |
☐ |
Smaller reporting company |
☐ |
|
Warner Chilcott Limited |
Large accelerated filer |
☐ |
Accelerated filer |
☐ |
|
|
Non-accelerated filer (Do not check if a smaller reporting company) |
☒ |
Smaller reporting company |
☐ |
Indicate by check mark whether the registrant is a shell company (as defined in Rule 12b-2 of the Act).
|
Allergan plc |
|
Yes ☐ |
|
No ☒ |
|
Warner Chilcott Limited |
|
Yes ☐ |
|
No ☒ |
The aggregate market value of the voting and non-voting stock held by non-affiliates of Allergan plc as of June 30, 2016, based upon the last sale price reported for such date on the New York Stock Exchange, was $91.3 billion. The calculation of the aggregate market value of voting and non-voting stock excludes Class A ordinary shares of Allergan plc held by executive officers, directors, and stockholders that the registrant concluded were affiliates of Allergan plc on that date.
Number of shares of Allergan plc’s Ordinary Shares outstanding on February 17, 2017: 335,224,713
This Annual Report on Form 10-K is a combined report being filed separately by two different registrants: Allergan plc and Warner Chilcott Limited. Warner Chilcott Limited is an indirect wholly owned subsidiary of Allergan plc. The information in this Annual Report on Form 10-K is equally applicable to Allergan plc and Warner Chilcott Limited, except where otherwise indicated. Warner Chilcott Limited meets the conditions set forth in General Instruction H(1)(a) and (b) of Form 10-K and, to the extent applicable, is therefore filing this form with a reduced disclosure format.
DOCUMENTS INCORPORATED BY REFERENCE
Certain information required by Part III of this Annual Report on Form 10-K (“Annual Report”) is incorporated by reference from the Allergan plc proxy statement to be filed pursuant to Regulation 14A with respect to the Registrant’s Annual General Meeting of Shareholders to be held on or about May 4, 2017.
WARNER CHILCOTT LIMITED
TABLE OF CONTENTS
FORM 10-K FOR THE YEAR ENDED DECEMBER 31, 2016
|
|
PAGE |
|||
|
|
||||
|
PART I |
||||
|
ITEM 1. |
3 |
|||
|
ITEM 1A. |
23 |
|||
|
ITEM 1B. |
43 |
|||
|
ITEM 2. |
43 |
|||
|
ITEM 3. |
44 |
|||
|
ITEM 4. |
44 |
|||
|
|
||||
|
ITEM 5. |
45 |
|||
|
ITEM 6. |
48 |
|||
|
ITEM 7. |
Management’s Discussion and Analysis of Financial Condition and Results of Operations |
50 |
||
|
ITEM 7A. |
96 |
|||
|
ITEM 8. |
97 |
|||
|
ITEM 9. |
Changes in and Disagreements With Accountants on Accounting and Financial Disclosure |
97 |
||
|
ITEM 9A. |
97 |
|||
|
ITEM 9B. |
98 |
|||
|
|
||||
|
ITEM 10. |
99 |
|||
|
ITEM 11. |
101 |
|||
|
ITEM 12. |
Security Ownership of Certain Beneficial Owners and Management |
101 |
||
|
ITEM 13. |
101 |
|||
|
ITEM 14. |
101 |
|||
|
|
||||
|
ITEM 15. |
102 |
|||
|
ITEM 16. |
102 |
|||
|
|
103 |
|||
|
|
|
|
||
2
Explanatory Note
This Annual Report on Form 10-K is a combined annual report being filed separately by two registrants: Allergan plc and its indirect wholly-owned subsidiary, Warner Chilcott Limited. Each registrant hereto is filing on its own behalf all the information contained in this annual report that relates to such registrant. Each registrant hereto is not filing any information that does not relate to such registrant, and therefore makes no representations as to any such information.
Company History
Allergan plc (formerly known as Actavis plc) was incorporated in Ireland on May 16, 2013 as a private limited company and re-registered effective September 20, 2013 as a public limited company. It was established for the purpose of facilitating the business combination between Allergan Finance, LLC (formerly known as Actavis, Inc.) and Warner Chilcott plc (“Warner Chilcott”). On October 1, 2013, pursuant to the transaction agreement dated May 19, 2013 among Allergan Finance, LLC, Warner Chilcott, Actavis plc (now known as Allergan plc), Actavis Ireland Holding Limited, Actavis W.C. Holding LLC (now known as Actavis W.C. Holding Inc.) and Actavis W.C. Holding 2 LLC (now known as Actavis W.C. Holding 2 Inc.), (i) the Company acquired Warner Chilcott (the “Warner Chilcott Acquisition”) pursuant to a scheme of arrangement under Section 201, and a capital reduction under Sections 72 and 74, of the Irish Companies Act of 1963, where each Warner Chilcott ordinary share was converted into 0.160 of an Allergan plc ordinary share (the “Company Ordinary Shares”), or $5,833.9 million in equity consideration, and (ii) Actavis W.C. Holding 2 Inc. merged with and into Allergan Finance, LLC, with Allergan Finance, LLC. as the surviving corporation in the merger (the “Merger” and, together with the Warner Chilcott Acquisition, the “Warner Chilcott Transactions”). Following the consummation of the Warner Chilcott Transactions, Allergan Finance, LLC and Warner Chilcott became wholly-owned subsidiaries of Allergan plc. Each of Allergan Finance, LLC’s common shares was converted into one Company Ordinary Share. Effective October 1, 2013, through a series of related-party transactions, Allergan plc contributed its indirect subsidiaries, including Allergan Finance, LLC, to its subsidiary Warner Chilcott Limited.
Except where otherwise indicated, and excluding certain insignificant cash and non-cash transactions at the Allergan plc level, the consolidated financial statements and disclosures are for two separate registrants, Allergan plc and Warner Chilcott Limited. The results of Warner Chilcott Limited are consolidated into the results of Allergan plc. Due to the deminimis activity between Allergan plc and Warner Chilcott Limited, references throughout this document relate to both Allergan plc and Warner Chilcott Limited. Refer to “Note 3 —Reconciliation of Warner Chilcott Limited results to Allergan plc results” in the accompanying “Notes to the Consolidated Financial Statements” in this document for a summary of the details on the differences between Allergan plc and Warner Chilcott Limited.
On March 17, 2015, the Company acquired Allergan, Inc. (“Legacy Allergan”) for approximately $77.0 billion including outstanding indebtedness assumed of $2.2 billion, cash consideration of $40.1 billion and equity consideration of $34.7 billion, which includes outstanding equity awards (the “Allergan Acquisition”). Under the terms of the agreement, Legacy Allergan shareholders received 111.2 million of the Company’s ordinary shares, 7.0 million of the Company’s non-qualified stock options and 0.5 million of the Company’s share units. The addition of Legacy Allergan’s therapeutic franchises in ophthalmology, neurosciences and medical aesthetics/dermatology/plastic surgery complemented the Company’s existing central nervous system, gastroenterology, women’s health and urology franchises. The combined company benefits from Legacy Allergan’s global brand equity and consumer awareness of key products, including Botox® and Restasis®. The transaction expanded our presence and market and product reach across many international markets, with strengthened commercial positions across Canada, Europe, Southeast Asia and other high-value growth markets, including China, India, the Middle East and Latin America.
In connection with the Allergan Acquisition, the Company changed its name from Actavis plc to Allergan plc. Actavis plc’s ordinary shares were traded on the NYSE under the symbol “ACT” until the opening of trading on June 15, 2015, at which time Actavis plc changed its corporate name to “Allergan plc” and changed its ticker symbol to “AGN.” Pursuant to Rule 12g-3(c) under the Securities Exchange Act of 1934, as amended (the “Exchange Act”), Allergan plc is the successor issuer to Actavis plc’s ordinary shares and Actavis plc’s mandatory convertible preferred shares, both of which are deemed to be registered under Section 12(b) of the Exchange Act, and Allergan plc is subject to the informational requirements of the Exchange Act, and the rules and regulations promulgated thereunder.
References throughout to “we,” “our,” “us,” the “Company” or “Allergan” refer to financial information and transactions of Watson Pharmaceuticals, Inc. prior to January 23, 2013, Allergan Finance, LLC from January 23, 2013 until October 1, 2013 and Allergan plc and Warner Chilcott Limited subsequent to October 1, 2013.
3
References throughout to “Ordinary Shares” refer to Allergan Finance, LLC’s Class A common shares, par value $0.0033 per share, prior to the consummation of the Warner Chilcott Transactions and to Allergan plc’s ordinary shares, par value $0.0001 per share, since the consummation of the Warner Chilcott Transactions.
On July 26, 2015 we entered into a master purchase agreement (the “Teva Agreement”), under which Teva Pharmaceutical Industries Ltd. (“Teva”) agreed to acquire our global generic pharmaceuticals business and certain other assets (the “Teva Transaction”). Upon the closing of the Teva Transaction on August 2, 2016, we received $33.3 billion in cash, net of cash acquired by Teva, which included estimated working capital and other contractual adjustments, and 100.3 million unregistered Teva ordinary shares (or American Depository Shares with respect thereto), which approximated $5.0 billion in value using the closing date Teva opening stock price discounted at a rate of 5.9 percent due to the lack of marketability.
As part of the Teva Transaction, Teva acquired our global generics business, including the United States (“US”) and international generic commercial units, our third-party supplier Medis, our global generic manufacturing operations, our global generic research and development (“R&D”) unit, our international over-the-counter (“OTC”) commercial unit (excluding OTC eye care products) and certain established international brands.
On October 3, 2016, the Company completed the divestiture of the Anda Distribution business to Teva for $500.0 million. Teva acquired our Anda Distribution business, which distributes generic, branded, specialty and OTC pharmaceutical products from more than 300 manufacturers to retail independent and chain pharmacies, nursing homes, mail order pharmacies, hospitals, clinics and physician offices across the US
The Company recognized a combined gain on the sale of our Anda Distribution business and the sale of our global generics business of $15,932.2 million as well as deferred liabilities relating to other elements of our arrangements with Teva of $299.2 million.
As a result of the Teva Transaction and the divestiture of the Company’s Anda Distribution business, and in accordance with Financial Accounting Standards Board (“FASB”) Accounting Standards Update (“ASU”) number 2014-08 “Presentation of Financial Statements (Topic 205) and Property, Plant and Equipment (Topic 360): Reporting Discontinued Operations and Disclosures of Disposals of Components of an Entity”, the Company is accounting for the assets and liabilities divested as held for sale as of December 31, 2015. Further, the financial results of the businesses held for sale have been reclassified to discontinued operations for all periods presented in our consolidated financial statements. The results of our discontinued operations include the results of our generic product development, manufacturing and distribution of off-patent pharmaceutical products, certain established international brands marketed similarly to generic products and out-licensed generic pharmaceutical products primarily in Europe through our Medis third-party business through August 2, 2016, as well as our Anda Distribution business through October 3, 2016.
This discussion contains forward-looking statements that are subject to known and unknown risks, uncertainties and other factors that may cause our actual results to differ materially from those expressed or implied by such forward-looking statements. These risks, uncertainties and other factors include, among others, those identified under “Risk Factors” in this Annual Report and in other reports we have filed with the US Securities and Exchange Commission (“SEC”).
Business Overview
Allergan plc is a global specialty pharmaceutical company engaged in the development, manufacturing, marketing, and distribution of brand name pharmaceutical products (“brand”, “branded” or “specialty brand”), medical aesthetics, biosimilar and OTC pharmaceutical products. The Company has operations in more than 100 countries. Warner Chilcott Limited is an indirect wholly-owned subsidiary of Allergan plc and has the same principal business activities. As a result of the Allergan Acquisition, the Company expanded its franchises to include ophthalmology, neurosciences and medical aesthetics/dermatology/plastic surgery, which complemented the Company’s central nervous system, gastroenterology, women’s health and urology franchises. The Company benefits significantly from our global brand equity and consumer awareness of key products, including Botox® and Restasis®.
Allergan plc’s principal executive offices are located at Clonshaugh Business and Technology Park, Coolock, Dublin, Ireland and our administrative headquarters are located at Morris Corporate Center III, 400 Interpace Parkway, Parsippany, NJ 07054. Our Internet website address is www.allergan.com. We do not intend this website address to be an active link or to otherwise incorporate by reference the contents of the website into this report. Our annual reports on Form 10-K, quarterly reports on Form 10-Q and current reports on Form 8-K, and all amendments thereto, are available free of charge on our Internet website. These reports are posted on our website as soon as reasonably practicable after such reports are electronically filed with the SEC. The public may read and copy any materials that we file with the SEC at the SEC’s Public Reference Room at 100 F Street, NE, Washington D.C., 20549 or electronically through the SEC website (www.sec.gov). The information contained on the SEC’s website is not incorporated by reference into this Form 10-K and should not be considered to be part of this Form 10-K. Information may be obtained regarding the
4
operation of the Public Reference Room by calling the SEC at 1-800-SEC-0330. Within the Investors section of our website, we provide information concerning corporate governance, including our Corporate Governance Guidelines, Board Committee Charters and Composition, Code of Conduct and other information. Refer to “ITEM 1A. RISK FACTORS-CAUTIONARY NOTE REGARDING FORWARD-LOOKING STATEMENTS” in this document.
Business Development
2016 Significant Business Developments
The following are the material transactions that were completed in the year ended December 31, 2016.
Acquisitions
Tobira Therapeutics, Inc.
On November 1, 2016, the Company acquired Tobira Therapeutics, Inc. (“Tobira”), a clinical-stage biopharmaceutical company focused on developing and commercializing therapies for non-alcoholic steatohepatitis (“NASH”) and other liver diseases, for an acquisition accounting purchase price of $570.1 million, plus contingent consideration of up to $49.84 per share in contingent value rights (“CVR”), or up to $1,101.3 million, that may be payable based on the successful completion of certain development, regulatory and commercial milestones (the “Tobira Acquisition”). The CVR had an acquisition date fair value of $479.0 million. The Tobira Acquisition adds to the Company’s pipeline Cenicriviroc and Evogliptin, two differentiated, complementary development programs for the treatment of the multi-factorial elements of NASH, including inflammation, metabolic syndromes and fibrosis.
Vitae Pharmaceuticals, Inc.
On October 25, 2016, the Company acquired Vitae Pharmaceuticals, Inc. (“Vitae”), a clinical-stage biotechnology company, for an acquisition accounting purchase price of $621.4 million (the “Vitae Acquisition”). The Vitae Acquisition strengthens Allergan’s dermatology product pipeline with the addition of a Phase II orally active RORyt (retinoic acid receptor-related orphan receptor gamma) inhibitor for the potential treatment of psoriasis and other autoimmune disorders. In addition, as a result of the Vitae Acquisition, the Company expanded its pipeline with the acquisition of a Phase II atopic dermatitis drug candidate.
ForSight VISION5, Inc.
On September 23, 2016, the Company acquired ForSight VISION5, Inc. (“ForSight’), a privately held, clinical-stage biotechnology company focused on eye care, in an all cash transaction of approximately $95.0 million (the “ForSight Acquisition”). Under the terms of the ForSight Acquisition, the Company acquired ForSight for an acquisition accounting purchase price of $74.5 million plus the payment of outstanding indebtedness of $14.8 million and other miscellaneous charges. ForSight shareholders are eligible to receive contingent consideration of up to $125.0 million, which has an initial estimated fair value of $79.8 million, relating to commercialization milestones. The Company acquired ForSight for its lead development program, a peri-ocular ring designed for extended drug delivery and reducing elevated intraocular pressure (“IOP”) in glaucoma patients.
Licenses and Asset Acquisitions
Motus Therapeutics, Inc.
On December 15, 2016, the Company acquired Motus Therapeutics, Inc. (“Motus”) for an upfront payment of approximately $200.0 million (the “Motus Transaction”). Motus has the worldwide rights to RM-131 (relamorelin), a peptide ghrelin agonist being developed for the treatment of diabetic gastroparesis. Under the terms of the Motus Transaction, Motus shareholders are eligible to receive contingent consideration in connection with the commercial launch of the product. The Company concluded based on the stage of development of the assets, the lack of acquired employees as well as certain other inputs and processes that the transaction did not qualify as a business. The total upfront net payment of $199.5 million was expensed as a component of R&D expense and the future milestone will be recorded if the corresponding event becomes probable.
Chase Pharmaceuticals Corporation
On November 22, 2016, the Company acquired Chase Pharmaceuticals Corporation (“Chase”), a clinical-stage biopharmaceutical company focused on the development of improved treatments for neurodegenerative disorders including Alzheimer's disease, for an upfront payment of approximately $125.0 million plus potential regulatory and commercial milestones of up to $875.0 million related to Chase's lead compound, CPC-201, and certain backup compounds (the “Chase Transaction”). The Company concluded based on the stage of development of the assets, the lack of acquired employees as well as certain other inputs
5
and processes that the Chase Transaction did not qualify as a business. The total upfront net payment of $122.9 million was expensed as a component of R&D expense and the future milestones will be recorded if the corresponding events become probable.
AstraZeneca License
On October 2, 2016, the Company entered into a licensing agreement with MedImmune, AstraZeneca's global biologics research and development arm, for the global rights to Brazikumab (the “AstraZeneca Transaction”). Brazikumab is an anti-IL-23 monoclonal antibody currently in Phase IIb clinical development for the treatment of patients with moderate-to-severe Crohn's disease and is Phase II ready for ulcerative colitis and other conditions treated with anti-IL23 monoclonal antibodies. Under the terms of the AstraZeneca Transaction, AstraZeneca received $250.0 million for the exclusive, worldwide license to develop and commercialize Brazikumab and is eligible to receive contingent consideration of up to $1.27 billion, payable over a period of up to 15 years, including development and launch milestone payments of up to $540.0 million and sales-based milestone payments of $725.0 million, as well as tiered royalties on sales of the product. The Company concluded based on the stage of development of the assets, the lack of acquired employees and manufacturing as well as certain other inputs and processes that the transaction did not qualify as a business. The total upfront payment of $250.0 million was expensed as a component of R&D expense and the future milestones will be recorded if the corresponding events become probable.
RetroSense Therapeutics, LLC
On September 6, 2016, the Company acquired certain assets of RetroSense Therapeutics, LLC (“RetroSense”), a private, clinical-stage biotechnology company focused on novel gene therapy approaches to restore vision in patients suffering from blindness (the “RetroSense Transaction”). Under the terms of the RetroSense Transaction, RetroSense received approximately $60.0 million upfront, and is eligible to receive up to $495.0 million in contingent regulatory and commercialization milestone payments related to its lead development program, RST-001, a novel gene therapy for the treatment of Retinitis Pigmentosa. The Company concluded based on the stage of development of the assets, the lack of acquired employees as well as certain other inputs and processes that the RetroSense Transaction did not qualify as a business. The total upfront net payment of $59.7 million was expensed as a component of R&D expense and the future milestones will be recorded if the corresponding events become probable.
Akarna Therapeutics, Ltd
On August 26, 2016, the Company acquired Akarna Therapeutics, Ltd (“Akarna”), a biopharmaceutical company developing novel small molecule therapeutics that target inflammatory and fibrotic diseases (the “Akarna Transaction”). Under the terms of the Akarna Transaction, Akarna shareholders received approximately $50.0 million upfront and are eligible to receive contingent development and commercialization milestones of up to $1,015.0 million. The Company concluded based on the stage of development of the assets as well as a lack of certain other inputs and processes that the Akarna Transaction did not qualify as a business. The total upfront net payment of $48.2 million was expensed as a component of R&D expense and the future milestones will be recorded if the corresponding events become probable.
Topokine Therapeutics, Inc.
On April 21, 2016, the Company acquired Topokine Therapeutics, Inc. (“Topokine”), a privately held, clinical-stage biotechnology company focused on development stage topical medicines for fat reduction (the “Topokine Transaction”). Under the terms of the Topokine Transaction, Topokine shareholders received an upfront payment of approximately $85.0 million and are eligible to receive contingent development and commercialization milestones of up to $260.0 million for XAF5, a first-in-class topical agent in development for the treatment of steatoblepharon, also known as undereye bags. The Company concluded based on the stage of development of the assets, the lack of acquired employees as well as certain other inputs and processes that the Topokine Transaction did not qualify as a business. The total upfront net payment of approximately $85.0 million was expensed as a component of R&D expense and the future milestones will be recorded if the corresponding events become probable.
Heptares Therapeutics Ltd
On April 6, 2016, the Company entered into an agreement with Heptares Therapeutics Ltd. (“Heptares”), under which the Company licensed exclusive global rights to a portfolio of novel subtype-selective muscarinic receptor agonists in development for the treatment of major neurological disorders, including Alzheimer's disease (the “Heptares Transaction”). Under the terms of the Heptares Transaction, Heptares received an upfront payment of $125.0 million and is eligible to receive contingent milestone payments of up to approximately $665.0 million contingent upon the successful Phase I, II and III clinical development and launch of the first three licensed compounds for multiple indications and up to approximately $2.575 billion associated with achieving certain annual sales thresholds during the several years following launch. In addition, Heptares is eligible to receive contingent tiered royalties on net sales of all products resulting from the partnership. The Company concluded based on the stage of development of the assets,
6
the lack of acquired employees as well as certain other inputs and processes that the Heptares Transaction did not qualify as a business. The total upfront payment of $125.0 million was expensed as a component of R&D expense and the future milestones will be recorded when the event becomes probable.
Anterios, Inc.
On January 6, 2016, the Company acquired Anterios, Inc. (“Anterios”), a clinical stage biopharmaceutical company developing a next generation delivery system and botulinum toxin-based prescription products (the “Anterios Transaction”). Under the terms of the Anterios Transaction, Anterios shareholders received an upfront net payment of approximately $90.0 million and are eligible to receive contingent development and commercialization milestone payments up to $387.5 million related to an investigational topical formulation of botulinum toxin type A in development for the potential treatment of hyperhidrosis, acne, and crow’s feet lines and the related NDS™, Anterios' proprietary platform delivery technology that enables local, targeted delivery of neurotoxins through the skin without the need for injections. The Company concluded based on the stage of development of the assets, the lack of acquired employees as well as certain other inputs and processes that the Anterios Transaction did not qualify as a business. The total upfront net payment of $89.2 million was expensed as a component of R&D expense and the future milestones will be recorded if the corresponding events become probable.
2015 Significant Business Developments
The following are the material transactions that were completed in the year ended December 31, 2015.
Acquisitions
AqueSys, Inc.
On October 16, 2015, the Company acquired AqueSys, Inc. (“AqueSys”), a private, clinical-stage medical device company focused on developing ocular implants that reduce IOP associated with glaucoma, in an all-cash transaction (the “AqueSys Acquisition”). Under the terms of the AqueSys Acquisition, the Company acquired AqueSys for an acquisition accounting purchase price of $298.9 million, including $193.5 million for the estimated fair value of contingent consideration relating to the regulatory approval and commercialization milestone payments. The Company acquired AqueSys for the lead development program, including XEN45, a soft shunt that is implanted in the sub conjunctival space in the eye through a minimally invasive procedure with a single use, pre-loaded proprietary injector. On November 16, 2016, the Company received approval from the United States Food and Drug Administration (“FDA”) for XEN45, which triggered a CVR payment of $100.0 million in the year ending December 31, 2016.
Kythera Biopharmaceuticals, Inc.
On October 1, 2015, the Company acquired Kythera Biopharmaceuticals, Inc. (“Kythera”), for $75 per share, or an acquisition accounting purchase price of $2,089.5 million (the “Kythera Acquisition”), for the discovery, development and commercialization of novel prescription aesthetic products. Kythera’s lead product, Kybella® injection, is the first and only FDA approved, non-surgical treatment for moderate to severe submental fullness, commonly referred to as double chin.
Oculeve, Inc.
On August 10, 2015, the Company acquired Oculeve, Inc. (“Oculeve”), a development-stage medical device company focused on developing novel treatments for dry eye disease (the “Oculeve Acquisition”). Under the terms of the Oculeve Acquisition, Allergan acquired Oculeve for an acquisition accounting purchase price of $134.5 million, including $90.0 million for the estimated fair value of contingent consideration of which the Company may owe up to $300.0 million in future payments. The Company acquired Oculeve and its lead product candidate OD-01, an intranasal neurostimulation device, as well as other dry eye products in development.
Allergan, Inc.
On March 17, 2015, the Company completed the Allergan Acquisition. The addition of Legacy Allergan’s therapeutic franchises in ophthalmology, neurosciences and medical aesthetics/dermatology/plastic surgery complemented the Company’s existing central nervous system, gastroenterology, women’s health and urology franchises. The combined company benefited from Legacy Allergan’s global brand equity and consumer awareness of key products, including Botox® and Restasis®. The transaction also expanded our presence and market and product reach across many international markets, with strengthened commercial positions across Canada, Europe, Southeast Asia and other high-value growth markets, including China, India, the Middle East and Latin America.
7
Licenses and Asset Acquisitions
Mimetogen Pharmaceuticals, Inc.
On November 4, 2015, the Company entered into an exclusive licensing agreement with Mimetogen Pharmaceuticals, Inc. (“Mimetogen”), a clinical stage biotechnology company, to develop and commercialize tavilermide (MIM-D3), a topical formulation of a novel small molecule TrkA agonist for the treatment of dry eye disease, in exchange for an upfront payment of $50.0 million to Mimetogen, which is included as a component of R&D expense in the year ended December 31, 2015 (the “Mimetogen Transaction”). Mimetogen will be entitled to receive potential milestones based on achieving regulatory approval and predefined labeling of the product. In addition, Mimetogen is entitled to receive one-time annual sales based milestone payments based on multiple pre-defined annual net sales thresholds which may or may not be achieved, and tiered royalties based on net sales to third parties of the licensed products. The Company concluded based on the stage of development of the assets, the lack of acquired employees and manufacturing as well as certain other inputs and processes that the Mimetogen Transaction did not qualify as a business.
Almirall
On October 27, 2015, the Company and Ironwood Pharmaceuticals, Inc. announced that Allergan acquired rights to Constella® (linaclotide) in the European Union, Switzerland, Turkey and the Commonwealth of Independent States from Almirall, S.A. and has also reacquired rights to Linzess® (linaclotide) in Mexico from Almirall, S.A. for €60.0 million. The consideration was accounted for as an asset acquisition and included as a component of intangible assets. The Company concluded based on the lack of acquired employees and the lack of certain other inputs and processes that this transaction did not qualify as a business.
Naurex, Inc.
On August 28, 2015, the Company acquired certain products in early stage development of Naurex, Inc. (“Naurex”) in an all-cash transaction of $571.7 million, plus future contingent payments up to $1,150.0 million, which was accounted for as an asset acquisition (the “Naurex Transaction”). The Company recognized the upfront consideration of $571.7 million as a component of R&D expense in the year ended December 31, 2015. The Company concluded based on the stage of development of the assets, the lack of acquired employees and manufacturing as well as certain other inputs and processes that the Naurex Transaction did not qualify as a business. The Naurex Transaction expands our pipeline with Naurex’s two leading product candidates GLYX-13 and NRX-1074, two compounds that utilize NMDA modulation as a potential new approach to the treatment of Major Depressive Disorder (“MDD”), a disease that can lead to suicidality among the most severe patients.
Migraine License
On August 17, 2015, the Company entered into an agreement with Merck & Co. (“Merck”) under which the Company acquired the exclusive worldwide rights to Merck’s early development stage investigational small molecule oral calcitonin gene-related peptide receptor antagonists, which are being developed for the treatment and prevention of migraines (the “Merck Transaction”). The Merck Transaction is being accounted for as an asset acquisition. The Company acquired these rights for an upfront charge of $250.0 million which was recognized as a component of R&D expense in the year ended December 31, 2015. The Company concluded based on the stage of development of the assets, the lack of acquired employees and manufacturing as well as certain other inputs and processes that the Merck Transaction did not qualify as a business. During the year ended December 31, 2016, the Company incurred $100.0 million of milestones under the agreement, which were included as a component of R&D expense. Additionally, Merck is owed contingent payments based on commercial and development milestones of up to $865.0 million as well as potential future royalties.
Divestitures
Respiratory Business
As part of the Forest Acquisition (defined below), we acquired certain assets that comprised Legacy Forest’s branded respiratory business in the US and Canada (the “Respiratory Business”). During the year ended December 31, 2014, we held for sale assets of the Respiratory Business of $734.0 million, including allocated goodwill to this unit of $309.1 million. On March 2, 2015, the Company sold the Respiratory Business to AstraZeneca plc (“AstraZeneca”) for consideration of $600.0 million upon closing, additional funds to be received for the sale of certain of our inventory to AstraZeneca and low single-digit royalties above a certain revenue threshold. AstraZeneca also paid Allergan an additional $100.0 million and Allergan has agreed to a number of contractual consents and approvals, including certain amendments to the ongoing collaboration agreements between AstraZeneca and Allergan (the “Respiratory Sale”). As a result of the terms of the Respiratory Sale, in the year ended December 31, 2015, the Company recognized an incremental charge in cost of sales (including the acquisition accounting fair value mark-up of inventory) relating to inventory that will not be sold to AstraZeneca of $35.3 million. The Company recognized a loss in other (expense) income, net for the sale of the business of $5.3 million in the year ended December 31, 2015.
8
As part of the Forest Acquisition, the Company acquired certain manufacturing plants and contract manufacturing agreements within the business known as Aptalis Pharmaceutical Technologies (“Pharmatech”). In accordance with acquisition accounting, the assets were fair valued on July 1, 2014 as assets held in use, including market participant synergies anticipated under the concept of “highest and best use.” During the fourth quarter of 2014, the decision was made to hold these assets for sale as one complete unit, without integrating the unit and realizing anticipated synergies. During the year ended December 31, 2014, the Company recognized an impairment on assets held for sale of $189.9 million (the “Pharmatech Transaction”) which included a portion of goodwill allocated to this business unit. In the year ended December 31, 2015, the Company completed the divestiture of the Pharmatech business and there was no material impact to the Company’s results of operations.
2014 Significant Business Developments
The following are the material transactions that were completed in the year ended December 31, 2014.
Acquisitions
Durata Therapeutics, Inc.
On November 17, 2014, the Company completed its tender offer to purchase all of the outstanding shares of Durata Therapeutics, Inc. (“Durata”), an innovative pharmaceutical company focused on the development and commercialization of novel therapeutics for patients with infectious diseases and acute illnesses (the “Durata Acquisition”). The Company purchased all outstanding shares of Durata, which were valued at approximately $724.5 million, including the assumption of debt and there is one CVR per share, entitling the holder to receive additional cash payments of up to $5.00 per CVR if certain regulatory or commercial milestones related to Durata’s lead product Dalvance® are achieved. The CVR had an acquisition date fair value of $49.0 million.
Furiex Pharmaceuticals, Inc.
On July 2, 2014, the Company acquired Furiex Pharmaceuticals, Inc. (“Furiex”) in an all-cash transaction valued at $1,156.2 million (including the assumption of debt) and up to approximately $360.0 million in a CVR payable based on which controlled substance schedule designation that eluxadoline, Furiex’s lead product would receive following approval, which had an acquisition accounting fair value of $88.0 million on the date of acquisition (included in the value of $1,156.2 million) (the “Furiex Acquisition”). In the second quarter of 2015, the Company received approval from the FDA of the eluxadoline product, Viberzi®. Viberzi® is a first-in-class, locally-acting mu opioid receptor agonist and delta opioid receptor antagonist for treating symptoms of diarrhea-predominant irritable bowel syndrome (IBS-d), a condition that affects approximately 28 million patients in the United States and Europe. In connection with the close of the Furiex Acquisition, the Company further announced that it closed the transaction related to the sale of Furiex’s royalties on Alogliptin and Priligy® to Royalty Pharma for $408.6 million in cash consideration.
Forest Laboratories, Inc.
On July 1, 2014, the Company acquired Forest Laboratories, Inc. (“Legacy Forest”) for $30.9 billion including outstanding indebtedness assumed of $3.3 billion, equity consideration of $20.6 billion, which includes outstanding equity awards, and cash consideration of $7.1 billion (the “Forest Acquisition”). Under the terms of the Forest Acquisition, Legacy Forest shareholders received 89.8 million Allergan plc (formerly Actavis plc) ordinary shares, 6.1 million Allergan plc non-qualified stock options and 1.1 million Allergan plc share units. Legacy Forest was a leading, fully integrated, specialty pharmaceutical company largely focused on the United States market. Legacy Forest marketed a portfolio of branded drug products and developed new medicines to treat patients suffering from diseases principally in the following therapeutic areas: central nervous system, cardiovascular, gastrointestinal, respiratory, anti-infective, and cystic fibrosis.
Business Description
Prescription pharmaceutical products in the United States generally are marketed as either brand pharmaceuticals or generics. Results in continuing operations in the United States are primarily due to brand pharmaceuticals. Brand pharmaceutical products, including aesthetic products, are marketed under brand names through programs that are designed to generate physician and consumer loyalty.
9
As a result of the differences between the types of products we market and/or distribute, we operate and manage our business in three distinct operating segments: US Specialized Therapeutics, US General Medicine and International. The operating segments are organized as follows:
|
|
• |
The US Specialized Therapeutics segment includes sales and expenses relating to certain branded products within the US, including Medical Aesthetics, Medical Dermatology, Eye Care, Neurosciences and Urology therapeutic products. |
|
|
• |
The US General Medicine segment includes sales and expenses relating to branded products within the US that do not fall into the US Specialized Therapeutics business units, including Central Nervous System, Gastrointestinal, Women’s Health, Anti-Infectives and Diversified Brands. |
|
|
• |
The International segment includes sales and expenses relating to products sold outside the US. |
Business Strategy
We apply three key strategies to achieve growth for our US Specialized Therapeutics, US General Medicine and International businesses: (i) internal development of differentiated and high-demand products, (ii) establishment of strategic alliances and collaborations and (iii) acquisition of products and companies that complement our current business.
Based upon business conditions, our financial strength and other factors, we regularly reexamine our business strategies and may change them at any time. Refer to “ITEM 1A. RISK FACTORS —Risks Related to Our Business” in this document.
10
As of December 31, 2016, our portfolio of products within the US Specialized Therapeutics, US General Medicine and International segments include the following key promoted products:
|
Product |
|
Therapeutic Area |
|
Active Ingredient |
|
Therapeutic Classification |
|
Aczone® |
|
Medical Dermatology |
|
Dapzone |
|
Acne |
|
Alphagan®/Combigan® |
|
Eye Care |
|
Brimonidine tartrate |
|
Selective alpha2 agonist |
|
Armour Thyroid |
|
Diversified Brands |
|
Levothyroxine and liothyronine |
|
Underactive thyroid |
|
Asacol®/Delzicol® |
|
Gastrointestinal (GI) |
|
Mesalamine |
|
Ulcerative colitis |
|
Avycaz® |
|
Anti-Infectives |
|
Ceftazidime |
|
Urinary and abdominal infections |
|
Botox® Cosmetics |
|
Facial Aesthetics |
|
Onabotulinumtoxin A |
|
Acetylcholine release inhibitor |
|
Botox® Hyperhidrosis |
|
Medical Dermatology |
|
Onabotulinumtoxin A |
|
Acetylcholine release inhibitor |
|
Botox® Therapeutics |
|
Neuroscience and Urology |
|
Botulinum toxin |
|
Musculoskeletal agent |
|
Breast Implants |
|
Plastic Surgery |
|
Silicone |
|
Reconstructive plastic surgery |
|
Bystolic®/Byvalson® |
|
Diversified Brands |
|
Nebivolol |
|
Hypertension |
|
Canasa®/Salofalk® |
|
GI |
|
Mesalamine |
|
Ulcerative colitis |
|
Carafate®/Sulcrate® |
|
GI |
|
Sucralfate |
|
Ulcerative colitis |
|
Dalvance® |
|
Anti-Infectives |
|
Dalbavancin |
|
Acute bacterial skin infections |
|
Estrace® Cream |
|
Women's Health |
|
Estradiol |
|
Hormone therapy |
|
Kybella® |
|
Facial Aesthetics |
|
Deoxycholic acid |
|
Submental fullness |
|
Latisse® |
|
Skin Care |
|
Bimatoprost |
|
Eyelash growth |
|
Lexapro® |
|
Diversified Brands |
|
Escitalopram Oxalate |
|
Anxiety, depressive disorders |
|
Liletta® |
|
Women's Health |
|
Levonorgestrel |
|
Contraceptive intrauterine device |
|
Linzess®/Constella® |
|
GI |
|
Linaclotide |
|
Irritable bowel syndrome |
|
Lo Loestrin® |
|
Women's Health |
|
Ethinyl estradiol and norethindrone |
|
Oral contraceptive |
|
Lumigan®/Ganfort® |
|
Eye Care |
|
Bimatoprost |
|
Prostaglandin analogue |
|
Minastrin® 24 |
|
Women's Health |
|
Ethinyl estradiol and norethindrone |
|
Oral contraceptive |
|
Namenda® IR |
|
Central Nervous System (CNS) |
|
Memantine HCl |
|
Dementia |
|
Namenda XR® |
|
CNS |
|
Memantine HCl |
|
Dementia |
|
Namzaric® |
|
CNS |
|
Memantine HCl |
|
Dementia |
|
Ozurdex® |
|
Eye Care |
|
Dexamethasone |
|
Intravitreal eye implant |
|
Rapaflo® |
|
Neuroscience and Urology |
|
Silodosin |
|
Benign prostatic hyperplasia |
|
Restasis® |
|
Eye Care |
|
Cyclosporine |
|
Topical immunomodulator |
|
Saphris® |
|
CNS |
|
Asenapine |
|
Schizophrenia, bipolar mania |
|
Savella® |
|
Diversified Brands |
|
Milnacipran |
|
Fibromyalgia |
|
Tazorac® |
|
Medical Dermatology |
|
Tazarotene |
|
Acne |
|
Teflaro® |
|
Anti-Infectives |
|
Ceftaroline fosamil |
|
Acute bacterial skin infections, community-acquired bacterial pneumonia |
|
Viberzi® |
|
GI |
|
Eluxadoline |
|
Irritable bowel syndrome |
|
Viibryd®/Fetzima® |
|
CNS |
|
Vilazodone HCl/Levomilnacipran |
|
Major depressive disorders |
|
Vraylar™ |
|
CNS |
|
Cariprazine HCl |
|
Schizophrenia, bipolar mania |
|
Zenpep® |
|
GI |
|
Pancrelipase |
|
Exocrine pancreatic insufficiency |
Our portfolio of products also includes eye drops, fillers, and SkinMedica® products.
US Specialized Therapeutics
Our US Specialized Therapeutics business offers certain of our branded products within the US, including Medical Aesthetics, Medical Dermatology, Eye Care, Neurosciences and Urology therapeutic products. Net revenues in our US Specialized Therapeutics segment were $5,811.7 million, $4,309.8 million, and $111.9 million or approximately 39.9%, 34.0%, and 2.4% of our total net revenues, in the years ended December 31, 2016, 2015, and 2014, respectively. The US Specialized Therapeutics segment is primarily attributable to the Allergan Acquisition. Revenues within this segment include revenues that were distributed through the Anda Distribution business to third party customers through October 3, 2016.
11
US Specialized Therapeutics Strategy
Our US Specialized Therapeutics business is focused on maintaining a leading position in the therapeutic areas in which we participate within the US market. Our sales and marketing efforts focus on targeted activities, including direct-to-consumer advertising, to increase consumer awareness of our products and also to engage specialty physicians and surgeons through our sales professionals and other programs to ensure they are fully informed about our product offerings. For reimbursed products we also contract with payors to ensure that our products are widely available to patients.
US General Medicine
Our US General Medicine business is focused on newly developed pharmaceutical products, which are normally patented or have market exclusivity. These patented and off-patent trademarked products are branded pharmaceutical products, and as a result of these patents or exclusivity, are generally offered by a single provider when first introduced to the market. We market a number of branded products to physicians, hospitals, and other customers that we serve.
Net revenues in our US General Medicine segment were $5,923.9 million, $6,338.4 million, and $4,399.3 million, or approximately 40.7%, 50.0%, and 94.1% of our total net revenues, in the years ended December 31, 2016, 2015, and 2014, respectively. Revenues within this segment include revenues that were distributed through the Anda Distribution business to third party customers through October 3, 2016.
US General Medicine Strategy
We market our branded products through our active sales professionals in the United States. Our sales and marketing efforts focus on both general practitioners and specialty physicians who specialize in the diagnosis and treatment of particular medical conditions. We also conduct targeted activities, including direct-to-consumer advertising, to increase consumer awareness of our products. We believe that our current sales force structure gives us a competitive advantage in launching and promoting products due to our ability to reach a larger target audience of both general practitioners and specialists. For reimbursed products we also contract with payors to ensure that our products are widely available to patients.
International
Our International segment offers a wide array of branded and aesthetics products outside of the United States, primarily products acquired in the Allergan Acquisition. Net revenues in our International segment were $2,881.3 million, $2,187.3 million, and $203.5 million, or approximately 19.8%, 17.2% and 4.4% of our total net revenues, in the years ended December 31, 2016, 2015, and 2014, respectively.
International Strategy
Our International business is focused on maintaining a leading position by offering a consistent and reliable supply of quality branded and aesthetic products. We have maintained an ongoing effort to enhance efficiencies and reduce costs in our manufacturing operations.
Research and Development
We devote significant resources to the R&D of branded products, biosimilars and proprietary drug delivery technologies. R&D activities are expensed as incurred and consist of self-funded R&D costs, the costs associated with work performed under collaborative R&D agreements, regulatory fees, and acquisition and license related milestone payments, if any.
Our R&D strategy focuses on the following product development areas:
|
|
• |
the application of proprietary drug-delivery technology for new product development in specialty areas; |
|
|
• |
the acquisition of mid-to-late development-stage brand drugs and biosimilars; and |
|
|
• |
the development of sustained-release, semi-solid, liquid, oral transmucosal, transdermal, gel, injectable, and other drug delivery technologies and the application of these technologies to proprietary drug forms. |
As of December 31, 2016, we conducted the majority of our branded drug delivery R&D activities in Irvine, California. We are presently developing a number of products through a combination of internal and collaborative programs.
12
As of December 31, 2016, we are developing a number of branded products, some of which utilize novel drug delivery systems, through a combination of internal and collaborative programs including the following:
|
Product |
|
Therapeutic Area |
|
Indication |
|
Expected Launch Year |
|
Phase |
|
Esmya |
|
Women's healthcare |
|
Uterine Fibroids |
|
2018 |
|
III |
|
Sarecycline |
|
Dermatology |
|
Severe Acne |
|
2019 |
|
III |
|
Ubrogepant |
|
Neurology |
|
Acute Migraine |
|
2020 |
|
III |
|
Abicipar |
|
Eye Care |
|
Age Related Macular Degeneration |
|
2020 |
|
III |
|
Bimatoprost SR |
|
Eye Care |
|
Glaucoma |
|
2021 |
|
III |
|
Relamorelin |
|
Gastrointestinal |
|
Gastroparesis |
|
2021 |
|
II |
|
Rapastinel |
|
Psychiatry |
|
Depression |
|
2021 |
|
III |
|
Cenicriviroc |
|
Gastrointestinal |
|
NASH |
|
2021 |
|
II |
|
Atogepant |
|
CNS |
|
Migraine Prevention |
|
2022 |
|
II |
We also have a number of products in development as part of our life-cycle management strategy for our existing product portfolio.
Financial Information About Segments and Geographic Areas
During 2016, Allergan announced a realignment of its businesses to streamline operations. Prior to the realignment, the Company operated and managed its business as four distinct operating segments: US Brands, US Medical Aesthetics, International and Anda Distribution. Under the new organizational structure being reported, and as a result of our decision to sell our Anda Distribution business, the Company organized its businesses into the following segments: US Specialized Therapeutics, US General Medicine and International. In addition, certain revenues and shared costs, and the results of corporate initiatives, are managed outside of the three segments. Prior period results have been recast to align to the current segment presentation.
The operating segments are organized as follows:
|
|
• |
The US Specialized Therapeutics segment includes sales and expenses relating to branded products within the US, including Medical Aesthetics, Medical Dermatology, Eye Care, Neurosciences and Urology therapeutic products. |
|
|
• |
The US General Medicine segment includes sales and expenses relating to branded products within the US that do not fall into the US Specialized Therapeutics business units, including Central Nervous System, Gastrointestinal, Women’s Health, Anti-Infectives and Diversified Brands. |
|
|
• |
The International segment includes sales and expenses relating to products sold outside the US. |
The Company evaluates segment performance based on segment contribution. Segment contribution for our segments represents net revenues less cost of sales (defined below), selling and marketing expenses, and select general and administrative expenses. Included in segment revenues are product sales that were sold through the Anda Distribution business once the Anda Distribution business had sold the product to a third party customer. These sales are included in segment results and are reclassified into revenues from discontinued operations through a reduction of Corporate revenues which eliminates the sales made by the Anda Distribution business through October 3, 2016 from results of continuing operations. Cost of sales for these products in discontinued operations is equal to our average third party cost of sales for third party branded products distributed by Anda Distribution. The Company does not evaluate the following items at the segment level:
|
|
• |
Revenues and operating expenses within cost of sales, selling and marketing expenses, and general and administrative expenses that result from the impact of corporate initiatives. Corporate initiatives primarily include integration, restructuring, acquisition and other shared costs. |
|
|
• |
General and administrative expenses that result from shared infrastructure, including certain expenses located within the United States. |
|
|
• |
Total assets including capital expenditures. |
|
|
• |
Other select revenues and operating expenses including R&D expenses, amortization, IPR&D impairments and asset sales and impairments, net as not all such information has been accounted for at the segment level, or such information has not been used by all segments. |
13
The Company defines segment net revenues as product sales and other revenue derived from branded products or licensing agreements. In March 2015, as a result of the Allergan Acquisition, we began to promote Restasis®, Lumigan®/Ganfort®, Alphagan®/Combigan®, Botox®, fillers, other aesthetic products and other eye care products. In July 2014, as a result of the Forest Acquisition, the Company also began recognizing revenues on key US brands, including, but not limited to, Bystolic ®, Canasa®, Carafate®, Fetzima ®, Linzess ®, Namenda®IR (which lost exclusivity in July 2015), Namenda XR®, Saphris®, Teflaro® and Viibryd®.
Cost of sales within segment contribution includes standard production and packaging costs for the products we manufacture, third party acquisition costs for products manufactured by others, profit-sharing or royalty payments for products sold pursuant to licensing agreements and finished goods inventory reserve charges. Cost of sales included within segment contribution does not include non-standard production costs, such as non-finished goods inventory obsolescence charges, manufacturing variances and excess capacity utilization charges, where applicable. Cost of sales does not include amortization or impairment costs for acquired product rights or other acquired intangibles.
Selling and marketing expenses consist mainly of personnel-related costs, product promotion costs, distribution costs, professional service costs, insurance, depreciation and travel costs.
General and administrative expenses consist mainly of personnel-related costs, facilities costs, transaction costs, insurance, depreciation, litigation and settlement costs and professional services costs which are general in nature and attributable to the segment.
Customers
In US Specialized Therapeutics, US General Medicine and International operations, we sell our brand and aesthetic pharmaceutical products primarily to drug wholesalers, retailers and distributors, including national retail drug and food store chains, hospitals, clinics, mail order retailers, government agencies and managed healthcare providers such as health maintenance organizations and other institutions.
Sales to certain of our customers accounted for 10% or more of our annual revenues during the past three years. The following table illustrates customers and the respective percentage of revenues which they comprised in each of the last three years:
|
Customer |
|
2016 |
|
|
2015 |
|
|
2014 |
|
|||
|
McKesson Corporation |
|
|
23 |
% |
|
|
27 |
% |
|
|
29 |
% |
|
Cardinal Health, Inc. |
|
|
18 |
% |
|
|
20 |
% |
|
|
21 |
% |
|
AmerisourceBergen Corporation |
|
|
18 |
% |
|
|
19 |
% |
|
|
22 |
% |
Our significant customers comprise a large part of the distribution network for pharmaceutical products in North America. As a result, a small number of large wholesaler distributors control a significant share of the market for our products.
The loss of any of these customers could have a material adverse effect on our business, results of operations, financial condition and cash flows.
Competition
The pharmaceutical industry is highly competitive. In our US Specialized Therapeutics, US General Medicine and International businesses, we compete with different companies to develop competitive products, in certain product categories, and within each applicable product category, upon dosage strengths and drug delivery systems. Our competitors include the major brand name manufacturers of pharmaceutical products. In addition to product development, other competitive factors in the pharmaceutical industry include product quality, price, reputation, service and access to proprietary and technical information. It is possible that developments by others will make our products or technologies noncompetitive or obsolete.
Competing in the brand and aesthetic product business requires us to identify and successfully bring to market new products embodying technological innovations. Successful marketing of brand and aesthetic products depends primarily on the ability to communicate the effectiveness, safety and value of these products to healthcare professionals in private practice and group practices and to receive formulary status from managed care organizations. We anticipate that our brand and aesthetic product offerings will support our existing areas of therapeutic focus. Based upon business conditions and other factors, we regularly reevaluate our business strategies and may from time to time reallocate our resources from one therapeutic area to another, withdraw from a therapeutic area or add an additional therapeutic area in order to maximize our overall growth opportunities.
14
Many of our competitors have been in business for a longer period of time, have a greater number of products on the market and have greater financial and other resources than we do. When we directly compete with these companies for certain contracted business or for the same markets and/or products, their financial strength could prevent us from capturing a meaningful share of those markets.
Social Contract
In September 2016, we introduced our Social Contract with Patients, in which we committed to limit price increases on our products to once per year, and to only increase the list price of a product by single-digits, with the expectation that net price increases, which are price increases after discounts and rebates, would be in the low to mid- single digit range.
For the full-year 2016, our net price increases on US products averaged 4.8 percent (list price increases averaged 8.1 percent).
Manufacturing, Suppliers and Materials
As of December 31, 2016, we manufactured many of our own finished products at our plants which include major manufacturing sites in:
|
Location |
|
State / Country |
|
Guarulhos |
|
Brazil |
|
San Jose |
|
California |
|
San Jose |
|
Costa Rica |
|
Pringy |
|
France |
|
Weiterstadt |
|
Germany |
|
Dublin |
|
Ireland |
|
Westport |
|
Ireland |
|
Fall River |
|
Massachusetts |
|
Cincinnati |
|
Ohio |
|
Waco |
|
Texas |
We have development and manufacturing capabilities for raw material and active pharmaceutical ingredients (“API”) and intermediate ingredients to support our R&D internal product development efforts in our San Jose, California facility.
Our manufacturing operations are subject to extensive regulatory oversight and could be interrupted at any time. Refer to Legal Matters in “NOTE 24 — Commitments and Contingencies” in the accompanying “Notes to Consolidated Financial Statements” in this document.
In addition, we are dependent on third parties for the supply of the raw materials necessary to develop and manufacture our products, including the API and inactive pharmaceutical ingredients used in many of our products. We are required to identify the supplier(s) of all the raw materials for our products in the drug applications that we file with the FDA. If raw materials for a particular product become unavailable from an approved supplier specified in a drug application, we would be required to qualify a substitute supplier with the FDA, which could interrupt manufacturing of the affected product. To the extent practicable, we attempt to identify more than one supplier in each drug application. However, some raw materials are available only from a single source and, in many of our drug applications, only one supplier of raw materials has been identified, even in instances where multiple sources exist.
Furthermore, we obtain a significant portion of our raw materials from foreign suppliers. Arrangements with international raw material suppliers are subject to, among other things, FDA regulation, customs clearance, various import duties, foreign currency risk and other government clearances. Acts of governments outside the US may affect the price or availability of raw materials needed for the development or manufacture of our products. In addition, any changes in patent laws in jurisdictions outside the US may make it increasingly difficult to obtain raw materials for R&D prior to the expiration of the applicable US or foreign patents. Refer to “ITEM 1A. RISK FACTORS — Risks Related to Our Business — If we are unable to obtain sufficient supplies from key manufacturing sites or suppliers that in some cases may be the only source of finished products or raw materials, our ability to deliver our products to the market may be impeded” in this document and “ITEM 1A — RISK FACTORS — Risks Relating to Investing in the Pharmaceutical Industry — The supply of APIs into Europe may be negatively affected by recent regulations promulgated by the European Union” in this document.
15
Patents and Proprietary Rights
We believe patent protection of our proprietary products is important to our products. Our success with our branded products will depend, in part, on our ability to obtain, and successfully defend if challenged, patent or other proprietary protection for such products. We currently have a number of US and foreign patents issued or pending. However, the issuance of a patent is not conclusive as to its validity or as to the enforceable scope of the claims of the patent. Accordingly, our patents may not prevent other companies from developing similar or functionally equivalent products or from successfully challenging the validity of our patents. If our patent applications are not approved or, even if approved, if such patents are circumvented or not upheld in a court of law or in administrative proceedings, including oppositions, re-examinations or inter partes review (“IPR”), our ability to competitively market our patented products and technologies may be significantly reduced. Also, such patents may or may not provide competitive advantages for their respective products or they may be challenged or circumvented by competitors, in which case our ability to commercially market these products may be diminished. From time to time, we may need to obtain licenses to patents and other proprietary rights held by third parties to develop, manufacture and market our products. If we are unable to timely obtain these licenses on commercially reasonable terms, our ability to commercially market such products may be inhibited or prevented. In addition, patents covering, for example, Actonel® (certain indications), Aczone® 5%, Androderm®, Botox® (for hyperhidrosis), Carafate®, Estrace® Cream, Femhrt®, INFed® and Namenda® (IR) products have expired and we have no further patent protection on these products, and generic versions of our Minastrin® product will enter the market as early as March 2017 pursuant to settlement agreements previously entered into.
We also rely on trade secrets and proprietary know-how that we seek to protect, in part, through confidentiality agreements with our partners, customers, employees and consultants. It is possible that these agreements will be breached or will not be enforceable in every instance, and we will not have adequate remedies for any such breach. It is also possible that our trade secrets will otherwise become known or independently developed by competitors.
We may find it necessary to initiate litigation to enforce our patent rights, to protect our trade secrets or know-how or to determine the scope and validity of the proprietary rights of others. Litigation concerning patents, trademarks, copyrights and proprietary technologies can often be protracted and expensive and, as with litigation generally, the outcome is inherently uncertain.
Litigation alleging infringement of patents, copyrights or other intellectual property rights may be costly and time consuming. Refer to “ITEM 1A. RISK FACTORS — Risks Related to Our Business — Third parties may claim that we infringe their proprietary rights and may prevent us from manufacturing and selling some of our products” and Legal Matters in “NOTE 24 — Commitments and Contingencies” in the accompanying “Notes to Consolidated Financial Statements” in this document.
Government Regulation and Regulatory Matters
The following discussion focuses on key markets to the Company’s overall business.
United States
All pharmaceutical manufacturers, including Allergan, are subject to extensive, complex and evolving regulation by the federal government, principally the FDA, and to a lesser extent, by the US Drug Enforcement Administration (“DEA”), Occupational Safety and Health Administration and state government agencies, as well as by various regulatory agencies in foreign countries where our products or product candidates are being manufactured and/or marketed. The Federal Food, Drug and Cosmetic Act, the Controlled Substances Act and other federal statutes and regulations govern or influence the testing, manufacturing, packing, labeling, storing, record keeping, safety, approval, advertising, promotion, sale and distribution of our products. In our international markets, the approval, manufacture and sale of pharmaceutical products is similar to the United States with some variations dependent upon local market dynamics.
Specialty Pharmaceuticals
In the United States, FDA approval is required before any dosage form of any new drug, including an off-patent equivalent of a previously approved drug, can be marketed. The process for obtaining governmental approval to manufacture and market pharmaceutical products is rigorous, time-consuming and costly, and the extent to which it may be affected by legislative and regulatory developments cannot be predicted. We are dependent on receiving FDA and other governmental approvals prior to manufacturing, marketing and shipping new products. Refer to “ITEM 1A. RISK FACTORS — Risks Related to Our Business — If we are unable to successfully develop or commercialize new products, our operating results will suffer” and “— Extensive industry regulation has had, and will continue to have, a significant impact on our business, especially our product development, manufacturing and distribution capabilities” in this document.
16
All applications for FDA approval must contain information relating to product formulation, raw material suppliers, stability, manufacturing processes, packaging, labeling and quality control. We file a New Drug Application (“NDA”) when we seek approval for drugs with active ingredients and/or with dosage strengths, dosage forms, delivery systems or pharmacokinetic profiles that have not been previously approved by the FDA. Generally, NDAs are filed for newly developed branded products or for a new dosage form of previously approved drugs.
For innovative or non-generic new drugs, an FDA-approved NDA is required before the drug may be marketed in the United States. The NDA must contain data to demonstrate that the drug is safe and effective for its intended uses and that it will be manufactured to appropriate quality standards. In order to demonstrate safety and effectiveness, an NDA generally must include or reference pre-clinical studies and clinical data from controlled trials in humans. For a new chemical entity, this generally means that lengthy, uncertain and rigorous pre-clinical and clinical testing must be conducted. For compounds that have a record of prior or current use, it may be possible to utilize existing data or medical literature and limited new testing to support an NDA. Any pre-clinical testing that we wish to rely upon for FDA action must comply with the FDA’s good laboratory practice and other requirements. Clinical testing in human subjects must be conducted in accordance with the FDA’s good clinical practice and other requirements. In order to initiate a clinical trial, the sponsor must submit an Investigational New Drug Application (“IND”) to the FDA or meet one of the narrow exemptions that exist from the IND requirement.
The FDA has the authority to either approve or not approve NDAs, and if an application is not approved, additional data (clinical, non-clinical, manufacturing or quality data, among other types of data) is generally required. In addition, the FDA may approve an NDA subject to post-approval studies or monitoring requirements, or require that other risk management measures be utilized in connection with the product. There are also requirements to conduct pediatric trials for all new NDAs and supplements to NDAs for pharmaceutical products that may be used in the pediatric patient population, unless a waiver or deferral applies.
Once approved, the NDA is subject to life-cycle management regulations (for example, supplemental applications and annual reports) in order to maintain product registrations. Supplemental NDAs are required for changes that require FDA evaluation and/or approval prior to implementation, including the transfer of certain products from one manufacturing site to another, a change in API supplier, or a new indication or dosage form, and may be under review for a year or more. In addition, certain products may only be approved for transfer once new bioequivalency studies are conducted or other requirements are satisfied. In addition, FDA may require post-marketing clinical studies.
To obtain FDA approval of NDAs and supplemental New Drug Applications (“sNDA”), our manufacturing procedures and operations must conform to FDA quality system and control requirements generally referred to as current Good Manufacturing Practices (“cGMP”), as defined in Title 21 of the US Code of Federal Regulations, and cGMP must be adhered to throughout the life-cycle of a product, as these regulations encompass all aspects of the production process from receipt and qualification of components to distribution procedures for finished products. cGMP standards are evolving standards; thus, we must continue to expend substantial time, money and effort in all production and quality control areas to maintain compliance with these standards. The evolving and complex nature of regulatory requirements, the broad authority and discretion of the FDA, and the generally high level of regulatory oversight results in the continuing possibility that we may be adversely affected by regulatory actions despite our efforts to maintain compliance with regulatory requirements.
We are subject to the periodic inspection of our facilities, procedures and operations and/or the testing of our products by the FDA, the DEA and other authorities, which conduct periodic inspections to assess compliance with applicable regulations. In addition, in connection with its review of our applications for new products, the FDA conducts pre-approval and post-approval reviews and plant inspections to determine whether our systems and processes comply with cGMP and other FDA regulations. Among other things, the FDA may withhold approval of NDAs, sNDAs, or other product applications of a facility if deficiencies are found at that facility. Vendors that supply finished products or components to us that we use to manufacture, package and label products are subject to similar regulation and periodic inspections.
Following such inspections, the FDA may issue notices on Form 483 and Warning Letters that could cause us to modify certain activities identified during the inspection. A Form 483 notice may be issued at the conclusion of an FDA inspection and lists conditions the FDA investigators believe may violate cGMP or other FDA regulations. FDA guidelines specify that a Warning Letter be issued only for violations of “regulatory significance” for which the failure to adequately and promptly achieve correction may be expected to result in an enforcement action.
Failure to comply with FDA and other governmental regulations can result in fines, unanticipated compliance expenditures, recall or seizure of products, total or partial suspension of production and/or distribution, suspension of the FDA’s review of NDAs or other product application enforcement actions, injunctions and criminal prosecution. Under certain circumstances, the FDA also has the authority to revoke previously granted drug approvals. Although we have internal compliance programs, if these programs do not meet regulatory agency standards or if our compliance is deemed deficient in any significant way, it could have a material adverse
17
effect on us. Refer to “ITEM 1A. RISK FACTORS — Risks Related to Our Business — Extensive industry regulation has had, and will continue to have, a significant impact on our business, especially our product development, manufacturing and distribution capabilities.” in this document. The FDA can also significantly delay the approval of any pending NDA or other regulatory submissions under the Fraud, Untrue Statements of Material Facts, Bribery and Illegal Gratuities Policy Act.
Medical Devices
Medical devices are subject to regulation by the FDA, state agencies and foreign government health agencies in the US. FDA regulations, as well as various US federal and state laws, govern the development, clinical testing, manufacturing, labeling, record keeping and marketing of medical device products. Our medical device product candidates, including our breast implants, must undergo rigorous clinical testing and an extensive government regulatory clearance or approval process prior to sale in the United States and other countries. The lengthy process of clinical development and submissions for approvals, and the continuing need for compliance with applicable laws and regulations, require the expenditure of substantial resources. Regulatory clearance or approval, when and if obtained, may be limited in scope, and may significantly limit the indicated uses for which a product may be marketed. Approved products and their manufacturers are subject to ongoing review, and discovery of previously unknown problems with products may result in restrictions on their manufacture, sale, use or their withdrawal from the market.
Our medical device products are subject to extensive regulation by the FDA in the United States. Unless an exemption applies, each medical device we market in the United States must have a 510(k) clearance or a Premarket Approval Application (PMA) in accordance with the Federal Food, Drug, and Cosmetic Act (FFDCA) and its implementing regulations. The FDA classifies medical devices into one of three classes, depending on the degree of risk associated with each medical device and the extent of controls that are needed to ensure safety and effectiveness. Devices deemed to pose a lower risk are placed in either Class I or Class II, and devices deemed by the FDA to pose the greatest risk, such as life-sustaining, life-supporting or implantable devices, or a device deemed to be not substantially equivalent to a previously cleared 510(k) device, are placed in Class III. In general, a Class III device cannot be marketed in the United States unless the FDA approves the device after submission of a PMA application, and any changes to the device subsequent to initial FDA approval must also be reviewed and approved by the FDA. The majority of our medical device products, including our breast implants, are regulated as Class III medical devices. A Class III device may have significant additional obligations imposed in its conditions of approval, and the time in which it takes to obtain approval can be long. Compliance with regulatory requirements is assured through periodic, unannounced facility inspections by the FDA and other regulatory authorities, and these inspections may include the manufacturing facilities of our subcontractors or other third party manufacturers. Failure to comply with applicable regulatory requirements can result in enforcement action by the FDA, which may include any of the following sanctions: warning letters or untitled letters; fines, injunctions and civil penalties; recall or seizure of our products; operating restrictions, partial suspension or total shutdown of production; refusing our request for 510(k) clearance or PMA approval of new products; withdrawing 510(k) clearance or PMAs that are already granted; and criminal prosecution.
A clinical trial is almost always required to support a PMA application and is sometimes required for a 510(k) premarket notification. Clinical trials generally require submission of an application for an investigational device exemption, which must be supported by appropriate data, such as animal and laboratory testing results, showing that it is safe to test the device in humans and that the testing protocol is scientifically sound, as well as approval by the FDA and the IRB overseeing the trial. The results of clinical testing may not be sufficient to obtain approval of the applicable device.
Once a device is approved, the manufacture and distribution of the device remains subject to continuing regulation by the FDA, including Quality System Regulation requirements, which involve design, testing, control, documentation and other quality assurance procedures during the manufacturing process. Medical device manufacturers and their subcontractors are required to register their establishments and list their manufactured devices with the FDA, and are subject to periodic unannounced inspections by the FDA and certain state agencies for compliance with regulatory requirements. Manufacturers must also report to the FDA if their devices may have caused or contributed to a death or serious injury or malfunctioned in a way that could likely cause or contribute to a death or serious injury, or if the manufacturer conducts a field correction or product recall or removal to reduce a risk to health posed by a device or to remedy a violation of the FFDCA that may present a health risk. Further, the FDA continues to regulate device labeling, and prohibits the promotion of products for unapproved or “off-label” uses along with other labeling restrictions. If a manufacturer or distributor fails to comply with any of these regulatory requirements, or if safety concerns with a device arise, the FDA may take legal or regulatory action, including civil or criminal penalties, suspension, withdrawal or delay in the issuance of approvals, or seizure or recall of products, any one or more of which could have a material adverse effect upon us.
The FDA imposes a number of complex regulatory requirements on entities that advertise and promote medical devices, including, but not limited to, standards and regulations for direct-to-consumer advertising, off-label promotion, industry-sponsored scientific and educational activities, and promotional activities including internet marketing. Medical devices can only be marketed for indications approved or cleared by the FDA. Failure to comply with these regulations can result in penalties, the issuance of warning
18
letters directing a company to correct deviations from FDA standards, a requirement that future advertising and promotional materials be pre-cleared by the FDA, and federal and state civil and criminal investigations and prosecutions.
US government reimbursement programs include Medicare, Medicaid, TriCare, and State Pharmacy Assistance Programs established according to statute, government regulations and policy. Federal law requires that all pharmaceutical manufacturers, as a condition of having their products receive federal reimbursement under Medicaid, must pay rebates to state Medicaid programs on units of their pharmaceuticals that are dispensed to Medicaid beneficiaries. With enactment of the Patient Protection and Affordable Care Act, as amended by the Health Care and Education Affordability Reconciliation Act (collectively, the “ACA”), for products marketed under NDAs, the manufacturers rebate increased from 15.1% to 23.1% of the average manufacturer price, or the difference between the average manufacturer price and the lowest net sales price to a non-government customer during a specified period. In some states, supplemental rebates are required as a condition of including the manufacturer’s drug on the state’s Preferred Drug List.
The ACA prescribed that the coverage gap phase of the Medicare Part D benefit be closed such that by 2020, beneficiaries will pay co-insurance of 25% (or co-payment equivalents) of the cost of prescription drugs dispensed to them under their applicable Medicare Part D plans, until they reach the catastrophic phase of the Medicare Part D benefit. As such, the coverage gap or “donut hole” will be effectively closed beginning in the 2020 plan year. The cost of closing the donut hole is being borne in part by brand drug companies as well as Medicare Part D plan sponsors and the federal government. Beginning in 2011, brand drug manufacturers were required to provide a 50% discount on their drugs. Additionally, beginning in 2013, the government/Medicare Part D plan sponsors began providing additional subsidies for brand name drugs bought by seniors who enter the coverage gap. When the government/sponsor share, which started at 2.5%, but increases to 25% by 2020, the combined industry discounts and government subsidies will add up to 75% of brand name drug costs.
On January 21, 2016, the Center for Medical Services issued final rules on the calculation of AMP, Best Price and Unit Rebate Amounts for the Medicaid program; the final rule took effect in April 2016. Allergan has implemented the required changes to its Medicaid rebate calculations, effective with its Q2 2016 submissions.
The ACA also expanded the government’s 340B drug discount program by increasing the category of entities qualified to participate in the program and benefit from its deeply discounted drug pricing. The ACA also obligates the Health Resources and Services Administration (HRSA), which administers the 340B program, to update the agreement that each manufacturer must sign to participate in the 340B program to require each manufacturer to offer the 340B price to covered entities if the manufacturer makes the drug product available to any other purchaser at any price, and to report the ceiling prices for its drugs to the government. HRSA issued this update in late 2016 and the Company signed subsequently executed an amendment to our agreement. In addition, on January 5, 2017, HRSA finalized regulations that, among other things, implement rules regarding civil monetary penalties for knowing and intentional overcharges of 340B covered entities by pharmaceutical manufacturers effective March 6, 2017, subject to the 60-day “regulatory freeze” executive order issued by the Trump Administration on January 20, 2017.
HRSA also has issued proposed regulations to implement an administrative dispute resolution process for certain disputes arising under the 340B program, including (1) claims by covered entities that they have been overcharged for covered outpatient drugs by manufacturers; and (2) claims by manufacturers, after a manufacturer has conducted an audit, that a covered entity has violated the prohibition on diversion to ineligible patients or duplicate discounts. The exact timing and content of final guidance on these matters is uncertain at this time, particularly in light of the Trump Administration’s “one in, two out” executive order issued on January 30, 2017. Depending on their final form, these actions could affect our obligations under the 340B program in ways that may have an adverse impact on our business. In addition, in connection with the commercialization of our products, we have obtained authorization to receive reimbursement at varying levels for the cost of certain products and related treatments from government authorities and private health insurers and other organizations, such as Health Maintenance Organizations and Managed Care Organizations.
Additionally, we may in the future, and have in the past, received requests for information, sometimes in the form of civil investigative demands or subpoenas, from the FTC and the European Competition Commission, and are subject to ongoing FTC and European Competition Commission investigations. Any adverse outcome of these types of investigations or actions could have a material adverse effect on our business, results of operations, financial condition and cash flows. Refer to “ITEM 1A. RISK FACTORS — Risks Related to Our Business—Federal regulation of arrangements between manufacturers of brand and generic products could adversely affect our business.” Also refer to Legal Matters in “NOTE 24 — Commitments and Contingencies” in the accompanying “Notes to Consolidated Financial Statements” in this document.
As part of the Medicare Prescription Drug and Modernization Act of 2003 (“MMA”), companies are required to file with the US Federal Trade Commission (“FTC”) and the Department of Justice certain types of agreements entered into between brand and generic pharmaceutical companies related to the manufacture, marketing and sale of generic versions of brand drugs. This requirement could affect the manner in which drug manufacturers resolve intellectual property litigation and other disputes with competitor
19
pharmaceutical companies, and could result generally in an increase in private-party litigation against pharmaceutical companies. The impact of this requirement, and the potential private-party lawsuits associated with arrangements between brand name and generic drug manufacturers, is uncertain and could adversely affect our business. For example, in January 2009, the FTC and the State of California filed a lawsuit against us alleging that our settlement with Solvay related to our ANDA for a generic version of Androgel® is unlawful. Beginning in February 2009, several private parties purporting to represent various classes of plaintiffs filed similar lawsuits. Those lawsuits, as well as additional suits challenging the validity of our settlements related to Asacol®, Namenda® and Loestrin® 24 and generic versions of Actos®, Cipro®, and Lidoderm®, remain pending. Refer to Legal Matters in “NOTE 24 — Commitments and Contingencies” in the accompanying “Notes to Consolidated Financial Statements” in this document.
Federal, state, local and foreign laws of general applicability, such as laws regulating working conditions, also govern us. In addition, we are subject, as are all manufacturers generally, to numerous and increasingly stringent federal, state and local environmental laws and regulations concerning, among other things, the generation, handling, storage, transportation, treatment and disposal of toxic and hazardous substances and the discharge of pollutants into the air and water. Environmental permits and controls are required for some of our operations, and these permits are subject to modification, renewal and revocation by the issuing authorities. Our environmental capital expenditures and costs for environmental compliance may increase in the future as a result of changes in environmental laws and regulations or increased manufacturing activities at any of our facilities. We could be adversely affected by any failure to comply with environmental laws, including the costs of undertaking a clean-up at a site to which our wastes were transported.
European Union
We encounter similar regulatory and legislative issues in most other countries. Pharmaceutical manufacturers are regulated in the European Union (the “EU”) by the European Medicines Agency (the “EMA”) and national health authorities. All manufacturers are required to submit medicinal products, including generic versions of previously approved products and new strengths, dosages and formulations of previously approved products, to the EMA and its member states for review and marketing authorization before such products are placed on the market in the EU.
Marketing authorizations are granted to applicants after the relevant health authority issues a positive assessment of quality, safety and efficacy of the product. In order to receive such assessment, applicants must submit applications, which must contain the results of pre-clinical tests, pharmaceutical tests, and clinical trials with respect to original products, or originator data with respect to the generic versions of previously approved products. All of these tests or trials must be conducted in accordance within European regulations and must allow the reviewing body to evaluate the quality, safety and efficacy of the medicinal product.
In addition to obtaining marketing authorization for each product, all member states require that a manufacturer’s facilities obtain approval from the national authority. The EU has a code of good manufacturing practices that each manufacturer must follow and comply with. Regulatory authorities in the EU may conduct inspections of the manufacturing facilities to review procedures, operating systems and personnel qualifications. Refer to “ITEM 1A. — RISK FACTORS — Risks Related to Our Business — The supply of APIs into Europe may be negatively affected by recent regulations promulgated by the European Union” in this document.
In the EU, member states regulate the pricing of pharmaceutical products, and in some cases, the formulation and dosing of products. This regulation is handled by individual member state national health services. These individual regulatory bodies can result in considerable price differences and product availability among member states. The implementation of tendering systems for the pricing of pharmaceuticals in several countries generally impacts drug pricing for generics; generally “tendering” refers to a system that requires bids to be submitted to the government by competing manufacturers to be the exclusive, or one of a few, supplier(s) of a product in a particular country.
Further, faced with major budget constraints, many European countries have resorted to price cuts that affect both innovative and generic pharmaceuticals. Refer to “ITEM 1A. RISK FACTORS — Risks Related to Our Business—Global economic conditions could harm us” in this document.
Medical device products that are marketed in the European Union must comply with the requirements of the Medical Device Directive, (the “MDD”), as implemented in the national legislation of the European Union member states. The MDD, as implemented, provides for a regulatory regime with respect to the design, manufacture, clinical trials, labeling and adverse event reporting for medical devices to ensure that medical devices marketed in the European Union are safe and effective for their intended uses. Medical devices that comply with the MDD, as implemented, are entitled to bear a CE marking evidencing such compliance and may be marketed in the European Union. Failure to comply with these domestic and international regulatory requirements could affect our ability to market and sell our products in these countries.
20
In Canada, pharmaceutical manufacturers are regulated by the Therapeutic Products Directorate (the “TPD”) which derives its authority from the Canadian federal government under the Food and Drugs Act and the Controlled Drug and Substances Act. The TPD evaluates and monitors the safety, effectiveness and quality of pharmaceutical products. Products are officially approved for marketing in Canada following receipt of a market authorization, or “Notice of Compliance” (a “NOC”), which is subject to the Food and Drug Regulations. Issuance of a NOC for generic drug products is also subject to the Patented Medicines (Notice of Compliance) Regulations (the “NOC Regulations”) under the Patent Act.
The NOC Regulations allow branded drug marketers to list patents relating to the medicinal ingredient, formulation, dosage form or the use of the medicinal ingredient in their branded drug on a patent register maintained by Health Canada. In its abbreviated new drug submission, a generic applicant must address each patent listed against the reference product by making at least one statutory allowed allegation (for example, alleging that the patent is invalid or would not be infringed). If the generic applicant alleges invalidity or non-infringement, it must provide the branded manufacturer with an explanation of its allegations. Upon receipt of the explanation, the branded manufacturer may apply to the Federal Court of Canada for an Order prohibiting Health Canada from issuing a NOC for the generic. Health Canada may not issue a NOC until the earlier of the determination of the application by the court after a hearing on the allegations, or the expiration of 24 months from the commencement of the application.
Facilities, procedures, operations and/or testing of products are subject to periodic inspection by Health Canada and the Health Products and Food Branch Inspectorate. In addition, Health Canada conducts pre-approval and post-approval reviews and plant inspections to determine whether our systems are in compliance with the good manufacturing practices in Canada, Drug Establishment Licensing requirements and other provisions of the NOC Regulations. Competitors are subject to similar regulations and inspections.
Each Canadian province also provides a comprehensive public drug program, which controls drug pricing and reimbursement and is responsible for ensuring eligible patients receive drugs through public funding. The provinces and territories in Canada operate drug benefit programs through which eligible recipients receive drugs through public funding; these drugs are listed on provincial or territorial Drug Benefit Formularies (“Formularies”). Eligible recipients include seniors, persons on social assistance, low-income earners, and those with certain specified conditions or diseases. Formulary listings are also used by private payors to reimburse generic products. To be listed in a Formulary, drug products must have been issued a NOC and must comply with each jurisdiction’s individual review process. Currently, Canada’s provinces are looking at national competitive bidding processes/tendering of drugs, which may affect the sustainability of the industry and the supply of pharmaceuticals.
Finally, Canada has reached a trade agreement in principle with the European Union (“CETA”) in which it has agreed to implement patent term extensions and certain procedural amendments to the NOC Regulations. Canada is further involved in trade negotiations with ten Pacific countries (the “Trans Pacific Partnership”), which could lead to further changes to Canada’s intellectual property framework and affect our business.
Environmental Matters
We are subject to federal, state, and local environmental laws and regulations in the United States and abroad. We believe that our operations comply in all material respects with applicable environmental laws and regulations in each jurisdiction where we have a business presence, and we periodically audit our manufacturing and R&D facilities for compliance with all federal, state and local environmental laws and regulations. Although we continue to make capital expenditures for environmental protection, we do not anticipate any significant expenditure in order to comply with such laws and regulations that would have a material impact on our earnings or competitive position. We are not aware of any pending litigation or significant financial obligations arising from current or past environmental practices that are likely to have a material adverse effect on our financial position. We cannot assure you, however, that environmental problems relating to facilities owned or operated by us will not develop in the future, and we cannot predict whether any such problems, if they were to develop, could require significant expenditures on our part. In addition, we are unable to predict what legislation or regulations may be adopted or enacted in the future with respect to environmental protection and waste disposal. Refer to “ITEM 1A. RISK FACTORS — Risks Related to Our Business — Our business will continue to expose us to risks of environmental liabilities” in this document.
Seasonality
Consistent with the United States pharmaceutical industry, our business experiences seasonality with the first quarter of each year typically being the lowest revenue quarter for branded products. In addition, our aesthetics products, including our breast aesthetics and Botox® cosmetic indications, have tended to be marginally higher during the second and fourth quarters, presumably in advance of the summer vacation and holiday seasons. Fluctuations of our sales are also impacted by the effect of promotions, which cause non-seasonal variability in sales trends.
21
As a result of the extent of our supply chain, backlog of orders is not material to our business.
Employees
As of December 31, 2016, we had approximately 16,700 employees. Of our employees, approximately 2,100 were engaged to support R&D functions, 4,200 supported COGS functions, 9,000 supported sales, marketing and distribution functions, and 1,400 supported administrative functions.
22
CAUTIONARY NOTE REGARDING FORWARD-LOOKING STATEMENTS
Any statements made in this report that are not statements of historical fact or that refer to estimated or anticipated future events are forward‑looking statements. We have based our forward‑looking statements on management’s beliefs and assumptions based on information available to our management at the time these statements are made. Such forward‑looking statements reflect our current perspective of our business, future performance, existing trends and information as of the date of this filing. These include, but are not limited to, our beliefs about future revenue and expense levels and growth rates, prospects related to our strategic initiatives and business strategies, including the integration of, and synergies associated with, strategic acquisitions, express or implied assumptions about government regulatory action or inaction, anticipated product approvals and launches, business initiatives and product development activities, assessments related to clinical trial results, product performance and competitive environment, and anticipated financial performance. Without limiting the generality of the foregoing, words such as “may,” “will,” “expect,” “believe,” “anticipate,” “plan,” “intend,” “could,” “would,” “should,” “estimate,” “continue,” or “pursue,” or the negative or other variations thereof or comparable terminology, are intended to identify forward‑looking statements. The statements are not guarantees of future performance and involve certain risks, uncertainties and assumptions that are difficult to predict. We caution the reader that these statements are based on certain assumptions, risks and uncertainties, many of which are beyond our control. In addition, certain important factors may affect our actual operating results and could cause such results to differ materially from those expressed or implied by forward‑looking statements. We believe the risks and uncertainties discussed under the section entitled “Risks Related to Our Business,” and other risks and uncertainties detailed herein and from time to time in our SEC filings, may cause our actual results to vary materially from those anticipated in any forward‑looking statement.
We disclaim any obligation to publicly update any forward‑looking statements, whether as a result of new information, future events or otherwise, except as required by law. This discussion is provided as permitted by the Private Securities Litigation Reform Act of 1995.
We operate in a rapidly changing environment that involves a number of risks and uncertainties, some of which are beyond our control. The following discussion highlights some of these risks and speaks as of the date of this document, including the assets held for sale. These and other risks could have a material adverse effect on our business, results of operations, financial condition and cash flows.
Risks Related to Our Business
Global economic conditions could harm us.
While global economic conditions have been fairly stable as a whole in recent years, continued concerns about the systemic impact of potential geopolitical issues and economic policy uncertainty, particularly in areas in which we operate, could potentially cause economic and market instability in the future and could adversely affect the Company’s business, including the Company’s financial performance.
Challenging economic conditions could result in tighter credit conditions. The cost and availability of credit may be adversely affected by illiquid credit markets and wider credit spreads, which could adversely affect the ability of third-party distributors, partners, manufacturers and suppliers to buy inventory or raw materials and to perform their obligations under agreements with us, which could disrupt our operations, and which could adversely affect the liquidity and financial conditions of our customers.
Global efforts towards health care cost containment continue to exert pressure on product pricing and market access. In many international markets, government-mandated pricing actions have reduced prices of patented drugs. Some countries may be subject to periods of financial instability or may have reduced resources to spend on healthcare or may be or will be in the future subject to economic sanctions, and our business in these countries may be disproportionately affected by these changes. In addition, the currencies of some countries may depreciate against the US Dollar substantially and if the Company is unable to offset the impact of such depreciation, then the Company’s financial performance within such countries could be adversely affected.
If we are unable to successfully develop or commercialize new products, our operating results will suffer.
Our future results of operations depend to a significant extent upon our ability to successfully develop and commercialize new products in a timely manner. There are numerous difficulties in developing and commercializing new products, including:
|
|
• |
developing, testing and manufacturing products in compliance with regulatory standards in a timely manner; |
|
|
• |
receiving requisite regulatory approvals for such products in a timely manner, or at all; |
23
|
|
• |
the availability, on commercially reasonable terms, of raw materials, including API and other key ingredients; |
|
|
• |
preclusion from commercialization by the proprietary rights of others; |
|
|
• |
developing products that are economical to manufacture and commercialize; |
|
|
• |
time consuming and costly nature of developing and commercializing new products; |
|
|
• |
costly legal actions brought by our competitors that may delay or prevent the development and commercialization of new products; |
|
|
• |
delays as a result of limited resources at the FDA or other regulatory agencies; |
|
|
• |
changing review and approval policies and standards at the FDA and other regulatory agencies; and |
|
|
• |
completion of numerous other regulatory approvals in international markets. |
As a result of these and other difficulties, products currently in development by us may or may not receive timely regulatory approvals necessary for marketing by us or other third‑party partners, or approvals at all. This risk particularly exists with respect to the development of proprietary products because of the uncertainties, higher costs and lengthy time frames associated with R&D of such products and the inherent unproven market acceptance of such products. Our operating results and financial condition may fluctuate as the amount we spend to research and develop, promote, acquire or license new products, technologies and businesses changes. Additionally, we face heightened risks in connection with our development of extended release or controlled release generic products because of the technical difficulties and regulatory requirements related to such products. If any of our products or the products of our third‑party partners are not approved in a timely manner or, when acquired or developed and approved, cannot be successfully manufactured or commercialized in a timely manner, our operating results could be adversely affected. We cannot guarantee that any investment we make in developing products will be recouped, even if we are successful in commercializing those products. Refer to “Our branded pharmaceutical expenditures may not result in commercially successful products.”
Our branded pharmaceutical expenditures may not result in commercially successful products.
Developing and commercializing branded pharmaceutical products is generally more costly than developing and commercializing generic products. In order to grow and achieve success in our business, we must continually identify, develop, acquire and license new products that we can ultimately market. In the future, we anticipate continuing and increasing our product development expenditures. There are many difficulties and uncertainties inherent in pharmaceutical research and development, and there is a high rate of failure inherent in new drug discovery and development. Failure can occur at any point in the process, including late in the process after substantial investment. New product candidates that appear promising in development may fail to reach the market or may have only limited commercial success because of efficacy or safety concerns, inability to obtain necessary regulatory approvals and payer reimbursement, limited scope of approved uses, difficulty or excessive costs to manufacture, or infringement of the patents or intellectual property rights of others. Products that do reach the market may ultimately be subject to recalls or other suspensions in sales. Delays and uncertainties in the FDA approval process and the approval processes in other countries can result in delays in product launches and lost market opportunity. Because there is a high rate of failure inherent in the research and development process of new products, there is a significant risk that funds invested by the Company in research and development will not generate financial returns. The Company cannot be certain when or whether any of its products currently under development will be approved or launched or whether, once launched, such products will be commercially successful.
We may be required to spend several years and incur substantial expense in completing certain clinical trials. The length of time, number of trial sites and patients required for clinical trials vary substantially, and we may have difficulty finding a sufficient number of sites and subjects to participate in our trials. Delays in planned clinical trials can result in increased development costs, delays in regulatory approvals and delays in product candidates reaching the market. We rely on independent third‑party clinical investigators to recruit subjects and conduct clinical trials in accordance with applicable study protocols and laws and regulations. If regulatory authorities determine that we have not complied with regulations in the R&D of a product candidate, they may refuse to accept trial data from the site and/or not approve the product candidate, and we would not be able to market and sell that product. If we are not able to market and sell our products after significant expenditures to develop and test them, our business and results of operations could be materially and adversely affected.
We currently have products in various stages of development, including new hormonal contraceptive therapy, dermatology products and infectious disease products, among others. Such clinical trials are costly and may not result in successful outcomes. The results of preclinical studies and early clinical studies may not be predictive of the results of later‑stage clinical studies. Product candidates that have shown promising results in early‑stage clinical studies may still suffer significant setbacks in subsequent clinical studies. There is a high rate of failure for products proceeding through clinical studies, and product candidates in later stages of clinical studies may fail to show the desired safety and efficacy traits despite having progressed through preclinical studies and initial
24
clinical studies. Clinical studies may not proceed as planned or be completed on schedule, if at all. The rate of completion of clinical trials is significantly dependent upon a number of factors, including the rate of patient enrollment. We may not be able to attract a sufficient number of sites or enroll a sufficient number of patients in a timely manner in order to complete clinical trials. Moreover, nonclinical and clinical data are often susceptible to varying interpretations and analyses, and our data may not provide adequate efficacy and safety information to obtain regulatory approval of our candidates. We cannot be sure that our business expenditures, including but not limited to our expenditures related to our Esmya™ product, products acquired in the Warner Chilcott Acquisition, the Forest Acquisition and the Allergan Acquisition, or products of our third‑party partners, among others, will result in the successful discovery, development or launch of branded products that will prove to be commercially successful or will improve the long‑term profitability of our business. If such business expenditures do not result in successful discovery, development or launch of commercially successful branded products our results of operations and financial condition could be materially adversely affected.
If generic products that compete with any of our branded pharmaceutical products are approved and sold, sales of our products will be adversely affected.
Generic equivalents for branded pharmaceutical products are typically sold at lower costs than the branded products. The regulatory approval process in the United States and European Union exempts generic products from costly and time-consuming clinical trials to demonstrate their safety and efficacy and rely instead on the safety and efficacy of prior products, manufacturers of generic products can invest far less in research and development. After the introduction of a competing generic product, a significant percentage of the prescriptions previously written for the branded product are often written for the generic version. In addition, legislation enacted in most US states and Canadian provinces allows or, in some instances mandates, that a pharmacist dispense an available generic equivalent when filling a prescription for a branded product, in the absence of specific instructions from the prescribing physician. Pursuant to the provisions of the Hatch‑Waxman Act, manufacturers of branded products often bring lawsuits to enforce their patent rights against generic products released prior to the expiration of branded products’ patents, but it is possible for generic manufacturers to offer generic products while such litigation is pending. Refer to “If we are unable to adequately protect our technology or enforce our patents, our business could suffer.” As a result, branded products typically experience a significant loss in revenues following the introduction of a competing generic product, even if subject to an existing patent. Our branded pharmaceutical products are or may become subject to competition from generic equivalents because there is no proprietary protection for some of the branded pharmaceutical products we sell, because our patent protection expires or because our patent protection is not sufficiently broad or enforceable. In addition, we may not be successful in our efforts to extend the proprietary protection afforded our branded products through the development and commercialization of proprietary product improvements.
Our Actonel® products no longer have patent protection in Canada or the Western European countries in which we sell these products, and Asacol® is not protected by a patent in the United Kingdom. Our Actonel® once‑a‑month product lost US patent protection in June 2014 (including a 6‑month pediatric extension of regulatory exclusivity) and generic versions of our Loestrin® 24 Fe product entered the market in January 2014 pursuant to settlement agreements previously entered into. Generic versions of Namenda® (IR) tablets entered the US market in July 2015 pursuant to settlement agreements previously entered into. An authorized generic version of Asacol HD® entered the market in July 2016 pursuant to a settlement agreement previously entered into. In addition, other products such as Estrace® Cream, Asacol® 400 mg, Aczone 5%, Femhrt®, Latisse®, and Carafate® are not protected by patents in the United States where we sell these products. Generic equivalents are currently available in Canada and Western Europe for Actonel® and in the United States for certain versions of our Femhrt® products, Femcon® Fe and certain other less significant products.
During the next few years, additional products of ours, including some of our large revenue drivers, like Aczone® 5%, Bystolic®, Canasa®, Delzicol®, Gelnique®, Minastrin®, Namenda XR®, Pylera®, Rapaflo®, Saphris® and Viibryd®, will lose patent protection and/or likely become subject to generic or other competition. Generic versions of our Canasa® product may enter the market as early as December 2018 or earlier pursuant to an agreement previously entered into and generic versions of our Minastrin® may enter the market as early as March 2017 pursuant to settlement agreements previously entered into. Some of our products may also become subject to generic competition prior to the expiration of patent protection in the event a generic competitor elects to launch its generic equivalent product “at‑risk.” For example, before the Court of Appeals for the Federal Circuit has reviewed Allergan’s appeal of a district court judgment of patent invalidity, Sandoz launched “at risk” a generic version of Latisse® in December 2016. Competition from generic equivalents could result in a material impairment of our intangible assets or the acceleration of amortization on our non‑impaired intangible assets and may have a material adverse impact on our revenues, financial condition, results of operations and cash flows.
The pharmaceutical industry is highly competitive and our future revenue growth and profitability are dependent on our timely development and launches of new products ahead of our competitors.
We face strong competition across our business. The intensely competitive environment of the pharmaceutical industry requires an ongoing, extensive search for technological innovations and the ability to market and price products effectively, including the
25
ability to communicate the effectiveness, safety and value of branded products to healthcare professionals in private practice, group practices and Managed Care Organizations. Our competitors vary depending upon product categories, and within each product category, upon dosage strengths and drug‑delivery systems. Based on total assets, annual revenues, and market capitalization, we are smaller than certain of our national and international competitors in the brand and distribution product arenas. Most of our competitors have been in business for a longer period of time than we have, have a greater number of products on the market and have greater financial and other resources than we do. Furthermore, recent trends in this industry are toward further market consolidation of large drug companies into a smaller number of very large entities, further concentrating financial, technical and market strength and increasing competitive pressure in the industry. If we directly compete with them for the same markets and/or products, their financial strength could prevent us from capturing a profitable share of those markets. It is possible that developments by our competitors will make our products or technologies noncompetitive or obsolete. In addition, competitive forces may result in changes to the mix of products that we sell during a given time period or lower demand for our products than expected.
Some of our competitors have technical, competitive or other advantages over us for the development of technologies and processes. We face increased competition from new infection prevention, sterile processing, contamination control, surgical support, cleaning consumables, gastrointestinal endoscopy accessories, contract sterilization, and other products and services entering the market. These advantages may make it difficult for us to compete with them to successfully discover, develop and market new products and for our current products to compete with new products that these competitors may bring to market. As a result, our products may compete against products that have lower prices, equivalent or superior performance, a better safety profile, are easier to administer, achieve earlier entry into the market or that are otherwise competitive with our products.
If we are unable to adequately protect our technology or enforce our patents, our business could suffer.
Our success with the branded products that we develop will depend, in part, on our ability to obtain patent protection for these products. We currently have a number of US and foreign patents issued and pending. However, issuance of a patent is not conclusive evidence of its validity or enforceability. We cannot be sure that we will receive patents for any of our pending patent applications or any patent applications we may file in the future, or that our issued patents will be upheld if challenged. If our current and future patent applications are not approved or, if approved, our patents are not upheld in a court of law if challenged, it may reduce our ability to competitively utilize our patented products. Also, such patents may or may not provide competitive advantages for their respective products or they may be challenged or circumvented by our competitors, in which case our ability to commercially market these products may be diminished. Patent disputes may be lengthy and a potential violator of our patents may bring a potentially infringing product to market during the dispute, subjecting us to competition and damages due to infringement of the competitor product. For example, patents covering our Actonel® (certain indications), Aczone® 5%, Androderm®, Carafate®, Estrace® Cream, Femhrt®, INFed® and Namenda® (IR) products have expired and we have no further patent protection on these products. During the next few years, additional products acquired pursuant to the Warner Chilcott Acquisition, the Forest Acquisition, and the Allergan Acquisition will lose patent protection and/or likely become subject to generic or other competition, including Aczone® 5%, Bystolic®, Canasa®, Delzicol®, Gelnique®, Minastrin®, Namenda XR®, Pylera®, Rapaflo®, Saphris® and Viibryd®. Therefore, it is possible that a competitor may launch a generic version of any of these products at any time, which would result in a significant decline in that product’s revenue and profit.
Generic versions of our Loestrin® 24 Fe product entered the market in January 2014 pursuant to settlement agreements previously entered into; an authorized generic version of our Asacol® HD 800 mg product entered the market in August 2016 pursuant to an agreement previously entered into; our immediate release Namenda® product lost US patent protection in 2015 and generic versions entered the market in July 2015 pursuant to agreements previously entered into; generic versions of our Minastrin® product may enter the market as early as March 2017 pursuant to settlement agreements previously entered into; and generic versions of our Canasa® product may enter the market as early as December 2018 pursuant to a settlement agreement previously entered into. Some of our products may also become subject to generic competition prior to the expiration of patent protection in the event a generic competitor elects to launch its generic equivalent product “at risk.”
Generic competitors to our branded products may also challenge the validity or enforceability of the patents protecting our products or otherwise seek to circumvent them. Forest also recently brought actions against certain manufacturers of generic drugs for infringement of several patents covering our Canasa®, Delzicol®, Linzess®, Namenda XR®, Namzaric®, Pylera®, Saphris®, Savella®, Teflaro® and Viibryd® products. Allergan recently brought actions against manufacturers of generic drugs in the United States for infringement of several patents covering our Acular LS®, Combigan®, Lastacaft®, Latisse®, and Restasis® products. While we intend to vigorously defend these and other patents and pursue our legal rights, we can offer no assurance as to when the pending or any future litigation will be decided, whether such lawsuits will be successful or that a generic equivalent of one or more of our products will not be approved and enter the market. In addition, patents covering our branded pharmaceutical products may be challenged in proceedings other than court proceedings, including inter partes review (IPR) at the US Patent Office. In 2011, Congress amended the patent laws and created a new way to challenge the validity of patents: the inter partes review. IPR proceedings take place in the US Patent Office and have both advantages and disadvantages when compared to district court proceedings. Although IPR proceedings
26
are limited to certain types of invalidity challenges, the Patent Office applies different standards that make it easier for challengers to invalidate patents. Moreover, IPR proceedings generally take no more than 18 months, which means it is much faster than challenging a patent’s validity in a district court proceeding. In addition, an IPR challenge can be mounted even after a patent has been upheld in court. IPR challenges have recently been brought by Mylan against some or all of our patents covering our Restasis® and Delzicol® products. For example, following Mylan’s IPR challenge, the US Patent and Trial Appeal Board, in December 2016, instituted inter partes review for all of our Orange Book-listed patents covering Restasis®. And, in November 2016, Mylan filed an IPR challenge against our one Orange Book-listed patent covering Delzicol®.
In addition to patent protection, our business relies on our protection of other intellectual property rights, trade secrets, and other proprietary technologies. We rely on trademark, copyright, and patent law, trade‑secret protection, and confidentiality and/or license agreements with our employees, customers, partners and others to protect our proprietary rights. The protection of our proprietary technology may require the expenditure of significant financial and managerial resources. We may not be able to discover or determine the extent of any unauthorized use of our proprietary rights, and we may not be able to prevent third parties from misappropriating or infringing upon our proprietary rights.
We rely on certain information, processes, and know‑how that are not protected by patents or other intellectual property rights. We seek to protect this information through trade secret or confidentiality agreements, as well as through other measures. These measures may not provide adequate protection for our unpatented technology.
If we are unable to adequately protect our technology, trade secrets or proprietary know‑how, or enforce our intellectual property rights, our results of operations, financial condition and cash flows could suffer.
From time to time we may need to rely on licenses to proprietary technologies, which may be difficult or expensive to obtain.
We may need to obtain licenses to patents and other proprietary rights held by third parties to develop, manufacture and market products. If we are unable to timely obtain these licenses on commercially reasonable terms, our ability to commercially market our products may be inhibited or prevented, which could have a material adverse effect on our business, results of operations, financial condition and cash flows. For example, because we license significant intellectual property with respect to certain of our products, including Delzicol®, Namenda XR®, Namzaric®, Linzess®, Teflaro® and Viibryd®, any loss or suspension of our rights to licensed intellectual property could materially adversely affect our business, financial condition, cash flows and results of operations.
Third parties may claim that we infringe their proprietary rights and may prevent us from manufacturing and selling some of our products.
The manufacture, use and sale of new products that are the subject of conflicting patent rights have been the subject of substantial litigation in the pharmaceutical industry. These lawsuits relate to the validity, enforceability and infringement of patents or proprietary rights of third parties. We may have to defend ourselves against charges that we violated patents or proprietary rights of third parties. This is especially true in the case of new branded products where a competitor has obtained patents for similar products. Litigation may be costly, unpredictable, time‑consuming, often involves complex legal, scientific and factual questions, and could divert the attention of our management and technical personnel. In addition, if it is determined that we infringe the rights of others, we could lose our right to develop, manufacture or market products, product launches could be delayed or we could be required to pay monetary damages or royalties to license proprietary rights from third parties. Furthermore, we cannot be certain that the necessary licenses would be available to us on commercially reasonable terms, or at all. As a result, an adverse determination in a judicial or administrative proceeding or failure to obtain necessary licenses could result in substantial monetary damage awards and could prevent us from manufacturing and selling a number of our products, which could have a material adverse effect on our business, results of operations, financial condition and cash flows.
Certain aspects of our operations are highly dependent upon third‑party service providers.
We rely on suppliers, vendors and other third‑party service providers to research, develop, manufacture, commercialize, promote and sell our products. Reliance on third‑party manufacturers reduces our oversight and control of the manufacturing process. Some of these third‑party providers are subject to legal and regulatory requirements, privacy and security risks, and market risks of their own. The failure of a critical third‑party service provider to meet its obligations could have a material adverse impact on our operations and results. If any third‑party service providers have violated or are alleged to have violated any laws or regulations during the performance of their obligations to us, it is possible that we could suffer financial and reputation harm or other negative outcomes, including possible legal consequences.
27
If we are unable to obtain sufficient supplies from key manufacturing sites or suppliers that in some cases may be the only source of finished products or raw materials, our ability to deliver our products to the market may be impeded.
We are required to identify the supplier(s) of all the raw materials for our products in our applications with the FDA and other regulatory agencies in the US To the extent practicable, we attempt to identify more than one supplier in each drug application. However, some products and raw materials are available only from a single source and, in many of our drug applications, only one supplier of products and raw materials or site of manufacture has been identified, even in instances where multiple sources exist. Some of these products have historically or may in the future account for a significant portion of our revenues, such as our products Botox®, our Juvederm® dermal filler family of products, Namenda®, Linzess®, Bystolic®, and a significant number of our oral contraceptive and controlled substance products. In addition, certain manufacturing facilities in Ireland are the exclusive qualified manufacturing facilities for finished dosage forms of many of our products, including our products, Namenda®, Bystolic® and Linzess®. Any failure by us to forecast demand for, or to maintain an adequate supply of, the raw material and finished product could result in an interruption in the supply of certain products and a decline in sales of that product. In addition, if our suppliers are unable to meet our manufacturing requirements, we may not be able to produce a sufficient amount of materials or products in a timely manner, which could cause a decline in our sales. We expect to continue to rely on our third‑party manufacturing partners, such as Contract Pharmaceuticals Limited Canada for Estrace® Cream and Patheon for Viberzi®. Such transfers are subject to regulatory approvals, and the failure to obtain such approvals in a timely manner may delay production at the new facility and result in an interruption in our product supply. From time to time, certain of our manufacturing sites or outside suppliers have experienced regulatory or supply‑related difficulties that have inhibited their ability to deliver products and raw materials to us, causing supply delays or interruptions. The availability and prices of raw materials and supplies are subject to volatility and are influenced by worldwide economic conditions, speculative action, world supply and demand balances, inventory levels, availability of substitute materials, currency exchange rates, anticipated or perceived shortages, product contamination, among other factors. To the extent any difficulties experienced by our manufacturing sites or suppliers cannot be resolved or extensions of our key supply agreements cannot be negotiated within a reasonable time and on commercially reasonable terms, or if raw materials for a particular product become unavailable from an approved supplier and we are required to qualify a new supplier with the FDA or other regulatory agency, or if we are unable to do so, our profit margins and market share for the affected product could decrease or be eliminated, as well as delay our development and sales and marketing efforts. Such outcomes could have a material adverse effect on our business, results of operations, financial condition and cash flows.
Our manufacturing sites outside of the United States and our arrangements with foreign suppliers are subject to certain additional risks, including the availability of government clearances, export duties, political instability, war, acts of terrorism, currency fluctuations and restrictions on the transfer of funds. For example, we obtain a significant portion of our raw materials from foreign suppliers. Arrangements with international raw material suppliers are subject to, among other things, FDA and foreign regulatory body regulation, customs clearances, various import duties and other government clearances, as well as potential shipping delays due to inclement weather, political instability, strikes or other matters outside of our control. Acts of governments outside the US may affect the price or availability of raw materials needed for the development or manufacture of our products. In addition, recent changes in patent laws in jurisdictions outside the US may make it increasingly difficult to obtain raw materials for R&D prior to the expiration of the applicable US or foreign patents.
The design, development, manufacture and sale of our products involves the risk of product liability claims by consumers and other third parties, and insurance against such potential claims is expensive and may be difficult to obtain.
The design, development, manufacture and sale of our products involves an inherent risk of product liability claims and the associated adverse publicity. For example, Forest is subject to approximately 200 legal actions asserting product liability claims relating to the use of Celexa® or Lexapro®. These cases include claims that Celexa® or Lexapro® caused various birth defects. While we believe there is no merit to these cases, litigation is inherently subject to uncertainties and we may be required to expend substantial amounts in the defense or resolution of certain of these matters. We regularly monitor the use of our products for trends or increases in reports of adverse events or product complaints, and regularly report such matters to the FDA. In some, but not all cases, an increase in adverse event reports may be an indication that there has been a change in a product’s specifications or efficacy. Such changes could lead to a recall of the product in question or, in some cases, increases in product liability claims related to the product in question. If the coverage limits for product liability insurance policies are not adequate or if certain of our products are excluded from coverage, a claim brought against us, whether covered by insurance or not, could have a material adverse effect on our business, results of operations, financial condition and cash flows. We also rely on self‑insurance to cover product liability claims, and these claims may exceed amounts we have reserved under our self‑insurance program.
We are also subject to a variety of other types of claims, proceedings, investigations and litigation initiated by government agencies or third parties. These include compliance matters, product regulation or safety, taxes, employee benefit plans, employment discrimination, health and safety, environmental, antitrust, customs, import/export, government contract compliance, financial controls or reporting, intellectual property, allegations of misrepresentation, false claims or false statements, commercial claims, claims
28
regarding promotion of our products and services, or other similar matters. For example, consumer groups and certain plaintiffs have alleged that certain uses of Botox®, including off-label uses, have caused patient injuries and death and have further failed to adequately warn patients of the risks relating to Botox® use. From time to time reports related to the quality and safety of breast implant devices are published, including reports that have suggested a possible association between anaplastic large cell lymphoma and breast implants, as well as negative reports from regulatory authorities in Europe related to a breast implant manufacturer that is not affiliated with the Company. In addition, government investigations related to the use of products, but not the efficacy themselves, may cause reputational harm to the Company. Negative publicity, whether accurate or inaccurate, about the efficacy, safety or side effects of our products or product categories, whether involving us or a competitor, could materially reduce market acceptance to our products, cause consumers to seek alternatives to our products, result in product withdrawals and cause our stock price to decline. Negative publicity could also result in an increased number of product liability claims, whether or not these claims have a basis in scientific fact. Any such claims, proceedings, investigations or litigation, regardless of the merits, might result in substantial costs, restrictions on product use or sales, or otherwise injure our business.
Our business could suffer as a result of manufacturing difficulties or delays.
The manufacture of certain of our products and product candidates, particularly our controlled‑release products, transdermal products, injectable products, and our oral contraceptive products, is more difficult than the manufacture of immediate‑release products. Successful manufacturing of these types of products requires precise manufacturing process controls, API that conforms to very tight tolerances for specific characteristics and equipment that operates consistently within narrow performance ranges. Manufacturing complexity, testing requirements, and safety and security processes combine to increase the overall difficulty of manufacturing these products and resolving manufacturing problems that we may encounter.
Our manufacturing and other processes utilize sophisticated equipment, which sometimes require a significant amount of time to obtain and install. Our business could suffer if certain manufacturing or other equipment, or a portion or all of our facilities were to become inoperable for a period of time. This could occur for various reasons, including catastrophic events such as earthquake, monsoon, hurricane or explosion, unexpected equipment failures or delays in obtaining components or replacements thereof, contamination by microorganisms or viruses, labor disputes or shortages, contractual disputes with our suppliers and contract manufacturers, as well as construction delays or defects and other events, both within and outside of our control. We manufacture certain products, including Botox®, our Juvederm® dermal filler family of products, Linzess® and Bystolic®, at a single facility or a single site. Therefore, a significant disruptive event, including a fire or natural disaster, at certain manufacturing facilities or sites could materially and adversely affect our business and results of operations as noted with our supply interruption with Avycaz® in 2016. In the event of a disruption, we may need to build or locate replacement facilities as well as seek and obtain the necessary regulatory approvals for these facilities. Interruption of our efficient manufacture and supply of products may cause delays in shipments and supply constraints. Our inability to timely manufacture any of our significant products could have a material adverse effect on our results of operations, financial condition and cash flows.
Our manufacturing processes and those of our third‑party contract manufacturers must undergo a potentially lengthy FDA or other regulatory approval process and are subject to continued review by the FDA and other regulatory authorities. It can take longer than five years to build, validate and license a new manufacturing plant and it can take longer than three years to qualify and license a new contract manufacturer. If regulatory authorities determine that we or our third‑party contract manufacturers or certain of our third‑party service providers have violated regulations or if they restrict, suspend or revoke our prior approvals, they could prohibit us from manufacturing our products or conducting clinical trials or selling our marketed products until we or the affected third‑party contract manufacturers or third‑party service providers comply, or indefinitely. Because our third‑party contract manufacturers and certain of our third‑party service providers are subject to the FDA and foreign regulatory authorities, alternative qualified third‑party contract manufacturers and third‑party service providers may not be available on a timely basis or at all. If we or our third‑party contract manufacturers or third‑party service providers cease or interrupt production or if our third‑party contract manufacturers and third‑party service providers fail to supply materials, products or services to us, we may experience delayed shipments, supply constraints, stock‑outs and/or recalls of our products.
Investigations of the calculation of average wholesale prices may adversely affect our business.
Many government and third‑party payers, including Medicare, Medicaid, Health Maintenance Organization and Managed Care Organization, have historically reimbursed doctors, pharmacies and others for the purchase of certain prescription drugs based on a drug’s average wholesale price (“AWP”) or wholesale acquisition cost (“WAC”). In the past several years, state and federal government agencies have conducted ongoing investigations of manufacturers’ reporting practices with respect to AWP and WAC, in which they have suggested that reporting of inflated AWP’s or WAC’s has led to excessive payments for prescription drugs. For example, beginning in July 2002, we and certain of our subsidiaries, as well as numerous other pharmaceutical companies, were named as defendants in various state and federal court actions alleging improper or fraudulent practices related to the reporting of AWP and/or WAC of certain products, and other improper acts, in order to increase prices and market shares. Similarly, in December
29
2015, Forest and other company subsidiaries were named as defendants in a private class action litigation in Pennsylvania based on similar allegations. Additional actions are possible. These actions, if successful, could adversely affect us and may have a material adverse effect on our business, results of operations, financial condition and cash flows.
We are subject to US federal and state healthcare fraud and abuse and health information privacy and security laws, and the failure to comply with such laws may adversely affect our business.
In the United States, many of our products are reimbursed under federal and state health care programs such as Medicaid, Medicare, TriCare, and/or state pharmaceutical assistance programs, and as a result, certain federal and state healthcare laws and regulations pertaining to fraud and abuse and patients’ rights are and will be applicable to our business. We could be subject to healthcare fraud and abuse and patient privacy regulation by both the federal government and the states in which we conduct our business. The laws that may affect our ability to operate include, but are not limited to: (i) the US Anti‑Kickback Statute, which applies to our marketing and research practices, educational programs, pricing policies and relationships with healthcare providers or other entities, by prohibiting, among other things, soliciting, receiving, offering or paying remuneration, directly or indirectly, to induce, or in return for, either the referral of an individual or the purchase or recommendation of an item or service reimbursable under a federal healthcare program, such as the Medicare and Medicaid programs; (ii) federal civil and criminal false claims laws and civil monetary penalty laws, which prohibit, among other things, individuals or entities from knowingly presenting, or causing to be presented, claims for payment from Medicare, Medicaid or other third‑party payers that are false or fraudulent; (iii) the US Health Insurance Portability and Accountability Act of 1996, (“HIPAA”), which among other things created new federal criminal statutes that prohibit executing a scheme to defraud any healthcare benefit program or making false statements relating to healthcare matters, and HIPAA, as amended by the Health Information Technology for Economic and Clinical Health Act of 2009, and its implementing regulations, which imposes certain requirements relating to the privacy, security and transmission of individually identifiable health information and places restrictions on the use of such information for marketing communications; (iv) the US Physician Payments Sunshine Act, which among other things, requires manufacturers of drugs, devices, biologics and medical supplies for which payment is available under a federal healthcare program to report annually information related to “payments or other transfers of value” made to physicians and teaching hospitals, and ownership and investment interests held by certain healthcare professionals and their immediate family members and similar state laws; (v) the government pricing rules applicable to the Medicaid, Medicare Part B, 340B Drug Pricing Program, the US Department of Veterans Affairs program, the TRICARE program, and state price reporting laws; and (vi) state and foreign law equivalents of each of the above US laws, such as anti‑kickback and false claims laws which may apply to items or services reimbursed by any third‑party payer, including commercial insurers, and state and foreign laws governing the privacy and security of health information in certain circumstances, many of which differ from each other in significant ways and often are not preempted by HIPAA, thus complicating compliance efforts. Violations of the fraud and abuse laws may result in severe penalties against Allergan and/or its responsible employees, including jail sentences, large fines, and the exclusion of our products from reimbursement under federal and state programs. Defense of litigation claims and government investigations can be costly, time‑consuming, and distract management, and it is possible that Allergan could incur judgments or enter into settlements that would require us to change the way we operate our business. We are committed to conducting the sales and marketing of our products in compliance with the healthcare fraud and abuse laws, but certain applicable laws may impose liability even in the absence of specific intent to defraud. Furthermore, should there be ambiguity, a governmental authority may take a position contrary to a position we have taken, or should an employee violate these laws without our knowledge, a governmental authority may impose civil and/or criminal sanctions.
Any adverse outcome in these types of actions, or the imposition of penalties or sanctions for failing to comply with the fraud and abuse laws, could adversely affect us and may have a material adverse effect on our business, results of operations, financial condition and cash flows. Some of the statutes and regulations that govern our activities, such as federal and state anti‑kickback and false claims laws, are broad in scope, and while exemptions and safe harbors protecting certain common activities exist, they are often narrowly drawn. While we manage our business activities to comply with these statutory provisions, due to their breadth, complexity and, in certain cases, uncertainty of application, it is possible that our activities could be subject to challenge by various government agencies. In particular, the FDA, the US Department of Justice and other agencies have increased their enforcement activities with respect to the sales, marketing, research and similar activities of pharmaceutical companies in recent years, and many pharmaceutical companies have been subject to government investigations related to these practices. A determination that we are in violation of these and/or other government regulations and legal requirements may result in civil damages and penalties, criminal fines and prosecution, administrative remedies, the recall of products, the total or partial suspension of manufacture and/or distribution, seizure of products, injunctions, whistleblower lawsuits, failure to obtain approval of pending product applications, withdrawal of existing product approvals, exclusion from participation in government healthcare programs and other sanctions.
Allergan is also currently responding to subpoenas seeking information relating to its sales and marketing activities, including payments to people who are in a position to recommend drugs and off‑label promotion and the Company is defending litigations based on similar allegations. Refer to Legal Matters in “NOTE 24 — Commitments and Contingencies” in the accompanying “Notes to Consolidated Financial Statements” for more information. We cannot predict or determine the impact of these inquiries on our future
30
financial condition or results of operations. These investigations and any other threatened or actual government enforcement action could also generate adverse publicity and require that we devote substantial resources that could be used productively on other aspects of our business.
Any of these types of investigations or enforcement actions could affect our ability to commercially distribute our products and could materially and adversely affect our business, financial condition, results of operations and cash flows.
Extensive industry regulation has had, and will continue to have, a significant impact on our business, especially our product development, manufacturing and distribution capabilities.
All pharmaceutical companies, including Allergan, are subject to extensive, complex, costly and evolving government regulation. For the US, this is principally administered by the FDA, but is also administered by the Drug Enforcement Agency “DEA” and state government agencies, as well as by varying regulatory agencies in foreign countries where products or product candidates are being manufactured and/or marketed. The Federal Food, Drug and Cosmetic Act, the Controlled Substances Act and other federal statutes and regulations, and similar foreign statutes and regulations, govern or influence the development, testing, manufacturing, packing, labeling, storing, record keeping, safety, approval, advertising, promotion, sale, distribution and import/ export of our products. Foreign regulatory authorities impose similar requirements focused on drug safety and effectiveness. Obtaining and maintaining regulatory approval has been and will continue to be increasingly difficult, time‑consuming and costly. In addition, changes in applicable federal, state and foreign laws and regulations or the implementation of new laws and regulations could affect our ability to obtain or maintain approval of our products and could have a material adverse effect on the Company’s business. There is currently the potential for regulatory changes adverse to our business due to recent uncertainty related to the direction of US regulatory policy related to the pharmaceutical industry.
Once regulatory approval has been obtained, agencies continue to have substantial authority to require additional testing, perform inspections, change product labeling based on post-marketing safety information or mandate withdrawals of our products. Failure to comply with applicable regulatory requirements may subject us to administrative or judicially‑imposed sanctions. These sanctions may include, among others, untitled letters, warning letters, fines, civil penalties, criminal penalties, injunctions, debarment, product seizure or detention, product recalls and total or partial suspension of production, sale and promotion. In addition, we may voluntarily elect to recall or restrict the use of a product. Any recall or restriction could divert managerial and financial resources and might harm our reputation.
Under these statutes and regulations, we are subject to periodic inspection of our facilities, procedures and operations and/or the testing of our products by the FDA and similar ex‑US authorities, the DEA and other authorities, which conduct periodic inspections to confirm that we are in compliance with all applicable requirements. In addition, the FDA and foreign regulatory agencies conduct pre‑approval and post‑approval reviews and plant inspections to determine whether our systems and processes are in compliance with cGMP and other regulations. Following such inspections, the FDA or other agency may issue observations, notices, citations and/or warning letters that could cause us to modify certain activities identified during the inspection. FDA guidelines specify that a warning letter is issued only for violations of “regulatory significance” for which the failure to adequately and promptly achieve correction may be expected to result in an enforcement action. We are also required to report adverse events associated with our products to the FDA and other regulatory authorities. Unexpected or serious health or safety concerns could result in product liability claims, labeling changes, recalls, market withdrawals or other regulatory actions, including withdrawal of product approvals. Adverse events and safety concerns can arise as our product candidates are evaluated in clinical trials or as our marketed products are used in clinical practice. We are required to communicate to regulatory agencies adverse events reported to us regarding our products.
We cannot assure that the FDA inspections at any of our manufacturing sites will not result in inspectional observations at such sites, that approval of any of the pending or subsequently submitted NDAs or supplements to such applications by Allergan plc or our subsidiaries will be granted or that the FDA will not seek to impose additional sanctions against Allergan plc or any of its subsidiaries. The range of possible sanctions includes, among others, FDA issuance of adverse publicity, product recalls or seizures, fines, total or partial suspension of production and/or distribution, suspension of the FDA’s review of product applications, enforcement actions, injunctions, and civil or criminal prosecution. Any such sanctions, if imposed, could have a material adverse effect on our business, operating results, financial condition and cash flows. Under certain circumstances, the FDA also has the authority to revoke previously granted drug approvals. Similar sanctions as detailed above may be available to the FDA under a consent decree, depending upon the actual terms of such decree. Although we have instituted internal compliance programs, if these programs do not meet regulatory agency standards or if compliance is deemed deficient in any significant way, it could materially harm our business. Certain of our vendors are subject to similar regulation and periodic inspections and may be operating under consent decrees.
In order to market our products in the United States and other jurisdictions, we must obtain separate regulatory approvals and comply with numerous and varying regulatory requirements required for approval as well as maintaining registrations post-approval. The process for obtaining governmental approval to manufacture and market pharmaceutical products is rigorous, time‑consuming,
31
uncertain and costly, and we cannot predict the extent to which we may be affected by legislative and regulatory developments. We are dependent on receiving FDA and other governmental or third‑party approvals prior to manufacturing, marketing and shipping our products. There is always the chance that we will not obtain FDA or other necessary approvals, or that the rate, timing and cost of obtaining such approvals, will adversely affect our product introduction plans or results of operations. Additionally, any regulatory approvals we receive may be subject to limitations on the approved indicated uses for which the product may be marketed or to the conditions of approval or may contain requirements for potentially costly additional clinical trials and surveillance to monitor the safety and efficacy of the product. We may only market or promote our products for their approved indications, and our labeling, promotional activities and advertising are subject to extensive regulation and oversight. We carry inventories of certain product(s) in anticipation of launch, and if such product(s) are not subsequently launched, we may be required to write‑off the related inventory.
Our customers are subject to various regulatory requirements, including requirements of the DEA, FDA, state boards of pharmacy and city and county health regulators, among others. These include licensing, registration, recordkeeping, security and reporting requirements. Additionally, although physicians may prescribe FDA approved products for an “off label” indication, we are permitted to market our products only for the indications for which they have been approved. Some of our products are prescribed off label and the FDA, the US Department of Justice, the US Attorney or other regulatory authorities could take enforcement actions if they conclude that we or our distributors have engaged in off label marketing. In addition, historically a number of states and the federal government have enforced licensing and anti-counterfeit drug pedigree laws which require the tracking of all transactions involving prescription drugs beginning with the manufacturer, through the supply chain, and down to the pharmacy or other health care provider dispensing or administering prescription drug products. Therefore, manufacturers and wholesale distributors have been required to maintain records documenting the chain of custody on distribution of prescription drugs. On November 27, 2013, the federal government enacted the Drug Quality and Security Act (DQSA) amending federal requirements in regard to the licensing and tracking of prescription drugs. Certain provisions in the new law related to licensing and track and trace specifically preempted prior state laws related to drug pedigrees that are inconsistent, more stringent, or in addition to the federal law. Specifically, Title II of the DQSA, also known as the Drug Supply Chain Security Act (DSCSA), provides for creation of an electronic, interoperable system to identify and trace certain prescription drugs as they are distributed in the United States. These amendments include new requirements on licensing, tracking and tracing and other operations applicable to manufacturers and wholesale distributors of prescription drug products. The full requirements of the DSCSA will be phased in over a ten year period; however, in January 2015, specific product tracing requirements for manufacturers, wholesalers, repackagers and dispensers (e.g., pharmacies) of prescription drugs became effective. Also, as of January 2015, the DSCSA required manufacturers and wholesale distributors to implement systems to identify potential “suspect” or “illegitimate” product, and take appropriate action. The DSCSA also addresses product tracing using unique product identifiers on packaging, and requirements for standardized numerical identifiers which will take effect in the future.
In addition to government agencies that promulgate regulations and guidelines directly applicable to us, other professional societies, practice management groups, insurance carriers, physicians, private health or science foundations and organizations involved in various diseases from time to time may also publish guidelines or recommendations to healthcare providers, administrators and payers, and patient communities. For example, the treatment practices of physicians that currently prescribe our products may change. Recommendations by government agencies or other groups and organizations may relate to such matters as usage, dosage, route of administration and use of related therapies, as well as reimbursement of our products by government and private payers. Any recommendations or guidelines that result in decreased use, dosage or reimbursement of our products could materially and adversely affect our product sales, business and operating results.
The supply of APIs into Europe may be negatively affected by recent regulations promulgated by the European Union.
As of July 2, 2013, all APIs imported into the EU must be certified as complying with the good manufacturing practice standards established by the EU, as stipulated by the International Conference for Harmonization. These new regulations place the certification requirement on the regulatory bodies of the exporting countries. Accordingly, the national regulatory authorities of each exporting country must: (i) ensure that all manufacturing plants within their borders that export API into the EU comply with EU manufacturing standards and; (ii) for each API exported, present a written document confirming that the exporting plant conforms to EU manufacturing standards. The imposition of this responsibility on the governments of the nations exporting API may cause a shortage of API necessary to manufacture our products, as certain governments may not be willing or able to comply with the regulation in a timely fashion, or at all. A shortage in API may cause us to have to cease manufacture of certain products, or to incur costs and delays to qualify other suppliers to substitute for those API manufacturers unable to export. This could adversely affect the Company and could have a material adverse effect on our business, results of operations, financial condition and cash flow.
Federal regulation of arrangements between manufacturers of branded and generic products could adversely affect our business.
As part of the Medicare Prescription Drug and Modernization Act of 2003, companies are required to file with the FTC and the Department of Justice certain types of agreements entered into between branded and generic pharmaceutical companies related to the manufacture, marketing and sale of generic versions of branded drugs. This requirement, as well as legislation pending in the US
32
Congress related to settlements between brand and generic drug manufacturers, could affect the manner in which brand drug manufacturers resolve intellectual property litigation and other disputes with generic pharmaceutical companies and could result generally in an increase or lengthening of litigation against pharmaceutical companies or additional investigations or proceedings by the FTC or other governmental authorities. The impact of this requirement, the pending legislation and the potential private‑party lawsuits associated with arrangements between brand and generic drug manufacturers, is uncertain and could adversely affect our business. For example, on April 5, 2013, class actions were filed against Warner Chilcott plc and certain affiliates alleging that its 2009 patent lawsuit settlements with Watson Laboratories, Inc. and Lupin Pharmaceuticals, Inc. related to Loestrin® 24 Fe (norethindrone acetate/ethinyl estradiol tablets and ferrous fumarate tablets, “Loestrin® 24”) are unlawful. The complaints generally allege that Watson and Lupin improperly delayed launching generic versions of Loestrin® 24 in exchange for substantial payments from Warner Chilcott in violation of federal and state antitrust and consumer protection laws. Similar lawsuits have been filed against the Company challenging the lawfulness of patent litigation settlements related to Asacol® and Namenda®. We have also received requests for information and Statements of Objection in connection with investigations into settlements and other arrangements between competing pharmaceutical companies by the Federal Trade Commission and the European Competition Commission. For example, in May 2014, Forest received a Civil Investigatory Demand from the FTC requesting information about Forest’s agreements with ANDA filers for Bystolic®. Any adverse outcome of these actions or investigations, or actions or investigations related to other settlements we have entered into, could have a material adverse effect on our business, results of operations, financial condition and cash flows. Refer to Legal Matters in “NOTE 24 — Commitments and Contingencies” in the accompanying “Notes to Consolidated Financial Statements.”
Healthcare reform and a reduction in the coverage and reimbursement levels by governmental authorities, HMOs, MCOs or other third‑party payers may adversely affect our business.
Demand for our products depends in part on the extent to which coverage and reimbursement is available from third‑party payers, such as the Medicare and Medicaid programs and private payors. In order to commercialize our products, we have obtained from government authorities and private health insurers and other organizations, such as Health Maintenance Organizations and Managed Care Organizations, recognition for coverage and reimbursement at varying levels for the cost of certain of our products and related treatments. Third‑party payers increasingly challenge pricing of pharmaceutical products. Further, the trend toward managed healthcare in the US, the growth of organizations such as HMOs and MCOs and legislative proposals to reform healthcare and government insurance programs create uncertainties regarding the future levels of coverage and reimbursement for pharmaceutical products. Such cost containment measures and healthcare reform could reduce reimbursement of our pharmaceutical products, resulting in lower prices and a reduction in the product demand. This could affect our ability to sell our products and could have a material adverse effect on our business, results of operations, financial condition and cash flows.
There have been changes in reimbursement for pharmaceuticals under various government programs, including Medicaid, and there is uncertainty surrounding implementation of legislation and regulatory changes relating to reimbursement for pharmaceuticals under Medicaid and other government programs such as Medicare and Tricare. Reimbursement changes under such government programs may impact demand for our products and may negatively affect the price. In addition, any reimbursement granted may not be maintained or limits on reimbursement available from third party payers may reduce demand for, or negatively affect the price of, those products. Additionally, various legislative and regulatory initiatives in states, including proposed modifications to reimbursements and rebates, product pedigree and tracking, pharmaceutical waste “take back” initiatives, and therapeutic category generic substitution carve out legislation may also have a negative impact on the Company. We maintain a full time government affairs department in Washington, D.C., which is responsible for coordinating state and federal legislative activities, and places a major emphasis in terms of management time and resources to ensure a fair and balanced legislative and regulatory arena.
Although the ACA reforms have significantly impacted our business, in the coming years, it is likely that additional changes, including the potential repeal of all or certain aspects of these reforms, will be made to governmental healthcare and insurance reimbursement programs. On January 20, 2017, President Donald Trump signed an executive order, which stated that it is the policy of his Administration to seek the prompt repeal of the ACA and directed executive departments and federal agencies to waive, defer, grant exemptions from, or delay the implementation of the provisions of the ACA to the maximum extent permitted by law. Additionally, the House and Senate recently passed a budget resolution that authorizes congressional committees to draft legislation to repeal all or portions of the ACA and permits such legislation to pass with a majority vote in the Senate. The Trump Administration has also issued numerous executive orders in its early days, including a “regulatory freeze” order issued on January 20, 2017 that temporarily postpones by 60 days the effective date of regulations that have not yet taken effect (subject to certain limitations) and a “one in, two out” executive order issued on January 30, 2017 that requires two rules be “identified for elimination” for every new one proposed. There is uncertainty with respect to the timing of any potential changes, to coverage and reimbursement for healthcare items and services covered by plans that were authorized by the ACA. We cannot predict the ultimate content, timing or effect of any such reform on our business. Additionally, the pricing and reimbursement of pharmaceutical products have recently received the attention of US policymakers, the Trump Administration, and others. At this time, we cannot predict the impact of this increased scrutiny on the pricing or reimbursement of our products or pharmaceutical products generally.
33
Sales of our products may continue to be adversely affected by the continuing consolidation of our distribution network and the concentration of our customer base.
Our principal customers are wholesale drug distributors and major retail drug store chains. These customers comprise a significant part of the distribution network for pharmaceutical products in the US This distribution network is continuing to undergo significant consolidation marked by mergers and acquisitions among wholesale distributors and the growth of large retail drug store chains. As a result, a small number of large wholesale distributors and large chain drug stores control a significant share of the market. We expect that consolidation of drug wholesalers and retailers will increase pricing and other competitive pressures on drug manufacturers, including the Company.
The loss of any of these customers could have a material adverse effect on our business, results of operations, financial condition and cash flows. In addition, none of our customers are party to any long‑term supply agreements with us, and thus are able to change suppliers freely should they wish to do so.
Developments after a product reaches the market may adversely affect sales of our products.
Even after regulatory approval, certain developments may decrease demand for our products, including the following:
|
|
• |
the re‑review of products that are already marketed; |
|
|
• |
new scientific information and evolution of scientific theories; |
|
|
• |
the recall or loss of marketing approval of products that are already marketed; |
|
|
• |
changing government standards or public expectations regarding safety, efficacy or labeling changes; and |
|
|
• |
greater scrutiny in advertising and promotion. |
In the past, clinical trials and post‑marketing surveillance of certain marketed drugs of the Company and of competitors within the industry have raised concerns that have led to recalls, withdrawals or adverse labeling of marketed products. If previously unknown side effects are discovered or if there is an increase in negative publicity regarding known side effects of any of our products, it could significantly reduce demand for the product or require us to take actions that could negatively affect sales, including removing the product from the market, restricting its distribution or applying for labeling changes.
In addition, certain health authorities, regulators and agencies have increased their focus on safety when assessing the balance of benefits and risks of drugs. Some health authorities appear to have become more cautious when making decisions about approvability of new products and are re‑reviewing select products that are already marketed, adding further to the uncertainties in the regulatory processes. There is also greater regulatory scrutiny, especially in the U.S., on advertising, and promotion (in particular, direct‑to‑consumer advertising) and pricing of pharmaceutical products. Certain regulatory changes or decisions could make it more difficult for us to sell our products and could have a material adverse effect on our business, results of operations, financial condition and cash flows.
If we do not successfully integrate newly acquired businesses into our business operations, our business could be adversely affected.
We will need to successfully integrate the operations of recently and pending acquired businesses, including Tobira, Vitae, and ForSight, with our business operations. As a result of these and other recent and any other future or pending acquisitions, we have undergone substantial changes in a short period of time and our business has changed and broadened in size and the scope of products we offer. Integrating the operations of multiple new businesses with that of our own is a complex, costly and time‑consuming process, which requires significant management attention and resources to integrate the business practice and operations. The integration process may disrupt the businesses and, if implemented ineffectively, would preclude realization of the full benefits expected by us. Our failure to meet the challenges involved in integrating the businesses in order to realize the anticipated benefits of the acquisitions could cause an interruption of, or a loss of momentum in, our activities and could adversely affect our results of operations. Prior to each acquisition, the acquired business operated independently, with its own business, corporate culture, locations, employees and systems. There may be substantial difficulties, costs and delays involved in any integration of other businesses with that of our own. These may include:
|
|
• |
distracting management from day‑to‑day operations; |
|
|
• |
potential incompatibility of corporate cultures; |
|
|
• |
an inability to achieve synergies as planned; |
34
|
|
• |
adverse effects on existing business relationships with suppliers or customers; |
|
|
• |
inheriting and uncovering previously unknown issues, problems and costs from the acquired company; |
|
|
• |
delays between our expenditures to acquire new products, technologies or businesses and the generation of revenues from those acquired products, technologies or businesses; |
|
|
• |
realization of assets and settlement of liabilities at amounts equal to estimated fair value as of the acquisition date of any acquisition or disposition; |
|
|
• |
revenue recognition related to licensing agreements and/or strategic collaborations; |
|
|
• |
costs and delays in implementing common systems and procedures (including technology, compliance programs, financial systems, distribution and general business operations, among others); and |
|
|
• |
increased difficulties in managing our business due to the addition of international locations. |
These risks may be heightened in cases where the majority of the former businesses’ operations, employees and customers are located outside of the United States. Any one or all of these factors may increase operating costs or lower anticipated financial performance. Many of these factors are also outside of our control. In addition, dispositions of certain key products, technologies and other rights may affect our business operations.
In addition, even if the operations of the businesses are integrated successfully, we may not realize the full benefits of the acquisitions, including the synergies, cost savings or sales or growth opportunities that we expect. These benefits may not be achieved within the anticipated time frames, or at all. Additional unanticipated costs may be incurred in the integration of the businesses. All of these factors could cause a reduction to our earnings, decrease or delay the expected accretive effect of the transactions, and negatively impact the price of our ordinary shares.
The failure to integrate the business operations of the acquired businesses successfully would have a material adverse effect on our business, financial condition and results of operations.
Any acquisitions of businesses, technologies, or products or other significant transactions could adversely affect our relationships with employees, vendors or key customers.
We regularly review potential acquisitions of technologies, products and businesses complementary to our business. Acquisitions typically entail many risks and could result in difficulties in integrating operations, personnel, technologies and products. Refer to “If we do not successfully integrate newly acquired businesses into our business operations our business could be adversely affected.” In connection with acquisitions, we could experience disruption in our business, technology and information systems, financial systems, vendors customer or employee base, including diversion of management’s attention from our continuing operations, among others. Refer to “Certain aspects of our operations are highly dependent on third party service providers.” There is also a risk that key employees of companies that we acquire or key employees necessary to successfully commercialize technologies and products that we acquire may seek employment elsewhere, including with our competitors. Furthermore, there may be overlap between our products or customers and the companies that we acquire that may create conflicts in relationships or other commitments detrimental to the integrated businesses.
If we are unsuccessful in our joint ventures and other collaborations, our operating results could suffer.
We have made substantial investments in joint ventures and other collaborations, and may use these and other methods to develop or commercialize products in the future. These arrangements typically involve other pharmaceutical companies as partners that may be competitors of ours in certain markets. In many instances, we will not control these joint ventures or collaborations or the commercial exploitation of the licensed products, and cannot assure you that these ventures will be profitable. Joint venture agreements may place limitations or restrictions on marketing our products. Any such marketing restrictions could affect future revenues and have a material adverse effect on our operations. Our results of operations may suffer if existing joint venture or collaboration partners withdraw, or if these products are not timely developed, approved or successfully commercialized and we cannot guarantee the successful outcome of such efforts, nor that they will result in any intellectual property rights or products that inure to our benefit.
35
We have incurred and will continue to incur significant transaction, integration and restructuring costs in connection with recent transactions, including our acquisitions of Legacy Allergan, LifeCell, and the sale of our generics business and certain other assets to Teva.
We have incurred significant transaction costs related to our acquisitions such as Legacy Allergan, LifeCell, and the sale of our generics business and certain other assets to Teva and will continue to incur significant transaction costs related to past acquisitions. In addition, we will incur integration costs and restructuring costs as we integrate the businesses. While Allergan has assumed that a certain level of transaction and coordination expenses will be incurred, there are a number of factors beyond Allergan’s control that could affect the total amount or the timing of these transaction and coordination expenses. Many of the expenses that will be incurred, by their nature, are difficult to estimate accurately. Although we expect that the realization of benefits and efficiencies related to the integration of the businesses may offset these transaction costs, integration costs and restructuring costs over time, no assurances can be made that this net benefit will be achieved in the near term, or at all. The failure to realize the expected benefits and efficiencies related to the integration of the businesses could adversely affect our financial condition and results of operations.
In addition, as a result of acquiring businesses, technologies or products, or entering into other significant transactions, we may experience significant charges to earnings for merger and related expenses. These costs may include substantial fees for investment bankers, attorneys, accountants, advisors, consultants and severance and other closure costs associated with regulator‑mandated divestitures and the elimination of duplicate or discontinued products, operations and facilities. Charges that we may incur in connection with acquisitions could adversely affect our results of operations for particular quarterly or annual periods.
We could be liable for sales price adjustments relating to the Teva Transaction.
As described in “NOTE 7 – Discontinued Operations”, the purchase price payable to us by Teva in connection with our divestiture of the global generic pharmaceutical business and other assets is subject to adjustment based on working capital amounts, the amounts of which have not yet been agreed upon. Teva may make claims against us relating to the provision for adjustment of the sales prices, and the amounts relating to those claims could be substantial.
Our operating results and financial condition may fluctuate.
Our operating results and financial condition may fluctuate from quarter to quarter and year to year for a number of reasons. As a result, we believe that period‑to‑period comparisons of our results of operations are not necessarily meaningful, and these comparisons should not be relied upon as an indication of future performance. Our operating results and financial condition are also subject to fluctuation from all of the risks described throughout this section. These fluctuations may adversely affect our results of operations and financial conditions.
Our debt and other financial obligations could impair our financial condition and our ability to fulfill our debt obligations. Any refinancing of this debt could be at significantly higher interest rates.
Our indebtedness and other financial obligations could:
|
|
• |
impair our ability to obtain financing or additional debt in the future for working capital, capital expenditures, acquisitions or general corporate purposes; |
|
|
• |
impair our ability to access capital and credit markets on terms that are favorable to us; |
|
|
• |
have a material adverse effect on us if we fail to comply with financial and affirmative and restrictive covenants in our debt agreements and an event of default occurs as a result of a failure that is not cured or waived; |
|
|
• |
require us to dedicate a substantial portion of our cash flow for interest payments on our indebtedness and other financial obligations, thereby reducing the availability of our cash flow to fund working capital and capital expenditures; |
|
|
• |
limit our flexibility in planning for, or reacting to, changes in our business and the industry in which we operate; and |
|
|
• |
place us at a competitive disadvantage compared to our competitors that have proportionally less debt. |
Additionally, certain of our financing agreements may contain cross‑default or other similar provisions whereby a default under one financing agreement could result in a default under our other financing agreements.
If we are unable to meet our debt service obligations and other financial obligations such as planned dividends, we could be forced to restructure or refinance our indebtedness and other financial transactions, seek additional equity capital or sell our assets. We might then be unable to obtain such financing or capital or sell our assets on satisfactory terms, if at all. Any refinancing of our
36
indebtedness could be at significantly higher interest rates, and/or incur significant transaction fees. Refer to “NOTE 16 — Long-Term Debt and Leases” for a detailed discussion of our outstanding indebtedness.
Significant balances of intangible assets, including product rights and goodwill acquired, are subject to impairment testing and may result in impairment charges, which will adversely affect our results of operations and financial condition.
A significant amount of our total assets is related to acquired intangibles and goodwill. As of December 31, 2016, the carrying value of our product rights and other intangible assets was $62,618.6 million and the carrying value of our goodwill was $46,356.1 million.
Our product rights are stated at cost, less accumulated amortization. We determine original fair value and amortization periods for product rights based on our assessment of various factors impacting estimated useful lives and cash flows of the acquired products. Such factors include the product’s position in its life cycle, the existence or absence of like products in the market, various other competitive and regulatory issues and contractual terms. Significant adverse changes to any of these factors would require us to perform an impairment test on the affected asset and, if evidence of impairment exists, we would be required to take an impairment charge with respect to the asset. For assets that are not impaired, the Company may adjust the remaining useful lives. Such a charge could have a material adverse effect on our results of operations and financial condition.
Our other significant intangible assets include acquired core technology and customer relationships, which are intangible assets with definite lives, and our acquired IPR&D intangible products, acquired in recent business acquisitions, which are intangible assets with indefinite lives.
Our acquired core technology and customer relationship intangible assets are stated at cost, less accumulated amortization. We determined the original fair value of our other intangible assets by performing a discounted cash flow analysis, which is based on our assessment of various factors. Such factors include existing operating margins, the number of existing and potential competitors, product pricing patterns, product market share analysis, product approval and launch dates, the effects of competition, customer attrition rates, consolidation within the industry and generic product lifecycle estimates. Our other intangible assets with definite lives are tested for impairment when there are significant changes to any of these factors. If evidence of impairment exists, we would be required to take an impairment charge with respect to the impaired asset. Such a charge could have a material adverse effect on our results of operations and financial condition.
Goodwill and our IPR&D intangible assets are tested for impairment annually, or when events occur or circumstances change that could potentially reduce the fair value of the reporting unit or intangible asset. Impairment testing compares the fair value of the reporting unit or intangible asset to its carrying amount. A goodwill or IPR&D impairment, if any, would be recorded in operating income and could have a material adverse effect on our results of operations and financial condition.
We may need to raise additional funds in the future which may not be available on acceptable terms or at all.
We may consider issuing additional debt or equity securities in the future to fund potential acquisitions or investments, to refinance existing debt, or for general corporate purposes. If we issue equity, convertible preferred equity or convertible debt securities to raise additional funds, our existing shareholders may experience dilution, and the new equity or debt securities may have rights, preferences and privileges senior to those of our existing shareholders. If we incur additional debt, it may increase our leverage relative to our earnings or to our equity capitalization, requiring us to pay additional interest expenses and potentially lowering our credit ratings. We may not be able to market such issuances on favorable terms, or at all, in which case, we may not be able to develop or enhance our products, execute our business plan, take advantage of future opportunities, or respond to competitive pressures or unanticipated customer requirements.
The loss of our key personnel could cause our business to suffer.
The success of our present and future operations will depend, to a significant extent, upon the experience, abilities and continued services of key personnel. For example, although we have other senior management personnel, a significant loss of the services of Brent Saunders, our Chief Executive Officer, or other senior executive officers without having or hiring a suitable successor, could cause our business to suffer. We cannot assure you that we will be able to attract and retain key personnel. We have entered into employment agreements with certain of our senior executive officers but such agreements do not guarantee that our senior executive officers will remain employed by us for a significant period of time, or at all. We do not carry key‑employee life insurance on any of our officers.
37
Substantial amounts of our information concerning our products, customers, employees and ongoing business are stored digitally and are subject to threats of theft, tampering, or other intrusion.
We collect and maintain information in digital form that is necessary to conduct our business, and we are increasingly dependent upon information technology systems, infrastructure and data. This digital information includes, but is not limited to, confidential and proprietary information as well as personal information regarding our customers and employees. Data maintained in digital form is subject to the risk of intrusion, tampering, and theft. Cyber‑attacks are increasing in frequency, sophistication and intensity. Cyber‑attacks could include the deployment of harmful malware, denial‑of‑service attacks, worms, social engineering and other means to affect service reliability and threaten data confidentiality, integrity and availability. We have established physical, electronic, and organizational measures to safeguard and secure our systems to prevent a data compromise, and rely on commercially available systems, software, tools, and monitoring to provide security for the processing, transmission and storage of digital information. However, the development and maintenance of these systems is costly and requires ongoing monitoring and updating as technologies change and efforts to overcome security measures become increasingly more sophisticated. Despite our efforts, the possibility of a future data compromise cannot be eliminated entirely, and risks associated with intrusion, tampering, and theft remain. Data privacy or security breaches by employees or others may pose a risk that data, including intellectual property or personal information, may be exposed to unauthorized individuals or to the public. In addition, we provide confidential, proprietary and personal information to third parties when it is necessary to pursue our business objectives. While we obtain assurances that these third parties will protect this information and, where appropriate, monitor the protections employed by these third parties, there is a risk the confidentiality of data held by third parties may be compromised. If our data systems are compromised, our business operations may be impaired, we may lose profitable opportunities or the value of those opportunities may be diminished, and we may lose revenue as a result of unlicensed use of our intellectual property. If personal information of our customers or employees is misappropriated, our reputation with our customers and employees may be injured resulting in loss of business and/or morale, and we may incur costs to remediate possible injury to our customers and employees or be required to pay fines or take other action with respect to judicial or regulatory actions arising out of such incidents.
Our business will continue to expose us to risks of environmental liabilities.
Our product and API development programs, manufacturing processes and distribution logistics involve the controlled use of hazardous materials, chemicals and toxic compounds in our owned and leased facilities. As a result, we are subject to numerous and increasingly stringent federal, state and local environmental laws and regulations concerning, among other things, the generation, handling, storage, transportation, treatment and disposal of toxic and hazardous materials and the discharge of pollutants into the air and water. Our programs and processes expose us to risks that an accidental contamination could result in (i) our noncompliance with such environmental laws and regulations and (ii) regulatory enforcement actions or claims for personal injury and property damage against us. If an accident or environmental discharge occurs, or if we discover contamination caused by prior operations, including by prior owners and operators of properties we acquire, we could be liable for cleanup obligations, damages and fines. The substantial unexpected costs we may incur could have a material and adverse effect on our business, results of operations, financial condition, and cash flows. In addition, environmental permits and controls are required for some of our operations, and these permits are subject to modification, renewal and revocation by the issuing authorities. Any modification, revocation or non‑renewal of our environmental permits could have a material adverse effect on our ongoing operations, business and financial condition. Our environmental capital expenditures and costs for environmental compliance may increase in the future as a result of changes in environmental laws and regulations or increased development or manufacturing activities at any of our facilities.
Our foreign operations may become less attractive if political and diplomatic relations between the United States and any country where we conduct business operations deteriorates.
The relationship between the United States and the foreign countries where we conduct business operations may weaken over time. Changes in the state of the relations between any such country and the United States are difficult to predict and could adversely affect our future operations. This could lead to a decline in our profitability. Any meaningful deterioration of the political, economic and diplomatic relations between the United States and the relevant country could have a material adverse effect on our operations.
Our global operations, particularly following our acquisitions including Legacy Allergan, expose us to risks and challenges associated with conducting business internationally.
We operate on a global basis with offices or activities in Europe, Africa, Asia, South America, Australia and North America. We face several risks inherent in conducting business internationally, including compliance with international and US laws and regulations that apply to our international operations. These laws and regulations include data privacy requirements; labor relations laws; tax laws; competition regulations; import and trade restrictions; economic sanctions; export requirements; US laws such as the Foreign Corrupt Practices Act; the UK Bribery Act 2010; and other local laws that prohibit corrupt payments to governmental officials or certain payments or remunerations to customers. Given the high level of complexity of these laws there is a risk that some
38
provisions may be breached by us, for example through fraudulent or negligent behavior of individual employees, our failure to comply with certain formal documentation requirements, or otherwise. Violations of these laws and regulations could result in fines, criminal sanctions against us, our officers or our employees, requirements to obtain export licenses, cessation of business activities in sanctioned countries, implementation of compliance programs, and prohibitions on the conduct of our business. Any such violations could include prohibitions on our ability to offer our products in one or more countries and could materially damage our reputation, our brand, our international expansion efforts, our ability to attract and retain employees, our business and our operating results. Our success depends, in part, on our ability to anticipate these risks and manage these challenges. Further, certain of our employees, including employees located in certain jurisdictions in Canada, Europe and Asia, are represented by collective bargaining or other labor agreements or arrangements that provide bargaining or other rights to employees. Such employment rights require us to expend greater time and expense in making changes to employees’ terms of employment or carrying out staff reductions. In addition, any national or other labor disputes in these regions could result in a work stoppage or strike by our employees that could delay or interrupt our ability to supply products and conduct operations. Due to the nature of these collective bargaining agreements, we will have no control over such work stoppages or strikes by such employees, and a strike may occur even if the employees do not have any grievances against us. Any interruption in manufacturing or operations could interfere with our business and could have a material adverse effect on our revenues.
In addition to the foregoing, engaging in international business inherently involves a number of other difficulties and risks, including:
|
|
• |
longer payment cycles and difficulties in enforcing agreements and collecting receivables through certain foreign legal systems; |
|
|
• |
political and economic instability or sanctions in areas in which we operate; |
|
|
• |
potentially adverse tax consequences, tariffs, customs charges, bureaucratic requirements and other trade barriers; |
|
|
• |
regulations related to customs and import/export matters (including sanctions); |
|
|
• |
tax issues, such as tax law changes and variations in tax laws; |
|
|
• |
challenges in collecting accounts receivable from customers in the jurisdictions in which we operate; |
|
|
• |
complying with laws, rules and regulations relating to the manufacturing, marketing, distribution and sale of pharmaceutical products in the jurisdictions in which we do or will operate; |
|
|
• |
operating under regulations in jurisdictions related to obtaining eligibility for government or private payor reimbursement for our products at the wholesale/retail level; |
|
|
• |
competition from local, regional and international competitors; |
|
|
• |
difficulties and costs of staffing and managing foreign operations, including cultural and language differences and additional employment regulations, union workforce negotiations and potential disputes in the jurisdictions in which we operate; |
|
|
• |
difficulties associated with compliance with a variety of laws and regulations governing international trade, including the Foreign Corrupt Practices Act; |
|
|
• |
difficulties protecting or procuring intellectual property rights; and |
|
|
• |
fluctuations in foreign currency exchange rates. |
These factors or any combination of these factors could have a material adverse effect on our results of operations and financial condition.
Our ordinary share dividend policy is subject to change and could adversely affect the price of our ordinary shares.
Our ordinary share dividend policy is based upon our Board of Directors’ current assessment of our business and the environment in which we operate. That assessment could change based on competitive or commercial developments (which could, for example, increase our need for capital expenditures), new growth opportunities, the terms of future debt instruments, legal risks, changes in Irish corporate or tax or federal tax law and challenges to our business model. Our Board of Directors may, in its discretion, amend or repeal our dividend policy to decrease the level of dividends on our ordinary shares or entirely discontinue the payment of dividends on our ordinary shares. The reduction or elimination of our cash dividend could adversely affect the market price of our ordinary shares.
39
Our share repurchase program may not enhance shareholder value.
Repurchases of our ordinary shares under our completed share repurchase program or under our continuing accelerated share repurchase program reduce the number of outstanding shares of our ordinary shares. There can be no assurance that any share repurchases will enhance shareholder value because the market price of our ordinary shares may decline below the levels at which we repurchased ordinary shares. Although our share repurchase program is intended to enhance long-term shareholder value, short-term stock price fluctuations could reduce the program's effectiveness.
We have exposure to tax liabilities.
As a multinational corporation, we are subject to income taxes as well as non‑income based taxes in various jurisdictions. Significant judgment is required in determining our worldwide provision for income taxes and other tax liabilities. We are subject to costs and other potential outcomes from tax audits. The Company believes that its accrual for tax contingencies is adequate for all open years based on past experience, interpretations of tax law, and judgments about potential actions by tax authorities; however, due to the complexity of tax contingencies, the ultimate resolution of any tax matters may result in payments greater or less than amounts accrued.
Changes in tax laws or tax rulings may have a significantly adverse impact on our effective tax rate. Proposals for fundamental US international tax reform, including without limitation provisions that would limit the ability of US corporations to deduct interest, if enacted, could have a significant adverse impact on our effective tax rate. Many countries in Europe, as well as a number of other countries and organizations, have recently proposed or recommended changes to existing tax laws which could impact our future tax obligations. The Organization for Economic Cooperation and Development has been working on a Base Erosion and Profit Sharing Project, and is expected to continue to issue guidelines and proposals that may change various aspects of the existing framework under which our tax obligations are determined in many of the countries in which we do business. The European Commission has conducted investigations in multiple countries focusing on whether local country tax rulings or tax legislation provides preferential tax treatment that violates European Union state aid rules. If the Company’s effective tax rates were to increase, or if the ultimate determination of the Company’s taxes owed is for an amount in excess of amounts previously accrued, the Company’s operating results, cash flows, and financial condition could be adversely affected.
We would be adversely affected if, either based on current law or in the event of a change in law, the Internal Revenue Service did not agree that Allergan plc is a foreign corporation for US federal tax purposes. In addition, future changes to international tax laws not specifically related to inversions could adversely affect us.
Allergan plc believes that, under current law, it is treated as a foreign corporation for US federal tax purposes, because it is an Irish incorporated entity. However, the IRS may assert that Allergan plc should be treated as a US corporation for US federal tax purposes pursuant to Section 7874. Under Section 7874, a corporation created or organized outside the United States (i.e., a foreign corporation) will be treated as a US corporation for US federal tax purposes when (i) the foreign corporation directly or indirectly acquires substantially all of the assets held directly or indirectly by a US corporation (including the indirect acquisition of assets of the US corporation by acquiring all the outstanding shares of the US corporation), (ii) the shareholders of the acquired US corporation hold at least 80% (by either vote or value) of the shares of the foreign acquiring corporation after the acquisition by reason of holding shares in the US acquired corporation (including the receipt of the foreign corporation’s shares in exchange for the US corporation’s shares), and (iii) the foreign corporation’s “expanded affiliated group” does not have substantial business activities in the foreign corporation’s country of organization or incorporation relative to such expanded affiliated group’s worldwide activities. For purposes of Section 7874, multiple acquisitions of US corporations by a foreign corporation, if treated as part of a plan or series of related transactions, may be treated as a single acquisition. If multiple acquisitions of US corporations are treated as a single acquisition, all shareholders of the acquired US corporations would be aggregated for purposes of the test set forth above concerning such shareholders holding at least 80% (by either vote or value) of the shares of the foreign acquiring corporation after the acquisitions by reason of holding shares in the acquired US corporations.
Allergan believes that the test set forth above to treat Allergan as a foreign corporation was satisfied in connection with the transactions resulting in the combination of Actavis, Inc., a Nevada corporation, and Warner Chilcott plc, a company incorporated under the laws of Ireland (the “Warner Chilcott Transactions”), the subsequent acquisition of Forest Laboratories, Inc., a company incorporated under the laws of the State of Delaware (the “Forest Acquisition”), and the acquisition of Allergan, Inc., a company incorporated under the laws of the State of Delaware (the “Allergan Acquisision”). However, the law and Treasury regulations promulgated under Section 7874 are somewhat unclear, and thus it cannot be assured that the IRS will agree that the ownership requirements to treat Allergan as a foreign corporation were met in the Warner Chilcott Transactions, the Forest Acquisition and/or the Allergan Acquisition and the IRS may assert that, even though the Allergan Acquisition is a separate transaction from the Warner Chilcott Transactions and the Forest Acquisition, the Allergan Transaction should be integrated with the Warner Chilcott Transactions
40
and the Forest Acquisition as a single transaction. In the event the IRS were to prevail with such assertion, Allergan would be treated as a U.S. corporation for U.S. federal tax purposes and significant adverse tax consequences would result for Allergan.
Even if Allergan is respected as a foreign corporation for US federal tax purposes, Allergan might be adversely impacted by recent proposals that have aimed to make other changes in the taxation of multinational corporations. For example, the Organisation for Economic Co‑operation and Development has released proposals to create an agreed set of international rules for fighting base erosion and profit shifting. As a result, the tax laws in the United States, Ireland, and other countries in which we and our affiliates do business could change on a prospective or retroactive basis, and any such changes could adversely affect Allergan and its affiliates (including Legacy Allergan and its affiliates).
Moreover, US and foreign tax authorities may carefully scrutinize companies that result from cross‑border business combinations, such as Allergan, which may lead such authorities to assert that Allergan owes additional taxes.
Foreign currency fluctuations could adversely affect our business and financial results.
We do business and generate sales in numerous countries outside the United States. The Company has also entered and will from time to time enter into acquisition, licensing, borrowing, hedging or other financial transactions that may give rise to currency and interest rate exposure. As such, foreign currency fluctuations may affect the costs that we incur in such international operations. Some of our operating expenses are incurred in non‑US dollar currencies. The appreciation of non‑US dollar currencies in those countries where we have operations against the US dollar could increase our costs and could harm our results of operations and financial condition.
A failure of our internal control over financial reporting could materially impact our business or share price.
The Company’s management is responsible for establishing and maintaining adequate internal control over financial reporting. An internal control system, no matter how well designed and operated, can provide only reasonable, not absolute, assurance that the objectives of the control system are met. Further, the design of a control system must reflect the fact that there are resource constraints, and the benefits of controls must be considered relative to their costs. Because of the inherent limitations in all internal control systems, internal control over financial reporting may not prevent or detect misstatements. Any failure to maintain an effective system of internal control over financial reporting could limit our ability to report our financial results accurately and timely or to detect and prevent fraud, and could expose us to litigation or adversely affect the market price of the Allergan plc Ordinary Shares.
In the year ended December 31, 2016, management concluded that there was a material weakness in internal controls over financial reporting as it did not maintain effective controls to appropriately assess the tax implications of certain transactions between our subsidiaries. This control deficiency did not result in a material misstatement of our current or prior period consolidated financial statements. However, this control deficiency could have resulted in a misstatement to the income tax accounts and disclosures, which would have resulted in a material misstatement to the annual or interim consolidated financial statements that would not be prevented or detected. Accordingly, management has concluded that this control deficiency constitutes a material weakness. Management has begun to take steps to remediate the material weakness including adding resources and enhancing existing controls and income tax reporting policies and procedures to ensure the implications of certain transactions between our subsidiaries are fully analyzed. While we have made significant progress, the material weakness cannot be considered remediated until the enhanced controls have operated effectively for a sufficient period of time.
We are incorporated in Ireland, and Irish law differs from the laws in effect in the United States and may afford less protection to, or otherwise adversely affect, our shareholders.
Our shareholders may have more difficulty protecting their interests than would shareholders of a corporation incorporated in a jurisdiction of the United States. As an Irish company, we are governed by the Irish Companies Act 2014 (the “Companies Act”). The Companies Act and other relevant aspects of Irish law differ in some material respects from laws generally applicable to US corporations and shareholders, including the provisions relating to interested directors, mergers, amalgamations and acquisitions, takeovers, shareholder lawsuits and indemnification of directors. For example, under Irish law, the duties of directors and officers of a company are generally owed to the company only. As a result, shareholders of Irish companies do not have the right to bring an action against the directors or officers of a company, except in limited circumstances. In addition, depending on the circumstances, you may be subject to different or additional tax consequences under Irish law as a result of your acquisition, ownership and/or disposition of our ordinary shares, including, but not limited to, Irish stamp duty, dividend withholding tax and capital acquisitions tax.
41
As a result of different shareholder voting requirements in Ireland relative to laws in effect in certain states in the United States, we may have less flexibility with respect to certain aspects of capital management than companies organized in the United States.
Under Irish law, our authorized share capital can be increased by an ordinary resolution of our shareholders and the directors may issue new ordinary or preferred shares up to a maximum amount equal to the authorized but unissued share capital, without shareholder approval, once authorized to do so by our articles of association or by an ordinary resolution of our shareholders. Additionally, subject to specified exceptions, Irish law grants statutory preemption rights to existing shareholders where shares are being issued for cash consideration but allows shareholders to disapply such statutory preemption rights either in our articles of association or by way of special resolution. Such disapplication can either be generally applicable or be in respect of a particular allotment of shares. Accordingly, our articles of association contain, as permitted by Irish company law, provisions authorizing the board to issue new shares, and to disapply statutory preemption rights. The authorization of the directors to issue shares and the disapplication of statutory preemption rights must both be renewed by the shareholders at least every five years, and we cannot provide any assurance that these authorizations will always be approved, which could limit our ability to issue equity and thereby adversely affect the holders of our securities.
We are an Irish company and it may be difficult for you to enforce judgments against us or certain of our officers and directors.
We are incorporated in Ireland and a substantial portion of our assets are located in jurisdictions outside the United States. In addition, some of our officers and directors reside outside the United States, and some or all of their respective assets are or may be located in jurisdictions outside of the United States. Therefore, it may be difficult for investors to effect service of process against us or such officers or directors or to enforce against us or them judgments of US courts predicated upon civil liability provisions of the US federal securities laws.
There is no treaty between Ireland and the United States providing for the reciprocal enforcement of foreign judgments. The following requirements must be met before the foreign judgment will be deemed to be enforceable in Ireland:
|
|
• |
the judgment must be for a definite sum; |
|
|
• |
the judgment must be final and conclusive; and |
|
|
• |
the judgment must be provided by a court of competent jurisdiction. |
An Irish court will also exercise its right to refuse judgment if the foreign judgment was obtained by fraud, if the judgment violated Irish public policy, if the judgment is in breach of natural justice or if it is irreconcilable with an earlier judgment. Further, an Irish court may stay proceedings if concurrent proceedings are being brought elsewhere. Judgments of US courts of liabilities predicated upon US federal securities laws may not be enforced by Irish courts if deemed to be contrary to public policy in Ireland.
A transfer of Company Ordinary Shares, other than by means of the transfer of book‑entry interests in the Depository Trust Company (“DTC”), may be subject to Irish stamp duty, as may a transfer of preference shares.
Transfers of Company Ordinary Shares effected by means of the transfer of book entry interests in DTC will not be subject to Irish stamp duty. However, if you hold your Company Ordinary Shares directly rather than beneficially through DTC, any transfer of your Company Ordinary Shares could be subject to Irish stamp duty (currently at the rate of 1% of the higher of the price paid or the market value of the shares acquired). Payment of Irish stamp duty is generally a legal obligation of the transferee. Transfers of preference shares may also be subject to Irish stamp duty at the same rate. The potential for stamp duty could adversely affect the price of your shares.
In certain limited circumstances, dividends we pay may be subject to Irish dividend withholding tax.
In certain limited circumstances, dividend withholding tax (currently at a rate of 20%) may arise in respect of any dividends paid on our ordinary shares or our preference shares. A number of exemptions from dividend withholding tax exist such that shareholders resident in the US and shareholders resident in certain countries may be entitled to exemptions from dividend withholding tax.
Shareholders resident in the US that hold their shares through DTC will not be subject to dividend withholding tax provided the addresses of the beneficial owners of such shares in the records of the brokers holding such shares are recorded as being in the US (and such brokers have further transmitted the relevant information to a qualifying intermediary appointed by us). US resident shareholders in Allergan plc that hold their shares outside of DTC and shareholders resident in certain other countries (irrespective of whether they hold their shares through DTC or outside DTC) will not be subject to dividend withholding tax provided the beneficial owners of such shares have furnished completed and valid dividend withholding tax forms or an IRS Form 6166, as appropriate, to our
42
transfer agent or their brokers (and such brokers have further transmitted the relevant information to our transfer agent). However, other shareholders may be subject to dividend withholding tax, which could adversely affect the price of your shares.
Dividends received by Irish residents and certain other shareholders may be subject to Irish income tax.
Shareholders entitled to an exemption from Irish dividend withholding tax on dividends received from us will not be subject to Irish income tax in respect of those dividends, unless they have some connection with Ireland other than their shareholding in us (for example, they are resident in Ireland). Shareholders who are not resident nor ordinarily resident in Ireland but who are not entitled to an exemption from Irish dividend withholding tax will generally have no further liability to Irish income tax on those dividends which suffer dividend withholding tax.
Company Ordinary Shares received by means of a gift or inheritance could be subject to Irish capital acquisitions tax.
Irish capital acquisitions tax (“CAT”) could apply to a gift or inheritance of Company Ordinary Shares or our preference shares irrespective of the place of residence, ordinary residence or domicile of the parties. This is because Company Ordinary Shares and preference shares are regarded as property situated in Ireland. The person who receives the gift or inheritance has primary liability for CAT. Gifts and inheritances passing between spouses are exempt from CAT. Children have a tax-free threshold of €300,000 (with effect from 12 October 2016) in respect of taxable gifts or inheritances received from their parents. Certain other tax-free thresholds may also apply.
There are no unresolved staff comments.
We conduct our operations using a combination of owned and leased properties.
Our owned and leased properties consist of facilities used for R&D, manufacturing, distribution (including warehousing and storage), sales and marketing and administrative functions and relate to our US Specialized Therapeutics, US General Medicine and International segments. The following table provides a summary of locations for our significant owned and leased properties as of December 31, 2016:
|
Location |
|
Primary Use |
|
Leased / Owned |
|
Cincinnati, OH, USA |
|
Manufacturing |
|
Owned |
|
Dublin, Ireland |
|
Manufacturing, R&D, Administration |
|
Owned |
|
Fall River, MA, USA |
|
Manufacturing |
|
Owned |
|
Guarulhos, Brazil |
|
Manufacturing |
|
Owned |
|
Irvine, California, USA |
|
R&D, Administration |
|
Both |
|
Jersey City, NJ, USA |
|
Administration |
|
Leased |
|
Madison, NJ, USA |
|
Administration |
|
Leased |
|
Marlow, UK |
|
Administration |
|
Leased |
|
Parsippany, NJ, USA |
|
Administration |
|
Leased |
|
Pringy, France |
|
Manufacturing |
|
Owned |
|
Rockaway, NJ, USA |
|
Administration |
|
Leased |
|
San Jose, CA, USA |
|
Manufacturing |
|
Owned |
|
San Jose, Costa Rica |
|
Manufacturing |
|
Owned |
|
Waco, Texas, USA |
|
Manufacturing |
|
Owned |
|
Weiterstadt, Germany |
|
Manufacturing |
|
Owned |
|
Weston, FL, USA |
|
Administration, R&D |
|
Leased |
|
Westport, Ireland |
|
Manufacturing, Administration, R&D |
|
Owned |
Our leased properties are subject to various lease terms and expirations.
We believe that we have sufficient facilities to conduct our operations during 2017. However, we continue to evaluate the purchase or lease of additional properties, or the consolidation of existing properties, as our business requires.
43
For information regarding legal proceedings, refer to Legal Matters in “NOTE 24 — Commitments and Contingencies” in the accompanying “Notes to Consolidated Financial Statements” in this Annual Report.
Not applicable.
44
|
ITEM 5. |
MARKET FOR REGISTRANT’S COMMON EQUITY, RELATED STOCKHOLDER MATTERS AND ISSUER PURCHASES OF EQUITY SECURITIES |
Market for Registrant’s Common Equity
Allergan plc Ordinary Shares traded on the New York Stock Exchange under the symbol “ACT” until close of business on June 15, 2015, at which time the symbol was changed to “AGN.” The following table sets forth the quarterly high and low closing share trading price information for the periods indicated:
|
Year ended December 31, 2016: |
|
High |
|
|
Low |
|
||
|
First |
|
$ |
310.83 |
|
|
$ |
261.60 |
|
|
Second |
|
$ |
277.96 |
|
|
$ |
195.50 |
|
|
Third |
|
$ |
261.27 |
|
|
$ |
228.68 |
|
|
Fourth |
|
$ |
244.66 |
|
|
$ |
184.50 |
|
|
|
|
|
|
|
|
|
|
|
|
Year ended December 31, 2015: |
|
|
|
|
|
|
|
|
|
First |
|
$ |
317.72 |
|
|
$ |
253.00 |
|
|
Second |
|
$ |
315.00 |
|
|
$ |
279.74 |
|
|
Third |
|
$ |
340.34 |
|
|
$ |
245.32 |
|
|
Fourth |
|
$ |
322.68 |
|
|
$ |
237.50 |
|
As of February 17, 2017, there were approximately 3,650 registered holders of Allergan plc’s Ordinary Shares.
We have not paid any cash dividends on common stock or ordinary shares since our initial public offering in February 1993. On November 2, 2016, the Company announced that its Board of Directors approved the initiation of a regular quarterly cash dividend of Allergan plc ordinary shares of $0.70 per share, with the first payment anticipated to occur on March 28, 2017 to shareholders of record at the close of business on February 28, 2017.
The Company pays a quarterly dividend on shares of its mandatory convertible preferred shares.
Warner Chilcott is a wholly-owned subsidiary of Allergan and has no publicly traded equity securities.
Issuer Purchases of Equity Securities
During the quarter ended December 31, 2016, we repurchased 33,568 of Allergan plc’s Ordinary Shares to satisfy tax withholding obligations in connection with the vesting of restricted stock issued to employees and 48.8 million ordinary shares under the share repurchase programs:
|
Period |
|
Total Number of Shares Purchased |
|
|
Average Price Paid per Share |
|
|
Total Number of Shares Purchased as Part of Publicly Announced Program |
|
|
Average Price Paid per Share as Part of Publicly Announced Program |
|
|
Approximate Dollar Value of Shares that May Yet Be Purchased Under the Program |
||||
|
October 1 - 31, 2016 |
|
|
15,189 |
|
|
$ |
232.84 |
|
|
|
8,221,797 |
|
|
$ |
232.34 |
|
|
- |
|
November 1 - 30, 2016 |
|
|
6,878 |
|
|
$ |
211.14 |
|
|
|
40,575,702 |
|
|
$ |
197.16 |
|
|
- |
|
December 1 - 31, 2016 |
|
|
11,501 |
|
|
$ |
223.77 |
|
|
|
- |
|
|
$ |
- |
|
|
- |
|
October 1 – December 31, 2016 |
|
|
33,568 |
|
|
$ |
225.29 |
|
|
|
48,797,499 |
|
|
$ |
203.09 |
|
|
- |
On August 8, 2016, the Company’s Board of Directors approved a $5.0 billion share repurchase program which was completed in October 2016. Additionally, on November 2, 2016, the Company announced that the Board of Directors approved a $10.0 billion accelerated share repurchase program, which was initiated in November 2016 and will be completed by the third quarter of 2017. Under the accelerated share repurchase program, the Company received $8.0 billion of repurchased shares during the year ended
45
December 31, 2016. During the year ended December 31, 2016, the Company repurchased an aggregate of 61.6 million ordinary shares under the share repurchase programs at an average price of $211.04 per share.
Securities Authorized for Issuance Under Equity Compensation Plans
For information regarding securities authorized for issuance under equity compensation plans, refer to “ITEM 12. SECURITY OWNERSHIP OF CERTAIN BENEFICIAL OWNERS AND MANAGEMENT AND RELATED STOCKHOLDER MATTERS” and “NOTE 19 — Stockholders’ Equity” in the accompanying “Notes to Consolidated Financial Statements” in this Annual Report.
Performance Graph
The information in this section of the Annual Report pertaining to Allergan plc’s performance relative to our peers is being furnished but not filed with the SEC, and as such, the information is neither subject to Regulation 14A or 14C or to the liabilities of Section 18 of the Securities Exchange Act of 1934, as amended.
46
The following graph compares the cumulative 5-year total return of holders of Allergan plc’s Ordinary Shares (formerly Class A common shares of Actavis plc) with the cumulative total returns of the S&P 500 index and the Dow Jones US Pharmaceuticals index. The graph tracks the performance of a $100 investment in our Ordinary Shares and in each of the indexes (with reinvestment of all dividends, if any) on December 31, 2011 with relative performance tracked through December 31, 2016.
Notwithstanding anything to the contrary set forth in our previous filings under the Securities Act of 1933, as amended, or the Securities Exchange Act of 1934, as amended, which might incorporate future filings made by us under those statutes, the following graph will not be deemed incorporated by reference into any future filings made by us under those statutes.
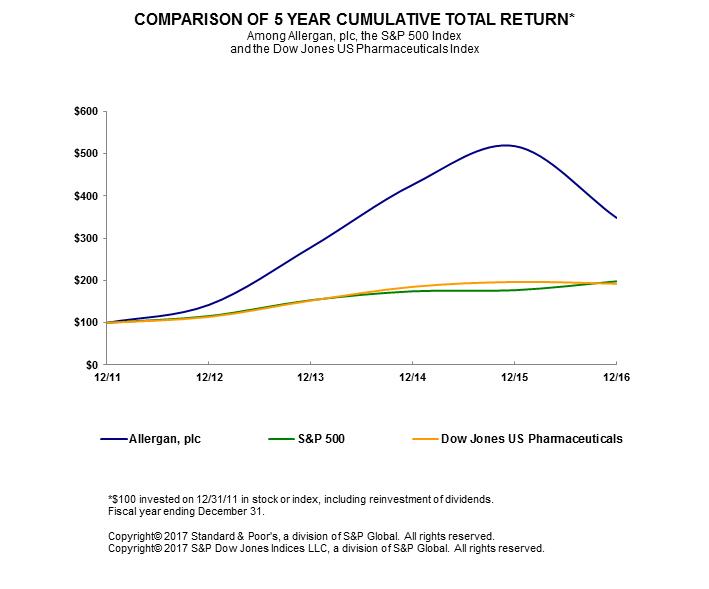
|
|
12/11 |
|
12/12 |
|
12/13 |
|
12/14 |
|
12/15 |
|
12/16 |
|
||||||
|
Allergan plc |
|
100.00 |
|
|
142.53 |
|
|
278.42 |
|
|
426.60 |
|
|
517.90 |
|
|
348.04 |
|
|
S&P 500 |
|
100.00 |
|
|
116.00 |
|
|
153.58 |
|
|
174.60 |
|
|
177.01 |
|
|
198.18 |
|
|
Dow Jones US Pharmaceuticals |
|
100.00 |
|
|
113.90 |
|
|
152.54 |
|
|
185.19 |
|
|
196.69 |
|
|
192.41 |
|
The stock price performance included in this graph is not necessarily indicative of future stock price performance.
47
The following table sets forth our selected historical consolidated financial data. The selected consolidated financial data as of December 31, 2016 and 2015 and for the years ended December 31, 2016, 2015 and 2014 presented in this table have been derived from our audited consolidated financial statements and related notes included elsewhere in this Annual Report. The selected consolidated financial data as of December 31, 2014, 2013 and 2012 and for the years ended December 31, 2013 and 2012 presented in this table are derived from our audited consolidated financial statements, as revised for discontinued operations accounting, and related notes which are not included in this Annual Report.
The selected consolidated financial data set forth below should be read in conjunction with, and is qualified by reference to, “Management’s Discussion and Analysis of Financial Condition and Results of Operations” and the Notes to the Consolidated Financial Statements included elsewhere in this Annual Report and in our previously filed Annual Reports on Form 10-K, as amended by Form 8-K, where applicable.
ALLERGAN PLC
FINANCIAL HIGHLIGHTS
($ in millions, except per share amounts)
|
|
|
Years Ended December 31, |
|
|||||||||||||||||
|
|
|
2016(4)(5) |
|
|
2015(4)(5)(7) |
|
|
2014(4)(5)(10) |
|
|
2013(4)(5)(11) |
|
|
2012(4)(5) |
|
|||||
|
Operating Highlights: |
|
|
|
|
|
|
|
|
|
|
|
|
|
|
|
|
|
|
|
|
|
Net revenues |
|
$ |
14,570.6 |
|
|
$ |
12,688.1 |
|
|
$ |
4,676.5 |
|
|
$ |
1,025.7 |
|
|
$ |
665.0 |
|
|
Net (loss) from continuing operations, net of tax |
|
|
(935.0 |
) |
|
|
(2,941.6 |
) |
|
|
(2,484.6 |
) |
|
|
(569.1 |
) |
|
|
(269.2 |
) |
|
Net income/(loss) attributable to ordinary shareholders |
|
|
14,695.0 |
|
|
|
3,683.2 |
|
|
|
(1,630.5 |
) |
|
|
(750.4 |
) |
|
|
97.3 |
|
|
Basic earnings/(loss) per share from continuing operations |
|
$ |
(3.17 |
) |
|
$ |
(8.64 |
) |
|
$ |
(11.31 |
) |
|
$ |
(4.00 |
) |
|
$ |
(2.14 |
) |
|
Diluted earnings/(loss) per share from continuing operations |
|
$ |
(3.17 |
) |
|
$ |
(8.64 |
) |
|
$ |
(11.31 |
) |
|
$ |
(4.00 |
) |
|
$ |
(2.14 |
) |
|
Basic earnings/(loss) per share |
|
$ |
38.18 |
|
|
$ |
10.01 |
|
|
$ |
(7.42 |
) |
|
$ |
(5.27 |
) |
|
$ |
0.77 |
|
|
Diluted earnings/(loss) per share |
|
$ |
38.18 |
|
|
$ |
10.01 |
|
|
$ |
(7.42 |
) |
|
$ |
(5.27 |
) |
|
$ |
0.76 |
|
|
Weighted average shares outstanding: |
|
|
|
|
|
|
|
|
|
|
|
|
|
|
|
|
|
|
|
|
|
Basic |
|
|
384.9 |
|
|
|
367.8 |
|
|
|
219.7 |
|
|
|
142.3 |
|
|
|
125.8 |
|
|
Diluted |
|
|
384.9 |
|
|
|
367.8 |
|
|
|
219.7 |
|
|
|
142.3 |
|
|
|
128.4 |
|
|
|
|
|
|
|
|
|
|
|
|
|
|
|
|
|
|
|
|
|
|
|
|
|
|
At December 31, |
|
|||||||||||||||||
|
|
|
2016(1)(2)(3)(4)(5) |
|
|
2015(4)(5)(6)(7) |
|
|
2014(4)(5)(8)(9)(10) |
|
|
2013(4)(5)(11) |
|
|
2012(4)(5) |
|
|||||
|
Balance Sheet Highlights: |
|
|
|
|
|
|
|
|
|
|
|
|
|
|
|
|
|
|
|
|
|
Total assets |
|
$ |
128,986.3 |
|
|
$ |
135,583.3 |
|
|
$ |
52,758.0 |
|
|
$ |
22,725.9 |
|
|
$ |
14,114.8 |
|
|
Total debt and capital leases |
|
|
32,768.7 |
|
|
|
42,530.4 |
|
|
|
15,531.1 |
|
|
|
9,052.0 |
|
|
|
6,433.3 |
|
|
Total equity |
|
|
76,200.5 |
|
|
|
76,589.3 |
|
|
|
28,335.5 |
|
|
|
9,537.1 |
|
|
|
3,856.4 |
|
|
(1) |
On November 1, 2016, Allergan plc completed the Tobira Acquisition. The acquisition had the impact of increasing the Company’s intangible assets and lowering working capital. |
|
(2) |
On October 25, 2016, Allergan plc completed the Vitae Acquisition. The acquisition had the impact of increasing the Company’s intangible assets and lowering working capital. |
|
(3) |
During the year ended December 31, 2016, the Company repurchased equity of $15.0 billion as part of its cumulative share buyback programs. |
|
(4) |
On October 3, 2016, we completed the divestiture of the Anda Distribution business to Teva. We completed the divestiture of our Anda Distribution business, which distributes generic, brand, specialty and OTC pharmaceutical products from more than 300 manufacturers to retail independent and chain pharmacies, nursing homes, mail order pharmacies, hospitals, clinics and physician offices across the U.S. |
|
(5) |
On August 2, 2016, Teva acquired our global generics business, including the U.S. and international generic commercial units, our third-party supplier Medis, our global generic manufacturing operations, our global generic R&D unit, our international OTC commercial unit (excluding OTC eye care products) and certain established international brands to Teva. |
|
(6) |
On October 1, 2015, Allergan plc completed the Kythera Acquisition. The acquisition increased the Company’s intangible assets. |
48
|
|
• |
total revenues and related cost of sales for Legacy Allergan products; |
|
|
• |
selling, general and administrative expenses and research and development expenses; |
|
|
• |
amortization expense for intangible assets acquired; |
|
|
• |
impairment losses on select assets; and |
|
|
• |
increased interest expense from the senior secured notes assumed and the indebtedness incurred. |
|
(8) |
On November 17, 2014, Allergan plc completed the Durata Acquisition. The acquisition had the impact of increasing the Company’s intangible assets and lowering working capital. |
|
(9) |
On July 2, 2014, the Company completed the Furiex Acquisition. The acquisition had the impact of increasing the Company’s intangible assets and lowering working capital. |
|
(10) |
On July 1, 2014, the Company completed the Forest Acquisition. Forest was a leading, fully integrated, specialty pharmaceutical company largely focused on the United States market. Forest marketed a portfolio of branded drug products and developed new medicines to treat patients suffering from diseases principally in the following therapeutic areas: central nervous system, cardiovascular, gastrointestinal, respiratory, anti-infective, and cystic fibrosis. Beginning July 1, 2014, the following items were included in our operating results: |
|
|
• |
total revenues and related cost of sales for Forest products; |
|
|
• |
selling, general and administrative expenses and research and development expenses; |
|
|
• |
amortization expense for intangible assets acquired; |
|
|
• |
impairment losses on select assets; and |
|
|
• |
increased interest expense from the senior secured notes assumed and the indebtedness incurred. |
|
(11) |
On October 1, 2013, we completed the Warner Chilcott Acquisition. Warner Chilcott was a leading specialty pharmaceutical company focused on women’s healthcare, gastroenterology, urology and dermatology segments of the branded pharmaceuticals market, primarily in North America. Beginning October 1, 2013, the following items were included in our operating results: |
|
|
• |
total revenues and related cost of sales for Warner Chilcott products; |
|
|
• |
selling, general and administrative expenses and research and development expenses; |
|
|
• |
amortization expense for intangible assets acquired; and |
|
|
• |
increased interest expense from the senior secured notes assumed and the $2.0 billion aggregate term loan indebtedness assumed, and subsequently refinanced, in connection with the Warner Chilcott Acquisition. |
49
The following discussion contains forward-looking statements that are subject to known and unknown risks, uncertainties and other factors that may cause actual results to differ materially from those expressed or implied by such forward-looking statements. We discuss such risks, uncertainties and other factors throughout this report and specifically under the caption “Cautionary Note Regarding Forward-Looking Statements” under “ITEM 1A. RISK FACTORS” in this document. In addition, the following discussion of financial condition and results of operations should be read in conjunction with the Consolidated Financial Statements and Notes thereto included elsewhere in this document.
The results of Warner Chilcott Limited are consolidated into the results of Allergan plc. Due to the de minimis activity between Allergan plc and Warner Chilcott Limited, references throughout this section relate to both Allergan and Warner Chilcott Limited.
EXECUTIVE SUMMARY
Overview
Allergan plc is a global specialty pharmaceutical company engaged in the development, manufacturing, marketing, and distribution of brand name pharmaceutical products, medical aesthetics, biosimilar and OTC pharmaceutical products. The Company has operations in more than 100 countries. Warner Chilcott Limited is an indirect wholly-owned subsidiary of Allergan plc and has the same principal business activities. As a result of the Allergan Acquisition which closed on March 17, 2015, the Company expanded its franchises to include ophthalmology, neurosciences and medical aesthetics/dermatology/plastic surgery, which complemented the Company’s existing central nervous system, gastroenterology, women’s health and urology franchises. The combined company benefits significantly from Legacy Allergan’s global brand equity and consumer awareness of key products, including Botox® and Restasis®. The Allergan Acquisition expanded our presence and market and product reach across many international markets, with strengthened commercial positions across Canada, Europe, Southeast Asia and other high-value growth markets, including China, India, the Middle East and Latin America.
On July 26, 2015 we entered into the Teva Agreement. Upon the closing of the Teva Transaction on August 2, 2016, we received $33.3 billion in cash, net of cash acquired by Teva, which included estimated working capital and other contractual adjustments, and 100.3 million unregistered Teva ordinary shares (or American Depository Shares with respect thereto), which approximated $5.0 billion in value using the closing date Teva opening stock price discounted at a rate of 5.9 percent due to the lack of marketability.
As part of the Teva Agreement, Teva acquired our global generics business, including the U.S. and international generic commercial units, our third-party supplier Medis, our global generic manufacturing operations, our global generic R&D unit, our international OTC commercial unit (excluding OTC eye care products) and certain established international brands.
On October 3, 2016, the Company completed the divestiture of the Anda Distribution business to Teva for $500.0 million. Teva acquired our Anda Distribution business, which distributes generic, brand, specialty and OTC pharmaceutical products from more than 300 manufacturers to retail independent and chain pharmacies, nursing homes, mail order pharmacies, hospitals, clinics and physician offices across the U.S.
The Company recognized a combined gain on the sale of the Anda Distribution business and the sale of our global generics business of $15,932.2 million as well as deferred liabilities relating to other elements of our arrangements with Teva of $299.2 million.
As a result of the Teva Transaction and the divestiture of the Company’s Anda Distribution business, and in accordance with FASB ASU number 2014-08 “Presentation of Financial Statements (Topic 205) and Property, Plant and Equipment (Topic 360): Reporting Discontinued Operations and Disclosures of Disposals of Components of an Entity”, the Company is accounting for the assets and liabilities divested as held for sale. Further, the financial results of the businesses held for sale have been reclassified to discontinued operations for all periods presented in our consolidated financial statements. The results of our discontinued operations include the results of our generic product development, manufacturing and distribution of off-patent pharmaceutical products, certain established international brands marketed similarly to generic products and out-licensed generic pharmaceutical products primarily in Europe through our Medis third-party business through August 2, 2016, as well as our Anda Distribution business through October 3, 2016.
50
2016 Significant Business Developments
The following are the material transactions that were completed in the year ended December 31, 2016.
Acquisitions
Tobira Therapeutics, Inc.
On November 1, 2016, the Company completed the Tobira Acquisition. The Company included the results of Tobira in its Consolidated Statement of Operations beginning November 1, 2016, including $27.0 million in stock compensation expense in the year ended December 31, 2016. Additionally, the Company recorded contingent consideration adjustments of $33.2 million during the year ended December 31, 2016.
Vitae Pharmaceuticals, Inc.
On October 25, 2016, the Company completed the Vitae Acquisition. During the year ended December 31, 2016, subsequent to the acquisition of Vitae, the Company impaired its acquired intangible asset relating to Atopic Dermatitis by $46.0 million as the Company anticipates a delay in potential launch timing, if any, resulting from revised clinical data.
ForSight VISION5, Inc.
On September 23, 2016, the Company completed the ForSight Acquisition. During the year ended December 31, 2016, subsequent to the acquisition of ForSight, the Company impaired its acquired intangible asset by $33.0 million as the Company anticipates a delay in potential launch timing. Offsetting this impairment was a corresponding reduction of acquired contingent consideration of $15.0 million, which reduced overall R&D expenses.
Licenses and Asset Acquisitions
The following table presents R&D milestone expenses incurred for License and Asset Acquisitions for the year ended December 31, 2016 ($ in millions):
|
Acquisition Date |
|
License / Asset Acquisition |
|
Amount |
|
|
|
December 15, 2016 |
|
Motus Therapeutics, Inc. |
|
$ |
199.5 |
|
|
November 22, 2016 |
|
Chase Pharmaceuticals Corporation |
|
|
122.9 |
|
|
October 2, 2016 |
|
AstraZeneca License |
|
|
250.0 |
|
|
September 6, 2016 |
|
RetroSense Therapeutics LLC |
|
|
59.7 |
|
|
August 26, 2016 |
|
Akarna Therapeutics, Ltd |
|
|
48.2 |
|
|
April 21, 2016 |
|
Topokine Therapeutics, Inc. |
|
|
85.8 |
|
|
April 6, 2016 |
|
Heptares Therapeutics Ltd |
|
|
125.0 |
|
|
January 6, 2016 |
|
Anterios, Inc. |
|
|
89.2 |
|
2015 Significant Business Developments
The following are the material transactions that were completed in the year ended December 31, 2015.
Acquisitions
AqueSys, Inc.
On October 16, 2015, the Company completed the AqueSys Acquisition. Under the terms of the agreement, the Company acquired XEN45, a soft shunt that is implanted in the sub conjunctival space in the eye through a minimally invasive procedure with a single use, pre-loaded proprietary injector. On November 16, 2016, the Company received approval from the FDA for XEN45, which triggered a CVR payment of $100.0 million in the year ended December 31, 2016. The Company incurred fair value adjustments to contingent consideration, including accretion, relating to the AqueSys Acquisition of $10.4 million in the year ended December 31, 2016.
51
Kythera Biopharmaceuticals, Inc.
On October 1, 2015, the Company completed the Kythera Acquisition. The Company included the results of Kythera in its Consolidated Statement of Operations beginning October 1, 2015, including $9.0 million and $77.2 million in stock compensation expense in the years ended December 31, 2016 and 2015, respectively.
Oculeve, Inc.
On August 10, 2015, the Company completed the Oculeve Acquisition. The Company acquired Oculeve and its lead product candidate OD-01, an intranasal neurostimulation device, as well as other dry eye products in development. The Oculeve Acquisition had deminimis impact on the results of operations for the year ended December 31, 2015.
Auden Mckenzie Holdings Limited
On May 29, 2015 the Company acquired Auden Mckenzie Holdings Limited (“Auden”), a company specializing in the development, licensing and marketing of niche generic medicines and proprietary brands in the United Kingdom (“UK”) and across Europe for approximately 323.7 million British Pounds, or $495.9 million (the “Auden Acquisition”). The assets and liabilities acquired, as well as the results of operations for the acquired Auden business are part of the assets divested in the Teva Transaction and are included as a component of income from discontinued operations. In addition the acquired financial position was included in assets and liabilities held for sale.
Allergan, Inc.
On March 17, 2015, the Company completed the Allergan Acquisition. The contribution from the acquisition of Legacy Allergan for the years ended December 31, 2016 and 2015 is as follows ($ in millions):
|
|
|
Years Ended December 31, |
|
|||||
|
|
|
2016 |
|
|
2015 |
|
||
|
|
|
|
|
|
|
|
|
|
|
Net revenues |
|
$ |
8,436.8 |
|
|
$ |
6,164.6 |
|
|
|
|
|
|
|
|
|
|
|
|
Operating expenses: |
|
|
|
|
|
|
|
|
|
Cost of sales(1) |
|
|
813.5 |
|
|
|
1,471.7 |
|
|
Selling and marketing |
|
|
1,850.2 |
|
|
|
1,450.2 |
|
|
General and administrative |
|
|
555.6 |
|
|
|
909.6 |
|
|
Contribution |
|
$ |
5,217.5 |
|
|
$ |
2,333.1 |
|
|
(1) |
Excludes amortization and impairment of acquired intangibles including product rights. |
52
As a result of the acquisition, the Company incurred the following transaction and integration costs in the years ended December 31, 2016 and 2015 ($ in millions):
|
|
|
Years Ended December 31, |
|
|||||
|
|
|
2016 |
|
|
2015 |
|
||
|
Cost of sales |
|
|
|
|
|
|
|
|
|
Stock-based compensation acquired for Legacy Allergan employees |
|
$ |
9.6 |
|
|
$ |
22.5 |
|
|
Acquisition, integration and restructuring related charges |
|
|
18.1 |
|
|
|
14.9 |
|
|
Research and development |
|
|
|
|
|
|
|
|
|
Stock-based compensation acquired for Legacy Allergan employees |
|
|
43.0 |
|
|
|
124.8 |
|
|
Acquisition, integration and restructuring related charges |
|
|
11.8 |
|
|
|
83.5 |
|
|
Selling and marketing |
|
|
|
|
|
|
|
|
|
Stock-based compensation acquired for Legacy Allergan employees |
|
|
65.3 |
|
|
|
110.0 |
|
|
Acquisition, integration and restructuring related charges |
|
|
24.7 |
|
|
|
75.7 |
|
|
General and administrative |
|
|
|
|
|
|
|
|
|
Stock-based compensation acquired for Legacy Allergan employees |
|
|
33.6 |
|
|
|
258.9 |
|
|
Acquisition-related expenditures |
|
|
- |
|
|
|
65.5 |
|
|
Acquisition, integration and restructuring related charges |
|
|
197.4 |
|
|
|
298.6 |
|
|
Other (expense) income |
|
|
|
|
|
|
|
|
|
Bridge loan facilities expense |
|
|
- |
|
|
|
(264.9 |
) |
|
Interest rate lock |
|
|
- |
|
|
|
30.9 |
|
|
Total transaction and integration costs |
|
$ |
403.5 |
|
|
$ |
1,288.4 |
|
Licenses and Asset Acquisitions
Mimetogen Pharmaceuticals, Inc.
On November 4, 2015, as a result of the Mimetogen Transaction, the Company incurred R&D milestone expenses of $50.0 million.
Almirall
On October 27, 2015, the Company and Ironwood Pharmaceuticals, Inc. announced that Allergan has acquired rights to Constella® (linaclotide) in the European Union, Switzerland, Turkey and the Commonwealth of Independent States from Almirall, S.A. and has also reacquired rights to Linzess® (linaclotide) in Mexico from Almirall for €60.0 million. The consideration was accounted for as an asset acquisition and included as a component of intangible assets.
Naurex, Inc.
On August 28, 2015, the Company incurred $571.7 million of R&D milestone expenses associated with the Naurex Transaction.
Migraine License
On August 6, 2015, the Company incurred $250.0 million of R&D milestone expenses associated with the Merck Transaction. In the year ended December 31, 2016, the Company incurred $100.0 million of milestones under the agreement, which were included as a component of R&D expense.
Divestitures
Respiratory Business
As a result of the Respiratory Sale in the year ended December 31, 2015, the Company recognized an incremental charge in cost of sales (including the acquisition accounting fair value mark-up of inventory) relating to inventory that will not be sold to AstraZeneca of $35.3 million. The Company recognized a loss in other (expense) income, net for the sale of the business of $5.3 million in the year ended December 31, 2015.
53
During the year ended December 31, 2014, the Company recognized an impairment on assets held for sale of $189.9 million relating to the Pharmatech Transaction which included a portion of goodwill allocated to this business unit. In the second quarter of 2015, the Company completed the divestiture of the Pharmatech business with an immaterial impact on our earnings.
2014 Significant Business Developments
The following are the material transactions that were completed in the year ended December 31, 2014.
Acquisitions
Durata Therapeutics, Inc.
On November 17, 2014, the Company completed the Durata Acquisition. Durata is an innovative pharmaceutical company focused on the development and commercialization of novel therapeutics for patients with infectious diseases and acute illnesses.
Contingent Consideration
At the time of the Durata Acquisition, additional consideration in the form of three potential CVR payments was conditionally due to the seller in the event of the approval of dalbavancin in Europe, the approval of a single dose indication and the product reaching certain sales milestones. The Company estimated the acquisition accounting fair value of the contingent consideration to be $49.0 million using a probability weighted approach that considered the possible outcomes based on assumptions related to the timing and probability of the product launch date, discount rates matched to the timing of the payment, and probability of success rates and discount adjustments on the related cash flows. On March 2, 2015, the Company announced that the European Commission had granted Allergan’s subsidiary Durata Therapeutics International B.V., marketing authorization for Xydalba™ (dalbavancin) for the treatment of acute bacterial skin and skin structure infections (ABSSSI) in adults. The authorization triggered the first CVR payment of $30.9 million in the quarter ended March 31, 2015. In January 2016, the Company received approval from the FDA for an expanded label that includes a single dose of Dalvance®, which triggered a second CVR payment of $30.9 million in the quarter ended March 31, 2016. The difference between the probability weighted fair value and the final payments are recorded as a component of cost of sales.
Furiex Pharmaceuticals, Inc.
On July 2, 2014, the Company completed the Furiex Acquisition. In the second quarter of 2015, the Company received approval from the FDA of the eluxadoline product, Viberzi®. In the year ended December 31, 2015, the Company received a schedule IV (“C-IV”) designation from the DEA for Viberzi® and recognized an expense of $29.8 million as a component of R&D expense. This expense represents the difference between the final CVR payment amount of $118.5 million, or $10 for each CVR outstanding, versus the probability-weighted CVR fair value initially established in acquisition accounting adjusted for accretion.
Forest Laboratories, Inc.
On July 1, 2014, the Company completed the Forest Acquisition. The contribution from the acquisition of Forest for the years ended December 31, 2015 and 2014 is as follows ($ in millions):
|
|
|
Year Ended December 31, |
|
|||||
|
|
|
2015 |
|
|
2014 |
|
||
|
Net revenues |
|
$ |
4,259.3 |
|
|
$ |
2,304.9 |
|
|
|
|
|
|
|
|
|
|
|
|
Operating expenses: |
|
|
|
|
|
|
|
|
|
Cost of sales(1) |
|
|
1,048.1 |
|
|
|
1,284.9 |
|
|
Selling and marketing |
|
|
1,064.5 |
|
|
|
709.5 |
|
|
General and administrative |
|
|
197.8 |
|
|
|
455.8 |
|
|
Contribution |
|
$ |
1,948.9 |
|
|
$ |
(145.3 |
) |
|
(1) |
Excludes amortization and impairment of acquired intangibles including product rights. |
54
As a result of the Forest Acquisition, the Company incurred the following transaction and integration costs in the years ended December 31, 2016, 2015 and 2014 ($ in millions):
|
|
|
Years Ended December 31, |
|
|||||||||
|
|
|
2016 |
|
|
2015 |
|
|
2014 |
|
|||
|
Cost of sales |
|
|
|
|
|
|
|
|
|
|
|
|
|
Stock-based compensation acquired for Forest employees |
|
$ |
1.7 |
|
|
$ |
4.7 |
|
|
$ |
9.5 |
|
|
Severance-related charges |
|
|
- |
|
|
|
1.1 |
|
|
|
11.3 |
|
|
Research and development |
|
|
|
|
|
|
|
|
|
|
|
|
|
Stock-based compensation acquired for Forest employees |
|
|
12.7 |
|
|
|
36.3 |
|
|
|
66.7 |
|
|
Severance-related charges |
|
|
0.5 |
|
|
|
9.2 |
|
|
|
24.5 |
|
|
Selling and marketing |
|
|
|
|
|
|
|
|
|
|
|
|
|
Stock-based compensation acquired for Forest employees |
|
|
25.0 |
|
|
|
47.9 |
|
|
|
58.7 |
|
|
Severance-related charges |
|
|
- |
|
|
|
17.4 |
|
|
|
45.3 |
|
|
Other integration costs |
|
|
|
|
|
|
- |
|
|
|
3.8 |
|
|
General and administrative |
|
|
|
|
|
|
|
|
|
|
|
|
|
Stock-based compensation acquired for Forest employees |
|
|
31.4 |
|
|
|
53.9 |
|
|
|
152.6 |
|
|
Severance-related charges |
|
|
- |
|
|
|
17.1 |
|
|
|
71.5 |
|
|
Other integration costs |
|
|
1.7 |
|
|
|
58.4 |
|
|
|
92.9 |
|
|
Financing related charges |
|
|
- |
|
|
|
- |
|
|
|
9.3 |
|
|
Other income (expense) |
|
|
|
|
|
|
|
|
|
|
|
|
|
Bridge loan facilities |
|
|
- |
|
|
|
- |
|
|
|
(25.8 |
) |
|
Total transaction and integration costs |
|
$ |
73.0 |
|
|
$ |
246.0 |
|
|
$ |
571.9 |
|
Silom Medical Company
On April 1, 2014, the Company acquired Silom Medical Company (“Silom”), a privately held generic pharmaceutical company focused on developing and marketing therapies in Thailand, for consideration of approximately $103.0 million in cash (the “Silom Acquisition”). The Silom Acquisition expanded the Company’s position in the Thai generic pharmaceutical market, with leading positions in the ophthalmic and respiratory therapeutic categories and a strong cardiovascular franchise. We accounted for the acquisition as a business combination requiring that the assets acquired and liabilities assumed be recognized at their fair values as of the acquisition date. The assets and liabilities acquired, as well as the results of operations for the acquired Silom business are part of the assets divested in the Teva Transaction and are included as a component of income from discontinued operations. In addition the acquired financial position was included in assets and liabilities held for sale.
Divestitures
Corona Facility
During the year ended December 31, 2014, we held for sale certain assets in our Corona, California manufacturing facility. As a result, the Company recognized an impairment charge as a component of discontinued operations of $20.0 million in the year ended December 31, 2014, including a write-off of property, plant and equipment, net, due to the integration of Warner Chilcott of $5.8 million. The Company completed the sale of these assets during the year ended December 31, 2015 with no material impact to the Company’s results of operations.
Segments
During 2016, Allergan announced a realignment of its businesses to streamline operations. Prior to the realignment, the Company operated and managed its business as four distinct operating segments: US Brands, US Medical Aesthetics, International and Anda Distribution. Under the new organizational structure being reported, and as a result of our decision to sell our Anda Distribution business, the Company organized its businesses into the following segments: US Specialized Therapeutics, US General Medicine and International. In addition, certain revenues and shared costs, and the results of corporate initiatives, are managed outside of the three segments. Prior period results have been recast to align to the current segment presentation.
55
The operating segments are organized as follows:
|
|
• |
The US Specialized Therapeutics segment includes sales and expenses relating to certain branded products within the US, including Medical Aesthetics, Medical Dermatology, Eye Care, Neurosciences and Urology therapeutic products. |
|
|
• |
The US General Medicine segment includes sales and expenses relating to branded products within the US that do not fall into the US Specialized Therapeutics business units, including Central Nervous System, Gastrointestinal, Women’s Health, Anti-Infectives and Diversified Brands. |
|
|
• |
The International segment includes sales and expenses relating to products sold outside the US. |
The Company evaluates segment performance based on segment contribution. Segment contribution for our segments represents net revenues less cost of sales (defined below), selling and marketing expenses, and select general and administrative expenses. Included in segment revenues are product sales that were sold through the Anda Distribution business once the Anda Distribution business had sold the product to a third party customer. These sales are included in segment results and are reclassified into revenues from discontinued operations through a reduction of Corporate revenues which eliminates the sales made by the Anda Distribution business from results of continuing operations prior to October 3, 2016. Cost of sales for these products in discontinued operations is equal to our average third party cost of sales for third party branded products distributed by Anda Distribution. The Company does not evaluate the following items at the segment level:
|
|
• |
Revenues and operating expenses within cost of sales, selling and marketing expenses, and general and administrative expenses that result from the impact of corporate initiatives. Corporate initiatives primarily include integration, restructuring, acquisition and other shared costs. |
|
|
• |
General and administrative expenses that result from shared infrastructure, including certain expenses located within the United States. |
|
|
• |
Total assets including capital expenditures. |
|
|
• |
Other select revenues and operating expenses including R&D expenses, amortization, IPR&D impairments and asset sales and impairments, net as not all such information has been accounted for at the segment level, or such information has not been used by all segments. |
The Company defines segment net revenues as product sales and other revenue derived from branded products or licensing agreements. In March 2015, as a result of the Allergan Acquisition, we began to promote Restasis®, Lumigan®/Ganfort®, Alphagan®/Combigan®, Botox®, Fillers, other aesthetic products and other eye care products. In July 2014, as a result of the Forest Acquisition, the Company also began recognizing revenues on key US brands, including, but not limited to, Bystolic ®, Canasa®, Carafate®, Fetzima ®, Linzess ®, Namenda®IR (which lost exclusivity in July 2015), Namenda XR®, Saphris®, Teflaro® and Viibryd®.
Cost of sales within segment contribution includes standard production and packaging costs for the products we manufacture, third party acquisition costs for products manufactured by others, profit-sharing or royalty payments for products sold pursuant to licensing agreements and finished goods inventory reserve charges. Cost of sales included within segment contribution does not include non-standard production costs, such as non-finished goods inventory obsolescence charges, manufacturing variances and excess capacity utilization charges, where applicable. Cost of sales does not include amortization or impairment costs for acquired product rights or other acquired intangibles.
Selling and marketing expenses consist mainly of personnel-related costs, product promotion costs, distribution costs, professional service costs, insurance, depreciation and travel costs.
General and administrative expenses consist mainly of personnel-related costs, facilities costs, transaction costs, insurance, depreciation, litigation and settlement costs and professional services costs which are general in nature and attributable to the segment.
56
YEAR ENDED DECEMBER 31, 2016 COMPARED TO 2015
Results of operations, including segment net revenues, segment operating expenses and segment contribution consisted of the following ($ in millions):
|
|
|
Year Ended December 31, 2016 |
|
|||||||||||||
|
|
|
US Specialized |
|
|
US General |
|
|
|
|
|
|
|
|
|
||
|
|
|
Therapeutics |
|
|
Medicine |
|
|
International |
|
|
Total |
|
||||
|
|
|
|
|
|
|
|
|
|
|
|
|
|
|
|
|
|
|
Net revenues |
|
$ |
5,811.7 |
|
|
$ |
5,923.9 |
|
|
$ |
2,881.3 |
|
|
$ |
14,616.9 |
|
|
|
|
|
|
|
|
|
|
|
|
|
|
|
|
|
|
|
|
Operating expenses: |
|
|
|
|
|
|
|
|
|
|
|
|
|
|
|
|
|
Cost of sales(1) |
|
|
290.9 |
|
|
|
879.8 |
|
|
|
418.2 |
|
|
|
1,588.9 |
|
|
Selling and marketing |
|
|
1,137.0 |
|
|
|
1,185.7 |
|
|
|
788.2 |
|
|
|
3,110.9 |
|
|
General and administrative |
|
|
174.2 |
|
|
|
174.9 |
|
|
|
117.2 |
|
|
|
466.3 |
|
|
Segment Contribution |
|
$ |
4,209.6 |
|
|
$ |
3,683.5 |
|
|
$ |
1,557.7 |
|
|
$ |
9,450.8 |
|
|
Contribution margin |
|
|
72.4 |
% |
|
|
62.2 |
% |
|
|
54.1 |
% |
|
|
64.7 |
% |
|
Corporate |
|
|
|
|
|
|
|
|
|
|
|
|
|
|
1,481.3 |
|
|
Research and development |
|
|
|
|
|
|
|
|
|
|
|
|
|
|
2,575.7 |
|
|
Amortization |
|
|
|
|
|
|
|
|
|
|
|
|
|
|
6,470.4 |
|
|
In-process research and development impairments |
|
|
|
|
|
|
|
|
|
|
|
|
|
|
743.9 |
|
|
Asset sales and impairments, net |
|
|
|
|
|
|
|
|
|
|
|
|
|
|
5.0 |
|
|
Operating (loss) |
|
|
|
|
|
|
|
|
|
|
|
|
|
$ |
(1,825.5 |
) |
|
Operating margin |
|
|
|
|
|
|
|
|
|
|
|
|
|
|
(12.5 |
)% |
|
(1) |
Excludes amortization and impairment of acquired intangibles including product rights. |
|
|
|
Year Ended December 31, 2015 |
|
|||||||||||||
|
|
|
US Specialized |
|
|
US General |
|
|
|
|
|
|
|
|
|
||
|
|
|
Therapeutics |
|
|
Medicine |
|
|
International |
|
|
Total |
|
||||
|
|
|
|
|
|
|
|
|
|
|
|
|
|
|
|
|
|
|
Net revenues |
|
$ |
4,309.8 |
|
|
$ |
6,338.4 |
|
|
$ |
2,187.3 |
|
|
$ |
12,835.5 |
|
|
|
|
|
|
|
|
|
|
|
|
|
|
|
|
|
|
|
|
Operating expenses: |
|
|
|
|
|
|
|
|
|
|
|
|
|
|
|
|
|
Cost of sales(1) |
|
|
235.8 |
|
|
|
909.5 |
|
|
|
350.9 |
|
|
|
1,496.2 |
|
|
Selling and marketing |
|
|
772.8 |
|
|
|
1,194.7 |
|
|
|
569.2 |
|
|
|
2,536.7 |
|
|
General and administrative |
|
|
68.3 |
|
|
|
105.3 |
|
|
|
107.6 |
|
|
|
281.2 |
|
|
Segment Contribution |
|
$ |
3,232.9 |
|
|
$ |
4,128.9 |
|
|
$ |
1,159.6 |
|
|
$ |
8,521.4 |
|
|
Contribution margin |
|
|
75.0 |
% |
|
|
65.1 |
% |
|
|
53.0 |
% |
|
|
66.4 |
% |
|
Corporate |
|
|
|
|
|
|
|
|
|
|
|
|
|
|
3,066.6 |
|
|
Research and development |
|
|
|
|
|
|
|
|
|
|
|
|
|
|
2,358.5 |
|
|
Amortization |
|
|
|
|
|
|
|
|
|
|
|
|
|
|
5,443.7 |
|
|
In-process research and development impairments |
|
|
|
|
|
|
|
|
|
|
|
|
|
|
511.6 |
|
|
Asset sales and impairments, net |
|
|
|
|
|
|
|
|
|
|
|
|
|
|
272.0 |
|
|
Operating (loss) |
|
|
|
|
|
|
|
|
|
|
|
|
|
$ |
(3,131.0 |
) |
|
Operating margin |
|
|
|
|
|
|
|
|
|
|
|
|
|
|
(24.4 |
)% |
|
(1) |
Excludes amortization and impairment of acquired intangibles including product rights. |
57
The following is a reconciliation of net revenues for the operating segments to the Company’s net revenues for the years ended December 31, 2016 and 2015 ($ in millions):
|
|
|
Years Ended December 31, |
|
|
Change |
|
||||||||||
|
|
|
2016 |
|
|
2015 |
|
|
Dollars |
|
|
% |
|
||||
|
Segment net revenues |
|
$ |
14,616.9 |
|
|
$ |
12,835.5 |
|
|
$ |
1,781.4 |
|
|
|
13.9 |
% |
|
Corporate revenues |
|
|
(46.3 |
) |
|
|
(147.4 |
) |
|
|
101.1 |
|
|
|
(68.6 |
)% |
|
Net revenues |
|
$ |
14,570.6 |
|
|
$ |
12,688.1 |
|
|
$ |
1,882.5 |
|
|
|
14.8 |
% |
No country represents ten percent or more of net revenues outside of the United States. The US Specialized Therapeutics and US General Medicine segments are comprised solely of sales within the United States.
The following table presents global net revenues for the top products of the Company for the years ended December 31, 2016 and 2015 ($ in millions):
|
|
Year Ended December 31, 2016 |
|
Year Ended December 31, 2015 |
|
Change |
|
||||||||||||||||||||||||||||||
|
|
US Specialized Therapeutics |
|
US General Medicine |
|
International |
|
Corporate |
|
Total |
|
US Specialized Therapeutics |
|
US General Medicine |
|
International |
|
Corporate |
|
Total |
|
Dollars |
|
Percentage |
|
||||||||||||
|
Botox® |
$ |
1,983.2 |
|
$ |
- |
|
$ |
803.0 |
|
$ |
- |
|
$ |
2,786.2 |
|
$ |
1,386.4 |
|
$ |
- |
|
$ |
584.4 |
|
$ |
- |
|
$ |
1,970.8 |
|
$ |
815.4 |
|
|
41.4 |
% |
|
Restasis® |
|
1,419.5 |
|
|
- |
|
|
68.0 |
|
|
- |
|
|
1,487.5 |
|
|
999.6 |
|
|
- |
|
|
48.2 |
|
|
- |
|
|
1,047.8 |
|
|
439.7 |
|
|
42.0 |
% |
|
Fillers |
|
446.9 |
|
|
- |
|
|
420.4 |
|
|
- |
|
|
867.3 |
|
|
304.4 |
|
|
- |
|
|
269.5 |
|
|
- |
|
|
573.9 |
|
|
293.4 |
|
|
51.1 |
% |
|
Lumigan®/Ganfort® |
|
326.4 |
|
|
- |
|
|
361.7 |
|
|
- |
|
|
688.1 |
|
|
260.7 |
|
|
- |
|
|
283.4 |
|
|
- |
|
|
544.1 |
|
|
144.0 |
|
|
26.5 |
% |
|
Linzess®/Constella® |
|
- |
|
|
625.6 |
|
|
17.3 |
|
|
- |
|
|
642.9 |
|
|
- |
|
|
454.8 |
|
|
4.5 |
|
|
- |
|
|
459.3 |
|
|
183.6 |
|
|
40.0 |
% |
|
Bystolic® / Byvalson® |
|
- |
|
|
638.8 |
|
|
1.7 |
|
|
- |
|
|
640.5 |
|
|
- |
|
|
644.8 |
|
|
1.3 |
|
|
- |
|
|
646.1 |
|
|
(5.6 |
) |
|
(0.9 |
)% |
|
Namenda XR® |
|
- |
|
|
627.6 |
|
|
- |
|
|
- |
|
|
627.6 |
|
|
- |
|
|
759.3 |
|
|
- |
|
|
- |
|
|
759.3 |
|
|
(131.7 |
) |
|
(17.3 |
)% |
|
Alphagan®/Combigan® |
|
376.6 |
|
|
- |
|
|
169.3 |
|
|
- |
|
|
545.9 |
|
|
285.0 |
|
|
- |
|
|
126.1 |
|
|
- |
|
|
411.1 |
|
|
134.8 |
|
|
32.8 |
% |
|
Asacol®/Delzicol® |
|
- |
|
|
360.8 |
|
|
53.7 |
|
|
- |
|
|
414.5 |
|
|
- |
|
|
552.9 |
|
|
65.5 |
|
|
- |
|
|
618.4 |
|
|
(203.9 |
) |
|
(33.0 |
)% |
|
Lo Loestrin® |
|
- |
|
|
403.5 |
|
|
- |
|
|
- |
|
|
403.5 |
|
|
- |
|
|
346.5 |
|
|
3.1 |
|
|
- |
|
|
349.6 |
|
|
53.9 |
|
|
15.4 |
% |
|
Estrace® Cream |
|
- |
|
|
379.4 |
|
|
- |
|
|
- |
|
|
379.4 |
|
|
- |
|
|
326.2 |
|
|
- |
|
|
- |
|
|
326.2 |
|
|
53.2 |
|
|
16.3 |
% |
|
Eye Drops |
|
186.5 |
|
|
- |
|
|
276.2 |
|
|
- |
|
|
462.7 |
|
|
177.0 |
|
|
- |
|
|
220.6 |
|
|
- |
|
|
397.6 |
|
|
65.1 |
|
|
16.4 |
% |
|
Breast Implants |
|
206.0 |
|
|
- |
|
|
149.9 |
|
|
- |
|
|
355.9 |
|
|
175.0 |
|
|
- |
|
|
125.5 |
|
|
- |
|
|
300.5 |
|
|
55.4 |
|
|
18.4 |
% |
|
Viibryd®/Fetzima® |
|
- |
|
|
342.3 |
|
|
- |
|
|
- |
|
|
342.3 |
|
|
- |
|
|
327.6 |
|
|
- |
|
|
- |
|
|
327.6 |
|
|
14.7 |
|
|
4.5 |
% |
|
Minastrin® 24 |
|
- |
|
|
325.9 |
|
|
1.4 |
|
|
- |
|
|
327.3 |
|
|
- |
|
|
272.4 |
|
|
0.6 |
|
|
- |
|
|
273.0 |
|
|
54.3 |
|
|
19.9 |
% |
|
Ozurdex ® |
|
84.4 |
|
|
- |
|
|
179.0 |
|
|
- |
|
|
263.4 |
|
|
56.1 |
|
|
- |
|
|
112.3 |
|
|
- |
|
|
168.4 |
|
|
95.0 |
|
|
56.4 |
% |
|
Carafate ® / Sulcrate ® |
|
- |
|
|
229.0 |
|
|
2.4 |
|
|
- |
|
|
231.4 |
|
|
- |
|
|
213.1 |
|
|
- |
|
|
- |
|
|
213.1 |
|
|
18.3 |
|
|
8.6 |
% |
|
Aczone® |
|
217.3 |
|
|
- |
|
|
- |
|
|
- |
|
|
217.3 |
|
|
170.8 |
|
|
- |
|
|
- |
|
|
- |
|
|
170.8 |
|
|
46.5 |
|
|
27.2 |
% |
|
Zenpep® |
|
- |
|
|
200.7 |
|
|
- |
|
|
- |
|
|
200.7 |
|
|
- |
|
|
167.4 |
|
|
- |
|
|
- |
|
|
167.4 |
|
|
33.3 |
|
|
19.9 |
% |
|
Canasa®/Salofalk® |
|
- |
|
|
178.7 |
|
|
17.7 |
|
|
- |
|
|
196.4 |
|
|
- |
|
|
137.1 |
|
|
18.5 |
|
|
- |
|
|
155.6 |
|
|
40.8 |
|
|
26.2 |
% |
|
Saphris® |
|
- |
|
|
166.8 |
|
|
- |
|
|
- |
|
|
166.8 |
|
|
- |
|
|
186.7 |
|
|
- |
|
|
- |
|
|
186.7 |
|
|
(19.9 |
) |
|
(10.7 |
)% |
|
Armour Thyroid |
|
- |
|
|
166.5 |
|
|
- |
|
|
- |
|
|
166.5 |
|
|
- |
|
|
130.8 |
|
|
- |
|
|
- |
|
|
130.8 |
|
|
35.7 |
|
|
27.3 |
% |
|
Teflaro® |
|
- |
|
|
133.6 |
|
|
- |
|
|
- |
|
|
133.6 |
|
|
- |
|
|
137.6 |
|
|
- |
|
|
- |
|
|
137.6 |
|
|
(4.0 |
) |
|
(2.9 |
)% |
|
Rapaflo® |
|
116.6 |
|
|
- |
|
|
5.8 |
|
|
- |
|
|
122.4 |
|
|
115.2 |
|
|
- |
|
|
10.9 |
|
|
- |
|
|
126.1 |
|
|
(3.7 |
) |
|
(2.9 |
)% |
|
SkinMedica® |
|
108.3 |
|
|
- |
|
|
- |
|
|
- |
|
|
108.3 |
|
|
76.6 |
|
|
- |
|
|
- |
|
|
- |
|
|
76.6 |
|
|
31.7 |
|
|
41.4 |
% |
|
Savella® |
|
- |
|
|
103.2 |
|
|
- |
|
|
- |
|
|
103.2 |
|
|
- |
|
|
106.4 |
|
|
- |
|
|
- |
|
|
106.4 |
|
|
(3.2 |
) |
|
(3.0 |
)% |
|
Tazorac® |
|
95.5 |
|
|
- |
|
|
0.8 |
|
|
- |
|
|
96.3 |
|
|
92.3 |
|
|
- |
|
|
1.4 |
|
|
- |
|
|
93.7 |
|
|
2.6 |
|
|
2.8 |
% |
|
Vraylar™ |
|
- |
|
|
94.3 |
|
|
- |
|
|
- |
|
|
94.3 |
|
|
- |
|
|
- |
|
|
- |
|
|
- |
|
|
- |
|
|
94.3 |
|
n.a. |
|
|
|
Viberzi® |
|
- |
|
|
93.3 |
|
|
- |
|
|
- |
|
|
93.3 |
|
|
- |
|
|
12.3 |
|
|
- |
|
|
- |
|
|
12.3 |
|
|
81.0 |
|
n.m. |
|
|
|
Latisse® |
|
77.9 |
|
|
- |
|
|
8.5 |
|
|
- |
|
|
86.4 |
|
|
63.2 |
|
|
- |
|
|
10.0 |
|
|
- |
|
|
73.2 |
|
|
13.2 |
|
|
18.0 |
% |
|
Lexapro® |
|
- |
|
|
66.6 |
|
|
- |
|
|
- |
|
|
66.6 |
|
|
- |
|
|
71.6 |
|
|
- |
|
|
- |
|
|
71.6 |
|
|
(5.0 |
) |
|
(7.0 |
)% |
|
Namzaric® |
|
- |
|
|
57.5 |
|
|
- |
|
|
- |
|
|
57.5 |
|
|
- |
|
|
11.2 |
|
|
- |
|
|
- |
|
|
11.2 |
|
|
46.3 |
|
n.m. |
|
|
|
Kybella® / Belkyra® |
|
50.2 |
|
|
- |
|
|
2.3 |
|
|
- |
|
|
52.5 |
|
|
3.2 |
|
|
- |
|
|
- |
|
|
- |
|
|
3.2 |
|
|
49.3 |
|
n.m. |
|
|
|
Dalvance® |
|
- |
|
|
39.3 |
|
|
- |
|
|
- |
|
|
39.3 |
|
|
- |
|
|
16.8 |
|
|
- |
|
|
- |
|
|
16.8 |
|
|
22.5 |
|
|
133.9 |
% |
|
Avycaz® |
|
- |
|
|
36.1 |
|
|
- |
|
|
- |
|
|
36.1 |
|
|
- |
|
|
22.6 |
|
|
- |
|
|
- |
|
|
22.6 |
|
|
13.5 |
|
|
59.7 |
% |
|
Liletta® |
|
- |
|
|
23.3 |
|
|
- |
|
|
- |
|
|
23.3 |
|
|
- |
|
|
14.8 |
|
|
- |
|
|
- |
|
|
14.8 |
|
|
8.5 |
|
|
57.4 |
% |
|
Enablex® |
|
- |
|
|
17.1 |
|
|
- |
|
|
- |
|
|
17.1 |
|
|
- |
|
|
69.2 |
|
|
- |
|
|
- |
|
|
69.2 |
|
|
(52.1 |
) |
|
(75.3 |
)% |
|
Namenda® IR |
|
- |
|
|
15.1 |
|
|
- |
|
|
- |
|
|
15.1 |
|
|
- |
|
|
556.3 |
|
|
- |
|
|
- |
|
|
556.3 |
|
|
(541.2 |
) |
|
(97.3 |
)% |
|
Other Products Revenues |
|
116.4 |
|
|
598.9 |
|
|
342.2 |
|
|
33.7 |
|
|
1,091.2 |
|
|
144.3 |
|
|
800.0 |
|
|
301.5 |
|
|
10.0 |
|
|
1,255.8 |
|
|
(164.6 |
) |
|
(13.1 |
)% |
|
Less product sold through our Anda Distribution business |
n.a. |
|
n.a. |
|
n.a. |
|
|
(80.0 |
) |
|
(80.0 |
) |
n.a. |
|
n.a. |
|
n.a. |
|
|
(157.4 |
) |
|
(157.4 |
) |
|
77.4 |
|
|
(49.2 |
)% |
||||||
|
Total Net Revenues |
$ |
5,811.7 |
|
$ |
5,923.9 |
|
$ |
2,881.3 |
|
$ |
(46.3 |
) |
$ |
14,570.6 |
|
$ |
4,309.8 |
|
$ |
6,338.4 |
|
$ |
2,187.3 |
|
$ |
(147.4 |
) |
$ |
12,688.1 |
|
$ |
1,882.5 |
|
|
14.8 |
% |
58
US Specialized Therapeutics Segment
The following table presents net contribution for the US Specialized Therapeutics segment for the years ended December 31, 2016 and 2015 ($ in millions):
|
|
Years Ended December 31, |
|
|
Change |
|
||||||||||
|
|
2016 (1) |
|
|
2015 (1) |
|
|
Dollars |
|
|
% |
|
||||
|
Total Eye Care |
$ |
2,437.7 |
|
|
$ |
1,831.3 |
|
|
$ |
606.4 |
|
|
|
33.1 |
% |
|
Restasis® |
|
1,419.5 |
|
|
|
999.6 |
|
|
|
419.9 |
|
|
|
42.0 |
% |
|
Alphagan®/Combigan® |
|
376.6 |
|
|
|
285.0 |
|
|
|
91.6 |
|
|
|
32.1 |
% |
|
Lumigan®/Ganfort® |
|
326.4 |
|
|
|
260.7 |
|
|
|
65.7 |
|
|
|
25.2 |
% |
|
Ozurdex® |
|
84.4 |
|
|
|
56.1 |
|
|
|
28.3 |
|
|
|
50.4 |
% |
|
Eye Drops |
|
186.5 |
|
|
|
177.0 |
|
|
|
9.5 |
|
|
|
5.4 |
% |
|
Other Eye Care |
|
44.3 |
|
|
|
52.9 |
|
|
|
(8.6 |
) |
|
|
(16.3 |
)% |
|
Total Medical Aesthetics |
|
1,622.9 |
|
|
|
1,145.0 |
|
|
|
477.9 |
|
|
|
41.7 |
% |
|
Facial Aesthetics |
|
1,226.3 |
|
|
|
817.8 |
|
|
|
408.5 |
|
|
|
50.0 |
% |
|
Botox® Cosmetics |
|
729.2 |
|
|
|
510.2 |
|
|
|
219.0 |
|
|
|
42.9 |
% |
|
Fillers |
|
446.9 |
|
|
|
304.4 |
|
|
|
142.5 |
|
|
|
46.8 |
% |
|
Kybella® |
|
50.2 |
|
|
|
3.2 |
|
|
|
47.0 |
|
|
n.m. |
|
|
|
Plastic Surgery |
|
210.4 |
|
|
|
187.4 |
|
|
|
23.0 |
|
|
|
12.3 |
% |
|
Breast Implants |
|
206.0 |
|
|
|
175.0 |
|
|
|
31.0 |
|
|
|
17.7 |
% |
|
Other Plastic Surgery |
|
4.4 |
|
|
|
12.4 |
|
|
|
(8.0 |
) |
|
|
(64.5 |
)% |
|
Skin Care |
|
186.2 |
|
|
|
139.8 |
|
|
|
46.4 |
|
|
|
33.2 |
% |
|
SkinMedica® |
|
108.3 |
|
|
|
76.6 |
|
|
|
31.7 |
|
|
|
41.4 |
% |
|
Latisse® |
|
77.9 |
|
|
|
63.2 |
|
|
|
14.7 |
|
|
|
23.3 |
% |
|
Total Medical Dermatology |
|
396.5 |
|
|
|
355.9 |
|
|
|
40.6 |
|
|
|
11.4 |
% |
|
Aczone® |
|
217.3 |
|
|
|
170.8 |
|
|
|
46.5 |
|
|
|
27.2 |
% |
|
Tazorac® |
|
95.5 |
|
|
|
92.3 |
|
|
|
3.2 |
|
|
|
3.5 |
% |
|
Botox® Hyperhidrosis |
|
65.2 |
|
|
|
52.5 |
|
|
|
12.7 |
|
|
|
24.2 |
% |
|
Other Medical Dermatology |
|
18.5 |
|
|
|
40.3 |
|
|
|
(21.8 |
) |
|
|
(54.1 |
)% |
|
Total Neuroscience & Urology |
|
1,306.3 |
|
|
|
938.9 |
|
|
|
367.4 |
|
|
|
39.1 |
% |
|
Botox® Therapeutics |
|
1,188.8 |
|
|
|
823.7 |
|
|
|
365.1 |
|
|
|
44.3 |
% |
|
Rapaflo® |
|
116.6 |
|
|
|
115.2 |
|
|
|
1.4 |
|
|
|
1.2 |
% |
|
Other Neuroscience & Urology |
|
0.9 |
|
|
|
- |
|
|
|
0.9 |
|
|
n.a. |
|
|
|
Other Revenues |
|
48.3 |
|
|
|
38.7 |
|
|
|
9.6 |
|
|
|
24.8 |
% |
|
Net revenues |
$ |
5,811.7 |
|
|
$ |
4,309.8 |
|
|
$ |
1,501.9 |
|
|
|
34.8 |
% |
|
Operating expenses: |
|
|
|
|
|
|
|
|
|
|
|
|
|
|
|
|
Cost of sales(2) |
|
290.9 |
|
|
|
235.8 |
|
|
|
55.1 |
|
|
|
23.4 |
% |
|
Selling and marketing |
|
1,137.0 |
|
|
|
772.8 |
|
|
|
364.2 |
|
|
|
47.1 |
% |
|
General and administrative |
|
174.2 |
|
|
|
68.3 |
|
|
|
105.9 |
|
|
|
155.1 |
% |
|
Segment contribution |
$ |
4,209.6 |
|
|
$ |
3,232.9 |
|
|
$ |
976.7 |
|
|
|
30.2 |
% |
|
Segment margin |
|
72.4 |
% |
|
|
75.0 |
% |
|
|
|
|
|
|
(2.6 |
)% |
|
Segment gross margin(3) |
|
95.0 |
% |
|
|
94.5 |
% |
|
|
|
|
|
|
0.5 |
% |
|
(1) |
Includes revenues earned that were distributed through the Anda Distribution business prior to October 3, 2016 to third party customers. |
|
(2) |
Excludes amortization and impairment of acquired intangibles including product rights, as well as indirect cost of sales not attributable to segment results. |
|
(3) |
Defined as net revenues less segment related cost of sales as a percentage of net revenues. |
Net Revenues
The increase in segment revenues is primarily due to a full year contribution from the Allergan Acquisition versus nine and a half months in the prior year. In addition, the Company acquired the rights to Kybella®, a facial aesthetic product indicated for submental
59
fullness, in 2015, and launched the product in the fourth quarter of that year. The Company has continued to realize strong organic growth from these products acquired from Allergan, including Restasis®, Ozurdex®, Botox®, Fillers and the SkinMedica® line.
Cost of Sales
The increase in cost of sales is due to a full year contribution from the Allergan Acquisition versus nine and a half months in the prior year.
Selling and Marketing Expenses
The increase in selling and marketing expenses was primarily due to a full year contribution from the Allergan Acquisition versus nine and a half months in the prior year, as well as increases in selling and marketing efforts for Kybella®, Restasis®, Botox® Cosmetics, Fillers, and Botox® Therapeutics.
General and Administrative Expenses
The increase in general and administrative expenses was primarily due to a full year contribution from the Allergan Acquisition versus nine and a half months in the prior year and an increase due to the Company’s new operating management structure wherein more costs are directly supporting the operating segments versus corporate functions. Consequently, general and administrative expenses increased as a result of this change. In addition, there was also a period over period increase in compensation costs.
60
The following table presents net contribution for the US General Medicine segment for the years ended December 31, 2016 and 2015 ($ in millions):
|
|
Years Ended December 31, |
|
|
Change |
|
||||||||||
|
|
2016 (1) |
|
|
2015 (1) |
|
|
Dollars |
|
|
% |
|
||||
|
Total Central Nervous System (CNS) |
$ |
1,303.6 |
|
|
$ |
1,841.1 |
|
|
$ |
(537.5 |
) |
|
|
(29.2 |
)% |
|
Namenda XR® |
|
627.6 |
|
|
|
759.3 |
|
|
|
(131.7 |
) |
|
|
(17.3 |
)% |
|
Namzaric® |
|
57.5 |
|
|
|
11.2 |
|
|
|
46.3 |
|
|
n.m. |
|
|
|
Viibryd®/Fetzima® |
|
342.3 |
|
|
|
327.6 |
|
|
|
14.7 |
|
|
|
4.5 |
% |
|
Saphris® |
|
166.8 |
|
|
|
186.7 |
|
|
|
(19.9 |
) |
|
|
(10.7 |
)% |
|
Vraylar™ |
|
94.3 |
|
|
|
- |
|
|
|
94.3 |
|
|
n.a. |
|
|
|
Namenda® IR |
|
15.1 |
|
|
|
556.3 |
|
|
|
(541.2 |
) |
|
|
(97.3 |
)% |
|
Total Gastrointestinal (GI) |
|
1,721.0 |
|
|
|
1,575.3 |
|
|
|
145.7 |
|
|
|
9.2 |
% |
|
Linzess® |
|
625.6 |
|
|
|
454.8 |
|
|
|
170.8 |
|
|
|
37.6 |
% |
|
Asacol®/Delzicol® |
|
360.8 |
|
|
|
552.9 |
|
|
|
(192.1 |
) |
|
|
(34.7 |
)% |
|
Carafate®/Sulcrate® |
|
229.0 |
|
|
|
213.1 |
|
|
|
15.9 |
|
|
|
7.5 |
% |
|
Zenpep® |
|
200.7 |
|
|
|
167.4 |
|
|
|
33.3 |
|
|
|
19.9 |
% |
|
Canasa®/Salofalk® |
|
178.7 |
|
|
|
137.1 |
|
|
|
41.6 |
|
|
|
30.3 |
% |
|
Viberzi® |
|
93.3 |
|
|
|
12.3 |
|
|
|
81.0 |
|
|
n.m. |
|
|
|
Other GI |
|
32.9 |
|
|
|
37.7 |
|
|
|
(4.8 |
) |
|
|
(12.7 |
)% |
|
Total Women's Health |
|
1,179.6 |
|
|
|
998.0 |
|
|
|
181.6 |
|
|
|
18.2 |
% |
|
Lo Loestrin® |
|
403.5 |
|
|
|
346.5 |
|
|
|
57.0 |
|
|
|
16.5 |
% |
|
Estrace® Cream |
|
379.4 |
|
|
|
326.2 |
|
|
|
53.2 |
|
|
|
16.3 |
% |
|
Minastrin® 24 |
|
325.9 |
|
|
|
272.4 |
|
|
|
53.5 |
|
|
|
19.6 |
% |
|
Liletta® |
|
23.3 |
|
|
|
14.8 |
|
|
|
8.5 |
|
|
|
57.4 |
% |
|
Other Women's Health |
|
47.5 |
|
|
|
38.1 |
|
|
|
9.4 |
|
|
|
24.7 |
% |
|
Total Anti-Infectives |
|
225.1 |
|
|
|
188.8 |
|
|
|
36.3 |
|
|
|
19.2 |
% |
|
Teflaro® |
|
133.6 |
|
|
|
137.6 |
|
|
|
(4.0 |
) |
|
|
(2.9 |
)% |
|
Dalvance® |
|
39.3 |
|
|
|
16.8 |
|
|
|
22.5 |
|
|
|
133.9 |
% |
|
Avycaz® |
|
36.1 |
|
|
|
22.6 |
|
|
|
13.5 |
|
|
|
59.7 |
% |
|
Other Anti-Infectives |
|
16.1 |
|
|
|
11.8 |
|
|
|
4.3 |
|
|
|
36.4 |
% |
|
Diversified Brands |
|
1,366.6 |
|
|
|
1,649.2 |
|
|
|
(282.6 |
) |
|
|
(17.1 |
)% |
|
Bystolic® / Byvalson® |
|
638.8 |
|
|
|
644.8 |
|
|
|
(6.0 |
) |
|
|
(0.9 |
)% |
|
Armour Thyroid |
|
166.5 |
|
|
|
130.8 |
|
|
|
35.7 |
|
|
|
27.3 |
% |
|
Savella® |
|
103.2 |
|
|
|
106.4 |
|
|
|
(3.2 |
) |
|
|
(3.0 |
)% |
|
Lexapro® |
|
66.6 |
|
|
|
71.6 |
|
|
|
(5.0 |
) |
|
|
(7.0 |
)% |
|
Enablex® |
|
17.1 |
|
|
|
69.2 |
|
|
|
(52.1 |
) |
|
|
(75.3 |
)% |
|
PacPharma |
|
52.0 |
|
|
|
82.1 |
|
|
|
(30.1 |
) |
|
|
(36.7 |
)% |
|
Other Diversified Brands |
|
322.4 |
|
|
|
544.3 |
|
|
|
(221.9 |
) |
|
|
(40.8 |
)% |
|
Other Revenues |
|
128.0 |
|
|
|
86.0 |
|
|
|
42.0 |
|
|
|
48.8 |
% |
|
Net revenues |
$ |
5,923.9 |
|
|
$ |
6,338.4 |
|
|
$ |
(414.5 |
) |
|
|
(6.5 |
)% |
|
Operating expenses: |
|
|
|
|
|
|
|
|
|
|
|
|
|
|
|
|
Cost of sales(2) |
|
879.8 |
|
|
|
909.5 |
|
|
|
(29.7 |
) |
|
|
(3.3 |
)% |
|
Selling and marketing |
|
1,185.7 |
|
|
|
1,194.7 |
|
|
|
(9.0 |
) |
|
|
(0.8 |
)% |
|
General and administrative |
|
174.9 |
|
|
|
105.3 |
|
|
|
69.6 |
|
|
|
66.1 |
% |
|
Segment contribution |
$ |
3,683.5 |
|
|
$ |
4,128.9 |
|
|
$ |
(445.4 |
) |
|
|
(10.8 |
)% |
|
Segment margin |
|
62.2 |
% |
|
|
65.1 |
% |
|
|
|
|
|
|
(2.9 |
)% |
|
Segment gross margin(3) |
|
85.1 |
% |
|
|
85.7 |
% |
|
|
|
|
|
|
(0.6 |
)% |
|
(1) |
Includes revenues earned that were distributed through the Anda Distribution business prior to October 3, 2016 to third party customers. |
61
|
(2) |
Excludes amortization and impairment of acquired intangibles including product rights, as well as indirect cost of sales not attributable to segment results. |
|
(3) |
Defined as net revenues less segment related cost of sales as a percentage of net revenues. |
Net Revenues
The decrease in the US General Medicine segment revenues is primarily driven by the loss of exclusivity on Namenda® IR, which declined $541.2 million, or 97.3%, versus the prior year period. Namenda XR® contributed revenues of $627.6 million in the year ended December 31, 2016, a decline of $131.7 million, or 17.3%, versus the prior year period due to a decline in average net selling price to maintain strong formulary coverage, coupled with a decline in demand. The launches of Namzaric® and Vraylar™ have partially offset the impact of the decline of Namenda® IR and Namenda XR®.
Growth within our Gastrointestinal franchise was primarily driven by Linzess® and newly launched Viberzi®. Linzess® revenues increased $170.8 million, or 37.6%, versus the prior year period primarily due to strong demand growth and price appreciation. The Asacol® / Delzicol® franchise revenues decreased $192.1 million, or 34.7%, due in part to a reduction in demand as a result of lower promotion and some loss in formulary coverage. In addition, an authorized generic of Asacol® HD was launched in August. Offsetting this decline, in part, is royalty revenue of $45.5 million relating to our authorized generic version of Asacol® HD, which is included within “Other Revenues”.
Our Women’s Healthcare franchise increased $181.6 million, or 18.2%, versus the prior year period. Lo Loestrin® increased 16.5% due to strong demand growth and modest net price appreciation. Estrace® Cream increased 16.3% as a result of net price appreciation and demand growth. Minastrin® 24 increased 19.6% primarily as a result of net price appreciation. Patents covering generic versions of our Minastrin® product will enter the market as early as March 2017 pursuant to settlement agreements previously entered into.
The decline in Diversified Brands revenues is primarily due to loss of exclusivity on certain products and to product divestitures.
Cost of Sales
The decrease in cost of sales was primarily due to a decline in product revenues as well as an unfavorable product mix, including increased sales of products that are royalty bearing. Segment gross margins declined to 85.1% for the year ended December 31, 2016 compared to 85.7% for the year ended December 31, 2015.
Selling and Marketing Expenses
A modest decrease in selling and marketing expenses is attributable to the overall decline in revenues offset, in part, by redeployment of promotional efforts to key growth brands, including newly launched products Viberzi® and Vraylar™.
General and Administrative Expenses
The increase in general and administrative costs is a result of the Company’s new operating management structure wherein more costs are directly supporting the operating segments versus corporate functions. Consequently, general and administrative expenses increased as a result of this change. In addition, there was also a period over period increase in compensation costs.
62
The following table presents net contribution for the International segment for the years ended December 31, 2016 and 2015 ($ in millions):
|
|
Years Ended December 31, |
|
|
Change |
|
||||||||||||||||||||||||||
|
|
2016 |
|
|
2015 |
|
|
$ Overall Change |
|
|
$ Currency Change |
|
|
$ Operational Change |
|
|
% Overall Change |
|
|
% Currency Change |
|
|
% Operational Change |
|
||||||||
|
Total Eye Care |
$ |
1,219.4 |
|
|
$ |
918.7 |
|
|
$ |
300.7 |
|
|
$ |
(28.6 |
) |
|
$ |
329.3 |
|
|
|
32.7 |
% |
|
|
(3.1 |
)% |
|
|
35.8 |
% |
|
Lumigan®/Ganfort® |
|
361.7 |
|
|
|
283.4 |
|
|
|
78.3 |
|
|
|
(7.7 |
) |
|
|
86.0 |
|
|
|
27.6 |
% |
|
|
(2.7 |
)% |
|
|
30.3 |
% |
|
Alphagan®/Combigan® |
|
169.3 |
|
|
|
126.1 |
|
|
|
43.2 |
|
|
|
(3.6 |
) |
|
|
46.8 |
|
|
|
34.3 |
% |
|
|
(2.9 |
)% |
|
|
37.1 |
% |
|
Ozurdex® |
|
179.0 |
|
|
|
112.3 |
|
|
|
66.7 |
|
|
|
(2.4 |
) |
|
|
69.1 |
|
|
|
59.4 |
% |
|
|
(2.1 |
)% |
|
|
61.5 |
% |
|
Optive® |
|
101.9 |
|
|
|
76.9 |
|
|
|
25.0 |
|
|
|
(1.9 |
) |
|
|
26.9 |
|
|
|
32.5 |
% |
|
|
(2.5 |
)% |
|
|
35.0 |
% |
|
Other Eye Drops |
|
174.3 |
|
|
|
143.7 |
|
|
|
30.6 |
|
|
|
(5.2 |
) |
|
|
35.8 |
|
|
|
21.3 |
% |
|
|
(3.6 |
)% |
|
|
24.9 |
% |
|
Restasis® |
|
68.0 |
|
|
|
48.2 |
|
|
|
19.8 |
|
|
|
(2.1 |
) |
|
|
21.9 |
|
|
|
41.1 |
% |
|
|
(4.4 |
)% |
|
|
45.4 |
% |
|
Other Eye Care |
|
165.2 |
|
|
|
128.1 |
|
|
|
37.1 |
|
|
|
(5.7 |
) |
|
|
42.8 |
|
|
|
29.0 |
% |
|
|
(4.4 |
)% |
|
|
33.4 |
% |
|
Total Medical Aesthetics |
|
1,064.6 |
|
|
|
756.3 |
|
|
|
308.3 |
|
|
|
(23.0 |
) |
|
|
331.3 |
|
|
|
40.8 |
% |
|
|
(3.0 |
)% |
|
|
43.8 |
% |
|
Facial Aesthetics |
|
902.7 |
|
|
|
619.8 |
|
|
|
282.9 |
|
|
|
(20.8 |
) |
|
|
303.7 |
|
|
|
45.6 |
% |
|
|
(3.4 |
)% |
|
|
49.0 |
% |
|
Botox® Cosmetics |
|
480.0 |
|
|
|
350.3 |
|
|
|
129.7 |
|
|
|
(11.5 |
) |
|
|
141.2 |
|
|
|
37.0 |
% |
|
|
(3.3 |
)% |
|
|
40.3 |
% |
|
Fillers |
|
420.4 |
|
|
|
269.5 |
|
|
|
150.9 |
|
|
|
(9.3 |
) |
|
|
160.2 |
|
|
|
56.0 |
% |
|
|
(3.5 |
)% |
|
|
59.4 |
% |
|
Belkyra® (Kybella®) |
|
2.3 |
|
|
|
- |
|
|
|
2.3 |
|
|
|
- |
|
|
|
2.3 |
|
|
n.a. |
|
|
n.a. |
|
|
n.a. |
|
|||
|
Plastic Surgery |
|
150.7 |
|
|
|
125.6 |
|
|
|
25.1 |
|
|
|
(2.1 |
) |
|
|
27.2 |
|
|
|
20.0 |
% |
|
|
(1.7 |
)% |
|
|
21.7 |
% |
|
Breast Implants |
|
149.9 |
|
|
|
125.5 |
|
|
|
24.4 |
|
|
|
(2.1 |
) |
|
|
26.5 |
|
|
|
19.4 |
% |
|
|
(1.7 |
)% |
|
|
21.1 |
% |
|
Earfold™ |
|
0.8 |
|
|
|
0.1 |
|
|
|
0.7 |
|
|
|
- |
|
|
|
0.7 |
|
|
n.m. |
|
|
n.a. |
|
|
n.a. |
|
|||
|
Skin Care |
|
11.2 |
|
|
|
10.9 |
|
|
|
0.3 |
|
|
|
(0.1 |
) |
|
|
0.4 |
|
|
|
2.8 |
% |
|
|
(0.9 |
)% |
|
|
3.7 |
% |
|
Botox® Therapeutics and Other |
|
537.3 |
|
|
|
453.7 |
|
|
|
83.6 |
|
|
|
(16.4 |
) |
|
|
100.0 |
|
|
|
18.4 |
% |
|
|
(3.6 |
)% |
|
|
22.0 |
% |
|
Botox® Therapeutics |
|
323.0 |
|
|
|
234.1 |
|
|
|
88.9 |
|
|
|
(7.7 |
) |
|
|
96.6 |
|
|
|
38.0 |
% |
|
|
(3.3 |
)% |
|
|
41.3 |
% |
|
Asacol®/Delzicol® |
|
53.7 |
|
|
|
65.5 |
|
|
|
(11.8 |
) |
|
|
(4.3 |
) |
|
|
(7.5 |
) |
|
|
(18.0 |
)% |
|
|
(6.6 |
)% |
|
|
(11.5 |
)% |
|
Constella® |
|
17.3 |
|
|
|
4.5 |
|
|
|
12.8 |
|
|
|
(0.6 |
) |
|
|
13.4 |
|
|
|
284.4 |
% |
|
|
(13.3 |
)% |
|
|
297.8 |
% |
|
Other Products |
|
143.3 |
|
|
|
149.6 |
|
|
|
(6.3 |
) |
|
|
(3.8 |
) |
|
|
(2.5 |
) |
|
|
(4.2 |
)% |
|
|
(2.5 |
)% |
|
|
(1.7 |
)% |
|
Other Revenues |
|
60.0 |
|
|
|
58.6 |
|
|
|
1.4 |
|
|
|
- |
|
|
|
1.4 |
|
|
|
2.4 |
% |
|
n.a. |
|
|
n.a. |
|
||
|
Net revenues |
$ |
2,881.3 |
|
|
$ |
2,187.3 |
|
|
$ |
694.0 |
|
|
$ |
(68.0 |
) |
|
$ |
762.0 |
|
|
|
31.7 |
% |
|
|
(3.1 |
)% |
|
|
34.8 |
% |
|
Operating expenses: |
|
|
|
|
|
|
|
|
|
|
|
|
|
|
|
|
|
|
|
|
|
|
|
|
|
|
|
|
|
|
|
|
Cost of sales(1) |
|
418.2 |
|
|
|
350.9 |
|
|
|
67.3 |
|
|
|
(9.9 |
) |
|
|
77.2 |
|
|
|
19.2 |
% |
|
|
(2.8 |
)% |
|
|
22.0 |
% |
|
Selling and marketing |
|
788.2 |
|
|
|
569.2 |
|
|
|
219.0 |
|
|
|
(17.8 |
) |
|
|
236.8 |
|
|
|
38.5 |
% |
|
|
(3.1 |
)% |
|
|
41.6 |
% |
|
General and administrative |
|
117.2 |
|
|
|
107.6 |
|
|
|
9.6 |
|
|
|
(4.0 |
) |
|
|
13.6 |
|
|
|
8.9 |
% |
|
|
(3.7 |
)% |
|
|
12.6 |
% |
|
Segment contribution |
$ |
1,557.7 |
|
|
$ |
1,159.6 |
|
|
$ |
398.1 |
|
|
$ |
(36.3 |
) |
|
$ |
434.4 |
|
|
|
34.3 |
% |
|
|
(3.1 |
)% |
|
|
37.5 |
% |
|
Segment margin |
|
54.1 |
% |
|
|
53.0 |
% |
|
|
|
|
|
|
|
|
|
|
|
|
|
|
1.1 |
% |
|
|
|
|
|
|
|
|
|
Segment gross margin(2) |
|
85.5 |
% |
|
|
84.0 |
% |
|
|
|
|
|
|
|
|
|
|
|
|
|
|
1.5 |
% |
|
|
|
|
|
|
|
|
|
(1) |
Excludes amortization and impairment of acquired intangibles including product rights. |
|
(2) |
Defined as net revenues less segment related cost of sales as a percentage of net revenues. |
Net Revenues
The increase in net revenues was primarily due to the contribution from the Allergan Acquisition, which contributed a full year in 2016 as opposed to nine and a half months in 2015. The company has continued to experience strong organic growth in the Facial aesthetics, Botox Therapeutic and Eye Care franchises.
Cost of Sales
The increase in cost of sales was primarily due to the contribution from the Allergan Acquisition, which contributed a full year in 2016 as opposed to nine and a half months in 2015, which was offset by a favorable product mix.
63
Selling and Marketing Expenses
The increase in selling and marketing expenses was primarily due to the contribution from the Allergan Acquisition, which contributed a full year in 2016 as opposed to nine and a half months in 2015.
General and Administrative Expenses
The increase in general and administrative expenses was primarily due to the contribution from the Allergan Acquisition, which contributed a full year in 2016 as opposed to nine and a half months in 2015, offset, in part, by cost savings due to corporate initiatives.
Corporate
Corporate represents the results of corporate initiatives as well as the impact of select revenues and shared costs. The following represents the corporate amounts for the years ended December 31, 2016 and 2015 ($ in millions):
|
|
|
Year Ended December 31, 2016 |
|
|||||||||||||||||||
|
|
|
Integration and Restructuring |
|
Fair Value Adjustments |
|
Effect of Purchase Accounting |
|
Reclassification of Sales Distributed Through Anda to Discontinued Operations |
|
Other |
|
Revenues and Shared Costs |
|
Total |
|
|||||||
|
|
|
|
|
|
|
|
|
|
|
|
|
|
|
|
|
|
|
|
|
|
|
|
|
Net Sales |
|
$ |
- |
|
$ |
- |
|
$ |
- |
|
$ |
(80.0 |
) |
$ |
- |
|
$ |
33.7 |
|
$ |
(46.3 |
) |
|
Operating expenses: |
|
|
|
|
|
- |
|
|
|
|
|
|
|
|
|
|
|
|
|
|
|
|
|
Cost of sales(1) |
|
|
23.0 |
|
|
(17.4 |
) |
|
50.5 |
|
|
(78.2 |
) |
|
- |
|
|
294.0 |
|
|
271.9 |
|
|
Selling and marketing |
|
|
82.5 |
|
|
- |
|
|
65.4 |
|
|
- |
|
|
- |
|
|
7.6 |
|
|
155.5 |
|
|
General and administrative |
|
|
269.6 |
|
|
24.3 |
|
|
80.5 |
|
|
- |
|
|
136.3 |
|
|
496.9 |
|
|
1,007.6 |
|
|
Contribution |
|
$ |
(375.1 |
) |
$ |
(6.9 |
) |
$ |
(196.4 |
) |
$ |
(1.8 |
) |
$ |
(136.3 |
) |
$ |
(764.8 |
) |
$ |
(1,481.3 |
) |
|
|
|
|
|
|
|
|
|
|
|
|
|
|
|
|
|
|
|
|
|
|
|
|
|
(1) Excludes amortization and impairment of acquired intangibles including product rights. |
|
|||||||||||||||||||||
|
|
|
Year Ended December 31, 2015 |
|
|||||||||||||||||||
|
|
|
Integration and Restructuring |
|
Fair Value Adjustments |
|
Effect of Purchase Accounting |
|
Reclassification of Sales Distributed Through Anda to Discontinued Operations |
|
Other |
|
Revenues and Shared Costs |
|
Total |
|
|||||||
|
|
|
|
|
|
|
|
|
|
|
|
|
|
|
|
|
|
|
|
|
|
|
|
|
Net Sales |
|
$ |
- |
|
$ |
- |
|
$ |
- |
|
$ |
(157.4 |
) |
$ |
3.8 |
|
$ |
6.2 |
|
$ |
(147.4 |
) |
|
Operating expenses: |
|
|
|
|
|
|
|
|
|
|
|
|
|
|
|
|
|
|
|
|
|
|
|
Cost of sales(1) |
|
|
53.0 |
|
|
58.5 |
|
|
1,180.0 |
|
|
(146.9 |
) |
|
0.1 |
|
|
110.9 |
|
|
1,255.6 |
|
|
Selling and marketing |
|
|
96.9 |
|
|
- |
|
|
130.3 |
|
|
- |
|
|
(1.7 |
) |
|
2.9 |
|
|
228.4 |
|
|
General and administrative |
|
|
517.0 |
|
|
(0.5 |
) |
|
322.4 |
|
|
- |
|
|
93.1 |
|
|
503.2 |
|
|
1,435.2 |
|
|
Contribution |
|
$ |
(666.9 |
) |
$ |
(58.0 |
) |
$ |
(1,632.7 |
) |
$ |
(10.5 |
) |
$ |
(87.7 |
) |
$ |
(610.8 |
) |
$ |
(3,066.6 |
) |
|
|
|
|
|
|
|
|
|
|
|
|
|
|
|
|
|
|
|
|
|
|
|
|
|
(1) Excludes amortization and impairment of acquired intangibles including product rights. |
|
|||||||||||||||||||||
In the year ended December 31, 2016, integration and restructuring charges primarily related to the integration of the Legacy Allergan business. In the year ended December 31, 2016, the Company incurred purchase accounting effects of $42.4 million in cost of sales primarily related to the fair value inventory step-up from the Allergan and Forest acquisitions as products were sold to the Company’s third party customers. The Company also incurred charges related to the purchase accounting impact on stock-based compensation related to the Allergan and Forest acquisitions, which increased cost of sales, selling and marketing and general and administrative expenses. General and administrative costs included legal settlement charges of $117.3 million.
64
Shared costs primarily include above site and unallocated costs associated with running our global manufacturing facilities and corporate general and administrative expenses. The increase in shared cost of sales is primarily due to higher operating costs supporting our global operations including higher costs for inventory obsolescence, product validations and capacity expansions. The increase in “Revenues and Shared Costs” versus the prior year were also due to the Allergan Acquisition, which contributed a full twelve months in 2016 as opposed to nine and a half months in 2015.
In the year ended December 31, 2015, integration and restructuring charges were primarily related to the integration of the Legacy Allergan business, as well as the Forest Acquisition. In the year ended December 31, 2015, the Company incurred $1,151.4 million in cost of sales primarily related to the fair value inventory step-up from the Allergan Acquisition and the Forest Acquisition as products were sold to the Company’s third party customers. The Company also incurred charges related to the purchase accounting impact on stock-based compensation related to the Allergan, Kythera, and Forest acquisitions, which increased cost of sales, selling and marketing and general and administrative expenses. In the year ended December 31, 2015, other expenses included the impact of legal settlement reserves. In addition, in the year ended December 31, 2015, the Company incurred mark-to-market unrealized losses for foreign currency option contracts that were entered into to offset future exposure to movements in currencies.
Research and Development Expenses
R&D expenses consist predominantly of personnel-related costs, active pharmaceutical ingredient costs, contract research, license and milestone fees, biostudy and facilities costs associated with product development.
R&D expenses consisted of the following components in the years ended December 31, 2016 and 2015 ($ in millions):
|
|
|
Years Ended December 31, |
|
|
Change |
|
||||||||||
|
|
|
2016 |
|
|
2015 |
|
|
Dollars |
|
|
% |
|
||||
|
Ongoing operating expenses |
|
$ |
1,433.8 |
|
|
$ |
1,116.8 |
|
|
$ |
317.0 |
|
|
|
28.4 |
% |
|
Brand related milestone payments and upfront license payments |
|
|
1,134.7 |
|
|
|
950.4 |
|
|
|
184.3 |
|
|
|
19.4 |
% |
|
Contingent consideration adjustments, net |
|
|
(71.1 |
) |
|
|
37.7 |
|
|
|
(108.8 |
) |
|
|
(288.6 |
)% |
|
Acquisition, integration, and restructuring charges |
|
|
24.5 |
|
|
|
102.7 |
|
|
|
(78.2 |
) |
|
|
(76.1 |
)% |
|
Acquisition accounting fair market value adjustments to stock-based compensation |
|
|
53.8 |
|
|
|
150.9 |
|
|
|
(97.1 |
) |
|
|
(64.3 |
)% |
|
Total expenditures |
|
$ |
2,575.7 |
|
|
$ |
2,358.5 |
|
|
$ |
217.2 |
|
|
|
9.2 |
% |
The increase in ongoing operating expenses in the year ended December 31, 2016 versus the prior year period is primarily due to the impact of the Allergan Acquisition which contributed twelve months in 2016 versus nine and a half months in 2015 coupled with an increase in clinical trial activity.
The following represents brand related milestone payments and upfront license payments in the years ended December 31, 2016 and 2015, respectively ($ in millions):
|
|
Years Ended December 31, |
|
|||||
|
|
2016 |
|
|
2015 |
|
||
|
AstraZeneca License |
$ |
250.0 |
|
|
$ |
- |
|
|
Motus Transaction |
|
199.5 |
|
|
|
- |
|
|
Chase Transaction |
|
122.9 |
|
|
|
- |
|
|
Heptares Transaction |
|
125.0 |
|
|
|
- |
|
|
Merck Transaction |
|
100.0 |
|
|
|
250.0 |
|
|
Anterios Transaction |
|
89.2 |
|
|
|
- |
|
|
Topokine Transaction |
|
85.8 |
|
|
|
- |
|
|
RetroSense Transaction |
|
59.7 |
|
|
|
- |
|
|
Akarna Transaction |
|
48.2 |
|
|
|
- |
|
|
Naurex Transaction |
|
- |
|
|
|
571.7 |
|
|
Mimetogen Transaction |
|
- |
|
|
|
50.0 |
|
|
Other |
|
54.4 |
|
|
|
78.7 |
|
|
|
$ |
1,134.7 |
|
|
$ |
950.4 |
|
65
In the year ended December 31, 2016, the Company had net contingent consideration income of $71.1 million primarily driven by ongoing R&D projects that were terminated based on clinical data acquired in the Allergan Acquisition, which was offset by additional contingent consideration expense relating to milestones achieved in connection with the AqueSys and Allergan Acquisitions.
Amortization
|
|
|
Years Ended December 31, |
|
|
Change |
|
||||||||||
|
($ in millions) |
|
2016 |
|
|
2015 |
|
|
Dollars |
|
|
% |
|
||||
|
Amortization |
|
$ |
6,470.4 |
|
|
$ |
5,443.7 |
|
|
$ |
1,026.7 |
|
|
|
18.9 |
% |
Amortization for the year ended December 31, 2016 increased as compared to the prior year period primarily as a result of twelve months of amortization related to identifiable assets acquired in the Allergan Acquisition, compared to nine months of amortization in the year ended December 31, 2015, as well as amortization related to products acquired as part of the Kythera Acquisition and recently launched products.
IPR&D Impairments and Asset Sales and Impairments, Net
|
|
|
Years Ended December 31, |
|
|
Change |
|
||||||||||
|
($ in millions) |
|
2016 |
|
|
2015 |
|
|
Dollars |
|
|
% |
|
||||
|
IPR&D impairments |
|
$ |
743.9 |
|
|
$ |
511.6 |
|
|
$ |
232.3 |
|
|
|
45.4 |
% |
|
Asset sales and impairments, net |
|
|
5.0 |
|
|
|
272.0 |
|
|
|
(267.0 |
) |
|
|
(98.2 |
)% |
The Company regularly reviews IPR&D assets for impairment indicators. In the year ended December 31, 2016, the Company recorded the following significant impairments:
|
|
• |
$210.0 million relating to a urology product acquired in the Allergan Acquisition due to clinical data not supporting continuation of the R&D study. This impairment was offset, in part, by a reduction of the contingent liability of $186.0 million recorded in R&D; |
|
|
• |
$106.0 million relating to a migraine treatment acquired in the Allergan Acquisition based on a decrease in projected cash flows due to a delay in potential launch; |
|
|
• |
$46.0 million relating to the Atopic Dermatitis pipeline candidate acquired in the Vitae Acquisition; |
|
|
• |
$33.0 million of the acquired ForSight IPR&D asset as the Company anticipates a delay in potential launch timing. Offsetting this impairment was a corresponding reduction of acquired contingent consideration of $15.0 million, which reduced overall R&D expenses; |
|
|
• |
$35.0 million for an international eye care pipeline project based on a decrease in projected cash flows due to market conditions; |
|
|
• |
$40.0 million for a Botox® premature ejaculation product based on a decrease in projected cash flows; |
|
|
• |
$24.0 million relating to women’s healthcare IPR&D projects based on clinical trial results; |
|
|
• |
$190.0 million relating to a osteoarthritis project based on clinical trial results; and |
|
|
• |
$42.0 million on a gastroenterology project based on the lack of future availability of active pharmaceutical ingredients. |
Asset sales and impairments, net in the twelve months ended December 31, 2016, included the gain on the sale of certain investments, offset in part by the impairment of intellectual property for Nuvessa® based on revised cash flow forecasts.
In the year ended December 31, 2015, the Company made the decision to abandon a select IPR&D asset (acquired in connection with the Allergan Acquisition) based on the review of research studies, resulting in an impairment of the full asset value of $300.0 million. The Company also recorded an impairment of $192.1 million related to a reduction in cash flows for women’s healthcare portfolio products acquired in the Warner Chilcott Acquisition as planned promotional initiatives on these future products has been reduced. Asset sales and impairments, net primarily relates to the abandonment of a surgical product line of $229.6 million acquired in the Allergan Acquisition and a $32.2 million impairment charge as a result of a change in projected cash flows relating to an acquired product, Tretin-X.
66
|
|
|
Years Ended December 31, |
|
|
Change |
|
||||||||||
|
($ in millions) |
|
2016 |
|
|
2015 |
|
|
Dollars |
|
|
% |
|
||||
|
Interest income |
|
$ |
69.9 |
|
|
$ |
10.6 |
|
|
$ |
59.3 |
|
|
|
559.4 |
% |
Interest income represents interest earned on cash and cash equivalents and marketable securities held during the respective periods.
Interest income in the year ended December 31, 2016 increased as a result of the Company investing the cash proceeds from the Teva Transaction in Marketable Securities and Cash and Cash Equivalents.
Interest Expense
|
|
|
Years Ended December 31, |
|
|
Change |
|
||||||||||
|
($ in millions) |
|
2016 |
|
|
2015 |
|
|
Dollars |
|
|
% |
|
||||
|
Fixed Rate Notes |
|
$ |
1,140.0 |
|
|
$ |
1,003.1 |
|
|
|
136.9 |
|
|
|
13.6 |
% |
|
AGN Term Loan |
|
|
74.9 |
|
|
|
79.1 |
|
|
|
(4.2 |
) |
|
|
(5.3 |
)% |
|
Floating Rate Notes |
|
|
21.7 |
|
|
|
18.8 |
|
|
|
2.9 |
|
|
|
15.4 |
% |
|
ACT Term Loan |
|
|
34.9 |
|
|
|
50.8 |
|
|
|
(15.9 |
) |
|
|
(31.3 |
)% |
|
WC Term Loan |
|
|
6.4 |
|
|
|
17.4 |
|
|
|
(11.0 |
) |
|
|
(63.2 |
)% |
|
Revolving Credit Facility |
|
|
2.6 |
|
|
|
4.8 |
|
|
|
(2.2 |
) |
|
|
(45.8 |
)% |
|
Other |
|
|
15.1 |
|
|
|
19.3 |
|
|
|
(4.2 |
) |
|
|
(21.8 |
)% |
|
Interest expense |
|
$ |
1,295.6 |
|
|
$ |
1,193.3 |
|
|
$ |
102.3 |
|
|
|
8.6 |
% |
Interest expense increased for the year ended December 31, 2016 over the prior year primarily due to a full year’s interest from the senior notes indebtedness incurred as part of the Allergan Acquisition, offset, in part, by interest savings due to the repayment of term loan indebtedness on August 2, 2016 in connection with the Teva Transaction.
Other Income (expense)
|
|
|
Years Ended December 31, |
|
|
Change |
|
||||||||||
|
($ in millions) |
|
2016 |
|
|
2015 |
|
|
Dollars |
|
|
% |
|
||||
|
Pfizer termination fee |
|
$ |
150.0 |
|
|
$ |
- |
|
|
|
150.0 |
|
|
|
100.0 |
% |
|
Dividend income |
|
|
68.2 |
|
|
|
- |
|
|
|
68.2 |
|
|
|
100.0 |
% |
|
Bridge loan commitment fee |
|
|
- |
|
|
|
(264.9 |
) |
|
|
264.9 |
|
|
|
(100.0 |
)% |
|
Interest rate lock |
|
|
- |
|
|
|
31.0 |
|
|
|
(31.0 |
) |
|
|
(100.0 |
)% |
|
Other (expense) income |
|
|
1.0 |
|
|
|
0.1 |
|
|
|
0.9 |
|
|
n.m. |
|
|
|
Other (expense) income, net |
|
$ |
219.2 |
|
|
$ |
(233.8 |
) |
|
$ |
453.0 |
|
|
|
|
|
Pfizer termination fee
On November 23, 2015, the Company announced that it entered into a definitive merger agreement (the “Pfizer Agreement”) under which Pfizer Inc. (“Pfizer”), a global innovative biopharmaceutical company, and Allergan plc would merge in a stock and cash transaction. On April 6, 2016, the Company announced that its merger agreement with Pfizer was terminated by mutual agreement. In connection with the termination, Pfizer agreed to pay the Company $150.0 million for reimbursement of expenses associated with the transaction, which was reported as other income during the year ended December 31, 2016.
Dividend income
Dividend income in the year ended December 31, 2016 is a result of the Company’s investment in Teva ordinary shares received in the Teva Transaction. Teva shares currently pay dividends quarterly.
67
During the year ended December 31, 2015, we incurred costs associated with bridge loan commitments in connection with the Allergan Acquisition of $264.9 million.
Interest rate lock
During the year ended December 31, 2015, the Company entered into interest rate locks on a portion of the $21.0 billion of debt issued as part of the Allergan Acquisition. As a result of the interest rate locks, the Company recorded income of $31.0 million.
(Benefit) for Income Taxes
|
|
|
Years Ended December 31, |
|
|
Change |
|
||||||||||
|
($ in millions) |
|
2016 |
|
|
2015 |
|
|
Dollars |
|
|
% |
|
||||
|
(Benefit) for income taxes |
|
$ |
(1,897.0 |
) |
|
$ |
(1,605.9 |
) |
|
$ |
(291.1 |
) |
|
|
18.1 |
% |
|
Effective tax rate |
|
|
(67.0 |
)% |
|
|
(35.3 |
)% |
|
|
|
|
|
|
|
|
The Company’s effective tax rate for the twelve months ended December 31, 2016 was a benefit of (67.0%) compared to a benefit of (35.3%) for the twelve months ended December 31, 2015. The reconciliations between the statutory Irish tax rates for Allergan plc and the effective income tax rates were as follows:
|
|
|
Allergan plc |
|
|||||
|
|
|
Years Ended December 31, |
|
|||||
|
|
|
2016 |
|
|
2015 |
|
||
|
Statutory rate |
|
|
(12.5 |
%) |
|
|
(12.5 |
%) |
|
Earnings subject to the U.S. federal and state tax rates (1) (3) |
|
|
(37.5 |
%) |
|
|
(18.6 |
%) |
|
Earnings subject to rates different than the statutory rate (2)(3) |
|
|
(18.3 |
%) |
|
|
(2.2 |
%) |
|
Tax reserves and audit outcomes |
|
|
(0.7 |
%) |
|
|
0.3 |
% |
|
Non-deductible expenses |
|
|
3.1 |
% |
|
|
1.3 |
% |
|
Impact of acquisitions and reorganizations |
|
|
3.1 |
% |
|
|
4.0 |
% |
|
Tax credits and U.S. manufacturing deduction |
|
|
(3.1 |
%) |
|
|
(0.5 |
%) |
|
Rate changes (4) |
|
|
(7.4 |
%) |
|
|
0.0 |
% |
|
Valuation allowances (5) |
|
|
6.5 |
% |
|
|
(6.5 |
%) |
|
Other |
|
|
(0.2 |
%) |
|
|
(0.6 |
%) |
|
Effective income tax rate |
|
|
(67.0 |
%) |
|
|
(35.3 |
%) |
The material drivers of the period-over-period tax rate movements are as follows:
|
(1) |
Earnings subject to U.S. federal and state tax had a larger impact on the effective tax rate for the period ended December 31, 2016 compared to the period ended December 31, 2015 due to an increase in expenses in 2016. These expenses included a full year of amortization expense related to intangibles acquired as part of the Allergan Acquisition and incremental costs associated with the acquisition related financing. |
|
(2) |
Earnings subject to tax rates different than the statutory rate had a larger impact on the effective tax rate for the period ended December 31, 2016 compared to the period ended December 31, 2015. This was primarily driven by the inclusion of a full year of Allergan post-acquisition operating income earned in jurisdictions with tax rates lower than the Irish statutory rate and changes to the earnings mix resulting from restructuring associated with the sale of the global generics business. |
|
(3) |
In 2016, the Company recorded $6.5 billion of amortization expense. A significant portion of this amount was incurred in jurisdictions with tax rates higher than the statutory rate resulting in a $482.3 million favorable impact on the effective tax rate. |
|
(4) |
In the fourth quarter of 2016, a tax rate change was enacted in France resulting in a $209.0 million tax benefit. |
|
(5) |
In 2016, the Company recorded a tax expense of $183.8 million predominately related to a change in the valuation allowance on U.S. capital loss carryforwards resulting from restructuring associated with the sale of the global generics business. |
68
YEAR ENDED DECEMBER 31, 2015 COMPARED TO 2014
Results of operations, including segment net revenues, segment operating expenses and segment contribution consisted of the following ($ in millions):
|
|
|
Year Ended December 31, 2015 |
|
|||||||||||||||
|
|
|
US Specialized |
|
|
US General |
|
|
|
|
|
|
|
|
|
|
|
||
|
|
|
Therapeutics |
|
|
Medicine |
|
|
International |
|
|
|
|
Total |
|
||||
|
Net revenues |
|
$ |
4,309.8 |
|
|
$ |
6,338.4 |
|
|
$ |
2,187.3 |
|
|
|
|
$ |
12,835.5 |
|
|
|
|
|
|
|
|
|
|
|
|
|
|
|
|
|
|
|
|
|
|
Operating expenses: |
|
|
|
|
|
|
|
|
|
|
|
|
|
|
|
|
|
|
|
Cost of sales(1) |
|
|
235.8 |
|
|
|
909.5 |
|
|
|
350.9 |
|
|
|
|
|
1,496.2 |
|
|
Selling and marketing |
|
|
772.8 |
|
|
|
1,194.7 |
|
|
|
569.2 |
|
|
|
|
|
2,536.7 |
|
|
General and administrative |
|
|
68.3 |
|
|
|
105.3 |
|
|
|
107.6 |
|
|
|
|
|
281.2 |
|
|
Segment Contribution |
|
$ |
3,232.9 |
|
|
$ |
4,128.9 |
|
|
$ |
1,159.6 |
|
|
|
|
$ |
8,521.4 |
|
|
Contribution margin |
|
|
75.0 |
% |
|
|
65.1 |
% |
|
|
53.0 |
% |
|
|
|
|
66.4 |
% |
|
Corporate |
|
|
|
|
|
|
|
|
|
|
|
|
|
|
|
|
3,066.6 |
|
|
Research and development |
|
|
|
|
|
|
|
|
|
|
|
|
|
|
|
|
2,358.5 |
|
|
Amortization |
|
|
|
|
|
|
|
|
|
|
|
|
|
|
|
|
5,443.7 |
|
|
In-process research and development impairments |
|
|
|
|
|
|
|
|
|
|
|
|
|
|
|
|
511.6 |
|
|
Asset sales and impairments, net |
|
|
|
|
|
|
|
|
|
|
|
|
|
|
|
|
272.0 |
|
|
Operating (loss) |
|
|
|
|
|
|
|
|
|
|
|
|
|
|
|
$ |
(3,131.0 |
) |
|
Operating margin |
|
|
|
|
|
|
|
|
|
|
|
|
|
|
|
|
(24.4 |
)% |
|
|
|
|
|
|
|
|
|
|
|
|
|
|
|
|
|
|
|
|
|
(1) Excludes amortization and impairment of acquired intangibles including product rights. |
|
|
|
|
|
|
|
|||||||||||
|
|
|
|
|
|
|
|
|
|
|
|
|
|
|
|
|
|
|
|
|
|
|
Year Ended December 31, 2014 |
|
|||||||||||||||
|
|
|
US Specialized |
|
|
US General |
|
|
|
|
|
|
|
|
|
|
|
||
|
|
|
Therapeutics |
|
|
Medicine |
|
|
International |
|
|
|
|
Total |
|
||||
|
|
|
|
|
|
|
|
|
|
|
|
|
|
|
|
|
|
|
|
|
Net revenues |
|
$ |
111.9 |
|
|
$ |
4,399.3 |
|
|
$ |
203.5 |
|
|
|
|
$ |
4,714.7 |
|
|
|
|
|
|
|
|
|
|
|
|
|
|
|
|
|
|
|
|
|
|
Operating expenses: |
|
|
|
|
|
|
|
|
|
|
|
|
|
|
|
|
|
|
|
Cost of sales(1) |
|
|
29.2 |
|
|
|
707.5 |
|
|
|
48.2 |
|
|
|
|
|
784.9 |
|
|
Selling and marketing |
|
|
11.8 |
|
|
|
794.6 |
|
|
|
48.2 |
|
|
|
|
|
854.6 |
|
|
General and administrative |
|
|
3.0 |
|
|
|
116.5 |
|
|
|
12.0 |
|
|
|
|
|
131.5 |
|
|
Segment Contribution |
|
$ |
67.9 |
|
|
$ |
2,780.7 |
|
|
$ |
95.1 |
|
|
|
|
$ |
2,943.7 |
|
|
Contribution margin |
|
|
60.7 |
% |
|
|
63.2 |
% |
|
|
46.7 |
% |
|
|
|
|
62.4 |
% |
|
Corporate |
|
|
|
|
|
|
|
|
|
|
|
|
|
|
|
|
2,239.4 |
|
|
Research and development |
|
|
|
|
|
|
|
|
|
|
|
|
|
|
|
|
605.7 |
|
|
Amortization |
|
|
|
|
|
|
|
|
|
|
|
|
|
|
|
|
1,935.8 |
|
|
In-process research and development impairments |
|
|
|
|
|
|
|
|
|
|
|
|
|
|
|
|
424.3 |
|
|
Asset sales and impairments, net |
|
|
|
|
|
|
|
|
|
|
|
|
|
|
|
|
305.7 |
|
|
Operating (loss) |
|
|
|
|
|
|
|
|
|
|
|
|
|
|
|
$ |
(2,567.2 |
) |
|
Operating margin |
|
|
|
|
|
|
|
|
|
|
|
|
|
|
|
|
(54.5 |
)% |
|
|
|
|
|
|
|
|
|
|
|
|
|
|
|
|
|
|
|
|
|
(1) Excludes amortization and impairment of acquired intangibles including product rights. |
|
|
|
|
|
|
|
|||||||||||
69
The following is a reconciliation of net revenues for the operating segments to the Company’s net revenues for the years ended December 31, 2015 and 2014 ($ in millions):
|
|
|
Years Ended December 31, |
|
|
Change |
|
||||||||||
|
|
|
2015 |
|
|
2014 |
|
|
Dollars |
|
|
% |
|
||||
|
Segment net revenues |
|
$ |
12,835.5 |
|
|
$ |
4,714.7 |
|
|
$ |
8,120.8 |
|
|
|
172.2 |
% |
|
Corporate revenues |
|
|
(147.4 |
) |
|
|
(38.2 |
) |
|
|
(109.2 |
) |
|
n.m. |
|
|
|
Net revenues |
|
$ |
12,688.1 |
|
|
$ |
4,676.5 |
|
|
$ |
8,011.6 |
|
|
|
171.3 |
% |
No country represents ten percent or more of net revenues outside of the United States. The US Specialized Therapeutics and US General Medicine segments are comprised solely of sales within the United States.
The following table presents global net revenues for the top products of the Company for the years ended December 31, 2015 and 2014 ($ in millions):
|
|
Year Ended December 31, 2015 |
|
Year Ended December 31, 2014 |
|
Change |
|
||||||||||||||||||||||||||||||
|
|
US Specialized Therapeutics |
|
US General Medicine |
|
International |
|
Corporate |
|
Total |
|
US Specialized Therapeutics |
|
US General Medicine |
|
International |
|
Corporate |
|
Total |
|
Dollars |
|
Percentage |
|
||||||||||||
|
Botox® |
$ |
1,386.4 |
|
$ |
- |
|
$ |
584.4 |
|
$ |
- |
|
$ |
1,970.8 |
|
$ |
- |
|
$ |
- |
|
$ |
- |
|
$ |
- |
|
$ |
- |
|
$ |
1,970.8 |
|
n.a. |
|
|
|
Restasis® |
|
999.6 |
|
|
- |
|
|
48.2 |
|
|
- |
|
|
1,047.8 |
|
|
- |
|
|
- |
|
|
- |
|
|
- |
|
|
- |
|
|
1,047.8 |
|
n.a. |
|
|
|
Fillers |
|
304.4 |
|
|
- |
|
|
269.5 |
|
|
- |
|
|
573.9 |
|
|
- |
|
|
- |
|
|
- |
|
|
- |
|
|
- |
|
|
573.9 |
|
n.a. |
|
|
|
Lumigan®/Ganfort® |
|
260.7 |
|
|
- |
|
|
283.4 |
|
|
- |
|
|
544.1 |
|
|
- |
|
|
- |
|
|
- |
|
|
- |
|
|
- |
|
|
544.1 |
|
n.a. |
|
|
|
Linzess®/Constella® |
|
- |
|
|
454.8 |
|
|
4.5 |
|
|
- |
|
|
459.3 |
|
|
- |
|
|
173.2 |
|
|
1.2 |
|
|
- |
|
|
174.4 |
|
|
284.9 |
|
|
163.4 |
% |
|
Bystolic® / Byvalson® |
|
- |
|
|
644.8 |
|
|
1.3 |
|
|
- |
|
|
646.1 |
|
|
- |
|
|
291.6 |
|
|
0.9 |
|
|
- |
|
|
292.5 |
|
|
353.6 |
|
|
120.9 |
% |
|
Namenda XR® |
|
- |
|
|
759.3 |
|
|
- |
|
|
- |
|
|
759.3 |
|
|
- |
|
|
269.5 |
|
|
- |
|
|
- |
|
|
269.5 |
|
|
489.8 |
|
|
181.7 |
% |
|
Alphagan®/Combigan® |
|
285.0 |
|
|
- |
|
|
126.1 |
|
|
- |
|
|
411.1 |
|
|
- |
|
|
- |
|
|
- |
|
|
- |
|
|
- |
|
|
411.1 |
|
n.a. |
|
|
|
Asacol®/Delzicol® |
|
- |
|
|
552.9 |
|
|
65.5 |
|
|
- |
|
|
618.4 |
|
|
- |
|
|
541.0 |
|
|
73.1 |
|
|
- |
|
|
614.1 |
|
|
4.3 |
|
|
0.7 |
% |
|
Lo Loestrin® |
|
- |
|
|
346.5 |
|
|
3.1 |
|
|
- |
|
|
349.6 |
|
|
- |
|
|
275.7 |
|
|
- |
|
|
- |
|
|
275.7 |
|
|
73.9 |
|
|
26.8 |
% |
|
Estrace® Cream |
|
- |
|
|
326.2 |
|
|
- |
|
|
- |
|
|
326.2 |
|
|
- |
|
|
258.2 |
|
|
- |
|
|
- |
|
|
258.2 |
|
|
68.0 |
|
|
26.3 |
% |
|
Eye Drops |
|
177.0 |
|
|
- |
|
|
220.6 |
|
|
- |
|
|
397.6 |
|
|
- |
|
|
- |
|
|
- |
|
|
- |
|
|
- |
|
|
397.6 |
|
n.a. |
|
|
|
Breast Implants |
|
175.0 |
|
|
- |
|
|
125.5 |
|
|
- |
|
|
300.5 |
|
|
- |
|
|
- |
|
|
- |
|
|
- |
|
|
- |
|
|
300.5 |
|
n.a. |
|
|
|
Viibryd®/Fetzima® |
|
- |
|
|
327.6 |
|
|
- |
|
|
- |
|
|
327.6 |
|
|
- |
|
|
140.3 |
|
|
- |
|
|
- |
|
|
140.3 |
|
|
187.3 |
|
|
133.5 |
% |
|
Minastrin® 24 |
|
- |
|
|
272.4 |
|
|
0.6 |
|
|
- |
|
|
273.0 |
|
|
- |
|
|
217.9 |
|
|
- |
|
|
- |
|
|
217.9 |
|
|
55.1 |
|
|
25.3 |
% |
|
Ozurdex ® |
|
56.1 |
|
|
- |
|
|
112.3 |
|
|
- |
|
|
168.4 |
|
|
- |
|
|
- |
|
|
- |
|
|
- |
|
|
- |
|
|
168.4 |
|
n.a. |
|
|
|
Carafate ® / Sulcrate ® |
|
- |
|
|
213.1 |
|
|
- |
|
|
- |
|
|
213.1 |
|
|
- |
|
|
90.9 |
|
|
1.3 |
|
|
- |
|
|
92.2 |
|
|
120.9 |
|
|
131.1 |
% |
|
Aczone® |
|
170.8 |
|
|
- |
|
|
- |
|
|
- |
|
|
170.8 |
|
|
- |
|
|
- |
|
|
- |
|
|
- |
|
|
- |
|
|
170.8 |
|
n.a. |
|
|
|
Zenpep® |
|
- |
|
|
167.4 |
|
|
- |
|
|
- |
|
|
167.4 |
|
|
- |
|
|
65.1 |
|
|
- |
|
|
- |
|
|
65.1 |
|
|
102.3 |
|
|
157.1 |
% |
|
Canasa®/Salofalk® |
|
- |
|
|
137.1 |
|
|
18.5 |
|
|
- |
|
|
155.6 |
|
|
- |
|
|
74.6 |
|
|
11.5 |
|
|
- |
|
|
86.1 |
|
|
69.5 |
|
|
80.7 |
% |
|
Saphris® |
|
- |
|
|
186.7 |
|
|
- |
|
|
- |
|
|
186.7 |
|
|
- |
|
|
69.9 |
|
|
- |
|
|
- |
|
|
69.9 |
|
|
116.8 |
|
|
167.1 |
% |
|
Armour Thyroid |
|
- |
|
|
130.8 |
|
|
- |
|
|
- |
|
|
130.8 |
|
|
- |
|
|
47.9 |
|
|
- |
|
|
- |
|
|
47.9 |
|
|
82.9 |
|
|
173.1 |
% |
|
Teflaro® |
|
- |
|
|
137.6 |
|
|
- |
|
|
- |
|
|
137.6 |
|
|
- |
|
|
56.2 |
|
|
- |
|
|
- |
|
|
56.2 |
|
|
81.4 |
|
|
144.8 |
% |
|
Rapaflo® |
|
115.2 |
|
|
- |
|
|
10.9 |
|
|
- |
|
|
126.1 |
|
|
111.9 |
|
|
- |
|
|
5.2 |
|
|
- |
|
|
117.1 |
|
|
9.0 |
|
|
7.7 |
% |
|
SkinMedica® |
|
76.6 |
|
|
- |
|
|
- |
|
|
- |
|
|
76.6 |
|
|
- |
|
|
- |
|
|
- |
|
|
- |
|
|
- |
|
|
76.6 |
|
n.a. |
|
|
|
Savella® |
|
- |
|
|
106.4 |
|
|
- |
|
|
- |
|
|
106.4 |
|
|
- |
|
|
49.4 |
|
|
- |
|
|
- |
|
|
49.4 |
|
|
57.0 |
|
|
115.4 |
% |
|
Tazorac® |
|
92.3 |
|
|
- |
|
|
1.4 |
|
|
- |
|
|
93.7 |
|
|
- |
|
|
- |
|
|
- |
|
|
- |
|
|
- |
|
|
93.7 |
|
n.a. |
|
|
|
Vraylar™ |
|
- |
|
|
- |
|
|
- |
|
|
- |
|
|
- |
|
|
- |
|
|
- |
|
|
- |
|
|
- |
|
|
- |
|
|
- |
|
n.a. |
|
|
|
Viberzi® |
|
- |
|
|
12.3 |
|
|
- |
|
|
- |
|
|
12.3 |
|
|
- |
|
|
- |
|
|
- |
|
|
- |
|
|
- |
|
|
12.3 |
|
n.a. |
|
|
|
Latisse® |
|
63.2 |
|
|
- |
|
|
10.0 |
|
|
- |
|
|
73.2 |
|
|
- |
|
|
- |
|
|
- |
|
|
- |
|
|
- |
|
|
73.2 |
|
n.a. |
|
|
|
Lexapro® |
|
- |
|
|
71.6 |
|
|
- |
|
|
- |
|
|
71.6 |
|
|
- |
|
|
35.1 |
|
|
- |
|
|
- |
|
|
35.1 |
|
|
36.5 |
|
|
104.0 |
% |
|
Namzaric® |
|
- |
|
|
11.2 |
|
|
- |
|
|
- |
|
|
11.2 |
|
|
- |
|
|
- |
|
|
- |
|
|
- |
|
|
- |
|
|
11.2 |
|
n.a. |
|
|
|
Kybella® / Belkyra® |
|
3.2 |
|
|
- |
|
|
- |
|
|
- |
|
|
3.2 |
|
|
- |
|
|
- |
|
|
- |
|
|
- |
|
|
- |
|
|
3.2 |
|
n.a. |
|
|
|
Dalvance® |
|
- |
|
|
16.8 |
|
|
- |
|
|
- |
|
|
16.8 |
|
|
- |
|
|
1.4 |
|
|
- |
|
|
- |
|
|
1.4 |
|
|
15.4 |
|
n.m. |
|
|
|
Avycaz® |
|
- |
|
|
22.6 |
|
|
- |
|
|
- |
|
|
22.6 |
|
|
- |
|
|
- |
|
|
- |
|
|
- |
|
|
- |
|
|
22.6 |
|
n.a. |
|
|
|
Liletta® |
|
- |
|
|
14.8 |
|
|
- |
|
|
- |
|
|
14.8 |
|
|
- |
|
|
- |
|
|
- |
|
|
- |
|
|
- |
|
|
14.8 |
|
n.a. |
|
|
|
Enablex® |
|
- |
|
|
69.2 |
|
|
- |
|
|
- |
|
|
69.2 |
|
|
- |
|
|
85.9 |
|
|
- |
|
|
- |
|
|
85.9 |
|
|
(16.7 |
) |
|
(19.4 |
)% |
|
Namenda® IR |
|
- |
|
|
556.3 |
|
|
- |
|
|
- |
|
|
556.3 |
|
|
- |
|
|
629.7 |
|
|
- |
|
|
- |
|
|
629.7 |
|
|
(73.4 |
) |
|
(11.7 |
)% |
|
Other Products Revenues |
|
144.3 |
|
|
800.0 |
|
|
301.5 |
|
|
10.0 |
|
|
1,255.8 |
|
|
- |
|
|
1,025.8 |
|
|
110.3 |
|
|
- |
|
|
1,136.1 |
|
|
119.7 |
|
|
10.5 |
% |
|
Less product sold through our Anda Distribution business |
n.a. |
|
n.a. |
|
n.a. |
|
|
(157.4 |
) |
|
(157.4 |
) |
n.a. |
|
n.a. |
|
n.a. |
|
|
(38.2 |
) |
|
(38.2 |
) |
|
(119.2 |
) |
n.m. |
|
|||||||
|
Total Net Revenues |
$ |
4,309.8 |
|
$ |
6,338.4 |
|
$ |
2,187.3 |
|
$ |
(147.4 |
) |
$ |
12,688.1 |
|
$ |
111.9 |
|
$ |
4,399.3 |
|
$ |
203.5 |
|
$ |
(38.2 |
) |
$ |
4,676.5 |
|
$ |
8,011.6 |
|
|
171.3 |
% |
70
US Specialized Therapeutics Segment
The following table presents net contribution for the US Specialized Therapeutics segment for the years ended December 31, 2015 and 2014 ($ in millions):
|
|
Years Ended December 31, |
|
|
Change |
|
||||||||||
|
|
2015 (1) |
|
|
2014 (1) |
|
|
Dollars |
|
|
% |
|
||||
|
Total Eye Care |
$ |
1,831.3 |
|
|
$ |
- |
|
|
$ |
1,831.3 |
|
|
n.a. |
|
|
|
Restasis® |
|
999.6 |
|
|
|
- |
|
|
|
999.6 |
|
|
n.a. |
|
|
|
Alphagan®/Combigan® |
|
285.0 |
|
|
|
- |
|
|
|
285.0 |
|
|
n.a. |
|
|
|
Lumigan®/Ganfort® |
|
260.7 |
|
|
|
- |
|
|
|
260.7 |
|
|
n.a. |
|
|
|
Ozurdex® |
|
56.1 |
|
|
|
- |
|
|
|
56.1 |
|
|
n.a. |
|
|
|
Eye Drops |
|
177.0 |
|
|
|
- |
|
|
|
177.0 |
|
|
n.a. |
|
|
|
Other Eye Care |
|
52.9 |
|
|
|
- |
|
|
|
52.9 |
|
|
n.a. |
|
|
|
Total Medical Aesthetics |
|
1,145.0 |
|
|
|
- |
|
|
|
1,145.0 |
|
|
n.a. |
|
|
|
Facial Aesthetics |
|
817.8 |
|
|
|
- |
|
|
|
817.8 |
|
|
n.a. |
|
|
|
Botox® Cosmetics |
|
510.2 |
|
|
|
- |
|
|
|
510.2 |
|
|
n.a. |
|
|
|
Fillers |
|
304.4 |
|
|
|
- |
|
|
|
304.4 |
|
|
n.a. |
|
|
|
Kybella® |
|
3.2 |
|
|
|
- |
|
|
|
3.2 |
|
|
n.a. |
|
|
|
Plastic Surgery |
|
187.4 |
|
|
|
- |
|
|
|
187.4 |
|
|
n.a. |
|
|
|
Breast Implants |
|
175.0 |
|
|
|
- |
|
|
|
175.0 |
|
|
n.a. |
|
|
|
Other Plastic Surgery |
|
12.4 |
|
|
|
- |
|
|
|
12.4 |
|
|
n.a. |
|
|
|
Skin Care |
|
139.8 |
|
|
|
- |
|
|
|
139.8 |
|
|
n.a. |
|
|
|
SkinMedica® |
|
76.6 |
|
|
|
- |
|
|
|
76.6 |
|
|
n.a. |
|
|
|
Latisse® |
|
63.2 |
|
|
|
- |
|
|
|
63.2 |
|
|
n.a. |
|
|
|
Total Medical Dermatology |
|
355.9 |
|
|
|
- |
|
|
|
355.9 |
|
|
n.a. |
|
|
|
Aczone® |
|
170.8 |
|
|
|
- |
|
|
|
170.8 |
|
|
n.a. |
|
|
|
Tazorac® |
|
92.3 |
|
|
|
- |
|
|
|
92.3 |
|
|
n.a. |
|
|
|
Botox® Hyperhidrosis |
|
52.5 |
|
|
|
- |
|
|
|
52.5 |
|
|
n.a. |
|
|
|
Other Medical Dermatology |
|
40.3 |
|
|
|
- |
|
|
|
40.3 |
|
|
n.a. |
|
|
|
Total Neuroscience & Urology |
|
938.9 |
|
|
|
111.9 |
|
|
|
827.0 |
|
|
n.m. |
|
|
|
Botox® Therapeutics |
|
823.7 |
|
|
|
- |
|
|
|
823.7 |
|
|
n.a. |
|
|
|
Rapaflo® |
|
115.2 |
|
|
|
111.9 |
|
|
|
3.3 |
|
|
|
2.9 |
% |
|
Other Neuroscience & Urology |
|
- |
|
|
|
- |
|
|
|
- |
|
|
n.a. |
|
|
|
Other Revenues |
|
38.7 |
|
|
|
- |
|
|
|
38.7 |
|
|
n.a. |
|
|
|
Net revenues |
$ |
4,309.8 |
|
|
$ |
111.9 |
|
|
$ |
4,197.9 |
|
|
n.m. |
|
|
|
Operating expenses: |
|
|
|
|
|
|
|
|
|
|
|
|
|
|
|
|
Cost of sales(2) |
|
235.8 |
|
|
|
29.2 |
|
|
|
206.6 |
|
|
n.m. |
|
|
|
Selling and marketing |
|
772.8 |
|
|
|
11.8 |
|
|
|
761.0 |
|
|
n.m. |
|
|
|
General and administrative |
|
68.3 |
|
|
|
3.0 |
|
|
|
65.3 |
|
|
n.m. |
|
|
|
Segment contribution |
$ |
3,232.9 |
|
|
$ |
67.9 |
|
|
$ |
3,165.0 |
|
|
n.m. |
|
|
|
Segment margin |
|
75.0 |
% |
|
|
60.7 |
% |
|
|
|
|
|
n.m. |
|
|
|
Segment gross margin(3) |
|
94.5 |
% |
|
|
73.9 |
% |
|
|
|
|
|
n.m. |
|
|
|
(1) |
Includes revenues earned that were distributed through the Anda Distribution business to third party customers. |
|
(2) |
Excludes amortization and impairment of acquired intangibles including product rights, as well as indirect cost of sales not attributable to segment results. |
|
(3) |
Defined as net revenues less segment related cost of sales as a percentage of net revenues. |
The US Specialized Therapeutics segment is primarily attributable to the Allergan Acquisition. As such, the increased contribution is not comparable year-over-year.
71
The following table presents net contribution for the US General Medicine segment for the years ended December 31, 2015 and 2014 ($ in millions):
|
|
Years Ended December 31, |
|
|
Change |
|
||||||||||
|
|
2015 (1) |
|
|
2014 (1) |
|
|
Dollars |
|
|
% |
|
||||
|
Total Central Nervous System (CNS) |
$ |
1,841.1 |
|
|
$ |
1,109.4 |
|
|
$ |
731.7 |
|
|
|
66.0 |
% |
|
Namenda XR® |
|
759.3 |
|
|
|
269.5 |
|
|
|
489.8 |
|
|
|
181.7 |
% |
|
Namzaric® |
|
11.2 |
|
|
|
- |
|
|
|
11.2 |
|
|
n.a. |
|
|
|
Viibryd®/Fetzima® |
|
327.6 |
|
|
|
140.3 |
|
|
|
187.3 |
|
|
|
133.5 |
% |
|
Saphris® |
|
186.7 |
|
|
|
69.9 |
|
|
|
116.8 |
|
|
|
167.1 |
% |
|
Vraylar™ |
|
- |
|
|
|
- |
|
|
|
- |
|
|
n.a. |
|
|
|
Namenda® IR |
|
556.3 |
|
|
|
629.7 |
|
|
|
(73.4 |
) |
|
|
(11.7 |
)% |
|
Total Gastrointestinal (GI) |
|
1,575.3 |
|
|
|
966.8 |
|
|
|
608.5 |
|
|
|
62.9 |
% |
|
Linzess® |
|
454.8 |
|
|
|
173.2 |
|
|
|
281.6 |
|
|
|
162.6 |
% |
|
Asacol®/Delzicol® |
|
552.9 |
|
|
|
541.0 |
|
|
|
11.9 |
|
|
|
2.2 |
% |
|
Carafate®/Sulcrate® |
|
213.1 |
|
|
|
90.9 |
|
|
|
122.2 |
|
|
|
134.4 |
% |
|
Zenpep® |
|
167.4 |
|
|
|
65.1 |
|
|
|
102.3 |
|
|
|
157.1 |
% |
|
Canasa®/Salofalk® |
|
137.1 |
|
|
|
74.6 |
|
|
|
62.5 |
|
|
|
83.8 |
% |
|
Viberzi® |
|
12.3 |
|
|
|
- |
|
|
|
12.3 |
|
|
n.a. |
|
|
|
Other GI |
|
37.7 |
|
|
|
22.0 |
|
|
|
15.7 |
|
|
|
71.4 |
% |
|
Total Women's Health |
|
998.0 |
|
|
|
791.7 |
|
|
|
206.3 |
|
|
|
26.1 |
% |
|
Lo Loestrin® |
|
346.5 |
|
|
|
275.7 |
|
|
|
70.8 |
|
|
|
25.7 |
% |
|
Estrace® Cream |
|
326.2 |
|
|
|
258.2 |
|
|
|
68.0 |
|
|
|
26.3 |
% |
|
Minastrin® 24 |
|
272.4 |
|
|
|
217.9 |
|
|
|
54.5 |
|
|
|
25.0 |
% |
|
Liletta® |
|
14.8 |
|
|
|
- |
|
|
|
14.8 |
|
|
n.a. |
|
|
|
Other Women's Health |
|
38.1 |
|
|
|
39.9 |
|
|
|
(1.8 |
) |
|
|
(4.5 |
)% |
|
Total Anti-Infectives |
|
188.8 |
|
|
|
62.7 |
|
|
|
126.1 |
|
|
n.m. |
|
|
|
Teflaro® |
|
137.6 |
|
|
|
56.2 |
|
|
|
81.4 |
|
|
|
144.8 |
% |
|
Dalvance® |
|
16.8 |
|
|
|
1.4 |
|
|
|
15.4 |
|
|
n.m. |
|
|
|
Avycaz® |
|
22.6 |
|
|
|
- |
|
|
|
22.6 |
|
|
n.a. |
|
|
|
Other Anti-Infectives |
|
11.8 |
|
|
|
5.1 |
|
|
|
6.7 |
|
|
|
131.4 |
% |
|
Diversified Brands |
|
1,649.2 |
|
|
|
1,411.5 |
|
|
|
237.7 |
|
|
|
16.8 |
% |
|
Bystolic® / Byvalson® |
|
644.8 |
|
|
|
291.6 |
|
|
|
353.2 |
|
|
|
121.1 |
% |
|
Armour Thyroid |
|
130.8 |
|
|
|
47.9 |
|
|
|
82.9 |
|
|
|
173.1 |
% |
|
Savella® |
|
106.4 |
|
|
|
49.4 |
|
|
|
57.0 |
|
|
|
115.4 |
% |
|
Lexapro® |
|
71.6 |
|
|
|
35.1 |
|
|
|
36.5 |
|
|
|
104.0 |
% |
|
Enablex® |
|
69.2 |
|
|
|
85.9 |
|
|
|
(16.7 |
) |
|
|
(19.4 |
)% |
|
PacPharma |
|
82.1 |
|
|
|
- |
|
|
|
82.1 |
|
|
n.a. |
|
|
|
Other Diversified Brands |
|
544.3 |
|
|
|
901.6 |
|
|
|
(357.3 |
) |
|
|
(39.6 |
)% |
|
Other Revenues |
|
86.0 |
|
|
|
57.2 |
|
|
|
28.8 |
|
|
|
50.3 |
% |
|
Net revenues |
$ |
6,338.4 |
|
|
$ |
4,399.3 |
|
|
$ |
1,939.1 |
|
|
|
44.1 |
% |
|
Operating expenses: |
|
|
|
|
|
|
|
|
|
|
|
|
|
|
|
|
Cost of sales(2) |
|
909.5 |
|
|
|
707.5 |
|
|
|
202.0 |
|
|
|
28.6 |
% |
|
Selling and marketing |
|
1,194.7 |
|
|
|
794.6 |
|
|
|
400.1 |
|
|
|
50.4 |
% |
|
General and administrative |
|
105.3 |
|
|
|
116.5 |
|
|
|
(11.2 |
) |
|
|
(9.6 |
)% |
|
Segment contribution |
$ |
4,128.9 |
|
|
$ |
2,780.7 |
|
|
$ |
1,348.2 |
|
|
|
48.5 |
% |
|
Segment margin |
|
65.1 |
% |
|
|
63.2 |
% |
|
|
|
|
|
|
1.9 |
% |
|
Segment gross margin(3) |
|
85.7 |
% |
|
|
83.9 |
% |
|
|
|
|
|
|
1.8 |
% |
|
(1) |
Includes revenues earned that were distributed through the Anda Distribution business to third party customers. |
72
|
(2) |
Excludes amortization and impairment of acquired intangibles including product rights, as well as indirect cost of sales not attributable to segment results. |
|
(3) |
Defined as net revenues less segment related cost of sales as a percentage of net revenues. |
The increase in segment revenues is primarily due to a full year of contribution from the Forest Acquisition versus six months in the year ended December 31, 2014. The increase in Women’s Health is due to growth in oral contraceptives and Estrace® Cream.
The increase in operating expenses is due to a full year of contribution from the Forest Acquisition versus six months in the year ended December 31, 2014, offset, in part by savings due to corporate initiatives due to the restructurings after the Forest Acquisition and Warner Chilcott Acquisition during 2014 and the year ended December 31, 2015.
International Segment
The following table presents net contribution for the International segment for the years ended December 31, 2015 and 2014 ($ in millions):
|
|
Years Ended December 31, |
|
|
Change |
|
||||||||||||||||||||||||||
|
|
2015 |
|
|
2014 |
|
|
$ Overall Change |
|
|
$ Currency Change |
|
|
$ Operational Change |
|
|
% Overall Change |
|
|
% Currency Change |
|
|
% Operational Change |
|
||||||||
|
Total Eye Care |
$ |
918.7 |
|
|
$ |
- |
|
|
$ |
918.7 |
|
|
$ |
- |
|
|
$ |
918.7 |
|
|
n.a. |
|
|
n.a. |
|
|
n.a. |
|
|||
|
Lumigan®/Ganfort® |
|
283.4 |
|
|
|
- |
|
|
|
283.4 |
|
|
|
- |
|
|
|
283.4 |
|
|
n.a. |
|
|
n.a. |
|
|
n.a. |
|
|||
|
Alphagan®/Combigan® |
|
126.1 |
|
|
|
- |
|
|
|
126.1 |
|
|
|
- |
|
|
|
126.1 |
|
|
n.a. |
|
|
n.a. |
|
|
n.a. |
|
|||
|
Ozurdex® |
|
112.3 |
|
|
|
- |
|
|
|
112.3 |
|
|
|
- |
|
|
|
112.3 |
|
|
n.a. |
|
|
n.a. |
|
|
n.a. |
|
|||
|
Optive® |
|
76.9 |
|
|
|
- |
|
|
|
76.9 |
|
|
|
- |
|
|
|
76.9 |
|
|
n.a. |
|
|
n.a. |
|
|
n.a. |
|
|||
|
Other Eye Drops |
|
143.7 |
|
|
|
- |
|
|
|
143.7 |
|
|
|
- |
|
|
|
143.7 |
|
|
n.a. |
|
|
n.a. |
|
|
n.a. |
|
|||
|
Restasis® |
|
48.2 |
|
|
|
- |
|
|
|
48.2 |
|
|
|
- |
|
|
|
48.2 |
|
|
n.a. |
|
|
n.a. |
|
|
n.a. |
|
|||
|
Other Eye Care |
|
128.1 |
|
|
|
- |
|
|
|
128.1 |
|
|
|
- |
|
|
|
128.1 |
|
|
n.a. |
|
|
n.a. |
|
|
n.a. |
|
|||
|
Total Medical Aesthetics |
|
756.3 |
|
|
|
- |
|
|
|
756.3 |
|
|
|
- |
|
|
|
756.3 |
|
|
n.a. |
|
|
n.a. |
|
|
n.a. |
|
|||
|
Facial Aesthetics |
|
619.8 |
|
|
|
- |
|
|
|
619.8 |
|
|
|
- |
|
|
|
619.8 |
|
|
n.a. |
|
|
n.a. |
|
|
n.a. |
|
|||
|
Botox® Cosmetics |
|
350.3 |
|
|
|
- |
|
|
|
350.3 |
|
|
|
- |
|
|
|
350.3 |
|
|
n.a. |
|
|
n.a. |
|
|
n.a. |
|
|||
|
Fillers |
|
269.5 |
|
|
|
- |
|
|
|
269.5 |
|
|
|
- |
|
|
|
269.5 |
|
|
n.a. |
|
|
n.a. |
|
|
n.a. |
|
|||
|
Belkyra® (Kybella®) |
|
- |
|
|
|
- |
|
|
|
- |
|
|
|
- |
|
|
|
- |
|
|
n.a. |
|
|
n.a. |
|
|
n.a. |
|
|||
|
Plastic Surgery |
|
125.6 |
|
|
|
- |
|
|
|
125.6 |
|
|
|
- |
|
|
|
125.6 |
|
|
n.a. |
|
|
n.a. |
|
|
n.a. |
|
|||
|
Breast Implants |
|
125.5 |
|
|
|
- |
|
|
|
125.5 |
|
|
|
- |
|
|
|
125.5 |
|
|
n.a. |
|
|
n.a. |
|
|
n.a. |
|
|||
|
Earfold™ |
|
0.1 |
|
|
|
- |
|
|
|
0.1 |
|
|
|
- |
|
|
|
0.1 |
|
|
n.a. |
|
|
n.a. |
|
|
n.a. |
|
|||
|
Skin Care |
|
10.9 |
|
|
|
- |
|
|
|
10.9 |
|
|
|
- |
|
|
|
10.9 |
|
|
n.a. |
|
|
n.a. |
|
|
n.a. |
|
|||
|
Botox® Therapeutics and Other |
|
453.7 |
|
|
|
193.3 |
|
|
|
260.4 |
|
|
|
(24.3 |
) |
|
|
284.7 |
|
|
|
134.7 |
% |
|
|
(12.6 |
)% |
|
|
147.3 |
% |
|
Botox® Therapeutics |
|
234.1 |
|
|
|
- |
|
|
|
234.1 |
|
|
|
- |
|
|
|
234.1 |
|
|
n.a. |
|
|
n.a. |
|
|
n.a. |
|
|||
|
Asacol®/Delzicol® |
|
65.5 |
|
|
|
73.1 |
|
|
|
(7.6 |
) |
|
|
(6.5 |
) |
|
|
(1.1 |
) |
|
|
(10.4 |
)% |
|
|
(8.9 |
)% |
|
|
(1.5 |
)% |
|
Constella® |
|
4.5 |
|
|
|
1.2 |
|
|
|
3.3 |
|
|
|
- |
|
|
|
3.3 |
|
|
n.m. |
|
|
n.a. |
|
|
n.m. |
|
|||
|
Other Products |
|
149.6 |
|
|
|
119.0 |
|
|
|
30.6 |
|
|
|
(17.8 |
) |
|
|
48.4 |
|
|
|
25.7 |
% |
|
|
(15.0 |
)% |
|
|
40.7 |
% |
|
Other Revenues |
|
58.6 |
|
|
|
10.2 |
|
|
|
48.4 |
|
|
|
- |
|
|
|
48.4 |
|
|
n.m. |
|
|
n.a. |
|
|
n.m. |
|
|||
|
Net revenues |
$ |
2,187.3 |
|
|
$ |
203.5 |
|
|
$ |
1,983.8 |
|
|
$ |
(24.3 |
) |
|
$ |
2,008.1 |
|
|
n.m. |
|
|
|
(11.9 |
)% |
|
n.m. |
|
||
|
Operating expenses: |
|
|
|
|
|
|
|
|
|
|
|
|
|
|
|
|
|
|
|
|
|
|
|
|
|
|
|
|
|
|
|
|
Cost of sales(1) |
|
350.9 |
|
|
|
48.2 |
|
|
|
302.7 |
|
|
|
(5.8 |
) |
|
|
308.5 |
|
|
n.m. |
|
|
|
(12.0 |
)% |
|
n.m. |
|
||
|
Selling and marketing |
|
569.2 |
|
|
|
48.2 |
|
|
|
521.0 |
|
|
|
(5.8 |
) |
|
|
526.8 |
|
|
n.m. |
|
|
|
(12.0 |
)% |
|
n.m. |
|
||
|
General and administrative |
|
107.6 |
|
|
|
12.0 |
|
|
|
95.6 |
|
|
|
(1.4 |
) |
|
|
97.0 |
|
|
n.m. |
|
|
|
(11.7 |
)% |
|
n.m. |
|
||
|
Segment contribution |
$ |
1,159.6 |
|
|
$ |
95.1 |
|
|
$ |
1,064.5 |
|
|
$ |
(11.3 |
) |
|
$ |
1,075.8 |
|
|
n.m. |
|
|
|
(11.9 |
)% |
|
n.m. |
|
||
|
Segment margin |
|
53.0 |
% |
|
|
46.7 |
% |
|
|
|
|
|
|
|
|
|
|
|
|
|
|
6.3 |
% |
|
|
|
|
|
|
|
|
|
Segment gross margin(2) |
|
84.0 |
% |
|
|
76.3 |
% |
|
|
|
|
|
|
|
|
|
|
|
|
|
|
7.7 |
% |
|
|
|
|
|
|
|
|
|
(1) |
Excludes amortization and impairment of acquired intangibles including product rights, as well as indirect cost of sales not attributable to segment results. |
|
(2) |
Defined as net revenues less segment related cost of sales as a percentage of net revenues. |
73
The International segment is primarily attributable to the Allergan Acquisition. As such, the increased contribution is not comparable period-over-period.
Corporate
Corporate represents the results of corporate initiatives as well as the impact of select revenues and shared costs. The following represents the corporate amounts for the years ended December 31, 2015 and 2014 ($ in millions):
|
|
|
Year Ended December 31, 2015 |
|
|||||||||||||||||||
|
|
|
Integration and Restructuring |
|
Fair Value Adjustments |
|
Effect of Purchase Accounting |
|
Reclassification of Sales Distributed Through Anda to Discontinued Operations |
|
Other |
|
Revenues and Shared Costs |
|
Total |
|
|||||||
|
|
|
|
|
|
|
|
|
|
|
|
|
|
|
|
|
|
|
|
|
|
|
|
|
Net Sales |
|
$ |
- |
|
$ |
- |
|
$ |
- |
|
$ |
(157.4 |
) |
$ |
3.8 |
|
$ |
6.2 |
|
$ |
(147.4 |
) |
|
Operating expenses: |
|
|
|
|
|
|
|
|
|
|
|
|
|
|
|
|
|
|
|
|
|
|
|
Cost of sales(1) |
|
|
53.0 |
|
|
58.5 |
|
|
1,180.0 |
|
|
(146.9 |
) |
|
0.1 |
|
|
110.9 |
|
|
1,255.6 |
|
|
Selling and marketing |
|
|
96.9 |
|
|
- |
|
|
130.3 |
|
|
- |
|
|
(1.7 |
) |
|
2.9 |
|
|
228.4 |
|
|
General and administrative |
|
|
517.0 |
|
|
(0.5 |
) |
|
322.4 |
|
|
- |
|
|
93.1 |
|
|
503.2 |
|
|
1,435.2 |
|
|
Contribution |
|
$ |
(666.9 |
) |
$ |
(58.0 |
) |
$ |
(1,632.7 |
) |
$ |
(10.5 |
) |
$ |
(87.7 |
) |
$ |
(610.8 |
) |
$ |
(3,066.6 |
) |
|
|
|
|
|
|
|
|
|
|
|
|
|
|
|
|
|
|
|
|
|
|
|
|
|
(1) Excludes amortization and impairment of acquired intangibles including product rights. |
|
|||||||||||||||||||||
|
|
|
|
|
|
|
|
|
|
|
|
|
|
|
|
|
|
|
|
|
|
|
|
|
|
|
Year Ended December 31, 2014 |
|
|||||||||||||||||||
|
|
|
Integration and Restructuring |
|
Fair Value Adjustments |
|
Effect of Purchase Accounting |
|
Reclassification of Sales Distributed Through Anda to Discontinued Operations |
|
Other |
|
Revenues and Shared Costs |
|
Total |
|
|||||||
|
|
|
|
|
|
|
|
|
|
|
|
|
|
|
|
|
|
|
|
|
|
|
|
|
Net Sales |
|
$ |
- |
|
$ |
- |
|
$ |
- |
|
$ |
(38.2 |
) |
$ |
- |
|
$ |
- |
|
$ |
(38.2 |
) |
|
Operating expenses: |
|
|
|
|
|
|
|
|
|
|
|
|
|
|
|
|
|
|
|
|
|
|
|
Cost of sales(1) |
|
|
25.9 |
|
|
(9.9 |
) |
|
941.1 |
|
|
(37.2 |
) |
|
- |
|
|
- |
|
|
919.9 |
|
|
Selling and marketing |
|
|
49.5 |
|
|
- |
|
|
46.2 |
|
|
- |
|
|
115.1 |
|
|
0.6 |
|
|
211.4 |
|
|
General and administrative |
|
|
292.7 |
|
|
- |
|
|
171.7 |
|
|
- |
|
|
168.3 |
|
|
437.2 |
|
|
1,069.9 |
|
|
Contribution |
|
$ |
(368.1 |
) |
$ |
9.9 |
|
$ |
(1,159.0 |
) |
$ |
(1.0 |
) |
$ |
(283.4 |
) |
$ |
(437.8 |
) |
$ |
(2,239.4 |
) |
|
|
|
|
|
|
|
|
|
|
|
|
|
|
|
|
|
|
|
|
|
|
|
|
|
(1) Excludes amortization and impairment of acquired intangibles including product rights. |
|
|||||||||||||||||||||
In the year ended December 31, 2015, integration and restructuring charges were primarily related to the integration of the Legacy Allergan business, as well as the Forest Acquisition. In the year ended December 31, 2015, the Company incurred $1,151.4 million in cost of sales primarily related to the fair value inventory step-up from the Allergan Acquisition and the Forest Acquisition as products were sold to the Company’s third party customers. The Company also incurred charges related to the purchase accounting impact on stock-based compensation related to the Allergan Acquisition, Kythera Acquisition, and Forest Acquisition, which increased cost of sales, selling and marketing and general and administrative expenses. In the year ended December 31, 2015, other expenses include the impact of legal settlement reserves. In addition, in the year ended December 31, 2015, the Company incurred mark-to-market unrealized losses for foreign currency option contracts that are entered into to offset future exposure to movements in currencies.
74
In the year ended December 31, 2014, integration and restructuring charges were primarily related to integration of the Forest and Warner Chilcott businesses. In the year ended December 31, 2014, the Company incurred $933.3 million in cost of sales related to the fair value inventory step-up primarily from the acquired Forest and Warner Chilcott inventory as those products were sold to the Company’s third party customers. The Company also incurred charges related to the purchase accounting impact of stock-based compensation related to the Forest, Furiex, Durata and Warner Chilcott acquisitions, which increased cost of sales, selling and marketing and general and administrative expenses. Other costs include a charge of $105.1 million to account for an additional year of the non-tax deductible Branded Prescription Drug Fee in accordance with final regulations issued in the third quarter by the Internal Revenue Service as well as the impact of legal settlement reserves.
Research and Development Expenses
R&D expenses consisted of the following components in the years ended December 31, 2015 and 2014 ($ in millions):
|
|
|
Years Ended December 31, |
|
|
Change |
|
||||||||||
|
|
|
2015 |
|
|
2014 |
|
|
Dollars |
|
|
% |
|
||||
|
Ongoing operating expenses |
|
$ |
1,116.8 |
|
|
$ |
517.4 |
|
|
$ |
599.4 |
|
|
|
115.8 |
% |
|
Brand related milestone payments and upfront license payments |
|
|
950.4 |
|
|
|
65.1 |
|
|
|
885.3 |
|
|
|
1,359.9 |
% |
|
Contingent consideration adjustments, net |
|
|
37.7 |
|
|
|
(69.3 |
) |
|
|
107.0 |
|
|
|
(154.4 |
)% |
|
Acquisition, integration, and restructuring charges |
|
|
102.7 |
|
|
|
25.7 |
|
|
|
77.0 |
|
|
|
299.6 |
% |
|
Acquisition accounting fair market value adjustments to stock-based compensation |
|
|
150.9 |
|
|
|
66.8 |
|
|
|
84.1 |
|
|
|
125.9 |
% |
|
Total expenditures |
|
$ |
2,358.5 |
|
|
$ |
605.7 |
|
|
$ |
1,752.8 |
|
|
|
289.4 |
% |
The increase in ongoing operating expenses is primarily due to the impact of the Forest and Allergan acquisitions. Included within brand related milestone payments and upfront license charges in the year ended December 31, 2015 is $250.0 million related to the Merck Transaction, $50.0 million relating to the Mimetogen Transaction and $571.7 million related to the Naurex Transaction. Additionally, the Company incurred additional contingent consideration expense primarily as a result of the scheduling of Viberzi® as a controlled substance and the related CVR payment.
For the year ended December 31, 2014, R&D expenses primarily related to ongoing operating expenses for the acquired Forest business and the Warner Chilcott business. Included within brand related milestone payments and upfront license charges in the year ended December 31, 2014 is a $40.0 million payment to Rhythm Health, Inc. Offsetting the increase was favorable contingent consideration adjustments due to the impairment of IPR&D projects and the timing of launch of certain products.
Amortization
|
|
|
Years Ended December 31, |
|
|
Change |
|
||||||||||
|
($ in millions) |
|
2015 |
|
|
2014 |
|
|
Dollars |
|
|
% |
|
||||
|
Amortization |
|
$ |
5,443.7 |
|
|
$ |
1,935.8 |
|
|
$ |
3,507.9 |
|
|
|
181.2 |
% |
Amortization for the year ended December 31, 2015 increased compared to the prior year primarily as a result of increased amortization of identifiable assets acquired in the Allergan Acquisition of $2,779.1 million and the impact of a full year of amortization related to the Forest Acquisition compared to six months in the prior year.
IPR&D Impairments and Asset Sales and Impairments, Net
|
|
|
Years Ended December 31, |
|
|
Change |
|
||||||||||
|
($ in millions) |
|
2015 |
|
|
2014 |
|
|
Dollars |
|
|
% |
|
||||
|
IPR&D impairments |
|
$ |
511.6 |
|
|
$ |
424.3 |
|
|
$ |
87.3 |
|
|
|
20.6 |
|
|
Asset sales and impairments, net |
|
|
272.0 |
|
|
|
305.7 |
|
|
|
(33.7 |
) |
|
|
11.0 |
|
The Company regularly reviews IPR&D assets for impairment indicators. In the year ended December 31, 2015, the Company made the decision to abandon a select IPR&D asset (acquired in connection with the Allergan Acquisition) based on the review of research studies, resulting in an impairment of the full asset value of $300.0 million. The Company also recorded an impairment of $192.1 million related to a reduction in cash flows for women’s healthcare portfolio products acquired in the Warner Chilcott Acquisition as planned promotional initiatives on these future products has been reduced. Asset sales and impairments, net primarily
75
relates to the abandonment of a surgical product line of $229.6 million acquired in the Allergan Acquisition and a $32.2 million impairment charge as a result of a change in projected cash flows relating to an acquired product, Tretin-X.
IPR&D impairments for the year ended December 31, 2014 primarily include an impairment charge of $165.0 million related to the abandonment of certain R&D projects, an impairment charge of $193.0 million related to acquired IPR&D due to the FDA communications relating to Allergan’s NDA for the fixed-dose combination of nebivolol and valsartan for the treatment of hypertension, the abandonment of a select dermatology project of $32.0 million, the impairment of IPR&D relating to Aeroquin of $18.0 million and impairments related to the Estelle and Colvir assets acquired in the Uteron Acquisition of $15.1 million. Asset sales and impairments, net in the year-ended December 31, 2014 primarily related to the impairment on assets held for sale in the Pharmatech Transaction of $189.9 million which included a portion of goodwill allocated to this business unit and an impairment charge related to Doryx® of $89.0 million. The impairment was caused by a shortening of the product’s life cycle for which to recover the value of the asset.
Interest Income
|
|
|
Years Ended December 31, |
|
|
Change |
|
||||||||||
|
($ in millions) |
|
2015 |
|
|
2014 |
|
|
Dollars |
|
|
% |
|
||||
|
Interest income |
|
$ |
10.6 |
|
|
$ |
8.1 |
|
|
$ |
2.5 |
|
|
|
30.9 |
% |
Interest income represents interest earned on cash and cash equivalents held during the respective periods.
Interest Expense
|
|
|
Years Ended December 31, |
|
|
Change |
|
||||||||||
|
($ in millions) |
|
2015 |
|
|
2014 |
|
|
Dollars |
|
|
% |
|
||||
|
Fixed Rate Notes |
|
$ |
1,003.1 |
|
|
$ |
324.4 |
|
|
$ |
678.7 |
|
|
|
209.2 |
% |
|
AGN Term Loan |
|
|
79.1 |
|
|
|
- |
|
|
|
79.1 |
|
|
n.a. |
|
|
|
ACT Term Loan |
|
|
50.8 |
|
|
|
44.9 |
|
|
|
5.9 |
|
|
|
13.1 |
% |
|
Floating Rate Notes |
|
|
18.8 |
|
|
|
- |
|
|
|
18.8 |
|
|
n.a. |
|
|
|
WC Term Loan |
|
|
17.4 |
|
|
|
30.5 |
|
|
|
(13.1 |
) |
|
|
(43.0 |
)% |
|
Revolving Credit Facility |
|
|
4.8 |
|
|
|
3.5 |
|
|
|
1.3 |
|
|
|
37.1 |
% |
|
Other |
|
|
19.3 |
|
|
|
8.5 |
|
|
|
10.8 |
|
|
|
127.1 |
% |
|
Interest expense |
|
$ |
1,193.3 |
|
|
$ |
411.8 |
|
|
$ |
781.5 |
|
|
|
189.8 |
% |
Interest expense increased for the year ended December 31, 2015 over the prior year primarily due to interest from the indebtedness incurred as part of the Allergan Acquisition of $710.9 million and the full year impact of indebtedness incurred associated with the Forest Acquisition.
Other Income (expense)
|
|
|
Years Ended December 31, |
|
|
Change |
|
||||||||||
|
($ in millions) |
|
2015 |
|
|
2014 |
|
|
Dollars |
|
|
% |
|
||||
|
Bridge loan commitment fee |
|
$ |
(264.9 |
) |
|
$ |
(73.6 |
) |
|
$ |
(191.3 |
) |
|
|
259.9 |
% |
|
Interest rate lock |
|
|
31.0 |
|
|
|
- |
|
|
|
31.0 |
|
|
n.a |
|
|
|
Extinguishment of debt |
|
|
- |
|
|
|
29.9 |
|
|
|
(29.9 |
) |
|
|
(100.0 |
)% |
|
Other (expense) income |
|
|
0.1 |
|
|
|
16.4 |
|
|
|
(16.3 |
) |
|
|
(99.4 |
)% |
|
Other (expense) income, net |
|
$ |
(233.8 |
) |
|
$ |
(27.3 |
) |
|
$ |
(206.5 |
) |
|
|
|
|
Bridge Loan Commitment Fee
During the year ended December 31, 2015, we incurred costs associated with bridge loan commitments in connection with the Allergan Acquisition of $264.9 million.
76
During the year ended December 31, 2014, the Company recognized an expense of $47.8 million associated with the Allergan Acquisition bridge and term loan financing commitment fees. In connection with the Forest Acquisition, we secured a bridge loan commitment of up to $7.0 billion and incurred associated commitment costs of $25.8 million, which have been expensed in full.
Interest rate lock
During the year ended December 31, 2015, the Company entered into interest rate locks on a portion of the $21.0 billion of debt issued as part of the Allergan Acquisition. As a result of the interest rate locks, the Company recorded income of $31.0 million.
Extinguishment of Debt
On July 21, 2014, the Company redeemed the Warner Chilcott Company, LLC’s and Warner Chilcott Finance LLC’s 7.75% senior notes due 2018 (the “WC Notes”) for $1,311.8 million, which included a make-whole premium of $61.8 million, and the principal amount of the WC Notes of $1,250.0 million. As a result of the transaction, the Company recognized a gain of $29.9 million, which includes the write-off of the then outstanding unamortized premium.
(Benefit) for Income Taxes
|
|
|
Years Ended December 31, |
|
|
Change |
|
||||||||||
|
($ in millions) |
|
2015 |
|
|
2014 |
|
|
Dollars |
|
|
% |
|
||||
|
(Benefit) for income taxes |
|
$ |
(1,605.9 |
) |
|
$ |
(513.6 |
) |
|
$ |
(1,092.3 |
) |
|
|
212.7 |
% |
|
Effective tax rate |
|
|
(35.3 |
)% |
|
|
(17.1 |
)% |
|
|
|
|
|
|
|
|
The Company’s effective tax rate for the twelve months ended December 31, 2015 was a benefit of (35.3%) compared to a benefit of (17.1%) for the twelve months ended December 31, 2014. The reconciliations between the statutory Irish income tax rates for Allergan plc and the effective income tax rates were as follows:
|
|
|
Allergan plc |
|
|||||
|
|
|
Years Ended December 31, |
|
|||||
|
|
|
2015 |
|
|
2014 |
|
||
|
Statutory rate |
|
|
(12.5 |
%) |
|
|
(12.5 |
%) |
|
Earnings subject to the U.S. federal and state tax rates (1) (3) |
|
|
(18.6 |
%) |
|
|
(11.8 |
%) |
|
Earnings subject to rates different than the statutory rate (2)(3) |
|
|
(2.2 |
%) |
|
|
1.1 |
% |
|
Tax reserves and audit outcomes |
|
|
0.3 |
% |
|
|
1.2 |
% |
|
Non-deductible expenses (4) |
|
|
1.3 |
% |
|
|
3.7 |
% |
|
Impact of acquisitions and reorganizations (4) |
|
|
4.0 |
% |
|
|
1.2 |
% |
|
Tax credits and U.S. manufacturing deduction |
|
|
(0.5 |
%) |
|
|
(1.2 |
%) |
|
Rate changes |
|
|
0.0 |
% |
|
|
1.4 |
% |
|
Valuation allowances (5) |
|
|
(6.5 |
%) |
|
|
0.0 |
% |
|
Other |
|
|
(0.6 |
%) |
|
|
(0.2 |
%) |
|
Effective income tax rate |
|
|
(35.3 |
%) |
|
|
(17.1 |
%) |
The material drivers of the period-over-period tax rate movements are as follows:
|
(1) |
Earnings subject to U.S. federal and state tax had a larger impact on the effective tax rate for the period ended December 31, 2015 compared to the period ended December 31, 2014 due to a significant increase in expenses in 2015. These expenses included amortization expense related to intangibles acquired as part of the Allergan Acquisition and incremental costs associated with the acquisition related financing. |
|
(2) |
The impact of earnings subject to tax rates different than the statutory rate is primarily driven by the inclusion of Allergan post-acquisition operating income earned outside of the U.S. and Ireland. In addition, 2015 includes a full year of operating income from Forest compared to six months in 2014. The impact of this additional income is partially offset by an increase in amortization expense in jurisdictions with tax rates lower than the statutory rate. |
|
(3) |
In 2015, the Company recorded $5.5 billion of amortization expense. A significant portion of this amount was incurred in jurisdictions with tax rates higher than the statutory rate resulting in a $246.2 million favorable impact on the effective tax rate. |
77
|
(5) |
Valuation allowances for the year ended December 31, 2015 included the release of a $296.2 million valuation allowance on certain capital loss carryforwards as a result of restructuring related to the global generics sale. |
Discontinued Operations
On July 27, 2015, the Company announced that it entered into the Teva Transaction, which closed on August 2, 2016. Under the Teva Agreement, Teva acquired Allergan's global generics business, including the U.S. and international generic commercial units, our third-party supplier Medis, our global generic manufacturing operations, our global generic R&D unit, our international OTC commercial unit (excluding OTC eye care products) and some established international brands. Allergan retained its global branded pharmaceutical and medical aesthetics businesses, as well as its biosimilars development programs and certain OTC products. The Company also has continuing involvement with Teva after the close of the transaction. As a result of the Teva Transaction, the Company holds equity in Teva and purchases product manufactured by Teva for sale in our US General Medicine segment as part of ongoing transitional service and contract manufacturing agreements. On October 3, 2016, the Company completed the divestiture of the Anda Distribution business to Teva for $500.0 million. Teva acquired our Anda Distribution business, which distributes generic, brand, specialty and OTC pharmaceutical products from more than 300 manufacturers to retail independent and chain pharmacies, nursing homes, mail order pharmacies, hospitals, clinics and physician offices across the U.S. The Company recognized a combined gain on the sale of the Anda Distribution business and the sale of our global generics business of $15,932.2 million.
The Company notes the following reconciliation of the proceeds received in the combined transaction to the gain recognized in income from discontinued operations ($ in millions):
|
Net cash proceeds received |
|
$ |
|
33,804.2 |
|
|
August 2, 2016 fair value of Teva shares |
|
|
|
5,038.6 |
|
|
Total Proceeds |
|
$ |
|
38,842.8 |
|
|
Net assets sold to Teva, excluding cash |
|
|
|
(12,487.7 |
) |
|
Other comprehensive income disposed |
|
|
|
(1,544.8 |
) |
|
Deferral of proceeds relating to additional elements of agreements with Teva |
|
|
|
(299.2 |
) |
|
Pre-tax gain on sale of generics business and Anda Distribution business |
|
$ |
|
24,511.1 |
|
|
Income taxes |
|
|
|
(8,578.9 |
) |
|
Net gain on sale of generics business and Anda Distribution business |
|
$ |
|
15,932.2 |
|
In October 2016, pursuant to the Teva Agreement, Teva provided its proposed estimated adjustment to the closing date working capital balance to the Company. The final amount of any agreed contractual adjustment could vary materially from the adjustment calculated by the Company at the time of the closing of the Teva Transaction and any agreed adjustment to the Company’s proceeds from the Teva Transaction could have a material adverse effect on the Company’s results of operations and cash flows. The Company expects the amount of the adjustment will be determined in accordance with and subject to the terms of the Teva Agreement.
The Teva Shares are recorded within “Marketable securities” on the Company’s Consolidated Balance Sheet. The closing Teva transaction date opening stock price discounted at a rate of 5.9 percent due to the lack of marketability was used to initially value the shares. During the year ended December 31, 2016, the Company recorded a $1,599.4 million unrealized loss on the Teva Shares due to a decline in share price, which was recorded as a component of “Other comprehensive income.” The Company currently considers the decline in value of its investment in Teva securities to be temporary. We will continue to monitor the value of this investment to determine if the decline in value becomes other than temporary.
Financial results of the global generics business and the Anda Distribution business are presented as “Income from discontinued operations” on the Consolidated Statements of Operations for the years ended December 31, 2016, 2015 and 2014; and assets and liabilities of the businesses are presented as “Current assets held for sale”, “Non current assets held for sale”, “Current liabilities held for sale” and “Long term liabilities held for sale” on the Consolidated Balance Sheet as of December 31, 2015.
78
The following table presents key financial results of the global generics business and the Anda Distribution business included in “Income from discontinued operations” for the years ended December 31, 2016, 2015 and 2014 ($ in millions):
|
|
Years Ended December 31, |
|
|||||||||
|
|
2016 |
|
|
2015 |
|
|
2014 |
|
|||
|
Net revenues |
$ |
4,504.3 |
|
|
$ |
8,499.0 |
|
|
$ |
8,385.8 |
|
|
Operating expenses: |
|
|
|
|
|
|
|
|
|
|
|
|
Cost of sales (excludes amortization and impairment of acquired intangibles including product rights) |
|
2,798.3 |
|
|
|
4,847.5 |
|
|
|
4,599.0 |
|
|
Research and development |
|
269.4 |
|
|
|
422.2 |
|
|
|
480.2 |
|
|
Selling and marketing |
|
352.9 |
|
|
|
706.6 |
|
|
|
784.0 |
|
|
General and administrative |
|
425.8 |
|
|
|
702.2 |
|
|
|
541.8 |
|
|
Amortization |
|
4.8 |
|
|
|
333.3 |
|
|
|
661.7 |
|
|
Asset sales and impairments, net |
|
- |
|
|
|
62.4 |
|
|
|
19.6 |
|
|
Total operating expenses |
|
3,851.2 |
|
|
|
7,074.2 |
|
|
|
7,086.3 |
|
|
Operating income |
|
653.1 |
|
|
|
1,424.8 |
|
|
|
1,299.5 |
|
|
Other (expense) income, net |
|
15,932.2 |
|
|
|
(7.1 |
) |
|
|
(13.7 |
) |
|
Provision / (benefit) for income taxes |
|
670.8 |
|
|
|
(5,443.3 |
) |
|
|
431.7 |
|
|
Net income from discontinued operations |
$ |
15,914.5 |
|
|
$ |
6,861.0 |
|
|
$ |
854.1 |
|
The operating income reflects approximately seven months of operating activity of the Company’s former generics business in the year ended December 31, 2016 versus twelve months activity in the prior year period and approximately nine months of operating activity of the Anda Distribution business in the year ended December 31, 2016 versus twelve months activity in the prior year period. “Other (expense) income, net” included the gain on sale of the businesses to Teva.
For the year ended December 31, 2015, the Company recorded a deferred tax benefit of $5,738.8 million related to investments in certain subsidiaries. The recognition of this benefit has been reflected in “Income from discontinued operations, net of tax” with the deferred tax asset reflected in non-current “Deferred tax liabilities” on the December 31, 2015 balance sheet as adjusted for activity in the fourth quarter of 2015. For the year ended December 31, 2016, the Company recorded a deferred tax expense of $462.2 million to adjust its deferred tax asset related to investments in certain subsidiaries. The recognition of this expense has been reflected in “Income from discontinued operations, net of tax.” Upon the closing of the Teva Transaction, the Company recorded the reversal of the corresponding deferred tax asset of $5,276.6 million against the current income taxes payable in continuing operations.
The results of our former global generics business operations were dependent on the timing of product launches and competition within the generics market, primarily in the United States. The increase in operating income for the year ended December 31, 2015 compared to the year ended December 31, 2014 is the result of continued cost savings initiatives as well as the cessation of depreciation and amortization for assets being divested to Teva once they met the definition of held for sale on July 27, 2015. Offsetting these amounts, is an increase in divestiture related expenses in the year ended December 31, 2015 of $97.2 million.
79
LIQUIDITY AND CAPITAL RESOURCES
Working Capital Position
Working capital at December 31, 2016 and 2015 is summarized as follows:
|
|
December 31, |
|
|
December 31, |
|
|
Increase |
|
|||
|
($ in millions): |
2016 |
|
|
2015 |
|
|
(Decrease) |
|
|||
|
Current assets: |
|
|
|
|
|
|
|
|
|
|
|
|
Cash and cash equivalents |
$ |
1,724.0 |
|
|
$ |
1,096.0 |
|
|
$ |
628.0 |
|
|
Marketable securities |
|
11,501.5 |
|
|
|
9.3 |
|
|
|
11,492.2 |
|
|
Accounts receivable, net |
|
2,531.0 |
|
|
|
2,125.4 |
|
|
|
405.6 |
|
|
Inventories |
|
718.0 |
|
|
|
757.5 |
|
|
|
(39.5 |
) |
|
Prepaid expenses and other current assets |
|
1,383.4 |
|
|
|
495.3 |
|
|
|
888.1 |
|
|
Current assets held for sale |
|
- |
|
|
|
4,095.6 |
|
|
|
(4,095.6 |
) |
|
Total current assets |
|
17,857.9 |
|
|
|
8,579.1 |
|
|
|
9,278.8 |
|
|
Current liabilities: |
|
|
|
|
|
|
|
|
|
|
|
|
Accounts payable and accrued expenses |
|
5,019.0 |
|
|
|
4,148.6 |
|
|
|
870.4 |
|
|
Income taxes payable |
|
57.8 |
|
|
|
53.7 |
|
|
|
4.1 |
|
|
Current portion of long-term debt and capital leases |
|
2,797.9 |
|
|
|
2,396.5 |
|
|
|
401.4 |
|
|
Current liabilities held for sale |
|
- |
|
|
|
1,693.2 |
|
|
|
(1,693.2 |
) |
|
Total current liabilities |
|
7,874.7 |
|
|
|
8,292.0 |
|
|
|
(417.3 |
) |
|
Working Capital |
$ |
9,983.2 |
|
|
$ |
287.1 |
|
|
$ |
9,696.1 |
|
|
Working Capital excluding assets held for sale, net |
$ |
9,983.2 |
|
|
$ |
(2,115.3 |
) |
|
$ |
12,098.5 |
|
|
Adjusted Current Ratio |
|
2.27 |
|
|
|
0.68 |
|
|
|
|
|
Working capital excluding assets held for sale, net, increased $12,098.5 million primarily due to cash proceeds of $33,804.2 million and Teva securities which had a recorded value of $3,439.2 million as of December 31, 2016, both of which were received in the Teva Transaction. The proceeds were offset in part by the payment of cash taxes relating to the Teva Transaction of $3,293.7 million, the net repayment of long-term and current indebtedness in the year ended December 31, 2016 of $9,798.9 million, and the repurchase of our ordinary shares in connection with the share repurchase programs of $15,000.0 million. The increase in accounts payable and accrued expenses primarily relates to contractual commitments of $264.9 million and an increase in contingent consideration, including amounts owed as part of the Tobira Acquisition.
Cash Flows from Operations
Our cash flows from operations are summarized as follows:
|
|
|
Years Ended December 31, |
|
|||||
|
($ in millions) |
|
2016 |
|
|
2015 |
|
||
|
Net cash provided by operating activities |
|
$ |
1,425.3 |
|
|
$ |
4,530.0 |
|
Cash flows from operations represent net income adjusted for certain non-cash items and changes in assets and liabilities. Cash provided by operating activities decreased $3,104.7 million in the year ended December 31, 2016 versus the prior year period, due primarily to $3,293.7 million in cash tax payments made in connection with the Teva Transaction, along with a decline in cash flows as a result of divesting the Company’s generics and Anda Distribution businesses, which contributed a full year’s cash flows in 2015 versus partial contribution in 2016, offset in part, by a full year of contribution resulting from the Allergan Acquisition.
Management expects that available cash balances and 2017 cash flows from operating activities will provide sufficient resources to fund our operating liquidity needs and expected 2017 capital expenditure funding requirements.
80
Our cash flows from investing activities are summarized as follows:
|
|
|
Years Ended December 31, |
|
|||||
|
($ in millions) |
|
2016 |
|
|
2015 |
|
||
|
Net cash provided by / (used in) investing activities |
|
$ |
24,333.3 |
|
|
$ |
(37,120.9 |
) |
Investing cash flows consist primarily of cash used in acquisitions of businesses and intangibles (primarily product rights), capital expenditures and purchases of investments and marketable securities partially offset by proceeds from the sale of investments and marketable securities. Included in the year ended December 31, 2016 were cash proceeds received from the sale of the global generics and Anda Distribution businesses to Teva of $33,804.2 million offset, in part, by purchases of marketable securities and other assets, net of $7,971.9 million, cash used for capital expenditures of $331.4 million and cash used in connection with acquisitions of $1,198.9 million, primarily related to the Tobira Acquisition, the Vitae Acquisition and the ForSight Acquisition.
Included in the year ended December 31, 2015 was cash used in connection with the Allergan Acquisition, Kythera Acquisition and the Auden Acquisition, net of cash acquired, of $34,646.2 million, $1,955.9 million and $463.7 million, respectively, $444.3 million for other business acquisitions and capital expenditures for property, plant and equipment of $454.9 million, offset, in part by cash received from the sale of assets, primarily the respiratory business and Pharmatech assets, of $883.0 million.
Financing Cash Flows
Our cash flows from financing activities are summarized as follows:
|
|
|
Years Ended December 31, |
|
|||||
|
($ in millions) |
|
2016 |
|
|
2015 |
|
||
|
Net cash (used in) / provided by financing activities |
|
$ |
(25,122.1 |
) |
|
$ |
33,443.4 |
|
Financing cash flows consist primarily of borrowings and repayments of debt, repurchases of ordinary shares and proceeds from the exercise of stock options. Cash provided by financing activities in the year ended December 31, 2016 primarily included payments of debt of $10,848.7 million, contingent consideration of $161.1 million, dividends on our preferred stock of $278.4 million and the repurchase of ordinary shares of $15,076.4 million, including $15,000.0 million repurchased under the Company’s share repurchase programs, offset by borrowings under the credit facility of $1,050.0 million.
Cash provided by financing activities in the year ended December 31, 2015 primarily included the issuance of indebtedness of $30,137.7 million, the issuance of ordinary shares of $4,071.1 million and the issuance of Mandatory Convertible Preferred Shares of $4,929.7 million in connection with the Allergan Acquisition, offset in part by payments of debt of $5,134.2 million and debt issuance costs of $310.8 million.
81
Debt consisted of the following ($ in millions):
|
|
|
Balance As of |
|
|
Fair Market Value As of |
|
||||||||||
|
|
|
December 31, 2016 |
|
|
December 31, 2015 |
|
|
December 31, 2016 |
|
|
December 31, 2015 |
|
||||
|
Senior Notes: |
|
|
|
|
|
|
|
|
|
|
|
|
|
|
|
|
|
Floating Rate Notes |
|
|
|
|
|
|
|
|
|
|
|
|
|
|
|
|
|
$500.0 million floating rate notes due September 1, 2016 |
|
$ |
- |
|
|
$ |
500.0 |
|
|
$ |
- |
|
|
$ |
500.5 |
|
|
$500.0 million floating rate notes due March 12, 2018 |
|
|
500.0 |
|
|
|
500.0 |
|
|
|
502.5 |
|
|
|
499.6 |
|
|
$500.0 million floating rate notes due March 12, 2020 |
|
|
500.0 |
|
|
|
500.0 |
|
|
|
509.4 |
|
|
|
496.2 |
|
|
|
|
|
1,000.0 |
|
|
|
1,500.0 |
|
|
|
1,011.9 |
|
|
|
1,496.3 |
|
|
Fixed Rate Notes |
|
|
|
|
|
|
|
|
|
|
|
|
|
|
|
|
|
$800.0 million 5.750% notes due April 1, 2016 |
|
|
- |
|
|
|
800.0 |
|
|
|
- |
|
|
|
808.4 |
|
|
$1,000.0 million 1.850% notes due March 1, 2017 |
|
|
1,000.0 |
|
|
|
1,000.0 |
|
|
|
1,001.1 |
|
|
|
1,001.5 |
|
|
$500.0 million 1.300% notes due June 15, 2017 |
|
|
500.0 |
|
|
|
500.0 |
|
|
|
499.7 |
|
|
|
496.3 |
|
|
$1,200.0 million 1.875% notes due October 1, 2017 |
|
|
1,200.0 |
|
|
|
1,200.0 |
|
|
|
1,202.5 |
|
|
|
1,196.0 |
|
|
$3,000.0 million 2.350% notes due March 12, 2018 |
|
|
3,000.0 |
|
|
|
3,000.0 |
|
|
|
3,018.0 |
|
|
|
3,004.6 |
|
|
$250.0 million 1.350% notes due March 15, 2018 |
|
|
250.0 |
|
|
|
250.0 |
|
|
|
248.4 |
|
|
|
244.9 |
|
|
$1,050.0 million 4.375% notes due February 1, 2019 |
|
|
1,050.0 |
|
|
|
1,050.0 |
|
|
|
1,090.0 |
|
|
|
1,099.5 |
|
|
$500.0 million 2.450% notes due June 15, 2019 |
|
|
500.0 |
|
|
|
500.0 |
|
|
|
501.2 |
|
|
|
494.4 |
|
|
$400.0 million 6.125% notes due August 15, 2019 |
|
|
400.0 |
|
|
|
400.0 |
|
|
|
437.7 |
|
|
|
444.2 |
|
|
$3,500.0 million 3.000% notes due March 12, 2020 |
|
|
3,500.0 |
|
|
|
3,500.0 |
|
|
|
3,541.8 |
|
|
|
3,505.1 |
|
|
$650.0 million 3.375% notes due September 15, 2020 |
|
|
650.0 |
|
|
|
650.0 |
|
|
|
663.6 |
|
|
|
656.6 |
|
|
$750.0 million 4.875% notes due February 15, 2021 |
|
|
750.0 |
|
|
|
750.0 |
|
|
|
803.3 |
|
|
|
807.4 |
|
|
$1,200.0 million 5.000% notes due December 15, 2021 |
|
|
1,200.0 |
|
|
|
1,200.0 |
|
|
|
1,297.7 |
|
|
|
1,299.4 |
|
|
$3,000.0 million 3.450% notes due March 15, 2022 |
|
|
3,000.0 |
|
|
|
3,000.0 |
|
|
|
3,030.7 |
|
|
|
3,006.8 |
|
|
$1,700.0 million 3.250% notes due October 1, 2022 |
|
|
1,700.0 |
|
|
|
1,700.0 |
|
|
|
1,693.1 |
|
|
|
1,669.6 |
|
|
$350.0 million 2.800% notes due March 15, 2023 |
|
|
350.0 |
|
|
|
350.0 |
|
|
|
335.6 |
|
|
|
327.7 |
|
|
$1,200.0 million 3.850% notes due June 15, 2024 |
|
|
1,200.0 |
|
|
|
1,200.0 |
|
|
|
1,211.7 |
|
|
|
1,202.6 |
|
|
$4,000.0 million 3.800% notes due March 15, 2025 |
|
|
4,000.0 |
|
|
|
4,000.0 |
|
|
|
3,995.6 |
|
|
|
3,984.6 |
|
|
$2,500.0 million 4.550% notes due March 15, 2035 |
|
|
2,500.0 |
|
|
|
2,500.0 |
|
|
|
2,458.5 |
|
|
|
2,462.2 |
|
|
$1,000.0 million 4.625% notes due October 1, 2042 |
|
|
1,000.0 |
|
|
|
1,000.0 |
|
|
|
967.6 |
|
|
|
956.1 |
|
|
$1,500.0 million 4.850% notes due June 15, 2044 |
|
|
1,500.0 |
|
|
|
1,500.0 |
|
|
|
1,496.4 |
|
|
|
1,483.6 |
|
|
$2,500.0 million 4.750% notes due March 15, 2045 |
|
|
2,500.0 |
|
|
|
2,500.0 |
|
|
|
2,466.9 |
|
|
|
2,452.7 |
|
|
|
|
|
31,750.0 |
|
|
|
32,550.0 |
|
|
|
31,961.1 |
|
|
|
32,604.2 |
|
|
Total Senior Notes Gross |
|
|
32,750.0 |
|
|
|
34,050.0 |
|
|
|
32,973.0 |
|
|
|
34,100.5 |
|
|
Unamortized premium |
|
|
171.2 |
|
|
|
225.9 |
|
|
|
- |
|
|
|
- |
|
|
Unamortized discount |
|
|
(95.8 |
) |
|
|
(107.4 |
) |
|
|
- |
|
|
|
- |
|
|
Total Senior Notes Net |
|
|
32,825.4 |
|
|
|
34,168.5 |
|
|
|
32,973.0 |
|
|
|
34,100.5 |
|
|
Term Loan Indebtedness: |
|
|
|
|
|
|
|
|
|
|
|
|
|
|
|
|
|
WC Term Loan |
|
|
|
|
|
|
|
|
|
|
|
|
|
|
|
|
|
WC Three Year Tranche variable rate debt maturing October 1, 2016 |
|
|
- |
|
|
|
191.5 |
|
|
|
|
|
|
|
|
|
|
WC Five Year Tranche variable rate debt maturing October 1, 2018 |
|
|
- |
|
|
|
498.8 |
|
|
|
|
|
|
|
|
|
|
|
|
|
- |
|
|
|
690.3 |
|
|
|
|
|
|
|
|
|
|
ACT Term Loan |
|
|
|
|
|
|
|
|
|
|
|
|
|
|
|
|
|
2017 Term Loan variable rate debt maturing October 31, 2017 |
|
|
- |
|
|
|
572.1 |
|
|
|
|
|
|
|
|
|
|
2019 Term Loan variable rate debt maturing July 1, 2019 |
|
|
- |
|
|
|
1,700.0 |
|
|
|
|
|
|
|
|
|
|
|
|
|
- |
|
|
|
2,272.1 |
|
|
|
|
|
|
|
|
|
|
AGN Term Loan |
|
|
|
|
|
|
|
|
|
|
|
|
|
|
|
|
|
AGN Three Year Tranche variable rate debt maturing March 17, 2018 |
|
|
- |
|
|
|
2,750.0 |
|
|
|
|
|
|
|
|
|
|
AGN Five Year Tranche variable rate debt maturing March 17, 2020 |
|
|
- |
|
|
|
2,543.8 |
|
|
|
|
|
|
|
|
|
|
|
|
|
- |
|
|
|
5,293.8 |
|
|
|
|
|
|
|
|
|
|
Total Term Loan Indebtedness |
|
|
- |
|
|
|
8,256.2 |
|
|
|
|
|
|
|
|
|
|
Other Indebtedness |
|
|
|
|
|
|
|
|
|
|
|
|
|
|
|
|
|
Revolver Borrowings |
|
|
- |
|
|
|
200.0 |
|
|
|
|
|
|
|
|
|
|
Debt Issuance Costs |
|
|
(144.6 |
) |
|
|
(195.8 |
) |
|
|
|
|
|
|
|
|
|
Other |
|
|
85.5 |
|
|
|
97.4 |
|
|
|
|
|
|
|
|
|
|
Total Other Borrowings |
|
|
(59.1 |
) |
|
|
101.6 |
|
|
|
|
|
|
|
|
|
|
Capital Leases |
|
|
2.4 |
|
|
|
4.1 |
|
|
|
|
|
|
|
|
|
|
Total Indebtedness |
|
$ |
32,768.7 |
|
|
$ |
42,530.4 |
|
|
|
|
|
|
|
|
|
82
Fair market value in the table above is determined in accordance with ASC Topic 820 “Fair Value Measurement” (“ASC 820”) under Level 2 based upon quoted prices for similar items in active markets.
Floating Rate Notes
On March 4, 2015, Actavis Funding SCS, a limited partnership (société en commandite simple) organized under the laws of the Grand Duchy of Luxembourg and an indirect wholly-owned subsidiary of Allergan plc, issued floating rate notes due 2016 (the “2016 Floating Rate Notes”), floating rate notes due 2018 (the “2018 Floating Rate Notes”), floating rate notes due 2020 (the “2020 Floating Rate Notes”), 1.850% notes due 2017 (the “1.850% 2017 Notes”), 2.350% notes due 2018 (the “2.350% 2018 Notes”), 3.000% notes due 2020 (the “3.000% 2020 Notes”), 3.450% notes due 2022 (the “3.450% 2022 Notes”), 3.800% notes due 2025 (the “3.800% 2025 Notes”), 4.550% notes due 2035 (the “4.550% 2035 Notes”) and 4.750% notes due 2045 (the “4.750% 2045 Notes”). The notes are fully and unconditionally guaranteed by Actavis Funding SCS’s indirect parents, Warner Chilcott Limited and Actavis Capital S.a.r.l. (“Actavis Capital”), and by Allergan Finance LLC (formerly known as Actavis, Inc.), a subsidiary of Actavis Capital, on an unsecured and unsubordinated basis. Allergan plc has not guaranteed the notes.
The 2016 Floating Rate Notes were paid in full at maturity on September 1, 2016 and bore interest at the three-month LIBOR plus 0.875%. The 2018 Floating Rate Notes and the 2020 Floating Rate Notes bear interest at a floating rate equal to three-month LIBOR plus 1.080% and 1.255% per annum, respectively. Interest on the 2018 Floating Rate Notes and the 2020 Floating Rate Notes is payable quarterly on March 12, June 12, September 12 and December 12 of each year, and began on June 12, 2015.
Fixed Rate Notes
Acquired Allergan Notes
On March 17, 2015 in connection with the Allergan Acquisition, the Company acquired, and subsequently guaranteed, along with Warner Chilcott Limited, the indebtedness of Allergan, Inc. comprised of the $350.0 million 2.800% senior notes due 2023, the $650.0 million 3.375% senior notes due 2020, the $250.0 million 1.350% senior notes due 2018 and the $800.0 million 5.750% senior notes due 2016. Interest payments are due on the $350.0 million senior notes semi-annually on the principal amount of the notes at a rate of 2.80% per annum, and are redeemable at any time at the Company’s option, subject to a make-whole provision based on the present value of remaining interest payments at the time of the redemption, if the redemption occurs prior to December 15, 2022 (three months prior to the maturity of the 2023 senior notes). If the redemption occurs on or after December 15, 2022, then such redemption is not subject to the make-whole provision. Interest payments are due on the $650.0 million senior notes semi-annually on the principal amount of the notes at a rate of 3.375% per annum, and are redeemable at any time at the Company’s option, subject to a make-whole provision based on the present value of remaining interest payments at the time of the redemption. Interest payments are due on the $250.0 million senior notes semi-annually on the principal amount of the notes at a rate of 1.350% per annum, and are redeemable at any time at the Company’s option, subject to a make-whole provision based on the present value of remaining interest payments at the time of the redemption. Interest payments were due on the $800.0 million senior notes semi-annually on the principal amount of the notes at a rate of 5.750% per annum. The fair value of the acquired senior notes was determined to be $2,087.5 million as of March 17, 2015. As such, as part of acquisition accounting, the company recorded a premium of $37.5 million to be amortized as contra interest over the life of the notes.
The $800.0 million 5.750% senior notes were paid in full on April 1, 2016 with proceeds from the first quarter of 2016 borrowings under the revolving credit facility of $900.0 million at maturity.
Acquired Forest Notes
On July 1, 2014 in connection with the Forest Acquisition, the Company acquired the indebtedness of Forest comprised of the $1,050.0 million 4.375% senior notes due 2019, the $750.0 million 4.875% senior notes due 2021 and the $1,200.0 million 5.000% senior notes due 2021 (together the “Acquired Forest Notes”). Interest payments are due on the $1,050.0 million senior notes semi-annually in arrears on February 1 and August 1 beginning August 1, 2014. Interest payments are due on the $750.0 million senior notes due 2021 semi-annually in arrears on February 15 and August 15 beginning August 15, 2014. Interest payments are due on the $1,200.0 million senior note due 2021 semi-annually in arrears on June 15 and December 15, beginning December 15, 2014. As a result of acquisition accounting, the notes were fair valued with a premium of $260.3 million as of July 1, 2014, which will be amortized as contra-interest over the life of the notes. The guarantor of the debt is Allergan plc.
Allergan Acquisition Notes
In connection with the Allergan Acquisition, Actavis Funding SCS issued the $1,000.0 million 1.850% notes due March 1, 2017, the $3,000.0 million 2.350% notes due March 12, 2018, the $3,500.0 million 3.000% notes due March 12, 2020, the
83
$3,000.0 million 3.450% notes due March 15, 2022, the $4,000.0 million 3.800% notes due March 15, 2025, the $2,500.0 million 4.550% notes due March 15, 2035 and the $2,500.0 million 4.750% notes due March 15, 2045. These fixed rate securities were issued, in part, to finance the Allergan Acquisition.
2014 Notes Issuance
On June 10, 2014, Actavis Funding SCS issued the $500.0 million 1.300% notes due 2017, $500.0 million 2.450% notes due 2019, $1,200.0 million 3.850% notes due 2024 and $1,500.0 million 4.850% notes due 2044 (the “2014 New Notes”). Interest payments are due on the 2014 New Notes on June 15 and December 15 semi-annually, beginning on December 15, 2014. The guarantors of the debt are Warner Chilcott Limited, Actavis Capital S.a.r.l., and Allergan Finance, LLC.
Allergan Finance LLC Supplemental Indenture
On October 1, 2013, the Company, Allergan Finance LLC, a wholly owned subsidiary of the Company, and Wells Fargo Bank, National Association, as trustee, entered into a fourth supplemental indenture (the “Fourth Supplemental Indenture”) to the indenture, dated as of August 24, 2009 (the “Base Indenture” and, together with the First Supplemental Indenture, the Second Supplemental Indenture and the Third Supplemental Indenture (each as defined below), the “Indenture”), as supplemented by the first supplemental indenture, dated as of August 24, 2009 (the “First Supplemental Indenture”), the second supplemental indenture, dated as of May 7, 2010 (the “Second Supplemental Indenture”), and the third supplemental indenture, dated as of October 2, 2012 (the “Third Supplemental Indenture”). Pursuant to the Fourth Supplemental Indenture, the Company has provided a full and unconditional guarantee of Allergan Finance LLC’s obligations under its then outstanding $450.0 million 5.000% senior notes due August 15, 2014, (the “2014 Notes”), its $1,200.0 million 1.875% senior notes due October 1, 2017 (the “2017 Notes”), its $400.0 million 6.125% senior notes due August 15, 2019 (the “2019 Notes”), its $1,700.0 million 3.250% senior notes due October 1, 2022 (the “2022 Notes”) and its $1,000.0 million 4.625% Senior Notes due October 1, 2042 (the “2042 Notes.”).
WC Supplemental Indenture
On October 1, 2013, the Company, WCCL (defined below), Warner Chilcott Finance LLC (the “Co-Issuer” and together with WC Company, the “Issuers”) and Wells Fargo Bank, National Association, as trustee (the “WC Trustee”), entered into a third supplemental indenture (the “Supplemental Indenture”) to the indenture, dated as of August 20, 2010 (the “WC Indenture”), among the Issuers, the guarantors party thereto and the WC Trustee, with respect to the Issuers’ WC Notes. Pursuant to the Supplemental Indenture, the Company had provided a full and unconditional guarantee of the Issuers’ obligations under the WC Notes and the WC Indenture.
On July 21, 2014, the Company redeemed the WC Notes for $1,311.8 million, which includes a make-whole premium of $61.8 million and the principal amount of the WC Notes of $1,250.0 million. As a result of the transaction, the Company recognized a gain in July of 2014 of $29.9 million, which includes the write-off of the then outstanding unamortized premium.
2012 Notes Issuance
On October 2, 2012, Allergan Finance, LLC issued the 2017 Notes, the 2022 Notes, and the 2042 Notes (collectively the “2012 Senior Notes”). Interest payments are due on the 2012 Senior Notes semi-annually in arrears on April 1 and October 1 beginning April 1, 2013. Net proceeds from the offering of the 2012 Senior Notes were used for the acquisition of the Actavis Group. The guarantors of the debt are Warner Chilcott Limited and Allergan plc.
2009 Notes Issuance
On August 24, 2009, Allergan Finance, LLC issued the 2014 Notes and the 2019 Notes (collectively the “2009 Senior Notes”). Interest payments are due on the 2009 Senior Notes semi-annually in arrears on February 15 and August 15, respectively, beginning February 15, 2010. Net proceeds from the offering of 2009 Senior Notes were used to repay certain debt with the remaining net proceeds being used to fund a portion of the cash consideration for the acquisition of the Arrow Group. The guarantors of the debt are Warner Chilcott Limited and Allergan plc.
Credit Facility Indebtedness
On August 2, 2016, the Company repaid the remaining balances of all outstanding term-loan indebtedness and terminated its then existing revolving credit facility with proceeds from the Teva Transaction.
84
On December 17, 2014, Allergan plc and certain of its subsidiaries entered into a second amendment agreement (the “WC Term Loan Amendment”) among Allergan plc, Warner Chilcott Limited, Warner Chilcott Finance, LLC, Actavis WC 2 S.à r.l. (“Actavis WC 2”), WCCL, Warner Chilcott Corporation (“WC Corporation” and together with Actavis WC 2 and WCCL, the “WC Borrowers”), Bank of America, N.A. (“BofA”), as administrative agent, and the lenders party thereto. The WC Term Loan Amendment amended and restated Allergan plc’s existing amended and restated WC term loan credit and guaranty agreement, dated as of June 9, 2014 (such agreement, prior to its amendment and restatement pursuant to the WC Term Loan Amendment, the “2014 WC Term Loan”), among the WC Borrowers, Allergan plc, Warner Chilcott Limited, Warner Chilcott Finance, LLC, the lenders from time to time party thereto and BofA, as administrative agent, which amended and restated Allergan plc’s existing WC term loan credit and guaranty agreement, dated as of August 1, 2013 (such agreement, prior to its amendment and restatement pursuant to the 2014 WC Term Loan Amendment, the “Existing WC Term Loan”) among the WC Borrowers, Warner Chilcott Finance, LLC, Actavis Limited, BofA, as administrative agent and a syndicate of banks participating as lenders.
Pursuant to the Existing WC Term Loan, on October 1, 2013 (the “WC Closing Date”), the lenders party thereto provided term loans in a total aggregate principal amount of $2.0 billion, comprised of (i) a $1.0 billion tranche that would have matured on October 1, 2016 (the “WC Three Year Tranche”) and (ii) a $1.0 billion tranche that would have matured on October 1, 2018 (the “WC Five Year Tranche”). The proceeds of borrowings under the Existing WC Term Loan Agreement, together with $41.0 million of cash on hand, were used to finance the repayment in full of all amounts outstanding under Warner Chilcott’s then-existing Credit Agreement, dated as of March 17, 2011, as amended by Amendment No. 1 on August 20, 2012, among the WC Borrowers, Warner Chilcott Holdings Company III, Limited, BofA, as administrative agent and a syndicate of banks participating as lenders.
Borrowings under the WC Term Loan Agreement bore interest at the applicable borrower’s choice of a per annum rate equal to either (a) a base rate plus an applicable margin per annum varying from (x) 0.00% per annum to 0.75% per annum under the WC Three Year Tranche and (y) 0.125% per annum to 0.875% per annum under the WC Five Year Tranche, depending on the publicly announced debt ratings for non-credit-enhanced, senior unsecured long-term indebtedness of Allergan plc (such applicable debt rating the “Debt Rating”) or (b) a Eurodollar rate, plus an applicable margin varying from (x) 1.00% per annum to 1.75% per annum under the WC Three Year Tranche and (y) 1.125% per annum to 1.875% per annum under the WC Five Year Tranche, depending on the Debt Rating.
ACT Term Loan
On December 17, 2014, Allergan plc and certain of its subsidiaries entered into a third amendment agreement (the “ACT Term Loan Amendment”) among Allergan plc, Warner Chilcott Limited, Actavis Capital, Allergan Finance LLC Actavis Funding SCS, BofA, as administrative agent, and the lenders party thereto. The ACT Term Loan Amendment amended and restated Allergan plc’s existing second amended and restated Allergan term loan credit and guaranty agreement, dated as of March 31, 2014 (such agreement, prior to its amendment and restatement pursuant to the ACT Term Loan Amendment, the “2014 ACT Term Loan Agreement” and together with the Existing ACT Term Loan Agreement (defined below), the “ACT Term Loan”) among Actavis Capital, Allergan plc, Warner Chilcott Limited, Allergan Finance, LLC Actavis Funding SCS, BofA, as administrative agent, and the lenders from time to time party thereto, which amended and restated Allergan plc’s existing amended and restated Allergan term loan credit and guaranty agreement, dated as of October 1, 2013 (such agreement, prior to its amendment and restatement pursuant to the ACT Term Loan Amendment, the “Existing ACT Term Loan Agreement”) among Actavis Capital, Allergan plc, Allergan Finance, LLC, BofA, as administrative agent, and the lenders from time to time party thereto.
The Existing ACT Term Loan Agreement amended and restated Allergan Finance, LLC’s $1,800.0 million senior unsecured term loan credit facility, dated as of June 22, 2012. At the closing of the Existing ACT Term Loan Agreement, an aggregate principal amount of $1,572.5 million was outstanding (the “2017 Term Loan”).
On March 31, 2014, Allergan plc, Actavis Capital, Allergan Finance, LLC, BofA, as Administrative Agent, and a syndicate of banks participating as lenders entered into the 2014 ACT Term Loan Agreement to amend and restate the Existing ACT Term Loan Agreement. On July 1, 2014, in connection with the Forest Acquisition, the Company borrowed $2.0 billion of term loan indebtedness under tranche A-2 of the 2014 ACT Term Loan Agreement, which was due July 1, 2019 (the “2019 Term Loan”).
Loans under the ACT Term Loan bore interest, at the Company’s choice, of a per annum rate equal to either (a) a base rate, plus an applicable margin per annum varying from (x) 0.00% per annum to 1.00% per annum with respect to the 2017 term-loan and (y) 0.125% per annum to 0.875% per annum with respect to the 2019 term-loan, depending on the Debt Rating or (b) a Eurodollar rate, plus an applicable margin varying from (x) 1.00% per annum to 2.00% per annum with respect to the 2017 term-loan and (y) 1.125% per annum to 1.875% per annum with respect to the 2019 term-loan, depending on the Debt Rating.
85
On December 17, 2014, Allergan, Inc. and certain of its subsidiaries entered into a senior unsecured term loan credit agreement (the “AGN Term Loan”), among Actavis Capital, as borrower, Allergan plc, Warner Chilcott Limited, Allergan Finance LLC, Actavis Funding SCS, the lenders from time to time party thereto (the “Term Lenders”), JPMorgan Chase Bank, N.A. (“JPMCB”), as administrative agent and the other financial institutions party thereto. Under the AGN Term Loan, the Term Lenders provided (i) a $2.75 billion tranche maturing on March 17, 2018 (the “AGN Three Year Tranche”) and (ii) a $2.75 billion tranche and maturing on March 17, 2020 (the “AGN Five Year Tranche”). The proceeds of borrowings under the AGN Term Loan were used to finance, in part, the cash component of the Allergan Acquisition consideration and certain fees and expenses incurred in connection with the Allergan Acquisition.
Borrowings under the AGN Term Loan bore interest at our choice of a per annum rate equal to either (a) a base rate plus an applicable margin per annum varying from (x) 0.00% per annum to 1.00% per annum under the AGN Three Year Tranche and (y) 0.125% per annum to 1.250% per annum under the AGN Five Year Tranche, depending on the Debt Rating or (b) a Eurodollar rate, plus an applicable margin varying from (x) 1.00% per annum to 2.00% per annum under the AGN Three Year Tranche and (y) 1.125% per annum to 2.250% per annum under the AGN Five Year Tranche, depending on the Debt Rating. The outstanding principal amount of loans under the AGN Three Year Tranche was not subject to quarterly amortization and was payable in full on the maturity date. The outstanding principal amount of loans under the AGN Five Year Tranche was payable in equal quarterly amounts of 2.50% per quarter prior to March 17, 2020, with the remaining balance payable on March 17, 2020.
Bridge Loan Facility
On December 17, 2014, Allergan and certain of its subsidiaries entered into a 364-day senior unsecured bridge credit agreement (the “Bridge Loan Facility”), among Actavis Capital, as borrower, Allergan plc, Warner Chilcott Limited, Allergan Finance LLC, Actavis Funding SCS, the lenders from time to time party thereto, JPMCB, as administrative agent and the other financial institutions party thereto. No amounts were borrowed under the Bridge Loan Facility and the commitments under the Bridge Loan Facility expired on March 17, 2015 upon the closing of the Allergan Acquisition.
Cash Bridge Loan Facility
On March 11, 2015, Allergan and certain of its subsidiaries entered into a 60-day senior unsecured bridge credit agreement (the “Cash Bridge Loan Facility”), among Actavis Capital, as borrower, Allergan plc, Warner Chilcott Limited, Allergan Finance, LLC Actavis Funding SCS, the lenders from time to time party thereto (the “Cash Bridge Lenders”), JPMCB, as administrative agent and the other financial institutions party thereto. Under the Cash Bridge Loan Facility, the Cash Bridge Lenders committed to provide, subject to certain conditions, unsecured bridge financing, of which $2.8 billion was drawn to finance the Allergan Acquisition on March 17, 2015. The outstanding balance of the Cash Bridge Loan Facility was repaid on April 9, 2015.
Borrowings under the Cash Bridge Loan Facility bore interest at our choice of a per annum rate equal to either (a) a base rate plus an applicable margin per annum varying from 0.00% per annum to 1.00% per annum, depending on the Debt Rating or (b) a Eurodollar rate, plus an applicable margin varying from 1.00% per annum to 2.00% per annum, depending on the Debt Rating.
86
The following table lists our enforceable and legally binding obligations as of December 31, 2016. Certain amounts included herein are based on management’s estimates and assumptions about these obligations, including their duration, the possibility of renewal, anticipated actions by third parties and other factors. Because these estimates and assumptions are necessarily subjective, the enforceable and legally binding obligation we will actually pay in future periods may vary from those reflected in the table:
|
|
|
Payments Due by Period (Including Interest on Debt) |
|
|||||||||||||||||
|
($ in millions): |
|
Total |
|
|
2017 |
|
|
2018-2019 |
|
|
2020-2021 |
|
|
Thereafter |
|
|||||
|
Long-term debt(1) |
|
$ |
32,835.5 |
|
|
$ |
2,785.5 |
|
|
$ |
5,700.0 |
|
|
$ |
6,600.0 |
|
|
$ |
17,750.0 |
|
|
Cash interest(1) |
|
|
12,312.4 |
|
|
|
1,140.6 |
|
|
|
1,990.4 |
|
|
|
1,647.4 |
|
|
|
7,534.0 |
|
|
Other contingent consideration liabilities(2) |
|
|
346.2 |
|
|
|
27.7 |
|
|
|
52.7 |
|
|
|
44.9 |
|
|
|
220.9 |
|
|
Operating lease obligations(3) |
|
|
349.7 |
|
|
|
45.7 |
|
|
|
74.9 |
|
|
|
56.3 |
|
|
|
172.8 |
|
|
Capital lease obligations(4) |
|
|
2.4 |
|
|
|
2.4 |
|
|
|
- |
|
|
|
- |
|
|
|
- |
|
|
R&D and sales milestone obligations(5) |
|
|
17,384.5 |
|
|
|
863.5 |
|
|
|
1,246.4 |
|
|
|
1,720.9 |
|
|
|
13,553.7 |
|
|
Other obligations and commitments |
|
|
886.2 |
|
|
|
148.0 |
|
|
|
610.0 |
|
|
|
117.2 |
|
|
|
11.0 |
|
|
Total |
|
$ |
64,116.9 |
|
|
$ |
5,013.4 |
|
|
$ |
9,674.4 |
|
|
$ |
10,186.7 |
|
|
$ |
39,242.4 |
|
|
(1) |
Amounts represent total minimum cash payments and anticipated interest payments, as applicable, assuming scheduled repayments under the Company’s existing notes. Amounts exclude fair value adjustments, discounts or premiums on outstanding debt obligations. |
|
(2) |
Amount primarily represents contingent consideration obligations, including accretion resulting from various acquisitions. |
|
(3) |
Amount represents operating leases for our global business. There are no contingent rental amounts or sublease rentals. |
|
(4) |
Amount represents capital leases for our global business, including interest. Leases are for property, plant and equipment, vehicles and furniture and fixtures. |
|
(5) |
The table above reflects the anticipated timing of R&D and approval related milestones with sales based milestones included in the period thereafter as the achievement of sales targets is variable. Certain agreements also include royalties based on commercial sales. The following is a contractual commitments relating to these milestones ($ in millions): |
|
Transaction |
Product |
Maximum Milestones |
|
R&D / Approval Milestones |
|
Sales Based and Other Milestones |
|
|||
|
Heptares Transaction |
Neurological disorders |
$ |
3,239.5 |
|
$ |
664.5 |
|
$ |
2,575.0 |
|
|
AstraZeneca License |
brazikumab (MEDI2070) |
|
1,265.0 |
|
|
105.0 |
|
|
1,160.0 |
|
|
Tobira Acquisition |
CVC |
|
1,203.5 |
|
|
738.5 |
|
|
465.0 |
|
|
Naurex Transaction |
GLYX-13 and NRX-1074 |
|
1,150.0 |
|
|
750.0 |
|
|
400.0 |
|
|
Akarna Transaction |
Inflammatory and fibrotic diseases |
|
1,015.0 |
|
|
640.0 |
|
|
375.0 |
|
|
Merck Transaction |
Migraine Products |
|
865.0 |
|
|
435.0 |
|
|
430.0 |
|
|
Chase Transaction |
Neurodegenerative disorders |
|
875.0 |
|
|
325.0 |
|
|
550.0 |
|
|
Retrosense Transaction |
Novel gene therapy - vision |
|
501.7 |
|
|
251.7 |
|
|
250.0 |
|
|
AqueSys Transaction |
XEN45 |
|
325.0 |
|
|
25.0 |
|
|
300.0 |
|
|
Anterios Transaction |
Botulinum toxin type A |
|
387.5 |
|
|
207.5 |
|
|
180.0 |
|
|
Oculeve Acquisition |
OD-01 |
|
300.0 |
|
|
200.0 |
|
|
100.0 |
|
|
Topokine Transaction |
XAF5 |
|
260.0 |
|
|
110.0 |
|
|
150.0 |
|
|
Forsight Acquisition |
Eye care |
|
125.0 |
|
|
125.0 |
|
|
- |
|
|
Northwood Acquisition |
earFold |
|
65.0 |
|
|
10.0 |
|
|
55.0 |
|
|
All Other |
|
|
5,807.3 |
|
|
2,046.9 |
|
|
3,760.4 |
|
|
Total |
|
$ |
17,384.5 |
|
$ |
6,634.1 |
|
$ |
10,750.4 |
|
Off-Balance Sheet Arrangements
We do not have any material off-balance sheet arrangements that have, or are reasonably likely to have, a current or future effect on our financial condition, changes in financial condition, net revenues or expenses, results of operations, liquidity, capital expenditures or capital resources.
87
Our consolidated financial statements are prepared in accordance with accounting principles generally accepted in the United States (“GAAP”). These accounting principles require us to make certain estimates, judgments and assumptions. We believe that the estimates, judgments and assumptions are reasonable based upon information available to us at the time that these estimates, judgments and assumptions are made. These estimates, judgments and assumptions can affect the reported amounts of assets and liabilities as of the date of the financial statements, as well as the reported amounts of revenues and expenses during the periods presented. To the extent there are material differences between these estimates, judgments or assumptions and actual results, our financial statements will be affected. The significant accounting estimates that we believe are important to aid in fully understanding and evaluating our reported financial results include the following:
|
|
• |
Revenue Recognition |
|
|
• |
Inventory Valuation |
|
|
• |
Product Rights and other Definite-Lived Intangible Assets |
|
|
• |
Goodwill and Intangible Assets with Indefinite-Lives |
|
|
• |
Allocation of Acquisition Fair Values to Assets Acquired and Liabilities Assumed |
|
|
• |
Income Taxes |
|
|
• |
Defined Benefit Plans |
|
|
• |
Contingent Consideration and Other Commitments |
In many cases, the accounting treatment of a particular transaction is specifically dictated by GAAP and requires management’s best estimates of the underlying data in its application. There are also areas in which management’s judgment in selecting among available GAAP alternatives would not produce a materially different result.
Revenue Recognition
General
Revenue from product sales is recognized when title and risk of loss to the product transfers to the customer, which is based on the transaction shipping terms. Recognition of revenue also requires reasonable assurance of collection of sales proceeds, the seller’s price to the buyer to be fixed or determinable and the completion of all performance obligations. The Company warrants products against defects and for specific quality standards, permitting the return of products under certain circumstances. Product sales are recorded net of all sales-related deductions including, but not limited to: chargebacks, trade discounts, sales returns and allowances, commercial and government rebates, customer loyalty programs and fee-for-service arrangements with certain distributors, which we refer to in the aggregate as “SRA” allowances.
Royalty and commission revenue is recognized as a component of net revenues in accordance with the terms of their respective contractual agreements when collectability is reasonably assured and when revenue can be reasonably measured.
Provisions for SRAs
As is customary in the pharmaceutical industry, our gross product sales are subject to a variety of deductions in arriving at reported net product sales. When the Company recognizes gross revenue from the sale of products, an estimate of SRA is recorded, which reduces the product revenues. Accounts receivable and/or accrued liabilities are also reduced and/or increased by the SRA amount depending on whether we have the right of offset with the customer. These provisions are estimated based on historical payment experience, historical relationship of the deductions to gross product revenues, government regulations, estimated utilization or redemption rates, estimated customer inventory levels and current contract sales terms. The estimation process used to determine our SRA provision has been applied on a consistent basis and no material revenue adjustments have been necessary to increase or decrease our reserves for SRA as a result of a significant change in underlying estimates. The Company uses a variety of methods to assess the adequacy of the SRA reserves to ensure that our financial statements are fairly stated.
Chargebacks — A chargeback represents an amount payable in the future to a wholesaler for the difference between the invoice price paid by our wholesale customer for a particular product and the negotiated contract price that the wholesaler’s customer pays for that product. The chargeback provision and related reserve varies with changes in product mix, changes in customer pricing and changes to estimated wholesaler inventories. The provision for chargebacks also takes into account an estimate of the expected wholesaler sell-through levels to indirect customers at certain contract prices. The Company validates the chargeback accrual quarterly
88
through a review of the inventory reports obtained from our largest wholesale customers. This customer inventory information is used to verify the estimated liability for future chargeback claims based on historical chargeback and contract rates. These large wholesalers represent the vast majority of the recipients of the Company’s chargeback payments. We continually monitor current pricing trends and wholesaler inventory levels to ensure the liability for future chargebacks is fairly stated.
Rebates — Rebates include volume related incentives to direct and indirect customers, third-party managed care and Medicare Part D rebates, Medicaid rebates and other government rebates. Rebates are accrued based on an estimate of claims to be paid for product sold into trade by the Company. Volume rebates are generally offered to customers as an incentive to use the Company’s products and to encourage greater product sales. These rebate programs include contracted rebates based on customers’ purchases made during an applicable monthly, quarterly or annual period. The provision for third-party rebates is estimated based on our customers’ contracted rebate programs and the Company’s historical experience of rebates paid. Any significant changes to our customer rebate programs are considered in establishing the provision for rebates. The provisions for government rebates are based, in part, upon historical experience of claims submitted by the various states / authorities, contractual terms and government regulations. We monitor legislative changes to determine what impact such legislation may have on our provision.
Cash Discounts — Cash discounts are provided to customers that pay within a specific period. The provision for cash discounts is estimated based upon invoice billings and historical customer payment experience. The Company’s experience of payment history is fairly consistent and most customer payments qualify for the cash discount.
Returns and Other Allowances — The Company’s provision for returns and other allowances include returns, promotional allowances, and loyalty cards.
Consistent with industry practice, the Company maintains a returns policy that allows customers to return product for a credit. In accordance with the Company’s policy, credits for customer returns of products are applied against outstanding account activity or are settled in cash. Product exchanges are not permitted. Customer returns of product are generally not resalable. The Company’s estimate of the provision for returns is based upon historical experience and current trends of actual customer returns. Additionally, we consider other factors when estimating the current period returns provision, including levels of inventory in the distribution channel, as well as significant market changes which may impact future expected returns.
Promotional allowances are credits that are issued in connection with a product launch or as an incentive for customers to carry our product. The Company establishes a reserve for promotional allowances based upon contractual terms.
Loyalty cards allow the end user patients a discount per prescription and are accrued based on historical experience, contract terms and the volume of product and cards in the distribution channel.
The following table summarizes the activity from continuing operations in the Company’s major categories of SRA ($ in millions):
|
|
|
Chargebacks |
|
|
Rebates |
|
|
Return and Other Allowances |
|
|
Cash Discounts |
|
|
Total |
|
|||||
|
Balance at December 31, 2013 |
|
$ |
21.8 |
|
|
$ |
284.1 |
|
|
$ |
198.7 |
|
|
$ |
6.6 |
|
|
$ |
511.2 |
|
|
Add: Forest Acquisition |
|
|
27.9 |
|
|
|
425.0 |
|
|
|
94.3 |
|
|
|
9.8 |
|
|
|
557.0 |
|
|
Provision related to sales in 2014 |
|
|
442.9 |
|
|
|
1,516.5 |
|
|
|
79.4 |
|
|
|
134.2 |
|
|
|
2,173.0 |
|
|
Credits and payments |
|
|
(464.6 |
) |
|
|
(1,229.8 |
) |
|
|
(117.2 |
) |
|
|
(134.3 |
) |
|
|
(1,945.9 |
) |
|
Balance at December 31, 2014 |
|
$ |
28.0 |
|
|
$ |
995.8 |
|
|
$ |
255.2 |
|
|
$ |
16.3 |
|
|
$ |
1,295.3 |
|
|
Add: Allergan Acquisition |
|
|
14.1 |
|
|
|
306.4 |
|
|
|
100.4 |
|
|
|
8.6 |
|
|
|
429.5 |
|
|
Provision related to sales in 2015 |
|
|
649.9 |
|
|
|
4,035.7 |
|
|
|
659.9 |
|
|
|
275.6 |
|
|
|
5,621.1 |
|
|
Credits and payments |
|
|
(613.8 |
) |
|
|
(3,993.5 |
) |
|
|
(648.0 |
) |
|
|
(275.4 |
) |
|
|
(5,530.7 |
) |
|
Balance at December 31, 2015 |
|
$ |
78.2 |
|
|
$ |
1,344.4 |
|
|
$ |
367.5 |
|
|
$ |
25.1 |
|
|
$ |
1,815.2 |
|
|
Provision related to sales in 2016 |
|
|
1,003.2 |
|
|
|
4,338.7 |
|
|
|
1,390.1 |
|
|
|
306.5 |
|
|
|
7,038.5 |
|
|
Credits and payments |
|
|
(967.2 |
) |
|
|
(4,069.1 |
) |
|
|
(1,341.7 |
) |
|
|
(296.9 |
) |
|
|
(6,674.9 |
) |
|
Balance at December 31, 2016 |
|
$ |
114.2 |
|
|
$ |
1,614.0 |
|
|
$ |
415.9 |
|
|
$ |
34.7 |
|
|
$ |
2,178.8 |
|
89
The following table summarizes the balance sheet classification of our SRA reserves ($ in millions):
|
|
|
As of December 31, |
|
|||||
|
|
|
2016 |
|
|
2015 |
|
||
|
Accounts receivable |
|
$ |
287.4 |
|
|
$ |
245.0 |
|
|
Accounts payable and accrued expenses |
|
|
1,891.4 |
|
|
|
1,570.2 |
|
|
|
|
$ |
2,178.8 |
|
|
$ |
1,815.2 |
|
The provisions recorded to reduce gross product sales to net product sales, excluding discontinued operations, were as follows ($ in millions):
|
Years Ended December 31, |
|
Gross Product Sales |
|
|
Chargebacks |
|
|
Rebates |
|
|
Return and Other Allowances |
|
|
Cash Discounts |
|
|
Net Product Sales |
|
|
Gross-to-net Percentages |
|
|||||||
|
2014 |
|
$ |
6,782.1 |
|
|
$ |
442.9 |
|
|
$ |
1,516.5 |
|
|
$ |
79.4 |
|
|
$ |
134.2 |
|
|
$ |
4,609.1 |
|
|
|
68.0 |
% |
|
2015 |
|
$ |
18,125.1 |
|
|
$ |
649.9 |
|
|
$ |
4,035.7 |
|
|
$ |
659.9 |
|
|
$ |
275.6 |
|
|
$ |
12,504.0 |
|
|
|
69.0 |
% |
|
2016 |
|
$ |
21,398.6 |
|
|
$ |
1,003.2 |
|
|
$ |
4,338.7 |
|
|
$ |
1,390.1 |
|
|
$ |
306.5 |
|
|
$ |
14,360.1 |
|
|
|
67.1 |
% |
The following table summarizes the activity from discontinued operations in the Company’s major categories of SRA ($ in millions):
|
|
|
Chargebacks |
|
|
Rebates |
|
|
Return and Other Allowances |
|
|
Cash Discounts |
|
|
Total |
|
|||||
|
Balance at December 31, 2013 |
|
$ |
224.6 |
|
|
$ |
777.7 |
|
|
$ |
419.2 |
|
|
$ |
41.1 |
|
|
$ |
1,462.6 |
|
|
Provision related to sales in 2014 |
|
|
4,148.8 |
|
|
|
1,807.4 |
|
|
|
780.0 |
|
|
|
216.5 |
|
|
|
6,952.7 |
|
|
Credits and payments |
|
|
(3,836.5 |
) |
|
|
(1,834.3 |
) |
|
|
(842.3 |
) |
|
|
(213.2 |
) |
|
|
(6,726.3 |
) |
|
Balance at December 31, 2014 |
|
$ |
536.9 |
|
|
$ |
750.8 |
|
|
$ |
356.9 |
|
|
$ |
44.4 |
|
|
$ |
1,689.0 |
|
|
Provision related to sales in 2015 |
|
|
5,907.2 |
|
|
|
1,991.9 |
|
|
|
729.4 |
|
|
|
277.3 |
|
|
|
8,905.8 |
|
|
Credits and payments |
|
|
(5,825.1 |
) |
|
|
(2,011.7 |
) |
|
|
(757.7 |
) |
|
|
(261.6 |
) |
|
|
(8,856.1 |
) |
|
Balance at December 31, 2015 |
|
$ |
619.0 |
|
|
$ |
731.0 |
|
|
$ |
328.6 |
|
|
$ |
60.1 |
|
|
$ |
1,738.7 |
|
|
Provision related to sales in 2016 |
|
|
3,525.4 |
|
|
|
1,290.4 |
|
|
|
583.0 |
|
|
|
159.1 |
|
|
|
5,557.9 |
|
|
Credits and payments |
|
|
(3,655.0 |
) |
|
|
(1,350.0 |
) |
|
|
(496.3 |
) |
|
|
(155.4 |
) |
|
|
(5,656.7 |
) |
|
Disposal of businesses |
|
|
(489.4 |
) |
|
|
(671.4 |
) |
|
|
(415.3 |
) |
|
|
(63.8 |
) |
|
|
(1,639.9 |
) |
|
Balance at December 31, 2016 |
|
$ |
- |
|
|
$ |
- |
|
|
$ |
- |
|
|
$ |
- |
|
|
$ |
- |
|
The following table summarizes the balance sheet classification of our SRA reserves relating to the assets divested to Teva ($ in millions):
|
|
|
As of December 31, |
|
|
|
|
|
2015 |
|
|
|
Current assets held for sale |
|
$ |
1,325.2 |
|
|
Current liabilities held for sale |
|
|
413.5 |
|
|
|
|
$ |
1,738.7 |
|
90
The Company’s divested generics business also had the following type of SRA’s:
|
|
• |
Pricing adjustments, included shelf stock adjustments which are credits issued to reflect price decreases in selling prices charged to the Company’s direct customers. Shelf stock adjustments are based upon the amount of product our customers have in their inventory at the time of an agreed-upon price reduction. The provision for shelf stock adjustments was based upon specific terms with the Company’s customers and includes estimates of existing customer inventory levels based upon their historical purchasing patterns. |
|
|
• |
Billback adjustments are credits that are issued to certain customers who purchase directly from us as well as indirectly through a wholesaler. These credits are issued in the event there was a difference between the customer’s direct and indirect contract price. The provision for billbacks was estimated based upon historical purchasing patterns of qualified customers who purchase product directly from us and supplement their purchases indirectly through our wholesale customers. |
Inventory Valuation
Inventories consist of finished goods held for distribution, raw materials and work in process. Inventory includes brand pharmaceutical products which represents FDA approved or likely to be approved indications. Inventory valuation reserves are established based on a number of factors/situations including, but not limited to, raw materials, work in process or finished goods not meeting product specifications, product obsolescence, or application of the lower of cost (first-in, first-out method) or market (net realizable value) concepts. The determination of events requiring the establishment of inventory valuation reserves, together with the calculation of the amount of such reserves may require judgment. Assumptions utilized in our quantification of inventory reserves include, but are not limited to, estimates of future product demand, consideration of current and future market conditions, product net selling price, anticipated product launch dates, potential product obsolescence and other events relating to special circumstances surrounding certain products. No material adjustments have been required to our inventory reserve estimates for the periods presented. Adverse changes in assumptions utilized in our inventory reserve calculations could result in an increase to our inventory valuation reserves and higher cost of sales.
Product Rights and Other Definite-Lived Intangible Assets
Our product rights and other definite-lived intangible assets are stated at cost, less accumulated amortization, and are amortized using the economic benefit model or the straight-line method, if results are materially aligned, over their estimated useful lives. We determine amortization periods for product rights and other definite-lived intangible assets based on our assessment of various factors impacting estimated useful lives and cash flows. Such factors include the product’s position in its life cycle, the existence or absence of like products in the market, various other competitive and regulatory issues, and contractual terms. Significant changes to any of these factors may result in a reduction in the intangibles useful life and an acceleration of related amortization expense, which could cause our net results to decline.
Product rights and other definite-lived intangible assets are tested periodically for impairment when events or changes in circumstances indicate that an asset’s carrying value may not be recoverable. The impairment testing involves comparing the carrying amount of the asset to the forecasted undiscounted future cash flows. In the event the carrying value of the asset exceeds the undiscounted future cash flows, the carrying value is considered not recoverable and an impairment exists. An impairment loss is measured as the excess of the asset’s carrying value over its fair value, calculated using discounted future cash flows. The computed impairment loss is recognized in net (loss) / income in the period that the impairment occurs. Assets which are not impaired may require an adjustment to the remaining useful lives for which to amortize the asset. Our projections of discounted cash flows use a discount rate determined by our management to be commensurate with the risk inherent in our business model. Our estimates of future cash flows attributable to our other definite-lived intangible assets require significant judgment based on our historical and anticipated results and are subject to many factors. Different assumptions and judgments could materially affect the calculation of the fair value of the other definite-lived intangible assets which could trigger impairment.
Goodwill and Intangible Assets with Indefinite Lives
General
The Company tests goodwill and intangible assets with indefinite-lives for impairment annually in the second quarter by comparing the fair value of each of the Company’s reporting units to the respective carrying value of the reporting units. Additionally, the Company may perform interim tests if an event occurs or circumstances change that could potentially reduce the fair value of a reporting unit below its carrying amount or when the Company has a change to reporting units. The carrying value of each reporting unit is determined by assigning the assets and liabilities, including the existing goodwill and intangible assets, to those reporting units.
91
Goodwill is considered impaired if the carrying amount of the net assets exceeds the fair value of the reporting unit. Impairment, if any, would be recorded in operating income and this could result in a material impact to net (loss) / income and (loss) / earnings per share.
Acquired IPR&D intangible assets represent the value assigned to acquired research and development projects that, as of the date acquired, represent the right to develop, use, sell and/or offer for sale a product or other intellectual property that the Company has acquired with respect to products and/or processes that have not been completed or approved. The IPR&D intangible assets are subject to impairment testing until completion or abandonment of each project. Upon abandonment, the assets are impaired. Impairment testing requires the development of significant estimates and assumptions involving the determination of estimated net cash flows for each year for each project or product (including net revenues, cost of sales, R&D costs, selling and marketing costs and other costs which may be allocated), the appropriate discount rate to select in order to measure the risk inherent in each future cash flow stream, the assessment of each asset’s life cycle, the potential regulatory and commercial success risks, and competitive trends impacting the asset and each cash flow stream as well as other factors. The major risks and uncertainties associated with the timely and successful completion of the IPR&D projects include legal risk, market risk and regulatory risk. Changes in these assumptions could result in future impairment charges. No assurances can be given that the underlying assumptions used to prepare the discounted cash flow analysis will not change or the timely completion of each project to commercial success will occur. For these and other reasons, actual results may vary significantly from estimated results.
Upon successful completion of each project and approval of the product, we will make a separate determination of the useful life of the intangible, transfer the amount to currently marketed products (“CMP”) and amortization expense will be recorded over the estimated useful life.
Annual Testing
In connection with the realignment of the Company’s operating segments in the second quarter of 2016, goodwill was reallocated to reporting units under the new segment structure. The Company evaluated goodwill for six reporting units during the second quarter of 2016. The Company performed its annual impairment test utilizing long-term growth rates for its reporting units ranging from 0% to 2.5% in its estimation of fair value and discount rates ranging from 8.0% to 9.5%. The factors used in evaluating goodwill for impairment are subject to change and are tracked against historical results by management. Changes in the key assumptions by management can change the results of testing. The Company determined there was no impairment associated with goodwill.
During 2016, the Company tested its indefinite-lived trade name intangible assets for impairment noting no impairment.
The Company regularly reviews IPR&D assets for impairment indicators. In the year ended December 31, 2016, the Company recorded the following significant impairments:
|
|
• |
$210.0 million relating to a urology product acquired in the Allergan Acquisition due to clinical data not supporting continuation of the R&D study. This impairment was offset, in part, by a reduction contingent liability of $186.0 million recorded in R&D; |
|
|
• |
$106.0 million relating to a migraine treatment acquired in the Allergan Acquisition based on a decrease in projected cash flows due to a delay in potential launch; |
|
|
• |
$46.0 million relating to the Atopic Dermatitis pipeline candidate acquired in the Vitae Acquisition; |
|
|
• |
$33.0 million of the acquired ForSight IPR&D asset as the Company anticipates a delay in potential launch timing. Offsetting this impairment was a corresponding reduction of acquired contingent consideration of $15.0 million, which reduced overall R&D expenses; |
|
|
• |
$35.0 million for an international eye care pipeline project based on a decrease in projected cash flows due to market conditions; |
|
|
• |
$40.0 million for a Botox® premature ejaculation product based on a decrease in projected cash flows; |
|
|
• |
$24.0 million relating to women’s healthcare IPR&D projects based on clinical trial results; |
|
|
• |
$190.0 million relating to osteoarthritis project based on clinical trial results; and |
|
|
• |
$42.0 million on a gastroenterology project based on the lack of future availability of active pharmaceutical ingredients. |
During the year ended December 31, 2015, the Company recorded a $197.6 million impairment related to IPR&D for select projects as the Company revised its sales forecast of certain assets as well as the timing of the launch of certain projects in connection
92
with the Company’s annual review. In addition, during the year ended December 31, 2015, the Company made the decision to abandon a select IPR&D asset (acquired in connection with the Allergan Acquisition) based on review of research studies, resulting in an impairment of the full asset value of $300.0 million. In-process research and development impairments for the year ended December 31, 2014 primarily included an impairment charge of $165.5 million related to the abandonment of certain R&D projects, an impairment charge of $193.0 million related to acquired IPR&D due to the FDA communications relating to Allergan’s NDA for the fixed-dose combination of nebivolol and valsartan for the treatment of hypertension and the abandonment of a select dermatology project of $32.0 million.
Allocation of Acquisition Fair Values to Assets Acquired and Liabilities Assumed
We account for acquired businesses using the acquisition method of accounting, which requires that assets acquired and liabilities assumed be recorded at the date of acquisition at their respective fair values. The consolidated financial statements and results of operations reflect an acquired business after the completion of the acquisition. The fair value of the consideration paid, including contingent consideration, is assigned to the underlying net assets of the acquired business based on their respective fair values as determined using a market participant concept. Any excess of the purchase price over the estimated fair values of the net assets acquired is recorded as goodwill.
The most material line items impacted by the allocation of acquisition fair values are:
|
|
• |
Intangible assets (including IPR&D assets upon successful completion of the project and approval of the product) which are amortized to amortization expense over the expected life of the asset. Significant judgments are used in determining the estimated fair values assigned to the assets acquired and liabilities assumed and in determining estimates of useful lives of long-lived assets. Fair value determinations and useful life estimates are based on, among other factors, estimates of expected future net cash flows, estimates of appropriate discount rates used to present value expected future net cash flow streams, the timing of approvals for IPR&D projects and the timing of related product launch dates, the assessment of each asset’s life cycle, the impact of competitive trends on each asset’s life cycle and other factors. These judgments can materially impact the estimates used to allocate acquisition date fair values to assets acquired and liabilities assumed and the future useful lives. For these and other reasons, actual results may vary significantly from estimated results. |
|
|
• |
Fixed asset valuations which are depreciated over the expected life of the asset. Significant judgments are used in determining the estimated fair values assigned to the assets acquired and in determining estimates of useful lives of long-lived assets. Fair value determinations and useful life estimates are based on, among other factors, estimates of expected future net cash flows, estimates of appropriate discount rates and intended uses of the assets. |
|
|
• |
Inventory which is recorded at fair market value factoring in selling price and costs to dispose. Inventory acquired is typically valued higher than replacement cost. |
Income Taxes
Income taxes are accounted for using an asset and liability approach that requires the recognition of deferred tax assets and liabilities for the expected future tax consequences of temporary differences between the financial statement and tax bases of assets and liabilities at the applicable tax rates. A valuation allowance is provided when it is more likely than not that some portion or all of the deferred tax assets will not be realized. The Company evaluates the realizability of its deferred tax assets by assessing its valuation allowance and by adjusting the amount of such allowance, if necessary. The factors used to assess the likelihood of realization include the Company’s forecast of future taxable income and available tax planning strategies that could be implemented to realize the net deferred tax assets. Failure to achieve forecasted taxable income in applicable tax jurisdictions could affect the ultimate realization of deferred tax assets and could result in an increase in the Company’s effective tax rate on future earnings.
Income tax positions must meet a more-likely-than-not recognition threshold to be recognized. Income tax positions that previously failed to meet the more-likely-than-not threshold are recognized in the first financial reporting period in which that threshold is met. Previously recognized tax positions that no longer meet the more-likely-than-not threshold are derecognized in the first financial reporting period in which that threshold is no longer met. The Company recognizes potential accrued interest and penalties related to unrecognized tax benefits within the consolidated statements of operations as income tax expense.
Defined Benefit Plans
The Company recognizes the overfunded or underfunded status of each of its defined benefit plans as an asset or liability on its consolidated balance sheets. The obligations are generally measured at the actuarial present value of all benefits attributable to employee service rendered, as provided by the applicable benefit formula. The estimates of the obligation and related expense of these plans recorded in the financial statements are based on certain assumptions. The most significant assumptions relate to discount rate
93
and expected return on plan assets. Other assumptions used may include employee demographic factors such as compensation rate increases, retirement patterns, expected employee turnover and participant mortality rates. The difference between these assumptions and actual experience results in the recognition of an asset or liability based upon a net actuarial (gain) / loss. If the total net actuarial (gain) / loss included in accumulated other comprehensive income/ (loss) exceeds a threshold of 10% of the greater of the projected benefit obligation or the market related value of plan assets, it is subject to amortization and recorded as a component of net periodic pension cost over the average remaining service lives of the employees participating in the pension plan. Net periodic benefit costs are recognized in the consolidated statement of operations.
Contingent Consideration and Other Commitments
We determine the acquisition date fair value of contingent consideration obligations based on a probability-weighted income approach derived from revenue estimates, post-tax gross profit levels and a probability assessment with respect to the likelihood of achieving contingent obligations including contingent payments such as milestone obligations, royalty obligations and contract earn-out criteria, where applicable. The fair value measurement is based on significant inputs not observable in the market and thus represents a Level 3 measurement as defined using the fair value concepts defined in ASC 820. The resultant probability-weighted cash flows are discounted using an appropriate effective annual interest rate. At each reporting date, the contingent consideration obligation will be revalued to estimated fair value and changes in fair value will be reflected as income or expense in our consolidated statement of operations. Changes in the fair value of the contingent consideration obligations may result from changes in discount periods and rates, changes in the timing and amount of revenue estimates and changes in probability assumptions with respect to the likelihood of achieving the various contingent payment obligations. Adverse changes in assumptions utilized in our contingent consideration fair value estimates could result in an increase in our contingent consideration obligation and a corresponding charge to operating results.
We are involved in various legal proceedings in the normal course of our business, including product liability litigation, intellectual property litigation, employment litigation and other litigation. We record reserves related to these legal matters when losses related to such litigation or contingencies are both probable and reasonably estimable. Refer to “NOTE 24 — Commitment and Contingencies” in the accompanying “Notes to the Consolidated Financial Statements” in this document for a description of our significant current legal proceedings.
RECENT ACCOUNTING PRONOUNCEMENTS
On May 28, 2014, the FASB issued Accounting Standards Update (“ASU”) No. 2014-09, Revenue from Contracts with Customers (Topic 606), with an effective date for annual reporting periods beginning after December 15, 2016, including interim periods within that reporting period. The effective date for ASU 2014-09 was deferred by one year through the issuance of ASU 2015-14, to annual reporting periods beginning after December 15, 2017, including interim reporting periods within that reporting period. Subsequent to the issuance of ASU 2014-09, the FASB issued multiple updates which are intended to improve the operability and understandability of the implementation guidance, and to provide clarifying guidance in certain narrow areas and add some practical expedients, which include guidance on principal versus agent considerations; identifying performance obligations; licensing implementation guidance; assessing the specific collectability criterion and accounting for certain contracts; presentation of sales taxes and other similar taxes collected from customers; noncash consideration; contract modifications at transition and completed contracts at transition. The guidance provides clarification that an entity that retrospectively applies the guidance in Topic 606 to each prior reporting period is not required to disclose the effect of the accounting change for the period of adoption, however, an entity is still required to disclose the effect of the changes on any prior periods retrospectively adjusted. The Company is continuing to evaluate the impact of the new revenue guidance. The majority of the Company’s revenue relates to the sale of finished product to various customers and we do not believe that the adoption of the new standard will have a material impact on these transactions. The Company is continuing to evaluate the impact of certain less significant transactions involving collaboration arrangements, warranties, as well as certain rebates and discounts offered. The Company expects to adopt the standard in 2018 using the modified retrospective approach.
In January 2016, the FASB issued ASU 2016-01, which changes the requirement to require equity securities (including other ownership interests, such as partnerships, unincorporated joint ventures, and limited liability companies) to be measured at fair value with changes in the fair value recognized through net income. This update is effective for fiscal years beginning after December 15, 2017, including interim periods within those fiscal years. The adoption of this guidance is not anticipated to have a material impact on the Company’s financial position or results of operations.
In February 2016, the FASB issued ASU 2016-02, which states that a lessee should recognize the assets and liabilities that arise from leases. This update is effective for fiscal years beginning after December 15, 2018, including interim periods within those fiscal years. The Company is evaluating the impact, if any, the pronouncement will have on our financial positions and results of operations.
94
In March 2016, the FASB issued ASU No. 2016-07: Simplifying the Transition to the Equity Method of Accounting. This guidance eliminates the requirement to retroactively adopt the equity method of accounting when there is an increase in the level of ownership interest or degree of influence. This guidance is effective for fiscal years, and interim periods within those years, beginning after December 15, 2016. Management believes that the adoption of this guidance will not have a material impact on our financial statements.
In March 2016, the FASB issued ASU No. 2016-09, Compensation - Stock Compensation (Topic 718): Improvements to Employee Share-Based Payment Accounting. The amendments are intended to improve the accounting for employee share-based payments and affect all organizations that issue share-based payment awards to their employees. Several aspects of the accounting for share-based payment award transactions are simplified, including: (a) income tax consequences; (b) classification of awards as either equity or liabilities; and (c) classification on the statement of cash flows. The amendments are effective for annual periods beginning after December 15, 2016, and interim periods within those annual periods. Early adoption is permitted for any organization in any interim or annual period. The Company has assessed the implementation impact on Retained Earnings noting a reduction in retained earnings of $62.4 million on January 1, 2017.
In June 2016, the FASB issued ASU No. 2016-13, Financial Instruments – Credit Losses (Topic 326): Measurement of Credit Losses on Financial Instruments. The ASU is intended to improve financial reporting by requiring timelier recording of credit losses on loans and other financial instruments held by financial institutions and other organizations. The ASU requires the measurement of all expected credit losses for financial assets including trade receivables held at the reporting date based on historical experience, current conditions, and reasonable and supportable forecasts. Financial institutions and other organizations will now use forward-looking information to better inform their credit loss estimates. The ASU is effective for fiscal years, and interim periods within those fiscal years, beginning after December 15, 2019. Early application will be permitted for all organizations for fiscal years, and interim periods within those fiscal years, beginning after December 15, 2018. The Company is evaluating the impact, if any, the pronouncement will have on our financial positions and results of operations.
In October 2016, the FASB issued ASU No. 2016-16, Income Taxes (Topic 740): Intra-Entity Transfers of Assets Other Than Inventory. Current GAAP prohibits the recognition of current and deferred income taxes for an intra-entity asset transfer until the asset has been sold to an outside party. This prohibition on recognition is an exception to the principle of comprehensive recognition of current and deferred income taxes in GAAP. The amendments require an entity to recognize the income tax consequences of an intra-entity transfer of an asset other than inventory when the transfer occurs. The amendments eliminate the exception for an intra-entity transfer of an asset other than inventory. Two common examples of assets included in the scope of the amendments are intellectual property and property, plant, and equipment. The amendments are effective for public business entities for annual reporting periods beginning after December 15, 2017, including interim reporting periods within those annual reporting periods. Early adoption is permitted for all entities in the first interim period if an entity issues interim financial statements. The amendments should be applied on a modified retrospective basis through a cumulative-effect adjustment directly to retained earnings as of the beginning of the period of adoption. The Company is evaluating the impact the pronouncement will have on our financial positions and results of operations.
In January 2017, the FASB issued ASU No. 2017-01, Business Combinations (Topic 805): Clarifying the Definition of a Business, clarifying the definition of a business. The amendments are intended to help companies evaluate whether transactions should be accounted for as acquisitions (or disposals) of assets or businesses. When substantially all of the fair value of gross assets acquired is concentrated in a single asset (or a group of similar assets), the assets acquired would not represent a business. This introduces an initial required screening that, if met, eliminates the need for further assessment. To be considered a business, an acquisition would have to include an input and a substantive process that together significantly contribute to the ability to create outputs. To be a business without outputs, there will need to be an organized workforce. The ASU also narrows the definition of the term “outputs” to be consistent with how it is described in Topic 606, Revenue from Contracts with Customers. The amendments are effective for annual periods beginning after December 15, 2017, including interim periods within those periods. Early adoption is permitted. The changes to the definition of a business may result in more acquisitions being accounted for as asset acquisitions.
In January 2017, the FASB issued ASU No. 2017-04, Intangibles - Goodwill and Other (Topic 350): Simplifying the Test for Goodwill Impairment. The amendments eliminate Step 2 from the goodwill impairment test. The goodwill impairment test is performed by comparing the fair value of a reporting unit with its carrying amount. An impairment charge should be recognized for the amount by which the carrying amount exceeds the reporting unit’s fair value; however, the loss recognized should not exceed the total amount of goodwill allocated to that reporting unit. In addition, income tax effects from any tax deductible goodwill on the carrying amount of the reporting unit should be considered when measuring the goodwill impairment loss, if applicable. The amendments also eliminate the requirements for any reporting unit with a zero or negative carrying amount to perform a qualitative assessment. The amendments should be applied on a prospective basis. The nature of and reason for the change in accounting principle should be disclosed upon transition. The amendments are effective for annual or any interim goodwill impairment tests in fiscal years beginning after December 15, 2019. Early adoption is permitted for interim or annual goodwill impairment tests performed on testing dates after January 1, 2017. The Company is evaluating the impact, if any, the amendments will have on our financial positions and results of operations.
95
The following discussion provides forward-looking quantitative and qualitative information about our potential exposure to market risk. Market risk represents the potential loss arising from adverse changes in the value of financial instruments. The risk of loss is assessed based on the likelihood of adverse changes in fair values, cash flows or future earnings. We are exposed to market risk for changes in the market values of our investments (Investment Risk), the impact of interest rate changes (Interest Rate Risk) and the impact of foreign currency exchange changes (Foreign Currency Exchange Risk).
We maintain our portfolio of cash equivalents and short-term investments in a variety of securities, including both government and government agency obligations with ratings of A or better and money market funds. Our investments in marketable securities are governed by our investment policy which seeks to preserve the value of our principal, provide liquidity and maximize return on the Company’s investment against minimal interest rate risk. Consequently, our interest rate and principal risk are minimal on our non-equity investment portfolio. The quantitative and qualitative disclosures about market risk are set forth below.
Investment Risk
As of December 31, 2016, our total investments in marketable and equity securities of other companies, including equity method investments were $11,596.5 million (included in marketable securities and investments and other assets). The fair values of these investments are subject to significant fluctuations due to volatility of the stock market and changes in general economic conditions.
As of August 2, 2016, the Company owns 100.3 million Teva ordinary shares, which approximated $5.0 billion in value using the closing date Teva opening stock price discounted at a rate of 5.9 percent due to the lack of marketability, and which are subject to changes in value based on the price of Teva shares. The Company is subject to lock-up restrictions with the investment in Teva, and as such, these shares are also subject to liquidity risk. During the year ended December 31, 2016, the Company recorded a $1,599.4 million unrealized loss on the Teva Shares due to a decline in share price, which was recorded as a component of “Other comprehensive income.” The Company currently considers the decline in value of its investment in Teva securities to be temporary. We will continue to monitor the value of this investment to determine if the decline in value becomes other than temporary.
We regularly review the carrying value of our investments and identify and recognize losses, for income statement purposes, when events and circumstances indicate that any declines in the fair values of such investments below our accounting basis are other than temporary.
Interest Rate Risk
Our exposure to interest rate risk relates primarily to our non-equity investment portfolio and our floating rate debt. Our cash is invested in bank deposits and A-rated or better money market mutual funds.
Our portfolio of marketable securities includes U.S. treasury and agency securities classified as available-for-sale securities, with no security having a maturity in excess of two years. These securities are exposed to interest rate fluctuations. Because of the short-term nature of these investments, we are subject to minimal interest rate risk and do not believe that an increase in market rates would have a significant negative impact on the realized value of our portfolio.
Floating Rate Debt
At December 31, 2016, borrowings outstanding under the floating rate notes were $1,000.0 million. Assuming a one percent increase in the applicable interest rate on the Company’s floating rates notes, annual interest expense would increase by approximately $10.0 million over the next twelve months.
Fixed Rate Debt
The Company has outstanding borrowings under its fixed rate notes. Changes in market interest rates generally affect the fair value of fixed-rate debt, but do not impact earnings or cash flows.
96
Foreign Currency Exchange Risk
Overall, we are a net recipient of currencies other than the U.S. dollar and, as such, benefit from a weaker dollar and are adversely affected by a stronger dollar relative to major currencies worldwide. Accordingly, changes in exchange rates, and in particular a strengthening of the U.S. dollar, may negatively affect our consolidated revenues or operating costs and expenses as expressed in U.S. dollars.
From time to time, we enter into foreign currency option and forward contracts to reduce earnings and cash flow volatility associated with foreign exchange rate changes to allow our management to focus its attention on our core business issues. Accordingly, we enter into various contracts which change in value as foreign exchange rates change to allow the Company at its option to economically offset the effect of changes in the value of foreign currency assets and liabilities, commitments and anticipated foreign currency denominated sales and operating expenses. We enter into foreign currency option and forward contracts in amounts between minimum and maximum anticipated foreign exchange exposures.
At times we use foreign currency option contracts, which provide for the sale or purchase of foreign currencies, if exercised, to economically hedge the currency exchange risks associated with probable but not firmly committed transactions that arise in the normal course of our business. Probable but not firmly committed transactions are comprised primarily of sales of products and purchases of raw material in currencies other than the U.S. dollar. The foreign currency option contracts are entered into to reduce the volatility of earnings generated in currencies other than the U.S. dollar, primarily earnings denominated in the Euro. While these instruments are subject to fluctuations in value, such fluctuations are anticipated to offset changes in the value of the underlying exposures.
Net foreign currency gains and losses did not have a material effect on the Company’s results of operations for the years ended December 31, 2016, 2015 or 2014, respectively.
The information required by this Item is contained in the financial statements set forth in Item 15 (a) under the caption “Consolidated Financial Statements and Supplementary Data” as a part of this Annual Report on Form 10-K.
There have been no changes in or disagreements with accountants on accounting or financial disclosure matters.
Evaluation of Disclosure Controls and Procedures
Allergan plc maintains “disclosure controls and procedures,” as such term is defined under Rule 13a-15(e) of the Exchange Act, that are designed to provide reasonable assurance that information required to be disclosed in the Allergan plc’s Exchange Act reports is recorded, processed, summarized and reported within the time periods specified in the SEC’s rules and forms, and that such information is accumulated and communicated to Allergan plc’s management, including its Principal Executive Officer and Principal Financial Officer, as appropriate, to allow timely decisions regarding required disclosure. In designing and evaluating the disclosure controls and procedures, management recognizes that any controls and procedures, no matter how well designed and operated, can provide only reasonable assurance of achieving the desired control objective.
As required by SEC Rule 13a-15(b), the Allergan plc carried out an evaluation, under the supervision and with the participation of Allergan plc’s management, including Allergan plc’s Principal Executive Officer and Principal Financial Officer, of the effectiveness of the design and operation of Allergan plc’s disclosure controls and procedures as of the end of the period covered by this annual report. Based on this evaluation Allergan plc’s Principal Executive Officer and Principal Financial Officer concluded that Allergan plc’s disclosure controls and procedures were not effective as of December 31, 2016 because of the material weakness in our internal control over financial reporting described below.
Warner Chilcott Limited maintains “disclosure controls and procedures,” as such term is defined under Rule 13a-15(e) of the Exchange Act, that are designed to provide reasonable assurance that information required to be disclosed in the Company’s Exchange Act reports is recorded, processed, summarized and reported within the time periods specified in the SEC’s rules and forms, and that such information is accumulated and communicated to Warner Chilcott Limited’s management, including its Principal Executive Officer and Principal Financial Officer, as appropriate, to allow timely decisions regarding required disclosure. In designing and evaluating the disclosure controls and procedures, management recognizes that any controls and procedures, no matter how well designed and operated, can provide only reasonable assurance of achieving the desired control objective.
97
As required by SEC Rule 13a-15(b), Warner Chilcott Limited carried out an evaluation, under the supervision and with the participation of Warner Chilcott Limited’s management, including Warner Chilcott Limited’s Principal Executive Officer and Principal Financial Officer, of the effectiveness of the design and operation of Warner Chilcott Limited’s disclosure controls and procedures as of the end of the period covered by this annual report. Based on this evaluation Warner Chilcott Limited’s Principal Executive Officer and Principal Financial Officer concluded that Warner Chilcott Limited’s disclosure controls and procedures were not effective as of December 31, 2016 because of the material weakness in our internal control over financial reporting described below.
Management’s Reports on Internal Control over Financial Reporting of Allergan plc and Warner Chilcott Limited
Management is responsible for establishing and maintaining adequate internal control over financial reporting, as such term is defined under Rule 13a-15(f) of the Exchange Act. We maintain internal control over financial reporting designed to provide reasonable assurance regarding the reliability of financial reporting and the preparation of financial statements for external purposes in accordance with generally accepted accounting principles.
Because of its inherent limitations, internal control over financial reporting may not prevent or detect misstatements. Also, projections of any evaluation of effectiveness to future periods are subject to the risk that controls may become inadequate because of changes in conditions, or that the degree of compliance with the policies or procedures may deteriorate. A material weakness is a deficiency, or combination of deficiencies, in internal control over financial reporting, such that there is a reasonable possibility that a material misstatement of Allergan plc and Warner Chilcott Limited’s annual or interim financial statements will not be prevented or detected on a timely basis.
Management of Allergan plc and Warner Chilcott Limited has assessed the effectiveness of Allergan plc and Warner Chilcott Limited’s internal control over financial reporting as of December 31, 2016 based on criteria set forth in “Internal Control — Integrated Framework” (2013) issued by Committee of Sponsoring Organizations of the Treadway Commission. Based on its assessment of internal control over financial reporting management concluded that Allergan plc and Warner Chilcott Limited did not maintain effective controls to appropriately assess the tax implications of certain transactions between our subsidiaries. This control deficiency did not result in a material misstatement of our current or prior period consolidated financial statements. However, this control deficiency could have resulted in a misstatement to the income tax accounts and disclosures, which would have resulted in a material misstatement to the annual or interim consolidated financial statements that would not be prevented or detected. Accordingly, management has concluded that this control deficiency constitutes a material weakness.
Because of the above described material weakness in internal control over financial reporting, management concluded that our internal control over financial reporting was not effective as of December 31, 2016.
The effectiveness of Allergan plc’s internal control over financial reporting as of December 31, 2016 has been audited by PricewaterhouseCoopers LLP, an independent registered public accounting firm, as stated in their report which appears herein.
Material Weakness Remediation
Management has begun to take steps to remediate the material weakness, including adding resources and enhancing existing controls and income tax reporting policies and procedures to ensure the implications of certain transactions between our subsidiaries are fully analyzed. While we have made significant progress, the material weakness cannot be considered remediated until the enhanced controls have operated effectively for a sufficient period of time.
Changes in Internal Control Over Financial Reporting of Allergan plc and Warner Chilcott Limited
During the quarter ended December 31, 2016, there were no changes in our internal control over financial reporting that have materially affected, or are reasonably likely to materially affect, Allergan plc and Warner Chilcott Limited’s internal control over financial reporting.
None.
98
Directors
The information concerning directors of Allergan required under this Item is incorporated herein by reference to the “Director Nominees For Election at the Annual Meeting” section of our definitive proxy statement, to be filed pursuant to Regulation 14A, related to our 2017 Annual General Meeting of Shareholders to be held on or about May 4, 2017 (our “2017 Proxy Statement”).
The information concerning our Audit Committee and the independence of its members required by this Item, along with information about the financial expert(s) serving on the Audit Committee, is incorporated by reference to “Audit and Compliance Committee” section of our 2017 Proxy Statement.
Executive Officers of the Registrant
Below are our executive officers as of February 24, 2017:
|
Name |
|
Age |
|
Principal Position with Registrant |
|
Brenton L. Saunders |
|
47 |
|
Chairman, Chief Executive Officer and President |
|
Robert A. Stewart |
|
49 |
|
Chief Operating Officer |
|
William Meury |
|
49 |
|
Chief Commercial Officer |
|
Maria Teresa Hilado |
|
52 |
|
Chief Financial Officer |
|
A. Robert D. Bailey |
|
53 |
|
Chief Legal Officer and Corporate Secretary |
|
Karen Ling |
|
53 |
|
Chief Human Resources Officer |
|
Dr. C. David Nicholson |
|
62 |
|
Chief R&D Officer |
|
James C. D’Arecca |
|
46 |
|
Chief Accounting Officer |
Brenton L. Saunders
Mr. Saunders is Chairman, President and Chief Executive Officer of Allergan plc. He was elected Chairman in 2016, and has served as a Director and as Chief Executive Officer and President from July 2014 to May 2016. He previously served as Chief Executive Officer and President of Forest Laboratories, Inc. and had served as a Director of Forest beginning in 2011. Mr. Saunders has significant healthcare industry expertise and a proven track-record leading business transformations and integrations. Prior to Forest, he served as Chief Executive Officer of Bausch + Lomb Incorporated, a leading global eye health company, serving in this capacity from March 2010 until August 2013. Mr. Saunders also held a number of leadership positions at Schering-Plough, including the position of President of Global Consumer Health Care and was named head of integration for the company’s merger with Merck & Co. and for Schering-Plough’s acquisition of Organon BioSciences. Before joining Schering-Plough, Mr. Saunders was a Partner and Head of Compliance Business Advisory at PricewaterhouseCoopers LLP. Prior to that, he was Chief Risk Officer at Coventry Health Care and Senior Vice President, Compliance, Legal and Regulatory at Home Care Corporation of America. Mr. Saunders began his career as Chief Compliance Officer for the Thomas Jefferson University Health System. Mr. Saunders serves on the Board of Directors at RWJBarnabas Health and is a member of the Business Council and PhRMA. He received a B.A. from the University of Pittsburgh, an M.B.A. from Temple University School of Business, and a J.D. from Temple University School of Law.
Robert A. Stewart
Mr. Stewart is the Chief Operating Officer, and has served in this role since May 2016. Prior to his current appointment, Mr. Stewart served as President, Generics and Global Operations from March 2015 to May 2016; Chief Operating Officer from July 2014 to March 2015; and President, Global Operations, from August 2010 to July 2014. He joined the Company (then Watson) in November 2009 as Senior Vice President, Global Operations. Prior to joining Watson, Mr. Stewart held various positions with Abbott Laboratories, Inc. from 2001 until 2009 where he most recently served as Divisional Vice President, Global Supply Chain, Quality Assurance and prior to this position served as Divisional Vice President for U.S./Puerto Rico and Latin America Plant Operations. Prior to joining Abbott Laboratories, Inc., he worked for Knoll Pharmaceutical Company from 1995 to 2001 and Hoffman La-Roche Inc. Mr. Stewart received B.S. degrees in Business Management / Finance from Fairleigh Dickinson University.
William Meury
Mr. Meury is the Chief Commercial Officer, and has served in this role since May 2016. He previously served as President, Branded Pharma from March 2015 to May 2016. Mr. Meury joined the Company (then Actavis) in July 2014 as Executive Vice
99
President, Commercial, North American Brands. He has significant experience in launching and commercializing healthcare products. Prior to joining Actavis, he served as Executive Vice President, Sales and Marketing at Forest Laboratories, Inc. He joined Forest in 1993 and held multiple roles of increasing responsibility in Marketing, New Products, Business Development, and Sales. Before joining Forest, Mr. Meury worked in public accounting for Reznick Fedder & Silverman and in financial reporting for MCI Communications. He received a B.S. in Economics from the University of Maryland. Mr. Meury is currently a Board of Director of several organizations including The Jed Foundation, International Council of Ophthalmology Foundation, and The Allergan Foundation.
Maria Teresa Hilado
Ms. Hilado is the Chief Financial Officer, and has served in this role since December 2014. Prior to joining the Company, she served as Senior Vice President, Finance and Treasurer of PepsiCo, Inc. from 2009 to 2014. Before joining PepsiCo, Ms. Hilado served as Vice President and Treasurer for Schering-Plough Corporation from 2008 to 2009. Before joining Schering-Plough, she spent more than 17 years with General Motors Corporation in leadership roles of increasing responsibility, most notably Assistant Treasurer from 2006 to 2008 and CFO, GMAC Commercial Finance LLC from 2001 to 2005. Ms. Hilado began her career with Far East Bank and Trust Company, Manila, Philippines. Ms. Hilado received a B.S. in Management Engineering from Ateneo de Manila University in the Philippines, and an MBA from the University of Virginia’s Darden School of Business Administration.
Robert D. Bailey
Mr. Bailey is the Chief Legal Officer and Corporate Secretary, and has served in this role since July 2014. He previously served as Senior Vice President, Chief Legal Officer, General Counsel and Corporate Secretary of Forest Laboratories, Inc. from November 2013 to June 2014. Prior to that, Mr. Bailey served as Executive Vice President, Law, Policy and Communications at Bausch + Lomb from 2007 to 2013. Before joining Bausch + Lomb in 1994, he was an attorney at Nixon Peabody (formerly Nixon, Hargrave, Devans & Doyle). Mr. Bailey received his J.D. from the University of Minnesota and his B.A. from St. Olaf College in Northfield, MN.
Karen Ling
Ms. Ling is the Chief Human Resources Officer, and has served in this role since July 2014. She previously served as Senior Vice President and Chief Human Resources Officer at Forest Laboratories, Inc. from January 2014 to July 2014. Ms. Ling joined Forest from Merck & Co., where she served as Senior Vice President, Human Resources, for the company’s Global Human Health and Consumer Care businesses worldwide beginning in November 2011. Previously, she served as Vice President, Compensation and Benefits at Merck and Group Vice President, Global Compensation & Benefits at Schering-Plough (which was acquired by Merck). Prior to joining Schering-Plough in 2008, Ms. Ling spent 14 years at Wyeth Pharmaceuticals in various positions of responsibility in human resources and in Wyeth’s Labour and Employment Department. Before joining Wyeth, Ms. Ling was an attorney at Goldstein and Manello, P.C. in Boston. She is currently a member of the Board of Directors of the Glaucoma Foundation, Inc., a non-for-profit organization. Ms. Ling received her J.D. from Boston University School of Law and a B.A. from Yale University.
Dr. C. David Nicholson
Dr. Nicholson is the Chief R&D Officer and has served in this role since March 2015. He joined the Company as Senior Vice President, Global Brands R&D in August 2014. Previously, he served as Chief Technology Officer and EVP, R&D for Bayer CropScience from March 2012 to August 2014; Vice President of Licensing and Knowledge Management at Merck from 2009 to December 2011; and Senior Vice President, responsible for Global Project Management and Drug Safety at Schering-Plough from 2007 to 2009. From 1988 to 2007, Dr. Nicholson held various leadership positions at Organon, where he most recently served as Executive Vice President, Research & Development and was a member of the company’s Executive Management Committee. He received a B.Sc. from the University of Manchester and his Ph.D. from the University of Wales.
James C. D’Arecca
Mr. D’Arecca is the Chief Accounting Officer, and has served in this role since August 2013. Prior to joining the Company, he held a similar position at Bausch + Lomb. Prior to joining Bausch + Lomb, Mr. D’Arecca worked for Merck & Co. where he was Executive Director and Business Development Controller. Prior to joining Merck, Mr. D’Arecca was Executive Director and Assistant Controller at Schering-Plough. He also spent 13 years with PricewaterhouseCoopers as a Certified Public Accountant. Mr. D’Arecca received his M.B.A. from Columbia University and his B.S. in Accounting from Rutgers University.
100
Our executive officers are appointed annually by the Board of Directors, hold office until their successors are chosen and qualified and may be removed at any time by the affirmative vote of a majority of the Board of Directors. We have employment agreements with most of our executive officers. There are no family relationships between any director and executive officer of Allergan.
Section 16(a) Compliance
The information concerning compliance with Section 16(a) of the Securities Exchange Act of 1934 required by this Item is incorporated by reference to the “Section 16(a) Beneficial Ownership Reporting Compliance” section of our 2017 Proxy Statement.
Code of Ethics
We have adopted a Code of Conduct that applies to our employees, including our principal executive officer, principal financial officer and principal accounting officer. The Code of Conduct is posted on our Internet website at www.Allergan.com. Any person may request a copy of our Code of Conduct by contacting us at our administrative address: Morris Corporate Center III, 400 Interpace Parkway, Parsippany, NJ 07054, Attn: Secretary. Any amendments to or waivers from the Code of Conduct will be posted on our website at www.Allergan.com under the caption “Corporate Governance” within the Investors section of our website.
The information concerning executive and director compensation, and concerning our compensation committee and the compensation committee report for Allergan required under this Item is incorporated herein by reference to the “Compensation Discussion and Analysis” section of our 2017 Proxy Statement.
|
ITEM 12. |
SECURITY OWNERSHIP OF CERTAIN BENEFICIAL OWNERS AND MANAGEMENT AND RELATED STOCKHOLDER MATTERS |
The information concerning security ownership of certain beneficial owners and management and related stockholder matters and the equity compensation plan information required under this Item is incorporated herein by reference to the “Stock Ownership of Directors and Executive Officers” and “Equity Compensation Plan Information as of December 31, 2016” sections of our 2017 Proxy Statement.
The information concerning certain relationships and related transactions, and director independence required under this Item is incorporated herein by reference to the “Certain Relationships and Related Transactions” and “Director Independence” sections of our 2017 Proxy Statement.
The information concerning principal accountant fees and services required under this Item is incorporated herein by reference to the “Audit Fees” section of our 2017 Proxy Statement.
101
|
|
(a) |
The following documents are filed as part of the Annual Report on Form 10-K: |
|
|
1. |
Consolidated Financial Statement and Supplementary Data |
|
|
Page |
|||
|
|
|
|||
|
F-2 |
||||
|
|
|
|||
|
Consolidated Balance Sheets of Allergan plc as of December 31, 2016 and 2015 |
F-4 |
|||
|
|
|
|||
|
F-5 |
||||
|
|
|
|||
|
F-6 |
||||
|
|
|
|||
|
F-7 |
||||
|
|
|
|||
|
F-8 |
||||
|
|
|
|||
|
Consolidated Balance Sheets of Warner Chilcott Limited as of December 31, 2016 and 2015 |
F-9 |
|||
|
|
|
|||
|
F-10 |
||||
|
|
|
|||
|
F-11 |
||||
|
|
|
|||
|
F-12 |
||||
|
|
|
|||
|
F-13 |
||||
|
|
|
|||
|
F-14 |
||||
|
|
|
|||
|
|
2. |
Financial Statement Schedule |
|
|
|
|
|
|||
|
F-111 |
||||
All other financial statement schedules have been omitted because they are not applicable or the required information is included in the Consolidated Financial Statements or notes thereto.
|
|
3. |
Exhibits |
Reference is hereby made to the Exhibit Index immediately following page F-112 Supplementary Data (Unaudited) of this Annual Report on Form 10-K.
Not applicable.
102
Pursuant to the requirements of Section 13 or 15(d) of the Securities Exchange Act of 1934, the registrant has duly caused this Annual Report to be signed on its behalf by the undersigned, thereunto duly authorized on the 24th day of February, 2017.
|
ALLERGAN plc |
||
|
|
|
|
|
By: |
|
/s/ Brenton L. Saunders |
|
|
|
Brenton L. Saunders |
|
|
|
Chief Executive Officer and President |
Pursuant to the requirements of the Securities Exchange Act of 1934, this Annual Report has been signed below by the following persons and in the capacities indicated on the 24th day of February, 2017.
|
Signature |
|
Title |
|
|
|
|
|
/s/ Brenton L. Saunders |
|
Chairman, Chief Executive Officer, President, Director |
|
Brenton L. Saunders |
|
|
|
|
|
|
|
/s/ Maria Teresa Hilado |
|
Chief Financial Officer |
|
Maria Teresa Hilado |
|
|
|
|
|
|
|
/s/ James C. D'Arecca |
|
Chief Accounting Officer |
|
James C. D'Arecca |
|
|
|
|
|
|
|
* |
|
Director |
|
Nesli Basgoz, M.D. |
|
|
|
|
|
|
|
* |
|
Director |
|
Paul M. Bisaro |
|
|
|
|
|
|
|
* |
|
Director |
|
James H. Bloem |
|
|
|
|
|
|
|
* |
|
Director |
|
Christopher W. Bodine |
|
|
|
|
|
|
|
* |
|
Director |
|
Adriane M. Brown |
|
|
|
|
|
|
|
* |
|
Director |
|
Christopher J. Coughlin |
|
|
|
|
|
|
|
* |
|
Director |
|
Michael R. Gallagher |
|
|
|
|
|
|
|
* |
|
Director |
|
Catherine M. Klema |
|
|
|
|
|
|
|
* |
|
Director |
|
Peter J. McDonnell, M.D. |
|
|
|
|
|
|
|
* |
|
Director |
|
Patrick J. O'Sullivan |
|
|
|
|
|
|
|
* |
|
Director |
|
Ronald Taylor |
|
|
|
|
|
|
|
* |
|
Director |
|
Fred Weiss |
|
|
|
*By: |
/s/ A. Robert D. Bailey |
|
|
A. Robert D. Bailey |
|
|
Attorney-in-fact |
103
Pursuant to the requirements of Section 13 or 15(d) of the Securities Exchange Act of 1934, the registrant has duly caused this Annual Report to be signed on its behalf by the undersigned, thereunto duly authorized on the 24th day of February, 2017.
|
WARNER CHILCOTT LIMITED |
||
|
|
|
|
|
By: |
|
/s/ A. Robert D. Bailey |
|
|
|
A. Robert D. Bailey |
|
|
|
Secretary |
Pursuant to the requirements of the Securities Exchange Act of 1934, this Annual Report has been signed below by the following persons and in the capacities indicated on the 24th day of February, 2017.
|
Signature |
|
Title |
|
|
|
|
|
/s/ Robert Whiteford |
|
Vice President, Director of Finance and Assistant Corporate Secretary (Principal Financial Officer and Principal Accounting Officer) |
|
Robert Whiteford |
|
|
|
|
|
|
|
/s/ A. Robert D. Bailey |
|
Authorized Representative in the United States |
|
A. Robert D. Bailey |
|
|
|
|
|
|
|
/s/ Robert Whiteford |
|
Director |
|
Robert Whiteford |
|
|
|
|
|
|
|
/s/ Donnan Hurst |
|
Director |
|
Donnan Hurst |
|
|
|
|
|
|
|
|
|
|
104
INDEX TO CONSOLIDATED FINANCIAL STATEMENTS
The following Consolidated Financial Statements of the Registrants and their subsidiaries are required to be included in Item 15:
|
|
Page |
|
|
|
|
F-2 |
|
|
|
|
|
Consolidated Balance Sheets of Allergan plc as of December 31, 2016 and 2015 |
F-4 |
|
|
|
|
F-5 |
|
|
|
|
|
F-6 |
|
|
|
|
|
F-7 |
|
|
|
|
|
F-8 |
|
|
|
|
|
Consolidated Balance Sheets of Warner Chilcott Limited as of December 31, 2016 and 2015 |
F-9 |
|
|
|
|
F-10 |
|
|
|
|
|
F-11 |
|
|
|
|
|
F-12 |
|
|
|
|
|
F-13 |
|
|
|
|
|
F-14 |
|
|
|
|
|
F-111 |
|
|
|
|
|
F-112 |
|
|
|
|
|
Exhibits |
|
F-1
Report of Independent Registered Public Accounting Firm
To the Board of Directors and Stockholders of Allergan plc:
In our opinion, the accompanying consolidated balance sheets and the related consolidated statements of operations, comprehensive income/(loss), stockholders’ equity and cash flows present fairly, in all material respects, the financial position of Allergan plc and its subsidiaries at December 31, 2016 and December 31, 2015, and the results of their operations and their cash flows for each of the three years in the period ended December 31, 2016 in conformity with accounting principles generally accepted in the United States of America. In addition, in our opinion, the financial statement schedule listed in the index appearing under Item 15(a)(2) presents fairly, in all material respects, the information set forth therein when read in conjunction with the related consolidated financial statements. Also in our opinion, the Company did not maintain, in all material respects, effective internal control over financial reporting as of December 31, 2016, based on criteria established in Internal Control - Integrated Framework (2013) issued by the Committee of Sponsoring Organizations of the Treadway Commission (COSO) because a material weakness in internal control over financial reporting related to the assessment of tax implications of certain transactions between its subsidiaries existed as of that date. A material weakness is a deficiency, or a combination of deficiencies, in internal control over financial reporting, such that there is a reasonable possibility that a material misstatement of the annual or interim financial statements will not be prevented or detected on a timely basis. The material weakness referred to above is described in Management’s Report on Internal Control over Financial Reporting appearing under Item 9A. We considered this material weakness in determining the nature, timing, and extent of audit tests applied in our audit of the 2016 consolidated financial statements, and our opinion regarding the effectiveness of the Company’s internal control over financial reporting does not affect our opinion on those consolidated financial statements. The Company's management is responsible for these financial statements and financial statement schedule, for maintaining effective internal control over financial reporting and for its assessment of the effectiveness of internal control over financial reporting included in management's report referred to above. Our responsibility is to express opinions on these financial statements, on the financial statement schedule, and on the Company's internal control over financial reporting based on our integrated audits. We conducted our audits in accordance with the standards of the Public Company Accounting Oversight Board (United States). Those standards require that we plan and perform the audits to obtain reasonable assurance about whether the financial statements are free of material misstatement and whether effective internal control over financial reporting was maintained in all material respects. Our audits of the financial statements included examining, on a test basis, evidence supporting the amounts and disclosures in the financial statements, assessing the accounting principles used and significant estimates made by management, and evaluating the overall financial statement presentation. Our audit of internal control over financial reporting included obtaining an understanding of internal control over financial reporting, assessing the risk that a material weakness exists, and testing and evaluating the design and operating effectiveness of internal control based on the assessed risk. Our audits also included performing such other procedures as we considered necessary in the circumstances. We believe that our audits provide a reasonable basis for our opinions.
A company’s internal control over financial reporting is a process designed to provide reasonable assurance regarding the reliability of financial reporting and the preparation of financial statements for external purposes in accordance with generally accepted accounting principles. A company’s internal control over financial reporting includes those policies and procedures that (i) pertain to the maintenance of records that, in reasonable detail, accurately and fairly reflect the transactions and dispositions of the assets of the company; (ii) provide reasonable assurance that transactions are recorded as necessary to permit preparation of financial statements in accordance with generally accepted accounting principles, and that receipts and expenditures of the company are being made only in accordance with authorizations of management and directors of the company; and (iii) provide reasonable assurance regarding prevention or timely detection of unauthorized acquisition, use, or disposition of the company’s assets that could have a material effect on the financial statements.
Because of its inherent limitations, internal control over financial reporting may not prevent or detect misstatements. Also, projections of any evaluation of effectiveness to future periods are subject to the risk that controls may become inadequate because of changes in conditions, or that the degree of compliance with the policies or procedures may deteriorate.
/s/PricewaterhouseCoopers LLP
Florham Park, New Jersey
February 24, 2017
F-2
Report of Independent Registered Public Accounting Firm
To the Board of Directors and Stockholders of Warner Chilcott Limited
In our opinion, the accompanying consolidated balance sheets and the related consolidated statements of operations, comprehensive income/(loss), member’s equity and cash flows present fairly, in all material respects, the financial position of Warner Chilcott Limited and its subsidiaries as of December 31, 2016 and December 31, 2015, and the results of their operations and their cash flows for each of the three years in the period ended December 31, 2016 in conformity with accounting principles generally accepted in the United States of America. In addition, in our opinion, the financial statement schedule appearing under Item 15(a)(2) presents fairly, in all material respects, the information set forth therein when read in conjunction with the related consolidated financial statements. These financial statements and financial statement schedule are the responsibility of the Company's management. Our responsibility is to express an opinion on these financial statements and financial statement schedule based on our audits. We conducted our audits of these statements in accordance with the standards of the Public Company Accounting Oversight Board (United States). Those standards require that we plan and perform the audit to obtain reasonable assurance about whether the financial statements are free of material misstatement. An audit includes examining, on a test basis, evidence supporting the amounts and disclosures in the financial statements, assessing the accounting principles used and significant estimates made by management, and evaluating the overall financial statement presentation. We believe that our audits provide a reasonable basis for our opinion.
/s/PricewaterhouseCoopers LLP
Florham Park, New Jersey
February 24, 2017
F-3
(In millions, except par value and share data)
|
|
|
December 31, |
|
|
December 31, |
|
||
|
|
|
2016 |
|
|
2015 |
|
||
|
ASSETS |
|
|
|
|||||
|
Current assets: |
|
|
|
|
|
|
|
|
|
Cash and cash equivalents |
|
$ |
1,724.0 |
|
|
$ |
1,096.0 |
|
|
Marketable securities |
|
|
11,501.5 |
|
|
|
9.3 |
|
|
Accounts receivable, net |
|
|
2,531.0 |
|
|
|
2,125.4 |
|
|
Inventories |
|
|
718.0 |
|
|
|
757.5 |
|
|
Prepaid expenses and other current assets |
|
|
1,383.4 |
|
|
|
495.3 |
|
|
Current assets held for sale |
|
- |
|
|
|
4,095.6 |
|
|
|
Total current assets |
|
|
17,857.9 |
|
|
|
8,579.1 |
|
|
Property, plant and equipment, net |
|
|
1,611.3 |
|
|
|
1,531.3 |
|
|
Investments and other assets |
|
|
282.1 |
|
|
|
408.7 |
|
|
Non current assets held for sale |
|
|
27.0 |
|
|
|
10,713.3 |
|
|
Deferred tax assets |
|
|
233.3 |
|
|
|
49.5 |
|
|
Product rights and other intangibles |
|
|
62,618.6 |
|
|
|
67,836.2 |
|
|
Goodwill |
|
|
46,356.1 |
|
|
|
46,465.2 |
|
|
Total assets |
|
$ |
128,986.3 |
|
|
$ |
135,583.3 |
|
|
LIABILITIES AND EQUITY |
|
|
|
|
|
|
|
|
|
Current liabilities: |
|
|
|
|
|
|
|
|
|
Accounts payable and accrued expenses |
|
$ |
5,019.0 |
|
|
$ |
4,148.6 |
|
|
Income taxes payable |
|
|
57.8 |
|
|
|
53.7 |
|
|
Current portion of long-term debt and capital leases |
|
|
2,797.9 |
|
|
|
2,396.5 |
|
|
Current liabilities held for sale |
|
- |
|
|
|
1,693.2 |
|
|
|
Total current liabilities |
|
|
7,874.7 |
|
|
|
8,292.0 |
|
|
Long-term debt and capital leases |
|
|
29,970.8 |
|
|
|
40,133.9 |
|
|
Other long-term liabilities |
|
|
1,085.0 |
|
|
|
1,262.0 |
|
|
Long-term liabilities held for sale |
|
- |
|
|
|
535.4 |
|
|
|
Other taxes payable |
|
|
886.2 |
|
|
|
801.9 |
|
|
Deferred tax liabilities |
|
|
12,969.1 |
|
|
|
7,968.8 |
|
|
Total liabilities |
|
|
52,785.8 |
|
|
|
58,994.0 |
|
|
Commitments and contingencies (Refer to Note 24) |
|
|
|
|
|
|
|
|
|
Equity: |
|
|
|
|
|
|
|
|
|
Preferred shares, $0.0001 par value per share, 5.1 million shares authorized, 5.1 million and 5.1 million shares issued and outstanding, respectively |
|
|
4,929.7 |
|
|
|
4,929.7 |
|
|
Ordinary shares; $0.0001 par value per share; 1,000.0 million shares authorized, 334.9 million and 394.5 million shares issued and outstanding, respectively |
|
|
- |
|
|
|
- |
|
|
Additional paid-in capital |
|
|
53,958.9 |
|
|
|
68,508.3 |
|
|
Retained earnings |
|
|
18,342.5 |
|
|
|
3,647.5 |
|
|
Accumulated other comprehensive (loss) |
|
|
(1,038.4 |
) |
|
|
(494.1 |
) |
|
Total shareholders’ equity |
|
|
76,192.7 |
|
|
|
76,591.4 |
|
|
Noncontrolling interest |
|
|
7.8 |
|
|
|
(2.1 |
) |
|
Total equity |
|
|
76,200.5 |
|
|
|
76,589.3 |
|
|
Total liabilities and equity |
|
$ |
128,986.3 |
|
|
$ |
135,583.3 |
|
See accompanying Notes to Consolidated Financial Statements.
F-4
CONSOLIDATED STATEMENTS OF OPERATIONS
(In millions, except per share amounts)
|
|
|
Years Ended December 31, |
|
|||||||||
|
|
|
2016 |
|
|
2015 |
|
|
2014 |
|
|||
|
Net revenues |
|
$ |
14,570.6 |
|
|
$ |
12,688.1 |
|
|
$ |
4,676.5 |
|
|
Operating expenses: |
|
|
|
|
|
|
|
|
|
|
|
|
|
Cost of sales (excludes amortization and impairment of acquired intangibles including product rights) |
|
|
1,860.8 |
|
|
|
2,751.8 |
|
|
|
1,704.8 |
|
|
Research and development |
|
|
2,575.7 |
|
|
|
2,358.5 |
|
|
|
605.7 |
|
|
Selling and marketing |
|
|
3,266.4 |
|
|
|
2,765.1 |
|
|
|
1,066.0 |
|
|
General and administrative |
|
|
1,473.9 |
|
|
|
1,716.4 |
|
|
|
1,201.4 |
|
|
Amortization |
|
|
6,470.4 |
|
|
|
5,443.7 |
|
|
|
1,935.8 |
|
|
In-process research and development impairments |
|
|
743.9 |
|
|
|
511.6 |
|
|
|
424.3 |
|
|
Asset sales and impairments, net |
|
|
5.0 |
|
|
|
272.0 |
|
|
|
305.7 |
|
|
Total operating expenses |
|
|
16,396.1 |
|
|
|
15,819.1 |
|
|
|
7,243.7 |
|
|
Operating (loss) |
|
|
(1,825.5 |
) |
|
|
(3,131.0 |
) |
|
|
(2,567.2 |
) |
|
|
|
|
|
|
|
|
|
|
|
|
|
|
|
Interest income |
|
|
69.9 |
|
|
|
10.6 |
|
|
|
8.1 |
|
|
Interest (expense) |
|
|
(1,295.6 |
) |
|
|
(1,193.3 |
) |
|
|
(411.8 |
) |
|
Other income (expense), net |
|
|
219.2 |
|
|
|
(233.8 |
) |
|
|
(27.3 |
) |
|
Total other (expense), net |
|
|
(1,006.5 |
) |
|
|
(1,416.5 |
) |
|
|
(431.0 |
) |
|
(Loss) before income taxes and noncontrolling interest |
|
|
(2,832.0 |
) |
|
|
(4,547.5 |
) |
|
|
(2,998.2 |
) |
|
(Benefit) for income taxes |
|
|
(1,897.0 |
) |
|
|
(1,605.9 |
) |
|
|
(513.6 |
) |
|
Net (loss) from continuing operations, net of tax |
|
|
(935.0 |
) |
|
|
(2,941.6 |
) |
|
|
(2,484.6 |
) |
|
Income from discontinued operations, net of tax |
|
|
15,914.5 |
|
|
|
6,861.0 |
|
|
|
854.1 |
|
|
Net income / (loss) |
|
|
14,979.5 |
|
|
|
3,919.4 |
|
|
|
(1,630.5 |
) |
|
(Income) attributable to noncontrolling interest |
|
|
(6.1 |
) |
|
|
(4.2 |
) |
|
|
- |
|
|
Net income / (loss) attributable to shareholders |
|
|
14,973.4 |
|
|
|
3,915.2 |
|
|
|
(1,630.5 |
) |
|
Dividends on preferred shares |
|
|
278.4 |
|
|
|
232.0 |
|
|
|
- |
|
|
Net income / (loss) attributable to ordinary shareholders |
|
$ |
14,695.0 |
|
|
$ |
3,683.2 |
|
|
$ |
(1,630.5 |
) |
|
|
|
|
|
|
|
|
|
|
|
|
|
|
|
(Loss) / income per share attributable to ordinary shareholders - basic: |
|
|
|
|
|
|
|
|
|
|
|
|
|
Continuing operations |
|
$ |
(3.17 |
) |
|
$ |
(8.64 |
) |
|
$ |
(11.31 |
) |
|
Discontinued operations |
|
|
41.35 |
|
|
|
18.65 |
|
|
|
3.89 |
|
|
Net income / (loss) per share - basic |
|
$ |
38.18 |
|
|
$ |
10.01 |
|
|
$ |
(7.42 |
) |
|
(Loss) / income per share attributable to ordinary shareholders - diluted: |
|
|
|
|
|
|
|
|
|
|
|
|
|
Continuing operations |
|
$ |
(3.17 |
) |
|
$ |
(8.64 |
) |
|
$ |
(11.31 |
) |
|
Discontinued operations |
|
|
41.35 |
|
|
|
18.65 |
|
|
|
3.89 |
|
|
Net income / (loss) per share - diluted |
|
$ |
38.18 |
|
|
$ |
10.01 |
|
|
$ |
(7.42 |
) |
|
|
|
|
|
|
|
|
|
|
|
|
|
|
|
Weighted average shares outstanding: |
|
|
|
|
|
|
|
|
|
|
|
|
|
Basic |
|
|
384.9 |
|
|
|
367.8 |
|
|
|
219.7 |
|
|
Diluted |
|
|
384.9 |
|
|
|
367.8 |
|
|
|
219.7 |
|
See accompanying Notes to Consolidated Financial Statements.
F-5
CONSOLIDATED STATEMENTS OF COMPREHENSIVE INCOME / (LOSS)
(In millions)
|
|
|
Years Ended December 31, |
|
|||||||||
|
|
|
2016 |
|
|
2015 |
|
|
2014 |
|
|||
|
Net income / (loss) |
|
$ |
14,979.5 |
|
|
$ |
3,919.4 |
|
|
$ |
(1,630.5 |
) |
|
Other comprehensive (loss) / income |
|
|
|
|
|
|
|
|
|
|
|
|
|
Foreign currency translation (losses) |
|
|
(441.6 |
) |
|
|
(129.9 |
) |
|
|
(519.5 |
) |
|
Impact of Teva Transaction |
|
|
1,544.8 |
|
|
- |
|
|
- |
|
||
|
Unrealized (losses) / gains, net of tax |
|
|
(1,647.5 |
) |
|
|
101.2 |
|
|
|
(36.4 |
) |
|
Total other comprehensive (loss), net of tax |
|
|
(544.3 |
) |
|
|
(28.7 |
) |
|
|
(555.9 |
) |
|
Comprehensive income / (loss) |
|
|
14,435.2 |
|
|
|
3,890.7 |
|
|
|
(2,186.4 |
) |
|
Comprehensive (income) attributable to noncontrolling interest |
|
|
(6.1 |
) |
|
|
(4.2 |
) |
|
|
- |
|
|
Comprehensive income / (loss) attributable to ordinary shareholders |
|
$ |
14,429.1 |
|
|
$ |
3,886.5 |
|
|
$ |
(2,186.4 |
) |
See accompanying Notes to Consolidated Financial Statements.
F-6
CONSOLIDATED STATEMENTS OF CASH FLOWS
(In millions)
|
|
|
Years Ended December 31, |
|
|||||||||
|
|
|
2016 |
|
|
2015 |
|
|
2014 |
|
|||
|
Cash Flows From Operating Activities: |
|
|
|
|
|
|
|
|
|
|
|
|
|
Net income / (loss) |
|
$ |
14,979.5 |
|
|
$ |
3,919.4 |
|
|
$ |
(1,630.5 |
) |
|
Reconciliation to net cash provided by operating activities: |
|
|
|
|
|
|
|
|
|
|
|
|
|
Depreciation |
|
|
155.8 |
|
|
|
218.3 |
|
|
|
230.9 |
|
|
Amortization |
|
|
6,475.2 |
|
|
|
5,777.0 |
|
|
|
2,597.5 |
|
|
Provision for inventory reserve |
|
|
181.4 |
|
|
|
140.9 |
|
|
|
156.1 |
|
|
Share-based compensation |
|
|
334.5 |
|
|
|
690.4 |
|
|
|
368.0 |
|
|
Deferred income tax benefit |
|
|
(1,443.9 |
) |
|
|
(7,380.1 |
) |
|
|
(690.1 |
) |
|
Pre-tax gain on sale of businesses to Teva |
|
|
(24,511.1 |
) |
|
|
- |
|
|
|
- |
|
|
Non-cash tax effect of gain on sale of businesses to Teva |
|
|
5,285.2 |
|
|
|
- |
|
|
|
- |
|
|
In-process research and development impairments |
|
|
743.9 |
|
|
|
511.6 |
|
|
|
424.3 |
|
|
Goodwill impairment |
|
|
- |
|
|
|
- |
|
|
|
17.3 |
|
|
Loss on asset sales and impairments, net |
|
|
5.0 |
|
|
|
334.4 |
|
|
|
143.1 |
|
|
Amortization of inventory step-up |
|
|
42.4 |
|
|
|
1,192.9 |
|
|
|
985.8 |
|
|
Amortization of deferred financing costs |
|
|
51.0 |
|
|
|
298.3 |
|
|
|
87.2 |
|
|
Accretion and contingent consideration |
|
|
(66.8 |
) |
|
|
108.8 |
|
|
|
(71.2 |
) |
|
Excess tax benefit from stock-based compensation |
|
|
(20.4 |
) |
|
|
(76.1 |
) |
|
|
(51.1 |
) |
|
Non-cash impact of debt extinguishment |
|
|
- |
|
|
|
- |
|
|
|
(91.7 |
) |
|
Impact of assets held for sale |
|
|
- |
|
|
|
- |
|
|
|
190.8 |
|
|
Other, net |
|
|
(59.9 |
) |
|
|
66.4 |
|
|
|
8.5 |
|
|
Changes in assets and liabilities (net of effects of acquisitions): |
|
|
|
|
|
|
|
|
|
|
|
|
|
Decrease / (increase) in accounts receivable, net |
|
|
(191.0 |
) |
|
|
(1,034.3 |
) |
|
|
(611.1 |
) |
|
Decrease / (increase) in inventories |
|
|
(268.4 |
) |
|
|
(226.2 |
) |
|
|
(207.2 |
) |
|
Decrease / (increase) in prepaid expenses and other current assets |
|
|
29.9 |
|
|
|
70.9 |
|
|
|
29.4 |
|
|
Increase / (decrease) in accounts payable and accrued expenses |
|
|
313.5 |
|
|
|
142.5 |
|
|
|
394.6 |
|
|
Increase / (decrease) in income and other taxes payable |
|
|
(326.6 |
) |
|
|
(87.8 |
) |
|
|
29.7 |
|
|
Increase / (decrease) in other assets and liabilities |
|
|
(283.9 |
) |
|
|
(137.3 |
) |
|
|
(67.3 |
) |
|
Net cash provided by operating activities |
|
|
1,425.3 |
|
|
|
4,530.0 |
|
|
|
2,243.0 |
|
|
Cash Flows From Investing Activities: |
|
|
|
|
|
|
|
|
|
|
|
|
|
Additions to property, plant and equipment |
|
|
(331.4 |
) |
|
|
(454.9 |
) |
|
|
(238.6 |
) |
|
Additions to product rights and other intangibles |
|
|
(2.0 |
) |
|
|
(154.7 |
) |
|
|
(36.1 |
) |
|
Sale of businesses to Teva |
|
|
33,804.2 |
|
|
|
- |
|
|
|
- |
|
|
Additions to investments |
|
|
(15,743.5 |
) |
|
|
(24.3 |
) |
|
|
(1.0 |
) |
|
Proceeds from sale of investments and other assets |
|
|
7,771.6 |
|
|
|
883.0 |
|
|
|
453.7 |
|
|
Proceeds from sales of property, plant and equipment |
|
|
33.3 |
|
|
|
140.1 |
|
|
|
13.7 |
|
|
Acquisitions of businesses, net of cash acquired |
|
|
(1,198.9 |
) |
|
|
(37,510.1 |
) |
|
|
(5,562.3 |
) |
|
Net cash provided by / (used in) investing activities |
|
|
24,333.3 |
|
|
|
(37,120.9 |
) |
|
|
(5,370.6 |
) |
|
Cash Flows From Financing Activities: |
|
|
|
|
|
|
|
|
|
|
|
|
|
Proceeds from borrowings of long-term indebtedness |
|
|
- |
|
|
|
26,455.7 |
|
|
|
8,076.2 |
|
|
Proceeds from borrowings on credit facility and other |
|
|
1,050.0 |
|
|
|
3,682.0 |
|
|
|
1,280.0 |
|
|
Debt issuance and other financing costs |
|
|
- |
|
|
|
(310.8 |
) |
|
|
(224.3 |
) |
|
Payments on debt, including capital lease obligations |
|
|
(10,848.7 |
) |
|
|
(5,134.2 |
) |
|
|
(6,127.0 |
) |
|
Proceeds from issuance of preferred shares |
|
|
- |
|
|
|
4,929.7 |
|
|
|
- |
|
|
Proceeds from issuance of ordinary shares |
|
|
- |
|
|
|
4,071.1 |
|
|
|
- |
|
|
Proceeds from stock plans |
|
|
172.1 |
|
|
|
230.0 |
|
|
|
105.9 |
|
|
Payments of contingent consideration |
|
|
(161.1 |
) |
|
|
(230.1 |
) |
|
|
(14.3 |
) |
|
Repurchase of ordinary shares |
|
|
(15,076.4 |
) |
|
|
(118.0 |
) |
|
|
(130.1 |
) |
|
Dividends |
|
|
(278.4 |
) |
|
|
(208.1 |
) |
|
|
- |
|
|
Excess tax benefit from stock-based compensation |
|
|
20.4 |
|
|
|
76.1 |
|
|
|
51.1 |
|
|
Net cash (used in) / provided by financing activities |
|
|
(25,122.1 |
) |
|
|
33,443.4 |
|
|
|
3,017.5 |
|
|
Effect of currency exchange rate changes on cash and cash equivalents |
|
|
(8.5 |
) |
|
|
(6.5 |
) |
|
|
(5.9 |
) |
|
Movement in cash held for sale |
|
|
- |
|
|
|
- |
|
|
|
37.0 |
|
|
Net increase / (decrease) in cash and cash equivalents |
|
|
628.0 |
|
|
|
846.0 |
|
|
|
(79.0 |
) |
|
Cash and cash equivalents at beginning of period |
|
|
1,096.0 |
|
|
|
250.0 |
|
|
|
329.0 |
|
|
Cash and cash equivalents at end of period |
|
$ |
1,724.0 |
|
|
$ |
1,096.0 |
|
|
$ |
250.0 |
|
|
Supplemental Disclosures of Cash Flow Information: |
|
|
|
|
|
|
|
|
|
|
|
|
|
Cash paid during the year for: |
|
|
|
|
|
|
|
|
|
|
|
|
|
Income taxes other, net of refunds |
|
$ |
3,692.7 |
|
|
$ |
377.6 |
|
|
$ |
560.6 |
|
|
Interest |
|
$ |
1,277.9 |
|
|
$ |
689.9 |
|
|
$ |
316.8 |
|
|
Schedule of Non-Cash Investing and Financing Activities: |
|
|
|
|
|
|
|
|
|
|
|
|
|
Non-cash receipt of Teva shares |
|
$ |
5,038.6 |
|
|
$ |
- |
|
|
$ |
- |
|
|
Dividends accrued |
|
$ |
23.2 |
|
|
$ |
24.0 |
|
|
$ |
- |
|
|
Non-cash equity issuance for the Acquisition of Allergan net assets |
|
$ |
- |
|
|
$ |
34,687.2 |
|
|
$ |
- |
|
|
Non-cash equity issuance for the Acquisition of Kythera net assets |
|
$ |
- |
|
|
$ |
40.0 |
|
|
$ |
- |
|
|
Non-cash equity issuance for the Acquisition of Forest net assets |
|
$ |
- |
|
|
$ |
- |
|
|
$ |
20,590.5 |
|
See accompanying Notes to Consolidated Financial Statements.
F-7
CONSOLIDATED STATEMENTS OF STOCKHOLDERS’ EQUITY
(In millions)
|
|
|
|
|
|
|
|
|
|
Retained |
|
|
Accumulated |
|
|
|
|
|
|
|
|
|||||||||||||||||||
|
|
|
|
|
|
|
|
|
|
|
|
|
|
|
|
|
|
Additional |
|
|
Earnings/ |
|
|
Other |
|
|
|
|
|
|
|
|
|
|
|
|
|
|||
|
|
|
Ordinary Shares |
|
Preferred Shares |
|
|
Paid-in- |
|
|
(Accumulated |
|
|
Comprehensive |
|
|
Treasury Shares |
|
|
|
|
|
||||||||||||||||||
|
|
|
Shares |
|
|
Amount |
|
Shares |
|
|
Amount |
|
|
Capital |
|
|
Deficit) |
|
|
Income / (Loss) |
|
|
Shares |
|
|
Amount |
|
|
Total |
|
||||||||||
|
BALANCE, January 1, 2014 |
|
|
174.2 |
|
|
$ |
- |
|
|
- |
|
|
$ |
- |
|
|
$ |
8,012.6 |
|
|
$ |
1,432.3 |
|
|
$ |
90.5 |
|
|
|
- |
|
|
$ |
(3.3 |
) |
|
$ |
9,532.1 |
|
|
Comprehensive income: |
|
|
|
|
|
|
|
|
|
|
|
|
|
|
|
|
|
|
|
|
|
|
|
|
|
|
|
|
|
|
|
|
|
|
|
|
|
|
|
|
Net income (loss) attributable to shareholders |
|
|
- |
|
|
|
- |
|
|
- |
|
|
|
- |
|
|
|
- |
|
|
|
(1,630.5 |
) |
|
|
- |
|
|
|
- |
|
|
|
- |
|
|
|
(1,630.5 |
) |
|
Other comprehensive (loss), net of tax |
|
|
- |
|
|
|
- |
|
|
- |
|
|
|
- |
|
|
|
- |
|
|
|
- |
|
|
|
(555.9 |
) |
|
|
- |
|
|
|
- |
|
|
|
(555.9 |
) |
|
Total comprehensive income |
|
|
|
|
|
|
|
|
|
- |
|
|
|
- |
|
|
|
|
|
|
|
|
|
|
|
|
|
|
|
|
|
|
|
|
|
|
|
(2,186.4 |
) |
|
Share-based compensation |
|
|
- |
|
|
|
- |
|
|
- |
|
|
|
- |
|
|
|
368.0 |
|
|
|
- |
|
|
|
- |
|
|
|
- |
|
|
|
- |
|
|
|
368.0 |
|
|
Issuance for the Forest Acquisition |
|
|
90.9 |
|
|
|
- |
|
|
- |
|
|
|
- |
|
|
|
20,590.5 |
|
|
|
- |
|
|
|
- |
|
|
|
- |
|
|
|
- |
|
|
|
20,590.5 |
|
|
Ordinary shares issued under employee stock plans |
|
|
1.4 |
|
|
|
- |
|
|
- |
|
|
|
- |
|
|
|
105.9 |
|
|
|
- |
|
|
|
- |
|
|
|
- |
|
|
|
- |
|
|
|
105.9 |
|
|
Tax benefits from exercise of options |
|
|
- |
|
|
|
- |
|
|
- |
|
|
|
- |
|
|
|
51.1 |
|
|
|
- |
|
|
|
- |
|
|
|
- |
|
|
|
- |
|
|
|
51.1 |
|
|
Repurchase of ordinary shares |
|
|
(0.6 |
) |
|
|
- |
|
|
- |
|
|
|
- |
|
|
|
(133.4 |
) |
|
|
- |
|
|
|
- |
|
|
|
- |
|
|
|
3.3 |
|
|
|
(130.1 |
) |
|
BALANCE, December 31, 2014 |
|
|
265.9 |
|
|
$ |
- |
|
|
- |
|
|
$ |
- |
|
|
$ |
28,994.7 |
|
|
$ |
(198.2 |
) |
|
$ |
(465.4 |
) |
|
|
- |
|
|
$ |
- |
|
|
$ |
28,331.1 |
|
|
Comprehensive income: |
|
|
|
|
|
|
|
|
|
|
|
|
|
|
|
|
|
|
|
|
|
|
|
|
|
|
|
|
|
|
|
|
|
|
|
|
|
|
|
|
Net income attributable to shareholders |
|
|
- |
|
|
|
- |
|
|
- |
|
|
|
- |
|
|
|
- |
|
|
|
3,915.2 |
|
|
|
- |
|
|
|
- |
|
|
|
- |
|
|
|
3,915.2 |
|
|
Other comprehensive (loss), net of tax |
|
|
- |
|
|
|
- |
|
|
- |
|
|
|
- |
|
|
|
- |
|
|
|
- |
|
|
|
(28.7 |
) |
|
|
- |
|
|
|
- |
|
|
|
(28.7 |
) |
|
Total comprehensive income |
|
|
|
|
|
|
|
|
|
|
|
|
|
|
|
|
|
|
|
|
|
|
|
|
|
|
|
|
|
|
|
|
|
|
|
|
|
3,886.5 |
|
|
Share-based compensation |
|
|
- |
|
|
|
- |
|
|
- |
|
|
|
- |
|
|
|
690.4 |
|
|
|
- |
|
|
|
- |
|
|
|
- |
|
|
|
- |
|
|
|
690.4 |
|
|
Issuance for the Allergan Acquisition |
|
|
126.3 |
|
|
|
- |
|
|
|
|
|
|
- |
|
|
|
38,757.6 |
|
|
|
- |
|
|
|
- |
|
|
|
- |
|
|
|
- |
|
|
|
38,757.6 |
|
|
Issuance of Mandatory Convertible Preferred Shares |
|
|
- |
|
|
|
- |
|
|
5.1 |
|
|
|
4,929.7 |
|
|
|
- |
|
|
|
- |
|
|
|
- |
|
|
|
- |
|
|
|
- |
|
|
|
4,929.7 |
|
|
Issuance for the Kythera Acquisition |
|
|
- |
|
|
|
- |
|
|
- |
|
|
|
- |
|
|
|
40.0 |
|
|
|
- |
|
|
|
- |
|
|
|
- |
|
|
|
- |
|
|
|
40.0 |
|
|
Ordinary shares issued under employee stock plans |
|
|
2.7 |
|
|
|
- |
|
|
- |
|
|
|
- |
|
|
|
230.0 |
|
|
|
- |
|
|
|
- |
|
|
|
- |
|
|
|
- |
|
|
|
230.0 |
|
|
Tax benefits from exercise of options |
|
|
- |
|
|
|
- |
|
|
- |
|
|
|
- |
|
|
|
76.1 |
|
|
|
- |
|
|
|
- |
|
|
|
- |
|
|
|
- |
|
|
|
76.1 |
|
|
Dividends declared |
|
|
- |
|
|
|
- |
|
|
- |
|
|
|
- |
|
|
|
(162.5 |
) |
|
|
(69.5 |
) |
|
|
- |
|
|
|
- |
|
|
|
- |
|
|
|
(232.0 |
) |
|
Repurchase of ordinary shares |
|
|
(0.4 |
) |
|
|
- |
|
|
- |
|
|
|
- |
|
|
|
(118.0 |
) |
|
|
- |
|
|
|
- |
|
|
|
- |
|
|
|
- |
|
|
|
(118.0 |
) |
|
BALANCE, December 31, 2015 |
|
|
394.5 |
|
|
$ |
- |
|
|
5.1 |
|
|
$ |
4,929.7 |
|
|
$ |
68,508.3 |
|
|
$ |
3,647.5 |
|
|
$ |
(494.1 |
) |
|
|
- |
|
|
$ |
- |
|
|
$ |
76,591.4 |
|
|
Comprehensive income: |
|
|
|
|
|
|
|
|
|
|
|
|
|
|
|
|
|
|
|
|
|
|
|
|
|
|
|
|
|
|
|
|
|
|
|
|
|
|
|
|
Net income attributable to shareholders |
|
|
- |
|
|
|
- |
|
|
- |
|
|
|
- |
|
|
|
- |
|
|
|
14,973.4 |
|
|
|
- |
|
|
|
- |
|
|
|
- |
|
|
|
14,973.4 |
|
|
Other comprehensive (loss), net of tax |
|
|
- |
|
|
|
- |
|
|
- |
|
|
|
- |
|
|
|
- |
|
|
|
- |
|
|
|
(2,089.1 |
) |
|
|
- |
|
|
|
- |
|
|
|
(2,089.1 |
) |
|
Other comprehensive income resulting from the Teva Transaction |
|
|
- |
|
|
|
- |
|
|
- |
|
|
|
- |
|
|
|
- |
|
|
|
- |
|
|
|
1,544.8 |
|
|
|
- |
|
|
|
- |
|
|
|
1,544.8 |
|
|
Total comprehensive income |
|
|
|
|
|
|
|
|
|
|
|
|
|
|
|
|
|
|
|
|
|
|
|
|
|
|
|
|
|
|
|
|
|
|
|
|
|
14,429.1 |
|
|
Share-based compensation |
|
|
- |
|
|
|
- |
|
|
- |
|
|
|
- |
|
|
|
334.5 |
|
|
|
- |
|
|
|
- |
|
|
|
- |
|
|
|
- |
|
|
|
334.5 |
|
|
Ordinary shares issued under employee stock plans |
|
|
2.3 |
|
|
|
- |
|
|
- |
|
|
|
- |
|
|
|
172.1 |
|
|
|
- |
|
|
|
- |
|
|
|
- |
|
|
|
- |
|
|
|
172.1 |
|
|
Tax benefits from exercise of options |
|
|
- |
|
|
|
- |
|
|
- |
|
|
|
- |
|
|
|
20.4 |
|
|
|
- |
|
|
|
- |
|
|
|
- |
|
|
|
- |
|
|
|
20.4 |
|
|
Dividends declared |
|
|
- |
|
|
|
- |
|
|
- |
|
|
|
- |
|
|
|
- |
|
|
|
(278.4 |
) |
|
|
- |
|
|
|
- |
|
|
|
- |
|
|
|
(278.4 |
) |
|
Repurchase of ordinary shares under the share repurchase programs |
|
|
(61.6 |
) |
|
|
- |
|
|
- |
|
|
|
- |
|
|
|
(15,000.0 |
) |
|
|
- |
|
|
|
- |
|
|
|
- |
|
|
|
- |
|
|
|
(15,000.0 |
) |
|
Repurchase of ordinary shares |
|
|
(0.3 |
) |
|
|
- |
|
|
- |
|
|
|
- |
|
|
|
(76.4 |
) |
|
|
- |
|
|
|
- |
|
|
|
- |
|
|
|
- |
|
|
|
(76.4 |
) |
|
BALANCE, December 31, 2016 |
|
|
334.9 |
|
|
$ |
- |
|
|
5.1 |
|
|
$ |
4,929.7 |
|
|
$ |
53,958.9 |
|
|
$ |
18,342.5 |
|
|
$ |
(1,038.4 |
) |
|
|
- |
|
|
$ |
- |
|
|
$ |
76,192.7 |
|
|
|
See accompanying Notes to Consolidated Financial Statements.
F-8
(In millions)
|
|
|
December 31, |
|
|
December 31, |
|
||
|
|
|
2016 |
|
|
2015 |
|
||
|
ASSETS |
|
|
|
|
|
|
|
|
|
Current assets: |
|
|
|
|
|
|
|
|
|
Cash and cash equivalents |
|
$ |
1,713.2 |
|
|
$ |
1,036.2 |
|
|
Marketable securities |
|
|
11,501.5 |
|
|
|
9.3 |
|
|
Accounts receivable, net |
|
|
2,531.0 |
|
|
|
2,125.4 |
|
|
Receivable from Parents |
|
|
9,289.2 |
|
|
|
457.3 |
|
|
Inventories |
|
|
718.0 |
|
|
|
757.5 |
|
|
Prepaid expenses and other current assets |
|
|
1,382.1 |
|
|
|
492.8 |
|
|
Current assets held for sale |
|
|
- |
|
|
|
4,095.6 |
|
|
Total current assets |
|
|
27,135.0 |
|
|
|
8,974.1 |
|
|
Property, plant and equipment, net |
|
|
1,611.3 |
|
|
|
1,531.3 |
|
|
Investments and other assets |
|
|
282.1 |
|
|
|
408.7 |
|
|
Non current receivables from Parents |
|
|
3,964.0 |
|
|
|
- |
|
|
Non current assets held for sale |
|
|
27.0 |
|
|
|
10,713.3 |
|
|
Deferred tax assets |
|
|
233.3 |
|
|
|
49.5 |
|
|
Product rights and other intangibles |
|
|
62,618.6 |
|
|
|
67,836.2 |
|
|
Goodwill |
|
|
46,356.1 |
|
|
|
46,465.2 |
|
|
Total assets |
|
$ |
142,227.4 |
|
|
$ |
135,978.3 |
|
|
LIABILITIES AND EQUITY |
|
|
|
|
|
|
|
|
|
Current liabilities: |
|
|
|
|
|
|
|
|
|
Accounts payable and accrued expenses |
|
$ |
4,993.3 |
|
|
$ |
4,094.5 |
|
|
Payables to Parents |
|
|
1,372.8 |
|
|
|
1,466.8 |
|
|
Income taxes payable |
|
|
57.8 |
|
|
|
53.7 |
|
|
Current portion of long-term debt and capital leases |
|
|
2,797.9 |
|
|
|
2,396.5 |
|
|
Current liabilities held for sale |
|
|
- |
|
|
|
1,693.2 |
|
|
Total current liabilities |
|
|
9,221.8 |
|
|
|
9,704.7 |
|
|
Long-term debt and capital leases |
|
|
29,970.8 |
|
|
|
40,133.9 |
|
|
Other long-term liabilities |
|
|
1,086.0 |
|
|
|
1,262.0 |
|
|
Long-term payables to Parents |
|
|
- |
|
|
|
- |
|
|
Long-term liabilities held for sale |
|
|
- |
|
|
|
535.4 |
|
|
Other taxes payable |
|
|
886.2 |
|
|
|
801.9 |
|
|
Deferred tax liabilities |
|
|
12,969.1 |
|
|
|
7,968.8 |
|
|
Total liabilities |
|
|
54,133.9 |
|
|
|
60,406.7 |
|
|
Commitments and contingencies |
|
|
|
|
|
|
|
|
|
Equity: |
|
|
|
|
|
|
|
|
|
Member's capital |
|
|
72,935.1 |
|
|
|
72,935.1 |
|
|
Retained earnings |
|
|
16,189.0 |
|
|
|
3,132.7 |
|
|
Accumulated other comprehensive (loss) |
|
|
(1,038.4 |
) |
|
|
(494.1 |
) |
|
Total members’ equity |
|
|
88,085.7 |
|
|
|
75,573.7 |
|
|
Noncontrolling interest |
|
|
7.8 |
|
|
|
(2.1 |
) |
|
Total equity |
|
|
88,093.5 |
|
|
|
75,571.6 |
|
|
Total liabilities and equity |
|
$ |
142,227.4 |
|
|
$ |
135,978.3 |
|
See accompanying Notes to Consolidated Financial Statements.
F-9
CONSOLIDATED STATEMENTS OF OPERATIONS
(In millions)
|
|
|
Years Ended December 31, |
|
|||||||||
|
|
|
2016 |
|
|
2015 |
|
|
2014 |
|
|||
|
Net revenues |
|
$ |
14,570.6 |
|
|
$ |
12,688.1 |
|
|
$ |
4,676.5 |
|
|
Operating expenses: |
|
|
|
|
|
|
|
|
|
|
|
|
|
Cost of sales (excludes amortization and impairment of acquired intangibles including product rights) |
|
|
1,860.8 |
|
|
|
2,751.8 |
|
|
|
1,704.8 |
|
|
Research and development |
|
|
2,575.7 |
|
|
|
2,358.5 |
|
|
|
605.7 |
|
|
Selling and marketing |
|
|
3,266.4 |
|
|
|
2,765.1 |
|
|
|
1,066.0 |
|
|
General and administrative |
|
|
1,350.4 |
|
|
|
1,581.0 |
|
|
|
1,131.4 |
|
|
Amortization |
|
|
6,470.4 |
|
|
|
5,443.7 |
|
|
|
1,935.8 |
|
|
In-process research and development impairments |
|
|
743.9 |
|
|
|
511.6 |
|
|
|
424.3 |
|
|
Asset sales and impairments, net |
|
|
5.0 |
|
|
|
272.0 |
|
|
|
305.7 |
|
|
Total operating expenses |
|
|
16,272.6 |
|
|
|
15,683.7 |
|
|
|
7,173.7 |
|
|
Operating (loss) |
|
|
(1,702.0 |
) |
|
|
(2,995.6 |
) |
|
|
(2,497.2 |
) |
|
Non-operating income (expense): |
|
|
|
|
|
|
|
|
|
|
|
|
|
Interest income |
|
|
111.1 |
|
|
|
10.6 |
|
|
|
8.1 |
|
|
Interest (expense) |
|
|
(1,295.6 |
) |
|
|
(1,193.3 |
) |
|
|
(411.8 |
) |
|
Other income (expense), net |
|
|
172.2 |
|
|
|
(233.8 |
) |
|
|
(27.3 |
) |
|
Total other income (expense), net |
|
|
(1,012.3 |
) |
|
|
(1,416.5 |
) |
|
|
(431.0 |
) |
|
(Loss) before income taxes and noncontrolling interest |
|
|
(2,714.3 |
) |
|
|
(4,412.1 |
) |
|
|
(2,928.2 |
) |
|
(Benefit) for income taxes |
|
|
(1,897.0 |
) |
|
|
(1,605.9 |
) |
|
|
(513.6 |
) |
|
Net (loss) from continuing operations, net of tax |
|
|
(817.3 |
) |
|
|
(2,806.2 |
) |
|
|
(2,414.6 |
) |
|
Income from discontinued operations, net of tax |
|
|
15,914.5 |
|
|
|
6,861.0 |
|
|
|
854.1 |
|
|
Net income / (loss) |
|
|
15,097.2 |
|
|
|
4,054.8 |
|
|
|
(1,560.5 |
) |
|
(Income) attributable to noncontrolling interest |
|
|
(6.1 |
) |
|
|
(4.2 |
) |
|
|
- |
|
|
Net income / (loss) attributable to members |
|
$ |
15,091.1 |
|
|
$ |
4,050.6 |
|
|
$ |
(1,560.5 |
) |
See accompanying Notes to Consolidated Financial Statements.
F-10
CONSOLIDATED STATEMENTS OF COMPREHENSIVE INCOME / (LOSS)
(In millions)
|
|
|
Years Ended December 31, |
|
|||||||||
|
|
|
2016 |
|
|
2015 |
|
|
2014 |
|
|||
|
Net income / (loss) |
|
$ |
15,097.2 |
|
|
$ |
4,054.8 |
|
|
$ |
(1,560.5 |
) |
|
Other comprehensive (loss) / income |
|
|
|
|
|
|
|
|
|
|
|
|
|
Foreign currency translation (losses) |
|
|
(441.6 |
) |
|
|
(129.9 |
) |
|
|
(519.5 |
) |
|
Impact of Teva Transaction |
|
|
1,544.8 |
|
|
|
- |
|
|
|
- |
|
|
Unrealized (losses) / gains, net of tax |
|
|
(1,647.5 |
) |
|
|
101.2 |
|
|
|
(36.4 |
) |
|
Total other comprehensive (loss), net of tax |
|
|
(544.3 |
) |
|
|
(28.7 |
) |
|
|
(555.9 |
) |
|
Comprehensive income / (loss) |
|
|
14,552.9 |
|
|
|
4,026.1 |
|
|
|
(2,116.4 |
) |
|
Comprehensive (income) attributable to noncontrolling interest |
|
|
(6.1 |
) |
|
|
(4.2 |
) |
|
|
- |
|
|
Comprehensive income / (loss) attributable to members |
|
$ |
14,546.8 |
|
|
$ |
4,021.9 |
|
|
$ |
(2,116.4 |
) |
See accompanying Notes to Consolidated Financial Statements.
F-11
CONSOLIDATED STATEMENTS OF CASH FLOWS
(In millions)
|
|
|
Years Ended December 31, |
|
|||||||||
|
|
|
2016 |
|
|
2015 |
|
|
2014 |
|
|||
|
Cash Flows From Operating Activities: |
|
|
|
|
|
|
|
|
|
|
|
|
|
Net income / (loss) |
|
$ |
15,097.2 |
|
|
$ |
4,054.8 |
|
|
$ |
(1,560.5 |
) |
|
Reconciliation to net cash provided by operating activities: |
|
|
|
|
|
|
|
|
|
|
|
|
|
Depreciation |
|
|
155.8 |
|
|
|
218.3 |
|
|
|
230.9 |
|
|
Amortization |
|
|
6,475.2 |
|
|
|
5,777.0 |
|
|
|
2,597.5 |
|
|
Provision for inventory reserve |
|
|
181.4 |
|
|
|
140.9 |
|
|
|
156.1 |
|
|
Share-based compensation |
|
|
334.5 |
|
|
|
690.4 |
|
|
|
368.0 |
|
|
Deferred income tax benefit |
|
|
(1,443.9 |
) |
|
|
(7,380.1 |
) |
|
|
(690.1 |
) |
|
Pre-tax gain on sale of businesses to Teva |
|
|
(24,511.1 |
) |
|
|
- |
|
|
|
- |
|
|
Non-cash tax effect of gain on sale of businesses to Teva |
|
|
5,285.2 |
|
|
|
- |
|
|
|
- |
|
|
In-process research and development impairments |
|
|
743.9 |
|
|
|
511.6 |
|
|
|
424.3 |
|
|
Goodwill impairment |
|
|
- |
|
|
|
- |
|
|
|
17.3 |
|
|
Loss on asset sales and impairments, net |
|
|
5.0 |
|
|
|
334.4 |
|
|
|
143.1 |
|
|
Amortization of inventory step-up |
|
|
42.4 |
|
|
|
1,192.9 |
|
|
|
985.8 |
|
|
Amortization of deferred financing costs |
|
|
51.0 |
|
|
|
298.3 |
|
|
|
87.2 |
|
|
Accretion and contingent consideration |
|
|
(66.8 |
) |
|
|
108.8 |
|
|
|
(71.2 |
) |
|
Non-cash impact of debt extinguishment |
|
|
- |
|
|
|
- |
|
|
|
(91.7 |
) |
|
Impact of assets held for sale |
|
|
- |
|
|
|
- |
|
|
|
190.8 |
|
|
Other, net |
|
|
(59.9 |
) |
|
|
66.4 |
|
|
|
8.5 |
|
|
Changes in assets and liabilities (net of effects of acquisitions): |
|
|
|
|
|
|
|
|
|
|
|
|
|
Decrease / (increase) in accounts receivable, net |
|
|
(191.0 |
) |
|
|
(1,033.6 |
) |
|
|
(611.2 |
) |
|
Decrease / (increase) in inventories |
|
|
(268.4 |
) |
|
|
(226.2 |
) |
|
|
(207.2 |
) |
|
Decrease / (increase) in prepaid expenses and other current assets |
|
|
28.6 |
|
|
|
71.3 |
|
|
|
29.4 |
|
|
Increase / (decrease) in accounts payable and accrued expenses |
|
|
339.2 |
|
|
|
193.5 |
|
|
|
387.6 |
|
|
Increase / (decrease) in income and other taxes payable |
|
|
(326.6 |
) |
|
|
(87.8 |
) |
|
|
29.7 |
|
|
Increase / (decrease) in other assets and liabilities, including receivable / payable with Parents |
|
|
(292.7 |
) |
|
|
(266.9 |
) |
|
|
(154.6 |
) |
|
Net cash provided by operating activities |
|
|
1,579.0 |
|
|
|
4,664.0 |
|
|
|
2,269.7 |
|
|
Cash Flows From Investing Activities: |
|
|
|
|
|
|
|
|
|
|
|
|
|
Additions to property, plant and equipment |
|
|
(331.4 |
) |
|
|
(454.9 |
) |
|
|
(238.6 |
) |
|
Additions to product rights and other intangibles |
|
|
(2.0 |
) |
|
|
(154.7 |
) |
|
|
(36.1 |
) |
|
Sale of businesses to Teva |
|
|
33,804.2 |
|
|
|
- |
|
|
|
- |
|
|
Additions to investments |
|
|
(15,743.5 |
) |
|
|
(24.3 |
) |
|
|
(1.0 |
) |
|
Proceeds from the sale of investments and other assets |
|
|
7,771.6 |
|
|
|
883.0 |
|
|
|
453.7 |
|
|
Loans to Parent |
|
|
(13,232.2 |
) |
|
|
- |
|
|
|
- |
|
|
Proceeds from sales of property, plant and equipment |
|
|
33.3 |
|
|
|
140.1 |
|
|
|
13.7 |
|
|
Acquisitions of businesses, net of cash acquired |
|
|
(1,198.9 |
) |
|
|
(37,510.1 |
) |
|
|
(5,562.3 |
) |
|
Net cash provided by / (used in) investing activities |
|
|
11,101.1 |
|
|
|
(37,120.9 |
) |
|
|
(5,370.6 |
) |
|
Cash Flows From Financing Activities: |
|
|
|
|
|
|
|
|
|
|
|
|
|
Proceeds from borrowings of long-term indebtedness |
|
|
- |
|
|
|
26,455.7 |
|
|
|
8,076.2 |
|
|
Proceeds from borrowings on credit facility and other |
|
|
1,050.0 |
|
|
|
3,682.0 |
|
|
|
1,280.0 |
|
|
Debt issuance and other financing costs |
|
|
- |
|
|
|
(310.8 |
) |
|
|
(224.3 |
) |
|
Payments on debt, including capital lease obligations |
|
|
(10,848.7 |
) |
|
|
(5,134.2 |
) |
|
|
(6,127.0 |
) |
|
Payments of contingent consideration |
|
|
(161.1 |
) |
|
|
(230.1 |
) |
|
|
(14.3 |
) |
|
Dividend to Parent |
|
|
(2,034.8 |
) |
|
|
(208.1 |
) |
|
|
- |
|
|
Contribution from Parent |
|
|
- |
|
|
|
9,000.8 |
|
|
|
- |
|
|
Net cash (used in) / provided by financing activities |
|
|
(11,994.6 |
) |
|
|
33,255.3 |
|
|
|
2,990.6 |
|
|
Effect of currency exchange rate changes on cash and cash equivalents |
|
|
(8.5 |
) |
|
|
(6.5 |
) |
|
|
(5.9 |
) |
|
Movement in cash held for sale |
|
|
- |
|
|
|
- |
|
|
|
37.0 |
|
|
Net increase / (decrease) in cash and cash equivalents |
|
|
677.0 |
|
|
|
791.9 |
|
|
|
(79.2 |
) |
|
Cash and cash equivalents at beginning of period |
|
|
1,036.2 |
|
|
|
244.3 |
|
|
|
323.5 |
|
|
Cash and cash equivalents at end of period |
|
$ |
1,713.2 |
|
|
$ |
1,036.2 |
|
|
$ |
244.3 |
|
|
Supplemental Disclosures of Cash Flow Information: |
|
|
|
|
|
|
|
|
|
|
|
|
|
Cash paid during the year for: |
|
|
|
|
|
|
|
|
|
|
|
|
|
Income taxes other, net of refunds |
|
$ |
3,692.7 |
|
|
$ |
377.6 |
|
|
$ |
560.6 |
|
|
Interest |
|
$ |
1,277.9 |
|
|
$ |
689.9 |
|
|
$ |
316.8 |
|
|
Schedule of Non-Cash Investing and Financing Activities: |
|
|
|
|
|
|
|
|
|
|
|
|
|
Non-cash receipt of Teva shares |
|
$ |
5,038.6 |
|
|
$ |
- |
|
|
$ |
- |
|
See accompanying Notes to Consolidated Financial Statements.
F-12
CONSOLIDATED STATEMENTS OF MEMBER’S EQUITY
(In millions, except share data)
|
|
|
Member's Capital |
|
|
|
|
|
|
|
|
|
|
|
|
|
|||||
|
|
|
Shares |
|
|
Amount |
|
|
Retained Earnings |
|
|
Accumulated Other Comprehensive Income / (Loss) |
|
|
Total |
|
|||||
|
BALANCE, January 1, 2014 |
|
|
100.0 |
|
|
$ |
8,049.8 |
|
|
$ |
1,458.2 |
|
|
$ |
90.5 |
|
|
$ |
9,598.5 |
|
|
Comprehensive income: |
|
|
|
|
|
|
|
|
|
|
|
|
|
|
|
|
|
|
|
|
|
Net (loss) attributable to members |
|
|
- |
|
|
|
- |
|
|
|
(1,560.5 |
) |
|
|
- |
|
|
|
(1,560.5 |
) |
|
Other comprehensive (loss), net of tax |
|
|
- |
|
|
|
- |
|
|
|
- |
|
|
|
(555.9 |
) |
|
|
(555.9 |
) |
|
Total comprehensive income |
|
|
|
|
|
|
|
|
|
|
|
|
|
|
|
|
|
|
(2,116.4 |
) |
|
Contribution from Parent |
|
|
- |
|
|
|
21,406.1 |
|
|
|
- |
|
|
|
- |
|
|
|
21,406.1 |
|
|
Dividend to Parent |
|
|
- |
|
|
|
- |
|
|
|
(815.6 |
) |
|
|
- |
|
|
|
(815.6 |
) |
|
BALANCE, December 31, 2014 |
|
|
100.0 |
|
|
$ |
29,455.9 |
|
|
$ |
(917.9 |
) |
|
$ |
(465.4 |
) |
|
$ |
28,072.6 |
|
|
Comprehensive income: |
|
|
|
|
|
|
|
|
|
|
|
|
|
|
|
|
|
|
|
|
|
Net income attributable to members |
|
|
- |
|
|
|
- |
|
|
|
4,050.6 |
|
|
|
- |
|
|
|
4,050.6 |
|
|
Other comprehensive (loss), net of tax |
|
|
- |
|
|
|
- |
|
|
|
- |
|
|
|
(28.7 |
) |
|
|
(28.7 |
) |
|
Total comprehensive income |
|
|
|
|
|
|
|
|
|
|
|
|
|
|
|
|
|
|
4,021.9 |
|
|
Contribution from Parent |
|
|
- |
|
|
|
43,687.3 |
|
|
|
- |
|
|
|
- |
|
|
|
43,687.3 |
|
|
Dividend to Parent |
|
|
- |
|
|
|
(208.1 |
) |
|
|
- |
|
|
|
- |
|
|
|
(208.1 |
) |
|
BALANCE, December 31, 2015 |
|
|
100.0 |
|
|
$ |
72,935.1 |
|
|
$ |
3,132.7 |
|
|
$ |
(494.1 |
) |
|
$ |
75,573.7 |
|
|
Comprehensive income: |
|
|
|
|
|
|
|
|
|
|
|
|
|
|
|
|
|
|
|
|
|
Net income attributable to members |
|
|
- |
|
|
|
- |
|
|
|
15,091.1 |
|
|
|
- |
|
|
|
15,091.1 |
|
|
Other comprehensive (loss), net of tax |
|
|
- |
|
|
|
- |
|
|
|
- |
|
|
|
(2,089.1 |
) |
|
|
(2,089.1 |
) |
|
Other comprehensive income resulting from the Teva Transaction |
|
|
- |
|
|
|
- |
|
|
|
- |
|
|
|
1,544.8 |
|
|
|
1,544.8 |
|
|
Total comprehensive income |
|
|
|
|
|
|
|
|
|
|
|
|
|
|
|
|
|
|
14,546.8 |
|
|
Dividend to Parent |
|
|
- |
|
|
|
- |
|
|
|
(2,034.8 |
) |
|
|
- |
|
|
|
(2,034.8 |
) |
|
BALANCE, December 31, 2016 |
|
|
100.0 |
|
|
$ |
72,935.1 |
|
|
$ |
16,189.0 |
|
|
$ |
(1,038.4 |
) |
|
$ |
88,085.7 |
|
See accompanying Notes to Consolidated Financial Statements.
F-13
NOTES TO THE CONSOLIDATED FINANCIAL STATEMENTS
NOTE 1 — Description of Business
Allergan plc is a global specialty pharmaceutical company engaged in the development, manufacturing, marketing, and distribution of brand name pharmaceutical products (“brand”, “branded” or “specialty brand”), medical aesthetics, biosimilar and over-the-counter (“OTC”) pharmaceutical products. The Company has operations in more than 100 countries. Warner Chilcott Limited is an indirect wholly-owned subsidiary of Allergan plc and has the same principal business activities. As a result of the Allergan Acquisition, the Company expanded its franchises to include ophthalmology, neurosciences and medical aesthetics/dermatology/plastic surgery, which complements the Company’s central nervous system, gastroenterology, women’s health and urology franchises. The Company benefits significantly from our global brand equity and consumer awareness of key products, including Botox® and Restasis®.
On July 26, 2015 we entered into a master purchase agreement (the “Teva Agreement”), under which Teva Pharmaceutical Industries Ltd. (“Teva”) agreed to acquire our global generic pharmaceuticals business and certain other assets (the “Teva Transaction”). Upon the closing of the Teva Transaction on August 2, 2016, we received $33.3 billion in cash, net of cash acquired by Teva, which includes estimated working capital and other contractual adjustments, and 100.3 million unregistered Teva ordinary shares (or American depository Shares with respect thereto), which approximated $5.0 billion in value using the closing date Teva opening stock price discounted at a rate of 5.9 percent due to the lack of marketability.
On October 3, 2016, the Company completed the divestiture of the Anda Distribution business to Teva for $500.0 million. Teva acquired our Anda Distribution business, which distributes generic, branded, specialty and OTC pharmaceutical products from more than 300 manufacturers to retail independent and chain pharmacies, nursing homes, mail order pharmacies, hospitals, clinics and physician offices across the U.S.
The Company recognized a combined gain on the sale of the Anda Distribution business and the sale of our global generics business of $15,932.2 million as well as deferred liabilities relating to other elements of our arrangements with Teva of $299.2 million.
As part of the Teva Transaction, Teva acquired our global generics business, including the United States (“U.S.”) and international generic commercial units, our third-party supplier Medis, our global generic manufacturing operations, our global generic research and development (“R&D”) unit, our international OTC commercial unit (excluding OTC eye care products) and certain established international brands.
As a result of the Teva Transaction and the divestiture of the Company’s Anda Distribution business, and in accordance with Financial Accounting Standards Board (“FASB”) Accounting Standards Update (“ASU”) number 2014-08 “Presentation of Financial Statements (Topic 205) and Property, Plant and Equipment (Topic 360): Reporting Discontinued Operations and Disclosures of Disposals of Components of an Entity”, the Company accounted for the assets and liabilities divested as held for sale as of December 31, 2015. Further, the financial results of the businesses held for sale have been reclassified to discontinued operations for all periods presented in our consolidated financial statements. The results of our discontinued operations include the results of our generic product development, manufacturing and distribution of off-patent pharmaceutical products, certain established international brands marketed similarly to generic products and out-licensed generic pharmaceutical products primarily in Europe through our Medis third-party business through August 2, 2016, as well as our Anda Distribution business through October 3, 2016.
NOTE 2 — Formation of the Company
Allergan plc (formerly known as Actavis plc) was incorporated in Ireland on May 16, 2013 as a private limited company and re-registered effective September 20, 2013 as a public limited company. It was established for the purpose of facilitating the business combination between Allergan Finance, LLC (formerly known as Actavis, Inc.) and Warner Chilcott plc (“Warner Chilcott”). On October 1, 2013, pursuant to the transaction agreement dated May 19, 2013 among Allergan Finance, LLC (formerly known as Actavis, Inc.), Warner Chilcott, the Company, Actavis Ireland Holding Limited, Actavis W.C. Holding LLC (now known as Actavis W.C. Holding Inc.) and Actavis W.C. Holding 2 LLC (now known as Actavis W.C. Holding 2 Inc.), (i) the Company acquired Warner Chilcott (the “Warner Chilcott Acquisition”) pursuant to a scheme of arrangement under Section 201, and a capital reduction under Sections 72 and 74, of the Irish Companies Act of 1963, where each Warner Chilcott ordinary share was converted into 0.160 of an Allergan plc ordinary share (the “Company Ordinary Shares”), or $5,833.9 million in equity consideration, and (ii) Actavis W.C. Holding 2 Inc. merged with and into Allergan Finance, LLC, with Allergan Finance, LLC as the surviving corporation in the merger (the “Merger” and, together with the Warner Chilcott Acquisition, the “Warner Chilcott Transactions”). Following the consummation of the Warner Chilcott Transactions, Allergan Finance, LLC and Warner Chilcott became wholly-owned subsidiaries of Allergan plc. Each of Allergan Finance, LLC’s common shares was converted into one Company Ordinary Share. Effective October 1, 2013, through a series of related-party transactions, Allergan plc contributed its indirect subsidiaries, including Allergan Finance, LLC, to its subsidiary Warner Chilcott Limited.
F-14
Except where otherwise indicated, and excluding certain insignificant cash and non-cash transactions at the Allergan plc level, the consolidated financial statements and disclosures are for two separate registrants, Allergan plc and Warner Chilcott Limited. The results of Warner Chilcott Limited are consolidated into the results of Allergan plc. Due to the deminimis activity between Allergan plc and Warner Chilcott Limited, references throughout this document relate to both Allergan plc and Warner Chilcott Limited. Refer to “Note 3 —Reconciliation of Warner Chilcott Limited results to Allergan plc results” in the accompanying “Notes to the Consolidated Financial Statements” in this document for a summary of the details on the differences between Allergan plc and Warner Chilcott Limited.
On March 17, 2015, the Company acquired Legacy Allergan for approximately $77.0 billion including outstanding indebtedness assumed of $2.2 billion, cash consideration of $40.1 billion and equity consideration of $34.7 billion, which includes outstanding equity awards (the “Allergan Acquisition”). Under the terms of the agreement, Legacy Allergan shareholders received 111.2 million of the Company’s ordinary shares, 7.0 million of the Company’s non-qualified stock options and 0.5 million of the Company’s share units. The addition of Legacy Allergan’s therapeutic franchises in ophthalmology, neurosciences and medical aesthetics/dermatology/plastic surgery complements the Company’s existing central nervous system, gastroenterology, women’s health and urology franchises. The combined company benefits from Legacy Allergan’s global brand equity and consumer awareness of key products, including Botox® and Restasis®. The transaction expanded our presence and market and product reach across many international markets, with strengthened commercial positions across Canada, Europe, Southeast Asia and other high-value growth markets, including China, India, the Middle East and Latin America.
In connection with the Allergan Acquisition, the Company changed its name from Actavis plc to Allergan plc. Actavis plc’s ordinary shares were traded on the NYSE under the symbol “ACT” until the opening of trading on June 15, 2015, at which time Actavis plc changed its corporate name to “Allergan plc” and changed its ticker symbol to “AGN.” Pursuant to Rule 12g-3(c) under the Securities Exchange Act of 1934, as amended (the “Exchange Act”), Allergan plc is the successor issuer to Actavis plc’s ordinary shares which are deemed to be registered under Section 12(b) of the Exchange Act, and Allergan plc is subject to the informational requirements of the Exchange Act, and the rules and regulations promulgated thereunder.
References throughout to “we,” “our,” “us,” the “Company” or “Allergan” refer to financial information and transactions of Allergan plc. References to “Warner Chilcott Limited” refer to Warner Chilcott Limited, the Company’s indirect wholly-owned subsidiary, and, unless the context otherwise requires, its subsidiaries.
References throughout to “Ordinary Shares” refer to Allergan Finance, LLC’s Class A common shares, par value $0.0033 per share, prior to the consummation of the Warner Chilcott Transactions and to Allergan plc’s ordinary shares, par value $0.0001 per share, since the consummation of the Warner Chilcott Transactions.
NOTE 3 — Reconciliation of Warner Chilcott Limited results to Allergan plc results
Warner Chilcott Limited is an indirect wholly-owned subsidiary of Allergan plc (together with other Warner Chilcott Limited parents, the “Parent”), the ultimate parent of the group. The results of Warner Chilcott Limited are consolidated into the results of Allergan plc. Due to the deminimis activity between Allergan plc and Warner Chilcott Limited, references throughout this filing relate to both Allergan plc and Warner Chilcott Limited. Warner Chilcott Limited representations relate only to itself and not to any other company.
Except where otherwise indicated, and excluding certain insignificant cash and non-cash transactions at the Allergan plc level, these notes relate to the consolidated financial statements for both separate registrants, Allergan plc and Warner Chilcott Limited. In addition to certain inter-company payable and receivable amounts between the entities, the following is a reconciliation of the results of Warner Chilcott Limited to Allergan plc ($ in millions):
|
|
|
December 31, 2016 |
|
|
December 31, 2015 |
|
||||||||||||||||||
|
|
|
Allergan plc |
|
|
Warner Chilcott Limited |
|
|
Difference |
|
|
Allergan plc |
|
|
Warner Chilcott Limited |
|
|
Difference |
|
||||||
|
Cash and cash equivalents |
|
$ |
1,724.0 |
|
|
$ |
1,713.2 |
|
|
$ |
10.8 |
|
|
$ |
1,096.0 |
|
|
$ |
1,036.2 |
|
|
$ |
59.8 |
|
|
Prepaid expenses and other current assets |
|
|
1,383.4 |
|
|
|
1,382.1 |
|
|
|
1.3 |
|
|
|
495.3 |
|
|
|
492.8 |
|
|
|
2.5 |
|
|
Accounts payable and accrued liabilities |
|
|
5,019.0 |
|
|
|
4,993.3 |
|
|
|
25.7 |
|
|
|
4,148.6 |
|
|
|
4,094.5 |
|
|
|
54.1 |
|
|
Other long-term liabilities |
|
|
1,085.0 |
|
|
|
1,086.0 |
|
|
|
(1.0 |
) |
|
|
1,262.0 |
|
|
|
1,262.0 |
|
|
|
- |
|
F-15
|
|
|
Year Ended December 31, 2016 |
|
|
Year Ended December 31, 2015 |
|
|
Year Ended December 31, 2014 |
|
|||||||||||||||||||||||||||
|
|
|
Allergan plc |
|
|
Warner Chilcott Limited |
|
|
Difference |
|
|
Allergan plc |
|
|
Warner Chilcott Limited |
|
|
Difference |
|
|
Allergan plc |
|
|
Warner Chilcott Limited |
|
|
Difference |
|
|||||||||
|
General and administrative expenses |
|
$ |
1,473.9 |
|
|
$ |
1,350.4 |
|
|
$ |
123.5 |
|
|
$ |
1,716.4 |
|
|
$ |
1,581.0 |
|
|
$ |
135.4 |
|
|
$ |
1,201.4 |
|
|
$ |
1,131.4 |
|
|
$ |
70.0 |
|
|
Operating (loss) |
|
|
(1,825.5 |
) |
|
|
(1,702.0 |
) |
|
|
(123.5 |
) |
|
|
(3,131.0 |
) |
|
|
(2,995.6 |
) |
|
|
(135.4 |
) |
|
|
(2,567.2 |
) |
|
|
(2,497.2 |
) |
|
|
(70.0 |
) |
|
Interest Income |
|
|
69.9 |
|
|
|
111.1 |
|
|
|
(41.2 |
) |
|
|
10.6 |
|
|
|
10.6 |
|
|
|
- |
|
|
|
8.1 |
|
|
|
8.1 |
|
|
|
- |
|
|
Other income (expense), net |
|
|
219.2 |
|
|
|
172.2 |
|
|
|
47.0 |
|
|
|
(233.8 |
) |
|
|
(233.8 |
) |
|
|
- |
|
|
|
(27.3 |
) |
|
|
(27.3 |
) |
|
|
- |
|
|
(Loss) before income taxes and noncontrolling interest |
|
|
(2,832.0 |
) |
|
|
(2,714.3 |
) |
|
|
(117.7 |
) |
|
|
(4,547.5 |
) |
|
|
(4,412.1 |
) |
|
|
(135.4 |
) |
|
|
(2,998.2 |
) |
|
|
(2,928.2 |
) |
|
|
(70.0 |
) |
|
(Benefit) for income taxes |
|
|
(1,897.0 |
) |
|
|
(1,897.0 |
) |
|
|
- |
|
|
|
(1,605.9 |
) |
|
|
(1,605.9 |
) |
|
|
- |
|
|
|
(513.6 |
) |
|
|
(513.6 |
) |
|
|
- |
|
|
Net (loss) from continuing operations, net of tax |
|
|
(935.0 |
) |
|
|
(817.3 |
) |
|
|
(117.7 |
) |
|
|
(2,941.6 |
) |
|
|
(2,806.2 |
) |
|
|
(135.4 |
) |
|
|
(2,484.6 |
) |
|
|
(2,414.6 |
) |
|
|
(70.0 |
) |
|
Net income / (loss) |
|
|
14,979.5 |
|
|
|
15,097.2 |
|
|
|
(117.7 |
) |
|
|
3,919.4 |
|
|
|
4,054.8 |
|
|
|
(135.4 |
) |
|
|
(1,630.5 |
) |
|
|
(1,560.5 |
) |
|
|
(70.0 |
) |
|
Net income / (loss) attributable to ordinary shareholders/members |
|
|
14,695.0 |
|
|
|
15,091.1 |
|
|
|
(396.1 |
) |
|
|
3,683.2 |
|
|
|
4,050.6 |
|
|
|
(367.4 |
) |
|
|
(1,630.5 |
) |
|
|
(1,560.5 |
) |
|
|
(70.0 |
) |
|
Dividends on preferred stock |
|
|
278.4 |
|
|
|
- |
|
|
|
278.4 |
|
|
|
232.0 |
|
|
|
- |
|
|
|
232.0 |
|
|
|
- |
|
|
|
- |
|
|
|
- |
|
The difference between general and administrative expenses in the years ending December 31, 2016, 2015 and 2014 were due to corporate related expenses incurred at Allergan plc as well as non-recurring transaction costs incurred as part of the acquisitions of the Company, including Allergan, Forest and the terminated transaction with Pfizer Inc. Movements in equity are due to historical differences in the results of operations of the companies and differences in equity awards.
As of December 31, 2016, Warner Chilcott Limited had $9.3 billion in Receivables from Parents and $4.0 billion in Non-current Receivables from Parents. These receivables related to intercompany loans between Allergan plc and Actavis Capital, S.a.r.l and Forest Finance BV, subsidiaries of Warner Chilcott Limited. These loans are interest-bearing loans with varying term dates. Total interest income recognized during the year ended December 31, 2016 was $41.2 million.
NOTE 4 — Summary of Significant Accounting Policies
Basis of Presentation
The Company’s consolidated financial statements are prepared in accordance with accounting principles generally accepted in the U.S. (“GAAP”). The consolidated financial statements include the accounts of wholly owned subsidiaries, after elimination of intercompany accounts and transactions. The consolidated financial information presented herein reflects all financial information that, in the opinion of management, is necessary for a fair statement of financial position, results of operations and cash flows for the periods presented.
The Company’s consolidated financial statements include the financial results of all acquired companies subsequent to the acquisition date.
Reclassifications
In April 2015, the FASB issued guidance which changes the classification of debt issuance costs from being an asset on the balance sheet to netting the costs against the carrying value of the debt. As a result, the Company reclassified debt issuance costs as of December 31, 2015 by decreasing “prepaid expenses and other current assets” and “current portion of long-term debt and capital leases” by $36.3 million as well as decreasing “investments and other assets” and “long-term debt and capital leases” by $159.5 million. In addition, the Company made certain presentation reclassifications relating to segment results and guarantor financial statements.
Use of Estimates
Management is required to make certain estimates and assumptions in order to prepare consolidated financial statements in conformity with GAAP. Such estimates and assumptions affect the reported financial statements. The Company’s most significant estimates relate to the determination of SRA’s (defined below) included within either accounts receivable or accrued liabilities, the valuation of inventory balances, the determination of useful lives for intangible assets, pension and other post-retirement benefit plan assumptions, the assessment of expected cash flows used in evaluating goodwill and other long-lived assets for impairment and recognition and measurement of assets acquired and liabilities assumed in business combinations at fair value. The estimation process required to prepare the Company’s consolidated financial statements requires assumptions to be made about future events and conditions, and as such, is inherently subjective and uncertain. The Company’s actual results could differ materially from those estimates.
F-16
For most of the Company’s international operations, the local currency has been determined to be the functional currency. The results of its non-U.S. dollar based operations are translated to U.S. dollars at the average exchange rates during the period. Assets and liabilities are translated at the rate of exchange prevailing on the balance sheet date. Equity is translated at the prevailing rate of exchange at the date of the equity transaction. Translation adjustments are reflected in stockholders’ equity and are included as a component of other comprehensive (loss) / income. The effects of revaluing non-functional currency assets and liabilities into the functional currency are recorded as general and administrative expenses in the consolidated statements of operations.
The Company realizes foreign currency gains / (losses) in the normal course of business based on movement in the applicable exchange rates. These transactional gains / (losses) are included as a component of general and administrative expenses.
Cash and Cash Equivalents
The Company considers cash and cash equivalents to include cash in banks, commercial paper and deposits with financial institutions that can be liquidated without prior notice or penalty. The Company considers all highly liquid investments with an original maturity of three months or less to be cash equivalents.
Fair Value of Other Financial Instruments
The Company’s financial instruments consist primarily of cash and cash equivalents, marketable securities, accounts and other receivables, investments, trade accounts payable, and long-term debt, including the current portion. The carrying amounts of cash and cash equivalents, marketable securities, accounts and other receivables and trade accounts payable are representative of their respective fair values due to their relatively short maturities. The fair values of investments in companies that are publicly traded and not accounted for under the equity method are based on quoted market prices. The Company estimates the fair value of its fixed rate long-term obligations based on quoted market rates.
Inventories
Inventories consist of finished goods held for distribution, raw materials and work in process. Inventory includes brand pharmaceutical and medical aesthetic products which represent Food and Drug Administration (“FDA”) approved or likely to be approved indications. Inventory valuation reserves are established based on a number of factors/situations including, but not limited to, raw materials, work in process or finished goods not meeting product specifications, product obsolescence, or application of the lower of cost (first-in, first-out method) or market (net realizable value) concepts. The determination of events requiring the establishment of inventory valuation reserves, together with the calculation of the amount of such reserves may require judgment. Assumptions utilized in our quantification of inventory reserves include, but are not limited to, estimates of future product demand, consideration of current and future market conditions, product net selling price, anticipated product launch dates, potential product obsolescence and other events relating to special circumstances surrounding certain products. No material adjustments have been required to our inventory reserve estimates for the periods presented. Adverse changes in assumptions utilized in our inventory reserve calculations could result in an increase to our inventory valuation reserves and higher cost of sales.
Property, Plant and Equipment
Property, plant and equipment are stated at cost, less accumulated depreciation. Major renewals and improvements are capitalized, while routine maintenance and repairs are expensed as incurred. The Company capitalizes interest on qualified construction projects. At the time property, plant and equipment are retired from service, the cost and accumulated depreciation is removed from the respective accounts.
Depreciation expense is computed principally on the straight-line method, over the estimated useful lives of the related assets. The following table provides the range of estimated useful lives used for each asset type:
|
Computer software/hardware (including internally developed) |
|
3-10 years |
|
Machinery and equipment |
|
3-15 years |
|
Research and laboratory equipment |
|
3-10 years |
|
Furniture and fixtures |
|
3-10 years |
|
Buildings, improvements, leasehold improvements and other |
|
4-50 years |
|
Transportation equipment |
|
3-20 years |
F-17
The Company assesses property, plant and equipment for impairment whenever events or changes in circumstances indicate that an asset’s carrying amount may not be recoverable.
Investments
The Company’s equity investments are accounted for under the equity method of accounting when the Company can exert significant influence and the Company’s ownership interest does not exceed 50%. The Company records equity method investments at cost and adjusts for the appropriate share of investee net earnings or losses. Investments in which the Company owns less than a 20% interest and cannot exert significant influence are accounted for using the cost method if the fair value of such investments is not readily determinable.
Marketable Securities
The Company’s marketable securities consist of U.S. treasury and agency securities and debt and equity securities of publicly-held companies. The Company’s marketable securities are classified as available-for-sale and are recorded at fair value, based upon quoted market prices. Unrealized temporary adjustments to fair value are included on the balance sheet in a separate component of stockholders’ equity as unrealized gains and losses and are reported as a component of accumulated other comprehensive income / (loss). No gains or losses on marketable securities are realized until shares are sold or a decline in fair value is determined to be other-than-temporary. If a decline in fair value is determined to be other-than-temporary, an impairment charge is recorded and a new cost basis in the investment is established.
Product Rights and Other Definite-Lived Intangible Assets
Our product rights and other definite-lived intangible assets are stated at cost, less accumulated amortization, and are amortized using the economic benefit model or the straight-line method, if results are materially aligned, over their estimated useful lives. We determine amortization periods for product rights and other definite-lived intangible assets based on our assessment of various factors impacting estimated useful lives and cash flows. Such factors include the product’s position in its life cycle, the existence or absence of like products in the market, various other competitive and regulatory issues, and contractual terms. Significant changes to any of these factors may result in a reduction in the intangibles useful life and an acceleration of related amortization expense, which could cause our net results to decline.
Product rights and other definite-lived intangible assets are tested periodically for impairment when events or changes in circumstances indicate that an asset’s carrying value may not be recoverable. The impairment testing involves comparing the carrying amount of the asset to the forecasted undiscounted future cash flows. In the event the carrying value of the asset exceeds the undiscounted future cash flows, the carrying value is considered not recoverable and an impairment exists. An impairment loss is measured as the excess of the asset’s carrying value over its fair value, calculated using discounted future cash flows. The computed impairment loss is recognized in net (loss) / income in the period that the impairment occurs. Assets which are not impaired may require an adjustment to the remaining useful lives for which to amortize the asset. Our projections of discounted cash flows use a discount rate determined by our management to be commensurate with the risk inherent in our business model. Our estimates of future cash flows attributable to our other definite-lived intangible assets require significant judgment based on our historical and anticipated results and are subject to many factors. Different assumptions and judgments could materially affect the calculation of the fair value of the other definite-lived intangible assets which could trigger impairment.
Goodwill and Intangible Assets with Indefinite Lives
The Company tests goodwill and intangible assets with indefinite-lives for impairment annually in the second quarter by comparing the fair value of each of the Company’s reporting units to the respective carrying value of the reporting units. Additionally, the Company may perform interim tests if an event occurs or circumstances change that could potentially reduce the fair value of a reporting unit below its carrying amount or when the Company has a change to reporting units. The carrying value of each reporting unit is determined by assigning the assets and liabilities, including the existing goodwill and intangible assets, to those reporting units.
Goodwill is considered impaired if the carrying amount of the net assets exceeds the fair value of the reporting unit. Impairment, if any, would be recorded in operating income and this could result in a material impact to net (loss) / income and (loss) / earnings per share.
Acquired IPR&D intangible assets represent the value assigned to acquired research and development projects that, as of the date acquired, represent the right to develop, use, sell and/or offer for sale a product or other intellectual property that the Company has acquired with respect to products and/or processes that have not been completed or approved. The IPR&D intangible assets are subject to impairment testing until completion or abandonment of each project. Upon abandonment, the assets are impaired.
F-18
Impairment testing requires the development of significant estimates and assumptions involving the determination of estimated net cash flows for each year for each project or product (including net revenues, cost of sales, R&D costs, selling and marketing costs and other costs which may be allocated), the appropriate discount rate to select in order to measure the risk inherent in each future cash flow stream, the assessment of each asset’s life cycle, the potential regulatory and commercial success risks, and competitive trends impacting the asset and each cash flow stream as well as other factors. The major risks and uncertainties associated with the timely and successful completion of the IPR&D projects include legal risk, market risk and regulatory risk. Changes in these assumptions could result in future impairment charges. No assurances can be given that the underlying assumptions used to prepare the discounted cash flow analysis will not change or the timely completion of each project to commercial success will occur. For these and other reasons, actual results may vary significantly from estimated results.
Upon successful completion of each project and approval of the product, we will make a separate determination of the useful life of the intangible, transfer the amount to currently marketed products (“CMP”) and amortization expense will be recorded over the estimated useful life.
Warranties
The Company provides warranty programs for breast implant sales primarily in the United States, Europe and certain other countries. Management estimates the amount of potential future claims from these warranty programs based on actuarial analyses. Expected future obligations are determined based on the history of product shipments and claims and are discounted to a current value. The provision for warranty expense in the year ended December 31, 2016 and 2015 was $6.8 million and $4.5 million, respectively. The liability is included in both current and long-term liabilities in the Company’s consolidated balance sheets and amounted to $2.2 million and $28.1 million, respectively, as of December 31, 2016, and $7.6 million and $28.4 million, respectively, as of December 31, 2015. The U.S. programs include the ConfidencePlus® and ConfidencePlus® Premier warranty programs. The ConfidencePlus® program, which is limited to saline breast implants, currently provides lifetime product replacement and contralateral implant replacement. The ConfidencePlus® Premier program, which is standard for silicone gel implants and requires a low enrollment fee for saline breast implants, generally provides lifetime product replacement, $2,400 of financial assistance for saline breast implants and $3,500 of financial assistance for silicone gel breast implants for surgical procedures within ten years of implantation and contralateral implant replacement. The warranty programs in non-U.S. markets generally have similar terms and conditions to the U.S. programs. The Company does not warrant any level of aesthetic result and, as required by government regulation, makes extensive disclosures concerning the risks of the use of its products and breast implant surgery. Changes to actual warranty claims incurred and interest rates could have a material impact on the actuarial analysis and the Company’s estimated liabilities. A large majority of the product warranty liability arises from the U.S. warranty programs. The Company does not currently offer any similar warranty program on any other product.
Contingent Consideration
Contingent consideration is recorded at the acquisition date estimated fair value of the contingent payment for all applicable acquisitions. The fair value of the contingent consideration is remeasured at each reporting period with any adjustments in fair value included in our consolidated statement of operations. (Refer to “NOTE 23 — Fair Value Measurement” for additional details regarding the fair value of contingent consideration.)
Revenue Recognition
General
Revenue from product sales is recognized when title and risk of loss to the product transfers to the customer, which is based on the transaction shipping terms. Recognition of revenue also requires reasonable assurance of collection of sales proceeds, the seller’s price to the buyer to be fixed or determinable and the completion of all performance obligations. The Company warrants products against defects and for specific quality standards, permitting the return of products under certain circumstances. Product sales are recorded net of all sales-related deductions including, but not limited to: chargebacks, trade discounts, sales returns and allowances, commercial and government rebates, customer loyalty programs and fee-for-service arrangements with certain distributors, which we refer to in the aggregate as “SRA” allowances.
Royalty and commission revenue is recognized as a component of net revenues in accordance with the terms of their respective contractual agreements when collectability is reasonably assured and when revenue can be reasonably measured.
F-19
As is customary in the pharmaceutical industry, our gross product sales are subject to a variety of deductions in arriving at reported net product sales. When the Company recognizes gross revenue from the sale of products, an estimate of SRA is recorded, which reduces the product revenues. Accounts receivable and/or accrued liabilities are also reduced and/or increased by the SRA amount depending on whether we have the right of offset with the customer. These provisions are estimated based on historical payment experience, historical relationship of the deductions to gross product revenues, government regulations, estimated utilization or redemption rates, estimated customer inventory levels and current contract sales terms. The estimation process used to determine our SRA provision has been applied on a consistent basis and no material revenue adjustments have been necessary to increase or decrease our reserves for SRA as a result of a significant change in underlying estimates. The Company uses a variety of methods to assess the adequacy of the SRA reserves to ensure that our financial statements are fairly stated.
Chargebacks — A chargeback represents an amount payable in the future to a wholesaler for the difference between the invoice price paid by our wholesale customer for a particular product and the negotiated contract price that the wholesaler’s customer pays for that product. The chargeback provision and related reserve varies with changes in product mix, changes in customer pricing and changes to estimated wholesaler inventories. The provision for chargebacks also takes into account an estimate of the expected wholesaler sell-through levels to indirect customers at certain contract prices. The Company validates the chargeback accrual quarterly through a review of the inventory reports obtained from our largest wholesale customers. This customer inventory information is used to verify the estimated liability for future chargeback claims based on historical chargeback and contract rates. These large wholesalers represent the vast majority of the recipients of the Company’s chargeback payments. We continually monitor current pricing trends and wholesaler inventory levels to ensure the liability for future chargebacks is fairly stated.
Rebates — Rebates include volume related incentives to direct and indirect customers, third-party managed care and Medicare Part D rebates, Medicaid rebates and other government rebates. Rebates are accrued based on an estimate of claims to be paid for product sold into trade by the Company. Volume rebates are generally offered to customers as an incentive to use the Company’s products and to encourage greater product sales. These rebate programs include contracted rebates based on customers’ purchases made during an applicable monthly, quarterly or annual period. The provision for third-party rebates is estimated based on our customers’ contracted rebate programs and the Company’s historical experience of rebates paid. Any significant changes to our customer rebate programs are considered in establishing the provision for rebates. The provisions for government rebates are based, in part, upon historical experience of claims submitted by the various states / authorities, contractual terms and government regulations. We monitor legislative changes to determine what impact such legislation may have on our provision.
Cash Discounts — Cash discounts are provided to customers that pay within a specific period. The provision for cash discounts is estimated based upon invoice billings and historical customer payment experience. The Company’s experience of payment history is fairly consistent and most customer payments qualify for the cash discount.
Returns and Other Allowances — The Company’s provision for returns and other allowances include returns, promotional allowances, and loyalty cards.
Consistent with industry practice, the Company maintains a returns policy that allows customers to return product for a credit. In accordance with the Company’s policy, credits for customer returns of products are applied against outstanding account activity or are settled in cash. Product exchanges are not permitted. Customer returns of product are generally not resalable. The Company’s estimate of the provision for returns is based upon historical experience and current trends of actual customer returns. Additionally, we consider other factors when estimating the current period returns provision, including levels of inventory in the distribution channel, as well as significant market changes which may impact future expected returns.
Promotional allowances are credits that are issued in connection with a product launch or as an incentive for customers to carry our product. The Company establishes a reserve for promotional allowances based upon contractual terms.
Loyalty cards allow the end user patients a discount per prescription and are accrued based on historical experience, contract terms and the volume of product and cards in the distribution channel.
F-20
The following table summarizes the activity from continuing operations in the Company’s major categories of SRA ($ in millions):
|
|
|
Chargebacks |
|
|
Rebates |
|
|
Return and Other Allowances |
|
|
Cash Discounts |
|
|
Total |
|
|||||
|
Balance at December 31, 2013 |
|
$ |
21.8 |
|
|
$ |
284.1 |
|
|
$ |
198.7 |
|
|
$ |
6.6 |
|
|
$ |
511.2 |
|
|
Add: Forest Acquisition |
|
|
27.9 |
|
|
|
425.0 |
|
|
|
94.3 |
|
|
|
9.8 |
|
|
|
557.0 |
|
|
Provision related to sales in 2014 |
|
|
442.9 |
|
|
|
1,516.5 |
|
|
|
79.4 |
|
|
|
134.2 |
|
|
|
2,173.0 |
|
|
Credits and payments |
|
|
(464.6 |
) |
|
|
(1,229.8 |
) |
|
|
(117.2 |
) |
|
|
(134.3 |
) |
|
|
(1,945.9 |
) |
|
Balance at December 31, 2014 |
|
$ |
28.0 |
|
|
$ |
995.8 |
|
|
$ |
255.2 |
|
|
$ |
16.3 |
|
|
$ |
1,295.3 |
|
|
Add: Allergan Acquisition |
|
|
14.1 |
|
|
|
306.4 |
|
|
|
100.4 |
|
|
|
8.6 |
|
|
|
429.5 |
|
|
Provision related to sales in 2015 |
|
|
649.9 |
|
|
|
4,035.7 |
|
|
|
659.9 |
|
|
|
275.6 |
|
|
|
5,621.1 |
|
|
Credits and payments |
|
|
(613.8 |
) |
|
|
(3,993.5 |
) |
|
|
(648.0 |
) |
|
|
(275.4 |
) |
|
|
(5,530.7 |
) |
|
Balance at December 31, 2015 |
|
$ |
78.2 |
|
|
$ |
1,344.4 |
|
|
$ |
367.5 |
|
|
$ |
25.1 |
|
|
$ |
1,815.2 |
|
|
Provision related to sales in 2016 |
|
|
1,003.2 |
|
|
|
4,338.7 |
|
|
|
1,390.1 |
|
|
|
306.5 |
|
|
|
7,038.5 |
|
|
Credits and payments |
|
|
(967.2 |
) |
|
|
(4,069.1 |
) |
|
|
(1,341.7 |
) |
|
|
(296.9 |
) |
|
|
(6,674.9 |
) |
|
Balance at December 31, 2016 |
|
$ |
114.2 |
|
|
$ |
1,614.0 |
|
|
$ |
415.9 |
|
|
$ |
34.7 |
|
|
$ |
2,178.8 |
|
The following table summarizes the balance sheet classification of our SRA reserves ($ in millions):
|
|
|
As of December 31, |
|
|||||
|
|
|
2016 |
|
|
2015 |
|
||
|
Accounts receivable |
|
$ |
287.4 |
|
|
$ |
245.0 |
|
|
Accounts payable and accrued expenses |
|
|
1,891.4 |
|
|
|
1,570.2 |
|
|
|
|
$ |
2,178.8 |
|
|
$ |
1,815.2 |
|
The provisions recorded to reduce gross product sales to net product sales were as follows ($ in millions):
|
Years Ended December 31, |
|
Gross Product Sales |
|
|
Chargebacks |
|
|
Rebates |
|
|
Return and Other Allowances |
|
|
Cash Discounts |
|
|
Net Product Sales |
|
|
Gross-to-net Percentages |
|
|||||||
|
2014 |
|
$ |
6,782.1 |
|
|
$ |
442.9 |
|
|
$ |
1,516.5 |
|
|
$ |
79.4 |
|
|
$ |
134.2 |
|
|
$ |
4,609.1 |
|
|
|
68.0 |
% |
|
2015 |
|
$ |
18,125.1 |
|
|
$ |
649.9 |
|
|
$ |
4,035.7 |
|
|
$ |
659.9 |
|
|
$ |
275.6 |
|
|
$ |
12,504.0 |
|
|
|
69.0 |
% |
|
2016 |
|
$ |
21,398.6 |
|
|
$ |
1,003.2 |
|
|
$ |
4,338.7 |
|
|
$ |
1,390.1 |
|
|
$ |
306.5 |
|
|
$ |
14,360.1 |
|
|
|
67.1 |
% |
The following table summarizes the activity from discontinued operations in the Company’s major categories of SRA ($ in millions):
|
|
|
Chargebacks |
|
|
Rebates |
|
|
Return and Other Allowances |
|
|
Cash Discounts |
|
|
Total |
|
|||||
|
Balance at December 31, 2013 |
|
$ |
224.6 |
|
|
$ |
777.7 |
|
|
$ |
419.2 |
|
|
$ |
41.1 |
|
|
$ |
1,462.6 |
|
|
Provision related to sales in 2014 |
|
|
4,148.8 |
|
|
|
1,807.4 |
|
|
|
780.0 |
|
|
|
216.5 |
|
|
|
6,952.7 |
|
|
Credits and payments |
|
|
(3,836.5 |
) |
|
|
(1,834.3 |
) |
|
|
(842.3 |
) |
|
|
(213.2 |
) |
|
|
(6,726.3 |
) |
|
Balance at December 31, 2014 |
|
$ |
536.9 |
|
|
$ |
750.8 |
|
|
$ |
356.9 |
|
|
$ |
44.4 |
|
|
$ |
1,689.0 |
|
|
Provision related to sales in 2015 |
|
|
5,907.2 |
|
|
|
1,991.9 |
|
|
|
729.4 |
|
|
|
277.3 |
|
|
|
8,905.8 |
|
|
Credits and payments |
|
|
(5,825.1 |
) |
|
|
(2,011.7 |
) |
|
|
(757.7 |
) |
|
|
(261.6 |
) |
|
|
(8,856.1 |
) |
|
Balance at December 31, 2015 |
|
$ |
619.0 |
|
|
$ |
731.0 |
|
|
$ |
328.6 |
|
|
$ |
60.1 |
|
|
$ |
1,738.7 |
|
|
Provision related to sales in 2016 |
|
|
3,525.4 |
|
|
|
1,290.4 |
|
|
|
583.0 |
|
|
|
159.1 |
|
|
|
5,557.9 |
|
|
Credits and payments |
|
|
(3,655.0 |
) |
|
|
(1,350.0 |
) |
|
|
(496.3 |
) |
|
|
(155.4 |
) |
|
|
(5,656.7 |
) |
|
Disposal of businesses |
|
|
(489.4 |
) |
|
|
(671.4 |
) |
|
|
(415.3 |
) |
|
|
(63.8 |
) |
|
|
(1,639.9 |
) |
|
Balance at December 31, 2016 |
|
$ |
- |
|
|
$ |
- |
|
|
$ |
- |
|
|
$ |
- |
|
|
$ |
- |
|
F-21
The following table summarizes the balance sheet classification of our SRA reserves relating to the assets divested to Teva ($ in millions):
|
|
|
As of December 31, |
|
|
|
|
|
2015 |
|
|
|
Current assets held for sale |
|
$ |
1,325.2 |
|
|
Current liabilities held for sale |
|
|
413.5 |
|
|
|
|
$ |
1,738.7 |
|
The Company’s divested generics business also had the following type of SRA’s:
|
|
• |
Pricing adjustments, included shelf stock adjustments which are credits issued to reflect price decreases in selling prices charged to the Company’s direct customers. Shelf stock adjustments are based upon the amount of product our customers have in their inventory at the time of an agreed-upon price reduction. The provision for shelf stock adjustments was based upon specific terms with the Company’s customers and includes estimates of existing customer inventory levels based upon their historical purchasing patterns. |
|
|
• |
Billback adjustments are credits that are issued to certain customers who purchase directly from us as well as indirectly through a wholesaler. These credits are issued in the event there was a difference between the customer’s direct and indirect contract price. The provision for billbacks was estimated based upon historical purchasing patterns of qualified customers who purchase product directly from us and supplement their purchases indirectly through our wholesale customers. |
Branded Prescription Drug Fee
On July 28, 2014, the Internal Revenue Service (“IRS”) issued revised final rules and regulations for the Branded Prescription Drug Fee, an annual fee payable to the federal government based on an allocation of the Company’s market share for branded prescription and authorized generic drugs sold to certain government programs compared to that of the industry. The final rules accelerated the expense recognition criteria for the fee obligation from the year in which the fee is paid, to the year in which the market share used to allocate the fee is determined. This change required Allergan (and other industry participants) to recognize an additional year of expense in the third quarter of 2014 of $105.1 million, which is reflected in our 2014 selling and marketing expense.
Litigation and Contingencies
The Company is involved in various legal proceedings in the normal course of its business, including product liability litigation, intellectual property litigation, employment litigation and other litigation. Additionally, the Company, in consultation with its counsel, assesses the need to record a liability for contingencies on a case-by-case basis in accordance with FASB Accounting Standards Codification (“ASC”) Topic 450 “Contingencies” (“ASC 450”). Accruals are recorded when the Company determines that a loss related to a matter is both probable and reasonably estimable. These accruals are adjusted periodically as assessment efforts progress or as additional information becomes available. Acquired contingencies in business combinations are recorded at fair value to the extent determinable, otherwise in accordance with ASC 450. Refer to “NOTE 24 — Commitments and Contingencies” for more information.
R&D Activities
R&D activities are expensed as incurred and consist of self-funded R&D costs, the costs associated with work performed under collaborative R&D agreements, regulatory fees, and license and milestone payments, if any.
F-22
As of December 31, 2016, the Company is developing a number of branded products, some of which utilize novel drug delivery systems, through a combination of internal and collaborative programs including the following:
|
Product |
|
Therapeutic Area |
|
Indication |
|
Expected Launch Year |
|
Phase |
|
Esmya |
|
Women's healthcare |
|
Uterine Fibroids |
|
2018 |
|
III |
|
Sarecycline |
|
Dermatology |
|
Severe Acne |
|
2019 |
|
III |
|
Ubrogepant |
|
Neurology |
|
Acute Migraine |
|
2020 |
|
III |
|
Abicipar |
|
Eye Care |
|
Age Related Macular Degeneration |
|
2020 |
|
III |
|
Bimatoprost SR |
|
Eye Care |
|
Glaucoma |
|
2021 |
|
III |
|
Relamorelin |
|
Gastrointestinal |
|
Gastroparesis |
|
2021 |
|
II |
|
Rapastinel |
|
Psychiatry |
|
Depression |
|
2021 |
|
III |
|
Cenicriviroc |
|
Gastrointestinal |
|
NASH |
|
2021 |
|
II |
|
Atogepant |
|
CNS |
|
Migraine Prevention |
|
2022 |
|
II |
We also have a number of products in development as part of our life-cycle management strategy for our existing product portfolio.
Allocation of Acquisition Fair Values to Assets Acquired and Liabilities Assumed
We account for acquired businesses using the acquisition method of accounting, which requires that assets acquired and liabilities assumed be recorded at the date of acquisition at their respective fair values. The consolidated financial statements and results of operations reflect an acquired business after the completion of the acquisition. The fair value of the consideration paid, including contingent consideration, is assigned to the underlying net assets of the acquired business based on their respective fair values as determined using a market participant concept. Any excess of the purchase price over the estimated fair values of the net assets acquired is recorded as goodwill.
The most material line items impacted by the allocation of acquisition fair values are:
|
|
• |
Intangible assets (including IPR&D assets upon successful completion of the project and approval of the product) which are amortized to amortization expense over the expected life of the asset. Significant judgments are used in determining the estimated fair values assigned to the assets acquired and liabilities assumed and in determining estimates of useful lives of long-lived assets. Fair value determinations and useful life estimates are based on, among other factors, estimates of expected future net cash flows, estimates of appropriate discount rates used to present value expected future net cash flow streams, the timing of approvals for IPR&D projects and the timing of related product launch dates, the assessment of each asset’s life cycle, the impact of competitive trends on each asset’s life cycle and other factors. These judgments can materially impact the estimates used to allocate acquisition date fair values to assets acquired and liabilities assumed and the future useful lives. For these and other reasons, actual results may vary significantly from estimated results. |
|
|
• |
Fixed asset valuations which are depreciated over the expected life of the asset. Significant judgments are used in determining the estimated fair values assigned to the assets acquired and in determining estimates of useful lives of long-lived assets. Fair value determinations and useful life estimates are based on, among other factors, estimates of expected future net cash flows, estimates of appropriate discount rates and intended uses of the assets. |
|
|
• |
Inventory is recorded at fair market value factoring in selling price and costs to dispose. Inventory acquired is typically valued higher than replacement cost. |
Income Taxes
Income taxes are accounted for using an asset and liability approach that requires the recognition of deferred tax assets and liabilities for the expected future tax consequences of temporary differences between the financial statement and tax bases of assets and liabilities at the applicable tax rates. A valuation allowance is provided when it is more likely than not that some portion or all of the deferred tax assets will not be realized. The Company evaluates the realizability of its deferred tax assets by assessing its valuation allowance and by adjusting the amount of such allowance, if necessary. The factors used to assess the likelihood of realization include the Company’s forecast of future taxable income and available tax planning strategies that could be implemented to realize the net deferred tax assets. Failure to achieve forecasted taxable income in applicable tax jurisdictions could affect the ultimate realization of deferred tax assets and could result in an increase in the Company’s effective tax rate on future earnings.
F-23
Income tax positions must meet a more-likely-than-not recognition threshold to be recognized. Income tax positions that previously failed to meet the more-likely-than-not threshold are recognized in the first financial reporting period in which that threshold is met. Previously recognized tax positions that no longer meet the more-likely-than-not threshold are derecognized in the first financial reporting period in which that threshold is no longer met. The Company recognizes potential accrued interest and penalties related to unrecognized tax benefits within the consolidated statements of operations as income tax expense.
Comprehensive Income / (Loss)
Comprehensive income / (loss) includes all changes in equity during a period except those that resulted from investments by or distributions to the Company’s stockholders. Other comprehensive income / (loss) refers to revenues, expenses, gains and losses that are included in comprehensive income / (loss), but excluded from net income / (loss) as these amounts are recorded directly as an adjustment to stockholders’ equity. The Company’s other comprehensive income / (loss) is comprised of unrealized gains / (losses) on certain holdings of publicly traded equity securities, investments in U.S. treasury and agency securities and actuarial gains/(losses), net of realized gains / (losses) included in net income / (loss), net of tax and foreign currency translation adjustments.
Earnings Per Share (“EPS”)
The Company computes EPS in accordance with ASC Topic 260, “Earnings Per Share” (“ASC 260”) and related guidance, which requires two calculations of EPS to be disclosed: basic and diluted. Basic EPS is computed by dividing net (loss) / income by the weighted average ordinary shares outstanding during a period. Diluted EPS is based on the treasury stock method and includes the effect from potential issuance of ordinary shares, such as shares issuable pursuant to the exercise of stock options and restricted stock units. Diluted EPS also includes the impact of ordinary share equivalents to be issued upon the mandatory conversion of the Company’s preferred shares. Ordinary share equivalents have been excluded where their inclusion would be anti-dilutive to continuing operations.
A reconciliation of the numerators and denominators of basic and diluted EPS consisted of the following ($ in millions, except per share amounts):
|
|
|
Years Ended December 31, |
|
|||||||||
|
|
|
2016 |
|
|
2015 |
|
|
2014 |
|
|||
|
Net income: |
|
|
|
|
|
|
|
|
|
|
|
|
|
Net (loss) attributable to ordinary shareholders excluding income from discontinued operations, net of tax |
|
$ |
(1,219.5 |
) |
|
$ |
(3,177.8 |
) |
|
$ |
(2,484.6 |
) |
|
Income from discontinued operations, net of tax |
|
|
15,914.5 |
|
|
|
6,861.0 |
|
|
|
854.1 |
|
|
Net income/(loss) attributable to ordinary shareholders |
|
$ |
14,695.0 |
|
|
$ |
3,683.2 |
|
|
$ |
(1,630.5 |
) |
|
|
|
|
|
|
|
|
|
|
|
|
|
|
|
Basic weighted average ordinary shares outstanding |
|
|
384.9 |
|
|
|
367.8 |
|
|
|
219.7 |
|
|
|
|
|
|
|
|
|
|
|
|
|
|
|
|
Basic EPS: |
|
|
|
|
|
|
|
|
|
|
|
|
|
Continuing operations |
|
$ |
(3.17 |
) |
|
$ |
(8.64 |
) |
|
$ |
(11.31 |
) |
|
Discontinued operations |
|
$ |
41.35 |
|
|
$ |
18.65 |
|
|
$ |
3.89 |
|
|
Net income / (loss) per share |
|
$ |
38.18 |
|
|
$ |
10.01 |
|
|
$ |
(7.42 |
) |
|
|
|
|
|
|
|
|
|
|
|
|
|
|
|
Diluted weighted average ordinary shares outstanding |
|
|
384.9 |
|
|
|
367.8 |
|
|
|
219.7 |
|
|
|
|
|
|
|
|
|
|
|
|
|
|
|
|
Diluted EPS: |
|
|
|
|
|
|
|
|
|
|
|
|
|
Continuing operations |
|
$ |
(3.17 |
) |
|
$ |
(8.64 |
) |
|
$ |
(11.31 |
) |
|
Discontinued operations |
|
$ |
41.35 |
|
|
$ |
18.65 |
|
|
$ |
3.89 |
|
|
Net income / (loss) per share |
|
$ |
38.18 |
|
|
$ |
10.01 |
|
|
$ |
(7.42 |
) |
Stock awards to purchase 4.7 million ordinary shares for the year ended December 31, 2016 were outstanding, but not included in the computation of diluted EPS, because the awards were anti-dilutive for continuing operations and as such the treatment for discontinued operations is also anti-dilutive. As of December 31, 2016, the Company has repurchased 61.6 million shares under the Company’s share repurchase program. The impact of the share repurchase on basic EPS was 10.7 million weighted average shares for the year ended December 31, 2016. Refer to “NOTE 19 –Shareholder’s Equity” for further discussion on the Company’s Share Repurchase Program. The impact of the Share Repurchase Program was anti-dilutive for the year ended December 31, 2016.
F-24
Stock awards to purchase/acquire 5.2 million and 3.0 million ordinary shares for the year ended December 31, 2015 and 2014, respectively, were outstanding, but not included in the computation of diluted EPS, because the awards were anti-dilutive for continuing operations and as such the treatment for discontinued operations is also anti-dilutive.
The weighted average impact of ordinary share equivalents of 17.6 million and 13.6 million for year ended December 31, 2016 and 2015, respectively, which are anticipated to result from the mandatory conversion of the Company’s preferred shares were not included in the calculation of diluted EPS as their impact would be anti-dilutive.
Employee Benefits
Defined Contribution Plans
The Company has defined contribution plans that are post-employment benefit plans under which the Company pays fixed contributions to a separate entity and has no legal or constructive obligation to pay further amounts. Obligations for contributions to the defined contribution plans are recognized as an employee benefit expense in the consolidated statement of operations in the periods during which the related services were rendered.
Defined Benefit Plans
The Company recognizes the overfunded or underfunded status of each of its defined benefit plans as an asset or liability on its consolidated balance sheets. The obligations are generally measured at the actuarial present value of all benefits attributable to employee service rendered, as provided by the applicable benefit formula. The estimates of the obligation and related expense of these plans recorded in the financial statements are based on certain assumptions. The most significant assumptions relate to discount rate and expected return on plan assets. Other assumptions used may include employee demographic factors such as compensation rate increases, retirement patterns, expected employee turnover and participant mortality rates. The difference between these assumptions and actual experience results in the recognition of an asset or liability based upon a net actuarial (gain) / loss. If the total net actuarial (gain) / loss included in accumulated other comprehensive (loss) / income exceeds a threshold of 10% of the greater of the projected benefit obligation or the market related value of plan assets, it is subject to amortization and recorded as a component of net periodic pension cost over the average remaining service lives of the employees participating in the pension plan. Net periodic benefit costs are recognized in the consolidated statement of operations.
Share-based Compensation
The Company has adopted several equity award plans which authorize the granting of options, restricted shares, restricted stock units and other forms of equity awards of the Company’s ordinary shares, subject to certain conditions.
The Company grants or has granted awards with the following features:
|
|
• |
Time-based vesting restricted stock and restricted stock units awards; |
|
|
• |
Performance-based restricted stock unit awards measured to the EBITDA, as defined, of the Company or other performance-based targets defined by the Company; |
|
|
• |
Performance-based restricted stock unit awards based on pre-established total shareholder returns metrics; |
|
|
• |
Non-qualified options to purchase outstanding shares; and |
|
|
• |
Cash-settled awards recorded as a liability. These cash settled awards are based on pre-established total shareholder returns metrics. |
The Company recognizes share-based compensation expense for the granted awards over the applicable vesting period, net of estimated forfeitures. Estimates of anticipated vesting of awards are revised in future periods based on actual forfeiture rates and targets achieved.
F-25
The Company records liabilities for costs associated with exit or disposal activities in the period in which the liability is incurred. In accordance with existing benefit arrangements, employee severance costs are accrued when the restructuring actions are probable and estimable. Costs for one-time termination benefits in which the employee is required to render service until termination in order to receive the benefits are recognized ratably over the future service period. The Company also incurs costs with contract terminations and costs of transferring products as part of restructuring activities. Refer to “NOTE 21 — Business Restructuring Charges” for more information.
Recent Accounting Pronouncements
On May 28, 2014, the FASB issued Accounting Standards Update (“ASU”) No. 2014-09, Revenue from Contracts with Customers (Topic 606), with an effective date for annual reporting periods beginning after December 15, 2016, including interim periods within that reporting period. The effective date for ASU 2014-09 was deferred by one year through the issuance of ASU 2015-14, to annual reporting periods beginning after December 15, 2017, including interim reporting periods within that reporting period. Subsequent to the issuance of ASU 2014-09, the FASB issued multiple updates which are intended to improve the operability and understandability of the implementation guidance, and to provide clarifying guidance in certain narrow areas and add some practical expedients, which include guidance on principal versus agent considerations; identifying performance obligations; licensing implementation guidance; assessing the specific collectability criterion and accounting for certain contracts; presentation of sales taxes and other similar taxes collected from customers; noncash consideration; contract modifications at transition and completed contracts at transition. The guidance provides clarification that an entity that retrospectively applies the guidance in Topic 606 to each prior reporting period is not required to disclose the effect of the accounting change for the period of adoption, however, an entity is still required to disclose the effect of the changes on any prior periods retrospectively adjusted. The Company is continuing to evaluate the impact of the new revenue guidance. The majority of the Company’s revenue relates to the sale of finished product to various customers and we do not believe that the adoption of the new standard will have a material impact on these transactions. The Company is continuing to evaluate the impact of certain less significant transactions involving collaboration arrangements, warranties, as well as certain rebates and discounts offered. The Company expects to adopt the standard in 2018 using the modified retrospective approach.
In January 2016, the FASB issued ASU 2016-01, which changes the requirement to require equity securities (including other ownership interests, such as partnerships, unincorporated joint ventures, and limited liability companies) to be measured at fair value with changes in the fair value recognized through net income. This update is effective for fiscal years beginning after December 15, 2017, including interim periods within those fiscal years. The adoption of this guidance is not anticipated to have a material impact on the Company’s financial position or results of operations.
In February 2016, the FASB issued ASU 2016-02, which states that a lessee should recognize the assets and liabilities that arise from leases. This update is effective for fiscal years beginning after December 15, 2018, including interim periods within those fiscal years. The Company is evaluating the impact, if any, the pronouncement will have on our financial positions and results of operations.
In March 2016, the FASB issued ASU No. 2016-07: Simplifying the Transition to the Equity Method of Accounting. This guidance eliminates the requirement to retroactively adopt the equity method of accounting when there is an increase in the level of ownership interest or degree of influence. This guidance is effective for fiscal years, and interim periods within those years, beginning after December 15, 2016. Management believes that the adoption of this guidance will not have a material impact on our financial statements.
In March 2016, the FASB issued ASU No. 2016-09, Compensation - Stock Compensation (Topic 718): Improvements to Employee Share-Based Payment Accounting. The amendments are intended to improve the accounting for employee share-based payments and affect all organizations that issue share-based payment awards to their employees. Several aspects of the accounting for share-based payment award transactions are simplified, including: (a) income tax consequences; (b) classification of awards as either equity or liabilities; and (c) classification on the statement of cash flows. The amendments are effective for annual periods beginning after December 15, 2016, and interim periods within those annual periods. Early adoption is permitted for any organization in any interim or annual period. The Company has assessed the implementation impact on Retained Earnings noting a reduction in retained earnings of $62.4 million on January 1, 2017.
In June 2016, the FASB issued ASU No. 2016-13, Financial Instruments – Credit Losses (Topic 326): Measurement of Credit Losses on Financial Instruments. The ASU is intended to improve financial reporting by requiring timelier recording of credit losses on loans and other financial instruments held by financial institutions and other organizations. The ASU requires the measurement of all expected credit losses for financial assets including trade receivables held at the reporting date based on historical experience, current conditions, and reasonable and supportable forecasts. Financial institutions and other organizations will now use forward-
F-26
looking information to better inform their credit loss estimates. The ASU is effective for fiscal years, and interim periods within those fiscal years, beginning after December 15, 2019. Early application will be permitted for all organizations for fiscal years, and interim periods within those fiscal years, beginning after December 15, 2018. The Company is evaluating the impact, if any, the pronouncement will have on our financial positions and results of operations.
In October 2016, the FASB issued ASU No. 2016-16, Income Taxes (Topic 740): Intra-Entity Transfers of Assets Other Than Inventory. Current GAAP prohibits the recognition of current and deferred income taxes for an intra-entity asset transfer until the asset has been sold to an outside party. This prohibition on recognition is an exception to the principle of comprehensive recognition of current and deferred income taxes in GAAP. The amendments require an entity to recognize the income tax consequences of an intra-entity transfer of an asset other than inventory when the transfer occurs. The amendments eliminate the exception for an intra-entity transfer of an asset other than inventory. Two common examples of assets included in the scope of the amendments are intellectual property and property, plant, and equipment. The amendments are effective for public business entities for annual reporting periods beginning after December 15, 2017, including interim reporting periods within those annual reporting periods. Early adoption is permitted for all entities in the first interim period if an entity issues interim financial statements. The amendments should be applied on a modified retrospective basis through a cumulative-effect adjustment directly to retained earnings as of the beginning of the period of adoption. The Company is evaluating the impact the pronouncement will have on our financial positions and results of operations.
In January 2017, the FASB issued ASU No. 2017-01, Business Combinations (Topic 805): Clarifying the Definition of a Business, clarifying the definition of a business. The amendments are intended to help companies evaluate whether transactions should be accounted for as acquisitions (or disposals) of assets or businesses. When substantially all of the fair value of gross assets acquired is concentrated in a single asset (or a group of similar assets), the assets acquired would not represent a business. This introduces an initial required screening that, if met, eliminates the need for further assessment. To be considered a business, an acquisition would have to include an input and a substantive process that together significantly contribute to the ability to create outputs. To be a business without outputs, there will need to be an organized workforce. The ASU also narrows the definition of the term “outputs” to be consistent with how it is described in Topic 606, Revenue from Contracts with Customers. The amendments are effective for annual periods beginning after December 15, 2017, including interim periods within those periods. Early adoption is permitted. The changes to the definition of a business may result in more acquisitions being accounted for as asset acquisitions.
In January 2017, the FASB issued ASU No. 2017-04, Intangibles - Goodwill and Other (Topic 350): Simplifying the Test for Goodwill Impairment. The amendments eliminate Step 2 from the goodwill impairment test. The goodwill impairment test is performed by comparing the fair value of a reporting unit with its carrying amount. An impairment charge should be recognized for the amount by which the carrying amount exceeds the reporting unit’s fair value; however, the loss recognized should not exceed the total amount of goodwill allocated to that reporting unit. In addition, income tax effects from any tax deductible goodwill on the carrying amount of the reporting unit should be considered when measuring the goodwill impairment loss, if applicable. The amendments also eliminate the requirements for any reporting unit with a zero or negative carrying amount to perform a qualitative assessment. The amendments should be applied on a prospective basis. The nature of and reason for the change in accounting principle should be disclosed upon transition. The amendments are effective for annual or any interim goodwill impairment tests in fiscal years beginning after December 15, 2019. Early adoption is permitted for interim or annual goodwill impairment tests performed on testing dates after January 1, 2017. The Company is evaluating the impact, if any, the amendments will have on our financial positions and results of operations.
NOTE 5 — Business Development
During the years ended December 31, 2015 and 2014, the Company acquired material assets and businesses. The unaudited pro forma results of the businesses acquired that materially impacted the reported results of the Company are as follows ($ in millions except per share information):
|
|
|
Year Ended December 31, 2015 (unaudited) |
|
|||||||||
|
|
|
As reported |
|
|
Allergan Acquisition |
|
|
Pro Forma |
|
|||
|
Net Revenue |
|
$ |
12,688.1 |
|
|
$ |
1,523.0 |
|
|
$ |
14,211.1 |
|
|
Net income attributable to ordinary shareholders |
|
$ |
3,683.2 |
|
|
$ |
377.7 |
|
|
$ |
4,060.9 |
|
|
Net income per share |
|
|
|
|
|
|
|
|
|
|
|
|
|
Basic |
|
$ |
10.01 |
|
|
|
|
|
|
$ |
10.32 |
|
|
Diluted |
|
$ |
10.01 |
|
|
|
|
|
|
$ |
10.32 |
|
F-27
|
|
|
Year Ended December 31, 2014 (unaudited) |
|
|||||||||||||
|
|
|
As reported |
|
|
Allergan Acquisition |
|
|
Forest Acquisition |
|
|
Pro Forma |
|
||||
|
Net Revenue |
|
$ |
4,676.5 |
|
|
$ |
7,225.4 |
|
|
$ |
2,239.8 |
|
|
$ |
14,141.7 |
|
|
Net (loss) / income attributable to ordinary shareholders |
|
$ |
(1,630.5 |
) |
|
$ |
(3,067.8 |
) |
|
$ |
146.1 |
|
|
$ |
(4,552.2 |
) |
|
Net (loss) per share |
|
|
|
|
|
|
|
|
|
|
|
|
|
|
|
|
|
Basic |
|
$ |
(7.42 |
) |
|
|
|
|
|
|
|
|
|
$ |
(11.66 |
) |
|
Diluted |
|
$ |
(7.42 |
) |
|
|
|
|
|
|
|
|
|
$ |
(11.66 |
) |
2016 Significant Business Developments
The following are the material transactions that were completed in the year ended December 31, 2016. Refer to “NOTE 7 – Discontinued Operations” for material divestitures that were completed / entered into during the year ended December 31, 2016.
Acquisitions
Tobira Therapeutics, Inc.
On November 1, 2016, the Company acquired Tobira Therapeutics, Inc. (“Tobira”), a clinical-stage biopharmaceutical company focused on developing and commercializing therapies for non-alcoholic steatohepatitis (“NASH”) and other liver diseases for an acquisition accounting purchase price of $570.1 million, plus contingent consideration of up to $49.84 per share in contingent value rights (“CVR”), or up to $1,101.3 million, that may be payable based on the successful completion of certain development, regulatory and commercial milestones (the “Tobira Acquisition”). The CVR had an acquisition date fair value of $479.0 million. The acquisition adds Cenicriviroc and Evogliptin, two differentiated, complementary development programs for the treatment of the multi-factorial elements of NASH, including inflammation, metabolic syndromes and fibrosis, to Allergan's global Gastroenterology R&D pipeline.
Assets Acquired and Liabilities Assumed at Fair Value
The transaction has been accounted for using the acquisition method of accounting. This method requires that assets acquired and liabilities assumed in a business combination be recognized at their fair values as of the acquisition date. As of December 31, 2016, certain amounts relating to the valuation of tax related matters and intangible assets have not been finalized. The finalization of these matters may result in changes to goodwill.
The following table summarizes the preliminary fair values of the assets acquired and liabilities assumed at the acquisition date ($ in millions):
|
|
|
Amount |
|
|
|
Cash and cash equivalents |
|
$ |
21.3 |
|
|
IPR&D intangible asset |
|
|
1,357.0 |
|
|
Goodwill |
|
|
112.7 |
|
|
Indebtedness |
|
|
(15.9 |
) |
|
Contingent consideration |
|
|
(479.0 |
) |
|
Deferred tax liabilities, net |
|
|
(395.9 |
) |
|
Other assets and liabilities |
|
|
(30.1 |
) |
|
Net assets acquired |
|
$ |
570.1 |
|
IPR&D and Intangible Assets
IPR&D intangible assets represent the value assigned to acquired R&D projects that, as of the acquisition date, had not established technological feasibility and had no alternative future use. The IPR&D intangible assets are capitalized and accounted for as indefinite-lived intangible assets and will be subject to impairment testing until completion or abandonment of the projects. Upon successful completion of each project and launch of the product, the Company will make a separate determination of the estimated useful life of the IPR&D intangible asset and the related amortization will be recorded as an expense over the estimated useful life (“IPR&D Acquisition Accounting”).
The estimated fair value of the IPR&D intangible assets was determined using the “income approach,” which is a valuation technique that provides an estimate of the fair value of an asset based on market participant expectations of the cash flows an asset
F-28
would generate over its remaining useful life. Some of the more significant assumptions inherent in the development of those asset valuations include the estimated net cash flows for each year for each asset or product (including net revenues, cost of sales, R&D costs, selling and marketing costs, other allocated costs, and working capital/asset contributory asset charges), the appropriate discount rate to select in order to measure the risk inherent in each future cash flow stream, the assessment of each asset’s life cycle, the potential regulatory and commercial success risks, competitive trends impacting the asset and each cash flow stream as well as other factors (the “IPR&D and Intangible Asset Valuation Technique”).
The fair value of the IPR&D intangible assets was determined using the IPR&D and Intangible Asset Valuation Technique. The discount rate used to arrive at the present value for IPR&D intangible assets was 11.5% to reflect the internal rate of return and incremental commercial uncertainty in the cash flow projections. The discount rate of the acquisition was driven by the stage of the product and the therapeutic indication. No assurances can be given that the underlying assumptions used to prepare the discounted cash flow analysis will not change. For these and other reasons, actual results may vary significantly from estimated results.
Goodwill
Among the reasons the Company acquired Tobira and the factors that contributed to the preliminary recognition of goodwill was the expansion of the Company’s pipeline of NASH products. Goodwill from the Tobira Acquisition of $112.7 million was assigned to the US General Medicine segment and is non-deductible for tax purposes.
Contingent Consideration
As part of the acquisition, the Company is required to pay the former shareholders of Tobira up to $1,101.3 million based on the timing of the certain development, regulatory and commercial milestones, if any. The Company estimated the fair value of the contingent consideration to be $479.0 million using a probability weighted average approach that considered the possible outcomes of scenarios related to the specified product.
Long-Term Deferred Tax Liabilities and Other Tax Liabilities
Long-term deferred tax liabilities and other tax liabilities result from identifiable intangible assets’ fair value adjustments. These adjustments create excess book basis over the tax basis which is multiplied by the statutory tax rate for the jurisdiction in which the deferred taxes exist.
Vitae Pharmaceuticals, Inc.
On October 25, 2016, the Company acquired Vitae Pharmaceuticals, Inc. (“Vitae”), a clinical-stage biotechnology company for an acquisition accounting purchase price of $621.4 million (the “Vitae Acquisition”). The acquisition strengthens Allergan’s dermatology product pipeline, with the addition of a Phase II, orally active RORyt (retinoic acid receptor-related orphan receptor gamma) inhibitor for the potential treatment of psoriasis and other autoimmune disorders. In addition, the Company expanded its pipeline with the acquisition of a Phase II atopic dermatitis drug candidate.
Assets Acquired and Liabilities Assumed at Fair Value
The transaction has been accounted for using the acquisition method of accounting. This method requires that assets acquired and liabilities assumed in a business combination be recognized at their fair values as of the acquisition date. As of December 31, 2016, certain amounts relating to the valuation of tax related matters and intangible assets have not been finalized. The finalization of these matters may result in changes to goodwill.
F-29
The following table summarizes the preliminary fair values of the assets acquired and liabilities assumed at the acquisition date ($ in millions):
|
|
|
Amount |
|
|
|
Cash and cash equivalents |
|
$ |
44.7 |
|
|
Marketable securities |
|
|
20.2 |
|
|
Property, plant and equipment, net |
|
|
5.0 |
|
|
IPR&D assets |
|
|
686.0 |
|
|
Assets held for sale |
|
|
22.5 |
|
|
Goodwill |
|
|
34.4 |
|
|
Other liabilities |
|
|
(20.7 |
) |
|
Deferred tax liabilities, net |
|
|
(170.7 |
) |
|
Net assets acquired |
|
$ |
621.4 |
|
IPR&D and Intangible Assets
The fair value of the IPR&D intangible assets was determined using the IPR&D and Intangible Asset Valuation Technique. The discount rate used to arrive at the present value for IPR&D intangible assets was 9.5% to reflect the internal rate of return and incremental commercial uncertainty in the cash flow projections. The discount rate of the acquisition was driven by the stage of the product and the therapeutic indication. No assurances can be given that the underlying assumptions used to prepare the discounted cash flow analysis will not change. For these and other reasons, actual results may vary significantly from estimated results.
Goodwill
Among the reasons the Company acquired Vitae and the factors that contributed to the preliminary recognition of goodwill was the expansion of the Company’s pipeline of dermatology products. Goodwill from the Vitae Acquisition of $34.4 million was assigned to the US Specialized Therapeutic segment and is non-deductible for tax purposes.
Long-Term Deferred Tax Liabilities and Other Tax Liabilities
Long-term deferred tax liabilities and other tax liabilities result from identifiable intangible assets’ fair value adjustments. These adjustments create excess book basis over the tax basis which is multiplied by the statutory tax rate for the jurisdiction in which the deferred taxes exist.
Assets held for sale
The Company held for sale certain intangible assets acquired as part of the Vitae Acquisition. These assets had an acquisition accounting value of $22.5 million. Actual amounts to be received, if any, may change.
ForSight VISION5, Inc.
On September 23, 2016, the Company acquired ForSight VISION5, Inc. (“ForSight’), a privately held, clinical-stage biotechnology company focused on eye care, in an all cash transaction of approximately $95.0 million. Under the terms of the agreement, the Company acquired ForSight for an acquisition accounting purchase price of $74.5 million plus the payment of outstanding indebtedness of $14.8 million and other miscellaneous charges. ForSight shareholders are eligible to receive contingent consideration of up to $125.0 million, which has an initial estimated fair value of $79.8 million, relating to commercialization milestones (the “ForSight Acquisition”). The Company acquired ForSight for its lead development program, a peri-ocular ring designed for extended drug delivery and reducing elevated intraocular pressure (“IOP”) in glaucoma patients.
Assets Acquired and Liabilities Assumed at Fair Value
The transaction has been accounted for using the acquisition method of accounting. This method requires that assets acquired and liabilities assumed in a business combination be recognized at their fair values as of the acquisition date.
F-30
The following table summarizes the fair values of the assets acquired and liabilities assumed at the acquisition date ($ in millions):
|
|
|
Amount |
|
|
|
Cash and cash equivalents |
|
$ |
1.0 |
|
|
IPR&D intangible asset |
|
|
158.0 |
|
|
Goodwill |
|
51.6 |
|
|
|
Current liabilities |
|
|
(14.8 |
) |
|
Contingent consideration |
|
|
(79.8 |
) |
|
Deferred tax liabilities, net |
|
|
(38.3 |
) |
|
Other |
|
|
(3.2 |
) |
|
Net assets acquired |
|
$ |
74.5 |
|
IPR&D and Intangible Assets
The fair value of the IPR&D intangible assets was determined using the IPR&D and Intangible Asset Valuation Technique. The discount rate used to arrive at the present value for IPR&D intangible assets was 13.0% to reflect the internal rate of return and incremental commercial uncertainty in the cash flow projections. The discount rate of the acquisition was driven by the early stage of the product and the therapeutic indication. No assurances can be given that the underlying assumptions used to prepare the discounted cash flow analysis will not change. For these and other reasons, actual results may vary significantly from estimated results.
Goodwill
Among the reasons the Company acquired ForSight and the factors that contributed to the preliminary recognition of goodwill was the expansion of the Company’s pipeline of eye care products. Goodwill from the ForSight Acquisition of $51.6 million was assigned to the US Specialized Therapeutics segment and is non-deductible for tax purposes.
Contingent Consideration
As part of the acquisition, the Company is required to pay the former shareholders of ForSight up to $125.0 million based on the timing of the first commercial sale, if any. The Company estimated the fair value of the contingent consideration to be $79.8 million using a probability weighted average approach that considered the possible outcomes of scenarios related to the specified product. The Company recognized approximately $33.0 million in impairments of the acquired ForSight IPR&D asset as the Company anticipates a delay in potential launch timing, if any. Offsetting this impairment was a corresponding reduction of acquired contingent consideration of $15.0 million, which reduced overall R&D expenses.
Long-Term Deferred Tax Liabilities and Other Tax Liabilities
Long-term deferred tax liabilities and other tax liabilities result from identifiable intangible assets’ fair value adjustments. These adjustments create excess book basis over the tax basis which is multiplied by the statutory tax rate for the jurisdiction in which the deferred taxes exist.
Licenses and Asset Acquisitions
Motus Therapeutics, Inc.
On December 15, 2016, the Company acquired Motus Therapeutics, Inc. (“Motus”) for an upfront payment of approximately $200.0 million. Motus has the worldwide rights to RM-131 (relamorelin), a peptide ghrelin agonist being developed by Motus for the treatment of diabetic gastroparesis. Under the terms of the agreement, Motus is eligible to receive contingent consideration in connection with the commercial launch of the product (the “Motus Transaction”). The Company concluded based on the stage of development of the assets, the lack of acquired employees as well as certain other inputs and processes that the transaction did not qualify as a business. The total upfront net payment of $199.5 million was expensed as a component of R&D expense and the future milestone will be recorded if the corresponding event becomes probable.
Chase Pharmaceuticals Corporation
On November 22, 2016, the Company acquired Chase Pharmaceuticals Corporation, (“Chase”) a clinical-stage biopharmaceutical company focused on the development of improved treatments for neurodegenerative disorders including
F-31
Alzheimer's disease, for an upfront payment of approximately $125.0 million plus potential regulatory and commercial milestones of up to $875.0 million related to Chase's lead compound, CPC-201, and certain backup compounds (the “Chase Transaction”). The Company concluded based on the stage of development of the assets, the lack of acquired employees as well as certain other inputs and processes that the transaction did not qualify as a business. The total upfront net payment of $122.9 million was expensed as a component of R&D expense and the future milestones will be recorded if the corresponding events become probable.
AstraZeneca License
On October 2, 2016, the Company entered into a licensing agreement with MedImmune, AstraZeneca's global biologics research and development arm, for the global rights to Brazikumab (“AstraZeneca License”). Brazikumab is an anti-IL-23 monoclonal antibody for the treatment of patients with moderate-to-severe Crohn's disease and is Phase II ready for ulcerative colitis and other conditions treated with anti-IL23 monoclonal antibodies. Under the terms of the agreement, AstraZeneca received $250.0 million for the exclusive, worldwide license to develop and commercialize Brazikumab and is eligible to receive contingent consideration of up to $1.27 billion, payable over a period of up to 15 years, including development and launch milestone payments of up to $540.0 million and sales-based milestone payments of $725.0 million, as well as tiered royalties on sales of the product (the “AstraZeneca License Transaction”). The Company concluded based on the stage of development of the assets, the lack of acquired employees and manufacturing as well as certain other inputs and processes that the transaction did not qualify as a business. The total upfront payment of $250.0 million was expensed as a component of R&D expense and the future milestones will be recorded if the corresponding events become probable.
RetroSense Therapeutics, LLC
On September 6, 2016, the Company acquired certain assets of RetroSense Therapeutics LLC (“RetroSense”), a private, clinical-stage biotechnology company focused on novel gene therapy approaches to restore vision in patients suffering from blindness. Under the terms of the transaction, RetroSense received approximately $60.0 million upfront, and is eligible to receive up to $495.0 million in contingent regulatory and commercialization milestone payments related to its lead development program, RST-001, a novel gene therapy for the treatment of Retinitis Pigmentosa (the “RetroSense Transaction”). The Company concluded based on the stage of development of the assets, the lack of acquired employees as well as certain other inputs and processes that the transaction did not qualify as a business. The total upfront net payment of $59.7 million was expensed as a component of R&D expense and the future milestones will be recorded if the corresponding events become probable.
Akarna Therapeutics, Ltd
On August 26, 2016, the Company acquired Akarna Therapeutics, Ltd (“Akarna”), a biopharmaceutical company developing novel small molecule therapeutics that target inflammatory and fibrotic diseases. Under the terms of the transaction, Akarna shareholders received approximately $50.0 million upfront and are eligible to receive contingent development and commercialization milestones of up to $1,015.0 million (the “Akarna Transaction”). The Company concluded based on the stage of development of the assets as well as a lack of certain other inputs and processes that the transaction did not qualify as a business. The total upfront net payment of $48.2 million was expensed as a component of R&D expense and the future milestones will be recorded if the corresponding events become probable.
Topokine Therapeutics, Inc.
On April 21, 2016, the Company acquired Topokine Therapeutics, Inc. (“Topokine”), a privately held, clinical-stage biotechnology company focused on development stage topical medicines for fat reduction. Under the terms of the agreement, Topokine shareholders received an upfront payment of $85.8 million and are eligible to receive contingent development and commercialization milestones of up to $260.0 million for XAF5, a first-in-class topical agent in development for the treatment of steatoblepharon, also known as undereye bags (the “Topokine Transaction”). The Company concluded based on the stage of development of the assets, the lack of acquired employees as well as certain other inputs and processes that the transaction did not qualify as a business. The total upfront net payment of approximately $85.0 million was expensed as a component of R&D expense and the future milestones will be recorded if the corresponding events become probable.
Heptares Therapeutics Ltd
On April 6, 2016, the Company entered into an agreement with Heptares Therapeutics Ltd. (“Heptares”), under which the Company licensed exclusive global rights to a portfolio of novel subtype-selective muscarinic receptor agonists in development for the treatment of major neurological disorders, including Alzheimer's disease. Under the terms of the agreement, Heptares received an upfront payment of $125.0 million and is eligible to receive contingent milestone payments of up to approximately $665.0 million contingent
F-32
upon the successful Phase 1, 2 and 3 clinical development and launch of the first three licensed compounds for multiple indications and up to approximately $2.575 billion associated with achieving certain annual sales thresholds during the several years following launch (the “Heptares Transaction”). In addition, Heptares is eligible to receive contingent tiered royalties on net sales of all products resulting from the partnership. The Company concluded based on the stage of development of the assets, the lack of acquired employees as well as certain other inputs and processes that the transaction did not qualify as a business. The total upfront payment of $125.0 million was expensed as a component of R&D expense and the future milestones will be recorded when the event becomes probable.
Anterios, Inc.
On January 6, 2016, the Company acquired Anterios, Inc. (“Anterios”), a clinical stage biopharmaceutical company developing a next generation delivery system and botulinum toxin-based prescription products. Under the terms of the agreement, Anterios shareholders received an upfront net payment of approximately $90.0 million and are eligible to receive contingent development and commercialization milestone payments up to $387.5 million related to an investigational topical formulation of botulinum toxin type A in development for the potential treatment of hyperhidrosis, acne, and crow’s feet lines and the related NDS™, Anterios' proprietary platform delivery technology that enables local, targeted delivery of neurotoxins through the skin without the need for injections (“the Anterios Transaction”). The Company concluded based on the stage of development of the assets, the lack of acquired employees as well as certain other inputs and processes that the transaction did not qualify as a business. The total upfront net payment of $89.2 million was expensed as a component of R&D expense and the future milestones will be recorded if the corresponding events become probable.
2015 Significant Business Developments
The following are the material transactions that were completed in the year ended December 31, 2015.
Acquisitions
AqueSys, Inc.
On October 16, 2015, the Company acquired AqueSys, Inc. (“AqueSys”), a private, clinical-stage medical device company focused on developing ocular implants that reduce IOP associated with glaucoma, in an all-cash transaction. Under the terms of the agreement, the Company acquired AqueSys for an acquisition accounting purchase price of $298.9 million, including $193.5 million for the estimated fair value of contingent consideration relating to the regulatory approval and commercialization milestone payments. The Company acquired AqueSys for the lead development program, including XEN45, a soft shunt that is implanted in the sub conjunctival space in the eye through a minimally invasive procedure with a single use, pre-loaded proprietary injector (the “AqueSys Acquisition”).
Assets Acquired and Liabilities Assumed at Fair Value
The transaction has been accounted for using the acquisition method of accounting. This method requires that assets acquired and liabilities assumed in a business combination be recognized at their fair values as of the acquisition date.
The following table summarizes the fair values of the assets acquired and liabilities assumed at the acquisition date ($ in millions):
|
|
|
Amount |
|
|
|
Cash and cash equivalents |
|
$ |
6.2 |
|
|
Current assets |
|
|
1.2 |
|
|
IPR&D intangible assets |
|
|
302.0 |
|
|
Intangible assets |
|
|
221.0 |
|
|
Goodwill |
|
|
138.5 |
|
|
Current liabilities |
|
|
(6.9 |
) |
|
Contingent consideration |
|
|
(193.5 |
) |
|
Deferred tax liabilities, net |
|
|
(169.6 |
) |
|
Net assets acquired |
|
$ |
298.9 |
|
F-33
The fair value of the CMP and IPR&D intangible assets was determined using the IPR&D and Intangible Asset Valuation Technique. The discount rate used to arrive at the present value for CMP and IPR&D intangible assets was 21.0% to reflect the internal rate of return and incremental commercial uncertainty in the cash flow projections. The discount rate of the acquisition was driven by the early stage of the product and the therapeutic indication. No assurances can be given that the underlying assumptions used to prepare the discounted cash flow analysis will not change. For these and other reasons, actual results may vary significantly from estimated results. The CMP intangible asset will be amortized over a period of 12.2 years.
Goodwill
Goodwill from the AqueSys Acquisition of $138.5 million, of which $50.5 million was assigned to the US Specialized Therapeutic segment and $88.0 million was assigned to the International segment. The goodwill arose in part, due to anticipated efficiencies in marketing the CMP asset in our International and US General Medicine segments where we have an established infrastructure.
Contingent Consideration
As part of the acquisition, the Company was required to pay the former shareholders of AqueSys amounts based on the launch, labeling, and sales of the product. The Company estimated the acquisition accounting fair value of the contingent consideration to be $193.5 million using a probability weighted approach that considered the possible outcomes of the scenarios relating to the specified product. On November 16, 2016, the Company received approval from the FDA for XEN45, which triggered a CVR payment of $100.0 million in the year ended December 31, 2016.
Long-Term Deferred Tax Liabilities and Other Tax Liabilities
Long-term deferred tax liabilities and other tax liabilities result from identifiable intangible assets fair value adjustments. These adjustments create excess book basis over the tax basis which is multiplied by the statutory tax rate for the jurisdiction in which the deferred taxes exist.
Northwood Medical Innovation
On October 1, 2015, the Company completed the Northwood Acquisition under which we acquired earFold™ which is a medical device for the correction of prominent ears, with or without asymmetry, in patients aged 7 years and older. earFold™ received a Conformité Européene (“CE”) mark in April 2015, and has been made available by Northwood Medical Innovation Ltd to trained and accredited plastic surgeons, otolaryngologists (Ear, Nose and Throat) and maxillo-facial surgeons, primarily in the United Kingdom (“UK”). The Company acquired Northwood Medical Innovation Ltd. for acquisition accounting purchase price consideration of $25.5 million (the “Northwood Acquisition”), including $15.0 million of contingent consideration.
Assets Acquired and Liabilities Assumed at Fair Value
The transaction has been accounted for using the acquisition method of accounting. This method requires that assets acquired and liabilities assumed in a business combination be recognized at their fair values as of the acquisition date.
The following table summarizes the fair values of the assets acquired and liabilities assumed at the acquisition date ($ in millions):
|
|
|
Amount |
|
|
|
Cash and cash equivalents |
|
$ |
0.5 |
|
|
IPR&D intangible assets |
|
|
13.6 |
|
|
Intangible assets |
|
|
19.5 |
|
|
Goodwill |
|
|
13.6 |
|
|
Other assets and liabilities |
|
|
(0.1 |
) |
|
Contingent consideration |
|
|
(15.0 |
) |
|
Deferred tax liabilities, net |
|
|
(6.6 |
) |
|
Net assets acquired |
|
$ |
25.5 |
|
F-34
The fair value of the CMP and IPR&D intangible assets was determined using the IPR&D and Intangible Asset Valuation Technique. The discount rate used to arrive at the present value for CMP and IPR&D intangible assets was 15.0% to reflect the internal rate of return and incremental commercial uncertainty in the cash flow projections. No assurances can be given that the underlying assumptions used to prepare the discounted cash flow analysis will not change. For these and other reasons, actual results may vary significantly from estimated results.
Goodwill
Goodwill from the acquisition of $13.6 million was assigned to the International segment. The goodwill arose in part, due to anticipated efficiencies in marketing the CMP asset in our International segment where we have an established infrastructure.
Contingent Consideration
As part of the acquisition, the Company is required to pay the former shareholders of Northwood Medical Innovation Ltd. amounts based on the sales of the product. The Company estimated the acquisition accounting fair value of the contingent consideration to be $15.0 million using a probability weighted approach that considered the possible outcomes of the scenarios relating to the specified product.
Long-Term Deferred Tax Liabilities and Other Tax Liabilities
Long-term deferred tax liabilities and other tax liabilities result from identifiable intangible assets fair value adjustments. These adjustments create excess book basis over the tax basis which is multiplied by the statutory tax rate for the jurisdiction in which the deferred taxes exist.
Kythera Biopharmaceuticals, Inc.
On October 1, 2015, the Company acquired Kythera Biopharmaceuticals, Inc. (“Kythera”), for $75 per share, or an acquisition accounting purchase price of $2,089.5 million (the “Kythera Acquisition”), which is being accounted for as a business acquisition. Kythera was focused on the discovery, development and commercialization of novel prescription aesthetic products. Kythera’s lead product, Kybella® injection, is the first and only FDA approved, non-surgical treatment for moderate to severe submental fullness, commonly referred to as double chin.
Assets Acquired and Liabilities Assumed at Fair Value
The transaction has been accounted for using the acquisition method of accounting. This method requires that assets acquired and liabilities assumed in a business combination be recognized at their fair values as of the acquisition date.
The following table summarizes the fair values of the assets acquired and liabilities assumed at the acquisition date ($ in millions):
|
|
|
Amount |
|
|
|
Cash and cash equivalents |
|
$ |
78.1 |
|
|
Marketable securities |
|
|
79.9 |
|
|
Inventories |
|
|
18.2 |
|
|
Other current assets |
|
|
14.5 |
|
|
IPR&D intangible assets |
|
|
320.0 |
|
|
Intangible assets |
|
|
2,120.0 |
|
|
Goodwill |
|
|
328.7 |
|
|
Other current liabilities |
|
|
(48.6 |
) |
|
Deferred tax, net |
|
|
(766.7 |
) |
|
Outstanding indebtedness |
|
|
(54.6 |
) |
|
Net assets acquired |
|
$ |
2,089.5 |
|
F-35
The fair value of the IPR&D intangible assets was determined using the IPR&D and Intangible Asset Valuation Technique. The discount rate used to arrive at the present value for CMP was 8.5% and for IPR&D intangible assets was 9.5% to reflect the internal rate of return and incremental commercial uncertainty in the cash flow projections. No assurances can be given that the underlying assumptions used to prepare the discounted cash flow analysis will not change. For these and other reasons, actual results may vary significantly from estimated results. The CMP intangible asset will be amortized over a period of 17.3 years.
Goodwill
Goodwill from the Kythera Acquisition of $208.7 million was assigned to the US Specialized Therapeutics segment and $120.0 million assigned to International segment. The goodwill arose in part, due to anticipated efficiencies in marketing the CMP asset where we have an established infrastructure and is not deductible for tax purposes.
Long-Term Deferred Tax Liabilities and Other Tax Liabilities
Long-term deferred tax liabilities and other tax liabilities result from identifiable intangible assets fair value adjustments. These adjustments create excess book basis over the tax basis which is multiplied by the statutory tax rate for the jurisdiction in which the deferred taxes exist.
Oculeve, Inc.
On August 10, 2015, the Company acquired Oculeve, Inc. (“Oculeve”), a development-stage medical device company focused on developing novel treatments for dry eye disease. Under the terms of the agreement, Allergan acquired Oculeve for an acquisition accounting purchase price of $134.5 million (the “Oculeve Acquisition”), including $90.0 million for the estimated fair value of contingent consideration of which the Company may owe up to $300.0 million in future payments. The Company acquired Oculeve and its lead product candidate OD-01, an intranasal neurostimulation device, as well as other dry eye products in development.
Assets Acquired and Liabilities Assumed at Fair Value
The transaction has been accounted for using the acquisition method of accounting. This method requires that assets acquired and liabilities assumed in a business combination be recognized at their fair values as of the acquisition date.
The following table summarizes the fair values of the assets acquired and liabilities assumed at the acquisition date ($ in millions):
|
|
|
Amount |
|
|
|
Cash and cash equivalents |
|
$ |
1.6 |
|
|
IPR&D intangible assets |
|
|
286.0 |
|
|
Goodwill |
|
|
33.3 |
|
|
Other assets and liabilities |
|
|
(1.9 |
) |
|
Contingent consideration |
|
|
(90.0 |
) |
|
Deferred tax liabilities, net |
|
|
(94.5 |
) |
|
Net assets acquired |
|
$ |
134.5 |
|
IPR&D and Intangible Assets
The fair value of the IPR&D intangible assets was determined using the IPR&D and Intangible Asset Valuation Technique. The discount rate used to arrive at the present value for IPR&D intangible assets was 11.0% to reflect the internal rate of return and incremental commercial uncertainty in the cash flow projections. No assurances can be given that the underlying assumptions used to prepare the discounted cash flow analysis will not change. For these and other reasons, actual results may vary significantly from estimated results.
Goodwill
Among the primary reasons the Company acquired Oculeve and factors that contributed to the preliminary recognition of goodwill were to expand the Company’s pipeline of eye care products. Goodwill from the Oculeve Acquisition of $33.3 million was assigned to the US Specialized Therapeutic segment and is not deductible for tax purposes.
F-36
As part of the acquisition, the Company is required to pay the former shareholders of Oculeve amounts based on the launch, labeling, and sales of the product. The Company estimated the acquisition accounting fair value of the contingent consideration to be $90.0 million using a probability weighted approach that considered the possible outcomes of the scenarios relating to the specified product.
Long-Term Deferred Tax Liabilities and Other Tax Liabilities
Long-term deferred tax liabilities and other tax liabilities result from identifiable intangible assets fair value adjustments. These adjustments create excess book basis over the tax basis which is multiplied by the statutory tax rate for the jurisdiction in which the deferred taxes exist.
Auden Mckenzie Holdings Limited
On May 29, 2015, the Company acquired Auden Mckenzie Holdings Limited (“Auden”), a company specializing in the development, licensing and marketing of niche generic medicines and proprietary brands in the UK and across Europe for approximately 323.7 million British Pounds, or $495.9 million (the “Auden Acquisition”). The assets and liabilities acquired, as well as the results of operations for the acquired Auden business are part of the assets divested in the Teva Transaction and are included as a component of income from discontinued operations. In addition, the acquired financial position was included in assets and liabilities held for sale as of December 31, 2015.
Recognition and Measurement of Assets Acquired and Liabilities Assumed at Fair Value
The Auden Acquisition has been accounted for using the acquisition method of accounting. This method requires that assets acquired and liabilities assumed in a business combination be recognized at their fair values as of the acquisition date. The following table summarizes the fair values of the tangible and identifiable intangible assets acquired and liabilities assumed at the acquisition date ($ in millions):
|
|
|
Amount |
|
|
|
Cash and cash equivalents |
|
$ |
32.2 |
|
|
Inventory |
|
|
49.1 |
|
|
IPR&D intangible assets |
|
|
38.6 |
|
|
Intangible assets |
|
|
342.4 |
|
|
Goodwill |
|
|
123.3 |
|
|
Other assets and liabilities |
|
|
7.2 |
|
|
Contingent consideration |
|
|
(17.3 |
) |
|
Deferred tax liabilities, net |
|
|
(79.6 |
) |
|
Net assets acquired |
|
$ |
495.9 |
|
IPR&D and Intangible Assets
The fair value of the IPR&D and CMP intangible assets was determined using the IPR&D and Intangible Asset Valuation Technique. The discount rate used to arrive at the present value of CMPs was 15.0% and for IPR&D intangible assets was 16.0% to reflect the internal rate of return and incremental commercial uncertainty in the cash flow projections. No assurances can be given that the underlying assumptions used to prepare the discounted cash flow analysis will not change. For these and other reasons, actual results may vary significantly from estimated results.
The acquired intangible assets represent generic products with multiple useful lives across multiple therapeutic areas.
Goodwill
Among the primary reasons the Company acquired Auden and factors that contributed to the preliminary recognition of goodwill were to expand the Company’s pipeline of generics products. Goodwill from the Auden Acquisition of $123.3 million was included as a component of assets held for sale as of December 31, 2015.
F-37
As part of the acquisition, the Company was required to pay royalties based on the sales of hydrocortisone. The Company estimated the acquisition accounting fair value of the contingent consideration to be $17.3 million using a probability weighted approach that considered the possible outcomes of the scenarios relating to the specified product.
Allergan, Inc.
On March 17, 2015, the Company completed the Allergan Acquisition. The addition of Legacy Allergan’s therapeutic franchises in ophthalmology, neurosciences and medical aesthetics/dermatology/plastic surgery complements the Company’s existing central nervous system, gastroenterology, women’s health and urology franchises. The combined company benefited from Legacy Allergan’s global brand equity and consumer awareness of key products, including Botox® and Restasis®. The transaction also expanded our presence and market and product reach across many international markets, with strengthened commercial positions across Canada, Europe, Southeast Asia and other high-value growth markets, including China, India, the Middle East and Latin America.
Assets Acquired and Liabilities Assumed at Fair Value
The transaction has been accounted for using the acquisition method of accounting. This method requires that assets acquired and liabilities assumed in a business combination be recognized at their fair values as of the acquisition date.
The following table summarizes the final fair values of the assets acquired and liabilities assumed at the acquisition date and reflects purchase accounting adjustments subsequent to the acquisition date ($ in millions):
|
|
|
Amount |
|
|
|
Cash and cash equivalents |
|
$ |
5,424.5 |
|
|
Accounts receivable |
|
|
948.7 |
|
|
Inventories |
|
|
1,218.6 |
|
|
Other current assets |
|
|
318.8 |
|
|
Property, plant and equipment, net |
|
|
1,214.5 |
|
|
Other long-term assets |
|
|
196.1 |
|
|
IPR&D intangible assets |
|
|
9,700.0 |
|
|
Intangible assets |
|
|
45,050.5 |
|
|
Goodwill |
|
|
27,088.9 |
|
|
Current liabilities |
|
|
(1,222.1 |
) |
|
Contingent consideration |
|
|
(383.7 |
) |
|
Deferred tax liabilities, net |
|
|
(11,880.1 |
) |
|
Other taxes payable |
|
|
(111.3 |
) |
|
Other long-term liabilities |
|
|
(622.0 |
) |
|
Outstanding indebtedness |
|
|
(2,183.5 |
) |
|
Net assets acquired |
|
$ |
74,757.9 |
|
Consideration
The total consideration for the Allergan Acquisition of $74.8 billion is comprised of the equity value of shares that were outstanding and vested prior to March 17, 2015 of $33.9 billion, the portion of outstanding equity awards deemed to have been earned as of March 17, 2015 of $0.8 billion and cash of $40.1 billion. The portion of outstanding equity awards deemed not to have been earned of $843.1 million as of March 17, 2015 will be expensed over the remaining future vesting period, including $151.5 million and $516.2 million in the years ended December 31, 2016 and 2015, respectively.
Inventories
The fair value of inventories acquired included an acquisition accounting fair market value step-up of $923.9 million. In the year ended December 31, 2015, the Company recognized $902.3 million as a component of cost of sales as the inventory acquired was sold to the Company’s customers. Included in finished goods inventory as of December 31, 2016 and 2015, was zero million and $21.6 million, respectively, relating to the remaining fair value step-up associated with the Allergan Acquisition.
F-38
The fair value of the intangible assets was determined using the IPR&D and Intangible Asset Valuation Technique. The discount rate used to arrive at the present value at the acquisition date of CMPs was 10.0% and for IPR&D intangibles ranged from 10.0% to 11.0% to reflect the internal rate of return and incremental commercial uncertainty in the cash flow projections. No assurances can be given that the underlying assumptions used to prepare the discounted cash flow analysis will not change. For these and other reasons, actual results may vary significantly from estimated results.
The following table identifies the summarized amounts recognized and the weighted average useful lives using the economic benefit of intangible assets ($ in millions):
|
|
|
Amount recognized as of the acquisition date |
|
|
Weighted average useful lives (years) |
|
||
|
Definite-lived assets |
|
|
|
|
|
|
|
|
|
Restasis® |
|
$ |
3,970.0 |
|
|
|
4.0 |
|
|
Refresh® / Optive® |
|
|
2,720.0 |
|
|
|
7.6 |
|
|
Other Eye Care Products |
|
|
6,690.0 |
|
|
|
4.2 |
|
|
Botox® |
|
|
22,600.0 |
|
|
|
8.0 |
|
|
Aczone® |
|
|
160.0 |
|
|
|
1.3 |
|
|
Other Skin Products |
|
|
820.0 |
|
|
|
5.0 |
|
|
Other Aesthetics |
|
|
6,350.0 |
|
|
|
6.0 |
|
|
Total CMP |
|
|
43,310.0 |
|
|
|
6.7 |
|
|
Trade name |
|
|
690.0 |
|
|
|
4.5 |
|
|
Customer relationships |
|
|
1,050.5 |
|
|
|
3.4 |
|
|
Total definite-lived assets |
|
|
45,050.5 |
|
|
|
6.6 |
|
|
In-process research and development |
|
|
|
|
|
|
|
|
|
Eye Care |
|
|
5,500.0 |
|
|
|
|
|
|
Botox® |
|
|
810.0 |
|
|
|
|
|
|
Aesthetics |
|
|
2,270.0 |
|
|
|
|
|
|
Other |
|
|
1,120.0 |
|
|
|
|
|
|
Total IPR&D |
|
|
9,700.0 |
|
|
|
|
|
|
Total intangible assets |
|
$ |
54,750.5 |
|
|
|
|
|
Goodwill
Among the primary reasons the Company acquired Allergan and factors that contributed to the preliminary recognition of goodwill were to expand the Company’s product portfolio, and to acquire certain benefits from the Legacy Allergan pipeline and the expectation of certain synergies. The goodwill recognized from the Allergan Acquisition, which includes the increase in the purchase price resulting from the movement in Allergan plc’s share price from the date of announcing the deal, until the date of acquisition, is not deductible for tax purposes.
Contingent Consideration
The Company acquired certain contingent obligations classified as contingent consideration related to historical business combinations. Additional consideration is conditionally due upon the achievement of certain milestones in respect to the development and commercialization of the products as well as reaching certain sales targets. The Company estimated the fair value of the contingent consideration acquired to be $383.7 million using a probability weighting approach that considered the possible outcomes based on assumptions related to the timing and probability of the product launch date, discount rates matched to the timing of first payment, and probability of success rates and discount adjustments on the related cash flows.
F-39
The Company acquired post-retirement plans as part of the Allergan Acquisition including defined benefit pension plans in the United States and Europe which had a net liability balance of $302.6 million. As of March 17, 2015, the Allergan Inc. defined benefit pension plans had assets with a fair value of $1,042.0 million, which included cash and cash equivalents of $13.6 million, equity securities of $480.1 million, and fixed income securities of $548.3 million. The Company assumed other post-retirement benefit obligations with defined benefits of $60.2 million. In addition, the Company acquired other benefit obligations which had an acquisition date fair value of assets of $117.1 million and an acquisition date fair value of liabilities of $120.0 million. Prior to the Allergan Acquisition, Legacy Allergan froze most of their defined benefit plans. As a result, the company anticipates deminimis service costs in its statement of operations.
Deferred Tax Liabilities, Net
Deferred tax liabilities, net, include the impact resulting from identifiable intangible assets and inventory fair value adjustments. These adjustments create excess book basis over the tax basis which is multiplied by the statutory tax rate for the jurisdiction in which the deferred taxes exist.
Acquisition-Related Expenses
As a result of the acquisition, the Company incurred the following transaction and integration costs in the years ended December 31, 2016 and 2015 ($ in millions):
|
|
|
Years Ended December 31, |
|
|||||
|
|
|
2016 |
|
|
2015 |
|
||
|
Cost of sales |
|
|
|
|
|
|
|
|
|
Stock-based compensation acquired for Legacy Allergan employees |
|
$ |
9.6 |
|
|
$ |
22.5 |
|
|
Acquisition, integration and restructuring related charges |
|
|
18.1 |
|
|
|
14.9 |
|
|
Research and development |
|
|
|
|
|
|
|
|
|
Stock-based compensation acquired for Legacy Allergan employees |
|
|
43.0 |
|
|
|
124.8 |
|
|
Acquisition, integration and restructuring related charges |
|
|
11.8 |
|
|
|
83.5 |
|
|
Selling and marketing |
|
|
|
|
|
|
|
|
|
Stock-based compensation acquired for Legacy Allergan employees |
|
|
65.3 |
|
|
|
110.0 |
|
|
Acquisition, integration and restructuring related charges |
|
|
24.7 |
|
|
|
75.7 |
|
|
General and administrative |
|
|
|
|
|
|
|
|
|
Stock-based compensation acquired for Legacy Allergan employees |
|
|
33.6 |
|
|
|
258.9 |
|
|
Acquisition-related expenditures |
|
|
- |
|
|
|
65.5 |
|
|
Acquisition, integration and restructuring related charges |
|
|
197.4 |
|
|
|
298.6 |
|
|
Other (expense) income |
|
|
|
|
|
|
|
|
|
Bridge loan facilities expense |
|
|
- |
|
|
|
(264.9 |
) |
|
Interest rate lock |
|
|
- |
|
|
|
30.9 |
|
|
Total transaction and integration costs |
|
$ |
403.5 |
|
|
$ |
1,288.4 |
|
Licenses and Asset Acquisitions
Mimetogen Pharmaceuticals, Inc.
On November 4, 2015, the Company entered into an exclusive licensing agreement with Mimetogen Pharmaceuticals, Inc. (“Mimetogen”), a clinical stage biotechnology company, to develop and commercialize tavilermide (MIM-D3), a topical formulation of a novel small molecule TrkA agonist for the treatment of dry eye disease, in exchange for an upfront payment of $50.0 million to Mimetogen, which is included as a component of R&D expense in the year ended December 31, 2015. Mimetogen will be entitled to receive potential commercial milestones based on the achieving regulatory approval and predefined product labeling of the product. In addition, Mimetogen is entitled to receive one-time annual sales based milestone payments based on multiple pre-defined annual net sales thresholds which may or may not be received, and tiered royalties based on net sales to third parties of the licensed products (the “Mimetogen Transaction”). The Company concluded based on the stage of development of the assets, the lack of acquired employees and manufacturing as well as certain other inputs and processes that the transaction did not qualify as a business.
F-40
On October 27, 2015, the Company and Ironwood Pharmaceuticals, Inc. announced that Allergan has acquired rights to Constella® (linaclotide) in the European Union, Switzerland, Turkey and the Commonwealth of Independent States from Almirall, S.A. and has also reacquired rights to Linzess® (linaclotide) in Mexico from Almirall for €60.0 million. The consideration was accounted for as an asset acquisition and included as a component of intangible assets. The Company concluded based on the lack of acquired employees and the lack of certain other inputs and processes that the transaction did not qualify as a business.
Naurex, Inc.
On August 28, 2015, the Company acquired certain products in early stage development of Naurex, Inc. (“Naurex”) in an all-cash transaction of $571.7 million (the “Naurex Transaction”), plus future contingent payments up to $1,150.0 million, which was accounted for as an asset acquisition. The Company recognized the upfront consideration of $571.7 million as a component of R&D expense in the year ended December 31, 2015. The Company concluded based on the stage of development of the assets, the lack of acquired employees and manufacturing as well as certain other inputs and processes that the transaction did not qualify as a business. The Naurex Transaction expands our pipeline with Naurex’s two leading product candidates GLYX-13 and NRX-1074, two compounds that utilize NMDA modulation as a potential new approach to the treatment of Major Depressive Disorder (“MDD”), a disease that can lead to suicidality among the most severe patients.
Migraine License
On August 17, 2015, the Company entered into an agreement with Merck & Co. (“Merck”) under which the Company acquired the exclusive worldwide rights to Merck’s early development stage investigational small molecule oral calcitonin gene-related peptide receptor antagonists, which are being developed for the treatment and prevention of migraines (the “Merck Transaction”). The transaction is being accounted for as an asset acquisition. The Company acquired these rights for an upfront charge of $250.0 million which was recognized as a component of R&D expense in the year ended December 31, 2015. The Company concluded based on the stage of development of the assets, the lack of acquired employees and manufacturing as well as certain other inputs and processes that the transaction did not qualify as a business. In the year ended December 31, 2016, the Company incurred $100.0 million of milestones under the agreement, which were included as a component of R&D expense. Additionally, Merck is owed contingent payments based on commercial and development milestones of up to $865.0 million as well as potential future royalties.
Divestitures
Respiratory Business
As part of the Forest Acquisition (defined below), we acquired certain assets that comprised Legacy Forest’s branded respiratory business in the U.S. and Canada (the “Respiratory Business”). During the year ended December 31, 2014, we held for sale respiratory assets of $734.0 million, including allocated goodwill to this unit of $309.1 million. On March 2, 2015, the Company sold the Respiratory Business to AstraZeneca plc (“AstraZeneca”) for consideration of $600.0 million upon closing, additional funds to be received for the sale of certain of our inventory to AstraZeneca and low single-digit royalties above a certain revenue threshold. AstraZeneca also paid Allergan an additional $100.0 million and Allergan has agreed to a number of contractual consents and approvals, including certain amendments to the ongoing collaboration agreements between AstraZeneca and Allergan (the “Respiratory Sale”). As a result of the final terms of the agreement, in the year ended December 31, 2015, the Company recognized an incremental charge in cost of sales (including the acquisition accounting fair value mark-up of inventory) relating to inventory that will not be sold to AstraZeneca of $35.3 million. The Company recognized a loss in other (expense) income, net for the sale of the business of $5.3 million in the year ended December 31, 2015.
Pharmatech
As part of the Forest Acquisition, the Company acquired certain manufacturing plants and contract manufacturing agreements within the business known as Aptalis Pharmaceutical Technologies (“Pharmatech”). In accordance with acquisition accounting, the assets were fair valued on July 1, 2014 as assets held in use, including market participant synergies anticipated under the concept of “highest and best use.” During the fourth quarter of 2014, the decision was made to hold these assets for sale as one complete unit, without integrating the unit and realizing anticipated synergies. During the year ended December 31, 2014, the Company recognized an impairment on assets held for sale of $189.9 million (the “Pharmatech Transaction”) which included a portion of goodwill allocated to this business unit. In the year ended 2015, the Company completed the divestiture of the Pharmatech business and there was no material impact to the Company’s results of operations.
F-41
The following are the material transactions that were completed in the year ended December 31, 2014.
Acquisitions
Durata Therapeutics
On November 17, 2014, the Company completed its tender offer to purchase all of the outstanding shares of Durata Therapeutics, Inc. (“Durata”), an innovative pharmaceutical company focused on the development and commercialization of novel therapeutics for patients with infectious diseases and acute illnesses (the “Durata Acquisition”). Allergan purchased all outstanding shares of Durata, which were valued at approximately $724.5 million, including the assumption of debt. Additionally, there is one contingent value right (“CVR”) per share, entitling the holder to receive additional cash payments of up to $5.00 per CVR if certain regulatory or commercial milestones related to Durata’s lead product Dalvance™ are achieved. The CVR had an acquisition date fair value of $49.0 million.
Recognition and Measurement of Assets Acquired and Liabilities Assumed at Fair Value
The Durata Acquisition has been accounted for using the acquisition method of accounting. This method requires that assets acquired and liabilities assumed in a business combination be recognized at their fair values as of the acquisition date. The following table summarizes the fair values of the tangible and identifiable intangible assets acquired and liabilities assumed at the acquisition date ($ in millions):
|
|
|
Amount |
|
|
|
Cash and cash equivalents |
|
$ |
17.8 |
|
|
Inventory |
|
|
21.0 |
|
|
IPR&D intangible assets |
|
|
249.0 |
|
|
Intangible assets |
|
|
480.0 |
|
|
Goodwill |
|
|
75.8 |
|
|
Other assets and liabilities |
|
|
(30.2 |
) |
|
Contingent consideration |
|
|
(49.0 |
) |
|
Deferred tax liabilities, net |
|
|
(39.9 |
) |
|
Outstanding indebtedness |
|
|
(67.0 |
) |
|
Net assets acquired |
|
$ |
657.5 |
|
IPR&D and Intangible Assets
The fair value of the IPR&D and CMP intangible assets was determined using the IPR&D and Intangible Asset Valuation Technique. The discount rate used to arrive at the present value of CMPs was 9.5% and for IPR&D intangible assets was 10.5% to reflect the internal rate of return and incremental commercial uncertainty in the cash flow projections. No assurances can be given that the underlying assumptions used to prepare the discounted cash flow analysis will not change. For these and other reasons, actual results may vary significantly from estimated results.
Goodwill
Goodwill resulting from the Durata Acquisition is assigned to our US General Medicine segment and is not deductible for tax purposes. Among the primary reasons the Company acquired Durata and the factors that contributed to the recognition of goodwill is the strategic fit of DalvanceTM into our portfolio.
Contingent Consideration
At the time of the Durata Acquisition, additional consideration was conditionally due to the seller based upon the approval of Dalvance® in Europe, the approval of a single dose indication and the product reaching certain sales milestones. The Company estimated the acquisition accounting fair value of the contingent consideration to be $49.0 million using a probability weighted approach that considered the possible outcomes based on assumptions related to the timing and probability of the product launch date, discount rates matched to the timing of the payment, and probability of success rates and discount adjustments on the related cash flows. On March 2, 2015, the Company announced that the European Commission had granted Allergan’s subsidiary Durata Therapeutics International B.V., marketing authorization for Xydalba™ (dalbavancin) for the treatment of acute bacterial skin and skin structure infections (ABSSSI) in adults. The approval triggered the first CVR payment in the quarter ended March 31, 2015 of
F-42
$30.9 million. In January 2016, the Company received approval from the FDA for an expanded label that will include a single dose of Dalvance®, which triggered a second CVR payment of $30.9 million in the quarter ended March 31, 2016. The difference between the probability weighted fair value and the final payments are recorded as a component of cost of sales.
Long-Term Deferred Tax Liabilities and Other Tax Liabilities
Long-term deferred tax liabilities and other tax liabilities result from identifiable intangible assets fair value adjustments. These adjustments create excess book basis over the tax basis which is multiplied by the statutory tax rate for the jurisdiction in which the deferred taxes exist.
Furiex Pharmaceuticals, Inc.
On July 2, 2014, the Company acquired Furiex Pharmaceuticals, Inc. (“Furiex”) in an all-cash transaction (the “Furiex Acquisition”) valued at $1,156.2 million (including the assumption of debt) and up to approximately $360.0 million in a CVR payable based on which controlled substance schedule designation that eluxadoline, Furiex’s lead product would receive following approval, which had an acquisition accounting fair value of $88.0 million on the date of acquisition (included in the value of $1,156.2 million). In the second quarter of 2015, the Company received approval from the FDA of the eluxadoline product, Viberzi®.
Viberzi® is a first-in-class, locally-acting mu opioid receptor agonist and delta opioid receptor antagonist for treating symptoms of diarrhea-predominant irritable bowel syndrome (IBS-d), a condition that affects approximately 28 million patients in the United States and Europe. In connection with the close of the Furiex Acquisition, the Company further announced that it closed the transaction related to the sale of Furiex’s royalties on Alogliptin and Priligy® to Royalty Pharma for $408.6 million in cash consideration.
Recognition and Measurement of Assets Acquired and Liabilities Assumed at Fair Value
The Furiex Acquisition has been accounted for using the acquisition method of accounting. This method requires that assets acquired and liabilities assumed in a business combination be recognized at their fair values as of the acquisition date.
The following table summarizes the final fair values of the tangible and identifiable intangible assets acquired and liabilities assumed at the acquisition date ($ in millions):
|
|
|
Amount |
|
|
|
Cash and cash equivalents |
|
$ |
14.9 |
|
|
IPR&D intangible assets |
|
|
1,003.0 |
|
|
Intangible assets |
|
|
408.6 |
|
|
Goodwill |
|
|
251.9 |
|
|
Other assets and liabilities |
|
|
(30.1 |
) |
|
Contingent consideration |
|
|
(88.0 |
) |
|
Deferred tax liabilities, net |
|
|
(404.1 |
) |
|
Outstanding indebtedness |
|
|
(55.3 |
) |
|
Net assets acquired |
|
$ |
1,100.9 |
|
IPR&D and Intangible Assets
The fair value of the IPR&D and CMP intangible assets was determined using the IPR&D and Intangible Asset Valuation Technique. The discount rate used to arrive at the present value of IPR&D intangible assets as of the acquisition date was 9.9% to reflect the internal rate of return and incremental commercial uncertainty in the cash flow projections. No assurances can be given that the underlying assumptions used to prepare the discounted cash flow analysis will not change. For these and other reasons, actual results may vary significantly from estimated results. As a result of this transaction, the Company recognized IPR&D of $1,003.0 million related to eluxadoline, now a component of CMP, and $408.6 million of product rights and other intangibles related to the royalty rights for Alogliptin and Priligy®, which were sold in the year ended December 31, 2014.
Goodwill
Goodwill resulting from the Furiex Acquisition is assigned to our US General Medicine segment and is not deductible for tax purposes. Among the primary reasons the Company acquired Furiex and the factors that contributed to the recognition of goodwill was to expand the Company’s branded pharmaceuticals business within this therapeutic area.
F-43
In the year ended December 31, 2015, the Company received a schedule IV (“C-IV”) designation from the Drug Enforcement Agency (“DEA”) for Viberzi® and recognized an expense of $29.8 million as a component of R&D expense. This expense represents the difference between the final CVR payment amount of $118.5 million, or $10 for each CVR outstanding, versus the probability-weighted CVR fair value initially established in acquisition accounting, adjusted for accretion.
Long-Term Deferred Tax Liabilities and Other Tax Liabilities
Long-term deferred tax liabilities and other tax liabilities result from identifiable intangible assets fair value adjustments. These adjustments create excess book basis over the tax basis which is multiplied by the statutory tax rate for the jurisdiction in which the deferred taxes exist.
Forest Laboratories, Inc.
On July 1, 2014, the Company acquired Forest Laboratories, Inc. (“Legacy Forest”) for $30.9 billion including outstanding indebtedness assumed of $3.3 billion, equity consideration of $20.6 billion, which includes outstanding equity awards, and cash consideration of $7.1 billion (the “Forest Acquisition”). Under the terms of the transaction, Legacy Forest shareholders received 89.8 million Allergan plc ordinary shares, 6.1 million Allergan plc non-qualified stock options and 1.1 million Allergan plc share units. Legacy Forest was a leading, fully integrated, specialty pharmaceutical company largely focused on the United States market. Legacy Forest marketed a portfolio of branded drug products and developed new medicines to treat patients suffering from diseases principally in the following therapeutic areas: central nervous system, cardiovascular, gastrointestinal, respiratory, anti-infective, and cystic fibrosis. A portion of the assets acquired were divested as part of the Teva Transaction.
Assets Acquired and Liabilities Assumed at Fair Value
The transaction has been accounted for using the acquisition method of accounting. This method requires that assets acquired and liabilities assumed in a business combination be recognized at their fair values as of the acquisition date. The following table summarizes the fair values of the assets acquired and liabilities assumed at the acquisition date, of which the majority of the assets and liabilities relate to continuing operations. ($ in millions):
|
|
|
Amount |
|
|
|
Cash and cash equivalents |
|
$ |
3,424.2 |
|
|
Accounts receivable |
|
|
496.2 |
|
|
Inventories |
|
|
1,455.8 |
|
|
Other current assets |
|
|
261.2 |
|
|
Current assets held for sale |
|
|
87.1 |
|
|
Property, plant and equipment, net |
|
|
221.1 |
|
|
Other long-term assets |
|
|
84.1 |
|
|
IPR&D intangible assets |
|
|
1,362.0 |
|
|
Intangible assets |
|
|
11,515.5 |
|
|
Goodwill |
|
|
16,403.6 |
|
|
Current liabilities |
|
|
(1,372.1 |
) |
|
Deferred tax liabilities, net |
|
|
(2,277.3 |
) |
|
Other taxes payable |
|
|
(618.4 |
) |
|
Other long-term liabilities |
|
|
(120.0 |
) |
|
Outstanding indebtedness |
|
|
(3,261.9 |
) |
|
Net assets acquired |
|
$ |
27,661.1 |
|
In the year ended December 31, 2015, the Company recorded an out-of-period adjustment in the final valuation of Forest stated in the table above relating to the valuation of an acquired currently marketed product and deferred tax liabilities. The Company over valued the asset and undervalued goodwill based on information available as of the acquisition date. The Company corrected this error as of December 31, 2015 by decreasing the value of intangible assets by $135.0 million, decreasing deferred tax liabilities by $51.4 million and increasing the value of goodwill by $83.6 million. The impact was not material to the statement of operations and the Company did not consider the amount material to prior periods.
F-44
The total consideration for the Forest Acquisition of $27.7 billion is comprised of the equity value of shares that were outstanding and vested prior to July 1, 2014 of $20.0 billion, the portion of outstanding equity awards deemed to have been earned as of July 1, 2014 of $568.1 million and cash of $7.1 billion. The portion of outstanding equity awards deemed not to have been earned of $570.4 million as of July 1, 2014 will be expensed over the remaining future vesting period, including $70.7 million, $142.8 million and $287.5 million in the years ended December 31, 2016, 2015 and 2014.
Inventories
The fair value of inventories acquired included an acquisition accounting fair market value step-up of $1,036.3 million. The Company recognized $19.3 million, $224.7 million, and $751.0 million as a component of cost of sales in the years ended December 31, 2016, 2015, and 2014, respectively, as the inventory acquired on July 1, 2014 was sold to the Company’s customers in addition to a write-off associated with the Respiratory Sale. These amounts include zero, $0.6 million and $40.6 million related to discontinued operations in the years ended December 31, 2016, 2015 and 2014, respectively.
IPR&D and Intangible Assets
The estimated fair value of the IPR&D and identifiable intangible assets was determined using the IPR&D and Intangible Asset Valuation Technique. The discount rates used to arrive at the present value at the acquisition date of CMPs was 8.0% and for IPR&D ranged from 8.0% to 9.0%, to reflect the internal rate of return and incremental commercial uncertainty in the cash flow projections. No assurances can be given that the underlying assumptions used to prepare the discounted cash flow analysis will not change. For these and other reasons, actual results may vary significantly from estimated results.
The following table identifies the summarized amounts recognized and the weighted average useful lives using the economic benefit of intangible assets ($ in millions):
|
|
|
Amounts Recognized as of the Acquisition Date |
|
|
Weighted Average Useful Lives (Years) |
|
||
|
CMP: |
|
|
|
|
|
|
|
|
|
Namenda Franchise |
|
$ |
2,125.0 |
|
|
|
1.7 |
|
|
Bystolic Franchise |
|
|
1,810.0 |
|
|
|
3.3 |
|
|
Linzess® |
|
|
1,052.0 |
|
|
|
5.0 |
|
|
Zenpep® |
|
|
978.0 |
|
|
|
6.8 |
|
|
Carafate® |
|
|
915.0 |
|
|
|
6.2 |
|
|
Armour Thyroid® |
|
|
747.0 |
|
|
|
5.9 |
|
|
Viibryd® |
|
|
413.0 |
|
|
|
4.5 |
|
|
Fetzima® |
|
|
392.0 |
|
|
|
5.0 |
|
|
Teflaro® |
|
|
343.0 |
|
|
|
3.0 |
|
|
Canasa® |
|
|
327.0 |
|
|
|
2.6 |
|
|
Daliresp® |
|
|
269.0 |
|
|
|
3.5 |
|
|
Other CMP Products |
|
|
1,904.0 |
|
|
|
5.7 |
|
|
Total CMP |
|
|
11,275.0 |
|
|
|
4.3 |
|
|
IPR&D: |
|
|
|
|
|
|
|
|
|
Gastroenterology |
|
|
791.0 |
|
|
|
|
|
|
Central nervous system |
|
|
304.0 |
|
|
|
|
|
|
Cardiovascular |
|
|
193.0 |
|
|
|
|
|
|
Other |
|
|
74.0 |
|
|
|
|
|
|
Total IPR&D |
|
|
1,362.0 |
|
|
|
|
|
|
Customer relationships |
|
|
67.0 |
|
|
|
4.5 |
|
|
Other |
|
|
173.5 |
|
|
|
4.2 |
|
|
|
|
|
|
|
|
|
|
|
|
Total identifiable intangible assets |
|
$ |
12,877.5 |
|
|
|
|
|
F-45
Among the primary reasons the Company acquired Forest and factors that contributed to the preliminary recognition of goodwill were to expand the Company’s branded pharmaceuticals product portfolio, and to acquire certain benefits from the Forest pipeline and the expectation of the Company generating certain synergies. The goodwill recognized from the Forest Acquisition, which includes the increase in the purchase price resulting from the movement in Allergan plc’s share price from the date of announcing the deal, until the date of acquisition, is not deductible for tax purposes. Goodwill from the Forest Acquisition was primarily assigned to the US General Medicine segment.
Deferred Tax Liabilities, net
Deferred tax liabilities, net, include the impact resulting from identifiable intangible assets and inventory fair value adjustments. These adjustments create excess book basis over the tax basis which is multiplied by the statutory tax rate for the jurisdiction in which the deferred taxes exist.
Divested Products
In order to complete the Forest Acquisition, the Company divested two legacy Actavis products to Impax Laboratories, Inc. (“Impax”); Lamotrigine ODT and Ursodiol Tablets for cash consideration. In exchange for the products, the Company received $8.0 million on July 1, 2014, which resulted in a gain on sale of asset of $5.4 million. In addition, the Company and Impax entered into a supply agreement whereby the Company will supply product to Impax. Revenues recognized from the divested products were deminimis in the year ended December 31, 2014. In addition, on July 1, 2014, the Company divested two acquired Forest products for a combined consideration of $13.5 million. The product revenues were not included in the results of operations of the Company.
Acquisition-Related Expenses
As a result of the Forest Acquisition, the Company incurred the following transaction and integration costs in the years ended December 31, 2016, 2015 and 2014($ in millions):
|
|
|
Years Ended December 31, |
|
|||||||||
|
|
|
2016 |
|
|
2015 |
|
|
2014 |
|
|||
|
Cost of sales |
|
|
|
|
|
|
|
|
|
|
|
|
|
Stock-based compensation acquired for Forest employees |
|
$ |
1.7 |
|
|
$ |
4.7 |
|
|
$ |
9.5 |
|
|
Severance-related charges |
|
|
- |
|
|
|
1.1 |
|
|
|
11.3 |
|
|
Research and development |
|
|
|
|
|
|
|
|
|
|
|
|
|
Stock-based compensation acquired for Forest employees |
|
|
12.7 |
|
|
|
36.3 |
|
|
|
66.7 |
|
|
Severance-related charges |
|
|
0.5 |
|
|
|
9.2 |
|
|
|
24.5 |
|
|
Selling and marketing |
|
|
|
|
|
|
|
|
|
|
|
|
|
Stock-based compensation acquired for Forest employees |
|
|
25.0 |
|
|
|
47.9 |
|
|
|
58.7 |
|
|
Severance-related charges |
|
|
- |
|
|
|
17.4 |
|
|
|
45.3 |
|
|
Other integration costs |
|
|
|
|
|
|
- |
|
|
|
3.8 |
|
|
General and administrative |
|
|
|
|
|
|
|
|
|
|
|
|
|
Stock-based compensation acquired for Forest employees |
|
|
31.4 |
|
|
|
53.9 |
|
|
|
152.6 |
|
|
Severance-related charges |
|
|
- |
|
|
|
17.1 |
|
|
|
71.5 |
|
|
Other integration costs |
|
|
1.7 |
|
|
|
58.4 |
|
|
|
92.9 |
|
|
Financing related charges |
|
|
- |
|
|
|
- |
|
|
|
9.3 |
|
|
Other income (expense) |
|
|
|
|
|
|
|
|
|
|
|
|
|
Bridge loan facilities |
|
|
- |
|
|
|
- |
|
|
|
(25.8 |
) |
|
Total transaction and integration costs |
|
$ |
73.0 |
|
|
$ |
246.0 |
|
|
$ |
571.9 |
|
Silom Medical Company
On April 1, 2014, the Company acquired Silom Medical Company (“Silom”), a privately held generic pharmaceutical company focused on developing and marketing therapies in Thailand, for consideration of approximately $103.0 million in cash (the “Silom Acquisition”). The Silom Acquisition expanded the Company’s position in the Thai generic pharmaceutical market, with leading positions in the ophthalmic and respiratory therapeutic categories and a strong cardiovascular franchise. We accounted for the acquisition as a business combination requiring that the assets acquired and liabilities assumed be recognized at their fair values as of the acquisition date. The assets and liabilities acquired, as well as the results of operations for the acquired Silom business were part
F-46
of the assets divested in the Teva Transaction and are included as a component of income from discontinued operations. In addition the acquired financial position is included in assets and liabilities held for sale as of December 31, 2015.
The Silom Acquisition has been accounted for using the acquisition method of accounting. This method requires that assets acquired and liabilities assumed in a business combination be recognized at their fair values as of the acquisition date as follows ($ in millions):
|
|
|
Amount |
|
|
|
Cash and cash equivalents |
|
$ |
3.0 |
|
|
Inventories, net |
|
|
4.0 |
|
|
Property, plant and equipment, net |
|
|
16.0 |
|
|
Product rights and other intangibles |
|
|
64.0 |
|
|
Goodwill |
|
|
20.0 |
|
|
Other assets and liabilities |
|
|
(4.0 |
) |
|
Net assets acquired |
|
$ |
103.0 |
|
Divestitures
Corona Facility
During the year ended December 31, 2014, we held for sale assets in our Corona, California manufacturing facility. As a result, the Company recognized an impairment charge as a component of discontinued operations of $20.0 million in the year ended December 31, 2014, including a write-off of property, plant and equipment, net, due to the integration of Warner Chilcott of $5.8 million. The Company completed the sale of these assets during the year ended December 31, 2015 with no material impact to the Company’s results of operations.
NOTE 6 — Collaborations
The Company has ongoing transactions with other entities through collaboration agreements. The following represent the material collaboration agreements impacting the years ended December 31, 2016, 2015 and 2014.
Acquired agreements from the Allergan Acquisition
Apollo EndoSurgery, Inc.
On December 2, 2013, Legacy Allergan completed the sale of the obesity intervention business to Apollo Endosurgery, Inc. for cash consideration of $75.0 million, subject to certain adjustments, and certain additional consideration, including a minority equity interest in Apollo with an estimated fair value of $15.0 million as of December 31, 2016 and 2015. The Company is accounting for this asset as a cost method investment and it is included as a component of “investments and other assets”.
LiRIS
On August 13, 2014, Legacy Allergan completed the acquisition of LiRIS Biomedical, Inc. (“LiRIS”), a clinical-stage specialty pharmaceutical company based in the United States focused on developing a pipeline of innovative treatments for bladder diseases, for an upfront payment of $67.5 million, plus up to an aggregate of $295.0 million in payments contingent upon achieving certain future development milestones and up to an aggregate of $225.0 million in payments contingent upon achieving certain commercial milestones. The Company accounted for the contingent consideration in the Allergan Acquisition with an initial acquisition date fair value of $169.6 million. In the year ended December 31, 2016, the Company recognized approximately $210.0 million of impairments due to clinical data not supporting continuation of the R&D study offset, in part, by a reduction of contingent liability of $186.0 million recorded in R&D.
Acquired agreements from the Forest Acquisition
Trevena
On May 9, 2013, in connection with entering into an agreement with Trevena, Inc. to acquire the option to license one of Trevena, Inc.’s products (which option has since lapsed), Forest purchased $30.0 million of Trevena preferred stock in a round of private placement financing. Trevena filed an initial public offering (“IPO”), at which time the Company’s preferred stock was converted to common stock traded on the NASDAQ stock market. In conjunction with the IPO, the Company purchased an additional
F-47
$3.0 million of common stock of Trevena. At December 31, 2016 and 2015, the fair value of the Trevena common stock held by the Company was $20.0 million and $35.6 million, respectively and is included as a component of “investments and other assets”.
Ironwood collaboration agreement
In September 2007, Forest entered into a collaboration agreement with Ironwood Pharmaceuticals (“Ironwood”) to jointly develop and commercialize Linzess® (linaclotide) for the treatment of irritable bowel syndrome with constipation (IBS-C) and chronic idiopathic constipation (CIC). Under the terms of the agreement, the Company shares equally with Ironwood all profits and losses (as defined) from the development and commercialization of Linzess in the U.S. In addition, the Company expanded this agreement to cover the acquired Constella rights internationally.
The agreement included contingent milestone payments as well as a contingent equity investment based on the achievement of specific clinical and commercial milestones. The Company may be obligated to pay up to an additional $100.0 million if certain sales milestones are achieved.
Based on the nature of the arrangement (including its contractual terms), the nature of the payments and applicable guidance, the Company records receipts from and payments to Ironwood in two pools: the “Development pool” which consists of R&D expenses, and the “Commercialization pool,” which consists of revenue, cost of sales and other operating expenses. The net payment to or receipt from Ironwood for the Development pool is recorded in R&D expense and the net payment to or receipt from Ironwood for the Commercialization pool is recorded in cost of goods sold. As of December 31, 2016 and 2015, the fair value of the Ironwood shares was $31.9 million and $24.1 million, respectively and is included as a component of “investments and other assets.”
Amgen Collaboration
In December 2011, we entered into a collaboration agreement with Amgen Inc. (“Amgen”) to develop and commercialize, on a worldwide basis, biosimilar versions of Herceptin®, Avastin®, Rituxan/Mab Thera®, and Erbitux® (the “Amgen Collaboration Agreement”). Amgen has assumed primary responsibility for developing, manufacturing and initially commercializing the oncology antibody products. As of December 31, 2016, the Company will contribute up to $160.8 million in co-development costs over the remaining course of development, including the provision of development support, and will share product development risks. In addition, we will contribute our significant expertise in the commercialization and marketing of products in highly competitive specialty markets, including helping effectively manage the lifecycle of the biosimilar products. The collaboration products are expected to be sold under a joint Amgen/Allergan label. We will initially receive royalties and sales milestones from product revenues. The collaboration will not pursue biosimilars of Amgen’s proprietary products.
NOTE 7 — Discontinued Operations
Global Generics Business
On July 27, 2015, the Company announced that it entered into the Teva Transaction, which closed on August 2, 2016. Under the Teva Transaction, Teva acquired Allergan's global generics business, including the U.S. and international generic commercial units, our third-party supplier Medis, our global generic manufacturing operations, our global generic R&D unit, our international OTC commercial unit (excluding OTC eye care products) and some established international brands. Allergan retained its global branded pharmaceutical and medical aesthetics businesses, as well as its biosimilars development programs, and certain OTC products. The Company will also have continuing involvement with Teva after the close of the transaction. As a result of the Teva Transaction, the Company holds equity in Teva and purchases product manufactured by Teva for sale in our US General Medicine segment as part of ongoing transitional service and contract manufacturing agreements.
On October 3, 2016, the Company completed the divestiture of the Anda Distribution business for $500.0 million. Teva acquired our Anda Distribution business, which distributes generic, brand, specialty and OTC pharmaceutical products from more than 300 manufacturers to retail independent and chain pharmacies, nursing homes, mail order pharmacies, hospitals, clinics and physician offices across the United States.
F-48
The Company notes the following reconciliation of the proceeds received in the sale of the generics business and Anda Distribution business to the gain recognized in income from discontinued operations ($ in millions):
|
Net cash proceeds received |
|
$ |
|
33,804.2 |
|
|
August 2, 2016 fair value of Teva shares |
|
|
|
5,038.6 |
|
|
Total Proceeds |
|
$ |
|
38,842.8 |
|
|
Net assets sold to Teva, excluding cash |
|
|
|
(12,487.7 |
) |
|
Other comprehensive income disposed |
|
|
|
(1,544.8 |
) |
|
Deferral of proceeds relating to additional elements of agreements with Teva |
|
|
|
(299.2 |
) |
|
Pre-tax gain on sale of generics business and Anda Distribution business |
|
$ |
|
24,511.1 |
|
|
Income taxes |
|
|
|
(8,578.9 |
) |
|
Net gain on sale of generics business and Anda Distribution business |
|
$ |
|
15,932.2 |
|
In October 2016, pursuant to the Teva Transaction, Teva provided its proposed estimated adjustment to the closing date working capital balance to the Company. The final amount of any agreed contractual adjustment could vary materially from the adjustment calculated by the Company at the time of the closing of the Teva Transaction and any agreed adjustment to the Company’s proceeds from the Teva Transaction could have a material adverse effect on the Company’s results of operations and cash flows. The Company expects the amount of the adjustment will be determined in accordance with and subject to the terms of the Teva Transaction. As of December 31, 2016, the amount had yet to be settled.
The Teva Shares are recorded within “Marketable securities” on the Company’s Consolidated Balance Sheet. The closing Teva transaction date opening stock price discounted at a rate of 5.9 percent due to the lack of marketability was used to initially value the shares. During the year ended December 31, 2016, the Company recorded a $1,599.4 million unrealized loss on the Teva Shares due to a decline in the share price, which was recorded as a component of “Other comprehensive income.” The Company currently considers the decline in value of its investment in Teva securities to be temporary. We will continue to monitor the value of this investment to determine if the decline in value becomes other than temporary.
Financial results of the global generics business and the Anda Distribution business are presented as “Income from discontinued operations, net of tax” on the Consolidated Statements of Operations for the years ended December 31, 2016, 2015 and 2014; and assets and liabilities of the businesses are presented as “Current assets held for sale”, “Non current assets held for sale”, “Current liabilities held for sale” and “Long term liabilities held for sale” on the Consolidated Balance Sheet as of December 31, 2015.
The following table presents key financial results of the global generics business and the Anda Distribution business included in “Income from discontinued operations” for the years ended December 31, 2016, 2015 and 2014 ($ in millions):
|
|
Years Ended December 31, |
|
|||||||||
|
|
2016 |
|
|
2015 |
|
|
2014 |
|
|||
|
Net revenues |
$ |
4,504.3 |
|
|
$ |
8,499.0 |
|
|
$ |
8,385.8 |
|
|
Operating expenses: |
|
|
|
|
|
|
|
|
|
|
|
|
Cost of sales (excludes amortization and impairment of acquired intangibles including product rights) |
|
2,798.3 |
|
|
|
4,847.5 |
|
|
|
4,599.0 |
|
|
Research and development |
|
269.4 |
|
|
|
422.2 |
|
|
|
480.2 |
|
|
Selling and marketing |
|
352.9 |
|
|
|
706.6 |
|
|
|
784.0 |
|
|
General and administrative |
|
425.8 |
|
|
|
702.2 |
|
|
|
541.8 |
|
|
Amortization |
|
4.8 |
|
|
|
333.3 |
|
|
|
661.7 |
|
|
Asset sales and impairments, net |
|
- |
|
|
|
62.4 |
|
|
|
19.6 |
|
|
Total operating expenses |
|
3,851.2 |
|
|
|
7,074.2 |
|
|
|
7,086.3 |
|
|
Operating income |
|
653.1 |
|
|
|
1,424.8 |
|
|
|
1,299.5 |
|
|
Other (expense) income, net |
|
15,932.2 |
|
|
|
(7.1 |
) |
|
|
(13.7 |
) |
|
Provision / (benefit) for income taxes |
|
670.8 |
|
|
|
(5,443.3 |
) |
|
|
431.7 |
|
|
Net income from discontinued operations |
$ |
15,914.5 |
|
|
$ |
6,861.0 |
|
|
$ |
854.1 |
|
The operating income reflects approximately seven months of operating activity of the Company’s former generics business in the year ended December 31, 2016 versus twelve months activity in the prior year period and approximately nine months of operating activity of the Anda Distribution business in the year ended December 31, 2016 versus twelve months activity in the prior year period. “Other (expense) income, net” included the gain on sale of the businesses to Teva.
F-49
For the year ended December 31, 2015, the Company recorded a deferred tax benefit of $5,738.8 million related to investments in certain subsidiaries. The recognition of this benefit has been reflected in “Income from discontinued operations, net of tax” with the deferred tax asset reflected in non-current “Deferred tax liabilities” on the December 31, 2015 balance sheet as adjusted for activity in the fourth quarter of 2015. For the year ended December 31, 2016, the Company recorded a deferred tax expense of $462.2 million to adjust its deferred tax asset related to investments in certain subsidiaries. The recognition of this expense has been reflected in “Income from discontinued operations, net of tax.” Upon the closing of the Teva Transaction, the Company recorded the reversal of the corresponding deferred tax asset of $5,276.6 million against the current income taxes payable in continuing operations.
The following table presents the aggregate carrying amounts of the major classes of assets and liabilities related to the global generics business and Anda Distribution business which were disposed of during the year ended December 31, 2016 ($ in millions):
|
|
|
December 31, 2015 |
|
|
|
Assets: |
|
|
|
|
|
Accounts receivable, net |
|
$ |
2,365.9 |
|
|
Inventories |
|
|
1,390.7 |
|
|
Prepaid expenses and other current assets |
|
|
329.7 |
|
|
Property, plant and equipment, net |
|
|
1,398.2 |
|
|
Investments and other assets |
|
|
42.2 |
|
|
Non-current deferred tax assets |
|
|
162.1 |
|
|
Product rights and other intangibles |
|
|
3,014.8 |
|
|
Goodwill |
|
|
6,096.0 |
|
|
Total assets |
|
$ |
14,799.6 |
|
|
|
|
|
|
|
|
Liabilities: |
|
|
|
|
|
Accounts payable and accrued expenses |
|
$ |
1,656.7 |
|
|
Income taxes payable |
|
|
34.4 |
|
|
Debt and capital leases |
|
|
5.8 |
|
|
Other long-term liabilities |
|
|
92.0 |
|
|
Other taxes payable |
|
|
69.0 |
|
|
Long-term deferred tax liabilities |
|
|
370.7 |
|
|
Total liabilities |
|
$ |
2,228.6 |
|
Depreciation and amortization was ceased upon the determination that the held for sale criteria were met, which were the announcement dates of the Teva Transaction and the divestiture of the Anda Distribution business. The depreciation, amortization and significant operating and investing non-cash items of the discontinued operations were as follows ($ in millions):
|
|
|
Years Ended December 31, |
|
|||||||||
|
|
|
2016 |
|
|
2015 |
|
|
2014 |
|
|||
|
Depreciation from discontinued operations |
|
$ |
2.1 |
|
|
$ |
93.7 |
|
|
$ |
163.1 |
|
|
Amortization from discontinued operations |
|
|
4.8 |
|
|
|
333.3 |
|
|
|
661.7 |
|
|
Capital expenditures |
|
|
85.3 |
|
|
|
234.5 |
|
|
|
184.5 |
|
|
Deferred taxes |
|
|
6,038.5 |
|
|
|
(5,568.8 |
) |
|
|
(259.5 |
) |
NOTE 8 — Share-Based Compensation
The Company recognizes compensation expense for all share-based compensation awards made to employees and directors based on the fair value of the awards on the date of grant. A summary of the Company’s share-based compensation plans is presented below.
Equity Award Plans
The Company has adopted several equity award plans which authorize the granting of options, restricted shares, restricted stock units and other forms of equity awards of the Company’s ordinary shares, subject to certain conditions.
F-50
The Company grants awards with the following features:
|
|
• |
Time-based vesting restricted stock and restricted stock units awards; |
|
|
• |
Performance-based restricted stock unit awards measured to the EBITDA, as defined, of the Company or other performance-based targets defined by the Company; |
|
|
• |
Performance-based restricted stock unit awards based on pre-established total shareholder returns metrics; |
|
|
• |
Non-qualified options to purchase outstanding shares; and |
|
|
• |
Cash-settled awards recorded as a liability. These cash settled awards are based on pre-established total shareholder returns metrics. |
Option awards require options to be granted at the fair value of the shares underlying the options at the date of the grant and generally become exercisable over periods ranging from three to five years. Each option granted expires ten years from the date of the grant. Restricted stock awards are grants that entitle the holder to ordinary shares, subject to certain terms. Restricted stock unit awards are grants that entitle the holder the right to receive an ordinary share, subject to certain terms. Restricted stock and restricted stock unit awards (both time-based vesting and performance-based vesting) generally have restrictions eliminated over a one to four year vesting period. Restrictions generally lapse for non-employee directors after one year. Certain restricted stock units are performance-based awards issued at a target number with the actual number of restricted shares issued ranging based on achievement of the performance criteria. The Company’s equity awards include the acquired awards from the Allergan Acquisition and the Kythera Acquisition (“2015 Acquired Awards”) and the acquired awards from the Forest Acquisition (“2014 Acquired Awards”).
Fair Value Assumptions
All restricted stock and restricted stock units (whether time-based vesting or performance-based vesting), are granted and expensed, using the fair value per share on the applicable grant date, over the applicable vesting period. Non-qualified options to purchase ordinary shares are granted to employees at exercise prices per share equal to the closing market price per share on the date of grant. The fair value of non-qualified options is determined on the applicable grant dates using the Black-Scholes method of valuation and that amount is recognized as an expense over the vesting period. Using the Black-Scholes valuation model, the fair value of options is based on the following assumptions:
|
|
|
2016 Grants |
|
|
2015 Grants |
|
|
2015 Acquired Awards |
|
|||
|
Dividend yield |
|
|
0 |
% |
|
|
0 |
% |
|
|
0 |
% |
|
Expected volatility |
|
|
27.0 |
% |
|
26.0 - 29.0% |
|
|
26.0 - 27.0% |
|
||
|
Risk-free interest rate |
|
1.3 - 2.4% |
|
|
1.9-2.1% |
|
|
0.1-2.1% |
|
|||
|
Expected term (years) |
|
7.0 - 7.5 |
|
|
7.0 - 7.5 |
|
|
up to 6.9 |
|
|||
Share-Based Compensation Expense
Share-based compensation expense recognized in the Company’s results of operations, including discontinued operations, for the years ended December 31, 2016, 2015 and 2014 was as follows ($ in millions):
|
|
Year Ended December 31, |
|
|||||||||
|
|
2016 |
|
|
2015 |
|
|
2014 |
|
|||
|
Equity-based compensation awards |
$ |
334.5 |
|
|
$ |
690.4 |
|
|
$ |
368.0 |
|
|
Cash-settled equity awards in connection with the Tobira Acquisition |
|
27.0 |
|
|
|
- |
|
|
|
- |
|
|
Cash-settled equity awards in connection with the Vitae Acquisition |
|
18.6 |
|
|
|
- |
|
|
|
- |
|
|
Cash-settled equity awards in connection with the ForSight Acquisition |
|
3.1 |
|
|
|
- |
|
|
|
- |
|
|
Cash-settled equity awards in connection with the Allergan Acquisition |
|
- |
|
|
|
127.1 |
|
|
|
- |
|
|
Cash-settled equity awards in connection with the Kythera Acquisition |
|
- |
|
|
|
9.6 |
|
|
|
- |
|
|
Cash-settled equity awards in connection with the Durata Acquisition |
|
- |
|
|
|
- |
|
|
|
16.6 |
|
|
Cash-settled equity awards in connection with the Furiex Acquisition |
|
- |
|
|
|
- |
|
|
|
16.6 |
|
|
Non equity-settled awards other |
|
- |
|
|
|
98.6 |
|
|
|
- |
|
|
Total stock-based compensation expense |
$ |
383.2 |
|
|
$ |
925.7 |
|
|
$ |
401.2 |
|
F-51
In the years ended December 31, 2016, 2015, and 2014, share-based compensation expense included as discontinued operations was $12.9 million, $36.4 million, and $18.8 million, respectively.
In the years ended December 31, 2016, 2015 and 2014 the related tax benefits were $131.8 million, $285.9 million and $145.7 million, respectively relating to stock-based compensation.
Included in the equity-based compensation awards for the year ended December 31, 2016 is the impact of accelerations and step-ups relating to the acquisition accounting treatment of outstanding awards acquired in the Allergan and Forest Acquisitions of $108.9 million and $45.2 million, respectively. Included in the year ended December 31, 2015 is the impact of accelerations and step-ups relating to the acquisition accounting treatment of outstanding awards acquired in the Allergan, Kythera and Forest Acquisitions of $314.8 million, $64.4 million and $109.7 million, respectively. Included in the year ended December 31, 2014, was $287.5 million of stock-based compensation inclusive of a $249.1 million step-up relating to the acquisition accounting treatment of outstanding awards acquired in the Forest Acquisition.
Unrecognized future stock-based compensation expense was $448.8 million as of December 31, 2016, including $146.9 million from the Allergan Acquisition and $32.3 million from the Forest Acquisition. This amount will be recognized as an expense over a remaining weighted average period of 1.5 years. Stock-based compensation is being amortized and charged to operations over the same period as the restrictions are eliminated for the participants, which is generally on a straight-line basis.
Share Activity
The following is a summary of equity award activity for unvested restricted stock and stock units in the period from December 31, 2015 through December 31, 2016:
|
(in millions, except per share data) |
Shares |
|
|
Weighted Average Grant Date Fair Value |
|
|
Weighted Average Remaining Contractual Term (Years) |
|
|
Aggregate Grant Date Fair Value |
|
||||
|
Restricted shares / units outstanding at December 31, 2015 |
|
2.0 |
|
|
$ |
209.90 |
|
|
|
1.7 |
|
|
$ |
419.9 |
|
|
Granted |
|
0.7 |
|
|
|
270.29 |
|
|
|
|
|
|
|
189.2 |
|
|
Vested |
|
(0.8 |
) |
|
|
(171.39 |
) |
|
|
|
|
|
|
(137.1 |
) |
|
Forfeited |
|
(0.4 |
) |
|
|
(209.97 |
) |
|
|
|
|
|
|
(84.0 |
) |
|
Restricted shares / units outstanding at December 31, 2016 |
|
1.5 |
|
|
$ |
251.88 |
|
|
|
1.6 |
|
|
$ |
388.0 |
|
The following is a summary of equity award activity for non-qualified options to purchase ordinary shares in the period from December 31, 2015 through December 31, 2016:
|
(in millions, except per share data) |
Options |
|
|
Weighted Average Exercise Price |
|
|
Weighted Average Remaining Contractual Term (Years) |
|
|
Aggregate Intrinsic Value |
|
||||
|
Outstanding, December 31, 2015 |
|
10.5 |
|
|
$ |
149.11 |
|
|
|
6.7 |
|
|
$ |
1,707.8 |
|
|
Granted |
|
0.2 |
|
|
|
269.72 |
|
|
|
|
|
|
|
|
|
|
Exercised |
|
(1.5 |
) |
|
|
(111.02 |
) |
|
|
|
|
|
|
|
|
|
Cancelled |
|
(0.2 |
) |
|
|
(168.92 |
) |
|
|
|
|
|
|
|
|
|
Outstanding, December 31, 2016 |
|
9.0 |
|
|
$ |
113.77 |
|
|
|
5.9 |
|
|
$ |
861.7 |
|
|
Vested and expected to vest at December 31, 2016 |
|
8.5 |
|
|
$ |
110.74 |
|
|
|
5.9 |
|
|
$ |
843.9 |
|
F-52
NOTE 9 — Pension and Other Postretirement Benefit Plans
Defined Benefit Plan Obligations
The Company has numerous defined benefit plans offered to employees around the world. For these plans, retirement benefits are generally based on an employee’s years of service and compensation. Funding requirements are determined on an individual country and plan basis and are subject to local country practices and market circumstances. As of December 31, 2016, a majority of the Company’s plans were frozen for future enrollment.
The net periodic benefit cost of the defined benefit plans for continuing operations for the years ended December 31, 2016, 2015 and 2014 was as follows ($ in millions):
|
|
|
|
|
Defined Benefit Year Ended December 31, |
|
|||||||||
|
|
|
|
|
2016 |
|
|
2015 |
|
|
2014 |
|
|||
|
Service cost |
|
|
|
$ |
5.0 |
|
|
$ |
5.0 |
|
|
$ |
2.0 |
|
|
Interest cost |
|
|
|
|
44.5 |
|
|
|
35.0 |
|
|
|
3.3 |
|
|
Expected Return on plan assets |
|
|
|
|
(53.0 |
) |
|
|
(46.4 |
) |
|
|
(3.5 |
) |
|
Settlement |
|
|
|
|
(1.8 |
) |
|
|
(4.3 |
) |
|
|
- |
|
|
Net periodic benefit (income) cost |
|
|
|
$ |
(5.3 |
) |
|
$ |
(10.7 |
) |
|
$ |
1.8 |
|
Obligations and Funded Status
Employee benefit plans are an exception to the recognition and fair value measurement principles in business combinations. Employee benefit plan obligations are recognized and measured in accordance with the existing authoritative literature for accounting for benefit plans rather than at fair value. Accordingly, the Company remeasured the benefit plans acquired as part of its acquisitions and recognized an asset or liability for the funded status of these plans as of the respective acquisition dates.
Benefit obligation and asset data for the defined benefit plans for continuing operations, were as follows ($ in millions):
|
|
|
Year Ended December 31, |
|
|||||
|
|
|
2016 |
|
|
2015(1) |
|
||
|
Change in Plan Assets |
|
|
|
|
|
|
|
|
|
Fair value of plan assets at beginning of year |
|
$ |
1,051.1 |
|
|
$ |
83.6 |
|
|
Fair value of plan assets assumed in the Allergan Acquisition |
|
|
- |
|
|
|
1,042.0 |
|
|
Employer contribution |
|
|
37.4 |
|
|
|
107.6 |
|
|
Return on plan assets |
|
|
116.8 |
|
|
|
(60.3 |
) |
|
Benefits paid |
|
|
(32.5 |
) |
|
|
(21.5 |
) |
|
Settlements |
|
|
(47.7 |
) |
|
|
(100.0 |
) |
|
Effects of exchange rate changes and other |
|
|
(31.2 |
) |
|
|
(0.3 |
) |
|
Fair value of plan assets at end of year |
|
$ |
1,093.9 |
|
|
$ |
1,051.1 |
|
F-53
|
|
Year Ended December 31, |
|
||||||
|
|
|
2016 |
|
|
2015(1) |
|
||
|
Change in Benefit Obligation |
|
|
|
|
|
|
|
|
|
Benefit obligation at beginning of the year |
|
$ |
1,188.5 |
|
|
$ |
111.6 |
|
|
Benefit obligation assumed in the Allergan Acquisition |
|
|
- |
|
|
|
1,344.6 |
|
|
Service cost |
|
|
5.0 |
|
|
|
5.0 |
|
|
Interest cost |
|
|
44.5 |
|
|
|
35.0 |
|
|
Actuarial loss/(gain) |
|
|
108.0 |
|
|
|
(191.2 |
) |
|
Settlements and other |
|
|
(46.9 |
) |
|
|
(101.1 |
) |
|
Benefits paid |
|
|
(32.5 |
) |
|
|
(21.5 |
) |
|
Effects of exchange rate changes and other |
|
|
(32.5 |
) |
|
|
6.1 |
|
|
Benefit obligation at end of year |
|
$ |
1,234.1 |
|
|
$ |
1,188.5 |
|
|
Funded status at end of year |
|
$ |
(140.2 |
) |
|
$ |
(137.4 |
) |
|
(1) |
The year ended December 31, 2015 includes benefit obligation and asset data from the Allergan Plans following the Allergan Acquisition on March 17, 2015. |
The following table outlines the funded actuarial amounts recognized ($ in millions):
|
|
|
As of December 31, |
|
|||||
|
|
|
2016 |
|
|
2015 |
|
||
|
Noncurrent assets |
|
$ |
9.4 |
|
|
$ |
- |
|
|
Current liabilities |
|
|
(0.7 |
) |
|
|
(29.3 |
) |
|
Noncurrent liabilities |
|
|
(148.9 |
) |
|
|
(108.1 |
) |
|
|
|
$ |
(140.2 |
) |
|
$ |
(137.4 |
) |
The underfunding of pension benefits is primarily a function of the different funding incentives that exist outside of the United States. In certain countries, there are no legal requirements or financial incentives provided to companies to pre-fund pension obligations. In these instances, benefit payments are typically paid directly by the Company as they become due.
Discontinued Operations
As of December 31, 2015, the following is the plan assets and liabilities included in assets and liabilities held for sale as part of the Teva Transaction ($ in millions):
|
|
|
Year Ended December 31, |
|
|
|
|
|
2015 |
|
|
|
Fair value of plan assets at end of year |
|
$ |
111.9 |
|
|
Benefit obligation at end of year |
|
|
161.8 |
|
|
Funded status at end of year |
|
$ |
(49.9 |
) |
For the years ended December 31, 2016, 2015 and 2014, the Company recognized $2.1 million, $6.8 million and $4.7 million, respectively, as a component of income from discontinued operations related to the Teva Transaction relating to defined benefit plans.
Plan Assets
Companies are required to use a fair value hierarchy as defined in ASC Topic 820 “Fair Value Measurement,” (“ASC 820”) which maximizes the use of observable inputs and minimizes the use of unobservable inputs when measuring fair value (“Fair Value Leveling”). There are three levels of inputs used to measure fair value with Level 1 having the highest priority and Level 3 having the lowest:
Level 1 — Quoted prices (unadjusted) in active markets for identical assets or liabilities.
Level 2 — Observable inputs other than Level 1 prices, such as quoted prices for similar assets or liabilities, or other inputs that are observable or can be corroborated by observable market data for substantially the full term of the assets or liabilities.
F-54
Level 3 — Unobservable inputs that are supported by little or no market activity. The Level 3 assets are those whose values are determined using pricing models, discounted cash flow methodologies, or similar techniques with significant unobservable inputs, as well as instruments for which the determination of fair value requires significant judgment or estimation.
If the inputs used to measure the financial assets fall within more than one level described above, the categorization is based on the lowest level input that is significant to the fair value measurement of the instrument.
The fair values of the Company’s pension plan assets for continuing operations at December 31, 2016 by asset category are as follows ($ in millions):
|
|
|
Quoted Prices in Active Markets for Identical Assets (Level 1) |
|
|
Significant Other Observable Inputs (Level 2) |
|
|
Significant Unobservable Inputs (Level 3) |
|
|
Total |
|
||||
|
Assets |
|
|
|
|
|
|
|
|
|
|
|
|
|
|
|
|
|
Investment funds |
|
|
|
|
|
|
|
|
|
|
|
|
|
|
|
|
|
U.S. equities |
|
$ |
41.5 |
|
|
$ |
- |
|
|
$ |
- |
|
|
$ |
41.5 |
|
|
International equities |
|
|
244.4 |
|
|
|
- |
|
|
|
- |
|
|
|
244.4 |
|
|
Other equity securities |
|
|
87.4 |
|
|
|
- |
|
|
|
- |
|
|
|
87.4 |
|
|
Equity securities |
|
$ |
373.3 |
|
|
$ |
- |
|
|
$ |
- |
|
|
$ |
373.3 |
|
|
|
|
|
|
|
|
|
|
|
|
|
|
|
|
|
|
|
|
U.S. Treasury bonds |
|
$ |
- |
|
|
$ |
23.6 |
|
|
$ |
- |
|
|
$ |
23.6 |
|
|
Bonds and bond funds |
|
|
- |
|
|
|
684.8 |
|
|
|
- |
|
|
|
684.8 |
|
|
Other debt securities |
|
|
- |
|
|
|
8.3 |
|
|
|
- |
|
|
|
8.3 |
|
|
Debt securities |
|
$ |
- |
|
|
$ |
716.7 |
|
|
$ |
- |
|
|
$ |
716.7 |
|
|
Other investments |
|
|
|
|
|
|
|
|
|
|
|
|
|
|
|
|
|
Other |
|
|
- |
|
|
|
3.9 |
|
|
|
- |
|
|
|
3.9 |
|
|
Total assets |
|
$ |
373.3 |
|
|
$ |
720.6 |
|
|
$ |
- |
|
|
$ |
1,093.9 |
|
The fair values of the Company’s pension plan assets for continuing operations at December 31, 2015 by asset category are as follows ($ in millions):
|
|
|
Quoted Prices in Active Markets for Identical Assets (Level 1) |
|
|
Significant Other Observable Inputs (Level 2) |
|
|
Significant Unobservable Inputs (Level 3) |
|
|
Total |
|
||||
|
Assets |
|
|
|
|
|
|
|
|
|
|
|
|
|
|
|
|
|
Investment funds |
|
|
|
|
|
|
|
|
|
|
|
|
|
|
|
|
|
U.S. equities |
|
$ |
114.6 |
|
|
$ |
- |
|
|
$ |
- |
|
|
$ |
114.6 |
|
|
International equities |
|
|
151.3 |
|
|
|
- |
|
|
|
- |
|
|
|
151.3 |
|
|
Other equity securities |
|
|
99.1 |
|
|
|
- |
|
|
|
- |
|
|
|
99.1 |
|
|
Equity securities |
|
$ |
365.0 |
|
|
$ |
- |
|
|
$ |
- |
|
|
$ |
365.0 |
|
|
|
|
|
|
|
|
|
|
|
|
|
|
|
|
|
|
|
|
U.S. Treasury bonds |
|
$ |
- |
|
|
$ |
120.6 |
|
|
$ |
- |
|
|
$ |
120.6 |
|
|
Bonds and bond funds |
|
|
- |
|
|
|
490.7 |
|
|
|
- |
|
|
|
490.7 |
|
|
Other debt securities |
|
|
- |
|
|
|
60.0 |
|
|
|
- |
|
|
|
60.0 |
|
|
Debt securities |
|
$ |
- |
|
|
$ |
671.3 |
|
|
$ |
- |
|
|
$ |
671.3 |
|
|
Other investments |
|
|
|
|
|
|
|
|
|
|
|
|
|
|
|
|
|
Other |
|
|
- |
|
|
|
14.8 |
|
|
|
- |
|
|
|
14.8 |
|
|
Total assets |
|
$ |
365.0 |
|
|
$ |
686.1 |
|
|
$ |
- |
|
|
$ |
1,051.1 |
|
F-55
The assets of the pension plan are held in separately administered trusts. The investment guidelines for the Company’s pension plans is to create an asset allocation that is expected to deliver a rate of return sufficient to meet the long-term obligation of the plan, given an acceptable level of risk. The target investment portfolio of the Company’s continuing operations pension plans is allocated as follows:
|
|
|
Target Allocation as of December 31, |
|
|||||
|
|
|
2016 |
|
|
2015(1) |
|
||
|
Bonds |
|
|
68.3 |
% |
|
|
35.0 |
% |
|
Equity securities |
|
|
31.5 |
% |
|
|
62.5 |
% |
|
Other investments |
|
|
0.2 |
% |
|
|
2.5 |
% |
|
(1) |
Includes the asset allocation of the Allergan Plans following the Allergan Acquisition on March 17, 2015. |
Expected Contributions
Employer contributions to the pension plan during the year ending December 31, 2017 are expected to be $4.9 million for continuing operations.
Expected Benefit Payments
Total expected benefit payments for the Company’s continuing operations pension plans are as follows ($ in millions):
|
2017 |
|
$ |
32.0 |
|
|
2018 |
|
|
34.0 |
|
|
2019 |
|
|
36.3 |
|
|
2020 |
|
|
38.4 |
|
|
2021 |
|
|
40.7 |
|
|
Thereafter |
|
|
1,052.7 |
|
|
Total liability |
|
$ |
1,234.1 |
|
Expected benefit payments are based on the same assumptions used to measure the benefit obligations and include estimated future employee service. The majority of the payments will be paid from plan assets and not Company assets.
Information for continuing operations defined benefit plans with an accumulated benefit obligation in excess of plan assets is presented below ($ in millions):
|
|
|
Defined Benefit as of December 31, |
|
|||||
|
|
|
2016 |
|
|
2015 |
|
||
|
Projected benefit obligations |
|
$ |
1,234.1 |
|
|
$ |
1,188.5 |
|
|
Accumulated benefit obligations |
|
$ |
1,220.1 |
|
|
$ |
1,054.6 |
|
|
Plan assets |
|
$ |
1,093.9 |
|
|
$ |
1,051.1 |
|
Amounts Recognized in Other Comprehensive Income / (Loss)
Net loss / gain amounts reflect experience differentials primarily relating to differences between expected and actual returns on plan assets as well as the effects of changes in actuarial assumptions. Net loss amounts in excess of certain thresholds are amortized into net pension cost over the average remaining service life of employees. Balances recognized within accumulated other comprehensive income/(loss) that have not been recognized as components of net periodic benefit costs are as follows ($ in millions):
|
|
|
Defined Benefit |
|
|
|
Balance as of December 31, 2014 |
|
$ |
(30.8 |
) |
|
Net actuarial gain |
|
|
101.2 |
|
|
Balance as of December 31, 2015 |
|
|
70.4 |
|
|
Net actuarial loss |
|
|
(46.0 |
) |
|
Balance as of December 31, 2016 |
|
$ |
24.4 |
|
F-56
The weighted average assumptions used to calculate the projected benefit obligations of the Company’s defined benefit plans, including assets and liabilities held for sale, are as follows:
|
|
|
As of December 31, |
|
|||||
|
|
|
2016 |
|
|
2015 |
|
||
|
Discount rate |
|
|
3.3 |
% |
|
|
3.8 |
% |
|
Salary growth rate |
|
|
3.0 |
% |
|
|
3.7 |
% |
The weighted average assumptions used to calculate the net periodic benefit cost of the Company’s defined benefit plans, including assets and liabilities held for sale, are as follows:
|
|
|
As of December 31, |
|
|||||
|
|
|
2016 |
|
|
2015 |
|
||
|
Discount rate |
|
|
3.8 |
% |
|
|
3.5 |
% |
|
Expected rate of return on plan assets |
|
|
5.1 |
% |
|
|
4.6 |
% |
|
Salary growth rate |
|
|
3.0 |
% |
|
|
3.5 |
% |
In order to select a discount rate for purposes of valuing the plan obligations the Company uses market returns and adjusts them as needed to fit the estimated duration of the plan liabilities.
The expected rate of return represents the average rate of return to be earned on plan assets over the period the benefits included in the benefit obligation are to be paid. In developing the expected rate of return, long-term historical returns data are considered as well as actual returns on the plan assets and other capital markets experience. Using this reference information, the long-term return expectations for each asset category and a weighted average expected return was developed, according to the allocation among those investment categories.
Other Post-Employment Benefit Plans
As a result of the Allergan and Forest acquisitions, the Company assumed post-retirement benefit plans. Accumulated benefit obligation and asset data for the defined benefit plans, were as follows ($ in millions):
|
Accumulated benefit obligation as of December 31, 2014 |
|
$ |
20.5 |
|
|
Accumulated benefit obligation assumed as part of the Allergan Acquisition |
|
|
60.2 |
|
|
Interest cost |
|
|
(2.3 |
) |
|
Actuarial gain |
|
|
(26.3 |
) |
|
Benefits paid |
|
|
(2.0 |
) |
|
Accumulated benefit obligation as of December 31, 2015 |
|
$ |
50.1 |
|
|
Service cost |
|
|
0.3 |
|
|
Interest cost |
|
|
2.1 |
|
|
Actuarial charge |
|
|
3.6 |
|
|
Benefits paid |
|
|
(3.4 |
) |
|
Accumulated benefit obligation as of December 31, 2016 |
|
$ |
52.7 |
|
Savings Plans
The Company also maintains certain defined contribution savings plans covering substantially all U.S.-based employees. The Company contributes to the plans based upon the employee contributions. The Company’s contributions to these retirement plans for amounts included in continuing operations were $75.6 million, $26.6 million and $35.0 million in the years ended December 31, 2016, 2015 and 2014, respectively. The Company’s contributions to these retirement plans for amounts included in income from discontinued operations were $23.6 million and $31.0 million in the years ended 2015 and 2014, respectively.
F-57
NOTE 10 — Other Income (Expense)
Other income (expense) consisted of the following ($ in millions):
|
|
|
Years Ended December 31, |
|
|||||||||
|
|
|
2016 |
|
|
2015 |
|
|
2014 |
|
|||
|
Pfizer termination fee |
|
$ |
150.0 |
|
|
$ |
- |
|
|
$ |
- |
|
|
Dividend income |
|
|
68.2 |
|
|
|
- |
|
|
|
- |
|
|
Bridge loan commitment fee |
|
|
- |
|
|
|
(264.9 |
) |
|
|
(73.6 |
) |
|
Interest rate lock |
|
|
- |
|
|
|
31.0 |
|
|
|
- |
|
|
Extinguishment of debt |
|
|
- |
|
|
|
- |
|
|
|
29.9 |
|
|
Other (expense) income |
|
|
1.0 |
|
|
|
0.1 |
|
|
|
16.4 |
|
|
Other (expense) income, net |
|
$ |
219.2 |
|
|
$ |
(233.8 |
) |
|
$ |
(27.3 |
) |
Pfizer termination fee
On November 23, 2015, the Company announced that it entered into a definitive merger agreement (the “Pfizer Agreement”) under which Pfizer Inc. (“Pfizer”), a global innovative biopharmaceutical company, and Allergan plc would merge in a stock and cash transaction. On April 6, 2016, the Company announced that its merger agreement with Pfizer was terminated by mutual agreement. In connection with the termination of the merger agreement, Pfizer has paid Allergan plc $150.0 million for expenses associated with the transaction which is included as a component of other income (expense) during the year ended December 31, 2016.
Dividend income
As a result of the Teva Transaction, the Company acquired 100.3 million Teva ordinary shares. During year ended December 31, 2016, the Company received dividend income of $68.2 million.
Bridge Loan Commitment Fee
During the year ended December 31, 2015, in connection with the Allergan Acquisition, we incurred costs associated with bridge loan commitments of $264.9 million.
During the year ended December 31, 2014, the Company recognized an expense of $47.8 million associated with the Allergan Acquisition bridge and term loan financing commitment fees. In connection with the Forest Acquisition, we secured a bridge loan commitment of up to $7.0 billion and incurred associated commitment costs of $25.8 million, which have been expensed in full.
Interest rate lock
During the year ended December 31, 2015, the Company entered into interest rate locks on a portion of the $21.0 billion of debt issued as part of the Allergan Acquisition. As a result of the interest rate locks, the Company recorded income of $31.0 million.
Extinguishment of Debt
On July 21, 2014, the Company redeemed the WC Notes (defined below) for $1,311.8 million, which included a make-whole premium of $61.8 million and the principal amount of the WC Notes of $1,250.0 million. As a result of the transaction, the Company recognized a gain of $29.9 million, which includes the write-off of the then outstanding unamortized premium.
NOTE 11 — Inventories
Inventories consist of finished goods held for sale and distribution, raw materials and work-in-process. Inventories are stated at the lower of cost (first-in, first-out method) or market (net realizable value). The Company writes down inventories to net realizable value based on forecasted demand, market conditions or other factors, which may differ from actual results.
F-58
Inventories consisted of the following ($ in millions):
|
|
|
December 31, |
|
|
December 31, |
|
||
|
|
|
2016 |
|
|
2015 |
|
||
|
Raw materials |
|
$ |
297.1 |
|
|
$ |
242.4 |
|
|
Work-in-process |
|
|
145.4 |
|
|
|
149.7 |
|
|
Finished goods |
|
|
357.7 |
|
|
|
451.9 |
|
|
|
|
|
800.2 |
|
|
|
844.0 |
|
|
Less: inventory reserves |
|
|
82.2 |
|
|
|
86.5 |
|
|
Total Inventories |
|
$ |
718.0 |
|
|
$ |
757.5 |
|
NOTE 12 — Accounts payable and accrued expenses
Accounts payable and accrued expenses consisted of the following ($ in millions):
|
|
|
December 31, 2016 |
|
|
December 31, 2015 |
|
||
|
Accrued expenses: |
|
|
|
|
|
|
|
|
|
Accrued third-party rebates |
|
$ |
1,595.5 |
|
|
$ |
1,281.6 |
|
|
Accrued payroll and related benefits |
|
|
543.5 |
|
|
|
401.0 |
|
|
Contractual commitments |
|
|
264.9 |
|
|
|
- |
|
|
Accrued pharmaceutical fees |
|
|
221.3 |
|
|
|
162.2 |
|
|
Current portion of contingent consideration obligations |
|
|
511.0 |
|
|
|
79.9 |
|
|
Accrued returns |
|
|
295.9 |
|
|
|
288.4 |
|
|
Interest payable |
|
|
294.2 |
|
|
|
312.0 |
|
|
Royalties payable |
|
|
146.6 |
|
|
|
119.1 |
|
|
Litigation-related reserves and legal fees |
|
|
101.1 |
|
|
|
191.7 |
|
|
Accrued R&D expenditures |
|
|
154.0 |
|
|
|
384.1 |
|
|
Accrued severance, retention and other shutdown costs |
|
|
86.2 |
|
|
|
108.5 |
|
|
Accrued non-provision taxes |
|
|
55.0 |
|
|
|
98.1 |
|
|
Accrued selling and marketing expenditures |
|
|
95.9 |
|
|
|
127.2 |
|
|
Dividends payable |
|
|
23.2 |
|
|
|
24.0 |
|
|
Other accrued expenses |
|
|
405.8 |
|
|
|
354.9 |
|
|
Total accrued expenses |
|
$ |
4,794.1 |
|
|
$ |
3,932.7 |
|
|
Accounts payable |
|
|
224.9 |
|
|
|
215.9 |
|
|
Total Accounts Payable and Accrued Expenses |
|
$ |
5,019.0 |
|
|
$ |
4,148.6 |
|
F-59
NOTE 13 — Property, plant and equipment, net
Property, plant and equipment, net consisted of the following as of December 31, 2016 and 2015 ($ in millions):
|
|
|
Machinery and Equipment |
|
|
Research and Laboratory Equipment |
|
|
Transportation / Other |
|
|
Land, Buildings and Leasehold Improvements |
|
|
Construction in Progress |
|
|
Total |
|
||||||
|
At December 31, 2015 |
|
$ |
1,231.7 |
|
|
$ |
171.9 |
|
|
$ |
596.0 |
|
|
$ |
1,439.9 |
|
|
$ |
578.4 |
|
|
$ |
4,017.9 |
|
|
Additions |
|
|
55.1 |
|
|
|
4.9 |
|
|
|
25.7 |
|
|
|
8.7 |
|
|
|
237.0 |
|
|
|
331.4 |
|
|
Additions due to acquisitions |
|
|
- |
|
|
|
- |
|
|
|
5.0 |
|
|
|
- |
|
|
|
- |
|
|
|
5.0 |
|
|
Disposals/transfers/impairments |
|
|
(846.5 |
) |
|
|
(127.4 |
) |
|
|
(239.6 |
) |
|
|
(741.7 |
) |
|
|
(368.5 |
) |
|
|
(2,323.7 |
) |
|
Currency translation |
|
|
(3.2 |
) |
|
|
(0.6 |
) |
|
|
(5.7 |
) |
|
|
(1.6 |
) |
|
|
(0.8 |
) |
|
|
(11.9 |
) |
|
At December 31, 2016 |
|
$ |
437.1 |
|
|
$ |
48.8 |
|
|
$ |
381.4 |
|
|
$ |
705.3 |
|
|
$ |
446.1 |
|
|
$ |
2,018.7 |
|
|
Accumulated depreciation |
|
|
|
|
|
|
|
|
|
|
|
|
|
|
|
|
|
|
|
|
|
|
|
|
|
At December 31, 2015 |
|
$ |
442.2 |
|
|
$ |
130.1 |
|
|
$ |
316.5 |
|
|
$ |
199.6 |
|
|
$ |
- |
|
|
$ |
1,088.4 |
|
|
Additions |
|
|
56.2 |
|
|
|
5.8 |
|
|
|
66.4 |
|
|
|
27.4 |
|
|
|
- |
|
|
|
155.8 |
|
|
Disposals/transfers/impairments |
|
|
(349.3 |
) |
|
|
(111.5 |
) |
|
|
(215.9 |
) |
|
|
(151.7 |
) |
|
|
- |
|
|
|
(828.4 |
) |
|
Currency translation |
|
|
(0.7 |
) |
|
|
(0.4 |
) |
|
|
(2.5 |
) |
|
|
(4.8 |
) |
|
|
- |
|
|
|
(8.4 |
) |
|
At December 31, 2016 |
|
$ |
148.4 |
|
|
$ |
24.0 |
|
|
$ |
164.5 |
|
|
$ |
70.5 |
|
|
$ |
- |
|
|
$ |
407.4 |
|
The net book value of property, plant and equipment reflected in continuing operations and discontinued operations as of December 31, 2016 and 2015 consisted of the following ($ in millions):
|
|
|
Machinery and Equipment |
|
|
Research and Laboratory Equipment |
|
|
Transportation / Other |
|
|
Land, Buildings and Leasehold Improvements |
|
|
Construction in Progress |
|
|
Total |
|
||||||
|
At December 31, 2015 |
|
$ |
789.5 |
|
|
$ |
41.8 |
|
|
$ |
279.5 |
|
|
$ |
1,240.3 |
|
|
$ |
578.4 |
|
|
$ |
2,929.5 |
|
|
Continuing Operations |
|
$ |
253.4 |
|
|
$ |
17.8 |
|
|
$ |
186.7 |
|
|
$ |
652.1 |
|
|
$ |
421.3 |
|
|
$ |
1,531.3 |
|
|
Discontinued Operations |
|
$ |
536.1 |
|
|
$ |
24.0 |
|
|
$ |
92.8 |
|
|
$ |
588.2 |
|
|
$ |
157.1 |
|
|
$ |
1,398.2 |
|
|
|
|
|
|
|
|
|
|
|
|
|
|
|
|
|
|
|
|
|
|
|
|
|
|
|
|
At December 31, 2016 |
|
$ |
288.7 |
|
|
$ |
24.7 |
|
|
$ |
216.9 |
|
|
$ |
634.8 |
|
|
$ |
446.2 |
|
|
$ |
1,611.3 |
|
Depreciation expense for continuing operations was $153.7 million, $124.6 million and $67.8 million in the years ended December 31, 2016, 2015 and 2014, respectively.
NOTE 14 — Investments and Other Assets..
Prepaid expenses and other current assets consisted of the following ($ in millions):
|
|
|
December 31, 2016 |
|
|
December 31, 2015 |
|
||
|
Prepaid taxes |
|
$ |
957.4 |
|
|
$ |
240.5 |
|
|
Prepaid insurance |
|
|
25.7 |
|
|
|
24.1 |
|
|
Royalty receivables |
|
|
94.3 |
|
|
|
13.8 |
|
|
Sales and Marketing |
|
|
42.5 |
|
|
|
36.7 |
|
|
Other |
|
|
263.5 |
|
|
|
180.2 |
|
|
Total prepaid expenses and other current assets |
|
$ |
1,383.4 |
|
|
$ |
495.3 |
|
F-60
Investments in marketable securities, including those classified in cash and cash equivalents due to the maturity term of the instrument, other investments and other assets consisted of the following ($ in millions):
|
|
|
December 31, 2016 |
|
|
December 31, 2015 |
|
||
|
Marketable securities: |
|
|
|
|
|
|
|
|
|
Short-term investments |
|
$ |
8,062.3 |
|
|
$ |
9.3 |
|
|
Teva shares |
|
|
3,439.2 |
|
|
|
- |
|
|
Total marketable securities |
|
$ |
11,501.5 |
|
|
$ |
9.3 |
|
|
Investments and other assets: |
|
|
|
|
|
|
|
|
|
Legacy Allergan Deferred executive compensation investments |
|
$ |
111.7 |
|
|
$ |
118.1 |
|
|
Equity method investments |
|
|
12.8 |
|
|
|
17.3 |
|
|
Cost method investments |
|
|
15.0 |
|
|
|
16.7 |
|
|
Other long-term investments |
|
|
67.2 |
|
|
|
78.2 |
|
|
Taxes receivable |
|
|
36.0 |
|
|
|
39.6 |
|
|
Other assets |
|
|
39.4 |
|
|
|
138.8 |
|
|
Total investments and other assets |
|
$ |
282.1 |
|
|
$ |
408.7 |
|
The Company’s marketable securities and other long-term investments are classified as available-for-sale and are recorded at fair value based on quoted market prices using the specific identification method. These investments are classified as either current or non-current, as appropriate, in the Company’s consolidated balance sheets.
Investments in securities as of December 31, 2016 included the following:
|
|
|
Investments in Securities as of December 31, 2016: |
|
|||||||||||||||||||||||||||
|
Level 1 |
|
Carrying amount |
|
|
Unrecognized gain |
|
|
Unrecognized loss |
|
|
Estimated fair value |
|
|
Cash & cash equivalents |
|
|
Marketable securities |
|
||||||||||||
|
Money market funds |
|
$ |
|
1,238.9 |
|
|
$ |
- |
|
|
$ |
- |
|
|
$ |
|
1,238.9 |
|
|
$ |
|
1,238.9 |
|
|
$ |
- |
|
|||
|
Total |
|
$ |
|
1,238.9 |
|
|
$ |
- |
|
|
$ |
- |
|
|
$ |
|
1,238.9 |
|
|
$ |
|
1,238.9 |
|
|
$ |
- |
|
|||
|
|
|
|
|
|
|
|
|
|
|
|
|
|
|
|
|
|
|
|
|
|
|
|
|
|
|
|
|
|
|
|
|
Level 2 |
|
Carrying amount |
|
|
Unrecognized gain |
|
|
Unrecognized loss |
|
|
Estimated fair value |
|
|
Cash & cash equivalents |
|
|
Marketable securities |
|
||||||||||||
|
Commercial paper |
|
$ |
|
3,909.7 |
|
|
$ |
|
0.2 |
|
|
$ |
- |
|
|
$ |
|
3,909.9 |
|
|
$ |
- |
|
|
$ |
|
3,909.9 |
|
||
|
Investment in Teva ordinary shares |
|
|
|
5,038.6 |
|
|
|
- |
|
|
|
|
(1,599.4 |
) |
|
|
|
3,439.2 |
|
|
|
- |
|
|
|
|
3,439.2 |
|
||
|
Certificates of deposit |
|
|
|
4,152.4 |
|
|
|
- |
|
|
|
- |
|
|
|
|
4,152.4 |
|
|
|
- |
|
|
|
|
4,152.4 |
|
|||
|
Total |
|
$ |
|
13,100.7 |
|
|
$ |
|
0.2 |
|
|
$ |
|
(1,599.4 |
) |
|
$ |
|
11,501.5 |
|
|
$ |
- |
|
|
$ |
|
11,501.5 |
|
|
Fair value is the price that would be received to sell an asset or paid to transfer a liability (an exit price) in an orderly transaction between market participants. Fair values are determined based on Fair Value Leveling.
Marketable securities and investments consist of available-for-sale investments in U.S. treasury and agency securities and debt and equity securities of publicly traded companies for which market prices are readily available. Unrealized gains or losses on marketable securities and investments are recorded in accumulated other comprehensive (loss) / income. Realized gains or losses on marketable securities and investments are recorded in interest income. The Company’s marketable securities and other long-term investments are classified as available-for-sale and are recorded at fair value based on quoted market prices using the specific identification method. These investments are classified as either current or non-current, as appropriate, in the Company’s consolidated balance sheets. The Company may sell certain of its marketable securities prior to their stated maturities for strategic reasons including, but not limited to, anticipation of credit deterioration and maturity management.
The Company considers the declines in market value of its marketable securities investment portfolio to be temporary in nature. The Company typically invests in highly-rated securities, and its investment policy generally limits the amount of credit exposure to any one issuer. The policy requires investments to be investment grade, with the primary objective of minimizing the potential risk of principal loss. Fair values were determined for each individual security in the investment portfolio.
F-61
The movements in long-term investments were as follows ($ in millions):
|
|
|
Equity Method Investments |
|
|
Cost Method and Other Long-term Investments |
|
||
|
Balance at December 31, 2015 |
|
$ |
17.3 |
|
|
$ |
94.9 |
|
|
Additions |
|
|
- |
|
|
|
- |
|
|
Other |
|
|
(4.5 |
) |
|
|
(12.7 |
) |
|
Balance at December 31, 2016 |
|
$ |
12.8 |
|
|
$ |
82.2 |
|
Other Assets
Other assets include security and equipment deposits and long-term receivables.
NOTE 15 — Goodwill, Product Rights and Other Intangible Assets
Goodwill
During 2016, there was a strategic shift in the business to streamline our operations. Under the new organizational structure being reported, the Company organized its business into the following segments: US Specialized Therapeutics, US General Medicine and International. The Company recast goodwill by segment as a result of this change.
Goodwill for the Company’s reporting segments consisted of the following ($ in millions):
|
|
|
US Brands |
|
|
US Medical Aesthetics |
|
|
US Specialized Therapeutics |
|
|
US General Medicine |
|
|
International |
|
|
Total |
|
||||||
|
Balance as of December 31, 2015 |
|
$ |
36,107.5 |
|
|
$ |
4,006.7 |
|
|
$ |
- |
|
|
$ |
- |
|
|
$ |
6,351.0 |
|
|
$ |
46,465.2 |
|
|
Allocation to current segments |
|
|
(36,107.5 |
) |
|
|
(4,006.7 |
) |
|
|
18,347.2 |
|
|
|
21,340.5 |
|
|
|
426.5 |
|
|
|
0.0 |
|
|
Additions through acquisitions |
|
|
- |
|
|
|
- |
|
|
|
86.0 |
|
|
|
112.7 |
|
|
|
- |
|
|
|
198.7 |
|
|
Foreign exchange and other adjustments |
|
|
- |
|
|
|
- |
|
|
|
- |
|
|
|
(26.6 |
) |
|
|
(281.2 |
) |
|
|
(307.8 |
) |
|
Balance as of December 31, 2016 |
|
$ |
- |
|
|
$ |
- |
|
|
$ |
18,433.2 |
|
|
$ |
21,426.6 |
|
|
$ |
6,496.3 |
|
|
$ |
46,356.1 |
|
As of December 31, 2016 and 2015, the gross balance of goodwill, pre-impairments, was and $46,373.4 million and $46,482.5 million, respectively.
The following items had a significant impact on goodwill in the year ended December 31, 2016:
|
|
• |
An increase in goodwill of $112.7 million resulting from the Tobira Acquisition. |
|
|
• |
An increase in goodwill of $34.4 million resulting from the Vitae Acquisition. |
|
|
• |
An increase in goodwill of $51.6 million resulting from the ForSight Acquisition. |
F-62
Product Rights and Other Intangible Assets
Product rights and other intangible assets consisted of the following for the years ended December 31, 2016 and 2015 ($ in millions):
|
Cost Basis |
|
Balance as of December 31, 2015 |
|
|
Acquisitions |
|
|
Impairments |
|
|
IPR&D to CMP Transfers |
|
|
Disposals/ Held for Sale/ Other |
|
|
Foreign Currency Translation |
|
|
Balance as of December 31, 2016 |
|
|||||||
|
Intangibles with definite lives: |
|
|
|
|
|
|
|
|
|
|
|
|
|
|
|
|
|
|
|
|
|
|
|
|
|
|
|
|
|
Product rights and other related intangibles |
|
$ |
64,366.0 |
|
|
$ |
43.6 |
|
|
$ |
- |
|
|
$ |
3,809.9 |
|
|
$ |
(194.6 |
) |
|
$ |
(223.5 |
) |
|
$ |
67,801.4 |
|
|
Trade name |
|
|
690.0 |
|
|
|
- |
|
|
|
- |
|
|
|
- |
|
|
|
- |
|
|
|
- |
|
|
|
690.0 |
|
|
Total definite-lived intangible assets |
|
$ |
65,056.0 |
|
|
$ |
43.6 |
|
|
$ |
- |
|
|
$ |
3,809.9 |
|
|
$ |
(194.6 |
) |
|
$ |
(223.5 |
) |
|
$ |
68,491.4 |
|
|
Intangibles with indefinite lives: |
|
|
|
|
|
|
|
|
|
|
|
|
|
|
|
|
|
|
|
|
|
|
|
|
|
|
|
|
|
IPR&D |
|
$ |
11,128.2 |
|
|
$ |
2,223.5 |
|
|
$ |
(743.9 |
) |
|
$ |
(3,809.9 |
) |
|
$ |
(22.5 |
) |
|
$ |
(17.1 |
) |
|
$ |
8,758.3 |
|
|
Total indefinite- lived intangible assets |
|
$ |
11,128.2 |
|
|
$ |
2,223.5 |
|
|
$ |
(743.9 |
) |
|
$ |
(3,809.9 |
) |
|
$ |
(22.5 |
) |
|
$ |
(17.1 |
) |
|
$ |
8,758.3 |
|
|
Total product rights and related intangibles |
|
$ |
76,184.2 |
|
|
$ |
2,267.1 |
|
|
$ |
(743.9 |
) |
|
$ |
- |
|
|
$ |
(217.1 |
) |
|
$ |
(240.6 |
) |
|
$ |
77,249.7 |
|
|
Accumulated Amortization |
|
Balance as of December 31, 2015 |
|
|
Amortization |
|
|
Impairments |
|
|
Disposals/ Held for Sale/ Other |
|
|
Foreign Currency Translation |
|
|
Balance as of December 31, 2016 |
|
||||||
|
Intangibles with definite lives: |
|
|
|
|
|
|
|
|
|
|
|
|
|
|
|
|
|
|
|
|
|
|
|
|
|
Product rights and other related intangibles |
|
$ |
(8,288.5 |
) |
|
$ |
(6,392.7 |
) |
|
$ |
(28.9 |
) |
|
$ |
176.8 |
|
|
$ |
39.4 |
|
|
$ |
(14,493.9 |
) |
|
Trade name |
|
|
(59.5 |
) |
|
|
(77.7 |
) |
|
|
- |
|
|
- |
|
|
|
- |
|
|
|
(137.2 |
) |
|
|
Total definite-lived intangible assets |
|
$ |
(8,348.0 |
) |
|
$ |
(6,470.4 |
) |
|
$ |
(28.9 |
) |
|
$ |
176.8 |
|
|
$ |
39.4 |
|
|
$ |
(14,631.1 |
) |
|
Total product rights and related intangibles |
|
$ |
(8,348.0 |
) |
|
$ |
(6,470.4 |
) |
|
$ |
(28.9 |
) |
|
$ |
176.8 |
|
|
$ |
39.4 |
|
|
$ |
(14,631.1 |
) |
|
Net Product Rights and Other Intangibles |
|
$ |
67,836.2 |
|
|
|
|
|
|
|
|
|
|
|
|
|
|
|
|
|
|
$ |
62,618.6 |
|
The following items had a significant impact on net product rights and other intangibles in the year ended December 31, 2016:
|
|
• |
The Company acquired $1,357.0 million in IPR&D assets in connection with the Tobira Acquisition; |
|
|
• |
The Company acquired $686.0 million in IPR&D assets in connection with the Vitae Acquisition; |
|
|
• |
The Company acquired $158.0 million in IPR&D assets in connection with the ForSight Acquisition; |
|
|
• |
The Company recognized approximately $210.0 million in impairments relating to a urology product acquired in the Allergan Acquisition due to clinical data not supporting continuation of the R&D study. This impairment was offset, in part, by a reduction of contingent liability of $186.0 million which reduced overall R&D expenses; |
|
|
• |
The Company recognized approximately $106 million in impairments relating to a migraine treatment acquired in the Allergan Acquisition based on a decrease in projected cash flows due to a delay in potential launch; |
|
|
• |
The Company recognized approximately $46.0 million in impairments relating to the atopic dermatitis pipeline candidate acquired in the Vitae Acquisition; |
|
|
• |
The Company recognized approximately $33.0 million in impairments of the acquired ForSight IPR&D asset as the Company anticipates a delay in potential launch timing, if any. Offsetting this impairment was a corresponding reduction of acquired contingent consideration of $15.0 million, which reduced overall R&D expenses; |
F-63
|
|
• |
The Company recognized approximately $42.0 million in IPR&D impairments on a gastroenterology project based on the lack of future availability of active pharmaceutical ingredients; |
|
|
• |
The Company recognized approximately $190.0 million in IPR&D impairments due to the termination of an osteoarthritis R&D project due to clinical results; |
|
|
• |
The Company impaired IPR&D assets relating to an international eye care pipeline project of $35.0 million based on a decrease in projected cash flows due to market conditions; |
|
|
• |
The Company impaired IPR&D assets of $40.0 million for a Botox® premature ejaculation product based on a decrease in projected cash flows; |
|
|
• |
The Company recognized $24.0 million in IPR&D impairments relating to the termination of a women’s healthcare R&D project due to clinical results; and |
|
|
• |
During the year ended December 31, 2016, the Company reclassified certain intangible assets from IPR&D to CMP primarily related to Restasis®, Belkyra® (Kybella®), XEN45, Optive®,Taytulla™, Aczone®, Juvederm®, Dalvance® and Botox®. |
Product rights and other intangible assets consisted of the following for the years ended December 31, 2015 and 2014 ($ in millions):
|
Cost Basis |
|
Balance as of December 31, 2014 |
|
|
Acquisitions |
|
|
Impairments |
|
|
IPR&D to CMP Transfers |
|
|
Disposals/ Held for Sale/ Other |
|
|
Foreign Currency Translation |
|
|
Balance as of December 31, 2015 |
|
|||||||
|
Intangibles with definite lives: |
|
|
|
|
|
|
|
|
|
|
|
|
|
|
|
|
|
|
|
|
|
|
|
|
|
|
|
|
|
Product rights and other related intangibles |
|
$ |
15,127.5 |
|
|
$ |
47,163.8 |
|
|
$ |
(242.2 |
) |
|
$ |
3,128.5 |
|
|
$ |
(975.5 |
) |
|
$ |
163.9 |
|
|
$ |
64,366.0 |
|
|
Trade name |
|
|
- |
|
|
|
690.0 |
|
|
|
- |
|
|
|
- |
|
|
|
- |
|
|
|
- |
|
|
|
690.0 |
|
|
Total definite-lived intangible assets |
|
$ |
15,127.5 |
|
|
$ |
47,853.8 |
|
|
$ |
(242.2 |
) |
|
$ |
3,128.5 |
|
|
$ |
(975.5 |
) |
|
$ |
163.9 |
|
|
$ |
65,056.0 |
|
|
Intangibles with indefinite lives: |
|
|
|
|
|
|
|
|
|
|
|
|
|
|
|
|
|
|
|
|
|
|
|
|
|
|
|
|
|
IPR&D |
|
$ |
4,116.4 |
|
|
$ |
10,714.4 |
|
|
$ |
(511.6 |
) |
|
$ |
(3,128.5 |
) |
|
$ |
(38.8 |
) |
|
$ |
(23.7 |
) |
|
$ |
11,128.2 |
|
|
Trade name |
|
|
- |
|
|
|
- |
|
|
|
- |
|
|
|
- |
|
|
|
- |
|
|
|
- |
|
|
|
- |
|
|
Total indefinite- lived intangible assets |
|
$ |
4,116.4 |
|
|
$ |
10,714.4 |
|
|
$ |
(511.6 |
) |
|
$ |
(3,128.5 |
) |
|
$ |
(38.8 |
) |
|
$ |
(23.7 |
) |
|
$ |
11,128.2 |
|
|
Total product rights and related intangibles |
|
$ |
19,243.9 |
|
|
$ |
58,568.2 |
|
|
$ |
(753.8 |
) |
|
$ |
- |
|
|
$ |
(1,014.3 |
) |
|
$ |
140.2 |
|
|
$ |
76,184.2 |
|
|
Accumulated Amortization |
|
Balance as of December 31, 2014 |
|
|
Amortization |
|
|
Impairments |
|
|
Disposals/ Held for Sale/ Other |
|
|
Foreign Currency Translation |
|
|
Balance as of December 31, 2015 |
|
||||||
|
Intangibles with definite lives: |
|
|
|
|
|
|
|
|
|
|
|
|
|
|
|
|
|
|
|
|
|
|
|
|
|
Product rights and other related intangibles |
|
$ |
(3,258.4 |
) |
|
$ |
(5,384.2 |
) |
|
$ |
(7.5 |
) |
|
$ |
361.7 |
|
|
$ |
(0.1 |
) |
|
$ |
(8,288.5 |
) |
|
Trade name |
|
|
- |
|
|
|
(59.5 |
) |
|
|
- |
|
|
|
- |
|
|
|
- |
|
|
|
(59.5 |
) |
|
Total definite-lived intangible assets |
|
$ |
(3,258.4 |
) |
|
$ |
(5,443.7 |
) |
|
$ |
(7.5 |
) |
|
$ |
361.7 |
|
|
$ |
(0.1 |
) |
|
$ |
(8,348.0 |
) |
|
Total product rights and related intangibles |
|
$ |
(3,258.4 |
) |
|
$ |
(5,443.7 |
) |
|
$ |
(7.5 |
) |
|
$ |
361.7 |
|
|
$ |
(0.1 |
) |
|
$ |
(8,348.0 |
) |
|
Net Product Rights and Other Intangibles |
|
$ |
15,985.5 |
|
|
|
|
|
|
|
|
|
|
|
|
|
|
|
|
|
|
$ |
67,836.2 |
|
F-64
The following items had a significant impact on net product rights and other intangibles in the year ended December 31, 2015:
|
|
• |
The Company acquired intangible assets in connection with the Allergan Acquisition of $54,750.5 million, including product rights and other related intangibles, trade name and IPR&D assets of $44,360.5 million, $690.0 million, and $9,700.0 million, respectively; |
|
|
• |
The Company acquired IPR&D assets of $286.0 million in connection with the Oculeve Acquisition; |
|
|
• |
The Company acquired CMP and IPR&D assets of $2,120.0 million and $320.0 million, respectively, in connection with the Kythera Acquisition; |
|
|
• |
The Company acquired CMP and IPR&D assets of $221.0 million and $302.0 million, respectively, in connection with the AqueSys Acquisition; |
|
|
• |
The Company acquired CMP and IPR&D assets of $19.5 million and $13.6 million, respectively, in connection with Northwood Acquisition; |
|
|
• |
In the year ended December 31, 2015, the Company divested Doryx® resulting in a reduction of intangible assets of approximately $46.6 million; |
|
|
• |
In the year ended December 31, 2015, the Company recognized $511.6 million in IPR&D impairments which reduced product rights and other intangibles. As part of IPR&D impairments, the Company made the decision to abandon a select IPR&D asset (acquired in connection with the Allergan Acquisition) based on the review of research studies, resulting in an impairment of the full asset value of $300.0 million. The Company recorded an impairment of $192.1 million related to a reduction in cash flows for women’s healthcare portfolio products acquired in the Warner Chilcott Acquisition as planned promotional initiatives on these future products has been reduced. The Company also recorded an impairment of $14.0 million due to the expected delay in the launch of a product acquired as part of the Allergan Acquisition; |
|
|
• |
In the year ended December 31, 2015, the Company recorded an impairment to CMP $206.1 million related to the abandonment of an surgical product line; |
|
|
• |
In the year ended December 31, 2015, the Company wrote off the value of royalty rights that expired in connection with the Respiratory Sale of $38.8 million; and |
|
|
• |
In the year ended December 31, 2015, the Company recognized an out-of-period adjustment in intangible assets relating to the Forest Acquisition of $135.0 million relating to a contract termination. |
Assuming no additions, disposals or adjustments are made to the carrying values and/or useful lives of the intangible assets, continuing operations related to annual amortization expense on product rights and other related intangibles as of December 31, 2016 over each of the next five years is estimated to be as follows ($ in millions):
|
|
|
Amortization Expense |
|
|
|
2017 |
|
$ |
6,624.0 |
|
|
2018 |
|
$ |
6,231.5 |
|
|
2019 |
|
$ |
6,188.7 |
|
|
2020 |
|
$ |
5,963.6 |
|
|
2021 |
|
$ |
5,105.9 |
|
The above amortization expense is an estimate. Actual amounts may change from such estimated amounts due to fluctuations in foreign currency exchange rates, additional intangible asset acquisitions, finalization of preliminary fair value estimate, potential impairments, accelerated amortization or other events.
F-65
NOTE 16 — Long-Term Debt and Leases
Debt consisted of the following ($ in millions):
|
|
|
Balance As of |
|
|
Fair Market Value As of |
|
||||||||||
|
|
|
December 31, 2016 |
|
|
December 31, 2015 |
|
|
December 31, 2016 |
|
|
December 31, 2015 |
|
||||
|
Senior Notes: |
|
|
|
|
|
|
|
|
|
|
|
|
|
|
|
|
|
Floating Rate Notes |
|
|
|
|
|
|
|
|
|
|
|
|
|
|
|
|
|
$500.0 million floating rate notes due September 1, 2016 |
|
$ |
- |
|
|
$ |
500.0 |
|
|
$ |
- |
|
|
$ |
500.5 |
|
|
$500.0 million floating rate notes due March 12, 2018 |
|
|
500.0 |
|
|
|
500.0 |
|
|
|
502.5 |
|
|
|
499.6 |
|
|
$500.0 million floating rate notes due March 12, 2020 |
|
|
500.0 |
|
|
|
500.0 |
|
|
|
509.4 |
|
|
|
496.2 |
|
|
|
|
|
1,000.0 |
|
|
|
1,500.0 |
|
|
|
1,011.9 |
|
|
|
1,496.3 |
|
|
Fixed Rate Notes |
|
|
|
|
|
|
|
|
|
|
|
|
|
|
|
|
|
$800.0 million 5.750% notes due April 1, 2016 |
|
|
- |
|
|
|
800.0 |
|
|
|
- |
|
|
|
808.4 |
|
|
$1,000.0 million 1.850% notes due March 1, 2017 |
|
|
1,000.0 |
|
|
|
1,000.0 |
|
|
|
1,001.1 |
|
|
|
1,001.5 |
|
|
$500.0 million 1.300% notes due June 15, 2017 |
|
|
500.0 |
|
|
|
500.0 |
|
|
|
499.7 |
|
|
|
496.3 |
|
|
$1,200.0 million 1.875% notes due October 1, 2017 |
|
|
1,200.0 |
|
|
|
1,200.0 |
|
|
|
1,202.5 |
|
|
|
1,196.0 |
|
|
$3,000.0 million 2.350% notes due March 12, 2018 |
|
|
3,000.0 |
|
|
|
3,000.0 |
|
|
|
3,018.0 |
|
|
|
3,004.6 |
|
|
$250.0 million 1.350% notes due March 15, 2018 |
|
|
250.0 |
|
|
|
250.0 |
|
|
|
248.4 |
|
|
|
244.9 |
|
|
$1,050.0 million 4.375% notes due February 1, 2019 |
|
|
1,050.0 |
|
|
|
1,050.0 |
|
|
|
1,090.0 |
|
|
|
1,099.5 |
|
|
$500.0 million 2.450% notes due June 15, 2019 |
|
|
500.0 |
|
|
|
500.0 |
|
|
|
501.2 |
|
|
|
494.4 |
|
|
$400.0 million 6.125% notes due August 15, 2019 |
|
|
400.0 |
|
|
|
400.0 |
|
|
|
437.7 |
|
|
|
444.2 |
|
|
$3,500.0 million 3.000% notes due March 12, 2020 |
|
|
3,500.0 |
|
|
|
3,500.0 |
|
|
|
3,541.8 |
|
|
|
3,505.1 |
|
|
$650.0 million 3.375% notes due September 15, 2020 |
|
|
650.0 |
|
|
|
650.0 |
|
|
|
663.6 |
|
|
|
656.6 |
|
|
$750.0 million 4.875% notes due February 15, 2021 |
|
|
750.0 |
|
|
|
750.0 |
|
|
|
803.3 |
|
|
|
807.4 |
|
|
$1,200.0 million 5.000% notes due December 15, 2021 |
|
|
1,200.0 |
|
|
|
1,200.0 |
|
|
|
1,297.7 |
|
|
|
1,299.4 |
|
|
$3,000.0 million 3.450% notes due March 15, 2022 |
|
|
3,000.0 |
|
|
|
3,000.0 |
|
|
|
3,030.7 |
|
|
|
3,006.8 |
|
|
$1,700.0 million 3.250% notes due October 1, 2022 |
|
|
1,700.0 |
|
|
|
1,700.0 |
|
|
|
1,693.1 |
|
|
|
1,669.6 |
|
|
$350.0 million 2.800% notes due March 15, 2023 |
|
|
350.0 |
|
|
|
350.0 |
|
|
|
335.6 |
|
|
|
327.7 |
|
|
$1,200.0 million 3.850% notes due June 15, 2024 |
|
|
1,200.0 |
|
|
|
1,200.0 |
|
|
|
1,211.7 |
|
|
|
1,202.6 |
|
|
$4,000.0 million 3.800% notes due March 15, 2025 |
|
|
4,000.0 |
|
|
|
4,000.0 |
|
|
|
3,995.6 |
|
|
|
3,984.6 |
|
|
$2,500.0 million 4.550% notes due March 15, 2035 |
|
|
2,500.0 |
|
|
|
2,500.0 |
|
|
|
2,458.5 |
|
|
|
2,462.2 |
|
|
$1,000.0 million 4.625% notes due October 1, 2042 |
|
|
1,000.0 |
|
|
|
1,000.0 |
|
|
|
967.6 |
|
|
|
956.1 |
|
|
$1,500.0 million 4.850% notes due June 15, 2044 |
|
|
1,500.0 |
|
|
|
1,500.0 |
|
|
|
1,496.4 |
|
|
|
1,483.6 |
|
|
$2,500.0 million 4.750% notes due March 15, 2045 |
|
|
2,500.0 |
|
|
|
2,500.0 |
|
|
|
2,466.9 |
|
|
|
2,452.7 |
|
|
|
|
|
31,750.0 |
|
|
|
32,550.0 |
|
|
|
31,961.1 |
|
|
|
32,604.2 |
|
|
Total Senior Notes Gross |
|
|
32,750.0 |
|
|
|
34,050.0 |
|
|
|
32,973.0 |
|
|
|
34,100.5 |
|
|
Unamortized premium |
|
|
171.2 |
|
|
|
225.9 |
|
|
|
- |
|
|
|
- |
|
|
Unamortized discount |
|
|
(95.8 |
) |
|
|
(107.4 |
) |
|
|
- |
|
|
|
- |
|
|
Total Senior Notes Net |
|
|
32,825.4 |
|
|
|
34,168.5 |
|
|
|
32,973.0 |
|
|
|
34,100.5 |
|
|
Term Loan Indebtedness: |
|
|
|
|
|
|
|
|
|
|
|
|
|
|
|
|
|
WC Term Loan |
|
|
|
|
|
|
|
|
|
|
|
|
|
|
|
|
|
WC Three Year Tranche variable rate debt maturing October 1, 2016 |
|
|
- |
|
|
|
191.5 |
|
|
|
|
|
|
|
|
|
|
WC Five Year Tranche variable rate debt maturing October 1, 2018 |
|
|
- |
|
|
|
498.8 |
|
|
|
|
|
|
|
|
|
|
|
|
|
- |
|
|
|
690.3 |
|
|
|
|
|
|
|
|
|
|
ACT Term Loan |
|
|
|
|
|
|
|
|
|
|
|
|
|
|
|
|
|
2017 Term Loan variable rate debt maturing October 31, 2017 |
|
|
- |
|
|
|
572.1 |
|
|
|
|
|
|
|
|
|
|
2019 Term Loan variable rate debt maturing July 1, 2019 |
|
|
- |
|
|
|
1,700.0 |
|
|
|
|
|
|
|
|
|
|
|
|
|
- |
|
|
|
2,272.1 |
|
|
|
|
|
|
|
|
|
|
AGN Term Loan |
|
|
|
|
|
|
|
|
|
|
|
|
|
|
|
|
|
AGN Three Year Tranche variable rate debt maturing March 17, 2018 |
|
|
- |
|
|
|
2,750.0 |
|
|
|
|
|
|
|
|
|
|
AGN Five Year Tranche variable rate debt maturing March 17, 2020 |
|
|
- |
|
|
|
2,543.8 |
|
|
|
|
|
|
|
|
|
|
|
|
|
- |
|
|
|
5,293.8 |
|
|
|
|
|
|
|
|
|
|
Total Term Loan Indebtedness |
|
|
- |
|
|
|
8,256.2 |
|
|
|
|
|
|
|
|
|
|
Other Indebtedness |
|
|
|
|
|
|
|
|
|
|
|
|
|
|
|
|
|
Revolver Borrowings |
|
|
- |
|
|
|
200.0 |
|
|
|
|
|
|
|
|
|
|
Debt Issuance Costs |
|
|
(144.6 |
) |
|
|
(195.8 |
) |
|
|
|
|
|
|
|
|
|
Other |
|
|
85.5 |
|
|
|
97.4 |
|
|
|
|
|
|
|
|
|
|
Total Other Borrowings |
|
|
(59.1 |
) |
|
|
101.6 |
|
|
|
|
|
|
|
|
|
|
Capital Leases |
|
|
2.4 |
|
|
|
4.1 |
|
|
|
|
|
|
|
|
|
|
Total Indebtedness |
|
$ |
32,768.7 |
|
|
$ |
42,530.4 |
|
|
|
|
|
|
|
|
|
F-66
Fair market value in the table above is determined in accordance with ASC Topic 820 “Fair Value Measurement” (“ASC 820”) under Level 2 based upon quoted prices for similar items in active markets.
Floating Rate Notes
On March 4, 2015, Actavis Funding SCS, a limited partnership (société en commandite simple) organized under the laws of the Grand Duchy of Luxembourg and an indirect wholly-owned subsidiary of Allergan plc, issued floating rate notes due 2016 (the “2016 Floating Rate Notes”), floating rate notes due 2018 (the “2018 Floating Rate Notes”), floating rate notes due 2020 (the “2020 Floating Rate Notes”), 1.850% notes due 2017 (the “1.850% 2017 Notes”), 2.350% notes due 2018 (the “2.350% 2018 Notes”), 3.000% notes due 2020 (the “3.000% 2020 Notes”), 3.450% notes due 2022 (the “3.450% 2022 Notes”), 3.800% notes due 2025 (the “3.800% 2025 Notes”), 4.550% notes due 2035 (the “4.550% 2035 Notes”) and 4.750% notes due 2045 (the “4.750% 2045 Notes”). The notes are fully and unconditionally guaranteed by Actavis Funding SCS’s indirect parents, Warner Chilcott Limited and Actavis Capital S.a.r.l. (“Actavis Capital”), and by Allergan Finance, LLC (formerly known as Actavis, Inc.), a subsidiary of Actavis Capital, on an unsecured and unsubordinated basis.
The 2016 Floating Rate Notes were paid in full at maturity on September 1, 2016 and bore interest at the three-month LIBOR plus 0.875%. The 2018 Floating Rate Notes and the 2020 Floating Rate Notes bear interest at a floating rate equal to three-month LIBOR plus 1.080% and 1.255% per annum, respectively. Interest on the 2018 Floating Rate Notes and the 2020 Floating Rate Notes is payable quarterly on March 12, June 12, September 12 and December 12 of each year, and began on June 12, 2015.
Acquired Allergan Notes
On March 17, 2015 in connection with the Allergan Acquisition, the Company acquired, and subsequently guaranteed, along with Warner Chilcott Limited, the indebtedness of Allergan, Inc. comprised of the $350.0 million 2.800% senior notes due 2023, the $650.0 million 3.375% senior notes due 2020, the $250.0 million 1.350% senior notes due 2018 and the $800.0 million 5.750% senior notes due 2016. Interest payments are due on the $350.0 million senior notes semi-annually on the principal amount of the notes at a rate of 2.80% per annum, and are redeemable at any time at the Company’s option, subject to a make-whole provision based on the present value of remaining interest payments at the time of the redemption, if the redemption occurs prior to December 15, 2022 (three months prior to the maturity of the 2023 senior notes). If the redemption occurs on or after December 15, 2022, then such redemption is not subject to the make-whole provision. Interest payments are due on the $650.0 million senior notes semi-annually on the principal amount of the notes at a rate of 3.375% per annum, and are redeemable at any time at the Company’s option, subject to a make-whole provision based on the present value of remaining interest payments at the time of the redemption. Interest payments are due on the $250.0 million senior notes semi-annually on the principal amount of the notes at a rate of 1.350% per annum, and are redeemable at any time at the Company’s option, subject to a make-whole provision based on the present value of remaining interest payments at the time of the redemption. Interest payments were due on the $800.0 million senior notes semi-annually on the principal amount of the notes at a rate of 5.750% per annum. The fair value of the acquired senior notes was determined to be $2,087.5 million as of March 17, 2015. As such, as part of acquisition accounting, the company recorded a premium of $37.5 million to be amortized as contra interest over the life of the notes.
The $800.0 million 5.750% senior notes were paid in full on April 1, 2016 with proceeds from the first quarter of 2016 borrowings under the revolving credit facility of $900.0 million at maturity.
Acquired Forest Notes
On July 1, 2014 in connection with the Forest Acquisition, the Company acquired the indebtedness of Forest comprised of the $1,050.0 million 4.375% senior notes due 2019, the $750.0 million 4.875% senior notes due 2021 and the $1,200.0 million 5.000% senior notes due 2021 (together the “Acquired Forest Notes”). Interest payments are due on the $1,050.0 million senior notes semi-annually in arrears on February 1 and August 1 beginning August 1, 2014. Interest payments are due on the $750.0 million senior notes due 2021 semi-annually in arrears on February 15 and August 15 beginning August 15, 2014. Interest payments are due on the $1,200.0 million senior note due 2021 semi-annually in arrears on June 15 and December 15, beginning December 15, 2014. As a result of acquisition accounting, the notes were fair valued with a premium of $260.3 million as of July 1, 2014, which will be amortized as contra-interest over the life of the notes. The guarantor of the debt is Allergan plc.
Allergan Acquisition Notes
In connection with the Allergan Acquisition, Actavis Funding SCS issued the $1,000.0 million 1.850% notes due March 1, 2017, the $3,000.0 million 2.350% notes due March 12, 2018, the $3,500.0 million 3.000% notes due March 12, 2020, the $3,000.0 million 3.450% notes due March 15, 2022, the $4,000.0 million 3.800% notes due March 15, 2025, the $2,500.0 million 4.550% notes due March
F-67
15, 2035 and the $2,500.0 million 4.750% notes due March 15, 2045. These fixed rate securities were issued, in part, to finance the Allergan Acquisition. The guarantors of the debt are Warner Chilcott Limited, Actavis Capital S.a.r.l., and Allergan Finance, LLC.
2014 Notes Issuance
On June 10, 2014, Actavis Funding SCS issued the $500.0 million 1.300% notes due 2017, $500.0 million 2.450% notes due 2019, $1,200.0 million 3.850% notes due 2024 and $1,500.0 million 4.850% notes due 2044 (the “2014 New Notes”). Interest payments are due on the 2014 New Notes on June 15 and December 15 semi-annually, beginning on December 15, 2014. The guarantors of the debt are Warner Chilcott Limited, Actavis Capital S.a.r.l., and Allergan Finance, LLC.
Actavis, Inc. Supplemental Indenture
On October 1, 2013, the Company, Allergan Finance, LLC, a wholly owned subsidiary of the Company, and Wells Fargo Bank, National Association, as trustee, entered into a fourth supplemental indenture (the “Fourth Supplemental Indenture”) to the indenture, dated as of August 24, 2009 (the “Base Indenture” and, together with the First Supplemental Indenture, the Second Supplemental Indenture and the Third Supplemental Indenture (each as defined below), the “Indenture”), as supplemented by the first supplemental indenture, dated as of August 24, 2009 (the “First Supplemental Indenture”), the second supplemental indenture, dated as of May 7, 2010 (the “Second Supplemental Indenture”), and the third supplemental indenture, dated as of October 2, 2012 (the “Third Supplemental Indenture”). Pursuant to the Fourth Supplemental Indenture, the Company has provided a full and unconditional guarantee of Actavis, Inc.’s obligations under its then outstanding $450.0 million 5.000% senior notes due August 15, 2014, (the “2014 Notes”), its $400.0 million 6.125% senior notes due August 15, 2019 (the “2019 Notes”), its $1,200.0 million 1.875% senior notes due October 1, 2017 (the “2017 Notes”), its $1,700.0 million 3.250% senior notes due October 1, 2022 (the “2022 Notes”) and its $1,000.0 million 4.625% Senior Notes due October 1, 2042 (the “2042 Notes”).
WC Supplemental Indenture
On October 1, 2013, the Company, WCCL (defined below), Warner Chilcott Finance LLC (the “Co-Issuer” and together with WC Company, the “Issuers”) and Wells Fargo Bank, National Association, as trustee (the “WC Trustee”), entered into a third supplemental indenture (the “Supplemental Indenture”) to the indenture, dated as of August 20, 2010 (the “WC Indenture”), among the Issuers, the guarantors party thereto and the WC Trustee, with respect to the Issuers’ WC Notes. Pursuant to the Supplemental Indenture, the Company had provided a full and unconditional guarantee of the Issuers’ obligations under the WC Notes and the WC Indenture.
On July 21, 2014, the Company redeemed the WC Notes for $1,311.8 million, which includes a make-whole premium of $61.8 million and the principal amount of the WC Notes of $1,250.0 million. As a result of the transaction, the Company recognized a gain in July of 2014 of $29.9 million, which includes the write-off of the then outstanding unamortized premium.
2012 Notes Issuance
On October 2, 2012, Allergan Finance, LLC issued the 2017 Notes, the 2022 Notes, and the 2042 Notes (collectively the “2012 Senior Notes”). Interest payments are due on the 2012 Senior Notes semi-annually in arrears on April 1 and October 1 beginning April 1, 2013. Net proceeds from the offering of the 2012 Senior Notes were used for the acquisition of the Actavis Group. The guarantors of the debt are Warner Chilcott Limited and Allergan plc.
2009 Notes Issuance
On August 24, 2009, Allergan Finance, LLC issued the 2014 Notes and the 2019 Notes (collectively the “2009 Senior Notes”). Interest payments are due on the 2009 Senior Notes semi-annually in arrears on February 15 and August 15, respectively, beginning February 15, 2010. Net proceeds from the offering of 2009 Senior Notes were used to repay certain debt with the remaining net proceeds being used to fund a portion of the cash consideration for the Arrow Group acquisition. The guarantors of the debt are Warner Chilcott Limited and Allergan plc.
Credit Facility Indebtedness
On August 2, 2016, the Company repaid the remaining balances of all outstanding term-loan indebtedness and terminated its then existing revolving credit facility with proceeds from the Teva Transaction.
F-68
On December 17, 2014, Allergan plc and certain of its subsidiaries entered into a second amendment agreement (the “WC Term Loan Amendment”) among Allergan plc, Warner Chilcott Limited, Warner Chilcott Finance, LLC, Actavis WC 2 S.à r.l. (“Actavis WC 2”), Warner Chilcott Company, LLC (“WCCL”), Warner Chilcott Corporation (“WC Corporation” and together with Actavis WC 2 and WCCL, the “WC Borrowers”), Bank of America, N.A. (“BofA”), as administrative agent, and the lenders party thereto. The WC Term Loan Amendment amends and restates Allergan plc’s existing amended and restated WC term loan credit and guaranty agreement, dated as of June 9, 2014 (such agreement, prior to its amendment and restatement pursuant to the WC Term Loan Amendment, the “2014 WC Term Loan Agreement” and the 2014 WC Term Loan Agreement as amended and restated by the WC Term Loan Amendment, the “WC Term Loan Agreement”), among the WC Borrowers, Allergan plc, Warner Chilcott Limited, Warner Chilcott Finance, LLC, the lenders from time to time party thereto and BofA, as administrative agent, which amended and restated Allergan plc’s existing WC term loan credit and guaranty agreement, dated as of August 1, 2013 (such agreement, prior to its amendment and restatement, the “Existing WC Term Loan Agreement”) among the WC Borrowers, Warner Chilcott Finance, LLC, Actavis Limited, BofA, as administrative agent and a syndicate of banks participating as lenders.
Pursuant to the Existing WC Term Loan Agreement, on October 1, 2013 (the “WC Closing Date”), the lenders party thereto provided term loans in a total aggregate principal amount of $2.0 billion, comprised of (i) a $1.0 billion tranche that will mature on October 1, 2016 (the “WC Three Year Tranche”) and (ii) a $1.0 billion tranche that will mature on October 1, 2018 (the “WC Five Year Tranche”). The proceeds of borrowings under the Existing WC Term Loan Agreement, together with $41.0 million of cash on hand, were used to finance the repayment in full of all amounts outstanding under Warner Chilcott’s then-existing Credit Agreement, dated as of March 17, 2011, as amended by Amendment No. 1 on August 20, 2012, among the WC Borrowers, Warner Chilcott Holdings Company III, Limited, BofA, as administrative agent and a syndicate of banks participating as lenders.
Borrowings under the WC Term Loan Agreement bear interest at the applicable borrower’s choice of a per annum rate equal to either (a) a base rate plus an applicable margin per annum varying from (x) 0.00% per annum to 0.75% per annum under the WC Three Year Tranche and (y) 0.125% per annum to 0.875% per annum under the WC Five Year Tranche, depending on the publicly announced debt ratings for non-credit-enhanced, senior unsecured long-term indebtedness of Allergan plc (such applicable debt rating the “Debt Rating”) or (b) a Eurodollar rate, plus an applicable margin varying from (x) 1.00% per annum to 1.75% per annum under the WC Three Year Tranche and (y) 1.125% per annum to 1.875% per annum under the WC Five Year Tranche, depending on the Debt Rating. The outstanding principal amount of loans under the WC Three Year Tranche is not subject to quarterly amortization and shall be payable in full on the three year anniversary of the WC Closing Date. The outstanding principal amount of loans under the WC Five Year Tranche is payable in equal quarterly amounts of 2.50% per quarter prior to the fifth anniversary of the WC Closing Date, with the remaining balance payable on the fifth year anniversary of the WC Closing Date.
ACT Term Loan
On December 17, 2014, Allergan plc and certain of its subsidiaries entered into a third amendment agreement (the “ACT Term Loan Amendment”) among Allergan plc, Warner Chilcott Limited, Actavis Capital, Allergan Finance, LLC, Actavis Funding SCS, BofA, as administrative agent, and the lenders party thereto. The ACT Term Loan Amendment amends and restates Allergan plc’s existing second amended and restated Allergan term loan credit and guaranty agreement, dated as of March 31, 2014 (such agreement, prior to its amendment and restatement pursuant to the ACT Term Loan Amendment, the “2014 ACT Term Loan Agreement” and together with the Existing ACT Term Loan Agreement (defined below), the “ACT Term Loan”) among Actavis Capital, Allergan plc, Warner Chilcott Limited, Allergan Finance, LLC, Actavis Funding SCS, BofA, as administrative agent, and the lenders from time to time party thereto, which amended and restated Allergan plc’s existing amended and restated Allergan term loan credit and guaranty agreement, dated as of October 1, 2013 (such agreement, prior to its amendment and restatement pursuant to the ACT Term Loan Amendment, the “Existing ACT Term Loan Agreement”) among Actavis Capital, Allergan plc, Allergan Finance, LLC, BofA, as administrative agent, and the lenders from time to time party thereto.
The Existing ACT Term Loan Agreement amended and restated Allergan Finance, LLC’s $1,800.0 million senior unsecured term loan credit facility, dated as of June 22, 2012. At the closing of the Existing ACT Term Loan Agreement, an aggregate principal amount of $1,572.5 million was outstanding (the “2017 Term Loan”).
On March 31, 2014, Allergan plc, Actavis Capital, Allergan Finance, LLC, BofA, as Administrative Agent, and a syndicate of banks participating as lenders entered into the 2014 ACT Term Loan Agreement to amend and restate the Existing ACT Term Loan Agreement. On July 1, 2014, in connection with the Forest Acquisition, the Company borrowed $2.0 billion of term loan indebtedness under tranche A-2 of the 2014 ACT Term Loan Agreement, which was due July 1, 2019 (the “2019 Term Loan”).
Loans under the ACT Term Loan bore interest, at the Company’s choice, of a per annum rate equal to either (a) a base rate, plus an applicable margin per annum varying from (x) 0.00% per annum to 1.00% per annum with respect to the 2017 term-loan and
F-69
(y) 0.125% per annum to 0.875% per annum with respect to the 2019 term-loan, depending on the Debt Rating or (b) a Eurodollar rate, plus an applicable margin varying from (x) 1.00% per annum to 2.00% per annum with respect to the 2017 term-loan and (y) 1.125% per annum to 1.875% per annum with respect to the 2019 term-loan, depending on the Debt Rating.
AGN Term Loan
On December 17, 2014, Allergan, Inc., and certain of its subsidiaries entered into a senior unsecured term loan credit agreement (the “AGN Term Loan”), among Actavis Capital, as borrower, Allergan plc, Warner Chilcott Limited, Allergan Finance, LLC, Actavis Funding SCS, the lenders from time to time party thereto (the “Term Lenders”), JPMorgan Chase Bank, N.A. (“JPMCB”), as administrative agent and the other financial institutions party thereto. Under the AGN Term Loan, the Term Lenders provided (i) a $2.75 billion tranche maturing on March 17, 2018 (the “AGN Three Year Tranche”) and (ii) a $2.75 billion tranche and maturing on March 17, 2020 (the “AGN Five Year Tranche”). The proceeds of borrowings under the AGN Term Loan were used to finance, in part, the cash component of the Allergan Acquisition consideration and certain fees and expenses incurred in connection with the Allergan Acquisition.
Borrowings under the AGN Term Loan bore interest at our choice of a per annum rate equal to either (a) a base rate plus an applicable margin per annum varying from (x) 0.00% per annum to 1.00% per annum under the AGN Three Year Tranche and (y) 0.125% per annum to 1.250% per annum under the AGN Five Year Tranche, depending on the Debt Rating or (b) a Eurodollar rate, plus an applicable margin varying from (x) 1.00% per annum to 2.00% per annum under the AGN Three Year Tranche and (y) 1.125% per annum to 2.250% per annum under the AGN Five Year Tranche, depending on the Debt Rating. The outstanding principal amount of loans under the AGN Three Year Tranche was not subject to quarterly amortization and was payable in full on the maturity date. The outstanding principal amount of loans under the AGN Five Year Tranche was payable in equal quarterly amounts of 2.50% per quarter prior to March 17, 2020, with the remaining balance payable on March 17, 2020.
Bridge Loan Facility
On December 17, 2014, Allergan and certain of its subsidiaries entered into a 364-day senior unsecured bridge credit agreement (the “Bridge Loan Facility”), among Actavis Capital, as borrower, Allergan plc, Warner Chilcott Limited, Allergan Finance, LLC, Actavis Funding SCS, the lenders from time to time party thereto, JPMCB, as administrative agent and the other financial institutions party thereto. No amounts were borrowed under the Bridge Loan Facility and the commitments under the Bridge Loan Facility expired on March 17, 2015 upon the closing of the Allergan Acquisition.
Cash Bridge Loan Facility
On March 11, 2015, Allergan and certain of its subsidiaries entered into a 60-day senior unsecured bridge credit agreement (the “Cash Bridge Loan Facility”), among Actavis Capital, as borrower, Allergan plc, Warner Chilcott Limited, Allergan Finance, LLC, Actavis Funding SCS, the lenders from time to time party thereto (the “Cash Bridge Lenders”), JPMCB, as administrative agent and the other financial institutions party thereto. Under the Cash Bridge Loan Facility, the Cash Bridge Lenders committed to provide, subject to certain conditions, unsecured bridge financing, of which $2.8 billion was drawn to finance the Allergan Acquisition on March 17, 2015. The outstanding balance of the Cash Bridge Loan Facility was repaid on April 9, 2015.
Borrowings under the Cash Bridge Loan Facility bore interest at our choice of a per annum rate equal to either (a) a base rate plus an applicable margin per annum varying from 0.00% per annum to 1.00% per annum, depending on the Debt Rating or (b) a Eurodollar rate, plus an applicable margin varying from 1.00% per annum to 2.00% per annum, depending on the Debt Rating.
F-70
As of December 31, 2016, annual debt maturities were as follows ($ in millions):
|
|
|
Total Payments |
|
|
|
2017 |
|
$ |
2,700.0 |
|
|
2018 |
|
|
3,750.0 |
|
|
2019 |
|
|
1,950.0 |
|
|
2020 |
|
|
4,650.0 |
|
|
2021 |
|
|
1,950.0 |
|
|
2022 and after |
|
|
17,750.0 |
|
|
Total Senior Notes Gross |
|
$ |
32,750.0 |
|
|
Capital leases |
|
|
2.4 |
|
|
Other borrowings and debt issuance costs |
|
|
(59.1 |
) |
|
Unamortized premium |
|
|
171.2 |
|
|
Unamortized discount |
|
|
(95.8 |
) |
|
Total Indebtedness |
|
$ |
32,768.7 |
|
Amounts represent total anticipated cash payments assuming scheduled repayments.
Lease Commitments
The Company has operating leases for certain facilities and equipment. The terms of the operating leases for the Company’s facility leases require the Company to pay property taxes, normal maintenance expense and maintain minimum insurance coverage. Total rental expense for operating leases for the years ended December 31, 2016, 2015, and 2014 was $47.7 million, $49.9 million, and $69.7 million, respectively. The Company also has deminimis capital leases for certain facilities and equipment. The future minimum lease payments under both capital and operating leases that have remaining terms in excess of one year are ($ in millions):
|
|
|
Leases |
|
|
|
2017 |
|
$ |
48.1 |
|
|
2018 |
|
|
37.1 |
|
|
2019 |
|
|
37.8 |
|
|
2020 |
|
|
29.1 |
|
|
2021 |
|
|
27.2 |
|
|
Thereafter |
|
|
172.8 |
|
|
Total minimum lease payments |
|
$ |
352.1 |
|
The Company has entered into certain sub-lease agreements which will offset future lease commitments.
NOTE 17 — Other Long-Term Liabilities
Other long-term liabilities consisted of the following ($ in millions):
|
|
|
December 31, |
|
|
December 31, |
|
||
|
|
|
2016 |
|
|
2015 |
|
||
|
Acquisition related contingent consideration liabilities |
|
$ |
661.1 |
|
|
$ |
788.1 |
|
|
Long-term pension and post retirement liability |
|
|
201.6 |
|
|
|
222.1 |
|
|
Legacy Allergan deferred executive compensation |
|
|
111.7 |
|
|
|
117.9 |
|
|
Product warranties |
|
|
28.1 |
|
|
|
28.4 |
|
|
Long-term contractual obligations |
|
|
25.3 |
|
|
|
26.4 |
|
|
Long-term severance and restructuring liabilities |
|
|
22.0 |
|
|
|
34.9 |
|
|
Deferred revenue |
|
|
15.7 |
|
|
|
18.2 |
|
|
Other long-term liabilities |
|
|
19.5 |
|
|
|
26.0 |
|
|
Total other long-term liabilities |
|
$ |
1,085.0 |
|
|
$ |
1,262.0 |
|
F-71
The Company determines the acquisition date fair value of contingent consideration obligations based on a probability-weighted income approach derived from revenue estimates and a probability assessment with respect to the likelihood of achieving contingent obligations including contingent payments such as milestone obligations, royalty obligations and contract earn-out criteria, where applicable. The fair value measurement is based on significant inputs not observable in the market and thus represents a Level 3 measurement as defined in ASC 820. The resultant probability-weighted cash flows are discounted using an appropriate effective annual interest rate to reflect the internal rate of return and incremental commercial uncertainty, major risks and uncertainties associated with the successful completion of the projects triggering the contingent obligation. At each reporting date, the Company revalues the contingent consideration obligation to estimated fair value and records changes in fair value as income or expense in our consolidated statement of operations. Changes in the fair value of the contingent consideration obligations may result from changes in discount periods and rates, changes in the timing and amount of revenue estimates and changes in probability assumptions with respect to the likelihood of achieving the various contingent consideration obligations. Accretion expense related to the increase in the net present value of the contingent liability is included in operating income for the period.
NOTE 18 — Income Taxes
For the years ended December 31, 2016, 2015 and 2014, foreign losses before taxes were $1,502.8 million, $4,291.7 million and $2,966.0 million, respectively.
The Company’s (benefit)/provision for income taxes consisted of the following ($ in millions):
|
|
|
Years Ended December 31, |
|
|||||||||
|
|
|
2016 |
|
|
2015 |
|
|
2014 |
|
|||
|
Current (benefit) provision: |
|
|
|
|
|
|
|
|
|
|
|
|
|
U.S. federal |
|
$ |
(17.5 |
) |
|
$ |
14.4 |
|
|
$ |
(62.0 |
) |
|
U.S. state |
|
|
- |
|
|
|
9.7 |
|
|
|
12.9 |
|
|
Non-U.S. |
|
|
166.2 |
|
|
|
225.6 |
|
|
|
17.2 |
|
|
Total current (benefit) provision |
|
|
148.7 |
|
|
|
249.7 |
|
|
|
(31.9 |
) |
|
Deferred (benefit) provision: |
|
|
|
|
|
|
|
|
|
|
|
|
|
U.S. federal |
|
|
(1,218.5 |
) |
|
|
(1,370.2 |
) |
|
|
(350.9 |
) |
|
U.S. state |
|
|
(132.1 |
) |
|
|
(58.7 |
) |
|
|
(5.1 |
) |
|
Non-U.S. |
|
|
(695.1 |
) |
|
|
(426.7 |
) |
|
|
(125.7 |
) |
|
Total deferred (benefit) provision |
|
|
(2,045.7 |
) |
|
|
(1,855.6 |
) |
|
|
(481.7 |
) |
|
Total (benefit) / provision for income taxes |
|
$ |
(1,897.0 |
) |
|
$ |
(1,605.9 |
) |
|
$ |
(513.6 |
) |
The exercise of certain equity based awards resulted in a tax benefit that has been reflected as an increase to additional paid-in capital. The benefits recorded were $20.4 million, $76.1 million and $51.1 million for the years ended December 31, 2016, 2015 and 2014, respectively.
F-72
The reconciliations for the years ended December 31, 2016, 2015 and 2014 between the statutory Irish and Bermuda income tax rates for Allergan plc and Warner Chilcott Limited, respectively, and the effective income tax rates were as follows:
|
|
|
Allergan plc |
|
|||||||||
|
|
|
Years Ended December 31, |
|
|||||||||
|
|
|
2016 |
|
|
2015 |
|
|
2014 |
|
|||
|
Statutory rate |
|
|
(12.5 |
%) |
|
|
(12.5 |
%) |
|
|
(12.5 |
%) |
|
Earnings subject to the U.S. federal and state tax rates (1) (3) |
|
|
(37.5 |
%) |
|
|
(18.6 |
%) |
|
|
(11.8 |
%) |
|
Earnings subject to rates different than the statutory rate (2)(3) |
|
|
(18.3 |
%) |
|
|
(2.2 |
%) |
|
|
1.1 |
% |
|
Tax reserves and audit outcomes |
|
|
(0.7 |
%) |
|
|
0.3 |
% |
|
|
1.2 |
% |
|
Non-deductible expenses |
|
|
3.1 |
% |
|
|
1.3 |
% |
|
|
3.7 |
% |
|
Impact of acquisitions and reorganizations |
|
|
3.1 |
% |
|
|
4.0 |
% |
|
|
1.2 |
% |
|
Tax credits and U.S. manufacturing deduction |
|
|
(3.1 |
%) |
|
|
(0.5 |
%) |
|
|
(1.2 |
%) |
|
Rate changes (4) |
|
|
(7.4 |
%) |
|
|
0.0 |
% |
|
|
1.4 |
% |
|
Valuation allowances (5) |
|
|
6.5 |
% |
|
|
(6.5 |
%) |
|
|
0.0 |
% |
|
Other |
|
|
(0.2 |
%) |
|
|
(0.6 |
%) |
|
|
(0.2 |
%) |
|
Effective income tax rate |
|
|
(67.0 |
%) |
|
|
(35.3 |
%) |
|
|
(17.1 |
%) |
|
(1) |
Earnings subject to U.S. federal and state tax had a larger impact on the effective tax rate for the period ended December 31, 2016 compared to the period ended December 31, 2015 due to an increase in expenses in 2016. These expenses included a full year of amortization expense related to intangibles acquired as part of the Allergan Acquisition and incremental costs associated with the acquisition related financing. |
|
(2) |
Earnings subject to tax rates different than the statutory rate had a larger impact on the effective tax rate for the period ended December 31, 2016 compared to the period ended December 31, 2015. This was primarily driven by the inclusion of a full year of Allergan post-acquisition operating income earned in jurisdictions with tax rates lower than the Irish statutory rate and changes to the earnings mix resulting from restructuring associated with the sale of the global generics business. |
|
(3) |
In 2016, the Company recorded $6.5 billion of amortization expense. A significant portion of this amount was incurred in jurisdictions with tax rates higher than the statutory rate resulting in a $482.3 million favorable impact on the effective tax rate. |
|
(4) |
In the fourth quarter of 2016, a tax rate change was enacted in France resulting in a $209.0 million tax benefit. |
|
(5) |
In 2016, the Company recorded a tax expense of $183.8 million predominately related to a change in the valuation allowance on U.S. capital loss carryforwards resulting from restructuring associated with the sale of the global generics business. |
|
|
|
Warner Chilcott Limited |
|
|||||||||
|
|
|
Years Ended December 31, |
|
|||||||||
|
|
|
2016 |
|
|
2015 |
|
|
2014 |
|
|||
|
Statutory rate |
|
|
0.0 |
% |
|
|
0.0 |
% |
|
|
0.0 |
% |
|
Earnings subject to the U.S. federal and state tax rates |
|
|
(58.4 |
%) |
|
|
(29.5 |
%) |
|
|
(18.4 |
%) |
|
Earnings subject to rates different than the statutory rate |
|
|
(11.9 |
%) |
|
|
(5.0 |
%) |
|
|
(5.4 |
%) |
|
Tax reserves and audit outcomes |
|
|
(0.7 |
%) |
|
|
0.3 |
% |
|
|
1.3 |
% |
|
Non-deductible expenses |
|
|
3.2 |
% |
|
|
1.3 |
% |
|
|
3.8 |
% |
|
Impact of acquisitions and reorganizations |
|
|
3.2 |
% |
|
|
4.1 |
% |
|
|
1.2 |
% |
|
Tax credits and U.S. manufacturing deduction |
|
|
(3.2 |
%) |
|
|
(0.5 |
%) |
|
|
(1.2 |
%) |
|
Rate changes |
|
|
(7.6 |
%) |
|
|
0.0 |
% |
|
|
1.4 |
% |
|
Valuation allowances |
|
|
6.7 |
% |
|
|
(6.7 |
%) |
|
|
0.0 |
% |
|
Other |
|
|
(0.1 |
%) |
|
|
(0.4 |
%) |
|
|
(0.2 |
%) |
|
Effective income tax rate |
|
|
(68.8 |
%) |
|
|
(36.4 |
%) |
|
|
(17.5 |
%) |
F-73
Deferred tax assets and liabilities are measured based on the difference between the financial statement and tax basis of assets and liabilities at the applicable tax rates. The significant components of the Company’s net deferred tax assets and liabilities consisted of the following (in millions):
|
|
|
Years Ended December 31, |
|
|||||
|
|
|
2016 |
|
|
2015 |
|
||
|
Benefits from net operating and capital losses and tax credit carryforwards |
|
$ |
702.0 |
|
|
$ |
1,305.8 |
|
|
Differences in financial statement and tax accounting for: |
|
|
|
|
|
|
|
|
|
Inventories, receivables and accruals |
|
|
433.6 |
|
|
|
1,005.4 |
|
|
Outside basis differences |
|
|
- |
|
|
|
5,738.8 |
|
|
Share-based and other compensation |
|
|
530.1 |
|
|
|
598.0 |
|
|
Other |
|
|
64.0 |
|
|
|
97.9 |
|
|
Total deferred tax asset, gross |
|
$ |
1,729.7 |
|
|
$ |
8,745.9 |
|
|
Less: Valuation allowance |
|
|
(183.9 |
) |
|
|
(196.2 |
) |
|
Total deferred tax asset, net |
|
$ |
1,545.8 |
|
|
$ |
8,549.7 |
|
|
Differences in financial statement and tax accounting for: |
|
|
|
|
|
|
|
|
|
Property, equipment and intangible assets |
|
|
(12,419.6 |
) |
|
|
(14,046.8 |
) |
|
Outside basis differences |
|
|
(1,793.7 |
) |
|
|
(2,422.2 |
) |
|
Other |
|
|
(68.3 |
) |
|
|
- |
|
|
Total deferred tax liabilities |
|
$ |
(14,281.6 |
) |
|
$ |
(16,469.0 |
) |
|
Total deferred taxes |
|
$ |
(12,735.8 |
) |
|
$ |
(7,919.3 |
) |
During the years ended December 31, 2016 and 2015, respectively, the Company recorded deferred tax liabilities of approximately $604.9 million and $12,911.5 million related to acquired entities.
During the year ended December 31, 2016, the Company’s net deferred tax liability increased by $4,816.5 million primarily due to the reversal of a deferred tax asset of $5,276.6 million, as adjusted for activity during 2016, related to investments in certain U.S. subsidiaries. This was partially offset by the reversal of deferred tax liabilities of $769.3 million related to investments in certain non-U.S. subsidiaries. Refer to “NOTE 7 – Discontinued Operations” for further discussion and additional disclosures related to our income tax provision reported as part of discontinued operations.
The Company had the following carryforward tax attributes at December 31, 2016:
|
|
• |
$954.5 million U.S. federal net operating losses (“NOL”) and other tax attributes which begin to expire in 2019; |
|
|
• |
$147.9 million of U.S. tax credits which begin to expire in 2017; |
|
|
• |
$791.8 million U.S. state tax NOLs which begin to expire in 2017; |
|
|
• |
$46.0 million non-U.S. tax NOLs which begin to expire in 2017 and $1,183.6 million non-U.S. NOLs which are not subject to expiration. |
Net operating loss and tax credit carryforwards of $954.5 million and $103.0 million, respectively, are subject to an annual limitation under Internal Revenue Code Section 382.
During the year ended December 31, 2016, the Company established a valuation allowance of $183.8 million predominately related to a U.S. capital loss carryforward. The tax expense was recorded as a component of income from continuing operations and the balance sheet as part of liabilities held for sale. As of December 31, 2016, a valuation allowance balance of $183.9 million is recorded due to the uncertainty of realizing net operating losses ($75.1 million), tax credits ($103.7 million) and other deferred tax assets ($5.1 million).
As of December 31, 2016, deferred income taxes have not been provided on approximately $7,837.1 million of undistributed earnings of certain non-Irish subsidiaries as these amounts are intended to be indefinitely reinvested in non-Irish operations. The undistributed earnings would be subject to withholding tax and in certain circumstances U.S. income tax of approximately $456.2 million if amounts were distributed to Allergan plc.
In making this assertion, the Company evaluates, among other factors, the profitability of its Irish and non-Irish operations and the need for cash within and outside Ireland, including cash requirements for capital improvement, acquisitions and market expansion.
F-74
As of December 31, 2016, the Company has accrued income taxes, including withholding taxes, of $1,396.3 million for certain pre-acquisition earnings primarily related to the Forest and Allergan acquisitions. The amount determined was generally based on the amount of cash and other assets available to be distributed or otherwise repatriated by Forest and Allergan’s non-U.S. subsidiaries. It is intended that these cash balances would eventually be remitted to the U.S. (and ultimately to Ireland) effectively to refinance a portion of the debt related to the acquisition of Forest Laboratories, Inc. and Allergan, Inc. by Allergan plc. The Company continues to evaluate its global cash needs but expects to repatriate these earnings as financing related to these acquisitions ultimately become payable.
Accounting for Uncertainty in Income Taxes
A reconciliation of the beginning and ending amount of unrecognized tax benefits is as follows (in millions):
|
|
|
Years Ended December 31, |
|
|||||||||
|
|
|
2016 |
|
|
2015 |
|
|
2014 |
|
|||
|
Balance at the beginning of the year |
|
$ |
781.7 |
|
|
$ |
712.2 |
|
|
$ |
119.3 |
|
|
Increases for current year tax positions |
|
|
100.7 |
|
|
|
41.2 |
|
|
|
51.3 |
|
|
Increases for prior year tax positions |
|
|
40.5 |
|
|
|
19.7 |
|
|
|
4.2 |
|
|
Increases due to acquisitions |
|
|
0.0 |
|
|
|
115.5 |
|
|
|
567.0 |
|
|
Decreases for prior year tax positions |
|
|
(77.9 |
) |
|
|
(41.4 |
) |
|
|
(26.6 |
) |
|
Settlements |
|
|
(30.8 |
) |
|
|
(60.6 |
) |
|
|
(0.4 |
) |
|
Lapse of applicable statute of limitations |
|
|
(2.9 |
) |
|
|
(3.2 |
) |
|
|
(0.5 |
) |
|
Foreign exchange |
|
|
(0.1 |
) |
|
|
(1.7 |
) |
|
|
(2.1 |
) |
|
Balance at the end of the year |
|
$ |
811.2 |
|
|
$ |
781.7 |
|
|
$ |
712.2 |
|
If these benefits were subsequently recognized, $757.9 million would favorably impact the Company’s effective tax rate.
The Company's continuing policy is to recognize interest and penalties related to uncertain tax positions in tax expense. During the years ended December 31, 2016, 2015 and 2014, the company recognized approximately $2.0 million, $(0.5) million and $5.1 million in interest and penalties, respectively. At December 31, 2016, 2015 and 2014, the Company had accrued $65.3 million (net of tax benefit of $35.4 million), $63.3 million (net of tax benefit of $34.2 million) and $65.6 million (net of tax benefit of $25.3 million) of interest and penalties related to uncertain tax positions, respectively. Although the company cannot determine the impact with certainty based on specific factors, it is reasonably possible that the unrecognized tax benefits may change by up to approximately $150.0 million within the next twelve months due to the resolution of certain tax examinations.
The Company conducts business globally and, as a result, it files U.S. federal, state and foreign tax returns. The Company strives to resolve open matters with each tax authority at the examination level and could reach agreement with a tax authority at any time. While the Company has accrued for amounts it believes are in accordance with the accounting standard, the final outcome with a tax authority may result in a tax liability that is more or less than that reflected in the consolidated financial statements. Furthermore, the Company may later decide to challenge any assessments, if made, and may exercise its right to appeal. The uncertain tax positions are reviewed quarterly and adjusted as events occur that affect potential liabilities for additional taxes, such as lapsing of applicable statutes of limitations, proposed assessments by tax authorities, negotiations with tax authorities, identification of new issues and issuance of new legislation, regulations or case law.
Due to our numerous acquisitions, the Company has several concurrent audits still pending with the IRS as set forth below:
|
IRS Audits |
|
Taxable Years |
|
Actavis W.C. Holding Inc. |
|
2013 and 2014 |
|
Warner Chilcott Corporation |
|
2010, 2011, 2012 and 2013 |
|
Forest Laboratories, Inc. |
|
2010, 2011, 2012, 2013 and 2014 |
|
Allergan, Inc. |
|
2009, 2010, 2011, 2012 and 2013 |
|
Anterios, Inc. |
|
2014 |
F-75
NOTE 19 — Stockholders’ Equity
Share Repurchases
During the year ended December 31, 2016, the Company’s Board of Directors approved a $5.0 billion share repurchase program which was completed in October 2016. Additionally, the Company announced that the Board of Directors approved a $10.0 billion accelerated share repurchase program, which was initiated in November 2016. Under the accelerated share repurchase program, the Company received $8.0 billion of repurchased shares during the year ended December 31, 2016. During the year ended December 31, 2016, the Company repurchased a total of 61.6 million shares of ordinary shares under the Share Repurchase Programs. The amount of shares, if any, to be received from the remaining $2.0 billion of repurchases is subject to the volume weighted average share price over the term of the agreement. Additionally, a portion of the accelerated share repurchase program is subject to a collar which would set the cap and floor of the share price for the transaction.
Quarterly Dividend
On November 2, 2016, the Company announced that its Board of Directors approved the initiation of a regular quarterly cash dividend for holders of the Company’s ordinary shares. In February 2017, the Board of Directors authorized a quarterly dividend of $0.70 per share with the first payment on March 28, 2017 to shareholders of record at the close of business on February 28, 2017.
Preferred Shares
On February 24, 2015, the Company completed an offering of 5,060,000 of our 5.500% mandatorily convertible preferred shares, Series A, par value $0.0001 per share (the “Mandatory Convertible Preferred Shares”). Dividends on the Mandatory Convertible Preferred Shares will be payable on a cumulative basis when, as and if declared by our board of directors, or an authorized committee thereof, at an annual rate of 5.500% on the liquidation preference of $1,000.00 per Mandatory Convertible Preferred Share. The Company may pay declared dividends in cash, by delivery of our ordinary shares or by delivery of any combination of cash and our ordinary shares, as determined by us in our sole discretion, subject to certain limitations, on March 1, June 1, September 1 and December 1 of each year commencing June 1, 2015, to and including March 1, 2018. The net proceeds from the Mandatory Convertible Preferred Share issuance of $4,929.7 million were used to fund the Allergan Acquisition.
Each Mandatory Convertible Preferred Share will automatically convert on March 1, 2018, into between 2.8345 and 3.4722 ordinary shares, subject to anti-dilution adjustments, including adjustments related to our new quarterly dividend. The number of our ordinary shares issuable on conversion of the Mandatory Convertible Preferred Shares will be determined based on the volume weighted average price per ordinary share over the 20 consecutive trading day period beginning on and including the 22nd scheduled trading day immediately preceding March 1, 2018, the mandatory conversion date. At any time prior to March 1, 2018, other than during a fundamental change conversion period as defined, holders of the Mandatory Convertible Preferred Shares may elect to convert each Mandatory Convertible Preferred Share into our ordinary shares at the minimum conversion rate of 2.8345 ordinary shares per Mandatory Convertible Preferred Share, subject to anti-dilution adjustments. In addition, holders may elect to convert any Mandatory Convertible Preferred Shares during a specified period beginning on the fundamental change effective date, in which case such Mandatory Convertible Preferred Shares will be converted into our ordinary shares at the fundamental change conversion rate and converting holders will also be entitled to receive a fundamental change dividend make-whole amount and accumulated dividend amount.
In the year ended December 31, 2016 and 2015, the Company paid $278.4 million and $208.1 million of dividends on preferred shares, respectively.
2015 Ordinary Shares Offering
On March 2, 2015, in connection with the Allergan Acquisition, the Company issued 14,513,889 of its ordinary shares for an actual public offering price of $288.00 per share. The net proceeds of $4,071.1 million were used, in part, to finance the Allergan Acquisition.
Accumulated Other Comprehensive Income / (Loss)
For most of the Company’s international operations, the local currency has been determined to be the functional currency. The results of its non-U.S. dollar based operations are translated to U.S. dollars at the average exchange rates during the period. Assets and liabilities are translated at the rate of exchange prevailing on the balance sheet date. Equity is translated at the prevailing rate of exchange at the date of the equity transaction. Translation adjustments are reflected in shareholders’ equity and are included as a component of other comprehensive income / (loss). The effects of converting non-functional currency assets and liabilities into the functional currency are recorded as transaction gains/losses in general and administrative expenses in the consolidated statements of operations
F-76
Unrealized gain / (losses) net of tax primarily represent experience differentials and other actuarial charges related to the Company’s defined benefit plans. The movements in accumulated other comprehensive (loss) for the years ended December, 2016 and 2015 were as follows ($ in millions):
|
|
|
Foreign Currency Translation Items |
|
|
Unrealized gain / (loss) net of tax |
|
|
Total Accumulated Other Comprehensive Income / (Loss) |
|
|||
|
Balance as of December 31, 2014 |
|
$ |
(434.4 |
) |
|
$ |
(31.0 |
) |
|
$ |
(465.4 |
) |
|
Other comprehensive (loss) before reclassifications into general and administrative |
|
|
(129.9 |
) |
|
|
101.2 |
|
|
|
(28.7 |
) |
|
Total other comprehensive (loss) |
|
|
(129.9 |
) |
|
|
101.2 |
|
|
|
(28.7 |
) |
|
Balance as of December 31, 2015 |
|
$ |
(564.3 |
) |
|
$ |
70.2 |
|
|
$ |
(494.1 |
) |
|
Other comprehensive gain / (loss) before reclassifications into general and administrative |
|
|
(441.6 |
) |
|
|
(48.1 |
) |
|
|
(489.7 |
) |
|
Impact of Teva Transaction |
|
|
1,540.6 |
|
|
|
4.2 |
|
|
|
1,544.8 |
|
|
Investment in Teva ordinary shares fair value movement |
|
|
- |
|
|
|
(1,599.4 |
) |
|
|
(1,599.4 |
) |
|
Total other comprehensive (loss) |
|
|
1,099.0 |
|
|
|
(1,643.3 |
) |
|
|
(544.3 |
) |
|
Balance as of December 31, 2016 |
|
$ |
534.7 |
|
|
$ |
(1,573.1 |
) |
|
$ |
(1,038.4 |
) |
NOTE 20 — Segments
During 2016, Allergan announced a realignment of its businesses to streamline operations. Prior to the realignment, the Company operated and managed its business as four distinct operating segments: US Brands, US Medical Aesthetics, International and Anda Distribution. Under the new organizational structure being reported, and the result of our decision to sell our Anda Distribution business, the Company organized its businesses into the following segments: US Specialized Therapeutics, US General Medicine and International. In addition, certain revenues and shared costs, and the results of corporate initiatives, are managed outside of the three segments. Prior period results have been recast to align to the current segment presentation.
The operating segments are organized as follows:
|
|
• |
The US Specialized Therapeutics segment includes sales and expenses relating to certain branded products within the US, including Medical Aesthetics, Medical Dermatology, Eye Care, Neurosciences and Urology therapeutic products. |
|
|
• |
The US General Medicine segment includes sales and expenses relating to branded products within the US that do not fall into the US Specialized Therapeutics business units, including Central Nervous System, Gastrointestinal, Women’s Health, Anti-Infectives and Diversified Brands. |
|
|
• |
The International segment includes sales and expenses relating to products sold outside the US. |
The Company evaluates segment performance based on segment contribution. Segment contribution for our segments represents net revenues less cost of sales (defined below), selling and marketing expenses, and select general and administrative expenses. Included in segment revenues are product sales that were sold through our former Anda Distribution business once the Anda Distribution business had sold the product to a third party customer. These sales are included in segment results and are reclassified into revenues from discontinued operations through a reduction of Corporate revenues which eliminates the sales made by our Anda Distribution business from results of continuing operations prior to October 3, 2016. Cost of sales for these products in discontinued operations is equal to our average third party cost of sales for third party branded products distributed by Anda Distribution. The Company does not evaluate the following items at the segment level:
|
|
• |
Revenues and operating expenses within cost of sales, selling and marketing expenses, and general and administrative expenses that result from the impact of corporate initiatives. Corporate initiatives primarily include integration, restructuring, acquisition and other shared costs. |
|
|
• |
General and administrative expenses that result from shared infrastructure, including certain expenses located within the United States. |
F-77
|
|
• |
Other select revenues and operating expenses including R&D expenses, amortization, IPR&D impairments and asset sales and impairments, net, as not all such information has been accounted for at the segment level, or such information has not been used by all segments. |
The Company defines segment net revenues as product sales and other revenue derived from branded products or licensing agreements. In March 2015, as a result of the Allergan Acquisition, we began to promote Restasis®, Lumigan®/Ganfort®, Alphagan®/Combigan®, Botox®, Fillers, other aesthetic products and other eye care products. In July 2014, as a result of the Forest Acquisition, the Company also began recognizing revenues on key US brands, including, but not limited to, Bystolic ®, Canasa®, Carafate®, Fetzima ®, Linzess ®, Namenda®IR (which lost exclusivity in July 2015), Namenda XR®, Saphris®, Teflaro® and Viibryd®.
Cost of sales within segment contribution includes standard production and packaging costs for the products we manufacture, third party acquisition costs for products manufactured by others, profit-sharing or royalty payments for products sold pursuant to licensing agreements and finished goods inventory reserve charges. Cost of sales included within segment contribution does not include non-standard production costs, such as non-finished goods inventory obsolescence charges, manufacturing variances and excess capacity utilization charges, where applicable. Cost of sales does not include amortization or impairment costs for acquired product rights or other acquired intangibles.
Selling and marketing expenses consist mainly of personnel-related costs, product promotion costs, distribution costs, professional service costs, insurance, depreciation and travel costs.
General and administrative expenses consist mainly of personnel-related costs, facilities costs, transaction costs, insurance, depreciation, litigation and settlement costs and professional services costs which are general in nature and attributable to the segment.
Segment net revenues, segment operating expenses and segment contribution information consisted of the following for the years ended December 31, 2016, 2015 and 2014 ($ in millions):
|
|
|
Year Ended December 31, 2016 |
|
|||||||||||||
|
|
|
US Specialized |
|
|
US General |
|
|
|
|
|
|
|
|
|
||
|
|
|
Therapeutics |
|
|
Medicine |
|
|
International |
|
|
Total |
|
||||
|
|
|
|
|
|
|
|
|
|
|
|
|
|
|
|
|
|
|
Net revenues |
|
$ |
5,811.7 |
|
|
$ |
5,923.9 |
|
|
$ |
2,881.3 |
|
|
$ |
14,616.9 |
|
|
|
|
|
|
|
|
|
|
|
|
|
|
|
|
|
|
|
|
Operating expenses: |
|
|
|
|
|
|
|
|
|
|
|
|
|
|
|
|
|
Cost of sales(1) |
|
|
290.9 |
|
|
|
879.8 |
|
|
|
418.2 |
|
|
|
1,588.9 |
|
|
Selling and marketing |
|
|
1,137.0 |
|
|
|
1,185.7 |
|
|
|
788.2 |
|
|
|
3,110.9 |
|
|
General and administrative |
|
|
174.2 |
|
|
|
174.9 |
|
|
|
117.2 |
|
|
|
466.3 |
|
|
Segment Contribution |
|
$ |
4,209.6 |
|
|
$ |
3,683.5 |
|
|
$ |
1,557.7 |
|
|
$ |
9,450.8 |
|
|
Contribution margin |
|
|
72.4 |
% |
|
|
62.2 |
% |
|
|
54.1 |
% |
|
|
64.7 |
% |
|
Corporate |
|
|
|
|
|
|
|
|
|
|
|
|
|
|
1,481.3 |
|
|
Research and development |
|
|
|
|
|
|
|
|
|
|
|
|
|
|
2,575.7 |
|
|
Amortization |
|
|
|
|
|
|
|
|
|
|
|
|
|
|
6,470.4 |
|
|
In-process research and development impairments |
|
|
|
|
|
|
|
|
|
|
|
|
|
|
743.9 |
|
|
Asset sales and impairments, net |
|
|
|
|
|
|
|
|
|
|
|
|
|
|
5.0 |
|
|
Operating (loss) |
|
|
|
|
|
|
|
|
|
|
|
|
|
$ |
(1,825.5 |
) |
|
Operating margin |
|
|
|
|
|
|
|
|
|
|
|
|
|
|
(12.5 |
)% |
|
(1) |
Excludes amortization and impairment of acquired intangibles including product rights. |
F-78
|
|
|
Year Ended December 31, 2015 |
|
|||||||||||||
|
|
|
US Specialized |
|
|
US General |
|
|
|
|
|
|
|
|
|
||
|
|
|
Therapeutics |
|
|
Medicine |
|
|
International |
|
|
Total |
|
||||
|
|
|
|
|
|
|
|
|
|
|
|
|
|
|
|
|
|
|
Net revenues |
|
$ |
4,309.8 |
|
|
$ |
6,338.4 |
|
|
$ |
2,187.3 |
|
|
$ |
12,835.5 |
|
|
|
|
|
|
|
|
|
|
|
|
|
|
|
|
|
|
|
|
Operating expenses: |
|
|
|
|
|
|
|
|
|
|
|
|
|
|
|
|
|
Cost of sales(1) |
|
|
235.8 |
|
|
|
909.5 |
|
|
|
350.9 |
|
|
|
1,496.2 |
|
|
Selling and marketing |
|
|
772.8 |
|
|
|
1,194.7 |
|
|
|
569.2 |
|
|
|
2,536.7 |
|
|
General and administrative |
|
|
68.3 |
|
|
|
105.3 |
|
|
|
107.6 |
|
|
|
281.2 |
|
|
Segment Contribution |
|
$ |
3,232.9 |
|
|
$ |
4,128.9 |
|
|
$ |
1,159.6 |
|
|
$ |
8,521.4 |
|
|
Contribution margin |
|
|
75.0 |
% |
|
|
65.1 |
% |
|
|
53.0 |
% |
|
|
66.4 |
% |
|
Corporate |
|
|
|
|
|
|
|
|
|
|
|
|
|
|
3,066.6 |
|
|
Research and development |
|
|
|
|
|
|
|
|
|
|
|
|
|
|
2,358.5 |
|
|
Amortization |
|
|
|
|
|
|
|
|
|
|
|
|
|
|
5,443.7 |
|
|
In-process research and development impairments |
|
|
|
|
|
|
|
|
|
|
|
|
|
|
511.6 |
|
|
Asset sales and impairments, net |
|
|
|
|
|
|
|
|
|
|
|
|
|
|
272.0 |
|
|
Operating (loss) |
|
|
|
|
|
|
|
|
|
|
|
|
|
$ |
(3,131.0 |
) |
|
Operating margin |
|
|
|
|
|
|
|
|
|
|
|
|
|
|
(24.4 |
)% |
|
(1) |
Excludes amortization and impairment of acquired intangibles including product rights. |
|
|
|
Year Ended December 31, 2014 |
|
|||||||||||||
|
|
|
US Specialized |
|
|
US General |
|
|
|
|
|
|
|
|
|
||
|
|
|
Therapeutics |
|
|
Medicine |
|
|
International |
|
|
Total |
|
||||
|
|
|
|
|
|
|
|
|
|
|
|
|
|
|
|
|
|
|
Net revenues |
|
$ |
111.9 |
|
|
$ |
4,399.3 |
|
|
$ |
203.5 |
|
|
$ |
4,714.7 |
|
|
|
|
|
|
|
|
|
|
|
|
|
|
|
|
|
|
|
|
Operating expenses: |
|
|
|
|
|
|
|
|
|
|
|
|
|
|
|
|
|
Cost of sales(1) |
|
|
29.2 |
|
|
|
707.5 |
|
|
|
48.2 |
|
|
|
784.9 |
|
|
Selling and marketing |
|
|
11.8 |
|
|
|
794.6 |
|
|
|
48.2 |
|
|
|
854.6 |
|
|
General and administrative |
|
|
3.0 |
|
|
|
116.5 |
|
|
|
12.0 |
|
|
|
131.5 |
|
|
Segment Contribution |
|
$ |
67.9 |
|
|
$ |
2,780.7 |
|
|
$ |
95.1 |
|
|
$ |
2,943.7 |
|
|
Contribution margin |
|
|
60.7 |
% |
|
|
63.2 |
% |
|
|
46.7 |
% |
|
|
62.4 |
% |
|
Corporate |
|
|
|
|
|
|
|
|
|
|
|
|
|
|
2,239.4 |
|
|
Research and development |
|
|
|
|
|
|
|
|
|
|
|
|
|
|
605.7 |
|
|
Amortization |
|
|
|
|
|
|
|
|
|
|
|
|
|
|
1,935.8 |
|
|
In-process research and development impairments |
|
|
|
|
|
|
|
|
|
|
|
|
|
|
424.3 |
|
|
Asset sales and impairments, net |
|
|
|
|
|
|
|
|
|
|
|
|
|
|
305.7 |
|
|
Operating (loss) |
|
|
|
|
|
|
|
|
|
|
|
|
|
$ |
(2,567.2 |
) |
|
Operating margin |
|
|
|
|
|
|
|
|
|
|
|
|
|
|
(54.5 |
)% |
|
(1) |
Excludes amortization and impairment of acquired intangibles including product rights. |
The following is a reconciliation of net revenues for the operating segments to the Company’s net revenues for the years ended December 31, 2016, 2015 and 2014 ($ in millions):
|
|
|
Years Ended December 31, |
|
|||||||||
|
|
|
2016 |
|
|
2015 |
|
|
2014 |
|
|||
|
Segment net revenues |
|
$ |
14,616.9 |
|
|
$ |
12,835.5 |
|
|
$ |
4,714.7 |
|
|
Corporate revenues |
|
|
(46.3 |
) |
|
|
(147.4 |
) |
|
|
(38.2 |
) |
|
Net revenues |
|
$ |
14,570.6 |
|
|
$ |
12,688.1 |
|
|
$ |
4,676.5 |
|
F-79
No country outside of the United States represents ten percent or more of net revenues. The US Specialized Therapeutics and US General Medicine segments are comprised solely of sales within the United States.
The following tables present global net revenues for the top products of the Company for the years ended December 31, 2016, 2015 and 2014 ($ in millions):
|
|
Year Ended December 31, 2016 |
|
|||||||||||||||||
|
|
US Specialized Therapeutics |
|
|
US General Medicine |
|
|
International |
|
|
Corporate |
|
|
Total |
|
|||||
|
Botox® |
$ |
1,983.2 |
|
|
$ |
- |
|
|
$ |
803.0 |
|
|
$ |
- |
|
|
$ |
2,786.2 |
|
|
Restasis® |
|
1,419.5 |
|
|
|
- |
|
|
|
68.0 |
|
|
|
- |
|
|
|
1,487.5 |
|
|
Fillers |
|
446.9 |
|
|
|
- |
|
|
|
420.4 |
|
|
|
- |
|
|
|
867.3 |
|
|
Lumigan®/Ganfort® |
|
326.4 |
|
|
|
- |
|
|
|
361.7 |
|
|
|
- |
|
|
|
688.1 |
|
|
Linzess®/Constella® |
|
- |
|
|
|
625.6 |
|
|
|
17.3 |
|
|
|
- |
|
|
|
642.9 |
|
|
Bystolic® / Byvalson® |
|
- |
|
|
|
638.8 |
|
|
|
1.7 |
|
|
|
- |
|
|
|
640.5 |
|
|
Namenda XR® |
|
- |
|
|
|
627.6 |
|
|
|
- |
|
|
|
- |
|
|
|
627.6 |
|
|
Alphagan®/Combigan® |
|
376.6 |
|
|
|
- |
|
|
|
169.3 |
|
|
|
- |
|
|
|
545.9 |
|
|
Asacol®/Delzicol® |
|
- |
|
|
|
360.8 |
|
|
|
53.7 |
|
|
|
- |
|
|
|
414.5 |
|
|
Lo Loestrin® |
|
- |
|
|
|
403.5 |
|
|
|
- |
|
|
|
- |
|
|
|
403.5 |
|
|
Estrace® Cream |
|
- |
|
|
|
379.4 |
|
|
|
- |
|
|
|
- |
|
|
|
379.4 |
|
|
Eye Drops |
|
186.5 |
|
|
|
- |
|
|
|
276.2 |
|
|
|
- |
|
|
|
462.7 |
|
|
Breast Implants |
|
206.0 |
|
|
|
- |
|
|
|
149.9 |
|
|
|
- |
|
|
|
355.9 |
|
|
Viibryd®/Fetzima® |
|
- |
|
|
|
342.3 |
|
|
|
- |
|
|
|
- |
|
|
|
342.3 |
|
|
Minastrin® 24 |
|
- |
|
|
|
325.9 |
|
|
|
1.4 |
|
|
|
- |
|
|
|
327.3 |
|
|
Ozurdex ® |
|
84.4 |
|
|
|
- |
|
|
|
179.0 |
|
|
|
- |
|
|
|
263.4 |
|
|
Carafate ® / Sulcrate ® |
|
- |
|
|
|
229.0 |
|
|
|
2.4 |
|
|
|
- |
|
|
|
231.4 |
|
|
Aczone® |
|
217.3 |
|
|
|
- |
|
|
|
- |
|
|
|
- |
|
|
|
217.3 |
|
|
Zenpep® |
|
- |
|
|
|
200.7 |
|
|
|
- |
|
|
|
- |
|
|
|
200.7 |
|
|
Canasa®/Salofalk® |
|
- |
|
|
|
178.7 |
|
|
|
17.7 |
|
|
|
- |
|
|
|
196.4 |
|
|
Saphris® |
|
- |
|
|
|
166.8 |
|
|
|
- |
|
|
|
- |
|
|
|
166.8 |
|
|
Armour Thyroid |
|
- |
|
|
|
166.5 |
|
|
|
- |
|
|
|
- |
|
|
|
166.5 |
|
|
Teflaro® |
|
- |
|
|
|
133.6 |
|
|
|
- |
|
|
|
- |
|
|
|
133.6 |
|
|
Rapaflo® |
|
116.6 |
|
|
|
- |
|
|
|
5.8 |
|
|
|
- |
|
|
|
122.4 |
|
|
SkinMedica® |
|
108.3 |
|
|
|
- |
|
|
|
- |
|
|
|
- |
|
|
|
108.3 |
|
|
Savella® |
|
- |
|
|
|
103.2 |
|
|
|
- |
|
|
|
- |
|
|
|
103.2 |
|
|
Tazorac® |
|
95.5 |
|
|
|
- |
|
|
|
0.8 |
|
|
|
- |
|
|
|
96.3 |
|
|
Vraylar™ |
|
- |
|
|
|
94.3 |
|
|
|
- |
|
|
|
- |
|
|
|
94.3 |
|
|
Viberzi® |
|
- |
|
|
|
93.3 |
|
|
|
- |
|
|
|
- |
|
|
|
93.3 |
|
|
Latisse® |
|
77.9 |
|
|
|
- |
|
|
|
8.5 |
|
|
|
- |
|
|
|
86.4 |
|
|
Lexapro® |
|
- |
|
|
|
66.6 |
|
|
|
- |
|
|
|
- |
|
|
|
66.6 |
|
|
Namzaric® |
|
- |
|
|
|
57.5 |
|
|
|
- |
|
|
|
- |
|
|
|
57.5 |
|
|
Kybella® / Belkyra® |
|
50.2 |
|
|
|
- |
|
|
|
2.3 |
|
|
|
- |
|
|
|
52.5 |
|
|
Dalvance® |
|
- |
|
|
|
39.3 |
|
|
|
- |
|
|
|
- |
|
|
|
39.3 |
|
|
Avycaz® |
|
- |
|
|
|
36.1 |
|
|
|
- |
|
|
|
- |
|
|
|
36.1 |
|
|
Liletta® |
|
- |
|
|
|
23.3 |
|
|
|
- |
|
|
|
- |
|
|
|
23.3 |
|
|
Enablex® |
|
- |
|
|
|
17.1 |
|
|
|
- |
|
|
|
- |
|
|
|
17.1 |
|
|
Namenda® IR |
|
- |
|
|
|
15.1 |
|
|
|
- |
|
|
|
- |
|
|
|
15.1 |
|
|
Other Products Revenues |
|
116.4 |
|
|
|
598.9 |
|
|
|
342.2 |
|
|
|
33.7 |
|
|
|
1,091.2 |
|
|
Less product sold through our former Anda Distribution business |
n.a. |
|
|
n.a. |
|
|
n.a. |
|
|
|
(80.0 |
) |
|
|
(80.0 |
) |
|||
|
Total Net Revenues |
$ |
5,811.7 |
|
|
$ |
5,923.9 |
|
|
$ |
2,881.3 |
|
|
$ |
(46.3 |
) |
|
$ |
14,570.6 |
|
F-80
|
|
Year Ended December 31, 2015 |
|
|||||||||||||||||
|
|
US Specialized Therapeutics |
|
|
US General Medicine |
|
|
International |
|
|
Corporate |
|
|
Total |
|
|||||
|
Botox® |
$ |
1,386.4 |
|
|
$ |
- |
|
|
$ |
584.4 |
|
|
$ |
- |
|
|
$ |
1,970.8 |
|
|
Restasis® |
|
999.6 |
|
|
|
- |
|
|
|
48.2 |
|
|
|
- |
|
|
|
1,047.8 |
|
|
Fillers |
|
304.4 |
|
|
|
- |
|
|
|
269.5 |
|
|
|
- |
|
|
|
573.9 |
|
|
Lumigan®/Ganfort® |
|
260.7 |
|
|
|
- |
|
|
|
283.4 |
|
|
|
- |
|
|
|
544.1 |
|
|
Linzess®/Constella® |
|
- |
|
|
|
454.8 |
|
|
|
4.5 |
|
|
|
- |
|
|
|
459.3 |
|
|
Bystolic® / Byvalson® |
|
- |
|
|
|
644.8 |
|
|
|
1.3 |
|
|
|
- |
|
|
|
646.1 |
|
|
Namenda XR® |
|
- |
|
|
|
759.3 |
|
|
|
- |
|
|
|
- |
|
|
|
759.3 |
|
|
Alphagan®/Combigan® |
|
285.0 |
|
|
|
- |
|
|
|
126.1 |
|
|
|
- |
|
|
|
411.1 |
|
|
Asacol®/Delzicol® |
|
- |
|
|
|
552.9 |
|
|
|
65.5 |
|
|
|
- |
|
|
|
618.4 |
|
|
Lo Loestrin® |
|
- |
|
|
|
346.5 |
|
|
|
3.1 |
|
|
|
- |
|
|
|
349.6 |
|
|
Estrace® Cream |
|
- |
|
|
|
326.2 |
|
|
|
- |
|
|
|
- |
|
|
|
326.2 |
|
|
Eye Drops |
|
177.0 |
|
|
|
- |
|
|
|
220.6 |
|
|
|
- |
|
|
|
397.6 |
|
|
Breast Implants |
|
175.0 |
|
|
|
- |
|
|
|
125.5 |
|
|
|
- |
|
|
|
300.5 |
|
|
Viibryd®/Fetzima® |
|
- |
|
|
|
327.6 |
|
|
|
- |
|
|
|
- |
|
|
|
327.6 |
|
|
Minastrin® 24 |
|
- |
|
|
|
272.4 |
|
|
|
0.6 |
|
|
|
- |
|
|
|
273.0 |
|
|
Ozurdex ® |
|
56.1 |
|
|
|
- |
|
|
|
112.3 |
|
|
|
- |
|
|
|
168.4 |
|
|
Carafate ® / Sulcrate ® |
|
- |
|
|
|
213.1 |
|
|
|
- |
|
|
|
- |
|
|
|
213.1 |
|
|
Aczone® |
|
170.8 |
|
|
|
- |
|
|
|
- |
|
|
|
- |
|
|
|
170.8 |
|
|
Zenpep® |
|
- |
|
|
|
167.4 |
|
|
|
- |
|
|
|
- |
|
|
|
167.4 |
|
|
Canasa®/Salofalk® |
|
- |
|
|
|
137.1 |
|
|
|
18.5 |
|
|
|
- |
|
|
|
155.6 |
|
|
Saphris® |
|
- |
|
|
|
186.7 |
|
|
|
- |
|
|
|
- |
|
|
|
186.7 |
|
|
Armour Thyroid |
|
- |
|
|
|
130.8 |
|
|
|
- |
|
|
|
- |
|
|
|
130.8 |
|
|
Teflaro® |
|
- |
|
|
|
137.6 |
|
|
|
- |
|
|
|
- |
|
|
|
137.6 |
|
|
Rapaflo® |
|
115.2 |
|
|
|
- |
|
|
|
10.9 |
|
|
|
- |
|
|
|
126.1 |
|
|
SkinMedica® |
|
76.6 |
|
|
|
- |
|
|
|
- |
|
|
|
- |
|
|
|
76.6 |
|
|
Savella® |
|
- |
|
|
|
106.4 |
|
|
|
- |
|
|
|
- |
|
|
|
106.4 |
|
|
Tazorac® |
|
92.3 |
|
|
|
- |
|
|
|
1.4 |
|
|
|
- |
|
|
|
93.7 |
|
|
Vraylar™ |
|
- |
|
|
|
- |
|
|
|
- |
|
|
|
- |
|
|
|
- |
|
|
Viberzi® |
|
- |
|
|
|
12.3 |
|
|
|
- |
|
|
|
- |
|
|
|
12.3 |
|
|
Latisse® |
|
63.2 |
|
|
|
- |
|
|
|
10.0 |
|
|
|
- |
|
|
|
73.2 |
|
|
Lexapro® |
|
- |
|
|
|
71.6 |
|
|
|
- |
|
|
|
- |
|
|
|
71.6 |
|
|
Namzaric® |
|
- |
|
|
|
11.2 |
|
|
|
- |
|
|
|
- |
|
|
|
11.2 |
|
|
Kybella® / Belkyra® |
|
3.2 |
|
|
|
- |
|
|
|
- |
|
|
|
- |
|
|
|
3.2 |
|
|
Dalvance® |
|
- |
|
|
|
16.8 |
|
|
|
- |
|
|
|
- |
|
|
|
16.8 |
|
|
Avycaz® |
|
- |
|
|
|
22.6 |
|
|
|
- |
|
|
|
- |
|
|
|
22.6 |
|
|
Liletta® |
|
- |
|
|
|
14.8 |
|
|
|
- |
|
|
|
- |
|
|
|
14.8 |
|
|
Enablex® |
|
- |
|
|
|
69.2 |
|
|
|
- |
|
|
|
- |
|
|
|
69.2 |
|
|
Namenda® IR |
|
- |
|
|
|
556.3 |
|
|
|
- |
|
|
|
- |
|
|
|
556.3 |
|
|
Other Products Revenues |
|
144.3 |
|
|
|
800.0 |
|
|
|
301.5 |
|
|
|
10.0 |
|
|
|
1,255.8 |
|
|
Less product sold through our former Anda Distribution business |
n.a. |
|
|
n.a. |
|
|
n.a. |
|
|
|
(157.4 |
) |
|
|
(157.4 |
) |
|||
|
Total Net Revenues |
$ |
4,309.8 |
|
|
$ |
6,338.4 |
|
|
$ |
2,187.3 |
|
|
$ |
(147.4 |
) |
|
$ |
12,688.1 |
|
F-81
|
|
Year Ended December 31, 2014 |
|
|||||||||||||||||
|
|
US Specialized Therapeutics |
|
|
US General Medicine |
|
|
International |
|
|
Corporate |
|
|
Total |
|
|||||
|
Botox® |
$ |
- |
|
|
$ |
- |
|
|
$ |
- |
|
|
$ |
- |
|
|
$ |
- |
|
|
Restasis® |
|
- |
|
|
|
- |
|
|
|
- |
|
|
|
- |
|
|
|
- |
|
|
Fillers |
|
- |
|
|
|
- |
|
|
|
- |
|
|
|
- |
|
|
|
- |
|
|
Lumigan®/Ganfort® |
|
- |
|
|
|
- |
|
|
|
- |
|
|
|
- |
|
|
|
- |
|
|
Linzess®/Constella® |
|
- |
|
|
|
173.2 |
|
|
|
1.2 |
|
|
|
- |
|
|
|
174.4 |
|
|
Bystolic® / Byvalson® |
|
- |
|
|
|
291.6 |
|
|
|
0.9 |
|
|
|
- |
|
|
|
292.5 |
|
|
Namenda XR® |
|
- |
|
|
|
269.5 |
|
|
|
- |
|
|
|
- |
|
|
|
269.5 |
|
|
Alphagan®/Combigan® |
|
- |
|
|
|
- |
|
|
|
- |
|
|
|
- |
|
|
|
- |
|
|
Asacol®/Delzicol® |
|
- |
|
|
|
541.0 |
|
|
|
73.1 |
|
|
|
- |
|
|
|
614.1 |
|
|
Lo Loestrin® |
|
- |
|
|
|
275.7 |
|
|
|
- |
|
|
|
- |
|
|
|
275.7 |
|
|
Estrace® Cream |
|
- |
|
|
|
258.2 |
|
|
|
- |
|
|
|
- |
|
|
|
258.2 |
|
|
Eye Drops |
|
- |
|
|
|
- |
|
|
|
- |
|
|
|
- |
|
|
|
- |
|
|
Breast Implants |
|
- |
|
|
|
- |
|
|
|
- |
|
|
|
- |
|
|
|
- |
|
|
Viibryd®/Fetzima® |
|
- |
|
|
|
140.3 |
|
|
|
- |
|
|
|
- |
|
|
|
140.3 |
|
|
Minastrin® 24 |
|
- |
|
|
|
217.9 |
|
|
|
- |
|
|
|
- |
|
|
|
217.9 |
|
|
Ozurdex ® |
|
- |
|
|
|
- |
|
|
|
- |
|
|
|
- |
|
|
|
- |
|
|
Carafate ® / Sulcrate ® |
|
- |
|
|
|
90.9 |
|
|
|
1.3 |
|
|
|
- |
|
|
|
92.2 |
|
|
Aczone® |
|
- |
|
|
|
- |
|
|
|
- |
|
|
|
- |
|
|
|
- |
|
|
Zenpep® |
|
- |
|
|
|
65.1 |
|
|
|
- |
|
|
|
- |
|
|
|
65.1 |
|
|
Canasa®/Salofalk® |
|
- |
|
|
|
74.6 |
|
|
|
11.5 |
|
|
|
- |
|
|
|
86.1 |
|
|
Saphris® |
|
- |
|
|
|
69.9 |
|
|
|
- |
|
|
|
- |
|
|
|
69.9 |
|
|
Armour Thyroid |
|
- |
|
|
|
47.9 |
|
|
|
- |
|
|
|
- |
|
|
|
47.9 |
|
|
Teflaro® |
|
- |
|
|
|
56.2 |
|
|
|
- |
|
|
|
- |
|
|
|
56.2 |
|
|
Rapaflo® |
|
111.9 |
|
|
|
- |
|
|
|
5.2 |
|
|
|
- |
|
|
|
117.1 |
|
|
SkinMedica® |
|
- |
|
|
|
- |
|
|
|
- |
|
|
|
- |
|
|
|
- |
|
|
Savella® |
|
- |
|
|
|
49.4 |
|
|
|
- |
|
|
|
- |
|
|
|
49.4 |
|
|
Tazorac® |
|
- |
|
|
|
- |
|
|
|
- |
|
|
|
- |
|
|
|
- |
|
|
Vraylar™ |
|
- |
|
|
|
- |
|
|
|
- |
|
|
|
- |
|
|
|
- |
|
|
Viberzi® |
|
- |
|
|
|
- |
|
|
|
- |
|
|
|
- |
|
|
|
- |
|
|
Latisse® |
|
- |
|
|
|
- |
|
|
|
- |
|
|
|
- |
|
|
|
- |
|
|
Lexapro® |
|
- |
|
|
|
35.1 |
|
|
|
- |
|
|
|
- |
|
|
|
35.1 |
|
|
Namzaric® |
|
- |
|
|
|
- |
|
|
|
- |
|
|
|
- |
|
|
|
- |
|
|
Kybella® / Belkyra® |
|
- |
|
|
|
- |
|
|
|
- |
|
|
|
- |
|
|
|
- |
|
|
Dalvance® |
|
- |
|
|
|
1.4 |
|
|
|
- |
|
|
|
- |
|
|
|
1.4 |
|
|
Avycaz® |
|
- |
|
|
|
- |
|
|
|
- |
|
|
|
- |
|
|
|
- |
|
|
Liletta® |
|
- |
|
|
|
- |
|
|
|
- |
|
|
|
- |
|
|
|
- |
|
|
Enablex® |
|
- |
|
|
|
85.9 |
|
|
|
- |
|
|
|
- |
|
|
|
85.9 |
|
|
Namenda® IR |
|
- |
|
|
|
629.7 |
|
|
|
- |
|
|
|
- |
|
|
|
629.7 |
|
|
Other Products Revenues |
|
- |
|
|
|
1,025.8 |
|
|
|
110.3 |
|
|
|
- |
|
|
|
1,136.1 |
|
|
Less product sold through our former Anda Distribution business |
n.a. |
|
|
n.a. |
|
|
n.a. |
|
|
|
(38.2 |
) |
|
|
(38.2 |
) |
|||
|
Total Net Revenues |
$ |
111.9 |
|
|
$ |
4,399.3 |
|
|
$ |
203.5 |
|
|
$ |
(38.2 |
) |
|
$ |
4,676.5 |
|
Unless included above, no product represents ten percent or more of total net revenues.
F-82
NOTE 21 — Business Restructuring Charges
During 2016, activity related to our business restructuring and facility rationalization activities primarily related to the cost optimization initiatives in conjunction with the Allergan Acquisition. Restructuring activities for the year ended December 31, 2016 is as follows ($ in millions):
|
|
|
Severance and Retention |
|
|
Share-Based Compensation |
|
|
Other |
|
|
Total |
|
||||
|
Reserve balance at December 31, 2015 |
|
$ |
94.8 |
|
|
$ |
- |
|
|
$ |
48.6 |
|
|
$ |
143.4 |
|
|
Acquired liability |
|
|
- |
|
|
|
- |
|
|
|
- |
|
|
|
- |
|
|
Charged to expense: |
|
|
|
|
|
|
|
|
|
|
|
|
|
|
|
|
|
Cost of sales |
|
|
3.9 |
|
|
|
0.5 |
|
|
|
4.9 |
|
|
|
9.3 |
|
|
Research and development |
|
|
11.1 |
|
|
|
1.0 |
|
|
|
0.7 |
|
|
|
12.8 |
|
|
Selling and marketing |
|
|
19.8 |
|
|
|
9.7 |
|
|
|
1.7 |
|
|
|
31.2 |
|
|
General and administrative |
|
|
27.9 |
|
|
|
9.8 |
|
|
|
15.1 |
|
|
|
52.8 |
|
|
Total expense |
|
|
62.7 |
|
|
|
21.0 |
|
|
|
22.4 |
|
|
|
106.1 |
|
|
Cash payments |
|
|
(81.9 |
) |
|
|
- |
|
|
|
(33.3 |
) |
|
|
(115.2 |
) |
|
Other reserve impact |
|
|
(7.1 |
) |
|
|
(21.0 |
) |
|
|
2.0 |
|
|
|
(26.1 |
) |
|
Reserve balance at December 31, 2016 |
|
$ |
68.5 |
|
|
$ |
- |
|
|
$ |
39.7 |
|
|
$ |
108.2 |
|
During 2015, activity related to our business restructuring and facility rationalization activities primarily related to the cost optimization initiatives in conjunction with the Allergan and Forest acquisitions. Restructuring activities for the year ended December 31, 2015 as follows ($ in millions):
|
|
|
Severance and Retention |
|
|
Share-Based Compensation |
|
|
Other |
|
|
Total |
|
||||
|
Reserve balance at December 31, 2014 |
|
$ |
111.1 |
|
|
$ |
- |
|
|
$ |
- |
|
|
$ |
111.1 |
|
|
Acquired liability |
|
|
27.9 |
|
|
|
- |
|
|
|
29.2 |
|
|
|
57.1 |
|
|
Charged to expense: |
|
|
|
|
|
|
|
|
|
|
|
|
|
|
|
|
|
Cost of sales |
|
|
9.3 |
|
|
|
19.8 |
|
|
|
23.4 |
|
|
|
52.5 |
|
|
Research and development |
|
|
77.7 |
|
|
|
104.6 |
|
|
|
- |
|
|
|
182.3 |
|
|
Selling and marketing |
|
|
71.5 |
|
|
|
47.0 |
|
|
|
- |
|
|
|
118.5 |
|
|
General and administrative |
|
|
128.6 |
|
|
|
293.3 |
|
|
|
42.4 |
|
|
|
464.3 |
|
|
Total expense |
|
|
287.1 |
|
|
|
464.7 |
|
|
|
65.8 |
|
|
|
817.6 |
|
|
Cash payments |
|
|
(312.3 |
) |
|
|
(127.1 |
) |
|
|
(59.1 |
) |
|
|
(498.5 |
) |
|
Other reserve impact |
|
|
(19.0 |
) |
|
|
(337.6 |
) |
|
|
12.7 |
|
|
|
(343.9 |
) |
|
Reserve balance at December 31, 2015 |
|
$ |
94.8 |
|
|
$ |
- |
|
|
$ |
48.6 |
|
|
$ |
143.4 |
|
During the years ended December 31, 2016, 2015 and 2014, the Company recognized restructuring charges related to continuing operations of $106.1 million, $817.6 million and $330.9 million, respectively.
NOTE 22 — Derivative Instruments and Hedging Activities
The Company’s revenue, earnings, cash flows and fair value of its assets and liabilities can be impacted by fluctuations in foreign exchange risks and interest rates, as applicable. The Company manages the impact of foreign exchange risk and interest rate movements through operational means and through the use of various financial instruments, including derivative instruments such as foreign currency derivatives.
Foreign Currency Derivatives
Overall, the Company is a net recipient of currencies other than the U.S. dollar and, as such, benefits from a weaker dollar and is adversely affected by a stronger dollar relative to major currencies worldwide. Accordingly, changes in exchange rates, and in particular a strengthening of the U.S. dollar, may negatively affect the Company’s consolidated revenues and favorably impact operating expenses in U.S. dollars.
Primarily as a result of the Allergan Acquisition and from time to time, the Company enters into foreign currency derivatives to reduce current and future earnings and cash flow volatility associated with foreign exchange rate changes to allow management to
F-83
focus its attention on its core business issues. Accordingly, the Company enters into various contracts which change in value as foreign exchange rates change to economically offset the effect of changes in the value of foreign currency assets and liabilities, commitments and anticipated foreign currency denominated sales and operating expenses. The Company enters into foreign currency derivatives in amounts between minimum and maximum anticipated foreign exchange exposures. The Company does not designate the current derivative instruments as accounting hedges.
The Company uses foreign currency derivatives, which provide for the sale or purchase or the option for sale or purchase of foreign currencies to economically hedge the currency exchange risks associated with probable but not firmly committed transactions that arise in the normal course of the Company’s business. Probable but not firmly committed transactions are comprised primarily of sales of products and purchases of raw material in currencies other than the U.S. dollar. The foreign currency derivatives are entered into to reduce the volatility of earnings generated in currencies other than the U.S. dollar. While these instruments are subject to fluctuations in value, such fluctuations are anticipated to offset changes in the value of the underlying exposures.
The Company recognized realized and unrealized (gains) on such contracts of $(4.0) million, $(1.4) million and $(2.3) million, respectively, during the years ended December 31, 2016, 2015 and 2014.
The fair value of outstanding foreign currency derivatives are recorded in “Prepaid expenses and other current assets,” “investments and other assets” or “Accounts payable and accrued expenses.” At December 31, 2016 and 2015, foreign currency derivative assets associated with the foreign exchange option contracts of $0.1 million and $25.0 million, respectively, were included in “Prepaid expenses and other current assets.” At December 31, 2015, foreign currency derivative assets associated with the foreign exchange option contracts of $48.5 million were included in “investments and other assets.” At December 31, 2016, there were no foreign currency derivative liabilities associated with the foreign exchange option contracts. At December 31, 2015, there was $0.3 million in foreign currency derivative liabilities associated with the foreign exchange forward contracts were included in “Accounts payable and accrued expenses.”
NOTE 23 — Fair Value Measurement
Assets and liabilities are measured at fair value using Fair Value Leveling or disclosed at fair value on a recurring basis as of December 31, 2016 and 2015 consisted of the following ($ in millions):
|
|
|
Fair Value Measurements as of December 31, 2016 Using: |
|
|||||||||||||
|
|
|
Total |
|
|
Level 1 |
|
|
Level 2 |
|
|
Level 3 |
|
||||
|
Assets: |
|
|
|
|
|
|
|
|
|
|
|
|
|
|
|
|
|
Cash equivalents* |
|
$ |
1,238.9 |
|
|
$ |
1,238.9 |
|
|
$ |
- |
|
|
$ |
- |
|
|
Marketable securities |
|
|
8,062.3 |
|
|
|
- |
|
|
|
8,062.3 |
|
|
|
- |
|
|
Deferred executive compensation investments |
|
|
111.7 |
|
|
|
90.5 |
|
|
|
21.2 |
|
|
|
- |
|
|
Foreign currency derivatives |
|
|
0.1 |
|
|
|
- |
|
|
|
0.1 |
|
|
|
- |
|
|
Investment in Teva ordinary shares |
|
|
3,439.2 |
|
|
|
- |
|
|
|
3,439.2 |
|
|
|
- |
|
|
Investments and other |
|
|
95.0 |
|
|
|
95.0 |
|
|
|
- |
|
|
|
- |
|
|
Total assets |
|
$ |
12,947.2 |
|
|
$ |
1,424.4 |
|
|
$ |
11,522.8 |
|
|
$ |
- |
|
|
Liabilities: |
|
|
|
|
|
|
|
|
|
|
|
|
|
|
|
|
|
Deferred executive compensation liabilities |
|
|
111.7 |
|
|
|
90.5 |
|
|
|
21.2 |
|
|
|
- |
|
|
Contingent consideration obligations |
|
|
1,172.1 |
|
|
|
- |
|
|
|
- |
|
|
|
1,172.1 |
|
|
Total liabilities |
|
$ |
1,283.8 |
|
|
$ |
90.5 |
|
|
$ |
21.2 |
|
|
$ |
1,172.1 |
|
|
* |
Marketable securities with less than 90 days remaining until maturity are classified as cash equivalents. |
F-84
|
|
|
Fair Value Measurements as of December 31, 2015 Using: |
|
|||||||||||||
|
|
|
Total |
|
|
Level 1 |
|
|
Level 2 |
|
|
Level 3 |
|
||||
|
Assets: |
|
|
|
|
|
|
|
|
|
|
|
|
|
|
|
|
|
Marketable securities |
|
$ |
29.9 |
|
|
$ |
29.9 |
|
|
$ |
- |
|
|
$ |
- |
|
|
Deferred executive compensation investments |
|
118.1 |
|
|
|
102.3 |
|
|
|
15.8 |
|
|
|
- |
|
|
|
Foreign currency derivatives |
|
73.2 |
|
|
|
- |
|
|
|
73.2 |
|
|
|
- |
|
|
|
Investments and other |
|
112.2 |
|
|
112.2 |
|
|
|
- |
|
|
|
- |
|
||
|
Total assets |
|
$ |
333.4 |
|
|
$ |
244.4 |
|
|
$ |
89.0 |
|
|
$ |
- |
|
|
Liabilities: |
|
|
|
|
|
|
|
|
|
|
|
|
|
|
|
|
|
Deferred executive compensation liabilities |
|
|
117.9 |
|
|
|
102.1 |
|
|
|
15.8 |
|
|
|
- |
|
|
Contingent consideration obligations |
|
|
868.0 |
|
|
|
- |
|
|
|
- |
|
|
|
868.0 |
|
|
Total liabilities |
|
$ |
985.9 |
|
|
$ |
102.1 |
|
|
$ |
15.8 |
|
|
$ |
868.0 |
|
Marketable securities and investments consist of available-for-sale investments in U.S. treasury and agency securities and publicly traded equity securities for which market prices are readily available. Unrealized gains or losses on marketable securities and investments are recorded in accumulated other comprehensive (loss) / income. Realized gains or losses on marketable securities and investments are recorded in interest income. The Company’s marketable securities and other long-term investments are classified as available-for-sale and are recorded at fair value based on quoted market prices using the specific identification method. These investments are classified as either current or non-current, as appropriate, in the Company’s consolidated balance sheets. The Company may sell certain of its marketable securities prior to their stated maturities for strategic reasons including, but not limited to, anticipation of credit deterioration and maturity management.
Foreign Currency Contracts
At December 31, 2016 and 2015, the notional principal and fair value of the Company’s outstanding foreign currency derivative financial instruments were as follows ($ in millions, except average contract rate or strike amount):
|
|
|
Year Ended December 31, 2016 |
|
|
Year Ended December 31, 2015 |
|
||||||||||
|
|
|
Notional Principal |
|
|
Average Contract Rate or Strike Amount |
|
|
Notional Principal |
|
|
Average Contract Rate or Strike Amount |
|
||||
|
Foreign currency forward contracts: |
|
|
|
|
|
|
|
|
|
|
|
|
|
|
|
|
|
(Receive U.S. dollar/pay foreign currency) |
|
|
|
|
|
|
|
|
|
|
|
|
|
|
|
|
|
Russian ruble |
|
$ |
22.5 |
|
|
|
61.02 |
|
|
$ |
18.8 |
|
|
|
72.97 |
|
|
|
|
$ |
22.5 |
|
|
|
|
|
|
$ |
18.8 |
|
|
|
|
|
|
|
|
|
|
|
|
|
|
|
|
|
|
|
|
|
|
|
|
Estimated fair value |
|
$ |
0.1 |
|
|
|
|
|
|
$ |
(0.3 |
) |
|
|
|
|
|
|
|
|
|
|
|
|
|
|
|
|
|
|
|
|
|
|
|
Foreign currency sold - put options: |
|
|
|
|
|
|
|
|
|
|
|
|
|
|
|
|
|
Euro |
|
$ |
- |
|
|
|
0.00 |
|
|
|
340.5 |
|
|
1.41 |
|
|
|
|
|
$ |
- |
|
|
|
|
|
|
$ |
340.5 |
|
|
|
|
|
|
|
|
|
|
|
|
|
|
|
|
|
|
|
|
|
|
|
|
Estimated fair value |
|
$ |
- |
|
|
|
|
|
|
$ |
73.5 |
|
|
|
|
|
The notional principal amounts provide one measure of the transaction volume outstanding as of December 31, 2016 and 2015, and do not represent the amount of the Company’s exposure to market loss. The estimates of fair value are based on applicable and commonly used pricing models using prevailing financial market information as of December 31, 2016 and 2015. The amounts ultimately realized upon settlement of these financial instruments, together with the gains and losses on the underlying exposures, will depend on actual market conditions during the remaining life of the instruments.
F-85
Contingent Consideration Obligations
The fair value measurement of the contingent consideration obligations is determined using Level 3 inputs and is based on a probability-weighted income approach. The measurement is based upon unobservable inputs supported by little or no market activity based on our own assumptions. Changes in the fair value of the contingent consideration obligations, including accretion, are recorded in our consolidated statements of operations as follows ($ in millions):
|
|
|
Years Ended December 31, |
|
|||||||||
|
Expense / (income) |
|
2016 |
|
|
2015 |
|
|
2014 |
|
|||
|
Cost of sales |
|
$ |
(17.4 |
) |
|
$ |
58.5 |
|
|
$ |
(9.9 |
) |
|
Research and development |
|
|
(71.1 |
) |
|
|
37.7 |
|
|
|
(69.3 |
) |
|
General and administrative |
|
|
24.3 |
|
|
|
(0.5 |
) |
|
|
0.4 |
|
|
Total |
|
$ |
(64.2 |
) |
|
$ |
95.7 |
|
|
$ |
(78.8 |
) |
During the year ended December 31, 2016, the Company had net contingent consideration income of $64.2 million primarily driven by ongoing R&D projects that were terminated based on clinical data acquired in the Allergan Acquisition, which was offset by additional contingent consideration expense relating to milestones achieved in connection with the AqueSys and Allergan Acquisitions.
During the year ended December 31, 2015, the Company recorded additional contingent consideration of $29.8 million in connection with the approval of Viberzi™, $81.4 million in connection with the approval of Liletta® and $6.4 million in connection with the approval of Dalvance®. Offsetting these amounts were gains from fair value of adjustments related to the Forest Acquisition of $32.3 million and the Allergan Acquisition of $8.2 million.
The table below provides a summary of the changes in fair value, including net transfers in and/or out, of all financial assets and liabilities measured at fair value on a recurring basis using significant unobservable inputs (Level 3) for the years ended December 31, 2016 and 2015 ($ in millions):
|
|
|
Balance as of December 31, 2015 |
|
|
Net transfers in to (out of) Level 3 |
|
|
Purchases and settlements, net |
|
|
Net accretion and fair value adjustments |
|
|
Foreign currency translation |
|
|
Balance as of December 31, 2016 |
|
||||||
|
Liabilities: |
|
|
|
|
|
|
|
|
|
|
|
|
|
|
|
|
|
|
|
|
|
|
|
|
|
Contingent consideration obligations |
|
$ |
868.0 |
|
|
$ |
- |
|
|
$ |
368.3 |
|
|
$ |
(64.2 |
) |
|
$ |
- |
|
|
$ |
1,172.1 |
|
|
|
|
Balance at December 31, 2014 |
|
|
Net transfers in to (out of) Level 3 |
|
|
Purchases and settlements, net |
|
|
Net accretion and fair value adjustments |
|
|
Foreign currency translation |
|
|
Balance at December 31, 2015 |
|
||||||
|
Liabilities: |
|
|
|
|
|
|
|
|
|
|
|
|
|
|
|
|
|
|
|
|
|
|
|
|
|
Contingent consideration obligations |
|
$ |
373.8 |
|
|
$ |
- |
|
|
$ |
405.1 |
|
|
$ |
95.7 |
|
|
$ |
(6.6 |
) |
|
$ |
868.0 |
|
F-86
During the year ended December 31, 2016, the following activity in contingent consideration obligations by acquisition was incurred ($ in millions):
|
|
|
Balance as of December 31, 2015 |
|
|
Acquisitions |
|
|
Fair Value Adjustments and Accretion |
|
|
Payments and Other |
|
|
Balance as of December 31, 2016 |
|
|||||
|
Allergan Acquisition |
|
$ |
329.7 |
|
|
$ |
- |
|
|
$ |
(90.1 |
) |
|
$ |
(40.0 |
) |
|
$ |
199.6 |
|
|
AqueSys Acquisition |
|
|
193.5 |
|
|
|
- |
|
|
|
10.4 |
|
|
|
(100.0 |
) |
|
|
103.9 |
|
|
Medicines 360 acquisition |
|
|
144.1 |
|
|
|
- |
|
|
|
(14.7 |
) |
|
|
(1.9 |
) |
|
|
127.5 |
|
|
Oculeve Acquisition |
|
|
90.0 |
|
|
|
- |
|
|
|
9.5 |
|
|
|
- |
|
|
|
99.5 |
|
|
Metrogel acquisition |
|
|
30.9 |
|
|
|
- |
|
|
|
(8.4 |
) |
|
|
(7.5 |
) |
|
|
15.0 |
|
|
Forest Acquisition |
|
|
20.4 |
|
|
|
- |
|
|
|
(7.8 |
) |
|
|
(1.6 |
) |
|
|
11.0 |
|
|
Uteron acquisition |
|
|
8.2 |
|
|
|
- |
|
|
|
- |
|
|
|
- |
|
|
|
8.2 |
|
|
Durata Acquisition |
|
|
24.5 |
|
|
|
- |
|
|
|
2.2 |
|
|
|
(26.7 |
) |
|
|
- |
|
|
ForSight Acquisition |
|
|
- |
|
|
|
79.8 |
|
|
|
(14.3 |
) |
|
|
(0.1 |
) |
|
|
65.4 |
|
|
Tobira Acquisition |
|
|
- |
|
|
|
479.0 |
|
|
|
35.3 |
|
|
|
0.1 |
|
|
|
514.4 |
|
|
Other |
|
|
26.7 |
|
|
|
- |
|
|
|
13.7 |
|
|
|
(12.8 |
) |
|
|
27.6 |
|
|
Total |
|
$ |
868.0 |
|
|
$ |
558.8 |
|
|
$ |
(64.2 |
) |
|
$ |
(190.5 |
) |
|
$ |
1,172.1 |
|
NOTE 24 — Commitments and Contingencies
The Company and its affiliates are involved in various disputes, governmental and/or regulatory inspections, inquires, investigations and proceedings, and litigation matters that arise from time to time in the ordinary course of business. The process of resolving matters through litigation or other means is inherently uncertain and it is possible that an unfavorable resolution of these matters will adversely affect the Company, its results of operations, financial condition and cash flows. The Company’s general practice is to expense legal fees as services are rendered in connection with legal matters, and to accrue for liabilities when losses are probable and reasonably estimable.
The Company evaluates, on a quarterly basis, developments in legal proceedings and other matters that could cause an increase or decrease in the amount of the liability that is accrued. As of December 31, 2016, the Company’s consolidated balance sheet includes accrued loss contingencies of approximately $70.0 million.
The Company’s legal proceedings range from cases brought by a single plaintiff to mass tort actions and class actions with thousands of putative class members. These legal proceedings, as well as other matters, involve various aspects of our business and a variety of claims (including, but not limited to, qui tam actions, antitrust, product liability, breach of contract, securities, patent infringement and trade practices), some of which present novel factual allegations and/or unique legal theories. In addition, a number of the matters pending against us are at very early stages of the legal process (which in complex proceedings of the sort faced by us often extend for several years). As a result, some matters have not yet progressed sufficiently through discovery and/or development of important factual information and legal issues to enable us to estimate a range of possible loss. In those proceedings in which plaintiffs do request publicly quantified amounts of relief, the Company does not believe that the quantified amounts are meaningful because they are merely stated jurisdictional limits, exaggerated and/or unsupported by the evidence or applicable burdens of proof.
In matters involving the defense of the Company’s intellectual property, the Company believes it has meritorious claims and intends to vigorously defend the patents or other intellectual property at issue in such litigation. Similarly, in matters where the Company is a defendant, the Company believes it has meritorious defenses and intends to defend itself vigorously. However, the Company can offer no assurances that it will be successful in a litigation or, in the case of patent enforcement matters, that a generic version of the product at issue will not be launched or enjoined. Failing to prevail in a litigation could adversely affect the Company and could have a material adverse effect on the Company’s business, results of operations, financial condition and cash flows.
Antitrust Litigation
Asacol® Litigation. Two class action complaints were filed on June 22, 2015, and three more on September 21, 2015, in federal court in Massachusetts on behalf of a putative class of indirect purchasers. In each complaint plaintiffs allege that they paid higher prices for Warner Chilcott’s Asacol® HD and Delzicol® products as a result of Warner Chilcott’s alleged actions preventing or delaying generic competition in the market for Warner Chilcott’s older Asacol® product in violation of U.S. federal antitrust laws and/or state laws. Plaintiffs seek unspecified injunctive relief, treble damages and/or attorneys’ fees. Defendants moved to dismiss the indirect purchasers’ complaint. A hearing was held on the motion to dismiss on May 11, 2016. On July 20, 2016, the court issued a decision granting the motion in part, dismissing the indirect purchaser plaintiffs’ claims based on purported reverse payments and
F-87
dismissing several of indirect purchaser plaintiffs’ claims based on state laws. On August 15, 2016, the indirect purchaser plaintiffs filed a second amended complaint. The Company filed an answer to the second amended complaint on October 4, 2016. Complaints were also filed on behalf of a putative class of direct purchasers of Asacol® in federal court in New York on April 26, 2016, and on June 29, 2016, in each case making similar allegations to the complaints filed by the indirect purchaser plaintiffs. Those matters have been consolidated with the indirect purchaser cases in the federal court in Massachusetts. On October 11, 2016, the Company filed a motion to dismiss the direct purchasers’ consolidated complaint and oral argument on the motion was held on December 16, 2016.
Botox® Litigation. A class action complaint was filed in federal court in California on February 24, 2015, and amended May 29, 2015, alleging unlawful market allocation in violation of Section 1 of the Sherman Act, 15 U.S.C. §1, agreement in restraint of trade in violation of 15 U.S.C. §1 of the Sherman Act, unlawful maintenance of monopoly market power in violation of Section 2 of the Sherman Act, 15 U.S.C. §2 of the Sherman Act, violations of California’s Cartwright Act, Section 16700 et seq. of Calif. Bus. and Prof. Code, and violations of California’s unfair competition law, Section 17200 et seq. of Calif. Bus. and Prof. Code. In the complaint, plaintiffs seek an unspecified amount of treble damages. On July 19, 2016, plaintiffs filed a motion for class certification. On October 14, 2016, the Company filed an opposition to plaintiffs’ motion for class certification. Oral argument on the class certification motion was heard on January 13, 2017.
Doryx® Litigation. In July 2012, Mylan Pharmaceuticals Inc. (“Mylan”) filed a complaint against Warner Chilcott and Mayne Pharma International Pty. Ltd. (“Mayne”) in federal court in Pennsylvania alleging that Warner Chilcott and Mayne prevented or delayed Mylan’s generic competition to Warner Chilcott’s Doryx® products in violation of U.S. federal antitrust laws and tortiously interfered with Mylan’s prospective economic relationships under Pennsylvania state law. In the complaint, Mylan seeks unspecified treble and punitive damages and attorneys’ fees. Warner Chilcott and Mylan filed motions for summary judgment on March 10, 2014. On April 16, 2015, the court issued an order granting Warner Chilcott and Mayne’s motion for summary judgment, denying Mylan’s summary judgment motion and entering judgment in favor of Warner Chilcott and Mayne on all counts. Mylan appealed the district court’s decision to the Third Circuit Court of Appeals. On September 28, 2016, the Court of Appeals issued its decision and affirmed the ruling of the district court. On November 30, 2016 the Third Circuit Court of Appeals denied Mylan’s petition for a rehearing en banc.
Loestrin® 24 Litigation. On April 5, 2013, two putative class actions were filed in the federal district court against Warner Chilcott and certain affiliates alleging that Warner Chilcott’s 2009 patent lawsuit settlements with Watson Laboratories and Lupin related to Loestrin® 24 Fe were unlawful. The complaints, both asserted on behalf of putative classes of end-payors, generally allege that Watson and Lupin improperly delayed launching generic versions of Loestrin® 24 in exchange for substantial payments from Warner Chilcott in violation of federal and state antitrust and consumer protection laws. The complaints each seek declaratory and injunctive relief and damages. Additional complaints have been filed by different plaintiffs seeking to represent the same putative class of end-payors. In addition to the end-payor suits, two lawsuits have been filed on behalf of a class of direct payors and by direct purchasers in their individual capacities. After a hearing on September 26, 2013, the JPML issued an order transferring all related Loestrin® 24 cases to the federal court for the District of Rhode Island. On September 4, 2014, the court granted the defendants’ motion to dismiss the complaint. The plaintiffs appealed the district court’s decision to the First Circuit Court of Appeals and oral argument was held on December 7, 2015. On February 22, 2016 the First Circuit issued its decision vacating the decision of, and remanding the matter to, the district court. On June 11, 2016, defendants filed an omnibus motion to dismiss the claims of the direct purchaser class plaintiffs, end-payor class plaintiffs and individual direct purchaser plaintiffs. Oral argument on the motion to dismiss was held on January 13, 2017.
Namenda® Litigation. On September 15, 2014, the State of New York, through the Office of the Attorney General of the State of New York, filed a lawsuit in the United States District Court for the Southern District of New York alleging that Forest was acting to prevent or delay generic competition to Forest’s immediate-release product Namenda® in violation of federal and New York antitrust laws and committed other fraudulent acts in connection with its commercial plans for Namenda® XR. On December 11, 2014, the district court issued a ruling granting the state’s preliminary injunction motion and issued an injunction on December 15, 2014 which the Court of Appeals for the Second Circuit affirmed on May 22, 2015. Forest and the New York Attorney General reached a settlement on November 24, 2015. On May 29, 2015, a putative class action was filed on behalf of a class of direct purchasers and on June 8, 2015 a similar putative class action was filed on behalf of a class of indirect purchasers. Since that time, additional complaints have been filed on behalf of putative classes of direct and indirect purchasers. The class action complaints make claims similar to those asserted by the New York Attorney General and also include claims that Namenda® patent litigation settlements between Forest and generic companies also violated the antitrust laws. On December 22, 2015, Forest and its co-defendants filed motions to dismiss the pending complaints. On September 13, 2016, the court issued a decision denying the Company’s motion to dismiss. On September 27, 2016 the Company filed an answer to the amended complaint.
Zymar®/Zymaxid® Litigation. On February 16, 2012, Apotex Inc. and Apotex Corp. filed a complaint in the federal district court in Delaware against Senju Pharmaceuticals Co., Ltd. (“Senju”), Kyorin Pharmaceutical Co., Ltd. (“Kyorin”), and Allergan, Inc. alleging monopolization in violation of Section 2 of the Sherman Act, conspiracy to monopolize, and unreasonable restraint of trade in the market for gatifloxacin ophthalmic formulations, which includes Allergan Inc.’s ZYMAR® gatifloxacin ophthalmic solution 0.3%
F-88
and ZYMAXID® gatifloxacin ophthalmic solution 0.5% products. In the complaint, Plaintiffs seek an unspecified amount of treble damages and disgorgement of profits.Following the court’s denial of Allergan Inc.’s motions to dismiss, Allergan Inc. filed an answer to Apotex’s complaint on June 1, 2015.
On June 6, 2014, a separate antitrust class action complaint was filed in the federal district court in Delaware against the same defendants as in the Apotex case. The complaint alleges that defendants unlawfully excluded or delayed generic competition in the gatifloxacin ophthalmic formulations market (generic versions of ZYMAR® and ZYMAXID®). On September 18, 2014, Allergan Inc. filed a motion to dismiss for lack of subject matter jurisdiction and joined in co-defendants’ motion to dismiss for failure to state a claim. On August 19, 2015, the court granted Allergan Inc.’s motion to dismiss. On September 18, 2015, plaintiff filed a notice of appeal with the U.S. Court of Appeals for the Third Circuit. The Third Circuit oral argument was held on June 13, 2016. On September 7, 2016, the U.S. Court of Appeals for the Third Circuit vacated the District Court’s granting of Allergan Inc.’s motion to dismiss and remanded to the District Court for further proceedings. The Third Circuit denied the Company’s petition for a rehearing on October 4, 2016.
Commercial Litigation
Celexa®/Lexapro® Class Actions. Forest and certain of its affiliates have been named as defendants in multiple federal court actions relating to the promotion of Celexa® and/or Lexapro® all of which have been consolidated in the Celexa®/Lexapro® MDL proceeding in the federal district court in Massachusetts. On November 13, 2013, an action was filed in federal court in Minnesota which sought to certify a nationwide class of third-party payor entities that purchased Celexa® and Lexapro® for pediatric use. The complaint asserts claims under the federal Racketeer Influenced and Corrupt Organizations (“RICO”) Act, alleging that Forest engaged in an off-label marketing scheme and paid illegal kickbacks to physicians to induce prescriptions of Celexa® and Lexapro®. Forest moved to dismiss the complaint and on December 12, 2014, and the court thereafter issued a ruling dismissing plaintiff’s claims under Minnesota’s Deceptive Trade Practices Act, but denying the remaining portions of the motion. A motion for class certification was filed in February, 2016, and denied on June 2, 2016. Thereafter, plaintiffs filed a 23(f) petition requesting leave to appeal the denial of class certification which the First Circuit denied on December 7, 2016. On August 28, 2014, an action was filed in the federal district court in Washington seeking to certify a nationwide class of consumers and subclasses of Washington and Massachusetts consumers that purchased Celexa® and Lexapro® for pediatric use. The complaint asserts claims under the federal RICO statute, alleging that Forest engaged in off-label marketing scheme and paid illegal kickbacks to physicians to induce prescriptions of Celexa® and Lexapro®. Forest’s moved to dismiss the complaint on December 19, 2014. On June 16, 2015, the court issued a ruling on the motion to dismiss, granting it in part and denying it in part. Plaintiffs thereafter filed an amended complaint. Forest moved to dismiss the amended complaint. On June 9, 2016, the court denied Forest’s motion.
Telephone Consumer Protection Act Litigation. In October 2012, Forest and certain of its affiliates were named as defendants, in a putative class action in federal court in Missouri. This suit alleges that Forest and another defendant violated the Telephone Consumer Protection Act (the “TCPA”) and was filed on behalf of a proposed class that includes all persons who, from four years prior to the filing of the action, were sent telephone facsimile messages of material advertising the commercial availability of any property, goods, or services by or on behalf of defendants, which did not display an opt-out notice compliant with a certain regulation promulgated by the FCC. On July 17, 2013, the district court granted Forest’s motion to stay the action pending the administrative proceeding initiated by the pending FCC Petition and a separate petition Forest filed. On October 31, 2015, another class action complaint was filed in Missouri state court against Allergan USA, Inc., Warner Chilcott Corporation and Actavis, Inc., now known as Allergan Finance LLC, alleging violations of the Telephone Consumer Protection Act, the Missouri Consumer Fraud and Protection Act and conversion on behalf of a putative nationwide class of plaintiffs to who defendant Warner Chilcott Corporation sent unsolicited facsimile advertisements. Defendants removed this action to the federal district court for the Western District of Missouri on December 10, 2015 and responded to the complaint on February 8, 2016. On February 17, 2016, plaintiffs voluntarily dismissed defendants Allergan USA, Inc. and Actavis, Inc. from the litigation.
In a related matter, on June 27, 2013, Forest filed a Petition for Declaratory Ruling with the FCC requesting that the FCC find that (1) the faxes at issue in the action complied, or substantially complied with the FCC regulation, and thus did not violate it, or (2) the FCC regulation was not properly promulgated under the TCPA. Warner Chilcott filed a similar petition with the FCC. On January 31, 2014, the FCC issued a Public Notice seeking comment on Forest’s and several other similar petitions. On October 30, 2014, the FCC issued a final order on the FCC Petition granting Forest and several other petitioners a retroactive waiver of the opt-out notice requirement for all faxes sent with express consent. The litigation plaintiffs, who had filed comments on the January 2014 Public Notice, have appealed the final order to the Court of Appeals for the District of Columbia. Forest and other petitioners have moved to intervene in the appeal seeking review of that portion of the FCC final order addressing the statutory basis for the opt out/express consent portion of the regulation. Oral argument before the appellate court took place on November 8, 2016.
Prescription Drug Abuse Litigation. The Company has been named as a defendant in three matters relating to the promotion and sale of prescription opioid pain relievers and additional suits may be filed. On May 21, 2014, the California counties Santa Clara and
F-89
Orange filed a lawsuit in California state court on behalf of the State of California against several pharmaceutical manufacturers. Plaintiffs named Actavis plc in the suit. The California plaintiffs filed an amended complaint on June 9, 2014. On June 2, 2014, the City of Chicago also filed a complaint in Illinois state court against the same set of defendants, including Actavis plc, that were sued in the California Action. Co-defendants in the action removed the matter to the federal court in Illinois. Both the California and Chicago complaints allege that the manufacturer defendants engaged in a deceptive campaign to promote their products in violation of state and local laws. Each of the complaints seeks unspecified monetary damages, penalties and injunctive relief. Defendants have moved to dismiss the complaints in each action. On May 8, 2015, the court in the Chicago litigation granted the Company’s motion to dismiss the complaint. On August 26, 2015, the City of Chicago filed a second amended complaint. On September 29, 2016, the court in the Chicago litigation granted in part and denied in part defendants’ motion to dismiss the second amended complaint. On October 25, 2016, Chicago filed a third amended complaint. On December 15, 2016, the Company moved to dismiss the third amended complaint and filed an answer to the complaint. In the California action, on August 27, 2015, the court stayed the action based on primary jurisdiction arguments raised in the motions to dismiss. On June 3, 2016, the California plaintiffs filed a motion to lift the stay and a motion for leave to file a third amended complaint. On July 1, 2016, the Company and co-defendants filed joint oppositions to the California plaintiffs’ motion to lift the stay and motion for leave to file a third amended complaint. On July 27, 2016, the court ordered the California plaintiffs to file another motion for leave to file an amended complaint along with a proposed amended complaint. On October 19, 2016, the court in the California litigation lifted the stay in part permitting defendants to challenge the third amended complaint and for the parties to discuss settlement and maintaining the stay in all other respects. On December 15, 2015, the State of Mississippi filed a lawsuit in Mississippi state court against several pharmaceutical manufacturers. The Mississippi action parallels the allegations in the California and Chicago matters and seeks monetary and equitable relief. In March and April 2016, the defendants filed motions to dismiss, stay, and transfer venue in the Mississippi action.
Testosterone Replacement Therapy Class Action. On November 24, 2014, the Company was served with a putative class action complaint filed on behalf a class of third party payers in federal court in Illinois. The suit alleges that the Company and other named pharmaceutical defendants violated various laws including the federal RICO statute and state consumer protection laws in connection with the sale and marketing of certain testosterone replacement therapy pharmaceutical products (“TRT Products”), including the Company’s Androderm® product. This matter was filed in the TRT Products Liability MDL, described in more detail below, notwithstanding that it is not a product liability matter. Plaintiff alleges that it reimbursed third parties for dispensing TRT Products to beneficiaries of its insurance policies. Plaintiff seeks to obtain certain equitable relief, including injunctive relief and an order requiring restitution and/or disgorgement, and to recover damages and multiple damages in an unspecified amount. Defendants filed a joint motion to dismiss the complaint, after which plaintiff amended its complaint. Defendants jointly filed a motion to dismiss the amended complaint, which was granted in part and denied in part on February 3, 2016. The Court dismissed plaintiff’s substantive RICO claims against the Company for mail and wire fraud for failure to plead with particularity under Rule 9(b) but granted plaintiffs leave to replead. The court also dismissed plaintiff’s state law statutory claims and common law claims for fraud and unjust enrichment. The Court declined to dismiss plaintiff’s conspiracy claims pursuant to 18 U.S.C. § 1962(d) and its claims for negligent misrepresentation. Plaintiff filed a Third Amended Complaint on April 7, 2016. Defendants jointly filed a motion to dismiss the Third Amended Complaint on May 5, 2016. On August 2, 2016, the court dismissed all claims in the Third Amended Complaint against the Company except plaintiffs’ RICO conspiracy claim. On August 29, 2016, the Company filed a Motion for Reconsideration or, in the Alternative, Motion to Certify for Interlocutory Appeal, which the court denied on the September 8, 2016. Discovery is in the early stages.
TNS Products Litigation. On March 19, 2014, a class action complaint was filed in the federal district court in California on behalf of a putative class of consumers. The complaint alleges violations of the California Unfair Competition Law, the Consumers Legal Remedies Act, and the False Advertising Law, and deceit. On June 2, 2014, Plaintiff filed a first amended complaint. On June 23, 2014, Allergan filed a motion to dismiss the first amended complaint. On September 5, 2014, the court granted-in-part and denied-in-part Allergan’s motion to dismiss. On September 8, 2014, the court set trial for September 1, 2015. On November 4, 2014, Allergan and SkinMedica filed a motion to dismiss. On January 7, 2015, Allergan and SkinMedica’s motion to dismiss was denied. On February 19, 2015 Plaintiff filed a third amended complaint. On May 27, 2015, the case was stayed pending the decision of the Ninth Circuit Court of Appeals in another matter involving similar legal issues.
Xaleron Dispute. On February 5, 2016, Xaleron Pharmaceuticals, Inc. filed a lawsuit against Allergan, Inc. and Actavis, Inc., now known as Allergan Finance, LLC in state court in New York. The complaint, filed on February 26, 2016, alleges the defendants misappropriated Xaleron’s confidential business information and asserts claims for unfair competition, tortious interference with prospective economic advantage and unjust enrichment. The company filed a motion to dismiss the complaint on April 15, 2016. On September 13, 2016 the court issued a decision denying the Company’s motion. Defendants filed an answer to the complaint and the parties are now engaged in discovery.
Employment Litigation
In July 2012, Forest was named as defendants in an action brought by certain former company sales representatives and specialty sales representatives in the federal district court in New York. The action is a putative class and collective action, and alleges
F-90
class claims under Title VII for gender discrimination with respect to pay and promotions, as well as discrimination on the basis of pregnancy, and a collective action claim under the Equal Pay Act. The proposed Title VII gender class includes all current and former female sales representatives employed by the Company throughout the U.S. from 2008 to the date of judgment, and the proposed Title VII pregnancy sub-class includes all current and former female sales representatives who have been, are, or will become pregnant while employed by the Company throughout the U.S. from 2008 to the date of judgment. The proposed Equal Pay Act collective action class includes current, former, and future female sales representatives who were not compensated equally to similarly-situated male employees during the applicable liability period. The Second Amended Complaint also includes non-class claims on behalf of certain of the named Plaintiffs for sexual harassment and retaliation under Title VII, and for violations of the Family and Medical Leave Act. On August 14, 2014, the court issued a decision on the Company’s motion to dismiss, granting it in part and denying it in part, striking the plaintiffs’ proposed class definition and instead limiting the proposed class to a smaller set of potential class members and dismissing certain of the individual plaintiffs’ claims. Plaintiffs filed a motion for conditional certification of an Equal Pay Act collective action on May 22, 2015 which the Company has opposed. On September 2, 2015, the court granted plaintiffs motion to conditionally certify a collective action.
Patent Litigation
Patent Enforcement Matters
Amrix®. In August 2014, Aptalis Pharmatech, Inc. (“Aptalis”) and Ivax International GmbH (“Ivax”), Aptalis’s licensee for Amrix, brought an action for infringement of U.S. Patent No. 7,790,199 (the “’199 patent”), and 7,829,121 (the “’121 patent”) in the U.S. District Court for the District of Delaware against Apotex Inc. and Apotex Corp. (collectively “Apotex”). Apotex has notified Aptalis that it has filed an ANDA with the FDA seeking to obtain approval to market a generic version of Amrix before these patents expire. (The ’199 and ’121 patents expire in November 2023.) This lawsuit triggered an automatic stay of approval of Apotex’s ANDA until no earlier than December 27, 2016 (unless there is a final court decision adverse to Plaintiffs sooner, and subject to any other exclusivities, such as a first filer 180 day market exclusivity). A bench trial concluded on November 17, 2015. Post-trial briefing concluded on April 8, 2016. On December 8, 2016, the court entered an order, opinion and judgment in favor of Plaintiffs and against Apotex, that Apotex infringes the asserted claims of the ‘199 and ‘121 patents. On December 8, 2016, Apotex filed a notice of appeal. On September 29, 2016, Adare Pharmaceuticals, Inc., and Ivax filed suit in U.S. District Court for the District of Delaware against Apotex asserting that Apotex’s generic product will infringe U.S. Patent No. 9,399,025 (the “’025 patent”). (The ‘025 patent expires in November 2023.) No schedule has been set.
Canasa®. In July 2013, Aptalis Pharma US, Inc. and Aptalis Pharma Canada Inc. brought actions for infringement of U.S. Patent Nos. 8,217,083 (the “’083 patent”) and 8,436,051 (the “’051 patent”) in the U.S. District Court for the District of New Jersey against Mylan and Sandoz. These companies have notified Aptalis that they have filed ANDAs with the FDA seeking to obtain approval to market generic versions of Canasa® before these patents expire. Amended complaints were filed against these companies in November 2013 adding claims for infringement of U.S. Patent No. 7,854,384 (the “’384 patent”). The ’083, ’051, and ’384 patents expire in June 2028. On November 11, 2015, Aptalis entered into a settlement agreement with Mylan. Under the terms of the settlement agreement, Mylan may launch its generic version of Canasa® on December 15, 2018, or earlier under certain circumstances. On March 22, 2016, Aptalis entered into a settlement agreement with Sandoz.
On December 14, 2015, Aptalis brought an action for infringement of the ’083, ’051, and ’384 patents in the U.S. District Court for the District of New Jersey against Pharmaceutical Sourcing Partners, Inc. (“PSP”). PSP had notified Aptalis that it had filed an ANDA with the FDA seeking to obtain approval to market generic versions of Canasa® before certain of these patents expire. This lawsuit triggered an automatic stay of approval of PSP’s ANDA that expires no earlier than May 2018 (unless a court issues a decision adverse to Aptalis sooner). On December 23 and 27, 2015, Aptalis brought actions for infringement of the ’083, ’051, and ’384 patents in the U.S. District Courts for the District of New Jersey and the District of Delaware, respectively, against Delcor Asset Corp., Renaissance Pharma, Inc. and Renaissance Acquisition Holdings, LLC (collectively, “Delcor”). Delcor has notified Aptalis that it has filed an ANDA with the FDA seeking to obtain approval to market generic versions of Canasa before certain of these patents expire. These lawsuits triggered an automatic stay of approval of Delcor’s ANDA that expires no earlier than May 2018 (unless there is a final court decision adverse to Aptalis sooner). On March 14, 2016, Aptalis filed a motion to dismiss PSP’s Seventh and Eighth counterclaims alleging unfair competition and tortious interference under state law, or in the alternative, to bifurcate the trial and stay discovery relating to PSP’s Seventh and Eighth counterclaims. Trial is scheduled for November 2017 in the PSP action. On April 8, 2016, Aptalis entered into a settlement agreement with Delcor. On May 27, 2016, the court denied Aptalis’ motion to the extent that it concerns dismissal of PSP’s Seventh and Eighth counterclaims, denied without prejudice to the extent that the motion concerns bifurcation and a stay and granted leave to Aptalis to move again concerning bifurcation and a stay. On June 24, 2016, Aptalis filed an answer to PSP’s counterclaims. On October 13, 2016, Aptalis entered into a settlement agreement with PSP, and the case was dismissed on October 20, 2016.
On January 30, 2017, Aptalis brought an action for infringement of the ’083, ’051, and ’384 patents in the U.S. District Court for the District of New Jersey against Zydus Pharmaceuticals (USA) Inc., Zydus Healthcare USA LLC and Cadila Healthcare Limited
F-91
(collectively “Zydus”). Zydus has notified Aptalis that it has filed an ANDA with the FDA seeking to obtain approval to market generic versions of Canasa® before certain of these patents expire. This lawsuit triggered an automatic stay of approval of Zydus’s ANDA that expires no earlier than June 2019 (unless a court issues a decision adverse to Aptalis sooner). No schedule has been set.
Combigan® II-III. In 2012, Allergan filed a complaint against Sandoz, Alcon, Apotex and Watson in the U.S. District Court for the Eastern District of Texas, Marshall Division, alleging that their proposed products infringe U.S. Patent Number 8,133,890 (the “890 Patent”), and subsequently amended their complaint to assert infringement of U.S. Patent Number 8,354,409. In March 2013, Allergan received a Paragraph IV invalidity and non-infringement certification from Sandoz, contending that the ‘890 Patent is invalid and not infringed by the proposed generic product. In October 2013, Allergan filed a motion to stay and administratively close the Combigan II matter, which was granted. In April 2015, Allergan filed a stipulation of dismissal and the U.S. District Court granted the Order with respect to the Watson defendants. In October 2015, the U.S. District Court entered an order consolidating the Combigan® III matter C.A. 2:15-cv-00347-JRG into this matter C.A. 2:12-cv-00207-JRG, as lead case. A Markman Hearing was held on March 2, 2016.
On May 19, 2016, Sandoz filed an opposed motion for leave to amend its answer and counterclaim seeking to add a count for declaratory judgment of invalidity of the ‘149 Patent. On July 20, 2016, Alcon and Sandoz filed motions for summary judgment of invalidity and non-infringement of claim 4 of the ‘149 Patent, and Allergan filed a motion for summary judgment of infringement of claim 4 of the ‘149 Patent and to preclude Sandoz from re-challenging the validity of that claim. On September 30, 2016, the court denied the parties’ motions for summary judgment. A bench trial concluded on October 27, 2016. On December 30, 2016, the court entered an opinion and final judgment in favor of Allergan and against Sandoz, that the asserted claims of the ‘149 Patent, and U.S. Patent Numbers 7,320,976 (“‘976 Patent”) and 8,748,425 (the “‘425 Patent”), were not invalid, and that Sandoz infringes the asserted claims of the ‘425 Patent. The court also held in favor of Sandoz and against Allergan, that Sandoz does not infringe the asserted claims of the ‘149 and ‘976 Patents. Sandoz filed a notice of appeal on January 17, 2017, and Allergan filed a notice of cross appeal on January 27, 2017.
Delzicol®. On August 28, 2015, Warner Chilcott Company, LLC, Warner Chilcott (US), LLC, and Qualicaps Co., Ltd. (collectively, “Plaintiffs”) brought an action for infringement of U.S. Patent No. 6,649,180 (the “‘180 patent”) in the United States District Court for the Eastern District of Texas against Teva Pharmaceuticals USA, Inc. and Teva Pharmaceutical Industries Ltd. (collectively, “Teva”). Teva notified Plaintiffs that it has filed an ANDA with the FDA seeking to obtain approval to market generic versions of Delzicol® before the ‘180 patent expires in April 2020. This lawsuit triggered an automatic stay of approval of Teva’s ANDA that expires no earlier than January 2018 (unless there is a final court decision adverse to Plaintiffs sooner). Trial is scheduled for October 2017. On November 9, 2015, Plaintiffs also brought an action for infringement of ‘180 patent in the United States District Court for the Eastern District of Texas against Mylan Pharmaceuticals, Inc., Mylan Laboratories Limited and Mylan, Inc. (collectively, “Mylan”). Mylan notified Plaintiffs that it has filed an ANDA with the FDA seeking to obtain approval to market generic versions of Delzicol® before the ‘180 patent expires in April 2020. This lawsuit triggered an automatic stay of approval of Mylan’s ANDA that expires no earlier than March 2018 (unless a court issues a decision adverse to Plaintiffs sooner). On December 16, 2015, Mylan filed a motion to dismiss for failure to state a claim, lack of personal jurisdiction, and improper venue. Trial is scheduled for October 2017. In March 2016, the court entered an order consolidating the Mylan litigation (C.A. 2:15-cv-01740) with the Teva litigation (C.A. 2:15-cv-01471) matter as the lead case.
On April 1, 2016, Warner Chilcott Company, LLC, Warner Chilcott (US), LLC, Allergan Pharmaceuticals International Ltd., Allergan USA, LLC and Qualicaps Co., Ltd. (collectively, “Plaintiffs”) brought an action for infringement of the ‘180 patent in the United States District Court for the Eastern District of Texas against Zydus International Pvt. Ltd., Zydus Pharmaceuticals (USA) Inc. and Cadila Healthcare Ltd. (collectively, “Zydus”). Zydus notified the Company that it has filed an ANDA with the FDA seeking to obtain approval to market generic versions of Delzicol® before the ‘180 patent expires. In May 2016, Plaintiffs filed a first amended complaint against Mylan and a first amended and second amended complaint against Teva. In June 2016, Plaintiffs filed a second amended complaint against Mylan and a third amended complaint against Teva. On June 27, 2016, Teva filed an answer and counterclaims and Mylan filed a motion to dismiss the second amended complaint for failure to state a claim, lack of personal jurisdiction, and improper venue. On June 9, 2016, Zydus filed an answer and counterclaims.
On July 21, 2016, the Plaintiffs filed an answer to Teva’s counterclaim and to Zydus’s counterclaim. On November 28, 2016, Plaintiffs entered into a settlement agreement with Zydus. Under the terms of the settlement agreement, Zydus may launch its generic version of Delzicol® on March 1, 2020, or earlier under certain circumstances. On January 19, 2017, the Magistrate Judge issued a Report and Recommendation denying Mylan’s motion to dismiss.
Delzicol® IPR. On November 4, 2016, Mylan Pharmaceuticals Inc. (“Mylan”) filed a petition for Inter Partes Review (“IPR”) with the USPTO regarding U.S. Patent No. 6,649,180 (the “‘180 patent”). Qualicaps Co., Ltd.’s deadline to file a patent owner preliminary response is February 21, 2017.
F-92
Gelnique® 10% gel. In October 2015, Actavis Laboratories, UT, Inc. filed a complaint in the U.S. District Court for the District of Delaware for infringement of U.S. Patent Nos. 7,029,694 (“’694 Patent”), 7,179,483 (“’483 Patent”), 8,241,662 (“’662 Patent”), and 8,920,392 (“’392 Patent”) against Par Pharmaceutical, Inc. (“Par”). Par notified plaintiff that it has filed an ANDA with the FDA seeking to obtain approval to market generic versions of Gelnique® 10% gel before the ’694 Patent, ’483 Patent, ’662 Patent, and the ’392 Patent expires. The ’694, ’483, and ’662 Patents expire in April 2020, and the ’392 Patent expires in March 2031. This lawsuit triggered an automatic stay of approval of Par’s ANDA that expires no earlier than February 19, 2018 (unless there is a final court decision adverse to Plaintiff sooner). In June and July 2016, the court entered stipulations and orders staying this litigation. On October 4, 2016, the parties entered into a settlement agreement, and the case was dismissed.
Lastacaft®. In May 2016, Allergan, Inc. and Vistakon Pharmaceuticals, LLC (“Vistakon”) filed a complaint in the U.S. District Court for the District of Delaware for infringement of U.S. Patent No. 8,664,215 (“’215 Patent”) against Somerset Therapeutics, LLC (“Somerset”). Somerset notified Allergan Inc. and Vistakon that it has filed an ANDA with the FDA seeking to obtain approval to market generic versions of Lastacaft® before the ‘215 Patent expires. On October 18, 2016, the parties entered into a settlement agreement, and the case was dismissed.
Latisse® III. In December 2014, Allergan and Duke University filed a complaint for declaratory judgment of infringement of U.S. Patent Nos. 8,906,962 (“‘962 Patent”) against Apotex. In January 2015, Allergan and Duke subsequently filed an amended complaint against Apotex to assert infringement of U.S. Patent Number 8,926,953 (“‘953 Patent”). In March 2015, Allergan and Duke filed a second amended complaint asserting only the ‘953 Patent. Apotex filed a motion to dismiss for failure to state a claim with respect to the ‘953 Patent. On August 31, 2015, the court issued an order and judgment dismissing the case with prejudice in favor of Apotex, Sandoz and Akorn on all of Allergan’s claims alleging infringement of the ‘953 patent. In the Sandoz and Akorn matters, the court also declared and adjudged the ‘953 patent invalid as obvious, and collaterally estopped Allergan from asserting the ‘953 patent against Sandoz or Akorn or contesting the invalidity of the ‘953 patent. In late September, the court entered a final judgment that declared and adjudged the claims of the ‘953 patent invalid as obvious and collaterally estopped Allergan from asserting the claims of the ‘953 patent against Apotex and Akorn or contesting the invalidity of the claims of the ‘953 patent. On September 30, 2015, Allergan filed a Notice of Appeal to the Court of Appeals for the Federal Circuit. On October 19, 2015, the U.S. Court of Appeals for the Federal Circuit docketed the appeal filed by Allergan. In March 2016, Allergan filed its opening brief. In June 2016, Akorn, Apotex, Hi-Tech and Sandoz filed their response brief. In July 2016, Allergan filed its reply brief. Sandoz launched “at risk” a generic version of Latisse® in December 2016. Oral argument is scheduled for February 8, 2017.
Linzess®. In October 2016, the Company and Ironwood received Paragraph IV certification notice letters from Teva Pharmaceuticals USA, Inc. (“Teva”) indicating that it had submitted to FDA an ANDA seeking approval to manufacture and sell a generic version of LINZESS® 145 mcg and 290 mcg capsules (“LINZESS”) before the expiration of the nine patents listed in the Orange Book, including U.S. Patent Nos. 7,304,036 (the “‘036 Patent”); 7,371,727 (the “‘727 Patent”); 7,704,947 (the “‘947 Patent”); 7,745,409 (the “‘409 Patent”); 8,080,526 (the “‘526 Patent”); 8,110,553 (the “‘553 Patent”); 8,748,573 (the “‘573 Patent”); 8,802,628 (the “‘628 Patent”); and 8,933,030 (the “‘030 Patent”). In October 2016, the Company and Ironwood also received Paragraph IV certification notice letters from Aurobindo Pharma Ltd. (“Aurobindo”) indicating that it had submitted to FDA an ANDA seeking approval to manufacture and sell a generic version of LINZESS before the expiration of the ‘573, ‘628 and ‘030 Patents. (The ‘727, ‘947, ‘409, ‘526 and ‘553 Patents expire in January 2024; the ‘036 Patent expires in August 2026; and the ‘573, ‘628 and ‘030 Patents expire in 2031.) Teva and Aurobindo claim that the patents discussed in their respective notice letters are invalid, unenforceable and/or would not be infringed. On November 30, 2016, Forest Laboratories, LLC, Forest Laboratories Holdings, Ltd., Allergan USA, Inc. and Ironwood Pharmaceuticals, Inc. (collectively, “Plaintiffs”), brought an action for infringement of some or all of the ‘036, ‘727, ‘947, ‘409, ‘526, ‘553, ‘573, ‘628 and ‘030 Patents in the U.S. District Court for the District of Delaware against Teva Pharmaceuticals USA, Inc., Mylan Pharmaceuticals Inc., Sandoz, Inc., Aurobindo Pharma Ltd., and Aurobindo Pharma USA, Inc. This lawsuit triggered an automatic stay of approval of the applicable ANDAs that expires no earlier than February 2020 (unless there is a final court decision adverse to Plaintiffs sooner). Teva and Sandoz filed their respective answers and counterclaims on January 20 and January 30, 2017. No schedule has been set.
Namenda XR®. Between January and October 2014, Forest Laboratories, Inc., Forest Laboratories Holdings, Ltd. (collectively, “Forest”) and Merz Pharma and Adamas Pharmaceuticals, Forest’s licensors for Namenda XR® (all collectively, “Plaintiffs”), brought actions for infringement of some or all of U.S. Patent Nos. 5,061,703 (the “‘703 patent”), 8,039,009 (the “‘009 patent”), 8,168,209 (the “‘209 patent”), 8,173,708 (the “‘708 patent”), 8,283,379 (the “‘379 patent”), 8,329,752 (the “‘752 patent”), 8,362,085 (the “‘085 patent”), and 8,598,233 (the “‘233 patent”) in the U.S. District Court for the District of Delaware against Wockhardt, Teva, Sun, Apotex, Anchen, Zydus, Watson, Par, Mylan, Amneal, Ranbaxy, and Amerigen, and related subsidiaries and affiliates thereof. These companies have notified Plaintiffs that they have filed ANDAs with the FDA seeking to obtain approval to market generic versions of Namenda XR® before these certain patents expire. Including a 6-month pediatric extension of regulatory exclusivity, the ‘703 patent expires in October 2015, the ‘009 patent expires in September 2029, and the ‘209, ‘708, ‘379, ‘752, ‘085, and ‘233 patents expire in May 2026. These lawsuits triggered an automatic stay of approval of the applicable ANDAs that expires no earlier than June 2016 (unless there is a final court decision adverse to Plaintiffs sooner). On June 11, 2014, Mylan filed a motion to
F-93
dismiss for lack of personal jurisdiction, which the district court denied on March 30, 2015. On December 18, 2014, Ranbaxy filed an IPR before the Patent Trial and Appeal Board, U.S. Patent and Trademark Office, with respect to the ‘085 patent. Adamas filed a preliminary response on April 14, 2015. On May 1, 2015, Forest entered into a settlement agreement with Ranbaxy. On May 15, 2015, the Patent Trial and Appeal Board granted Adamas and Ranbaxy’s joint motion to terminate the case. On October 17, 2014, Forest and Actavis Laboratories FL, Inc. (f/k/a Watson Laboratories, Inc. — Florida) filed a stipulation dismissing their respective claims without prejudice. On November 3, 2014, Plaintiffs entered into a settlement agreement with Wockhardt. Under the terms of the settlement agreement, and subject to review of the settlement terms by the U.S. Federal Trade Commission, Plaintiffs will provide a license to Wockhardt that will permit it to launch its generic version of Namenda XR® as of the date that is the later of (a) two (2) calendar months prior to the expiration date of the last to expire of the ‘703 patent, the ‘209 patent, the ‘708 patent, the ‘379 patent, the ‘752 patent, the ‘085 patent, and the ‘233 patent, including any extensions and/or pediatric exclusivities; or (b) the date that Wockhardt obtains final FDA approval of its ANDA, or earlier in certain circumstances. On January 13, 2015, Plaintiffs entered into settlement agreements with Anchen and Par. Under the terms of the settlement agreements, and subject to review of the settlement terms by the U.S. Federal Trade Commission, Plaintiffs will provide licenses to Anchen and Par that will permit them to launch their generic versions of Namenda XR® as of the date that is the later of (a) two (2) calendar months prior to the expiration date of the last to expire of the ‘209 patent, the ‘708 patent, the ‘379 patent, the ‘752 patent, the ‘085 patent, and the ‘233 patent, as well as the ‘009 patent for Par only, including any extensions and/or pediatric exclusivities; or (b) the dates that Anchen and Par obtain final FDA approval of their respective ANDAs, or earlier in certain circumstances. On May 11, 2015, Forest entered into a settlement agreement with Sun. On August 18, 2015, Forest entered into a settlement agreement with Zydus. On September 9, 2015, Forest entered into a settlement agreement with Amneal. Under the terms of the settlement agreement, and subject to review of the settlement terms by the U.S. Federal Trade Commission, Plaintiffs will provide a license to Amneal that will permit it to launch its generic version of Namenda XR® beginning January 31, 2020, following receipt by Amneal of final approval from the FDA on its ANDA for generic Namenda XR®; or (b) under certain circumstances, Amneal has an option to launch an authorized generic version of Namenda XR® beginning on January 31, 2021. The Company entered into a settlement agreement with Amerigen on October 20, 2015. The Company entered into a settlement agreement with Mylan on November 16, 2015. The Company entered into a settlement agreement with Lupin on December 22, 2015. On January 5, 2016, the district court issued a claim construction ruling that included findings of indefiniteness as to certain claim terms in the asserted patents. On February 11, 2016, the Company settled with Apotex. Trial began on February 16, 2016 with the remaining defendant Teva with respect to the ‘009 patent. Post-trial briefing concluded on April 29, 2016. The Parties have reached agreement on settlement with Teva subject to Court approval. In June 2016, after reaching an agreement to settle, the parties filed and the court entered a judgment of infringement in favor of Plaintiffs and against Teva regarding the ‘009 patent. On July 26, 2016, the court entered a final judgment of invalidity of claim 1 of the ‘209 patent, claims 1, 6, 10 and 15 of the ‘708 patent, claim 1 of the ‘379 patent, claims 1 and 9 of the ‘752 patent, claims 1 and 7 of the ‘085 patent and claim 1 of the ‘233 patent in favor of Teva. On August 23, 2016, the Company filed a Notice of Appeal to the U.S. Court of Appeals for the Federal Circuit in the actions involving Teva with respect to the district court’s January 5, 2016 claim construction opinion and order, and the July 26, 2016 final judgment of invalidity. On August 24, 2016, the U.S. Court of Appeals for the Federal Circuit docketed the appeal filed by the Company. The Company filed its opening brief on December 8, 2016. Teva filed its responsive brief on February 1, 2017. Oral argument has not yet been scheduled. The Company believes that its arguments on appeal are substantial and meritorious. On September 29, 2016, the Company issued a press release following announcement of ANDA approvals, including FDA final approval by Lupin. If the district court ruling is upheld on appeal to the U.S. Court of Appeals for the Federal Circuit, there is a possibility that generic entry for Namenda XR could occur following an adverse decision.
On October 9, 2015, the Company also brought an action for infringement of the ‘009, ‘209, ‘708, ‘379, ‘752, ‘085, and ‘233 patents in the U.S. District Court for the District of Delaware against Accord Healthcare, Inc. and Intas Pharmaceuticals Limited (collectively, “Accord”). The Accord defendants have notified Plaintiffs that they have filed an ANDA with the FDA seeking to obtain approval to market generic versions of Namenda XR® before these patents expire. On January 14, 2016, Forest entered into a settlement agreement with Accord. On December 8, 2015, the Company also brought an action for infringement of the ‘209, ‘708, ‘379, ‘752, ‘085, and ‘233 patents in the U.S. District Court for the District of Delaware against Panacea Biotec, Ltd. (“Panacea”). Panacea has notified Plaintiffs that it has filed an ANDA with the FDA seeking to obtain approval to market generic versions of Namenda XR® before these patents expire. On May 17, 2016, the Company entered into a settlement agreement with Panacea.
Namzaric®. On August 27, 2015, Forest Laboratories, LLC, Forest Laboratories Holdings, Ltd. and Adamas Pharmaceuticals, Inc. (all collectively, “Plaintiffs”), brought an action for infringement of some or all of U.S. Patent Nos. 8,039,009 (the “’009 patent”), 8,058,291 (the “‘291 patent”), 8,168,209 (the “‘209 patent”), 8,173,708 (the “‘708 patent”), 8,283,379 (the “‘379 patent”), 8,293,794 (the “‘794 patent”), 8,329,752 (the “‘752 patent”), 8,338,485 (the “‘485 patent”), 8,338,486 (the “‘486 patent”), 8,362,085 (the “‘085 patent”), 8,580,858 (the “‘858 patent”) and 8,598,233 (the “‘233 patent”) in the U.S. District Court for the District of Delaware against Amneal Pharmaceuticals LLC and Par Pharmaceutical, Inc., and related subsidiaries and affiliates thereof. These companies have notified Plaintiffs that they have filed ANDAs with the FDA seeking to obtain approval to market generic versions of Namzaric® before these certain patents expire. Including a 6-month pediatric extension of regulatory exclusivity, the ‘009 patent expires in September 2029, and the ‘209, ‘708, ‘379, ‘752, ‘085, and ‘233 patents expire in May 2026. The ‘291 patent expires in December 2029, and the ‘794, ‘485, ‘486, and ‘858 patents expire in November 2025. These lawsuits triggered an automatic stay of approval of the
F-94
applicable ANDAs that expires no earlier than January 2018 (unless there is a final court decision adverse to Plaintiffs sooner). On October 23, 2015, the Company also brought an action for infringement of the ‘009, ‘291, ‘209, ‘708, ‘379, ‘794, ‘752, ‘485, ‘486, ‘085, ‘858 and ‘233 patents in the U.S. District Court for the District of Delaware against Amerigen Pharmaceuticals, Inc. and Amerigen Pharmaceuticals Ltd. (collectively, “Amerigen”). The Amerigen defendants have notified Plaintiffs that they have filed an ANDA with the FDA seeking to obtain approval to market generic versions of Namzaric® before these certain patents expire. On January 5, 2016, the district court in the Namenda XR® patent litigations issued a claim construction ruling that included findings of indefiniteness as to certain claim terms in certain of the patents also asserted in the pending Namzaric® patent litigations. The Company entered into a settlement agreement with Par on April 29, 2016. Under the terms of the settlement agreement, and subject to review of the settlement terms by the U.S. Federal Trade Commission, Plaintiffs will provide a license to Par that will permit it to launch its generic version of Namzaric® as of June 5, 2029, or earlier in certain circumstances. Trial is scheduled for October 2017. In June 2016, Forest filed a motion for leave to file an amended complaint to add the ‘009 patent against Amneal, which the District Court granted on July 19, 2016. On May 20, 2016, the Company also brought an action for infringement of the ‘009, ‘291, ‘209, ‘708, ‘379, ‘794, ‘752, ‘485, ‘486, ‘085, ‘858 and ‘233 patents in the U.S. District Court for the District of Delaware against Accord Healthcare Inc. USA and Intas Pharmaceuticals Limited (collectively, “Accord”). The Accord defendants have notified Plaintiffs that they have filed an ANDA with the FDA seeking to obtain approval to market generic versions of Namzaric® before these certain patents expire. The Company entered into a settlement agreement with Accord on July 20, 2016. On August 30, 2016, Plaintiffs entered into a settlement agreement with Amneal, who is believed to be a first applicant with respect to certain dosage strengths (memantine hydrochloride extended-release and donepezil hydrochloride, 14 mg/10 mg and 28 mg/10 mg) of Namzaric®. Under the terms of the agreement, and subject to review of the settlement terms by the U.S. Federal Trade Commission, Plaintiffs will provide a license to Amneal that will permit it to launch its generic version of Namzaric® as of January 1, 2025, or earlier in certain circumstances. Alternatively, under certain circumstances, Amneal has an option to launch an authorized generic version of Namzaric beginning on January 1, 2026. On October 21, 2016, Plaintiffs entered into a settlement agreement with Amerigen, and the case was dismissed.
On November 10, 2016, the Company also brought an action for infringement of the ‘009, ‘291, ‘485, ‘486, and ‘858 patents in the U.S. District Court for the District of Delaware against Apotex Corp and Apotex Inc. (“Apotex”). Apotex has notified Plaintiffs that it has filed an ANDA with the FDA seeking to obtain approval to market generic versions of Namzaric® before these patents expire. This lawsuit triggered an automatic stay of approval of Apotex’s ANDA that expires no earlier than March 2019 (unless there is a final court decision adverse to Plaintiffs sooner). No schedule has been set.
Pylera®. On November 18, 2016, Aptalis Pharma Canada ULC, Forest Laboratories, LLC, and Allergan USA, Inc. (collectively, “Allergan”) brought an action for infringement of U.S. Patent No. 6,350,468 (the “‘468 patent”) in the U.S. District Court for the District of Delaware against Par Pharmaceutical, Inc. (“Par”). Par notified Allergan that it filed an ANDA with the FDA seeking to obtain approval to market a generic version of Pylera® before the ‘468 patent expires in December 2018. This lawsuit triggered an automatic stay of approval of Par’s ANDA until at least the expiration of the ‘468 patent (unless a court issues a decision adverse to Allergan sooner). No schedule has been set.
Rapaflo®. On June 17, 2013, Actavis, Inc, now known as Allergan Finance, LLC., Watson Laboratories, Inc., (collectively, “Actavis”) and Kissei Pharmaceutical Co., Ltd. (“Kissei”) sued Hetero USA Inc., Hetero Labs Limited, and Hetero Labs Limited, Unit 3 (collectively, “Hetero”) in the United States District Court for the District of Delaware, alleging that sales of silodosin tablets, a generic version of Actavis’ Rapaflo® tablets, would infringe U.S. Patent No. 5,387,603 (the “‘603 patent”). On June 17, 2013 Actavis and Kissei sued Sandoz Inc. (“Sandoz”) in the United States District Court for the District of Delaware, alleging that sales of Sandoz’s generic version of Rapaflo® would infringe the ‘603 patent. The complaint seeks injunctive relief. On December 22, 2014 the Parties completed a settlement agreement with Hetero. Actavis and Kissei’s lawsuit against Sandoz have been consolidated and remain pending. Pursuant to the provisions of the Hatch-Waxman Act, the FDA is precluded from granting final approval to the generic applicants prior to April 8, 2016.
Restasis®. Between August and September 2015, Allergan brought actions for infringement of U.S. Patent Nos. 8,629,111 (the “‘111 patent”), 8,633,162 (the “‘162 patent”), 8,642,556 (the “‘556 patent”), 8,648,048 (the “‘048 patent”), and 8,685,930 (the “‘930 patent”) in the U.S. District Court for the Eastern District of Texas against Akorn, Inc., Apotex, Inc., Mylan Pharmaceuticals, Inc., Teva Pharmaceuticals USA, Inc., InnoPharma, Inc., and Pfizer, Inc., and related subsidiaries and affiliates thereof. On September 14, 2015, Allergan brought an action for infringement of these patents in the U.S. District Court for the District of Delaware against InnoPharma, Inc. and Pfizer, Inc. These companies have notified Allergan that they have filed ANDAs with the FDA seeking to obtain approval to market generic versions of Restasis® before these patents expire in August 2024. In the Texas actions the District Court granted joint motions to dismiss without prejudice Teva Pharmaceutical Industries Ltd. and Pfizer, Inc., on October 12 and October 22, 2015, respectively. Teva Pharmaceuticals USA, Inc. (“Teva”) and InnoPharma, Inc. (“InnoPharma”) remain defendants in the respective actions. In October 2015, Mylan Pharmaceuticals, Inc. and Mylan, Inc. (“Mylan”) filed a motion to dismiss for lack of personal jurisdiction and improper venue, and for failure to state a claim as to Mylan, Inc.; Teva filed a motion to dismiss for lack of personal jurisdiction and improper venue; Apotex, Inc. and Apotex Corp. (“Apotex”) filed an answer, affirmative defenses and counterclaim; Akorn, Inc. (“Akorn”) filed an answer and counterclaim; and Teva filed an answer, counterclaim and motion to dismiss.
F-95
Allergan entered into a settlement agreement with Apotex on December 15, 2015. In December 2015, Allergan and Apotex filed a joint stipulation of dismissal and the U.S. District Court granted the Order with respect to the Apotex defendants. In January 2016, the court scheduled a bench trial for August 29, 2017.
In February 2016, Allergan filed an amended complaint to include U.S. Patent Number 9,248,191 (the “’191 patent”). In February and March 2016, Allergan received Paragraph IV letters from Apotex, Mylan and Teva notifying Allergan that they have filed ANDAs with the FDA seeking to obtain approval to market generic versions of Restasis® before the patents expire in August 2024, contending that the ‘191 patent is invalid and not infringed by their respective proposed generic products.
On March 1, 2016, Allergan received a Paragraph IV letter from Famy Care Limited (“Famy Care”) notifying Allergan that they have filed an ANDA with the FDA seeking to obtain approval to market generic versions of Restasis® before the patents expire in August 2024, contending that the ‘111 patent, the ʼ162 patent, the ‘556 patent, the ‘048 patent, the ‘930 patent, and the ‘191 patent are invalid and not infringed by their respective proposed generic products. In March 2016, the court entered an order requesting supplemental briefs on the effect of the Federal Circuit’s Acorda decision (No. 2014-1456) on Teva’s and Mylan’s pending motions to dismiss. In their supplemental briefs, Teva acknowledged that, under the Acorda decision, it is subject to specific personal jurisdiction in the Eastern District of Texas and that venue is proper, and Mylan requested that the District Court refrain from taking action on its pending motion until after Mylan has sought panel and en banc rehearing in the Acorda action. In April 2016, the court issued a memorandum and opinion denying Mylan’s and Teva’s motions to dismiss. On April 12, 2016, Allergan filed a complaint for infringement of the ʼ111 patent, ʼ162 patent, ʼ556 patent, ʼ048 patent, ʼ930 patent, and the ʼ191 patent in the U.S. District Court for the Eastern District of Texas against Famy Care. In March and April 2016, Allergan filed answers to Teva, Akorn and InnoPharma’s counterclaims. On June 6, 2016, Famy Care filed an answer, affirmative defenses and counterclaims. In June 2016, Allergan filed a motion for consolidation and the court entered an order consolidating the Famy Care matter, C.A. 2:16-cv-00401-WCB, into C.A. 2:15-cv-01455-WCB, (the “Lead” case).
On July 20, 2016, Allergan filed a complaint for infringement of the ʼ111 patent, ʼ162 patent, ʼ556 patent, ʼ048 patent, ʼ930 patent, and the ʼ191 patent in the U.S. District Court for the District of Delaware and, on July 21, 2016, a complaint in the U.S. District Court for the Eastern District of Texas against TWi Pharmaceuticals, Inc. and TWi Pharmaceuticals USA, Inc. (“TWi”). TWi notified Allergan that it has filed an ANDA with the FDA seeking to obtain approval to market generic versions of Restasis® before these certain patents expire. Allergan entered into a settlement agreement with TWi on January 11, 2017. On December 22, 2016, Allergan filed a complaint for infringement of the ʼ111 patent, ʼ162 patent, ʼ556 patent, ʼ048 patent, ʼ930 patent, and the ʼ191 patent in the U.S. District Court for the Eastern District of Texas against Deva Holding A.S. (“Deva”). Deva notified Allergan that it has filed an ANDA with the FDA seeking to obtain approval to market generic versions of Restasis® before these certain patents expire.
Restasis® IPR. On June 6, 2016, Allergan, Inc. received notification letters that Inter Partes Review of the USPTO (“IPR”) petitions were filed by Mylan Pharmaceuticals Inc. (“Mylan”) regarding U.S. Patent Nos. 8,629,111 (the “‘111 patent”), 8,633,162 (the “‘162 patent”), 8,642,556 (the “‘556 patent”), 8,648,048 (the “‘048 patent”), 8,685,930 (the “‘930 patent”), and 9,248,191 (the “‘191 patent”), which patents expire on August 27, 2024. Mylan filed the IPR petition on June 3, 2016. On June 23, 2016, Allergan received a notification letter that a IPR petition and motion for joinder was filed by Argentum Pharmaceuticals LLC (“Argentum”) regarding the ’111 patent. On December 7, 2016, Allergan entered into a settlement agreement with Argentum and Argentum’s petition was withdrawn. On December 8, 2016, the USPTO granted Mylan’s petitions to institute IPRs with respect to these patents. A hearing is expected on August 17, 2017. On January 6, 2017 each of Akorn, Famy Care and Teva filed, and on January 9, 2017 the USPTO received, IPR petitions with respect to these patents and motions for joinder with the Mylan IPR. On February 6, 2017, Allergan opposed joinder.
Saphris®. Between September 2014 and May 2015, Forest Laboratories, LLC, and Forest Laboratories Holdings Ltd. (collectively, “Forest”) brought actions for infringement of some or all of U.S. Patent Nos. 5,763,476 (the “‘476 patent”), 7,741,358 (the “‘358 patent”) and 8,022,228 (the “‘228 patent”) in the U.S. District Court for the District of Delaware against Sigmapharm Laboratories, LLC, Hikma Pharmaceuticals, LLC, Breckenridge Pharmaceutical, Inc., Alembic Pharmaceuticals, Ltd. and Amneal Pharmaceuticals, LLC, and related subsidiaries and affiliates thereof. Including a 6-month pediatric extension of regulatory exclusivity, the ‘476 patent expires in December 2020, and the ‘358 and ‘228 patents expire in October 2026. These lawsuits triggered an automatic stay of approval of the applicable ANDAs that expires no earlier than February 13, 2017 (unless a court issues a decision adverse to Forest sooner). On February 3, 2015, the District Court consolidated the then-pending actions for all purposes. On September 30, 2015, the District Court consolidated all pending actions. On March 28, 2016, the court entered Forest and Hikma’s proposed joint stipulation and order of adverse judgment and dismissal of claims related to the ‘358 and ‘228 patents. In April 2016, the court granted the proposed consent judgment of non-infringement and order of dismissal of counterclaims related to the ‘358 and ‘228 patents, as well as a stipulation and order with respect to infringement of Claims 1, 2, and 6 of the ʼ476 patent, between Plaintiffs and Breckenridge. The Court also granted the proposed stipulation of entry and proposed order of adverse judgment and dismissal of counterclaims related to the ʼ358 and ʼ228 patents between Plaintiffs and Sigmapharm. Trial is scheduled to begin in October 2016 with respect to the ‘476 patent, the only remaining patent-in-suit. In April, May and July 2016, the court granted the proposed
F-96
stipulations and orders of infringement of certain claims of the ‘476 patent as to Hikma, Breckenridge and Alembic. On October 13, 2016, the court stayed trial as to Sigmapharm and extended the 30-month stay as to Sigmapharm. Trial concluded on November 3, 2016. The parties filed their opening post-trial briefs on January 23, 2017.
Savella®. Between September 2013 and February 2014, Forest Laboratories, Inc., Forest Laboratories Holdings Ltd. (collectively, “Forest”) and Royalty Pharma Collection Trust (“Royalty”), Forest’s licensor for Savella®, brought actions for infringement of U.S. Patent Nos. 6,602,911 (the “‘911 patent”), 7,888,342 (the “‘342 patent”), and 7,994,220 (the “‘220 patent”) in the U.S. District Court for the District of Delaware against Amneal, Apotex, First Time US Generics, Glenmark, Hetero, Lupin, Mylan, Par, Ranbaxy, and Sandoz, and related subsidiaries and affiliates thereof. These companies have notified Forest and Royalty that they have filed ANDAs with the FDA seeking to obtain approval to market generic versions of Savella before these patents expire. (The ‘342 patent expires in November 2021, the ‘911 patent expires in January 2023, and the ‘220 patent expires in September 2029.) These lawsuits triggered an automatic stay of approval of the applicable ANDAs until July 14, 2016 (unless a court issues a decision adverse to Forest and Royalty Pharma sooner). On March 7, 2014, Forest and Royalty voluntarily dismissed, without prejudice, all claims against Sandoz. On March 20, 2014, the district court consolidated all of the remaining pending actions for all purposes and issued a scheduling order setting a trial date in January 2016. On May 12, 2014, Forest and Royalty entered into a settlement agreement with First Time US Generics. Under the terms of the settlement agreement, and subject to review of the settlement terms by the U.S. Federal Trade Commission, Forest will provide a license to First Time that will permit it to launch its generic version of Savella® as of the date that is the later of (a) six (6) -calendar months prior to the expiration date of the last to expire of the ‘911 patent, the ‘342 patent, and the ‘220 patent, including any extensions and/or pediatric exclusivities; or (b) the date that First Time obtains final FDA approval of its ANDA, or earlier in certain circumstances. On December 15, 2014, Forest and Royalty entered into a settlement agreement with Ranbaxy. On April 8, 2015, Defendants filed a motion to dismiss for lack of standing. On or about April 29, 2015, Forest entered into a settlement agreement with Par that will permit Par to launch its generic version of Savella® as of the date that is the later of (a) six (6) calendar months prior to the expiration date of the last to expire of the ‘911 patent, the ‘342 patent, and the ‘220 patent, including any extensions and/or pediatric exclusivities; or (b) the date that Par obtains final FDA approval of its ANDA, or earlier in certain circumstances. On December 11, 2015, Forest and Royalty entered into settlement agreements with Hetero and Glenmark. On January 8, 2016, Forest and Royalty entered into a settlement agreement with Amneal. On January 19, 2016, Forest and Royalty entered into a settlement agreement with Apotex. The defendants under these agreements may enter the market as of March 19, 2026. A bench trial concluded on January 26, 2016. Post-trial briefing concluded on April 26, 2016. In June 2016, Forest and Royalty entered into a settlement agreement with Lupin. On July 11, 2016, the court entered an order, opinion and judgment in favor of Plaintiffs and against Mylan that Mylan infringes the asserted claims of the ‘911, ‘342 and ‘220 patents, and that the asserted claims of the ‘911, ‘342 and ‘220 patents are valid. On August 9, 2016, Mylan filed a notice of appeal. On September 30, 2016, Forest and Royalty entered into a settlement agreement with Mylan, and the appeal was dismissed. Pursuant to the settlement agreement, Mylan may enter the market as of March 19, 2026, or earlier under certain circumstances.
Teflaro®. In January 2015, Forest Laboratories, LLC, Forest Laboratories Holdings Ltd., and Cerexa, Inc. (collectively, “Forest”) and Takeda Pharmaceutical Company Limited (“Takeda”), Forest’s licensor for Teflaro®, brought an action for infringement of some or all of U.S. Patent Nos. 6,417,175 (the “‘175 patent”), 6,906,055 (the “‘055 patent”), 7,419,973 (the “‘973 patent”) and 8,247,400 (the “‘400 patent”) in the U.S. District Court for the District of Delaware against Apotex and Sandoz, and related subsidiaries and affiliates thereof. These companies have notified Forest and Takeda that they have filed ANDAs with the FDA seeking to obtain approval to market generic versions of Teflaro® before some or all of the ‘175, ‘055, ‘973 and ‘400 patents expire. (The ‘175 patent expires in April 2022, the ‘055 and ‘973 patents expire in December 2021, and the ‘400 patent expires in February 2031.) These lawsuits triggered an automatic stay of approval of the applicable ANDAs until April 29, 2018 (unless a court issues a decision adverse to Forest and Takeda sooner). On June 24, 2015, the District Court issued a scheduling order setting a trial date in June 2017.
In April 2016, Forest filed a complaint for infringement of the ʼ175 patent in the U.S. District Court for the District of Delaware against Apotex. Apotex had notified Forest and Takeda that they have filed an ANDA with the FDA seeking to obtain approval to market generic versions of Teflaro® before the ‘175 patent expires in April 2022. This lawsuit triggered an automatic stay of approval of the applicable ANDA with respect to the ‘175 patent until September 8, 2018 (unless a court issues a decision adverse to Forest and Takeda sooner). In May 2016, Apotex filed an answer and counterclaim as to the ‘175 patent and Forest filed an answer to Apotex’s counterclaims. On June 14, 2016, Allergan filed a motion for consolidation and the court entered an order consolidating C.A. 1:16-cv-00269-GMS, into C.A. 1:15-cv-00018-GMS, (the “Lead” case). On July 27, 2016, Forest and Takeda dismissed the ‘055 and ‘973 patents with respect to Sandoz. On August 5, 2016, Forest and Takeda dismissed the ‘175 patent as to Sandoz, leaving the ‘400 patent as the only patent asserted against Sandoz. On November 11, 2016, the parties filed a stipulation of dismissal with respect to Sandoz, which the court ordered on November 17, 2016. The ‘175 patent and the ‘400 patent continued to be asserted against Apotex. On January 13, 2017, Forest and Takeda entered into a settlement agreement with Apotex. The Apotex matter was dismissed on January 17, 2017.
Viibryd®. In March 2015, Forest Laboratories, LLC, Forest Laboratories Holdings Ltd., (collectively, “Forest”) and Merck KGaA and Merck Patent Gesellschaft Mit Beschränkter Haftung (collectively, “Merck”), Forest’s licensor for Viibryd, brought actions for infringement of U.S. Patent Nos. 7,834,020 (the “‘020 patent”), 8,193,195 (the “‘195 patent”), 8,236,804 (the “‘804
F-97
patent”) and 8,673,921 (the “‘921 patent”) in the U.S. District Court for the District of Delaware against Accord Healthcare Inc. (“Accord”), Alembic Pharmaceuticals, Ltd. (“Alembic”), Apotex, Inc. (“Apotex”), InvaGen Pharmaceuticals, Inc. (“InvaGen”), and Teva Pharmaceuticals USA, Inc. (“Teva”), and related subsidiaries and affiliates thereof. These companies have notified Forest and/or Merck that they have filed ANDAs with the FDA seeking to obtain approval to market generic versions of Viibryd before the ‘020, ‘195, ‘804 and ‘921 patents expire in June 2022. These lawsuits triggered an automatic stay of approval of the applicable ANDAs until July 21, 2018 (unless a court issues a decision adverse to Forest and Merck sooner). On August 24, 2015, the District Court consolidated the actions for all purposes and issued a scheduling order setting a trial date in January 2018. On November 23, 2015, Forest and Merck brought an action for infringement of the ‘020, ‘195, ‘804 and ‘921 patents in the U.S. District Court for the District of Delaware against InvaGen, which matter was consolidated with the earlier-filed action against InvaGen.
Product Liability Litigation
Actonel® Litigation. Warner Chilcott is a defendant in approximately 164 cases and a potential defendant with respect to approximately 373 unfiled claims involving a total of approximately 446 plaintiffs and potential plaintiffs relating to Warner Chilcott’s bisphosphonate prescription drug Actonel®. The claimants allege, among other things, that Actonel® caused them to suffer osteonecrosis of the jaw (“ONJ”), a rare but serious condition that involves severe loss or destruction of the jawbone, and/or atypical fractures of the femur. All of the cases have been filed in either federal or state courts in the United States. Warner Chilcott is in the initial stages of discovery in these litigations. In addition, Warner Chilcott is aware of four purported product liability class actions that were brought against Warner Chilcott in provincial courts in Canada alleging, among other things, that Actonel® caused the plaintiffs and the proposed class members who ingested Actonel® to suffer atypical fractures or other side effects. It is expected that these plaintiffs will seek class certification. Plaintiffs have typically asked for unspecified monetary and injunctive relief, as well as attorneys’ fees. Warner Chilcott is indemnified by Sanofi for certain Actonel claims pursuant to a collaboration agreement relating to the two parties’ co-promotion of the product in the United States and other countries. In addition, Warner Chilcott is also partially indemnified by the Procter & Gamble Company (“P&G”) for ONJ claims that were pending at the time Warner Chilcott acquired P&G’s global pharmaceutical business in October 2009. In May and September 2013, Warner Chilcott entered into two settlement agreements that resolved a majority of the then-existing ONJ-related claims.
Benicar® Litigation. Forest is named in approximately 1,733 actions involving allegations that Benicar®, a treatment for hypertension that Forest co-promoted with Daiichi Sankyo between 2002 and 2008, caused certain gastrointestinal injuries. Under Forest’s Co-Promotion Agreement, Daiichi Sankyo is defending us in these lawsuits.
Celexa®/Lexapro® Litigation. Forest are defendants in approximately 179 actions alleging that Celexa® or Lexapro® caused various birth defects. Several of the cases involve multiple minor-plaintiffs. The majority of these actions have been consolidated in state court in Missouri. The company recently reached an agreement in principle with plaintiffs to settle five of the pending cases. There are birth defect cases pending in other jurisdictions, none of which are set for trial.
Testosterone Litigation. Beginning in 2014, a number of product liability suits were filed against Actavis, Inc., now known as Allergan Finance, LLC, and one or more of its former subsidiaries as well as other manufacturers and distributors of testosterone products, for personal injuries including but not limited to cardiovascular events allegedly arising out of the use of Androderm® and AndroGel®, a product that a subsidiary of the Company had co-promoted for another pharmaceutical company defendant.. There are approximately 562 currently pending actions which have been consolidated in an MDL in federal court in Illinois. The defendants have responded to the plaintiffs’ master complaint in the MDL. These cases are in the initial stages and discovery is ongoing. The Company anticipates that additional suits will be filed.
Government Investigations, Government Litigation and Qui Tam Litigation
Forest. Forest received a subpoena dated August 5, 2013 from the U.S. Department of Health and Human Services, Office of Inspector General. The subpoena requests documents relating to the marketing and promotion of Bystolic®, Savella®, and Namenda®, including with respect to speaker programs for these products. In February 2014, the U.S. District Court for the Eastern District of Wisconsin unsealed a qui tam complaint which asserts claims under the False Claims Act and contains allegations regarding off-label promotion of Bystolic® and Savella® and “kickbacks” provided to physicians to induce prescriptions of Bystolic®, Savella®, and Viibryd®. Forest moved to dismiss the complaint. On January 6, 2015, the court granted Forest’s motion to dismiss the complaint. On February 5, 2016, the relator filed a second amended complaint. The U.S. Attorney’s Office declined to intervene in this action but has reserved the right to do so at a later date. The Company recently reached an agreement with the Department of Justice, all fifty states and the District of Columbia as well as the relator that resolved both the government’s investigation and the qui tam action.
Forest received a subpoena, dated April 29, 2015, from the U.S. Department of Health and Human Services, Office of Inspector General (“OIG”). The subpoena requests documents relating to Average Manufacturer (“AMP”) and Best Price calculations for
F-98
several of its products. Subsequently, Forest received a Civil Investigative Demand from the OIG, dated August 16, 2016 primarily related to the calculation of Best Price. The Company is cooperating fully with the OIG’s requests.
In April 2014, the federal district court in Massachusetts unsealed a qui tam complaint which asserts claims under the False Claims Act and contains allegations regarding off-label promotion of Namenda®. The Company filed a motion to dismiss the relator’s Second Amended Complaint and the court granted in part and denied in part Forest’s motion, dismissing the False Claims Act conspiracy claim only. While this case is still in its early stages, on October 7, 2016, the Company filed a second motion to dismiss the relator’s Second Amended Complaint based on newly discovered evidence. The U.S. Attorney’s Office declined to intervene in this action but has reserved the right to do so at a later date.
Forest and certain of its affiliates are defendants in three state court actions pending in Illinois, Utah and Wisconsin involving qui tam actions alleging generally that the plaintiffs (all government agencies) were overcharged for their share of Medicaid drug reimbursement costs. Discovery is ongoing in these actions. Forest and the other defendants filed a motion to dismiss Utah’s amended complaint. This motion to dismiss was denied in part, and discovery is proceeding. On February 17, 2014, the Wisconsin state court granted defendants’ motion to dismiss plaintiff’s Second Amended Complaint. However, the relator filed a separate action making the same basic allegations as in its amended complaint in the original action.
On December 28, 2015, a putative class action complaint was filed in state court in Pennsylvania on behalf of a putative class of private payers. Defendants removed the complaint to the federal court in Pennsylvania. The complaint alleges that manufacturers of generic drugs, including a subsidiary of Forest Laboratories, Inc. that in the past had marketed generic products, caused plaintiffs to overpay for prescription drug products through the use of inflated AWPs. The complaint alleges violations of the Pennsylvania Unfair Trade Practices and Consumer Protection Law, negligent misrepresentation/fraud, unjust enrichment, civil conspiracy and aiding and abetting. Plaintiffs filed an amended complaint on March 29, 2016. On May 3, 2016, the court issued an order staying this action. An additional complaint then was filed in state court in Pennsylvania on behalf an individual indirect purchaser containing similar allegations to the class complaint.
Allergan. In December 2011, the federal district court in Pennsylvania issued an order partially unsealing the second amended qui tam complaint, filed by relators Herbert J. Nevyas, M.D. and Anita Nevyas-Wallace, M.D., to be informally provided to Allergan, Inc. The complaint asserts claims under Federal and State False Claims Acts and Federal and State Anti-Kickback Acts. On December 16, 2013, the court entered an order to unseal this qui tam action. On April 1, 2014, Allergan filed a motion to dismiss. On May 26, 2015, the court issued a ruling granting, in part, the motion to dismiss and denying it in part. Allergan filed an answer to the remaining claims on June 25, 2015. In May 2016, the parties reached a settlement, which remains subject to approval by various Federal and State agencies.
On November 25, 2014, prior to the completion of its merger with Actavis plc (“Actavis”), Allergan, Inc. received a request for documents and information from the United States Securities and Exchange Commission (“SEC”) related to Actavis or Salix Pharmaceuticals, Inc. (“Salix”). On June 30, 2015, Allergan, Inc. received a subpoena from the SEC requesting documents related to Actavis or Salix. On June 30, 2015, Actavis received a subpoena from the SEC requesting documents related to Allergan. In January 2016, the SEC began meeting with current and former employees of Allergan and Actavis and indicated that its review focused on the content of Allergan, Inc.’s disclosures during the pendency of the tender offer by Valeant Pharmaceuticals International for Allergan, Inc.’s common stock. The company recently reached an agreement with the SEC to resolve the SEC’s review of legacy Allergan’s disclosures during the Valeant tender offer period.
The Company and its affiliates are involved in various other disputes, governmental and/or regulatory inspections, inquires, investigations and proceedings that could result in litigation, and other litigation matters that arise from time to time.
Matters Relating to the Company’s Divested Generics Business
The following matters relate to the former generics business of the Company which was sold to Teva effective August 2, 2016, but are included herein because the Company or one of its current subsidiaries have been named as a party in such matter. The Master Purchase Agreement under which the global generics business was sold provides for assumption by Teva of liabilities and claims relating to the generics business and indemnification by Teva for losses imposed on, sustained, incurred or suffered by or asserted against the Company for third party claims relating to the generics business. The Company believes it has substantial and meritorious claims for indemnification by Teva for these matters and failing same, substantial and meritorious defenses with respect to the underlying claims against the Company and/or its current subsidiaries; and in each case the Company intends to assert and/or defends claims vigorously. However, it is impossible to predict with certainty the outcome of any litigation or indemnity claims.
Lidoderm® Litigation. On March 30, 2016, the U.S. Federal Trade Commission filed a lawsuit in federal district court in the Eastern District of Pennsylvania against the Company and one of its global generics business subsidiaries, Watson Laboratories, Inc.,
F-99
Endo Pharmaceuticals Inc. and others arising out of patent settlements relating to Lidoderm and Opana ER. The Lidoderm settlement was reached by Endo Pharmaceuticals Inc. and Watson Laboratories, Inc. in May 2012, prior to it’s being affiliated with the Company, and all allegations against the Company and Watson Laboratories, Inc. related to the Lidoderm settlement only. On October 25, 2016, the FTC voluntarily withdrew its complaint in federal court in Pennsylvania. Similar lawsuits filed by private plaintiffs were already pending in the federal district court in California. On January 23, 2017, both the FTC and State of California filed complaints against the Watson Laboratories, Endo Pharmaceuticals as well as the Company and its subsidiary Allergan Finance LLC in the same federal court in California alleging violations of federal and state antitrust laws. The FTC and California complaints contain allegations relating to the Lidoderm settlement only and seek injunctive relief, restitution or disgorgement of profits and, in the California action, statutory penalties. On January 27, 2017, Allergan Finance LLC filed a declaratory judgment action against the FTC in the same federal district court in the Eastern District of Pennsylvania where the FTC’s original action had been pending. The court consolidated Allergan Finance’s action with declaratory judgment actions that had already been filed by other parties that were named as defendants in the original FTC action in Pennsylvania.
Generic Drug Pricing Securities and ERISA Litigation. On November 4, 2016 a class action was filed by a putative class of Allergan shareholders in federal court in California against the Company and certain of its current and former officers alleging that the Company and certain of its current and former officers made materially false and misleading statements. The complaint alleges generally that between February 2014 and November 2016, Allergan and certain of its officers made materially false and misleading statements regarding the Company’s internal controls over its financial reporting and failed to disclose that its Actavis generics unit had engaged in illegal, anticompetitive price-fixing with its generic industry peers. The complaint seeks unspecified monetary damages. Additional complaints have been filed in other federal district courts. On February 2, 2017, the actions were consolidated in the federal district court in New Jersey. On February 14, 2017, a separate complaint was filed in the federal district court in California that is premised on the same alleged underlying conduct that is at issue in the securities litigation but that asserts claims under the Employee Retirement Income Security Act of 1974 (“ERISA). The ERISA complaint asserts claims on behalf of a putative class of individuals who participated in the Company’s retirement plans and seeks an unspecified amount of damages and other injunctive relief.
Hydrocortisone Investigation. On November 10, 2016, the Company received notice from the UK Competition and Markets Authority (“CMA”) that it would be included within the scope of the CMA’s formal investigation under Section 25 of the Competition Act of 1998 (“CA98”) into suspected abuse of dominance by a former generics business subsidiary of the Company in relation to the supply of 10mg and 20mg hydrocortisone tablets. The CMA is investigating whether the conduct infringes the Chapter II prohibition of the CA98 and/or Article 102 of the Treaty on the Functioning of the European Union. The Company intends to cooperate fully with the investigation.
NOTE 25 — Warner Chilcott Limited (“WCL”) Guarantor and Non-Guarantor Condensed Consolidating Financial Information
The following financial information is presented to segregate the financial results of WCL, Actavis Funding SCS, and Allergan Finance, LLC (the issuers of the long-term notes), the guarantor subsidiaries for the long-term notes and the non-guarantor subsidiaries. The guarantors jointly and severally, and fully and unconditionally, guarantee the Company’s obligation under the long-term notes.
The information includes elimination entries necessary to consolidate the guarantor and the non-guarantor subsidiaries. Investments in subsidiaries are accounted for using the equity method of accounting. The principal elimination entries eliminate investments in subsidiaries, equity and intercompany balances and transactions.
WCL, Actavis Capital S.a.r.l. and Allergan Finance, LLC are guarantors of the long-term notes.
Warner Chilcott Limited has revised its consolidating financial statements as previously presented in Footnote 25 of the 2014 Annual Report on Form 10-K and its balance sheet in Footnote 26 of the 2015 Annual Report on Form 10-K due to a change in the Company’s legal entity structure and other reclassifications that occurred during the year ended December 31, 2016. As a result, prior period information has been recast to conform to the current period presentation.
The following financial information presents the consolidating balance sheets as of December 31, 2016 and 2015, the related statement of operations and comprehensive income for the years ended December 31, 2016, 2015 and 2014 and the statement of cash flows for the years ended December 31, 2016, 2015 and 2014.
F-100
Consolidating Balance Sheets
As of December 31, 2016
($ in millions)
|
Current assets: |
|
Warner Chilcott Limited (Parent Guarantor) |
|
|
Actavis Capital S.a.r.l. (Guarantor) |
|
|
Actavis Funding SCS (Issuer) |
|
|
Allergan Finance LLC (Issuer and Guarantor) |
|
|
Non- guarantors |
|
|
Eliminations |
|
|
Consolidated Warner Chilcott Limited |
|
|||||||
|
Cash and cash equivalents |
|
$ |
0.1 |
|
|
$ |
513.9 |
|
|
$ |
- |
|
|
$ |
- |
|
|
$ |
1,199.2 |
|
|
$ |
- |
|
|
$ |
1,713.2 |
|
|
Marketable securities |
|
|
- |
|
|
|
6,351.8 |
|
|
|
- |
|
|
|
- |
|
|
|
5,149.7 |
|
|
|
- |
|
|
|
11,501.5 |
|
|
Accounts receivable, net |
|
|
- |
|
|
|
- |
|
|
|
- |
|
|
|
- |
|
|
|
2,531.0 |
|
|
|
- |
|
|
|
2,531.0 |
|
|
Receivable from Parents |
|
|
- |
|
|
|
4,196.9 |
|
|
|
- |
|
|
|
- |
|
|
|
5,092.3 |
|
|
|
- |
|
|
|
9,289.2 |
|
|
Inventories, net |
|
|
- |
|
|
|
- |
|
|
|
- |
|
|
|
- |
|
|
|
718.0 |
|
|
|
- |
|
|
|
718.0 |
|
|
Intercompany receivables |
|
|
- |
|
|
|
24,348.6 |
|
|
|
3,343.5 |
|
|
|
81.6 |
|
|
|
66,840.8 |
|
|
|
(94,614.5 |
) |
|
|
- |
|
|
Prepaid expenses and other current assets |
|
|
- |
|
|
|
14.2 |
|
|
|
- |
|
|
|
42.7 |
|
|
|
1,325.2 |
|
|
|
- |
|
|
|
1,382.1 |
|
|
Current assets held for sale |
|
|
- |
|
|
|
- |
|
|
|
- |
|
|
|
- |
|
|
|
- |
|
|
|
- |
|
|
|
- |
|
|
Total current assets |
|
|
0.1 |
|
|
|
35,425.4 |
|
|
|
3,343.5 |
|
|
|
124.3 |
|
|
|
82,856.2 |
|
|
|
(94,614.5 |
) |
|
|
27,135.0 |
|
|
Property, plant and equipment, net |
|
|
- |
|
|
|
- |
|
|
|
- |
|
|
|
- |
|
|
|
1,611.3 |
|
|
|
- |
|
|
|
1,611.3 |
|
|
Investments and other assets |
|
|
- |
|
|
|
- |
|
|
|
- |
|
|
|
15.8 |
|
|
|
266.3 |
|
|
|
- |
|
|
|
282.1 |
|
|
Investment in subsidiaries |
|
|
88,093.4 |
|
|
|
89,172.0 |
|
|
|
- |
|
|
|
73,659.3 |
|
|
|
- |
|
|
|
(250,924.7 |
) |
|
|
- |
|
|
Non current intercompany receivables |
|
|
- |
|
|
|
27,706.6 |
|
|
|
22,540.1 |
|
|
|
- |
|
|
|
9,686.6 |
|
|
|
(59,933.3 |
) |
|
|
- |
|
|
Non current receivables from Parents |
|
|
- |
|
|
|
- |
|
|
|
- |
|
|
|
- |
|
|
|
3,964.0 |
|
|
|
- |
|
|
|
3,964.0 |
|
|
Non current assets held for sale |
|
|
- |
|
|
|
- |
|
|
|
- |
|
|
|
- |
|
|
|
27.0 |
|
|
|
- |
|
|
|
27.0 |
|
|
Deferred tax assets |
|
|
- |
|
|
|
- |
|
|
|
- |
|
|
|
- |
|
|
|
233.3 |
|
|
|
- |
|
|
|
233.3 |
|
|
Product rights and other intangibles |
|
|
- |
|
|
|
- |
|
|
|
- |
|
|
|
- |
|
|
|
62,618.6 |
|
|
|
- |
|
|
|
62,618.6 |
|
|
Goodwill |
|
|
- |
|
|
|
- |
|
|
|
- |
|
|
|
- |
|
|
|
46,356.1 |
|
|
|
- |
|
|
|
46,356.1 |
|
|
Total assets |
|
$ |
88,093.5 |
|
|
$ |
152,304.0 |
|
|
$ |
25,883.6 |
|
|
$ |
73,799.4 |
|
|
$ |
207,619.4 |
|
|
$ |
(405,472.5 |
) |
|
$ |
142,227.4 |
|
|
|
|
|
|
|
|
|
|
|
|
|
|
|
|
|
|
|
|
|
|
|
|
|
|
|
|
|
|
|
|
Current liabilities: |
|
|
|
|
|
|
|
|
|
|
|
|
|
|
|
|
|
|
|
|
|
|
|
|
|
|
|
|
|
Accounts payable and accrued expenses |
|
|
- |
|
|
|
- |
|
|
|
208.9 |
|
|
|
- |
|
|
|
4,784.4 |
|
|
|
- |
|
|
|
4,993.3 |
|
|
Intercompany payables |
|
|
- |
|
|
|
55,828.8 |
|
|
|
1,652.9 |
|
|
|
9,359.1 |
|
|
|
27,773.7 |
|
|
|
(94,614.5 |
) |
|
|
- |
|
|
Payable to Parents |
|
|
- |
|
|
|
334.1 |
|
|
|
- |
|
|
|
- |
|
|
|
1,038.7 |
|
|
|
- |
|
|
|
1,372.8 |
|
|
Income taxes payable |
|
|
- |
|
|
|
- |
|
|
|
- |
|
|
|
- |
|
|
|
57.8 |
|
|
|
- |
|
|
|
57.8 |
|
|
Current portion of long-term debt and capital leases |
|
|
- |
|
|
|
- |
|
|
|
1,478.1 |
|
|
|
1,197.4 |
|
|
|
122.4 |
|
|
|
- |
|
|
|
2,797.9 |
|
|
Current liabilities held for sale |
|
|
- |
|
|
|
- |
|
|
|
- |
|
|
|
- |
|
|
|
- |
|
|
|
- |
|
|
|
- |
|
|
Total current liabilities |
|
|
- |
|
|
|
56,162.9 |
|
|
|
3,339.9 |
|
|
|
10,556.5 |
|
|
|
33,777.0 |
|
|
|
(94,614.5 |
) |
|
|
9,221.8 |
|
|
Long-term debt and capital leases |
|
|
- |
|
|
|
- |
|
|
|
22,540.1 |
|
|
|
3,079.0 |
|
|
|
4,351.7 |
|
|
|
- |
|
|
|
29,970.8 |
|
|
Other long-term liabilities |
|
|
- |
|
|
|
- |
|
|
|
- |
|
|
|
- |
|
|
|
1,086.0 |
|
|
|
- |
|
|
|
1,086.0 |
|
|
Non current intercompany payables |
|
|
- |
|
|
|
9,537.6 |
|
|
|
- |
|
|
|
149.0 |
|
|
|
50,246.7 |
|
|
|
(59,933.3 |
) |
|
|
- |
|
|
Other taxes payable |
|
|
- |
|
|
|
- |
|
|
|
- |
|
|
|
- |
|
|
|
886.2 |
|
|
|
- |
|
|
|
886.2 |
|
|
Deferred tax liabilities |
|
|
- |
|
|
|
- |
|
|
|
- |
|
|
|
- |
|
|
|
12,969.1 |
|
|
|
- |
|
|
|
12,969.1 |
|
|
Total liabilities |
|
|
- |
|
|
|
65,700.5 |
|
|
|
25,880.0 |
|
|
|
13,784.5 |
|
|
|
103,316.7 |
|
|
|
(154,547.8 |
) |
|
|
54,133.9 |
|
|
Total equity / (deficit) |
|
|
88,093.5 |
|
|
|
86,603.5 |
|
|
|
3.6 |
|
|
|
60,014.9 |
|
|
|
104,302.7 |
|
|
|
(250,924.7 |
) |
|
|
88,093.5 |
|
|
Total liabilities and equity |
|
$ |
88,093.5 |
|
|
$ |
152,304.0 |
|
|
$ |
25,883.6 |
|
|
$ |
73,799.4 |
|
|
$ |
207,619.4 |
|
|
$ |
(405,472.5 |
) |
|
$ |
142,227.4 |
|
|
|
|
|
|
|
|
|
|
|
|
|
|
|
|
|
|
|
|
|
|
|
|
|
|
|
|
|
|
|
|
|
|
|
|
|
|
|
|
|
|
|
|
|
|
|
|
|
|
|
|
|
|
|
|
|
|
|
|
|
F-101
Consolidating Balance Sheets
As of December 31, 2015
($ in millions)
|
Current assets: |
|
Warner Chilcott Limited (Parent Guarantor) |
|
|
Actavis Capital S.a.r.l. (Guarantor) |
|
|
Actavis Funding SCS (Issuer) |
|
|
Allergan Finance LLC (Issuer and Guarantor) |
|
|
Non- guarantors |
|
|
Eliminations |
|
|
Consolidated Warner Chilcott Limited |
|
|||||||
|
Cash and cash equivalents |
|
$ |
- |
|
|
$ |
13.5 |
|
|
$ |
- |
|
|
$ |
2.0 |
|
|
$ |
1,020.7 |
|
|
$ |
- |
|
|
$ |
1,036.2 |
|
|
Marketable securities |
|
|
- |
|
|
|
- |
|
|
|
- |
|
|
|
- |
|
|
|
9.3 |
|
|
|
- |
|
|
|
9.3 |
|
|
Accounts receivable, net |
|
|
- |
|
|
|
- |
|
|
|
- |
|
|
|
- |
|
|
|
2,125.4 |
|
|
|
- |
|
|
|
2,125.4 |
|
|
Receivable from Parents |
|
|
- |
|
|
|
- |
|
|
|
- |
|
|
|
- |
|
|
|
457.3 |
|
|
|
- |
|
|
|
457.3 |
|
|
Inventories, net |
|
|
- |
|
|
|
- |
|
|
|
- |
|
|
|
- |
|
|
|
757.5 |
|
|
|
- |
|
|
|
757.5 |
|
|
Intercompany receivables |
|
|
- |
|
|
|
55,415.1 |
|
|
|
25,225.6 |
|
|
|
302.4 |
|
|
|
60,464.0 |
|
|
|
(141,407.1 |
) |
|
|
- |
|
|
Prepaid expenses and other current assets |
|
|
- |
|
|
|
5.0 |
|
|
|
- |
|
|
|
6.1 |
|
|
|
481.7 |
|
|
|
- |
|
|
|
492.8 |
|
|
Current assets held for sale |
|
|
- |
|
|
|
- |
|
|
|
- |
|
|
|
- |
|
|
|
4,095.6 |
|
|
|
- |
|
|
|
4,095.6 |
|
|
Total current assets |
|
|
- |
|
|
|
55,433.6 |
|
|
|
25,225.6 |
|
|
|
310.5 |
|
|
|
69,411.5 |
|
|
|
(141,407.1 |
) |
|
|
8,974.1 |
|
|
Property, plant and equipment, net |
|
|
- |
|
|
|
- |
|
|
|
- |
|
|
|
34.3 |
|
|
|
1,497.0 |
|
|
|
- |
|
|
|
1,531.3 |
|
|
Investments and other assets |
|
|
- |
|
|
|
- |
|
|
|
- |
|
|
|
33.6 |
|
|
|
375.1 |
|
|
|
- |
|
|
|
408.7 |
|
|
Investment in subsidiaries |
|
|
75,571.6 |
|
|
|
79,597.3 |
|
|
|
- |
|
|
|
73,037.7 |
|
|
|
- |
|
|
|
(228,206.6 |
) |
|
|
- |
|
|
Non current intercompany receivables |
|
|
- |
|
|
|
39,584.1 |
|
|
|
- |
|
|
|
- |
|
|
|
41,400.8 |
|
|
|
(80,984.9 |
) |
|
|
- |
|
|
Non current receivables from Parents |
|
|
- |
|
|
|
- |
|
|
|
- |
|
|
|
- |
|
|
|
- |
|
|
|
- |
|
|
|
- |
|
|
Non current assets held for sale |
|
|
- |
|
|
|
- |
|
|
|
- |
|
|
|
45.8 |
|
|
|
10,667.5 |
|
|
|
- |
|
|
|
10,713.3 |
|
|
Deferred tax assets |
|
|
- |
|
|
|
- |
|
|
|
- |
|
|
|
- |
|
|
|
49.5 |
|
|
|
- |
|
|
|
49.5 |
|
|
Product rights and other intangibles |
|
|
- |
|
|
|
- |
|
|
|
- |
|
|
|
- |
|
|
|
67,836.2 |
|
|
|
- |
|
|
|
67,836.2 |
|
|
Goodwill |
|
|
- |
|
|
|
- |
|
|
|
- |
|
|
|
- |
|
|
|
46,465.2 |
|
|
|
- |
|
|
|
46,465.2 |
|
|
Total assets |
|
$ |
75,571.6 |
|
|
$ |
174,615.0 |
|
|
$ |
25,225.6 |
|
|
$ |
73,461.9 |
|
|
$ |
237,702.8 |
|
|
$ |
(450,598.6 |
) |
|
$ |
135,978.3 |
|
|
|
|
|
|
|
|
|
|
|
|
|
|
|
|
|
|
|
|
|
|
|
|
|
|
|
|
|
|
|
|
Current liabilities: |
|
|
|
|
|
|
|
|
|
|
|
|
|
|
|
|
|
|
|
|
|
|
|
|
|
|
|
|
|
Accounts payable and accrued expenses |
|
|
- |
|
|
|
3.9 |
|
|
|
210.5 |
|
|
|
171.5 |
|
|
|
3,708.6 |
|
|
|
- |
|
|
|
4,094.5 |
|
|
Intercompany payables |
|
|
- |
|
|
|
51,148.7 |
|
|
|
526.3 |
|
|
|
8,789.0 |
|
|
|
80,943.1 |
|
|
|
(141,407.1 |
) |
|
|
- |
|
|
Payable to Parents |
|
|
- |
|
|
|
- |
|
|
|
- |
|
|
|
- |
|
|
|
1,466.8 |
|
|
|
- |
|
|
|
1,466.8 |
|
|
Income taxes payable |
|
|
- |
|
|
|
- |
|
|
|
- |
|
|
|
44.1 |
|
|
|
9.6 |
|
|
|
- |
|
|
|
53.7 |
|
|
Current portion of long-term debt and capital leases |
|
|
- |
|
|
|
749.1 |
|
|
|
475.5 |
|
|
|
- |
|
|
|
1,171.9 |
|
|
|
- |
|
|
|
2,396.5 |
|
|
Current liabilities held for sale |
|
|
- |
|
|
|
- |
|
|
|
- |
|
|
|
23.3 |
|
|
|
1,669.9 |
|
|
|
- |
|
|
|
1,693.2 |
|
|
Total current liabilities |
|
|
- |
|
|
|
51,901.7 |
|
|
|
1,212.3 |
|
|
|
9,027.9 |
|
|
|
88,969.9 |
|
|
|
(141,407.1 |
) |
|
|
9,704.7 |
|
|
Long-term debt and capital leases |
|
|
- |
|
|
|
6,995.0 |
|
|
|
24,013.0 |
|
|
|
4,269.4 |
|
|
|
4,856.5 |
|
|
|
- |
|
|
|
40,133.9 |
|
|
Other long-term liabilities |
|
|
- |
|
|
|
- |
|
|
|
- |
|
|
|
- |
|
|
|
1,262.0 |
|
|
|
- |
|
|
|
1,262.0 |
|
|
Long-term intercompany payables |
|
|
- |
|
|
|
40,944.8 |
|
|
|
- |
|
|
|
456.0 |
|
|
|
39,584.1 |
|
|
|
(80,984.9 |
) |
|
|
- |
|
|
Long-term payables to Parents |
|
|
- |
|
|
|
- |
|
|
|
- |
|
|
|
- |
|
|
|
- |
|
|
|
- |
|
|
|
- |
|
|
Non current liabilities held for sale |
|
|
- |
|
|
|
- |
|
|
|
- |
|
|
|
- |
|
|
|
535.4 |
|
|
|
- |
|
|
|
535.4 |
|
|
Other taxes payable |
|
|
- |
|
|
|
- |
|
|
|
- |
|
|
|
72.1 |
|
|
|
729.8 |
|
|
|
- |
|
|
|
801.9 |
|
|
Deferred tax liabilities |
|
|
- |
|
|
|
- |
|
|
|
- |
|
|
|
- |
|
|
|
7,968.8 |
|
|
|
- |
|
|
|
7,968.8 |
|
|
Total liabilities |
|
|
- |
|
|
|
99,841.5 |
|
|
|
25,225.3 |
|
|
|
13,825.4 |
|
|
|
143,906.5 |
|
|
|
(222,392.0 |
) |
|
|
60,406.7 |
|
|
Total equity |
|
|
75,571.6 |
|
|
|
74,773.5 |
|
|
|
0.3 |
|
|
|
59,636.5 |
|
|
|
93,796.3 |
|
|
|
(228,206.6 |
) |
|
|
75,571.6 |
|
|
Total liabilities and equity |
|
$ |
75,571.6 |
|
|
$ |
174,615.0 |
|
|
$ |
25,225.6 |
|
|
$ |
73,461.9 |
|
|
$ |
237,702.8 |
|
|
$ |
(450,598.6 |
) |
|
$ |
135,978.3 |
|
F-102
Consolidating Statements of Operations and Comprehensive Income / (Loss)
For the Year Ended December 31, 2016
($ in millions)
|
|
|
Warner Chilcott Limited (Parent Guarantor) |
|
|
Actavis Capital S.a.r.l. (Guarantor) |
|
|
Actavis Funding SCS (Issuer) |
|
|
Allergan Finance LLC (Issuer and Guarantor) |
|
|
Non- guarantors |
|
|
Eliminations |
|
|
Consolidated Warner Chilcott Limited |
|
|||||||
|
Net revenues |
|
$ |
- |
|
|
$ |
- |
|
|
$ |
- |
|
|
$ |
- |
|
|
$ |
14,570.6 |
|
|
$ |
- |
|
|
$ |
14,570.6 |
|
|
|
|
|
|
|
|
|
|
|
|
|
|
|
|
|
|
|
|
|
|
|
|
|
|
|
|
|
|
|
|
Operating expenses: |
|
|
|
|
|
|
|
|
|
|
|
|
|
|
|
|
|
|
|
|
|
|
|
|
|
|
|
|
|
Cost of sales (excludes amortization and impairment of acquired intangibles including product rights) |
|
|
- |
|
|
|
- |
|
|
|
- |
|
|
|
- |
|
|
|
1,860.8 |
|
|
|
- |
|
|
|
1,860.8 |
|
|
Research and development |
|
|
- |
|
|
|
- |
|
|
|
- |
|
|
|
- |
|
|
|
2,575.7 |
|
|
|
- |
|
|
|
2,575.7 |
|
|
Selling and marketing |
|
|
- |
|
|
|
- |
|
|
|
- |
|
|
|
- |
|
|
|
3,266.4 |
|
|
|
- |
|
|
|
3,266.4 |
|
|
General and administrative |
|
|
- |
|
|
|
- |
|
|
|
- |
|
|
|
19.8 |
|
|
|
1,330.6 |
|
|
|
- |
|
|
|
1,350.4 |
|
|
Amortization |
|
|
- |
|
|
|
- |
|
|
|
- |
|
|
|
- |
|
|
|
6,470.4 |
|
|
|
- |
|
|
|
6,470.4 |
|
|
In-process research and development impairments |
|
|
- |
|
|
|
- |
|
|
|
- |
|
|
|
- |
|
|
|
743.9 |
|
|
|
- |
|
|
|
743.9 |
|
|
Asset sales and impairments, net |
|
|
- |
|
|
|
- |
|
|
|
- |
|
|
|
- |
|
|
|
5.0 |
|
|
|
- |
|
|
|
5.0 |
|
|
Total operating expenses |
|
|
- |
|
|
|
- |
|
|
|
- |
|
|
|
19.8 |
|
|
|
16,252.8 |
|
|
|
- |
|
|
|
16,272.6 |
|
|
Operating income / (loss) |
|
|
- |
|
|
|
- |
|
|
|
- |
|
|
|
(19.8 |
) |
|
|
(1,682.2 |
) |
|
|
- |
|
|
|
(1,702.0 |
) |
|
|
|
|
|
|
|
|
|
|
|
|
|
|
|
|
|
|
|
|
|
|
|
|
|
|
|
|
|
|
|
Non-operating income (expense): |
|
|
|
|
|
|
|
|
|
|
|
|
|
|
|
|
|
|
|
|
|
|
|
|
|
|
|
|
|
Interest income / (expense), net |
|
|
- |
|
|
|
2,255.3 |
|
|
|
3.4 |
|
|
|
(157.1 |
) |
|
|
(3,286.1 |
) |
|
|
- |
|
|
|
(1,184.5 |
) |
|
Other income (expense), net |
|
|
- |
|
|
|
- |
|
|
|
- |
|
|
|
- |
|
|
|
172.2 |
|
|
|
- |
|
|
|
172.2 |
|
|
Total other income (expense), net |
|
|
- |
|
|
|
2,255.3 |
|
|
|
3.4 |
|
|
|
(157.1 |
) |
|
|
(3,113.9 |
) |
|
|
- |
|
|
|
(1,012.3 |
) |
|
Income / (loss) before income taxes and noncontrolling interest |
|
|
- |
|
|
|
2,255.3 |
|
|
|
3.4 |
|
|
|
(176.9 |
) |
|
|
(4,796.1 |
) |
|
|
- |
|
|
|
(2,714.3 |
) |
|
Provision for income taxes |
|
|
- |
|
|
|
- |
|
|
|
0.1 |
|
|
|
66.3 |
|
|
|
(1,963.4 |
) |
|
|
- |
|
|
|
(1,897.0 |
) |
|
(Earnings) / losses of equity interest subsidiaries |
|
|
(15,091.1 |
) |
|
|
(9,994.6 |
) |
|
|
- |
|
|
|
(338.9 |
) |
|
|
- |
|
|
|
25,424.6 |
|
|
|
- |
|
|
Net income / (loss) from continuing operations, net of tax |
|
$ |
15,091.1 |
|
|
$ |
12,249.9 |
|
|
$ |
3.3 |
|
|
$ |
95.7 |
|
|
$ |
(2,832.7 |
) |
|
$ |
(25,424.6 |
) |
|
$ |
(817.3 |
) |
|
Income from discontinued operations |
|
|
- |
|
|
|
- |
|
|
|
- |
|
|
|
- |
|
|
|
15,914.5 |
|
|
|
- |
|
|
|
15,914.5 |
|
|
Net income / (loss) |
|
$ |
15,091.1 |
|
|
$ |
12,249.9 |
|
|
$ |
3.3 |
|
|
$ |
95.7 |
|
|
$ |
13,081.8 |
|
|
$ |
(25,424.6 |
) |
|
$ |
15,097.2 |
|
|
(Income) attributable to noncontrolling interest |
|
|
- |
|
|
|
- |
|
|
|
- |
|
|
|
- |
|
|
|
(6.1 |
) |
|
|
- |
|
|
|
(6.1 |
) |
|
Net income / (loss) attributable to ordinary shareholders |
|
$ |
15,091.1 |
|
|
$ |
12,249.9 |
|
|
$ |
3.3 |
|
|
$ |
95.7 |
|
|
$ |
13,075.7 |
|
|
$ |
(25,424.6 |
) |
|
$ |
15,091.1 |
|
|
Other comprehensive (loss) / income |
|
|
(544.3 |
) |
|
|
(419.9 |
) |
|
|
- |
|
|
|
282.7 |
|
|
|
(544.3 |
) |
|
|
681.5 |
|
|
|
(544.3 |
) |
|
Comprehensive income / (loss) |
|
$ |
14,546.8 |
|
|
$ |
11,830.0 |
|
|
$ |
3.3 |
|
|
$ |
378.4 |
|
|
$ |
12,531.4 |
|
|
$ |
(24,743.1 |
) |
|
$ |
14,546.8 |
|
F-103
Consolidating Statements of Operations and Comprehensive Income / (Loss)
For the Year Ended December 31, 2015
($ in millions)
|
|
|
Warner Chilcott Limited (Parent Guarantor) |
|
|
Actavis Capital S.a.r.l. (Guarantor) |
|
|
Actavis Funding SCS (Issuer) |
|
|
Allergan Finance LLC (Issuer and Guarantor) |
|
|
Non- guarantors |
|
|
Eliminations |
|
|
Consolidated Warner Chilcott Limited |
|
|||||||
|
Net revenues |
|
|
- |
|
|
|
- |
|
|
|
- |
|
|
|
- |
|
|
|
12,688.1 |
|
|
|
- |
|
|
|
12,688.1 |
|
|
|
|
|
|
|
|
|
|
|
|
|
|
|
|
|
|
|
|
|
|
|
|
|
|
|
|
|
|
|
|
Operating expenses: |
|
|
|
|
|
|
|
|
|
|
|
|
|
|
|
|
|
|
|
|
|
|
|
|
|
|
|
|
|
Cost of sales (excludes amortization and impairment of acquired intangibles including product rights) |
|
|
- |
|
|
|
- |
|
|
|
- |
|
|
|
- |
|
|
|
2,751.8 |
|
|
|
- |
|
|
|
2,751.8 |
|
|
Research and development |
|
|
- |
|
|
|
- |
|
|
|
- |
|
|
|
- |
|
|
|
2,358.5 |
|
|
|
- |
|
|
|
2,358.5 |
|
|
Selling and marketing |
|
|
- |
|
|
|
- |
|
|
|
- |
|
|
|
- |
|
|
|
2,765.1 |
|
|
|
- |
|
|
|
2,765.1 |
|
|
General and administrative |
|
|
- |
|
|
|
212.1 |
|
|
|
16.1 |
|
|
|
- |
|
|
|
1,352.8 |
|
|
|
- |
|
|
|
1,581.0 |
|
|
Amortization |
|
|
- |
|
|
|
- |
|
|
|
- |
|
|
|
- |
|
|
|
5,443.7 |
|
|
|
- |
|
|
|
5,443.7 |
|
|
In-process research and development impairments |
|
|
- |
|
|
|
- |
|
|
|
- |
|
|
|
- |
|
|
|
511.6 |
|
|
|
- |
|
|
|
511.6 |
|
|
Asset sales and impairments, net |
|
|
- |
|
|
|
- |
|
|
|
- |
|
|
|
- |
|
|
|
272.0 |
|
|
|
- |
|
|
|
272.0 |
|
|
Total operating expenses |
|
|
- |
|
|
|
212.1 |
|
|
|
16.1 |
|
|
|
- |
|
|
|
15,455.5 |
|
|
|
- |
|
|
|
15,683.7 |
|
|
Operating income / (loss) |
|
|
- |
|
|
|
(212.1 |
) |
|
|
(16.1 |
) |
|
|
- |
|
|
|
(2,767.4 |
) |
|
|
- |
|
|
|
(2,995.6 |
) |
|
|
|
|
|
|
|
|
|
|
|
|
|
|
|
|
|
|
|
|
|
|
|
|
|
|
|
|
|
|
|
Non-operating income (expense): |
|
|
|
|
|
|
|
|
|
|
|
|
|
|
|
|
|
|
|
|
|
|
|
|
|
|
|
|
|
Interest income / (expense), net |
|
|
- |
|
|
|
1,572.4 |
|
|
|
(14.6 |
) |
|
|
(168.5 |
) |
|
|
(2,572.0 |
) |
|
|
- |
|
|
|
(1,182.7 |
) |
|
Other income (expense), net |
|
|
- |
|
|
|
(265.4 |
) |
|
|
31.0 |
|
|
|
- |
|
|
|
0.6 |
|
|
|
- |
|
|
|
(233.8 |
) |
|
Total other income (expense), net |
|
|
- |
|
|
|
1,307.0 |
|
|
|
16.4 |
|
|
|
(168.5 |
) |
|
|
(2,571.4 |
) |
|
|
- |
|
|
|
(1,416.5 |
) |
|
Income / (loss) before income taxes and noncontrolling interest |
|
|
- |
|
|
|
1,094.9 |
|
|
|
0.3 |
|
|
|
(168.5 |
) |
|
|
(5,338.8 |
) |
|
|
- |
|
|
|
(4,412.1 |
) |
|
Provision for income taxes |
|
|
- |
|
|
|
- |
|
|
|
- |
|
|
|
(58.3 |
) |
|
|
(1,547.6 |
) |
|
|
- |
|
|
|
(1,605.9 |
) |
|
(Earnings) / losses of equity interest subsidiaries |
|
|
(4,050.6 |
) |
|
|
(4,336.5 |
) |
|
|
- |
|
|
|
(1,108.9 |
) |
|
|
- |
|
|
|
9,496.0 |
|
|
|
- |
|
|
Net income / (loss) from continuing operations, net of tax |
|
$ |
4,050.6 |
|
|
$ |
5,431.4 |
|
|
$ |
0.3 |
|
|
$ |
998.7 |
|
|
$ |
(3,791.2 |
) |
|
$ |
(9,496.0 |
) |
|
$ |
(2,806.2 |
) |
|
Income from discontinued operations |
|
|
- |
|
|
|
- |
|
|
|
- |
|
|
|
- |
|
|
|
6,861.0 |
|
|
|
- |
|
|
|
6,861.0 |
|
|
Net income / (loss) |
|
$ |
4,050.6 |
|
|
$ |
5,431.4 |
|
|
$ |
0.3 |
|
|
$ |
998.7 |
|
|
$ |
3,069.8 |
|
|
$ |
(9,496.0 |
) |
|
$ |
4,054.8 |
|
|
(Income) attributable to noncontrolling interest |
|
|
- |
|
|
|
- |
|
|
|
- |
|
|
|
- |
|
|
|
(4.2 |
) |
|
|
- |
|
|
|
(4.2 |
) |
|
Net income / (loss) attributable to ordinary shareholders |
|
$ |
4,050.6 |
|
|
$ |
5,431.4 |
|
|
$ |
0.3 |
|
|
$ |
998.7 |
|
|
$ |
3,065.6 |
|
|
$ |
(9,496.0 |
) |
|
$ |
4,050.6 |
|
|
Other comprehensive (loss) / income |
|
|
(28.7 |
) |
|
|
24.5 |
|
|
|
- |
|
|
|
(776.8 |
) |
|
|
(28.7 |
) |
|
|
781.0 |
|
|
|
(28.7 |
) |
|
Comprehensive income / (loss) |
|
$ |
4,021.9 |
|
|
$ |
5,455.9 |
|
|
$ |
0.3 |
|
|
$ |
221.9 |
|
|
$ |
3,036.9 |
|
|
$ |
(8,715.0 |
) |
|
$ |
4,021.9 |
|
F-104
Consolidating Statements of Operations and Comprehensive Income / (Loss)
For the Year Ended December 31, 2014
($ in millions)
|
|
|
Warner Chilcott Limited (Parent Guarantor) |
|
|
Actavis Capital S.a.r.l. (Guarantor) |
|
|
Actavis Funding SCS (Issuer) |
|
|
Allergan Finance LLC (Issuer and Guarantor) |
|
|
Non- guarantors |
|
|
Eliminations |
|
|
Consolidated Warner Chilcott Limited |
|
|||||||
|
Net revenues |
|
|
- |
|
|
|
- |
|
|
|
- |
|
|
|
- |
|
|
|
4,676.5 |
|
|
|
- |
|
|
$ |
4,676.5 |
|
|
|
|
|
|
|
|
|
|
|
|
|
|
|
|
|
|
|
|
|
|
|
|
|
|
|
|
|
|
|
|
Operating expenses: |
|
|
|
|
|
|
|
|
|
|
|
|
|
|
|
|
|
|
|
|
|
|
|
|
|
|
|
|
|
Cost of sales (excludes amortization and impairment of acquired intangibles including product rights) |
|
|
- |
|
|
|
- |
|
|
|
- |
|
|
|
- |
|
|
|
1,704.8 |
|
|
|
- |
|
|
|
1,704.8 |
|
|
Research and development |
|
|
- |
|
|
|
- |
|
|
|
- |
|
|
|
- |
|
|
|
605.7 |
|
|
|
- |
|
|
|
605.7 |
|
|
Selling and marketing |
|
|
- |
|
|
|
- |
|
|
|
- |
|
|
|
- |
|
|
|
1,066.0 |
|
|
|
- |
|
|
|
1,066.0 |
|
|
General and administrative |
|
|
- |
|
|
|
- |
|
|
|
- |
|
|
|
9.9 |
|
|
|
1,121.5 |
|
|
|
- |
|
|
|
1,131.4 |
|
|
Amortization |
|
|
- |
|
|
|
- |
|
|
|
- |
|
|
|
- |
|
|
|
1,935.8 |
|
|
|
- |
|
|
|
1,935.8 |
|
|
In process research and development impairments |
|
|
- |
|
|
|
- |
|
|
|
- |
|
|
|
- |
|
|
|
424.3 |
|
|
|
- |
|
|
|
424.3 |
|
|
Asset sales and impairments, net |
|
|
- |
|
|
|
- |
|
|
|
- |
|
|
|
(0.1 |
) |
|
|
305.8 |
|
|
|
- |
|
|
|
305.7 |
|
|
Total operating expenses |
|
|
- |
|
|
|
- |
|
|
|
- |
|
|
|
9.8 |
|
|
|
7,163.9 |
|
|
|
- |
|
|
|
7,173.7 |
|
|
Operating income / (loss) |
|
|
- |
|
|
|
- |
|
|
|
- |
|
|
|
(9.8 |
) |
|
|
(2,487.4 |
) |
|
|
- |
|
|
|
(2,497.2 |
) |
|
|
|
|
|
|
|
|
|
|
|
|
|
|
|
|
|
|
|
|
|
|
|
|
|
|
|
|
|
|
|
Non-operating income (expense): |
|
|
|
|
|
|
|
|
|
|
|
|
|
|
|
|
|
|
|
|
|
|
|
|
|
|
|
|
|
Interest income / (expense), net |
|
|
- |
|
|
|
(740.0 |
) |
|
|
- |
|
|
|
(182.0 |
) |
|
|
518.3 |
|
|
|
- |
|
|
|
(403.7 |
) |
|
Other income (expense), net |
|
|
- |
|
|
|
(74.5 |
) |
|
|
- |
|
|
|
- |
|
|
|
47.2 |
|
|
|
- |
|
|
|
(27.3 |
) |
|
Total other income (expense), net |
|
|
- |
|
|
|
(814.5 |
) |
|
|
- |
|
|
|
(182.0 |
) |
|
|
565.5 |
|
|
|
- |
|
|
|
(431.0 |
) |
|
Income / (loss) before income taxes and noncontrolling interest |
|
|
- |
|
|
|
(814.5 |
) |
|
|
- |
|
|
|
(191.8 |
) |
|
|
(1,921.9 |
) |
|
|
- |
|
|
|
(2,928.2 |
) |
|
Provision for income taxes |
|
|
- |
|
|
|
- |
|
|
|
- |
|
|
|
(108.6 |
) |
|
|
(405.0 |
) |
|
|
- |
|
|
|
(513.6 |
) |
|
(Earnings) / losses of equity interest subsidiaries |
|
|
1,560.5 |
|
|
|
539.7 |
|
|
|
- |
|
|
|
1.9 |
|
|
|
- |
|
|
|
(2,102.1 |
) |
|
|
- |
|
|
Net (loss) / income from continuing operations, net of tax |
|
$ |
(1,560.5 |
) |
|
$ |
(1,354.2 |
) |
|
$ |
- |
|
|
$ |
(85.1 |
) |
|
$ |
(1,516.9 |
) |
|
$ |
2,102.1 |
|
|
$ |
(2,414.6 |
) |
|
Income / (loss) from discontinued operations |
|
|
- |
|
|
|
- |
|
|
|
- |
|
|
|
- |
|
|
|
854.1 |
|
|
|
- |
|
|
|
854.1 |
|
|
Net (loss) /income |
|
$ |
(1,560.5 |
) |
|
$ |
(1,354.2 |
) |
|
$ |
- |
|
|
$ |
(85.1 |
) |
|
$ |
(662.8 |
) |
|
$ |
2,102.1 |
|
|
$ |
(1,560.5 |
) |
|
(Income) / loss attributable to noncontrolling interest |
|
|
- |
|
|
|
- |
|
|
|
- |
|
|
|
- |
|
|
|
- |
|
|
|
- |
|
|
|
- |
|
|
Net income / (loss) attributable to ordinary shareholders |
|
$ |
(1,560.5 |
) |
|
$ |
(1,354.2 |
) |
|
$ |
- |
|
|
$ |
(85.1 |
) |
|
$ |
(662.8 |
) |
|
$ |
2,102.1 |
|
|
$ |
(1,560.5 |
) |
|
Other comprehensive income / (loss) |
|
|
(555.9 |
) |
|
|
(505.9 |
) |
|
|
- |
|
|
|
(22.4 |
) |
|
|
(555.9 |
) |
|
|
1,084.2 |
|
|
|
(555.9 |
) |
|
Comprehensive (loss) / income |
|
$ |
(2,116.4 |
) |
|
$ |
(1,860.1 |
) |
|
$ |
- |
|
|
$ |
(107.5 |
) |
|
$ |
(1,218.7 |
) |
|
$ |
3,186.3 |
|
|
$ |
(2,116.4 |
) |
F-105
Consolidating Statement of Cash Flows
For the Year Ended December 31, 2016
($ in millions)
|
|
|
Warner Chilcott Limited (Parent Guarantor) |
|
|
Actavis Capital S.a.r.l. (Guarantor) |
|
|
Actavis Funding SCS (Issuer) |
|
|
Allergan Finance LLC (Issuer and Guarantor) |
|
|
Non- guarantors |
|
|
Eliminations |
|
|
Consolidated Warner Chilcott Limited |
|
|||||||
|
Cash Flows From Operating Activities: |
|
|
|
|
|
|
|
|
|
|
|
|
|
|
|
|
|
|
|
|
|
|
|
|
|
|
|
|
|
Net income / (loss) |
|
$ |
15,091.1 |
|
|
$ |
12,249.9 |
|
|
$ |
3.3 |
|
|
$ |
95.7 |
|
|
$ |
13,081.8 |
|
|
$ |
(25,424.6 |
) |
|
$ |
15,097.2 |
|
|
Reconciliation to net cash provided by operating activities: |
|
|
|
|
|
|
|
|
|
|
|
|
|
|
|
|
|
|
|
|
|
|
|
|
|
|
|
|
|
(Earnings) / losses of equity interest subsidiaries |
|
|
(15,091.1 |
) |
|
|
(9,994.6 |
) |
|
|
- |
|
|
|
(338.9 |
) |
|
|
- |
|
|
|
25,424.6 |
|
|
|
- |
|
|
Depreciation |
|
|
- |
|
|
|
- |
|
|
|
- |
|
|
|
- |
|
|
|
155.8 |
|
|
|
- |
|
|
|
155.8 |
|
|
Amortization |
|
|
- |
|
|
|
- |
|
|
|
- |
|
|
|
- |
|
|
|
6,475.2 |
|
|
|
- |
|
|
|
6,475.2 |
|
|
Provision for inventory reserve |
|
|
- |
|
|
|
- |
|
|
|
- |
|
|
|
- |
|
|
|
181.4 |
|
|
|
- |
|
|
|
181.4 |
|
|
Share-based compensation |
|
|
- |
|
|
|
- |
|
|
|
- |
|
|
|
- |
|
|
|
334.5 |
|
|
|
- |
|
|
|
334.5 |
|
|
Deferred income tax benefit |
|
|
- |
|
|
|
- |
|
|
|
- |
|
|
|
- |
|
|
|
(1,443.9 |
) |
|
|
- |
|
|
|
(1,443.9 |
) |
|
Pre-tax gain sale of generics business |
|
|
- |
|
|
|
- |
|
|
|
- |
|
|
|
- |
|
|
|
(24,511.1 |
) |
|
|
- |
|
|
|
(24,511.1 |
) |
|
Non-cash tax effect of gain on sale of generics business |
|
|
|
|
|
|
|
|
|
|
|
|
|
|
|
|
|
|
5,285.2 |
|
|
|
|
|
|
|
5,285.2 |
|
|
In-process research and development impairments |
|
|
- |
|
|
|
- |
|
|
|
- |
|
|
|
- |
|
|
|
743.9 |
|
|
|
- |
|
|
|
743.9 |
|
|
Loss / (gain) on asset sales and impairments, net |
|
|
- |
|
|
|
- |
|
|
|
- |
|
|
|
- |
|
|
|
5.0 |
|
|
|
- |
|
|
|
5.0 |
|
|
Amortization of inventory step-up |
|
|
- |
|
|
|
- |
|
|
|
- |
|
|
|
- |
|
|
|
42.4 |
|
|
|
- |
|
|
|
42.4 |
|
|
Amortization of deferred financing costs |
|
|
- |
|
|
|
23.5 |
|
|
|
23.3 |
|
|
|
4.2 |
|
|
|
- |
|
|
|
- |
|
|
|
51.0 |
|
|
Accretion and contingent consideration |
|
|
- |
|
|
|
- |
|
|
|
- |
|
|
|
- |
|
|
|
(66.8 |
) |
|
|
- |
|
|
|
(66.8 |
) |
|
Dividends from subsidiaries |
|
|
2,034.8 |
|
|
|
- |
|
|
|
- |
|
|
|
- |
|
|
|
- |
|
|
|
(2,034.8 |
) |
|
|
- |
|
|
Other, net |
|
|
- |
|
|
|
- |
|
|
|
- |
|
|
|
- |
|
|
|
(59.9 |
) |
|
|
- |
|
|
|
(59.9 |
) |
|
Changes in assets and liabilities (net of effects of acquisitions) |
|
|
0.1 |
|
|
|
16,536.2 |
|
|
|
473.4 |
|
|
|
237.0 |
|
|
|
(17,957.6 |
) |
|
|
- |
|
|
|
(710.9 |
) |
|
Net cash provided by / (used in) operating activities |
|
|
2,034.9 |
|
|
|
18,815.0 |
|
|
|
500.0 |
|
|
|
(2.0 |
) |
|
|
(17,734.1 |
) |
|
|
(2,034.8 |
) |
|
|
1,579.0 |
|
|
Cash Flows From Investing Activities: |
|
|
|
|
|
|
|
|
|
|
|
|
|
|
|
|
|
|
|
|
|
|
|
|
|
|
|
|
|
Additions to property plant and equipment |
|
|
- |
|
|
|
- |
|
|
|
- |
|
|
|
- |
|
|
|
(331.4 |
) |
|
|
- |
|
|
|
(331.4 |
) |
|
Additions to product rights and other intangibles |
|
|
- |
|
|
|
- |
|
|
|
- |
|
|
|
- |
|
|
|
(2.0 |
) |
|
|
- |
|
|
|
(2.0 |
) |
|
Sale of generics business |
|
|
- |
|
|
|
- |
|
|
|
- |
|
|
|
- |
|
|
|
33,804.2 |
|
|
|
- |
|
|
|
33,804.2 |
|
|
Additions to investments |
|
|
- |
|
|
|
(6,351.8 |
) |
|
|
- |
|
|
|
- |
|
|
|
(9,391.7 |
) |
|
|
- |
|
|
|
(15,743.5 |
) |
|
Proceeds from sale of investments and other assets |
|
|
- |
|
|
|
- |
|
|
|
- |
|
|
|
- |
|
|
|
7,771.6 |
|
|
|
- |
|
|
|
7,771.6 |
|
|
Loan to Parent |
|
|
- |
|
|
|
(4,196.9 |
) |
|
|
- |
|
|
|
- |
|
|
|
(9,035.3 |
) |
|
|
- |
|
|
|
(13,232.2 |
) |
|
Proceeds from sales of property, plant and equipment |
|
|
- |
|
|
|
- |
|
|
|
- |
|
|
|
- |
|
|
|
33.3 |
|
|
|
- |
|
|
|
33.3 |
|
|
Acquisitions of business, net of cash acquired |
|
|
- |
|
|
|
- |
|
|
|
- |
|
|
|
- |
|
|
|
(1,198.9 |
) |
|
|
- |
|
|
|
(1,198.9 |
) |
|
Net cash (used in) investing activities |
|
|
- |
|
|
|
(10,548.7 |
) |
|
|
- |
|
|
|
- |
|
|
|
21,649.8 |
|
|
|
- |
|
|
|
11,101.1 |
|
|
Cash Flows From Financing Activities: |
|
|
|
|
|
|
|
|
|
|
|
|
|
|
|
|
|
|
|
|
|
|
|
|
|
|
|
|
|
Proceeds from borrowings on credit facility and other |
|
|
- |
|
|
|
1,050.0 |
|
|
|
- |
|
|
|
- |
|
|
|
- |
|
|
|
- |
|
|
|
1,050.0 |
|
|
Payments on debt, including capital lease obligations |
|
|
- |
|
|
|
(8,815.9 |
) |
|
|
(500.0 |
) |
|
|
- |
|
|
|
(1,532.8 |
) |
|
|
- |
|
|
|
(10,848.7 |
) |
|
Payments of contingent consideration |
|
|
- |
|
|
|
- |
|
|
|
- |
|
|
|
- |
|
|
|
(161.1 |
) |
|
|
- |
|
|
|
(161.1 |
) |
|
Dividends to Parent |
|
|
(2,034.8 |
) |
|
|
- |
|
|
|
- |
|
|
|
- |
|
|
|
(2,034.8 |
) |
|
|
2,034.8 |
|
|
|
(2,034.8 |
) |
|
Net cash provided by / (used in) financing activities |
|
|
(2,034.8 |
) |
|
|
(7,765.9 |
) |
|
|
(500.0 |
) |
|
|
- |
|
|
|
(3,728.7 |
) |
|
|
2,034.8 |
|
|
|
(11,994.6 |
) |
|
Effect of currency exchange rate changes on cash and cash equivalents |
|
|
- |
|
|
|
- |
|
|
|
- |
|
|
|
- |
|
|
|
(8.5 |
) |
|
|
- |
|
|
|
(8.5 |
) |
|
Movement in cash held for sale |
|
|
- |
|
|
|
- |
|
|
|
- |
|
|
|
- |
|
|
|
- |
|
|
|
- |
|
|
|
- |
|
|
Net increase / (decrease) in cash and cash equivalents |
|
|
0.1 |
|
|
|
500.4 |
|
|
|
- |
|
|
|
(2.0 |
) |
|
|
178.5 |
|
|
|
- |
|
|
|
677.0 |
|
|
Cash and cash equivalents at beginning of period |
|
|
- |
|
|
|
13.5 |
|
|
|
- |
|
|
|
2.0 |
|
|
|
1,020.7 |
|
|
|
- |
|
|
|
1,036.2 |
|
|
Cash and cash equivalents at end of period |
|
$ |
0.1 |
|
|
$ |
513.9 |
|
|
$ |
- |
|
|
$ |
- |
|
|
$ |
1,199.2 |
|
|
$ |
- |
|
|
$ |
1,713.2 |
|
F-106
Consolidating Statement of Cash Flows
For the Year Ended December 31, 2015
($ in millions)
|
|
|
Warner Chilcott Limited (Parent Guarantor) |
|
|
Actavis Capital S.a.r.l. (Guarantor) |
|
|
Actavis Funding SCS (Issuer) |
|
|
Allergan Finance LLC (Issuer and Guarantor) |
|
|
Non- guarantors |
|
|
Eliminations |
|
|
Consolidated Warner Chilcott Limited |
|
|||||||
|
Cash Flows From Operating Activities: |
|
|
|
|
|
|
|
|
|
|
|
|
|
|
|
|
|
|
|
|
|
|
|
|
|
|
|
|
|
Net income / (loss) |
|
$ |
4,050.6 |
|
|
$ |
5,431.4 |
|
|
$ |
0.3 |
|
|
$ |
998.7 |
|
|
$ |
3,069.8 |
|
|
$ |
(9,496.0 |
) |
|
$ |
4,054.8 |
|
|
Reconciliation to net cash provided by operating activities: |
|
|
|
|
|
|
|
|
|
|
|
|
|
|
|
|
|
|
|
|
|
|
|
|
|
|
|
|
|
(Earnings) / losses of equity interest subsidiaries |
|
|
(4,050.6 |
) |
|
|
(4,336.5 |
) |
|
|
- |
|
|
|
(1,108.9 |
) |
|
|
- |
|
|
|
9,496.0 |
|
|
|
- |
|
|
Depreciation |
|
|
- |
|
|
|
- |
|
|
|
- |
|
|
|
0.2 |
|
|
|
218.1 |
|
|
|
- |
|
|
|
218.3 |
|
|
Amortization |
|
|
- |
|
|
|
- |
|
|
|
- |
|
|
|
- |
|
|
|
5,777.0 |
|
|
|
- |
|
|
|
5,777.0 |
|
|
Provision for inventory reserve |
|
|
- |
|
|
|
- |
|
|
|
- |
|
|
|
- |
|
|
|
140.9 |
|
|
|
- |
|
|
|
140.9 |
|
|
Share-based compensation |
|
|
- |
|
|
|
- |
|
|
|
- |
|
|
|
51.6 |
|
|
|
638.8 |
|
|
|
- |
|
|
|
690.4 |
|
|
Deferred income tax benefit |
|
|
- |
|
|
|
- |
|
|
|
- |
|
|
|
- |
|
|
|
(7,380.1 |
) |
|
|
- |
|
|
|
(7,380.1 |
) |
|
Pre-tax gain sale of generics business |
|
|
- |
|
|
|
- |
|
|
|
- |
|
|
|
- |
|
|
|
- |
|
|
|
- |
|
|
|
- |
|
|
Non-cash tax effect of gain on sale of generics business |
|
|
- |
|
|
|
- |
|
|
|
- |
|
|
|
- |
|
|
|
- |
|
|
|
- |
|
|
|
- |
|
|
In-process research and development impairments |
|
|
- |
|
|
|
- |
|
|
|
- |
|
|
|
- |
|
|
|
511.6 |
|
|
|
- |
|
|
|
511.6 |
|
|
Loss / (gain) on asset sales and impairments, net |
|
|
- |
|
|
|
- |
|
|
|
- |
|
|
|
- |
|
|
|
334.4 |
|
|
|
- |
|
|
|
334.4 |
|
|
Amortization of inventory step-up |
|
|
- |
|
|
|
- |
|
|
|
- |
|
|
|
- |
|
|
|
1,192.9 |
|
|
|
- |
|
|
|
1,192.9 |
|
|
Amortization of deferred financing costs |
|
|
- |
|
|
|
272.5 |
|
|
|
20.9 |
|
|
|
4.1 |
|
|
|
0.8 |
|
|
|
- |
|
|
|
298.3 |
|
|
Accretion and contingent consideration |
|
|
- |
|
|
|
- |
|
|
|
- |
|
|
|
- |
|
|
|
108.8 |
|
|
|
- |
|
|
|
108.8 |
|
|
Dividends from subsidiaries |
|
|
208.1 |
|
|
|
208.1 |
|
|
|
- |
|
|
|
- |
|
|
|
- |
|
|
|
(416.2 |
) |
|
|
- |
|
|
Other, net |
|
|
- |
|
|
|
- |
|
|
|
- |
|
|
|
- |
|
|
|
66.4 |
|
|
|
- |
|
|
|
66.4 |
|
|
Changes in assets and liabilities (net of effects of acquisitions) |
|
|
(0.1 |
) |
|
|
(370.6 |
) |
|
|
122.5 |
|
|
|
97.7 |
|
|
|
(1,199.2 |
) |
|
|
- |
|
|
|
(1,349.7 |
) |
|
Net cash provided by / (used in) operating activities |
|
|
208.0 |
|
|
|
1,204.9 |
|
|
|
143.7 |
|
|
|
43.4 |
|
|
|
3,480.2 |
|
|
|
(416.2 |
) |
|
|
4,664.0 |
|
|
Cash Flows From Investing Activities: |
|
|
|
|
|
|
|
|
|
|
|
|
|
|
|
|
|
|
|
|
|
|
|
|
|
|
|
|
|
Additions to property plant and equipment |
|
|
- |
|
|
|
- |
|
|
|
- |
|
|
|
(42.9 |
) |
|
|
(412.0 |
) |
|
|
- |
|
|
|
(454.9 |
) |
|
Additions to product rights and other intangibles |
|
|
- |
|
|
|
- |
|
|
|
- |
|
|
|
- |
|
|
|
(154.7 |
) |
|
|
- |
|
|
|
(154.7 |
) |
|
Additions to investments |
|
|
(9,000.8 |
) |
|
|
(9,000.8 |
) |
|
|
- |
|
|
|
- |
|
|
|
(24.3 |
) |
|
|
18,001.6 |
|
|
|
(24.3 |
) |
|
Proceeds from sale of investments and other assets |
|
|
- |
|
|
|
- |
|
|
|
- |
|
|
|
- |
|
|
|
883.0 |
|
|
|
- |
|
|
|
883.0 |
|
|
Proceeds from sales of property, plant and equipment |
|
|
- |
|
|
|
- |
|
|
|
- |
|
|
|
- |
|
|
|
140.1 |
|
|
|
- |
|
|
|
140.1 |
|
|
Acquisitions of business, net of cash acquired |
|
|
- |
|
|
|
- |
|
|
|
- |
|
|
|
- |
|
|
|
(37,510.1 |
) |
|
|
- |
|
|
|
(37,510.1 |
) |
|
Net cash (used in) investing activities |
|
|
(9,000.8 |
) |
|
|
(9,000.8 |
) |
|
|
- |
|
|
|
(42.9 |
) |
|
|
(37,078.0 |
) |
|
|
18,001.6 |
|
|
|
(37,120.9 |
) |
|
Cash Flows From Financing Activities: |
|
|
|
|
|
|
|
|
|
|
|
|
|
|
|
|
|
|
|
|
|
|
|
|
|
|
|
|
|
Proceeds from borrowings of long-term indebtedness |
|
|
- |
|
|
|
5,500.0 |
|
|
|
20,955.6 |
|
|
|
- |
|
|
|
0.1 |
|
|
|
- |
|
|
|
26,455.7 |
|
|
Financing structure and other activity with affiliates |
|
|
- |
|
|
|
(5,500.0 |
) |
|
|
(20,955.6 |
) |
|
|
- |
|
|
|
26,455.6 |
|
|
|
- |
|
|
|
- |
|
|
Proceeds from borrowings on credit facility and other |
|
|
- |
|
|
|
3,610.0 |
|
|
|
- |
|
|
|
- |
|
|
|
72.0 |
|
|
|
- |
|
|
|
3,682.0 |
|
|
Debt issuance and other financing costs |
|
|
- |
|
|
|
(167.1 |
) |
|
|
(143.7 |
) |
|
|
- |
|
|
|
- |
|
|
|
- |
|
|
|
(310.8 |
) |
|
Payments on debt, including capital lease obligations |
|
|
- |
|
|
|
(4,431.7 |
) |
|
|
- |
|
|
|
- |
|
|
|
(702.5 |
) |
|
|
- |
|
|
|
(5,134.2 |
) |
|
Payments of contingent consideration |
|
|
- |
|
|
|
- |
|
|
|
- |
|
|
|
- |
|
|
|
(230.1 |
) |
|
|
- |
|
|
|
(230.1 |
) |
|
Dividends to Parent |
|
|
(208.1 |
) |
|
|
(208.1 |
) |
|
|
- |
|
|
|
- |
|
|
|
(208.1 |
) |
|
|
416.2 |
|
|
|
(208.1 |
) |
|
Contribution from Parent |
|
|
9,000.8 |
|
|
|
9,000.8 |
|
|
|
- |
|
|
|
- |
|
|
|
9,000.8 |
|
|
|
(18,001.6 |
) |
|
|
9,000.8 |
|
|
Net cash provided by / (used in) financing activities |
|
|
8,792.7 |
|
|
|
7,803.9 |
|
|
|
(143.7 |
) |
|
|
- |
|
|
|
34,387.8 |
|
|
|
(17,585.4 |
) |
|
|
33,255.3 |
|
|
Effect of currency exchange rate changes on cash and cash equivalents |
|
|
- |
|
|
|
- |
|
|
|
- |
|
|
|
- |
|
|
|
(6.5 |
) |
|
|
- |
|
|
|
(6.5 |
) |
|
Movement in cash held for sale |
|
|
- |
|
|
|
- |
|
|
|
- |
|
|
|
- |
|
|
|
- |
|
|
|
- |
|
|
|
- |
|
|
Net increase / (decrease) in cash and cash equivalents |
|
|
(0.1 |
) |
|
|
8.0 |
|
|
|
- |
|
|
|
0.5 |
|
|
|
783.5 |
|
|
|
- |
|
|
|
791.9 |
|
|
Cash and cash equivalents at beginning of period |
|
|
0.1 |
|
|
|
5.5 |
|
|
|
- |
|
|
|
1.5 |
|
|
|
237.2 |
|
|
|
- |
|
|
|
244.3 |
|
|
Cash and cash equivalents at end of period |
|
$ |
- |
|
|
$ |
13.5 |
|
|
$ |
- |
|
|
$ |
2.0 |
|
|
$ |
1,020.7 |
|
|
$ |
- |
|
|
$ |
1,036.2 |
|
F-107
Consolidating Statement of Cash Flows
For the Year Ended December 31, 2014
($ in millions)
|
|
|
Warner Chilcott Limited (Parent Guarantor) |
|
|
Actavis Capital S.a.r.l. (Guarantor) |
|
|
Actavis Funding SCS (Issuer) |
|
|
Allergan Finance LLC (Issuer and Guarantor) |
|
|
Non- guarantors |
|
|
Eliminations |
|
|
Consolidated Warner Chilcott Limited |
|
|||||||
|
Cash Flows From Operating Activities: |
|
|
|
|
|
|
|
|
|
|
|
|
|
|
|
|
|
|
|
|
|
|
|
|
|
|
|
|
|
Net (loss) / income |
|
$ |
(1,560.5 |
) |
|
$ |
(1,354.2 |
) |
|
$ |
- |
|
|
$ |
(85.1 |
) |
|
$ |
(662.8 |
) |
|
$ |
2,102.1 |
|
|
$ |
(1,560.5 |
) |
|
Reconciliation to net cash provided by operating activities: |
|
|
|
|
|
|
|
|
|
|
|
|
|
|
|
|
|
|
|
|
|
|
|
|
|
|
|
|
|
Losses / (earnings) of equity interest subsidiaries |
|
|
1,560.5 |
|
|
|
539.7 |
|
|
|
- |
|
|
|
1.9 |
|
|
|
- |
|
|
|
(2,102.1 |
) |
|
|
- |
|
|
Depreciation |
|
|
- |
|
|
|
- |
|
|
|
- |
|
|
|
0.2 |
|
|
|
230.7 |
|
|
|
- |
|
|
|
230.9 |
|
|
Amortization |
|
|
- |
|
|
|
- |
|
|
|
- |
|
|
|
- |
|
|
|
2,597.5 |
|
|
|
- |
|
|
|
2,597.5 |
|
|
Provision for inventory reserve |
|
|
- |
|
|
|
- |
|
|
|
- |
|
|
|
- |
|
|
|
156.1 |
|
|
|
- |
|
|
|
156.1 |
|
|
Share-based compensation |
|
|
- |
|
|
|
- |
|
|
|
- |
|
|
|
1.4 |
|
|
|
366.6 |
|
|
|
- |
|
|
|
368.0 |
|
|
Deferred income tax benefit |
|
|
- |
|
|
|
- |
|
|
|
- |
|
|
|
- |
|
|
|
(690.1 |
) |
|
|
- |
|
|
|
(690.1 |
) |
|
In-process research and development impairments |
|
|
- |
|
|
|
- |
|
|
|
- |
|
|
|
- |
|
|
|
424.3 |
|
|
|
- |
|
|
|
424.3 |
|
|
Goodwill Impairment |
|
|
- |
|
|
|
- |
|
|
|
- |
|
|
|
- |
|
|
|
17.3 |
|
|
|
- |
|
|
|
17.3 |
|
|
Loss / (gain) on asset sales and impairments, net |
|
|
- |
|
|
|
- |
|
|
|
- |
|
|
|
- |
|
|
|
143.1 |
|
|
|
- |
|
|
|
143.1 |
|
|
Amortization of inventory step-up |
|
|
- |
|
|
|
- |
|
|
|
- |
|
|
|
- |
|
|
|
985.8 |
|
|
|
- |
|
|
|
985.8 |
|
|
Amortization of deferred financing costs |
|
|
- |
|
|
|
1.0 |
|
|
|
22.9 |
|
|
|
2.4 |
|
|
|
60.9 |
|
|
|
- |
|
|
|
87.2 |
|
|
Accretion and contingent consideration |
|
|
- |
|
|
|
- |
|
|
|
- |
|
|
|
- |
|
|
|
(71.2 |
) |
|
|
- |
|
|
|
(71.2 |
) |
|
Non-cash impact of debt extinguishment |
|
|
- |
|
|
|
- |
|
|
|
- |
|
|
|
- |
|
|
|
(91.7 |
) |
|
|
- |
|
|
|
(91.7 |
) |
|
Impact of assets held for sale |
|
|
- |
|
|
|
- |
|
|
|
- |
|
|
|
- |
|
|
|
190.8 |
|
|
|
- |
|
|
|
190.8 |
|
|
Other, net |
|
|
- |
|
|
|
- |
|
|
|
- |
|
|
|
- |
|
|
|
8.5 |
|
|
|
- |
|
|
|
8.5 |
|
|
Changes in assets and liabilities (net of effects of acquisitions) |
|
|
- |
|
|
|
1,156.5 |
|
|
|
(3,647.2 |
) |
|
|
89.2 |
|
|
|
1,875.2 |
|
|
|
- |
|
|
|
(526.3 |
) |
|
Net cash provided by / (used in) operating activities |
|
|
- |
|
|
|
343.0 |
|
|
|
(3,624.3 |
) |
|
|
10.0 |
|
|
|
5,541.0 |
|
|
|
- |
|
|
|
2,269.7 |
|
|
Cash Flows From Investing Activities: |
|
|
|
|
|
|
|
|
|
|
|
|
|
|
|
|
|
|
|
|
|
|
|
|
|
|
|
|
|
Additions to property plant and equipment |
|
|
- |
|
|
|
- |
|
|
|
- |
|
|
|
(9.9 |
) |
|
|
(228.7 |
) |
|
|
- |
|
|
|
(238.6 |
) |
|
Additions to product rights and other intangibles |
|
|
- |
|
|
|
- |
|
|
|
- |
|
|
|
- |
|
|
|
(36.1 |
) |
|
|
- |
|
|
|
(36.1 |
) |
|
Additions to investments |
|
|
- |
|
|
|
- |
|
|
|
- |
|
|
|
- |
|
|
|
(1.0 |
) |
|
|
- |
|
|
|
(1.0 |
) |
|
Proceeds from sale of investments and other assets |
|
|
- |
|
|
|
- |
|
|
|
- |
|
|
|
- |
|
|
|
453.7 |
|
|
|
- |
|
|
|
453.7 |
|
|
Proceeds from sales of property, plant and equipment |
|
|
- |
|
|
|
- |
|
|
|
- |
|
|
|
- |
|
|
|
13.7 |
|
|
|
- |
|
|
|
13.7 |
|
|
Acquisitions of business, net of cash acquired |
|
|
- |
|
|
|
- |
|
|
|
- |
|
|
|
- |
|
|
|
(5,562.3 |
) |
|
|
- |
|
|
|
(5,562.3 |
) |
|
Net cash (used in) investing activities |
|
|
- |
|
|
|
- |
|
|
|
- |
|
|
|
(9.9 |
) |
|
|
(5,360.7 |
) |
|
|
- |
|
|
|
(5,370.6 |
) |
|
Cash Flows From Financing Activities: |
|
|
|
|
|
|
|
|
|
|
|
|
|
|
|
|
|
|
|
|
|
|
|
|
|
|
|
|
|
Proceeds from borrowings of long-term indebtedness |
|
|
- |
|
|
|
- |
|
|
|
6,076.2 |
|
|
|
- |
|
|
|
2,000.0 |
|
|
|
- |
|
|
|
8,076.2 |
|
|
Proceeds from borrowings on credit facility and other |
|
|
- |
|
|
|
80.0 |
|
|
|
- |
|
|
|
- |
|
|
|
1,200.0 |
|
|
|
- |
|
|
|
1,280.0 |
|
|
Debt issuance and other financing costs |
|
|
- |
|
|
|
- |
|
|
|
(51.9 |
) |
|
|
- |
|
|
|
(172.4 |
) |
|
|
- |
|
|
|
(224.3 |
) |
|
Payments on debt, including capital lease obligations |
|
|
- |
|
|
|
(417.8 |
) |
|
|
(2,400.0 |
) |
|
|
- |
|
|
|
(3,309.2 |
) |
|
|
- |
|
|
|
(6,127.0 |
) |
|
Payments of contingent consideration |
|
|
- |
|
|
|
- |
|
|
|
- |
|
|
|
- |
|
|
|
(14.3 |
) |
|
|
- |
|
|
|
(14.3 |
) |
|
Net cash provided by / (used in) financing activities |
|
|
- |
|
|
|
(337.8 |
) |
|
|
3,624.3 |
|
|
|
- |
|
|
|
(295.9 |
) |
|
|
- |
|
|
|
2,990.6 |
|
|
Effect of currency exchange rate changes on cash and cash equivalents |
|
|
- |
|
|
|
- |
|
|
|
- |
|
|
|
- |
|
|
|
(5.9 |
) |
|
|
- |
|
|
|
(5.9 |
) |
|
Movement in cash held for sale |
|
|
- |
|
|
|
- |
|
|
|
- |
|
|
|
- |
|
|
|
37.0 |
|
|
|
- |
|
|
|
37.0 |
|
|
Net increase / (decrease) in cash and cash equivalents |
|
|
- |
|
|
|
5.2 |
|
|
|
- |
|
|
|
0.1 |
|
|
|
(84.5 |
) |
|
|
- |
|
|
|
(79.2 |
) |
|
Cash and cash equivalents at beginning of period |
|
|
0.1 |
|
|
|
0.3 |
|
|
|
- |
|
|
|
1.4 |
|
|
|
321.7 |
|
|
|
- |
|
|
|
323.5 |
|
|
Cash and cash equivalents at end of period |
|
$ |
0.1 |
|
|
$ |
5.5 |
|
|
$ |
- |
|
|
$ |
1.5 |
|
|
$ |
237.2 |
|
|
$ |
- |
|
|
$ |
244.3 |
|
F-108
The following table represents compensation costs for the years ended December 31, 2016, 2015 and 2014 ($ in millions):
|
|
|
Year Ended December 31, |
|
|||||||||
|
|
|
2016 |
|
|
2015 |
|
|
2014 |
|
|||
|
Wages and salaries |
|
$ |
2,108.7 |
|
|
$ |
2,252.3 |
|
|
$ |
1,557.9 |
|
|
Stock-based compensation |
|
|
396.1 |
|
|
|
925.7 |
|
|
|
401.2 |
|
|
Pensions |
|
|
156.8 |
|
|
|
99.9 |
|
|
|
89.0 |
|
|
Social welfare |
|
|
165.0 |
|
|
|
185.1 |
|
|
|
97.1 |
|
|
Other benefits |
|
|
321.0 |
|
|
|
271.6 |
|
|
|
231.8 |
|
|
Total |
|
$ |
3,147.6 |
|
|
$ |
3,734.6 |
|
|
$ |
2,377.0 |
|
|
Amount included in continuing operations |
|
$ |
2,578.4 |
|
|
$ |
2,597.7 |
|
|
$ |
1,259.9 |
|
|
Amount included in discontinued operations |
|
$ |
569.2 |
|
|
$ |
1,136.9 |
|
|
$ |
1,117.1 |
|
NOTE 27 — Concentration
The Company considers there to be a concentration risk for customers that account for 10% or more of their third party revenues. The following table illustrates any customer, on a global basis, which accounted for 10% or more of our annual revenues in any of the past three fiscal years and the respective percentage of our revenues for which they account for each of the last three years:
|
Customer |
|
2016 |
|
|
2015 |
|
|
2014 |
|
|||
|
McKesson Corporation |
|
|
23 |
% |
|
|
27 |
% |
|
|
29 |
% |
|
Cardinal Health, Inc. |
|
|
18 |
% |
|
|
20 |
% |
|
|
21 |
% |
|
AmerisourceBergen Corporation |
|
|
18 |
% |
|
|
19 |
% |
|
|
22 |
% |
Changes in the mix of concentration amongst the Company’s largest customers are due, in part, to the impact of acquisitions as well as changes in the supply chain of our indirect customers.
The Company’s accounts receivable primarily arise from product sales in North America and Europe and primarily represent amounts due from wholesalers, distributors, drug store chains and service providers in the health care and pharmaceutical industries, public hospitals and other government entities. Approximately 59% and 72% of the gross accounts receivable balance are concentrated among the Company’s three largest customers as of December 31, 2016 and 2015, respectively. The Company performs ongoing credit evaluations of its customers and maintains an allowance for potential uncollectible accounts. Actual losses from uncollectible accounts have been minimal.
Outside of the U.S., concentrations of credit risk with respect to accounts receivable are limited due to the wide variety of customers and markets using the Company’s products, as well as their dispersion across many different geographic areas. The Company monitors economic conditions, including volatility associated with international economies, and related impacts on the relevant financial markets and its business, especially in light of sovereign credit issues. The Company does not expect to have write-offs or adjustments to accounts receivable which would have a material adverse effect on its financial position, liquidity or results of operations.
Certain of the Company’s finished products and raw materials are obtained from single source suppliers. Although the Company seeks to identify more than one source for its various finished products and raw materials, loss of a single source supplier could have an adverse effect on the Company’s results of operations, financial condition and cash flows. Further, a second source supplier may not be able to produce the same volumes of inventory as the Company’s primary supplier. No third party manufacturer accounted for 10% or more of the Company’s products sold based on third-party revenues for the year ended December 31, 2016.
NOTE 28 — Subsequent Events
ZELTIQ® Aesthetics, Inc.
On February 13, 2017 the Company entered into a definitive agreement to acquire ZELTIQ® Aesthetics, Inc. (“ZELTIQ”). ZELTIQ is focused on developing and commercializing products utilizing its proprietary controlled-cooling technology platform for a price of $56.50 per share, or $2.475 billion. The transaction is expected to close in the second half of 2017 and is subject to customary closing conditions.
F-109
On February 1, 2017, the Company completed the acquisition of LifeCell Corporation (“LifeCell”), a regenerative medicine company, for approximately $2.9 billion in cash. The acquisition combines LifeCell's novel, regenerative medicines business, including its high-quality and durable portfolio of dermal matrix products with Allergan's leading portfolio of medical aesthetics, breast implants and tissue expanders.
Assembly Biosciences, Inc.
On January 9, 2017 the Company entered into a licensing agreement with Assembly Biosciences, Inc. (“Assembly”) for the worldwide rights to Assembly's microbiome GI development programs. The rights are for preclinical compounds ABI-M201 and ABI-M301, targeting ulcerative colitis (UC) and Crohn's disease (CD), as well as two additional compounds to be identified by Assembly for Irritable Bowel Syndromes (IBS); with Diarrhea, with Constipation or Mixed. Under the terms of the agreement, Allergan made an upfront payment to Assembly of $50.0 million for the exclusive, worldwide rights to develop and commercialize the UC, CD and IBS compounds, which was recorded as a component of R&D expense in the year ended December 31, 2017. Additionally, Assembly will be eligible to receive success-based development and commercial milestone payments. Assembly is also eligible to receive tiered royalties based on net sales. Allergan and Assembly will generally share development costs through proof-of-concept (POC) studies, and Allergan will assume all post-POC development costs.
Lysosomal Therapeutics, Inc.
On January 9, 2017 the Company entered into a definitive agreement to acquire Lysosomal Therapeutics Inc. (“LTI”). LTI is focused on innovative small-molecule research and development in the field of neurodegeneration, yielding new treatment options for patients with severe neurological diseases. LTI-291, LTI's lead program, aims to stimulate the activity of glucocerebrosidase in the brain. Under the option agreement, Allergan purchased an option right directly from LTI shareholders to acquire LTI following completion of a Phase 1b trial for LTI-291. In addition, Allergan provided a separate upfront research and development payment. The net payment of $145 million will be recorded as a component of R&D expense in the year ended December 31, 2017. Allergan and LTI will establish a joint development committee to oversee the development activities for LTI-291.
F-110
Allergan plc
Valuation and Qualifying Accounts
Years Ended December 31, 2016, 2015 and 2014
($ in millions)
|
|
|
Balance at Beginning of Period |
|
|
Charged to Costs and Expenses |
|
|
Deductions/ Write-offs |
|
|
Other* |
|
|
Balance at End of Period |
|
|||||
|
Allowance for doubtful accounts: |
|
|
|
|
|
|
|
|
|
|
|
|
|
|
|
|
|
|
|
|
|
Year ended December 31, 2016 |
|
$ |
80.6 |
|
|
$ |
3.5 |
|
|
$ |
(8.4 |
) |
|
$ |
- |
|
|
$ |
75.7 |
|
|
Year ended December 31, 2015 |
|
$ |
4.8 |
|
|
$ |
8.4 |
|
|
$ |
(7.3 |
) |
|
$ |
74.7 |
|
|
$ |
80.6 |
|
|
Year ended December 31, 2014 |
|
$ |
2.7 |
|
|
$ |
3.9 |
|
|
$ |
(4.2 |
) |
|
$ |
2.4 |
|
|
$ |
4.8 |
|
|
Tax valuation allowance: |
|
|
|
|
|
|
|
|
|
|
|
|
|
|
|
|
|
|
|
|
|
Year ended December 31, 2016 |
|
$ |
196.2 |
|
|
$ |
183.8 |
|
|
$ |
- |
|
|
$ |
(196.1 |
) |
|
$ |
183.9 |
|
|
Year ended December 31, 2015 |
|
$ |
474.0 |
|
|
$ |
(335.6 |
) |
|
$ |
- |
|
|
$ |
57.8 |
|
|
$ |
196.2 |
|
|
Year ended December 31, 2014 |
|
$ |
319.1 |
|
|
$ |
112.7 |
|
|
$ |
- |
|
|
$ |
42.2 |
|
|
$ |
474.0 |
|
|
* |
Includes opening balances of businesses acquired in the period and reclasses to assets held for sale. |
F-111
SUPPLEMENTARY DATA (UNAUDITED)
Selected unaudited quarterly consolidated financial data and market price information are shown below ($ in millions except per share data):
|
|
|
|
|
|
|
For Three Month Periods Ended |
|
|||||||||||||
|
|
|
Year Ended 12/31/2016 |
|
|
Dec. 31, 2016 |
|
|
Sept. 30, 2016 |
|
|
June 30, 2016 |
|
|
Mar. 31, 2016 |
|
|||||
|
Net revenues |
|
$ |
14,570.6 |
|
|
$ |
3,864.3 |
|
|
$ |
3,622.2 |
|
|
$ |
3,684.8 |
|
|
$ |
3,399.3 |
|
|
Net income/(loss) |
|
$ |
14,979.5 |
|
|
$ |
1.2 |
|
|
$ |
15,221.8 |
|
|
$ |
(499.9 |
) |
|
$ |
256.4 |
|
|
Basic earnings per share |
|
|
38.18 |
|
|
|
(0.20 |
) |
|
|
38.58 |
|
|
|
(1.44 |
) |
|
|
0.47 |
|
|
Diluted earnings per share |
|
|
38.18 |
|
|
|
(0.20 |
) |
|
|
38.58 |
|
|
|
(1.44 |
) |
|
|
0.47 |
|
|
Market price per share: |
|
|
|
|
|
|
|
|
|
|
|
|
|
|
|
|
|
|
|
|
|
High |
|
|
|
|
|
$ |
244.66 |
|
|
$ |
261.27 |
|
|
$ |
277.96 |
|
|
$ |
310.83 |
|
|
Low |
|
|
|
|
|
$ |
184.50 |
|
|
$ |
228.68 |
|
|
$ |
195.50 |
|
|
$ |
261.60 |
|
|
|
|
|
|
|
|
|
|
|
|
|
|
|
|
|
|
|
|
|
|
|
|
|
|
|
|
|
|
For Three Month Periods Ended |
|
|||||||||||||
|
|
|
Year Ended 12/31/2015 |
|
|
Dec. 31, 2015 |
|
|
Sept. 30, 2015 |
|
|
June 30, 2015 |
|
|
Mar. 31, 2015 |
|
|||||
|
Net revenues |
|
$ |
12,688.1 |
|
|
$ |
3,606.9 |
|
|
$ |
3,469.5 |
|
|
$ |
3,628.7 |
|
|
$ |
1,983.0 |
|
|
Net income/(loss) |
|
$ |
3,919.4 |
|
|
$ |
(629.3 |
) |
|
$ |
5,302.6 |
|
|
$ |
(241.6 |
) |
|
$ |
(512.3 |
) |
|
Basic earnings per share |
|
|
10.01 |
|
|
|
(1.78 |
) |
|
|
13.29 |
|
|
|
(0.80 |
) |
|
|
(1.85 |
) |
|
Diluted earnings per share |
|
|
10.01 |
|
|
|
(1.78 |
) |
|
|
13.29 |
|
|
|
(0.80 |
) |
|
|
(1.85 |
) |
|
Market price per share: |
|
|
|
|
|
|
|
|
|
|
|
|
|
|
|
|
|
|
|
|
|
High |
|
|
|
|
|
$ |
322.68 |
|
|
$ |
340.34 |
|
|
$ |
315.00 |
|
|
$ |
317.72 |
|
|
Low |
|
|
|
|
|
$ |
237.50 |
|
|
$ |
245.32 |
|
|
$ |
279.74 |
|
|
$ |
253.00 |
|
F-112
|
Exhibit No. |
|
Description |
|
|
|
|
|
2.1 |
|
Transaction Agreement, dated May 19, 2013, by and among Actavis, Inc., Warner Chilcott Public Limited Company, Actavis Limited (now known as Allergan plc), Actavis Ireland Holding Limited, Actavis W.C. Holding LLC (now known as Actavis W.C. Holding Inc.) and Actavis W.C. Holding 2 LLC (now known as Actavis W.C. Holding 2 Inc.) (incorporated by reference to Exhibit 2.1 to Actavis, Inc.’s Current Report on Form 8-K, filed with the SEC on May 23, 2013). |
|
|
|
|
|
2.2 |
|
Share Purchase Agreement, dated as of June 16, 2009, by and among Robin Hood Holdings Limited, Watson Pharmaceuticals, Inc., certain shareholders of Robin Hood Holdings Limited, and Anthony Selwyn Tabatznik, solely in his capacity as the Shareholders’ Representative (incorporated by reference to Exhibit 2.1 to Watson Pharmaceuticals, Inc.’s Current Report on Form 8-K, filed with the SEC on June 19, 2009). |
|
|
|
|
|
2.3 |
|
First Amendment to Share Purchase Agreement, dated as of November 26, 2009, by and among Robin Hood Holdings Limited, Arrow Pharmaceutical Holdings Ltd., Cobalt Laboratories, Inc., Arrow International Ltd., Arrow Supplies Ltd., Watson Pharmaceuticals, Inc., Watson Pharma S.À.R.L., Watson Cobalt Holdings, LLC, the shareholders of Robin Hood Holdings Limited, and Anthony Selwyn Tabatznik, solely in his capacity as Shareholders’ Representative (incorporated by reference to Exhibit 2.2 to Watson Pharmaceuticals, Inc.’s Current Report on Form 8-K, filed with the SEC on December 2, 2009). |
|
|
|
|
|
2.4 |
|
Share Purchase Agreement, dated as of May 25, 2011, by and among Watson Pharmaceuticals, Inc. and each of the shareholders of Paomar PLC (incorporated by reference to Exhibit 2.1 to Watson Pharmaceuticals, Inc.’s Current Report on Form 8-K, filed with the SEC on May 27, 2011). |
|
|
|
|
|
2.5 |
|
Share Purchase Agreement, dated as of January 24, 2012, by and among Watson Pharmaceuticals, Inc., Strides Pharma Limited, I-Investments Pty Ltd, Strides Arcolab Limited, Ascent Pharmahealth Limited and Dennis Bastas (incorporated by reference to Exhibit 2.1 to Watson Pharmaceuticals, Inc.’s Current Report on Form 8-K, filed with the SEC on January 26, 2012). |
|
|
|
|
|
2.6 |
|
Sale and Purchase Agreement, dated as of April 25, 2012, by and among Nitrogen DS Limited, Landsbanki Islands hf., ALMC Eignarhaldsfélag ehf., ALMC hf, Argon Management S.à.r.l., the Managers party thereto, Deutsche Bank AG, London Branch, Actavis Acquisition Debt S.à.r.l., Watson Pharma S.à.r.l., and Watson Pharmaceuticals, Inc. (incorporated by reference to Exhibit 2.1 to Watson Pharmaceuticals, Inc.’s Current Report on Form 8-K, filed with the SEC on April 30, 2012). |
|
|
|
|
|
2.7 |
|
Deed of Modification and Withdrawal from Escrow Accounts, dated as of October 31, 2012, to the Sale and Purchase Agreement dated April 25, 2012, by and among Nitrogen DS Limited, Landsbanki Islands hf., ALMC Eignarhaldsfélag ehf., ALMC hf., Argon Management S.à r.l., the Managers party thereto, Deutsche Bank AG, London Branch, Actavis Acquisition Debt S.à r.l., Watson Pharma S.à r.l. and Watson Pharmaceuticals, Inc. (incorporated by reference to Watson Pharmaceuticals, Inc.’s Current Report on Form 8-K, filed with the SEC on November 2, 2012). |
|
|
|
|
|
2.8 |
|
Stock Purchase Agreement, dated as of January 19, 2013, by and among Actavis, Inc., Watson Pharma Actavis S.a.r.l. and each of the shareholders of Uteron Pharma SA (incorporated by reference to Actavis, Inc.’s Current Report on Form 8-K, filed with the SEC on January 25, 2013). |
|
|
|
|
|
2.9 |
|
Agreement and Plan of Merger, dated as of February 17, 2014, by and among Actavis plc (now known as Allergan plc), Tango US Holdings Inc., Tango Merger Sub 1 LLC, Tango Merger Sub 2 LLC and Forest Laboratories, Inc. (incorporated by reference to Exhibit 2.1 to Allergan plc’s Current Report on Form 8-K, filed with the SEC on February 19, 2014). |
|
|
|
|
|
2.10 |
|
Agreement and Plan of Merger, dated as of April 27, 2014, by and among Forest Laboratories, LLC (as successor to Forest Laboratories, Inc.), Royal Empress, Inc. and Furiex Pharmaceuticals, Inc. (incorporated by reference to Exhibit 2.1 to Forest Laboratories, Inc.’s Current Report on Form 8-K filed with the SEC on April 28, 2014). |
|
|
|
|
|
2.11 |
|
Agreement and Plan of Merger, dated as of October 5, 2014, by and among Actavis W.C. Holding Inc., Delaware Merger Sub, Inc. and Durata Therapeutics, Inc. (incorporated by reference to Exhibit 2.1 to Allergan plc’s Current Report on Form 8-K filed on October 8, 2014). |
|
Exhibit No. |
|
Description |
|
|
|
|
|
|
Agreement and Plan of Merger, dated November 16, 2014, by and among Actavis plc (now known as Allergan plc), Avocado Acquisition Inc. and Allergan, Inc. (incorporated by reference to Exhibit 2.1 to Allergan plc’s Current Report on Form 8-K filed with the SEC on November 16, 2014). |
|
|
|
|
|
|
2.13 |
|
Amended and Restated Agreement and Plan of Merger, dated as of August 4, 2015, by and among Allergan plc, Keto Merger Sub, Inc. and KYTHERA Biopharmaceuticals, Inc. (incorporated by reference to Exhibit 2.1 to Allergan plc’s Current Report on Form 8-K, filed with the SEC on August 5, 2015). |
|
|
|
|
|
|
Master Purchase Agreement, dated July 26, 2015, by and between Teva Pharmaceutical Industries Ltd. and Allergan plc (incorporated by reference to Exhibit 2.2 to Allergan plc’s Quarterly Report on Form 10-Q, filed with the SEC on August 6, 2015). |
|
|
|
|
|
|
2.15 |
|
First Amendment to the Master Purchase Agreement, dated as of June 9, 2016, by and between Teva Pharmaceutical Industries Ltd. and Allergan plc. (incorporated by reference to Exhibit 2.1 to Allergan plc’s Current Report on Form 8-K filed on July 13, 2016). |
|
|
|
|
|
2.16 |
|
Second Amendment to the Master Purchase Agreement, dated as of July 5, 2016, by and between Teva Pharmaceutical Industries Ltd. and Allergan plc. (incorporated by reference to Exhibit 2.2 to Allergan plc’s Current Report on Form 8-K filed on July 13, 2016). |
|
|
|
|
|
2.17 |
|
Third Amendment to the Master Purchase Agreement, dated as of July 11, 2016, by and between Teva Pharmaceutical Industries Ltd. and Allergan plc. (incorporated by reference to Exhibit 2.3 to Allergan plc’s Current Report on Form 8-K filed on July 13, 2016). |
|
|
|
|
|
3.1 |
|
Certificate of Incorporation of Allergan plc (incorporated by reference to Exhibit 3.1 to Allergan plc’s Registration Statement on Form S-4, filed with the SEC on July 17, 2015). |
|
|
|
|
|
3.2 |
|
Amended and Restated Memorandum and Articles of Association of Allergan plc (incorporated by reference to Exhibit 3.2 to Allergan plc’s Quarterly Report on Form 10-Q, filed with the SEC on November 4, 2016). |
|
|
|
|
|
4.1 |
|
Indenture, dated as of April 12, 2006, among Allergan, Inc. and Wells Fargo Bank, National Association, as trustee (incorporated by reference to Exhibit 4.2 to Allergan, Inc.’s Current Report on Form 8-K, filed with the SEC on April 12, 2006). |
|
|
|
|
|
4.2 |
|
First Supplemental Indenture, dated as of April 16, 2015, among Allergan, Inc., Actavis plc (now known as Allergan plc), Warner Chilcott Limited and Wells Fargo Bank, National Association, as trustee (incorporated by reference to Exhibit 4.1 to Allergan plc’s Current Report on Form 8-K, filed with the SEC on April 22, 2015). |
|
|
|
|
|
4.3 |
|
Form of 5.75% Senior Note due 2016 (incorporated by reference to (and included in) the Indenture dated as of April 12, 2006 among Allergan, Inc. and Wells Fargo Bank, National Association, as trustee, at Exhibit 4.2 to Allergan, Inc.’s Current Report on Form 8-K, filed with the SEC on April 12, 2006). |
|
|
|
|
|
4.4 |
|
Registration Rights Agreement, dated as of April 12, 2006, among Allergan, Inc. and Morgan Stanley & Co. Incorporated, as representative of the Initial Purchasers named therein, relating to the $800,000,000 5.75% Senior Notes due 2016 (incorporated by reference to Exhibit 4.4 to Allergan, Inc’s Current Report on Form 8-K, filed with the SEC on April 12, 2006). |
|
|
|
|
|
4.5 |
|
Indenture between Watson Pharmaceuticals, Inc. and Wells Fargo Bank, N.A., as trustee, dated as of August 24, 2009 (incorporated by reference to Exhibit 4.1 to Watson Pharmaceuticals, Inc.’s Form 8-K, filed with the SEC on August 24, 2009). |
|
|
|
|
|
4.6 |
|
First Supplemental Indenture between Watson Pharmaceuticals, Inc. and Wells Fargo Bank, N.A., as trustee, dated as of August 24, 2009, including the forms of Watson Pharmaceuticals, Inc.’s 5.000% Senior Notes due 2014 and 6.125% Senior Notes due 2019 (incorporated by reference to Exhibit 4.2 to Watson Pharmaceuticals, Inc.’s Form 8-K, filed with the SEC on August 24, 2009). |
|
|
|
|
|
4.7 |
|
Second Supplemental Indenture between Watson Pharmaceuticals, Inc. and Wells Fargo Bank, N.A., as trustee, dated as of May 7, 2010 (incorporated by reference to Exhibit 10.2 to Watson Pharmaceuticals, Inc.’s Quarterly Report on Form 10-Q, filed with the SEC on May 10, 2010). |
|
Exhibit No. |
|
Description |
|
|
|
|
|
|
First Supplemental Indenture, dated as of June 12, 2014, between Forest Laboratories, Inc., as issuer, and Wells Fargo Bank, National Association, as trustee (incorporated by reference to Exhibit 4.1 of Forest Laboratories, Inc.’s Current Report on Form 8-K filed with the SEC on June 13, 2014). |
|
|
|
|
|
|
4.24 |
|
First Supplemental Indenture, dated as of June 12, 2014, between Forest Laboratories, Inc., as issuer, and Wells Fargo Bank, National Association, as trustee (incorporated by reference to Exhibit 4.2 of Forest Laboratories, Inc.’s Current Report on Form 8-K filed with the SEC on June 13, 2014). |
|
|
|
|
|
4.25 |
|
First Supplemental Indenture, dated as of June 12, 2014, between Forest Laboratories, Inc., as issuer, and Wells Fargo Bank, National Association, as trustee (incorporated by reference to Exhibit 4.3 of Forest Laboratories, Inc.’s Current Report on Form 8-K filed with the SEC on June 13, 2014). |
|
|
|
|
|
4.26 |
|
Second Supplemental Indenture, between Tango Merger Sub 2 LLC and Wells Fargo Bank, National Association, as trustee, dated July 1, 2014 (incorporated by reference to Exhibit 4.1 of Allergan plc’s Current Report on Form 8-K filed with the SEC on July 3, 2014). |
|
|
|
|
|
4.27 |
|
Second Supplemental Indenture, between Tango Merger Sub 2 LLC and Wells Fargo Bank, National Association, as trustee, dated July 1, 2014 (incorporated by reference to Exhibit 4.2 of Allergan plc’s Current Report on Form 8-K filed with the SEC on July 3, 2014). |
|
|
|
|
|
4.28 |
|
Second Supplemental Indenture, between Tango Merger Sub 2 LLC and Wells Fargo Bank, National Association, as trustee, dated July 1, 2014 (incorporated by reference to Exhibit 4.3 of Allergan plc’s Current Report on Form 8-K filed with the SEC on July 3, 2014. |
|
|
|
|
|
4.29 |
|
Third Supplemental Indenture, among Actavis plc (now known as Allergan plc), Tango Merger Sub 2 LLC and Wells Fargo Bank, National Association, as trustee, dated July 1, 2014 (incorporated by reference to Exhibit 4.4 of Allergan plc’s Current Report on Form 8-K filed with the SEC on July 3, 2014). |
|
|
|
|
|
4.30 |
|
Third Supplemental Indenture, among Actavis plc (now known as Allergan plc), Tango Merger Sub 2 LLC and Wells Fargo Bank, National Association, as trustee, dated July 1, 2014 (incorporated by reference to Exhibit 4.5 of Allergan plc’s Current Report on Form 8-K filed with the SEC on July 3, 2014). |
|
|
|
|
|
|
Third Supplemental Indenture, among Actavis plc (now known as Allergan plc), Tango Merger Sub 2 LLC and Wells Fargo Bank, National Association, as trustee, dated July 1, 2014 (incorporated by reference to Exhibit 4.6 of Allergan plc’s Current Report on Form 8-K filed with the SEC on July 3, 2014). |
|
|
|
|
|
|
4.32 |
|
Indenture, dated June 19, 2014, by and among Actavis Funding SCS, the guarantors named therein, and Wells Fargo Bank, National Association, as trustee (incorporated by reference to Exhibit 4.1 of Allergan plc’s Current Report on Form 8-K filed with the SEC on June 20, 2014). |
|
|
|
|
|
4.33 |
|
Indenture, dated as of March 12, 2015, among Actavis Funding SCS and Warner Chilcott Limited, Actavis Capital S.à r.l. and Actavis, Inc., as guarantors and Wells Fargo Bank, National Association, as trustee (incorporated by reference to Exhibit 4.1 to Allergan plc’s Current Report on Form 8-K, filed with the SEC on March 12, 2015). |
|
|
|
|
|
4.34 |
|
First Supplemental Indenture, dated as of March 12, 2015, among Actavis Funding SCS and Warner Chilcott Limited, Actavis Capital S.à r.l. and Actavis, Inc., as guarantors and Wells Fargo Bank, National Association, as trustee (incorporated by reference to Exhibit 4.2 to Allergan plc’s Current Report on Form 8-K, filed with the SEC on March 12, 2015). |
|
|
|
|
|
4.35 |
|
Second Supplemental Indenture, dated as of May 7, 2015, among Actavis Funding SCS and Wells Fargo Bank, National Association, as trustee (incorporated by reference to Exhibit 4.20 to Allergan plc’s Quarterly Report on Form 10-Q, filed with the SEC on May 11, 2015). |
|
|
|
|
|
10.1 |
|
Form of Director and Executive Officer Indemnity Agreement (incorporated by reference to Exhibit 10.1 to Allergan, Inc.'s Annual Report on Form 10-K for the Fiscal Year ended December 31, 2006). |
|
|
|
|
|
10.2 |
|
Allergan, Inc. Change in Control Policy (Effective April 2010) (incorporated by reference to Exhibit 10.2 to Allergan, Inc.’s Annual Report on Form 10-K for the Fiscal Year ended December 31, 2010). |
|
|
|
|
|
10.3# |
|
Allergan, Inc. Deferred Directors’ Fee Program (Restated December 2010) (incorporated by reference to Exhibit 10.11 to Allergan, Inc.’s Annual Report on Form 10-K for the Fiscal Year ended December 31, 2010). |
|
Exhibit No. |
|
Description |
|
|
|
|
|
|
|
|
|
10.4# |
|
Allergan, Inc. 1989 Incentive Compensation Plan (Restated November 2000) (incorporated by reference to Exhibit 10.5 to Allergan, Inc.’s Annual Report on Form 10-K for the Fiscal Year ended December 31, 2000). |
|
|
|
|
|
10.5# |
|
First Amendment to Allergan, Inc. 1989 Incentive Compensation Plan (Restated November 2000) (incorporated by reference to Exhibit 10.51 to Allergan, Inc.’s Report on Form 10-Q for the Quarter ended September 26, 2003). |
|
|
|
|
|
10.6# |
|
Second Amendment to Allergan, Inc. 1989 Incentive Compensation Plan (Restated November 2000) (incorporated by reference to Exhibit 10.7 to Allergan, Inc.’s Annual Report on Form 10-K for the Fiscal Year ended December 31, 2004). |
|
|
|
|
|
10.7# |
|
Third Amendment to Allergan, Inc. 1989 Incentive Compensation Plan (Restated November 2000) (incorporated by reference to Exhibit 10.15 to Allergan, Inc.’s Annual Report on Form 10-K for the Fiscal Year ended December 31, 2010). |
|
10.8 |
|
Allergan, Inc. Pension Plan (Restated 2013) (incorporated by reference to Exhibit 10.15 to Allergan, Inc.’s Annual Report on Form 10-K for the Fiscal Year ended December 31, 2012). |
|
|
|
|
|
10.9 |
|
First Amendment to the Allergan, Inc. Pension Plan (Restated 2013) (Incorporated by reference to Exhibit 10.14 to Allergan, Inc.’s Annual Report on Form 10-K for the Fiscal Year Ended December 31, 2013). |
|
|
|
|
|
10.10 |
|
Second Amendment to the Allergan, Inc. Pension Plan (Restated 2013 (Incorporated by reference to Exhibit 10.1 to Allergan, Inc.’s Report on Form 10-Q for the Quarter ended March 31, 2014). |
|
|
|
|
|
10.11 |
|
Third Amendment to Allergan, Inc. Pension Plan (Restated 2013) (Incorporated by reference to Exhibit 10.2 to Allergan, Inc.’s Report on Form 10-Q for the Quarter ended March 31, 2014. |
|
|
|
|
|
10.12# |
|
Allergan, Inc. Supplemental Executive Benefit Plan and Supplemental Retirement Income Plan (Restated 2011) (incorporated by reference to Exhibit 10.3 to Allergan, Inc.’s Report on Form 10-Q for the Quarter ended September 30, 2011). |
|
|
|
|
|
10.13# |
|
First Amendment to Allergan, Inc. Supplemental Executive Benefit Plan (incorporated by reference to Exhibit 10.18 to Allergan, Inc.’s Annual Report on Form 10-K for the Fiscal Year ended December 31, 2011). |
|
|
|
|
|
10.14# |
|
Allergan, Inc. Executive Severance Pay Plan (Effective January 2011) (incorporated by reference to Exhibit 10.1 to Allergan, Inc.’s Current Report on Form 8-K filed on December 21, 2010). |
|
|
|
|
|
10.15# |
|
Allergan, Inc. 2011 Executive Bonus Plan (incorporated by reference to Annex A to Allergan, Inc.’s Proxy Statement filed on March 8, 2011). |
|
|
|
|
|
10.16# |
|
Allergan, Inc. 2011 Executive Bonus Plan - 2015 Performance Objectives (incorporated by reference to Exhibit 10.21 to Allergan, Inc.’s Annual Report on Form 10-K for the Fiscal Year ended December 31, 2014). |
|
|
|
|
|
10.17# |
|
Allergan, Inc. 2015 Management Bonus Plan (incorporated by reference to Exhibit 10.22 to Allergan, Inc.’s Annual Report on Form 10-K for the Fiscal Year ended December 31, 2014). |
|
|
|
|
|
10.18# |
|
Allergan, Inc. Executive Deferred Compensation Plan (Restated 2009) (incorporated by reference to Exhibit 10.23 to Allergan, Inc.’s Annual Report on Form 10-K for the Fiscal Year ended December 31, 2008). |
|
|
|
|
|
|
Form of Non-Qualified Stock Option Grant Notice for Employees under the Allergan, Inc. 2008 Incentive Award Plan (incorporated by reference to Exhibit 10.5 to Allergan, Inc.’s Current Report on Form 8-K filed on May 6, 2008). |
|
|
|
|
|
|
10.20# |
|
Form of Non-Qualified Stock Option Grant Notice for Employees under the Allergan, Inc. 2008 Incentive Award Plan (Amended February 2010) (incorporated by reference to Exhibit 10.32 to Allergan, Inc.’s Annual Report on Form 10-K for the Fiscal Year ended December 31, 2009). |
|
|
|
|
|
10.21# |
|
Amended and Restated Allergan plc 2011 Incentive Award Plan (incorporated by reference to Exhibit 10.1 to Allergan, plc’s Quarterly Report on Form 10-Q for the Quarter ended June 31, 2016). |
|
|
|
|
|
10.22# |
|
Form of Non-Qualified Stock Option Grant Notice for Employees under the Allergan, Inc. 2011 Incentive Award Plan (incorporated by reference to Exhibit 10.6 to Allergan, Inc.’s Report on Form 10-Q for the Quarter ended March 31, 2011). |
|
Exhibit No. |
|
Description |
|
|
|
|
|
|
|
|
|
10.23# |
|
Form of Restricted Stock Award Grant Notice for Employees under the Allergan, Inc. 2011 Incentive Award Plan (incorporated by reference to Exhibit 10.7 to Allergan, Inc.’s Report on Form 10-Q for the Quarter ended March 31, 2011). |
|
|
|
|
|
10.24# |
|
Form of Restricted Stock Award Grant Notice for Employees (Management Bonus Plan) under the Allergan, Inc. 2011 Incentive Award Plan (incorporated by reference to Exhibit 10.8 to Allergan, Inc.’s Report on Form 10-Q for the Quarter ended March 31, 2011). |
|
|
|
|
|
10.25# |
|
Form of Restricted Stock Unit Award Grant Notice for Employees under the Allergan, Inc. 2011 Incentive Award Plan (incorporated by reference to Exhibit 10.9 to Allergan, Inc.’s Report on Form 10-Q for the Quarter ended March 31, 2011). |
|
|
|
|
|
10.26# |
|
Form of Restricted Stock Unit Award Grant Notice for Employees (Management Bonus Plan) under the Allergan, Inc. 2011 Incentive Award Plan (incorporated by reference to Exhibit 10.10 to Allergan, Inc.’s Report on Form 10-Q for the Quarter ended March 31, 2011). |
|
10.27# |
|
Form of Performance-Based Restricted Stock Unit Award Grant Notice for Employees under the Allergan, Inc. 2011 Incentive Award Plan (incorporated by reference to Exhibit 10.40 to Allergan, Inc.’s Annual Report on Form 10-K for the Fiscal Year ended December 31, 2011). |
|
|
|
|
|
10.28# |
|
Form of 2014 Performance-Based Restricted Stock Unit Award Grant Agreement for Employees under the Allergan, Inc. 2011 Incentive Award Plan ( incorporated by reference to Exhibit 10.1 to Allergan, Inc.’s Report on Form 10-Q for the Quarter Ended September 30, 2014) |
|
|
|
|
|
10.29# |
|
Form of Non-Qualified Stock Option Grant Agreement for Employees under the Allergan, Inc. 2011 Incentive Award Plan (Amended February 2014) (incorporated by reference to Exhibit 10.40 to Allergan, Inc.’s Annual Report on Form 10-K for the Fiscal Year ended December 31, 2013). |
|
|
|
|
|
10.30# |
|
Form of Restricted Stock Unit Grant Agreement for Employees under the Allergan, Inc. 2011 Incentive Award Plan (Amended February 2014) (incorporated by reference to Exhibit 10.41 to Allergan, Inc.’s Annual Report on form 10-K for the Fiscal Year ended December 31, 2013). |
|
|
|
|
|
10.31# |
|
Form of Restricted Stock Unit Grant Agreement for Employees (Management Bonus Plan) under the Allergan, Inc. 2011 Incentive Award Plan (Amended February 2014) (incorporated by reference to Exhibit 10.42 to Allergan, Inc.’s Annual Report on Form 10-K for the Fiscal Year ended December 31, 2013). |
|
|
|
|
|
10.32# |
|
Form of Restricted Stock Unit Award Grant Agreement for Employees under the Allergan, Inc. 2011 Incentive Award Plan (Amended February 2015) (incorporated by reference to Exhibit 10.48 to Allergan, Inc.’s Annual Report on Form 10-K for the Fiscal Year ended December 31, 2014). |
|
|
|
|
|
10.33# |
|
Form of Restricted Stock Unit Award Grant Agreement for Employees (Management Bonus Plan) under the Allergan, Inc. 2011 Incentive Award Plan (Amended February 2015) (incorporated by reference to Exhibit 10.49 to Allergan, Inc.’s Annual Report on Form 10-K for the Fiscal Year ended December 31, 2014). |
|
|
|
|
|
10.34# |
|
Form of Non-Qualified Stock Option Grant Agreement for Employees under the Allergan, Inc. 2011 Incentive Award Plan (Amended February 2015) (incorporated by reference to Exhibit 10.50 to Allergan, Inc.’s Annual Report on Form 10-K for the Fiscal Year ended December 31, 2014). |
|
|
|
|
|
10.35# |
|
Form of Non-Qualified Stock Option Grant Agreement for Employees under the Amended and Restated Allergan, Inc. 2011 Incentive Award Plan (March 2015) (incorporated by reference to Exhibit 10.35 to Allergan plc’s Quarterly Report on Form 10-Q, filed with the SEC on May 11, 2015). |
|
|
|
|
|
10.36# |
|
Form of Performance-Based Restricted Stock Unit Award Grant Agreement for Employees under the Amended and Restated Allergan, Inc. 2011 Incentive Award Plan (March 2015) (incorporated by reference to Exhibit 10.36 to Allergan plc’s Quarterly Report on Form 10-Q, filed with the SEC on May 11, 2015). |
|
|
|
|
|
10.37# |
|
Form of Restricted Stock Unit Award Grant Agreement for Employees under the Amended and Restated Allergan, Inc. 2011 Incentive Award Plan (March 2015) (incorporated by reference to Exhibit 10.37 to Allergan plc’s Quarterly Report on Form 10-Q, filed with the SEC on May 11, 2015). |
|
|
|
|
|
10.38# |
|
Separation Agreement, entered into as of March 21, 2015, by and between David Buchen and Actavis, Inc. (incorporated by reference to Exhibit 10.38 to Allergan plc’s Quarterly Report on Form 10-Q, filed with the SEC on May 11, 2015). |
|
Exhibit No. |
|
Description |
|
|
|
|
|
|
||
|
10.71 |
|
Contingent Value Rights Agreement, dated as of July 2, 2014, by and between Forest Laboratories, LLC and American Stock Transfer & Trust Company, LLC. (incorporated by reference to Exhibit 10.1 of Allergan plc’s Current Report on Form 8-K filed with the SEC on July 3, 2014). |
|
|
|
|
|
10.72# |
|
Amended and Restated 2013 Incentive Award Plan of Allergan plc (incorporated by reference to Exhibit 10.2 of Allergan plc’s Quarterly Report on Form 10-Q filed with the SEC on August 8, 2016). |
|
|
|
|
|
10.73*** |
|
Amendment to Supply Agreement, effective as of May 14, 2014, by and between Janssen Pharmaceuticals, Inc. and Watson Laboratories, Inc. (incorporated by reference to Exhibit 10.1 of Allergan plc’s Current Report on Form 8-K filed with the SEC on May 20, 2014). |
|
|
|
|
|
10.74 |
|
Corporate Integrity Agreement dated September 15, 2010 between the Office of Inspector General of the U.S. Department of Health and Human Services and Forest Laboratories, Inc. (incorporated by reference to Exhibit 10.1 to Forest Laboratories Inc.’s Quarterly Report on Form 10-Q for the quarter ended September 30, 2010). |
|
|
|
|
|
10.75 |
|
Settlement Agreement and Release, dated September 15, 2010, among Forest Laboratories, Inc., Forest Pharmaceuticals, Inc., the U.S. of America, acting through the U.S. Department of Justice on behalf of the Office of Inspector General of the Department of Health and Human Services, TRICARE Management Activity, the Veteran’s Affairs Administration, the U.S. Office of Personnel Management, and certain individual relators named therein (incorporated by reference to Exhibit 10.3 to Forest Laboratories, Inc.’s Quarterly Report on Form 10-Q for the quarter ended September 30, 2010). |
|
|
|
|
|
10.76*** |
|
License and Cooperation Agreement dated June 28, 2000 between Merz & Co. GmbH and Forest Laboratories Ireland Limited. (incorporated by reference to Exhibit 10.16 to Forest Laboratories Inc.’s Annual Report on Form 10-K (Commission File No. 1-5438) for the fiscal year ended March 31, 2004). |
|
|
|
|
|
10.77*** |
|
License, Development and Cooperation Agreement dated September 22, 2004 between Merck KGaA and Genaissance Pharmaceuticals, Inc. (incorporated by reference to Exhibit 10.3 to Forest Laboratories Inc.’s Quarterly Report on Form 10-Q (Commission File No. 1-5438) for the quarter ended September 30, 2011). |
|
|
|
|
|
10.78*** |
|
Collaboration Agreement dated September 12, 2007, as amended on November 3, 2009 between Forest Laboratories Inc. and Ironwood Pharmaceuticals, Inc. (incorporated by reference to Exhibit 10.50 to Forest Laboratories Inc.’s Annual Report on Form 10-K/A (Commission File No. 1-5438) for the fiscal year ended March 31, 2013). |
|
|
|
|
|
10.79*** |
|
Sale and Transfer Agreement dated March 30, 2012 between Janssen Pharmaceutica NV and Forest Laboratories Holding Limited. (incorporated by reference to Exhibit 10.51 to Forest Laboratories Inc.’s Annual Report on Form 10-K (Commission File No. 1-5438) for the fiscal year ended March 31, 2012). |
|
|
|
|
|
10.80*** |
|
MuDelta Development and License Agreement, dated as of November 16, 2009, by and between Janssen Pharmaceutica, N.V. and PPD Therapeutics, Inc., as amended February 9, 2010 (incorporated by reference to Exhibit 10.6 to Furiex Pharmaceuticals, Inc.’s Form 10—12B/A (Commission File No. 001-34641) filed with the SEC on May 14, 2010). |
|
|
|
|
|
10.81 |
|
Tender and Support Agreement, dated as of October 5, 2014, by and among Actavis W.C. Holding Inc., Delaware Merger Sub, Inc. and the individuals listed therein (incorporated by reference to Exhibit 99.2 to Allergan plc’s Current Report on Form 8-K filed on October 8, 2014). |
|
|
|
|
|
10.82 |
|
Contingent Value Rights Agreement, dated as of November 17, 2014, by and between Actavis W.C. Holding Inc., Computershare Inc. and Computershare Trust Company, N.A. (incorporated by reference to Exhibit 10.1 to Allergan plc’s Current Report on Form 8-K filed on November 17, 2014). |
|
|
|
|
|
10.83 |
|
Second Amendment Agreement, dated as of December 17, 2014, among Actavis plc (now known as Allergan plc), Warner Chilcott Limited, Warner Chilcott Corporation, Actavis WC 2 S.à r.l., Warner Chilcott Company, LLC, Warner Chilcott Finance, LLC, the lenders party thereto and Bank of America, N.A., as Administrative Agent (incorporated by reference to Exhibit 10.1 to Allergan plc’s Current Report on Form 8-K filed on December 22, 2014). |
|
|
|
|
|
10.84 |
|
Third Amendment Agreement, dated as of December 17, 2014, among Actavis plc (now known as Allergan plc), Warner Chilcott Limited, Actavis Capital S.à r.l., Actavis, Inc., Actavis Funding SCS, the lenders party thereto and Bank of America, N.A., as Administrative Agent (incorporated by reference to Exhibit 10.1 to Allergan plc’s Current Report on Form 8-K filed on December 22, 2014). |
|
Exhibit No. |
|
Description |
|
|
|
|
|
|
||
|
10.85 |
|
Actavis Bridge Loan Credit and Guaranty Agreement, dated as of December 17, 2014, by and among Actavis plc (now known as Allergan plc), Warner Chilcott Limited, Actavis Capital S.à r.l., Actavis, Inc., Actavis Funding SCS, the lenders from time to time party thereto, JPMorgan Chase Bank, N.A., as Administrative Agent and the other financial institutions party thereto (incorporated by reference to Exhibit 10.1 to Allergan plc’s Current Report on Form 8-K filed on December 22, 2014). |
|
|
|
|
|
|
Actavis Cash Bridge Loan Credit and Guaranty Agreement, dated as of March 11, 2015, by and among Actavis plc (now known as Allergan plc), Warner Chilcott Limited, Actavis Capital S.à r.l., Actavis, Inc., Actavis Funding SCS, the lenders from time to time party thereto, JPMorgan Chase Bank, National Association, as Administrative Agent and the other financial institutions party thereto (incorporated by reference to Exhibit 10.1 to Allergan plc’s Current Report on Form 8-K, filed with the SEC on March 13, 2015). |
|
|
|
|
|
|
10.87# |
|
Employee Severance Pay Plan for Employees of Actavis Inc. (now known as Allergan Finance, LLC) and Certain of Its U.S. Subsidiaries (incorporated by reference to Exhibit 10.1 of Allergan plc’s Quarterly Report on Form 10-Q for the period ending March 31, 2014). |
|
|
|
|
|
10.88# |
|
Change of Control Severance Pay Plan for Certain Management Employees of Actavis, Inc. and Its U.S. Subsidiaries (incorporated by reference to Exhibit 10.1 of Allergan plc’s Quarterly Report on Form 10-Q for the period ending March 31, 2014). |
|
|
|
|
|
10.89# |
|
2000 Stock Option Plan of Forest Laboratories, Inc. (incorporated by reference to Exhibit A of Forest Laboratories, Inc.’s Proxy Statement for the fiscal year ended March 31, 2000 filed with the SEC on June 29, 2000). |
|
|
|
|
|
10.90# |
|
2004 Stock Option Plan of Forest Laboratories, Inc. (incorporated by reference to Appendix C of Forest Laboratories, Inc.’s Proxy Statement for the fiscal year ended March 31, 2004 filed with the SEC on June 28, 2004). |
|
|
|
|
|
10.91# |
|
2007 Equity Incentive Plan of Forest Laboratories, Inc., as amended (incorporated by reference to Exhibit 10.1 of Forest Laboratories, Inc.’s Current Report on Form 8-K filed with the SEC on August 21, 2013). |
|
|
|
|
|
10.92# |
|
Amendment to 2007 Equity Incentive Plan of Forest Laboratories, Inc., as amended (Amended Forest Plan) (incorporated by reference to Exhibit 99.7 of the Actavis July 1, 2014 S-8). |
|
|
|
|
|
10.93# |
|
Form of Notice of Grant and Signature Page and Form of Option Award Agreement (Actavis Plan) (incorporated by reference to Exhibit 99.5 of the Actavis July 1, 2014 S-8). |
|
|
|
|
|
10.94# |
|
Form of Notice of Grant and Signature Page and Form of Restricted Stock Unit Award Agreement (Actavis Plan) (incorporated by reference to Exhibit 99.6 of the Actavis July 1, 2014 S-8). |
|
|
|
|
|
10.95# |
|
Form of Notice of Grant and Signature Page and Form of Other Cash-Based Award Agreement (Actavis Plan) (incorporated by reference to Exhibit 10.44 to Allergan plc’s Quarterly Report on Form 10-Q, filed with the SEC on August 5, 2014). |
|
|
|
|
|
10.96# |
|
Form of Amended and Restated Other Cash-Based Award Agreement (incorporated by reference to Exhibit 10.1 to Allergan plc’s Current Report on Form 8-K, filed with the SEC on August 8, 2016). |
|
|
|
|
|
10.97# |
|
Form Employee Stock Unit Agreement (Performance-Based Conditions) (Forest Plan) (incorporated by reference to Exhibit 99.8 of the Actavis July 1, 2014 S-8). |
|
|
|
|
|
10.98 |
|
Amended and Restated Stockholder Voting Agreement, dated as of August 4, 2015, by and between Allergan plc and the individuals listed therein (incorporated by reference to Exhibit 10.1 to Allergan plc’s Current Report on Form 8-K, filed with the SEC on August 5, 2015) |
|
|
|
|
|
10.99# |
|
Amended and Restated Employment Agreement, dated August 3, 2015, between Allergan plc and Brenton L. Saunders (incorporated by reference to Exhibit 10.3 to Allergan plc’s Quarterly Report on Form 10-Q, filed with the SEC on August 6, 2015). |
|
|
|
|
|
10.100# |
|
Amended and Restated Employment Agreement, dated August 3, 2015, between Allergan plc and Paul M. Bisaro (incorporated by reference to Exhibit 10.3 to Allergan plc’s Quarterly Report on Form 10-Q, filed with the SEC on August 6, 2015). |
|
|
|
|
|
10.101# |
|
Amended and Restated Change of Control Employment Agreement, dated October 29, 2008, between Forest Laboratories, Inc. and William Meury (incorporated by reference to Exhibit 10.19 to Forest Laboratories, Inc.’s Annual Report on Form 10-K, filed with the SEC on May 30, 2014). |
|
Exhibit No. |
|
Description |
|
|
|
|
|
|
|
|
|
21.1* |
|
Subsidiaries of the Company. |
|
|
|
|
|
23.1* |
|
Allergan plc Consent of PricewaterhouseCoopers LLP. |
|
|
|
|
|
23.2* |
|
Warner Chilcott Limited Consent of PricewaterhouseCoopers LLP. |
|
|
|
|
|
24.1* |
|
Power of Attorney |
|
|
|
|
|
|
Certification of Chief Executive Officer pursuant to Rule 13a-14a of the Securities Exchange Act of 1934. |
|
|
|
|
|
|
31.2* |
|
Certification of Chief Financial Officer pursuant to Rule 13a-14a of the Securities Exchange Act of 1934. |
|
|
|
|
|
32.1** |
|
Certification of Chief Executive Officer pursuant to 18 U.S.C. of Section 1350, as adopted pursuant to Section 906 of the Sarbanes-Oxley Act of 2002. |
|
|
|
|
|
32.2** |
|
Certification of Chief Financial Officer pursuant to 18 U.S.C. of Section 1350, as adopted pursuant to by Section 906 of the Sarbanes-Oxley Act of 2002. |
|
|
|
|
|
101.INS |
|
XBRL Instance Document. |
|
|
|
|
|
101.SCH |
|
XBRL Taxonomy Extension Schema Document. |
|
|
|
|
|
101.CAL |
|
XBRL Taxonomy Extension Calculation Linkbase Document. |
|
|
|
|
|
101.DEF |
|
XBRL Taxonomy Extension Label Definition Document. |
|
|
|
|
|
101.LAB |
|
XBRL Taxonomy Extension Label Linkbase Document. |
|
|
|
|
|
101.PRE |
|
XBRL Taxonomy Extension Presentation Linkbase Document. |
|
# |
Indicates a management contract or compensatory plan or arrangement. |
|
* |
Filed herewith. |
|
** |
Furnished herewith and not “filed” for purposes of Section 18 of the Exchange Act. |
|
*** |
Confidential portions of this exhibit have been omitted and filed separately with the SEC pursuant to a confidential treatment request in accordance with Rule 24b-2 of the Securities Exchange Act of 1934, as amended. |
|
† |
Pursuant to Item 601(b)(2) of Regulation S-K, certain schedules and similar attachments have been omitted. The registrant hereby agrees to furnish a copy of any omitted schedule or similar attachment to the SEC upon request. |