UNITED STATES
SECURITIES AND EXCHANGE COMMISSION
WASHINGTON, D.C. 20549
FORM 8-K
CURRENT REPORT
Pursuant to Section 13 or 15(d) of the
Securities Exchange Act of 1934
Date of Report (Date of Earliest Event Reported): May 11, 2015
Premier, Inc.
(Exact Name of Registrant as Specified in its Charter)
Delaware | 001-36092 | 35-2477140 | ||
(State or Other Jurisdiction of Incorporation) |
(Commission File Number) |
(IRS Employer Identification No.) |
13034 Ballantyne Corporate Place
Charlotte, NC 28277
(Address of Principal Executive Offices) (Zip Code)
(704) 357-0022
(Registrants Telephone Number, Including Area Code)
Not Applicable
(Former Name or Former Address, if Changed Since Last Report)
Check the appropriate box below if the Form 8-K filing is intended to simultaneously satisfy the filing obligation of the registrant under any of the following provisions:
¨ | Written communications pursuant to Rule 425 under the Securities Act (17 CFR 230.425) |
¨ | Soliciting material pursuant to Rule 14a-12 under the Exchange Act (17 CFR 240.14a-12) |
¨ | Pre-commencement communications pursuant to Rule 14d-2(b) under the Exchange Act (17 CFR 240.14d-2(b)) |
¨ | Pre-commencement communications pursuant to Rule 13e-4(c) under the Exchange Act (17 CFR 240.13e-4(c)) |
Item 2.02. | Results of Operations and Financial Condition. |
On May 11, 2015, Premier, Inc. (the Company) issued a press release reporting the financial results of the Company for the three and nine months ended March 31, 2015. A copy of the press release is attached to this report as Exhibit 99.1 and is incorporated herein by this reference.
As discussed in the press release, the Company held a conference call and webcast on May 11, 2015. Supplemental slides referenced during the conference call and webcast were available on the Companys website for viewing by call participants. A transcript of the call together with supplemental slides referenced during the conference call are attached as Exhibit 99.2 and Exhibit 99.3, respectively, to this Current Report on Form 8-K.
Item 7.01. | Regulation FD Disclosure. |
As noted above, the Company held a conference call and webcast on May 11, 2015, to discuss the Companys operating results for the three and nine months ended March 31, 2015. A copy of the press release, which contains additional information regarding how to access the conference call and webcast and how to listen to a recorded playback of the call, is attached as Exhibit 99.1 to this Current Report on From 8-K. A transcript of the call together with supplemental slides referenced during the conference call are attached as Exhibit 99.2 and Exhibit 99.3, respectively, to this Current Report on Form 8-K and are incorporated herein by reference.
* * *
The information discussed under Item 2.02 and Item 7.01 above, including Exhibit 99.1, Exhibit 99.2 and Exhibit 99.3, shall not be deemed filed for purposes of Section 18 of the Securities Exchange Act of 1934, as amended, or incorporated by reference in any filing by the Company under the Securities Act of 1933, as amended, except as shall be expressly set forth by specific reference in such a filing.
Item 9.01. | Financial Statements and Exhibits. |
(d) | Exhibits. |
99.1 | Press release of Premier, Inc., dated May 11, 2015. | |
99.2 | Transcript of conference call of Premier, Inc., dated May 11, 2015. | |
99.3 | Supplemental slides provided in connection with the third quarter 2015 earnings call of Premier, Inc. |
SIGNATURE
Pursuant to the requirements of the Securities Exchange Act of 1934, the registrant has duly caused this report to be signed on its behalf by the undersigned hereunto duly authorized.
Premier, Inc. | ||||
By: | /s/ Susan D. DeVore | |||
Name: | Susan D. DeVore | |||
Title: | Chief Executive Officer and President |
Date: May 13, 2015
Exhibit 99.1
PREMIER, INC. REPORTS FISCAL 2015 THIRD-QUARTER RESULTS
CHARLOTTE, NC, May 11, 2015 Premier, Inc. (NASDAQ: PINC) today reported financial results for the fiscal 2015 third quarter ended March 31, 2015.
Fiscal Third-Quarter Highlights:
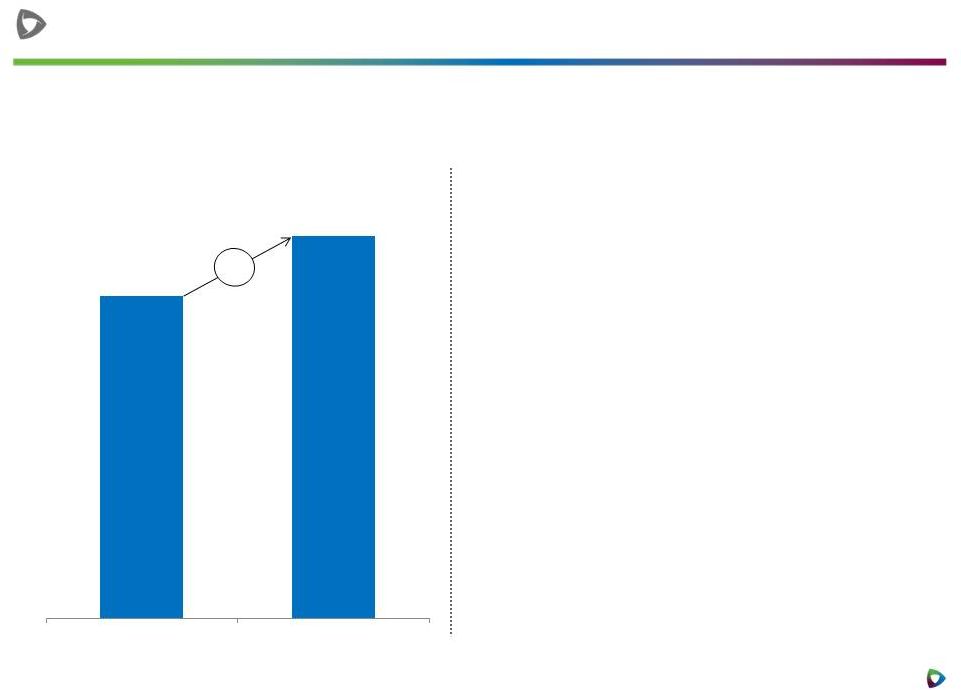
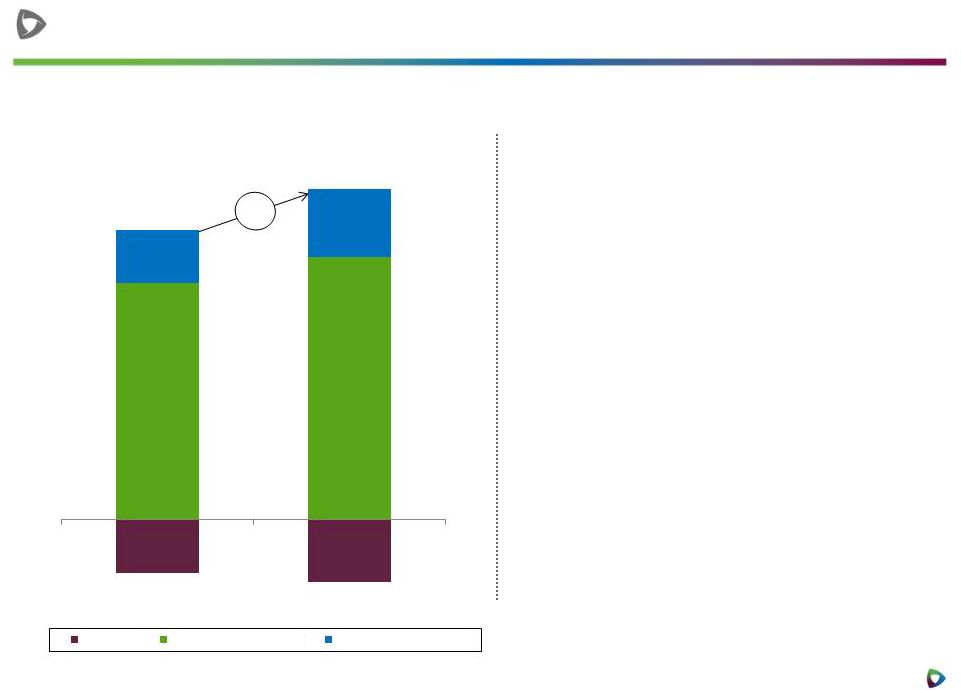
| Net revenue increased 16% to $261.7 million from the same period last year; Supply Chain Services segment revenue rose 15% and Performance Services segment revenue increased 19%. |
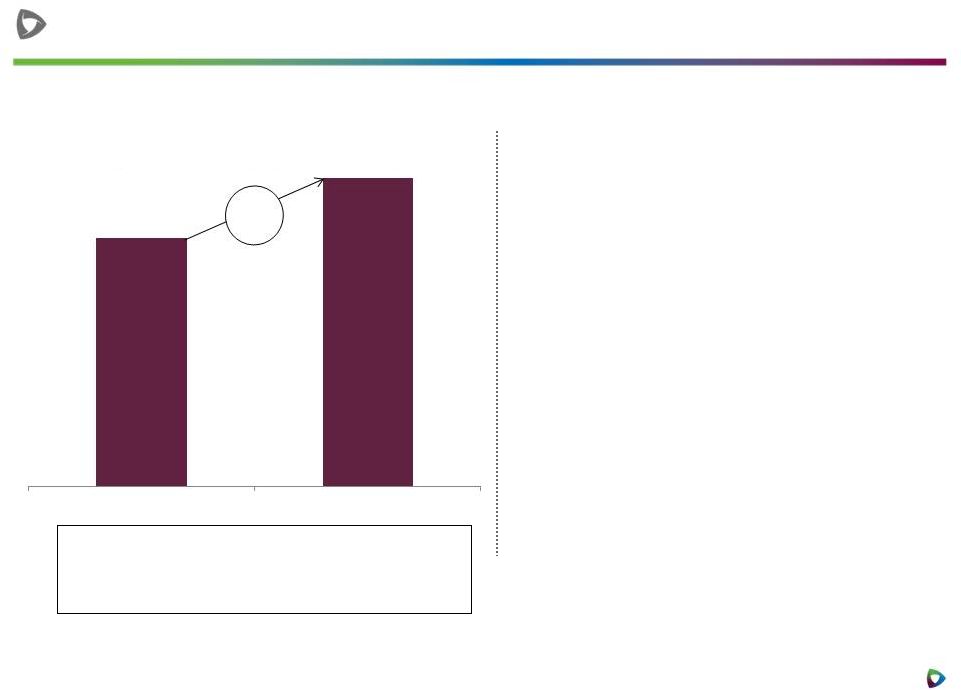
| Adjusted EBITDA* increased 14% to $103.7 million from the same period last year. |
| Adjusted fully distributed net income* increased 13% to $55.3 million, or $0.38 on a fully diluted per-share basis, from the same period a year ago. GAAP net income attributable to shareholders was $12.2 million, compared with $13.5 million in the prior year. |
| At March 31, 2015, cash, cash equivalents and short- and long-term marketable securities totaled $503.3 million, and the company had access to its entire unsecured $750.0 million, five-year revolving credit facility. |
| For the nine-months ended March 31, 2015, net revenue increased 17% to $740.5 million, adjusted EBITDA rose 14% to $293.1 million, and adjusted fully distributed net income increased 12% to $155.2 million, or $1.07 per diluted share, compared with non-GAAP pro forma* results for the same period a year ago. Net revenue for the nine-month period increased 10% and adjusted EBITDA decreased 2% from actual results for the same period a year ago. |
| Based on year-to-date performance and the current outlook and assumptions for the remainder of the fiscal year, the company is increasing its fiscal full-year guidance ranges for consolidated net revenue and consolidated adjusted EBITDA. |
* | Descriptions of adjusted EBITDA, adjusted fully distributed net income and other non-GAAP financial measures are provided in Use and Definition of Non-GAAP Measures, and reconciliations are provided in the tables at the end of this release. See Reorganization and Initial Public Offering for important information regarding non-GAAP pro forma results. |
Our strong third-quarter results were driven by continued growth in the demand for Premier products and services across our Supply Chain Services and Performance Services businesses, said Susan DeVore, president and chief executive officer. We are building a successful track record of financial performance based on our role as a trusted partner with solutions that enable healthcare providers to comprehensively reduce costs, improve quality and safety and prepare for the rapidly approaching population health management environment.
In the third quarter, double-digit revenue growth in our Supply Chain Services business was fueled by continued strength in our group purchasing organization and from our direct sourcing and specialty pharmacy businesses, DeVore said. Performance Services also produced double digit revenue growth, driven primarily by strong contributions from PremierConnect® SaaS-based subscriptions and renewals as well as advisory services.
Premier, Inc. FY15 Q3 Results
Page 2 of 14
Results of Operations for the Third Quarter of Fiscal 2015
Consolidated Third-Quarter and Year-to-Date Financial Highlights
Three Months Ended March 31, | Nine Months Ended March 31, | Nine Months Ended March 31, | ||||||||||||||||||||||||||||||||||
(in thousands, except per share data) |
2015 | 2014 | % Change | 2015 | 2014 | % Change | 2015 | 2014 | % Change | |||||||||||||||||||||||||||
Actual | Actual | Actual | Actual | Actual | Non-GAAP pro forma (a) |
|||||||||||||||||||||||||||||||
Net Revenue: |
||||||||||||||||||||||||||||||||||||
Supply Chain Services: |
||||||||||||||||||||||||||||||||||||
Net administrative fees |
$ | 117,959 | $ | 108,087 | 9 | % | $ | 337,157 | $ | 353,793 | -5 | % | $ | 337,157 | $ | 312,530 | 8 | % | ||||||||||||||||||
Other services and support |
740 | 197 | 276 | % | 1,192 | 504 | 137 | % | 1,192 | 504 | 137 | % | ||||||||||||||||||||||||
|
|
|
|
|
|
|
|
|
|
|
|
|
|
|
|
|
|
|||||||||||||||||||
Services |
118,699 | 108,284 | 10 | % | 338,349 | 354,297 | -5 | % | 338,349 | 313,034 | 8 | % | ||||||||||||||||||||||||
Products |
73,438 | 58,692 | 25 | % | 203,698 | 151,022 | 35 | % | 203,698 | 151,022 | 35 | % | ||||||||||||||||||||||||
|
|
|
|
|
|
|
|
|
|
|
|
|
|
|
|
|
|
|||||||||||||||||||
Total Supply Chain Services |
192,137 | 166,976 | 15 | % | 542,047 | 505,319 | 7 | % | 542,047 | 464,056 | 17 | % | ||||||||||||||||||||||||
Performance Services: |
||||||||||||||||||||||||||||||||||||
Services |
69,586 | 58,622 | 19 | % | 198,429 | 169,764 | 17 | % | 198,429 | 169,764 | 17 | % | ||||||||||||||||||||||||
|
|
|
|
|
|
|
|
|
|
|
|
|
|
|
|
|
|
|||||||||||||||||||
Total |
$ | 261,723 | $ | 225,598 | 16 | % | $ | 740,476 | $ | 675,083 | 10 | % | $ | 740,476 | $ | 633,820 | 17 | % | ||||||||||||||||||
|
|
|
|
|
|
|
|
|
|
|
|
|
|
|
|
|
|
|||||||||||||||||||
Adjusted EBITDA (b): |
||||||||||||||||||||||||||||||||||||
Supply Chain Services |
$ | 101,600 | $ | 91,477 | 11 | % | $ | 290,210 | $ | 302,076 | -4 | % | $ | 290,210 | $ | 260,813 | 11 | % | ||||||||||||||||||
Performance Services |
26,166 | 20,307 | 29 | % | 67,717 | 54,367 | 25 | % | 67,717 | 54,367 | 25 | % | ||||||||||||||||||||||||
|
|
|
|
|
|
|
|
|
|
|
|
|
|
|
|
|
|
|||||||||||||||||||
Total segment adjusted EBITDA |
127,766 | 111,784 | 14 | % | 357,927 | 356,443 | 0 | % | 357,927 | 315,180 | 14 | % | ||||||||||||||||||||||||
Corporate |
(24,021 | ) | (20,479 | ) | 17 | % | (64,856 | ) | (57,399 | ) | 13 | % | (64,856 | ) | (57,399 | ) | 13 | % | ||||||||||||||||||
|
|
|
|
|
|
|
|
|
|
|
|
|
|
|
|
|
|
|||||||||||||||||||
Total |
$ | 103,745 | $ | 91,305 | 14 | % | $ | 293,071 | $ | 299,044 | -2 | % | $ | 293,071 | $ | 257,781 | 14 | % | ||||||||||||||||||
|
|
|
|
|
|
|
|
|
|
|
|
|
|
|
|
|
|
|||||||||||||||||||
Non-GAAP adjusted fully distributed net income (b) |
$ | 55,286 | $ | 49,099 | 13 | % | $ | 155,181 | $ | 138,629 | 12 | % | ||||||||||||||||||||||||
|
|
|
|
|
|
|
|
|
|
|
|
|||||||||||||||||||||||||
Non-GAAP earnings per share on adjusted fully distributed net income - diluted (b) |
$ | 0.38 | $ | 0.34 | 13 | % | $ | 1.07 | $ | 0.96 | 12 | % | ||||||||||||||||||||||||
|
|
|
|
|
|
|
|
|
|
|
|
|||||||||||||||||||||||||
Weighted average fully distributed shares outstanding - diluted |
145,170 | 145,164 | 145,095 | 145,083 | ||||||||||||||||||||||||||||||||
|
|
|
|
|
|
|
|
(a) | Reflects the impact of the Companys Reorganization on the Supply Chain Services segment as a result of the 30% revenue share to owner members after the Reorganization. The impact of the non-GAAP pro forma adjustment on both Supply Chain Services net revenue and segment adjusted EBITDA was $41.3 million for the nine months ended March 31, 2014. Non-GAAP Pro forma adjustments do not impact the financial results of the Companys Performance Services segment. |
(b) | See attached supplemental financial information for reconciliation of reported GAAP results to Non-GAAP results. |
For the fiscal third quarter ended March 31, 2015, Premier generated net revenue of $261.7 million, an increase of 16%, from net revenue of $225.6 million for the same period a year ago.
Adjusted EBITDA of $103.7 million increased 14% from $91.3 million for the same period last year. The increase was driven by revenue growth in both of the companys business segments, and continued effective management of operating expenses relative to net revenue growth.
Adjusted fully distributed net income for the fiscal third quarter rose to $55.3 million, or $0.38 per fully diluted share, from $49.1 million, or $0.34 per fully diluted share, for the same period a year ago. Adjusted fully distributed earnings per share is a non-GAAP financial measure that represents net income, adjusted for non-recurring and non-cash items, attributable to all shareholders as if all Class B shareholders have converted to Class A shareholders, and reflects income taxes at an estimated effective rate of approximately 40% on 100% of pretax income.
Net income for the quarter totaled $72.0 million, compared with $102.0 million for the same quarter a year ago. The decline is attributable to a one-time investment gain of $37.9 million included in the prior-year period. In accordance with GAAP, net income attributable to shareholders of $12.2 million at March 31, 2015 requires a non-cash adjustment of $(387.1) million, and net income attributable to shareholders of $13.5 million at March 31, 2014 requires a non-cash adjustment of $495.7 million to reflect redeemable limited partners capital at the appropriate redemption amount attributable to the limited partners Class B common unit ownership at the end of each period. These non-cash adjustments result from changes in the companys stock price during the period. On a GAAP fully diluted per-share basis, the company reported a net loss attributable to shareholders of $10.05 compared with net income attributable to shareholders of $15.64 a year ago. (See income statement in the tables section of this press release.)
Premier, Inc. FY15 Q3 Results
Page 3 of 14
Segment Results
Supply Chain Services
For the fiscal third quarter ended March 31, 2015, the Supply Chain Services segment generated net revenue of $192.1 million, an increase of 15%, from $167.0 million a year ago. Revenue growth was driven by strong performances of both the companys group purchasing organization (GPO) and products businesses. GPO net administrative fees revenue of $118.0 million increased 9% from a year ago, reflecting the further contract penetration of existing members, the continuing impact of recruitment and conversion of new members, and the impact of increasing patient utilization. Product sales of $73.4 million increased 25% from a year ago from the ongoing expansion of member support for the companys direct sourcing and specialty pharmacy businesses.
Supply Chain Services segment adjusted EBITDA of $101.6 million for the fiscal 2015 third quarter increased 11%, from $91.5 million for the same period a year ago. The increase predominantly reflects growth in net administrative fees revenue, as well as continued effective management of operating expenses relative to net revenue growth.
Performance Services
For the fiscal third quarter ended March 31, 2015, the Performance Services segment generated net revenue of $69.6 million, an increase of 19%, from $58.6 million for the same quarter last year. Revenue growth was driven by PremierConnect SaaS-based (software-as-a-service) subscriptions and renewals, and includes TheraDoc and Aperek, which were acquired late in the fiscal first quarter, as well as by advisory services.
Performance Services segment adjusted EBITDA was $26.2 million for the fiscal 2015 third quarter, an increase of 29% from $20.3 million for the same quarter last year. The growth in adjusted EBITDA reflects the sale of new PremierConnect SaaS-based products, including the companys recent TheraDoc and Aperek acquisitions, and effective management of segment operating expenses relative to net revenue growth.
Results of Operations for the Nine-Months Ended March 31, 2015
Note: Comparisons of GAAP results are impacted by the changes associated with the Reorganization and IPO, as described below, and therefore, management believes they do not provide meaningful year-over-year comparisons. Performance Services segment results are not impacted by non-GAAP pro forma results.
The company generated net revenue of $740.5 million for the nine-month period ended March 31, 2015, an increase of 17% from non-GAAP pro forma net revenue of $633.8 million in the same period last year. Adjusted EBITDA for the nine-month period totaled $293.1 million, an increase of 14% from non-GAAP pro forma adjusted EBITDA of $257.8 million in the same period last year. Adjusted fully distributed net income totaled $155.2 million, or $1.07 per diluted share, compared with non-GAAP pro forma amount of $138.6 million, or $0.96 per diluted share, for the same period last year.
On a GAAP-comparison basis, net revenue of $740.5 million for the nine-month period ended March 31, 2015 increased 10% from net revenue of $675.1 million for the prior year. Adjusted EBITDA of $293.1 million decreased 2% from actual adjusted EBITDA of $299.0 million for the prior year. Net income of $202.7 million compared with $266.0 million for the same period
Premier, Inc. FY15 Q3 Results
Page 4 of 14
last year. In accordance with GAAP, net income attributable to shareholders of $30.8 million at March 31, 2015, requires a non-cash adjustment of $(812.0) million, and net income attributable to shareholders of $19.5 million at March 31, 2014, requires a non-cash adjustment of $(3,224.1) million to reflect redeemable limited partners capital at the appropriate redemption amount attributable to the limited partners Class B common unit ownership at the end of each period. These non-cash adjustments result from changes in the companys stock price during the period. On a fully diluted per-share basis, the company reported a net loss attributable to shareholders of $22.28 for the first nine months of fiscal 2015, compared with a net loss attributable to shareholders of $136.99 for the same period a year ago. (See income statement in the tables section of this press release.)
Supply Chain Services segment net revenue for the nine-month period increased 17% to $542.0 million from non-GAAP pro forma net revenue of $464.1 million a year earlier. Supply Chain Services segment adjusted EBITDA increased 11%, to $290.2 million from non-GAAP pro forma adjusted EBITDA of $260.8 million for the same period last year.
Performance Services segment net revenue for the nine-month period increased 17% to $198.4 million from $169.8 million in the same period last year. Performance Services segment adjusted EBITDA increased 25% to $67.7 million from $54.4 million the prior year.
On a GAAP-comparison basis, Supply Chain Services segment net revenue of $542.0 million increased 7% from $505.3 million for the same period a year ago. Segment adjusted EBITDA of $290.2 million decreased 4% from $302.1 million a year ago.
Cash Flows and Liquidity
Cash provided by operating activities was $255.6 million for the nine-month period ended March 31, 2015, compared with $288.7 million for the same period a year ago. Operating cash flows decreased primarily due to the addition of member owner revenue share as a result of the Reorganization and IPO effective October 2013. At March 31, 2015, the companys cash, cash equivalents, short- and long-term marketable securities totaled $503.3 million, compared with $540.4 million at March 31, 2014, and consisted of $155.6 million in cash and cash equivalents and $347.7 million in marketable securities with maturities ranging from three to 24 months.
Free cash flow for the fiscal third quarter ended March 31, 2015 was $59.5 million, compared with $58.9 million for the same period a year ago. The significant level of free cash flow relative to adjusted EBITDA in the third quarter results from strong performance in the companys Supply Chain Services segment. The company defines free cash flow as cash provided by operating activities less distributions to limited partners and purchases of property and equipment (see free cash flow reconciliation to net cash provided by operating activities in the tables section of this press release).
At March 31, 2015, there was no outstanding balance on the companys unsecured $750 million, five-year revolving credit facility.
Premier, Inc. FY15 Q3 Results
Page 5 of 14
Fiscal 2015 Outlook and Guidance
Fiscal 2015 Financial Guidance (1)
Premier, Inc. updates full-year fiscal 2015 financial guidance, as follows:
(in millions, except per share data) |
Updated FY 2015 |
Pro Forma % YoY Change |
Previous FY 2015 | |||
Net Revenue: |
||||||
Supply Chain Services segment |
$720.0 - $733.0 | 13% - 15% | $706.0 - $725.0 | |||
Performance Services segment |
$268.0 - $275.0 | 15% - 18% | $268.0 - $275.0 | |||
|
|
| ||||
Total Net Revenue |
$988.0 - $1008.0 | 14% - 16% | $974.0 - $1000.0 | |||
Non-GAAP adjusted EBITDA |
$384.0 - $392.0 | 9% - 12% | $382.0 - $390.0 | |||
Non-GAAP adjusted fully distributed EPS |
$1.40 - $1.44 | 8% - 11% | $1.40 - $1.44 | |||
|
|
|
(1) | Guidance is based on comparisons with prior-year pro forma results, which have been adjusted to reflect the impact of the companys reorganization and IPO. The Company does not reconcile guidance for adjusted EBITDA and non-GAAP adjusted fully distributed net income per-share to net income (loss) or GAAP earnings per share because the Company does not provide guidance for reconciling items between net income (loss) and adjusted EBITDA and non-GAAP adjusted fully distributed earnings per share. The Company is unable to provide guidance for these reconciling items since certain items that impact net income (loss) are outside of the Companys control and cannot be reasonably predicted. Accordingly, a reconciliation to net income (loss) or GAAP earnings per share is not available without unreasonable effort. |
Based on fiscal third-quarter results and managements current expectations for the remainder of fiscal 2015, Premier is increasing its full fiscal-year 2015 guidance ranges for consolidated net revenue and non-GAAP adjusted EBITDA, based on the following key assumptions.
The company is increasing its full-year revenue expectations for the Supply Chain Services segment based on assumptions of full-year growth of 6% to 7% in net administrative fees revenue and 27% to 32% in the companys direct sourcing and specialty pharmacy businesses.
The company is maintaining its existing full-year revenue expectations for the Performance Services segment, based on assumptions of continued revenue growth in PremierConnect SaaS-based subscriptions, continued demand for advisory services, and ongoing member participation in performance improvement collaboratives, in addition to the continuation of historically high renewal rates of SaaS-based offerings.
The company is raising its full-year adjusted EBITDA expectations, based on assumptions of continued growth in the Supply Chain Services segment.
Guidance assumptions do not contemplate the impact of any potential significant future acquisitions. For fiscal 2015, Premier expects capital expenditures of approximately $72.0 million and a consolidated EBITDA margin of approximately 39%.
We interact with approximately 68% of our nations community hospitals, working together to help them reduce costs, improve quality, drive better patient outcomes and build sustainable integrated care delivery strategies for the rapidly approaching future of advanced payment models and the drive to population health, DeVore said. We believe our aligned delivery channel, collaborative member relationships, industry-leading data analytics, and exceptional execution uniquely position Premier to continue to lead the transformation of healthcare delivery across our country for years to come.
The statements in this Outlook and Guidance discussion are forward-looking statements. For additional information regarding the use and limitations of such statements, see Forward-Looking Statements below and the Risk Factors section of the companys Form 10-K for the year ended June 30, 2014.
Premier, Inc. FY15 Q3 Results
Page 6 of 14
Conference Call
Premier management will host a conference call and live audio webcast on Monday, May 11, 2015, at 5:00 p.m. ET, to discuss the companys financial results. The conference call can be accessed through a link provided on the investor relations page on Premiers website at investors.premierinc.com. To expedite access, participants should preregister at this website, at which time the participant will be sent a confirmation email including dial-in numbers and a unique PIN for those who wish to participate by phone. A replay of the conference call will be available on the investor relations page of Premiers website.
About Premier, Inc.
Premier, Inc. (NASDAQ: PINC) is a leading healthcare improvement company, uniting an alliance of approximately 3,400 U.S. hospitals and 110,000 other providers to transform healthcare. With integrated data and analytics, collaboratives, supply chain solutions, and advisory and other services, Premier enables better care and outcomes at a lower cost. Premier, a Malcolm Baldrige National Quality Award recipient, plays a critical role in the rapidly evolving healthcare industry, collaborating with members to co-develop long-term innovations that reinvent and improve the way care is delivered to patients nationwide. Headquartered in Charlotte, N.C., Premier is passionate about transforming American healthcare. Please visit Premiers news and investor sites on www.premierinc.com; as well as Twitter, Facebook, LinkedIn, YouTube, Instagram, Foursquare and Premiers blog for more information about the company.
Reorganization and Initial Public Offering
On October 1, 2013, Premier completed its IPO by issuing 32,374,751 shares of its Class A common stock, at a price of $27.00 per share, raising net proceeds of approximately $821.7 million, before expenses. In connection with the IPO, Premier completed the reorganization of the company on October 1, 2013, issuing 112.6 million shares of Class B common stock representing, at that time, 77.7% of the common stock outstanding, and corresponding Class B common units in Premier Healthcare Alliance, L.P. (Premier LP) to its member owners.
The companys historical consolidated operating results for the nine-month period do not reflect the Reorganization, the IPO and contemplated use of net proceeds from the IPO. Therefore, in addition to presenting the historical actual results, the company presents and discusses non-GAAP pro forma results, which reflect the impact of the companys Reorganization and IPO and the contemplated use of net proceeds from the IPO, to provide a more comparable indication of future expectations.
The key non-GAAP pro forma adjustments include:
| The reorganization, which included the formation of a C-Corporation and the sale of approximately 22.3% of the members partnership interests to the public through the issuance of Premier Class A common stock, with the member owners retaining their approximately 77.7% ownership interest in the form of Premier LP Class B common units and an equal number of Premier Class B common stock. As part of the quarterly exchanges that occurred on October 31, 2014 and January 31, 2015, the member owners exchanged approximately 3.4% of their Class B common units and associated Class B common stock. As a result, at March 31, 2015, the public investors, which may include some member owners that have previously exchanged their Class B common units for Class A common stock, owned approximately 26% of the companys combined Class A and Class B common stock, and the member owners owned approximately 74%. |
| Payments to each member owner of revenue share from Premier equal to 30% of all gross administrative fees collected. |
| Payments due to member owners pursuant to the tax receivable agreement equal to 85% of the amount of cash savings, if any, in income and franchise taxes, that Premier realizes. |
| The further adjustments set forth in the notes to the supplemental non-GAAP pro forma financial information provided below. |
Further details of the Reorganization and non-GAAP pro forma adjustments are in Premiers Form 10-Q for the fiscal third quarter ended March 31, 2015, expected to be filed with the Securities and Exchange Commission (SEC) on or about May 12, 2015, and accessible on the SECs website at www.sec.gov and in the investor relations section of Premiers website at investors.premierinc.com.
Use and Definition of Non-GAAP Measures
Premier uses EBITDA, adjusted EBITDA, segment adjusted EBITDA, adjusted fully distributed net income, adjusted fully distributed net income per share, and free cash flow to facilitate a comparison of the companys operating performance on a consistent basis from period to period that, when viewed in combination with its results prepared in accordance with GAAP, provides a more complete understanding of factors and trends affecting the companys business than GAAP measures alone. The company believes adjusted EBITDA and segment adjusted EBITDA assist its board of directors, management and investors in comparing the companys operating performance on a consistent basis from period to period because they remove the impact of the companys asset base (primarily depreciation and amortization) and items outside the control of management (taxes), as well as other non-cash (impairment of intangible assets and purchase accounting adjustments) and non-recurring items, from operations.
In addition, adjusted fully distributed net income eliminates the variability of non-controlling interest as a result of member owner exchanges of Class B common stock and corresponding Class B units into shares of Class A common stock (which exchanges are a member owners cumulative right, but not obligation, which began on October 31, 2014, and occur each quarter thereafter, and are limited to one-seventh of the member owners initial allocation of Class B common units) and other potentially dilutive equity transactions which are outside of managements control. Adjusted fully distributed net income is defined as net income attributable to PHSI (i) excluding income tax expense, (ii) excluding the effect of non-recurring and non-cash items, (iii) assuming the exchange of all the Class B common units for shares of Class A common stock, which results in the elimination of non-controlling interest in Premier LP, and (iv) reflecting an adjustment for income tax expense on non-GAAP pro forma fully distributed net income before income taxes at the companys estimated effective income tax rate.
EBITDA is defined as net income before interest and investment income, net, income tax expense, depreciation and amortization and amortization of purchased intangible assets. Adjusted EBITDA is defined as EBITDA before merger and acquisition related expenses and non-recurring, non-cash or non-operating items, and including equity in net income of unconsolidated affiliates. Non-recurring items include certain strategic and financial restructuring expenses. Non-operating items include gain or loss on disposal of assets. Segment adjusted EBITDA is defined as the segments net revenue less operating expenses directly attributable to the segment, excluding depreciation and amortization, amortization of purchased intangible assets, merger and acquisition related expenses and non-recurring or non-cash items, and including equity in net
Premier, Inc. FY15 Q3 Results
Page 8 of 14
income of unconsolidated affiliates. Operating expenses directly attributable to the segment include expenses associated with sales and marketing, general and administrative and product development activities specific to the operation of each segment. General and administrative corporate expenses that are not specific to a particular segment are not included in the calculation of segment adjusted EBITDA. Adjusted EBITDA is a supplemental financial measure used by the company and by external users of the companys financial statements.
Management considers adjusted EBITDA an indicator of the operational strength and performance of the companys business. Adjusted EBITDA allows management to assess performance without regard to financing methods and capital structure and without the impact of other matters that management does not consider indicative of the operating performance of the business. Segment adjusted EBITDA is the primary earnings measure used by management to evaluate the performance of the companys business segments.
Free cash flow is defined as cash provided by operating activities less distributions to limited partners and purchases of property and equipment. Management believes free cash flow is an important measure because it represents the cash that the company generates after payment of tax distributions to limited partners and capital investment to maintain existing products and services as well as development of new and upgraded products and services to support future growth. Free cash flow is important because it allows the Company to enhance shareholder value through acquisitions, partnerships, investments in related or complimentary businesses and debt reductions.
Forward-Looking Statements
Statements made in this release that are not statements of historical or current facts, such as those under the heading Fiscal 2015 Outlook and Guidance are forward-looking statements within the meaning of the Private Securities Litigation Reform Act of 1995. Forward-looking statements may involve known and unknown risks, uncertainties and other factors that may cause the actual results, performance or achievements of Premier to be materially different from historical results or from any future results or projections expressed or implied by such forward-looking statements. Accordingly, readers should not place undue reliance on any forward looking statements. In addition to statements that explicitly describe such risks and uncertainties, readers are urged to consider statements in the conditional or future tenses or that include terms such as believes, belief, expects, estimates, intends, anticipates or plans to be uncertain and forward-looking. Forward-looking statements may include comments as to Premiers beliefs and expectations as to future events and trends affecting its business and are necessarily subject to uncertainties, many of which are outside Premiers control. More information on potential factors that could affect Premiers financial results is included from time to time in the Cautionary Note Regarding Forward Looking Statements, Risk Factors and Managements Discussion and Analysis of Financial Condition and Results of Operations sections of Premiers periodic and current filings with the SEC, including those discussed under the Risk Factors and Cautionary Note Regarding Forward Looking Statements section of Premiers Form 10-Q for the fiscal third quarter ended March 31, 2015, expected to be filed with the SEC on or about May 12, 2015, and also made available on Premiers website at investors.premierinc.com. Forward looking statements speak only as of the date they are made, and Premier undertakes no obligation to publicly update or revise any forward-looking statements, whether as a result of new information, future events or otherwise that occur after that date.
Premier, Inc. FY15 Q3 Results
Page 9 of 14
Contacts | ||
Investor relations contact: | Media contact: | |
Jim Storey | Christopher Allman | |
Vice President, Investor Relations | Senior Director, Public Relations | |
704.816.5958 | 704.816.540 | |
jim_storey@premierinc.com | chris_allman@premierinc.com |
(Tables Follow)
Consolidated Statements of Income
(Unaudited)
(In thousands, except per share data)
Three Months Ended March 31, |
Nine Months Ended March 31, |
|||||||||||||||
2015 | 2014 | 2015 | 2014 (a) | |||||||||||||
Net revenue: |
||||||||||||||||
Net administrative fees |
$ | 117,959 | $ | 108,087 | $ | 337,157 | $ | 353,793 | ||||||||
Other services and support |
70,326 | 58,819 | 199,621 | 170,268 | ||||||||||||
|
|
|
|
|
|
|
|
|||||||||
Services |
188,285 | 166,906 | 536,778 | 524,061 | ||||||||||||
Products |
73,438 | 58,692 | 203,698 | 151,022 | ||||||||||||
|
|
|
|
|
|
|
|
|||||||||
Net revenue |
261,723 | 225,598 | 740,476 | 675,083 | ||||||||||||
Cost of revenue: |
||||||||||||||||
Services |
36,026 | 28,382 | 104,066 | 84,887 | ||||||||||||
Products |
66,789 | 52,742 | 183,302 | 136,500 | ||||||||||||
|
|
|
|
|
|
|
|
|||||||||
Cost of revenue |
102,815 | 81,124 | 287,368 | 221,387 | ||||||||||||
|
|
|
|
|
|
|
|
|||||||||
Gross profit |
158,908 | 144,474 | 453,108 | 453,696 | ||||||||||||
Operating expenses: |
||||||||||||||||
Selling, general and administrative |
86,847 | 73,327 | 243,404 | 209,096 | ||||||||||||
Research and development |
596 | 820 | 2,385 | 2,714 | ||||||||||||
Amortization of purchased intangible assets |
2,554 | 802 | 6,598 | 2,158 | ||||||||||||
|
|
|
|
|
|
|
|
|||||||||
Total operating expenses |
89,997 | 74,949 | 252,387 | 213,968 | ||||||||||||
|
|
|
|
|
|
|
|
|||||||||
Operating income |
68,911 | 69,525 | 200,721 | 239,728 | ||||||||||||
|
|
|
|
|
|
|
|
|||||||||
Equity in net income of unconsolidated affiliates |
5,197 | 3,566 | 14,812 | 12,171 | ||||||||||||
Interest and investment income, net |
204 | 400 | 517 | 641 | ||||||||||||
(Loss) gain on investment |
(1,000 | ) | 37,850 | (1,000 | ) | 37,850 | ||||||||||
Other income (expense), net |
743 | 52 | (219 | ) | 56 | |||||||||||
|
|
|
|
|
|
|
|
|||||||||
Other income, net |
5,144 | 41,868 | 14,110 | 50,718 | ||||||||||||
|
|
|
|
|
|
|
|
|||||||||
Income before income taxes |
74,055 | 111,393 | 214,831 | 290,446 | ||||||||||||
Income tax expense |
2,026 | 9,413 | 12,107 | 24,461 | ||||||||||||
|
|
|
|
|
|
|
|
|||||||||
Net income |
72,029 | 101,980 | 202,724 | 265,985 | ||||||||||||
Net income attributable to noncontrolling interest in S2S Global |
(252 | ) | (530 | ) | (1,836 | ) | (477 | ) | ||||||||
Net income attributable to noncontrolling interest in Premier LP |
(59,568 | ) | (87,925 | ) | (170,135 | ) | (246,055 | ) | ||||||||
|
|
|
|
|
|
|
|
|||||||||
Net income attributable to noncontrolling interest |
(59,820 | ) | (88,455 | ) | (171,971 | ) | (246,532 | ) | ||||||||
|
|
|
|
|
|
|
|
|||||||||
Net income attributable to shareholders |
12,209 | 13,525 | 30,753 | 19,453 | ||||||||||||
Adjustment of redeemable limited partners capital to redemption amount |
(387,062 | ) | 495,714 | (811,969 | ) | (3,224,098 | ) | |||||||||
|
|
|
|
|
|
|
|
|||||||||
Net (loss) income attributable to shareholders after adjustment of redeemable limited partners capital to redemption amount |
$ | (374,853 | ) | $ | 509,239 | $ | (781,216 | ) | $ | (3,204,645 | ) | |||||
|
|
|
|
|
|
|
|
|||||||||
Weighted average shares outstanding: |
||||||||||||||||
Basic |
37,316 | 32,375 | 35,066 | 23,394 | ||||||||||||
Diluted |
37,316 | 32,556 | 35,066 | 23,394 | ||||||||||||
Earnings (loss) per share attributable to shareholders (b): |
||||||||||||||||
Basic |
$ | (10.05 | ) | $ | 15.73 | $ | (22.28 | ) | $ | (136.99 | ) | |||||
Diluted |
$ | (10.05 | ) | $ | 15.64 | $ | (22.28 | ) | $ | (136.99 | ) |
(a) | After the completion of the Reorganization, Premier Healthcare Solutions, Inc. (PHSI) became a consolidated subsidiary of Premier, Inc. Operating results for the nine months ended March 31, 2014 reflect the combined results of PHSI, the predecessor of the Company for accounting purposes, and Premier, Inc. These operating results differ significantly from subsequent periods, which reflect the impact of the Reorganization and IPO that became effective October 1, 2013. |
(b) | Loss per share attributable to shareholders includes an adjustment to net income attributable to shareholders of redeemable limited partners capital to redemption amount of $(387.1) million and $(812.0) million for the three and nine months ended March 31, 2015, respectively, and $495.7 million and $(3,224) million for the three and nine months ended March 31, 2014. |
Premier, Inc. FY15 Q3 Results
Page 10 of 14
Consolidated Balance Sheets
(In thousands, except share and per share data)
March 31, 2015 | June 30, 2014 | |||||||
(Unaudited) | (Audited) | |||||||
Assets |
||||||||
Cash and cash equivalents |
$ | 155,636 | $ | 131,786 | ||||
Marketable securities |
192,752 | 159,820 | ||||||
Accounts receivable |
101,165 | 67,577 | ||||||
Inventories |
29,858 | 20,823 | ||||||
Prepaid expenses and other current assets |
32,039 | 31,175 | ||||||
Due from related parties |
712 | 1,228 | ||||||
Deferred tax assets |
13,055 | 9,647 | ||||||
|
|
|
|
|||||
Total current assets |
525,217 | 422,056 | ||||||
Property and equipment |
152,972 | 134,551 | ||||||
Restricted cash |
5,000 | 5,000 | ||||||
Marketable securities |
154,944 | 248,799 | ||||||
Deferred tax assets |
348,564 | 286,936 | ||||||
Goodwill |
213,849 | 94,451 | ||||||
Intangible assets |
41,209 | 10,855 | ||||||
Other assets |
46,778 | 44,008 | ||||||
|
|
|
|
|||||
Total assets |
$ | 1,488,533 | $ | 1,246,656 | ||||
|
|
|
|
|||||
Liabilities, redeemable limited partners capital and stockholders deficit |
||||||||
Accounts payable |
$ | 30,514 | $ | 28,007 | ||||
Accrued expenses |
40,930 | 25,536 | ||||||
Revenue share obligations |
56,076 | 56,531 | ||||||
Limited partners distribution payable |
23,398 | 22,351 | ||||||
Accrued compensation and benefits |
45,235 | 46,713 | ||||||
Deferred revenue |
32,274 | 15,694 | ||||||
Current portion of tax receivable agreements |
10,940 | 11,035 | ||||||
Current portion of notes payable and line of credit |
4,393 | 17,696 | ||||||
Other current liabilities |
2,719 | 319 | ||||||
|
|
|
|
|||||
Total current liabilities |
246,479 | 223,882 | ||||||
Notes payable, less current portion |
15,970 | 16,051 | ||||||
Tax receivable agreement, less current portion |
233,564 | 181,256 | ||||||
Deferred compensation plan obligations |
36,031 | 32,872 | ||||||
Deferred rent |
16,047 | 15,960 | ||||||
Other long-term liabilities |
4,506 | 2,272 | ||||||
|
|
|
|
|||||
Total liabilities |
552,597 | 472,293 | ||||||
|
|
|
|
|||||
Redeemable limited partners capital |
3,995,025 | 3,244,674 | ||||||
Stockholders deficit: |
||||||||
Series A Preferred stock, $0.01 par value, 50,000,000 shares authorized; no shares issued and outstanding |
| | ||||||
Class A common stock, $0.01 par value, 500,000,000 shares authorized; 37,376,985 and 32,375,390 shares issued and outstanding at March 31, 2015 and June 30, 2014, respectively |
374 | 324 | ||||||
Class B common stock, $0.000001 par value, 600,000,000 shares authorized; 106,658,535 and 112,510,905 shares issued and outstanding at March 31, 2015 and June 30, 2014, respectively |
| | ||||||
Additional paid-in-capital |
| | ||||||
Accumulated deficit |
(3,059,480 | ) | (2,469,873 | ) | ||||
Accumulated other comprehensive (loss) income |
17 | 43 | ||||||
Noncontrolling interest |
| (805 | ) | |||||
|
|
|
|
|||||
Total stockholders deficit |
(3,059,089 | ) | (2,470,311 | ) | ||||
|
|
|
|
|||||
Total liabilities, redeemable limited partners capital and stockholders deficit |
$ | 1,488,533 | $ | 1,246,656 | ||||
|
|
|
|
Premier, Inc. FY15 Q3 Results
Page 11 of 14
Consolidated Statements of Cash Flows
(Unaudited)
(In thousands)
Nine Months Ended March 31, | ||||||||
2015 | 2014* | |||||||
Operating activities |
||||||||
Net income |
$ | 202,724 | $ | 265,985 | ||||
Adjustments to reconcile net income to net cash provided by operating activities: |
||||||||
Depreciation and amortization |
39,705 | 29,110 | ||||||
Equity in net income of unconsolidated affiliates |
(14,812 | ) | (12,171 | ) | ||||
Loss (gain) on investment |
1,000 | (37,850 | ) | |||||
Deferred taxes |
(269 | ) | 2,833 | |||||
Stock-based compensation |
21,129 | 13,118 | ||||||
Changes in operating assets and liabilities: |
||||||||
Accounts receivable, prepaid expenses and other current assets |
(23,645 | ) | (15,050 | ) | ||||
Other assets |
(1,130 | ) | (1,749 | ) | ||||
Inventories |
(9,035 | ) | (6,539 | ) | ||||
Accounts payable, accrued expenses revenue share obligations and other current liabilities |
35,670 | 51,265 | ||||||
Long-term liabilities |
2,417 | (8 | ) | |||||
Other operating activities |
1,821 | (253 | ) | |||||
|
|
|
|
|||||
Net cash provided by operating activities |
255,575 | 288,691 | ||||||
|
|
|
|
|||||
Investing activities |
||||||||
Purchase of marketable securities |
(239,782 | ) | (369,122 | ) | ||||
Proceeds from sale of marketable securities |
298,757 | 71,459 | ||||||
Proceeds from sale on investment in Global Healthcare Exchange, LLC |
| 37,850 | ||||||
Acquisition of SYMMEDRx, net of cash acquired |
| (28,690 | ) | |||||
Acquisition of Meddius, L.L.C., net of owner receivable |
| (7,737 | ) | |||||
Acquisition of Aperek, net of cash acquired |
(47,446 | ) | | |||||
Acquisition of TheraDoc, net of cash acquired |
(108,561 | ) | | |||||
Purchase of noncontrolling interest in S2S Global |
(14,518 | ) | | |||||
Distributions received on equity investment |
13,900 | 10,650 | ||||||
Purchases of property and equipment |
(51,064 | ) | (39,842 | ) | ||||
Other investing activities |
(443 | ) | | |||||
|
|
|
|
|||||
Net cash used in investing activities |
(149,157 | ) | (325,432 | ) | ||||
|
|
|
|
|||||
Financing activities |
||||||||
Payments made on notes payable |
(1,046 | ) | (5,121 | ) | ||||
Proceeds from S2S Global revolving line of credit |
1,007 | 6,000 | ||||||
Payments on S2S Global revolving line of credit |
(14,715 | ) | | |||||
Proceeds from senior secured line of credit |
| 60,000 | ||||||
Payments on senior secured line of credit |
| (60,000 | ) | |||||
Proceeds from issuance of Class A common stock in connection with the IPO, net of underwriting fees and commissions |
| 821,671 | ||||||
Payments made in connection with the IPO |
| (2,822 | ) | |||||
Purchase of Class B common units from member owners |
| (543,857 | ) | |||||
Proceeds from issuance of PHSI common stock |
| 300 | ||||||
Proceeds from notes receivable from partners |
| 12,706 | ||||||
Proceeds from exercise of stock options |
1,076 | | ||||||
Repurchase of restricted units |
(90 | ) | (4 | ) | ||||
Distributions to limited partners of Premier LP |
(68,800 | ) | (298,388 | ) | ||||
|
|
|
|
|||||
Net cash used in financing activities |
(82,568 | ) | (9,515 | ) | ||||
|
|
|
|
|||||
Net increase (decrease) in cash and cash equivalents |
23,850 | (46,256 | ) | |||||
Cash and cash equivalents at beginning of period |
131,786 | 198,296 | ||||||
|
|
|
|
|||||
Cash and cash equivalents at end of period |
$ | 155,636 | $ | 152,040 | ||||
|
|
|
|
* | After the completion of the Reorganization, Premier Healthcare Solutions, Inc. (PHSI) became a consolidated subsidiary of Premier, Inc. The Statement of Cash Flows for the nine months ended March 31, 2014 reflects the combined cash flows of PHSI, the predecessor of the Company for accounting purposes, and Premier, Inc. |
Premier, Inc. FY15 Q3 Results
Page 12 of 14
Supplemental Financial Information - Reporting of Pro Forma Adjusted EBITDA
and Non-GAAP Adjusted Fully Distributed Net Income
Reconciliation of Selected Non-GAAP Measures to GAAP Measures
(Unaudited)
(In thousands)
Three Months Ended March 31, |
Nine Months Ended March 31, |
|||||||||||||||
2015* | 2014* | 2015* | 2014 | |||||||||||||
Reconciliation of Pro Forma Net Revenue to Net Revenue: |
||||||||||||||||
Pro Forma Net Revenue |
$ | 261,723 | $ | 225,598 | $ | 740,476 | $ | 633,820 | ||||||||
Pro forma adjustment for revenue share post-IPO |
| | | 41,263 | ||||||||||||
|
|
|
|
|
|
|
|
|||||||||
Net Revenue |
$ | 261,723 | $ | 225,598 | $ | 740,476 | $ | 675,083 | ||||||||
|
|
|
|
|
|
|
|
|||||||||
Reconciliation of Net Income to Adjusted EBITDA and Reconciliation of Segment Adjusted EBITDA to Income Before Income Taxes: |
||||||||||||||||
Net income |
$ | 72,029 | $ | 101,980 | $ | 202,724 | $ | 265,985 | ||||||||
Pro forma adjustment for revenue share post-IPO |
| | | (41,263 | ) | |||||||||||
Interest and investment income, net |
(204 | ) | (400 | ) | (517 | ) | (641 | ) | ||||||||
Income tax expense |
2,026 | 9,413 | 12,107 | 24,461 | ||||||||||||
Depreciation and amortization |
11,538 | 9,396 | 33,107 | 26,952 | ||||||||||||
Amortization of purchased intangible assets |
2,554 | 802 | 6,598 | 2,158 | ||||||||||||
|
|
|
|
|
|
|
|
|||||||||
EBITDA |
87,943 | 121,191 | 254,019 | 277,652 | ||||||||||||
Stock-based compensation |
7,285 | 6,299 | 21,129 | 13,118 | ||||||||||||
Acquisition related expenses |
2,863 | 984 | 6,408 | 1,303 | ||||||||||||
Strategic and financial restructuring expenses |
2 | 733 | 1,281 | 3,614 | ||||||||||||
Loss (gain) on investment |
1,000 | (37,850 | ) | 1,000 | (37,850 | ) | ||||||||||
Adjustment to tax receivable agreement liability |
1,073 | | | | ||||||||||||
Acquisition related adjustment - deferred revenue |
3,563 | | 9,224 | | ||||||||||||
Other expense (income), net |
16 | (52 | ) | 10 | (56 | ) | ||||||||||
|
|
|
|
|
|
|
|
|||||||||
Adjusted EBITDA |
$ | 103,745 | $ | 91,305 | $ | 293,071 | $ | 257,781 | ||||||||
|
|
|
|
|
|
|
|
|||||||||
Segment Adjusted EBITDA: |
||||||||||||||||
Supply Chain Services |
$ | 101,600 | $ | 91,477 | $ | 290,210 | $ | 302,076 | ||||||||
Pro forma adjustment for revenue share post-IPO |
| | | (41,263 | ) | |||||||||||
|
|
|
|
|
|
|
|
|||||||||
Supply Chain Services (including pro forma adjustment) |
$ | 101,600 | $ | 91,477 | $ | 290,210 | $ | 260,813 | ||||||||
Performance Services |
26,166 | 20,307 | 67,717 | 54,367 | ||||||||||||
Corporate |
(24,021 | ) | (20,479 | ) | (64,856 | ) | (57,399 | ) | ||||||||
|
|
|
|
|
|
|
|
|||||||||
Adjusted EBITDA |
$ | 103,745 | $ | 91,305 | $ | 293,071 | $ | 257,781 | ||||||||
Depreciation and amortization |
(11,538 | ) | (9,396 | ) | (33,107 | ) | (26,952 | ) | ||||||||
Amortization of purchased intangible assets |
(2,554 | ) | (802 | ) | (6,598 | ) | (2,158 | ) | ||||||||
Stock-based compensation |
(7,285 | ) | (6,299 | ) | (21,129 | ) | (13,118 | ) | ||||||||
Acquisition related expenses |
(2,863 | ) | (984 | ) | (6,408 | ) | (1,303 | ) | ||||||||
Strategic and financial restructuring expenses |
(2 | ) | (733 | ) | (1,281 | ) | (3,614 | ) | ||||||||
Adjustment to tax receivable agreement liability |
(1,073 | ) | | | | |||||||||||
Acquisition related adjustment - deferred revenue |
(3,563 | ) | | (9,224 | ) | | ||||||||||
Equity in net income of unconsolidated affiliates |
(5,197 | ) | (3,566 | ) | (14,812 | ) | (12,171 | ) | ||||||||
Deferred compensation plan (income) expense |
(759 | ) | | 209 | | |||||||||||
|
|
|
|
|
|
|
|
|||||||||
68,911 | 69,525 | 200,721 | 198,465 | |||||||||||||
Pro forma adjustment for revenue share post-IPO |
| | | 41,263 | ||||||||||||
|
|
|
|
|
|
|
|
|||||||||
Operating income |
$ | 68,911 | $ | 69,525 | $ | 200,721 | $ | 239,728 | ||||||||
|
|
|
|
|
|
|
|
|||||||||
Equity in net income of unconsolidated affiliates |
5,197 | 3,566 | 14,812 | 12,171 | ||||||||||||
Interest and investment income, net |
204 | 400 | 517 | 641 | ||||||||||||
(Loss) gain on investment |
(1,000 | ) | 37,850 | (1,000 | ) | 37,850 | ||||||||||
Other income (expense), net |
743 | 52 | (219 | ) | 56 | |||||||||||
|
|
|
|
|
|
|
|
|||||||||
Income before income taxes |
$ | 74,055 | $ | 111,393 | $ | 214,831 | $ | 290,446 | ||||||||
|
|
|
|
|
|
|
|
|||||||||
Reconciliation of Non-GAAP Pro Forma Adjusted Fully Distributed Net Income: |
||||||||||||||||
Net income attributable to shareholders |
$ | 12,209 | $ | 13,525 | $ | 30,753 | $ | 19,453 | ||||||||
Pro forma adjustment for revenue share post-IPO |
| | | (41,263 | ) | |||||||||||
Income tax expense |
2,026 | 9,413 | 12,107 | 24,461 | ||||||||||||
Stock-based compensation |
7,285 | 6,299 | 21,129 | 13,118 | ||||||||||||
Acquisition related expenses |
2,863 | 984 | 6,408 | 1,303 | ||||||||||||
Strategic and financial restructuring expenses |
2 | 733 | 1,281 | 3,614 | ||||||||||||
Loss (gain) on investment |
1,000 | (37,850 | ) | 1,000 | (37,850 | ) | ||||||||||
Adjustment to tax receivable agreement liability |
1,073 | | | | ||||||||||||
Acquisition related adjustment - deferred revenue |
3,563 | | 9,224 | | ||||||||||||
Amortization of purchased intangible assets |
2,554 | 802 | 6,598 | 2,158 | ||||||||||||
Net income attributable to noncontrolling interest in Premier LP |
59,568 | 87,925 | 170,135 | 246,055 | ||||||||||||
|
|
|
|
|
|
|
|
|||||||||
Non-GAAP pro forma adjusted fully distributed income before income taxes |
92,143 | 81,831 | 258,635 | 231,049 | ||||||||||||
Income tax expense on fully distributed income before income taxes |
36,857 | 32,732 | 103,454 | 92,420 | ||||||||||||
|
|
|
|
|
|
|
|
|||||||||
Non-GAAP Pro Forma Adjusted Fully Distributed Net Income |
$ | 55,286 | $ | 49,099 | $ | 155,181 | $ | 138,629 | ||||||||
|
|
|
|
|
|
|
|
* | Note that no pro forma adjustments were made for the three and nine months ended March 31, 2015 and the three months ended March 31, 2014; as such, actual results are presented for each of these periods. |
Premier, Inc. FY15 Q3 Results
Page 13 of 14
Supplemental Financial Information - Reporting of Non-GAAP Free Cash Flow
Reconciliation of Selected Non-GAAP Measures to GAAP Measures
(Unaudited)
(In thousands)
Three Months Ended March 31, |
||||||||
2015 | 2014 | |||||||
Reconciliation of Non-GAAP Free Cash Flow to Net Cash Provided by Operating Activities: |
| |||||||
Net cash provided by operating activities |
$ | 101,860 | $ | 90,173 | ||||
Purchases of property and equipment |
(18,653 | ) | (13,823 | ) | ||||
Distributions to limited partners |
(23,701 | ) | (17,419 | ) | ||||
|
|
|
|
|||||
Non-GAAP free cash flow |
$ | 59,506 | $ | 58,931 | ||||
|
|
|
|
|||||
Non-GAAP Adjusted EBITDA |
$ | 103,745 | $ | 91,305 | ||||
|
|
|
|
|||||
57 | % | 65 | % |
Premier, Inc. FY15 Q3 Results
Page 14 of 14
Supplemental Financial Information - Reporting of Net Income and Earnings Per Share
Reconciliation of Selected Non-GAAP Measures to GAAP Measures
(Unaudited)
(In thousands, except per share data)
Three Months Ended March 31, |
Nine Months Ended March 31, |
|||||||||||||||
2015* | 2014* | 2015* | 2014 | |||||||||||||
Reconciliation of numerator for GAAP EPS to Non-GAAP EPS on Adjusted Fully Distributed Net Income |
||||||||||||||||
Net income (loss) attributable to shareholders after adjustment of redeemable limited partners capital to redemption amount |
$ | (374,853 | ) | $ | 509,239 | $ | (781,216 | ) | $ | (3,204,645 | ) | |||||
Adjustment of redeemable limited partners capital to redemption amount |
387,062 | (495,714 | ) | 811,969 | 3,224,098 | |||||||||||
|
|
|
|
|
|
|
|
|||||||||
Net income attributable to shareholders |
12,209 | 13,525 | 30,753 | 19,453 | ||||||||||||
Pro forma adjustment for revenue share post-IPO |
| | | (41,263 | ) | |||||||||||
Income tax expense |
2,026 | 9,413 | 12,107 | 24,461 | ||||||||||||
Stock-based compensation |
7,285 | 6,299 | 21,129 | 13,118 | ||||||||||||
Acquisition related expenses |
2,863 | 984 | 6,408 | 1,303 | ||||||||||||
Strategic and financial restructuring expenses |
2 | 733 | 1,281 | 3,614 | ||||||||||||
Loss (gain) on investment |
1,000 | (37,850 | ) | 1,000 | (37,850 | ) | ||||||||||
Adjustment to tax receivable agreement liability |
1,073 | | | | ||||||||||||
Acquisition related adjustment - deferred revenue |
3,563 | | 9,224 | | ||||||||||||
Amortization of purchased intangible assets |
2,554 | 802 | 6,598 | 2,158 | ||||||||||||
Net income attributable to noncontrolling interest in Premier LP |
59,568 | 87,925 | 170,135 | 246,055 | ||||||||||||
|
|
|
|
|
|
|
|
|||||||||
Non-GAAP pro forma adjusted fully distributed income before income taxes |
92,143 | 81,831 | 258,635 | 231,049 | ||||||||||||
Income tax expense on fully distributed income before income taxes |
36,857 | 32,732 | 103,454 | 92,420 | ||||||||||||
|
|
|
|
|
|
|
|
|||||||||
Non-GAAP pro forma adjusted fully distributed net income |
$ | 55,286 | $ | 49,099 | $ | 155,181 | $ | 138,629 | ||||||||
|
|
|
|
|
|
|
|
|||||||||
Reconciliation of denominator for GAAP EPS to Non-GAAP Adjusted Fully Distributed Net Income |
||||||||||||||||
Weighted Average: |
||||||||||||||||
Common shares used for basic and diluted earnings per share |
37,316 | 32,375 | 35,066 | 23,394 | ||||||||||||
Potentially dilutive shares |
1,148 | 181 | 845 | 100 | ||||||||||||
Class A common shares outstanding |
| | | 8,981 | ||||||||||||
Conversion of Class B common units |
106,706 | 112,608 | 109,184 | 112,608 | ||||||||||||
|
|
|
|
|
|
|
|
|||||||||
Weighted average fully distributed shares outstanding - diluted |
145,170 | 145,164 | 145,095 | 145,083 | ||||||||||||
|
|
|
|
|
|
|
|
|||||||||
Reconciliation of GAAP EPS to Adjusted Fully Distributed EPS |
||||||||||||||||
GAAP earnings (loss) per share |
$ | (10.05 | ) | $ | 15.73 | $ | (22.28 | ) | $ | (136.99 | ) | |||||
Impact of adjustment of redeemable limited partners capital to redemption amount |
$ | 10.37 | $ | (15.31 | ) | $ | 23.16 | $ | 137.82 | |||||||
Impact of additions: |
||||||||||||||||
Pro forma adjustment for revenue share post-IPO |
$ | | $ | | $ | | $ | (1.76 | ) | |||||||
Income tax expense |
$ | 0.05 | $ | 0.29 | $ | 0.35 | $ | 1.05 | ||||||||
Stock-based compensation |
$ | 0.20 | $ | 0.19 | $ | 0.60 | $ | 0.56 | ||||||||
Acquisition related expenses |
$ | 0.08 | $ | 0.03 | $ | 0.18 | $ | 0.06 | ||||||||
Strategic and financial restructuring expenses |
$ | 0.00 | $ | 0.02 | $ | 0.04 | $ | 0.15 | ||||||||
Loss (gain) on investment |
$ | 0.03 | $ | (1.17 | ) | $ | 0.03 | $ | (1.62 | ) | ||||||
Adjustment to tax receivable agreement liability |
$ | 0.03 | $ | | $ | | $ | | ||||||||
Acquisition related adjustment - deferred revenue |
$ | 0.10 | $ | | $ | 0.26 | $ | | ||||||||
Amortization of purchased intangible assets |
$ | 0.07 | $ | 0.02 | $ | 0.19 | $ | 0.09 | ||||||||
Net income attributable to noncontrolling interest in Premier LP |
$ | 1.60 | $ | 2.72 | $ | 4.85 | $ | 10.52 | ||||||||
Impact of corporation taxes |
$ | (0.99 | ) | $ | (1.01 | ) | $ | (2.95 | ) | $ | (3.95 | ) | ||||
Impact of increased share count |
$ | (1.11 | ) | $ | (1.17 | ) | $ | (3.36 | ) | $ | (4.97 | ) | ||||
|
|
|
|
|
|
|
|
|||||||||
Non-GAAP earnings per share on adjusted fully distributed net income - diluted |
$ | 0.38 | $ | 0.34 | $ | 1.07 | $ | 0.96 | ||||||||
|
|
|
|
|
|
|
|
* | Note that no pro forma adjustments were made for the three and nine months ended March 31, 2015 and the three months ended March 31, 2014; as such, actual results are presented for each of these periods. |
# # #
Exhibit 99.2
FISCAL 2015 THIRD QUARTER CONFERENCE CALL TRANSCRIPT
May 11, 2015 / 05:00 PM EDT
On May 11, 2015, Premier, Inc. hosted a conference call to discuss financial results for the fiscal 2015 third quarter, ended March 31, 2015. The following transcript is an interpretation of the statements made on the call. The actual conference call may have differed slightly.
CORPORATE PARTICIPANTS
Jim Storey Premier, Inc. VP of IR
Susan DeVore Premier, Inc. President & CEO
Mike Alkire Premier, Inc. COO
Craig McKasson Premier, Inc. CFO
Keith Figlioli Premier, Inc. SVP Healthcare Informatics
CONFERENCE CALL PARTICIPANTS
Ryan Daniels William Blair & Company Analyst
Jamie Stockton Wells Fargo Securities Analyst
Elizabeth Blake BofA Merrill Lynch Analyst
Lisa Gill JPMorgan Analyst
Donald Hooker KeyBanc Capital Markets Analyst
Michael Cherny ISI Analyst
Nicholas Jansen Raymond James Analyst
Sean Dodge Jefferies & Co. Analyst
Richard Close Avondale Partners Analyst
Sean Wieland Piper Jaffray Analyst
Gene Mannheimer Topeka Capital Markets Analyst
PRESENTATION
Operator
Good afternoon and welcome to the Premier, Inc. fiscal 2015 third-quarter results and conference call.
(Operator Instructions)
It is now my pleasure to introduce todays host, Jim Storey. Please begin.
Jim Storey Premier, Inc. VP of IR
Thank you operator and welcome everyone to Premier, Inc.s fiscal 2015 third-quarter conference call. Our speakers today are Susan DeVore, President and Chief Executive Officer; Mike Alkire, Chief Operating Officer; and Craig McKasson, Chief Financial Officer. Susan, Mike and Craig will review the quarters performance and discuss the outlook for the remainder of our fiscal year.
PREMIER, INC.
Fiscal 2015 Third Quarter Conference Call Transcript
Page 2 of 21
Before we get started, I wanted to remind everyone that copies of our press release and the supplemental slides accompanying this conference call are available in the Investor Relations section of our website at investors.premierinc.com. Managements remarks today contain certain forward-looking statements and actual results could differ materially from those discussed today. These forward-looking statements speak as of today and we undertake no obligation to update them. Factors that might affect future results are discussed in our filings with the SEC, including our most recent Form 10-K, and we encourage you to review these detailed Safe Harbor and risk factor disclosures.
Please also note that where appropriate, we will refer to non-GAAP financial measures such as adjusted EBITDA, segment adjusted EBITDA, adjusted fully distributed earnings per share and free cash flow, to evaluate our business. During this discussion we will also be comparing current year-to-date results with last years results on a non-GAAP pro forma basis, since our Company had not completed its reorganization and IPO until after last years first quarter.
Comparisons made in accordance with GAAP do not reflect the impact of the reorganization and IPO and therefore management believes they do not provide meaningful year-over-year comparisons. Reconciliations of non-GAAP financial measures to GAAP financial measures are included in our earnings release in the appendix of the supplemental slides accompanying this presentation, and in our Form 8-K filing with the SEC, which we expect will be soon. Now, let me turn the call over to Susan DeVore.
Susan DeVore Premier, Inc. President & CEO
Thanks, Jim, and hello everyone. Ill start off with an overview of our fiscal third-quarter performance and our expectations for the remainder of the year, ending June 30. As well as provide comments on some important changes in the environment that we expect to positively impact our business over the long run. Mike will then discuss our ongoing operational achievements and Craig will walk you through our third-quarter financials and revised outlook in more detail.
Before we begin, I want to remind you that Premier was developed, and it remains majority-owned by, healthcare provider systems. Our products and services are developed in close collaboration with our provider members and overall we believe this provider-centric co-innovative alignment drives consistent and increasing demand for the solutions we develop, and it positions Premier to deliver exceptional value and growth over the long run. Now lets review our strong third-quarter financial performance.
Year-over-year consolidated net revenue increased by 16%, driven by 15% growth in Supply Chain Services and a 19% gain in Performance Services. Consolidated adjusted EBITDA increased 14% and adjusted fully distributed earnings per share rose 13%. Our Supply Chain Services segment outperformed managements expectations. Due both to a strong 9.1% year-over-year increase in net administrative fees revenue from our group purchasing organization and continuing momentum in our direct sourcing and specialty pharmacy businesses, which drove a 25% rise in product revenue.
Turning to Performance Services now, we increased revenue in that segment 19% from a year ago. We also finished the quarter with solid bookings and a robust sales pipeline. And looking at our overall business, we are on track to achieve a 99% retention rate in our GPO business and a 94% SaaS-based institutional renewal rate for our fiscal year ending June 30.
As a result of our third-quarter performance and based on our expectations and assumptions for the remainder of the year, we are raising our full-year revenue and adjusted EBITDA guidance ranges. Craig will provide more specifics on guidance in a few minutes. We believe that Premiers continued strong financial performance and outlook are based on our unique role as a provider-led healthcare improvement company.
As an example, we are continually extending our PremierConnect platform across domains that align our capabilities with the performance improvement imperatives of our members in the areas of cost reduction, quality and safety improvement and population health management. Each PremierConnect domain offers distinct capabilities and when pulled together, they deliver a comprehensive view of total performance improvement opportunities across the health system. Add to this our wraparound advisory services, our performance improvement collaboratives, our Supply Chain Services offerings and we believe Premier is uniquely positioned to lead our members through the transformative changes sweeping our industry.
PREMIER, INC.
Fiscal 2015 Third Quarter Conference Call Transcript
Page 3 of 21
From Washingtons shift in support of HIT interoperability, to recent legislation propelling our industry into alternate payment models and population health, developments are occurring that we believe will require healthcare providers to adopt a comprehensive approach to the technologies and services that Premier provides, in order for them to succeed in this rapidly evolving environment. Just weeks ago, for instance, we witnessed the passage of federal legislation that permanently reforms the way Medicare pays for physician services, called the Medicare Access and CHIP Reauthorization Act of 2015, or MACRA. This legislation retires the flawed sustainable growth rate, SGR formula, and creates new incentives designed to encourage physicians now to move toward risk-based, alternate provider payment models, such as episodic bundled payments, shared savings and global payments.
We believe this legislation will spark greater participation in these models, ensuring that providers across the care continuum are all working together toward the aligned goals of high-quality and cost-effective care. We also believe this is a watershed event. When coupled with the recent Health and Human Services announced objective to shift up to 50% of Medicare payments to alternative models by 2018, this legislation also validates our position that advanced payment models are here to stay. And they will become the new standard.
We expect physicians and their professional groups will begin moving away from fee-for-service, ramping up efforts to join existing alternative payment programs, and collaborating with health systems to build the necessary infrastructure to take on risk and succeed in this fast approaching payment reform environment. Also, notably included in this legislation is a requirement to achieve EHR system interoperability which is also foundational to the most recent meaningful use proposed changes, enabling healthcare providers to access and use data that is currently locked in these EHR systems.
So, we at Premier have seen this transformation coming for years and weve been preparing for it for just as long. In fact, today we have nearly 400 hospitals across 30 states participating in our population health collaboratives, and our bundled payments collaborative which focuses on the capabilities necessary to successfully function under the episodic bundled payment model, includes approximately 120 hospitals, spanning 27 states. Members in these collaboratives leverage our PremierConnect, SaaS-based solutions to identify and replicate and scale success.
We also provide the health data analytics, the benchmarking and dedicated advisory services to support development and implementation of these capabilities. So weve been a pioneer in the development of data-driven performance improvement collaboratives and technologies, focused on alternative payment models and accountable care organizations. And our efforts have earned us recognition by KLAS as the leader in Population Health Management advisory services.
Our role has always been to serve as a strategic and operational extension of our member health systems, optimizing performance today and helping prepare for the future. As this industry-changing legislation further defines and accelerates the future of healthcare, we believe it will also afford us new opportunities to innovate and lead, to provide value to our members and to drive future growth for our Company. With that, let me turn the call over to Mike Alkire, our Chief Operating Officer.
Mike Alkire Premier, Inc. COO
Thanks Susan and welcome everyone to our conference call. Looking at our performance, from an operating perspective, we are very pleased with the third quarter. I believe our growing track record of achievements and member collaboration demonstrates that Premier is very well-positioned, as an industry leader, to capitalize on the transformational changes impacting our nations healthcare systems.
I want to start off by providing an update on my comment from our last call. When I noted that we were finalizing plans with one of the largest integrated delivery networks in the country to implement PremierConnect Enterprise. Im extremely excited to announce that the Denver-based Catholic Health Initiatives signed on for PremierConnect Enterprise in our third quarter.
Catholic Health Initiatives plans to use this broad capability to establish a single source for consistent, integrated quality reporting at the system, divisional, facility and physician level. And also to identify quality improvement opportunities and measures that measure the ongoing effectiveness of its quality improvement programs. CHI becomes the 11th member organization to join Premiers Data Alliance Collaborative, and were excited about working with them on PremierConnect Enterprise. Which as most of you know, is one of the domains of our PremierConnect platform.
PREMIER, INC.
Fiscal 2015 Third Quarter Conference Call Transcript
Page 4 of 21
Turning now to our third-quarter performance. As Susan noted, our Supply Chain Services business performed above managements expectations in the third quarter. And as Craig will discuss shortly, it is the driver behind our increased guidance for the full year.
In our GPO business, the 9.1% net administrative fee revenue growth was driven by continuing contract penetration among our existing members and by recruitment and conversion of new members. This growth was further amplified by the improved patient utilization trend that our members have been experiencing in recent quarters. A trend that we believe is being supported by the improving economy, as well as expanding healthcare coverage under the Affordable Care Act.
Within the segment I want to further discuss our rapidly growing direct sourcing and specialty pharmacy businesses that we launched a few years ago in collaboration with our members. Together, these businesses achieved 25% revenue growth in the third quarter and are up 35% year-over-year for the nine months of this fiscal year. Our direct sourcing business has achieved remarkable growth by helping our members achieve double-digit savings on basic commodity products, and our specialty pharmacy business has also delivered double-digit revenue growth. Both by adding members to the program and through expansion of the therapies we manage.
We believe revenue growth of both businesses will normalize as they mature. At the same time, we expect specialty pharmacy to play an expanding role in our business, as health systems increasingly move to population health models, where there is an even greater need to manage the chronic, high-cost patients that require specialty therapies and are the largest consumers of healthcare. This, combined with the sheer volume of the high cost therapies that continues to enter the market, has made specialty pharmacy management a strategic priority for many of our health systems.
As such, we are continuing to build out our clinical and information technology infrastructure to provide differentiated programs and tools to our member health systems and their patients to improve quality, patient satisfaction and health outcomes. We have seen strong uptake with new members utilizing our specialty pharmacy program in the past year.
Now I want to discuss PremierConnect Supply Chain, our new SaaS-based offering on the PremierConnect platform. We launched it in March and we believe this is a breakthrough solution that is also more cost effective to implement when compared with other competitive offerings in the marketplace. Overall, we believe it will further disrupt the Supply Chain and strongly position Premier for future growth, in both our Supply Chain and Performance Services businesses.
Let me briefly walk through this innovative offering with you. PremierConnect Supply Chain is designed to enable health systems to manage the entire procurement process across their acute and ambulatory settings. Powered by our development initiatives, as well as our recent Aperek acquisition, it allows for seamless integration across existing platforms while also providing the capability of a complete end-to-end procurement solution.
Using PremierConnect Supply Chain, members can manage every aspect of the procurement lifecycle and 100% of their purchasing, including both GPO and non-GPO spending. This integrated solution provides real-time supply analytics that look at the total supply chain spend by facility, by physician, by site and by service line. This enables more comprehensive visibility to cost throughout the health system and the ability to analyze and take action on usage patterns across all areas.
It also provides online sourcing and contract management, customizable catalog management and for those who need it, a full ERP materials management system that enables users to plan, buy, receive, pay and manage the procurement process across all sites of care. We believe we are the only company in our space that has this offering with these integrated capabilities.
PremierConnect Supply Chain has been tested and adopted by several major health systems and hospitals, including HonorHealth, formally Scottsdale Lincoln and Scottsdale Arizona; Venice Health in Roseville, California; Fairview Health Services in Minneapolis; Memorial Healthcare System in Hollywood, Florida; Mount Sinai Medical Center in South Florida; and Atlantic General Hospital in Maryland. We are currently implementing PremierConnect Supply Chain in a number of other systems across our member channel and it continues to be instrumental in winning our all-in business and expanding our relationships. We believe it is an innovative differentiator and just one of the strategic tools were using to disrupt the healthcare supply chain, drive revenue growth and continue to distinguish Premier as a marketplace leader in years to come.
PREMIER, INC.
Fiscal 2015 Third Quarter Conference Call Transcript
Page 5 of 21
Moving to Performance Services, given what Susan noted about the new health-care legislation, we believe provider demand for our services will increase as they seek to align with physicians and develop the necessary clinically integrated networks and alternate payment models that will enable success in this changing environment. Just a few recent examples of healthcare systems working with Premier to establish clinically integrated networks are North Shore LIJ Health System of New York, which has more than 12,000 affiliated physicians in 19 hospitals; LifeBridge Health of Baltimore, with more than 600 network physicians; and Innovative Health Alliance, an accountable care organization in Albany, New York working with a network of more than 300 physicians.
We have strong continuing provider interest in our alternate payment model and clinically integrated network capabilities, and we believe this interest will accelerate still further in the months and years to come, as the nations health care systems shift to the new payment models. Finally, the high cost physician preference arena remains a significant area of focus among our members. Evidenced by the continuing growth in our SYMMEDRx business. In the third quarter, SYMMEDRx teamed up with one of our large academic member health systems to achieve savings of approximately 24% on the purchase of medical devices related to just one disease state. During the quarter, SYMMEDRx also entered into a three-year agreement with the Greater New York Hospital Association, to provide comprehensive data analysis and advisory support to help drive savings across all disease states. Greater New York Hospital Association is one of our largest member owners and we work together to address the challenges of cost reduction, quality and safety improvement and population health management.
Thank you for your time today. Now let me turn the call over to Craig McKasson, our Chief Financial Officer.
Craig McKasson Premier, Inc. CFO
Thanks, Mike. As Susan and Mike already stated, we are very pleased with our fiscal third-quarter financial results, which included double-digit year-over-year consolidated revenue, adjusted EBITDA and adjusted fully distributed earnings per share growth. This was driven by strong revenue contribution from our Supply Chain Services segment and Performance Services segment results that were consistent with our expectations.
As a result of our year-to-date performance and our outlook for the fourth quarter, we are increasing consolidated revenue and adjusted EBITDA guidance for the full fiscal year ending June 30, 2015. Now lets review the quarter in more detail. Consolidated net revenues of $261.7 million increased 16% from year ago. These results are comprised of $192.1 million in net revenue from our Supply Chain Services business segment, up 15% year-over-year, and $69.6 million in revenue from Performance Services, up 19% over the prior year.
Looking at the segment level, the 15% revenue growth in Supply Chain Services exceeded our expectations and was driven by our core GPO business where net administrative fees revenue increased 9.1%, largely driven by contract penetration in both acute and alternate site members and the continuing impact from the recruitment and conversion of new members. This growth was further amplified by the improved patient utilization trends that Mike mentioned a few minutes ago.
In addition, our third-quarter net administrative fees revenue growth also benefited from some earlier than anticipated vendor reporting. Our GPO is subject to quarterly fluctuations in net administrative fees revenue, due to periodic variability based on the timing of when cash and vendor reports are received.
Our direct sourcing and specialty pharmacy product businesses combined to produce 25% top line growth in the quarter from a year ago. An increase that represents a more normalized pace than in previous quarters, which we have anticipated as these relatively new businesses continue to expand. Both businesses benefited from ongoing expansion of member support. Our direct sourcing revenue growth was fueled by demand for high-quality products at a reduced cost and our specialty pharmacy business continued to gain momentum, driven by increased member participation and expanding product uses, in particular the new hepatitis C therapies.
PREMIER, INC.
Fiscal 2015 Third Quarter Conference Call Transcript
Page 6 of 21
In Performance Services, the 19% revenue increase was consistent with our expectations and resulted from continued growth of our PremierConnect SaaS-based subscriptions and renewals, which historically account for approximately 60% of total segment revenue. Additionally, our advisory services business delivered growth led by engagements tied to the areas of cost management, population health, physician preference and capital equipment planning.
Consolidated adjusted EBITDA of $103.7 million for the quarter represents a 14% increase from a year ago, with Supply Chain Services increasing 11% and Performance Services up 29%. The increase in Supply Chain Services adjusted EBITDA predominantly reflects the growth in net administrative fees revenue, as well as continued expansion of our direct sourcing activities. The growth in Performance Services adjusted EBITDA was primarily the result of new PremierConnect SaaS-based subscription sales and the effective management of operating expenses.
Our adjusted EBITDA growth was strong in the quarter. The change in our EBITDA margin reflects our ongoing sales mix shift within Supply Chain Services, where an increasing proportion of segment revenue is being generated from the direct sourcing and specialty pharmacy businesses. We do expect this trend to normalize over time as these newer businesses continue to mature.
Looking at bottom-line performance, non-GAAP pro forma adjusted fully distributed net income totaled $55.3 million for the quarter or $0.38 per fully diluted share, compared with $49.1 million or $0.34 per share last year. As I previously discussed, because of our corporate structure and quarterly member owner share exchange process, we guide to adjusted fully distributed earnings per share. This non-GAAP measure calculates income taxes at 40% on pretax income, assuming the entire company is a taxable C Corporation and further assumes that all of the Companys Class A and Class B common shares are held by the public and included in the share count determination.
From a liquidity and balance sheet perspective, cash flow from operations in the quarter increased 13% to $101.9 million and for the first nine months of fiscal 2015, totaled $255.6 million. This is lower than the same nine-month period last year, primarily due to the addition of member owner revenue share, as a result of the reorganization and IPO, effective October 1, 2013. For the fiscal third quarter, free cash flow which we define as cash provided by operating activities less distributions to limited partners and purchases of property and equipment, was $59.5 million. The high level of free cash flow relative to adjusted EBITDA in the third quarter is largely attributable to the strong performance in our Supply Chain Services segment.
At March 31, 2015, our cash, cash equivalents and short and long-term marketable securities totaled approximately $503.3 million. We also ended the quarter with no outstanding borrowings on our five-year $750 million revolving credit facility. We believe that we are in excellent position to deploy capital to help provide solutions for our member needs and drive our strategic growth objectives, and we continue to evaluate an active pipeline of potential acquisition opportunities.
Now lets turn to our expectations for fiscal 2015. We are raising our outlook for fiscal full-year consolidated net revenue and adjusted EBITDA, based on the continued strength in our Supply Chain Services segment. Our revised guidance reflects our third-quarter performance and our expectations and assumptions for the remainder of the year, as discussed on this call and included in our earnings release.
For the full year, we now expect Supply Chain Services revenue to grow 13% to 15%, driven by 27% to 32% growth in our products businesses and 6% to 7% growth in net administrative fees revenue. We continue to expect Performance Services revenue to grow 15% to 18%. As a result we have revised guidance as follows. Total net revenue is expected to grow 14% to 16%, to between $988 million and $1.008 billion, which is an increase in the previous range.
Non-GAAP adjusted EBITDA is forecast to grow 9% to 12% to between $384 million and $392 million, which also raises the previous range. And non-GAAP adjusted fully distributed earnings per share is expected to grow 8% to 11%, to between $1.40 and $1.44, which remains unchanged from the previous guidance range.
Finally, let me provide a quick update on our recent quarterly exchange which took place on April 30. Approximately 276,000 Class B units were exchanged into Class A common shares, following the right of first refusal process in which non-exchanging member owners can purchase Class B units being offered for exchange. Our next quarterly exchange will occur on July 31. With that, let me turn the call back over to Susan.
PREMIER, INC.
Fiscal 2015 Third Quarter Conference Call Transcript
Page 7 of 21
Susan DeVore Premier, Inc. President & CEO
Thanks Craig. Before opening the call for questions I want to briefly expand on Craigs comments related to our capital deployment strategy. Acquisitions play an important role in our future and we continue to evaluate many opportunities in front of us. We do so focused on innovative and unique solutions and using a disciplined, well-defined due diligence process, to help ensure acquisitions perform as expected and provide a measurable return on investment over time.
As we have stated in the past we will evaluate potential acquisitions of all sizes including strategic tuck-ins that can be expanded through our member channel, as well as those that would be considered transformative, allowing us to establish or expand footholds in areas of the business that serve the needs of our health systems. So with that operator, you may now open the call for questions.
QUESTION AND ANSWER
Operator
(Operator Instructions)
Ryan Daniels, William Blair.
Ryan Daniels William Blair & Company Analyst
Yes guys, thanks for taking the questions. Mike, maybe I will start with one for you, congrats on the larger Premier Enterprise Connect deal with Catholic Health Initiatives. Can you talk a little bit about how that will be rolled out, when we might see that flow into the Performance Services revenue line, just any color there?
Mike Alkire Premier, Inc. COO
Well you know, let me just take a first pass and then I will ask Keith and Craig to weigh in. Its already in the guidance in terms of the revenue thats associated with it. From a technology standpoint Keith do you want to weigh in?
Craig McKasson Premier, Inc. CFO
Financially Ryan, this is Craig. As we have talked about in the past with PremierConnect Enterprise engagements, they dont have a long implementation period, so as Mike indicated we will start to see contributions from that in the fourth quarter and obviously moving into 2016. And continue to have opportunities with that relationship with Catholic Health Initiatives to expand our footprint there in terms of the capabilities we are providing them, in order to manage their quality improvement programs and the opportunities they are trying to identify within their system.
Ryan Daniels William Blair & Company Analyst
Okay great, and Mike, I meant to say Mike for this one, you mentioned PremierConnect Supply Chain and highlighted six clients that you have already. So maybe its too early given the recent launch, but number one, how quickly do you think that can roll out to the rest of the client base? And then number two, Im curious with the six accounts already using it if youve seen any changes in contract compliance or their behavior at all?
PREMIER, INC.
Fiscal 2015 Third Quarter Conference Call Transcript
Page 8 of 21
Mike Alkire Premier, Inc. COO
So we just, obviously just launched the program so we are already in the process of rolling it out. Obviously were seeing a lot of interest in it. As a part of the rollout we have wraparound services and capabilities from our field that analyze the data and look for that off-contract usage. I dont expect that you are just due to timing of us identifying those opportunities and by the time that we actually see that in terms of cash, it will be a few months before we actually see the uptake in the admin fees for any opportunities for contract penetrations.
Ryan Daniels William Blair & Company Analyst
Okay, that makes sense. And last one and I will hop off, and Susan this one I guess is for you. You talked a lot about the movement towards advanced payment models and Im curious if you looked at any of your IDMs with any higher risk-based reimbursements and try to determine what that has done to the GPO business. Meaning if their goal is really to reduce utilization and drive population health, is that having an impact on your GPO business and utilization there? Thanks
Susan DeVore Premier, Inc. President & CEO
Thanks Ryan. I think what we see on the population health front is as they move to these advanced payment models, it does create cost pressure. But also incents them to provide the care in the parts of their integrated delivery systems that are the most effective clinically and most efficient. And a lot of the more advanced health systems are moving to centralized purchasing where the buying for supplies is being done for all their physicians, all their affiliated entities, whether they are owned or not, and their hospitals and their surgery centers.
So we actually see it as a movement around the integrated delivery system to the right setting. And our utilization data for the last quarter would indicate that both inpatient and outpatient utilization is up, even in the world of population health and even in the world of population health for our advanced health systems. I think its demographics. I think its the exchanges. I think its the Affordable Care Act. I think its chronic conditions, but thats what we are seeing.
Ryan Daniels William Blair & Company Analyst
Okay, very helpful, thank you.
Susan DeVore Premier, Inc. President & CEO
Thank you.
Operator
Jamie Stockton, Wells Fargo.
Susan DeVore Premier, Inc. President & CEO
Hi Jamie
Jamie Stockton Wells Fargo Analyst
Good evening, thanks for taking my questions. I guess maybe the first one, Craig your comment about the GPO business, the acceleration of some fees during the quarter, if I look at kind of the implied guidance for the June quarter, would you say that $4 million of revenue in the March quarter might have been a decent number as far as the impact of that acceleration?
PREMIER, INC.
Fiscal 2015 Third Quarter Conference Call Transcript
Page 9 of 21
Craig McKasson Premier, Inc. CFO
Jamie, thats in the relative ballpark in terms of what we typically have is a obviously the way that we recognize revenue from an administrative fees perspective is when we receive the payment and the associated supplier report from the manufacturer to substantiate the payment that we receive. Sometimes the receipt of those can cross over the quarters. It tends to be potentially up to 1% or 2% variability and we did have some benefit from that in the third quarter
Jamie Stockton Wells Fargo Analyst
Should we interpret essentially those fees as being pulled from the June quarter?
Craig McKasson Premier, Inc. CFO
Thats correct.
Jamie Stockton Wells Fargo Analyst
Okay. And then maybe Susan just one quick one, I know you talked about the M&A picture. We obviously saw a lot of activity here in the last few months with moves that players like IBM have made in the space. You have a growing cash balance. I know you are being disciplined about the way you approach M&A. I guess maybe if you could just help us understand internally how you guys see the trade-off between purchasing a business that has the potential for high growth and what I assume are some very lofty valuations that some of these assets are going for these days.
Susan DeVore Premier, Inc. President & CEO
Yes, thanks Jamie. So we have a full-time corporate development group as you know, with several people and we have liaisons in each of the segments and were constantly sourcing population health companies, ambulatory data acquisition companies, supply chain workflow and analytics companies, specialty pharmacies, all kinds of capabilities that we are interested in. And we look at a variety of companies and they are all sizes and you are right, the valuations sometimes are high.
We are interested in things that strategically enhance this long-term all-in capability that we have to disrupt both supply chain and then help health systems from the inside with quality, safety, population health. And so the way we think about it is, we have a framework. We have a pretty definitive criteria that we assess every opportunity against. And its both strategic and financial.
So I think that I would say were trying to make prudent and wise business decisions that have a long-term ROI for the Company and for the shareholders. And so I think you will see a variety of acquisitions from us. Were a relatively small company, so everything we do is pretty visible in our financials and so I think you will see it. But were looking at all of it.
Jamie Stockton Wells Fargo Analyst
Okay, thats great, thank you.
Susan DeVore Premier, Inc. President & CEO
Thank you.
PREMIER, INC.
Fiscal 2015 Third Quarter Conference Call Transcript
Page 10 of 21
Operator
Elizabeth Blake, Bank of America, Merrill Lynch.
Susan DeVore Premier, Inc. President & CEO
Hi Elizabeth
Elizabeth Blake Bank of America, Merrill Lynch Analyst
Hi, good afternoon and thanks for taking my questions. First, could you update us on the Partnership for Patients contracts from last quarter?
Susan DeVore Premier, Inc. President & CEO
So last quarter we described that it had ended and then I think a few days after the call we were notified and had the ability to apply for a one-year extension. We have now applied for that extension, so we recruited hospitals across the country to participate with us and we have not heard anything yet. So we, as with all government contracts, are not sure of the timing of the final decision, but we have applied.
Elizabeth Blake Bank of America, Merrill Lynch Analyst
Okay, great, thank you. And then on the PremierConnect Supply Chain solution, could you elaborate a little bit on the response you are getting from non-GPO clients using that tool?
Susan DeVore Premier, Inc. President & CEO
I think what Mike said was that the tool helps health systems who are partners with us in Supply Chain and in the GPO, it helps them manage their GPO spend as well as their non-GPO spend. We are primarily selling it today to folks who are either current GPO customers or recruiting new customers and this supply chain analytics overlay is a real differentiator. So I think thats what he meant.
Elizabeth Blake Bank of America, Merrill Lynch Analyst
Okay. Great. Thats helpful. Thank you.
Susan DeVore Premier, Inc. President & CEO
Thank you.
Operator
Lisa Gill, JPMorgan
PREMIER, INC.
Fiscal 2015 Third Quarter Conference Call Transcript
Page 11 of 21
Susan DeVore Premier, Inc. President & CEO
Hi Lisa.
Lisa Gill JPMorgan Analyst
Hi Susan. My first question was around your comments as it pertains to population health. I think you talked today about 400 hospitals, 30 states, Im just wondering one, who are you competing against when you think about winning that business in population health because its clearly more than just your member hospitals? And then secondly, do you see opportunities to sell other collaboratives into those hospitals or is it primarily just population health that they are looking at, at this point?
Susan DeVore Premier, Inc. President & CEO
You know Lisa, we always view it as a foot in the door, so we do have actually a large number of members that participate with us in the population health collaboratives that we then have additional conversations about PremierConnect and about Supply Chain and about all of our other services. Our collaboratives in terms of the first part of your question, we compete with a variety of consulting firms or other companies, but we dont compete with anybody that really has the footprint, the sort of advanced intelligence in Washington, DC about whats coming and what the real details of all of these changes are. And companies that have technology and the breadth of data to provide the measurement. So I think thats why we get both current members and non-members and yes, its a door into our other services for sure.
Lisa Gill JPMorgan Analyst
So youre not competing against any of the traditional IP providers today that are selling a population health type of offering?
Susan DeVore Premier, Inc. President & CEO
I think we see all the competitors. I think what health systems have to have first is clinically integrated networks. So they have to align their physicians to their health systems and then they have to have analytics data that we bring to the table through our technologies and our services. And then as they evolve, they need additional operating capabilities and thats part of the logic around, I think it was Jamies question, around some of the acquisition capabilities we continue to partner or acquire.
But we compete with consultants, we compete with payers we compete with EHR vendors, we compete with a variety of companies who are marketing services. KLAS named us as the number one population health and we had sort of a, I think KLAS said it was 80% of our customers said they would come back to Premier for additional services. So we think we are pretty well-positioned because of the depth and breadth of our capabilities.
Lisa Gill JPMorgan Analyst
Okay, great, and my second question was just around some of your comments on the GPO side. And talking about further penetration within existing accounts. I think also, Im not sure if it was you or Mike that talked about both growth on inpatient as well as outpatient. As we look at some of the hospitals that reported on the public side, it looks like there was more on the outpatient side than the inpatient side. Im just wondering if you are seeing something different there? And secondly, I think someone asked earlier about the collaborations that you have and what its meaning to your GPO business, but Susan, do you think you are getting deeper penetrated because they are taking risk and therefore they are really laser focused on what they are buying and where they are buying it from? And trying to be adherent to whether its PPI or some of the other tools to bring down costs?
PREMIER, INC.
Fiscal 2015 Third Quarter Conference Call Transcript
Page 12 of 21
Susan DeVore Premier, Inc. President & CEO
So a couple of questions in there Lisa. On the utilization question, the trend we used to see was impatient slightly declining and outpatient growing. The trends we have seen in the last 3 to 6 rolling quarters and months is, inpatient is actually increasing but outpatient continues to increase at a higher rate. So I think what you are hearing from the hospitals is that outpatient continues to increase at a higher growth rate than inpatient, but at least our health systems and our footprint, which is a pretty big footprint, that we have data on are also seeing inpatient increases as well.
On the question of penetration of GPO contracts, I think part of it is the cost reduction they need and they know that compliance is tied to increased level of savings, but I also think its all of the services we provide in Supply Chain beyond just GPO. So our acquisition of SYMMEDRx, our acquisition of MEMdata, both of those helped them manage their supply chain cost in physician preference and capital. And that, together with the compliance that drives savings in commodities and in food and in pharmacy, I think pushes them towards higher penetration and were seeing higher penetration in many of our contract categories.
Mike Alkire Premier, Inc. COO
Susan, if I could just add a couple things. I think Lisa you asked about collaboratives, we do have an Ascend collaborative that really focuses on driving high levels of commitment for categories. That collaborative is doing very, very well and growing. I talked a little bit about PremierConnect Supply Chain and this is why this is so critical for our healthcare systems. The product itself will allow us to extend the catalogs into the ambulatory settings, so as our healthcare systems build out they are clinically integrated networks, theyre going to have the ability to extend that pricing and those catalogs out to those partners. So we do believe theres going to be higher levels of penetration for the system as they are building out their ambulatory settings.
Lisa Gill JPMorgan Analyst
And Mike, I know weve talked in the past about moving into the alternate site and your rollout there, but it sounds like today what you are saying is your relationship with the IDN can, in essence, get you there without necessarily having to go out and contract directly, am I hearing that correctly?
Mike Alkire Premier, Inc. COO
Yes, both. I think one is, doing it through our systems and as they are building out their clinically integrated networks. Two, we have a number of our systems that have their affiliated programs, so through their group affiliations were continuing to drive contract penetration into the ambulatory setting. And then weve also got our own sales and marketing model to continue to expand into that market. So we really have a three prong attack.
Lisa Gill JPMorgan Analyst
Okay, great. Thanks for all the comments and congratulations on a nice quarter.
Susan DeVore Premier, Inc. President & CEO
Thank you.
Operator
Donald Hooker, KeyBanc Capital Markets.
PREMIER, INC.
Fiscal 2015 Third Quarter Conference Call Transcript
Page 13 of 21
Donald Hooker KeyBanc Capital Markets Analyst
Hi, good afternoon.
Susan DeVore Premier, Inc. President & CEO
Hi, Donald.
Donald Hooker KeyBanc Capital Markets Analyst
With regards to the GPO, obviously a strong performance through this year and I think in the past you gave out a long-term view of GPO growth. Is that something that might be revised now? Is performance of the GPO strong enough this fiscal year that you might want to revise your prior longer-term view of, I think it was closer to 4% growth?
Craig McKasson Premier, Inc. CFO
Yes Don, this is Craig, thanks for the question. What we have historically talked about is kind of low to mid single-digit growth for our GPO. One of the things weve talked about that you have seen the benefit of this year, is last year we had gone through a process of recruiting some new organizations and it was taking some time for them to convert. And so what weve really seen the benefit of is that performance this year, plus the impacts of utilization which rebounded from a year ago, has caused us to have higher performance in the current year. Which is why we are now guiding and expecting that we will see 6% to 7% administrative fee growth this fiscal year.
Id say were not in a position yet to say we that would change our longer term outlook because once fully ramped up, that kind of low to mid single-digit range is still what we think is the current market for GPO growth.
Donald Hooker KeyBanc Capital Markets Analyst
Okay. And then with regards to the specialty pharmacy, can you maybe discuss a little bit how penetrated that services is into the membership and how that might trend over the next year or two?
Craig McKasson Premier, Inc. CFO
Sure, this is Craig, I will start and then Susan or Mike can add any color. What I would say is that were still early in the life of specialty pharmacy with our member organizations. This is, Ill say a more unique population health strategy as we have talked about as opposed to just being a pure play specialty pharmacy approach. And so a lot of our institutions that are more on the front edge in terms of thinking about their approach to population health and how to manage patients in a post-acute setting. To ensure protocols are followed to minimize re-admissions and things of that nature. So theres still a pretty long runway, Don, in terms of opportunities to grow and expand our specialty pharmacy footprint. We are not at a point yet to say in two years its going to be x, but early stages of where we are in that business.
Mike Alkire Premier, Inc. COO
I think its a strong business for us, different markets have different requirements for specialty pharmacy and given all the things Ive said about alternative payment models and sort of the need to manage chronic patients, clearly its an opportunity for us longer-term.
PREMIER, INC.
Fiscal 2015 Third Quarter Conference Call Transcript
Page 14 of 21
Craig McKasson Premier, Inc. CFO
And Im sorry Don, one other last point I would reinforce is that as we look at the specialty pharmacy market, thats one of the areas we have identified for potential capital deployment. As we look at particular markets where you may need to have a bricks and mortar capability in order to actually drive business in specific geographies across the country.
Donald Hooker KeyBanc Capital Markets Analyst
And Ill just ask one last one, I know you havent historically provided this, but maybe you can provide some qualitative color. I know the specialty pharmacy and the other products business is lower margin obviously, but is it safe to assume both of those businesses are scaling and margins are improving sequentially?
Craig McKasson Premier, Inc. CFO
Yes absolutely.
Donald Hooker KeyBanc Capital Markets Analyst
Okay thank you.
Susan DeVore Premier, Inc. President & CEO
Thank you.
Operator
Michael Cherny, ISI.
Susan DeVore Premier, Inc. President & CEO
Hi, Michael.
Michael Cherny ISI Analyst
Good afternoon guys and congratulations on a nice quarter. I want to take the retention question from a different angle. You talked about 99% thats as good as weve heard from any services business, in terms of the 1% sorry to focus on this, or just ask the question, but what causes that 1% customer to leave? Is it all from consolidation you see across the industry or are there any competitive disruptions and if so, why would a customer decide that they no longer want to work with you?
Susan DeVore Premier, Inc. President & CEO
It is primarily acquisitions or affiliations where hospitals are getting together and theyre at different GPOs and they are making a decision. And so all that consolidation acquisition activity is both an opportunity for us sometimes and a risk for us sometimes. But its almost always related to some combination in some market.
PREMIER, INC.
Fiscal 2015 Third Quarter Conference Call Transcript
Page 15 of 21
Michael Cherny ISI Analyst
I know last year ahead of the IPO, there was a little lower retention because of the transition, so I just want to get an understanding now as you think about how you generate that record level, what is the driver of that?
Susan DeVore Premier, Inc. President & CEO
99% is so high, you almost cant go anywhere right? So its so high that we think its almost always its acquisition-related or affiliation-related.
Michael Cherny ISI Analyst
Got it. And then, a different way to take the acquisition front. I know you touched a bit about the type of assets youve been looking at. I want to take a step back and look at what youve already completed. You highlighted SYMMEDRx as an acquisition or at least an asset that youve taken in and had a really nice performance in the quarter, a nice expansion to the customer base. Can you maybe just touch qualitatively on the integration of some of your other businesses, particularly something like TheraDoc and how its fitting in with the overall portfolio you have in terms of client interest or whatever it may be?
Susan DeVore Premier, Inc. President & CEO
Great question and we do this routinely, internally. So Meddius was probably the oldest one and thats the data acquisition tool. Thats been completely integrated and it actually helps us get at more real-time data across lots of our applications, its proving to be just a wonderful data acquisition engine inside a lot of our other applications. SYMMEDRx, I already talked about, MEMdata I already talked about, TheraDoc was a medium-size acquisition for us. That one has been integrated. We are in the process of combining the two products. That particular application on a combined basis is also rated number one by KLAS, in clinical surveillance. Very critical to all the quality and safety and value-based purchasing that our health systems are engaged in.
Weve retained the leadership teams of all those companies and have integrated them with the rest of our businesses. You know we bought the rest of S2S, the remainder of S2S, that one was already integrated for all intents and purposes and we now own 100% of that company. And then Mike talked about Aperek as a part of this PremierConnect Supply Chain new offering. So we have taken it in. We have added it to all of our other capabilities, evolved it with our own organic development and that is what Mike talked about in the launch of that new product. So I would say so far really, really good, really good integration of all of the companies and lots of new customers and lots of retention of existing customers with those acquisitions.
Michael Cherny ISI Analyst
Thanks for the update and the scorecard, I really appreciate it Susan.
Susan DeVore Premier, Inc. President & CEO
Thank you.
Operator
Nicholas Jansen, Raymond James.
PREMIER, INC.
Fiscal 2015 Third Quarter Conference Call Transcript
Page 16 of 21
Nicholas Jansen Raymond James Analyst
Yes, how are you guys? Thanks for taking the questions, most of mine have been answered, but maybe just two follow-ups. You had almost 38% adjusted EBITDA margins in your Performance Services segment which I believe is a record high, I know theres some quarterly fluctuations here, but maybe want to get a little more detail on how margins expand about 300 basis points year-over-year. And then where ultimately do you think the Performance Service margins can grow as you get a higher mix of your revenue to SaaS applications? Thanks.
Craig McKasson Premier, Inc. CFO
Yes this is Craig, thanks Nick. The one thing I would point out in terms of Performance Services EBITDA margins is, we do get the benefit of the deferred revenue add back that we have in place following the TheraDoc and Aperek acquisitions. You are going to see that begin to taper off in the fourth quarter as we have gotten through the meat of that one-year deferral process. So the 37% you referenced is higher than we would normally expect. I think the more normalized place weve been, is in that low 30s range and I think thats more of an expectation of what you would see.
Nicholas Jansen Raymond James Analyst
Okay, thats helpful. And then secondly, a lots been discussed on M&A, it looks like your acquisition-related add backs in terms of expenses in the quarter seemed to pick up a little bit relative to the recent trajectory. So I just wanted to get your sense of, have you been disappointed by not closing deals, I just wanted to get a little bit more color surrounding whats going on there? Thanks.
Susan DeVore Premier, Inc. President & CEO
Yes, so I would just say we spend money pursuing acquisitions. And we will continue to spend money pursuing acquisitions and doing our due diligence and I think it just reflects the activity and the acquisitions are sort of part of our strategic DNA.
Nicholas Jansen Raymond James Analyst
Thank you, Susan.
Susan DeVore Premier, Inc. President & CEO
Thank you.
Operator
Sean Dodge, Jefferies.
Sean Dodge Jefferies & Co. Analyst
Hi, good afternoon. Susan, its been a few months now since HHS released its 2018 goals for alternative payment models. I realize you dont have explicit details yet on how all of thats going to happen, but Im curious if theres been any discernible changes in the conversations youve been having with clients on the heels of this. Has this encouraged a few more to come off the fence and begin moving more quickly to fee for value, or is everybody still in a wait and see mode?
PREMIER, INC.
Fiscal 2015 Third Quarter Conference Call Transcript
Page 17 of 21
Susan DeVore Premier, Inc. President & CEO
Yes, theres a lot of things. First the announcement, I think has accelerated health systems into saying, wow I need to get myself ready, I need to build the infrastructure which feeds into the things we provide, the clinically integrated network, the technology infrastructure, the data they need to actually move there. So I would say it has accelerated their urgency around it. I also think this new payment model for physicians, the macro that I talked about on the call, that is mobilizing health systems to integrate with their physicians and to build this stuff together and its mobilizing physicians as well.
So I think thats also going to create an acceleration of their interest in building all of these capabilities. So I think there is a lot of activity and I think recently, and I didnt talk about it in the script, but Medicare is also, CMS has also just certified the results from some of these pioneer and shared savings ACOs. And I think the reason thats important is, it means that CMS can take something from a demonstration straight into a program. And I think all of those things are certainly making health systems aware and interested in building the capabilities, because they think this is going to be new standard ways of paying for services.
Sean Dodge Jefferies & Co. Analyst
Okay, excellent, thanks. And it was mentioned earlier that the adoption of PremierConnect Enterprise enables clients to bring together for the most part your entire platform. Im curious, are those that have adopted so far, how big are those relationships, the PCE relationships relative to the average non-PCE client? Maybe taking a different how big of an inflection in revenue can the adoption of PCE drive within a client over time as they adopt more?
Susan DeVore Premier, Inc. President & CEO
Yes so what I would say is, and you saw it on the slide, PremierConnect is actually seven different domains. And so there is pricing for the technologies, for the services, for the wraparounds within each one of those domains on the platform. PremierConnect Enterprise being just one of the seven different domains. And I think, Craig youve talked a little bit before about what the average kind of revenue is for PremierConnect Enterprise domain.
Craig McKasson Premier, Inc. CFO
Yes. What I would add is that, so in and of itself, again varies obviously by engagement, but the opportunity for PremierConnect Enterprise engagements to have an annual value of $500,000 up to $1 million. Importantly though, its also a natural extension of the relationship that we may have with some of our institutions that are leveraging some of our capabilities. And if they are not taking advantage of all of those, the data management and data analytics capabilities that PremierConnect Enterprise affords does give us an opportunity to actually move into other domains across the PremierConnect platform longer-term. As Susan just described.
Sean Dodge Jefferies & Co. Analyst
Perfect, thank you
Susan DeVore Premier, Inc. President & CEO
Thank you.
Operator
Richard Close, Avondale Partners.
PREMIER, INC.
Fiscal 2015 Third Quarter Conference Call Transcript
Page 18 of 21
Susan DeVore Premier, Inc. President & CEO
Hi, Richard.
Richard Close Avondale Partners Analyst
Hello, thanks for taking the question, congratulations. I was wondering if you could break down the GPO revenue a little bit more. Obviously 9% or so growth there and you talked a little bit about a pull forward, but if you were to break it up between increased utilization, the new customers and the contract compliance, any ballparks on those what those contributed?
Craig McKasson Premier, Inc. CFO
Sure, this is Craig. So broadly we talked about the pullthrough being a few million of the increase that you saw, and then what I would say is we dont specifically disclose percentages, but I would say that probably a little more than half is a result of continuing penetration of our existing members in the acute and the nonacute space. And then the balance of that being the conversion and migration of newer members that we have added.
Richard Close Avondale Partners Analyst
Okay, and just a follow-up on the GPO side. How are you viewing the competitive marketplace out there? Are there deals to be won? In terms of RFPs or contracts coming up for renewals, just any thoughts about maybe the churn or expected churn in the GPO side going forward over the next year or so?
Susan DeVore Premier, Inc. President & CEO
So all I would say is that most health systems today have a GPO relationship. Its highly penetrated and so, you know this, not many move every year. But we certainly are a market taker and we get more than our share, I think because of the broad-based set of supply chain solutions that we can bring to the table and the connection of the supply chain solutions with the other utilization and standardization data that we have over on the clinical side.
So I think that consolidation in the industry continues to happen and that maybe creates fewer and larger entities. But I think that the differentiation we have in terms of our service capabilities, technology capabilities and the embeddedness that we provide anytime we propose on a new deal, its just a different comprehensive level of service.
Richard Close Avondale Partners Analyst
Okay thats all I had, thanks, congratulations
Susan DeVore Premier, Inc. President & CEO
Thank you Richard.
Operator
Sean Wieland, Piper Jaffray.
PREMIER, INC.
Fiscal 2015 Third Quarter Conference Call Transcript
Page 19 of 21
Susan DeVore Premier, Inc. President & CEO
Hi, Sean.
Sean Wieland Piper Jaffray Analyst
Hi Susan, thanks for taking the question.
Susan DeVore Premier, Inc. President & CEO
How are you?
Sean Wieland Piper Jaffray Analyst
Im doing well, thank you. On the CHI deal, congrats on that. Am I thinking that they are not a GPO customer, but they are now using PremierConnect Enterprise?
Susan DeVore Premier, Inc. President & CEO
They are not a GPO customer. They have been using some of our quality and safety applications in some of their facilities and this is sort of an all-in on the quality side with PremierConnect Enterprise.
Sean Wieland Piper Jaffray Analyst
So, when that GPO business comes up for bid at some point, how does this affect your abilities to win that how does that affect your positioning relative to the GPO business?
Susan DeVore Premier, Inc. President & CEO
So obviously, GPO decisions are comprehensive and very detailed and when we go to pursue a GPO and clearly if you have relationships in one side of the business it works both ways for us, but it gives us an opportunity to really show health systems how you can take a GPO and a direct sourcing company and a specialty pharmacy along with all your population health stuff and all your PremierConnect Enterprise and quality and safety solutions and really drive savings and really drive improvement. Thats how we view it and thats how we approach it. Now those decisions get made a lot of different ways in health systems, but that is our approach.
Mike Alkire Premier, Inc. COO
Hi, Sean, this is Mike. One other build, when we have the PremierConnect Quality application into these healthcare systems, it does allow us to connect quality and cost which really helps us around resource utilization. So as healthcare systems look to standardize how theyre providing care, leveraging supply chain products, we are able to actually bring the power of that supply chain quality to the table to show appropriate resource utilization and the value of really focusing in on that cost.
Sean Wieland Piper Jaffray Analyst
How many PremierConnect Enterprise customers are not GPO customers?
PREMIER, INC.
Fiscal 2015 Third Quarter Conference Call Transcript
Page 20 of 21
Susan DeVore Premier, Inc. President & CEO
Keith?
Keith Figlioli Premier, Inc. SVP of healthcare Informatics
Probably just that one.
Susan DeVore Premier, Inc. President & CEO
Theyre probably the only one right now.
Sean Wieland Piper Jaffray Analyst
Okay.
Keith Figlioli Premier, Inc. SVP of healthcare Informatics
So Sean, I think its just that one, its Keith.
Sean Wieland Piper Jaffray Analyst
Okay, thanks Keith. And then in the Performance Services business, do you have what the organic growth rate was in the quarter?
Craig McKasson Premier, Inc. CFO
Sean as we discussed, we dont separately breakout organic and inorganic, I will continue to reinforce the messaging Ive had that we expected about $20 million of revenue contribution from our TheraDoc and Aperek acquisitions this year. Which we disclosed when we issued guidance at the beginning of the year, those acquisitions have continued to be on plan.
Sean Wieland Piper Jaffray Analyst
Super. Okay, thats all Ive got. Thank you very much.
Susan DeVore Premier, Inc. President & CEO
Thanks, Sean.
Operator
Gene Mannheimer, Topeka Capital Markets.
Susan DeVore Premier, Inc. President & CEO
Hi Gene.
PREMIER, INC.
Fiscal 2015 Third Quarter Conference Call Transcript
Page 21 of 21
Gene Mannheimer Topeka Capital Markets Analyst
Good afternoon and congrats on a good quarter. I wanted to ask, with respect to the acquisition of Phytel by IBM, given that Phytel is a partner of yours on the population health side, is there any impact at all from that transaction, do you see on your business?
Susan DeVore Premier, Inc. President & CEO
So, no impact. Both IBM and Phytel are current business partners in our population health and enterprise analytic offerings. We dont anticipate any changes to the relationships. We built into the relationships sort of anticipation of future changes on both sides and so obviously there are future opportunities for both of us, so well continue to always explore those.
Gene Mannheimer Topeka Capital Markets Analyst
Great, thanks a lot.
Susan DeVore Premier, Inc. President & CEO
Thank you.
Operator
Thank you. At this time Id like to turn it back to todays staff for any final or closing remarks.
Susan DeVore Premier, Inc. President & CEO
Thanks so much everybody for participating on the call today. Our next conference call where we will cover the fourth quarter and our fiscal year is currently scheduled for August 24 and we look forward to meeting and speaking with many of you in the interim. Operator, you may now close the call.
Operator
Thank you. On behalf of Premier, Inc., we would like to thank you for your participation. You may now disconnect and have a wonderful day.
![]() Third Quarter Fiscal 2015
Financial Results and Update
May 11, 2015
Exhibit 99.3 |
![]() 2
©
2015 PREMIER, INC.
Forward-looking statements and Non-GAAP financial
measures |
![]() Susan DeVore, President & CEO
Overview and Business Update |
![]() 4
©
2015 PREMIER, INC.
Third-quarter highlights
*
*See non-GAAP Adjusted EBITDA, Segment Adjusted EBITDA, and Adjusted Fully
Distributed Earnings Per Share reconciliations to GAAP equivalents in Appendix.
Strong overall financial performance
Total net revenue up 16% YoY, driven by double-digit
growth in both business segments
Adjusted EBITDA up 14% YoY
Adjusted fully distributed earnings per share of
$0.38 up 13% YoY
On track to achieve 99% GPO retention rate and 94%
SaaS institutional renewal rate for FY2015
Raising full-year guidance |
![]() 5
©
2015 PREMIER, INC.
Third-quarter revenue growth drivers
Supply Chain Services revenue up 15%
»
Net administrative fees revenue up 9.1%
»
Products revenue up 25%
Performance Services revenue up 19%
»
Continued growth of PremierConnect
Saas-based subscriptions and renewals,
and growth in Advisory Services
»
Finished quarter with solid bookings &
strong sales pipeline |
![]() 6
©
2015 PREMIER, INC.
Addressing member needs for continuous improvement
Manage
Populations
Improve
Quality and Safety
Reduce
Costs
BILLING
PURCHASING
CLAIMS
CLINICAL
FINANCIAL
Combines People, Process, and Technology |
![]() 7
©
2015 PREMIER, INC.
Medicare payment reform
a watershed event
Payment reform rewarding value, promoting
population health and discouraging fee-for-service
»
»
Bill permanently reforms the Medicare physician
payment system (Sustainable Growth Rate formula)
»
Alters the economic incentives in market, pushing
providers to embrace population health and risk-based
contracts for cost and quality outcomes
We believe Premier is well positioned to lead health
systems through this transformation
Congress passes Medicare Access and
CHIP
Reauthorization Act of 2015 (MACRA) |
![]() 8
©
2015 PREMIER, INC.
Recognized leader in population health management
Premier Population Health Management Advisory
Services ranked #1 by KLAS
The PACT Population Health Collaborative
is the model for integrated care delivery,
bringing together approx. 400 hospitals in
30 states
The Bundled Payment Collaborative works
to reduce the cost of an episode of care,
improve patient outcomes and redesign
care delivery with approximately 120
hospitals in 27 states
Pioneered data-driven performance improvement
collaboratives and technologies focused on
accountable care organizations and alternate
payment models |
![]() Michael Alkire, Chief Operating Officer
Operations Update |
![]() 10
©
2015 PREMIER, INC.
A platform for continuous performance improvement
Manage
Populations
Improve
Quality and Safety
Reduce
Costs
BILLING
PURCHASING
CLAIMS
CLINICAL
FINANCIAL
Combines People, Process, and Technology |
![]() 11
©
2015 PREMIER, INC.
Third-quarter Supply Chain Services revenue
Supply Chain Services revenue
increased 15%
»
»
Expanding contract penetration in
both acute and alternate site
»
Continuing impact of the
recruitment and conversion of new
members
»
Improved utilization trends
»
Timing of cash receipts
»
»
Ongoing member support for direct
sourcing and specialty pharmacy
businesses
$108.1
$118.0
$58.7
$73.4
3Q'14
3Q'15
Net Admin Fees
Products
Other Services and Support
15%
$167.0
$192.1
Supply Chain Services
Net revenue
(millions)
GPO net admin fees revenue
increased 9.1%
Products revenue increased 25% |
![]() 12
©
2015 PREMIER, INC.
High-growth Supply Chain Products businesses
Direct sourcing
»
Helping our members
achieve significant savings
on basic commodity products
Specialty pharmacy
»
Helping our members
manage chronic, high-cost
patients in a population
health environment
$ 58.7
$ 73.4
3Q'14
3Q'15
Supply Chain Products
Net revenue
(millions)
25% |
![]() 13
©
2015 PREMIER, INC.
A platform for continuous performance improvement
Manage
Populations
Improve
Quality and Safety
Reduce
Costs
BILLING
PURCHASING
CLAIMS
CLINICAL
FINANCIAL
Combines People, Process, and Technology |
![]() 14
©
2015 PREMIER, INC.
Supply
Analytics
Sourcing &
Contract
Management
Catalog
Management
ERP / Materials
Management
PREMIERCONNECT
SUPPLY CHAIN
PremierConnect
®
Supply Chain
Supply Chain Workflow
Plan
Source
Contract
Buy
Receive
Pay
Manage |
![]() 15
©
2015 PREMIER, INC.
Supply
Analytics
Complete Visibility
Categorize ALL
transactions
Contract Optimization
Identify trends and
variation
Actionable Information
Understand Why spend
is changing
Sourcing &
Contract
Management
Optimize & Manage
GPO, regional and local
contracts
Source of Truth
Right product, right time,
best price
Data Integration
Insights across all
your facilities
Catalog
Management
Drive Standardization
Cleanse, standardize &
control item master
Customized Catalog
Supports your
standards across acute
& non-acute
Price Accuracy
Maintains pricing
across multiple ERPs
ERP / Materials
Management
Manage Process
Supply chain &
operations
End to End
Procurement
Financial, Fixed Assets &
Purchasing
Flexible & Scalable
Cloud
based
connect
your growing facilities
Technology enabled supply chain |
![]() 16
©
2015 PREMIER, INC.
Expanding Population Health Advisory Services relationships
Innovate
Health
Alliance
Albany
NY
North
Shore-LIJ
Health
System
New
York
LifeBridge
Health
Baltimore |
![]() 17
©
2015 PREMIER, INC.
SYMMEDRx providing solutions for physician preference
Physician
preference contract
management and
data services
Partnership with large academic member
health system delivers savings of ~24% on
medical devices related to just one disease
state
Three-year agreement with Greater New York
Hospital Association to provide comprehensive
data analysis and consultative support to drive
savings across all disease states |
![]() Craig McKasson, Chief Financial Officer
Financial Review |
![]() 19
©
2015 PREMIER, INC.
the
Third-quarter consolidated and segment highlights
*
Consolidated
Net revenue (millions)
Supply Chain Services
Net revenue (millions)
Performance Services
Net revenue (millions)
Adjusted
EBITDA
(millions)
Adjusted EBITDA (millions)
*See
non-GAAP
Adjusted
EBITDA
and
non-GAAP
Segment
Adjusted
EBITDA
reconciliations
to
GAAP
equivalents
in
Appendix.
16%
15%
19%
14%
11%
29%
$20.3
$26.2
3Q'14
3Q'15
$91.3
$103.7
3Q'14
3Q'15
$58.6
$69.6
3Q'14
3Q'15
$91.5
$101.6
3Q'14
3Q'15
$167.0
$192.1
3Q'14
3Q'15
$225.6
$261.7
3Q'14
3Q'15 |
![]() 20
©
2015 PREMIER, INC.
Third-quarter Supply Chain Services revenue
Supply Chain Services revenue
increased 15%
»
GPO net admin fees revenue
increased 9.1%
»
Expanding contract penetration in
both acute and alternate site
»
Continuing impact of the
recruitment and conversion of new
members
»
Improved utilization trends
»
Timing of cash receipts
»
Products revenue increased 25%
»
Ongoing member support for direct
sourcing and specialty pharmacy
businesses
$58.7
$73.4
3Q'14
3Q'15
Net Admin Fees
Products
Other Services and Support
15%
$167.0
$192.1
Supply Chain Services
Net
revenue
(millions)
$108.1
$118.0 |
![]() 21
©
2015 PREMIER, INC.
Third-quarter Performance Services revenue
»
Performance Services revenue
increased 19%
»
Continued growth of PremierConnect
SaaS-based subscriptions and
renewals
»
Continued growth of Advisory
Services led by engagements tied to:
»
Cost management
»
Population health
»
Physician preference
»
Capital equipment planning
$58.6
$69.6
3Q'14
3Q'15
19%
Performance Services
Net
revenue
(millions) |
![]() 22
©
2015 PREMIER, INC.
Third-quarter adjusted EBITDA*
Consolidated adjusted EBITDA
increased 14%
»
»
Strong net admin fee revenue
growth
»
Expanding direct sourcing
activities
»
»
New PremierConnect SaaS-based
subscription sales
»
Contribution from Aperek and
Theradoc acquisitions
»
Effective management of operating
expenses
Supply Chain Services adjusted
EBITDA increased 11%
Performance Services adjusted
EBITDA increased 29%
($20.5)
($24.0)
$91.5
$101.6
$20.3
$26.2
3Q'14
3Q'15
Corporate
Supply Chain Services
Performance Services
14%
Adjusted EBITDA
(millions)
$91.3
$103.7
* See non-GAAP adjusted fully distributed net income and non-GAAP earnings per share on
fully distributed net income reconciliations to GAAP equivalents in Appendix |
![]() 23
©
2015 PREMIER, INC.
Third-quarter non-GAAP adjusted fully distributed net
income*
$0.34
$0.38
Non-GAAP earnings per share on adjusted fully
distributed net income
diluted
»
Calculates income taxes at
40% on pre-tax income,
assuming taxable C corporate
structure
»
Calculates adjusted fully
distributed earnings per
share, assuming total Class A
and B common shares held
by public
$49.1
$55.3
3Q'14
3Q'15
(in millions, except per share data)
13%
* See non-GAAP adjusted fully distributed net income and non-GAAP earnings per share on
fully distributed net income reconciliations to GAAP equivalents in Appendix |
![]() 24
©
2015 PREMIER, INC.
Cash flow and capital flexibility at March 31, 2015
CONSIDERABLE CASH AND
DEBT CAPACITY
AVAILABLE
AMPLE CAPITAL
FLEXIBILITY FOR FUTURE
ACQUISITIONS AND
BUSINESS GROWTH
*Three
months
ended
March
31,
2015.
Company
defines
free
cash
flow
as
cash
provided
by
operating
activities
less
distributions
to
limited
partners
and
purchases of property and equipment. See non-GAAP free cash flow
reconciliation to GAAP equivalent in Appendix. Year-to-date cash flow
from operations of $255.6 million
Third-quarter free cash flow of $59.5 million
*
Cash, cash equivalents & marketable securities
of $503.3 million
No outstanding borrowings on $750 million five-
year unsecured revolving credit facility |
![]() 25
©
2015 PREMIER, INC.
Fiscal 2015 annual guidance*
*
Guidance is based on comparisons with prior-year non-GAAP pro forma
results, which have been adjusted to reflect the impact of the companys reorganization and IPO. The
Company does not reconcile guidance for adjusted EBITDA and non-GAAP adjusted
fully distributed net income per-share to net income (loss) or GAAP earnings per share
because the Company does not provide guidance for reconciling items between net
income (loss) and adjusted EBITDA and non-GAAP adjusted fully distributed earnings per
share. The Company is unable to provide guidance for these reconciling items since
certain items that impact net income (loss) are outside of the Companys control and cannot be
reasonably predicted. Accordingly, a reconciliation to net income (loss) or GAAP
earnings per share is not available without unreasonable effort. Financial
guidance for year ending June 30, 2015: »
6%-7% net administrative fee revenue growth
»
27%-32% product revenue growth
»
Continued high GPO retention rates
Guidance Assumptions:
»
Continued demand for integrated offerings of SaaS-based
subscription and licensed products, advisory services and
collaboratives
»
Continuation of high SaaS institutional renewal rates
Updated
Pro Forma
Previous
(in millions, except per share data)
FY 2015
% YoY Change
FY 2015
Net Revenue:
Supply Chain Services segment
$720.0 -
$733.0
13% -
15%
$706.0 -
$725.0
Performance Services segment
$268.0 -
$275.0
15% -
18%
$268.0 -
$275.0
Total Net Revenue
$988.0 -
$1008.0
14% -
16%
$974.0 -
$1000.0
Non-GAAP adjusted EBITDA
$384.0 -
$392.0
9% -
12%
$382.0 -
$390.0
Non-GAAP adjusted fully distributed EPS
$1.40 -
$1.44
8% -
11%
$1.40 -
$1.44
Premier, Inc. updates full-year fiscal 2015 financial guidance, as
follows: Fiscal 2015 Financial Guidance
Supply Chain Services growth driven by:
Performance Services growth driven by: |
![]() 26
©
2015 PREMIER, INC.
Exchange update
On April 30, 2015, approximately 276,000
Class B units were exchanged for Class A
common shares on 1-for-1 basis; equal
number of Class B common shares retired
Next exchange on July 31, 2015 |
![]() 27
©
2015 PREMIER, INC.
Targeted and disciplined acquisition strategy
We expect acquisitions to play major role in
providing solutions for member health systems
to thrive in the healthcare environment of
tomorrow
»
Evaluating multiple opportunities
»
Seeking innovative and unique solutions
»
Employing well-defined, diligent process
»
Continue to evaluate all types of acquisitions,
from strategic tuck-ins to transformational |
![]() Questions |
![]() Appendix |
![]() 30
©
2015 PREMIER, INC.
Year-to-date nine-month financial highlights
*
Consolidated
Supply Chain Services
Net revenue (millions)
Performance Services
Net revenue (millions)
Adjusted
EBITDA
(millions)
Adjusted EBITDA (millions)
*Comparisons are with year-ago non-GAAP pro forma information that reflects
the impact of the companys reorganization and initial public offering.
See Adjusted EBITDA, Segment Adjusted EBITDA and Adjusted Fully Distributed Net
Income reconciliations to GAAP equivalents in Appendix. $633.8
$740.5
$464.1
$542.0
$169.8
$198.4
$257.8
$293.1
3Q'14
3Q'15
$260.8
$290.2
3Q'14
3Q'15
$54.4
$67.7
3Q'14
3Q'15
3Q'14
3Q'15
3Q'14
3Q'15
3Q'14
3Q'15
17%
17%
14%
17%
11%
25%
Consolidated
Net revenue (millions) |
![]() 31
©
2015 PREMIER, INC.
Fiscal 2015 and fiscal 2014 non-GAAP reconciliations
2015*
2014*
2015*
2014
Reconciliation of Pro Forma Net Revenue to Net Revenue:
Pro Forma Net Revenue
261,723
$
225,598
$
740,476
$
633,820
$
Pro forma adjustment for revenue share post-IPO
41,263
Net Revenue
261,723
$
225,598
$
740,476
$
675,083
$
Net income
72,029
$
101,980
$
202,724
$
265,985
$
Pro forma adjustment for revenue share post-IPO
(41,263)
Interest and investment income, net
(204)
(400)
(517)
(641)
Income tax expense
2,026
9,413
12,107
24,461
Depreciation and amortization
11,538
9,396
33,107
26,952
Amortization of purchased intangible assets
2,554
802
6,598
2,158
EBITDA
87,943
121,191
254,019
277,652
Stock-based compensation
7,285
6,299
21,129
13,118
Acquisition related expenses
2,863
984
6,408
1,303
Strategic and financial restructuring expenses
2
733
1,281
3,614
Loss (gain) on investment
1,000
(37,850)
1,000
(37,850)
Adjustment to tax receivable agreement liability
1,073
Acquisition related adjustment -
deferred revenue
3,563
9,224
Other expense (income), net
16
(52)
10
(56)
Adjusted EBITDA
103,745
$
91,305
$
293,071
$
257,781
$
Segment Adjusted EBITDA:
Supply Chain Services
101,600
$
91,477
$
290,210
$
302,076
$
Pro forma adjustment for revenue share post-IPO
(41,263)
Supply Chain Services
(including pro forma adjustment)
101,600
$
91,477
$
290,210
$
260,813
$
Performance Services
26,166
20,307
67,717
54,367
Corporate
(24,021)
(20,479)
(64,856)
(57,399)
Adjusted EBITDA
103,745
$
91,305
$
293,071
$
257,781
$
Depreciation and amortization
(11,538)
(9,396)
(33,107)
(26,952)
Amortization of purchased intangible assets
(2,554)
(802)
(6,598)
(2,158)
Stock-based compensation
(7,285)
(6,299)
(21,129)
(13,118)
Acquisition related expenses
(2,863)
(984)
(6,408)
(1,303)
Strategic and financial restructuring expenses
(2)
(733)
(1,281)
(3,614)
Adjustment to tax receivable agreement liability
(1,073)
Acquisition related adjustment -
deferred revenue
(3,563)
(9,224)
Equity in net income of unconsolidated affiliates
(5,197)
(3,566)
(14,812)
(12,171)
Deferred compensation plan (income) expense
(759)
209
68,911
69,525
200,721
198,465
Pro forma adjustment for revenue share post-IPO
41,263
Operating income
68,911
$
69,525
$
200,721
$
239,728
$
Equity in net income of unconsolidated affiliates
5,197
3,566
14,812
12,171
Interest and investment income, net
204
400
517
641
(Loss) gain on investment
(1,000)
37,850
(1,000)
37,850
Other income (expense), net
743
52
(219)
56
Income before income taxes
74,055
$
111,393
$
214,831
$
290,446
$
Three Months Ended
March 31,
Nine Months Ended
March 31,
Supplemental Financial Information -
Reporting of Pro Forma Adjusted EBITDA
(Unaudited)
(In thousands)
Reconciliation of Selected Non-GAAP Measures to GAAP Measures
and Non-GAAP Adjusted Fully Distributed Net Income
Reconciliation of Net Income to Adjusted EBITDA and Reconciliation of
Segment Adjusted EBITDA to Income Before Income Taxes: * Note
that no pro forma adjustments were made for the three and nine months ended March 31, 2015 and the three months
ended March 31, 2014; as such, actual results are presented for each of
these periods. |
![]() 32
©
2015 PREMIER, INC.
Fiscal 2015 and fiscal 2014 non-GAAP reconciliations
2015*
2014*
2015*
2014
Reconciliation of Non-GAAP Pro Forma Adjusted Fully Distributed Net
Income: Net income attributable to shareholders
12,209
$
13,525
$
30,753
$
19,453
$
Pro forma adjustment for revenue share post-IPO
(41,263)
Income tax expense
2,026
9,413
12,107
24,461
Stock-based compensation
7,285
6,299
21,129
13,118
Acquisition related expenses
2,863
984
6,408
1,303
Strategic and financial restructuring expenses
2
733
1,281
3,614
Loss (gain) on investment
1,000
(37,850)
1,000
(37,850)
Adjustment to tax receivable agreement liability
1,073
Acquisition related adjustment -
deferred revenue
3,563
9,224
Amortization of purchased intangible assets
2,554
802
6,598
2,158
Net income attributable to noncontrolling interest in Premier LP
59,568
87,925
170,135
246,055
Non-GAAP pro forma adjusted fully distributed income before income
taxes 92,143
81,831
258,635
231,049
Income tax expense on fully distributed income before income
taxes 36,857
32,732
103,454
92,420
Non-GAAP Pro Forma Adjusted Fully Distributed Net Income
55,286
$
49,099
$
155,181
$
138,629
$
*
Note
that
no
pro
forma
adjustments
were
made
for
the
three
and
nine
months
ended
March
31,
2015
and
the
three
months
ended
March
31,
2014; as such, actual results are presented for each of these
periods. Three Months Ended
March 31,
Nine Months Ended
March 31,
(Unaudited)
(In thousands)
Reconciliation of Selected Non-GAAP Measures to GAAP Measures
and Non-GAAP Adjusted Fully Distributed Net Income
Supplemental Financial Information - Reporting of Pro Forma Adjusted
EBITDA |
![]() 33
©
2015 PREMIER, INC.
Fiscal 2015 and fiscal 2014 non-GAAP reconciliations
2015
2014
Reconciliation of Non-GAAP Free Cash Flow to Net Cash Provided by
Operating Activities: Net cash provided by operating
activities 101,860
$
90,173
$
Purchases of property and equipment
(18,653)
(13,823)
Distributions to limited partners
(23,701)
(17,419)
Non-GAAP free cash flow
59,506
$
58,931
$
Non-GAAP Adjusted EBITDA
103,745
$
91,305
$
Supplemental Financial Information -
Reporting of Non-GAAP Free Cash Flow
Reconciliation of Selected Non-GAAP Measures to GAAP Measures
(Unaudited)
(In thousands)
Three Months Ended
March 31, |
![]() 34
©
2015 PREMIER, INC.
Fiscal 2015 and fiscal 2014 non-GAAP reconciliations
2015*
2014*
2015*
2014
Reconciliation of numerator for GAAP EPS to Non-GAAP EPS on Adjusted
Fully Distributed Net Income Net income (loss) attributable to
shareholders after adjustment of redeemable limited partners'
capital to redemption amount (374,853)
$
509,239
$
(781,216)
$
(3,204,645)
$
Adjustment of redeemable limited partners' capital to redemption
amount
387,062
(495,714)
811,969
3,224,098
Net income attributable to shareholders
12,209
13,525
30,753
19,453
Pro forma adjustment for revenue share post-IPO
(41,263)
Income tax expense
2,026
9,413
12,107
24,461
Stock-based compensation
7,285
6,299
21,129
13,118
Acquisition related expenses
2,863
984
6,408
1,303
Strategic and financial restructuring expenses
2
733
1,281
3,614
Loss (gain) on investment
1,000
(37,850)
1,000
(37,850)
Adjustment to tax receivable agreement liability
1,073
Acquisition related adjustment -
deferred revenue
3,563
9,224
Amortization of purchased intangible assets
2,554
802
6,598
2,158
Net income attributable to noncontrolling interest in Premier LP
59,568
87,925
170,135
246,055
Non-GAAP pro forma adjusted fully distributed income before income
taxes 92,143
81,831
258,635
231,049
Income tax expense on fully distributed income before income
taxes 36,857
32,732
103,454
92,420
Non-GAAP pro forma adjusted fully distributed net income
55,286
$
49,099
$
155,181
$
138,629
$
Reconciliation of denominator for GAAP EPS to Non-GAAP Adjusted Fully
Distributed Net Income Weighted Average:
Common shares used for basic and diluted earnings per share
37,316
32,375
35,066
23,394
Potentially dilutive shares
1,148
181
845
100
Class A common shares outstanding
-
-
-
8,981
Conversion of Class B common units
106,706
112,608
109,184
112,608
Weighted average fully distributed shares outstanding -
diluted
145,170
145,164
145,095
145,083
Reconciliation of GAAP EPS to Adjusted Fully Distributed EPS
GAAP earnings (loss) per share
$
(10.05) $
15.73 $
(22.28) $
(136.99) Impact of adjustment of redeemable limited partners'
capital to redemption amount
$
10.37 $
(15.31)
$ 23.16
$ 137.82
Impact of additions:
Pro forma adjustment for revenue share post-IPO
$
-
$
-
$
-
$
(1.76) Income tax expense
$
0.05
$
0.29
$
0.35
$
1.05 Stock-based compensation
$
0.20
$
0.19
$
0.60
$
0.56 Acquisition related expenses
$
0.08
$
0.03
$
0.18
$
0.06 Strategic and financial restructuring expenses
$
0.00
$
0.02
$
0.04
$
0.15 Loss (gain) on investment
$
0.03
$
(1.17)
$
0.03
$
(1.62) Adjustment to tax receivable agreement liability
$
0.03
$
-
$
-
$
- Acquisition related
adjustment - deferred revenue
$
0.10
$
-
$
0.26
$
- Amortization of purchased
intangible assets
$
0.07
$
0.02
$
0.19
$
0.09 Net income attributable to noncontrolling interest in
Premier LP
$
1.60
$
2.72
$
4.85
$ 10.52
Impact of corporation taxes
$
(0.99)
$
(1.01)
$
(2.95)
$
(3.95) Impact of increased share count
$
(1.11)
$
(1.17)
$
(3.36)
$
(4.97) Non-GAAP earnings per share on adjusted fully
distributed net income -
diluted
$
0.38
$ 0.34
$
1.07
$
0.96
Three Months Ended
March 31,
Nine Months Ended
March 31,
(Unaudited)
(In thousands, except per share data)
Reconciliation of Selected Non-GAAP Measures to GAAP Measures
* Note that no pro forma adjustments were made for the three and nine
months ended March 31, 2015 and the three months ended March 31,
2014; as such, actual results are presented for each of these periods.
Supplemental Financial Information - Reporting of Net Income and
Earnings Per Share |
WA_29Z'17GG_"=:[_T)
MVH?^1/\`XW1_PG6N_P#0G:A_Y$_^-T?7:?G]S#V\/Z3/0Z*\\_X3K7?^A.U#
M_P`B?_&Z/^$ZUW_H3M0_\B?_`!NCZ[3\_N8>WA_29Z'17GG_``G6N_\`0G:A
M_P"1/_C='_"=:[_T)VH?^1/_`(W1]=I^?W,/;P_I,]#HKSS_`(3K7?\`H3M0
M_P#(G_QNC_A.M=_Z$[4/_(G_`,;H^NT_/[F'MX?TF>AUQWQ4\4IX1\'7U^&4
M7+*8;=3SF1NAQWP,L?I3_"WC!M8U&>PO=/ETV]C4.(I2 :29!B0=@&Z<<_F/2JJS7M$^E^_]6)IQ]QI]
MO,Q?AXUG+XC23PWXENKK3?*_TC3[YF,N[!^9<@#TZ>AKF?[0TV3Q;XDC\1^)
M=9L$BO66V2UFDVL-[Y&`K8'"UTVD:+JVJ^.].UNZT"#0;>R5@^V16>P&W<<+GTSVJ9YXHWC2250\F=@9@,XYKSZXN%UA=6^UP"-FN=/@N
M8''W7$P#`GTQT]:O1236OB'2])NR[R6OG&"
#6;K3_
M``+'J>K@K=I;;F5A@LW1