Exhibit 99.1

PRESS RELEASE
|
For information contact: |
|
|
Jim Storey |
Alven Weil |
|
Vice President, Investor Relations |
Director, PR and Communications |
|
704.816.5958 |
704.816.5797 |
|
jim_storey@premierinc.com |
alven_weil@premierinc.com |
PREMIER, INC. REPORTS FISCAL 2014 SECOND-QUARTER RESULTS
CHARLOTTE, NC, February 13, 2014 — Premier, Inc. (NASDAQ: PINC) today reported financial results for the fiscal 2014 second quarter ended December 31, 2013.
Second-Quarter Highlights:
Pro forma results reflect the impact of the company’s reorganization and initial public offering (IPO)*.
· Net revenue of $208.9 million increased 11% from pro forma net revenue and 1% from GAAP net revenue for the same period a year ago. GAAP net revenue for the same period a year ago was $206.4 million, but does not reflect the company’s current operating structure.
· Adjusted EBITDA* of $83.4 million increased 8% from pro forma Adjusted EBITDA for the same period a year ago.
· Adjusted fully distributed net income* increased 3% to $43.3 million, or $0.30 per share from pro forma results for the same period a year ago. GAAP net income attributable to shareholders was $6.4 million.
· Supply Chain Services segment revenue rose 10% to $150.9 million and segment adjusted EBITDA increased 5% to $85.1 million, compared with pro forma results for the same period a year ago.
· Performance Services segment revenue increased 15% to $58.0 million and segment adjusted EBITDA increased 29% to $17.7 million, compared with the same period a year ago.
· The company acquired Meddius, LLC, a data acquisition and integration-as-a-service company.
· For the six months ended December 31, 2013, the company generated cash flow from operations of $195.7 million, an increase of $34.2 million from the same period a year ago. At December 31, 2013, the company’s cash, cash equivalents and marketable securities totaled $408.7 million, compared with $255.6 million at June 30, 2013.
· The company reiterates its fiscal year 2014 financial guidance of pro forma revenues of $845.0 million to $869.0 million, pro forma adjusted EBITDA of $335.0 million to $355.0 million, and pro forma adjusted fully distributed earnings per share of $1.20 to $1.29.
* Actual results prior to the company’s reorganization and IPO consummated on October 1, 2013, do not reflect the impact of the reorganization and IPO, and therefore, management believes they do not provide meaningful year-over-year comparisons. A description of adjusted EBITDA and other non-GAAP financial measures is provided in “Use and Definition of Non-GAAP Measures,” and reconciliations are provided in the tables as part of this release. See “Reorganization and Initial Public Offering” for important information regarding pro forma results.
“Our second-quarter results are consistent with management expectations,” said Susan DeVore, president and chief executive officer. “We achieved our financial objectives, generating 11% growth in consolidated net revenue and delivering an 8% increase in adjusted EBITDA from pro forma results for the same period last year. Most importantly, we continued to add to our product and service offerings, make and integrate acquisitions, and renew and expand member relationships to collaboratively address the challenges of a changing healthcare landscape. We believe these results demonstrate the growth opportunities and future operating leverage inherent in our diverse delivery channels.
“Within Supply Chain Services, strong growth from the direct sourcing and specialty pharmacy businesses, accompanied by solid existing acute member and alternate-site group purchasing (GPO) volume, produced 10% revenue growth and a 5% increase in segment adjusted EBITDA versus pro forma results a year ago,” DeVore continued. “GPO net administrative fees were unchanged from a year ago, reflecting the expected lag in new member conversions, relative to the loss of volume from departed members who did not participate in the company’s reorganization and IPO. As new members continue to convert to our GPO contracts, we expect revenue contribution from net administrative fee revenues will increase through the second half of fiscal 2014.
“In Performance Services, demand for our SaaS-based (software-as-a-service) subscriptions, advisory services and performance improvement collaborative programs delivered 15% revenue growth from a year ago, with segment adjusted EBITDA increasing 29%,” DeVore said.
“At Premier, we take pride in our ability to co-innovate from the inside of many of the nation’s leading health systems, leveraging our integrated, data-driven solutions to transform our industry across the cost, quality and safety continuum,” DeVore continued. “We are helping prepare for changing delivery and payment models that are part of this industry’s shift toward population health management. During the quarter, our ability to collaborate with these providers was recognized in numerous ways. We continued to add participants to our bundled-payment collaborative; we extended our Partnership for Patients initiative, which comprises nearly 425 organizations across 38 states; and we were designated by KLAS, an independent healthcare research firm, as an early leader in population health management. Additionally, during the quarter, we continued to build momentum in our Medicare breakeven initiative, which we launched last summer to help health care providers operate profitably under current and future Medicare payment rates. We continued to see uptake of our new program focused on driving physician preference cost savings through the use of our recent SYMMEDRx acquisition; and we acquired Meddius, LLC, a data acquisition and integration-as-a-service company. Meddius spans multiple hospital transaction systems, and we expect its real-time technology to be integral to our core informatics products and services.”
Results of Operations for the Second Quarter of Fiscal 2014
Consolidated Second-Quarter Financial Highlights
|
|
|
Three Months Ended December 31, |
| ||||||
|
(in thousands, except per share data) |
|
2013 |
|
2012 |
|
% Change |
| ||
|
|
|
Actual |
|
Pro Forma (a) |
|
|
| ||
|
Net revenue: |
|
|
|
|
|
|
| ||
|
Supply Chain Services Segment |
|
$ |
150,885 |
|
$ |
137,526 |
|
10 |
% |
|
Performance Services Segment |
|
58,024 |
|
50,580 |
|
15 |
% | ||
|
Total net revenue |
|
$ |
208,909 |
|
$ |
188,106 |
|
11 |
% |
|
|
|
|
|
|
|
|
| ||
|
Adjusted EBITDA (b) |
|
|
|
|
|
|
| ||
|
Supply Chain Services Segment |
|
$ |
85,119 |
|
$ |
80,770 |
|
5 |
% |
|
Performance Services Segment |
|
17,731 |
|
13,733 |
|
29 |
% | ||
|
Segment adjusted EBITDA |
|
$ |
102,850 |
|
$ |
94,503 |
|
9 |
% |
|
Corporate |
|
(19,445 |
) |
(17,002 |
) |
14 |
% | ||
|
Total adjusted EBITDA |
|
$ |
83,405 |
|
$ |
77,501 |
|
8 |
% |
|
|
|
|
|
|
|
|
| ||
|
Non-GAAP adjusted fully distributed net income (b) |
|
$ |
43,256 |
|
$ |
41,882 |
|
3 |
% |
|
Non-GAAP earnings per share on adjusted fully distributed net income - diluted |
|
$ |
0.30 |
|
$ |
0.29 |
|
3 |
% |
|
Weighted average fully distributed shares outstanding - diluted |
|
145,093 |
|
144,983 |
|
|
| ||
(a) Reflects the impact of the Company’s Reorganization on the Supply Chain Services segment as a result of the 30% revenue share to owner members after the Reorganization. The impact of the pro forma adjustment on both Supply Chain Services net revenue and segment adjusted EBITDA was $18.3 million for the three months ended December 31, 2012. Pro forma adjustments do not impact the financial results of the Company’s Performance Services segment.
(b) See attached supplemental financial information for reconciliation of reported GAAP results to Non-GAAP results.
For the three months ended December 31, 2013, Premier generated net revenue of $208.9 million. This represents an increase of $20.8 million, or 11%, from pro forma net revenue of $188.1 million for the same period last year. The primary drivers of revenue growth were improved product revenue sales within the Supply Chain Services segment and increased SaaS (software-as-a-service) informatics product subscriptions and advisory services engagements within the Performance Services segment.
Adjusted EBITDA for the fiscal second quarter totaled $83.4 million, an increase of $5.9 million, or 8%, from pro forma adjusted EBITDA of $77.5 million for the same period last year. Adjusted fully distributed net income rose to $43.3 million, or $0.30 per fully diluted share, compared with pro forma adjusted fully distributed net income of $41.9 million, or $0.29 per fully diluted share, for the second quarter of fiscal 2013.
Adjusted EBITDA and adjusted fully distributed net income for the second quarter of fiscal 2014 add back strategic and financial restructuring expenses, acquisition-related expenses, and stock-based compensation expenses totaling $7.7 million, compared with actual EBITDA and net income. Pro forma adjusted EBITDA and adjusted fully distributed net income for the prior year results add back $1.4 million in expenses related to strategic and financial restructuring costs, compared with pro forma EBITDA and pro forma net income. Adjusted EBITDA and adjusted
fully distributed net income for the second quarter of fiscal 2014 were positively impacted by revenue growth in both of the company’s business segments. Revenue growth was partially offset by increased selling, general and administrative services expenses, due to higher employee and travel-related expenses resulting from increased selling and service personnel headcount and incremental expenses associated with becoming a public company.
On a GAAP basis, net revenue totaled $208.9 million for the quarter ended December 31, 2013, compared with $206.4 million for the same period last year. Net income totaled $51.5 million, compared with $85.4 million, and net income attributable to shareholders was $6.4 million, compared with $2.0 million for the same period a year ago. Note: Comparisons of GAAP results are impacted by the changes associated with the reorganization and IPO, as described below, and therefore, management believes they do not provide meaningful year-over-year comparisons.
Segment Results
Premier approaches the market with an integrated sales and field force and holistic, programmatic solutions based on what it believes is one of the largest data analytics platforms serving the industry. Financially, the company’s operations are divided into two business segments:
· Supply Chain Services includes one of the largest healthcare group purchasing organizations (GPOs) in the United States, serving acute and alternate sites. The segment also includes the company’s specialty pharmacy and direct sourcing activities.
· Performance Services includes one of the nation’s largest informatics and advisory services businesses focused on healthcare providers. The Performance Services segment includes the company’s SaaS informatics products, technology-enabled performance improvement collaboratives, advisory services and insurance services.
|
Segment Results |
|
Three Months Ended December 31, |
|
Three Months Ended December 31, |
| ||||||||||||
|
(in thousands) |
|
2013 |
|
2012 |
|
% Change |
|
2013 |
|
2012 |
|
% Change |
| ||||
|
|
|
Actual |
|
Actual |
|
|
|
Actual |
|
Pro Forma (a) |
|
|
| ||||
|
Net Revenue: |
|
|
|
|
|
|
|
|
|
|
|
|
| ||||
|
Supply Chain Services: |
|
|
|
|
|
|
|
|
|
|
|
|
| ||||
|
Net administrative fees |
|
$ |
102,130 |
|
$ |
120,630 |
|
-15 |
% |
$ |
102,130 |
|
$ |
102,311 |
|
0 |
% |
|
Other services and support |
|
173 |
|
55 |
|
215 |
% |
173 |
|
55 |
|
215 |
% | ||||
|
Services |
|
102,303 |
|
120,685 |
|
-15 |
% |
102,303 |
|
102,366 |
|
0 |
% | ||||
|
Products |
|
48,582 |
|
35,160 |
|
38 |
% |
48,582 |
|
35,160 |
|
38 |
% | ||||
|
Total Supply Chain Services |
|
150,885 |
|
155,845 |
|
-3 |
% |
150,885 |
|
137,526 |
|
10 |
% | ||||
|
Performance Services: |
|
|
|
|
|
|
|
|
|
|
|
|
| ||||
|
Services |
|
58,024 |
|
50,580 |
|
15 |
% |
58,024 |
|
50,580 |
|
15 |
% | ||||
|
Total |
|
$ |
208,909 |
|
$ |
206,425 |
|
1 |
% |
$ |
208,909 |
|
$ |
188,106 |
|
11 |
% |
|
|
|
|
|
|
|
|
|
|
|
|
|
|
| ||||
|
Adjusted EBITDA (b): |
|
|
|
|
|
|
|
|
|
|
|
|
| ||||
|
Supply Chain Services |
|
$ |
85,119 |
|
$ |
99,089 |
|
-14 |
% |
$ |
85,119 |
|
$ |
80,770 |
|
5 |
% |
|
Performance Services |
|
17,731 |
|
13,733 |
|
29 |
% |
17,731 |
|
13,733 |
|
29 |
% | ||||
|
Total segment adjusted EBITDA |
|
102,850 |
|
112,822 |
|
-9 |
% |
102,850 |
|
94,503 |
|
9 |
% | ||||
|
Corporate |
|
(19,445 |
) |
(17,002 |
) |
14 |
% |
(19,445 |
) |
(17,002 |
) |
14 |
% | ||||
|
Total |
|
$ |
83,405 |
|
$ |
95,820 |
|
-13 |
% |
$ |
83,405 |
|
$ |
77,501 |
|
8 |
% |
(a) Reflects the impact of the Company’s Reorganization on the Supply Chain Services segment as a result of the 30% revenue share to owner members after the Reorganization. The impact of the pro forma adjustment on both Supply Chain Services net revenue and segment adjusted EBITDA was $18.3 million for the three months ended December 31, 2012. Pro forma adjustments do not impact the financial results of the Company’s Performance Services segment.
(b) See attached supplemental financial information for reconciliation of reported GAAP results to Non-GAAP results.
Supply Chain Services
For the fiscal second quarter ended December 31, 2013, the Supply Chain Services segment produced net revenue of $150.9 million, an increase of $13.4 million, or 10%, from pro forma net revenue of $137.5 million a year ago. Revenue growth in the segment was driven largely by product revenues, which encompass the company’s direct sourcing and specialty pharmacy business. Product revenues rose 38% to $48.6 million. GPO net administrative fee revenues were unchanged compared with pro forma net administrative fee revenue a year ago, reflecting the expected timing lag of contract conversions among member owners that joined during fiscal year 2013, relative to the loss of administrative fee revenue from departed members that did not participate in the company’s reorganization and IPO. The company expects net administrative fees to increase in the second half of the year as it begins to see the benefit of cash collections from anticipated purchasing by newer GPO members as a result of the progression of their ramp up and conversion to the company’s contract portfolio.
Supply Chain Services segment adjusted EBITDA of $85.1 million for the fiscal second quarter increased $4.3 million, or 5%, from pro forma segment adjusted EBITDA of $80.8 million for the same period a year ago.
Supply Chain Services segment net revenue totaled $150.9 million for the fiscal second quarter, compared with segment GAAP net revenue of $155.8 million for the same period a year ago. Segment adjusted EBITDA was $85.1 million, compared with $99.1 million for the same period a year ago. Note: the declines from the year-ago period are a function of the changes described with the pro forma results, an outcome of the company’s reorganization and IPO, and as a result, management believes they do not provide meaningful year-over-year comparisons.
Performance Services
For the fiscal second quarter ended December 31, 2013, the Performance Services segment generated net revenue of $58.0 million, an increase of $7.4 million, or 15%, from $50.6 million for the same quarter last year. The revenue growth is attributable primarily to new SaaS informatics product subscriptions and from increased revenue from advisory services and performance improvement collaboratives.
Performance Services segment adjusted EBITDA was $17.7 million, an increase of $4.0 million, or 29%, from $13.7 million for the same quarter last year. Pro forma results do not impact the financial results for the company’s Performance Services segment.
Results of Operations for the Six Months Ended December 31, 2013
Consolidated Six-Month Financial Highlights
|
|
|
Six Months Ended December 31, |
|
Six Months Ended December 31, |
| ||||||||||||
|
(in thousands, except per share data) |
|
2013 |
|
2012 |
|
% Change |
|
2013 |
|
2012 |
|
% Change |
| ||||
|
|
|
Actual |
|
Pro Forma (a) |
| ||||||||||||
|
Net revenue: |
|
|
|
|
|
|
|
|
|
|
|
|
| ||||
|
Supply Chain Services Segment |
|
$ |
338,343 |
|
$ |
306,303 |
|
10 |
% |
$ |
297,080 |
|
$ |
270,527 |
|
10 |
% |
|
Performance Services Segment |
|
111,142 |
|
98,688 |
|
13 |
% |
111,142 |
|
98,688 |
|
13 |
% | ||||
|
Total net revenue |
|
$ |
449,485 |
|
$ |
404,991 |
|
11 |
% |
$ |
408,222 |
|
$ |
369,215 |
|
11 |
% |
|
|
|
|
|
|
|
|
|
|
|
|
|
|
| ||||
|
Adjusted EBITDA (b): |
|
|
|
|
|
|
|
|
|
|
|
|
| ||||
|
Supply Chain Services Segment |
|
$ |
210,599 |
|
$ |
197,356 |
|
7 |
% |
$ |
169,336 |
|
$ |
161,580 |
|
5 |
% |
|
Performance Services Segment |
|
34,060 |
|
25,733 |
|
32 |
% |
34,060 |
|
25,733 |
|
32 |
% | ||||
|
Segment adjusted EBITDA |
|
$ |
244,659 |
|
$ |
223,089 |
|
10 |
% |
$ |
203,396 |
|
$ |
187,313 |
|
9 |
% |
|
Corporate |
|
(36,920 |
) |
(32,580 |
) |
13 |
% |
(36,920 |
) |
(32,580 |
) |
13 |
% | ||||
|
Total adjusted EBITDA |
|
$ |
207,739 |
|
$ |
190,509 |
|
9 |
% |
$ |
166,476 |
|
$ |
154,733 |
|
8 |
% |
|
|
|
|
|
|
|
|
|
|
|
|
|
|
| ||||
|
Non-GAAP adjusted fully distributed net income (b) |
|
|
|
|
|
|
|
$ |
87,239 |
|
$ |
83,763 |
|
4 |
% | ||
|
Non-GAAP earnings per share on adjusted fully distributed net income - diluted |
|
|
|
|
|
|
|
$ |
0.60 |
|
$ |
0.58 |
|
4 |
% | ||
|
Weighted average fully distributed shares outstanding - diluted |
|
|
|
|
|
|
|
145,041 |
|
144,983 |
|
|
| ||||
(a) Reflects the impact of the Company’s Reorganization on the Supply Chain Services segment as a result of the 30% revenue share to owner members after the Reorganization. The impact of the pro forma adjustment on both Supply Chain Services net revenue and segment adjusted EBITDA was $41.3 million for the six months ended December 31, 2013 and $35.8 million for the six months ended December 31, 2012. Pro forma adjustments do not impact the financial results of the Company’s Performance Services segment.
(b) See attached supplemental financial information for reconciliation of reported GAAP results to Non-GAAP results.
The company generated pro forma net revenue of $408.2 million for the six-month period ended December 31, 2013, an increase of $39.0 million, or 11%, from $369.2 million in the same period last year. Pro forma adjusted EBITDA totaled $166.5 million, an increase of 8% from $154.7 million in the same period last year. Pro forma adjusted fully distributed net income totaled $87.2 million, or $0.60 per diluted share, compared with $83.8 million, or $0.58 per diluted share, for the same period last year.
Supply Chain Services segment pro forma net revenue increased $26.6 million, or 10%, to $297.1 million for the six-month period, from $270.5 million a year earlier. Pro forma segment adjusted EBITDA increased $7.8 million, or 5%, to $169.3 million, from $161.6 million.
Performance Services segment net revenue for the six-month period totaled $111.1 million, an increase of $12.4 million, or 13%, from $98.7 million for the same period the prior year. Segment adjusted EBITDA of $34.1 million increased $8.4 million, or 32%, from $25.7 million a year ago.
The company generated GAAP net revenue of $449.5 million for the six months ended December 31, 2013, compared with $405.0 million for the same period last year. GAAP net income totaled $164.0 million, compared with $170.4 million for the same period last year, while GAAP net income attributable to shareholders was $5.9 million compared with $3.9 million. Adjusted EBITDA totaled $207.7 million, compared with $190.5 million for the year-ago period. Supply Chain Services GAAP net revenue was $338.3 million, up from $306.3 million for the same period last year. Supply Chain Services segment adjusted EBITDA was $210.6 million, compared with $197.4 million a year earlier. Note: Comparisons of GAAP results are impacted by the changes associated with the company’s reorganization and IPO, as described below, and as a result, management believes they do not provide meaningful year-over-year comparisons. Performance Services segment financial results are not impacted by pro forma adjustments.
Cash Flows and Liquidity
Cash provided by operating activities was $195.7 million for the six months ended December 31, 2013, an increase of $34.2 million from $161.5 million for the same period a year ago. The increase was primarily due to cash from operations as a result of net income adjusted for increases in non-cash add-backs to net income, including depreciation and amortization and stock-based compensation, as well as working capital changes, primarily an increase in revenue share obligations as a result of the reorganization.
Capital expenditures were $26.0 million for the six months ended December 31, 2013, compared with $19.0 million for the same period last year. The increase was primarily related to capitalized internally developed software and associated hardware. Other investing activities in the six-month period primarily consisted of the first-quarter, $28.7 million acquisition of SYMMEDRx, LLC and the second-quarter acquisition of Meddius, LLC for $8.1 million, with $7.7 million in the form of cash consideration. SYMMEDRx is a business with a track record of analyzing and reducing costs for health systems through the innovative use of data. Meddius is a data acquisition and integration-as-a-service company that spans multiple hospital transaction systems including enterprise resource planning, materials management, enterprise health records and patient accounting.
At December 31, 2013, the company’s cash, cash equivalents and marketable securities with maturities ranging from three to 24 months totaled $408.7 million, consisting of $158.1 million in cash and cash equivalents and $250.6 million in marketable securities with maturities ranging from three to 24 months. At December 31, 2013, there was no outstanding balance on the company’s senior revolving credit facility.
Adjustment to Update Balance Sheet Presentation
In preparing to file its Form 10-Q for the fiscal second quarter ended December 31, 2013, the company identified an update in the reporting of redeemable limited partner’s capital on its balance sheet. The company operates through an Up-C structure and utilizes the controlled company exception pursuant to NASDAQ guidelines, which allows the majority of the board of directors to be executives from its member owners. The board, controlled by a majority of member owner directors, approves the redemption of a member owner’s capital account in the event that member wishes to terminate its relationship with the company. Therefore, prior to and subsequent to the Reorganization and IPO, the company reflects limited partners’ capital on the consolidated balance sheets as redeemable limited partners’ capital in temporary equity, rather than permanent equity, at the greater of book value or the redemption amount per the limited partnership agreement. However, following the IPO, member owners are now able to exchange Class B common units for cash or Class A common stock which is currently greater than the book value redemption amount per the limited partnership agreement. As a result, the company has recorded on its balance sheet a $3.9 billion non-cash increase in redeemable limited partner’s capital as of December 31, 2013, which reflects the redemption amount at the closing price of Class A common stock at $36.76 on that date. There is a corresponding offset to additional paid-in capital and retained earnings, which will create an accumulated deficit on the balance sheet. These balance sheet items represent non-cash activity and do not impact the company’s operating performance.
The company also has assessed this balance sheet treatment of temporary equity on the calculation of earnings per share for GAAP purposes. As a result of the member owners being party to multiple agreements in conjunction with the company’s Reorganization and IPO, GAAP per-share earnings have been adjusted to reflect the adjustment to redeemable limited partners’ capital to the redemption amount. The financial guidance provided for Pro Forma Adjusted Fully Distributed Earnings per Share will not be impacted by this GAAP treatment. As previously discussed, Non GAAP Pro Forma Adjusted Fully Distributed Earnings per Share represents net income, adjusted for non-recurring and non-cash items, attributable to all shareholders as if all Class B shareholders have converted into Class A shareholders, and reflects income taxes at an estimated effective rate of approximately 41% on 100% of pretax income.
In order to record redeemable limited partner’s capital at the greater of book value or the redemption amount, the company will amend its first quarter 10-Q to reflect the updated pro forma balance sheet and updated pro forma GAAP EPS amount as of September 30, 2013. The company will also include an updated pro forma balance sheet and updated pro forma GAAP EPS amount as of June 30, 2013, under the caption “Other Information” in its Form 10-Q that it intends to file with the SEC on February 14, 2014.
Outlook and Guidance
“Premier’s mission is to improve the health of communities by transforming care delivery in America,” DeVore said. “We believe we are well positioned to help our members successfully address the cost, quality, safety, efficiency and population health management issues facing the healthcare industry over the next several years. As we continue to build our platform to pursue this mission, the channels of growth available to us are diverse, and we believe the value we can bring to our members and the performance we seek to deliver to our shareholders are closely aligned.”
The guidance below is based on the following key assumptions: increasing use of Performance Services products and offerings, as well as stable growth in the Supply Chain segment through the continued growth of the company’s direct sourcing and specialty pharmacy businesses, the addition of acute and alternate-site GPO members, the ramp-up of new members, and deeper penetration of existing members’ supply spend. Based on these assumptions, year-to-date results and the company’s current outlook, Premier reiterates the following financial guidance for the full fiscal year ending June 30, 2014:
Fiscal 2014 Financial Guidance
Premier, Inc. affirms full-year fiscal 2014 financial guidance, as follows:
|
(in millions, except per share data) |
|
FY 2014 |
|
% YoY Change |
|
|
Pro Forma Net Revenue: |
|
|
|
|
|
|
Supply Chain Services segment |
|
$614.0 - $631.0 |
|
10% - 13% |
|
|
Performance Services segment |
|
$231.0 - $238.0 |
|
13% - 16% |
|
|
Total Pro Forma Net Revenue |
|
$845.0 - $869.0 |
|
11% - 13% |
|
|
|
|
|
|
|
|
|
Non-GAAP pro forma adjusted EBITDA |
|
$335.0 - $355.0 |
|
7% - 13% |
|
|
|
|
|
|
|
|
|
Non-GAAP pro forma adjusted fully distributed EPS |
|
$1.20 - $1.29 |
|
NA* |
|
* not applicable
The statements in this “Outlook and Guidance” discussion are “forward-looking statements.” For additional information regarding the use and limitations of such statements, see “Forward-Looking Statements” below.
Conference Call
Premier management will host a conference call and live audio webcast on Thursday, February 13, 2014, at 5:00 p.m. EST, to discuss the company’s financial results. The conference call can be accessed through a link provided on the investor relations page on Premier’s website at investors.premierinc.com. Those wishing to participate in the call should dial 855-601-0048 (international callers should dial 702-495-1234) and provide the operator with conference ID number 49152488. Please dial in approximately 15 minutes before the start of the call to ensure you are connected. A replay of the conference call will be available beginning approximately two hours after the completion of the conference call through February 28, 2014, by dialing 800-585-8367 (702-495-1234 for international callers), and using the conference ID number above. The webcast will also be archived on the investor relations page on Premier’s website.
About Premier, Inc.
Premier, Inc. (NASDAQ:PINC) is a leading healthcare improvement company, uniting an alliance of more than 2,900 U.S. hospitals and nearly 100,000 other providers to transform healthcare. With integrated data and analytics, collaboratives, supply chain solutions, and advisory and other services, Premier enables better care and outcomes at a lower cost. Premier, a Malcolm Baldrige National Quality Award recipient, plays a critical role in the rapidly evolving healthcare industry, collaborating with members to co-develop long-term innovations that reinvent and improve the way care is delivered to patients nationwide. Headquartered in Charlotte, N.C., Premier is passionate about transforming American healthcare. Please visit Premier’s news and investor sites on www.premierinc.com; as well as Twitter, Facebook, LinkedIn, YouTube, Instagram, Foursquare and Premier’s blog for more information about the company.
Reorganization and Initial Public Offering
On October 1, 2013, Premier completed its IPO by issuing 32,374,751 shares of its Class A common stock, at a price of $27.00 per share, raising net proceeds of approximately $821.7 million, after underwriting discounts and commissions but before expenses. In connection with the IPO, Premier completed the reorganization of the company on October 1, 2013, issuing 112.6 million shares of Class B common stock representing 77.7% of the common stock outstanding, and corresponding Class B common units in Premier Healthcare Alliance, L.P. to its 181 member owners.
The company’s historical consolidated operating results do not reflect the reorganization, the IPO and contemplated use of net proceeds from the IPO. Therefore, in addition to presenting the historical actual results, the company presents and discusses pro forma results, which reflect the impact of the company’s reorganization and IPO and the contemplated use of net proceeds from the IPO, to provide a more comparable indication of future expectations.
The key pro forma adjustments include:
· The reorganization, which included the formation of a C-Corporation and the sale of 22.3% of the member’s partnership interests to the public through the issuance of
approximately 32.4 million shares of Premier Class A common stock, with the member owners retaining their ownership interest in the form of 112.6 million shares of Premier Class B common stock.
· Payments to each member owner of revenue share from Premier equal to 30% of all gross administrative fees collected.
· Payments due to member owners pursuant to the tax receivable agreement equal to 85% of the amount of cash savings, if any, in income and franchise taxes, that Premier realizes.
· The further adjustments set forth in the notes to the pro forma financial statements provided below.
Further details of the reorganization and pro forma adjustments are in the company’s IPO prospectus, dated September 25, 2013, as filed with the Securities and Exchange Commission (SEC), and in the company’s Form 10-Q for the quarter ended December 31, 2013, expected to be filed with the SEC on or about February 14, 2014. The prospectus is, and Form 10-Q will be, accessible on the SEC’s website at www.sec.gov and in the investor relations section of the company’s website at investors.premierinc.com.
Use and Definition of Non-GAAP Measures
Premier, Inc. uses adjusted EBITDA, segment adjusted EBITDA and adjusted fully distributed net income to facilitate a comparison of the company’s operating performance on a consistent basis from period to period that, when viewed in combination with its results prepared in accordance with GAAP, provides a more complete understanding of factors and trends affecting the company’s business than GAAP measures alone. The company believes adjusted EBITDA and segment adjusted EBITDA assist its board of directors, management and investors in comparing the company’s operating performance on a consistent basis from period to period because they remove the impact of the company’s asset base (primarily depreciation and amortization) and items outside the control of management (taxes), as well as other non-cash (impairment of intangible assets and purchase accounting adjustments) and non-recurring items, from operations.
In addition, adjusted fully distributed net income eliminates the variability of noncontrolling interest as a result of member owner exchanges of Class B common stock and corresponding Class B units into shares of Class A common stock (which exchanges are a member owner’s cumulative right, but not obligation, beginning on October 31, 2014, and each year thereafter, and are limited to one-seventh of the member owner’s initial allocation of Class B common units) and other potentially dilutive equity transactions which are outside of management’s control. Adjusted fully distributed net income is defined as net income attributable to PHSI (i) excluding income tax expense, (ii) excluding the effect of non-recurring and non-cash items, (iii) assuming the exchange of all the Class B common units into shares of Class A common stock, which results in the elimination of noncontrolling interest in Premier LP, and (iv) reflecting an adjustment for income tax expense on pro forma fully distributed net income before income taxes at the company’s estimated effective income tax rate.
EBITDA is defined as net income before interest and investment income, net, income tax expense, depreciation and amortization and amortization of purchased intangible assets. Adjusted EBITDA is defined as EBITDA before merger and acquisition related expenses and non-recurring, non-cash or non-operating items, and including equity in net income of unconsolidated affiliates. Non-recurring items are expenses that have not been incurred within the prior two years and are not expected to recur within the next two years. Such expenses include certain
strategic and financial restructuring expenses. Non-operating items include gain or loss on disposal of assets. Segment adjusted EBITDA is defined as the segment’s net revenue less operating expenses directly attributable to the segment, excluding depreciation and amortization, amortization of purchased intangible assets, merger and acquisition related expenses and non-recurring or non-cash items, and including equity in net income of unconsolidated affiliates. Operating expenses directly attributable to the segment include expenses associated with sales and marketing, general and administrative and product development activities specific to the operation of each segment. General and administrative corporate expenses that are not specific to a particular segment are not included in the calculation of segment adjusted EBITDA. Adjusted EBITDA is a supplemental financial measure used by the company and by external users of the company’s financial statements.
Management considers adjusted EBITDA an indicator of the operational strength and performance of the company’s business. Adjusted EBITDA allows management to assess performance without regard to financing methods and capital structure and without the impact of other matters that management does not consider indicative of the operating performance of the business. Segment adjusted EBITDA is the primary earnings measure used by management to evaluate the performance of the company’s business segments.
Forward-Looking Statements
Statements made in this release that are not statements of historical or current facts, such as those under the heading “Outlook and Guidance,” are “forward-looking statements” within the meaning of the Private Securities Litigation Reform Act of 1995. Forward-looking statements may involve known and unknown risks, uncertainties and other factors that may cause the actual results, performance or achievements of Premier to be materially different from historical results or from any future results or projections expressed or implied by such forward-looking statements. Accordingly, readers should not place undue reliance on any forward looking statements. In addition to statements that explicitly describe such risks and uncertainties, readers are urged to consider statements in the conditional or future tenses or that include terms such as “believes,” “belief,” “expects,” “estimates,” “intends,” “anticipates” or “plans” to be uncertain and forward-looking. Forward-looking statements may include comments as to Premier’s beliefs and expectations as to future events and trends affecting its business and are necessarily subject to uncertainties, many of which are outside Premier’s control. More information on potential factors that could affect Premier’s financial results is included from time to time in the “Forward Looking Statements,” “Risk Factors” and “Management’s Discussion and Analysis of Financial Condition and Results of Operations” sections of Premier’s periodic and current filings with the SEC, as well as those discussed under the “Risk Factors” and “Forward Looking Statements” section of Premier’s IPO Prospectus, dated September 25, 2013, filed with the SEC and available on Premier’s website at http://investors.premierinc.com. Forward looking statements speak only as of the date they are made, Premier undertakes no obligation to publicly update or revise any forward-looking statements, whether as a result of new information, future events or otherwise that occur after that date.
(Tables Follow)
Premier, Inc.
Consolidated Statements of Income
(Unaudited)
(In thousands, except pershare data)
|
|
|
Three Months Ended |
|
Six Months Ended |
| ||||||||
|
|
|
December 31, |
|
December 31, |
| ||||||||
|
|
|
2013 |
|
2012 (a) |
|
2013 (a) |
|
2012 (a) |
| ||||
|
Net revenue: |
|
|
|
|
|
|
|
|
| ||||
|
Net administrative fees |
|
$ |
102,130 |
|
$ |
120,630 |
|
$ |
245,706 |
|
$ |
238,119 |
|
|
Other services and support |
|
58,197 |
|
50,635 |
|
111,449 |
|
98,782 |
| ||||
|
Services |
|
160,327 |
|
171,265 |
|
357,155 |
|
336,901 |
| ||||
|
Products |
|
48,582 |
|
35,160 |
|
92,330 |
|
68,090 |
| ||||
|
|
|
208,909 |
|
206,425 |
|
449,485 |
|
404,991 |
| ||||
|
Cost of revenue: |
|
|
|
|
|
|
|
|
| ||||
|
Services |
|
29,017 |
|
25,590 |
|
56,505 |
|
49,670 |
| ||||
|
Products |
|
43,720 |
|
32,586 |
|
83,758 |
|
62,738 |
| ||||
|
|
|
72,737 |
|
58,176 |
|
140,263 |
|
112,408 |
| ||||
|
Gross profit |
|
136,172 |
|
148,249 |
|
309,222 |
|
292,583 |
| ||||
|
Operating expenses: |
|
|
|
|
|
|
|
|
| ||||
|
Selling, general and administrative |
|
73,126 |
|
61,436 |
|
135,769 |
|
117,168 |
| ||||
|
Research and development |
|
1,042 |
|
2,372 |
|
1,894 |
|
6,010 |
| ||||
|
Amortization of purchased intangible assets |
|
755 |
|
384 |
|
1,356 |
|
769 |
| ||||
|
|
|
74,923 |
|
64,192 |
|
139,019 |
|
123,947 |
| ||||
|
Operating income |
|
61,249 |
|
84,057 |
|
170,203 |
|
168,636 |
| ||||
|
Equity in net income of unconsolidated affiliates |
|
4,491 |
|
3,396 |
|
8,605 |
|
6,177 |
| ||||
|
Interest and investment income, net |
|
21 |
|
94 |
|
241 |
|
318 |
| ||||
|
Gain on disposal of assets |
|
— |
|
— |
|
4 |
|
— |
| ||||
|
Other income, net |
|
4,512 |
|
3,490 |
|
8,850 |
|
6,495 |
| ||||
|
Income before income taxes |
|
65,761 |
|
87,547 |
|
179,053 |
|
175,131 |
| ||||
|
Income tax expense |
|
14,284 |
|
2,166 |
|
15,048 |
|
4,683 |
| ||||
|
Net income |
|
51,477 |
|
85,381 |
|
164,005 |
|
170,448 |
| ||||
|
Add: Net (income) loss attributable to noncontrolling interest in S2S Global |
|
(157 |
) |
394 |
|
53 |
|
699 |
| ||||
|
Less: Net income attributable to noncontrolling interest in Premier LP |
|
(44,916 |
) |
(83,784 |
) |
(158,130 |
) |
(167,201 |
) | ||||
|
Net income attributable to noncontrolling interest |
|
(45,073 |
) |
(83,390 |
) |
(158,077 |
) |
(166,502 |
) | ||||
|
Net income attributable to shareholders |
|
$ |
6,404 |
|
$ |
1,991 |
|
$ |
5,928 |
|
$ |
3,946 |
|
|
|
|
|
|
|
|
|
|
|
| ||||
|
Weighted average shares outstanding: |
|
|
|
|
|
|
|
|
| ||||
|
Basic |
|
32,375 |
|
6,040 |
|
19,001 |
|
6,032 |
| ||||
|
Diluted |
|
32,375 |
|
6,040 |
|
19,001 |
|
6,032 |
| ||||
|
|
|
|
|
|
|
|
|
|
| ||||
|
(Loss) earnings per share attributable to shareholders (b): |
|
|
|
|
|
|
|
|
| ||||
|
Basic |
|
$ |
(114.70 |
) |
$ |
0.33 |
|
$ |
(195.46 |
) |
$ |
0.65 |
|
|
Diluted |
|
$ |
(114.70 |
) |
$ |
0.33 |
|
$ |
(195.46 |
) |
$ |
0.65 |
|
(a) After the completion of the Reorganization, Premier Healthcare Solutions, Inc. (PHSI) became a consolidated subsidiary of Premier, Inc. PHSI is considered the predecessor of the Company for accounting purposes, and accordingly, PHSI’s consolidated financial statements are included herein as Premier, Inc.’s historical financial statements.
(b) Loss per share attributable to shareholders includes an adjustment to net income attributable to shareholders of redeemable limited partners’ capital to redemption amount of $3,719.8 million for the three and six months ended December 31, 2013.
Premier, Inc.
Consolidated Balance Sheets
(In thousands, except share data)
|
|
|
December 31, 2013 |
|
June 30, 2013* |
| ||
|
|
|
(Unaudited) |
|
|
| ||
|
Assets |
|
|
|
|
| ||
|
Cash and cash equivalents |
|
$ |
158,059 |
|
$ |
198,296 |
|
|
Marketable securities |
|
75,802 |
|
57,323 |
| ||
|
Accounts receivable |
|
68,688 |
|
62,162 |
| ||
|
Inventories |
|
16,116 |
|
12,741 |
| ||
|
Prepaid expenses and other current assets |
|
27,232 |
|
25,466 |
| ||
|
Due from related party |
|
2,212 |
|
1,650 |
| ||
|
Deferred tax assets |
|
9,969 |
|
8,403 |
| ||
|
Total current assets |
|
358,078 |
|
366,041 |
| ||
|
Property and equipment |
|
124,096 |
|
115,587 |
| ||
|
Restricted cash |
|
5,000 |
|
5,000 |
| ||
|
Marketable securities |
|
174,824 |
|
— |
| ||
|
Deferred tax assets |
|
293,916 |
|
15,077 |
| ||
|
Goodwill |
|
90,285 |
|
61,410 |
| ||
|
Intangible assets |
|
10,672 |
|
4,292 |
| ||
|
Other assets |
|
38,763 |
|
31,509 |
| ||
|
Total assets |
|
$ |
1,095,634 |
|
$ |
598,916 |
|
|
|
|
|
|
|
| ||
|
Liabilities, redeemable limited partners’ capital and stockholders’ equity |
|
|
|
|
| ||
|
Accounts payable |
|
$ |
24,062 |
|
$ |
21,788 |
|
|
Accrued expenses |
|
32,496 |
|
28,883 |
| ||
|
Revenue share obligations |
|
49,182 |
|
10,532 |
| ||
|
Limited partners’ distribution payable |
|
17,419 |
|
— |
| ||
|
Accrued compensation and benefits |
|
30,054 |
|
51,359 |
| ||
|
Deferred revenue |
|
18,150 |
|
18,880 |
| ||
|
Current portion of tax receivable agreement |
|
6,966 |
|
— |
| ||
|
Current portion of notes payable and line of credit |
|
20,432 |
|
12,149 |
| ||
|
Other current liabilities |
|
13,279 |
|
1,557 |
| ||
|
Total current liabilities |
|
212,040 |
|
145,148 |
| ||
|
Notes payable, less current portion |
|
19,757 |
|
22,468 |
| ||
|
Tax receivable agreement, less current portion |
|
179,111 |
|
— |
| ||
|
Deferred compensation plan obligations |
|
29,605 |
|
24,081 |
| ||
|
Deferred rent |
|
15,902 |
|
15,779 |
| ||
|
Other long-term liabilities |
|
5,592 |
|
6,037 |
| ||
|
Total liabilities |
|
462,007 |
|
213,513 |
| ||
|
Redeemable limited partners’ capital |
|
4,118,121 |
|
307,635 |
| ||
|
Stockholders’ (deficit) equity: |
|
|
|
|
| ||
|
Series A Preferred stock, par value $0.01, 50,000,000 shares authorized; no shares issued and outstanding |
|
— |
|
— |
| ||
|
PHSI common stock, par value $0.01, 12,250,000 shares authorized; 0 and 5,653,390 shares issued and outstanding at December 31, 2013 and June 30, 2013, respectively |
|
— |
|
57 |
| ||
|
Class A common stock, par value $0.01, 500,000,000 shares authorized; 32,374,818 and 0 shares issued and outstanding at December 31, 2013 and June 30, 2013, respectively |
|
324 |
|
— |
| ||
|
Class B common stock, par value $0.01, 600,000,000 shares authorized; 112,607,832 and 0 shares issued and outstanding at December 31, 2013 and June 30, 2013, respectively |
|
— |
|
— |
| ||
|
Additional paid-in-capital |
|
— |
|
28,866 |
| ||
|
PHSI Common stock subscribed, 0 and 23,266 shares at December 31, 2013 and June 30, 2013, respectively |
|
— |
|
300 |
| ||
|
Subscriptions receivable |
|
— |
|
(300 |
) | ||
|
(Accumulated deficit) retained earnings |
|
(3,482,996 |
) |
50,599 |
| ||
|
Accumulated other comprehensive loss |
|
(15 |
) |
— |
| ||
|
Noncontrolling interest |
|
(1,807 |
) |
(1,754 |
) | ||
|
Total stockholders’ (deficit) equity |
|
(3,484,494 |
) |
77,768 |
| ||
|
Total liabilities, redeemable limited partners’ capital and stockholders’ (deficit) equity |
|
$ |
1,095,634 |
|
$ |
598,916 |
|
* After the completion of the Reorganization, Premier Healthcare Solutions, Inc. (PHSI) became a consolidated subsidiary of Premier, Inc. PHSI is considered the predecessor of the Company for accounting purposes, and accordingly, PHSI’s consolidated financial statements are included herein as Premier, Inc.’s historical financial statements.
Premier, Inc.
Consolidated Statements of Cash Flows
(Unaudited)
(In thousands)
|
|
|
Six months ended December 31, |
| ||||
|
|
|
2013* |
|
2012* |
| ||
|
|
|
|
|
|
| ||
|
Operating activities |
|
|
|
|
| ||
|
Net income |
|
$ |
164,005 |
|
$ |
170,448 |
|
|
Adjustments to reconcile net income to net cash provided by operating activities: |
|
|
|
|
| ||
|
Depreciation and amortization |
|
18,912 |
|
13,778 |
| ||
|
Equity in net income of unconsolidated affiliates |
|
(8,605 |
) |
(6,177 |
) | ||
|
Deferred taxes |
|
2,593 |
|
(2,912 |
) | ||
|
Stock-based compensation |
|
6,819 |
|
— |
| ||
|
Changes in operating assets and liabilities: |
|
|
|
|
| ||
|
Accounts receivable, prepaid expenses and other current assets |
|
(17,446 |
) |
(732 |
) | ||
|
Other assets |
|
(1,751 |
) |
323 |
| ||
|
Inventories |
|
(3,375 |
) |
(1,844 |
) | ||
|
Accounts payable, accrued expenses and other current liabilities |
|
34,798 |
|
(15,447 |
) | ||
|
Long-term liabilities |
|
(321 |
) |
4,130 |
| ||
|
Other operating activities |
|
67 |
|
(46 |
) | ||
|
Net cash provided by operating activities |
|
195,696 |
|
161,521 |
| ||
|
Investing activities |
|
|
|
|
| ||
|
Purchase of marketable securities |
|
(231,121 |
) |
(17,791 |
) | ||
|
Proceeds from sale of marketable securities |
|
37,689 |
|
61,551 |
| ||
|
Acquisition of SYMMEDRx, net of cash acquired |
|
(28,688 |
) |
— |
| ||
|
Acquisition of Meddius, net of owner note receivable |
|
(7,737 |
) |
— |
| ||
|
Distributions received on equity investment |
|
6,800 |
|
6,644 |
| ||
|
Purchases of property and equipment |
|
(26,019 |
) |
(19,035 |
) | ||
|
Other investing activities |
|
— |
|
(1,000 |
) | ||
|
Net cash (used in) provided by investing activities |
|
(249,076 |
) |
30,369 |
| ||
|
Financing activities |
|
|
|
|
| ||
|
Payments made on notes payable |
|
(1,926 |
) |
(6,831 |
) | ||
|
Proceeds from S2S Global revolving line of credit |
|
5,200 |
|
3,004 |
| ||
|
Proceeds from senior secured line of credit |
|
60,000 |
|
10,000 |
| ||
|
Payments on senior secured line of credit |
|
(60,000 |
) |
— |
| ||
|
Proceeds from issuance of Class A common stock |
|
821,671 |
|
— |
| ||
|
Purchase of Class B common units from member owners |
|
(543,857 |
) |
— |
| ||
|
Proceeds from issuance of PHSI common stock |
|
300 |
|
— |
| ||
|
Proceeds from notes receivable from partners |
|
12,726 |
|
— |
| ||
|
Repurchase of restricted units |
|
(2 |
) |
— |
| ||
|
Distributions to limited partners of Premier LP |
|
(280,969 |
) |
(183,200 |
) | ||
|
Net cash provided by (used in) financing activities |
|
13,143 |
|
(177,027 |
) | ||
|
Net (decrease) increase in cash and cash equivalents |
|
(40,237 |
) |
14,863 |
| ||
|
Cash and cash equivalents at beginning of year |
|
198,296 |
|
140,822 |
| ||
|
Cash and cash equivalents at end of year |
|
$ |
158,059 |
|
$ |
155,685 |
|
* After the completion of the Reorganization, Premier Healthcare Solutions, Inc. (PHSI) became a consolidated subsidiary of Premier, Inc. PHSI is considered the predecessor of the Company for accounting purposes, and accordingly, PHSI’s consolidated financial statements are included herein as Premier, Inc.’s historical financial statements.
Premier, Inc.
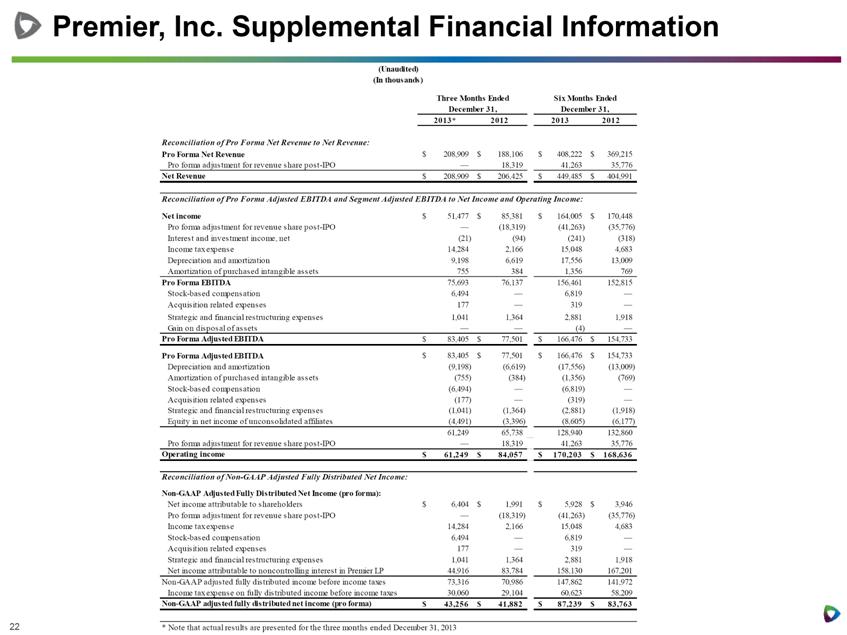
Supplemental Financial Information
(Unaudited)
(In thousands)
|
|
|
Three Months Ended |
|
Six Months Ended |
| ||||||||
|
|
|
December 31, |
|
December 31, |
| ||||||||
|
|
|
2013* |
|
2012 |
|
2013 |
|
2012 |
| ||||
|
|
|
|
|
|
|
|
|
|
| ||||
|
Reconciliation of Pro Forma Net Revenue to Net Revenue: |
|
|
|
|
|
|
|
|
| ||||
|
Pro Forma Net Revenue |
|
$ |
208,909 |
|
$ |
188,106 |
|
$ |
408,222 |
|
$ |
369,215 |
|
|
Pro forma adjustment for revenue share post-IPO |
|
— |
|
18,319 |
|
41,263 |
|
35,776 |
| ||||
|
Net Revenue |
|
$ |
208,909 |
|
$ |
206,425 |
|
$ |
449,485 |
|
$ |
404,991 |
|
|
|
|
|
|
|
|
|
|
|
| ||||
|
Reconciliation of Pro Forma Adjusted EBITDA and Segment Adjusted EBITDA to Net Income and Operating Income: |
|
|
|
|
|
|
|
|
| ||||
|
Net income |
|
$ |
51,477 |
|
$ |
85,381 |
|
$ |
164,005 |
|
$ |
170,448 |
|
|
Pro forma adjustment for revenue share post-IPO |
|
— |
|
(18,319 |
) |
(41,263 |
) |
(35,776 |
) | ||||
|
Interest and investment income, net |
|
(21 |
) |
(94 |
) |
(241 |
) |
(318 |
) | ||||
|
Income tax expense |
|
14,284 |
|
2,166 |
|
15,048 |
|
4,683 |
| ||||
|
Depreciation and amortization |
|
9,198 |
|
6,619 |
|
17,556 |
|
13,009 |
| ||||
|
Amortization of purchased intangible assets |
|
755 |
|
384 |
|
1,356 |
|
769 |
| ||||
|
Pro Forma EBITDA |
|
75,693 |
|
76,137 |
|
156,461 |
|
152,815 |
| ||||
|
Stock-based compensation |
|
6,494 |
|
— |
|
6,819 |
|
— |
| ||||
|
Acquisition related expenses |
|
177 |
|
— |
|
319 |
|
— |
| ||||
|
Strategic and financial restructuring expenses |
|
1,041 |
|
1,364 |
|
2,881 |
|
1,918 |
| ||||
|
Gain on disposal of assets |
|
— |
|
— |
|
(4 |
) |
— |
| ||||
|
Pro Forma Adjusted EBITDA |
|
$ |
83,405 |
|
$ |
77,501 |
|
$ |
166,476 |
|
$ |
154,733 |
|
|
Pro Forma Adjusted EBITDA |
|
$ |
83,405 |
|
$ |
77,501 |
|
$ |
166,476 |
|
$ |
154,733 |
|
|
Depreciation and amortization |
|
(9,198 |
) |
(6,619 |
) |
(17,556 |
) |
(13,009 |
) | ||||
|
Amortization of purchased intangible assets |
|
(755 |
) |
(384 |
) |
(1,356 |
) |
(769 |
) | ||||
|
Stock-based compensation |
|
(6,494 |
) |
— |
|
(6,819 |
) |
— |
| ||||
|
Acquisition related expenses |
|
(177 |
) |
— |
|
(319 |
) |
— |
| ||||
|
Strategic and financial restructuring expenses |
|
(1,041 |
) |
(1,364 |
) |
(2,881 |
) |
(1,918 |
) | ||||
|
Equity in net income of unconsolidated affiliates |
|
(4,491 |
) |
(3,396 |
) |
(8,605 |
) |
(6,177 |
) | ||||
|
|
|
61,249 |
|
65,738 |
|
128,940 |
|
132,860 |
| ||||
|
Pro forma adjustment for revenue share post-IPO |
|
— |
|
18,319 |
|
41,263 |
|
35,776 |
| ||||
|
Operating income |
|
$ |
61,249 |
|
$ |
84,057 |
|
$ |
170,203 |
|
$ |
168,636 |
|
|
|
|
|
|
|
|
|
|
|
| ||||
|
Reconciliation of Non-GAAP Adjusted Fully Distributed Net Income: |
|
|
|
|
|
|
|
|
| ||||
|
Non-GAAP Adjusted Fully Distributed Net Income (pro forma): |
|
|
|
|
|
|
|
|
| ||||
|
Net income attributable to shareholders |
|
$ |
6,404 |
|
$ |
1,991 |
|
$ |
5,928 |
|
$ |
3,946 |
|
|
Pro forma adjustment for revenue share post-IPO |
|
— |
|
(18,319 |
) |
(41,263 |
) |
(35,776 |
) | ||||
|
Income tax expense |
|
14,284 |
|
2,166 |
|
15,048 |
|
4,683 |
| ||||
|
Stock-based compensation |
|
6,494 |
|
— |
|
6,819 |
|
— |
| ||||
|
Acquisition related expenses |
|
177 |
|
— |
|
319 |
|
— |
| ||||
|
Strategic and financial restructuring expenses |
|
1,041 |
|
1,364 |
|
2,881 |
|
1,918 |
| ||||
|
Net income attributable to noncontrolling interest in Premier LP |
|
44,916 |
|
83,784 |
|
158,130 |
|
167,201 |
| ||||
|
Non-GAAP adjusted fully distributed income before income taxes |
|
73,316 |
|
70,986 |
|
147,862 |
|
141,972 |
| ||||
|
Income tax expense on fully distributed income before income taxes |
|
30,060 |
|
29,104 |
|
60,623 |
|
58,209 |
| ||||
|
Non-GAAP adjusted fully distributed net income (pro forma) |
|
$ |
43,256 |
|
$ |
41,882 |
|
$ |
87,239 |
|
$ |
83,763 |
|
* Note that actual results are presented for the three months ended December 31, 2013
# # #