Table of Contents
UNITED STATES
SECURITIES AND EXCHANGE COMMISSION
Washington, D.C. 20549
FORM N-CSR
CERTIFIED SHAREHOLDER REPORT OF REGISTERED
MANAGEMENT INVESTMENT COMPANIES
Investment Company Act file number(s) 811-22845
Babson Capital Funds Trust
(Exact Name of Registrant as Specified in Charter)
550 South Tryon Street
Suite 3300
Charlotte, NC 28202
(Address of Principal Executive Offices)
Registrant’s telephone number, including area code: (704) 805-7200
Janice M. Bishop
Vice President, Secretary and Chief Legal Officer
c/o Babson Capital Management LLC
Independence Wharf
470 Atlantic Avenue, Boston MA 02210
(Name and Address of Agent for Service)
Date of fiscal year end: June 30
Date of reporting period: June 30, 2016
Table of Contents
| Item 1. | Reports to Stockholders. |
The Report to Shareholders is attached hereto.
Table of Contents

BABSON CAPITAL FUNDS TRUST
Annual Report
June 30, 2016

Table of Contents

BCFT Service Providers
ADVISER
Babson Capital Management LLC
550 South Tryon Street
Suite 3300
Charlotte, NC 28202
SUB-ADVISER
Babson Capital Global Advisors Limited
61 Aldwych
London, UK
WC2B 4AE
COUNSEL TO THE TRUST
Ropes & Gray LLP
Prudential Tower
800 Boylston Street
Boston, MA 02110
INDEPENDENT REGISTERED PUBLIC ACCOUNTING FIRM
Deloitte & Touche LLP
200 Berkeley Street
Boston, MA 02116
CUSTODIAN
State Street Bank & Trust
One Lincoln Street
Boston, MA 02111
TRANSFER AGENT AND REGISTRAR
ALPS Fund Services, Inc.
1290 Broadway
Suite 1100
Denver, CO 80203
FUND ADMINISTRATION/ACCOUNTING
State Street Bank & Trust
One Lincoln Street
Boston, MA 02111
FUND DISTRIBUTOR
ALPS Distributors, Inc.
1290 Broadway
Suite 1100
Denver, CO 80203
BLUE SKY ADMINISTRATION
Boston Financial Data Services
2000 Crown Colony Drive
Quincy, MA 02169
PROXY VOTING POLICIES & PROCEDURES
The Trustees of Babson Capital Funds Trust (the “Trust”) have delegated proxy voting responsibilities relating to the voting of securities held by the Trust to Babson Capital Management LLC (“Babson Capital”). A description of Babson Capital’s proxy voting policies and procedures is available (1) without charge, upon request, by calling, toll-free 1-877-766-0014; (2) on the Trust’s website at http://www.BabsonCapital.com; and (3) on the U.S. Securities and Exchange Commission’s (“SEC”) website at http://www.sec.gov.
FORM N-Q
The Trust will file its complete schedule of portfolio holdings with the SEC for the first and third quarters of each fiscal year on Form N-Q. This information is available (i) on the SEC’s website at http://www.sec.gov; and (ii) at the SEC’s Public Reference Room in Washington, DC (which information on their operation may be obtained by calling 1-800-SEC-0330). A complete schedule of portfolio holdings as of each quarter-end is available on the Trust’s website at http://www.BabsonCapital.com or upon request by calling, toll-free, 1-877-766-0014.
Table of Contents


Table of Contents
Babson Global Floating Rate Fund 2016 Annual Report
Investment Objective
The investment objective of the Babson Global Floating Rate Fund (“Global Floating Rate Fund” or the “Fund”) is to seek a high level of current income. Preservation of capital is a secondary goal.
Portfolio Management Commentary
How did the Fund perform?
| n | The Fund reported a net total rate of return for the annual reporting period from July 1, 2015 through June 30, 2016 of 0.22% and underperformed the Credit Suisse Global Loan Benchmark (the “Benchmark”), which returned 1.24%.1 |
What factors influenced performance of the Fund?
| n | For the annual reporting period, the Fund’s European loans and both U.S. and European bonds were the largest contributors to performance relative to the Benchmark. The Fund’s U.S. loan holdings, however, negatively impacted Fund performance. Commodity related companies comprised seven of the Fund’s top ten detractors. |
| n | Although prices for most U.S. senior secured loans and high yield bonds of commodity-related issuers bottomed in mid-February, the sector faced significant selling pressure over the past twelve months and detracted from performance. The Fund was negatively impacted by its exposure to these credits relative to the Benchmark. Seven of the Fund’s bottom ten contributors to its underperformance were commodity-related issuers. In our view, the underlying credit fundamentals for many of these issuers imply a higher value than current trading levels. We feel the selling was indiscriminate at times. While it is difficult to predict the price of commodities, we believe that most of these companies have sufficient liquidity and flexibility in their capital expenditure and operating budgets to withstand the volatility in commodity prices for longer than their current prices would suggest. |
Describe recent portfolio activity.
| n | The number of holdings in the portfolio decreased by ten credits, from 197 to 187 over the year while the Fund’s asset size remained basically unchanged. Over the last 12 months, the Fund increased its exposure to the U.S. and reduced its exposure to Europe. The Fund’s U.S. exposure increased by 4.9% to 69.2%. |
| n | However, despite the decrease in European exposure, the Fund remained overweight to European assets relative to the global senior secured loan market. The Fund increased its exposure to U.S. assets over the past twelve months as prices widened more significantly than in Europe which, in our opinion, positions the Fund to capture the best risk-adjusted returns from the market. |
| n | Over the past 12 months, the Fund’s top three sector exposures have changed as only Healthcare, Education and Childcare remained in the top three. Three sectors had changes larger than 2.0% during the previous twelve months with Diversified/Conglomerate Services down 3.6%, Finance down 2.4% and Telecommunications down 2.1%. The two largest sector increases were Containers, Packaging and Glass and Electronics, which both increased 1.9%. |
Describe portfolio positioning at period end.
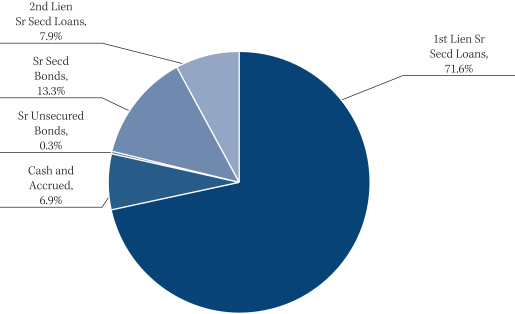
| n | The Fund finished the annual reporting period, June 30, 2016, with a 83.8% weighting to global senior secured loans. The remainder of the portfolio was invested in global high yield bonds (9.2%), primarily senior secured bonds, and cash (7.0%). |
1. Total return describes the return to an investor based on the Class Y net expense ratio and includes the reinvestment of dividends and capital gains. Performance results reflect past performance and are no guarantee of future results. Current performance may be lower or higher than the performance data quoted. The net asset value (NAV) will fluctuate with market conditions. All returns 1-year or less are cumulative. The Credit Suisse Global Loan Benchmark is a market capitalization weighted average of the Credit Suisse Leveraged Loan Index and the Credit Suisse Western European Leveraged Loan Index. The Credit Suisse Leveraged Loan Index is designed to mirror the investable universe of the U.S. dollar-denominated leveraged loan market. The Credit Suisse Western European Leveraged Loan Index is designed to mirror the investable universe of the Western European leveraged loan market, with loans denominated in U.S. and Western European currencies. Indices are unmanaged. It is not possible to invest directly in an index.
2
Table of Contents
Babson Global Floating Rate Fund 2016 Annual Report
| n | From an industry perspective, the Fund remains well-diversified across a number of sectors based on Moody’s Industry Classification, with higher concentrations in Healthcare, Education and Childcare (11.1%), Chemicals, Plastics and Rubber (7.9%), and Retail Stores (6.6%) as of June 30, 2016. |
| n | As of June 30, 2016, the Fund had the following credit quality breakdown: 2.9% in Baa assets, 20.5% in Ba assets, 54.6% in single-B credits and 5.5% in Caa and below assets. Approximately 8.3% of the Fund’s assets are not publicly rated, primarily consisting of European issuers that we believe have a credit quality similar to that of other assets in the portfolio. Cash and accrued assets accounted for the remaining 8.3% of the portfolio assets. Over the course of the year, the single-B and not publically rated assets decreased as the Fund’s exposure to Baa, Ba and Caa and below assets all increased.2 |
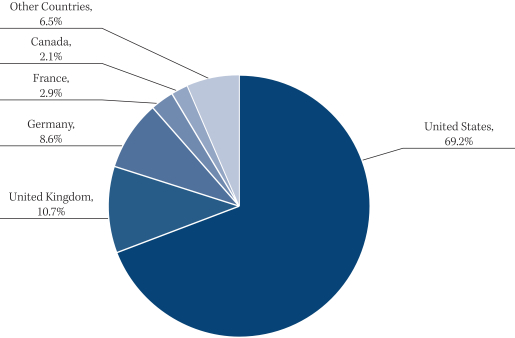
| n | The top five countries in the portfolio at the end of the annual reporting period are the United States (69.2%), the United Kingdom (10.7%), Germany (8.6%), France (2.9%) and Canada (2.1%). Overall, the Fund has exposure to 17 different countries, and we continue to focus on building a well-diversified portfolio of global floating rate securities. |
Describe market and portfolio outlook.
| n | The global high yield markets held up relatively well following the Brexit referendum. While we expect to see some headline-driven weakness in high yield markets in the near term—particularly in sterling denominated credits—it will take time for the economic implications of the vote to become clear. |
| n | That said, outside of commodity related sectors, credit fundamentals for high yield borrowers across geographies remain largely intact. Further, we believe the European high yield markets will benefit from the expansion of the European Central Bank’s purchasing program to include corporate credit. |
| n | Negative pressure in the near term will most likely stem from broader market sentiment rather than the fundamentals of individual credits. |
| 2. | Ratings shown are the highest rating given by one of the following national rating agencies: S&P, Moody’s or Fitch. Additional information about ratings can be found, respectively, at www.standardandpoors.com, www.moodys.com and www.fitchratings.com. Credit ratings are subject to change. AAA, AA, A, and BBB are investment grade ratings categories used by S&P and Fitch; BB, B, CCC/CC/C and D are below investment grade ratings categories used by S&P and Fitch. Aaa, Aa, A and Baa are investment grade ratings categories used by Moody’s; Ba, B, Caa/Ca and C are below investment grade ratings categories used by Moody’s. Bonds backed by U.S. Government or agency securities are given an implied rating equal to the rating of such securities. Holdings designated Not Publicly Rated are not rated by these national rating agencies. |
3
Table of Contents
Babson Global Floating Rate Fund 2016 Annual Report
PORTFOLIO COMPOSITION (% OF ASSETS*)
| * | The percentages shown above represent a percentage of the assets as of June 30, 2016. |
COUNTRY COMPOSITION (% OF ASSETS**)
| ** | Percentage of assets are expressed by market value excluding cash and accrued income, and may vary over time. The percentages shown above represent a percentage of the assets as of June 30, 2016. |
4
Table of Contents
Babson Global Credit Income Opportunities Fund 2016 Annual Report
Investment Objective
The investment objective of the Babson Global Credit Income Opportunities Fund (“Global Credit Income Opportunities Fund” or the “Fund”) is to seek an absolute return, primarily through current income and secondarily through capital appreciation.
Portfolio Management Commentary
How did the Fund perform?
| n | The Fund reported a net total rate of return for the annual reporting period from July 1, 2015 through June 30, 2016, of -0.61% and underperformed the 3 Month USD LIBOR + 500 basis points1 Benchmark, which retuned 5.63%.2 |
What factors influenced performance of the Fund?
| n | During the annual reporting period, the main contributor to performance was the Fund’s allocation to high yield bonds in both the U.S and Europe. European loans also were a minor positive contributor. |
| n | Commodity related issuers, including Energy, Metals & Minerals and Utilities, faced significant pressure over the past twelve months and all three sectors were major detractors from performance. The Fund’s Collateralized Loan Obligation (CLO) holdings also had a negative impact on performance during the last year. Eight of the Fund’s bottom ten contributors to its underperformance were commodity-related issuers or CLOs. While commodity related names and CLOs were a detractor for the full year, in the quarter ended June 30, 2016 all were positive contributors. |
| n | The Fund’s special situation credits had a negative impact on performance during the annual reporting period; however, we believe these assets provide attractive current income to the portfolio and should contribute to the Fund’s performance in the future. |
Describe recent portfolio activity.
| n | The number of holdings in the portfolio increased over the year as the Fund grew since July 1, 2015. Despite the increased number of holdings, the Fund’s positioning between the U.S. and Europe remained fairly consistent although there was some movement within individual countries within Europe. |
| n | During the year, the Fund reduced its exposure to global senior secured loans (down 6.4%) and increased its exposure to global high yield bonds (up 7.1%) to focus on what we believe to be a more attractive part of the below investment grade market from a risk-adjusted basis. |
| n | The following sectors all had shifts of greater than 1% over the last twelve months, Healthcare, Education and Childcare down 2.1%. Telecommunications down 2.0%, Oil & Gas down 1.6%, and Chemicals, Plastics & Rubber up 2.2%. |
Describe portfolio positioning at period end.
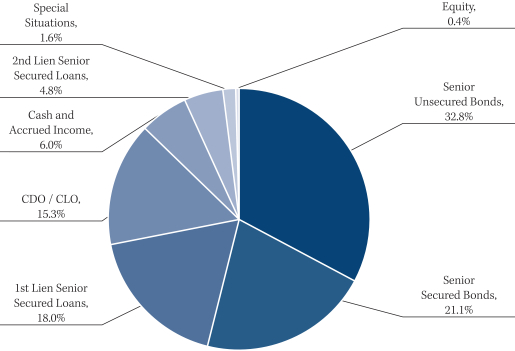
| n | The Fund finished the annual reporting period, June 30, 2016, with an allocation of 53.9%, 22.8%, and 15.3% to global high yield bonds, global senior secured loans and CLOs, respectively. The remainder of the portfolio was invested in a few opportunistic special situation credits at 1.6%, equity at 0.4% and cash at 6.0%. A significant portion of the portfolio (59.1%) is senior secured in nature (includes CLOs backed by secured loans), which can potentially mitigate principal loss in the event that default rates increase. |
| 1. | A unit that is equal to 1/100th of 1% or 0.01%. |
| 2. | Total return describes the return to an investor based on the Class Y net expense ratio and includes the reinvestment of dividends and capital gains. Performance results reflect past performance and are no guarantee of future results. Current performance may be lower or higher than the performance data quoted. The net asset value (NAV) will fluctuate with market conditions. All returns 1-year or less are cumulative. The 3 Month USD LIBOR (London Interbank Offered Rate) is an average interest rate, determined by the Intercontinental Exchange, that banks charge one another for the use of short-term money (3 months) in England’s Eurodollar market. The return shown includes 3 Month USD LIBOR plus 500 bps, or 5% per annum. LIBOR is unmanaged. It is not possible to invest directly in LIBOR. No assurance can be given that the Fund’s performance will exceed that of LIBOR by any given increment, or at all. |
5
Table of Contents
Babson Global Credit Income Opportunities Fund 2016 Annual Report
| n | From an industry perspective, the Fund remains well-diversified across a number of sectors based on Moody’s Industry Classification, with higher concentrations in Oil and Gas (6.3%), Chemicals, Plastics & Rubber (5.9%), and Healthcare, Education and Childcare (5.2%) as of June 30, 2016. |
| n | As of June 30, 2016, the Fund had the following credit quality breakdown excluding cash and accrued income: 0.7% in Baa assets, 31.7% in Ba assets, 50.4% in single-B credits and 13.4% in Caa and below. Approximately 3.8% of the Fund’s assets are not publicly rated, primarily consisting of European issuers that we believe have a credit quality similar to that of other assets in the portfolio. Over the last twelve months, there were not any material changes to the ratings profile of the Fund.3 |
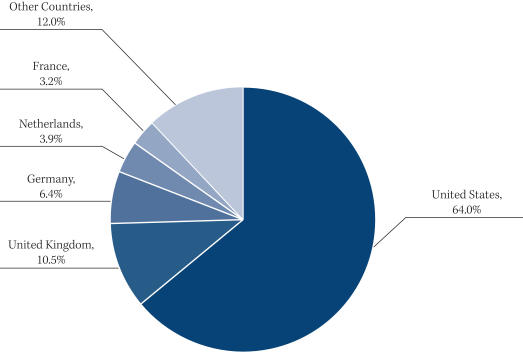
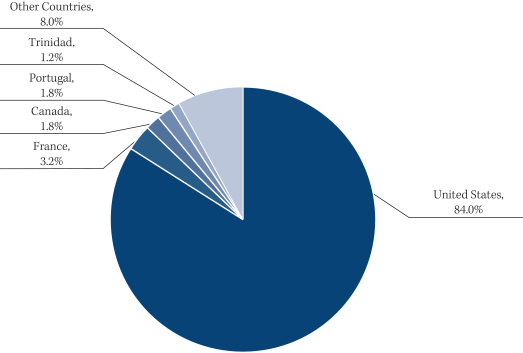
| n | The Top 5 countries in the portfolio at the end of the annual reporting period are the United States (64.0%), the United Kingdom (10.5%), Germany (6.4%), the Netherlands (3.9%), and France (3.2%). The Cayman Islands exposure related to the Fund’s CLO holdings is included in the United States. Overall, the Fund has exposure to 22 different countries, and we continue to focus on building a well-diversified portfolio of global high yield securities. |
Describe market and portfolio outlook.
| n | The global high yield markets held up relatively well following the Brexit referendum. While we expect to see some headline-driven weakness in high yield markets in the near term — particularly in sterling denominated credits — it will take time for the economic implications of the vote to become clear. |
| n | That said, outside of commodity-related sectors, credit fundamentals for high yield borrowers across geographies remain largely intact. Further, we believe the European high yield markets will benefit from the expansion of the European Central Bank’s purchasing program to include corporate credit. |
| n | Negative pressure in the near term will most likely stem from broader market sentiment rather than the fundamentals of individual credits. |
| 3. | Ratings shown are the highest rating given by one of the following national rating agencies: S&P, Moody’s or Fitch. Additional information about ratings can be found, respectively, at www.standardandpoors.com, www.moodys.com and www.fitchratings.com. Credit ratings are subject to change. AAA, AA, A, and BBB are investment grade ratings categories used by S&P and Fitch; BB, B, CCC/CC/C and D are below investment grade ratings categories used by S&P and Fitch. Aaa, Aa, A and Baa are investment grade ratings categories used by Moody’s; Ba, B, Caa/Ca and C are below investment grade ratings categories used by Moody’s. Bonds backed by U.S. Government or agency securities are given an implied rating equal to the rating of such securities. Holdings designated Not Publicly Rated are not rated by these national rating agencies. |
6
Table of Contents
Babson Global Credit Income Opportunities Fund 2016 Annual Report
PORTFOLIO COMPOSITION (% OF ASSETS*)
| * | The percentages shown above represent a percentage of the assets as of June 30, 2016. |
COUNTRY COMPOSITION (% OF ASSETS**)
| ** | Percentage of assets are expressed by market value excluding cash and accrued income, and may vary over time. The percentages shown above represent a percentage of the assets as of June 30, 2016. |
7
Table of Contents
Babson Active Short Duration Fund 2016 Annual Report
Investment Objective
Babson Active Short Duration Bond Fund (“Active Short Duration Bond Fund” or the “Fund”) seeks to achieve a high total rate of return primarily from current income while minimizing fluctuations in capital values by investing primarily in a diversified portfolio of short-term investment grade fixed income securities.
Portfolio Management Commentary
How did the Fund perform?
| n | The Fund was launched on July 8, 2015 and reported a net total rate of return since inception through June 30, 2016 of 1.36%, outperforming the Barclays U.S. 1-3 Year Government Bond Index, which returned 1.18%.1 |
What factors influenced performance of the Fund?
| n | Duration positioning positively contributed to performance. The front-end of the U.S. Treasury yield curve, between the one to three years, flattened substantially as the market priced in a lower probability of an extended series of Federal Reserve interest rate hikes over the last six months. The Fund was at its maximum duration of approximately 2.9 years during much of 2015. However, over the first six months of 2016 as the short-end of the yield curve flattened, the duration of the Fund has shortened to 1.8 years in accordance with our process. |
| n | The securitized sector positively impacted performance over the period. Asset-backed securities (ABS) with allocations to student loans and commercial collateral were the largest contributing sub-sectors. Allocations to U.S. agency mortgage-backed securities (MBS) and commercial mortgage-backed securities (CMBS) also benefitted. |
| n | The Fund’s allocation to corporate credit was mixed; investment grade corporate credit helped performance, while allocations to BB-rated high yield bonds and convertible securities were the primary detractors to performance, driven largely by the sell-off in Metals & Mining and Oil & Gas producers during the first quarter. |
Describe recent portfolio activity.
| n | Since inception, the Fund has experienced positive inflows and portfolio activity has been allocated across corporate, securitized, and government sectors. |
| n | ABS secondary market trading volume was steady in the second quarter and the Fund added exposure of commercial sectors such as Student Loans, Automobile, Timeshares, Medical, and Movie Receivables. |
| n | Following the unexpected decision of British voters to leave the European Union, the Fund exited holdings to European banks and purchased shorter emerging market securities offering a significant spread pick-up to developed market corporate credit. |
Describe portfolio positioning at period end.
| n | The Fund’s duration ended the period at 1.8 years. Since the beginning of 2016, duration has been steadily shortened from the strategy’s maximum of three years as the slope of the U.S. Treasury yield curve between one and three years has flattened. |
| n | From a sector perspective, the Fund continues to be well-diversified across corporates, securitized, and governments. The corporate allocation is at approximately 41%, with 35% in investment grade corporates and 6% in BB-rated and crossover high yield. However, a more cautious positioning is warranted given the macro-economic |
| 1. | Total return describes the return to an investor based on the Class Y net expense ratio and includes the reinvestment of dividends and capital gains. Performance results reflect past performance and are no guarantee of future results. Current performance may be lower or higher than the performance data quoted. The net asset value (NAV) will fluctuate with market conditions. All returns 1-year or less are cumulative. The Barclays U.S. 1-3 Year Government Bond Index is comprised of the U.S. Treasury and U.S. Agency Indices. The U.S. Government Index includes Treasuries (public obligations of the U.S. Treasury) and U.S. agency debentures (publicly issued debt of U.S. Government agencies, quasi-federal corporations, and corporate or foreign debt guaranteed by the U.S. Government) that have remaining maturities of more than one year and up to but not including 3 years. Indices are unmanaged. It is not possible to invest directly in an index. |
8
Table of Contents
Babson Active Short Duration Fund 2016 Annual Report
| headwinds. The Banking sector has been reduced through sales of European paper and the Fund exited the Energy sector in the first quarter. Opportunities are in specific single names, often post-merger and acquisition event new issuance, where we believe the company fundamentals and spreads provide attractive opportunities. |
| n | During the period, the securitized ABS allocation was brought to approximately 25%. Automotive loan collateral represents the largest positioning, followed by FFELP Student Loans. Additional collateral consists of timeshares and whole business franchise receivables. An active CMBS positioning remains in shorter-maturity seasoned issues. |
| n | The agency mortgage-backed securities allocation (4.0%) is in lower coupon 15-year Federal National Mortgage Associations (Fannie Mae’s). |
Describe market and portfolio outlook.
| n | Volatility will likely persist in the near-term driven by changes in commodity price levels, slow global economic growth, and signs of deterioration in corporate fundamentals. This has driven the U.S. Treasury yield curve flatter between one and three years. In accordance with our duration management process, the duration of the Fund was shortened to approximately 1.8 years. Given the current slope of the yield curve, we will look to further reduce duration. |
| n | The Fund will continue to maintain the large underweight in both Treasury and Agency securities with likely an active allocation to corporate bonds. Issuance has remained robust due to the low interest rate environment, and the Fund’s credit exposure is focused on short/intermediate maturities with attractive roll-down characteristics. |
| n | The Fund will continue to selectively add exposure to ABS, such as subprime automobile receivables, student loans, and franchise whole business deals as opportunities arise. |
9
Table of Contents
Babson Active Short Duration Fund 2016 Annual Report
PORTFOLIO COMPOSITION (% OF ASSETS*)
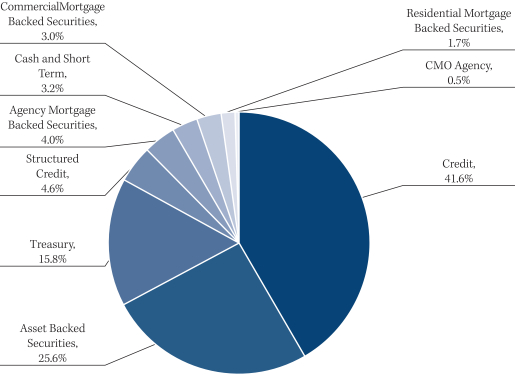
| * | The percentages shown above represent a percentage of the assets as of June 30, 2016. |
10
Table of Contents
Babson Total Return Bond Fund 2016 Annual Report
Investment Objective
Babson Total Return Bond Fund (“Total Return Bond Fund” or the “Fund”) seeks a superior total rate of return by investing in fixed income instruments.
Portfolio Management Commentary
How did the Fund perform?
| n | The Fund was launched on July 8, 2015 and reported a net total rate of return since inception through June 30, 2016 of 4.89%, underperforming the Barclays U.S. Aggregate Bond Index, which returned 5.48%.1 |
What factors influenced performance of the Fund?
| n | Although the Fund rebounded since the end of February, over the reporting period, an overweight to investment grade corporate credit and an allocation to convertible securities were the primary detractors to performance. Within those allocations, exposures to Oil & Gas producers, as well as commodity miners, were the main negative drivers, with most of the underperformance coming in the first quarter of 2016. |
| n | An allocation to high yield was the primary contributor to performance as spreads rebounded significantly in the second quarter of 2016. |
| n | Asset-backed securities (ABS) were the primary detractor in the securitized sector, largely due to holdings in government guaranteed FFELP student loans, which underperformed during the period. |
| n | Downside derivative mitigation, such as using investment grade CDX index credit default swaps (a swap where the seller compensates the buyer in the event of a default) to partially hedge our longer duration ABS exposures, IGCDX put spread options (purchased put options on credit default swaps), and USD/CNH (long US dollar currency forwards and short the Chinese Renminbi currency forward) position benefitted performance during the period. |
Describe recent portfolio activity.
| n | Given the uncertainty and regulatory environment following the British referendum to leave the European Union, the Fund recently exited holdings in European banks. Purchases were in emerging market corporates that offer a significant spread pick-up to developed market credit. |
| n | The agency mortgage-backed securities allocation remains underweight while opportunistically rotating from 30-year conventional pass-throughs to 15-year conventional pass-throughs based on relative value. |
| n | The Fund selectively added exposure to asset-backed securities in consumer and commercial sectors such as student loans, business franchise whole loans and automobile receivables. |
Describe portfolio positioning at period end.
| n | Duration and the yield curve for the Fund were neutral relative to the benchmark. |
| n | The largest overweight relative to the benchmark remains in corporate credit, representing approximately a 48.2% allocation versus 31.0% for the index. High yield corporates made up 8.6% of that exposure. Diversified Industrials and Banking were the largest sectors within corporate credit. The Energy allocation represented about 2.9%. During the period, the Fund exited a convertible securities allocation. |
| 1. | Total return describes the return to an investor based on the Class Y net expense ratio and includes the reinvestment of dividends and capital gains. Performance results reflect past performance and are no guarantee of future results. Current performance may be lower or higher than the performance data quoted. The net asset value (NAV) will fluctuate with market conditions. All returns 1-year or less are cumulative. The Barclays U.S. Aggregate Index represents securities that are SEC-registered, taxable, and dollar denominated. The index covers the U.S. investment grade fixed rate bond market, with index components for government and corporate securities, mortgage pass-through securities, and asset-backed securities. These major sectors are subdivided into more specific indices that are calculated and reported on a regular basis. Indices are unmanaged. It is not possible to invest directly in an index. |
11
Table of Contents
Babson Total Return Bond Fund 2016 Annual Report
| n | Within agency mortgage-backed securities, the Fund was underweight (23.7%) relative to the benchmark (27.7%). There has been a rotation from To-Be-Announced (TBA) securities into call-protected MBS pools. |
| n | During the period, the allocation to ABS was increased and is comprised of traditional automotive loan collateral, FFELP student loans, and compelling collateral such as timeshares, cell towers, and personal consumer loans. |
| n | Commercial mortgage-backed securities made up 4.9% of the Fund, representing a 3.2% overweight. BBB-rated tranches backed by 2012 vintage collateral represent the best value, however, they are difficult to source given their strong underwriting profile. The Fund has gained exposure to these vintages using CMBX, a synthetic index. |
Describe market and portfolio outlook.
| n | Numerous secular and cyclical changes are working their way through the credit markets, creating volatility and opportunities during the period. Global growth continues at a modest pace. |
| n | After a brief downdraft post-Brexit results, risk assets have recovered nicely as central banks around the world stepped up in surprisingly effective and coordinated ways to calm market fears. Still, there is a growing nervousness globally over reliance on monetary policy to promote growth and support asset prices. |
| n | With an overall decline in corporate fundamentals, the Fund is focusing on specific single names, often post-merger and acquisition event, where we believe spreads provide attractive opportunities. |
| n | The Fund remains overweight in spread sectors such as Corporates and Structured Products relative to liquid products such as governments and agencies and seeks to add alpha (the return in excess to the benchmark) by investing in under covered sectors where we have competitive advantages, such as esoteric ABS, CLOs, and emerging market corporates. |
12
Table of Contents
Babson Total Return Bond Fund 2016 Annual Report
PORTFOLIO COMPOSITION (% OF ASSETS*)
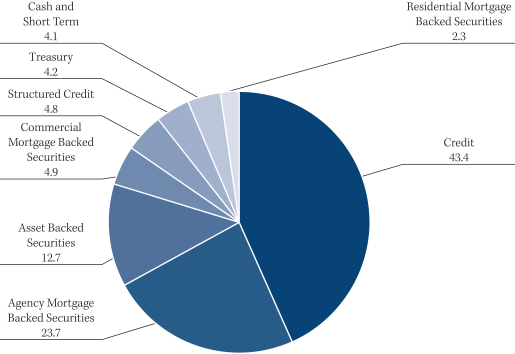
| * | The percentages shown above represent a percentage of the assets as of June 30, 2016. |
13
Table of Contents
Babson Emerging Markets Debt Blended Total Return Fund 2016 Annual Report
Investment Objective
The investment objective of the Babson Emerging Markets Debt Blended Total Return Fund (“EMD Blended Total Return “ or the “Fund”) is to seek to achieve maximum total return, consistent with preservation of capital and prudent investment management, through high current income generation and, where appropriate, capital appreciation.
Portfolio Management Commentary
How did the Fund perform?
| n | The Fund was launched on October 21, 2015 and reported a net total rate of return since inception through June 30, 2016 of 2.79%.1 |
What factors influenced performance of the Fund?
| n | For the semi-annual reporting period, the Fund’s positioning in South African rates and currency, Mexican rates, government bonds and corporate bonds, the Russian Rouble and Serbian rates were the primary contributors to performance. Corporate holdings in Petrobras, Office Cherifien Des Pho and Vale, also aided returns. Key detractors from performance were the Fund’s local rates positioning in Brazil, the Mexican Peso, and Singaporean Dollar, while the Fund’s holding in Proman Holding also detracted from returns. |
| n | The emerging markets debt sector performed well during the first half of 2016 as central banks remained accommodative, oil and commodities continued to strengthen and infrastructure spending in China took hold. Dovish sentiment from the Federal Reserve and the European Central Bank, coupled with the Bank of England’s announcement of pending Brexit-induced easing, provided support to the markets. |
| n | Within the portfolio, South Africa contributed 1.25% as both rates and the South African Rand recovered from President Zuma’s missteps in 2015 and from a recovery in commodities. The Fund’s positioning in Brazilian rates, ahead of what turned out to be a peaceful transition to interim President Temer, was the largest performance detractor (-1.84%). |
Describe recent portfolio activity.
| n | During the first half of 2016, the Fund added 13.6% to Brazilian credits across corporates, sovereign and local rates and increased Mexican exposure by 6.5% to 23.3% as we added exposure to corporate credits in energy and financials. Additionally, the Fund took a notable position in Argentinean debt (3.7%), as the country made its long awaited return to external markets, following the 2001 default and holdout restructuring under new president Mauricio Macri. |
Describe portfolio positioning at period end.
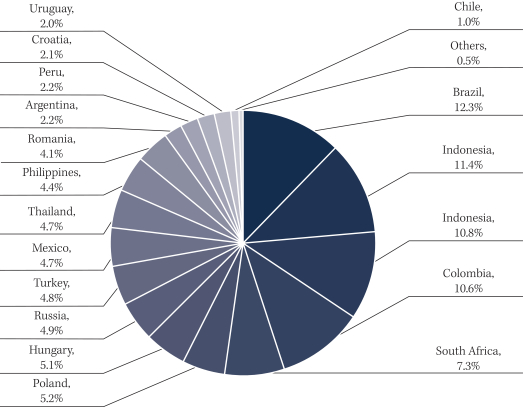
| n | The Fund finished the annual reporting period, June 30, 2016, with a 45% exposure to emerging markets corporate bonds, 25% exposure to emerging markets local debt and currencies, 27% exposure to sovereign hard currency bonds and a 3% cash position. |
| n | The top five countries in the portfolio at the end of the annual reporting period are Mexico (23.3%), Brazil (18.9%), South Africa (6.1%), Colombia (5.6%), and Chile (4.1%). The top five corporate bonds are Petrobras (4.67%), Marfrig Global Foods (4.1%), PEMEX (4.0%), AES Corp (3.67%) and Vale (2.7%). Overall, the Fund has exposure to 20 countries, 22 corporates, and 22 different currencies. |
| 1. | Total return describes the return to an investor based on the Class Y net expense ratio and includes the reinvestment of dividends and capital gains. Performance results reflect past performance and are no guarantee of future results. Current performance may be lower or higher than the performance data quoted. The net asset value (NAV) will fluctuate with market conditions. All returns 1-year or less are cumulative. |
14
Table of Contents
Babson Emerging Markets Debt Blended Total Return Fund 2016 Annual Report
Describe market and portfolio outlook.
| n | We remain optimistic that some emerging markets headwinds are poised to reverse and become tailwinds or at least stabilize. |
| n | Credit selection will be key to seeking the best risk-adjusted return opportunities across the emerging markets corporate debt spectrum. |
| n | Lower net supply, driven by reduced issuance and heightened buyback activity, will likely serve as a strong supportive technical factor for emerging markets corporate debt. For emerging markets sovereigns, we continue to favor Central European countries, as well as Caribbean and Central American countries which should continue to be beneficiaries of the pickup in growth out of core Europe and the United States. |
| n | Currency valuations have adjusted significantly over the past 24 months and we are now seeing some emerging markets currencies at their most attractive levels in more than 10 years, thereby providing for selective emerging markets growth prospects. |
| n | The portfolio continues to be positioned in selective rates where inflation is falling along with narrowing current account deficits. A picture of global disinflation should remain favorable for emerging markets local debt and the Fund. |
15
Table of Contents
Babson Emerging Markets Debt Blended Total Return Fund 2016 Annual Report
PORTFOLIO COMPOSITION (% OF ASSETS*)
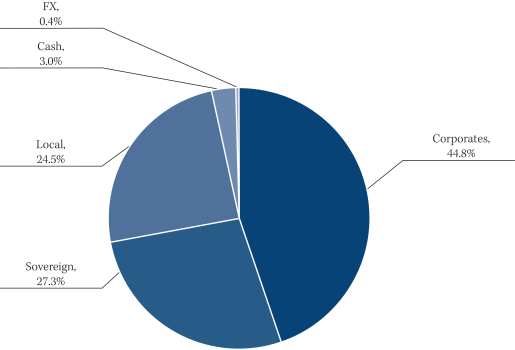
| * | The percentages shown above represent a percentage of the assets as of June 30, 2016. |
COUNTRY COMPOSITION (% OF ASSETS**) (is this country of issue?)
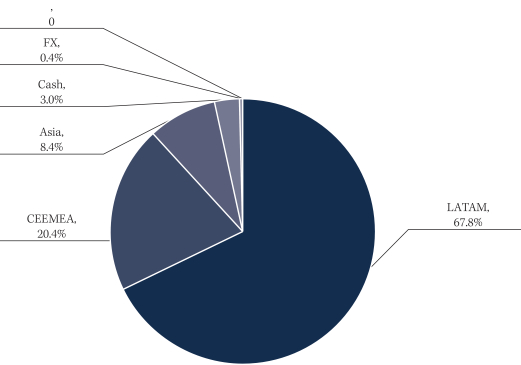
| ** | Percentage of assets are expressed by market value excluding cash and accrued income, and may vary over time. The percentages shown above represent a percentage of the assets as of June 30, 2016. |
16
Table of Contents
Babson Emerging Markets Local Currency Debt Fund 2016 Annual Report
Investment Objective
The investment objective of the Babson Emerging Markets Local Currency Debt Fund (“EM Local Debt Fund” or the “Fund”) is to seek long-term total return through investment in a diversified portfolio of emerging markets local currency-denominated debt securities.
Portfolio Management Commentary
How did the Fund perform?
| n | The Fund was launched on December 8, 2015 and reported a net total rate of return since inception through June 30, 2016 of 12.74%, outperforming the J.P. Morgan Government Bond Index Emerging Markets (GBI-EM) Global Diversified Index, which returned 12.20%.1 |
What factors influenced performance of the Fund?
| n | For the semi-annual reporting period, the Fund’s overall long-duration and overweight in currencies positively impacted Fund performance. The Fund’s positions in Colombia, South Africa and Serbia were the primary drivers of positive performance versus the benchmark. The Fund’s underweight duration in Brazil, Polish Zloty versus the Euro and underweight positioning in Turkish rates were detractors from performance relative to the benchmark. |
| n | For the first six months of 2016, EM Local Debt Fund has materially appreciated on the heels of accommodative global central banks, stronger oil and commodity prices and infrastructure growth in China. Emerging markets currencies gained 5.25% versus the U.S. Dollar on higher oil and commodity prices, while rates gained 7.47% on lower global growth and low inflation. Brazil has turned in the strongest performance for the benchmark as both rates and the Real have rallied on the heels of the Brazilian Senate’s vote in favor of accepting the petition for President Dilma Rousseff’s impeachment and a peaceful transition to Interim President Temer. In late June, Colombia, another top contributor, declared an end to the war with the FARC, the country’s largest rebel group, thereby ending 50 years of war. Mexico was the only country to negatively detract from performance, as its currency lost 6.4% year-to-date. |
Describe recent portfolio activity.
| n | Over the quarter, the Fund increased its position in the Mexican Peso during periods of weakness, as we believe it is one of the least expensive currencies in the benchmark. The Fund also increased its exposure to Peru following the Presidential election, which we believe is a favorable outcome for the country. |
Describe portfolio positioning at period end.
| n | The Fund finished the annual reporting period, June 30, 2016, with a 93% exposure to Emerging Market bonds and a 7% cash position. |
| n | The Top 5 countries in the portfolio at the end of the annual reporting period are Brazil (12.3%), Malaysia (11.1%), Indonesia (10.6%), Colombia (10.6%) and South Africa (7.3%). Overall, the Fund has exposure to 23 different countries and 34 different currencies. |
| 1. | Total return describes the return to an investor based on the Class Y net expense ratio and includes the reinvestment of dividends and capital gains. Performance results reflect past performance and are no guarantee of future results. Current performance may be lower or higher than the performance data quoted. The net asset value (NAV) will fluctuate with market conditions. All returns 1-year or less are cumulative. J.P. Morgan GBI-EM Global Diversified consists of regularly traded, fixed-rate, domestic currency government bonds which international investors can readily access. The maximum weight to any country in the index is capped at 10%. The performance of the index does not reflect the deduction of expenses associated with a fund, such as investment management fees. By contrast, the performance of the Fund reflects the deduction of the fund expenses, including sales charges if applicable. Indices are unmanaged. It is not possible to invest directly in an index. |
17
Table of Contents
Babson Emerging Markets Local Currency Debt Fund 2016 Annual Report
Describe market and portfolio outlook.
| n | We remain optimistic that some Emerging Markets headwinds are poised to reverse and become tailwinds or at least stabilize. |
| n | Currency valuations have adjusted significantly over the past 24 months and we are now seeing some emerging markets currencies at their most attractive levels in more than 10 years, thereby providing for selective emerging markets growth prospects. |
| n | The portfolio continues to add to constructive positioning on selected European and Latin American currencies, less so on Asian currencies, while maintaining a watchful eye on commodity prices. |
| n | The portfolio continues to be positioned in selective rates where inflation is falling along with narrowing current account deficits. A picture of global disinflation should remain favorable for emerging markets local debt and the Fund. |
18
Table of Contents
Babson Emerging Markets Local Currency Debt Fund 2016 Annual Report
COUNTRY COMPOSITION (% OF ASSETS*)
| * | Percentage of assets are expressed by market value excluding cash and accrued income, and may vary over time. The percentages shown above represent a percentage of the assets as of June 30, 2016. |
CONTRIBUTION TO DURATION (IN YEARS)
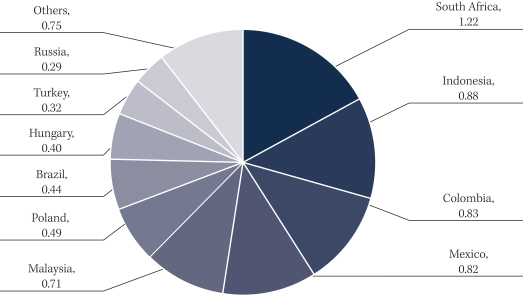
| ** | The values shown above represent the contribution to duration, in years, of the assets as of June 30, 2016. |
19
Table of Contents
Babson Global High Yield Fund 2016 Annual Report
Investment Objective
The investment objective of the Babson Global High Yield Fund (“Global High Yield Fund” or the “Fund”) is to seek to provide high current income generation and, where appropriate, capital appreciation.
Portfolio Management Commentary
How did the Fund perform?
| n | The Fund was launched on October 30, 2015 and reported a net total rate of return since inception through June 30, 2016 of 4.62%, outperforming the Bank of America Merrill Lynch Non-Financial Developed Markets High Yield Constrained Index (the “Index”), which returned 4.30%. As a reminder, following the January 28th, 2016 Board of Trustee’s meeting, the Fund changed the Index from the Bank of America Merrill Lynch Global Non-Financial High Yield Constrained Index to the Bank of America Merrill Lynch Non-Financial Developed Markets High Yield Constrained Index. The previous index returned 4.91% over the same time period. |
What factors influenced performance of the Fund?
| n | On a year-to-date basis through June 30, 2016, the underperformance relative to the Index can largely be attributed to the Oil and Gas, and Mining, Steel, Iron and Non-Precious Metals sectors. Within these sectors, lower quality credits continued to recover from the heavy losses suffered in 2015 and early 2016 which helped Index performance to appreciate significantly over this time period. With the Fund’s slight underweight towards these sectors as well as its upward credit quality bias, performance lagged, but we remain well positioned as we believe there will be bouts of volatility in the commodity sector through the remainder of the year. |
| n | Prudent credit selection within the single-B ratings category was a primary positive contributor to performance over the past six months as well as the Fund’s underweight in the double-B segment compared to the Index. The Fund’s credit selection within the triple-C ratings category and overweight to the single-B ratings segment negatively impacted performance relative to the Index. |
| n | From a region perspective, the Fund’s overweight positioning to the European market and credit selection negatively impacted performance compared to the Index as the European market did not rally as strongly as the U.S. market on the back of the recovery of U.S. focused, commodity related assets. Furthermore, credit selection within the U.S. portfolio of the Fund had a negative impact on performance relative to the Index due to the portfolio’s upward credit quality bias in the commodity sectors as mentioned previously. |
Describe recent portfolio activity.
| n | The Fund remains underweight in the double-B ratings category relative to the Index, favoring single-B and triple-C rated credits that we believe will continue to outperform. Over the past six months, the Fund’s allocation shifted slightly by deploying cash and increasing exposure to single-B and triple-C credits given the continued rally seen in the lower tier of the market. |
| 1. | Total return describes the return to an investor based on the Class Y net expense ratio and includes the reinvestment of dividends and capital gains. Performance results reflect past performance and are no guarantee of future results. Current performance may be lower or higher than the performance data quoted. The net asset value (NAV) will fluctuate with market conditions. All returns 1-year or less are cumulative. The Bank of America Merrill Lynch Non-Financial Developed Markets High Yield Constrained Index contains all securities in the Bank of America Merrill Lynch Global High Yield Index that are non-financials and from developed markets countries, but caps issuer exposure at 2%. Developed markets is defined as an FX-G10 member, a Western European nation, or a territory of the U.S. or a Western European nation. Indices are unmanaged. It is not possible to invest directly in an index. |
20
Table of Contents
Babson Global High Yield Fund 2016 Annual Report
| n | As previously mentioned, the Fund’s weighting toward the Oil and Gas, and Mining, Steel, Iron and Non-Precious Metals sectors is now a slight underweight, due largely to meaningful upward moves in market values as the sectors recovered from their February troughs. That said, these sectors represent the largest sector composition shift over the past six months and now represent the largest sector exposure when combined. |
| n | The Fund’s weighting between regions remained very similar since the beginning of the year with no meaningful shifts. The Fund continues to emphasize an overweight to the European market and an underweight to the U.S. market. |
Describe portfolio positioning at period end.
| n | On a traded basis, the Fund finished the fiscal year-end with a 28.4% weighting to senior secured high yield bonds and a 68.7% weighting to senior unsecured bonds. |
| n | From an industry perspective, the Fund remains well-diversified across a number of Moody’s-based sectors, with higher concentrations in Oil & Gas (13.4%), Telecommunications (7.3%), and Healthcare, Education and Childcare (6.9%) as of fiscal year-end. |
| n | In terms of portfolio credit quality as of June 30, 2016, the Fund had the following weighting breakdown: 3.5% in Baa, 31.1% in Ba, 52.9% in single-B, 9.7% in Caa and below and 2.9% in cash and accrued income.2 |
| n | The Top 5 countries in the portfolio as of the fiscal year-end are currently represented by the U.S. (69.6%), the U.K. (10.4%), France (5.8%), Germany (2.7%) and Portugal (2.0%). Overall, the Fund has exposure to 15 countries and supports our focus on building a well-diversified portfolio of global high yield bonds. |
Describe market and portfolio outlook.
| n | The global high yield markets held up relatively well following the Brexit referendum. While we expect to see some headline-driven weakness in high yield markets in the near term — particularly in sterling denominated credits — it will take time for the economic implications of the vote to become clear. |
| n | That said, outside of commodity related sectors, credit fundamentals for high yield borrowers across geographies remain largely intact. Further, we believe the European high yield markets will benefit from the expansion of the European Central Bank’s purchasing program to include corporate credit. |
| n | Negative pressure in the near-term will most likely stem from broader market sentiment rather than the fundamentals of individual credits. Additionally, the macro-driven volatility tied to Brexit may result in some spread widening, which could present opportunities in quality credits that have been trading at tighter levels following the recent strong performance. |
| 2. | Ratings shown are the highest rating given by one of the following national rating agencies: S&P, Moody’s or Fitch. Additional information about ratings can be found, respectively, at www.standardandpoors.com, www.moodys.com and www.fitchratings.com. Credit ratings are subject to change. AAA, AA, A, and BBB are investment grade ratings categories used by S&P and Fitch; BB, B, CCC/CC/C and D are below investment grade ratings categories used by S&P and Fitch. Aaa, Aa, A and Baa are investment grade ratings categories used by Moody’s; Ba, B, Caa/Ca and C are below investment grade ratings categories used by Moody’s. Bonds backed by U.S. Government or agency securities are given an implied rating equal to the rating of such securities. Holdings designated Not Publicly Rated are not rated by these national rating agencies. |
21
Table of Contents
Babson Global High Yield Fund 2016 Annual Report
CREDIT QUALITY COMPOSITION (% OF ASSETS*)
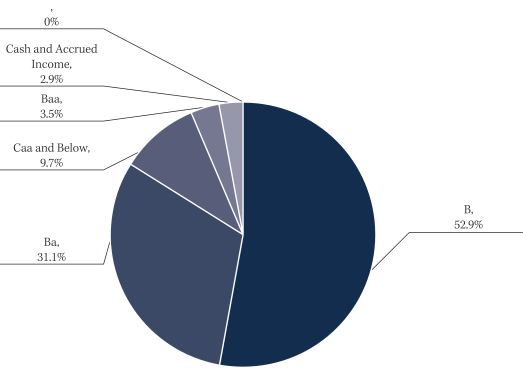
| * | The percentages shown above represent a percentage of the assets as of June 30, 2016. |
COUNTRY COMPOSITION (% OF ASSETS*)
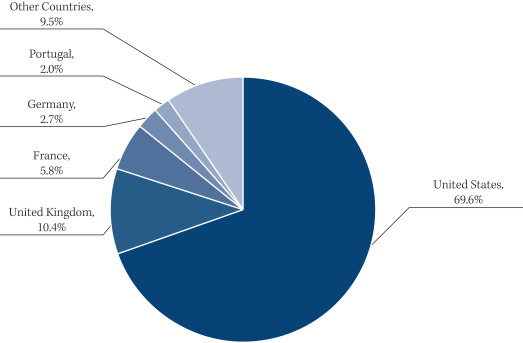
| * | Percentage of assets are expressed by market value excluding cash and accrued income, and may vary over time. The percentages shown above represent a percentage of the assets as of June 30, 2016. |
22
Table of Contents
Babson U.S. High Yield Fund 2016 Annual Report
Investment Objective
The investment objective of the Babson U.S. High Yield Fund (“U.S. High Yield Fund” or the “Fund”) is to seek to achieve a high level of total return, with an emphasis on current income, by investing primarily in high yield debt and related securities.
Portfolio Management Commentary
How did the Fund perform?
| n | The Fund was launched on October 30, 2015 and reported a net total rate of return since inception through June 30, 2016 of 5.52%, outperforming the Barclays Capital U.S. Corporate High Yield Index (the “Index”), which returned 3.84%.1 |
What factors influenced performance of the Fund?
| n | On a year-to-date basis through June 30, 2016, one of the main reasons for the underperformance relative to the Index can be attributed to the Oil and Gas, and Mining, Steel, Iron and Non-Precious Metals sectors. Within these sectors, lower quality credits continued to recover from the heavy losses suffered in 2015 and early 2016 which helped Index performance to appreciate significantly over this time period. With the Fund’s slight underweight towards these sectors as well as its upward credit quality bias, performance lagged, but we remain well positioned as we believe there will be bouts of volatility in the commodity sector through the remainder of the year. |
| n | Prudent credit selection within the single-B ratings category was a primary contributor to performance over the past six months as well as the Fund’s underweight in the double-B segment compared to the Index. The Fund’s credit selection within the triple-C segment and overweight to the single-B ratings category negatively impacted performance relative to the Index. |
Describe recent portfolio activity.
| n | The Fund remains underweight the double-B ratings category relative to the Index, favoring single-B and triple-C rated credits that we believe will continue to outperform. Over the past six months, the Fund’s allocation shifted slightly by deploying cash and increasing exposure to single-B and triple-C credits given the continued rally seen in the lower tier of the market. |
| n | As previously mentioned, the Fund’s weighting toward the Oil and Gas, and Mining, Steel, Iron and Non-Precious Metals sectors is now a slight underweight, due largely to meaningful upward moves in market values as the sectors recovered from their February troughs. That said, these sectors represent the largest sector shift over the past six months and now represent the largest sector exposure when combined. |
Describe portfolio positioning at period end.
| n | On a traded basis, the Fund finished the fiscal year-end with a weighting to high yield bonds of over 85%. The portfolio was also invested in senior secured loans (1.2%). |
| 1. | Total return describes the return to an investor based on the Class Y net expense ratio and includes the reinvestment of dividends and capital gains. Performance results reflect past performance and are no guarantee of future results. Current performance may be lower or higher than the performance data quoted. The net asset value (NAV) will fluctuate with market conditions. All returns 1-year or less are cumulative. The Barclays Capital U.S. Corporate High Yield Index covers the universe of fixed-rate, non-investment grade debt focusing on corporate USD denominated and non-convertible debt. Indices are unmanaged. It is not possible to invest directly in an index. |
23
Table of Contents
Babson U.S. High Yield Fund 2016 Annual Report
| n | From a sector perspective, the Fund remains well-diversified across a number of Moody’s-based sectors, with higher concentrations in Oil and Gas (13.8%), Telecommunications (8.2%), and Healthcare, Education and Childcare (7.4%) as of the fiscal year-end. |
| n | In terms of portfolio credit quality as of June 30, 2016, the Fund had the following weighting breakdown: 6.2% in Baa, 31.2% in Ba, 46.2% in single-B, 11.4% in Caa and below and cash and accrued income at 4.9%.2 |
Describe market and portfolio outlook.
| n | Although fears of a Brexit related market panic quickly subsided, almost all details remain unknown regarding the terms and process of the United Kingdom’s departure from the European Union, which is expected to take years to complete. Assumptions are that global central banks will remain accommodative in the near term with the likelihood of a rate hike in the U.S. being pushed even further into the future. Ultimately, we do not expect Brexit to have major ramifications for U.S. based issuers, although foreign exchange headwinds will likely persist for companies with European operations. |
2. Ratings shown are the highest rating given by one of the following national rating agencies: S&P, Moody’s or Fitch. Additional information about ratings can be found, respectively, at www.standardandpoors.com, www.moodys.com and www.fitchratings.com. Credit ratings are subject to change. AAA, AA, A, and BBB are investment grade ratings categories used by S&P and Fitch; BB, B, CCC/CC/C and D are below investment grade ratings categories used by S&P and Fitch. Aaa, Aa, A and Baa are investment grade ratings categories used by Moody’s; Ba, B, Caa/Ca and C are below investment grade ratings categories used by Moody’s. Bonds backed by U.S. Government or agency securities are given an implied rating equal to the rating of such securities. Holdings designated Not Publicly Rated are not rated by these national rating agencies.
24
Table of Contents
Babson U.S. High Yield Fund 2016 Annual Report
CREDIT QUALITY COMPOSITION (% OF ASSETS*)
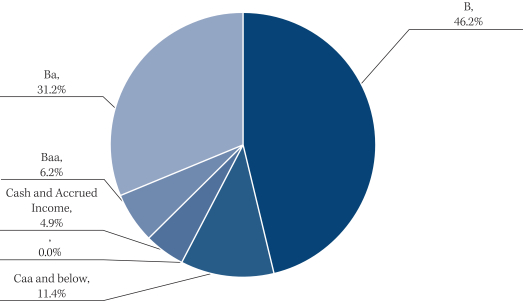
| * | The percentages shown above represent a percentage of the assets as of June 30, 2016. |
COUNTRY COMPOSITION (% OF ASSETS*)
| * | Percentage of assets are expressed by market value excluding cash and accrued income, and may vary over time. The percentages shown above represent a percentage of the assets as of June 30, 2016. |
25
Table of Contents
Babson Capital Funds Trust 2016 Annual Report
SHAREHOLDER EXPENSES (UNAUDITED)
As a shareholder of Babson Global Floating Rate Fund, Babson Global Credit Income Opportunities Fund, Babson Active Short Duration Bond Fund, Babson Total Return Bond Fund, Babson Emerging Markets Debt Blended Total Return Fund, Babson Emerging Markets Local Currency Debt Fund, Babson Global High Yield Fund or Babson U.S. High Yield Fund you incur ongoing expenses, such as management fees, shareholder service fees, distribution fees and other fund expenses. The following table is intended to help you understand your ongoing expenses (in dollars and cents) of investing in the Funds and to compare these expenses with the ongoing expenses of investing in other funds.
The table is based on an investment of $1,000 invested at the beginning of the period and held for the entire period from January 1, 2016 to June 30, 2016.
Actual Expenses
The first line in the table below provides information about the actual account values and actual expenses. You may use the information in this line, together with the amount you invested, to estimate the expenses that you paid over the period. Simply divide your account value by $1,000 (for example, an $8,600 account value divided by $1,000 = 8.6), then multiply the result by the number in the first line for the Fund under the heading entitled “Operating Expenses Incurred” to estimate the expenses you paid on your account during this period.
Hypothetical Example for Comparison Purposes
The second line in the table below provides information about the hypothetical account values and hypothetical expenses based on the Fund’s actual expense ratio and an assumed rate of return of 5% per year before expenses, which is not the Fund’s actual return. The hypothetical account value and expenses may not be used to estimate the actual ending account balance or expenses you paid for the period. You may use this information to compare the ongoing costs of investing in your Fund and other funds. To do so, compare this 5% hypothetical example with the 5% hypothetical examples that appear in the shareholder reports of the other funds.
Babson Global Floating Rate Fund
| EXPENSE RATIO |
BEGINNING AMOUNT |
ENDING VALUE |
AVERAGE VALUE |
OPERATING EXPENSE INCURRED* |
||||||||||||||||
| Class A |
||||||||||||||||||||
| Actual |
1.05 | % | $ | 1,000.00 | $ | 1,037.40 | $ | 1,018.70 | $ | 5.32 | ||||||||||
| Hypothetical |
1.05 | % | 1,000.00 | 1,019.60 | 1,009.80 | 5.27 | ||||||||||||||
| Class C |
||||||||||||||||||||
| Actual |
1.80 | % | 1,000.00 | 1,033.50 | 1,016.75 | 9.10 | ||||||||||||||
| Hypothetical |
1.80 | % | 1,000.00 | 1,015.90 | 1,007.95 | 9.02 | ||||||||||||||
| Class I |
||||||||||||||||||||
| Actual |
0.75 | % | 1,000.00 | 1,038.90 | 1,019.45 | 3.80 | ||||||||||||||
| Hypothetical |
0.75 | % | 1,000.00 | 1,021.10 | 1,010.55 | 3.77 | ||||||||||||||
| Class Y |
||||||||||||||||||||
| Actual |
0.75 | % | 1,000.00 | 1,038.90 | 1,019.45 | 3.80 | ||||||||||||||
| Hypothetical |
0.75 | % | 1,000.00 | 1,021.10 | 1,010.55 | 3.77 | ||||||||||||||
| * | For each Class of the Fund, net expenses are equal to the annualized expense ratio net of any expenses waived or reimbursed by the advisor for such class multiplied by the average account value over the period, multiplied by 182/366. |
26
Table of Contents
Babson Capital Funds Trust 2016 Annual Report
SHAREHOLDER EXPENSES (UNAUDITED) (CONTINUED)
Babson Global Credit Income Opportunities Fund
| EXPENSE RATIO |
BEGINNING AMOUNT |
ENDING VALUE |
AVERAGE VALUE |
OPERATING EXPENSE INCURRED* |
||||||||||||||||
| Class A |
||||||||||||||||||||
| Actual |
1.20 | % | $ | 1,000.00 | $ | 1,044.30 | $ | 1,022.15 | $ | 6.10 | ||||||||||
| Hypothetical |
1.20 | % | 1,000.00 | 1,018.90 | 1,009.45 | 6.02 | ||||||||||||||
| Class C |
||||||||||||||||||||
| Actual |
1.95 | % | 1,000.00 | 1,040.40 | 1,020.20 | 9.89 | ||||||||||||||
| Hypothetical |
1.95 | % | 1,000.00 | 1,015.20 | 1,007.60 | 9.77 | ||||||||||||||
| Class I |
||||||||||||||||||||
| Actual |
0.95 | % | 1,000.00 | 1,045.60 | 1,022.80 | 4.83 | ||||||||||||||
| Hypothetical |
0.95 | % | 1,000.00 | 1,020.10 | 1,010.05 | 4.77 | ||||||||||||||
| Class Y |
||||||||||||||||||||
| Actual |
0.95 | % | 1,000.00 | 1,045.60 | 1,022.80 | 4.83 | ||||||||||||||
| Hypothetical |
0.95 | % | 1,000.00 | 1,020.10 | 1,010.05 | 4.77 | ||||||||||||||
Babson Active Short Duration Bond Fund
| EXPENSE RATIO |
BEGINNING AMOUNT |
ENDING VALUE |
AVERAGE VALUE |
OPERATING EXPENSE INCURRED* |
||||||||||||||||
| Class A |
||||||||||||||||||||
| Actual |
0.65 | % | $ | 1,000.00 | $ | 1,022.00 | $ | 1,011.00 | $ | 3.27 | ||||||||||
| Hypothetical |
0.65 | % | 1,000.00 | 1,021.60 | 1,010.80 | 3.27 | ||||||||||||||
| Class C |
||||||||||||||||||||
| Actual |
1.40 | %** | 1,000.00 | 1,018.10 | 1,009.05 | 7.02 | ||||||||||||||
| Hypothetical |
1.40 | %** | 1,000.00 | 1,017.90 | 1,008.95 | 7.02 | ||||||||||||||
| Class I |
||||||||||||||||||||
| Actual |
0.40 | % | 1,000.00 | 1,022.90 | 1,011.45 | 2.01 | ||||||||||||||
| Hypothetical |
0.40 | % | 1,000.00 | 1,022.90 | 1,011.45 | 2.01 | ||||||||||||||
| Class Y |
||||||||||||||||||||
| Actual |
0.40 | % | 1,000.00 | 1,023.20 | 1,011.60 | 2.01 | ||||||||||||||
| Hypothetical |
0.40 | % | 1,000.00 | 1,022.90 | 1,011.45 | 2.01 | ||||||||||||||
| * | For each Class of the Fund, net expenses are equal to the annualized expense ratio net of any expenses waived or reimbursed by the advisor for such class multiplied by the average account value over the period, multiplied by 182/366. |
| ** | Expenses shown reflect an overaccrual of 12b-1 fees for the period of $1,478 at a rate of 0.50% of net assets. Subsequent to the period, the Fund was reimbursed for the overaccrued amount. |
27
Table of Contents
Babson Capital Funds Trust 2016 Annual Report
SHAREHOLDER EXPENSES (UNAUDITED) (CONTINUED)
Babson Total Return Bond Fund
| EXPENSE RATIO |
BEGINNING AMOUNT |
ENDING VALUE |
AVERAGE VALUE |
OPERATING EXPENSE INCURRED* |
||||||||||||||||
| Class A |
||||||||||||||||||||
| Actual |
0.80 | % | $ | 1,000.00 | $ | 1,055.80 | $ | 1,027.90 | $ | 4.09 | ||||||||||
| Hypothetical |
0.80 | % | 1,000.00 | 1,020.90 | 1,010.45 | 4.02 | ||||||||||||||
| Class C |
||||||||||||||||||||
| Actual |
1.55 | % | 1,000.00 | 1,051.90 | 1,025.95 | 7.91 | ||||||||||||||
| Hypothetical |
1.55 | % | 1,000.00 | 1,017.20 | 1,008.60 | 7.77 | ||||||||||||||
| Class I |
||||||||||||||||||||
| Actual |
0.55 | % | 1,000.00 | 1,057.10 | 1,028.55 | 2.81 | ||||||||||||||
| Hypothetical |
0.55 | % | 1,000.00 | 1,022.10 | 1,011.05 | 2.77 | ||||||||||||||
| Class Y |
||||||||||||||||||||
| Actual |
0.55 | % | 1,000.00 | 1,057.10 | 1,028.55 | 2.81 | ||||||||||||||
| Hypothetical |
0.55 | % | 1,000.00 | 1,022.10 | 1,011.05 | 2.77 | ||||||||||||||
Babson Emerging Markets Debt Blended Total Return Fund
| EXPENSE RATIO |
BEGINNING AMOUNT |
ENDING VALUE |
AVERAGE VALUE |
OPERATING EXPENSE INCURRED* |
||||||||||||||||
| Class A |
||||||||||||||||||||
| Actual |
1.20 | % | $ | 1,000.00 | $ | 1,063.00 | $ | 1,031.50 | $ | 6.16 | ||||||||||
| Hypothetical |
1.20 | % | 1,000.00 | 1,018.90 | 1,009.45 | 6.02 | ||||||||||||||
| Class C |
||||||||||||||||||||
| Actual |
1.95 | % | 1,000.00 | 1,059.10 | 1,029.55 | 9.98 | ||||||||||||||
| Hypothetical |
1.95 | % | 1,000.00 | 1,015.20 | 1,007.60 | 9.77 | ||||||||||||||
| Class I |
||||||||||||||||||||
| Actual |
0.95 | % | 1,000.00 | 1,064.30 | 1,032.15 | 4.88 | ||||||||||||||
| Hypothetical |
0.95 | % | 1,000.00 | 1,020.10 | 1,010.05 | 4.77 | ||||||||||||||
| Class Y |
||||||||||||||||||||
| Actual |
0.95 | % | 1,000.00 | 1,064.30 | 1,032.15 | 4.88 | ||||||||||||||
| Hypothetical |
0.95 | % | 1,000.00 | 1,020.10 | 1,010.05 | 4.77 | ||||||||||||||
| * | For each Class of the Fund, net expenses are equal to the annualized expense ratio net of any expenses waived or reimbursed by the advisor for such class multiplied by the average account value over the period, multiplied by 182/366. |
28
Table of Contents
Babson Capital Funds Trust 2016 Annual Report
SHAREHOLDER EXPENSES (UNAUDITED) (CONTINUED)
Babson Emerging Markets Local Currency Debt Fund
| EXPENSE RATIO |
BEGINNING AMOUNT |
ENDING VALUE |
AVERAGE VALUE |
OPERATING EXPENSE INCURRED* |
||||||||||||||||
| Class A |
||||||||||||||||||||
| Actual |
1.20 | % | $ | 1,000.00 | $ | 1,158.30 | $ | 1,079.15 | $ | 6.44 | ||||||||||
| Hypothetical |
1.20 | % | 1,000.00 | 1,018.90 | 1,009.45 | 6.02 | ||||||||||||||
| Class C |
||||||||||||||||||||
| Actual |
1.95 | % | 1,000.00 | 1,154.10 | 1,077.05 | 10.44 | ||||||||||||||
| Hypothetical |
1.95 | % | 1,000.00 | 1,015.20 | 1,007.60 | 9.77 | ||||||||||||||
| Class I |
||||||||||||||||||||
| Actual |
0.95 | % | 1,000.00 | 1,159.80 | 1,079.90 | 5.10 | ||||||||||||||
| Hypothetical |
0.95 | % | 1,000.00 | 1,020.10 | 1,010.05 | 4.77 | ||||||||||||||
| Class Y |
||||||||||||||||||||
| Actual |
0.95 | % | 1,000.00 | 1,159.80 | 1,079.90 | 5.10 | ||||||||||||||
| Hypothetical |
0.95 | % | 1,000.00 | 1,020.10 | 1,010.05 | 4.77 | ||||||||||||||
Babson Global High Yield Fund
| EXPENSE RATIO |
BEGINNING AMOUNT |
ENDING VALUE |
AVERAGE VALUE |
OPERATING EXPENSE INCURRED* |
||||||||||||||||
| Class A |
||||||||||||||||||||
| Actual |
1.05 | % | $ | 1,000.00 | $ | 1,070.60 | $ | 1,035.30 | $ | 5.41 | ||||||||||
| Hypothetical |
1.05 | % | 1,000.00 | 1,019.60 | 1,009.80 | 5.27 | ||||||||||||||
| Class C |
||||||||||||||||||||
| Actual |
1.80 | % | 1,000.00 | 1,066.60 | 1,033.30 | 9.25 | ||||||||||||||
| Hypothetical |
1.80 | % | 1,000.00 | 1,015.90 | 1,007.95 | 9.02 | ||||||||||||||
| Class I |
||||||||||||||||||||
| Actual |
0.80 | % | 1,000.00 | 1,071.90 | 1,035.95 | 4.12 | ||||||||||||||
| Hypothetical |
0.80 | % | 1,000.00 | 1,020.90 | 1,010.45 | 4.02 | ||||||||||||||
| Class Y |
||||||||||||||||||||
| Actual |
0.80 | % | 1,000.00 | 1,071.90 | 1,035.95 | 4.12 | ||||||||||||||
| Hypothetical |
0.80 | % | 1,000.00 | 1,020.90 | 1,010.45 | 4.02 | ||||||||||||||
| * | For each Class of the Fund, net expenses are equal to the annualized expense ratio net of any expenses waived or reimbursed by the advisor for such class multiplied by the average account value over the period, multiplied by 182/366. |
29
Table of Contents
Babson Capital Funds Trust 2016 Annual Report
SHAREHOLDER EXPENSES (UNAUDITED) (CONTINUED)
Babson U.S. High Yield Fund
| EXPENSE RATIO |
BEGINNING AMOUNT |
ENDING VALUE |
AVERAGE VALUE |
OPERATING EXPENSE INCURRED* |
||||||||||||||||
| Class A |
||||||||||||||||||||
| Actual |
1.00 | % | $ | 1,000.00 | $ | 1,084.80 | $ | 1,042.40 | $ | 5.18 | ||||||||||
| Hypothetical |
1.00 | % | 1,000.00 | 1,019.90 | 1,009.95 | 5.02 | ||||||||||||||
| Class C |
||||||||||||||||||||
| Actual |
1.75 | % | 1,000.00 | 1,080.80 | 1,040.40 | 9.05 | ||||||||||||||
| Hypothetical |
1.75 | % | 1,000.00 | 1,016.20 | 1,008.10 | 8.77 | ||||||||||||||
| Class I |
||||||||||||||||||||
| Actual |
0.75 | % | 1,000.00 | 1,086.10 | 1,043.05 | 3.89 | ||||||||||||||
| Hypothetical |
0.75 | % | 1,000.00 | 1,021.10 | 1,010.55 | 3.77 | ||||||||||||||
| Class Y |
||||||||||||||||||||
| Actual |
0.75 | % | 1,000.00 | 1,086.10 | 1,043.05 | 3.89 | ||||||||||||||
| Hypothetical |
0.75 | % | 1,000.00 | 1,021.10 | 1,010.55 | 3.77 | ||||||||||||||
| * | For each Class of the Fund, net expenses are equal to the annualized expense ratio net of any expenses waived or reimbursed by the advisor for such class multiplied by the average account value over the period, multiplied by 182/366. |
30
Table of Contents
Babson Capital Funds Trust 2016 Annual Report
31
Table of Contents
Babson Capital Funds Trust 2016 Annual Report
STATEMENTS OF ASSETS AND LIABILITIES
June 30, 2016
| BABSON GLOBAL FLOATING RATE FUND |
BABSON GLOBAL OPPORTUNITIES FUND |
BABSON ACTIVE SHORT DURATION BOND FUND |
BABSON TOTAL RETURN |
|||||||||||||
| Assets | ||||||||||||||||
| Investments, at fair value (cost $184,287,909, $109,705,371, $155,298,241 and $29,712,167, respectively) | $ | 172,663,644 | $ | 101,427,091 | $ | 156,314,542 | $ | 30,229,477 | ||||||||
| Foreign currency, at value (cost $259,658, $84,539, $0 and $0, respectively) | 250,492 | 80,118 | – | – | ||||||||||||
| Receivable for investments sold | 12,590,172 | 2,879,654 | 3,968,747 | 127,373 | ||||||||||||
| Receivable for TBA securities sold | – | – | 6,184,980 | 6,671,000 | ||||||||||||
| Receivable for Fund shares sold | 4,856,491 | 118,401 | 2,228,584 | – | ||||||||||||
| Interest receivable | 1,180,699 | 1,506,908 | 767,788 | 144,759 | ||||||||||||
| Receivable from adviser (see Note 3) | – | – | 31,187 | – | ||||||||||||
| Receivable for variation margin on open centrally cleared swap contracts | – | – | 2,382 | 757 | ||||||||||||
| Receivable for variation margin on open futures contracts | – | – | 30,502 | 381 | ||||||||||||
| Foreign tax reclaims receivable | – | 562 | – | – | ||||||||||||
| Unrealized appreciation on forward foreign currency exchange contracts | 1,819,442 | 1,379,685 | 48,523 | 24,351 | ||||||||||||
| Prepaid expenses | 25,664 | 15,436 | 45,782 | 27,206 | ||||||||||||
|
|
|
|
|
|
|
|
|
|||||||||
| Total assets |
193,386,604 | 107,407,855 | 169,623,017 | 37,225,304 | ||||||||||||
|
|
|
|
|
|
|
|
|
|||||||||
| Liabilities | ||||||||||||||||
| Payable for investments purchased | 19,958,347 | 6,567,586 | 687,093 | 575,670 | ||||||||||||
| Payable for TBA and when-issued securities purchased | – | – | 12,334,548 | 10,429,138 | ||||||||||||
| Payable for Fund shares repurchased | 6,352,737 | 40,187 | 426,852 | – | ||||||||||||
| Swap contracts, at fair value (up-front net premiums received of $0, $0, $21,801 and $5,251, respectively) | – | – | 38,457 | 9,614 | ||||||||||||
| Investment advisory fee payable (see Note 3) | 12,613 | 41,722 | – | 73,912 | ||||||||||||
| Cash collateral Due to Broker | – | 1,400,000 | – | – | ||||||||||||
| Distribution fees payable | 7,547 | 5,398 | 7,801 | 208 | ||||||||||||
| Dividends payable | 223,318 | 319,125 | 78,415 | 53,860 | ||||||||||||
| Unrealized depreciation on forward foreign currency exchange contracts | 22,671 | 802 | 50,495 | 25,963 | ||||||||||||
| Accrued expenses and other liabilities | 166,343 | 112,339 | 134,853 | 48,930 | ||||||||||||
|
|
|
|
|
|
|
|
|
|||||||||
| Total liabilities |
26,743,576 | 8,487,159 | 13,758,514 | 11,217,295 | ||||||||||||
|
|
|
|
|
|
|
|
|
|||||||||
| Total net assets |
$ | 166,643,028 | $ | 98,920,696 | $ | 155,864,503 | $ | 26,008,009 | ||||||||
|
|
|
|
|
|
|
|
|
|||||||||
See accompanying Notes to the Financial Statements.
32
Table of Contents
Babson Capital Funds Trust 2016 Annual Report
STATEMENTS OF ASSETS AND LIABILITIES (CONTINUED)
June 30, 2016
| BABSON GLOBAL FLOATING RATE FUND |
BABSON GLOBAL OPPORTUNITIES FUND |
BABSON ACTIVE SHORT DURATION BOND FUND |
BABSON TOTAL RETURN |
|||||||||||||
| Composition of net assets | ||||||||||||||||
| Shares of beneficial interest outstanding (par value $0.00001 per share), unlimited number of shares authorized | $ | 182 | $ | 112 | $ | 156 | $ | 26 | ||||||||
| Additional paid-in capital | 180,676,757 | 110,245,423 | 155,044,037 | 25,539,236 | ||||||||||||
| Undistributed (distributions in excess of) net investment income | (1,114,593 | ) | (704,256 | ) | 29,798 | (5,783 | ) | |||||||||
| Accumulated net realized loss | (3,104,075 | ) | (3,745,669 | ) | (86,065 | ) | (127,592 | ) | ||||||||
| Net unrealized appreciation (depreciation) | (9,815,243 | ) | (6,874,914 | ) | 876,577 | 602,122 | ||||||||||
|
|
|
|
|
|
|
|
|
|||||||||
| Total net assets |
$ | 166,643,028 | $ | 98,920,696 | $ | 155,864,503 | $ | 26,008,009 | ||||||||
|
|
|
|
|
|
|
|
|
|||||||||
| Class A | ||||||||||||||||
| Net assets applicable to outstanding shares | $ | 13,979,936 | $ | 12,340,432 | $ | 39,991,908 | $ | 210,898 | ||||||||
|
|
|
|
|
|
|
|
|
|||||||||
| Shares of beneficial interest outstanding | 1,530,805 | 1,402,367 | 4,007,382 | 20,709 | ||||||||||||
|
|
|
|
|
|
|
|
|
|||||||||
| Net asset value per share outstanding | $ | 9.13 | $ | 8.80 | $ | 9.98 | $ | 10.18 | ||||||||
|
|
|
|
|
|
|
|
|
|||||||||
| Maximum offering price per share outstanding (Net asset value plus sales charge of 3.00%, 4.00%, 0.00% and 4.00%, respectively) | $ | 9.41 | $ | 9.17 | $ | 9.98 | $ | 10.60 | ||||||||
|
|
|
|
|
|
|
|
|
|||||||||
| Class C | ||||||||||||||||
| Net assets applicable to outstanding shares | $ | 6,803,093 | $ | 3,578,440 | $ | 256,745 | $ | 204,290 | ||||||||
|
|
|
|
|
|
|
|
|
|||||||||
| Shares of beneficial interest outstanding | 747,594 | 407,067 | 25,746 | 20,061 | ||||||||||||
|
|
|
|
|
|
|
|
|
|||||||||
| Net asset value per share outstanding | $ | 9.10 | $ | 8.79 | $ | 9.97 | $ | 10.18 | ||||||||
|
|
|
|
|
|
|
|
|
|||||||||
| Class I | ||||||||||||||||
| Net assets applicable to outstanding shares | $ | 19,902,985 | $ | 24,689,344 | $ | 5,970,513 | $ | 12,581,626 | ||||||||
|
|
|
|
|
|
|
|
|
|||||||||
| Shares of beneficial interest outstanding | 2,175,504 | 2,806,051 | 598,837 | 1,235,482 | ||||||||||||
|
|
|
|
|
|
|
|
|
|||||||||
| Net asset value per share outstanding | $ | 9.15 | $ | 8.80 | $ | 9.97 | $ | 10.18 | ||||||||
|
|
|
|
|
|
|
|
|
|||||||||
| Class Y | ||||||||||||||||
| Net assets applicable to outstanding shares | $ | 125,957,014 | $ | 58,312,480 | $ | 109,645,337 | $ | 13,011,195 | ||||||||
|
|
|
|
|
|
|
|
|
|||||||||
| Shares of beneficial interest outstanding | 13,771,934 | 6,627,553 | 10,995,127 | 1,277,658 | ||||||||||||
|
|
|
|
|
|
|
|
|
|||||||||
| Net asset value per share outstanding | $ | 9.15 | $ | 8.80 | $ | 9.97 | $ | 10.18 | ||||||||
|
|
|
|
|
|
|
|
|
|||||||||
See accompanying Notes to the Financial Statements.
33
Table of Contents
Babson Capital Funds Trust 2016 Annual Report
STATEMENTS OF ASSETS AND LIABILITIES
June 30, 2016
| BABSON EMERGING MARKETS DEBT BLENDED TOTAL RETURN FUND |
BABSON EMERGING MARKETS LOCAL CURRENCY DEBT FUND |
BABSON GLOBAL HIGH YIELD FUND |
BABSON U.S. HIGH YIELD FUND |
|||||||||||||
| Assets | ||||||||||||||||
| Investments, at fair value (cost $9,643,460, $5,101,929, $25,604,275 and $28,081,456, respectively) | $ | 9,753,116 | $ | 5,325,242 | $ | 25,116,074 | $ | 28,262,879 | ||||||||
| Foreign currency, at value (cost $0, $1,962, $5,212 and $0, respectively) | – | 2,020 | 4,915 | – | ||||||||||||
| Receivable for Fund shares sold | – | – | 100,000 | – | ||||||||||||
| Interest and dividends receivable | 236,846 | 195,200 | 472,140 | 498,922 | ||||||||||||
| Swap contracts, at fair value | 12,211 | 42,875 | – | – | ||||||||||||
| Foreign tax reclaims receivable | – | 437 | – | – | ||||||||||||
| Unrealized appreciation on forward foreign currency exchange contracts | 147,954 | 110,160 | 284,477 | – | ||||||||||||
| Prepaid expenses | 26,670 | 26,254 | 26,569 | 26,875 | ||||||||||||
|
|
|
|
|
|
|
|
|
|||||||||
| Total assets |
10,176,797 | 5,702,188 | 26,004,175 | 28,788,676 | ||||||||||||
|
|
|
|
|
|
|
|
|
|||||||||
| Liabilities | ||||||||||||||||
| Payable for investments purchased | – | – | 482,368 | 692,857 | ||||||||||||
| Swap contracts, at fair value (up-front net premiums received of $0, $0, $0 and $0, respectively) | 8,941 | 6,395 | – | – | ||||||||||||
| Investment advisory fee payable (see Note 3) | 69,009 | 57,854 | 58,478 | 58,955 | ||||||||||||
| Distribution fees payable | 198 | 108 | 103 | 118 | ||||||||||||
| Dividends payable | 40,485 | 23,425 | 139,100 | 141,827 | ||||||||||||
| Unrealized depreciation on forward foreign currency exchange contracts | 114,417 | 111,356 | 3,588 | – | ||||||||||||
| Accrued expenses and other liabilities | 40,759 | 42,538 | 49,395 | 49,667 | ||||||||||||
|
|
|
|
|
|
|
|
|
|||||||||
| Total liabilities |
273,809 | 241,676 | 733,032 | 943,424 | ||||||||||||
|
|
|
|
|
|
|
|
|
|||||||||
| Total net assets |
$ | 9,902,988 | $ | 5,460,512 | $ | 25,271,143 | $ | 27,845,252 | ||||||||
|
|
|
|
|
|
|
|
|
|||||||||
| Composition of net assets | ||||||||||||||||
| Shares of beneficial interest outstanding (par value $0.00001 per share), unlimited number of shares authorized | $ | 10 | $ | 5 | $ | 25 | $ | 27 | ||||||||
| Additional paid-in capital | 10,003,090 | 4,999,995 | 25,138,737 | 27,375,232 | ||||||||||||
| Undistributed (distributions in excess of) net investment income | (81,669 | ) | 197,484 | 54,471 | – | |||||||||||
| Accumulated net realized gain (loss) | (165,820 | ) | 6,820 | 291,015 | 288,570 | |||||||||||
| Net unrealized appreciation (depreciation) | 147,377 | 256,208 | (213,105 | ) | 181,423 | |||||||||||
|
|
|
|
|
|
|
|
|
|||||||||
| Total net assets |
$ | 9,902,988 | $ | 5,460,512 | $ | 25,271,143 | $ | 27,845,252 | ||||||||
|
|
|
|
|
|
|
|
|
|||||||||
See accompanying Notes to the Financial Statements.
34
Table of Contents
Babson Capital Funds Trust 2016 Annual Report
STATEMENTS OF ASSETS AND LIABILITIES (CONTINUED)
June 30, 2016
| BABSON EMERGING MARKETS DEBT BLENDED TOTAL RETURN FUND |
BABSON EMERGING MARKETS LOCAL CURRENCY DEBT FUND |
BABSON GLOBAL HIGH YIELD FUND |
BABSON U.S. HIGH YIELD FUND |
|||||||||||||
| Class A | ||||||||||||||||
| Net assets applicable to outstanding shares | $ | 198,062 | $ | 109,210 | $ | 100,529 | $ | 206,005 | ||||||||
|
|
|
|
|
|
|
|
|
|||||||||
| Shares of beneficial interest outstanding | 20,006 | 10,000 | 10,000 | 20,315 | ||||||||||||
|
|
|
|
|
|
|
|
|
|||||||||
| Net asset value per share outstanding | $ | 9.90 | $ | 10.92 | $ | 10.05 | $ | 10.14 | ||||||||
|
|
|
|
|
|
|
|
|
|||||||||
| Maximum offering price per share outstanding (Net asset value plus sales charge of 4.00%) | $ | 10.31 | $ | 11.38 | $ | 10.47 | $ | 10.56 | ||||||||
|
|
|
|
|
|
|
|
|
|||||||||
| Class C | ||||||||||||||||
| Net assets applicable to outstanding shares | $ | 198,058 | $ | 109,211 | $ | 100,530 | $ | 101,407 | ||||||||
|
|
|
|
|
|
|
|
|
|||||||||
| Shares of beneficial interest outstanding | 20,006 | 10,000 | 10,000 | 10,000 | ||||||||||||
|
|
|
|
|
|
|
|
|
|||||||||
| Net asset value per share outstanding | $ | 9.90 | $ | 10.92 | $ | 10.05 | $ | 10.14 | ||||||||
|
|
|
|
|
|
|
|
|
|||||||||
| Class I | ||||||||||||||||
| Net assets applicable to outstanding shares | $ | 4,753,355 | $ | 2,621,046 | $ | 12,465,604 | $ | 14,863,305 | ||||||||
|
|
|
|
|
|
|
|
|
|||||||||
| Shares of beneficial interest outstanding | 480,156 | 240,000 | 1,240,000 | 1,465,647 | ||||||||||||
|
|
|
|
|
|
|
|
|
|||||||||
| Net asset value per share outstanding | $ | 9.90 | $ | 10.92 | $ | 10.05 | $ | 10.14 | ||||||||
|
|
|
|
|
|
|
|
|
|||||||||
| Class Y | ||||||||||||||||
| Net assets applicable to outstanding shares | $ | 4,753,513 | $ | 2,621,045 | $ | 12,604,480 | $ | 12,674,535 | ||||||||
|
|
|
|
|
|
|
|
|
|||||||||
| Shares of beneficial interest outstanding | 480,156 | 240,000 | 1,253,816 | 1,249,880 | ||||||||||||
|
|
|
|
|
|
|
|
|
|||||||||
| Net asset value per share outstanding | $ | 9.90 | $ | 10.92 | $ | 10.05 | $ | 10.14 | ||||||||
|
|
|
|
|
|
|
|
|
|||||||||
See accompanying Notes to the Financial Statements.
35
Table of Contents
Babson Capital Funds Trust 2016 Annual Report
For the Year Ended June 30, 2016
| BABSON GLOBAL FLOATING RATE FUND |
BABSON GLOBAL CREDIT INCOME OPPORTUNITIES FUND |
BABSON ACTIVE SHORT DURATION BOND FUND (1) |
BABSON TOTAL RETURN BOND FUND (1) |
|||||||||||||
| Investment Income | ||||||||||||||||
| Interest income |
$ | 9,328,891 | $ | 6,484,302 | $ | 2,080,708 | $ | 596,697 | ||||||||
| Dividends |
– | – | 4,013 | 215,851 | ||||||||||||
| Other income |
187,220 | 26,736 | 2,075 | – | ||||||||||||
|
|
|
|
|
|
|
|
|
|||||||||
| Total investment income |
9,516,111 | 6,511,038 | 2,086,796 | 812,548 | ||||||||||||
|
|
|
|
|
|
|
|
|
|||||||||
| Operating Expenses | ||||||||||||||||
| Advisory fees |
1,060,920 | 651,423 | 341,708 | 97,807 | ||||||||||||
| 12b-1 distribution and servicing plan |
||||||||||||||||
| Class A |
15,553 | 30,395 | 31,717 | 489 | ||||||||||||
| Class C |
63,221 | 33,689 | 2,957 | 1,948 | ||||||||||||
| Administrator fees |
331,845 | 181,586 | 157,980 | 52,130 | ||||||||||||
| Custody fees |
236,908 | 138,770 | 124,990 | 44,386 | ||||||||||||
| Professional fees |
143,254 | 130,089 | 77,637 | 57,247 | ||||||||||||
| Transfer agent fees |
71,179 | 68,588 | 61,092 | 33,237 | ||||||||||||
| Directors’ fees |
88,411 | 66,373 | 39,353 | 28,989 | ||||||||||||
| Registration fees |
61,244 | 59,908 | 25,610 | 7,671 | ||||||||||||
| Printing and mailing expenses |
46,073 | 32,927 | 14,461 | 6,681 | ||||||||||||
| Interest expense |
– | – | 45 | 20 | ||||||||||||
| Other operating expenses |
63,448 | 39,033 | 39,859 | 21,046 | ||||||||||||
|
|
|
|
|
|
|
|
|
|||||||||
| Total operating expenses |
2,182,056 | 1,432,781 | 917,409 | 351,651 | ||||||||||||
| Reimbursement of expenses |
||||||||||||||||
| Class A |
(41,735 | ) | (84,890 | ) | (67,053 | ) | (9,393 | ) | ||||||||
| Class C |
(44,450 | ) | (32,198 | ) | (11,887 | ) | (9,402 | ) | ||||||||
| Class I |
(123,249 | ) | (148,155 | ) | (103,766 | ) | (98,306 | ) | ||||||||
| Class Y |
(663,440 | ) | (278,319 | ) | (293,654 | ) | (97,608 | ) | ||||||||
|
|
|
|
|
|
|
|
|
|||||||||
| Net operating expenses |
1,309,182 | 889,219 | 441,049 | 136,942 | ||||||||||||
|
|
|
|
|
|
|
|
|
|||||||||
| Net investment income |
8,206,929 | 5,621,819 | 1,645,747 | 675,606 | ||||||||||||
|
|
|
|
|
|
|
|
|
|||||||||
See accompanying Notes to the Financial Statements.
36
Table of Contents
Babson Capital Funds Trust 2016 Annual Report
STATEMENTS OF OPERATIONS (CONTINUED)
For the Year Ended June 30, 2016
| BABSON GLOBAL FLOATING RATE FUND |
BABSON GLOBAL CREDIT INCOME OPPORTUNITIES FUND |
BABSON ACTIVE SHORT DURATION BOND FUND (1) |
BABSON TOTAL RETURN BOND FUND (1) |
|||||||||||||
| Realized and Unrealized Gains (Losses) on Investments | ||||||||||||||||
| Net realized loss on investments |
$ | (3,884,661 | ) | $ | (3,949,580 | ) | $ | (142,905 | ) | $ | (111,557 | ) | ||||
| Net realized gain (loss) on forward foreign currency exchange contracts |
144,895 | (76,585 | ) | – | (7,665 | ) | ||||||||||
| Net realized gain on foreign currency and translation |
670,785 | 480,416 | – | 10 | ||||||||||||
| Net realized gain on futures contracts |
– | – | 56,839 | 41,803 | ||||||||||||
| Net realized gain on swap contracts |
– | – | 11,753 | 2,982 | ||||||||||||
| Net realized gain on written options |
– | 847,320 | – | – | ||||||||||||
|
|
|
|
|
|
|
|
|
|||||||||
| Net realized loss |
(3,068,981 | ) | (2,698,429 | ) | (74,313 | ) | (74,427 | ) | ||||||||
|
|
|
|
|
|
|
|
|
|||||||||
| Net change in unrealized appreciation (depreciation) on investments |
(6,790,834 | ) | (4,505,610 | ) | 1,016,301 | 517,310 | ||||||||||
| Net change in unrealized appreciation on unfunded loan commitments |
4,592 | 4,592 | – | – | ||||||||||||
| Net change in unrealized appreciation (depreciation) on forward foreign currency exchange contracts |
2,166,841 | 1,522,515 | (1,972 | ) | (1,612 | ) | ||||||||||
| Net change in unrealized depreciation on foreign currency and translation |
(91,659 | ) | (45,464 | ) | – | – | ||||||||||
| Net change in unrealized appreciation (depreciation) on futures contracts |
– | – | (120,041 | ) | 91,118 | |||||||||||
| Net change in unrealized depreciation on swap contracts |
– | – | (17,711 | ) | (4,694 | ) | ||||||||||
| Net change in unrealized depreciation on written option contracts |
– | (62,523 | ) | – | – | |||||||||||
|
|
|
|
|
|
|
|
|
|||||||||
| Net change in unrealized appreciation (depreciation) |
(4,711,060 | ) | (3,086,490 | ) | 876,577 | 602,122 | ||||||||||
|
|
|
|
|
|
|
|
|
|||||||||
| Net realized and unrealized gains (losses) on investments |
(7,780,041 | ) | (5,784,919 | ) | 802,264 | 527,695 | ||||||||||
|
|
|
|
|
|
|
|
|
|||||||||
| Net increase (decrease) in net assets resulting from operations |
$ | 426,888 | $ | (163,100 | ) | $ | 2,448,011 | $ | 1,203,301 | |||||||
|
|
|
|
|
|
|
|
|
|||||||||
| (1) | Fund commenced operations on July 8, 2015. |
See accompanying Notes to the Financial Statements.
37
Table of Contents
Babson Capital Funds Trust 2016 Annual Report
STATEMENTS OF OPERATIONS (CONTINUED)
For the Year Ended June 30, 2016
| BABSON EMERGING MARKETS DEBT BLENDED TOTAL RETURN FUND (1) |
BABSON EMERGING MARKETS LOCAL CURRENCY DEBT FUND (3) |
BABSON GLOBAL HIGH YIELD FUND (2) |
BABSON U.S. HIGH YIELD FUND (2) |
|||||||||||||
| Investment Income | ||||||||||||||||
| Interest income (net of withholding tax of $7,390, $9,166, $0 and $0, respectively) |
$ | 511,115 | $ | 281,973 | $ | 1,105,860 | $ | 1,182,800 | ||||||||
| Other income |
– | – | 3,229 | – | ||||||||||||
|
|
|
|
|
|
|
|
|
|||||||||
| Total investment income |
511,115 | 281,973 | 1,109,089 | 1,182,800 | ||||||||||||
|
|
|
|
|
|
|
|
|
|||||||||
| Operating Expenses | ||||||||||||||||
| Advisory fees |
49,860 | 21,357 | 97,064 | 95,231 | ||||||||||||
| 12b-1 distribution and servicing plan |
||||||||||||||||
| Class A |
333 | 142 | 162 | 194 | ||||||||||||
| Class C |
1,330 | 570 | 647 | 647 | ||||||||||||
| Administrator fees |
23,430 | 15,063 | 35,380 | 36,991 | ||||||||||||
| Custody fees |
20,761 | 15,707 | 25,448 | 25,748 | ||||||||||||
| Professional fees |
39,730 | 38,832 | 43,587 | 40,939 | ||||||||||||
| Transfer agent fees |
22,719 | 10,384 | 15,475 | 14,281 | ||||||||||||
| Directors’ fees |
12,204 | 11,624 | 14,007 | 14,252 | ||||||||||||
| Registration fees |
3,087 | 2,277 | 4,618 | 4,882 | ||||||||||||
| Printing and mailing expenses |
4,532 | 479 | 6,646 | 7,099 | ||||||||||||
| Other operating expenses |
5,722 | 3,776 | 8,840 | 9,130 | ||||||||||||
|
|
|
|
|
|
|
|
|
|||||||||
| Total operating expenses |
183,708 | 120,211 | 251,874 | 249,394 | ||||||||||||
| Reimbursement of expenses |
||||||||||||||||
| Class A |
(7,521 | ) | (4,254 | ) | (3,949 | ) | (3,482 | ) | ||||||||
| Class C |
(7,541 | ) | (4,266 | ) | (3,955 | ) | (3,608 | ) | ||||||||
| Class I |
(52,975 | ) | (43,597 | ) | (57,679 | ) | (58,706 | ) | ||||||||
| Class Y |
(52,974 | ) | (43,598 | ) | (57,693 | ) | (54,424 | ) | ||||||||
|
|
|
|
|
|
|
|
|
|||||||||
| Net operating expenses |
62,697 | 24,496 | 128,598 | 129,174 | ||||||||||||
|
|
|
|
|
|
|
|
|
|||||||||
| Net investment income |
448,418 | 257,477 | 980,491 | 1,053,626 | ||||||||||||
|
|
|
|
|
|
|
|
|
|||||||||
| Realized and Unrealized Gains (Losses) on Investments | ||||||||||||||||
| Net realized gain on investments(4) |
109,387 | 127,298 | 268,896 | 288,570 | ||||||||||||
| Net realized loss on forward foreign currency exchange contracts |
(256,581 | ) | (40,748 | ) | (44,058 | ) | – | |||||||||
| Net realized gain (loss) on foreign currency and translation |
(14,608 | ) | 2,395 | 120,648 | – | |||||||||||
| Net realized loss on futures contracts |
(6,838 | ) | – | – | – | |||||||||||
| Net realized gain (loss) on swap contracts |
(166,095 | ) | 21,286 | – | – | |||||||||||
|
|
|
|
|
|
|
|
|
|||||||||
| Net realized gain (loss) |
(334,735 | ) | 110,231 | 345,486 | 288,570 | |||||||||||
|
|
|
|
|
|
|
|
|
|||||||||
See accompanying Notes to the Financial Statements.
38
Table of Contents
Babson Capital Funds Trust 2016 Annual Report
STATEMENTS OF OPERATIONS (CONTINUED)
For the Year Ended June 30, 2016
| BABSON EMERGING MARKETS DEBT BLENDED TOTAL RETURN FUND (1) |
BABSON EMERGING MARKETS LOCAL CURRENCY DEBT FUND (3) |
BABSON GLOBAL HIGH YIELD FUND (2) |
BABSON U.S. HIGH YIELD FUND (2) |
|||||||||||||
| Net change in unrealized appreciation (depreciation) on investments(5) |
$ | 109,656 | $ | 217,854 | $ | (488,201 | ) | $ | 181,423 | |||||||
| Net change in unrealized appreciation (depreciation) on forward foreign currency exchange contracts |
33,537 | (1,196 | ) | 280,889 | – | |||||||||||
| Net change in unrealized appreciation (depreciation) on foreign currency and translation |
914 | 3,070 | (5,793 | ) | – | |||||||||||
| Net change in unrealized appreciation on swap contracts |
3,270 | 36,480 | – | – | ||||||||||||
|
|
|
|
|
|
|
|
|
|||||||||
| Net change in unrealized appreciation (depreciation) |
147,377 | 256,208 | (213,105 | ) | 181,423 | |||||||||||
|
|
|
|
|
|
|
|
|
|||||||||
| Net realized and unrealized gains (losses) on investments |
(187,358 | ) | 366,439 | 132,381 | 469,993 | |||||||||||
|
|
|
|
|
|
|
|
|
|||||||||
| Net increase in net assets resulting from operations |
$ | 261,060 | $ | 623,916 | $ | 1,112,872 | $ | 1,523,619 | ||||||||
|
|
|
|
|
|
|
|
|
|||||||||
| (1) | Fund commenced operations on October 21, 2015. |
| (2) | Fund commenced operations on October 30, 2015. |
| (3) | Fund commenced operations on December 8, 2015. |
| (4) | Net of foreign capital gains taxes of $265. |
| (5) | Net unrealized depreciation of foreign capital gains taxes of $5,459. |
See accompanying Notes to the Financial Statements.
39
Table of Contents
Babson Capital Funds Trust 2016 Annual Report
STATEMENTS OF CHANGES IN NET ASSETS
| BABSON GLOBAL FLOATING RATE FUND |
BABSON GLOBAL CREDIT INCOME OPPORTUNITIES FUND |
|||||||||||||||
| FOR THE YEAR ENDED JUNE 30, 2016 |
FOR THE YEAR ENDED JUNE 30, 2015 |
FOR THE YEAR ENDED JUNE 30, 2016 |
FOR THE YEAR ENDED JUNE 30, 2015 |
|||||||||||||
| Operations | ||||||||||||||||
| Net investment income |
$ | 8,206,929 | $ | 5,541,218 | $ | 5,621,819 | $ | 4,332,948 | ||||||||
| Net realized gain (loss) on investments |
(3,068,981 | ) | 1,558,409 | (2,698,429 | ) | 451,988 | ||||||||||
| Net change in unrealized depreciation on investments |
(4,711,060 | ) | (5,820,218 | ) | (3,086,490 | ) | (4,970,881 | ) | ||||||||
|
|
|
|
|
|
|
|
|
|||||||||
| Net increase (decrease) in net assets from operations |
426,888 | 1,279,409 | (163,100 | ) | (185,945 | ) | ||||||||||
|
|
|
|
|
|
|
|
|
|||||||||
| Dividends to Common Shareholders | ||||||||||||||||
| Net investment income |
||||||||||||||||
| Class A |
(304,354 | ) | (805,770 | ) | (835,584 | ) | (1,114,861 | ) | ||||||||
|
|
|
|
|
|
|
|
|
|||||||||
| Class C |
(268,027 | ) | (199,251 | ) | (205,363 | ) | (136,768 | ) | ||||||||
|
|
|
|
|
|
|
|
|
|||||||||
| Class I |
(1,191,256 | ) | (2,251,195 | ) | (1,782,878 | ) | (2,110,134 | ) | ||||||||
|
|
|
|
|
|
|
|
|
|||||||||
| Class Y |
(6,742,434 | ) | (4,937,396 | ) | (3,292,537 | ) | (2,778,042 | ) | ||||||||
|
|
|
|
|
|
|
|
|
|||||||||
| Net realized gain |
||||||||||||||||
| Class A |
– | (11,345 | ) | – | (186,020 | ) | ||||||||||
|
|
|
|
|
|
|
|
|
|||||||||
| Class C |
– | (2,779 | ) | – | (25,871 | ) | ||||||||||
|
|
|
|
|
|
|
|
|
|||||||||
| Class I |
– | (27,574 | ) | – | (340,131 | ) | ||||||||||
|
|
|
|
|
|
|
|
|
|||||||||
| Class Y |
– | (49,009 | ) | – | (416,997 | ) | ||||||||||
|
|
|
|
|
|
|
|
|
|||||||||
| Total dividends to common shareholders |
(8,506,071 | ) | (8,284,319 | ) | (6,116,362 | ) | (7,108,824 | ) | ||||||||
|
|
|
|
|
|
|
|
|
|||||||||
| Capital Share Transactions | ||||||||||||||||
| Net proceeds from sale of shares |
76,837,249 | 103,090,790 | 38,204,380 | 42,681,717 | ||||||||||||
| Net Asset Value of shares issued to shareholders in payment of distributions declared |
6,057,323 | 8,079,411 | 2,714,185 | 6,926,691 | ||||||||||||
| Cost of shares redeemed |
(74,331,498 | ) | (52,643,055 | ) | (17,451,036 | ) | (24,420,068 | ) | ||||||||
| Redemption fees |
– | 5,459 | – | 13,600 | ||||||||||||
|
|
|
|
|
|
|
|
|
|||||||||
| Net increase in net assets resulting from capital stock transactions |
8,563,074 | 58,532,605 | 23,467,529 | 25,201,940 | ||||||||||||
|
|
|
|
|
|
|
|
|
|||||||||
| Total increase in net assets |
483,891 | 51,527,695 | 17,188,067 | 17,907,171 | ||||||||||||
|
|
|
|
|
|
|
|
|
|||||||||
| Net Assets | ||||||||||||||||
| Beginning of year |
166,159,137 | 114,631,442 | 81,732,629 | 63,825,458 | ||||||||||||
|
|
|
|
|
|
|
|
|
|||||||||
| End of year (includes undistributed net investment income of $(1,114,593), $385,459, $(704,256) and $832,841, respectively) |
$ | 166,643,028 | $ | 166,159,137 | $ | 98,920,696 | $ | 81,732,629 | ||||||||
|
|
|
|
|
|
|
|
|
|||||||||
See accompanying Notes to the Financial Statements.
40
Table of Contents
Babson Capital Funds Trust 2016 Annual Report
STATEMENTS OF CHANGES IN NET ASSETS (CONTINUED)
| BABSON ACTIVE SHORT DURATION BOND FUND |
BABSON TOTAL RETURN BOND FUND |
|||||||
| PERIOD FROM JULY 8, 2015 THROUGH JUNE 30, 2016 (1) |
PERIOD FROM JULY 8, 2015 THROUGH JUNE 30, 2016 (1) |
|||||||
| Operations | ||||||||
| Net investment income |
$ | 1,645,747 | $ | 675,606 | ||||
| Net realized loss on investments |
(74,313 | ) | (74,427 | ) | ||||
| Net change in unrealized appreciation on investments |
876,577 | 602,122 | ||||||
|
|
|
|
|
|||||
| Net increase in net assets resulting from operations |
2,448,011 | 1,203,301 | ||||||
|
|
|
|
|
|||||
| Dividends to Common Shareholders | ||||||||
| Net investment income |
||||||||
| Class A |
(189,128 | ) | (5,003 | ) | ||||
|
|
|
|
|
|||||
| Class C |
(2,030 | ) | (3,522 | ) | ||||
|
|
|
|
|
|||||
| Class I |
(328,113 | ) | (336,827 | ) | ||||
|
|
|
|
|
|||||
| Class Y |
(1,108,430 | ) | (338,788 | ) | ||||
|
|
|
|
|
|||||
| Net realized gain |
||||||||
| Class A |
– | (403 | ) | |||||
|
|
|
|
|
|||||
| Class C |
– | (402 | ) | |||||
|
|
|
|
|
|||||
| Class I |
– | (24,782 | ) | |||||
|
|
|
|
|
|||||
| Class Y |
– | (24,827 | ) | |||||
|
|
|
|
|
|||||
| Total dividends to common shareholders |
(1,627,701 | ) | (734,554 | ) | ||||
|
|
|
|
|
|||||
| Capital Share Transactions | ||||||||
| Net proceeds from sale of shares |
209,020,134 | 25,427,645 | ||||||
| Net Asset Value of shares issued to shareholders in payment of distributions declared |
841,543 | 111,617 | ||||||
| Cost of shares redeemed |
(54,817,484 | ) | – | |||||
|
|
|
|
|
|||||
| Net increase in net assets resulting from capital stock transactions |
155,044,193 | 25,539,262 | ||||||
|
|
|
|
|
|||||
| Total increase in net assets |
155,864,503 | 26,008,009 | ||||||
|
|
|
|
|
|||||
| Net Assets | ||||||||
| Beginning of year |
– | – | ||||||
|
|
|
|
|
|||||
| End of period (includes undistributed and distributions in excess of net investment income of $29,798 and $(5,783), respectively) |
$ | 155,864,503 | $ | 26,008,009 | ||||
|
|
|
|
|
|||||
| (1) | Fund commenced operations on July 8, 2015. |
See accompanying Notes to the Financial Statements.
41
Table of Contents
Babson Capital Funds Trust 2016 Annual Report
STATEMENTS OF CHANGES IN NET ASSETS
| BABSON EMERGING MARKETS DEBT BLENDED TOTAL RETURN FUND |
BABSON EMERGING MARKETS LOCAL CURRENCY DEBT FUND |
|||||||
| PERIOD FROM JUNE 30, 2016 (1) |
PERIOD FROM JUNE 30, 2016 (2) |
|||||||
| Operations | ||||||||
| Net investment income |
$ | 448,418 | $ | 257,477 | ||||
| Net realized gain (loss) on investments |
(334,735 | ) | 110,231 | |||||
| Net change in unrealized appreciation on investments |
147,377 | 256,208 | ||||||
|
|
|
|
|
|||||
| Net increase in net assets resulting from operations |
261,060 | 623,916 | ||||||
|
|
|
|
|
|||||
| Dividends to Common Shareholders | ||||||||
| Net investment income |
||||||||
| Class A |
(6,867 | ) | (3,143 | ) | ||||
|
|
|
|
|
|||||
| Class C |
(5,895 | ) | (2,726 | ) | ||||
|
|
|
|
|
|||||
| Class I |
(172,655 | ) | (78,768 | ) | ||||
|
|
|
|
|
|||||
| Class Y |
(172,655 | ) | (78,767 | ) | ||||
|
|
|
|
|
|||||
| Net realized gain |
||||||||
| Class A |
(62 | ) | – | |||||
|
|
|
|
|
|||||
| Class C |
(62 | ) | – | |||||
|
|
|
|
|
|||||
| Class I |
(1,488 | ) | – | |||||
|
|
|
|
|
|||||
| Class Y |
(1,488 | ) | – | |||||
|
|
|
|
|
|||||
| Total dividends to common shareholders |
(361,172 | ) | (163,404 | ) | ||||
|
|
|
|
|
|||||
| Capital Share Transactions | ||||||||
| Net proceeds from sale of shares |
10,000,000 | 5,000,000 | ||||||
| Net Asset Value of shares issued to shareholders in payment of distributions declared |
3,100 | – | ||||||
|
|
|
|
|
|||||
| Net increase in net assets resulting from capital stock transactions |
10,003,100 | 5,000,000 | ||||||
|
|
|
|
|
|||||
| Total increase in net assets |
9,902,988 | 5,460,512 | ||||||
|
|
|
|
|
|||||
| Net Assets | ||||||||
| Beginning of year |
— | — | ||||||
|
|
|
|
|
|||||
| End of period (includes undistributed and distributions in excess of net investment income of $(81,669) and $197,484, respectively) |
$ | 9,902,988 | $ | 5,460,512 | ||||
|
|
|
|
|
|||||
| (1) | Fund commenced operations on October 21, 2015. |
| (2) | Fund commenced operations on December 8, 2015. |
See accompanying Notes to the Financial Statements.
42
Table of Contents
Babson Capital Funds Trust 2016 Annual Report
STATEMENTS OF CHANGES IN NET ASSETS (CONTINUED)
| BABSON GLOBAL HIGH YIELD FUND |
BABSON U.S. HIGH YIELD FUND |
|||||||
| PERIOD
FROM JUNE 30, 2016 (1) |
PERIOD
FROM JUNE 30, 2016 (1) |
|||||||
| Operations | ||||||||
| Net investment income |
$ | 980,491 | $ | 1,053,626 | ||||
| Net realized gain on investments |
345,486 | 288,570 | ||||||
| Net change in unrealized appreciation (depreciation) on investments |
(213,105 | ) | 181,423 | |||||
|
|
|
|
|
|||||
| Net increase in net assets resulting from operations |
1,112,872 | 1,523,619 | ||||||
|
|
|
|
|
|||||
| Dividends to Common Shareholders | ||||||||
| Net investment income |
||||||||
| Class A |
(3,764 | ) | (4,605 | ) | ||||
|
|
|
|
|
|||||
| Class C |
(3,285 | ) | (3,286 | ) | ||||
|
|
|
|
|
|||||
| Class I |
(486,534 | ) | (559,016 | ) | ||||
|
|
|
|
|
|||||
| Class Y |
(486,908 | ) | (486,719 | ) | ||||
|
|
|
|
|
|||||
| Total dividends to common shareholders |
(980,491 | ) | (1,053,626 | ) | ||||
|
|
|
|
|
|||||
| Capital Share Transactions | ||||||||
| Net proceeds from sale of shares |
25,138,500 | 27,302,500 | ||||||
| Net Asset Value of shares issued to shareholders in payment of distributions declared |
262 | 72,759 | ||||||
|
|
|
|
|
|||||
| Net increase in net assets resulting from capital stock transactions |
25,138,762 | 27,375,259 | ||||||
|
|
|
|
|
|||||
| Total increase in net assets |
25,271,143 | 27,845,252 | ||||||
|
|
|
|
|
|||||
| Net Assets | ||||||||
| Beginning of year |
– | – | ||||||
|
|
|
|
|
|||||
| End of period (includes undistributed net investment income of $54,471 and $0, respectively) |
$ | 25,271,143 | $ | 27,845,252 | ||||
|
|
|
|
|
|||||
| (1) | Fund commenced operations on October 30, 2015. |
See accompanying Notes to the Financial Statements.
43
Table of Contents
Babson Global Floating Rate Fund 2016 Annual Report
| CLASS A | ||||||||||||
| FOR THE YEAR ENDED JUNE 30, 2016 |
FOR THE YEAR ENDED JUNE 30, 2015 |
PERIOD FROM SEPTEMBER 16, 2013 THROUGH JUNE 30, 2014 (1) |
||||||||||
| Per Common Share Data | ||||||||||||
| Net asset value, beginning of year |
$ | 9.60 | $ | 10.20 | $ | 10.00 | ||||||
| Income from investment operations: |
||||||||||||
| Net investment income (2) |
0.44 | 0.44 | 0.30 | |||||||||
| Net realized and unrealized gain (loss) on investments |
(0.45 | ) | (0.35 | ) | 0.08 | |||||||
|
|
|
|
|
|
|
|||||||
| Total increase from investment operations |
(0.01 | ) | 0.09 | 0.38 | ||||||||
|
|
|
|
|
|
|
|||||||
| Less dividends and distributions: |
||||||||||||
| From net investment income |
(0.46 | ) | (0.68 | ) | (0.18 | ) | ||||||
| From net realized gain |
– | (0.01 | ) | – | ||||||||
|
|
|
|
|
|
|
|||||||
| Total dividends and distributions |
(0.46 | ) | (0.69 | ) | (0.18 | ) | ||||||
|
|
|
|
|
|
|
|||||||
| Redemption fees |
0.00 | 0.00 | (3) | 0.00 | ||||||||
|
|
|
|
|
|
|
|||||||
| Net asset value, at end of year |
$ | 9.13 | $ | 9.60 | $ | 10.20 | ||||||
|
|
|
|
|
|
|
|||||||
| Total investment return (4) |
(0.04 | )% | 0.95 | % | 3.81 | %(5) | ||||||
|
|
|
|
|
|
|
|||||||
| Supplemental Data and Ratios | ||||||||||||
| Net assets, end of year (000’s) |
$ | 13,980 | $ | 5,153 | $ | 12,464 | ||||||
| Ratio of total expenses (before reductions and reimbursements) to average net assets (6) |
1.72 | % | 1.74 | % | 2.27 | %(7) | ||||||
| Ratio of net expenses to average net assets |
1.05 | % | 1.05 | % | 1.05 | %(7) | ||||||
| Ratio of net investment income to average net assets |
4.74 | % | 4.44 | % | 3.76 | %(7) | ||||||
| Portfolio turnover rate |
62.99 | % | 63.17 | % | 49.51 | %(5) | ||||||
| (1) | Fund commenced operations on September 16, 2013. |
| (2) | Calculated using average shares outstanding. |
| (3) | Amount rounds to less than $.01 per share. |
| (4) | Total investment return calculation does not consider the effects of sales loads and assumes the reinvestment of dividends at actual prices pursuant to the Fund’s dividend reinvestment plan. |
| (5) | Not annualized. |
| (6) | The Adviser has agreed to waive and/or reimburse certain fees and/or expense so that, on an annualized basis, such expenses incurred will not exceed 1.05% as a percentage of average daily net assets. |
| (7) | Annualized for periods less than one full year. |
See accompanying Notes to the Financial Statements.
44
Table of Contents
Babson Global Floating Rate Fund 2016 Annual Report
FINANCIAL HIGHLIGHTS (CONTINUED)
| CLASS C | ||||||||||||
| FOR THE YEAR ENDED JUNE 30, 2016 |
FOR THE YEAR ENDED JUNE 30, 2015 |
PERIOD FROM SEPTEMBER 16, 2013 THROUGH JUNE 30, 2014 (1) |
||||||||||
| Per Common Share Data | ||||||||||||
| Net asset value, beginning of year |
$ | 9.57 | $ | 10.16 | $ | 10.00 | ||||||
| Income from investment operations: |
||||||||||||
| Net investment income (2) |
0.37 | 0.35 | 0.24 | |||||||||
| Net realized and unrealized gain (loss) on investments |
(0.45 | ) | (0.33 | ) | 0.07 | |||||||
|
|
|
|
|
|
|
|||||||
| Total increase from investment operations |
(0.08 | ) | 0.02 | 0.31 | ||||||||
|
|
|
|
|
|
|
|||||||
| Less dividends and distributions: |
||||||||||||
| From net investment income |
(0.39 | ) | (0.60 | ) | (0.15 | ) | ||||||
| From net realized gain |
– | (0.01 | ) | – | ||||||||
|
|
|
|
|
|
|
|||||||
| Total dividends and distributions |
(0.39 | ) | (0.61 | ) | (0.15 | ) | ||||||
|
|
|
|
|
|
|
|||||||
| Redemption fees |
0.00 | 0.00 | (3) | 0.00 | ||||||||
|
|
|
|
|
|
|
|||||||
| Net asset value, at end of year |
$ | 9.10 | $ | 9.57 | $ | 10.16 | ||||||
|
|
|
|
|
|
|
|||||||
| Total investment return (4) |
(0.81 | )% | 0.30 | % | 3.15 | %(5) | ||||||
|
|
|
|
|
|
|
|||||||
| Supplemental Data and Ratios | ||||||||||||
| Net assets, end of year (000’s) |
$ | 6,803 | $ | 5,461 | $ | 2,396 | ||||||
| Ratio of total expenses (before reductions and reimbursements) to average net assets (6) |
2.50 | % | 3.12 | % | 4.97 | %(7) | ||||||
| Ratio of net expenses to average net assets |
1.80 | % | 1.80 | % | 1.80 | %(7) | ||||||
| Ratio of net investment income to average net assets |
4.04 | % | 3.60 | % | 3.07 | %(7) | ||||||
| Portfolio turnover rate |
62.99 | % | 63.17 | % | 49.51 | %(5) | ||||||
| (1) | Fund commenced operations on September 16, 2013. |
| (2) | Calculated using average shares outstanding. |
| (3) | Amount rounds to less than $.01 per share. |
| (4) | Total investment return calculation does not consider the effects of sales loads and assumes the reinvestment of dividends at actual prices pursuant to the Fund’s dividend reinvestment plan. |
| (5) | Not annualized. |
| (6) | The Adviser has agreed to waive and/or reimburse certain fees and/or expense so that, on an annualized basis, such expenses incurred will not exceed 1.80% as a percentage of average daily net assets. |
| (7) | Annualized for periods less than one full year. |
See accompanying Notes to the Financial Statements.
45
Table of Contents
Babson Global Floating Rate Fund 2016 Annual Report
FINANCIAL HIGHLIGHTS (CONTINUED)
| CLASS I | ||||||||||||
| FOR THE YEAR ENDED JUNE 30, 2016 |
FOR THE YEAR ENDED JUNE 30, 2015 |
PERIOD FROM SEPTEMBER 16, 2013 THROUGH JUNE 30, 2014 (1) |
||||||||||
| Per Common Share Data | ||||||||||||
| Net asset value, beginning of year |
$ | 9.62 | $ | 10.21 | $ | 10.00 | ||||||
| Income from investment operations: |
||||||||||||
| Net investment income (2) |
0.47 | 0.46 | 0.30 | |||||||||
| Net realized and unrealized gain (loss) on investments |
(0.45 | ) | (0.34 | ) | 0.10 | |||||||
|
|
|
|
|
|
|
|||||||
| Total increase from investment operations |
0.02 | 0.12 | 0.40 | |||||||||
|
|
|
|
|
|
|
|||||||
| Less dividends and distributions: |
||||||||||||
| From net investment income |
(0.49 | ) | (0.70 | ) | (0.19 | ) | ||||||
| From net realized gain |
– | (0.01 | ) | – | ||||||||
|
|
|
|
|
|
|
|||||||
| Total dividends and distributions |
(0.49 | ) | (0.71 | ) | (0.19 | ) | ||||||
|
|
|
|
|
|
|
|||||||
| Redemption fees |
0.00 | 0.00 | (3) | 0.00 | ||||||||
|
|
|
|
|
|
|
|||||||
| Net asset value, at end of year |
$ | 9.15 | $ | 9.62 | $ | 10.21 | ||||||
|
|
|
|
|
|
|
|||||||
| Total investment return (4) |
0.25 | % | 1.34 | % | 4.04 | %(5) | ||||||
|
|
|
|
|
|
|
|||||||
| Supplemental Data and Ratios | ||||||||||||
| Net assets, end of year (000’s) |
$ | 19,903 | $ | 25,885 | $ | 32,772 | ||||||
| Ratio of total expenses (before reductions and reimbursements) to average net assets (6) |
1.29 | % | 1.31 | % | 1.52 | %(7) | ||||||
| Ratio of net expenses to average net assets |
0.75 | % | 0.75 | % | 0.75 | %(7) | ||||||
| Ratio of net investment income to average net assets |
5.07 | % | 4.69 | % | 3.72 | %(7) | ||||||
| Portfolio turnover rate |
62.99 | % | 63.17 | % | 49.51 | %(5) | ||||||
| (1) | Fund commenced operations on September 16, 2013. |
| (2) | Calculated using average shares outstanding. |
| (3) | Amount rounds to less than $.01 per share. |
| (4) | Total investment return calculation assumes the reinvestment of dividends at actual prices pursuant to the Fund’s dividend reinvestment plan. |
| (5) | Not annualized. |
| (6) | The Adviser has agreed to waive and/or reimburse certain fees and/or expense so that, on an annualized basis, such expenses incurred will not exceed .75% as a percentage of average daily net assets. |
| (7) | Annualized for periods less than one full year. |
See accompanying Notes to the Financial Statements.
46
Table of Contents
Babson Global Floating Rate Fund 2016 Annual Report
FINANCIAL HIGHLIGHTS (CONTINUED)
| CLASS Y | ||||||||||||
| FOR THE YEAR ENDED JUNE 30, 2016 |
FOR THE YEAR ENDED JUNE 30, 2015 |
PERIOD FROM SEPTEMBER 16, 2013 THROUGH JUNE 30, 2014 (1) |
||||||||||
| Per Common Share Data | ||||||||||||
| Net asset value, beginning of year |
$ | 9.62 | $ | 10.21 | $ | 10.00 | ||||||
| Income from investment operations: |
||||||||||||
| Net investment income (2) |
0.47 | 0.45 | 0.30 | |||||||||
| Net realized and unrealized gain (loss) on investments |
(0.45 | ) | (0.33 | ) | 0.10 | |||||||
|
|
|
|
|
|
|
|||||||
| Total increase from investment operations |
0.02 | 0.12 | 0.40 | |||||||||
|
|
|
|
|
|
|
|||||||
| Less dividends and distributions: |
||||||||||||
| From net investment income |
(0.49 | ) | (0.70 | ) | (0.19 | ) | ||||||
| From net realized gain |
– | (0.01 | ) | – | ||||||||
|
|
|
|
|
|
|
|||||||
| Total dividends and distributions |
(0.49 | ) | (0.71 | ) | (0.19 | ) | ||||||
|
|
|
|
|
|
|
|||||||
| Redemption fees |
0.00 | 0.00 | (3) | 0.00 | ||||||||
|
|
|
|
|
|
|
|||||||
| Net asset value, at end of year |
$ | 9.15 | $ | 9.62 | $ | 10.21 | ||||||
|
|
|
|
|
|
|
|||||||
| Total investment return (4) |
0.22 | % | 1.28 | % | 4.04 | %(5) | ||||||
|
|
|
|
|
|
|
|||||||
| Supplemental Data and Ratios | ||||||||||||
| Net assets, end of year (000’s) |
$ | 125,957 | $ | 129,659 | $ | 66,999 | ||||||
| Ratio of total expenses (before reductions and reimbursements) to average net assets (6) |
1.27 | % | 1.25 | % | 1.53 | %(7) | ||||||
| Ratio of net expenses to average net assets |
0.75 | % | 0.75 | % | 0.75 | %(7) | ||||||
| Ratio of net investment income to average net assets |
5.08 | % | 4.58 | % | 3.80 | %(7) | ||||||
| Portfolio turnover rate |
62.99 | % | 63.17 | % | 49.51 | %(5) | ||||||
| (1) | Fund commenced operations on September 16, 2013. |
| (2) | Calculated using average shares outstanding. |
| (3) | Amount rounds to less than $.01 per share. |
| (4) | Total investment return calculation assumes the reinvestment of dividends at actual prices pursuant to the Fund’s dividend reinvestment plan. |
| (5) | Not annualized. |
| (6) | The Adviser has agreed to waive and/or reimburse certain fees and/or expense so that, on an annualized basis, such expenses incurred will not exceed .75% as a percentage of average daily net assets. |
| (7) | Annualized for periods less than one full year. |
See accompanying Notes to the Financial Statements.
47
Table of Contents
Babson Global Credit Income Opportunities Fund 2016 Annual Report
FINANCIAL HIGHLIGHTS (CONTINUED)
| CLASS A | ||||||||||||
| FOR THE YEAR ENDED JUNE 30, 2016 |
FOR THE YEAR ENDED JUNE 30, 2015 |
PERIOD FROM SEPTEMBER 16, 2013 THROUGH JUNE 30, 2014 (1) |
||||||||||
| Per Common Share Data | ||||||||||||
| Net asset value, beginning of year |
$ | 9.51 | $ | 10.45 | $ | 10.00 | ||||||
| Income from investment operations: |
||||||||||||
| Net investment income (2) |
0.56 | 0.54 | 0.40 | |||||||||
| Net realized and unrealized gain (loss) on investments |
(0.66 | ) | (0.57 | ) | 0.33 | |||||||
|
|
|
|
|
|
|
|||||||
| Total increase (decrease) from investment operations |
(0.10 | ) | (0.03 | ) | 0.73 | |||||||
|
|
|
|
|
|
|
|||||||
| Less dividends and distributions: |
||||||||||||
| From net investment income |
(0.61 | ) | (0.78 | ) | (0.28 | ) | ||||||
| From net realized gain |
– | (0.13 | ) | – | ||||||||
|
|
|
|
|
|
|
|||||||
| Total dividends and distributions |
(0.61 | ) | (0.91 | ) | (0.28 | ) | ||||||
|
|
|
|
|
|
|
|||||||
| Redemption fees |
0.00 | 0.00 | (3) | 0.00 | ||||||||
|
|
|
|
|
|
|
|||||||
| Net asset value, at end of year |
$ | 8.80 | $ | 9.51 | $ | 10.45 | ||||||
|
|
|
|
|
|
|
|||||||
| Total investment return (4) |
(0.84 | )% | (0.11 | )% | 7.30 | %(5) | ||||||
|
|
|
|
|
|
|
|||||||
| Supplemental Data and Ratios | ||||||||||||
| Net assets, end of year (000’s) |
$ | 12,340 | $ | 12,718 | $ | 2,591 | ||||||
| Ratio of total expenses (before reductions and reimbursements) to average net assets (6) |
1.90 | % | 1.98 | % | 3.95 | %(7) | ||||||
| Ratio of net expenses to average net assets |
1.20 | % | 1.20 | % | 1.20 | %(7) | ||||||
| Ratio of net investment income to average net assets |
6.28 | % | 5.46 | % | 4.88 | %(7) | ||||||
| Portfolio turnover rate |
58.08 | % | 84.65 | % | 99.72 | %(5) | ||||||
| (1) | Fund commenced operations on September 16, 2013. |
| (2) | Calculated using average shares outstanding. |
| (3) | Amount rounds to less than $.01 per share. |
| (4) | Total investment return calculation does not consider the effects of sales loads and assumes the reinvestment of dividends at actual prices pursuant to the Fund’s dividend reinvestment plan. |
| (5) | Not annualized. |
| (6) | The Adviser has agreed to waive and/or reimburse certain fees and/or expense so that, on an annualized basis, such expenses incurred will not exceed 1.20% as a percentage of average daily net assets. |
| (7) | Annualized for periods less than one full year. |
See accompanying Notes to the Financial Statements.
48
Table of Contents
Babson Global Credit Income Opportunities Fund 2016 Annual Report
FINANCIAL HIGHLIGHTS (CONTINUED)
| CLASS C | ||||||||||||
| FOR THE YEAR ENDED JUNE 30, 2016 |
FOR THE YEAR ENDED JUNE 30, 2015 |
PERIOD FROM SEPTEMBER 16, 2013 THROUGH JUNE 30, 2014 (1) |
||||||||||
| Per Common Share Data | ||||||||||||
| Net asset value, beginning of year |
$ | 9.50 | $ | 10.45 | $ | 10.00 | ||||||
| Income from investment operations: |
||||||||||||
| Net investment income (2) |
0.49 | 0.47 | 0.35 | |||||||||
| Net realized and unrealized gain (loss) on investments |
(0.65 | ) | (0.58 | ) | 0.32 | |||||||
|
|
|
|
|
|
|
|||||||
| Total increase (decrease) from investment operations |
(0.16 | ) | (0.11 | ) | 0.67 | |||||||
|
|
|
|
|
|
|
|||||||
| Less dividends and distributions: |
||||||||||||
| From net investment income |
(0.55 | ) | (0.71 | ) | (0.22 | ) | ||||||
| From net realized gain |
– | (0.13 | ) | – | ||||||||
|
|
|
|
|
|
|
|||||||
| Total dividends and distributions |
(0.55 | ) | (0.84 | ) | (0.22 | ) | ||||||
|
|
|
|
|
|
|
|||||||
| Redemption fees |
0.00 | 0.00 | (3) | 0.00 | ||||||||
|
|
|
|
|
|
|
|||||||
| Net asset value, at end of year |
$ | 8.79 | $ | 9.50 | $ | 10.45 | ||||||
|
|
|
|
|
|
|
|||||||
| Total investment return (4) |
(1.59 | )% | (0.93 | )% | 6.75 | %(5) | ||||||
|
|
|
|
|
|
|
|||||||
| Supplemental Data and Ratios | ||||||||||||
| Net assets, end of year (000’s) |
$ | 3,578 | $ | 3,579 | $ | 944 | ||||||
| Ratio of total expenses (before reductions and reimbursements) to average net assets (6) |
2.91 | % | 4.09 | % | 10.50 | %(7) | ||||||
| Ratio of net expenses to average net assets |
1.95 | % | 1.95 | % | 1.95 | %(7) | ||||||
| Ratio of net investment income to average net assets |
5.50 | % | 4.79 | % | 4.39 | %(7) | ||||||
| Portfolio turnover rate |
58.08 | % | 84.65 | % | 99.72 | %(5) | ||||||
| (1) | Fund commenced operations on September 16, 2013. |
| (2) | Calculated using average shares outstanding. |
| (3) | Amount rounds to less than $.01 per share. |
| (4) | Total investment return calculation does not consider the effects of sales loads and assumes the reinvestment of dividends at actual prices pursuant to the Fund’s dividend reinvestment plan. |
| (5) | Not annualized. |
| (6) | The Adviser has agreed to waive and/or reimburse certain fees and/or expense so that, on an annualized basis, such expenses incurred will not exceed 1.95% as a percentage of average daily net assets. |
| (7) | Annualized for periods less than one full year. |
See accompanying Notes to the Financial Statements.
49
Table of Contents
Babson Global Credit Income Opportunities Fund 2016 Annual Report
FINANCIAL HIGHLIGHTS (CONTINUED)
| CLASS I | ||||||||||||
| FOR THE YEAR ENDED JUNE 30, 2016 |
FOR THE YEAR ENDED JUNE 30, 2015 |
PERIOD FROM SEPTEMBER 16, 2013 THROUGH JUNE 30, 2014 (1) |
||||||||||
| Per Common Share Data | ||||||||||||
| Net asset value, beginning of year |
$ | 9.51 | $ | 10.46 | $ | 10.00 | ||||||
| Income from investment operations: |
||||||||||||
| Net investment income (2) |
0.58 | 0.56 | 0.41 | |||||||||
| Net realized and unrealized gain (loss) on investments |
(0.65 | ) | (0.58 | ) | 0.35 | |||||||
|
|
|
|
|
|
|
|||||||
| Total increase (decrease) from investment operations |
(0.07 | ) | (0.02 | ) | 0.76 | |||||||
|
|
|
|
|
|
|
|||||||
| Less dividends and distributions: |
||||||||||||
| From net investment income |
(0.64 | ) | (0.80 | ) | (0.30 | ) | ||||||
| From net realized gain |
– | (0.13 | ) | – | ||||||||
|
|
|
|
|
|
|
|||||||
| Total dividends and distributions |
(0.64 | ) | (0.93 | ) | (0.30 | ) | ||||||
|
|
|
|
|
|
|
|||||||
| Redemption fees |
0.00 | 0.00 | (3) | 0.00 | ||||||||
|
|
|
|
|
|
|
|||||||
| Net asset value, at end of year |
$ | 8.80 | $ | 9.51 | $ | 10.46 | ||||||
|
|
|
|
|
|
|
|||||||
| Total investment return (4) |
(0.61 | )% | 0.05 | % | 7.59 | %(5) | ||||||
|
|
|
|
|
|
|
|||||||
| Supplemental Data and Ratios | ||||||||||||
| Net assets, end of year (000’s) |
$ | 24,689 | $ | 26,428 | $ | 26,406 | ||||||
| Ratio of total expenses (before reductions and reimbursements) to average net assets (6) |
1.54 | % | 1.58 | % | 1.83 | %(7) | ||||||
| Ratio of net expenses to average net assets |
0.95 | % | 0.95 | % | 0.95 | %(7) | ||||||
| Ratio of net investment income to average net assets |
6.54 | % | 5.69 | % | 5.02 | %(7) | ||||||
| Portfolio turnover rate |
58.08 | % | 84.65 | % | 99.72 | %(5) | ||||||
| (1) | Fund commenced operations on September 16, 2013. |
| (2) | Calculated using average shares outstanding. |
| (3) | Amount rounds to less than $.01 per share. |
| (4) | Total investment return calculation assumes the reinvestment of dividends at actual prices pursuant to the Fund’s dividend reinvestment plan. |
| (5) | Not annualized. |
| (6) | The Adviser has agreed to waive and/or reimburse certain fees and/or expense so that, on an annualized basis, such expenses incurred will not exceed .95% as a percentage of average daily net assets. |
| (7) | Annualized for periods less than one full year. |
See accompanying Notes to the Financial Statements.
50
Table of Contents
Babson Global Credit Income Opportunities Fund 2016 Annual Report
FINANCIAL HIGHLIGHTS (CONTINUED)
| CLASS Y | ||||||||||||
| FOR THE YEAR ENDED JUNE 30, 2016 |
FOR THE YEAR ENDED JUNE 30, 2015 |
PERIOD FROM SEPTEMBER 16, 2013 THROUGH JUNE 30, 2014 (1) |
||||||||||
| Per Common Share Data | ||||||||||||
| Net asset value, beginning of year |
$ | 9.51 | $ | 10.46 | $ | 10.00 | ||||||
| Income from investment operations: |
||||||||||||
| Net investment income (2) |
0.59 | 0.56 | 0.41 | |||||||||
| Net realized and unrealized gain (loss) on investments |
(0.66 | ) | (0.58 | ) | 0.35 | |||||||
|
|
|
|
|
|
|
|||||||
| Total increase (decrease) from investment operations |
(0.07 | ) | (0.02 | ) | 0.76 | |||||||
|
|
|
|
|
|
|
|||||||
| Less dividends and distributions: |
||||||||||||
| From net investment income |
(0.64 | ) | (0.80 | ) | (0.30 | ) | ||||||
| From net realized gain |
– | (0.13 | ) | – | ||||||||
|
|
|
|
|
|
|
|||||||
| Total dividends and distributions |
(0.64 | ) | (0.93 | ) | (0.30 | ) | ||||||
|
|
|
|
|
|
|
|||||||
| Redemption fees |
0.00 | 0.00 | (3) | 0.00 | ||||||||
|
|
|
|
|
|
|
|||||||
| Net asset value, at end of year |
$ | 8.80 | $ | 9.51 | $ | 10.46 | ||||||
|
|
|
|
|
|
|
|||||||
| Total investment return (4) |
(0.61 | )% | 0.05 | % | 7.59 | %(5) | ||||||
|
|
|
|
|
|
|
|||||||
| Supplemental Data and Ratios | ||||||||||||
| Net assets, end of year (000’s) |
$ | 58,312 | $ | 39,006 | $ | 33,885 | ||||||
| Ratio of total expenses (before reductions and reimbursements) to average net assets (6) |
1.55 | % | 1.58 | % | 1.84 | %(7) | ||||||
| Ratio of net expenses to average net assets |
0.95 | % | 0.95 | % | 0.95 | %(7) | ||||||
| Ratio of net investment income to average net assets |
6.56 | % | 5.67 | % | 5.04 | %(7) | ||||||
| Portfolio turnover rate |
58.08 | % | 84.65 | % | 99.72 | %(5) | ||||||
| (1) | Fund commenced operations on September 16, 2013. |
| (2) | Calculated using average shares outstanding. |
| (3) | Amount rounds to less than $.01 per share. |
| (4) | Total investment return calculation assumes the reinvestment of dividends at actual prices pursuant to the Fund’s dividend reinvestment plan. |
| (5) | Not annualized. |
| (6) | The Adviser has agreed to waive and/or reimburse certain fees and/or expense so that, on an annualized basis, such expenses incurred will not exceed .95% as a percentage of average daily net assets. |
| (7) | Annualized for periods less than one full year. |
See accompanying Notes to the Financial Statements.
51
Table of Contents
Babson Active Short Duration Bond Fund 2016 Annual Report
FINANCIAL HIGHLIGHTS (CONTINUED)
| CLASS A | ||||
| PERIOD FROM JULY 8, 2015 THROUGH JUNE 30, 2016 (1) |
||||
| Per Common Share Data | ||||
| Net asset value, beginning of year |
$ | 10.00 | ||
| Income from investment operations: |
||||
| Net investment income (2) |
0.15 | |||
| Net realized and unrealized loss on investments |
(0.03 | )(3) | ||
|
|
|
|||
| Total increase from investment operations |
0.12 | |||
|
|
|
|||
| Less dividends and distributions: |
||||
| From net investment income |
(0.14 | ) | ||
|
|
|
|||
| Net asset value, at end of year |
$ | 9.98 | ||
|
|
|
|||
| Total investment return (4) |
1.17 | %(5) | ||
|
|
|
|||
| Supplemental Data and Ratios | ||||
| Net assets, end of year (000’s) |
$ | 39,992 | ||
| Ratio of total expenses (before reductions and reimbursements) to average net assets (6) |
1.18 | %(7) | ||
| Ratio of net expenses to average net assets |
0.65 | %(7) | ||
| Ratio of net investment income to average net assets |
1.51 | %(7) | ||
| Portfolio turnover rate |
218.67 | %(5) | ||
| (1) | Fund commenced operations on July 8, 2015. |
| (2) | Calculated using average shares outstanding. |
| (3) | The per share amount varies from the net realized and unrealized gain/loss for the period because of the timing of sales of fund shares and the per share amount of realized and unrealized gains and losses at such time. |
| (4) | Total investment return calculation assumes the reinvestment of dividends at actual prices pursuant to the Fund’s dividend reinvestment plan. |
| (5) | Not annualized. |
| (6) | The Adviser has agreed to waive and/or reimburse certain fees and/or expense so that, on an annualized basis, such expenses incurred will not exceed .65% as a percentage of average daily net assets. |
| (7) | Annualized for periods less than one full year. |
See accompanying Notes to the Financial Statements.
52
Table of Contents
Babson Active Short Duration Bond Fund 2016 Annual Report
FINANCIAL HIGHLIGHTS (CONTINUED)
| CLASS C | ||||
| PERIOD FROM JULY 8, 2015 THROUGH JUNE 30, 2016 (1) |
||||
| Per Common Share Data | ||||
| Net asset value, beginning of year |
$ | 10.00 | ||
| Income from investment operations: |
||||
| Net investment income (2) |
0.07 | |||
| Net realized and unrealized loss on investments |
(0.03 | )(3) | ||
|
|
|
|||
| Total increase from investment operations |
0.04 | |||
|
|
|
|||
| Less dividends and distributions: |
||||
| From net investment income |
(0.07 | ) | ||
|
|
|
|||
| Net asset value, at end of year |
$ | 9.97 | ||
|
|
|
|||
| Total investment return (4) |
0.39 | %(5),(8) | ||
|
|
|
|||
| Supplemental Data and Ratios | ||||
| Net assets, end of year (000’s) |
$ | 257 | ||
| Ratio of total expenses (before reductions and reimbursements) to average net assets (6) |
5.44 | %(7),(8) | ||
| Ratio of net expenses to average net assets |
1.40 | %(7),(8) | ||
| Ratio of net investment income to average net assets |
0.71 | %(7),(8) | ||
| Portfolio turnover rate |
218.67 | %(5) | ||
| (1) | Fund commenced operations on July 8, 2015. |
| (2) | Calculated using average shares outstanding. |
| (3) | The per share amount varies from the net realized and unrealized gain/loss for the period because of the timing of sales of fund shares and the per share amount of realized and unrealized gains and losses at such time. |
| (4) | Total investment return calculation assumes the reinvestment of dividends at actual prices pursuant to the Fund’s dividend reinvestment plan. |
| (5) | Not annualized. |
| (6) | The Adviser has agreed to waive and/or reimburse certain fees and/or expense so that, on an annualized basis, such expenses incurred will not exceed 0.90% as a percentage of average daily net assets. |
| (7) | Annualized for periods less than one full year. |
| (8) | Expenses shown reflect an overaccrual of 12b-1 fees for the period of $1,478 or 0.50% of average net assets over the period. Subsequent to the period, the Fund was reimbursed for the overaccrued amount. |
See accompanying Notes to the Financial Statements.
53
Table of Contents
Babson Active Short Duration Bond Fund 2016 Annual Report
FINANCIAL HIGHLIGHTS (CONTINUED)
| CLASS I | ||||
| PERIOD FROM JUNE 30, 2016 (1) |
||||
| Per Common Share Data | ||||
| Net asset value, beginning of year |
$ | 10.00 | ||
| Income from investment operations: |
||||
| Net investment income (2) |
0.16 | |||
| Net realized and unrealized loss on investments |
(0.03 | )(3) | ||
|
|
|
|||
| Total increase from investment operations |
0.13 | |||
|
|
|
|||
| Less dividends and distributions: |
||||
| From net investment income |
(0.16 | ) | ||
|
|
|
|||
| Net asset value, at end of year |
$ | 9.97 | ||
|
|
|
|||
| Total investment return (4) |
1.35 | %(5) | ||
|
|
|
|||
| Supplemental Data and Ratios | ||||
| Net assets, end of year (000’s) |
$ | 5,971 | ||
| Ratio of total expenses (before reductions and reimbursements) to average net assets (7) |
0.96 | %(6) | ||
| Ratio of net expenses to average net assets |
0.44 | %(6) | ||
| Ratio of net investment income to average net assets |
1.67 | %(6) | ||
| Portfolio turnover rate |
218.67 | %(5) | ||
| (1) | Fund commenced operations on July 8, 2015. |
| (2) | Calculated using average shares outstanding. |
| (3) | The per share amount varies from the net realized and unrealized gain/loss for the period because of the timing of sales of fund shares and the per share amount of realized and unrealized gains and losses at such time. |
| (4) | Total investment return calculation assumes the reinvestment of dividends at actual prices pursuant to the Fund’s dividend reinvestment plan. |
| (5) | Not annualized. |
| (6) | Annualized for periods less than one full year. |
| (7) | The Adviser has agreed to waive and/or reimburse certain fees and/or expense so that, on an annualized basis, such expenses incurred will not exceed 0.40% as a percentage of average daily net assets. |
See accompanying Notes to the Financial Statements.
54
Table of Contents
Babson Active Short Duration Bond Fund 2016 Annual Report
FINANCIAL HIGHLIGHTS (CONTINUED)
| CLASS Y | ||||
| PERIOD FROM JUNE 30, 2016 (1) |
||||
| Per Common Share Data | ||||
| Net asset value, beginning of year |
$ | 10.00 | ||
| Income from investment operations: |
||||
| Net investment income (2) |
0.17 | |||
| Net realized and unrealized loss on investments |
(0.04 | )(3) | ||
|
|
|
|||
| Total increase from investment operations |
0.13 | |||
|
|
|
|||
| Less dividends and distributions: |
||||
| From net investment income |
(0.16 | ) | ||
|
|
|
|||
| Net asset value, at end of year |
$ | 9.97 | ||
|
|
|
|||
| Total investment return (4) |
1.36 | %(5) | ||
|
|
|
|||
| Supplemental Data and Ratios | ||||
| Net assets, end of year (000’s) |
$ | 109,645 | ||
| Ratio of total expenses (before reductions and reimbursements) to average net assets (6) |
0.87 | %(7) | ||
| Ratio of net expenses to average net assets |
0.41 | %(7) | ||
| Ratio of net investment income to average net assets |
1.73 | %(7) | ||
| Portfolio turnover rate |
218.67 | %(5) | ||
| (1) | Fund commenced operations on July 8, 2015. |
| (2) | Calculated using average shares outstanding. |
| (3) | The per share amount varies from the net realized and unrealized gain/loss for the period because of the timing of sales of fund shares and the per share amount of realized and unrealized gains and losses at such time. |
| (4) | Total investment return calculation assumes the reinvestment of dividends at actual prices pursuant to the Fund’s dividend reinvestment plan. |
| (5) | Not annualized. |
| (6) | The Adviser has agreed to waive and/or reimburse certain fees and/or expense so that, on an annualized basis, such expenses incurred will not exceed 0.40% as a percentage of average daily net assets. |
| (7) | Annualized for periods less than one full year. |
See accompanying Notes to the Financial Statements.
55
Table of Contents
Babson Total Return Bond Fund 2016 Annual Report
FINANCIAL HIGHLIGHTS (CONTINUED)
| CLASS A | ||||
| PERIOD FROM JULY 8, 2015 THROUGH JUNE 30, 2016 (1) |
||||
| Per Common Share Data | ||||
| Net asset value, beginning of year |
$ | 10.00 | ||
| Income from investment operations: |
||||
| Net investment income (2) |
0.25 | |||
| Net realized and unrealized gain on investments |
0.20 | |||
|
|
|
|||
| Total increase from investment operations |
0.45 | |||
|
|
|
|||
| Less dividends and distributions: |
||||
| From net investment income |
(0.25 | ) | ||
| From net realized gain |
(0.02 | ) | ||
|
|
|
|||
| Total dividends and distributions |
(0.27 | ) | ||
|
|
|
|||
| Net asset value, at end of year |
$ | 10.18 | ||
|
|
|
|||
| Total investment return (3) |
4.63 | %(4) | ||
|
|
|
|||
| Supplemental Data and Ratios | ||||
| Net assets, end of year (000’s) |
$ | 211 | ||
| Ratio of total expenses (before reductions and reimbursements) to average net assets (5) |
5.60 | %(6) | ||
| Ratio of net expenses to average net assets |
0.80 | %(6) | ||
| Ratio of net investment income to average net assets |
2.52 | %(6) | ||
| Portfolio turnover rate |
434.37 | %(4) | ||
| (1) | Fund commenced operations on July 8, 2015. |
| (2) | Calculated using average shares outstanding. |
| (3) | Total investment return calculation does not consider the effects of sales loads and assumes the reinvestment of dividends at actual prices pursuant to the Fund’s dividend reinvestment plan. |
| (4) | Not annualized. |
| (5) | The Adviser has agreed to waive and/or reimburse certain fees and/or expense so that, on an annualized basis, such expenses incurred will not exceed .80% as a percentage of average daily net assets. |
| (6) | Annualized for periods less than one full year. |
See accompanying Notes to the Financial Statements.
56
Table of Contents
Babson Total Return Bond Fund 2016 Annual Report
FINANCIAL HIGHLIGHTS (CONTINUED)
| CLASS C | ||||
| PERIOD FROM JULY 8, 2015 THROUGH JUNE 30, 2016 (1) |
||||
| Per Common Share Data | ||||
| Net asset value, beginning of year |
$ | 10.00 | ||
| Income from investment operations: |
||||
| Net investment income (2) |
0.17 | |||
| Net realized and unrealized gain on investments |
0.21 | |||
|
|
|
|||
| Total increase from investment operations |
0.38 | |||
|
|
|
|||
| Less dividends and distributions: |
||||
| From net investment income |
(0.18 | ) | ||
| From net realized gain |
(0.02 | ) | ||
|
|
|
|||
| Total dividends and distributions |
(0.20 | ) | ||
|
|
|
|||
| Net asset value, at end of year |
$ | 10.18 | ||
|
|
|
|||
| Total investment return (3) |
3.87 | %(4) | ||
|
|
|
|||
| Supplemental Data and Ratios | ||||
| Net assets, end of year (000’s) |
$ | 204 | ||
| Ratio of total expenses (before reductions and reimbursements) to average net assets (5) |
6.38 | %(6) | ||
| Ratio of net expenses to average net assets |
1.55 | %(6) | ||
| Ratio of net investment income to average net assets |
1.77 | %(6) | ||
| Portfolio turnover rate |
434.37 | %(4) | ||
| (1) | Fund commenced operations on July 8, 2015. |
| (2) | Calculated using average shares outstanding. |
| (3) | Total investment return calculation does not consider the effects of sales loads and assumes the reinvestment of dividends at actual prices pursuant to the Fund’s dividend reinvestment plan. |
| (4) | Not annualized. |
| (5) | The Adviser has agreed to waive and/or reimburse certain fees and/or expense so that, on an annualized basis, such expenses incurred will not exceed 1.55% as a percentage of average daily net assets. |
| (6) | Annualized for periods less than one full year. |
See accompanying Notes to the Financial Statements.
57
Table of Contents
Babson Total Return Bond Fund 2016 Annual Report
FINANCIAL HIGHLIGHTS (CONTINUED)
| CLASS I | ||||
| PERIOD FROM JULY 8, 2015 THROUGH JUNE 30, 2016 (1) |
||||
| Per Common Share Data | ||||
| Net asset value, beginning of year |
$ | 10.00 | ||
| Income from investment operations: |
||||
| Net investment income (2) |
0.27 | |||
| Net realized and unrealized gain on investments |
0.20 | |||
|
|
|
|||
| Total increase from investment operations |
0.47 | |||
|
|
|
|||
| Less dividends and distributions: |
||||
| From net investment income |
(0.27 | ) | ||
| From net realized gain |
(0.02 | ) | ||
|
|
|
|||
| Total dividends and distributions |
(0.29 | ) | ||
|
|
|
|||
| Net asset value, at end of year |
$ | 10.18 | ||
|
|
|
|||
| Total investment return (3) |
4.89 | %(4) | ||
|
|
|
|||
| Supplemental Data and Ratios | ||||
| Net assets, end of year (000’s) |
$ | 12,582 | ||
| Ratio of total expenses (before reductions and reimbursements) to average net assets (5) |
1.37 | %(6) | ||
| Ratio of net expenses to average net assets |
0.55 | %(6) | ||
| Ratio of net investment income to average net assets |
2.77 | %(6) | ||
| Portfolio turnover rate |
434.37 | %(4) | ||
| (1) | Fund commenced operations on July 8, 2015. |
| (2) | Calculated using average shares outstanding. |
| (3) | Total investment return calculation assumes the reinvestment of dividends at actual prices pursuant to the Fund’s dividend reinvestment plan. |
| (4) | Not annualized. |
| (5) | The Adviser has agreed to waive and/or reimburse certain fees and/or expense so that, on an annualized basis, such expenses incurred will not exceed .55% as a percentage of average daily net assets. |
| (6) | Annualized for periods less than one full year. |
See accompanying Notes to the Financial Statements.
58
Table of Contents
Babson Total Return Bond Fund 2016 Annual Report
FINANCIAL HIGHLIGHTS (CONTINUED)
| CLASS Y | ||||
| PERIOD FROM JULY 8, 2015 THROUGH JUNE 30, 2016 (1) |
||||
| Per Common Share Data | ||||
| Net asset value, beginning of year |
$ | 10.00 | ||
| Income from investment operations: |
||||
| Net investment income (2) |
0.27 | |||
| Net realized and unrealized gain on investments |
0.20 | |||
|
|
|
|||
| Total increase from investment operations |
0.47 | |||
|
|
|
|||
| Less dividends and distributions: |
||||
| From net investment income |
(0.27 | ) | ||
| From net realized gain |
(0.02 | ) | ||
|
|
|
|||
| Total dividends and distributions |
(0.29 | ) | ||
|
|
|
|||
| Net asset value, at end of year |
$ | 10.18 | ||
|
|
|
|||
| Total investment return (3) |
4.89 | %(4) | ||
|
|
|
|||
| Supplemental Data and Ratios | ||||
| Net assets, end of year (000’s) |
$ | 13,011 | ||
| Ratio of total expenses (before reductions and reimbursements) to average net assets (5) |
1.36 | %(6) | ||
| Ratio of net expenses to average net assets |
0.55 | %(6) | ||
| Ratio of net investment income to average net assets |
2.77 | %(6) | ||
| Portfolio turnover rate |
434.37 | %(4) | ||
| (1) | Fund commenced operations on July 8, 2015. |
| (2) | Calculated using average shares outstanding. |
| (3) | Total investment return calculation assumes the reinvestment of dividends at actual prices pursuant to the Fund’s dividend reinvestment plan. |
| (4) | Not annualized. |
| (5) | The Adviser has agreed to waive and/or reimburse certain fees and/or expense so that, on an annualized basis, such expenses incurred will not exceed .55% as a percentage of average daily net assets. |
| (6) | Annualized for periods less than one full year. |
See accompanying Notes to the Financial Statements.
59
Table of Contents
Babson Emerging Markets Debt Blended Total Return Fund 2016 Annual Report
FINANCIAL HIGHLIGHTS (CONTINUED)
| CLASS A | ||||
| PERIOD FROM OCTOBER 21, 2015 THROUGH JUNE 30, 2016 (1) |
||||
| Per Common Share Data | ||||
| Net asset value, beginning of year |
$ | 10.00 | ||
| Income from investment operations: |
||||
| Net investment income (2) |
0.43 | |||
| Net realized and unrealized loss on investments |
(0.19 | ) | ||
|
|
|
|||
| Total increase from investment operations |
0.24 | |||
|
|
|
|||
| Less dividends and distributions: |
||||
| From net investment income |
(0.34 | ) | ||
| From net realized gain |
(0.00 | )(3) | ||
|
|
|
|||
| Total dividends and distributions |
(0.34 | ) | ||
|
|
|
|||
| Net asset value, at end of year |
$ | 9.90 | ||
|
|
|
|||
| Total investment return (4) |
2.62 | %(5) | ||
|
|
|
|||
| Supplemental Data and Ratios | ||||
| Net assets, end of year (000’s) |
$ | 198 | ||
| Ratio of total expenses (before reductions and reimbursements) to average net assets (6) |
6.82 | %(7) | ||
| Ratio of net expenses to average net assets |
1.16 | %(7) | ||
| Ratio of net investment income to average net assets |
6.52 | %(7) | ||
| Portfolio turnover rate |
83.26 | %(5) | ||
| (1) | Fund commenced operations on October 21, 2015. |
| (2) | Calculated using average shares outstanding. |
| (3) | Amount rounds to less than $.01 per share. |
| (4) | Total investment return calculation does not consider the effects of sales loads and assumes the reinvestment of dividends at actual prices pursuant to the Fund’s dividend reinvestment plan. |
| (5) | Not annualized. |
| (6) | The Adviser has agreed to waive and/or reimburse certain fees and/or expense so that, on an annualized basis, such expenses incurred will not exceed 1.20% as a percentage of average daily net assets. |
| (7) | Annualized for periods less than one full year. |
See accompanying Notes to the Financial Statements.
60
Table of Contents
Babson Emerging Markets Debt Blended Total Return Fund 2016 Annual Report
FINANCIAL HIGHLIGHTS (CONTINUED)
| CLASS C | ||||
| PERIOD FROM OCTOBER 21, 2015 THROUGH JUNE 30, 2016 (1) |
||||
| Per Common Share Data | ||||
| Net asset value, beginning of year |
$ | 10.00 | ||
| Income from investment operations: |
| |||
| Net investment income (2) |
0.38 | |||
| Net realized and unrealized loss on investments |
(0.19 | ) | ||
|
|
|
|||
| Total increase from investment operations |
0.19 | |||
|
|
|
|||
| Less dividends and distributions: |
| |||
| From net investment income |
(0.29 | ) | ||
| From net realized gain |
(0.00 | )(3) | ||
|
|
|
|||
| Total dividends and distributions |
(0.29 | ) | ||
|
|
|
|||
| Net asset value, at end of year |
$ | 9.90 | ||
|
|
|
|||
| Total investment return (4) |
2.10 | %(5) | ||
|
|
|
|||
| Supplemental Data and Ratios | ||||
| Net assets, end of year (000’s) |
$ | 198 | ||
| Ratio of total expenses (before reductions and reimbursements) to average net assets (6) |
7.57 | %(7) | ||
| Ratio of net expenses to average net assets |
1.90 | %(7) | ||
| Ratio of net investment income to average net assets |
5.79 | %(7) | ||
| Portfolio turnover rate |
83.26 | %(5) | ||
| (1) | Fund commenced operations on October 21, 2015. |
| (2) | Calculated using average shares outstanding. |
| (3) | Amount rounds to less than $.01 per share. |
| (4) | Total investment return calculation does not consider the effects of sales loads and assumes the reinvestment of dividends at actual prices pursuant to the Fund’s dividend reinvestment plan. |
| (5) | Not annualized. |
| (6) | The Adviser has agreed to waive and/or reimburse certain fees and/or expense so that, on an annualized basis, such expenses incurred will not exceed 1.95% as a percentage of average daily net assets. |
| (7) | Annualized for periods less than one full year. |
See accompanying Notes to the Financial Statements.
61
Table of Contents
Babson Emerging Markets Debt Blended Total Return Fund 2016 Annual Report
FINANCIAL HIGHLIGHTS (CONTINUED)
| CLASS I | ||||
| PERIOD FROM OCTOBER 21, 2015 THROUGH JUNE 30, 2016 (1) |
||||
| Per Common Share Data | ||||
| Net asset value, beginning of year |
$ | 10.00 | ||
| Income from investment operations: |
||||
| Net investment income (2) |
0.45 | |||
| Net realized and unrealized loss on investments |
(0.19 | ) | ||
|
|
|
|||
| Total increase from investment operations |
0.26 | |||
|
|
|
|||
| Less dividends and distributions: |
||||
| From net investment income |
(0.36 | ) | ||
| From net realized gain |
(0.00 | )(3) | ||
|
|
|
|||
| Total dividends and distributions |
(0.36 | ) | ||
|
|
|
|||
| Net asset value, at end of year |
$ | 9.90 | ||
|
|
|
|||
| Total investment return (4) |
2.79 | %(5) | ||
|
|
|
|||
| Supplemental Data and Ratios | ||||
| Net assets, end of year (000’s) |
$ | 4,753 | ||
| Ratio of total expenses (before reductions and reimbursements) to average net assets (7) |
2.58 | %(6) | ||
| Ratio of net expenses to average net assets |
0.92 | %(6) | ||
| Ratio of net investment income to average net assets |
6.77 | %(6) | ||
| Portfolio turnover rate |
83.26 | %(5) | ||
| (1) | Fund commenced operations on October 21, 2015. |
| (2) | Calculated using average shares outstanding. |
| (3) | Amount rounds to less than $.01 per share. |
| (4) | Total investment return calculation assumes the reinvestment of dividends at actual prices pursuant to the Fund’s dividend reinvestment plan. |
| (5) | Not annualized. |
| (6) | Annualized for periods less than one full year. |
| (7) | The Adviser has agreed to waive and/or reimburse certain fees and/or expense so that, on an annualized basis, such expenses incurred will not exceed 0.95% as a percentage of average daily net assets. |
See accompanying Notes to the Financial Statements.
62
Table of Contents
Babson Emerging Markets Debt Blended Total Return Fund 2016 Annual Report
FINANCIAL HIGHLIGHTS (CONTINUED)
| CLASS Y | ||||
| PERIOD FROM THROUGH |
||||
| Per Common Share Data | ||||
| Net asset value, beginning of year |
$ | 10.00 | ||
| Income from investment operations: |
||||
| Net investment income (2) |
0.45 | |||
| Net realized and unrealized loss on investments |
(0.19 | ) | ||
|
|
|
|||
| Total increase from investment operations |
0.26 | |||
|
|
|
|||
| Less dividends and distributions: |
||||
| From net investment income |
(0.36 | ) | ||
| From net realized gain |
(0.00 | )(3) | ||
|
|
|
|||
| Total dividends and distributions |
(0.36 | ) | ||
|
|
|
|||
| Net asset value, at end of year |
$ | 9.90 | ||
|
|
|
|||
| Total investment return (4) |
2.79 | %(5) | ||
|
|
|
|||
| Supplemental Data and Ratios | ||||
| Net assets, end of year (000’s) |
$ | 4,754 | ||
| Ratio of total expenses (before reductions and reimbursements) to average net assets (7) |
2.58 | %(6) | ||
| Ratio of net expenses to average net assets |
0.92 | %(6) | ||
| Ratio of net investment income to average net assets |
6.77 | %(6) | ||
| Portfolio turnover rate |
83.26 | %(5) | ||
| (1) | Fund commenced operations on October 21, 2015. |
| (2) | Calculated using average shares outstanding. |
| (3) | Amount rounds to less than $.01 per share. |
| (4) | Total investment return calculation assumes the reinvestment of dividends at actual prices pursuant to the Fund’s dividend reinvestment plan. |
| (5) | Not annualized. |
| (6) | Annualized for periods less than one full year. |
| (7) | The Adviser has agreed to waive and/or reimburse certain fees and/or expense so that, on an annualized basis, such expenses incurred will not exceed 0.95% as a percentage of average daily net assets. |
See accompanying Notes to the Financial Statements.
63
Table of Contents
Babson Emerging Markets Local Currency Debt Fund 2016 Annual Report
FINANCIAL HIGHLIGHTS (CONTINUED)
| CLASS A | ||||
| PERIOD FROM DECEMBER 8, 2015 THROUGH JUNE 30, 2016 (1) |
||||
| Per Common Share Data | ||||
| Net asset value, beginning of year |
$ | 10.00 | ||
| Income from investment operations: |
||||
| Net investment income (2) |
0.50 | |||
| Net realized and unrealized gain on investments |
0.73 | |||
|
|
|
|||
| Total increase from investment operations |
1.23 | |||
|
|
|
|||
| Less dividends and distributions: |
||||
| From net investment income |
(0.31 | ) | ||
|
|
|
|||
| Net asset value, at end of year |
$ | 10.92 | ||
|
|
|
|||
| Total investment return (3) |
12.58 | %(4) | ||
|
|
|
|||
| Supplemental Data and Ratios | ||||
| Net assets, end of year (000’s) |
$ | 109 | ||
| Ratio of total expenses (before reductions and reimbursements) to average net assets (6) |
8.55 | %(5) | ||
| Ratio of net expenses to average net assets |
1.08 | %(5) | ||
| Ratio of net investment income to average net assets |
8.82 | %(5) | ||
| Portfolio turnover rate |
37.68 | %(4) | ||
| (1) | Fund commenced operations on December 8, 2015. |
| (2) | Calculated using average shares outstanding. |
| (3) | Total investment return calculation does not consider the effects of sales loads and assumes the reinvestment of dividends at actual prices pursuant to the Fund’s dividend reinvestment plan. |
| (4) | Not annualized. |
| (5) | Annualized for periods less than one full year. |
| (6) | The Adviser has agreed to waive and/or reimburse certain fees and/or expense so that, on an annualized basis, such expenses incurred will not exceed 1.20% as a percentage of average daily net assets. |
See accompanying Notes to the Financial Statements.
64
Table of Contents
Babson Emerging Markets Local Currency Debt Fund 2016 Annual Report
FINANCIAL HIGHLIGHTS (CONTINUED)
| CLASS C | ||||
| PERIOD FROM DECEMBER 8, 2015 THROUGH JUNE 30, 2016 (1) |
||||
| Per Common Share Data | ||||
| Net asset value, beginning of year |
$ | 10.00 | ||
| Income from investment operations: |
||||
| Net investment income (2) |
0.46 | |||
| Net realized and unrealized gain on investments |
0.73 | |||
|
|
|
|||
| Total increase from investment operations |
1.19 | |||
|
|
|
|||
| Less dividends and distributions: |
||||
| From net investment income |
(0.27 | ) | ||
|
|
|
|||
| Net asset value, at end of year |
$ | 10.92 | ||
|
|
|
|||
| Total investment return (3) |
12.13 | %(4) | ||
|
|
|
|||
| Supplemental Data and Ratios | ||||
| Net assets, end of year (000’s) |
$ | 109 | ||
| Ratio of total expenses (before reductions and reimbursements) to average net assets (5) |
9.30 | %(6) | ||
| Ratio of net expenses to average net assets |
1.81 | %(6) | ||
| Ratio of net investment income to average net assets |
8.09 | %(6) | ||
| Portfolio turnover rate |
37.68 | %(4) | ||
| (1) | Fund commenced operations on December 8, 2015. |
| (2) | Calculated using average shares outstanding. |
| (3) | Total investment return calculation does not consider the effects of sales loads and assumes the reinvestment of dividends at actual prices pursuant to the Fund’s dividend reinvestment plan. |
| (4) | Not annualized. |
| (5) | The Adviser has agreed to waive and/or reimburse certain fees and/or expense so that, on an annualized basis, such expenses incurred will not exceed 1.95% as a percentage of average daily net assets. |
| (6) | Annualized for periods less than one full year. |
See accompanying Notes to the Financial Statements.
65
Table of Contents
Babson Emerging Markets Local Currency Debt Fund 2016 Annual Report
FINANCIAL HIGHLIGHTS (CONTINUED)
| CLASS I | ||||
| PERIOD FROM DECEMBER 8, 2015 THROUGH JUNE 30, 2016 (1) |
||||
| Per Common Share Data | ||||
| Net asset value, beginning of year |
$ | 10.00 | ||
| Income from investment operations: |
||||
| Net investment income (2) |
0.52 | |||
| Net realized and unrealized gain on investments |
0.73 | |||
|
|
|
|||
| Total increase from investment operations |
1.25 | |||
|
|
|
|||
| Less dividends and distributions: |
||||
| From net investment income |
(0.33 | ) | ||
|
|
|
|||
| Net asset value, at end of year |
$ | 10.92 | ||
|
|
|
|||
| Total investment return (3) |
12.73 | %(4) | ||
|
|
|
|||
| Supplemental Data and Ratios | ||||
| Net assets, end of year (000’s) |
$ | 2,621 | ||
| Ratio of total expenses (before reductions and reimbursements) to average net assets (5) |
4.03 | %(6) | ||
| Ratio of net expenses to average net assets |
0.84 | %(6) | ||
| Ratio of net investment income to average net assets |
9.07 | %(6) | ||
| Portfolio turnover rate |
37.68 | %(4) | ||
| (1) | Fund commenced operations on December 8, 2015. |
| (2) | Calculated using average shares outstanding. |
| (3) | Total investment return calculation assumes the reinvestment of dividends at actual prices pursuant to the Fund’s dividend reinvestment plan. |
| (4) | Not annualized. |
| (5) | The Adviser has agreed to waive and/or reimburse certain fees and/or expense so that, on an annualized basis, such expenses incurred will not exceed 0.95% as a percentage of average daily net assets. |
| (6) | Annualized for periods less than one full year. |
See accompanying Notes to the Financial Statements.
66
Table of Contents
Babson Emerging Markets Local Currency Debt Fund 2016 Annual Report
FINANCIAL HIGHLIGHTS (CONTINUED)
| CLASS Y | ||||
| PERIOD FROM DECEMBER 8, 2015 THROUGH JUNE 30, 2016 (1) |
||||
| Per Common Share Data | ||||
| Net asset value, beginning of year |
$ | 10.00 | ||
| Income from investment operations: |
||||
| Net investment income (2) |
0.52 | |||
| Net realized and unrealized gain on investments |
0.73 | |||
|
|
|
|||
| Total increase from investment operations |
1.25 | |||
|
|
|
|||
| Less dividends and distributions: |
||||
| From net investment income |
(0.33 | ) | ||
|
|
|
|||
| Net asset value, at end of year |
$ | 10.92 | ||
|
|
|
|||
| Total investment return (3) |
12.73 | %(4) | ||
|
|
|
|||
| Supplemental Data and Ratios | ||||
| Net assets, end of year (000’s) |
$ | 2,621 | ||
| Ratio of total expenses (before reductions and reimbursements) to average net assets (5) |
4.03 | %(6) | ||
| Ratio of net expenses to average net assets |
0.84 | %(6) | ||
| Ratio of net investment income to average net assets |
9.07 | %(6) | ||
| Portfolio turnover rate |
37.68 | %(4) | ||
| (1) | Fund commenced operations on December 8, 2015. |
| (2) | Calculated using average shares outstanding. |
| (3) | Total investment return calculation assumes the reinvestment of dividends at actual prices pursuant to the Fund’s dividend reinvestment plan. |
| (4) | Not annualized. |
| (5) | The Adviser has agreed to waive and/or reimburse certain fees and/or expense so that, on an annualized basis, such expenses incurred will not exceed 0.95% as a percentage of average daily net assets. |
| (6) | Annualized for periods less than one full year. |
See accompanying Notes to the Financial Statements.
67
Table of Contents
Babson Global High Yield Fund 2016 Annual Report
FINANCIAL HIGHLIGHTS (CONTINUED)
| CLASS A | ||||
| PERIOD FROM OCTOBER 30, 2015 THROUGH JUNE 30, 2016 (1) |
||||
| Per Common Share Data | ||||
| Net asset value, beginning of year |
$ | 10.00 | ||
| Income from investment operations: |
||||
| Net investment income (2) |
0.38 | |||
| Net realized and unrealized gain on investments |
0.05 | |||
|
|
|
|||
| Total increase from investment operations |
0.43 | |||
|
|
|
|||
| Less dividends and distributions: |
||||
| From net investment income |
(0.38 | ) | ||
|
|
|
|||
| Net asset value, at end of year |
$ | 10.05 | ||
|
|
|
|||
| Total investment return (3) |
4.45 | %(4) | ||
|
|
|
|||
| Supplemental Data and Ratios | ||||
| Net assets, end of year (000’s) |
$ | 101 | ||
| Ratio of total expenses (before reductions and reimbursements) to average net assets (5) |
7.14 | %(6) | ||
| Ratio of net expenses to average net assets |
1.04 | %(6) | ||
| Ratio of net investment income to average net assets |
5.83 | %(6) | ||
| Portfolio turnover rate |
83.24 | %(4) | ||
| (1) | Fund commenced operations on October 30, 2015. |
| (2) | Calculated using average shares outstanding. |
| (3) | Total investment return calculation does not consider the effects of sales loads and assumes the reinvestment of dividends at actual prices pursuant to the Fund’s dividend reinvestment plan. |
| (4) | Not annualized. |
| (5) | The Adviser has agreed to waive and/or reimburse certain fees and/or expense so that, on an annualized basis, such expenses incurred will not exceed 1.05% as a percentage of average daily net assets. |
| (6) | Annualized for periods less than one full year. |
See accompanying Notes to the Financial Statements.
68
Table of Contents
Babson Global High Yield Fund 2016 Annual Report
FINANCIAL HIGHLIGHTS (CONTINUED)
| CLASS C | ||||
| PERIOD FROM OCTOBER 30, 2015 THROUGH JUNE 30, 2016 (1) |
||||
| Per Common Share Data | ||||
| Net asset value, beginning of year |
$ | 10.00 | ||
| Income from investment operations: |
| |||
| Net investment income (2) |
0.33 | |||
| Net realized and unrealized gain on investments |
0.05 | |||
|
|
|
|||
| Total increase from investment operations |
0.38 | |||
|
|
|
|||
| Less dividends and distributions: |
| |||
| From net investment income |
(0.33 | ) | ||
|
|
|
|||
| Net asset value, at end of year |
$ | 10.05 | ||
|
|
|
|||
| Total investment return (3) |
3.94 | %(4) | ||
|
|
|
|||
| Supplemental Data and Ratios | ||||
| Net assets, end of year (000’s) |
$ | 101 | ||
| Ratio of total expenses (before reductions and reimbursements) to average net assets (5) |
7.89 | %(6) | ||
| Ratio of net expenses to average net assets |
1.78 | %(6) | ||
| Ratio of net investment income to average net assets |
5.09 | %(6) | ||
| Portfolio turnover rate |
83.24 | %(4) | ||
| (1) | Fund commenced operations on October 30, 2015. |
| (2) | Calculated using average shares outstanding. |
| (3) | Total investment return calculation does not consider the effects of sales loads and assumes the reinvestment of dividends at actual prices pursuant to the Fund’s dividend reinvestment plan. |
| (4) | Not annualized. |
| (5) | The Adviser has agreed to waive and/or reimburse certain fees and/or expense so that, on an annualized basis, such expenses incurred will not exceed 1.80% as a percentage of average daily net assets. |
| (6) | Annualized for periods less than one full year. |
See accompanying Notes to the Financial Statements.
69
Table of Contents
Babson Global High Yield Fund 2016 Annual Report
FINANCIAL HIGHLIGHTS (CONTINUED)
| CLASS I | ||||
| PERIOD FROM OCTOBER 30, 2015 THROUGH JUNE 30, 2016 (1) |
||||
| Per Common Share Data | ||||
| Net asset value, beginning of year |
$ | 10.00 | ||
| Income from investment operations: |
||||
| Net investment income (2) |
0.39 | |||
| Net realized and unrealized gain on investments |
0.05 | |||
|
|
|
|||
| Total increase from investment operations |
0.44 | |||
|
|
|
|||
| Less dividends and distributions: |
||||
| From net investment income |
(0.39 | ) | ||
|
|
|
|||
| Net asset value, at end of year |
$ | 10.05 | ||
|
|
|
|||
| Total investment return (3) |
4.62 | %(4) | ||
|
|
|
|||
| Supplemental Data and Ratios | ||||
| Net assets, end of year (000’s) |
$ | 12,466 | ||
| Ratio of total expenses (before reductions and reimbursements) to average net assets (6) |
1.51 | %(5) | ||
| Ratio of net expenses to average net assets |
0.79 | %(5) | ||
| Ratio of net investment income to average net assets |
6.08 | %(5) | ||
| Portfolio turnover rate |
83.24 | %(4) | ||
| (1) | Fund commenced operations on October 30, 2015. |
| (2) | Calculated using average shares outstanding. |
| (3) | Total investment return calculation assumes the reinvestment of dividends at actual prices pursuant to the Fund’s dividend reinvestment plan. |
| (4) | Not annualized. |
| (5) | Annualized for periods less than one full year. |
| (6) | The Adviser has agreed to waive and/or reimburse certain fees and/or expense so that, on an annualized basis, such expenses incurred will not exceed 0.80% as a percentage of average daily net assets. |
See accompanying Notes to the Financial Statements.
70
Table of Contents
Babson Global High Yield Fund 2016 Annual Report
FINANCIAL HIGHLIGHTS (CONTINUED)
| CLASS Y | ||||
| PERIOD FROM OCTOBER 30, 2015 THROUGH JUNE 30, 2016 (1) |
||||
| Per Common Share Data | ||||
| Net asset value, beginning of year |
$ | 10.00 | ||
| Income from investment operations: |
| |||
| Net investment income (2) |
0.39 | |||
| Net realized and unrealized gain on investments |
0.05 | |||
|
|
|
|||
| Total increase from investment operations |
0.44 | |||
|
|
|
|||
| Less dividends and distributions: |
| |||
| From net investment income |
(0.39 | ) | ||
|
|
|
|||
| Net asset value, at end of year |
$ | 10.05 | ||
|
|
|
|||
| Total investment return (3) |
4.62 | %(4) | ||
|
|
|
|||
| Supplemental Data and Ratios | ||||
| Net assets, end of year (000’s) |
$ | 12,604 | ||
| Ratio of total expenses (before reductions and reimbursements) to average net assets (5) |
1.51 | %(6) | ||
| Ratio of net expenses to average net assets |
0.79 | %(6) | ||
| Ratio of net investment income to average net assets |
6.08 | %(6) | ||
| Portfolio turnover rate |
83.24 | %(4) | ||
| (1) | Fund commenced operations on October 30, 2015. |
| (2) | Calculated using average shares outstanding. |
| (3) | Total investment return calculation assumes the reinvestment of dividends at actual prices pursuant to the Fund’s dividend reinvestment plan. |
| (4) | Not annualized. |
| (5) | The Adviser has agreed to waive and/or reimburse certain fees and/or expense so that, on an annualized basis, such expenses incurred will not exceed 0.80% as a percentage of average daily net assets. |
| (6) | Annualized for periods less than one full year. |
See accompanying Notes to the Financial Statements.
71
Table of Contents
Babson U.S. High Yield Fund 2016 Annual Report
FINANCIAL HIGHLIGHTS (CONTINUED)
| CLASS A | ||||
| PERIOD FROM OCTOBER 30, 2015 THROUGH JUNE 30, 2016 (1) |
||||
| Per Common Share Data | ||||
| Net asset value, beginning of year |
$ | 10.00 | ||
| Income from investment operations: |
||||
| Net investment income (2) |
0.39 | |||
| Net realized and unrealized gain on investments |
0.13 | |||
|
|
|
|||
| Total increase from investment operations |
0.52 | |||
|
|
|
|||
| Less dividends and distributions: |
||||
| From net investment income |
(0.38 | ) | ||
|
|
|
|||
| Net asset value, at end of year |
$ | 10.14 | ||
|
|
|
|||
| Total investment return (3) |
5.36 | %(4) | ||
|
|
|
|||
| Supplemental Data and Ratios | ||||
| Net assets, end of year (000’s) |
$ | 206 | ||
| Ratio of total expenses (before reductions and reimbursements) to average net assets (5) |
5.47 | %(6) | ||
| Ratio of net expenses to average net assets |
0.99 | %(6) | ||
| Ratio of net investment income to average net assets |
5.93 | %(6) | ||
| Portfolio turnover rate |
77.52 | %(4) | ||
| (1) | Fund commenced operations on October 30, 2015. |
| (2) | Calculated using average shares outstanding. |
| (3) | Total investment return calculation does not consider the effects of sales loads and assumes the reinvestment of dividends at actual prices pursuant to the Fund’s dividend reinvestment plan. |
| (4) | Not annualized. |
| (5) | The Adviser has agreed to waive and/or reimburse certain fees and/or expense so that, on an annualized basis, such expenses incurred will not exceed 1.00% as a percentage of average daily net assets. |
| (6) | Annualized for periods less than one full year. |
See accompanying Notes to the Financial Statements.
72
Table of Contents
Babson U.S. High Yield Fund 2016 Annual Report
FINANCIAL HIGHLIGHTS (CONTINUED)
| CLASS C | ||||
| PERIOD FROM OCTOBER 30, 2015 THROUGH JUNE 30, 2016 (1) |
||||
| Per Common Share Data | ||||
| Net asset value, beginning of year |
$ | 10.00 | ||
| Income from investment operations: |
||||
| Net investment income (2) |
0.33 | |||
| Net realized and unrealized gain on investments |
0.14 | |||
|
|
|
|||
| Total increase from investment operations |
0.47 | |||
|
|
|
|||
| Less dividends and distributions: |
||||
| From net investment income |
(0.33 | ) | ||
|
|
|
|||
| Net asset value, at end of year |
$ | 10.14 | ||
|
|
|
|||
| Total investment return (3) |
4.85 | %(4) | ||
|
|
|
|||
| Supplemental Data and Ratios | ||||
| Net assets, end of year (000’s) |
$ | 101 | ||
| Ratio of total expenses (before reductions and reimbursements) to average net assets (6) |
7.30 | %(5) | ||
| Ratio of net expenses to average net assets |
1.73 | %(5) | ||
| Ratio of net investment income to average net assets |
5.08 | %(5) | ||
| Portfolio turnover rate |
77.52 | %(4) | ||
| (1) | Fund commenced operations on October 30, 2015. |
| (2) | Calculated using average shares outstanding. |
| (3) | Total investment return calculation does not consider the effects of sales loads and assumes the reinvestment of dividends at actual prices pursuant to the Fund’s dividend reinvestment plan. |
| (4) | Not annualized. |
| (5) | Annualized for periods less than one full year. |
| (6) | The Adviser has agreed to waive and/or reimburse certain fees and/or expense so that, on an annualized basis, such expenses incurred will not exceed 1.75% as a percentage of average daily net assets. |
See accompanying Notes to the Financial Statements.
73
Table of Contents
Babson U.S. High Yield Fund 2016 Annual Report
FINANCIAL HIGHLIGHTS (CONTINUED)
| CLASS I | ||||
| PERIOD FROM OCTOBER 30, 2015 THROUGH JUNE 30, 2016 (1) |
||||
| Per Common Share Data | ||||
| Net asset value, beginning of year |
$ | 10.00 | ||
| Income from investment operations: |
||||
| Net investment income (2) |
0.40 | |||
| Net realized and unrealized gain on investments |
0.13 | |||
|
|
|
|||
| Total increase from investment operations |
0.53 | |||
|
|
|
|||
| Less dividends and distributions: |
||||
| From net investment income |
(0.39 | ) | ||
|
|
|
|||
| Net asset value, at end of year |
$ | 10.14 | ||
|
|
|
|||
| Total investment return (3) |
5.53 | %(4) | ||
|
|
|
|||
| Supplemental Data and Ratios | ||||
| Net assets, end of year (000’s) |
$ | 14,863 | ||
| Ratio of total expenses (before reductions and reimbursements) to average net assets (6) |
1.38 | %(5) | ||
| Ratio of net expenses to average net assets |
0.74 | %(5) | ||
| Ratio of net investment income to average net assets |
6.11 | %(5) | ||
| Portfolio turnover rate |
77.52 | %(4) | ||
| (1) | Fund commenced operations on October 30, 2015. |
| (2) | Calculated using average shares outstanding. |
| (3) | Total investment return calculation assumes the reinvestment of dividends at actual prices pursuant to the Fund’s dividend reinvestment plan. |
| (4) | Not annualized. |
| (5) | Annualized for periods less than one full year. |
| (6) | The Adviser has agreed to waive and/or reimburse certain fees and/or expense so that, on an annualized basis, such expenses incurred will not exceed 0.75% as a percentage of average daily net assets. |
See accompanying Notes to the Financial Statements.
74
Table of Contents
Babson U.S. High Yield Fund 2016 Annual Report
FINANCIAL HIGHLIGHTS (CONTINUED)
| CLASS Y | ||||
| PERIOD FROM OCTOBER 30, 2015 THROUGH JUNE 30, 2016 (1) |
||||
| Per Common Share Data | ||||
| Net asset value, beginning of year |
$ | 10.00 | ||
| Income from investment operations: |
||||
| Net investment income (2) |
0.39 | |||
| Net realized and unrealized gain on investments |
0.14 | |||
|
|
|
|||
| Total increase from investment operations |
0.53 | |||
|
|
|
|||
| Less dividends and distributions: |
||||
| From net investment income |
(0.39 | ) | ||
|
|
|
|||
| Net asset value, at end of year |
$ | 10.14 | ||
|
|
|
|||
| Total investment return (3) |
5.52 | %(4) | ||
|
|
|
|||
| Supplemental Data and Ratios | ||||
| Net assets, end of year (000’s) |
$ | 12,675 | ||
| Ratio of total expenses (before reductions and reimbursements) to average net assets (6) |
1.42 | %(5) | ||
| Ratio of net expenses to average net assets |
0.74 | %(5) | ||
| Ratio of net investment income to average net assets |
6.06 | %(5) | ||
| Portfolio turnover rate |
77.52 | %(4) | ||
| (1) | Fund commenced operations on October 30, 2015. |
| (2) | Calculated using average shares outstanding. |
| (3) | Total investment return calculation assumes the reinvestment of dividends at actual prices pursuant to the Fund’s dividend reinvestment plan. |
| (4) | Not annualized. |
| (5) | Annualized for periods less than one full year. |
| (6) | The Adviser has agreed to waive and/or reimburse certain fees and/or expense so that, on an annualized basis, such expenses incurred will not exceed 0.75% as a percentage of average daily net assets. |
See accompanying Notes to the Financial Statements.
75
Table of Contents
Babson Global Floating Rate Fund 2016 Annual Report
June 30, 2016
| SHARES | COST | FAIR VALUE |
||||||||||||||||||
| Common Stocks — 0.0%*: |
||||||||||||||||||||
| Boomerang Tube LLC¤ |
2,007 | $– | $– | |||||||||||||||||
| Southcross Energy Partners LP¤ |
22 | – | 7,480 | |||||||||||||||||
| Southcross Holdings, L.P.¤ |
22 | – | – | |||||||||||||||||
|
|
|
|
|
|
|
|||||||||||||||
| Total Common Stocks |
2,051 | – | 7,480 | |||||||||||||||||
|
|
|
|
|
|
|
|||||||||||||||
| Total Equities |
2,051 | – | 7,480 | |||||||||||||||||
|
|
|
|
|
|
|
|||||||||||||||
| EFFECTIVE INTEREST RATE |
DUE DATE | PRINCIPAL ‡‡ | COST | FAIR VALUE |
||||||||||||||||
| Fixed Income — 93.0%**: |
||||||||||||||||||||
| Bank Loans — 83.8%**§: |
||||||||||||||||||||
| Aerospace and Defense — 1.3%*: |
||||||||||||||||||||
| Swissport Investments SA+ |
6.25 | % | 2/9/2022 | 700,000 | 744,876 | 765,033 | ||||||||||||||
| TransDigm, Inc. |
3.75 | 5/14/2022 | 997,597 | 987,691 | 981,077 | |||||||||||||||
| TransDigm, Inc. |
3.75 | 6/9/2023 | 500,000 | 496,272 | 491,770 | |||||||||||||||
|
|
|
|
|
|
|
|||||||||||||||
| Total Aerospace and Defense |
2,197,597 | 2,228,839 | 2,237,880 | |||||||||||||||||
|
|
|
|
|
|
|
|||||||||||||||
| Automobile — 1.7%*: |
||||||||||||||||||||
| FPC Holdings, Inc. |
5.25 | 11/19/2019 | 1,687,589 | 1,615,002 | 1,420,393 | |||||||||||||||
| Gates Global, Inc. |
4.25 | 7/6/2021 | 1,457,327 | 1,452,957 | 1,379,302 | |||||||||||||||
|
|
|
|
|
|
|
|||||||||||||||
| Total Automobile |
3,144,916 | 3,067,959 | 2,799,695 | |||||||||||||||||
|
|
|
|
|
|
|
|||||||||||||||
| Beverage, Food and Tobacco — 1.6%*: |
||||||||||||||||||||
| Burton’s Foods Ltd.+ |
5.73 | 11/27/2020 | 500,000 | 674,165 | 584,918 | |||||||||||||||
| CTI Foods Holding Co, LLC |
4.50 | 6/29/2020 | 1,371,857 | 1,361,757 | 1,358,138 | |||||||||||||||
| Del Monte Foods, Inc. |
4.25 | 2/18/2021 | 244,375 | 243,564 | 227,269 | |||||||||||||||
| Deoleo SA+ |
4.50 | 6/11/2021 | 500,000 | 677,357 | 436,503 | |||||||||||||||
|
|
|
|
|
|
|
|||||||||||||||
| Total Beverage, Food and Tobacco |
2,616,232 | 2,956,843 | 2,606,828 | |||||||||||||||||
|
|
|
|
|
|
|
|||||||||||||||
| Broadcasting and Entertainment — 3.3%*: |
||||||||||||||||||||
| All3Media International+ |
5.25 | 6/30/2021 | 1,500,000 | 2,302,471 | 1,865,839 | |||||||||||||||
| Cumulus Media Holdings, Inc. |
4.25 | 12/23/2020 | 152,239 | 150,470 | 106,377 | |||||||||||||||
| DLG Acquisitions Ltd.+ |
8.25 | 6/30/2022 | 500,000 | 672,001 | 468,869 | |||||||||||||||
| Tech Finance & Co. S.C.A+ |
5.00 | 7/10/2020 | 484,541 | 541,296 | 532,917 | |||||||||||||||
| Tele Columbus AG+ |
4.50 | 1/4/2021 | 500,000 | 546,701 | 548,494 | |||||||||||||||
| Univision Communications, Inc. |
4.00 | 3/1/2020 | 1,975,030 | 1,974,505 | 1,962,331 | |||||||||||||||
|
|
|
|
|
|
|
|||||||||||||||
| Total Broadcasting and Entertainment |
5,111,810 | 6,187,444 | 5,484,827 | |||||||||||||||||
|
|
|
|
|
|
|
|||||||||||||||
| Buildings and Real Estate — 2.5%*: |
||||||||||||||||||||
| Avocado BidCo Luxembourg Sarl+ |
5.25 | 2/28/2023 | 500,000 | 552,353 | 552,101 | |||||||||||||||
| Builders FirstSource, Inc. |
6.00 | 7/31/2022 | 1,583,526 | 1,578,862 | 1,581,547 | |||||||||||||||
| Cemex SAB de CV+ |
3.50 | 7/23/2020 | 97,070 | 106,733 | 107,319 | |||||||||||||||
| Cemex SAB de CV+ |
3.96 | 7/23/2020 | 441,849 | 441,849 | 433,012 | |||||||||||||||
| DTZ US Borrower LLC |
4.25 | 11/4/2021 | 1,548,443 | 1,543,474 | 1,524,256 | |||||||||||||||
|
|
|
|
|
|
|
|||||||||||||||
| Total Buildings and Real Estate |
4,170,888 | 4,223,271 | 4,198,235 | |||||||||||||||||
|
|
|
|
|
|
|
|||||||||||||||
See accompanying Notes to the Financial Statements.
76
Table of Contents
Babson Global Floating Rate Fund 2016 Annual Report
SCHEDULE OF INVESTMENTS (CONTINUED)
June 30, 2016
| EFFECTIVE INTEREST RATE |
DUE DATE | PRINCIPAL ‡‡ | COST | FAIR VALUE |
||||||||||||||||
| Bank Loans (Continued) |
||||||||||||||||||||
| Cargo Transport — 1.0%*: |
||||||||||||||||||||
| XPO Logistics, Inc. |
5.50 | % | 11/1/2021 | 1,737,588 | $1,714,987 | $1,737,588 | ||||||||||||||
|
|
|
|
|
|
|
|||||||||||||||
| Chemicals, Plastics and Rubber — 7.6%*: |
||||||||||||||||||||
| Allnex (Luxembourg) & Cy S.C.A.+ |
4.25 | 5/31/2023 | 1,127,743 | 1,217,002 | 1,199,330 | |||||||||||||||
| Allnex USA, Inc.+ |
4.25 | 5/31/2023 | 322,257 | 320,646 | 318,229 | |||||||||||||||
| Chromaflo Technologies Corp. |
4.50 | 12/2/2019 | 1,202,903 | 1,201,223 | 1,181,852 | |||||||||||||||
| Flint Group GmbH+ |
4.25 | 9/7/2021 | 497,500 | 534,459 | 547,960 | |||||||||||||||
| Flint Group GmbH+ |
4.50 | 9/7/2021 | 90,107 | 89,431 | 88,587 | |||||||||||||||
| Flint Group US LLC+ |
4.50 | 9/7/2021 | 545,072 | 540,982 | 535,877 | |||||||||||||||
| MacDermid European Holdings B.V. |
5.50 | 6/7/2020 | 496,250 | 524,303 | 544,518 | |||||||||||||||
| MacDermid, Inc. |
5.50 | 6/7/2020 | 1,470,052 | 1,444,306 | 1,448,736 | |||||||||||||||
| Methanol Holdings (Trinidad) Ltd. |
4.25 | 6/30/2022 | 1,124,106 | 1,114,445 | 1,101,624 | |||||||||||||||
| Novacap S.A.+ |
5.00 | 6/22/2023 | 500,000 | 558,050 | 553,626 | |||||||||||||||
| OXEA Finance & Cy S.C.A.+ |
4.50 | 1/15/2020 | 494,924 | 523,736 | 523,153 | |||||||||||||||
| OXEA Finance LLC+ |
4.25 | 1/15/2020 | 352,314 | 346,995 | 340,204 | |||||||||||||||
| Styrolution Group GmbH+ |
6.50 | 11/7/2019 | 591,000 | 729,991 | 655,534 | |||||||||||||||
| Tronox Pigments (United States) B.V.+ |
4.50 | 3/19/2020 | 1,396,401 | 1,345,485 | 1,333,563 | |||||||||||||||
| Univar, Inc. |
4.25 | 7/1/2022 | 978,185 | 977,110 | 962,642 | |||||||||||||||
| Vantage Specialty Chemicals, Inc. |
5.00 | 2/10/2019 | 1,431,372 | 1,422,225 | 1,406,323 | |||||||||||||||
|
|
|
|
|
|
|
|||||||||||||||
| Total Chemicals, Plastics and Rubber |
12,620,186 | 12,890,389 | 12,741,758 | |||||||||||||||||
|
|
|
|
|
|
|
|||||||||||||||
| Containers, Packaging and Glass — 6.1%*: |
||||||||||||||||||||
| Consolidated Container Co. LLC |
5.00 | 7/3/2019 | 1,477,509 | 1,476,022 | 1,423,152 | |||||||||||||||
| Consolidated Container Co. LLC |
7.75 | 1/3/2020 | 188,280 | 185,884 | 168,354 | |||||||||||||||
| Hilex Poly Co. LLC |
6.00 | 12/5/2021 | 400,686 | 397,535 | 400,686 | |||||||||||||||
| Horizon Holdings III SAS+ |
4.50 | 8/1/2022 | 1,000,000 | 1,129,171 | 1,104,667 | |||||||||||||||
| Mauser US Corporate LLC+ |
4.50 | 7/31/2021 | 1,556,468 | 1,556,584 | 1,523,393 | |||||||||||||||
| Mauser US Corporate LLC+ |
8.75 | 7/31/2022 | 120,928 | 101,622 | 111,405 | |||||||||||||||
| Multi Packaging Solutions, Inc. |
4.25 | 9/30/2020 | 1,867,712 | 1,857,496 | 1,844,365 | |||||||||||||||
| Prolampac Intermediate, Inc. |
5.75 | 8/18/2022 | 951,795 | 943,431 | 938,708 | |||||||||||||||
| Prolampac Intermediate, Inc. |
9.25 | 8/18/2023 | 1,000,000 | 982,122 | 940,000 | |||||||||||||||
| Tekni-Plex, Inc. |
4.50 | 6/1/2022 | 1,663,481 | 1,643,457 | 1,630,211 | |||||||||||||||
|
|
|
|
|
|
|
|||||||||||||||
| Total Containers, Packaging and Glass |
10,226,859 | 10,273,324 | 10,084,941 | |||||||||||||||||
|
|
|
|
|
|
|
|||||||||||||||
| Diversified/Conglomerate Manufacturing — 2.8%*: |
|
|||||||||||||||||||
| Acosta Holdco, Inc. |
4.25 | 9/26/2021 | 1,401,353 | 1,393,999 | 1,345,299 | |||||||||||||||
| MTS Systems Corp. |
4.25 | 6/21/2023 | 392,809 | 388,881 | 391,336 | |||||||||||||||
| Pelican Products, Inc. |
5.25 | 4/10/2020 | 967,841 | 966,050 | 938,806 | |||||||||||||||
| STS Operating, Inc. |
4.75 | 2/12/2021 | 302,043 | 302,320 | 265,798 | |||||||||||||||
| Tennessee Acquisition Holding B.V.+ |
5.25 | 1/27/2023 | 500,000 | 534,944 | 545,858 | |||||||||||||||
| Triple Point Technology, Inc. |
5.25 | 7/10/2020 | 336,858 | 316,873 | 275,661 | |||||||||||||||
| Triple Point Technology, Inc.†† |
9.25 | 7/10/2021 | 145,677 | 138,062 | 88,863 | |||||||||||||||
| West Corp. |
2.71 | 7/1/2019 | 482,319 | 471,037 | 469,055 | |||||||||||||||
| West Corp. |
3.75 | 6/1/2023 | 285,286 | 283,859 | 284,039 | |||||||||||||||
|
|
|
|
|
|
|
|||||||||||||||
| Total Diversified/Conglomerate Manufacturing |
4,814,186 | 4,796,025 | 4,604,715 | |||||||||||||||||
|
|
|
|
|
|
|
|||||||||||||||
See accompanying Notes to the Financial Statements.
77
Table of Contents
Babson Global Floating Rate Fund 2016 Annual Report
SCHEDULE OF INVESTMENTS (CONTINUED)
June 30, 2016
| EFFECTIVE INTEREST RATE |
DUE DATE | PRINCIPAL ‡‡ | COST | FAIR VALUE |
||||||||||||||||
| Bank Loans (Continued) |
||||||||||||||||||||
| Diversified/Conglomerate Service — 5.1%*: |
||||||||||||||||||||
| Aquilex Holdings LLC |
5.00 | % | 12/31/2020 | 183,676 | $183,378 | $174,492 | ||||||||||||||
| Atrium Innovations, Inc.+ |
4.25 | 2/13/2021 | 1,118,590 | 1,112,324 | 1,083,634 | |||||||||||||||
| EIG Investors Corp. |
6.48 | 11/9/2019 | 801,725 | 802,228 | 762,304 | |||||||||||||||
| Garda World Security Corp.+ |
4.00 | 11/6/2020 | 912,967 | 908,431 | 884,665 | |||||||||||||||
| Men’s Wearhouse, Inc. (The) |
4.50 | 6/18/2021 | 914,636 | 827,235 | 878,051 | |||||||||||||||
| MH Sub I LLC |
4.75 | 7/8/2021 | 580,887 | 578,483 | 576,048 | |||||||||||||||
| MH Sub I LLC |
8.50 | 7/8/2022 | 400,000 | 396,981 | 386,000 | |||||||||||||||
| Northgate Information Solutions Ltd.+ |
6.50 | 3/23/2022 | 500,000 | 517,319 | 549,787 | |||||||||||||||
| Power Team Services LLC |
8.25 | 11/6/2020 | 500,000 | 496,856 | 485,000 | |||||||||||||||
| Prime Security Services Borrower, LLC |
4.75 | 5/2/2022 | 256,119 | 253,623 | 256,439 | |||||||||||||||
| RP Crown Parent LLC |
6.00 | 12/21/2018 | 542,637 | 543,780 | 509,569 | |||||||||||||||
| RP Crown Parent LLC |
11.25 | 12/20/2019 | 678,572 | 687,724 | 560,955 | |||||||||||||||
| Vogue International, Inc. |
7.25 | 2/14/2020 | 1,427,081 | 1,436,410 | 1,424,412 | |||||||||||||||
|
|
|
|
|
|
|
|||||||||||||||
| Total Diversified/Conglomerate Service |
8,816,890 | 8,744,772 | 8,531,356 | |||||||||||||||||
|
|
|
|
|
|
|
|||||||||||||||
| Ecological — 2.0%*: |
||||||||||||||||||||
| Biffa Waste Services Ltd.+ |
5.59 | 1/30/2018 | 2,000,000 | 3,187,299 | 2,559,886 | |||||||||||||||
| Emerald 3 Ltd.+ |
8.00 | 5/31/2022 | 390,426 | 387,496 | 347,480 | |||||||||||||||
| PHS Group PLC+ |
6.00 | 4/17/2020 | 299,197 | 462,964 | 396,565 | |||||||||||||||
|
|
|
|
|
|
|
|||||||||||||||
| Total Ecological |
2,689,623 | 4,037,759 | 3,303,931 | |||||||||||||||||
|
|
|
|
|
|
|
|||||||||||||||
| Electronics — 4.3%*: |
||||||||||||||||||||
| CDW LLC |
3.25 | 4/29/2020 | 1,184,699 | 1,180,146 | 1,183,052 | |||||||||||||||
| Dell Inc. |
3.25 | 5/24/2023 | 1,800,000 | 1,791,000 | 1,792,494 | |||||||||||||||
| Informatica Corp. |
4.50 | 8/5/2022 | 1,588,000 | 1,586,257 | 1,542,059 | |||||||||||||||
| Renaissance Learning, Inc. |
4.50 | 4/9/2021 | 1,478,574 | 1,461,802 | 1,439,761 | |||||||||||||||
| Western Digital Corp. |
6.25 | 4/29/2023 | 1,186,188 | 1,156,232 | 1,189,901 | |||||||||||||||
|
|
|
|
|
|
|
|||||||||||||||
| Total Electronics |
7,237,461 | 7,175,437 | 7,147,267 | |||||||||||||||||
|
|
|
|
|
|
|
|||||||||||||||
| Finance — 4.9%*: |
||||||||||||||||||||
| Alliant Holdings I, Inc. |
4.50 | 8/12/2022 | 1,240,602 | 1,230,792 | 1,220,752 | |||||||||||||||
| Confie Seguros Holdings II Co. |
5.75 | 11/9/2018 | 528,596 | 527,331 | 521,989 | |||||||||||||||
| Cunningham Lindsey US, Inc. |
5.00 | 12/10/2019 | 483,581 | 482,237 | 386,865 | |||||||||||||||
| Cunningham Lindsey US, Inc. |
9.25 | 6/10/2020 | 748,546 | 749,763 | 276,962 | |||||||||||||||
| Eze Castle Software, Inc. |
4.00 | 4/6/2020 | 971,818 | 967,894 | 965,744 | |||||||||||||||
| First Data Corp. |
4.20 | 7/8/2022 | 1,022,479 | 1,015,485 | 1,012,254 | |||||||||||||||
| GENEX Holdings, Inc. |
5.25 | 5/30/2021 | 1,488,608 | 1,483,732 | 1,458,836 | |||||||||||||||
| Moneygram International, Inc. |
4.25 | 3/27/2020 | 825,229 | 778,396 | 779,065 | |||||||||||||||
| SAM Finance Lux Sarl+ |
5.00 | 12/17/2020 | 335,477 | 542,055 | 446,269 | |||||||||||||||
| Sedgwick Claims Management Services, Inc. |
3.75 | 3/1/2021 | 488,750 | 487,934 | 477,142 | |||||||||||||||
| Sedgwick Claims Management Services, Inc. |
6.75 | 2/28/2022 | 561,418 | 560,904 | 537,558 | |||||||||||||||
|
|
|
|
|
|
|
|||||||||||||||
| Total Finance |
8,695,104 | 8,826,523 | 8,083,436 | |||||||||||||||||
|
|
|
|
|
|
|
|||||||||||||||
See accompanying Notes to the Financial Statements.
78
Table of Contents
Babson Global Floating Rate Fund 2016 Annual Report
SCHEDULE OF INVESTMENTS (CONTINUED)
June 30, 2016
| EFFECTIVE INTEREST RATE |
DUE DATE | PRINCIPAL ‡‡ | COST | FAIR VALUE |
||||||||||||||||
| Bank Loans (Continued) |
||||||||||||||||||||
| Healthcare, Education and Childcare — 9.9%*: |
|
|||||||||||||||||||
| ADMI Corp. |
5.25 | % | 4/30/2022 | 1,485,000 | $1,494,350 | $1,485,000 | ||||||||||||||
| Amedes Holding AG+ |
4.75 | 8/19/2022 | 500,000 | 533,751 | 554,392 | |||||||||||||||
| AmSurg Corp. |
3.50 | 7/16/2021 | 379,033 | 379,023 | 379,023 | |||||||||||||||
| CareCore National LLC |
5.50 | 3/5/2021 | 663,745 | 663,453 | 612,305 | |||||||||||||||
| Explorer Holdings, Inc. |
6.00 | 5/2/2023 | 528,674 | 523,495 | 528,452 | |||||||||||||||
| Financiere Verdi+ |
5.50 | 9/30/2022 | 500,000 | 529,891 | 555,846 | |||||||||||||||
| Greatbatch Ltd. |
5.25 | 10/27/2022 | 1,496,250 | 1,485,613 | 1,481,287 | |||||||||||||||
| Jaguar Holding Co. II |
4.25 | 8/18/2022 | 898,098 | 894,154 | 888,893 | |||||||||||||||
| Kindred Healthcare, Inc. |
4.25 | 4/9/2021 | 1,686,117 | 1,637,188 | 1,631,319 | |||||||||||||||
| MI Opco Holdings, Inc. |
5.75 | 10/27/2022 | 433,482 | 429,543 | 432,398 | |||||||||||||||
| Ortho-Clinical Diagnostics, Inc. |
4.75 | 6/30/2021 | 2,030,840 | 2,020,194 | 1,917,458 | |||||||||||||||
| Rodenstock GmbH+ |
4.14 | 5/30/2019 | 1,500,000 | 1,766,839 | 1,564,747 | |||||||||||||||
| Synarc-Biocore Holdings LLC |
5.50 | 3/10/2021 | 488,750 | 485,458 | 478,975 | |||||||||||||||
| Synarc-Biocore Holdings LLC |
9.25 | 3/10/2022 | 500,000 | 496,427 | 475,000 | |||||||||||||||
| Team Health, Inc. |
3.75 | 11/23/2022 | 465,424 | 467,722 | 464,647 | |||||||||||||||
| Tecomet, Inc. |
5.75 | 12/5/2021 | 875,916 | 843,511 | 823,361 | |||||||||||||||
| Tunstall Group Holdings Ltd.+ |
5.74 | 10/16/2020 | 500,000 | 794,461 | 619,697 | |||||||||||||||
| Valeant Pharmaceuticals International |
5.00 | 4/1/2022 | 1,717,928 | 1,680,724 | 1,670,204 | |||||||||||||||
|
|
|
|
|
|
|
|||||||||||||||
| Total Healthcare, Education and Childcare |
16,649,257 | 17,125,797 | 16,563,004 | |||||||||||||||||
|
|
|
|
|
|
|
|||||||||||||||
| Home and Office Furnishings, Housewares, and Durable Consumer Products — 0.8%*: |
|
|||||||||||||||||||
| Leslie’s Poolmart, Inc. |
4.25 | 10/16/2019 | 1,282,448 | 1,279,643 | 1,271,765 | |||||||||||||||
|
|
|
|
|
|
|
|||||||||||||||
| Hotels, Motels, Inns and Gaming — 1.4%*: |
||||||||||||||||||||
| Compass Holdco 2 Ltd.+ |
5.81 | 11/10/2022 | 500,000 | 755,482 | 661,105 | |||||||||||||||
| Cyan Blue Holdco 3 Ltd.+ |
6.25 | 2/25/2022 | 500,000 | 735,886 | 657,970 | |||||||||||||||
| Financiere Sun S.A.S.+ |
6.00 | 3/14/2023 | 500,000 | 535,686 | 529,212 | |||||||||||||||
| HNVR Holdco Ltd.+ |
6.25 | 5/31/2023 | 500,000 | 549,876 | 540,310 | |||||||||||||||
|
|
|
|
|
|
|
|||||||||||||||
| Total Hotels, Motels, Inns and Gaming |
2,000,000 | 2,576,930 | 2,388,597 | |||||||||||||||||
|
|
|
|
|
|
|
|||||||||||||||
| Insurance — 2.5%*: |
||||||||||||||||||||
| Asurion LLC |
4.25 | 7/8/2020 | 578,867 | 540,354 | 564,395 | |||||||||||||||
| Asurion LLC |
5.00 | 5/24/2019 | 895,890 | 875,630 | 890,479 | |||||||||||||||
| Hub International Ltd. |
4.00 | 10/2/2020 | 1,712,521 | 1,707,180 | 1,679,692 | |||||||||||||||
| York Risk Services Holding Corp. |
4.75 | 10/1/2021 | 1,180,662 | 1,154,289 | 1,033,079 | |||||||||||||||
|
|
|
|
|
|
|
|||||||||||||||
| Total Insurance |
4,367,940 | 4,277,453 | 4,167,645 | |||||||||||||||||
|
|
|
|
|
|
|
|||||||||||||||
| Leisure, Amusement, Entertainment — 2.8%*: |
|
|||||||||||||||||||
| AP NMT Acquisition B.V.+ |
6.75 | 8/13/2021 | 610,321 | 586,753 | 498,681 | |||||||||||||||
| AP NMT Acquisition B.V.+ |
7.00 | 8/13/2021 | 534,955 | 646,763 | 500,461 | |||||||||||||||
| AP NMT Acquisition B.V.+ |
10.00 | 8/13/2022 | 182,720 | 153,135 | 116,484 | |||||||||||||||
| Delta 2 (Lux) Sarl+ |
4.75 | 7/30/2021 | 1,587,247 | 1,583,171 | 1,524,249 | |||||||||||||||
| Delta 2 (Lux) Sarl+ |
7.75 | 7/31/2022 | 437,500 | 436,840 | 413,984 | |||||||||||||||
| Tackle Sarl+ |
5.50 | 6/15/2022 | 500,000 | 553,792 | 554,992 | |||||||||||||||
| WMG Acquisition Corp. |
3.75 | 7/1/2020 | 1,056,162 | 1,049,160 | 1,042,960 | |||||||||||||||
|
|
|
|
|
|
|
|||||||||||||||
| Total Leisure, Amusement, Entertainment |
4,908,905 | 5,009,614 | 4,651,811 | |||||||||||||||||
|
|
|
|
|
|
|
|||||||||||||||
See accompanying Notes to the Financial Statements.
79
Table of Contents
Babson Global Floating Rate Fund 2016 Annual Report
SCHEDULE OF INVESTMENTS (CONTINUED)
June 30, 2016
| EFFECTIVE INTEREST RATE |
DUE DATE | PRINCIPAL ‡‡ | COST | FAIR VALUE |
||||||||||||||||
| Bank Loans (Continued) |
||||||||||||||||||||
| Machinery Non-Agriculture, Non-Construction, Non-Electronic — 5.6%*: |
|
|||||||||||||||||||
| Alison Bidco Sarl+ |
5.25 | % | 8/29/2021 | 292,056 | $289,892 | $284,512 | ||||||||||||||
| Apex Tool Group LLC |
4.50 | 1/31/2020 | 1,984,616 | 1,957,463 | 1,935,000 | |||||||||||||||
| Doncasters Finance US LLC |
4.50 | 4/9/2020 | 1,698,022 | 1,653,681 | 1,633,497 | |||||||||||||||
| Gardner Denver, Inc. |
4.25 | 7/30/2020 | 1,630,786 | 1,550,201 | 1,497,600 | |||||||||||||||
| Husky Injection Molding Systems Ltd.+ |
4.25 | 6/30/2021 | 937,249 | 936,576 | 929,929 | |||||||||||||||
| Husky Injection Molding Systems Ltd.+ |
7.25 | 6/30/2022 | 369,936 | 356,368 | 357,451 | |||||||||||||||
| Intelligrated, Inc. |
4.50 | 7/30/2018 | 1,697,045 | 1,690,611 | 1,682,196 | |||||||||||||||
| Schenck Measuring and Process Technologies+ |
6.25 | 5/13/2022 | 500,000 | 547,767 | 548,866 | |||||||||||||||
| Silver II US Holdings LLC |
4.00 | 12/13/2019 | 435,311 | 431,985 | 389,603 | |||||||||||||||
|
|
|
|
|
|
|
|||||||||||||||
| Total Machinery Non-Agriculture, Non-Construction, Non-Electronic |
9,545,021 | 9,414,544 | 9,258,654 | |||||||||||||||||
|
|
|
|
|
|
|
|||||||||||||||
| Mining, Steel, Iron and Non-Precious Metals — 3.1%*: |
|
|||||||||||||||||||
| Arch Coal, Inc. |
5.00 | 1/31/2017 | 540,905 | 540,905 | 532,792 | |||||||||||||||
| Arch Coal, Inc. |
7.50 | 5/16/2018 | 1,479,606 | 1,297,709 | 678,769 | |||||||||||||||
| Boomerang Tube LLC¤ |
15.00 | 2/2/2020 | 32,825 | 32,900 | 32,825 | |||||||||||||||
| Boomerang Tube LLC¤ |
17.50 | 2/2/2020 | 72,403 | 72,403 | 72,403 | |||||||||||||||
| Boomerang Tube LLC¤ |
15.65 | 2/2/2020 | 87,925 | 87,925 | 87,925 | |||||||||||||||
| Boomerang Tube LLC¤ |
20.00 | 2/2/2020 | 31,324 | 28,767 | 28,192 | |||||||||||||||
| Fortescue Metals Group Ltd. (FMG Resources)+ |
4.25 | 6/30/2019 | 1,320,413 | 1,232,936 | 1,260,994 | |||||||||||||||
| H.C. Starck GmbH+ |
8.00 | 5/30/2020 | 1,043,603 | 1,040,548 | 967,605 | |||||||||||||||
| Murray Energy Corp. |
7.50 | 4/16/2020 | 742,142 | 725,161 | 538,052 | |||||||||||||||
| Peabody Energy Corp. |
4.25 | 9/24/2020 | 617,204 | 566,238 | 260,510 | |||||||||||||||
| Peabody Energy Corp. |
10.00 | 9/12/2017 | 160,099 | 153,100 | 164,701 | |||||||||||||||
| Zekelman Industries, Inc. |
6.00 | 6/14/2021 | 601,399 | 595,385 | 600,395 | |||||||||||||||
|
|
|
|
|
|
|
|||||||||||||||
| Total Mining, Steel, Iron and Non-Precious Metals |
6,729,848 | 6,373,977 | 5,225,163 | |||||||||||||||||
|
|
|
|
|
|
|
|||||||||||||||
| Oil and Gas — 3.8%*: |
|
|||||||||||||||||||
| Caelus Energy Alaska O3 LLC |
8.75 | 4/15/2020 | 1,692,308 | 1,554,755 | 998,461 | |||||||||||||||
| CITGO Holding, Inc. |
9.50 | 5/12/2018 | 618,276 | 616,473 | 622,141 | |||||||||||||||
| Drillships Financing Holding, Inc. |
6.00 | 3/31/2021 | 984,772 | 863,305 | 383,076 | |||||||||||||||
| Fieldwood Energy LLC |
7.00 | 9/28/2018 | 555,855 | 492,305 | 457,652 | |||||||||||||||
| Fieldwood Energy LLC PIK |
7.13 | 9/30/2020 | 1,613,838 | 754,143 | 629,619 | |||||||||||||||
| Floatel International Ltd. |
6.00 | 6/27/2020 | 402,352 | 399,639 | 243,825 | |||||||||||||||
| Paragon Offshore Finance Co. |
5.25 | 7/18/2021 | 545,863 | 456,294 | 136,466 | |||||||||||||||
| Sabine Oil & Gas LLC~ |
10.00 | 12/31/2018 | 700,000 | 706,294 | 23,625 | |||||||||||||||
| Seadrill Partners Finco LLC |
4.00 | 2/21/2021 | 1,774,626 | 1,186,056 | 787,934 | |||||||||||||||
| Southcross Holdings Borrower LP |
9.00 | 4/13/2023 | 19,460 | 19,460 | 16,347 | |||||||||||||||
| Templar Energy LLC |
8.50 | 11/25/2020 | 361,162 | 287,351 | 90,291 | |||||||||||||||
| TPF II Power LLC |
5.52 | 10/2/2021 | 499,094 | 496,270 | 496,808 | |||||||||||||||
| Western Refining, Inc. |
4.50 | 6/23/2023 | 1,500,000 | 1,470,000 | 1,459,380 | |||||||||||||||
|
|
|
|
|
|
|
|||||||||||||||
| Total Oil and Gas |
11,267,606 | 9,302,345 | 6,345,625 | |||||||||||||||||
|
|
|
|
|
|
|
|||||||||||||||
See accompanying Notes to the Financial Statements.
80
Table of Contents
Babson Global Floating Rate Fund 2016 Annual Report
SCHEDULE OF INVESTMENTS (CONTINUED)
June 30, 2016
| EFFECTIVE INTEREST RATE |
DUE DATE | PRINCIPAL ‡‡ | COST | FAIR VALUE |
||||||||||||||||
| Bank Loans (Continued) |
||||||||||||||||||||
| Personal and Non-Durable Consumer Products Mfg. Only — 0.3%*: |
|
|||||||||||||||||||
| Coty Inc. |
3.50 | % | 10/27/2022 | 500,000 | $567,238 | $553,027 | ||||||||||||||
|
|
|
|
|
|
|
|||||||||||||||
| Personal Transportation — 0.8%*: |
|
|||||||||||||||||||
| Travelport Finance (Luxembourg) Sarl |
5.00 | 9/2/2021 | 1,305,933 | 1,304,074 | 1,297,771 | |||||||||||||||
|
|
|
|
|
|
|
|||||||||||||||
| Personal, Food and Miscellaneous — 0.1%*: |
|
|||||||||||||||||||
| Redtop Acquisitions Ltd.+ |
8.25 | 6/3/2021 | 155,189 | 153,912 | 146,364 | |||||||||||||||
|
|
|
|
|
|
|
|||||||||||||||
| Printing and Publishing — 1.6%*: |
|
|||||||||||||||||||
| Cengage Learning Holdings II L.P. |
4.25 | 6/7/2023 | 941,511 | 932,096 | 929,742 | |||||||||||||||
| Springer Science+Business Media Deutschland GmbH+ |
3.50 | 8/14/2020 | 1,892,619 | 1,883,290 | 1,816,914 | |||||||||||||||
|
|
|
|
|
|
|
|||||||||||||||
| Total Printing and Publishing |
2,834,130 | 2,815,386 | 2,746,656 | |||||||||||||||||
|
|
|
|
|
|
|
|||||||||||||||
| Retail Stores — 5.3%*: |
|
|||||||||||||||||||
| Academy, Ltd. |
5.00 | 7/1/2022 | 1,588,853 | 1,549,580 | 1,485,578 | |||||||||||||||
| Advantage Sales & Marketing, Inc. |
4.25 | 7/23/2021 | 1,582,446 | 1,575,973 | 1,539,593 | |||||||||||||||
| Container Store, Inc. (The) |
4.25 | 4/6/2019 | 498,587 | 452,742 | 432,524 | |||||||||||||||
| Kirk Beauty One GmbH+ |
6.00 | 8/13/2022 | 799,999 | 889,638 | 887,897 | |||||||||||||||
| Mattress Holding Corp. |
6.25 | 10/20/2021 | 1,564,722 | 1,520,986 | 1,525,604 | |||||||||||||||
| Maxeda DIY B.V.+ |
7.00 | 6/28/2019 | 583,334 | 648,219 | 521,580 | |||||||||||||||
| NBTY, Inc. |
5.00 | 5/5/2023 | 1,800,000 | 1,797,495 | 1,783,926 | |||||||||||||||
| Talbots, Inc. (The) |
5.50 | 3/19/2020 | 730,735 | 711,592 | 706,986 | |||||||||||||||
|
|
|
|
|
|
|
|||||||||||||||
| Total Retail Stores |
9,148,676 | 9,146,225 | 8,883,688 | |||||||||||||||||
|
|
|
|
|
|
|
|||||||||||||||
| Telecommunications — 0.7%*: |
|
|||||||||||||||||||
| Eircom Finco Sarl+ |
4.50 | 5/31/2022 | 500,000 | 544,791 | 545,065 | |||||||||||||||
| Equinix, Inc. |
4.50 | 1/8/2023 | 498,750 | 747,158 | 662,301 | |||||||||||||||
|
|
|
|
|
|
|
|||||||||||||||
| Total Telecommunications |
998,750 | 1,291,949 | 1,207,366 | |||||||||||||||||
|
|
|
|
|
|
|
|||||||||||||||
| Utilities — 0.9%*: |
|
|||||||||||||||||||
| Dynegy, Inc. |
4.00 | 6/20/2023 | 1,500,000 | 1,485,000 | 1,472,820 | |||||||||||||||
|
|
|
|
|
|
|
|||||||||||||||
| Total Bank Loans |
147,273,043 | 149,247,659 | 139,742,413 | |||||||||||||||||
|
|
|
|
|
|
|
|||||||||||||||
| Corporate Bonds — 9.2%**: |
|
|||||||||||||||||||
| Aerospace and Defense — 0.1%*: |
|
|||||||||||||||||||
| Swissport Investments SA+ |
6.75 | 12/15/2021 | 100,000 | 109,490 | 113,749 | |||||||||||||||
|
|
|
|
|
|
|
|||||||||||||||
| Banking — 0.1%*: |
|
|||||||||||||||||||
| Lock AS+ |
5.50 | # | 8/15/2020 | 100,000 | 110,780 | 108,756 | ||||||||||||||
| Lock AS+ |
7.00 | 8/15/2021 | 100,000 | 134,225 | 112,917 | |||||||||||||||
|
|
|
|
|
|
|
|||||||||||||||
| Total Banking |
200,000 | 245,005 | 221,673 | |||||||||||||||||
|
|
|
|
|
|
|
|||||||||||||||
| Beverage, Food and Tobacco — 0.1%*: |
|
|||||||||||||||||||
| Pizzaexpress Financing 2 PLC+ |
6.63 | 8/1/2021 | 100,000 | 169,730 | 124,783 | |||||||||||||||
|
|
|
|
|
|
|
|||||||||||||||
See accompanying Notes to the Financial Statements.
81
Table of Contents
Babson Global Floating Rate Fund 2016 Annual Report
SCHEDULE OF INVESTMENTS (CONTINUED)
June 30, 2016
| EFFECTIVE INTEREST RATE |
DUE DATE | PRINCIPAL ‡‡ | COST | FAIR VALUE |
||||||||||||||||
| Corporate Bonds (Continued) |
|
|||||||||||||||||||
| Broadcasting and Entertainment — 0.1%*: |
|
|||||||||||||||||||
| Entertainment One Ltd.+ |
6.88 | % | 12/15/2022 | 100,000 | $150,241 | $133,711 | ||||||||||||||
|
|
|
|
|
|
|
|||||||||||||||
| Buildings and Real Estate — 0.1%*: |
|
|||||||||||||||||||
| Paroc Group Oy+ |
6.25 | 5/15/2020 | 100,000 | 137,565 | 110,087 | |||||||||||||||
| Paroc Group Oy MTN+ |
4.99 | # | 5/15/2020 | 100,000 | 137,565 | 106,814 | ||||||||||||||
|
|
|
|
|
|
|
|||||||||||||||
| Total Buildings and Real Estate |
200,000 | 275,130 | 216,901 | |||||||||||||||||
|
|
|
|
|
|
|
|||||||||||||||
| Cargo Transport — 0.3%*: |
|
|||||||||||||||||||
| Deck Chassis Acquisition, Inc.^ |
10.00 | 6/15/2023 | 336,000 | 336,000 | 347,760 | |||||||||||||||
| WFS Global Holding SAS+ |
9.50 | 7/15/2022 | 100,000 | 113,435 | 103,762 | |||||||||||||||
|
|
|
|
|
|
|
|||||||||||||||
| Total Cargo Transport |
436,000 | 449,435 | 451,522 | |||||||||||||||||
|
|
|
|
|
|
|
|||||||||||||||
| Chemicals, Plastics and Rubber — 0.3%*: |
|
|||||||||||||||||||
| Ineos Finance PLC+ |
4.00 | 5/1/2023 | 150,000 | 162,382 | 159,647 | |||||||||||||||
| Pinnacle Operating Corp.^ |
9.00 | 11/15/2020 | 500,000 | 528,431 | 420,000 | |||||||||||||||
| TPC Group, Inc.^ |
8.75 | 12/15/2020 | 1,000 | 725 | 783 | |||||||||||||||
|
|
|
|
|
|
|
|||||||||||||||
| Total Chemicals, Plastics and Rubber |
651,000 | 691,538 | 580,430 | |||||||||||||||||
|
|
|
|
|
|
|
|||||||||||||||
| Containers, Packaging and Glass — 0.6%*: |
|
|||||||||||||||||||
| Innovia Group Finance PLC+ |
4.74 | # | 3/31/2020 | 500,000 | 684,794 | 546,552 | ||||||||||||||
| Reynolds Group Issuer, Inc. / Reynolds Group Issuer LLC / Reynolds Group Issuer Lu#^ |
4.13 | 7/15/2021 | 222,000 | 219,784 | 222,555 | |||||||||||||||
| Reynolds Group Issuer, Inc. / Reynolds Group Issuer LLC / Reynolds Group Issuer Lu^ |
5.13 | 7/15/2023 | 178,000 | 178,000 | 180,225 | |||||||||||||||
| Verallia Packaging SASU+ |
5.13 | 8/1/2022 | 100,000 | 109,775 | 113,610 | |||||||||||||||
|
|
|
|
|
|
|
|||||||||||||||
| Total Containers, Packaging and Glass |
1,000,000 | 1,192,353 | 1,062,942 | |||||||||||||||||
|
|
|
|
|
|
|
|||||||||||||||
| Diversified/Conglomerate Manufacturing — 0.3%*: |
|
|||||||||||||||||||
| Appvion, Inc.^ |
9.00 | 6/1/2020 | 460,000 | 466,443 | 260,475 | |||||||||||||||
| Galapagos SA+ |
4.49 | # | 6/15/2021 | 200,000 | 272,630 | 205,304 | ||||||||||||||
|
|
|
|
|
|
|
|||||||||||||||
| Total Diversified/Conglomerate Manufacturing |
660,000 | 739,073 | 465,779 | |||||||||||||||||
|
|
|
|
|
|
|
|||||||||||||||
| Diversified/Conglomerate Service — 0.7%*: |
|
|||||||||||||||||||
| Carlson Travel Holdings, Inc. PIK^ |
7.50 | 8/15/2019 | 470,000 | 474,066 | 448,850 | |||||||||||||||
| Sabre GLBL, Inc.^ |
5.38 | 4/15/2023 | 561,000 | 571,534 | 573,622 | |||||||||||||||
| Verisure Holding AB+ |
6.00 | 11/1/2022 | 100,000 | 110,105 | 118,133 | |||||||||||||||
|
|
|
|
|
|
|
|||||||||||||||
| Total Diversified/Conglomerate Service |
1,131,000 | 1,155,705 | 1,140,605 | |||||||||||||||||
|
|
|
|
|
|
|
|||||||||||||||
| Electronics — 0.2%*: |
|
|||||||||||||||||||
| Prime Security Services Borrower LLC/Prime Finance, Inc.^ |
9.25 | 5/15/2023 | 271,000 | 271,000 | 287,260 | |||||||||||||||
|
|
|
|
|
|
|
|||||||||||||||
| Finance — 1.0%*: |
|
|||||||||||||||||||
| Arrow Global Finance PLC+ |
4.75 | 5/1/2023 | 100,000 | 111,201 | 109,310 | |||||||||||||||
| Arrow Global Finance PLC+ |
4.99 | # | 11/1/2021 | 150,000 | 167,753 | 165,630 | ||||||||||||||
See accompanying Notes to the Financial Statements.
82
Table of Contents
Babson Global Floating Rate Fund 2016 Annual Report
SCHEDULE OF INVESTMENTS (CONTINUED)
June 30, 2016
| EFFECTIVE INTEREST RATE |
DUE DATE | PRINCIPAL ‡‡ | COST | FAIR VALUE |
||||||||||||||||
| Corporate Bonds (Continued) |
||||||||||||||||||||
| Finance (Continued) |
||||||||||||||||||||
| First Data Corp.^ |
5.00 | % | 1/15/2024 | 179,000 | $177,910 | $179,448 | ||||||||||||||
| Galaxy Bidco Ltd.+ |
5.59 | # | 11/15/2019 | 100,000 | 161,168 | 131,527 | ||||||||||||||
| Garfunkelux Holdco 3 SA+ |
8.50 | 11/1/2022 | 250,000 | 386,655 | 314,807 | |||||||||||||||
| Marlin Intermediate Holdings PLC MTN+ |
10.50 | 8/1/2020 | 500,000 | 825,386 | 718,875 | |||||||||||||||
|
|
|
|
|
|
|
|||||||||||||||
| Total Finance |
1,279,000 | 1,830,073 | 1,619,597 | |||||||||||||||||
|
|
|
|
|
|
|
|||||||||||||||
| Grocery — 0.1%*: |
|
|||||||||||||||||||
| Premier Foods Finance PLC+ |
5.57 | # | 3/16/2020 | 100,000 | 167,370 | 124,571 | ||||||||||||||
| Premier Foods Finance PLC+ |
6.50 | 3/15/2021 | 100,000 | 146,396 | 126,469 | |||||||||||||||
|
|
|
|
|
|
|
|||||||||||||||
| Total Grocery |
200,000 | 313,766 | 251,040 | |||||||||||||||||
|
|
|
|
|
|
|
|||||||||||||||
| Healthcare, Education and Childcare — 1.3%*: |
|
|||||||||||||||||||
| Care UK Health & Social Care PLC+ |
5.59 | # | 7/15/2019 | 343,000 | 521,188 | 374,427 | ||||||||||||||
| HCA, Inc. |
5.25 | 6/15/2026 | 82,000 | 82,000 | 85,126 | |||||||||||||||
| Prospect Medical Holdings, Inc.^ |
8.38 | 5/1/2019 | 435,000 | 456,126 | 452,400 | |||||||||||||||
| Tenet Healthcare Corp.# |
4.15 | 6/15/2020 | 789,000 | 785,808 | 779,138 | |||||||||||||||
| Unilabs Subholding AB+ |
7.25 | # | 7/15/2018 | 400,000 | 549,479 | 436,354 | ||||||||||||||
|
|
|
|
|
|
|
|||||||||||||||
| Total Healthcare, Education and Childcare |
2,049,000 | 2,394,601 | 2,127,445 | |||||||||||||||||
|
|
|
|
|
|
|
|||||||||||||||
| Hotels, Motels, Inns and Gaming — 0.2%*: |
|
|||||||||||||||||||
| Gala Group Finance PLC+ |
8.88 | 9/1/2018 | 125,714 | 196,315 | 171,373 | |||||||||||||||
| TVL Finance PLC+ |
8.50 | 5/15/2023 | 100,000 | 147,170 | 128,366 | |||||||||||||||
|
|
|
|
|
|
|
|||||||||||||||
| Total Hotels, Motels, Inns and Gaming |
225,714 | 343,485 | 299,739 | |||||||||||||||||
|
|
|
|
|
|
|
|||||||||||||||
| Leisure, Amusement, Entertainment — 0.4%*: |
|
|||||||||||||||||||
| Odeon & UCI Finco PLC MTN+ |
9.00 | 8/1/2018 | 100,000 | 157,204 | 134,190 | |||||||||||||||
| Vougeot Bidco PLC+ |
5.00 | # | 7/15/2020 | 100,000 | 134,939 | 109,532 | ||||||||||||||
| WMG Acquisition Corp. |
6.25 | 1/15/2021 | 387,000 | 466,220 | 440,210 | |||||||||||||||
|
|
|
|
|
|
|
|||||||||||||||
| Total Leisure, Amusement, Entertainment |
587,000 | 758,363 | 683,932 | |||||||||||||||||
|
|
|
|
|
|
|
|||||||||||||||
| Oil and Gas — 0.5%*: |
|
|||||||||||||||||||
| Sabine Pass Liquefaction LLC |
5.63 | 3/1/2025 | 495,000 | 495,000 | 493,144 | |||||||||||||||
| Shelf Drilling Holdings Ltd.+^ |
8.63 | 11/1/2018 | 438,000 | 380,345 | 321,930 | |||||||||||||||
|
|
|
|
|
|
|
|||||||||||||||
| Total Oil and Gas |
933,000 | 875,345 | 815,074 | |||||||||||||||||
|
|
|
|
|
|
|
|||||||||||||||
| Personal Transportation — 0.1%*: |
|
|||||||||||||||||||
| AA Bond Co. Ltd.+ |
5.50 | 7/31/2043 | 150,000 | 223,140 | 190,202 | |||||||||||||||
|
|
|
|
|
|
|
|||||||||||||||
| Personal, Food and Miscellaneous — 0.3%*: |
|
|||||||||||||||||||
| Brakes Capital+ |
7.13 | 12/15/2018 | 300,000 | 512,081 | 413,593 | |||||||||||||||
| Brakes Capital MTN+ |
4.74 | # | 12/15/2018 | 100,000 | 136,645 | 112,018 | ||||||||||||||
|
|
|
|
|
|
|
|||||||||||||||
| Total Personal, Food and Miscellaneous |
400,000 | 648,726 | 525,611 | |||||||||||||||||
|
|
|
|
|
|
|
|||||||||||||||
| Retail Stores — 1.4%*: |
|
|||||||||||||||||||
| Boing Group Financing PLC MTN+ |
6.63 | 7/15/2019 | 350,000 | 397,624 | 356,174 | |||||||||||||||
| Brighthouse Group PLC MTN+ |
7.88 | 5/15/2018 | 150,000 | 242,271 | 179,549 | |||||||||||||||
See accompanying Notes to the Financial Statements.
83
Table of Contents
Babson Global Floating Rate Fund 2016 Annual Report
SCHEDULE OF INVESTMENTS (CONTINUED)
June 30, 2016
| EFFECTIVE INTEREST RATE |
DUE DATE | PRINCIPAL ‡‡ | COST | FAIR VALUE |
||||||||||||||||
| Corporate Bonds (Continued) |
||||||||||||||||||||
| Retail Stores (Continued) |
||||||||||||||||||||
| House of Fraser Funding PLC+ |
6.32 | #% | 9/15/2020 | 300,000 | $464,335 | $371,579 | ||||||||||||||
| HSS Financing PLC+ |
6.75 | 8/1/2019 | 68,000 | 112,557 | 88,171 | |||||||||||||||
| Takko Luxembourg 2 S.C.A. MTN+ |
9.88 | 4/15/2019 | 425,000 | 360,239 | 267,658 | |||||||||||||||
| Travelex Financing PLC+ |
6.59 | # | 8/1/2018 | 700,000 | 1,122,407 | 927,215 | ||||||||||||||
| Travelex Financing PLC+ |
8.00 | 8/1/2018 | 100,000 | 158,773 | 134,057 | |||||||||||||||
|
|
|
|
|
|
|
|||||||||||||||
| Total Retail Stores |
2,093,000 | 2,858,206 | 2,324,403 | |||||||||||||||||
|
|
|
|
|
|
|
|||||||||||||||
| Telecommunications — 0.7%*: |
|
|||||||||||||||||||
| Numericable-SFR+ |
5.38 | 5/15/2022 | 100,000 | 138,295 | 112,484 | |||||||||||||||
| Numericable-SFR SA^+ |
7.38 | 5/1/2026 | 217,000 | 217,000 | 214,559 | |||||||||||||||
| Numericable-SFR SAS+ |
5.63 | 5/15/2024 | 100,000 | 138,165 | 111,625 | |||||||||||||||
| Numericable-SFR SAS+^ |
6.00 | 5/15/2022 | 646,000 | 645,327 | 628,235 | |||||||||||||||
| Wind Acquisition Finance SA+ |
4.13 | # | 7/15/2020 | 150,000 | 159,292 | 163,806 | ||||||||||||||
|
|
|
|
|
|
|
|||||||||||||||
| Total Telecommunications |
1,213,000 | 1,298,079 | 1,230,709 | |||||||||||||||||
|
|
|
|
|
|
|
|||||||||||||||
| Utilities — 0.3%*: |
|
|||||||||||||||||||
| Calpine Corp.^ |
5.25 | 6/1/2026 | 449,000 | 449,000 | 447,878 | |||||||||||||||
|
|
|
|
|
|
|
|||||||||||||||
| Total Corporate Bonds |
14,427,714 | 17,441,484 | 15,314,985 | |||||||||||||||||
|
|
|
|
|
|
|
|||||||||||||||
| Total Fixed Income |
161,700,757 | 166,689,143 | 155,057,398 | |||||||||||||||||
|
|
|
|
|
|
|
|||||||||||||||
| Short-Term Investment — 10.6%*: |
| |||||||||||||||||||
| Bank Deposit — 10.6%*: |
| |||||||||||||||||||
| State Street Bank & Trust Co. Euro Time Deposit |
0.01 | 7/1/2016 | 17,598,766 | 17,598,766 | 17,598,766 | |||||||||||||||
|
|
|
|
|
|
|
|||||||||||||||
| Total Investments |
179,301,574 | 184,287,909 | 172,663,644 | |||||||||||||||||
|
|
|
|
|
|
|
|||||||||||||||
| Other assets and liabilities — (3.6%) |
(6,020,616 | ) | ||||||||||||||||||
|
|
|
|||||||||||||||||||
| Net Assets — 100.0% |
$166,643,028 | |||||||||||||||||||
|
|
|
|||||||||||||||||||
| MTN | Medium Term Note |
| PIK | Payment-in-kind |
| ‡‡ | Unless otherwise indicated, all principal amounts are denominated in United States Dollars. |
| * | Calculated as a percentage of net assets applicable to common shareholders. |
| + | Foreign security. |
Distributions of investments by country of risk (excluding temporary cash investments) as a percentage of total investments in securities, is as follows:
| United States | 69.1% | |||||
| United Kingdom | 10.8% | |||||
| Germany | 8.6% | |||||
| France | 2.9% | |||||
| Canada | 2.1% | |||||
| Netherlands | 1.4% | |||||
| Luxembourg | 1.0% | |||||
| Other (Individually less than 1%) | 4.1% | |||||
|
|
|
|||||
| Total | 100.0% | |||||
|
|
|
See accompanying Notes to the Financial Statements.
84
Table of Contents
Babson Global Floating Rate Fund 2016 Annual Report
SCHEDULE OF INVESTMENTS (CONTINUED)
June 30, 2016
| ^ | Security acquired in a transaction exempt from registration under Rule 144A of the Securities Act of 1933. These securities may only be resold in transactions exempt from registration, normally to qualified institutional buyers. |
| § | Bank loans are exempt from registration under the Securities Act of 1933, as amended, but contain certain restrictions on resale and cannot be sold publicly. These loans pay interest at rates which adjust periodically. The interest rates shown for bank loans are the current interest rates at June 30, 2016. Bank loans are also subject to mandatory and/or optional prepayment which cannot be predicted. As a result, the remaining maturity may be substantially less than the stated maturity shown. |
| # | Variable rate security. The interest rate shown is the rate in effect at June 30, 2016. |
| ¤ | For fair value measurement disclosure purposes, security is categorized as Level 3 (See Note 2). |
| †† | Illiquid security. |
| ~ | Defaulted security. |
A summary of outstanding financial instruments at June 30, 2016 is as follows:
Forward Foreign Currency Exchange Contracts to Buy
| EXPIRATION DATE |
COUNTERPARTY | LOCAL CURRENCY |
VALUE IN USD | IN FOR USD |
NET UNREALIZED (DEPRECIATION) |
|||||||||||||||||
| 7/14/16 | Morgan Stanley & Co. |
EUR | 1,030,894 | 1,144,388 | 1,167,059 | $ | (22,671 | ) | ||||||||||||||
Forward Foreign Currency Exchange Contracts to Sell
| EXPIRATION DATE |
COUNTERPARTY | LOCAL CURRENCY |
VALUE IN USD | IN FOR USD |
NET UNREALIZED APPRECIATION |
|||||||||||||||||
| 7/14/16 | Morgan Stanley & Co. |
EUR | 19,508,862 | 21,656,653 | 22,174,079 | $ | 517,426 | |||||||||||||||
| 7/14/16 | Morgan Stanley & Co. |
GBP | 10,383,160 | 13,823,268 | 15,125,284 | 1,302,016 | ||||||||||||||||
|
|
|
|||||||||||||||||||||
| Net unrealized appreciation on forward foreign exchange contracts to sell |
|
$ | 1,819,442 | |||||||||||||||||||
|
|
|
|||||||||||||||||||||
Currency Legend
| EUR | – | Euro | ||
| GBP | – | British Pound Sterling |
See accompanying Notes to the Financial Statements.
85
Table of Contents
Babson Global Credit Income Opportunities Fund 2016 Annual Report
SCHEDULE OF INVESTMENTS
June 30, 2016
| SHARES |
COST | FAIR VALUE |
||||||||||||||||||
| Equities — 0.4%*: |
||||||||||||||||||||
| Common Stocks — 0.4%*: |
||||||||||||||||||||
| Energy Equipment and Services — 0.0%*: |
| |||||||||||||||||||
| Southcross Energy Partners LP¤ |
11 | $– | $3,740 | |||||||||||||||||
| Southcross Holdings, L.P.(1)¤ |
11 | – | – | |||||||||||||||||
|
|
|
|
|
|
|
|||||||||||||||
| Total Energy Equipment and Services |
22 | – | 3,740 | |||||||||||||||||
|
|
|
|
|
|
|
|||||||||||||||
| Mining, Steel, Iron and Non-Precious Metals — 0.0%*: |
| |||||||||||||||||||
| Boomerang Tube LLC¤ |
2,007 | – | – | |||||||||||||||||
|
|
|
|
|
|
|
|||||||||||||||
| Retail Stores — 0.4%*: |
| |||||||||||||||||||
| Maxeda DIY B.V.¤+ |
18,859,871 | 373,738 | 418,595 | |||||||||||||||||
| Maxeda DIY B.V.¤+ |
10,446 | – | – | |||||||||||||||||
|
|
|
|
|
|
|
|||||||||||||||
| Total Retail Stores |
18,870,317 | 373,738 | 418,595 | |||||||||||||||||
|
|
|
|
|
|
|
|||||||||||||||
| Total Common Stocks |
18,872,346 | 373,738 | 422,335 | |||||||||||||||||
|
|
|
|
|
|
|
|||||||||||||||
| Total Equities |
18,872,346 | 373,738 | 422,335 | |||||||||||||||||
|
|
|
|
|
|
|
|||||||||||||||
| EFFECTIVE INTEREST RATE |
DUE DATE | PRINCIPAL ‡‡ | COST | FAIR VALUE |
||||||||||||||||
| Fixed Income — 94.2%**: |
||||||||||||||||||||
| Asset-Backed Securities — 15.3%*: |
||||||||||||||||||||
| CDO/CLO — 15.3%*: |
| |||||||||||||||||||
| ALM VI Ltd. 2012-6A ER^ |
7.23 | #% | 7/15/2026 | 371,795 | 230,356 | 257,052 | ||||||||||||||
| Apidos CLO XII 2013-12A F^ |
5.53 | # | 4/15/2025 | 500,000 | 451,875 | 328,664 | ||||||||||||||
| Apidos CLO XV 2013-15A E^ |
6.13 | # | 10/20/2025 | 500,000 | 465,123 | 339,689 | ||||||||||||||
| Apidos CLO XVI 2013-16A D^ |
5.13 | # | 1/19/2025 | 500,000 | 442,694 | 397,811 | ||||||||||||||
| Atlas Senior Loan Fund VI Ltd. 2014-6A E^ |
5.83 | # | 10/15/2026 | 800,000 | 735,393 | 634,592 | ||||||||||||||
| Atrium IX 9A E^ |
5.67 | # | 2/28/2024 | 500,000 | 425,078 | 425,691 | ||||||||||||||
| Avery Point IV CLO Ltd. 2014-1A E^ |
5.24 | # | 4/25/2026 | 500,000 | 463,831 | 371,993 | ||||||||||||||
| BlueMountain CLO Ltd. 2014-1A^ |
Zero Coupon | 4/30/2026 | 250,000 | 239,846 | 151,935 | |||||||||||||||
| Cairn CLO B.V. 2013-3A E+^ |
4.90 | # | 10/20/2028 | 1,000,000 | 1,024,133 | 928,275 | ||||||||||||||
| Carlyle Global Market Strategies CLO Ltd. 2013-3A D^ |
5.23 | # | 7/15/2025 | 500,000 | 460,710 | 407,187 | ||||||||||||||
| Carlyle Global Market Strategies CLO Ltd. 2013-4A E^ |
5.13 | # | 10/15/2025 | 500,000 | 465,696 | 404,993 | ||||||||||||||
| Carlyle Global Market Strategies CLO Ltd. 2013-4A F^ |
5.83 | # | 10/15/2025 | 500,000 | 458,383 | 331,216 | ||||||||||||||
| Carlyle Global Market Strategies CLO Ltd. 2014-1A E^ |
5.08 | # | 4/17/2025 | 1,000,000 | 893,280 | 794,170 | ||||||||||||||
| Carlyle Global Market Strategies CLO Ltd. 2014-5A D^ |
5.40 | # | 10/16/2025 | 500,000 | 455,594 | 401,317 | ||||||||||||||
| Dryden 41 Senior Loan Fund 2015-41A E^ |
6.28 | # | 1/15/2028 | 500,000 | 466,242 | 421,336 | ||||||||||||||
| Dryden XXXI Senior Loan Fund 2014-31A E^ |
4.88 | # | 4/18/2026 | 1,000,000 | 898,673 | 751,275 | ||||||||||||||
| Dryden XXXI Senior Loan Fund 2014-31A F^ |
5.98 | # | 4/18/2026 | 500,000 | 463,832 | 298,623 | ||||||||||||||
| Eaton Vance CLO Ltd. 2013-1A D^ |
5.63 | # | 11/13/2024 | 500,000 | 467,898 | 407,076 | ||||||||||||||
| GoldenTree Loan Opportunities VII Ltd. 2013-7A F^ |
5.89 | # | 4/25/2025 | 500,000 | 469,210 | 336,519 | ||||||||||||||
See accompanying Notes to the Financial Statements.
86
Table of Contents
Babson Global Credit Income Opportunities Fund 2016 Annual Report
SCHEDULE OF INVESTMENTS (CONTINUED)
June 30, 2016
| EFFECTIVE INTEREST RATE |
DUE DATE | PRINCIPAL ‡‡ | COST | FAIR VALUE |
||||||||||||||||
| Asset-Backed Securities (Continued) |
|
|||||||||||||||||||
| CDO/CLO (Continued) |
||||||||||||||||||||
| LCM XIII LP 13A E^ |
5.48 | #% | 1/19/2023 | 750,000 | $707,677 | $638,751 | ||||||||||||||
| LCM XV LP 15A E1^ |
5.11 | # | 8/25/2024 | 500,000 | 469,832 | 394,811 | ||||||||||||||
| LCM XVII LP 17A E^ |
5.38 | # | 10/15/2026 | 1,000,000 | 902,772 | 803,130 | ||||||||||||||
| Madison Park Funding XIII Ltd. 2014-13A^ |
Zero Coupon | 1/19/2025 | 500,000 | 394,736 | 354,753 | |||||||||||||||
| Oak Hill Credit Partners X Ltd. 2014-10A^ |
Zero Coupon | 7/20/2026 | 500,000 | 453,505 | 283,924 | |||||||||||||||
| OHA Credit Partners IX Ltd. 2013-9A E^ |
5.63 | 10/20/2025 | 500,000 | 470,375 | 415,331 | |||||||||||||||
| Pinnacle Park CLO Ltd. 2014-1A E^ |
5.58 | # | 4/15/2026 | 500,000 | 471,820 | 392,733 | ||||||||||||||
| Seneca Park CLO Ltd. 2014-1A E^ |
5.33 | # | 7/17/2026 | 1,020,000 | 933,579 | 761,009 | ||||||||||||||
| Silver Spring CLO Ltd. 2014-1A E^ |
5.53 | # | 10/15/2026 | 1,000,000 | 910,783 | 506,569 | ||||||||||||||
| Symphony CLO XI Ltd. 2013-11A D^ |
4.63 | # | 1/17/2025 | 500,000 | 456,082 | 485,608 | ||||||||||||||
| Tryon Park CLO Ltd. 2013-1A D^ |
5.03 | # | 7/15/2025 | 500,000 | 466,314 | 396,610 | ||||||||||||||
| Voya CLO Ltd. 2013-2A E^ |
6.14 | # | 4/25/2025 | 500,000 | 468,776 | 326,356 | ||||||||||||||
| Voya CLO Ltd. 2013-3A D^ |
5.13 | # | 1/18/2026 | 750,000 | 680,800 | 601,660 | ||||||||||||||
| Voya CLO Ltd. 2014-3A D^ |
5.64 | # | 7/25/2026 | 500,000 | 459,893 | 388,045 | ||||||||||||||
|
|
|
|
|
|
|
|||||||||||||||
| Total CDO/CLO |
19,941,795 | 18,224,791 | 15,138,704 | |||||||||||||||||
|
|
|
|
|
|
|
|||||||||||||||
| Total Asset-Backed Securities |
19,941,795 | 18,224,791 | 15,138,704 | |||||||||||||||||
|
|
|
|
|
|
|
|||||||||||||||
| Bank Loans — 24.3%**§: |
||||||||||||||||||||
| Aerospace and Defense — 1.1%*: |
||||||||||||||||||||
| Swissport Investments SA+ |
6.25 | 2/9/2022 | 500,000 | 532,054 | 546,452 | |||||||||||||||
| TransDigm, Inc. |
3.75 | 5/14/2022 | 497,603 | 492,194 | 489,363 | |||||||||||||||
|
|
|
|
|
|
|
|||||||||||||||
| Total Aerospace and Defense |
997,603 | 1,024,248 | 1,035,815 | |||||||||||||||||
|
|
|
|
|
|
|
|||||||||||||||
| Beverage, Food and Tobacco — 0.4%*: |
||||||||||||||||||||
| Deoleo SA+ |
4.50 | 6/11/2021 | 500,000 | 554,155 | 436,503 | |||||||||||||||
|
|
|
|
|
|
|
|||||||||||||||
| Broadcasting and Entertainment — 0.6%*: |
||||||||||||||||||||
| All3Media International+ |
5.25 | 6/30/2021 | 500,000 | 834,582 | 621,947 | |||||||||||||||
|
|
|
|
|
|
|
|||||||||||||||
| Chemicals, Plastics and Rubber — 2.3%*: |
||||||||||||||||||||
| Allnex (Luxembourg) & Cy S.C.A.+ |
4.25 | 5/31/2023 | 285,162 | 283,736 | 281,597 | |||||||||||||||
| Allnex USA, Inc.+ |
4.25 | 5/31/2023 | 214,838 | 213,764 | 212,153 | |||||||||||||||
| MacDermid, Inc. |
5.50 | 6/7/2020 | 464,875 | 456,733 | 458,134 | |||||||||||||||
| Methanol Holdings (Trinidad) Ltd. |
4.25 | 6/30/2022 | 348,965 | 345,966 | 341,986 | |||||||||||||||
| Styrolution Group GmbH+ |
6.50 | 11/7/2019 | 492,500 | 608,326 | 546,279 | |||||||||||||||
| Tronox Pigments (United States) B.V. |
4.50 | 3/19/2020 | 498,715 | 479,217 | 476,272 | |||||||||||||||
|
|
|
|
|
|
|
|||||||||||||||
| Total Chemicals, Plastics and Rubber |
2,305,055 | 2,387,742 | 2,316,421 | |||||||||||||||||
|
|
|
|
|
|
|
|||||||||||||||
| Containers, Packaging and Glass — 0.6%*: |
||||||||||||||||||||
| Consolidated Container Co. LLC |
7.75 | 1/3/2020 | 94,140 | 92,942 | 84,177 | |||||||||||||||
| Prolampac Intermediate, Inc. |
9.25 | 8/18/2023 | 500,000 | 491,061 | 470,000 | |||||||||||||||
|
|
|
|
|
|
|
|||||||||||||||
| Total Containers, Packaging and Glass |
594,140 | 584,003 | 554,177 | |||||||||||||||||
|
|
|
|
|
|
|
|||||||||||||||
See accompanying Notes to the Financial Statements.
87
Table of Contents
Babson Global Credit Income Opportunities Fund 2016 Annual Report
SCHEDULE OF INVESTMENTS (CONTINUED)
June 30, 2016
| EFFECTIVE INTEREST RATE |
DUE DATE | PRINCIPAL ‡‡ | COST | FAIR VALUE |
||||||||||||||||
| Bank Loans (Continued) |
||||||||||||||||||||
| Diversified/Conglomerate Manufacturing — 0.8%*: |
|
|||||||||||||||||||
| MTS Systems Corp. |
4.25 | % | 6/21/2023 | 111,340 | $109,842 | $110,923 | ||||||||||||||
| Triple Point Technology, Inc. |
5.25 | 7/10/2020 | 336,858 | 316,873 | 275,661 | |||||||||||||||
| Triple Point Technology, Inc.†† |
9.25 | 7/10/2021 | 50,846 | 47,922 | 31,016 | |||||||||||||||
| West Corp. |
2.71 | 7/1/2019 | 356,497 | 348,158 | 346,693 | |||||||||||||||
|
|
|
|
|
|
|
|||||||||||||||
| Total Diversified/Conglomerate Manufacturing |
855,541 | 822,795 | 764,293 | |||||||||||||||||
|
|
|
|
|
|
|
|||||||||||||||
| Diversified/Conglomerate Service — 2.1%*: |
||||||||||||||||||||
| Aquilex Holdings LLC |
5.00 | 12/31/2020 | 91,838 | 91,689 | 87,246 | |||||||||||||||
| Atrium Innovations, Inc.+ |
4.25 | 2/13/2021 | 459,352 | 458,202 | 444,997 | |||||||||||||||
| MH Sub I LLC |
8.50 | 7/8/2022 | 650,000 | 646,694 | 627,250 | |||||||||||||||
| Power Team Services LLC |
8.25 | 11/6/2020 | 300,000 | 299,037 | 291,000 | |||||||||||||||
| RP Crown Parent LLC |
6.00 | 12/21/2018 | 542,637 | 543,780 | 509,569 | |||||||||||||||
| RP Crown Parent LLC |
11.25 | 12/20/2019 | 178,571 | 182,012 | 147,619 | |||||||||||||||
|
|
|
|
|
|
|
|||||||||||||||
| Total Diversified/Conglomerate Service |
2,222,398 | 2,221,414 | 2,107,681 | |||||||||||||||||
|
|
|
|
|
|
|
|||||||||||||||
| Ecological — 0.8%*: |
||||||||||||||||||||
| Biffa Waste Services Ltd.+ |
5.59 | 1/30/2018 | 500,000 | 702,492 | 639,972 | |||||||||||||||
| Emerald 3 Ltd.+ |
8.00 | 5/31/2022 | 196,488 | 193,638 | 174,874 | |||||||||||||||
|
|
|
|
|
|
|
|||||||||||||||
| Total Ecological |
696,488 | 896,130 | 814,846 | |||||||||||||||||
|
|
|
|
|
|
|
|||||||||||||||
| Electronics — 0.2%*: |
||||||||||||||||||||
| Western Digital Corp. |
6.25 | 4/29/2023 | 205,471 | 199,445 | 206,114 | |||||||||||||||
|
|
|
|
|
|
|
|||||||||||||||
| Finance — 0.9%*: |
||||||||||||||||||||
| Moneygram International, Inc. |
4.25 | 3/27/2020 | 632,629 | 604,358 | 597,240 | |||||||||||||||
| Sedgwick Claims Management Services, Inc. |
3.75 | 3/1/2021 | 291,932 | 291,444 | 284,998 | |||||||||||||||
|
|
|
|
|
|
|
|||||||||||||||
| Total Finance |
|
924,561 | 895,802 | 882,238 | ||||||||||||||||
|
|
|
|
|
|
|
|||||||||||||||
| Healthcare, Education and Childcare — 1.9%*: |
|
|||||||||||||||||||
| Rodenstock GmbH+ |
4.14 | 5/30/2019 | 500,000 | 533,123 | 521,582 | |||||||||||||||
| Synarc-Biocore Holdings LLC |
5.50 | 3/10/2021 | 391,861 | 389,221 | 384,024 | |||||||||||||||
| Synarc-Biocore Holdings LLC |
9.25 | 3/10/2022 | 500,000 | 496,427 | 475,000 | |||||||||||||||
| Tecomet, Inc. |
5.75 | 12/5/2021 | 576,570 | 548,549 | 541,976 | |||||||||||||||
|
|
|
|
|
|
|
|||||||||||||||
| Total Healthcare, Education and Childcare |
1,968,431 | 1,967,320 | 1,922,582 | |||||||||||||||||
|
|
|
|
|
|
|
|||||||||||||||
| Hotels, Motels, Inns and Gaming — 0.7%*: |
||||||||||||||||||||
| Compass Holdco 2 Ltd.+ |
5.82 | 11/10/2022 | 500,000 | 755,482 | 661,105 | |||||||||||||||
|
|
|
|
|
|
|
|||||||||||||||
| Leisure, Amusement, Entertainment — 1.5%*: |
||||||||||||||||||||
| AP NMT Acquisition B.V.+ |
7.00 | 8/13/2021 | 399,222 | 487,112 | 373,480 | |||||||||||||||
| AP NMT Acquisition B.V.+ |
10.00 | 8/13/2022 | 300,000 | 281,518 | 191,250 | |||||||||||||||
| Delta 2 (Lux) Sarl+ |
7.75 | 7/31/2022 | 125,000 | 124,628 | 118,281 | |||||||||||||||
| WMG Acquisition Corp. |
3.75 | 7/1/2020 | 790,545 | 784,550 | 780,663 | |||||||||||||||
|
|
|
|
|
|
|
|||||||||||||||
| Total Leisure, Amusement, Entertainment |
1,614,767 | 1,677,808 | 1,463,674 | |||||||||||||||||
|
|
|
|
|
|
|
|||||||||||||||
See accompanying Notes to the Financial Statements.
88
Table of Contents
Babson Global Credit Income Opportunities Fund 2016 Annual Report
SCHEDULE OF INVESTMENTS (CONTINUED)
June 30, 2016
| EFFECTIVE INTEREST RATE |
DUE DATE | PRINCIPAL ‡‡ | COST | FAIR VALUE |
||||||||||||||||
| Bank Loans (Continued) |
||||||||||||||||||||
| Machinery Non-Agriculture, Non-Construction, Non-Electronic — 1.0%*: |
|
|||||||||||||||||||
| Alison Bidco Sarl+ |
5.25 | % | 8/29/2021 | 146,028 | $144,946 | $142,256 | ||||||||||||||
| Gardner Denver, Inc. |
4.25 | 7/30/2020 | 864,934 | 824,936 | 794,295 | |||||||||||||||
|
|
|
|
|
|
|
|||||||||||||||
| Total Machinery Non-Agriculture, |
1,010,962 | 969,882 | 936,551 | |||||||||||||||||
|
|
|
|
|
|
|
|||||||||||||||
| Mining, Steel, Iron and Non-Precious Metals — 1.2%*: |
|
|||||||||||||||||||
| Arch Coal, Inc. |
5.00 | 1/31/2017 | 269,993 | 269,993 | 265,943 | |||||||||||||||
| Arch Coal, Inc. |
7.50 | 5/16/2018 | 738,547 | 732,820 | 338,808 | |||||||||||||||
| Boomerang Tube LLC¤ |
15.00 | 2/2/2020 | 32,825 | 32,900 | 32,825 | |||||||||||||||
| Boomerang Tube LLC¤ |
15.65 | 2/2/2020 | 87,925 | 87,925 | 87,925 | |||||||||||||||
| Boomerang Tube LLC¤ |
17.50 | 2/2/2020 | 72,403 | 72,403 | 72,403 | |||||||||||||||
| Boomerang Tube LLC¤ |
20.00 | 2/2/2020 | 31,324 | 28,767 | 28,192 | |||||||||||||||
| Murray Energy Corp. |
7.50 | 4/16/2020 | 197,750 | 193,225 | 143,369 | |||||||||||||||
| Zekelman Industries, Inc. |
6.00 | 6/14/2021 | 180,195 | 178,393 | 179,894 | |||||||||||||||
|
|
|
|
|
|
|
|||||||||||||||
| Total Mining, Steel, Iron and Non-Precious Metals |
|
1,610,962 | 1,596,426 | 1,149,359 | ||||||||||||||||
|
|
|
|
|
|
|
|||||||||||||||
| Oil and Gas — 2.8%*: |
||||||||||||||||||||
| American Energy – Marcellus LLC |
7.50 | 8/4/2021 | 60,369 | 59,708 | 8,955 | |||||||||||||||
| Caelus Energy Alaska O3 LLC |
8.75 | 4/15/2020 | 846,154 | 774,350 | 499,231 | |||||||||||||||
| Fieldwood Energy LLC |
7.00 | 9/30/2018 | 649,368 | 575,127 | 534,644 | |||||||||||||||
| Fieldwood Energy LLC PIK |
7.13 | 9/30/2020 | 1,885,340 | 767,304 | 735,543 | |||||||||||||||
| Floatel International Ltd. |
6.00 | 6/27/2020 | 201,176 | 199,820 | 121,913 | |||||||||||||||
| Jonah Energy LLC |
7.50 | 5/12/2021 | 173,566 | 171,753 | 151,436 | |||||||||||||||
| Paragon Offshore Finance Co. |
5.25 | 7/18/2021 | 479,874 | 390,543 | 119,968 | |||||||||||||||
| Seadrill Partners Finco LLC |
4.00 | 2/21/2021 | 253,761 | 160,141 | 112,670 | |||||||||||||||
| Southcross Holdings Borrower LP |
9.00 | 4/13/2023 | 9,730 | 9,730 | 8,173 | |||||||||||||||
| Western Refining, Inc. |
4.50 | 6/23/2023 | 500,000 | 490,000 | 486,460 | |||||||||||||||
|
|
|
|
|
|
|
|||||||||||||||
| Total Oil and Gas |
5,059,338 | 3,598,476 | 2,778,993 | |||||||||||||||||
|
|
|
|
|
|
|
|||||||||||||||
| Printing and Publishing — 2.0%*: |
||||||||||||||||||||
| Springer Science+Business Media Deutschland GmbH+ |
3.75 | 8/14/2020 | 500,000 | 559,816 | 552,101 | |||||||||||||||
| Springer Science+Business Media Deutschland GmbH+ |
9.00 | 8/14/2021 | 1,300,000 | 1,496,048 | 1,471,528 | |||||||||||||||
|
|
|
|
|
|
|
|||||||||||||||
| Total Printing and Publishing |
1,800,000 | 2,055,864 | 2,023,629 | |||||||||||||||||
|
|
|
|
|
|
|
|||||||||||||||
| Retail Stores — 2.1%*: |
||||||||||||||||||||
| Academy, Ltd. |
5.00 | 7/1/2022 | 497,341 | 475,749 | 465,014 | |||||||||||||||
| Container Store, Inc. (The) |
4.25 | 4/6/2019 | 498,587 | 452,742 | 432,524 | |||||||||||||||
| Mattress Holding Corp. |
6.25 | 10/20/2021 | 623,952 | 608,664 | 608,354 | |||||||||||||||
| Maxeda DIY B.V.+ |
7.00 | 6/28/2019 | 583,333 | 635,206 | 521,579 | |||||||||||||||
|
|
|
|
|
|
|
|||||||||||||||
| Total Retail Stores |
2,203,213 | 2,172,361 | 2,027,471 | |||||||||||||||||
|
|
|
|
|
|
|
|||||||||||||||
See accompanying Notes to the Financial Statements.
89
Table of Contents
Babson Global Credit Income Opportunities Fund 2016 Annual Report
SCHEDULE OF INVESTMENTS (CONTINUED)
June 30, 2016
| EFFECTIVE INTEREST RATE |
DUE DATE | PRINCIPAL ‡‡ | COST | FAIR VALUE |
||||||||||||||||
| Bank Loans (Continued) |
||||||||||||||||||||
| Utilities — 1.3%*: |
||||||||||||||||||||
| Dynegy, Inc. |
4.00 | % | 6/20/2023 | 499,093 | $494,102 | $490,050 | ||||||||||||||
| EFS Cogen Holdings I LLC |
4.25 | 6/22/2023 | 794,138 | 786,180 | 795,130 | |||||||||||||||
|
|
|
|
|
|
|
|||||||||||||||
| Total Utilities |
1,293,231 | 1,280,282 | 1,285,180 | |||||||||||||||||
|
|
|
|
|
|
|
|||||||||||||||
| Total Bank Loans |
26,862,161 | 26,494,217 | 23,988,579 | |||||||||||||||||
|
|
|
|
|
|
|
|||||||||||||||
| Corporate Bonds — 54.6%**: |
||||||||||||||||||||
| Aerospace and Defense — 0.8%*: |
||||||||||||||||||||
| CPI International, Inc. |
8.75 | 2/15/2018 | 814,000 | 824,199 | 807,895 | |||||||||||||||
|
|
|
|
|
|
|
|||||||||||||||
| Automobile — 3.4%*: |
||||||||||||||||||||
| Allied Specialty Vehicles, Inc.^ |
8.50 | 11/1/2019 | 1,000,000 | 1,022,242 | 1,012,500 | |||||||||||||||
| Gates Global LLC/Gates Global Co.^ |
6.00 | 7/15/2022 | 1,000,000 | 775,486 | 875,000 | |||||||||||||||
| International Automotive Components Group SA^ |
9.13 | 6/1/2018 | 940,000 | 956,280 | 940,000 | |||||||||||||||
| JB Poindexter & Co., Inc.^ |
9.00 | 4/1/2022 | 500,000 | 521,420 | 520,000 | |||||||||||||||
|
|
|
|
|
|
|
|||||||||||||||
| Total Automobile |
3,440,000 | 3,275,428 | 3,347,500 | |||||||||||||||||
|
|
|
|
|
|
|
|||||||||||||||
| Banking — 0.3%*: |
||||||||||||||||||||
| Lock AS+ |
7.00 | 8/15/2021 | 250,000 | 335,562 | 282,293 | |||||||||||||||
|
|
|
|
|
|
|
|||||||||||||||
| Beverage, Food and Tobacco — 0.9%*: |
||||||||||||||||||||
| Boparan Finance PLC+ |
5.50 | 7/15/2021 | 450,000 | 625,868 | 522,682 | |||||||||||||||
| Pizzaexpress Financing 2 PLC+ |
6.63 | 8/1/2021 | 150,000 | 254,595 | 187,175 | |||||||||||||||
| US Foods, Inc.^ |
5.88 | 6/15/2024 | 154,000 | 154,000 | 157,850 | |||||||||||||||
|
|
|
|
|
|
|
|||||||||||||||
| Total Beverage, Food and Tobacco |
754,000 | 1,034,463 | 867,707 | |||||||||||||||||
|
|
|
|
|
|
|
|||||||||||||||
| Broadcasting and Entertainment — 2.6%*: |
||||||||||||||||||||
| DISH DBS Corp.^ |
7.75 | 7/1/2026 | 750,000 | 755,615 | 772,500 | |||||||||||||||
| Entertainment One Ltd.+ |
6.88 | 12/15/2022 | 200,000 | 302,472 | 267,422 | |||||||||||||||
| RCN Telecom Services LLC/RCN Capital Corp.^ |
8.50 | 8/15/2020 | 775,000 | 777,436 | 794,375 | |||||||||||||||
| Unitymedia GmbH+ |
3.75 | 1/15/2027 | 300,000 | 335,460 | 304,626 | |||||||||||||||
| Univision Communications, Inc.^ |
8.50 | 5/15/2021 | 393,000 | 400,809 | 410,685 | |||||||||||||||
|
|
|
|
|
|
|
|||||||||||||||
| Total Broadcasting and Entertainment |
2,418,000 | 2,571,792 | 2,549,608 | |||||||||||||||||
|
|
|
|
|
|
|
|||||||||||||||
| Buildings and Real Estate — 1.9%*: |
||||||||||||||||||||
| Brookfield Residential Properties, Inc.^+ |
6.38 | 5/15/2025 | 400,000 | 365,076 | 365,000 | |||||||||||||||
| Cemex Finance LLC+^ |
9.38 | 10/12/2022 | 400,000 | 434,122 | 440,000 | |||||||||||||||
| Cemex SAB de CV+ |
4.38 | 3/5/2023 | 100,000 | 111,980 | 107,746 | |||||||||||||||
| Keystone Financing PLC+ |
9.50 | 10/15/2019 | 350,000 | 564,491 | 469,618 | |||||||||||||||
| Paroc Group Oy+ |
6.25 | 5/15/2020 | 100,000 | 137,565 | 110,087 | |||||||||||||||
| Paroc Group Oy MTN+ |
4.99 | # | 5/15/2020 | 100,000 | 137,565 | 106,813 | ||||||||||||||
| William Lyon Homes, Inc. |
7.00 | 8/15/2022 | 295,000 | 300,349 | 292,050 | |||||||||||||||
|
|
|
|
|
|
|
|||||||||||||||
| Total Buildings and Real Estate |
1,745,000 | 2,051,148 | 1,891,314 | |||||||||||||||||
|
|
|
|
|
|
|
|||||||||||||||
See accompanying Notes to the Financial Statements.
90
Table of Contents
Babson Global Credit Income Opportunities Fund 2016 Annual Report
SCHEDULE OF INVESTMENTS (CONTINUED)
June 30, 2016
| EFFECTIVE INTEREST RATE |
DUE DATE | PRINCIPAL ‡‡ | COST | FAIR VALUE |
||||||||||||||||
| Corporate Bonds (Continued) |
||||||||||||||||||||
| Cargo Transport — 2.9%*: |
||||||||||||||||||||
| Deck Chassis Acquisition, Inc.^ |
10.00 | % | 6/15/2023 | 580,000 | $580,000 | $600,300 | ||||||||||||||
| DH Services Luxembourg Sarl^ |
7.75 | 12/15/2020 | 200,000 | 204,415 | 209,500 | |||||||||||||||
| Moto Finance PLC+ |
6.38 | 9/1/2020 | 200,000 | 300,551 | 271,575 | |||||||||||||||
| OPE KAG Finance Sub, Inc.^ |
7.88 | 7/31/2023 | 1,367,000 | 1,367,000 | 1,346,495 | |||||||||||||||
| WFS Global Holding SAS+ |
9.50 | 7/15/2022 | 150,000 | 170,153 | 155,643 | |||||||||||||||
| WFS Global Holding SAS+ |
12.50 | 12/30/2022 | 300,000 | 328,145 | 298,660 | |||||||||||||||
|
|
|
|
|
|
|
|||||||||||||||
| Total Cargo Transport |
2,797,000 | 2,950,264 | 2,882,173 | |||||||||||||||||
|
|
|
|
|
|
|
|||||||||||||||
| Chemicals, Plastics and Rubber — 3.6%*: |
||||||||||||||||||||
| Consolidated Energy Finance SA+^ |
6.75 | 10/15/2019 | 1,000,000 | 994,310 | 940,000 | |||||||||||||||
| Huntsman International LLC |
4.25 | 4/1/2025 | 300,000 | 279,134 | 301,131 | |||||||||||||||
| Ineos Finance PLC+ |
4.00 | 5/1/2023 | 200,000 | 216,510 | 212,863 | |||||||||||||||
| LSB Industries, Inc. |
7.75 | 8/1/2019 | 270,000 | 232,239 | 268,988 | |||||||||||||||
| Monitchem HoldCo 3 SA+ |
5.25 | 6/15/2021 | 100,000 | 112,352 | 109,310 | |||||||||||||||
| OMNOVA Solutions, Inc. |
7.88 | 11/1/2018 | 723,000 | 733,034 | 723,000 | |||||||||||||||
| Pinnacle Operating Corp.^ |
9.00 | 11/15/2020 | 600,000 | 613,261 | 504,000 | |||||||||||||||
| PSPC Escrow Corp. |
6.00 | 2/1/2023 | 250,000 | 243,335 | 234,435 | |||||||||||||||
| Trinseo Materials Operating SCA/Trinseo Materials Finance, Inc. |
6.38 | 5/1/2022 | 200,000 | 219,674 | 223,226 | |||||||||||||||
|
|
|
|
|
|
|
|||||||||||||||
| Total Chemicals, Plastics and Rubber |
3,643,000 | 3,643,849 | 3,516,953 | |||||||||||||||||
|
|
|
|
|
|
|
|||||||||||||||
| Containers, Packaging and Glass — 3.7%*: |
||||||||||||||||||||
| Ardagh Packaging Finance PLC/Ardagh Holdings USA, Inc.+ |
6.75 | 5/15/2024 | 300,000 | 343,086 | 337,919 | |||||||||||||||
| Coveris Holdings SA^ |
7.88 | 11/1/2019 | 900,000 | 902,481 | 874,125 | |||||||||||||||
| Iron Mountain Europe PLC+ |
6.13 | 9/15/2022 | 300,000 | 432,933 | 402,769 | |||||||||||||||
| Mustang Merger Corp.^ |
8.50 | 8/15/2021 | 750,000 | 746,622 | 783,750 | |||||||||||||||
| SIG Combibloc Holdings SCA+ |
7.75 | 2/15/2023 | 400,000 | 459,340 | 467,382 | |||||||||||||||
| Signode Industrial Group Lux SA/Signode Industrial Group US, Inc.^ |
6.38 | 5/1/2022 | 500,000 | 488,957 | 478,125 | |||||||||||||||
| Verallia Packaging SASU+ |
5.13 | 8/1/2022 | 300,000 | 340,753 | 340,832 | |||||||||||||||
|
|
|
|
|
|
|
|||||||||||||||
| Total Containers, Packaging and Glass |
3,450,000 | 3,714,172 | 3,684,902 | |||||||||||||||||
|
|
|
|
|
|
|
|||||||||||||||
| Diversified Natural Resources, Precious Metals and Minerals — 0.2%*: |
|
|||||||||||||||||||
| Ence Energia y Celulosa SA+ |
5.38 | 11/1/2022 | 200,000 | 224,776 | 233,259 | |||||||||||||||
|
|
|
|
|
|
|
|||||||||||||||
| Diversified/Conglomerate Manufacturing — 3.2%*: |
|
|||||||||||||||||||
| Appvion, Inc.^ |
9.00 | 6/1/2020 | 500,000 | 510,716 | 283,125 | |||||||||||||||
| CTP Transportation Products LLC/CTP Finance, Inc.^ |
8.25 | 12/15/2019 | 648,000 | 662,012 | 570,240 | |||||||||||||||
| EnPro Industries, Inc. |
5.88 | 9/15/2022 | 400,000 | 403,792 | 402,000 | |||||||||||||||
| Galapagos SA+ |
5.38 | 6/15/2021 | 175,000 | 219,658 | 179,058 | |||||||||||||||
| Griffon Corp.^ |
5.25 | 3/1/2022 | 800,000 | 790,257 | 790,000 | |||||||||||||||
| StoneMor Partners LP/Cornerstone Family Services of West Virginia Subsidiary |
7.88 | 6/1/2021 | 500,000 | 515,431 | 495,000 | |||||||||||||||
| West Corp.^ |
5.38 | 7/15/2022 | 500,000 | 477,420 | 465,000 | |||||||||||||||
|
|
|
|
|
|
|
|||||||||||||||
| Total Diversified/Conglomerate Manufacturing |
3,523,000 | 3,579,286 | 3,184,423 | |||||||||||||||||
|
|
|
|
|
|
|
|||||||||||||||
See accompanying Notes to the Financial Statements.
91
Table of Contents
Babson Global Credit Income Opportunities Fund 2016 Annual Report
SCHEDULE OF INVESTMENTS (CONTINUED)
June 30, 2016
| EFFECTIVE INTEREST RATE |
DUE DATE | PRINCIPAL ‡‡ | COST | FAIR VALUE |
||||||||||||||||
| Corporate Bonds (Continued) |
||||||||||||||||||||
| Diversified/Conglomerate Service — 2.3%*: |
||||||||||||||||||||
| Avis Budget Car Rental LLC/Avis Budget Finance, Inc.^ |
6.38 | % | 4/1/2024 | 261,000 | $258,393 | $258,390 | ||||||||||||||
| Carlson Travel Holdings, Inc. PIK^ |
7.50 | 8/15/2019 | 665,000 | 672,237 | 635,075 | |||||||||||||||
| Verisure Holding AB+ |
6.00 | 11/1/2022 | 450,000 | 500,405 | 531,598 | |||||||||||||||
| Zachry Holdings, Inc.^ |
7.50 | 2/1/2020 | 871,000 | 868,038 | 862,290 | |||||||||||||||
|
|
|
|
|
|
|
|||||||||||||||
| Total Diversified/Conglomerate Service |
2,247,000 | 2,299,073 | 2,287,353 | |||||||||||||||||
|
|
|
|
|
|
|
|||||||||||||||
| Electronics — 1.0%*: |
||||||||||||||||||||
| Prime Security Services Borrower LLC/Prime Finance, Inc.^ |
9.25 | 5/15/2023 | 491,000 | 491,000 | 520,460 | |||||||||||||||
| WESCO Distribution, Inc.^ |
5.38 | 6/15/2024 | 443,000 | 443,000 | 443,000 | |||||||||||||||
|
|
|
|
|
|
|
|||||||||||||||
| Total Electronics |
934,000 | 934,000 | 963,460 | |||||||||||||||||
|
|
|
|
|
|
|
|||||||||||||||
| Finance — 3.4%*: |
||||||||||||||||||||
| Arrow Global Finance PLC+ |
4.75 | # | 5/1/2023 | 100,000 | 111,201 | 109,310 | ||||||||||||||
| Cabot Financial Luxembourg SA+ |
10.38 | 10/1/2019 | 100,000 | 170,917 | 140,447 | |||||||||||||||
| Galaxy Finco Ltd.+ |
7.88 | 11/15/2021 | 550,000 | 817,083 | 717,543 | |||||||||||||||
| Garfunkelux Holdco 3 SA+ |
7.50 | 8/1/2022 | 100,000 | 110,662 | 108,645 | |||||||||||||||
| Garfunkelux Holdco 3 SA+ |
8.50 | 11/1/2022 | 650,000 | 1,006,940 | 818,499 | |||||||||||||||
| Marlin Intermediate Holdings PLC MTN+ |
10.50 | 8/1/2020 | 200,000 | 306,392 | 287,550 | |||||||||||||||
| National Financial Partners Corp.^ |
9.00 | 7/15/2021 | 279,000 | 277,807 | 268,886 | |||||||||||||||
| TMF Group Holding BV+ |
9.88 | 12/1/2019 | 800,000 | 1,076,055 | 947,282 | |||||||||||||||
|
|
|
|
|
|
|
|||||||||||||||
| Total Finance |
2,779,000 | 3,877,057 | 3,398,162 | |||||||||||||||||
|
|
|
|
|
|
|
|||||||||||||||
| Grocery — 0.3%*: |
||||||||||||||||||||
| Premier Foods Finance PLC+ |
6.50 | 3/15/2021 | 200,000 | 338,743 | 252,937 | |||||||||||||||
|
|
|
|
|
|
|
|||||||||||||||
| Healthcare, Education and Childcare — 3.3%*: |
|
|||||||||||||||||||
| Alere, Inc.^ |
6.38 | 7/1/2023 | 490,000 | 490,000 | 510,825 | |||||||||||||||
| Capsugel SA PIK^ |
7.00 | 5/15/2019 | 500,000 | 504,660 | 501,250 | |||||||||||||||
| Care UK Health & Social Care PLC+ |
5.59 | # | 7/15/2019 | 100,000 | 153,513 | 109,163 | ||||||||||||||
| Cerberus Nightingale 1 Sarl+ |
8.25 | 2/1/2020 | 550,000 | 627,428 | 621,959 | |||||||||||||||
| Cognita Financing PLC+ |
7.75 | 8/15/2021 | 350,000 | 545,450 | 472,469 | |||||||||||||||
| ConvaTec Healthcare E SA^ |
10.50 | 12/15/2018 | 200,000 | 202,518 | 204,500 | |||||||||||||||
| Ephios Bondco PLC+ |
6.25 | 7/1/2022 | 100,000 | 114,600 | 117,079 | |||||||||||||||
| Kinetic Concepts, Inc./KCI USA, Inc.^ |
7.88 | 2/15/2021 | 199,000 | 209,399 | 211,561 | |||||||||||||||
| Tenet Healthcare Corp. |
6.75 | 6/15/2023 | 294,000 | 292,680 | 281,505 | |||||||||||||||
| Unilabs Subholding AB+ |
8.50 | 7/15/2018 | 200,000 | 281,209 | 226,478 | |||||||||||||||
|
|
|
|
|
|
|
|||||||||||||||
| Total Healthcare, Education and Childcare |
2,983,000 | 3,421,457 | 3,256,789 | |||||||||||||||||
|
|
|
|
|
|
|
|||||||||||||||
| Home and Office Furnishings, Housewares, and Durable Consumer Products — 0.5%*: |
|
|||||||||||||||||||
| LSF9 Balta Issuer SA+ |
7.75 | 9/15/2022 | 400,000 | 480,303 | 467,515 | |||||||||||||||
|
|
|
|
|
|
|
|||||||||||||||
| Hotels, Motels, Inns and Gaming — 0.4%*: |
||||||||||||||||||||
| Gala Electric Casinos PLC+ |
11.50 | 6/1/2019 | 63,636 | 110,775 | 87,363 | |||||||||||||||
| TVL Finance PLC+ |
8.50 | 5/15/2023 | 250,000 | 366,342 | 320,915 | |||||||||||||||
|
|
|
|
|
|
|
|||||||||||||||
| Total Hotels, Motels, Inns and Gaming |
313,636 | 477,117 | 408,278 | |||||||||||||||||
|
|
|
|
|
|
|
|||||||||||||||
See accompanying Notes to the Financial Statements.
92
Table of Contents
Babson Global Credit Income Opportunities Fund 2016 Annual Report
SCHEDULE OF INVESTMENTS (CONTINUED)
June 30, 2016
| EFFECTIVE INTEREST RATE |
DUE DATE | PRINCIPAL ‡‡ | COST | FAIR VALUE |
||||||||||||||||
| Corporate Bonds (Continued) |
| |||||||||||||||||||
| Leisure, Amusement, Entertainment — 2.6%*: |
||||||||||||||||||||
| CPUK Finance Ltd.+ |
7.00 | % | 2/28/2042 | 483,000 | $734,387 | $659,068 | ||||||||||||||
| Interval Acquisition Corp. |
5.63 | 4/15/2023 | 459,000 | 459,000 | 460,148 | |||||||||||||||
| Odeon & UCI Finco PLC MTN+ |
9.00 | 8/1/2018 | 200,000 | 318,173 | 268,380 | |||||||||||||||
| Perform Group Financing PLC+ |
8.50 | 11/15/2020 | 150,000 | 224,140 | 180,717 | |||||||||||||||
| WMG Acquisition Corp.^ |
6.75 | 4/15/2022 | 950,000 | 898,786 | 957,125 | |||||||||||||||
|
|
|
|
|
|
|
|||||||||||||||
| Total Leisure, Amusement, Entertainment |
2,242,000 | 2,634,486 | 2,525,438 | |||||||||||||||||
|
|
|
|
|
|
|
|||||||||||||||
| Machinery Non-Agriculture, Non-Construction, Non-Electronic — 2.3%*: |
|
|||||||||||||||||||
| Apex Tool Group LLC^ |
7.00 | 2/1/2021 | 750,000 | 657,631 | 646,875 | |||||||||||||||
| Milacron LLC/Mcron Finance Corp.^ |
7.75 | 2/15/2021 | 905,000 | 929,319 | 932,150 | |||||||||||||||
| Xerium Technologies, Inc. |
8.88 | 6/15/2018 | 720,000 | 731,827 | 709,200 | |||||||||||||||
|
|
|
|
|
|
|
|||||||||||||||
| Total Machinery Non-Agriculture, Non-Construction, Non-Electronic |
2,375,000 | 2,318,777 | 2,288,225 | |||||||||||||||||
|
|
|
|
|
|
|
|||||||||||||||
| Mining, Steel, Iron and Non-Precious Metals — 0.7%*: |
|
|||||||||||||||||||
| BlueScope Steel Finance Ltd./BlueScope Steel Finance USA LLC^+ |
6.50 | 5/15/2021 | 166,000 | 166,000 | 171,876 | |||||||||||||||
| Constellium NV+ |
7.00 | 1/15/2023 | 600,000 | 644,246 | 536,342 | |||||||||||||||
|
|
|
|
|
|
|
|||||||||||||||
| Total Mining, Steel, Iron and Non-Precious Metals |
766,000 | 810,246 | 708,218 | |||||||||||||||||
|
|
|
|
|
|
|
|||||||||||||||
| Oil and Gas — 3.5%*: |
||||||||||||||||||||
| Calumet Specialty Products Partners LP/Calumet Finance Corp. |
6.50 | 4/15/2021 | 500,000 | 500,000 | 357,500 | |||||||||||||||
| Calumet Specialty Products Partners LP/Calumet Finance Corp. |
7.75 | 4/15/2023 | 250,000 | 175,250 | 171,875 | |||||||||||||||
| Citgo Holding, Inc.^ |
10.75 | 2/15/2020 | 350,000 | 340,455 | 351,750 | |||||||||||||||
| Energy Transfer Equity LP |
5.50 | 6/1/2027 | 111,000 | 95,348 | 104,340 | |||||||||||||||
| EP Energy LLC/Everest Acquisition Finance, Inc. |
9.38 | 5/1/2020 | 350,000 | 278,871 | 247,625 | |||||||||||||||
| Genesis Energy LP/Genesis Energy Finance Corp. |
6.75 | 8/1/2022 | 500,000 | 480,526 | 485,000 | |||||||||||||||
| Kosmos Energy Ltd.^ |
7.88 | 8/1/2021 | 571,000 | 532,242 | 551,015 | |||||||||||||||
| Shelf Drilling Holdings Ltd.+^ |
8.63 | 11/1/2018 | 439,000 | 381,213 | 322,665 | |||||||||||||||
| Sunoco LP/Sunoco Finance Corp.^ |
5.50 | 8/1/2020 | 302,000 | 302,000 | 298,225 | |||||||||||||||
| Sunoco LP/Sunoco Finance Corp.^ |
6.25 | 4/15/2021 | 600,000 | 598,559 | 598,500 | |||||||||||||||
|
|
|
|
|
|
|
|||||||||||||||
| Total Oil and Gas |
3,973,000 | 3,684,464 | 3,488,495 | |||||||||||||||||
|
|
|
|
|
|
|
|||||||||||||||
| Personal and Non-Durable Consumer Products Mfg. Only — 0.1%*: |
|
|||||||||||||||||||
| WEPA Hygieneprodukte GmbH+ |
3.75 | 5/15/2024 | 100,000 | 114,230 | 110,995 | |||||||||||||||
|
|
|
|
|
|
|
|||||||||||||||
| Personal Transportation — 1.2%*: |
||||||||||||||||||||
| AA Bond Co. Ltd.+ |
5.50 | 7/31/2043 | 600,000 | 847,469 | 760,809 | |||||||||||||||
| Avis Budget Car Rental LLC/Avis Budget Finance, Inc.^ |
5.25 | 3/15/2025 | 500,000 | 451,273 | 452,500 | |||||||||||||||
|
|
|
|
|
|
|
|||||||||||||||
| Total Personal Transportation |
1,100,000 | 1,298,742 | 1,213,309 | |||||||||||||||||
|
|
|
|
|
|
|
|||||||||||||||
See accompanying Notes to the Financial Statements.
93
Table of Contents
Babson Global Credit Income Opportunities Fund 2016 Annual Report
SCHEDULE OF INVESTMENTS (CONTINUED)
June 30, 2016
| EFFECTIVE INTEREST RATE |
DUE DATE | PRINCIPAL ‡‡ | COST | FAIR VALUE |
||||||||||||||||
| Corporate Bonds (Continued) |
|
|||||||||||||||||||
| Personal, Food and Miscellaneous — 0.3%*: |
|
|||||||||||||||||||
| Landry’s, Inc.^ |
9.38 | % | 5/1/2020 | 70,000 | $73,417 | $73,500 | ||||||||||||||
| Wagamama Finance PLC+ |
7.88 | 2/1/2020 | 200,000 | 298,487 | 270,909 | |||||||||||||||
|
|
|
|
|
|
|
|||||||||||||||
| Total Personal, Food and Miscellaneous |
270,000 | 371,904 | 344,409 | |||||||||||||||||
|
|
|
|
|
|
|
|||||||||||||||
| Printing and Publishing — 1.0%*: |
||||||||||||||||||||
| Cimpress NV^ |
7.00 | 4/1/2022 | 470,000 | 457,153 | 465,300 | |||||||||||||||
| MHGE Parent LLC/MHGE Parent Finance, Inc.^ |
8.50 | 8/1/2019 | 500,000 | 507,939 | 505,000 | |||||||||||||||
|
|
|
|
|
|
|
|||||||||||||||
| Total Printing and Publishing |
970,000 | 965,092 | 970,300 | |||||||||||||||||
|
|
|
|
|
|
|
|||||||||||||||
| Retail Stores — 2.7%*: |
|
|||||||||||||||||||
| BiSoho SAS+ |
5.88 | 5/1/2023 | 100,000 | 114,230 | 113,746 | |||||||||||||||
| Boing Group Financing PLC MTN+ |
6.63 | 7/15/2019 | 200,000 | 272,200 | 203,528 | |||||||||||||||
| Brighthouse Group PLC MTN+ |
7.88 | 5/15/2018 | 150,000 | 242,271 | 179,549 | |||||||||||||||
| Dollar Tree, Inc.^ |
5.25 | 3/1/2020 | 50,000 | 51,129 | 51,500 | |||||||||||||||
| Dollar Tree, Inc.^ |
5.75 | 3/1/2023 | 815,000 | 839,744 | 865,938 | |||||||||||||||
| Douglas GmbH+ |
6.25 | 7/15/2022 | 550,000 | 614,377 | 650,036 | |||||||||||||||
| House of Fraser Funding PLC+ |
6.32 | # | 9/15/2020 | 150,000 | 232,168 | 185,789 | ||||||||||||||
| HSS Financing PLC+ |
6.75 | 8/1/2019 | 204,000 | 307,969 | 264,514 | |||||||||||||||
| Takko Luxembourg 2 S.C.A. MTN+ |
9.88 | 4/15/2019 | 300,000 | 329,851 | 188,935 | |||||||||||||||
|
|
|
|
|
|
|
|||||||||||||||
| Total Retail Stores |
|
2,519,000 | 3,003,939 | 2,703,535 | ||||||||||||||||
|
|
|
|
|
|
|
|||||||||||||||
| Telecommunications — 5.0%*: |
|
|||||||||||||||||||
| Altice Financing SA^+ |
7.50 | 5/15/2026 | 825,000 | 827,101 | 808,500 | |||||||||||||||
| CCO Holdings LLC/CCO Holdings Capital Corp.^ |
5.88 | 5/1/2027 | 391,000 | 391,000 | 403,707 | |||||||||||||||
| eircom Finance DAC+ |
4.50 | 5/31/2022 | 150,000 | 170,363 | 164,249 | |||||||||||||||
| LGE HoldCo VI BV+ |
7.13 | 5/15/2024 | 250,000 | 309,712 | 305,875 | |||||||||||||||
| Numericable-SFR SA^+ |
7.38 | 5/1/2026 | 397,000 | 397,000 | 392,534 | |||||||||||||||
| Numericable-SFR SAS+ |
5.63 | 5/15/2024 | 100,000 | 138,165 | 111,625 | |||||||||||||||
| Numericable-SFR SAS+^ |
6.00 | 5/15/2022 | 315,000 | 315,000 | 306,337 | |||||||||||||||
| T-Mobile USA, Inc. |
6.50 | 1/15/2026 | 294,000 | 294,000 | 310,170 | |||||||||||||||
| Telenet Finance VI Luxembourg SCA+ |
4.88 | 7/15/2027 | 100,000 | 114,290 | 112,640 | |||||||||||||||
| UPCB Finance IV Ltd.+ |
4.00 | 1/15/2027 | 250,000 | 278,660 | 268,074 | |||||||||||||||
| Virgin Media Finance PLC+ |
6.38 | 10/15/2024 | 250,000 | 375,512 | 331,148 | |||||||||||||||
| VTR Finance BV^+ |
6.88 | 1/15/2024 | 250,000 | 243,404 | 249,245 | |||||||||||||||
| Wind Acquisition Finance SA+ |
3.75 | # | 7/15/2020 | 100,000 | 135,965 | 107,646 | ||||||||||||||
| Wind Acquisition Finance SA+ |
4.00 | 7/15/2020 | 200,000 | 243,182 | 218,621 | |||||||||||||||
| Wind Acquisition Finance SA+^ |
7.38 | 4/23/2021 | 850,000 | 801,636 | 809,625 | |||||||||||||||
|
|
|
|
|
|
|
|||||||||||||||
| Total Telecommunications |
4,722,000 | 5,034,990 | 4,899,996 | |||||||||||||||||
|
|
|
|
|
|
|
|||||||||||||||
| Textiles and Leather — 0.2%*: |
|
|||||||||||||||||||
| Hanesbrands, Inc.^ |
4.88 | 5/15/2026 | 167,000 | 167,000 | 167,601 | |||||||||||||||
|
|
|
|
|
|
|
|||||||||||||||
See accompanying Notes to the Financial Statements.
94
Table of Contents
Babson Global Credit Income Opportunities Fund 2016 Annual Report
SCHEDULE OF INVESTMENTS (CONTINUED)
June 30, 2016
| EFFECTIVE INTEREST RATE |
DUE DATE | PRINCIPAL ‡‡ | COST | FAIR VALUE |
||||||||||||||||
| Corporate Bonds (Continued) |
|
|||||||||||||||||||
| Utilities — 0.3%*: |
||||||||||||||||||||
| NRG Energy, Inc.^ |
7.25 | % | 5/15/2026 | 327,000 | $327,000 | $325,365 | ||||||||||||||
|
|
|
|
|
|
|
|||||||||||||||
| Total Corporate Bonds |
52,421,636 | 56,763,559 | 54,028,407 | |||||||||||||||||
|
|
|
|
|
|
|
|||||||||||||||
| Total Fixed Income |
|
99,225,592 | 101,482,567 | 93,155,690 | ||||||||||||||||
|
|
|
|
|
|
|
|||||||||||||||
| Short-Term Investment — 7.9%*: |
|
|||||||||||||||||||
| Bank Deposit — 7.9%*: |
|
|||||||||||||||||||
| State Street Bank & Trust Co. Euro Time Deposit |
0.01 | 7/1/2016 | 7,849,066 | 7,849,066 | 7,849,066 | |||||||||||||||
|
|
|
|
|
|
|
|||||||||||||||
| Total Investments |
125,947,004 | 109,705,371 | 101,427,091 | |||||||||||||||||
|
|
|
|
|
|
|
|||||||||||||||
| Other assets and liabilities — (2.5%) |
(2,506,395 | ) | ||||||||||||||||||
|
|
|
|||||||||||||||||||
| Net Assets — 100.0% |
$98,920,696 | |||||||||||||||||||
|
|
|
|||||||||||||||||||
| MTN | Medium Term Note |
| PIK | Payment-in-kind |
| ‡‡ | Unless otherwise indicated, all principal amounts are denominated in United States Dollars. |
| * | Calculated as a percentage of net assets applicable to common shareholders. |
| + | Foreign security. |
Distributions of investments by country of risk (excluding temporary cash investments) as a percentage of total investments in securities, is as follows:
| United States | 64.0% | |||||
| United Kingdom | 10.5% | |||||
| Germany | 6.4% | |||||
| Netherlands | 3.9% | |||||
| France | 3.2% | |||||
| Switzerland | 1.6% | |||||
| Cayman Islands | 1.3% | |||||
| Italy | 1.2% | |||||
| Trinidad And Tobago | 1.0% | |||||
| Other (Individually less than 1%) | 6.9% | |||||
|
|
|
|||||
| Total | 100.0% | |||||
|
|
|
| ^ | Security acquired in a transaction exempt from registration under Rule 144A of the Securities Act of 1933. These securities may only be resold in transactions exempt from registration, normally to qualified institutional buyers. |
| § | Bank loans are exempt from registration under the Securities Act of 1933, as amended, but contain certain restrictions on resale and cannot be sold publicly. These loans pay interest at rates which adjust periodically. The interest rates shown for bank loans are the current interest rates at June 30, 2016. Bank loans are also subject to mandatory and/or optional prepayment which cannot be predicted. As a result, the remaining maturity may be substantially less than the stated maturity shown. |
| # | Variable rate security. The interest rate shown is the rate in effect at June 30, 2016. |
| †† | Illiquid security. |
| ¤ | For fair value measurement disclosure purposes, security is categorized as Level 3 (See Note 2). |
| (1) | Non-income producing security. |
See accompanying Notes to the Financial Statements.
95
Table of Contents
Babson Global Credit Income Opportunities Fund 2016 Annual Report
SCHEDULE OF INVESTMENTS (CONTINUED)
June 30, 2016
A summary of outstanding financial instruments at June 30, 2016 is as follows:
Forward Foreign Currency Exchange Contracts to Buy
| EXPIRATION DATE |
COUNTERPARTY | LOCAL CURRENCY |
VALUE IN USD | IN EXCHANGE FOR USD |
NET UNREALIZED APPRECIATION (DEPRECIATION) |
|||||||||||||||||
| 7/14/16 | Bank of America N.A. |
EUR | 384,522 | 426,855 | 425,565 | $ | 1,290 | |||||||||||||||
| 7/14/16 | JPMorgan Chase Bank N.A. |
GBP | 224,713 | 299,164 | 299,966 | (802 | ) | |||||||||||||||
|
|
|
|||||||||||||||||||||
| Net unrealized appreciation on forward foreign exchange contracts to buy |
|
$ | 488 | |||||||||||||||||||
|
|
|
|||||||||||||||||||||
Forward Foreign Currency Exchange Contracts to Sell
| EXPIRATION DATE |
COUNTERPARTY | LOCAL CURRENCY |
VALUE IN USD | IN EXCHANGE FOR USD |
NET UNREALIZED APPRECIATION |
|||||||||||||||||
| 7/14/16 | Citibank N.A. |
EUR | 674,045 | 748,253 | 764,011 | $ | 15,758 | |||||||||||||||
| 7/14/16 | JPMorgan Chase Bank N.A. |
EUR | 14,193,436 | 15,756,035 | 16,134,251 | 378,216 | ||||||||||||||||
| 7/14/16 | Morgan Stanley & Co. |
EUR | 647,500 | 718,785 | 734,692 | 15,907 | ||||||||||||||||
| 7/14/16 | JPMorgan Chase Bank N.A. |
GBP | 7,718,113 | 10,275,248 | 11,243,762 | 968,514 | ||||||||||||||||
|
|
|
|||||||||||||||||||||
| Net unrealized appreciation on forward foreign exchange contracts to sell |
|
$ | 1,378,395 | |||||||||||||||||||
|
|
|
|||||||||||||||||||||
Currency Legend
| EUR | – | Euro | ||
| GBP | – | British Pound Sterling |
See accompanying Notes to the Financial Statements.
96
Table of Contents
Babson Active Short Duration Bond Fund 2016 Annual Report
SCHEDULE OF INVESTMENTS
June 30, 2016
| EFFECTIVE INTEREST RATE |
DUE DATE | PRINCIPAL ‡‡ | COST | FAIR VALUE |
||||||||||||||||
| Fixed Income — 95.4%**: |
| |||||||||||||||||||
| Asset-Backed Securities — 30.5%**: |
| |||||||||||||||||||
| CDO/CLO — 9.8%*: |
| |||||||||||||||||||
| AIMCO CLO Series 2014-A A^ |
2.17 | #% | 7/20/2026 | 450,000 | $448,894 | $448,142 | ||||||||||||||
| ALM XIV Ltd. 2014-14A A1^ |
2.06 | # | 7/28/2026 | 500,000 | 498,819 | 497,961 | ||||||||||||||
| American Credit Acceptance Receivables Trust 2016-2^ |
2.22 | 7/13/2020 | 462,612 | 462,601 | 462,753 | |||||||||||||||
| Apidos CLO XVII Series 2014-17A A1^ |
2.13 | # | 4/17/2026 | 450,000 | 448,894 | 449,293 | ||||||||||||||
| Atlas Senior Loan Fund V Ltd. 2014-1A A^ |
2.18 | # | 7/16/2026 | 500,000 | 499,629 | 497,769 | ||||||||||||||
| BlueMountain CLO Ltd. 2013-3A A^ |
2.04 | # | 10/29/2025 | 500,000 | 496,948 | 497,409 | ||||||||||||||
| BlueMountain CLO Ltd. 2015-2A A1^ |
2.06 | # | 7/18/2027 | 500,000 | 492,597 | 496,183 | ||||||||||||||
| Carlyle Global Market Strategies CLO Ltd. 2014-1A A^ |
2.15 | # | 4/17/2025 | 500,000 | 500,000 | 499,341 | ||||||||||||||
| Carlyle Global Market Strategies CLO Ltd. 2014-4A A1^ |
2.13 | # | 10/15/2026 | 250,000 | 250,000 | 248,884 | ||||||||||||||
| Chesapeake Funding II LLC^ |
1.88 | 6/15/2028 | 290,000 | 289,985 | 289,956 | |||||||||||||||
| CPS Auto Receivables Trust 2016-B^ |
2.07 | 11/15/2019 | 241,115 | 241,107 | 240,938 | |||||||||||||||
| Credit Acceptance Auto Loan Trust 2016-2^ |
2.42 | 11/15/2023 | 300,000 | 299,931 | 302,766 | |||||||||||||||
| Diamond Resorts Owner Trust 2013-1^ |
1.95 | 1/20/2025 | 504,314 | 501,052 | 501,491 | |||||||||||||||
| Diamond Resorts Owner Trust 2015-2^ |
2.99 | 5/22/2028 | 229,141 | 231,829 | 234,053 | |||||||||||||||
| DRB Prime Student Loan Trust 2016-B^ |
2.89 | 6/25/2040 | 300,000 | 299,909 | 302,042 | |||||||||||||||
| DT Auto Owner Trust 2016-2^ |
2.92 | 5/15/2020 | 460,000 | 459,991 | 461,947 | |||||||||||||||
| Earnest Student Loan Program 2016-B LLC^ |
2.49 | # | 2/26/2035 | 480,000 | 480,000 | 479,993 | ||||||||||||||
| Elara HGV Timeshare Issuer 2016-A LLC^ |
2.73 | 4/25/2028 | 350,000 | 349,994 | 349,959 | |||||||||||||||
| Flagship Credit Auto Trust 2013-2^ |
3.21 | 8/15/2019 | 250,000 | 252,734 | 252,538 | |||||||||||||||
| Galaxy XX CLO Ltd. 2015-20A A^ |
2.08 | # | 7/20/2027 | 250,000 | 246,902 | 248,079 | ||||||||||||||
| Goldentree Loan Opportunities VIII Ltd. 2014-8A A^ |
2.08 | # | 4/19/2026 | 900,000 | 896,014 | 896,470 | ||||||||||||||
| LCM XVI LP 16A A^ |
2.13 | # | 7/15/2026 | 250,000 | 250,000 | 249,254 | ||||||||||||||
| Leaf Receivables Funding 11 LLC^ |
1.00 | # | 6/15/2017 | 451,648 | 451,648 | 451,652 | ||||||||||||||
| Madison Park Funding XII Ltd. 2014-12A A^ |
2.13 | # | 7/20/2026 | 250,000 | 248,326 | 249,573 | ||||||||||||||
| Madison Park Funding XIV Ltd. 2014-14A A2^ |
2.08 | # | 7/20/2026 | 250,000 | 249,852 | 249,142 | ||||||||||||||
| Morgan Stanley ABS Capital I, Inc. Trust 2005-WMC6 |
1.20 | # | 7/25/2035 | 43,631 | 43,199 | 43,384 | ||||||||||||||
| Navitas Equipment Receivables LLC 2015-1^ |
2.12 | 11/15/2018 | 292,200 | 292,112 | 292,351 | |||||||||||||||
| NextGear Floorplan Master Owner Trust^ |
2.14 | # | 4/15/2021 | 490,000 | 490,000 | 491,043 | ||||||||||||||
| OHA Credit Partners VI Ltd. Series 2012-6A AR^ |
1.85 | # | 5/15/2023 | 623,675 | 621,033 | 622,296 | ||||||||||||||
| OHA Loan Funding 2015-1 Ltd.^ |
2.13 | # | 2/15/2027 | 350,000 | 350,000 | 349,301 | ||||||||||||||
| OnDeck Asset Securitization Trust II LLC^ |
4.21 | 5/17/2020 | 110,000 | 109,993 | 110,447 | |||||||||||||||
| Oscar US Funding Trust 2015 1A A4^ |
2.44 | 6/15/2022 | 270,000 | 262,118 | 267,767 | |||||||||||||||
| Oxford Finance Funding 2016-1 LLC^ |
3.97 | 6/17/2024 | 170,000 | 170,000 | 169,896 | |||||||||||||||
| Santander Drive Auto Receivables Trust 2015-2 |
2.44 | 4/15/2021 | 420,000 | 422,983 | 424,404 | |||||||||||||||
| Santander Drive Auto Receivables Trust 2016-1 |
4.02 | 4/15/2022 | 430,000 | 440,840 | 444,100 | |||||||||||||||
| Seneca Park CLO Ltd. 2014-1A A^ |
2.11 | # | 7/17/2026 | 360,000 | 358,492 | 359,131 | ||||||||||||||
| SMB Private Education Loan Trust 2015-A^ |
1.44 | # | 6/15/2027 | 100,000 | 98,188 | 96,058 | ||||||||||||||
| SMB Private Education Loan Trust 2016-A^ |
1.14 | # | 5/15/2023 | 550,000 | 550,000 | 549,998 | ||||||||||||||
See accompanying Notes to the Financial Statements.
97
Table of Contents
Babson Active Short Duration Bond Fund 2016 Annual Report
SCHEDULE OF INVESTMENTS (CONTINUED)
June 30, 2016
| EFFECTIVE INTEREST RATE |
DUE DATE | PRINCIPAL ‡‡ | COST | FAIR VALUE |
||||||||||||||||
| Asset-Backed Securities (Continued) |
|
|||||||||||||||||||
| CDO/CLO (Continued) |
||||||||||||||||||||
| SoFi Professional Loan Program 2016-B LLC^ |
1.64 | #% | 6/25/2033 | 350,000 | $350,000 | $349,998 | ||||||||||||||
| SoFi Professional Loan Program 2016-B LLC^ |
1.68 | 3/25/2031 | 340,000 | 339,972 | 339,730 | |||||||||||||||
| Symphony CLO XV Ltd. 2014-15A A^ |
2.08 | # | 10/17/2026 | 250,000 | 248,063 | 249,366 | ||||||||||||||
| Westlake Automobile Receivables Trust 2016-2^ |
1.57 | 6/17/2019 | 290,000 | 289,983 | 290,341 | |||||||||||||||
|
|
|
|
|
|
|
|||||||||||||||
| Total CDO/CLO |
15,308,336 | 15,284,632 | 15,307,199 | |||||||||||||||||
|
|
|
|
|
|
|
|||||||||||||||
| Other Asset-Backed Securities — 20.7%*: |
|
|||||||||||||||||||
| 321 Henderson Receivables II LLC 2006-3A A1^ |
0.64 | # | 9/15/2041 | 223,522 | 216,477 | 213,262 | ||||||||||||||
| Access Group, Inc. 2002-A A2 |
1.96 | # | 9/25/2037 | 950,000 | 871,974 | 897,750 | ||||||||||||||
| Access Group, Inc. 2005-1 A3 |
0.80 | # | 6/22/2022 | 111,773 | 110,292 | 110,306 | ||||||||||||||
| Access Group, Inc. 2015-1 A^ |
1.15 | # | 7/25/2056 | 191,209 | 186,977 | 186,924 | ||||||||||||||
| Access Group, Inc. 2015-1 B^ |
1.95 | # | 7/25/2058 | 100,000 | 86,230 | 87,238 | ||||||||||||||
| Alterna Funding I LLC Series 2014-1A^ |
1.64 | 2/15/2021 | 353,743 | 349,543 | 344,015 | |||||||||||||||
| American Credit Acceptance Receivables Trust 2015-3 A^ |
1.95 | 9/12/2019 | 86,319 | 86,314 | 86,231 | |||||||||||||||
| American Credit Acceptance Receivables Trust 2016-1A^ |
2.37 | 5/12/2020 | 92,252 | 92,251 | 92,285 | |||||||||||||||
| AmeriCredit Automobile Receivables Trust 2014-1 D |
2.54 | 6/8/2020 | 310,000 | 309,588 | 313,119 | |||||||||||||||
| Arbys Funding LLC 2015-1A A2^ |
4.97 | 10/30/2045 | 79,600 | 79,600 | 83,083 | |||||||||||||||
| Argent Securities, Inc. Asset-Backed Pass-Through Certificates Series 2004-W10 |
1.35 | # | 10/25/2034 | 391,969 | 354,284 | 349,980 | ||||||||||||||
| ARI Fleet Lease Trust 2016-A A3^ |
2.11 | 7/15/2024 | 200,000 | 199,962 | 203,317 | |||||||||||||||
| Avis Budget Rental Car Funding AESOP LLC Series 2012-3A A^ |
2.10 | 3/20/2019 | 240,000 | 238,759 | 241,209 | |||||||||||||||
| BlueVirgo Trust 2015-1A^ |
3.00 | 12/15/2022 | 330,443 | 329,078 | 329,330 | |||||||||||||||
| California Republic Auto Receivables Trust 2015-4 A4^ |
2.58 | 6/15/2021 | 180,000 | 179,984 | 184,912 | |||||||||||||||
| Capital Automotive REIT 2010-1A A^ |
5.73 | 12/15/2038 | 91,587 | 95,313 | 93,711 | |||||||||||||||
| CarFinance Capital Auto Trust 2013-2A^ |
4.04 | 8/15/2019 | 650,000 | 653,082 | 653,119 | |||||||||||||||
| CarFinance Capital Auto Trust 2014-2^ |
1.44 | 11/16/2020 | 186,428 | 184,825 | 185,601 | |||||||||||||||
| Cazenovia Creek Funding I LLC 2015-1A A^ |
2.00 | 12/10/2023 | 283,296 | 280,312 | 281,880 | |||||||||||||||
| Chase Issuance Trust Series 2014-A1 |
1.15 | 1/15/2019 | 3,000,000 | 3,004,719 | 3,006,007 | |||||||||||||||
| Citi Held For Asset Issuance 2015-PM1 A^ |
1.85 | 12/15/2021 | 34,421 | 34,421 | 34,332 | |||||||||||||||
| Citi Held For Asset Issuance 2015-PM2 A^ |
2.35 | 3/15/2022 | 53,007 | 53,003 | 52,959 | |||||||||||||||
| Citi Held For Asset Issuance 2015-PM3 A^ |
2.56 | 5/16/2022 | 63,443 | 63,443 | 63,456 | |||||||||||||||
| CKE Restaurant Holdings, Inc. 2013-1A A2^ |
4.47 | 3/20/2043 | 461,356 | 465,790 | 461,722 | |||||||||||||||
| CLI Funding V LLC 2013-1A^ |
2.83 | 3/18/2028 | 67,500 | 67,164 | 64,765 | |||||||||||||||
| CLI Funding V LLC 2014-1A A^ |
3.29 | 6/18/2029 | 197,581 | 191,751 | 189,302 | |||||||||||||||
| College Loan Corp. Trust I 2005-2 B |
1.12 | # | 1/15/2037 | 237,576 | 207,933 | 198,359 | ||||||||||||||
| CPS Auto Receivables Trust 2013-A A^ |
1.31 | 6/15/2020 | 165,562 | 164,965 | 163,968 | |||||||||||||||
See accompanying Notes to the Financial Statements.
98
Table of Contents
Babson Active Short Duration Bond Fund 2016 Annual Report
SCHEDULE OF INVESTMENTS (CONTINUED)
June 30, 2016
| EFFECTIVE INTEREST RATE |
DUE DATE | PRINCIPAL ‡‡ | COST | FAIR VALUE |
||||||||||||||||
| Asset-Backed Securities (Continued) |
| |||||||||||||||||||
| Other Asset-Backed Securities (Continued) |
| |||||||||||||||||||
| CPS Auto Receivables Trust 2014-D A^ |
1.49 | % | 4/15/2019 | 173,612 | $172,839 | $173,638 | ||||||||||||||
| CPS Auto Receivables Trust 2015-B A^ |
1.65 | 11/15/2019 | 187,441 | 185,880 | 186,442 | |||||||||||||||
| CPS Auto Receivables Trust 2015-C A^ |
1.77 | 6/17/2019 | 66,158 | 66,154 | 66,094 | |||||||||||||||
| CPS Auto Receivables Trust 2015-C B^ |
2.55 | 2/18/2020 | 100,000 | 99,985 | 99,968 | |||||||||||||||
| CPS Auto Receivables Trust 2016-A A^ |
2.25 | 10/15/2019 | 136,625 | 136,620 | 136,965 | |||||||||||||||
| Credit Suisse ABS Repackaging Trust 2013-A B^ |
2.50 | 1/25/2030 | 129,282 | 122,823 | 122,227 | |||||||||||||||
| DB Master Finance LLC 2015-1A A2I^ |
3.26 | 2/20/2045 | 488,812 | 483,395 | 493,358 | |||||||||||||||
| Diamond Resorts Owner Trust 2013-2 A^ |
2.27 | 5/20/2026 | 762,638 | 756,478 | 760,782 | |||||||||||||||
| Diamond Resorts Owner Trust 2015-1 A^ |
2.73 | 7/20/2027 | 52,238 | 52,233 | 52,756 | |||||||||||||||
| Diamond Resorts Owner Trust 2015-2 B^ |
3.54 | 5/22/2028 | 83,324 | 83,320 | 84,923 | |||||||||||||||
| Domino’s Pizza Master Issuer LLC 2012-1A A2^ |
5.22 | 1/25/2042 | 236,050 | 241,774 | 242,943 | |||||||||||||||
| Domino’s Pizza Master Issuer LLC 2015 1A-A2I^ |
3.48 | 10/25/2045 | 338,300 | 332,389 | 347,704 | |||||||||||||||
| DRB Prime Student Loan Trust 2015-A A2^ |
3.06 | 7/25/2031 | 120,697 | 119,128 | 120,674 | |||||||||||||||
| DRB Prime Student Loan Trust 2015-B A2^ |
3.17 | 7/25/2031 | 318,456 | 317,186 | 323,800 | |||||||||||||||
| DRB Prime Student Loan Trust 2015-B A3^ |
2.54 | 4/27/2026 | 72,484 | 72,476 | 72,381 | |||||||||||||||
| DRB Prime Student Loan Trust 2015-D A1^ |
2.15 | # | 1/25/2040 | 267,401 | 261,642 | 260,821 | ||||||||||||||
| DRB Prime Student Loan Trust 2015-D A2^ |
3.20 | 1/25/2040 | 486,303 | 485,462 | 496,549 | |||||||||||||||
| DRB Prime Student Loan Trust 2016-A A1^ |
2.45 | # | 4/25/2040 | 323,652 | 322,988 | 322,725 | ||||||||||||||
| Drive Auto Receivables Trust 2015-CA A3^ |
1.38 | 10/15/2018 | 170,493 | 170,489 | 170,477 | |||||||||||||||
| Drive Auto Receivables Trust 2016-B^ |
2.56 | 6/15/2020 | 130,000 | 129,996 | 130,407 | |||||||||||||||
| Drug Royalty LP 1 2012-1 A1^ |
5.88 | # | 7/15/2024 | 90,820 | 92,981 | 92,536 | ||||||||||||||
| DT Auto Owner Trust 2015-3A A^ |
1.66 | 3/15/2019 | 49,287 | 49,284 | 49,330 | |||||||||||||||
| DT Auto Owner Trust 2016-1A A^ |
2.00 | 9/16/2019 | 230,526 | 230,518 | 231,213 | |||||||||||||||
| DT Auto Owner Trust 2016-1A B^ |
2.79 | 5/15/2020 | 230,000 | 229,990 | 231,415 | |||||||||||||||
| Education Funding Capital Trust IV 2004-1 A5 |
1.45 | # | 6/15/2043 | 50,000 | 47,028 | 48,333 | ||||||||||||||
| Elara HGV Timeshare Issuer LLC 2014-A B^ |
3.02 | 2/25/2027 | 50,502 | 50,059 | 50,414 | |||||||||||||||
| Element Rail Leasing II LLC 2015-1A A1^ |
2.71 | 2/19/2045 | 528,468 | 523,723 | 517,902 | |||||||||||||||
| Element Rail Leasing II LLC 2015-1A A1+^ |
3.97 | 3/19/2046 | 163,766 | 163,767 | 165,010 | |||||||||||||||
| Entegry New Orleans Storm Recovery Funding I LLC 2015-1 A |
2.67 | 6/1/2027 | 169,078 | 169,040 | 176,967 | |||||||||||||||
| Enterprise Fleet Financing LLC 2016-1 A2^ |
1.83 | 9/20/2021 | 600,000 | 599,922 | 599,852 | |||||||||||||||
| Exeter Automobile Receivables Trust 2015-3A A^ |
2.00 | 3/16/2020 | 177,137 | 177,208 | 177,341 | |||||||||||||||
| First Franklin Mortgage Loan Trust 2005 FF3 M3 |
1.17 | # | 4/25/2035 | 621,945 | 618,866 | 616,195 | ||||||||||||||
| First Investors Auto Owner Trust 2015-2A A1^ |
1.59 | 12/16/2019 | 35,796 | 35,796 | 35,743 | |||||||||||||||
| First Investors Auto Owner Trust 2016-1A A1^ |
1.92 | 5/15/2020 | 368,922 | 368,914 | 370,350 | |||||||||||||||
| Flagship Credit Auto Trust 2014-1^ |
1.21 | 4/15/2019 | 139,328 | 138,997 | 138,924 | |||||||||||||||
| Flagship Credit Auto Trust 2015-2 A^ |
1.98 | 10/15/2020 | 92,211 | 92,203 | 91,975 | |||||||||||||||
| Flagship Credit Auto Trust 2015-3^ |
2.38 | 10/15/2020 | 123,211 | 123,211 | 123,428 | |||||||||||||||
| Flagship Credit Auto Trust 2016-1 A^ |
2.77 | 12/15/2020 | 434,736 | 433,763 | 438,218 | |||||||||||||||
| FNA 2015-1 Trust^ |
3.24 | 12/10/2023 | 444,901 | 445,128 | 444,431 | |||||||||||||||
| Ford Credit Auto Owner Trust 2015-2 A^ |
2.44 | 1/15/2027 | 130,000 | 131,204 | 134,614 | |||||||||||||||
| FRS I LLC 2013-1A A1^ |
1.80 | 4/15/2043 | 46,717 | 46,234 | 45,641 | |||||||||||||||
| Global SC Finance II SRL 2014-1A A1+^ |
3.19 | 7/17/2029 | 250,583 | 250,528 | 238,894 | |||||||||||||||
See accompanying Notes to the Financial Statements.
99
Table of Contents
Babson Active Short Duration Bond Fund 2016 Annual Report
SCHEDULE OF INVESTMENTS (CONTINUED)
June 30, 2016
| EFFECTIVE INTEREST RATE |
DUE DATE | PRINCIPAL ‡‡ | COST | FAIR VALUE |
||||||||||||||||
| Asset-Backed Securities (Continued) |
| |||||||||||||||||||
| Other Asset-Backed Securities (Continued) |
| |||||||||||||||||||
| Goal Capital Funding Trust 2007-1 C1 |
1.04 | #% | 6/25/2042 | 200,277 | $196,072 | $197,210 | ||||||||||||||
| Goal Structured Solution Trust 2015-1 B^ |
1.95 | # | 9/25/2043 | 100,000 | 75,573 | 87,188 | ||||||||||||||
| Green Tree Agency Advance Funding Trust I 2015-T2 AT2^ |
3.09 | 10/15/2048 | 100,000 | 100,000 | 100,421 | |||||||||||||||
| GSAMP Trust 2005-SEA2 A1^ |
0.80 | # | 1/25/2045 | 67,373 | 64,723 | 66,650 | ||||||||||||||
| Hilton Grand Vacations Trust 2013-A^ |
2.28 | 1/25/2026 | 94,496 | 93,038 | 94,624 | |||||||||||||||
| Miramax LLC 2014-1A A2^ |
3.34 | 7/20/2026 | 148,428 | 148,942 | 148,956 | |||||||||||||||
| MVW Owner Trust 2013-1A A^ |
2.15 | 4/22/2030 | 239,778 | 236,597 | 237,970 | |||||||||||||||
| MVW Owner Trust 2015-1A A^ |
2.52 | 12/20/2032 | 78,336 | 78,330 | 78,893 | |||||||||||||||
| National Collegiate Student Loan Trust 2006-3 |
0.60 | # | 10/25/2027 | 28,003 | 27,699 | 27,892 | ||||||||||||||
| Nations Equipment Finance Funding III LLC 2016-1A A^ |
3.61 | 2/20/2021 | 358,533 | 358,526 | 359,269 | |||||||||||||||
| Navient Private Education Loan Trust 2015-BA A1^ |
1.04 | # | 5/15/2023 | 23,666 | 23,637 | 23,643 | ||||||||||||||
| Nelnet Student Loan Trust 2008-3 A4 |
2.31 | # | 11/25/2024 | 225,000 | 229,097 | 226,905 | ||||||||||||||
| NextGear Floorplan Master Owner Trust 2015-2A A^ |
2.38 | 10/15/2020 | 100,000 | 99,992 | 100,020 | |||||||||||||||
| NRZ Advance Receivables Trust 2015-T3 AT3^ |
2.54 | 11/15/2046 | 430,000 | 430,000 | 430,127 | |||||||||||||||
| Ocwen Master Advance Receivables Trust 2015-T1 AT1^ |
2.54 | 9/17/2046 | 100,000 | 100,000 | 100,007 | |||||||||||||||
| Ocwen Master Advance Receivables Trust 2015-T2 AT2^ |
2.53 | 11/15/2046 | 100,000 | 100,000 | 100,116 | |||||||||||||||
| OneMain Financial Issuance Trust 2014-2A A^ |
2.47 | 9/18/2024 | 230,000 | 230,781 | 230,499 | |||||||||||||||
| Oscar US Funding Trust 2016 1A A1^ |
0.95 | 4/17/2017 | 121,168 | 121,168 | 121,063 | |||||||||||||||
| Oscar US Funding Trust 2016 1A A2B^ |
2.14 | 7/15/2020 | 200,000 | 200,000 | 199,822 | |||||||||||||||
| PHEAA Student Loan Trust 2003-1 A3 |
1.95 | # | 7/25/2042 | 350,000 | 349,564 | 350,128 | ||||||||||||||
| Popular ABS Mortgage Pass-Through Trust 2006-B A3 |
0.73 | # | 5/25/2036 | 139,300 | 133,569 | 135,996 | ||||||||||||||
| Prestige Auto Receivables Trust 2016 1A A1^ |
0.85 | 4/17/2017 | 197,139 | 197,139 | 197,142 | |||||||||||||||
| Santander Drive Auto Receivables Trust 2014-4 B |
1.82 | 5/15/2019 | 260,000 | 260,982 | 260,912 | |||||||||||||||
| Santander Drive Auto Receivables Trust 2014-4 D |
3.10 | 11/16/2020 | 540,000 | 546,574 | 550,158 | |||||||||||||||
| Santander Drive Auto Receivables Trust 2016-1 A1 |
0.85 | 2/15/2017 | 60,106 | 60,106 | 60,108 | |||||||||||||||
| Santander Drive Auto Receivables Trust 2016-1 A3 |
1.62 | 3/16/2020 | 180,000 | 179,974 | 180,047 | |||||||||||||||
| Santander Drive Auto Receivables Trust 2016-1 B |
2.47 | 12/15/2020 | 360,000 | 359,982 | 360,265 | |||||||||||||||
| SBA Tower Trust 2014-1A C^ |
2.90 | 10/15/2044 | 390,000 | 389,703 | 395,415 | |||||||||||||||
| Sierra Timeshare Receivables Funding LLC 2014-1A A^ |
2.07 | 3/20/2030 | 139,542 | 138,676 | 139,231 | |||||||||||||||
| Sierra Timeshare Receivables Funding LLC 2014-2A A^ |
2.05 | 6/20/2031 | 125,338 | 123,891 | 125,083 | |||||||||||||||
| Sierra Timeshare Receivables Funding LLC 2014-3A A^ |
2.30 | 10/20/2031 | 458,211 | 455,363 | 459,601 | |||||||||||||||
See accompanying Notes to the Financial Statements.
100
Table of Contents
Babson Active Short Duration Bond Fund 2016 Annual Report
SCHEDULE OF INVESTMENTS (CONTINUED)
June 30, 2016
| EFFECTIVE INTEREST RATE |
DUE DATE | PRINCIPAL ‡‡ | COST | FAIR VALUE |
||||||||||||||||
| Asset-Backed Securities (Continued) |
||||||||||||||||||||
| Other Asset-Backed Securities (Continued) |
||||||||||||||||||||
| Sierra Timeshare Receivables Funding LLC 2015 3A B^ |
3.08 | % | 9/20/2032 | 68,149 | $68,149 | $68,323 | ||||||||||||||
| Sierra Timeshare Receivables Funding LLC 2015-1A A^ |
2.40 | 3/22/2032 | 351,089 | 346,627 | 353,552 | |||||||||||||||
| Sierra Timeshare Receivables Funding LLC 2015-2A B^ |
3.02 | 6/20/2032 | 55,208 | 55,196 | 55,436 | |||||||||||||||
| Sierra Timeshare Receivables Funding LLC 2015-3A A^ |
2.58 | 9/20/2032 | 68,149 | 68,136 | 68,835 | |||||||||||||||
| SLC Private Student Loan Trust 2006-A A5 |
0.80 | # | 7/15/2036 | 267,774 | 266,197 | 266,044 | ||||||||||||||
| SLC Private Student Loan Trust 2006-A C |
1.08 | # | 7/15/2036 | 350,000 | 308,331 | 303,977 | ||||||||||||||
| SLC Student Loan Trust 2005-1 B |
0.83 | # | 2/15/2045 | 302,107 | 250,915 | 251,518 | ||||||||||||||
| SLM Student Loan Trust 2003-14 A6 |
0.94 | # | 7/25/2025 | 40,000 | 38,391 | 37,630 | ||||||||||||||
| SLM Student Loan Trust 2003-4 B |
1.30 | # | 6/15/2038 | 146,761 | 134,160 | 121,697 | ||||||||||||||
| SLM Student Loan Trust 2005-4 B |
0.82 | # | 7/25/2040 | 461,353 | 382,749 | 390,188 | ||||||||||||||
| SLM Student Loan Trust 2006-1 A5 |
0.75 | # | 7/26/2021 | 100,000 | 96,787 | 97,813 | ||||||||||||||
| SLM Student Loan Trust 2006-9 A5 |
0.74 | # | 1/26/2026 | 150,000 | 145,911 | 146,801 | ||||||||||||||
| SLM Student Loan Trust 2008-5 A4 |
2.34 | # | 7/25/2023 | 95,904 | 96,984 | 95,934 | ||||||||||||||
| SLM Student Loan Trust 2012-5 A2 |
0.75 | # | 6/25/2019 | 89,336 | 88,807 | 88,717 | ||||||||||||||
| SLM Student Loan Trust 2013-6 A3 |
1.10 | # | 6/25/2055 | 180,000 | 171,766 | 176,562 | ||||||||||||||
| SoFi Consumer Loan Program 2016-1 LLC^ |
3.26 | 8/25/2025 | 600,000 | 599,935 | 603,187 | |||||||||||||||
| SoFi Professional Loan Program LLC 2014-B A1^ |
1.70 | # | 8/25/2032 | 306,543 | 301,420 | 306,542 | ||||||||||||||
| SoFi Professional Loan Program LLC 2015-C A2^ |
2.51 | 8/25/2033 | 76,029 | 75,628 | 76,798 | |||||||||||||||
| SoFi Professional Loan Program LLC 2016 A A1^ |
2.20 | # | 8/25/2036 | 302,342 | 299,674 | 304,589 | ||||||||||||||
| SoFi Professional Loan Program LLC 2016 A A2^ |
2.76 | 12/26/2036 | 331,106 | 328,118 | 329,572 | |||||||||||||||
| SpringCastle America Funding LLC 2014-AA A^ |
2.70 | 5/25/2023 | 392,292 | 392,257 | 393,626 | |||||||||||||||
| SPS Servicer Advance Receivable 2015-T3 AT3^ |
2.92 | 7/15/2047 | 100,000 | 99,991 | 100,438 | |||||||||||||||
| SVO VOI Mortgage LLC 2012-AA A^ |
2.00 | 9/20/2029 | 527,425 | 519,840 | 521,587 | |||||||||||||||
| Taco Bell Funding LLC^ |
3.83 | 5/25/2046 | 330,000 | 331,104 | 336,428 | |||||||||||||||
| Trinity Rail Leasing LP 2012-1A A1^ |
2.27 | 1/15/2043 | 71,729 | 69,548 | 69,978 | |||||||||||||||
| United Auto Credit Securitization Trust 2016-1 A^ |
2.00 | 10/15/2017 | 101,977 | 101,974 | 101,952 | |||||||||||||||
| Wendys Funding LLC 2015 1A A2I^ |
3.37 | 6/15/2045 | 744,375 | 741,821 | 748,469 | |||||||||||||||
| Westgate Resorts LLC 2015-2A A^ |
3.20 | 7/20/2028 | 351,902 | 351,454 | 352,599 | |||||||||||||||
| Westlake Automobile Receivables Trust 2016-1A A1^ |
0.85 | 1/15/2017 | 69,565 | 69,561 | 69,566 | |||||||||||||||
| Westlake Automobile Receivables Trust 2016-1A A2B^ |
1.49 | # | 1/15/2019 | 420,000 | 420,000 | 420,721 | ||||||||||||||
|
|
|
|
|
|
|
|||||||||||||||
| Total Other Asset-Backed Securities |
32,600,296 | 32,120,784 | 32,260,942 | |||||||||||||||||
|
|
|
|
|
|
|
|||||||||||||||
| Total Asset-Backed Securities |
47,908,632 | 47,405,416 | 47,568,141 | |||||||||||||||||
|
|
|
|
|
|
|
|||||||||||||||
See accompanying Notes to the Financial Statements.
101
Table of Contents
Babson Active Short Duration Bond Fund 2016 Annual Report
SCHEDULE OF INVESTMENTS (CONTINUED)
June 30, 2016
| EFFECTIVE INTEREST RATE |
DUE DATE | PRINCIPAL ‡‡ | COST | FAIR VALUE |
||||||||||||||||
| Corporate Bonds — 41.0%**: |
||||||||||||||||||||
| Advertising — 0.4%*: |
||||||||||||||||||||
| S&P Global, Inc. |
2.50 | % | 8/15/2018 | 260,000 | $260,895 | $265,357 | ||||||||||||||
| S&P Global, Inc. |
3.30 | 8/14/2020 | 300,000 | 308,979 | 313,873 | |||||||||||||||
|
|
|
|
|
|
|
|||||||||||||||
| Total Advertising |
560,000 | 569,874 | 579,230 | |||||||||||||||||
|
|
|
|
|
|
|
|||||||||||||||
| Aerospace/Defense — 1.0%*: |
||||||||||||||||||||
| Harris Corp. |
2.00 | 4/27/2018 | 500,000 | 499,769 | 502,546 | |||||||||||||||
| Harris Corp. |
2.70 | 4/27/2020 | 170,000 | 166,937 | 172,310 | |||||||||||||||
| L-3 Communications Corp. |
5.20 | 10/15/2019 | 745,000 | 781,525 | 811,120 | |||||||||||||||
|
|
|
|
|
|
|
|||||||||||||||
| Total Aerospace/Defense |
1,415,000 | 1,448,231 | 1,485,976 | |||||||||||||||||
|
|
|
|
|
|
|
|||||||||||||||
| Agriculture — 1.0%*: |
||||||||||||||||||||
| Bunge Ltd. Finance Corp. |
3.50 | 11/24/2020 | 725,000 | 736,935 | 759,958 | |||||||||||||||
| Imperial Brands Finance PLC+^ |
2.05 | 7/20/2018 | 335,000 | 333,826 | 338,756 | |||||||||||||||
| Imperial Brands Finance PLC+^ |
2.95 | 7/21/2020 | 407,000 | 413,793 | 419,121 | |||||||||||||||
|
|
|
|
|
|
|
|||||||||||||||
| Total Agriculture |
1,467,000 | 1,484,554 | 1,517,835 | |||||||||||||||||
|
|
|
|
|
|
|
|||||||||||||||
| Airlines — 0.3%*: |
||||||||||||||||||||
| WestJet Airlines Ltd.+^ |
3.50 | 6/16/2021 | 490,000 | 489,339 | 493,908 | |||||||||||||||
|
|
|
|
|
|
|
|||||||||||||||
| Auto Manufacturers — 2.0%*: |
||||||||||||||||||||
| American Honda Finance Corp.+ |
1.70 | 2/22/2019 | 395,000 | 394,930 | 401,831 | |||||||||||||||
| Ford Motor Credit Co. LLC |
2.24 | 6/15/2018 | 730,000 | 726,818 | 737,360 | |||||||||||||||
| Ford Motor Credit Co. LLC |
3.34 | 3/18/2021 | 315,000 | 315,000 | 326,695 | |||||||||||||||
| General Motors Co. |
3.50 | 10/2/2018 | 250,000 | 254,518 | 257,394 | |||||||||||||||
| General Motors Financial Co. |
3.20 | 7/13/2020 | 690,000 | 682,459 | 699,019 | |||||||||||||||
| Hyundai Capital America^ |
2.00 | 7/1/2019 | 70,000 | 69,951 | 70,432 | |||||||||||||||
| Hyundai Capital America+^ |
2.40 | 10/30/2018 | 150,000 | 150,063 | 152,095 | |||||||||||||||
| Hyundai Capital America^ |
2.55 | 2/6/2019 | 250,000 | 250,393 | 254,127 | |||||||||||||||
| Hyundai Capital America+^ |
3.00 | 10/30/2020 | 280,000 | 285,398 | 290,399 | |||||||||||||||
|
|
|
|
|
|
|
|||||||||||||||
| Total Auto Manufacturers |
3,130,000 | 3,129,530 | 3,189,352 | |||||||||||||||||
|
|
|
|
|
|
|
|||||||||||||||
| Auto Parts&Equipment — 1.0%*: |
||||||||||||||||||||
| Goodyear Tire & Rubber Co. (The) |
5.13 | 11/15/2023 | 750,000 | 773,127 | 774,375 | |||||||||||||||
| Lear Corp. |
4.75 | 1/15/2023 | 750,000 | 774,024 | 770,625 | |||||||||||||||
|
|
|
|
|
|
|
|||||||||||||||
| Total Auto Parts&Equipment |
1,500,000 | 1,547,151 | 1,545,000 | |||||||||||||||||
|
|
|
|
|
|
|
|||||||||||||||
| Beverages — 0.7%*: |
||||||||||||||||||||
| Anheuser-Busch InBev Finance, Inc.+ |
2.65 | 2/1/2021 | 295,000 | 294,152 | 305,919 | |||||||||||||||
| Coca-Cola Femsa SAB de CV+ |
2.38 | 11/26/2018 | 594,000 | 601,163 | 605,426 | |||||||||||||||
| Molson Coors Brewing Co. |
2.10 | 7/15/2021 | 170,000 | 169,935 | 170,517 | |||||||||||||||
|
|
|
|
|
|
|
|||||||||||||||
| Total Beverages |
1,059,000 | 1,065,250 | 1,081,862 | |||||||||||||||||
|
|
|
|
|
|
|
|||||||||||||||
| Biotechnology — 0.5%*: |
||||||||||||||||||||
| Celgene Corp. |
2.13 | 8/15/2018 | 420,000 | 420,827 | 426,277 | |||||||||||||||
| Celgene Corp. |
2.25 | 5/15/2019 | 250,000 | 250,439 | 254,168 | |||||||||||||||
| Celgene Corp. |
2.88 | 8/15/2020 | 110,000 | 113,364 | 113,754 | |||||||||||||||
|
|
|
|
|
|
|
|||||||||||||||
| Total Biotechnology |
780,000 | 784,630 | 794,199 | |||||||||||||||||
|
|
|
|
|
|
|
|||||||||||||||
See accompanying Notes to the Financial Statements.
102
Table of Contents
Babson Active Short Duration Bond Fund 2016 Annual Report
SCHEDULE OF INVESTMENTS (CONTINUED)
June 30, 2016
| EFFECTIVE INTEREST RATE |
DUE DATE | PRINCIPAL ‡‡ | COST | FAIR VALUE |
||||||||||||||||
| Corporate Bonds (Continued) |
||||||||||||||||||||
| Chemicals — 1.5%*: |
||||||||||||||||||||
| Airgas, Inc. |
2.38 | % | 2/15/2020 | 250,000 | $247,945 | $255,143 | ||||||||||||||
| Airgas, Inc. |
3.05 | 8/1/2020 | 450,000 | 457,973 | 468,375 | |||||||||||||||
| Ecolab, Inc. |
2.00 | 1/14/2019 | 235,000 | 234,677 | 238,066 | |||||||||||||||
| Incitec Pivot Finance LLC+^ |
6.00 | 12/10/2019 | 195,000 | 210,495 | 212,787 | |||||||||||||||
| LyondellBasell Industries NV |
5.00 | 4/15/2019 | 637,000 | 677,183 | 689,478 | |||||||||||||||
| RPM International, Inc. |
6.13 | 10/15/2019 | 180,000 | 197,831 | 200,294 | |||||||||||||||
| RPM International, Inc. |
6.50 | 2/15/2018 | 265,000 | 282,700 | 283,505 | |||||||||||||||
|
|
|
|
|
|
|
|||||||||||||||
| Total Chemicals |
2,212,000 | 2,308,804 | 2,347,648 | |||||||||||||||||
|
|
|
|
|
|
|
|||||||||||||||
| Commercial Banks — 6.2%*: |
||||||||||||||||||||
| ANZ New Zealand Int’l Ltd.+^ |
2.25 | 2/1/2019 | 745,000 | 745,474 | 756,553 | |||||||||||||||
| Bank of America Corp. |
5.42 | 3/15/2017 | 1,000,000 | 1,025,397 | 1,028,096 | |||||||||||||||
| Bank of America Corp. MTN |
2.25 | 4/21/2020 | 850,000 | 831,664 | 854,752 | |||||||||||||||
| CIT Group, Inc. |
4.25 | 8/15/2017 | 835,000 | 846,924 | 850,448 | |||||||||||||||
| Credit Agricole SA+^ |
2.13 | 4/17/2018 | 245,000 | 246,553 | 247,687 | |||||||||||||||
| First Horizon National Corp. |
3.50 | 12/15/2020 | 745,000 | 741,445 | 751,822 | |||||||||||||||
| First Tennessee Bank N.A. |
2.95 | 12/1/2019 | 550,000 | 546,933 | 552,507 | |||||||||||||||
| Goldman Sachs Group, Inc. (The) |
2.38 | 1/22/2018 | 590,000 | 596,442 | 597,930 | |||||||||||||||
| Goldman Sachs Group, Inc. (The) |
2.55 | 10/23/2019 | 650,000 | 649,670 | 665,051 | |||||||||||||||
| Goldman Sachs Group, Inc. (The) |
2.88 | 2/25/2021 | 90,000 | 89,860 | 92,270 | |||||||||||||||
| Itau Unibanco Holding SA+^ |
2.85 | 5/26/2018 | 400,000 | 395,515 | 398,400 | |||||||||||||||
| Mitsubishi UFJ Trust & Banking Corp.+^ |
2.65 | 10/19/2020 | 650,000 | 651,262 | 667,707 | |||||||||||||||
| Morgan Stanley |
2.13 | 4/25/2018 | 415,000 | 417,740 | 419,343 | |||||||||||||||
| Morgan Stanley |
2.45 | 2/1/2019 | 590,000 | 590,184 | 601,077 | |||||||||||||||
| Regions Bank |
7.50 | 5/15/2018 | 212,000 | 233,439 | 232,499 | |||||||||||||||
| Regions Financial Corp. |
2.00 | 5/15/2018 | 500,000 | 498,817 | 500,874 | |||||||||||||||
| Regions Financial Corp. |
3.20 | 2/8/2021 | 260,000 | 261,279 | 267,618 | |||||||||||||||
| SVB Financial Group |
5.38 | 9/15/2020 | 200,000 | 220,217 | 223,257 | |||||||||||||||
|
|
|
|
|
|
|
|||||||||||||||
| Total Commercial Banks |
9,527,000 | 9,588,815 | 9,707,891 | |||||||||||||||||
|
|
|
|
|
|
|
|||||||||||||||
| Commercial Services — 0.3%*: |
||||||||||||||||||||
| Western Union Co. (The) |
5.93 | 10/1/2016 | 400,000 | 404,442 | 403,912 | |||||||||||||||
|
|
|
|
|
|
|
|||||||||||||||
| Construction Materials — 0.5%*: |
||||||||||||||||||||
| Masco Corp. |
3.50 | 4/1/2021 | 260,000 | 261,416 | 265,278 | |||||||||||||||
| Masco Corp. |
7.13 | 3/15/2020 | 390,000 | 444,007 | 449,085 | |||||||||||||||
|
|
|
|
|
|
|
|||||||||||||||
| Total Construction Materials |
650,000 | 705,423 | 714,363 | |||||||||||||||||
|
|
|
|
|
|
|
|||||||||||||||
| Diversified Financial Services — 2.9%*: |
||||||||||||||||||||
| AerCap Ireland Capital Ltd./AerCap Global Aviation Trust+ |
2.75 | 5/15/2017 | 415,000 | 414,331 | 415,279 | |||||||||||||||
| AerCap Ireland Capital Ltd./AerCap Global Aviation Trust+ |
3.95 | 2/1/2022 | 380,000 | 379,301 | 380,000 | |||||||||||||||
| Air Lease Corp. |
2.13 | 1/15/2018 | 530,000 | 526,225 | 527,350 | |||||||||||||||
| Air Lease Corp. |
2.63 | 9/4/2018 | 125,000 | 124,548 | 124,974 | |||||||||||||||
| Air Lease Corp. |
3.38 | 1/15/2019 | 200,000 | 203,882 | 204,000 | |||||||||||||||
See accompanying Notes to the Financial Statements.
103
Table of Contents
Babson Active Short Duration Bond Fund 2016 Annual Report
SCHEDULE OF INVESTMENTS (CONTINUED)
June 30, 2016
| EFFECTIVE INTEREST RATE |
DUE DATE | PRINCIPAL ‡‡ | COST | FAIR VALUE |
||||||||||||||||
| Corporate Bonds (Continued) |
||||||||||||||||||||
| Diversified Financial Services (Continued) |
||||||||||||||||||||
| Ally Financial, Inc. |
4.75 | % | 9/10/2018 | 795,000 | $811,723 | $810,900 | ||||||||||||||
| BGC Partners, Inc.^ |
5.13 | 5/27/2021 | 470,000 | 467,491 | 471,980 | |||||||||||||||
| Icahn Enterprises LP/Icahn Enterprises Finance Corp. |
3.50 | 3/15/2017 | 750,000 | 749,657 | 753,225 | |||||||||||||||
| International Lease Finance Corp. |
3.88 | 4/15/2018 | 350,000 | 351,433 | 356,412 | |||||||||||||||
| Lazard Group LLC |
4.25 | 11/14/2020 | 385,000 | 398,634 | 409,797 | |||||||||||||||
|
|
|
|
|
|
|
|||||||||||||||
| Total Diversified Financial Services |
4,400,000 | 4,427,225 | 4,453,917 | |||||||||||||||||
|
|
|
|
|
|
|
|||||||||||||||
| Electric — 1.4%*: |
||||||||||||||||||||
| Ameren Corp. |
2.70 | 11/15/2020 | 330,000 | 331,410 | 339,866 | |||||||||||||||
| EDP Finance BV+^ |
4.13 | 1/15/2020 | 660,000 | 674,156 | 680,856 | |||||||||||||||
| EDP Finance BV+^ |
4.90 | 10/1/2019 | 89,000 | 93,857 | 94,534 | |||||||||||||||
| Entergy Texas, Inc. |
2.55 | 6/1/2021 | 170,000 | 169,692 | 175,560 | |||||||||||||||
| Entergy Texas, Inc. |
7.13 | 2/1/2019 | 300,000 | 336,107 | 339,808 | |||||||||||||||
| IPALCO Enterprises, Inc. |
5.00 | 5/1/2018 | 150,000 | 156,480 | 156,750 | |||||||||||||||
| Southern Co. (The) |
1.85 | 7/1/2019 | 130,000 | 129,976 | 131,645 | |||||||||||||||
| Southern Co. (The) |
2.35 | 7/1/2021 | 260,000 | 259,653 | 265,162 | |||||||||||||||
|
|
|
|
|
|
|
|||||||||||||||
| Total Electric |
2,089,000 | 2,151,331 | 2,184,181 | |||||||||||||||||
|
|
|
|
|
|
|
|||||||||||||||
| Electronics — 0.1%*: |
||||||||||||||||||||
| FLIR Systems, Inc. |
3.13 | 6/15/2021 | 155,000 | 154,894 | 159,148 | |||||||||||||||
| Tech Data Corp. |
3.75 | 9/21/2017 | 60,000 | 61,260 | 61,481 | |||||||||||||||
|
|
|
|
|
|
|
|||||||||||||||
| Total Electronics |
215,000 | 216,154 | 220,629 | |||||||||||||||||
|
|
|
|
|
|
|
|||||||||||||||
| Engineering&Construction — 0.2%*: |
||||||||||||||||||||
| SBA Tower Trust^ |
3.60 | 4/15/2043 | 330,000 | 328,651 | 332,229 | |||||||||||||||
|
|
|
|
|
|
|
|||||||||||||||
| Environmental Control — 0.3%*: |
||||||||||||||||||||
| Clean Harbors, Inc. |
5.25 | 8/1/2020 | 415,000 | 423,370 | 424,856 | |||||||||||||||
|
|
|
|
|
|
|
|||||||||||||||
| Food — 0.5%*: |
||||||||||||||||||||
| JBS Investments GmbH+^ |
7.75 | 10/28/2020 | 415,000 | 445,047 | 437,825 | |||||||||||||||
| Tyson Foods, Inc. |
2.65 | 8/15/2019 | 335,000 | 337,684 | 344,160 | |||||||||||||||
|
|
|
|
|
|
|
|||||||||||||||
| Total Food |
750,000 | 782,731 | 781,985 | |||||||||||||||||
|
|
|
|
|
|
|
|||||||||||||||
| Forestry and Paper Products — 0.5%*: |
||||||||||||||||||||
| Sappi Papier Holding GmbH+^ |
7.75 | 7/15/2017 | 700,000 | 729,348 | 726,250 | |||||||||||||||
|
|
|
|
|
|
|
|||||||||||||||
| Hand/Machine Tools — 0.2%*: |
||||||||||||||||||||
| Stanley Black & Decker, Inc. |
2.45 | 11/17/2018 | 325,000 | 326,873 | 332,066 | |||||||||||||||
|
|
|
|
|
|
|
|||||||||||||||
| Healthcare-Products — 0.5%*: |
||||||||||||||||||||
| Boston Scientific Corp. |
2.85 | 5/15/2020 | 350,000 | 354,021 | 362,580 | |||||||||||||||
| Zimmer Biomet Holdings, Inc. |
2.00 | 4/1/2018 | 480,000 | 480,657 | 484,011 | |||||||||||||||
|
|
|
|
|
|
|
|||||||||||||||
| Total Healthcare-Products |
830,000 | 834,678 | 846,591 | |||||||||||||||||
|
|
|
|
|
|
|
|||||||||||||||
See accompanying Notes to the Financial Statements.
104
Table of Contents
Babson Active Short Duration Bond Fund 2016 Annual Report
SCHEDULE OF INVESTMENTS (CONTINUED)
June 30, 2016
| EFFECTIVE INTEREST RATE |
DUE DATE | PRINCIPAL ‡‡ | COST | FAIR VALUE |
||||||||||||||||
| Corporate Bonds (Continued) |
||||||||||||||||||||
| Healthcare-Services — 2.2%*: |
||||||||||||||||||||
| Aetna, Inc. |
1.90 | % | 6/7/2019 | 410,000 | $409,699 | $415,326 | ||||||||||||||
| Anthem, Inc. |
1.88 | 1/15/2018 | 250,000 | 250,071 | 251,415 | |||||||||||||||
| Cigna Corp. |
4.00 | 2/15/2022 | 252,000 | 268,793 | 271,436 | |||||||||||||||
| Cigna Corp. |
4.50 | 3/15/2021 | 420,000 | 454,873 | 461,071 | |||||||||||||||
| HCA, Inc. |
3.75 | 3/15/2019 | 725,000 | 735,318 | 750,375 | |||||||||||||||
| Humana, Inc. |
6.30 | 8/1/2018 | 150,000 | 162,814 | 164,090 | |||||||||||||||
| Laboratory Corp. of America Holdings |
2.63 | 2/1/2020 | 420,000 | 419,207 | 428,984 | |||||||||||||||
| UnitedHealth Group, Inc. |
1.70 | 2/15/2019 | 750,000 | 752,472 | 757,909 | |||||||||||||||
|
|
|
|
|
|
|
|||||||||||||||
| Total Healthcare-Services |
3,377,000 | 3,453,247 | 3,500,606 | |||||||||||||||||
|
|
|
|
|
|
|
|||||||||||||||
| Home Builders — 0.5%*: |
||||||||||||||||||||
| Lennar Corp. |
4.50 | 6/15/2019 | 150,000 | 153,449 | 155,685 | |||||||||||||||
| Lennar Corp. |
4.50 | 11/15/2019 | 500,000 | 513,607 | 520,825 | |||||||||||||||
| Lennar Corp. |
4.75 | 4/1/2021 | 140,000 | 140,000 | 145,600 | |||||||||||||||
|
|
|
|
|
|
|
|||||||||||||||
| Total Home Builders |
790,000 | 807,056 | 822,110 | |||||||||||||||||
|
|
|
|
|
|
|
|||||||||||||||
| Housewares — 0.3%*: |
||||||||||||||||||||
| Newell Brands, Inc. |
2.60 | 3/29/2019 | 455,000 | 454,904 | 466,912 | |||||||||||||||
|
|
|
|
|
|
|
|||||||||||||||
| Insurance — 2.8%*: |
||||||||||||||||||||
| American International Group, Inc. |
3.30 | 3/1/2021 | 700,000 | 699,397 | 723,174 | |||||||||||||||
| CNA Financial Corp. |
5.75 | 8/15/2021 | 341,000 | 377,770 | 392,614 | |||||||||||||||
| Lincoln National Corp. |
6.25 | 2/15/2020 | 300,000 | 332,306 | 337,294 | |||||||||||||||
| Reinsurance Group of America, Inc. |
5.63 | 3/15/2017 | 450,000 | 461,933 | 462,872 | |||||||||||||||
| TIAA Asset Management Finance Co. LLC^ |
2.95 | 11/1/2019 | 835,000 | 845,828 | 855,422 | |||||||||||||||
| Trinity Acquisition PLC+ |
3.50 | 9/15/2021 | 600,000 | 602,405 | 621,954 | |||||||||||||||
| Unum Group |
3.00 | 5/15/2021 | 120,000 | 119,746 | 122,728 | |||||||||||||||
| Willis Group Holdings PLC+ |
5.75 | 3/15/2021 | 370,000 | 407,957 | 413,733 | |||||||||||||||
| XLIT Ltd.+ |
5.75 | 10/1/2021 | 335,000 | 380,513 | 383,140 | |||||||||||||||
|
|
|
|
|
|
|
|||||||||||||||
| Total Insurance |
4,051,000 | 4,227,855 | 4,312,931 | |||||||||||||||||
|
|
|
|
|
|
|
|||||||||||||||
| Internet — 0.5%*: |
||||||||||||||||||||
| Alibaba Group Holding Ltd.+ |
2.50 | 11/28/2019 | 250,000 | 248,405 | 252,923 | |||||||||||||||
| Expedia, Inc. |
7.46 | 8/15/2018 | 539,000 | 593,486 | 596,064 | |||||||||||||||
|
|
|
|
|
|
|
|||||||||||||||
| Total Internet |
789,000 | 841,891 | 848,987 | |||||||||||||||||
|
|
|
|
|
|
|
|||||||||||||||
| Investment Company Security — 0.5%*: |
||||||||||||||||||||
| Ares Capital Corp. |
3.88 | 1/15/2020 | 150,000 | 155,570 | 155,150 | |||||||||||||||
| Ares Capital Corp. |
4.88 | 11/30/2018 | 200,000 | 207,568 | 209,260 | |||||||||||||||
| FS Investment Corp. |
4.00 | 7/15/2019 | 335,000 | 338,467 | 338,382 | |||||||||||||||
|
|
|
|
|
|
|
|||||||||||||||
| Total Investment Company Security |
685,000 | 701,605 | 702,792 | |||||||||||||||||
|
|
|
|
|
|
|
|||||||||||||||
| IT Services — 0.7%*: |
||||||||||||||||||||
| Diamond 1 Finance Corp./Diamond 2 Finance Corp.^ |
3.48 | 6/1/2019 | 325,000 | 324,921 | 332,933 | |||||||||||||||
See accompanying Notes to the Financial Statements.
105
Table of Contents
Babson Active Short Duration Bond Fund 2016 Annual Report
SCHEDULE OF INVESTMENTS (CONTINUED)
June 30, 2016
| EFFECTIVE INTEREST RATE |
DUE DATE | PRINCIPAL ‡‡ | COST | FAIR VALUE |
||||||||||||||||
| Corporate Bonds (Continued) |
||||||||||||||||||||
| IT Services (Continued) |
||||||||||||||||||||
| Diamond 1 Finance Corp./Diamond 2 Finance Corp.^ |
4.42 | % | 6/15/2021 | 180,000 | $179,949 | $185,269 | ||||||||||||||
| Leidos Holdings, Inc. |
4.45 | 12/1/2020 | 500,000 | 496,946 | 500,000 | |||||||||||||||
|
|
|
|
|
|
|
|||||||||||||||
| Total IT Services |
1,005,000 | 1,001,816 | 1,018,202 | |||||||||||||||||
|
|
|
|
|
|
|
|||||||||||||||
| Leisure Time — 0.1%*: |
||||||||||||||||||||
| Brunswick Corp.^ |
4.63 | 5/15/2021 | 225,000 | 225,262 | 227,813 | |||||||||||||||
|
|
|
|
|
|
|
|||||||||||||||
| Lodging — 0.4%*: |
||||||||||||||||||||
| Marriott International, Inc. |
2.30 | 1/15/2022 | 300,000 | 298,773 | 301,803 | |||||||||||||||
| Marriott International, Inc. |
2.88 | 3/1/2021 | 275,000 | 274,159 | 284,280 | |||||||||||||||
|
|
|
|
|
|
|
|||||||||||||||
| Total Lodging |
575,000 | 572,932 | 586,083 | |||||||||||||||||
|
|
|
|
|
|
|
|||||||||||||||
| Machinery-Diversified — 0.2%*: |
||||||||||||||||||||
| Case New Holland Industrial, Inc.+ |
7.88 | 12/1/2017 | 360,000 | 380,525 | 387,000 | |||||||||||||||
|
|
|
|
|
|
|
|||||||||||||||
| Media — 0.9%*: |
||||||||||||||||||||
| Charter Communications Operating LLC/Charter Communications Operating Capital^ |
3.58 | 7/23/2020 | 415,000 | 415,636 | 432,347 | |||||||||||||||
| Sirius XM Radio, Inc.^ |
4.25 | 5/15/2020 | 385,000 | 386,217 | 389,225 | |||||||||||||||
| Sirius XM Radio, Inc.^ |
5.75 | 8/1/2021 | 200,000 | 206,788 | 207,750 | |||||||||||||||
| Viacom, Inc. |
6.13 | 10/5/2017 | 400,000 | 416,332 | 421,637 | |||||||||||||||
|
|
|
|
|
|
|
|||||||||||||||
| Total Media |
1,400,000 | 1,424,973 | 1,450,959 | |||||||||||||||||
|
|
|
|
|
|
|
|||||||||||||||
| Mining — 0.5%*: |
||||||||||||||||||||
| Glencore Canada Corp.+ |
5.50 | 6/15/2017 | 596,000 | 611,978 | 609,523 | |||||||||||||||
| Glencore Finance Canada Ltd.+^ |
2.70 | 10/25/2017 | 140,000 | 139,689 | 139,475 | |||||||||||||||
|
|
|
|
|
|
|
|||||||||||||||
| Total Mining |
736,000 | 751,667 | 748,998 | |||||||||||||||||
|
|
|
|
|
|
|
|||||||||||||||
| Miscellaneous Manufacturing — 0.2%*: |
||||||||||||||||||||
| Tyco Electronics Group SA+ |
2.35 | 8/1/2019 | 135,000 | 134,946 | 137,050 | |||||||||||||||
| Tyco Electronics Group SA+ |
2.38 | 12/17/2018 | 200,000 | 201,966 | 202,961 | |||||||||||||||
|
|
|
|
|
|
|
|||||||||||||||
| Total Miscellaneous Manufacturing |
335,000 | 336,912 | 340,011 | |||||||||||||||||
|
|
|
|
|
|
|
|||||||||||||||
| Office/Business Equip — 0.1%*: |
||||||||||||||||||||
| Pitney Bowes, Inc. |
4.75 | 5/15/2018 | 200,000 | 209,087 | 210,908 | |||||||||||||||
|
|
|
|
|
|
|
|||||||||||||||
| Packaging and Containers — 0.5%*: |
||||||||||||||||||||
| Graphic Packaging International, Inc. |
4.75 | 4/15/2021 | 750,000 | 787,149 | 784,215 | |||||||||||||||
|
|
|
|
|
|
|
|||||||||||||||
| Pharmaceuticals — 2.0%*: |
||||||||||||||||||||
| AbbVie, Inc. |
1.80 | 5/14/2018 | 720,000 | 721,388 | 725,054 | |||||||||||||||
| Actavis Funding SCS+ |
2.35 | 3/12/2018 | 335,000 | 336,471 | 339,566 | |||||||||||||||
| Baxalta, Inc. |
2.00 | 6/22/2018 | 330,000 | 329,958 | 330,168 | |||||||||||||||
| Express Scripts Holding Co. |
3.30 | 2/25/2021 | 675,000 | 674,613 | 707,814 | |||||||||||||||
| Mylan NV+^ |
2.50 | 6/7/2019 | 330,000 | 329,638 | 334,382 | |||||||||||||||
| Mylan NV+^ |
3.15 | 6/15/2021 | 635,000 | 634,272 | 644,111 | |||||||||||||||
|
|
|
|
|
|
|
|||||||||||||||
| Total Pharmaceuticals |
3,025,000 | 3,026,340 | 3,081,095 | |||||||||||||||||
|
|
|
|
|
|
|
|||||||||||||||
See accompanying Notes to the Financial Statements.
106
Table of Contents
Babson Active Short Duration Bond Fund 2016 Annual Report
SCHEDULE OF INVESTMENTS (CONTINUED)
June 30, 2016
| EFFECTIVE INTEREST RATE |
DUE DATE | PRINCIPAL ‡‡ | COST | FAIR VALUE |
||||||||||||||||
| Corporate Bonds (Continued) |
||||||||||||||||||||
| Real Estate Investment Trusts — 2.2%*: |
||||||||||||||||||||
| American Tower Corp. |
3.30 | % | 2/15/2021 | 180,000 | $179,758 | $187,776 | ||||||||||||||
| American Tower Corp. |
4.50 | 1/15/2018 | 300,000 | 310,683 | 312,984 | |||||||||||||||
| Crown Castle International Corp. |
3.40 | 2/15/2021 | 372,000 | 383,796 | 388,344 | |||||||||||||||
| DDR Corp. |
4.75 | 4/15/2018 | 445,000 | 462,897 | 464,283 | |||||||||||||||
| DDR Corp. MTN |
7.50 | 7/15/2018 | 31,000 | 34,130 | 34,206 | |||||||||||||||
| Digital Realty Trust LP |
3.40 | 10/1/2020 | 385,000 | 389,357 | 399,624 | |||||||||||||||
| Duke Realty LP |
3.88 | 2/15/2021 | 100,000 | 103,338 | 105,785 | |||||||||||||||
| Duke Realty LP |
6.50 | 1/15/2018 | 140,000 | 148,996 | 150,425 | |||||||||||||||
| HCP, Inc. |
6.00 | 1/30/2017 | 390,000 | 399,741 | 400,211 | |||||||||||||||
| Highwoods Realty LP |
7.50 | 4/15/2018 | 370,000 | 403,657 | 403,737 | |||||||||||||||
| Regency Centers LP |
5.88 | 6/15/2017 | 150,000 | 155,740 | 155,906 | |||||||||||||||
| Weyerhaeuser Co. |
7.38 | 10/1/2019 | 315,000 | 357,168 | 362,077 | |||||||||||||||
|
|
|
|
|
|
|
|||||||||||||||
| Total REITS |
3,178,000 | 3,329,261 | 3,365,358 | |||||||||||||||||
|
|
|
|
|
|
|
|||||||||||||||
| Retail — 1.5%*: |
||||||||||||||||||||
| AutoNation, Inc. |
3.35 | 1/15/2021 | 355,000 | 356,178 | 363,509 | |||||||||||||||
| Best Buy Co., Inc. |
5.00 | 8/1/2018 | 200,000 | 206,148 | 210,624 | |||||||||||||||
| CVS Health Corp. |
2.13 | 6/1/2021 | 555,000 | 553,481 | 561,825 | |||||||||||||||
| Dollar Tree, Inc.^ |
5.75 | 3/1/2023 | 750,000 | 790,641 | 796,875 | |||||||||||||||
| Home Depot, Inc. (The) |
2.00 | 4/1/2021 | 305,000 | 303,991 | 313,152 | |||||||||||||||
| QVC, Inc. |
3.13 | 4/1/2019 | 103,000 | 105,602 | 105,739 | |||||||||||||||
|
|
|
|
|
|
|
|||||||||||||||
| Total Retail |
2,268,000 | 2,316,041 | 2,351,724 | |||||||||||||||||
|
|
|
|
|
|
|
|||||||||||||||
| Semiconductors — 0.7%*: |
||||||||||||||||||||
| KLA-Tencor Corp. |
2.38 | 11/1/2017 | 390,000 | 391,892 | 393,324 | |||||||||||||||
| KLA-Tencor Corp.+ |
3.38 | 11/1/2019 | 200,000 | 204,508 | 206,824 | |||||||||||||||
| NXP BV/NXP Funding LLC^ |
4.13 | 6/1/2021 | 500,000 | 500,000 | 507,500 | |||||||||||||||
|
|
|
|
|
|
|
|||||||||||||||
| Total Semiconductors |
1,090,000 | 1,096,400 | 1,107,648 | |||||||||||||||||
|
|
|
|
|
|
|
|||||||||||||||
| Transportation — 1.4%*: |
||||||||||||||||||||
| Asciano Finance Ltd.+^ |
5.00 | 4/7/2018 | 550,000 | 568,459 | 568,265 | |||||||||||||||
| Penske Truck Leasing Co. LP/PTL Finance Corp.^ |
3.05 | 1/9/2020 | 200,000 | 202,357 | 203,635 | |||||||||||||||
| PT Penske Truck Leasing Co. LP/L Finance Corp.^ |
2.50 | 6/15/2019 | 285,000 | 281,055 | 288,105 | |||||||||||||||
| PT Penske Truck Leasing Co. LP/L Finance Corp.^ |
3.20 | 7/15/2020 | 135,000 | 134,921 | 138,082 | |||||||||||||||
| PT Penske Truck Leasing Co. LP/L Finance Corp.^ |
3.30 | 4/1/2021 | 60,000 | 59,756 | 61,678 | |||||||||||||||
| Ryder System, Inc. |
2.50 | 3/1/2018 | 250,000 | 250,700 | 253,754 | |||||||||||||||
| Ryder System, Inc. |
2.55 | 6/1/2019 | 185,000 | 184,632 | 188,539 | |||||||||||||||
| Ryder System, Inc. |
2.88 | 9/1/2020 | 200,000 | 198,180 | 203,445 | |||||||||||||||
| TTX Co.^ |
2.25 | 2/1/2019 | 250,000 | 249,724 | 254,233 | |||||||||||||||
|
|
|
|
|
|
|
|||||||||||||||
| Total Transportation |
2,115,000 | 2,129,784 | 2,159,736 | |||||||||||||||||
|
|
|
|
|
|
|
|||||||||||||||
See accompanying Notes to the Financial Statements.
107
Table of Contents
Babson Active Short Duration Bond Fund 2016 Annual Report
SCHEDULE OF INVESTMENTS (CONTINUED)
June 30, 2016
| EFFECTIVE INTEREST RATE |
DUE DATE | PRINCIPAL ‡‡ | COST | FAIR VALUE |
||||||||||||||||
| Corporate Bonds (Continued) |
||||||||||||||||||||
| Trucking and Leasing — 0.8%*: |
||||||||||||||||||||
| Aviation Capital Group Corp.^ |
2.88 | % | 9/17/2018 | 480,000 | $478,279 | $475,200 | ||||||||||||||
| Aviation Capital Group Corp.^ |
6.75 | 4/6/2021 | 200,000 | 221,406 | 226,000 | |||||||||||||||
| GATX Corp. |
2.60 | 3/30/2020 | 495,000 | 484,181 | 491,973 | |||||||||||||||
|
|
|
|
|
|
|
|||||||||||||||
| Total Trucking and Leasing |
1,175,000 | 1,183,866 | 1,193,173 | |||||||||||||||||
|
|
|
|
|
|
|
|||||||||||||||
| Total Corporate Bonds |
61,828,000 | 63,004,977 | 63,831,141 | |||||||||||||||||
|
|
|
|
|
|
|
|||||||||||||||
| Mortgage-Backed Securities — 3.3%**: |
||||||||||||||||||||
| Banc of America Commercial Mortgage Trust 2007-4 AM |
6.00 | # | 2/10/2051 | 255,000 | 272,364 | 265,705 | ||||||||||||||
| Banc of America Commercial Mortgage Trust 2008-1 A4 |
6.44 | # | 2/10/2051 | 194,621 | 211,571 | 204,831 | ||||||||||||||
| Bear Stearns Commercial Mortgage Securities Trust 2006-PWR14 AM |
5.24 | 12/11/2038 | 220,000 | 229,889 | 221,677 | |||||||||||||||
| Bear Stearns Commercial Mortgage Securities Trust 2006-TOP24 AM |
5.57 | # | 10/12/2041 | 220,000 | 230,503 | 220,834 | ||||||||||||||
| Bear Stearns Commercial Mortgage Securities Trust 2007-PWR17 AM |
5.92 | # | 6/11/2050 | 160,000 | 171,742 | 164,270 | ||||||||||||||
| CD 2007-CD4 Commercial Mortgage Trust |
5.32 | 12/11/2049 | 198,137 | 200,844 | 200,219 | |||||||||||||||
| COMM Mortgage Trust 2007-C9 AM |
5.65 | # | 12/10/2049 | 100,000 | 106,578 | 103,055 | ||||||||||||||
| Fannie Mae Connecticut Avenue Securities CAS 2015-C03 1M1 |
1.95 | # | 7/25/2025 | 179,189 | 179,261 | 179,699 | ||||||||||||||
| Fannie Mae Connecticut Avenue Securities CAS 2015-C04 1M1 |
2.05 | # | 4/25/2028 | 114,066 | 114,066 | 114,220 | ||||||||||||||
| Freddie Mac Structured Agency Credit Risk Debt Notes 2016-DNA1 M1 |
1.90 | # | 7/25/2028 | 241,278 | 241,277 | 242,110 | ||||||||||||||
| JPMorgan Chase Commercial Mortgage Securities Trust 2006-LDP7 AM |
5.99 | # | 4/17/2045 | 164,248 | 170,414 | 164,030 | ||||||||||||||
| JPMorgan Chase Commercial Mortgage Securities Trust 2007-CIBC18 |
5.47 | # | 6/12/2047 | 700,000 | 717,141 | 705,169 | ||||||||||||||
| JPMorgan Chase Commercial Mortgage Securities Trust 2007-CIBC20 |
5.79 | # | 2/12/2051 | 247,420 | 257,351 | 256,875 | ||||||||||||||
| JPMorgan Chase Commercial Mortgage Securities Trust 2007-CIBC20 AM |
6.09 | # | 2/12/2051 | 210,000 | 228,137 | 219,166 | ||||||||||||||
| ML-CFC Commercial Mortgage Trust 2006-3 AM |
5.46 | # | 7/12/2046 | 700,000 | 712,612 | 700,586 | ||||||||||||||
| ML-CFC Commercial Mortgage Trust 2006-4 AM |
5.20 | 12/12/2049 | 210,000 | 219,517 | 211,947 | |||||||||||||||
| Morgan Stanley Capital I Trust 2006-IQ12 AM |
5.37 | 12/15/2043 | 290,000 | 303,299 | 292,085 | |||||||||||||||
| Morgan Stanley Capital I Trust 2008-TOP29 A4 |
6.48 | # | 1/11/2043 | 187,928 | 205,548 | 198,585 | ||||||||||||||
| Wachovia Bank Commercial Mortgage Trust 2006-C29 AM |
5.34 | 11/15/2048 | 280,000 | 289,046 | 282,706 | |||||||||||||||
| Wachovia Bank Commercial Mortgage Trust 2007-C33 A1A |
6.15 | # | 2/15/2051 | 195,736 | 210,522 | 203,258 | ||||||||||||||
|
|
|
|
|
|
|
|||||||||||||||
| Total Mortgage-Backed Securities |
5,067,623 | 5,271,682 | 5,151,027 | |||||||||||||||||
|
|
|
|
|
|
|
|||||||||||||||
See accompanying Notes to the Financial Statements.
108
Table of Contents
Babson Active Short Duration Bond Fund 2016 Annual Report
SCHEDULE OF INVESTMENTS (CONTINUED)
June 30, 2016
| EFFECTIVE INTEREST RATE |
DUE DATE | PRINCIPAL ‡‡ | COST | FAIR VALUE |
||||||||||||||||
| U.S. Treasury & Government Agencies — 20.6%**: |
|
|||||||||||||||||||
| Education Funding Capital Trust IV |
0.84 | #% | 12/16/2024 | 197,000 | $196,608 | $194,819 | ||||||||||||||
| Federal Home Loan Mortgage Corp. |
4.00 | 3/15/2040 | 496,375 | 530,000 | 530,811 | |||||||||||||||
| Federal National Mortgage Association REMICS 2015-62 VA |
4.00 | 10/25/2026 | 135,323 | 146,085 | 149,861 | |||||||||||||||
| Federal National Mortgage Association TBA |
3.00 | 8/1/2031 | 5,900,000 | 6,179,036 | 6,179,328 | |||||||||||||||
| Federal National Mortgage Association 2015-58 JP |
2.50 | 3/25/2037 | 100,493 | 102,658 | 104,309 | |||||||||||||||
| Goal Capital Funding Trust 2010-1 A^ |
1.36 | # | 8/25/2048 | 130,929 | 125,536 | 127,088 | ||||||||||||||
| Navient Student Loan Trust 2014-1 A1 |
0.70 | # | 3/25/2021 | 133,816 | 133,369 | 133,584 | ||||||||||||||
| SLM Student Loan Trust 2003-12 A5^ |
0.93 | # | 9/15/2022 | 100,973 | 100,287 | 100,659 | ||||||||||||||
| SLM Student Loan Trust 2005-8 A3 |
0.75 | # | 10/25/2024 | 152,429 | 151,771 | 152,372 | ||||||||||||||
| U.S. Treasury Note``1 |
0.75 | 2/28/2018 | 15,880,000 | 15,879,726 | 15,923,416 | |||||||||||||||
| U.S. Treasury Note |
1.38 | 4/30/2020 | 2,770,000 | 2,764,829 | 2,822,153 | |||||||||||||||
| U.S. Treasury Note |
1.75 | 10/31/2018 | 5,460,000 | 5,559,489 | 5,599,061 | |||||||||||||||
|
|
|
|
|
|
|
|||||||||||||||
| Total U.S. Treasury & Government Agencies |
31,457,338 | 31,869,394 | 32,017,461 | |||||||||||||||||
|
|
|
|
|
|
|
|||||||||||||||
| Total Fixed Income |
146,261,593 | 147,551,469 | 148,567,770 | |||||||||||||||||
|
|
|
|
|
|
|
|||||||||||||||
| Short-Term Investments — 4.9%**: |
| |||||||||||||||||||
| Bank Deposit — 0.0%*: |
| |||||||||||||||||||
| State Street Bank & Trust Co. Euro Time Deposit |
0.01 | 7/1/2016 | 47,434 | 47,434 | 47,434 | |||||||||||||||
|
|
|
|
|
|
|
|||||||||||||||
| Commercial Paper — 4.9%*: |
| |||||||||||||||||||
| Construction Materials — 0.7%*: |
| |||||||||||||||||||
| Mohawk Industries, Inc.^ |
0.01 | 7/1/2016 | 1,200,000 | 1,200,000 | 1,200,000 | |||||||||||||||
|
|
|
|
|
|
|
|||||||||||||||
| Electric — 1.3%*: |
| |||||||||||||||||||
| Nextera Energy Capital Holdings, Inc.^ |
0.01 | 7/7/2016 | 2,000,000 | 1,999,774 | 1,999,774 | |||||||||||||||
|
|
|
|
|
|
|
|||||||||||||||
| Oil and Gas Services — 1.6%*: |
| |||||||||||||||||||
| Spectra Energy Capital^ |
0.01 | 7/6/2016 | 2,500,000 | 2,499,722 | 2,499,722 | |||||||||||||||
|
|
|
|
|
|
|
|||||||||||||||
| Pipelines — 1.3%*: |
|
|||||||||||||||||||
| Potash Corp. of Saskatchewan, Inc.+^ |
0.01 | 7/5/2016 | 2,000,000 | 1,999,842 | 1,999,842 | |||||||||||||||
|
|
|
|
|
|
|
|||||||||||||||
| Total Commercial Paper |
7,700,000 | 7,699,338 | 7,699,338 | |||||||||||||||||
|
|
|
|
|
|
|
|||||||||||||||
| Total Short-Term Investments |
7,747,434 | 7,746,772 | 7,746,772 | |||||||||||||||||
|
|
|
|
|
|
|
|||||||||||||||
| Total Investments |
154,009,027 | 155,298,241 | 156,314,542 | |||||||||||||||||
|
|
|
|
|
|
|
|||||||||||||||
| Other assets and liabilities — (0.3%)* |
(450,039 | ) | ||||||||||||||||||
|
|
|
|||||||||||||||||||
| Net Assets — 100.0% |
$155,864,503 | |||||||||||||||||||
|
|
|
|||||||||||||||||||
See accompanying Notes to the Financial Statements.
109
Table of Contents
Babson Active Short Duration Bond Fund 2016 Annual Report
SCHEDULE OF INVESTMENTS (CONTINUED)
June 30, 2016
| MTN | Medium Term Note |
| TBA | To Be Announced: Securities purchased on a forward commitment basis with an approximate principal amount and maturity date. The actual principal amount and maturity date will be determined upon settlement. |
| 1 | All or a portion of this security is held for swaps collateral. |
| ‡‡ | Unless otherwise indicated, all principal amounts are denominated in United States Dollars. |
| * | Calculated as a percentage of net assets applicable to common shareholders. |
| + | Foreign security. |
Distributions of investments by country of risk (excluding temporary cash investments) as a percentage of total investments in securities, is as follows:
| United States | 91.0% | |||||
| Canada | 1.7% | |||||
| Other (Individually less than 1%) | 7.3% | |||||
|
|
|
|||||
| Total | 100.0% | |||||
|
|
|
| ^ | Security acquired in a transaction exempt from registration under Rule 144A of the Securities Act of 1933. These securities may only be resold in transactions exempt from registration, normally to qualified institutional buyers. |
| # | Variable rate security. The interest rate shown is the rate in effect at June 30, 2016. |
| `` | Security has been fully or partially segregated to cover margin requirements for open futures contracts as of June 30, 2016. |
A summary of outstanding derivatives at June 30, 2016 is as follows:
Forward Foreign Currency Exchange Contracts to Buy
| EXPIRATION DATE |
COUNTERPARTY | LOCAL CURRENCY |
VALUE IN USD | IN EXCHANGE FOR USD |
NET UNREALIZED (DEPRECIATION) |
|||||||||||||||||
| 3/15/17 | JPMorgan Chase Bank N.A. |
CNH | 14,511,200 | 2,149,505 | 2,200,000 | $ | (50,495 | ) | ||||||||||||||
Forward Foreign Currency Exchange Contracts to Sell
| EXPIRATION DATE |
COUNTERPARTY | LOCAL CURRENCY |
VALUE IN USD | IN EXCHANGE FOR USD |
NET UNREALIZED APPRECIATION |
|||||||||||||||||
| 3/15/17 | JPMorgan Chase Bank N.A. |
CNH | 29,376,600 | 4,351,477 | 4,400,000 | $ | 48,523 | |||||||||||||||
|
|
|
|||||||||||||||||||||
| Net unrealized appreciation on forward foreign exchange contracts to sell |
|
$ | 48,523 | |||||||||||||||||||
|
|
|
|||||||||||||||||||||
Currency Legend
| CNH | – | Chinese Yuan Renminbi |
Futures
| TYPE | EXPIRATION DATE |
CONTRACTS | POSITION | FAIR VALUE | UNREALIZED APPRECIATION |
|||||||||||||
| Long Futures |
| |||||||||||||||||
| U.S. 2-Year Treasury Note |
09/30/16 | 248 | Long | $ | 54,393,375 | $ | 312,198 | |||||||||||
|
|
|
|||||||||||||||||
See accompanying Notes to the Financial Statements.
110
Table of Contents
Babson Active Short Duration Bond Fund 2016 Annual Report
SCHEDULE OF INVESTMENTS (CONTINUED)
June 30, 2016
| TYPE | EXPIRATION DATE |
CONTRACTS | POSITION | FAIR VALUE |
UNREALIZED DEPRECIATION |
|||||||||||||||
| Short Futures |
| |||||||||||||||||||
| U.S. 10-Year Treasury Note |
09/21/16 | 61 | Short | $ | 8,112,047 | $ | (185,668 | ) | ||||||||||||
| U.S. 10-Year Ultra Bond |
09/21/16 | 3 | Short | 437,015 | (15,127 | ) | ||||||||||||||
| U.S. 5-Year Treasury Note |
09/30/16 | 123 | Short | 15,026,180 | (231,444 | ) | ||||||||||||||
|
|
|
|||||||||||||||||||
| Total Short Futures |
(432,239 | ) | ||||||||||||||||||
|
|
|
|||||||||||||||||||
OTC Credit Default Swaps – Sell Protection (1)(2)
| REFERENCE OBLIGATION |
FIXED-DEAL RECEIVED |
MATURITY DATE |
COUNTERPARTY | ORIGINAL NOTIONAL AMOUNT |
CURRENT NOTIONAL AMOUNT (3) |
UPFRONT PREMIUMS PAID/ (RECEIVED) |
FAIR VALUE (4) |
UNREALIZED APPRECIATION/ (DEPRECIATION) |
||||||||||||||||||||||
| CMBX.NA.BBB-.6† | 3.00 | % | 11/17/2045 | JPMorgan Chase Bank N.A. |
230,000 | $ | 230,000 | $ | 553 | $ | (17,010 | ) | $ | (17,563 | ) | |||||||||||||||
| CMBX.NA.BBB-.6† | 3.00 | % | 5/11/2063 | Goldman Sachs & Co. |
290,000 | $ | 290,000 | (22,354 | ) | (21,447 | ) | 907 | ||||||||||||||||||
|
|
|
|
|
|
|
|||||||||||||||||||||||||
| $ | (21,801 | ) | $ | (38,457 | ) | $ | (16,656 | ) | ||||||||||||||||||||||
|
|
|
|
|
|
|
|||||||||||||||||||||||||
Centrally Cleared Credit Default Swaps – Buy Protection
| REFERENCE OBLIGATION |
FIXED-DEAL RECEIVED RATE |
MATURITY DATE |
ORIGINAL NOTIONAL AMOUNT |
CURRENT NOTIONAL AMOUNT (2) |
UPFRONT PREMIUMS PAID/ (RECEIVED) |
FAIR VALUE (3) |
UNREALIZED APPRECIATION/ (DEPRECIATION) |
|||||||||||||||||||
| CDX.NA.IG.26 in |
1.00% | 6/20/2021 | 1,530,000 | $ | 1,530,000 | $ | (14,707 | ) | $ | (15,762 | ) | $ | (1,055 | ) | ||||||||||||
| (1) | If the Fund is a seller of protection and a credit event occurs, as defined under the terms of that particular swap agreement, the Fund will either (i) pay to the buyer of protection an amount equal to the notional amount of the swap and take delivery of the referenced obligation or underlying securities comprising the referenced index or (ii) pay a net settlement amount in the form of cash or securities equal to the notional amount of the swap less the recovery value of the referenced obligation or underlying securities comprising the referenced index. |
| (2) | Represents an investment grade index of single name credit default swaps (CDS). All of the companies underlying the single name CDS within the index are rated investment grade or higher. Rating represents a weighted average of the credit ratings of all the companies underlying the single name CDS within the index. |
| (3) | The maximum potential amount the Fund could be required to make as a seller of credit protection or receive as a buyer of credit event as defined under the terms of that particular swap agreement. |
| (4) | The quoted market prices and resulting values for credit default swap agreements on asset-backed securities and credit indices serve as an indicator of the current status of the payment/performance risk and represent the expected amount paid or received for the credit derivative if the amount of the swap agreement was closed/sold as of the period end. Increasing market values, in absolute terms when compared to the notional amount of the swap, represent a deterioration of the referenced entity’s credit soundness and a greater likelihood or risk of default or other credit event occurring as defined under the terms of the agreements. |
| † | Payment is based on a percentage of the index. Reference entities are a number of individual issuers comprising the index. |
See accompanying Notes to the Financial Statements.
111
Table of Contents
Babson Total Return Bond Fund 2016 Annual Report
SCHEDULE OF INVESTMENTS
June 30, 2016
| EFFECTIVE INTEREST RATE |
DUE DATE | PRINCIPAL ‡‡ | COST | FAIR VALUE |
||||||||||||||||
| Fixed Income — 87.2%**: |
||||||||||||||||||||
| Asset-Backed Securities — 19.2%**: |
||||||||||||||||||||
| CDO/CLO — 4.8%*: |
||||||||||||||||||||
| ALM XIV Ltd. 2014-14A A1^ |
2.06 | #% | 7/28/2026 | 250,000 | $249,409 | $248,981 | ||||||||||||||
| Atlas Senior Loan Fund V Ltd. 2014-1A A^ |
2.18 | # | 7/16/2026 | 250,000 | 249,815 | 248,884 | ||||||||||||||
| Carlyle Global Market Strategies CLO Ltd. 2014-1A A^ |
2.15 | # | 4/17/2025 | 250,000 | 250,000 | 249,671 | ||||||||||||||
| Carlyle Global Market Strategies CLO Ltd. 2014-4A A1^ |
2.13 | # | 10/15/2026 | 250,000 | 250,000 | 248,884 | ||||||||||||||
| Madison Park Funding XIV Ltd. 2014-14A A2^ |
2.08 | # | 7/20/2026 | 250,000 | 249,852 | 249,142 | ||||||||||||||
|
|
|
|
|
|
|
|||||||||||||||
| Total CDO/CLO |
1,250,000 | 1,249,076 | 1,245,562 | |||||||||||||||||
|
|
|
|
|
|
|
|||||||||||||||
| Other Asset-Backed Securities — 14.4%*: |
| |||||||||||||||||||
| Access Group, Inc. 2006-1 B |
1.11 | # | 8/25/2037 | 79,288 | 69,103 | 64,353 | ||||||||||||||
| Access Group, Inc. 2015-1 A^ |
1.15 | # | 7/25/2056 | 83,134 | 81,294 | 81,271 | ||||||||||||||
| Access Group, Inc. 2015-1 B^ |
1.95 | # | 7/25/2058 | 100,000 | 86,230 | 87,238 | ||||||||||||||
| American Credit Acceptance Receivables Trust |
2.37 | 5/12/2020 | 23,063 | 23,063 | 23,071 | |||||||||||||||
| AmeriCredit Automobile Receivables Trust |
2.87 | 11/8/2021 | 20,000 | 20,000 | 20,508 | |||||||||||||||
| Arbys Funding LLC 2015-1A A2^ |
4.97 | 10/30/2045 | 39,800 | 39,800 | 41,541 | |||||||||||||||
| Argent Securities, Inc. Asset-Backed Pass- |
1.35 | # | 10/25/2034 | 70,554 | 63,771 | 62,996 | ||||||||||||||
| Citi Held For Asset Issuance 2015-PM1 A^ |
1.85 | 12/15/2021 | 34,421 | 34,421 | 34,332 | |||||||||||||||
| CKE Restaurant Holdings, Inc. 2013-1A A2^ |
4.47 | 3/20/2043 | 123,662 | 126,640 | 123,761 | |||||||||||||||
| CLI Funding VI LLC^ |
4.21 | 2/18/2041 | 93,747 | 93,737 | 90,843 | |||||||||||||||
| College Loan Corp. Trust I 2005-2 B |
1.12 | # | 1/15/2037 | 124,728 | 109,165 | 104,139 | ||||||||||||||
| CPS Auto Receivables Trust 2013-A A^ |
1.31 | 6/15/2020 | 70,364 | 70,110 | 69,687 | |||||||||||||||
| Credit Suisse ABS Repackaging Trust 2013-A B^ |
2.50 | 1/25/2030 | 53,868 | 51,245 | 50,928 | |||||||||||||||
| DB Master Finance LLC 2015-1^ |
3.98 | 2/20/2045 | 49,375 | 50,406 | 50,806 | |||||||||||||||
| DB Master Finance LLC 2015-1A A2I^ |
3.26 | 2/20/2045 | 98,750 | 98,780 | 99,668 | |||||||||||||||
| Diamond Resorts Owner Trust 2013-2 A^ |
2.27 | 5/20/2026 | 55,577 | 55,202 | 55,442 | |||||||||||||||
| Diamond Resorts Owner Trust 2015-1 A^ |
2.73 | 7/20/2027 | 52,238 | 52,233 | 52,756 | |||||||||||||||
| Domino’s Pizza Master Issuer LLC 2015 1A-A2I^ |
3.48 | 10/25/2045 | 59,700 | 59,700 | 61,360 | |||||||||||||||
| Domino’s Pizza Master Issuer LLC 2015-1A A2II^ |
4.47 | 10/25/2045 | 59,700 | 59,700 | 61,513 | |||||||||||||||
| DRB Prime Student Loan Trust 2015-B^ |
2.35 | # | 10/27/2031 | 81,106 | 80,958 | 80,957 | ||||||||||||||
| Drive Auto Receivables Trust 2015-CA A3^ |
1.38 | 10/15/2018 | 94,718 | 94,716 | 94,709 | |||||||||||||||
| Drive Auto Receivables Trust 2016-B^ |
2.56 | 6/15/2020 | 20,000 | 19,999 | 20,063 | |||||||||||||||
| Drug Royalty LP 1 2012-1 A1^ |
5.88 | # | 7/15/2024 | 41,282 | 42,447 | 42,062 | ||||||||||||||
| Element Rail Leasing II LLC 2015-1A A1^ |
2.71 | 2/19/2045 | 81,303 | 78,505 | 79,677 | |||||||||||||||
| Entegry New Orleans Storm Recovery Funding I |
2.67 | 6/1/2027 | 93,932 | 93,911 | 98,315 | |||||||||||||||
| First Franklin Mortgage Loan Trust 2005 FF3 M3 |
1.17 | # | 4/25/2035 | 107,804 | 107,270 | 106,807 | ||||||||||||||
| Flagship Credit Auto Trust 2016-2^ |
3.05 | 8/16/2021 | 60,000 | 59,997 | 60,341 | |||||||||||||||
See accompanying Notes to the Financial Statements.
112
Table of Contents
Babson Total Return Bond Fund 2016 Annual Report
SCHEDULE OF INVESTMENTS (CONTINUED)
June 30, 2016
| EFFECTIVE INTEREST RATE |
DUE DATE | PRINCIPAL ‡‡ | COST | FAIR VALUE |
||||||||||||||||
| Asset-Backed Securities (Continued) |
||||||||||||||||||||
| Other Asset-Backed Securities (Continued) |
||||||||||||||||||||
| FNA 2015-1 Trust^ |
3.24 | % | 12/10/2023 | 63,556 | $63,615 | $63,489 | ||||||||||||||
| GSAMP Trust 2005-SEA2 A1^ |
0.80 | # | 1/25/2045 | 18,586 | 17,855 | 18,386 | ||||||||||||||
| J.G. Wentworth XXXV LLC 2015-2A A^ |
3.87 | 3/15/2058 | 49,672 | 49,634 | 51,201 | |||||||||||||||
| Miramax LLC 2014-1A A2^ |
3.34 | 7/20/2026 | 70,680 | 71,158 | 70,931 | |||||||||||||||
| Nelnet Student Loan Trust 2008-3 A4 |
2.31 | # | 11/25/2024 | 125,000 | 127,276 | 126,058 | ||||||||||||||
| NRZ Advance Receivables Trust 2015-T3 AT3^ |
2.54 | 11/15/2046 | 100,000 | 100,000 | 100,029 | |||||||||||||||
| Ocwen Master Advance Receivables Trust 2015-T1 AT1^ |
2.54 | 9/17/2046 | 100,000 | 100,000 | 100,007 | |||||||||||||||
| OneMain Financial Issuance Trust 2014-2A A^ |
2.47 | 9/18/2024 | 130,000 | 130,441 | 130,282 | |||||||||||||||
| Popular ABS Mortgage Pass-Through Trust 2006-B A3 |
0.73 | # | 5/25/2036 | 67,660 | 64,877 | 66,055 | ||||||||||||||
| Santander Drive Auto Receivables Trust 2014-4 B |
1.82 | 5/15/2019 | 120,000 | 120,453 | 120,421 | |||||||||||||||
| Sierra Timeshare Receivables Funding LLC 2015-2A B^ |
3.02 | 6/20/2032 | 55,208 | 55,196 | 55,436 | |||||||||||||||
| SLC Private Student Loan Trust 2006-A A5 |
0.80 | # | 7/15/2036 | 76,507 | 76,056 | 76,013 | ||||||||||||||
| SLC Private Student Loan Trust 2006-A C |
1.08 | # | 7/15/2036 | 140,000 | 124,303 | 121,591 | ||||||||||||||
| SLC Student Loan Trust 2005-1 B |
0.83 | # | 2/15/2045 | 114,801 | 98,104 | 95,577 | ||||||||||||||
| SLM Student Loan Trust 2002-7 A11 |
1.75 | # | 3/15/2028 | 50,000 | 49,390 | 49,867 | ||||||||||||||
| SLM Student Loan Trust 2003-4 B |
1.30 | # | 6/15/2038 | 83,165 | 76,024 | 68,962 | ||||||||||||||
| SLM Student Loan Trust 2005-4 B |
0.82 | # | 7/25/2040 | 112,849 | 95,365 | 95,442 | ||||||||||||||
| SoFi Consumer Loan Program 2016-1 LLC^ |
3.26 | 8/25/2025 | 100,000 | 99,989 | 100,531 | |||||||||||||||
| SoFi Professional Loan Program LLC 2016 A A2^ |
2.76 | 12/26/2036 | 94,602 | 93,748 | 94,163 | |||||||||||||||
| SpringCastle America Funding LLC 2014-AA A^ |
2.70 | 5/25/2023 | 46,152 | 46,284 | 46,309 | |||||||||||||||
| Taco Bell Funding LLC^ |
3.83 | 5/25/2046 | 80,000 | 80,253 | 81,558 | |||||||||||||||
| Taco Bell Funding LLC^ |
4.97 | 5/25/2046 | 70,000 | 70,640 | 72,197 | |||||||||||||||
| Wendys Funding LLC 2015 1A A2I^ |
3.37 | 6/15/2045 | 129,025 | 128,582 | 129,735 | |||||||||||||||
|
|
|
|
|
|
|
|||||||||||||||
| Total Other Asset-Backed Securities |
3,869,577 | 3,761,646 | 3,753,384 | |||||||||||||||||
|
|
|
|
|
|
|
|||||||||||||||
| Total Asset-Backed Securities |
5,119,577 | 5,010,722 | 4,998,946 | |||||||||||||||||
|
|
|
|
|
|
|
|||||||||||||||
| Corporate Bonds — 34.0%**: |
||||||||||||||||||||
| Advertising — 0.6%*: |
||||||||||||||||||||
| S&P Global, Inc. |
3.30 | 8/14/2020 | 45,000 | 44,956 | 47,081 | |||||||||||||||
| S&P Global, Inc. |
4.00 | 6/15/2025 | 50,000 | 50,197 | 54,579 | |||||||||||||||
| WPP Finance 2010+ |
5.63 | 11/15/2043 | 35,000 | 38,212 | 40,209 | |||||||||||||||
|
|
|
|
|
|
|
|||||||||||||||
| Total Advertising |
130,000 | 133,365 | 141,869 | |||||||||||||||||
|
|
|
|
|
|
|
|||||||||||||||
| Aerospace/Defense — 0.0%*: |
||||||||||||||||||||
| Spirit AeroSystems, Inc. |
3.85 | 6/15/2026 | 5,000 | 4,996 | 5,167 | |||||||||||||||
|
|
|
|
|
|
|
|||||||||||||||
| Agriculture — 1.3%*: |
||||||||||||||||||||
| Altria Group, Inc. |
2.85 | 8/9/2022 | 50,000 | 48,340 | 52,371 | |||||||||||||||
| Altria Group, Inc. |
4.25 | 8/9/2042 | 30,000 | 26,835 | 32,755 | |||||||||||||||
| Bunge Ltd. Finance Corp. |
3.50 | 11/24/2020 | 5,000 | 4,996 | 5,241 | |||||||||||||||
See accompanying Notes to the Financial Statements.
113
Table of Contents
Babson Total Return Bond Fund 2016 Annual Report
SCHEDULE OF INVESTMENTS (CONTINUED)
June 30, 2016
| EFFECTIVE INTEREST RATE |
DUE DATE | PRINCIPAL ‡‡ | COST | FAIR VALUE |
||||||||||||||||
| Corporate Bonds (Continued) |
|
|||||||||||||||||||
| Agriculture (Continued) |
||||||||||||||||||||
| Imperial Tobacco Finance PLC+^ |
3.75 | % | 7/21/2022 | 200,000 | $197,156 | $211,060 | ||||||||||||||
| Reynolds American, Inc. |
4.45 | 6/12/2025 | 30,000 | 30,620 | 33,598 | |||||||||||||||
|
|
|
|
|
|
|
|||||||||||||||
| Total Agriculture |
315,000 | 307,947 | 335,025 | |||||||||||||||||
|
|
|
|
|
|
|
|||||||||||||||
| Airlines — 0.3%*: |
||||||||||||||||||||
| WestJet Airlines Ltd.+^ |
3.50 | 6/16/2021 | 80,000 | 79,892 | 80,638 | |||||||||||||||
|
|
|
|
|
|
|
|||||||||||||||
| Auto Manufacturers — 1.2%*: |
||||||||||||||||||||
| Ford Motor Co. |
7.45 | 7/16/2031 | 60,000 | 76,235 | 80,452 | |||||||||||||||
| General Motors Co. |
5.20 | 4/1/2045 | 35,000 | 34,580 | 34,675 | |||||||||||||||
| General Motors Financial Co., Inc. |
3.20 | 7/6/2021 | 130,000 | 129,762 | 130,207 | |||||||||||||||
| General Motors Financial Co., Inc. |
3.70 | 5/9/2023 | 25,000 | 24,937 | 25,130 | |||||||||||||||
| General Motors Financial Co., Inc. |
4.30 | 7/13/2025 | 50,000 | 49,668 | 51,299 | |||||||||||||||
|
|
|
|
|
|
|
|||||||||||||||
| Total Auto Manufacturers |
300,000 | 315,182 | 321,763 | |||||||||||||||||
|
|
|
|
|
|
|
|||||||||||||||
| Beverages — 0.6%*: |
|
|||||||||||||||||||
| Anheuser-Busch InBev Finance, Inc.+ |
3.65 | 2/1/2026 | 50,000 | 49,919 | 53,562 | |||||||||||||||
| Anheuser-Busch InBev Worldwide, Inc.+ |
8.20 | 1/15/2039 | 35,000 | 52,381 | 55,781 | |||||||||||||||
| Molson Coors Brewing Co. |
3.00 | 7/15/2026 | 40,000 | 39,938 | 39,961 | |||||||||||||||
| Molson Coors Brewing Co. |
4.20 | 7/15/2046 | 10,000 | 9,936 | 10,043 | |||||||||||||||
|
|
|
|
|
|
|
|||||||||||||||
| Total Beverages |
135,000 | 152,174 | 159,347 | |||||||||||||||||
|
|
|
|
|
|
|
|||||||||||||||
| Biotechnology — 0.4%*: |
|
|||||||||||||||||||
| Amgen, Inc. |
5.15 | 11/15/2041 | 25,000 | 26,057 | 28,451 | |||||||||||||||
| Celgene Corp. |
3.55 | 8/15/2022 | 60,000 | 59,856 | 62,861 | |||||||||||||||
| Gilead Sciences, Inc. |
4.75 | 3/1/2046 | 10,000 | 9,959 | 11,371 | |||||||||||||||
|
|
|
|
|
|
|
|||||||||||||||
| Total Biotechnology |
95,000 | 95,872 | 102,683 | |||||||||||||||||
|
|
|
|
|
|
|
|||||||||||||||
| Chemicals — 0.7%*: |
|
|||||||||||||||||||
| LYB International Finance B.V. |
5.25 | 7/15/2043 | 35,000 | 36,005 | 38,272 | |||||||||||||||
| RPM International, Inc. |
6.13 | 10/15/2019 | 90,000 | 99,290 | 100,147 | |||||||||||||||
| Westlake Chemical Corp. |
3.60 | 7/15/2022 | 50,000 | 49,526 | 51,174 | |||||||||||||||
|
|
|
|
|
|
|
|||||||||||||||
| Total Chemicals |
175,000 | 184,821 | 189,593 | |||||||||||||||||
|
|
|
|
|
|
|
|||||||||||||||
| Commercial Banks — 4.7%*: |
|
|||||||||||||||||||
| Associated Banc-Corp |
2.75 | 11/15/2019 | 45,000 | 45,208 | 45,543 | |||||||||||||||
| Associated Banc-Corp |
4.25 | 1/15/2025 | 70,000 | 70,020 | 72,263 | |||||||||||||||
| Bank of America Corp. |
4.45 | 3/3/2026 | 25,000 | 25,000 | 26,148 | |||||||||||||||
| Bank of America Corp. |
7.63 | 6/1/2019 | 120,000 | 137,647 | 138,892 | |||||||||||||||
| Bank of America Corp. MTN |
3.95 | 4/21/2025 | 45,000 | 43,931 | 45,826 | |||||||||||||||
| Bank of America Corp. MTN |
4.00 | 4/1/2024 | 25,000 | 25,582 | 26,682 | |||||||||||||||
| Bank of America Corp. MTN |
5.88 | 2/7/2042 | 25,000 | 28,709 | 31,557 | |||||||||||||||
| Bank of Nova Scotia (The)+ |
4.50 | 12/16/2025 | 20,000 | 19,998 | 20,779 | |||||||||||||||
| Citigroup, Inc. |
3.88 | 3/26/2025 | 60,000 | 58,425 | 60,607 | |||||||||||||||
| Citigroup, Inc. |
4.60 | 3/9/2026 | 45,000 | 44,913 | 47,708 | |||||||||||||||
See accompanying Notes to the Financial Statements.
114
Table of Contents
Babson Total Return Bond Fund 2016 Annual Report
SCHEDULE OF INVESTMENTS (CONTINUED)
June 30, 2016
| EFFECTIVE INTEREST RATE |
DUE DATE | PRINCIPAL ‡‡ | COST | FAIR VALUE |
||||||||||||||||
| Corporate Bonds (Continued) |
|
|||||||||||||||||||
| Commercial Banks (Continued) |
|
|||||||||||||||||||
| Goldman Sachs Group, Inc. (The) |
5.15 | % | 5/22/2045 | 70,000 | $ | 67,755 | $ | 73,028 | ||||||||||||
| Goldman Sachs Group, Inc. (The) |
5.95 | 1/15/2027 | 50,000 | 55,956 | 57,626 | |||||||||||||||
| ICICI Bank Ltd.+^ |
4.75 | 11/25/2016 | 200,000 | 202,402 | 202,300 | |||||||||||||||
| JPMorgan Chase & Co. |
4.50 | 1/24/2022 | 25,000 | 26,637 | 27,821 | |||||||||||||||
| JPMorgan Chase & Co. |
4.95 | 6/1/2045 | 40,000 | 39,303 | 43,919 | |||||||||||||||
| Morgan Stanley |
3.95 | 4/23/2027 | 100,000 | 94,873 | 101,130 | |||||||||||||||
| Morgan Stanley MTN |
6.63 | 4/1/2018 | 110,000 | 118,938 | 119,215 | |||||||||||||||
| SVB Financial Group |
3.50 | 1/29/2025 | 40,000 | 39,102 | 39,878 | |||||||||||||||
| Wells Fargo & Co. MTN |
4.30 | 7/22/2027 | 40,000 | 39,857 | 43,189 | |||||||||||||||
|
|
|
|
|
|
|
|||||||||||||||
| Total Commercial Banks |
1,155,000 | 1,184,256 | 1,224,111 | |||||||||||||||||
|
|
|
|
|
|
|
|||||||||||||||
| Commercial Services — 0.2%*: |
|
|||||||||||||||||||
| ERAC USA Finance LLC^ |
5.63 | 3/15/2042 | 20,000 | 21,553 | 24,248 | |||||||||||||||
| Total System Services, Inc. |
4.80 | 4/1/2026 | 15,000 | 14,960 | 16,266 | |||||||||||||||
|
|
|
|
|
|
|
|||||||||||||||
| Total Commercial Services |
35,000 | 36,513 | 40,514 | |||||||||||||||||
|
|
|
|
|
|
|
|||||||||||||||
| Construction Materials — 0.4%*: |
|
|||||||||||||||||||
| Masco Corp. |
3.50 | 4/1/2021 | 48,000 | 47,844 | 48,974 | |||||||||||||||
| Owens Corning |
4.20 | 12/1/2024 | 50,000 | 49,353 | 52,319 | |||||||||||||||
|
|
|
|
|
|
|
|||||||||||||||
| Total Construction Materials |
98,000 | 97,197 | 101,293 | |||||||||||||||||
|
|
|
|
|
|
|
|||||||||||||||
| Distribution/Wholesale — 0.2%*: |
|
|||||||||||||||||||
| Ingram Micro, Inc. |
4.95 | 12/15/2024 | 45,000 | 46,253 | 44,821 | |||||||||||||||
|
|
|
|
|
|
|
|||||||||||||||
| Diversified Financial Services — 1.9%*: |
|
|||||||||||||||||||
| Affiliated Managers Group, Inc. |
4.25 | 2/15/2024 | 50,000 | 51,409 | 52,925 | |||||||||||||||
| Air Lease Corp. |
2.63 | 9/4/2018 | 110,000 | 109,602 | 109,977 | |||||||||||||||
| Air Lease Corp. |
3.38 | 1/15/2019 | 25,000 | 25,504 | 25,500 | |||||||||||||||
| Air Lease Corp. |
3.38 | 6/1/2021 | 5,000 | 4,955 | 5,125 | |||||||||||||||
| Brookfield Finance, Inc.+ |
4.25 | 6/2/2026 | 60,000 | 59,425 | 61,329 | |||||||||||||||
| Discover Financial Services |
3.75 | 3/4/2025 | 30,000 | 28,874 | 30,223 | |||||||||||||||
| General Electric Co. MTN |
6.88 | 1/10/2039 | 35,000 | 46,910 | 52,831 | |||||||||||||||
| Lazard Group LLC |
4.25 | 11/14/2020 | 130,000 | 135,983 | 138,373 | |||||||||||||||
| Legg Mason, Inc. |
4.75 | 3/15/2026 | 5,000 | 4,998 | 5,273 | |||||||||||||||
|
|
|
|
|
|
|
|||||||||||||||
| Total Diversified Financial Services |
450,000 | 467,660 | 481,556 | |||||||||||||||||
|
|
|
|
|
|
|
|||||||||||||||
| Electric — 1.6%*: |
|
|||||||||||||||||||
| Appalachian Power Co. |
6.70 | 8/15/2037 | 30,000 | 37,610 | 38,802 | |||||||||||||||
| CMS Energy Corp. |
3.88 | 3/1/2024 | 50,000 | 51,338 | 54,378 | |||||||||||||||
| Duke Energy Florida LLC |
3.10 | 8/15/2021 | 50,000 | 51,326 | 53,220 | |||||||||||||||
| Indianapolis Power & Light Co.^ |
4.05 | 5/1/2046 | 45,000 | 44,700 | 46,338 | |||||||||||||||
| LG&E and KU Energy LLC |
4.38 | 10/1/2021 | 50,000 | 53,599 | 55,177 | |||||||||||||||
| NiSource Finance Corp. |
6.13 | 3/1/2022 | 50,000 | 56,953 | 59,499 | |||||||||||||||
| PPL Capital Funding, Inc. |
3.10 | 5/15/2026 | 35,000 | 34,956 | 35,380 | |||||||||||||||
See accompanying Notes to the Financial Statements.
115
Table of Contents
Babson Total Return Bond Fund 2016 Annual Report
SCHEDULE OF INVESTMENTS (CONTINUED)
June 30, 2016
| EFFECTIVE INTEREST RATE |
DUE DATE | PRINCIPAL ‡‡ | COST | FAIR VALUE |
||||||||||||||||
| Corporate Bonds (Continued) |
|
|||||||||||||||||||
| Electric (Continued) |
|
|||||||||||||||||||
| Puget Sound Energy, Inc. |
4.30 | % | 5/20/2045 | 30,000 | $ | 30,665 | $ | 34,329 | ||||||||||||
| Southwestern Public Service Co. |
6.00 | 10/1/2036 | 30,000 | 35,682 | 38,430 | |||||||||||||||
|
|
|
|
|
|
|
|||||||||||||||
| Total Electric |
370,000 | 396,829 | 415,553 | |||||||||||||||||
|
|
|
|
|
|
|
|||||||||||||||
| Electrical Components and Equipment — 0.2%*: |
|
|||||||||||||||||||
| Legrand France SA+ |
8.50 | 2/15/2025 | 35,000 | 46,796 | 47,499 | |||||||||||||||
|
|
|
|
|
|
|
|||||||||||||||
| Electronics — 0.5%*: |
|
|||||||||||||||||||
| Agilent Technologies, Inc. |
3.88 | 7/15/2023 | 50,000 | 50,570 | 52,928 | |||||||||||||||
| FLIR Systems, Inc. |
3.13 | 6/15/2021 | 25,000 | 24,983 | 25,669 | |||||||||||||||
| Jabil Circuit, Inc. |
7.75 | 7/15/2016 | 50,000 | 50,110 | 50,050 | |||||||||||||||
|
|
|
|
|
|
|
|||||||||||||||
| Total Electronics |
125,000 | 125,663 | 128,647 | |||||||||||||||||
|
|
|
|
|
|
|
|||||||||||||||
| Environmental Control — 0.5%*: |
|
|||||||||||||||||||
| Republic Services, Inc. |
4.75 | 5/15/2023 | 50,000 | 54,136 | 57,239 | |||||||||||||||
| Waste Management, Inc. |
7.00 | 7/15/2028 | 50,000 | 65,054 | 68,093 | |||||||||||||||
|
|
|
|
|
|
|
|||||||||||||||
| Total Environmental Control |
100,000 | 119,190 | 125,332 | |||||||||||||||||
|
|
|
|
|
|
|
|||||||||||||||
| Food — 0.3%*: |
|
|||||||||||||||||||
| Kraft Heinz Foods Co.^ |
2.80 | 7/2/2020 | 40,000 | 40,226 | 41,538 | |||||||||||||||
| Kraft Heinz Foods Co.^ |
3.00 | 6/1/2026 | 20,000 | 19,913 | 20,163 | |||||||||||||||
| Whole Foods Market, Inc.^ |
5.20 | 12/3/2025 | 20,000 | 19,974 | 21,564 | |||||||||||||||
|
|
|
|
|
|
|
|||||||||||||||
| Total Food |
80,000 | 80,113 | 83,265 | |||||||||||||||||
|
|
|
|
|
|
|
|||||||||||||||
| Forestry and Paper Products — 0.7%*: |
|
|||||||||||||||||||
| Celulosa Arauco y Constitucion SA+ |
4.75 | 1/11/2022 | 30,000 | 31,135 | 31,955 | |||||||||||||||
| Domtar Corp. |
4.40 | 4/1/2022 | 50,000 | 50,776 | 51,848 | |||||||||||||||
| International Paper Co. |
9.38 | 5/15/2019 | 73,000 | 85,975 | 86,942 | |||||||||||||||
|
|
|
|
|
|
|
|||||||||||||||
| Total Forestry and Paper Products |
153,000 | 167,886 | 170,745 | |||||||||||||||||
|
|
|
|
|
|
|
|||||||||||||||
| Gas — 0.3%*: |
|
|||||||||||||||||||
| CenterPoint Energy Resources Corp. |
4.50 | 1/15/2021 | 25,000 | 26,733 | 27,127 | |||||||||||||||
| CenterPoint Energy Resources Corp. |
5.85 | 1/15/2041 | 20,000 | 23,425 | 23,212 | |||||||||||||||
| Laclede Group, Inc. (The) |
4.70 | 8/15/2044 | 25,000 | 25,259 | 26,348 | |||||||||||||||
|
|
|
|
|
|
|
|||||||||||||||
| Total Gas |
70,000 | 75,417 | 76,687 | |||||||||||||||||
|
|
|
|
|
|
|
|||||||||||||||
| Healthcare-Products — 0.1%*: |
|
|||||||||||||||||||
| Zimmer Biomet Holdings, Inc. |
3.55 | 4/1/2025 | 35,000 | 34,266 | 36,075 | |||||||||||||||
|
|
|
|
|
|
|
|||||||||||||||
| Healthcare-Services — 0.3%*: |
|
|||||||||||||||||||
| Aetna, Inc. |
2.40 | 6/15/2021 | 35,000 | 34,997 | 35,710 | |||||||||||||||
| Aetna, Inc. |
3.20 | 6/15/2026 | 40,000 | 39,851 | 41,153 | |||||||||||||||
| Aetna, Inc. |
4.38 | 6/15/2046 | 10,000 | 9,990 | 10,385 | |||||||||||||||
|
|
|
|
|
|
|
|||||||||||||||
| Total Healthcare-Services |
85,000 | 84,838 | 87,248 | |||||||||||||||||
|
|
|
|
|
|
|
|||||||||||||||
See accompanying Notes to the Financial Statements.
116
Table of Contents
Babson Total Return Bond Fund 2016 Annual Report
SCHEDULE OF INVESTMENTS (CONTINUED)
June 30, 2016
| EFFECTIVE INTEREST RATE |
DUE DATE | PRINCIPAL ‡‡ | COST | FAIR VALUE |
||||||||||||||||
| Corporate Bonds (Continued) |
|
|||||||||||||||||||
| Housewares — 0.4%*: |
|
|||||||||||||||||||
| Newell Rubbermaid, Inc. |
3.85 | % | 4/1/2023 | 40,000 | $ | 39,988 | $ | 42,427 | ||||||||||||
| Newell Rubbermaid, Inc. |
3.90 | 11/1/2025 | 20,000 | 19,941 | 20,949 | |||||||||||||||
| Toro Co. (The) |
7.80 | 6/15/2027 | 25,000 | 32,044 | 32,842 | |||||||||||||||
|
|
|
|
|
|
|
|||||||||||||||
| Total Housewares |
85,000 | 91,973 | 96,218 | |||||||||||||||||
|
|
|
|
|
|
|
|||||||||||||||
| Insurance — 2.2%*: |
|
|||||||||||||||||||
| Allstate Corp. (The) |
5.75 | # | 8/15/2053 | 110,000 | 116,547 | 112,805 | ||||||||||||||
| American International Group, Inc. |
3.30 | 3/1/2021 | 30,000 | 29,974 | 30,993 | |||||||||||||||
| American International Group, Inc. |
3.90 | 4/1/2026 | 20,000 | 19,990 | 20,611 | |||||||||||||||
| Arch Capital Group US, Inc. |
5.14 | 11/1/2043 | 25,000 | 25,311 | 27,113 | |||||||||||||||
| Brown & Brown, Inc. |
4.20 | 9/15/2024 | 13,000 | 13,087 | 13,258 | |||||||||||||||
| Liberty Mutual Group, Inc.^ |
4.25 | 6/15/2023 | 50,000 | 51,520 | 53,112 | |||||||||||||||
| Marsh & McLennan Cos., Inc. |
5.88 | 8/1/2033 | 20,000 | 23,157 | 24,706 | |||||||||||||||
| Prudential Financial, Inc. |
8.88 | # | 6/15/2038 | 100,000 | 117,130 | 110,000 | ||||||||||||||
| Reinsurance Group of America, Inc. |
3.95 | 9/15/2026 | 40,000 | 39,998 | 41,216 | |||||||||||||||
| Trinity Acquisition PLC+ |
4.40 | 3/15/2026 | 5,000 | 4,979 | 5,220 | |||||||||||||||
| Unum Group |
3.00 | 5/15/2021 | 20,000 | 19,958 | 20,455 | |||||||||||||||
| Unum Group |
4.00 | 3/15/2024 | 30,000 | 30,835 | 30,975 | |||||||||||||||
| Willis North America, Inc.+ |
7.00 | 9/29/2019 | 50,000 | 55,559 | 56,605 | |||||||||||||||
| XLIT Ltd.+ |
5.50 | 3/31/2045 | 30,000 | 28,766 | 29,634 | |||||||||||||||
|
|
|
|
|
|
|
|||||||||||||||
| Total Insurance |
543,000 | 576,811 | 576,703 | |||||||||||||||||
|
|
|
|
|
|
|
|||||||||||||||
| Internet — 1.1%*: |
|
|||||||||||||||||||
| Baidu, Inc.+ |
2.25 | 11/28/2017 | 200,000 | 200,719 | 201,807 | |||||||||||||||
| Expedia, Inc.^ |
5.00 | 2/15/2026 | 40,000 | 39,822 | 41,275 | |||||||||||||||
| Expedia, Inc. |
7.46 | 8/15/2018 | 45,000 | 49,624 | 49,764 | |||||||||||||||
|
|
|
|
|
|
|
|||||||||||||||
| Total Internet |
285,000 | 290,165 | 292,846 | |||||||||||||||||
|
|
|
|
|
|
|
|||||||||||||||
| Investment Company Security — 0.2%*: |
|
|||||||||||||||||||
| Ares Capital Corp. |
3.88 | 1/15/2020 | 30,000 | 30,594 | 31,030 | |||||||||||||||
| FS Investment Corp. |
4.00 | 7/15/2019 | 30,000 | 30,473 | 30,303 | |||||||||||||||
|
|
|
|
|
|
|
|||||||||||||||
| Total Investment Company Security |
60,000 | 61,067 | 61,333 | |||||||||||||||||
|
|
|
|
|
|
|
|||||||||||||||
| Iron/Steel — 0.2%*: |
|
|||||||||||||||||||
| Reliance Steel & Aluminum Co. |
6.20 | 11/15/2016 | 55,000 | 55,919 | 55,829 | |||||||||||||||
|
|
|
|
|
|
|
|||||||||||||||
| IT Services — 0.4%*: |
|
|||||||||||||||||||
| Diamond 1 Finance Corp./Diamond 2 Finance Corp.^ |
4.42 | 6/15/2021 | 45,000 | 44,987 | 46,317 | |||||||||||||||
| Leidos Holdings, Inc. |
4.45 | 12/1/2020 | 50,000 | 50,360 | 50,000 | |||||||||||||||
|
|
|
|
|
|
|
|||||||||||||||
| Total IT Services |
95,000 | 95,347 | 96,317 | |||||||||||||||||
|
|
|
|
|
|
|
|||||||||||||||
| Lodging — 0.7%*: |
|
|||||||||||||||||||
| Marriott International, Inc. |
2.30 | 1/15/2022 | 70,000 | 69,714 | 70,421 | |||||||||||||||
| Wyndham Worldwide Corp. |
5.63 | 3/1/2021 | 90,000 | 97,798 | 100,480 | |||||||||||||||
|
|
|
|
|
|
|
|||||||||||||||
| Total Lodging |
160,000 | 167,512 | 170,901 | |||||||||||||||||
|
|
|
|
|
|
|
|||||||||||||||
See accompanying Notes to the Financial Statements.
117
Table of Contents
Babson Total Return Bond Fund 2016 Annual Report
SCHEDULE OF INVESTMENTS (CONTINUED)
June 30, 2016
| EFFECTIVE INTEREST RATE |
DUE DATE | PRINCIPAL ‡‡ | COST | FAIR VALUE |
||||||||||||||||
| Corporate Bonds (Continued) |
|
|||||||||||||||||||
| Media — 0.8%*: |
|
|||||||||||||||||||
| Charter Communications Operating LLC / Charter Communications Operating Capital^ |
4.46 | % | 7/23/2022 | 90,000 | $ | 90,000 | $ | 96,726 | ||||||||||||
| Discovery Communications LLC |
4.88 | 4/1/2043 | 25,000 | 22,751 | 22,554 | |||||||||||||||
| Time Warner Cable, Inc. |
4.50 | 9/15/2042 | 60,000 | 49,241 | 55,887 | |||||||||||||||
| Time Warner Cable, Inc. |
5.50 | 9/1/2041 | 35,000 | 32,632 | 36,763 | |||||||||||||||
|
|
|
|
|
|
|
|||||||||||||||
| Total Media |
210,000 | 194,624 | 211,930 | |||||||||||||||||
|
|
|
|
|
|
|
|||||||||||||||
| Medical Equipment and Devices Manufacturing — 0.2%*: |
|
|||||||||||||||||||
| St. Jude Medical, Inc. |
2.80 | 9/15/2020 | 40,000 | 39,984 | 41,235 | |||||||||||||||
|
|
|
|
|
|
|
|||||||||||||||
| Miscellaneous Manufacturing — 0.4%*: |
||||||||||||||||||||
| Carlisle Cos., Inc. |
3.75 | 11/15/2022 | 50,000 | 50,183 | 51,437 | |||||||||||||||
| Textron, Inc. |
4.30 | 3/1/2024 | 50,000 | 51,314 | 53,732 | |||||||||||||||
|
|
|
|
|
|
|
|||||||||||||||
| Total Miscellaneous Manufacturing |
100,000 | 101,497 | 105,169 | |||||||||||||||||
|
|
|
|
|
|
|
|||||||||||||||
| Oil and Gas — 1.6%*: |
||||||||||||||||||||
| Anadarko Petroleum Corp. |
5.55 | 3/15/2026 | 20,000 | 19,939 | 22,086 | |||||||||||||||
| Exxon Mobil Corp. |
3.04 | 3/1/2026 | 45,000 | 45,000 | 47,768 | |||||||||||||||
| Newfield Exploration Co. |
5.38 | 1/1/2026 | 140,000 | 139,863 | 136,150 | |||||||||||||||
| Petroleos Mexicanos+ |
5.50 | 1/21/2021 | 55,000 | 59,274 | 58,239 | |||||||||||||||
| Phillips 66 |
4.30 | 4/1/2022 | 50,000 | 52,327 | 54,610 | |||||||||||||||
| Phillips 66 |
4.65 | 11/15/2034 | 30,000 | 29,841 | 31,980 | |||||||||||||||
| Pioneer Natural Resources Co. |
7.50 | 1/15/2020 | 50,000 | 57,144 | 58,547 | |||||||||||||||
| Rowan Cos., Inc. |
4.88 | 6/1/2022 | 8,000 | 7,985 | 7,000 | |||||||||||||||
|
|
|
|
|
|
|
|||||||||||||||
| Total Oil and Gas |
398,000 | 411,373 | 416,380 | |||||||||||||||||
|
|
|
|
|
|
|
|||||||||||||||
| Oil and Gas Services — 0.5%*: |
||||||||||||||||||||
| Schlumberger Holdings Corp.^ |
4.00 | 12/21/2025 | 25,000 | 24,984 | 26,906 | |||||||||||||||
| SESI LLC |
7.13 | 12/15/2021 | 32,000 | 33,676 | 30,800 | |||||||||||||||
| Weatherford International Ltd. |
5.95 | 4/15/2042 | 30,000 | 25,119 | 21,300 | |||||||||||||||
| Weatherford International Ltd. |
6.00 | 3/15/2018 | 50,000 | 51,930 | 52,500 | |||||||||||||||
|
|
|
|
|
|
|
|||||||||||||||
| Total Oil and Gas Services |
137,000 | 135,709 | 131,506 | |||||||||||||||||
|
|
|
|
|
|
|
|||||||||||||||
| Packaging and Containers — 0.4%*: |
||||||||||||||||||||
| Brambles USA, Inc.+^ |
4.13 | 10/23/2025 | 10,000 | 9,977 | 10,726 | |||||||||||||||
| Brambles USA, Inc.+^ |
5.35 | 4/1/2020 | 50,000 | 54,255 | 55,528 | |||||||||||||||
| Sonoco Products Co. |
4.38 | 11/1/2021 | 41,000 | 43,367 | 44,129 | |||||||||||||||
|
|
|
|
|
|
|
|||||||||||||||
| Total Packaging and Containers |
101,000 | 107,599 | 110,383 | |||||||||||||||||
|
|
|
|
|
|
|
|||||||||||||||
| Pharmaceuticals — 2.0%*: |
||||||||||||||||||||
| AbbVie, Inc. |
3.20 | 5/14/2026 | 60,000 | 59,774 | 60,779 | |||||||||||||||
| AbbVie, Inc. |
4.50 | 5/14/2035 | 30,000 | 29,817 | 31,355 | |||||||||||||||
| Actavis Funding SCS+ |
3.45 | 3/15/2022 | 50,000 | 49,735 | 51,928 | |||||||||||||||
| Allergan, Inc. |
2.80 | 3/15/2023 | 50,000 | 46,557 | 49,714 | |||||||||||||||
| AstraZeneca PLC+ |
6.45 | 9/15/2037 | 35,000 | 44,926 | 47,772 | |||||||||||||||
See accompanying Notes to the Financial Statements.
118
Table of Contents
Babson Total Return Bond Fund 2016 Annual Report
SCHEDULE OF INVESTMENTS (CONTINUED)
June 30, 2016
| EFFECTIVE INTEREST RATE |
DUE DATE | PRINCIPAL ‡‡ | COST | FAIR VALUE |
||||||||||||||||
| Corporate Bonds (Continued) |
|
|||||||||||||||||||
| Pharmaceuticals (Continued) |
||||||||||||||||||||
| Express Scripts Holding Co. |
3.00 | % | 7/15/2023 | 60,000 | $ | 59,947 | $ | 60,067 | ||||||||||||
| Express Scripts Holding Co. |
3.30 | 2/25/2021 | 10,000 | 9,980 | 10,486 | |||||||||||||||
| Express Scripts Holding Co. |
4.80 | 7/15/2046 | 25,000 | 24,956 | 24,967 | |||||||||||||||
| McKesson Corp. |
6.00 | 3/1/2041 | 50,000 | 55,905 | 63,146 | |||||||||||||||
| Mylan NV+^ |
3.95 | 6/15/2026 | 25,000 | 24,809 | 25,300 | |||||||||||||||
| Mylan NV+^ |
5.25 | 6/15/2046 | 40,000 | 39,994 | 41,668 | |||||||||||||||
| Mylan, Inc. |
2.55 | 3/28/2019 | 60,000 | 59,697 | 60,737 | |||||||||||||||
|
|
|
|
|
|
|
|||||||||||||||
| Total Pharmaceuticals |
495,000 | 506,097 | 527,919 | |||||||||||||||||
|
|
|
|
|
|
|
|||||||||||||||
| Pipelines — 1.1%*: |
||||||||||||||||||||
| Energy Transfer Partners LP |
4.75 | 1/15/2026 | 30,000 | 29,821 | 30,852 | |||||||||||||||
| Enterprise Products Operating LLC |
5.95 | 2/1/2041 | 25,000 | 26,724 | 29,337 | |||||||||||||||
| Kinder Morgan Energy Partners LP MTN |
6.95 | 1/15/2038 | 30,000 | 32,038 | 33,107 | |||||||||||||||
| Kinder Morgan, Inc. |
3.05 | 12/1/2019 | 35,000 | 35,106 | 35,366 | |||||||||||||||
| Magellan Midstream Partners LP |
5.00 | 3/1/2026 | 65,000 | 65,514 | 73,530 | |||||||||||||||
| MPLX LP |
4.00 | 2/15/2025 | 77,000 | 75,490 | 69,944 | |||||||||||||||
|
|
|
|
|
|
|
|||||||||||||||
| Total Pipelines |
262,000 | 264,693 | 272,136 | |||||||||||||||||
|
|
|
|
|
|
|
|||||||||||||||
| Property & Casualty Insurance — 0.0%*: |
|
|||||||||||||||||||
| Marsh & McLennan Cos., Inc. |
3.75 | 3/14/2026 | 10,000 | 9,993 | 10,547 | |||||||||||||||
|
|
|
|
|
|
|
|||||||||||||||
| Real Estate — 0.1%*: |
||||||||||||||||||||
| Prologis LP |
3.35 | 2/1/2021 | 25,000 | 25,465 | 26,451 | |||||||||||||||
|
|
|
|
|
|
|
|||||||||||||||
| Real Estate Investment Trusts — 0.9%*: |
|
|||||||||||||||||||
| American Tower Corp. |
3.45 | 9/15/2021 | 80,000 | 80,059 | 83,269 | |||||||||||||||
| Brandywine Operating Partnership LP |
4.95 | 4/15/2018 | 40,000 | 41,746 | 41,974 | |||||||||||||||
| DDR Corp. |
4.75 | 4/15/2018 | 3,000 | 3,132 | 3,130 | |||||||||||||||
| Digital Realty Trust LP |
3.40 | 10/1/2020 | 20,000 | 19,961 | 20,760 | |||||||||||||||
| Digital Realty Trust LP |
3.95 | 7/1/2022 | 35,000 | 35,220 | 36,663 | |||||||||||||||
| Host Hotels & Resorts LP |
4.75 | 3/1/2023 | 50,000 | 52,267 | 53,405 | |||||||||||||||
|
|
|
|
|
|
|
|||||||||||||||
| Total REITS |
|
228,000 | 232,385 | 239,201 | ||||||||||||||||
|
|
|
|
|
|
|
|||||||||||||||
| Retail — 2.3%*: |
||||||||||||||||||||
| CVS Health Corp. |
2.88 | 6/1/2026 | 10,000 | 9,915 | 10,219 | |||||||||||||||
| CVS Health Corp. |
3.50 | 7/20/2022 | 120,000 | 119,955 | 129,203 | |||||||||||||||
| CVS Pass-Through Trust^ |
5.93 | 1/10/2034 | 31,087 | 35,615 | 36,041 | |||||||||||||||
| El Puerto de Liverpool SAB de CV+^ |
3.95 | 10/2/2024 | 200,000 | 199,088 | 204,750 | |||||||||||||||
| O’Reilly Automotive, Inc. |
3.55 | 3/15/2026 | 10,000 | 9,983 | 10,485 | |||||||||||||||
| O’Reilly Automotive, Inc. |
3.85 | 6/15/2023 | 45,000 | 45,816 | 48,517 | |||||||||||||||
| O’Reilly Automotive, Inc. |
4.88 | 1/14/2021 | 30,000 | 32,581 | 33,460 | |||||||||||||||
| Signet UK Finance plc+ |
4.70 | 6/15/2024 | 34,000 | 33,069 | 33,182 | |||||||||||||||
| Wal-Mart Stores, Inc. |
5.63 | 4/1/2040 | 30,000 | 35,676 | 40,392 | |||||||||||||||
| Walgreens Boots Alliance, Inc. |
2.70 | 11/18/2019 | 25,000 | 25,166 | 25,830 | |||||||||||||||
| Walgreens Boots Alliance, Inc. |
3.80 | 11/18/2024 | 35,000 | 34,605 | 37,082 | |||||||||||||||
|
|
|
|
|
|
|
|||||||||||||||
| Total Retail |
|
570,087 | 581,469 | 609,161 | ||||||||||||||||
|
|
|
|
|
|
|
|||||||||||||||
See accompanying Notes to the Financial Statements.
119
Table of Contents
Babson Total Return Bond Fund 2016 Annual Report
SCHEDULE OF INVESTMENTS (CONTINUED)
June 30, 2016
| EFFECTIVE INTEREST RATE |
DUE DATE | PRINCIPAL ‡‡ | COST | FAIR VALUE |
||||||||||||||||
| Corporate Bonds (Continued) |
|
|||||||||||||||||||
| Semiconductors — 0.3%*: |
||||||||||||||||||||
| KLA-Tencor Corp. |
4.65 | % | 11/1/2024 | 30,000 | $ | 30,151 | $ | 32,726 | ||||||||||||
| Lam Research Corp. |
2.75 | 3/15/2020 | 50,000 | 49,927 | 51,096 | |||||||||||||||
|
|
|
|
|
|
|
|||||||||||||||
| Total Semiconductors |
80,000 | 80,078 | 83,822 | |||||||||||||||||
|
|
|
|
|
|
|
|||||||||||||||
| Software — 0.2%*: |
||||||||||||||||||||
| Broadridge Financial Solutions, Inc. |
3.40 | 6/27/2026 | 20,000 | 19,918 | 20,216 | |||||||||||||||
| Oracle Corp. |
5.38 | 7/15/2040 | 35,000 | 39,051 | 42,319 | |||||||||||||||
|
|
|
|
|
|
|
|||||||||||||||
| Total Software |
55,000 | 58,969 | 62,535 | |||||||||||||||||
|
|
|
|
|
|
|
|||||||||||||||
| Telecommunications — 0.5%*: |
|
|||||||||||||||||||
| AT&T, Inc. |
3.40 | 5/15/2025 | 40,000 | 38,493 | 40,916 | |||||||||||||||
| AT&T, Inc. |
6.55 | 2/15/2039 | 25,000 | 29,016 | 30,808 | |||||||||||||||
| Telefonaktiebolaget LM Ericsson+ |
4.13 | 5/15/2022 | 30,000 | 31,245 | 32,457 | |||||||||||||||
| Verizon Communications, Inc. |
3.50 | 11/1/2024 | 35,000 | 34,405 | 37,224 | |||||||||||||||
|
|
|
|
|
|
|
|||||||||||||||
| Total Telecommunications |
130,000 | 133,159 | 141,405 | |||||||||||||||||
|
|
|
|
|
|
|
|||||||||||||||
| Transportation — 0.3%*: |
||||||||||||||||||||
| Burlington Northern Santa Fe LLC |
6.75 | 3/15/2029 | 25,000 | 31,034 | 34,251 | |||||||||||||||
| Penske Truck Leasing Co. LP/PTL Finance Corp.^ |
3.38 | 2/1/2022 | 45,000 | 44,217 | 45,891 | |||||||||||||||
|
|
|
|
|
|
|
|||||||||||||||
| Total Transportation |
70,000 | 75,251 | 80,142 | |||||||||||||||||
|
|
|
|
|
|
|
|||||||||||||||
| Trucking and Leasing — 0.2%*: |
||||||||||||||||||||
| Aviation Capital Group Corp.^ |
2.88 | 9/17/2018 | 40,000 | 39,867 | 39,600 | |||||||||||||||
|
|
|
|
|
|
|
|||||||||||||||
| Total Corporate Bonds |
8,305,087 | 8,574,132 | 8,859,100 | |||||||||||||||||
|
|
|
|
|
|
|
|||||||||||||||
| Foreign Government — 0.5%*: |
||||||||||||||||||||
| Canada — 0.2%*: |
||||||||||||||||||||
| Province of Quebec Canada+ |
2.63 | 2/13/2023 | 25,000 | 25,226 | 26,233 | |||||||||||||||
| Province of Quebec Canada+ |
7.50 | 9/15/2029 | 15,000 | 21,577 | 22,748 | |||||||||||||||
|
|
|
|
|
|
|
|||||||||||||||
| Total Canada |
40,000 | 46,803 | 48,981 | |||||||||||||||||
|
|
|
|
|
|
|
|||||||||||||||
| Mexico — 0.3%*: |
| |||||||||||||||||||
| Mexico Government International Bond+ |
5.55 | 1/21/2045 | 60,000 | 64,701 | 71,850 | |||||||||||||||
|
|
|
|
|
|
|
|||||||||||||||
| Total Foreign Government |
100,000 | 111,504 | 120,831 | |||||||||||||||||
|
|
|
|
|
|
|
|||||||||||||||
| Mortgage-Backed Securities — 5.5%*: |
| |||||||||||||||||||
| Banc of America Commercial Mortgage Trust 2008-1 A4 |
6.44 | # | 2/10/2051 | 108,123 | 117,540 | 113,795 | ||||||||||||||
| Bear Stearns Commercial Mortgage Securities Trust 2006-PWR14 AM |
5.24 | 12/11/2038 | 120,000 | 125,394 | 120,915 | |||||||||||||||
| Bear Stearns Commercial Mortgage Securities Trust 2006-TOP24 AM |
5.57 | # | 10/12/2041 | 120,000 | 125,729 | 120,455 | ||||||||||||||
| Bear Stearns Commercial Mortgage Securities Trust 2007-PWR17 AM |
5.92 | # | 6/11/2050 | 85,000 | 91,238 | 87,268 | ||||||||||||||
| Fannie Mae Connecticut Avenue Securities CAS 2015-C03 1M1 |
1.95 | # | 7/25/2025 | 85,328 | 85,424 | 85,571 | ||||||||||||||
See accompanying Notes to the Financial Statements.
120
Table of Contents
Babson Total Return Bond Fund 2016 Annual Report
SCHEDULE OF INVESTMENTS (CONTINUED)
June 30, 2016
| EFFECTIVE INTEREST RATE |
DUE DATE | PRINCIPAL ‡‡ | COST | FAIR VALUE |
||||||||||||||||
| Foreign Government (Continued) |
| |||||||||||||||||||
| Mortgage-Backed Securities (Continued) |
| |||||||||||||||||||
| Fannie Mae Connecticut Avenue Securities CAS 2015-C04 1M1 |
2.05 | # % | 4/25/2028 | 57,033 | $ | 57,033 | $ | 57,110 | ||||||||||||
| GS Mortgage Securities Trust 2015-GC32 B |
4.55 | # | 7/10/2048 | 100,000 | 102,919 | 107,323 | ||||||||||||||
| JPMorgan Chase Commercial Mortgage Securities Trust 2006-LDP7 AM |
5.99 | # | 4/17/2045 | 89,590 | 92,953 | 89,471 | ||||||||||||||
| JPMorgan Chase Commercial Mortgage Securities Trust 2007-CIBC20 AM |
6.09 | # | 2/12/2051 | 110,000 | 119,500 | 114,801 | ||||||||||||||
| ML-CFC Commercial Mortgage Trust 2006-3 AM |
5.46 | # | 7/12/2046 | 70,000 | 72,690 | 70,059 | ||||||||||||||
| ML-CFC Commercial Mortgage Trust 2006-4 AM |
5.20 | 12/12/2049 | 120,000 | 125,439 | 121,112 | |||||||||||||||
| Morgan Stanley Capital I Trust 2006-IQ12 AM |
5.37 | 12/15/2043 | 120,000 | 125,948 | 120,863 | |||||||||||||||
| Morgan Stanley Capital I Trust 2008-TOP29 A4 |
6.48 | # | 1/11/2043 | 106,220 | 116,179 | 112,244 | ||||||||||||||
| Wachovia Bank Commercial Mortgage Trust 2007-C33 A1A |
6.15 | # | 2/15/2051 | 106,765 | 114,830 | 110,868 | ||||||||||||||
|
|
|
|
|
|
|
|||||||||||||||
| Total Mortgage-Backed Securities |
|
1,398,059 | 1,472,816 | 1,431,855 | ||||||||||||||||
|
|
|
|
|
|
|
|||||||||||||||
| U.S. Treasury & Government Agencies — 28.0%*: |
| |||||||||||||||||||
| Federal Home Loan Mortgage Corp. |
3.50 | 11/1/2045 | 242,696 | 252,660 | 258,436 | |||||||||||||||
| Federal Home Loan Mortgage Corp. |
3.50 | 6/1/2046 | 175,000 | 183,859 | 184,945 | |||||||||||||||
| Federal Home Loan Mortgage Corp. |
4.50 | 8/1/2040 | 21,578 | 23,747 | 23,955 | |||||||||||||||
| Federal Home Loan Mortgage Corp. |
4.50 | 10/1/2040 | 30,244 | 33,112 | 33,384 | |||||||||||||||
| Federal Home Loan Mortgage Corp. |
4.50 | 10/1/2041 | 38,072 | 41,670 | 42,006 | |||||||||||||||
| Federal Home Loan Mortgage Corp. |
4.50 | 1/1/2042 | 28,398 | 31,087 | 31,302 | |||||||||||||||
| Federal Home Loan Mortgage Corp. |
4.50 | 5/1/2042 | 153,107 | 167,272 | 167,886 | |||||||||||||||
| Federal Home Loan Mortgage Corp. |
4.50 | 9/1/2043 | 25,386 | 27,866 | 28,172 | |||||||||||||||
| Federal National Mortgage Association |
3.50 | 12/1/2028 | 68,553 | 73,025 | 72,857 | |||||||||||||||
| Federal National Mortgage Association |
3.50 | 11/1/2045 | 316,176 | 329,517 | 336,122 | |||||||||||||||
| Federal National Mortgage Association |
3.50 | 12/1/2045 | 434,994 | 450,330 | 463,104 | |||||||||||||||
| Federal National Mortgage Association |
3.50 | 1/1/2046 | 293,151 | 304,655 | 312,893 | |||||||||||||||
| Federal National Mortgage Association |
4.00 | 9/1/2042 | 79,639 | 86,152 | 86,886 | |||||||||||||||
| Federal National Mortgage Association |
4.50 | 9/1/2040 | 16,339 | 17,908 | 17,985 | |||||||||||||||
| Federal National Mortgage Association |
4.50 | 3/1/2041 | 22,824 | 25,130 | 25,240 | |||||||||||||||
| Federal National Mortgage Association |
4.50 | 10/1/2042 | 31,177 | 34,135 | 34,342 | |||||||||||||||
| Federal National Mortgage Association |
4.50 | 11/1/2042 | 58,037 | 63,769 | 64,258 | |||||||||||||||
| Federal National Mortgage Association |
5.00 | 6/1/2040 | 15,399 | 17,165 | 17,345 | |||||||||||||||
| Federal National Mortgage Association |
5.00 | 7/1/2040 | 122,763 | 136,248 | 137,091 | |||||||||||||||
| Federal National Mortgage Association |
5.00 | 2/1/2044 | 46,268 | 51,466 | 51,665 | |||||||||||||||
| Federal National Mortgage Association TBA |
2.50 | 8/1/2031 | 875,000 | 903,257 | 903,984 | |||||||||||||||
| Federal National Mortgage Association TBA |
2.50 | 7/1/2046 | 575,000 | 574,349 | 582,367 | |||||||||||||||
| Federal National Mortgage Association TBA |
3.00 | 8/1/2031 | 750,000 | 785,478 | 785,508 | |||||||||||||||
| Federal National Mortgage Association TBA |
3.00 | 8/1/2046 | 125,000 | 129,336 | 129,468 | |||||||||||||||
| Federal National Mortgage Association TBA |
4.50 | 7/1/2046 | 175,000 | 190,598 | 191,051 | |||||||||||||||
| Government National Mortgage Association TBA |
3.00 | 7/1/2046 | 250,000 | 261,172 | 261,392 | |||||||||||||||
See accompanying Notes to the Financial Statements.
121
Table of Contents
Babson Total Return Bond Fund 2016 Annual Report
SCHEDULE OF INVESTMENTS (CONTINUED)
June 30, 2016
| EFFECTIVE INTEREST RATE |
DUE DATE | PRINCIPAL ‡‡ | COST | FAIR VALUE |
||||||||||||||||
| U.S. Treasury & Government Agencies (Continued) |
| |||||||||||||||||||
| Government National Mortgage Association TBA |
3.00 | % | 8/1/2046 | 675,000 | $ | 699,520 | $ | 704,136 | ||||||||||||
| Government National Mortgage Association TBA |
4.00 | 7/1/2046 | 50,000 | 53,344 | 53,445 | |||||||||||||||
| Government National Mortgage Association TBA |
4.50 | 7/1/2046 | 175,000 | 188,043 | 187,852 | |||||||||||||||
| U.S. Treasury Bond |
2.50 | 5/15/2046 | 15,000 | 15,671 | 15,631 | |||||||||||||||
| U.S. Treasury Bond |
2.88 | 8/15/2045 | 15,000 | 15,753 | 16,843 | |||||||||||||||
| U.S. Treasury Bond``1 |
3.00 | 11/15/2044 | 655,000 | 657,425 | 753,097 | |||||||||||||||
| U.S. Treasury Bond |
3.50 | 2/15/2039 | 185,000 | 223,485 | 233,476 | |||||||||||||||
| U.S. Treasury Notes |
1.25 | 3/31/2021 | 70,000 | 70,575 | 70,815 | |||||||||||||||
|
|
|
|
|
|
|
|||||||||||||||
| Total U.S. Treasury & Government Agencies |
6,809,801 | 7,118,779 | 7,278,939 | |||||||||||||||||
|
|
|
|
|
|
|
|||||||||||||||
| Total Fixed Income |
21,732,524 | 22,287,953 | 22,689,671 | |||||||||||||||||
|
|
|
|
|
|
|
|||||||||||||||
| SHARES | COST | FAIR VALUE |
||||||||||||||||||
| Mutual Fund — 8.8%*: |
| |||||||||||||||||||
| Babson U.S. High Yield Fund |
225,647 | 2,172,465 | 2,288,057 | |||||||||||||||||
|
|
|
|
|
|
|
|||||||||||||||
| EFFECTIVE INTEREST RATE |
DUE DATE | PRINCIPAL ‡‡ | COST | FAIR VALUE |
||||||||||||||||
| Short-Term Investments — 20.2%**: |
| |||||||||||||||||||
| Bank Deposit — 3.1%*: |
| |||||||||||||||||||
| State Street Bank & Trust Co. Euro Time Deposit |
0.01 | 7/1/2016 | 805,781 | 805,781 | 805,781 | |||||||||||||||
|
|
|
|
|
|
|
|||||||||||||||
| Commercial Paper — 17.1%*: |
| |||||||||||||||||||
| Advertising — 2.4%*: |
| |||||||||||||||||||
| WPP CP LLC |
Zero Coupon | 9/9/2016 | 625,000 | 623,627 | 623,627 | |||||||||||||||
|
|
|
|
|
|
|
|||||||||||||||
| Auto Manufacturers — 2.4%*: |
| |||||||||||||||||||
| Hyundai Capital America+ |
Zero Coupon | 8/22/2016 | 625,000 | 623,871 | 623,871 | |||||||||||||||
|
|
|
|
|
|
|
|||||||||||||||
| Chemicals — 2.4%*: |
| |||||||||||||||||||
| ONEOK Partners LP |
Zero Coupon | 7/12/2016 | 625,000 | 624,790 | 624,790 | |||||||||||||||
|
|
|
|
|
|
|
|||||||||||||||
| Commercial Services — 2.4%*: |
| |||||||||||||||||||
| ERAC USA Finance LLC |
Zero Coupon | 8/18/2016 | 625,000 | 624,208 | 624,208 | |||||||||||||||
|
|
|
|
|
|
|
|||||||||||||||
| Media — 2.4%*: |
| |||||||||||||||||||
| Thomson Reuters Corp. |
Zero Coupon | 7/18/2016 | 625,000 | 624,705 | 624,705 | |||||||||||||||
|
|
|
|
|
|
|
|||||||||||||||
| Pipelines — 5.1%*: |
| |||||||||||||||||||
| Potash Corp. of Saskatchewan, Inc.+ |
Zero Coupon | 7/6/2016 | 700,000 | 699,925 | 699,925 | |||||||||||||||
|
|
|
|
|
|
|
|||||||||||||||
See accompanying Notes to the Financial Statements.
122
Table of Contents
Babson Total Return Bond Fund 2016 Annual Report
SCHEDULE OF INVESTMENTS (CONTINUED)
June 30, 2016
| EFFECTIVE INTEREST RATE |
DUE DATE | PRINCIPAL ‡‡ | COST | FAIR VALUE |
||||||||||||||||
| Commercial Paper (Continued) |
||||||||||||||||||||
| Pipelines (Continued) |
| |||||||||||||||||||
| TransCanada American Investments Ltd. |
Zero Coupon | % | 7/11/2016 | 625,000 | $624,842 | $624,842 | ||||||||||||||
|
|
|
|
|
|
|
|||||||||||||||
| Total Pipelines |
1,325,000 | 1,324,767 | 1,324,767 | |||||||||||||||||
|
|
|
|
|
|
|
|||||||||||||||
| Total Commercial Paper |
4,450,000 | 4,445,968 | 4,445,968 | |||||||||||||||||
|
|
|
|
|
|
|
|||||||||||||||
| Total Short-Term Investments |
5,255,781 | 5,251,749 | 5,251,749 | |||||||||||||||||
|
|
|
|
|
|
|
|||||||||||||||
| Total Investments |
27,213,952 | 29,712,167 | 30,229,477 | |||||||||||||||||
|
|
|
|
|
|
|
|||||||||||||||
| Other assets and liabilities — (16.2%)* |
(4,221,468 | ) | ||||||||||||||||||
|
|
|
|||||||||||||||||||
| Net Assets — 100.0% |
$26,008,009 | |||||||||||||||||||
|
|
|
|||||||||||||||||||
| MTN | Medium Term Note |
| TBA | To Be Announced: Securities purchased on a forward commitment basis with an approximate principal amount and maturity date. The actual principal amount and maturity date will be determined upon settlement. |
| 1 | All or a portion of this security is held for open swaps collateral. |
| ‡‡ | Unless otherwise indicated, all principal amounts are denominated in United States Dollars. |
| * | Calculated as a percentage of net assets applicable to common shareholders. |
| + | Foreign security. |
Distributions of investments by country of risk (excluding temporary cash investments) as a percentage of total investments in securities, is as follows:
| United States | 87.7% | |||||
| United Kingdom | 3.2% | |||||
| Canada | 3.1% | |||||
| Kenya |
2.1% | |||||
| Mexico | 1.1% | |||||
| Other (Individually less than 1%) | 2.8% | |||||
|
|
|
|||||
| Total | 100.0% | |||||
|
|
|
| ^ | Security acquired in a transaction exempt from registration under Rule 144A of the Securities Act of 1933. These securities may only be resold in transactions exempt from registration, normally to qualified institutional buyers. |
| # | Variable rate security. The interest rate shown is the rate in effect at June 30, 2016. |
| `` | Security has been fully or partially segregated to cover margin requirements for open futures contracts as of June 30, 2016. |
A summary of outstanding derivatives at June 30, 2016 is as follows:
Cross Currency Forward Foreign Currency Exchange Contracts
| EXPIRATION DATE |
DELIVER/RECEIVE | COUNTERPARTY | CONTRACT AMOUNT PURCHASED |
CONTRACT AMOUNT SOLD |
NET UNREALIZED APPRECIATION (DEPRECIATION) |
|||||||||||
| 9/29/16 | CZK/EUR |
Citibank N.A. | 25,000 | 678,263 | $ | (52 | ) | |||||||||
| 7/26/16 | EUR/HUF |
Citibank N.A. | 5,639,222 | 18,004 | (176 | ) | ||||||||||
| 7/26/16 | EUR/PLN |
JPMorgan Chase Bank N.A. | 136,861 | 30,979 | 266 | |||||||||||
| 7/26/16 | EUR/PLN |
Bank of America N.A. | 132,412 | 30,000 | 227 | |||||||||||
| 7/26/16 | HRK/EUR |
BNP Paribas S.A. | 56,000 | 421,288 | 77 | |||||||||||
|
|
|
|||||||||||||||
| Net unrealized appreciation on cross currency forward foreign exchange contracts |
|
$ | 342 | |||||||||||||
|
|
|
|||||||||||||||
See accompanying Notes to the Financial Statements.
123
Table of Contents
Babson Total Return Bond Fund 2016 Annual Report
SCHEDULE OF INVESTMENTS (CONTINUED)
June 30, 2016
Forward Foreign Currency Exchange Contracts to Buy
| EXPIRATION DATE |
COUNTERPARTY | LOCAL CURRENCY |
VALUE IN USD | IN EXCHANGE FOR USD |
NET UNREALIZED APPRECIATION (DEPRECIATION) |
|||||||||||||||||
| 12/6/16 | JPMorgan Chase Bank N.A. |
ARS | 117,600 | 7,204 | 7,000 | $ | 204 | |||||||||||||||
| 7/26/16 | BNP Paribas |
AUD | 9,694 | 7,224 | 7,000 | 224 | ||||||||||||||||
| 3/15/17 | JPMorgan Chase Bank N.A. |
CNH | 5,441,700 | 806,065 | 825,000 | (18,935 | ) | |||||||||||||||
| 7/26/16 | Bank of America N.A. |
COP | 101,486,560 | 34,578 | 33,953 | 625 | ||||||||||||||||
| 7/26/16 | BNP Paribas |
INR | 947,555 | 13,982 | 14,044 | (62 | ) | |||||||||||||||
| 7/26/16 | JPMorgan Chase Bank N.A. |
KZT | 11,655,000 | 34,195 | 35,000 | (805 | ) | |||||||||||||||
| 7/26/16 | Citibank N.A. |
MXN | 1,191,951 | 65,069 | 69,000 | (3,931 | ) | |||||||||||||||
| 7/26/16 | BNP Paribas |
MXN | 726,381 | 39,653 | 39,000 | 653 | ||||||||||||||||
| 7/26/16 | BNP Paribas |
SEK | 112,161 | 13,269 | 14,000 | (731 | ) | |||||||||||||||
| 9/13/16 | BNP Paribas |
THB | 2,449,774 | 69,632 | 69,310 | 322 | ||||||||||||||||
| 7/26/16 | Bank of America N.A. |
TRY | 40,956 | 14,152 | 14,191 | (39 | ) | |||||||||||||||
| 7/26/16 | Citibank N.A. |
TRY | 62,779 | 21,693 | 21,000 | 693 | ||||||||||||||||
| 7/26/16 | JPMorgan Chase Bank N.A. |
ZAR | 448,569 | 30,328 | 30,618 | (290 | ) | |||||||||||||||
| 7/26/16 | Goldman Sachs |
ZAR | 313,602 | 21,203 | 20,702 | 501 | ||||||||||||||||
| 7/26/16 | BNP Paribas |
ZAR | 240,820 | 16,282 | 15,000 | 1,282 | ||||||||||||||||
|
|
|
|||||||||||||||||||||
| Net unrealized depreciation on forward foreign exchange contracts to buy |
|
$ | (20,289 | ) | ||||||||||||||||||
|
|
|
|||||||||||||||||||||
Forward Foreign Currency Exchange Contracts to Sell
| EXPIRATION DATE |
COUNTERPARTY | LOCAL CURRENCY |
VALUE IN USD | IN EXCHANGE FOR USD |
NET UNREALIZED APPRECIATION (DEPRECIATION) |
|||||||||||||||||
| 7/26/16 | BNP Paribas |
AUD | 9,703 | 7,231 | 7,341 | $ | 110 | |||||||||||||||
| 7/26/16 | Bank of America N.A. |
CHF | 13,835 | 14,187 | 14,304 | 117 | ||||||||||||||||
| 2/22/17 | JPMorgan Chase Bank N.A. |
CNH | 237,722 | 35,261 | 35,000 | (261 | ) | |||||||||||||||
| 3/15/17 | JPMorgan Chase Bank N.A. |
CNH | 11,016,225 | 1,631,804 | 1,650,000 | 18,196 | ||||||||||||||||
| 7/26/16 | Goldman Sachs |
HKD | 271,429 | 34,996 | 35,000 | 4 | ||||||||||||||||
| 7/26/16 | JPMorgan Chase Bank N.A. |
ILS | 55,222 | 14,314 | 14,714 | 400 | ||||||||||||||||
| 7/26/16 | JPMorgan Chase Bank N.A. |
INR | 947,555 | 13,982 | 14,012 | 30 | ||||||||||||||||
| 7/26/16 | Bank of America N.A. |
PHP | 660,226 | 14,001 | 13,969 | (32 | ) | |||||||||||||||
| 7/26/16 | BNP Paribas |
SGD | 49,135 | 36,468 | 36,310 | (158 | ) | |||||||||||||||
| 7/26/16 | Bank of America N.A. |
TRY | 64,223 | 22,192 | 22,000 | (192 | ) | |||||||||||||||
| 7/26/16 | Bank of America N.A. |
ZAR | 245,233 | 16,580 | 17,000 | 420 | ||||||||||||||||
| 7/26/16 | Goldman Sachs |
ZAR | 757,758 | 51,232 | 50,933 | (299 | ) | |||||||||||||||
|
|
|
|||||||||||||||||||||
| Net unrealized appreciation on forward foreign exchange contracts to sell |
|
$ | 18,335 | |||||||||||||||||||
|
|
|
|||||||||||||||||||||
See accompanying Notes to the Financial Statements.
124
Table of Contents
Babson Total Return Bond Fund 2016 Annual Report
SCHEDULE OF INVESTMENTS (CONTINUED)
June 30, 2016
Currency Legend
| ARS | – | Argentine Peso | ||
| AUD | – | Australian Dollar | ||
| CHF | – | Swiss Franc | ||
| CNH | – | Chinese Yuan Renminbi | ||
| COP | – | Colombian Peso | ||
| CZK | – | Czech Koruna | ||
| EUR | – | Euro | ||
| HKD | – | Hong Kong Dollar | ||
| HRK | – | Croatian Kuna | ||
| HUF | – | Hungarian Forint | ||
| ILS | – | Israeli Shekel | ||
| INR | – | Indian Rupee | ||
| KZT | – | Kazakhstan Tenge | ||
| MXN | – | Mexican Peso | ||
| PHP | – | Philippines Peso | ||
| PLN | – | Polish Zloty | ||
| SEK | – | Swedish Krona | ||
| SGD | – | Singapore Dollar | ||
| THB | – | Thai Baht | ||
| TRY | – | New Turkish Lira | ||
| ZAR | – | South African Rand |
Futures
| TYPE | EXPIRATION DATE |
CONTRACTS | POSITION | FAIR VALUE | UNREALIZED APPRECIATION |
|||||||||||||
| Long Futures |
| |||||||||||||||||
| U.S. 2-Year Treasury Note |
09/30/16 | 13 | Long | $ | 2,851,266 | $ | 18,522 | |||||||||||
| U.S. 5-Year Treasury Note |
09/30/16 | 24 | Long | 2,931,937 | 48,690 | |||||||||||||
| U.S. Long Bond |
09/21/16 | 1 | Long | 172,344 | 9,664 | |||||||||||||
| U.S. Ultra Bond |
09/21/16 | 4 | Long | 745,500 | 38,362 | |||||||||||||
|
|
|
|||||||||||||||||
| $ | 115,238 | |||||||||||||||||
|
|
|
|||||||||||||||||
| TYPE | EXPIRATION DATE |
CONTRACTS | POSITION | FAIR VALUE | UNREALIZED DEPRECIATION |
|||||||||||||
| Short Futures |
| |||||||||||||||||
| U.S. 10-Year Treasury Note |
09/21/16 | 8 | Short | $ | 1,063,875 | $ | (24,120 | ) | ||||||||||
See accompanying Notes to the Financial Statements.
125
Table of Contents
Babson Total Return Bond Fund 2016 Annual Report
SCHEDULE OF INVESTMENTS (CONTINUED)
June 30, 2016
OTC Credit Default Swaps – Sell Protection(1)(2)
| REFERENCE OBLIGATION |
FIXED-DEAL RECEIVED RATE |
MATURITY DATE |
COUNTERPARTY | ORIGINAL AMOUNT |
CURRENT AMOUNT (3) |
UPFRONT PAID/ (RECEIVED) |
FAIR VALUE (4) |
UNREALIZED (DEPRECIATION) |
||||||||||||||||||||
| CMBX.NA.BBB-.6† |
3.00% | 11/17/2045 | JPMorgan Chase Bank N.A. | 60,000 | $ | 60,000 | $ | 144 | $ | (4,437 | ) | $ | (4,581 | ) | ||||||||||||||
| CMBX.NA.BBB-.6† |
3.00% | 5/11/2063 | Goldman Sachs & Co. | 70,000 | $ | 70,000 | (5,395 | ) | (5,177 | ) | 218 | |||||||||||||||||
|
|
|
|
|
|
|
|||||||||||||||||||||||
| $ | (5,251 | ) | $ | (9,614 | ) | $ | (4,363 | ) | ||||||||||||||||||||
|
|
|
|
|
|
|
|||||||||||||||||||||||
Centrally Cleared Credit Default Swaps – Buy Protection
| REFERENCE OBLIGATION |
FIXED-DEAL RECEIVED RATE |
MATURITY DATE |
ORIGINAL AMOUNT |
CURRENT AMOUNT (2) |
UPFRONT PAID/ (RECEIVED) |
FAIR VALUE (3) |
UNREALIZED APPRECIATION/ (DEPRECIATION) |
|||||||||||||||||||
| CDX.NA.IG.26 |
1.00% | 6/20/2021 | 480,000 | $ | 480,000 | $ | (4,614 | ) | $ | (4,945 | ) | $ | (331 | ) | ||||||||||||
| (1) | If the Fund is a seller of protection and a credit event occurs, as defined under the terms of that particular swap agreement, the Fund will either (i) pay to the buyer of protection an amount equal to the notional amount of the swap and take delivery of the referenced obligation or underlying securities comprising the referenced index or (ii) pay a net settlement amount in the form of cash or securities equal to the notional amount of the swap less the recovery value of the referenced obligation or underlying securities comprising the referenced index. |
| (2) | Represents an investment grade index of single name credit default swaps (CDS). All of the companies underlying the single name CDS within the index are rated investment grade or higher. Rating represents a weighted average of the credit ratings of all the companies underlying the single name CDS within the index. |
| (3) | The maximum potential amount the Fund could be required to make as a seller of credit protection or receive as a buyer of credit event as defined under the terms of that particular swap agreement. |
| (4) | The quoted market prices and resulting values for credit default swap agreements on asset-backed securities and credit indices serve as an indicator of the current status of the payment/performance risk and represent the expected amount paid or received for the credit derivative if the amount of the swap agreement was closed/sold as of the period end. Increasing market values, in absolute terms when compared to the notional amount of the swap, represent a deterioration of the referenced entity’s credit soundness and a greater likelihood or risk of default or other credit event occurring as defined under the terms of the agreements. |
| † | Payment is based on a percentage of the index. Reference entities are a number of individual issuers comprising the index. |
See accompanying Notes to the Financial Statements.
126
Table of Contents
Babson Emerging Markets Debt Blended Total Return Fund 2016 Annual Report
SCHEDULE OF INVESTMENTS
June 30, 2016
| EFFECTIVE INTEREST RATE |
DUE DATE | PRINCIPAL ‡‡ | COST | FAIR VALUE |
||||||||||||||||
| Fixed Income — 95.5%*: |
| |||||||||||||||||||
| Corporate Bonds — 44.9%*: |
| |||||||||||||||||||
| Auto Parts&Equipment — 1.5%*: |
| |||||||||||||||||||
| Metalsa SA de CV+^ |
4.90 | % | 4/24/2023 | 150,000 | $136,259 | $146,625 | ||||||||||||||
|
|
|
|
|
|
|
|||||||||||||||
| Chemicals — 2.1%*: |
| |||||||||||||||||||
| OCP SA+ |
6.88 | 4/25/2044 | 200,000 | 209,915 | 210,691 | |||||||||||||||
|
|
|
|
|
|
|
|||||||||||||||
| Commercial Banks — 8.2%*: |
| |||||||||||||||||||
| BBVA Bancomer SA+^ |
5.35 | # | 11/12/2029 | 200,000 | 198,550 | 197,500 | ||||||||||||||
| BBVA Bancomer SA+^ |
6.75 | 9/30/2022 | 200,000 | 222,319 | 222,274 | |||||||||||||||
| Sberbank of Russia Via SB Capital SA+^ |
5.50 | # | 2/26/2024 | 200,000 | 186,757 | 198,500 | ||||||||||||||
| Turkiye Halk Bankasi AS+^ |
3.88 | 2/5/2020 | 200,000 | 194,645 | 194,000 | |||||||||||||||
|
|
|
|
|
|
|
|||||||||||||||
| Total Commercial Banks |
|
800,000 | 802,271 | 812,274 | ||||||||||||||||
|
|
|
|
|
|
|
|||||||||||||||
| Construction Materials — 1.7%*: |
| |||||||||||||||||||
| Cemex SAB de CV+^ |
4.38 | 3/5/2023 | 150,000 | 165,046 | 161,618 | |||||||||||||||
|
|
|
|
|
|
|
|||||||||||||||
| Electric — 5.8%*: |
| |||||||||||||||||||
| Abengoa Transmision Sur SA+^ |
6.88 | 4/30/2043 | 200,000 | 204,988 | 208,000 | |||||||||||||||
| AES El Salvador Trust II+^ |
6.75 | 3/28/2023 | 200,000 | 181,363 | 172,000 | |||||||||||||||
| Empresa Electrica Angamos SA+ |
4.88 | 5/25/2029 | 200,000 | 189,338 | 192,750 | |||||||||||||||
|
|
|
|
|
|
|
|||||||||||||||
| Total Electric |
|
600,000 | 575,689 | 572,750 | ||||||||||||||||
|
|
|
|
|
|
|
|||||||||||||||
| Food — 4.1%*: |
| |||||||||||||||||||
| Marfrig Holdings Europe BV+^ |
8.00 | 6/8/2023 | 200,000 | 197,398 | 203,250 | |||||||||||||||
| Marfrig Overseas Ltd.+^ |
9.50 | 5/4/2020 | 200,000 | 206,232 | 204,696 | |||||||||||||||
|
|
|
|
|
|
|
|||||||||||||||
| Total Food |
|
400,000 | 403,630 | 407,946 | ||||||||||||||||
|
|
|
|
|
|
|
|||||||||||||||
| Gas — 2.4%*: |
| |||||||||||||||||||
| Fermaca Enterprises S de RL de CV+^ |
6.38 | 3/30/2038 | 241,727 | 235,700 | 240,519 | |||||||||||||||
|
|
|
|
|
|
|
|||||||||||||||
| Home Furnishings — 2.0%*: |
| |||||||||||||||||||
| Arcelik AS+^ |
5.00 | 4/3/2023 | 200,000 | 195,604 | 197,844 | |||||||||||||||
|
|
|
|
|
|
|
|||||||||||||||
| Iron/Steel — 2.7%*: |
| |||||||||||||||||||
| Vale Overseas Ltd.+ |
4.38 | 1/11/2022 | 135,000 | 124,809 | 126,522 | |||||||||||||||
| Vale Overseas Ltd.+ |
5.88 | 6/10/2021 | 140,000 | 140,000 | 140,175 | |||||||||||||||
|
|
|
|
|
|
|
|||||||||||||||
| Total Iron/Steel |
|
275,000 | 264,809 | 266,697 | ||||||||||||||||
|
|
|
|
|
|
|
|||||||||||||||
| Media — 4.0%*: |
| |||||||||||||||||||
| Altice Financing SA+^ |
6.63 | 2/15/2023 | 200,000 | 196,510 | 196,374 | |||||||||||||||
| VTR Finance BV+^ |
6.88 | 1/15/2024 | 200,000 | 186,063 | 199,396 | |||||||||||||||
|
|
|
|
|
|
|
|||||||||||||||
| Total Media |
|
400,000 | 382,573 | 395,770 | ||||||||||||||||
|
|
|
|
|
|
|
|||||||||||||||
| Oil and Gas — 8.7%*: |
| |||||||||||||||||||
| Petrobras Global Finance BV+ |
3.25 | 4/1/2019 | 450,000 | 475,144 | 465,054 | |||||||||||||||
| Petroleos Mexicanos+ |
3.50 | 1/30/2023 | 200,000 | 181,002 | 188,320 | |||||||||||||||
| Petroleos Mexicanos+ |
4.88 | 1/24/2022 | 200,000 | 201,950 | 204,478 | |||||||||||||||
|
|
|
|
|
|
|
|||||||||||||||
| Total Oil and Gas |
|
850,000 | 858,096 | 857,852 | ||||||||||||||||
|
|
|
|
|
|
|
|||||||||||||||
See accompanying Notes to the Financial Statements.
127
Table of Contents
Babson Emerging Markets Debt Blended Total Return Fund 2016 Annual Report
SCHEDULE OF INVESTMENTS (CONTINUED)
June 30, 2016
| EFFECTIVE INTEREST RATE |
DUE DATE | PRINCIPAL ‡‡ | COST | FAIR VALUE |
||||||||||||||||
| Corporate Bonds (Continued) |
| |||||||||||||||||||
| Telecommunications — 1.7%*: |
| |||||||||||||||||||
| Digicel Ltd.+^ |
6.75 | % | 3/1/2023 | 200,000 | $187,918 | $170,000 | ||||||||||||||
|
|
|
|
|
|
|
|||||||||||||||
| Total Corporate Bonds |
|
4,466,727 | 4,417,510 | 4,440,586 | ||||||||||||||||
|
|
|
|
|
|
|
|||||||||||||||
| Foreign Government — 50.6%*: |
| |||||||||||||||||||
| Argentina — 3.7%*: |
| |||||||||||||||||||
| Argentine Republic Government International Bond+ |
7.50 | 4/22/2026 | 150,000 | 150,000 | 162,150 | |||||||||||||||
| Provincia de Cordoba+^ |
7.13 | 6/10/2021 | 200,000 | 200,000 | 200,500 | |||||||||||||||
|
|
|
|
|
|
|
|||||||||||||||
| Total Argentina |
|
350,000 | 350,000 | 362,650 | ||||||||||||||||
|
|
|
|
|
|
|
|||||||||||||||
| Armenia — 2.1%*: |
| |||||||||||||||||||
| Armenia International Bond+^ |
6.00 | 9/30/2020 | 200,000 | 198,860 | 202,500 | |||||||||||||||
|
|
|
|
|
|
|
|||||||||||||||
| Brazil — 5.8%*: |
| |||||||||||||||||||
| Brazil Notas do Tesouro Nacional Serie B+ |
6.00 | 8/15/2050 | 460,000 | 386,513 | 331,825 | |||||||||||||||
| Brazilian Government International Bond+ |
8.25 | 1/20/2034 | 200,000 | 230,974 | 243,000 | |||||||||||||||
|
|
|
|
|
|
|
|||||||||||||||
| Total Brazil |
|
660,000 | 617,487 | 574,825 | ||||||||||||||||
|
|
|
|
|
|
|
|||||||||||||||
| Colombia — 5.4%*: |
| |||||||||||||||||||
| Colombia Government International Bond+ |
5.63 | 2/26/2044 | 200,000 | 206,497 | 222,000 | |||||||||||||||
| Colombian TES+ |
7.75 | 9/18/2030 | 900,000,000 | 276,363 | 310,062 | |||||||||||||||
|
|
|
|
|
|
|
|||||||||||||||
| Total Colombia |
|
900,200,000 | 482,860 | 532,062 | ||||||||||||||||
|
|
|
|
|
|
|
|||||||||||||||
| Croatia — 2.1%*: |
| |||||||||||||||||||
| Croatia Government Bond+^ |
5.50 | 4/4/2023 | 200,000 | 207,612 | 211,920 | |||||||||||||||
|
|
|
|
|
|
|
|||||||||||||||
| Dominican Republic — 2.1%*: |
| |||||||||||||||||||
| Dominican Republic International Bond+^ |
5.88 | 4/18/2024 | 200,000 | 196,865 | 209,000 | |||||||||||||||
|
|
|
|
|
|
|
|||||||||||||||
| El Salvador — 2.0%*: |
| |||||||||||||||||||
| Republic of El Salvador+^ |
7.38 | 12/1/2019 | 200,000 | 205,960 | 200,500 | |||||||||||||||
|
|
|
|
|
|
|
|||||||||||||||
| Ghana — 2.1%*: |
| |||||||||||||||||||
| Republic of Ghana+^ |
10.75 | 10/14/2030 | 200,000 | 213,705 | 210,700 | |||||||||||||||
|
|
|
|
|
|
|
|||||||||||||||
| Indonesia — 2.5%*: |
| |||||||||||||||||||
| Indonesia Treasury Bond+ |
8.38 | 3/15/2034 | 3,140,000,000 | 214,663 | 250,637 | |||||||||||||||
|
|
|
|
|
|
|
|||||||||||||||
| Jamaica — 2.1%*: |
| |||||||||||||||||||
| Government of Jamaica+ |
6.75 | 4/28/2028 | 200,000 | 202,410 | 209,600 | |||||||||||||||
|
|
|
|
|
|
|
|||||||||||||||
| Malaysia — 4.0%*: |
| |||||||||||||||||||
| Malaysia Government Bond+ |
4.13 | 4/15/2032 | 1,610,000 | 360,450 | 392,839 | |||||||||||||||
|
|
|
|
|
|
|
|||||||||||||||
| Mexico — 8.8%*: |
| |||||||||||||||||||
| Mexican Bonos+ |
7.75 | 11/13/2042 | 7,100,000 | 483,289 | 449,452 | |||||||||||||||
| United Mexican States+ |
5.75 | 10/12/2110 | 380,000 | 368,282 | 418,000 | |||||||||||||||
|
|
|
|
|
|
|
|||||||||||||||
| Total Mexico |
|
7,480,000 | 851,571 | 867,452 | ||||||||||||||||
|
|
|
|
|
|
|
|||||||||||||||
| South Africa — 5.8%*: |
| |||||||||||||||||||
| South Africa Government Bond+ |
8.75 | 2/28/2048 | 9,300,000 | 624,731 | 577,495 | |||||||||||||||
|
|
|
|
|
|
|
|||||||||||||||
See accompanying Notes to the Financial Statements.
128
Table of Contents
Babson Emerging Markets Debt Blended Total Return Fund 2016 Annual Report
SCHEDULE OF INVESTMENTS (CONTINUED)
June 30, 2016
| EFFECTIVE INTEREST RATE |
DUE DATE | PRINCIPAL ‡‡ | COST | FAIR VALUE |
||||||||||||||||
| Foreign Government (Continued) |
| |||||||||||||||||||
| Uruguay — 2.1%*: |
| |||||||||||||||||||
| Republica Orient Uruguay+ |
4.38 | % | 10/27/2027 | 200,000 | $199,426 | $211,000 | ||||||||||||||
|
|
|
|
|
|
|
|||||||||||||||
| Total Foreign Government |
|
4,061,000,000 | 4,926,600 | 5,013,180 | ||||||||||||||||
|
|
|
|
|
|
|
|||||||||||||||
| Total Fixed Income |
|
4,065,466,727 | 9,344,110 | 9,453,766 | ||||||||||||||||
|
|
|
|
|
|
|
|||||||||||||||
| Short-Term Investment — 3.0%*: |
| |||||||||||||||||||
| Bank Deposit — 3.0%*: |
| |||||||||||||||||||
| State Street Bank & Trust Co. Euro Time Deposit |
0.01 | 7/1/2016 | 299,350 | 299,350 | 299,350 | |||||||||||||||
|
|
|
|
|
|
|
|||||||||||||||
| Total Investments |
|
4,065,766,077 | 9,643,460 | 9,753,116 | ||||||||||||||||
|
|
|
|
|
|
|
|||||||||||||||
| Other assets and liabilities — 1.5% |
|
149,872 | ||||||||||||||||||
|
|
|
|||||||||||||||||||
| Net Assets — 100.0% |
|
$9,902,988 | ||||||||||||||||||
|
|
|
|||||||||||||||||||
| ‡‡ | Unless otherwise indicated, all principal amounts are denominated in United States Dollars. |
| * | Calculated as a percentage of net assets applicable to common shareholders. |
| + | Foreign security. |
Distributions of investments by country of risk (excluding temporary cash investments) as a percentage of total investments in securities, is as follows:
| Mexico | 23.6% | |||||
| Brazil | 18.1% | |||||
| South Africa | 6.1% | |||||
| Colombia | 5.6% | |||||
| Malaysia | 4.2% | |||||
| Chile | 4.2% | |||||
| Turkey | 4.2% | |||||
| Jamaica | 4.0% | |||||
| El Salvador | 3.9% | |||||
| Argentina | 3.8% | |||||
| Indonesia | 2.7% | |||||
| Croatia | 2.2% | |||||
| Uruguay | 2.2% | |||||
| Ghana | 2.2% | |||||
| Morocco | 2.2% | |||||
| Dominican Republic | 2.2% | |||||
| Peru | 2.2% | |||||
| Armenia | 2.2% | |||||
| Russia | 2.1% | |||||
| Israel | 2.1% | |||||
|
|
|
|||||
| Total | 100.0% | |||||
|
|
|
| ^ | Security acquired in a transaction exempt from registration under Rule 144A of the Securities Act of 1933. These securities may only be resold in transactions exempt from registration, normally to qualified institutional buyers. |
| # | Variable rate security. The interest rate shown is the rate in effect at June 30, 2016. |
See accompanying Notes to the Financial Statements.
129
Table of Contents
Babson Emerging Markets Debt Blended Total Return Fund 2016 Annual Report
SCHEDULE OF INVESTMENTS (CONTINUED)
June 30, 2016
A summary of outstanding derivatives at June 30, 2016 is as follows:
Forward Foreign Currency Exchange Contracts to Buy Cross Currency Forward Foreign Currency Exchange Contracts
| EXPIRATION DATE |
DELIVER/RECEIVE | COUNTERPARTY | CONTRACT AMOUNT PURCHASED |
CONTRACT AMOUNT SOLD |
NET UNREALIZED APPRECIATION (DEPRECIATION) |
|||||||||||
| 9/29/16 | CZK/EUR |
Citibank N.A. | 352,000 | 9,549,936 | $ | (726 | ) | |||||||||
| 7/19/16 | EUR/PLN |
Citibank N.A. | 1,963,040 | 445,000 | 3,308 | |||||||||||
| 7/19/16 | EUR/PLN |
Goldman Sachs & Co. | 1,808,059 | 417,955 | (5,932 | ) | ||||||||||
| 7/26/16 | EUR/RSD |
BNP Paribas S.A. | 5,805,600 | 47,001 | (39 | ) | ||||||||||
| 7/26/16 | HRK/EUR |
BNP Paribas S.A. | 792,000 | 5,958,216 | 1,080 | |||||||||||
| 7/26/16 | HUF/EUR |
Citibank N.A. | 141,370 | 44,262,285 | 1,440 | |||||||||||
|
|
|
|||||||||||||||
| Net unrealized depreciation on cross currency forward foreign exchange contracts |
|
$ | (869 | ) | ||||||||||||
|
|
|
|||||||||||||||
| EXPIRATION DATE |
COUNTERPARTY | LOCAL CURRENCY |
VALUE IN USD | IN EXCHANGE FOR USD |
NET UNREALIZED APPRECIATION (DEPRECIATION) |
|||||||||||||||||
| 12/6/16 | JPMorgan Chase Bank N.A. |
ARS | 1,629,600 | 99,826 | 97,000 | $ | 2,826 | |||||||||||||||
| 7/26/16 | BNP Paribas S.A. |
AUD | 134,325 | 100,101 | 97,000 | 3,101 | ||||||||||||||||
| 2/22/17 | JPMorgan Chase Bank N.A. |
CNH | 223,512 | 33,153 | 34,000 | (847 | ) | |||||||||||||||
| 7/26/16 | BNP Paribas S.A. |
COP | 527,962,250 | 179,884 | 180,421 | (537 | ) | |||||||||||||||
| 7/19/16 | JPMorgan Chase Bank N.A. |
EUR | 420,675 | 467,076 | 479,901 | (12,825 | ) | |||||||||||||||
| 7/19/16 | BNP Paribas S.A. |
EUR | 62,251 | 69,117 | 70,180 | (1,063 | ) | |||||||||||||||
| 7/19/16 | Bank of America N.A. |
HUF | 127,109,790 | 446,760 | 462,033 | (15,273 | ) | |||||||||||||||
| 7/26/16 | BNP Paribas S.A. |
INR | 12,732,035 | 187,874 | 188,701 | (827 | ) | |||||||||||||||
| 7/26/16 | JPMorgan Chase Bank N.A. |
KZT | 160,839,000 | 471,885 | 483,000 | (11,115 | ) | |||||||||||||||
| 7/26/16 | JPMorgan Chase Bank N.A. |
MXN | 8,265,499 | 451,216 | 454,920 | (3,704 | ) | |||||||||||||||
| 7/26/16 | BNP Paribas S.A. |
MXN | 10,299,716 | 562,265 | 553,000 | 9,265 | ||||||||||||||||
| 7/26/16 | BNP Paribas S.A. |
RUB | 12,939,409 | 201,180 | 194,440 | 6,740 | ||||||||||||||||
| 7/26/16 | BNP Paribas S.A. |
SEK | 1,546,225 | 182,917 | 193,000 | (10,083 | ) | |||||||||||||||
| 7/26/16 | Citibank N.A. |
SGD | 92,778 | 68,861 | 69,000 | (139 | ) | |||||||||||||||
| 9/13/16 | BNP Paribas S.A. |
THB | 34,269,913 | 974,077 | 969,578 | 4,499 | ||||||||||||||||
| 7/26/16 | Bank of America N.A. |
TRY | 1,340,724 | 463,283 | 447,993 | 15,290 | ||||||||||||||||
| 7/26/16 | Citibank N.A. |
TRY | 863,965 | 298,540 | 289,000 | 9,540 | ||||||||||||||||
| 7/26/16 | Goldman Sachs & Co. |
ZAR | 4,377,007 | 295,931 | 288,942 | 6,989 | ||||||||||||||||
| 7/26/16 | BNP Paribas S.A. |
ZAR | 3,403,591 | 230,118 | 212,000 | 18,118 | ||||||||||||||||
|
|
|
|||||||||||||||||||||
| Net unrealized appreciation on forward foreign exchange contracts to buy |
|
$ | 19,955 | |||||||||||||||||||
|
|
|
|||||||||||||||||||||
See accompanying Notes to the Financial Statements.
130
Table of Contents
Babson Emerging Markets Debt Blended Total Return Fund 2016 Annual Report
SCHEDULE OF INVESTMENTS (CONTINUED)
June 30, 2016
Forward Foreign Currency Exchange Contracts to Sell
| EXPIRATION DATE |
COUNTERPARTY | LOCAL CURRENCY |
VALUE IN USD | IN EXCHANGE FOR USD |
NET UNREALIZED APPRECIATION (DEPRECIATION) |
|||||||||||||||||
| 7/26/16 | BNP Paribas S.A. |
AUD | 135,719 | 101,140 | 102,683 | $ | 1,543 | |||||||||||||||
| 7/26/16 | Goldman Sachs & Co. |
BRL | 1,340,102 | 414,471 | 382,122 | (32,349 | ) | |||||||||||||||
| 7/26/16 | Bank of America N.A. |
CHF | 196,650 | 201,655 | 203,326 | 1,671 | ||||||||||||||||
| 2/22/17 | JPMorgan Chase Bank N.A. |
CNH | 3,396,030 | 503,722 | 500,000 | (3,722 | ) | |||||||||||||||
| 7/19/16 | JPMorgan Chase Bank N.A. |
EUR | 1,378,186 | 1,530,202 | 1,572,129 | 41,927 | ||||||||||||||||
| 7/19/16 | Goldman Sachs & Co. |
EUR | 78,053 | 86,662 | 88,000 | 1,338 | ||||||||||||||||
| 7/26/16 | Goldman Sachs & Co. |
HKD | 3,745,726 | 482,946 | 483,000 | 54 | ||||||||||||||||
| 7/12/16 | Bank of America N.A. |
IDR | 3,430,661,700 | 260,194 | 253,496 | (6,698 | ) | |||||||||||||||
| 7/26/16 | JPMorgan Chase Bank N.A. |
ILS | 808,614 | 209,596 | 215,455 | 5,859 | ||||||||||||||||
| 7/26/16 | JPMorgan Chase Bank N.A. |
INR | 12,732,035 | 187,874 | 188,274 | 400 | ||||||||||||||||
| 7/26/16 | Citibank N.A. |
MYR | 1,596,736 | 400,335 | 405,582 | 5,247 | ||||||||||||||||
| 7/26/16 | Bank of America N.A. |
PHP | 9,384,641 | 199,012 | 198,566 | (446 | ) | |||||||||||||||
| 7/26/16 | BNP Paribas S.A. |
SGD | 748,763 | 555,742 | 553,326 | (2,416 | ) | |||||||||||||||
| 7/26/16 | Bank of America N.A. |
TRY | 1,626,025 | 561,867 | 560,007 | (1,860 | ) | |||||||||||||||
| 7/26/16 | Bank of America N.A. |
ZAR | 5,523,085 | 373,417 | 381,136 | 7,719 | ||||||||||||||||
| 7/26/16 | JPMorgan Chase Bank N.A. |
ZAR | 10,868,412 | 734,816 | 731,000 | (3,816 | ) | |||||||||||||||
|
|
|
|||||||||||||||||||||
| Net unrealized appreciation on forward foreign exchange contracts to sell |
|
$ | 14,451 | |||||||||||||||||||
|
|
|
|||||||||||||||||||||
Currency Legend
| ARS | – | Argentine Peso | ||
| AUD | – | Australian Dollar | ||
| BRL | – | Brazilian Real | ||
| CHF | – | Swiss Franc | ||
| CNH | – | Chinese Yuan Renminbi | ||
| COP | – | Colombian Peso | ||
| CZK | – | Czech Koruna | ||
| EUR | – | Euro | ||
| HKD | – | Hong Kong Dollar | ||
| HRK | – | Croatian Kuna | ||
| HUF | – | Hungarian Forint | ||
| IDR | – | Indonesian Rupiah | ||
| ILS | – | Israeli Shekel | ||
| INR | – | Indian Rupee | ||
| KRW | – | South Korean Won | ||
| KZT | – | Kazakhstan Tenge | ||
| MXN | – | Mexican Peso | ||
| MYR | – | Malaysian Ringgit | ||
| PHP | – | Philippines Peso | ||
| PLN | – | Polish Zloty | ||
| RSD | – | Serbian Dinar | ||
| RUB | – | Russian Ruble | ||
| SEK | – | Swedish Krona | ||
| SGD | – | Singapore Dollar | ||
| THB | – | Thai Baht |
See accompanying Notes to the Financial Statements.
131
Table of Contents
Babson Emerging Markets Debt Blended Total Return Fund 2016 Annual Report
SCHEDULE OF INVESTMENTS (CONTINUED)
June 30, 2016
| TRY | – | New Turkish Lira | ||
| ZAR | – | South African Rand |
OTC – Interest Rate Swaps
| DESCRIPTION | NOTIONAL AMOUNT |
UNREALIZED APPRECIATION (DEPRECIATION) |
VALUE | |||||||||
| Agreement with Bank of America N.A. dated 12/9/15 receiving a fixed rate of 12.50% paying the notional amount multiplied by the BRL-CDI rate. Expiring 1/2/25 |
BRL | 625,257 | $ | 2,769 | $ | 2,769 | ||||||
| Agreement with JPMorgan Chase Bank N.A. dated 5/19/16 receiving a fixed rate of 2.46% paying the notional amount multiplied by the PLN-WIBOR rate. Expiring 6/21/26 |
PLN | 1,100,000 | 6,834 | 6,834 | ||||||||
| Agreement with JPMorgan Chase Bank N.A. dated 4/26/16 paying a fixed rate of 1.79% receiving the notional amount multiplied by the PLN-WIBOR rate. Expiring 6/21/19 |
PLN | 3,300,000 | (3,702 | ) | (3,702 | ) | ||||||
| Agreement with JPMorgan Chase Bank N.A. dated 5/19/16 paying a fixed rate of 1.64% receiving the notional amount multiplied by the KRW-KSDA rate. Expiring 5/20/26 |
KRW | 190,000,000 | (5,239 | ) | (5,239 | ) | ||||||
| Agreement with JPMorgan Chase Bank N.A. dated 5/19/16 receiving a fixed rate of 1.67% paying the notional amount multiplied by the ILS-TELBO rate. Expiring 5/23/26 |
ILS | 610,000 | 2,608 | 2,608 | ||||||||
See accompanying Notes to the Financial Statements.
132
Table of Contents
Babson Emerging Markets Local Currency Debt Fund 2016 Annual Report
SCHEDULE OF INVESTMENTS
June 30, 2016
| EFFECTIVE INTEREST RATE |
DUE DATE | PRINCIPAL ‡‡ | COST | FAIR VALUE |
||||||||||||||||
| Fixed Income — 90.8%*: |
||||||||||||||||||||
| Foreign Government — 90.8%*+: |
||||||||||||||||||||
| Argentina — 2.0%*: |
||||||||||||||||||||
| Argentine Bonad Bonds¤ |
1.75 | % | 10/28/2016 | 112,000 | $107,294 | $110,510 | ||||||||||||||
|
|
|
|
|
|
|
|||||||||||||||
| Brazil — 9.5%*: |
| |||||||||||||||||||
| Brazil Letras do Tesouro Nacional |
Zero Coupon | 1/1/2017 | 518,000 | 129,087 | 151,375 | |||||||||||||||
| Brazil Notas do Tesouro Nacional Serie B |
6.00 | 8/15/2020 | 313,000 | 252,708 | 223,178 | |||||||||||||||
| Brazil Notas do Tesouro Nacional Serie B |
6.00 | 8/15/2050 | 200,000 | 163,908 | 144,657 | |||||||||||||||
|
|
|
|
|
|
|
|||||||||||||||
| Total Brazil |
|
1,031,000 | 545,703 | 519,210 | ||||||||||||||||
|
|
|
|
|
|
|
|||||||||||||||
| Chile — 0.9%*: |
| |||||||||||||||||||
| Chile Government International Bond |
5.50 | 8/5/2020 | 32,300,000 | 48,065 | 51,519 | |||||||||||||||
|
|
|
|
|
|
|
|||||||||||||||
| Colombia — 9.8%*: |
| |||||||||||||||||||
| Colombian TES |
7.75 | 9/18/2030 | 1,552,000,000 | 425,907 | 536,867 | |||||||||||||||
|
|
|
|
|
|
|
|||||||||||||||
| Croatia — 2.0%*: |
| |||||||||||||||||||
| Croatia Government Bond |
4.25 | 12/14/2026 | 700,000 | 110,516 | 106,698 | |||||||||||||||
|
|
|
|
|
|
|
|||||||||||||||
| Ghana — 0.5%*: |
| |||||||||||||||||||
| Ghana Government Bond |
24.75 | 3/1/2021 | 100,000 | 26,816 | 25,848 | |||||||||||||||
|
|
|
|
|
|
|
|||||||||||||||
| Hungary — 4.7%*: |
| |||||||||||||||||||
| Hungary Government Bond |
6.00 | 11/24/2023 | 7,650,000 | 32,176 | 32,598 | |||||||||||||||
| Hungary Government Bond |
6.75 | 10/22/2028 | 47,000,000 | 233,026 | 223,104 | |||||||||||||||
|
|
|
|
|
|
|
|||||||||||||||
| Total Hungary |
|
54,650,000 | 265,202 | 255,702 | ||||||||||||||||
|
|
|
|
|
|
|
|||||||||||||||
| Indonesia — 10.0%*: |
| |||||||||||||||||||
| Indonesia Treasury Bond |
8.25 | 7/15/2021 | 475,000,000 | 36,089 | 37,421 | |||||||||||||||
| Indonesia Treasury Bond |
8.38 | 3/15/2034 | 6,369,000,000 | 436,074 | 508,378 | |||||||||||||||
|
|
|
|
|
|
|
|||||||||||||||
| Total Indonesia |
|
6,844,000,000 | 472,163 | 545,799 | ||||||||||||||||
|
|
|
|
|
|
|
|||||||||||||||
| Malaysia — 10.3%*: |
| |||||||||||||||||||
| Malaysia Government Bond |
3.48 | 3/15/2023 | 1,720,000 | 385,871 | 420,134 | |||||||||||||||
| Malaysia Government Bond |
4.50 | 4/15/2030 | 550,000 | 128,541 | 140,825 | |||||||||||||||
|
|
|
|
|
|
|
|||||||||||||||
| Total Malaysia |
|
2,270,000 | 514,412 | 560,959 | ||||||||||||||||
|
|
|
|
|
|
|
|||||||||||||||
| Mexico — 4.4%*: |
| |||||||||||||||||||
| Mexican Bonos |
7.75 | 11/13/2042 | 3,830,000 | 246,638 | 240,261 | |||||||||||||||
|
|
|
|
|
|
|
|||||||||||||||
| Peru — 2.0%*: |
| |||||||||||||||||||
| Peru Government Bond |
7.84 | 8/12/2020 | 330,000 | 98,419 | 110,183 | |||||||||||||||
|
|
|
|
|
|
|
|||||||||||||||
| Philippines — 4.1%*: |
| |||||||||||||||||||
| Philippine Government International Bond |
4.95 | 1/15/2021 | 10,000,000 | 220,116 | 221,053 | |||||||||||||||
|
|
|
|
|
|
|
|||||||||||||||
| Poland — 4.8%*: |
| |||||||||||||||||||
| Poland Government Bond |
5.75 | 4/25/2029 | 820,000 | 277,049 | 263,408 | |||||||||||||||
|
|
|
|
|
|
|
|||||||||||||||
See accompanying Notes to the Financial Statements.
133
Table of Contents
Babson Emerging Markets Local Currency Debt Fund 2016 Annual Report
SCHEDULE OF INVESTMENTS (CONTINUED)
June 30, 2016
| EFFECTIVE INTEREST RATE |
DUE DATE | PRINCIPAL ‡‡ | COST | FAIR VALUE |
||||||||||||||||
| Foreign Government (Continued) |
||||||||||||||||||||
| Romania — 3.8%*: |
| |||||||||||||||||||
| Romania Government Bond |
5.80 | % | 7/26/2027 | 230,000 | $67,782 | $66,105 | ||||||||||||||
| Romania Government Bond |
6.75 | 6/11/2017 | 550,000 | 141,015 | 142,514 | |||||||||||||||
|
|
|
|
|
|
|
|||||||||||||||
| Total Romania |
|
780,000 | 208,797 | 208,619 | ||||||||||||||||
|
|
|
|
|
|
|
|||||||||||||||
| Russia — 4.6%*: |
| |||||||||||||||||||
| Russian Federal Bond—OFZ |
7.05 | 1/19/2028 | 2,800,000 | 36,205 | 40,205 | |||||||||||||||
| Russian Federal Inflation Linked Bond |
2.50 | 8/16/2023 | 13,482,378 | 194,374 | 208,406 | |||||||||||||||
|
|
|
|
|
|
|
|||||||||||||||
| Total Russia |
|
16,282,378 | 230,579 | 248,611 | ||||||||||||||||
|
|
|
|
|
|
|
|||||||||||||||
| South Africa — 6.7%*: |
| |||||||||||||||||||
| South Africa Government Bond |
8.75 | 2/28/2048 | 5,900,000 | 361,543 | 368,444 | |||||||||||||||
|
|
|
|
|
|
|
|||||||||||||||
| Thailand — 4.4%*: |
| |||||||||||||||||||
| Thailand Government Bond |
1.20 | 7/14/2021 | 8,504,160 | 226,638 | 237,931 | |||||||||||||||
|
|
|
|
|
|
|
|||||||||||||||
| Turkey — 4.5%*: |
||||||||||||||||||||
| Turkey Government Bond |
8.00 | 3/12/2025 | 750,000 | 241,551 | 244,901 | |||||||||||||||
|
|
|
|
|
|
|
|||||||||||||||
| Uruguay — 1.8%*: |
||||||||||||||||||||
| Uruguay Government International Bond |
4.38 | 12/15/2028 | 3,419,112 | 105,604 | 99,802 | |||||||||||||||
|
|
|
|
|
|
|
|||||||||||||||
| Total Foreign Government |
8,537,778,650 | 4,733,012 | 4,956,325 | |||||||||||||||||
|
|
|
|
|
|
|
|||||||||||||||
| Total Fixed Income |
8,537,778,650 | 4,733,012 | 4,956,325 | |||||||||||||||||
|
|
|
|
|
|
|
|||||||||||||||
| Short-Term Investment — 6.7%*: |
| |||||||||||||||||||
| Bank Deposit — 6.7%*: |
| |||||||||||||||||||
| State Street Bank & Trust Co. Euro Time Deposit |
0.01 | 7/1/2016 | 368,917 | 368,917 | 368,917 | |||||||||||||||
|
|
|
|
|
|
|
|||||||||||||||
| Total Investments |
8,538,147,567 | 5,101,929 | 5,325,242 | |||||||||||||||||
|
|
|
|
|
|
|
|||||||||||||||
| Other assets and liabilities — 2.5%* |
135,270 | |||||||||||||||||||
|
|
|
|||||||||||||||||||
| Net Assets — 100.0% |
$5,460,512 | |||||||||||||||||||
|
|
|
|||||||||||||||||||
| ‡‡ | Unless otherwise indicated, all principal amounts are denominated in United States Dollars. |
| * | Calculated as a percentage of net assets applicable to common shareholders. |
| + | Foreign security. |
See accompanying Notes to the Financial Statements.
134
Table of Contents
Babson Emerging Markets Local Currency Debt Fund 2016 Annual Report
SCHEDULE OF INVESTMENTS (CONTINUED)
June 30, 2016
Distributions of investments by country of risk (excluding temporary cash investments) as a percentage of total investments in securities, is as follows:
| Malaysia | 11.3% | |||||
| Indonesia | 11.0% | |||||
| Colombia | 10.8% | |||||
| Brazil | 10.5% | |||||
| South Africa | 7.4% | |||||
| Poland | 5.3% | |||||
| Hungary | 5.2% | |||||
| Russia | 5.0% | |||||
| Turkey | 5.0% | |||||
| Mexico | 4.9% | |||||
| Thailand | 4.8% | |||||
| Philippines | 4.5% | |||||
| Romania | 4.2% | |||||
| Argentina | 2.2% | |||||
| Peru | 2.2% | |||||
| Croatia | 2.2% | |||||
| Uruguay | 2.0% | |||||
| Chile | 1.0% | |||||
| Other (Individually less than 1%) | 0.5% | |||||
|
|
|
|||||
| Total | 100.0% | |||||
|
|
|
| ¤ | For fair value measurement disclosure purposes, security is categorized as Level 3 (See Note 2). |
A summary of outstanding derivatives at June 30, 2016 is as follows:
Cross Currency Forward Foreign Currency Exchange Contracts
| EXPIRATION DATE |
DELIVER/RECEIVE | COUNTERPARTY | CONTRACT AMOUNT PURCHASED |
CONTRACT AMOUNT SOLD |
NET UNREALIZED APPRECIATION (DEPRECIATION) |
|||||||||||
| 9/29/16 | CZK/EUR |
Citibank N.A. | 191,000 | 5,181,926 | (228 | ) | ||||||||||
| 7/26/16 | EUR/HUF |
Citibank N.A. | 9,491,810 | 30,304 | (290 | ) | ||||||||||
| 7/26/16 | EUR/HUF |
JPMorgan Chase Bank N.A. | 7,620,710 | 24,000 | 135 | |||||||||||
| 7/26/16 | EUR/PLN |
JPMorgan Chase Bank N.A. | 75,387 | 17,000 | 119 | |||||||||||
| 7/26/16 | EUR/PLN |
Bank of America N.A. | 582,612 | 132,000 | 236 | |||||||||||
| 7/26/16 | EUR/RON |
Goldman Sachs & Co. | 810,405 | 181,199 | (2,305 | ) | ||||||||||
| 7/26/16 | EUR/RSD |
BNP Paribas S.A. | 6,165,000 | 49,911 | (36 | ) | ||||||||||
| 7/26/16 | HRK/EUR |
BNP Paribas S.A. | 525,653 | 3,954,489 | 560 | |||||||||||
| 7/26/16 | HUF/EUR |
Citibank N.A. | 25,000 | 7,828,990 | 244 | |||||||||||
| 7/26/16 | PLN/EUR |
JPMorgan Chase Bank N.A. | 51,091 | 225,724 | (148 | ) | ||||||||||
| 7/26/16 | RON/EUR |
Bank of America N.A. | 32,000 | 143,580 | 294 | |||||||||||
|
|
|
|||||||||||||||
| Net unrealized depreciation on cross currency forward foreign exchange contracts |
|
$ | (1,419 | ) | ||||||||||||
|
|
|
|||||||||||||||
See accompanying Notes to the Financial Statements.
135
Table of Contents
Babson Emerging Markets Local Currency Debt Fund 2016 Annual Report
SCHEDULE OF INVESTMENTS (CONTINUED)
June 30, 2016
Forward Foreign Currency Exchange Contracts to Buy
| EXPIRATION DATE |
COUNTERPARTY | LOCAL |
VALUE IN USD | IN EXCHANGE FOR USD |
NET UNREALIZED APPRECIATION (DEPRECIATION) |
|||||||||||||||||||
| 12/6/16 | Citibank N.A. |
ARS | 845,000 | 52,110 | 50,000 | $ | 2,110 | |||||||||||||||||
| 3/1/17 | JPMorgan Chase Bank N.A. |
ARS | 1,881,000 | 110,332 | 100,000 | 10,332 | ||||||||||||||||||
| 7/26/16 | BNP Paribas S.A. |
AUD | 69,239 | 51,517 | 50,000 | 1,517 | ||||||||||||||||||
| 7/26/16 | BNP Paribas S.A. |
BRL | 222,115 | 68,888 | 61,034 | 7,854 | ||||||||||||||||||
| 7/26/16 | Goldman Sachs & Co. |
BRL | 257,615 | 79,898 | 77,325 | 2,573 | ||||||||||||||||||
| 7/26/16 | BNP Paribas S.A. |
COP | 245,151,224 | 83,940 | 83,157 | 783 | ||||||||||||||||||
| 7/26/16 | JPMorgan Chase Bank N.A. |
EUR | 258,806 | 287,736 | 294,706 | (6,970 | ) | |||||||||||||||||
| 7/26/16 | JPMorgan Chase Bank N.A. |
HUF | 71,409,975 | 251,295 | 252,264 | (969 | ) | |||||||||||||||||
| 7/12/16 | Bank of America N.A. |
IDR | 696,089,880 | 52,846 | 52,249 | 597 | ||||||||||||||||||
| 7/26/16 | BNP Paribas S.A. |
INR | 6,990,550 | 103,184 | 103,607 | (423 | ) | |||||||||||||||||
| 7/26/16 | JPMorgan Chase Bank N.A. |
KZT | 35,964,000 | 105,515 | 108,000 | (2,485 | ) | |||||||||||||||||
| 7/26/16 | Bank of America N.A. |
MXN | 1,043,675 | 56,463 | 55,000 | 1,463 | ||||||||||||||||||
| 7/26/16 | BNP Paribas S.A. |
MXN | 3,240,779 | 175,327 | 174,000 | 1,327 | ||||||||||||||||||
| 7/26/16 | JPMorgan Chase Bank N.A. |
MXN | 8,521,595 | 461,020 | 458,563 | 2,457 | ||||||||||||||||||
| 7/26/16 | Goldman Sachs & Co. |
MYR | 275,493 | 69,012 | 67,702 | 1,310 | ||||||||||||||||||
| 9/6/16 | JPMorgan Chase Bank N.A. |
PLN | 2,677,802 | 674,952 | 705,679 | (30,727 | ) | |||||||||||||||||
| 7/26/16 | BNP Paribas S.A. |
RUB | 12,865,322 | 200,271 | 192,057 | 8,214 | ||||||||||||||||||
| 7/26/16 | BNP Paribas S.A. |
SEK | 865,245 | 102,213 | 108,000 | (5,787 | ) | |||||||||||||||||
| 9/13/16 | BNP Paribas S.A. |
THB | 15,663,033 | 445,201 | 443,145 | 2,056 | ||||||||||||||||||
| 7/26/16 | Citibank N.A. |
TRY | 215,244 | 74,400 | 72,000 | 2,400 | ||||||||||||||||||
| 7/26/16 | JPMorgan Chase Bank N.A. |
TRY | 1,922,532 | 664,534 | 640,025 | 24,509 | ||||||||||||||||||
| 7/26/16 | Bank of America N.A. |
ZAR | 4,300,145 | 292,376 | 270,913 | 21,463 | ||||||||||||||||||
| 7/26/16 | BNP Paribas S.A. |
ZAR | 786,679 | 53,488 | 49,000 | 4,488 | ||||||||||||||||||
|
|
|
|||||||||||||||||||||||
|
|
Net unrealized appreciation on forward foreign exchange contracts to buy |
|
$ | 48,092 | ||||||||||||||||||||
|
|
|
|||||||||||||||||||||||
Forward Foreign Currency Exchange Contracts to Sell
| EXPIRATION DATE |
COUNTERPARTY | LOCAL CURRENCY |
VALUE IN USD | IN EXCHANGE FOR USD |
NET UNREALIZED APPRECIATION (DEPRECIATION) |
|||||||||||||||||
| 7/26/16 | BNP Paribas S.A. |
AUD | 69,711 | 51,866 | 49,807 | $ | (2,059 | ) | ||||||||||||||
| 7/26/16 | BNP Paribas S.A. |
BRL | 823,215 | 255,316 | 228,742 | (26,574 | ) | |||||||||||||||
| 7/26/16 | Citibank N.A. |
CAD | 32,517 | 25,040 | 26,000 | 960 | ||||||||||||||||
| 7/26/16 | Goldman Sachs & Co. |
CAD | 33,545 | 25,832 | 26,000 | 168 | ||||||||||||||||
| 7/26/16 | BNP Paribas S.A. |
CHF | 98,547 | 101,294 | 99,541 | (1,753 | ) | |||||||||||||||
| 7/26/16 | BNP Paribas S.A. |
CLP | 66,527,421 | 100,281 | 95,126 | (5,155 | ) | |||||||||||||||
| 2/22/17 | JPMorgan Chase Bank N.A. |
CNH | 1,698,015 | 251,844 | 250,000 | (1,844 | ) | |||||||||||||||
| 7/26/16 | JPMorgan Chase Bank N.A. |
COP | 259,497,939 | 88,853 | 86,744 | (2,109 | ) | |||||||||||||||
| 7/26/16 | JPMorgan Chase Bank N.A. |
EUR | 730,305 | 811,939 | 816,285 | 4,346 | ||||||||||||||||
| 7/26/16 | Goldman Sachs & Co. |
HKD | 2,101,639 | 270,975 | 271,000 | 25 | ||||||||||||||||
| 7/26/16 | Goldman Sachs & Co. |
HUF | 9,522,268 | 33,509 | 33,174 | (335 | ) | |||||||||||||||
| 7/12/16 | Bank of America N.A. |
IDR | 454,240,000 | 34,485 | 34,000 | (485 | ) | |||||||||||||||
| 7/26/16 | BNP Paribas S.A. |
ILS | 357,894 | 92,969 | 92,728 | (241 | ) | |||||||||||||||
| 7/26/16 | JPMorgan Chase Bank N.A. |
INR | 6,990,550 | 103,183 | 103,372 | 189 | ||||||||||||||||
| 7/26/16 | JPMorgan Chase Bank N.A. |
JPY | 5,682,726 | 55,428 | 52,000 | (3,428 | ) | |||||||||||||||
See accompanying Notes to the Financial Statements.
136
Table of Contents
Babson Emerging Markets Local Currency Debt Fund 2016 Annual Report
SCHEDULE OF INVESTMENTS (CONTINUED)
June 30, 2016
| EXPIRATION DATE |
COUNTERPARTY | LOCAL CURRENCY |
VALUE IN USD | IN EXCHANGE FOR USD |
NET UNREALIZED APPRECIATION (DEPRECIATION) |
|||||||||||||||||||
| 7/26/16 | Citibank N.A. |
MYR | 444,245 | 111,284 | 112,841 | $ | 1,557 | |||||||||||||||||
| 7/26/16 | Bank of America N.A. |
NOK | 436,637 | 52,179 | 54,000 | 1,821 | ||||||||||||||||||
| 7/26/16 | BNP Paribas S.A. |
NOK | 423,892 | 50,655 | 51,000 | 345 | ||||||||||||||||||
| 7/26/16 | Bank of America N.A. |
PHP | 19,097,670 | 405,061 | 407,026 | 1,965 | ||||||||||||||||||
| 9/6/16 | JPMorgan Chase Bank N.A. |
PLN | 178,752 | 45,055 | 44,584 | (471 | ) | |||||||||||||||||
| 7/26/16 | JPMorgan Chase Bank N.A. |
RON | 892,495 | 219,322 | 221,065 | 1,743 | ||||||||||||||||||
| 7/26/16 | BNP Paribas S.A. |
RUB | 7,645,052 | 119,008 | 116,000 | (3,008 | ) | |||||||||||||||||
| 7/26/16 | JPMorgan Chase Bank N.A. |
SGD | 352,442 | 261,829 | 254,609 | (7,220 | ) | |||||||||||||||||
| 7/26/16 | Bank of America N.A. |
TRY | 992,995 | 343,235 | 342,388 | (847 | ) | |||||||||||||||||
| 8/26/16 | Citibank N.A. |
UYU | 2,924,531 | 93,525 | 90,235 | (3,290 | ) | |||||||||||||||||
| 7/26/16 | JPMorgan Chase Bank N.A. |
ZAR | 2,958,706 | 201,169 | 199,000 | (2,169 | ) | |||||||||||||||||
|
|
|
|||||||||||||||||||||||
|
|
Net unrealized depreciation on forward foreign exchange contracts to sell |
|
$ | (47,869 | ) | |||||||||||||||||||
|
|
|
|||||||||||||||||||||||
Currency Legend
| ARS | – | Argentine Peso | ||
| AUD | – | Australian Dollar | ||
| BRL | – | Brazilian Real | ||
| CAD | – | Canadian Dollar | ||
| CHF | – | Swiss Franc | ||
| CLP | – | Chilean Peso | ||
| CNH | – | Chinese Yuan Renminbi | ||
| COP | – | Colombian Peso | ||
| CZK | – | Czech Republic Koruna | ||
| EUR | – | Euro | ||
| HKD | – | Hong Kong Dollar | ||
| HRK | – | Croatian Kuna | ||
| HUF | – | Hungarian Forint | ||
| IDR | – | Indonesian Rupiah | ||
| ILS | – | Israeli Shekel | ||
| INR | – | Indian Rupee | ||
| JPY | – | Japanese Yen | ||
| KRW | – | South Korean Won | ||
| KZT | – | Kazakhstani Tenge | ||
| MXN | – | Mexican Peso | ||
| MYR | – | Malaysian Ringgit | ||
| NOK | – | Norwegian Krona | ||
| PHP | – | Philippines Peso | ||
| PLN | – | Polish Zloty | ||
| RON | – | New Romanian Leu | ||
| RSD | – | Serbian Dinar | ||
| RUB | – | Russian Ruble | ||
| SEK | – | Swedish Krona | ||
| SGD | – | Singapore Dollar | ||
| THB | – | Thai Baht | ||
| TRY | – | New Turkish Lira | ||
| UYU | – | Uruguayan Peso | ||
| ZAR | – | South African Rand |
See accompanying Notes to the Financial Statements.
137
Table of Contents
Babson Emerging Markets Local Currency Debt Fund 2016 Annual Report
SCHEDULE OF INVESTMENTS (CONTINUED)
June 30, 2016
OTC – Interest Rate Swaps
| DESCRIPTION | NOTIONAL AMOUNT |
UNREALIZED APPRECIATION (DEPRECIATION) |
VALUE | |||||||||||||
| Agreement with Bank of America N.A. dated 12/9/15 receiving a fixed rate of 8.68% paying the notional amount
multiplied by the |
ZAR | 8,000,000 | $ | 13,197 | $ | 13,197 | ||||||||||
| Agreement with Bank of America N.A. dated 5/23/16 paying a fixed rate of 13.13% receiving the notional amount multiplied by the BRL-CDI rate. Expiring 7/3/17 |
BRL | 1,788,280 | 1,565 | 1,565 | ||||||||||||
| Agreement with Bank of America N.A. dated 6/24/16 paying a fixed rate of 12.68% receiving the notional amount multiplied by the BRL-CDI rate. Expiring 1/2/18 |
BRL | 1,753,202 | 1,564 | 1,564 | ||||||||||||
| Agreement with Bank of America N.A. dated 6/24/16 receiving a fixed rate of 12.50% paying the notional amount multiplied by the BRL-CDI rate. Expiring 1/2/25 |
BRL | 220,679 | 980 | 980 | ||||||||||||
| Agreement with JPMorgan Chase Bank N.A. dated 12/12/15 paying a fixed rate of 0.25% receiving the notional amount multiplied by the CZK-PRIBO rate. Expiring 2/16/21 |
CZK | 2,500,000 | 154 | 154 | ||||||||||||
| Agreement with JPMorgan Chase Bank N.A. dated 12/9/15 receiving a fixed rate of 6.35% paying the notional
amount multiplied by the |
MXN | 4,750,000 | 5,946 | 5,946 | ||||||||||||
| Agreement with JPMorgan Chase Bank N.A. dated 4/26/16 paying a fixed rate of 1.26% receiving the notional
amount multiplied by the |
CLP | 76,404,734 | 13,616 | 13,616 | ||||||||||||
| Agreement with JPMorgan Chase Bank N.A. dated 5/19/16 paying a fixed rate of 1.64% receiving the notional amount multiplied by the KRW-KSDA rate. Expiring 5/20/26 |
KRW | 159,000,000 | (4,384 | ) | (4,384 | ) | ||||||||||
| Agreement with JPMorgan Chase Bank N.A. dated 5/19/16 receiving a fixed rate of 1.67% paying the notional
amount multiplied by the |
ILS | 510,000 | 2,185 | 2,185 | ||||||||||||
| Agreement with JPMorgan Chase Bank N.A. dated 6/17/16 paying a fixed rate of 1.79% receiving the notional amount multiplied by the PLN-WIBOR rate. Expiring 6/21/19 |
PLN | 1,800,000 | (2,011 | ) | (2,011 | ) | ||||||||||
| Agreement with JPMorgan Chase Bank N.A. dated 6/7/16 receiving a fixed rate of 2.46% paying the notional
amount multiplied by the |
PLN | 600,000 | 3,668 | 3,668 | ||||||||||||
|
|
|
|||||||||||||||
| Total Interest Rate Swaps |
36,480 | |||||||||||||||
|
|
|
|||||||||||||||
See accompanying Notes to the Financial Statements.
138
Table of Contents
Babson Global High Yield Fund 2016 Annual Report
SCHEDULE OF INVESTMENTS
June 30, 2016
| EFFECTIVE INTEREST RATE |
DUE DATE | PRINCIPAL ‡‡ | COST | FAIR VALUE |
||||||||||||||||
| Fixed Income — 97.6%*: |
||||||||||||||||||||
| Corporate Bonds — 97.6%*: |
||||||||||||||||||||
| Aerospace and Defense — 2.0%*: |
||||||||||||||||||||
| CPI International, Inc. |
8.75 | % | 2/15/2018 | 500,000 | $502,740 | $496,251 | ||||||||||||||
|
|
|
|
|
|
|
|||||||||||||||
| Automobile — 2.5%*: |
||||||||||||||||||||
| Gates Global LLC/Gates Global Co.^ |
6.00 | 7/15/2022 | 125,000 | 96,936 | 109,375 | |||||||||||||||
| International Automotive Components Group SA^ |
9.13 | 6/1/2018 | 250,000 | 251,913 | 250,000 | |||||||||||||||
| JB Poindexter & Co., Inc.^ |
9.00 | 4/1/2022 | 250,000 | 263,090 | 260,000 | |||||||||||||||
|
|
|
|
|
|
|
|||||||||||||||
| Total Automobile |
625,000 | 611,939 | 619,375 | |||||||||||||||||
|
|
|
|
|
|
|
|||||||||||||||
| Banking — 0.9%*: |
||||||||||||||||||||
| Lock AS+ |
7.00 | 8/15/2021 | 200,000 | 230,033 | 225,834 | |||||||||||||||
|
|
|
|
|
|
|
|||||||||||||||
| Beverage, Food and Tobacco — 3.6%*: |
||||||||||||||||||||
| Boparan Finance PLC+ |
5.50 | 7/15/2021 | 250,000 | 357,519 | 290,379 | |||||||||||||||
| KFC Holding Co/Pizza Hut Holdings LLC/Taco Bell of America LLC^ |
5.00 | 6/1/2024 | 117,000 | 117,000 | 119,047 | |||||||||||||||
| KFC Holding Co/Pizza Hut Holdings LLC/Taco Bell of America LLC^ |
5.25 | 6/1/2026 | 125,000 | 125,000 | 128,125 | |||||||||||||||
| Manitowoc Foodservice, Inc.^ |
9.50 | 2/15/2024 | 250,000 | 250,000 | 279,375 | |||||||||||||||
| Performance Food Group, Inc.^ |
5.50 | 6/1/2024 | 95,000 | 95,000 | 96,663 | |||||||||||||||
|
|
|
|
|
|
|
|||||||||||||||
| Total Beverage, Food and Tobacco |
837,000 | 944,519 | 913,589 | |||||||||||||||||
|
|
|
|
|
|
|
|||||||||||||||
| Broadcasting and Entertainment — 4.4%*: |
||||||||||||||||||||
| CCO Holdings LLC/CCO Holdings Capital Corp.^ |
5.75 | 2/15/2026 | 250,000 | 250,000 | 257,500 | |||||||||||||||
| DISH DBS Corp.^ |
7.75 | 7/1/2026 | 316,000 | 316,000 | 325,480 | |||||||||||||||
| Entertainment One Ltd.+ |
6.88 | 12/15/2022 | 100,000 | 150,241 | 133,710 | |||||||||||||||
| Gray Television, Inc. |
7.50 | 10/1/2020 | 174,000 | 180,867 | 181,395 | |||||||||||||||
| Unitymedia Hessen GmbH & Co. KG / Unitymedia NRW GmbH+ |
3.50 | 1/15/2027 | 200,000 | 214,585 | 213,627 | |||||||||||||||
|
|
|
|
|
|
|
|||||||||||||||
| Total Broadcasting and Entertainment |
1,040,000 | 1,111,693 | 1,111,712 | |||||||||||||||||
|
|
|
|
|
|
|
|||||||||||||||
| Buildings and Real Estate — 2.6%*: |
||||||||||||||||||||
| Brookfield Residential Properties, Inc.+^ |
6.50 | 12/15/2020 | 250,000 | 249,443 | 249,375 | |||||||||||||||
| GEO Group, Inc. (The) |
6.00 | 4/15/2026 | 250,000 | 250,000 | 252,500 | |||||||||||||||
| Paroc Group Oy+ |
6.25 | 5/15/2020 | 150,000 | 158,827 | 165,131 | |||||||||||||||
|
|
|
|
|
|
|
|||||||||||||||
| Total Buildings and Real Estate |
650,000 | 658,270 | 667,006 | |||||||||||||||||
|
|
|
|
|
|
|
|||||||||||||||
| Cargo Transport — 5.2%*: |
||||||||||||||||||||
| Deck Chassis Acquisition, Inc.^ |
10.00 | 6/15/2023 | 300,000 | 300,000 | 310,500 | |||||||||||||||
| OPE KAG Finance Sub, Inc.^ |
7.88 | 7/31/2023 | 750,000 | 779,834 | 738,750 | |||||||||||||||
| WFS Global Holding SAS+ |
9.50 | 7/15/2022 | 250,000 | 281,017 | 259,404 | |||||||||||||||
|
|
|
|
|
|
|
|||||||||||||||
| Total Cargo Transport |
1,300,000 | 1,360,851 | 1,308,654 | |||||||||||||||||
|
|
|
|
|
|
|
|||||||||||||||
See accompanying Notes to the Financial Statements.
139
Table of Contents
Babson Global High Yield Fund 2016 Annual Report
SCHEDULE OF INVESTMENTS (CONTINUED)
June 30, 2016
| EFFECTIVE INTEREST RATE |
DUE DATE | PRINCIPAL ‡‡ | COST | FAIR VALUE |
||||||||||||||||
| Corporate Bonds (Continued) |
||||||||||||||||||||
| Chemicals, Plastics and Rubber — 6.2%*: |
||||||||||||||||||||
| Consolidated Energy Finance SA+^ |
6.75 | % | 10/15/2019 | 370,000 | $364,049 | $347,800 | ||||||||||||||
| CVR Partners LP/CVR Nitrogen Finance Corp.^ |
9.25 | 6/15/2023 | 250,000 | 243,785 | 254,375 | |||||||||||||||
| LBC Tank Terminals Holding Netherlands BV^ |
6.88 | 5/15/2023 | 215,000 | 207,100 | 207,475 | |||||||||||||||
| LSB Industries, Inc. |
7.75 | 8/1/2019 | 263,000 | 227,168 | 262,014 | |||||||||||||||
| Platform Specialty Products Corp.^ |
10.38 | 5/1/2021 | 392,000 | 392,000 | 394,940 | |||||||||||||||
| Trinseo Materials Operating SCA/Trinseo Materials Finance, Inc. |
6.38 | 5/1/2022 | 100,000 | 117,119 | 111,613 | |||||||||||||||
|
|
|
|
|
|
|
|||||||||||||||
| Total Chemicals, Plastics and Rubber |
1,590,000 | 1,551,221 | 1,578,217 | |||||||||||||||||
|
|
|
|
|
|
|
|||||||||||||||
| Containers, Packaging and Glass — 5.9%*: |
||||||||||||||||||||
| Coveris Holdings SA^ |
7.88 | 11/1/2019 | 372,000 | 350,589 | 361,305 | |||||||||||||||
| Horizon Holdings I SASU+ |
7.25 | 8/1/2023 | 300,000 | 343,484 | 344,661 | |||||||||||||||
| Mustang Merger Corp.^ |
8.50 | 8/15/2021 | 334,000 | 349,999 | 349,030 | |||||||||||||||
| Plastipak Holdings, Inc.^ |
6.50 | 10/1/2021 | 125,000 | 125,605 | 127,500 | |||||||||||||||
| Reynolds Group Issuer, Inc./Reynolds Group Issuer LLC/Reynolds Group Issuer Lu^ |
7.00 | 7/15/2024 | 141,000 | 141,000 | 145,159 | |||||||||||||||
| SIG Combibloc Holdings SCA+ |
7.75 | 2/15/2023 | 150,000 | 173,096 | 175,268 | |||||||||||||||
|
|
|
|
|
|
|
|||||||||||||||
| Total Containers, Packaging and Glass |
1,422,000 | 1,483,773 | 1,502,923 | |||||||||||||||||
|
|
|
|
|
|
|
|||||||||||||||
| Diversified/Conglomerate Manufacturing — 1.8%*: |
|
|||||||||||||||||||
| EnPro Industries, Inc. |
5.88 | 9/15/2022 | 221,000 | 223,033 | 222,105 | |||||||||||||||
| West Corp.^ |
5.38 | 7/15/2022 | 250,000 | 240,234 | 232,500 | |||||||||||||||
|
|
|
|
|
|
|
|||||||||||||||
| Total Diversified/Conglomerate Manufacturing |
471,000 | 463,267 | 454,605 | |||||||||||||||||
|
|
|
|
|
|
|
|||||||||||||||
| Diversified/Conglomerate Service — 2.5%*: |
||||||||||||||||||||
| Avis Budget Car Rental LLC/Avis Budget Finance, Inc.^ |
6.38 | 4/1/2024 | 115,000 | 111,252 | 113,850 | |||||||||||||||
| Infor Software Parent LLC/Infor Software Parent, Inc. PIK^ |
7.13 | 5/1/2021 | 304,000 | 267,034 | 269,040 | |||||||||||||||
| Zachry Holdings, Inc.^ |
7.50 | 2/1/2020 | 250,000 | 252,701 | 247,500 | |||||||||||||||
|
|
|
|
|
|
|
|||||||||||||||
| Total Diversified/Conglomerate Service |
669,000 | 630,987 | 630,390 | |||||||||||||||||
|
|
|
|
|
|
|
|||||||||||||||
| Electronics — 3.9%*: |
||||||||||||||||||||
| Diamond 1 Finance Corp./Diamond 2 Finance Corp.^ |
5.88 | 6/15/2021 | 140,000 | 140,000 | 142,768 | |||||||||||||||
| Diamond 1 Finance Corp./Diamond 2 Finance Corp.^ |
7.13 | 6/15/2024 | 154,000 | 154,000 | 160,841 | |||||||||||||||
| NXP BV/NXP Funding LLC^ |
4.63 | 6/1/2023 | 250,000 | 250,000 | 254,375 | |||||||||||||||
| Prime Security Services Borrower LLC/Prime Finance, Inc.^ |
9.25 | 5/15/2023 | 250,000 | 250,000 | 265,000 | |||||||||||||||
| Western Digital Corp.^ |
10.50 | 4/1/2024 | 150,000 | 150,000 | 160,500 | |||||||||||||||
|
|
|
|
|
|
|
|||||||||||||||
| Total Electronics |
944,000 | 944,000 | 983,484 | |||||||||||||||||
|
|
|
|
|
|
|
|||||||||||||||
See accompanying Notes to the Financial Statements.
140
Table of Contents
Babson Global High Yield Fund 2016 Annual Report
SCHEDULE OF INVESTMENTS (CONTINUED)
June 30, 2016
| EFFECTIVE INTEREST RATE |
DUE DATE | PRINCIPAL ‡‡ | COST | FAIR VALUE |
||||||||||||||||
| Corporate Bonds (Continued) |
||||||||||||||||||||
| Finance — 3.5%*: |
||||||||||||||||||||
| Galaxy Finco Ltd.+ |
7.88 | % | 11/15/2021 | 250,000 | $381,739 | $326,156 | ||||||||||||||
| Garfunkelux Holdco 3 SA+ |
8.50 | 11/1/2022 | 300,000 | 460,335 | 377,769 | |||||||||||||||
| TMF Group Holding BV+ |
9.88 | 12/1/2019 | 150,000 | 182,895 | 177,615 | |||||||||||||||
|
|
|
|
|
|
|
|||||||||||||||
| Total Finance |
700,000 | 1,024,969 | 881,540 | |||||||||||||||||
|
|
|
|
|
|
|
|||||||||||||||
| Grocery — 0.5%*: |
||||||||||||||||||||
| Premier Foods Finance PLC+ |
6.50 | 3/15/2021 | 100,000 | 146,396 | 126,469 | |||||||||||||||
|
|
|
|
|
|
|
|||||||||||||||
| Healthcare, Education and Childcare — 6.9%*: |
||||||||||||||||||||
| Alere, Inc.^ |
6.38 | 7/1/2023 | 250,000 | 256,898 | 260,625 | |||||||||||||||
| Capsugel SA PIK^ |
7.00 | 5/15/2019 | 290,000 | 292,142 | 290,725 | |||||||||||||||
| Cerberus Nightingale 1 Sarl+ |
8.25 | 2/1/2020 | 100,000 | 110,512 | 113,084 | |||||||||||||||
| HCA, Inc. |
5.38 | 2/1/2025 | 375,000 | 381,201 | 384,375 | |||||||||||||||
| HCA, Inc. |
5.88 | 2/15/2026 | 125,000 | 125,000 | 129,687 | |||||||||||||||
| RegionalCare Hospital Partners Holdings, Inc.^ |
8.25 | 5/1/2023 | 132,000 | 132,000 | 135,300 | |||||||||||||||
| Valeant Pharmaceuticals International, Inc.^ |
6.13 | 4/15/2025 | 525,000 | 451,765 | 421,312 | |||||||||||||||
|
|
|
|
|
|
|
|||||||||||||||
| Total Healthcare, Education and Childcare |
1,797,000 | 1,749,518 | 1,735,108 | |||||||||||||||||
|
|
|
|
|
|
|
|||||||||||||||
| Home and Office Furnishings, Housewares, and Durable Consumer Products — 0.7%*: |
|
|||||||||||||||||||
| LSF9 Balta Issuer SA+ |
7.75 | 9/15/2022 | 150,000 | 171,799 | 175,318 | |||||||||||||||
|
|
|
|
|
|
|
|||||||||||||||
| Hotels, Motels, Inns and Gaming — 0.5%*: |
||||||||||||||||||||
| TVL Finance PLC+ |
8.50 | 5/15/2023 | 100,000 | 146,115 | 128,366 | |||||||||||||||
|
|
|
|
|
|
|
|||||||||||||||
| Insurance — 1.7%*: |
||||||||||||||||||||
| CNO Financial Group, Inc. |
5.25 | 5/30/2025 | 250,000 | 251,810 | 257,500 | |||||||||||||||
| York Risk Services Holding Corp.^ |
8.50 | 10/1/2022 | 250,000 | 225,185 | 184,375 | |||||||||||||||
|
|
|
|
|
|
|
|||||||||||||||
| Total Insurance |
500,000 | 476,995 | 441,875 | |||||||||||||||||
|
|
|
|
|
|
|
|||||||||||||||
| Leisure, Amusement, Entertainment — 6.2%*: |
|
|||||||||||||||||||
| Brunswick Corp. |
7.13 | 8/1/2027 | 817,000 | 869,188 | 878,684 | |||||||||||||||
| CPUK Finance Ltd.+ |
7.00 | 2/28/2042 | 200,000 | 311,716 | 272,906 | |||||||||||||||
| Odeon & UCI Finco PLC MTN+ |
9.00 | 8/1/2018 | 100,000 | 157,204 | 134,190 | |||||||||||||||
| Perform Group Financing PLC+ |
8.50 | 11/15/2020 | 100,000 | 149,427 | 120,478 | |||||||||||||||
| WMG Acquisition Corp.^ |
6.75 | 4/15/2022 | 150,000 | 151,125 | 151,125 | |||||||||||||||
|
|
|
|
|
|
|
|||||||||||||||
| Total Leisure, Amusement, Entertainment |
1,367,000 | 1,638,660 | 1,557,383 | |||||||||||||||||
|
|
|
|
|
|
|
|||||||||||||||
| Machinery Non-Agriculture, Non-Construction, Non-Electronic — 1.3%*: |
|
|||||||||||||||||||
| Apex Tool Group LLC^ |
7.00 | 2/1/2021 | 88,000 | 77,355 | 75,900 | |||||||||||||||
| Xerium Technologies, Inc. |
8.88 | 6/15/2018 | 250,000 | 252,932 | 246,250 | |||||||||||||||
|
|
|
|
|
|
|
|||||||||||||||
| Total Machinery Non-Agriculture, |
338,000 | 330,287 | 322,150 | |||||||||||||||||
|
|
|
|
|
|
|
|||||||||||||||
| Mining, Steel, Iron and Non-Precious Metals — 5.8%*: |
|
|||||||||||||||||||
| Constellium NV+ |
7.00 | 1/15/2023 | 130,000 | 125,563 | 116,207 | |||||||||||||||
| Constellium NV+^ |
7.88 | 4/1/2021 | 250,000 | 250,000 | 257,813 | |||||||||||||||
See accompanying Notes to the Financial Statements.
141
Table of Contents
Babson Global High Yield Fund 2016 Annual Report
SCHEDULE OF INVESTMENTS (CONTINUED)
June 30, 2016
| EFFECTIVE INTEREST RATE |
DUE DATE | PRINCIPAL ‡‡ | COST | FAIR VALUE |
||||||||||||||||
| Corporate Bonds (Continued) |
||||||||||||||||||||
| Mining, Steel, Iron and Non-Precious Metals (Continued) |
|
|||||||||||||||||||
| Freeport-McMoRan, Inc. |
3.55 | % | 3/1/2022 | 313,000 | $247,578 | $275,440 | ||||||||||||||
| Freeport-McMoRan, Inc. |
4.00 | 11/14/2021 | 107,000 | 83,092 | 96,668 | |||||||||||||||
| Hecla Mining Co. |
6.88 | 5/1/2021 | 250,000 | 215,388 | 239,375 | |||||||||||||||
| SunCoke Energy Partners LP/SunCoke Energy Partners Finance Corp.^ |
7.38 | 2/1/2020 | 324,000 | 270,540 | 272,160 | |||||||||||||||
| United States Steel Corp.^ |
8.38 | 7/1/2021 | 117,000 | 117,000 | 122,850 | |||||||||||||||
| Zekelman Industries, Inc.^ |
9.88 | 6/15/2023 | 92,000 | 92,000 | 92,920 | |||||||||||||||
|
|
|
|
|
|
|
|||||||||||||||
| Total Mining, Steel, Iron and Non-Precious Metals |
1,583,000 | 1,401,161 | 1,473,433 | |||||||||||||||||
|
|
|
|
|
|
|
|||||||||||||||
| Oil and Gas — 13.4%*: |
||||||||||||||||||||
| Calumet Specialty Products Partners LP/Calumet Finance Corp. |
6.50 | 4/15/2021 | 150,000 | 107,561 | 107,250 | |||||||||||||||
| Calumet Specialty Products Partners LP/Calumet Finance Corp. |
7.75 | 4/15/2023 | 52,000 | 49,567 | 35,750 | |||||||||||||||
| Citgo Holding, Inc.^ |
10.75 | 2/15/2020 | 341,000 | 345,505 | 342,705 | |||||||||||||||
| Continental Resources, Inc. |
5.00 | 9/15/2022 | 250,000 | 217,838 | 244,375 | |||||||||||||||
| Energy Transfer Equity LP |
5.88 | 1/15/2024 | 157,000 | 146,120 | 152,683 | |||||||||||||||
| EP Energy LLC/Everest Acquisition Finance, Inc. |
9.38 | 5/1/2020 | 508,000 | 457,363 | 359,410 | |||||||||||||||
| Genesis Energy LP/Genesis Energy Finance Corp. |
6.75 | 8/1/2022 | 250,000 | 244,773 | 242,500 | |||||||||||||||
| Hornbeck Offshore Services, Inc. |
5.88 | 4/1/2020 | 250,000 | 157,007 | 158,125 | |||||||||||||||
| Kosmos Energy Ltd.^ |
7.88 | 8/1/2021 | 250,000 | 225,068 | 241,250 | |||||||||||||||
| Laredo Petroleum, Inc. |
7.38 | 5/1/2022 | 250,000 | 238,409 | 250,625 | |||||||||||||||
| Newfield Exploration Co. |
5.38 | 1/1/2026 | 250,000 | 241,674 | 243,125 | |||||||||||||||
| Sabine Pass Liquefaction LLC^ |
5.88 | 6/30/2026 | 250,000 | 250,000 | 250,937 | |||||||||||||||
| Summit Midstream Holdings LLC/Summit Midstream Finance Corp. |
5.50 | 8/15/2022 | 291,000 | 208,771 | 250,260 | |||||||||||||||
| Tullow Oil PLC+^ |
6.25 | 4/15/2022 | 250,000 | 196,549 | 200,000 | |||||||||||||||
| Weatherford International Ltd. |
7.75 | 6/15/2021 | 125,000 | 125,000 | 121,719 | |||||||||||||||
| Weatherford International Ltd. |
8.25 | 6/15/2023 | 125,000 | 125,000 | 118,750 | |||||||||||||||
| WPX Energy, Inc. |
6.00 | 1/15/2022 | 68,000 | 61,312 | 63,240 | |||||||||||||||
|
|
|
|
|
|
|
|||||||||||||||
| Total Oil and Gas |
3,817,000 | 3,397,517 | 3,382,704 | |||||||||||||||||
|
|
|
|
|
|
|
|||||||||||||||
| Personal Transportation — 1.8%*: |
||||||||||||||||||||
| AA Bond Co. Ltd.+ |
5.50 | 7/31/2043 | 350,000 | 498,195 | 443,805 | |||||||||||||||
|
|
|
|
|
|
|
|||||||||||||||
| Retail Stores — 4.9%*: |
||||||||||||||||||||
| Brighthouse Group PLC MTN+ |
7.88 | 5/15/2018 | 100,000 | 147,385 | 119,699 | |||||||||||||||
| Debenhams PLC+ |
5.25 | 7/15/2021 | 150,000 | 232,699 | 189,193 | |||||||||||||||
| Dollar Tree, Inc.^ |
5.75 | 3/1/2023 | 500,000 | 523,995 | 531,250 | |||||||||||||||
| HSS Financing PLC+ |
6.75 | 8/1/2019 | 68,000 | 97,975 | 88,172 | |||||||||||||||
| Penske Automotive Group, Inc. |
5.50 | 5/15/2026 | 250,000 | 250,000 | 237,500 | |||||||||||||||
| Takko Luxembourg 2 S.C.A. MTN+ |
9.88 | 4/15/2019 | 100,000 | 69,633 | 62,978 | |||||||||||||||
|
|
|
|
|
|
|
|||||||||||||||
| Total Retail Stores |
1,168,000 | 1,321,687 | 1,228,792 | |||||||||||||||||
|
|
|
|
|
|
|
|||||||||||||||
See accompanying Notes to the Financial Statements.
142
Table of Contents
Babson Global High Yield Fund 2016 Annual Report
SCHEDULE OF INVESTMENTS (CONTINUED)
June 30, 2016
| EFFECTIVE INTEREST RATE |
DUE DATE | PRINCIPAL ‡‡ | COST | FAIR VALUE |
||||||||||||||||
| Corporate Bonds (Continued) |
||||||||||||||||||||
| Telecommunications — 7.3%*: |
||||||||||||||||||||
| Altice Financing SA+^ |
6.63 | % | 2/15/2023 | 250,000 | $251,621 | $245,468 | ||||||||||||||
| Altice Financing SA^+ |
7.50 | 5/15/2026 | 250,000 | 250,000 | 245,000 | |||||||||||||||
| Digicel Ltd.^+ |
6.00 | 4/15/2021 | 250,000 | 228,077 | 214,300 | |||||||||||||||
| Numericable-SFR SA^+ |
7.38 | 5/1/2026 | 350,000 | 350,000 | 346,062 | |||||||||||||||
| Sprint Corp. |
7.88 | 9/15/2023 | 250,000 | 229,995 | 204,375 | |||||||||||||||
| Virgin Media Secured Finance PLC MTN+ |
5.13 | 1/15/2025 | 150,000 | 227,282 | 194,695 | |||||||||||||||
| Wind Acquisition Finance SA+^ |
7.38 | 4/23/2021 | 200,000 | 190,698 | 190,500 | |||||||||||||||
| Ziggo Bond Finance BV+ |
4.63 | 1/15/2025 | 200,000 | 206,029 | 211,407 | |||||||||||||||
|
|
|
|
|
|
|
|||||||||||||||
| Total Telecommunications |
1,900,000 | 1,933,702 | 1,851,807 | |||||||||||||||||
|
|
|
|
|
|
|
|||||||||||||||
| Textiles and Leather — 1.6%*: |
||||||||||||||||||||
| Hanesbrands, Inc.^ |
4.63 | 5/15/2024 | 167,000 | 167,000 | 167,417 | |||||||||||||||
| Hanesbrands, Inc.^ |
4.88 | 5/15/2026 | 246,000 | 246,000 | 246,886 | |||||||||||||||
|
|
|
|
|
|
|
|||||||||||||||
| Total Textiles and Leather |
413,000 | 413,000 | 414,303 | |||||||||||||||||
|
|
|
|
|
|
|
|||||||||||||||
| Total Corporate Bonds |
24,531,000 | 25,143,294 | 24,655,093 | |||||||||||||||||
|
|
|
|
|
|
|
|||||||||||||||
| Total Fixed Income |
24,531,000 | 25,143,294 | 24,655,093 | |||||||||||||||||
|
|
|
|
|
|
|
|||||||||||||||
| Short-Term Investment — 1.8%*: |
||||||||||||||||||||
| Bank Deposit — 1.8%*: |
||||||||||||||||||||
| State Street Bank & Trust Co. Euro Time Deposit |
0.01 | 7/1/2016 | 460,981 | 460,981 | 460,981 | |||||||||||||||
|
|
|
|
|
|
|
|||||||||||||||
| Total Investments |
24,991,981 | 25,604,275 | 25,116,074 | |||||||||||||||||
|
|
|
|
|
|
|
|||||||||||||||
| Other assets and liabilities — 0.6%* |
155,069 | |||||||||||||||||||
|
|
|
|||||||||||||||||||
| Net Assets — 100.0% |
$25,271,143 | |||||||||||||||||||
|
|
|
|||||||||||||||||||
| MTN | Medium Term Note |
| PIK | Payment-in-kind |
| ‡‡ | Unless otherwise indicated, all principal amounts are denominated in United States Dollars. |
| * | Calculated as a percentage of net assets applicable to common shareholders. |
| + | Foreign security. |
See accompanying Notes to the Financial Statements.
143
Table of Contents
Babson Global High Yield Fund 2016 Annual Report
SCHEDULE OF INVESTMENTS (CONTINUED)
June 30, 2016
Distributions of investments by country of risk (excluding temporary cash investments) as a percentage of total investments in securities, is as follows:
| United States | 69.6% | |||||
| United Kingdom | 10.4% | |||||
| France | 5.8% | |||||
| Germany | 2.7% | |||||
| Portugal | 2.0% | |||||
| Netherlands | 1.6% | |||||
| Trinidad And Tobago | 1.4% | |||||
| Canada | 1.0% | |||||
| Other (Individually less than 1%) | 5.5% | |||||
|
|
|
|||||
| Total | 100.0% | |||||
|
|
|
| ^ | Security acquired in a transaction exempt from registration under Rule 144A of the Securities Act of 1933. These securities may only be resold in transactions exempt from registration, normally to qualified institutional buyers. |
A summary of outstanding financial instruments at June 30, 2016 is as follows:
Forward Foreign Currency Exchange Contracts to Buy
| EXPIRATION DATE |
COUNTERPARTY | LOCAL CURRENCY |
VALUE IN USD | IN EXCHANGE FOR USD |
NET UNREALIZED APPRECIATION (DEPRECIATION) |
|||||||||||||||||
| 7/8/16 | BNP Paribas S.A. |
EUR | 55,385 | 61,470 | 60,840 | $ | 630 | |||||||||||||||
| 7/8/16 | Goldman Sachs & Co. |
EUR | 106,560 | 118,267 | 121,533 | (3,266 | ) | |||||||||||||||
| 7/8/16 | JPMorgan Chase Bank N.A. |
EUR | 12,095 | 13,424 | 13,746 | (322 | ) | |||||||||||||||
| 7/8/16 | Citibank N.A. |
GBP | 62,603 | 83,341 | 82,505 | 836 | ||||||||||||||||
|
|
|
|||||||||||||||||||||
| Net unrealized depreciation on forward foreign exchange contracts to buy |
|
$ | (2,122 | ) | ||||||||||||||||||
|
|
|
|||||||||||||||||||||
Forward Foreign Currency Exchange Contracts to Sell
| EXPIRATION DATE |
COUNTERPARTY | LOCAL CURRENCY |
VALUE IN USD | IN EXCHANGE FOR USD |
NET UNREALIZED APPRECIATION |
|||||||||||||||||
| 7/8/16 | Citibank N.A. |
EUR | 2,353,593 | 2,612,162 | 2,629,959 | $ | 17,797 | |||||||||||||||
| 7/8/16 | Citibank N.A. |
GBP | 2,350,919 | 3,129,700 | 3,394,914 | 265,214 | ||||||||||||||||
|
|
|
|||||||||||||||||||||
| Net unrealized appreciation on forward foreign exchange contracts to sell |
|
$ | 283,011 | |||||||||||||||||||
|
|
|
|||||||||||||||||||||
Currency Legend
| EUR | – | Euro | ||
| GBP | – | British Pound Sterling |
See accompanying Notes to the Financial Statements.
144
Table of Contents
Babson U.S. High Yield Fund 2016 Annual Report
SCHEDULE OF INVESTMENTS
June 30, 2016
| EFFECTIVE INTEREST RATE |
DUE DATE | PRINCIPAL ‡‡ | COST | FAIR VALUE |
||||||||||||||||
| Fixed Income — 95.8%*: |
||||||||||||||||||||
| Bank Loans — 1.2%*§: |
||||||||||||||||||||
| Oil and Gas — 1.2%*: |
||||||||||||||||||||
| Fieldwood Energy LLC |
7.00 | % | 9/28/2018 | 172,215 | $152,526 | $141,790 | ||||||||||||||
| Fieldwood Energy LLC PIK |
7.13 | 9/30/2020 | 500,000 | 188,813 | 195,069 | |||||||||||||||
|
|
|
|
|
|
|
|||||||||||||||
| Total Oil and Gas |
672,215 | 341,339 | 336,859 | |||||||||||||||||
|
|
|
|
|
|
|
|||||||||||||||
| Total Bank Loans |
672,215 | 341,339 | 336,859 | |||||||||||||||||
|
|
|
|
|
|
|
|||||||||||||||
| Corporate Bonds — 94.6%*: |
||||||||||||||||||||
| Aerospace and Defense — 2.6%*: |
||||||||||||||||||||
| American Airlines Group, Inc.^ |
4.63 | 3/1/2020 | 250,000 | 248,923 | 238,750 | |||||||||||||||
| CPI International, Inc. |
8.75 | 2/15/2018 | 500,000 | 502,740 | 496,250 | |||||||||||||||
|
|
|
|
|
|
|
|||||||||||||||
| Total Aerospace and Defense |
750,000 | 751,663 | 735,000 | |||||||||||||||||
|
|
|
|
|
|
|
|||||||||||||||
| Automobile — 2.8%*: |
||||||||||||||||||||
| Gates Global LLC/Gates Global Co.^ |
6.00 | 7/15/2022 | 125,000 | 96,936 | 109,375 | |||||||||||||||
| International Automotive Components Group SA^ |
9.13 | 6/1/2018 | 250,000 | 251,914 | 250,000 | |||||||||||||||
| JB Poindexter & Co., Inc.^ |
9.00 | 4/1/2022 | 410,000 | 431,459 | 426,400 | |||||||||||||||
|
|
|
|
|
|
|
|||||||||||||||
| Total Automobile |
785,000 | 780,309 | 785,775 | |||||||||||||||||
|
|
|
|
|
|
|
|||||||||||||||
| Beverage, Food and Tobacco — 3.9%*: |
||||||||||||||||||||
| Carrols Restaurant Group, Inc. |
8.00 | 5/1/2022 | 260,000 | 274,589 | 280,150 | |||||||||||||||
| KeHE Distributors LLC/KeHE Finance Corp.^ |
7.63 | 8/15/2021 | 200,000 | 198,250 | 197,750 | |||||||||||||||
| KFC Holding Co/Pizza Hut Holdings LLC/Taco Bell of America LLC^ |
5.00 | 6/1/2024 | 117,000 | 117,000 | 119,047 | |||||||||||||||
| KFC Holding Co/Pizza Hut Holdings LLC/Taco Bell of America LLC^ |
5.25 | 6/1/2026 | 125,000 | 125,000 | 128,125 | |||||||||||||||
| Manitowoc Foodservice, Inc.^ |
9.50 | 2/15/2024 | 250,000 | 250,000 | 279,375 | |||||||||||||||
| Performance Food Group, Inc.^ |
5.50 | 6/1/2024 | 95,000 | 95,000 | 96,663 | |||||||||||||||
|
|
|
|
|
|
|
|||||||||||||||
| Total Beverage, Food and Tobacco |
1,047,000 | 1,059,839 | 1,101,110 | |||||||||||||||||
|
|
|
|
|
|
|
|||||||||||||||
| Broadcasting and Entertainment — 4.9%*: |
||||||||||||||||||||
| CCO Holdings LLC/CCO Holdings Capital Corp.^ |
5.75 | 2/15/2026 | 500,000 | 500,000 | 515,000 | |||||||||||||||
| DISH DBS Corp.^ |
7.75 | 7/1/2026 | 316,000 | 316,000 | 325,480 | |||||||||||||||
| Gray Television, Inc. |
7.50 | 10/1/2020 | 249,000 | 257,752 | 259,583 | |||||||||||||||
| RCN Telecom Services LLC/RCN Capital Corp.^ |
8.50 | 8/15/2020 | 250,000 | 257,220 | 256,250 | |||||||||||||||
|
|
|
|
|
|
|
|||||||||||||||
| Total Broadcasting and Entertainment |
1,315,000 | 1,330,972 | 1,356,313 | |||||||||||||||||
|
|
|
|
|
|
|
|||||||||||||||
| Buildings and Real Estate — 4.6%*: |
| |||||||||||||||||||
| Brookfield Residential Properties, Inc.+^ |
6.50 | 12/15/2020 | 250,000 | 249,443 | 249,375 | |||||||||||||||
| GEO Group, Inc. (The) |
6.00 | 4/15/2026 | 250,000 | 250,000 | 252,500 | |||||||||||||||
| M/I Homes, Inc. |
6.75 | 1/15/2021 | 250,000 | 250,000 | 248,750 | |||||||||||||||
| MPT Operating Partnership LP/MPT Finance Corp. |
6.38 | 3/1/2024 | 495,000 | 495,000 | 527,175 | |||||||||||||||
|
|
|
|
|
|
|
|||||||||||||||
| Total Buildings and Real Estate |
1,245,000 | 1,244,443 | 1,277,800 | |||||||||||||||||
|
|
|
|
|
|
|
|||||||||||||||
See accompanying Notes to the Financial Statements.
145
Table of Contents
Babson U.S. High Yield Fund 2016 Annual Report
SCHEDULE OF INVESTMENTS (CONTINUED)
June 30, 2016
| EFFECTIVE INTEREST RATE |
DUE DATE | PRINCIPAL ‡‡ | COST | FAIR VALUE |
||||||||||||||||
| Corporate Bonds (Continued) |
||||||||||||||||||||
| Cargo Transport — 3.8%*: |
| |||||||||||||||||||
| Deck Chassis Acquisition, Inc.^ |
10.00 | % | 6/15/2023 | 300,000 | $300,000 | $310,500 | ||||||||||||||
| OPE KAG Finance Sub, Inc.^ |
7.88 | 7/31/2023 | 750,000 | 779,835 | 738,750 | |||||||||||||||
|
|
|
|
|
|
|
|||||||||||||||
| Total Cargo Transport |
1,050,000 | 1,079,835 | 1,049,250 | |||||||||||||||||
|
|
|
|
|
|
|
|||||||||||||||
| Chemicals, Plastics and Rubber — 5.9%*: |
| |||||||||||||||||||
| Consolidated Energy Finance SA+^ |
6.75 | 10/15/2019 | 370,000 | 364,049 | 347,800 | |||||||||||||||
| CVR Partners LP/CVR Nitrogen Finance Corp.^ |
9.25 | 6/15/2023 | 250,000 | 243,784 | 254,375 | |||||||||||||||
| LBC Tank Terminals Holding Netherlands BV^ |
6.88 | 5/15/2023 | 250,000 | 240,814 | 241,250 | |||||||||||||||
| LSB Industries, Inc. |
7.75 | 8/1/2019 | 263,000 | 227,167 | 262,014 | |||||||||||||||
| OMNOVA Solutions, Inc. |
7.88 | 11/1/2018 | 141,000 | 140,423 | 141,000 | |||||||||||||||
| Platform Specialty Products Corp.^ |
10.38 | 5/1/2021 | 392,000 | 392,000 | 394,940 | |||||||||||||||
|
|
|
|
|
|
|
|||||||||||||||
| Total Chemicals, Plastics and Rubber |
1,666,000 | 1,608,237 | 1,641,379 | |||||||||||||||||
|
|
|
|
|
|
|
|||||||||||||||
| Containers, Packaging and Glass — 5.1%*: |
||||||||||||||||||||
| Coveris Holdings SA^ |
7.88 | 11/1/2019 | 500,000 | 462,925 | 485,625 | |||||||||||||||
| Mustang Merger Corp.^ |
8.50 | 8/15/2021 | 333,000 | 348,951 | 347,985 | |||||||||||||||
| Plastipak Holdings, Inc.^ |
6.50 | 10/1/2021 | 125,000 | 125,605 | 127,500 | |||||||||||||||
| Reynolds Group Issuer, Inc./Reynolds Group Issuer LLC/Reynolds Group Issuer Lu^ |
7.00 | 7/15/2024 | 141,000 | 141,000 | 145,159 | |||||||||||||||
| Sealed Air Corp.^ |
6.88 | 7/15/2033 | 300,000 | 310,463 | 318,000 | |||||||||||||||
|
|
|
|
|
|
|
|||||||||||||||
| Total Containers, Packaging and Glass |
1,399,000 | 1,388,944 | 1,424,269 | |||||||||||||||||
|
|
|
|
|
|
|
|||||||||||||||
| Diversified/Conglomerate Manufacturing — 3.2%*: |
||||||||||||||||||||
| Amsted Industries, Inc.^ |
5.38 | 9/15/2024 | 200,000 | 192,911 | 196,000 | |||||||||||||||
| EnPro Industries, Inc. |
5.88 | 9/15/2022 | 220,000 | 222,024 | 221,100 | |||||||||||||||
| StoneMor Partners LP/Cornerstone Family Services of West Virginia Subsidiary |
7.88 | 6/1/2021 | 250,000 | 258,586 | 247,500 | |||||||||||||||
| West Corp.^ |
5.38 | 7/15/2022 | 250,000 | 240,234 | 232,500 | |||||||||||||||
|
|
|
|
|
|
|
|||||||||||||||
| Total Diversified/Conglomerate Manufacturing |
920,000 | 913,755 | 897,100 | |||||||||||||||||
|
|
|
|
|
|
|
|||||||||||||||
| Diversified/Conglomerate Service — 2.3%*: |
||||||||||||||||||||
| Avis Budget Car Rental LLC/Avis Budget Finance, Inc.^ |
6.38 | 4/1/2024 | 115,000 | 111,252 | 113,850 | |||||||||||||||
| Infor Software Parent LLC/Infor Software Parent, Inc. PIK^ |
7.13 | 5/1/2021 | 319,000 | 280,156 | 282,315 | |||||||||||||||
| Zachry Holdings, Inc.^ |
7.50 | 2/1/2020 | 250,000 | 252,701 | 247,500 | |||||||||||||||
|
|
|
|
|
|
|
|||||||||||||||
| Total Diversified/Conglomerate Service |
684,000 | 644,109 | 643,665 | |||||||||||||||||
|
|
|
|
|
|
|
|||||||||||||||
| Electronics — 4.9%*: |
||||||||||||||||||||
| Diamond 1 Finance Corp./Diamond 2 Finance Corp.^ |
5.88 | 6/15/2021 | 140,000 | 140,000 | 142,768 | |||||||||||||||
| Diamond 1 Finance Corp./Diamond 2 Finance Corp.^ |
7.13 | 6/15/2024 | 154,000 | 154,000 | 160,841 | |||||||||||||||
| NXP BV/NXP Funding LLC^ |
4.63 | 6/1/2023 | 270,000 | 270,000 | 274,725 | |||||||||||||||
See accompanying Notes to the Financial Statements.
146
Table of Contents
Babson U.S. High Yield Fund 2016 Annual Report
SCHEDULE OF INVESTMENTS (CONTINUED)
June 30, 2016
| EFFECTIVE INTEREST RATE |
DUE DATE | PRINCIPAL ‡‡ | COST | FAIR VALUE |
||||||||||||||||
| Corporate Bonds (Continued) |
||||||||||||||||||||
| Electronics (Continued) |
||||||||||||||||||||
| Prime Security Services Borrower LLC/Prime Finance, Inc.^ |
9.25 | % | 5/15/2023 | 250,000 | $250,000 | $265,000 | ||||||||||||||
| WESCO Distribution, Inc.^ |
5.38 | 6/15/2024 | 250,000 | 250,000 | 250,000 | |||||||||||||||
| Western Digital Corp.^ |
10.50 | 4/1/2024 | 250,000 | 250,000 | 267,500 | |||||||||||||||
|
|
|
|
|
|
|
|||||||||||||||
| Total Electronics |
1,314,000 | 1,314,000 | 1,360,834 | |||||||||||||||||
|
|
|
|
|
|
|
|||||||||||||||
| Finance — 0.9%*: |
||||||||||||||||||||
| Aircastle Ltd. |
5.00 | 4/1/2023 | 250,000 | 250,000 | 254,050 | |||||||||||||||
|
|
|
|
|
|
|
|||||||||||||||
| Healthcare, Education and Childcare — 7.4%*: |
||||||||||||||||||||
| Alere, Inc.^ |
6.38 | 7/1/2023 | 325,000 | 335,898 | 338,813 | |||||||||||||||
| Capsugel SA PIK^ |
7.00 | 5/15/2019 | 290,000 | 292,142 | 290,725 | |||||||||||||||
| HCA, Inc. |
5.25 | 6/15/2026 | 225,000 | 225,000 | 233,578 | |||||||||||||||
| HCA, Inc. |
5.38 | 2/1/2025 | 375,000 | 381,201 | 384,375 | |||||||||||||||
| RegionalCare Hospital Partners Holdings, Inc.^ |
8.25 | 5/1/2023 | 132,000 | 132,000 | 135,300 | |||||||||||||||
| Tenet Healthcare Corp. |
6.75 | 6/15/2023 | 250,000 | 250,583 | 239,375 | |||||||||||||||
| Valeant Pharmaceuticals International, Inc.^ |
6.13 | 4/15/2025 | 534,000 | 459,256 | 428,535 | |||||||||||||||
|
|
|
|
|
|
|
|||||||||||||||
| Total Healthcare, Education and Childcare |
2,131,000 | 2,076,080 | 2,050,701 | |||||||||||||||||
|
|
|
|
|
|
|
|||||||||||||||
| Insurance — 1.6%*: |
|
|||||||||||||||||||
| CNO Financial Group, Inc. |
5.25 | 5/30/2025 | 250,000 | 251,810 | 257,500 | |||||||||||||||
| York Risk Services Holding Corp.^ |
8.50 | 10/1/2022 | 250,000 | 225,185 | 184,375 | |||||||||||||||
|
|
|
|
|
|
|
|||||||||||||||
| Total Insurance |
500,000 | 476,995 | 441,875 | |||||||||||||||||
|
|
|
|
|
|
|
|||||||||||||||
| Leisure, Amusement, Entertainment — 4.1%*: |
|
|||||||||||||||||||
| Brunswick Corp.^ |
4.63 | 5/15/2021 | 375,000 | 378,367 | 379,688 | |||||||||||||||
| Brunswick Corp. |
7.13 | 8/1/2027 | 567,000 | 604,597 | 609,808 | |||||||||||||||
| WMG Acquisition Corp.^ |
6.75 | 4/15/2022 | 150,000 | 151,125 | 151,125 | |||||||||||||||
|
|
|
|
|
|
|
|||||||||||||||
| Total Leisure, Amusement, Entertainment |
1,092,000 | 1,134,089 | 1,140,621 | |||||||||||||||||
|
|
|
|
|
|
|
|||||||||||||||
| Machinery Non-Agriculture, Non-Construction, Non-Electronic — 1.2%*: |
|
|||||||||||||||||||
| Apex Tool Group LLC^ |
7.00 | 2/1/2021 | 96,000 | 84,383 | 82,800 | |||||||||||||||
| Xerium Technologies, Inc. |
8.88 | 6/15/2018 | 250,000 | 252,932 | 246,250 | |||||||||||||||
|
|
|
|
|
|
|
|||||||||||||||
| Total Machinery Non-Agriculture, Non-Construction, Non-Electronic |
346,000 | 337,315 | 329,050 | |||||||||||||||||
|
|
|
|
|
|
|
|||||||||||||||
| Mining, Steel, Iron and Non-Precious Metals — 5.2%*: |
|
|||||||||||||||||||
| Constellium NV+^ |
7.88 | 4/1/2021 | 300,000 | 300,000 | 309,375 | |||||||||||||||
| Freeport-McMoRan, Inc. |
3.55 | 3/1/2022 | 353,000 | 280,599 | 310,640 | |||||||||||||||
| Freeport-McMoRan, Inc. |
4.00 | 11/14/2021 | 107,000 | 83,091 | 96,668 | |||||||||||||||
| Hecla Mining Co. |
6.88 | 5/1/2021 | 250,000 | 215,388 | 239,375 | |||||||||||||||
| SunCoke Energy Partners LP/SunCoke Energy Partners Finance Corp.^ |
7.38 | 2/1/2020 | 325,000 | 271,375 | 273,000 | |||||||||||||||
| United States Steel Corp.^ |
8.38 | 7/1/2021 | 117,000 | 117,000 | 122,850 | |||||||||||||||
| Zekelman Industries, Inc.^ |
9.88 | 6/15/2023 | 92,000 | 92,000 | 92,920 | |||||||||||||||
|
|
|
|
|
|
|
|||||||||||||||
| Total Mining, Steel, Iron and Non-Precious Metals |
1,544,000 | 1,359,453 | 1,444,828 | |||||||||||||||||
|
|
|
|
|
|
|
|||||||||||||||
See accompanying Notes to the Financial Statements.
147
Table of Contents
Babson U.S. High Yield Fund 2016 Annual Report
SCHEDULE OF INVESTMENTS (CONTINUED)
June 30, 2016
| EFFECTIVE INTEREST RATE |
DUE DATE | PRINCIPAL ‡‡ | COST | FAIR VALUE |
||||||||||||||||
| Corporate Bonds (Continued) |
||||||||||||||||||||
| Oil and Gas — 12.6%*: |
|
|||||||||||||||||||
| Calumet Specialty Products Partners LP/Calumet Finance Corp. |
6.50 | % | 4/15/2021 | 150,000 | $107,561 | $107,250 | ||||||||||||||
| Calumet Specialty Products Partners LP/Calumet Finance Corp. |
7.75 | 4/15/2023 | 53,000 | 50,520 | 36,438 | |||||||||||||||
| Citgo Holding, Inc.^ |
10.75 | 2/15/2020 | 341,000 | 345,505 | 342,705 | |||||||||||||||
| Continental Resources, Inc. |
5.00 | 9/15/2022 | 250,000 | 217,838 | 244,375 | |||||||||||||||
| Energy Transfer Equity LP |
5.88 | 1/15/2024 | 174,000 | 161,944 | 169,215 | |||||||||||||||
| EP Energy LLC/Everest Acquisition Finance, Inc. |
9.38 | 5/1/2020 | 507,000 | 456,460 | 358,702 | |||||||||||||||
| Genesis Energy LP/Genesis Energy Finance Corp. |
6.75 | 8/1/2022 | 250,000 | 244,773 | 242,500 | |||||||||||||||
| Hornbeck Offshore Services, Inc. |
5.88 | 4/1/2020 | 250,000 | 157,007 | 158,125 | |||||||||||||||
| Kosmos Energy Ltd.^ |
7.88 | 8/1/2021 | 250,000 | 225,068 | 241,250 | |||||||||||||||
| Newfield Exploration Co. |
5.38 | 1/1/2026 | 250,000 | 241,674 | 243,125 | |||||||||||||||
| Sabine Pass Liquefaction LLC^ |
5.88 | 6/30/2026 | 250,000 | 250,000 | 250,937 | |||||||||||||||
| SM Energy Co. |
6.50 | 1/1/2023 | 250,000 | 185,048 | 232,500 | |||||||||||||||
| Summit Midstream Holdings LLC/Summit Midstream Finance Corp. |
5.50 | 8/15/2022 | 295,000 | 211,641 | 253,700 | |||||||||||||||
| Sunoco LP/Sunoco Finance Corp.^ |
6.25 | 4/15/2021 | 250,000 | 250,000 | 249,375 | |||||||||||||||
| Tullow Oil PLC+^ |
6.25 | 4/15/2022 | 250,000 | 196,549 | 200,000 | |||||||||||||||
| Welltec A/S+^ |
8.00 | 2/1/2019 | 200,000 | 190,220 | 185,750 | |||||||||||||||
|
|
|
|
|
|
|
|||||||||||||||
| Total Oil and Gas |
3,970,000 | 3,491,808 | 3,515,947 | |||||||||||||||||
|
|
|
|
|
|
|
|||||||||||||||
| Personal Transportation — 0.9%*: |
|
|||||||||||||||||||
| Watco Cos. LLC/Watco Finance Corp.^ |
6.38 | 4/1/2023 | 250,000 | 250,582 | 247,500 | |||||||||||||||
|
|
|
|
|
|
|
|||||||||||||||
| Personal, Food and Miscellaneous — 1.5%*: |
|
|||||||||||||||||||
| Landry’s, Inc.^ |
9.38 | 5/1/2020 | 405,000 | 430,576 | 425,250 | |||||||||||||||
|
|
|
|
|
|
|
|||||||||||||||
| Printing and Publishing — 0.9%*: |
|
|||||||||||||||||||
| MHGE Parent LLC/MHGE Parent Finance, Inc.^ |
8.50 | 8/1/2019 | 250,000 | 252,129 | 252,500 | |||||||||||||||
|
|
|
|
|
|
|
|||||||||||||||
| Retail Stores — 2.8%*: |
|
|||||||||||||||||||
| Dollar Tree, Inc.^ |
5.75 | 3/1/2023 | 500,000 | 523,995 | 531,250 | |||||||||||||||
| Penske Automotive Group, Inc. |
5.50 | 5/15/2026 | 250,000 | 250,000 | 237,500 | |||||||||||||||
|
|
|
|
|
|
|
|||||||||||||||
| Total Retail Stores |
750,000 | 773,995 | 768,750 | |||||||||||||||||
|
|
|
|
|
|
|
|||||||||||||||
| Telecommunications — 8.2%*: |
|
|||||||||||||||||||
| Altice Financing SA+^ |
6.63 | 2/15/2023 | 250,000 | 251,622 | 245,468 | |||||||||||||||
| Altice Financing SA+^ |
7.50 | 5/15/2026 | 250,000 | 250,000 | 245,000 | |||||||||||||||
| Digicel Ltd.+^ |
6.00 | 4/15/2021 | 250,000 | 227,931 | 214,300 | |||||||||||||||
| Numericable-SFR SA+^ |
7.38 | 5/1/2026 | 350,000 | 350,000 | 346,062 | |||||||||||||||
| Numericable-SFR SAS+^ |
6.00 | 5/15/2022 | 250,000 | 251,602 | 243,125 | |||||||||||||||
| Sprint Corp. |
7.88 | 9/15/2023 | 250,000 | 229,995 | 204,375 | |||||||||||||||
| T-Mobile USA, Inc. |
6.50 | 1/15/2026 | 500,000 | 500,000 | 527,500 | |||||||||||||||
| Wind Acquisition Finance SA+^ |
7.38 | 4/23/2021 | 284,000 | 260,101 | 270,510 | |||||||||||||||
|
|
|
|
|
|
|
|||||||||||||||
| Total Telecommunications |
2,384,000 | 2,321,251 | 2,296,340 | |||||||||||||||||
|
|
|
|
|
|
|
|||||||||||||||
See accompanying Notes to the Financial Statements.
148
Table of Contents
Babson U.S. High Yield Fund 2016 Annual Report
SCHEDULE OF INVESTMENTS (CONTINUED)
June 30, 2016
| EFFECTIVE INTEREST RATE |
DUE DATE | PRINCIPAL ‡‡ | COST | FAIR VALUE |
||||||||||||||||
| Corporate Bonds (Continued) |
||||||||||||||||||||
| Textiles and Leather — 1.5%*: |
|
|||||||||||||||||||
| Hanesbrands, Inc.^ |
4.63 | % | 5/15/2024 | 167,000 | $167,000 | $167,417 | ||||||||||||||
| Hanesbrands, Inc.^ |
4.88 | 5/15/2026 | 246,000 | 246,000 | 246,886 | |||||||||||||||
|
|
|
|
|
|
|
|||||||||||||||
| Total Textiles and Leather |
413,000 | 413,000 | 414,303 | |||||||||||||||||
|
|
|
|
|
|
|
|||||||||||||||
| Utilities — 1.8%*: |
|
|||||||||||||||||||
| NRG Energy, Inc.^ |
7.25 | 5/15/2026 | 250,000 | 250,000 | 248,750 | |||||||||||||||
| Teine Energy Ltd.+^ |
6.88 | 9/30/2022 | 250,000 | 228,678 | 245,000 | |||||||||||||||
|
|
|
|
|
|
|
|||||||||||||||
| Total Utilities |
500,000 | 478,678 | 493,750 | |||||||||||||||||
|
|
|
|
|
|
|
|||||||||||||||
| Total Corporate Bonds |
26,960,000 | 26,162,057 | 26,347,960 | |||||||||||||||||
|
|
|
|
|
|
|
|||||||||||||||
| Total Fixed Income |
27,632,215 | 26,503,396 | 26,684,819 | |||||||||||||||||
|
|
|
|
|
|
|
|||||||||||||||
| Short-Term Investment — 5.7%*: |
||||||||||||||||||||
| Bank Deposit — 5.7%*: |
||||||||||||||||||||
| State Street Bank & Trust Co. Euro Time Deposit |
0.01 | 7/1/2016 | 1,578,060 | 1,578,060 | 1,578,060 | |||||||||||||||
|
|
|
|
|
|
|
|||||||||||||||
| Total Investments |
29,210,275 | 28,081,456 | 28,262,879 | |||||||||||||||||
|
|
|
|
|
|
|
|||||||||||||||
| Other assets and liabilities — (1.5%)* |
(417,627 | ) | ||||||||||||||||||
|
|
|
|||||||||||||||||||
| Net Assets — 100.0% |
$27,845,252 | |||||||||||||||||||
|
|
|
|||||||||||||||||||
| PIK | Payment-in-kind |
| ‡‡ | Unless otherwise indicated, all principal amounts are denominated in United States Dollars. |
| * | Calculated as a percentage of net assets applicable to common shareholders. |
| + | Foreign security. |
Distributions of investments by country of risk (excluding temporary cash investments) as a percentage of total investments in securities, is as follows:
| United States | 88.4% | |||||
| France | 3.4% | |||||
| Canada | 1.9% | |||||
| Portugal | 1.8% | |||||
| Trinidad And Tobago | 1.3% | |||||
| Italy | 1.0% | |||||
| Other (Individually less than 1%) | 2.2% | |||||
|
|
|
|||||
| Total | 100.0% | |||||
|
|
|
| ^ | Security acquired in a transaction exempt from registration under Rule 144A of the Securities Act of 1933. These securities may only be resold in transactions exempt from registration, normally to qualified institutional buyers. |
| § | Bank loans are exempt from registration under the Securities Act of 1933, as amended, but contain certain restrictions on resale and cannot be sold publicly. These loans pay interest at rates which adjust periodically. The interest rates shown for bank loans are the current interest rates at June 30, 2016. Bank loans are also subject to mandatory and/or optional prepayment which cannot be predicted. As a result, the remaining maturity may be substantially less than the stated maturity shown. |
| # | Variable rate security. The interest rate shown is the rate in effect at June 30, 2016. |
See accompanying Notes to the Financial Statements.
149
Table of Contents
Babson Capital Funds Trust 2016 Annual Report
NOTES TO THE FINANCIAL STATEMENTS
June 30, 2016
150
Table of Contents
Babson Capital Funds Trust 2016 Annual Report
NOTES TO THE FINANCIAL STATEMENTS (CONTINUED)
June 30, 2016
151
Table of Contents
Babson Capital Funds Trust 2016 Annual Report
NOTES TO THE FINANCIAL STATEMENTS (CONTINUED)
June 30, 2016
152
Table of Contents
Babson Capital Funds Trust 2016 Annual Report
NOTES TO THE FINANCIAL STATEMENTS (CONTINUED)
June 30, 2016
153
Table of Contents
Babson Capital Funds Trust 2016 Annual Report
NOTES TO THE FINANCIAL STATEMENTS (CONTINUED)
June 30, 2016
Global Floating Rate Fund
| DESCRIPTION | LEVEL 1 | LEVEL 2 | LEVEL 3 | TOTAL INVESTMENTS | ||||||||||||
| Assets:* |
|
|||||||||||||||
| Equities: | ||||||||||||||||
| Common Stocks |
$ | – | $ | 7,480 | $ | 0 | ** | $ | 7,480 | |||||||
|
|
|
|
|
|
|
|
|
|||||||||
| Total Equities | – | 7,480 | 0 | 7,480 | ||||||||||||
|
|
|
|
|
|
|
|
|
|||||||||
| Fixed Income: | ||||||||||||||||
| Bank Loans |
– | 139,521,068 | 221,345 | 139,742,413 | ||||||||||||
| Corporate Bonds |
– | 15,314,985 | – | 15,314,985 | ||||||||||||
|
|
|
|
|
|
|
|
|
|||||||||
| Total Fixed Income | – | 154,836,053 | 221,345 | 155,057,398 | ||||||||||||
|
|
|
|
|
|
|
|
|
|||||||||
| Short-Term Investment | – | 17,598,766 | – | 17,598,766 | ||||||||||||
| Derivative Securities: | ||||||||||||||||
| Forward Foreign Currency Exchange Contracts |
– | 1,819,442 | – | 1,819,442 | ||||||||||||
|
|
|
|
|
|
|
|
|
|||||||||
| Total | $ | – | $ | 174,261,741 | $ | 221,345 | $ | 174,483,086 | ||||||||
|
|
|
|
|
|
|
|
|
|||||||||
| Liabilities:* | ||||||||||||||||
| Derivative Securities: | ||||||||||||||||
| Forward Foreign Currency Exchange Contracts |
– | (22,671 | ) | – | (22,671 | ) | ||||||||||
|
|
|
|
|
|
|
|
|
|||||||||
| Total Investments | $ | – | $ | 174,239,070 | $ | 221,345 | $ | 174,460,415 | ||||||||
|
|
|
|
|
|
|
|
|
|||||||||
| * | There were no transfers between levels during the year ended June 30, 2016. |
| ** | Includes two securities valued at $0. |
154
Table of Contents
Babson Capital Funds Trust 2016 Annual Report
NOTES TO THE FINANCIAL STATEMENTS (CONTINUED)
June 30, 2016
The following is a reconciliation of investments with unobservable inputs (Level 3) that were used in determining fair value:
| INVESTMENTS IN SECURITIES |
BALANCE AS OF JULY 1, 2015 |
REALIZED (LOSS) |
CHANGE IN UNREALIZED APPRECIATION (DEPRECIATION) |
NET TRANSFERS IN (OUT) OF LEVEL 3 |
ACCRUED PREMIUMS/ |
PURCHASES | SALES | BALANCE AS OF |
CHANGE IN UNREALIZED APPRECIATION (DEPRECIATION) FROM INVESTMENTS HELD AT JUNE 30, 2016 |
|||||||||||||||||||||||||||
| Fixed Income |
||||||||||||||||||||||||||||||||||||
| Bank Loans |
$ | 1,054,891 | $ | 4,275 | $ | 12,254 | $ | – | $ | 2,994 | $ | 225,330 | $ | (1,078,399 | ) | $ | 221,345 | $ | 12,254 | |||||||||||||||||
|
|
|
|
|
|
|
|
|
|
|
|
|
|
|
|
|
|
|
|||||||||||||||||||
| Total | $ | 1,054,891 | $ | 4,275 | $ | 12,254 | $ | – | $ | 2,994 | $ | 225,330 | $ | (1,078,399 | ) | $ | 221,345 | $ | 12,254 | |||||||||||||||||
|
|
|
|
|
|
|
|
|
|
|
|
|
|
|
|
|
|
|
|||||||||||||||||||
Global Credit Income Opportunities Fund
| DESCRIPTION | LEVEL 1 | LEVEL 2 | LEVEL 3 | TOTAL INVESTMENTS | ||||||||||||
| Assets:* |
|
|||||||||||||||
| Equities: | ||||||||||||||||
| Common Stocks |
$ | – | $ | 3,740 | $ | 418,595 | $ | 422,335 | ||||||||
|
|
|
|
|
|
|
|
|
|||||||||
| Total Equities | – | 3,740 | 418,595 | 422,335 | ||||||||||||
|
|
|
|
|
|
|
|
|
|||||||||
| Fixed Income: | ||||||||||||||||
| Asset-Backed Securities |
– | 15,138,704 | – | 15,138,704 | ||||||||||||
| Bank Loans |
– | 23,767,234 | 221,345 | 23,988,579 | ||||||||||||
| Corporate Bonds |
– | 54,028,407 | – | 54,028,407 | ||||||||||||
|
|
|
|
|
|
|
|
|
|||||||||
| Total Fixed Income | – | 92,934,345 | 221,345 | 93,155,690 | ||||||||||||
|
|
|
|
|
|
|
|
|
|||||||||
| Short-Term Investment | – | 7,849,066 | – | 7,849,066 | ||||||||||||
| Derivative Securities: | ||||||||||||||||
| Forward Foreign Currency Exchange Contracts |
– | 1,379,685 | – | 1,379,685 | ||||||||||||
|
|
|
|
|
|
|
|
|
|||||||||
| Total | $ | – | $ | 102,166,836 | $ | 639,940 | $ | 102,806,776 | ||||||||
|
|
|
|
|
|
|
|
|
|||||||||
| Liabilities:* | ||||||||||||||||
| Derivative Securities: | ||||||||||||||||
| Forward Foreign Currency Exchange Contracts |
– | (802 | ) | – | (802 | ) | ||||||||||
|
|
|
|
|
|
|
|
|
|||||||||
| Total Investments | $ | – | $ | 102,166,034 | $ | 639,940 | $ | 102,805,974 | ||||||||
|
|
|
|
|
|
|
|
|
|||||||||
| * | There were no transfers between levels during the year ended June 30, 2016. |
155
Table of Contents
Babson Capital Funds Trust 2016 Annual Report
NOTES TO THE FINANCIAL STATEMENTS (CONTINUED)
June 30, 2016
The following is a reconciliation of investments with unobservable inputs (Level 3) that were used in determining fair value:
| INVESTMENTS IN SECURITIES |
BALANCE AS JULY 1, |
REALIZED (LOSS) |
CHANGE IN UNREALIZED APPRECIATION (DEPRECIATION) |
NET TRANSFERS IN (OUT) OF LEVEL 3 |
ACCRUED PREMIUMS/ |
PURCHASES | SALES | BALANCE AS OF |
CHANGE
IN UNREALIZED APPRECIATION (DEPRECIATION) FROM INVESTMENTS HELD AT JUNE 30, 2016 |
|||||||||||||||||||||||||||
| Equities |
||||||||||||||||||||||||||||||||||||
| Common Stock |
$ | – | $ | – | $ | 44,857 | $ | – | $ | – | $ | 373,738 | $ | – | $ | 418,595 | $ | 44,857 | ||||||||||||||||||
|
|
|
|
|
|
|
|
|
|
|
|
|
|
|
|
|
|
|
|||||||||||||||||||
| Fixed Income | ||||||||||||||||||||||||||||||||||||
| Bank Loans |
$ | 808,335 | $ | 9,861 | $ | 1,638 | $ | – | $ | 2,992 | $ | 225,331 | $ | (826,812 | ) | $ | 221,345 | $ | (650 | ) | ||||||||||||||||
|
|
|
|
|
|
|
|
|
|
|
|
|
|
|
|
|
|
|
|||||||||||||||||||
| Total | $ | 808,335 | $ | 9,861 | $ | 46,495 | $ | – | $ | 2,992 | $ | 599,069 | $ | (826,812 | ) | $ | 639,940 | $ | 44,207 | |||||||||||||||||
|
|
|
|
|
|
|
|
|
|
|
|
|
|
|
|
|
|
|
|||||||||||||||||||
Active Short Duration Bond Fund
| DESCRIPTION | LEVEL 1 | LEVEL 2 | LEVEL 3 | TOTAL INVESTMENTS | ||||||||||||
| Assets:* |
|
|||||||||||||||
| Fixed Income: | ||||||||||||||||
| Asset-Backed Securities |
$ | – | $ | 47,568,141 | $ | – | $ | 47,568,141 | ||||||||
| Corporate Bonds |
– | 63,831,141 | – | 63,831,141 | ||||||||||||
| Mortgage-Backed Securities |
– | 5,151,027 | – | 5,151,027 | ||||||||||||
| U.S. Treasury & Government Agencies |
– | 32,017,461 | – | 32,017,461 | ||||||||||||
|
|
|
|
|
|
|
|
|
|||||||||
| Total Fixed Income | – | 148,567,770 | – | 148,567,770 | ||||||||||||
|
|
|
|
|
|
|
|
|
|||||||||
| Short-Term Investments: | ||||||||||||||||
| Bank Deposit |
– | 47,434 | – | 47,434 | ||||||||||||
| Commercial Paper |
– | 7,699,338 | – | 7,699,338 | ||||||||||||
|
|
|
|
|
|
|
|
|
|||||||||
| Total Short-Term Investments | – | 7,746,772 | – | 7,746,772 | ||||||||||||
|
|
|
|
|
|
|
|
|
|||||||||
| Derivative Securities: | ||||||||||||||||
| Forward Foreign Currency Exchange Contracts |
– | 48,523 | – | 48,523 | ||||||||||||
| Futures** |
312,198 | – | – | 312,198 | ||||||||||||
|
|
|
|
|
|
|
|
|
|||||||||
| Total Derivative Securities | 312,198 | 48,523 | – | 360,721 | ||||||||||||
|
|
|
|
|
|
|
|
|
|||||||||
| Total |
$ | 312,198 | $ | 156,363,065 | $ | – | $ | 156,675,263 | ||||||||
|
|
|
|
|
|
|
|
|
|||||||||
| Liabilities:* |
|
|||||||||||||||
| Derivative Securities: | ||||||||||||||||
| OTC – Credit Default Swaps |
– | (38,457 | ) | – | (38,457 | ) | ||||||||||
| Centrally Cleared Credit Default Swaps** |
– | (1,055 | ) | – | (1,055 | ) | ||||||||||
| Forward Foreign Currency Exchange Contracts |
– | (50,495 | ) | – | (50,495 | ) | ||||||||||
| Futures** |
(432,239 | ) | – | – | (432,239 | ) | ||||||||||
|
|
|
|
|
|
|
|
|
|||||||||
| Total Derivative Securities | (432,239 | ) | (90,007 | ) | – | (522,246 | ) | |||||||||
|
|
|
|
|
|
|
|
|
|||||||||
| Total Investments |
$ | (120,041 | ) | $ | 156,273,058 | $ | – | $ | 156,153,017 | |||||||
|
|
|
|
|
|
|
|
|
|||||||||
| * | There were no transfers between levels during the year ended June 30, 2016. |
| ** | Centrally Cleared Swaps and Futures are valued at unrealized appreciation/depreciation. Only current day’s variation margin, if any, is reported on the Statement of Assets and Liabilities. |
156
Table of Contents
Babson Capital Funds Trust 2016 Annual Report
NOTES TO THE FINANCIAL STATEMENTS (CONTINUED)
June 30, 2016
Total Return Bond Fund
| DESCRIPTION | LEVEL 1 | LEVEL 2 | LEVEL 3 | TOTAL INVESTMENTS | ||||||||||||
| Assets:* |
|
|||||||||||||||
| Fixed Income: | ||||||||||||||||
| Asset-Backed Securities |
$ | – | $ | 4,998,946 | $ | – | $ | 4,998,946 | ||||||||
| Corporate Bonds |
– | 8,859,100 | – | 8,859,100 | ||||||||||||
| Foreign Government |
– | 120,831 | – | 120,831 | ||||||||||||
| Mortgage-Backed Securities |
– | 1,431,855 | – | 1,431,855 | ||||||||||||
| U.S. Treasury & Government Agencies |
– | 7,278,939 | – | 7,278,939 | ||||||||||||
|
|
|
|
|
|
|
|
|
|||||||||
| Total Fixed Income | – | 22,689,671 | – | 22,689,671 | ||||||||||||
|
|
|
|
|
|
|
|
|
|||||||||
| Mutual Fund: | ||||||||||||||||
| Mutual Fund |
2,288,057 | – | – | 2,288,057 | ||||||||||||
| Short-Term Investments: | ||||||||||||||||
| Bank Deposit |
– | 805,781 | – | 805,781 | ||||||||||||
| Commercial Paper |
– | 4,445,968 | – | 4,445,968 | ||||||||||||
|
|
|
|
|
|
|
|
|
|||||||||
| Total Short-Term Investments | – | 5,251,749 | – | 5,251,749 | ||||||||||||
|
|
|
|
|
|
|
|
|
|||||||||
| Derivative Securities: | ||||||||||||||||
| Forward Foreign Currency Exchange Contracts |
– | 24,351 | – | 24,351 | ||||||||||||
| Futures** |
115,238 | – | – | 115,238 | ||||||||||||
|
|
|
|
|
|
|
|
|
|||||||||
| Total Derivative Securities | 115,238 | 24,351 | – | 139,589 | ||||||||||||
|
|
|
|
|
|
|
|
|
|||||||||
| Total |
$ | 2,403,295 | $ | 27,965,771 | $ | – | $ | 30,369,066 | ||||||||
|
|
|
|
|
|
|
|
|
|||||||||
| Liabilities:* |
|
|||||||||||||||
| Derivative Securities: | ||||||||||||||||
| OTC – Credit Default Swaps |
– | (9,614 | ) | – | (9,614 | ) | ||||||||||
| Centrally Cleared Credit Default Swaps** |
– | (331 | ) | – | (331 | ) | ||||||||||
| Forward Foreign Currency Exchange Contracts |
– | (25,963 | ) | – | (25,963 | ) | ||||||||||
| Futures** |
(24,120 | ) | – | – | (24,120 | ) | ||||||||||
|
|
|
|
|
|
|
|
|
|||||||||
| Total Derivative Securities | (24,120 | ) | (35,908 | ) | – | (60,028 | ) | |||||||||
|
|
|
|
|
|
|
|
|
|||||||||
| Total Investments |
$ | 2,379,175 | $ | 27,929,863 | $ | – | $ | 30,309,038 | ||||||||
|
|
|
|
|
|
|
|
|
|||||||||
| * | There were no transfers between levels during the year ended June 30, 2016. |
| ** | Centrally Cleared Swaps and Futures are valued at unrealized appreciation/depreciation. Only current day’s variation margin, if any, is reported on the Statement of Assets and Liabilities. |
157
Table of Contents
Babson Capital Funds Trust 2016 Annual Report
NOTES TO THE FINANCIAL STATEMENTS (CONTINUED)
June 30, 2016
Emerging Markets Debt Blended Total Return Fund
| DESCRIPTION | LEVEL 1 | LEVEL 2 | LEVEL 3 | TOTAL INVESTMENTS | ||||||||||||
| Assets:* |
|
|||||||||||||||
| Fixed Income: | ||||||||||||||||
| Corporate Bonds |
$ | – | $ | 4,440,586 | $ | – | $ | 4,440,586 | ||||||||
| Foreign Government |
– | 5,013,180 | – | 5,013,180 | ||||||||||||
|
|
|
|
|
|
|
|
|
|||||||||
| Total Fixed Income | – | 9,453,766 | – | 9,453,766 | ||||||||||||
|
|
|
|
|
|
|
|
|
|||||||||
| Short-Term Investment | – | 299,350 | – | 299,350 | ||||||||||||
| Derivative Securities: | ||||||||||||||||
| Forward Foreign Currency Exchange Contracts |
– | 147,954 | – | 147,954 | ||||||||||||
| Interest Rate Swaps |
– | 12,211 | – | 12,211 | ||||||||||||
|
|
|
|
|
|
|
|
|
|||||||||
| Total Derivative Securities | – | 160,165 | – | 160,165 | ||||||||||||
|
|
|
|
|
|
|
|
|
|||||||||
| Total |
$ | – | $ | 9,913,281 | $ | – | $ | 9,913,281 | ||||||||
|
|
|
|
|
|
|
|
|
|||||||||
| Liabilities:* |
|
|||||||||||||||
| Derivative Securities: | ||||||||||||||||
| Forward Foreign Currency Exchange Contracts |
– | (114,417 | ) | – | (114,417 | ) | ||||||||||
| Interest Rate Swaps |
– | (8,941 | ) | – | (8,941 | ) | ||||||||||
|
|
|
|
|
|
|
|
|
|||||||||
| Total Derivative Securities | – | (123,358 | ) | – | (123,358 | ) | ||||||||||
|
|
|
|
|
|
|
|
|
|||||||||
| Total Investments |
$ | – | $ | 9,789,923 | $ | – | $ | 9,789,923 | ||||||||
|
|
|
|
|
|
|
|
|
|||||||||
| * | There were no transfers between levels during the year ended June 30, 2016. |
Emerging Markets Local Currency Debt Fund
| DESCRIPTION | LEVEL 1 | LEVEL 2 | LEVEL 3 | TOTAL INVESTMENTS | ||||||||||||
| Assets:* |
|
|||||||||||||||
| Fixed Income: | ||||||||||||||||
| Foreign Government |
$ | – | $ | 4,956,325 | $ | – | $ | 4,956,325 | ||||||||
|
|
|
|
|
|
|
|
|
|||||||||
| Total Fixed Income | – | 4,956,325 | – | 4,956,325 | ||||||||||||
|
|
|
|
|
|
|
|
|
|||||||||
| Short-Term Investment | – | 368,917 | – | 368,917 | ||||||||||||
| Derivative Securities: | ||||||||||||||||
| Forward Foreign Currency Exchange Contracts |
– | 110,160 | – | 110,160 | ||||||||||||
| Interest Rate Swaps |
– | 42,875 | – | 42,875 | ||||||||||||
|
|
|
|
|
|
|
|
|
|||||||||
| Total Derivative Securities | – | 153,035 | – | 153,035 | ||||||||||||
|
|
|
|
|
|
|
|
|
|||||||||
| Total |
$ | – | $ | 5,478,277 | $ | – | $ | 5,478,277 | ||||||||
|
|
|
|
|
|
|
|
|
|||||||||
| Liabilities:* |
|
|||||||||||||||
| Derivative Securities: | ||||||||||||||||
| Forward Foreign Currency Exchange Contracts |
– | (111,356 | ) | – | (111,356 | ) | ||||||||||
| Interest Rate Swaps |
– | (6,395 | ) | – | (6,395 | ) | ||||||||||
|
|
|
|
|
|
|
|
|
|||||||||
| Total Derivative Securities | – | (117,751 | ) | – | (117,751 | ) | ||||||||||
|
|
|
|
|
|
|
|
|
|||||||||
| Total Investments |
$ | – | $ | 5,360,526 | $ | – | $ | 5,360,526 | ||||||||
|
|
|
|
|
|
|
|
|
|||||||||
| * | There were no transfers between levels during the year ended June 30, 2016. |
158
Table of Contents
Babson Capital Funds Trust 2016 Annual Report
NOTES TO THE FINANCIAL STATEMENTS (CONTINUED)
June 30, 2016
Global High Yield Fund
| DESCRIPTION | LEVEL 1 | LEVEL 2 | LEVEL 3 | TOTAL INVESTMENTS | ||||||||||||
| Assets:* |
|
|||||||||||||||
| Fixed Income: | ||||||||||||||||
| Corporate Bonds |
$ | – | $ | 24,655,093 | $ | – | $ | 24,655,093 | ||||||||
|
|
|
|
|
|
|
|
|
|||||||||
| Total Fixed Income | – | 24,655,093 | – | 24,655,093 | ||||||||||||
|
|
|
|
|
|
|
|
|
|||||||||
| Short-Term Investment |
– | 460,981 | – | 460,981 | ||||||||||||
| Derivative Securities: | ||||||||||||||||
| Forward Foreign Currency Exchange Contracts |
– | 284,477 | – | 284,477 | ||||||||||||
|
|
|
|
|
|
|
|
|
|||||||||
| Total | $ | – | $ | 25,400,551 | $ | – | $ | 25,400,551 | ||||||||
|
|
|
|
|
|
|
|
|
|||||||||
| Liabilities:* |
|
|||||||||||||||
| Derivative Securities: | ||||||||||||||||
| Forward Foreign Currency Exchange Contracts |
– | (3,588 | ) | – | (3,588 | ) | ||||||||||
|
|
|
|
|
|
|
|
|
|||||||||
| Total Investments | $ | – | $ | 25,396,963 | $ | – | $ | 25,396,963 | ||||||||
|
|
|
|
|
|
|
|
|
|||||||||
| * | There were no transfers between levels during the year ended June 30, 2016. |
U.S. High Yield Fund
| DESCRIPTION | LEVEL 1 | LEVEL 2 | LEVEL 3 | TOTAL INVESTMENTS | ||||||||||||
| Assets:* |
|
|||||||||||||||
| Fixed Income: | ||||||||||||||||
| Bank Loans |
$ | – | $ | 336,859 | $ | – | $ | 336,859 | ||||||||
| Corporate Bonds |
– | 26,347,960 | – | 26,347,960 | ||||||||||||
|
|
|
|
|
|
|
|
|
|||||||||
| Total Fixed Income | – | 26,684,819 | – | 26,684,819 | ||||||||||||
|
|
|
|
|
|
|
|
|
|||||||||
| Short-Term Investment |
– | 1,578,060 | – | 1,578,060 | ||||||||||||
|
|
|
|
|
|
|
|
|
|||||||||
| Total | $ | – | $ | 28,262,879 | $ | – | $ | 28,262,879 | ||||||||
|
|
|
|
|
|
|
|
|
|||||||||
| * | There were no transfers between levels during the year ended June 30, 2016. |
159
Table of Contents
Babson Capital Funds Trust 2016 Annual Report
NOTES TO THE FINANCIAL STATEMENTS (CONTINUED)
June 30, 2016
160
Table of Contents
Babson Capital Funds Trust 2016 Annual Report
NOTES TO THE FINANCIAL STATEMENTS (CONTINUED)
June 30, 2016
161
Table of Contents
Babson Capital Funds Trust 2016 Annual Report
NOTES TO THE FINANCIAL STATEMENTS (CONTINUED)
June 30, 2016
162
Table of Contents
Babson Capital Funds Trust 2016 Annual Report
NOTES TO THE FINANCIAL STATEMENTS (CONTINUED)
June 30, 2016
163
Table of Contents
Babson Capital Funds Trust 2016 Annual Report
NOTES TO THE FINANCIAL STATEMENTS (CONTINUED)
June 30, 2016
164
Table of Contents
Babson Capital Funds Trust 2016 Annual Report
NOTES TO THE FINANCIAL STATEMENTS (CONTINUED)
June 30, 2016
Active Short Duration Bond Fund
| ASSET DERIVATIVES |
STATEMENTS OF ASSETS AND LIABILITIES LOCATION |
FOREIGN EXCHANGE CONTRACTS RISK |
INTEREST RATE RISK |
CREDIT RISK |
TOTAL | |||||||||||||
| Forward Foreign Currency Exchange Contracts |
Unrealized appreciation on forward foreign currency exchange contracts | $ | 48,523 | $ | – | $ | – | $ | 48,523 | |||||||||
| Futures Contracts |
Includes cumulative unrealized appreciation/ depreciation of futures contracts as reported in the Schedule of Investments. Only current day’s variation margin is reported within the Statements of Assets and Liabilities. |
– | 312,198 | – | 312,198 | |||||||||||||
|
|
|
|
|
|
|
|
|
|||||||||||
| Total |
$ | 48,523 | $ | 312,198 | $ | – | $ | 360,721 | ||||||||||
|
|
|
|
|
|
|
|
|
|||||||||||
| LIABILITY DERIVATIVES |
STATEMENTS OF ASSETS LOCATION |
FOREIGN EXCHANGE CONTRACTS RISK |
INTEREST RATE RISK |
CREDIT RISK |
TOTAL | |||||||||||||
| Forward Foreign Currency Exchange Contracts |
Unrealized depreciation on forward foreign currency exchange contracts | $ | (50,495 | ) | $ | – | $ | – | $ | (50,495 | ) | |||||||
| Futures Contracts |
Includes cumulative unrealized appreciation/depreciation of futures contracts as reported in the Schedule of Investments. Only current day’s variation margin is reported within the Statements of Assets and Liabilities. | – | (432,239 | ) | – | (432,239 | ) | |||||||||||
| OTC – Swaps Contracts |
Swap contracts, at fair value | – | – | (38,457 | ) | (38,457 | ) | |||||||||||
| Centrally Cleared Credit Default Swaps Contracts |
Includes cumulative unrealized appreciation/depreciation of swaps contracts as reported in the Schedule of Investments. Only current day’s variation margin is reported within the Statements of Assets and Liabilities. | – | – | (1,055 | ) | (1,055 | ) | |||||||||||
|
|
|
|
|
|
|
|
|
|||||||||||
| Total |
$ | (50,495 | ) | $ | (432,239 | ) | $ | (39,512 | ) | $ | (522,246 | ) | ||||||
|
|
|
|
|
|
|
|
|
|||||||||||
165
Table of Contents
Babson Capital Funds Trust 2016 Annual Report
NOTES TO THE FINANCIAL STATEMENTS (CONTINUED)
June 30, 2016
Total Return Bond Fund
| ASSET DERIVATIVES |
STATEMENTS OF ASSETS LOCATION |
FOREIGN EXCHANGE CONTRACTS RISK |
INTEREST RATE RISK |
CREDIT RISK |
TOTAL | |||||||||||||
| Forward Foreign Currency Exchange Contracts |
Unrealized appreciation on forward foreign currency exchange contracts | $ | 24,351 | $ | – | $ | – | $ | 24,351 | |||||||||
| Futures Contracts |
Includes cumulative unrealized appreciation/depreciation of futures contracts as reported in the Schedule of Investments. Only current day’s variation margin is reported within the Statements of Assets and Liabilities. | – | 115,238 | – | 115,238 | |||||||||||||
|
|
|
|
|
|
|
|
|
|||||||||||
| Total |
$ | 24,351 | $ | 115,238 | $ | – | $ | 139,589 | ||||||||||
|
|
|
|
|
|
|
|
|
|||||||||||
| LIABILITY DERIVATIVES |
STATEMENTS OF ASSETS AND LIABILITIES LOCATION |
FOREIGN EXCHANGE CONTRACTS RISK |
INTEREST RATE RISK |
CREDIT RISK |
TOTAL | |||||||||||||
| Forward Foreign Currency Exchange Contracts |
Unrealized depreciation on forward foreign currency exchange contracts | $ | (25,963 | ) | $ | – | $ | – | $ | (25,963 | ) | |||||||
| Futures Contracts |
Includes cumulative unrealized appreciation/ depreciation of futures contracts as reported in the Schedule of Investments. Only current day’s variation margin is reported within the Statements of Assets and Liabilities. | – | (24,120 | ) | – | (24,120 | ) | |||||||||||
| OTC – Swaps Contracts |
Swap contracts, at fair value | – | – | (9,614 | ) | (9,614 | ) | |||||||||||
| Centrally Cleared Credit Default Swaps Contracts |
Includes cumulative unrealized appreciation/ depreciation of swaps contracts as reported in the Schedule of Investments. Only current day’s variation margin is reported within the Statements of Assets and Liabilities. | – | – | (331 | ) | (331 | ) | |||||||||||
|
|
|
|
|
|
|
|
|
|||||||||||
| Total |
$ | (25,963 | ) | $ | (24,120 | ) | $ | (9,945 | ) | $ | (60,028 | ) | ||||||
|
|
|
|
|
|
|
|
|
|||||||||||
166
Table of Contents
Babson Capital Funds Trust 2016 Annual Report
NOTES TO THE FINANCIAL STATEMENTS (CONTINUED)
June 30, 2016
Emerging Markets Debt Blended Total Return Fund
| ASSET DERIVATIVES |
STATEMENTS OF ASSETS AND LIABILITIES LOCATION |
FOREIGN EXCHANGE CONTRACTS RISK |
INTEREST RATE RISK |
TOTAL | ||||||||||||
| Forward Foreign Currency Exchange Contracts |
|
Unrealized appreciation on forward foreign currency exchange contracts |
|
$ | 147,954 | $ | – | $ | 147,954 | |||||||
| Swaps Contracts |
|
Swap contracts, at fair value |
|
– | 12,211 | 12,211 | ||||||||||
|
|
|
|
|
|
|
|||||||||||
| Total |
$ | 147,954 | $ | 12,211 | $ | 160,165 | ||||||||||
|
|
|
|
|
|
|
|||||||||||
| LIABILITY DERIVATIVES |
STATEMENTS OF ASSETS AND LIABILITIES LOCATION |
FOREIGN EXCHANGE CONTRACTS RISK |
INTEREST RATE RISK |
TOTAL | ||||||||||||
| Forward Foreign Currency Exchange Contracts |
|
Unrealized depreciation on forward foreign currency exchange contracts |
|
$ | (114,417 | ) | $ | – | $ | (114,417 | ) | |||||
| Swaps Contracts |
|
Swap contracts, at fair value |
|
– | (8,941 | ) | (8,941 | ) | ||||||||
|
|
|
|
|
|
|
|||||||||||
| Total |
$ | (114,417 | ) | $ | (8,941 | ) | $ | (123,358 | ) | |||||||
|
|
|
|
|
|
|
|||||||||||
Emerging Markets Local Currency Debt Fund
| ASSET DERIVATIVES |
STATEMENTS OF ASSETS AND LIABILITIES LOCATION |
FOREIGN EXCHANGE CONTRACTS RISK |
INTEREST RATE RISK |
TOTAL | ||||||||||||
| Forward Foreign Currency Exchange Contracts |
|
Unrealized appreciation on forward foreign currency exchange contracts |
|
$ | 110,160 | $ | – | $ | 110,160 | |||||||
| Swaps Contracts |
|
Swap contracts, at fair value |
|
– | 42,875 | 42,875 | ||||||||||
|
|
|
|
|
|
|
|||||||||||
| Total |
$ | 110,160 | $ | 42,875 | $ | 153,035 | ||||||||||
|
|
|
|
|
|
|
|||||||||||
167
Table of Contents
Babson Capital Funds Trust 2016 Annual Report
NOTES TO THE FINANCIAL STATEMENTS (CONTINUED)
June 30, 2016
| LIABILITY DERIVATIVES |
STATEMENTS OF ASSETS AND LIABILITIES LOCATION |
FOREIGN EXCHANGE CONTRACTS RISK |
INTEREST RATE RISK |
TOTAL | ||||||||||||
| Forward Foreign Currency Exchange Contracts |
|
Unrealized depreciation on forward foreign currency exchange contracts |
|
$ | (111,356 | ) | $ | – | $ | (111,356 | ) | |||||
| Swaps Contracts |
|
Swap contracts, at fair value |
|
– | (6,395 | ) | (6,395 | ) | ||||||||
|
|
|
|
|
|
|
|||||||||||
| Total |
$ | (111,356 | ) | $ | (6,395 | ) | $ | (117,751 | ) | |||||||
|
|
|
|
|
|
|
|||||||||||
Global Credit Income Opportunities Fund
| FOREIGN EXCHANGE CONTRACTS RISK |
CREDIT RISK | TOTAL | ||||||||||
| Forward Foreign Currency Exchange Contracts |
$ | (76,585 | ) | $ | – | $ | (76,585 | ) | ||||
| Purchased Options(1) |
– | (940,540 | ) | (940,540 | ) | |||||||
| Options Written |
– | 847,320 | 847,320 | |||||||||
|
|
|
|
|
|
|
|||||||
| Total |
$ | (76,585 | ) | $ | (93,220 | ) | $ | (169,805 | ) | |||
|
|
|
|
|
|
|
|||||||
| (1) | Statements of Operations location: Net realized gain on investments. |
168
Table of Contents
Babson Capital Funds Trust 2016 Annual Report
NOTES TO THE FINANCIAL STATEMENTS (CONTINUED)
June 30, 2016
Active Short Duration Bond Fund
| INTEREST RATE RISK |
CREDIT RISK | TOTAL | ||||||||||
| Futures Contracts |
$ | 56,839 | $ | – | $ | 56,839 | ||||||
| Purchased Options(1) |
57,582 | – | 57,582 | |||||||||
| Swaps Contracts |
– | 11,753 | 11,753 | |||||||||
|
|
|
|
|
|
|
|||||||
| Total |
$ | 114,421 | $ | 11,753 | $ | 126,174 | ||||||
|
|
|
|
|
|
|
|||||||
| (1) | Statements of Operations location: Net realized gain on investments. |
Total Return Bond Fund
| FOREIGN EXCHANGE CONTRACTS RISK |
INTEREST RATE RISK |
CREDIT RISK | TOTAL | |||||||||||||
| Forward Foreign Currency Exchange Contracts |
$ | (7,665 | ) | $ | – | $ | – | $ | (7,665 | ) | ||||||
| Futures Contracts |
– | 41,803 | – | 41,803 | ||||||||||||
| Purchased Options(1) |
– | 104,558 | – | 104,558 | ||||||||||||
| Swaps Contracts |
– | – | 2,982 | 2,982 | ||||||||||||
|
|
|
|
|
|
|
|
|
|||||||||
| Total |
$ | (7,665 | ) | $ | 146,361 | $ | 2,982 | $ | 141,678 | |||||||
|
|
|
|
|
|
|
|
|
|||||||||
| (1) | Statements of Operations location: Net realized gain on investments. |
Emerging Markets Debt Blended Total Return Fund
| FOREIGN EXCHANGE CONTRACTS RISK |
INTEREST RATE RISK |
CREDIT RISK | TOTAL | |||||||||||||
| Forward Foreign Currency Exchange Contracts |
$ | (256,581 | ) | $ | – | $ | – | $ | (256,581 | ) | ||||||
| Futures Contracts |
– | (6,838 | ) | – | (6,838 | ) | ||||||||||
| Swaps Contracts |
– | (170,485 | ) | 4,390 | (166,095 | ) | ||||||||||
|
|
|
|
|
|
|
|
|
|||||||||
| Total |
$ | (256,581 | ) | $ | (177,323 | ) | $ | 4,390 | $ | (429,514 | ) | |||||
|
|
|
|
|
|
|
|
|
|||||||||
Emerging Markets Local Currency Debt Fund
| FOREIGN EXCHANGE CONTRACTS RISK |
INTEREST RATE RISK |
TOTAL | ||||||||||
| Forward Foreign Currency Exchange Contracts |
$ | (40,748 | ) | $ | – | $ | (40,748 | ) | ||||
| Swaps Contracts |
– | 21,286 | 21,286 | |||||||||
|
|
|
|
|
|
|
|||||||
| Total |
$ | (40,748 | ) | $ | 21,286 | $ | (19,462 | ) | ||||
|
|
|
|
|
|
|
|||||||
169
Table of Contents
Babson Capital Funds Trust 2016 Annual Report
NOTES TO THE FINANCIAL STATEMENTS (CONTINUED)
June 30, 2016
Global Credit Income Opportunities Fund
| FOREIGN EXCHANGE CONTRACTS RISK |
CREDIT RISK | TOTAL | ||||||||||
| Forward Foreign Currency Exchange Contracts |
$ | 1,522,515 | $ | – | $ | 1,522,515 | ||||||
| Purchased Options |
– | 30,173 | 30,173 | |||||||||
| Options Written |
– | (62,523 | ) | (62,523 | ) | |||||||
|
|
|
|
|
|
|
|||||||
| Total |
$ | 1,522,515 | $ | (32,350 | ) | $ | 1,490,165 | |||||
|
|
|
|
|
|
|
|||||||
Active Short Duration Bond Fund
| FOREIGN EXCHANGE CONTRACTS RISK |
INTEREST RATE RISK |
CREDIT RISK |
TOTAL | |||||||||||||
| Forward Foreign Currency Exchange Contracts |
$ | (1,972 | ) | $ | – | $ | – | $ | (1,972 | ) | ||||||
| Futures Contracts |
– | (120,041 | ) | – | (120,041 | ) | ||||||||||
| Swaps Contracts |
– | – | (17,711 | ) | (17,711 | ) | ||||||||||
|
|
|
|
|
|
|
|
|
|||||||||
| Total |
$ | (1,972 | ) | $ | (120,041 | ) | $ | (17,711 | ) | $ | (139,724 | ) | ||||
|
|
|
|
|
|
|
|
|
|||||||||
Total Return Bond Fund
| FOREIGN EXCHANGE CONTRACTS RISK |
INTEREST RATE RISK |
CREDIT RISK | TOTAL | |||||||||||||
| Forward Foreign Currency Exchange Contracts |
$ | (1,612 | ) | $ | – | $ | – | $ | (1,612 | ) | ||||||
| Futures Contracts |
– | 91,118 | – | 91,118 | ||||||||||||
| Swaps Contracts |
– | – | (4,694 | ) | (4,694 | ) | ||||||||||
|
|
|
|
|
|
|
|
|
|||||||||
| Total |
$ | (1,612 | ) | $ | 91,118 | $ | (4,694 | ) | $ | 84,812 | ||||||
|
|
|
|
|
|
|
|
|
|||||||||
170
Table of Contents
Babson Capital Funds Trust 2016 Annual Report
NOTES TO THE FINANCIAL STATEMENTS (CONTINUED)
June 30, 2016
Emerging Markets Debt Blended Total Return Fund
| FOREIGN EXCHANGE CONTRACTS RISK |
INTEREST RATE RISK |
TOTAL | ||||||||||
| Forward Foreign Currency Exchange Contracts |
$ | 33,537 | $ | – | $ | 33,537 | ||||||
| Swaps Contracts |
– | 3,270 | 3,270 | |||||||||
|
|
|
|
|
|
|
|||||||
| Total |
$ | 33,537 | $ | 3,270 | $ | 36,807 | ||||||
|
|
|
|
|
|
|
|||||||
Emerging Markets Local Currency Debt Fund
| FOREIGN EXCHANGE CONTRACTS RISK |
INTEREST RATE RISK |
TOTAL | ||||||||||
| Forward Foreign Currency Exchange Contracts |
$ | (1,196 | ) | $ | – | $ | – | |||||
| Swaps Contracts |
– | 36,480 | 36,480 | |||||||||
|
|
|
|
|
|
|
|||||||
| Total |
$ | (1,196 | ) | $ | 36,480 | $ | 35,284 | |||||
|
|
|
|
|
|
|
|||||||
Global Credit Income Opportunities Fund
| FOREIGN EXCHANGE CONTRACTS RISK |
CREDIT RISK |
TOTAL | ||||||||||
| Forward Foreign Currency Exchange Contracts(1) |
$ | 24,877,913 | $ | – | $ | 24,877,913 | ||||||
| Purchased Options(1) |
– | 24,230,769 | 24,230,769 | |||||||||
| Written Options(1) |
– | (24,230,769 | ) | (24,230,769 | ) | |||||||
|
|
|
|
|
|
|
|||||||
| Total |
$ | 24,877,913 | $ | – | $ | 24,877,913 | ||||||
|
|
|
|
|
|
|
|||||||
| (1) | Volume of derivative activity is based on an average of month-end notional amounts outstanding during the period. |
171
Table of Contents
Babson Capital Funds Trust 2016 Annual Report
NOTES TO THE FINANCIAL STATEMENTS (CONTINUED)
June 30, 2016
Active Short Duration Bond Fund
| FOREIGN EXCHANGE CONTRACTS RISK |
INTEREST RATE RISK |
CREDIT RISK | TOTAL | |||||||||||||
| Forward Foreign Currency Exchange Contracts(1) |
2,200,000 | – | – | 2,200,000 | ||||||||||||
| Futures Contracts(2) |
– | 266 | – | 266 | ||||||||||||
| Purchased Options(1) |
1,020,000 | 3,125,000 | – | 4,145,000 | ||||||||||||
| Swap Contracts(1) |
– | – | 502,500 | 502,500 | ||||||||||||
|
|
|
|
|
|
|
|
|
|||||||||
| Total |
3,220,000 | 3,125,266 | 502,500 | 6,847,766 | ||||||||||||
|
|
|
|
|
|
|
|
|
|||||||||
| (1) | Volume of derivative activity is based on an average of month-end notional amounts outstanding during the period. |
| (2) | Volume of derivative activity is based on an average of month-end contracts outstanding during the period. |
Total Return Bond Fund
| FOREIGN CONTRACTS RISK |
INTEREST RATE RISK |
CREDIT RISK | TOTAL | |||||||||||||
| Forward Foreign Currency Exchange Contracts(1) |
1,571,877 | – | – | 1,571,877 | ||||||||||||
| Futures Contracts(2) |
– | 47 | – | 47 | ||||||||||||
| Purchased Options(1) |
– | 3,892,500 | – | 3,892,500 | ||||||||||||
| Swap Contracts(1) |
– | – | 135,000 | 135,000 | ||||||||||||
|
|
|
|
|
|
|
|
|
|||||||||
| Total |
1,571,877 | 3,892,547 | 135,000 | 5,599,424 | ||||||||||||
|
|
|
|
|
|
|
|
|
|||||||||
| (1) | Volume of derivative activity is based on an average of month-end notional amounts outstanding during the period. |
| (2) | Volume of derivative activity is based on an average of month-end contracts outstanding during the period. |
Emerging Markets Debt Blended Total Return Fund
| FOREIGN CONTRACTS RISK |
INTEREST RATE RISK |
CREDIT RISK | TOTAL | |||||||||||||
| Forward Foreign Currency Exchange Contracts(1) |
14,587,836 | – | – | 14,587,836 | ||||||||||||
| Futures Contracts(2) |
– | 2 | – | 2 | ||||||||||||
| Swap Contracts(1) |
– | 43,781,275 | 111,111 | 43,892,386 | ||||||||||||
|
|
|
|
|
|
|
|
|
|||||||||
| Total |
14,587,836 | 43,781,277 | 111,111 | 58,480,224 | ||||||||||||
|
|
|
|
|
|
|
|
|
|||||||||
| (1) | Volume of derivative activity is based on an average of month-end notional amounts outstanding during the period. |
| (2) | Volume of derivative activity is based on an average of month-end contracts outstanding during the period. |
Emerging Markets Local Currency Debt Fund
| FOREIGN EXCHANGE CONTRACTS RISK |
INTEREST RATE RISK |
TOTAL | ||||||||||
| Forward Foreign Currency Exchange Contracts(1) |
9,376,554 | – | 9,376,554 | |||||||||
| Swap Contracts(1) |
– | 95,603,252 | 95,603,252 | |||||||||
|
|
|
|
|
|
|
|||||||
| Total |
9,376,554 | 95,603,252 | 104,979,806 | |||||||||
|
|
|
|
|
|
|
|||||||
| (1) | Volume of derivative activity is based on an average of month-end notional amounts outstanding during the period. |
172
Table of Contents
Babson Capital Funds Trust 2016 Annual Report
NOTES TO THE FINANCIAL STATEMENTS (CONTINUED)
June 30, 2016
Global High Yield Fund
| FOREIGN EXCHANGE CONTRACTS RISK |
||||
| Forward Foreign Currency Exchange Contracts(1) |
6,311,793 | |||
|
|
|
|||
| Total |
6,311,793 | |||
|
|
|
|||
| (1) | Volume of derivative activity is based on an average of month-end notional amounts outstanding during the period. |
| K. | Disclosures about Offsetting Assets and Liabilities |
The Financial Accounting Standards Board (“FASB”) issued Accounting Standards Update No. 2011-11 “Disclosures about Offsetting Assets and Liabilities” (“ASU 2011-11”). These disclosure requirements are intended to help better assess the effect or potential effect of offsetting arrangements on a Fund’s financial position. In addition, FASB issued Accounting Standards Update No. 2013-01 “Clarifying the Scope of Offsetting Assets and Liabilities” (“ASU 2013-01”), specifying which transactions are subject to disclosures about offsetting. In order to better define its contractual rights and to secure rights that will help the Fund mitigate its counterparty risk, the Fund may enter into an International Swaps and Derivatives Association, Inc. Master Agreement (“ISDA Master Agreement”) or similar agreement with its counterparties. An ISDA Master Agreement is a bilateral agreement between the Fund and a counterparty that governs certain OTC derivatives and typically contains, among other things, collateral posting terms and netting provisions in the event of a default and/or termination event. Under an ISDA Master Agreement, the Fund may, under certain circumstances, offset with the counterparty certain derivative financial instruments’ payables and/or receivables with collateral held and/or posted and create one single net payment. The provisions of the ISDA Master Agreement typically permit a single net payment in the event of default including the bankruptcy or insolvency of the counterparty. Bankruptcy or insolvency laws of a particular jurisdiction may restrict or prohibit the right of offset in bankruptcy, insolvency or other events. In addition, certain ISDA Master Agreements allow counterparties to terminate derivative contracts prior to maturity in the event the Fund’s net assets decline by a stated percentage or the Fund fails to meet the terms of its ISDA Master Agreements. The result would cause the Fund to accelerate payment of any net liability owed to the counterparty.
The following tables illustrate gross and net information about recognized assets eligible for offset in the Statement of Assets and Liabilities; and disclose such amounts subject to an enforceable master netting agreement or similar agreement, by counterparty. A master netting agreement is an agreement between two counterparties who have multiple contracts with each other that provides for the net settlement of all contracts, as well as cash collateral, through a single payment in the event of default on or termination of any one contract:
Global Floating Rate Fund
| DESCRIPTION | GROSS AMOUNTS OF RECOGNIZED ASSETS |
GROSS AMOUNTS OFFSET IN THE STATEMENTS OF ASSETS AND LIABILITIES |
NET AMOUNTS OF ASSETS PRESENTED IN THE STATEMENTS OF ASSETS AND LIABILITIES |
|||||||||
| Forward Foreign Currency Exchange Contracts |
$ | 1,819,442 | $ | – | $ | 1,819,442 | ||||||
|
|
|
|
|
|
|
|||||||
| Total |
$ | 1,819,442 | $ | – | $ | 1,819,442 | ||||||
|
|
|
|
|
|
|
|||||||
173
Table of Contents
Babson Capital Funds Trust 2016 Annual Report
NOTES TO THE FINANCIAL STATEMENTS (CONTINUED)
June 30, 2016
| GROSS AMOUNTS NOT OFFSET IN
THE STATEMENTS OF ASSETS AND LIABILITIES |
||||||||||||||||
| COUNTERPARTY | NET AMOUNTS OF ASSETS PRESENTED IN THE STATEMENTS OF ASSETS AND LIABILITIES |
FINANCIAL INSTRUMENTS |
CASH COLLATERAL RECEIVED (a) |
NET AMOUNT (b) |
||||||||||||
| Morgan Stanley & Co. |
$ | 1,819,442 | $ | (22,671 | ) | $ | – | $ | 1,796,771 | |||||||
|
|
|
|
|
|
|
|
|
|||||||||
| Total |
$ | 1,819,442 | $ | (22,671 | ) | $ | – | $ | 1,796,771 | |||||||
|
|
|
|
|
|
|
|
|
|||||||||
| (a) | Collateral disclosed is limited to an amount not to exceed 100% of the net amount of assets presented in the Statements of Assets and Liabilities, for each respective counterparty. |
| (b) | Net Amount represents the amount that is subject to loss in the event of a counterparty failure as of June 30, 2016. |
| DESCRIPTION | GROSS AMOUNTS OF RECOGNIZED LIABILITIES |
GROSS AMOUNTS OFFSET IN THE STATEMENTS OF ASSETS AND LIABILITIES |
NET AMOUNTS OF LIABILITIES PRESENTED IN THE STATEMENTS OF ASSETS AND LIABILITIES |
|||||||||
| Forward Foreign Currency Exchange Contracts |
$ | 22,671 | $ | – | $ | 22,671 | ||||||
|
|
|
|
|
|
|
|||||||
| Total |
$ | 22,671 | $ | – | $ | 22,671 | ||||||
|
|
|
|
|
|
|
|||||||
| GROSS AMOUNTS NOT OFFSET IN
THE STATEMENTS OF ASSETS AND LIABILITIES |
||||||||||||||||
| COUNTERPARTY | NET AMOUNTS OF LIABILITIES PRESENTED IN THE STATEMENTS OF ASSETS AND LIABILITIES |
FINANCIAL INSTRUMENTS |
CASH COLLATERAL PLEDGED (a) |
NET AMOUNT (b) |
||||||||||||
| Morgan Stanley & Co. |
$ | 22,671 | $ | (22,671 | ) | $ | – | $ | – | |||||||
|
|
|
|
|
|
|
|
|
|||||||||
| Total |
$ | 22,671 | $ | (22,671 | ) | $ | – | $ | – | |||||||
|
|
|
|
|
|
|
|
|
|||||||||
| (a) | Collateral disclosed is limited to an amount not to exceed 100% of the net amount of assets presented in the Statements of Assets and Liabilities, for each respective counterparty. |
| (b) | Net Amount represents the amount that is subject to loss in the event of a counterparty failure as of June 30, 2016. |
Global Credit Income Opportunities Fund
| DESCRIPTION | GROSS AMOUNTS OF RECOGNIZED ASSETS |
GROSS AMOUNTS OFFSET IN THE STATEMENTS OF ASSETS AND LIABILITIES |
NET AMOUNTS OF ASSETS PRESENTED IN THE STATEMENTS OF ASSETS AND LIABILITIES |
|||||||||
| Forward Foreign Currency Exchange Contracts |
$ | 1,379,685 | $ | – | $ | 1,379,685 | ||||||
|
|
|
|
|
|
|
|||||||
| Total |
$ | 1,379,685 | $ | – | $ | 1,379,685 | ||||||
|
|
|
|
|
|
|
|||||||
174
Table of Contents
Babson Capital Funds Trust 2016 Annual Report
NOTES TO THE FINANCIAL STATEMENTS (CONTINUED)
June 30, 2016
| GROSS AMOUNTS NOT OFFSET IN
THE STATEMENTS OF ASSETS AND LIABILITIES |
||||||||||||||||
| COUNTERPARTY | NET AMOUNTS OF ASSETS PRESENTED IN THE STATEMENTS OF ASSETS AND LIABILITIES |
FINANCIAL INSTRUMENTS |
CASH COLLATERAL RECEIVED (a) |
NET AMOUNT (b) |
||||||||||||
| Bank of America N.A. |
$ | 1,290 | $ | – | $ | – | $ | 1,290 | ||||||||
| Citibank N.A. |
15,758 | – | – | 15,758 | ||||||||||||
| JPMorgan Chase Bank N.A. |
1,346,730 | (802 | ) | (1,345,928 | ) | – | ||||||||||
| Morgan Stanley & Co. |
15,907 | – | – | 15,907 | ||||||||||||
|
|
|
|
|
|
|
|
|
|||||||||
| Total |
$ | 1,379,685 | $ | (802 | ) | $ | (1,345,928 | ) | $ | 32,955 | ||||||
|
|
|
|
|
|
|
|
|
|||||||||
| (a) | Collateral disclosed is limited to an amount not to exceed 100% of the net amount of assets presented in the Statements of Assets and Liabilities, for each respective counterparty. |
| (b) | Net Amount represents the amount that is subject to loss in the event of a counterparty failure as of June 30, 2016. |
| DESCRIPTION | GROSS AMOUNTS OF RECOGNIZED LIABILITIES |
GROSS AMOUNTS OFFSET IN THE STATEMENTS OF ASSETS AND LIABILITIES |
NET AMOUNTS OF LIABILITIES PRESENTED IN THE STATEMENTS OF ASSETS AND LIABILITIES |
|||||||||
| Forward Foreign Currency Exchange Contracts |
$ | 802 | $ | – | $ | 802 | ||||||
|
|
|
|
|
|
|
|||||||
| Total |
$ | 802 | $ | – | $ | 802 | ||||||
|
|
|
|
|
|
|
|||||||
| GROSS AMOUNTS NOT OFFSET IN
THE STATEMENTS OF ASSETS AND LIABILITIES |
||||||||||||||||
| COUNTERPARTY | NET AMOUNTS OF LIABILITIES PRESENTED IN THE STATEMENTS OF ASSETS AND LIABILITIES |
FINANCIAL INSTRUMENTS |
CASH COLLATERAL PLEDGED (a) |
NET AMOUNT (b) |
||||||||||||
| JPMorgan Chase Bank N.A. |
$ | 802 | $ | (802 | ) | $ | – | $ | – | |||||||
|
|
|
|
|
|
|
|
|
|||||||||
| Total |
$ | 802 | $ | (802 | ) | $ | – | $ | – | |||||||
|
|
|
|
|
|
|
|
|
|||||||||
| (a) | Collateral disclosed is limited to an amount not to exceed 100% of the net amount of assets presented in the Statements of Assets and Liabilities, for each respective counterparty. |
| (b) | Net Amount represents the amount that is subject to loss in the event of a counterparty failure as of June 30, 2016. |
175
Table of Contents
Babson Capital Funds Trust 2016 Annual Report
NOTES TO THE FINANCIAL STATEMENTS (CONTINUED)
June 30, 2016
Active Short Duration Bond Fund
| DESCRIPTION | GROSS AMOUNTS OF RECOGNIZED ASSETS |
GROSS AMOUNTS OFFSET IN THE STATEMENTS OF ASSETS AND LIABILITIES |
NET AMOUNTS OF ASSETS PRESENTED IN THE STATEMENTS OF ASSETS AND LIABILITIES |
|||||||||
| Forward Foreign Currency Exchange Contracts |
$ | 48,523 | $ | – | $ | 48,523 | ||||||
|
|
|
|
|
|
|
|||||||
| Total |
$ | 48,523 | $ | – | $ | 48,523 | ||||||
|
|
|
|
|
|
|
|||||||
| GROSS AMOUNTS NOT OFFSET IN
THE STATEMENTS OF ASSETS AND LIABILITIES |
||||||||||||||||
| COUNTERPARTY | NET AMOUNTS OF ASSETS PRESENTED IN THE STATEMENTS OF ASSETS AND LIABILITIES |
FINANCIAL INSTRUMENTS |
CASH COLLATERAL RECEIVED (a) |
NET AMOUNT (b) |
||||||||||||
| JPMorgan Chase Bank N.A. |
$ | 48,523 | $ | (48,523 | ) | $ | – | $ | – | |||||||
|
|
|
|
|
|
|
|
|
|||||||||
| Total |
$ | 48,523 | $ | (48,523 | ) | $ | – | $ | – | |||||||
|
|
|
|
|
|
|
|
|
|||||||||
| (a) | Collateral disclosed is limited to an amount not to exceed 100% of the net amount of assets presented in the Statements of Assets and Liabilities, for each respective counterparty. |
| (b) | Net Amount represents the amount that is subject to loss in the event of a counterparty failure as of June 30, 2016. |
| DESCRIPTION | GROSS AMOUNTS OF RECOGNIZED LIABILITIES |
GROSS AMOUNTS OFFSET IN THE STATEMENTS OF ASSETS AND LIABILITIES |
NET AMOUNTS OF LIABILITIES PRESENTED IN THE STATEMENTS OF ASSETS AND LIABILITIES |
|||||||||
| Forward Foreign Currency Exchange Contracts |
$ | 50,495 | $ | – | $ | 50,495 | ||||||
| Swap Contracts |
38,457 | – | 38,457 | |||||||||
|
|
|
|
|
|
|
|||||||
| Total |
$ | 88,952 | $ | – | $ | 88,952 | ||||||
|
|
|
|
|
|
|
|||||||
| GROSS AMOUNTS NOT OFFSET IN
THE STATEMENTS OF ASSETS AND LIABILITIES |
||||||||||||||||
| COUNTERPARTY | NET AMOUNTS OF LIABILITIES PRESENTED IN THE STATEMENTS OF ASSETS AND LIABILITIES |
FINANCIAL INSTRUMENTS |
CASH COLLATERAL PLEDGED (a) |
NET AMOUNT (b) |
||||||||||||
| Goldman Sachs & Co. |
$ | 21,447 | $ | – | $ | – | $ | 21,447 | ||||||||
| JPMorgan Chase Bank N.A. |
67,505 | (48,523 | ) | – | 18,982 | |||||||||||
|
|
|
|
|
|
|
|
|
|||||||||
| Total |
$ | 88,952 | $ | (48,523 | ) | $ | – | $ | 40,429 | |||||||
|
|
|
|
|
|
|
|
|
|||||||||
| (a) | Collateral disclosed is limited to an amount not to exceed 100% of the net amount of assets presented in the Statements of Assets and Liabilities, for each respective counterparty. |
| (b) | Net Amount represents the amount that is subject to loss in the event of a counterparty failure as of June 30, 2016. |
176
Table of Contents
Babson Capital Funds Trust 2016 Annual Report
NOTES TO THE FINANCIAL STATEMENTS (CONTINUED)
June 30, 2016
Total Return Bond Fund
| DESCRIPTION | GROSS AMOUNTS OF RECOGNIZED ASSETS |
GROSS AMOUNTS OFFSET IN THE STATEMENTS OF ASSETS AND LIABILITIES |
NET AMOUNTS OF ASSETS PRESENTED IN THE STATEMENTS OF ASSETS AND LIABILITIES |
|||||||||
| Forward Foreign Currency Exchange Contracts |
$ | 24,351 | $ | – | $ | 24,351 | ||||||
|
|
|
|
|
|
|
|||||||
| Total |
$ | 24,351 | $ | – | $ | 24,351 | ||||||
|
|
|
|
|
|
|
|||||||
| GROSS AMOUNTS NOT OFFSET IN THE STATEMENTS OF ASSETS AND LIABILITIES |
||||||||||||||||
| COUNTERPARTY | NET AMOUNTS OF ASSETS PRESENTED IN THE STATEMENTS OF ASSETS AND LIABILITIES |
FINANCIAL INSTRUMENTS |
CASH COLLATERAL RECEIVED (a) |
NET AMOUNT (b) |
||||||||||||
| Bank of America N.A. |
$ | 1,389 | $ | (263 | ) | $ | – | $ | 1,126 | |||||||
| BNP Paribas S.A. |
2,668 | (951 | ) | – | 1,717 | |||||||||||
| Citibank N.A. |
693 | (693 | ) | – | – | |||||||||||
| Goldman Sachs & Co. |
505 | (505 | ) | – | – | |||||||||||
| JPMorgan Chase Bank N.A. |
19,096 | (19,096 | ) | – | – | |||||||||||
|
|
|
|
|
|
|
|
|
|||||||||
| Total |
$ | 24,351 | $ | (21,508 | ) | $ | – | $ | 2,843 | |||||||
|
|
|
|
|
|
|
|
|
|||||||||
| (a) | Collateral disclosed is limited to an amount not to exceed 100% of the net amount of assets presented in the Statements of Assets and Liabilities, for each respective counterparty. |
| (b) | Net Amount represents the amount that is subject to loss in the event of a counterparty failure as of June 30, 2016. |
| DESCRIPTION | GROSS AMOUNTS OF RECOGNIZED LIABILITIES |
GROSS AMOUNTS OFFSET IN THE STATEMENTS OF ASSETS AND LIABILITIES |
NET AMOUNTS OF LIABILITIES PRESENTED IN THE STATEMENTS OF ASSETS AND LIABILITIES |
|||||||||
| Forward Foreign Currency Exchange Contracts |
$ | 25,963 | $ | – | $ | 25,963 | ||||||
| Swap contracts |
9,614 | – | 9,614 | |||||||||
|
|
|
|
|
|
|
|||||||
| Total |
$ | 35,577 | $ | – | $ | 35,577 | ||||||
|
|
|
|
|
|
|
|||||||
177
Table of Contents
Babson Capital Funds Trust 2016 Annual Report
NOTES TO THE FINANCIAL STATEMENTS (CONTINUED)
June 30, 2016
| GROSS AMOUNTS NOT OFFSET IN THE STATEMENTS OF ASSETS AND LIABILITIES |
||||||||||||||||
| COUNTERPARTY |
NET AMOUNTS OF LIABILITIES PRESENTED IN THE STATEMENTS OF ASSETS AND LIABILITIES |
FINANCIAL INSTRUMENTS |
CASH COLLATERAL |
NET AMOUNT (b) |
||||||||||||
| Bank of America N.A. |
$ | 263 | $ | (263 | ) | $ | – | $ | – | |||||||
| BNP Paribas S.A. |
951 | (951 | ) | – | – | |||||||||||
| Citibank N.A. |
4,159 | (693 | ) | – | 3,466 | |||||||||||
| Goldman Sachs & Co. |
5,476 | (505 | ) | – | 4,971 | |||||||||||
| JPMorgan Chase Bank N.A. |
24,728 | (19,096 | ) | – | 5,632 | |||||||||||
|
|
|
|
|
|
|
|
|
|||||||||
| Total |
$ | 35,577 | $ | (21,508 | ) | $ | – | $ | 14,069 | |||||||
|
|
|
|
|
|
|
|
|
|||||||||
| (a) | Collateral disclosed is limited to an amount not to exceed 100% of the net amount of assets presented in the Statements of Assets and Liabilities, for each respective counterparty. |
| (b) | Net Amount represents the amount that is subject to loss in the event of a counterparty failure as of June 30, 2016. |
Emerging Markets Debt Blended Total Return Fund
| DESCRIPTION |
GROSS AMOUNTS OF RECOGNIZED ASSETS |
GROSS AMOUNTS OFFSET IN THE STATEMENTS OF ASSETS AND LIABILITIES |
NET AMOUNTS OF ASSETS PRESENTED IN THE STATEMENTS OF ASSETS AND LIABILITIES |
|||||||||
| Forward Foreign Currency Exchange Contracts |
$ | 147,954 | $ | – | $ | 147,954 | ||||||
| Swap contracts |
12,211 | – | 12,211 | |||||||||
|
|
|
|
|
|
|
|||||||
| Total |
$ | 160,165 | $ | – | $ | 160,165 | ||||||
|
|
|
|
|
|
|
|||||||
| GROSS AMOUNTS NOT OFFSET IN THE STATEMENTS OF ASSETS AND LIABILITIES |
||||||||||||||||
| COUNTERPARTY | NET AMOUNTS OF ASSETS PRESENTED IN THE STATEMENTS OF ASSETS AND LIABILITIES |
FINANCIAL INSTRUMENTS |
CASH COLLATERAL RECEIVED (a) |
NET AMOUNT (b) |
||||||||||||
| Bank of America N.A. |
$ | 27,449 | $ | (24,277 | ) | $ | – | $ | 3,172 | |||||||
| BNP Paribas S.A. |
44,346 | (14,965 | ) | – | 29,381 | |||||||||||
| Citibank N.A. |
19,535 | (865 | ) | – | 18,670 | |||||||||||
| Goldman Sachs & Co. |
8,381 | (8,381 | ) | – | – | |||||||||||
| JPMorgan Chase Bank N.A. |
60,454 | (44,970 | ) | – | 15,484 | |||||||||||
|
|
|
|
|
|
|
|
|
|||||||||
| Total |
$ | 160,165 | $ | (93,458 | ) | $ | – | $ | 66,707 | |||||||
|
|
|
|
|
|
|
|
|
|||||||||
| (a) | Collateral disclosed is limited to an amount not to exceed 100% of the net amount of assets presented in the Statements of Assets and Liabilities, for each respective counterparty. |
| (b) | Net Amount represents the amount that is subject to loss in the event of a counterparty failure as of June 30, 2016. |
178
Table of Contents
Babson Capital Funds Trust 2016 Annual Report
NOTES TO THE FINANCIAL STATEMENTS (CONTINUED)
June 30, 2016
| DESCRIPTION | GROSS AMOUNTS OF RECOGNIZED LIABILITIES |
GROSS AMOUNTS OFFSET IN THE STATEMENTS OF ASSETS AND LIABILITIES |
NET AMOUNTS OF LIABILITIES PRESENTED IN THE STATEMENTS OF ASSETS AND LIABILITIES |
|||||||||
| Forward Foreign Currency Exchange Contracts |
$ | 114,417 | $ | – | $ | 114,417 | ||||||
| Swap contracts |
8,941 | – | 8,941 | |||||||||
|
|
|
|
|
|
|
|||||||
| Total |
$ | 123,358 | $ | – | $ | 123,358 | ||||||
|
|
|
|
|
|
|
|||||||
| GROSS AMOUNTS NOT OFFSET IN THE STATEMENTS OF ASSETS AND LIABILITIES |
||||||||||||||||
| COUNTERPARTY | NET AMOUNTS OF LIABILITIES PRESENTED IN THE STATEMENTS OF ASSETS AND LIABILITIES |
FINANCIAL INSTRUMENTS |
CASH COLLATERAL PLEDGED (a) |
NET AMOUNT (b) |
||||||||||||
| Bank of America N.A. |
$ | 24,277 | $ | (24,277 | ) | $ | – | $ | – | |||||||
| BNP Paribas S.A. |
14,965 | (14,965 | ) | – | – | |||||||||||
| Citibank N.A. |
865 | (865 | ) | – | – | |||||||||||
| Goldman Sachs & Co. |
38,281 | (8,381 | ) | – | 29,900 | |||||||||||
| JPMorgan Chase Bank N.A. |
44,970 | (44,970 | ) | – | – | |||||||||||
|
|
|
|
|
|
|
|
|
|||||||||
| Total |
$ | 123,358 | $ | (93,458 | ) | $ | – | $ | 29,900 | |||||||
|
|
|
|
|
|
|
|
|
|||||||||
| (a) | Collateral disclosed is limited to an amount not to exceed 100% of the net amount of assets presented in the Statements of Assets and Liabilities, for each respective counterparty. |
| (b) | Net Amount represents the amount that is subject to loss in the event of a counterparty failure as of June 30, 2016. |
Emerging Markets Local Currency Debt Fund
| DESCRIPTION | GROSS AMOUNTS OF RECOGNIZED ASSETS |
GROSS AMOUNTS OFFSET IN THE STATEMENTS OF ASSETS AND LIABILITIES |
NET AMOUNTS OF ASSETS PRESENTED IN THE STATEMENTS OF ASSETS AND LIABILITIES |
|||||||||
| Forward Foreign Currency Exchange Contracts |
$ | 110,160 | $ | – | $ | 110,160 | ||||||
| Swap contracts |
42,875 | – | 42,875 | |||||||||
|
|
|
|
|
|
|
|||||||
| Total |
$ | 153,035 | $ | – | $ | 153,035 | ||||||
|
|
|
|
|
|
|
|||||||
179
Table of Contents
Babson Capital Funds Trust 2016 Annual Report
NOTES TO THE FINANCIAL STATEMENTS (CONTINUED)
June 30, 2016
| GROSS AMOUNTS NOT OFFSET IN
THE STATEMENTS OF ASSETS AND LIABILITIES |
||||||||||||||||
| COUNTERPARTY | NET AMOUNTS OF ASSETS PRESENTED IN THE STATEMENTS OF ASSETS AND LIABILITIES |
FINANCIAL INSTRUMENTS |
CASH COLLATERAL RECEIVED (a) |
NET AMOUNT (b) |
||||||||||||
| Bank of America N.A. |
$ | 45,145 | $ | (1,332 | ) | $ | – | $ | 43,813 | |||||||
| BNP Paribas S.A. |
27,144 | (27,144 | ) | – | – | |||||||||||
| Citibank N.A. |
7,271 | (3,808 | ) | – | 3,463 | |||||||||||
| Goldman Sachs & Co. |
4,076 | (2,640 | ) | – | 1,436 | |||||||||||
| JPMorgan Chase Bank N.A. |
69,399 | (64,935 | ) | – | 4,464 | |||||||||||
|
|
|
|
|
|
|
|
|
|||||||||
| Total |
$ | 153,035 | $ | (99,859 | ) | $ | – | $ | 53,176 | |||||||
|
|
|
|
|
|
|
|
|
|||||||||
| (a) | Collateral disclosed is limited to an amount not to exceed 100% of the net amount of assets presented in the Statements of Assets and Liabilities, for each respective counterparty. |
| (b) | Net Amount represents the amount that is subject to loss in the event of a counterparty failure as of June 30, 2016. |
| DESCRIPTION | GROSS AMOUNTS OF RECOGNIZED LIABILITIES |
GROSS AMOUNTS OFFSET IN THE STATEMENTS OF ASSETS AND LIABILITIES |
NET AMOUNTS OF LIABILITIES PRESENTED IN THE STATEMENTS OF ASSETS AND LIABILITIES |
|||||||||
| Forward Foreign Currency Exchange Contracts |
$ | 111,356 | $ | – | $ | 111,356 | ||||||
| Swap contracts |
6,395 | – | 6,395 | |||||||||
|
|
|
|
|
|
|
|||||||
| Total |
$ | 117,751 | $ | – | $ | 117,751 | ||||||
|
|
|
|
|
|
|
|||||||
| GROSS AMOUNTS NOT OFFSET IN THE STATEMENTS OF ASSETS AND LIABILITIES |
||||||||||||||||
| COUNTERPARTY | NET AMOUNTS OF LIABILITIES PRESENTED IN THE STATEMENTS OF ASSETS AND LIABILITIES |
FINANCIAL INSTRUMENTS |
CASH COLLATERAL PLEDGED (a) |
NET AMOUNT (b) |
||||||||||||
| Bank of America N.A. |
$ | 1,332 | $ | (1,332 | ) | $ | – | $ | – | |||||||
| BNP Paribas S.A. |
45,036 | (27,144 | ) | – | 17,892 | |||||||||||
| Citibank N.A. |
3,808 | (3,808 | ) | – | – | |||||||||||
| Goldman Sachs & Co. |
2,640 | (2,640 | ) | – | – | |||||||||||
| JPMorgan Chase Bank N.A. |
64,935 | (64,935 | ) | – | – | |||||||||||
|
|
|
|
|
|
|
|
|
|||||||||
| Total |
$ | 117,751 | $ | (99,859 | ) | $ | – | $ | 17,892 | |||||||
|
|
|
|
|
|
|
|
|
|||||||||
| (a) | Collateral disclosed is limited to an amount not to exceed 100% of the net amount of assets presented in the Statements of Assets and Liabilities, for each respective counterparty. |
| (b) | Net Amount represents the amount that is subject to loss in the event of a counterparty failure as of June 30, 2016. |
180
Table of Contents
Babson Capital Funds Trust 2016 Annual Report
NOTES TO THE FINANCIAL STATEMENTS (CONTINUED)
June 30, 2016
Global High Yield Fund
| DESCRIPTION | GROSS AMOUNTS OF RECOGNIZED ASSETS |
GROSS AMOUNTS OFFSET IN THE STATEMENTS OF ASSETS AND LIABILITIES |
NET AMOUNTS OF ASSETS PRESENTED IN THE STATEMENTS OF ASSETS AND LIABILITIES |
|||||||||
| Forward Foreign Currency Exchange Contracts |
$ | 284,477 | $ | – | $ | 284,477 | ||||||
|
|
|
|
|
|
|
|||||||
| Total |
$ | 284,477 | $ | – | $ | 284,477 | ||||||
|
|
|
|
|
|
|
|||||||
| GROSS AMOUNTS NOT OFFSET IN THE STATEMENTS OF ASSETS AND LIABILITIES |
||||||||||||||||
| COUNTERPARTY | NET AMOUNTS OF ASSETS PRESENTED IN THE STATEMENTS OF ASSETS AND LIABILITIES |
FINANCIAL INSTRUMENTS |
CASH COLLATERAL RECEIVED (a) |
NET AMOUNT (b) |
||||||||||||
| BNP Paribas S.A. |
$ | 630 | $ | – | $ | – | $ | 630 | ||||||||
| Citibank N.A. |
283,847 | – | – | 283,847 | ||||||||||||
|
|
|
|
|
|
|
|
|
|||||||||
| Total |
$ | 284,477 | $ | – | $ | – | $ | 284,477 | ||||||||
|
|
|
|
|
|
|
|
|
|||||||||
| (a) | Collateral disclosed is limited to an amount not to exceed 100% of the net amount of assets presented in the Statements of Assets and Liabilities, for each respective counterparty. |
| (b) | Net Amount represents the amount that is subject to loss in the event of a counterparty failure as of June 30, 2016. |
| DESCRIPTION | GROSS AMOUNTS OF RECOGNIZED LIABILITIES |
GROSS AMOUNTS OFFSET IN THE STATEMENTS OF ASSETS AND LIABILITIES |
NET AMOUNTS OF LIABILITIES PRESENTED IN THE STATEMENTS OF ASSETS AND LIABILITIES |
|||||||||
| Forward Foreign Currency Exchange Contracts |
$ | 3,588 | $ | – | $ | 3,588 | ||||||
|
|
|
|
|
|
|
|||||||
| Total |
$ | 3,588 | $ | – | $ | 3,588 | ||||||
|
|
|
|
|
|
|
|||||||
| GROSS AMOUNTS NOT OFFSET IN THE STATEMENTS OF ASSETS AND LIABILITIES |
||||||||||||||||
| COUNTERPARTY | NET AMOUNTS OF LIABILITIES PRESENTED IN THE STATEMENTS OF ASSETS AND LIABILITIES |
FINANCIAL INSTRUMENTS |
CASH COLLATERAL PLEDGED (a) |
NET AMOUNT (b) |
||||||||||||
| Goldman Sachs & Co. |
$ | 3,266 | $ | – | $ | – | $ | 3,266 | ||||||||
| JPMorgan Chase Bank N.A. |
322 | – | – | 322 | ||||||||||||
|
|
|
|
|
|
|
|
|
|||||||||
| Total |
$ | 3,588 | $ | – | $ | – | $ | 3,588 | ||||||||
|
|
|
|
|
|
|
|
|
|||||||||
| (a) | Collateral disclosed is limited to an amount not to exceed 100% of the net amount of assets presented in the Statements of Assets and Liabilities, for each respective counterparty. |
| (b) | Net Amount represents the amount that is subject to loss in the event of a counterparty failure as of June 30, 2016. |
181
Table of Contents
Babson Capital Funds Trust 2016 Annual Report
NOTES TO THE FINANCIAL STATEMENTS (CONTINUED)
June 30, 2016
182
Table of Contents
Babson Capital Funds Trust 2016 Annual Report
NOTES TO THE FINANCIAL STATEMENTS (CONTINUED)
June 30, 2016
183
Table of Contents
Babson Capital Funds Trust 2016 Annual Report
NOTES TO THE FINANCIAL STATEMENTS (CONTINUED)
June 30, 2016
As of June 30, 2016, the components of distributable earnings on a tax-basis were as follows:
| UNDISTRIBUTED ORDINARY INCOME |
UNDISTRIBUTED LONG-TERM CAPITAL GAINS |
CAPITAL LOSS CARRYFORWARDS |
OTHER TEMPORARY DIFFERENCES |
UNREALIZED APPRECIATION (DEPRECIATION) |
TOTAL DISTRIBUTABLE EARNINGS |
|||||||||||||||||||
| Global Floating Rate Fund |
$ | – | $ | – | $ | (1,879,277 | ) | (223,318 | ) | $ | (11,931,316 | ) | $ | (14,033,911 | ) | |||||||||
| Global Credit Income Opportunities Fund |
– | – | (2,734,993 | ) | (319,126 | ) | (8,270,720 | ) | (11,324,839 | ) | ||||||||||||||
| Active Short Duration Bond Fund |
90,502 | – | (200,887 | ) | (78,416 | ) | 1,009,111 | 820,310 | ||||||||||||||||
| Total Return Bond Fund |
43,383 | – | (37,575 | ) | (53,860 | ) | 516,799 | 468,747 | ||||||||||||||||
| Emerging Markets Debt Blended Total Return Fund |
– | – | (165,784 | ) | (40,485 | ) | 106,157 | (100,112 | ) | |||||||||||||||
184
Table of Contents
Babson Capital Funds Trust 2016 Annual Report
NOTES TO THE FINANCIAL STATEMENTS (CONTINUED)
June 30, 2016
| UNDISTRIBUTED ORDINARY INCOME |
UNDISTRIBUTED LONG-TERM CAPITAL GAINS |
CAPITAL LOSS CARRYFORWARDS |
OTHER TEMPORARY DIFFERENCES |
UNREALIZED APPRECIATION (DEPRECIATION) |
TOTAL DISTRIBUTABLE EARNINGS |
|||||||||||||||||||
| Emerging Markets Local Currency Debt Fund |
220,909 | 222 | – | (23,425 | ) | 262,806 | 460,512 | |||||||||||||||||
| Global High Yield Fund |
565,223 | 200,252 | – | (139,100 | ) | (493,994 | ) | 132,381 | ||||||||||||||||
| U.S. High Yield Fund |
430,397 | – | – | (141,827 | ) | 181,423 | 469,993 | |||||||||||||||||
On June 30, 2016, the following funds had capital loss carryforwards available to be offset against future net capital gains through the indicated expiration dates as follows:
| EXPIRING JUNE 30, | ||||||||||||||||||||
| 2016 | 2017 | 2018 | UNLIMITED - TERM |
UNLIMITED - TERM |
||||||||||||||||
| Global Floating Rate Fund |
$ | – | $ | – | $ | – | $ | 828,275 | $ | 159,728 | ||||||||||
| Global Credit Income Opportunities |
– | – | – | 953,908 | 1,395,956 | |||||||||||||||
| Active Short Duration Bond Fund |
– | – | – | – | 15,294 | |||||||||||||||
Under current tax rules, regulated investment companies can elect to treat certain late-year ordinary losses incurred and post-October capital losses (capital losses realized after October 31) as arising on the first day of the following taxable year. As of June 30, 2016, Active Short Duration Bond Fund, Total Return Bond Fund and Emerging Markets Debt Blended Total Return Fund have elected to defer current year post-October losses of $185,593, $37,575 and $124,600, respectively.
As of June 30, 2016, the aggregate unrealized security gains and losses based on cost for U.S. federal income tax purposes were as follows:
| COST OF INVESTMENTS |
GROSS UNREALIZED APPRECIATION |
GROSS UNREALIZED DEPRECIATION |
NET UNREALIZED APPRECIATION (DEPRECIATION) |
|||||||||||||
| Global Floating Rate Fund |
$ | 184,607,211 | $ | 636,790 | $ | (12,580,357 | ) | $ | (11,943,567 | ) | ||||||
| Global Credit Income Opportunities Fund |
109,722,294 | 963,055 | (9,258,258 | ) | (8,295,203 | ) | ||||||||||
| Active Short Duration Bond Fund |
155,305,432 | 1,249,128 | (240,018 | ) | 1,009,110 | |||||||||||
| Total Return Bond Fund |
29,712,914 | 629,947 | (113,384 | ) | 516,563 | |||||||||||
| Emerging Markets Debt Blended Total Return Fund |
9,643,460 | 243,405 | (133,749 | ) | 109,656 | |||||||||||
| Emerging Markets Local Currency Debt Fund |
5,101,929 | 265,518 | (42,205 | ) | 223,313 | |||||||||||
| Global High Yield Fund |
25,604,275 | 442,020 | (930,221 | ) | (488,201 | ) | ||||||||||
| U.S. High Yield Fund |
28,081,456 | 650,783 | (469,360 | ) | 181,423 | |||||||||||
185
Table of Contents
Babson Capital Funds Trust 2016 Annual Report
NOTES TO THE FINANCIAL STATEMENTS (CONTINUED)
June 30, 2016
| 8. | Investment Transactions |
Purchases and sales of securities (excluding short-term debt securities) for the year ended June 30, 2016 were as follows:
| PURCHASES | SALES | GOVERNMENT PURCHASES |
GOVERNMENT SALES |
|||||||||||||
| Global Floating Rate Fund |
$ | 111,808,460 | $ | 96,350,433 | $ | – | $ | – | ||||||||
| Global Credit Income Opportunities Fund |
79,800,535 | 47,124,187 | – | – | ||||||||||||
| Active Short Duration Bond Fund |
143,749,531 | 24,051,909 | 227,094,545 | 196,279,704 | ||||||||||||
| Total Return Bond Fund |
22,487,842 | 4,341,509 | 107,561,251 | 100,630,581 | ||||||||||||
| Emerging Markets Debt Blended Total Return Fund |
16,741,059 | 7,495,934 | – | – | ||||||||||||
| Emerging Markets Local Currency Debt Fund |
6,231,646 | 1,769,899 | – | – | ||||||||||||
| Global High Yield Fund |
45,438,304 | 19,736,486 | – | – | ||||||||||||
| U.S. High Yield Fund |
45,774,872 | 19,024,184 | – | – | ||||||||||||
| 9. | Common Stock |
Transactions in common stock for the year ended June 30, 2016 were as follows:
Global Floating Rate Fund
| FOR THE YEAR ENDED JUNE 30, 2016 |
FOR THE YEAR ENDED JUNE 30, 2015 |
|||||||||||||||
| CLASS A | SHARES | AMOUNT | SHARES | AMOUNT | ||||||||||||
| Shares sold |
1,852,982 | $ | 17,065,312 | 1,046,486 | $ | 10,379,529 | ||||||||||
| Shares sold through reinvestments of distributions |
32,710 | 300,004 | 83,026 | 807,940 | ||||||||||||
| Shares redeemed |
(891,508 | ) | (8,232,099 | ) | (1,815,123 | ) | (17,653,590 | ) | ||||||||
| Redemption fees |
– | – | – | 676 | ||||||||||||
|
|
|
|
|
|
|
|
|
|||||||||
| Net increase (decrease) |
994,184 | $ | 9,133,217 | (685,611 | ) | $ | (6,465,445 | ) | ||||||||
|
|
|
|
|
|
|
|
|
|||||||||
186
Table of Contents
Babson Capital Funds Trust 2016 Annual Report
NOTES TO THE FINANCIAL STATEMENTS (CONTINUED)
June 30, 2016
| FOR THE YEAR ENDED JUNE 30, 2016 |
FOR THE YEAR ENDED JUNE 30, 2015 |
|||||||||||||||
| CLASS C | SHARES | AMOUNT | SHARES | AMOUNT | ||||||||||||
| Shares sold |
373,886 | $ | 3,471,934 | 335,871 | $ | 3,264,612 | ||||||||||
| Shares sold through reinvestments of distributions |
26,532 | 241,938 | 19,258 | 185,848 | ||||||||||||
| Shares redeemed |
(223,482 | ) | (2,060,431 | ) | (20,267 | ) | (195,905 | ) | ||||||||
| Redemption fees |
– | – | – | 169 | ||||||||||||
|
|
|
|
|
|
|
|
|
|||||||||
| Net increase |
176,936 | $ | 1,653,441 | 334,862 | $ | 3,254,724 | ||||||||||
|
|
|
|
|
|
|
|
|
|||||||||
| CLASS I |
||||||||||||||||
| Shares sold |
– | $ | – | – | $ | – | ||||||||||
| Shares sold through reinvestments of distributions |
19,954 | 191,212 | 234,264 | 2,279,655 | ||||||||||||
| Shares redeemed |
(535,014 | ) | (5,000,000 | ) | (753,573 | ) | (7,271,983 | ) | ||||||||
| Redemption fees |
– | – | – | 1,694 | ||||||||||||
|
|
|
|
|
|
|
|
|
|||||||||
| Net decrease |
(515,060 | ) | $ | (4,808,788 | ) | (519,309 | ) | $ | (4,990,634 | ) | ||||||
|
|
|
|
|
|
|
|
|
|||||||||
| CLASS Y |
||||||||||||||||
| Shares sold |
6,086,197 | $ | 56,300,003 | 9,236,912 | $ | 89,446,649 | ||||||||||
| Shares sold through reinvestments of distributions |
579,714 | 5,324,169 | 493,939 | 4,805,968 | ||||||||||||
| Shares redeemed |
(6,374,723 | ) | (59,038,968 | ) | (2,813,208 | ) | (27,521,577 | ) | ||||||||
| Redemption fees |
– | – | – | 2,920 | ||||||||||||
|
|
|
|
|
|
|
|
|
|||||||||
| Net increase |
291,188 | $ | 2,585,204 | 6,917,643 | $ | 66,733,960 | ||||||||||
|
|
|
|
|
|
|
|
|
|||||||||
Global Credit Income Opportunities Fund
| FOR THE YEAR ENDED JUNE 30, 2016 |
FOR THE YEAR ENDED JUNE 30, 2015 |
|||||||||||||||
| CLASS A | SHARES | AMOUNT | SHARES | AMOUNT | ||||||||||||
| Shares sold |
649,098 | $ | 5,795,169 | 2,316,931 | $ | 23,545,838 | ||||||||||
| Shares sold through reinvestments of distributions |
84,775 | 750,428 | 127,930 | 1,237,474 | ||||||||||||
| Shares redeemed |
(668,631 | ) | (5,921,877 | ) | (1,355,520 | ) | (13,184,266 | ) | ||||||||
| Redemption fees |
– | – | – | 2,624 | ||||||||||||
|
|
|
|
|
|
|
|
|
|||||||||
| Net increase |
65,242 | $ | 623,720 | 1,089,341 | $ | 11,601,670 | ||||||||||
|
|
|
|
|
|
|
|
|
|||||||||
| CLASS C |
||||||||||||||||
| Shares sold |
112,563 | $ | 1,006,877 | 285,284 | $ | 2,802,118 | ||||||||||
| Shares sold through reinvestments of distributions |
17,988 | 158,913 | 13,552 | 130,085 | ||||||||||||
| Shares redeemed |
(100,203 | ) | (894,804 | ) | (12,493 | ) | (121,540 | ) | ||||||||
| Redemption fees |
– | – | – | 343 | ||||||||||||
|
|
|
|
|
|
|
|
|
|||||||||
| Net increase |
30,348 | $ | 270,986 | 286,343 | $ | 2,811,006 | ||||||||||
|
|
|
|
|
|
|
|
|
|||||||||
| CLASS I |
||||||||||||||||
| Shares sold |
– | $ | – | – | $ | – | ||||||||||
| Shares sold through reinvestments of distributions |
27,127 | 255,093 | 253,647 | 2,450,842 | ||||||||||||
| Shares redeemed |
– | – | – | – | ||||||||||||
| Redemption fees |
– | – | – | 4,679 | ||||||||||||
|
|
|
|
|
|
|
|
|
|||||||||
| Net increase |
27,127 | $ | 255,093 | 253,647 | $ | 2,455,521 | ||||||||||
|
|
|
|
|
|
|
|
|
|||||||||
187
Table of Contents
Babson Capital Funds Trust 2016 Annual Report
NOTES TO THE FINANCIAL STATEMENTS (CONTINUED)
June 30, 2016
| FOR THE YEAR ENDED JUNE 30, 2016 |
FOR THE YEAR ENDED JUNE 30, 2015 |
|||||||||||||||
| CLASS Y | SHARES | AMOUNT | SHARES | AMOUNT | ||||||||||||
| Shares sold |
3,557,814 | $ | 31,402,334 | 1,654,908 | $ | 16,333,761 | ||||||||||
| Shares sold through reinvestments of distributions |
173,660 | 1,549,751 | 321,379 | 3,108,290 | ||||||||||||
| Shares redeemed |
(1,205,725 | ) | (10,634,355 | ) | (1,114,834 | ) | (11,114,262 | ) | ||||||||
| Redemption fees |
– | – | – | 5,954 | ||||||||||||
|
|
|
|
|
|
|
|
|
|||||||||
| Net increase |
2,525,749 | $ | 22,317,730 | 861,453 | $ | 8,333,743 | ||||||||||
|
|
|
|
|
|
|
|
|
|||||||||
Active Short Duration Bond Fund
| PERIOD FROM JULY 8, 2015* THROUGH JUNE 30, 2016 |
||||||||
| CLASS A | SHARES | AMOUNT | ||||||
| Shares sold |
4,326,156 | $ | 42,899,831 | |||||
| Shares sold through reinvestments of distributions |
18,550 | 184,208 | ||||||
| Shares redeemed |
(337,324 | ) | (3,344,883 | ) | ||||
|
|
|
|
|
|||||
| Net increase |
4,007,382 | $ | 39,739,156 | |||||
|
|
|
|
|
|||||
| CLASS C |
||||||||
| Shares sold |
47,683 | $ | 474,468 | |||||
| Shares sold through reinvestments of distributions |
124 | 1,231 | ||||||
| Shares redeemed |
(22,061 | ) | (218,571 | ) | ||||
|
|
|
|
|
|||||
| Net increase |
25,746 | $ | 257,128 | |||||
|
|
|
|
|
|||||
| Shares sold |
2,230,000 | $ | 22,300,000 | |||||
| Shares sold through reinvestments of distributions |
4,437 | 44,099 | ||||||
| Shares redeemed |
(1,635,600 | ) | (16,250,000 | ) | ||||
|
|
|
|
|
|||||
| Net increase |
598,837 | $ | 6,094,099 | |||||
|
|
|
|
|
|||||
| CLASS Y |
||||||||
| Shares sold |
14,461,202 | $ | 143,345,835 | |||||
| Shares sold through reinvestments of distributions |
61,721 | 612,005 | ||||||
| Shares redeemed |
(3,527,796 | ) | (35,004,030 | ) | ||||
|
|
|
|
|
|||||
| Net increase |
10,995,127 | $ | 108,953,810 | |||||
|
|
|
|
|
|||||
| * | Commencement of operations |
188
Table of Contents
Babson Capital Funds Trust 2016 Annual Report
NOTES TO THE FINANCIAL STATEMENTS (CONTINUED)
June 30, 2016
Total Return Bond Fund
| PERIOD FROM JULY 8, 2015* THROUGH JUNE 30, 2016 |
||||||||
| CLASS A | SHARES | AMOUNT | ||||||
| Shares sold |
20,626 | $ | 206,304 | |||||
| Shares sold through reinvestments of distributions |
83 | 821 | ||||||
| Shares redeemed |
– | – | ||||||
|
|
|
|
|
|||||
| Net increase |
20,709 | $ | 207,125 | |||||
|
|
|
|
|
|||||
| CLASS C |
||||||||
| Shares sold |
20,000 | $ | 200,000 | |||||
| Shares sold through reinvestments of distributions |
61 | 596 | ||||||
| Shares redeemed |
– | – | ||||||
|
|
|
|
|
|||||
| Net increase |
20,061 | $ | 200,596 | |||||
|
|
|
|
|
|||||
| CLASS I |
||||||||
| Shares sold |
1,230,000 | $ | 12,300,000 | |||||
| Shares sold through reinvestments of distributions |
5,482 | 54,097 | ||||||
| Shares redeemed |
– | – | ||||||
|
|
|
|
|
|||||
| Net increase |
1,235,482 | $ | 12,354,097 | |||||
|
|
|
|
|
|||||
| CLASS Y |
||||||||
| Shares sold |
1,271,976 | $ | 12,721,341 | |||||
| Shares sold through reinvestments of distributions |
5,682 | 56,103 | ||||||
| Shares redeemed |
– | – | ||||||
|
|
|
|
|
|||||
| Net increase |
1,277,658 | $ | 12,777,444 | |||||
|
|
|
|
|
|||||
| * | Commencement of operations |
Emerging Markets Debt Blended Total Return Fund
| PERIOD FROM OCTOBER 21, 2015* THROUGH JUNE 30, 2016 |
||||||||
| CLASS A | SHARES | AMOUNT | ||||||
| Shares sold |
20,000 | $ | 200,000 | |||||
| Shares sold through reinvestments of distributions |
6 | 62 | ||||||
| Shares redeemed |
– | – | ||||||
|
|
|
|
|
|||||
| Net increase |
20,006 | $ | 200,062 | |||||
|
|
|
|
|
|||||
| CLASS C |
||||||||
| Shares sold |
20,000 | $ | 200,000 | |||||
| Shares sold through reinvestments of distributions |
6 | 62 | ||||||
| Shares redeemed |
– | – | ||||||
|
|
|
|
|
|||||
| Net increase |
20,006 | $ | 200,062 | |||||
|
|
|
|
|
|||||
189
Table of Contents
Babson Capital Funds Trust 2016 Annual Report
NOTES TO THE FINANCIAL STATEMENTS (CONTINUED)
June 30, 2016
| PERIOD FROM OCTOBER 21, 2015* THROUGH JUNE 30, 2016 |
||||||||
| CLASS I | SHARES | AMOUNT | ||||||
| Shares sold |
480,000 | $ | 4,800,000 | |||||
| Shares sold through reinvestments of distributions |
156 | 1,488 | ||||||
| Shares redeemed |
– | – | ||||||
|
|
|
|
|
|||||
| Net increase |
480,156 | $ | 4,801,488 | |||||
|
|
|
|
|
|||||
| CLASS Y |
||||||||
| Shares sold |
480,000 | $ | 4,800,000 | |||||
| Shares sold through reinvestments of distributions |
156 | 1,488 | ||||||
| Shares redeemed |
– | – | ||||||
|
|
|
|
|
|||||
| Net increase |
480,156 | $ | 4,801,488 | |||||
|
|
|
|
|
|||||
| * | Commencement of operations |
Emerging Markets Local Currency Debt Fund
| PERIOD FROM DECEMBER 8, 2015* THROUGH JUNE 30, 2016 |
||||||||
| CLASS A | SHARES | AMOUNT | ||||||
| Shares sold |
10,000 | $ | 100,000 | |||||
| Shares sold through reinvestments of distributions |
– | – | ||||||
| Shares redeemed |
– | – | ||||||
|
|
|
|
|
|||||
| Net increase |
10,000 | $ | 100,000 | |||||
|
|
|
|
|
|||||
| CLASS C |
||||||||
| Shares sold |
10,000 | $ | 100,000 | |||||
| Shares sold through reinvestments of distributions |
– | – | ||||||
| Shares redeemed |
– | – | ||||||
|
|
|
|
|
|||||
| Net increase |
10,000 | $ | 100,000 | |||||
|
|
|
|
|
|||||
| Shares sold |
240,000 | $ | 2,400,000 | |||||
| Shares sold through reinvestments of distributions |
– | – | ||||||
| Shares redeemed |
– | – | ||||||
|
|
|
|
|
|||||
| Net increase |
240,000 | $ | 2,400,000 | |||||
|
|
|
|
|
|||||
| CLASS Y |
||||||||
| Shares sold |
240,000 | $ | 2,400,000 | |||||
| Shares sold through reinvestments of distributions |
– | – | ||||||
| Shares redeemed |
– | – | ||||||
|
|
|
|
|
|||||
| Net increase |
240,000 | $ | 2,400,000 | |||||
|
|
|
|
|
|||||
| * | Commencement of operations |
190
Table of Contents
Babson Capital Funds Trust 2016 Annual Report
NOTES TO THE FINANCIAL STATEMENTS (CONTINUED)
June 30, 2016
Global High Yield Fund
| PERIOD FROM OCTOBER 30, 2015* THROUGH JUNE 30, 2016 |
||||||||
| CLASS A | SHARES | AMOUNT | ||||||
| Shares sold |
10,000 | $ | 100,000 | |||||
| Shares sold through reinvestments of distributions |
– | – | ||||||
| Shares redeemed |
– | – | ||||||
|
|
|
|
|
|||||
| Net increase |
10,000 | $ | 100,000 | |||||
|
|
|
|
|
|||||
| CLASS C |
||||||||
| Shares sold |
10,000 | $ | 100,000 | |||||
| Shares sold through reinvestments of distributions |
– | – | ||||||
| Shares redeemed |
– | – | ||||||
|
|
|
|
|
|||||
| Net increase |
10,000 | $ | 100,000 | |||||
|
|
|
|
|
|||||
| CLASS I |
||||||||
| Shares sold |
1,240,000 | $ | 12,400,000 | |||||
| Shares sold through reinvestments of distributions |
– | – | ||||||
| Shares redeemed |
– | – | ||||||
|
|
|
|
|
|||||
| Net increase |
1,240,000 | $ | 12,400,000 | |||||
|
|
|
|
|
|||||
| CLASS Y |
||||||||
| Shares sold |
1,253,790 | $ | 12,538,500 | |||||
| Shares sold through reinvestments of distributions |
27 | 262 | ||||||
| Shares redeemed |
– | – | ||||||
|
|
|
|
|
|||||
| Net increase |
1,253,817 | $ | 12,538,762 | |||||
|
|
|
|
|
|||||
| * | Commencement of operations |
U.S. High Yield Fund
| PERIOD FROM OCTOBER 30, 2015* THROUGH JUNE 30, 2016 |
||||||||
| CLASS A | SHARES | AMOUNT | ||||||
| Shares sold |
20,304 | $ | 202,500 | |||||
| Shares sold through reinvestments of distributions |
11 | 107 | ||||||
| Shares redeemed |
– | – | ||||||
|
|
|
|
|
|||||
| Net increase |
20,315 | $ | 202,607 | |||||
|
|
|
|
|
|||||
| CLASS C |
||||||||
| Shares sold |
10,000 | $ | 100,000 | |||||
| Shares sold through reinvestments of distributions |
– | – | ||||||
| Shares redeemed |
– | – | ||||||
|
|
|
|
|
|||||
| Net increase |
10,000 | $ | 100,000 | |||||
|
|
|
|
|
|||||
191
Table of Contents
Babson Capital Funds Trust 2015 Annual Report
NOTES TO THE FINANCIAL STATEMENTS (CONTINUED)
June 30, 2015
| PERIOD FROM OCTOBER 30, 2015* THROUGH JUNE 30, 2016 |
||||||||
| CLASS I | SHARES | AMOUNT | ||||||
| Shares sold |
1,458,295 | $ | 14,500,000 | |||||
| Shares sold through reinvestments of distributions |
7,352 | 72,465 | ||||||
| Shares redeemed |
– | – | ||||||
|
|
|
|
|
|||||
| Net increase |
1,465,647 | $ | 14,572,465 | |||||
|
|
|
|
|
|||||
| CLASS Y |
||||||||
| Shares sold |
1,249,862 | $ | 12,500,000 | |||||
| Shares sold through reinvestments of distributions |
18 | 187 | ||||||
| Shares redeemed |
– | – | ||||||
|
|
|
|
|
|||||
| Net increase |
1,249,880 | $ | 12,500,187 | |||||
|
|
|
|
|
|||||
| * | Commencement of operations |
192
Table of Contents
Babson Capital Funds Trust 2016 Annual Report
REPORT OF INDEPENDENT REGISTERED PUBLIC ACCOUNTING FIRM
To the Board of Trustees of Babson Capital Funds Trust and Shareholders of Babson Global Floating Rate Fund, Babson Global Credit Income Opportunities, Babson Active Short Duration Bond Fund, Babson Total Return Bond Fund, Babson Emerging Market Debt Blended Total Return Fund, Babson Emerging Market Local Currency Debt Fund, Babson Global High Yield Fund, and Babson U.S. High Yield Fund (collectively, the “Funds”):
We have audited the accompanying statements of assets and liabilities, including the schedules of investments, of Babson Capital Funds Trust (the “Funds”) comprising of Babson Global Floating Rate Fund, Babson Global Credit Income Opportunities Fund, Babson Emerging Market Local Currency Debt Fund, Babson Emerging Market Debt Blended Total Return Fund, Babson Total Return Fund, Babson Global High Yield Fund, Babson Active Short Duration Bond Fund and Babson U.S. High Yield Fund as of June 30, 2016, and the related statements of operations for the period then ended, and the statements of changes in net assets and the financial highlights for each of the periods presented. These financial statements and financial highlights are the responsibility of the Funds’ management. Our responsibility is to express an opinion on these financial statements and financial highlights based on our audits.
We conducted our audits in accordance with the standards of the Public Company Accounting Oversight Board (United States). Those standards require that we plan and perform the audit to obtain reasonable assurance about whether the financial statements and financial highlights are free of material misstatement. The Funds are not required to have, nor were we engaged to perform, an audit of their internal control over financial reporting. Our audits included consideration of internal control over financial reporting as a basis for designing audit procedures that are appropriate in the circumstances, but not for the purpose of expressing an opinion on the effectiveness of the Funds’ internal control over financial reporting. Accordingly, we express no such opinion. An audit also includes examining, on a test basis, evidence supporting the amounts and disclosures in the financial statements, assessing the accounting principles used and significant estimates made by management, as well as evaluating the overall financial statement presentation. Our procedures included confirmation of securities owned as of June 30, 2016, by correspondence with the custodian, brokers, and agent banks; where replies were not received from brokers and agent banks, we performed other auditing procedures. We believe that our audits provide a reasonable basis for our opinion.
In our opinion, the financial statements and financial highlights referred to above present fairly, in all material respects, the financial position of each of the Funds constituting Babson Capital Funds Trust as of June 30, 2016, the results of their operations for the period then ended, and the changes in their net assets and the financial highlights for each of the periods presented, in conformity with accounting principles generally accepted in the United States of America.
Deloitte & Touche LLP
Boston, Massachusetts
August 26, 2016
193
Table of Contents
Babson Capital Funds Trust 2016 Annual Report
| NAME (AGE), ADDRESS | POSITION(S) WITH THE TRUST |
OFFICE TERM AND LENGTH OF TIME SERVED |
PRINCIPAL OCCUPATIONS DURING PAST 5 YEARS |
PORTFOLIOS OVERSEEN IN FUND COMPLEX |
OTHER DIRECTORSHIPS HELD BY DIRECTOR | |||||
| Thomas M. Finke (52) 550 South Tryon Street Suite 3300 Charlotte, NC 28202 |
Trustee | Trustee since 2013 | Chairman and Chief Executive Officer (since 2008), Member of the Board of Managers (since 2006), President (2007-2008), Managing Director (2002-2008), Babson; Chief Investment Officer and Executive Vice President (2008-2011), Massachusetts Mutual Life Insurance Company. | 9 | Trustee (since 2013), Babson Capital Global Short Duration High Yield Fund (closed-end investment company advised by Babson); Chairman (2012-2015), Director (since 2008), Babson Capital Management (UK) Limited (investment advisory firm); Chairman and Director (2012-2015), Babson Capital Global Advisors Limited (investment advisory firm); Director (since 2008), Babson Capital Guernsey Limited (holding company); Vice Chairman and Manager (since 2011), MM Asset Management Holding LLC (holding company); Manager (since 2011), Wood Creek Capital Management, LLC (investment advisory firm); Chairman and Director (since 2007), Cornerstone Real Estate Advisers LLC (real estate advisory firm); Director (since 2004), Jefferies Finance LLC (finance company); Manager (2007-2015), Credit Strategies Management LLC (general partner of an investment fund); Manager (since 2005), Loan Strategies Management, LLC (general partner of an investment fund); Manager (since 2005), Jefferies Finance CP Funding LLC (investment company); Manager (2004-2012), Class C Member LLC (equity holding company); Chairman, Chief Executive Officer and Director (2009-2011), MassMutual Capital Partners, LLC (investment company); Director (2007-2011), Scottish Re Group Limited (reinsurance specialist). |
194
Table of Contents
Babson Capital Funds Trust 2016 Annual Report
| NAME (AGE), ADDRESS | POSITION(S) WITH THE TRUST |
OFFICE TERM AND LENGTH OF TIME SERVED |
PRINCIPAL OCCUPATIONS DURING PAST 5 YEARS |
PORTFOLIOS OVERSEEN IN FUND COMPLEX |
OTHER DIRECTORSHIPS HELD BY DIRECTOR | |||||
| Thomas W. Bunn (62) 550 South Tryon Street Suite 3300 Charlotte, NC 28202 |
Trustee | Trustee since 2013 | Retired (since 2009); Vice Chairman (2002-2009), Head of National Banking (2006-2009), Head of Corporate and Investment Banking (2002-2006), KeyCorp (commercial and investment banking firm). | 9 | Trustee (since 2013), Babson Capital Global Short Duration High Yield Fund (closed-end investment company advised by Babson); Director (since 2010), Southern Weaving Co. (webbing and sleeving design and manufacturing company); Trustee (since 2010), Wake Forest University Board of Trustees; Member (since 1998), Babcock School of Business Board of Visitors; Senior Operating Advisor (since 2010), Sound Harbor Partners (investment management firm); Director (since 2009), Nature Conservancy of North Carolina; Director (2010-2016), SquareTwo Financial (asset recovery and management firm); Director (2009-2014), Kiawah Island Conservancy. | |||||
| Rodney J. Dillman (64) 550 South Tryon Street Suite 3300 Charlotte, NC 28202 |
Trustee, Chairman | Trustee since 2013 | Retired (since 2012); Deputy General Counsel (2011-2012), Senior Vice President (2008-2012), Vice President (2000-2008), Massachusetts Mutual Life Insurance Company; Member of the Board of Directors and President (2008-2011), MassMutual International LLC; General Counsel (2006-2008), Babson. |
9 | Trustee (since 2012), Babson Capital Global Short Duration High Yield Fund (closed-end investment company advised by Babson); Director (since 2016), Social Reality, Inc. (digital platform technology and management software company for internet advertising); Director (2008-2011), Compania de Seguros CorpVida S.A. (insurance company); Director (2009-2011), MassMutual Europe S.A. (insurance company); Director (2008-2011), MassMutual Asia Limited (insurance company); Director (2008-2011), MassMutual Life Insurance Company; Director (2008-2010), MassMutual Mercuries Life Insurance Company. | |||||
| Bernard A. Harris, Jr. (60) 550 South Tryon Street Suite 3300 Charlotte, NC 28202 |
Trustee | Trustee since 2013 | Chief Executive Officer and Managing Partner (since 2002), Vesalius Ventures, Inc.; Director and President (since 1998), The Space Agency; President (since 1999), The Harris Foundation; Clinical Scientist, Flight Surgeon and Astronaut (1986-1996), NASA. |
9 | Trustee (since 2012), Babson Capital Global Short Duration High Yield Fund (closed-end investment company advised by Babson); Trustee (since 2011), Salient Midstream & MLP Fund and Salient MLP & Energy Infrastructure Fund; Trustee (since 2010), Salient Absolute Return Fund; Director (since 2009), Monebo Technologies Inc. (medical technology design company); Director (since 2009), The Endowment Funds (TEF); Director (since 2008), US Physical Therapy (USPH); Director (since 2012), E-Cardio, Inc. (provides services for cardiac monitoring). | |||||
195
Table of Contents
Babson Capital Funds Trust 2016 Annual Report
INDEPENDENT TRUSTEES (CONTINUED)
| NAME (AGE), ADDRESS | POSITION(S) WITH THE TRUST |
OFFICE TERM AND LENGTH OF TIME SERVED |
PRINCIPAL OCCUPATIONS DURING PAST 5 YEARS |
PORTFOLIOS OVERSEEN IN FUND COMPLEX |
OTHER DIRECTORSHIPS HELD BY DIRECTOR | |||||
| Thomas W. Okel (53) 550 South Tryon Street Suite 3300 Charlotte, NC 28202 |
Trustee | Trustee since 2013 | Executive Director (since 2011), Catawba Lands Conservancy; Global Head of Syndicated Capital Markets (1998-2010), Bank of America Merrill Lynch. | 9 | Trustee (since 2012), Babson Capital Global Short Duration High Yield Fund (closed-end investment company advised by Babson); Trustee (since 2015), Horizon Funds (mutual fund complex). | |||||
| Martin A. Sumichrast (49) 550 South Tryon Street Suite 3300 Charlotte, NC 28202 |
Trustee | Trustee since 2013 | Vice Chairman and Principal (since 2013), Siskey Capital, LLC (merchant banking); Managing Director (2012-2013), Washington Capital, LLC (family office); Managing Director (2009-2012), Lomond International (business advisory firm). | 9 | Trustee (since 2012), Babson Capital Global Short Duration High Yield Fund (closed-end investment company advised by Babson); Director (since 2014), Kure Corp. (retail); Director (since 2014), Jadeveon Clowney Help-In-Time Foundation; Director (since 2015), Social Reality, Inc. (digital platform technology and management software company for internet advertising); Chairman and Director (since 2015), Level Beauty Group Inc. (a retail/e-commerce beauty investment/management company). | |||||
196
Table of Contents
Babson Capital Funds Trust 2016 Annual Report
| NAME (AGE), ADDRESS | POSITION(S) WITH THE TRUST |
OFFICE TERM* AND LENGTH OF TIME SERVED |
PRINCIPAL OCCUPATION(S) DURING PAST 5 YEARS | |||
| Anthony J. Sciacca (45) 550 South Tryon Street Charlotte, NC 28202 |
President | Since 2013 | Head of Babson Capital Strategic Investors (since 2014), Head of Global Business Development Group (since 2008), Managing Director (since 2006), Babson. | |||
| Russell D. Morrison (52) 550 South Tryon Street Charlotte, NC 28202 |
Senior Vice President | Since 2013 | Vice Chairman (since 2014), Member of the Board of Managers (since 2014), Head of Global Fixed Income Group (since 2012), Head of Global High Yield Investments Group (2010-2012); Co-Head U.S. Loan Team (2006-2009), Managing Director (since 2002), Babson; Chairman and Director (since 2015), Babson Capital Management (UK) Limited (investment advisory firm); Chairman and Director (since 2015), Babson Capital Global Advisors Limited (investment advisory firm); President (since 2012), Babson Capital Global Short Duration High Yield Fund (closed-end investment company advised by Babson). | |||
| Carlene Pollock (49) 550 South Tryon Street Charlotte, NC 28202 |
Chief Financial Officer | Since 2016 | Assistant Treasurer (2015-2016), Babson Capital Funds Trust; Director (since 2015), Babson; Director (2013-2015), Corrum Capital Management (investment adviser); Vice President (2008-2013), Bank of New York Mellon (third party administrator); Chief Financial Officer (since 2016), Assistant Treasurer (2015-2016), Babson Capital Global Short Duration High Yield Fund (closed-end investment company advised by Babson). | |||
| Andrew Lennon (42) 550 South Tryon Street Charlotte, NC 28202 |
Treasurer | Since 2013 | Managing Director (since 2010), Director (2005-2009), Babson; Treasurer (since 2013), Babson Capital Global Short Duration High Yield Fund (closed-end investment company advised by Babson). | |||
| Paul J. Thompson (43) 550 South Tryon Street Charlotte, NC 28202 |
Vice President | Since 2013 | Chief Financial Officer (since 2015), Chief Operating Officer and Head of Global Investment Services (since 2010), Head of Operations and Portfolio/Client Services (2002-2010), Managing Director (since 2008), Babson. | |||
| Paul Gehrig (49) 550 South Tryon Street Charlotte, NC 28202 |
Vice President | Since 2013 | Managing Director (since 2008), Babson. | |||
| Brian W. Pope (38) 550 South Tryon Street Charlotte, NC 28202 |
Vice President | Since 2013 | Director (since 2009), Babson | |||
| Duncan Robertson (47) 550 South Tryon Street Charlotte, NC 28202 |
Vice President | Since 2014 | Managing Director (since 2008), Babson. | |||
197
Table of Contents
Babson Capital Funds Trust 2016 Annual Report
OFFICERS OF THE TRUST (CONTINUED)
| NAME (AGE), ADDRESS | POSITION(S) WITH THE TRUST |
OFFICE TERM* AND LENGTH OF TIME SERVED |
PRINCIPAL OCCUPATION(S) DURING PAST 5 YEARS | |||
| Melissa LaGrant (43) 550 South Tryon Street Charlotte, NC 28202 |
Chief Compliance Officer | Since 2013 | Managing Director (since 2005), Babson; Chief Compliance Officer (since 2013), Babson Capital Finance LLC; Chief Compliance Officer (since 2006), Babson Capital Corporate Investors and Babson Capital Participation Investors (closed-end investment companies advised by Babson); Chief Compliance Officer (since 2012), Babson Capital Global Short Duration High Yield Fund (closed-end investment company advised by Babson). | |||
| Janice M. Bishop (52) 550 South Tryon Street Charlotte, NC 28202 |
Vice President, Secretary and Chief Legal Officer | Since 2013 | Senior Counsel and Managing Director (since 2014), Counsel (2007-2014), Babson; Vice President, Secretary and Chief Legal Officer (since 2015), Associate Secretary (2008-2015), Babson Capital Corporate Investors and Babson Capital Participation Investors (closed-end investment companies advised by Babson); Vice President, Secretary and Chief Legal Officer (since 2012), Babson Capital Global Short Duration High Yield Fund (closed-end investment company advised by Babson); Vice President and Secretary (since 2015), Assistant Secretary (2008-2015), CI Subsidiary Trust and PI Subsidiary Trust. | |||
| Michelle Manha (44) 550 South Tryon Street Charlotte, NC 28202 |
Assistant Secretary | Since 2013 | Associate General Counsel and Managing Director (since 2014), Counsel (2008-2014), Babson; Assistant Secretary (since 2012), Babson Capital Global Short Duration High Yield Fund, (closed-end investment company advised by Babson). | |||
| Kristin Goodchild (31) 550 South Tryon Street Charlotte, NC 28202 |
Assistant Secretary | Since 2015 | Senior Paralegal (since 2013), Paralegal (2008-2012), Babson; Assistant Secretary (since 2015), Babson Capital Global Short Duration High Yield Fund (closed-end investment company advised by Babson); Associate Secretary (since 2015), Babson Capital Corporate Investors and Babson Capital Participation Investors (closed-end investment companies advised by Babson); Assistant Secretary (since 2015), CI Subsidiary Trust and PI Subsidiary Trust. | |||
198
Table of Contents
Babson Capital Funds Trust 2016 Annual Report
JOINT PRIVACY NOTICE OF BABSON CAPITAL MANAGEMENT LLC AND
BABSON CAPITAL FUNDS TRUST

This privacy notice is being provided on behalf of Babson Capital Management LLC and its affiliates; Babson Capital Securities LLC; Babson Capital Management (Australia) Pty Ltd.; Babson Capital Management (Japan) KK; Babson Capital Cornerstone Asia Limited; Babson Capital Funds Trust; Babson Capital Global Short Duration High Yield Fund; Babson Capital Corporate Investors and Babson Capital Participation Investors (together, for purposes of this privacy notice, “Babson Capital”).
When you use Babson Capital you entrust us not only with your hard-earned assets but also with your personal and financial data. We consider your data to be private and confidential, and protecting its confidentiality is important to us. Our policies and procedures regarding your personal information are summarized below.
We may collect non-public personal information about you from:
| n | Applications or other forms, interviews, or by other means; |
| n | Consumer or other reporting agencies, government agencies, employers or others; |
| n | Your transactions with us, our affiliates, or others; and |
| n | Our Internet website. |
We may share the financial information we collect with our financial service affiliates, such as insurance companies, investment companies and securities broker-dealers. Additionally, so that we may continue to offer you products and services that best meet your investment needs and to effect transactions that you request or authorize, we may disclose the information we collect, as described above, to companies that perform administrative or marketing services on our behalf, such as transfer agents, custodian banks, service providers or printers and mailers that assist us in the distribution of investor materials or that provide operational support to Babson Capital. These companies are required to protect this information and will use this information only for the services for which we hire them, and are not permitted to use or share this information for any other purpose. Some of these companies may perform such services in jurisdictions other than the United States. We may share some or all of the information we collect with other financial institutions with whom we jointly market products. This may be done only if it is permitted by the state in which you live. Some disclosures may be limited to your name, contact and transaction information with us or our affiliates.
Any disclosures will be only to the extent permitted by federal and state law. Certain disclosures may require us to get an “opt-in” or “opt-out” from you. If this is required, we will do so before information is shared. Otherwise, we do not share any personal information about our customers or former customers unless authorized by the customer or as permitted by law.
We restrict access to personal information about you to those employees who need to know that information to provide products and services to you. We maintain physical, electronic and procedural safeguards that comply with legal standards to guard your personal information. As an added measure, we do not include personal or account information in non-secure e-mails that we send you via the Internet without your prior consent. We advise you not to send such information to us in non-secure e-mails.
This joint notice describes the privacy policies of Babson Capital, the Funds and Babson Capital Securities LLC. It applies to all Babson Capital and the Funds accounts you presently have, or may open in the future, using your social security number or federal taxpayer identification number – whether or not you remain a shareholder of our Funds or as an advisory client of Babson Capital. As mandated by rules issued by the Securities and Exchange Commission, we will be sending you this notice annually, as long as you own shares in the Funds or have an account with Babson Capital.
Babson Capital Securities LLC is a member of the Financial Industry Regulatory Authority (FINRA) and the Securities Investor Protection Corporation (SIPC). Investors may obtain information about SIPC including the SIPC brochure by contacting SIPC online at www.sipc.org or calling (202)-371-8300. Investors may obtain information about FINRA including the FINRA Investor Brochure by contacting FINRA online at www.finra.org or by calling (800) 289-9999.
May 2016
199
Table of Contents

Babson Capital Funds Trust
ANNUAL REPORT
June 30, 2016

Table of Contents
| Item 2. | Code of Ethics. |
The Registrant adopted a Code of Ethics for Principal Executive and Senior Financial Officers (the “Code”) on July 29, 2013, which is available on the Registrant’s website at www.babsoncapital.com/funds/mutual-funds. During the period covered by this Form N-CSR, there were no amendments to, or waivers from, the Code.
| Item 3. | Audit Committee Financial Expert. |
The Registrant’s Board of Trustees has determined that Dr. Bernard A. Harris, Jr., Mr. Thomas W. Okel and Mr. Martin A. Sumichrast, constituting all the members of the Registrant’s Audit Committee, are audit committee financial experts. Dr. Harris, Mr. Okel and Mr. Sumichrast are “independent” for purposes of this Item 3 as required by applicable regulation.
| Item 4. | Principal Accountant Fees and Services. |
The Registrant has engaged its principal accountant, Deloitte & Touche LLP (“Deloitte”), to perform audit services, audit-related services, tax services and other services. The following tables detail the aggregate fees billed or expected to be billed for each of the last two fiscal years by Deloitte.
Fees Billed to the Registrant:
| Year Ended June 30, 2016 |
Year Ended June 30, 2015 |
|||||||
| Audit Fees |
$ | 241,960 | $ | 130,850 | ||||
| Audit-Related Fees |
$ | 0 | $ | 0 | ||||
| Tax Fees |
$ | 90,000 | $ | 54,000 | ||||
| All Other Fees |
$ | 0 | $ | 0 | ||||
|
|
|
|
|
|||||
| Total Fees |
$ | 331,960 | $ | 184,850 | ||||
Non-Audit Fees Billed to Babson Capital and MassMutual:
| Year Ended June 30, 2016 |
Year Ended June 30, 2015 |
|||||||
| Audit Fees |
$ | 3,511,806 | $ | 3,396,868 | ||||
| Audit-Related Fees |
$ | 0 | $ | 0 | ||||
| Tax Fees |
$ | 2,156,622 | $ | 1,687,113 | ||||
| All Other Fees |
$ | 963,660 | $ | 2,031,819 | ||||
|
|
|
|
|
|||||
| Total Fees |
$ | 6,632,088 | $ | 7,115,800 | ||||
The category “Audit Fees” refers to performing an audit of the Registrant’s, Babson Capital Management LLC’s (“Babson Capital”) or Massachusetts Mutual Life Insurance Company’s (“MassMutual”) annual financial statements or services that are normally provided by the principal accountant in connection with statutory and regulatory filings or engagements. The category “Audit-Related Fees” reflects fees billed by Deloitte for various non-audit and non-tax services rendered to the Registrant, Babson Capital, and MassMutual. Preparation of Federal, state and local income tax and tax compliance work are representative of the fees reported in the “Tax Fees” category. The category “All Other Fees” represents fees billed by Deloitte for consulting rendered to the Registrant, Babson Capital, and MassMutual.
The Sarbanes-Oxley Act of 2002 and its implementing regulations allow the Registrant’s Audit Committee to establish a pre-approval policy for certain services rendered by the Registrant’s principal accountant, Deloitte. During the fiscal year ended June 30, 2016, the Registrant’s Audit Committee approved all of the services rendered to the Registrant by Deloitte and did not rely on such a pre-approval policy for any such services.
The Audit Committee has also reviewed the aggregate fees billed for professional services rendered by Deloitte for the years ended June 30, 2015 and June 30, 2016 for the Registrant and for the non-audit services provided to Babson Capital, and Babson Capital’s parent, MassMutual. As part of this review, the Audit Committee considered whether the provision of such non-audit services was compatible with maintaining the principal accountant’s independence.
Table of Contents
| Item 5. | Audit Committee of Listed Registrants. |
Not applicable.
| Item 6. | Schedule of Investments. |
| (a) | The Registrant’s Consolidated Schedule of Investments as of the close of the reporting period is included in the Report to Shareholders filed under Item 1 of this form. |
| (b) | Not applicable. |
| Item 7. | Disclosure of Proxy Voting Policies and Procedures for Closed-End Management Investment Companies. |
Not applicable.
| Item 8. | Portfolio Managers of Closed-End Investment Management Companies. |
Not applicable.
| Item 9. | Purchases of Equity Securities by Closed-End Management Investment Company and Affiliated Purchasers. |
Not applicable.
| Item 10. | Submission of Matters to a Vote of Security Holders. |
There have been no material changes to procedures by which the shareholders may recommend nominees to the Registrant’s Board of Trustees.
| Item 11. | Controls and Procedures. |
| (a) | The Registrant’s principal executive officer and principal financial officer, or persons performing similar functions, have concluded that the Registrant’s disclosure controls and procedures as defined in Rule 30a-3(c) under the Investment Company Act of 1940, as amended (the “1940 Act”), are effective as of the date within 90 days of the filing date of this report based on the evaluation of these controls and procedures required by Rule 30a-3(b) under the 1940 Act and Rules 13a-15(b) or 15d-15(b) under the Securities Exchange Act of 1934, as amended. |
| (b) | There were no changes in the Registrant’s internal control over financial reporting (as defined in Rule 30a- 3(d) under the 1940 Act) that occurred during the second fiscal quarter of the period covered by this report that have materially affected or are reasonably likely to materially affect, the Registrant’s internal control over financial reporting. |
| Item 12. | Exhibits. |
| (a)(1) | The Registrant has posted its Code of Ethics on its website at www.babsoncapital.com/funds/mutual-funds. | |
| (a)(2) | Certifications pursuant to Rule 30a-2(a) under the 1940 Act are attached hereto. | |
| Exhibit 99.1 Cert | ||
| Exhibit 99.2 Cert | ||
| (a)(3) | Not applicable. | |
| (b) | Certification pursuant to Rule 30a-2(b) under the 1940 Act is attached hereto. | |
| Exhibit 99.906 Cert | ||
Table of Contents
SIGNATURES
Pursuant to the requirements of the Securities Exchange Act of 1934 and the Investment Company Act of 1940, the Registrant has duly caused this report to be signed on its behalf by the undersigned, thereunto duly authorized.
| (Registrant) | Babson Capital Funds Trust | |
| By (Signature and Title) | /s/ Duncan Robertson | |
| Duncan Robertson, President (Principal Executive Officer) | ||
| Date | September 8, 2016 |
Pursuant to the requirements of the Securities Exchange Act of 1934 and the Investment Company Act of 1940, this report has been signed below by the following persons on behalf of the Registrant and in the capacities and on the dates indicated.
| By (Signature and Title) | /s/ Duncan Robertson | |
| Duncan Robertson, President (Principal Executive Officer) |
| Date | September 8, 2016 |
| By (Signature and Title) | /s/ Carlene Pollock | |
| Carlene Pollock, Chief Financial Officer (Principal Financial Officer) | ||
| Date | September 8, 2016 |