UNITED STATES
SECURITIES AND EXCHANGE COMMISSION
Washington, D.C. 20549
FORM N-CSR
CERTIFIED SHAREHOLDER REPORT OF REGISTERED
MANAGEMENT INVESTMENT COMPANIES
Investment Company Act file number (811-22852)
Loeb King Trust
(Exact name of registrant as specified in charter)
125 Broad Street, 14th Floor
New York, New York 10004
(Address of principal executive offices) (Zip code)
David S. Hampson
125 Broad Street, 14th Floor
New York, New York 10004
(Name and address of agent for service)
212-483-7000
Registrant’s telephone number, including area code
Date of fiscal year end: 08/31/2014
Date of reporting period: 02/28/2014
Item 1. Reports to Stockholders.
Loeb King Alternative Strategies Fund
Investor Class: LKASX
Institutional Class: LKAIX
SEMI-ANNUAL REPORT
February 28, 2014
![]()
Loeb King Alternative Strategies Fund
As of February 28, 2014
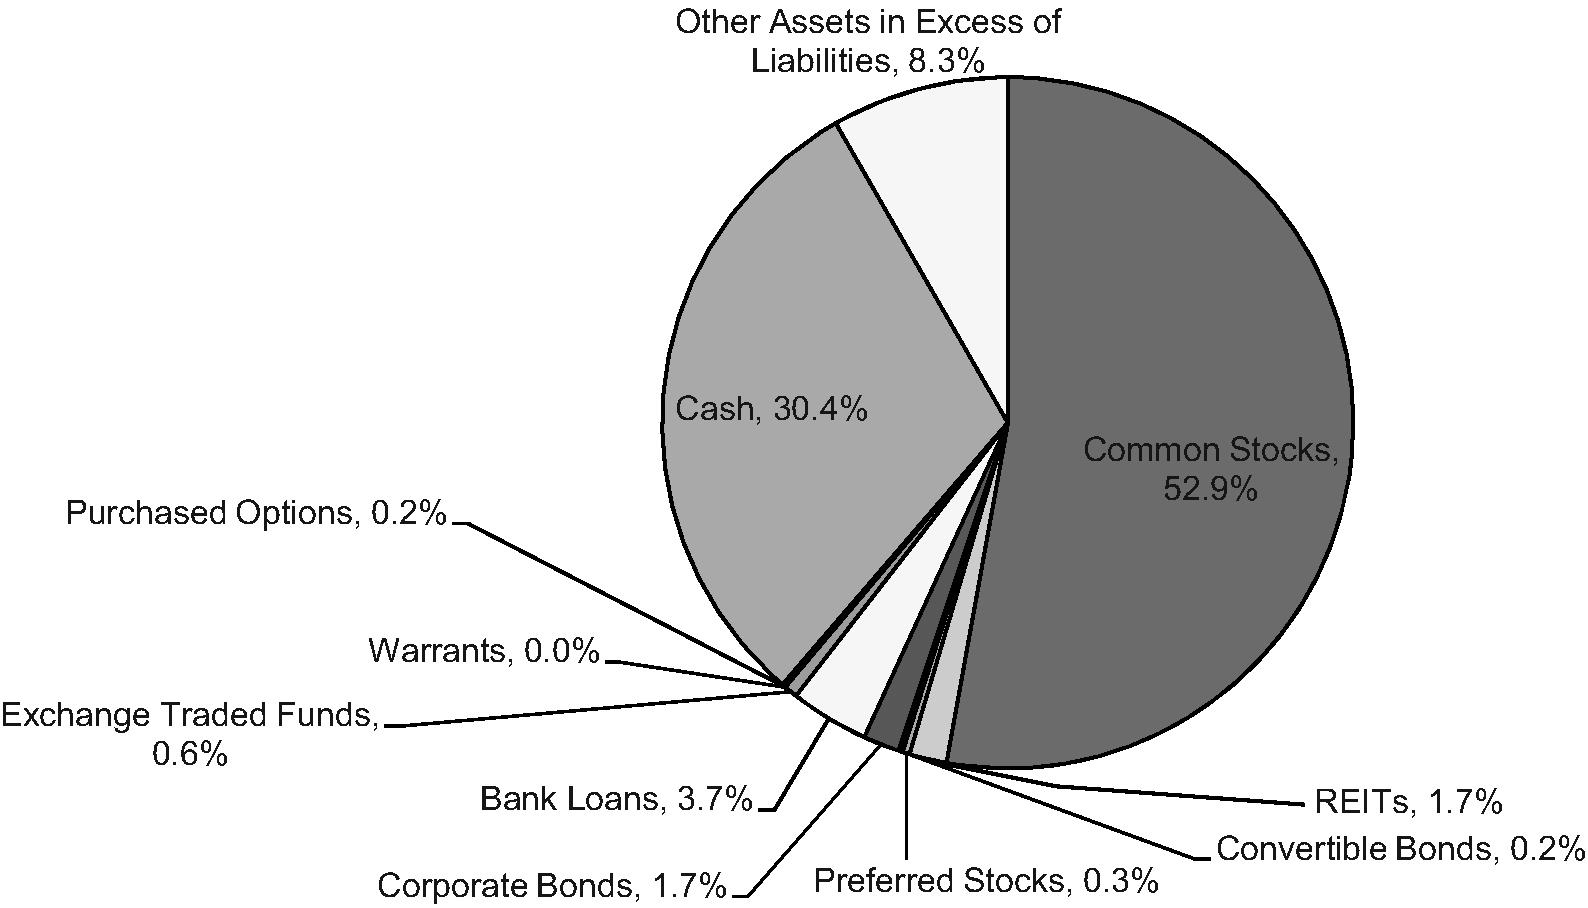
Percentages represent market value of long positions as a percentage of net assets.
1
Loeb King Alternative Strategies Fund
Schedule of Investments
February 28, 2014 (Unaudited)
Shares |
Fair Value |
|||||
| COMMON STOCKS - 52.9% |
||||||
| Consumer Discretionary - 9.1% |
||||||
| Aarons, Inc. | 2,941 | $ | 90,377 | |||
| Beazer Homes USA, Inc. (a) | 500 | 11,595 | ||||
| Bob Evans Farms, Inc. | 674 | 34,873 | ||||
| Canadian Tire Ltd. (b) | 3 | 271 | ||||
| Charter Communications, Inc. (a) | 435 | 55,145 | ||||
| Chinaedu Corp. - ADR (a) | 53 | 363 | ||||
| Coastal Contacts, Inc. (a)(b) | 5,541 | 62,451 | ||||
| Cooper Tire & Rubber Co. | 3,680 | 91,742 | ||||
| Daimler AG (b) | 601 | 56,012 | ||||
| Darden Restaurants, Inc. | 2,194 | 112,026 | ||||
| Dish Network Corp. (a) | 1,144 | 67,313 | ||||
| Freds, Inc. | 601 | 11,978 | ||||
| General Motors Co. (a) | 1 | 36 | ||||
| The Jones Group, Inc. | 583 | 8,710 | ||||
| Jos A Bank Clothiers, Inc. (a) | 240 | 14,899 | ||||
| KB Home | 400 | 8,160 | ||||
| Lennar Corp. | 200 | 8,776 | ||||
| Longview Oil Corp. (a)(b) | 937 | 4,553 | ||||
| Loral Space & Communications, Inc. (a) | 464 | 36,665 | ||||
| Mega Brands, Inc. (a)(b) | 1,499 | 23,988 | ||||
| MGM Resorts International (a) | 490 | 13,499 | ||||
| Mood Media Corp. (a)(b) | 220 | 173 | ||||
| Morgans Hotel Group Co. (a) | 1,676 | 13,408 | ||||
| New York & Co, Inc. (a) | 9,286 | 41,137 | ||||
| Omnicom Group, Inc. | 2,788 | 210,996 | ||||
| Sirius XM Holdings, Inc. (a) | 21,882 | 78,994 | ||||
| Sizmek, Inc. (a) | 586 | 7,261 | ||||
| Sothebys | 600 | 28,206 | ||||
| TRI Pointe Homes, Inc. (a) | 2,989 | 419,506 | ||||
| Tri Pointe Homes, Inc. (a) | 1,542 | 28,095 | ||||
| Tribune Co. (a) | 704 | 55,792 | ||||
| Vitacost Com, Inc. (a) | 2,389 | 17,798 | ||||
| Total Consumer Discretionary | 1,614,798 | |||||
| Consumer Staples - 3.7% |
||||||
| B & G Foods, Inc. | 615 | 18,425 | ||||
| Beam, Inc. | 2,608 | 216,360 | ||||
| CVS Caremark Corp. | 140 | 10,240 | ||||
| Magic Holdings International (b) | 26,015 | 20,884 | ||||
| Maple Leaf Foods, Inc. (a)(b)(e) | 6,865 | 100,746 | ||||
| Reynolds American, Inc. | 909 | 46,205 | ||||
| Safeway, Inc. | 2,387 | 89,393 | ||||
| Shoppers Drug Mart Corp. (b) | 1,594 | 86,804 | ||||
| Sysco Corp. | 1,694 | 61,018 | ||||
| Total Consumer Staples | 650,075 | |||||
| Energy - 2.6% |
||||||
| Anadarko Petroluem Corp. | 1,339 | 112,690 | ||||
| Baytex Energy Corp. (a)(b) | 594 | 21,656 | ||||
Shares |
Fair Value |
|||||
| Energy (continued) |
||||||
| BP PLC - ADR (e) | 734 | $ | 37,148 | |||
| Equal Energy Ltd. | 17,996 | 96,099 | ||||
| Fission Uranium Corp. (a)(b) | 7,027 | 8,948 | ||||
| Goodrich Petroluem Corp. (a) | 283 | 3,854 | ||||
| Harvest Natural Resources, Inc. (a) | 6,799 | 28,556 | ||||
| Noble Corp. PLC | 1,178 | 36,577 | ||||
| Pacific Drilling S.A. (a) | 814 | 8,840 | ||||
| Syntroleum Corp. (a) | 5,048 | 20,141 | ||||
| Talisman Energy, Inc. (a)(b) | 1,903 | 19,592 | ||||
| Weatherford International Ltd. (a) | 3,668 | 61,146 | ||||
| Total Energy | 455,247 | |||||
| Financials - 7.3% |
||||||
| Aareal Bank AG (b) | 626 | 27,564 | ||||
| Ambac Financial Group, Inc. (a) | 853 | 29,480 | ||||
| Aozora Bank Ltd. (b)(e) | 45,456 | 132,210 | ||||
| BGC Partners, Inc. | 13,216 | 89,869 | ||||
| Brookfield Office Properties, Inc. | 7,974 | 152,622 | ||||
| CapitalSource, Inc. | 2,775 | 40,792 | ||||
| Chong Hing Bank Ltd. (a)(b)(f) | 2,101 | 2,908 | ||||
| Commerzbank AG (a)(b) | 7,229 | 131,113 | ||||
| Connectone Bancorp, Inc. (a) | 11 | 523 | ||||
| DIC Asset AG (b) | 6,702 | 63,238 | ||||
| Federal Home Loan Mortgage Corp. (a) | 144 | 665 | ||||
| Federal National Mortgage Association (a) | 636 | 3,053 | ||||
| First Merchants Corp. | 1,260 | 26,989 | ||||
| Home Federal Bancorp, Inc. | 6,441 | 97,195 | ||||
| Hudson City Bancorp, Inc. | 9,020 | 85,690 | ||||
| Mediobanca SPA (b) | 2,483 | 24,762 | ||||
| MPHB Capital Berhad (a)(b) | 60,220 | 34,553 | ||||
| National Interstate Corp. | 1,944 | 58,845 | ||||
| Nicholas Financial, Inc. | 908 | 14,328 | ||||
| SLM Corp. | 1,349 | 32,295 | ||||
| SWS Group, Inc. (a) | 4,626 | 37,702 | ||||
| Synovus Financial Corp. | 20,136 | 70,073 | ||||
| United Bankshares, Inc. | 2,612 | 76,871 | ||||
| Valley National Bancorp | 3,675 | 37,044 | ||||
| Washington Banking Co. | 1,071 | 19,728 | ||||
| Total Financials | 1,290,112 | |||||
| Health Care - 9.3% |
||||||
| AbbVie, Inc. | 342 | 17,411 | ||||
| Actavis PLC (a) | 49 | 10,820 | ||||
| Aetna, Inc. | 166 | 12,070 | ||||
| Alkermes PLC (a) | 152 | 7,398 | ||||
| Allergan, Inc. | 346 | 43,942 | ||||
| Amerisourcebergen Corp. | 142 | 9,635 | ||||
| Amgen, Inc. | 119 | 14,758 | ||||
| Arthrocare Corp. (a) | 2,349 | 113,339 | ||||
| Basilea Pharmaceutica AG (b) | 43 | 6,322 | ||||
The accompanying notes are an integral part of these financial statements.
2
Loeb King Alternative Strategies Fund
Schedule of Investments
February 28, 2014 (Unaudited)
Shares |
Fair Value |
|||||
| Health Care (continued) |
||||||
| Baxter International, Inc. | 793 | $ | 55,114 | |||
| BioDelivery Sciences International, Inc. (a) | 3,225 | 30,218 | ||||
| Biogen Idec, Inc. (a) | 33 | 11,243 | ||||
| Biomarin Pharmaceutical, Inc. (a) | 121 | 9,801 | ||||
| Bluebird Bio, Inc. (a) | 194 | 4,947 | ||||
| Bristol-Myers Squibb Co. | 306 | 16,454 | ||||
| Cadence Pharmaceuticals, Inc. (a) | 4,289 | 60,003 | ||||
| Cardinal Health, Inc. | 115 | 8,226 | ||||
| Celgene Corp. (a) | 88 | 14,146 | ||||
| Cempra, Inc. (a) | 703 | 8,007 | ||||
| Centene Corp. (a) | 168 | 10,698 | ||||
| Cerner Corp. (a) | 102 | 6,260 | ||||
| Chindex International, Inc. (a) | 313 | 6,025 | ||||
| Cigna Corp. | 142 | 11,302 | ||||
| Clovis Oncology, Inc. (a) | 47 | 3,742 | ||||
| Community Health Systems, Inc. (a) | 142 | 5,894 | ||||
| Concordia Healthcare Corp. (a)(b) | 193 | 2,775 | ||||
| Conmed Corp. | 464 | 21,632 | ||||
| Covidien PLC | 232 | 16,692 | ||||
| Cubist Pharmaceuticals, Inc. (a) | 102 | 8,111 | ||||
| Davita Healthcare Partners, Inc. (a) | 181 | 12,440 | ||||
| Durata Therapeutics, Inc. (a) | 478 | 6,553 | ||||
| Enanta Pharmaceuticals, Inc. (a) | 198 | 7,294 | ||||
| Endo Health Solutions, Inc. (a) | 440 | 35,121 | ||||
| Enteromedics, Inc. (a) | 2,078 | 5,050 | ||||
| Epizyme, Inc. (a) | 176 | 5,262 | ||||
| Express Scripts Holding Co. (a) | 219 | 16,493 | ||||
| Forest Labs, Inc. (a) | 880 | 85,862 | ||||
| Furiex Pharmaceuticals, Inc. (a) | 507 | 46,913 | ||||
| Gilead Sciences, Inc. (a) | 240 | 19,870 | ||||
| Grifols SA - ADR | 401 | 16,874 | ||||
| HCA Holdings, Inc. | 343 | 17,562 | ||||
| Heartware International, Inc. (a) | 49 | 4,706 | ||||
| Impax Laboratories, Inc. (a) | 359 | 9,251 | ||||
| Intermune, Inc. (a) | 276 | 8,291 | ||||
| Jazz Pharmaceuticals PLC (a) | 51 | 7,749 | ||||
| Lipocine, Inc. (a) | 697 | 5,576 | ||||
| Macrogenics, Inc. (a) | 133 | 4,655 | ||||
| Mckesson Corp. | 79 | 13,987 | ||||
| Medivation, Inc. (a) | 121 | 8,701 | ||||
| Medtronic, Inc. | 200 | 11,852 | ||||
| Merck & Co., Inc. | 292 | 16,641 | ||||
| Merge Healthcare, Inc. (a) | 2,442 | 6,129 | ||||
| Momenta Pharmaceuticals, Inc. (a) | 244 | 3,611 | ||||
| Morphosys (a)(b) | 105 | 9,751 | ||||
| Mylan, Inc. (a) | 167 | 9,280 | ||||
| Nektar Therapeutics (a) | 569 | 7,300 | ||||
| Novartis AG (b) | 177 | 14,782 | ||||
| Omnicare, Inc. | 191 | 11,250 | ||||
Shares |
Fair Value |
|||||
| Health Care (continued) |
||||||
| Ovascience, Inc. (a) | 929 | $ | 10,024 | |||
| Paladin Labs, Inc. (a)(b) | 1,410 | 180,895 | ||||
| Patheon, Inc. (a) | 916 | 8,492 | ||||
| Patheon, Inc. (a)(b) | 7,659 | 70,828 | ||||
| Patient Safety Technologies, Inc. (a) | 579 | 1,280 | ||||
| PerkinElmer, Inc. | 245 | 11,103 | ||||
| Pernix Therapeutics Holdings, Inc. (a) | 1,729 | 6,345 | ||||
| Pfizer, Inc. | 564 | 18,110 | ||||
| Portola Pharmaceuticals, Inc. (a) | 201 | 4,902 | ||||
| QLT, Inc. | 965 | 5,800 | ||||
| Receptos, Inc. (a) | 24 | 1,113 | ||||
| Regado Biosciences, Inc. (a) | 637 | 4,567 | ||||
| Regeneron Pharmaceuticals (a) | 21 | 6,983 | ||||
| Retrophin, Inc. (a) | 221 | 3,905 | ||||
| Rhoen-Klinikum AG (b) | 1,496 | 48,257 | ||||
| Roche Holdings AG (b) | 65 | 20,058 | ||||
| Synageva BioPharma Corp. (a) | 58 | 6,651 | ||||
| Team Health Holdings, Inc. (a) | 163 | 7,338 | ||||
| Teleflex, Inc. | 118 | 12,035 | ||||
| Tetraphase Pharmaceuticals, Inc. (a) | 512 | 6,963 | ||||
| Teva Pharmaceutical Industries, Ltd. - ADR (e) | 3,552 | 177,209 | ||||
| Thermo Fisher Scientific, Inc. | 66 | 8,220 | ||||
| Thoratec Corp. (a) | 258 | 9,582 | ||||
| UnitedHealth Group, Inc. | 167 | 12,904 | ||||
| Universal Health Services, Inc. | 193 | 15,494 | ||||
| VIVUS, Inc. (a) | 384 | 2,316 | ||||
| Wright Medical Group, Inc. (a) | 306 | 9,737 | ||||
| Total Health Care | 1,646,902 | |||||
| Industrials - 1.8% |
||||||
| Dover Corp. | 394 | 37,154 | ||||
| Edwards Group Ltd. - ADR (a)(f) | 3,587 | 3,659 | ||||
| Foster Wheeler AG (a)(b) | 3,545 | 113,865 | ||||
| Pacer International, Inc. (a) | 11,167 | 100,168 | ||||
| Titan Internatoinal, Inc. | 1,769 | 33,540 | ||||
| Vitran Corp, Inc. (a) | 3,685 | 23,916 | ||||
| Total Industrials | 312,302 | |||||
| Information Technology - 12.0% |
||||||
| Accelrys, Inc. (a) | 5,412 | 67,542 | ||||
| ATMI, Inc. (a) | 3,869 | 131,585 | ||||
| Autonavi Holdings Ltd. - ADR (a) | 337 | 7,013 | ||||
| Blackberry Ltd. (a) | 2,405 | 24,050 | ||||
| Blackhawk Network Holdings, Inc. (a) | 1,061 | 26,292 | ||||
| Cabot Microelectronics Corp. (a) | 1,587 | 70,098 | ||||
| Camelot Information Systems, Inc. - ADR (a) | 23,874 | 48,703 | ||||
| Compuware Corp. | 5,668 | 62,065 | ||||
| Diebold, Inc. | 1,829 | 68,386 | ||||
| Ebay, Inc. (a) | 4,257 | 250,184 | ||||
| Entropic Communications, Inc. (a) | 4,761 | 20,853 | ||||
The accompanying notes are an integral part of these financial statements.
3
Loeb King Alternative Strategies Fund
Schedule of Investments
February 28, 2014 (Unaudited)
Shares |
Fair Value |
|||||
| Information Technology (continued) |
||||||
| Knowles Corp. (a) | 1,720 | $ | 55,298 | |||
| LSI Corp. | 9,618 | 106,664 | ||||
| Mitel Networks Corp. (a)(b) | 6,721 | 63,734 | ||||
| Ninetowns Internet Technology Group Co., Ltd. - ADR (a) | 3,627 | 6,311 | ||||
| Nokia Corp. - ADR (a) | 31,141 | 236,049 | ||||
| Nuance Communications, Inc. (a) | 7,655 | 117,045 | ||||
| NXP Semiconductors NV (a) | 337 | 18,949 | ||||
| Pactera Technology International Ltd. - ADR (a) | 8,957 | 64,490 | ||||
| Pandora Media, Inc. (a) | 439 | 16,427 | ||||
| QLogic Corp. (a) | 3,565 | 40,712 | ||||
| Quantum Corp. (a) | 14,591 | 17,071 | ||||
| RDA Microelectronics, Inc. - ADR | 3,033 | 54,776 | ||||
| RealD, Inc. (a) | 2,358 | 26,056 | ||||
| RF Micro Devices, Inc. (a) | 2,914 | 20,631 | ||||
| Shanda Games Ltd. - ADR (a) | 3,367 | 22,289 | ||||
| Sina Corp. (a) | 600 | 40,998 | ||||
| Supertex, Inc. (a) | 2,463 | 81,107 | ||||
| Tokyo Electron Ltd. (b) | 593 | 34,041 | ||||
| Tokyo Electron Ltd. - ADR (a) | 7,938 | 113,910 | ||||
| TriQuint Semiconductor, Inc. (a) | 5,577 | 68,262 | ||||
| Trunkbow International Holdings Ltd. (a) | 14,056 | 19,819 | ||||
| Violin Memory, Inc. (a) | 4,212 | 18,322 | ||||
| Xerox Corp. | 1,542 | 16,947 | ||||
| Xyratex Ltd. | 6,019 | 79,391 | ||||
| Zynga, Inc. (a) | 4,032 | 20,402 | ||||
| Total Information Technology | 2,136,472 | |||||
| Materials - 3.4% |
||||||
| Amcol International Corp. | 1,227 | 54,454 | ||||
| Asanko Gold, Inc. (a)(b) | 2,297 | 4,978 | ||||
| Augusta Resource Corp. (a)(b) | 7,286 | 22,767 | ||||
| Barrick Gold Corp. | 782 | 15,937 | ||||
| Bayer AG (b) | 120 | 17,044 | ||||
| Brigus Gold Corp. (a)(b) | 54,601 | 62,624 | ||||
| Gold Reserve, Inc. (a) | 2,571 | 8,356 | ||||
| KWG Resources, Inc. (a)(b) | 1,355,985 | 55,106 | ||||
| LSB Industries, Inc. (a) | 715 | 23,373 | ||||
| Martin Marietta Materials, Inc. | 550 | 67,089 | ||||
| Material Sciences Corp. (a) | 2,563 | 32,576 | ||||
| Minerals Technologies, Inc. | 585 | 31,298 | ||||
| Newmont Mining Corp. | 770 | 17,910 | ||||
| Osisko Mining Corp. (a)(b) | 9,396 | 59,823 | ||||
| Solitario Exploration & Royalty Corp. (a) | 26,598 | 41,493 | ||||
| Verso Paper Corp. (a) | 612 | 1,499 | ||||
| Yongye International, Inc. (a) | 12,378 | 81,571 | ||||
| Zoltek Companies, Inc. (a) | 740 | 12,395 | ||||
| Total Materials | 610,293 | |||||
Shares |
Fair Value |
|||||
| Telecommunication Services - 3.4% |
||||||
| Fairpoint Communications, Inc. (a) | 638 | $ | 8,473 | |||
| Globalstar, Inc. (a) | 4,810 | 10,919 | ||||
| Leap Wireless International, Inc. (a) | 6,347 | 111,199 | ||||
| NTS, Inc. (a) | 16,419 | 32,674 | ||||
| Telephone & Data Systems, Inc. | 2,005 | 45,694 | ||||
| T-Mobile US, Inc. (a)(e) | 6,628 | 202,154 | ||||
| Verizon Communications, Inc. (e) | 1,536 | 73,104 | ||||
| Vodafone Group PLC - ADR (e) | 2,661 | 110,599 | ||||
| Total Telecommunication Services | 594,816 | |||||
| Utilities - 0.3% |
||||||
| China Hydroelectric Corp. - ADR (a) | 9,377 | 31,975 | ||||
| UNS Energy Corp. | 482 | 29,166 | ||||
| Total Utilities | 61,141 | |||||
| TOTAL COMMON STOCKS (Cost $9,094,534) |
9,372,158 | |||||
| REITS - 1.7% |
||||||
| American Realty Capital Properties, Inc. | 748 | 10,988 | ||||
| BRE Properties, Inc. | 1,271 | 78,510 | ||||
| Chatham Lodging Trust | 4,200 | 87,654 | ||||
| Commonwealth REIT | 1,232 | 33,449 | ||||
| Spirit Realty Capital, Inc. | 6,959 | 75,992 | ||||
| Strategic Hotels & Resorts, Inc. (a) | 981 | 9,800 | ||||
| Strategic Hotels & Resorts, Inc. - Preferred Series B | 236 | 5,891 | ||||
| Strategic Hotels & Resorts, Inc. - Preferred Series C | 243 | 6,075 | ||||
| TOTAL REITS (Cost $298,012) | 308,359 | |||||
| PREFERRED STOCKS - 0.3% |
||||||
| Financials - 0.2% |
||||||
| Ally Financial, Inc. (c) | 17 | 16,759 | ||||
| Astoria Financial Corp. | 786 | 18,620 | ||||
| Fannie Mae (a)(d) | 536 | 6,459 | ||||
| Federal Home Loan Mortgage Corp. (a)(d) | 35 | 429 | ||||
| Federal Home Loan Mortgage Corp. (a) | 105 | 1,092 | ||||
| Total Financials | 43,359 | |||||
| Telecommunication Services - 0.1% |
||||||
| Oi SA | 11,134 | 16,924 | ||||
| TOTAL PREFERRED STOCKS (Cost $59,266) |
60,283 | |||||
Principal Amount |
Fair Value |
|||||
| CONVERTIBLE BONDS - 0.2% |
||||||
| Information Technology - 0.2% |
||||||
| Nortel Networks Corp., 1.75%, 4/15/2014 (g) | $ | 33,000 | $ | 32,720 | ||
| TOTAL CONVERTIBLE BONDS (Cost $32,720) |
32,720 | |||||
The accompanying notes are an integral part of these financial statements.
4
Loeb King Alternative Strategies Fund
Schedule of Investments
February 28, 2014 (Unaudited)
Principal Amount |
Fair Value |
|||||
| CORPORATE BONDS - 1.7% |
||||||
| Consumer Discretionary - 0.3% |
||||||
| Paris Las Vegas Holding, 11.00%, 10/1/2021 (c) |
$ | 36,000 | $ | 38,070 | ||
| River Cree Enterprises Ltd., 11.00%, 1/20/2021 (b)(c) | 27,000 | 25,633 | ||||
| Total Consumer Discretionary | 63,703 | |||||
| Materials - 0.2% |
||||||
| Hexion U.S. Financial Corp., 6.625%, 4/15/2020 | 30,000 | 31,012 | ||||
| Utilities - 0.1% |
||||||
| Energy Future International Holding Co., 11.00%, 10/1/2021 | 16,000 | 17,680 | ||||
| Financials - 0.8% |
||||||
| Lehman Brothers Holdings, Inc., 5.625%, 12/31/2014 (g) | 626,000 | 142,415 | ||||
| Information Technology - 0.3% |
||||||
| Avaya, Inc., 10.50%, 3/1/2021 (c) | 45,000 | 42,638 | ||||
| Northern Telecom Ltd., 6.875%, 9/1/2023 (g) | 9,000 | 4,500 | ||||
| Total Information Technology | 47,138 | |||||
| TOTAL CORPORATE BONDS (Cost $292,112) |
301,948 | |||||
| BANK LOANS - 3.7% |
||||||
| Avaya, Inc., 4.736%, 10/26/2017 (d) | 29,822 | 29,019 | ||||
| Caesars Entertainment Corp., 7.00%, 10/11/2020 (d) | 24,000 | 24,356 | ||||
| Clear Channel Communications, 6.91%, 1/30/2019 (d) | 47,750 | 46,855 | ||||
| Fairpoint Communications, Inc., 7.50%, 1/30/2019 (d) | 40,000 | 41,033 | ||||
| Harland Clarke, 6.00%, 8/17/2019 (d) | 23,000 | 23,029 | ||||
| HD Supply, Inc. 4.50%, 10/12/2017 (d) | 78,802 | 79,023 | ||||
| Kinetic Concepts, Inc., 4.00%, 5/4/2018 (d) | 19,950 | 20,009 | ||||
| Manwin Licensing International, 14.00%, 10/18/2018 (d) | 75,000 | 79,688 | ||||
| NRG Energy, Inc., 2.75%, 07/01/2018 (d) | 52,867 | 52,483 | ||||
| Reynolds Group, Inc., 4.00%, 12/1/2018 (d) | 23,000 | 23,155 | ||||
| Samson Investment, 5.00%, 9/25/2018 (d) | 29,000 | 29,225 | ||||
| Servicemaster Co., 4.42%, 01/31/2017 (d) | 27,430 | 27,457 | ||||
| TransDigm Group, Inc., 3.50%, 02/14/2017 (d) | 51,869 | 52,154 | ||||
| Travelport LLC, 9.50%, 1/31/2016 (d) | 48,000 | 49,740 | ||||
| Valeant Pharmaceuticals International, Inc., 3.75%, 02/13/2019 (d) | 78,000 | 78,207 | ||||
| TOTAL BANK LOANS (Cost $650,485) | 655,433 | |||||
Shares |
Fair Value |
|||||
| EXCHANGE TRADED FUNDS - 0.6% |
||||||
| ProShares Short 20+Year Treasury (a) | 1,625 | $ | 49,790 | |||
| SPDR Gold Shares (a) | 500 | 63,810 | ||||
| TOTAL EXCHANGE TRADED FUNDS (Cost $116,249) |
113,600 | |||||
| WARRANTS - 0.0% |
||||||
| General Motors Co. |
||||||
| Expiration July 2016, Exercise Price: $10.00 (a) |
1 | 27 | ||||
| Expiration July 2019, Exercise Price: $18.33 (a) |
1 | 18 | ||||
| TOTAL WARRANTS (Cost $53) |
45 | |||||
Contracts |
Fair Value |
|||||
| PURCHASED OPTIONS - 0.2% |
||||||
| Call Options - 0.1% |
||||||
| BGC Partners, Inc. |
||||||
| Expiration: May 2014, Exercise Price: $7.50 |
3 | $ | 30 | |||
| Cablevision Systems Corp. |
||||||
| Expiration: March 2014, Exercise Price: $20.00 |
4 | 20 | ||||
| Charter Communications, Inc. |
||||||
| Expiration: March 2014, Exercise Price: $130.00 |
2 | 380 | ||||
| Nuance Communications, Inc. |
||||||
| Expiration: July 2014, Exercise Price: $17.00 |
30 | 2,250 | ||||
| ProShares UltraPro Short S&P 500 |
||||||
| Expiration: March 2014, Exercise Price: $1,830.00 |
2 | 7,780 | ||||
| SPDR S&P 500 |
||||||
| Expiration: March 2014, Exercise Price: $186.00 |
1 | 222 | ||||
| Expiration: March 2014, Exercise Price: $187.00 |
1 | 162 | ||||
10,844 | ||||||
| Put Options - 0.1% |
||||||
| Beazer Homes USA, Inc. |
||||||
| Expiration: April 2014, Exercise Price: $22.00 |
5 | 365 | ||||
| eBay, Inc. |
||||||
| Expiration: March 2014, Exercise Price: $52.50 |
18 | 108 | ||||
| Expiration: March 2014, Exercise Price: $55.00 |
6 | 138 | ||||
| iShares iBoxx $ High Yield Corporate Bond |
||||||
| Expiration: March 2014, Exercise Price: $91.00 |
4 | 0 | ||||
The accompanying notes are an integral part of these financial statements.
5
Loeb King Alternative Strategies Fund
Schedule of Investments
February 28, 2014 (Unaudited)
Contracts |
Fair Value |
|||||
| Put Options (continued) |
||||||
| Expiration: March 2014, Exercise Price: $92.00 |
5 | $ | 50 | |||
| iShares Russell 2000 |
||||||
| Expiration: March 2014, Exercise Price: $117.00 |
5 | 870 | ||||
| Expiration: April 2014, Exercise Price: $117.00 |
16 | 4,464 | ||||
| Expiration: April 2014, Exercise Price: $118.00 |
2 | 654 | ||||
| KB Home |
||||||
| Expiration: April 2014, Exercise Price: $19.00 |
4 | 220 | ||||
| Nokia Corp. |
||||||
| Expiration: March 2014, Exercise Price: $7.00 |
30 | 270 | ||||
| Expiration: April 2014, Exercise Price: $6.00 |
74 | 370 | ||||
| Expiration: April 2014, |
||||||
| Exercise Price: $7.00 | 149 | 2980 | ||||
| Nuance Communications, Inc. |
||||||
| Expiration: April 2014, |
||||||
| Exercise Price: $14.00 | 7 | 175 | ||||
| SPDR Gold Shares |
||||||
| Expiration: April 2014, Exercise Price: $126.00 |
5 | 960 | ||||
| SPDR S&P 500 |
||||||
| Expiration: March 2014, Exercise Price: $181.00 |
1 | 78 | ||||
Contracts |
Fair Value |
|||||
| Put Options (continued) |
||||||
| Expiration: March 2014, Exercise Price: $182.00 |
1 | $ | 98 | |||
| Expiration: March 2014, Exercise Price: $183.00 |
4 | 476 | ||||
| Expiration: March 2014, Exercise Price: $184.00 |
2 | 282 | ||||
| Expiration: April 2014, Exercise Price: $185.00 |
22 | 6,380 | ||||
| T-Mobile US, Inc. |
||||||
| Expiration: March 2014, Exercise Price: $28.00 |
14 | 938 | ||||
| Expiration: April 2014, Exercise Price: $30.00 |
6 | 1,134 | ||||
| Total Put Options | 21,010 | |||||
| TOTAL PURCHASED OPTIONS (Cost $38,263) |
31,854 | |||||
| Total Investments (Cost $10,581,694) - 61.3% |
$ | 10,876,400 | ||||
| Cash (e) - 30.4% | 5,404,778 | |||||
| Other Assets in Excess of Liabilities - 8.3% | 1,473,478 | |||||
| TOTAL NET ASSETS - 100.0% | $ | 17,754,656 | ||||
Percentages are stated as a percent of net assets.
ADR American Depository Receipt
| (a) | Non-income producing. |
| (b) | Foreign issued security. |
| (c) | Restricted security as defined in Rule 144(a) under the Securities Act of 1933. Purchased in private placement transaction; resale to the public may require registration or may extend only to qualified institutional buyers. At February 28, 2014, the market value of these securities total $34,690 which represents 0.2% of total net assets. |
| (d) | Variable Rate Security. The rate shown represents the rate at February 28, 2014. |
| (e) | All or a portion of the security has been pledged in connection with open short securities and written options contracts. |
| (f) | Securities for which market quotations are not readily available are valued at fair value determined by the Adviser. Such values are approved on a quarterly basis by the Board of Trustees. The total fair value of such securities at February 28, 2014 is $6,567, which represents 0.04% of total net assets. |
| (g) | Represents a security in default. |
The Global Industry Classification Standard (GICS®) was developed by and/or is the exclusive property of MSCI, Inc. and Standard & Poor Financial Services LLC (“S&P”). GICS is a service mark of MSCI and S&P and has been licensed for use by U.S. Bancorp Fund Services, LLC.
The accompanying notes are an integral part of these financial statements.
6
Loeb King Alternative Strategies Fund
Schedule of Securities Sold Short
February 28, 2014 (Unaudited)
Shares |
Fair Value |
|||||
| COMMON STOCKS - 9.0% |
||||||
| Consumer Discretionary - 1.6% |
||||||
| Amazon Com, Inc. (b) | 47 | $ | 17,019 | |||
| Best Buy, Inc. | 237 | 6,311 | ||||
| Comcast Corp. | 120 | 6,203 | ||||
| Hyatt Hotels Corp. (b) | 103 | 5,372 | ||||
| Las Vegas Sands Corp. | 40 | 3,410 | ||||
| Liberty Global PLC (b) | 922 | 79,799 | ||||
| Liberty Global PLC (b) | 727 | 61,548 | ||||
| Liberty Media Corp. (b) | 371 | 50,886 | ||||
| Marriott International, Inc. | 108 | 5,857 | ||||
| Rent-A-Center, Inc. | 702 | 17,648 | ||||
| Sinclair Broadcast Group, Inc. | 230 | 6,813 | ||||
| Starwood Hotels & Resorts Worldwide, Inc. | 68 | 5,607 | ||||
| Ulta Salon, Cosmetics & Fragrance, Inc. (b) | 79 | 7,086 | ||||
| Wyndham Worldwide Corp. | 72 | 5,247 | ||||
278,806 | ||||||
| Consumer Staples - 0.5% |
||||||
| Lorillard, Inc. | 925 | 45,381 | ||||
| George Weston Ltd (a)(b) | 511 | 37,112 | ||||
82,493 | ||||||
| Energy - 0.2% |
||||||
| Apache Corp. | 77 | 6,105 | ||||
| Cameco Corp. (a)(b) | 117 | 2,833 | ||||
| Noble Energy, Inc. | 194 | 13,339 | ||||
| Renewable Energy Group, Inc. (b) | 1,625 | 18,964 | ||||
41,241 | ||||||
| Financials - 1.6% |
||||||
| Assured Guaranty Ltd. | 195 | 4,787 | ||||
| Cascade Bancorp (b) | 4,456 | 21,745 | ||||
| Center Bancorp, Inc. | 35 | 651 | ||||
| First Merchants Corp. | 1,260 | 26,989 | ||||
| Heritage Financial Corp. | 953 | 16,897 | ||||
| M & T Bank Corp. | 758 | 88,375 | ||||
| MBIA, Inc. (a) | 494 | 6,694 | ||||
| PacWest Bancorp | 787 | 34,156 | ||||
| Prospect Capital Corp. Com | 317 | 3,500 | ||||
| United Bankshares, Inc. | 2,613 | 76,901 | ||||
280,695 | ||||||
| Health Care - 1.7% |
||||||
| Acorda Therapeutics, Inc. (b) | 51 | 1,869 | ||||
| Actavis PLC (b) | 229 | 50,568 | ||||
| Ampio Pharmaceuticals, Inc. (b) | 364 | 2,592 | ||||
| Aratana Therapeutics, Inc. (b) | 121 | 2,828 | ||||
| Cepheid (b) | 100 | 5,366 | ||||
| Endo Health Solutions, Inc. (b) | 2,302 | 183,745 | ||||
| Haemonetics Corp. (b) | 91 | 3,320 | ||||
| Insys Therapeutics, Inc. (b) | 61 | 4,104 | ||||
Shares |
Fair Value |
|||||
| Health Care (continued) |
||||||
| Intercept Pharmaceuticals, Inc. (b) | 28 | $ | 11,494 | |||
| Invacare Corp. | 275 | 5,450 | ||||
| Mednax, Inc. (b) | 62 | 3,771 | ||||
| MiMedx Group, Inc. (b) | 485 | 3,468 | ||||
| Osiris Therapeutics, Inc. (b) | 243 | 3,710 | ||||
| Raptor Pharmaceutical Corp. (b) | 355 | 5,620 | ||||
| Sangamo Biosciences, Inc. (b) | 146 | 2,657 | ||||
| Stemline Therapeutics, Inc. (b) | 97 | 2,508 | ||||
| Team Health Holdings, Inc. (b) | 134 | 6,033 | ||||
299,103 | ||||||
| Industrials - 0.1% |
||||||
| XPO Logistics, Inc. (b) | 194 | 6,099 | ||||
| Information Technology - 1.8% |
||||||
| Apple, Inc. | 48 | 25,259 | ||||
| Applied Materials, Inc. | 9,305 | 176,423 | ||||
| Linkedin Corp. (b) | 46 | 9,386 | ||||
| Mitel Networks Corp. (b) | 6,722 | 63,859 | ||||
| Qualcomm, Inc. | 241 | 18,145 | ||||
| Riverbed Technology, Inc. (b) | 364 | 8,110 | ||||
| Sierra Wireless, Inc. (b) | 1,087 | 22,240 | ||||
323,422 | ||||||
| Materials - 0.9% |
||||||
| Asanko Gold, Inc. (a)(b) | 2,297 | 4,979 | ||||
| Primero Mining Corp. (a)(b) | 9,555 | 61,957 | ||||
| Goldcorp, Inc. | 862 | 23,214 | ||||
| Texas Industries, Inc. (b) | 890 | 75,561 | ||||
165,711 | ||||||
| Telecommunication Services - 0.6% |
||||||
| Verizon Communications, Inc. | 2,374 | 112,955 | ||||
| TOTAL COMMON STOCKS (Proceeds $1,520,427) |
1,590,525 | |||||
Principal Value |
Fair Value |
|||||
| CORPORATE BONDS - 2.0% |
||||||
| Consumer Discretionary - 0.1% |
||||||
| Servicemaster Co., 7.00%, 8/15/2020 | 20,000 | 20,750 | ||||
| Consumer Staples - 0.1% |
||||||
| Constellation Brands, Inc., 4.25%, 5/1/2023 | 17,000 | 16,660 | ||||
| Health Care - 0.7% |
||||||
| Kinetic Concepts, Inc., 10.50%, 11/1/2018 | 26,000 | 30,063 | ||||
| Valeant Pharmaceuticals International, Inc. |
||||||
| 6.750%, 8/15/2018 (c) | 44,000 | 48,510 | ||||
| 7.500%, 7/15/2021 (c) | 35,000 | 39,900 | ||||
88,410 | ||||||
118,473 | ||||||
The accompanying notes are an integral part of these consolidated financial statements.
7
Loeb King Alternative Strategies Fund
Schedule of Securities Sold Short
February 28, 2014 (Unaudited)
Principal Value |
Fair Value |
|||||
| Information Technology - 0.0% |
||||||
| Ipayment, Inc., 10.250%, 5/15/2018 | 9,000 | $ | 7,020 | |||
| Industrials - 0.5% |
||||||
| HD Supply Holdings, Inc., 7.50%, 7/15/2020 | 51,000 | 55,845 | ||||
| Transdigm, Inc., 7.50%, 7/15/2021 | 34,000 | 37,485 | ||||
93,330 | ||||||
| Materials - 0.2% |
||||||
| Hexion U.S. Financial Corp. |
||||||
| 9.00%, 11/15/2020 | 10,000 | 10,275 | ||||
| 8.875%, 2/1/2018 | 20,000 | 20,850 | ||||
31,125 | ||||||
| Telecommunication Services - 0.2% |
||||||
| Verizon Communications, Inc., 6.55%, 9/15/2043 | 24,000 | 29,380 | ||||
| Utilities - 0.2% |
||||||
| NRG Energy, Inc., 7.875%, 5/15/2021 | 32,000 | 35,520 | ||||
| TOTAL CORPORATE BONDS (Proceeds $343,345) |
352,258 | |||||
Shares |
Fair Value |
|||||
| EXCHANGE TRADED FUNDS - 10.7% |
||||||
| First Trust ISE-Revere Natural Gas Index Fund | 767 | 15,217 | ||||
| iShares China Large-Cap ETF | 213 | 7,538 | ||||
| iShares iBoxx $ High Yield Corporate Bond ETF | 702 | 66,641 | ||||
| iShares MSCI Germany Index | 1,616 | 51,243 | ||||
| iShares MSCI Malaysia Index | 784 | 12,019 | ||||
| iShares MSCI United Kingdom Index | 5,068 | 107,746 | ||||
Shares |
Fair Value |
|||||
| EXCHANGE TRADED FUNDS (continued) |
||||||
| iShares Nasdaq Biotechnology ETF | 17 | $ | 4,495 | |||
| iShares Russell 2000 Index ETF | 1,840 | 216,237 | ||||
| iShares U.S. Real Estate ETF | 178 | 12,166 | ||||
| Market Vectors Oil Services ETF | 1,343 | 65,565 | ||||
| Market Vectors Semiconductor ETF | 414 | 18,071 | ||||
| Nomura Tokyo Price Index ETF (a) | 3,367 | 40,826 | ||||
| PowerShares QQQQ Trust, Series 1 | 872 | 78,777 | ||||
| SPDR Health Care Select Fund | 664 | 39,468 | ||||
| SPDR Energy Select Sector Fund | 299 | 26,207 | ||||
| SPDR Financial Select Sector Fund | 1,406 | 30,510 | ||||
| SPDR Barclays High Yield Bond ETF | 432 | 17,941 | ||||
| SPDR S&P 500 ETF | 3,368 | 627,459 | ||||
| SPDR S&P Biotech ETF | 804 | 131,631 | ||||
| SPDR S&P Oil & Gas Exploration & Production ETF | 1,130 | 78,750 | ||||
| SPDR S&P Regional Banking ETF | 2,260 | 90,151 | ||||
| Vanguard REIT Index ETF | 2,081 | 147,231 | ||||
| WisdomTree Japan Hedged Equity Fund | 316 | 15,076 | ||||
| TOTAL EXCHANGE TRADED FUNDS (Proceeds $1,843,126) |
1,900,965 | |||||
| REITS - 0.4% |
||||||
| American Capital Agency Corp. | 133 | 2,965 | ||||
| Essex Property Trust, Inc. | 378 | 63,220 | ||||
| Host Hotels & Resorts, Inc. | 267 | 5,252 | ||||
| TOTAL REITS (Proceeds $64,970) | 71,437 | |||||
| Total Securities Sold Short (Proceeds $3,771,868) |
$ | 3,915,185 | ||||
Percentages are stated as a percent of net assets.
As of February 28, 2014, securities and cash collateral of $6,157,010 has been pledged in connection with open short securities and written options contracts.
| (a) | Foreign issued security. |
| (b) | Non-income producing. |
| (c) | Restricted security as defined in Rule 144(a) under the Securities Act of 1933. Purchased in private placement transaction; resale to the public may require registration or may extend only to qualified institutional buyers. At February 28, 2014, the market value of these securities total $34,690 which represents 0.2% of total net assets. |
The Global Industry Classification Standard (GICS®) was developed by and/or is the exclusive property of MSCI, Inc. and Standard & Poor Financial Services LLC (“S&P”). GICS is a service mark of MSCI and S&P and has been licensed for use by U.S. Bancorp Fund Services, LLC.
The accompanying notes are an integral part of these consolidated financial statements.
8
Loeb King Alternative Strategies Fund
Schedule of Options Written
February 28, 2014 (Unaudited)
Number of Contracts |
Fair Value |
|||||
| CALL OPTIONS |
||||||
| ArthroCare Corp. |
||||||
| Expiration: March 2014, Exercise Price: $50.00 | 2 | $ | 50 | |||
| Beazer Homes USA, Inc. |
||||||
| Expiration: April 2014, Exercise Price: $23.00 | 5 | 750 | ||||
| BioDelivery Sciences International, Inc. |
||||||
| Expiration: April 2014, Exercise Price: $10.00 | 6 | 462 | ||||
| Christopher & Banks Corp. |
||||||
| Expiration: April 2014, Exercise Price: $13.00 | 6 | 521 | ||||
| Charter Communications, Inc. |
||||||
| Expiration: March 2014, Exercise Price: $120.00 | 2 | 1,560 | ||||
| Compuware Corp. |
||||||
| Expiration: May 2014, Exercise Price: $11.00 | 12 | 660 | ||||
| Cooper Tire & Rubber Co. |
||||||
| Expiration: March 2014, Exercise Price: $22.00 | 7 | 2,310 | ||||
| Expiration: March 2014, Exercise Price: $23.00 | 8 | 1,776 | ||||
| Expiration: March 2014, Exercise Price: $24.00 | 11 | 1,540 | ||||
| Expiration: April 2014, Exercise Price: $23.00 | 5 | 1,300 | ||||
| Darden Restaurants, Inc. |
||||||
| Expiration: March 2014, Exercise Price: $49.00 | 8 | 1,624 | ||||
| Dish Network Corp. |
||||||
| Expiration: March 2014, Exercise Price: $55.00 | 5 | 2,050 | ||||
| Dover Corp. |
||||||
| Expiration: March 2014, Exercise Price: $85.00 | 3 | 2,700 | ||||
| eBay, Inc. |
||||||
| Expiration: March 2014, Exercise Price: $55.00 | 6 | 2,490 | ||||
| Expiration: March 2014, Exercise Price: $57.50 | 18 | 3,960 | ||||
| Expiration: March 2014, Exercise Price: $60.00 | 6 | 570 | ||||
| Endo International PLC |
||||||
| Expiration: April 2014, Exercise Price: $75.00 | 2 | 1,520 | ||||
| Harvest Natural Resources, Inc. |
||||||
| Expiration: June 2014, Exercise Price: $5.00 | 7 | 315 | ||||
| KB Home |
||||||
| Expiration: April 2014, Exercise Price: $20.00 | 4 | 560 | ||||
| Lennar Corp. |
||||||
| Expiration: April 2014, Exercise Price: $40.00 | 2 | 890 | ||||
| Nokia Corp. |
||||||
| Expiration: April 2014, Exercise Price: $8.00 | 164 | 4,592 | ||||
Number of Contracts |
Fair Value |
|||||
| Nuance Communications, Inc. |
||||||
| Expiration: March 2014, Exercise Price: $15.00 | 8 | $ | 424 | |||
| Expiration: April 2014, Exercise Price: $15.00 | 7 | 665 | ||||
| Expiration: July 2014, Exercise Price: $20.00 | 30 | 750 | ||||
| NXP Semiconductors NV |
||||||
| Expiration: March 2014, Exercise Price: $50.00 | 2 | 1,380 | ||||
| Pandora Media, Inc. |
||||||
| Expiration: March 2014, Exercise Price: $37.00 | 2 | 408 | ||||
| ProShares UltraPro Short S&P 500 |
||||||
| Expiration: March 2014, Exercise Price: $1,820.00 | 2 | 9,820 | ||||
| Safeway, Inc. |
||||||
| Expiration: March 2014, Exercise Price: $38.00 | 6 | 720 | ||||
| Expiration: March 2014, Exercise Price: $39.00 | 12 | 1,080 | ||||
| SINA Corp. |
||||||
| Expiration: March 2014, Exercise Price: $70.00 | 6 | 1,158 | ||||
| Sotheby's |
||||||
| Expiration: March 2014, Exercise Price: $47.00 | 6 | 804 | ||||
| SPDR Gold Shares |
||||||
| Expiration: April 2014, Exercise Price: $128.00 | 5 | 1,215 | ||||
| SPDR S&P 500 |
||||||
| Expiration: March 2014, Exercise Price: $184.00 | 1 | 365 | ||||
| Expiration: March 2014, Exercise Price: $185.00 | 4 | 1,148 | ||||
| Teva Pharmaceutical Industries Ltd. |
||||||
| Expiration: March 2014, Exercise Price: $44.00 | 12 | 7,380 | ||||
| Expiration: March 2014, Exercise Price: $46.00 | 5 | 2,125 | ||||
| Time Warner Cable, Inc. |
||||||
| Expiration: March 2014, Exercise Price: $135.00 | 1 | 670 | ||||
| Expiration: April 2014, Exercise Price: $135.00 | 2 | 1,628 | ||||
| T-Mobile US, Inc. |
||||||
| Expiration: March 2014, Exercise Price: $29.00 | 6 | 1,512 | ||||
| Expiration: March 2014, Exercise Price: $30.00 | 14 | 2,758 | ||||
| Expiration: April 2014, Exercise Price: $33.00 | 6 | 690 | ||||
| Expiration: May 2014, Exercise Price: $36.00 | 4 | 312 | ||||
| XPO Logistics, Inc. |
||||||
| Expiration: March 2014, Exercise Price: $25.00 | 1 | 670 | ||||
| Expiration: March 2014, Exercise Price: $30.00 | 1 | 205 | ||||
| Total Options Written (Premiums received $42,921) |
$ | 70,087 | ||||
As of February 28, 2014, securities and cash collateral of $6,157,010 has been pledged in connection with open short securities and written options contracts.
The accompanying notes are an integral part of these consolidated financial statements.
9
Loeb King Alternative Strategies Fund
Schedule of Total Return Swaps
February 28, 2014 (Unaudited)
Reference Entity |
Counterparty |
Termination Date |
Interest Rate Receive/(Pay) (a) |
Number of Contracts Long/(Short) |
Notional Amount (b) |
Unrealized Appreciation/ (Depreciation) |
||||||
| Abcam PLC | JP Morgan Chase | 1/23/2015 | (1.08)% | 1,204 | $ | 9,924 | $ | 18 | ||||
| Ablynx NV | JP Morgan Chase | 7/31/2014 | (0.72)% | 311 | 4,151 | 327 | ||||||
| Active Biotech AB | JP Morgan Chase | 7/31/2014 | (1.47)% | 708 | 4,362 | 361 | ||||||
| Airbus Group NV | JP Morgan Chase | 7/31/2014 | (0.72)% | 319 | 23,508 | 468 | ||||||
| Algeta ASA | JP Morgan Chase | 7/31/2014 | (2.22)% | 3,115 | 185,281 | 685 | ||||||
| Almirall SA | JP Morgan Chase | 7/31/2014 | (0.72)% | 807 | 14,191 | 354 | ||||||
| AMEC PLC | JP Morgan Chase | 1/23/2015 | (0.06)% | (3,190 | ) |
(59,988 | ) |
(3,639 | ) |
|||
| Assicurazioni Generali SPA | JP Morgan Chase | 7/31/2014 | 0.41% | (1,889 | ) |
(42,474 | ) |
147 | ||||
| Aurora Oil & Gas Ltd. | JP Morgan Chase | 2/17/2015 | (3.11)% | 7,119 | 26,554 | 277 | ||||||
| AZ Electronic Materials SA | JP Morgan Chase | 1/23/2015 | (1.08)% | 18,306 | 122,432 | 910 | ||||||
| C&C Group PLC | JP Morgan Chase | 7/31/2014 | (0.85)% | 7,127 | 48,272 | 1,996 | ||||||
| Caisse Regionale Credit Agricole Mutuel d'Ille et Vilaine | JP Morgan Chase | 7/31/2014 | (0.72)% | 117 | 9,108 | 98 | ||||||
| Caisse Regionale de Credit Agricole Mutuel Alpes Provence | JP Morgan Chase | 7/31/2014 | (0.72)% | 67 | 6,528 | 62 | ||||||
| Cellectis | JP Morgan Chase | 7/31/2014 | (0.72)% | 844 | 5,615 | (17 | ) |
|||||
| Coloplast AS | JP Morgan Chase | 7/31/2014 | (0.68)% | 78 | 6,570 | 351 | ||||||
| Credit Agricole Atlantique Vendee-CCI | JP Morgan Chase | 7/31/2014 | (0.72)% | 112 | 14,683 | 373 | ||||||
| Credit Agricole de la Touraine et du Poitou | JP Morgan Chase | 7/31/2014 | (0.72)% | 86 | 7,710 | 195 | ||||||
| Credit Agricole de Normandie-Seine | JP Morgan Chase | 7/31/2014 | (0.72)% | 176 | 26,514 | 607 | ||||||
| Credit Agricole Loire Haute-Loire | JP Morgan Chase | 7/31/2014 | (0.72)% | 60 | 4,783 | 18 | ||||||
| Credit Agricole Nord de France CCI | JP Morgan Chase | 7/31/2014 | (0.72)% | 567 | 12,624 | 417 | ||||||
| Deutsche Wohnen AG-BR | JP Morgan Chase | 7/31/2014 | (0.72)% | (2,009 | ) |
(42,566 | ) |
(3,714 | ) |
|||
| Deutsche Wohnen AG NPV Young | JP Morgan Chase | 7/31/2014 | 0.41% | 2,369 | 48,738 | 1,089 | ||||||
| Dixons Retail PLC | JP Morgan Chase | 1/23/2015 | (1.08)% | 14,093 | 12,130 | 240 | ||||||
| Ericsson | JP Morgan Chase | 7/31/2014 | (0.25)% | (1,235 | ) |
(16,007 | ) |
(1,088 | ) |
|||
| F&C Asset Management PLC | JP Morgan Chase | 1/23/2015 | (1.08)% | 10,807 | 22,892 | 327 | ||||||
| Genfit | JP Morgan Chase | 7/31/2014 | (0.72)% | 1,007 | 41,907 | 4,053 | ||||||
| Genmab A/S | JP Morgan Chase | 7/31/2014 | (0.68)% | 153 | 6,911 | 97 | ||||||
| GlaxoSmithKline PLC | JP Morgan Chase | 1/23/2015 | (1.08)% | 323 | 9,041 | (11 | ) |
|||||
| Innate Pharma SA | JP Morgan Chase | 7/31/2014 | (0.72)% | 590 | 8,551 | (155 | ) |
|||||
| iShares FTSE 100 UCITS ETF | JP Morgan Chase | 1/23/2015 | 0.84% | (1,033 | ) |
(11,719 | ) |
33 | ||||
| Ipsen SA | JP Morgan Chase | 7/31/2014 | (0.72)% | 166 | 7,134 | 81 | ||||||
| Lyxor STOXX Europe 600 Banks ETF | JP Morgan Chase | 7/31/2014 | 2.46% | (4,041 | ) |
(121,931 | ) |
(3,017 | ) |
|||
| Lyxor CAC 40 ETF | JP Morgan Chase | 7/31/2014 | 1.41% | (603 | ) |
(36,514 | ) |
(1,262 | ) |
|||
| Mediobanca SPA | JP Morgan Chase | 7/31/2014 | (0.72)% | 4,373 | 43,611 | 520 | ||||||
| Medivir AB | JP Morgan Chase | 7/31/2014 | (1.47)% | 370 | 6,608 | 1,097 | ||||||
| Publicis Groupe | JP Morgan Chase | 7/31/2014 | 0.41% | (2,269 | ) |
(215,475 | ) |
(7,962 | ) |
|||
| Rautaruukki Oyj | JP Morgan Chase | 7/31/2014 | (0.72)% | 3,523 | 41,285 | 156 | ||||||
| Sanofi | JP Morgan Chase | 7/31/2014 | (0.72)% | 98 | 10,190 | 284 | ||||||
| Scania AB | JP Morgan Chase | 7/31/2014 | (1.47)% | 2,356 | 72,389 | 1,664 | ||||||
| Shire PLC | JP Morgan Chase | 1/23/2015 | (1.08)% | 335 | 18,624 | 58 | ||||||
| SSAB AB-A | JP Morgan Chase | 7/31/2014 | 2.46% | (1,674 | ) |
(13,211 | ) |
(97 | ) |
|||
| SSAB AB-B | JP Morgan Chase | 7/31/2014 | 8.16% | (4,275 | ) |
(30,104 | ) |
(345 | ) |
|||
| Swedish Orphan Biovitrum AB | JP Morgan Chase | 7/31/2014 | (1.47)% | 458 | 6,072 | 180 | ||||||
| Telecom Italia SPA | JP Morgan Chase | 7/31/2014 | 0.41% | (39,341 | ) |
(44,718 | ) |
(590 | ) |
|||
| Telecom Italia SPA-RSP | JP Morgan Chase | 7/31/2014 | (0.72)% | 47,616 | 41,735 | (2,357 | ) |
|||||
| Telekom Austria AG | JP Morgan Chase | 7/31/2014 | 0.00% | 1,681 | 16,370 | (344 | ) |
|||||
| Transgene SA | JP Morgan Chase | 7/31/2014 | 0.00% | 206 | 3,672 | – | ||||||
| Unit4 NV | JP Morgan Chase | 7/31/2014 | (0.72)% | 2,909 | 155,010 | 140 | ||||||
| Vectura Group PLC | JP Morgan Chase | 1/23/2015 | (1.08)% | 4,419 | 11,988 | (457 | ) |
|||||
The accompanying notes are an integral part of these consolidated financial statements.
10
Loeb King Alternative Strategies Fund
Schedule of Total Return Swaps
February 28, 2014 (Unaudited)
Reference Entity |
Counterparty |
Termination Date |
Interest Rate Receive/(Pay) (a) |
Number of Contracts Long/(Short) |
Notional Amount (b) |
Unrealized Appreciation/ (Depreciation) |
||||||
| Verizon Communications Inc. | JP Morgan Chase | 1/23/2015 | (0.42)% | 742 | $ | 35,202 | $ | 232 | ||||
| Vodafone Group PLC | JP Morgan Chase | 1/23/2015 | (1.08)% | 14,386 | 59,984 | 1,842 | ||||||
| Ziggo NV | JP Morgan Chase | 7/31/2014 | (0.68)% | 4,435 | 202,932 | (1,861 | ) |
|||||
$ | (7,159 | ) |
||||||||||
| (a) | The interest rate represents the average financing rate as of February 28, 2014. |
| (b) | Notional value represents the market value (including any fees or commissions) of the long and short positions when they are established. |
The accompanying notes are an integral part of these consolidated financial statements.
11
Loeb King Alternative Strategies Fund
Statement of Assets & Liabilities
February 28, 2014 (Unaudited)
| ASSETS |
|||
| Investments, at value (cost $10,581,694) | $ | 10,876,400 | |
| Cash | 5,404,778 | ||
| Foreign Currency, at value (cost $265,044) | 265,669 | ||
| Receivables: |
|||
| Swap contracts dividends and interest | 17,396 | ||
| Unrealized appreciation on open swap contracts | 19,756 | ||
| Investments sold | 926,347 | ||
| Fund shares sold | 50,000 | ||
| Dividends and interest | 63,720 | ||
| Deposits at brokers for securities sold short | 4,967,116 | ||
| Deposits at brokers for open swap contracts | 680,000 | ||
| Deferred offering costs | 9,580 | ||
| Prepaid expenses | 38,117 | ||
| Due from Adviser | 30,057 | ||
| TOTAL ASSETS | 23,348,936 | ||
| LIABILITIES |
|||
| Written options, at value (premiums received $42,921) | 70,087 | ||
| Short securities, at value (proceeds received $3,771,868) | 3,915,185 | ||
| Payables: |
|||
| Investments purchased | 1,517,374 | ||
| To distributor | 2,198 | ||
| To custodian | 17,893 | ||
| Dividends and interest on short positions | 6,785 | ||
| Swap contracts dividends and interest | 49 | ||
| Unrealized depreciation on open swap contracts | 26,915 | ||
| Accrued expenses and other liabilities | 37,794 | ||
| TOTAL LIABILITIES | 5,594,280 | ||
| NET ASSETS | $ | 17,754,656 | |
| Net assets consist of: |
|||
| Paid-in capital | 17,683,124 | ||
| Accumulated net investment loss | (79,806 | ) |
|
| Accumulated net realized gain | 11,919 | ||
| Net unrealized appreciation (depreciation) on: |
|||
| Investments | 323,470 | ||
| Swap contracts | (7,159 | ) |
|
| Securities sold short | (143,317 | ) |
|
| Purchased options | (6,409 | ) |
|
| Written options | (27,166 | ) |
|
| NET ASSETS | $ | 17,754,656 | |
| Investor Class |
|||
| Net assets | $ | 3,458,794 | |
| Shares of beneficial interest outstanding (unlimited number of shares authorized, no par value) | 345,045 | ||
| Net asset value, offering, and redemption price per share | $ | 10.02 | |
| Institutional Class |
|||
| Net assets | $ | 14,295,862 | |
| Shares of beneficial interest outstanding (unlimited number of shares authorized, no par value) | 1,424,374 | ||
| Net asset value, offering, and redemption price per share | $ | 10.04 |
The accompanying notes are an integral part of these consolidated financial statements.
12
Loeb King Alternative Strategies Fund
Statement of Operations
For the Period Ended February 28, 2014(1) (Unaudited)
| INVESTMENT INCOME |
|||
| Dividend income(2) | $ | 49,185 | |
| Interest income | 10,912 | ||
| Term loan fee income | 2,149 | ||
| TOTAL INVESTMENT INCOME | 62,246 | ||
| EXPENSES |
|||
| Advisory fees (Note 5) | 78,089 | ||
| Administration and accounting fees | 41,211 | ||
| Dividend and interest expenses on securities sold short | 35,568 | ||
| Transfer agent fees and expenses | 20,083 | ||
| Federal and state registration fees | 19,089 | ||
| Custody fees | 44,555 | ||
| Audit and tax fees | 7,678 | ||
| Legal fees | 32,497 | ||
| Distribution fees - Investor Class (Note 5) | 2,603 | ||
| Reports to shareholders | 5,206 | ||
| Trustees' fees | 8,745 | ||
| Organizational costs (Note 2) | 45,560 | ||
| Other expenses | 22,572 | ||
| TOTAL EXPENSES | 363,456 | ||
| Less waivers and reimbursement by Adviser (Note 5) | (221,623 | ) |
|
| NET EXPENSES | 141,833 | ||
| NET INVESTMENT LOSS | (79,587 | ) |
|
| REALIZED AND UNREALIZED GAIN (LOSS) ON INVESTMENTS |
|||
| Net realized gain (loss) on: |
|||
| Investments | 231,132 | ||
| Swap contracts | 73,964 | ||
| Securities sold short | (150,087 | ) |
|
| Purchased options | (115,595 | ) |
|
| Written options | (1,422 | ) |
|
37,992 | |||
| Net change in unrealized appreciation (depreciation) on: |
|||
| Investments | 323,470 | ||
| Swap contracts | (7,159 | ) |
|
| Securities sold short | (143,317 | ) |
|
| Purchased options | (6,409 | ) |
|
| Written options | (27,166 | ) |
|
139,419 | |||
| NET REALIZED AND UNREALIZED GAIN ON INVESTMENTS | 177,411 | ||
| NET INCREASE IN NET ASSETS FROM OPERATIONS | $ | 97,824 |
| (1) | The Fund commenced operations on September 27, 2013. |
| (2) | Net of $1,348 in foreign withholding taxes and issuance fees. |
The accompanying notes are an integral part of these consolidated financial statements.
13
Loeb King Alternative Strategies Fund
Statement of Changes in Net Assets
Period Ended February 28, 2014(1) (Unaudited) |
|||
| FROM OPERATIONS |
|||
| Net investment loss | $ | (79,587 | ) |
| Net realized gain (loss) on: |
|||
| Investments | 231,132 | ||
| Swap contracts | 73,964 | ||
| Securities sold short | (150,087 | ) |
|
| Purchased options | (115,595 | ) |
|
| Written options | (1,422 | ) |
|
| Net change in unrealized appreciation (depreciation) on: |
|||
| Investments | 323,470 | ||
| Swap contracts | (7,159 | ) |
|
| Securities sold short | (143,317 | ) |
|
| Purchased options | (6,409 | ) |
|
| Written options | (27,166 | ) |
|
| Net increase in net assets from operations | 97,824 | ||
| FROM DISTRIBUTIONS |
|||
| Net investment income - Investor Class | — | ||
| Net investment income - Institutional Class | (219 | ) |
|
| Net realized gain on investments - Investor Class | (5,372 | ) |
|
| Net realized gain on investments - Institutional Class | (20,701 | ) |
|
| Net decrease in net assets resulting from distributions paid | (26,292 | ) |
|
| FROM CAPITAL SHARE TRANSACTIONS |
|||
| Proceeds from shares sold: |
|||
| Investor Class | 4,443,071 | ||
| Institutional Class | 22,382,468 | ||
| Proceeds from shares issued to holders in reinvestment of dividends: |
|||
| Investor Class | 1,634 | ||
| Institutional Class | 20,919 | ||
| Payments for shares redeemed: |
|||
| Investor Class | (996,192 | ) |
|
| Institutional Class | (8,168,776 | ) |
|
| Net increase in net assets from capital share transactions | 17,683,124 | ||
| TOTAL INCREASE IN NET ASSETS | 17,754,656 | ||
| NET ASSETS: |
|||
| Beginning of Period | — | ||
| End of Period | $ | 17,754,656 | |
| ACCUMULATED NET INVESTMENT LOSS | $ | (79,806 | ) |
| (1) | The Fund commenced operations on September 27, 2013. |
The accompanying notes are an integral part of these consolidated financial statements.
14
Loeb King Alternative Strategies Fund
Statement of Changes in Net Assets(continued)
Period Ended February 28, 2014(1) (Unaudited) |
|||
| CHANGES IN SHARES OUTSTANDING: |
|||
| Shares sold: |
|||
| Investor Class | 444,515 | ||
| Institutional Class | 2,234,290 | ||
| Shares issued to holders as reinvestment of dividends: |
|||
| Investor Class | 163 | ||
| Institutional Class | 2,090 | ||
| Shares redeemed: |
|||
| Investor Class | (99,633 | ) |
|
| Institutional Class | (812,006 | ) |
|
| Net increase in shares outstanding | 1,769,419 | ||
| (1) | The Fund commenced operations on September 27, 2013. |
The accompanying notes are an integral part of these consolidated financial statements.
15
Loeb King Alternative Strategies Fund
Statement of Cash Flows
For the Period Ended February 28, 2014 (Unaudited)
| Increase (decrease) in cash— |
|||
| Cash flows from operating activities: |
|||
| Net increase (decrease) in net assets from operations | $ | 97,824 | |
| Adjustments to reconcile net increase (decrease) in net assets from operations to net cash provided (used) in operating activities: |
|||
| Payments to purchase securities | (44,929,610 | ) |
|
| Payments to cover short securities | (13,163,820 | ) |
|
| Payments to close written options | (190,183 | ) |
|
| Proceeds from sale of securities | 34,617,311 | ||
| Proceeds from securities sold short | 16,785,601 | ||
| Proceeds from written options | 231,682 | ||
| (Purchase) sale of short term investments, net | (154,056 | ) |
|
| Realized gain on investments in securities | (115,537 | ) |
|
| Realized loss on securities sold short | 150,087 | ||
| Realized loss on written options | 1,422 | ||
| Change in unrealized appreciation on investments in securities | (317,061 | ) |
|
| Change in unrealized depreciation on securities sold short | 143,317 | ||
| Change in unrealized depreciation on written options | 27,166 | ||
| (Increases) decreases in operating assets: |
|||
| Increase in foreign currencies | (265,669 | ) |
|
| Increase in deposits at broker | (5,647,116 | ) |
|
| Unrealized appreciation on open swap contracts | (19,756 | ) |
|
| Increase in dividends and interest receivable | (81,116 | ) |
|
| Increase in receivable for securities sold | (926,347 | ) |
|
| Increase in due from Adviser | (30,057 | ) |
|
| Increase in prepaid expenses and other assets | (47,697 | ) |
|
| Increases (decreases) in operating liabilities: |
|||
| Unrealized depreciation on open swap contracts | 26,915 | ||
| Increase in payable for securities purchased | 1,517,374 | ||
| Increase in payable for dividends and interest on short positions | 6,834 | ||
| Increase in distribution fees | 2,198 | ||
| Increase in custody fees | 17,893 | ||
| Increase in other accrued expenses | 37,794 | ||
| Net cash used in operating activities | (12,224,607 | ) |
|
| Cash flows from financing activities: |
|||
| Proceeds from shares sold | 26,798,092 | ||
| Payment on shares redeemed | (9,164,968 | ) |
|
| Distributions paid in cash | (3,739 | ) |
|
| Net cash provided by financing activities | 17,629,385 | ||
| Net increase in cash | 5,404,778 | ||
| Cash: |
|||
| Beginning balance | — | ||
| Ending balance | $ | 5,404,778 | |
| Supplemental information: |
|||
| Non-cash financing activities not included herein consists of dividend reinvestment of dividends and distributions | $ | 22,553 | |
| Cash paid for interest | $ | 6,418 | |
The accompanying notes are an integral part of these consolidated financial statements.
16
Loeb King Alternative Strategies Fund-Investor Class
Financial Highlights
Per Share Data for a Share Outstanding Throughout the Period
Period Ended February 28, 2014(1) (Unaudited) |
|||
| Net Asset Value, Beginning of Period | $ | 10.00 | |
| Income (loss) from investment operations: |
|||
| Net investment loss(2) | (0.07) | ||
| Net realized and unrealized gain on investments | 0.11 | ||
| Total from investment operations | 0.04 | ||
| Less distributions paid: |
|||
| From net realized gain on investments | (0.02) | ||
| Total distributions paid | (0.02) | ||
| Net Asset Value, End of Period | $ | 10.02 | |
| Total return(3) | 0.42% | ||
| Supplemental Data and Ratios: |
|||
| Net assets, end of period (000's) | $ | 3,459 | |
| Ratio of expenses to average net assets(4) |
|||
| Before reimbursements and/or waivers | 6.98% | ||
| After reimbursements and/or waivers | 2.98% | ||
| Ratio of expenses excluding dividend and interest expense on short positions to average net assets(4) |
|||
| Before reimbursements and/or waivers | 6.24% | ||
| After reimbursements and/or waivers | 2.24% | ||
| Ratio of net investment loss to average net assets(4)(5) |
|||
| Before reimbursements and/or waivers | -5.69% | ||
| After reimbursements and/or waivers | -1.69% | ||
| Portfolio turnover rate(3)(6) | 377% | ||
| (1) | The Fund commenced operations on September 27, 2013. |
| (2) | Per share net investment loss was calculated using average shares outstanding. |
| (3) | Not annualized. |
| (4) | Annualized. |
| (5) | The net investment loss ratios include dividend and interest expense on short positions. |
| (6) | Consists of long-term investments only; excludes securities sold short and derivative instruments. |
The accompanying notes are an integral part of these consolidated financial statements.
17
Loeb King Alternative Strategies Fund-Institutional Class
Financial Highlights
Per Share Data for a Share Outstanding Throughout the Period
Period Ended February 28, 2014(1) (Unaudited) |
|||
| Net Asset Value, Beginning of Period | $ | 10.00 | |
| Income (loss) from investment operations: |
|||
| Net investment loss(2) | (0.06) | ||
| Net realized and unrealized gain on investments | 0.12 | ||
| Total from investment operations | 0.06 | ||
| Less distributions paid: |
|||
| From net realized gain on investments | (0.02) | ||
| Total distributions paid | (0.02) | ||
| Net Asset Value, End of Period | $ | 10.04 | |
| Total return(3) | 0.62% | ||
| Supplemental Data and Ratios: |
|||
| Net assets, end of period (000's) | $ | 14,296 | |
| Ratio of expenses to average net assets(4) |
|||
| Before reimbursements and/or waivers | 6.98% | ||
| After reimbursements and/or waivers | 2.66% | ||
| Ratio of expenses excluding dividend and interest expense on short positions to average net assets(4) |
|||
| Before reimbursements and/or waivers | 6.31% | ||
| After reimbursements and/or waivers | 1.99% | ||
| Ratio of net investment loss to average net assets(4)(5) |
|||
| Before reimbursements and/or waivers | -5.81% | ||
| After reimbursements and/or waivers | -1.49% | ||
| Portfolio turnover rate(3)(6) | 377% | ||
| (1) | The Fund commenced operations on September 27, 2013. |
| (2) | Per share net investment loss was calculated using average shares outstanding. |
| (3) | Not annualized. |
| (4) | Annualized. |
| (5) | The net investment loss ratios include dividend and interest expense on short positions. |
| (6) | Consists of long-term investments only; excludes securities sold short and derivative instruments. |
The accompanying notes are an integral part of these consolidated financial statements.
18
Loeb King Alternative Strategies Fund
Notes to the Financial Statements
February 28, 2014 (Unaudited)
The Loeb King Alternative Strategies Fund (the “Fund”) is a series of the Loeb King Trust (the “Trust”) which was formed as a Delaware statutory trust on May 22, 2013, and is registered under the Investment Company Act of 1940, as amended (the “1940 Act”). The Fund is an open-end, diversified, management investment company. The Fund is managed by Carl M. Loeb Advisory Partners L.P. (the “Adviser”). The Fund’s investment objective is to seek positive absolute returns and income with lower volatility than global capital markets and traditional investment strategies. The Fund commenced operations on September 27, 2013.
The Fund currently offers Investor Class and Institutional Class shares. Each class of shares differs principally in its distribution expenses. The Fund may issue an unlimited number of shares of beneficial interest, with no par value. Each class of shares has identical rights to earnings, assets and voting privileges, except for class-specific expenses and exclusive rights to vote on matters affecting only individual classes.
2. Significant Accounting Policies
The following is a summary of significant accounting policies consistently followed by the Fund in the preparation of the financial statements. These policies are in conformity with U.S. generally accepted accounting principles.
A. Securities Valuation: All investments in securities are recorded at their estimated fair value, as described in Note 3.
B. Use of Estimates: The preparation of financial statements in conformity with accounting principles generally accepted in the United States of America (“GAAP”) requires management to make estimates and assumptions that affect the reported amount of assets and liabilities, recognition of revenue and expenses and disclosure of contingent assets and liabilities at the date of the financial statements. Actual results could differ from those estimates.
C. Federal Income Taxes: The Fund intends to qualify each year as a regulated investment company under Subchapter M of the Internal Revenue Code, provided it complies with all applicable requirements regarding the source of its income, diversification of its assets and timing and amount of distributions. The Fund intends to distribute substantially all of its taxable income and net capital gains to shareholders. In addition, by distributing in each calendar year substantially all of its net investment income and capital gains, if any, the Fund will not be subject to a federal excise tax. Therefore, no federal income or excise tax provision is required.
The Fund recognizes the tax benefits of uncertain tax positions only where the position is “more likely than not” to be sustained assuming examination by tax authorities. Management has analyzed the Fund’s tax positions, and has concluded that no liability for unrecognized tax benefits should be recorded related to uncertain tax positions expected to be taken in the Fund’s 2014 tax returns. The Fund identifies its major tax jurisdictions as U.S. Federal and the state of Delaware; however, the Fund is not aware of any tax positions for which it is reasonably possible that the total amounts of unrecognized tax benefits will change materially in the next twelve months.
D. Securities Transactions, Income and Distributions: Securities transactions are accounted for on the trade date. Realized gains and losses on securities sold are determined on a specific identification basis. Interest income is recorded on an accrual basis. Dividend income and distributions to shareholders are recorded on the ex-dividend date. Withholding taxes on foreign dividends have been provided for in accordance with the Funds’ understanding of the applicable country’s tax rules and rates.
The Fund distributes substantially all net investment income, if any, and net realized capital gains, if any, annually. The amount of dividends and distributions to shareholders from net investment income and net realized capital gains is determined in accordance with Federal income tax regulations, which differ from accounting principles generally accepted in the United States of America. To the extent these book/tax differences are permanent, such amounts are reclassified within the capital accounts based on their Federal tax treatment.
Investment income, expenses (other than those specific to the class of shares), and realized and unrealized gains and losses on investments are allocated to the separate classes of the Fund’s shares based upon their relative net assets on the date income is earned or expensed and realized and unrealized gains and losses are incurred.
E. Foreign Currency Translation: The books and records of the Fund are maintained in U.S. dollars. Foreign currency amounts are translated into U.S. dollars at the prevailing exchange rates of such currencies against the U.S. dollar. The market value of investment securities and the other assets and liabilities are translated at the exchange rate as of the valuation date. Purchases and sales of investment securities, income and expenses are translated at the exchange rate prevailing on the respective dates of such transactions.
Although the net assets of the Fund are presented at the foreign exchange rates and market values at the close of the period, the Fund does not isolate that portion of the results of operations arising as a result of changes in the foreign exchange rates from the fluctuations arising from changes in the market prices of securities held or sold during the period. Accordingly, such foreign currency gains (losses) are included in the reported net realized and unrealized gains (losses) on investment transactions.
Reported realized foreign currency gains or losses arise from the disposition of foreign currency and forward foreign currency exchange contracts, currency gains or losses realized between the trade and settlement dates on securities transactions, and the difference between the amounts of dividends, interest and foreign withholding taxes recorded on the Fund’s books on the transaction date and the U.S. dollar equivalent of the amounts actually received or paid. Unrealized foreign exchange gains and losses arise from changes (due to the changes in the exchange rate) in the value of foreign currency and assets and liabilities (other than investments) denominated in foreign currencies, which are held at period end.
F. Loan Participations and Assignments: The Fund may invest in loan participations and assignments. When the Fund purchases a loan participation, the Fund typically enters into a contractual relationship with the lender or a third party selling such participations (“Selling Participant”), but not the borrower. In this case, the Fund assumes the credit risk of the borrower and the Selling Participant and any other persons inter-positioned between the Fund and the borrower (“Intermediate Participants”). In contrast, when the Fund purchases an assignment, the contractual relationship is with the borrower and the credit risk assumed by the Fund is only with the borrower. Although certain loan participations or assignments are secured by collateral, the Fund could experience delays or limitations in realizing proceeds on such collateral or have its interest subordinated to other indebtedness of the obligor. The Fund may also enter into unfunded loan commitments, which are contractual obligations for future funding. These unfunded commitments represent a future obligation in full, even though a
19
Loeb King Alternative Strategies Fund
Notes to the Financial Statements
February 28, 2014 (Unaudited)
percentage of the loan may not be utilized by the borrower. These types of investments may include standby financing commitments, such as revolving credit facilities, which obligate the Fund to supply additional cash to the borrower on demand. The value of the unfunded portion of the investment is determined using a pro-rata allocation, based on its par value relative to the par value of the entire investment. The unrealized appreciation (depreciation) from unfunded commitments is reported in the Statements of Assets and Liabilities. In addition, loan participations and assignments are vulnerable to market conditions such that economic conditions or other events may reduce the demand for loan participations and assignments and certain loan participations and assignments which were liquid, when purchased, may become illiquid.
G. Convertible Securities: The Fund invests in preferred stocks and fixed-income securities which are convertible into common stock. Convertible securities may be converted either at a stated price or rate within a specified period of time into a specified number of shares of common stock. By investing in a convertible security, the Fund may participate in any capital appreciation or depreciation of a company’s stock, but to a lesser degree than if it had invested in that company’s common stock. Convertible securities rank senior to common stock in a corporation’s capital structure and, therefore, entail less risk than the corporation’s common stock. The Fund may attempt to hedge some of its investments in convertible debt securities by selling short the issuer’s common stock.
H. Short Sales: The Fund sells securities it does not own as a hedge against some of its long positions and/or in anticipation of a decline in the market value of that security (short sale). When the Fund makes a short sale, it must borrow the security sold short and deliver it to the broker-dealer through which it made the short sale. The Fund may have to pay a fee to borrow the particular security and may be obligated to remit any interest or dividends received on such borrowed securities. Dividends declared on short positions open are recorded on the ex-date as an expense. A gain, limited to the price at which the Fund sold the security short, or a loss, unlimited in magnitude, will be recognized upon the termination of a short sale if the market price at termination is less than or greater than, respectively, the proceeds originally received. The Fund is also subject to the risk that they may be unable to reacquire a security to terminate a short position except at a price substantially in excess of the last quoted price. The Fund is also subject to risk of loss if the broker were to fail to perform its obligations under the contractual terms. Liabilities for securities sold short are reported at market value on the Statement of Assets and Liabilities and the change in market value is recorded as unrealized gain or loss on the Statement of Operations.
The Fund is required to pledge cash or securities to the broker as collateral for the securities sold short. Collateral requirements are calculated daily based on the current market value of the short positions. Cash deposited with broker for collateral for securities sold short is recorded as an asset on the Statement of Assets and Liabilities and securities segregated as collateral are denoted in the Schedule of Investments. The Fund may receive or pay the net of the following amounts: (i) a portion of the income from the investment of cash collateral; (ii) the broker’s fee on the borrowed securities; and (iii) a financing charge for the difference in the market value of the short position and cash collateral deposited with the broker. This income or fee is calculated daily based upon the market value of each borrowed security and a variable rate that is dependent on the availability of the security. The net amount of fees incurred is included in dividend and interest on securities sold short in the Statement of Operations.
I. Master Agreements: The Fund is a party to ISDA (International Swap and Derivatives Association, Inc.) Master Agreements (“Master Agreements”) with certain counterparties that govern over-the-counter derivative (including Total Return, Credit Default and Interest Rate Swaps) and foreign exchange contracts entered into by the Fund. The Master Agreements may contain provisions regarding, among other things, the parties’ general obligations, representations, agreements, collateral requirements, events of default and early termination. Termination events applicable to the Fund may occur upon a decline in the Fund’s net assets below a specified threshold over a certain period of time. Termination events applicable to counterparties may occur upon a decline in the counterparty’s long-term and short-term credit ratings below a specified level. In each case, upon occurrence, the other party may elect to terminate early and cause settlement of all derivative and foreign exchange contracts outstanding, including the payment of any losses and costs resulting from such early termination, as reasonably determined by the terminating party. Any decision by one or more of the Fund’s counterparties to elect early termination could impact the Fund’s future derivative activity. Collateral and margin requirements differ between exchange traded derivatives and over-the-counter (“OTC”) derivatives. Margin requirements are established by the broker or clearing house for exchange-traded and centrally cleared derivatives (futures contracts, options and centrally cleared swaps) pursuant to the governing agreements for those investment types. For OTC derivatives traded under an ISDA Master Agreement, posting of collateral is required by either the Fund or the applicable counterparty if the total net exposure of all OTC derivatives with the applicable counterparty exceeds the minimum transfer amount and can vary depending on the counterparty and the type of the agreement. For swaps, futures and forward foreign currency exchange contracts, the Fund may be required to post collateral if the Fund is in a net liability position with the counterparty exceeding certain amounts. Generally, collateral is determined at the close of fund business each day. Collateral posted for the benefit of the Fund is held in a segregated account by a custodian of the Fund’s custodian and with respect to those amounts which can be sold or repledged, are presented in the Fund’s Schedule of Investments. Collateral pledged by the Fund is segregated by the Fund’s custodian and identified in the Fund’s Schedule of Investments. Collateral can be in the form of cash, debt securities issued by the U.S. Government and related agencies, other securities or money market funds as agreed to by the Fund and the applicable counterparty. Collateral requirements are generally determined based on the Fund’s net position with each counterparty. The Fund’s derivative assets and liabilities on the Statement of Assets and Liabilities are presented net only within a derivative type when a legally enforceable master netting agreement exists between the Fund and a derivative counterparty. For additional information regarding the offsetting of assets and liabilities at February 28, 2014, please reference the table in Note 4.
J. Futures Contracts: The Fund may invest in futures contracts as part of its investment strategy. Investments in futures may increase or decrease exposure to a particular market. In the event of a bankruptcy or insolvency of a futures commission merchant that holds margin on behalf of the Fund, the Fund may not be entitled to the return of all of the margin owed to the Fund, potentially resulting in a loss. No monies are paid to or received by the Fund upon the purchase or sale of a futures contract. Initially, the Fund will be required to deposit with the broker an amount of cash or cash equivalents, known as initial margin, based on the value of the contract. Subsequent payments to and from the broker, will be made on a periodic basis as the price of the underlying instruments fluctuates. Changes in market value of open futures contracts are recorded as unrealized appreciation or depreciation in the Statement of Operations. Realized gains or losses represent the difference between the value of the contract at the time it was opened and the value at the time it was closed or expired, and are reported on the Statement of Operations. Securities deposited as initial margin are designated in the Schedule of Investments and cash deposited is presented as Due from Broker on the Statement of Assets and Liabilities. The use of long futures contracts subjects the Fund to risk of loss in excess of the amounts shown on the Statement of Assets and Liabilities, up to the contract amount of the futures contracts. The use of short futures contracts subjects the Fund to unlimited risk of loss. Futures contracts outstanding at period end, if any, are listed after the Fund’s Schedule of Investments.
20
Loeb King Alternative Strategies Fund
Notes to the Financial Statements
February 28, 2014 (Unaudited)
K. Forward Foreign Currency Exchange Contracts: The Fund may buy and sell forward foreign currency exchange contracts, which are agreements between two parties to buy and sell currencies at a set price on a future date. These contracts are used to protect against a decline in value relative to the U.S. dollar of the currencies in which portfolio securities are denominated or quoted (or an increase in the value of a currency in which securities the Fund intends to buy are denominated, when the Fund holds cash reserves and short term investments), or for other investment purposes. The U.S. dollar value of forward foreign currency exchange contracts is determined using current forward currency exchange rates supplied by a quotation service. The market value of the contract will fluctuate with changes in currency exchange rates. The contract is marked to market daily and the change in market value is recorded as an unrealized appreciation or depreciation. When the contract is closed, the Fund records a realized gain or loss equal to the difference between the value of the contract at the time it was opened and the value at the time it was closed. The Fund could be exposed to risk if the value of the currency changes unfavorably, if the counterparties to the contracts are unable to meet the terms of their contracts or if the Fund is unable to enter into a closing position. Risks may exceed amounts recognized on the Statement of Assets and Liabilities. Non-deliverable forward foreign currency exchange contracts are settled with the counterparty in U.S. dollar without the delivery of foreign currency. Forward foreign currency exchange contracts outstanding at period end, if any, are listed after the Fund’s Schedule of Investments.
L. Swap Contracts: The Fund engages in various swap transactions to manage risks within its portfolio or as an alternative to direct investments. Swap transactions are privately negotiated in the OTC market and payments are settled through direct payments between the Fund and the counterparty. By contrast, certain swap transactions are subject to mandatory central clearing (“centrally cleared swaps”). These swaps are executed through a derivatives clearing member (“DCM”), acting in an agency capacity, and submitted to a central counterparty (“CCP”), in which case all payments are settled with the CCP through the DCM. For credit default and interest rate contracts, an up-front payment received by the Fund is recorded as a liability on the Fund’s Statement of Assets and Liabilities. An up-front payment made by a Fund is recorded as an asset on the Fund’s Statement of Assets and Liabilities. Up-front payments are amortized over the term of the contract. Periodic payments received or paid by a Fund are recorded as realized gains or losses.
M. Total Return Swap Contracts: The Fund invests in total return swaps to obtain exposure to the underlying referenced instrument, obtain leverage or attain the returns from ownership without actually owning the underlying position. Total return swaps are two-party contracts that generally obligate one party to pay the positive return and the other party to pay the negative return on a specified reference security, security index or index component during the period of the swap. Total return swap contracts are marked to market daily based on the value of the underlying reference entity and the change, if any, is recorded as an unrealized gain or loss. Total return swaps normally do not involve the delivery of securities or other underlying assets. If the other party to a total return swap defaults, the Fund’s risk of loss consists of the net amount of payments that the Fund is contractually entitled to receive, if any. Total return swaps are derivatives and their value can be volatile. To the extent that the Adviser does not accurately analyze and predict future market trends, the values of assets or economic factors, the Fund may suffer a loss, which may exceed the related amounts shown in the Statement of Assets and Liabilities. Periodic payments received or paid by the Fund are recorded as realized gains or losses. Total return swap contracts outstanding at period end, if any, are listed after the Fund’s Schedule of Investments.
N. High Yield Securities: The Fund invests in lower-quality debt securities. Investments in lower-rated securities or unrated securities of comparable quality tend to be more sensitive to economic conditions than higher rated securities causing greater price volatility. These instruments involve a greater risk of loss due to default by the issuer because such securities are generally unsecured and are often subordinated to other creditors’ claims.
O. Mutual Fund and ETF Trading Risk: The Fund may invest in other mutual funds that are either open-end or closed-end investment companies as well as Exchange Traded Funds (“ETFs”). ETFs are investment companies that are bought and sold on a national securities exchange. Unlike mutual funds, ETFs do not necessarily trade at the net asset values of their underlying securities, which means an ETF could potentially trade above or below the value of the underlying portfolios. Additionally, because ETFs trade like stocks on exchanges, they are subject to trading and commission costs unlike mutual funds. Also, both mutual funds and ETFs have management fees that are part of their costs, and the Fund will indirectly bear its proportionate share of the costs.
P. Cash and Cash Equivalents: Cash and cash equivalents include U.S. dollar and foreign currency deposited at bank accounts at amounts which may exceed insured limits. The Fund is subject to risk to the extent that the institutions may be unable to fulfill their obligations.
Q. Due to/from Broker: Due to/from Broker represents cash balances on deposit with the Fund’s prime brokers and counterparties. The Fund is subject to credit risk should the prime brokers and counterparties be unable to meet their obligations to the Fund.
R. Organizational and Offering Costs: Organizational costs incurred by the Fund, including professional and incorporation fees, are fully expensed by the end of the fiscal period. Offering costs, including professional fees and the offering of the initial registration, are amortized over a period not longer than twelve months from the date the Fund commenced operations. The Adviser is entitled to seek reimbursement from the Fund for such costs pursuant to the terms of the Adviser’s investment advisory agreement and operating expenses limitation agreement with the Trust.
S. Events Subsequent to the Fiscal Period End: In preparing the financial statements as of February 28, 2014, management considered the impact of subsequent events for potential recognition or disclosure in the financial statements.
T. Indemnification: In the normal course of business, the Fund may enter into various agreements that provide for general indemnifications. The Fund’s maximum exposure under these arrangements is unknown as any potential exposure involves future claims that may be made against the Fund. However, based on experience, the Fund expects the risk of loss to be remote.
21
Loeb King Alternative Strategies Fund
Notes to the Financial Statements
February 28, 2014 (Unaudited)
3. Investment Valuation
The Fund has adopted accounting standards which establish an authoritative definition of fair value and set out a hierarchy for measuring fair value. These standards require additional disclosures about the various inputs and valuation techniques used to develop the measurements of fair value, a discussion of changes in valuation techniques and related inputs during the period, and expanded disclosure of valuation levels for major security types. These inputs are summarized in the three broad levels listed below:
Level 1 – Unadjusted quoted prices in active markets for identical assets or liabilities that the Fund has the ability to access.
Level 2 – Observable inputs other than quoted prices included in Level 1 that are observable for the asset or liability, either directly or indirectly. These inputs may include quoted prices for the identical instrument on an inactive market, prices for similar instruments, interest rates, prepayment speeds, credit risk, yield curves, default rates and similar data.
Level 3 – Unobservable inputs for the asset or liability, to the extent relevant observable inputs are not available, representing the Fund’s own assumptions about the assumptions a market participant would use in valuing the asset or liability, and would be based on the best information available.
Following is a description of the valuation techniques applied to the Fund’s major categories of assets and liabilities measured at fair value on a recurring basis.
Equity Securities: Equity securities, including common stocks, preferred stocks, foreign- issued common stocks, exchange-traded funds, closed-end mutual funds and real estate investment trusts (REITs), that are listed on a securities exchange, market or automated quotation system (except for securities traded on the NASDAQ Global Market System), including securities traded over the counter, are valued at the last quoted sale price on the primary exchange or market (foreign or domestic) on which they are traded on the day of valuation or, if there has been no sale on such day, long positions are valued at the most recent bid price, and short positions are valued at the most recent ask price. Securities primarily traded on the NASDAQ Global Market System for which market quotations are readily available shall be valued using the NASDAQ Official Closing Price (“NOCP”). To the extent these securities are actively traded and valuation adjustments are not applied, they are categorized in level 1 of the fair value hierarchy.
Debt Securities: Fixed income securities, including asset backed securities, corporate bonds, municipal bonds, US Treasury Bonds and bank loans are normally valued on the basis of quotes obtained from brokers and dealers or an independent pricing service (“Pricing Service”). Debt securities, other than short-term instruments, are valued at the last reported sales price if the security is actively traded. If the debt security is not actively traded or if prices are not readily available, a Pricing Service may provide a price determined by a matrix pricing method or other analytical pricing models. The Fund’s Pricing Services use multiple valuation techniques to determine fair value. In instances where sufficient market activity exists, the pricing services may utilize a market-based approach through which quotes from market makers are used to determine fair value. In instances where sufficient market activity may not exist or is limited, the pricing services also utilize proprietary valuation models which may consider market characteristics such as benchmark yield curves, option-adjusted spreads, credit spreads, estimated default rates, coupon rates, anticipated timing of principal repayments, underlying collateral, and other unique security features in order to estimate the relevant cash flows, which are then discounted to calculate the fair value and generally will be classified as Level 2. Securities that use similar valuation techniques and inputs as described above are categorized as Level 2 of the fair value hierarchy.
Investment Companies: Investments in open-end mutual funds, including money market funds, are generally priced at their net asset value per share provided by the service agent of the funds and will be classified in Level 1 of the fair value hierarchy.
Exchange-Traded Notes: Investments in exchange-traded notes are actively traded on a national securities exchange and are valued based on the last sales price from the exchange and are categorized in Level 1 of the fair value hierarchy.
Derivative Instruments: Listed derivatives, including options, rights, warrants and futures that are actively traded are valued based on quoted prices from the exchange (last quoted sales price, if available, and if no sale on such date, then the most recent bid price for long positions and the most recent ask price for short positions). Over-the-counter financial derivative instruments, such as foreign currency contracts, futures, or swap agreements, derive their value from underlying asset prices, indices, reference rates, and other inputs or a combination of these factors. These contracts are normally valued on the basis of broker-dealer quotations or a Pricing Service at the settlement price determined by the relevant exchange. Depending on the product and the terms of the transaction, the value of the derivative contracts can be estimated by a Pricing Service using a series of techniques, including simulation pricing models. The pricing models use inputs that are observed from actively quoted markets such as issuer details, indices, spreads, interest rates, curves, dividends and exchange rates. Derivatives are typically categorized in either Level 1 or Level 2 of the fair value hierarchy depending on the valuation techniques and inputs described above.
Short-Term Debt Securities: Short-term securities having a maturity of less than 60 days are valued at amortized cost, which approximates market value. To the extent the inputs are observable and timely, these securities would be classified in Level 2 of the fair value hierarchy.
Securities for which market quotations are not readily available or if the closing price does not represent fair value, are valued following procedures approved by the Board of Trustees (“Board”). These procedures consider many factors, including the type of security, size of holding, trading volume and news events. Depending on the relative significance of the valuation inputs, these securities may be classified in either Level 2 or Level 3 of the fair value hierarchy.
The Board has delegated day-to-day valuation issues to a Valuation Committee which is comprised of representatives from the Fund’s Adviser, the members of the Board, and the Trust’s Principal Financial Officer. The function of the Valuation Committee is to value securities where current and reliable market quotations are not readily available. All actions taken by the Valuation Committee are reviewed and ratified by the Board.
Regardless of the method employed to value a particular security, all valuations are subject to review by the Fund’s Board of Trustees or its designee. In accordance with the Trust’s fair value procedures, the Adviser is required to consider all appropriate factors relevant to the value of securities for which it has determined other pricing sources are not available or reliable as described above. No single standard for determining fair value exists, since fair value depends upon the circumstances of each individual case. As a general principle, the current fair value of an issue of securities being valued by the Adviser would appear to be the amount which the owner might reasonably expect to receive for them upon their current sale. Methods which are in accordance with this principle may, for example, be based on a (i) a discount from market of a similar freely traded security (including a derivative security or a basket of securities traded
22
Loeb King Alternative Strategies Fund
Notes to the Financial Statements
February 28, 2014 (Unaudited)
on other markets, exchanges or among dealers); or (ii) yield to maturity with respect to debt issues, or a combination of these and other methods. To the extent that valuation of these securities is based on models or inputs that are less observable or unobservable in the market, the determination of fair value requires more judgment. Accordingly, the degree of judgment exercised in determining fair value is greatest for investments categorized in Level 3. Fair value pricing models are reviewed monthly. The outcomes of the pricing models are compared to significant observable market activity, if any exists, and to market valuations of any similar newly issued securities. Market resources are continually monitored to evaluate unobservable inputs such as general market commentary from financial institutions, commentary and reports from credit rating agencies and the financial reporting from municipal bond issuers.
The Fund has performed an analysis of all existing investments to determine the significance and character of all inputs to their fair value determination. The inputs or methodology used for valuing securities are not an indication of the risk associated with investing in those securities. The following table is a summary of the inputs used to value the Fund’s assets and liabilities measured at fair value as of February 28, 2014:
Loeb King Alternative Strategies Fund
Level 1 |
Level 2 |
Level 3 |
Total |
|||||||||
| Assets |
||||||||||||
| Common Stocks(1) | $ | 9,365,591 | $ | — | $ | 6,567 | $ | 9,372,158 | ||||
| Real Estate Investment Trusts | 308,359 | — | — | 308,359 | ||||||||
| Preferred Stocks(1) | 43,524 | 16,759 | — | 60,283 | ||||||||
| Convertible Bonds(1) | — | 32,720 | — | 32,720 | ||||||||
| Corporate Bonds(1) | — | 301,948 | — | 301,948 | ||||||||
| Bank Loans | — | 655,433 | — | 655,433 | ||||||||
| Exchange Traded Funds | 113,600 | — | — | 113,600 | ||||||||
| Warrants | 45 | — | — | 45 | ||||||||
| Purchased Options | 30,495 | 1,359 | — | 31,854 | ||||||||
| Total Assets | 9,861,614 | 1,008,219 | 6,567 | 10,876,400 | ||||||||
| Liabilities |
||||||||||||
| Common Stocks(1) | $ | 1,590,525 | $ | — | $ | — | $ | 1,590,525 | ||||
| Corporate Bonds(1) | — | 352,258 | — | 352,258 | ||||||||
| Exchange Traded Funds | 1,900,965 | — | — | 1,900,965 | ||||||||
| Real Estate Investment Trusts | 71,437 | — | — | 71,437 | ||||||||
| Options Written | 62,723 | 7,364 | — | 70,087 | ||||||||
| Total Liabilities | $ | 3,625,650 | $ | 7,364 | $ | — | $ | 3,985,272 | ||||
| Swaps(2) | $ | — | $ | (7,159 | ) |
$ | — | $ | (7,159 | ) |
||
| Total Other Financial Instruments | $ | — | $ | (7,159 | ) |
$ | — | $ | (7,159 | ) |
||
| (1) | See the Schedule of Investments for industry classifications |
| (2) | Reflected at the net unrealized appreciation (depreciation) on the contracts held. |
Transfers between levels are recognized at the end of the reporting period. During the period ended February 28, 2014, the Fund recognized no transfers between levels.
Level 3 Reconciliation Disclosure
Following is a reconciliation of Level 3 assets for which significant unobservable inputs were used to determine fair value.
Common Stocks |
|||
| Balance as of September 27, 2013 (inception) | $ | — | |
| Accrued discounts/premiums | — | ||
| Realized gain (loss) | — | ||
| Change in unrealized appreciation (depreciation) | — | ||
| Purchases | 6,567 | ||
| (Sales) | — | ||
| Transfer in and/or out of Level 3 | — | ||
| Balance as of February 28, 2014 | $ | 6,567 | |
| Change in unrealized appreciation/depreciation during the period for Level 3 investments held at February 28, 2014 | $ | — | |
The Level 3 investments as of February 28, 2014 represented 0.04% of net assets and did not warrant a disclosure of significant unobservable valuation inputs.
23
Loeb King Alternative Strategies Fund
Notes to the Financial Statements
February 28, 2014 (Unaudited)
4. Derivative Transactions
The Fund may use certain derivative instruments as a substitute for a comparable market position in the underlying security, to attempt to hedge or limit the exposure of the Fund’s position, to create a synthetic money market position, for certain tax-related purposes and to effect closing transactions. The various derivative instruments that the Fund may use are options, futures, swaps, and forward foreign currency contracts, among others. The Fund may also use derivatives for leverage, in which case their use would involve leveraging risk. The Fund’s use of derivative instruments involves risks different from, or possibly greater than, the risks associated with investing directly in securities and other traditional investments. Derivatives are subject to a number of risks, such as liquidity risk, interest rate risk, market risk, credit risk, and management risk. A fund investing in a derivative instrument could lose more than the principal amount invested.
The Fund has adopted the disclosure provisions of FASB Accounting Standard Codification 815, Derivatives and Hedging (“ASC 815”). ASC 815 requires enhanced disclosures about the Fund’s use of, and accounting for, derivative instruments and the effect of derivative instruments on the Fund’s results of operations and financial position. Tabular disclosure regarding derivative fair value and gain/loss by contract type (e.g., interest rate contracts, foreign exchange contracts, credit contracts, etc.) is required and derivatives accounted for as hedging instruments under ASC 815 must be disclosed separately from those that do not qualify for hedge accounting. Even though the Fund may use derivatives in an attempt to achieve an economic hedge, the Fund’s derivatives are not accounted for as hedging instruments under ASC 815 because investment companies account for their derivatives at fair value and record any changes in fair value in current period earnings.
The locations on the Statement of Assets and Liabilities of the Fund’s derivative positions by type of exposure, all of which are not accounted for as hedging instruments under GAAP, are as follows:
The fair value of derivative instruments as reported within the Statement of Assets and Liabilities as of February 28, 2014:
Asset Derivatives |
Liability Derivatives |
|||||||
Derivatives not accounted for as hedging instruments |
Statement of Assets & Liabilities Location |
Value |
Statement of Assets & Liabilities Location |
Value |
||||
| Equity Contracts - Options | Investments, at value | $ | 31,854 | Written options, at value | $ | 70,087 | ||
| Total Return Contracts - Swaps | Appreciation on open swap contracts | 19,757 | Depreciation on open swap contracts | 26,916 | ||||
| Total | $ | 51,611 | $ | 97,003 | ||||
The effect of derivative instruments on the Statement of Operations for the period September 27, 2013 (fund inception) through February 28, 2014 was as follows:
Amount of Realized Gain (Loss) on Derivatives Recognized in Income |
||||||||||||
Derivatives not accounted for as hedging instruments |
Purchased Options |
Written Options |
Swap Contracts |
Total |
||||||||
| Equity Contracts | $ | (115,595 | ) |
$ | (1,422 | ) |
$ | — | $ | (117,017 | ) |
|
| Total Return Contracts | — | — | 72,368 | 72,368 | ||||||||
| Total | $ | (115,595 | ) |
$ | (1,422 | ) |
$ | 72,368 | $ | (44,649 | ) |
|
Change in Unrealized Appreciation (Depreciation) on Derivatives Recognized in Income |
||||||||||||
Derivatives not accounted for as hedging instruments |
Purchased Options |
Written Options |
Swap Contracts |
Total |
||||||||
| Equity Contracts | $ | (6,409 | ) |
$ | (27,166 | ) |
$ | — | $ | (33,575 | ) |
|
| Total Return Contracts | — | — | (7,159 | ) |
(7,159 | ) |
||||||
| Total | $ | (6,409 | ) |
$ | (27,166 | ) |
$ | (7,159 | ) |
$ | (40,734 | ) |
| Assets: | Gross Amounts not Offset in the Statement of Assets and Liabilities |
|||||||||||||||||
Gross Amounts of Recognized Assets |
Gross Amounts Offset in the Statement Assets and Liabilities |
Net Amounts Presented in the Statement of Assets and Liabilities |
Financial Instruments |
Collateral Received (Pledged) |
Net Amount |
|||||||||||||
| Description |
||||||||||||||||||
| Total Return Swap Contracts | $ | 19,757 | $ | — | $ | 19,757 | $ | 19,757 | $ | — | $ | — | ||||||
| Total | $ | 19,757 | $ | — | $ | 19,757 | $ | 19,757 | $ | — | $ | — | ||||||
24
Loeb King Alternative Strategies Fund
Notes to the Financial Statements
February 28, 2014 (Unaudited)
| Liabilities: | Gross Amounts not Offset in the Statement of Assets and Liabilities |
|||||||||||||||||
Gross Amounts of Recognized Liabilities |
Gross Amounts Offset in the Statement of Assets and Liabilities |
Net Amounts Presented in the Statement of Assets and Liabilities |
Financial Instruments |
Collateral Pledged (Received) |
Net Amount |
|||||||||||||
| Description |
||||||||||||||||||
| Written Options | $ | 70,087 | $ | — | $ | 70,087 | $ | — | $ | 70,087 | $ | — | ||||||
| Total Return Swap Contracts | 26,916 | — | 26,916 | 26,916 | — | — | ||||||||||||
| Total | $ | 97,003 | $ | — | $ | 97,003 | $ | 26,916 | $ | 70,087 | $ | — | ||||||
The Fund is subject to a netting arrangement, which governs the terms of certain transactions with select counterparties. The netting arrangement allows the Fund to close out and net its total exposure to a counterparty in the event of a default with respect to all the transactions governed under a single agreement with a counterparty. The netting arrangement also specifies collateral posting arrangements at pre-arranged exposure levels. Under the netting arrangement, collateral is routinely transferred if the total net exposure to certain transactions (net of existing collateral already in place) governed under the relevant netting arrangement with a counterparty in a given account exceeds a specified threshold depending on the counterparty and the type of netting arrangement. For additional information, please reference the “Master Agreements” section in Note 2.
The average monthly fair values of purchased and written options during the period ended February 28, 2014 were $44,227 and $27,921, respectively. The average monthly notional amount of swaps during the period ended February 28, 2014 was $1,395,375 for long positions and $461,525 for short positions.
Transactions in written options contracts for the period ended February 28, 2014, are as follows:
Number of Contracts |
Premiums Received |
|||||
| Beginning Balance | — | $ | — | |||
| Options written | (1,448 | ) |
(231,682 | ) |
||
| Options closed | 906 | 148,015 | ||||
| Options expired | 36 | 8,664 | ||||
| Options exercised | 74 | 32,082 | ||||
| Outstanding at February 28, 2014 | (432 | ) |
$ | (42,921 | ) |
|
5. Investment Advisory Fee and Other Transactions with Affiliates
The Fund has entered into an investment advisory agreement (“Advisory Agreement”) with Carl M. Loeb Advisory Partners L.P. Under the Advisory Agreement, the Adviser has overall responsibility for the general management and investment of the Fund’s portfolio, subject to the supervision of the Board of Trustees. The Fund compensates the Adviser for its services at the annual rate of 1.50% of its average daily net assets, payable on a monthly basis in arrears.
The Fund is responsible for its own operating expenses. Pursuant to an operating expense limitation agreement between the Adviser and the Fund, the Adviser has contractually agreed to waive its fees or reimburse Fund expenses until at least December 31, 2015, to ensure that Total Annual Fund Operating Expenses (exclusive of interest, taxes, acquired fund fees and expenses, distribution and/or service (12b-1) fees, borrowing costs, dividend and interest expenses on short positions, brokerage commissions, transaction costs and extraordinary expenses and inclusive of organizational expenses) will not exceed 1.99% of the Fund’s average daily net assets. Any waiver of advisory fees or reimbursement of Fund expenses by the Adviser may be recouped in subsequent years if the aggregate amount actually paid by the Fund toward operating expenses for such fiscal year (taking into account the recoupment) does not exceed the applicable limitation on Fund expenses at the time of recoupment. The Adviser is permitted to recoup fees waived and expenses reimbursed in the prior three fiscal years. Any such recoupment will be reviewed by the Board of Trustees. The Fund must pay its current ordinary operating expenses before the Adviser is entitled to any recoupment of fees waived or expenses reimbursed. This arrangement can be terminated only by, or with the consent of, the Board of Trustees. Cumulative expenses subject to recapture pursuant to the aforementioned conditions are $221,623, which expire on August 31, 2017.
The Fund has adopted a plan pursuant to Rule 12b-1 under the Investment Company Act of 1940, as amended, that authorizes payments in connection with the distribution of the Fund’s Investor Class shares at an annual rate of up to 0.25% of the average daily net assets of the Investor Class shares. Amounts paid under the plan may be spent on any activities or expenses primarily intended to result in the sale of shares, including but not limited to, advertising, compensation for sales and marketing activities or financial institutions and others such as dealers and distributors, shareholder account servicing, the printing and mailing of prospectuses to other than current shareowners, and the printing and mailing of sales literature.
U.S. Bancorp Fund Services, LLC (“USBFS”) provides the Fund with administrative, fund accounting, and transfer agent services, including all regulatory reporting, and necessary office equipment and personnel. U.S. Bank, N.A., serves as the Fund’s custodian. Quasar Distributors, LLC acts as the Fund’s principal underwriter in a continuous public offering of the Fund’s shares. Quasar Distributors, LLC is an affiliate of USBFS and U.S. Bank, N.A.
6. Securities Transactions
For the period ended February 28, 2014, aggregate purchases and sales of securities, excluding short-term investments, securities sold short and derivative instruments were $44,929,611 and $34,691,670, respectively. There were no purchases or sales of U.S. government obligations during the period ended February 28, 2014.
25
Loeb King Alternative Strategies Fund
Notes to the Financial Statements
February 28, 2014 (Unaudited)
7. Income Taxes and Distributions to Shareholders
The tax character of distributions paid during the period ended February 28, 2014 is as follows:
Period Ended February 28, 2014 |
|||
| Ordinary income | $ | 26,292 | |
| Long-term capital gains | $ | — | |
26
Loeb King Alternative Strategies Fund
Expense Examples
February 28, 2014 (Unaudited)
As a shareholder of the Fund, you incur two types of costs: transaction costs, such as wire fees; and ongoing costs, including management fees, distribution and service (12b-1) fees and other Fund operating expenses. This example is intended to help you understand your ongoing costs (in dollars) of investing in the Fund, and to compare these costs with the ongoing costs of investing in other mutual funds.
This example is based on an investment of $1,000 invested at the beginning of the period and held for the period of September 27, 2013 (inception of the Fund) through February 28, 2014.
Actual expenses
The first line of the table below provides information about actual account values and actual expenses. You may use the information in this line, together with the amount you invested at the beginning of the period, to estimate the expenses that you paid over the period. Simply divide your account value by $1,000 (for example, an $8,600 account value divided by $1,000 = 8.6), then multiply the result by the number in the first line under the heading “Expenses Paid During Period” to estimate the expenses you paid on your account during this period.
Hypothetical example for comparison purposes
The second line of the table provides information about hypothetical account values and hypothetical expenses based on the Fund’s actual expense ratio and an assumed rate of return of 5% per year before expenses, which is not the Fund’s actual return. The hypothetical account values and expenses may not be used to estimate the actual ending account balance or expenses you paid for the period. You may use this information to compare ongoing costs of investing in the Fund and other funds. To do so, compare this 5% hypothetical example with the 5% hypothetical examples that appear in the shareholder reports of other funds.
Please note that the expenses shown in the table are meant to highlight your ongoing costs only and do not reflect any direct costs, such as wire fees or low balance fees. Therefore, the second line of the table is useful in comparing ongoing costs only, and will not help you determine the relative total costs of owning different funds. In addition, if these transaction costs were included, your costs would be higher.
Beginning Account Value September 27, 2013 |
Ending Account Value February 28, 2014 |
Expenses Paid During Period* September 27, 2013 Through February 28, 2014 |
|||||||
| Actual - Investor Class | $ | 1,000.00 | $ | 1,004.20 | $ | 13.61 | |||
| Hypothetical |
|||||||||
| (5% return before expenses) | 1,000.00 | 1,009.20 | 13.64 | ||||||
| Actual - Institutional Class | $ | 1,000.00 | $ | 1,006.20 | $ | 12.16 | |||
| Hypothetical |
|||||||||
| (5% return before expenses) | 1,000.00 | 1,010.66 | 12.18 | ||||||
| * | Expenses are equal to the Fund’s annualized expense ratio of 2.98% for Investor Class and 2.66% for Institutional Class, which is net of any expenses paid indirectly, multiplied by the average account value over the period, multiplied by 154 days/337 days (to reflect the since inception period). The Fund’s ending account value on the first line in the table is based on its actual total return of 0.42% for Investor Class and 0.62% for Institutional Class for the since inception period of September 27, 2013 to February 28, 2014. |
The accompanying notes are an integral part of these consolidated financial statements.
27
How to Obtain a Copy of the Fund’s Proxy Voting Policy and Proxy Voting Records
A description of the policies and procedures the Fund uses to determine how to vote proxies relating to portfolio securities is available without charge: (1) by calling 1-855-722-4550; or (2) on the U.S. Securities and Exchange Commission’s website at www.sec.gov. The Fund’s proxy voting record will be available by calling 1-855-722-4550 and on the SEC’s website at www.sec.gov no later than August 31 for the prior 12 months ending June 30.
Quarterly Filings on Form N-Q
The Fund files its complete schedule of portfolio holdings with the SEC for the first and third quarters of each fiscal year on Form N-Q. The Fund’s Form N-Q will be available on the SEC’s website at www.sec.gov. The Fund’s Form N-Q may be reviewed and copied at the SEC’s Public Reference Room in Washington, DC and information on the operation of the Public Reference Room may be obtained by calling 1-800-SEC-0330. Information included in the Fund’s N-Q will also be available upon request by calling 1-855-722-4550.
Householding
In an effort to decrease costs, the Fund intends to reduce the number of duplicate prospectuses and annual and semi-annual reports you receive by sending only one copy of each to those addresses shared by two or more accounts and to shareholders the Fund reasonably believes are from the same family or household. If you would like to discontinue householding for your accounts, please call 1-855-722-4550 to request individual copies of these documents. Once the Fund receives notice to stop householding, the Fund will begin sending individual copies 30 days after receiving your request. This policy does not apply to account statements.
28
Board Approval of Investment Advisory Agreement
The Board of Trustees (the “Board” or “Trustees”) of Loeb King Trust (the “Trust”) met in person at a meeting held on August 13, 2013 to consider the approval of the investment advisory agreement (the “Advisory Agreement”) for the Loeb King Alternative Strategies Fund (the “Fund”), a series of the Trust, entered into between the Fund’s investment adviser, Carl M. Loeb Advisory Partners L.P. (the “Adviser”) and the Fund.
In advance of the meeting, the Trustees requested and received materials to assist them in considering the approval of the Advisory Agreement. The materials provided contained information with respect to the factors enumerated below, including a copy of the Advisory Agreement, a memorandum prepared by the Trust’s outside legal counsel discussing in detail the Trustees’ obligations and the factors they should assess in considering the approval of the Advisory Agreement, due diligence materials prepared by the Adviser (including the Adviser’s response to a specific request letter from Trust counsel, the Adviser’s Form ADV, bibliographic information of key management and compliance personnel, a compliance program summary and certain specific compliance policies and procedures, including the Adviser’s code of ethics) and other pertinent information.
In considering the Advisory Agreement between the Adviser and the Fund and reaching their conclusions, the Trustees reviewed and analyzed various factors that they determined were relevant, including the following: (1) the nature, extent, and quality of the services to be provided by the Adviser; (2) the cost of the services to be provided and the profits to be realized by the Adviser and its affiliates from services rendered to the Trust; (3) comparative performance, fee and expense data for the Fund and other investment companies with similar investment objectives; (4) the extent to which economies of scale would be realized as the Fund proposed to be managed by the Adviser grows and whether the proposed advisory fee for the Fund reflects these economies of scale for the benefit of the Fund; and (5) other financial benefits to the Adviser and its affiliates resulting from services rendered to the Fund. In their deliberations, the Trustees did not identify any particular information that was all-important or controlling. Based on their evaluation of the information provided by the Adviser, in conjunction with the Fund’s other service providers, the Trustees, by a unanimous vote (including a separate vote of the Independent Trustees), approved the Advisory Agreement for an initial term ending two years following the hiring of the Adviser.
DISCUSSION OF FACTORS CONSIDERED
Nature, Extent and Quality of Services to be Provided to the Fund. The Trustees noted that they had reviewed the scope of services to be provided under the Advisory Agreement. In considering the nature, extent and quality of the services to be provided by the Adviser, the Board noted it had reviewed and considered the qualifications of the Adviser’s chief compliance officer and the firm’s compliance history. The Board also considered the Adviser’s experience managing strategies similar to those of the Fund. The Adviser’s registration form (“Form ADV”) was provided to the Board, as was the response of the Adviser to a detailed series of questions which included, among other things, information about the background and experience of the portfolio managers primarily responsible for the day-to-day management of the Fund.
The Board also considered other services to be provided to the Fund by the Adviser, such as monitoring adherence to the Fund’s investment restrictions and monitoring compliance with various Fund policies and procedures and with applicable securities regulations. Based on the factors above, as well as those discussed below, the Board concluded that it was satisfied with the nature, extent and quality of the services to be provided to the Fund by the Adviser.
Investment Performance of the Adviser. The Trustees noted that there was no prior performance of the Fund to consider, but they had considered the Adviser’s experience managing related investment vehicles and the performance of such accounts. They noted that such performance demonstrated the Adviser’s ability to effectively manage investments using alternative strategies. After considering all of the information, the Trustees concluded that the Fund and its shareholders were likely to benefit from the Adviser’s management.
Cost of Services Provided and Profits Realized by the Adviser. The Board reviewed the Fund’s estimated expense ratio and the advisory fee to be paid by the Fund, considered the expense ratios of comparable funds and the advisory fees charged by the Adviser for its separately-managed accounts, and concluded that the advisory fees were reasonable. The Board noted the Fund’s proposed management fee of 1.50% was higher than the peer group average of 1.13% and fell within the fourth quartile for its peer group. The Board also noted that the Fund’s total expense ratio for Investor Class Shares is 2.24% and the total expense ratio for Institutional Class Shares is 1.94%. These fall into the second and fourth quartiles, respectively, for the Fund’s peer group. The peer group average of 2.11% fell within the second quartile. Additionally, the Board took into consideration that the Adviser has contractually agreed to limit the total operating expenses of the Fund, which may result in the Adviser waiving some or all of its advisory fees or reimbursing Fund expenses so that the Fund’s total operating expenses do not exceed 1.99% of the Fund’s average annual assets.. The Board also evaluated the compensation and benefits expected to be received by the Adviser from its relationship with the Fund, including the Fund’s brokerage commissions and use of soft dollars by the Adviser. The Trustees also considered the overall profitability of the Adviser, reviewing the Adviser’s financial information and noted that after such review, the expected profitability to the Adviser with respect to the Advisory Agreement was not excessive, and that the Adviser should be able to maintain adequate profit levels to support the services it will provide to the Fund.
Economies of Scale. The Board determined that, while the Adviser is likely to realize economies of scale in managing the Fund as assets grow in size, the Fund has not yet commenced operations, therefore, it cannot benefit from significant economies of scale given its current size.
Benefits Derived from the Relationship with the Fund. The Board considered the direct and indirect benefits that could be received by the Adviser from its association with the Fund. The Board determined that the benefits the Adviser may receive, such as greater name recognition, the ability to attract additional investor assets and for Fund brokers’ provisions of brokerage and research services to the Adviser, appear to be reasonable, and in many cases, may benefit the Fund.
CONCLUSION
The Trustees considered all of the foregoing factors. In considering the approval of the Advisory Agreement, the Trustees did not identify any one factor as all-important, but rather considered these factors collectively. Based on the Board’s deliberations and its evaluation of the information described above, the Board, including the Independent Trustees, unanimously: (a) concluded that the terms of the Advisory Agreement are fair and reasonable; (b) concluded that the Adviser’s fees are reasonable in light of the services that the Adviser will provide to the Fund; and (c) agreed to approve the Advisory Agreement for an initial term of two years as being in the best interests of the Fund and its shareholders.
29
Privacy Notice
Rev. March 2014
|
|
|||
| FACTS |
WHAT DOES LOEB KING TRUST (THE “TRUST”) DO WITH YOUR PERSONAL INFORMATION?
|
||
|
|
|||
| Why? |
Financial companies choose how they share your personal information. Federal law gives consumers the right to limit some but not all sharing. Federal law also requires us to tell you how we collect, share, and protect your personal information. Please read this notice carefully to understand what we do.
|
||
|
|
|||
| What? |
The types of personal information we collect and share depend on the product or service you have with us. This information can include:
■ Social Security number and wire transfer instructions ■ account transactions and transaction history ■ investment experience and purchase history When you are no longer a customer, we continue to share your information as described in this notice. |
||
|
|
|||
| How? |
All financial companies need to share customers’ personal information to run their everyday business. In the section below, we list the reasons financial companies can share their customers’ personal information; the reasons the Trust chooses to share; and whether you can limit this sharing.
|
||
|
Reasons we can share your personal information
|
Does the Trust share? | Can you limit this sharing? |
|
For our everyday business purposes -
such as to process your transactions, maintain your account(s), respond to court orders and legal investigations, or report to credit bureaus |
Yes
|
No
|
|
For our marketing purposes -
to offer our products and services to you |
No
|
We don’t share
|
|
For joint marketing with other financial companies
|
No
|
We don’t share
|
|
For our affiliates’ everyday business purposes -
information about your transactions and experiences |
No
|
We don’t share
|
|
For our affiliates’ everyday business purposes -
information about your creditworthiness |
No
|
We don’t share
|
|
For non-affiliates to market to you
|
No
|
We don’t share
|
|
|
|||
| Questions? |
Call toll-free 855-722-4550 or go to www.loebkingfunds.com
|
||
30
Page 2
|
What we do
|
||
|
How does the Trust protect my personal information?
|
To protect your personal information from unauthorized access and use, we use security measures that comply with federal law. These measures include computer safeguards and secured files and buildings.
We permit only authorized parties and affiliates (as permitted by law) who have signed an agreement with us to have access to customer information. |
|
|
How does the Trust collect my personal information?
|
We collect your personal information, for example, when you
|
|
■
|
open an account or deposit money | |
■
|
direct us to buy securities or direct us to sell your securities | |
|
■
|
seek advice about your investments
|
|
|
Why can’t I limit all sharing?
|
Federal law gives you the right to limit only
|
|
■
|
sharing for affiliates’ everyday business purposes — information about your creditworthiness | |
■
|
affiliates from using your information to market to you | |
■
|
sharing for non-affiliates to market to you | |
|
State laws and individual companies may give you additional rights to limit sharing.
|
||
|
Definitions
|
||
|
Affiliates
|
Companies related by common ownership or control. They can be financial and nonfinancial companies.
|
|
|
■
|
The Trust does not share with our affiliates.
|
|
|
Non-affiliates
|
Companies not related by common ownership or control. They can be financial and nonfinancial companies.
|
|
|
■
|
The Trust does not share with non-affiliates so they can market to you.
|
|
|
Joint marketing
|
A formal agreement between non-affiliated financial companies that together market financial products or services to you.
|
|
|
■
|
The Trust does not jointly market.
|
|
|
Other important information
|
||
| In the event that you hold shares of a series of the Trust through a financial intermediary, including, but not limited to, a broker-dealer, bank or trust company, the privacy policy of your financial intermediary governs how your non-public personal information is shared with unaffiliated third parties. | ||
31
|
Adviser
|
Carl M. Loeb Advisory Partners L.P.
125 Broad Street, 14th Floor New York, NY 10004 |
Distributor
|
Quasar Distributors, LLC
615 East Michigan Street Milwaukee, Wisconsin 53202 |
|
Legal Counsel
|
Godfrey & Kahn, S.C.
780 North Water Street Milwaukee, Wisconsin 53202 |
Custodian
|
U.S. Bank, N.A.
1555 N. Rivercenter Dr. Milwaukee, Wisconsin 53212 |
Independent Registered Public Accountant
|
BBD, LLP
1835 Market Street, 26th Floor Philadelphia, Pennsylvania 19103 |
Transfer Agent, Fund Accountant and Fund Administrator
|
U.S. Bancorp Fund Services, LLC
615 East Michigan Street Milwaukee, Wisconsin 53202 |
32
Item 2. Code of Ethics.
Not applicable for semi-annual reports.
Item 3. Audit Committee Financial Expert.
Not applicable for semi-annual reports.
Item 4. Principal Accountant Fees and Services.
Not applicable for semi-annual reports.
Item 5. Audit Committee of Listed Registrants.
Not applicable to registrants who are not listed issuers (as defined in Rule 10A-3 under the Securities Exchange Act of 1934).
Item 6. Investments.
| (a) | Schedule of Investments is included as part of the report to shareholders filed under Item 1 of this Form. |
| (b) | Not Applicable. |
Item 7. Disclosure of Proxy Voting Policies and Procedures for Closed-End Management Investment Companies.
Not applicable to open-end investment companies.
Item 8. Portfolio Managers of Closed-End Management Investment Companies.
Not applicable to open-end investment companies.
Item 10. Submission of Matters to a Vote of Security Holders.
Not Applicable.
Item 11. Controls and Procedures.
| (a) | The Registrant’s President and Treasurer have reviewed the Registrant’s disclosure controls and procedures (as defined in Rule 30a-3(c) under the Investment Company Act of 1940 (the “Act”)) as of a date within 90 days of the filing of this report, as required by Rule 30a-3(b) under the Act and Rules 13a-15(b) or 15d-15(b) under the Securities Exchange Act of 1934. Based on their review, such officers have concluded that the disclosure controls and procedures are effective in ensuring that information required to be disclosed in this report is appropriately recorded, processed, summarized and reported and made known to them by others within the Registrant and by the Registrant’s service provider. |
| (b) | There were no changes in the Registrant’s internal control over financial reporting (as defined in Rule 30a-3(d) under the Act) that occurred during the second fiscal quarter of the period covered by this report that has materially affected, or is reasonably likely to materially affect, the Registrant’s internal control over financial reporting. |
Item 12. Exhibits.
| (a) | (1) Any code of ethics or amendment thereto, that is the subject of the disclosure required by Item 2, to the extent that the registrant intends to satisfy Item 2 requirements through filing an exhibit. Not Applicable. |
(2) A separate certification for each principal executive and principal financial officer pursuant to Section 302 of the Sarbanes-Oxley Act of 2002. Filed herewith.
(3) Any written solicitation to purchase securities under Rule 23c-1 under the Act sent or given during the period covered by the report by or on behalf of the registrant to 10 or more persons. Not applicable to open-end investment companies.
| (b) | Certifications pursuant to Section 906 of the Sarbanes-Oxley Act of 2002. Furnished herewith. |
SIGNATURES
Pursuant to the requirements of the Securities Exchange Act of 1934 and the Investment Company Act of 1940, the registrant has duly caused this report to be signed on its behalf by the undersigned, thereunto duly authorized.
(Registrant) Loeb King Trust
By (Signature and Title) /s/Gideon J. King________
Gideon J. King, President
Date 5/1/2014
Pursuant to the requirements of the Securities Exchange Act of 1934 and the Investment Company Act of 1940, this report has been signed below by the following persons on behalf of the registrant and in the capacities and on the dates indicated.
By (Signature and Title) /s/Gideon J. King________
Gideon J. King, President
Date 5/1/2014_
By (Signature and Title) /s/David S. Hampson____
David S. Hampson, Treasurer
Date 5/1/2014_