UNITED STATES
SECURITIES AND EXCHANGE COMMISSION
Washington, D.C. 20549
FORM
CURRENT REPORT
Pursuant to Section 13 or 15(d)
of the Securities Exchange Act of 1934
Date of Report (Date of Earliest Event Reported):
(Exact name of registrant as specified in its charter)
(State or other jurisdiction | (Commission | (I.R.S. Employer |
(Address of principal executive offices) | (Zip Code) |
(
Registrant’s telephone number, including area code:
Not Applicable
(Former name or former address, if changed since last report.)
Check the appropriate box below if the Form 8-K filing is intended to simultaneously satisfy the filing obligation of the registrant under any of the following provisions:
Written communications pursuant to Rule 425 under the Securities Act (17 CFR 230.425) | |
Soliciting material pursuant to Rule 14a-12 under the Exchange Act (17 CFR 240.14a-12) | |
Pre-commencement communications pursuant to Rule 14d-2(b) under the Exchange Act (17 CFR 240.14d-2(b)) | |
Pre-commencement communications pursuant to Rule 13e-4(c) under the Exchange Act (17 CFR 240.13e-4(c)) |
Indicate by check mark whether the registrant is an emerging growth company as defined in Rule 405 of the Securities Act of 1933 (§230.405 of this chapter) or Rule 12b-2 of the Securities Exchange Act of 1934 (§240.12b-2 of this chapter).
Emerging growth company
If an emerging growth company, indicate by check mark if the registrant has elected not to use the extended transition period for complying with any new or revised financial accounting standards provided pursuant to Section 13(a) of the Exchange Act. ☐
Securities registered pursuant to Section 12(b) of the Act:
Title of each class: |
| Trading Symbol |
| Name of each exchange on which registered: |
Item 2.02 Results of Operations and Financial Condition.
On April 27, 2020, QTS Realty Trust, Inc. (the “Company”) announced its financial results for the first quarter ended March 31, 2020. A copy of the Company’s press release is attached hereto as Exhibit 99.1 and a copy of the Company’s First Quarter 2020 Supplemental Information is attached hereto as Exhibit 99.2.
The information included in this Current Report on Form 8-K (including Exhibits 99.1 and 99.2 hereto) shall not be deemed “filed” for the purposes of Section 18 of the Securities Exchange Act of 1934, as amended (the “Exchange Act”), or otherwise subject to the liabilities of that section, nor shall it be deemed incorporated by reference into any filing made by the Company under the Exchange Act or the Securities Act of 1933, as amended, except as shall be expressly set forth by specific reference in such filing.
Item 7.01. Regulation FD Disclosure.
The disclosure contained in Item 2.02 is incorporated herein by reference.
Item 9.01 Financial Statements and Exhibits.
(d) Exhibits
Exhibit |
| Exhibit Description |
99.1 | Press Release dated April 27, 2020 | |
99.2 | First Quarter Ended 2020 Supplemental Information |
EXHIBIT INDEX
Exhibit |
| Exhibit Description |
99.1 | ||
99.2 | ||
104 | Inline XBRL Taxonomy Extension Presentation Linkbase Document Cover Page Interactive Data File (formatted as Inline XBRL and contained in Exhibit 101) |
SIGNATURES
Pursuant to the requirements of the Securities Exchange Act of 1934, the registrant has duly caused this report to be signed on its behalf by the undersigned hereunto duly authorized.
QTS Realty Trust, Inc. | ||
By: | /s/ Shirley E. Goza | |
Shirley E. Goza | ||
Secretary and General Counsel | ||
April 27, 2020 |
Exhibit 99.1
QTS REPORTS FIRST QUARTER 2020 OPERATING RESULTS
OVERLAND PARK, Kan. –April 27, 2020 – QTS Realty Trust, Inc. (“QTS” or the “Company”) (NYSE: QTS) today announced operating results for the first quarter ended March 31, 2020.
First Quarter GAAP & Other Highlights
|
|
Three Months Ended |
||||
|
|
March 31, |
||||
($ in thousands except per share data) |
|
2020 |
|
2019 |
||
Total revenue |
|
$ |
126,292 |
|
$ |
112,689 |
Net income |
|
$ |
8,120 |
|
$ |
21,148 |
Net income attributable to common stockholders |
|
$ |
965 |
|
$ |
12,513 |
Net income (loss) per share attributable to basic common shares (1) |
|
$ |
(0.01) |
|
$ |
0.20 |
Net income (loss) per share attributable to diluted common shares (1) |
|
$ |
(0.01) |
|
$ |
0.20 |
FFO available to common stockholders & OP unit holders (2) |
|
$ |
43,730 |
|
$ |
36,937 |
(1) |
Basic and diluted net income (loss) per share were calculated using the two-class method. |
(2) |
Includes QTS’ pro rata share of results from its unconsolidated entity. |
Additional First Quarter Highlights
· |
Recognized total consolidated revenues of $126.3 million for the quarter ended March 31, 2020, an increase of 12.1% compared to the same period in 2019. Total consolidated revenues do not include QTS’ pro rata share of revenue attributable to its unconsolidated joint venture of $1.5 million and $0.4 million for the quarters ended March 31, 2020 and 2019, respectively. |
· |
Reported Adjusted EBITDA of $66.8 million for the quarter ended March 31, 2020, an increase of 13.5% compared to Adjusted EBITDA of $58.8 million for the same period in 2019. |
· |
Reported Operating FFO available to common stockholders and OP unit holders of $43.9 million for the quarter ended March 31, 2020, an increase of 15.2% compared to Operating FFO available to common stockholders and OP unit holders of $38.2 million for the same period in 2019. |
· |
Reported Operating FFO per fully diluted share of $0.66 for the quarter ended March 31, 2020, compared to Operating FFO per fully diluted share of $0.64 in the same period of 2019. |
· |
Signed new and modified renewal leases during the first quarter of 2020 aggregating to $21.8 million of incremental annualized rent, net of downgrades. |
· |
Reported a Company record high annualized booked-not-billed monthly recurring revenue (“MRR”) balance of $100.9 million as of March 31, 2020 compared to $93.1 million as of December 31, 2019. |
· |
Through incremental common stock sold on a forward basis through its “at-the-market” (“ATM”) equity offering program through the date of this report, the Company currently has access to approximately $342 million of undrawn net proceeds through sales of the aforementioned forward stock. These available forward stock proceeds represent funding that is expected to be sufficient to support the Company’s capital development plan for the remainder of 2020 and into 2021. |
“In the midst of unprecedented disruption across the economy as a result of the COVID-19 pandemic, QTS’ business has continued to execute well,” said Chad Williams, Chairman and CEO of QTS.
Williams added, “Following a year of record leasing performance in 2019, we are pleased to extend our momentum with another strong performance in the first quarter. Our strategic differentiators, record booked-not-billed backlog and strong balance sheet and liquidity position QTS well to continue to drive market share growth.”
1 QTS Q1 Earnings 2020 |
Contact: IR@qtsdatacenters.com |
Financial Results
QTS recognized net income of $8.1 million in the first quarter of 2020 compared to net income of $21.1 million recognized in the first quarter of 2019. Net income attributable to common stockholders recognized in the first quarter of 2020 was $1.0 million compared to net income attributable to common stockholders of $12.5 million recognized in the first quarter of 2019. The change in net income and net income attributable to common stockholders was primarily driven by a gain on sale of real estate of approximately $13.4 million in the first quarter of 2019 associated with the Company’s assets that were contributed to the Company’s joint venture.
QTS generated total revenues of $126.3 million in the first quarter of 2020, an increase of 12.1% compared to total revenue of $112.7 million in the first quarter of 2019. MRR as of March 31, 2020 was $35.0 million compared to MRR as of March 31, 2019 of $32.0 million.
QTS generated $66.8 million of Adjusted EBITDA in the first quarter of 2020, an increase of 13.5% compared to Adjusted EBITDA of $58.8 million for the first quarter of 2019.
Additionally, QTS generated Operating FFO available to common stockholders and OP unit holders of $43.9 million in the first quarter of 2020, an increase of 15.2% compared to Operating FFO available to common stockholders and OP unit holders of $38.2 million in the first quarter of 2019.
Operating FFO per fully diluted share was $0.66 in the first quarter of 2020, compared to Operating FFO per fully diluted share of $0.64 in the first quarter of 2019.
Leasing Activity
During the quarter ended March 31, 2020, QTS entered into new and modified renewal leases aggregating to $21.8 million of incremental annualized rent. The Company’s first quarter leasing performance was primarily driven by strong sales in its hyperscale product vertical, highlighted by two existing hyperscale tenants’ expansions, as well as consistent performance in the hybrid colocation product vertical.
During the quarter ended March 31, 2020, QTS renewed leases with total annualized rent of $11.3 million at an average rent per square foot of $871, which was 5.0% higher than the annualized rent prior to their renewals. The increase in the renewal rate of 5.0% for the quarter ended March 31, 2020 was primarily attributable to a large number of hybrid colocation renewals with power and/or connectivity increases upon renewal. There is variability in the Company’s renewal rates based on the mix of product types renewed, and renewal rates are generally expected to increase in the low to mid-single digit percentage range as compared to pre-renewal pricing.
Rental Churn (which the Company defines as MRR lost in the period to a customer intending to fully exit the QTS platform in the near term compared to total MRR at the beginning of the period) was 0.6% for the three months ended March 31, 2020.
As of March 31, 2020, the booked-not-billed MRR balance (which represents customer leases that have been executed, but for which lease payments have not commenced as of March 31, 2020) was the highest in Company history and represented $8.4 million, or $100.9 million of annualized rent, and compares to $7.8 million, or $93.1 million of annualized rent at December 31, 2019. The booked-not-billed balance is expected to contribute an incremental $16.6 million to MRR in 2020 (representing $35.2 million in annualized MRR), an incremental $28.0 million in 2021 (representing $40.6 million in annualized MRR), and an incremental $25.2 million in annualized MRR thereafter.
Development
During the quarter ended March 31, 2020, the Company brought online approximately 21 megawatts of gross power and approximately 60,000 net rentable square feet (“NRSF”) of raised floor and customer specific capital at its Ashburn, Fort Worth and Atlanta (DC-1) facilities at an aggregate cost of approximately $224.0 million.
During the first quarter of 2020, the Company’s significant development activity continued at the Ashburn, Irving, Chicago, Richmond, Piscataway, Atlanta (DC-2), Hillsboro and Manassas facilities to have space ready for customers in 2020 and forward. Including the Company’s proportionate share of development activity related to its unconsolidated entity, the Company expects to bring an additional 133,000 raised floor NRSF into service in 2020 at an aggregate cost of approximately $302 million, of which $159 million has already been spent as of March 31, 2020.
2 QTS Q1 Earnings 2020 |
Contact: IR@qtsdatacenters.com |
Balance Sheet and Liquidity
In June 2019, the Company established a new “at-the-market” (“ATM”) equity offering program pursuant to which the Company may issue, from time to time, up to $400 million of its Class A common stock, which may include shares to be issued on a forward basis. Pursuant to this ATM program, through the date of this report the Company sold on a forward basis approximately 7.4 million shares of QTS’ Class A common stock representing available proceeds upon physical settlement of approximately $389 million. During the three months ended March 31, 2020, the Company elected to settle 1.9 million shares of forward stock and received net proceeds of approximately $83 million (of which 1.0 million shares and $47 million related to the ATM program and 0.9 million shares and $36 million related to the forward agreement entered into during the first quarter of 2019). Following these settlements, as of the date of this report, the Company currently has access to approximately $342 million of undrawn net proceeds through forward stock sales of 6.4 million shares from the ATM program. The Company expects to physically settle (by delivering shares of common stock) the remaining forward sales prior to the first anniversary date of each respective transaction.
As of March 31, 2020, the Company’s total net indebtedness, inclusive of its pro rata share of joint venture net debt, was approximately $1.5 billion. The Company’s net debt to annualized Adjusted EBITDA ratio pro forma for the effects of cash expected to be received upon the full physical settlement of, and issuance of, 6.4 million shares of common stock pursuant to forward equity sales described above, assuming such proceeds were used to repay a portion of the Company’s outstanding debt, is approximately 4.5x. Excluding the effects of cash expected to be received under the aforementioned forward stock sales, the Company’s leverage ratio is 5.8x.
As of March 31, 2020, resulting from heightened volatility in the capital markets the Company increased its cash and cash equivalents balance to $172 million, primarily through settlement of the aforementioned forward equity sales and draws on its unsecured revolving credit facility, which is considerably greater than historical levels. In addition, the Company increased its bad debt reserve as of March 31, 2020 due to the risk of non-payment for customers experiencing potential business disruptions due to COVID-19. Subsequent to March 31, 2020, the Company reduced its cash position to more normalized levels by using a portion of cash on hand to repay a portion of the Company’s unsecured revolving credit facility, pay dividends to common and preferred stockholders and fund additional capital expenditures.
As of March 31, 2020, pro forma for approximately $342 million of available proceeds at the Company’s election to physically settle the aforementioned forward equity sales as of the date of this report, the Company’s total available liquidity is approximately $980 million. Total available liquidity is comprised of $342 million of available proceeds from forward equity sales, $467 million of available capacity under the Company’s unsecured revolving credit facility and approximately $172 million of cash and cash equivalents.
Novel Coronavirus (COVID-19)
QTS is actively monitoring developments with respect to COVID-19 and has taken numerous actions based on corporate policies specifically focusing on the safety and wellness of its customers, partners, and employees, as well as providing continuous and resilient services. Although the COVID-19 pandemic is causing significant disruptions to the United States and global economy and has contributed to significant volatility and negative pressure in financial markets, as of the date of this report these developments have not had a known material adverse effect on the Company’s business. As of the date of this report, each of the Company’s data centers in North America and Europe are fully operational and operating in accordance with the Company’s business continuity plans. Across each of the respective jurisdictions in which the Company operates, the Company’s business has been deemed essential operations, which allows the Company to remain fully staffed with critical personnel in place to continue to provide continued service and support for its customers.
Since the beginning of the economic disruptions from COVID-19, the Company has experienced a modest increase in customer requests for payment relief, primarily concentrated in the retail, oil and gas, hospitality and transportation customer verticals. As of March 31, 2020, less than 10% of the Company’s MRR balance was generated from these industries. The total revenue associated with customers requesting some form of payment relief represented less than 5% of the Company’s revenue for the three months ended March 31, 2020. Importantly, of the small number of customers requesting some form of payment relief, as of March 31, 2020, the large majority of these customers were current on their rental payments and while QTS has not reduced their future payments, it has in certain circumstances provided additional flexibility in the form of extended payment terms.
In addition to these customer requests for payment relief, the Company also has experienced modest delays in construction activity in a few of its markets primarily as a result of availability of contractors and slower permitting. However, as of the date of this report none of these delays are expected to create a material adverse change in the Company’s anticipated infrastructure deliveries to customers. From a supply chain perspective, given the long-lead time generally associated with larger components in data center development, such as generators, UPS systems and chillers, as of the date of this report the Company has acquired the vast majority of
3 QTS Q1 Earnings 2020 |
Contact: IR@qtsdatacenters.com |
equipment needed to complete its 2020 development activities. In addition, the Company has accelerated the acquisition of additional infrastructure equipment to support its early 2021 expected development activity around its customers’ continued growth expectations.
The extent to which COVID-19 impacts our and our customers’ operations will depend on future developments, which are highly uncertain and cannot be predicted with confidence, including the duration of the outbreak, new information that may emerge concerning the severity of COVID-19 and the actions taken to contain COVID-19 or treat its impact, among others.
2020 Guidance
|
|
2020 Guidance |
||||
($ in millions except per share amounts) |
|
Low |
|
High |
||
Revenue |
|
$ |
523 |
|
$ |
537 |
Adjusted EBITDA |
|
$ |
275 |
|
$ |
285 |
Operating FFO per fully diluted share |
|
$ |
2.69 |
|
$ |
2.83 |
The Company is reaffirming its Revenue guidance range for 2020 of $523 million to $537 million which assumes annual rental churn as previously announced of between 3% and 6%. The Company is also reaffirming its Adjusted EBITDA guidance range for 2020 of $275 million to $285 million and reaffirming its Operating FFO per fully diluted share guidance range for 2020 of $2.69 per share to $2.83 per share. In addition, the Company is reaffirming its cash paid for capital expenditures guidance range for 2020 of $550 million to $600 million, excluding acquisitions. The Company’s 2020 capital expenditure guidance includes its proportionate share of cash capital expenditures associated with the unconsolidated joint venture.
The Company’s 2020 guidance includes the effects of the Company’s joint venture, which is reflected as an unconsolidated entity accounted for under the equity method on QTS’ financial statements. Consistent with GAAP accounting standards, revenue from the unconsolidated entity is not included in QTS’ reported consolidated GAAP financial statements. Also consistent with NAREIT-defined standards, QTS includes its proportionate ownership of non-GAAP measures such as EBITDAre, Adjusted EBITDA and FFO from the joint venture in its reported EBITDAre, Adjusted EBITDA and FFO results, respectively.
The Company’s 2020 guidance assumes, among other things, that its facilities continue to operate and it does not experience significant work stoppages or closures, it is able to mitigate any supply chain disruptions for its development activities, and it is able to collect revenues in line with current expectations. The Company is also monitoring the impacts of COVID-19 on the fair value of its assets. While the Company does not currently anticipate any material impairments on its assets as a result of COVID-19, future changes in expectations for sales, earnings and cash flows related to fixed assets, intangible assets and goodwill could cause these assets to be impaired. While these are the Company’s current assumptions, this is an emerging situation and these assumptions could change, including if the duration of the pandemic is extended, which could affect outlook.
QTS does not provide reconciliations for the non-GAAP financial measures included in its guidance provided above due to the inherent difficulty in forecasting and quantifying certain amounts that are necessary for such reconciliations, including net income (loss) and adjustments that could be made for restructuring costs, transaction costs, lease exit costs, asset impairments and gain (loss) on disposals and other charges as those amounts are subject to significant variability based on future transactions that are not yet known, the amount of which, based on historical experience, could be significant.
Non-GAAP Financial Measures
This release includes certain non-GAAP financial measures that management believes are helpful in understanding the Company’s business, as further described below. The Company does not, nor does it suggest investors should, consider such non-GAAP financial measures in isolation from, or as a substitute for, GAAP financial information. The Company believes that the presentation of non-GAAP financial measures provide meaningful supplemental information to both management and investors that is indicative of the Company’s operations. The Company has included a reconciliation of this additional information to the most comparable GAAP measure in the selected financial information below.
Conference Call Details
The Company will host a conference call and webcast on April 28, 2020, at 8:30 a.m. Eastern time (7:30 a.m. Central time) to discuss its financial results, current business trends and market conditions.
The dial-in number for the conference call is (877) 883-0383 (U.S.) or (412) 902-6506 (International). The participant entry number is 4539827# and callers are asked to dial in ten minutes prior to start time. A link to the live broadcast and the replay will be available on the Company’s website (www.qtsdatacenters.com) under the Investors tab.
4 QTS Q1 Earnings 2020 |
Contact: IR@qtsdatacenters.com |
About QTS
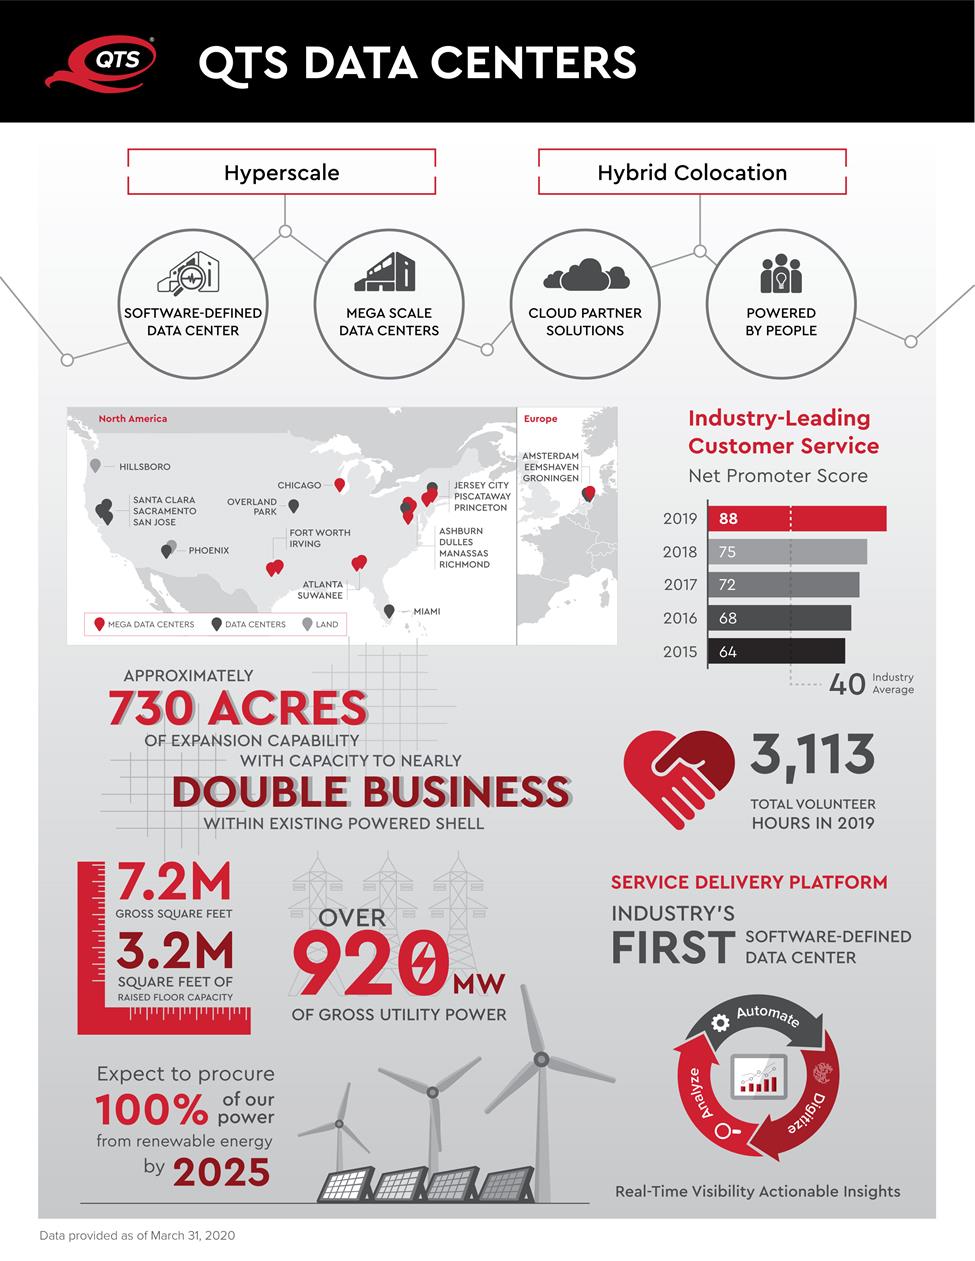
QTS Realty Trust, Inc. (NYSE: QTS) is a leading provider of data center solutions across a diverse footprint spanning more than 6 million square feet of owned data center space throughout primarily North America and Europe. Through its software-defined technology platform, QTS is able to deliver secure, compliant infrastructure solutions, robust connectivity and premium customer service to leading hyperscale technology companies, enterprises, and government entities. QTS owns, operates or manages 24 data centers and supports more than 1,200 customers primarily in North America and Europe.
QTS Investor Relations Contact
Stephen Douglas – EVP – Finance
ir@qtsdatacenters.com
Forward Looking Statements
Some of the statements contained in this release constitute forward-looking statements within the meaning of the federal securities laws. Forward-looking statements relate to expectations, beliefs, projections, future plans and strategies, anticipated events or trends and similar expressions concerning matters that are not historical facts. In particular, statements pertaining to the COVID-19 pandemic, its impact on the Company and the Company’s response thereto and to the Company’s strategy, plans, intentions, capital resources, liquidity, portfolio performance, results of operations, anticipated growth in our funds from operations and anticipated market conditions contain forward-looking statements. In some cases, you can identify forward-looking statements by the use of forward-looking terminology such as “may,” “will,” “should,” “expects,” “intends,” “plans,” “anticipates,” “believes,” “estimates,” “predicts,” or “potential” or the negative of these words and phrases or similar words or phrases which are predictions of or indicate future events or trends and which do not relate solely to historical matters.
The forward-looking statements contained in this release reflect the Company’s current views about future events and are subject to numerous known and unknown risks, uncertainties, assumptions and changes in circumstances that may cause actual results to differ significantly from those expressed in any forward-looking statement. The Company does not guarantee that the transactions and events described will happen as described (or that they will happen at all). The following factors, among others, could cause actual results and future events to differ materially from those set forth or contemplated in the forward-looking statements: adverse economic or real estate developments in the Company’s markets or the technology industry; obsolescence or reduction in marketability of our infrastructure due to changing industry demands; global, national and local economic conditions; risks related to the COVID-19 pandemic, including, but not limited to, the risk of business and/or operational disruptions, disruption of the Company’s customers’ businesses that could affect their ability to make rental payments to the Company, supply chain disruptions and delays in the construction or development of the Company’s data centers; risks related to the Company’s international operations; difficulties in identifying properties to acquire and completing acquisitions; the Company’s failure to successfully develop, redevelop and operate acquired properties or lines of business; significant increases in construction and development costs; the increasingly competitive environment in which the Company operates; defaults on, or termination or non-renewal of leases by customers; decreased rental rates or increased vacancy rates; increased interest rates and operating costs, including increased energy costs; financing risks, including the Company’s failure to obtain necessary outside financing; dependence on third parties to provide Internet, telecommunications and network connectivity to the Company’s data centers; the Company’s failure to qualify and maintain its qualification as a real estate investment trust; environmental uncertainties and risks related to natural disasters; financial market fluctuations; changes in real estate and zoning laws, revaluations for tax purposes and increases in real property tax rates; and limitations inherent in our current and any future joint venture investments, such as lack of sole decision-making authority and reliance on our partners' financial condition.
While forward-looking statements reflect the Company’s good faith beliefs, they are not guarantees of future performance. Any forward-looking statement speaks only as of the date on which it was made. The Company disclaims any obligation to publicly update or revise any forward-looking statement to reflect changes in underlying assumptions or factors, of new information, data or methods, future events or other changes. For a further discussion of these and other factors that could cause the Company’s future results to differ materially from any forward-looking statements, see the section entitled “Risk Factors” in the Company’s Annual Report on Form 10-K for the year ended December 31, 2019 and the risk factor related to the novel coronavirus (COVID-19) pandemic filed in an 8-K with the Securities and Exchange Commission on March 30, 2020, as well as other periodic reports the Company files with the Securities and Exchange Commission, many of which should be interpreted as being heightened as a result of the ongoing COVID-19 pandemic and the actions taken to contain the pandemic or mitigate its impact.
5 QTS Q1 Earnings 2020 |
Contact: IR@qtsdatacenters.com |
Consolidated Balance Sheets
(unaudited and in thousands except shares data)
|
|
March 31, |
|
December 31, |
||
|
|
2020 (1) |
|
2019 (1) |
||
ASSETS |
|
|
|
|
|
|
Real Estate Assets |
|
|
|
|
|
|
Land |
|
$ |
130,576 |
|
$ |
130,605 |
Buildings, improvements and equipment |
|
|
2,411,426 |
|
|
2,178,901 |
Less: Accumulated depreciation |
|
|
(588,685) |
|
|
(558,560) |
|
|
|
1,953,317 |
|
|
1,750,946 |
Construction in progress (2) |
|
|
877,313 |
|
|
920,922 |
Real Estate Assets, net |
|
|
2,830,630 |
|
|
2,671,868 |
Investments in unconsolidated entity |
|
|
32,051 |
|
|
30,218 |
Operating lease right-of-use assets, net |
|
|
55,716 |
|
|
57,141 |
Cash and cash equivalents |
|
|
171,957 |
|
|
15,653 |
Rents and other receivables, net |
|
|
74,506 |
|
|
81,181 |
Acquired intangibles, net |
|
|
78,139 |
|
|
81,679 |
Deferred costs, net (3) |
|
|
53,271 |
|
|
52,363 |
Prepaid expenses |
|
|
13,747 |
|
|
10,586 |
Goodwill |
|
|
173,843 |
|
|
173,843 |
Other assets, net (5) |
|
|
49,337 |
|
|
49,001 |
TOTAL ASSETS |
|
$ |
3,533,197 |
|
$ |
3,223,533 |
|
|
|
|
|
|
|
LIABILITIES |
|
|
|
|
|
|
Unsecured credit facility, net (4) |
|
$ |
1,222,946 |
|
$ |
1,010,640 |
Senior notes, net of debt issuance costs (4) |
|
|
395,740 |
|
|
395,549 |
Finance leases and mortgage notes payable |
|
|
46,244 |
|
|
46,876 |
Operating lease liabilities |
|
|
62,843 |
|
|
64,416 |
Accounts payable and accrued liabilities |
|
|
177,949 |
|
|
142,547 |
Dividends and distributions payable |
|
|
37,464 |
|
|
34,500 |
Advance rents, security deposits and other liabilities |
|
|
24,569 |
|
|
18,027 |
Derivative liabilities |
|
|
61,706 |
|
|
26,609 |
Deferred income taxes |
|
|
479 |
|
|
749 |
Deferred income |
|
|
39,561 |
|
|
39,169 |
TOTAL LIABILITIES |
|
|
2,069,501 |
|
|
1,779,082 |
|
|
|
|
|
|
|
EQUITY |
|
|
|
|
|
|
7.125% Series A cumulative redeemable perpetual preferred stock: $0.01 par value (liquidation preference $25.00 per share), 4,600,000 shares authorized, 4,280,000 shares issued and outstanding as of March 31, 2020 and December 31, 2019, respectively (6) |
|
|
103,212 |
|
|
103,212 |
6.50% Series B cumulative convertible perpetual preferred stock: $0.01 par value (liquidation preference $100.00 per share), 3,162,500 shares authorized, issued and outstanding as of March 31, 2020 and December 31, 2019, respectively (7) |
|
|
304,223 |
|
|
304,223 |
Common stock: $0.01 par value, 450,133,000 shares authorized, 60,398,036 and 58,227,523 shares issued and outstanding as of March 31, 2020 and December 31, 2019, respectively |
|
|
604 |
|
|
582 |
Additional paid-in capital |
|
|
1,412,025 |
|
|
1,330,444 |
Accumulated other comprehensive income (loss) |
|
|
(57,998) |
|
|
(24,642) |
Accumulated dividends in excess of earnings |
|
|
(403,430) |
|
|
(376,002) |
Total stockholders’ equity |
|
|
1,358,636 |
|
|
1,337,817 |
Noncontrolling interests |
|
|
105,060 |
|
|
106,634 |
TOTAL EQUITY |
|
|
1,463,696 |
|
|
1,444,451 |
TOTAL LIABILITIES AND EQUITY |
|
$ |
3,533,197 |
|
$ |
3,223,533 |
(1) |
The balance sheet at March 31, 2020 and December 31, 2019, has been derived from the consolidated financial statements at that date, but does not include all of the information and footnotes required by United States generally accepted accounting principles for complete financial statements. |
(2) |
As of March 31, 2020, construction in progress included $201.2 million related to land acquisitions whereby the initiation of development activities has begun to prepare the property for its intended use. |
(3) |
As of March 31, 2020 and December 31, 2019, deferred costs, net included $7.5 million and $8.0 million of deferred financing costs net of amortization, respectively, and $45.7 million and $44.3 million of deferred leasing costs net of amortization, respectively. |
(4) |
Debt issuance costs, net related to the Senior Notes and term loan portion of the Company’s unsecured credit facility aggregating $10.4 million and $10.8 million at March 31, 2020 and December 31, 2019, respectively, have been netted against the related debt liability line items for both periods presented. |
(5) |
As of March 31, 2020 and December 31, 2019, other assets, net included $45.9 million and $45.8 million of corporate fixed assets, respectively, primarily relating to construction of corporate offices, leasehold improvements and product related assets. |
(6) |
As of March 31, 2020, the total liquidation preference of the Series A Preferred Stock was $107.0 million, calculated as $25.00 liquidation preference per share times 4,280,000 shares outstanding. |
(7) |
As of March 31, 2020, the total liquidation preference of the Series B Preferred Stock was $316.3 million, calculated as $100.00 liquidation preference per share times 3,162,500 shares outstanding. |
6 QTS Q1 Earnings 2020 |
Contact: IR@qtsdatacenters.com |
Consolidated Statements of Operations
(unaudited and in thousands except share and per share data)
|
|
Three Months Ended |
|||||||
|
|
March 31, |
|
December 31, |
|
March 31, |
|||
|
|
2020 |
|
2019 |
|
2019 |
|||
Revenues: |
|
|
|
|
|
|
|
|
|
Rental (1) |
|
$ |
120,081 |
|
$ |
119,282 |
|
$ |
109,389 |
Other (2) |
|
|
6,211 |
|
|
4,425 |
|
|
3,300 |
Total revenues |
|
|
126,292 |
|
|
123,707 |
|
|
112,689 |
Operating expenses: |
|
|
|
|
|
|
|
|
|
Property operating costs |
|
|
40,781 |
|
|
38,645 |
|
|
34,103 |
Real estate taxes and insurance |
|
|
3,911 |
|
|
4,068 |
|
|
3,367 |
Depreciation and amortization |
|
|
45,070 |
|
|
45,161 |
|
|
38,788 |
General and administrative (3) |
|
|
20,683 |
|
|
20,866 |
|
|
19,891 |
Transaction, integration and impairment costs (4) |
|
|
216 |
|
|
12,110 |
|
|
1,214 |
Total operating expenses |
|
|
110,661 |
|
|
120,850 |
|
|
97,363 |
Gain on sale of real estate, net |
|
|
— |
|
|
1,361 |
|
|
13,408 |
Operating income |
|
|
15,631 |
|
|
4,218 |
|
|
28,734 |
Other income and expense: |
|
|
|
|
|
|
|
|
|
Interest income |
|
|
— |
|
|
8 |
|
|
45 |
Interest expense |
|
|
(7,162) |
|
|
(6,264) |
|
|
(7,146) |
Debt restructuring costs |
|
|
— |
|
|
(1,523) |
|
|
— |
Other income (expense) |
|
|
159 |
|
|
(380) |
|
|
— |
Equity in net loss of unconsolidated entity |
|
|
(677) |
|
|
(481) |
|
|
(274) |
Income (loss) before taxes |
|
|
7,951 |
|
|
(4,422) |
|
|
21,359 |
Tax benefit (expense) of taxable REIT subsidiaries |
|
|
169 |
|
|
816 |
|
|
(211) |
Net income (loss) |
|
|
8,120 |
|
|
(3,606) |
|
|
21,148 |
Net (income) loss attributable to noncontrolling interests (5) |
|
|
(110) |
|
|
1,095 |
|
|
(1,590) |
Net income (loss) attributable to QTS Realty Trust, Inc. |
|
$ |
8,010 |
|
$ |
(2,511) |
|
$ |
19,558 |
Preferred stock dividends |
|
|
(7,045) |
|
|
(7,045) |
|
|
(7,045) |
Net income (loss) attributable to common stockholders |
|
$ |
965 |
|
$ |
(9,556) |
|
$ |
12,513 |
|
|
|
|
|
|
|
|
|
|
Net income (loss) per share attributable to common shares: |
|
|
|
|
|
|
|
|
|
Basic (6) |
|
$ |
(0.01) |
|
$ |
(0.20) |
|
$ |
0.20 |
Diluted (6) |
|
|
(0.01) |
|
|
(0.20) |
|
|
0.20 |
(1) |
Represents lease revenue, inclusive of recoveries from customers as well as straight line rent. Recoveries from customers was $12.3 million, $14.0 million, and $10.8 million for the three months ended March 31, 2020, December 31, 2019, and March 31, 2019, respectively. Straight line rent was $3.8 million, $3.3 million and $1.5 million for the three months ended March 31, 2020, December 31, 2019 and March 31, 2019, respectively. |
(2) |
Includes revenue from managed services, sales of scrap metals and other unused materials, management fees, service fees, development fees and various other non-rental revenue items. |
(3) |
Includes personnel costs, sales and marketing costs, professional fees, travel costs, product investment costs and other corporate general and administrative expenses. General and administrative expenses were 16.4%, 16.9%, and 17.7% of total revenues for the three months ended March 31, 2020, December 31, 2019 and March 31, 2019, respectively. |
(4) |
The three months ended December 31, 2019 includes $11.5 million of impairment costs related to the Company’s write-down of certain data center assets and equipment in one of its Dulles, VA data centers. The Dulles campus has two data center buildings and the Company is currently relocating customers from the smaller and older facility to the newer facility in an effort to optimize its operating cost structure. |
(5) |
The weighted average noncontrolling ownership interest of QualityTech, LP was 10.2%, 10.3% and 11.3% for the three months ended March 31, 2020, December 31, 2019 and March 31, 2019, respectively. |
(6) |
Basic and diluted net income (loss) per share were calculated using the two-class method. |
7 QTS Q1 Earnings 2020 |
Contact: IR@qtsdatacenters.com |
Consolidated Statements of Comprehensive Income
(unaudited and in thousands)
|
|
Three Months Ended |
|||||||
|
|
March 31, |
|
December 31, |
|
March 31, |
|||
|
|
2020 |
|
2019 |
|
2019 |
|||
Net income (loss) |
|
$ |
8,120 |
|
$ |
(3,606) |
|
$ |
21,148 |
Other comprehensive income (loss): |
|
|
|
|
|
|
|
|
|
Foreign currency translation adjustment gain (loss) |
|
|
(223) |
|
|
394 |
|
|
— |
Increase (decrease) in fair value of derivative contracts |
|
|
(36,715) |
|
|
4,349 |
|
|
(9,853) |
Reclassification of other comprehensive income to utilities expense |
|
|
354 |
|
|
262 |
|
|
— |
Reclassification of other comprehensive income to interest expense |
|
|
758 |
|
|
169 |
|
|
(494) |
Comprehensive income (loss) |
|
|
(27,706) |
|
|
1,568 |
|
|
10,801 |
Comprehensive (income) loss attributable to noncontrolling interests |
|
|
2,831 |
|
|
(161) |
|
|
(1,217) |
Comprehensive income (loss) attributable to QTS Realty Trust, Inc. |
|
$ |
(24,875) |
|
$ |
1,407 |
|
$ |
9,584 |
8 QTS Q1 Earnings 2020 |
Contact: IR@qtsdatacenters.com |
FFO, Operating FFO, and Adjusted Operating FFO
The Company considers funds from operations (“FFO”), to be a supplemental measure of its performance which should be considered along with, but not as an alternative to, net income (loss) and cash provided by operating activities as a measure of operating performance. The Company calculates FFO in accordance with the standards established by the National Association of Real Estate Investment Trusts (“NAREIT”). FFO represents net income (loss) (computed in accordance with GAAP), adjusted to exclude gains (or losses) from sales of depreciable real estate related to its primary business, impairment write-downs of depreciable real estate related to its primary business, real estate-related depreciation and amortization and similar adjustments for unconsolidated entities. To the extent the Company incurs gains or losses from the sale of assets that are incidental to its primary business, or incurs impairment write-downs associated with assets that are incidental to its primary business, it includes such charges in its calculation of FFO. The Company’s management uses FFO as a supplemental operating performance measure because, in excluding real estate-related depreciation and amortization, impairment write-downs of depreciable real estate and gains and losses from property dispositions, it provides a performance measure that, when compared year over year, captures trends in occupancy rates, rental rates and operating costs.
Due to the volatility and nature of certain significant charges and gains recorded in the Company’s operating results that management believes are not reflective of its operating performance, management computes an adjusted measure of FFO, which the Company refers to as Operating funds from operations (“Operating FFO”). Operating FFO is a non-GAAP measure that is used as a supplemental operating measure and to provide additional information to users of the financial statements. The Company generally calculates Operating FFO as FFO excluding certain non-routine charges and gains and losses that management believes are not indicative of the results of the Company’s operating real estate portfolio. The Company believes that Operating FFO provides investors with another financial measure that may facilitate comparisons of operating performance between periods and, to the extent they calculate Operating FFO on a comparable basis, between REITs.
Adjusted Operating Funds From Operations (“Adjusted Operating FFO”) is a non-GAAP measure that is used as a supplemental operating measure and to provide additional information to users of the financial statements. The Company calculates Adjusted Operating FFO by adding or subtracting from Operating FFO items such as: maintenance capital investment, paid leasing commissions, amortization of deferred financing costs, non-real estate depreciation and amortization, straight line rent adjustments, income taxes, equity-based compensation and similar adjustments for unconsolidated entities.
The Company offers these measures because it recognizes that FFO, Operating FFO and Adjusted Operating FFO will be used by investors as a basis to compare its operating performance with that of other REITs. However, because FFO, Operating FFO and Adjusted Operating FFO exclude real estate depreciation and amortization and capture neither the changes in the value of the Company’s properties that result from use or market conditions, nor the level of capital expenditures and capitalized leasing commissions necessary to maintain the operating performance of its properties, all of which have real economic effect and could materially impact its financial condition, cash flows and results of operations, the utility of FFO, Operating FFO and Adjusted Operating FFO as measures of its operating performance is limited. The Company’s calculation of FFO may not be comparable to measures calculated by other companies who do not use the NAREIT definition of FFO or do not calculate FFO in accordance with NAREIT guidance. In addition, the Company’s calculations of FFO, Operating FFO and Adjusted Operating FFO are not necessarily comparable to FFO, Operating FFO and Adjusted Operating FFO as calculated by other REITs that do not use the same definition or implementation guidelines or interpret the standards differently from us. FFO, Operating FFO and Adjusted Operating FFO are non-GAAP measures and should not be considered a measure of the Company’s results of operations or liquidity or as a substitute for, or an alternative to, net income (loss), cash provided by operating activities or any other performance measure determined in accordance with GAAP, nor is it indicative of funds available to fund its cash needs, including its ability to make distributions to its stockholders.
A reconciliation of net income (loss) to FFO, Operating FFO and Adjusted Operating FFO is presented below (unaudited and in thousands):
9 QTS Q1 Earnings 2020 |
Contact: IR@qtsdatacenters.com |
|
|
Three Months Ended |
|||||||
|
|
March 31, 2020 |
|
December 31, 2019 |
|
March 31, 2019 |
|||
FFO |
|
|
|
|
|
|
|
|
|
Net income (loss) |
|
$ |
8,120 |
|
$ |
(3,606) |
|
$ |
21,148 |
Equity in net loss of unconsolidated entity |
|
|
677 |
|
|
481 |
|
|
274 |
Real estate depreciation and amortization |
|
|
41,700 |
|
|
41,947 |
|
|
35,927 |
Gain on sale of real estate, net |
|
|
— |
|
|
— |
|
|
(13,408) |
Impairments of depreciated property |
|
|
— |
|
|
11,461 |
|
|
— |
Pro rata share of FFO from unconsolidated entity |
|
|
278 |
|
|
324 |
|
|
41 |
FFO (1) |
|
|
50,775 |
|
|
50,607 |
|
|
43,982 |
Preferred stock dividends |
|
|
(7,045) |
|
|
(7,045) |
|
|
(7,045) |
FFO available to common stockholders & OP unit holders |
|
|
43,730 |
|
|
43,562 |
|
|
36,937 |
|
|
|
|
|
|
|
|
|
|
Debt restructuring costs |
|
|
— |
|
|
1,523 |
|
|
— |
Transaction and integration costs |
|
|
216 |
|
|
649 |
|
|
1,214 |
Operating FFO available to common stockholders & OP unit holders (2) |
|
|
43,946 |
|
|
45,734 |
|
|
38,151 |
|
|
|
|
|
|
|
|
|
|
Maintenance capital expenditures |
|
|
(1,662) |
|
|
(910) |
|
|
(709) |
Leasing commissions paid |
|
|
(8,998) |
|
|
(10,757) |
|
|
(6,515) |
Amortization of deferred financing costs |
|
|
987 |
|
|
982 |
|
|
978 |
Non real estate depreciation and amortization |
|
|
3,370 |
|
|
3,214 |
|
|
2,861 |
Straight line rent revenue and expense and other |
|
|
(3,755) |
|
|
(3,243) |
|
|
(1,422) |
Tax expense (benefit) from operating results |
|
|
(169) |
|
|
(816) |
|
|
211 |
Equity-based compensation expense |
|
|
4,875 |
|
|
4,360 |
|
|
3,300 |
Adjustments for unconsolidated entity |
|
|
66 |
|
|
75 |
|
|
22 |
Adjusted Operating FFO available to common stockholders & OP unit holders (2) |
|
$ |
38,660 |
|
$ |
38,639 |
|
$ |
36,877 |
(1) |
No gains, losses or impairment write-downs associated with assets incidental to our primary business were incurred during the three months ended March 31, 2020. FFO for the three months ended December 31, 2019 includes a $1.4 million gain on sale of real estate related to certain assets considered incidental to our primary business and were included in the “Gain on sale of real estate, net” line item of the consolidated statement of operations. No gains, losses or impairment write-downs associated with assets incidental to our primary business were incurred during the three months ended March 31, 2019. |
(2) |
The Company’s calculations of Operating FFO and Adjusted Operating FFO may not be comparable to Operating FFO and Adjusted Operating FFO as calculated by other REITs that do not use the same definition. |
10 QTS Q1 Earnings 2020 |
Contact: IR@qtsdatacenters.com |
Earnings Before Interest, Taxes, Depreciation and Amortization for Real Estate (EBITDAre) and Adjusted EBITDA
The Company calculates EBITDAre in accordance with the standards established by NAREIT. EBITDAre represents net income (loss) (computed in accordance with GAAP), adjusted to exclude gains (or losses) from sales of depreciated property related to its primary business, income tax expense (or benefit), interest expense, depreciation and amortization, impairments of depreciated property related to its primary business, and similar adjustments for unconsolidated entities. The Company’s management uses EBITDAre as a supplemental performance measure because it provides performance measures that, when compared year over year, captures the performance of the Company’s operations by removing the impact of capital structure (primarily interest expense) and asset based charges (primarily depreciation and amortization) from its operating results.
Due to the volatility and nature of certain significant charges and gains recorded in the Company’s operating results that management believes are not reflective of its operating performance, management computes an adjusted measure of EBITDAre, which the Company refers to as Adjusted EBITDA. The Company generally calculates Adjusted EBITDA excluding certain non-routine charges, write off of unamortized deferred financing costs, gains (losses) on extinguishment of debt, restructuring costs, and transaction and integration costs, as well as the Company’s pro-rata share of each of those respective expenses associated with the unconsolidated entity aggregated into one line item categorized as “Adjustments for the unconsolidated entity.” In addition, the Company calculates Adjusted EBITDA excluding certain non-cash recurring costs such as equity-based compensation. The Company believes that Adjusted EBITDA provides investors with another financial measure that may facilitate comparisons of operating performance between periods and, to the extent other REITs calculate Adjusted EBITDA on a comparable basis, between REITs.
Management uses EBITDAre and Adjusted EBITDA as supplemental performance measures as they provide useful measures of assessing the Company’s operating results. Other companies may not calculate EBITDAre or Adjusted EBITDA in the same manner. Accordingly, the Company’s EBITDAre and Adjusted EBITDA may not be comparable to others. EBITDAre and Adjusted EBITDA should be considered only as supplements to net income (loss) as measures of the Company’s performance and should not be used as substitutes for net income (loss), as measures of its results of operations or liquidity or as an indications of funds available to meet its cash needs, including its ability to make distributions to its stockholders.
A reconciliation of net income (loss) to EBITDAre and Adjusted EBITDA is presented below (unaudited and in thousands):
|
|
Three Months Ended |
|||||||
|
|
March 31, 2020 |
|
December 31, 2019 |
|
March 31, 2019 |
|||
EBITDAre and Adjusted EBITDA |
|
|
|
|
|
|
|
|
|
Net income (loss) |
|
$ |
8,120 |
|
$ |
(3,606) |
|
$ |
21,148 |
Equity in net loss of unconsolidated entity |
|
|
677 |
|
|
481 |
|
|
274 |
Interest income |
|
|
— |
|
|
(8) |
|
|
(45) |
Interest expense |
|
|
7,162 |
|
|
6,264 |
|
|
7,146 |
Tax expense (benefit) of taxable REIT subsidiaries |
|
|
(169) |
|
|
(816) |
|
|
211 |
Depreciation and amortization |
|
|
45,070 |
|
|
45,161 |
|
|
38,788 |
Gain on disposition of depreciated property |
|
|
— |
|
|
— |
|
|
(13,408) |
Impairments of depreciated property |
|
|
— |
|
|
11,461 |
|
|
— |
Pro rata share of EBITDAre from unconsolidated entity |
|
|
819 |
|
|
830 |
|
|
215 |
EBITDAre (1) |
|
$ |
61,679 |
|
$ |
59,767 |
|
$ |
54,329 |
|
|
|
|
|
|
|
|
|
|
Debt restructuring costs |
|
|
— |
|
|
1,523 |
|
|
— |
Equity-based compensation expense |
|
|
4,875 |
|
|
4,360 |
|
|
3,300 |
Transaction and integration costs |
|
|
216 |
|
|
649 |
|
|
1,214 |
Adjusted EBITDA |
|
$ |
66,770 |
|
$ |
66,299 |
|
$ |
58,843 |
(1) |
No gains, losses or impairment write-downs associated with assets incidental to our primary business were incurred during the three months ended March 31, 2020. EBITDAre for the three months ended December 31, 2019 includes a $1.4 million gain on sale of real estate related to certain assets considered incidental to our primary business and were included in the “Gain on sale of real estate, net” line item of the consolidated statement of operations. No gains, losses or impairment write-downs associated with assets incidental to our primary business were incurred during the three months ended March 31, 2019. |
11 QTS Q1 Earnings 2020 |
Contact: IR@qtsdatacenters.com |
Net Operating Income (NOI)
The Company calculates net operating income (“NOI”) as net income (loss) (computed in accordance with GAAP), excluding: interest expense, interest income, tax expense (benefit) of taxable REIT subsidiaries, depreciation and amortization, write off of unamortized deferred financing costs, other (income) expense, debt restructuring costs, transaction, integration and impairment costs, gain (loss) on sale of real estate, restructuring costs, general and administrative expenses and similar adjustments for unconsolidated entities. The Company allocates a management fee charge of 4% of cash revenues for all facilities as a property operating cost and a corresponding reduction to general and administrative expense to cover the day-to-day administrative costs to operate our data centers. The management fee charge is reflected as a reduction to net operating income.
Management uses NOI as a supplemental performance measure because it provides a useful measure of the operating results from its customer leases. In addition, management believes it is useful to investors in evaluating and comparing the operating performance of its properties and to compute the fair value of its properties. The Company’s NOI may not be comparable to other REITs’ NOI as other REITs may not calculate NOI in the same manner. NOI should be considered only as a supplement to net income as a measure of the Company’s performance and should not be used as a measure of results of operations or liquidity or as an indication of funds available to meet cash needs, including the ability to make distributions to stockholders. NOI is a measure of the operating performance of the Company’s properties and not of the Company’s performance as a whole. NOI is therefore not a substitute for net income (loss) as computed in accordance with GAAP.
A reconciliation of net income (loss) to NOI is presented below (unaudited and in thousands):
|
|
Three Months Ended |
|||||||
|
|
March 31, 2020 |
|
December 31, 2019 |
|
March 31, 2019 |
|||
Net Operating Income (NOI) |
|
|
|
|
|
|
|
|
|
Net income (loss) |
|
$ |
8,120 |
|
$ |
(3,606) |
|
$ |
21,148 |
Equity in net loss of unconsolidated entity |
|
|
677 |
|
|
481 |
|
|
274 |
Interest income |
|
|
— |
|
|
(8) |
|
|
(45) |
Interest expense |
|
|
7,162 |
|
|
6,264 |
|
|
7,146 |
Depreciation and amortization |
|
|
45,070 |
|
|
45,161 |
|
|
38,788 |
Debt restructuring costs |
|
|
— |
|
|
1,523 |
|
|
— |
Other (income) expense |
|
|
(159) |
|
|
380 |
|
|
— |
Tax expense (benefit) of taxable REIT subsidiaries |
|
|
(169) |
|
|
(816) |
|
|
211 |
Transaction, integration and impairment costs |
|
|
216 |
|
|
12,110 |
|
|
1,214 |
General and administrative expenses |
|
|
20,683 |
|
|
20,866 |
|
|
19,891 |
Gain on sale of real estate, net |
|
|
— |
|
|
(1,361) |
|
|
(13,408) |
NOI from consolidated operations (1) |
|
$ |
81,600 |
|
$ |
80,994 |
|
$ |
75,219 |
Pro rata share of NOI from unconsolidated entity |
|
|
844 |
|
|
841 |
|
|
234 |
Total NOI (1) |
|
$ |
82,444 |
|
$ |
81,835 |
|
$ |
75,453 |
(1) |
Includes facility level general and administrative allocation charges of 4% of cash revenue for all facilities. These allocated charges aggregated to $4.7 million, $4.7 million and $4.5 million for the three months ended March 31, 2020, December 31, 2019 and March 31, 2019, respectively. |
12 QTS Q1 Earnings 2020 |
Contact: IR@qtsdatacenters.com |
Monthly Recurring Revenue (MRR) and Recognized MRR
The Company calculates MRR as monthly contractual revenue under signed leases as of a particular date, which includes revenue from its rental and managed services activities, but excludes customer recoveries, deferred set-up fees, variable related revenues, non-cash revenues and other one-time revenues. MRR is also calculated to include the Company’s pro rata share of monthly contractual revenue under signed leases as of a particular date associated with unconsolidated entities, which includes revenue from the unconsolidated entity’s rental and managed services activities, but excludes the unconsolidated entity’s customer recoveries, deferred set-up fees, variable related revenues, non-cash revenues and other one-time revenues. MRR reflects the annualized cash rental payments. It does not include the impact from booked-not-billed leases as of a particular date, unless otherwise specifically noted.
Separately, the Company calculates recognized MRR as the recurring revenue recognized during a given period, which includes revenue from its rental and managed services activities, but excludes customer recoveries, deferred set up fees, variable related revenues, non-cash revenues and other one-time revenues.
Management uses MRR and recognized MRR as supplemental performance measures because they provide useful measures of increases in contractual revenue from the Company’s customer leases and customer leases attributable to the Company’s business. MRR and recognized MRR should not be viewed by investors as alternatives to actual monthly revenue, as determined in accordance with GAAP. Other companies may not calculate MRR or recognized MRR in the same manner. Accordingly, the Company’s MRR and recognized MRR may not be comparable to other companies’ MRR and recognized MRR. MRR and recognized MRR should be considered only as supplements to total revenues as a measure of its performance. MRR and recognized MRR should not be used as measures of the Company’s results of operations or liquidity, nor is it indicative of funds available to meet its cash needs, including its ability to make distributions to its stockholders.
A reconciliation of total revenues to recognized MRR in the period and MRR at period-end is presented below (unaudited and in thousands):
|
|
Three Months Ended |
|||||||
|
|
March 31, 2020 |
|
December 31, 2019 |
|
March 31, 2019 |
|||
Recognized MRR in the period |
|
|
|
|
|
|
|
|
|
Total period revenues (GAAP basis) |
|
$ |
126,292 |
|
$ |
123,707 |
|
$ |
112,689 |
Less: Total period variable lease revenue from recoveries |
|
|
(12,275) |
|
|
(14,018) |
|
|
(10,793) |
Total period deferred setup fees |
|
|
(3,924) |
|
|
(4,062) |
|
|
(3,232) |
Total period straight line rent and other |
|
|
(8,032) |
|
|
(5,156) |
|
|
(3,942) |
Recognized MRR in the period |
|
|
102,061 |
|
|
100,471 |
|
|
94,722 |
|
|
|
|
|
|
|
|
|
|
MRR at period end |
|
|
|
|
|
|
|
|
|
Total period revenues (GAAP basis) |
|
$ |
126,292 |
|
$ |
123,707 |
|
$ |
112,689 |
Less: Total revenues excluding last month |
|
|
(82,446) |
|
|
(81,699) |
|
|
(73,809) |
Total revenues for last month of period |
|
|
43,846 |
|
|
42,008 |
|
|
38,880 |
Less: Last month variable lease revenue from recoveries |
|
|
(4,156) |
|
|
(4,578) |
|
|
(3,871) |
Last month deferred setup fees |
|
|
(1,410) |
|
|
(1,333) |
|
|
(1,242) |
Last month straight line rent and other |
|
|
(3,669) |
|
|
(2,413) |
|
|
(2,068) |
Add: Pro rata share of MRR at period end of unconsolidated entity |
|
|
352 |
|
|
350 |
|
|
253 |
MRR at period end |
|
$ |
34,963 |
|
$ |
34,034 |
|
$ |
31,952 |
13 QTS Q1 Earnings 2020 |
Contact: IR@qtsdatacenters.com |
Exhibit 99.2
Table of Contents
Overview |
|
3 | |
|
|
Financial Statements |
|
4 | |
5 | |
6 | |
7 | |
9 | |
10 | |
|
|
Operating Portfolio |
|
11 | |
12 | |
13 | |
14 | |
15 | |
16 | |
17 | |
18 | |
19 | |
|
|
Capital Structure |
|
20 | |
21 | |
|
|
22 |
1 QTS Q1 Earnings 2020 |
Contact: IR@qtsdatacenters.com |
Forward Looking Statements
Some of the statements contained in this document constitute forward-looking statements within the meaning of the federal securities laws. Forward-looking statements relate to expectations, beliefs, projections, future plans and strategies, anticipated events or trends and similar expressions concerning matters that are not historical facts. In particular, statements pertaining to the COVID-19 pandemic, its impact on the Company and the Company’s response thereto and to the Company’s strategy, plans, intentions, capital resources, liquidity, portfolio performance, results of operations, anticipated growth in our funds from operations and anticipated market conditions contain forward-looking statements. In some cases, you can identify forward-looking statements by the use of forward-looking terminology such as “may,” “will,” “should,” “expects,” “intends,” “plans,” “anticipates,” “believes,” “estimates,” “predicts,” or “potential” or the negative of these words and phrases or similar words or phrases which are predictions of or indicate future events or trends and which do not relate solely to historical matters.
The forward-looking statements contained in this document reflect the Company’s current views about future events and are subject to numerous known and unknown risks, uncertainties, assumptions and changes in circumstances that may cause actual results to differ significantly from those expressed in any forward-looking statement. The Company does not guarantee that the transactions and events described will happen as described (or that they will happen at all). The following factors, among others, could cause actual results and future events to differ materially from those set forth or contemplated in the forward-looking statements: adverse economic or real estate developments in the Company’s markets or the technology industry; obsolescence or reduction in marketability of our infrastructure due to changing industry demands; global, national and local economic conditions; risks related to the COVID-19 pandemic, including, but not limited to, the risk of business and/or operational disruptions, disruption of the Company’s customers’ businesses that could affect their ability to make rental payments to the Company, supply chain disruptions and delays in the construction or development of the Company’s data centers; risks related to our international operations; difficulties in identifying properties to acquire and completing acquisitions; the Company’s failure to successfully develop, redevelop and operate acquired properties or lines of business; significant increases in construction and development costs; the increasingly competitive environment in which the Company operates; defaults on, or termination or non-renewal of, leases by customers; decreased rental rates or increased vacancy rates; increased interest rates and operating costs, including increased energy costs; financing risks, including the Company’s failure to obtain necessary outside financing; dependence on third parties to provide Internet, telecommunications and network connectivity to the Company’s data centers; the Company’s failure to qualify and maintain its qualification as a real estate investment trust; environmental uncertainties and risks related to natural disasters; financial market fluctuations; changes in real estate and zoning laws, revaluations for tax purposes and increases in real property tax rates; and limitations inherent in our current and any future joint venture investments, such as lack of sole decision-making authority and reliance on our partners’ financial condition.
While forward-looking statements reflect the Company’s good faith beliefs, they are not guarantees of future performance. Any forward-looking statement speaks only as of the date on which it was made. The Company disclaims any obligation to publicly update or revise any forward-looking statement to reflect changes in underlying assumptions or factors, of new information, data or methods, future events or other changes. For a further discussion of these and other factors that could cause the Company’s future results to differ materially from any forward-looking statements, see the section entitled “Risk Factors” in the Company’s Annual Report on Form 10-K for the year ended December 31, 2019 and the risk factor related to the novel coronavirus (COVID-19) pandemic filed in an 8-K with the Securities and Exchange Commission on March 30, 2020, as well as other periodic reports the Company files with the Securities and Exchange Commission, many of which should be interpreted as being heightened as a result of the ongoing COVID-19 pandemic and the actions taken to contain the pandemic or mitigate its impact.
2 QTS Q1 Earnings 2020 |
Contact: IR@qtsdatacenters.com |
3 QTS Q1 Earnings 2020 |
Contact: IR@qtsdatacenters.com |
(unaudited and in thousands except share data)
|
|
March 31, |
|
December 31, |
||
|
|
2020 (1) |
|
2019 (1) |
||
ASSETS |
|
|
|
|
|
|
Real Estate Assets |
|
|
|
|
|
|
Land |
|
$ |
130,576 |
|
$ |
130,605 |
Buildings, improvements and equipment |
|
|
2,411,426 |
|
|
2,178,901 |
Less: Accumulated depreciation |
|
|
(588,685) |
|
|
(558,560) |
|
|
|
1,953,317 |
|
|
1,750,946 |
Construction in progress (2) |
|
|
877,313 |
|
|
920,922 |
Real Estate Assets, net |
|
|
2,830,630 |
|
|
2,671,868 |
Investments in unconsolidated entity |
|
|
32,051 |
|
|
30,218 |
Operating lease right-of-use assets, net |
|
|
55,716 |
|
|
57,141 |
Cash and cash equivalents |
|
|
171,957 |
|
|
15,653 |
Rents and other receivables, net |
|
|
74,506 |
|
|
81,181 |
Acquired intangibles, net |
|
|
78,139 |
|
|
81,679 |
Deferred costs, net (3) |
|
|
53,271 |
|
|
52,363 |
Prepaid expenses |
|
|
13,747 |
|
|
10,586 |
Goodwill |
|
|
173,843 |
|
|
173,843 |
Other assets, net (5) |
|
|
49,337 |
|
|
49,001 |
TOTAL ASSETS |
|
$ |
3,533,197 |
|
$ |
3,223,533 |
|
|
|
|
|
|
|
LIABILITIES |
|
|
|
|
|
|
Unsecured credit facility, net (4) |
|
$ |
1,222,946 |
|
$ |
1,010,640 |
Senior notes, net of debt issuance costs (4) |
|
|
395,740 |
|
|
395,549 |
Finance leases and mortgage notes payable |
|
|
46,244 |
|
|
46,876 |
Operating lease liabilities |
|
|
62,843 |
|
|
64,416 |
Accounts payable and accrued liabilities |
|
|
177,949 |
|
|
142,547 |
Dividends and distributions payable |
|
|
37,464 |
|
|
34,500 |
Advance rents, security deposits and other liabilities |
|
|
24,569 |
|
|
18,027 |
Derivative liabilities |
|
|
61,706 |
|
|
26,609 |
Deferred income taxes |
|
|
479 |
|
|
749 |
Deferred income |
|
|
39,561 |
|
|
39,169 |
TOTAL LIABILITIES |
|
|
2,069,501 |
|
|
1,779,082 |
|
|
|
|
|
|
|
EQUITY |
|
|
|
|
|
|
7.125% Series A cumulative redeemable perpetual preferred stock: $0.01 par value (liquidation preference $25.00 per share), 4,600,000 shares authorized, 4,280,000 shares issued and outstanding as of March 31, 2020 and December 31, 2019, respectively (6) |
|
|
103,212 |
|
|
103,212 |
6.50% Series B cumulative convertible perpetual preferred stock: $0.01 par value (liquidation preference $100.00 per share), 3,162,500 shares authorized, issued and outstanding as of March 31, 2020 and December 31, 2019, respectively (7) |
|
|
304,223 |
|
|
304,223 |
Common stock: $0.01 par value, 450,133,000 shares authorized, 60,398,036 and 58,227,523 shares issued and outstanding as of March 31, 2020 and December 31, 2019, respectively |
|
|
604 |
|
|
582 |
Additional paid-in capital |
|
|
1,412,025 |
|
|
1,330,444 |
Accumulated other comprehensive income (loss) |
|
|
(57,998) |
|
|
(24,642) |
Accumulated dividends in excess of earnings |
|
|
(403,430) |
|
|
(376,002) |
Total stockholders’ equity |
|
|
1,358,636 |
|
|
1,337,817 |
Noncontrolling interests |
|
|
105,060 |
|
|
106,634 |
TOTAL EQUITY |
|
|
1,463,696 |
|
|
1,444,451 |
TOTAL LIABILITIES AND EQUITY |
|
$ |
3,533,197 |
|
$ |
3,223,533 |
(1) |
The balance sheet at March 31, 2020 and December 31, 2019, has been derived from the consolidated financial statements at that date, but does not include all of the information and footnotes required by United States generally accepted accounting principles for complete financial statements. |
(2) |
As of March 31, 2020, construction in progress included $201.2 million related to land acquisitions whereby the initiation of development activities has begun to prepare the property for its intended use. |
(3) |
As of March 31, 2020 and December 31, 2019, deferred costs, net included $7.5 million and $8.0 million of deferred financing costs net of amortization, respectively, and $45.7 million and $44.3 million of deferred leasing costs net of amortization, respectively. |
(4) |
Debt issuance costs, net related to the Senior Notes and term loan portion of the Company’s unsecured credit facility aggregating $10.4 million and $10.8 million at March 31, 2020 and December 31, 2019, respectively, have been netted against the related debt liability line items for both periods presented. |
(5) |
As of March 31, 2020 and December 31, 2019, other assets, net included $45.9 million and $45.8 million of corporate fixed assets, respectively, primarily relating to construction of corporate offices, leasehold improvements and product related assets. |
(6) |
As of March 31, 2020, the total liquidation preference of the Series A Preferred Stock was $107.0 million, calculated as $25.00 liquidation preference per share times 4,280,000 shares outstanding. |
(7) |
As of March 31, 2020, the total liquidation preference of the Series B Preferred Stock was $316.3 million, calculated as $100.00 liquidation preference per share times 3,162,500 shares outstanding. |
4 QTS Q1 Earnings 2020 |
Contact: IR@qtsdatacenters.com |
(unaudited and in thousands except share and per share data)
|
|
Three Months Ended |
|||||||
|
|
March 31, |
|
December 31, |
|
March 31, |
|||
|
|
2020 |
|
2019 |
|
2019 |
|||
Revenues: |
|
|
|
|
|
|
|
|
|
Rental (1) |
|
$ |
120,081 |
|
$ |
119,282 |
|
$ |
109,389 |
Other (2) |
|
|
6,211 |
|
|
4,425 |
|
|
3,300 |
Total revenues |
|
|
126,292 |
|
|
123,707 |
|
|
112,689 |
Operating expenses: |
|
|
|
|
|
|
|
|
|
Property operating costs |
|
|
40,781 |
|
|
38,645 |
|
|
34,103 |
Real estate taxes and insurance |
|
|
3,911 |
|
|
4,068 |
|
|
3,367 |
Depreciation and amortization |
|
|
45,070 |
|
|
45,161 |
|
|
38,788 |
General and administrative (3) |
|
|
20,683 |
|
|
20,866 |
|
|
19,891 |
Transaction, integration and impairment costs (4) |
|
|
216 |
|
|
12,110 |
|
|
1,214 |
Total operating expenses |
|
|
110,661 |
|
|
120,850 |
|
|
97,363 |
Gain on sale of real estate, net |
|
|
— |
|
|
1,361 |
|
|
13,408 |
Operating income |
|
|
15,631 |
|
|
4,218 |
|
|
28,734 |
Other income and expense: |
|
|
|
|
|
|
|
|
|
Interest income |
|
|
— |
|
|
8 |
|
|
45 |
Interest expense |
|
|
(7,162) |
|
|
(6,264) |
|
|
(7,146) |
Debt restructuring costs |
|
|
— |
|
|
(1,523) |
|
|
— |
Other income (expense) |
|
|
159 |
|
|
(380) |
|
|
— |
Equity in net loss of unconsolidated entity |
|
|
(677) |
|
|
(481) |
|
|
(274) |
Income (loss) before taxes |
|
|
7,951 |
|
|
(4,422) |
|
|
21,359 |
Tax benefit (expense) of taxable REIT subsidiaries |
|
|
169 |
|
|
816 |
|
|
(211) |
Net income (loss) |
|
|
8,120 |
|
|
(3,606) |
|
|
21,148 |
Net (income) loss attributable to noncontrolling interests (5) |
|
|
(110) |
|
|
1,095 |
|
|
(1,590) |
Net income (loss) attributable to QTS Realty Trust, Inc. |
|
$ |
8,010 |
|
$ |
(2,511) |
|
$ |
19,558 |
Preferred stock dividends |
|
|
(7,045) |
|
|
(7,045) |
|
|
(7,045) |
Net income (loss) attributable to common stockholders |
|
$ |
965 |
|
$ |
(9,556) |
|
$ |
12,513 |
|
|
|
|
|
|
|
|
|
|
Net income (loss) per share attributable to common shares: |
|
|
|
|
|
|
|
|
|
Basic (6) |
|
$ |
(0.01) |
|
$ |
(0.20) |
|
$ |
0.20 |
Diluted (6) |
|
|
(0.01) |
|
|
(0.20) |
|
|
0.20 |
(1) |
Represents lease revenue, inclusive of recoveries from customers as well as straight line rent. Recoveries from customers was $12.3 million, $14.0 million, and $10.8 million for the three months ended March 31, 2020, December 31, 2019, and March 31, 2019, respectively. Straight line rent was $3.8 million, $3.3 million and $1.5 million for the three months ended March 31, 2020, December 31, 2019 and March 31, 2019, respectively. |
(2) |
Includes revenue from managed services, sales of scrap metals and other unused materials, management fees, service fees, development fees and various other non-rental revenue items. |
(3) |
Includes personnel costs, sales and marketing costs, professional fees, travel costs, product investment costs and other corporate general and administrative expenses. General and administrative expenses were 16.4%, 16.9%, and 17.7% of total revenues for the three months ended March 31, 2020, December 31, 2019 and March 31, 2019, respectively. |
(4) |
The three months ended December 31, 2019 includes $11.5 million of impairment costs related to the Company’s write-down of certain data center assets and equipment in one of its Dulles, VA data centers. The Dulles campus has two data center buildings and the Company is currently relocating customers from the smaller and older facility to the newer facility in an effort to optimize its operating cost structure. |
(5) |
The weighted average noncontrolling ownership interest of QualityTech, LP was 10.2%, 10.3% and 11.3% for the three months ended March 31, 2020, December 31, 2019 and March 31, 2019, respectively. |
(6) |
Basic and diluted net income (loss) per share were calculated using the two-class method. |
5 QTS Q1 Earnings 2020 |
Contact: IR@qtsdatacenters.com |
(unaudited and in thousands)
|
|
Three Months Ended |
|||||||
|
|
March 31, |
|
December 31, |
|
March 31, |
|||
|
|
2020 |
|
2019 |
|
2019 |
|||
Net income (loss) |
|
$ |
8,120 |
|
$ |
(3,606) |
|
$ |
21,148 |
Other comprehensive income (loss): |
|
|
|
|
|
|
|
|
|
Foreign currency translation adjustment gain (loss) |
|
|
(223) |
|
|
394 |
|
|
— |
Increase (decrease) in fair value of derivative contracts |
|
|
(36,715) |
|
|
4,349 |
|
|
(9,853) |
Reclassification of other comprehensive income to utilities expense |
|
|
354 |
|
|
262 |
|
|
— |
Reclassification of other comprehensive income to interest expense |
|
|
758 |
|
|
169 |
|
|
(494) |
Comprehensive income (loss) |
|
|
(27,706) |
|
|
1,568 |
|
|
10,801 |
Comprehensive (income) loss attributable to noncontrolling interests |
|
|
2,831 |
|
|
(161) |
|
|
(1,217) |
Comprehensive income (loss) attributable to QTS Realty Trust, Inc. |
|
$ |
(24,875) |
|
$ |
1,407 |
|
$ |
9,584 |
6 QTS Q1 Earnings 2020 |
Contact: IR@qtsdatacenters.com |
(unaudited and in thousands, except operating portfolio statistics data and per share data)
This summary includes certain non-GAAP financial measures that management believes are helpful in understanding the Company’s business as further described in the Appendix. The Company does not, nor does it suggest investors should, consider such non-GAAP financial measures in isolation from, or as a substitute for, GAAP financial information or as an expectation of future performance of the Company’s business. The Company believes that the presentation of non-GAAP financial measures provide meaningful supplemental information to both management and investors that is indicative of the Company’s current operations and its business. The Company has included a reconciliation of this additional information to the most comparable GAAP measure in the summary financial information below.
|
|
Three Months Ended |
|
|||||||||
|
|
March 31, |
|
|
December 31, |
|
|
March 31, |
|
|||
Summary of Results |
|
2020 |
|
|
2019 |
|
|
2019 |
|
|||
Total revenue (1) |
|
$ |
126,292 |
|
|
$ |
123,707 |
|
|
$ |
112,689 |
|
Net income (loss) |
|
$ |
8,120 |
|
|
$ |
(3,606) |
|
|
$ |
21,148 |
|
Net income (loss) attributable to common stockholders |
|
$ |
965 |
|
|
$ |
(9,556) |
|
|
$ |
12,513 |
|
Net income (loss) per share attributable to basic common shares |
|
$ |
(0.01) |
|
|
$ |
(0.20) |
|
|
$ |
0.20 |
|
Net income (loss) per share attributable to diluted common shares |
|
$ |
(0.01) |
|
|
$ |
(0.20) |
|
|
$ |
0.20 |
|
FFO available to common stockholders & OP unit holders |
|
$ |
43,730 |
|
|
$ |
43,562 |
|
|
$ |
36,937 |
|
Note: All metrics in the following tables include QTS’ pro rata share of results from the unconsolidated joint venture.
|
|
Three Months Ended |
|
|||||||||
Other Data (including QTS' pro rata share of |
|
March 31, |
|
|
December 31, |
|
|
March 31, |
|
|||
unconsolidated JV, excl. total revenue) |
|
2020 |
|
|
2019 |
|
|
2019 |
|
|||
Total revenue (1) |
|
$ |
126,292 |
|
|
$ |
123,707 |
|
|
$ |
112,689 |
|
MRR (at period end) |
|
$ |
34,963 |
|
|
$ |
34,034 |
|
|
$ |
31,952 |
|
NOI |
|
$ |
82,444 |
|
|
$ |
81,835 |
|
|
$ |
75,453 |
|
NOI as a % of revenue |
|
|
65.3 |
% |
|
|
66.2 |
% |
|
|
67.0 |
% |
Adjusted EBITDA |
|
$ |
66,770 |
|
|
$ |
66,299 |
|
|
$ |
58,843 |
|
Adjusted EBITDA as a % of revenue |
|
|
52.9 |
% |
|
|
53.6 |
% |
|
|
52.2 |
% |
Operating FFO available to common stockholders & OP unit holders |
|
$ |
43,946 |
|
|
$ |
45,734 |
|
|
$ |
38,151 |
|
Operating FFO per diluted share |
|
$ |
0.66 |
|
|
$ |
0.69 |
|
|
$ |
0.64 |
|
Annualized ROIC |
|
|
11.8 |
% |
|
|
12.3 |
% |
|
|
12.4 |
% |
|
|
March 31, |
|
|
December 31, |
|
||
Balance Sheet Data (including QTS' pro rata share of unconsolidated JV) (2) |
|
2020 |
|
|
2019 |
|
||
Total indebtedness, net of cash and cash equivalents |
|
$ |
1,539,000 |
|
|
$ |
1,482,260 |
|
Indebtedness to last quarter annualized Adjusted EBITDA |
|
|
5.8x |
|
|
|
5.6x |
|
Indebtedness to last quarter annualized Adjusted EBITDA pro forma for the effects of forward equity sales |
|
|
4.5x |
(3) |
|
|
4.8x |
(4) |
Indebtedness to undepreciated real estate assets |
|
|
44.3% |
|
|
|
45.3% |
|
Indebtedness to Implied Enterprise Value |
|
|
25.9% |
|
|
|
27.0% |
|
(1) |
Excludes QTS’ pro rata share of the unconsolidated joint venture revenue. Total unconsolidated JV revenue at the JV’s 100% share was $3.1 million, $3.7 million and $0.9 million for the three months ended March 31, 2020, December 31, 2019 and March 31, 2019, respectively. QTS’ 50% pro rata share of unconsolidated JV revenue was $1.5 million, $1.9 million and $0.4 million for the three months ended March 31, 2020, December 31, 2019 and March 31, 2019, respectively. |
(2) |
The Company has excluded associated debt issuance costs from the Total indebtedness line item for both periods presented. Therefore, the total debt amount, as well as calculations based on the total debt amount, represents the full amount of debt that will be repaid less the amount of cash and cash equivalents on hand. |
(3) |
Represents the Company’s leverage ratio pro forma for the effects of approximately $342 million in net proceeds available under forward equity agreements executed through April 27, 2020, the date of this report. |
(4) |
Represented the Company’s leverage ratio pro forma for the effects of approximately $220 million in net proceeds available under forward equity agreements executed through February 18, 2020, the release date of the December 31, 2019 earnings report. |
7 QTS Q1 Earnings 2020 |
Contact: IR@qtsdatacenters.com |
Operating Portfolio Statistics |
|
|
March 31, |
|
|
|
December 31, |
|
(including unconsolidated JV at the JV’s 100% share) |
|
|
2020 |
|
|
|
2019 |
|
Built out square footage: |
|
|
|
|
|
|
|
|
Raised floor |
|
|
1,717,536 |
|
|
|
1,659,137 |
|
Leasable raised floor |
|
|
1,378,791 |
|
|
|
1,340,755 |
|
Leased raised floor |
|
|
1,241,999 |
|
|
|
1,226,188 |
|
Data center % occupied |
|
|
90.1% |
|
|
|
91.5% |
|
|
|
|
|
|
|
|
|
|
Total Raw Shell: |
|
|
|
|
|
|
|
|
Total |
|
|
7,187,195 |
|
|
|
7,188,833 |
|
Basis-of-design raised floor space (1) |
|
|
3,212,211 |
|
|
|
3,213,799 |
|
|
|
|
|
|
|
|
|
|
Data center properties |
|
|
24 |
|
|
|
24 |
|
Basis of design raised floor % developed |
|
|
53.5% |
|
|
|
51.6% |
|
|
|
|
|
|
|
|
|
|
Data center raised floor % owned (2) |
|
|
96.2% |
|
|
|
96.0% |
|
(1) |
See definition in Appendix. |
(2) |
Includes the Santa Clara facility which is subject to a long-term ground lease, includes unconsolidated JV property at the JV's 100% share, and excludes facilities subject to finance lease obligations. Had the Santa Clara facility been excluded as an owned facility, the owned data center raised floor percentage would be 92.7% and 92.4% at March 31, 2020 and December 31, 2019, respectively. |
2020 Guidance
|
|
2020 Guidance |
||||
($ in millions except per share amounts) |
|
Low |
|
High |
||
Revenue |
|
$ |
523 |
|
$ |
537 |
Adjusted EBITDA |
|
$ |
275 |
|
$ |
285 |
Operating FFO per fully diluted share |
|
$ |
2.69 |
|
$ |
2.83 |
The Company is reaffirming its Revenue guidance range for 2020 of $523 million to $537 million which assumes annual rental churn as previously announced of between 3% and 6%. The Company is also reaffirming its Adjusted EBITDA guidance range for 2020 of $275 million to $285 million and reaffirming its Operating FFO per fully diluted share guidance range for 2020 of $2.69 per share to $2.83 per share. In addition, the Company is reaffirming its cash paid for capital expenditures guidance range for 2020 of $550 million to $600 million, excluding acquisitions. The Company’s 2020 capital expenditure guidance includes its proportionate share of cash capital expenditures associated with the unconsolidated joint venture.
The Company’s 2020 guidance includes the effects of the Company’s joint venture, which is reflected as an unconsolidated entity accounted for under the equity method on QTS’ financial statements. Consistent with GAAP accounting standards, revenue from the unconsolidated entity is not included in QTS’ reported consolidated GAAP financial statements. Also consistent with NAREIT-defined standards, QTS includes its proportionate ownership of non-GAAP measures such as EBITDAre, Adjusted EBITDA and FFO from the joint venture in its reported EBITDAre, Adjusted EBITDA and FFO results, respectively.
The Company’s 2020 guidance assumes, among other things, that its facilities continue to operate and it does not experience significant work stoppages or closures, it is able to mitigate any supply chain disruptions for its development activities, and it is able to collect revenues in line with current expectations. The Company is also monitoring the impacts of COVID-19 on the fair value of its assets. While the Company does not currently anticipate any material impairments on its assets as a result of COVID-19, future changes in expectations for sales, earnings and cash flows related to fixed assets, intangible assets and goodwill could cause these assets to be impaired. While these are the Company’s current assumptions, this is an emerging situation and these assumptions could change, including if the duration of the pandemic is extended, which could affect outlook.
QTS does not provide reconciliations for the non-GAAP financial measures included in its guidance provided above due to the inherent difficulty in forecasting and quantifying certain amounts that are necessary for such reconciliations, including net income (loss) and adjustments that could be made for restructuring costs, transaction costs, lease exit costs, asset impairments and gain (loss) on disposals and other charges as those amounts are subject to significant variability based on future transactions that are not yet known, the amount of which, based on historical experience, could be significant.
8 QTS Q1 Earnings 2020 |
Contact: IR@qtsdatacenters.com |
Reconciliations of Return on Invested Capital (ROIC)
(unaudited and in thousands)
Return on Invested Capital (“ROIC”) is a non-GAAP measure that provides additional information to users of the financial statements. Management believes ROIC is a helpful metric for users of the financial statements to gauge the Company's performance of its business against the capital it has invested in the business.
ROIC (including QTS' pro rata share of unconsolidated JV) |
|
Three Months Ended |
|||||||
|
|
March 31, |
|
December 31, |
|
March 31, |
|||
|
|
2020 |
|
2019 |
|
2019 |
|||
NOI (1) (2) |
|
$ |
82,444 |
|
$ |
81,835 |
|
$ |
75,453 |
Annualized NOI |
|
|
329,776 |
|
|
327,340 |
|
|
301,812 |
Average undepreciated real estate assets and other net fixed assets placed in service |
|
|
2,797,898 |
|
|
2,670,448 |
|
|
2,426,978 |
Annualized ROIC |
|
|
11.8% |
|
|
12.3% |
|
|
12.4% |
(1) |
Includes facility level G&A expense allocation charges of 4% of cash revenue for all facilities. These allocated charges, with respect to operations for the applicable periods, aggregated to $4.7 million, $4.7 million and $4.5 million for the three months ended March 31, 2020, December 31, 2019 and March 31, 2019 respectively. |
(2) |
NOI includes QTS’ pro rata share of NOI from the unconsolidated joint venture. |
|
|
As of |
|||||||
Calculation of Average Undepreciated Real Estate |
|
March 31, |
|
December 31, |
|
March 31, |
|||
Assets and Other Net Fixed Assets Placed in Service |
|
2020 |
|
2019 |
|
2019 |
|||
Real Estate Assets, net |
|
$ |
2,830,630 |
|
$ |
2,671,868 |
|
$ |
2,446,467 |
Less: Construction in progress |
|
|
(877,313) |
|
|
(920,923) |
|
|
(803,888) |
Plus: Accumulated depreciation |
|
|
588,685 |
|
|
558,560 |
|
|
494,787 |
Plus: Goodwill |
|
|
173,843 |
|
|
173,843 |
|
|
173,843 |
Plus: Other fixed assets, net |
|
|
39,789 |
|
|
40,509 |
|
|
41,163 |
Plus: Acquired intangibles, net (1) |
|
|
67,083 |
|
|
70,036 |
|
|
79,168 |
Plus: Leasing Commissions, net |
|
|
45,734 |
|
|
44,330 |
|
|
38,522 |
Plus: Assets placed in service in unconsolidated JV (2) |
|
|
45,455 |
|
|
43,668 |
|
|
29,464 |
Total as of period end |
|
$ |
2,913,906 |
|
$ |
2,681,891 |
|
$ |
2,499,526 |
|
|
|
|
|
|
|
|
|
|
Average undepreciated real estate assets and other net fixed assets as of reporting period (3) |
|
$ |
2,797,898 |
|
$ |
2,670,448 |
|
$ |
2,426,978 |
(1) |
Net of acquired intangible liabilities and deferred tax liabilities. |
(2) |
Represents QTS’ basis in the assets in the JV which were $45.5 million as of March 31, 2020 (calculated as the cost basis of the assets contributed for in serviced phases of $92.2 million less the equity contribution of the JV partner and the JV partner’s portion of debt of $46.7 million), $43.7 million as of December 31, 2019 (calculated as the cost basis of the assets contributed for in serviced phases of $88.6 million less the equity contribution of the JV partner and the JV partner’s portion of debt of $44.9 million) and $29.5 million as of March 31, 2019 (calculated as the cost basis of the assets contributed for in serviced phases of $58.9 million less the equity contribution of the JV partner and the JV partner’s portion of debt of $29.5 million). |
(3) |
Calculated by using average quarterly balance of each account. |
9 QTS Q1 Earnings 2020 |
Contact: IR@qtsdatacenters.com |
Implied Enterprise Value and
|
|
Shares or |
|
Market Price or |
|
Market |
|
||
|
|
Equivalents |
|
Liquidation Value as of |
|
Capitalization |
|
||
Implied Enterprise Value as of March 31, 2020: |
|
Outstanding |
|
March 31, 2020 |
|
(in thousands) |
|
||
Class A Common Stock |
|
60,269,628 |
|
$ |
58.01 |
|
$ |
3,496,241 |
|
Class B Common Stock |
|
128,408 |
|
|
58.01 |
|
|
7,449 |
|
Total Shares Outstanding |
|
60,398,036 |
|
|
|
|
|
|
|
Units of Limited Partnership Interest (1) |
|
6,711,258 |
|
|
58.01 |
|
|
389,320 |
|
Options to purchase Class A Common Stock and performance units (2) |
|
971,283 |
|
|
58.01 |
|
|
56,344 |
|
Effect of Class A common stock associated with forward equity sale (3) |
|
532,831 |
|
|
58.01 |
|
|
30,910 |
|
Fully Diluted Total Shares and Units of Limited Partnership Interest outstanding as of March 31, 2020 |
|
68,613,408 |
|
|
|
|
|
|
|
Liquidation value of Series A Preferred Stock |
|
4,280,000 |
|
|
25.00 |
|
|
107,000 |
|
Liquidation value of Series B Convertible Preferred Stock |
|
3,162,500 |
|
|
100.00 |
|
|
316,250 |
|
Total Equity |
|
|
|
|
|
|
$ |
4,403,514 |
|
Total Indebtedness |
|
|
|
|
|
|
|
1,539,000 |
(4) |
Implied Enterprise Value |
|
|
|
|
|
|
$ |
5,942,514 |
|
(1) |
Includes 40,270 of operating partnership units representing the “in the money” value of Class O LTIP units on an “as if” converted basis as of March 31, 2020. |
(2) |
Represents options to purchase shares of Class A Common Stock of QTS Realty Trust, Inc. representing the “in the money” value of options on an “as if” converted basis and the value of performance awards on an “as if” converted basis as of March 31, 2020. |
(3) |
Represents the “in the money” value of the forward equity shares on an “as if” converted basis as of March 31, 2020. |
(4) |
Excludes all debt issuance costs reflected as a reduction to liabilities at March 31, 2020 representing the full amount of debt that will be repaid, less the amount of cash and cash equivalents on hand. This also includes the Company’s pro rata share of unconsolidated joint venture debt, net of its pro rata share of cash on hand at the joint venture. |
The following table presents the weighted average fully diluted shares for the three months ended March 31, 2020:
|
|
Three Months Ended |
|
|
March 31, 2020 |
Weighted average shares outstanding - basic |
|
58,624,935 |
Effect of Class A partnership units (1) |
|
6,670,988 |
Effect of Class O units on an "as if" converted basis (1) |
|
40,270 |
Effect of options to purchase Class A common stock, restricted Class A common stock and performance units on an "as if" converted basis (2) |
|
626,209 |
Effect of Class A common stock associated with forward equity sale (3) |
|
828,538 |
Weighted average shares outstanding - diluted (4) |
|
66,790,940 |
(1) |
The Class A units and Class O units represent limited partnership interests in the Operating Partnership. |
(2) |
The average share price for the three months ended March 31, 2020 was $55.32. |
(3) |
Represents the weighted average “in the money” value of the forward equity shares on an “as if” converted basis. |
(4) |
Series B Convertible Preferred stock was not incorporated on an “as if” converted basis as the conversion would have been antidilutive for the period presented. |
10 QTS Q1 Earnings 2020 |
Contact: IR@qtsdatacenters.com |
The table below presents an overview of the portfolio of data center properties that the Company owns or leases, referred to herein as our data center properties, based on information as of March 31, 2020.
|
|
|
|
|
|
Net Rentable Square Feet (Operating NRSF) (1) |
|
|
|
|
|
|
|
|
|
|
|||||||||
|
|
|
|
|
|
|
|
|
|
|
|
|
|
|
|
|
|
Available |
|
Basis of |
|
Current |
|||
|
|
|
|
Gross |
|
|
|
|
|
|
|
|
|
|
|
|
|
Utility |
|
Design |
|
Raised |
|||
|
|
Year |
|
Square |
|
Raised |
|
Office & |
|
Supporting |
|
|
|
% |
|
Annualized |
|
Power |
|
("BOD") |
|
Floor as a |
|||
Properties |
|
Acquired (2) |
|
Feet (3) |
|
Floor (4) |
|
Other (5) |
|
Infrastructure (6) |
|
Total |
|
Occupied (7) |
|
Rent (8) |
|
(MW) (9) |
|
NRSF |
|
% of BOD |
|||
Richmond, VA |
|
2010 |
|
1,318,353 |
|
117,309 |
|
51,093 |
|
131,654 |
|
300,056 |
|
84.9 |
% |
|
$ |
33,570,024 |
|
110 |
|
557,309 |
|
21.0 |
% |
Atlanta, GA (DC - 1) (10) |
|
2006 |
|
968,695 |
|
527,186 |
|
36,953 |
|
364,815 |
|
928,954 |
|
97.0 |
% |
|
|
118,129,363 |
|
72 |
|
527,186 |
|
100.0 |
% |
Irving, TX |
|
2013 |
|
698,000 |
|
187,742 |
|
6,981 |
|
198,913 |
|
393,636 |
|
95.9 |
% |
|
|
52,201,124 |
|
140 |
|
275,701 |
|
68.1 |
% |
Princeton, NJ |
|
2014 |
|
553,930 |
|
58,157 |
|
2,229 |
|
111,405 |
|
171,791 |
|
100.0 |
% |
|
|
10,380,831 |
|
22 |
|
158,157 |
|
36.8 |
% |
Chicago, IL |
|
2014 |
|
474,979 |
|
70,000 |
|
1,786 |
|
71,622 |
|
143,408 |
|
95.3 |
% |
|
|
19,256,457 |
|
56 |
|
215,855 |
|
32.4 |
% |
Ashburn, VA |
|
2017 |
|
445,000 |
|
110,606 |
|
6,096 |
|
110,560 |
|
227,262 |
|
66.1 |
% |
|
|
6,882,751 |
|
50 |
|
178,000 |
|
62.1 |
% |
Suwanee, GA |
|
2005 |
|
369,822 |
|
205,608 |
|
8,697 |
|
107,128 |
|
321,433 |
|
94.0 |
% |
|
|
60,505,502 |
|
36 |
|
205,608 |
|
100.0 |
% |
Piscataway, NJ |
|
2016 |
|
360,000 |
|
103,820 |
|
14,311 |
|
104,301 |
|
222,432 |
|
90.9 |
% |
|
|
20,486,370 |
|
111 |
|
176,000 |
|
59.0 |
% |
Fort Worth, TX |
|
2016 |
|
261,836 |
|
55,828 |
|
17,232 |
|
97,699 |
|
170,759 |
|
77.0 |
% |
|
|
5,605,624 |
|
50 |
|
80,000 |
|
69.8 |
% |
Santa Clara, CA (11) |
|
2007 |
|
135,322 |
|
59,905 |
|
944 |
|
45,094 |
|
105,943 |
|
90.3 |
% |
|
|
22,882,619 |
|
11 |
|
80,940 |
|
74.0 |
% |
Sacramento, CA |
|
2012 |
|
92,644 |
|
54,595 |
|
2,794 |
|
23,916 |
|
81,305 |
|
35.8 |
% |
|
|
10,243,959 |
|
8 |
|
54,595 |
|
100.0 |
% |
Dulles, VA (12) |
|
2017 |
|
87,159 |
|
30,545 |
|
5,997 |
|
32,892 |
|
69,434 |
|
89.4 |
% |
|
|
17,846,722 |
|
13 |
|
48,270 |
|
63.3 |
% |
Leased facilities (13) |
|
2006 & 2015 |
|
190,875 |
|
62,274 |
|
18,650 |
|
41,901 |
|
122,825 |
|
84.2 |
% |
|
|
24,238,797 |
|
14 |
|
82,886 |
|
75.1 |
% |
Other (14) |
|
Misc. |
|
459,549 |
|
51,561 |
|
49,337 |
|
70,636 |
|
171,534 |
|
84.9 |
% |
|
|
13,095,663 |
|
98 |
|
180,380 |
|
28.6 |
% |
|
|
|
|
6,416,164 |
|
1,695,136 |
|
223,100 |
|
1,512,536 |
|
3,430,772 |
|
89.9 |
% |
|
$ |
415,325,806 |
|
791 |
|
2,820,887 |
|
60.1 |
% |
|
|
|
|
|
|
|
|
|
|
|
|
|
|
|
|
|
|
|
|
|
|
|
|
|
|
New Property Development |
|
|
|
|
|
|
|
|
|
|
|
|
|
|
|
|
|
|
|
|
|
|
|
|
|
Atlanta, GA (DC - 2) (15) |
|
2018 |
|
495,000 |
|
— |
|
— |
|
— |
|
— |
|
— |
% |
|
|
— |
|
— |
|
240,000 |
|
— |
% |
Hillsboro, OR |
|
2017 |
|
158,000 |
|
— |
|
— |
|
— |
|
— |
|
— |
% |
|
|
— |
|
— |
|
85,000 |
|
— |
% |
|
|
|
|
|
|
|
|
|
|
|
|
|
|
|
|
|
|
|
|
|
|
|
|
|
|
Unconsolidated JV Properties - at the JV's 100% Share (16) |
|
|
|
|
|
|
|
|
|
|
|
|
|
|
|
|
|
|
|
|
|
|
|
|
|
Manassas, VA |
|
2018 |
|
118,031 |
|
22,400 |
|
12,663 |
|
39,044 |
|
74,107 |
|
100.0 |
% |
|
$ |
8,456,635 |
|
135 |
|
66,324 |
|
33.8 |
% |
|
|
|
|
|
|
|
|
|
|
|
|
|
|
|
|
|
|
|
|
|
|
|
|
|
|
Total properties |
|
|
|
7,187,195 |
|
1,717,536 |
|
235,763 |
|
1,551,580 |
|
3,504,879 |
|
90.1 |
% |
|
$ |
423,782,441 |
|
926 |
|
3,212,211 |
|
53.5 |
% |
(1) |
Represents the total square feet of a building that is currently leased or available for lease plus developed supporting infrastructure, based on engineering drawings and estimates, but does not include space held for redevelopment or space used for the Company’s own office space. |
(2) |
Represents the year a property was acquired or, in the case of a property under lease, the year the Company’s initial lease commenced for the property. |
(3) |
With respect to the Company’s owned properties, gross square feet represents the entire building area. With respect to leased properties, gross square feet represents that portion of the gross square feet subject to our lease. This includes 383,761 square feet of QTS office and support space, which is not included in operating NRSF. |
(4) |
Represents management’s estimate of the portion of NRSF of the facility with available power and cooling capacity that is currently leased or readily available to be leased to customers as data center space based on engineering drawings. |
(5) |
Represents the operating NRSF of the facility other than data center space (typically office and storage space) that is currently leased or available to be leased. |
(6) |
Represents required data center support space, including mechanical, telecommunications and utility rooms, as well as building common areas. |
(7) |
Calculated as data center raised floor that is subject to a signed lease for which billing has commenced divided by leasable raised floor based on the current configuration of the properties, expressed as a percentage. |
(8) |
The Company defines annualized rent as MRR multiplied by 12. The Company calculates MRR as monthly contractual revenue under executed contracts as of a particular date, but excludes customer recoveries, deferred set up fees, variable related revenues, non-cash revenues and other one-time revenues. MRR does not include the impact from booked-not-billed contracts as of a particular date, unless otherwise specifically noted. This amount reflects the annualized cash rental payments. It does not reflect the accounting associated with any free rent, rent abatements or future scheduled rent increases and also excludes operating expense and power reimbursements. |
(9) |
Represents installed utility power and transformation capacity that is available for use by the facility as of March 31, 2020. |
(10) |
This property was formerly known as “Atlanta, GA (Metro)” but has been renamed “Atlanta, GA (DC-1)” to distinguish between the existing data center and the new property development shown as “Atlanta, GA (DC – 2)” within the new property development section. |
(11) |
Subject to long-term ground lease. |
(12) |
The Dulles campus has two data center buildings and the Company is currently relocating customers from the smaller and older facility to the newer facility in an effort to optimize its operating cost structure. |
(13) |
Includes 7 facilities. All facilities are leased, including those subject to finance leases. |
(14) |
Consists of Miami, FL; Lenexa, KS; Overland Park, KS; Eemshaven, Netherlands and Groningen, Netherlands facilities. |
(15) |
Represents the development of a new data center building at our Atlanta, GA campus. |
(16) |
Represents the Company’s unconsolidated joint venture at the JV’s 100% share. QTS’ pro rata share of the JV is 50%. |
11 QTS Q1 Earnings 2020 |
Contact: IR@qtsdatacenters.com |
(in millions, except NRSF data)
During the first quarter of 2020, the Company brought online approximately 21 megawatts of gross power and approximately 60,000 net rentable square feet (“NRSF”) of raised floor and customer specific capital at its Ashburn, Fort Worth and Atlanta (DC-1) facilities at an aggregate cost of approximately $224.0 million.
The under construction table below summarizes the Company’s outlook for development projects which it expects to complete by December 31, 2020 (in millions).
|
|
Under Construction Costs (1) |
|||||||||
|
|
|
|
Estimated Cost to |
|
|
|
Expected |
|||
Properties |
|
Actual (2) |
|
Completion (3) |
|
Total |
|
Completion date |
|||
Ashburn, VA |
|
$ |
35 |
|
$ |
24 |
|
$ |
59 |
|
Q4 2020 |
Irving, TX |
|
|
10 |
|
|
1 |
|
|
11 |
|
Q3 2020 |
Chicago, IL |
|
|
23 |
|
|
4 |
|
|
27 |
|
Q2 2020 |
Richmond, VA |
|
|
5 |
|
|
2 |
|
|
7 |
|
Q3 2020 |
Piscataway, NJ |
|
|
3 |
|
|
1 |
|
|
4 |
|
Q2 2020 |
|
|
$ |
76 |
|
$ |
32 |
|
$ |
108 |
|
|
|
|
|
|
|
|
|
|
|
|
|
|
New Property Development |
|||||||||||
Atlanta, GA (DC - 2) (4) |
|
|
61 |
|
|
99 |
|
|
160 |
|
Q3/Q4 2020 |
Hillsboro, OR |
|
|
17 |
|
|
5 |
|
|
22 |
|
Q2 2020 |
|
|
|
|
|
|
|
|
|
|
|
|
Unconsolidated JV Properties - at the Company's 50% Share (5) |
|||||||||||
Manassas, VA |
|
|
5 |
|
|
7 |
|
|
12 |
|
Q2/Q4 2020 |
|
|
|
|
|
|
|
|
|
|
|
|
Totals |
|
$ |
159 |
|
$ |
143 |
|
$ |
302 |
|
|
(1) |
In addition to projects currently under construction, the Company’s near-term development projects are expected to be delivered in a modular manner, and the Company currently expects to invest additional capital to complete these near term projects. The ultimate timing and completion of, and the commitment of capital to, the Company’s future development projects are within the Company’s discretion and will depend upon a variety of factors, including the actual contracts executed, availability of financing and the Company’s estimation of the future market for data center space in each particular market. |
(2) |
Represents actual costs under construction through March 31, 2020. In addition to the $159 million of construction costs incurred through March 31, 2020 for development expected to be completed by December 31, 2020, as of March 31, 2020 the Company had incurred $718 million of additional costs (including acquisition costs and other capitalized costs) for other development projects that are expected to be completed after December 31, 2020. |
(3) |
Represents management’s estimate of the additional costs required to complete the current NRSF under development. There may be an increase in costs if customers’ requirements exceed the Company’s current basis of design. |
(4) |
Represents the development of a new data center building at our Atlanta, GA campus. |
(5) |
Represents QTS’ basis in the assets in the JV that will be in serviced, which is calculated as the cost basis of the assets contributed for in serviced phases of approximately $25 million less the equity contribution of the JV partner and the JV partner’s portion of debt of approximately $13 million. |
12 QTS Q1 Earnings 2020 |
Contact: IR@qtsdatacenters.com |
(in millions, except NRSF data)
The following development table presents an overview of the Company’s development pipeline, based on information as of March 31, 2020. This table shows the Company’s ability to increase its raised floor of 1.7 million square feet as of March 31, 2020 to 3.2 million square feet, exclusive of incremental development capacity on adjacent land holdings.
|
|
Raised Floor NRSF |
||||||||
|
|
Overview as of March 31, 2020 |
||||||||
|
|
Current |
|
|
|
|
|
|
|
Approximate |
|
|
NRSF in |
|
Under |
|
Future |
|
Basis of |
|
Adjacent Acreage |
Properties |
|
Service |
|
Construction (1) |
|
Available (2) |
|
Design NRSF |
|
of Land (3) |
Richmond, VA |
|
117,309 |
|
5,000 |
|
435,000 |
|
557,309 |
|
182.2 |
Atlanta, GA (DC - 1) (4) |
|
527,186 |
|
— |
|
— |
|
527,186 |
|
— |
Irving, TX |
|
187,742 |
|
12,000 |
|
75,959 |
|
275,701 |
|
29.4 |
Princeton, NJ |
|
58,157 |
|
— |
|
100,000 |
|
158,157 |
|
65.0 |
Chicago, IL |
|
70,000 |
|
20,000 |
|
125,855 |
|
215,855 |
|
23.0 |
Ashburn, VA |
|
110,606 |
|
30,000 |
|
37,394 |
|
178,000 |
|
62.9 |
Suwanee, GA |
|
205,608 |
|
— |
|
— |
|
205,608 |
|
15.4 |
Piscataway, NJ |
|
103,820 |
|
6,000 |
|
66,180 |
|
176,000 |
|
— |
Fort Worth, TX |
|
55,828 |
|
— |
|
24,172 |
|
80,000 |
|
26.5 |
Santa Clara, CA |
|
59,905 |
|
— |
|
21,035 |
|
80,940 |
|
— |
Sacramento, CA |
|
54,595 |
|
— |
|
— |
|
54,595 |
|
— |
Dulles, VA |
|
30,545 |
|
— |
|
17,725 |
|
48,270 |
|
— |
Leased facilities (5) |
|
62,274 |
|
— |
|
20,612 |
|
82,886 |
|
— |
Phoenix, AZ |
|
— |
|
— |
|
— |
|
— |
|
84.2 |
Manassas, VA |
|
— |
|
— |
|
— |
|
— |
|
87.1 |
Other (6) |
|
51,561 |
|
— |
|
128,819 |
|
180,380 |
|
— |
|
|
1,695,136 |
|
73,000 |
|
1,052,751 |
|
2,820,887 |
|
575.7 |
|
|
|
|
|
|
|
|
|
|
|
New Property Development |
|
|
|
|
|
|
|
|
|
|
Atlanta, GA (DC - 2) (7) |
|
— |
|
42,202 |
|
197,798 |
|
240,000 |
|
63.4 |
Hillsboro, OR |
|
— |
|
7,000 |
|
78,000 |
|
85,000 |
|
92.0 |
|
|
|
|
|
|
|
|
|
|
|
Unconsolidated JV Properties - at the JV's 100% Share (8) |
||||||||||
Manassas, VA |
|
22,400 |
|
11,200 |
|
32,724 |
|
66,324 |
|
— |
|
|
|
|
|
|
|
|
|
|
|
Totals as of March 31, 2020 |
|
1,717,536 |
|
133,402 |
|
1,361,273 |
|
3,212,211 |
|
731.1 |
(1) |
Reflects NRSF at a facility for which the initiation of substantial activities has begun to prepare the property for its intended use on or before December 31, 2020. |
(2) |
Reflects NRSF at a facility for which the initiation of substantial activities has begun to prepare the property for its intended use after December 31, 2020. |
(3) |
The total cost basis of adjacent land, which is land available for the future development, is approximately $233.3 million, of which approximately $201.2 million is included in Construction in Progress on the consolidated balance sheet. The Basis of Design NRSF does not include any build-out on the available land. |
(4) |
This property was formerly known as “Atlanta, GA (Metro)” but has been renamed “Atlanta, GA (DC-1)” to distinguish between the existing data center and the new property development shown as “Atlanta, GA (DC – 2)” within the new property development section. |
(5) |
Includes 7 facilities. All facilities are leased, including those subject to finance leases. |
(6) |
Consists of Miami, FL; Lenexa, KS; Overland Park, KS; Eemshaven, Netherlands and Groningen, Netherlands facilities. |
(7) |
Represents the development of a new data center building at our Atlanta, GA campus. |
(8) |
Represents the Company’s unconsolidated joint venture at the JV’s 100% share. QTS’ pro rata share of the JV is 50%. |
13 QTS Q1 Earnings 2020 |
Contact: IR@qtsdatacenters.com |
NOI by Facility and Capital Expenditure Summary
(unaudited and in thousands)
The Company calculates net operating income, or NOI, as net income (loss) (computed in accordance with GAAP), excluding: interest expense, interest income, tax expense (benefit) of taxable REIT subsidiaries, depreciation and amortization, write-off of unamortized deferred financing costs, other (income) expense, debt restructuring costs, transaction and integration costs, gain (loss) on sale of real estate, restructuring costs, general and administrative expenses and similar adjustments for unconsolidated entities. The Company believes that NOI is another metric that is often utilized to evaluate returns on operating real estate from period to period and also, in part, to assess the value of the operating real estate.
The breakdown of NOI by facility is shown below:
|
|
Three Months Ended |
|
|||||||
|
|
March 31, 2020 |
|
December 31, 2019 |
|
March 31, 2019 |
|
|||
Breakdown of NOI by facility: |
|
|
|
|
|
|
|
|
|
|
Atlanta (DC - 1) data center (1) |
|
$ |
26,101 |
|
$ |
25,094 |
|
$ |
23,667 |
|
Atlanta-Suwanee data center |
|
|
12,802 |
|
|
12,869 |
|
|
11,797 |
|
Richmond data center |
|
|
6,276 |
|
|
6,305 |
|
|
8,779 |
|
Irving data center |
|
|
11,412 |
|
|
11,450 |
|
|
11,420 |
|
Dulles data center |
|
|
3,159 |
|
|
3,078 |
|
|
2,932 |
|
Leased data centers (2) |
|
|
1,883 |
|
|
1,885 |
|
|
2,551 |
|
Santa Clara data center |
|
|
2,595 |
|
|
2,095 |
|
|
1,681 |
|
Piscataway data center |
|
|
3,635 |
|
|
3,507 |
|
|
3,455 |
|
Princeton data center |
|
|
2,506 |
|
|
2,549 |
|
|
2,474 |
|
Sacramento data center |
|
|
1,597 |
|
|
1,547 |
|
|
1,675 |
|
Chicago data center |
|
|
3,891 |
|
|
3,889 |
|
|
2,741 |
|
Ashburn data center |
|
|
2,606 |
|
|
2,392 |
|
|
317 |
|
Fort Worth data center |
|
|
1,322 |
|
|
1,880 |
|
|
265 |
|
Other facilities (3) |
|
|
1,815 |
|
|
2,454 |
|
|
1,465 |
|
NOI from consolidated operations (4) |
|
$ |
81,600 |
|
$ |
80,994 |
|
$ |
75,219 |
|
Pro rata share of NOI from unconsolidated entity (5) |
|
|
844 |
|
|
841 |
|
|
234 |
|
Total NOI |
|
$ |
82,444 |
|
$ |
81,835 |
|
$ |
75,453 |
|
(1) |
This property was formerly known as “Atlanta-Metro data center” but has been renamed “Atlanta (DC-1) data center” to distinguish between the existing data center and the new property development. |
(2) |
Includes 7 facilities. All facilities are leased, including those subject to finance leases. |
(3) |
Consists of Miami, FL; Lenexa, KS; Overland Park, KS; and Groningen, Netherlands facilities. In addition, includes management fees and development fees. |
(4) |
Includes facility level G&A expense allocation charges of 4% of cash revenue for all facilities. These allocated charges aggregated to $4.7 million, $4.7 million and $4.5 million for the three months ended March 31, 2020, December 31, 2019 and March 31, 2019, respectively. |
(5) |
QTS’ pro rata share of the JV is 50%. |
Our cash paid for capital expenditures is summarized as follows:
|
Capital Expenditures |
|||||||
|
Three Months Ended |
|||||||
|
March 31, |
|
December 31, |
|
March 31, |
|||
|
2020 |
|
2019 |
|
2019 |
|||
Development (1) |
$ |
144,480 |
|
$ |
62,324 |
|
$ |
73,408 |
Acquisitions |
|
1,797 |
|
|
7,866 |
|
|
— |
Maintenance capital expenditures |
|
1,662 |
|
|
910 |
|
|
709 |
Other capital expenditures (2) |
|
26,403 |
|
|
30,343 |
|
|
18,859 |
Total capital expenditures |
$ |
174,342 |
|
$ |
101,443 |
|
$ |
92,976 |
(1) |
Includes QTS’ pro rata share of capital expenditures associated with the unconsolidated joint venture. Total capital expenditures at the joint venture were approximately $1 million ($0.5 million our pro rata share) for the three months ended March 31, 2020, less the equity contribution of the JV partner and the JV partners’ portion of debt of $0.5 million. Total capital expenditures at the joint venture were approximately $3 million ($1 million our pro rata share) for the three months ended December 31, 2019, less the equity contribution of the JV partner and the JV partners’ portion of debt of $2 million. Total capital expenditures at the joint venture were approximately $26 million ($13 million our pro rata share) for the three months ended March 31, 2019, less the equity contribution of the JV partner and the JV partners’ portion of debt of $13 million. |
(2) |
Represents capital expenditures for capitalized interest, commissions, personal property, overhead costs and corporate fixed assets. Corporate fixed assets primarily relate to construction of corporate offices, leasehold improvements and product related assets. |
14 QTS Q1 Earnings 2020 |
Contact: IR@qtsdatacenters.com |
Leasing Statistics – Signed Leases
Incremental Annualized Rent, Net of Downgrades reflects net incremental MRR signed during the period for purposes of tracking incremental revenue contribution. The amounts below include renewals when there was a change in square footage rented, but exclude renewals where square footage remained consistent before and after renewal. (See renewal table on page 16 for such renewals). The amounts below include results of the consolidated business as well as QTS’ 50% pro rata share of the leasing activity attributable to the JV, if any.
During the first quarter of 2020, the Company entered into 486 new and modified leases aggregating to $21.8 million of incremental annualized rent. The Company’s first quarter leasing performance was primarily driven by strong sales in its hyperscale product vertical, highlighted by two existing hyperscale tenants’ expansions, as well as consistent performance in the hybrid colocation product vertical. The pricing on new and modified leases signed varies quarter to quarter based on the mix of deals leased, as hyperscale and hybrid colocation vary on a rate per square foot basis. Annualized rent per leased square foot is computed using the total rent associated with all new and modified leases for the respective periods.
|
|
|
|
|
|
|
|
|
|
|
Incremental |
|
|
|
|
|
|
|
|
Annualized |
|
|
Annualized |
|
|
|
|
|
Number of |
|
|
rent per |
|
|
Rent, Net of |
|
|
Period |
|
|
Leases |
|
|
leased sq ft |
|
|
Downgrades (1) |
New/modified leases signed |
|
Q1 2020 |
|
|
486 |
|
$ |
388 |
|
$ |
21,832,767 |
|
|
P4QA (2) |
|
|
435 |
|
|
465 |
|
|
19,014,233 |
|
|
Q4 2019 |
|
|
373 |
|
|
465 |
|
|
27,742,166 |
|
|
Q3 2019 |
|
|
444 |
|
|
404 |
|
|
17,385,468 |
|
|
Q2 2019 |
|
|
404 |
|
|
544 |
|
|
19,624,574 |
|
|
Q1 2019 |
|
|
520 |
|
|
477 |
|
|
11,304,724 |
(1) |
Amounts include incremental MRR only, net of downgrades. |
(2) |
Average of prior four quarters. |
NOTE: Figures above do not include cost recoveries.
The following table outlines the booked-not-billed (“BNB”) balance as of March 31, 2020 and how it is expected to affect revenue in 2020 and subsequent years based on the current terms of the applicable contracts.
Note: The following table includes QTS’ 50% pro rata share of BNB revenue from the unconsolidated joint venture.
Booked-not-billed ("BNB") (1) |
2020 |
|
2021 |
|
Thereafter |
|
Total |
||||
MRR |
$ |
2,931,570 |
|
$ |
3,380,378 |
|
$ |
2,099,609 |
|
$ |
8,411,557 |
Incremental revenue (2) |
|
16,597,741 |
|
|
27,959,324 |
|
|
25,195,308 |
|
|
|
Annualized revenue (3) (4) |
|
35,178,845 |
|
|
40,564,534 |
|
|
25,195,308 |
|
|
100,938,687 |
(1) |
Includes the Company’s consolidated booked-not-billed balance in addition to booked-not-billed revenue associated with the unconsolidated JV at QTS’ pro rata share of the booked-not-billed revenue. Of the $100.9 million annualized BNB revenue, approximately $1.8 million related to QTS’ pro rata share of booked-not-billed revenue associated with the unconsolidated JV. |
(2) |
Incremental revenue represents the expected amount of recognized MRR for the business in the period based on when the booked-not-billed leases commence throughout the period. |
(3) |
Annualized revenue represents the booked-not-billed MRR multiplied by 12, demonstrating how much recognized MRR might have been recognized if the booked-not-billed leases commencing in the period were in place for an entire year. |
(4) |
As of March 31, 2020, adjusting booked-not-billed revenue for the effects of revenue which had begun recognition via straight line rent, the Company’s annualized booked-not-billed balance was $54.8 million, of which $26.1 million was attributable to 2020, $16.7 million was attributable to 2021, and $12.0 million was attributable to years thereafter. |
The Company estimates the remaining cost to provide the space, power, connectivity and other services to the customer contracts which had not billed as of March 31, 2020 to be approximately $226 million. This estimate generally includes customers with newly contracted space of more than 3,300 square feet of raised floor space. The space, power, connectivity and other services provided to customers that contract for smaller amounts of space is generally provided by existing space which was previously developed.
15 QTS Q1 Earnings 2020 |
Contact: IR@qtsdatacenters.com |
Leasing Statistics – Renewed Leases and Rental Churn
The mix of leasing activity has a significant impact on quarterly rates, both within major product segments and for overall blended renewal rates. The Company’s rate performance will vary quarter to quarter based on the mix of deals leased as hyperscale and hybrid colocation vary on a rate per square foot basis.
Consistent with the Company’s strategy and business model, the renewal rates below reflect total MRR per square foot including all subscribed services. For comparability, the Company includes only those customers that have maintained consistent space footprints in the computations below. All customers with space changes are incorporated into new/modified leasing statistics and rates. The amounts below include results of the consolidated business as well as QTS’ 50% pro rata share of the renewal leasing activity attributable to the JV, if any.
The average rent per square foot for renewals signed in the first quarter of 2020 was 5.0% higher than the rates for those customers immediately prior to renewal. The increase in the renewal rate of 5.0% was primarily attributable to a large number of hybrid colocation renewals with power and/or connectivity increases upon renewal. The Company expects renewal rates will generally increase in the low to mid-single digit percentage range.
Rental Churn (which the Company defines as MRR lost in the period to a customer intending to fully exit the QTS platform in the near term compared to total MRR at the beginning of the period) was 0.6% for the first quarter of 2020.
|
|
|
|
|
|
Annualized |
|
|
|
|
|
|||
|
|
|
|
Number of |
|
rent per |
|
Annualized |
|
Rent |
|
|||
|
|
Period |
|
renewed leases |
|
leased sq ft |
|
Rent |
|
Change (1) |
|
|||
Renewed Leases |
|
Q1 2020 |
|
78 |
|
$ |
871 |
|
$ |
11,279,385 |
|
5.0 |
% |
|
|
|
P4Q avg (2) |
|
94 |
|
|
673 |
|
|
15,694,743 |
|
1.0 |
% |
|
|
|
Q4 2019 |
|
90 |
|
|
777 |
|
|
11,522,508 |
|
(2.2) |
% |
(3) |
|
|
Q3 2019 |
|
88 |
|
|
541 |
|
|
25,862,052 |
|
2.0 |
% |
|
|
|
Q2 2019 |
|
109 |
|
|
732 |
|
|
13,938,384 |
|
1.2 |
% |
|
|
|
Q1 2019 |
|
88 |
|
|
988 |
|
|
11,456,028 |
|
1.6 |
% |
|
(1) |
Calculated as the percentage change of the rent per square foot immediately before renewal when compared to the rent per square foot immediately after renewal. |
(2) |
Average of prior four quarters. |
(3) |
The decline in the renewal rate of 2.2% was largely due to one customer’s change in power density upon renewal. Excluding this customer lease from the renewal base, QTS’ renewal rates on a per square foot basis would have represented a 2.7% increase relative to pre-renewal rates. |
16 QTS Q1 Earnings 2020 |
Contact: IR@qtsdatacenters.com |
Hyperscale leases are typically 5-10 years with the majority of hyperscale lease expirations occurring in 2022 and beyond. Hybrid colocation leases are typically 3 years in duration, with the majority of hybrid colocation lease expirations occurring between 2020 and 2022. The following table sets forth a summary schedule of the lease expirations as of March 31, 2020. Unless otherwise stated in the footnotes, the information set forth in the table assumes that customers exercise no renewal options and all early termination rights are exercised.
Note: The table below includes the Company’s pro rata share of leases associated with the unconsolidated joint venture. QTS’ pro rata share of the JV is 50%.
|
|
|
|
|
|
|
|
|
|
|
|
|
|
Hybrid |
|||||
|
|
|
|
Total Raised |
|
|
|
|
|
|
|
Hyperscale as |
|
Colocation as |
|||||
|
|
Number of |
|
Floor of |
|
% of Portfolio |
|
|
|
% of Portfolio |
|
% of Portfolio |
|
% of Portfolio |
|||||
Year of Lease |
|
Leases |
|
Expiring |
|
Leased Raised |
|
Annualized |
|
Annualized |
|
Annualized |
|
Annualized |
|||||
Expiration |
|
Expiring (1) |
|
Leases |
|
Floor |
|
Rent (2) |
|
Rent |
|
Rent |
|
Rent |
|||||
Month-to-Month (3) |
|
1,182 |
|
11,363 |
|
1 |
% |
|
$ |
10,357,714 |
|
2 |
% |
|
— |
% |
|
2 |
% |
2020 |
|
1,593 |
|
162,146 |
|
13 |
% |
|
|
90,048,436 |
|
21 |
% |
|
1 |
% |
|
20 |
% |
2021 |
|
1,244 |
|
244,769 |
|
20 |
% |
|
|
88,913,827 |
|
21 |
% |
|
5 |
% |
|
16 |
% |
2022 |
|
966 |
|
339,567 |
|
28 |
% |
|
|
113,559,144 |
|
28 |
% |
|
14 |
% |
|
14 |
% |
2023 |
|
361 |
|
124,680 |
|
10 |
% |
|
|
47,446,079 |
|
11 |
% |
|
3 |
% |
|
8 |
% |
After 2023 |
|
375 |
|
348,624 |
|
28 |
% |
|
|
69,228,923 |
|
17 |
% |
|
11 |
% |
|
6 |
% |
Portfolio Total |
|
5,721 |
|
1,231,149 |
|
100 |
% |
|
$ |
419,554,123 |
|
100 |
% |
|
34 |
% |
|
66 |
% |
(1) |
Represents each agreement with a customer signed as of March 31, 2020 for which billing has commenced; a lease agreement could include multiple spaces and a customer could have multiple leases. |
(2) |
The Company defines annualized rent as MRR multiplied by 12. The Company calculates MRR as monthly contractual revenue under executed contracts as of a particular date, but excludes customer recoveries, deferred set up fees, variable related revenues, non-cash revenues and other one-time revenues. MRR does not include the impact from booked-not-billed contracts as of a particular date, unless otherwise specifically noted. This amount reflects the annualized cash rental payments. |
(3) |
Consists of customer leases whose original contract terms ended and have continued on a month-to-month basis. |
17 QTS Q1 Earnings 2020 |
Contact: IR@qtsdatacenters.com |
As of March 31, 2020, the Company’s portfolio was leased to over 1,200 customers comprised of companies of all sizes representing an array of industries, each with unique and varied business models and needs. The following table sets forth information regarding the ten largest customers in the portfolio based on annualized rent as of March 31, 2020 (does not include rents or maturities associated with booked-not-billed customers or ramps for existing customers which have not yet commenced billing).
Note: The table below includes the Company’s pro rata share of leases associated with the unconsolidated joint venture. QTS’ pro rata share of the JV is 50%.
|
|
|
|
|
|
|
|
|
|
Weighted |
|
|
|
|
|
|
|
|
|
|
|
Average |
|
|
|
|
|
|
|
|
|
% of Portfolio |
|
Remaining |
|
|
|
|
|
Number of |
|
Annualized |
|
Annualized |
|
Lease Term |
|
Principal Customer Industry |
|
|
|
Locations |
|
Rent (1) |
|
Rent |
|
(Months) (2) |
|
Content & Digital Media |
|
|
|
1 |
|
$ |
45,656,849 |
|
10.9% |
|
28 |
Cloud & IT Services |
|
|
|
4 |
|
|
23,652,027 |
|
5.6% |
|
59 |
Cloud & IT Services |
|
|
|
1 |
|
|
19,241,360 |
|
4.6% |
|
24 |
Content & Digital Media |
|
|
|
3 |
|
|
15,337,039 |
|
3.7% |
|
27 |
Cloud & IT Services |
|
|
|
4 |
|
|
13,889,138 |
|
3.3% |
|
47 |
Cloud & IT Services |
|
|
|
1 |
|
|
8,078,502 |
|
1.9% |
|
42 |
Cloud & IT Services |
|
|
|
6 |
|
|
7,547,448 |
|
1.8% |
|
18 |
Government & Security |
|
|
|
1 |
|
|
6,807,642 |
|
1.6% |
|
36 |
Retail |
|
|
|
1 |
|
|
6,520,886 |
|
1.6% |
|
27 |
Financial Services |
|
|
|
1 |
|
|
4,990,632 |
|
1.2% |
|
52 |
Total / Weighted Average |
|
|
|
|
|
$ |
151,721,523 |
|
36.2% |
|
35 |
(1) |
Annualized rent is presented for leases commenced as of March 31, 2020. We define annualized rent as MRR multiplied by 12. We calculate MRR as monthly contractual revenue under signed leases as of a particular date, but excludes customer recoveries, deferred set-up fees, variable related revenues, non-cash revenues and other one-time revenues. MRR does not include the impact from booked-not-billed leases (which represent customer leases that have been executed but for which lease payments have not commenced) as of a particular date. This amount reflects the annualized cash rental payments. It does not reflect any free rent, rent abatements or future scheduled rent increases and also excludes operating expense and power reimbursements. |
(2) |
Weighted average based on customer’s percentage of total annualized rent expiring and is as of March 31, 2020. |
18 QTS Q1 Earnings 2020 |
Contact: IR@qtsdatacenters.com |
Product & Industry Diversification
The following table sets forth information relating to the distribution of leases at the properties, by type of product offering, as of March 31, 2020:
|
|
March 31, 2020 |
|
|
December 31, 2019 |
||||||
|
|
Annualized Rent (1) |
|
% of Portfolio |
|
|
Annualized Rent (1) |
|
% of Portfolio |
||
Hyperscale |
|
$ |
141,131,612 |
|
34% |
|
|
$ |
136,232,356 |
|
33% |
Hybrid Colocation |
|
|
278,422,511 |
|
66% |
|
|
|
272,170,874 |
|
67% |
Portfolio Total |
|
$ |
419,554,123 |
|
100% |
|
|
$ |
408,403,230 |
|
100% |
(1) |
Includes the Company’s pro rata share of leases associated with the unconsolidated joint venture. QTS’ pro rata share of the JV is 50% |
The following table sets forth information relating to the industry segmentation of customers as of March 31, 2020:
(1) |
Includes the Company’s pro rata share of leases associated with the unconsolidated joint venture. QTS’ pro rata share of the JV is 50%. |
The following table sets forth information relating to the industry segmentation of customers as of December 31, 2019:
(1) |
Includes the Company’s pro rata share of leases associated with the unconsolidated joint venture. QTS’ pro rata share of the JV is 50%. |
19 QTS Q1 Earnings 2020 |
Contact: IR@qtsdatacenters.com |
Debt Summary and Debt Maturities
(unaudited and in thousands)
The following tables set forth a summary of the Company’s debt instruments:
|
|
|
Weighted Average |
|
|
|
|
|
|
|
|
||||
|
|
|
Effective Interest Rate at |
|
|
|
|
Outstanding Balance as of: |
|||||||
|
|
|
March 31, 2020 (1) |
|
Maturity Date |
|
|
March 31, 2020 |
|
December 31, 2019 |
|||||
Unsecured Credit Facility (2) |
|
|
|
|
|
|
|
|
|
|
|
|
|
|
|
Revolving Credit Facility |
|
|
1.96% |
|
December 17, 2023 |
|
|
$ |
529,135 |
|
$ |
317,028 |
|||
Term Loan A |
|
|
3.26% |
|
December 17, 2024 |
|
|
|
225,000 |
|
|
225,000 |
|||
Term Loan B |
|
|
3.30% |
|
April 27, 2025 |
|
|
|
225,000 |
|
|
225,000 |
|||
Term Loan C |
|
|
3.46% |
|
October 18, 2026 |
|
|
|
250,000 |
|
|
250,000 |
|||
Senior Notes (3) |
|
|
4.75% |
|
November 15, 2025 |
|
|
|
400,000 |
|
|
400,000 |
|||
Lenexa Mortgage |
|
|
4.10% |
|
May 1, 2022 |
|
|
|
1,724 |
|
|
1,736 |
|||
Finance Leases |
|
|
4.35% |
|
2021 - 2038 |
|
|
|
44,520 |
|
|
45,140 |
|||
Total consolidated debt |
|
|
3.27% |
|
|
|
|
|
|
|
|
1,675,379 |
|
|
1,463,904 |
|
|
|
|
|
|
|
|
|
|
|
|
|
|
|
|
QTS’ Pro Rata Share of Unconsolidated JV Debt (4) |
|
|
4.40% |
|
February 22, 2023 |
|
|
|
36,915 |
|
|
35,166 |
|||
Total consolidated and unconsolidated debt |
|
|
|
|
|
|
|
|
|
|
$ |
1,712,294 |
|
$ |
1,499,070 |
(1) |
The coupon interest rates associated with Term Loan A, Term Loan B, Term Loan C and debt at the unconsolidated JV level incorporate the effects of interest rate swaps in effect as of March 31, 2020. |
(2) |
Balances exclude debt issuance costs reflected as offsets to liabilities aggregating $6.2 million and $6.4 million as of March 31, 2020 and December 31, 2019, respectively. |
(3) |
Balance excludes debt issuance costs reflected as offsets to liabilities aggregating $4.3 million and $4.5 million as of March 31, 2020 and December 31, 2019, respectively. |
(4) |
Balances excludes QTS’ pro rata share of debt issuance costs reflected as offsets to liabilities aggregating $1.0 million and $1.1 million at March 31, 2020 and December 31, 2019, respectively. |
|
|
Outstanding Balance as of: |
|
% of |
|
Outstanding Balance as of: |
|
% of |
||
|
|
March 31, 2020 (1) |
|
total |
|
December 31, 2019 (1) |
|
total |
||
Fixed Rate Debt |
|
$ |
1,181,359 |
|
69.0% |
|
$ |
1,082,042 |
|
72.2% |
Floating Rate Debt |
|
|
530,935 |
|
31.0% |
|
|
417,028 |
|
27.8% |
|
|
$ |
1,712,294 |
|
100.0% |
|
$ |
1,499,070 |
|
100.0% |
(1) |
As of March 31, 2020, the entire balance of all term loan debt is swapped to a fixed rate. As of March 31, 2020, the calculation includes the effects of $70 million of debt at the joint venture (of which $35 million is QTS’ share) that is swapped to a fixed rate. As of December 31, 2019, the calculation included all debt that was currently at a fixed rate and pro forma for an additional $200 million of debt that was swapped to a fixed rate that became effective January 2, 2020. As of December 31, 2019, the calculation also included the effects of $70 million of debt at the joint venture (of which $35 million is QTS’ share) that was swapped to a fixed rate. |
Scheduled debt maturities as of March 31, 2020:
Debt instruments |
|
2020 |
|
2021 |
|
2022 |
|
2023 |
|
2024 |
|
Thereafter |
|
Total |
|||||||
Unsecured Credit Facility (1) |
|
$ |
— |
|
$ |
— |
|
$ |
— |
|
$ |
529,135 |
|
$ |
225,000 |
|
$ |
475,000 |
|
$ |
1,229,135 |
Senior Notes (2) |
|
|
— |
|
|
— |
|
|
— |
|
|
— |
|
|
— |
|
|
400,000 |
|
|
400,000 |
Lenexa Mortgage |
|
|
52 |
|
|
73 |
|
|
1,599 |
|
|
— |
|
|
— |
|
|
— |
|
|
1,724 |
Finance Leases |
|
|
1,960 |
|
|
2,712 |
|
|
2,958 |
|
|
3,229 |
|
|
3,516 |
|
|
30,145 |
|
|
44,520 |
Total consolidated debt |
|
|
2,012 |
|
|
2,785 |
|
|
4,557 |
|
|
532,364 |
|
|
228,516 |
|
|
905,145 |
|
|
1,675,379 |
|
|
|
|
|
|
|
|
|
|
|
|
|
|
|
|
|
|
|
|
|
|
QTS’ Pro Rata Share of Unconsolidated JV Debt |
|
|
3 |
|
|
4 |
|
|
4 |
|
|
36,804 |
|
|
4 |
|
|
96 |
|
|
36,915 |
Total consolidated and unconsolidated debt |
|
$ |
2,015 |
|
$ |
2,789 |
|
$ |
4,561 |
|
$ |
569,168 |
|
$ |
228,520 |
|
$ |
905,241 |
|
$ |
1,712,294 |
(1) |
Balance excludes debt issuance costs reflected as offsets to liabilities aggregating $6.2 million as of March 31, 2020. |
(2) |
Balance excludes debt issuance costs reflected as offsets to liabilities aggregating $4.3 million as of March 31, 2020. |
20 QTS Q1 Earnings 2020 |
Contact: IR@qtsdatacenters.com |
(unaudited and in thousands)
A summary of the Company’s interest expense is as follows:
|
|
Three Months Ended |
|||||||
|
|
March 31, |
|
December 31, |
|
March 31, |
|||
|
|
2020 |
|
2019 |
|
2019 |
|||
Interest costs and fees |
|
$ |
14,276 |
|
$ |
13,629 |
|
$ |
13,981 |
Amortization of deferred financing costs |
|
|
987 |
|
|
982 |
|
|
978 |
Capitalized interest (1) |
|
|
(8,101) |
|
|
(8,347) |
|
|
(7,813) |
Total consolidated interest expense |
|
|
7,162 |
|
|
6,264 |
|
|
7,146 |
|
|
|
|
|
|
|
|
|
|
QTS’ pro rata share of unconsolidated JV interest expense |
|
|
541 |
|
|
507 |
|
|
173 |
Total consolidated and unconsolidated interest expense |
|
$ |
7,703 |
|
$ |
6,771 |
|
$ |
7,319 |
(1) |
The weighted average interest rate, including the effects of interest rate swaps, for the three months ended March 31, 2020, December 31, 2019, and March 31, 2019 was 3.85%, 4.04%, and 4.40%, respectively. |
21 QTS Q1 Earnings 2020 |
Contact: IR@qtsdatacenters.com |
Non-GAAP Financial Measures
This document includes certain non-GAAP financial measures that management believes are helpful in understanding the Company’s business, as further described below.
The Company considers the following non-GAAP financial measures to be useful to investors as key supplemental measures of the Company’s performance: (1) Revenue; (2) FFO, Operating FFO and Adjusted Operating FFO; (3) MRR and Recognized MRR; (4) NOI; and (5) EBITDAre and Adjusted EBITDA. These non-GAAP financial measures should be considered along with, but not as alternatives to, net income or loss and cash flows from operating activities as a measure of the Company’s operating performance. Revenue, FFO, Operating FFO, Adjusted Operating FFO, MRR, NOI, EBITDA and Adjusted EBITDA, as calculated by us may not be comparable to FFO, Operating FFO, Adjusted Operating FFO, MRR, NOI, EBITDA and Adjusted EBITDA as reported by other companies that do not use the same definition or implementation guidelines or interpret the standards differently from us.
Definitions
Booked-not-billed (“BNB”). The Company defines booked-not-billed as customer leases that have been signed, but for which lease payments have not yet commenced.
Leasable raised floor. The Company defines leasable raised floor as the amount of raised floor square footage that the Company has leased plus the available capacity of raised floor square footage that is in a leasable format as of a particular date and according to a particular product configuration. The amount of leasable raised floor may change even without completion of new development projects due to changes in the Company’s configuration of product space.
Basis-of-design raised floor space. The Company defines basis-of-design raised floor space as the total data center raised floor potential of its existing data center facilities.
Operating NRSF. Represents the total square feet of a building that is currently leased or available for lease plus developed supporting infrastructure, based on engineering drawings and estimates, but does not include space held for development or space used for the Company’s own office space.
The Company. Refers to QTS Realty Trust, Inc., a Maryland corporation, together with its consolidated subsidiaries, including QualityTech, LP (the “Operating Partnership” or “OP”).
22 QTS Q1 Earnings 2020 |
Contact: IR@qtsdatacenters.com |
FFO, Operating FFO, and Adjusted Operating FFO
The Company considers funds from operations (“FFO”), to be a supplemental measure of its performance which should be considered along with, but not as an alternative to, net income (loss) and cash provided by operating activities as a measure of operating performance. The Company calculates FFO in accordance with the standards established by the National Association of Real Estate Investment Trusts (“NAREIT”). FFO represents net income (loss) (computed in accordance with GAAP), adjusted to exclude gains (or losses) from sales of depreciable real estate related to its primary business, impairment write-downs of depreciable real estate related to its primary business, real estate-related depreciation and amortization and similar adjustments for unconsolidated entities. To the extent the Company incurs gains or losses from the sale of assets that are incidental to its primary business, or incurs impairment write-downs associated with assets that are incidental to its primary business, it includes such charges in its calculation of FFO. The Company’s management uses FFO as a supplemental operating performance measure because, in excluding real estate-related depreciation and amortization, impairment write-downs of depreciable real estate and gains and losses from property dispositions, it provides a performance measure that, when compared year over year, captures trends in occupancy rates, rental rates and operating costs.
Due to the volatility and nature of certain significant charges and gains recorded in the Company’s operating results that management believes are not reflective of its operating performance, management computes an adjusted measure of FFO, which the Company refers to as Operating funds from operations (“Operating FFO”). Operating FFO is a non-GAAP measure that is used as a supplemental operating measure and to provide additional information to users of the financial statements. The Company generally calculates Operating FFO as FFO excluding certain non-routine charges and gains and losses that management believes are not indicative of the results of the Company’s operating real estate portfolio. The Company believes that Operating FFO provides investors with another financial measure that may facilitate comparisons of operating performance between periods and, to the extent they calculate Operating FFO on a comparable basis, between REITs.
Adjusted Operating Funds From Operations (“Adjusted Operating FFO”) is a non-GAAP measure that is used as a supplemental operating measure and to provide additional information to users of the financial statements. The Company calculates Adjusted Operating FFO by adding or subtracting from Operating FFO items such as: maintenance capital investment, paid leasing commissions, amortization of deferred financing costs, non-real estate depreciation and amortization, straight line rent adjustments, income taxes, equity-based compensation and similar adjustments for unconsolidated entities.
The Company offers these measures because it recognizes that FFO, Operating FFO and Adjusted Operating FFO will be used by investors as a basis to compare its operating performance with that of other REITs. However, because FFO, Operating FFO and Adjusted Operating FFO exclude real estate depreciation and amortization and capture neither the changes in the value of the Company’s properties that result from use or market conditions, nor the level of capital expenditures and capitalized leasing commissions necessary to maintain the operating performance of its properties, all of which have real economic effect and could materially impact its financial condition, cash flows and results of operations, the utility of FFO, Operating FFO and Adjusted Operating FFO as measures of its operating performance is limited. The Company’s calculation of FFO may not be comparable to measures calculated by other companies who do not use the NAREIT definition of FFO or do not calculate FFO in accordance with NAREIT guidance. In addition, the Company’s calculations of FFO, Operating FFO and Adjusted Operating FFO are not necessarily comparable to FFO, Operating FFO and Adjusted Operating FFO as calculated by other REITs that do not use the same definition or implementation guidelines or interpret the standards differently from us. FFO, Operating FFO and Adjusted Operating FFO are non-GAAP measures and should not be considered a measure of the Company’s results of operations or liquidity or as a substitute for, or an alternative to, net income (loss), cash provided by operating activities or any other performance measure determined in accordance with GAAP, nor is it indicative of funds available to fund its cash needs, including its ability to make distributions to its stockholders.
23 QTS Q1 Earnings 2020 |
Contact: IR@qtsdatacenters.com |
A reconciliation of net income (loss) to FFO, Operating FFO and Adjusted Operating FFO is presented below (unaudited and in thousands):
|
|
Three Months Ended |
|||||||
|
|
March 31, 2020 |
|
December 31, 2019 |
|
March 31, 2019 |
|||
FFO |
|
|
|
|
|
|
|
|
|
Net income (loss) |
|
$ |
8,120 |
|
$ |
(3,606) |
|
$ |
21,148 |
Equity in net loss of unconsolidated entity |
|
|
677 |
|
|
481 |
|
|
274 |
Real estate depreciation and amortization |
|
|
41,700 |
|
|
41,947 |
|
|
35,927 |
Gain on sale of real estate, net |
|
|
— |
|
|
— |
|
|
(13,408) |
Impairments of depreciated property |
|
|
— |
|
|
11,461 |
|
|
— |
Pro rata share of FFO from unconsolidated entity |
|
|
278 |
|
|
324 |
|
|
41 |
FFO (1) |
|
|
50,775 |
|
|
50,607 |
|
|
43,982 |
Preferred stock dividends |
|
|
(7,045) |
|
|
(7,045) |
|
|
(7,045) |
FFO available to common stockholders & OP unit holders |
|
|
43,730 |
|
|
43,562 |
|
|
36,937 |
|
|
|
|
|
|
|
|
|
|
Debt restructuring costs |
|
|
— |
|
|
1,523 |
|
|
— |
Transaction and integration costs |
|
|
216 |
|
|
649 |
|
|
1,214 |
Operating FFO available to common stockholders & OP unit holders (2) |
|
|
43,946 |
|
|
45,734 |
|
|
38,151 |
|
|
|
|
|
|
|
|
|
|
Maintenance capital expenditures |
|
|
(1,662) |
|
|
(910) |
|
|
(709) |
Leasing commissions paid |
|
|
(8,998) |
|
|
(10,757) |
|
|
(6,515) |
Amortization of deferred financing costs |
|
|
987 |
|
|
982 |
|
|
978 |
Non real estate depreciation and amortization |
|
|
3,370 |
|
|
3,214 |
|
|
2,861 |
Straight line rent revenue and expense and other |
|
|
(3,755) |
|
|
(3,243) |
|
|
(1,422) |
Tax expense (benefit) from operating results |
|
|
(169) |
|
|
(816) |
|
|
211 |
Equity-based compensation expense |
|
|
4,875 |
|
|
4,360 |
|
|
3,300 |
Adjustments for unconsolidated entity |
|
|
66 |
|
|
75 |
|
|
22 |
Adjusted Operating FFO available to common stockholders & OP unit holders (2) |
|
$ |
38,660 |
|
$ |
38,639 |
|
$ |
36,877 |
(1) |
No gains, losses or impairment write-downs associated with assets incidental to our primary business were incurred during the three months ended March 31, 2020. FFO for the three months ended December 31, 2019 includes a $1.4 million gain on sale of real estate related to certain assets considered incidental to our primary business and were included in the “Gain on sale of real estate, net” line item of the consolidated statement of operations. No gains, losses or impairment write-downs associated with assets incidental to our primary business were incurred during the three months ended March 31, 2019. |
(2) |
The Company’s calculations of Operating FFO and Adjusted Operating FFO may not be comparable to Operating FFO and Adjusted Operating FFO as calculated by other REITs that do not use the same definition. |
24 QTS Q1 Earnings 2020 |
Contact: IR@qtsdatacenters.com |
Monthly Recurring Revenue (MRR) and Recognized MRR
The Company calculates MRR as monthly contractual revenue under signed leases as of a particular date, which includes revenue from its rental and managed services activities, but excludes customer recoveries, deferred set-up fees, variable related revenues, non-cash revenues and other one-time revenues. MRR is also calculated to include the Company’s pro rata share of monthly contractual revenue under signed leases as of a particular date associated with unconsolidated entities, which includes revenue from the unconsolidated entity’s rental and managed services activities, but excludes the unconsolidated entity’s customer recoveries, deferred set-up fees, variable related revenues, non-cash revenues and other one-time revenues. MRR reflects the annualized cash rental payments. It does not include the impact from booked-not-billed leases as of a particular date, unless otherwise specifically noted.
Separately, the Company calculates recognized MRR as the recurring revenue recognized during a given period, which includes revenue from its rental and managed services activities, but excludes customer recoveries, deferred set up fees, variable related revenues, non-cash revenues and other one-time revenues.
Management uses MRR and recognized MRR as supplemental performance measures because they provide useful measures of increases in contractual revenue from the Company’s customer leases and customer leases attributable to the Company’s business. MRR and recognized MRR should not be viewed by investors as alternatives to actual monthly revenue, as determined in accordance with GAAP. Other companies may not calculate MRR or recognized MRR in the same manner. Accordingly, the Company’s MRR and recognized MRR may not be comparable to other companies’ MRR and recognized MRR. MRR and recognized MRR should be considered only as supplements to total revenues as a measure of its performance. MRR and recognized MRR should not be used as measures of the Company’s results of operations or liquidity, nor is it indicative of funds available to meet its cash needs, including its ability to make distributions to its stockholders.
A reconciliation of total revenues to recognized MRR in the period and MRR at period-end is presented below (unaudited and in thousands):
|
|
Three Months Ended |
|||||||
|
|
March 31, 2020 |
|
December 31, 2019 |
|
March 31, 2019 |
|||
Recognized MRR in the period |
|
|
|
|
|
|
|
|
|
Total period revenues (GAAP basis) |
|
$ |
126,292 |
|
$ |
123,707 |
|
$ |
112,689 |
Less: Total period variable lease revenue from recoveries |
|
|
(12,275) |
|
|
(14,018) |
|
|
(10,793) |
Total period deferred setup fees |
|
|
(3,924) |
|
|
(4,062) |
|
|
(3,232) |
Total period straight line rent and other |
|
|
(8,032) |
|
|
(5,156) |
|
|
(3,942) |
Recognized MRR in the period |
|
|
102,061 |
|
|
100,471 |
|
|
94,722 |
|
|
|
|
|
|
|
|
|
|
MRR at period end |
|
|
|
|
|
|
|
|
|
Total period revenues (GAAP basis) |
|
$ |
126,292 |
|
$ |
123,707 |
|
$ |
112,689 |
Less: Total revenues excluding last month |
|
|
(82,446) |
|
|
(81,699) |
|
|
(73,809) |
Total revenues for last month of period |
|
|
43,846 |
|
|
42,008 |
|
|
38,880 |
Less: Last month variable lease revenue from recoveries |
|
|
(4,156) |
|
|
(4,578) |
|
|
(3,871) |
Last month deferred setup fees |
|
|
(1,410) |
|
|
(1,333) |
|
|
(1,242) |
Last month straight line rent and other |
|
|
(3,669) |
|
|
(2,413) |
|
|
(2,068) |
Add: Pro rata share of MRR at period end of unconsolidated entity |
|
|
352 |
|
|
350 |
|
|
253 |
MRR at period end |
|
$ |
34,963 |
|
$ |
34,034 |
|
$ |
31,952 |
25 QTS Q1 Earnings 2020 |
Contact: IR@qtsdatacenters.com |
Earnings Before Interest, Taxes, Depreciation and Amortization for Real Estate (EBITDAre) and Adjusted EBITDA,
The Company calculates EBITDAre in accordance with the standards established by NAREIT. EBITDAre represents net income (loss) (computed in accordance with GAAP), adjusted to exclude gains (or losses) from sales of depreciated property related to its primary business, income tax expense (or benefit), interest expense, depreciation and amortization, impairments of depreciated property related to its primary business , and similar adjustments for unconsolidated entities. The Company’s management uses EBITDAre as a supplemental performance measure because it provides performance measures that, when compared year over year, captures the performance of the Company’s operations by removing the impact of capital structure (primarily interest expense) and asset based charges (primarily depreciation and amortization) from its operating results.
Due to the volatility and nature of certain significant charges and gains recorded in the Company’s operating results that management believes are not reflective of its operating performance, management computes an adjusted measure of EBITDAre, which the Company refers to as Adjusted EBITDA. The Company generally calculates Adjusted EBITDA excluding certain non-routine charges, write off of unamortized deferred financing costs, gains (losses) on extinguishment of debt, restructuring costs, and transaction and integration costs, as well as the Company’s pro-rata share of each of those respective expenses associated with the unconsolidated entity aggregated into one line item categorized as “Adjustments for the unconsolidated entity.” In addition, the Company calculates Adjusted EBITDA excluding certain non-cash recurring costs such as equity-based compensation. The Company believes that Adjusted EBITDA provides investors with another financial measure that may facilitate comparisons of operating performance between periods and, to the extent other REITs calculate Adjusted EBITDA on a comparable basis, between REITs.
Management uses EBITDAre and Adjusted EBITDA as supplemental performance measures as they provide useful measures of assessing the Company’s operating results. Other companies may not calculate EBITDAre or Adjusted EBITDA in the same manner. Accordingly, the Company’s EBITDAre and Adjusted EBITDA may not be comparable to others. EBITDAre and Adjusted EBITDA should be considered only as supplements to net income (loss) as measures of the Company’s performance and should not be used as substitutes for net income (loss), as measures of its results of operations or liquidity or as an indications of funds available to meet its cash needs, including its ability to make distributions to its stockholders.
A reconciliation of net income (loss) to EBITDAre and Adjusted EBITDA is presented below (unaudited and in thousands):
|
|
Three Months Ended |
|||||||
|
|
March 31, 2020 |
|
December 31, 2019 |
|
March 31, 2019 |
|||
EBITDAre and Adjusted EBITDA |
|
|
|
|
|
|
|
|
|
Net income (loss) |
|
$ |
8,120 |
|
$ |
(3,606) |
|
$ |
21,148 |
Equity in net loss of unconsolidated entity |
|
|
677 |
|
|
481 |
|
|
274 |
Interest income |
|
|
— |
|
|
(8) |
|
|
(45) |
Interest expense |
|
|
7,162 |
|
|
6,264 |
|
|
7,146 |
Tax expense (benefit) of taxable REIT subsidiaries |
|
|
(169) |
|
|
(816) |
|
|
211 |
Depreciation and amortization |
|
|
45,070 |
|
|
45,161 |
|
|
38,788 |
Gain on disposition of depreciated property |
|
|
— |
|
|
— |
|
|
(13,408) |
Impairments of depreciated property |
|
|
— |
|
|
11,461 |
|
|
— |
Pro rata share of EBITDAre from unconsolidated entity |
|
|
819 |
|
|
830 |
|
|
215 |
EBITDAre (1) |
|
$ |
61,679 |
|
$ |
59,767 |
|
$ |
54,329 |
|
|
|
|
|
|
|
|
|
|
Debt restructuring costs |
|
|
— |
|
|
1,523 |
|
|
— |
Equity-based compensation expense |
|
|
4,875 |
|
|
4,360 |
|
|
3,300 |
Transaction and integration costs |
|
|
216 |
|
|
649 |
|
|
1,214 |
Adjusted EBITDA |
|
$ |
66,770 |
|
$ |
66,299 |
|
$ |
58,843 |
(1) |
No gains, losses or impairment write-downs associated with assets incidental to our primary business were incurred during the three months ended March 31, 2020. EBITDAre for the three months ended December 31, 2019 includes a $1.4 million gain on sale of real estate related to certain assets considered incidental to our primary business and were included in the “Gain on sale of real estate, net” line item of the consolidated statement of operations. No gains, losses or impairment write-downs associated with assets incidental to our primary business were incurred during the three months ended March 31, 2019. |
26 QTS Q1 Earnings 2020 |
Contact: IR@qtsdatacenters.com |
Net Operating Income (NOI)
The Company calculates net operating income (“NOI”) as net income (loss) (computed in accordance with GAAP), excluding: interest expense, interest income, tax expense (benefit) of taxable REIT subsidiaries, depreciation and amortization, write off of unamortized deferred financing costs, other (income) expense, debt restructuring costs, transaction, integration and impairment costs, gain (loss) on sale of real estate, restructuring costs, general and administrative expenses and similar adjustments for unconsolidated entities. The Company allocates a management fee charge of 4% of cash revenues for all facilities as a property operating cost and a corresponding reduction to general and administrative expense to cover the day-to-day administrative costs to operate our data centers. The management fee charge is reflected as a reduction to net operating income.
Management uses NOI as a supplemental performance measure because it provides a useful measure of the operating results from its customer leases. In addition, management believes it is useful to investors in evaluating and comparing the operating performance of its properties and to compute the fair value of its properties. The Company’s NOI may not be comparable to other REITs’ NOI as other REITs may not calculate NOI in the same manner. NOI should be considered only as a supplement to net income as a measure of the Company’s performance and should not be used as a measure of results of operations or liquidity or as an indication of funds available to meet cash needs, including the ability to make distributions to stockholders. NOI is a measure of the operating performance of the Company’s properties and not of the Company’s performance as a whole. NOI is therefore not a substitute for net income (loss) as computed in accordance with GAAP.
A reconciliation of net income (loss) to NOI is presented below (unaudited and in thousands):
|
|
Three Months Ended |
|||||||
|
|
March 31, 2020 |
|
December 31, 2019 |
|
March 31, 2019 |
|||
Net Operating Income (NOI) |
|
|
|
|
|
|
|
|
|
Net income (loss) |
|
$ |
8,120 |
|
$ |
(3,606) |
|
$ |
21,148 |
Equity in net loss of unconsolidated entity |
|
|
677 |
|
|
481 |
|
|
274 |
Interest income |
|
|
— |
|
|
(8) |
|
|
(45) |
Interest expense |
|
|
7,162 |
|
|
6,264 |
|
|
7,146 |
Depreciation and amortization |
|
|
45,070 |
|
|
45,161 |
|
|
38,788 |
Debt restructuring costs |
|
|
— |
|
|
1,523 |
|
|
— |
Other (income) expense |
|
|
(159) |
|
|
380 |
|
|
— |
Tax expense (benefit) of taxable REIT subsidiaries |
|
|
(169) |
|
|
(816) |
|
|
211 |
Transaction, integration and impairment costs |
|
|
216 |
|
|
12,110 |
|
|
1,214 |
General and administrative expenses |
|
|
20,683 |
|
|
20,866 |
|
|
19,891 |
Gain on sale of real estate, net |
|
|
— |
|
|
(1,361) |
|
|
(13,408) |
NOI from consolidated operations (1) |
|
$ |
81,600 |
|
$ |
80,994 |
|
$ |
75,219 |
Pro rata share of NOI from unconsolidated entity |
|
|
844 |
|
|
841 |
|
|
234 |
Total NOI (1) |
|
$ |
82,444 |
|
$ |
81,835 |
|
$ |
75,453 |
(1) |
Includes facility level general and administrative allocation charges of 4% of cash revenue for all facilities. These allocated charges aggregated to $4.7 million, $4.7 million and $4.5 million for the three months ended March 31, 2020, December 31, 2019 and March 31, 2019, respectively. |
27 QTS Q1 Earnings 2020 |
Contact: IR@qtsdatacenters.com |
\.)7=F@*>I%-I5ST%2,2B@@C@BB@ (R
M,4444 '04@;)QBA_NT@3UH =1C=QBFY9>*5B0,B@!2<#)IAV@Y4]Z4[F;:
M* @!YH I#,PHP=VTFG8V\44 (?E7BD(+?-C\/6E*C.XTI..M $=.^5GV^U*
M5!I0H'2@ 7"G'IUI"PS@F@ ALFA0I.YEH 8AQGB@X)R!3B,C[E'4_,K42*!4&.11AP
M< 4UL?PBG;>^?TI^\+WAISWHIW3^.FLQ# !Z@7,+PO(-#%NAI,THW#H*"A*,
M'&:&!'%+L/8T^5@)CVH(SP13BK8VBFME>HI !SV%&: -W04*&QTH #C@44,
M-PR:*">8: .!11S!RAM4K3?+'HWYU(J\ 0: Y4-&>XH^E.VO\ WJ(UW'!H&(%4K\E*
M$/ *D
M0H X-.Z 8%8KNQ3FW?PTX1L%*@=:5E_NBES , )&&-/QN^;.* IQTH6)F]
MJ.8 _=T'#=#3E0K\M 4GD"I "3BG[%]*1$8\BI5! H 01DT%5')%.Z'D57U
M/4K72K5KR[E5%5\\0ZA)J^LWC3W5YN:ZDFFW,[9[G^?:H[">'>L4Z1*JJ0JEMOT&>YK2
MLM-W5#.KY;AOE?'S>G'7Z5,MA&
M_P#JV7:K?D2>N1UQ]* YBAL/E>;'&SI][Y>I]LX&/SH8.9/W3A5E7:W'W3@<
M9';ZDL7EYVMG>ZX(QD=>.XI>\29NGPI
M%^[9?.DZ;F;=\OIS_D5:@LA$[6,:[3(V/F8\?C@]ZL0VS0LJ[7^0;/F[=^N.
M>M:EEI<8MHV=BDG13MSUI@9UK;2SD;T623[K3"0_*WOW/^%:=A;F\0Q#[H1_A_
MA3M\#,L<4B_O,ENHJ%8I0[0SMM;@1LI(YSGI3A+#'-(8KM3M;#97^G^%3\0%
MJ/RV52,[6'\/3CKQCI5I&%NP667[W3:O"\<5FA@)6E"@;5Q&V?E/L/>BVN]^
MU0OSLV&^;MGH*B6P&DMP@C61]W^SZ'/M3O,8R>6\?W?X5XW_ )53FN_)79+#
MD8PK;@.3Q_D5&MVL<68FWLHPRJ_W.>M,7O%^&XBW[I(@W?R\X/I4+77ESMYS
M*GRX#9/RGMFJ3W)90SK]W^/C"^Y-.DN<[9"8\-STSN]*KE&6)KR2"%GDVL6^
M]\W)]^:X7Q7>2Q_%+1'9_E^SW(6/;\P.T9__ %UU,UP))?*C=MVX *VT@_E7
M"^+KKR_BYH
"K7
MQ%9RK)]HA4RAOX6!P?R.:W-4:"6(I