UNITED STATES
SECURITIES AND EXCHANGE COMMISSION
Washington, D.C. 20549
FORM 8-K
CURRENT REPORT
Pursuant to Section 13 or 15(d)
of the Securities Exchange Act of 1934
Date of Report (Date of Earliest Event Reported): October 24, 2017
QTS Realty Trust, Inc.
(Exact name of registrant as specified in its charter)
Maryland |
001-36109 |
46-2809094 |
(State or other jurisdiction |
(Commission |
(I.R.S. Employer |
12851 Foster Street |
|
Overland Park, KS 66213 |
66213 |
(Address of principal executive offices) |
(Zip Code) |
(913) 814-9988
Registrant’s telephone number, including area code:
Not Applicable
(Former name or former address, if changed since last report.)
Check the appropriate box below if the Form 8-K filing is intended to simultaneously satisfy the filing obligation of the registrant under any of the following provisions:
☐ |
Written communications pursuant to Rule 425 under the Securities Act (17 CFR 230.425) |
|
|
☐ |
Soliciting material pursuant to Rule 14a-12 under the Exchange Act (17 CFR 240.14a-12) |
|
|
☐ |
Pre-commencement communications pursuant to Rule 14d-2(b) under the Exchange Act (17 CFR 240.14d-2(b)) |
|
|
☐ |
Pre-commencement communications pursuant to Rule 13e-4(c) under the Exchange Act (17 CFR 240.13e-4(c)) |
Indicate by check mark whether the registrant is an emerging growth company as defined in Rule 405 of the Securities Act of 1933 (§230.405 of this chapter) or Rule 12b-2 of the Securities Exchange Act of 1934 (§240.12b-2 of this chapter).
Emerging growth company ☐
If an emerging growth company, indicate by check mark if the registrant has elected not to use the extended transition period for complying with any new or revised financial accounting standards provided pursuant to Section 13(a) of the Exchange Act. ☐
Item 2.02 Results of Operations and Financial Condition.
On October 24, 2017, QTS Realty Trust, Inc. (the “Company”) announced its financial results for the third quarter ended September 30, 2017. A copy of the Company’s press release is attached hereto as Exhibit 99.1 and a copy of the Company’s Third Quarter 2017 Supplemental Information is attached hereto as Exhibit 99.2.
The information included in this Current Report on Form 8-K (including Exhibits 99.1 and 99.2 hereto) shall not be deemed “filed” for the purposes of Section 18 of the Securities Exchange Act of 1934, as amended (the “Exchange Act”), or otherwise subject to the liabilities of that section, nor shall it be deemed incorporated by reference into any filing made by the Company under the Exchange Act or the Securities Act of 1933, as amended, except as shall be expressly set forth by specific reference in such filing.
Item 7.01. Regulation FD Disclosure.
The disclosure contained in Item 2.02 is incorporated herein by reference.
Item 9.01 Financial Statements and Exhibits.
(d) Exhibits
Exhibit |
|
Exhibit Description |
99.1 |
|
Press Release dated October 24, 2017 |
|
|
|
99.2 |
|
Third Quarter 2017 Supplemental Information |
EXHIBIT INDEX
Exhibit |
|
Exhibit Description |
|
|
|
99.1 |
|
|
|
|
|
99.2 |
|
SIGNATURES
Pursuant to the requirements of the Securities Exchange Act of 1934, the registrant has duly caused this report to be signed on its behalf by the undersigned hereunto duly authorized.
|
QTS Realty Trust, Inc. |
|
|
|
|
|
By: |
/s/Shirley E. Goza |
|
|
Shirley E. Goza |
|
|
Secretary and General Counsel |
October 24, 2017 |
|
|
Exhibit 99.1
QTS REPORTS THIRD QUARTER 2017 OPERATING RESULTS
OVERLAND PARK, Kan. – October 24, 2017 – QTS Realty Trust, Inc. (“QTS” or the “Company”) (NYSE: QTS) today announced operating results for the third quarter ended September 30, 2017.
Third Quarter Highlights
· |
Reported net income of $7.4 million in the third quarter of 2017, an increase of 13.1% compared to the third quarter of 2016. Net income was $0.13 per basic and diluted share for the third quarter of 2017, compared to net income per basic and diluted share of $0.12 for the third quarter of 2016. |
· |
Reported Operating FFO of $39.7 million in the third quarter of 2017, compared to Operating FFO of $37.4 million in the third quarter of 2016. Operating FFO in the third quarter of 2017 and 2016 included a non-cash deferred tax benefit of $2.5 million and $3.1 million, respectively. Operating FFO for the third quarter of 2017 on a fully diluted per share basis was $0.70 per share, an increase of 4.2% compared to Operating FFO per fully diluted share in the third quarter of 2016 of $0.67. Excluding the effects of the Company’s non-cash deferred tax benefit, Operating FFO in the third quarter of 2017 was $37.2 million, or $0.66 per share on a fully diluted per share basis, compared to Operating FFO in the third quarter of 2016 of $34.3 million, or $0.62 per share on a fully diluted per share basis. |
· |
Reported FFO of $38.6 million in the third quarter of 2017, an increase of 10.3% compared to FFO of $35.0 million in the third quarter of 2016. On a fully diluted per share basis, FFO was $0.68 per share for the third quarter of 2017 compared to $0.63 per share for the third quarter of 2016, an increase of 8.1%. |
· |
Reported Adjusted EBITDA of $52.9 million in the third quarter of 2017, an increase of 11.9% compared to the third quarter of 2016. |
· |
Reported NOI of $70.9 million in the third quarter of 2017, an increase of 9.7% compared to the third quarter of 2016. |
· |
Recognized total revenues of $113.8 million in the third quarter of 2017, an increase of 10.0% compared to the third quarter of 2016. |
· |
Signed new and modified renewal leases aggregating to $15.3 million of incremental annualized rent, net of downgrades, during the third quarter of 2017, an increase of 40.1% compared to the prior four quarter average. Strong leasing during the quarter increased the booked-not-billed backlog of annualized rent from $39.7 million at June 30, 2017 to $56.6 million at September 30, 2017. |
“QTS continues to execute on our integrated 3C platform strategy with solid performance in the third quarter across all key financial metrics and leasing activity reflecting the strong pipeline of demand across our integrated platform,” said Chad Williams, Chairman and CEO of QTS.
Williams added, “We are pleased with the expansion of our mega data center campus announcement in Ashburn, Virginia. The Ashburn market is the nation’s largest and fastest growing Tier 1 market. This will support our growth strategy with hyperscale customers and is already contributing to our strong leasing results.”
1 QTS Q3 Earnings 2017 |
Contact: IR@qtsdatacenters.com |
Financial Results
Net income in the third quarter of 2017 was $7.4 million ($0.13 per basic and diluted share), which included approximately $1.1 million of transaction, integration and other costs and $2.5 million of income tax benefit, compared to net income of $6.5 million ($0.12 per basic and diluted share) recognized in the third quarter of 2016, which included approximately $3.5 million of transaction and integration costs and $4.2 million of income tax benefit.
QTS generated Operating FFO of $39.7 million, or $0.70 per fully diluted share, in the third quarter of 2017, which includes a non-cash tax benefit of approximately $2.5 million, compared to Operating FFO of $37.4 million, or $0.67 per fully diluted share, for the third quarter of 2016, which included a non-cash tax benefit of approximately $3.1 million. Operating FFO for the third quarter of 2017 represents an increase of approximately 6.4% compared to the prior year. Excluding the effects of the Company’s non-cash deferred tax benefit, Operating FFO in the third quarter of 2017 was $37.3 million, or $0.66 per share on a fully diluted per share basis, compared to Operating FFO in the third quarter of 2016 of $34.3 million, or $0.62 per share on a fully diluted per share basis.
Additionally, QTS generated $52.9 million of Adjusted EBITDA in the third quarter of 2017, an increase of 11.9% compared to $47.3 million for the third quarter of 2016.
QTS generated total revenues of $113.8 million in the third quarter of 2017, an increase of 10.0% compared to $103.5 million in the third quarter of 2016. MRR as of September 30, 2017 was $31.6 million, an increase of 6.2% compared to MRR as of September 30, 2016 of $29.8 million.
Leasing Activity
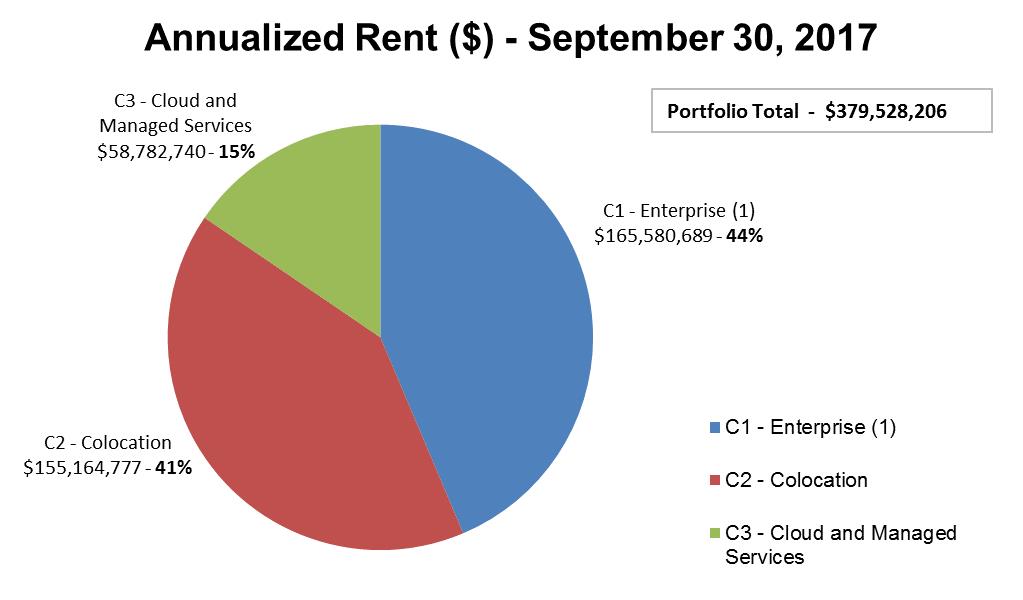
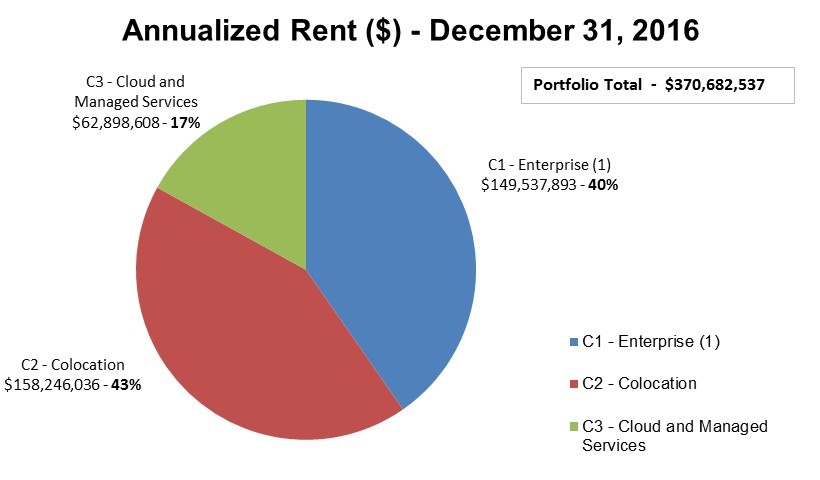
During the third quarter of 2017, QTS entered into new and modified customer leases representing approximately $15.3 million of incremental annualized rent, net of downgrades, which was 40.1% higher than the prior four quarter average. Blended pricing on new and modified leases signed during the third quarter was lower than the prior four quarter average, primarily driven by a larger mix of C1 leases signed, which tend to have a lower rate per square foot, in relation to C2/C3 leases. Strength in C1 leasing was driven by both hyperscale and large enterprise customers across multiple regions including Atlanta, Dallas, Chicago and Northern Virginia.
During the third quarter of 2017, QTS renewed leases with a total annualized rent of $11.4 million at an average rent per square foot of $660, which was 2.1% higher than the annualized rent prior to their respective renewals. The Company defines renewals as leases for which the customer retains the same amount of space before and after renewal. There is variability in the Company’s renewal rates based on the mix of product types renewed, however renewal rates are generally expected to increase in the low to mid-single digits as compared to pre-renewal pricing. Rental churn (which the Company defines as MRR lost in the period to a customer intending to fully exit the QTS platform in the near term compared to total MRR at the beginning of the period) was 1.3% for the third quarter of 2017. Rental churn was 5.6% for the nine months ended September 30, 2017, a significant portion of which was the result of a single customer termination in the first quarter of 2017 at one of the Company’s leased facilities in Northern Virginia which was disclosed in prior quarters. Excluding this customer termination, rental churn for the nine months ended September 30, 2017 would be 3.1%.
During the third quarter of 2017, QTS commenced customer leases (which includes new customers and also existing customers that renewed their lease term) representing approximately $32.6 million of annualized rent at $617 per square foot. Average pricing on commenced leases during the third quarter of 2017 increased compared to the prior four quarter average primarily due to a larger mix of C2/C3 commencements which tend to have a higher rate per square foot in comparison to C1 deals.
As of September 30, 2017, the booked-not-billed MRR balance (which represents customer leases that have been executed, but for which lease payments have not commenced as of September 30, 2017) was approximately $4.7 million, or $56.6 million of annualized rent, and compares to $39.7 million of annualized rent at June 30, 2017. The booked-not-billed balance is expected to contribute an incremental $2.7 million to revenue in 2017 (representing $15.5 million in annualized revenues), an incremental $13.1 million in 2018 (representing $19.9 million in annualized revenues), and an incremental $21.1 million in annualized revenues thereafter.
2 QTS Q3 Earnings 2017 |
Contact: IR@qtsdatacenters.com |
Development, Redevelopment, and Acquisitions
During the third quarter of 2017, the Company brought online approximately two megawatts of gross power and approximately 9,000 net rentable square feet (“NRSF”) of raised floor and various portions of customer specific capital at an aggregate cost of approximately $19 million. In addition, during the third quarter of 2017, the Company continued redevelopment of the Atlanta-Metro, Irving, Chicago, Piscataway, Fort Worth, Santa Clara and Northern Virginia Facilities to have space ready for customers later in 2017 and forward. The Company expects to bring an additional 44,000 raised floor NRSF into service in the fourth quarter of 2017 at an aggregate cost of approximately $69 million.
Since the end of the second quarter, the Company has completed the acquisition of approximately 52 acres of land in Ashburn, Virginia. The land was acquired in two separate parcels. The first, which closed during the third quarter of 2017, consists of approximately 24 acres and was purchased for approximately $17 million. The second, which closed in October 2017, consists of approximately 28 acres and was purchased for approximately $36 million. The Company has commenced development of a mega data center facility on the first 24 acre parcel and currently plans to deliver Phase 1 of development at the site, representing four megawatts of critical sellable capacity, by mid-2018. To date, QTS has pre-leased 2.2 megawatts, representing over 50% of Phase 1 development capacity. Ultimately, QTS believes the 24 acre parcel of land can support approximately 36 megawatts of gross power and 178,000 square feet of raised floor capacity upon completion.
The Company also completed the acquisition of two additional land parcels since the end of the second quarter of 2017. During the third quarter of 2017, the Company completed the acquisition of approximately 84 acres of land in Phoenix, Arizona for $25 million to be used for future development. Subsequent to the end of the third quarter of 2017, QTS completed the acquisition of 92 acres of land in Hillsboro, Oregon at a purchase price of approximately $26 million.
In addition, in October 2017, QTS also completed the buyout of its Vault Campus in Dulles, Virginia, which is located approximately a quarter mile from the aforementioned Ashburn land purchases. The Company previously leased the property under a capital lease agreement and purchased it for approximately $34 million.
Relative to the redevelopment plan disclosed during the second quarter of 2017, and as a result of the capital investments made in new markets and Northern Virginia since the end of the second quarter discussed above, the Company has pushed out portions of development space in Fort Worth, Santa Clara and the Vault in Northern Virginia, that were previously scheduled to come online in the fourth quarter of 2017. The Company now expects these development spaces to be brought online during 2018 as part of its disciplined approach to capital allocation.
Balance Sheet and Liquidity
As of September 30, 2017, the Company’s total debt balance net of cash and cash equivalents was $1,100.5 million, resulting in a net debt to last quarter annualized Adjusted EBITDA of 5.2x. This ratio compares to the 5.3x net debt to annualized Adjusted EBITDA reported in the second quarter of 2017 and remains in line with company expectations. The Company’s booked-not-billed backlog of $56.6 million in annualized rent will continue to provide enhanced visibility in 2017 and beyond.
In March 2017, the Company established an “at-the-market” (“ATM”) equity offering program pursuant to which the Company may issue, from time to time, up to $300 million of its Class A common stock. Pursuant to this ATM program, during the three months ended September 30, 2017, the Company issued 1,015,332 shares of QTS’ Class A common stock at a weighted average price of $53.65 per share which generated net proceeds of approximately $53.7 million. During the nine months ended September 30, 2017, the Company issued 1,761,681 shares of QTS’ Class A common stock through the ATM Program at a weighted average price of $53.63 per share which generated net proceeds of approximately $93.1 million.
On April 5, 2017, QTS entered into interest rate swaps relating to $400 million of the Company’s term loan borrowings. These swaps will effectively convert floating rate debt to fixed rate debt with an interest rate of approximately 3.5% starting on January 2, 2018 through the maturity of their respective term loans. Due to the effect of these swaps, as of September 30, 2017 approximately 66% of the Company’s currently outstanding debt will carry a fixed interest rate beginning in 2018.
3 QTS Q3 Earnings 2017 |
Contact: IR@qtsdatacenters.com |
As of September 30, 2017, the Company had total available liquidity of approximately $430 million which was comprised of $421 million of available capacity under the Company’s unsecured revolving credit facility and approximately $9 million of cash and cash equivalents.
2017 Guidance
The Company is reiterating its guidance for revenue growth, adjusted EBITDA and Operating FFO for 2017. The Company continues to expect 2017 year-over-year revenue growth to be at the lower end of its previously provided range of 11 - 13%. In addition, the Company is reaffirming its 2017 adjusted EBITDA guidance of $203.0 million to $211.0 million. The Company is maintaining its Operating FFO guidance of $152.0 million to $158.0 million, which reflects an increase in the non-cash tax benefit assumption of approximately $1 million to $6.5 million, offset by higher assumed interest expense associated with investment activity since the end of the second quarter. However, factoring in the higher non-cash tax benefit assumption and capital efficiency reducing the need for additional equity in the fourth quarter, the Company is raising its guidance for Operating FFO per share to a range of $2.68 to $2.80. The Company is maintaining its guidance for expected churn at the high end of its historical average of 5-8%. Additionally, even with the new development spend in Northern Virginia, the Company continues to expect 2017 Capital Expenditures, excluding acquisitions, to be in the range of approximately $325.0 million to $375.0 million.
QTS Investor Day – Fort Worth, TX
QTS is hosting an investor day on November 13, 2017 from 1-5pm CT at its data center facility in Fort Worth, TX. A live webcast of the event will be made available on the Company’s website. For additional registration details, please contact the Company at ir@qtsdatacenters.com.
Non-GAAP Financial Measures
This release includes certain non-GAAP financial measures that management believes are helpful in understanding the Company’s business, as further described below. The Company does not, nor does it suggest investors should, consider such non-GAAP financial measures in isolation from, or as a substitute for, GAAP financial information. The Company believes that the presentation of non-GAAP financial measures provide meaningful supplemental information to both management and investors that is indicative of the Company’s operations. The Company has included a reconciliation of this additional information to the most comparable GAAP measure in the selected financial information below.
Conference Call Details
The Company will host a conference call and webcast on October 25, 2017, at 8:30 a.m. Eastern time (7:30 a.m. Central time) to discuss its financial results, current business trends and market conditions.
The dial-in number for the conference call is (877) 883-0383 (U.S.) or (412) 902-6506 (International). The participant entry number is 3482294# and callers are asked to dial in ten minutes prior to start time. A link to the live broadcast and the replay will be available on the Company’s website (www.qtsdatacenters.com) under the Investors tab.
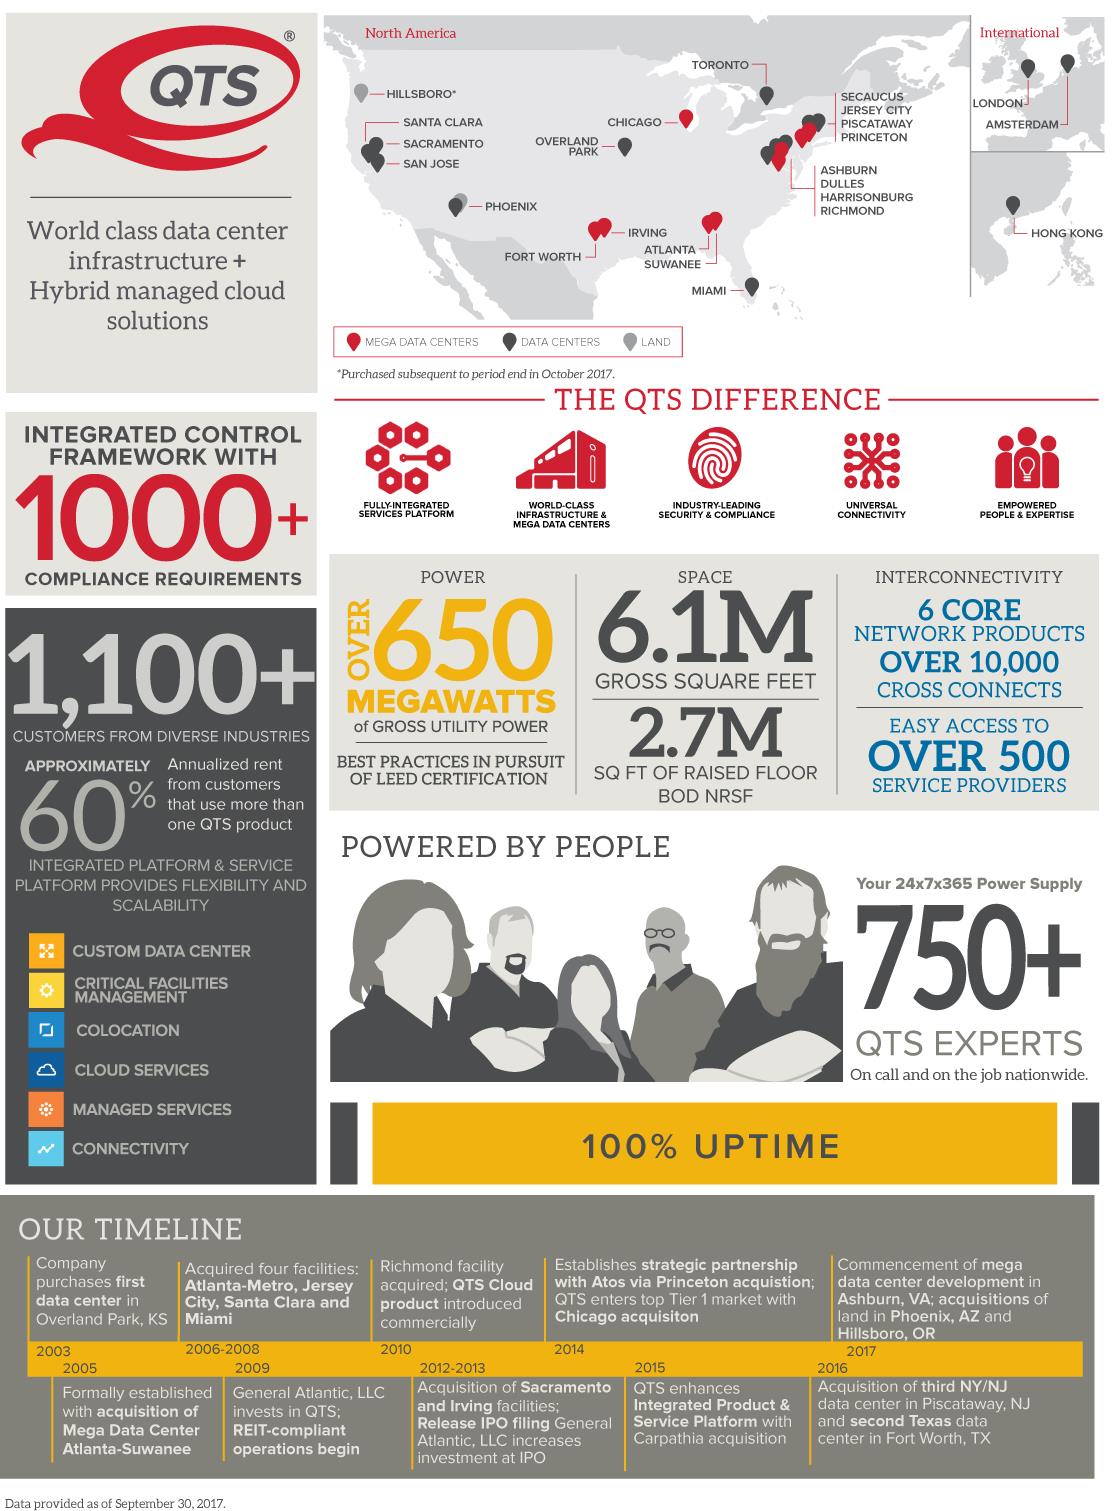
About QTS
QTS Realty Trust, Inc. (NYSE: QTS) is a leading provider of secure, compliant data center solutions, hybrid cloud and fully managed services. QTS’ integrated technology service platform of custom data center (C1), colocation (C2) and cloud and managed services (C3) provides flexible, scalable, secure IT solutions for web and IT applications. QTS’ Critical Facilities Management (CFM) provides increased efficiency and greater performance for third-party data center owners and operators. QTS owns, operates or manages 25 data centers and supports more than 1,100 customers in North America, Europe and Asia.
QTS Investor Relations Contact
Stephen Douglas – Vice President – Investor Relations and Strategic Planning
Jeff Berson – Chief Financial Officer
William Schafer – Executive Vice President – Finance and Accounting
ir@qtsdatacenters.com
4 QTS Q3 Earnings 2017 |
Contact: IR@qtsdatacenters.com |
Forward Looking Statements
Some of the statements contained in this release constitute forward-looking statements within the meaning of the federal securities laws. Forward-looking statements relate to expectations, beliefs, projections, future plans and strategies, anticipated events or trends and similar expressions concerning matters that are not historical facts. In particular, statements pertaining to the Company’s capital resources, portfolio performance and results of operations contain forward-looking statements. Likewise, all of the statements regarding anticipated growth in funds from operations and anticipated market conditions are forward-looking statements. In some cases, you can identify forward-looking statements by the use of forward-looking terminology such as “may,” “will,” “should,” “expects,” “intends,” “plans,” “anticipates,” “believes,” “estimates,” “predicts,” or “potential” or the negative of these words and phrases or similar words or phrases which are predictions of or indicate future events or trends and which do not relate solely to historical matters. You also can identify forward-looking statements by discussions of strategy, plans or intentions.
The forward-looking statements contained in this release reflect the Company’s current views about future events and are subject to numerous known and unknown risks, uncertainties, assumptions and changes in circumstances that may cause actual results to differ significantly from those expressed in any forward-looking statement. The Company does not guarantee that the transactions and events described will happen as described (or that they will happen at all). The following factors, among others, could cause actual results and future events to differ materially from those set forth or contemplated in the forward-looking statements: adverse economic or real estate developments in the Company’s markets or the technology industry; global, national and local economic conditions; risks related to the Company’s international operations; difficulties in identifying properties to acquire and completing acquisitions; the Company’s failure to successfully develop, redevelop and operate acquired properties or lines of business; significant increases in construction and development costs; the increasingly competitive environment in which the Company operates; defaults on, or termination or non-renewal of leases by customers; increased interest rates and operating costs, including increased energy costs; financing risks, including the Company’s failure to obtain necessary outside financing; decreased rental rates or increased vacancy rates; dependence on third parties to provide Internet, telecommunications and network connectivity to the Company’s data centers; the Company’s failure to qualify and maintain its qualification as a real estate investment trust; environmental uncertainties and risks related to natural disasters; financial market fluctuations; and changes in real estate and zoning laws, revaluations for tax purposes and increases in real property tax rates.
While forward-looking statements reflect the Company’s good faith beliefs, they are not guarantees of future performance. Any forward-looking statement speaks only as of the date on which it was made. The Company disclaims any obligation to publicly update or revise any forward-looking statement to reflect changes in underlying assumptions or factors, of new information, data or methods, future events or other changes. For a further discussion of these and other factors that could cause the Company’s future results to differ materially from any forward-looking statements, see the section entitled “Risk Factors” in the Company’s Annual Report on Form 10-K for the year ended December 31, 2016 and other periodic reports the Company files with the Securities and Exchange Commission.
5 QTS Q3 Earnings 2017 |
Contact: IR@qtsdatacenters.com |
Consolidated Balance Sheets
(in thousands except share data)
|
|
September 30, |
|
December 31, |
||
|
|
2017 |
|
2016 (1) |
||
|
|
(unaudited) |
|
|
|
|
ASSETS |
|
|
|
|
|
|
Real Estate Assets |
|
|
|
|
|
|
Land |
|
$ |
86,192 |
|
$ |
74,130 |
Buildings, improvements and equipment |
|
|
1,668,503 |
|
|
1,524,767 |
Less: Accumulated depreciation |
|
|
(378,883) |
|
|
(317,834) |
|
|
|
1,375,812 |
|
|
1,281,063 |
Construction in progress (2) |
|
|
429,390 |
|
|
365,960 |
Real Estate Assets, net |
|
|
1,805,202 |
|
|
1,647,023 |
Cash and cash equivalents |
|
|
9,271 |
|
|
9,580 |
Rents and other receivables, net |
|
|
47,307 |
|
|
41,540 |
Acquired intangibles, net |
|
|
114,286 |
|
|
129,754 |
Deferred costs, net (3) (4) |
|
|
38,172 |
|
|
38,507 |
Prepaid expenses |
|
|
7,209 |
|
|
6,918 |
Goodwill |
|
|
173,843 |
|
|
173,843 |
Other assets, net (5) |
|
|
63,156 |
|
|
39,305 |
TOTAL ASSETS |
|
$ |
2,258,446 |
|
$ |
2,086,470 |
|
|
|
|
|
|
|
LIABILITIES |
|
|
|
|
|
|
Unsecured credit facility, net (4) |
|
$ |
775,398 |
|
$ |
634,939 |
Senior notes, net of discount and debt issuance costs (4) |
|
|
293,192 |
|
|
292,179 |
Capital lease, lease financing obligations and mortgage notes payable |
|
|
30,725 |
|
|
38,708 |
Accounts payable and accrued liabilities |
|
|
67,232 |
|
|
86,129 |
Dividends and distributions payable |
|
|
22,230 |
|
|
19,634 |
Advance rents, security deposits and other liabilities |
|
|
29,210 |
|
|
24,893 |
Deferred income taxes |
|
|
9,814 |
|
|
15,185 |
Deferred income |
|
|
22,540 |
|
|
21,993 |
TOTAL LIABILITIES |
|
|
1,250,341 |
|
|
1,133,660 |
|
|
|
|
|
|
|
EQUITY |
|
|
|
|
|
|
Common stock, $0.01 par value, 450,133,000 shares authorized, 50,424,244 and 47,831,250 shares issued and outstanding as of September 30, 2017 and December 31, 2016, respectively |
|
|
504 |
|
|
478 |
Additional paid-in capital |
|
|
1,032,912 |
|
|
931,783 |
Accumulated other comprehensive loss |
|
|
(1,565) |
|
|
- |
Accumulated dividends in excess of earnings |
|
|
(139,740) |
|
|
(97,793) |
Total stockholders’ equity |
|
|
892,111 |
|
|
834,468 |
Noncontrolling interests |
|
|
115,994 |
|
|
118,342 |
TOTAL EQUITY |
|
|
1,008,105 |
|
|
952,810 |
TOTAL LIABILITIES AND EQUITY |
|
$ |
2,258,446 |
|
$ |
2,086,470 |
(1) |
The balance sheet at December 31, 2016, has been derived from the audited consolidated financial statements at that date, but does not include all of the information and footnotes required by United States generally accepted accounting principles for complete financial statements. |
(2) |
As of September 30, 2017, construction in progress included $42.0 million related to land acquisitions completed in the third quarter of 2017. |
(3) |
As of September 30, 2017 and December 31, 2016, deferred costs, net included $5.7 million and $7.0 million of net deferred financing costs related to the revolving portion of the Company’s unsecured credit facility, respectively, and $32.5 million and $31.5 million of deferred leasing costs net of amortization, respectively. |
(4) |
Debt issuance costs, net related to the Senior Notes and term loan portion of the Company’s unsecured credit facility aggregating $8.9 million and $10.1 million at September 30, 2017 and December 31, 2016, respectively, have been netted against the related debt liability line items for both periods presented. |
(5) |
As of September 30, 2017 and December 31, 2016, other assets, net included $55.1 million and $31.7 million of corporate fixed assets, respectively, primarily relating to construction of corporate offices, leasehold improvements and product related assets. During the quarter ended June 30, 2017, fixed assets and the associated accumulated depreciation related to the Duluth, GA facility aggregating to $10.6 million were moved from Real Estate Assets, net to Other assets, net as the facility was transitioned to corporate office space. |
6 QTS Q3 Earnings 2017 |
Contact: IR@qtsdatacenters.com |
Consolidated Statements of Operations
(unaudited and in thousands except share and per share data)
|
|
Three Months Ended |
|
Nine Months Ended |
|||||||||||
|
|
September 30, |
|
June 30, |
|
September 30, |
|
September 30, |
|||||||
|
|
2017 |
|
2017 |
|
2016 |
|
2017 |
|
2016 |
|||||
Revenues: |
|
|
|
|
|
|
|
|
|
|
|
|
|
|
|
Rental |
|
$ |
85,831 |
|
$ |
80,793 |
|
$ |
77,005 |
|
$ |
245,741 |
|
$ |
217,101 |
Recoveries from customers |
|
|
9,698 |
|
|
8,774 |
|
|
8,703 |
|
|
26,833 |
|
|
20,306 |
Cloud and managed services |
|
|
16,224 |
|
|
16,856 |
|
|
16,243 |
|
|
50,045 |
|
|
52,148 |
Other (1) |
|
|
2,014 |
|
|
1,445 |
|
|
1,514 |
|
|
4,980 |
|
|
7,365 |
Total revenues |
|
|
113,767 |
|
|
107,868 |
|
|
103,465 |
|
|
327,599 |
|
|
296,920 |
Operating expenses: |
|
|
|
|
|
|
|
|
|
|
|
|
|
|
|
Property operating costs |
|
|
39,743 |
|
|
36,846 |
|
|
36,288 |
|
|
112,010 |
|
|
100,715 |
Real estate taxes and insurance |
|
|
3,116 |
|
|
2,946 |
|
|
2,566 |
|
|
9,209 |
|
|
6,326 |
Depreciation and amortization |
|
|
35,309 |
|
|
34,527 |
|
|
32,699 |
|
|
103,784 |
|
|
91,693 |
General and administrative (2) |
|
|
21,652 |
|
|
22,562 |
|
|
19,942 |
|
|
66,411 |
|
|
61,836 |
Transaction, integration and other costs (3) |
|
|
1,114 |
|
|
161 |
|
|
3,465 |
|
|
1,611 |
|
|
9,385 |
Total operating expenses |
|
|
100,934 |
|
|
97,042 |
|
|
94,960 |
|
|
293,025 |
|
|
269,955 |
|
|
|
|
|
|
|
|
|
|
|
|
|
|
|
|
Operating income |
|
|
12,833 |
|
|
10,826 |
|
|
8,505 |
|
|
34,574 |
|
|
26,965 |
|
|
|
|
|
|
|
|
|
|
|
|
|
|
|
|
Other income and expense: |
|
|
|
|
|
|
|
|
|
|
|
|
|
|
|
Interest income |
|
|
65 |
|
|
- |
|
|
1 |
|
|
66 |
|
|
3 |
Interest expense |
|
|
(7,958) |
|
|
(7,647) |
|
|
(6,179) |
|
|
(22,474) |
|
|
(17,034) |
Other income/(expense), net |
|
|
- |
|
|
- |
|
|
1 |
|
|
- |
|
|
1 |
Income before taxes |
|
|
4,940 |
|
|
3,179 |
|
|
2,328 |
|
|
12,166 |
|
|
9,935 |
Tax benefit of taxable REIT subsidiaries (4) |
|
|
2,454 |
|
|
1,429 |
|
|
4,210 |
|
|
5,404 |
|
|
9,269 |
Net income |
|
|
7,394 |
|
|
4,608 |
|
|
6,538 |
|
|
17,570 |
|
|
19,204 |
Net income attributable to noncontrolling interests (5) |
|
|
(887) |
|
|
(568) |
|
|
(808) |
|
|
(2,146) |
|
|
(2,485) |
Net income attributable to QTS Realty Trust, Inc. |
|
$ |
6,507 |
|
$ |
4,040 |
|
$ |
5,730 |
|
$ |
15,424 |
|
$ |
16,719 |
|
|
|
|
|
|
|
|
|
|
|
|
|
|
|
|
Net income per share attributable to common shares: |
|
|
|
|
|
|
|
|
|
|
|
|
|
|
|
Basic (6) |
|
$ |
0.13 |
|
$ |
0.08 |
|
$ |
0.12 |
|
$ |
0.31 |
|
$ |
0.37 |
Diluted (6) |
|
|
0.13 |
|
|
0.08 |
|
|
0.12 |
|
|
0.30 |
|
|
0.36 |
(1) |
Other revenue – Includes straight line rent, sales of scrap metals and other unused materials and various other revenue items. Straight line rent was $1.4 million, $0.9 million and $1.5 million for the three months ended September 30, 2017, June 30, 2017 and September 30, 2016, respectively. Straight line rent was $3.8 million and $6.9 million for the nine months ended September 30, 2017 and 2016, respectively. |
(2) |
General and administrative expenses – Includes personnel costs, sales and marketing costs, professional fees, travel costs, product investment costs and other corporate general and administrative expenses. General and administrative expenses were 19.0%, 20.9%, and 19.3% of total revenues for the three month periods ended September 30, 2017, June 30, 2017 and September 30, 2016, respectively. General and administrative expenses were 20.3% and 20.8% of total revenues for the nine months ended September 30, 2017 and 2016, respectively. |
(3) |
Transaction, integration and other costs – For the three months ended September 30, 2017, June 30, 2017 and September 30, 2016, the Company recognized $0.1 million, $0.2 million and $3.5 million, respectively, in transaction and integration costs. Transaction and integration costs were $0.6 million and $9.4 million for the nine months ended September 30, 2017 and 2016, respectively. The Company also recognized $1.0 million in other non-routine costs for the three and nine months ended September 30, 2017 related to the reassessment of prior years’ personal property taxes at its Sacramento, CA facility. No other non-routine costs were incurred in the three months ended June 30, 2017 or the three and nine months ended September 30, 2016. |
(4) |
Tax benefit of taxable REIT subsidiaries – For the three months ended September 30, 2017, June 30, 2017 and September 30, 2016, the Company recorded an approximate $2.5 million, $1.4 million and $4.2 million non-cash deferred tax benefit, respectively, related to operating losses which include certain transaction and integration costs. The Company recorded $5.4 million and $9.3 million in non-cash deferred tax benefits for the nine months ended September 30, 2017 and 2016, respectively. |
(5) |
Noncontrolling interest – The noncontrolling ownership interest of QualityTech, LP was 11.5% and 12.4% as of September 30, 2017 and 2016, respectively. |
(6) |
The calculation of net income per share excludes the effects of participating securities. |
7 QTS Q3 Earnings 2017 |
Contact: IR@qtsdatacenters.com |
Consolidated Statements of Comprehensive Income
(unaudited and in thousands)
|
|
Three Months Ended |
|
Nine Months Ended |
||||||||||||
|
|
September 30, |
|
June 30, |
|
September 30, |
|
September 30, |
||||||||
|
|
2017 |
|
2017 |
|
2016 |
|
2017 |
|
2016 |
||||||
Net income |
|
$ |
7,394 |
|
$ |
4,608 |
|
$ |
6,538 |
|
$ |
17,570 |
|
$ |
19,204 | |
Other comprehensive loss: |
|
|
|
|
|
|
|
|
|
|
|
|
|
|
|
|
Decrease in fair value of interest rate swaps |
|
|
(1,785) |
|
|
(1,499) |
|
|
— |
|
|
(1,785) |
|
|
— |
|
Comprehensive income |
|
|
5,609 |
|
|
3,109 |
|
|
6,538 |
|
|
15,785 |
|
|
19,204 | |
Comprehensive income attributable to noncontrolling interests |
|
|
(667) |
|
|
(385) |
|
|
(808) |
|
|
(1,926) |
|
|
(2,485) |
|
Comprehensive income attributable to QTS Realty Trust, Inc. |
|
$ |
4,942 |
|
$ |
2,724 |
|
$ |
5,730 |
|
$ |
13,859 |
|
$ |
16,719 |
8 QTS Q3 Earnings 2017 |
Contact: IR@qtsdatacenters.com |
Reconciliations of Net Income to FFO, Operating FFO & Adjusted Operating FFO
(unaudited and in thousands except per share data)
The Company considers funds from operations (“FFO”), to be a supplemental measure of its performance which should be considered along with, but not as an alternative to, net income (loss) and cash provided by operating activities as a measure of operating performance. The Company calculates FFO in accordance with the standards established by the National Association of Real Estate Investment Trusts (“NAREIT”). FFO represents net income (loss) (computed in accordance with GAAP), adjusted to exclude gains (or losses) from sales of property, real estate-related depreciation and amortization and similar adjustments for unconsolidated partnerships and joint ventures. The Company’s management uses FFO as a supplemental performance measure because, in excluding real estate related depreciation and amortization and gains and losses from property dispositions, it provides a performance measure that, when compared year over year, captures trends in occupancy rates, rental rates and operating costs.
Due to the volatility and nature of certain significant charges and gains recorded in the Company’s operating results that management believes are not reflective of its core operating performance, management computes an adjusted measure of FFO, which the Company refers to as Operating FFO. The Company generally calculates Operating FFO as FFO excluding certain non-routine charges and gains and losses that management believes are not indicative of the results of the Company’s operating real estate portfolio. The Company believes that Operating FFO provides investors with another financial measure that may facilitate comparisons of operating performance between periods and, to the extent they calculate Operating FFO on a comparable basis, between REITs.
Operating FFO and Adjusted Operating Funds From Operations (“Adjusted Operating FFO”) are non-GAAP measures that are used as supplemental operating measures and to provide additional information to users of the financial statements. The Company calculates Adjusted Operating FFO by adding or subtracting from Operating FFO items such as: maintenance capital investment, paid leasing commissions, amortization of deferred financing costs and bond discount, non-real estate depreciation, straight line rent adjustments, deferred taxes and non-cash compensation.
The Company offers these measures because it recognizes that FFO, Operating FFO and Adjusted Operating FFO will be used by investors as a basis to compare its operating performance with that of other REITs. However, because FFO, Operating FFO and Adjusted Operating FFO exclude real estate depreciation and amortization and capture neither the changes in the value of the Company’s properties that result from use or market conditions, nor the level of capital expenditures and capitalized leasing commissions necessary to maintain the operating performance of its properties, all of which have real economic effect and could materially impact its financial condition, cash flows and results of operations, the utility of FFO, Operating FFO and Adjusted Operating FFO as measures of its operating performance is limited. The Company’s calculation of FFO may not be comparable to measures calculated by other companies who do not use the NAREIT definition of FFO or do not calculate FFO in accordance with NAREIT guidance. In addition, the Company’s calculations of FFO, Operating FFO and Adjusted Operating FFO are not necessarily comparable to FFO, Operating FFO and Adjusted Operating FFO as calculated by other REITs that do not use the same definition or implementation guidelines or interpret the standards differently from us. FFO, Operating FFO and Adjusted Operating FFO are non-GAAP measures and should not be considered a measure of the Company’s results of operations or liquidity or as a substitute for, or an alternative to, net income (loss), cash provided by operating activities or any other performance measure determined in accordance with GAAP, nor is it indicative of funds available to fund its cash needs, including its ability to make distributions to its stockholders.
9 QTS Q3 Earnings 2017 |
Contact: IR@qtsdatacenters.com |
A reconciliation of net income to FFO, Operating FFO and Adjusted Operating FFO is presented below:
|
Three Months Ended |
|
Nine Months Ended |
|||||||||||
|
September 30, |
|
June 30, |
|
September 30, |
|
September 30, |
|||||||
|
2017 |
|
2017 |
|
2016 |
|
2017 |
|
2016 |
|||||
FFO |
|
|
|
|
|
|
|
|
|
|
|
|
|
|
Net income |
$ |
7,394 |
|
$ |
4,608 |
|
$ |
6,538 |
|
$ |
17,570 |
|
$ |
19,204 |
Real estate depreciation and amortization |
|
31,237 |
|
|
30,275 |
|
|
28,493 |
|
|
91,016 |
|
|
79,771 |
FFO |
|
38,631 |
|
|
34,883 |
|
|
35,031 |
|
|
108,586 |
|
|
98,975 |
|
|
|
|
|
|
|
|
|
|
|
|
|
|
|
Transaction, integration and other costs |
|
1,114 |
|
|
161 |
|
|
3,465 |
|
|
1,611 |
|
|
9,385 |
Tax benefit associated with transaction and integration costs |
|
- |
|
|
- |
|
|
(1,136) |
|
|
- |
|
|
(3,067) |
Operating FFO * |
|
39,745 |
|
|
35,044 |
|
|
37,360 |
|
|
110,197 |
|
|
105,293 |
|
|
|
|
|
|
|
|
|
|
|
|
|
|
|
Maintenance Capex |
|
(2,193) |
|
|
(1,172) |
|
|
(1,731) |
|
|
(4,161) |
|
|
(2,446) |
Leasing commissions paid |
|
(5,592) |
|
|
(4,055) |
|
|
(4,402) |
|
|
(13,816) |
|
|
(13,597) |
Amortization of deferred financing costs and bond discount |
|
992 |
|
|
971 |
|
|
879 |
|
|
2,943 |
|
|
2,633 |
Non real estate depreciation and amortization |
|
4,071 |
|
|
4,254 |
|
|
4,207 |
|
|
12,768 |
|
|
11,923 |
Straight line rent revenue and expense and other |
|
(1,149) |
|
|
(637) |
|
|
(957) |
|
|
(2,913) |
|
|
(5,810) |
Tax benefit from operating results |
|
(2,454) |
|
|
(1,429) |
|
|
(3,075) |
|
|
(5,404) |
|
|
(6,203) |
Equity-based compensation expense |
|
3,693 |
|
|
3,732 |
|
|
2,637 |
|
|
10,507 |
|
|
7,887 |
Adjusted Operating FFO * |
$ |
37,113 |
|
$ |
36,708 |
|
$ |
34,918 |
|
$ |
110,121 |
|
$ |
99,680 |
|
|
|
|
|
|
|
|
|
|
|
|
|
|
|
Fully diluted weighted average shares |
|
56,833 |
|
|
55,458 |
|
|
55,688 |
|
|
56,129 |
|
|
53,420 |
Operating FFO per diluted share |
$ |
0.70 |
|
$ |
0.63 |
|
$ |
0.67 |
|
$ |
1.96 |
|
$ |
1.97 |
* |
The Company’s calculations of Operating FFO and Adjusted Operating FFO may not be comparable to Operating FFO and Adjusted Operating FFO as calculated by other REITs that do not use the same definition. |
10 QTS Q3 Earnings 2017 |
Contact: IR@qtsdatacenters.com |
Reconciliations of Net Income to EBITDA and Adjusted EBITDA
(unaudited and in thousands)
The Company calculates EBITDA as net income (loss) (computed in accordance with GAAP) adjusted to exclude interest expense and interest income, provision (benefit) for income taxes (including income taxes applicable to sale of assets) and depreciation and amortization. Management believes that EBITDA is useful to investors in evaluating and facilitating comparisons of the Company’s operating performance between periods and between REITs by removing the impact of its capital structure (primarily interest expense) and asset base charges (primarily depreciation and amortization) from its operating results.
In addition to EBITDA, the Company calculates an adjusted measure of EBITDA, which it refers to as Adjusted EBITDA, as EBITDA excluding write off of unamortized deferred financing costs, gains (losses) on extinguishment of debt, transaction and integration costs, equity-based compensation expense, restructuring costs and gain (loss) on sale of real estate. The Company believes that Adjusted EBITDA provides investors with another financial measure that can facilitate comparisons of operating performance between periods and between REITs.
Management uses EBITDA and Adjusted EBITDA as supplemental performance measures as they provide useful measures of assessing the Company’s operating results. Other companies may not calculate EBITDA or Adjusted EBITDA in the same manner. Accordingly, the Company’s EBITDA and Adjusted EBITDA may not be comparable to others. EBITDA and Adjusted EBITDA should be considered only as supplements to net income (loss) as measures of the Company’s performance and should not be used as substitutes for net income (loss), as measures of its results of operations or liquidity or as an indications of funds available to meet its cash needs, including its ability to make distributions to its stockholders.
A reconciliation of net income to EBITDA and Adjusted EBITDA is presented below:
|
Three Months Ended |
|
Nine Months Ended |
|||||||||||
|
September 30, |
|
June 30, |
|
September 30, |
|
September 30, |
|||||||
|
2017 |
|
2017 |
|
2016 |
|
2017 |
|
2016 |
|||||
EBITDA and Adjusted EBITDA |
|
|
|
|
|
|
|
|
|
|
|
|
|
|
Net income |
$ |
7,394 |
|
$ |
4,608 |
|
$ |
6,538 |
|
$ |
17,570 |
|
$ |
19,204 |
Interest expense |
|
7,958 |
|
|
7,647 |
|
|
6,179 |
|
|
22,474 |
|
|
17,034 |
Interest income |
|
(65) |
|
|
- |
|
|
(1) |
|
|
(66) |
|
|
(3) |
Tax benefit of taxable REIT subsidiaries |
|
(2,454) |
|
|
(1,429) |
|
|
(4,210) |
|
|
(5,404) |
|
|
(9,269) |
Depreciation and amortization |
|
35,309 |
|
|
34,527 |
|
|
32,699 |
|
|
103,784 |
|
|
91,693 |
EBITDA |
|
48,142 |
|
|
45,353 |
|
|
41,205 |
|
|
138,358 |
|
|
118,659 |
|
|
|
|
|
|
|
|
|
|
|
|
|
|
|
Equity-based compensation expense |
|
3,693 |
|
|
3,732 |
|
|
2,637 |
|
|
10,507 |
|
|
7,887 |
Transaction, integration and other costs |
|
1,114 |
|
|
161 |
|
|
3,465 |
|
|
1,611 |
|
|
9,385 |
Adjusted EBITDA |
$ |
52,949 |
|
$ |
49,246 |
|
$ |
47,307 |
|
$ |
150,476 |
|
$ |
135,931 |
11 QTS Q3 Earnings 2017 |
Contact: IR@qtsdatacenters.com |
Reconciliations of Net Income to Net Operating Income (NOI)
(unaudited and in thousands)
The Company calculates net operating income (“NOI”) as net income (loss) (computed in accordance with GAAP), excluding: interest expense, interest income, tax expense (benefit) of taxable REIT subsidiaries, depreciation and amortization, write off of unamortized deferred financing costs, gain (loss) on extinguishment of debt, transaction and integration costs, gain (loss) on sale of real estate, restructuring costs and general and administrative expenses. Management uses NOI as a supplemental performance measure because it provides a useful measure of the operating results from its customer leases. In addition, management believes it is useful to investors in evaluating and comparing the operating performance of its properties and to compute the fair value of its properties. The Company’s NOI may not be comparable to other REITs’ NOI as other REITs may not calculate NOI in the same manner. NOI should be considered only as a supplement to net income as a measure of the Company’s performance and should not be used as a measure of results of operations or liquidity or as an indication of funds available to meet cash needs, including the ability to make distributions to stockholders. NOI is a measure of the operating performance of the Company’s properties and not of the Company’s performance as a whole. NOI is therefore not a substitute for net income as computed in accordance with GAAP. A reconciliation of net income to NOI is presented below:
|
Three Months Ended |
|
Nine Months Ended |
|||||||||||
|
September 30, |
|
June 30, |
|
September 30, |
|
September 30, |
|||||||
|
2017 |
|
2017 |
|
2016 |
|
2017 |
|
2016 |
|||||
Net Operating Income (NOI) |
|
|
|
|
|
|
|
|
|
|
|
|
|
|
Net income |
$ |
7,394 |
|
$ |
4,608 |
|
$ |
6,538 |
|
$ |
17,570 |
|
$ |
19,204 |
Interest expense |
|
7,958 |
|
|
7,647 |
|
|
6,179 |
|
|
22,474 |
|
|
17,034 |
Interest income |
|
(65) |
|
|
- |
|
|
(1) |
|
|
(66) |
|
|
(3) |
Depreciation and amortization |
|
35,309 |
|
|
34,527 |
|
|
32,699 |
|
|
103,784 |
|
|
91,693 |
Tax benefit of taxable REIT subsidiaries |
|
(2,454) |
|
|
(1,429) |
|
|
(4,210) |
|
|
(5,404) |
|
|
(9,269) |
Transaction, integration and other costs |
|
1,114 |
|
|
161 |
|
|
3,465 |
|
|
1,611 |
|
|
9,385 |
General and administrative expenses |
|
21,652 |
|
|
22,562 |
|
|
19,942 |
|
|
66,411 |
|
|
61,836 |
NOI (1) |
$ |
70,908 |
|
$ |
68,076 |
|
$ |
64,612 |
|
$ |
206,380 |
|
$ |
189,880 |
Breakdown of NOI by facility: |
|
|
|
|
|
|
|
|
|
|
|
|
|
|
Atlanta-Metro data center |
$ |
18,588 |
|
$ |
20,704 |
|
$ |
20,030 |
|
$ |
59,803 |
|
$ |
60,887 |
Atlanta-Suwanee data center |
|
12,206 |
|
|
11,423 |
|
|
11,051 |
|
|
35,587 |
|
|
33,823 |
Leased data centers (2) |
|
8,278 |
|
|
8,408 |
|
|
10,751 |
|
|
25,696 |
|
|
33,134 |
Richmond data center |
|
11,687 |
|
|
8,389 |
|
|
7,850 |
|
|
28,306 |
|
|
22,428 |
Irving data center |
|
8,707 |
|
|
8,057 |
|
|
5,118 |
|
|
23,204 |
|
|
11,656 |
Santa Clara data center |
|
2,741 |
|
|
2,705 |
|
|
2,961 |
|
|
8,725 |
|
|
10,378 |
Piscataway data center |
|
2,427 |
|
|
2,279 |
|
|
2,086 |
|
|
7,109 |
|
|
2,756 |
Princeton data center |
|
2,415 |
|
|
2,393 |
|
|
2,468 |
|
|
7,207 |
|
|
7,180 |
Sacramento data center |
|
1,525 |
|
|
1,778 |
|
|
1,780 |
|
|
5,140 |
|
|
5,842 |
Chicago data center |
|
1,285 |
|
|
1,275 |
|
|
(157) |
|
|
3,207 |
|
|
(157) |
Fort Worth data center |
|
94 |
|
|
75 |
|
|
- |
|
|
275 |
|
|
- |
Other facilities (3) |
|
955 |
|
|
590 |
|
|
674 |
|
|
2,121 |
|
|
1,953 |
NOI (1) |
$ |
70,908 |
|
$ |
68,076 |
|
$ |
64,612 |
|
$ |
206,380 |
|
$ |
189,880 |
(1) |
Includes facility level G&A expense allocation charges of 4% of cash revenue for all entities, with the exception of the leased facilities acquired in 2015, which include G&A expense allocation charges of 10% of cash revenue. These allocated charges aggregated to $5.5 million, $5.3 million and $5.2 million for the three month periods ended September 30, 2017, June 30, 2017 and September 30, 2016, respectively, and $16.0 million and $15.3 million for the nine month periods ended September 30, 2017 and 2016, respectively. |
(2) |
Includes 13 facilities. All facilities are leased, including those subject to capital leases. During the quarter ended March 31, 2017, the Company moved its Jersey City, NJ facility to the “Leased data centers” line item. In October 2017, the Company finalized the buyout of the Vault facility in Ashburn, VA that was previously subject to a capital lease agreement. As the purchase occurred subsequent to September 30, 2017, the Vault facility is included within the “Leased Facilities” line item herein. |
(3) |
Consists of Miami, FL; Lenexa, KS; Overland Park, KS; and Duluth, GA facilities. During the quarter ended March 31, 2017, the Company moved its Miami, FL facility to the “Other facilities” line item. |
12 QTS Q3 Earnings 2017 |
Contact: IR@qtsdatacenters.com |
Reconciliations of Total Revenues to Recognized MRR in the period and MRR at period end
(unaudited and in thousands)
The Company calculates MRR as monthly contractual revenue under signed leases as of a particular date, which includes revenue from its C1, C2 and C3 rental and cloud and managed services activities, but excludes customer recoveries, deferred set-up fees, variable related revenues, non-cash revenues and other one-time revenues. MRR does not include the impact from booked-not-billed leases as of a particular date, unless otherwise specifically noted.
Separately, the Company calculates recognized MRR as the recurring revenue recognized during a given period, which includes revenue from its C1, C2 and C3 rental and cloud and managed services activities, but excludes customer recoveries, deferred set up fees, variable related revenues, non-cash revenues and other one-time revenues.
Management uses MRR and recognized MRR as supplemental performance measures because they provide useful measures of increases in contractual revenue from the Company’s customer leases. MRR and recognized MRR should not be viewed by investors as alternatives to actual monthly revenue, as determined in accordance with GAAP. Other companies may not calculate MRR or recognized MRR in the same manner. Accordingly, the Company’s MRR and recognized MRR may not be comparable to other companies’ MRR and recognized MRR. MRR and recognized MRR should be considered only as supplements to total revenues as a measure of its performance. MRR and recognized MRR should not be used as measures of the Company’s results of operations or liquidity, nor is it indicative of funds available to meet its cash needs, including its ability to make distributions to its stockholders.
A reconciliation of total GAAP revenues to recognized MRR in the period and MRR at period-end is presented below:
|
Three Months Ended |
|
Nine Months Ended |
|||||||||||||
|
September 30, |
|
June 30, |
|
September 30, |
|
September 30, |
|||||||||
|
2017 |
|
2017 |
|
2016 |
|
2017 |
|
2016 |
|||||||
Recognized MRR in the period |
|
|
|
|
|
|
|
|
|
|
|
|
|
|
||
Total period revenues (GAAP basis) |
$ |
113,767 |
|
$ |
107,868 |
|
$ |
103,465 |
|
$ |
327,599 |
|
$ |
296,920 |
||
Less: Total period recoveries |
|
(9,698) |
|
|
(8,774) |
|
|
(8,703) |
|
|
(26,833) |
|
|
(20,306) |
||
Total period deferred setup fees |
|
(2,659) |
|
|
(2,436) |
|
|
(2,377) |
|
|
(7,711) |
|
|
(6,536) |
||
Total period straight line rent and other |
|
(6,982) |
|
|
(3,306) |
|
|
(3,697) |
|
|
(13,406) |
|
|
(13,722) |
||
Recognized MRR in the period |
|
94,428 |
|
|
93,352 |
|
|
88,688 |
|
|
279,649 |
|
|
256,356 |
||
|
|
|
|
|
|
|
|
|
|
|
|
|
|
|
||
MRR at period end |
|
|
|
|
|
|
|
|
|
|
|
|
|
|
||
Total period revenues (GAAP basis) |
$ |
113,767 |
|
$ |
107,868 |
|
$ |
103,465 |
|
$ |
327,599 |
|
$ |
296,920 |
||
Less: Total revenues excluding last month |
|
(76,912) |
|
|
(71,262) |
|
|
(69,427) |
|
|
(290,744) |
|
|
(262,882) |
||
Total revenues for last month of period |
|
36,855 |
|
|
36,606 |
|
|
34,038 |
|
|
36,855 |
|
|
34,038 |
||
Less: Last month recoveries |
|
(2,631) |
|
|
(2,872) |
|
|
(2,398) |
|
|
(2,631) |
|
|
(2,398) |
||
Last month deferred setup fees |
|
(893) |
|
|
(822) |
|
|
(828) |
|
|
(893) |
|
|
(828) |
||
Last month straight line rent and other |
|
(1,704) |
|
|
(1,221) |
|
|
(1,034) |
|
|
(1,704) |
|
|
(1,034) |
||
MRR at period end |
$ |
31,627 |
|
$ |
31,691 |
|
$ |
29,778 |
|
$ |
31,627 |
|
$ |
29,778 |
13 QTS Q3 Earnings 2017 |
Contact: IR@qtsdatacenters.com |
Exhibit 99.2
Table of Contents
Overview |
|
3 | |
|
|
Financial Statements |
|
4 | |
5 | |
6 | |
7 | |
9 | |
10 | |
|
|
Operating Portfolio |
|
11 | |
12 | |
13 | |
14 | |
15 | |
17 | |
18 | |
19 | |
20 | |
21 | |
22 | |
|
|
Capital Structure |
|
23 | |
24 | |
|
|
25 |
1 QTS Q3 Earnings 2017 |
Contact: IR@qtsdatacenters.com |
Forward Looking Statements
Some of the statements contained in this document constitute forward-looking statements within the meaning of the federal securities laws. Forward-looking statements relate to expectations, beliefs, projections, future plans and strategies, anticipated events or trends and similar expressions concerning matters that are not historical facts. In particular, statements pertaining to the Company’s capital resources, portfolio performance and results of operations contain forward-looking statements. Likewise, all of the statements regarding anticipated growth in funds from operations and anticipated market conditions are forward-looking statements. In some cases, you can identify forward-looking statements by the use of forward-looking terminology such as “may,” “will,” “should,” “expects,” “intends,” “plans,” “anticipates,” “believes,” “estimates,” “predicts,” or “potential” or the negative of these words and phrases or similar words or phrases which are predictions of or indicate future events or trends and which do not relate solely to historical matters. You also can identify forward-looking statements by discussions of strategy, plans or intentions.
The forward-looking statements contained in this document reflect the Company’s current views about future events and are subject to numerous known and unknown risks, uncertainties, assumptions and changes in circumstances that may cause actual results to differ significantly from those expressed in any forward-looking statement. The Company does not guarantee that the transactions and events described will happen as described (or that they will happen at all). The following factors, among others, could cause actual results and future events to differ materially from those set forth or contemplated in the forward-looking statements: adverse economic or real estate developments in the Company’s markets or the technology industry; global, national and local economic conditions; risks related to our international operations; difficulties in identifying properties to acquire and completing acquisitions; the Company’s failure to successfully develop, redevelop and operate acquired properties or lines of business; significant increases in construction and development costs; the increasingly competitive environment in which the Company operates; defaults on, or termination or non-renewal of, leases by customers; increased interest rates and operating costs, including increased energy costs; financing risks, including the Company’s failure to obtain necessary outside financing; decreased rental rates or increased vacancy rates; dependence on third parties to provide Internet, telecommunications and network connectivity to the Company’s data centers; the Company’s failure to qualify and maintain its qualification as a real estate investment trust; environmental uncertainties and risks related to natural disasters; financial market fluctuations; and changes in real estate and zoning laws, revaluations for tax purposes and increases in real property tax rates.
While forward-looking statements reflect the Company’s good faith beliefs, they are not guarantees of future performance. Any forward-looking statement speaks only as of the date on which it was made. The Company disclaims any obligation to publicly update or revise any forward-looking statement to reflect changes in underlying assumptions or factors, of new information, data or methods, future events or other changes. For a further discussion of these and other factors that could cause the Company’s future results to differ materially from any forward-looking statements, see the section entitled “Risk Factors” in the Company’s Annual Report on Form 10-K for the year ended December 31, 2016 and other periodic reports the Company files with the Securities and Exchange Commission.
2 QTS Q3 Earnings 2017 |
Contact: IR@qtsdatacenters.com |
3 QTS Q3 Earnings 2017 |
Contact: IR@qtsdatacenters.com |
(in thousands except share data)
|
|
September 30, |
|
December 31, |
||
|
|
2017 |
|
2016 (1) |
||
|
|
(unaudited) |
|
|
|
|
ASSETS |
|
|
|
|
|
|
Real Estate Assets |
|
|
|
|
|
|
Land |
|
$ |
86,192 |
|
$ |
74,130 |
Buildings, improvements and equipment |
|
|
1,668,503 |
|
|
1,524,767 |
Less: Accumulated depreciation |
|
|
(378,883) |
|
|
(317,834) |
|
|
|
1,375,812 |
|
|
1,281,063 |
Construction in progress (2) |
|
|
429,390 |
|
|
365,960 |
Real Estate Assets, net |
|
|
1,805,202 |
|
|
1,647,023 |
Cash and cash equivalents |
|
|
9,271 |
|
|
9,580 |
Rents and other receivables, net |
|
|
47,307 |
|
|
41,540 |
Acquired intangibles, net |
|
|
114,286 |
|
|
129,754 |
Deferred costs, net (3) (4) |
|
|
38,172 |
|
|
38,507 |
Prepaid expenses |
|
|
7,209 |
|
|
6,918 |
Goodwill |
|
|
173,843 |
|
|
173,843 |
Other assets, net (5) |
|
|
63,156 |
|
|
39,305 |
TOTAL ASSETS |
|
$ |
2,258,446 |
|
$ |
2,086,470 |
|
|
|
|
|
|
|
LIABILITIES |
|
|
|
|
|
|
Unsecured credit facility, net (4) |
|
$ |
775,398 |
|
$ |
634,939 |
Senior notes, net of discount and debt issuance costs (4) |
|
|
293,192 |
|
|
292,179 |
Capital lease, lease financing obligations and mortgage notes payable |
|
|
30,725 |
|
|
38,708 |
Accounts payable and accrued liabilities |
|
|
67,232 |
|
|
86,129 |
Dividends and distributions payable |
|
|
22,230 |
|
|
19,634 |
Advance rents, security deposits and other liabilities |
|
|
29,210 |
|
|
24,893 |
Deferred income taxes |
|
|
9,814 |
|
|
15,185 |
Deferred income |
|
|
22,540 |
|
|
21,993 |
TOTAL LIABILITIES |
|
|
1,250,341 |
|
|
1,133,660 |
|
|
|
|
|
|
|
EQUITY |
|
|
|
|
|
|
Common stock, $0.01 par value, 450,133,000 shares authorized, 50,424,244 and 47,831,250 shares issued and outstanding as of September 30, 2017 and December 31, 2016, respectively |
|
|
504 |
|
|
478 |
Additional paid-in capital |
|
|
1,032,912 |
|
|
931,783 |
Accumulated other comprehensive loss |
|
|
(1,565) |
|
|
- |
Accumulated dividends in excess of earnings |
|
|
(139,740) |
|
|
(97,793) |
Total stockholders’ equity |
|
|
892,111 |
|
|
834,468 |
Noncontrolling interests |
|
|
115,994 |
|
|
118,342 |
TOTAL EQUITY |
|
|
1,008,105 |
|
|
952,810 |
TOTAL LIABILITIES AND EQUITY |
|
$ |
2,258,446 |
|
$ |
2,086,470 |
(1) |
The balance sheet at December 31, 2016, has been derived from the audited consolidated financial statements at that date, but does not include all of the information and footnotes required by United States generally accepted accounting principles for complete financial statements. |
(2) |
As of September 30, 2017, construction in progress included $42.0 million related to land acquisitions completed in the third quarter of 2017. |
(3) |
As of September 30, 2017 and December 31, 2016, deferred costs, net included $5.7 million and $7.0 million of net deferred financing costs related to the revolving portion of the Company’s unsecured credit facility, respectively, and $32.5 million and $31.5 million of deferred leasing costs net of amortization, respectively. |
(4) |
Debt issuance costs, net related to the Senior Notes and term loan portion of the Company’s unsecured credit facility aggregating $8.9 million and $10.1 million at September 30, 2017 and December 31, 2016, respectively, have been netted against the related debt liability line items for both periods presented. |
(5) |
As of September 30, 2017 and December 31, 2016, other assets, net included $55.1 million and $31.7 million of corporate fixed assets, respectively, primarily relating to construction of corporate offices, leasehold improvements and product related assets. During the quarter ended June 30, 2017, fixed assets and the associated accumulated depreciation related to the Duluth, GA facility aggregating to $10.6 million were moved from Real Estate Assets, net to Other assets, net as the facility was transitioned to corporate office space. |
4 QTS Q3 Earnings 2017 |
Contact: IR@qtsdatacenters.com |
(unaudited and in thousands except share and per share data)
|
|
Three Months Ended |
|
Nine Months Ended |
|||||||||||
|
|
September 30, |
|
June 30, |
|
September 30, |
|
September 30, |
|||||||
|
|
2017 |
|
2017 |
|
2016 |
|
2017 |
|
2016 |
|||||
Revenues: |
|
|
|
|
|
|
|
|
|
|
|
|
|
|
|
Rental |
|
$ |
85,831 |
|
$ |
80,793 |
|
$ |
77,005 |
|
$ |
245,741 |
|
$ |
217,101 |
Recoveries from customers |
|
|
9,698 |
|
|
8,774 |
|
|
8,703 |
|
|
26,833 |
|
|
20,306 |
Cloud and managed services |
|
|
16,224 |
|
|
16,856 |
|
|
16,243 |
|
|
50,045 |
|
|
52,148 |
Other (1) |
|
|
2,014 |
|
|
1,445 |
|
|
1,514 |
|
|
4,980 |
|
|
7,365 |
Total revenues |
|
|
113,767 |
|
|
107,868 |
|
|
103,465 |
|
|
327,599 |
|
|
296,920 |
Operating expenses: |
|
|
|
|
|
|
|
|
|
|
|
|
|
|
|
Property operating costs |
|
|
39,743 |
|
|
36,846 |
|
|
36,288 |
|
|
112,010 |
|
|
100,715 |
Real estate taxes and insurance |
|
|
3,116 |
|
|
2,946 |
|
|
2,566 |
|
|
9,209 |
|
|
6,326 |
Depreciation and amortization |
|
|
35,309 |
|
|
34,527 |
|
|
32,699 |
|
|
103,784 |
|
|
91,693 |
General and administrative (2) |
|
|
21,652 |
|
|
22,562 |
|
|
19,942 |
|
|
66,411 |
|
|
61,836 |
Transaction, integration and other costs (3) |
|
|
1,114 |
|
|
161 |
|
|
3,465 |
|
|
1,611 |
|
|
9,385 |
Total operating expenses |
|
|
100,934 |
|
|
97,042 |
|
|
94,960 |
|
|
293,025 |
|
|
269,955 |
|
|
|
|
|
|
|
|
|
|
|
|
|
|
|
|
Operating income |
|
|
12,833 |
|
|
10,826 |
|
|
8,505 |
|
|
34,574 |
|
|
26,965 |
|
|
|
|
|
|
|
|
|
|
|
|
|
|
|
|
Other income and expense: |
|
|
|
|
|
|
|
|
|
|
|
|
|
|
|
Interest income |
|
|
65 |
|
|
- |
|
|
1 |
|
|
66 |
|
|
3 |
Interest expense |
|
|
(7,958) |
|
|
(7,647) |
|
|
(6,179) |
|
|
(22,474) |
|
|
(17,034) |
Other income/(expense), net |
|
|
- |
|
|
- |
|
|
1 |
|
|
- |
|
|
1 |
Income before taxes |
|
|
4,940 |
|
|
3,179 |
|
|
2,328 |
|
|
12,166 |
|
|
9,935 |
Tax benefit of taxable REIT subsidiaries (4) |
|
|
2,454 |
|
|
1,429 |
|
|
4,210 |
|
|
5,404 |
|
|
9,269 |
Net income |
|
|
7,394 |
|
|
4,608 |
|
|
6,538 |
|
|
17,570 |
|
|
19,204 |
Net income attributable to noncontrolling interests (5) |
|
|
(887) |
|
|
(568) |
|
|
(808) |
|
|
(2,146) |
|
|
(2,485) |
Net income attributable to QTS Realty Trust, Inc. |
|
$ |
6,507 |
|
$ |
4,040 |
|
$ |
5,730 |
|
$ |
15,424 |
|
$ |
16,719 |
|
|
|
|
|
|
|
|
|
|
|
|
|
|
|
|
Net income per share attributable to common shares: |
|
|
|
|
|
|
|
|
|
|
|
|
|
|
|
Basic (6) |
|
$ |
0.13 |
|
$ |
0.08 |
|
$ |
0.12 |
|
$ |
0.31 |
|
$ |
0.37 |
Diluted (6) |
|
|
0.13 |
|
|
0.08 |
|
|
0.12 |
|
|
0.30 |
|
|
0.36 |
(1) |
Other revenue - Includes straight line rent, sales of scrap metals and other unused materials and various other revenue items. Straight line rent was $1.4 million, $0.9 million and $1.5 million for the three months ended September 30, 2017, June 30, 2017 and September 30, 2016, respectively. Straight line rent was $3.8 million and $6.9 million for the nine months ended September 30, 2017 and 2016, respectively. |
(2) |
General and administrative expenses - Includes personnel costs, sales and marketing costs, professional fees, travel costs, product investment costs and other corporate general and administrative expenses. General and administrative expenses were 19.0%, 20.9%, and 19.3% of total revenues for the three month periods ended September 30, 2017, June 30, 2017 and September 30, 2016, respectively. General and administrative expenses were 20.3% and 20.8% of total revenues for the nine month periods ended September 30, 2017 and 2016, respectively. |
(3) |
Transaction, integration and other costs - For the three months ended September 30, 2017, June 30, 2017 and September 30, 2016, the Company recognized $0.1 million, $0.2 million and $3.5 million, respectively, in transaction and integration costs. Transaction and integration costs were $0.6 million and $9.4 million for the nine months ended September 30, 2017 and 2016, respectively. The Company also recognized $1.0 million in other non-routine costs for the three and nine months ended September 30, 2017 related to the reassessment of prior years’ personal property taxes at its Sacramento, CA facility. No other non-routine costs were incurred in the three months ended June 30, 2017 or the three and nine months ended September 30, 2016. |
(4) |
Tax benefit of taxable REIT subsidiaries - For the three months ended September 30, 2017, June 30, 2017 and September 30, 2016, the Company recorded an approximate $2.5 million, $1.4 million and $4.2 million non-cash deferred tax benefit, respectively, related to recorded operating losses which include certain transaction and integration costs. The Company recorded $5.4 million and $9.3 million in tax benefits for the nine months ended September 30, 2017 and 2016, respectively. |
(5) |
Noncontrolling interest - The noncontrolling ownership interest of QualityTech, LP was 11.5% and 12.4% as of September 30, 2017 and 2016, respectively. |
(6) |
The calculation of net income per share excludes the effects of participating securities. |
5 QTS Q3 Earnings 2017 |
Contact: IR@qtsdatacenters.com |
(unaudited and in thousands)
|
|
Three Months Ended |
|
Nine Months Ended |
|||||||||||
|
|
September 30, |
|
June 30, |
|
September 30, |
|
September 30, |
|||||||
|
|
2017 |
|
2017 |
|
2016 |
|
2017 |
|
2016 |
|||||
Net income |
|
$ |
7,394 |
|
$ |
4,608 |
|
$ |
6,538 |
|
$ |
17,570 |
|
$ |
19,204 |
Other comprehensive loss: |
|
|
|
|
|
|
|
|
|
|
|
|
|
|
|
Decrease in fair value of interest rate swaps |
|
|
(1,785) |
|
|
(1,499) |
|
|
— |
|
|
(1,785) |
|
|
— |
Comprehensive income |
|
|
5,609 |
|
|
3,109 |
|
|
6,538 |
|
|
15,785 |
|
|
19,204 |
Comprehensive income attributable to noncontrolling interests |
|
|
(667) |
|
|
(385) |
|
|
(808) |
|
|
(1,926) |
|
|
(2,485) |
Comprehensive income attributable to QTS Realty Trust, Inc. |
|
$ |
4,942 |
|
$ |
2,724 |
|
$ |
5,730 |
|
$ |
13,859 |
|
$ |
16,719 |
6 QTS Q3 Earnings 2017 |
Contact: IR@qtsdatacenters.com |
Summary of Financial Data
(unaudited and in thousands, except operating portfolio statistics data and per share data)
This summary includes certain non-GAAP financial measures that management believes are helpful in understanding the Company’s business, as further described in the Appendix. The Company does not, nor does it suggest investors should, consider such non-GAAP financial measures in isolation from, or as a substitute for, GAAP financial information. The Company believes that the presentation of non-GAAP financial measures provide meaningful supplemental information to both management and investors that is indicative of the Company’s operations. The Company has included a reconciliation of this additional information to the most comparable GAAP measure in the selected financial information below.
|
|
|
|
|
|
|
|
|
|
|
|
|
|
|
|
|
|
|
Three Months Ended |
|
Nine Months Ended |
||||||||||||
|
|
September 30, |
|
June 30, |
|
|
September 30, |
|
September 30, |
|||||||
Summary of Results |
|
2017 |
|
2017 |
|
|
2016 |
|
2017 |
|
2016 |
|||||
Total revenue |
|
$ |
113,767 |
|
$ |
107,868 |
|
|
$ |
103,465 |
|
$ |
327,599 |
|
$ |
296,920 |
Net income |
|
$ |
7,394 |
|
$ |
4,608 |
|
|
$ |
6,538 |
|
$ |
17,570 |
|
$ |
19,204 |
Fully diluted weighted average shares outstanding |
|
|
56,833 |
|
|
55,458 |
|
|
|
55,688 |
|
|
56,129 |
|
|
53,420 |
Net income per basic share |
|
$ |
0.13 |
|
$ |
0.08 |
|
|
$ |
0.12 |
|
$ |
0.31 |
|
$ |
0.37 |
Net income per diluted share |
|
$ |
0.13 |
|
$ |
0.08 |
|
|
$ |
0.12 |
|
$ |
0.30 |
|
$ |
0.36 |
|
|
|
|
|
|
|
|
|
|
|
|
|
|
|
|
|
Other Data |
|
|
|
|
|
|
|
|
|
|
|
|
|
|
|
|
FFO |
|
$ |
38,631 |
|
$ |
34,883 |
|
|
$ |
35,031 |
|
$ |
108,586 |
|
$ |
98,975 |
Operating FFO |
|
$ |
39,745 |
|
$ |
35,044 |
|
|
$ |
37,360 |
|
$ |
110,197 |
|
$ |
105,293 |
Operating FFO per diluted share |
|
$ |
0.70 |
|
$ |
0.63 |
|
|
$ |
0.67 |
|
$ |
1.96 |
|
$ |
1.97 |
Recognized MRR in the period |
|
$ |
94,428 |
|
$ |
93,352 |
|
|
$ |
88,688 |
|
$ |
279,649 |
|
$ |
256,356 |
MRR (at period end) |
|
$ |
31,627 |
|
$ |
31,691 |
|
|
$ |
29,778 |
|
$ |
31,627 |
|
$ |
29,778 |
EBITDA |
|
$ |
48,142 |
|
$ |
45,353 |
|
|
$ |
41,205 |
|
$ |
138,358 |
|
$ |
118,659 |
Adjusted EBITDA |
|
$ |
52,949 |
|
$ |
49,246 |
|
|
$ |
47,307 |
|
$ |
150,476 |
|
$ |
135,931 |
NOI |
|
$ |
70,908 |
|
$ |
68,076 |
|
|
$ |
64,612 |
|
$ |
206,380 |
|
$ |
189,880 |
NOI as a % of revenue |
|
|
62.3% |
|
|
63.1% |
|
|
|
62.4% |
|
|
63.0% |
|
|
63.9% |
Adjusted EBITDA as a % of revenue |
|
|
46.5% |
|
|
45.7% |
|
|
|
45.7% |
|
|
45.9% |
|
|
45.8% |
General and administrative expenses as a % of revenue |
|
|
19.0% |
|
|
20.9% |
|
|
|
19.3% |
|
|
20.3% |
|
|
20.8% |
Annualized ROIC |
|
|
13.8% |
|
|
13.6% |
|
|
|
14.2% |
|
|
13.7% |
|
|
15.0% |
|
|
|
September 30, |
|
December 31, |
|
|
Balance Sheet Data |
|
|
2017 |
|
2016 |
|
|
Real estate at cost |
|
$ |
2,184,085 |
|
$ |
1,964,857 |
|
Net investment in real estate |
|
|
1,805,202 |
|
|
1,647,023 |
|
Total assets |
|
|
2,258,446 |
|
|
2,086,470 |
|
Total debt, net of cash and cash equivalents |
|
|
1,100,455 |
(1) |
|
968,128 |
(1) |
Debt to last quarter annualized Adjusted EBITDA |
|
|
5.2x |
(2) |
|
5.0x |
(2) |
Debt to undepreciated real estate assets |
|
|
50.4% |
(2) |
|
49.3% |
(2) |
Debt to Implied Enterprise Value |
|
|
26.7% |
(2) |
|
26.0% |
(2) |
(1) |
The Company has excluded the Senior Note discount and associated debt issuance costs from the Total Debt line item for both periods presented. As a result, the amounts referenced above represent the full amount of debt that will be repaid less the amount of cash and cash equivalents on hand. |
(2) |
Calculated using total debt, which excludes the Senior Note discount and associated debt issuance costs, less the amount of cash and cash equivalents on hand. |
7 QTS Q3 Earnings 2017 |
Contact: IR@qtsdatacenters.com |
|
|
|
September 30, |
|
|
December 31, |
Operating Portfolio Statistics |
|
|
2017 |
|
|
2016 |
Built out square footage: |
|
|
|
|
|
|
Raised floor |
|
|
1,403,212 |
|
|
1,345,680 |
Leasable raised floor (1) |
|
|
1,111,462 |
|
|
1,083,708 |
Leased raised floor |
|
|
971,124 |
|
|
955,844 |
|
|
|
|
|
|
|
Total Raw Shell: |
|
|
|
|
|
|
Total |
|
|
6,113,562 |
|
|
5,662,087 |
Basis-of-design raised floor space (1) |
|
|
2,677,270 |
|
|
2,496,106 |
|
|
|
|
|
|
|
Data center properties |
|
|
25 |
|
|
25 |
Basis of design raised floor % developed |
|
|
52.4% |
|
|
53.9% |
Data center % occupied |
|
|
87.4% |
|
|
88.2% |
|
|
|
|
|
|
|
Data center raised floor % wholly-owned (2) |
|
|
88.2% |
|
|
88.1% |
(1) |
See definition in Appendix. |
(2) |
Wholly owned data centers do not include those subject to capital lease obligations or the Santa Clara facility which is subject to a long-term ground lease. Had the Santa Clara facility been included as a wholly owned facility, the wholly owned data center raised floor percentage would be 92.2% and 92.2% at September 30, 2017 and December 31, 2016, respectively. In October 2017, the Company finalized the buyout of the Vault facility in Ashburn, VA that was previously subject to a capital lease agreement. Had the Vault facility been included as a wholly owned facility, the wholly owned data center raised floor percentage would be 90.4% at September 30, 2017. Had the Vault and Santa Clara facilities been included as wholly owned facilities, the wholly owned data center raised floor percentage would be 94.4% at September 30, 2017. |
2017 Guidance
|
|
2016 Actuals |
|
2017 |
|||||
($ in millions except per share amounts) |
|
|
|
|
Low |
|
High |
||
Adjusted EBITDA |
|
$ |
184.3 |
|
$ |
203.0 |
|
$ |
211.0 |
Operating FFO (1) |
|
$ |
140.7 |
|
$ |
152.0 |
|
$ |
158.0 |
Operating FFO per share (1) |
|
$ |
2.61 |
|
$ |
2.68 |
|
$ |
2.80 |
Capital Expenditures (2) |
|
$ |
280.0 |
|
$ |
325.0 |
|
$ |
375.0 |
(1) |
Incorporates approximately $6.5 million of estimated non-cash tax benefit being recognized in 2017 compared to $6.4 million of non-cash tax benefit recognized in 2016. |
(2) |
Excludes acquisitions. |
The Company continues to expect year-over-year revenue growth at the low end of 11%-13% range. The Company is maintaining its Operating FFO guidance of $152.0 million to $158.0 million, which reflects an increase in the non-cash tax benefit assumption of approximately $1 million to $6.5 million, offset by higher assumed interest expense associated with investment activity since the end of the second quarter. However, factoring in the higher non-cash tax benefit assumption and capital efficiency reducing the need for additional equity in the fourth quarter, the Company is raising its guidance for Operating FFO per share to a range of $2.68 to $2.80. The Company continues to expect 2017 churn at the high end of its historical range of 5%-8%. This guidance does not contemplate any acquisitions or dispositions.
8 QTS Q3 Earnings 2017 |
Contact: IR@qtsdatacenters.com |
Reconciliations of Return on Invested Capital (ROIC)
(unaudited and in thousands)
Return on Invested Capital (“ROIC”) is a non-GAAP measure that provides additional information to users of the financial statements. Management believes ROIC is a helpful metric for users of the financial statements to gauge the Company's performance against the capital it has invested.
Return on Invested Capital (ROIC) |
|
Three Months Ended |
|
Nine Months Ended |
|||||||||||
|
|
September 30, |
|
June 30, |
|
September 30, |
|
September 30, |
|||||||
|
|
2017 |
|
2017 |
|
2016 |
|
2017 |
|
2016 |
|||||
NOI (1) |
|
$ |
70,908 |
|
$ |
68,076 |
|
$ |
64,612 |
|
$ |
206,380 |
|
$ |
189,880 |
Annualized NOI |
|
|
283,632 |
|
|
272,304 |
|
|
258,448 |
|
|
275,173 |
|
|
253,173 |
Average undepreciated real estate assets and other net fixed assets placed in service (2) |
|
|
2,059,454 |
|
|
2,008,565 |
|
|
1,817,740 |
|
|
2,004,389 |
|
|
1,693,193 |
Annualized ROIC |
|
|
13.8% |
|
|
13.6% |
|
|
14.2% |
|
|
13.7% |
|
|
15.0% |
(1) |
Includes facility level G&A expense allocation charges of 4% of cash revenue for all facilities, with the exception of the leased facilities acquired in 2015, which include G&A expense allocation charges of 10% of cash revenue. These allocated charges aggregated to $5.5 million, $5.3 million and $5.2 million for the three month periods ended September 30, 2017, June 30, 2017 and September 30, 2016, respectively, and $16.0 million and $15.3 million for the nine month periods ended September 30, 2017 and 2016, respectively. |
(2) |
Calculated by using average quarterly balance of each account. |
Calculation of Average Undepreciated Real Estate Assets and other Net Fixed Assets Placed in Service |
|
As of |
|
As of |
|||||||||||
Undepreciated Real Estate Assets and other |
|
September 30, |
|
June 30, |
|
September 30, |
|
September 30, |
|||||||
Net Fixed Assets Placed in Service |
|
2017 |
|
2017 |
|
2016 |
|
2017 |
|
2016 |
|||||
Real Estate Assets, net |
|
$ |
1,805,202 |
|
$ |
1,720,373 |
|
$ |
1,548,115 |
|
$ |
1,805,202 |
|
$ |
1,548,115 |
Less: Construction in progress |
|
|
(429,390) |
|
|
(363,449) |
|
|
(320,649) |
|
|
(429,390) |
|
|
(320,649) |
Plus: Accumulated depreciation |
|
|
378,883 |
|
|
354,522 |
|
|
295,879 |
|
|
378,883 |
|
|
295,879 |
Plus: Goodwill |
|
|
173,843 |
|
|
173,843 |
|
|
173,843 |
|
|
173,843 |
|
|
173,843 |
Plus: Other fixed assets, net |
|
|
27,983 |
|
|
28,373 |
|
|
17,570 |
|
|
27,983 |
|
|
17,570 |
Plus: Acquired intangibles, net (1) |
|
|
90,903 |
|
|
93,293 |
|
|
104,458 |
|
|
90,903 |
|
|
104,458 |
Plus: Leasing Commissions, net |
|
|
32,493 |
|
|
32,036 |
|
|
30,602 |
|
|
32,493 |
|
|
30,602 |
Total as of period end |
|
$ |
2,079,917 |
|
$ |
2,038,991 |
|
$ |
1,849,818 |
|
$ |
2,079,917 |
|
$ |
1,849,818 |
|
|
|
|
|
|
|
|
|
|
|
|
|
|
|
|
Average undepreciated real estate assets and other net fixed assets as of reporting period (2) |
|
$ |
2,059,454 |
|
$ |
2,008,565 |
|
$ |
1,817,740 |
|
$ |
2,004,389 |
|
$ |
1,693,193 |
(1) |
Net of acquired intangible liabilities and deferred tax liabilities. |
(2) |
Calculated by using average quarterly balance of each account. |
9 QTS Q3 Earnings 2017 |
Contact: IR@qtsdatacenters.com |
Implied Enterprise Value and
Implied Enterprise Value as of September 30, 2017: |
|
|
|
|
Total Shares Outstanding: |
|
|
|
|
Class A Common Stock |
|
|
50,295,836 |
|
Class B Common Stock |
|
|
128,408 |
|
Total Shares Outstanding |
|
|
50,424,244 |
|
Units of Limited Partnership (1) |
|
|
6,879,739 |
|
Options to purchase Class A Common Stock (2) |
|
|
369,074 |
|
Fully Diluted Total Shares and Units of Limited Partnership outstanding as of September 30, 2017 |
|
|
57,673,057 |
|
Share price as of September 30, 2017 |
|
$ |
52.36 |
|
Market equity capitalization (in thousands) |
|
$ |
3,019,761 |
|
Debt (in thousands) |
|
|
1,100,455 |
(3) |
Implied Enterprise Value (in thousands) |
|
$ |
4,120,216 |
|
(1) |
Includes 323,510 of operating partnership units representing the “in the money” value of Class O LTIP units on an “as if” converted basis as of September 30, 2017. |
(2) |
Represents options to purchase shares of Class A Common Stock of QTS Realty Trust, Inc. representing the “in the money” value of options on an “as if” converted basis as of September 30, 2017. |
(3) |
Excludes the Senior Note discount and all debt issuance costs reflected as a reduction to liabilities at September 30, 2017 representing the full amount of debt that will be repaid, less the amount of cash and cash equivalents on hand. |
The following table presents the weighted average fully diluted shares for the three and nine months ended September 30, 2017:
|
|
Three Months Ended |
|
Nine Months Ended |
|
|
September 30, 2017 |
|
September 30, 2017 |
Weighted average shares outstanding - basic |
|
49,319,102 |
|
48,476,741 |
Effect of Class A partnership units (1) |
|
6,668,729 |
|
6,744,450 |
Effect of Class O units on an "as if" converted basis (1) |
|
456,247 |
|
518,198 |
Effect of options to purchase Class A common stock and restricted Class A common stock on an "as if" converted basis (2) |
|
388,776 |
|
389,647 |
Weighted average shares outstanding - diluted |
|
56,832,854 |
|
56,129,036 |
(1) |
The Class A units and Class O units represent limited partnership interests in the Operating Partnership. |
(2) |
The average share price for the three and nine months ended September 30, 2017 was $52.91 and $51.42, respectively. |
10 QTS Q3 Earnings 2017 |
Contact: IR@qtsdatacenters.com |
The table below presents an overview of the portfolio of data center properties that the Company owns or leases, referred to herein as our data center properties, based on information as of September 30, 2017. The table excludes data center development associated with land acquired in Phoenix, AZ which was finalized in the third quarter of 2017, as well as data center development associated with land acquisitions that occurred subsequent to September 30, 2017 in Ashburn, VA and Hillsboro, OR.
|
|
|
|
|
|
Net Rentable Square Feet (Operating NRSF) (3) |
|
|
|
|
|
|
|
|
|
|
|
||||||||
Property |
|
Year Acquired (1) |
|
Gross Square Feet (2) |
|
Raised Floor (4) |
|
Office & Other (5) |
|
Supporting Infrastructure (6) |
|
Total |
|
% Occupied (7) |
|
Annualized Rent (8) |
|
Available Utility Power (MW) (9) |
|
Basis of |
|
Current |
|
||
Richmond, VA |
|
2010 |
|
1,318,353 |
|
167,309 |
|
51,093 |
|
178,854 |
|
397,256 |
|
86.5 |
% |
|
$ |
44,431,764 |
|
110 |
|
557,309 |
|
30.0 |
% |
|
|
|
|
|
|
|
|
|
|
|
|
|
|
|
|
|
|
|
|
|
|
|
|
|
|
Atlanta, GA (Metro) |
|
2006 |
|
968,695 |
|
456,986 |
|
36,953 |
|
333,186 |
|
827,125 |
|
96.3 |
% |
|
$ |
95,817,300 |
|
72 |
|
527,186 |
|
86.7 |
% |
|
|
|
|
|
|
|
|
|
|
|
|
|
|
|
|
|
|
|
|
|
|
|
|
|
|
Irving, TX |
|
2013 |
|
698,000 |
|
148,160 |
|
6,981 |
|
141,123 |
|
296,264 |
|
98.5 |
% |
|
$ |
38,971,116 |
|
140 |
|
275,701 |
|
53.7 |
% |
|
|
|
|
|
|
|
|
|
|
|
|
|
|
|
|
|
|
|
|
|
|
|
|
|
|
Princeton, NJ |
|
2014 |
|
553,930 |
|
58,157 |
|
2,229 |
|
111,405 |
|
171,791 |
|
100.0 |
% |
|
$ |
9,995,820 |
|
22 |
|
158,157 |
|
36.8 |
% |
|
|
|
|
|
|
|
|
|
|
|
|
|
|
|
|
|
|
|
|
|
|
|
|
|
|
Chicago, IL |
|
2014 |
|
474,979 |
|
28,000 |
|
- |
|
30,452 |
|
58,452 |
|
64.9 |
% |
|
$ |
6,955,260 |
|
8 |
|
215,855 |
|
13.0 |
% |
|
|
|
|
|
|
|
|
|
|
|
|
|
|
|
|
|
|
|
|
|
|
|
|
|
|
Ashburn, VA |
|
2017 |
|
445,000 |
|
- |
|
- |
|
- |
|
- |
|
- |
% |
|
$ |
- |
|
- |
|
178,000 |
|
- |
% |
|
|
|
|
|
|
|
|
|
|
|
|
|
|
|
|
|
|
|
|
|
|
|
|
|
|
Suwanee, GA |
|
2005 |
|
369,822 |
|
205,608 |
|
8,697 |
|
107,128 |
|
321,433 |
|
86.1 |
% |
|
$ |
58,595,749 |
|
36 |
|
205,608 |
|
100.0 |
% |
|
|
|
|
|
|
|
|
|
|
|
|
|
|
|
|
|
|
|
|
|
|
|
|
|
|
Piscataway, NJ |
|
2016 |
|
360,000 |
|
88,820 |
|
14,311 |
|
91,851 |
|
194,982 |
|
83.3 |
% |
|
$ |
13,210,068 |
|
111 |
|
176,000 |
|
50.5 |
% |
|
|
|
|
|
|
|
|
|
|
|
|
|
|
|
|
|
|
|
|
|
|
|
|
|
|
Fort Worth, TX |
|
2016 |
|
261,836 |
|
10,600 |
|
|
|
19,438 |
|
30,038 |
|
100.0 |
% |
|
$ |
1,777,200 |
|
50 |
|
80,000 |
|
13.3 |
% |
|
|
|
|
|
|
|
|
|
|
|
|
|
|
|
|
|
|
|
|
|
|
|
|
|
|
Santa Clara, CA* |
|
2007 |
|
135,322 |
|
55,905 |
|
944 |
|
45,094 |
|
101,943 |
|
67.5 |
% |
|
$ |
20,600,285 |
|
11 |
|
80,940 |
|
69.1 |
% |
|
|
|
|
|
|
|
|
|
|
|
|
|
|
|
|
|
|
|
|
|
|
|
|
|
|
Sacramento, CA |
|
2012 |
|
92,644 |
|
54,595 |
|
2,794 |
|
23,916 |
|
81,305 |
|
46.3 |
% |
|
$ |
11,469,456 |
|
8 |
|
54,595 |
|
100.0 |
% |
|
|
|
|
|
|
|
|
|
|
|
|
|
|
|
|
|
|
|
|
|
|
|
|
|
|
Leased facilities ** |
|
2006 & 2015 |
|
287,546 |
|
106,692 |
|
19,626 |
|
74,893 |
|
201,211 |
|
45.0 |
% |
|
$ |
71,778,588 |
|
27 |
|
145,539 |
|
73.3 |
% |
|
|
|
|
|
|
|
|
|
|
|
|
|
|
|
|
|
|
|
|
|
|
|
|
|
|
Other *** |
|
Misc. |
|
147,435 |
|
22,380 |
|
49,337 |
|
30,074 |
|
101,791 |
|
65.5 |
% |
|
$ |
5,925,600 |
|
5 |
|
22,380 |
|
100.0 |
% |
|
|
|
|
|
|
|
|
|
|
|
|
|
|
|
|
|
|
|
|
|
|
|
|
|
|
Total |
|
|
|
6,113,562 |
|
1,403,212 |
|
192,965 |
|
1,187,414 |
|
2,783,591 |
|
87.4 |
% |
|
$ |
379,528,206 |
|
600 |
|
2,677,270 |
|
52.4 |
% |
(1) |
Represents the year a property was acquired or, in the case of a property under lease, the year the Company’s initial lease commenced for the property. |
(2) |
With respect to the Company’s owned properties, gross square feet represents the entire building area. With respect to leased properties, gross square feet represents that portion of the gross |
square feet subject to our lease. This includes 347,261 square feet of QTS office and support space, which is not included in operating NRSF.
(3) |
Represents the total square feet of a building that is currently leased or available for lease plus developed supporting infrastructure, based on engineering drawings and estimates, but does not |
include space held for redevelopment or space used for the Company’s own office space.
(4) |
Represents management’s estimate of the portion of NRSF of the facility with available power and cooling capacity that is currently leased or readily available to be leased to customers as data |
center space based on engineering drawings.
(5) |
Represents the operating NRSF of the facility other than data center space (typically office and storage space) that is currently leased or available to be leased. |
(6) |
Represents required data center support space, including mechanical, telecommunications and utility rooms, as well as building common areas. |
(7) |
Calculated as data center raised floor that is subject to a signed lease for which space is occupied (971,124 square feet as of September 30, 2017), divided by leasable raised floor based on the |
current configuration of the properties (1,111,462 square feet as of September 30, 2017), expressed as a percentage.
(8) |
The Company defines annualized rent as MRR multiplied by 12. The Company calculates MRR as monthly contractual revenue under executed contracts as of a particular date, which includes |
revenue from the Company’s C1, C2 and C3 rental and cloud and managed services activities, but excludes customer recoveries, deferred set up fees, variable related revenues, non-cash
revenues and other one-time revenues. MRR does not include the impact from booked-not-billed contracts as of a particular date, unless otherwise specifically noted. This amount reflects
the annualized cash rental payments. It does not reflect the accounting associated with any free rent, rent abatements or future scheduled rent increases and also excludes operating expense
and power reimbursements.
(9) |
Represents installed utility power and transformation capacity that is available for use by the facility as of September 30, 2017. |
* Subject to long-term ground lease.
** Includes 13 facilities. All facilities are leased, including those subject to capital leases. In October 2017, the Company finalized the buyout of the Vault facility in Ashburn, VA that was previously subject to a capital lease agreement. As the purchase occurred subsequent to September 30, 2017, the Vault facility is included within the “Leased Facilities” line item herein.
***Consists of Miami, FL; Lenexa, KS; Overland Park, KS; and Duluth, GA facilities.
11 QTS Q3 Earnings 2017 |
Contact: IR@qtsdatacenters.com |
(in millions, except NRSF data)
During the third quarter of 2017, the Company brought online approximately 2 megawatts of gross power and approximately 9,000 NRSF of raised floor and customer specific capital at its Atlanta-Metro and Irving data centers at an aggregate cost of approximately $19 million. For the nine months ended September 30, 2017, the Company brought online approximately 13 megawatts of gross power and approximately 58,000 NRSF of raised floor and customer specific capital at its Atlanta-Metro, Chicago, Irving, Fort Worth and Northern Virginia facilities at an aggregate cost of approximately $122 million.
Relative to the redevelopment plan disclosed in the prior quarter, and as a result of the capital investments made in new markets since the end of the second quarter, the Company has pushed out a portion of development space in Fort Worth, the Vault in Northern Virginia and Santa Clara, that was previously scheduled to come online in the fourth quarter of 2017. The Company now expects this development space to be brought online during 2018 as part of its overall focus on capital efficiency and discipline.
The under construction table below summarizes the Company’s outlook for development projects which it expects to complete by December 31, 2017 (in millions).
|
|
Under Construction Costs (1) |
|||||||||
Property |
|
Actual (2) |
|
Estimated Cost to Completion (3) |
|
Total |
|
Expected Completion date |
|||
Atlanta-Metro |
|
$ |
5 |
|
$ |
1 |
|
$ |
6 |
|
Q4 2017 |
Irving |
|
|
35 |
|
|
5 |
|
|
40 |
|
Q4 2017 |
Chicago |
|
|
5 |
|
|
9 |
|
|
14 |
|
Q4 2017 |
Piscataway |
|
|
8 |
|
|
1 |
|
|
9 |
|
Q4 2017 |
Totals |
|
$ |
53 |
|
$ |
16 |
|
$ |
69 |
|
|
(1) |
In addition to projects currently under construction, the Company’s near-term redevelopment projects are expected to be delivered in a modular manner, and the Company currently expects to invest additional capital to complete these near term projects. The ultimate timing and completion of, and the commitment of capital to, the Company’s future redevelopment projects are within the Company’s discretion and will depend upon a variety of factors, including the actual contracts executed, availability of financing and the Company’s estimation of the future market for data center space in each particular market. |
(2) |
Represents actual costs under construction through September 30, 2017. In addition to the $53 million of construction costs incurred through September 30, 2017 for redevelopment expected to be completed by December 31, 2017, as of September 30, 2017 the Company had incurred $376 million of additional costs (including acquisition costs and other capitalized costs) for other redevelopment projects that are expected to be completed after December 31, 2017. |
(3) |
Represents management’s estimate of the additional costs required to complete the current NRSF under development. There may be an increase in costs if customers’ requirements exceed the Company’s current basis of design. |
12 QTS Q3 Earnings 2017 |
Contact: IR@qtsdatacenters.com |
(in millions, except NRSF data)
The following redevelopment table presents an overview of the Company’s redevelopment pipeline, based on information as of September 30, 2017. This table shows the Company’s ability to increase its raised floor of 1,403,212 square feet as of September 30, 2017 by approximately 1.9 times to 2.7 million square feet. The table excludes data center development associated with land acquisitions that occurred subsequent to September 30, 2017 in Ashburn, VA and Hillsboro, OR.
|
|
Raised Floor NRSF |
||||||||
|
|
Overview as of September 30, 2017 |
||||||||
Property |
|
Current NRSF in Service |
|
Under Construction (1) |
|
Future Available (2) |
|
Basis of Design NRSF |
|
Approximate Adjacent Acreage of Land (3) |
Richmond |
|
167,309 |
|
- |
|
390,000 |
|
557,309 |
|
111.1 |
Atlanta-Metro |
|
456,986 |
|
7,000 |
|
63,200 |
|
527,186 |
|
12.6 |
Irving |
|
148,160 |
|
20,000 |
|
107,541 |
|
275,701 |
|
29.4 |
Princeton |
|
58,157 |
|
- |
|
100,000 |
|
158,157 |
|
65.0 |
Chicago |
|
28,000 |
|
7,000 |
|
180,855 |
|
215,855 |
|
23.0 |
Ashburn |
|
- |
|
- |
|
178,000 |
|
178,000 |
|
- |
Atlanta-Suwanee |
|
205,608 |
|
- |
|
- |
|
205,608 |
|
15.4 |
Piscataway |
|
88,820 |
|
10,000 |
|
77,180 |
|
176,000 |
|
- |
Fort Worth |
|
10,600 |
|
- |
|
69,400 |
|
80,000 |
|
26.5 |
Santa Clara |
|
55,905 |
|
- |
|
25,035 |
|
80,940 |
|
- |
Sacramento |
|
54,595 |
|
- |
|
- |
|
54,595 |
|
- |
Leased facilities (4) |
|
106,692 |
|
- |
|
38,847 |
|
145,539 |
|
- |
Phoenix |
|
- |
|
- |
|
- |
|
- |
|
84.2 |
Other (5) |
|
22,380 |
|
- |
|
- |
|
22,380 |
|
- |
Totals as of September 30, 2017 |
|
1,403,212 |
|
44,000 |
|
1,230,058 |
|
2,677,270 |
|
367.2 |
(1) |
Reflects NRSF at a facility for which the initiation of substantial activities has begun to prepare the property for its intended use on or before December 31, 2017. |
(2) |
Reflects NRSF at a facility for which the initiation of substantial activities has begun to prepare the property for its intended use after December 31, 2017. |
(3) |
The total cost basis of adjacent land, which is land available for the future development, is approximately $30 million. This is included in land on the Combined Consolidated Balance Sheets. The Basis of Design NRSF does not include any build-out on the adjacent land. |
(4) |
Includes 13 facilities. All facilities are leased, including those subject to capital leases. In October 2017, the Company finalized the buyout of the Vault facility in Ashburn, VA that was previously subject to a capital lease agreement. As the purchase occurred subsequent to September 30, 2017, the Vault facility is included within the “Leased Facilities” line item herein. |
(5) |
Consists of Miami, FL; Lenexa, KS; Overland Park, KS; and Duluth, GA facilities. |
13 QTS Q3 Earnings 2017 |
Contact: IR@qtsdatacenters.com |
NOI by Facility and Capital Expenditure Summary
(unaudited and in thousands)
The Company calculates net operating income, or NOI, as net income (loss), excluding: interest expense, interest income, tax expense (benefit) of taxable REIT subsidiaries, depreciation and amortization, write-off of unamortized deferred financing costs, gain (loss) on extinguishment of debt, transaction and integration costs, gain (loss) on sale of real estate, restructuring costs and general and administrative expenses. The Company believes that NOI is another metric that is often utilized to evaluate returns on operating real estate from period to period and also, in part, to assess the value of the operating real estate. The breakdown of NOI by facility is shown below:
|
Three Months Ended |
|
Nine Months Ended |
|||||||||||
|
September 30, |
|
June 30, |
|
September 30, |
|
September 30, |
|||||||
|
2017 |
|
2017 |
|
2016 |
|
2017 |
|
2016 |
|||||
Breakdown of NOI by facility: |
|
|
|
|
|
|
|
|
|
|
|
|
|
|
Atlanta-Metro data center |
$ |
18,588 |
|
$ |
20,704 |
|
$ |
20,030 |
|
$ |
59,803 |
|
$ |
60,887 |
Atlanta-Suwanee data center |
|
12,206 |
|
|
11,423 |
|
|
11,051 |
|
|
35,587 |
|
|
33,823 |
Leased data centers (1) |
|
8,278 |
|
|
8,408 |
|
|
10,751 |
|
|
25,696 |
|
|
33,134 |
Richmond data center |
|
11,687 |
|
|
8,389 |
|
|
7,850 |
|
|
28,306 |
|
|
22,428 |
Irving data center |
|
8,707 |
|
|
8,057 |
|
|
5,118 |
|
|
23,204 |
|
|
11,656 |
Santa Clara data center |
|
2,741 |
|
|
2,705 |
|
|
2,961 |
|
|
8,725 |
|
|
10,378 |
Piscataway data center |
|
2,427 |
|
|
2,279 |
|
|
2,086 |
|
|
7,109 |
|
|
2,756 |
Princeton data center |
|
2,415 |
|
|
2,393 |
|
|
2,468 |
|
|
7,207 |
|
|
7,180 |
Sacramento data center |
|
1,525 |
|
|
1,778 |
|
|
1,780 |
|
|
5,140 |
|
|
5,842 |
Chicago data center |
|
1,285 |
|
|
1,275 |
|
|
(157) |
|
|
3,207 |
|
|
(157) |
Fort Worth data center |
|
94 |
|
|
75 |
|
|
- |
|
|
275 |
|
|
- |
Other facilities (2) |
|
955 |
|
|
590 |
|
|
674 |
|
|
2,121 |
|
|
1,953 |
NOI (3) |
$ |
70,908 |
|
$ |
68,076 |
|
$ |
64,612 |
|
$ |
206,380 |
|
$ |
189,880 |
(1) |
Includes 13 facilities. All facilities are leased, including those subject to capital leases. During the quarter ended March 31, 2017, the Company moved its Jersey City, NJ facility to the “Leased data centers” line item. In October 2017, the Company finalized the buyout of the Vault facility in Ashburn, VA that was previously subject to a capital lease agreement. As the purchase occurred subsequent to September 30, 2017, the Vault facility is included within the “Leased Facilities” line item herein. |
(2) |
Consists of Miami, FL; Lenexa, KS; Overland Park, KS; and Duluth, GA facilities. During the quarter ended March 31, 2017, the Company moved its Miami, FL facility to the “Other facilities” line item. |
(3) |
Includes facility level G&A expense allocation charges of 4% of cash revenue for all facilities, with the exception of the leased facilities acquired in 2015, which include G&A expense allocation charges of 10% of cash revenue. These allocated charges aggregated to $5.5 million, $5.3 million and $5.2 million for the three month periods ended September 30, 2017, June 30, 2017 and September 30, 2016, respectively, and $16.0 million and $15.3 million for the nine month periods ended September 30, 2017 and 2016, respectively. |
Our cash paid for capital expenditures is summarized as follows:
|
Capital Expenditures (1) |
||||||||||||||
|
Three Months Ended |
|
|
Nine Months Ended |
|||||||||||
|
September 30, |
|
June 30, |
|
September 30, |
|
|
September 30, |
|||||||
|
2017 |
|
2017 |
|
2016 |
|
|
2017 |
|
2016 |
|||||
Development |
$ |
68,179 |
|
$ |
53,489 |
|
$ |
27,781 |
|
|
$ |
168,286 |
|
$ |
143,249 |
Acquisitions |
|
41,994 |
|
|
5,019 |
|
|
- |
|
|
|
47,013 |
|
|
122,981 |
Maintenance capital expenditures |
|
2,193 |
|
|
1,172 |
|
|
1,731 |
|
|
|
4,161 |
|
|
2,446 |
Other capital expenditures (2) |
|
26,781 |
|
|
19,038 |
|
|
18,936 |
|
|
|
64,524 |
|
|
52,056 |
Total capital expenditures |
$ |
139,147 |
|
$ |
78,718 |
|
$ |
48,448 |
|
|
$ |
283,984 |
|
$ |
320,732 |
(1) |
During the quarter ended December 31, 2016 the Company transitioned presentation of capital expenditures to a cash basis. Previously, capital expenditure disclosures reflected an incurred basis. The prior year comparative periods have been conformed to cash basis presentation as well. |
(2) |
Represents capital expenditures for capitalized interest, commissions, personal property, overhead costs and corporate fixed assets. Corporate fixed assets primarily relate to construction of corporate offices, leasehold improvements and product related assets. |
14 QTS Q3 Earnings 2017 |
Contact: IR@qtsdatacenters.com |
Leasing Statistics – Signed Leases
The mix of leasing activity has a significant impact on quarterly rates, both within major product segments and for overall blended leasing rates. The Company’s rate performance will vary quarter to quarter based on the mix of deals leased – C1 - Custom Data Center, C2 - Colocation (Cabinet, Cage and Suite), and C3 - Cloud and Managed Services categories all vary on a rate per square foot basis. The amounts below include renewals when there was a change in square footage rented, and renewals where C3 dedicated server cloud customers had shifts in their MRR related to their use of fully depreciated equipment. The amounts below exclude renewals where square footage remained consistent before and after renewal. (See renewal table on page 16 for such renewals).
During the third quarter of 2017, the Company entered into 488 new and modified leases aggregating to $38.6 million of annualized rent which includes new leased revenue plus revenue from modified renewals. Removing non-incremental annualized modified renewal MRR and deducting downgrades during the period resulted in $15.3 million in incremental annualized rent for the quarter ended September 30, 2017 which was 40.1% higher than the prior four quarter average. Blended pricing on new and modified leases signed during the third quarter was lower than the prior four quarter average primarily driven by a larger mix of C1 leases signed in relation to C2/C3 leases. Pricing on new and modified C1 leases declined relative to the prior four quarter average as a result of multiple larger footprint leases signed during the quarter which tend to have a lower rate per square foot. Pricing on new and modified C2/C3 leases increased materially relative to the prior four quarter average driven by a higher mix of C3 leases signed.
Annualized Rent of New and Modified Leases represents total MRR associated with all new and modified leases for the respective periods for purposes of computing annualized rent rates per square foot during the period. Incremental Annualized Rent, Net of Downgrades reflects net incremental MRR signed during the period for purposes of tracking incremental revenue contribution.
|
|
Period |
|
|
Number of Leases |
|
|
Total Leased sq ft |
|
|
Annualized Rent per Leased sq ft |
|
|
Annualized Rent of New and Modified Leases |
|
|
Incremental Annualized Rent, Net of Downgrades |
|
|
|
|
|
|
|
|
|
|
|
|
|
|
|
|
|
|
New/modified leases signed - Total |
|
Q3 2017 |
|
|
488 |
|
|
79,662 |
|
$ |
485 |
|
$ |
38,596,383 |
|
$ |
15,329,139 |
|
|
P4QA* |
|
|
438 |
|
|
27,700 |
|
|
793 |
|
|
21,955,855 |
|
|
10,939,266 |
|
|
Q2 2017 |
|
|
475 |
|
|
20,799 |
|
|
1,018 |
|
|
21,177,858 |
|
|
13,314,696 |
|
|
Q1 2017 |
|
|
411 |
|
|
17,631 |
|
|
849 |
|
|
14,962,595 |
|
|
4,333,697 |
|
|
Q4 2016 |
|
|
415 |
|
|
31,762 |
|
|
715 |
|
|
22,705,378 |
|
|
11,605,699 |
|
|
Q3 2016 |
|
|
451 |
|
|
40,607 |
|
|
714 |
|
|
28,977,588 |
|
|
14,502,971 |
|
|
|
|
|
|
|
|
|
|
|
|
|
|
|
|
|
|
New/modified leases signed - C1 |
|
Q3 2017 |
|
|
46 |
|
|
70,026 |
|
$ |
210 |
|
$ |
14,700,946 |
|
|
|
|
|
P4QA* |
|
|
32 |
|
|
17,164 |
|
|
339 |
|
|
5,822,030 |
|
|
|
|
|
Q2 2017 |
|
|
36 |
|
|
11,895 |
|
|
363 |
|
|
4,314,426 |
|
|
|
|
|
Q1 2017 |
|
|
30 |
|
|
10,000 |
|
|
155 |
|
|
1,551,888 |
|
|
|
|
|
Q4 2016 |
|
|
25 |
|
|
23,088 |
|
|
329 |
|
|
7,585,764 |
|
|
|
|
|
Q3 2016 |
|
|
38 |
|
|
23,671 |
|
|
416 |
|
|
9,836,040 |
|
|
|
|
|
|
|
|
|
|
|
|
|
|
|
|
|
|
|
|
|
New/modified leases signed - C2/C3 |
|
Q3 2017 |
|
|
442 |
|
|
9,636 |
|
$ |
2,480 |
|
$ |
23,895,437 |
|
|
|
|
|
P4QA* |
|
|
406 |
|
|
10,536 |
|
|
1,531 |
|
|
16,133,825 |
|
|
|
|
|
Q2 2017 |
|
|
439 |
|
|
8,904 |
|
|
1,894 |
|
|
16,863,432 |
|
|
|
|
|
Q1 2017 |
|
|
381 |
|
|
7,631 |
|
|
1,757 |
|
|
13,410,707 |
|
|
|
|
|
Q4 2016 |
|
|
390 |
|
|
8,674 |
|
|
1,743 |
|
|
15,119,614 |
|
|
|
|
|
Q3 2016 |
|
|
413 |
|
|
16,936 |
|
|
1,130 |
|
|
19,141,548 |
|
|
|
* |
Average of prior 4 quarters |
NOTE: Figures above do not include cost recoveries. In general, C1 customers reimburse the Company for certain operating costs whereas C2/C3 customers are on a gross lease basis. As a result, pricing and resulting per square foot rates for C2/C3 customers includes the recovery of such operating costs.
15 QTS Q3 Earnings 2017 |
Contact: IR@qtsdatacenters.com |
The following table outlines the booked-not-billed (“BNB”) balance as of September 30, 2017 and how that will affect revenue in 2017 and subsequent years:
Booked-not-billed ("BNB") |
2017 |
|
2018 |
|
Thereafter |
|
Total |
||||
MRR |
$ |
1,294,300 |
|
$ |
1,656,231 |
|
$ |
1,762,405 |
|
$ |
4,712,936 |
Incremental revenue (1) |
|
2,745,851 |
|
|
13,130,210 |
|
|
21,148,860 |
|
|
|
Annualized revenue (2) |
|
15,531,600 |
|
|
19,874,772 |
|
|
21,148,860 |
|
|
56,555,232 |
(1) |
Incremental revenue represents the expected amount of recognized MRR in the period based on when the booked-not-billed leases commence throughout the period. |
(2) |
Annualized revenue represents the booked-not-billed MRR multiplied by 12, demonstrating how much recognized MRR might have been recognized if the booked-not-billed leases commencing in the period were in place for an entire year. |
The Company estimates the remaining cost to provide the space, power, connectivity and other services to the customer contracts which had not billed as of September 30, 2017 to be approximately $28 million. This estimate generally includes C1 customers with newly contracted space of more than 3,300 square feet. The space, power, connectivity and other services provided to customers that contract for smaller amounts of space is generally provided by existing space which was previously developed.
16 QTS Q3 Earnings 2017 |
Contact: IR@qtsdatacenters.com |
Leasing Statistics – Renewed Leases and Rental Churn
The mix of leasing activity has a significant impact on quarterly rates, both within major product segments and for overall blended renewal rates. The Company’s rate performance will vary quarter to quarter based on the mix of deals leased – C1 Custom Data Center, C2 Colocation, and C3 Cloud and Managed Services categories all vary on a rate per square foot basis.
Consistent with the Company’s 3C strategy and business model, the renewal rates below reflect total MRR per square foot including all subscribed services. For comparability, the Company includes only those customers that have maintained consistent space footprints in the computations below. All customers with space changes are incorporated into new/modified leasing statistics and rates.
The overall blended rate for renewals signed in the third quarter of 2017 was 2.1% higher than the rates for those customers immediately prior to renewal. The Company expects renewal rates will generally increase in the low to mid-single digits.
Rental Churn (which the Company defines as MRR lost in the period to a customer intending to fully exit the QTS platform in the near term compared to total MRR at the beginning of the period) was 1.3% for the third quarter of 2017. Rental Churn was 5.6% for the nine months ended September 30, 2017, the majority of which was the result of a single customer termination in the first quarter of 2017 at one of the Company’s leased facilities in Northern Virginia which was disclosed in prior quarters. Excluding this customer termination, rental churn for the nine months ended September 30, 2017 would be 3.1%.
|
|
Period |
|
Number of renewed leases |
|
Total Leased sq ft |
|
|
Annualized rent per leased sq ft |
|
|
Annualized Rent |
|
|
Rent Change (1) |
|
|
|
|
|
|
|
|
|
|
|
|
|
|
|
|
Renewed Leases - Total |
|
Q3 2017 |
|
88 |
|
17,257 |
|
$ |
660 |
|
$ |
11,392,275 |
|
|
2.1% |
|
|
P4QA* |
|
92 |
|
20,255 |
|
|
645 |
|
|
13,058,652 |
|
|
2.2% |
|
|
Q2 2017 |
|
111 |
|
17,491 |
|
|
1,077 |
|
|
18,831,663 |
|
|
1.0% |
|
|
Q1 2017 |
|
77 |
|
11,808 |
|
|
661 |
|
|
7,802,039 |
|
|
2.6% |
|
|
Q4 2016 |
|
84 |
|
42,849 |
|
|
348 |
|
|
14,919,636 |
|
|
4.7% |
|
|
Q3 2016 |
|
94 |
|
8,871 |
|
|
1,204 |
|
|
10,681,272 |
|
|
0.8% |
|
|
|
|
|
|
|
|
|
|
|
|
|
|
|
|
|
|
|
|
|
|
|
|
|
|
|
|
|
|
|
|
Renewed Leases - C1 |
|
Q3 2017 |
|
3 |
|
5,008 |
|
$ |
286 |
|
$ |
1,431,982 |
|
|
-3.2% |
|
|
P4QA* |
|
2 |
|
11,080 |
|
|
231 |
|
|
2,564,273 |
|
|
3.8% |
|
|
Q2 2017 |
|
1 |
|
3,000 |
|
|
433 |
|
|
1,300,200 |
|
|
4.3% |
|
|
Q1 2017 |
|
1 |
|
6,007 |
|
|
179 |
|
|
1,073,888 |
|
|
0.6% |
|
|
Q4 2016 |
|
5 |
|
35,311 |
|
|
223 |
|
|
7,883,004 |
|
|
4.1% |
|
|
Q3 2016 |
|
- |
|
- |
|
|
- |
|
|
- |
|
|
0.0% |
|
|
|
|
|
|
|
|
|
|
|
|
|
|
|
|
|
|
|
|
|
|
|
|
|
|
|
|
|
|
|
|
Renewed Leases - C2/C3 |
|
Q3 2017 |
|
85 |
|
12,249 |
|
$ |
813 |
|
$ |
9,960,292 |
|
|
2.9% |
|
|
P4QA* |
|
90 |
|
9,175 |
|
|
1,144 |
|
|
10,494,379 |
|
|
1.9% |
|
|
Q2 2017 |
|
110 |
|
14,491 |
|
|
1,210 |
|
|
17,531,463 |
|
|
0.7% |
|
|
Q1 2017 |
|
76 |
|
5,801 |
|
|
1,160 |
|
|
6,728,151 |
|
|
3.0% |
|
|
Q4 2016 |
|
79 |
|
7,538 |
|
|
933 |
|
|
7,036,632 |
|
|
5.4% |
|
|
Q3 2016 |
|
94 |
|
8,871 |
|
|
1,204 |
|
|
10,681,272 |
|
|
0.8% |
* |
Average of prior 4 quarters |
(1) |
Calculated as the percentage change of the rent per square foot immediately before renewal when compared to the rent per square foot immediately after renewal. |
17 QTS Q3 Earnings 2017 |
Contact: IR@qtsdatacenters.com |
Leasing Statistics – Commenced Leases
The mix of leasing activity across C1, C2 and C3 has significant impact on quarterly rates, both within major product segments and for overall blended commencement rates. The Company’s rate performance will vary quarter to quarter based on the mix of deals leased. C1 Custom Data Center, C2 Colocation, and C3 Cloud and Managed Services categories all vary on a rate per square foot basis.
During the third quarter of 2017, the Company commenced customer leases (which includes both new customers and existing customers that renewed their lease terms) representing approximately $32.6 million of annualized rent at $617 per square foot. This compares to customer leases representing an aggregate trailing four quarter average of approximately $30.6 million of annualized rent at $569 per square foot. Average pricing on commenced leases during the third quarter of 2017 increased compared to the prior four quarter average primarily due to a larger mix of C2/C3 commencements which tend to have a higher rate per square foot in comparison to C1 deals.
|
|
Period |
|
Number of leases |
|
Total Leased sq ft |
|
Annualized rent per leased sq ft |
|
Annualized Rent |
||
|
|
|
|
|
|
|
|
|
|
|
|
|
Leases commenced - Total |
|
Q3 2017 |
|
568 |
|
52,833 |
|
$ |
617 |
|
$ |
32,585,052 |
|
|
P4QA* |
|
461 |
|
53,821 |
|
|
569 |
|
|
30,606,409 |
|
|
Q2 2017 |
|
526 |
|
44,743 |
|
|
778 |
|
|
34,787,704 |
|
|
Q1 2017 |
|
448 |
|
59,253 |
|
|
418 |
|
|
24,743,966 |
|
|
Q4 2016 |
|
467 |
|
71,399 |
|
|
464 |
|
|
33,118,296 |
|
|
Q3 2016 |
|
404 |
|
39,889 |
|
|
746 |
|
|
29,775,672 |
|
|
|
|
|
|
|
|
|
|
|
|
|
Leases commenced - C1 |
|
Q3 2017 |
|
49 |
|
23,710 |
|
$ |
183 |
|
$ |
4,342,383 |
|
|
P4QA* |
|
30 |
|
38,276 |
|
|
209 |
|
|
7,997,214 |
|
|
Q2 2017 |
|
42 |
|
25,527 |
|
|
192 |
|
|
4,895,828 |
|
|
Q1 2017 |
|
36 |
|
47,531 |
|
|
203 |
|
|
9,642,316 |
|
|
Q4 2016 |
|
20 |
|
52,247 |
|
|
191 |
|
|
9,997,212 |
|
|
Q3 2016 |
|
20 |
|
27,800 |
|
|
268 |
|
|
7,453,500 |
|
|
|
|
|
|
|
|
|
|
|
|
|
Leases commenced - C2/C3 |
|
Q3 2017 |
|
519 |
|
29,123 |
|
$ |
970 |
|
$ |
28,242,669 |
|
|
P4QA* |
|
432 |
|
15,545 |
|
|
1,454 |
|
|
22,609,196 |
|
|
Q2 2017 |
|
484 |
|
19,216 |
|
|
1,556 |
|
|
29,891,876 |
|
|
Q1 2017 |
|
412 |
|
11,722 |
|
|
1,288 |
|
|
15,101,650 |
|
|
Q4 2016 |
|
447 |
|
19,152 |
|
|
1,207 |
|
|
23,121,084 |
|
|
Q3 2016 |
|
384 |
|
12,089 |
|
|
1,846 |
|
|
22,322,172 |
* |
Average of prior 4 quarters |
18 QTS Q3 Earnings 2017 |
Contact: IR@qtsdatacenters.com |
C1 leases are typically 5-10 years with the majority of C1 lease expirations occurring in 2018 and beyond. C2/C3 leases are typically 3 years in duration, with the majority of C2/C3 lease expirations occurring in 2017 and 2018. The following table sets forth a summary schedule of the lease expirations as of September 30, 2017 at the properties in the Company’s portfolio. Unless otherwise stated in the footnotes, the information set forth in the table assumes that customers exercise no renewal options and all early termination rights are exercised:
|
|
|
|
|
|
|
|
|
|
|
|
|
|
|
|
|
|
|
|
|
|
|
|
|
|
|
|
|
|
|
|
|
|
|
|
|
|
|
|
|
|
|
|
|
|
Year of Lease Expiration |
|
Number of Leases Expiring (1) |
|
Total Raised Floor of Expiring Leases |
|
% of Portfolio Leased Raised Floor |
|
|
Annualized Rent (2) |
|
% of Portfolio Annualized Rent |
|
|
C1 as % of Portfolio Annualized Rent |
|
|
C2 as % of Portfolio Annualized Rent |
|
|
C3 as % of Portfolio Annualized Rent |
|
|
Month-to-Month (3) |
|
436 |
|
22,404 |
|
2 |
% |
|
$ |
25,152,804 |
|
7 |
% |
|
1 |
% |
|
4 |
% |
|
2 |
% |
2017 |
|
474 |
|
24,603 |
|
2 |
% |
|
|
29,177,367 |
|
8 |
% |
|
2 |
% |
|
3 |
% |
|
3 |
% |
2018 |
|
1,416 |
|
300,507 |
|
31 |
% |
|
|
118,466,045 |
|
31 |
% |
|
11 |
% |
|
15 |
% |
|
5 |
% |
2019 |
|
910 |
|
130,557 |
|
13 |
% |
|
|
65,686,539 |
|
17 |
% |
|
6 |
% |
|
10 |
% |
|
1 |
% |
2020 |
|
606 |
|
75,660 |
|
8 |
% |
|
|
39,663,176 |
|
10 |
% |
|
3 |
% |
|
6 |
% |
|
1 |
% |
2021 |
|
118 |
|
74,413 |
|
8 |
% |
|
|
21,475,948 |
|
6 |
% |
|
3 |
% |
|
2 |
% |
|
1 |
% |
After 2021 |
|
163 |
|
342,980 |
|
36 |
% |
|
|
79,906,328 |
|
21 |
% |
|
18 |
% |
|
1 |
% |
|
2 |
% |
Portfolio Total |
|
4,123 |
|
971,124 |
|
100 |
% |
|
$ |
379,528,206 |
|
100 |
% |
|
44 |
% |
|
41 |
% |
|
15 |
% |
(1) |
Represents each agreement with a customer signed as of September 30, 2017 for which billing has commenced; a lease agreement could include multiple spaces and a customer could have multiple leases. |
(2) |
Annualized rent is presented for leases commenced as of September 30, 2017. The Company defines annualized rent as MRR multiplied by 12. The Company calculates MRR as monthly contractual revenue under signed leases as of a particular date, which includes revenue from our C1, C2 and C3 rental and cloud and managed services activities, but excludes customer recoveries, deferred set-up fees, variable related revenues, non-cash revenues and other one-time revenues. MRR does not include the impact from booked-not-billed leases as of a particular date, unless otherwise specifically noted. This amount reflects the annualized cash rental payments. It does not reflect the accounting associated with any free rent, rent abatements or future scheduled rent increases and also excludes operating expense and power reimbursements. |
(3) |
Consists of both customer leases whose original contract terms ended on September 30, 2017 and have yet to commence signed renewals as well as customers whose leases expired prior to September 30, 2017 and have continued on a month-to-month basis. |
19 QTS Q3 Earnings 2017 |
Contact: IR@qtsdatacenters.com |
As of September 30, 2017, the Company’s portfolio was leased to over 1,100 customers comprised of companies of all sizes representing an array of industries, each with unique and varied business models and needs. The following table sets forth information regarding the ten largest customers in the portfolio based on annualized rent as of September 30, 2017 (does not include rents or maturities associated with booked-not-billed customers or ramps for existing customers which have not yet commenced billing):
Principal Customer Industry |
|
Product |
|
Number of Locations |
|
Annualized Rent (1) |
|
% of Portfolio Annualized Rent |
|
Weighted Average Remaining Lease Term (Months) (2) |
|
Content & Digital Media |
|
C1 |
|
2 |
|
$ |
47,337,530 |
|
12.5% |
|
31 |
Cloud & IT Services |
|
C1 |
|
2 |
|
|
15,440,959 |
|
4.1% |
|
79 |
Cloud & IT Services |
|
C1 |
|
1 |
|
|
15,051,235 |
|
4.0% |
|
54 |
Cloud & IT Services |
|
C1, C3 |
|
3 |
|
|
12,722,296 |
|
3.4% |
|
78 |
Cloud & IT Services |
|
C1, C2, C3 |
|
6 |
|
|
12,009,000 |
|
3.2% |
|
25 |
Content & Digital Media |
|
C1 |
|
1 |
|
|
9,644,400 |
|
2.5% |
|
13 |
Content & Digital Media |
|
C2, C3 |
|
4 |
|
|
7,191,909 |
|
1.9% |
|
6 |
Cloud & IT Services |
|
C2, C3 |
|
7 |
|
|
6,718,805 |
|
1.8% |
|
14 |
Content & Digital Media |
|
C3 |
|
2 |
|
|
5,006,367 |
|
1.3% |
|
5 |
Financial Services |
|
C2, C3 |
|
1 |
|
|
4,774,068 |
|
1.3% |
|
3 |
Total / Weighted Average |
|
|
|
|
|
$ |
135,896,569 |
|
35.8% |
|
37 |
(1) |
Annualized rent is presented for leases commenced as of September 30, 2017. We define annualized rent as MRR multiplied by 12. We calculate MRR as monthly contractual revenue under signed leases as of a particular date, which includes revenue from our C1, C2 and C3 rental and cloud and managed services activities, but excludes customer recoveries, deferred set-up fees, variable related revenues, non-cash revenues and other one-time revenues. MRR does not include the impact from booked-not-billed leases (which represent customer leases that have been executed but for which lease payments have not commenced) as of a particular date. This amount reflects the annualized cash rental payments. It does not reflect any free rent, rent abatements or future scheduled rent increases and also excludes operating expense and power reimbursements. |
(2) |
Weighted average based on customer’s percentage of total annualized rent expiring and is as of September 30, 2017. |
20 QTS Q3 Earnings 2017 |
Contact: IR@qtsdatacenters.com |
The following table sets forth information relating to the industry segmentation of customers as of September 30, 2017:
|
The following table sets forth information relating to the industry segmentation of customers as of December 31, 2016:
21 QTS Q3 Earnings 2017 |
Contact: IR@qtsdatacenters.com |
The following table sets forth information relating to the distribution of leases at the properties, by type of product offering, as of September 30, 2017:
(1) |
As of September 30, 2017, C1 customers renting at least 6,600 square feet represented $145.2 million of annualized C1 MRR, C1 customers renting between 3,300 and 6,599 square feet represented $8.6 million of annualized C1 MRR, and C1 customers renting below 3,300 square feet represented $11.7 million of annualized C1 MRR. As of September 30, 2017, C1 customers’ median used square footage was 5,400 square feet. |
The following table sets forth information relating to the distribution of leases at the properties, by type of product offering, as of December 31, 2016:
(1) |
As of December 31, 2016, C1 customers renting at least 6,600 square feet represented $124.6 million of annualized C1 MRR, C1 customers renting between 3,300 and 6,599 square feet represented $13.0 million of annualized C1 MRR, and C1 customers renting below 3,300 square feet represented $11.9 million of annualized C1 MRR. As of December 31, 2016, C1 customers’ median used square footage was 4,600 square feet. |
22 QTS Q3 Earnings 2017 |
Contact: IR@qtsdatacenters.com |
Debt Summary and Debt Maturities
(unaudited and in thousands)
The following tables set forth a summary of the Company’s debt instruments:
|
|
|
Weighted Average |
|
|
|
|
|
|
|
|
||||
|
|
|
Coupon Interest Rate at |
|
|
|
|
|
|
|
Outstanding Balance as of: |
||||
|
|
|
September 30, 2017 |
|
Maturities |
|
|
September 30, 2017 |
|
December 31, 2016 |
|||||
Unsecured Credit Facility (1) |
|
|
|
|
|
|
|
|
|
|
|
|
|
|
|
Revolving Credit Facility |
|
|
2.78% |
|
December 17, 2020 |
|
|
$ |
279,000 |
|
$ |
139,000 |
|||
Term Loan I |
|
|
2.74% |
|
December 17, 2021 |
|
|
|
300,000 |
|
|
300,000 |
|||
Term Loan II |
|
|
2.74% |
|
April 27, 2022 |
|
|
|
200,000 |
|
|
200,000 |
|||
Senior Notes (2) |
|
|
5.88% |
|
August 1, 2022 |
|
|
|
300,000 |
|
|
300,000 |
|||
Lenexa Mortgage |
|
|
4.10% |
|
May 1, 2022 |
|
|
|
1,882 |
|
|
- |
|||
Capital Lease and Lease Financing Obligations |
|
|
3.87% |
|
2017 - 2025 |
|
|
|
28,843 |
(3) |
|
38,708 |
|||
Total |
|
|
3.63% |
|
|
|
|
|
|
|
$ |
1,109,725 |
|
$ |
977,708 |
(1) |
Balances exclude debt issuance costs reflected as liabilities aggregating $3.6 million and $4.1 million at September 30, 2017 and December 31, 2016, respectively. |
(2) |
Balance excludes the Senior Note discount and debt issuance costs reflected as liabilities aggregating $6.8 million and $7.8 million at September 30, 2017 and December 31, 2016, respectively. |
(3) |
In October 2017, the Company finalized the buyout of the Vault facility in Ashburn, VA that was previously subject to a capital lease agreement. The facility was purchased for approximately $34 million which was funded from a draw on the Company’s unsecured revolving credit facility. Had the purchase occurred prior to period end, the balance of capital lease and lease financing obligations would have been $11.0 million as of September 30, 3017. |
|
|
Outstanding Balance as of: |
|
% of |
|
Outstanding Balance as of: |
|
% of |
||
|
|
September 30, 2017 (1) |
|
total |
|
December 31, 2016 |
|
total |
||
Fixed Rate Debt |
|
$ |
730,725 |
|
65.8% |
|
$ |
338,708 |
|
34.6% |
Floating Rate Debt |
|
|
379,000 |
|
34.2% |
|
|
639,000 |
|
65.4% |
|
|
$ |
1,109,725 |
|
100.0% |
|
$ |
977,708 |
|
100.0% |
(1) |
Includes all debt that is currently at a fixed rate and pro forma for $400 million of debt that was swapped to a fixed rate that will become effective January 2, 2018. |
Scheduled debt maturities as of September 30, 2017:
Debt instruments |
|
2017 |
|
2018 |
|
2019 |
|
2020 |
|
2021 |
|
Thereafter |
|
Total |
|||||||
Unsecured Credit Facility (1) |
|
$ |
- |
|
$ |
- |
|
$ |
- |
|
$ |
279,000 |
|
$ |
300,000 |
|
$ |
200,000 |
|
$ |
779,000 |
Senior Notes (2) |
|
|
- |
|
|
- |
|
|
- |
|
|
- |
|
|
- |
|
|
300,000 |
|
|
300,000 |
Lenexa Mortgage |
|
|
11 |
|
|
65 |
|
|
68 |
|
|
71 |
|
|
74 |
|
|
1,593 |
|
|
1,882 |
Capital Lease and Lease Financing Obligations |
|
|
3,078 |
|
|
9,370 |
|
|
2,844 |
|
|
2,190 |
|
|
2,388 |
|
|
8,973 |
|
|
28,843 |
Total |
|
$ |
3,089 |
|
$ |
9,435 |
|
$ |
2,912 |
|
$ |
281,261 |
|
$ |
302,462 |
|
$ |
510,566 |
|
$ |
1,109,725 |
(1) |
Balances exclude debt issuance costs reflected as liabilities aggregating $3.6 million at September 30, 2017. |
(2) |
Balance excludes the Senior Note discount and debt issuance costs reflected as liabilities aggregating $6.8 million at September 30, 2017. |
23 QTS Q3 Earnings 2017 |
Contact: IR@qtsdatacenters.com |
(unaudited and in thousands)
|
|
Three Months Ended |
|
Nine Months Ended |
|||||||||||
|
|
September 30, |
|
June 30, |
|
September 30, |
|
September 30, |
|
September 30, |
|||||
|
|
2017 |
|
2017 |
|
2016 |
|
2017 |
|
2016 |
|||||
Interest expense and fees |
|
$ |
10,602 |
|
$ |
9,827 |
|
$ |
7,777 |
|
$ |
29,460 |
|
$ |
22,815 |
Amortization of deferred financing costs and bond discount |
|
|
992 |
|
|
971 |
|
|
880 |
|
|
2,943 |
|
|
2,634 |
Capitalized interest (1) |
|
|
(3,636) |
|
|
(3,151) |
|
|
(2,478) |
|
|
(9,929) |
|
|
(8,415) |
Total interest expense |
|
$ |
7,958 |
|
$ |
7,647 |
|
$ |
6,179 |
|
$ |
22,474 |
|
$ |
17,034 |
(1) |
The weighted average interest rate for the three months ended September 30, 2017, June 30, 2017, and September 30, 2016 was 4.13%, 4.01%, and 3.98%, respectively. As of September 30, 2017 and December 31, 2016 our weighted average coupon interest rate was 3.63% and 3.39%, respectively. |
24 QTS Q3 Earnings 2017 |
Contact: IR@qtsdatacenters.com |
Non-GAAP Financial Measures
This document includes certain non-GAAP financial measures that management believes are helpful in understanding the Company’s business, as further described below.
The Company considers the following non-GAAP financial measures to be useful to investors as key supplemental measures of the Company’s performance: (1) FFO; (2) Operating FFO; (3) Adjusted Operating FFO; (4) MRR; (5) NOI; (6) EBITDA; and (7) Adjusted EBITDA. These non-GAAP financial measures should be considered along with, but not as alternatives to, net income or loss and cash flows from operating activities as a measure of the Company’s operating performance. FFO, Operating FFO, Adjusted Operating FFO, MRR, NOI, EBITDA and Adjusted EBITDA, as calculated by us, may not be comparable to FFO, Operating FFO, Adjusted Operating FFO, MRR, NOI, EBITDA and Adjusted EBITDA as reported by other companies that do not use the same definition or implementation guidelines or interpret the standards differently from us.
Definitions
C1 – Custom Data Center. Power costs are passed on to customers (metered power); generally 3,000 square feet or more of raised floor; lease term of 5 to 10 years; customers are large corporations, government agencies, and global Internet businesses.
C2 – Colocation. Power overages charged separately; specified kW included in lease; up to 3,000 square feet of raised floor; lease term of up to 3 years; customers are large corporations, small and medium businesses and government agencies.
C3 – Cloud and Managed Services. Power bundled with service; small amounts of space; customers rent managed virtual servers; lease term up to 3 years; customers are large corporations, small and medium businesses and government agencies.
Booked-not-billed (“BNB”). The Company defines booked-not-billed as customer leases that have been signed, but for which lease payments have not yet commenced.
Leasable raised floor. The Company defines leasable raised floor as the amount of raised floor square footage that the Company has leased plus the available capacity of raised floor square footage that is in a leasable format as of a particular date and according to a particular product configuration. The amount of leasable raised floor may change even without completion of new redevelopment projects due to changes in the Company’s configuration of C1, C2 and C3 product space.
Basis-of-design floor space. The Company defines basis-of-design floor space as the total data center raised floor potential of its existing data center facilities.
Operating NRSF. Represents the total square feet of a building that is currently leased or available for lease plus developed supporting infrastructure, based on engineering drawings and estimates, but does not include space held for redevelopment or space used for the Company’s own office space.
The Company. Refers to QTS Realty Trust, Inc., a Maryland corporation, together with its consolidated subsidiaries, including QualityTech, LP.
25 QTS Q3 Earnings 2017 |
Contact: IR@qtsdatacenters.com |
FFO, Operating FFO and Adjusted Operating FFO
The Company considers funds from operations (“FFO”), to be a supplemental measure of its performance which should be considered along with, but not as an alternative to, net income (loss) and cash provided by operating activities as a measure of operating performance. The Company calculates FFO in accordance with the standards established by the National Association of Real Estate Investment Trusts (“NAREIT”). FFO represents net income (loss) (computed in accordance with GAAP), adjusted to exclude gains (or losses) from sales of property, real estate-related depreciation and amortization and similar adjustments for unconsolidated partnerships and joint ventures. The Company’s management uses FFO as a supplemental performance measure because, in excluding real estate related depreciation and amortization and gains and losses from property dispositions, it provides a performance measure that, when compared year over year, captures trends in occupancy rates, rental rates and operating costs.
Due to the volatility and nature of certain significant charges and gains recorded in the Company’s operating results that management believes are not reflective of its core operating performance, management computes an adjusted measure of FFO, which the Company refers to as Operating FFO. The Company generally calculates Operating FFO as FFO excluding certain non-routine charges and gains and losses that management believes are not indicative of the results of the Company’s operating real estate portfolio. The Company believes that Operating FFO provides investors with another financial measure that may facilitate comparisons of operating performance between periods and, to the extent other REITs calculate Operating FFO on a comparable basis, between REITs.
Operating FFO and Adjusted Operating Funds From Operations (“Adjusted Operating FFO”) are non-GAAP measures that are used as supplemental operating measures and to provide additional information to users of the financial statements. The Company calculates Adjusted Operating FFO by adding or subtracting from Operating FFO items such as: maintenance capital investment, paid leasing commissions, amortization of deferred financing costs and bond discount, non-real estate depreciation, straight line rent adjustments, deferred taxes and non-cash compensation.
The Company offers these measures because it recognizes that FFO, Operating FFO and Adjusted Operating FFO will be used by investors as a basis to compare its operating performance with that of other REITs. However, because FFO, Operating FFO and Adjusted Operating FFO exclude real estate depreciation and amortization and capture neither the changes in the value of the Company’s properties that result from use or market conditions, nor the level of capital expenditures and capitalized leasing commissions necessary to maintain the operating performance of its properties, all of which have real economic effect and could materially impact its financial condition, cash flows and results of operations, the utility of FFO, Operating FFO and Adjusted Operating FFO as measures of its operating performance is limited. The Company’s calculation of FFO may not be comparable to measures calculated by other companies who do not use the NAREIT definition of FFO or do not calculate FFO in accordance with NAREIT guidance. In addition, the Company’s calculations of FFO, Operating FFO and Adjusted Operating FFO are not necessarily comparable to FFO, Operating FFO and Adjusted Operating FFO as calculated by other REITs that do not use the same definition or implementation guidelines or interpret the standards differently from us. FFO, Operating FFO and Adjusted Operating FFO are non-GAAP measures and should not be considered a measure of the Company’s results of operations or liquidity or as a substitute for, or an alternative to, net income (loss), cash provided by operating activities or any other performance measure determined in accordance with GAAP, nor is it indicative of funds available to fund its cash needs, including its ability to make distributions to its stockholders.
26 QTS Q3 Earnings 2017 |
Contact: IR@qtsdatacenters.com |
A reconciliation of net income to FFO, Operating FFO and Adjusted Operating FFO is presented below:
|
Three Months Ended |
|
Nine Months Ended |
|||||||||||
|
September 30, |
|
June 30, |
|
September 30, |
|
September 30, |
|||||||
|
2017 |
|
2017 |
|
2016 |
|
2017 |
|
2016 |
|||||
FFO |
|
|
|
|
|
|
|
|
|
|
|
|
|
|
Net income |
$ |
7,394 |
|
$ |
4,608 |
|
$ |
6,538 |
|
$ |
17,570 |
|
$ |
19,204 |
Real estate depreciation and amortization |
|
31,237 |
|
|
30,275 |
|
|
28,493 |
|
|
91,016 |
|
|
79,771 |
FFO |
|
38,631 |
|
|
34,883 |
|
|
35,031 |
|
|
108,586 |
|
|
98,975 |
|
|
|
|
|
|
|
|
|
|
|
|
|
|
|
Transaction, integration and other costs |
|
1,114 |
|
|
161 |
|
|
3,465 |
|
|
1,611 |
|
|
9,385 |
Tax benefit associated with transaction and integration costs |
|
- |
|
|
- |
|
|
(1,136) |
|
|
- |
|
|
(3,067) |
Operating FFO * |
|
39,745 |
|
|
35,044 |
|
|
37,360 |
|
|
110,197 |
|
|
105,293 |
|
|
|
|
|
|
|
|
|
|
|
|
|
|
|
Maintenance Capex |
|
(2,193) |
|
|
(1,172) |
|
|
(1,731) |
|
|
(4,161) |
|
|
(2,446) |
Leasing commissions paid |
|
(5,592) |
|
|
(4,055) |
|
|
(4,402) |
|
|
(13,816) |
|
|
(13,597) |
Amortization of deferred financing costs and bond discount |
|
992 |
|
|
971 |
|
|
879 |
|
|
2,943 |
|
|
2,633 |
Non real estate depreciation and amortization |
|
4,071 |
|
|
4,254 |
|
|
4,207 |
|
|
12,768 |
|
|
11,923 |
Straight line rent revenue and expense and other |
|
(1,149) |
|
|
(637) |
|
|
(957) |
|
|
(2,913) |
|
|
(5,810) |
Tax benefit from operating results |
|
(2,454) |
|
|
(1,429) |
|
|
(3,075) |
|
|
(5,404) |
|
|
(6,203) |
Equity-based compensation expense |
|
3,693 |
|
|
3,732 |
|
|
2,637 |
|
|
10,507 |
|
|
7,887 |
Adjusted Operating FFO * |
$ |
37,113 |
|
$ |
36,708 |
|
$ |
34,918 |
|
$ |
110,121 |
|
$ |
99,680 |
|
|
|
|
|
|
|
|
|
|
|
|
|
|
|
Fully diluted weighted average shares |
|
56,833 |
|
|
55,458 |
|
|
55,688 |
|
|
56,129 |
|
|
53,420 |
Operating FFO per diluted share |
$ |
0.70 |
|
$ |
0.63 |
|
$ |
0.67 |
|
$ |
1.96 |
|
$ |
1.97 |
* |
The Company’s calculations of Operating FFO and Adjusted Operating FFO may not be comparable to Operating FFO and Adjusted Operating FFO as calculated by other REITs that do not use the same definition. |
27 QTS Q3 Earnings 2017 |
Contact: IR@qtsdatacenters.com |
Monthly Recurring Revenue (MRR)
The Company calculates MRR as monthly contractual revenue under signed leases as of a particular date, which includes revenue from its C1, C2 and C3 rental and cloud and managed services activities, but excludes customer recoveries, deferred set-up fees, variable related revenues, non-cash revenues and other one-time revenues. MRR does not include the impact from booked-not-billed leases as of a particular date, unless otherwise specifically noted.
Separately, the Company calculates recognized MRR as the recurring revenue recognized during a given period, which includes revenue from its C1, C2 and C3 rental and cloud and managed services activities, but excludes customer recoveries, deferred set up fees, variable related revenues, non-cash revenues and other one-time revenues.
Management uses MRR and recognized MRR as supplemental performance measures because they provide useful measures of increases in contractual revenue from the Company’s customer leases. MRR and recognized MRR should not be viewed by investors as alternatives to actual monthly revenue, as determined in accordance with GAAP. Other companies may not calculate MRR or recognized MRR in the same manner. Accordingly, the Company’s MRR and recognized MRR may not be comparable to other companies’ MRR and recognized MRR. MRR and recognized MRR should be considered only as supplements to total revenues as a measure of its performance. MRR and recognized MRR should not be used as measures of the Company’s results of operations or liquidity, nor is it indicative of funds available to meet its cash needs, including its ability to make distributions to its stockholders.
A reconciliation of total GAAP revenues to recognized MRR in the period and MRR at period-end is presented below:
|
Three Months Ended |
|
Nine Months Ended |
|||||||||||
|
September 30, |
|
June 30, |
|
September 30, |
|
September 30, |
|||||||
|
2017 |
|
2017 |
|
2016 |
|
2017 |
|
2016 |
|||||
Recognized MRR in the period |
|
|
|
|
|
|
|
|
|
|
|
|
|
|
Total period revenues (GAAP basis) |
$ |
113,767 |
|
$ |
107,868 |
|
$ |
103,465 |
|
$ |
327,599 |
|
$ |
296,920 |
Less: Total period recoveries |
|
(9,698) |
|
|
(8,774) |
|
|
(8,703) |
|
|
(26,833) |
|
|
(20,306) |
Total period deferred setup fees |
|
(2,659) |
|
|
(2,436) |
|
|
(2,377) |
|
|
(7,711) |
|
|
(6,536) |
Total period straight line rent and other |
|
(6,982) |
|
|
(3,306) |
|
|
(3,697) |
|
|
(13,406) |
|
|
(13,722) |
Recognized MRR in the period |
|
94,428 |
|
|
93,352 |
|
|
88,688 |
|
|
279,649 |
|
|
256,356 |
|
|
|
|
|
|
|
|
|
|
|
|
|
|
|
MRR at period end |
|
|
|
|
|
|
|
|
|
|
|
|
|
|
Total period revenues (GAAP basis) |
$ |
113,767 |
|
$ |
107,868 |
|
$ |
103,465 |
|
$ |
327,599 |
|
$ |
296,920 |
Less: Total revenues excluding last month |
|
(76,912) |
|
|
(71,262) |
|
|
(69,427) |
|
|
(290,744) |
|
|
(262,882) |
Total revenues for last month of period |
|
36,855 |
|
|
36,606 |
|
|
34,038 |
|
|
36,855 |
|
|
34,038 |
Less: Last month recoveries |
|
(2,631) |
|
|
(2,872) |
|
|
(2,398) |
|
|
(2,631) |
|
|
(2,398) |
Last month deferred setup fees |
|
(893) |
|
|
(822) |
|
|
(828) |
|
|
(893) |
|
|
(828) |
Last month straight line rent and other |
|
(1,704) |
|
|
(1,221) |
|
|
(1,034) |
|
|
(1,704) |
|
|
(1,034) |
MRR at period end |
$ |
31,627 |
|
$ |
31,691 |
|
$ |
29,778 |
|
$ |
31,627 |
|
$ |
29,778 |
28 QTS Q3 Earnings 2017 |
Contact: IR@qtsdatacenters.com |
Earnings Before Interest, Taxes, Depreciation and Amortization (EBITDA) and Adjusted EBITDA
The Company calculates EBITDA as net income (loss) (computed in accordance with GAAP) adjusted to exclude interest expense and interest income, provision (benefit) for income taxes (including income taxes applicable to sale of assets) and depreciation and amortization. Management believes that EBITDA is useful to investors in evaluating and facilitating comparisons of the Company’s operating performance between periods and between REITs by removing the impact of its capital structure (primarily interest expense) and asset base charges (primarily depreciation and amortization) from its operating results.
In addition to EBITDA, the Company calculates an adjusted measure of EBITDA, which it refers to as Adjusted EBITDA, as EBITDA excluding write off of unamortized deferred financing costs, gains (losses) on extinguishment of debt, transaction and integration costs, equity-based compensation expense, restructuring costs and gain (loss) on sale of real estate. The Company believes that Adjusted EBITDA provides investors with another financial measure that can facilitate comparisons of operating performance between periods and between REITs.
Management uses EBITDA and Adjusted EBITDA as supplemental performance measures as they provide useful measures of assessing the Company’s operating results. Other companies may not calculate EBITDA or Adjusted EBITDA in the same manner. Accordingly, the Company’s EBITDA and Adjusted EBITDA may not be comparable to others. EBITDA and Adjusted EBITDA should be considered only as supplements to net income (loss) as measures of the Company’s performance and should not be used as substitutes for net income (loss), as measures of its results of operations or liquidity or as an indications of funds available to meet its cash needs, including its ability to make distributions to its stockholders.
A reconciliation of net income to EBITDA and Adjusted EBITDA is presented below:
|
Three Months Ended |
|
Nine Months Ended |
|||||||||||
|
September 30, |
|
June 30, |
|
September 30, |
|
September 30, |
|||||||
|
2017 |
|
2017 |
|
2016 |
|
2017 |
|
2016 |
|||||
EBITDA and Adjusted EBITDA |
|
|
|
|
|
|
|
|
|
|
|
|
|
|
Net income |
$ |
7,394 |
|
$ |
4,608 |
|
$ |
6,538 |
|
$ |
17,570 |
|
$ |
19,204 |
Interest expense |
|
7,958 |
|
|
7,647 |
|
|
6,179 |
|
|
22,474 |
|
|
17,034 |
Interest income |
|
(65) |
|
|
- |
|
|
(1) |
|
|
(66) |
|
|
(3) |
Tax benefit of taxable REIT subsidiaries |
|
(2,454) |
|
|
(1,429) |
|
|
(4,210) |
|
|
(5,404) |
|
|
(9,269) |
Depreciation and amortization |
|
35,309 |
|
|
34,527 |
|
|
32,699 |
|
|
103,784 |
|
|
91,693 |
EBITDA |
|
48,142 |
|
|
45,353 |
|
|
41,205 |
|
|
138,358 |
|
|
118,659 |
|
|
|
|
|
|
|
|
|
|
|
|
|
|
|
Equity-based compensation expense |
|
3,693 |
|
|
3,732 |
|
|
2,637 |
|
|
10,507 |
|
|
7,887 |
Transaction, integration and other costs |
|
1,114 |
|
|
161 |
|
|
3,465 |
|
|
1,611 |
|
|
9,385 |
Adjusted EBITDA |
$ |
52,949 |
|
$ |
49,246 |
|
$ |
47,307 |
|
$ |
150,476 |
|
$ |
135,931 |
29 QTS Q3 Earnings 2017 |
Contact: IR@qtsdatacenters.com |
Net Operating Income (NOI)
The Company calculates net operating income (“NOI”) as net income (loss) (computed in accordance with GAAP), excluding: interest expense, interest income, tax expense (benefit) of taxable REIT subsidiaries, depreciation and amortization, write off of unamortized deferred financing costs, gain (loss) on extinguishment of debt, transaction and integration costs, gain (loss) on sale of real estate, restructuring costs and general and administrative expenses. Management uses NOI as a supplemental performance measure because it provides a useful measure of the operating results from its customer leases. In addition, management believes it is useful to investors in evaluating and comparing the operating performance of its properties and to compute the fair value of its properties. The Company’s NOI may not be comparable to other REITs’ NOI as other REITs may not calculate NOI in the same manner. NOI should be considered only as a supplement to net income as a measure of the Company’s performance and should not be used as a measure of results of operations or liquidity or as an indication of funds available to meet cash needs, including the ability to make distributions to stockholders. NOI is a measure of the operating performance of the Company’s properties and not of the Company’s performance as a whole. NOI is therefore not a substitute for net income as computed in accordance with GAAP. A reconciliation of net income to NOI is presented below:
|
Three Months Ended |
|
Nine Months Ended |
|||||||||||
|
September 30, |
|
June 30, |
|
September 30, |
|
September 30, |
|||||||
|
2017 |
|
2017 |
|
2016 |
|
2017 |
|
2016 |
|||||
Net Operating Income (NOI) |
|
|
|
|
|
|
|
|
|
|
|
|
|
|
Net income |
$ |
7,394 |
|
$ |
4,608 |
|
$ |
6,538 |
|
$ |
17,570 |
|
$ |
19,204 |
Interest expense |
|
7,958 |
|
|
7,647 |
|
|
6,179 |
|
|
22,474 |
|
|
17,034 |
Interest income |
|
(65) |
|
|
- |
|
|
(1) |
|
|
(66) |
|
|
(3) |
Depreciation and amortization |
|
35,309 |
|
|
34,527 |
|
|
32,699 |
|
|
103,784 |
|
|
91,693 |
Tax benefit of taxable REIT subsidiaries |
|
(2,454) |
|
|
(1,429) |
|
|
(4,210) |
|
|
(5,404) |
|
|
(9,269) |
Transaction, integration and other costs |
|
1,114 |
|
|
161 |
|
|
3,465 |
|
|
1,611 |
|
|
9,385 |
General and administrative expenses |
|
21,652 |
|
|
22,562 |
|
|
19,942 |
|
|
66,411 |
|
|
61,836 |
NOI (1) |
$ |
70,908 |
|
$ |
68,076 |
|
$ |
64,612 |
|
$ |
206,380 |
|
$ |
189,880 |
Breakdown of NOI by facility: |
|
|
|
|
|
|
|
|
|
|
|
|
|
|
Atlanta-Metro data center |
$ |
18,588 |
|
$ |
20,704 |
|
$ |
20,030 |
|
$ |
59,803 |
|
$ |
60,887 |
Atlanta-Suwanee data center |
|
12,206 |
|
|
11,423 |
|
|
11,051 |
|
|
35,587 |
|
|
33,823 |
Leased data centers (2) |
|
8,278 |
|
|
8,408 |
|
|
10,751 |
|
|
25,696 |
|
|
33,134 |
Richmond data center |
|
11,687 |
|
|
8,389 |
|
|
7,850 |
|
|
28,306 |
|
|
22,428 |
Irving data center |
|
8,707 |
|
|
8,057 |
|
|
5,118 |
|
|
23,204 |
|
|
11,656 |
Santa Clara data center |
|
2,741 |
|
|
2,705 |
|
|
2,961 |
|
|
8,725 |
|
|
10,378 |
Piscataway data center |
|
2,427 |
|
|
2,279 |
|
|
2,086 |
|
|
7,109 |
|
|
2,756 |
Princeton data center |
|
2,415 |
|
|
2,393 |
|
|
2,468 |
|
|
7,207 |
|
|
7,180 |
Sacramento data center |
|
1,525 |
|
|
1,778 |
|
|
1,780 |
|
|
5,140 |
|
|
5,842 |
Chicago data center |
|
1,285 |
|
|
1,275 |
|
|
(157) |
|
|
3,207 |
|
|
(157) |
Fort Worth data center |
|
94 |
|
|
75 |
|
|
- |
|
|
275 |
|
|
- |
Other facilities (3) |
|
955 |
|
|
590 |
|
|
674 |
|
|
2,121 |
|
|
1,953 |
NOI (1) |
$ |
70,908 |
|
$ |
68,076 |
|
$ |
64,612 |
|
$ |
206,380 |
|
$ |
189,880 |
(1) |
Includes facility level G&A expense allocation charges of 4% of cash revenue for all entities, with the exception of the leased facilities acquired in 2015, which include G&A expense allocation charges of 10% of cash revenue. These allocated charges aggregated to $5.5 million, $5.3 million and $5.2 million for the three month periods ended September 30, 2017, June 30, 2017 and September 30, 2016, respectively, and $16.0 million and $15.3 million for the nine month periods ended September 30, 2017 and 2016, respectively. |
(2) |
Includes 13 facilities. All facilities are leased, including those subject to capital leases. During the quarter ended March 31, 2017, the Company moved its Jersey City, NJ facility to the “Leased data centers” line item. In October 2017, the Company finalized the buyout of the Vault facility in Ashburn, VA that was previously subject to a capital lease agreement. As the purchase occurred subsequent to September 30, 2017, the Vault facility is included within the “Leased Facilities” line item herein. |
(3) |
Consists of Miami, FL; Lenexa, KS; Overland Park, KS; and Duluth, GA facilities. During the quarter ended March 31, 2017, the Company moved its Miami, FL facility to the “Other facilities” line item. |
30 QTS Q3 Earnings 2017 |
Contact: IR@qtsdatacenters.com |
DDX[GR7,I'10']W71:*?]&-<[!_JZZ'1?^/<
MUO$B6AT>G_ZNJ>L-\AJU8?ZNLW7),(:L@ABO]L(&:?'J?;- P-0!MI'O1S.W*'F6X+?SKQ%]S
M5B/6988@@[\#FJL5P8YD=:K8W$C/W<&DI..P6ON3@&2/+ J?8M_.
M-V/TJQ_PDA5L[J\Q\:>*AHILOG"^;OZGTV_XUS\?Q$5_^6OZU^@9744<'!>O
MYL_F3C+_ )'N(O\ W?\ TB)[W;>*/]OGZU;D\1"2/&ZO!;;QX"PQ)G\:Z#3_
M !1]H48?]:]F-1,^(ZZ';ZIJ1FSSFOHO]G>3=HR]^E?)WV\S=\U]5_LYMG0U
MKQS"F[@BS#S=X]EJ!84GBN8V'S*YVM^/_UJM06TOG!PORE1
MS5&^A=9IBN=H;)_3_&A[#1+;VYM9)HF()"@\?@:=