UNITED STATES
SECURITIES AND EXCHANGE COMMISSION
Washington, D.C. 20549
FORM 8-K
CURRENT REPORT
Pursuant to Section 13 or 15(d)
of the Securities Exchange Act of 1934
Date of Report (Date of Earliest Event Reported): April 27, 2015
QTS Realty Trust, Inc.
(Exact name of registrant as specified in its charter)
Maryland | 001-36109 | 46-2809094 | ||
(State or other jurisdiction of incorporation)
|
(Commission File No.)
|
(I.R.S. Employer Identification No.)
|
12851 Foster Street Overland Park, KS 66213
|
66213 | |
(Address of principal executive offices) | (Zip Code) |
(913) 814-9988
Registrant’s telephone number, including area code:
Not Applicable
(Former name or former address, if changed since last report.)
Check the appropriate box below if the Form 8-K filing is intended to simultaneously satisfy the filing obligation of the registrant under any of the following provisions:
¨ | Written communications pursuant to Rule 425 under the Securities Act (17 CFR 230.425) |
¨ | Soliciting material pursuant to Rule 14a-12 under the Exchange Act (17 CFR 240.14a-12) |
¨ | Pre-commencement communications pursuant to Rule 14d-2(b) under the Exchange Act (17 CFR 240.14d-2(b)) |
¨ | Pre-commencement communications pursuant to Rule 13e-4(c) under the Exchange Act (17 CFR 240.13e-4(c)) |
Item 2.02 Results of Operations and Financial Condition.
On April 27, 2015, QTS Realty Trust, Inc. (the “Company”) announced its financial results for the first quarter ended March 31, 2015. A copy of the Company’s press release is attached hereto as Exhibit 99.1 and a copy of the Company’s First Quarter 2015 Supplemental Information is attached hereto as Exhibit 99.2.
The information included in this Current Report on Form 8-K (including Exhibits 99.1 and 99.2 hereto) shall not be deemed “filed” for the purposes of Section 18 of the Securities Exchange Act of 1934, as amended (the “Exchange Act”), or otherwise subject to the liabilities of that section, nor shall it be deemed incorporated by reference into any filing made by the Company under the Exchange Act or the Securities Act of 1933, as amended, except as shall be expressly set forth by specific reference in such filing.
Item 9.01 Financial Statements and Exhibits.
(d) Exhibits
Exhibit Number |
Exhibit Description | |
99.1 | Press Release dated April 27, 2015 | |
99.2 | First Quarter 2015 Supplemental Information |
SIGNATURES
Pursuant to the requirements of the Securities Exchange Act of 1934, the registrant has duly caused this report to be signed on its behalf by the undersigned hereunto duly authorized.
QTS Realty Trust, Inc. | |||
By: |
/s/ Shirley E. Goza | ||
Shirley E. Goza | |||
Secretary and General Counsel |
April 27, 2015
EXHIBIT INDEX
Exhibit Number |
Exhibit Description | |
99.1 | Press Release dated April 27, 2015 | |
99.2 | First Quarter 2015 Supplemental Information |
Exhibit 99.1
QTS REPORTS FIRST QUARTER 2015 OPERATING RESULTS
OVERLAND PARK, Kan. – April 27, 2015 – QTS Realty Trust, Inc. (“QTS” or the “Company”) (NYSE: QTS) today announced operating results for the first quarter ended March 31, 2015.
First Quarter Highlights
· | Reported Operating FFO of $19.4 million in the first quarter of 2015, an increase of 12.7% compared to the first quarter of 2014. Operating FFO for the first quarter of 2015 on a fully diluted per share basis was $0.50 per share. Adjusted Operating FFO was $20.1 million in the first quarter of 2015, an increase of 13.2% compared to the first quarter of 2014. |
· | Reported Adjusted EBITDA of $28.0 million in the first quarter of 2015, an increase of 29.6% compared to the first quarter of 2014. |
· | Reported NOI of $40.6 million in the first quarter of 2015, an increase of 28.8% compared to the first quarter of 2014. |
· | Total revenues of $61.4 million recognized in the first quarter of 2015, an increase of 25.4% compared to the first quarter of 2014. Monthly Recurring Revenue (“MRR”) as of March 31, 2015 increased by 22.3% to $17.8 million compared to MRR as of March 31, 2014. |
· | During the first quarter of 2015 the Company executed new and modified leases aggregating to a net increase of $13.6 million in incremental annualized rent, net of downgrades, which brought the Company’s booked-not-billed annualized rent to $64.3 million as of March 31, 2015, the highest level in the Company’s history. |
· | On March 2, 2015 the Company issued 5,000,000 shares of its Class A common stock and used the net proceeds of approximately $166.4 million to repay amounts outstanding under its unsecured revolving credit facility. |
1 QTS Q1 Earnings 2015 | Contact: IR@qtsdatacenters.com |
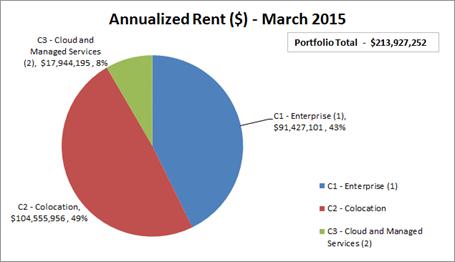
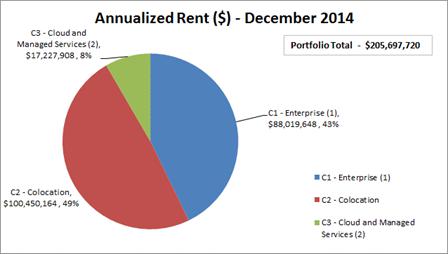
“We are pleased that our performance during the first quarter of 2015 continues to demonstrate the strength of our fully integrated technology services platform. Our strong net incremental leasing activity of $13.6 million demonstrated the continued consistent growth of the engine of our business, C2- colocation and C3- cloud and managed services, and the ability to accelerate growth with C1- custom data center. We continue to experience strong pricing metrics and low churn, and our record booked-not-billed backlog of $64.3 million in annualized rent provides us continued visibility and confidence in our future performance,” said Chad Williams, Chairman and CEO of QTS.
Williams added, “We will continue to focus on expanding and investing in our business and developing our remaining capacity in a capital efficient, profitable manner, while leveraging our product mix to provide enterprise customers with the solutions that they increasingly require in today’s complex technology environments.”
Financial
Results
Net income recognized in the first quarter of 2015 was $5.0 million ($0.13 per basic and diluted share) compared to net income of $5.3 million recognized in the first quarter of 2014. QTS generated Operating FFO of $19.4 million in the first quarter of 2015, an increase of approximately 12.7% compared to $17.3 million for the first quarter of 2014. This increase in Operating FFO reflects the increased interest expense impact of QTS’ July 2014 $300 million Senior Note offering, where QTS locked in long-term, fixed rate capital with a maturity date in 2022. Adjusted Operating FFO was $20.1 million in the first quarter of 2015, an increase of 13.2% compared to $17.7 million in the first quarter of 2014. Additionally, QTS generated $28.0 million of Adjusted EBITDA in the first quarter of 2015, an increase of 29.6% compared to $21.6 million for the first quarter of 2014. MRR as of March 31, 2015 was $17.8 million, an increase of 22.3% compared to MRR as of March 31, 2014 of $14.6 million, with total revenues increasing by 25.4% to $61.4 million for the first quarter 2015 compared to $48.9 million for the first quarter 2014.
Leasing Activity
During the first
quarter of 2015, QTS entered into customer leases representing approximately $13.6 million of incremental annualized rent, net
of downgrades. C1 leasing activity was higher
than the prior four quarter average, and QTS continues to expect that C1 leasing activity will be uneven, but in aggregate will
be positive. C1 prices were above the prior four quarter average due to the signing of smaller C1 deals which tend to have a greater
rate per square foot. QTS’ C2/C3 leasing activity continues to perform on a consistent basis.
During the first quarter of 2015, QTS renewed leases with a total annualized rent of $5.4 million at an average rent per square foot of $863, which was 1.2% higher than the annualized rent prior to their respective renewals, and in line with the Company’s expectation of low to mid-single digit increases. This compares to a prior four quarter average increase of 2.7% over the rates immediately prior to renewal. The Company defines renewals as leases for which the customer retains the same amount of space before and after renewal, which facilitates rate comparability. As summarized in more detail in our supplemental information, there is variability in our renewal rates based on the mix of product types renewed, and renewal rates are expected to increase in the low single digits. Rental churn (which is the MRR impact from a customer completely departing the platform in a given period compared to the total MRR at the beginning of the period) for the first quarter of 2015 was 0.4%.
During the first quarter of 2015, QTS commenced customer leases (which includes new customers and also existing customers that renewed their lease term) at an average rent of $817 per square foot. This compares to commenced customer leases with an aggregate trailing four quarter average of $497 per square foot. C1 rates increased 17.4% from the prior four quarter average, and C2/C3 rates increased 12.6% from the prior four quarter average. In addition, a higher portion of C2/C3 leases in the first quarter of 2015 contributed to the increased consolidated rent per leased square foot compared to the prior four quarter average. A more detailed analysis of this activity is set forth in the Company’s supplemental information.
2 QTS Q1 Earnings 2015 | Contact: IR@qtsdatacenters.com |
As of March 31, 2015, the booked-not-billed MRR balance (which represents customer leases that have been executed, but for which lease payments have not commenced as of March 31, 2015) was approximately $5.4 million, or $64.3 million of annualized rent, the highest amount in the Company’s history, and compares to $57.8 million at December 31, 2014. The booked-not-billed balance is expected to contribute an incremental $9.7 million to revenue in 2015 (representing $22.0 million in annualized revenues), an incremental $18.4 million in 2016 (representing $25.2 million in annualized revenues), and an incremental $17.1 million in annualized revenues thereafter.
Development, Redevelopment, and Acquisitions
During the first quarter of 2015, the Company brought online approximately 33,000 net rentable square feet (“NRSF”) of raised floor at an aggregate cost of approximately $41 million. In addition, during the first quarter of 2015, the Company continued redevelopment of the Dallas – Fort Worth, Atlanta – Metro, Richmond and Chicago facilities to have space ready for customers later in 2015, 2016 and forward. The Company expects to place approximately $116 million and 73,000 raised floor NRSF into service in the remaining three quarters of 2015. The majority of the capital spend that is not placed into service in 2015 will be for ongoing expansion and development of our facilities, including the Chicago facility, and to facilitate the booked-not-billed backlog.
Balance Sheet and Liquidity
As of March 31, 2015, QTS’ total debt balance was $537.3 million, resulting in a debt to annualized Adjusted EBITDA of 4.8x. This ratio was impacted by various portions of QTS’ portfolio that were placed into service in the first quarter of 2015 which have not yet produced a stabilized Adjusted EBITDA. In addition, the Company incurred costs included in construction in progress related to revenue which will begin to ramp in 2015 and 2016 associated with the Company’s record booked-not-billed backlog of $64.3 million in annualized rent. As the revenues associated with this backlog commence, the Company expects its long term debt to Adjusted EBITDA ratio to continue to improve.
On March 2, 2015, the Company issued 5,000,000 shares and GA QTS Interholdco, LLC, a selling stockholder and an affiliate of General Atlantic LLC, sold 4,350,000 shares of QTS’ Class A common stock at a price of $34.75 per share. The selling stockholder granted the underwriters a 30-day option to purchase an aggregate of up to an additional 1,402,500 shares of common stock at the public offering price, which the underwriters exercised. The Company used the net proceeds of approximately $166.4 million to repay amounts outstanding under its unsecured revolving credit facility. The Company did not receive any proceeds from the offering of shares by the selling stockholder.
2015 Guidance
QTS is maintaining its 2015 guidance for Adjusted EBITDA in the range of $115.0 million to $123.0 million. QTS is updating its 2015 guidance for Operating FFO to a range of $87.2 million to $91.2 million, or Operating FFO per share of $2.07 to $2.17, to reflect the equity issuance discussed above. The updates to Operating FFO and Operating FFO per share solely reflect the impact of the equity issuance and do not represent any change in views for the core operating performance of the Company, which remains unchanged. QTS is also revising its 2015 guidance on development Capital Expenditures, excluding acquisitions, to approximately $275 million to $325 million to incorporate the positive acceleration of customer activity in Richmond and Dallas-Fort Worth.
This guidance is calculated based on core revenue growth, excluding acquisitions, in the mid to high teens (which ramp during the year), annual rental churn of 5-8%, and does not contemplate any acquisitions, dispositions or financing activities other than those which have already been disclosed.
3 QTS Q1 Earnings 2015 | Contact: IR@qtsdatacenters.com |
Non-GAAP Financial Measures
This release includes certain non-GAAP financial measures that management believes are helpful in understanding the Company’s business, as further described below.
Conference Call Details
The Company will host a conference call and webcast on April 28, 2015, at 10:00 a.m., Eastern time (9:00 a.m. Central time) to discuss its financial results, current business trends and market conditions.
The dial-in number for the conference call is (877) 883-0383 (U.S.) or (412) 902-6506 (International). The participant entry number is 8080910# and callers are asked to dial in ten minutes prior to start time. A link to the live broadcast, earnings presentation and the replay will be available on the Company’s website (www.qtsdatacenters.com) under the Investors tab.
About QTS
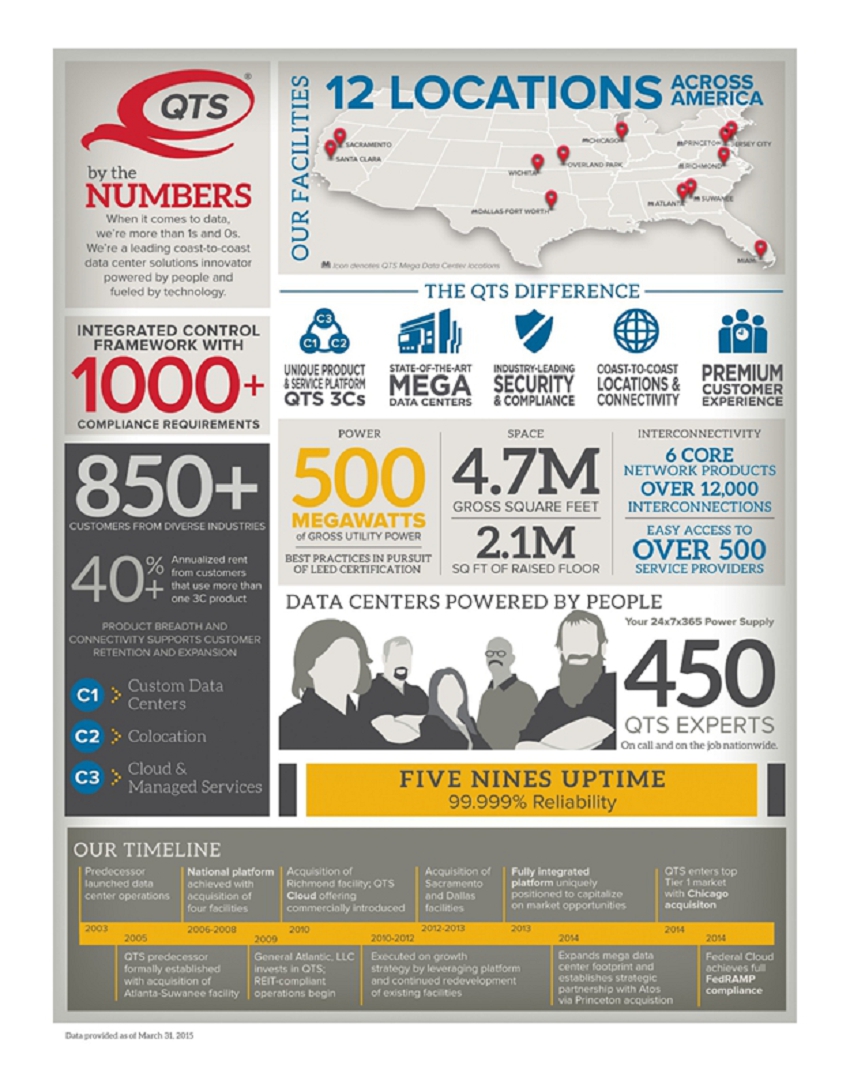
QTS Realty Trust, Inc. (NYSE:QTS) is a leading owner, developer and operator of state-of-the-art, carrier-neutral, multi-tenant data centers. The Company’s data centers are facilities that house the network and computer equipment of multiple customers and provide access to a range of communications carriers. The Company has a fully integrated platform through which it owns and operates its data centers and provides a broad range of information technology infrastructure solutions. The Company believes that it owns and operates one of the largest portfolios of multi-tenant data centers in the United States, as measured by gross square footage, and has the capacity to more than double its leased raised floor square footage without constructing any new buildings. The Company’s portfolio is currently leased to over 850 customers comprised of companies of all sizes representing an array of industries
QTS Investor Relations Contact
Jeff Berson – Chief Investment Officer
William Schafer – Chief Financial Officer
ir@qtsdatacenters.com
Forward Looking Statements
Some of the statements contained in this release constitute forward-looking statements within the meaning of the federal securities laws. Forward-looking statements relate to expectations, beliefs, projections, future plans and strategies, anticipated events or trends and similar expressions concerning matters that are not historical facts. In particular, statements pertaining to the Company’s capital resources, portfolio performance and results of operations contain forward-looking statements. Likewise, all of the statements regarding anticipated growth in funds from operations and anticipated market conditions are forward-looking statements. In some cases, you can identify forward-looking statements by the use of forward-looking terminology such as “may,” “will,” “should,” “expects,” “intends,” “plans,” “anticipates,” “believes,” “estimates,” “predicts,” or “potential” or the negative of these words and phrases or similar words or phrases which are predictions of or indicate future events or trends and which do not relate solely to historical matters. You can also identify forward-looking statements by discussions of strategy, plans or intentions.
The forward-looking statements contained in this release reflect the Company’s current views about future events and are subject to numerous known and unknown risks, uncertainties, assumptions and changes in circumstances that may cause actual results to differ significantly from those expressed in any forward-looking statement. The Company does not guarantee that the transactions and events described will happen as described (or that they will happen at all). The following factors, among others, could cause actual results and future events to differ materially from those set forth or contemplated in the forward-looking statements: adverse economic or real estate developments in the Company’s markets or the technology industry; national and local economic conditions; difficulties in identifying properties to acquire and completing acquisitions; the Company’s failure to successfully develop, redevelop and operate acquired properties; significant increases in construction and development costs; the increasingly competitive environment in which the Company operates; defaults on or non-renewal of leases by customers; increased interest rates and operating costs, including increased energy costs; financing risks, including the Company’s failure to obtain necessary outside financing; decreased rental rates or increased vacancy rates; dependence on third parties to provide Internet, telecommunications and network connectivity to the Company’s data centers; the Company’s failure to qualify and maintain its qualification as a real estate investment trust; environmental uncertainties and risks related to natural disasters; financial market fluctuations; and changes in real estate and zoning laws and increases in real property tax rates.
While forward-looking statements reflect the Company’s good faith beliefs, they are not guarantees of future performance. The Company disclaims any obligation to publicly update or revise any forward-looking statement to reflect changes in underlying assumptions or factors, of new information, data or methods, future events or other changes. For a further discussion of these and other factors that could cause the Company’s future results to differ materially from any forward-looking statements, see the section entitled “Risk Factors” in the Company’s Annual Report on Form 10-K for the year ended December 31, 2014.
4 QTS Q1 Earnings 2015 | Contact: IR@qtsdatacenters.com |
Combined Consolidated Balance Sheets
(in thousands)
March 31, | December 31, | |||||||
2015 | 2014 | |||||||
ASSETS | (unaudited) | |||||||
Real Estate Assets | ||||||||
Land | $ | 48,577 | $ | 48,577 | ||||
Buildings and improvements | 954,915 | 914,286 | ||||||
Less: Accumulated depreciation | (192,107 | ) | (180,167 | ) | ||||
811,385 | 782,696 | |||||||
Construction in progress | 266,234 | 214,719 | ||||||
Real Estate Assets, net | 1,077,619 | 997,415 | ||||||
Cash and cash equivalents | 5,748 | 10,788 | ||||||
Rents and other receivables, net | 16,730 | 15,579 | ||||||
Acquired intangibles, net | 17,262 | 18,000 | ||||||
Deferred costs, net (1) | 37,902 | 37,058 | ||||||
Prepaid expenses | 6,477 | 3,079 | ||||||
Other assets, net (2) | 24,252 | 24,640 | ||||||
TOTAL ASSETS | $ | 1,185,990 | $ | 1,106,559 | ||||
LIABILITIES | ||||||||
Mortgage notes payable | $ | 86,016 | $ | 86,600 | ||||
Unsecured credit facility | 140,000 | 239,838 | ||||||
Senior notes | 297,791 | 297,729 | ||||||
Capital lease obligations | 13,509 | 13,062 | ||||||
Accounts payable and accrued liabilities | 82,230 | 64,607 | ||||||
Dividends and distributions payable | 13,381 | 10,705 | ||||||
Advance rents, security deposits and other liabilities | 3,439 | 3,302 | ||||||
Deferred income | 11,401 | 10,531 | ||||||
TOTAL LIABILITIES | 647,767 | 726,374 | ||||||
EQUITY | ||||||||
Common stock, $0.01 par value, 450,133,000 shares authorized, 34,818,437 and 29,408,138 shares issued and outstanding as of March 31, 2015 and December 31, 2014, respectively | 348 | 294 | ||||||
Additional paid-in capital | 474,185 | 324,917 | ||||||
Accumulated dividends in excess of earnings | (29,563 | ) | (22,503 | ) | ||||
Total stockholders’ equity | 444,970 | 302,708 | ||||||
Noncontrolling interests | 93,253 | 77,477 | ||||||
TOTAL EQUITY | 538,223 | 380,185 | ||||||
TOTAL LIABILITIES AND EQUITY | $ | 1,185,990 | $ | 1,106,559 |
(1) | As of March 31, 2015 and December 31, 2014, deferred costs, net, included $16.0 million and $16.5 million of deferred financing costs net of amortization, respectively, $18.8 million and $17.4 million of deferred leasing costs net of amortization, respectively, and $3.1 million and $3.2 million, net of amortization, related to a leasing arrangement at the Company’s Princeton facility, respectively. |
(2) | As of March 31, 2015 and December 31, 2014, other assets, net, primarily included $21.8 million and $21.4 million of corporate fixed assets, respectively, primarily relating to construction of corporate offices, leasehold improvements and product related assets. |
5 QTS Q1 Earnings 2015 | Contact: IR@qtsdatacenters.com |
Combined Consolidated Statements of Operations and
Comprehensive Income
(in thousands)
Three Months Ended (unaudited) | ||||||||||||
March 31, | December 31, | March 31, | ||||||||||
Revenues: | 2015 | 2014 | 2014 | |||||||||
Rental | $ | 49,333 | $ | 47,656 | $ | 40,579 | ||||||
Recoveries from customers | 5,664 | 5,520 | 3,691 | |||||||||
Cloud and managed services | 5,795 | 5,788 | 4,231 | |||||||||
Other (1) | 594 | 599 | 442 | |||||||||
Total revenues | 61,386 | 59,563 | 48,943 | |||||||||
Operating expenses: | ||||||||||||
Property operating costs | 19,336 | 18,397 | 16,223 | |||||||||
Real estate taxes and insurance | 1,485 | 1,403 | 1,218 | |||||||||
Depreciation and amortization | 16,243 | 16,008 | 13,247 | |||||||||
General and administrative (2) | 13,838 | 11,987 | 10,778 | |||||||||
Restructuring | - | 26 | - | |||||||||
Transaction costs (3) | 105 | 60 | 64 | |||||||||
Total operating expenses | 51,007 | 47,881 | 41,530 | |||||||||
Operating income | 10,379 | 11,682 | 7,413 | |||||||||
Other income and expense: | ||||||||||||
Interest income | - | - | 8 | |||||||||
Interest expense | (5,342 | ) | (5,625 | ) | (2,065 | ) | ||||||
Other expense, net (4) | - | (291 | ) | - | ||||||||
Income before taxes | 5,037 | 5,766 | 5,356 | |||||||||
Tax benefit (expense) of taxable REIT subsidiaries | - | 82 | (28 | ) | ||||||||
Net income | 5,037 | 5,848 | 5,328 | |||||||||
Net income attributable to noncontrolling interests (5) | (955 | ) | (1,221 | ) | (1,130 | ) | ||||||
Net income attributable to QTS Realty Trust, Inc | 4,082 | 4,627 | 4,198 | |||||||||
Unrealized gain on swap (6) | - | - | 105 | |||||||||
Comprehensive income | $ | 4,082 | $ | 4,627 | $ | 4,303 |
(1) | Other revenue – Includes straight line rent, sales of scrap metals and other unused materials and various other income items. Straight line rent was $0.4 million, $0.4 million and $0.2 million for the three months ended March 31, 2015, December 31, 2014 and March 31, 2014, respectively. |
(2) | General and administrative expenses – Includes personnel costs, sales and marketing costs, professional fees, travel costs, product investment costs and other corporate general and administrative expenses. General and administrative expenses were 22.5%, 20.1%, and 22.0% of total revenues for the three month periods ended March 31, 2015, December 31, 2014 and March 31, 2014, respectively. |
(3) | Transaction costs – For the three months ended March 31, 2015, December 31, 2014 and March 31, 2014, the Company recognized $0.1 million, $0.1 million and $0.1 million, respectively, in costs related to the examination of actual and potential acquisitions. |
(4) | Other expense, net – Generally includes write offs of unamortized deferred financing costs associated with the early extinguishment of certain debt instruments. |
(5) | Noncontrolling interest –As of March 31, 2015, the noncontrolling ownership interest of QualityTech, LP was 17.3%, which is related to certain persons who were owners of QualityTech, LP prior to the Company’s initial public offering. |
(6) | Unrealized gain on swap – For derivative instruments that are accounted for as hedges, or for the effective portions of qualifying hedges, the change in fair value is recorded as unrealized gains (losses) on swap and is included in other comprehensive income. The swaps that the Company previously held matured in September 2014, therefore, all gains were realized within that period and there was no unrealized gain or loss recognized in the Combined Consolidated Statements of Operations and Comprehensive Income for the three month periods ended March 31, 2015 and December 31, 2014. |
6 QTS Q1 Earnings 2015 | Contact: IR@qtsdatacenters.com |
Reconciliations of Net Income to FFO, Operating FFO & Adjusted Operating FFO
(unaudited and in thousands)
The Company calculates FFO in accordance with the standards established by the National Association of Real Estate Investment Trusts (“NAREIT”). FFO represents net income (computed in accordance with GAAP), adjusted to exclude gains (or losses) from sales of property, real estate related depreciation and amortization and similar adjustments for unconsolidated partnerships and joint ventures. The Company generally calculates Operating FFO as FFO excluding certain non-recurring and primarily non-cash charges and gains and losses that management believes are not indicative of the results of the Company’s operating real estate portfolio. The Company believes that Operating FFO provides investors with another financial measure that may facilitate comparisons of operating performance and liquidity between periods and, to the extent other REITs calculate Operating FFO on a comparable basis, between the Company and these other REITs. The Company calculates Adjusted Operating FFO by adding or subtracting from Operating FFO items such as: maintenance capital investment, paid leasing commissions, amortization of deferred financing costs, non-real estate depreciation, straight line rent adjustments, and non-cash compensation.
A reconciliation of net income to FFO, Operating FFO and Adjusted Operating FFO is presented below:
Three Months Ended | ||||||||||||
March 31, | December 31, | March 31, | ||||||||||
2015 | 2014 | 2014 | ||||||||||
FFO | ||||||||||||
Net income | $ | 5,037 | $ | 5,848 | $ | 5,328 | ||||||
Real estate depreciation and amortization | 14,302 | 14,192 | 11,864 | |||||||||
FFO | 19,339 | 20,040 | 17,192 | |||||||||
Write off of unamortized deferred finance costs | - | 291 | - | |||||||||
Restructuring costs | - | 26 | - | |||||||||
Transaction costs | 105 | 60 | 64 | |||||||||
Operating FFO * | 19,444 | 20,417 | 17,256 | |||||||||
Maintenance Capex | (17 | ) | (712 | ) | (73 | ) | ||||||
Leasing commissions paid | (3,084 | ) | (3,615 | ) | (2,249 | ) | ||||||
Amortization of deferred financing costs and bond discount | 849 | 842 | 582 | |||||||||
Non real estate depreciation and amortization | 1,941 | 1,817 | 1,382 | |||||||||
Straight line rent revenue | (436 | ) | (369 | ) | (152 | ) | ||||||
Straight line rent expense | 71 | 71 | 75 | |||||||||
Equity-based compensation expense | 1,307 | 1,252 | 911 | |||||||||
Adjusted Operating FFO * | $ | 20,075 | $ | 19,703 | $ | 17,732 |
* | The Company’s calculations of Operating FFO and Adjusted Operating FFO may not be comparable to Operating FFO and Adjusted Operating FFO as calculated by other REITs that do not use the same definition. |
7 QTS Q1 Earnings 2015 | Contact: IR@qtsdatacenters.com |
Reconciliations of Net Income to EBITDA and Adjusted EBITDA
(unaudited and in thousands)
The Company calculates EBITDA as net income excluding interest expense and interest income, provision for income taxes (including income taxes applicable to sale of assets) and depreciation and amortization. The Company believes that EBITDA is another metric that is often utilized to evaluate and compare the Company’s ongoing operating results and also, in part, to assess the value of the Company’s operating portfolio. In addition to EBITDA, the Company calculates an adjusted measure of EBITDA, which the Company refers to as Adjusted EBITDA, as EBITDA excluding write off of unamortized deferred financing costs, gain on extinguishment of debt, transaction costs, equity-based compensation expense, restructuring charge, gain on legal settlement and gain on sale of real estate. The Company believes that Adjusted EBITDA provides investors with another financial measure that can facilitate comparisons of operating performance between periods and between REITs.
A reconciliation of net income to EBITDA and Adjusted EBITDA is presented below:
Three Months Ended | ||||||||||||
March 31, | December 31, | March 31, | ||||||||||
2015 | 2014 | 2014 | ||||||||||
EBITDA and Adjusted EBITDA | ||||||||||||
Net income | $ | 5,037 | $ | 5,848 | $ | 5,328 | ||||||
Interest expense | 5,342 | 5,625 | 2,065 | |||||||||
Interest income | - | - | (8 | ) | ||||||||
Tax (benefit) expense of taxable REIT subsidiaries | - | (82 | ) | 28 | ||||||||
Depreciation and amortization | 16,243 | 16,008 | 13,247 | |||||||||
EBITDA | 26,622 | 27,399 | 20,660 | |||||||||
Write off of unamortized deferred finance costs | - | 291 | - | |||||||||
Equity-based compensation expense | 1,307 | 1,252 | 911 | |||||||||
Restructuring costs | - | 26 | - | |||||||||
Transaction costs | 105 | 60 | 64 | |||||||||
Adjusted EBITDA | $ | 28,034 | $ | 29,028 | $ | 21,635 |
8 QTS Q1 Earnings 2015 | Contact: IR@qtsdatacenters.com |
Reconciliations of Net Income to Net Operating Income (NOI)
(unaudited and in thousands)
The Company calculates net operating income (“NOI”) as net income, excluding: interest expense, interest income, tax expense of taxable REIT subsidiaries, depreciation and amortization, write off of unamortized deferred financing costs, gain on extinguishment of debt, transaction costs, gain on legal settlement, gain on sale of real estate, restructuring charge and general and administrative expenses. The Company believes that NOI is another metric that is often utilized to evaluate returns on operating real estate from period to period and also, in part, to assess the value of the operating real estate. A reconciliation of net income to NOI is presented below:
Three Months Ended | ||||||||||||
March 31, | December 31, | March 31, | ||||||||||
2015 | 2014 | 2014 | ||||||||||
Net Operating Income (NOI) | ||||||||||||
Net income | $ | 5,037 | $ | 5,848 | $ | 5,328 | ||||||
Interest expense | 5,342 | 5,625 | 2,065 | |||||||||
Interest income | - | - | (8 | ) | ||||||||
Depreciation and amortization | 16,243 | 16,008 | 13,247 | |||||||||
Write off of unamortized deferred finance costs | - | 291 | - | |||||||||
Tax (benefit) expense of taxable REIT subsidiaries | - | (82 | ) | 28 | ||||||||
Restructuring costs | - | 26 | - | |||||||||
Transaction costs | 105 | 60 | 64 | |||||||||
General and administrative expenses | 13,838 | 11,987 | 10,778 | |||||||||
NOI (1) | $ | 40,565 | $ | 39,763 | $ | 31,502 | ||||||
Breakdown of NOI by facility: | ||||||||||||
Atlanta-Metro data center | $ | 16,766 | $ | 16,386 | $ | 14,402 | ||||||
Atlanta-Suwanee data center | 10,130 | 9,711 | 8,174 | |||||||||
Santa Clara data center | 3,377 | 3,390 | 2,730 | |||||||||
Richmond data center | 4,255 | 4,208 | 3,047 | |||||||||
Sacramento data center | 1,871 | 1,869 | 2,324 | |||||||||
Princeton data center | 2,349 | 2,739 | - | |||||||||
Dallas-Fort Worth data center | 749 | 395 | - | |||||||||
Other facilities | 1,068 | 1,065 | 825 | |||||||||
NOI (1) | $ | 40,565 | $ | 39,763 | $ | 31,502 |
(1) | Includes facility level general and administrative expense allocation charges of 4% of revenue which aggregated to $2.5 million, $2.4 million and $2.0 million for the three month periods ended March 31, 2015, December 31, 2014, and March 31, 2014, respectively. |
9 QTS Q1 Earnings 2015 | Contact: IR@qtsdatacenters.com |
Reconciliations of Total Revenues to Recognized MRR in the period and MRR at period end
(unaudited and in thousands)
The Company calculates MRR as monthly contractual revenue under signed leases as of a particular date, which includes revenue from its C1, C2 and C3 rental and cloud and managed services activities, but excludes customer recoveries, deferred set-up fees, variable related revenues, non-cash revenues and other one-time revenues. MRR does not include the impact from booked-not-billed leases (which represent customer leases that have been executed but for which lease payments have not commenced) as of a particular date, unless otherwise specifically noted. The Company calculates recognized MRR as the recurring revenue recognized during a given period, which includes revenue from its C1, C2 and C3 rental and cloud and managed services activities, but excludes customer recoveries, deferred set-up fees, variable related revenues, non-cash revenues and other one-time revenues. Management uses MRR and recognized MRR as supplemental performance measures because they provide useful measures of increases in contractual revenue from customer leases. A reconciliation of total revenues to recognized MRR in the period and MRR at period-end is presented below:
Three Months Ended | ||||||||||||
March 31, | December 31, | March 31, | ||||||||||
2015 | 2014 | 2014 | ||||||||||
Recognized MRR in the period | ||||||||||||
Total period revenues (GAAP basis) | $ | 61,386 | $ | 59,563 | $ | 48,943 | ||||||
Less: Total period recoveries | (5,664 | ) | (5,520 | ) | (3,691 | ) | ||||||
Total period deferred setup fees | (1,246 | ) | (1,201 | ) | (1,219 | ) | ||||||
Total period straight line rent and other | (2,012 | ) | (1,981 | ) | (878 | ) | ||||||
Recognized MRR in the period | 52,464 | 50,861 | 43,155 | |||||||||
MRR at period end | ||||||||||||
Total period revenues (GAAP basis) | $ | 61,386 | $ | 59,563 | $ | 48,943 | ||||||
Less: Total revenues excluding last month | (40,100 | ) | (39,605 | ) | (32,551 | ) | ||||||
Total revenues for last month of period | 21,286 | 19,958 | 16,392 | |||||||||
Less: Last month recoveries | (1,749 | ) | (1,908 | ) | (1,136 | ) | ||||||
Last month deferred setup fees | (418 | ) | (372 | ) | (410 | ) | ||||||
Last month straight line rent and other | (1,292 | ) | (537 | ) | (272 | ) | ||||||
MRR at period end | $ | 17,827 | $ | 17,141 | $ | 14,574 |
10 QTS Q1 Earnings 2015 | Contact: IR@qtsdatacenters.com |
Exhibit 99.2
Table of Contents
Overview | ||||
Company Profile | 3 | |||
Financial Statements | ||||
Combined Consolidated Balance Sheets | 4 | |||
Combined Consolidated Statements of Operations and Comprehensive Income (Loss) | 5 | |||
Summary of Financial Data | 6 | |||
Reconciliations of Return on Invested Capital (ROIC) | 8 | |||
Implied Enterprise Value | 9 | |||
Operating Portfolio | ||||
Data Center Properties | 10 | |||
Redevelopment Costs Summary | 11 | |||
Redevelopment Summary | 12 | |||
NOI by Facility and Capital Expenditure Summary | 13 | |||
Leasing Statistics – Signed Leases | 14 | |||
Leasing Statistics – Renewed Leases and Rental Churn | 16 | |||
Leasing Statistics – Commenced Leases | 17 | |||
Lease Expirations | 18 | |||
Largest Customers | 19 | |||
Industry Segmentation | 20 | |||
Product Diversification | 21 | |||
Capital Structure | ||||
Debt Summary and Debt Maturities | 22 | |||
Interest Summary | 23 | |||
Appendix | 24 |
1 QTS Q1 Earnings 2015 | Contact: IR@qtsdatacenters.com |
Forward Looking Statements
Some of the statements contained in this document constitute forward-looking statements within the meaning of the federal securities laws. Forward-looking statements relate to expectations, beliefs, projections, future plans and strategies, anticipated events or trends and similar expressions concerning matters that are not historical facts. In particular, statements pertaining to the Company’s capital resources, portfolio performance and results of operations contain forward-looking statements. Likewise, all of the statements regarding anticipated growth in funds from operations and anticipated market conditions are forward-looking statements. In some cases, you can identify forward-looking statements by the use of forward-looking terminology such as “may,” “will,” “should,” “expects,” “intends,” “plans,” “anticipates,” “believes,” “estimates,” “predicts,” or “potential” or the negative of these words and phrases or similar words or phrases which are predictions of or indicate future events or trends and which do not relate solely to historical matters. You can also identify forward-looking statements by discussions of strategy, plans or intentions.
The forward-looking statements contained in this document reflect the Company’s current views about future events and are subject to numerous known and unknown risks, uncertainties, assumptions and changes in circumstances that may cause actual results to differ significantly from those expressed in any forward-looking statement. The Company does not guarantee that the transactions and events described will happen as described (or that they will happen at all). The following factors, among others, could cause actual results and future events to differ materially from those set forth or contemplated in the forward-looking statements: adverse economic or real estate developments in the Company’s markets or the technology industry; national and local economic conditions; difficulties in identifying properties to acquire and completing acquisitions; the Company’s failure to successfully develop, redevelop and operate acquired properties; significant increases in construction and development costs; the increasingly competitive environment in which the Company operates; defaults on or non-renewal of leases by customers; increased interest rates and operating costs, including increased energy costs; financing risks, including the Company’s failure to obtain necessary outside financing; decreased rental rates or increased vacancy rates; dependence on third parties to provide Internet, telecommunications and network connectivity to the Company’s data centers; the Company’s failure to qualify and maintain its qualification as a real estate investment trust; environmental uncertainties and risks related to natural disasters; financial market fluctuations; and changes in real estate and zoning laws and increases in real property tax rates.
While forward-looking statements reflect the Company’s good faith beliefs, they are not guarantees of future performance. The Company disclaims any obligation to publicly update or revise any forward-looking statement to reflect changes in underlying assumptions or factors, of new information, data or methods, future events or other changes. For a further discussion of these and other factors that could cause the Company’s future results to differ materially from any forward-looking statements, see the section entitled “Risk Factors” in the Company’s Annual Report on Form 10-K for the year ended December 31, 2014.
2 QTS Q1 Earnings 2015 | Contact: IR@qtsdatacenters.com |
Company Profile
3 QTS Q1 Earnings 2015 | Contact: IR@qtsdatacenters.com |
Combined Consolidated Balance Sheets
(in thousands)
March 31, | December 31, | |||||||
2015 | 2014 | |||||||
ASSETS | (unaudited) | |||||||
Real Estate Assets | ||||||||
Land | $ | 48,577 | $ | 48,577 | ||||
Buildings and improvements | 954,915 | 914,286 | ||||||
Less: Accumulated depreciation | (192,107 | ) | (180,167 | ) | ||||
811,385 | 782,696 | |||||||
Construction in progress | 266,234 | 214,719 | ||||||
Real Estate Assets, net | 1,077,619 | 997,415 | ||||||
Cash and cash equivalents | 5,748 | 10,788 | ||||||
Rents and other receivables, net | 16,730 | 15,579 | ||||||
Acquired intangibles, net | 17,262 | 18,000 | ||||||
Deferred costs, net (1) | 37,902 | 37,058 | ||||||
Prepaid expenses | 6,477 | 3,079 | ||||||
Other assets, net (2) | 24,252 | 24,640 | ||||||
TOTAL ASSETS | $ | 1,185,990 | $ | 1,106,559 | ||||
LIABILITIES | ||||||||
Mortgage notes payable | $ | 86,016 | $ | 86,600 | ||||
Unsecured credit facility | 140,000 | 239,838 | ||||||
Senior notes | 297,791 | 297,729 | ||||||
Capital lease obligations | 13,509 | 13,062 | ||||||
Accounts payable and accrued liabilities | 82,230 | 64,607 | ||||||
Dividends and distributions payable | 13,381 | 10,705 | ||||||
Advance rents, security deposits and other liabilities | 3,439 | 3,302 | ||||||
Deferred income | 11,401 | 10,531 | ||||||
TOTAL LIABILITIES | 647,767 | 726,374 | ||||||
EQUITY | ||||||||
Common stock, $0.01 par value, 450,133,000 shares authorized, 34,818,437 and 29,408,138 shares issued and outstanding as of March 31, 2015 and December 31, 2014, respectively | 348 | 294 | ||||||
Additional paid-in capital | 474,185 | 324,917 | ||||||
Accumulated dividends in excess of earnings | (29,563 | ) | (22,503 | ) | ||||
Total stockholders’ equity | 444,970 | 302,708 | ||||||
Noncontrolling interests | 93,253 | 77,477 | ||||||
TOTAL EQUITY | 538,223 | 380,185 | ||||||
TOTAL LIABILITIES AND EQUITY | $ | 1,185,990 | $ | 1,106,559 |
(1) | As of March 31, 2015 and December 31, 2014, deferred costs, net, included $16.0 million and $16.5 million of deferred financing costs net of amortization, respectively, $18.8 million and $17.4 million of deferred leasing costs net of amortization, respectively, and $3.1 million and $3.2 million, net of amortization, related to a leasing arrangement at the Company’s Princeton facility, respectively. |
(2) | As
of March 31, 2015 and December 31, 2014, other assets, net, primarily included $21.8
million and $21.4 million of corporate fixed assets, respectively, primarily relating
to construction of corporate offices, leasehold improvements and product related assets. |
4 QTS Q1 Earnings 2015 | Contact: IR@qtsdatacenters.com |
Combined Consolidated Statements of Operations and Comprehensive Income
(in thousands)
Three Months Ended (unaudited) | ||||||||||||
March 31, | December 31, | March 31, | ||||||||||
Revenues: | 2015 | 2014 | 2014 | |||||||||
Rental | $ | 49,333 | $ | 47,656 | $ | 40,579 | ||||||
Recoveries from customers | 5,664 | 5,520 | 3,691 | |||||||||
Cloud and managed services | 5,795 | 5,788 | 4,231 | |||||||||
Other (1) | 594 | 599 | 442 | |||||||||
Total revenues | 61,386 | 59,563 | 48,943 | |||||||||
Operating expenses: | ||||||||||||
Property operating costs | 19,336 | 18,397 | 16,223 | |||||||||
Real estate taxes and insurance | 1,485 | 1,403 | 1,218 | |||||||||
Depreciation and amortization | 16,243 | 16,008 | 13,247 | |||||||||
General and administrative (2) | 13,838 | 11,987 | 10,778 | |||||||||
Restructuring | - | 26 | - | |||||||||
Transaction costs (3) | 105 | 60 | 64 | |||||||||
Total operating expenses | 51,007 | 47,881 | 41,530 | |||||||||
Operating income | 10,379 | 11,682 | 7,413 | |||||||||
Other income and expense: | ||||||||||||
Interest income | - | - | 8 | |||||||||
Interest expense | (5,342 | ) | (5,625 | ) | (2,065 | ) | ||||||
Other expense, net (4) | - | (291 | ) | - | ||||||||
Income before taxes | 5,037 | 5,766 | 5,356 | |||||||||
Tax benefit (expense) of taxable REIT subsidiaries | - | 82 | (28 | ) | ||||||||
Net income | 5,037 | 5,848 | 5,328 | |||||||||
Net income attributable to noncontrolling interests (5) | (955 | ) | (1,221 | ) | (1,130 | ) | ||||||
Net income attributable to QTS Realty Trust, Inc | 4,082 | 4,627 | 4,198 | |||||||||
Unrealized gain on swap (6) | - | - | 105 | |||||||||
Comprehensive income | $ | 4,082 | $ | 4,627 | $ | 4,303 |
(1) | Other revenue - Includes straight line rent, sales of scrap metals and other unused materials and various other income items. Straight line rent was $0.4 million, $0.4 million and $0.2 million for the three month periods ended March 31, 2015, December 31, 2014, and March 31, 2014, respectively. |
(2) | General and administrative expenses - Includes personnel costs, sales and marketing costs, professional fees, travel costs, product investment costs and other corporate general and administrative expenses. General and administrative expenses were 22.5%, 20.1%, and 22.0% of total revenues for the three month periods ended March 31, 2015, December 31, 2014, and March 31, 2014, respectively. |
(3) | Transaction costs - For the three month periods ended March 31, 2015, December 31, 2014, and March 31, 2014, the Company recognized $0.1 million, $0.1 million and $0.1 million, respectively, in costs related to the examination of actual and potential acquisitions. |
(4) | Other expense, net - Generally includes write offs of unamortized deferred financing costs associated with the early extinguishment of certain debt instruments. |
(5) | Noncontrolling interest - As of March 31, 2015, the noncontrolling ownership interest of QualityTech, LP was 17.3%, which is related to certain persons who were owners of QualityTech, LP prior to the Company’s initial public offering. |
(6) | Unrealized gain on swap - For derivative instruments that are accounted for as hedges, or for the effective portions of qualifying hedges, the change in fair value is recorded as unrealized gains (losses) on swap and is included in other comprehensive income. The swaps that the Company previously held matured in September 2014, therefore, all gains were realized within that period and no unrealized gain or loss was recognized in the Combined Consolidated Statements of Operations and Comprehensive Income for the three months ended March 31, 2015 and December 31, 2014. |
5 QTS Q1 Earnings 2015 | Contact: IR@qtsdatacenters.com |
Summary of Financial Data
(in thousands, except share, per share and operating portfolio statistics data)
Three Months Ended | ||||||||||||
March 31, | December 31, | March 31, | ||||||||||
Summary of Results | 2015 | 2014 | 2014 | |||||||||
Total revenue | $ | 61,386 | $ | 59,563 | $ | 48,943 | ||||||
Net income | 5,037 | 5,848 | 5,328 | |||||||||
Other Data | ||||||||||||
FFO | $ | 19,339 | $ | 20,040 | $ | 17,192 | ||||||
Operating FFO | 19,444 | 20,417 | 17,256 | |||||||||
Operating FFO per share | 0.50 | 0.55 | 0.47 | |||||||||
Adjusted Operating FFO | 20,075 | 19,703 | 17,732 | |||||||||
Adjusted Operating FFO per share | 0.51 | 0.53 | 0.48 | |||||||||
Recognized MRR in the period | 52,464 | 50,861 | 43,155 | |||||||||
MRR (at period end) | 17,827 | 17,141 | 14,574 | |||||||||
EBITDA | 26,622 | 27,399 | 20,660 | |||||||||
Adjusted EBITDA | 28,034 | 29,028 | 21,635 | |||||||||
NOI | 40,565 | 39,763 | 31,502 | |||||||||
NOI as a % of revenue | 66.1 | % | 66.8 | % | 64.4 | % | ||||||
Adjusted EBITDA as a % of revenue | 45.7 | % | 48.7 | % | 44.2 | % | ||||||
General and administrative expenses as a % of revenue | 22.5 | % | * | 20.1 | % | 22.0 | % | |||||
Annualized ROIC | 15.5 | % | 15.7 | % | 15.8 | % |
* | Costs related to advertising and marketing and investing in our product portfolio aggregated to $1.3 million, $0.8 million and $0.5 million for the three months ended March 31, 2015, December 31, 2014 and March 31, 2014, respectively. Excluding the increase in these costs of $0.8 million from the three months ended March 31, 2015, as compared to the three months ended March 31, 2014, would have resulted in general and administrative expenses as a percent of revenue of 21.2%. |
March 31, | December 31, | |||||||
Balance Sheet Data | 2015 | 2014 | ||||||
Real estate at cost | $ | 1,269,727 | $ | 1,177,582 | ||||
Net investment in real estate | 1,077,619 | 997,415 | ||||||
Total assets | 1,185,990 | 1,106,559 | ||||||
Credit facilities, senior notes, mortgages payables, and capital leases | 537,316 | 637,229 | ||||||
Debt to last quarter annualized Adjusted EBITDA | 4.8 | x | 5.5 | x | ||||
Debt to Undepreciated real estate assets | 42.3 | % | 54.1 | % | ||||
Debt to Implied Enterprise Value | 25.6 | % | 33.4 | % |
6 QTS Q1 Earnings 2015 | Contact: IR@qtsdatacenters.com |
March 31, | December 31, | |||||||
Operating Portfolio Statistics | 2015 | 2014 | ||||||
Built out square footage: | ||||||||
Raised floor | 960,768 | 927,075 | ||||||
Leasable raised floor (1) | 726,558 | 698,232 | ||||||
Leased raised floor | 603,395 | 593,610 | ||||||
Total Raw Shell: | ||||||||
Total | 4,688,164 | 4,688,164 | ||||||
Basis-of-design raised floor space (1) | 2,090,959 | 2,090,959 | ||||||
Data center properties | 12 | 12 | ||||||
Basis of design raised floor % developed | 45.9 | % | 44.3 | % | ||||
Data center % occupied | 83.0 | % | 85.0 | % |
(1) | See definition in Appendix. |
7 QTS Q1 Earnings 2015 | Contact: IR@qtsdatacenters.com |
Reconciliations of Return on Invested Capital (ROIC)
(unaudited and in thousands)
Return on Invested Capital (ROIC) | Three Months Ended | |||||||||||
March 31, | December 31, | March 31, | ||||||||||
2015 | 2014 | 2014 | ||||||||||
NOI (1) | $ | 40,565 | $ | 39,763 | $ | 31,502 | ||||||
Annualized NOI | 162,260 | 159,052 | 126,008 | |||||||||
Average Undepreciated Real Estate Assets and other Net Fixed Assets Placed in Service | 1,043,654 | 1,013,331 | 795,423 | |||||||||
Annualized ROIC | 15.5 | % | 15.7 | % | 15.8 | % |
(1) | Includes facility level G&A allocation charges of 4% of revenue which aggregated to $2.5 million, $2.4 million and $2.0 million for the three month periods ended March 31, 2015, December 31, 2014, and March 31, 2014, respectively. |
Calculation of Average Undepreciated Real Estate Assets and other Net Fixed Assets Placed in Service | As of | |||||||||||
Undepreciated Real Estate Assets and other | March 31, | December 31, | March 31, | |||||||||
Net Fixed Assets Placed in Service | 2015 | 2014 | 2014 | |||||||||
Real Estate Assets, net | $ | 1,077,619 | $ | 997,415 | $ | 809,065 | ||||||
Less: Construction in progress | (266,234 | ) | (214,719 | ) | (182,699 | ) | ||||||
Plus: Accumulated depreciation | 192,107 | 180,167 | 147,336 | |||||||||
Plus: Other fixed assets, net | 21,843 | 21,387 | 17,273 | |||||||||
Plus: Acquired intangibles, net | 17,262 | 18,000 | 4,413 | |||||||||
Plus: Leasing Commissions, net | 21,872 | 20,589 | 12,081 | |||||||||
Total as of period end | $ | 1,064,469 | $ | 1,022,839 | $ | 807,469 | ||||||
Average undepreciated real estate assets and other net fixed assets as of reporting period (2) | $ | 1,043,654 | $ | 1,013,331 | $ | 795,423 |
(2) | Calculated by using average quarterly balance of each account. |
8 QTS Q1 Earnings 2015 | Contact: IR@qtsdatacenters.com |
Implied Enterprise Value
Implied Enterprise Value as of March 31, 2015: | ||||
Total Shares Outstanding: | ||||
Class A Common Stock | 34,685,437 | |||
Class B Common Stock | 133,000 | |||
Total Shares Outstanding | 34,818,437 | |||
Units of Limited Partnership (1) | 7,779,393 | |||
Options to purchase Class A Common Stock (2) | 214,672 | |||
Fully Diluted Total Shares and Units of Limited Partnership outstanding as of March 31, 2015 (3) | 42,812,502 | |||
Share price as of March 31, 2015 | $ | 36.41 | ||
Market equity capitalization (in thousands) | $ | 1,558,803 | ||
Debt (in thousands) | 537,316 | |||
Implied Enterprise Value (in thousands) | $ | 2,096,119 |
(1) | Includes 482,393 of operating partnership units representing the “in the money” value of Class O LTIP units on an “as if” converted basis. |
(2) | Represents options to purchase 214,672 shares of Class A Common Stock of QTS Realty Trust Inc. representing the “in the money” value options on an “as if” converted basis. |
(3) | Weighted average fully diluted shares and units for the three months ended March 31, 2015 were 39,209,226. |
9 QTS Q1 Earnings 2015 | Contact: IR@qtsdatacenters.com |
Data Center Properties
(in thousands, except NRSF data)
The following table presents an overview of the portfolio of data center properties that the Company owns or leases, referred to herein as our data center properties, based on information as of March 31, 2015:
Operating Net Rentable Square Feet (Operating NRSF) (3) | ||||||||||||||||||||||||||||||||||||||||||
Property | Year Acquired (1) | Gross Square Feet (2) | Raised Floor (4) | Office & Other (5) | Supporting Infrastructure (6) | Total | %
Occupied and Billing (7) | Annualized Rent (8) | Available Utility Power (MW) (9) | Basis of Design NRSF | % Raised Floor | |||||||||||||||||||||||||||||||
Richmond, VA | 2010 | 1,318,353 | 95,581 | 24,678 | 115,627 | 235,886 | 90.5 | % | $ | 21,183,226 | 110 | 556,595 | 17.2 | % | ||||||||||||||||||||||||||||
Atlanta, GA (Metro) | 2006 | 968,695 | 407,986 | 36,953 | 315,676 | 760,615 | 81.8 | % | $ | 73,908,580 | 72 | 527,186 | 77.4 | % | ||||||||||||||||||||||||||||
Dallas-Fort Worth, TX | 2013 | 698,000 | 47,014 | 2,321 | 28,825 | 78,160 | 86.4 | % | $ | 5,251,542 | 140 | 292,000 | 16.1 | % | ||||||||||||||||||||||||||||
Princeton, NJ | 2014 | 553,930 | 58,157 | 2,229 | 111,405 | 171,791 | 100.0 | % | $ | 9,540,975 | 22 | 158,157 | 36.8 | % | ||||||||||||||||||||||||||||
Suwanee, GA | 2005 | 369,822 | 185,422 | 8,697 | 108,266 | 302,385 | 77.7 | % | $ | 51,456,615 | 36 | 208,008 | 89.1 | % | ||||||||||||||||||||||||||||
Chicago, IL | 2014 | 317,000 | - | - | - | - | - | % | $ | - | 8 | 133,000 | - | % | ||||||||||||||||||||||||||||
Santa Clara, CA** | 2007 | 135,322 | 55,494 | 944 | 45,687 | 102,125 | 97.6 | % | $ | 23,048,080 | 11 | 80,347 | 69.1 | % | ||||||||||||||||||||||||||||
Jersey City, NJ* | 2006 | 122,448 | 31,503 | 14,208 | 41,901 | 87,612 | 99.2 | % | $ | 11,497,340 | 7 | 52,744 | 59.7 | % | ||||||||||||||||||||||||||||
Sacramento, CA | 2012 | 92,644 | 54,595 | 2,794 | 23,916 | 81,305 | 52.2 | % | $ | 11,979,818 | 8 | 57,906 | 94.3 | % | ||||||||||||||||||||||||||||
Miami, FL | 2008 | 30,029 | 19,887 | - | 6,592 | 26,479 | 67.9 | % | $ | 5,151,704 | 4 | 19,887 | 100.0 | % | ||||||||||||||||||||||||||||
Other | Misc | 81,921 | 5,129 | 37,854 | 38,723 | 81,706 | 21.5 | % | $ | 909,372 | 1 | 5,129 | 100.0 | % | ||||||||||||||||||||||||||||
Total | 4,688,164 | 960,768 | 130,678 | 836,618 | 1,928,064 | 83.0 | % | $ | 213,927,252 | 419 | 2,090,959 | 45.9 | % |
(1) | Represents the year a property was acquired or, in the case of a property under lease, the year the Company’s initial lease commenced for the property. |
(2) | With respect to the Company’s owned properties, gross square feet represents the entire building area. With respect to leased properties, gross square feet represents that portion of the gross square feet subject to our lease. This includes 181,478 square feet of QTS office and support space, which is not included in operating NRSF. |
(3) | Represents the total square feet of a building that is currently leased or available for lease plus developed supporting infrastructure, based on engineering drawings and estimates, but does not include space held for redevelopment or space used for the Company’s own office space. |
(4) | Represents management’s estimate of the portion of NRSF of the facility with available power and cooling capacity that is currently leased or readily available to be leased to customers as data center space based on engineering drawings. |
(5) | Represents the operating NRSF of the facility other than data center space (typically office and storage space) that is currently leased or available to be leased. |
(6) | Represents required data center support space, including mechanical, telecommunications and utility rooms, as well as building common areas. |
(7) | Calculated as data center raised floor that is subject to a signed lease for which billing has commenced (603,395 square feet as of March 31, 2015, divided by leasable raised floor based on the current configuration of the properties (726,558 square feet as of March 31, 2015), expressed as a percentage. |
(8) | The Company defines annualized rent as MRR multiplied by 12. The Company calculates MRR as monthly contractual revenue under executed contracts as of a particular date, which includes revenue from the Company’s C1, C2 and C3 rental activities and cloud and managed services, but excludes customer recoveries, deferred set up fees and other one-time and variable revenues. MRR does not include the impact from booked-not-billed contracts as of a particular date, unless otherwise specifically noted. |
(9) | Represents installed utility power and transformation capacity that is available for use by the facility as of March 31, 2015. |
* | Represents facilities that we lease. | |
** | Subject to long term ground lease. |
10 QTS Q1 Earnings 2015 | Contact: IR@qtsdatacenters.com |
Redevelopment Costs Summary
(in thousands, except NRSF data)
During the first quarter of 2015, the Company brought online approximately 33,000 NRSF of raised floor at an aggregate cost of approximately $41 million. The under construction table below summarizes the Company’s outlook for development projects which it expects to complete by December 31, 2015 (in millions). The majority of capital in this plan is discretionary. In addition to the projects in the first quarter of 2015, this table reflects modifications to the Company’s capital plan as of March 31, 2015, relating to its plan to operate its facilities at higher efficiency levels and to better match new capacity with lease-up at each facility.
Under Construction Costs (1) | ||||||||||||||
Property | Actual (2) | Estimated Cost to Completion (3) | Total | Expected Completion date | ||||||||||
Richmond | $ | 45 | $ | 30 | $ | 75 | Q2 2015 - Q4 2015 | |||||||
Atlanta Metro | 11 | 12 | 23 | Q2 2015 - Q4 2015 | ||||||||||
Dallas-Fort Worth | 7 | 7 | 14 | Q2 2015 - Q4 2015 | ||||||||||
Jersey City | - | 4 | 4 | Q4 2015 | ||||||||||
Totals | $ | 63 | $ | 53 | $ | 116 |
(1) | In addition to projects currently under construction, the Company’s near-term redevelopment projects are expected to be delivered in a modular manner, and the Company currently expects to invest additional capital to complete these near term projects. The ultimate timing and completion of, and the commitment of capital to, the Company’s future redevelopment projects are within the Company’s discretion and will depend upon a variety of factors, including the actual contracts executed, availability of financing and the Company’s estimation of the future market for data center space in each particular market. |
(2) | Actual costs under construction through March 31, 2015. In addition to the $63 million of construction costs incurred through March 31, 2015 for redevelopment expected to be completed by December 31, 2015, as of March 31, 2015 the Company had incurred $203 million of additional costs (including acquisition costs and other capitalized costs) for other redevelopment projects that are expected to be completed after December 31, 2015. |
(3) | Represents management’s estimate of the additional costs required to complete the current NRSF under development. There may be an increase in costs if customers’ requirements exceed the Company’s current basis of design. |
11 QTS Q1 Earnings 2015 | Contact: IR@qtsdatacenters.com |
Redevelopment Summary
(in thousands, except NRSF data)
The following redevelopment table presents an overview of the Company’s redevelopment pipeline, based on information as of March 31, 2015. This table shows the Company’s ability to increase its raised floor of 960,768 square feet by approximately 2.2 times to 2.1 million square feet as of March 31, 2015.
Raised Floor NRSF | ||||||||||||||||||||
Overview as of March 31, 2015 | ||||||||||||||||||||
Property | Current NRSF in Service | Under Construction (1) | Future Available (2) | Basis of Design NRSF | Approximate Adjacent Acreage of Land (3) | |||||||||||||||
Richmond | 95,581 | 56,014 | 405,000 | 556,595 | 111.1 | |||||||||||||||
Atlanta Metro | 407,986 | 10,000 | 109,200 | 527,186 | 6.0 | |||||||||||||||
Dallas-Fort Worth | 47,014 | 7,000 | 237,986 | 292,000 | 15.0 | |||||||||||||||
Princeton | 58,157 | - | 100,000 | 158,157 | 65.0 | |||||||||||||||
Atlanta Suwanee | 185,422 | - | 22,586 | 208,008 | 15.4 | |||||||||||||||
Santa Clara | 55,494 | - | 24,853 | 80,347 | - | |||||||||||||||
Sacramento | 54,595 | - | 3,311 | 57,906 | - | |||||||||||||||
Jersey City | 31,503 | - | 21,241 | 52,744 | - | |||||||||||||||
Chicago | - | - | 133,000 | 133,000 | 23.0 | |||||||||||||||
Miami | 19,887 | - | - | 19,887 | - | |||||||||||||||
Other | 5,129 | - | - | 5,129 | - | |||||||||||||||
Totals as of March 31, 2015 | 960,768 | 73,014 | 1,057,177 | 2,090,959 | 235.5 |
(1) | Reflects NRSF at a facility for which the initiation of substantial activities has begun to prepare the property for its intended use on or before December 31, 2015. |
(2) | Reflects NRSF at a facility for which the initiation of substantial activities has begun to prepare the property for its intended use after December 31, 2015. |
(3) | The total cost basis of adjacent land, which is land available for the future development, is approximately $15 million. This is included in land on the Combined Consolidated Balance Sheets. The Basis of Design NRSF does not include any build-out on the adjacent land. |
12 QTS Q1 Earnings 2015 | Contact: IR@qtsdatacenters.com |
NOI by Facility and Capital Expenditure Summary
(unaudited and in thousands, except NRSF data)
The Company calculates net operating income, or NOI, as net income (loss), excluding: interest expense, interest income, depreciation and amortization, write-off of unamortized deferred financing costs, tax expense of taxable REIT subsidiaries, gain on extinguishment of debt, transaction costs, gain on legal settlement, gain on sale of real estate, restructuring charge and general and administrative expenses. The Company believes that NOI is another metric that is often utilized to evaluate returns on operating real estate from period to period and also, in part, to assess the value of the operating real estate. The breakdown of NOI by facility is shown below:
Three Months Ended | ||||||||||||
March 31, | December 31, | March 31, | ||||||||||
2015 | 2014 | 2014 | ||||||||||
Breakdown of NOI by facility: | ||||||||||||
Atlanta-Metro data center | $ | 16,766 | $ | 16,386 | $ | 14,402 | ||||||
Atlanta-Suwanee data center | 10,130 | 9,711 | 8,174 | |||||||||
Santa Clara data center | 3,377 | 3,390 | 2,730 | |||||||||
Richmond data center | 4,255 | 4,208 | 3,047 | |||||||||
Sacramento data center | 1,871 | 1,869 | 2,324 | |||||||||
Princeton data center | 2,349 | 2,739 | - | |||||||||
Dallas-Fort Worth data center | 749 | 395 | - | |||||||||
Other facilities | 1,068 | 1,065 | 825 | |||||||||
NOI (1) | $ | 40,565 | $ | 39,763 | $ | 31,502 |
(1) | Includes facility level G&A allocation charges of 4% of revenue which aggregated to $2.5 million, $2.4 million and $2.0 million, for the three month periods ended March 31, 2015, December 31, 2014, and March 31, 2014, respectively. |
Capital expenditures related to real estate assets are summarized as follows:
Real Estate Capital Expenditures (1) | ||||||||
Three Months Ended March 31, | ||||||||
2015 | 2014 | |||||||
Redevelopment | $ | 86,067 | $ | 46,324 | ||||
Maintenance capital expenditures | 17 | 73 | ||||||
Other capitalized costs | 6,059 | 4,268 | ||||||
Total capital expenditures | $ | 92,143 | $ | 50,665 |
(1) | Does not include capitalized leasing commissions included in deferred costs, acquired intangibles or other management-related fixed assets included in other assets. |
13 QTS Q1 Earnings 2015 | Contact: IR@qtsdatacenters.com |
Leasing Statistics – Signed Leases
(in thousands)
The mix of leasing activity has a significant impact on quarterly rates, both within major product segments and for overall blended leasing rates. The Company’s rate performance will vary quarter to quarter based on the mix of deals leased – C1 Custom Data Center, C2 Colocation (Cabinet, Cage and Suite), and C3 Cloud and Managed Services categories all vary on a rate per square foot basis. The amounts below include renewals when there was a change in square footage rented, but not renewals where square footage remained consistent before and after renewal (See renewal table on page 16 for such renewals).
During the first quarter of 2015, the Company signed 340 new and modified leases aggregating to $27.8 million of annualized rent which includes new leased revenue plus revenue from modified renewals. Removing annualized modified renewal MRR and deducting period downgrades results in $13.6 million in incremental annualized rent for the quarter, which is in line with the prior four quarter average. C1 leasing activity returned to previous levels and was higher than the prior four quarter average, and QTS continues to expect that C1 leasing activity will be uneven, but in aggregate will be positive. C1 prices were above the prior four quarter average due to the signing of smaller C1 deals which tend to have a greater rate per square foot. QTS’ C2/C3 leasing activity continues to perform on a consistent basis.
Annualized Rent of New and Modified Leases represents total MRR associated with all new and modified leases for the respective periods for the purposes of computing annualized rent rates per square foot during the period. Incremental Annualized Rent, Net of Downgrades reflects net incremental MRR signed during the period for purposes of tracking incremental revenue contribution.
Period | Number of Leases | Total Leased sq ft | Annualized Rent per Leased sq ft | Annualized Rent of New and Modified Leases | Incremental Annualized Rent, Net of Downgrades | |||||||||||||||||
New/modified leases signed - Total | Q1 2015 | 340 | 47,052 | $ | 590 | $ | 27,778,291 | $ | 13,618,400 | |||||||||||||
P4QA* | 336 | 55,004 | 356 | 19,579,022 | 14,494,544 | |||||||||||||||||
Q4 2014 | 347 | 10,596 | 1,011 | 10,717,456 | 4,116,717 | |||||||||||||||||
Q3 2014 | 361 | 130,617 | 248 | 32,417,738 | 25,629,407 | |||||||||||||||||
Q2 2014 | 335 | 66,009 | 329 | 21,688,736 | 17,717,391 | |||||||||||||||||
Q1 2014 | 301 | 12,793 | 1,055 | 13,492,159 | 10,514,660 | |||||||||||||||||
New/modified leases signed - C1 | Q1 2015 | 18 | 30,386 | $ | 340 | $ | 10,333,301 | |||||||||||||||
P4QA* | 14 | 45,546 | 207 | 9,409,778 | ||||||||||||||||||
Q4 2014 | 21 | 315 | 580 | 182,772 | ||||||||||||||||||
Q3 2014 | 15 | 121,658 | 190 | 23,165,719 | ||||||||||||||||||
Q2 2014 | 7 | 59,340 | 230 | 13,633,836 | ||||||||||||||||||
Q1 2014 | 14 | 872 | 753 | 656,784 | ||||||||||||||||||
New/modified leases signed - C2/C3 | Q1 2015 | 322 | 16,666 | $ | 1,047 | $ | 17,444,990 | |||||||||||||||
P4QA* | 322 | 9,458 | 1,075 | 10,169,236 | ||||||||||||||||||
Q4 2014 | 326 | 10,281 | 1,025 | 10,534,684 | ||||||||||||||||||
Q3 2014 | 346 | 8,959 | 1,033 | 9,252,019 | ||||||||||||||||||
Q2 2014 | 328 | 6,669 | 1,208 | 8,054,900 | ||||||||||||||||||
Q1 2014 | 287 | 11,921 | 1,077 | 12,835,341 |
* | Average
of prior 4 quarters NOTE: Figures above do not include cost recoveries. In general, C1 customers reimburse the Company for certain operating costs whereas C2/C3 customers are on a gross lease basis. As a result, pricing and resulting per square foot rates for C2/C3 customers includes the recovery of such operating costs. |
14 QTS Q1 Earnings 2015 | Contact: IR@qtsdatacenters.com |
The following table outlines the booked-not-billed (“BNB”) balance as of March 31, 2015 and how that will affect revenue in 2015 and subsequent years:
Booked-not-billed ("BNB") | 2015 | 2016 | Thereafter | Total | ||||||||||||
MRR | $ | 1,836,706 | $ | 2,095,115 | $ | 1,425,816 | $ | 5,357,637 | ||||||||
Incremental revenue | 9,720,939 | 18,392,916 | 17,109,794 | |||||||||||||
Annualized revenue | 22,040,469 | 25,141,378 | 17,109,794 | 64,291,641 |
The Company estimates the cost to provide the space, power, connectivity and other services to the customer contracts which had not billed as of March 31, 2015 to be approximately $115 million. This estimate generally includes C1 customers with newly contracted space of more than 3,300 square feet. The space, power, connectivity and other services provided to customers that contract for smaller amounts of space is generally provided by existing space which was previously developed.
15 QTS Q1 Earnings 2015 | Contact: IR@qtsdatacenters.com |
Leasing Statistics – Renewed Leases and Rental Churn
(in thousands)
The mix of leasing activity has a significant impact on quarterly rates, both within major product segments and for overall blended renewal rates. The Company’s rate performance will vary quarter to quarter based on the mix of deals leased – C1 Custom Data Center, C2 Colocation, and C3 Cloud and Managed Services categories all vary on a rate per square foot basis.
Consistent with the Company’s 3C strategy and business model, the renewal rates below reflect total MRR per square foot including all subscribed services. For comparability, the Company includes only those customers that have maintained consistent space footprints in the computations below. All customers with space changes are incorporated into new/modified leasing statistics and rates.
The overall blended rate for renewals signed in the first quarter of 2015 was 1.2% higher than the rates for those customers immediately prior to renewal. The change in the first quarter of 2015 renewal rates compares to a prior four quarter average increase of 2.7%. As the Company has previously stated, it expects renewal rates to be in the low to mid-single digits, and this continues to support that assertion.
Rental Churn (which the Company defines as MRR lost to complete termination of customer services in a given period compared to total MRR at the beginning of the period) for the first quarter of 2015 was 0.4%. The Company still expects churn for the full year 2015 to be 5-8%.
Period | Number of renewed leases | Total Leased sq ft | Annualized rent per leased sq ft | Annualized Rent | Rent Change(1) | |||||||||||||||||||
Renewed Leases - Total | Q1 2015 | 65 | 6,291 | $ | 863 | $ | 5,427,185 | 1.2 | % | |||||||||||||||
P4QA* | 63 | 7,704 | 779 | 5,916,964 | 2.7 | % | ||||||||||||||||||
Q4 2014 | 64 | 6,317 | 940 | 5,941,125 | 3.4 | % | ||||||||||||||||||
Q3 2014 | 59 | 7,740 | 669 | 5,181,226 | -2.9 | % | ||||||||||||||||||
Q2 2014 | 74 | 10,199 | 735 | 7,495,879 | 1.0 | % | ||||||||||||||||||
Q1 2014 | 56 | 6,558 | 770 | 5,049,624 | 8.9 | % | ||||||||||||||||||
Renewed Leases - C1 | Q1 2015 | 0 | - | $ | - | $ | - | 0.0 | % | |||||||||||||||
P4QA* | 0 | 625 | 75 | 188,310 | 0.0 | % | ||||||||||||||||||
Q4 2014 | 0 | - | - | - | 0.0 | % | ||||||||||||||||||
Q3 2014 | 0 | - | - | - | 0.0 | % | ||||||||||||||||||
Q2 2014 | 0 | - | - | - | 0.0 | % | ||||||||||||||||||
Q1 2014 | 1 | 2,500 | 301 | 753,240 | 0.0 | % | ||||||||||||||||||
Renewed Leases - C2/C3 | Q1 2015 | 65 | 6,291 | $ | 863 | $ | 5,427,185 | 1.2 | % | |||||||||||||||
P4QA* | 63 | 7,079 | 851 | 5,728,654 | 3.7 | % | ||||||||||||||||||
Q4 2014 | 64 | 6,317 | 940 | 5,941,125 | 3.4 | % | ||||||||||||||||||
Q3 2014 | 59 | 7,740 | 669 | 5,181,226 | -2.9 | % | ||||||||||||||||||
Q2 2014 | 74 | 10,199 | 735 | 7,495,879 | 1.0 | % | ||||||||||||||||||
Q1 2014 | 55 | 4,058 | 1,059 | 4,296,384 | 10.6 | % |
* | Average of prior 4 quarters |
(1) | Calculated as the percentage change of the rent per square foot immediately before renewal when compared to the rent per square foot immediately after renewal. |
16 QTS Q1 Earnings 2015 | Contact: IR@qtsdatacenters.com |
Leasing Statistics – Commenced Leases
(in thousands)
The mix of leasing activity across C1, C2 and C3 has significant impact on quarterly rates, both within major product segments and for overall blended commencement rates. The Company’s rate performance will vary quarter to quarter based on the mix of deals leased. C1 Custom Data Center, C2 Colocation, and C3 Cloud and Managed Services categories all vary on a rate per square foot basis.
During the first quarter of 2015, the Company commenced customer leases (which includes both new customers and existing customers that modified their lease terms) representing approximately $17.8 million of annualized rent at $817 per square foot. This compares to customer leases representing an aggregate trailing four quarter average of approximately $17.2 million of annualized rent at $497 per square foot. The higher annualized rent per leased square foot on a consolidated basis in the first quarter of 2015 compared to the prior four quarter average is due to both C1 and C2/C3 lease rates being higher than their respective prior four quarter averages. In addition, a higher portion of C2/C3 leases in the first quarter of 2015 contributed to the increased consolidated rent per leased square foot compared to the prior four quarter average.
C2/C3 average commencement
rate for the first quarter of 2015 was $1,264 per square foot with rates for that period skewed by greater C3 commencements in
the first quarter of 2015 compared to the prior four quarter average.
Period | Number of leases | Total Leased sq ft | Annualized rent per leased sq ft | Annualized Rent | ||||||||||||||
Leases commenced - Total | Q1 2015 | 369 | 21,813 | $ | 817 | $ | 17,829,577 | |||||||||||
P4QA* | 377 | 34,728 | 497 | 17,243,772 | ||||||||||||||
Q4 2014 | 401 | 48,080 | 391 | 18,815,804 | ||||||||||||||
Q3 2014 | 379 | 36,054 | 520 | 18,739,920 | ||||||||||||||
Q2 2014 | 421 | 32,838 | 584 | 19,172,568 | ||||||||||||||
Q1 2014 | 307 | 21,941 | 558 | 12,246,796 | ||||||||||||||
Leases commenced - C1 | Q1 2015 | 21 | 8,289 | $ | 215 | $ | 1,780,368 | |||||||||||
P4QA* | 30 | 23,138 | 183 | 4,234,960 | ||||||||||||||
Q4 2014 | 30 | 34,657 | 176 | 6,112,759 | ||||||||||||||
Q3 2014 | 35 | 24,480 | 199 | 4,866,264 | ||||||||||||||
Q2 2014 | 33 | 22,023 | 203 | 4,480,666 | ||||||||||||||
Q1 2014 | 22 | 11,394 | 130 | 1,480,149 | ||||||||||||||
Leases commenced - C2/C3 | Q1 2015 | 348 | 13,524 | $ | 1,264 | $ | 17,089,279 | |||||||||||
P4QA* | 347 | 11,590 | 1,122 | 13,008,813 | ||||||||||||||
Q4 2014 | 371 | 13,423 | 946 | 12,703,045 | ||||||||||||||
Q3 2014 | 344 | 11,574 | 1,199 | 13,873,656 | ||||||||||||||
Q2 2014 | 388 | 10,815 | 1,358 | 14,691,902 | ||||||||||||||
Q1 2014 | 285 | 10,547 | 1,043 | 10,766,647 |
* | Average of prior 4 quarters |
17 QTS Q1 Earnings 2015 | Contact: IR@qtsdatacenters.com |
Lease Expirations
C1 leases are typically 5-10 years with the majority of C1 lease expirations occurring in 2017 and beyond. C2/C3 leases are typically 3 years in duration, thus the majority of C2/C3 lease expirations are in 2015 and 2016. The following table sets forth a summary schedule of the lease expirations as of March 31, 2015 at the properties in the Company’s portfolio. Unless otherwise stated in the footnotes, the information set forth in the table assumes that customers exercise no renewal options and all early termination rights are exercised:
Year of Lease Expiration | Number of Leases Expiring (1) | Total Raised Floor of Expiring Leases | % of Portfolio Leased Raised Floor | Annualized Rent (2) | % of Portfolio Annualized Rent | C1 as % of Portfolio Annualized Rent | C2 as % of Portfolio Annualized Rent | C3 as % of Portfolio Annualized Rent | ||||||||||||||||||||||||
Month-to-Month (3) | 380 | 9,412 | 2 | % | $ | 9,532,950 | 4 | % | 0 | % | 3 | % | 1 | % | ||||||||||||||||||
2015 | 724 | 48,151 | 8 | % | 35,507,645 | 17 | % | 3 | % | 12 | % | 2 | % | |||||||||||||||||||
2016 | 957 | 70,967 | 12 | % | 42,311,327 | 20 | % | 5 | % | 14 | % | 1 | % | |||||||||||||||||||
2017 | 656 | 81,256 | 13 | % | 45,575,588 | 21 | % | 7 | % | 11 | % | 3 | % | |||||||||||||||||||
2018 | 252 | 242,844 | 40 | % | 46,536,109 | 22 | % | 17 | % | 5 | % | 0 | % | |||||||||||||||||||
2019 | 79 | 12,380 | 2 | % | 8,460,611 | 4 | % | 1 | % | 3 | % | 0 | % | |||||||||||||||||||
After 2019 | 77 | 138,385 | 23 | % | 26,003,022 | 12 | % | 10 | % | 1 | % | 1 | % | |||||||||||||||||||
Portfolio Total | 3,125 | 603,395 | 100 | % | $ | 213,927,252 | 100 | % | 43 | % | 49 | % | 8 | % |
(1) | Represents each agreement with a customer signed as of March 31, 2015 for which billing has commenced; a lease agreement could include multiple spaces and a customer could have multiple leases. |
(2) | Annualized rent is presented for leases commenced as of March 31, 2015. The Company defines annualized rent as MRR multiplied by 12. The Company calculates MRR as monthly contractual revenue under signed leases as of a particular date, which includes revenue from our C1, C2 and C3 rental and cloud and managed services activities, but excludes customer recoveries, deferred set-up fees, variable related revenues, non-cash revenues and other one-time revenues. MRR does not include the impact from booked-not-billed leases as of a particular date, unless otherwise specifically noted. This amount reflects the annualized cash rental payments. It does not reflect the accounting associated with any free rent, rent abatements or future scheduled rent increases and also excludes operating expense and power reimbursements. |
(3) | Consists of customers whose leases expired prior to March 31, 2015 and have continued on a month-to-month basis. |
18 QTS Q1 Earnings 2015 | Contact: IR@qtsdatacenters.com |
Largest Customers
As of March 31, 2015, the Company’s portfolio was leased to over 850 customers comprised of companies of all sizes representing an array of industries, each with unique and varied business models and needs. The following table sets forth information regarding the ten largest customers in the portfolio based on annualized rent as of March 31, 2015 (does not include rents or maturities associated with booked-not-billed customers):
Principal Customer Industry | Number of Locations | Annualized Rent (1) | % of Portfolio Annualized Rent | Weighted Average Remaining Lease Term (Months) (2) | ||||||||||
Internet | 1 | $ | 18,740,637 | 8.8 | % | 43 | ||||||||
Internet | 1 | 9,644,400 | 4.5 | % | 43 | |||||||||
Information Technology | 2 | 9,578,475 | 4.5 | % | 111 | |||||||||
Information Technology | 2 | 7,469,964 | 3.5 | % | 107 | |||||||||
Financial Services | 1 | 4,618,740 | 2.2 | % | 33 | |||||||||
Information Technology | 2 | 4,466,041 | 2.1 | % | 17 | |||||||||
Financial Services | 1 | 4,381,920 | 2.0 | % | 22 | |||||||||
Professional Services | 1 | 3,363,060 | 1.6 | % | 2 | |||||||||
Financial Services | 2 | 3,244,109 | 1.5 | % | 33 | |||||||||
Information Technology | 3 | 2,863,194 | 1.3 | % | 20 | |||||||||
Total / Weighted Average | $ | 68,370,540 | 32.0 | % | 52 |
(1) | Annualized rent is presented for leases commenced as of March 31, 2015. We define annualized rent as MRR multiplied by 12. We calculate MRR as monthly contractual revenue under signed leases as of a particular date, which includes revenue from our C1, C2 and C3 rental and cloud and managed services activities, but excludes customer recoveries, deferred set-up fees, variable related revenues, non-cash revenues and other one-time revenues. MRR does not include the impact from booked-not-billed leases as of a particular date. This amount reflects the annualized cash rental payments. It does not reflect any free rent, rent abatements or future scheduled rent increases and also excludes operating expense and power reimbursements. |
(2) | Weighted average based on customer’s percentage of total annualized rent expiring and is as of March 31, 2015. |
19 QTS Q1 Earnings 2015 | Contact: IR@qtsdatacenters.com |
Industry Segmentation
The following table sets forth information relating to the industry segmentation as of March 31, 2015:
The following table sets forth information relating to the industry segmentation as of December 31, 2014:
20 QTS Q1 Earnings 2015 | Contact: IR@qtsdatacenters.com |
Product Diversification
The following table sets forth information relating to the distribution of leases at the properties, by type of product offering, as of March 31, 2015:
(1) | As of March 31, 2015, C1 customers renting at least 6,600 square feet represented $50.5 million of annualized C1 MRR, C1 customers renting 3,300 square feet to 6,599 square feet represented $17.7 million of annualized C1 MRR, and C1 customers renting below 3,300 square feet represented $23.2 million of annualized C1 MRR. As of March 31, 2015, C1 customers’ median used square footage was 3,752 square feet. |
(2) | C3
- Cloud and Managed Services shown here do not include Managed Services provided to C1
and C2 customers. |
The following table sets forth information relating to the distribution of leases at the properties, by type of product offering, as of December 31, 2014:.
(1) | As of December 31, 2014, C1 customers renting at least 6,600 square feet represented $52.1 million of annualized C1 MRR, C1 customers renting between 3,300 and 6,599 square feet represented $17.9 million of annualized C1 MRR, and C1 customers renting below 3,300 square feet represented $18.0 million of annualized C1 MRR. As of December 31, 2014, C1 customers’ median used square footage was 3,856 square feet. |
(2) | C3 – Cloud and Managed Services shown here do not include Managed Services provided to C1 and C2 customers. |
21 QTS Q1 Earnings 2015 | Contact: IR@qtsdatacenters.com |
Debt Summary and Debt Maturities
(in thousands)
March 31, | December 31, | |||||||
2015 | 2014 | |||||||
Unsecured Credit Facility | $ | 140,000 | $ | 239,838 | ||||
Senior Notes, net of discount | 297,791 | 297,729 | ||||||
Richmond Credit Facility | 70,000 | 70,000 | ||||||
Atlanta-Metro Equipment Loan | 16,016 | 16,600 | ||||||
Total (1) | $ | 523,807 | $ | 624,167 |
(1) | Exclusive
of capital lease obligations which totaled $13.5 million and $13.1 million as of March
31, 2015 and December 31, 2014, respectively |
As of March 31, 2015:
Debt instruments | 2015 | 2016 | 2017 | 2018 | 2019 | Thereafter | Total | |||||||||||||||||||||
Unsecured Credit Facility (1) | $ | - | $ | - | $ | - | $ | 40,000 | $ | 100,000 | $ | - | $ | 140,000 | ||||||||||||||
Senior Notes (2) | - | - | - | - | - | 300,000 | 300,000 | |||||||||||||||||||||
Richmond Credit Facility | - | - | - | - | 70,000 | - | 70,000 | |||||||||||||||||||||
Atlanta-Metro Equipment Loan | 1,813 | 2,567 | 2,748 | 2,942 | 3,151 | 2,795 | 16,016 | |||||||||||||||||||||
Total | $ | 1,813 | $ | 2,567 | $ | 2,748 | $ | 42,942 | $ | 173,151 | $ | 302,795 | $ | 526,016 |
(1) | Pursuant to a credit agreement amendment that the Company entered into on December 17, 2014, the revolving portion of the Unsecured Credit Facility has a stated maturity of December 17, 2018 with an option to extend for one additional year. |
(2) | Excludes discount reflected at March 31, 2015. |
22 QTS Q1 Earnings 2015 | Contact: IR@qtsdatacenters.com |
Interest Summary
(unaudited and in thousands)
Three Months Ended | ||||||||||||
March 31, | December 31, | March 31, | ||||||||||
2015 | 2014 | 2014 | ||||||||||
Interest expense and fees | $ | 6,471 | $ | 6,566 | $ | 2,911 | ||||||
Swap interest | - | - | 161 | |||||||||
Amortization of deferred financing costs and bond discount | 849 | 842 | 582 | |||||||||
Capitalized interest (1) | (1,978 | ) | (1,783 | ) | (1,589 | ) | ||||||
Total interest expense | $ | 5,342 | $ | 5,625 | $ | 2,065 |
(1) | The weighted average interest rate for the three months ended March 31, 2015, December 31, 2014, and March 31, 2014 was 4.71%, 4.74%, and 3.75%, respectively. As of March 31, 2015 and December 31, 2014 our weighted average coupon interest rate was 4.35% and 3.95%, respectively. |
23 QTS Q1 Earnings 2015 | Contact: IR@qtsdatacenters.com |
Appendix
Non-GAAP Financial Measures
This document includes certain non-GAAP financial measures that management believes are helpful in understanding the Company’s business, as further described below.
The Company considers the following non-GAAP financial measures to be useful to investors as key supplemental measures of the Company’s performance: (1) FFO; (2) Operating FFO; (3) Adjusted Operating FFO; (4) MRR; (5) NOI; (6) EBITDA; and (7) Adjusted EBITDA. These non-GAAP financial measures should be considered along with, but not as alternatives to, net income or loss and cash flows from operating activities as a measure of the Company’s operating performance and liquidity. FFO, Operating FFO, Adjusted Operating FFO, MRR, NOI, EBITDA and Adjusted EBITDA, as calculated by us, may not be comparable to FFO, Operating FFO, Adjusted Operating FFO, MRR, NOI, EBITDA and Adjusted EBITDA as reported by other companies that do not use the same definition or implementation guidelines or interpret the standards differently from us.
Definitions
C1 – Custom Data Center. Power costs are passed on to customers (metered power); generally 3,000 square feet or more of raised floor; lease term of 5 to 10 years; customers are large corporations, government agencies, and global Internet businesses.
C2 – Colocation. Power overages charged separately; specified kW included in lease; up to 3,000 square feet of raised floor; lease term of up to 3 years; customers are large corporations, small and medium businesses and government agencies.
C3 – Cloud and Managed Services. Power bundled with service; small amounts of space; customers rent managed virtual servers; lease term up to 3 years; customers are large corporations, small and medium businesses and government agencies.
Booked-not-billed (“BNB”). The Company defines booked-not-billed as customer leases that have been signed, but for which lease payments have not yet commenced.
Leasable raised floor. The Company defines leasable raised floor as the amount of raised floor square footage that the Company has leased plus the available capacity of raised floor square footage that is in a leasable format as of a particular date and according to a particular product configuration. The amount of leasable raised floor may change even without completion of new redevelopment projects due to changes in the Company’s configuration of C1, C2 and C3 product space.
Basis-of-design floor space. The Company defines basis-of-design floor space as the total data center raised floor potential of its existing data center facilities.
Operating NRSF. Represents the total square feet of a building that is currently leased or available for lease plus developed supporting infrastructure, based on engineering drawings and estimates, but does not include space held for redevelopment or space used for the Company’s own office space.
The Company. Refers to QTS Realty Trust, Inc., a Maryland corporation, together with its consolidated subsidiaries, including QualityTech, LP.
24 QTS Q1 Earnings 2015 | Contact: IR@qtsdatacenters.com |
FFO, Operating FFO and Adjusted Operating FFO
The Company considers funds from operations (“FFO”), to be a supplemental measure of its performance which should be considered along with, but not as an alternative to, net income (loss) and cash provided by operating activities as a measure of operating performance and liquidity. The Company calculates FFO in accordance with the standards established by the National Association of Real Estate Investment Trusts (“NAREIT”). FFO represents net income (loss) (computed in accordance with GAAP), adjusted to exclude gains (or losses) from sales of property, real estate related depreciation and amortization and similar adjustments for unconsolidated partnerships and joint ventures. The Company’s management uses FFO as a supplemental performance measure because, in excluding real estate related depreciation and amortization and gains and losses from property dispositions, it provides a performance measure that, when compared year over year, captures trends in occupancy rates, rental rates and operating costs.
Due to the volatility and nature of certain significant charges and gains recorded in the Company’s operating results that management believes are not reflective of its core operating performance and liquidity, management computes an adjusted measure of FFO, which the Company refers to as Operating FFO. The Company generally calculates Operating FFO as FFO excluding certain non-recurring and often non-cash charges and gains and losses that management believes are not indicative of the results of the Company’s operating real estate portfolio. The Company believes that Operating FFO provides investors with another financial measure that may facilitate comparisons of operating performance and liquidity between periods and, to the extent they calculate Operating FFO on a comparable basis, between REITs.
Adjusted Operating Funds From Operations (“Adjusted Operating FFO”) is a non-GAAP measure that is used as a supplemental operating measure specifically for comparing year over year ability to fund dividend distributions from operating activities. Adjusted Operating FFO is used by the Company as a basis to address cash flow and its ability to fund its dividend payments. The Company calculates Adjusted Operating FFO by adding or subtracting from Operating FFO items such as: maintenance capital investment, paid leasing commissions, amortization of deferred financing costs, non-real estate depreciation, straight line rent adjustments, and non-cash compensation.
The Company offers these measures because it recognizes that FFO, Operating FFO and Adjusted Operating FFO will be used by investors as a basis to compare its operating performance and liquidity with that of other REITs. However, because FFO, Operating FFO and Adjusted Operating FFO exclude real estate depreciation and amortization and capture neither the changes in the value of the Company’s properties that result from use or market conditions, nor the level of capital expenditures and capitalized leasing commissions necessary to maintain the operating performance of its properties, all of which have real economic effect and could materially impact its financial condition, cash flows and results of operations, the utility of FFO, Operating FFO and Adjusted Operating FFO as measures of its operating performance and liquidity is limited. The Company’s calculation of FFO may not be comparable to measures calculated by other companies that do not use the NAREIT definition of FFO or do not calculate FFO in accordance with NAREIT guidance. In addition, the Company’s calculations of FFO, Operating FFO and Adjusted Operating FFO are not necessarily comparable to FFO, Operating FFO and Adjusted Operating FFO as calculated by other REITs that do not use the same definition or implementation guidelines or interpret the standards differently from us. FFO, Operating FFO and Adjusted Operating FFO are non-GAAP measures and should not be considered a measure of the Company’s results of operations or liquidity or as a substitute for, or an alternative to, net income (loss), cash provided by operating activities or any other performance measure determined in accordance with GAAP, nor is it indicative of funds available to fund its cash needs, including its ability to make distributions to its stockholders.
25 QTS Q1 Earnings 2015 | Contact: IR@qtsdatacenters.com |
Three Months Ended | ||||||||||||
March 31, | December 31, | March 31, | ||||||||||
2015 | 2014 | 2014 | ||||||||||
FFO | ||||||||||||
Net income | $ | 5,037 | $ | 5,848 | $ | 5,328 | ||||||
Real estate depreciation and amortization | 14,302 | 14,192 | 11,864 | |||||||||
FFO | 19,339 | 20,040 | 17,192 | |||||||||
Write off of unamortized deferred finance costs | - | 291 | - | |||||||||
Restructuring costs | - | 26 | - | |||||||||
Transaction costs | 105 | 60 | 64 | |||||||||
Operating FFO * | 19,444 | 20,417 | 17,256 | |||||||||
Maintenance Capex | (17 | ) | (712 | ) | (73 | ) | ||||||
Leasing Commissions paid | (3,084 | ) | (3,615 | ) | (2,249 | ) | ||||||
Amortization of deferred financing costs and bond discount | 849 | 842 | 582 | |||||||||
Non real estate depreciation and amortization | 1,941 | 1,817 | 1,382 | |||||||||
Straight line rent revenue | (436 | ) | (369 | ) | (152 | ) | ||||||
Straight line rent expense | 71 | 71 | 75 | |||||||||
Equity-based compensation expense | 1,307 | 1,252 | 911 | |||||||||
Adjusted Operating FFO * | $ | 20,075 | $ | 19,703 | $ | 17,732 |
* | The Company’s calculations of Operating FFO and Adjusted Operating FFO may not be comparable to Operating FFO and Adjusted Operating FFO as calculated by other REITs that do not use the same definition. |
Monthly Recurring Revenue (MRR)
The Company calculates MRR as monthly contractual revenue under signed leases as of a particular date, which includes revenue from its C1, C2 and C3 rental and cloud and managed services activities, but excludes customer recoveries, deferred set-up fees, variable related revenues, non-cash revenues and other one-time revenues. MRR does not include the impact from booked-not-billed leases as of a particular date, unless otherwise specifically noted.
Separately, the Company calculates recognized MRR as the recurring revenue recognized during a given period, which includes revenue from its C1, C2 and C3 rental and cloud and managed services activities, but excludes customer recoveries, deferred set-up fees, variable related revenues, non-cash revenues and other one-time revenues.
Management uses MRR and recognized MRR as supplemental performance measures because they provide useful measures of increases in contractual revenue from the Company’s customer leases. MRR and recognized MRR should not be viewed by investors as alternatives to actual monthly revenue, as determined in accordance with GAAP. Other companies may not calculate MRR or recognized MRR in the same manner. Accordingly, the Company’s MRR and recognized MRR may not be comparable to other companies’ MRR and recognized MRR. MRR and recognized MRR should be considered only as supplements to total revenues as a measure of its performance. MRR and recognized MRR should not be used as measures of the Company’s results of operations or liquidity, nor is it indicative of funds available to meet its cash needs, including its ability to make distributions to its stockholders.
26 QTS Q1 Earnings 2015 | Contact: IR@qtsdatacenters.com |
Three Months Ended | ||||||||||||
March 31, | December 31, | March 31, | ||||||||||
2015 | 2014 | 2014 | ||||||||||
Recognized MRR in the period | ||||||||||||
Total period revenues (GAAP basis) | $ | 61,386 | $ | 59,563 | $ | 48,943 | ||||||
Less: Total period recoveries | (5,664 | ) | (5,520 | ) | (3,691 | ) | ||||||
Total period deferred setup fees | (1,246 | ) | (1,201 | ) | (1,219 | ) | ||||||
Total period straight line rent and other | (2,012 | ) | (1,981 | ) | (878 | ) | ||||||
Recognized MRR in the period | 52,464 | 50,861 | 43,155 | |||||||||
MRR at period end | ||||||||||||
Total period revenues (GAAP basis) | $ | 61,386 | $ | 59,563 | $ | 48,943 | ||||||
Less: Total revenues excluding last month | (40,100 | ) | (39,605 | ) | (32,551 | ) | ||||||
Total revenues for last month of period | 21,286 | 19,958 | 16,392 | |||||||||
Less: Last month recoveries | (1,749 | ) | (1,908 | ) | (1,136 | ) | ||||||
Last month deferred setup fees | (418 | ) | (372 | ) | (410 | ) | ||||||
Last month straight line rent and other | (1,292 | ) | (537 | ) | (272 | ) | ||||||
MRR at period end | $ | 17,827 | $ | 17,141 | $ | 14,574 |
Earnings Before Interest, Taxes, Depreciation and Amortization (EBITDA) and Adjusted EBITDA
The Company calculates EBITDA as net income (loss) adjusted to exclude interest expense and interest income, provision for income taxes (including income taxes applicable to sale of assets) and depreciation and amortization. Management believes that EBITDA is useful to investors in evaluating and facilitating comparisons of the Company’s operating performance between periods and between REITs by removing the impact of its capital structure (primarily interest expense) and asset base charges (primarily depreciation and amortization) from its operating results.
In addition to EBITDA, the Company calculates an adjusted measure of EBITDA, which it refers to as Adjusted EBITDA, as EBITDA excluding unamortized deferred financing costs, gains on extinguishment of debt, transaction costs, equity-based compensation expense, restructuring charge, gain (loss) on legal settlement and gain on sale of real estate. The Company believes that Adjusted EBITDA provides investors with another financial measure that can facilitate comparisons of operating performance between periods and between REITs.
Management uses EBITDA and Adjusted EBITDA as supplemental performance measures as they provide useful measures of assessing the Company’s operating results. Other companies may not calculate EBITDA or Adjusted EBITDA in the same manner. Accordingly, the Company’s EBITDA and Adjusted EBITDA may not be comparable to others. EBITDA and Adjusted EBITDA should be considered only as supplements to net income (loss) as measures of the Company’s performance and should not be used as substitutes for net income (loss), as measures of its results of operations or liquidity or as an indications of funds available to meet its cash needs, including its ability to make distributions to its stockholders.
27 QTS Q1 Earnings 2015 | Contact: IR@qtsdatacenters.com |
Three Months Ended | ||||||||||||
March 31, | December 31, | March 31, | ||||||||||
2015 | 2014 | 2014 | ||||||||||
EBITDA and Adjusted EBITDA | ||||||||||||
Net income | $ | 5,037 | $ | 5,848 | $ | 5,328 | ||||||
Interest expense | 5,342 | 5,625 | 2,065 | |||||||||
Interest income | - | - | (8 | ) | ||||||||
Tax (benefit) expense of taxable REIT subsidiaries | - | (82 | ) | 28 | ||||||||
Depreciation and amortization | 16,243 | 16,008 | 13,247 | |||||||||
EBITDA | 26,622 | 27,399 | 20,660 | |||||||||
Write off of unamortized deferred finance costs | - | 291 | - | |||||||||
Equity-based compensation expense | 1,307 | 1,252 | 911 | |||||||||
Restructuring costs | - | 26 | - | |||||||||
Transaction costs | 105 | 60 | 64 | |||||||||
Adjusted EBITDA | $ | 28,034 | $ | 29,028 | $ | 21,635 |
28 QTS Q1 Earnings 2015 | Contact: IR@qtsdatacenters.com |
Net Operating Income (NOI)
The Company calculates net operating income (“NOI”) as net income (loss), excluding: interest expense, interest income, tax expense of taxable REIT subsidiaries, depreciation and amortization, write off of unamortized deferred financing costs, gain on extinguishment of debt, transaction costs, gain on legal settlement, gain on sale of real estate, restructuring charge and general and administrative expenses. The Company believes that NOI is another metric that is often utilized to evaluate returns on operating real estate from period to period and also, in part, to assess the value of the operating real estate. A reconciliation of net income (loss) to NOI is presented below:
Three Months Ended | ||||||||||||
March 31, | December 31, | March 31, | ||||||||||
2015 | 2014 | 2014 | ||||||||||
Net Operating Income (NOI) | ||||||||||||
Net income | $ | 5,037 | $ | 5,848 | $ | 5,328 | ||||||
Interest expense | 5,342 | 5,625 | 2,065 | |||||||||
Interest income | - | - | (8 | ) | ||||||||
Depreciation and amortization | 16,243 | 16,008 | 13,247 | |||||||||
Write off of unamortized deferred finance costs | - | 291 | - | |||||||||
Tax (benefit) expense of taxable REIT subsidiaries | - | (82 | ) | 28 | ||||||||
Restructuring costs | - | 26 | - | |||||||||
Transaction costs | 105 | 60 | 64 | |||||||||
General and administrative expenses | 13,838 | 11,987 | 10,778 | |||||||||
NOI (1) | $ | 40,565 | $ | 39,763 | $ | 31,502 | ||||||
Breakdown of NOI by facility: | ||||||||||||
Atlanta-Metro data center | $ | 16,766 | $ | 16,386 | $ | 14,402 | ||||||
Atlanta-Suwanee data center | 10,130 | 9,711 | 8,174 | |||||||||
Santa Clara data center | 3,377 | 3,390 | 2,730 | |||||||||
Richmond data center | 4,255 | 4,208 | 3,047 | |||||||||
Sacramento data center | 1,871 | 1,869 | 2,324 | |||||||||
Princeton data center | 2,349 | 2,739 | - | |||||||||
Dallas-Fort Worth data center | 749 | 395 | - | |||||||||
Other facilities | 1,068 | 1,065 | 825 | |||||||||
NOI (1) | $ | 40,565 | $ | 39,763 | $ | 31,502 |
(1) | Includes facility level G&A allocation charges of 4% of revenue which aggregated to $2.5 million, $2.4 million and $2.0 million for the three month periods ended March 31, 2015, December 31, 2014, and March 31, 2014, respectively. |
29 QTS Q1 Earnings 2015 | Contact: IR@qtsdatacenters.com |
+*)I6E12[PJ1C+`'\$?^"QW_``52\$?MGP^#
MOA/\!)=7;X5>&;Z]U37O$5]IUUI%YK>K82UL(+.UN&AN5TM+7[0]Q%>V<$RF
M>%<9#*/P2TWPO)=W5C!I^CM]HO6*6?EVJHGFEPIN/M1"QQI(Y#DNZJN?O`9-
M=W+\/K[2Y6@\1ZCI^@7#6ZZ@ED97O+Z[MY"1%Y(M8Y;)I[K8RHMQ=1,&C_>E
M%8$\>(QV`P-)U\;C:6%C%I2E5<'&R>L5%.4[O5*R[6/J>'^!N+^+,=1RWAWA
MW.,VQN(M["AA\'54);-N>)M&C&+BW+FE4BFEI>[//U.R-@V`ZA4)C8&(!26R
MRM\V`&R0GS@Y)&"*Z2#PSJ D>#/$/P\33AX?@\20:I'8:K!XDTC38$M;5]/TV03P)?0V4;7`ND
M64H(T%8W_!;C1-=G_;Y^$WV;1-4D74_AC\+(;+[+I]Q=1ZFW]NWI6*W>.)DD
MG?>NT!LAF4YY!K\Q_P!J/]L7XZ_M>^(](\0?Q"EVGA_P"T/X<\.:)+ '["_G6*YUB2VEFA@"6BDS,3+&,`@R*.:
MYLO(T8A:: H/L:??SU
M`_I<^"W_``3&_:O^%'B'PMK7P9_X*%>#;+X!Z7XBT_Q3 VNB>#GOK
MO_A&?AUXQ;3;'PWK-E%*+*'4_$R:L2LEM+5:
M^;8'1_\`!3V+P=^V5_P3,^!G[?>A^'-&TGXBZ+K-AI_Q'UW3[*T2^OH7@N]!
MUY-2O+..%9XDU^ULDMFNEQ$NV./86VG^7^/,BE@P(*%TR!Q$<94GNQR,>V1C
MG-?Z86L?"3]C37?V==;^&T6A?!ZR_9XUNWBLK[3M*D\/0>"&,5WYT)50[::L
M]O?H)XMP++<1[L%A7\7/_!5K_@G%H7[%.M>$/B5\(?$-QXW^`OQ4O+R*PU^2
M2TO;7PUKID%S8:)%J=B_V::/4;*X9M/58HLK8RLGF#(6H2Z?#?C3
M^VG\"/ACX_TR'6O"'BKQ%J=KKFE7$,<\%Y;6OA_5+Z**5)DDA9#<6\9=)$8,
M@(&"_'XU[>#XEXOY>3"T)XQJ-GSX:=
M2I%K?=*[ZZ]>A^&\3_1\^A;BE0KYCQ7DV3QC=P>7\387#4JJFWRN=.%9MM/X
M;WM9&"_@OC_BIO$H&3G_BGK;!]?^8AQZ_SIC>&/!VR8P^)/$LDGEE889-"
MMXDFN1N\M3(M^Q4,^T9521U`/0;(T2]61V-[X7DC109%;Q3HQ6,`G/EA-3>$Q/M7.T9*LTEJU8[6PT_Q3<03->ZF/"VE7-J2MSK%_
M+HV@7,4P#+9VL$8:`"9,-!9K$D912!@*!6`OBSPEH-M=P6&G2>)M<>*2(:GK
M2)!IVD7:C$5QIMH7NK?6HW8LZIUM@/V\^)MQ;#_@A-\`+-
M&@^WM^T;J4ILVNHWNW2)O'ZR3/;[S*(T=U(W($7*@'D5^,_@#1M!\2^.O!_A
MOQ5XAD\+^'?$'B'3=$UCQ/+#'
H*.N#O9\%AD]L'!.2,X
M<_,.3G';&**L`HHHH`****`"BBB@`HHHH`****`"BBB@`HHHH`****`/=_@;
M\<%^"UYKD[?#GX;?$$>(9-(C*?$/P5X9\8KI?]GRW(']D?\`"1:7J7]G/=B\
M(NVLQ"9_)@\TOY4>W]-OVY?C9X1^%4OPI\,>$?V=*M_B;\`M.\8:S=6?
MP@\`0:C:ZSK'B7Q9HD]Q87:^'?M-G+%:Z7:R0R6TL)CD&]`LF6/XIQ,$G@^9
M0SW$$:[NI5YD\TKTW,N%^0?,<^E?I)_P4MN()O%W[,OD203]EOPO&RQR),
ML