
ACUITAS INTERNATIONAL SMALL CAP FUND
ACUITAS US MICROCAP FUND
ANNUAL REPORT
June 30, 2019
Beginning on January 2021, as permitted by regulations adopted by the Securities and Exchange Commission, paper copies of the Funds’ shareholder reports will no longer be sent by mail, unless you specifically request paper copies of the reports from the Fund or from your financial intermediary, such as a broker-dealer or bank. Instead, the reports will be made available on a website, and you will be notified by mail each time a report is posted and provided with a website link to access the report.
If you already elected to receive shareholder reports electronically, you will not be affected by this change and you need not take any action. You may elect to receive shareholder reports and other communications from the Fund or your financial intermediary electronically by contacting the Fund at (844) 805-5628, acuitas.ta@apexfs.com, or by contacting your financial intermediary directly.
You may elect to receive all future reports in paper free of charge. You can inform the Fund or your financial intermediary that you wish to continue receiving paper copies of your shareholder reports by contacting the Fund at (844) 805-5628, acuitas.ta@apexfs.com, or by contacting your financial intermediary directly. Your election to receive reports in paper will apply to all of the Acuitas Funds.
TABLE OF CONTENTS
| Acuitas International Small Cap Fund | |
| A Message to Our Shareholders (Unaudited) | 2 |
| Performance Chart and Analysis (Unaudited) | 5 |
| Schedule of Investments | 6 |
| Statement of Assets and Liabilities | 8 |
| Statement of Operations | 9 |
| Statements of Changes in Net Assets | 10 |
| Financial Highlights | 11 |
| Acuitas US Microcap Fund | |
| A Message to Our Shareholders (Unaudited) | 12 |
| Performance Chart and Analysis (Unaudited) | 14 |
| Schedule of Investments | 15 |
| Statement of Assets and Liabilities | 18 |
| Statement of Operations | 19 |
| Statements of Changes in Net Assets | 20 |
| Financial Highlights | 21 |
| Notes to Financial Statements | 22 |
| Report of Independent Registered Public Accounting Firm | 27 |
| Additional Information (Unaudited) | 28 |
ACUITAS INTERNATIONAL SMALL CAP FUND
A MESSAGE TO OUR SHAREHOLDERS (Unaudited)
JUNE 30, 2019
Dear Shareholders:
As of June 30, 2019, the Acuitas International Small Cap Fund’s (the “Fund”) net asset value was $8.74 per share. Year-to-date, the Fund has returned 11.05% net of all fees, compared to 12.31% for the FTSE Global Small Cap ex. U.S. Index (the “Index”). This represents 126 basis points of underperformance vs. the Index so far in 2019. Since the July 18, 2014 inception, the Fund has returned -0.30% net of all fees and expenses, underperforming the Index’s 2.13% return by -243 basis points over the same time period. The Fund’s gross expense ratio, gross of any fee or expense waivers, is 1.99% and 2.24% for Institutional and Investor Shares, respectively. For the most recent month-end performance, please call (844) 805-5628.
Performance data quoted represents past performance, which does not guarantee future results. Investment return and principal value will fluctuate, so that an investor’s shares, when redeemed, may be worth more or less than their original cost; and the current performance may be lower or higher than the performance data quoted.
The Acuitas International Small Cap Fund uses a multi-manager structure to invest in publicly traded international small cap companies. We tend to think of small caps as stocks with market caps of $4 billion or less. The Fund invests in equity securities and does not use derivative instruments.
Over the last year we have witnessed a multitude of impactful events affecting non-U.S. markets. We have seen both threats and early actions toward a trade war, oil prices that have risen dramatically and the impact of the Federal Reserve’s increasingly accommodative policy in the U.S. The UK continues toward Brexit with pressure mounting. Many market participants believe that the newly elected Boris Johnson increases the risk of a hard Brexit. Meanwhile the ECB continues to leave rates unchanged amidst forecasts of slower global growth.
From a sector standpoint, the biggest contributors to the Fund were health care and consumer discretionary. Stock selection was the main driver of returns for both sectors.
The greatest detractors from a sector standpoint were producer durables, financial services, and materials and processing. Again, it was stock selection that was most impactful, particularly in materials and processing. Producer durables was the largest weight in the Index and impacted the Fund by approximately -146 basis points of underperformance for the year.
From a country perspective, countries that negatively impacted performance the most were Japan, Canada, and Sweden. A nearly 10% overweight to Canada, and poor stock selection within the country led to a 134 basis point detraction. Similarly, a nearly 12% overweight to Japan dragged on returns. The country with the most positive impact on the Fund was the United Kingdom. Even though our slight overweight was a drag, superior stock selection resulted in an overall contribution of 165 bps.
As of June 30, 2019, the Fund’s sector allocation, as a percentage of equity, was:
| Acuitas International Small Cap Fund | FTSE Global Small Cap ex. U.S. Index | |
| Producer Durables | 23.3% | 19.1% |
| Financial Services | 23.0% | 22.7% |
| Technology | 17.1% | 12.4% |
| Consumer Discretionary | 16.8% | 13.2% |
| Health Care | 6.3% | 6.6% |
| Consumer Staples | 5.5% | 5.7% |
| Materials & Processing | 4.9% | 12.2% |
| Energy | 1.7% | 3.9% |
| Utilities | 1.4% | 4.2% |
ACUITAS INTERNATIONAL SMALL CAP FUND
A MESSAGE TO OUR SHAREHOLDERS (Unaudited)
JUNE 30, 2019
As of June 30, 2019, the Fund’s top ten countries, as a percentage of equity, were:
| Acuitas International Small Cap Fund | FTSE Global Small Cap ex. U.S. Index | |
| Japan | 30.0% | 14.7% |
| United Kingdom | 15.4% | 10.4% |
| United States | 7.8% | 0.1% |
| Australia | 7.7% | 4.9% |
| Canada | 5.4% | 14.9% |
| Austria | 5.1% | 1.1% |
| Sweden | 5.0% | 3.7% |
| France | 4.9% | 2.1% |
| New Zealand | 3.0% | 0.8% |
| Germany | 2.8% | 3.5% |
As of June 30, 2019, the 10 largest positions in the Fund, as a percentage of investments, were:
| Name | Weight |
| iShares MSCI Emerging Markets Small-Cap ETF | 3.6% |
| SPDR S&P Emerging Markets SmallCap ETF | 3.6% |
| Internet Initiative Japan, Inc. | 2.8% |
| Nihon Chouzai Co., Ltd. | 2.8% |
| Clipper Logistics PLC | 2.7% |
| Vista Group International, Ltd. | 2.7% |
| FinTech Group AG | 2.5% |
| Yumeshin Holdings Co., Ltd. | 2.5% |
| Palfinger AG | 2.3% |
| Norway Royal Salmon ASA | 2.3% |
Uncertainty remains in international markets as the implementation and effects of tariffs and an escalating trade war between the U.S. and multiple countries continues to progress. While U.S. markets have continued to climb higher, international markets have not fared as well. Signs of further cooling of business activity in China underscore greater worries that investors have about the effects of a continued trade war, and global growth revisions have helped to mute international returns. On the flip side, U.S. valuations are looking less attractive, and we believe there is more opportunity for growth within international equities. Overall, we continue to believe that there are pockets of opportunity within the international landscape with encouraging prospects and we continue to believe that our managers will capitalize on these opportunities through high-quality stock selection.
We thank you for your continued support.
Best Regards,

Christopher Tessin
ACUITAS INTERNATIONAL SMALL CAP FUND
A MESSAGE TO OUR SHAREHOLDERS (Unaudited)
JUNE 30, 2019
IMPORTANT RISKS AND DISCLOSURE:
Equity stocks of small-cap companies carry greater risk, and more volatility than equity stocks of larger, more established companies. Foreign securities are more volatile, harder to price and less liquid than U.S. securities; and are subject to different accounting and regulatory standards, and political and economic risks. These risks are enhanced in emerging markets countries. There can be no guarantee that any strategy (risk management or otherwise) will be successful. All investing involves risk, including potential loss of principal.
The views in this report were those of the Fund managers as of June 30, 2019 and may not reflect their views on the date this report is first published or any time thereafter. These views are intended to assist shareholders in understanding their investment in the International Fund and do not constitute investment advice. This letter may contain discussions about certain investments both held and not held in the portfolio. All current and future holdings are subject to risk and to change.
ACUITAS INTERNATIONAL SMALL CAP FUND
PERFORMANCE CHART AND ANALYSIS (Unaudited)
JUNE 30, 2019
The following chart reflects the change in the value of a hypothetical $100,000 investment in Institutional Shares, including reinvested dividends and distributions, in Acuitas International Small Cap Fund (the “Fund”) compared with the performance of the benchmark, FTSE Global Small Cap ex. U.S. Index (“FTSE Global Ex-US”), since inception. The FTSE Global Ex-US is a market-capitalization weighted index representing the performance of small cap stocks in developed and emerging markets excluding the U.S. The total return of the FTSE Global Ex-US includes the reinvestment of dividends and income. The total return of the Fund includes operating expenses that reduce returns, while the total return of the FTSE Global Ex-US does not include expenses. The Fund is professionally managed, while the FTSE Global Ex-US is unmanaged and is not available for investment.
Comparison of Change in Value of a $100,000 Investment
Acuitas International Small Cap Fund vs. FTSE Global Small Cap ex. U.S. Index
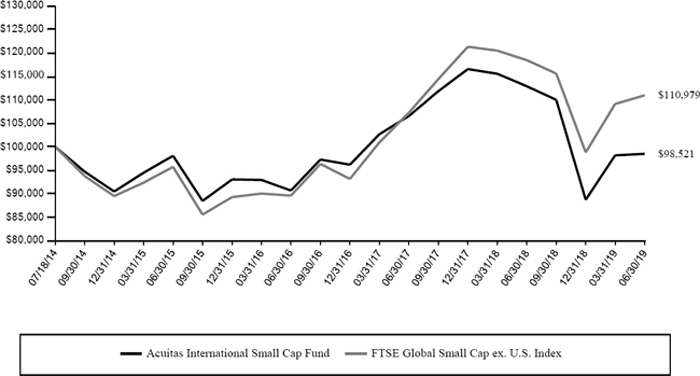
| Average Annual Total Returns Periods Ended June 30, 2019 | One Year | Three Year | Since Inception 07/18/14 |
| Acuitas International Small Cap Fund | -12.76% | 2.81% | -0.30% |
| FTSE Global Small Cap ex. U.S. Index | -6.33% | 7.40% | 2.13% |
Performance data quoted represents past performance and is no guarantee of future results. Current performance may be lower or higher than the performance data quoted. Investment return and principal value will fluctuate so that shares, when redeemed, may be worth more or less than original cost. As stated in the Fund’s prospectus, the annual operating expense ratios (gross) for Institutional and Investor Shares are 1.99% and 2.24%, respectively. However, the Fund’s adviser has contractually agreed to waive its fee and/or reimburse Fund expenses to limit Total Annual Fund Operating Expenses After Fee Waiver and/or Expense Reimbursement (excluding all taxes, interest, portfolio transaction expenses, acquired fund fees and expenses, proxy expenses and extraordinary expenses) to 1.50% and 1.75% for Institutional and Investor Shares, respectively, through November 1, 2019 (the “Expense Cap”). The Expense Cap may be raised or eliminated only with the consent of the Board of Trustees. The adviser may be reimbursed by the Fund for fees waived and expenses reimbursed by the adviser pursuant to the Expense Cap if such payment is approved by the Board, made within three years of the fee waiver or expense reimbursement and does not cause the Total Annual Fund Operating Expenses After Fee Waiver and/or Expense Reimbursement to exceed the lesser of (i) the then-current Expense Cap and (ii) the Expense Cap in place at the time the fees/expenses were waived/reimbursed. Total Annual Fund Operating Expenses After Fee Waiver and/or Expense Reimbursement will increase if exclusions from the Expense Cap apply. Shares redeemed or exchanged within 60 days of purchase will be charged a 1.00% redemption fee. The performance table and graph do not reflect the deduction of taxes that a shareholder would pay on Fund distributions or the redemption of Fund shares. Returns greater than one year are annualized. For the most recent month-end performance, please call (844) 805-5628.
ACUITAS INTERNATIONAL SMALL CAP FUND
SCHEDULE OF INVESTMENTS
JUNE 30, 2019
| Shares | Security Description | Value | |||||
| Common Stock - 80.9% | |||||||
| Australia - 6.8% | |||||||
| 1,381 | ARB Corp., Ltd. | $ | 17,646 | ||||
| 13,174 | Duxton Water, Ltd. | 12,393 | |||||
| 5,250 | MNF Group, Ltd. | 14,190 | |||||
| 3,685 | SmartGroup Corp., Ltd. | 21,576 | |||||
| 8,243 | Western Areas, Ltd. | 11,372 | |||||
| 77,177 | |||||||
| Austria - 4.5% | |||||||
| 906 | FACC AG | 12,713 | |||||
| 828 | Palfinger AG | 25,421 | |||||
| 152 | Schoeller-Bleckmann Oilfield Equipment AG | 12,894 | |||||
| 51,028 | |||||||
| Belgium - 1.9% | |||||||
| 307 | Akka Technologies | 22,097 | |||||
| Canada - 4.7% | |||||||
| 3,900 | Alithya Group, Inc., Class A (a) | 10,572 | |||||
| 5,352 | EXFO, Inc. (a) | 20,557 | |||||
| 1,593 | Extendicare, Inc. | 10,206 | |||||
| 8,783 | Horizon North Logistics, Inc. | 12,475 | |||||
| 53,810 | |||||||
| China - 1.4% | |||||||
| 73,228 | Goodbaby International Holdings, Ltd. (a) | 16,592 | |||||
| Cyprus - 1.3% | |||||||
| 5,714 | Atalaya Mining PLC (a) | 14,840 | |||||
| Finland - 0.7% | |||||||
| 690 | Ferratum OYJ | 8,081 | |||||
| France - 4.3% | |||||||
| 168 | Albioma SA | 4,451 | |||||
| 90 | Devoteam SA | 10,766 | |||||
| 1,048 | FIGEAC-AERO (a) | 13,705 | |||||
| 835 | Maisons du Monde SA (b) | 19,901 | |||||
| 48,823 | |||||||
| Germany - 2.4% | |||||||
| 1,261 | FinTech Group AG (a) | 27,932 | |||||
| Ireland - 1.4% | |||||||
| 9,721 | Hibernia REIT PLC | 16,028 | |||||
| Italy - 1.1% | |||||||
| 949 | doValue SpA (b) | 12,604 | |||||
| Japan - 26.4% | |||||||
| 107 | Digital Arts, Inc. | 9,428 | |||||
| 321 | Hirata Corp. | 18,608 | |||||
| 1,627 | Internet Initiative Japan, Inc. | 30,483 | |||||
| 300 | Katitas Co., Ltd. | 11,144 | |||||
| 495 | Makino Milling Machine Co., Ltd. | 19,949 | |||||
| 700 | Metaps, Inc. (a) | 7,960 | |||||
| 518 | Milbon Co., Ltd. | 25,080 | |||||
| 972 | Nihon Chouzai Co., Ltd. | 30,067 | |||||
| 752 | Nippon Ceramic Co., Ltd. | 20,144 | |||||
| 1,031 | Optex Group Co., Ltd. | 12,948 | |||||
| 1,939 | Poletowin Pitcrew Holdings, Inc. | 20,412 | |||||
| 271 | Rakus Co., Ltd. | 6,555 | |||||
| 765 | Taiyo Holdings Co., Ltd. | 23,060 | |||||
| 192 | V Technology Co., Ltd. | 8,762 | |||||
| 3,101 | Yonex Co., Ltd. | 17,804 | |||||
| 3,877 | Yumeshin Holdings Co., Ltd. | 27,653 | |||||
| 1,055 | Zojirushi Corp. | 11,243 | |||||
| 301,300 | |||||||
| Shares | Security Description | Value | |||||
| Luxembourg - 1.3% | |||||||
| 1,500 | Solutions 30 SE (a) | $ | 15,010 | ||||
| New Zealand - 2.6% | |||||||
| 7,288 | Vista Group International, Ltd. | 29,621 | |||||
| Norway - 2.2% | |||||||
| 1,190 | Norway Royal Salmon ASA | 25,263 | |||||
| Sweden - 4.4% | |||||||
| 516 | BioGaia AB | 23,866 | |||||
| 2,758 | Humana AB | 16,662 | |||||
| 915 | Troax Group AB | 9,360 | |||||
| 49,888 | |||||||
| United Kingdom - 13.5% | |||||||
| 1,857 | accesso Technology Group PLC (a) | 16,272 | |||||
| 5,918 | Biffa PLC (b) | 15,482 | |||||
| 8,380 | Clipper Logistics PLC | 30,064 | |||||
| 2,435 | CVS Group PLC | 22,373 | |||||
| 1,350 | OneSavings Bank PLC | 6,217 | |||||
| 2,292 | Safestore Holdings PLC REIT | 17,857 | |||||
| 937 | Savills PLC | 10,674 | |||||
| 6,560 | The Gym Group PLC (b) | 20,411 | |||||
| 3,543 | Urban & Civic PLC | 14,893 | |||||
| 154,243 | |||||||
| Total Common Stock (Cost $924,584) | 924,337 | ||||||
| Exchange Traded Funds - 6.9% | |||||||
| 893 | iShares MSCI Emerging Markets Small-Cap ETF | 39,622 | |||||
| 874 | SPDR S&P Emerging Markets SmallCap ETF | 39,068 | |||||
| Total Exchange Traded Funds (Cost $78,490) | 78,690 | ||||||
| Money Market Fund - 8.1% | |||||||
| 93,196 | BlackRock Liquidity Funds FedFund Portfolio, Institutional Shares, 2.26% (c) | ||||||
| (Cost $93,196) | 93,196 | ||||||
| Investments, at value - 95.9% (Cost $1,096,270) | $ | 1,096,223 | |||||
| Other Assets & Liabilities, Net - 4.1% | 46,284 | ||||||
| Net Assets - 100.0% | $ | 1,142,507 | |||||
| ETF | Exchange Traded Fund |
| PLC | Public Limited Company |
| REIT | Real Estate Investment Trust |
| (a) | Non-income producing security. |
| (b) | Security exempt from registration under Rule 144A under the Securities Act of 1933. At the period end, the value of these securities amounted to $68,398 or 6.0% of net assets. |
| (c) | Dividend yield changes daily to reflect current market conditions. Rate was the quoted yield as of June 30, 2019. |
The following is a summary of the inputs used to value the Fund's investments as of June 30, 2019.
The inputs or methodology used for valuing securities are not necessarily an indication of the risks associated with investing in those securities. For more information on valuation inputs, and their aggregation into the levels used in the table below, please refer to the Security Valuation section in Note 2 of the accompanying Notes to Financial Statements.
See Notes to Financial Statements.
ACUITAS INTERNATIONAL SMALL CAP FUND
SCHEDULE OF INVESTMENTS
JUNE 30, 2019
| Level 1 | Level 2 | Level 3 | Total | |||||||||||||
| Investments at Value | ||||||||||||||||
| Common Stock | ||||||||||||||||
| Australia | $ | 77,177 | $ | – | $ | – | $ | 77,177 | ||||||||
| Austria | 51,028 | – | – | 51,028 | ||||||||||||
| Belgium | 22,097 | – | – | 22,097 | ||||||||||||
| Canada | 53,810 | – | – | 53,810 | ||||||||||||
| China | 16,592 | – | – | 16,592 | ||||||||||||
| Cyprus | 14,840 | – | – | 14,840 | ||||||||||||
| Finland | 8,081 | – | – | 8,081 | ||||||||||||
| France | 48,823 | – | – | 48,823 | ||||||||||||
| Germany | 27,932 | – | – | 27,932 | ||||||||||||
| Ireland | 16,028 | – | – | 16,028 | ||||||||||||
| Italy | 12,604 | – | – | 12,604 | ||||||||||||
| Japan | 301,300 | – | – | 301,300 | ||||||||||||
| Luxembourg | 15,010 | – | – | 15,010 | ||||||||||||
| New Zealand | 29,621 | – | – | 29,621 | ||||||||||||
| Norway | 25,263 | – | – | 25,263 | ||||||||||||
| Sweden | 49,888 | – | – | 49,888 | ||||||||||||
| United Kingdom | 154,243 | – | – | 154,243 | ||||||||||||
| Exchange Traded Funds | 78,690 | – | – | 78,690 | ||||||||||||
| Money Market Fund | – | 93,196 | – | 93,196 | ||||||||||||
| Investments at Value | $ | 1,003,027 | $ | 93,196 | $ | – | $ | 1,096,223 | ||||||||
| PORTFOLIO HOLDINGS (Unaudited) | |
| % of Total Investments | |
| Australia | 7.0% |
| Austria | 4.7% |
| Belgium | 2.0% |
| Canada | 4.9% |
| China | 1.5% |
| Cyprus | 1.4% |
| Finland | 0.7% |
| France | 4.5% |
| Germany | 2.5% |
| Ireland | 1.5% |
| Italy | 1.1% |
| Japan | 27.5% |
| Luxembourg | 1.4% |
| New Zealand | 2.7% |
| Norway | 2.3% |
| Sweden | 4.5% |
| United Kingdom | 14.1% |
| Exchange Traded Funds | 7.2% |
| Money Market Fund | 8.5% |
| 100.0% |
See Notes to Financial Statements.
ACUITAS INTERNATIONAL SMALL CAP FUND
STATEMENT OF ASSETS AND LIABILITIES
JUNE 30, 2019
| ASSETS | ||||
| Investments, at value (Cost $1,096,270) | $ | 1,096,223 | ||
| Foreign currency (Cost $1,520) | 1,525 | |||
| Receivables: | ||||
| Dividends | 39,349 | |||
| From investment adviser | 39,197 | |||
| Prepaid expenses | 18,087 | |||
| Total Assets | 1,194,381 | |||
| LIABILITIES | ||||
| Payables: | ||||
| Fund shares redeemed | 10,225 | |||
| Accrued Liabilities: | ||||
| Trustees’ fees and expenses | 23 | |||
| Fund services fees | 4,167 | |||
| Other expenses | 37,459 | |||
| Total Liabilities | 51,874 | |||
| NET ASSETS | $ | 1,142,507 | ||
| COMPONENTS OF NET ASSETS | ||||
| Paid-in capital | $ | 5,891,525 | ||
| Distributable earnings | (4,749,018 | ) | ||
| NET ASSETS | $ | 1,142,507 | ||
| SHARES OF BENEFICIAL INTEREST AT NO PAR VALUE (UNLIMITED SHARES AUTHORIZED) | ||||
| Institutional Shares | 130,775 | |||
| NET ASSET VALUE, OFFERING AND REDEMPTION PRICE PER SHARE* | ||||
| Institutional Shares (based on net assets of $1,142,507) | $ | 8.74 | ||
| * | Shares redeemed or exchanged within 60 days of purchase are charged a 1.00% redemption fee. |
See Notes to Financial Statements.
ACUITAS INTERNATIONAL SMALL CAP FUND
STATEMENT OF OPERATIONS
YEAR ENDED JUNE 30, 2019
| INVESTMENT INCOME | ||||
| Dividend income (Net of foreign withholding taxes of $54,225) | $ | 362,376 | ||
| Total Investment Income | 362,376 | |||
| EXPENSES | ||||
| Investment adviser fees | 343,449 | |||
| Fund services fees | 132,193 | |||
| Shareholder service fees | 27,982 | |||
| Custodian fees | 58,419 | |||
| Registration fees | 19,720 | |||
| Professional fees | 55,317 | |||
| Trustees' fees and expenses | 3,729 | |||
| Other expenses | 54,025 | |||
| Total Expenses | 694,834 | |||
| Fees waived | (265,598 | ) | ||
| Net Expenses | 429,236 | |||
| NET INVESTMENT LOSS | (66,860 | ) | ||
| NET REALIZED AND UNREALIZED GAIN (LOSS) | ||||
| Net realized loss on: | ||||
| Investments (Net of foreign withholding taxes of $795) | (3,875,978 | ) | ||
| Foreign currency transactions | (16,531 | ) | ||
| Net realized loss | (3,892,509 | ) | ||
| Net change in unrealized appreciation (depreciation) on: | ||||
| Investments | (2,068,939 | ) | ||
| Foreign currency translations | 15,459 | |||
| Net change in unrealized appreciation (depreciation) | (2,053,480 | ) | ||
| NET REALIZED AND UNREALIZED LOSS | (5,945,989 | ) | ||
| DECREASE IN NET ASSETS RESULTING FROM OPERATIONS | $ | (6,012,849 | ) | |
See Notes to Financial Statements.
ACUITAS INTERNATIONAL SMALL CAP FUND
STATEMENTS OF CHANGES IN NET ASSETS
| For the Years Ended June 30, | ||||||||
| 2019 | 2018 | |||||||
| OPERATIONS | ||||||||
| Net investment income (loss) | $ | (66,860 | ) | $ | 380,066 | |||
| Net realized gain (loss) | (3,892,509 | ) | 4,676,716 | |||||
| Net change in unrealized appreciation (depreciation) | (2,053,480 | ) | (2,320,959 | ) | ||||
| Increase (Decrease) in Net Assets Resulting from Operations | (6,012,849 | ) | 2,735,823 | |||||
| DISTRIBUTIONS TO SHAREHOLDERS | ||||||||
| Institutional Shares | (532,942 | ) | (2,541,258 | )* | ||||
| Total Distributions Paid | (532,942 | ) | (2,541,258 | ) | ||||
| CAPITAL SHARE TRANSACTIONS | ||||||||
| Sale of shares: | ||||||||
| Institutional Shares | 2,914,159 | 4,867,589 | ||||||
| Reinvestment of distributions: | ||||||||
| Institutional Shares | 532,942 | 2,541,258 | ||||||
| Redemption of shares: | ||||||||
| Institutional Shares | (43,757,828 | ) | (5,944,619 | ) | ||||
| Redemption fees: | ||||||||
| Institutional Shares | 11 | 43 | ||||||
| Increase (Decrease) in Net Assets from Capital Share Transactions | (40,310,716 | ) | 1,464,271 | |||||
| Increase (Decrease) in Net Assets | (46,856,507 | ) | 1,658,836 | |||||
| NET ASSETS | ||||||||
| Beginning of Year | 47,999,014 | 46,340,178 | ||||||
| End of Year | $ | 1,142,507 | $ | 47,999,014 | ** | |||
| SHARE TRANSACTIONS | ||||||||
| Sale of shares: | ||||||||
| Institutional Shares | 316,012 | 459,848 | ||||||
| Reinvestment of distributions: | ||||||||
| Institutional Shares | 68,151 | 242,950 | ||||||
| Redemption of shares: | ||||||||
| Institutional Shares | (4,974,594 | ) | (566,179 | ) | ||||
| Increase (Decrease) in Shares | (4,590,431 | ) | 136,619 | |||||
| * | Distribution was the result of net investment income as of June 30, 2018. |
| ** | Includes distributions in excess of net investment income of $(15,461) at June 30, 2018. The requirement to disclose the corresponding amount as of June 30, 2019 was eliminated. |
See Notes to Financial Statements.
ACUITAS INTERNATIONAL SMALL CAP FUND
FINANCIAL HIGHLIGHTS
These financial highlights reflect selected data for a share outstanding throughout each period.
| July 18, 2014 (a) | ||||||||||||||||||||
| For the Years Ended June 30, | Through | |||||||||||||||||||
| 2019 | 2018 | 2017 | 2016 | June 30, 2015 | ||||||||||||||||
| INSTITUTIONAL SHARES | ||||||||||||||||||||
| NET ASSET VALUE, Beginning of Period | $ | 10.17 | $ | 10.11 | $ | 8.78 | $ | 9.79 | $ | 10.00 | ||||||||||
| INVESTMENT OPERATIONS | ||||||||||||||||||||
| Net investment income (loss) (b) | (0.02 | ) | 0.08 | 0.09 | 0.12 | 0.08 | ||||||||||||||
| Net realized and unrealized gain (loss) | (1.29 | ) | 0.54 | 1.43 | (0.85 | ) | (0.27 | ) | ||||||||||||
| Total from Investment Operations | (1.31 | ) | 0.62 | 1.52 | (0.73 | ) | (0.19 | ) | ||||||||||||
| DISTRIBUTIONS TO SHAREHOLDERS FROM | ||||||||||||||||||||
| Net investment income | (0.12 | ) | (0.56 | ) | (0.19 | ) | (0.28 | ) | (0.02 | ) | ||||||||||
| Total Distributions to Shareholders | (0.12 | ) | (0.56 | ) | (0.19 | ) | (0.28 | ) | (0.02 | ) | ||||||||||
| REDEMPTION FEES(b) | 0.00 | (c) | 0.00 | (c) | 0.00 | (c) | 0.00 | (c) | 0.00 | (c) | ||||||||||
| NET ASSET VALUE, End of Period | $ | 8.74 | $ | 10.17 | $ | 10.11 | $ | 8.78 | $ | 9.79 | ||||||||||
| TOTAL RETURN | (12.76 | )% | 5.94 | % | 17.57 | % | (7.57 | )% | (1.91 | )%(d) | ||||||||||
| RATIOS/SUPPLEMENTARY DATA | ||||||||||||||||||||
| Net Assets at End of Period (000s omitted) | $ | 1,143 | $ | 47,999 | $ | 46,340 | $ | 42,674 | $ | 46,653 | ||||||||||
| Ratios to Average Net Assets: | ||||||||||||||||||||
| Net investment income (loss) | (0.23 | )% | 0.77 | % | 0.91 | % | 1.35 | % | 0.91 | %(e) | ||||||||||
| Net expenses | 1.50 | % | 1.50 | % | 1.50 | % | 1.50 | % | 1.50 | %(e) | ||||||||||
| Gross expenses (f) | 2.43 | % | 1.99 | % | 2.04 | % | 2.15 | % | 2.40 | %(e) | ||||||||||
| PORTFOLIO TURNOVER RATE | 105 | % | 144 | % | 105 | % | 104 | % | 112 | %(d) | ||||||||||
| (a) | Commencement of operations. |
| (b) | Calculated based on average shares outstanding during each period. |
| (c) | Less than $0.01 per share. |
| (d) | Not annualized. |
| (e) | Annualized. |
| (f) | Reflects the expense ratio excluding any waivers and/or reimbursements. |
See Notes to Financial Statements.
ACUITAS US MICROCAP FUND
A MESSAGE TO OUR SHAREHOLDERS (Unaudited)
JUNE 30, 2019
Dear Shareholders:
As of June 30, 2019, the Acuitas US Microcap Fund’s (the “Fund”) net asset value was $10.05 per share. Calendar year-to-date, the Fund returned 11.05%, compared to 14.15% for the Russell Microcap Index (the “Index”). This represents 310 basis points of underperformance vs. the Index so far in 2019. Since the July 18, 2014 inception, the Fund has returned an annualized 6.89%, outperforming the Index return of 6.49% by 40 basis points over the same time period. The Fund’s gross expense ratio, gross of any fee or expense waivers, is 1.80% and 2.05% for Institutional and Investor Shares, respectively. For the most recent month-end performance, please call (844) 805-5628.
Performance data quoted represents past performance, which does not guarantee future results. Investment return and principal value will fluctuate, so that an investor’s shares, when redeemed, may be worth more or less than their original cost; and the current performance may be lower or higher than the performance data quoted.
The Acuitas U.S. Microcap Fund uses a multi-manager structure to invest in publicly traded domestic microcap companies. We tend to think of microcaps as stocks with market caps of $1 billion or less. The Fund invests in equity securities and does not use derivative instruments.
With the recent rally of U.S. equities, especially compared to that of their international counterparts, valuations are looking less attractive, especially for large stocks. In spite of strong gains throughout 2019 so far, steady growth will likely continue, and economic data remains mixed. As businesses postpone investments due to trade uncertainty, manufacturing growth has continued to stall, growing at a slower pace for the third month in a row. Companies also continue to slash second quarter earnings, and the speed of recent downgrades has been notable, with analysts cutting forecasts at the fastest pace in nearly three years. On top of this, after two consecutive months of improvement, consumer confidence declined in June although levels still remain at historical highs. In contrast to these signs of weakness, payroll growth rebounded sharply, with the U.S. economy adding 224,000 jobs in June, the best gain since January which helps assuage worries that both the employment picture and overall growth are beginning to weaken. Despite low unemployment levels, rising wages, and low inflation, investors worry about the sustainability of growth and gains in the market.
From a sector standpoint, the biggest contributors to the Fund over the last 12 months were technology, producer durables and consumer discretionary. Stock selection within technology had the most notable positive impact with the overweight positively contributing as well. Stock selection within financials was a drag on performance and detracted from the Fund’s relative performance versus the Index. The Fund’s significant underweight to financial services also detracted from performance over the last 12 months.
As of June 30, 2019, the Fund’s sector allocation, as a percentage of common stock, were:
|
Acuitas US Microcap Fund |
Russell Microcap® Index |
|
| Producer Durables | 23.0% | 11.1% |
| Health Care | 20.7% | 25.7% |
| Financial Services | 18.9% | 29.6% |
| Technology | 14.0% | 10.0% |
| Materials & Processing | 8.0% | 4.5% |
| Energy | 7.2% | 3.5% |
| Consumer Discretionary | 6.9% | 11.6% |
| Utilities | 1.1% | 1.9% |
| Consumer Staples | 0.2% | 2.1% |
ACUITAS US MICROCAP FUND
A MESSAGE TO OUR SHAREHOLDERS (Unaudited)
JUNE 30, 2019
As of June 30, 2019, the 10 largest positions in the Fund, as a percentage of common stock, were:
| Name | Weight |
| UFP Technologies, Inc. | 2.2% |
| Great Lakes Dredge & Dock Corp. | 1.8% |
| Winmark Corp. | 1.8% |
| Par Pacific Holdings, Inc. | 1.7% |
| IES Holdings, Inc. | 1.6% |
| SIGA Technologies, Inc. | 1.5% |
| Northrim BanCorp, Inc. | 1.4% |
| Argan, Inc. | 1.3% |
| STAAR Surgical Co. | 1.2% |
| Bryn Mawr Bank Corp. | 1.2% |
Despite market concerns about tariffs and trade, stocks have continued to rise dramatically despite a brief but dramatic dip during the fourth quarter of 2018. Unfortunately, microcap has lagged the pack in this respect, and we believe a reversal in the future is possible. As we look into earnings season early signs indicate that we are seeing companies reign in expectations and post more sobering results. Looking at valuations relative to historical levels, microcap appears inexpensive. This isn’t just on a forecasted basis but based on last twelve months (“LTM”) earnings as well which is new and indicates that the market isn’t just less expensive because people are getting bullish and raising forward earnings expectations. That said, the indications from the Fed continue to fuel markets forward, especially the more expensive large cap stocks and it isn’t clear when the fuel will run out. While we welcome rising markets, the length of the recovery makes us nervous and we look forward to smaller stocks leading the market and the market aligning more with our strengths. An optimal environment for Acuitas on a relative basis would include a market that rewards quality, shows some volatility and generates flat to down returns. In our view there is higher probability that we will see this within the next few quarters. Regardless of the environment, we look forward to a longer period of time where fundamentals are rewarded and there is greater differentiation between active investment managers as we think this will help drive the relative returns of our Fund.
We thank you for your continued support.
Best Regards,
Christopher Tessin
IMPORTANT RISKS AND DISCLOSURE:
Equity stocks of microcap companies carry greater risk, and more volatility than equity stocks of larger, more established companies. There can be no guarantee that any strategy (risk management or otherwise) will be successful. All investing involves risk, including potential loss of principal.
The views in this report were those of the Fund managers as of June 30, 2019 and may not reflect their views on the date this report is first published or any time thereafter. These views are intended to assist shareholders in understanding their investment in the International Fund and do not constitute investment advice. This letter may contain discussions about certain investments both held and not held in the portfolio. All current and future holdings are subject to risk and to change.
ACUITAS US MICROCAP FUND
PERFORMANCE CHART AND ANALYSIS (Unaudited)
JUNE 30, 2019
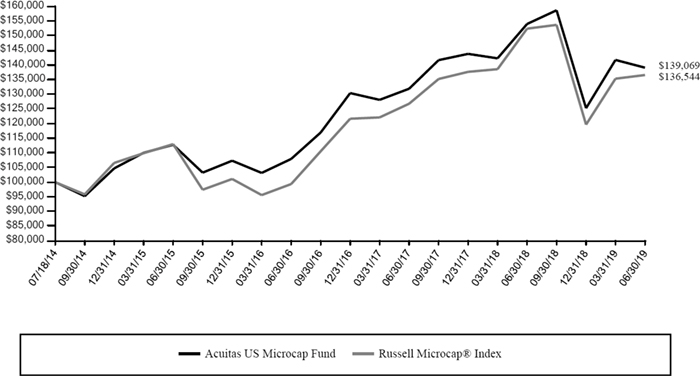
The following chart reflects the change in the value of a hypothetical $100,000 investment in Institutional Shares, including reinvested dividends and distributions, in Acuitas US Microcap Fund (the “Fund”) compared with the performance of the benchmark, Russell Microcap® Index (“Russell Microcap”), since inception. The Russell Microcap is an unmanaged index that measures the performance of the microcap segment of the US equity market, which consists of the smallest 1,000 securities in the Russell 2000® Index and the next 1,000 smallest eligible securities by market capitalization. The total return of the Russell Microcap includes the reinvestment of dividends and income. The total return of the Fund includes operating expenses that reduce returns, while the total return of the Russell Microcap does not include expenses. The Fund is professionally managed, while the Russell Microcap is unmanaged and is not available for investment.
Comparison of Change in Value of a $100,000 Investment
Acuitas US Microcap Fund vs. Russell Microcap Index
|
Average Annual Total Returns Periods Ended June 30, 2019 |
One Year | Three Year | Since Inception 07/18/14 |
| Acuitas US Microcap Fund | -9.68% | 8.83% | 6.89% |
| Russell Microcap® Index | -10.39% | 11.19% | 6.49% |
Performance data quoted represents past performance and is no guarantee of future results. Current performance may be lower or higher than the performance data quoted. Investment return and principal value will fluctuate so that shares, when redeemed, may be worth more or less than original cost. As stated in the Fund’s prospectus, the annual operating expense ratios (gross) for Institutional and Investor Shares are 1.80% and 2.05%, respectively. However, the Fund’s adviser has contractually agreed to waive its fee and/or reimburse Fund expenses to limit Total Annual Fund Operating Expenses After Fee Waiver and/or Expense Reimbursement (excluding all taxes, interest, portfolio transaction expenses, acquired fund fees and expenses, proxy expenses and extraordinary expenses) to 1.70% and 1.95% for Institutional and Investor Shares, respectively, through November 1, 2019 (the “Expense Cap”). The Expense Cap may be raised or eliminated only with the consent of the Board of Trustees. The adviser may be reimbursed by the Fund for fees waived and expenses reimbursed by the adviser pursuant to the Expense Cap if such payment is approved by the Board, made within three years of the fee waiver or expense reimbursement and does not cause the Total Annual Fund Operating Expenses After Fee Waiver and/or Expense Reimbursement to exceed the lesser of (i) the then-current Expense Cap and (ii) the Expense Cap in place at the time the fees/expenses were waived/reimbursed. Total Annual Fund Operating Expenses After Fee Waiver and/or Expense Reimbursement will increase if exclusions from the Expense Cap apply. Shares redeemed or exchanged within 60 days of purchase will be charged a 1.00% redemption fee. The performance table and graph do not reflect the deduction of taxes that a shareholder would pay on Fund distributions or the redemption of Fund shares. Returns greater than one year are annualized. For the most recent month-end performance, please call (844) 805-5628.
ACUITAS US MICROCAP FUND
SCHEDULE OF INVESTMENTS
JUNE 30, 2019
| Shares | Security Description | Value | |||||
| Common Stock - 97.9% | |||||||
| Consumer Discretionary - 6.7% | |||||||
| 61,536 | Aspen Group, Inc. (a) | $ | 233,837 | ||||
| 20,790 | Carriage Services, Inc. | 395,218 | |||||
| 22,410 | Chuy's Holdings, Inc. (a) | 513,637 | |||||
| 13,442 | Conn's, Inc. (a) | 239,537 | |||||
| 17,483 | CRA International, Inc. | 670,123 | |||||
| 63,200 | Fluent, Inc. (a) | 340,016 | |||||
| 18,800 | Fossil Group, Inc. (a) | 216,200 | |||||
| 12,900 | Points International, Ltd. (a) | 159,315 | |||||
| 31,079 | QuinStreet, Inc. (a) | 492,602 | |||||
| 103,471 | TravelCenters of America, LLC (a) | 374,565 | |||||
| 17,200 | Vera Bradley, Inc. (a) | 206,400 | |||||
| 7,952 | Winmark Corp. | 1,376,889 | |||||
| 5,218,339 | |||||||
| Consumer Staples - 0.2% | |||||||
| 5,700 | Seneca Foods Corp., Class A (a) | 158,631 | |||||
| Energy - 7.0% | |||||||
| 6,638 | CONSOL Energy, Inc. (a) | 176,637 | |||||
| 272,608 | HighPoint Resources Corp. (a) | 496,147 | |||||
| 87,704 | Midstates Petroleum Co., Inc. (a) | 516,577 | |||||
| 20,400 | Montage Resources Corp. (a) | 124,440 | |||||
| 51,127 | Natural Gas Services Group, Inc. (a) | 843,595 | |||||
| 21,700 | North American Construction Group, Ltd. | 234,360 | |||||
| 92,700 | Northern Oil and Gas, Inc. (a) | 178,911 | |||||
| 62,420 | Par Pacific Holdings, Inc. (a) | 1,280,858 | |||||
| 204,787 | Rosehill Resources, Inc. (a) | 757,712 | |||||
| 14,900 | SandRidge Energy, Inc. (a) | 103,108 | |||||
| 28,500 | SunCoke Energy, Inc. (a) | 253,080 | |||||
| 21,478 | Unit Corp. (a) | 190,939 | |||||
| 58,800 | W&T Offshore, Inc. (a) | 291,648 | |||||
| 5,448,012 | |||||||
| Financial Services - 18.5% | |||||||
| 64,900 | Ashford Hospitality Trust, Inc. REIT | 192,753 | |||||
| 36,310 | B. Riley Financial, Inc. | 757,427 | |||||
| 18,326 | Braemar Hotels & Resorts, Inc. REIT | 181,427 | |||||
| 25,680 | Bryn Mawr Bank Corp. | 958,378 | |||||
| 33,300 | Capstead Mortgage Corp. REIT | 278,055 | |||||
| 10,500 | Central Valley Community Bancorp | 225,435 | |||||
| 12,600 | ConnectOne Bancorp, Inc. | 285,516 | |||||
| 60,680 | Donnelley Financial Solutions, Inc. (a) | 809,471 | |||||
| 10,700 | Ellington Financial, Inc. | 192,279 | |||||
| 12,800 | Enterprise Financial Services Corp. | 532,480 | |||||
| 21,500 | Everi Holdings, Inc. (a) | 256,495 | |||||
| 6,800 | Federal Agricultural Mortgage Corp., Class C | 494,088 | |||||
| 13,400 | Financial Institutions, Inc. | 390,610 | |||||
| 19,900 | First Defiance Financial Corp. | 568,543 | |||||
| 11,900 | First Internet Bancorp | 256,326 | |||||
| 9,100 | Flushing Financial Corp. | 202,020 | |||||
| 39,550 | Fortress Transportation & Infrastructure Investors, LLC | 597,205 | |||||
| 7,500 | FS Bancorp, Inc. | 389,025 | |||||
| 34,100 | Global Medical REIT, Inc. | 358,050 | |||||
| 65,367 | Great Elm Capital Corp. | 568,693 | |||||
| 23,200 | Hallmark Financial Services, Inc. (a) | 330,136 | |||||
| 20,050 | Horizon Bancorp | 327,617 | |||||
| 20,600 | Luther Burbank Corp. | 224,334 | |||||
| 9,600 | Methode Electronics, Inc. | 274,272 | |||||
| 22,665 | Midland States Bancorp, Inc. | 605,609 | |||||
| 12,726 | NMI Holdings, Inc., Class A (a) | 361,291 | |||||
| 30,820 | Northrim BanCorp, Inc. | 1,099,041 | |||||
| 23,900 | OFG Bancorp | 568,103 | |||||
| 9,100 | Old Line Bancshares, Inc. | 242,151 | |||||
| Shares | Security Description | Value | ||||||
| Financial Services - 18.5% (continued) | ||||||||
| 33,400 | On Deck Capital, Inc. (a) | $ | 138,610 | |||||
| 25,600 | OP Bancorp | 277,504 | ||||||
| 2,321 | Plymouth Industrial REIT, Inc. | 43,960 | ||||||
| 13,987 | Premier Financial Bancorp, Inc. | 209,805 | ||||||
| 38,949 | Pzena Investment Management, Inc., Class A | 334,572 | ||||||
| 12,954 | Ready Capital Corp. REIT | 193,015 | ||||||
| 59,438 | Syncora Holdings, Ltd. (a) | 304,322 | ||||||
| 16,100 | The First of Long Island Corp. | 323,288 | ||||||
| 14,351,906 | ||||||||
| Health Care - 20.3% | ||||||||
| 36,600 | Akebia Therapeutics, Inc. (a) | 177,144 | ||||||
| 16,748 | Aldeyra Therapeutics, Inc. (a) | 100,488 | ||||||
| 10,900 | AngioDynamics, Inc. (a) | 214,621 | ||||||
| 5,900 | Anika Therapeutics, Inc. (a) | 239,658 | ||||||
| 28,143 | Apollo Endosurgery, Inc. (a) | 91,465 | ||||||
| 21,822 | AtriCure, Inc. (a) | 651,168 | ||||||
| 14,886 | Avedro, Inc. (a) | 292,361 | ||||||
| 167,547 | Avid Bioservices, Inc. (a) | 938,263 | ||||||
| 117,500 | BioDelivery Sciences International, Inc. (a) | 546,375 | ||||||
| 14,618 | BioLife Solutions, Inc. (a) | 247,775 | ||||||
| 3,600 | BioSpecifics Technologies Corp. (a) | 214,956 | ||||||
| 5,357 | BioTelemetry, Inc. (a) | 257,939 | ||||||
| 24,100 | Calithera Biosciences, Inc. (a) | 93,990 | ||||||
| 16,501 | Cardiovascular Systems, Inc. (a) | 708,388 | ||||||
| 41,350 | Castlight Health, Inc., Class B (a) | 133,560 | ||||||
| 57,000 | Catalyst Pharmaceuticals, Inc. (a) | 218,880 | ||||||
| 15,200 | Champions Oncology, Inc. (a) | 119,016 | ||||||
| 16,400 | ChemoCentryx, Inc. (a) | 152,520 | ||||||
| 12,200 | Codexis, Inc. (a) | 224,846 | ||||||
| 14,600 | Collegium Pharmaceutical, Inc. (a) | 191,990 | ||||||
| 32,173 | Cutera, Inc. (a) | 668,555 | ||||||
| 20,300 | Dicerna Pharmaceuticals, Inc. (a) | 319,725 | ||||||
| 22,959 | Electromed, Inc. (a) | 125,126 | ||||||
| 38,000 | Fluidigm Corp. (a) | 468,160 | ||||||
| 131,216 | Harvard Bioscience, Inc. (a) | 262,432 | ||||||
| 32,316 | IntriCon Corp. (a) | 754,902 | ||||||
| 9,700 | Kura Oncology, Inc. (a) | 190,993 | ||||||
| 25,100 | Lannett Co., Inc. (a) | 152,106 | ||||||
| 8,300 | MacroGenics, Inc. (a) | 140,851 | ||||||
| 55,400 | MEI Pharma, Inc. (a) | 138,500 | ||||||
| 23,659 | MiMedx Group, Inc. (a) | 95,819 | ||||||
| 23,142 | NeoGenomics, Inc. (a) | 507,735 | ||||||
| 69,468 | Pfenex, Inc. (a) | 468,214 | ||||||
| 58,879 | Quotient, Ltd. (a) | 550,519 | ||||||
| 47,774 | R1 RCM, Inc. (a) | 600,997 | ||||||
| 7,700 | Ra Pharmaceuticals, Inc. (a) | 231,539 | ||||||
| 10,500 | RadNet, Inc. (a) | 144,795 | ||||||
| 4,747 | Repligen Corp. (a) | 408,005 | ||||||
| 41,385 | SeaSpine Holdings Corp. (a) | 548,351 | ||||||
| 60,985 | Sientra, Inc. (a) | 375,668 | ||||||
| 202,260 | SIGA Technologies, Inc. (a) | 1,148,837 | ||||||
| 32,971 | STAAR Surgical Co. (a) | 968,688 | ||||||
| 3,400 | Surmodics, Inc. (a) | 146,778 | ||||||
| 6,160 | Veracyte, Inc. (a) | 175,622 | ||||||
| 2,295 | Vericel Corp. (a) | 43,353 | ||||||
| 15,832 | ViewRay, Inc. (a) | 139,480 | ||||||
| 17,203 | Xenon Pharmaceuticals, Inc. (a) | 169,622 | ||||||
| 15,760,775 | ||||||||
| Materials & Processing - 7.8% | ||||||||
| 23,519 | AdvanSix, Inc. (a) | 574,569 | ||||||
| 19,600 | American Vanguard Corp. | 302,036 | ||||||
| 21,592 | BlueLinx Holdings, Inc. (a) | 427,738 | ||||||
See Notes to Financial Statements.
ACUITAS US MICROCAP FUND
SCHEDULE OF INVESTMENTS
JUNE 30, 2019
| Shares | Security Description | Value | ||||||
| Materials & Processing - 7.8% (continued) | ||||||||
| 9,600 | Caesarstone, Ltd. | $ | 144,288 | |||||
| 7,980 | Chase Corp. | 858,967 | ||||||
| 17,700 | Foundation Building Materials, Inc. (a) | 314,706 | ||||||
| 14,483 | Insteel Industries, Inc. | 301,536 | ||||||
| 20,352 | Interface, Inc. | 311,996 | ||||||
| 101,969 | Landec Corp. (a) | 955,450 | ||||||
| 4,900 | Lawson Products, Inc./DE (a) | 179,977 | ||||||
| 9,400 | LB Foster Co., Class A (a) | 256,996 | ||||||
| 16,531 | Northern Technologies International Corp. | 404,183 | ||||||
| 13,174 | Northwest Pipe Co. (a) | 339,626 | ||||||
| 26,300 | PGT Innovations, Inc. (a) | 439,736 | ||||||
| 49,318 | Venator Materials PLC (a) | 260,892 | ||||||
| 6,072,696 | ||||||||
| Producer Durables - 22.6% | ||||||||
| 17,064 | Allied Motion Technologies, Inc. | 646,726 | ||||||
| 14,500 | American Outdoor Brands Corp. (a) | 130,645 | ||||||
| 24,300 | Argan, Inc. | 985,608 | ||||||
| 12,000 | Atkore International Group, Inc. (a) | 310,440 | ||||||
| 7,400 | Canadian Solar, Inc. (a) | 161,542 | ||||||
| 10,500 | Columbus McKinnon Corp. | 440,685 | ||||||
| 27,700 | Commercial Vehicle Group, Inc. (a) | 222,154 | ||||||
| 39,900 | DHT Holdings, Inc. | 235,809 | ||||||
| 6,000 | DXP Enterprises, Inc./TX (a) | 227,340 | ||||||
| 13,148 | GP Strategies Corp. (a) | 198,272 | ||||||
| 125,375 | Great Lakes Dredge & Dock Corp. (a) | 1,384,140 | ||||||
| 15,434 | Hamilton Beach Brands Holding Co., Class A | 294,018 | ||||||
| 7,254 | ICF International, Inc. | 528,091 | ||||||
| 66,224 | IES Holdings, Inc. (a) | 1,248,322 | ||||||
| 26,366 | Kornit Digital, Ltd. (a) | 834,748 | ||||||
| 23,700 | Limbach Holdings, Inc. (a) | 215,670 | ||||||
| 6,700 | Movado Group, Inc. | 180,900 | ||||||
| 8,300 | Napco Security Technologies, Inc. (a) | 246,344 | ||||||
| 18,008 | Patriot Transportation Holding, Inc. (a) | 305,596 | ||||||
| 41,967 | Perceptron, Inc. (a) | 186,753 | ||||||
| 8,600 | Powell Industries, Inc. | 326,800 | ||||||
| 49,525 | Radiant Logistics, Inc. (a) | 304,083 | ||||||
| 27,460 | Rosetta Stone, Inc. (a) | 628,285 | ||||||
| 12,400 | Select Interior Concepts, Inc., Class A (a) | 144,460 | ||||||
| 8,500 | SP Plus Corp. (a) | 271,405 | ||||||
| 166,307 | Sportsman's Warehouse Holdings, Inc. (a) | 628,640 | ||||||
| 19,444 | Systemax, Inc. | 430,879 | ||||||
| 25,525 | The Hackett Group, Inc. | 428,565 | ||||||
| 29,147 | The Manitowoc Co., Inc. (a) | 518,817 | ||||||
| 23,300 | Titan Machinery, Inc. (a) | 479,514 | ||||||
| 40,982 | UFP Technologies, Inc. (a) | 1,705,261 | ||||||
| 9,100 | Vectrus, Inc. (a) | 369,096 | ||||||
| 9,962 | Vishay Precision Group, Inc. (a) | 404,756 | ||||||
| 4,900 | VSE Corp. | 140,581 | ||||||
| 13,100 | Wabash National Corp. | 213,137 | ||||||
| 11,736 | WageWorks, Inc. (a) | 596,071 | ||||||
| 53,600 | Westport Fuel Systems, Inc. (a) | 145,256 | ||||||
| 214,804 | Yatra Online, Inc. (a) | 803,367 | ||||||
| 17,522,776 | ||||||||
| Technology - 13.7% | ||||||||
| 13,000 | Agilysys, Inc. (a) | 279,110 | ||||||
| 11,530 | AstroNova, Inc. | 297,935 | ||||||
| 12,758 | CalAmp Corp. (a) | 149,013 | ||||||
| 35,977 | Carbon Black, Inc. (a) | 601,535 | ||||||
| 89,400 | Digital Turbine, Inc. (a) | 447,000 | ||||||
| 19,207 | eGain Corp. (a) | 156,345 | ||||||
| 8,957 | Five9, Inc. (a) | 459,405 | ||||||
| 30,158 | Ichor Holdings, Ltd. (a) | 712,935 | ||||||
| Shares | Security Description | Value | ||||||
| Technology - 13.7% (continued) | ||||||||
| 19,700 | Kimball Electronics, Inc. (a) | $ | 319,928 | |||||
| 59,263 | Leaf Group, Ltd. (a) | 439,139 | ||||||
| 63,077 | Limelight Networks, Inc. (a) | 170,308 | ||||||
| 44,534 | MiX Telematics, Ltd., ADR | 669,346 | ||||||
| 14,853 | Monotype Imaging Holdings, Inc. | 250,124 | ||||||
| 23,138 | Perficient, Inc. (a) | 794,096 | ||||||
| 91,801 | Photronics, Inc. (a) | 752,768 | ||||||
| 26,967 | PlayAGS, Inc. (a) | 524,508 | ||||||
| 21,204 | QAD, Inc., Class A | 852,613 | ||||||
| 32,300 | Sapiens International Corp. NV | 536,826 | ||||||
| 72,100 | The Meet Group, Inc. (a) | 250,908 | ||||||
| 48,500 | The Rubicon Project, Inc. (a) | 308,460 | ||||||
| 34,662 | TrueCar, Inc. (a) | 189,255 | ||||||
| 18,900 | Ultra Clean Holdings, Inc. (a) | 263,088 | ||||||
| 14,271 | Upland Software, Inc. (a) | 649,759 | ||||||
| 13,000 | Veeco Instruments, Inc. (a) | 158,860 | ||||||
| 42,200 | Zix Corp. (a) | 383,598 | ||||||
| 10,616,862 | ||||||||
| Utilities - 1.1% | ||||||||
| 12,600 | AquaVenture Holdings, Ltd. (a) | 251,622 | ||||||
| 94,100 | Atlantic Power Corp. (a) | 227,722 | ||||||
| 22,578 | Boingo Wireless, Inc. (a) | 405,727 | ||||||
| 885,071 | ||||||||
| Total Common Stock (Cost $72,822,599) | 76,035,068 | |||||||
| Money Market Fund - 2.0% | ||||||||
| 1,522,145 | BlackRock Liquidity Funds FedFund Portfolio, Institutional Shares, 2.26% (b) | |||||||
| (Cost $1,522,145) | 1,522,145 | |||||||
| Investments, at value - 99.9% (Cost $74,344,744) | $ | 77,557,213 | ||||||
| Other Assets & Liabilities, Net - 0.1% | 105,906 | |||||||
| Net Assets - 100.0% | $ | 77,663,119 | ||||||
| ADR | American Depositary Receipt |
| LLC | Limited Liability Company |
| PLC | Public Limited Company |
| REIT | Real Estate Investment Trust |
| (a) | Non-income producing security. |
| (b) | Dividend yield changes daily to reflect current market conditions. Rate was the quoted yield as of June 30, 2019. |
The following is a summary of the inputs used to value the Fund's investments as of June 30, 2019.
The inputs or methodology used for valuing securities are not necessarily an indication of the risks associated with investing in those securities. For more information on valuation inputs, and their aggregation into the levels used in the table below, please refer to the Security Valuation section in Note 2 of the accompanying Notes to Financial Statements.
| Valuation Inputs | Investments in Securities | |||
| Level 1 - Quoted Prices | $ | 76,035,068 | ||
| Level 2 - Other Significant Observable Inputs | 1,522,145 | |||
| Level 3 - Significant Unobservable Inputs | – | |||
| Total | $ | 77,557,213 | ||
The Level 1 value displayed in this table is Common Stock. The Level 2 value displayed in this table is a Money Market Fund. Refer to this Schedule of Investments for a further breakout of each security by industry.
See Notes to Financial Statements.
ACUITAS US MICROCAP FUND
SCHEDULE OF INVESTMENTS
JUNE 30, 2019
| PORTFOLIO HOLDINGS (Unaudited) | |
| % of Total Investments | |
| Consumer Discretionary | 6.7% |
| Consumer Staples | 0.2% |
| Energy | 7.0% |
| Financial Services | 18.5% |
| Health Care | 20.3% |
| Materials & Processing | 7.8% |
| Producer Durables | 22.6% |
| Technology | 13.7% |
| Utilities | 1.2% |
| Money Market Fund | 2.0% |
| 100.0% |
See Notes to Financial Statements.
ACUITAS US MICROCAP FUND
STATEMENT OF ASSETS AND LIABILITIES
JUNE 30, 2019
| ASSETS | ||||
| Investments, at value (Cost $74,344,744) | $ | 77,557,213 | ||
| Receivables: | ||||
| Fund shares sold | 158,979 | |||
| Investment securities sold | 430,942 | |||
| Dividends | 47,544 | |||
| Prepaid expenses | 25,129 | |||
| Total Assets | 78,219,807 | |||
| LIABILITIES | ||||
| Payables: | ||||
| Investment securities purchased | 432,240 | |||
| Accrued Liabilities: | ||||
| Investment adviser fees | 68,325 | |||
| Trustees’ fees and expenses | 1,481 | |||
| Fund services fees | 14,209 | |||
| Other expenses | 40,433 | |||
| Total Liabilities | 556,688 | |||
| NET ASSETS | $ | 77,663,119 | ||
| COMPONENTS OF NET ASSETS | ||||
| Paid-in capital | $ | 77,710,665 | ||
| Distributable earnings | (47,546 | ) | ||
| NET ASSETS | $ | 77,663,119 | ||
| SHARES OF BENEFICIAL INTEREST AT NO PAR VALUE (UNLIMITED SHARES AUTHORIZED) | ||||
| Institutional Shares | 7,730,001 | |||
| NET ASSET VALUE, OFFERING AND REDEMPTION PRICE PER SHARE* | ||||
| Institutional Shares (based on net assets of $77,663,119) | $ | 10.05 | ||
| * | Shares redeemed or exchanged within 60 days of purchase are charged a 1.00% redemption fee. |
See Notes to Financial Statements.
ACUITAS US MICROCAP FUND
STATEMENT OF OPERATIONS
YEAR ENDED JUNE 30, 2019
| INVESTMENT INCOME | ||||
| Dividend income (Net of foreign withholding taxes of $3,211) | $ | 851,814 | ||
| Total Investment Income | 851,814 | |||
| EXPENSES | ||||
| Investment adviser fees | 1,295,098 | |||
| Fund services fees | 199,285 | |||
| Shareholder service fees | 92,373 | |||
| Custodian fees | 26,073 | |||
| Registration fees | 18,141 | |||
| Professional fees | 44,330 | |||
| Trustees' fees and expenses | 9,509 | |||
| Other expenses | 47,245 | |||
| Total Expenses | 1,732,054 | |||
| Fees waived | (159,221 | ) | ||
| Net Expenses | 1,572,833 | |||
| NET INVESTMENT LOSS | (721,019 | ) | ||
| NET REALIZED AND UNREALIZED GAIN (LOSS) | ||||
| Net realized gain (loss) on: | ||||
| Investments | 6,624,148 | |||
| Foreign currency transactions | (3 | ) | ||
| Net realized gain | 6,624,145 | |||
| Net change in unrealized appreciation (depreciation) on: | ||||
| Investments | (17,327,023 | ) | ||
| Foreign currency translations | 9 | |||
| Net change in unrealized appreciation (depreciation) | (17,327,014 | ) | ||
| NET REALIZED AND UNREALIZED LOSS | (10,702,869 | ) | ||
| DECREASE IN NET ASSETS RESULTING FROM OPERATIONS | $ | (11,423,888 | ) | |
See Notes to Financial Statements.
ACUITAS US MICROCAP FUND
STATEMENTS OF CHANGES IN NET ASSETS
| For the Years Ended June 30, | ||||||||
| 2019 | 2018 | |||||||
| OPERATIONS | ||||||||
| Net investment loss | $ | (721,019 | ) | $ | (888,475 | ) | ||
| Net realized gain | 6,624,145 | 10,834,970 | ||||||
| Net change in unrealized appreciation (depreciation) | (17,327,014 | ) | 5,420,770 | |||||
| Increase (Decrease) in Net Assets Resulting from Operations | (11,423,888 | ) | 15,367,265 | |||||
| DISTRIBUTIONS TO SHAREHOLDERS | ||||||||
| Institutional Shares | (16,940,075 | ) | (3,399,933 | )* | ||||
| Total Distributions Paid | (16,940,075 | ) | (3,399,933 | ) | ||||
| CAPITAL SHARE TRANSACTIONS | ||||||||
| Sale of shares: | ||||||||
| Institutional Shares | 17,861,183 | 14,489,617 | ||||||
| Reinvestment of distributions: | ||||||||
| Institutional Shares | 16,893,918 | 3,399,574 | ||||||
| Redemption of shares: | ||||||||
| Institutional Shares | (37,069,514 | ) | (9,207,906 | ) | ||||
| Redemption fees: | ||||||||
| Institutional Shares | 2,330 | 219 | ||||||
| Increase (Decrease) in Net Assets from Capital Share Transactions | (2,312,083 | ) | 8,681,504 | |||||
| Increase (Decrease) in Net Assets | (30,676,046 | ) | 20,648,836 | |||||
| NET ASSETS | ||||||||
| Beginning of Year | 108,339,165 | 87,690,329 | ||||||
| End of Year | $ | 77,663,119 | $ | 108,339,165 | ** | |||
| SHARE TRANSACTIONS | ||||||||
| Sale of shares: | ||||||||
| Institutional Shares | 1,699,846 | 1,094,290 | ||||||
| Reinvestment of distributions: | ||||||||
| Institutional Shares | 1,799,139 | 257,543 | ||||||
| Redemption of shares: | ||||||||
| Institutional Shares | (3,412,468 | ) | (686,187 | ) | ||||
| Increase in Shares | 86,517 | 665,646 | ||||||
| * | Distribution was the result of net realized gains at June 30, 2018. |
| ** | Includes accumulated net investment loss of $(47,511) at June 30, 2018. The requirement to disclose the corresponding amount as of June 30, 2019 was eliminated. |
See Notes to Financial Statements.
ACUITAS US MICROCAP FUND
FINANCIAL HIGHLIGHTS
These financial highlights reflect selected data for a share outstanding throughout each period.
| July 18, 2014 (a) | ||||||||||||||||||||
| For the Years Ended June 30, | Through | |||||||||||||||||||
| 2019 | 2018 | 2017 | 2016 | June 30, 2015 | ||||||||||||||||
| INSTITUTIONAL SHARES | ||||||||||||||||||||
| NET ASSET VALUE, Beginning of Period | $ | 14.17 | $ | 12.57 | $ | 10.38 | $ | 11.27 | $ | 10.00 | ||||||||||
| INVESTMENT OPERATIONS | ||||||||||||||||||||
| Net investment loss (b) | (0.09 | ) | (0.12 | ) | (0.09 | ) | (0.08 | ) | (0.07 | ) | ||||||||||
| Net realized and unrealized gain (loss) | (1.46 | ) | 2.19 | 2.39 | (0.41 | ) | 1.34 | |||||||||||||
| Total from Investment Operations | (1.55 | ) | 2.07 | 2.30 | (0.49 | ) | 1.27 | |||||||||||||
| DISTRIBUTIONS TO SHAREHOLDERS FROM | ||||||||||||||||||||
| Net realized gain | (2.57 | ) | (0.47 | ) | (0.11 | ) | (0.40 | ) | – | |||||||||||
| Total Distributions to Shareholders | (2.57 | ) | (0.47 | ) | (0.11 | ) | (0.40 | ) | – | |||||||||||
| REDEMPTION FEES(b) | 0.00 | (c) | 0.00 | (c) | 0.00 | (c) | 0.00 | (c) | 0.00 | (c) | ||||||||||
| NET ASSET VALUE, End of Period | $ | 10.05 | $ | 14.17 | $ | 12.57 | $ | 10.38 | $ | 11.27 | ||||||||||
| TOTAL RETURN | (9.68 | )% | 16.77 | % | 22.21 | % | (4.27 | )% | 12.70 | %(d) | ||||||||||
| RATIOS/SUPPLEMENTARY DATA | ||||||||||||||||||||
| Net Assets at End of Period (000s omitted) | $ | 77,663 | $ | 108,339 | $ | 87,690 | $ | 66,156 | $ | 37,823 | ||||||||||
| Ratios to Average Net Assets: | ||||||||||||||||||||
| Net investment loss | (0.78 | )% | (0.91 | )% | (0.78 | )% | (0.80 | )% | (0.74 | )%(e) | ||||||||||
| Net expenses | 1.70 | % | 1.70 | % | 1.70 | % | 1.70 | % | 1.70 | %(e) | ||||||||||
| Gross expenses (f) | 1.87 | % | 1.80 | % | 1.86 | % | 2.04 | % | 2.37 | %(e) | ||||||||||
| PORTFOLIO TURNOVER RATE | 108 | % | 48 | % | 50 | % | 52 | % | 58 | %(d) | ||||||||||
| (a) | Commencement of operations. |
| (b) | Calculated based on average shares outstanding during each period. |
| (c) | Less than $0.01 per share. |
| (d) | Not annualized. |
| (e) | Annualized. |
| (f) | Reflects the expense ratio excluding any waivers and/or reimbursements. |
See Notes to Financial Statements.
ACUITAS FUNDS
NOTES TO FINANCIAL STATEMENTS
JUNE 30, 2019
Note 1. Organization
Acuitas International Small Cap Fund and Acuitas US Microcap Fund (individually, a “Fund” and collectively, the “Funds”) are diversified portfolios of Forum Funds II (the “Trust”). The Trust is a Delaware statutory trust that is registered as an open-end, management investment company under the Investment Company Act of 1940, as amended (the “Act”). Under its Trust Instrument, the Trust is authorized to issue an unlimited number of each Fund’s shares of beneficial interest without par value. Each Fund currently offers two classes of shares: Institutional Shares and Investors Shares. As of June 30, 2019, Investor Shares had not commenced operations. Each Fund seeks capital appreciation. Each Fund commenced operations on July 18, 2014.
Note 2. Summary of Significant Accounting Policies
The Funds are investment companies and follow accounting and reporting guidance under Financial Accounting Standards Board (“FASB”) Accounting Standards Codification (“ASC”) Topic 946, “Financial Services – Investment Companies.” These financial statements are prepared in accordance with accounting principles generally accepted in the United States of America (“GAAP”), which require management to make estimates and assumptions that affect the reported amounts of assets and liabilities, the disclosure of contingent liabilities at the date of the financial statements, and the reported amounts of increases and decreases in net assets from operations during the fiscal year. Actual amounts could differ from those estimates. The following summarizes the significant accounting policies of each Fund:
Security Valuation – Securities are valued at market prices using the last quoted trade or official closing price from the principal exchange where the security is traded, as provided by independent pricing services on each Fund business day. In the absence of a last trade, securities are valued at the mean of the last bid and ask price provided by the pricing service. Forward currency contracts are generally valued based on interpolation of forward curve data points obtained from major banking institutions that deal in foreign currencies and currency dealers. Exchange-traded options for which the last quoted sale price is outside the closing bid and ask price will be valued at the mean of the closing bid and ask price. Shares of non-exchange traded open-end mutual funds are valued at net asset value (“NAV”). Short-term investments that mature in sixty days or less may be valued at amortized cost.
Each Fund values its investments at fair value pursuant to procedures adopted by the Trust’s Board of Trustees (the“Board”) if (1) market quotations are not readily available or (2) the Adviser, as defined in Note 3, believes that the values available are unreliable. The Trust’s Valuation Committee, as defined in each Fund’s registration statement, performs certain functions as they relate to the administration and oversight of each Fund’s valuation procedures. Under these procedures, the Valuation Committee convenes on a regular and ad hoc basis to review such investments and considers a number of factors, including valuation methodologies and significant unobservable inputs, when arriving at fair value.
The Valuation Committee may work with the Adviser to provide valuation inputs. In determining fair valuations, inputs may include market-based analytics that may consider related or comparable assets or liabilities, recent transactions, market multiples, book values and other relevant investment information. Adviser inputs may include an income-based approach in which the anticipated future cash flows of the investment are discounted in determining fair value. Discounts may also be applied based on the nature or duration of any restrictions on the disposition of the investments. The Valuation Committee performs regular reviews of valuation methodologies, key inputs and assumptions, disposition analysis and market activity.
Fair valuation is based on subjective factors and, as a result, the fair value price of an investment may differ from the security’s market price and may not be the price at which the asset may be sold. Fair valuation could result in a different NAV than a NAV determined by using market quotes.
GAAP has a three-tier fair value hierarchy. The basis of the tiers is dependent upon the various “inputs” used to determine the value of each Fund’s investments. These inputs are summarized in the three broad levels listed below:
Level 1 - Quoted prices in active markets for identical assets and liabilities.
Level 2 - Prices determined using significant other observable inputs (including quoted prices for similar securities, interest rates, prepayment speeds, credit risk, etc.). Short-term securities with maturities of sixty days or less are valued at amortized cost, which approximates market value, and are categorized as Level 2 in the hierarchy. Municipal securities, long-term U.S. government obligations and corporate debt securities are valued in accordance with the evaluated price supplied by a pricing service and
ACUITAS FUNDS
NOTES TO FINANCIAL STATEMENTS
JUNE 30, 2019
generally categorized as Level 2 in the hierarchy. Other securities that are categorized as Level 2 in the hierarchy include, but are not limited to, warrants that do not trade on an exchange, securities valued at the mean between the last reported bid and ask quotation and international equity securities valued by an independent third party with adjustments for changes in value between the time of the securities’ respective local market closes and the close of the U.S. market.
Level 3 - Significant unobservable inputs (including each Fund’s own assumptions in determining the fair value of investments).
The aggregate value by input level, as of June 30, 2019, for each Fund’s investments is included at the end of each Fund’s Schedule of Investments.
Security Transactions, Investment Income and Realized Gain and Loss – Investment transactions are accounted for on the trade date. Dividend income is recorded on the ex-dividend date. Foreign dividend income is recorded on the ex-dividend date or as soon as possible after determining the existence of a dividend declaration after exercising reasonable due diligence. Income and capital gains on some foreign securities may be subject to foreign withholding taxes, which are accrued as applicable. Interest income is recorded on an accrual basis. Premium is amortized and discount is accreted using the effective interest method. Identified cost of investments sold is used to determine the gain and loss for both financial statement and federal income tax purposes.
Foreign Currency Translations – Foreign currency amounts are translated into U.S. dollars as follows: (1) assets and liabilities at the rate of exchange at the end of the respective period; and (2) purchases and sales of securities and income and expenses at the rate of exchange prevailing on the dates of such transactions. The portion of the results of operations arising from changes in the exchange rates and the portion due to fluctuations arising from changes in the market prices of securities are not isolated. Such fluctuations are included with the net realized and unrealized gain or loss on investments.
Foreign Currency Transactions – The Acuitas International Small Cap Fund may enter into transactions to purchase or sell foreign currency contracts and options on foreign currency. Forward currency contracts are agreements to exchange one currency for another at a future date and at a specified price. A fund may use forward currency contracts to facilitate transactions in foreign securities, to manage a fund’s foreign currency exposure and to protect the U.S. dollar value of its underlying portfolio securities against the effect of possible adverse movements in foreign exchange rates. These contracts are intrinsically valued daily based on forward rates, and a fund’s net equity therein, representing unrealized gain or loss on the contracts as measured by the difference between the forward foreign exchange rates at the dates of entry into the contracts and the forward rates at the reporting date, is recorded as a component of NAV. These instruments involve market risk, credit risk, or both kinds of risks, in excess of the amount recognized in the Statements of Assets and Liabilities. Risks arise from the possible inability of counterparties to meet the terms of their contracts and from movement in currency and securities values and interest rates. Due to the risks associated with these transactions, a fund could incur losses up to the entire contract amount, which may exceed the net unrealized value included in its NAV.
Distributions to Shareholders – Each Fund declares any dividends from net investment income and pays them annually. Any net capital gains realized by the Funds are distributed at least annually. Distributions to shareholders are recorded on the ex-dividend date. Distributions are based on amounts calculated in accordance with applicable federal income tax regulations, which may differ from GAAP. These differences are due primarily to differing treatments of income and gain on various investment securities held by each Fund, timing differences and differing characterizations of distributions made by each Fund.
Federal Taxes – Each Fund intends to continue to qualify each year as a regulated investment company under Subchapter M of Chapter 1, Subtitle A, of the Internal Revenue Code of 1986, as amended (“Code”), and to distribute all of its taxable income to shareholders. In addition, by distributing in each calendar year substantially all of its net investment income and capital gains, if any, the Funds will not be subject to a federal excise tax. Therefore, no federal income or excise tax provision is required. Each Fund files a U.S. federal income and excise tax return as required. Each Fund’s federal income tax returns are subject to examination by the Internal Revenue Service for a period of three fiscal years after they are filed. As of June 30, 2019, there are no uncertain tax positions that would require financial statement recognition, de-recognition or disclosure.
Income and Expense Allocation – The Trust accounts separately for the assets, liabilities and operations of each of its investment portfolios. Expenses that are directly attributable to more than one investment portfolio are allocated among the respective investment portfolios in an equitable manner.
ACUITAS FUNDS
NOTES TO FINANCIAL STATEMENTS
JUNE 30, 2019
Redemption Fees – A shareholder who redeems or exchanges shares within 60 days of purchase will incur a redemption fee of 1.00% of the current NAV of shares redeemed or exchanged, subject to certain limitations. The fee is charged for the benefit of the remaining shareholders and will be paid to each Fund to help offset transaction costs. The fee is accounted for as an addition to paid-in capital. Each Fund reserves the right to modify the terms of or terminate the fee at any time. There are limited exceptions to the imposition of the redemption fee. Redemption fees incurred for the Funds, if any, are reflected on the Statements of Changes in Net Assets.
Commitments and Contingencies – In the normal course of business, each Fund enters into contracts that provide general indemnifications by each Fund to the counterparty to the contract. Each Fund’s maximum exposure under these arrangements is dependent on future claims that may be made against each Fund and, therefore, cannot be estimated; however, based on experience, the risk of loss from such claims is considered remote. Each Fund has determined that none of these arrangements requires disclosure on each Fund’s balance sheet.
Note 3. Fees and Expenses
Investment Adviser – Acuitas Investments, LLC (the “Adviser”) is the investment adviser to the Funds. Pursuant to an investment advisory agreement, the Adviser receives an advisory fee, payable monthly, at an annual rate of 1.20% and 1.40% of the average daily net assets of Acuitas International Small Cap Fund and Acuitas US Microcap Fund, respectively.
Each sub-advisory fee, calculated as a percentage of each Fund’s average daily net assets managed by each subadviser, is paid by the Adviser.
Distribution – Foreside Fund Services, LLC serves as each Fund’s distributor (the “Distributor”). The Funds have adopted a Distribution Plan (the “Plan”) for Investor Shares in accordance with Rule 12b-1 of the Act. Under the Plan, the Funds pay the Distributor and/or any other entity as authorized by the Board a fee of up to 0.25% of the average daily net assets of Investor Shares. The Distributor is not affiliated with the Adviser or Atlantic Fund Administration, LLC, a wholly owned subsidiary of Apex US Holdings, LLC (d/b/a Apex Fund Services) (“Apex”) or their affiliates.
Other Service Providers – Apex provides fund accounting, fund administration, compliance and transfer agency services to each Fund. The fees related to these services are included in Fund services fees within the Statements of Operations. Apex also provides certain shareholder report production and EDGAR conversion and filing services. Pursuant to an Apex services agreement, each Fund pays Apex customary fees for its services. Apex provides a Principal Executive Officer, a Principal Financial Officer, a Chief Compliance Officer and an Anti-Money Laundering Officer to each Fund, as well as certain additional compliance support functions.
Trustees and Officers – The Trust pays each Independent Trustee an annual fee of $16,000 ($21,000 for the Chairman) for service to the Trust. The Independent Trustees and Chairman may receive additional fees for special Board meetings. The Independent Trustees are also reimbursed for all reasonable out-of-pocket expenses incurred in connection with their duties as Trustees, including travel and related expenses incurred in attending Board meetings. The amount of Independent Trustees’ fees attributable to each Fund is disclosed in the Statements of Operations. Certain officers of the Trust are also officers or employees of the above named service providers, and during their terms of office received no compensation from each Fund.
Note 4. Expense Reimbursement and Fees Waived
The Adviser has contractually agreed to waive its fee and/or reimburse expenses to limit total annual fund operating expenses (excluding all taxes, interest, portfolio transaction expenses, acquired fund fees and expenses, proxy expenses and extraordinary expenses) of Institutional Shares to 1.50% and Investor Shares to 1.75% through November 1, 2019, for Acuitas International Small Cap Fund. The Adviser has also contractually agreed to waive its fees and/or reimburse expenses to limit total annual operating expenses (excluding all taxes, interest, portfolio transaction expenses, acquired fund fees and expenses, proxy expenses and extraordinary expenses) of Institutional Shares to 1.70% and Investor Shares to 1.95% through November 1, 2019, for Acuitas US Microcap Fund. Other fund service providers have voluntarily agreed to waive a portion of their fees. Voluntary fee waivers may be reduced or eliminated at any time. For the year ended June 30, 2019, the fees waived and/or reimbursed expenses were as follows:
ACUITAS FUNDS
NOTES TO FINANCIAL STATEMENTS
JUNE 30, 2019
| Investment Adviser Fees Waived |
Other Waivers | Total Fees Waived and Expenses Reimbursed |
||||||||||
| Acuitas International Small Cap Fund | $ | 239,191 | $ | 26,407 | $ | 265,598 | ||||||
| Acuitas US Microcap Fund | 136,804 | 22,417 | 159,221 | |||||||||
The Adviser may be reimbursed by each Fund for fees waived and expenses reimbursed by the Adviser pursuant to the Expense Cap if such payment is approved by the Board, made within three years of the fee waiver or expense reimbursement, and does not cause the Total Annual Fund Operating Expenses After Fee Waiver and/or Expense Reimbursement to exceed the lesser of (i) the then-current expense cap and (ii) the expense cap in place at the time the fees/expenses were waived/reimbursed. As of June 30, 2019, $690,799 and $329,194 are subject to recapture by the Adviser for the Acuitas International Small Cap Fund and the Acuitas US Microcap Fund, respectively. Other waivers are not eligible for recoupment.
Note 5. Security Transactions
The cost of purchases and proceeds from sales of investment securities (including maturities), other than short-term investments during the year ended June 30, 2019, were as follows:
| Purchases | Sales | |||||||
| Acuitas International Small Cap Fund | $ | 27,670,816 | $ | 67,804,599 | ||||
| Acuitas US Microcap Fund | 98,597,431 | 117,287,851 | ||||||
Note 6. Federal Income Tax
As of June 30, 2019, the cost for federal income tax purposes and the components of net unrealized appreciation (depreciation) were as follows:
| Tax Cost of Investments |
Gross Unrealized Appreciation |
Gross Unrealized Depreciation |
Net Unrealized Appreciation (Depreciation) |
|||||||||||||
| Acuitas International Small Cap Fund | $ | 1,160,426 | $ | 84,188 | $ | (148,391 | ) | $ | (64,203 | ) | ||||||
| Acuitas US Microcap Fund | 75,312,123 | 10,184,508 | (7,939,418 | ) | 2,245,090 | |||||||||||
Distributions paid during the fiscal years ended as noted were characterized for tax purposes as follows:
| Ordinary Income | Long-Term Capital Gain | Total | |||||||||||
| Acuitas International Small Cap Fund | |||||||||||||
| 2019 | $ | 532,942 | $ | – | $ | 532,942 | |||||||
| 2018 | 2,541,258 | 2,541,258 | |||||||||||
| Acuitas US Microcap Fund | – | ||||||||||||
| 2019 | 335,697 | 16,604,378 | 16,940,075 | ||||||||||
| 2018 | – | 3,399,933 | 3,399,933 | ||||||||||
As of June 30, 2019, distributable earnings on a tax basis were as follows:
| Undistributed Long-Term Gain |
Capital and Other Losses |
Unrealized Appreciation (Depreciation) |
Total | |||||||||||||
| Acuitas International Small Cap Fund | $ | – | $ | (4,685,120 | ) | $ | (63,898 | ) | $ | (4,749,018 | ) | |||||
| Acuitas US Microcap Fund | 43,104 | (2,335,749 | ) | 2,245,099 | (47,546 | ) | ||||||||||
The difference between components of distributable earnings on a tax basis and the amounts reflected in the Statements of Assets and Liabilities are primarily due to post-October losses, capital loss carryover, investments in passive foreign investment companies (“PFIC”) and wash sales in the Acuitas International Small Cap Fund and investments in PFICs, equity return of capital, partnerships, real estate investment trusts, post-October losses and late year ordinary losses and wash sales in the Acuitas US Microcap Fund.
As of June 30, 2019, the Acuitas International Small Cap Fund had $1,267,202 of available short-term capital loss carryforwards and $219,848 of available long-term capital loss carryforwards that have no expiration date.
ACUITAS FUNDS
NOTES TO FINANCIAL STATEMENTS
JUNE 30, 2019
For tax purposes, the current year post-October loss was $3,198,070 and $2,013,313 for Acuitas International Small Cap Fund and Acuitas US Microcap Fund, respectively, (realized during the period November 1, 2018 through June 30, 2019), and the current deferred late year ordinary loss was $322,436 for Acuitas US Microcap Fund (realized during the period January 1, 2019 through June 30, 2019). These losses will be recognized for tax purposes on the first business day of the Funds’ next fiscal year, July 1, 2019.
On the Statements of Assets and Liabilities, as a result of permanent book to tax differences, certain amounts have been reclassified for the year ended June 30, 2019. The following reclassifications were the result of taxable overdistribution and net investment losses in the Acuitas International Small Cap Fund and unused net investment losses in the Acuitas US Microcap Fund and have no impact on the net assets of each Fund.
| Distributable Earnings |
Paid-in-Capital | |||||||
| Acuitas International Small Cap Fund | $ | 258,499 | $ | (258,499 | ) | |||
| Acuitas US Microcap Fund | 201,600 | (201,600 | ) | |||||
Note 7. Recent Accounting Pronouncements
In August 2018, the Financial Accounting Standards Board (“FASB”) issued Accounting Standards Update No. 2018-13 “Fair Value Measurement (Topic 820): Disclosure Framework – Changes to the Disclosure Requirements for Fair Value Measurement” (“ASU 2018-13”) which includes amendments intended to improve the effectiveness of disclosures in the notes to financial statements. For example, ASU 2018-13 includes additional disclosures regarding the range and weighted average of significant unobservable inputs used to develop Level 3 fair value measurements, and clarifications to the narrative description of measurement uncertainty disclosures. ASU 2018-13 is effective for interim and annual periods beginning after December 15, 2019. Early adoption is permitted and the Funds have adopted ASU 2018-13 within these financial statements.
In September 2018, the Securities and Exchange Commission released Final Rule 33-10532 captioned “Disclosure Update and Simplification,” which includes: (i) an amendment to require presentation of the total, rather than the components, of distributable earnings on the Statements of Assets and Liabilities; and (ii) an amendment to require presentation of the total, rather than the components, of distributions to shareholders, except for tax return of capital distributions, on the Statements of Changes in Net Assets. The amendments also removed the requirement for parenthetical disclosure of undistributed net investment income on the Statements of Changes in Net Assets. These changes were effective November 5, 2018. These amendments are reflected in the Funds' financial statements for the year ended June 30, 2019.
Note 8. Subsequent Events
Subsequent events occurring after the date of this report through the date these financial statements were issued have been evaluated for potential impact, and each Fund has had no such events.
REPORT OF INDEPENDENT REGISTERED PUBLIC ACCOUNTING FIRM
To the Board of Trustees of Forum Funds II
and the Shareholders of Acuitas International Small Cap Fund
and Acuitas US Microcap Fund
Opinion on the Financial Statements
We have audited the accompanying statements of assets and liabilities of Acuitas International Small Cap Fund and Acuitas US Microcap Fund, each a series of shares of beneficial interest in Forum Funds II (the “Funds”), including the schedules of investments, as of June 30, 2019, and the related statements of operations for the year then ended, the statements of changes in net assets for each of the years in the two-year period then ended and the financial highlights for each of the years in the four-year period then ended and for the period from July 18, 2014 (commencement of operations) through June 30, 2015, and the related notes (collectively referred to as the “financial statements”). In our opinion, the financial statements present fairly, in all material respects, the financial position of the Funds as of June 30, 2019, and the results of their operations for the year then ended, the changes in their net assets for each of the years in the two-year period then ended and their financial highlights for each of the years in the four-year period then ended and for the period from July 18, 2014 (commencement of operations) through June 30, 2015, in conformity with accounting principles generally accepted in the United States of America.
Basis for Opinion
These financial statements are the responsibility of the Funds' management. Our responsibility is to express an opinion on the Funds’ financial statements based on our audits. We are a public accounting firm registered with the Public Company Accounting Oversight Board (United States) (“PCAOB”) and are required to be independent with respect to the Funds in accordance with the U.S. federal securities law and the applicable rules and regulations of the Securities and Exchange Commission and the PCAOB.
We conducted our audits in accordance with the standards of the PCAOB. Those standards require that we plan and perform the audits to obtain reasonable assurance about whether the financial statements are free of material misstatement, whether due to error or fraud. The Funds are not required to have, nor were we engaged to perform, an audit of their internal control over financial reporting. As part of our audits we are required to obtain an understanding of internal control over financial reporting but not for the purpose of expressing an opinion on the effectiveness of the Funds’ internal control over financial reporting. Accordingly, we express no such opinion.
Our audits included performing procedures to assess the risk of material misstatement of the financial statements, whether due to error or fraud, and performing procedures that respond to those risks. Such procedures included examining, on a test basis, evidence regarding the amounts and disclosures in the financial statements. Our procedures included confirmation of securities owned as of June 30, 2019 by correspondence with the custodian and brokers, or by other appropriate auditing procedures where replies from brokers were not received. Our audits also included evaluating the accounting principles used and significant estimates made by management, as well as evaluating the overall presentation of the financial statements. We believe that our audits provide a reasonable basis for our opinion.

BBD, LLP
We have served as the auditor of one or more of the Funds in the Forum Funds II since 2013.
Philadelphia, Pennsylvania
August 26, 2019
ACUITAS FUNDS
ADDITIONAL INFORMATION (Unaudited)
JUNE 30, 2019
Investment Advisory Agreement Approval
Acuitas International Small Cap Fund (“Small Cap Fund”) and Acuitas US Microcap Fund (“Microcap Fund”) (together, the “Funds”)
At the June 14, 2019 Board meeting (the “June meeting”), the Board, including the Independent Trustees, met in person and considered the approval of the continuance of the investment advisory agreement between the Adviser and the Trust pertaining to the Funds (the “Advisory Agreement”) and the subadvisory agreements between the Adviser and each of Falcon Point Capital, LLC and Global Alpha Capital Management (each a “Subadviser”) (the “Subadvisory Agreements”).
In preparation for the June meeting, the Board was presented with a range of information to assist in its deliberations. The Board requested and reviewed written responses from the Adviser and each Subadviser to a letter circulated on the Board's behalf concerning the personnel, operations, financial condition, performance, compensation, and services provided to the Funds by the Adviser and each of the respective Subadvisers. During its deliberations, the Board received an oral presentation from the Adviser and discussed the materials with the Adviser, independent legal counsel to the Independent Trustees (“Independent Legal Counsel”), and, as necessary, with the Trust's administrator, Apex Fund Services. The Independent Trustees also met in executive session with Independent Legal Counsel while deliberating.
At the June meeting, the Board reviewed, among other matters, the topics discussed below.
Nature, Extent and Quality of Services
Based on written materials received and the presentation from senior representatives of the Adviser regarding the personnel, operations, and financial condition of the Adviser and each Subadviser, the Board considered the quality of services provided by the Adviser under the Advisory Agreement and by each Subadviser under the respective Subadvisory Agreement. In this regard, the Board considered information regarding the experience, qualifications and professional background of the portfolio managers and other personnel at the Adviser and each Subadviser with principal responsibility for the Funds’ investments; the investment philosophy and decision-making process of the Adviser’s and Subadvisers’ investment professionals; the quality of the Adviser’s and Subadvisers’ services with respect to regulatory compliance; and the Adviser’s and each Subadviser’s representations that each firm is in stable financial condition to allow each firm to provide quality advisory services to the Funds.
The Board also considered the Adviser’s analysis of and recommendation to approve the continuance of the Subadvisory Agreements with the Subadvisers. The Board concluded that, overall, it was satisfied with the nature, extent and quality of services provided to the Funds by the Adviser under the Advisory Agreement and by each Subadviser under the respective Subadvisory Agreements.
Performance
In connection with a presentation by the Adviser regarding its approach to managing the Funds, including the investment objective and strategy of each Fund and the Adviser’s discussion of the performance of each of the Subadvisers, the Board reviewed the performance of the Microcap Fund and Small Cap Fund compared to their respective benchmarks.
The Board observed that the Microcap Fund outperformed the Russell Microcap Index, the Microcap Fund’s primary benchmark index, for the one-year period ended March 31, 2019, and for the period since the Microcap Fund’s inception on July 18, 2014. The Board observed that the Microcap Fund underperformed its primary benchmark index for the three-year period ended March 31, 2019. The Board observed that the Small Cap Fund underperformed the FTSE Global Small Cap ex-US Index, the Small Cap Fund’s primary benchmark index, for the one- and three-year periods ended March 31, 2019, and for the period since the Small Cap Fund’s inception on July 18, 2014. The Board also considered each Fund’s performance relative to independent peer groups of funds identified by Broadridge Financial Solutions, Inc. (“Broadridge”) as having characteristics similar to those of the respective Funds. Based on information presented by Broadridge, the Board observed that the Microcap Fund performed at the median of the Broadridge peers for the one-year period ended March 31, 2019, and outperformed the median of the Broadridge peers for the three- year period ended March 31, 2019. The Board observed that the Small Cap Fund underperformed the median of its Broadridge peers for the one- and three-year periods ended March 31, 2019.
ACUITAS FUNDS
ADDITIONAL INFORMATION (Unaudited)
JUNE 30, 2019
The Board noted the Adviser’s representation that the Microcap Fund’s underperformance relative to the benchmark index over the three-year period could be attributed, in part, to the Microcap Fund’s sector allocations, which detracted from performance by offsetting some of the value added from stock selection. The Board noted the Adviser’s representation that the Small Cap Fund’s underperformance relative to the benchmark index and peer group could be attributed, in part, to stock selection and the Small Cap Fund’s value bias in a market environment that favored growth managers over the past several years. The Board also noted the Adviser’s representation that underperformance was mainly driven by a single subadviser, whose value-biased strategy underperformed, at least in part, as a result of the aforementioned stylistic headwinds, and that the subadviser had since been terminated from the Small Cap Fund. The Board noted further the Adviser’s representation that it remained confident in its remaining Subadviser.
The Board also noted the Adviser’s representation that the Broadridge peer groups were not an optimal representation of the Funds’ investment strategies from a performance comparison standpoint because the funds within the peer groups were not necessarily multi-manager, multi-strategy funds, like the Funds. At the request of the Adviser, the Board reviewed performance of each Fund compared to the performance of peer groups of funds identified by the Adviser as being a more optimal comparison to the Funds (the “Comparable Funds”). The Board observed that the Microcap Fund outperformed the average of its peer group of Comparable Funds for the one- and three-year periods ended March 31, 2019. The Board also observed that the Small Cap Fund underperformed the average of its peer group of Comparable Funds for the one- and three-year periods ended March 31, 2019, however, the Board observed that the Small Cap Fund’s performance was more closely aligned with the performance of the Small Cap Fund’s Comparable Funds than the performance of the Broadridge peers.
The Board also evaluated the Adviser's assessment of each Subadviser’s performance. The Board acknowledged the Adviser’s representation that the different Subadvisers could be expected to achieve different performance results in light of the differences in their strategies, allocated assets, and market environment. In this regard, the Board noted that the Adviser emphasized its responsibility for allocating each Fund’s assets among Subadvisers on an ongoing basis in order to achieve the applicable Fund’s investment objective. In view of the respective roles of the Adviser and Subadvisers, the Board determined that it was appropriate to evaluate the individual performance achieved by each Subadviser as it contributed to the performance of the Fund as a whole. Based on the foregoing, among other applicable considerations, the Board concluded that each Fund and their respective shareholders could benefit from the Adviser’s management under the Advisory Agreement.
Compensation
The Board evaluated the Adviser’s compensation for providing advisory services to the Funds and analyzed comparative information on actual advisory fee rates and actual total expense ratios of the Funds’ Broadridge peers. The Board noted that, based on the information provided by Broadridge, the actual advisory fee rate and actual total expense ratio for the Small Cap Fund was each higher than the median of its Broadridge peers, though the Board observed that actual advisory fee rates for most of the Broadridge peers, including the Small Cap Fund, were within a close range. The Board noted that, based on the information provided by Broadridge, the actual advisory fee rate and actual total expense ratio for the Microcap Fund were each higher than the median of its Broadridge peers. The Board noted the Adviser’s representation that the Microcap Fund’s Broadridge peers are heavily weighted toward small cap managers, which offer lower fees than microcap managers, which could account for some of the variance in the fee and expense comparison. Finally, the Board noted the Adviser’s representation that many of the funds listed in the respective Broadridge peer groups did not operate pursuant to a multi-manager structure and that, unlike the peers in the Broadridge peer group, the Adviser paid each of the Subadvisers directly from the advisory fee paid to the Adviser such that the fees and expenses of the Broadridge peers were not directly comparable. Based on the foregoing and other relevant considerations, the Board concluded that the Adviser’s advisory fee rate charged to each Fund appeared to be reasonable in light of the nature, extent and quality of services provided by the Adviser.
Cost of Services and Profitability
The Board considered information provided by the Adviser regarding the costs of services and its profitability with respect to the Funds. In this regard, the Board considered the Adviser’s resources devoted to the Funds, as well as the Adviser’s discussion of the aggregate costs and profitability of its mutual fund activity, including the percentage and amount of the Adviser’s fee that the Adviser retained and the percentage and amount of the Adviser’s fee that was paid to the Subadvisers. The Board noted that the Adviser does not maintain separate profit and loss data by account, making it difficult to assess costs incurred specific to providing services to the
ACUITAS FUNDS
ADDITIONAL INFORMATION (Unaudited)
JUNE 30, 2019
Funds. The Board did note the Adviser’s representation that the operation of the Funds was more complex from a compliance and oversight perspective and drew more resources than the firm’s other business. Based on these and other applicable considerations, the Board concluded that the Adviser’s profits attributable to management of the Funds did not appear unreasonably high in light of the nature, extent and quality of the services provided by the Adviser. The Board also noted the Adviser’s representation that the Adviser continues to pay its subadvisers directly from the Adviser’s advisory fees and that the Adviser continued to subsidize the operation of the Funds by waiving its advisory fee and reimbursing expenses to the extent necessary to keep the Funds’ total expense ratios at competitive levels.
The Board did not consider information regarding the costs of services provided or profits realized by the Subadvisers from their relationships with the Funds, noting instead the arms-length nature of the relationship between the Adviser and each Subadviser with respect to the negotiation of the subadvisory fee rate on behalf of the Funds and that the Adviser, and not the Funds, was responsible for paying the subadvisory fee due under each Subadvisory Agreement.
Economies of Scale
The Board considered whether the Funds are benefitting, or would benefit in the future, from any economies of scale. In this respect, the Board noted the Adviser’s representation that the Funds were benefitting from expenses subsidized by the Adviser. The Board noted the Adviser’s representation that, although the Funds could benefit from economies of scale as assets grow, the Adviser was not proposing breakpoints in the advisory fee at this time. The Board also considered whether the Funds would benefit from any economies of scale with respect to the Subadvisory Agreements. In this respect, the Board noted that there were no breakpoints in the Subadvisory Agreements and that such breakpoints were likely to benefit the Adviser, rather than the Funds, because the Adviser pays the subadvisory fees directly from the Adviser’s advisory fee. Based on the foregoing representations and the size of the Funds, among other relevant considerations, the Board concluded that economies of scale were not a material factor in approving the continuation of the Advisory Agreement or Subadvisory Agreements.
Other Benefits
The Board noted the Adviser’s representation that, aside from its contractual advisory fees, it does not benefit in a material way from its relationship with the Funds. Based on the foregoing representation and other relevant considerations, the Board concluded that other benefits received by the Adviser from its relationship with the Funds were not a material factor in approving the continuation of the Advisory Agreement.
Conclusion
The Board did not identify any single factor as being of paramount importance, and different Trustees may have given different weight to different factors. In addition, various materials provided to and discussed with the Board throughout the year, including with respect to performance and compliance, also informed the Board’s decision. In light of the fact that the Funds are multi- manager Funds, however, for which the Adviser identifies Subadvisers whose strategies it seeks to combine to achieve the Funds’ investment objectives, when considering the renewal of the Subadvisory Agreements, the Board gave significant weight to the Adviser’s recommendation that the Subadvisory Agreements be renewed and to the Adviser’s representation that the reappointment of the Subadvisers would positively contribute to the Adviser’s successful execution of each Fund’s overall strategy. The Board reviewed a memorandum from Independent Legal Counsel discussing the legal standards applicable to its consideration of the Advisory Agreement and each Subadvisory Agreement. Based on its review, including consideration of each of the factors referenced above, the Board, in the exercise of its reasonable business judgment, approved the continuation of the Advisory Agreement and each Subadvisory Agreement.
Acuitas US Microcap Fund (the “Fund”) – ClariVest Asset Management, LLC
At the March 26, 2019 Board meeting (“March meeting”), the Board, including the Independent Trustees, considered the approval of a new investment subadvisory agreement between the Adviser and ClariVest Asset Management, LLC (“ClariVest”) pertaining to the Fund (the “Subadvisory Agreement”). The Subadvisory Agreement was being considered in connection with the anticipated termination of the original subadvisory agreement between ClariVest and the Adviser (“Original Agreement”) due to a strategic transaction between ClariVest and its minority owner, Eagle Asset Management, Inc. (“Eagle”), whereby Eagle would acquire the remaining voting interest in ClariVest and ClariVest would become a wholly owned subsidiary of Eagle (the “Transaction”). The
ACUITAS FUNDS
ADDITIONAL INFORMATION (Unaudited)
JUNE 30, 2019
Subadvisory Agreement is identical to the Original Agreement, except for the effective date. The Transaction is expected to result in a change in control of ClariVest, and thus, a termination of the Original Agreement. In preparation for its deliberations, the Board requested and reviewed written responses from ClariVest to a due diligence questionnaire circulated on the Board’s behalf concerning ClariVest’s personnel, operations, financial condition, and performance, and the services to be provided by ClariVest.
The Board recognized that the evaluation process with respect to ClariVest was an ongoing one and, in this regard, the Board further recognized that information was provided by ClariVest at regularly scheduled meetings during the past year, including, among other things, information concerning the performance of the portion of the Fund for which ClariVest provided subadvisory services (the “Managed Portion”). In evaluating the Subadvisory Agreement for the Fund, the Board discussed the materials with Independent Legal Counsel and, as necessary, with the Fund’s administrator, Atlantic Fund Services. During its deliberations, the Board received oral presentations from the Adviser and was assisted by the advice of Independent Legal Counsel.
At the meeting, the Board reviewed, among other matters: (1) the nature, extent and quality of the services proposed to be provided to the Fund by the Adviser and ClariVest, including information on the investment performance of the Fund and ClariVest; (2) the costs of the services to be provided and profitability to the Adviser of its relationship with the Fund; (3) the advisory fee and total expense ratio of the Fund compared to a relevant peer group of funds; (4) the extent to which economies of scale may be realized as the Fund grows and whether the advisory fee enables the Fund’s investors to share in the benefits of economies of scale; and (5) other benefits to be received by the Adviser and ClariVest from their respective relationships with the Fund.
Nature, Extent and Quality of Services
The Board received a presentation from senior representatives of the Adviser and discussed ClariVest personnel, operations and financial condition. In this context, the Board considered the adequacy of ClariVest’s resources and the quality of services to be provided by ClariVest under the Subadvisory Agreement. The Board reviewed information regarding the experience, qualifications and professional background of the portfolio managers and other personnel at ClariVest who, as ClariVest employees had, and under the Subadvisory Agreement would continue to have, responsibility for the Managed Portion. The Board considered the Adviser’s representation that the portfolio managers of ClariVest who were responsible for the Managed Portion would continue in that role as portfolio managers at ClariVest and noted that, since 2014, the same portfolio managers had provided such services to the Fund. The Board considered the investment philosophy and decision-making process of ClariVest and the capability and integrity of ClariVest’s senior management and staff. The Board also evaluated the anticipated quality of ClariVest’s services with respect to regulatory compliance and compliance with client investment policies and restrictions. In addition, the Board took into consideration the Adviser’s recommendation with respect to ClariVest. The Board also noted ClariVest’s representation that it is financially stable and able to provide investment advisory services to the Fund. The Board concluded that, overall, it was satisfied with the nature, extent, and quality of services to be provided to the Fund by ClariVest under the Subadvisory Agreement.
Performance
The Board considered the historical performance of the proposed portfolio managers of ClariVest in managing the Fund, including in particular, the Adviser’s evaluation of the performance ClariVest achieved for the Managed Portion, as provided to the Board by ClariVest at a meeting of the Board held on June 15, 2018. Based on the Adviser’s evaluation of ClariVest’s performance and other relevant facts and circumstances, the Board concluded that ClariVest’s proposed management of the Managed Portion of the Fund could benefit the Fund and its shareholders.
Compensation
The Board reviewed ClariVest’s proposed compensation for providing subadvisory services to the Fund and noted that the total advisory fee paid by the Fund would not change because the subadvisory fees are paid by the Adviser and not the Fund. The Board thus did not focus on information regarding the proposed compensation to be paid to ClariVest as a result of its relationship with the Fund, noting instead the arm’s-length nature of the relationship between the Adviser and ClariVest with respect to the negotiation of the subadvisory fee rate that would apply to ClariVest. The Board, however, did note that the compensation to be received by ClariVest under the Subadvisory Agreement would be no greater than the compensation that ClariVest received under the prior subadvisory agreement. As a result, the Board concluded that the proposed compensation for providing subadvisory services to the Fund was not a material factor in considering the approval of the Subadvisory Agreement.
ACUITAS FUNDS
ADDITIONAL INFORMATION (Unaudited)
JUNE 30, 2019
The Board considered that the advisory agreement between the Trust and the Adviser relating to the Fund had been most recently considered and renewed on June 15, 2018.The Board recalled that the actual advisory fee rate and the actual total expense ratio of the Fund had been compared to fees and expenses of other similarly managed mutual funds and the Board specifically considered that the Adviser’s advisory fee rate and total expense ratio for the Fund were each higher than the median of its Broadridge peers. The Board noted the Adviser’s representation that the Fund’s Broadridge peers are heavily weighted toward small cap managers, which offer lower fees than microcap managers, which could account for some of the variance in the fee and expense comparison.
The Board also recalled noting that it is difficult to make meaningful comparisons of the Fund’s actual advisory fee rate and expense ratio to those of their respective peers due to, among other things, variations between the services provided by the Adviser to the Fund and those provided to the Broadridge peer group of funds by their advisers. Finally, the Board recalled the Adviser’s representation that several of the funds listed in the respective Broadridge peer groups did not operate pursuant to a multi-manager structure and that, unlike the peers in the Broadridge peer group, the Adviser paid each of the Subadvisers directly from the advisory fee paid to the Adviser such that the fees and expenses of the Broadridge peers were not directly comparable. After consideration of these matters, the Board concluded that the subadvisory fee rate negotiated by the Adviser and ClariVest was not excessive.
Cost of Services and Profitability
The Board noted that the Adviser, and not the Fund, was responsible for paying the subadvisory fees due under the Subadvisory Agreement. The Board thus did not focus on information regarding the costs of services provided or profits to be realized by ClariVest from its relationship with the Fund. The Board concluded that ClariVest’s projected profitability was not a material factor in determining whether or not to approve the Subadvisory Agreement.
Economies of Scale
The Board considered whether the Fund would benefit from any economies of scale with respect to the Subadvisory Agreement. The Board determined that because the Adviser, and not the Fund, pays the subadvisory fee, shareholders would not benefit from any economies of scale in the form of breakpoints in the subadvisory fee rate. Based on the foregoing information, the Board concluded that economies of scale were not a material factor in approving the Subadvisory Agreement.
Other Benefits
The Board noted ClariVest’s representation that it would not receive significant ancillary benefits as a result of its relationship with the Fund. As a result, the Board concluded that other benefits accrued by ClariVest were not a material factor in approving the Subadvisory Agreement.
Conclusion
The Board did not identify any single factor as being of paramount importance, and different Trustees may have given different weight to different factors; however, in light of the fact that the Fund is a multi-manager Fund for which the Adviser identifies subadvisers whose strategies it seeks to combine to achieve the Fund’s investment objectives, the Board gave significant weight to the Adviser’s recommendation that ClariVest be appointed as a subadviser to the Fund and to the Adviser’s representation that the appointment of ClariVest would positively contribute to the Adviser’s successfully executing the overall strategy of the Fund. The Board reviewed a memorandum from Independent Legal Counsel discussing the legal standards applicable to its consideration of the Subadvisory Agreement. Based on its review, including consideration of each of the factors referenced above, the Board determined, in the exercise of its reasonable business judgment, that the subadvisory arrangement, as outlined in the Subadvisory Agreement, were fair and reasonable in light of the services to be performed, expenses to be incurred by the Fund and such other matters as the Board considered relevant.
Proxy Voting Information
A description of the policies and procedures that each Fund uses to determine how to vote proxies relating to securities held in each Fund’s portfolio is available, without charge and upon request, by calling (844) 805-5628 and on the U.S. Securities and Exchange Commission's (the "SEC") website at www.sec.gov. Each Fund’s proxy voting record for the most recent twelve-month period ended June 30 is available, without charge and upon request, by calling (844) 805-5628 and on the SEC’s website at www.sec.gov.
ACUITAS FUNDS
ADDITIONAL INFORMATION (Unaudited)
JUNE 30, 2019
Availability of Quarterly Portfolio Schedules
Each Fund files its complete schedule of portfolio holdings with the SEC for the first and third quarters of each fiscal year on Form N-Q. These filings are available, without charge and upon request on the SEC’s website at www.sec.gov or may be reviewed and copied at the SEC’s Public Reference Room in Washington, D.C. Information on the operation of the Public Reference Room may be obtained by calling (800) SEC-0330.
Shareholder Expense Example
As a shareholder of the Funds, you incur two types of costs: (1) transaction costs, including redemption fees, and (2) ongoing costs, including management fees, distribution and/or service (12b-1) fees (for Investor Shares only) and other Fund expenses. This example is intended to help you understand your ongoing costs (in dollars) of investing in the Funds, and to compare these costs with the ongoing costs of investing in other mutual funds.
The example is based on an investment of $1,000 invested at the beginning of the period and held for the entire period from January 1, 2019 through June 30, 2019.
Actual Expenses – The first line of the table below provides information about actual account values and actual expenses. You may use the information in this line, together with the amount you invested, to estimate the expenses that you paid over the period. Simply divide your account value by $1,000 (for example, an $8,600 account value divided by $1,000 = 8.6), then multiply the result by the number in the first line under the heading entitled “Expenses Paid During Period” to estimate the expenses you paid on your account during the period.
Hypothetical Example for Comparison Purposes – The second line of the table below provides information about hypothetical account values and hypothetical expenses based on each Fund’s actual expense ratio and an assumed rate of return of 5% per year before expenses, which is not each Fund’s actual return. The hypothetical account values and expenses may not be used to estimate the actual ending account balance or expenses you paid for the period. You may use this information to compare the ongoing costs of investing in each Fund and other funds. To do so, compare this 5% hypothetical example with the 5% hypothetical examples that appear in the shareholder reports of other funds.
Please note that the expenses shown in the table are meant to highlight your ongoing costs only and do not reflect any transactional costs, such as redemption fees. Therefore, the second line of the table is useful in comparing ongoing costs only and will not help you determine the relative total costs of owning different funds. In addition, if these transactional costs were included, your costs would have been higher.
| Beginning Account Value January 1, 2019 |
Ending Account Value June 30, 2019 |
Expenses Paid During Period* |
Annualized Expense Ratio* |
|||||
| Acuitas International Small Cap Fund | ||||||||
| Actual | $1,000.00 | $1,110.55 | $7.85 | 1.50% | ||||
| Hypothetical (5% return before expenses) | $1,000.00 | $1,017.36 | $7.50 | 1.50% | ||||
| Acuitas US Microcap Fund | ||||||||
| Actual | $1,000.00 | $1,110.49 | $8.90 | 1.70% | ||||
| Hypothetical (5% return before expenses) | $1,000.00 | $1,016.36 | $8.50 | 1.70% |
| * | Expenses are equal to the Fund’s annualized expense ratio multiplied by the average account value over the period, multiplied by the number of days in the most recent fiscal half-year (181) divided by 365 to reflect the half-year period. |
Federal Tax Status of Dividends Declared during the Fiscal Year
For federal income tax purposes, dividends from short-term capital gains are classified as ordinary income. The Acuitas International Small Cap Fund designates 54.76% of its income dividends as qualifying for the qualified dividend rate (QDI) as defined in section 1(h)(11) of the Code. The Acuitas US Microcap Fund designates 100.00% of its income dividend distributed as qualifying for the corporate dividends-received deduction (DRD) and 100.00% as QDI. The Acuitas US Microcap Fund also designates 100.00% of its income dividends as short term capital dividends exempt from U.S. tax for foreign shareholders (QSD).
ACUITAS FUNDS
ADDITIONAL INFORMATION (Unaudited)
JUNE 30, 2019
Pursuant to Section 852(b)(3) of the Internal Revenue Code, Acuitas US Microcap Fund designated $16,604,378 as long-term capital gain dividends.
Trustees and Officers of the Trust
The Board is responsible for oversight of the management of the Trust’s business affairs and of the exercise of all the Trust’s powers except those reserved for the shareholders. The following table provides information about each Trustee and certain officers of the Trust. Each Trustee and officer holds office until the person resigns, is removed, or is replaced. Unless otherwise noted, the persons have held their principal occupations for more than five years. The address for all Trustees and officers is Three Canal Plaza, Suite 600, Portland, Maine 04101. Each Fund’s Statement of Additional Information includes additional information about the Trustees and is available, without charge and upon request, by calling (844) 805-5628.
| Name and Year of Birth |
Position with the Trust |
Length of Time Served |
Principal Occupation(s) During Past Five Years |
Number of Series in Fund Complex Overseen By Trustee |
Other Directorships Held By Trustee During Past Five Years |
| Independent Trustees | |||||
|
David Tucker Born: 1958 |
Chairman of the Board; Trustee; Chairman, Nominating Committee and Qualified Legal Compliance Committee | Since 2013 | Director, Blue Sky Experience (a charitable endeavor), since 2008; Senior Vice President & General Counsel, American Century Companies (an investment management firm), 1998- 2008. | 2 | Trustee, Forum Funds; Trustee, Forum ETF Trust; Trustee, U.S. Global Investors Funds. |
| Mark D. Moyer Born: 1959 |
Trustee; Chairman Audit Committee |
Since 2013 |
Chief Financial Officer, Freedom House (a NGO advocating political freedom and democracy), since 2017; independent consultant providing interim CFO services, principally to non-profit organizations, 2011-2017; Chief Financial Officer, Institute of International Education (a NGO administering international educational exchange programs), 2008-2011; Chief Financial Officer and Chief Restructuring Officer, Ziff Davis Media Inc. (an integrated media company), 2005-2008; Adjunct Professor of Accounting, Fairfield University from 2009-2012. |
2 | Trustee, Forum Funds; Trustee, Forum ETF Trust; Trustee, U.S. Global Investors Funds. |
| Jennifer Brown-Strabley Born: 1964 |
Trustee | Since 2013 | Principal, Portland Global Advisors (a registered investment adviser), 1996- 2010. | 2 | Trustee, Forum Funds; Trustee, Forum ETF Trust; Trustee, U.S. Global Investors Funds. |
| Interested Trustees(1) | |||||
| Stacey E. Hong Born: 1966 |
Trustee | Since 2013 | Director, Apex since 2008. | 2 | Trustee, Forum Funds, Trustee, U.S. Global Investors Funds. |
| (1) | Stacey E. Hong is treated as interested persons of the Trust, as defined in the 1940 Act, due to their current or prior affiliation with Apex. Apex is a wholly owned subsidiary of Apex US Holdings LLC. |
ACUITAS FUNDS
ADDITIONAL INFORMATION (Unaudited)
JUNE 30, 2019
|
Name and Year of
Birth
|
Position
with the
Trust
|
Length of Time Served
|
Principal Occupation(s)
During Past 5 Years
|
| Officers | |||
|
Jessica Chase
Born: 1970
|
President; Principal Executive Officer |
Since 2015 | Director, Apex since 2008. |
|
Karen Shaw
Born: 1972
|
Treasurer; Principal Financial Officer |
Since 2013 | Senior Vice President, Apex since 2008. |
|
Zachary Tackett
Born: 1988 |
Vice President; Secretary and Anti- Money Laundering Compliance Officer |
Since 2014 | Counsel, Apex since 2014. |
|
Timothy Bowden Born: 1969 |
Vice President | Since 2013 | Manager, Apex since 2008. |
|
Michael J. McKeen Born: 1971 |
Vice President | Since 2013 | Senior Vice President, Apex since 2008. |
|
Geoffrey Ney Born: 1975 |
Vice President | Since 2013 | Manager, Apex since 2013. |
|
Todd Proulx Born: 1978 |
Vice President | Since 2013 | Manager, Apex since 2013. |
|
Carlyn Edgar Born: 1963
|
Chief Compliance Officer | Since 2013 | Senior Vice President, Apex since 2008. |
FOR MORE INFORMATION
Investment Adviser
Acuitas Investments, LLC
520 Pike Street, Suite 1221
Seattle, WA 98101
www.acuitasinvestments.com
Transfer Agent
Apex Fund Services
P.O. Box 588
Portland, ME 04112
www.apexfundservices.com
Distributor
Foreside Fund Services, LLC
Three Canal Plaza, Suite 100
Portland, ME 04101
www.foreside.com
Acuitas International Small Cap Fund
Acuitas US Microcap Fund
P.O. Box 588
Portland, ME 04112
(844) 805-5628
This report is submitted for the general information of the shareholders of the Funds. It is not authorized for distribution to prospective investors unless preceded or accompanied by an effective prospectus,which includes information regarding the Funds’ risks, objectives, fees and expenses, experience of its management, and other information.
220-ANR-0619
|
(a)
|
As of the end of the period covered by this report, Forum Funds II (the “Registrant”) has adopted a code of ethics, which applies to its Principal Executive Officer and Principal Financial Officer (the “Code of Ethics”).
|
| (c) |
There have been no amendments to the Registrant’s Code of Ethics during the period covered by this report.
|
|
(a)
|
Included as part of report to shareholders under Item 1.
|
|
(b)
|
Not applicable.
|
|
By:
|
/s/ Jessica Chase
|
|
|
Jessica Chase, Principal Executive Officer
|
||
|
Date:
|
August 27, 2019
|
|
By:
|
/s/ Jessica Chase
|
|
|
Jessica Chase, Principal Executive Officer
|
||
|
Date:
|
August 27, 2019
|
|
By:
|
/s/ Karen Shaw
|
|
|
Karen Shaw, Principal Financial Officer
|
||
|
Date:
|
August 27, 2019
|