Exhibit 99.1
This summary highlights selected information about us and this offering. This summary is not complete and does not contain all of the information that may be important to you. You should read carefully this entire offering memorandum, including the “Risk Factors” section, and the other documents that we refer to and incorporate by reference in this offering memorandum for a more complete understanding of us and this offering. In particular, we incorporate by reference important business and financial information into this offering memorandum. This summary contains forward-looking statements that involve risks and uncertainties.
The unaudited pro forma statement of operations information for the twelve-month period ended September 27, 2015 gives effect to the consummation of the Transactions (as defined below) as if they had been consummated on December 30, 2013, and the pro forma balance sheet information as of September 27, 2015 gives effect to the consummation of the Transactions as if they had been consummated as of September 27, 2015. See “Unaudited Pro Forma Condensed Consolidated Financial Statements” for a description of how such unaudited pro forma financial information was calculated. In this offering memorandum, we refer to the following, collectively, as the “Transactions”: (1) the issuance and sale of the notes offered hereby; (2) the incurrence of indebtedness under our new incremental senior secured term loan; (3) the use of the net proceeds from this offering, along with proceeds from borrowings under our new incremental senior secured term loan and cash on hand, to finance the consideration payable in connection with the Boulder Acquisition, repay outstanding indebtedness under Boulder’s existing credit facilities and pay transaction costs; and (4) the consummation of the Boulder Acquisition.
Unless the context requires otherwise, in this offering memorandum, “Pinnacle,” the “Company,” “we,” “us,” and “our” refer to Pinnacle Foods Finance LLC (“PFF”) and its consolidated subsidiaries (including Pinnacle Foods Group LLC), which includes all of PFF’s existing operations, and the “Issuers” refers to PFF and Pinnacle Foods Finance Corp. and not to any of their respective subsidiaries.
Our Company
We are a leading manufacturer, marketer and distributor of high-quality, branded food products in North America, with annual net sales of $2.6 billion in fiscal 2014. Our brands are leaders in many of their respective categories, and we hold the #1 or #2 market share position in 10 of the 14 major product categories in which we compete. Our brand portfolio enjoys strong household penetration in the United States, where our products can be found in over 85% of U.S. households. Our products are sold through supermarkets, grocery wholesalers and distributors, mass merchandisers, super centers, convenience stores, dollar stores, natural and organic food stores, drug stores and warehouse clubs in the United States and Canada, as well as in military channels and foodservice locations. Given our diverse portfolio of iconic brands with attractive market positions, our business generates significant and stable cash flows that have enabled us to pay regular quarterly dividends to our shareholders, reduce our debt and drive value creation through both reinvestment in our existing brands and periodic strategic acquisitions.
Our operations are managed and reported in three operating segments: the Birds Eye Frozen segment, the Duncan Hines Grocery segment and the Specialty Foods segment. The Birds Eye Frozen segment and the Duncan Hines Grocery segment, which collectively represent our North America Retail operations, include the following brands:
| Birds Eye Frozen Segment |
Industry Category |
Market Share 52 |
Category |
|||||||
| Major Pinnacle Brands: |
||||||||||
| Birds Eye |
Frozen vegetables | 28.1 | % | #1 | ||||||
| Birds Eye Voila! |
Frozen complete bagged meals | 39.8 | % | #1 | ||||||
| Gardein |
Frozen meat/poultry substitutes | 11.5 | % | #2 | ||||||
| Van de Kamp’s |
Frozen prepared seafood | 24.3 | % | #2 | ||||||
| Mrs. Paul’s |
||||||||||
| Lender’s |
Frozen and refrigerated bagels | 62.9 | % | #1 | ||||||
| Celeste |
Frozen pizza for one | 6.3 | % | #4 | ||||||
| Hungry-Man |
Full-calorie single-serve frozen dinners and entrées | 7.7 | % | #5 | ||||||
| Aunt Jemima |
Frozen pancakes/waffles/French toast | 4.9 | % | #3 | ||||||
| Duncan Hines Grocery Segment |
Industry Category |
Market Share 52 |
Category |
|||||||
| Major Pinnacle Brands: |
||||||||||
| Duncan Hines |
Cake/brownie mixes and frostings | 25.8 | % | #2 | ||||||
| Vlasic |
Shelf-stable pickles | 35.9 | % | #1 | ||||||
| Wish-Bone (2) Western |
Shelf-stable salad dressings | 11.6 | % | #3 | ||||||
| Mrs. Butterworth’s |
Table syrup | 21.5 | % | #1 | ||||||
| Log Cabin |
||||||||||
| Armour |
Canned meat | 21.1 | % | #2 | ||||||
| Brooks |
||||||||||
| Nalley |
||||||||||
| Comstock |
Pie/pastry fruit fillings | 38.5 | % | #1 | ||||||
| Wilderness |
||||||||||
| (1) | Based on IRI custom Pinnacle databases; rank among branded manufacturers, excluding Private Label. |
| (2) | Pinnacle is the number 3 competitor in the category and Wish-Bone is the number one brand in the Italian segment. |
In addition to our North America Retail operations, the Specialty Foods segment consists of a regional presence in snack products (including Tim’s Cascade and Snyder of Berlin), as well as our Foodservice and Private Label businesses.
Within our segments, we actively manage our portfolio by segregating our business into Leadership Brands and Foundation Brands. Our Leadership Brands enjoy a combination of higher growth and margins, greater potential for value-added innovation and enhanced responsiveness to consumer marketing than do our Foundation Brands. As a result, we focus our investment spending and brand-building activities on our Leadership Brands. By contrast, we manage our Foundation Brands for revenue and market share stability and for cash flow generation to support investment in our Leadership Brands, reduce our debt and fund other corporate priorities. As a result, we focus spending for our Foundation Brands on brand renovation and targeted consumer and trade programs.
Our Leadership Brands are comprised of Birds Eye, Birds Eye Voila!, gardein, Duncan Hines, Vlasic, Van de Kamp’s, Mrs. Paul’s, Mrs. Butterworth’s, Log Cabin and Wish-Bone. Historically, our Leadership Brands have received approximately 80% of our marketing investment and the majority of our innovation investment. In the 52-week period ended November 29, 2015, our Birds Eye and Birds Eye Voila! brands combined had retail revenue of approximately $1.2 billion, while our remaining Leadership Brands collectively had retail revenue of approximately $1.1 billion. In the nine months ended September 27, 2015, our Leadership Brands accounted for approximately 63% and 77% of our consolidated net sales and gross profit, respectively, and approximately 72% and 79% of our North America Retail net sales and gross profit, respectively.
Acquisition of Boulder
On November 24, 2015, Pinnacle Foods Inc. and Slope Acquisition Inc., a wholly-owned subsidiary of Pinnacle Foods Inc. (“Merger Sub”), entered into an Agreement and Plan of Merger (the “Merger Agreement”) with Boulder Brands, Inc. (“Boulder”) pursuant to which we have agreed to acquire Boulder. Boulder, headquartered in Boulder, Colorado, manufactures a portfolio of health and wellness brands that are sold in both traditional and natural and organic channels in the U.S. and Canada, with a consumer base that is younger than that of our current portfolio. Annual net sales of Boulder Brands totaled over $500 million in 2014.
Transaction Rationale
The Boulder Acquisition (defined below) establishes a leading health and wellness platform for Pinnacle. Anchored by our Birds Eye® and gardein™ brands, the combined health and wellness portfolio will account for more than 50% of our net sales, increasing our portfolio penetration among “millennial” consumers and adding a fully-dedicated gluten-free platform in an industry expected to reach $23 billion in annual sales by 2018, according to Mintel Group Ltd., a third-party provider of market research data.
The Boulder Acquisition also leverages scale and increases our importance to a broad range of retailers, including expanding our presence in natural and organic channels, which have historically been underrepresented in our business. It leverages our scale in frozen manufacturing and distribution capabilities to drive synergies and provides us the opportunity to use our brand reinvigoration capabilities to improve the performance of the Smart Balance brand. In addition to the scale and synergy benefits associated with combining complementary portfolios in dry grocery and frozen categories, the Boulder Acquisition provides us with a new growth platform in refrigerated foods.
Boulder’s product portfolio is comprised of leading health and wellness brands, with a significant presence and leadership in dedicated gluten-free offerings that span multiple categories under the Udi’s and Glutino brands, as well as on-trend, multi-category plant-based Earth Balance offerings and Evol natural frozen meal and burritos offerings. Combined, these brands represent approximately 75% of Boulder sales. The remaining 25% of Boulder’s portfolio is focused primarily on “heart healthy” offerings, under the Smart Balance brand.
In addition to establishing a leading health and wellness platform, the transaction offers attractive financial returns. We expect to realize $30 million in synergies over the next 24 months across procurement & manufacturing, transportation & warehousing, redundant public company costs and selling, general and administrative overhead by moving Boulder Brands onto the Pinnacle platform. We also expect to drive further operational efficiencies by executing organic cost savings initiatives previously identified by Boulder, which include, among other initiatives, supply chain rationalization and the reduction of SG&A overhead. While these savings will be partially offset by the impacts of SKU rationalization and reinvestment in the business, we believe these changes will create a more focused portfolio of brands that will help drive strong free cash flow generation and rapid debt pay down. Consistent with our track record of historical deleveraging post acquisitions, we are targeting to reduce our leverage ratio by approximately 0.5x per year, to approximately 4.0x within the next 24 months, with a long-term leverage ratio target of 3.0x, absent further acquisitions.
The Transactions
The Boulder Acquisition
Pursuant to the Merger Agreement, subject to the satisfaction or waiver of certain customary conditions and in accordance with the terms thereof, on December 9, 2015, Merger Sub commenced a cash tender offer for all of Boulder’s outstanding shares of common stock, par value $0.0001 per share (the “Shares”), at a purchase price of $11.00 per Share, net to the seller in cash, without interest, less any applicable withholding taxes (the “Boulder Acquisition”). If the Boulder Acquisition is completed, we will pay an aggregate purchase price of approximately $975 million, including approximately $265 million of net debt, which we intend to repay simultaneously with the consummation of the Boulder Acquisition.
Our obligation to consummate the Boulder Acquisition is subject to the condition that there be validly tendered in accordance with the terms of the tender offer and not validly withdrawn prior to the expiration of the tender offer that number of Shares that, when added to the Shares then owned by Pinnacle Foods Inc. and its subsidiaries, would represent at least a majority of the Shares outstanding on a fully diluted basis as of the expiration of the tender offer. The consummation of the tender offer is also subject to the satisfaction of other customary closing conditions, including the expiration or termination of the applicable waiting period under the Hart-Scott-Rodino Antitrust Improvements Act of 1976, as amended (the “HSR Act”). On December 16, 2015, the Federal Trade Commission (“FTC”) granted early termination of the waiting period under the HSR Act applicable to the tender offer and the Boulder Acquisition. The consummation of the tender offer is not subject to any financing condition.
The New Term Loan
We have received a commitment from affiliates of the initial purchasers of the notes to provide an incremental senior secured term loan in an aggregate principal amount of up to $900.0 million (the “Tranche I Term Loan”), to be incurred pursuant to an amendment to the Second Amended and Restated Credit Agreement, dated as of April 29, 2013, among PFF, Peak Finance Holdings LLC, the guarantors party thereto, Barclays Bank PLC, as administrative agent, collateral agent and swing line lender, and the other lenders party thereto (as amended, the “Credit Agreement”). The amount of the commitment will automatically be reduced by the gross proceeds we receive from this offering of notes. We intend to use the proceeds of the Tranche I Term Loan, together with the proceeds of the notes offered hereby and cash on hand, to finance the Boulder Acquisition, repay Boulder’s existing credit facilities and pay transaction costs. Certain of the initial purchasers, or certain of their affiliates, are lenders under Boulder’s existing credit facilities and, as a result, will receive a portion of the proceeds of this offering. See “Plan of Distribution.”
The following table sets forth the estimated sources and uses of cash to consummate the Transactions. The actual sources and uses of funds may be different from the amounts set forth below.
| Sources of Funds |
Amount |
Uses of Funds |
Amount |
|||||||
| ($ in millions) | ($ in millions) | |||||||||
| Tranche I Term Loan (1) |
550.0 | Boulder equity consideration (3) | $ | 712.0 | ||||||
| Notes offered hereby |
350.0 | Repayment of Boulder existing indebtedness (4) |
252.8 | |||||||
| Cash on hand (2) |
116.5 | Cash payment for termination of Boulder’s interest rate swap (5) |
1.1 | |||||||
| Estimated transaction fees and expenses (6) |
50.6 | |||||||||
|
|
|
|
|
|||||||
| Total |
$ | 1,016.5 | Total | $ | 1,016.5 | |||||
|
|
|
|
|
|||||||
| (1) | Reflects incremental Tranche I Term Loan in an aggregate principal amount of $550.0 million that we expect to enter into at the closing of the Transactions. The Tranche I Term Loan is assumed to be issued at a 1.0% discount, generating net proceeds of approximately $544.5 million. We expect the Tranche I Term Loan to require scheduled quarterly payments of 0.25% of the original principal amount, with the balance payable in the final quarterly installment. |
| (2) | Reflects our estimated cash balance of approximately $175 million as of December 27, 2015. This amount is only an estimate and is subject to our normal year-end review and audit procedures, which will not be completed until after the expected consummation of this offering. |
| (3) | Reflects the amount of total consideration to be paid to holders of outstanding shares of Boulder common stock and holders of Boulder equity awards. |
| (4) | Reflects the estimated amount of indebtedness to be repaid under Boulder’s existing credit facilities. Includes $2.8 million of accrued interest as of September 30, 2015, and is net of Boulder’s estimated cash of approximately $33 million as of December 31, 2015. This cash amount is only an estimate and is subject to normal year-end review and audit procedures, which will not be completed until after the expected consummation of this offering. |
| (5) | Represents use of cash for termination of interest rate swaps due to the repayment of Boulder’s existing indebtedness. |
| (6) | Reflects the estimated fees and expenses associated with the Transactions. |
Corporate Structure
The following chart summarizes our organizational structure and principal indebtedness following the completion of the Transactions. This chart is provided for illustrative purposes only and does not represent all legal entities affiliated with, or all obligations of, the Issuers and the Guarantors. For further information, please see “—The Transactions,” “Use of Proceeds” and “Capitalization.”
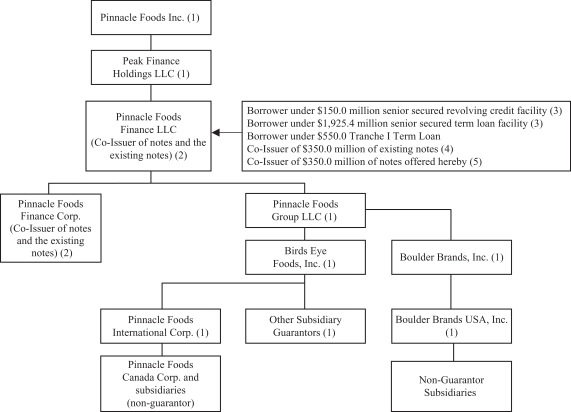
| (1) | The obligations under our senior secured credit facilities are guaranteed by Pinnacle Foods Inc., Peak Finance Holdings LLC and all of Pinnacle Foods Finance LLC’s existing and future direct and indirect material wholly-owned domestic subsidiaries, subject to certain exceptions. The notes will be guaranteed by Pinnacle Foods Inc. and all of Pinnacle Foods Finance LLC’s domestic subsidiaries (other than the co-issuer, Pinnacle Foods Finance Corp.) that guarantee our obligations under our senior secured credit facilities, subject to certain exceptions. See “Description of Other Indebtedness.” |
| (2) | Pinnacle Foods Finance LLC and Pinnacle Foods Finance Corp. will be co-issuers of the notes offered hereby. Pinnacle Foods Finance LLC and Pinnacle Foods Finance Corp. are co-issuers of our existing notes. Pinnacle Foods Finance Corp., formed solely to act as a co-issuer of our debt securities, has only nominal assets and does not conduct any operations. See “Description of Notes.” |
| (3) | Prior to the incurrence of the Tranche I Term Loan, our senior secured credit facilities consist of (a) a $150.0 million revolving credit facility maturing in 2018, (b) $1,409.6 million of Tranche G Term Loans maturing in 2020 and (c) $515.8 million of Tranche H Term Loans maturing in 2020. See “Description of Other Indebtedness—Senior Secured Credit Agreement.” |
| (4) | Represents $350.0 million of existing 4.875% Senior Notes due 2021. See “Description of Other Indebtedness—4.875% Senior Notes.” |
| (5) | Represents $350.0 million of notes that we expect to issue in connection with this offering. We intend to use the proceeds of this offering, along with the proceeds of the Tranche I Term Loan and cash on hand, to finance the Boulder Acquisition, repay debt outstanding under Boulder’s existing credit facilities and pay transaction costs. See “Use of Proceeds.” |
Summary Historical Consolidated Financial Data
The following Pinnacle Foods Inc. summary historical consolidated statement of operations and cash flow information for each of the fiscal years ended December 30, 2012, December 29, 2013 and December 28, 2014 and summary consolidated balance sheet information as of December 29, 2013 and December 28, 2014 have been derived from Pinnacle Foods Inc.’s audited consolidated financial statements incorporated by reference in this offering memorandum. We derived the summary consolidated balance sheet information as of December 30, 2012 from Pinnacle Foods Inc.’s audited consolidated balance sheet as of such date, which is not incorporated by reference in this offering memorandum. The Pinnacle Foods Inc. summary historical consolidated statement of operations and cash flow information for the nine-month periods ended September 27, 2015 and September 28, 2014, and Pinnacle Foods Inc.’s summary historical balance sheet information as of September 27, 2015, have been derived from Pinnacle Foods Inc.’s unaudited consolidated financial statements, which are incorporated by reference in this offering memorandum. The unaudited consolidated balance sheet information as of September 28, 2014 has been derived from Pinnacle Foods Inc.’s unaudited consolidated financial statements which are not incorporated by reference in this offering memorandum. In our opinion, the unaudited consolidated financial statements have been prepared on a basis consistent with the audited financial statements and the notes thereto and include all adjustments, consisting of normal recurring adjustments, necessary for a fair presentation of this information. The summary historical statement of operations information for the twelve-month period ended September 27, 2015 was calculated by subtracting the information for the nine-month period ended September 28, 2014 from the information for the year ended December 28, 2014, and then adding the information for the nine month period ended September 27, 2015.
The following summary unaudited pro forma condensed consolidated financial information is based upon the historical consolidated financial information of each of Pinnacle Foods Inc. and Boulder incorporated by reference into this offering memorandum, and has been prepared to reflect the Transactions based on the purchase method of accounting, with Pinnacle Foods Inc. treated as the accounting acquirer. Under the purchase method, the total consideration paid is allocated to the underlying tangible and intangible assets acquired and liabilities assumed based on their fair market value, with any excess purchase price allocated to goodwill. The unaudited pro forma condensed consolidated financial information presents the combination of the historical financial statements of Pinnacle Foods Inc. and Boulder, adjusted to give effect to (1) the issuance and sale of the notes offered hereby, (2) the incurrence of indebtedness under the Tranche I Term Loan, (3) the use of the net proceeds from this offering, along with proceeds from borrowings under the Tranche I Term Loan and cash on hand, to finance the consideration payable in connection with the Boulder Acquisition, repay debt outstanding under Boulder’s existing credit facilities and pay transaction costs and (4) the consummation of the Boulder Acquisition, in each case based on the assumptions and adjustments described in the notes accompanying the unaudited pro forma condensed consolidated financial information. The historical financial information has been adjusted to give effect to events that are directly attributable to the transactions and factually supportable and, in the case of the statement of income information, that are expected to have a continuing impact.
The unaudited pro forma condensed consolidated balance sheet information has been prepared as of September 27, 2015 and gives effect to the consummation of the Transactions as if they had occurred on that date. The unaudited pro forma condensed consolidated statement of income information, which has been prepared for the twelve-month period ended September 27, 2015, gives effect to the consummation of the Transactions as if they had occurred on December 30, 2013.
The unaudited pro forma statement of operations information for the twelve-month period ended September 27, 2015 was calculated by subtracting the unaudited pro forma statement of operations information for the nine-month period ended September 28, 2014 from the unaudited pro forma statement of operations information for the year ended December 28, 2014, and then adding the corresponding information for the nine-month period ended September 27, 2015. The unaudited pro forma balance sheet information has been derived
from Pinnacle Foods Inc.’s historical consolidated balance sheet information as of September 27, 2015 and Boulder’s historical consolidated balance sheet information as of September 30, 2015. See “Unaudited Pro Forma Condensed Consolidated Financial Statements.”
The unaudited pro forma condensed consolidated financial information is presented for informational purposes only and is not necessarily indicative of the financial position or results of operations that would have been achieved had the Transactions been completed at the dates indicated. In addition, the unaudited pro forma condensed consolidated financial information does not purport to project our future financial position or results of operations after completion of the Boulder Acquisition.
Also, as explained in more detail in the notes accompanying the unaudited pro forma condensed consolidated financial statements, the adjustments and the preliminary allocation of the purchase price reflected in the pro forma information are based on our estimates of the fair value of the assets acquired and liabilities assumed and are subject to adjustment, and may vary significantly from the actual purchase price allocation and asset and liability valuations that will be recorded upon consummation of the Boulder Acquisition and finalization of our valuation and purchase price allocation procedures. We cannot assure you that such variation will not be material to you. The pro forma adjustments are based on currently available information and certain estimates and assumptions. However, management believes that the assumptions provide a reasonable basis for presenting the significant effects of the Transactions and the pro forma adjustments give appropriate effect to these assumptions and are properly applied.
Pinnacle Foods Inc.’s historical results are not necessarily indicative of future operating results. Because the information in this table is only a summary and does not provide all of the information contained in our consolidated financial statements, the information should be read in conjunction with (1) “Management’s Discussion and Analysis of Financial Condition and Results of Operations” contained in reports of Pinnacle Foods Inc. incorporated by reference herein, (2) the unaudited pro forma financial information included under “Unaudited Pro Forma Condensed Consolidated Financial Statements” in this offering memorandum, (3) our consolidated financial statements, including the notes thereto, which are incorporated by reference herein and (4) the consolidated financial statements of Boulder, including the notes thereto, which are incorporated by reference herein.
| Actual |
Pro Forma |
|||||||||||||||||||||||||||
| ($ in millions) |
(53 weeks) |
(52 weeks) |
(52 weeks) |
Nine-month period ended |
(52 weeks) Twelve- |
Twelve- |
||||||||||||||||||||||
| September 28, 2014 |
September 27, 2015 |
|||||||||||||||||||||||||||
| (unaudited) | (unaudited) | |||||||||||||||||||||||||||
| Statement of Operations Data: |
||||||||||||||||||||||||||||
| Net sales |
$ | 2,478.5 | $ | 2,463.8 | $ | 2,591.2 | $ | 1,885.9 | $ | 1,933.3 | $ | 2,638.6 | $ | 3,146.8 | ||||||||||||||
| Cost of products sold |
1,893.9 | 1,809.6 | 1,910.0 | 1,393.1 | 1,415.6 | 1,932.5 | 2,284.7 | |||||||||||||||||||||
|
|
|
|
|
|
|
|
|
|
|
|
|
|
|
|||||||||||||||
| Gross profit |
584.5 | 654.2 | 681.2 | 492.8 | 517.7 | 706.1 | 862.2 | |||||||||||||||||||||
| Operating expenses |
||||||||||||||||||||||||||||
| Marketing and selling expenses |
169.7 | 175.7 | 177.4 | 133.8 | 136.9 | 180.4 | 226.9 | |||||||||||||||||||||
| Administrative expenses |
89.4 | 119.8 | 117.3 | 75.6 | 81.9 | 123.6 | 203.5 | |||||||||||||||||||||
| Research and development expenses |
12.0 | 10.5 | 11.3 | 8.5 | 9.9 | 12.7 | 12.7 | |||||||||||||||||||||
| Termination fee received, net of costs, associated with the Hillshire merger agreement |
— | — | (153.0 | ) | (153.0 | ) | — | — | — | |||||||||||||||||||
| Restructuring, acquisition and integration-related costs |
— | — | — | — | — | — | 7.0 | |||||||||||||||||||||
| Goodwill and tradename impairment |
— | — | — | — | — | — | 2.7 | |||||||||||||||||||||
| Other expense (income), net |
29.8 | 55.2 | 16.0 | 9.3 | 12.9 | 19.6 | 19.0 | |||||||||||||||||||||
|
|
|
|
|
|
|
|
|
|
|
|
|
|
|
|||||||||||||||
| Total operating expenses |
301.0 | 361.2 | 168.9 | 74.2 | 241.6 | 336.4 | 471.8 | |||||||||||||||||||||
|
|
|
|
|
|
|
|
|
|
|
|
|
|
|
|||||||||||||||
| Earnings before interest and taxes |
283.6 | 293.0 | 512.3 | 418.6 | 276.1 | 369.7 | 390.4 | |||||||||||||||||||||
| Interest expense |
198.5 | 132.4 | 96.2 | 73.8 | 66.1 | 88.5 | 140.4 | |||||||||||||||||||||
| Interest income |
0.1 | 0.1 | 0.1 | 0.1 | 0.2 | 0.2 | 0.2 | |||||||||||||||||||||
|
|
|
|
|
|
|
|
|
|
|
|
|
|
|
|||||||||||||||
| Earnings before income taxes |
85.2 | 160.8 | 416.2 | 345.0 | 210.1 | 281.4 | 250.2 | |||||||||||||||||||||
| Provision for income taxes |
32.7 | 71.5 | 167.8 | 132.7 | 76.8 | 111.9 | 100.4 | |||||||||||||||||||||
|
|
|
|
|
|
|
|
|
|
|
|
|
|
|
|||||||||||||||
| Net earnings |
$ | 52.5 | $ | 89.3 | $ | 248.4 | $ | 212.3 | $ | 133.3 | $ | 169.4 | $ | 149.8 | ||||||||||||||
|
|
|
|
|
|
|
|
|
|
|
|
|
|
|
|||||||||||||||
| Cash Flow: |
||||||||||||||||||||||||||||
| Net cash provided by (used in): |
||||||||||||||||||||||||||||
| Operating activities |
$ | 202.9 | $ | 262.2 | $ | 550.7 | $ | 412.6 | $ | 210.8 | $ | 348.9 | ||||||||||||||||
| Investing activities |
(77.7 | ) | (652.4 | ) | (270.0 | ) | (92.1 | ) | (82.9 | ) | (260.8 | ) | ||||||||||||||||
| Financing activities |
(184.1 | ) | 414.4 | (358.0 | ) | (296.8 | ) | (92.6 | ) | (153.8 | ) | |||||||||||||||||
| Balance sheet data (at end of period): |
||||||||||||||||||||||||||||
| Cash and cash equivalents |
$ | 92.3 | $ | 116.7 | $ | 38.5 | $ | 140.5 | $ | 73.0 | $ | 73.0 | — | |||||||||||||||
| Working capital (1) |
404.1 | 488.0 | 346.6 | 476.7 | 399.4 | 399.4 | 405.3 | |||||||||||||||||||||
| Total assets |
4,400.0 | 5,081.2 | 5,200.9 | 5,153.6 | 5,272.1 | 5,272.1 | 6,431.4 | |||||||||||||||||||||
| Total debt (2) |
2,608.9 | 2,503.2 | 2,300.3 | 2,300.3 | 2,291.6 | 2,291.6 | 3,246.3 | |||||||||||||||||||||
| Total liabilities |
3,511.3 | 3,483.2 | 3,487.0 | 3,424.6 | 3,514.3 | 3,514.3 | 4,697.9 | |||||||||||||||||||||
| Total shareholders’ equity |
888.7 | 1,598.0 | 1,714.0 | 1,729.0 | 1,757.8 | 1,757.8 | 1,733.5 | |||||||||||||||||||||
| Actual |
Pro Forma |
|||||||||||||||||||||||||||
| ($ in millions) |
(53 weeks) |
(52 weeks) |
(52 weeks) |
Nine-month period ended |
(52 weeks) Twelve- |
Twelve- |
||||||||||||||||||||||
| September 28, 2014 |
September 27, 2015 |
|||||||||||||||||||||||||||
| (unaudited) | (unaudited) | |||||||||||||||||||||||||||
| Other Financial Data: |
||||||||||||||||||||||||||||
| North American Retail net sales |
$ | 2,081.7 | $ | 2,101.9 | $ | 2,246.6 | $ | 1,623.9 | $ | 1,680.0 | $ | 2,302.7 | ||||||||||||||||
| Adjusted Gross Profit (3) |
622.8 | 664.4 | 711.3 | 503.8 | 525.9 | 733.4 | $893.8 | |||||||||||||||||||||
| Adjusted EBITDA (4) |
425.2 | 452.4 | 504.0 | 340.9 | 356.8 | 519.9 | 580.0 | |||||||||||||||||||||
| Covenant Compliance EBITDA (4) |
426.1 | 515.0 | 538.1 | 357.8 | 373.2 | 553.5 | 652.8 | |||||||||||||||||||||
| Capital expenditures |
78.3 | 84.1 | 103.0 | 82.7 | 84.7 | 105.0 | 121.5 | |||||||||||||||||||||
| Ratio of Covenant Compliance EBITDA (4) to Interest expense |
6.6 | 4.9 | ||||||||||||||||||||||||||
| Ratio of net debt to Covenant Compliance EBITDA (5) |
4.0 | 5.0 | ||||||||||||||||||||||||||
| (1) | Working capital excludes notes payable, debt drawn under our revolving credit facility and current portion of long-term debt. |
| (2) | Total debt includes notes payable, debt drawn under our revolving credit facility and current portion of long-term debt. |
| (3) | Adjusted Gross Profit is defined as gross profit before accelerated depreciation related to restructuring activities, certain non-cash items, acquisition, merger and other restructuring charges and other adjustments. We believe that the presentation of Adjusted Gross Profit is useful to investors because it is consistent with our definition of Adjusted EBITDA (defined below), a measure frequently used by securities analysts, investors and other interested parties in their evaluation of the operating performance of companies in industries similar to ours. In addition, we also use targets based on Adjusted Gross Profit as one of the components used to evaluate our management’s performance. Adjusted Gross Profit is not defined under GAAP, should not be considered in isolation or as a substitute for measures of our performance prepared in accordance with GAAP and is not indicative of gross profit as determined under GAAP. |
| The following table provides a reconciliation of our gross profit to Adjusted Gross Profit for the fiscal years ended December 30, 2012, December 29, 2013 and December 28, 2014, the nine month periods ended September 27, 2015 and September 28, 2014 and (on both an actual and pro forma basis) the twelve month period ended September 27, 2015. |
| Actual |
Pro Forma |
|||||||||||||||||||||||||||
| (53
weeks) |
(52
weeks) |
(52 weeks) |
Nine-month period ended |
(52 weeks) Twelve- period ended |
Twelve- period ended |
|||||||||||||||||||||||
| ($ in millions) |
September 28, |
September 27, |
||||||||||||||||||||||||||
| (unaudited) | (unaudited) | |||||||||||||||||||||||||||
| Gross profit |
$ | 584.5 | $ | 654.2 | $ | 681.2 | $ | 492.8 | $ | 517.7 | $ | 706.1 | $ | 862.2 | ||||||||||||||
| Pinnacle Adjustments |
||||||||||||||||||||||||||||
| Accelerated depreciation expense (a) |
21.0 | — | — | — | 1.1 | 1.1 | 1.1 | |||||||||||||||||||||
| Non-cash items (b) |
(1.3 | ) | 5.6 | 17.9 | 4.6 | 0.7 | 14.0 | 14.0 | ||||||||||||||||||||
| Acquisition, merger and other restructuring charges (c) |
16.9 | 4.5 | 12.3 | 6.4 | 6.3 | 12.2 | 12.2 | |||||||||||||||||||||
| Other adjustment items (d) |
1.6 | — | — | — | — | — | — | |||||||||||||||||||||
| Boulder Adjustments |
||||||||||||||||||||||||||||
| Non-cash items (e) |
2.2 | |||||||||||||||||||||||||||
| Discontinued brand losses (f) |
2.1 | |||||||||||||||||||||||||||
|
|
|
|
|
|
|
|
|
|
|
|
|
|
|
|||||||||||||||
| Adjusted Gross Profit |
$ | 622.8 | $ | 664.4 | $ | 711.3 | $ | 503.8 | $ | 525.9 | $ | 733.4 | $ | 893.8 | ||||||||||||||
|
|
|
|
|
|
|
|
|
|
|
|
|
|
|
|||||||||||||||
| % of Net Sales |
25.1 | 27.0 | 27.5 | 26.7 | 27.2 | 27.8 | 28.4 | |||||||||||||||||||||
| (a) | For fiscal year 2012, reflects accelerated depreciation related to plant closures. For the nine-month period ended September 27, 2015, reflects accelerated depreciation related to in-sourcing of Wish-Bone production. |
| (b) | Non-cash items comprise the following: |
| Actual |
Pro Forma |
|||||||||||||||||||||||||||
| (53 weeks) |
(52 weeks) |
(52 weeks) |
Nine-month period ended |
(52 weeks) Twelve- ended |
Twelve- ended |
|||||||||||||||||||||||
| ($ in millions) |
September 28, |
September 27, |
||||||||||||||||||||||||||
| (unaudited) | (unaudited) | |||||||||||||||||||||||||||
| Unrealized losses (gains) resulting from hedging activities (1) |
$ | (1.3 | ) | $ | (0.7 | ) | $ | 12.5 | $ | 3.6 | $ | (0.2 | ) | $ | 8.7 | $ | 8.7 | |||||||||||
| Effects of adjustments related to the application of purchase accounting (2) |
— | 6.3 | 0.6 | — | — | 0.6 | 0.6 | |||||||||||||||||||||
| Non-cash compensation charges (3) |
— | — | 4.7 | 1.0 | 1.0 | 4.7 | 4.7 | |||||||||||||||||||||
|
|
|
|
|
|
|
|
|
|
|
|
|
|
|
|||||||||||||||
| Non-cash items |
$ | (1.3 | ) | $ | 5.6 | $ | 17.9 | $ | 4.6 | $ | 0.7 | $ | 14.0 | $ | 14.0 | |||||||||||||
|
|
|
|
|
|
|
|
|
|
|
|
|
|
|
|||||||||||||||
| (1) | Represents non-cash gains and losses resulting from mark-to-market obligations under derivative contracts. |
| (2) | For fiscal year 2013, represents additional Cost of products sold attributable to the write-up to fair market value of inventories acquired as a result of the Wish-Bone acquisition. For fiscal year 2014, represents additional Cost of products sold attributable to the write-up to fair market value of inventories acquired as a result of the Garden Protein acquisition. |
| (3) | For the nine-month period ended September 27, 2015, represents non-cash employee incentives and retention charges resulting from the termination of the Hillshire merger agreement. For all other periods, it also includes equity based compensation resulting from the liquidity event associated with the reduction in December 2014 of Blackstone’s ownership to 16.5%. |
| (c) | Acquisition, merger and other restructuring charges comprise the following: |
| Actual |
Pro Forma |
|||||||||||||||||||||||||||
| (53 weeks) |
(52 weeks) |
(52 weeks) |
Nine-month period ended |
(52 weeks) Twelve- period ended |
Twelve- period ended |
|||||||||||||||||||||||
| ($ in millions) |
September 28, |
September 27, |
||||||||||||||||||||||||||
| (unaudited) | (unaudited) | |||||||||||||||||||||||||||
| Expenses in connection with an acquisition or other non-recurring merger costs (1) |
$ | — | $ | — | $ | 0.9 | $ | 0.4 | $ | 0.1 | $ | 0.6 | $ | 0.6 | ||||||||||||||
| Restructuring charges, integration costs and other business optimization expenses (2) |
16.9 | 4.3 | 10.7 | 5.7 | 6.2 | 11.2 | 11.2 | |||||||||||||||||||||
| Employee severance and recruiting (3) |
0.0 | 0.2 | 0.7 | 0.3 | — | 0.4 | 0.4 | |||||||||||||||||||||
|
|
|
|
|
|
|
|
|
|
|
|
|
|
|
|||||||||||||||
| Total acquisition, merger and other restructuring charges |
$ | 16.9 | $ | 4.5 | $ | 12.3 | $ | 6.4 | $ | 6.3 | $ | 12.2 | $ | 12.2 | ||||||||||||||
|
|
|
|
|
|
|
|
|
|
|
|
|
|
|
|||||||||||||||
| (1) | For the nine-month period ended September 27, 2015 and for fiscal year 2014, represents expenses incurred related to the terminated agreement with Hillshire. |
| (2) | For fiscal year 2012, primarily represents restructuring charges and consulting and business optimization expenses related to the closings of the Tacoma, Washington, Fulton, New York and Millsboro, Delaware facilities. For fiscal year 2013, primarily represents restructuring and restructuring related charges, consulting and business optimization expenses in connection with the closures at our Millsboro, DE (March 2013) and Fulton, NY (March, 2012) facilities and a gain from the sale of our Tacoma, WA location in July 2013. For fiscal year 2014, represents integration costs of the Wish-Bone and Gilster acquisitions and a gain on sale of our Millsboro, Delaware facility in September 2014. For the nine-month period ended September 27, 2015, primarily represents integration costs of the Garden Protein and Wish-Bone acquisitions. |
| (3) | Represents severance costs paid or accrued to terminated employees. |
| (d) | For fiscal year 2012, primarily represents costs for the recall of Aunt Jemima product, net of insurance recoveries. |
| (e) | Represents costs to discontinue the Level Life brand. |
| (f) | Represents operating losses incurred by the Level Life brand. |
| (4) | Our metric of Adjusted EBITDA, which we use to, among other things, establish targets for the bonus and equity portions of our compensation plans, is substantially equivalent to “Covenant Compliance EBITDA”, which is how we refer to the calculation of EBITDA in accordance with the terms of our Existing Credit Facilities and the indenture governing our existing notes. |
| We believe that our presentation of Adjusted EBITDA provides investors with useful information, as it is an important component in measuring covenant compliance in accordance with the financial covenant in, and determining our ability to engage in certain transactions in compliance with, our senior secured credit facilities and it is a metric used internally by our board of directors and senior management. |
| You should not consider Adjusted EBITDA as an alternative to operating or net earnings (loss), each as determined in accordance with GAAP, or as an indicator of our operating performance. |
| Adjusted EBITDA is defined as earnings before interest expense, taxes, depreciation and amortization (“EBITDA”), further adjusted to exclude certain non-cash items, non-recurring items and certain other adjustment items permitted in calculating Covenant Compliance EBITDA. Adjusted EBITDA does not include adjustments for equity based compensation and certain other adjustments related to acquisitions, both of which are permitted in calculating Covenant Compliance EBITDA. For more information, please see “Management’s Discussion and Analysis of Financial Condition and Results of Operations” in our Quarterly Report on Form 10-Q for the fiscal quarter ended September 27, 2015. |
| EBITDA and Adjusted EBITDA do not represent net earnings or (loss) or cash flow from operations as those terms are defined by GAAP and do not necessarily indicate whether cash flows will be sufficient to fund cash needs. In particular, in calculating Adjusted EBITDA, we add back certain non-cash, extraordinary, unusual or non-recurring charges that are deducted in calculating net earnings or loss. However, these are expenses that may recur, vary greatly and are difficult to predict. While EBITDA and Adjusted EBITDA and similar measures are frequently used as measures of performance, they are not necessarily comparable to other similarly titled captions of other companies due to the potential inconsistencies in the method of calculation. |
| The following table provides a reconciliation from our net earnings (loss) to EBITDA and Adjusted EBITDA for the fiscal years ended December 30, 2012, December 29, 2013 and December 28, 2014, the nine-month periods ended September 27, 2015 and September 28, 2014 and (on both an actual and pro forma basis) the twelve month period ended September 27, 2015. |
| Actual |
Pro Forma |
|||||||||||||||||||||||||||
| (53 weeks) |
(52 weeks) |
(52 weeks) |
Nine-month period ended |
(52 weeks) Twelve- period ended |
Twelve- period ended |
|||||||||||||||||||||||
| ($ in millions) |
September 28, |
September 27, |
||||||||||||||||||||||||||
| (unaudited) | (unaudited) | |||||||||||||||||||||||||||
| Net earnings |
$ | 52.5 | $ | 89.3 | $ | 248.4 | $ | 212.3 | $ | 133.3 | $ | 169.4 | $ | 149.7 | ||||||||||||||
| Interest expense, net |
198.4 | 132.2 | 96.1 | 73.7 | 66.0 | 88.4 | 140.2 | |||||||||||||||||||||
| Income tax expense |
32.7 | 71.5 | 167.8 | 132.7 | 76.8 | 111.9 | 100.4 | |||||||||||||||||||||
| Depreciation and amortization expense |
98.1 | 78.2 | 80.6 | 60.0 | 67.4 | 88.0 | 104.9 | |||||||||||||||||||||
|
|
|
|
|
|
|
|
|
|
|
|
|
|
|
|||||||||||||||
| EBITDA |
$ | 381.7 | $ | 371.3 | $ | 592.9 | $ | 478.6 | $ | 343.5 | $ | 457.7 | $ | 495.2 | ||||||||||||||
|
|
|
|
|
|
|
|
|
|
|
|
|
|
|
|||||||||||||||
| Pinnacle Adjustments |
||||||||||||||||||||||||||||
| Non-cash items (a) |
(0.8 | ) | 5.6 | 41.0 | 5.3 | 5.0 | 40.8 | 40.8 | ||||||||||||||||||||
| Acquisition, merger and other restructuring charges (b) |
23.3 | 22.1 | (130.1 | ) | (143.1 | ) | 8.2 | 21.3 | 21.3 | |||||||||||||||||||
| Other adjustment items (c) |
21.0 | 53.4 | 0.2 | 0.2 | — | — | — | |||||||||||||||||||||
| Boulder Adjustments |
||||||||||||||||||||||||||||
| Non-cash items (d) |
2.7 | |||||||||||||||||||||||||||
| Acquisition, merger and other restructuring charges (e) |
19.6 | |||||||||||||||||||||||||||
| Other adjustment items (f) |
0.4 | |||||||||||||||||||||||||||
|
|
|
|
|
|
|
|
|
|
|
|
|
|
|
|||||||||||||||
| Adjusted EBITDA |
$ | 425.2 | $ | 452.4 | $ | 504.0 | $ | 340.9 | $ | 356.8 | $ | 519.9 | $ | 580.0 | ||||||||||||||
|
|
|
|
|
|
|
|
|
|
|
|
|
|
|
|||||||||||||||
| Pinnacle Wish-Bone and Garden Protein acquisition adjustments (g) |
— | 54.7 | 25.3 | 10.1 | 6.5 | 21.7 | 21.7 | |||||||||||||||||||||
| Boulder synergies (h) |
30.0 | |||||||||||||||||||||||||||
| Pinnacle non-cash equity-based compensation charges (i) |
0.9 | 7.9 | 8.8 | 6.7 | 9.9 | 12.0 | 12.0 | |||||||||||||||||||||
| Boulder non-cash equity-based compensation charges |
9.2 | |||||||||||||||||||||||||||
|
|
|
|
|
|
|
|
|
|
|
|
|
|
|
|||||||||||||||
| Covenant Compliance EBITDA |
$ | 426.1 | $ | 515.0 | $ | 538.1 | $ | 357.8 | $ | 373.2 | $ | 553.5 | $ | 652.8 | ||||||||||||||
|
|
|
|
|
|
|
|
|
|
|
|
|
|
|
|||||||||||||||
(a) Non-cash items comprise the following:
| Actual |
Pro Forma |
|||||||||||||||||||||||||||
| ($ in millions) |
(53 weeks) |
(52 weeks) |
(52 weeks) |
Nine-month period ended |
(52 weeks) Twelve-month |
Twelve- month ended |
||||||||||||||||||||||
| September 28, 2014 |
September 27, 2015 |
|||||||||||||||||||||||||||
| (unaudited) | (unaudited) | |||||||||||||||||||||||||||
| Unrealized (gains) losses resulting from hedging activities (1) |
$ | (1.3 | ) | $ | (0.7 | ) | $ | 12.5 | $ | 3.6 | $ | (0.2 | ) | $ | 8.7 | $ | 8.7 | |||||||||||
| Effects of adjustments related to the application of purchase accounting (2) |
— | 6.3 | 0.6 | — | — | 0.6 | 0.6 | |||||||||||||||||||||
| Non-cash compensation charges (3) |
— | — | 27.2 | 1.7 | 1.6 | 27.1 | 27.1 | |||||||||||||||||||||
| Unrealized foreign exchange losses (4) |
— | — | 0.7 | — | 3.7 | 4.4 | 4.4 | |||||||||||||||||||||
| Other impairment charges (5) |
0.5 | — | — | — | — | — | — | |||||||||||||||||||||
|
|
|
|
|
|
|
|
|
|
|
|
|
|
|
|||||||||||||||
| Total non-cash items |
($ | 0.8 | ) | $ | 5.6 | $ | 41.0 | $ | 5.3 | $ | 5.0 | $ | 40.8 | $ | 40.8 | |||||||||||||
|
|
|
|
|
|
|
|
|
|
|
|
|
|
|
|||||||||||||||
| (1) | Represents non-cash (gains) losses resulting from mark-to-market adjustments of obligations under derivative contracts. |
| (2) | For fiscal year 2013, represents additional Cost of products sold attributable to the write-up to fair market value of inventories acquired as a result of the Wish-Bone acquisition. For fiscal year 2014, represents additional Cost of products sold attributable to the write-up to fair market value of inventories acquired as a result of the Garden Protein acquisition. |
| (3) | For fiscal year 2014, represents non-cash employee incentives and retention charges resulting from the termination of the Hillshire merger agreement and equity based compensation charges resulting from the liquidity event associated with the reduction in December 2014 of Blackstone’s ownership to 16.5%. For the nine-month period ended September 27, 2015, represents non-cash employee incentives and retention charges resulting from the termination of the Hillshire merger agreement. |
| (4) | Represents foreign exchange losses resulting from intra-entity loans that are anticipated to be settled in the foreseeable future. |
| (5) | For fiscal year 2012, represents impairment on the Bernstein’s tradename ($0.5 million). |
| (b) | Acquisition, merger and other restructuring charges comprise the following: |
| Actual |
Pro Forma |
|||||||||||||||||||||||||||
| ($ in millions) |
(53 weeks) |
(52 weeks) |
(52 weeks) |
Nine-month period ended |
(52 weeks) Twelve-month |
Twelve- month ended |
||||||||||||||||||||||
| September 28, |
September 27, |
|||||||||||||||||||||||||||
| (unaudited) | (unaudited) | |||||||||||||||||||||||||||
| Expenses in connection with an acquisition or other non-recurring merger costs (1) |
$ | 2.4 | $ | 9.5 | $ | (144.5 | ) | $ | (150.2 | ) | $ | 1.1 | $ | 6.8 | $ | 6.8 | ||||||||||||
| Restructuring charges, integration costs and other business optimization expenses (2) |
19.9 | 8.0 | 11.0 | 6.1 | 6.9 | 11.8 | 11.8 | |||||||||||||||||||||
| Employee severance (3) |
1.0 | 4.7 | 3.5 | 1.0 | 0.2 | 2.7 | 2.7 | |||||||||||||||||||||
|
|
|
|
|
|
|
|
|
|
|
|
|
|
|
|||||||||||||||
| Total acquisition, merger and other restructuring charges |
$ | 23.3 | $ | 22.1 | $ | (130.1 | ) | $ | (143.1 | ) | $ | 8.2 | $ | 21.3 | $ | 21.3 | ||||||||||||
|
|
|
|
|
|
|
|
|
|
|
|
|
|
|
|||||||||||||||
| (1) | For fiscal year 2012, primarily represents IPO-related expenses and due diligence investigations. For fiscal year 2013, primarily represents costs related to the Wish-Bone acquisition, IPO related expenses and due diligence investigations. For fiscal year 2014, primarily represents receipt of Hillshire merger termination fee, net of professional fees and employee incentives incurred related to the terminated agreement. Also includes expenses related to the secondary offerings of common stock. For the nine-month period ended September 27, 2015, represents expenses related to the secondary offerings of common stock. |
| (2) | For fiscal year 2012, primarily represents restructuring charges, consulting and business optimization expenses related to the closings of the Tacoma, Washington, Fulton, New York, Green Bay, Wisconsin and Millsboro, Delaware facilities. For fiscal year 2013, primarily represents restructuring and restructuring related charges related to the closure of our Millsboro, DE facility, consulting and business optimization expenses related to the expansion of headquarter direct sales coverage for retail and a gain from the sale of our Tacoma, WA location in July 2013. For fiscal year 2014, represents integration costs of the Wish-Bone and Gilster acquisitions and a gain from the sale of our Millsboro, DE facility in September 2014. For the nine-month period ended September 27, 2015, primarily represents integration costs of the Garden Protein and Wish-Bone acquisitions. |
| (3) | Represents severance costs paid or accrued to terminated employees. |
| (c) | Other adjustment items comprise the following: |
| Actual |
Pro Forma |
|||||||||||||||||||||||||||
| ($ in millions) |
(53 weeks) |
(52 weeks) |
(52 weeks) |
Nine-month period ended |
(52 weeks) Twelve-month |
Twelve- month ended |
||||||||||||||||||||||
| September 28, |
September 27, |
|||||||||||||||||||||||||||
| (unaudited) | (unaudited) | |||||||||||||||||||||||||||
| Management, monitoring, consulting and advisory fees (1) |
$ | 4.7 | $ | 19.2 | $ | — | $ | — | $ | — | $ | — | $ | — | ||||||||||||||
| Other (2) |
16.3 | 34.2 | 0.2 | 0.2 | — | — | — | |||||||||||||||||||||
|
|
|
|
|
|
|
|
|
|
|
|
|
|
|
|||||||||||||||
| Total other adjustments |
$ | 21.0 | $ | 53.4 | $ | 0.2 | $ | 0.2 | $ | — | $ | — | $ | — | ||||||||||||||
|
|
|
|
|
|
|
|
|
|
|
|
|
|
|
|||||||||||||||
| (1) | Represents management/advisory fees and expenses paid to an affiliate of Blackstone, including $15.1 million relating to the termination of the advisory agreement in connection with the 2013 IPO. |
| (2) | For fiscal year 2012, primarily represents $14.3 million of the premiums paid on the redemption of $150.0 million of 9.25% Senior Notes due 2015, the redemption of $199.0 million of 10.625% Senior Subordinated Notes due 2017 and the repurchase and retirement of $10.0 million of 9.25% Senior Notes due 2015, and costs for the recall of Aunt Jemima product of $2.1 million, net of insurance recoveries. For fiscal year 2013, primarily represents $34.2 million of the premiums paid on the redemption of $400.0 million of 8.25% Senior Notes due 2017. |
| (d) | Non-cash items comprise the following: |
| Pro Forma |
||||
| ($ in millions) |
Twelve-month |
|||
| (unaudited) | ||||
| Unrealized gains resulting from hedging activities (1) |
($ | 0.1 | ) | |
| Other impairment charges (2) |
$ | 2.8 | ||
|
|
|
|||
| Total non-cash items |
$ | 2.7 | ||
|
|
|
|||
| (1) | Represents non-cash gains resulting from mark-to-market adjustments of obligations under derivative contracts. |
| (2) | Represents impairment of goodwill related to the Level Life brand. |
| (e) | Acquisition, merger and other restructuring charges comprise the following: |
| Pro Forma |
||||
| ($ in millions) |
Twelve-month |
|||
| (unaudited) | ||||
| Expenses in connection with an acquisition or other non-recurring merger costs (1) |
3.5 | |||
| Restructuring charges, integration costs and other business optimization expenses (2) |
10.3 | |||
| Employee severance (3) |
5.8 | |||
|
|
|
|||
| Total acquisition, merger and other restructuring charges |
$ | 19.6 | ||
|
|
|
|||
| (1) | Represents expenses related to strategic alternatives incurred by Boulder. |
| (2) | Primarily represents costs incurred in connection with restructuring actions initiated by Boulder, the relocation of the headquarters office to Colorado, costs to discontinue the Level Life brand and operating losses incurred by the Level Life brand. Also includes a $4.7 million gain on the sale of an investment. |
| (3) | Represents severance costs paid or accrued to terminated employees. |
| (f) | Represents income attributable to non-controlling interest in certain Boulder subsidiaries. |
| (g) | For the nine-month period ended September 28, 2014 and fiscal year 2014, represents pro forma additional EBITDA from Garden Protein for the period of fiscal year 2014 prior to the acquisition and the net cost savings projected to be realized from the Garden Protein and Wish-Bone acquisitions, calculated consistent with the definitions of EBITDA in our Existing Credit Facilities and the indenture governing our existing notes. For the nine months ended September 27, 2015, represents the net cost savings projected to be realized from the Garden Protein and Wish-Bone acquisitions, calculated consistent with the definitions of EBITDA in our Existing Credit Facilities and the indenture governing our existing notes. We cannot assure you that these cost savings will be fully achieved or realized. |
| (h) | Represents $30 million in synergies we expect to realize over the next 24 months across procurement & manufacturing, transportation & warehousing, redundant public company costs and selling, general and administrative overhead by moving Boulder Brands onto the Pinnacle platform. This amount does not reflect the impact of further operational efficiencies we expect to achieve by executing organic cost savings initiatives previously identified by Boulder and does not reflect the offsetting impacts of SKU rationalization and reinvestment in the business. See “Risk Factors—Risks Related to the Acquisition—We may fail to realize the anticipated benefits of the Boulder Acquisition because of integration difficulties and other challenges.” |
| (i) | Represents non-cash compensation charges related to the granting of equity awards that occur in the normal course of business. Awards that were issued as a result of the termination of the Hillshire merger agreement and awards that vested as a result of the liquidity event associated with the reduction in December 2014 of Blackstone’s ownership to 16.5% are being treated as an adjustment in the determination of Adjusted EBITDA. See Non-cash items above for details. |
| (5) | Pro forma net debt as of September 27, 2015 was $3,246.3 million, after giving effect to the Transactions as if they had occurred on September 27, 2015. Net debt is a non-GAAP measure and is equal to total debt (as defined in footnote (b)(2) above) less cash and cash equivalents. |