Exhibit 99.1

Constellium Reports First Quarter 2014 Financial Results
Amsterdam, May 16, 2014 – Constellium N.V. (NYSE and NYSE Euronext: CSTM) today reported results for the first quarter ended March 31, 2014.
Highlights of results include:
| • | Shipments up 3% from prior year |
| • | Q1 2014 Revenues of €883 million and Adjusted EBITDA of €71 million |
| • | Major milestone reached with the signing of U.S. Body-in-White joint venture |
| • | Ratings upgraded to ‘Ba3’ (Moody’s) and ‘BB-’ (Standard & Poor’s ) |
| • | Successful completion of $400 million and €300 million bond offerings |
Constellium reported solid results for the first quarter of 2014 reflecting strong improvement in our automotive business and solid performance in our packaging business, despite a temporary equipment outage during the first quarter in one of our main aerospace plants.
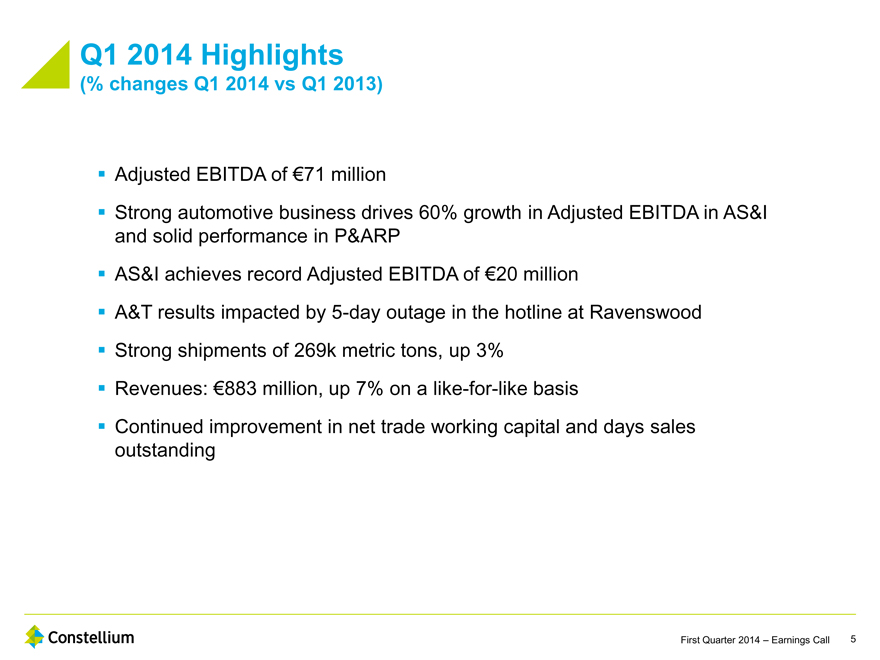
Revenues for the first quarter of 2014 were €883 million or 3% lower as compared with €911 million in the first quarter of 2013, reflecting lower London Metal Exchange (LME) prices. Excluding changes in LME prices and currency exchange rates, revenues on a like-for-like basis increased 7% compared with the first quarter of 2013.
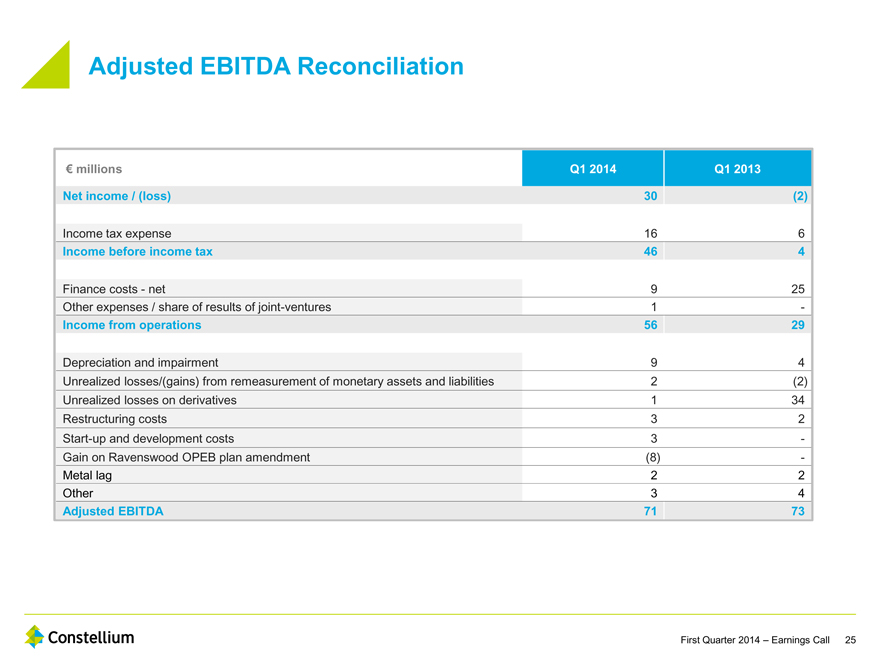
Adjusted EBITDA for the first quarter of 2014 was €71 million, which represented an increase of 20% from the fourth quarter of 2013 Adjusted EBITDA of €59 million and a decrease of 3%, or €2 million, from the first quarter of 2013 Adjusted EBITDA of €73 million.


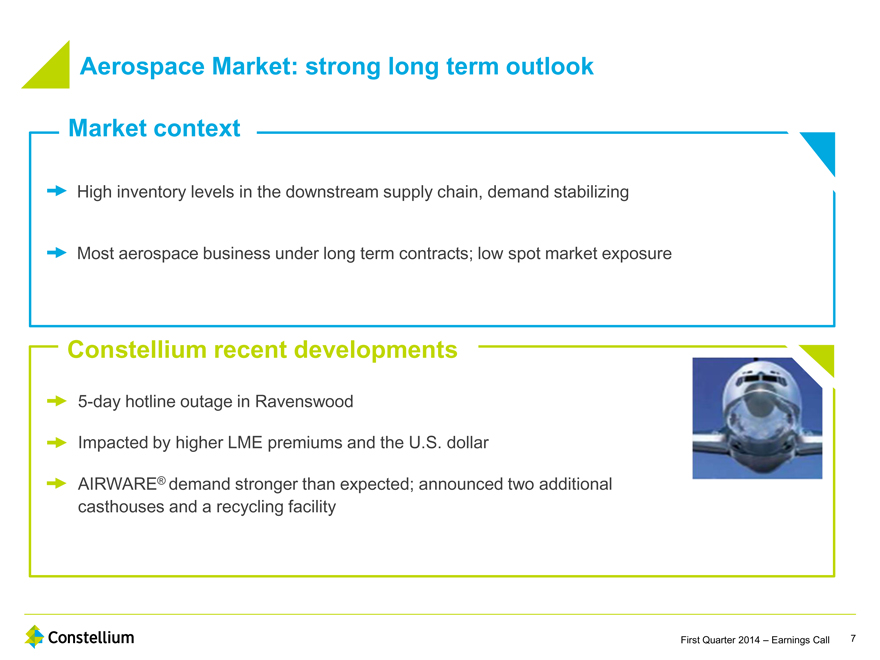
First quarter 2014 results were impacted by a five-day equipment outage of the hotline at our Ravenswood, West Virginia aerospace manufacturing facility, and by the impact of foreign exchange rates and higher aluminum premiums as compared with the first quarter of 2013.
First quarter 2014 shipments of 269k metric tons were 15% higher than fourth quarter 2013 shipments of 234k metric tons, and 3% higher than first quarter 2013 shipments of 260k metric tons. Adjusted EBITDA per metric ton for the first quarter 2014 was €263, which represented a decrease of 6% from €280 per metric ton in the first quarter 2013.
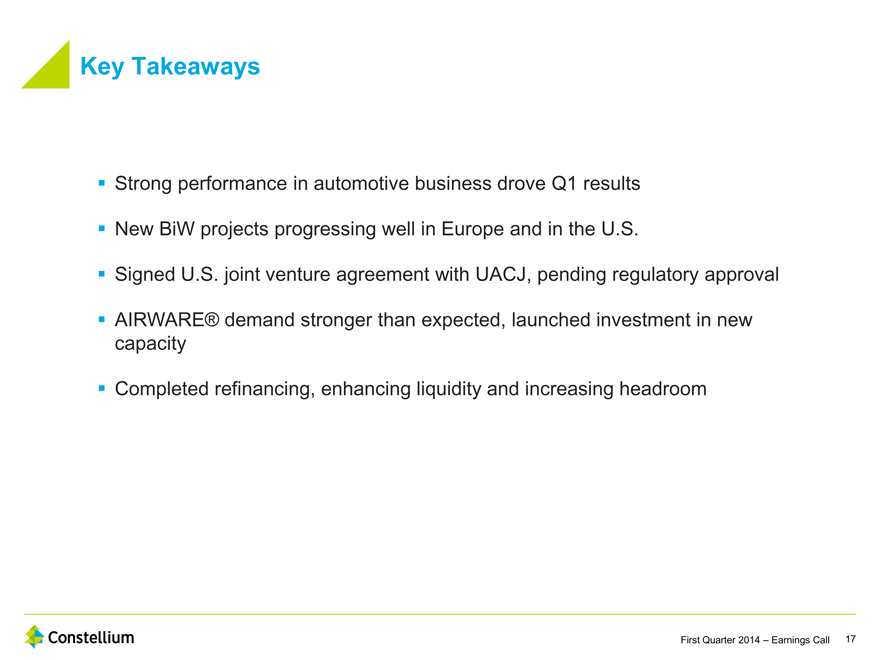
Commenting on the first quarter 2014 results, Pierre Vareille, Constellium’s Chief Executive Officer said: “First quarter results met expectations due to another solid performance in our packaging business and continued growth in our automotive business. Aerospace results were negatively impacted by operational issues in the first quarter, however, we have now returned to normal operating conditions. We see strong long term demand in aerospace, particularly for AIRWARE®, where we have a leadership position in the emerging aluminum lithium market. In our automotive markets, we are experiencing unprecedented levels of interest in auto body structures and crash management systems from our global automotive customers for next generation automotive platforms. In parallel, we continue to make significant progress in both Europe and in the U.S. in our long term projects in automotive body-in-white capacity expansions.”
| • | Group Summary |
| Q1 2014 |
Q1 2013 |
Var. | ||||||||||
| Shipments (k metric tons) |
269 | 260 | 3 | % | ||||||||
| Revenues (€ millions) |
883 | 911 | (3 | %) | ||||||||
| Adjusted EBITDA (€ millions) |
71 | 73 | (3 | %) | ||||||||
| Adjusted EBITDA per metric ton (€) |
263 | 280 | (6 | %) | ||||||||
Adjusted EBITDA per metric ton and percentage changes are calculated on unrounded underlying figures.
2
| • | Results by Segment |
| • | Aerospace & Transportation (A&T) |
| Q1 2014 |
Q1 2013 |
Var. | ||||||||||
| Shipments (k metric tons) |
61 | 59 | 3 | % | ||||||||
| Revenues (€ millions) |
300 | 306 | (2 | %) | ||||||||
| Adjusted EBITDA (€ millions) |
24 | 35 | (30 | %) | ||||||||
| Adjusted EBITDA per metric ton (€) |
395 | 584 | (32 | %) | ||||||||
Adjusted EBITDA per metric ton and percentage changes are calculated on unrounded underlying figures.
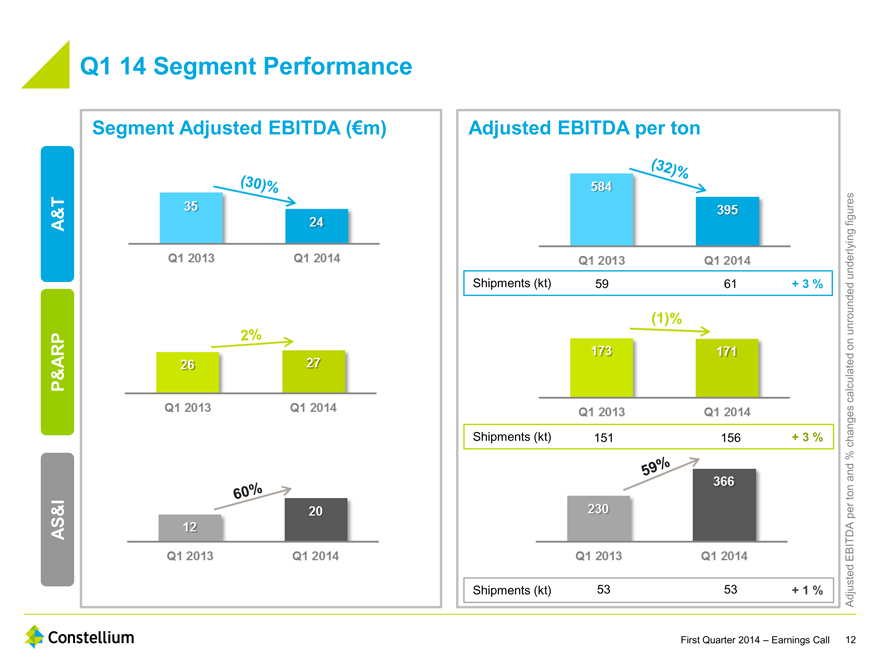
First quarter 2014 results in the A&T segment were €24 million in Adjusted EBITDA, representing a 30% decrease from €35 million in the first quarter of 2013. This decrease was partially due to a temporary equipment outage during the first quarter 2014 which limited shipments and affected Adjusted EBITDA performance. The equipment issue was resolved rapidly and the hotline resumed normal operations after 5 days. In addition, due to demand and bad weather we had to use express freight more extensively. The first quarter 2014 results were also impacted by higher aluminum premiums and less favorable hedged rates on the U.S. dollar. Shipments increased by 3% to 61k metric tons, primarily as a result of a 7% increase in shipments of non-aerospace products.
3
| • | Packaging & Automotive Rolled Products (P&ARP) |
| Q1 2014 |
Q1 2013 |
Var. | ||||||||||
| Shipments (k metric tons) |
156 | 151 | 3 | % | ||||||||
| Revenues (€ millions) |
361 | 390 | (7 | %) | ||||||||
| Adjusted EBITDA (€ millions) |
27 | 26 | 2 | % | ||||||||
| Adjusted EBITDA per metric ton (€) |
171 | 173 | (1 | %) | ||||||||
Adjusted EBITDA per metric ton and percentage changes are calculated on unrounded underlying figures.
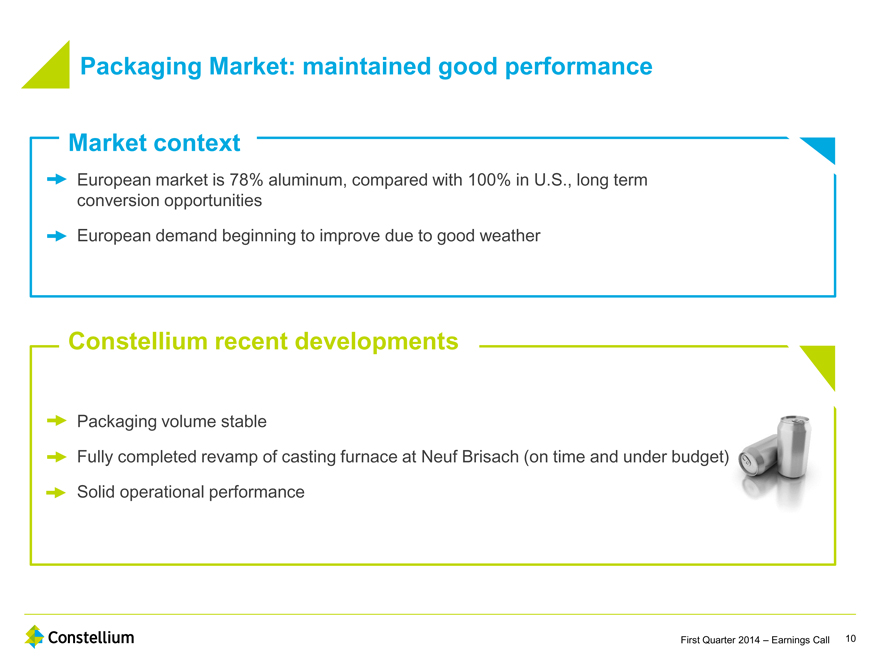
The P&ARP reporting segment had a solid quarter with 3% growth in shipments, Adjusted EBITDA of €27 million and Adjusted EBITDA per metric ton of €171. The increase in shipments reflected stable volumes in rigid packaging and strong growth in body-in-white automotive products. Revenues decreased 7% primarily as a result of lower LME prices. Adjusted EBITDA and Adjusted EBITDA per metric ton were substantially in line with the same period in the prior year reflecting the positive effect of the shift in product mix towards automotive products, offset by the impact of higher premiums and volatility of the U.S. dollar versus the euro.
4
| • | Automotive Structures & Industry (AS&I) |
| Q1 2014 |
Q1 2013 |
Var. | ||||||||||
| Shipments (k metric tons) |
53 | 53 | 1 | % | ||||||||
| Revenues (€ millions) |
228 | 233 | (2 | %) | ||||||||
| Adjusted EBITDA (€ millions) |
20 | 12 | 60 | % | ||||||||
| Adjusted EBITDA per metric ton (€)* |
366 | 230 | 59 | % | ||||||||
Adjusted EBITDA per metric ton and percentage changes are calculated on unrounded underlying figures.
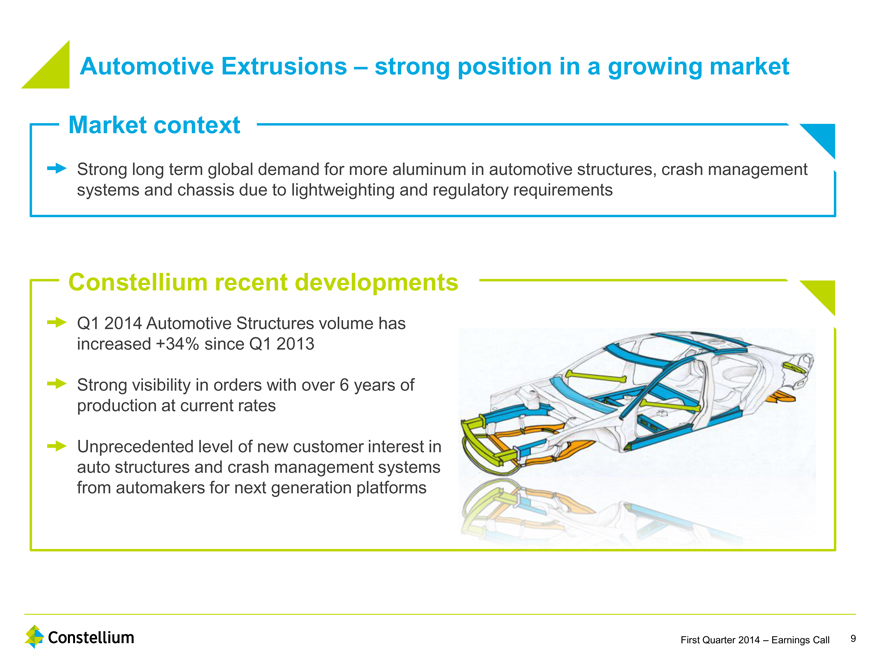
The AS&I reporting segment, achieved Adjusted EBITDA of €20 million in the first quarter of 2014, representing an improvement of 60% from the first quarter 2013 Adjusted EBITDA of €12 million. Shipments of 53k metric tons and revenues of €228 million were almost flat compared to the same period in the prior year, despite the sale in the second quarter of 2013 of two of our soft alloys plants in France. On a like-for-like basis, adjusting for the sale of these two plants, volumes increased by 13%, driven by a 34% increase in automotive structures and good performance in hard alloys. On a like-for-like basis revenues increased by 8% compared to the first quarter of 2013. Overall, this record performance in Adjusted EBITDA and Adjusted EBITDA per metric ton in the first quarter mainly reflected the strong activity in the automotive market, the positive impact of our exit from the soft alloys market in France and our continuing focus on cost control.
| • | Net income |
Net income in the first quarter of 2014 was €30 million compared to a loss of €2 million in the first quarter of 2013. This increase is primarily driven by the following items which significantly impacted the first quarter in 2013:
| • | The accelerated amortization of previously-paid fees and breakage costs relating to the refinancing of our May 2012 term loan in the first quarter of 2013, and |
| • | Changes in the fair value of derivatives which resulted in unrealized losses of €34 million in the first quarter of 2013. |
5
| • | Earnings per share |
Fully diluted earnings per share from continuing operations, was €0.28 in the first quarter of 2014 compared to a loss of €0.03 per share in the first quarter of 2013. Fully diluted earnings per share is calculated based on a weighted average of shares of 105.2 million and 89.4 million at March 31, 2014 and 2013, respectively. At March 31, 2014, the number of outstanding shares was approximately 105 million.
| • | Cash flow and liquidity |
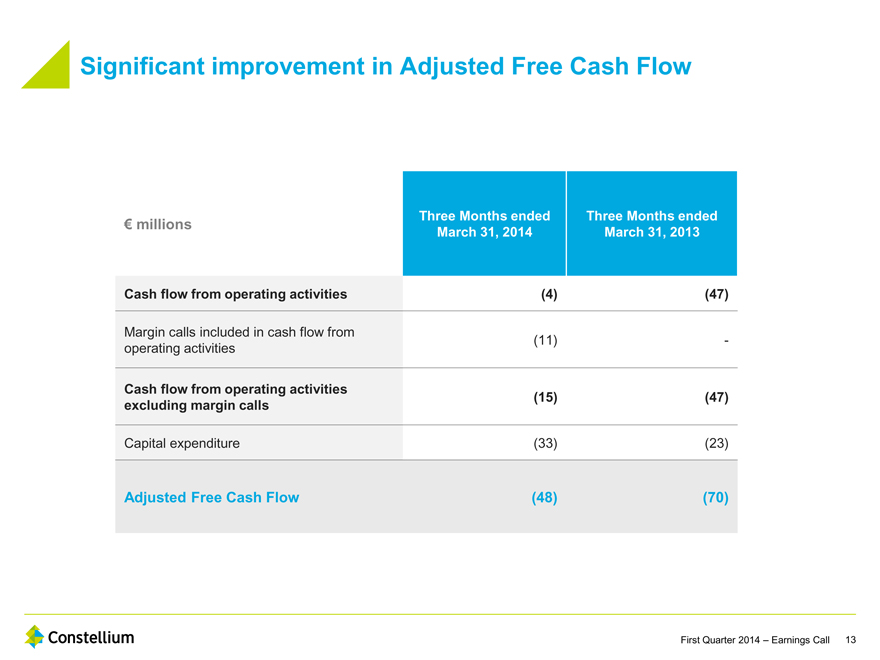
Cash flows from operations are historically negative in the first quarter of the year, reflecting seasonally higher working capital, most notably as a result of the can business which is typically stronger in spring and summer.
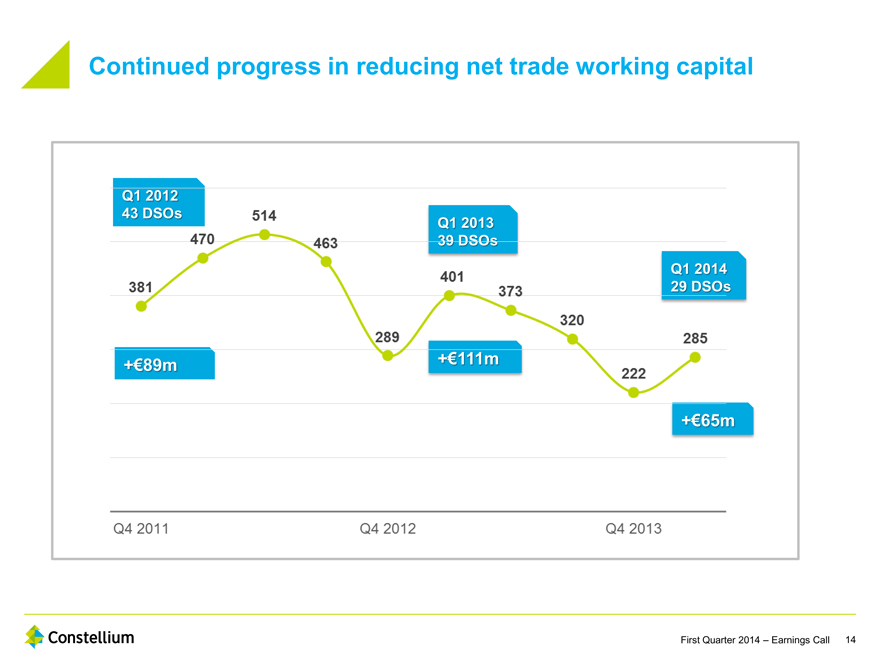
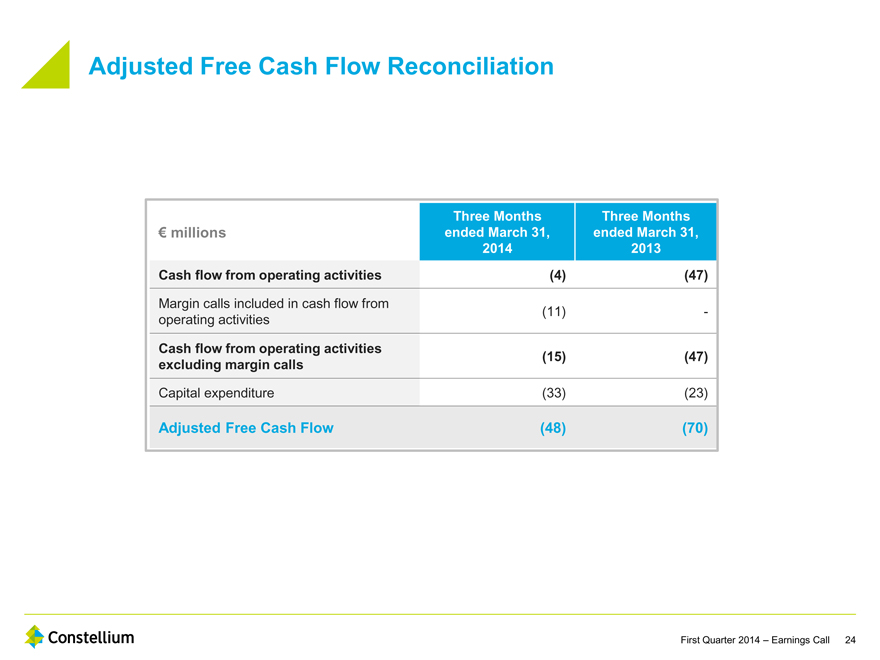
Adjusted Free Cash Flow was an outflow of €48 million for the first quarter of 2014, compared to an outflow of €70 million in the first quarter of 2013. This marked improvement over the corresponding period in the prior year is attributable to improved cash flows from operations, primarily as a result of our continuing efforts on working capital reduction, partially offset by a €10 million increase in capital expenditure as the company continues to improve its manufacturing facilities.
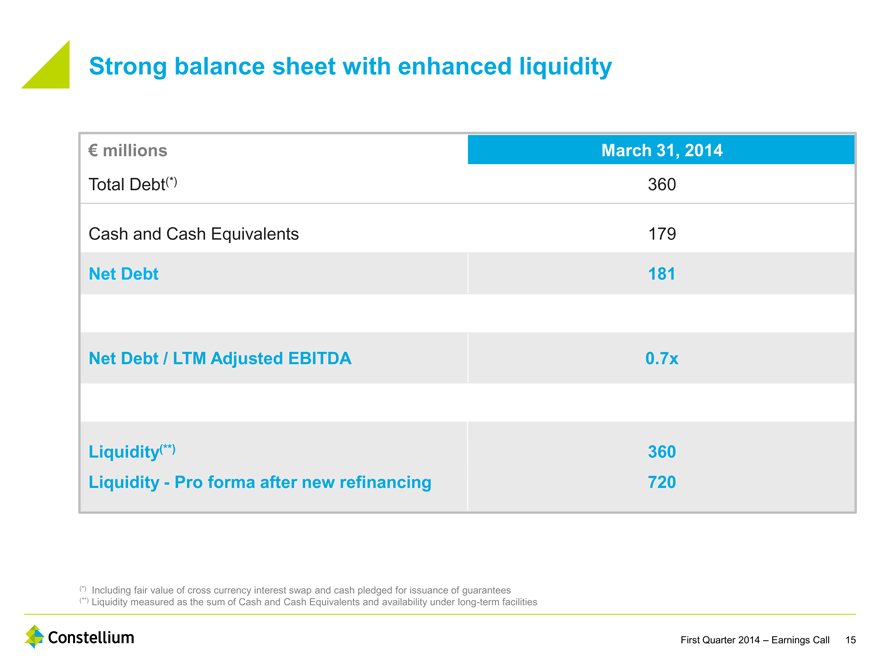
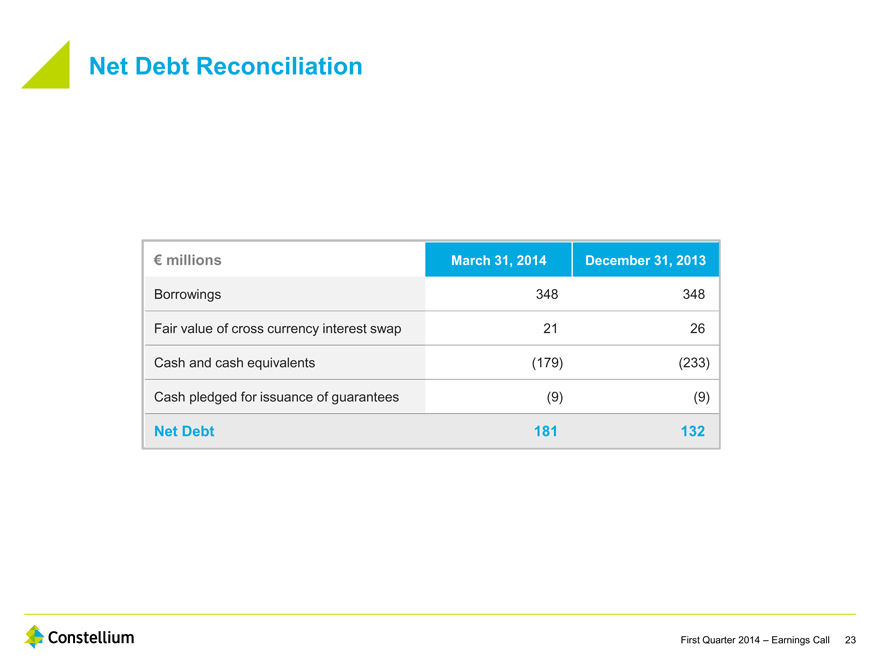
Net Debt at March 31, 2014 was €181 million, an increase of €49 million from December 31, 2013, and represents 0.7 times the last twelve months’ Adjusted EBITDA.
We continue to maintain a strong liquidity position. As of March 31, 2014, liquidity was €360 million, comprised of €143 million available under our factoring facilities, €38 million available under our Asset Based Lending facility and €179 million of cash and cash equivalents. Our liquidity position has been reinforced by the $400 million and €300 million bond offerings completed on May 7, 2014 and the €120 million unsecured revolving credit facility entered into in May 2014. Pro forma for these transactions, we estimate that our liquidity position as of March 31, 2014 would have been approximately €720 million.
6
| • | Recent Developments |
In April 2014, we announced that we will build two new casthouses in our Issoire (France) plant to accelerate production and recycling of our AIRWARE® aerospace technology. Building on the experience of Constellium’s first casthouse inaugurated in March 2013, which is already producing AIRWARE® on an industrial scale, the two new state-of-the-art casthouses are expected to start and ramp-up production in 2015 and 2016, respectively. These two additional casthouses are expected to allow Constellium to nearly triple its production of advanced solutions based on the AIRWARE® technology, which was selected to be part of major new aerospace programs including Airbus’ A350 XWB, Bombardier’s CSeries and SpaceX’s Falcon 9 Launcher.
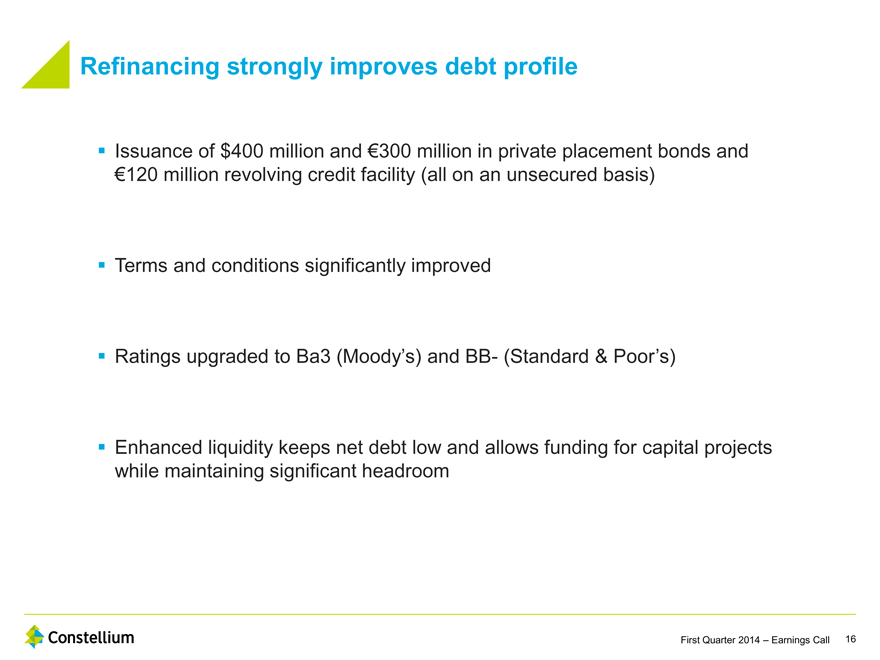
In April 2014, Constellium was upgraded to ‘Ba3’ by Moody’s and to ‘BB-’ by Standard & Poor’s.
In May 2014, Constellium successfully completed bond offerings for an aggregate amount of approximately €590 million. These private offerings were comprised of $400 million of U.S. dollar denominated senior notes due 2024 and €300 million of euro denominated notes due 2021. The U.S. dollar notes bear interest at a rate of 5.75% per annum, and the euro notes bear interest at a rate of 4.625% per annum. The notes are guaranteed on a senior unsecured basis by certain of the company’s subsidiaries. The company intends to use a portion of the proceeds from these offerings to repay the amounts outstanding under its existing term loan, with the balance to be used for general corporate purposes.
In May 2014, concurrently with the bond offering, Constellium entered into a new €120 million unsecured revolving credit facility with a term of three years.
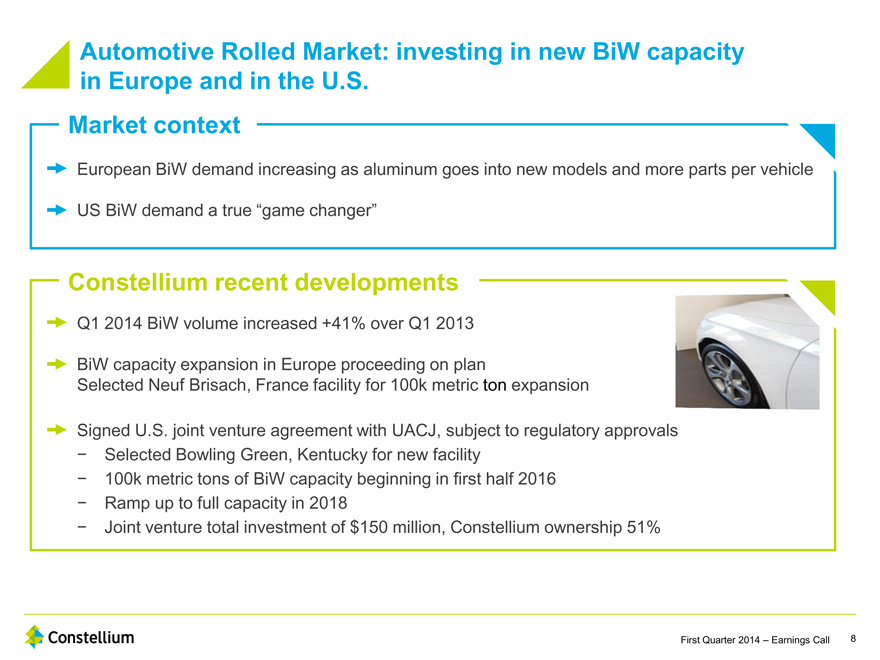
In May 2014, following the announcement in January 2014 of plans to join forces in the North American body-in-white market, Constellium and UACJ Corporation signed a Joint Venture Agreement to supply body-in-white aluminum sheet to the North American automotive industry. The joint venture, which is 51% owned by Constellium, will have an initial target capacity of 100,000 metric tons supplied by cold rolled coils from both partners’ rolling mills. The joint venture facility, which will be located in Bowling Green, Kentucky, will be designed to allow for expansion beyond 100,000 metric tons. The total joint investment is expected to be approximately $150 million. Production is scheduled to start in the first half of 2016, with full capacity expected to be reached by 2018. The finalization of the joint venture remains subject to regulatory approvals which are currently expected in the second half of 2014.
In addition, during the first quarter 2014, significant progress was made in our body-in-white European project with the selection of our Neuf-Brisach (France) plant as the location for the previously announced 100,000 metric tons capacity expansion.
7
| • | Forward-looking statements |
Certain statements contained in this press release may constitute forward-looking statements within the meaning of the Private Securities Litigation Reform Act of 1995. This press release may contain “forward-looking statements” with respect to our business, results of operations and financial condition, and our expectations or beliefs concerning future events and conditions. You can identify certain forward-looking statements because they contain words such as, but not limited to, “believes,” “expects,” “may,” “should,” “approximately,” “anticipates,” “estimates,” “intends,” “plans,” “targets,” “likely,” “will,” “would,” “could” and similar expressions (or the negative of these terminologies or expressions). All forward-looking statements involve risks and uncertainties. Many risks and uncertainties are inherent in our industry and markets. Others are more specific to our business and operations. These risks and uncertainties include, but are not limited to, those set forth under the heading “Risk Factors” in our Annual Report on Form 20-F, and described from time to time in subsequent reports, filed with the U.S. Securities and Exchange Commission, and include risks relating to the finalization of our U.S. body-in-white joint venture, including the failure to receive required regulatory approvals. The occurrence of the events described and the achievement of the expected results depend on many events, some or all of which are not predictable or within our control. Consequently, actual results may differ materially from the forward-looking statements contained in this press release. We undertake no obligation to publicly update or revise any forward-looking statement as a result of new information, future events or otherwise, except as required by law.
| • | About Constellium |
Constellium (NYSE and NYSE Euronext: CSTM) is a global sector leader that develops innovative, value added aluminum products for a broad scope of markets and applications, including aerospace, automotive and packaging. Constellium generated €3.5 billion of revenue in 2013. Constellium’s earnings materials for the quarter ended March 31, 2013 are available on the company’s website (www.constellium.com).
8
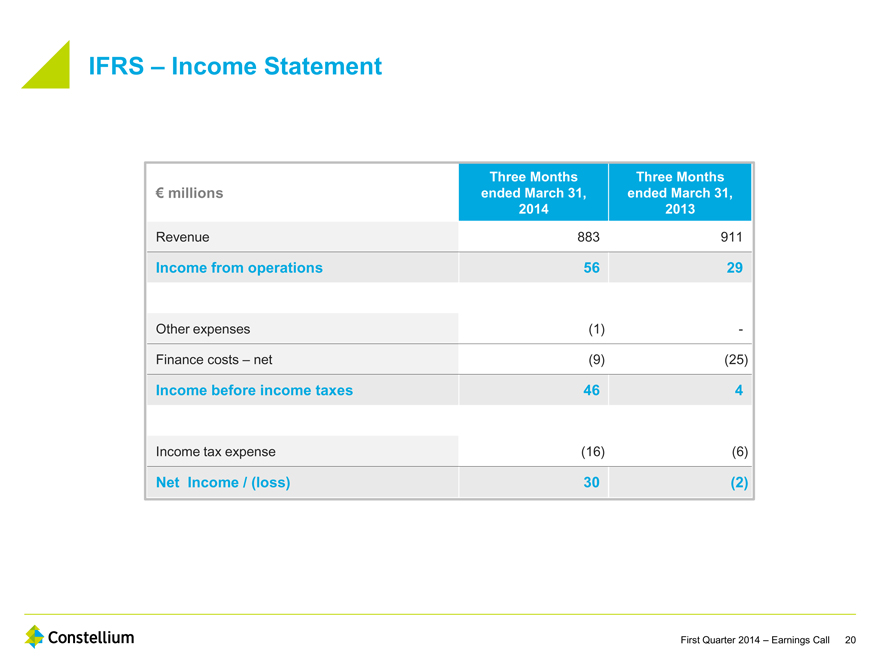
CONDENSED INTERIM CONSOLIDATED INCOME STATEMENT (Unaudited)
| (in millions of Euros) |
Three months ended March 31, 2014 |
Three months ended March 31, 2013 |
||||||
| Revenue |
883 | 911 | ||||||
| Cost of sales |
(766 | ) | (784 | ) | ||||
|
|
|
|
|
|||||
| Gross profit |
117 | 127 | ||||||
|
|
|
|
|
|||||
| Selling and administrative expenses |
(52 | ) | (55 | ) | ||||
| Research and development expenses |
(9 | ) | (9 | ) | ||||
| Restructuring costs |
(3 | ) | (2 | ) | ||||
| Other gains / (losses) - net |
3 | (32 | ) | |||||
|
|
|
|
|
|||||
| Income from operations |
56 | 29 | ||||||
|
|
|
|
|
|||||
| Other expenses |
(1 | ) | — | |||||
|
|
|
|
|
|||||
| Finance income |
— | 5 | ||||||
| Finance costs |
(9 | ) | (30 | ) | ||||
|
|
|
|
|
|||||
| Finance costs – net |
(9 | ) | (25 | ) | ||||
|
|
|
|
|
|||||
| Share of profit of joint-ventures |
— | — | ||||||
|
|
|
|
|
|||||
| Income before income tax |
46 | 4 | ||||||
|
|
|
|
|
|||||
| Income tax expense |
(16 | ) | (6 | ) | ||||
|
|
|
|
|
|||||
| Net Income / (Loss) from continuing operations |
30 | (2 | ) | |||||
|
|
|
|
|
|||||
| Discontinued operations |
||||||||
| Net Income from discontinued operations |
— | — | ||||||
|
|
|
|
|
|||||
| Net Income / (Loss) |
30 | (2 | ) | |||||
|
|
|
|
|
|||||
| Net Income / (Loss) attributable to: |
||||||||
| Owners of the Company |
29 | (3 | ) | |||||
| Non-controlling interests |
1 | 1 | ||||||
|
|
|
|
|
|||||
| Net Income / (Loss) |
30 | (2 | ) | |||||
|
|
|
|
|
|||||
Earnings per share attributable to the equity holders of the Company
| (in Euros per share) |
Three months ended March 31, 2014 |
Three months ended March 31, 2013 |
||||||
| From continuing and discontinued operations |
||||||||
| Basic |
0.28 | (0.03 | ) | |||||
| Diluted |
0.28 | (0.03 | ) | |||||
| From continuing operations |
||||||||
| Basic |
0.28 | (0.03 | ) | |||||
| Diluted |
0.28 | (0.03 | ) | |||||
| From discontinued operations |
||||||||
| Basic |
— | — | ||||||
| Diluted |
— | — | ||||||
9
CONDENSED INTERIM CONSOLIDATED STATEMENT OF COMPREHENSIVE INCOME (Unaudited)
| (in millions of Euros) |
Three months ended March 31, 2014 |
Three months ended March 31, 2013 |
||||||
| Net Income / (Loss) |
30 | (2 | ) | |||||
|
|
|
|
|
|||||
| Other Comprehensive (Loss) / Income |
||||||||
| Items that will not be reclassified subsequently to Income or Loss |
||||||||
| Remeasurement on post-employment benefit obligations |
(26 | ) | 21 | |||||
| Deferred tax on remeasurement on post-employment benefit obligations |
4 | — | ||||||
| Items that may be reclassified subsequently to Income or Loss |
||||||||
| Currency translation differences |
— | (7 | ) | |||||
|
|
|
|
|
|||||
| Other Comprehensive (Loss) / Income |
(22 | ) | 14 | |||||
|
|
|
|
|
|||||
| Total Comprehensive Income |
8 | 12 | ||||||
|
|
|
|
|
|||||
| Attributable to: |
||||||||
| Owners of the Company |
7 | 11 | ||||||
| Non-controlling interests |
1 | 1 | ||||||
|
|
|
|
|
|||||
| Total Comprehensive Income |
8 | 12 | ||||||
|
|
|
|
|
|||||
.
10
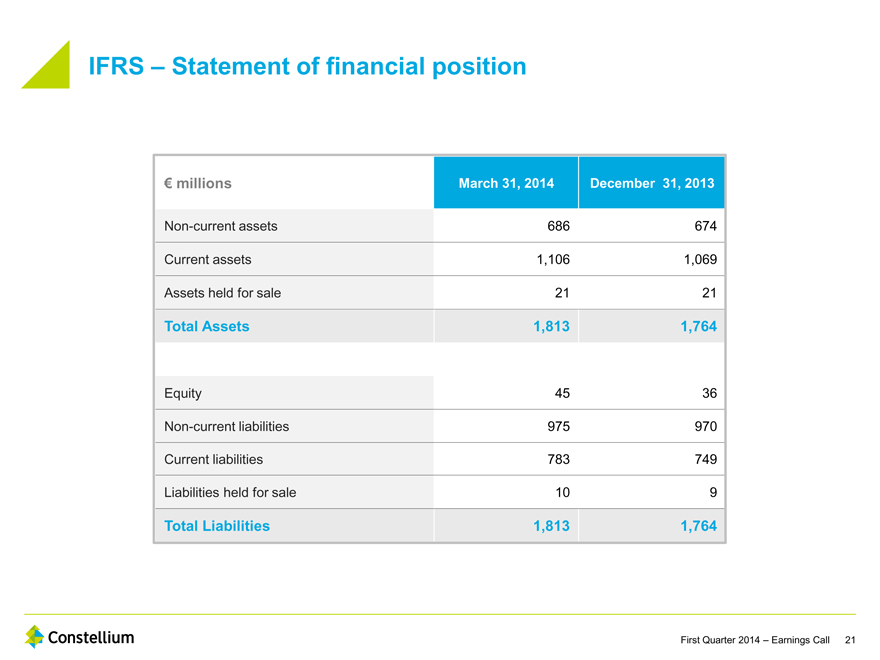
CONDENSED INTERIM CONSOLIDATED STATEMENT OF FINANCIAL POSITION (Unaudited)
| (in millions of Euros) |
March 31, 2014 |
December 31, 2013 |
||||||
| Assets |
||||||||
| Non-current assets |
||||||||
| Intangible assets (including goodwill) |
22 | 21 | ||||||
| Property, plant and equipment |
433 | 408 | ||||||
| Investments in joint ventures |
1 | 1 | ||||||
| Deferred income tax assets |
172 | 177 | ||||||
| Trade receivables and other |
56 | 60 | ||||||
| Other financial assets |
2 | 7 | ||||||
|
|
|
|
|
|||||
| 686 | 674 | |||||||
|
|
|
|
|
|||||
| Current assets |
||||||||
| Inventories |
343 | 328 | ||||||
| Trade receivables and other |
568 | 483 | ||||||
| Other financial assets |
16 | 25 | ||||||
| Cash and cash equivalents |
179 | 233 | ||||||
|
|
|
|
|
|||||
| 1,106 | 1,069 | |||||||
|
|
|
|
|
|||||
| Assets of disposal group classified as held for sale |
21 | 21 | ||||||
|
|
|
|
|
|||||
| Total Assets |
1,813 | 1,764 | ||||||
|
|
|
|
|
|||||
| Equity |
||||||||
| Share capital |
2 | 2 | ||||||
| Share premium account |
162 | 162 | ||||||
| Retained deficit and other reserves |
(124 | ) | (132 | ) | ||||
|
|
|
|
|
|||||
| Equity attributable to owners of the Company |
40 | 32 | ||||||
| Non-controlling interests |
5 | 4 | ||||||
|
|
|
|
|
|||||
| 45 | 36 | |||||||
|
|
|
|
|
|||||
| Liabilities |
||||||||
| Non-current liabilities |
||||||||
| Borrowings |
328 | 326 | ||||||
| Trade payables and other |
35 | 35 | ||||||
| Deferred income tax liabilities |
— | 1 | ||||||
| Pension and other post-employment benefits obligations |
522 | 507 | ||||||
| Other financial liabilities |
32 | 36 | ||||||
| Provisions |
58 | 65 | ||||||
|
|
|
|
|
|||||
| 975 | 970 | |||||||
|
|
|
|
|
|||||
| Current liabilities |
||||||||
| Borrowings |
20 | 22 | ||||||
| Trade payables and other |
679 | 646 | ||||||
| Income taxes payable |
20 | 19 | ||||||
| Other financial liabilities |
19 | 24 | ||||||
| Provisions |
45 | 38 | ||||||
|
|
|
|
|
|||||
| 783 | 749 | |||||||
|
|
|
|
|
|||||
| Liabilities of disposal group classified as held for sale |
10 | 9 | ||||||
|
|
|
|
|
|||||
| Total liabilities |
1,768 | 1,728 | ||||||
|
|
|
|
|
|||||
| Total equity and liabilities |
1,813 | 1,764 | ||||||
|
|
|
|
|
|||||
11
CONDENSED INTERIM CONSOLIDATED STATEMENT OF CHANGES IN EQUITY (Unaudited)
| (in millions of Euros) |
Share capital |
Share premium |
Remeasu- rement |
Foreign currency translation reserve |
Other reserves |
Retained losses |
Total Group share |
Non- controlling interests |
Total equity |
|||||||||||||||||||||||||||
| As at January 1, 2014 |
2 | 162 | (23 | ) | (14 | ) | 1 | (96 | ) | 32 | 4 | 36 | ||||||||||||||||||||||||
|
|
|
|
|
|
|
|
|
|
|
|
|
|
|
|
|
|
|
|||||||||||||||||||
| Net income |
— | — | — | — | — | 29 | 29 | 1 | 30 | |||||||||||||||||||||||||||
| Other comprehensive loss |
— | — | (22 | ) | — | — | — | (22 | ) | — | (22 | ) | ||||||||||||||||||||||||
|
|
|
|
|
|
|
|
|
|
|
|
|
|
|
|
|
|
|
|||||||||||||||||||
| Total Comprehensive Income |
— | — | (22 | ) | — | — | 29 | 7 | 1 | 8 | ||||||||||||||||||||||||||
|
|
|
|
|
|
|
|
|
|
|
|
|
|
|
|
|
|
|
|||||||||||||||||||
| Transactions with the owners |
||||||||||||||||||||||||||||||||||||
| Share equity plan |
— | — | — | — | 1 | — | 1 | — | 1 | |||||||||||||||||||||||||||
|
|
|
|
|
|
|
|
|
|
|
|
|
|
|
|
|
|
|
|||||||||||||||||||
| As at March 31, 2014 |
2 | 162 | (45 | ) | (14 | ) | 2 | (67 | ) | 40 | 5 | 45 | ||||||||||||||||||||||||
|
|
|
|
|
|
|
|
|
|
|
|
|
|
|
|
|
|
|
|||||||||||||||||||
| (in millions of Euros) |
Share premium |
Remeasur ement |
Foreign currency translation reserve |
Other reserves |
Retained losses |
Total Group share |
Non-controlling interests |
Total equity |
||||||||||||||||||||||||
| As at January 1, 2013 Restated* |
98 | (86 | ) | (14 | ) | 1 | (40 | ) | (41 | ) | 4 | (37 | ) | |||||||||||||||||||
|
|
|
|
|
|
|
|
|
|
|
|
|
|
|
|
|
|||||||||||||||||
| Net loss |
— | — | — | — | (3 | ) | (3 | ) | 1 | (2 | ) | |||||||||||||||||||||
| Other comprehensive income |
— | 21 | (7 | ) | — | — | 14 | — | 14 | |||||||||||||||||||||||
|
|
|
|
|
|
|
|
|
|
|
|
|
|
|
|
|
|||||||||||||||||
| Total Comprehensive Income |
— | 21 | (7 | ) | — | (3 | ) | 11 | 1 | 12 | ||||||||||||||||||||||
|
|
|
|
|
|
|
|
|
|
|
|
|
|
|
|
|
|||||||||||||||||
| Transactions with the owners |
||||||||||||||||||||||||||||||||
| Share premium distribution |
(98 | ) | — | — | — | (5 | ) | (103 | ) | — | (103 | ) | ||||||||||||||||||||
|
|
|
|
|
|
|
|
|
|
|
|
|
|
|
|
|
|||||||||||||||||
| As at March 31, 2013 |
— | (65 | ) | (21 | ) | 1 | (48 | ) | (133 | ) | 5 | (128 | ) | |||||||||||||||||||
|
|
|
|
|
|
|
|
|
|
|
|
|
|
|
|
|
|||||||||||||||||
| (in millions of Euros) |
Share capital |
Share premium |
Remeasur ement |
Foreign currency translation reserve |
Other reserves |
Retained losses |
Total Group share |
Non- controlling interests |
Total equity |
|||||||||||||||||||||||||||
| As at January 1, 2013 Restated* |
— | 98 | (86 | ) | (14 | ) | 1 | (40 | ) | (41 | ) | 4 | (37 | ) | ||||||||||||||||||||||
|
|
|
|
|
|
|
|
|
|
|
|
|
|
|
|
|
|
|
|||||||||||||||||||
| Net income |
— | — | — | — | — | 98 | 98 | 2 | 100 | |||||||||||||||||||||||||||
| Other comprehensive income |
— | — | 63 | — | — | — | 63 | — | 63 | |||||||||||||||||||||||||||
|
|
|
|
|
|
|
|
|
|
|
|
|
|
|
|
|
|
|
|||||||||||||||||||
| Total Comprehensive Income |
— | — | 63 | — | — | 98 | 161 | 2 | 163 | |||||||||||||||||||||||||||
|
|
|
|
|
|
|
|
|
|
|
|
|
|
|
|
|
|
|
|||||||||||||||||||
| Transactions with the owners |
||||||||||||||||||||||||||||||||||||
| Share premium distribution |
— | (98 | ) | — | — | — | (5 | ) | (103 | ) | — | (103 | ) | |||||||||||||||||||||||
| MEP shares changes |
— | — | — | — | (1 | ) | — | (1 | ) | — | (1 | ) | ||||||||||||||||||||||||
| Share equity plan |
— | — | — | — | 1 | — | 1 | — | 1 | |||||||||||||||||||||||||||
| Prorata share issuance |
2 | — | — | — | — | (2 | ) | — | — | — | ||||||||||||||||||||||||||
| Interim dividend distribution |
— | — | — | — | — | (147 | ) | (147 | ) | — | (147 | ) | ||||||||||||||||||||||||
| IPO Primary offering |
— | 154 | — | — | — | — | 154 | — | 154 | |||||||||||||||||||||||||||
| IPO Over-allotment |
— | 25 | — | — | — | — | 25 | — | 25 | |||||||||||||||||||||||||||
| IPO Fees |
— | (17 | ) | — | — | — | — | (17 | ) | — | (17 | ) | ||||||||||||||||||||||||
| Transactions with non-controlling interests |
— | — | — | — | — | — | — | (2 | ) | (2 | ) | |||||||||||||||||||||||||
|
|
|
|
|
|
|
|
|
|
|
|
|
|
|
|
|
|
|
|||||||||||||||||||
| As at December 31, 2013 |
2 | 162 | (23 | ) | (14 | ) | 1 | (96 | ) | 32 | 4 | 36 | ||||||||||||||||||||||||
|
|
|
|
|
|
|
|
|
|
|
|
|
|
|
|
|
|
|
|||||||||||||||||||
| * | Comparative financial statements have been restated following the application of IAS 19 revised. |
12
CONDENSED INTERIM CONSOLIDATED STATEMENT OF CASH FLOWS (Unaudited)
| (in millions of Euros) |
Three months ended March 31, 2014 |
Three months ended March 31, 2013 |
||||||
| Cash flows from / (used in) operating activities |
||||||||
| Net income / (loss) |
30 | (2 | ) | |||||
| Less: Net income / (loss) from discontinued operations |
— | — | ||||||
| Less: Net income attributable to non-controlling interests |
(1 | ) | (1 | ) | ||||
| Net income / (loss) from continuing operations before non-controlling interests |
29 | (3 | ) | |||||
|
|
|
|
|
|||||
| Adjustments |
42 | 76 | ||||||
| Changes in working capital: |
||||||||
| Inventories |
(16 | ) | (23 | ) | ||||
| Trade receivables |
(93 | ) | (119 | ) | ||||
| Margin call |
11 | — | ||||||
| Trade payables |
37 | 36 | ||||||
| Other working capital , net |
5 | 2 | ||||||
| Changes in other operating assets and liabilities: |
||||||||
| Provisions |
(3 | ) | (4 | ) | ||||
| Income tax paid |
(4 | ) | (2 | ) | ||||
| Pension liabilities and other post-employment benefit obligations |
(12 | ) | (10 | ) | ||||
|
|
|
|
|
|||||
| Net cash flows used in operating activities |
(4 | ) | (47 | ) | ||||
|
|
|
|
|
|||||
| Cash flows used in investing activities |
||||||||
| Purchases of property, plant and equipment |
(33 | ) | (23 | ) | ||||
| Proceeds from disposal of AIN entities |
— | — | ||||||
| Proceeds from finance lease |
1 | 2 | ||||||
| Other investing activities |
— | (2 | ) | |||||
|
|
|
|
|
|||||
| Net cash flows used in investing activities |
(32 | ) | (23 | ) | ||||
|
|
|
|
|
|||||
| Cash flows (used in) / from financing activities |
||||||||
| Interests paid |
(7 | ) | (14 | ) | ||||
| Net cash flows (used in) / from factoring |
— | — | ||||||
| Proceeds received from Term Loan |
— | 351 | ||||||
| Repayment of Term Loan |
(1 | ) | (154 | ) | ||||
| Proceeds / Repayment of other loans |
(1 | ) | 16 | |||||
| Payment of deferred financing costs |
— | (8 | ) | |||||
| Distribution of share premium to owners of the Company |
— | (103 | ) | |||||
| Other financing activities |
(8 | ) | 5 | |||||
|
|
|
|
|
|||||
| Net cash flows (used in) / from financing activities |
(17 | ) | 93 | |||||
|
|
|
|
|
|||||
| Net (decrease) / increase in cash and cash equivalents |
(53 | ) | 23 | |||||
| Cash and cash equivalents - beginning of period |
233 | 142 | ||||||
| Effect of exchange rate changes on cash and cash equivalents |
(1 | ) | — | |||||
|
|
|
|
|
|||||
| Cash and cash equivalents - end of period |
179 | 165 | ||||||
|
|
|
|
|
|||||
13
NON-GAAP MEASURES RECONCILIATIONS
Reconciliation of net income from continuing operations to Adjusted EBITDA (a non-IFRS measure)
| Q1 2014 |
Q1 2013 |
|||||||
| Net income / (loss) |
30 | (2 | ) | |||||
| Income tax expense |
16 | 6 | ||||||
| Income before income tax |
46 | 4 | ||||||
| Finance costs – net |
9 | 25 | ||||||
| Other expenses/share of results of joint-ventures |
1 | — | ||||||
| Income from operations |
56 | 29 | ||||||
| Depreciation and impairment |
9 | 4 | ||||||
| Unrealized losses/(gains) from re-measurement of monetary assets and liabilities |
2 | (2 | ) | |||||
| Unrealized losses on derivatives |
1 | 34 | ||||||
| Restructuring costs |
3 | 2 | ||||||
| Start-up and development costs |
3 | — | ||||||
| Gain on Ravenswood OPEB plan amendment |
(8 | ) | — | |||||
| Metal lag |
2 | 2 | ||||||
| Other |
3 | 4 | ||||||
| Adjusted EBITDA |
71 | 73 | ||||||
Reconciliation of cash flow from operating activities to Adjusted Free Cash Flow (a non-GAAP measure)
| Q1 2014 |
Q1 2013 |
|||||||
| Cash flow from operating activities |
(4 | ) | (47 | ) | ||||
| Margin calls included in cash flow from operating activities |
(11 | ) | — | |||||
| Cash flow from operating activities excluding margin calls |
(15 | ) | (47 | ) | ||||
| Capital expenditure |
(33 | ) | (23 | ) | ||||
| Adjusted Free Cash Flow |
(48 | ) | (70 | ) | ||||
14
Reconciliation of borrowings to Net Debt (a non-GAAP measure)
| As of March 31, 2014 |
As of Dec. 31, 2013 |
|||||||
| Borrowings |
348 | 348 | ||||||
| Fair value of cross currency interest swap |
21 | 26 | ||||||
| Cash and cash equivalents |
(179 | ) | (233 | ) | ||||
| Cash pledged for issuance of guarantees |
(9 | ) | (9 | ) | ||||
| Net Debt |
181 | 132 | ||||||
Non-GAAP measures
In addition to the results reported in accordance with International Financial Reporting Standards (“IFRS”) as issued by the International Accounting Standards Board (all standards applied by the Group have been endorsed by the European Union), this press release includes information regarding certain financial measures which are not prepared in accordance with IFRS (“non-GAAP measures”). The non-GAAP financial measures used in this press release are: Adjusted EBITDA, Adjusted EBITDA per metric ton, Adjusted Free Cash Flow and Net Debt. Reconciliations to the most directly comparable IFRS financial measures are presented in the schedules to this press release. We believe these non-GAAP measures are important supplemental measures of our operating performance. By providing these measures, together with the reconciliations, we believe we are enhancing investors’ understanding of our business and our results of operations, as well as assisting investors in evaluating how well we are executing our strategic initiatives. However, these non-GAAP financial measures supplement our IFRS disclosures and should not be considered an alternative to the IFRS measures and may not be comparable to similarly titled measures of other companies.
In considering the financial performance of the business, management and our chief operational decision maker, as defined by IFRS, analyze the primary financial performance measure of Adjusted EBITDA in all of our business segments. The most directly comparable IFRS measure to Adjusted EBITDA is our net income or loss for the period. We believe Adjusted EBITDA, as defined below, is useful to investors and is used by our management for measuring profitability because it excludes the impact of certain non-cash charges, such as depreciation, amortization, impairment and unrealized gains and losses on derivatives as well as items that do not impact the day-to-day operations and that management in many cases does not directly control or influence. Therefore, such adjustments eliminate items which have less bearing on our core operating performance.
Adjusted EBITDA measures are frequently used by securities analysts, investors and other interested parties in their evaluation of Constellium and in comparison to other companies, many of which present an Adjusted EBITDA-related performance measure when reporting their results.
15
Adjusted EBITDA is defined as profit from operations before depreciation, amortization and impairment, as adjusted to exclude losses on disposal of property, plant and equipment, acquisition and separation costs, restructuring costs, pension amendments and unrealized gains or losses on derivatives and foreign exchange differences on the re-measurement of monetary assets and liabilities, exceptional consulting costs, effects of purchase accounting adjustment, standalone costs and management fees payable by the company to an affiliate of Apollo Global Management, LLC, exceptional employee bonuses in relation to cost saving implementation and targets, start-up and development costs, share-based compensation expense and the effect of favorable or unfavorable metal price lag (the financial impact of the timing difference between when aluminum prices included within our revenues are established and when aluminum purchase prices included in our cost of sales are established)
Adjusted EBITDA is the measure of performance used by management in evaluating our operating performance, in preparing internal forecasts and budgets necessary for managing our business and, specifically in relation to the exclusion of the effect of favorable or unfavorable metal price lag, this measure allows management and the investor to assess operating results and trends without the impact of our accounting for inventories. We use the weighted average cost method in accordance with IFRS which leads to the purchase price paid for metal impacting our cost of goods sold and therefore profitability in the period subsequent to when the related sales price impacts our revenues. Management believes this measure also provides additional information used by our lending facilities providers with respect to the ongoing performance of our underlying business activities. We use Adjusted EBITDA in calculating our compliance with the financial covenants under certain of our loan facilities.
Adjusted EBITDA is not a presentation made in accordance with IFRS, is not a measure of financial condition, liquidity or profitability and should not be considered as an alternative to profit or loss for the period, revenues or operating cash flows determined in accordance with IFRS.
Adjusted Free Cash Flow is Net Cash Flow from Operating Activities, after capital expenditure and excluding margin calls. Net Debt is defined as borrowings plus or minus the fair value of cross currency interest swaps less cash and cash equivalents and cash pledged for the issuance of guarantees.
Management believes that Adjusted Free Cash Flow is a useful measure of the net cash flow generated or used by the business as it takes into account both the cash generated or consumed by operating activities, including working capital, and the capital expenditure requirements of the business. Management believes that Net Debt is a useful measure of indebtedness because it takes into account the cash and cash equivalent balances held by the Company as well as the total external debt of the Company.
Net Debt and Adjusted Free Cash Flow are not presentations made in accordance with IFRS, and should not be considered as an alternative to borrowings or operating cash flows determined in accordance with IFRS.
16