Exhibit 99.1

Constellium Reports Strong 2013 Financial Results
Amsterdam, March 20, 2014 – Constellium N.V. (NYSE and NYSE Euronext: CSTM) today reported results for the quarter and year ended December 31, 2013.
Highlights of results include:

|
2013 Sales of €3.5 billion, up 4% on a like-for-like basis |
|
|
2013 Adjusted EBITDA of €280 million, up €57 million or 26% from 2012 |
|
|
Q4 Adjusted EBITDA of €59 million, up €17 million or 40% from Q4 2012 |
|
|
2013 Adjusted EBITDA per metric ton of €273, up €57 or 26% from 2012 |
|
|
Financial results from all reporting segments ahead of prior year |
|
|
Year-end net debt of €132 million, reduced from Q3 net debt of €181 million |
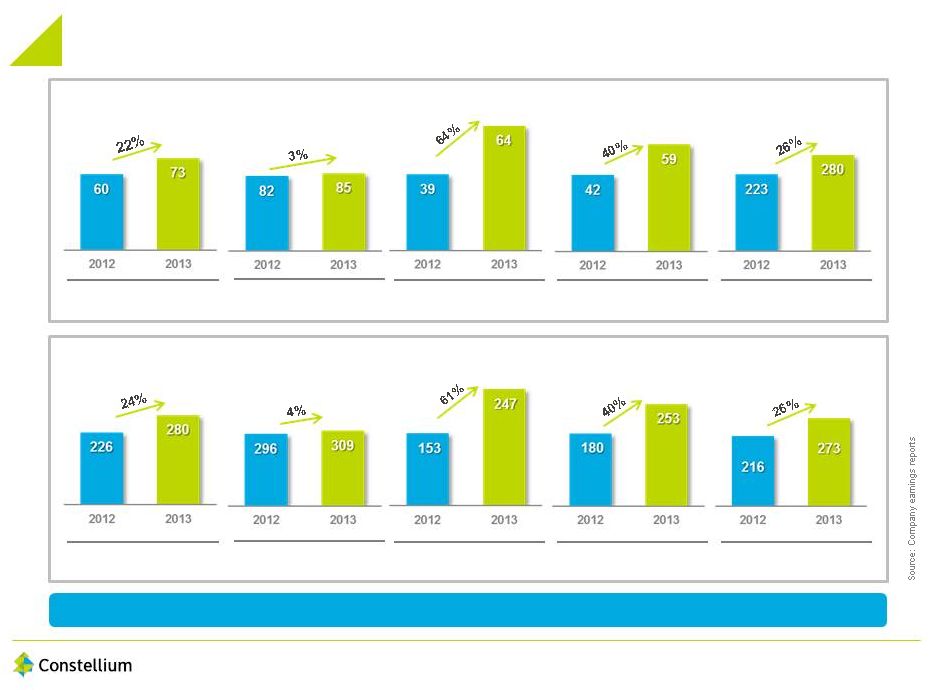
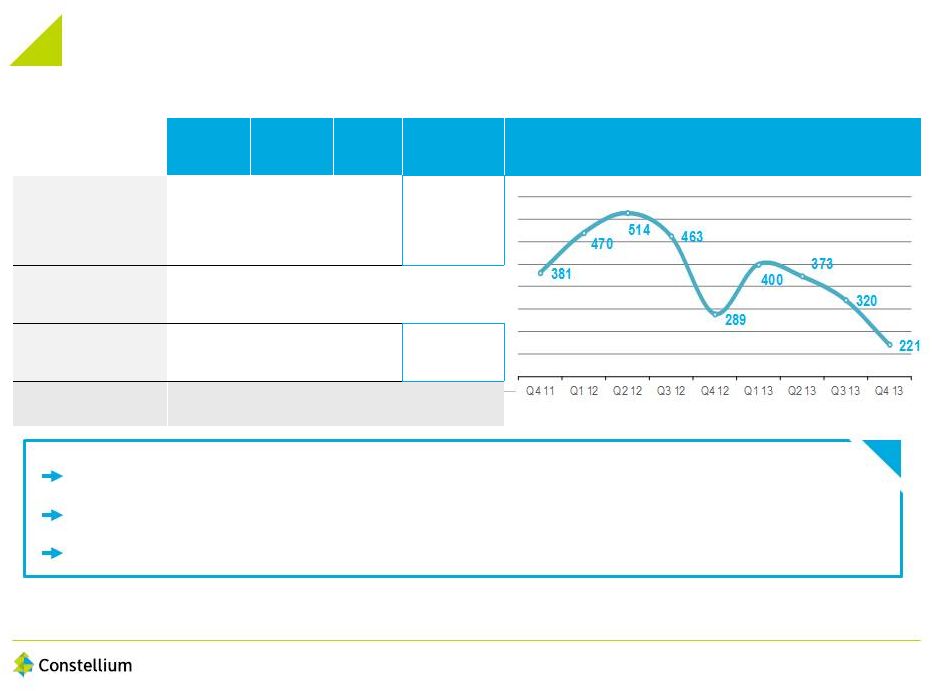
Constellium’s Adjusted EBITDA for 2013 was €280 million, which represented an increase of 26% from 2012 Adjusted EBITDA of €223 million. Fourth quarter 2013 Adjusted EBITDA was €59 million, which represented an increase of 40% from €42 million in Q4 2012. Our 2013 performance was supported by improved productivity and favorable demand for our products primarily in the automotive and aerospace sectors.
Adjusted EBITDA per metric ton for 2013 was €273, which represented an increase of €57 per metric ton, or 26% higher than the Adjusted EBITDA per metric ton of €216 in 2012.


Total shipments in 2013 were 1,025k metric tons, approximately flat with 2012 shipments. Higher shipment volumes in aerospace and automotive were offset by lower volumes in soft alloys and packaging. On a like-for-like basis, adjusting for divestitures, total shipments represented an increase of 11k metric tons. Revenues for 2013 were €3,495 million, which represented a decrease of €115 million, or 3% from 2012 revenues of €3,610 million; however after adjusting for constant London Metal Exchange (or LME) prices, exchange rates and the divestiture of two soft alloy plants in France, revenues for 2013 calculated on a like-for-like basis were 4% ahead of 2012.
In Q4 2013, total shipments were 234k metric tons, approximately flat with Q4 2012 shipments. Revenues for Q4 2013 were €806 million, which represented a decrease of €9 million from Q4 2012, however after adjusting for constant LME prices, exchange rates and the divestiture of two soft alloy plants in France, revenues for Q4 calculated on a like-for-like basis were 9% ahead of Q4 2012 and total shipments represented an increase of 5k metric tons. Adjusted EBITDA per ton increased 40% in Q4 2013 to €253 per metric ton compared with Q4 2012.
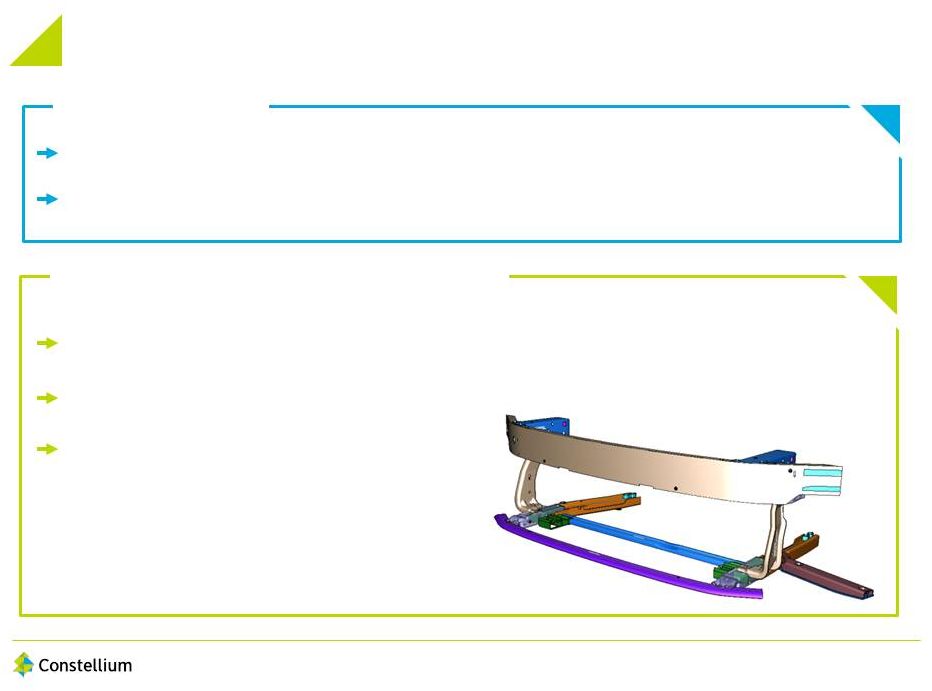
In 2013, we implemented a new contract with Airbus and we signed a new contract with Boeing. Our results were favorably impacted by the combined enhancement of our product mix, higher sales to the aerospace and automotive markets and the continued benefit from the cost and productivity improvements achieved, partially offset by the limited impact of work stoppages at two of our French plants.
Commenting on 2013, Pierre Vareille, Constellium’s Chief Executive Officer said: “2013 was a transformational year for Constellium. We posted strong year over year financial performance improvement across all reporting segments on the back of continued improvement in our operational performance and positive market conditions. Importantly we became a public company and recently increased our public float to more than 84% of shares outstanding. In automotive, accelerating trends in both Europe and in North America are fueling our expansion on both continents. Going forward, we believe the long term outlook for our targeted business segments remains favorable and we expect to continue in our drive to enhance shareholder value.”
2
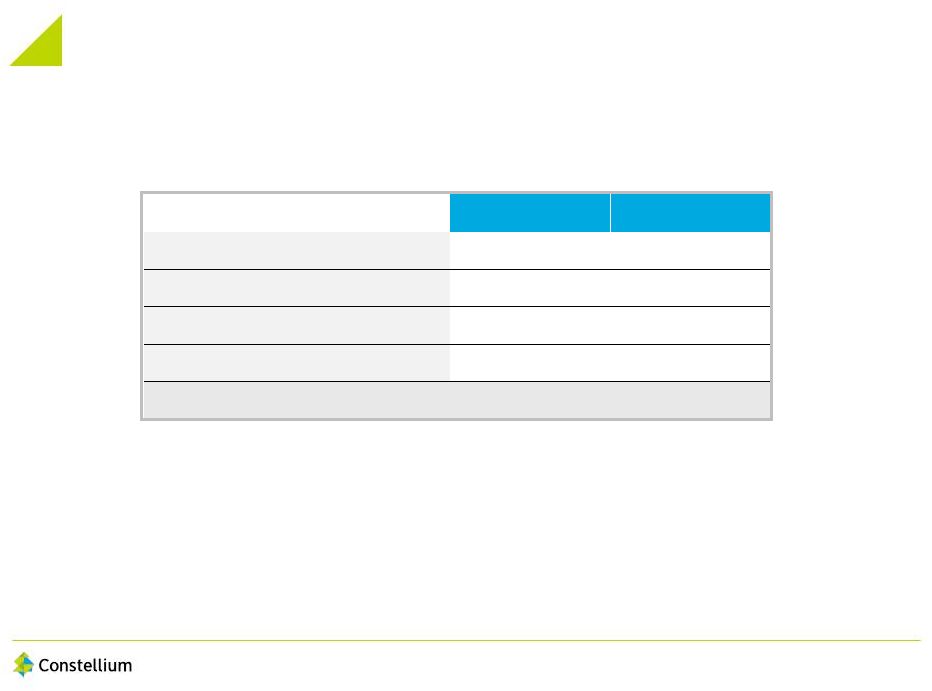
|
|
Group Summary |
| FY 2013 |
FY 2012 |
Var. | Q4 2013 |
Q4 2012 |
Var. | |||||||||||||||||||
| Shipments (k metric tons) |
1,025 | 1,033 | (1 | %) | 234 | 235 | (1 | %) | ||||||||||||||||
| Revenues (€ millions) |
3,495 | 3,610 | (3 | %) | 806 | 815 | (1 | %) | ||||||||||||||||
| Adjusted EBITDA (€ millions) |
280 | 223 | 26 | % | 59 | 42 | 40 | % | ||||||||||||||||
| Adjusted EBITDA per metric ton (€) |
273 | 216 | 26 | % | 253 | 180 | 40 | % | ||||||||||||||||
(Note: Adjusted EBITDA per metric ton is calculated on unrounded underlying figures.)
|
|
Results by Segment |
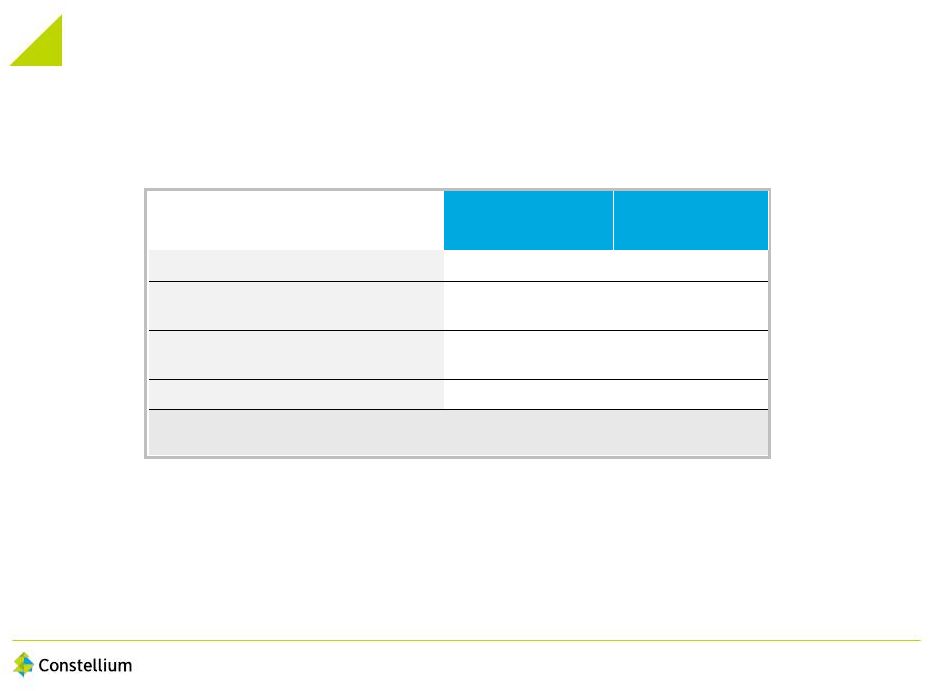
|
|
Aerospace & Transportation |
| FY 2013 |
FY 2012 |
Var. | Q4 2013 |
Q4 2012 |
Var. | |||||||||||||||||||
| Shipments (k metric tons) |
244 | 224 | 9 | % | 61 | 53 | 15 | % | ||||||||||||||||
| Revenues (€ millions) |
1,204 | 1,188 | 1 | % | 293 | 268 | 10 | % | ||||||||||||||||
| Adjusted EBITDA (€ millions) |
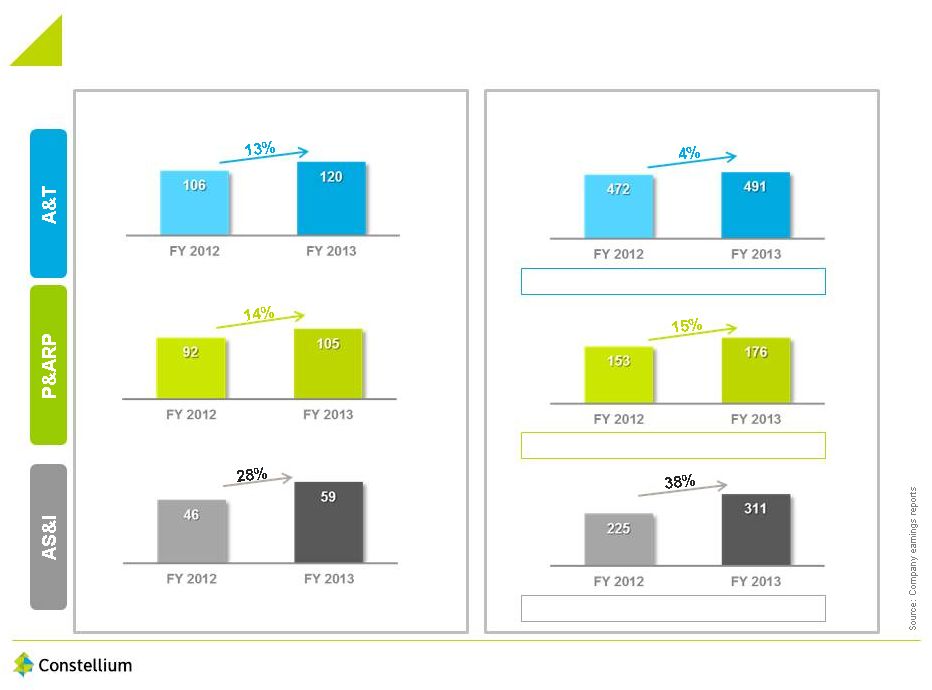
120 | 106 | 13 | % | 29 | 27 | 7 | % | ||||||||||||||||
| Adjusted EBITDA per metric ton (€) |
491 | 472 | 4 | % | 471 | 513 | (8 | %) | ||||||||||||||||
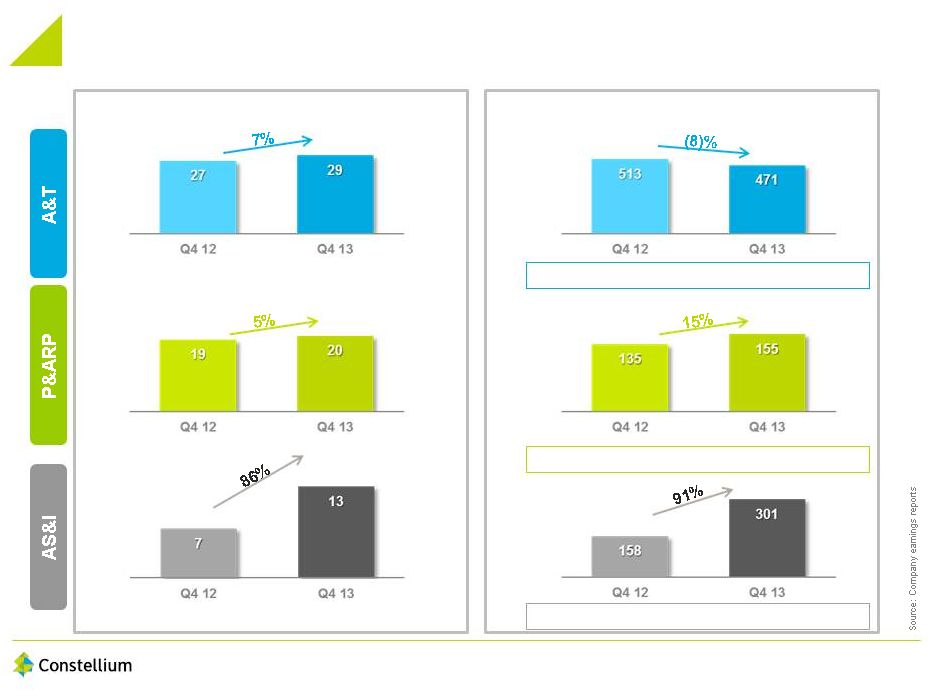
Shipments for the A&T reporting segment were 244k metric tons in 2013, which represented an increase of 20k metric tons, or 9% from 2012. In Q4 2013, shipments were 61k metric tons, which represented an increase of 8k metric tons, or 15% from Q4 2012. Adjusted EBITDA was €120 million in 2013 and €29 million in Q4 2013, which represented an increase of €14 million,
3
or 13% from 2012 and €2 million, or 7% from Q4 2012, respectively. Adjusted EBITDA per ton improved to €491 for the full year 2013 and was €471 in Q4 2013, which represented an increase of 4% from 2012 and a decrease of 8% from Q4 2012. These results reflect the benefits of the new contract with Airbus which resulted in increased shipments and a better product mix for this reporting segment along with our limited exposure to spot market conditions and prices.
|
|
Packaging & Automotive Rolled Products |
| FY 2013 |
FY 2012 |
Var. | Q4 2013 |
Q4 2012 |
Var. | |||||||||||||||||||
| Shipments (k metric tons) |
595 | 606 | (2 | %) | 131 | 137 | (4 | %) | ||||||||||||||||
| Revenues (€ millions) |
1,480 | 1,561 | (5 | %) | 315 | 350 | (10 | %) | ||||||||||||||||
| Adjusted EBITDA (€ millions) |
105 | 92 | 14 | % | 20 | 19 | 5 | % | ||||||||||||||||
| Adjusted EBITDA per metric ton (€) |
176 | 153 | 15 | % | 155 | 135 | 15 | % | ||||||||||||||||
Shipments for our P&ARP reporting segment were 595k metric tons in 2013, which represented a decrease of 2% from 2012. In Q4 2013 shipments were 131k metric tons which represented a decrease of 4% from Q4 2012. Shipments were impacted by slightly lower fourth quarter demand and production in can stock, mitigated by strong growth in auto body sheet and in foil stock.
Adjusted EBITDA improved to €105 million in 2013, which represented an increase of 14% from €92 million in 2012. Adjusted EBITDA per metric ton improved to €176 in 2013, which represented an increase of 15% from €153 in Adjusted EBITDA per metric ton in 2012. Results for this segment were driven by improved demand for automotive products and a good resiliency in can stock pricing. In addition improved productivity and cost saving initiatives contributed to the improved financial performance of the reporting segment.
4
|
|
Automotive Structures & Industry |
| FY 2013 |
FY 2012 |
Var. | Q4 2013 |
Q4 2012 |
Var. | |||||||||||||||||||
| Shipments (k metric tons) |
191 | 206 | (7 | %) | 45 | 46 | (2 | %) | ||||||||||||||||
| Revenues (€ millions) |
859 | 910 | (6 | %) | 204 | 208 | (2 | %) | ||||||||||||||||
| Adjusted EBITDA (€ millions) |
59 | 46 | 28 | % | 13 | 7 | 86 | % | ||||||||||||||||
| Adjusted EBITDA per metric ton (€) |
311 | 225 | 38 | % | 301 | 158 | 91 | % | ||||||||||||||||
Shipment volumes for the AS&I reporting segment were 191k metric tons in 2013, which represented a decrease of 15k metric tons or 7% from 2012 reflecting the sale of Ham and Saint Florentin soft alloy plants in France. Adjusting for the sale of these two plants, volumes on a like-for-like basis increased 2% for this segment. Adjusted EBITDA improved to €59 million in 2013, which represented an increase of 28% from the €46 million in 2012. Adjusted EBITDA per ton improved to €311, which represented an increase of 38% from the €225 in 2012.
In Q4 2013, shipments decreased 1k metric tons and Adjusted EBITDA grew 86% to €13 million on stronger automotive structures business as compared with Q4 2012. Adjusted EBITDA per ton improved to €301 per ton in Q4, or 91% from €158 per ton in Q4 2012. The sale of the two plants positively impacted Adjusted EBITDA per metric ton by about €55 per metric ton. Results for this segment reached record levels for Adjusted EBITDA and Adjusted EBITDA per metric ton driven by stronger demand for automotive products.
|
|
Net income |
Net income from continuing operations in Q4 2013 was €33 million, which was €29 million lower than in Q4 2012 which included a €48 million gain from amendments made to the OPEB plans applicable to employees at our Ravenswood, West Virginia facility. Partly offsetting this variance were lower restructuring, finance and tax charges in Q4 2013 as compared with Q4 2012.
For 2013, net income from continuing operations of €96 million was €53 million lower than in 2012. The decrease was mainly attributable to lower one-time credits to the Ravenswood pension and OPEB plan amendments (€47 million), lower unrealized gains on derivatives in 2013 compared with 2012, and the costs of Constellium’s initial public offering of €24 million
5
charged to the income statement in Q2 2013. These factors were partly offset by the higher Adjusted EBITDA performance in 2013 and other items including lower restructuring costs, down €17 million year over year.
|
|
Earnings per share |
Fully diluted earnings per share from continuing operations, was €0.30 in Q4 2013 and €0.95 per share for 2013. These figures are calculated by dividing the net income from continuing operations for the relevant period by the weighted average number of ordinary shares issued and outstanding for that period.
|
|
Cash flow and liquidity |
In Q4 2013, Adjusted Free Cash Flow was €53 million which was €12 million higher than in Q3 2013 but €68 million below Q4 2012 when there was a significant quarterly reduction in working capital. Trade working capital decreased by €99 million in Q4 2013 compared with a decrease of €174 million in Q4 2012.
Adjusted Free Cash Flow for 2013 was a positive €36 million. This represented a decrease of €77 million from 2012 due mainly to the fees paid in respect of the company’s initial public offering (€27 million) and higher capital expenditure invested in the business (up €18 million). There was a further reduction (of €68 million) in working capital during the year.
Net Debt as of December 31, 2013, was €132 million, an increase of €115 million from December 31, 2012. This increase mainly reflects the distributions of approximately €250 million made to shareholders prior to the completion of our initial public offering in May 2013. This cash outflow was partly offset by the proceeds from our initial public offering and the cash flow of the business over the twelve months ended December 31, 2013. Net Debt as of December 31, 2013 was 0.5 times the Adjusted EBITDA for the 2013 financial year.
As of December 31, 2013, liquidity, which is calculated as the unutilized balance on our long-term financing facilities plus cash and cash equivalents, was €392 million, comprised of €130 million available under our factoring facilities, €29 million under our Asset Based Loan (ABL) facility and €233 million of cash and cash equivalents.
|
|
Recent Developments |
On January 15, 2014, Constellium announced that the company plans to invest up to €200 million over the next three years to further grow its European Body-in-White (BiW) business. Constellium’s investment is expected to run through the end of 2016. In Phase 1, Constellium plans to increase production capacity at its Neuf-Brisach (France) plant and to start BiW production at its Singen (Germany) plant by revamping its continuous annealing line. By 2016, Constellium expects to add up to 40,000 metric tons to its current capacity with the first BiW coils produced at Singen as early as mid-2014. In Phase 2, Constellium plans to add a new continuous annealing and conversion line in Europe with a targeted capacity of 100,000 metric tons, with the aim to start commissioning in the second half of 2016.
6
On January 23, 2014, Constellium and UACJ Corporation announced that they will join forces to supply and market aluminum BiW sheet to the North American automotive industry. To achieve this goal, Constellium and UACJ, through Tri-Arrows Aluminum Inc. (UACJ’s subsidiary with Sumitomo Corporation and Itochu Group), intend to create a joint venture company in the United States, as an equal partnership, to serve the North American market. Constellium will own 51% of the equity of the partnership. The JV is expected to include a continuous heat treatment and conversion line with an initial target capacity of 100,000 metric tons supplied by cold rolled coils from both partners’ rolling mills. The planned facility is designed to allow for expansion beyond 100,000 tons. The total joint investment by both parties is expected to amount to approximately $150 million. The parties expect to finalize a definitive agreement for the joint venture in the first half of 2014.
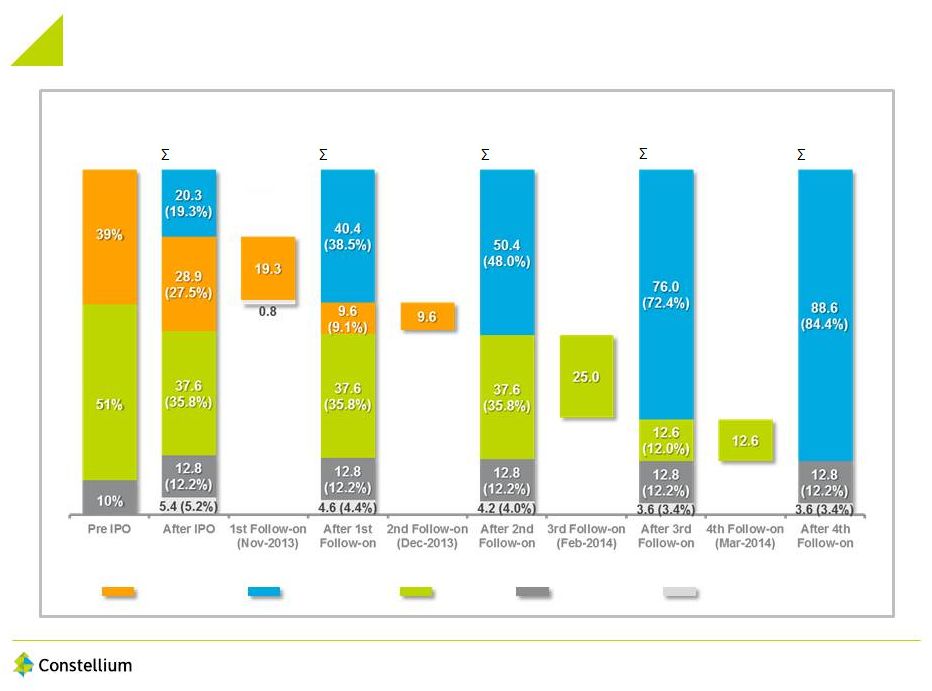
On February 5, 2014 Constellium filed a prospectus relating to the sale by Apollo Omega (Lux) S.a.r.l. of 25 million ordinary shares. The Company did not receive any proceeds from the sale of our ordinary shares sold by the selling shareholder. On March 5, 2014 Apollo Omega sold an additional 12,561,475 ordinary shares, representing its remaining shareholdings in Constellium. We did not receive any proceeds from the sale of ordinary shares by the selling shareholder. Constellium’s public stock float has increased from approximately 19% at the time of the IPO in May 2013 to approximately 84% today. Bpifrance, the French Government Sovereign Fund, holds approximately 12% of our ordinary shares, and just over 3% are held by Constellium management.
7
|
|
Non-GAAP measures reconciliations |
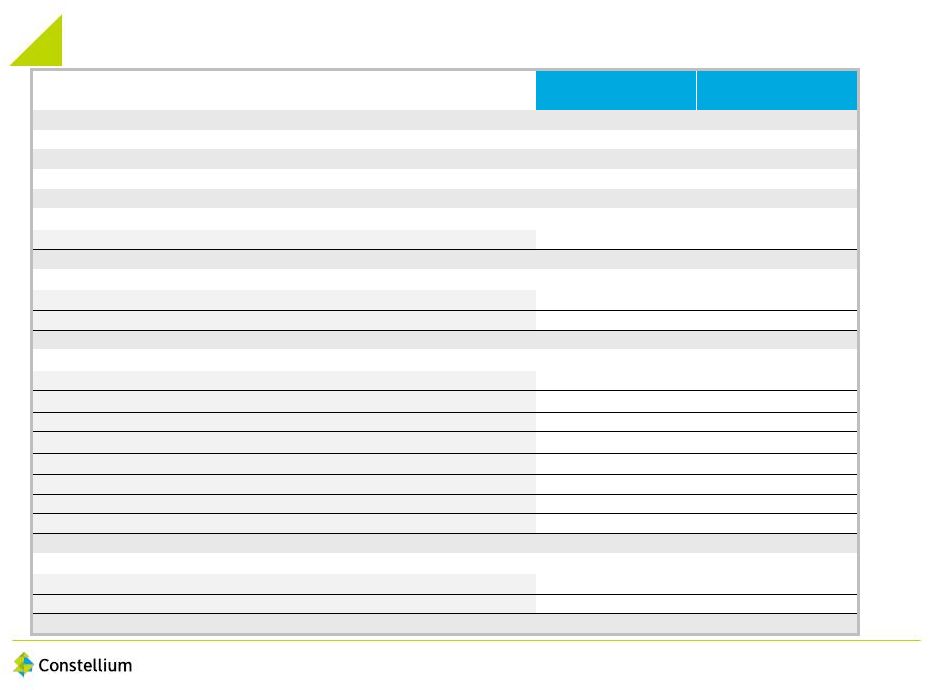
Reconciliation of net income from continuing operations to Adjusted EBITDA (a non-IFRS measure)
| Q4 2013 |
Q4 2012 |
|||||||
| Net income from continuing operations |
33 | 62 | ||||||
| Income tax (benefit)/expense |
(4 | ) | 4 | |||||
| Income before income tax |
29 | 66 | ||||||
| Finance costs – net |
6 | 11 | ||||||
| Other expenses/share of results of joint-ventures |
3 | 5 | ||||||
| Income from operations |
38 | 82 | ||||||
| Ravenswood OPEB plan amendment |
— | (48 | ) | |||||
| Restructuring costs |
2 | 10 | ||||||
| Losses on disposals |
1 | — | ||||||
| Unrealized (gains) on derivatives |
(10 | ) | (11 | ) | ||||
| Unrealized gains from re-measurement of monetary assets and liabilities |
(2 | ) | — | |||||
| Ravenswood CBA renegotiation |
— | (1 | ) | |||||
| Depreciation and impairment |
13 | 7 | ||||||
| Management Adjusted EBITDA |
42 | 39 | ||||||
| Metal lag |
8 | — | ||||||
| Other |
9 | 3 | ||||||
| Adjusted EBITDA |
59 | 42 | ||||||
8
| FY 2013 |
FY 2012 |
|||||||
| Net income from continuing operations |
96 | 149 | ||||||
| Income tax expense |
39 | 46 | ||||||
| Income before income tax |
135 | 195 | ||||||
| Finance costs – net |
50 | 60 | ||||||
| Other expenses/share of results of joint-ventures |
24 | 8 | ||||||
| Income from operations |
209 | 263 | ||||||
| Ravenswood OPEB plan amendment |
(11 | ) | (58 | ) | ||||
| Restructuring costs |
8 | 25 | ||||||
| Unrealized (gains) on derivatives |
(12 | ) | (61 | ) | ||||
| Unrealized (gains)/losses from re-measurement of monetary assets and liabilities |
(2 | ) | 1 | |||||
| Losses on disposal |
5 | — | ||||||
| Swiss pension plan settlement |
— | 8 | ||||||
| Ravenswood CBA renegotiation |
— | 7 | ||||||
| Depreciation and impairment |
32 | 14 | ||||||
| Management Adjusted EBITDA |
229 | 199 | ||||||
| Metal lag |
29 | 16 | ||||||
| Other |
22 | 8 | ||||||
| Adjusted EBITDA |
280 | 223 | ||||||
9
Reconciliation of cash flow from operating activities to Adjusted Free Cash Flow (a non-IFRS measure)
| Q4 2013 |
Q4 2012 |
FY 2013 |
FY 2012 |
|||||||||||||
| Cash flow from operating activities |
105 | 187 | 184 | 246 | ||||||||||||
| Margin calls included in cash flow from operating activities |
— | (10 | ) | (4 | ) | (7 | ) | |||||||||
| Cash flow from operating activities excluding margin calls |
105 | 177 | 180 | 239 | ||||||||||||
| Capital expenditure |
(52 | ) | (56 | ) | (144 | ) | (126 | ) | ||||||||
| Adjusted Free Cash Flow |
53 | 121 | 36 | 113 | ||||||||||||
Reconciliation of Net Debt (a non-IFRS measure)
| As of Dec. 31, | As of Dec. 31, | |||||||
| 2013 | 2012 | |||||||
| Borrowings |
348 | 158 | ||||||
| Fair value of cross currency interest swap |
26 | 14 | ||||||
| Cash and cash equivalents |
(233 | ) | (142 | ) | ||||
| Cash pledged for issuance of guarantees |
(9 | ) | (13 | ) | ||||
| Net Debt |
132 | 17 | ||||||
Non-GAAP measures
In addition to the results reported in accordance with International Financial Reporting Standards (“IFRS”) as issued by the International Accounting Standards Board (all standards applied by the Group have been endorsed by the European Union), this press release includes information regarding certain non-GAAP financial measures. The non-GAAP financial measures used in this press release are: Management Adjusted EBITDA, Adjusted EBITDA, Adjusted EBITDA per metric ton, Adjusted Free Cash Flow and Net Debt. Reconciliations to the most directly comparable IFRS financial measures are presented in the schedules to this press
10
release. We believe these non-GAAP measures are important supplemental measures of our operating performance. By providing these measures, together with the reconciliations, we believe we are enhancing investors’ understanding of our business and our results of operations, as well as assisting investors in evaluating how well we are executing our strategic initiatives. However, these non-GAAP financial measures supplement our IFRS disclosures and should not be considered an alternative to the IFRS measures.
In considering the financial performance of the business, management and our chief operational decision maker, as defined by IFRS, analyze the primary financial performance measure of Management Adjusted EBITDA in all of our business segments. The most directly comparable IFRS measure to Management Adjusted EBITDA is our profit or loss for the period. We believe Management Adjusted EBITDA, as defined below, is useful to investors and is used by our management for measuring profitability because it excludes the impact of certain non-cash charges, such as depreciation, amortization, impairment and unrealized gains and losses on derivatives as well as items that do not impact the day-to-day operations and that management in many cases does not directly control or influence. Therefore, such adjustments eliminate items which have less bearing on our core operating performance.
Adjusted EBITDA measures are frequently used by securities analysts, investors and other interested parties in their evaluation of Constellium and in comparison to other companies, many of which present an Adjusted EBITDA-related performance measure when reporting their results.
Management believes that Adjusted Free Cash Flow is a useful measure of the net cash flow generated or used by the business as it takes into account both the cash generated or consumed by operating activities, including working capital, and the capital expenditure requirements of the business.
Management further believes that Net Debt is a useful measure of indebtedness because it takes into account the cash and cash equivalent balances held by the Company as well as the total external debt of the Company.
Management Adjusted EBITDA is defined as profit from operations before depreciation, amortization and impairment, as adjusted to exclude losses on disposal of property, plant and equipment, acquisition and separation costs, restructuring costs, pension amendments and unrealized gains or losses on derivatives and foreign exchange differences on the remeasurement of monetary assets and liabilities.
Adjusted EBITDA is an additional performance measure used by management as an important supplemental measure in evaluating our operating performance, in preparing internal forecasts and budgets necessary for managing our business and, specifically in relation to the exclusion of the effect of favorable or unfavorable metal price lag (the financial impact of the timing difference between when aluminum prices included within our revenues are established and when aluminum purchase prices included in our cost of sales are established), this measure allows management and the investor to assess operating results and trends without the impact
11
of our accounting for inventories. We use the weighted average cost method in accordance with IFRS which leads to the purchase price paid for metal impacting our cost of goods sold and therefore profitability in the period subsequent to when the related sales price impacts our revenues. Management also believes this measure provides additional information used by our lending facilities providers with respect to the ongoing performance of our underlying business activities. We use Adjusted EBITDA in calculating our compliance with the financial covenants under our floating rate term loan facility. Adjusted EBITDA is defined as Management Adjusted EBITDA further adjusted for favorable (unfavorable) metal price lag, exceptional consulting costs, effects of purchase accounting adjustment, standalone costs and management fees payable by the company to an affiliate of Apollo Global Management, LLC, and exceptional employee bonuses in relation to cost saving implementation and targets.
Management Adjusted EBITDA and Adjusted EBITDA are not presentations made in accordance with IFRS, are not measures of financial condition, liquidity or profitability and should not be considered as an alternative to profit or loss for the period, revenues or operating cash flows determined in accordance with IFRS. These measures may not be comparable to similarly titled measures of other companies.
Adjusted Free Cash Flow is Net Cash Flow from Operating Activities, after capital expenditure and excluding margin calls. Net Debt is defined as borrowings and the fair value of cross currency interest swaps less cash and cash equivalents and cash pledged for the issuance of guarantees.
12
|
|
Forward-looking statements |
Certain statements contained in this press release may constitute forward-looking statements within the meaning of the Private Securities Litigation Reform Act of 1995. This press release may contain “forward-looking statements” with respect to our business, results of operations and financial condition, and our expectations or beliefs concerning future events and conditions. You can identify certain forward-looking statements because they contain words such as, but not limited to, “believes,” “expects,” “may,” “should,” “approximately,” “anticipates,” “estimates,” “intends,” “plans,” “targets,” “likely,” “will,” “would,” “could” and similar expressions (or the negative of these terminologies or expressions). All forward-looking statements involve risks and uncertainties. Many risks and uncertainties are inherent in our industry and markets. Others are more specific to our business and operations. These risks and uncertainties include, but are not limited to, those set forth under the heading “Risk Factors” in our most recent Form F-1 Registration Statement, and described from time to time in subsequent reports, filed with the U.S. Securities and Exchange Commission. The occurrence of the events described and the achievement of the expected results depend on many events, some or all of which are not predictable or within our control. Consequently, actual results may differ materially from the forward-looking statements contained in this press release. We undertake no obligation to publicly update or revise any forward-looking statement as a result of new information, future events or otherwise, except as required by law.
|
|
About Constellium |
Constellium (NYSE and NYSE Euronext: CSTM) is a global sector leader that develops innovative, value added aluminum products for a broad scope of markets and applications, including aerospace, automotive and packaging. Constellium generated €3.5 billion of revenue in 2013. Constellium’s earnings materials for the year ended December 31, 2013 are available on the company’s web-site (www.constellium.com) under the regulatory filings section.
13
CONSOLIDATED INCOME STATEMENT
| (in millions of Euros) |
Year ended December 31, 2013 |
Year ended December 31, 2012 Restated* |
Year ended December 31, 2011 Restated* |
|||||||||
| Revenue |
3,495 | 3,610 | 3,556 | |||||||||
| Cost of sales |
(3,024 | ) | (3,136 | ) | (3,239 | ) | ||||||
|
|
|
|
|
|
|
|||||||
| Gross profit |
471 | 474 | 317 | |||||||||
|
|
|
|
|
|
|
|||||||
| Selling and administrative expenses |
(210 | ) | (212 | ) | (216 | ) | ||||||
| Research and development expenses |
(36 | ) | (36 | ) | (33 | ) | ||||||
| Restructuring costs |
(8 | ) | (25 | ) | (20 | ) | ||||||
| Other (losses) / gains- net |
(8 | ) | 62 | (111 | ) | |||||||
|
|
|
|
|
|
|
|||||||
| Income / (Loss) from operations |
209 | 263 | (63 | ) | ||||||||
|
|
|
|
|
|
|
|||||||
| Other expenses |
(27 | ) | (3 | ) | (102 | ) | ||||||
|
|
|
|
|
|
|
|||||||
| Finance income |
17 | 4 | 2 | |||||||||
| Finance costs |
(67 | ) | (64 | ) | (41 | ) | ||||||
|
|
|
|
|
|
|
|||||||
| Finance costs – net |
(50 | ) | (60 | ) | (39 | ) | ||||||
|
|
|
|
|
|
|
|||||||
| Share of profit / (loss) of joint-ventures |
3 | (5 | ) | — | ||||||||
|
|
|
|
|
|
|
|||||||
| Income / (Loss) before income tax |
135 | 195 | (204 | ) | ||||||||
|
|
|
|
|
|
|
|||||||
| Income tax (expense) / benefit |
(39 | ) | (46 | ) | 34 | |||||||
|
|
|
|
|
|
|
|||||||
| Net Income / (Loss) from continuing operations |
96 | 149 | (170 | ) | ||||||||
|
|
|
|
|
|
|
|||||||
| Discontinued operations |
||||||||||||
| Net Income / (Loss) from discontinued operations |
4 | (8 | ) | (8 | ) | |||||||
|
|
|
|
|
|
|
|||||||
| Net Income / (Loss) |
100 | 141 | (178 | ) | ||||||||
|
|
|
|
|
|
|
|||||||
| Net Income / (Loss) attributable to: |
||||||||||||
| Owners of the Company |
98 | 139 | (179 | ) | ||||||||
| Non-controlling interests |
2 | 2 | 1 | |||||||||
|
|
|
|
|
|
|
|||||||
| Net Income / (Loss) |
100 | 141 | (178 | ) | ||||||||
|
|
|
|
|
|
|
|||||||
Earnings per share attributable to the equity holders of the Company
| (in Euros per share) | Year ended December 31, 2013 |
Year ended December 31, 2012 Restated* |
Year ended December 31, 2011 Restated* |
|||||||||
| From continuing and discontinued operations |
||||||||||||
| Basic |
1.00 | 1.55 | (2.00 | ) | ||||||||
| Diluted |
0.99 | 1.55 | (2.00 | ) | ||||||||
| From continuing operations |
||||||||||||
| Basic |
0.96 | 1.64 | (1.91 | ) | ||||||||
| Diluted |
0.95 | 1.64 | (1.91 | ) | ||||||||
| From discontinued operations |
||||||||||||
| Basic |
0.04 | (0.09 | ) | (0.09 | ) | |||||||
| Diluted |
0.04 | (0.09 | ) | (0.09 | ) | |||||||
| * | Comparative financial statements have been restated following the application of IAS 19 revised. |
14
CONSOLIDATED STATEMENT OF COMPREHENSIVE INCOME/ (LOSS)
| (in millions of Euros) |
At December 31, 2013 |
At December 31, 2012 Restated* |
At December 31, 2011 Restated* |
|||||||||
| Net Income / (Loss) |
100 | 141 | (178 | ) | ||||||||
|
|
|
|
|
|
|
|||||||
| Other Comprehensive Income / (Loss) |
||||||||||||
| Items that will not be reclassified subsequently to Profit or Loss |
||||||||||||
| Remeasurement on post-employment benefit obligations |
72 | (80 | ) | (23 | ) | |||||||
| Deferred tax on remeasurement on post-employment benefit obligations |
(9 | ) | 16 | 1 | ||||||||
| Items that may be reclassified subsequently to Profit or Loss |
||||||||||||
| Currency translation differences |
— | — | (14 | ) | ||||||||
|
|
|
|
|
|
|
|||||||
| Other Comprehensive Income / (Loss) |
63 | (64 | ) | (36 | ) | |||||||
|
|
|
|
|
|
|
|||||||
| Total Comprehensive Income / (Loss) |
163 | 77 | (214 | ) | ||||||||
|
|
|
|
|
|
|
|||||||
| Attributable to: |
||||||||||||
| Owners of the Company |
161 | 75 | (215 | ) | ||||||||
| Non-controlling interests |
2 | 2 | 1 | |||||||||
|
|
|
|
|
|
|
|||||||
| Total Comprehensive Income / (Loss) |
163 | 77 | (214 | ) | ||||||||
|
|
|
|
|
|
|
|||||||
| * | Comparative financial statements have been restated following the application of IAS 19 revised. |
15
CONSOLIDATED STATEMENT OF FINANCIAL POSITION
| (in millions of Euros) |
At December 31, 2013 | At December 31, 2012 Restated* |
||||||
| Assets |
||||||||
| Non-current assets |
||||||||
| Intangible assets (including goodwill) |
21 | 11 | ||||||
| Property, plant and equipment |
408 | 302 | ||||||
| Investments in joint ventures |
1 | 2 | ||||||
| Deferred income tax assets |
177 | 205 | ||||||
| Trade receivables and other |
60 | 64 | ||||||
| Other financial assets |
7 | 10 | ||||||
|
|
|
|
|
|||||
| 674 | 594 | |||||||
|
|
|
|
|
|||||
| Current assets |
||||||||
| Inventories |
328 | 385 | ||||||
| Trade receivables and other |
483 | 476 | ||||||
| Other financial assets |
25 | 34 | ||||||
| Cash and cash equivalents |
233 | 142 | ||||||
|
|
|
|
|
|||||
| 1,069 | 1,037 | |||||||
|
|
|
|
|
|||||
| Assets of disposal group classified as held for sale |
21 | — | ||||||
|
|
|
|
|
|||||
| Total Assets |
1,764 | 1,631 | ||||||
|
|
|
|
|
|||||
| Equity |
||||||||
| Share capital |
2 | — | ||||||
| Share premium account |
162 | 98 | ||||||
| Retained deficit and other reserves |
(132 | ) | (139 | ) | ||||
|
|
|
|
|
|||||
| Equity attributable to owners of the Company |
32 | (41 | ) | |||||
| Non-controlling interests |
4 | 4 | ||||||
|
|
|
|
|
|||||
| 36 | (37 | ) | ||||||
|
|
|
|
|
|||||
| Liabilities |
||||||||
| Non-current liabilities |
||||||||
| Borrowings |
326 | 140 | ||||||
| Trade payables and other |
35 | 26 | ||||||
| Deferred income tax liabilities |
1 | 11 | ||||||
| Pension and other post-employment benefit obligations |
507 | 611 | ||||||
| Other financial liabilities |
36 | 46 | ||||||
| Provisions |
65 | 89 | ||||||
|
|
|
|
|
|||||
| 970 | 923 | |||||||
|
|
|
|
|
|||||
| Current liabilities |
||||||||
| Borrowings |
22 | 18 | ||||||
| Trade payables and other |
646 | 656 | ||||||
| Income taxes payable |
19 | 14 | ||||||
| Other financial liabilities |
24 | 24 | ||||||
| Provisions |
38 | 33 | ||||||
|
|
|
|
|
|||||
| 749 | 745 | |||||||
|
|
|
|
|
|||||
| Liabilities of disposal group classified as held for sale |
9 | — | ||||||
|
|
|
|
|
|||||
| Total liabilities |
1,728 | 1,668 | ||||||
|
|
|
|
|
|||||
| Total equity and liabilities |
1,764 | 1,631 | ||||||
|
|
|
|
|
|||||
| * | Comparative financial statements have been restated following the application of IAS 19 revised. |
16
CONSOLIDATED STATEMENT OF CHANGES IN EQUITY
| (in millions of Euros) |
Share capital |
Share premium |
Remeasure -ment |
Foreign currency translation reserve |
Other reserves |
Retained losses |
Total Group share |
Non- controlling interests |
Total equity |
|||||||||||||||||||||||||||
| As at January 1, 2011 |
— | — | — | — | — | — | — | — | — | |||||||||||||||||||||||||||
|
|
|
|
|
|
|
|
|
|
|
|
|
|
|
|
|
|
|
|||||||||||||||||||
| Net loss |
— | — | — | — | — | (179 | ) | (179 | ) | 1 | (178 | ) | ||||||||||||||||||||||||
| Other comprehensive loss |
— | — | (22 | ) | (14 | ) | — | — | (36 | ) | — | (36 | ) | |||||||||||||||||||||||
|
|
|
|
|
|
|
|
|
|
|
|
|
|
|
|
|
|
|
|||||||||||||||||||
| Total Comprehensive Loss |
— | — | (22 | ) | (14 | ) | — | (179 | ) | (215 | ) | 1 | (214 | ) | ||||||||||||||||||||||
|
|
|
|
|
|
|
|
|
|
|
|
|
|
|
|
|
|
|
|||||||||||||||||||
| Transactions with the owners |
||||||||||||||||||||||||||||||||||||
| Issuance (amendment) of share capital |
— | 98 | — | — | — | — | 98 | — | 98 | |||||||||||||||||||||||||||
| Other |
— | — | — | — | 2 | — | 2 | — | 2 | |||||||||||||||||||||||||||
|
|
|
|
|
|
|
|
|
|
|
|
|
|
|
|
|
|
|
|||||||||||||||||||
| Transactions with non-controlling interests |
||||||||||||||||||||||||||||||||||||
| Non-controlling interest assumed in acquisition |
— | — | — | — | — | — | — | 1 | 1 | |||||||||||||||||||||||||||
|
|
|
|
|
|
|
|
|
|
|
|
|
|
|
|
|
|
|
|||||||||||||||||||
| As at December 31, 2011 Restated* |
— | 98 | (22 | ) | (14 | ) | 2 | (179 | ) | (115 | ) | 2 | (113 | ) | ||||||||||||||||||||||
|
|
|
|
|
|
|
|
|
|
|
|
|
|
|
|
|
|
|
|||||||||||||||||||
| (in millions of Euros) |
Share capital |
Share premium |
Remeasure -ment |
Foreign currency translation reserve |
Other reserves |
Retained losses |
Total Group share |
Non- controlling interests |
Total equity |
|||||||||||||||||||||||||||
| As at January 1, 2012 Restated* |
— | 98 | (22 | ) | (14 | ) | 2 | (179 | ) | (115 | ) | 2 | (113 | ) | ||||||||||||||||||||||
|
|
|
|
|
|
|
|
|
|
|
|
|
|
|
|
|
|
|
|||||||||||||||||||
| Net income |
— | — | — | — | — | 139 | 139 | 2 | 141 | |||||||||||||||||||||||||||
| Other comprehensive loss |
— | — | (64 | ) | — | — | — | (64 | ) | — | (64 | ) | ||||||||||||||||||||||||
|
|
|
|
|
|
|
|
|
|
|
|
|
|
|
|
|
|
|
|||||||||||||||||||
| Total Comprehensive Income |
— | — | (64 | ) | — | — | 139 | 75 | 2 | 77 | ||||||||||||||||||||||||||
|
|
|
|
|
|
|
|
|
|
|
|
|
|
|
|
|
|
|
|||||||||||||||||||
| Transactions with the owners |
||||||||||||||||||||||||||||||||||||
| Share equity plan |
— | — | — | — | 1 | — | 1 | — | 1 | |||||||||||||||||||||||||||
| Other |
— | — | — | — | (2 | ) | — | (2 | ) | — | (2 | ) | ||||||||||||||||||||||||
|
|
|
|
|
|
|
|
|
|
|
|
|
|
|
|
|
|
|
|||||||||||||||||||
| As at December 31, 2012 Restated* |
— | 98 | (86 | ) | (14 | ) | 1 | (40 | ) | (41 | ) | 4 | (37 | ) | ||||||||||||||||||||||
|
|
|
|
|
|
|
|
|
|
|
|
|
|
|
|
|
|
|
|||||||||||||||||||
| (in millions of Euros) |
Share capital |
Share premium |
Remeasure -ment |
Foreign currency translation reserve |
Other reserves |
Retained losses |
Total Group share |
Non- controlling interests |
Total equity |
|||||||||||||||||||||||||||
| As at January 1, 2013 Restated* |
— | 98 | (86 | ) | (14 | ) | 1 | (40 | ) | (41 | ) | 4 | (37 | ) | ||||||||||||||||||||||
|
|
|
|
|
|
|
|
|
|
|
|
|
|
|
|
|
|
|
|||||||||||||||||||
| Net income |
— | — | — | — | — | 98 | 98 | 2 | 100 | |||||||||||||||||||||||||||
| Other comprehensive income |
— | — | 63 | — | — | — | 63 | — | 63 | |||||||||||||||||||||||||||
|
|
|
|
|
|
|
|
|
|
|
|
|
|
|
|
|
|
|
|||||||||||||||||||
| Total Comprehensive Income |
— | — | 63 | — | — | 98 | 161 | 2 | 163 | |||||||||||||||||||||||||||
|
|
|
|
|
|
|
|
|
|
|
|
|
|
|
|
|
|
|
|||||||||||||||||||
| Transactions with the owners |
||||||||||||||||||||||||||||||||||||
| Share premium distribution |
— | (98 | ) | — | — | — | (5 | ) | (103 | ) | — | (103 | ) | |||||||||||||||||||||||
| MEP shares changes |
— | — | — | — | (1 | ) | — | (1 | ) | — | (1 | ) | ||||||||||||||||||||||||
| Share equity plan |
— | — | — | — | 1 | — | 1 | — | 1 | |||||||||||||||||||||||||||
| Prorata share issuance |
2 | — | — | — | — | (2 | ) | — | — | — | ||||||||||||||||||||||||||
| Interim dividend distribution |
— | — | — | — | — | (147 | ) | (147 | ) | — | (147 | ) | ||||||||||||||||||||||||
| IPO Primary offering |
— | 154 | — | — | — | — | 154 | — | 154 | |||||||||||||||||||||||||||
| IPO Over-allotment |
— | 25 | — | — | — | — | 25 | — | 25 | |||||||||||||||||||||||||||
| IPO Fees |
— | (17 | ) | — | — | — | — | (17 | ) | — | (17 | ) | ||||||||||||||||||||||||
| Transactions with non-controlling interests |
— | — | — | — | — | — | — | (2 | ) | (2 | ) | |||||||||||||||||||||||||
|
|
|
|
|
|
|
|
|
|
|
|
|
|
|
|
|
|
|
|||||||||||||||||||
| As at December 31, 2013 |
2 | 162 | (23 | ) | (14 | ) | 1 | (96 | ) | 32 | 4 | 36 | ||||||||||||||||||||||||
|
|
|
|
|
|
|
|
|
|
|
|
|
|
|
|
|
|
|
|||||||||||||||||||
| * | Comparative financial statements have been restated following the application of IAS 19 revised. |
17
CONSOLIDATED STATEMENT OF CASH FLOWS
| (in millions of Euros) | Year ended December 31, 2013 |
Year ended December, 2012 Restated* |
Year ended December, 2011 Restated* |
|||||||||
| Cash flows (used in ) / from operating activities |
||||||||||||
| Net income / (loss) |
100 | 141 | (178 | ) | ||||||||
| Less: Net income / (loss) from discontinued operations |
(4 | ) | 8 | 8 | ||||||||
| Less: Net income attributable to non-controlling interests |
(2 | ) | (2 | ) | (1 | ) | ||||||
| Net income / (loss) from continuing operations before non-controlling interests |
94 | 147 | (171 | ) | ||||||||
|
|
|
|
|
|
|
|||||||
| Adjustments: |
||||||||||||
| Income tax expense |
39 | 46 | (34 | ) | ||||||||
| Finance costs – net |
50 | 60 | 39 | |||||||||
| Depreciation and impairment |
32 | 14 | 2 | |||||||||
| Restructuring costs and other provisions |
(8 | ) | 16 | 14 | ||||||||
| Defined benefit pension costs |
29 | (2 | ) | 42 | ||||||||
| Unrealized (gains) / losses on derivatives - net and from remeasurement of monetary assets and liabilities - net |
(14 | ) | (60 | ) | 140 | |||||||
| Loss on disposal |
6 | — | — | |||||||||
| Share of profit / (loss) of joint-ventures |
(3 | ) | 5 | — | ||||||||
| Other |
2 | 2 | — | |||||||||
| Changes in working capital: |
||||||||||||
| Inventories |
41 | 35 | 23 | |||||||||
| Trade receivables and other |
34 | 93 | (31 | ) | ||||||||
| Trade payables and other |
(29 | ) | (11 | ) | 40 | |||||||
| Changes in other operating assets and liabilities: |
||||||||||||
| Provisions |
(17 | ) | (31 | ) | (14 | ) | ||||||
| Income tax paid |
(29 | ) | (28 | ) | (38 | ) | ||||||
| Pension liabilities and other post-employment benefit obligations |
(43 | ) | (40 | ) | (41 | ) | ||||||
| Net cash flows from / (used in) operating activities |
184 | 246 | (29 | ) | ||||||||
|
|
|
|
|
|
|
|||||||
| Cash flows (used in) / from investing activities |
||||||||||||
| Purchase of net assets on acquisition – net of cash and cash equivalents acquired |
— | — | 13 | |||||||||
| Purchases of property, plant and equipment |
(144 | ) | (126 | ) | (97 | ) | ||||||
| Proceeds from disposal |
3 | — | 9 | |||||||||
| Proceeds from disposal of joint-ventures |
4 | — | — | |||||||||
| Proceeds from finance lease |
6 | 8 | 7 | |||||||||
| Other investing activities |
(1 | ) | (13 | ) | (1 | ) | ||||||
|
|
|
|
|
|
|
|||||||
| Net cash flows used in investing activities |
(132 | ) | (131 | ) | (69 | ) | ||||||
|
|
|
|
|
|
|
|||||||
| Cash flows from / (used in) financing activities |
||||||||||||
| Net proceeds received from issuance of shares |
162 | — | 98 | |||||||||
| Interim dividend paid |
(147 | ) | — | — | ||||||||
| Withholding tax paid |
(20 | ) | — | — | ||||||||
| Distribution of share premium to owners of the Company |
(103 | ) | — | — | ||||||||
| Interests paid |
(36 | ) | (28 | ) | (31 | ) | ||||||
| Net cash flows (used in) / from factoring |
— | (49 | ) | 56 | ||||||||
| Proceeds received from Term Loan |
351 | 154 | 137 | |||||||||
| Repayment of Term Loan |
(156 | ) | (148 | ) | — | |||||||
| Proceeds / Repayment of other loans |
2 | 6 | (20 | ) | ||||||||
| Payment of deferred financing costs and debt fees |
(8 | ) | (14 | ) | (23 | ) | ||||||
| Transactions with non-controlling interests |
(2 | ) | — | — | ||||||||
| Other financing activities |
— | (7 | ) | (16 | ) | |||||||
|
|
|
|
|
|
|
|||||||
| Net cash flows from / (used in) financing activities |
43 | (86 | ) | 201 | ||||||||
|
|
|
|
|
|
|
|||||||
| Net increase in cash and cash equivalents |
95 | 29 | 103 | |||||||||
| Cash and cash equivalents - beginning of period |
142 | 113 | — | |||||||||
| Effect of exchange rate changes on cash and cash equivalents |
(1 | ) | — | 10 | ||||||||
|
|
|
|
|
|
|
|||||||
| Cash and cash equivalents – end of period |
236 | 142 | 113 | |||||||||
|
|
|
|
|
|
|
|||||||
| Less: Cash and cash equivalents classified as held for sale |
(3 | ) | — | — | ||||||||
|
|
|
|
|
|
|
|||||||
| Cash and cash equivalents as reported in the Statement of Financial Position |
233 | 142 | 113 | |||||||||
|
|
|
|
|
|
|
|||||||
| * | Comparative financial statements have been restated following the application of IAS 19 revised. |
18