Exhibit
Table of Contents
|
| |
Summary | |
Earnings Press Release | |
Fact Sheet | |
| |
Financial Information | |
Condensed Consolidated Statements of Operations | |
Funds from Operations | |
Core Net Operating Income—Total Portfolio | |
Same-Home Results—Quarterly and Year-to-Date Comparisons | |
Same-Home Results—Operating Metrics by Market | |
Condensed Consolidated Balance Sheets | |
Debt Summary, Maturity Schedule and Interest Expense Reconciliation | |
Capital Structure | |
| |
Property Information | |
Top 20 Markets Summary | |
Leasing Performance | |
Scheduled Lease Expirations | |
Top 20 Markets Home Price Appreciation Trends | |
| |
Other Information | |
Disposition Summary | |
ATM Share Issuance History | |
Defined Terms and Non-GAAP Reconciliations | |
American Homes 4 Rent Reports Third Quarter 2017 Financial and Operating Results
AGOURA HILLS, Calif., November 2, 2017—American Homes 4 Rent (NYSE: AMH) (the “Company”), a leading provider of high quality single-family homes for rent, today announced its financial and operating results for the quarter ended September 30, 2017.
Highlights
| |
• | Total revenues increased 4.6% to $246.8 million for the third quarter of 2017 from $236.1 million for the third quarter of 2016. |
| |
• | Net income attributable to common shareholders totaled $1.5 million, and a $0.00 loss per diluted share, for the third quarter of 2017, compared to a net loss attributable to common shareholders of $21.2 million, or a $0.09 loss per diluted share, for the third quarter of 2016. |
| |
• | Hurricanes Harvey and Irma impacted certain properties in our Houston, Florida and Southeast markets, resulting in net hurricane-related charges of $10.1 million during the quarter, which have been excluded from Core Funds from Operations attributable to common share and unit holders, Adjusted Funds from Operations attributable to common share and unit holders and our total and Same-Home operating results (see Other Events). |
| |
• | Core Funds from Operations attributable to common share and unit holders for the third quarter of 2017 was $79.4 million, or $0.25 per FFO share and unit, compared to $69.1 million, or $0.24 per FFO share and unit, for the same period in 2016, which represents a 4.2% increase on a per share and unit basis. |
| |
• | Adjusted Funds from Operations attributable to common share and unit holders for the third quarter of 2017 was $65.8 million, or $0.20 per FFO share and unit, compared to $56.6 million, or $0.19 per FFO share and unit, for the same period in 2016, which represents a 5.3% increase on a per share and unit basis. |
| |
• | Increased Core Net Operating Income ("Core NOI") margin on Same-Home properties to 63.3% for the third quarter of 2017, compared to 61.7% for the same period in 2016. |
| |
• | Increased Core NOI after capital expenditures from Same-Home properties by 5.5% year over year for the quarter ended September 30, 2017. |
| |
• | Maintained solid Same-Home portfolio leasing percentage of 95.2%, as of September 30, 2017. |
| |
• | Achieved rental rate growth with 4.9% and 3.6% rental rate increases on new and renewal leases, respectively, during the quarter ended September 30, 2017. |
| |
• | Issued 4,600,000 5.875% Series G perpetual preferred shares and 13,800,000 Class A common shares, raising gross proceeds of $115.0 million and $312.0 million, respectively, before offering costs. |
| |
• | Converted the Series A and B participating preferred shares into 12,398,276 Class A common shares in October 2017 (see Capital Activities and Balance Sheet). |
“Our strong third quarter results, including a 5.5% increase in Core NOI after capital expenditures from our Same-Home properties, while facing unprecedented back-to-back hurricanes, is a true testament to the quality of our people, platform and systems,” stated David Singelyn, American Homes 4 Rent’s Chief Executive Officer. “I am also pleased with the progress we have made executing our strategic growth plan, which exceeded our third quarter 2017 acquisition target. As we approach the end of 2017, I remain bullish on the future of American Homes 4 Rent and our unique opportunity to drive value for our shareholders using our sector-leading investment grade balance sheet.”
Third Quarter 2017 Financial Results
Total revenues increased 4.6% to $246.8 million for the third quarter of 2017 from $236.1 million for the third quarter of 2016. Revenue growth was primarily driven by continued strong acquisition and leasing activity, as our average leased portfolio grew to 46,058 homes for the quarter ended September 30, 2017, compared to 44,738 homes for the quarter ended September 30, 2016.
Earnings Press Release (continued)
Net income attributable to common shareholders totaled $1.5 million, and a $0.00 loss per diluted share, for the third quarter of 2017, compared to a net loss attributable to common shareholders of $21.2 million, or a $0.09 loss per diluted share, for the third quarter of 2016. This improvement was primarily attributable to higher revenues and the remeasurement of our participating preferred shares, partially offset by hurricane-related charges in the third quarter of 2017, as well as a loss on early extinguishment of debt in the third quarter of 2016.
Core NOI from Same-Home properties increased 5.0% to $100.5 million for the third quarter of 2017, compared to $95.7 million for the third quarter of 2016. After capital expenditures, Core NOI from Same-Home properties increased 5.5% to $91.5 million for the third quarter of 2017, compared to $86.7 million for the third quarter of 2016. These increases were primarily due to rental rate growth and lower core property operating expenses.
Core NOI on our total portfolio increased 9.2% to $131.5 million for the third quarter of 2017, compared to $120.4 million for the third quarter of 2016. This increase was primarily due to growth in rental income resulting from a larger number of leased properties.
Core Funds from Operations attributable to common share and unit holders ("Core FFO attributable to common share and unit holders") was $79.4 million, or $0.25 per FFO share and unit, for the third quarter of 2017, compared to $69.1 million, or $0.24 per FFO share and unit, for the third quarter of 2016. Adjusted Funds from Operations attributable to common share and unit holders ("Adjusted FFO attributable to common share and unit holders") for the third quarter of 2017 was $65.8 million, or $0.20 per FFO share and unit, compared to $56.6 million, or $0.19 per FFO share and unit, for the third quarter of 2016. This improvement was primarily attributable to increases in rental revenue driven by a larger number of leased properties and higher rental rates.
Year-to-Date 2017 Financial Results
Total revenues increased 10.2% to $717.6 million for the nine-month period ended September 30, 2017, from $651.3 million for the nine-month period ended September 30, 2016. Revenue growth was primarily driven by continued strong acquisition and leasing activity, as our average leased portfolio grew to 45,550 homes for the nine-month period ended September 30, 2017, compared to 42,583 homes for the nine-month period ended September 30, 2016.
Net loss attributable to common shareholders totaled $0.1 million, or a $0.00 loss per diluted share, for the nine-month period ended September 30, 2017, compared to a net loss attributable to common shareholders of $35.9 million, or a $0.15 loss per diluted share, for the nine-month period ended September 30, 2016. This improvement was primarily attributable to higher revenues and lower interest expense, partially offset by increases in property operating expenses and preferred dividends.
Core NOI from Same-Home properties increased 6.4% to $306.0 million for the nine-month period ended September 30, 2017, compared to $287.7 million for the nine-month period ended September 30, 2016. This increase was primarily due to rental rate growth and lower core property operating expenses. After capital expenditures, Core NOI from Same-Home properties increased 7.3% to $284.9 million for the nine-month period ended September 30, 2017, compared to $265.5 million for the nine-month period ended September 30, 2016. This additional improvement was attributable to our operational enhancements, which resulted in lower levels of capital expenditures.
Core NOI on our total portfolio increased 13.6% to $394.9 million for the nine-month period ended September 30, 2017, compared to $347.5 million for the nine-month period ended September 30, 2016. This increase was primarily due to substantial growth in rental income resulting from a larger number of leased properties.
Earnings Press Release (continued)
Core FFO attributable to common share and unit holders was $237.6 million, or $0.76 per FFO share and unit, for the nine-month period ended September 30, 2017, compared to $206.2 million, or $0.72 per FFO share and unit, for the nine-month period ended September 30, 2016. Adjusted FFO attributable to common share and unit holders for the nine-month period ended September 30, 2017, was $205.1 million, or $0.66 per FFO share and unit, compared to $174.8 million, or $0.61 per FFO share and unit, for the nine-month period ended September 30, 2016. This improvement was primarily attributable to significant increases in rental revenue driven by a larger number of leased properties and higher rental rates.
Portfolio
As of September 30, 2017, the Company had 46,026 leased properties, a decrease of 63 properties from June 30, 2017. As of September 30, 2017, the leased percentage on Same-Home properties was 95.2%, compared to 96.5% as of June 30, 2017.
Investments
As of September 30, 2017, the Company’s total portfolio consisted of 50,015 homes, including 469 homes held for sale, compared to 48,982 homes as of June 30, 2017, including 582 homes held for sale, an increase of 1,033 homes, which included 1,143 homes acquired and 110 homes sold or rescinded (including 67 former ARPI properties).
Capital Activities and Balance Sheet
In the third quarter of 2017, the Company established a new at-the-market common share offering program, which replaced the original at-the-market program, under which the Company may issue Class A common shares from time to time through various sales agents up to an aggregate of $500.0 million. The Company may suspend or terminate the program at any time.
In the third quarter of 2017, the Company issued 4,600,000 5.875% Series G cumulative redeemable perpetual preferred shares in an underwritten public offering, raising gross proceeds of $115.0 million before offering costs of approximately $4.1 million, with a liquidation preference of $25.00 per share.
In the third quarter of 2017, the Company issued 13,800,000 Class A common shares of beneficial interest, $0.01 par value per share, in an underwritten public offering, raising gross proceeds of $312.0 million before offering costs of approximately $9.2 million.
As of September 30, 2017, the Company had cash and cash equivalents of $243.5 million and had total outstanding debt of $2.4 billion, excluding an unamortized discount on acquired debt, the value of exchangeable senior notes classified within equity and unamortized deferred financing costs, with a weighted-average stated interest rate of 4.12% and a weighted-average term to maturity of 15.3 years. The Company’s $800.0 million revolving credit facility and $200.0 million term loan facility had outstanding borrowings of zero and $200.0 million, respectively, at the end of the quarter.
On October 3, 2017, the Company converted all 5,060,000 shares of the outstanding 5.0% Series A participating preferred shares and all 4,400,000 shares of the outstanding 5.0% Series B participating preferred shares into Class A common shares, in accordance with the conversion terms in the Articles Supplementary. This resulted in 12,398,276 total Class A common shares issued from the conversion, based on a conversion ratio of 1.3106 Class A common shares issued per Series A and B participating preferred share.
Other Events
Hurricanes Harvey and Irma impacted certain properties in our Houston, Florida and Southeast markets during the third quarter of 2017. Approximately 140 homes sustained major damage and nearly 3,400 homes incurred minor damage, consisting primarily
Earnings Press Release (continued)
of downed trees and damaged roofs and fences. The Company’s property and casualty insurance policies provide coverage for wind and flood damage, as well as business interruption costs, during the period of remediation and repairs, subject to deductibles and limits. During the third quarter of 2017, the Company recognized a $12.6 million impairment charge on impacted properties, of which we expect to recover $11.0 million through insurance claims, and accrued $8.5 million of additional repair, remediation and other costs. Of the $10.1 million of net hurricane-related charges recorded in the quarter, which have been excluded from Core Funds from Operations attributable to common share and unit holders, Adjusted Funds from Operations attributable to common share and unit holders and our total and Same-Home operating results, $5.8 million related to nearly 2,400 homes in the current Same-Home portfolio. The previously reported Same-Home portfolio has been revised to exclude approximately 100 homes that sustained major damages.
Additional Information
A copy of the Company’s Third Quarter 2017 Earnings Release and Supplemental Information Package and this press release are available on our website at www.americanhomes4rent.com. This information has also been furnished to the SEC in a current report on Form 8-K.
Conference Call
A conference call is scheduled on Friday, November 3, 2017, at 11:00 a.m. Eastern Time to discuss the Company’s financial results for the quarter ended September 30, 2017, and to provide an update on its business. The domestic dial-in number is (877) 451-6152 (for U.S. and Canada) and the international dial-in number is (201) 389-0879 (passcode not required). A simultaneous audio webcast may be accessed by using the link at www.americanhomes4rent.com, under “For Investors.” A replay of the conference call may be accessed through Friday, November 17, 2017, by calling (844) 512-2921 (U.S. and Canada) or (412) 317-6671 (international), replay passcode number 13671946#, or by using the link at www.americanhomes4rent.com, under “For Investors.”
About American Homes 4 Rent
American Homes 4 Rent (NYSE: AMH) is a leader in the single-family home rental industry and “American Homes 4 Rent” is fast becoming a nationally recognized brand for rental homes, known for high quality, good value and tenant satisfaction. We are an internally managed Maryland real estate investment trust, or REIT, focused on acquiring, renovating, leasing, and operating attractive, single-family homes as rental properties. As of September 30, 2017, we owned 50,015 single-family properties in selected submarkets in 22 states.
Forward-Looking Statements
This press release contains “forward-looking statements.” These forward-looking statements relate to beliefs, expectations or intentions and similar statements concerning matters that are not of historical fact and are generally accompanied by words such as “estimate,” “project,” “predict,” “believe,” “expect,” “anticipate,” “intend,” “potential,” “plan,” “goal” or other words that convey the uncertainty of future events or outcomes. Examples of forward-looking statements contained in this press release include, among others, our belief that our acquisition and homebuilding programs will result in continued growth and that we will continue to expand margins. The Company has based these forward-looking statements on its current expectations and assumptions about future events. While the Company's management considers these expectations to be reasonable, they are inherently subject to risks, contingencies and uncertainties, most of which are difficult to predict and many of which are beyond the Company’s control and could cause actual results to differ materially from any future results, performance or achievements expressed or implied by these forward-looking statements. Investors should not place undue reliance on these forward-looking statements, which speak only as of the date of this press release. The Company undertakes no obligation to update any forward-looking statements to conform to actual results or changes in its expectations, unless required by applicable law. For a further description of the risks and uncertainties that could cause actual results to differ from those expressed in these forward-looking
Earnings Press Release (continued)
statements, as well as risks relating to the business of the Company in general, see the “Risk Factors” disclosed in the Company’s Annual Report on Form 10-K for the year ended December 31, 2016, the Company's Quarterly Report on Form 10-Q for the quarter ended June 30, 2017, and in the Company’s subsequent filings with the SEC.
Fact Sheet
(Amounts in thousands, except per share and property data)
(Unaudited)
|
| | | | | | | | | | | | | | | |
| For the Three Months Ended
Sep 30, | | For the Nine Months Ended
Sep 30, |
| 2017 | | 2016 | | 2017 | | 2016 |
Operating Data | | | | | | | |
Net income (loss) attributable to common shareholders | $ | 1,535 |
| | $ | (21,152 | ) | | $ | (141 | ) | | $ | (35,933 | ) |
Core revenues | $ | 208,034 |
| | $ | 197,426 |
| | $ | 616,240 |
| | $ | 561,350 |
|
Core NOI | $ | 131,453 |
| | $ | 120,431 |
| | $ | 394,919 |
| | $ | 347,521 |
|
Core NOI margin | 63.2 | % | | 61.0 | % | | 64.1 | % | | 61.9 | % |
Platform Efficiency Percentage | 12.2 | % | | 13.1 | % | | 12.5 | % | | 13.6 | % |
Adjusted EBITDA after Capex and Leasing Costs | $ | 110,490 |
| | $ | 102,977 |
| | $ | 341,540 |
| | $ | 300,969 |
|
Adjusted EBITDA after Capex and Leasing Costs Margin | 52.4 | % | | 50.2 | % | | 54.6 | % | | 52.0 | % |
Per FFO share and unit: | | | | | | | |
FFO attributable to common share and unit holders | $ | 0.23 |
| | $ | 0.17 |
| | $ | 0.68 |
| | $ | 0.64 |
|
Core FFO attributable to common share and unit holders | $ | 0.25 |
| | $ | 0.24 |
| | $ | 0.76 |
| | $ | 0.72 |
|
Adjusted FFO attributable to common share and unit holders | $ | 0.20 |
| | $ | 0.19 |
| | $ | 0.66 |
| | $ | 0.61 |
|
|
| | | | | | | | | | | | | | | | | | | |
| Sep 30,
2017 | | Jun 30,
2017 | | Mar 31,
2017 | | Dec 31,
2016 | | Sep 30,
2016 |
Selected Balance Sheet Information - end of period | | | | | | | | | |
Single-family properties, net | $ | 7,802,499 |
| | $ | 7,633,784 |
| | $ | 7,542,196 |
| | $ | 7,547,856 |
| | $ | 7,545,398 |
|
Total assets | $ | 8,509,876 |
| | $ | 8,146,307 |
| | $ | 8,490,605 |
| | $ | 8,107,210 |
| | $ | 8,086,499 |
|
Outstanding borrowings under credit facilities, net | $ | 197,913 |
| | $ | 289,648 |
| | $ | 346,909 |
| | $ | 321,735 |
| | $ | 321,575 |
|
Total Debt | $ | 2,382,871 |
| | $ | 2,480,787 |
| | $ | 2,999,587 |
| | $ | 2,981,062 |
| | $ | 2,988,383 |
|
Total Market Capitalization | $ | 10,799,923 |
| | $ | 10,716,768 |
| | $ | 11,194,693 |
| | $ | 10,227,619 |
| | $ | 10,319,885 |
|
Total Debt to Total Market Capitalization | 22.1 | % | | 23.1 | % | | 26.8 | % | | 29.1 | % | | 29.0 | % |
Net Debt to Adjusted EBITDA | 4.2 x |
| | 4.8 x |
| | 5.1 x |
| | 6.1 x |
| | 6.6 x |
|
NYSE AMH Class A common share closing price | $ | 21.71 |
| | $ | 22.57 |
| | $ | 22.96 |
| | $ | 20.98 |
| | $ | 21.64 |
|
|
| | | | | | | | | | | | | | |
Portfolio Data - end of period | | | | | | | | | |
Leased single-family properties | 46,026 |
| | 46,089 |
| | 45,285 |
| | 44,798 |
| | 44,746 |
|
Occupied single-family properties | 45,660 |
| | 45,495 |
| | 44,941 |
| | 44,559 |
| | 44,267 |
|
Single-family properties newly acquired and being renovated | 858 |
| | 508 |
| | 367 |
| | 312 |
| | 406 |
|
Single-family properties being prepared for re-lease | 392 |
| | 161 |
| | 121 |
| | 91 |
| | 90 |
|
Vacant single-family properties available for re-lease | 1,974 |
| | 1,521 |
| | 1,796 |
| | 1,985 |
| | 1,625 |
|
Vacant single-family properties available for initial lease | 296 |
| | 121 |
| | 63 |
| | 117 |
| | 48 |
|
Total single-family properties, excluding held for sale | 49,546 |
| | 48,400 |
| | 47,632 |
| | 47,303 |
| | 46,915 |
|
Single-family properties held for sale | 469 |
| | 582 |
| | 704 |
| | 1,119 |
| | 1,238 |
|
Total single-family properties | 50,015 |
| | 48,982 |
| | 48,336 |
| | 48,422 |
| | 48,153 |
|
Total leased percentage (1) | 92.9 | % | | 95.2 | % | | 95.1 | % | | 94.7 | % | | 95.4 | % |
Total occupancy percentage (1) | 92.2 | % | | 94.0 | % | | 94.4 | % | | 94.2 | % | | 94.4 | % |
Same-Home leased percentage (36,682 properties) | 95.2 | % | | 96.5 | % | | 96.0 | % | | 95.7 | % | | 96.1 | % |
Same-Home occupancy percentage (36,682 properties) | 94.4 | % | | 95.3 | % | | 95.3 | % | | 95.3 | % | | 95.1 | % |
|
| | | | | | | | | | | | | | | | | | | |
Other Data | | | | | | | | | |
Distributions declared per common share | $ | 0.05 |
| | $ | 0.05 |
| | $ | 0.05 |
| | $ | 0.05 |
| | $ | 0.05 |
|
Distributions declared per Series A participating preferred share (2) | $ | 0.31 |
| | $ | 0.31 |
| | $ | 0.31 |
| | $ | 0.31 |
| | $ | 0.31 |
|
Distributions declared per Series B participating preferred share (2) | $ | 0.31 |
| | $ | 0.31 |
| | $ | 0.31 |
| | $ | 0.31 |
| | $ | 0.31 |
|
Distributions declared per Series C participating preferred share | $ | 0.34 |
| | $ | 0.34 |
| | $ | 0.34 |
| | $ | 0.34 |
| | $ | 0.34 |
|
Distributions declared per Series D perpetual preferred share | $ | 0.41 |
| | $ | 0.41 |
| | $ | 0.41 |
| | $ | 0.41 |
| | $ | 0.41 |
|
Distributions declared per Series E perpetual preferred share | $ | 0.40 |
| | $ | 0.40 |
| | $ | 0.40 |
| | $ | 0.40 |
| | $ | 0.41 |
|
Distributions declared per Series F perpetual preferred share (3) | $ | 0.37 |
| | $ | 0.27 |
| | $ | — |
| | $ | — |
| | $ | — |
|
Distributions declared per Series G perpetual preferred share (3) | $ | 0.30 |
| | $ | — |
| | $ | — |
| | $ | — |
| | $ | — |
|
| |
(1) | Leased and occupancy percentages are calculated based on total single-family properties, excluding held for sale properties. |
| |
(2) | All of the Series A and B participating preferred shares were converted into Class A common shares on October 3, 2017. |
| |
(3) | Series F and G perpetual preferred shares offering close dates and initial dividend start dates were April 24, 2017, and July 17, 2017, respectively. |
|
| | |
Refer to "Defined Terms and Non-GAAP Reconciliations" for definitions of metrics and reconciliations to GAAP. | | 8
|
Condensed Consolidated Statements of Operations
(Amounts in thousands, except share and per share data)
(Unaudited)
|
| | | | | | | | | | | | | | | |
| For the Three Months Ended
Sep 30, | | For the Nine Months Ended
Sep 30, |
| 2017 | | 2016 | | 2017 | | 2016 |
Revenues: | | | | | | | |
Rents from single-family properties | $ | 207,490 |
| | $ | 197,137 |
| | $ | 613,245 |
| | $ | 558,623 |
|
Fees from single-family properties | 2,843 |
| | 2,898 |
| | 8,137 |
| | 7,819 |
|
Tenant charge-backs | 36,094 |
| | 30,808 |
| | 91,849 |
| | 72,077 |
|
Other | 409 |
| | 5,214 |
| | 4,367 |
| | 12,811 |
|
Total revenues | 246,836 |
| | 236,057 |
| | 717,598 |
| | 651,330 |
|
| | | | | | | |
Expenses: | | | | | | | |
Property operating expenses | 97,944 |
| | 92,488 |
| | 267,203 |
| | 238,987 |
|
Property management expenses | 17,447 |
| | 18,335 |
| | 52,367 |
| | 53,177 |
|
General and administrative expense | 8,525 |
| | 8,043 |
| | 26,746 |
| | 24,544 |
|
Interest expense | 26,592 |
| | 32,851 |
| | 86,873 |
| | 99,309 |
|
Acquisition fees and costs expensed | 1,306 |
| | 1,757 |
| | 3,814 |
| | 10,899 |
|
Depreciation and amortization | 74,790 |
| | 75,392 |
| | 221,459 |
| | 224,513 |
|
Hurricane-related charges, net | 10,136 |
| | — |
| | 10,136 |
| | — |
|
Other | 1,285 |
| | 3,142 |
| | 4,202 |
| | 6,482 |
|
Total expenses | 238,025 |
| | 232,008 |
| | 672,800 |
| | 657,911 |
|
| | | | | | | |
Gain on sale of single-family properties and other, net | 1,895 |
| | 11,682 |
| | 6,375 |
| | 12,574 |
|
Loss on early extinguishment of debt | — |
| | (13,408 | ) | | (6,555 | ) | | (13,408 | ) |
Gain on conversion of Series E units | — |
| | — |
| | — |
| | 11,463 |
|
Remeasurement of participating preferred shares | 8,391 |
| | (2,490 | ) | | 1,341 |
| | (2,940 | ) |
| | | | | | | |
Net income (loss) | 19,097 |
| | (167 | ) | | 45,959 |
| | 1,108 |
|
| | | | | | | |
Noncontrolling interest | 309 |
| | 7,316 |
| | (22 | ) | | 10,391 |
|
Dividends on preferred shares | 17,253 |
| | 13,669 |
| | 46,122 |
| | 26,650 |
|
| | | | | | | |
Net income (loss) attributable to common shareholders | $ | 1,535 |
| | $ | (21,152 | ) | | $ | (141 | ) | | $ | (35,933 | ) |
| | | | | | | |
Weighted-average shares outstanding: | | | | | | | |
Basic | 266,767,313 | | 238,401,343 | | 256,768,343 | | 232,036,802 |
Diluted | 289,153,060 | | 238,401,343 | | 256,768,343 | | 232,036,802 |
| | | | | | | |
Net income (loss) attributable to common shareholders per share: | | | | | | | |
Basic | $ | 0.01 |
| | $ | (0.09 | ) | | $ | — |
| | $ | (0.15 | ) |
Diluted | $ | — |
| | $ | (0.09 | ) | | $ | — |
| | $ | (0.15 | ) |
|
| | |
Refer to "Defined Terms and Non-GAAP Reconciliations" for definitions of metrics and reconciliations to GAAP. | | 9
|
Funds from Operations
(Amounts in thousands, except share and per share data)
(Unaudited)
|
| | | | | | | | | | | | | | | |
| For the Three Months Ended
Sep 30, | | For the Nine Months Ended
Sep 30, |
| 2017 | | 2016 | | 2017 | | 2016 |
Net income (loss) attributable to common shareholders | $ | 1,535 |
| | $ | (21,152 | ) | | $ | (141 | ) | | $ | (35,933 | ) |
Adjustments: | | | | | | | |
Noncontrolling interests in the Operating Partnership | 340 |
| | 7,542 |
| | (30 | ) | | 10,838 |
|
Net (gain) on sale / impairment of single-family properties and other | (596 | ) | | (11,115 | ) | | (2,589 | ) | | (11,107 | ) |
Depreciation and amortization | 74,790 |
| | 75,392 |
| | 221,459 |
| | 224,513 |
|
Less: depreciation and amortization of non-real estate assets | (1,753 | ) | | (1,602 | ) | | (6,050 | ) | | (4,345 | ) |
FFO attributable to common share and unit holders | $ | 74,316 |
| | $ | 49,065 |
| | $ | 212,649 |
| | $ | 183,966 |
|
Adjustments: | | | | | | | |
Acquisition fees and costs expensed | 1,306 |
| | 1,757 |
| | 3,814 |
| | 10,899 |
|
Noncash share-based compensation - general and administrative | 699 |
| | 480 |
| | 1,917 |
| | 1,578 |
|
Noncash share-based compensation - property management | 417 |
| | 411 |
| | 1,258 |
| | 1,166 |
|
Noncash interest expense related to acquired debt | 910 |
| | 1,474 |
| | 2,624 |
| | 3,699 |
|
Hurricane-related charges, net | 10,136 |
| | — |
| | 10,136 |
| | — |
|
Loss on early extinguishment of debt | — |
| | 13,408 |
| | 6,555 |
| | 13,408 |
|
Gain on conversion of Series E units | — |
| | — |
| | — |
| | (11,463 | ) |
Remeasurement of participating preferred shares | (8,391 | ) | | 2,490 |
| | (1,341 | ) | | 2,940 |
|
Core FFO attributable to common share and unit holders | $ | 79,393 |
| | $ | 69,085 |
| | $ | 237,612 |
| | $ | 206,193 |
|
Recurring capital expenditures (1) | (11,600 | ) | | (10,411 | ) | | (27,140 | ) | | (25,183 | ) |
Leasing costs | (1,960 | ) | | (2,119 | ) | | (5,361 | ) | | (6,199 | ) |
Adjusted FFO attributable to common share and unit holders | $ | 65,833 |
| | $ | 56,555 |
| | $ | 205,111 |
| | $ | 174,811 |
|
| | | | | | | |
Per FFO share and unit: | | | | | | | |
FFO attributable to common share and unit holders | $ | 0.23 |
| | $ | 0.17 |
| | $ | 0.68 |
| | $ | 0.64 |
|
Core FFO attributable to common share and unit holders | $ | 0.25 |
| | $ | 0.24 |
| | $ | 0.76 |
| | $ | 0.72 |
|
Adjusted FFO attributable to common share and unit holders | $ | 0.20 |
| | $ | 0.19 |
| | $ | 0.66 |
| | $ | 0.61 |
|
| | | | | | | |
Weighted-average FFO shares and units: | | | | | | | |
Common shares outstanding | 266,767,313 |
| | 238,401,343 |
| | 256,768,343 |
| | 232,036,802 |
|
Share-based compensation plan (2) | 736,456 |
| | — |
| | 746,643 |
| | — |
|
Operating partnership units | 55,535,824 |
| | 55,557,147 |
| | 55,547,386 |
| | 55,287,787 |
|
Total weighted-average FFO shares and units | 323,039,593 |
| | 293,958,490 |
| | 313,062,372 |
| | 287,324,589 |
|
| |
(1) | As a portion of our homes are recently acquired and / or renovated, we estimate recurring capital expenditures for our entire portfolio by multiplying (a) current period actual capital expenditures per Same-Home Property by (b) our total number of properties, excluding non-stabilized and held for sale properties. |
| |
(2) | Reflects the effect of potentially dilutive securities issuable upon the assumed vesting / exercise of restricted stock units and stock options. |
|
| | |
Refer to "Defined Terms and Non-GAAP Reconciliations" for definitions of metrics and reconciliations to GAAP. | | 10
|
Core Net Operating Income - Total Portfolio
(Amounts in thousands)
(Unaudited)
|
| | | | | | | | | | | | | | | |
| For the Three Months Ended
Sep 30, | | For the Nine Months Ended
Sep 30, |
| 2017 | | 2016 | | 2017 | | 2016 |
Rents from single-family properties | $ | 207,490 |
| | $ | 197,137 |
| | $ | 613,245 |
| | $ | 558,623 |
|
Fees from single-family properties | 2,843 |
| | 2,898 |
| | 8,137 |
| | 7,819 |
|
Bad debt expense | (2,299 | ) | | (2,609 | ) | | (5,142 | ) | | (5,092 | ) |
Core revenues | 208,034 |
| | 197,426 |
| | 616,240 |
| | 561,350 |
|
| | | | | | | |
Property tax expense | 36,618 |
| | 35,871 |
| | 110,052 |
| | 102,309 |
|
HOA fees, net (1) | 4,246 |
| | 4,031 |
| | 12,231 |
| | 11,277 |
|
R&M and turnover costs, net (1) | 17,966 |
| | 18,379 |
| | 45,948 |
| | 45,635 |
|
Insurance | 1,981 |
| | 2,226 |
| | 5,845 |
| | 6,590 |
|
Property management expenses, net (2) | 15,770 |
| | 16,488 |
| | 47,245 |
| | 48,018 |
|
Core property operating expenses | 76,581 |
| | 76,995 |
| | 221,321 |
| | 213,829 |
|
| | | | | | | |
Core NOI | $ | 131,453 |
| | $ | 120,431 |
| | $ | 394,919 |
| | $ | 347,521 |
|
Core NOI margin | 63.2 | % | | 61.0 | % | | 64.1 | % | | 61.9 | % |
|
| | | | | | | | | | | | | | | | | | | | | | | |
| For the Three Months Ended
Sep 30, 2017 |
| Same-Home Properties | | Stabilized,
Non-Same-Home
Properties | | Former
ARPI
Properties | | Subtotal Same-Home, Stabilized and ARPI | | Other &
Held for Sale
Properties (3) | | Total
Single-Family
Properties |
Property count | 36,682 |
| | 3,448 |
| | 7,410 |
| | 47,540 |
| | 2,475 |
| | 50,015 |
|
| | | | | | | | | | | |
Rents from single-family properties | $ | 158,491 |
| | $ | 15,343 |
| | $ | 30,228 |
| | $ | 204,062 |
| | $ | 3,428 |
| | $ | 207,490 |
|
Fees from single-family properties | 2,099 |
| | 135 |
| | 431 |
| | 2,665 |
| | 178 |
| | 2,843 |
|
Bad debt expense | (1,755 | ) | | (136 | ) | | (349 | ) | | (2,240 | ) | | (59 | ) | | (2,299 | ) |
Core revenues | 158,835 |
| | 15,342 |
| | 30,310 |
| | 204,487 |
| | 3,547 |
| | 208,034 |
|
| | | | | | | | | | | |
Property tax expense | 28,011 |
| | 2,242 |
| | 5,317 |
| | 35,570 |
| | 1,048 |
| | 36,618 |
|
HOA fees, net (1) | 3,117 |
| | 290 |
| | 731 |
| | 4,138 |
| | 108 |
| | 4,246 |
|
R&M and turnover costs, net (1) | 13,720 |
| | 907 |
| | 2,482 |
| | 17,109 |
| | 857 |
| | 17,966 |
|
Insurance | 1,450 |
| | 167 |
| | 300 |
| | 1,917 |
| | 64 |
| | 1,981 |
|
Property management expenses, net (2) | 12,041 |
| | 1,163 |
| | 2,298 |
| | 15,502 |
| | 268 |
| | 15,770 |
|
Core property operating expenses | 58,339 |
| | 4,769 |
| | 11,128 |
| | 74,236 |
| | 2,345 |
| | 76,581 |
|
| | | | | | | | | | | |
Core NOI | $ | 100,496 |
| | $ | 10,573 |
| | $ | 19,182 |
| | $ | 130,251 |
| | $ | 1,202 |
| | $ | 131,453 |
|
Core NOI margin | 63.3 | % | | 68.9 | % | | 63.3 | % | | 63.7 | % | | 33.9 | % | | 63.2 | % |
| |
(1) | Presented net of tenant charge-backs. In-house maintenance costs, which were previously presented separately, are included in R&M and turnover costs, net. |
| |
(2) | Presented net of tenant charge-backs and excludes noncash share-based compensation expense related to centralized and field property management employees. |
| |
(3) | Includes 2,006 non-stabilized properties consisting of recent acquisitions and homes sustaining major damage from the third quarter 2017 hurricanes and 469 properties classified as held for sale. |
|
| | |
Refer to "Defined Terms and Non-GAAP Reconciliations" for definitions of metrics and reconciliations to GAAP. | | 11
|
Same-Home Results – Quarterly and Year-to-Date Comparisons (1)
(Amounts in thousands, except property and per property data)
(Unaudited)
|
| | | | | | | | | | | | | | | | | | | | | |
| For the Three Months Ended
Sep 30, | | | | For the Nine Months Ended
Sep 30, | | |
| 2017 | | 2016 | | Change | | 2017 | | 2016 | | Change |
Number of Same-Home properties | 36,682 |
| | 36,682 |
| | | | 36,682 |
| | 36,682 |
| | |
Leased percentage as of period end | 95.2 | % | | 96.1 | % | | (0.9 | )% | | 95.2 | % | | 96.1 | % | | (0.9 | )% |
Occupancy percentage as of period end | 94.4 | % | | 95.1 | % | | (0.7 | )% | | 94.4 | % | | 95.1 | % | | (0.7 | )% |
Average occupancy percentage | 95.0 | % | | 95.1 | % | | (0.1 | )% | | 95.1 | % | | 95.2 | % | | (0.1 | )% |
Average contractual monthly rent as of period end | $ | 1,535 |
| | $ | 1,490 |
| | 3.0 | % | | $ | 1,535 |
| | $ | 1,490 |
| | 3.0 | % |
Turnover Rate | 11.1 | % | | 11.5 | % | | (0.4 | )% | | 31.7 | % | | 32.9 | % | | (1.2 | )% |
Turnover Rate - TTM | 39.9 | % | | N/A |
| |
| | N/A |
| | N/A |
| |
|
| | | | | | | | | | | |
Core NOI: | | | | | | | | | | |
Rents from single-family properties | $ | 158,491 |
| | $ | 154,610 |
| | 2.5 | % | | $ | 473,441 |
| | $ | 458,279 |
| | 3.3 | % |
Fees from single-family properties | 2,099 |
| | 2,228 |
| | (5.8 | )% | | 5,948 |
| | 6,156 |
| | (3.4 | )% |
Bad debt expense | (1,755 | ) | | (1,805 | ) | | (2.8 | )% | | (3,947 | ) | | (3,907 | ) | | 1.0 | % |
Core revenues | 158,835 |
| | 155,033 |
| | 2.5 | % | | 475,442 |
| | 460,528 |
| | 3.2 | % |
| | | | | | | | | | | |
Property tax expense | 28,011 |
| | 27,755 |
| | 0.9 | % | | 84,245 |
| | 83,269 |
| | 1.2 | % |
HOA fees, net (2) | 3,117 |
| | 3,046 |
| | 2.3 | % | | 9,071 |
| | 8,955 |
| | 1.3 | % |
R&M and turnover costs, net (2) | 13,720 |
| | 13,947 |
| | (1.6 | )% | | 35,240 |
| | 35,953 |
| | (2.0 | )% |
Insurance | 1,450 |
| | 1,667 |
| | (13.0 | )% | | 4,423 |
| | 5,185 |
| | (14.7 | )% |
Property management expenses, net (3) | 12,041 |
| | 12,948 |
| | (7.0 | )% | | 36,455 |
| | 39,446 |
| | (7.6 | )% |
Core property operating expenses | 58,339 |
| | 59,363 |
| | (1.7 | )% | | 169,434 |
| | 172,808 |
| | (2.0 | )% |
| | | | | | | | | | | |
Core NOI | $ | 100,496 |
| | $ | 95,670 |
| | 5.0 | % | | $ | 306,008 |
| | $ | 287,720 |
| | 6.4 | % |
Core NOI margin | 63.3 | % | | 61.7 | % | | | | 64.4 | % | | 62.5 | % | | |
| | | | | | | | | | | |
Capital expenditures | 8,968 |
| | 8,949 |
| | 0.2 | % | | 21,077 |
| | 22,223 |
| | (5.2 | )% |
Core NOI After Capital Expenditures | $ | 91,528 |
| | $ | 86,721 |
| | 5.5 | % | | $ | 284,931 |
| | $ | 265,497 |
| | 7.3 | % |
| | | | | | | | | | | |
Per property: | | | | | | | | | | | |
Average capital expenditures | $ | 244 |
| | $ | 244 |
| | — | % | | $ | 574 |
| | $ | 606 |
| | (5.2 | )% |
Average R&M and turnover costs, net, plus capital expenditures | $ | 618 |
| | $ | 625 |
| | (1.1 | )% | | $ | 1,533 |
| | $ | 1,586 |
| | (3.3 | )% |
Same-Home Results – Sequential Quarterly History (1)
|
| | | | | | | | | | | | | | | | | | | |
| For the Three Months Ended |
| Sep 30,
2017 | | Jun 30,
2017 | | Mar 31,
2017 | | Dec 31,
2016 | | Sep 30,
2016 |
Core NOI: | | | | | | | | | |
Rents from single-family properties | $ | 158,491 |
| | $ | 158,278 |
| | $ | 156,672 |
| | $ | 155,925 |
| | $ | 154,610 |
|
Fees from single-family properties | 2,099 |
| | 1,964 |
| | 1,885 |
| | 1,791 |
| | 2,228 |
|
Bad debt expense | (1,755 | ) | | (1,012 | ) | | (1,180 | ) | | (1,383 | ) | | (1,805 | ) |
Core revenues | 158,835 |
| | 159,230 |
| | 157,377 |
| | 156,333 |
| | 155,033 |
|
| | | | | | | | | |
Property tax expense | 28,011 |
| | 27,897 |
| | 28,337 |
| | 26,913 |
| | 27,755 |
|
HOA fees, net (2) | 3,117 |
| | 3,030 |
| | 2,924 |
| | 2,989 |
| | 3,046 |
|
R&M and turnover costs, net (2) | 13,720 |
| | 12,106 |
| | 9,414 |
| | 10,529 |
| | 13,947 |
|
Insurance | 1,450 |
| | 1,434 |
| | 1,539 |
| | 1,659 |
| | 1,667 |
|
Property management expenses, net (3) | 12,041 |
| | 12,272 |
| | 12,142 |
| | 12,304 |
| | 12,948 |
|
Core property operating expenses | 58,339 |
| | 56,739 |
| | 54,356 |
| | 54,394 |
| | 59,363 |
|
| | | | | | | | | |
Core NOI | $ | 100,496 |
| | $ | 102,491 |
| | $ | 103,021 |
| | $ | 101,939 |
| | $ | 95,670 |
|
Core NOI margin | 63.3 | % | | 64.4 | % | | 65.5 | % | | 65.2 | % | | 61.7 | % |
| | | | | | | | | |
Capital expenditures | 8,968 |
| | 7,083 |
| | 5,026 |
| | 5,387 |
| | 8,949 |
|
Core NOI After Capital Expenditures | $ | 91,528 |
| | $ | 95,408 |
| | $ | 97,995 |
| | $ | 96,552 |
| | $ | 86,721 |
|
| | | | | | | | | |
Per property: | | | | | | | | | |
Average capital expenditures | $ | 244 |
| | $ | 193 |
| | $ | 137 |
| | $ | 147 |
| | $ | 244 |
|
Average R&M and turnover costs, net, plus capital expenditures | $ | 618 |
| | $ | 522 |
| | $ | 393 |
| | $ | 434 |
| | $ | 625 |
|
| |
(1) | Third quarter 2017 Same-Home results excludes approximately $5.8 million in hurricane-related damages sustained by nearly 2,400 homes. |
| |
(2) | Presented net of tenant charge-backs. In-house maintenance costs, previously presented separately, are included in R&M and turnover costs, net. |
| |
(3) | Presented net of tenant charge-backs and excludes noncash share-based compensation expense related to centralized and field property management employees. |
|
| | |
Refer to "Defined Terms and Non-GAAP Reconciliations" for definitions of metrics and reconciliations to GAAP. | | 12
|
Same-Home Results – Operating Metrics by Market
|
| | | | | | | | | | | | | |
Market | | Number of Properties | | Gross Book Value
per Property | | % of 3Q17 NOI | | Average Contractual Monthly Rent (1) |
Dallas-Fort Worth, TX | | 3,051 | | $ | 162,154 |
| | 7.3 | % | | $ | 1,664 |
|
Indianapolis, IN | | 2,718 | | 153,378 |
| | 6.3 | % | | 1,357 |
|
Atlanta, GA | | 2,432 | | 165,575 |
| | 7.1 | % | | 1,488 |
|
Charlotte, NC | | 2,193 | | 175,453 |
| | 6.6 | % | | 1,505 |
|
Greater Chicago area, IL and IN | | 1,997 | | 180,517 |
| | 4.7 | % | | 1,782 |
|
Houston, TX | | 1,855 | | 175,391 |
| | 4.2 | % | | 1,653 |
|
Cincinnati, OH | | 1,820 | | 173,847 |
| | 5.0 | % | | 1,520 |
|
Phoenix, AZ | | 1,575 | | 163,959 |
| | 3.9 | % | | 1,260 |
|
Tampa, FL | | 1,513 | | 190,320 |
| | 4.3 | % | | 1,656 |
|
Raleigh, NC | | 1,473 | | 181,739 |
| | 4.4 | % | | 1,478 |
|
Jacksonville, FL | | 1,463 | | 153,190 |
| | 3.6 | % | | 1,433 |
|
Nashville, TN | | 1,439 | | 210,078 |
| | 5.2 | % | | 1,702 |
|
Columbus, OH | | 1,374 | | 154,864 |
| | 3.8 | % | | 1,524 |
|
Orlando, FL | | 1,072 | | 170,155 |
| | 2.9 | % | | 1,559 |
|
Salt Lake City, UT | | 1,046 | | 220,790 |
| | 3.6 | % | | 1,607 |
|
Las Vegas, NV | | 950 | | 176,347 |
| | 2.8 | % | | 1,442 |
|
San Antonio, TX | | 831 | | 155,789 |
| | 1.9 | % | | 1,479 |
|
Austin, TX | | 664 | | 151,560 |
| | 1.4 | % | | 1,469 |
|
Denver, CO | | 634 | | 274,788 |
| | 2.8 | % | | 2,068 |
|
Charleston, SC | | 604 | | 179,960 |
| | 1.7 | % | | 1,593 |
|
All Other (2) | | 5,978 | | 174,159 |
| | 16.5 | % | | 1,463 |
|
Total / Average | | 36,682 | | $ | 174,184 |
| | 100.0 | % | | $ | 1,535 |
|
|
| | | | | | | | | | | | | | | | | | |
| | Average Occupancy Percentage | | Avg. Change in Rent for Renewals | | Avg. Change in Rent for Re-Leases | | Avg. Blended Change in Rent |
Market | | 3Q17 QTD | | 3Q16 QTD | | Change | | | |
Dallas-Fort Worth, TX | | 94.3 | % | | 95.9 | % | | (1.6 | )% | | 4.3 | % | | 5.9 | % | | 4.9 | % |
Indianapolis, IN | | 95.1 | % | | 94.0 | % | | 1.1 | % | | 2.8 | % | | 5.2 | % | | 3.8 | % |
Atlanta, GA | | 96.7 | % | | 96.2 | % | | 0.5 | % | | 4.7 | % | | 8.0 | % | | 5.9 | % |
Charlotte, NC | | 94.6 | % | | 96.3 | % | | (1.7 | )% | | 3.7 | % | | 4.1 | % | | 3.8 | % |
Greater Chicago area, IL and IN | | 95.6 | % | | 94.2 | % | | 1.4 | % | | 2.9 | % | | 4.5 | % | | 3.5 | % |
Houston, TX | | 91.8 | % | | 92.5 | % | | (0.7 | )% | | 2.4 | % | | (0.4 | )% | | 1.1 | % |
Cincinnati, OH | | 95.1 | % | | 94.6 | % | | 0.5 | % | | 3.2 | % | | 4.2 | % | | 3.6 | % |
Phoenix, AZ | | 97.2 | % | | 97.4 | % | | (0.2 | )% | | 4.9 | % | | 9.5 | % | | 6.8 | % |
Tampa, FL | | 94.8 | % | | 95.1 | % | | (0.3 | )% | | 3.2 | % | | 4.0 | % | | 3.5 | % |
Raleigh, NC | | 95.4 | % | | 94.8 | % | | 0.6 | % | | 3.3 | % | | 4.0 | % | | 3.5 | % |
Jacksonville, FL | | 95.0 | % | | 94.9 | % | | 0.1 | % | | 3.8 | % | | 5.0 | % | | 4.3 | % |
Nashville, TN | | 92.8 | % | | 96.4 | % | | (3.6 | )% | | 3.4 | % | | 3.5 | % | | 3.4 | % |
Columbus, OH | | 95.3 | % | | 96.1 | % | | (0.8 | )% | | 3.9 | % | | 4.4 | % | | 4.1 | % |
Orlando, FL | | 96.9 | % | | 96.6 | % | | 0.3 | % | | 4.2 | % | | 7.1 | % | | 5.4 | % |
Salt Lake City, UT | | 96.1 | % | | 95.6 | % | | 0.5 | % | | 3.7 | % | | 8.5 | % | | 6.1 | % |
Las Vegas, NV | | 97.8 | % | | 97.3 | % | | 0.5 | % | | 3.8 | % | | 5.8 | % | | 4.5 | % |
San Antonio, TX | | 94.0 | % | | 92.6 | % | | 1.4 | % | | 3.1 | % | | 4.0 | % | | 3.5 | % |
Austin, TX | | 94.5 | % | | 94.2 | % | | 0.3 | % | | 3.6 | % | | 4.1 | % | | 3.8 | % |
Denver, CO | | 96.1 | % | | 95.7 | % | | 0.4 | % | | 3.9 | % | | 6.4 | % | | 4.7 | % |
Charleston, SC | | 93.8 | % | | 96.6 | % | | (2.8 | )% | | 2.5 | % | | 2.7 | % | | 2.6 | % |
All Other (2) | | 94.7 | % | | 93.8 | % | | 0.9 | % | | 3.1 | % | | 3.5 | % | | 3.3 | % |
Total / Average | | 95.0 | % | | 95.1 | % | | (0.1 | )% | | 3.5 | % | | 4.7 | % | | 4.0 | % |
| |
(1) | Average contractual monthly rent as of September 30, 2017. |
| |
(2) | Represents 21 markets in 15 states. |
|
| | |
Refer to "Defined Terms and Non-GAAP Reconciliations" for definitions of metrics and reconciliations to GAAP. | | 13
|
Condensed Consolidated Balance Sheets
(Amounts in thousands)
|
| | | | | | | |
| Sep 30, 2017 | | Dec 31, 2016 |
| (Unaudited) | | |
Assets | | | |
Single-family properties: | | | |
Land | $ | 1,600,906 |
| | $ | 1,512,183 |
|
Buildings and improvements | 7,020,774 |
| | 6,614,953 |
|
Single-family properties held for sale, net | 50,370 |
| | 87,430 |
|
| 8,672,050 |
| | 8,214,566 |
|
Less: accumulated depreciation | (869,551 | ) | | (666,710 | ) |
Single-family properties, net | 7,802,499 |
| | 7,547,856 |
|
Cash and cash equivalents | 243,547 |
| | 118,799 |
|
Restricted cash | 119,574 |
| | 131,442 |
|
Rent and other receivables, net | 35,429 |
| | 17,618 |
|
Escrow deposits, prepaid expenses and other assets | 149,366 |
| | 133,594 |
|
Deferred costs and other intangibles, net | 13,516 |
| | 11,956 |
|
Asset-backed securitization certificates | 25,666 |
| | 25,666 |
|
Goodwill | 120,279 |
| | 120,279 |
|
Total assets | $ | 8,509,876 |
| | $ | 8,107,210 |
|
| | | |
Liabilities | | | |
Revolving credit facility | $ | — |
| | $ | — |
|
Term loan facility, net | 197,913 |
| | 321,735 |
|
Asset-backed securitizations, net | 1,981,444 |
| | 2,442,863 |
|
Exchangeable senior notes, net | 110,771 |
| | 108,148 |
|
Secured note payable | 49,107 |
| | 49,828 |
|
Accounts payable and accrued expenses | 263,745 |
| | 177,206 |
|
Participating preferred shares derivative liability | 68,469 |
| | 69,810 |
|
Total liabilities | 2,671,449 |
| | 3,169,590 |
|
| | | |
Commitments and contingencies | | | |
| | | |
Equity | | | |
Shareholders’ equity: | | | |
Class A common shares | 2,736 |
| | 2,427 |
|
Class B common shares | 6 |
| | 6 |
|
Preferred shares | 478 |
| | 370 |
|
Additional paid-in capital | 5,517,978 |
| | 4,568,616 |
|
Accumulated deficit | (417,609 | ) | | (378,578 | ) |
Accumulated other comprehensive income | — |
| | 95 |
|
Total shareholders’ equity | 5,103,589 |
| | 4,192,936 |
|
| | | |
Noncontrolling interest | 734,838 |
| | 744,684 |
|
Total equity | 5,838,427 |
| | 4,937,620 |
|
| | | |
Total liabilities and equity | $ | 8,509,876 |
| | $ | 8,107,210 |
|
|
| | |
Refer to "Defined Terms and Non-GAAP Reconciliations" for definitions of metrics and reconciliations to GAAP. | | 14
|
Debt Summary and Maturity Schedule as of September 30, 2017
(Amounts in thousands)
|
| | | | | | | | | | | | | | | | | | | |
| Secured | | Unsecured | | Total Balance | | % of Total | | Interest
Rate (1) | | Years to Maturity (2) |
Floating rate debt: | | | | | | | | | | | |
Revolving credit facility (3) | $ | — |
| | $ | — |
| | $ | — |
| | — | % | | 2.43 | % | | 4.8 |
Term loan facility (3) | — |
| | 200,000 |
| | 200,000 |
| | 8.4 | % | | 2.58 | % | | 4.8 |
Total floating rate debt | — |
| | 200,000 |
| | 200,000 |
| | 8.4 | % | | 2.58 | % | | 4.8 |
| | | | | | | | | | | |
Fixed rate debt: | | | | | | | | | | | |
AH4R 2014-SFR2 | 497,743 |
| | — |
| | 497,743 |
| | 20.9 | % | | 4.42 | % | | 7.0 |
AH4R 2014-SFR3 | 513,361 |
| | — |
| | 513,361 |
| | 21.5 | % | | 4.40 | % | | 7.2 |
AH4R 2015-SFR1 | 539,199 |
| | — |
| | 539,199 |
| | 22.6 | % | | 4.14 | % | | 27.5 |
AH4R 2015-SFR2 | 468,461 |
| | — |
| | 468,461 |
| | 19.7 | % | | 4.36 | % | | 28.0 |
Exchangeable senior notes | — |
| | 115,000 |
| | 115,000 |
| | 4.8 | % | | 3.25 | % | | 1.1 |
Secured note payable | 49,107 |
| | — |
| | 49,107 |
| | 2.1 | % | | 4.06 | % | | 1.8 |
Total fixed rate debt | 2,067,871 |
| | 115,000 |
| | 2,182,871 |
| | 91.6 | % | | 4.26 | % | | 16.2 |
| | | | | | | | | | | |
Total Debt | $ | 2,067,871 |
| | $ | 315,000 |
| | $ | 2,382,871 |
| | 100.0 | % | | 4.12 | % | | 15.3 |
| | | | | | | | | | | |
Unamortized discounts and loan costs | | | | | (43,636 | ) | | | | | | |
Total debt per balance sheet | | | | | $ | 2,339,235 |
| | | | | | |
|
| | | | | | | | | | | | | | | |
Year (2) | | Floating Rate | | Fixed Rate | | Total | | % of Total |
Remaining 2017 | | $ | — |
| | $ | 5,427 |
| | $ | 5,427 |
| | 0.2 | % |
2018 | | — |
| | 136,723 |
| | 136,723 |
| | 5.7 | % |
2019 | | — |
| | 68,564 |
| | 68,564 |
| | 2.9 | % |
2020 | | — |
| | 20,714 |
| | 20,714 |
| | 0.9 | % |
2021 | | — |
| | 20,714 |
| | 20,714 |
| | 0.9 | % |
2022 | | 200,000 |
| | 20,714 |
| | 220,714 |
| | 9.3 | % |
2023 | | — |
| | 20,714 |
| | 20,714 |
| | 0.9 | % |
2024 | | — |
| | 956,331 |
| | 956,331 |
| | 40.1 | % |
2025 | | — |
| | 10,302 |
| | 10,302 |
| | 0.4 | % |
2026 | | — |
| | 10,302 |
| | 10,302 |
| | 0.4 | % |
Thereafter | | — |
| | 912,366 |
| | 912,366 |
| | 38.3 | % |
Total | | $ | 200,000 |
| | $ | 2,182,871 |
| | $ | 2,382,871 |
| | 100.0 | % |
(1) Interest rates on floating rate debt reflect stated rates as of period end.
| |
(2) | Years to maturity and maturity schedule reflect all debt on a fully extended basis. |
| |
(3) | The interest rates shown above reflect the Company's LIBOR-based borrowing rates, based on 1-month LIBOR and applicable margin as of period end. Balances reflect borrowings outstanding as of September 30, 2017. |
Interest Expense Reconciliation
|
| | | | | | | | | | | | | | | |
| For the Three Months Ended
Sep 30, | | For the Nine Months Ended
Sep 30, |
| 2017 | | 2016 | | 2017 | | 2016 |
Interest expense per income statement | $ | 26,592 |
| | $ | 32,851 |
| | $ | 86,873 |
| | $ | 99,309 |
|
Less: noncash interest expense related to acquired debt | (910 | ) | | (1,474 | ) | | (2,624 | ) | | (3,699 | ) |
Interest expense included in Core FFO attributable to common share and unit holders | 25,682 |
| | 31,377 |
| | 84,249 |
| | 95,610 |
|
Less: amortization of deferred financing costs | (1,875 | ) | | (2,689 | ) | | (6,285 | ) | | (8,127 | ) |
Add: capitalized interest | 1,533 |
| | 582 |
| | 3,171 |
| | 1,577 |
|
Cash interest | $ | 25,340 |
| | $ | 29,270 |
| | $ | 81,135 |
| | $ | 89,060 |
|
|
| | |
Refer to "Defined Terms and Non-GAAP Reconciliations" for definitions of metrics and reconciliations to GAAP. | | 15
|
Capital Structure as of September 30, 2017
(Amounts in thousands, except share and per share data)
Total Capitalization
|
| | | | | | | | | | | |
Total Debt | | | | $ | 2,382,871 |
| | 22.1 | % |
| | | | | | |
Total preferred shares at liquidation value | | | | 1,259,477 |
| | 11.7 | % |
| | | | | | |
Common equity at market value: | | | | | | |
Common shares outstanding | | 274,240,778 |
| | | | |
Operating partnership units | | 55,449,466 |
| | | | |
Total shares and units | | 329,690,244 |
| | | | |
NYSE AMH Class A common share closing price at September 30, 2017 | | $ | 21.71 |
| | | | |
Market value of common shares and operating partnership units | | | | 7,157,575 |
| | 66.2 | % |
| | | | | | |
Total Market Capitalization | | | | $ | 10,799,923 |
| | 100.0 | % |
Preferred Shares
|
| | | | | | | | | | | | | | | | | | | | | |
| | Earliest Redemption Date | | Outstanding Shares | | Liquidation Value (1) | | Annual Dividend
Per Share | | Annual Dividend
Amount |
Series | | | | Per Share | | Total | | |
5.000% Series A Participating Preferred Shares (2) | | 9/30/2017 | | 5,060,000 |
| | $ | 28.96 |
| | $ | 146,522 |
| | $ | 1.250 |
| | $ | 6,325 |
|
5.000% Series B Participating Preferred Shares (2) | | 9/30/2017 | | 4,400,000 |
| | $ | 28.96 |
| | 127,411 |
| | $ | 1.250 |
| | 5,500 |
|
5.500% Series C Participating Preferred Shares | | 3/31/2018 | | 7,600,000 |
| | $ | 28.53 |
| | 216,794 |
| | $ | 1.375 |
| | 10,450 |
|
6.500% Series D Perpetual Preferred Shares | | 5/24/2021 | | 10,750,000 |
| | $ | 25.00 |
| | 268,750 |
| | $ | 1.625 |
| | 17,469 |
|
6.350% Series E Perpetual Preferred Shares | | 6/29/2021 | | 9,200,000 |
| | $ | 25.00 |
| | 230,000 |
| | $ | 1.588 |
| | 14,605 |
|
5.875% Series F Perpetual Preferred Shares | | 4/24/2022 | | 6,200,000 |
| | $ | 25.00 |
| | 155,000 |
| | $ | 1.469 |
| | 9,106 |
|
5.875% Series G Perpetual Preferred Shares | | 7/17/2022 | | 4,600,000 |
| | $ | 25.00 |
| | 115,000 |
| | $ | 1.469 |
| | 6,756 |
|
Total preferred shares at liquidation value | | | | 47,810,000 |
| | | | $ | 1,259,477 |
| | | | $ | 70,211 |
|
| |
(1) | Liquidation value for all Participating Preferred Shares reflects initial liquidation value of $25.00 per share, adjusted by most recent quarterly HPA adjustment calculation, which is made available under the “For Investors” page of the Company’s website. |
| |
(2) | All of the outstanding Series A and Series B participating preferred shares were converted into 12,398,276 Class A common shares on October 3, 2017, based on a conversion ratio of 1.3106 common shares per preferred share in accordance with the conversion terms in the Articles Supplementary. |
|
| | | | | | | | |
Credit Ratios | | | Credit Ratings | | | | |
| | | | | | | |
Net Debt to Adjusted EBITDA | 4.2 x |
| | Rating Agency | | Rating | | Outlook |
Debt and Preferred Shares to Adjusted EBITDA | 7.3 x |
| | Moody's Investor Service | | Baa3 | | Stable |
Fixed Charge Coverage | 2.9 x |
| | S&P Global Ratings | | BBB- | | Stable |
Unencumbered Core NOI percentage | 62.5 | % | | | | | | |
|
| | |
Refer to "Defined Terms and Non-GAAP Reconciliations" for definitions of metrics and reconciliations to GAAP. | | 16
|
Top 20 Markets Summary as of September 30, 2017
Property Information (1)
|
| | | | | | | | | | | | | | |
Market | | Number of
Properties | | Percentage
of Total
Properties | | Gross Book
Value per
Property | | Avg.
Sq. Ft. | | Avg. Age
(years) |
Dallas-Fort Worth, TX | | 4,354 | | 8.8 | % | | $ | 162,364 |
| | 2,121 |
| | 13.9 |
Atlanta, GA | | 4,319 | | 8.7 | % | | 165,430 |
| | 2,114 |
| | 16.4 |
Houston, TX | | 3,158 | | 6.4 | % | | 159,123 |
| | 2,113 |
| | 11.8 |
Charlotte, NC | | 3,248 | | 6.6 | % | | 181,934 |
| | 2,064 |
| | 14.1 |
Indianapolis, IN | | 2,897 | | 5.8 | % | | 151,377 |
| | 1,933 |
| | 15.0 |
Phoenix, AZ | | 2,768 | | 5.6 | % | | 162,343 |
| | 1,815 |
| | 14.9 |
Nashville, TN | | 2,557 | | 5.2 | % | | 202,594 |
| | 2,108 |
| | 13.3 |
Greater Chicago area, IL and IN | | 2,033 | | 4.1 | % | | 180,753 |
| | 1,896 |
| | 16.1 |
Cincinnati, OH | | 1,993 | | 4.0 | % | | 172,939 |
| | 1,852 |
| | 15.3 |
Raleigh, NC | | 1,968 | | 4.0 | % | | 179,187 |
| | 1,858 |
| | 12.9 |
Tampa, FL | | 1,951 | | 3.9 | % | | 188,935 |
| | 1,942 |
| | 14.0 |
Jacksonville, FL | | 1,918 | | 3.9 | % | | 161,337 |
| | 1,922 |
| | 13.3 |
Columbus, OH | | 1,789 | | 3.6 | % | | 161,213 |
| | 1,846 |
| | 16.0 |
Orlando, FL | | 1,601 | | 3.2 | % | | 170,977 |
| | 1,875 |
| | 16.3 |
Salt Lake City, UT | | 1,109 | | 2.2 | % | | 223,781 |
| | 2,138 |
| | 16.4 |
Las Vegas, NV | | 1,023 | | 2.1 | % | | 174,983 |
| | 1,841 |
| | 14.7 |
San Antonio, TX | | 1,022 | | 2.1 | % | | 157,290 |
| | 2,015 |
| | 14.1 |
Charleston, SC | | 916 | | 1.8 | % | | 187,267 |
| | 1,934 |
| | 11.5 |
Winston Salem, NC | | 766 | | 1.5 | % | | 150,191 |
| | 1,733 |
| | 13.8 |
Austin, TX | | 706 | | 1.4 | % | | 153,681 |
| | 1,865 |
| | 13.1 |
All Other (3) | | 7,450 | | 15.1 | % | | 189,457 |
| | 1,887 |
| | 14.2 |
Total / Average | | 49,546 | | 100.0 | % | | $ | 174,014 |
| | 1,968 |
| | 14.4 |
Leasing Information (1)
|
| | | | | | | | | | | | | | | | | | | |
Market | | Leased
Percentage (2) | | Occupancy
Percentage (2) | | Avg. Contractual
Monthly Rent
Per Property (2) | | Avg. Change in Rent for Renewals | | Avg. Change in Rent for Re-Leases | | Avg. Blended Change in Rent |
Dallas-Fort Worth, TX | | 94.0 | % | | 92.9 | % | | $ | 1,662 |
| | 4.2 | % | | 5.9 | % | | 4.9 | % |
Atlanta, GA | | 94.0 | % | | 93.5 | % | | 1,465 |
| | 4.5 | % | | 8.0 | % | | 5.8 | % |
Houston, TX | | 90.2 | % | | 89.3 | % | | 1,595 |
| | 2.4 | % | | 0.3 | % | | 1.5 | % |
Charlotte, NC | | 88.6 | % | | 88.2 | % | | 1,508 |
| | 3.7 | % | | 4.7 | % | | 4.1 | % |
Indianapolis, IN | | 95.0 | % | | 94.3 | % | | 1,350 |
| | 2.8 | % | | 5.3 | % | | 3.9 | % |
Phoenix, AZ | | 97.7 | % | | 97.3 | % | | 1,238 |
| | 4.9 | % | | 9.9 | % | | 6.9 | % |
Nashville, TN | | 92.1 | % | | 91.4 | % | | 1,656 |
| | 3.6 | % | | 3.7 | % | | 3.6 | % |
Greater Chicago area, IL and IN | | 95.4 | % | | 94.4 | % | | 1,784 |
| | 2.9 | % | | 4.5 | % | | 3.5 | % |
Cincinnati, OH | | 94.5 | % | | 93.8 | % | | 1,519 |
| | 3.2 | % | | 4.4 | % | | 3.7 | % |
Raleigh, NC | | 93.6 | % | | 92.7 | % | | 1,456 |
| | 3.3 | % | | 4.5 | % | | 3.7 | % |
Tampa, FL | | 90.2 | % | | 89.0 | % | | 1,624 |
| | 3.2 | % | | 4.2 | % | | 3.6 | % |
Jacksonville, FL | | 88.5 | % | | 87.6 | % | | 1,441 |
| | 3.9 | % | | 5.0 | % | | 4.3 | % |
Columbus, OH | | 89.0 | % | | 88.1 | % | | 1,529 |
| | 3.9 | % | | 4.4 | % | | 4.1 | % |
Orlando, FL | | 96.0 | % | | 95.6 | % | | 1,535 |
| | 4.4 | % | | 7.2 | % | | 5.5 | % |
Salt Lake City, UT | | 90.0 | % | | 89.4 | % | | 1,607 |
| | 3.7 | % | | 8.5 | % | | 6.1 | % |
Las Vegas, NV | | 97.0 | % | | 96.4 | % | | 1,430 |
| | 3.9 | % | | 6.0 | % | | 4.6 | % |
San Antonio, TX | | 92.5 | % | | 91.5 | % | | 1,478 |
| | 3.1 | % | | 4.1 | % | | 3.5 | % |
Charleston, SC | | 88.3 | % | | 88.0 | % | | 1,604 |
| | 2.5 | % | | 2.8 | % | | 2.7 | % |
Winston Salem, NC | | 92.8 | % | | 92.3 | % | | 1,270 |
| | 3.1 | % | | 4.9 | % | | 3.8 | % |
Austin, TX | | 92.8 | % | | 92.1 | % | | 1,476 |
| | 3.6 | % | | 4.1 | % | | 3.7 | % |
All Other (3) | | 93.7 | % | | 92.8 | % | | 1,552 |
| | 3.4 | % | | 3.6 | % | | 3.5 | % |
Total / Average | | 92.9 | % | | 92.2 | % | | $ | 1,523 |
| | 3.6 | % | | 4.9 | % | | 4.1 | % |
| |
(1) | Property and leasing information excludes held for sale properties. |
| |
(2) | Leased percentage, occupancy percentage and average contractual monthly rent per property are reflected as of period end. |
| |
(3) | Represents 22 markets in 16 states. |
|
| | |
Refer to "Defined Terms and Non-GAAP Reconciliations" for definitions of metrics and reconciliations to GAAP. | | 17
|
Leasing Performance
|
| | | | | | | | | | | | | | | |
| | 3Q17 | | 2Q17 | | 1Q17 | | 4Q16 | | 3Q16 |
Average Change in Rent for Renewals | | 3.6 | % | | 3.2 | % | | 3.1 | % | | 3.3 | % | | 3.4 | % |
Average Change in Rent for Re-leases | | 4.9 | % | | 6.1 | % | | 4.0 | % | | 2.7 | % | | 5.0 | % |
Average Blended Change in Rent | | 4.1 | % | | 4.4 | % | | 3.5 | % | | 3.0 | % | | 4.1 | % |
Scheduled Lease Expirations
|
| | | | | | | | | | | | |
| | MTM | | 4Q17 | | 1Q18 | | 2Q18 | | 3Q18 | | Thereafter |
Lease expirations | | 1,981 | | 7,637 | | 11,670 | | 12,070 | | 11,759 | | 909 |
Top 20 Markets Home Price Appreciation Trends
The table below summarizes historic changes in the House Price Index of the Federal Housing Finance Agency (“FHFA”), known as the Quarterly Purchase-Only Index, specifically the non-seasonally adjusted “Purchase-Only Index” for the “100 Largest Metropolitan Statistical Areas”, which is used for purposes of computing the “HPA Factor” for our 5% Series A participating preferred shares, 5% Series B participating preferred shares and 5.5% Series C participating preferred shares as described in the prospectuses for those securities.
|
| | | | | | | | | | | | | | | | | | | | | | | | |
| | HPA Index (1) | | HPA Index Change |
Market | | Dec 31,
2012 | | Dec 31,
2013 | | Dec 31,
2014 | | Dec 31,
2015 | | Dec 31,
2016 | | Mar 31,
2017 | | Jun 30,
2017 | |
Dallas-Fort Worth, TX (2) | | 100.0 |
| | 108.4 |
| | 115.2 |
| | 127.6 |
| | 140.1 |
| | 143.4 |
| | 150.0 |
| | 50.0 | % |
Indianapolis, IN | | 100.0 |
| | 106.4 |
| | 112.3 |
| | 117.8 |
| | 124.5 |
| | 123.4 |
| | 131.5 |
| | 31.5 | % |
Atlanta, GA | | 100.0 |
| | 114.2 |
| | 122.3 |
| | 132.0 |
| | 143.0 |
| | 144.4 |
| | 152.3 |
| | 52.3 | % |
Charlotte, NC | | 100.0 |
| | 113.4 |
| | 118.8 |
| | 126.8 |
| | 136.6 |
| | 142.4 |
| | 144.0 |
| | 44.0 | % |
Greater Chicago area, IL and IN | | 100.0 |
| | 111.0 |
| | 115.1 |
| | 118.8 |
| | 126.3 |
| | 125.9 |
| | 129.9 |
| | 29.9 | % |
Houston, TX | | 100.0 |
| | 110.8 |
| | 123.1 |
| | 130.1 |
| | 133.0 |
| | 132.7 |
| | 133.6 |
| | 33.6 | % |
Cincinnati, OH | | 100.0 |
| | 104.9 |
| | 111.2 |
| | 115.7 |
| | 121.4 |
| | 121.0 |
| | 126.8 |
| | 26.8 | % |
Tampa, FL | | 100.0 |
| | 113.0 |
| | 121.1 |
| | 132.3 |
| | 149.1 |
| | 149.9 |
| | 158.1 |
| | 58.1 | % |
Jacksonville, FL | | 100.0 |
| | 114.2 |
| | 121.7 |
| | 127.7 |
| | 142.3 |
| | 147.8 |
| | 148.2 |
| | 48.2 | % |
Nashville, TN | | 100.0 |
| | 111.0 |
| | 117.4 |
| | 131.1 |
| | 141.1 |
| | 145.9 |
| | 151.5 |
| | 51.5 | % |
Raleigh, NC | | 100.0 |
| | 106.7 |
| | 111.6 |
| | 120.0 |
| | 130.8 |
| | 132.1 |
| | 137.9 |
| | 37.9 | % |
Phoenix, AZ | | 100.0 |
| | 118.0 |
| | 123.3 |
| | 135.9 |
| | 146.1 |
| | 147.6 |
| | 151.8 |
| | 51.8 | % |
Columbus, OH | | 100.0 |
| | 108.9 |
| | 114.5 |
| | 120.8 |
| | 131.5 |
| | 127.5 |
| | 138.8 |
| | 38.8 | % |
Salt Lake City, UT | | 100.0 |
| | 109.4 |
| | 114.5 |
| | 123.2 |
| | 133.0 |
| | 138.3 |
| | 142.1 |
| | 42.1 | % |
Orlando, FL | | 100.0 |
| | 110.3 |
| | 123.5 |
| | 135.4 |
| | 144.9 |
| | 149.8 |
| | 154.4 |
| | 54.4 | % |
Las Vegas, NV | | 100.0 |
| | 125.1 |
| | 141.3 |
| | 149.0 |
| | 161.5 |
| | 164.3 |
| | 170.3 |
| | 70.3 | % |
San Antonio, TX | | 100.0 |
| | 101.1 |
| | 108.0 |
| | 113.9 |
| | 124.7 |
| | 127.2 |
| | 133.6 |
| | 33.6 | % |
Denver, CO | | 100.0 |
| | 111.0 |
| | 121.5 |
| | 136.5 |
| | 149.9 |
| | 156.7 |
| | 162.9 |
| | 62.9 | % |
Austin, TX | | 100.0 |
| | 110.1 |
| | 122.2 |
| | 133.9 |
| | 145.7 |
| | 145.8 |
| | 153.1 |
| | 53.1 | % |
Greenville, SC | | 100.0 |
| | 104.1 |
| | 110.8 |
| | 117.8 |
| | 127.6 |
| | 126.9 |
| | 129.6 |
| | 29.6 | % |
Average | | | | | | | | | | | | | | | | 45.0 | % |
| |
(1) | Updates to the Quarterly Purchase-Only Index are released by the FHFA on approximately the 20th day of the second month following quarter-end. Accordingly, information in the above table has been presented through June 30, 2017. For the illustrative purposes of this table, the HPA Index has been indexed as of December 31, 2012, and, as such, HPA Index values presented are relative measures calculated in relation to the baseline index value of 100.0 as of December 31, 2012. |
| |
(2) | Our Dallas-Fort Worth, TX market is comprised of the Dallas-Plano-Irving and Fort Worth-Arlington Metropolitan Divisions. |
|
| | |
Refer to "Defined Terms and Non-GAAP Reconciliations" for definitions of metrics and reconciliations to GAAP. | | 18
|
Disposition Summary
(Amounts in thousands, except property data)
|
| | | | | | | | | | | | | | | | |
| | Single-Family Properties Held for Sale (1) | | Single-Family Properties
Sold 3Q17 |
Market | | Vacant | | Leased | | Total | | Number
of Properties | | Net Proceeds |
Greater Chicago area, IL and IN | | 105 |
| | 184 |
| | 289 |
| | 61 |
| | $ | 4,672 |
|
Inland Empire, CA | | 6 |
| | 38 |
| | 44 |
| | 5 |
| | 1,228 |
|
Central Valley, CA | | 13 |
| | 19 |
| | 32 |
| | 9 |
| | 1,872 |
|
Miami, FL | | 16 |
| | 12 |
| | 28 |
| | 11 |
| | 3,266 |
|
Atlanta, GA | | 5 |
| | 8 |
| | 13 |
| | 3 |
| | 581 |
|
Nashville, TN | | 5 |
| | 3 |
| | 8 |
| | — |
| | — |
|
Dallas-Fort Worth, TX | | 4 |
| | 4 |
| | 8 |
| | 1 |
| | 160 |
|
San Antonio, TX | | 4 |
| | 3 |
| | 7 |
| | 5 |
| | 870 |
|
Memphis, TN | | 4 |
| | 2 |
| | 6 |
| | 1 |
| | 181 |
|
Oklahoma City, OK | | 1 |
| | 4 |
| | 5 |
| | — |
| | — |
|
Houston, TX | | 1 |
| | 3 |
| | 4 |
| | — |
| | — |
|
Phoenix, AZ | | 1 |
| | 2 |
| | 3 |
| | 3 |
| | 346 |
|
Raleigh, NC | | 3 |
| | — |
| | 3 |
| | 2 |
| | 207 |
|
Fort Myers, FL | | 3 |
| | — |
| | 3 |
| | — |
| | — |
|
Tucson, AZ | | 1 |
| | 2 |
| | 3 |
| | — |
| | — |
|
Orlando, FL | | 2 |
| | — |
| | 2 |
| | — |
| | — |
|
Tampa, FL | | 2 |
| | — |
| | 2 |
| | — |
| | — |
|
Denver, CO | | 1 |
| | 1 |
| | 2 |
| | 1 |
| | 243 |
|
Winston Salem, NC | | 2 |
| | — |
| | 2 |
| | — |
| | — |
|
Indianapolis, IN | | — |
| | 1 |
| | 1 |
| | 1 |
| | 127 |
|
Columbus, OH | | — |
| | 1 |
| | 1 |
| | — |
| | — |
|
Cincinnati, OH | | — |
| | 1 |
| | 1 |
| | — |
| | — |
|
Bay Area, CA | | 1 |
| | — |
| | 1 |
| | — |
| | — |
|
Jacksonville, FL | | 1 |
| | — |
| | 1 |
| | — |
| | — |
|
Austin, TX | | — |
| | — |
| | — |
| | 2 |
| | 288 |
|
Charleston, SC | | — |
| | — |
| | — |
| | 1 |
| | 113 |
|
Charlotte, NC | | — |
| | — |
| | — |
| | 1 |
| | 232 |
|
Total | | 181 |
| | 288 |
| | 469 |
| | 107 |
| | $ | 14,386 |
|
| |
(1) | Reflects single-family properties held for sale as of September 30, 2017. |
ATM Share Issuance History
(Amounts in thousands, except share and per share data)
|
| | | | | | | | | | | |
Board authorization announced on 11/10/16 | | | $ | 400,000 |
| | |
| | | | | | |
Quarterly Period | | Common Shares Issued | | Gross Proceeds | | Average Issuance Price Per Share |
4Q16 | | 4,919,948 |
| | $ | 103,983 |
| | $ | 21.13 |
|
1Q17 | | 629,532 |
| | 14,304 |
| | 22.72 |
|
2Q17 | | 222,073 |
| | 5,066 |
| | 22.81 |
|
3Q17 | | 1,181,493 |
| | $ | 26,855 |
| | $ | 22.73 |
|
Total | | 6,953,046 |
| | $ | 150,208 |
| | $ | 21.60 |
|
| | | | | | |
Board authorization announced on 8/10/17 (1) | | | $ | 500,000 |
| | |
| | | | | | |
| | Remaining authorization: |
| | $ | 500,000 |
| | |
| |
(1) | The Company's $500.0 million at-the-market common share offering program replaced the original at-the-market program. |
|
| | |
Refer to "Defined Terms and Non-GAAP Reconciliations" for definitions of metrics and reconciliations to GAAP. | | 19
|
Defined Terms and Non-GAAP Reconciliations
Average Change in Rent for Re-Leases
The percentage change in annual rent on properties re-leased during the period, compared to the annual rent of the previous expired lease for each individual property.
Average Change in Rent for Renewals
The percentage change in rent on non-month-to-month lease renewals during the period.
Average Blended Change in Rent
The percentage change in rent on all non-month-to-month lease renewals and re-leases during the period, compared to the annual rent of the previous expired non-month-to-month lease for each individual property.
Core Net Operating Income ("Core NOI") and Same-Home Core NOI After Capital Expenditures
Core NOI, which we also present separately for our Same-Home, unencumbered and encumbered portfolios, is a supplemental non-GAAP financial measure that we define as core revenues, which is calculated as rents and fees from single-family properties, net of bad debt expense, less core property operating expenses, which is calculated as property operating and property management expenses, excluding noncash share-based compensation expense, expenses reimbursed by tenant charge-backs and bad debt expense.
Core NOI also excludes (1) noncash fair value adjustments associated with remeasuring our participating preferred shares derivative liability to fair value, (2) noncash gain or loss on conversion of convertible units, (3) gain or loss on early extinguishment of debt, (4) hurricane-related charges, net, (5) gain or loss on sales of single-family properties and other, (6) depreciation and amortization, (7) acquisition fees and costs expensed incurred with recent business combinations and the acquisition of individual properties, (8) noncash share-based compensation expense, (9) interest expense, (10) general and administrative expense, (11) other expenses and (12) other revenues. We consider Core NOI to be a meaningful financial measure because we believe it is helpful to investors in understanding the operating performance of our single-family properties without the impact of certain operating expenses that are reimbursed through tenant charge-backs. We further adjust Core NOI for our Same-Home portfolio by subtracting capital expenditures to calculate Same-Home Core NOI After Capital Expenditures, which we believe is a meaningful supplemental non-GAAP financial measure because it more fully reflects our operating performance after the impact of all property-level expenditures, regardless of whether they are capitalized or expensed.
Core NOI and Same-Home Core NOI After Capital Expenditures should be considered only as supplements to net income or loss as a measure of our performance and should not be used as measures of our liquidity, nor are they indicative of funds available to fund our cash needs, including our ability to pay dividends or make distributions. Additionally, these metrics should not be used as substitutes for net income (loss) or net cash flows from operating activities (as computed in accordance with GAAP).
Defined Terms and Non-GAAP Reconciliations (continued)
The following are reconciliations of core revenues, core property operating expenses, Core NOI, Same-Home Core NOI, Same-Home Core NOI After Capital Expenditures, Unencumbered Core NOI and Encumbered Core NOI to their respective GAAP metrics for the three and nine months ended September 30, 2017 and 2016 (amounts in thousands):
|
| | | | | | | | | | | | | | | |
| For the Three Months Ended
Sep 30, | | For the Nine Months Ended
Sep 30, |
| 2017 | | 2016 | | 2017 | | 2016 |
| (Unaudited) | | (Unaudited) | | (Unaudited) | | (Unaudited) |
Core revenues | | | | | | | |
Total revenues | $ | 246,836 |
| | $ | 236,057 |
| | $ | 717,598 |
| | $ | 651,330 |
|
Tenant charge-backs | (36,094 | ) | | (30,808 | ) | | (91,849 | ) | | (72,077 | ) |
Bad debt expense | (2,299 | ) | | (2,609 | ) | | (5,142 | ) | | (5,092 | ) |
Other revenues | (409 | ) | | (5,214 | ) | | (4,367 | ) | | (12,811 | ) |
Core revenues | $ | 208,034 |
| | $ | 197,426 |
| | $ | 616,240 |
| | $ | 561,350 |
|
|
| | | | | | | | | | | | | | | |
Core property operating expenses | | | | | | | |
Property operating expenses | $ | 97,944 |
| | $ | 92,488 |
| | $ | 267,203 |
| | $ | 238,987 |
|
Property management expenses | 17,447 |
| | 18,335 |
| | 52,367 |
| | 53,177 |
|
Noncash share-based compensation - property management | (417 | ) | | (411 | ) | | (1,258 | ) | | (1,166 | ) |
Expenses reimbursed by tenant charge-backs | (36,094 | ) | | (30,808 | ) | | (91,849 | ) | | (72,077 | ) |
Bad debt expense | (2,299 | ) | | (2,609 | ) | | (5,142 | ) | | (5,092 | ) |
Core property operating expenses | $ | 76,581 |
| | $ | 76,995 |
| | $ | 221,321 |
| | $ | 213,829 |
|
|
| | | | | | | | | | | | | | | |
Core NOI, Same-Home Core NOI and Same-Home Core NOI After Capital Expenditures |
Net income (loss) | $ | 19,097 |
| | $ | (167 | ) | | $ | 45,959 |
| | $ | 1,108 |
|
Remeasurement of participating preferred shares | (8,391 | ) | | 2,490 |
| | (1,341 | ) | | 2,940 |
|
Gain on conversion of Series E units | — |
| | — |
| | — |
| | (11,463 | ) |
Loss on early extinguishment of debt | — |
| | 13,408 |
| | 6,555 |
| | 13,408 |
|
Hurricane-related charges, net | 10,136 |
| | — |
| | 10,136 |
| | — |
|
Gain on sale of single-family properties and other, net | (1,895 | ) | | (11,682 | ) | | (6,375 | ) | | (12,574 | ) |
Depreciation and amortization | 74,790 |
| | 75,392 |
| | 221,459 |
| | 224,513 |
|
Acquisition fees and costs expensed | 1,306 |
| | 1,757 |
| | 3,814 |
| | 10,899 |
|
Noncash share-based compensation - property management | 417 |
| | 411 |
| | 1,258 |
| | 1,166 |
|
Interest expense | 26,592 |
| | 32,851 |
| | 86,873 |
| | 99,309 |
|
General and administrative expense | 8,525 |
| | 8,043 |
| | 26,746 |
| | 24,544 |
|
Other expenses | 1,285 |
| | 3,142 |
| | 4,202 |
| | 6,482 |
|
Other revenues | (409 | ) | | (5,214 | ) | | (4,367 | ) | | (12,811 | ) |
Tenant charge-backs | 36,094 |
| | 30,808 |
| | 91,849 |
| | 72,077 |
|
Expenses reimbursed by tenant charge-backs | (36,094 | ) | | (30,808 | ) | | (91,849 | ) | | (72,077 | ) |
Bad debt expense excluded from operating expenses | 2,299 |
| | 2,609 |
| | 5,142 |
| | 5,092 |
|
Bad debt expense included in revenues | (2,299 | ) | | (2,609 | ) | | (5,142 | ) | | (5,092 | ) |
Core NOI | 131,453 |
| | 120,431 |
| | 394,919 |
| | 347,521 |
|
Less: Non-Same-Home Core NOI | 30,957 |
| | 24,761 |
| | 88,911 |
| | 59,801 |
|
Same-Home Core NOI | 100,496 |
| | 95,670 |
| | 306,008 |
| | 287,720 |
|
Less: Same-Home capital expenditures | 8,968 |
| | 8,949 |
| | 21,077 |
| | 22,223 |
|
Same-Home Core NOI After Capital Expenditures | $ | 91,528 |
| | $ | 86,721 |
| | $ | 284,931 |
| | $ | 265,497 |
|
|
| | | | | | | | | | | | | | | |
Unencumbered Core NOI and Encumbered Core NOI | | | | | | | |
Core NOI | $ | 131,453 |
| | $ | 120,431 |
| | $ | 394,919 |
| | $ | 347,521 |
|
Less: Encumbered Core NOI | 49,267 |
| | 47,589 |
| | 151,006 |
| | 143,075 |
|
Unencumbered Core NOI | $ | 82,186 |
| | $ | 72,842 |
| | $ | 243,913 |
| | $ | 204,446 |
|
Defined Terms and Non-GAAP Reconciliations (continued)
The following are reconciliations of core revenues, core property operating expenses, Core NOI, Same-Home Core NOI and Same-Home Core NOI After Capital Expenditures to their respective GAAP metrics for the trailing five quarters (amounts in thousands):
|
| | | | | | | | | | | | | | | | | | | |
| For the Three Months Ended |
| Sep 30,
2017 | | Jun 30,
2017 | | Mar 31,
2017 | | Dec 31,
2016 | | Sep 30,
2016 |
| (Unaudited) | | (Unaudited) | | (Unaudited) | | (Unaudited) | | (Unaudited) |
Core revenues | | | | | | | | | |
Total revenues | $ | 246,836 |
| | $ | 237,008 |
| | $ | 233,754 |
| | $ | 227,559 |
| | $ | 236,057 |
|
Tenant charge-backs | (36,094 | ) | | (27,382 | ) | | (28,373 | ) | | (23,177 | ) | | (30,808 | ) |
Bad debt expense | (2,299 | ) | | (1,333 | ) | | (1,510 | ) | | (1,877 | ) | | (2,609 | ) |
Other revenues | (409 | ) | | (2,288 | ) | | (1,670 | ) | | (2,987 | ) | | (5,214 | ) |
Core revenues | $ | 208,034 |
| | $ | 206,005 |
| | $ | 202,201 |
| | $ | 199,518 |
| | $ | 197,426 |
|
|
| | | | | | | | | | | | | | | | | | | |
Core property operating expenses | | | | | | | | | |
Property operating expenses | $ | 97,944 |
| | $ | 85,954 |
| | $ | 83,305 |
| | $ | 78,323 |
| | $ | 92,488 |
|
Property management expenses | 17,447 |
| | 17,442 |
| | 17,478 |
| | 17,547 |
| | 18,335 |
|
Noncash share-based compensation - property management | (417 | ) | | (424 | ) | | (417 | ) | | (394 | ) | | (411 | ) |
Expenses reimbursed by tenant charge-backs | (36,094 | ) | | (27,382 | ) | | (28,373 | ) | | (23,177 | ) | | (30,808 | ) |
Bad debt expense | (2,299 | ) | | (1,333 | ) | | (1,510 | ) | | (1,877 | ) | | (2,609 | ) |
Core property operating expenses | $ | 76,581 |
| | $ | 74,257 |
| | $ | 70,483 |
| | $ | 70,422 |
| | $ | 76,995 |
|
|
| | | | | | | | | | | | | | | | | | | |
Core NOI, Same-Home Core NOI and Same-Home Core NOI After Capital Expenditures |
Net income (loss) | $ | 19,097 |
| | $ | 15,066 |
| | $ | 11,796 |
| | $ | 9,338 |
| | $ | (167 | ) |
Remeasurement of participating preferred shares | (8,391 | ) | | 1,640 |
| | 5,410 |
| | 4,080 |
| | 2,490 |
|
Loss on early extinguishment of debt | — |
| | 6,555 |
| | — |
| | — |
| | 13,408 |
|
Hurricane-related charges, net | 10,136 |
| | — |
| | — |
| | — |
| | — |
|
Gain on sale of single-family properties and other, net | (1,895 | ) | | (2,454 | ) | | (2,026 | ) | | (1,995 | ) | | (11,682 | ) |
Depreciation and amortization | 74,790 |
| | 72,716 |
| | 73,953 |
| | 74,164 |
| | 75,392 |
|
Acquisition fees and costs expensed | 1,306 |
| | 1,412 |
| | 1,096 |
| | 544 |
| | 1,757 |
|
Noncash share-based compensation - property management | 417 |
| | 424 |
| | 417 |
| | 394 |
| | 411 |
|
Interest expense | 26,592 |
| | 28,392 |
| | 31,889 |
| | 31,538 |
| | 32,851 |
|
General and administrative expense | 8,525 |
| | 8,926 |
| | 9,295 |
| | 8,524 |
| | 8,043 |
|
Other expenses | 1,285 |
| | 1,359 |
| | 1,558 |
| | 5,496 |
| | 3,142 |
|
Other revenues | (409 | ) | | (2,288 | ) | | (1,670 | ) | | (2,987 | ) | | (5,214 | ) |
Tenant charge-backs | 36,094 |
| | 27,382 |
| | 28,373 |
| | 23,177 |
| | 30,808 |
|
Expenses reimbursed by tenant charge-backs | (36,094 | ) | | (27,382 | ) | | (28,373 | ) | | (23,177 | ) | | (30,808 | ) |
Bad debt expense excluded from operating expenses | 2,299 |
| | 1,333 |
| | 1,510 |
| | 1,877 |
| | 2,609 |
|
Bad debt expense included in revenues | (2,299 | ) | | (1,333 | ) | | (1,510 | ) | | (1,877 | ) | | (2,609 | ) |
Core NOI | 131,453 |
| | 131,748 |
| | 131,718 |
| | 129,096 |
| | 120,431 |
|
Less: Non-Same-Home Core NOI | 30,957 |
| | 29,257 |
| | 28,697 |
| | 27,157 |
| | 24,761 |
|
Same-Home Core NOI | 100,496 |
| | 102,491 |
| | 103,021 |
| | 101,939 |
| | 95,670 |
|
Less: Same-Home capital expenditures | 8,968 |
| | 7,083 |
| | 5,026 |
| | 5,387 |
| | 8,949 |
|
Same-Home Core NOI After Capital Expenditures | $ | 91,528 |
| | $ | 95,408 |
| | $ | 97,995 |
| | $ | 96,552 |
| | $ | 86,721 |
|
Defined Terms and Non-GAAP Reconciliations (continued)
Credit Ratios
We present the following selected metrics because we believe they are helpful as supplemental measures in assessing the Company’s ability to service its financing obligations and in evaluating balance sheet leverage against that of other real estate companies. The tables below reconcile these metrics, which are calculated in part based on several non-GAAP financial measures.
Debt and Preferred Shares to Adjusted EBITDA
|
| | | | |
| | Sep 30,
2017 |
| | (Unaudited) |
Total Debt | | $ | 2,382,871 |
|
Preferred shares at liquidation value (1) | | 1,259,477 |
|
Total Debt and preferred shares | | 3,642,348 |
|
| | |
Adjusted EBITDA - TTM | | $ | 496,105 |
|
| | |
Debt and Preferred Shares to Adjusted EBITDA | | 7.3 x |
|
| |
(1) | All of the outstanding Series A and Series B participating preferred shares were converted into 12,398,276 Class A common shares on October 3, 2017, based on a conversion ratio of 1.3106 common shares per preferred share in accordance with the conversion terms in the Articles Supplementary. |
Fixed Charge Coverage
|
| | | | |
| | For the Trailing Twelve Months Ended
Sep 30, 2017 |
| | (Unaudited) |
Interest expense per income statement | | $ | 118,411 |
|
Less: noncash interest expense related to acquired debt | | (3,489 | ) |
Less: amortization of deferred financing costs | | (8,925 | ) |
Add: capitalized interest | | 3,884 |
|
Cash interest | | 109,881 |
|
Dividends on preferred shares | | 59,709 |
|
Fixed charges | | 169,590 |
|
| | |
Adjusted EBITDA | | $ | 496,105 |
|
| | |
Fixed Charge Coverage | | 2.9 x |
|
Net Debt to Adjusted EBITDA
|
| | | | | | | | | | | | | | | | | | | | |
| | Sep 30,
2017 | | Jun 30,
2017 | | Mar 31,
2017 | | Dec 31,
2016 | | Sep 30,
2016 |
| | (Unaudited) | | (Unaudited) | | (Unaudited) | | (Unaudited) | | (Unaudited) |
Total Debt | | $ | 2,382,871 |
| | $ | 2,480,787 |
| | $ | 2,999,587 |
| | $ | 2,981,062 |
| | $ | 2,988,383 |
|
Less: cash and cash equivalents | | (243,547 | ) | | (67,325 | ) | | (495,802 | ) | | (118,799 | ) | | (106,308 | ) |
Less: asset-backed securitization certificates | | (25,666 | ) | | (25,666 | ) | | (25,666 | ) | | (25,666 | ) | | (25,666 | ) |
Less: restricted cash related to securitizations | | (46,166 | ) | | (56,058 | ) | | (63,147 | ) | | (62,062 | ) | | (61,434 | ) |
Net debt | | $ | 2,067,492 |
| | $ | 2,331,738 |
| | $ | 2,414,972 |
| | $ | 2,774,535 |
| | $ | 2,794,975 |
|
| | | | | | | | | | |
Adjusted EBITDA - TTM | | $ | 496,105 |
| | $ | 487,562 |
| | $ | 477,578 |
| | $ | 454,415 |
| | $ | 420,989 |
|
| | | | | | | | | | |
Net Debt to Adjusted EBITDA | | 4.2 x |
| | 4.8 x |
| | 5.1 x |
| | 6.1 x |
| | 6.6 x |
|
Defined Terms and Non-GAAP Reconciliations (continued)
Unencumbered Core NOI Percentage
|
| | | |
| For the Three Months Ended
Sep 30, 2017 |
| (Unaudited) |
Unencumbered Core NOI | $ | 82,186 |
|
Core NOI | $ | 131,453 |
|
Unencumbered Core NOI Percentage | 62.5 | % |
EBITDA / Adjusted EBITDA / Adjusted EBITDA after Capex and Leasing Costs / Adjusted EBITDA Margin / Adjusted EBITDA after Capex and Leasing Costs Margin
EBITDA is defined as earnings before interest, taxes, depreciation and amortization. EBITDA is a non-GAAP financial measure and is used by us and others as a supplemental measure of performance. Adjusted EBITDA is a supplemental non-GAAP financial measure calculated by adjusting EBITDA for (1) acquisition fees and costs expensed incurred with recent business combinations and the acquisition of individual properties, (2) net gain or loss on sales / impairment of single-family properties and other, (3) noncash share-based compensation expense, (4) hurricane-related charges, net, (5) gain or loss on early extinguishment of debt, (6) gain or loss on conversion of convertible units and (7) noncash fair value adjustments associated with remeasuring our participating preferred shares derivative liability to fair value. Adjusted EBITDA after Capex and Leasing Costs is a supplemental non-GAAP financial measure calculated by adjusting Adjusted EBITDA for (1) recurring capital expenditures and (2) leasing costs. Adjusted EBITDA Margin is a supplemental non-GAAP financial measure calculated as Adjusted EBITDA divided by total revenues, net of tenant charge-backs. Adjusted EBITDA after Capex and Leasing Costs Margin is a supplemental non-GAAP financial measure calculated as Adjusted EBITDA after Capex and Leasing costs divided by total revenues, net of tenant charge-backs. We consider these metrics to be meaningful financial measures of operating performance because they exclude the impact of various income and expense items that are not indicative of operating performance.
Defined Terms and Non-GAAP Reconciliations (continued)
The following is a reconciliation of net income or loss, as determined in accordance with GAAP, to EBITDA, Adjusted EBITDA, Adjusted EBITDA after Capex and Leasing Costs, Adjusted EBITDA Margin and Adjusted EBITDA after Capex and Leasing Costs Margin for the three and nine months ended September 30, 2017 and 2016 (amounts in thousands):
|
| | | | | | | | | | | | | | | |
| For the Three Months Ended
Sep 30, | | For the Nine Months Ended
Sep 30, |
| 2017 | | 2016 | | 2017 | | 2016 |
| (Unaudited) | | (Unaudited) | | (Unaudited) | | (Unaudited) |
Net income (loss) | $ | 19,097 |
| | $ | (167 | ) | | $ | 45,959 |
| | $ | 1,108 |
|
Interest expense | 26,592 |
| | 32,851 |
| | 86,873 |
| | 99,309 |
|
Depreciation and amortization | 74,790 |
| | 75,392 |
| | 221,459 |
| | 224,513 |
|
EBITDA | $ | 120,479 |
| | $ | 108,076 |
| | $ | 354,291 |
| | $ | 324,930 |
|
| | | | | | | |
Noncash share-based compensation - general and administrative | 699 |
| | 480 |
| | 1,917 |
| | 1,578 |
|
Noncash share-based compensation - property management | 417 |
| | 411 |
| | 1,258 |
| | 1,166 |
|
Acquisition fees and costs expensed | 1,306 |
| | 1,757 |
| | 3,814 |
| | 10,899 |
|
Net (gain) on sale / impairment of single-family properties and other | (596 | ) | | (11,115 | ) | | (2,589 | ) | | (11,107 | ) |
Hurricane-related charges, net | 10,136 |
| | — |
| | 10,136 |
| | — |
|
Loss on early extinguishment of debt | — |
| | 13,408 |
| | 6,555 |
| | 13,408 |
|
Gain on conversion of Series E units | — |
| | — |
| | — |
| | (11,463 | ) |
Remeasurement of participating preferred shares | (8,391 | ) | | 2,490 |
| | (1,341 | ) | | 2,940 |
|
Adjusted EBITDA | $ | 124,050 |
| | $ | 115,507 |
| | $ | 374,041 |
| | $ | 332,351 |
|
| | | | | | | |
Recurring capital expenditures (1) | (11,600 | ) | | (10,411 | ) | | (27,140 | ) | | (25,183 | ) |
Leasing costs | (1,960 | ) | | (2,119 | ) | | (5,361 | ) | | (6,199 | ) |
Adjusted EBITDA after Capex and Leasing Costs | $ | 110,490 |
| | $ | 102,977 |
| | $ | 341,540 |
| | $ | 300,969 |
|
| | | | | | | |
Total revenues | $ | 246,836 |
| | $ | 236,057 |
| | $ | 717,598 |
| | $ | 651,330 |
|
Less: tenant charge-backs | (36,094 | ) | | (30,808 | ) | | (91,849 | ) | | (72,077 | ) |
Total revenues, net of tenant charge-backs | $ | 210,742 |
| | $ | 205,249 |
| | $ | 625,749 |
| | $ | 579,253 |
|
| | | | | | | |
Adjusted EBITDA Margin | 58.9 | % | | 56.3 | % | | 59.8 | % | | 57.4 | % |
| | | | | | | |
Adjusted EBITDA after Capex and Leasing Costs Margin | 52.4 | % | | 50.2 | % | | 54.6 | % | | 52.0 | % |
| |
(1) | As a portion of our homes are recently acquired and / or renovated, we estimate recurring capital expenditures for our entire portfolio by multiplying (a) current period actual capital expenditures per Same-Home Property by (b) our total number of properties, excluding non-stabilized and held for sale properties. |
Defined Terms and Non-GAAP Reconciliations (continued)
The following is a reconciliation of net income or loss, as determined in accordance with GAAP, to EBITDA and Adjusted EBITDA for the following trailing twelve-month periods (amounts in thousands): |
| | | | | | | | | | | | | | | | | | | |
| For the Trailing Twelve Months Ended |
| Sep 30,
2017 | | Jun 30,
2017 | | Mar 31,
2017 | | Dec 31,
2016 | | Sep 30,
2016 |
| (Unaudited) | | (Unaudited) | | (Unaudited) | | (Unaudited) | | (Unaudited) |
Net income (loss) | $ | 55,297 |
| | $ | 36,033 |
| | $ | 17,214 |
| | $ | 10,446 |
| | $ | (10,239 | ) |
Interest expense | 118,411 |
| | 124,670 |
| | 131,759 |
| | 130,847 |
| | 127,183 |
|
Depreciation and amortization | 295,623 |
| | 296,225 |
| | 303,113 |
| | 298,677 |
| | 286,676 |
|
EBITDA | 469,331 |
| | 456,928 |
| | 452,086 |
| | 439,970 |
| | 403,620 |
|
| | | | | | | | | |
Noncash share-based compensation - general and administrative | 2,415 |
| | 2,196 |
| | 2,084 |
| | 2,076 |
| | 2,051 |
|
Noncash share-based compensation - property management | 1,652 |
| | 1,646 |
| | 1,620 |
| | 1,560 |
| | 1,475 |
|
Acquisition fees and costs expensed | 4,358 |
| | 4,809 |
| | 6,886 |
| | 11,443 |
| | 16,179 |
|
Net (gain) on sale / impairment of single-family properties and other | (1,081 | ) | | (11,600 | ) | | (10,636 | ) | | (9,599 | ) | | (11,107 | ) |
Hurricane-related charges, net | 10,136 |
| | — |
| | — |
| | — |
| | — |
|
Loss on early extinguishment of debt | 6,555 |
| | 19,963 |
| | 13,408 |
| | 13,408 |
| | 13,408 |
|
Gain on conversion of Series E units | — |
| | — |
| | — |
| | (11,463 | ) | | (11,463 | ) |
Remeasurement of Series E units | — |
| | — |
| | — |
| | — |
| | 1,356 |
|
Remeasurement of participating preferred shares | 2,739 |
| | 13,620 |
| | 12,130 |
| | 7,020 |
| | 5,470 |
|
Adjusted EBITDA | $ | 496,105 |
| | $ | 487,562 |
| | $ | 477,578 |
| | $ | 454,415 |
| | $ | 420,989 |
|
FFO / Core FFO / Adjusted FFO attributable to common share and unit holders
FFO attributable to common share and unit holders is a non-GAAP financial measure that we calculate in accordance with the White Paper on FFO approved by the Board of Governors of the National Association of Real Estate Investment Trusts (“NAREIT”), which defines FFO as net income or loss calculated in accordance with GAAP, excluding extraordinary items, as defined by GAAP, gains and losses from sales or impairment of real estate, plus real estate-related depreciation and amortization (excluding amortization of deferred financing costs and depreciation of non-real estate assets), and after adjustment for unconsolidated partnerships and joint ventures.
Core FFO attributable to common share and unit holders is a non-GAAP financial measure that we use as a supplemental measure of our performance. We compute this metric by adjusting FFO attributable to common share and unit holders for (1) acquisition fees and costs expensed incurred with recent business combinations and the acquisition of individual properties, (2) noncash share-based compensation expense, (3) noncash interest expense related to acquired debt, (4) hurricane-related charges, net, (5) gain or loss on early extinguishment of debt, (6) noncash gain or loss on conversion of convertible units and (7) noncash fair value adjustments associated with remeasuring our participating preferred shares derivative liability to fair value.
Adjusted FFO attributable to common share and unit holders is a non-GAAP financial measure that we use as a supplemental measure of our performance. We compute this metric by adjusting Core FFO attributable to common share and unit holders for (1) recurring capital expenditures that are necessary to help preserve the value and maintain functionality of our properties and (2) actual leasing costs incurred during the period. As a portion of our homes are recently acquired and / or renovated, we estimate recurring capital expenditures for our entire portfolio by multiplying (a) current period actual capital expenditures per Same-Home Property by (b) our total number of properties, excluding non-stabilized and held for sale properties.
Defined Terms and Non-GAAP Reconciliations (continued)
We present FFO attributable to common share and unit holders, as well as on a per FFO share and unit basis, because we consider this metric to be an important measure of the performance of real estate companies, as do many analysts in evaluating the Company. We believe that FFO attributable to common share and unit holders is a helpful measure of a REIT’s performance
since this metric excludes depreciation, which is included in computing net income and assumes the value of real estate diminishes predictably over time. We believe that real estate values fluctuate due to market conditions and in response to inflation.
We also believe that Core FFO and Adjusted FFO attributable to common share and unit holders, as well as on a per FFO share and unit basis, are helpful to investors as supplemental measures of the operating performance of the Company as they allow investors to compare our operating performance to prior reporting periods without the effect of certain items that, by nature, are not comparable from period to period.
FFO, Core FFO and Adjusted FFO attributable to common share and unit holders are not a substitute for net income (loss) per share or net cash flow provided by operating activities, as determined in accordance with GAAP, as a measure of our operating performance, liquidity or ability to pay dividends. These metrics also are not necessarily indicative of cash available to fund future cash needs. Because other REITs may not compute these measures in the same manner, they may not be comparable among REITs.
Refer to Funds from Operations for a reconciliation of these metrics to net income or loss attributable to common shareholders, determined in accordance with GAAP.
FFO Shares and Units
Includes weighted-average common shares and operating partnership units outstanding, as well as potentially dilutive securities.
Leased Property
A property is classified as leased upon the execution (i.e., signature) of a lease agreement.
Occupied Property
A property is classified as occupied upon commencement (i.e., start date) of a lease agreement, which can occur contemporaneously with or subsequent to execution (i.e., signature).
Defined Terms and Non-GAAP Reconciliations (continued)
Platform Efficiency Percentage
Management costs, including (1) property management expenses, net of tenant charge-backs and excluding noncash share-based compensation expense, (2) general and administrative expense, excluding noncash share-based compensation expense and (3) leasing costs, as a percentage of total portfolio rents and fees.
|
| | | | | | | | | | | | | | | |
| For the Three Months Ended
Sep 30, | | For the Nine Months Ended
Sep 30, |
| 2017 | | 2016 | | 2017 | | 2016 |
| (Unaudited) | | (Unaudited) | | (Unaudited) | | (Unaudited) |
Property management expenses | $ | 17,447 |
| | $ | 18,335 |
| | $ | 52,367 |
| | $ | 53,177 |
|
Less: tenant charge-backs | (1,260 | ) | | (1,436 | ) | | (3,864 | ) | | (3,993 | ) |
Less: noncash share-based compensation - property management | (417 | ) | | (411 | ) | | (1,258 | ) | | (1,166 | ) |
Property management expenses, net | 15,770 |
| | 16,488 |
| | 47,245 |
| | 48,018 |
|
| | | | | | | |
General and administrative expense | 8,525 |
| | 8,043 |
| | 26,746 |
| | 24,544 |
|
Less: noncash share-based compensation - general and administrative | (699 | ) | | (480 | ) | | (1,917 | ) | | (1,578 | ) |
General and administrative expense, net | 7,826 |
| | 7,563 |
| | 24,829 |
| | 22,966 |
|
| | | | | | | |
Leasing costs | 1,960 |
| | 2,119 |
| | 5,361 |
| | 6,199 |
|
Platform costs | $ | 25,556 |
| | $ | 26,170 |
| | $ | 77,435 |
| | $ | 77,183 |
|
| | | | | | | |
Rents from single-family properties | $ | 207,490 |
| | $ | 197,137 |
| | $ | 613,245 |
| | $ | 558,623 |
|
Fees from single-family properties | 2,843 |
| | 2,898 |
| | 8,137 |
| | 7,819 |
|
Total portfolio rents and fees | $ | 210,333 |
| | $ | 200,035 |
| | $ | 621,382 |
| | $ | 566,442 |
|
| | | | | | | |
Platform Efficiency Percentage | 12.2 | % | | 13.1 | % | | 12.5 | % | | 13.6 | % |
Same-Home Property
A property is classified as Same-Home if it has been stabilized longer than 90 days prior to the beginning of the earliest period presented under comparison. A property is removed from Same-Home if it has been classified as held for sale or has been taken out of service as a result of a casualty loss.
Stabilized Property
A property acquired individually (i.e., not through a bulk purchase) is classified as stabilized once it has been renovated or newly constructed and then initially leased or available for rent for a period greater than 90 days. Properties acquired through a bulk purchase are considered stabilized, as an entire group, provided (1) we have owned them for an adequate period of time to allow for complete on-boarding to our operating platform, and (2) a substantial portion of the properties have experienced tenant turnover at least once under our ownership, providing the opportunity for renovations and improvements to meet our property standards.
Total Debt
Includes principal balances on asset-backed securitizations, exchangeable senior notes, secured notes payable and borrowings outstanding under our revolving credit facility and term loan facility as of period end, and excludes unamortized discounts on acquired debt, the value of exchangeable senior notes classified within equity and unamortized deferred financing costs.
Total Market Capitalization
Includes the market value of all outstanding common shares and operating partnership units (based on the NYSE AMH Class A common share closing price as of period end), the current liquidation value of preferred shares as of period end and Total Debt.
Turnover Rate
The number of tenant move-outs during the period, divided by the total number of properties.
|
| | |
Executive Management |
| | |
David P. Singelyn | | Jack Corrigan |
Chief Executive Officer | | Chief Operating Officer |
| | |
Diana M. Laing | | Sara H. Vogt-Lowell |
Chief Financial Officer | | Chief Legal Officer |
| | |
David Goldberg | | Stephanie Heim |
Executive Vice President | | Executive Vice President - Counsel & Assistant Secretary |
| | |
Christopher C. Lau | | Bryan Smith |
Executive Vice President - Finance | | Executive Vice President - President of Property Management |
| | |
Corporate Information | | Investor Relations |
| | |
American Homes 4 Rent | | (855) 794-AH4R (2447) |
30601 Agoura Road, Suite 200 | | investors@ah4r.com |
Agoura Hills, CA 91301 | | |
(805) 413-5300 | | |
www.americanhomes4rent.com | | |
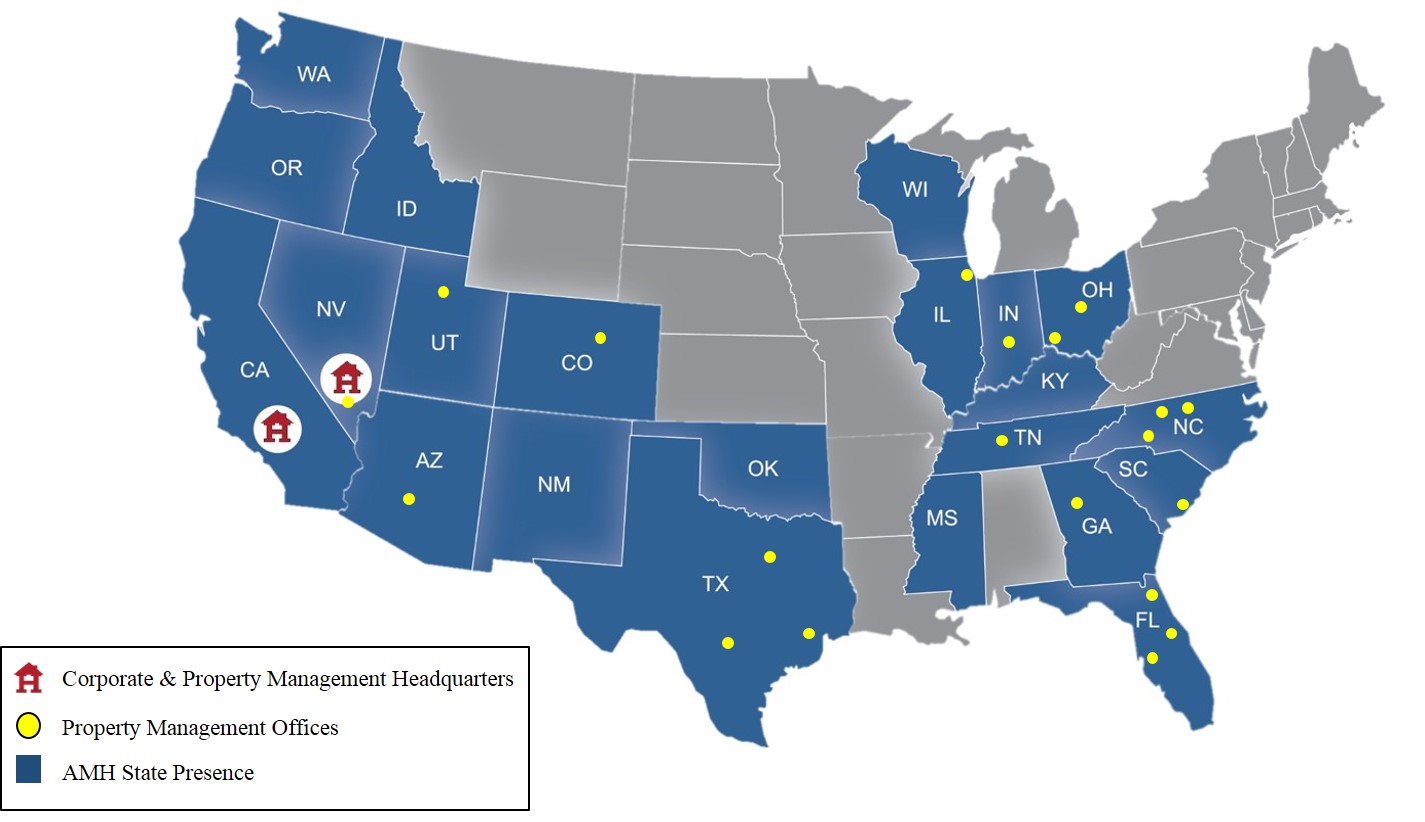
|
| | | |
Analyst Coverage (1) | | | |
| | | |
Bank of America Merrill Lynch | BTIG | Citi | Credit Suisse |
Juan Sanabria | Ryan Gilbert | Michael Bilerman | Douglas Harter |
juan.sanabria@baml.com | rgilbert@btig.com | michael.bilerman@citi.com | douglas.harter@credit-suisse.com |
| | | |
Evercore ISI | FBR Capital Markets & Co | Green Street Advisors | GS Global Investment Research |
Steve Sakwa | David Corak | John Pawlowski | Andrew Rosivach |
steve.sakwa@evercoreisi.com | dcorak@fbr.com | jpawlowski@greenst.com | andrew.rosivach@gs.com |
| | | |
JMP Securities | JP Morgan Securities | Keefe, Bruyette & Woods, Inc. | Mizuho Securities USA Inc. |
Aaron Hecht | Anthony Paolone | Jade Rahmani | Haendel St. Juste |
ahecht@jmpsecurities.com | anthony.paolone@jpmorgan.com | jrahmani@kbw.com | haendel.st.juste@mizuho-sc.com |
| | | |
Morgan Stanley | Raymond James & Associates, Inc. | Wells Fargo Securities | Zelman & Associates |
Richard Hill | Buck Horne | Jeff Donnelly | Dennis McGill |
richard.hill1@morganstanley.com | buck.horne@raymondjames.com | jeff.donnelly@wellsfargo.com | dennis@zelmanassociates.com |
| |
(1) | The sell-side analysts listed above follow American Homes 4 Rent ("AMH"). Any opinions, estimates or forecasts regarding AMH's performance made by these analysts are theirs alone and do not represent the opinions, forecasts or predictions of AMH or its management. AMH does not by its reference above or distribution imply its endorsement of or concurrence with such information, conclusions, or recommendations. The above list may not be complete and is subject to change as firms add or discontinue coverage. |