Exhibit 99.1

WhiteHorse Finance, Inc. Announces Second Quarter 2022 Earnings Results and Declares Quarterly Distribution of $0.355 Per Share
NEW YORK, August 10, 2022 /PRNewswire/ -- WhiteHorse Finance, Inc. (“WhiteHorse Finance” or the “Company”) (Nasdaq: WHF) today announced its financial results for the quarter ended June 30, 2022. In addition, the Company’s board of directors has declared a distribution of $0.355 per share with respect to the quarter ending September 30, 2022. The distribution will be payable on October 4, 2022 to stockholders of record as of September 20, 2022.
Second Quarter 2022 Summary Highlights
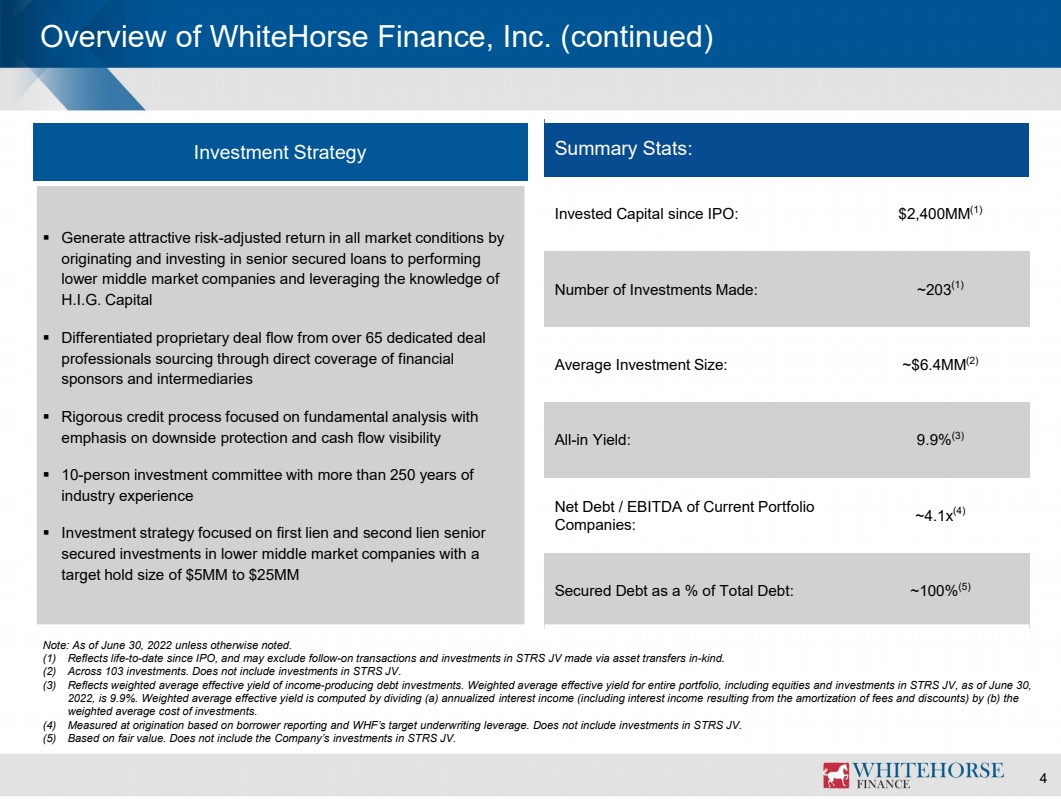
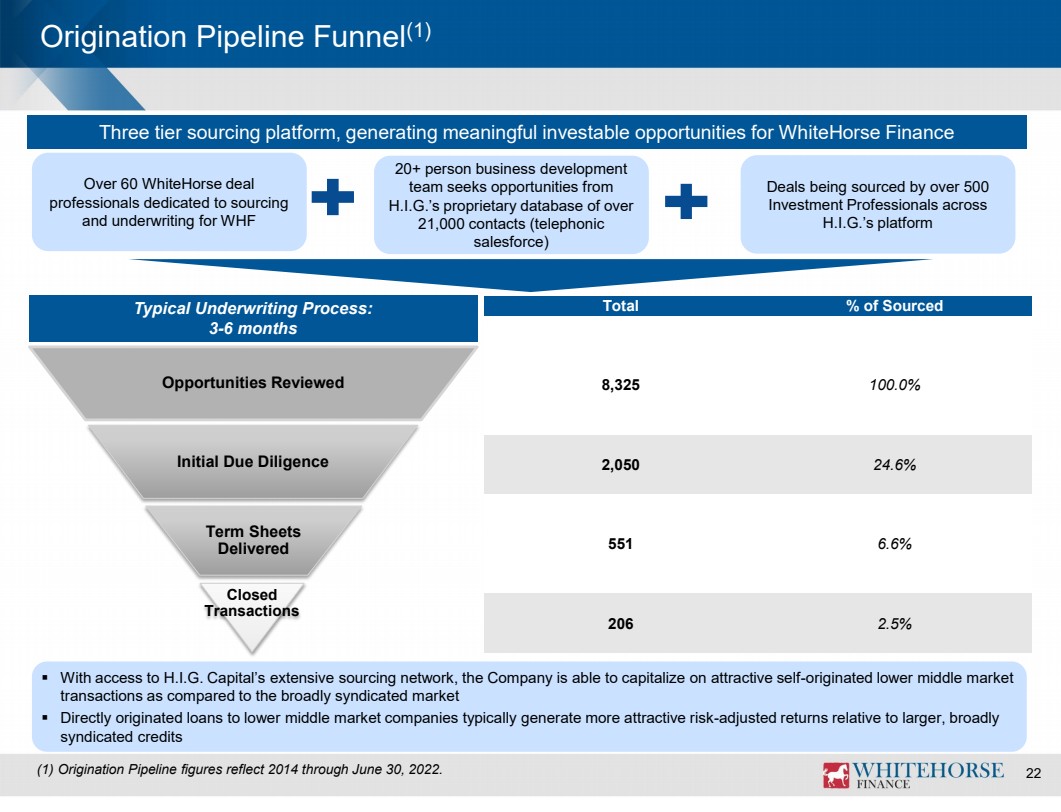
Stuart Aronson, WhiteHorse Finance’s Chief Executive Officer, commented, “Despite economic headwinds, our well-diversified portfolio continued to perform well this past quarter, and WhiteHorse ended the quarter with no investments on non-accrual status. We believe, given the modest leverage levels that we underwrite our loans to, that the majority of our portfolio companies will be able to service our debt in a rising interest rate environment. Additionally, as a result of elevated repayment activity during the quarter, we remain comfortably below our leverage targets and have capacity to redeploy capital to higher yielding assets. While our pipeline for future deal flow is at record levels, due in part to our differentiated three-tiered sourcing approach and relationship with the leading H.I.G. platform, we have a cautious approach and are selectively taking advantage of market conditions. Our investment portfolio is also well-positioned to benefit from a rising interest rate environment as nearly 100% of our debt portfolio is comprised of floating rate debt investments. Combined with the reset of three-month LIBOR and SOFR contracts and the full impact of our increased ownership in the Ohio STRS JV, we expect to achieve earnings accretion in the coming quarters.”
Portfolio and Investment Activity
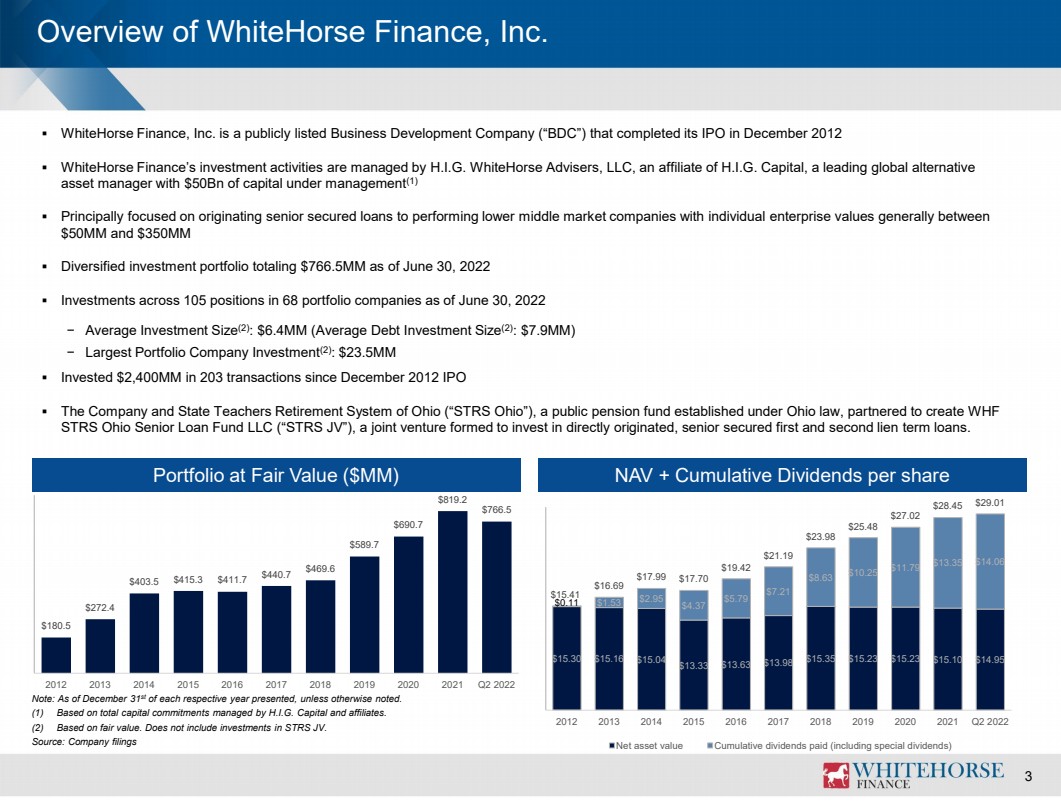
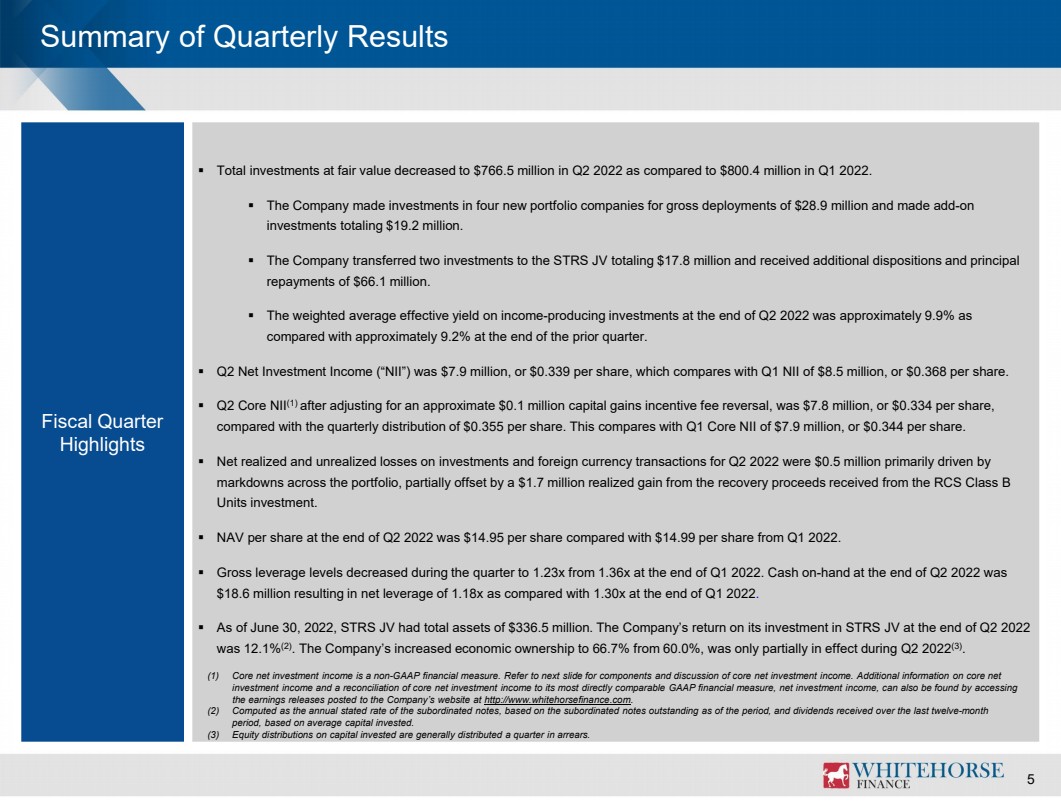
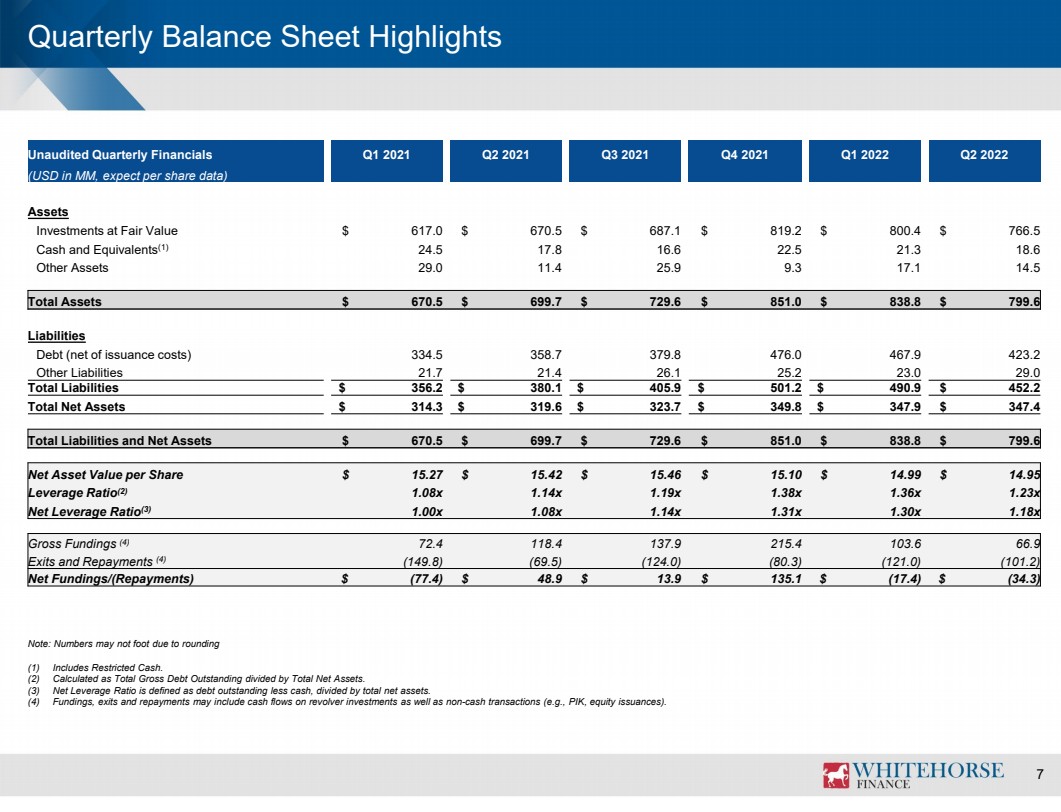
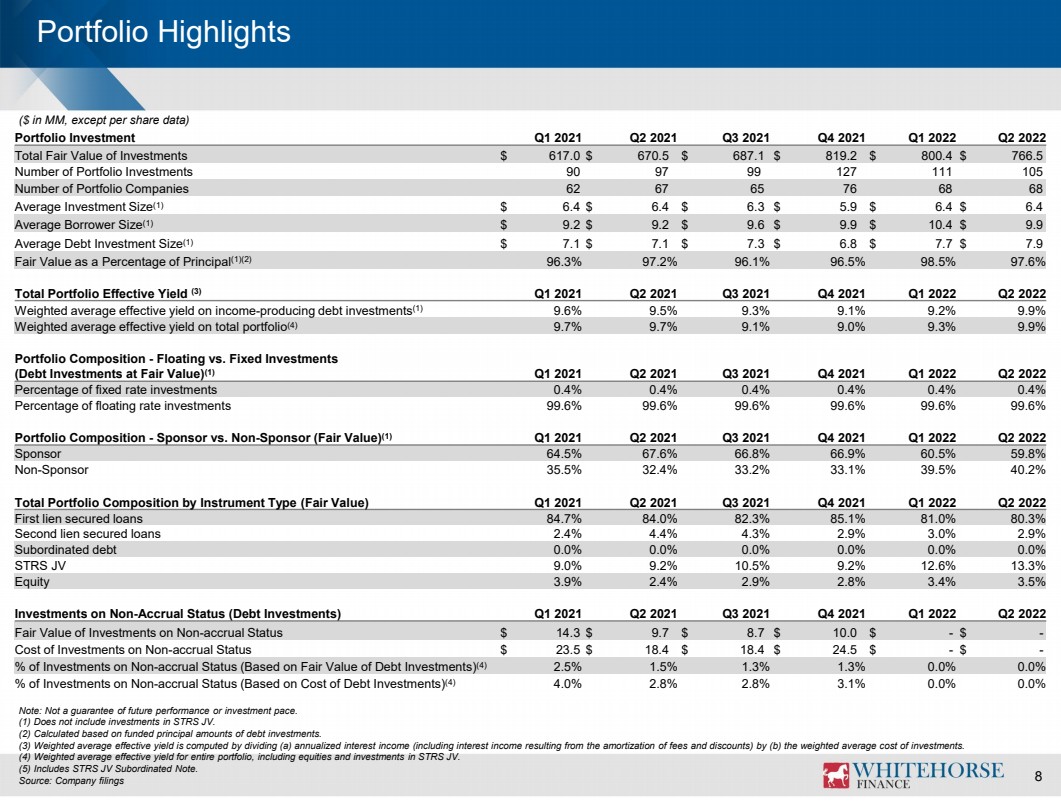
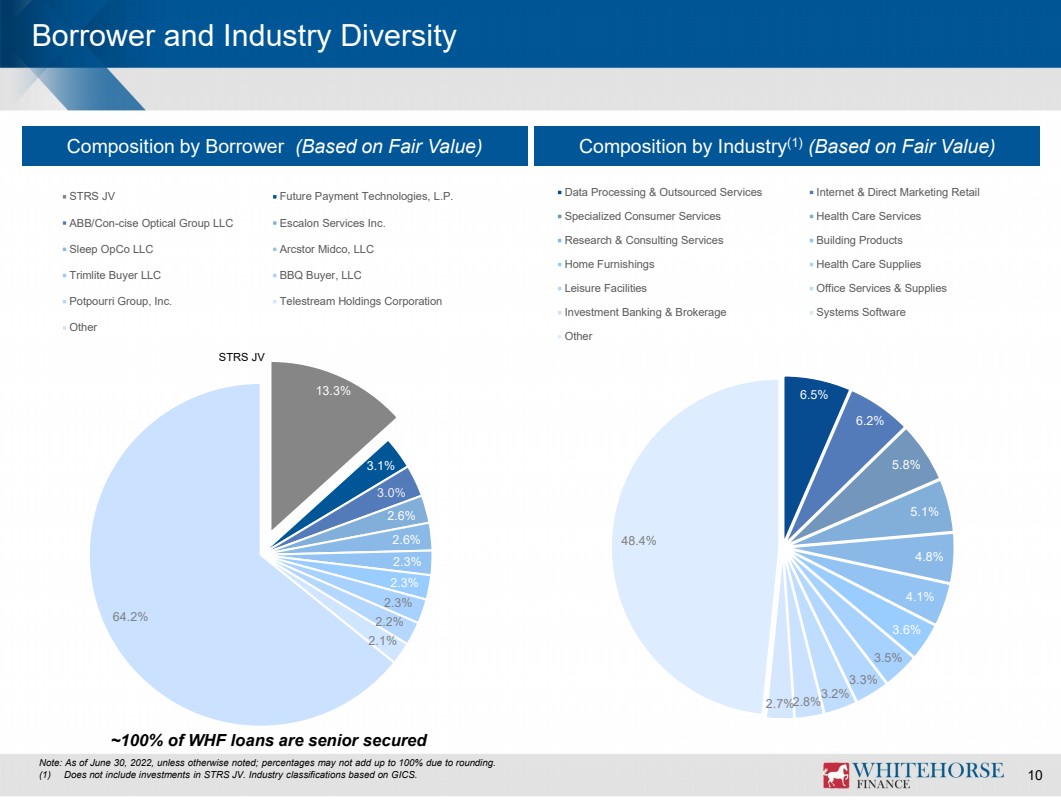
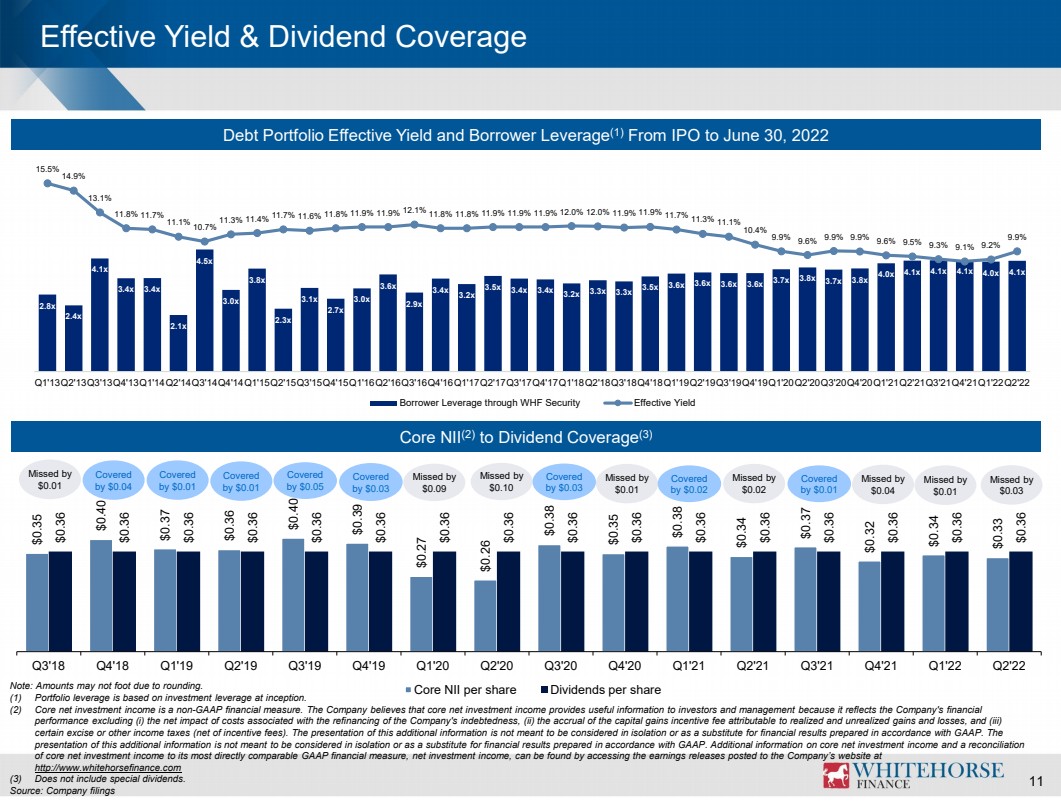
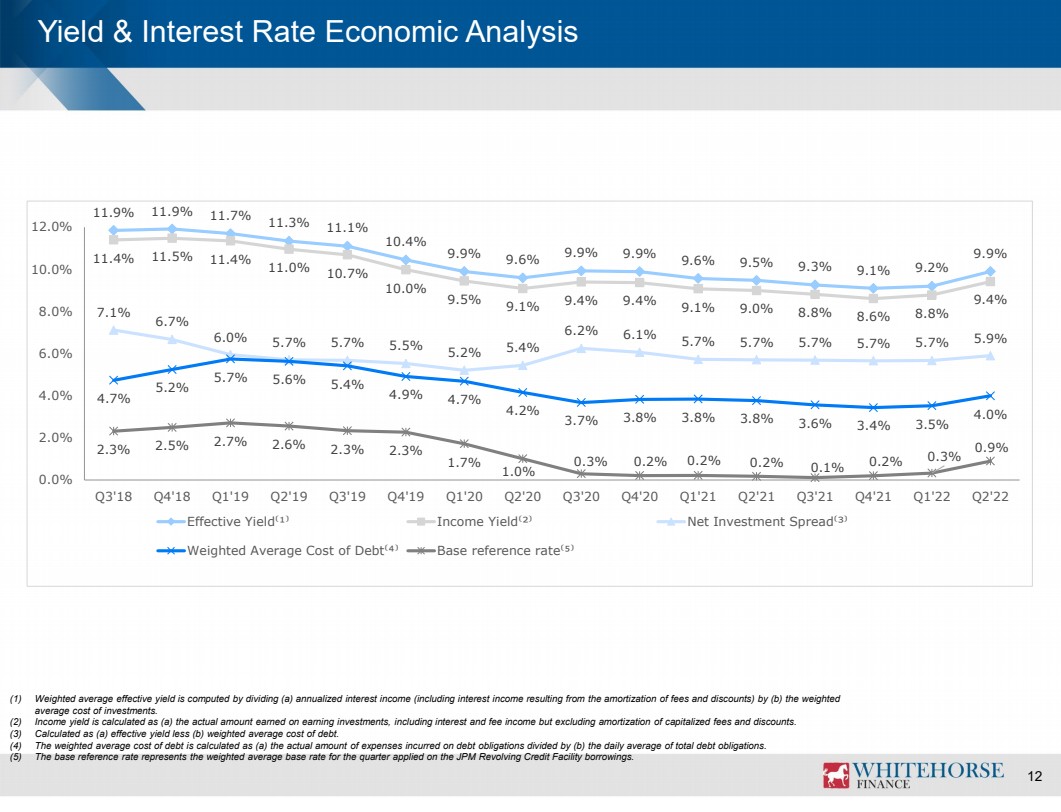
As of June 30, 2022, the fair value of WhiteHorse Finance’s investment portfolio was $766.5 million, compared with $800.4 million as of March 31, 2022. The portfolio as of June 30, 2022 consisted of 105 positions across 68 companies with a weighted average effective yield of 9.9% on income-producing debt investments. The average debt investment size (excluding investments in STRS JV (as defined below)) was $7.9 million with the overall portfolio comprised of approximately 80.3% first lien secured loans, 2.9% second lien secured loans, 3.5% equity and 13.3% in investments in STRS JV. Almost all loans were variable rate investments (primarily indexed to the London Interbank Offered Rate or Secured Overnight Financing Rate) with fixed rate securities representing only 0.4% of loans at fair value. Nearly all performing floating rate investments have interest rate floors.
During the three months ended June 30, 2022, WhiteHorse Finance made investments in four new portfolio companies for a total of $28.9 million, added a total of $19.2 million to existing portfolio companies, and made net fundings of $1.4 million to revolver loans. Proceeds from sales and repayments totaled approximately $66.1 million for the three months ended June 30, 2022, driven by five full realizations in IvyRehab Intermediate II, LLC, What If Holdings, LLC, RLJ Pro-Vac, Inc., Tensar Corporation and Education Networks of America, Inc.
In addition to the transactions discussed above, during the three months ended June 30, 2022, WhiteHorse Finance transferred assets comprised of one new portfolio company and one add-on investment, totaling $17.8 million to STRS JV in exchange for cash proceeds.
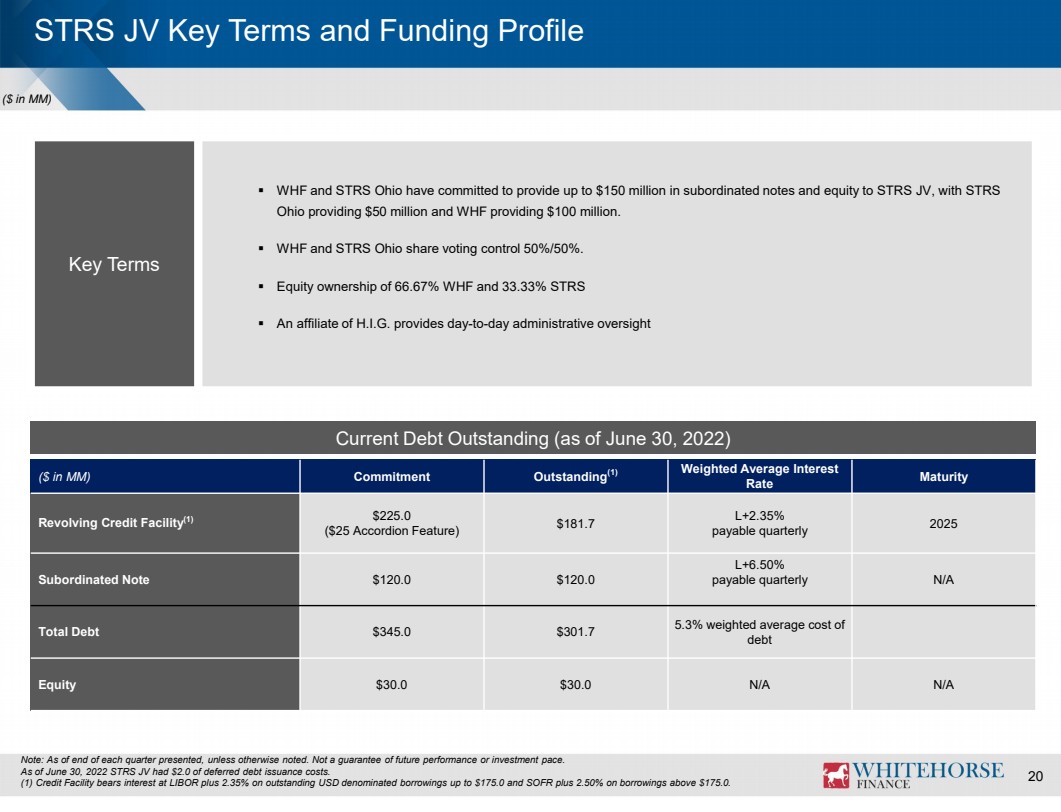
WHF STRS Ohio Senior Loan Fund LLC
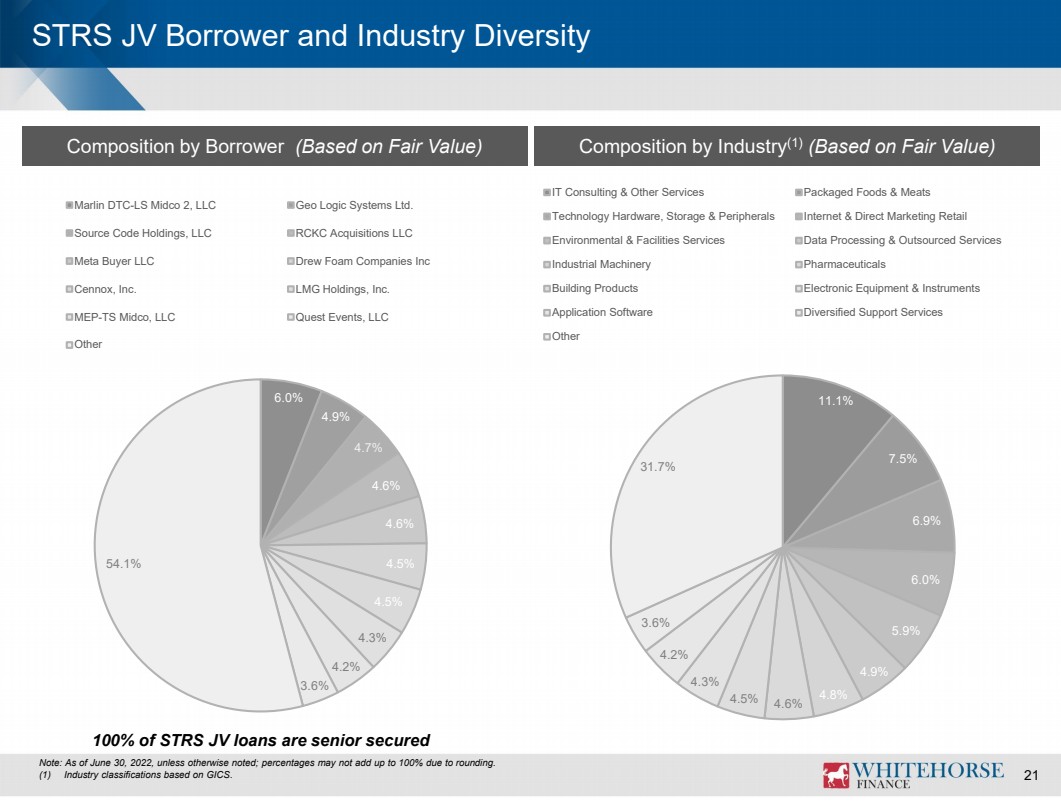
As of June 30, 2022, STRS JV’s portfolio totaled $318.8 million, consisted of 32 portfolio companies and had a weighted average effective yield of 8.7% on its portfolio.
Results of Operations
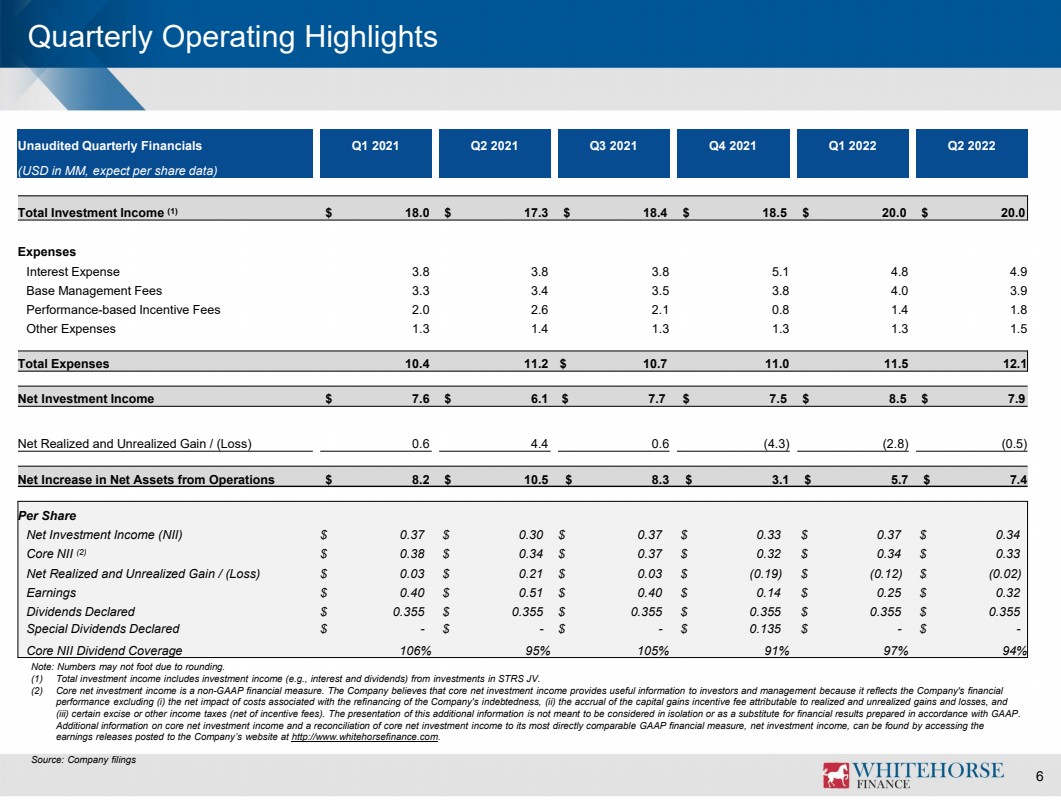
For the three months ended June 30, 2022, the Company’s net investment income was approximately $7.9 million, compared with approximately $6.1 million for the same period in the prior year, representing an increase of approximately 29.5%. The increase in net investment income for the year-over-year period was primarily attributable to higher investment income from interest income and STRS JV due to larger portfolio sizes in both the Company and STRS JV and higher accretion income due to more repayment activities. This was partially offset by higher interest expense incurred due to higher leverage balances and higher interest rates. For the three months ended June 30, 2022, the Company’s investment in STRS JV generated an annualized, gross investment yield of approximately 12.1%.
For the three months ended June 30, 2022, core net investment income(3) was $7.8 million, or $0.334 per share, compared with $7.0 million, or $0.338 per share for the same period in the prior year.
For the three months ended June 30, 2022, WhiteHorse Finance reported a net realized and unrealized loss on investments and foreign currency transactions of $0.5 million. This compares with a net realized and unrealized gain on investments and foreign currency transactions of $4.4 million for the three months ended June 30, 2021. The decrease for the year-over-year period was primarily attributable to markdowns on the portfolio in the current quarter, partially offset by a $1.7 million realized gain from the recovery proceeds received from the RCS Class B Units investment.
WhiteHorse Finance reported a net increase in net assets resulting from operations of approximately $7.3 million for the three months ended June 30, 2022, which compares with a net increase of $10.5 million the three months ended June 30, 2021.
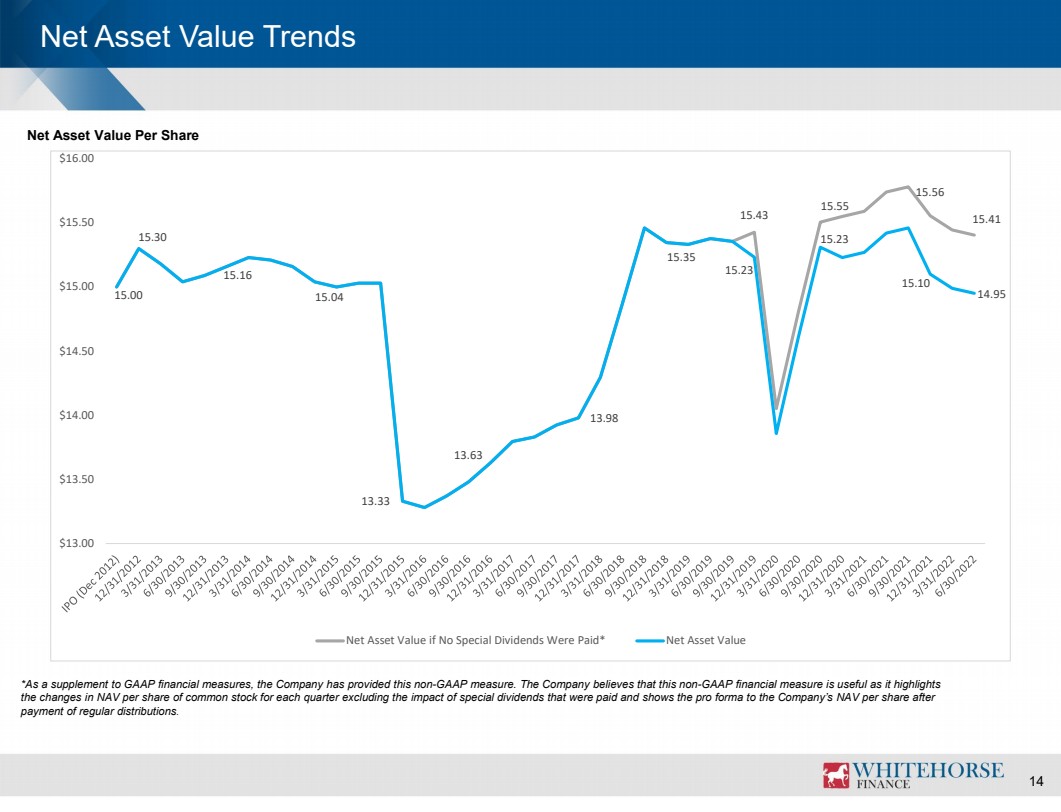
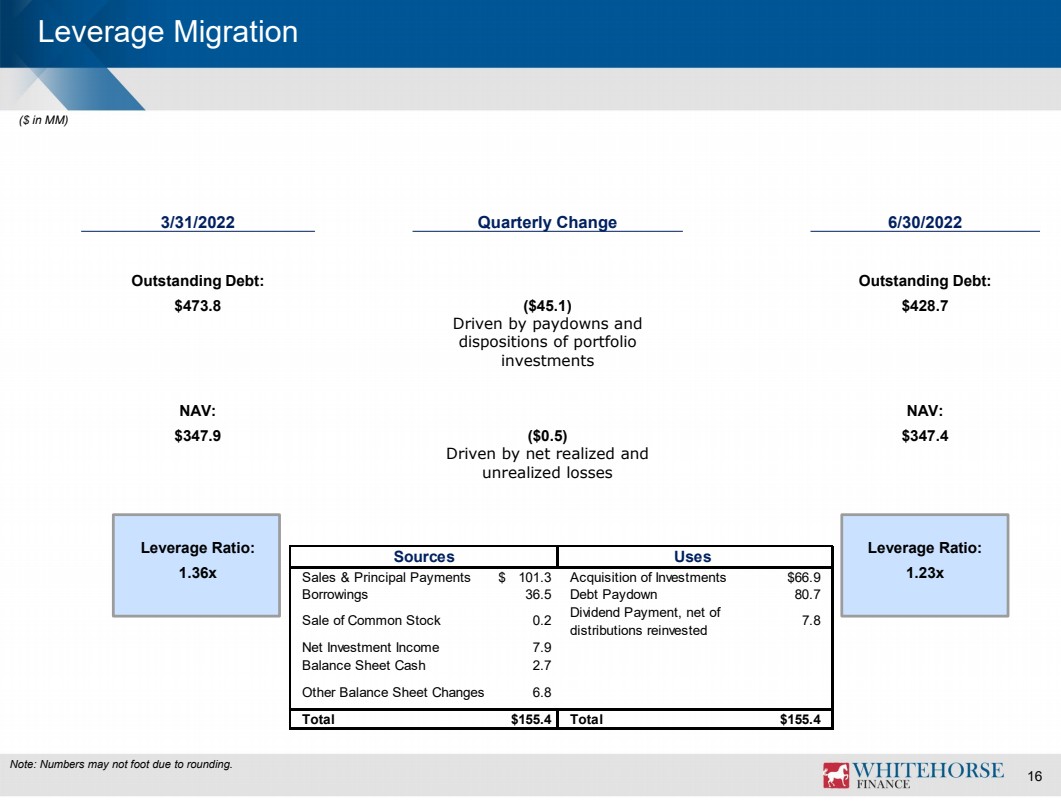
WhiteHorse Finance’s net asset value was $347.4 million, or $14.95 per share, as of June 30, 2022, compared with $347.9 million, or $14.99 per share, as of Mach 31, 2022.
Liquidity and Capital Resources
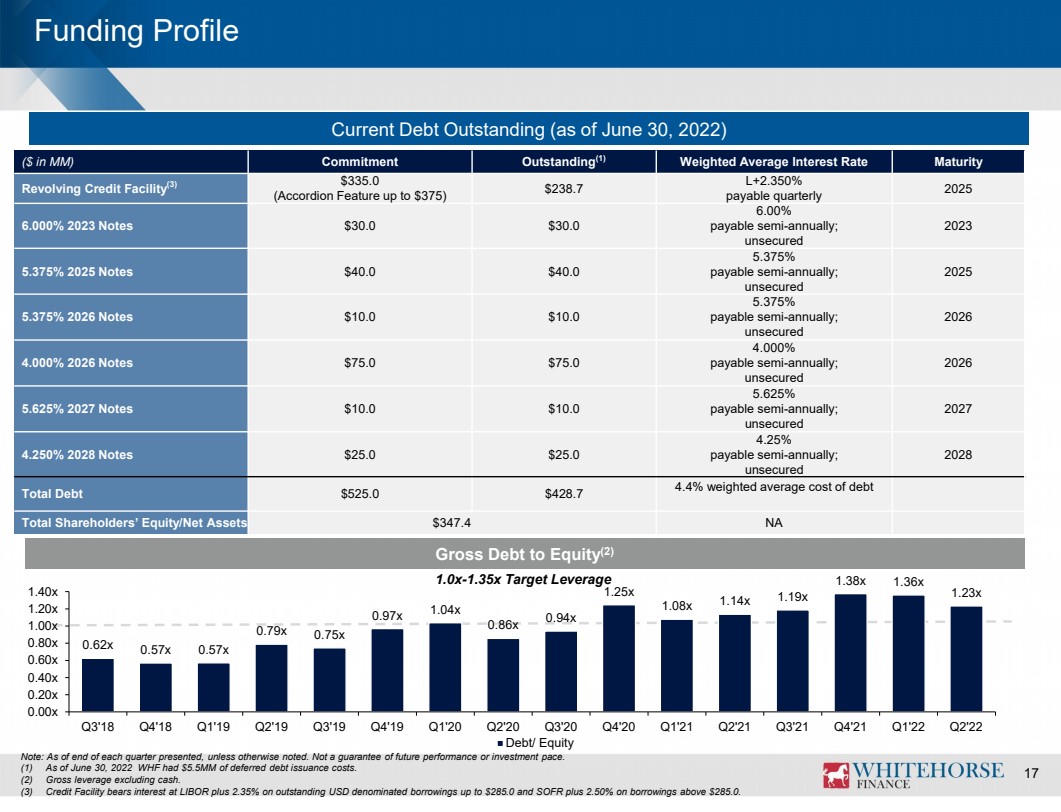
As of June 30, 2022, WhiteHorse Finance had cash and cash equivalents of $18.6 million, compared with $21.3 million as of Mach 31, 2022, inclusive of restricted cash. As of June 30, 2022, the Company also had $96.3 million of undrawn capacity under its revolving credit facility.
Distributions
The Company's Board of Directors has declared a distribution of $0.355 per share with respect to the quarter ending September 30, 2022. The distribution will be payable on October 4, 2022 to stockholders of record as of September 20, 2022.
On May 10, 2022, the Company declared a distribution of $0.355 per share for the quarter ended June 30, 2022, consistent with distributions declared for the thirty-ninth consecutive quarter since the Company’s initial public offering. The distribution was paid on July 5, 2022 to stockholders of record as of June 20, 2022.
Distributions are paid from taxable earnings and may include return of capital and/or capital gains. The specific tax characteristics of the distributions will be reported to stockholders on Form 1099-DIV after the end of the calendar year and in the Company’s periodic reports filed with the Securities and Exchange Commission.
Conference Call
WhiteHorse Finance will host a conference call to discuss its second quarter results for the period ended June 30, 2022 at 1:00 p.m. ET on Wednesday, August 10, 2022. To access the teleconference, please dial 800-459-5346 (domestic and international) approximately 10 minutes before the teleconference’s scheduled start time and reference Conference ID #WHFQ222. Investors may also access the call on the investor relations portion of the Company’s website at www.whitehorsefinance.com.
If you are unable to access the live teleconference, a replay will be available beginning approximately two hours after the call’s completion through August 17, 2022. The teleconference replay can be accessed by dialing 800-839-6911 (domestic and international). A webcast replay will also be available on the investor relations portion of the Company’s website at www.whitehorsefinance.com.
About WhiteHorse Finance, Inc.
WhiteHorse Finance is a business development company that originates and invests in loans to privately held, lower middle market companies across a broad range of industries. The Company’s investment activities are managed by H.I.G. WhiteHorse Advisers, LLC, an affiliate of H.I.G. Capital, LLC, (“H.I.G. Capital”). H.I.G. Capital is a leading global alternative asset manager with $50 billion of capital under management(4) across a number of funds focused on the small and mid-cap markets. For more information
about H.I.G. Capital, please visit http://www.higcapital.com. For more information about the Company, please visit http://www.whitehorsefinance.com.
Forward-Looking Statements
This press release may contain “forward-looking statements” within the meaning of the Private Securities Litigation Reform Act of 1995. Statements other than statements of historical facts included in this press release may constitute forward-looking statements and are not guarantees of future performance or results and involve a number of risks and uncertainties. Actual results may differ materially from those in the forward-looking statements as a result of a number of factors, including those described from time to time in filings with the Securities and Exchange Commission. The Company undertakes no duty to update any forward-looking statement made herein. All forward-looking statements speak only as of the date of this press release.
(1) Includes investments in WHF STRS Ohio Senior Loan Fund LLC (“STRS JV”), an unconsolidated joint venture, totaling $102.3 million, at fair value.
(2) Excludes investments made in STRS JV.
(3) “Core net investment income” is a non-GAAP financial measure. The Company believes that core net investment income provides useful information to investors and management because it reflects the Company’s financial performance excluding (i) the net impact of costs associated with the refinancing of the Company’s indebtedness, (ii) the accrual of the capital gains incentive fee attributable to net realized and unrealized gains and losses, and (iii) excise and other income taxes related to such net realized gains and losses (net of incentive fees). The presentation of this additional information is not meant to be considered in isolation or as a substitute for financial results prepared in accordance with GAAP. Additional information on core net investment income and a reconciliation of core net investment income to its most directly comparable GAAP financial measure, net investment income, are set forth in Schedule 1 hereto.
(4) Based on total capital commitments managed by H.I.G. Capital and affiliates.
SCHEDULE 1
As a supplement to GAAP financial measures, the Company has provided information relating to core net investment income, which is a non-GAAP measure. This measure is provided in addition to, but not as a substitute for, net investment income determined in accordance with GAAP. The Company’s non-GAAP measures may differ from similar measures by other companies, even if similar terms are used to identify such measures. Core net investment income represents net investment income adjusted to exclude the net impact of costs associated with the refinancing of the Company’s indebtedness, the accrual of the capital gains incentive fee attributable to net realized and unrealized gains and losses, and excise or other income taxes related to such net realized gains and losses (net of incentive fees). There were no excise or other income taxes related to net realized gains and losses nor did the Company
incur any costs with refinancing any of its indebtedness for the quarters ended June 30, 2022 and June 30, 2021.
The following table provides a reconciliation of net investment income to core net investment income for the three months ended June 30, 2022 and June 30, 2021 (in thousands, except per share data):
| | June 30, 2022 | | | June 30, 2021 | | ||||||||||
| | Amount | | | Per Share | | | Amount | | | Per Share | | ||||
| | | | | | Amounts | | | | | | | Amounts | | ||
Net investment income | | $ | 7,875 | | | $ | 0.339 | | | $ | 6,100 | | | $ | 0.296 | |
Net impact of costs associated with refinancing of indebtedness | | | - | | | | - | | | | - | | | | - | |
Accrual for capital gains incentive fee | | | (106) | | | | (0.005) | | | | 882 | | | | 0.042 | |
Net impact of excise tax expense related to net realized gains and losses | | | - | | | | - | | | | - | | | | - | |
Core net investment income | | $ | 7,769 | | | $ | 0.334 | | | $ | 6,982 | | | $ | 0.338 | |
WhiteHorse Finance, Inc.
Consolidated Statements of Assets and Liabilities
(in thousands, except share and per share data)
|
| | June 30, 2022 |
| | December 31, 2021 |
| | | (Unaudited) | | | |
Assets |
| | |
| |
|
Investments, at fair value |
| |
|
| |
|
Non-controlled/non-affiliate company investments | | $ | 651,983 | | $ | 736,727 |
Non-controlled affiliate company investments | | | 12,217 | | | 6,874 |
Controlled affiliate company investments | | | 102,279 | | | 75,607 |
Total investments, at fair value (amortized cost $767,809 and $831,960, respectively) | | | 766,479 | | | 819,208 |
Cash and cash equivalents | | | 9,231 | | | 12,185 |
Restricted cash and cash equivalents | | | 8,769 | | | 9,814 |
Restricted foreign currency (cost of $603 and $464, respectively) | | | 596 | | | 469 |
Interest and dividend receivable | | | 6,287 | | | 7,521 |
Amounts receivable on unsettled investment transactions | | | 6,271 | | | — |
Escrow receivable | | | 1,071 | | | 515 |
Prepaid expenses and other receivables | | | 905 | | | 1,307 |
Total assets | | $ | 799,609 | | $ | 851,019 |
| | | | | | |
Liabilities | | |
| | | |
Debt | | $ | 423,235 | | $ | 475,958 |
Distributions payable | | | 8,251 | | | 8,222 |
Management fees payable | | | 3,908 | | | 3,766 |
Incentive fees payable | | | 5,176 | | | 7,958 |
Amounts payable on unsettled investment transactions | | | 7,496 | | | — |
Interest payable | | | 2,117 | | | 2,087 |
Accounts payable and accrued expenses | | | 1,476 | | | 2,438 |
Advances received from unfunded credit facilities | | | 525 | | | 839 |
Total liabilities | | | 452,184 | | | 501,268 |
| | | | | | |
Commitments and contingencies | | |
| | |
|
| | | | | | |
Net assets | | |
| | |
|
Common stock, 23,243,088 and 23,162,667 shares issued and outstanding, par value $0.001 per share, respectively, and 100,000,000 shares authorized | | | 23 | | | 23 |
Paid-in capital in excess of par | | | 340,264 | | | 339,161 |
Accumulated earnings | | | 7,138 | | | 10,567 |
Total net assets | | | 347,425 | | | 349,751 |
Total liabilities and total net assets | | $ | 799,609 | | $ | 851,019 |
Number of shares outstanding | | | 23,243,088 | | | 23,162,667 |
Net asset value per share | | $ | 14.95 | | $ | 15.10 |
| | | | | | |
WhiteHorse Finance, Inc.
Consolidated Statements of Operations
(Unaudited)
(in thousands, except share and per share data)
| | | Three months ended June 30, | | | Six months ended June 30, | | ||||||
|
| | 2022 | | | 2021 |
| | 2022 | | | 2021 |
|
Investment income | | | | | | | | | | | | | |
From non-controlled/non-affiliate company investments |
| |
|
| |
|
| |
|
| |
|
|
Interest income | | $ | 16,028 | | $ | 14,148 | | $ | 32,769 | | $ | 28,960 | |
Fee income | | | 679 | | | 350 | | | 1,141 | | | 1,121 | |
Dividend income | | | 79 | | | 65 | | | 168 | | | 109 | |
From non-controlled affiliate company investments | | | | | | | | | | | | | |
Interest income | | | 73 | | | — | | | 133 | | | — | |
Dividend income | | | 109 | | | 717 | | | 240 | | | 967 | |
From controlled affiliate company investments | | | | | | | | | | | | | |
Interest income | | | 1,459 | | | 738 | | | 2,586 | | | 1,457 | |
Dividend income | | | 1,573 | | | 1,325 | | | 2,997 | | | 2,699 | |
Total investment income | | | 20,000 | | | 17,343 | | | 40,034 | | | 35,313 | |
Expenses | | |
| | |
| | |
| | |
| |
Interest expense | | | 4,945 | | | 3,811 | | | 9,719 | | | 7,613 | |
Base management fees | | | 3,908 | | | 3,357 | | | 7,859 | | | 6,701 | |
Performance-based incentive fees | | | 1,837 | | | 2,628 | | | 3,264 | | | 4,670 | |
Administrative service fees | | | 170 | | | 170 | | | 341 | | | 341 | |
General and administrative expenses | | | 1,088 | | | 875 | | | 2,036 | | | 1,696 | |
Total expenses | | | 11,948 | | | 10,841 | | | 23,219 | | | 21,021 | |
Net investment income before excise tax | | | 8,052 | | | 6,502 | | | 16,815 | | | 14,292 | |
Excise tax | | | 175 | | | 402 | | | 399 | | | 592 | |
Net investment income after excise tax | | | 7,877 | | | 6,100 | | | 16,416 | | | 13,700 | |
| | | | | | | | | | | | | |
Realized and unrealized gains (losses) on investments and foreign currency transactions | | |
| | |
| | |
| | |
| |
Net realized gains (losses) | | |
| | |
| | |
| | |
| |
Non-controlled/non-affiliate company investments | | | 686 | | | (555) | | | (17,498) | | | 7,605 | |
Non-controlled affiliate company investments | | | 1,725 | | | — | | | 1,725 | | | — | |
Foreign currency transactions | | | (61) | | | (4) | | | (342) | | | (3) | |
Foreign currency forward contracts | | | (8) | | | (4) | | | (8) | | | (4) | |
Net realized gains (losses) | | | 2,342 | | | (563) | | | (16,123) | | | 7,598 | |
Net change in unrealized appreciation (depreciation) | | |
| | |
| | |
| | |
| |
Non-controlled/non-affiliate company investments | | | (4,546) | | | 4,407 | | | 12,570 | | | (2,568) | |
Non-controlled affiliate company investments | | | (586) | | | 755 | | | (2,206) | | | 321 | |
Controlled affiliate company investments | | | 1,502 | | | (149) | | | 1,672 | | | (269) | |
Translation of assets and liabilities in foreign currencies | | | 756 | | | (40) | | | 727 | | | (102) | |
Foreign currency forward contracts | | | 4 | | | 1 | | | — | | | — | |
Net change in unrealized appreciation (depreciation) | | | (2,870) | | | 4,974 | | | 12,763 | | | (2,618) | |
Net realized and unrealized gains (losses) on investments and foreign currency transactions | | | (528) | | | 4,411 | | | (3,360) | | | 4,980 | |
Net increase in net assets resulting from operations | | $ | 7,349 | | $ | 10,511 | | $ | 13,056 | | $ | 18,680 | |
| | | | | | | | | | | | | |
Per Common Share Data | | | | | | | | | | | | | |
Basic and diluted earnings per common share | | $ | 0.32 | | $ | 0.51 | | $ | 0.56 | | $ | 0.91 | |
Dividends and distributions declared per common share | | $ | 0.36 | | $ | 0.36 | | $ | 0.71 | | $ | 0.71 | |
Basic and diluted weighted average common shares outstanding | | | 23,240,651 | | | 20,626,340 | | | 23,215,792 | | | 20,589,159 | |
WhiteHorse Finance, Inc.
Consolidated Schedule of Investments (Unaudited)
June 30, 2022
(in thousands)
Issuer |
| Investment Type(1) |
| Floor |
| Spread |
| Interest |
| Acquisition |
| Maturity |
| Principal/ |
| Amortized |
| Fair |
| Fair Value |
| ||
|---|---|---|---|---|---|---|---|---|---|---|---|---|---|---|---|---|---|---|---|---|---|---|---|
North America | | | | | | | | | | | | | | | | | | | | | | | |
Debt Investments | | | | | | | | | | | | | | | | | | | | | | | |
Air Freight & Logistics | | | | | | | | | | | | | | | | | | | | | | | |
Access USA Shipping, LLC (d/b/a MyUS.com) | | First Lien Secured Term Loan | | 1.50% | | L+ 8.00% | | 9.67% | | 02/08/19 | | 02/08/24 | | 4,791 | | $ | 4,768 | | $ | 4,791 | | 1.38 | % |
Motivational Marketing, LLC (d/b/a Motivational Fulfillment) | | First Lien Secured Term Loan | | 1.00% | | L+ 6.25% | | 7.50% | | 07/12/21 | | 07/12/26 | | 11,135 | | | 10,956 | | | 10,914 | | 3.14 | |
Motivational Marketing, LLC (d/b/a Motivational Fulfillment)(7) | | First Lien Secured Revolving Loan | | 1.00% | | L+ 6.25% | | 7.50% | | 07/12/21 | | 07/12/26 | | — | | | — | | | (4) | | — | |
| | | | | | | | | | | | | | | | | 15,724 | | | 15,701 | | 4.52 | |
Application Software | | | | | | | | | | | | | | | | | | | | | | | |
Atlas Purchaser, Inc. (d/b/a Aspect Software) | | Second Lien Secured Term Loan | | 0.75% | | L+ 9.00% | | 11.19% | | 05/03/21 | | 05/07/29 | | 15,000 | | | 14,614 | | | 13,890 | | 3.99 | |
Naviga Inc. (f/k/a Newscycle Solutions, Inc.) | | First Lien Secured Term Loan | | 1.00% | | L+ 7.00% | | 9.25% | | 06/14/19 | | 12/29/22 | | 3,197 | | | 3,188 | | | 3,197 | | 0.92 | |
Naviga Inc. (f/k/a Newscycle Solutions, Inc.)(7)(12) | | First Lien Secured Revolving Loan | | 1.00% | | Base rate+ 6.38% | | 10.41% | | 06/14/19 | | 12/29/22 | | 183 | | | 183 | | | 183 | | 0.05 | |
| | | | | | | | | | | | | | | | | 17,985 | | | 17,270 | | 4.96 | |
Asset Management & Custody Banks | | | | | | | | | | | | | | | | | | | | | | | |
JZ Capital Partners Ltd.(4)(5) | | First Lien Secured Term Loan | | 1.00% | | L+ 7.00% | | 8.21% | | 01/26/22 | | 01/26/27 | | 10,286 | | | 10,098 | | | 10,196 | | 2.93 | |
JZ Capital Partners Ltd.(4)(5)(7) | | First Lien Secured Delayed Draw Loan | | 1.00% | | L+ 7.00% | | 8.21% | | 01/26/22 | | 01/26/27 | | — | | | — | | | 55 | | 0.02 | |
| | | | | | | | | | | | | | | | | 10,098 | | | 10,251 | | 2.95 | |
Automotive Retail | | | | | | | | | | | | | | | | | | | | | | | |
Team Car Care Holdings, LLC (Heartland Auto)(12) | | First Lien Secured Term Loan | | 1.00% | | Base rate+ 7.98% | | 9.04% | | 02/16/18 | | 06/28/24 | | 14,825 | | | 14,753 | | | 14,791 | | 4.26 | |
| | | | | | | | | | | | | | | | | 14,753 | | | 14,791 | | 4.26 | |
Broadcasting | | | | | | | | | | | | | | | | | | | | | | | |
Coastal Television Broadcasting Group LLC | | First Lien Secured Term Loan | | 1.00% | | SF+ 6.50% | | 8.02% | | 12/30/21 | | 12/30/26 | | 8,191 | | | 8,044 | | | 8,041 | | 2.31 | |
Coastal Television Broadcasting Group LLC(7) | | First Lien Secured Revolving Loan | | 1.00% | | SF+ 6.50% | | 8.02% | | 12/30/21 | | 12/30/26 | | — | | | — | | | — | | — | |
| | | | | | | | | | | | | | | | | 8,044 | | | 8,041 | | 2.31 | |
Building Products | | | | | | | | | | | | | | | | | | | | | | | |
PFB Holdco, Inc. (d/b/a PFB Corporation)(13) | | First Lien Secured Term Loan | | 1.00% | | C+ 6.50% | | 7.73% | | 12/17/21 | | 12/17/26 | | 8,982 | | | 6,900 | | | 6,903 | | 1.98 | |
PFB Holdco, Inc. (d/b/a PFB Corporation)(7)(13) | | First Lien Secured Revolving Loan | | 1.00% | | C+ 6.50% | | 7.73% | | 12/17/21 | | 12/17/26 | | — | | | — | | | 7 | | — | |
PFB Holdco, Inc. (d/b/a PFB Corporation) | | First Lien Secured Term Loan | | 1.00% | | L+ 6.50% | | 7.50% | | 12/17/21 | | 12/17/26 | | 2,187 | | | 2,148 | | | 2,155 | | 0.62 | |
PFB Holdco, Inc. (d/b/a PFB Corporation)(7) | | First Lien Secured Revolving Loan | | 1.00% | | L+ 6.50% | | 7.50% | | 12/17/21 | | 12/17/26 | | — | | | — | | | 1 | | — | |
Trimlite Buyer LLC (d/b/a Trimlite LLC)(5)(13) | | First Lien Secured Term Loan | | 1.00% | | C+ 6.50% | | 9.18% | | 07/27/21 | | 07/27/26 | | 22,688 | | | 17,784 | | | 17,345 | | 4.99 | |
| | | | | | | | | | | | | | | | | 26,832 | | | 26,411 | | 7.59 | |
Cable & Satellite | | | | | | | | | | | | | | | | | | | | | | | |
Bulk Midco, LLC(15)(24) | | First Lien Secured Term Loan | | 1.00% | | L+ 7.17% | | 8.67% | | 06/08/18 | | 06/08/23 | | 14,922 | | | 14,880 | | | 14,326 | | 4.12 | |
| | | | | | | | | | | | | | | | | 14,880 | | | 14,326 | | 4.12 | |
Commodity Chemicals | | | | | | | | | | | | | | | | | | | | | | | |
Flexitallic Group SAS | | First Lien Secured Term Loan | | 1.00% | | L+ 7.50% | | 9.75% (9.25% Cash + 0.50% PIK) | | 10/28/19 | | 10/29/26 | | 15,682 | | | 15,078 | | | 15,333 | | 4.41 | |
| | | | | | | | | | | | | | | | | 15,078 | | | 15,333 | | 4.41 | |
Construction Materials | | | | | | | | | | | | | | | | | | | | | | | |
Claridge Products and Equipment, LLC | | First Lien Secured Term Loan | | 1.00% | | L+ 6.50% | | 8.75% | | 12/30/20 | | 12/29/25 | | 7,601 | | | 7,495 | | | 7,508 | | 2.15 | |
Claridge Products and Equipment, LLC(7)(12) | | First Lien Secured Revolving Loan | | 1.00% | | Base rate+ 5.93% | | 9.06% | | 12/30/20 | | 12/29/25 | | 891 | | | 882 | | | 872 | | 0.25 | |
| | | | | | | | | | | | | | | | | 8,377 | | | 8,380 | | 2.40 | |
Consumer Finance | | | | | | | | | | | | | | | | | | | | | | | |
Maxitransfers Blocker Corp. | | First Lien Secured Term Loan | | 1.00% | | L+ 8.50% | | 10.75% | | 10/07/20 | | 10/07/25 | | 8,367 | | | 8,237 | | | 8,367 | | 2.41 | |
Maxitransfers Blocker Corp.(4)(7) | | First Lien Secured Revolving Loan | | 1.00% | | L+ 8.50% | | 10.75% | | 10/07/20 | | 10/07/25 | | — | | | — | | | 16 | | — | |
| | | | | | | | | | | | | | | | | 8,237 | | | 8,383 | | 2.41 | |
WhiteHorse Finance, Inc.
Consolidated Schedule of Investments (Unaudited)
June 30, 2022
(in thousands)
Issuer |
| Investment Type(1) |
| Floor |
| Spread |
| Interest |
| Acquisition |
| Maturity |
| Principal/ |
| Amortized |
| Fair |
| Fair Value |
| ||
|---|---|---|---|---|---|---|---|---|---|---|---|---|---|---|---|---|---|---|---|---|---|---|---|
Data Processing & Outsourced Services | | | | | | | | | | | | | | | | | | | | | | | |
Escalon Services Inc. | | First Lien Secured Term Loan | | 1.00% | | L+ 10.31% | | 11.72% (10.22% Cash + 1.50% PIK) | | 12/04/20 | | 12/04/25 | | 17,247 | | | 16,514 | | | 17,592 | | 5.06 | % |
Future Payment Technologies, L.P. | | First Lien Secured Term Loan | | 1.00% | | L+ 8.25% | | 9.31% | | 12/23/16 | | 06/07/24 | | 23,533 | | | 23,371 | | | 23,533 | | 6.77 | |
| | | | | | | | | | | | | | | | | 39,885 | | | 41,125 | | 11.83 | |
Department Stores | | | | | | | | | | | | | | | | | | | | | | | |
Mills Fleet Farm Group, LLC | | First Lien Secured Term Loan | | 1.00% | | L+ 6.25% | | 7.92% | | 10/24/18 | | 10/24/24 | | 13,172 | | $ | 12,992 | | $ | 13,172 | | 3.79 | |
| | | | | | | | | | | | | | | | | 12,992 | | | 13,172 | | 3.79 | |
Distributors | | | | | | | | | | | | | | | | | | | | | | | |
Crown Brands LLC | | First Lien Secured Term Loan | | 1.00% | | SF+ 8.00% | | 9.05% | | 04/22/22 | | 12/09/25 | | 357 | | | 357 | | | 357 | | 0.10 | |
Crown Brands LLC(19) | | Second Lien Secured Term Loan | | 1.50% | | L+ 10.50% | | 12.17% | | 12/15/20 | | 01/08/26 | | 4,384 | | | 4,312 | | | 2,850 | | 0.82 | |
Crown Brands LLC(19) | | Second Lien Secured Delayed Draw Loan | | 1.50% | | L+ 10.50% | | 12.19% | | 12/15/20 | | 01/08/26 | | 651 | | | 651 | | | 423 | | 0.12 | |
| | | | | | | | | | | | | | | | | 5,320 | | | 3,630 | | 1.04 | |
Diversified Chemicals | | | | | | | | | | | | | | | | | | | | | | | |
Manchester Acquisition Sub LLC (d/b/a Draslovka Holding AS) | | First Lien Secured Term Loan | | 0.75% | | SF+ 5.75% | | 7.30% | | 11/16/21 | | 11/16/26 | | 7,960 | | | 7,572 | | | 7,571 | | 2.18 | |
Sklar Holdings, Inc. (d/b/a Starco) | | First Lien Secured Term Loan | | 1.00% | | L+ 9.75% | | 10.75% (8.75% Cash + 2.00% PIK) | | 11/13/19 | | 05/13/23 | | 7,371 | | | 7,299 | | | 7,003 | | 2.02 | |
| | | | | | | | | | | | | | | | | 14,871 | | | 14,574 | | 4.20 | |
Diversified Support Services | | | | | | | | | | | | | | | | | | | | | | | |
NNA Services, LLC | | First Lien Secured Term Loan | | 1.00% | | L+ 6.75% | | 9.00% | | 08/27/21 | | 08/27/26 | | 11,448 | | | 11,329 | | | 11,357 | | 3.27 | |
| | | | | | | | | | | | | | | | | 11,329 | | | 11,357 | | 3.27 | |
Education Services | | | | | | | | | | | | | | | | | | | | | | | |
EducationDynamics, LLC | | First Lien Secured Term Loan | | 1.00% | | L+ 7.00% | | 8.60% (8.10% Cash + 0.50% PIK) | | 09/15/21 | | 09/15/26 | | 13,186 | | | 12,964 | | | 13,169 | | 3.78 | |
EducationDynamics, LLC(4)(7) | | First Lien Secured Delayed Draw Loan | | 1.00% | | L+ 7.00% | | 8.60% (8.10% Cash + 0.50% PIK) | | 09/15/21 | | 09/15/26 | | — | | | — | | | 27 | | 0.01 | |
EducationDynamics, LLC(7) | | First Lien Secured Revolving Loan | | 1.00% | | L+ 7.00% | | 8.60% (8.10% Cash + 0.50% PIK) | | 09/15/21 | | 09/15/26 | | — | | | — | | | 19 | | 0.01 | |
EducationDynamics, LLC(4) | | Subordinated Unsecured Term Loan | | N/A | | 4.00% | | 4.00% | | 09/15/21 | | 03/15/27 | | 167 | | | 167 | | | 167 | | 0.05 | |
| | | | | | | | | | | | | | | | | 13,131 | | | 13,382 | | 3.85 | |
Electric Utilities | | | | | | | | | | | | | | | | | | | | | | | |
CleanChoice Energy, Inc. (d/b/a CleanChoice) | | First Lien Secured Term Loan | | 1.00% | | L+ 7.25% | | 8.29% | | 10/12/21 | | 10/12/26 | | 10,500 | | | 10,320 | | | 10,352 | | 2.98 | |
| | | | | | | | | | | | | | | | | 10,320 | | | 10,352 | | 2.98 | |
Environmental & Facilities Services | | | | | | | | | | | | | | | | | | | | | | | |
Industrial Specialty Services USA LLC | | First Lien Secured Term Loan | | 1.00% | | L+ 6.25% | | 8.50% | | 12/31/21 | | 12/31/26 | | 11,947 | | | 11,732 | | | 11,595 | | 3.34 | |
Industrial Specialty Services USA LLC(7) | | First Lien Secured Revolving Loan | | 1.00% | | L+ 6.25% | | 7.71% | | 12/31/21 | | 12/31/26 | | 1,016 | | | 998 | | | 984 | | 0.28 | |
| | | | | | | | | | | | | | | | | 12,730 | | | 12,579 | | 3.62 | |
Health Care Facilities | | | | | | | | | | | | | | | | | | | | | | | |
Bridgepoint Healthcare, LLC | | First Lien Secured Term Loan | | 1.00% | | L+ 7.75% | | 8.94% | | 10/05/21 | | 10/05/26 | | 10,701 | | | 10,518 | | | 10,508 | | 3.02 | |
Bridgepoint Healthcare, LLC(7) | | First Lien Secured Delayed Draw Loan | | 1.00% | | L+ 7.75% | | 8.94% | | 10/05/21 | | 10/05/26 | | — | | | — | | | (8) | | — | |
Bridgepoint Healthcare, LLC(7) | | First Lien Secured Revolving Loan | | 1.00% | | L+ 7.75% | | 8.94% | | 10/05/21 | | 10/05/26 | | — | | | — | | | (2) | | — | |
| | | | | | | | | | | | | | | | | 10,518 | | | 10,498 | | 3.02 | |
Health Care Services | | | | | | | | | | | | | | | | | | | | | | | |
CHS Therapy, LLC | | First Lien Secured Term Loan A | | 1.50% | | L+ 9.00% | | 11.25% (10.75% Cash + 0.50% PIK) | | 06/14/19 | | 06/14/24 | | 7,164 | | $ | 7,111 | | $ | 7,164 | | 2.06 | |
CHS Therapy, LLC | | First Lien Secured Term Loan C | | 1.50% | | L+ 9.00% | | 11.25% (10.75% Cash + 0.50% PIK) | | 10/07/20 | | 06/14/24 | | 881 | | | 872 | | | 881 | | 0.25 | |
Lab Logistics, LLC | | First Lien Secured Term Loan | | 1.00% | | SF+ 7.25% | | 8.63% | | 10/16/19 | | 09/25/23 | | 5,515 | | | 5,445 | | | 5,450 | | 1.57 | |
Lab Logistics, LLC | | First Lien Secured Delayed Draw Loan | | 1.00% | | L+ 7.25% | | 8.25% | | 10/16/19 | | 09/25/23 | | 5,157 | | | 5,145 | | | 5,157 | | 1.48 | |
PG Dental New Jersey Parent, LLC | | First Lien Secured Term Loan | | 1.00% | | L+ 9.75% | | 11.07% (9.57% Cash + 1.50% PIK) | | 11/25/20 | | 11/25/25 | | 14,787 | | | 14,565 | | | 13,548 | | 3.90 | |
WhiteHorse Finance, Inc.
Consolidated Schedule of Investments (Unaudited)
June 30, 2022
(in thousands)
Issuer |
| Investment Type(1) |
| Floor |
| Spread |
| Interest |
| Acquisition |
| Maturity |
| Principal/ |
| Amortized |
| Fair |
| Fair Value |
| ||
|---|---|---|---|---|---|---|---|---|---|---|---|---|---|---|---|---|---|---|---|---|---|---|---|
PG Dental New Jersey Parent, LLC(7) | | First Lien Secured Revolving Loan | | 1.00% | | L+ 9.75% | | 11.07% (9.57% Cash + 1.50% PIK) | | 11/25/20 | | 11/25/25 | | 352 | | | 346 | | | 298 | | 0.09 | % |
| | | | | | | | | | | | | | | | | 33,484 | | | 32,498 | | 9.35 | |
Health Care Supplies | | | | | | | | | | | | | | | | | | | | | | | |
ABB/Con-cise Optical Group LLC (d/b/a ABB Optical Group, LLC) | | First Lien Secured Term Loan | | 0.75% | | L+ 7.50% | | 8.26% | | 02/23/22 | | 02/23/28 | | 21,682 | | | 21,171 | | | 21,096 | | 6.07 | |
ABB/Con-cise Optical Group LLC (d/b/a ABB Optical Group, LLC)(7)(12) | | First Lien Secured Revolving Loan | | 0.75% | | Base rate+ 6.51% | | 11.22% | | 02/23/22 | | 02/23/28 | | 1,970 | | | 1,923 | | | 1,916 | | 0.55 | |
| | | | | | | | | | | | | | | | | 23,094 | | | 23,012 | | 6.62 | |
Heavy Electrical Equipment | | | | | | | | | | | | | | | | | | | | | | | |
PPS CR Acquisition, Inc. (d/b/a Power Plant Services) | | First Lien Secured Term Loan | | 1.00% | | L+ 6.25% | | 8.50% | | 06/25/21 | | 06/25/26 | | 11,067 | | | 10,891 | | | 10,953 | | 3.15 | |
PPS CR Acquisition, Inc. (d/b/a Power Plant Services)(7) | | First Lien Secured Revolving Loan | | 1.00% | | L+ 6.25% | | 8.50% | | 06/25/21 | | 06/25/24 | | 104 | | | 103 | | | 112 | | 0.03 | |
| | | | | | | | | | | | | | | | | 10,994 | | | 11,065 | | 3.18 | |
Home Furnishings | | | | | | | | | | | | | | | | | | | | | | | |
Sleep OpCo LLC (d/b/a Brooklyn Bedding LLC) | | First Lien Secured Term Loan | | 1.00% | | L+ 6.50% | | 7.51% | | 10/12/21 | | 10/12/26 | | 19,934 | | | 19,592 | | | 19,655 | | 5.66 | |
Sleep OpCo LLC (d/b/a Brooklyn Bedding LLC)(7) | | First Lien Secured Revolving Loan | | 1.00% | | L+ 6.50% | | 7.51% | | 10/12/21 | | 10/12/26 | | — | | | — | | | 8 | | — | |
Sure Fit Home Products, LLC | | First Lien Secured Term Loan | | 1.00% | | L+ 9.75% | | 12.01% | | 04/12/21 | | 07/13/23 | | 4,807 | | | 4,751 | | | 4,086 | | 1.18 | |
| | | | | | | | | | | | | | | | | 24,343 | | | 23,749 | | 6.84 | |
Household Appliances | | | | | | | | | | | | | | | | | | | | | | | |
Token Buyer, Inc. (d/b/a Therm-O-Disc, Inc.) | | First Lien Secured Term Loan | | 0.50% | | SF+ 6.00% | | 7.63% | | 05/26/22 | | 05/31/29 | | 6,180 | | | 5,691 | | | 5,686 | | 1.64 | |
| | | | | | | | | | | | | | | | | 5,691 | | | 5,686 | | 1.64 | |
Household Products | | | | | | | | | | | | | | | | | | | | | | | |
The Kyjen Company, LLC (d/b/a Outward Hound) | | First Lien Secured Term Loan | | 1.00% | | L+ 6.50% | | 7.99% | | 04/05/21 | | 04/05/26 | | 11,345 | | | 11,217 | | | 11,062 | | 3.18 | |
The Kyjen Company, LLC (d/b/a Outward Hound)(7) | | First Lien Secured Revolving Loan | | 1.00% | | L+ 6.50% | | 7.95% | | 04/05/21 | | 04/05/26 | | 704 | | | 696 | | | 683 | | 0.20 | |
| | | | | | | | | | | | | | | | | 11,913 | | | 11,745 | | 3.38 | |
Industrial Machinery | | | | | | | | | | | | | | | | | | | | | | | |
Project Castle, Inc. (d/b/a Material Handling Systems, Inc.) | | First Lien Secured Term Loan | | 0.50% | | L+ 5.50% | | 6.90% | | 06/09/22 | | 06/01/29 | | 8,376 | | | 7,496 | | | 7,559 | | 2.18 | |
| | | | | | | | | | | | | | | | | 7,496 | | | 7,559 | | 2.18 | |
Interactive Media & Services | | | | | | | | | | | | | | | | | | | | | | | |
MSI Information Services, Inc. | | First Lien Secured Term Loan | | 1.00% | | SF+ 7.75% | | 9.38% | | 04/25/22 | | 04/24/26 | | 7,950 | | | 7,798 | | | 7,791 | | 2.24 | |
MSI Information Services, Inc.(7)(12) | | First Lien Secured Revolving Loan | | 1.00% | | Base rate+ 6.84% | | 11.30% | | 04/25/22 | | 04/24/26 | | 481 | | | 472 | | | 471 | | 0.14 | |
| | | | | | | | | | | | | | | | | 8,270 | | | 8,262 | | 2.38 | |
Internet & Direct Marketing Retail | | | | | | | | | | | | | | | | | | | | | | | |
BBQ Buyer, LLC (d/b/a BBQ Guys) | | First Lien Secured Term Loan | | 1.50% | | L+ 10.00% | | 11.67% (9.67% Cash + 2.00% PIK) | | 08/28/20 | | 08/28/25 | | 12,686 | | | 12,484 | | | 12,528 | | 3.61 | |
BBQ Buyer, LLC (d/b/a BBQ Guys) | | First Lien Secured Delayed Draw Loan | | 1.50% | | L+ 10.00% | | 11.67% (9.67% Cash + 2.00% PIK) | | 04/29/22 | | 08/28/25 | | 2,586 | | | 2,543 | | | 2,560 | | 0.74 | |
Luxury Brand Holdings, Inc. (d/b/a Ross-Simons, Inc.) | | First Lien Secured Term Loan | | 1.00% | | L+ 6.50% | | 7.74% | | 12/04/20 | | 06/04/26 | | 5,910 | | | 5,826 | | | 5,873 | | 1.69 | |
Potpourri Group, Inc. | | First Lien Secured Term Loan | | 1.50% | | L+ 8.25% | | 9.75% | | 07/03/19 | | 07/03/24 | | 16,920 | | | 16,767 | | | 16,920 | | 4.87 | |
| | | | | | | | | | | | | | | | | 37,620 | | | 37,881 | | 10.91 | |
Investment Banking & Brokerage | | | | | | | | | | | | | | | | | | | | | | | |
JVMC Holdings Corp. (fka RJO Holdings Corp) | | First Lien Secured Term Loan | | 1.00% | | L+ 7.00% | | 8.67% | | 02/28/19 | | 02/28/24 | | 12,295 | | $ | 12,254 | | $ | 12,295 | | 3.54 | |
| | | | | | | | | | | | | | | | | 12,254 | | | 12,295 | | 3.54 | |
IT Consulting & Other Services | | | | | | | | | | | | | | | | | | | | | | | |
WhiteHorse Finance, Inc.
Consolidated Schedule of Investments (Unaudited)
June 30, 2022
(in thousands)
Issuer |
| Investment Type(1) |
| Floor |
| Spread |
| Interest |
| Acquisition |
| Maturity |
| Principal/ |
| Amortized |
| Fair |
| Fair Value |
| ||
|---|---|---|---|---|---|---|---|---|---|---|---|---|---|---|---|---|---|---|---|---|---|---|---|
ATSG, Inc. | | First Lien Secured Term Loan | | 1.00% | | L+ 6.50% | | 7.91% | | 11/12/21 | | 11/12/26 | | 13,921 | | | 13,678 | | | 13,708 | | 3.95 | % |
| | | | | | | | | | | | | | | | | 13,678 | | | 13,708 | | 3.95 | |
Leisure Facilities | | | | | | | | | | | | | | | | | | | | | | | |
Honors Holdings, LLC (d/b/a Orange Theory)(16)(24) | | First Lien Secured Term Loan | | 1.00% | | L+ 7.69% | | 9.35% (8.85% Cash + 0.50% PIK) | | 09/06/19 | | 09/06/24 | | 9,440 | | | 9,329 | | | 9,345 | | 2.69 | |
Honors Holdings, LLC (d/b/a Orange Theory)(16)(24) | | First Lien Secured Delayed Draw Loan | | 1.00% | | L+ 7.73% | | 9.05% (8.55% Cash + 0.50% PIK) | | 09/06/19 | | 09/06/24 | | 4,649 | | | 4,616 | | | 4,603 | | 1.32 | |
Lift Brands, Inc. (d/b/a Snap Fitness) | | First Lien Secured Term Loan A | | 1.00% | | L+ 7.50% | | 9.17% | | 06/29/20 | | 06/29/25 | | 5,603 | | | 5,550 | | | 5,546 | | 1.60 | |
Lift Brands, Inc. (d/b/a Snap Fitness) | | First Lien Secured Term Loan B | | N/A | | 9.50% | | 9.50% (0.00% Cash + 9.50% PIK) | | 06/29/20 | | 06/29/25 | | 1,330 | | | 1,313 | | | 1,303 | | 0.38 | |
Snap Fitness Holdings, Inc. (d/b/a Lift Brands, Inc.)(9) | | First Lien Secured Term Loan C | | N/A | | 9.50% | | 9.50% (0.00% Cash + 9.50% PIK) | | 06/29/20 | | NA | | 1,268 | | | 1,265 | | | 1,084 | | 0.31 | |
| | | | | | | | | | | | | | | | | 22,073 | | | 21,881 | | 6.30 | |
Leisure Products | | | | | | | | | | | | | | | | | | | | | | | |
Playmonster Group LLC(6)(20)(22) | | First Lien Secured Term Loan | | 1.00% | | L+ 8.00% | | 9.08% (1.08% Cash + 8.00% PIK) | | 01/24/22 | | 06/08/26 | | 3,489 | | | 3,489 | | | 3,489 | | 1.00 | |
| | | | | | | | | | | | | | | | | 3,489 | | | 3,489 | | 1.00 | |
Life Sciences Tools & Services | | | | | | | | | | | | | | | | | | | | | | | |
LSCS Holdings, Inc. (d/b/a Eversana Life Science Services, LLC) | | Second Lien Secured Term Loan | | 0.50% | | L+ 8.00% | | 10.25% | | 11/23/21 | | 12/16/29 | | 5,000 | | | 4,930 | | | 4,900 | | 1.41 | |
| | | | | | | | | | | | | | | | | 4,930 | | | 4,900 | | 1.41 | |
Office Services & Supplies | | | | | | | | | | | | | | | | | | | | | | | |
American Crafts, LC | | First Lien Secured Term Loan | | 1.00% | | L+ 8.50% | | 10.17% | | 05/28/21 | | 05/28/26 | | 8,245 | | | 8,149 | | | 8,030 | | 2.31 | |
American Crafts, LC | | First Lien Secured Delayed Draw Loan | | 1.00% | | L+ 8.50% | | 10.17% | | 01/25/22 | | 05/28/26 | | 1,385 | | | 1,360 | | | 1,359 | | 0.39 | |
Empire Office, Inc. | | First Lien Secured Term Loan | | 1.50% | | L+ 6.50% | | 8.17% | | 04/12/19 | | 04/12/24 | | 12,231 | | | 12,118 | | | 12,072 | | 3.47 | |
Empire Office, Inc.(4)(7) | | First Lien Secured Delayed Draw Loan | | 1.50% | | L+ 6.50% | | 8.17% | | 08/17/21 | | 04/12/24 | | — | | | — | | | (56) | | (0.02) | |
| | | | | | | | | | | | | | | | | 21,627 | | | 21,405 | | 6.15 | |
Packaged Foods & Meats | | | | | | | | | | | | | | | | | | | | | | | |
Lenny & Larry's, LLC(17)(24) | | First Lien Secured Term Loan | | 1.00% | | L+ 8.38% | | 9.70% (7.99% Cash + 1.71% PIK) | | 05/15/18 | | 05/15/23 | | 11,188 | | | 11,151 | | | 10,909 | | 3.15 | |
| | | | | | | | | | | | | | | | | 11,151 | | | 10,909 | | 3.15 | |
Personal Products | | | | | | | | | | | | | | | | | | | | | | | |
Inspired Beauty Brands, Inc. | | First Lien Secured Term Loan | | 1.00% | | L+ 7.00% | | 8.41% | | 12/30/20 | | 12/30/25 | | 11,960 | | | 11,792 | | | 11,841 | | 3.41 | |
Inspired Beauty Brands, Inc.(7) | | First Lien Secured Revolving Loan | | 1.00% | | L+ 7.00% | | 8.41% | | 12/30/20 | | 12/30/25 | | — | | | — | | | 2 | | — | |
Sunless, Inc. | | First Lien Secured Term Loan | | 1.00% | | L+ 6.50% | | 8.75% | | 06/30/22 | | 08/13/25 | | 2,097 | | | 2,055 | | | 2,055 | | 0.59 | |
| | | | | | | | | | | | | | | | | 13,847 | | | 13,898 | | 4.00 | |
Research & Consulting Services | | | | | | | | | | | | | | | | | | | | | | | |
Aeyon LLC(24) | | First Lien Secured Term Loan | | 1.00% | | SF+ 8.88% | | 10.07% | | 02/10/22 | | 02/10/27 | | 8,955 | | | 8,790 | | | 8,812 | | 2.54 | |
ALM Media, LLC | | First Lien Secured Term Loan | | 1.00% | | L+ 6.50% | | 8.17% | | 11/25/19 | | 11/25/24 | | 13,781 | | | 13,649 | | | 13,643 | | 3.93 | |
Nelson Worldwide, LLC | | First Lien Secured Term Loan | | 1.00% | | L+ 10.25% | | 11.29% (10.29% Cash + 1.00% PIK) | | 01/09/18 | | 01/09/23 | | 9,411 | | | 9,386 | | | 9,309 | | 2.68 | |
| | | | | | | | | | | | | | | | | 31,825 | | | 31,764 | | 9.15 | |
Specialized Consumer Services | | | | | | | | | | | | | | | | | | | | | | | |
Camp Facility Services Holdings, LLC (d/b/a Camp Construction Services, Inc.) | | First Lien Secured Term Loan | | 1.00% | | L+ 6.50% | | 8.10% | | 11/16/21 | | 11/16/27 | | 12,838 | | $ | 12,607 | | $ | 12,624 | | 3.63 | |
Camp Facility Services Holdings, LLC (d/b/a Camp Construction Services, Inc.)(4)(7) | | First Lien Secured Delayed Draw Loan | | 1.00% | | L+ 6.50% | | 8.10% | | 11/16/21 | | 11/16/27 | | — | | | — | | | 5 | | — | |
HC Salon Holdings, Inc. (d/b/a Hair Cuttery) | | First Lien Secured Term Loan | | 1.00% | | L+ 8.00% | | 10.25% | | 09/30/21 | | 09/30/26 | | 11,579 | | | 11,382 | | | 11,579 | | 3.33 | |
HC Salon Holdings, Inc. (d/b/a Hair Cuttery)(7) | | First Lien Secured Revolving Loan | | 1.00% | | L+ 8.00% | | 10.25% | | 09/30/21 | | 09/30/26 | | — | | | — | | | 12 | | — | |
True Blue Car Wash, LLC(24) | | First Lien Secured Term Loan | | 1.00% | | SF+ 6.85% | | 8.47% | | 10/17/19 | | 10/17/24 | | 10,035 | | | 9,930 | | | 9,943 | | 2.86 | |
WhiteHorse Finance, Inc.
Consolidated Schedule of Investments (Unaudited)
June 30, 2022
(in thousands)
Issuer |
| Investment Type(1) |
| Floor |
| Spread |
| Interest |
| Acquisition |
| Maturity |
| Principal/ |
| Amortized |
| Fair |
| Fair Value |
| ||
|---|---|---|---|---|---|---|---|---|---|---|---|---|---|---|---|---|---|---|---|---|---|---|---|
True Blue Car Wash, LLC(7)(24) | | First Lien Secured Delayed Draw Loan | | 1.00% | | SF+ 6.50% | | 7.98% | | 10/17/19 | | 10/17/24 | | 3,358 | | | 3,308 | | | 3,310 | | 0.95 | % |
| | | | | | | | | | | | | | | | | 37,227 | | | 37,473 | | 10.77 | |
Specialized Finance | | | | | | | | | | | | | | | | | | | | | | | |
WHF STRS Ohio Senior Loan Fund LLC(4)(5)(9)(14) | | Subordinated Note | | N/A | | L+ 6.50% | | 7.62% | | 07/19/19 | | N/A | | 80,000 | | | 80,000 | | | 80,000 | | 23.03 | |
| | | | | | | | | | | | | | | | | 80,000 | | | 80,000 | | 23.03 | |
Systems Software | | | | | | | | | | | | | | | | | | | | | | | |
Arcstor Midco, LLC (d/b/a Arcserve (USA), LLC | | First Lien Secured Term Loan | | 1.00% | | L+ 7.00% | | 9.25% | | 03/16/21 | | 03/16/27 | | 19,256 | | | 18,954 | | | 17,909 | | 5.15 | |
| | | | | | | | | | | | | | | | | 18,954 | | | 17,909 | | 5.15 | |
Technology Hardware, Storage & Peripherals | | | | | | | | | | | | | | | | | | | | | | | |
Telestream Holdings Corporation | | First Lien Secured Term Loan | | 1.00% | | SF+ 9.25% | | 10.59% | | 10/15/20 | | 10/15/25 | | 15,926 | | | 15,583 | | | 15,899 | | 4.58 | |
Telestream Holdings Corporation(7) | | First Lien Secured Revolving Loan | | 1.00% | | SF+ 9.25% | | 10.59% | | 10/15/20 | | 10/15/25 | | 530 | | | 519 | | | 546 | | 0.16 | |
Telestream Holdings Corporation(7) | | First Lien Secured Delayed Draw Loan | | 1.00% | | SF+ 9.25% | | 10.59% | | 05/12/22 | | 10/15/25 | | — | | | — | | | — | | — | |
| | | | | | | | | | | | | | | | | 16,102 | | | 16,445 | | 4.74 | |
| | | | | | | | | | | | | | | | | | | | | | | |
Total Debt Investments | | | | | | | | | | | | | | | | $ | 721,166 | | $ | 717,089 | | 206.35 | % |
| | | | | | | | | | | | | | | | | | | | | | | |
Equity Investments(23) | | | | | | | | | | | | | | | | | | | | | | | |
Advertising | | | | | | | | | | | | | | | | | | | | | | | |
Avision Holdings, LLC (d/b/a Avision Sales Group)(4) | | Class A LLC Interests | | N/A | | N/A | | N/A | | 12/15/21 | | N/A | | 201 | | $ | 251 | | $ | 185 | | 0.05 | % |
| | | | | | | | | | | | | | | | | 251 | | | 185 | | 0.05 | |
Air Freight & Logistics | | | | | | | | | | | | | | | | | | | | | | | |
Motivational CIV, LLC (d/b/a Motivational Fulfillment)(4) | | Class B Units | | N/A | | N/A | | N/A | | 07/12/21 | | N/A | | 1,250 | | | 1,250 | | | 650 | | 0.19 | |
| | | | | | | | | | | | | | | | | 1,250 | | | 650 | | 0.19 | |
Building Products | | | | | | | | | | | | | | | | | | | | | | | |
PFB Holdco, Inc. (d/b/a PFB Corporation)(4)(13) | | Class A Units | | N/A | | N/A | | N/A | | 12/17/21 | | N/A | | 1 | | | 423 | | | 576 | | 0.17 | |
| | | | | | | | | | | | | | | | | 423 | | | 576 | | 0.17 | |
Data Processing & Outsourced Services | | | | | | | | | | | | | | | | | | | | | | | |
Escalon Services Inc.(4) | | Warrants | | N/A | | N/A | | N/A | | 12/04/20 | | N/A | | 709 | | | 476 | | | 2,183 | | 0.63 | |
| | | | | | | | | | | | | | | | | 476 | | | 2,183 | | 0.63 | |
Diversified Support Services | | | | | | | | | | | | | | | | | | | | | | | |
Quest Events, LLC(4) | | Preferred Units | | N/A | | N/A | | N/A | | 12/28/18 | | 12/08/25 | | 324 | | | 324 | | | 53 | | 0.02 | |
ImageOne Industries, LLC(4) | | Common A Units | | N/A | | N/A | | N/A | | 09/20/19 | | N/A | | 227 | | | 2 | | | 120 | | 0.03 | |
| | | | | | | | | | | | | | | | | 326 | | | 173 | | 0.05 | |
Education Services | | | | | | | | | | | | | | | | | | | | | | | |
Eddy Acquisitions, LLC (d/b/a EducationDynamics, LLC)(4) | | Preferred Units | | N/A | | 12.00% | | 12.00% | | 09/15/21 | | N/A | | 167 | | | 167 | | | 167 | | 0.05 | |
| | | | | | | | | | | | | | | | | 167 | | | 167 | | 0.05 | |
Environmental & Facilities Services | | | | | | | | | | | | | | | | | | | | | | | |
BPII-JL Group Holdings LP (d/b/a Juniper Landscaping Holdings LLC)(4) | | Class A Units | | N/A | | N/A | | N/A | | 12/29/21 | | N/A | | 83 | | | 825 | | | 800 | | 0.23 | |
| | | | | | | | | | | | | | | | | 825 | | | 800 | | 0.23 | |
Health Care Services | | | | | | | | | | | | | | | | | | | | | | | |
Lab Logistics, LLC(4)(21) | | Preferred Units | | N/A | | 14.00% | | 14.00% PIK | | 10/29/19 | | N/A | | 2 | | $ | 857 | | $ | 1,141 | | 0.33 | |
| | | | | | | | | | | | | | | | | 857 | | | 1,141 | | 0.33 | |
Industrial Machinery | | | | | | | | | | | | | | | | | | | | | | | |
BL Products Parent, LP (d/b/a Bishop Lifting Products, Inc.)(4) | | Class A Units | | N/A | | N/A | | N/A | | 02/01/22 | | N/A | | 667 | | | 667 | | | 667 | | 0.19 | |
| | | | | | | | | | | | | | | | | 667 | | | 667 | | 0.19 | |
WhiteHorse Finance, Inc.
Consolidated Schedule of Investments (Unaudited)
June 30, 2022
(in thousands)
Issuer |
| Investment Type(1) |
| Floor |
| Spread |
| Interest |
| Acquisition |
| Maturity |
| Principal/ |
| Amortized |
| Fair |
| Fair Value |
| ||
|---|---|---|---|---|---|---|---|---|---|---|---|---|---|---|---|---|---|---|---|---|---|---|---|
Interactive Media & Services | | | | | | | | | | | | | | | | | | | | | | | |
What If Media Group, LLC(4) | | Common Units | | N/A | | N/A | | N/A | | 07/02/21 | | N/A | | 851 | | | 851 | | | 2,068 | | 0.60 | % |
| | | | | | | | | | | | | | | | | 851 | | | 2,068 | | 0.60 | |
Internet & Direct Marketing Retail | | | | | | | | | | | | | | | | | | | | | | | |
BBQ Buyer, LLC (d/b/a BBQ Guys)(4) | | Shares | | N/A | | N/A | | N/A | | 08/28/20 | | N/A | | 1,100 | | | 1,100 | | | 2,255 | | 0.65 | |
Ross-Simons Topco, LP (d/b/a Ross-Simons, Inc.)(4) | | Preferred Units | | N/A | | 8.00% | | 8.00% PIK | | 12/04/20 | | N/A | | 600 | | | 514 | | | 840 | | 0.24 | |
| | | | | | | | | | | | | | | | | 1,614 | | | 3,095 | | 0.89 | |
Investment Banking & Brokerage | | | | | | | | | | | | | | | | | | | | | | | |
Arcole Holding Corporation(4)(5)(6)(18) | | Shares | | N/A | | N/A | | N/A | | 10/01/20 | | N/A | | — | | | 6,944 | | | 6,475 | | 1.86 | |
| | | | | | | | | | | | | | | | | 6,944 | | | 6,475 | | 1.86 | |
IT Consulting & Other Services | | | | | | | | | | | | | | | | | | | | | | | |
CX Holdco LLC (d/b/a Cennox Inc.)(4) | | Common Units | | N/A | | N/A | | N/A | | 05/04/21 | | N/A | | 972 | | | 972 | | | 1,554 | | 0.45 | |
Keras Holdings, LLC (d/b/a KSM Consulting, LLC)(4) | | Shares | | N/A | | N/A | | N/A | | 12/31/20 | | N/A | | 496 | | | 496 | | | 496 | | 0.14 | |
| | | | | | | | | | | | | | | | | 1,468 | | | 2,050 | | 0.59 | |
Leisure Facilities | | | | | | | | | | | | | | | | | | | | | | | |
Snap Fitness Holdings, Inc. (d/b/a Lift Brands, Inc.)(4) | | Class A Common Stock | | N/A | | N/A | | N/A | | 06/29/20 | | N/A | | 2 | | | 1,941 | | | 183 | | 0.05 | |
Snap Fitness Holdings, Inc. (d/b/a Lift Brands, Inc.)(4) | | Warrants | | N/A | | N/A | | N/A | | 06/29/20 | | 06/28/28 | | 1 | | | 793 | | | 74 | | 0.02 | |
| | | | | | | | | | | | | | | | | 2,734 | | | 257 | | 0.07 | |
Leisure Products | | | | | | | | | | | | | | | | | | | | | | | |
Playmonster Group Equity, Inc. (d/b/a PlayMonster Group LLC)(4)(6)(8)(22) | | Preferred Stock | | N/A | | 14.00% | | 14.00% PIK | | 01/24/22 | | N/A | | 36 | | | 3,600 | | | 2,253 | | 0.66 | |
Playmonster Group Equity, Inc. (d/b/a PlayMonster Group LLC)(4)(6)(22) | | Common Stock | | N/A | | N/A | | N/A | | 01/24/22 | | N/A | | 72 | | | 460 | | | — | | — | |
| | | | | | | | | | | | | | | | | 4,060 | | | 2,253 | | 0.66 | |
Other Diversified Financial Services | | | | | | | | | | | | | | | | | | | | | | | |
SFS Global Holding Company (d/b/a Sigue Corporation)(4) | | Warrants | | N/A | | N/A | | N/A | | 06/28/18 | | 12/28/25 | | — | | | — | | | — | | — | |
Sigue Corporation(4) | | Warrants | | N/A | | N/A | | N/A | | 06/28/18 | | 12/28/25 | | 22 | | | 2,890 | | | 3,489 | | 1.00 | |
| | | | | | | | | | | | | | | | | 2,890 | | | 3,489 | | 1.00 | |
Specialized Consumer Services | | | | | | | | | | | | | | | | | | | | | | | |
Camp Facility Services Parent, LLC (d/b/a Camp Construction Services, Inc.)(4) | | Preferred Units | | N/A | | 10.00% | | 10.00% PIK | | 11/16/21 | | N/A | | 15 | | | 840 | | | 882 | | 0.26 | |
| | | | | | | | | | | | | | | | | 840 | | | 882 | | 0.26 | |
Specialized Finance | | | | | | | | | | | | | | | | | | | | | | | |
WHF STRS Ohio Senior Loan Fund(4)(5)(14) | | LLC Interests | | N/A | | N/A | | N/A | | 07/19/19 | | N/A | | 20,000 | | | 20,000 | | | 22,279 | | 6.41 | |
| | | | | | | | | | | | | | | | | 20,000 | | | 22,279 | | 6.41 | |
| | | | | | | | | | | | | | | | | | | | | | | |
Total Equity Investments | | | | | | | | | | | | | | | | $ | 46,643 | | $ | 49,390 | | 14.23 | % |
| | | | | | | | | | | | | | | | | | | | | | | |
Total Investments | | | | | | | | | | | | | | | | $ | 767,809 | | $ | 766,479 | | 220.58 | % |
WhiteHorse Finance, Inc.
Consolidated Schedule of Investments (Unaudited)
June 30, 2022
(in thousands)
| | | | | | | | | | | | | | |
Counterparty |
| Currency to be sold |
| Currency to be purchased |
| Settlement date |
| Unrealized |
| Unrealized | ||||
Morgan Stanley | | C$ | 80 CAD | | $ | 62 USD | | 7/29/22 | | $ | — | | $ | — |
Total | | | | | | | | | | $ | — | | $ | — |
| (1) | Except as otherwise noted, all investments are non-controlled/non-affiliate investments as defined by the Investment Company Act of 1940, as amended (the “1940 Act”), and provide collateral for the Company’s credit facility. |
| (2) | The investments bear interest at a rate that may be determined by reference to the London Interbank Offered Rate (“LIBOR” or “L”), which resets monthly, quarterly or semiannually, the Secured Overnight Financing Rate (“SOFR” or “SF”), the Canadian Dollar Offered Rate (“CDOR” or “C”), Canada Prime Rate (“CP”) or the U.S. Prime Rate (“Prime” or “P”). |
| (3) | The interest rate is the “all-in-rate” including the current index and spread, the fixed rate, and the payment-in-kind (“PIK”) interest rate, as the case may be. |
| (4) | The investment or a portion of the investment does not provide collateral for the Company’s credit facility. |
| (5) | Not a qualifying asset under Section 55(a) of the 1940 Act. Under the 1940 Act, the Company may not acquire any non-qualifying asset unless, at the time the acquisition is made, qualifying assets represent at least 70% of total assets. Qualifying assets represented 82.9% of total assets as of the date of the consolidated schedule of investments. |
| (6) | Investment is a non-controlled/affiliate investment as defined by the 1940 Act. |
| (7) | The investment has an unfunded commitment in addition to any amounts presented in the consolidated schedule of investments as of June 30, 2022. |
| (8) | Preferred equity investment is a non-income producing security. |
| (9) | Security is perpetual with no defined maturity date. |
| (10) | Except as otherwise noted, all of the Company’s portfolio company investments, which as of the date of the consolidated schedule of investments represented 220.6% of the Company’s net assets or 95.9% of the Company’s total assets, are subject to legal restrictions on sales. |
| (11) | The fair value of each investment was determined using significant unobservable inputs. |
| (12) | The investment was comprised of two contracts, which were indexed to different base rates, L and P, respectively. The Floor, Spread Above Index and Interest Rate presented represent the weighted average of both contracts. |
| (13) | Principal amount is non-USD denominated and is based in Canadian dollars. |
| (14) | Investment is a controlled affiliate investment as defined by the 1940 Act. On January 14, 2019, the Company entered into an agreement with State Teachers Retirement System of Ohio, a public pension fund established under Ohio law (“STRS Ohio”), to create WHF STRS Ohio Senior Loan Fund, LLC (“STRS JV”), a joint venture, which invests primarily in senior secured first and second lien term loans. |
| (15) | In addition to the interest earned based on the stated interest rate of this security, the Company is entitled to receive an additional interest in the amount of 2.75% on its “last out” tranche of the portfolio company’s senior term debt, which was previously syndicated into “first out” and “last out” tranches, whereby the “first out” tranche will have priority as to the “last out” tranche with respect to payments of principal, interest and any other amounts due thereunder. |
| (16) | In addition to the interest earned based on the stated interest rate of this security, the Company is entitled to receive an additional interest in the amount of 3.50% on its “last out” tranche of the portfolio company’s senior term debt, which was previously syndicated into “first out” and “last out” tranches, whereby the “first out” tranche will have priority as to the “last out” tranche with respect to payments of principal, interest and any other amounts due thereunder. |
| (17) | In addition to the interest earned based on the stated interest rate of this security, the Company is entitled to receive an additional interest in the amount of 3.00% on its “last out” tranche of the portfolio company’s senior term debt, which was previously syndicated into “first out” and “last out” tranches, whereby the “first out” tranche will have priority as to the “last out” tranche with respect to payments of principal, interest and any other amounts due thereunder. |
| (18) | On October 1, 2020, as part of a restructuring agreement between the Company and Arcole Acquisition Corp, the Company’s investments in first lien secured term loans to Arcole Acquisition Corp were converted into common shares of Arcole Holding Corp. |
| (19) | At the option of the issuer, interest can be paid in cash or cash and PIK. The issuer may elect to pay up to 2.00% PIK. |
| (20) | At the option of the issuer, interest can be paid in cash or cash and PIK. The issuer may elect to pay up to 9.00% PIK. |
| (21) | Investment earns 14.00% that converts to PIK on an annual basis and is recorded in interest and dividend receivable in the consolidated statements of assets and liabilities. |
| (22) | On January 24, 2022, as part of a restructuring agreement between the Company and PlayMonster LLC, the Company’s first lien secured term loan and delayed draw loan investments to PlayMonster LLC were converted into a new first lien secured term loan, preferred stock and common stock of Playmonster Group LLC. |
| (23) | Ownership of certain equity investments may occur through a holding company or partnership. |
| (24) | Investment is structured as a unitranche loan in which the Company may receive additional interest on its “last out” tranche of the portfolio company’s senior term debt, which was previously syndicated into “first out” and “last out” tranches, whereby the “first out” tranche will have priority as to the “last out” tranche with respect to payments of principal, interest and any other amounts due thereunder. |
| |
Contacts | |
| |
Stuart Aronson | |
WhiteHorse Finance, Inc. | |
212-506-0500 | |
saronson@higwhitehorse.com | |
| |
or | |
| |
Joyson Thomas | |
WhiteHorse Finance, Inc. | |
305-379-2322 | |
jthomas@higwhitehorse.com | |
| |
or | |
| |
Robert Brinberg | |
| |
| |
| |
| |
Source: WhiteHorse Finance, Inc. | |