EX-99.C.3
Exhibit (c)(3) PROJECT BOOTS Special Committee Materials April 2019
DRAFT Subject to changeExhibit (c)(3) PROJECT BOOTS Special Committee Materials April 2019 DRAFT Subject to change

TABLE OF CONTENTS Executive Summary 2 SHO Market Data 4 SHO Financial
Projections 9 Summary Valuation Analysis 12 Additional Analyses 19 1TABLE OF CONTENTS Executive Summary 2 SHO Market Data 4 SHO Financial Projections 9 Summary Valuation Analysis 12 Additional Analyses 19 1
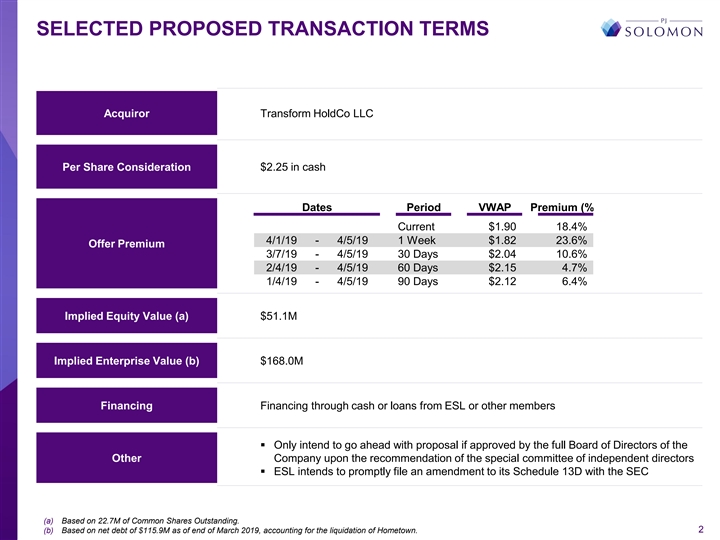
SELECTED PROPOSED TRANSACTION TERMS Acquiror Transform HoldCo LLC Per
Share Consideration $2.25 in cash Dates Period VWAP Premium (%) Current $1.90 18.4% 4/1/19 - 4/5/19 1 Week $1.82 23.6% Offer Premium 3/7/19 - 4/5/19 30 Days $2.04 10.6% 2/4/19 - 4/5/19 60 Days $2.15 4.7% 1/4/19 - 4/5/19 90 Days $2.12 6.4% Implied
Equity Value (a) $51.1M Implied Enterprise Value (b) $168.0M Financing Financing through cash or loans from ESL or other members ▪ Only intend to go ahead with proposal if approved by the full Board of Directors of the Other Company upon the
recommendation of the special committee of independent directors ▪ ESL intends to promptly file an amendment to its Schedule 13D with the SEC (a) Based on 22.7M of Common Shares Outstanding. (b) Based on net debt of $115.9M as of end of March
2019, accounting for the liquidation of Hometown. 2SELECTED PROPOSED TRANSACTION TERMS Acquiror Transform HoldCo LLC Per Share Consideration $2.25 in cash Dates Period VWAP Premium (%) Current $1.90 18.4% 4/1/19 - 4/5/19 1 Week $1.82 23.6% Offer
Premium 3/7/19 - 4/5/19 30 Days $2.04 10.6% 2/4/19 - 4/5/19 60 Days $2.15 4.7% 1/4/19 - 4/5/19 90 Days $2.12 6.4% Implied Equity Value (a) $51.1M Implied Enterprise Value (b) $168.0M Financing Financing through cash or loans from ESL or other
members ▪ Only intend to go ahead with proposal if approved by the full Board of Directors of the Other Company upon the recommendation of the special committee of independent directors ▪ ESL intends to promptly file an amendment to its
Schedule 13D with the SEC (a) Based on 22.7M of Common Shares Outstanding. (b) Based on net debt of $115.9M as of end of March 2019, accounting for the liquidation of Hometown. 2
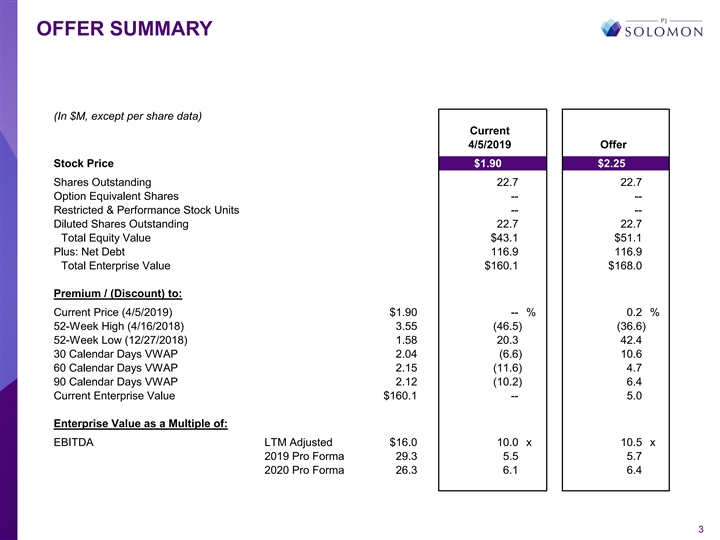
OFFER SUMMARY (In $M, except per share data) Current 4/5/2019 Offer
Stock Price $1.90 $2.25 Shares Outstanding 22.7 22.7 Option Equivalent Shares -- -- Restricted & Performance Stock Units -- -- Diluted Shares Outstanding 22.7 22.7 Total Equity Value $43.1 $51.1 Plus: Net Debt 116.9 116.9 Total Enterprise Value
$160.1 $168.0 Premium / (Discount) to: Current Price (4/5/2019) $1.90 -- % 0.2 % 52-Week High (4/16/2018) 3.55 (46.5) (36.6) 52-Week Low (12/27/2018) 1.58 20.3 42.4 30 Calendar Days VWAP 2.04 (6.6) 10.6 60 Calendar Days VWAP 2.15 (11.6) 4.7 90
Calendar Days VWAP 2.12 (10.2) 6.4 Current Enterprise Value $160.1 -- 5.0 Enterprise Value as a Multiple of: EBITDA LTM Adjusted $16.0 10.0 x 10.5 x 2019 Pro Forma 29.3 5.5 5.7 2020 Pro Forma 26.3 6.1 6.4 3OFFER SUMMARY (In $M, except per share
data) Current 4/5/2019 Offer Stock Price $1.90 $2.25 Shares Outstanding 22.7 22.7 Option Equivalent Shares -- -- Restricted & Performance Stock Units -- -- Diluted Shares Outstanding 22.7 22.7 Total Equity Value $43.1 $51.1 Plus: Net Debt 116.9
116.9 Total Enterprise Value $160.1 $168.0 Premium / (Discount) to: Current Price (4/5/2019) $1.90 -- % 0.2 % 52-Week High (4/16/2018) 3.55 (46.5) (36.6) 52-Week Low (12/27/2018) 1.58 20.3 42.4 30 Calendar Days VWAP 2.04 (6.6) 10.6 60 Calendar Days
VWAP 2.15 (11.6) 4.7 90 Calendar Days VWAP 2.12 (10.2) 6.4 Current Enterprise Value $160.1 -- 5.0 Enterprise Value as a Multiple of: EBITDA LTM Adjusted $16.0 10.0 x 10.5 x 2019 Pro Forma 29.3 5.5 5.7 2020 Pro Forma 26.3 6.1 6.4 3

SHO MARKET DATA 4SHO MARKET DATA 4

SUMMARY CAPITALIZATION AND VALUATION (Amounts in Millions, Except Per
Share Data) Stock Information Financial Information Credit Statistics Ticker Symbol SHOS Fiscal Year End Feb-19 As of Stock Exchange NasdaqCM Feb-19 Stock Price as of 4/5/19 $1.90 Adjusted Debt / EBITDAR (c) 8.0 x FY 2018A Sales (a) (b) $1,449.9
Total Debt / EBITDA 8.2 x 52-Week Stock Price FY 2018A Adj. EBITDA (a) (b) 16.0 Net Debt / EBITDA 7.3 x High 4/16/18 $3.55 EBITDA / Interest, Net 1.1 x FY 2019P Sales (a) (b) $716.3 Low 12/27/18 1.58 Since IPO Stock Price FY 2019P Adj. EBITDA (a)
(b) 29.3 Total Debt / Total Capitalization 53.6% High 6/3/16 $56.65 Net Debt / Net Capitalization 50.6% Low 12/27/18 1.58 FY 2019 EPS estimate (a) (b) -- FY 2020 EPS estimate (a) (b) ($2.88) Credit Rating S&P NA Average Daily Volume (3 Mo.) 0.2
FY 2021 EPS estimate (a) (b) $0.87 Moody's NA Shares Sold Short 3.0 Long-Term EPS Growth NA Short Int. as % of Shares Out. 13.2% Market Capitalization and Firm Value Valuation Beneficial Ownership by Category (f) Stock Price as of 4/5/19 $1.90
Enterprise Value as a Multiple of: Beneficial Percent of Shares Outstanding (d) 22.7 Ownership Total Option Equivalent Shares (e) -- FY2018A Sales (a) (b) 0.1 x Edward Lampert 13.3 58.8% Equity Value $43.1 FY2018A EBITDA (a) (b) 10.0 x Insiders 0.1
0.6% Plus: Total Debt 132.1 Top 10 Institutions 5.4 23.6% Plus: Minority Interest -- FY 2019P Sales (a) (b) 0.2 x Public and Other 3.9 17.0% Plus: Preferred Stock -- FY 2019P Adj. EBITDA (a) (b) 5.5 x Total 22.7 100.0% Less: Cash & Cash
Equivalents (15.1) Enterprise Value $160.1 P/E Ratios: FY 2019 EPS estimate (a) (b) NM FY 2020 EPS estimate (a) (b) NM FY 2021 EPS estimate (a) (b) 2.2 x (a) Adjusted to exclude unusual and extraordinary items. (b) Source: March 2019 Management
Projections. (c) Assumes 8.0x rent methodology. (d) Shares outstanding as of December 7, 2018. Source: Company's Form 10-Q for the period ended December 7, 2018. (e) Assumes the treasury stock method with no in-the-money options outstanding. (f)
Includes exercisable options held by directors and executive officers. Source: Company's Proxy Statement dated April 19, 2018 and Bloomberg. 5SUMMARY CAPITALIZATION AND VALUATION (Amounts in Millions, Except Per Share Data) Stock Information
Financial Information Credit Statistics Ticker Symbol SHOS Fiscal Year End Feb-19 As of Stock Exchange NasdaqCM Feb-19 Stock Price as of 4/5/19 $1.90 Adjusted Debt / EBITDAR (c) 8.0 x FY 2018A Sales (a) (b) $1,449.9 Total Debt / EBITDA 8.2 x 52-Week
Stock Price FY 2018A Adj. EBITDA (a) (b) 16.0 Net Debt / EBITDA 7.3 x High 4/16/18 $3.55 EBITDA / Interest, Net 1.1 x FY 2019P Sales (a) (b) $716.3 Low 12/27/18 1.58 Since IPO Stock Price FY 2019P Adj. EBITDA (a) (b) 29.3 Total Debt / Total
Capitalization 53.6% High 6/3/16 $56.65 Net Debt / Net Capitalization 50.6% Low 12/27/18 1.58 FY 2019 EPS estimate (a) (b) -- FY 2020 EPS estimate (a) (b) ($2.88) Credit Rating S&P NA Average Daily Volume (3 Mo.) 0.2 FY 2021 EPS estimate (a) (b)
$0.87 Moody's NA Shares Sold Short 3.0 Long-Term EPS Growth NA Short Int. as % of Shares Out. 13.2% Market Capitalization and Firm Value Valuation Beneficial Ownership by Category (f) Stock Price as of 4/5/19 $1.90 Enterprise Value as a Multiple of:
Beneficial Percent of Shares Outstanding (d) 22.7 Ownership Total Option Equivalent Shares (e) -- FY2018A Sales (a) (b) 0.1 x Edward Lampert 13.3 58.8% Equity Value $43.1 FY2018A EBITDA (a) (b) 10.0 x Insiders 0.1 0.6% Plus: Total Debt 132.1 Top 10
Institutions 5.4 23.6% Plus: Minority Interest -- FY 2019P Sales (a) (b) 0.2 x Public and Other 3.9 17.0% Plus: Preferred Stock -- FY 2019P Adj. EBITDA (a) (b) 5.5 x Total 22.7 100.0% Less: Cash & Cash Equivalents (15.1) Enterprise Value $160.1
P/E Ratios: FY 2019 EPS estimate (a) (b) NM FY 2020 EPS estimate (a) (b) NM FY 2021 EPS estimate (a) (b) 2.2 x (a) Adjusted to exclude unusual and extraordinary items. (b) Source: March 2019 Management Projections. (c) Assumes 8.0x rent methodology.
(d) Shares outstanding as of December 7, 2018. Source: Company's Form 10-Q for the period ended December 7, 2018. (e) Assumes the treasury stock method with no in-the-money options outstanding. (f) Includes exercisable options held by directors and
executive officers. Source: Company's Proxy Statement dated April 19, 2018 and Bloomberg. 5

Volume (000s) Volume (000s) SUMMARY HISTORICAL STOCK PRICE PERFORMANCE
STOCK PRICE PERFORMANCE – LAST TWELVE MONTHS 5.00 1.0 4.50 4.00 0.8 3.50 3.00 0.6 2.50 2.00 0.4 $1.90 1.50 1.00 0.2 0.50 0.00 0.0 Apr-18 Jun-18 Aug-18 Oct-18 Dec-18 Feb-19 Apr-19 STOCK PRICE PERFORMANCE – SINCE OCTOBER 12, 2012 SHO
SPINOUT $60.00 2.0 50.00 1.6 40.00 1.2 30.00 0.8 20.00 0.4 10.00 $1.90 0.00 0.0 Oct-12 Apr-13 Oct-13 Apr-14 Oct-14 Apr-15 Oct-15 Apr-16 Oct-16 Apr-17 Oct-17 Apr-18 Oct-18 Source: Capital IQ as of April 5, 2019. 6 Closing Stock Price Closing Stock
PriceVolume (000s) Volume (000s) SUMMARY HISTORICAL STOCK PRICE PERFORMANCE STOCK PRICE PERFORMANCE – LAST TWELVE MONTHS 5.00 1.0 4.50 4.00 0.8 3.50 3.00 0.6 2.50 2.00 0.4 $1.90 1.50 1.00 0.2 0.50 0.00 0.0 Apr-18 Jun-18 Aug-18 Oct-18 Dec-18
Feb-19 Apr-19 STOCK PRICE PERFORMANCE – SINCE OCTOBER 12, 2012 SHO SPINOUT $60.00 2.0 50.00 1.6 40.00 1.2 30.00 0.8 20.00 0.4 10.00 $1.90 0.00 0.0 Oct-12 Apr-13 Oct-13 Apr-14 Oct-14 Apr-15 Oct-15 Apr-16 Oct-16 Apr-17 Oct-17 Apr-18 Oct-18
Source: Capital IQ as of April 5, 2019. 6 Closing Stock Price Closing Stock Price
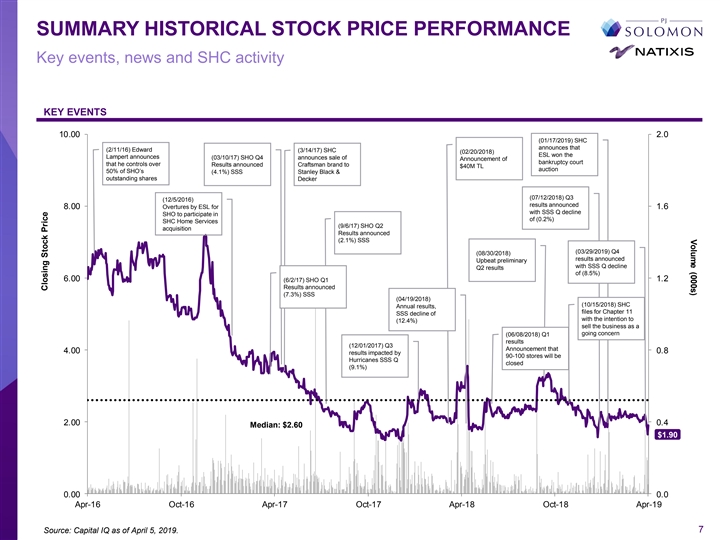
Volume (000s) SUMMARY HISTORICAL STOCK PRICE PERFORMANCE Key events,
news and SHC activity KEY EVENTS 10.00 2.0 (01/17/2019) SHC announces that (2/11/16) Edward (3/14/17) SHC (02/20/2018) ESL won the Lampert announces (03/10/17) SHO Q4 announces sale of Announcement of bankruptcy court that he controls over Results
announced Craftsman brand to $40M TL auction 50% of SHO’s (4.1%) SSS Stanley Black & outstanding shares Decker (07/12/2018) Q3 (12/5/2016) results announced 8.00 Overtures by ESL for 1.6 with SSS Q decline SHO to participate in of (0.2%)
SHC Home Services (9/6/17) SHO Q2 acquisition Results announced (2.1%) SSS (03/29/2019) Q4 (08/30/2018) results announced Upbeat preliminary with SSS Q decline Q2 results of (8.5%) 6.00 1.2 (6/2/17) SHO Q1 Results announced (7.3%) SSS (04/19/2018)
(10/15/2018) SHC Annual results, files for Chapter 11 SSS decline of with the intention to (12.4%) sell the business as a going concern (06/08/2018) Q1 results (12/01/2017) Q3 Announcement that 4.00 0.8 results impacted by 90-100 stores will be
Hurricanes SSS Q closed (9.1%) 2.00 0.4 Median: $2.60 $1.90 0.00 0.0 Apr-16 Oct-16 Apr-17 Oct-17 Apr-18 Oct-18 Apr-19 Source: Capital IQ as of April 5, 2019. 7 Closing Stock PriceVolume (000s) SUMMARY HISTORICAL STOCK PRICE PERFORMANCE Key events,
news and SHC activity KEY EVENTS 10.00 2.0 (01/17/2019) SHC announces that (2/11/16) Edward (3/14/17) SHC (02/20/2018) ESL won the Lampert announces (03/10/17) SHO Q4 announces sale of Announcement of bankruptcy court that he controls over Results
announced Craftsman brand to $40M TL auction 50% of SHO’s (4.1%) SSS Stanley Black & outstanding shares Decker (07/12/2018) Q3 (12/5/2016) results announced 8.00 Overtures by ESL for 1.6 with SSS Q decline SHO to participate in of (0.2%)
SHC Home Services (9/6/17) SHO Q2 acquisition Results announced (2.1%) SSS (03/29/2019) Q4 (08/30/2018) results announced Upbeat preliminary with SSS Q decline Q2 results of (8.5%) 6.00 1.2 (6/2/17) SHO Q1 Results announced (7.3%) SSS (04/19/2018)
(10/15/2018) SHC Annual results, files for Chapter 11 SSS decline of with the intention to (12.4%) sell the business as a going concern (06/08/2018) Q1 results (12/01/2017) Q3 Announcement that 4.00 0.8 results impacted by 90-100 stores will be
Hurricanes SSS Q closed (9.1%) 2.00 0.4 Median: $2.60 $1.90 0.00 0.0 Apr-16 Oct-16 Apr-17 Oct-17 Apr-18 Oct-18 Apr-19 Source: Capital IQ as of April 5, 2019. 7 Closing Stock Price

VOLUME WEIGHTED AVERAGE PRICE BY RANGE VOLUME PER PRICE RANGE –
LAST TWELVE MONTHS Number of trading days with Average LTM Daily Volume: daily VWAP in ranges below 67,295 85 68 34 23 17 15 7 3 1 $1.50 - $1.75 $1.76 - $2.00 $2.01 - $2.25 $2.26 - $2.50 $2.51 - $2.75 $2.76 - $3.00 $3.01 - $3.25 $3.26 - $3.50 $3.51
- $3.75 VWAP Range Volume Distribution (%) 1.8% 18.3% 28.4% 27.8% 5.6% 6.8% 7.1% 2.0% 2.2% Source: Capital IQ as of April 5, 2019. 8VOLUME WEIGHTED AVERAGE PRICE BY RANGE VOLUME PER PRICE RANGE – LAST TWELVE MONTHS Number of trading days with
Average LTM Daily Volume: daily VWAP in ranges below 67,295 85 68 34 23 17 15 7 3 1 $1.50 - $1.75 $1.76 - $2.00 $2.01 - $2.25 $2.26 - $2.50 $2.51 - $2.75 $2.76 - $3.00 $3.01 - $3.25 $3.26 - $3.50 $3.51 - $3.75 VWAP Range Volume Distribution (%) 1.8%
18.3% 28.4% 27.8% 5.6% 6.8% 7.1% 2.0% 2.2% Source: Capital IQ as of April 5, 2019. 8

SHO FINANCIAL PROJECTIONS 9SHO FINANCIAL PROJECTIONS 9
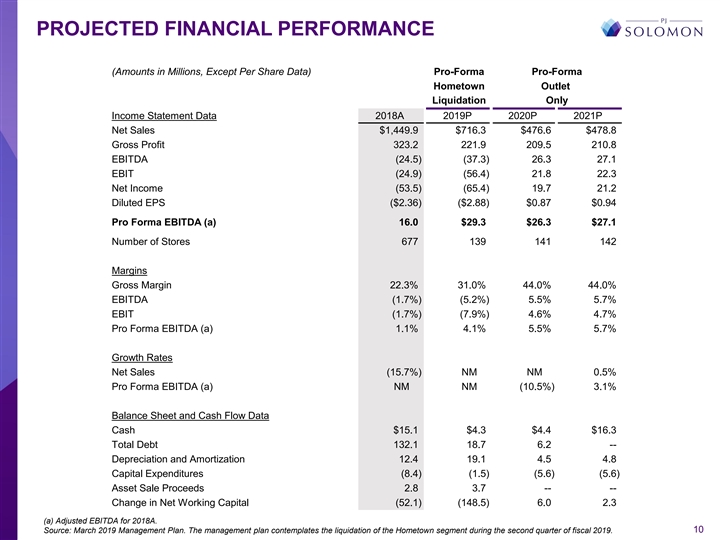
PROJECTED FINANCIAL PERFORMANCE (Amounts in Millions, Except Per Share
Data) Pro-Forma Pro-Forma Hometown Outlet Liquidation Only Income Statement Data 2018A 2019P 2020P 2021P Net Sales $1,449.9 $716.3 $476.6 $478.8 Gross Profit 323.2 221.9 209.5 210.8 EBITDA (24.5) (37.3) 26.3 27.1 EBIT (24.9) (56.4) 21.8 22.3 Net
Income (53.5) (65.4) 19.7 21.2 Diluted EPS ($2.36) ($2.88) $0.87 $0.94 Pro Forma EBITDA (a) 16.0 $29.3 $26.3 $27.1 Number of Stores 677 139 141 142 Margins Gross Margin 22.3% 31.0% 44.0% 44.0% EBITDA (1.7%) (5.2%) 5.5% 5.7% EBIT (1.7%) (7.9%) 4.6%
4.7% Pro Forma EBITDA (a) 1.1% 4.1% 5.5% 5.7% Growth Rates Net Sales (15.7%) NM NM 0.5% Pro Forma EBITDA (a) NM NM (10.5%) 3.1% Balance Sheet and Cash Flow Data Cash $15.1 $4.3 $4.4 $16.3 Total Debt 132.1 18.7 6.2 -- Depreciation and Amortization
12.4 19.1 4.5 4.8 Capital Expenditures (8.4) (1.5) (5.6) (5.6) Asset Sale Proceeds 2.8 3.7 -- -- Change in Net Working Capital (52.1) (148.5) 6.0 2.3 (a) Adjusted EBITDA for 2018A. Source: March 2019 Management Plan. The management plan contemplates
the liquidation of the Hometown segment during the second quarter of fiscal 2019. 10PROJECTED FINANCIAL PERFORMANCE (Amounts in Millions, Except Per Share Data) Pro-Forma Pro-Forma Hometown Outlet Liquidation Only Income Statement Data 2018A 2019P
2020P 2021P Net Sales $1,449.9 $716.3 $476.6 $478.8 Gross Profit 323.2 221.9 209.5 210.8 EBITDA (24.5) (37.3) 26.3 27.1 EBIT (24.9) (56.4) 21.8 22.3 Net Income (53.5) (65.4) 19.7 21.2 Diluted EPS ($2.36) ($2.88) $0.87 $0.94 Pro Forma EBITDA (a) 16.0
$29.3 $26.3 $27.1 Number of Stores 677 139 141 142 Margins Gross Margin 22.3% 31.0% 44.0% 44.0% EBITDA (1.7%) (5.2%) 5.5% 5.7% EBIT (1.7%) (7.9%) 4.6% 4.7% Pro Forma EBITDA (a) 1.1% 4.1% 5.5% 5.7% Growth Rates Net Sales (15.7%) NM NM 0.5% Pro Forma
EBITDA (a) NM NM (10.5%) 3.1% Balance Sheet and Cash Flow Data Cash $15.1 $4.3 $4.4 $16.3 Total Debt 132.1 18.7 6.2 -- Depreciation and Amortization 12.4 19.1 4.5 4.8 Capital Expenditures (8.4) (1.5) (5.6) (5.6) Asset Sale Proceeds 2.8 3.7 -- --
Change in Net Working Capital (52.1) (148.5) 6.0 2.3 (a) Adjusted EBITDA for 2018A. Source: March 2019 Management Plan. The management plan contemplates the liquidation of the Hometown segment during the second quarter of fiscal 2019. 10
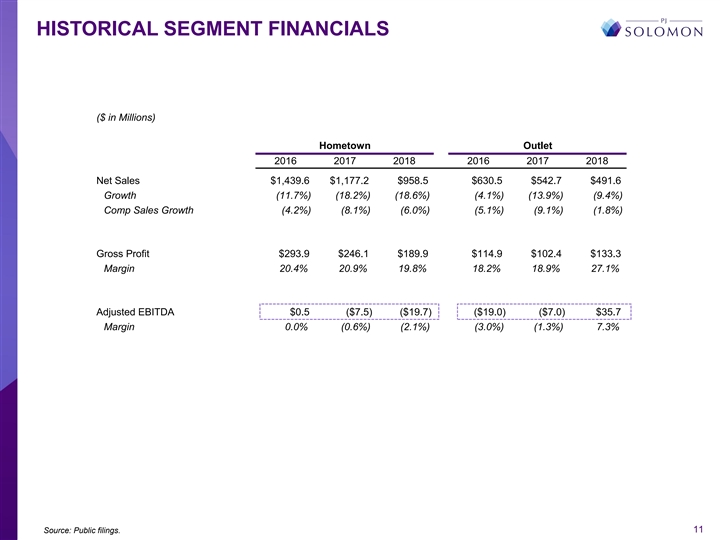
HISTORICAL SEGMENT FINANCIALS ($ in Millions) Hometown Outlet 2016
2017 2018 2016 2017 2018 Net Sales $1,439.6 $1,177.2 $958.5 $630.5 $542.7 $491.6 Growth (11.7%) (18.2%) (18.6%) (4.1%) (13.9%) (9.4%) Comp Sales Growth (4.2%) (8.1%) (6.0%) (5.1%) (9.1%) (1.8%) Gross Profit $293.9 $246.1 $189.9 $114.9 $102.4 $133.3
Margin 20.4% 20.9% 19.8% 18.2% 18.9% 27.1% Adjusted EBITDA $0.5 ($7.5) ($19.7) ($19.0) ($7.0) $35.7 Margin 0.0% (0.6%) (2.1%) (3.0%) (1.3%) 7.3% Source: Public filings. 11HISTORICAL SEGMENT FINANCIALS ($ in Millions) Hometown Outlet 2016 2017 2018
2016 2017 2018 Net Sales $1,439.6 $1,177.2 $958.5 $630.5 $542.7 $491.6 Growth (11.7%) (18.2%) (18.6%) (4.1%) (13.9%) (9.4%) Comp Sales Growth (4.2%) (8.1%) (6.0%) (5.1%) (9.1%) (1.8%) Gross Profit $293.9 $246.1 $189.9 $114.9 $102.4 $133.3 Margin
20.4% 20.9% 19.8% 18.2% 18.9% 27.1% Adjusted EBITDA $0.5 ($7.5) ($19.7) ($19.0) ($7.0) $35.7 Margin 0.0% (0.6%) (2.1%) (3.0%) (1.3%) 7.3% Source: Public filings. 11
SUMMARY VALUATION ANALYSIS 12SUMMARY VALUATION ANALYSIS 12

SUMMARY VALUATION OVERVIEW Transform HoldCo Offer: $2.25 52-Week
Trading Range $1.58 $3.55 Selected Precedent Transactions (a) $0.19 $3.36 Selected Public Companies (a) -- $0.40 Selected Public Companies (assumes Management Liquidation $5.96 $9.58 Plan) (b) Discounted Cash Flow (assumes Management Liquidation
$6.04 $8.05 Plan) (c) -- $2.00 $4.00 $6.00 $8.00 $10.00 (a) Based on LTM EBITDA and net debt of $115.9M as of end of March 2019. (b) Based on management projections for FY 2019 and FY 2020 EBITDA and net debt of $14.4M as of end of FY2019,
accounting for the effect of liquidating Hometown. (c) Impacted by liquidation of Hometown segment. 13SUMMARY VALUATION OVERVIEW Transform HoldCo Offer: $2.25 52-Week Trading Range $1.58 $3.55 Selected Precedent Transactions (a) $0.19 $3.36 Selected
Public Companies (a) -- $0.40 Selected Public Companies (assumes Management Liquidation $5.96 $9.58 Plan) (b) Discounted Cash Flow (assumes Management Liquidation $6.04 $8.05 Plan) (c) -- $2.00 $4.00 $6.00 $8.00 $10.00 (a) Based on LTM EBITDA and
net debt of $115.9M as of end of March 2019. (b) Based on management projections for FY 2019 and FY 2020 EBITDA and net debt of $14.4M as of end of FY2019, accounting for the effect of liquidating Hometown. (c) Impacted by liquidation of Hometown
segment. 13
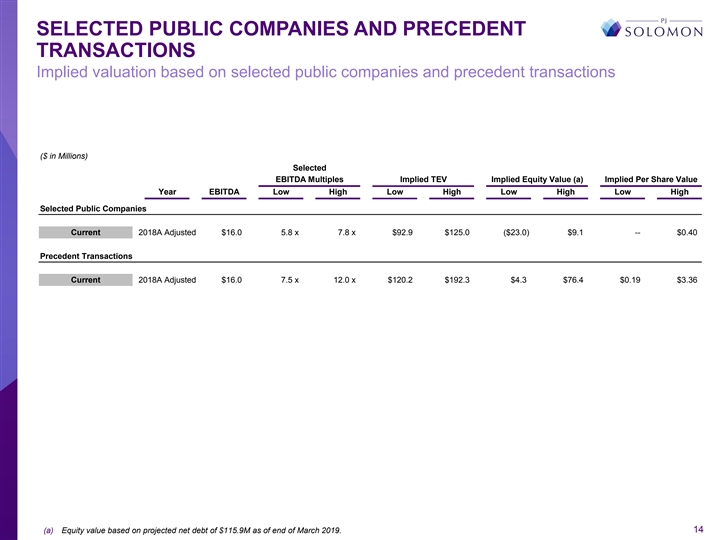
SELECTED PUBLIC COMPANIES AND PRECEDENT TRANSACTIONS Implied valuation
based on selected public companies and precedent transactions ($ in Millions) Selected EBITDA Multiples Implied TEV Implied Equity Value (a) Implied Per Share Value Year EBITDA Low High Low High Low High Low High Selected Public Companies Current
2018A Adjusted $16.0 5.8 x 7.8 x $92.9 $125.0 ($23.0) $9.1 -- $0.40 Precedent Transactions Current 2018A Adjusted $16.0 7.5 x 12.0 x $120.2 $192.3 $4.3 $76.4 $0.19 $3.36 (a) Equity value based on projected net debt of $115.9M as of end of March
2019. 14SELECTED PUBLIC COMPANIES AND PRECEDENT TRANSACTIONS Implied valuation based on selected public companies and precedent transactions ($ in Millions) Selected EBITDA Multiples Implied TEV Implied Equity Value (a) Implied Per Share Value Year
EBITDA Low High Low High Low High Low High Selected Public Companies Current 2018A Adjusted $16.0 5.8 x 7.8 x $92.9 $125.0 ($23.0) $9.1 -- $0.40 Precedent Transactions Current 2018A Adjusted $16.0 7.5 x 12.0 x $120.2 $192.3 $4.3 $76.4 $0.19 $3.36
(a) Equity value based on projected net debt of $115.9M as of end of March 2019. 14
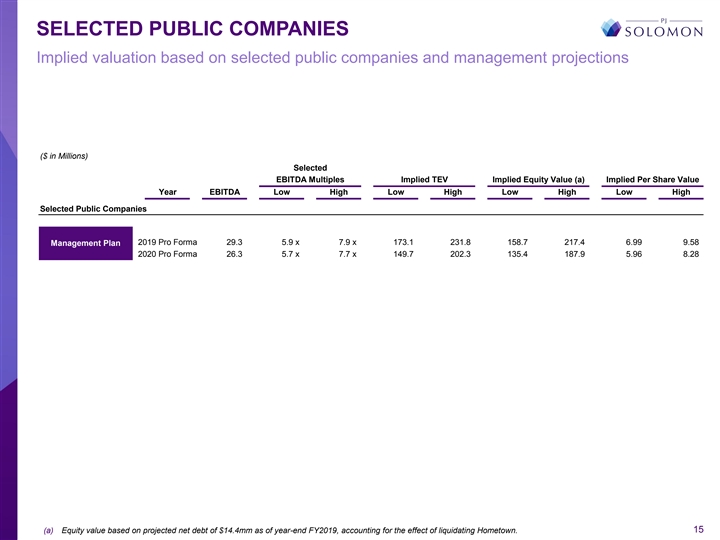
SELECTED PUBLIC COMPANIES Implied valuation based on selected public
companies and management projections ($ in Millions) Selected EBITDA Multiples Implied TEV Implied Equity Value (a) Implied Per Share Value Year EBITDA Low High Low High Low High Low High Selected Public Companies 2019 Pro Forma 29.3 5.9 x 7.9 x
173.1 231.8 158.7 217.4 6.99 9.58 Management Plan 2020 Pro Forma 26.3 5.7 x 7.7 x 149.7 202.3 135.4 187.9 5.96 8.28 (a) Equity value based on projected net debt of $14.4mm as of year-end FY2019, accounting for the effect of liquidating Hometown.
15SELECTED PUBLIC COMPANIES Implied valuation based on selected public companies and management projections ($ in Millions) Selected EBITDA Multiples Implied TEV Implied Equity Value (a) Implied Per Share Value Year EBITDA Low High Low High Low High
Low High Selected Public Companies 2019 Pro Forma 29.3 5.9 x 7.9 x 173.1 231.8 158.7 217.4 6.99 9.58 Management Plan 2020 Pro Forma 26.3 5.7 x 7.7 x 149.7 202.3 135.4 187.9 5.96 8.28 (a) Equity value based on projected net debt of $14.4mm as of
year-end FY2019, accounting for the effect of liquidating Hometown. 15

SELECTED PUBLIC COMPANIES (Amounts in Millions, Except for Per Share
Amounts) Market Data Closing Enterprise Value as a Multiple of: 5-Year Selected Price on Equity Enterprise LTM CY2019 CY2020 Price / EPS Growth PE / Growth Companies 4/5/2019 Value Value (b) Net Sales EBITDA EBITDA EBITDA CY2019 CY2020 Rate CY2019
CY2020 The Home Depot, Inc. $202.06 $223,758 $251,185 232.1 % 14.0 x 13.7 x 13.0 x 20.0 % 18.4 x 10.0 x 2.0 x 1.8 x Lowe's Companies, Inc. 114.98 91,634 107,128 150.2 13.9 12.8 12.0 19.0 16.4 14.7 1.3 1.1 Best Buy Co., Inc. 74.77 20,121 19,536 45.6
7.1 7.0 6.8 13.3 12.5 8.0 1.7 1.6 Bed Bath & Beyond Inc. 18.34 2,521 3,020 24.3 3.6 4.2 4.5 10.0 10.5 (15.5) (0.6) (0.7) Haverty Furniture Companies, Inc. 23.99 494 473 57.9 6.6 6.9 6.6 16.4 15.5 10.0 1.6 1.5 Kirkland's 6.78 97 39 6.1 1.1 1.2
1.2 37.7 24.2 16.0 2.4 1.5 Median 51.7 % 6.8 x 6.9 x 6.7 x 17.7 % 16.0 x 10.0 x 1.7 x 1.5 x Mean 86.0 7.7 7.6 7.3 19.4 16.2 7.2 1.4 1.1 Operating Data Margins Leverage and Coverate Ratios Selected Net Sales EBITDA EBIT EBITDA / Sales EBIT / Sales
Total Debt/ Net Debt/ EBITDA/ Companies LTM CAGR LTM CAGR LTM CAGR LTM Average LTM Average EBITDA EBITDA Net Interest The Home Depot, Inc. $108,203 7.0 % $17,929 7.9 % $15,777 8.4 % 16.6 % 16.5 % 14.6 % 14.5 % 1.6 x 1.5 x 18.7 x Lowe's Companies,
Inc. 71,309 4.7 7,712 0.4 6,105 1.6 10.8 11.3 8.6 9.1 2.1 2.0 12.4 Best Buy Co., Inc. 42,879 4.3 2,758 3.2 1,988 1.4 6.4 6.4 4.6 4.7 0.5 (0.2) NM Bed Bath & Beyond Inc. 12,437 1.0 849 (19.6) 517 (25.8) 6.8 11.5 4.2 9.1 1.8 0.6 12.1 Haverty
Furniture Companies, Inc. 818 (0.2) 72 (1.0) 42 (2.6) 8.8 8.8 5.1 5.2 0.7 (0.3) NM Kirkland's 647 4.3 34 (9.9) 5 (46.4) 5.3 6.1 0.8 1.7 NM (1.7) NM Median 4.3 % (0.3) % (0.6) % 7.8 % 10.1 % 4.9 % 7.1 % 1.6 x 0.2 x 12.4 x Mean 3.5 (3.2) (10.6) 9.1
10.1 6.3 7.4 1.3 0.3 14.4 Source: Company filings, Capital IQ and other publicly available sources. Note: CAGRs (Compound Annual Growth Rates) and Averages are for the last three completed fiscal years for each company. All operating data has been
adjusted to exclude unusual and extraordinary items. (a) Source of projected EPS, EBITDA and growth rate estimates: Thomson Reuters median estimate of Wall Street analysts as of April 5, 2019. (b) Enterprise value represents equity value plus book
values of total debt, preferred stock and minority interest less cash. 16SELECTED PUBLIC COMPANIES (Amounts in Millions, Except for Per Share Amounts) Market Data Closing Enterprise Value as a Multiple of: 5-Year Selected Price on Equity Enterprise
LTM CY2019 CY2020 Price / EPS Growth PE / Growth Companies 4/5/2019 Value Value (b) Net Sales EBITDA EBITDA EBITDA CY2019 CY2020 Rate CY2019 CY2020 The Home Depot, Inc. $202.06 $223,758 $251,185 232.1 % 14.0 x 13.7 x 13.0 x 20.0 % 18.4 x 10.0 x 2.0
x 1.8 x Lowe's Companies, Inc. 114.98 91,634 107,128 150.2 13.9 12.8 12.0 19.0 16.4 14.7 1.3 1.1 Best Buy Co., Inc. 74.77 20,121 19,536 45.6 7.1 7.0 6.8 13.3 12.5 8.0 1.7 1.6 Bed Bath & Beyond Inc. 18.34 2,521 3,020 24.3 3.6 4.2 4.5 10.0 10.5
(15.5) (0.6) (0.7) Haverty Furniture Companies, Inc. 23.99 494 473 57.9 6.6 6.9 6.6 16.4 15.5 10.0 1.6 1.5 Kirkland's 6.78 97 39 6.1 1.1 1.2 1.2 37.7 24.2 16.0 2.4 1.5 Median 51.7 % 6.8 x 6.9 x 6.7 x 17.7 % 16.0 x 10.0 x 1.7 x 1.5 x Mean 86.0 7.7
7.6 7.3 19.4 16.2 7.2 1.4 1.1 Operating Data Margins Leverage and Coverate Ratios Selected Net Sales EBITDA EBIT EBITDA / Sales EBIT / Sales Total Debt/ Net Debt/ EBITDA/ Companies LTM CAGR LTM CAGR LTM CAGR LTM Average LTM Average EBITDA EBITDA Net
Interest The Home Depot, Inc. $108,203 7.0 % $17,929 7.9 % $15,777 8.4 % 16.6 % 16.5 % 14.6 % 14.5 % 1.6 x 1.5 x 18.7 x Lowe's Companies, Inc. 71,309 4.7 7,712 0.4 6,105 1.6 10.8 11.3 8.6 9.1 2.1 2.0 12.4 Best Buy Co., Inc. 42,879 4.3 2,758 3.2
1,988 1.4 6.4 6.4 4.6 4.7 0.5 (0.2) NM Bed Bath & Beyond Inc. 12,437 1.0 849 (19.6) 517 (25.8) 6.8 11.5 4.2 9.1 1.8 0.6 12.1 Haverty Furniture Companies, Inc. 818 (0.2) 72 (1.0) 42 (2.6) 8.8 8.8 5.1 5.2 0.7 (0.3) NM Kirkland's 647 4.3 34 (9.9) 5
(46.4) 5.3 6.1 0.8 1.7 NM (1.7) NM Median 4.3 % (0.3) % (0.6) % 7.8 % 10.1 % 4.9 % 7.1 % 1.6 x 0.2 x 12.4 x Mean 3.5 (3.2) (10.6) 9.1 10.1 6.3 7.4 1.3 0.3 14.4 Source: Company filings, Capital IQ and other publicly available sources. Note: CAGRs
(Compound Annual Growth Rates) and Averages are for the last three completed fiscal years for each company. All operating data has been adjusted to exclude unusual and extraordinary items. (a) Source of projected EPS, EBITDA and growth rate
estimates: Thomson Reuters median estimate of Wall Street analysts as of April 5, 2019. (b) Enterprise value represents equity value plus book values of total debt, preferred stock and minority interest less cash. 16

PRECEDENT HARDLINES TRANSACTIONS (Amounts in Millions) Date Enterprise
Enterprise Value / LTM Announced Acquiror Target Value Sales EBITDA Jun-18 Vintage Capital Rent-A-Center 1,360 0.5 x 22.0 x Jun-17 Monomoy Capital West Marine $286 ND 7.6 Sycamore Staples Oct-16 6,555 ND 4.7 Nov-16 Cerberus Capital Management
Staples Inc. (European Operations) ND ND ND Oct-16 Bass Pro Shops Cabela's 4,684 (a) 1.3 10.6 Aug-16 Steinhoff Mattress Firm 3,897 1.4 15.6 Jul-16 Freeman Spogli Batteries Plus Bulbs ND ND ND Jun-16 Bed Bath & Beyond One Kings Lane ND ND ND
Apr-16 Restoration Hardware Waterworks 117 ND ND Feb-16 Lowe's Rona 3,049 CAD 0.7 12.1 Jan-16 KKR Mills Fleet Farms $1,200 ND 10.0 Dec-15 Icahn Industries Pep Boys 1,160 0.6 14.0 Nov-15 Mattress Firm Sleepy's 780 0.7 11.1 Jun-15 GameStop Geeknet 106
0.8 NM Oct-14 Brentwood Z Gallerie ND ND ND Jun-14 Shanghai International and Sanpower Brookstone 283 0.6 NM Feb-14 Signet Jewelers Limited Zale Corporation 1,174 0.6 14.8 Jan-14 Home Depot Blinds.com (GCC) ND ND ND Jan-14 Freeman Spogli Arhaus ND
ND ND Dec-13 Bain Capital Bob's Discount Furniture 405 0.5 8.1 Oct-13 Advance Auto Parts General Parts International 2,040 (b) 0.7 9.3 Sep-13 Jarden Yankee Candle Investments 1,805 2.1 8.9 Feb-13 OfficeMax Office Depot 1,148 0.2 5.7 Nov-12 Northern
Tool + Equipment (NTE) The Sportsman's Guide 215 0.5 ND Aug-12 CCMP Capital Advisors Ollie's Bargain Outlet 700 1.6 12.7 Jun-12 Thomas H. Lee Partners Party City 2,690 ND ND May-12 Bed Bath & Beyond Cost Plus 683 0.7 12.8 May-12 Madison Dearborn
Partners Things Remembered 295 0.9 (c) ND May-12 Golf Town USA Golfsmith International 150 0.4 7.7 Sep-11 Investcorp Bank Sur La Table ND ND ND Jul-11 AEA Investors Garden Ridge 714 2.1 8.2 May-11 Canadian Tire Corp. The Forzani Group 797 CAD 0.6
8.0 Nov-10 Ares Management / Freeman Spogli Floor and Décor Outlets of America ND ND 10.0 Source: SEC filings and other publicly available data. (a) EBITDA multiple assumes 50% of corporate overhead and D&A attributed to retail segment. (b)
Investor Presentation dated October 16, 2013. (c) Based on sales of $315mm for the FY ended Jan. 28, 2012 per Moody's Investors Service. 17PRECEDENT HARDLINES TRANSACTIONS (Amounts in Millions) Date Enterprise Enterprise Value / LTM Announced
Acquiror Target Value Sales EBITDA Jun-18 Vintage Capital Rent-A-Center 1,360 0.5 x 22.0 x Jun-17 Monomoy Capital West Marine $286 ND 7.6 Sycamore Staples Oct-16 6,555 ND 4.7 Nov-16 Cerberus Capital Management Staples Inc. (European Operations) ND
ND ND Oct-16 Bass Pro Shops Cabela's 4,684 (a) 1.3 10.6 Aug-16 Steinhoff Mattress Firm 3,897 1.4 15.6 Jul-16 Freeman Spogli Batteries Plus Bulbs ND ND ND Jun-16 Bed Bath & Beyond One Kings Lane ND ND ND Apr-16 Restoration Hardware Waterworks 117
ND ND Feb-16 Lowe's Rona 3,049 CAD 0.7 12.1 Jan-16 KKR Mills Fleet Farms $1,200 ND 10.0 Dec-15 Icahn Industries Pep Boys 1,160 0.6 14.0 Nov-15 Mattress Firm Sleepy's 780 0.7 11.1 Jun-15 GameStop Geeknet 106 0.8 NM Oct-14 Brentwood Z Gallerie ND ND
ND Jun-14 Shanghai International and Sanpower Brookstone 283 0.6 NM Feb-14 Signet Jewelers Limited Zale Corporation 1,174 0.6 14.8 Jan-14 Home Depot Blinds.com (GCC) ND ND ND Jan-14 Freeman Spogli Arhaus ND ND ND Dec-13 Bain Capital Bob's Discount
Furniture 405 0.5 8.1 Oct-13 Advance Auto Parts General Parts International 2,040 (b) 0.7 9.3 Sep-13 Jarden Yankee Candle Investments 1,805 2.1 8.9 Feb-13 OfficeMax Office Depot 1,148 0.2 5.7 Nov-12 Northern Tool + Equipment (NTE) The Sportsman's
Guide 215 0.5 ND Aug-12 CCMP Capital Advisors Ollie's Bargain Outlet 700 1.6 12.7 Jun-12 Thomas H. Lee Partners Party City 2,690 ND ND May-12 Bed Bath & Beyond Cost Plus 683 0.7 12.8 May-12 Madison Dearborn Partners Things Remembered 295 0.9 (c)
ND May-12 Golf Town USA Golfsmith International 150 0.4 7.7 Sep-11 Investcorp Bank Sur La Table ND ND ND Jul-11 AEA Investors Garden Ridge 714 2.1 8.2 May-11 Canadian Tire Corp. The Forzani Group 797 CAD 0.6 8.0 Nov-10 Ares Management / Freeman
Spogli Floor and Décor Outlets of America ND ND 10.0 Source: SEC filings and other publicly available data. (a) EBITDA multiple assumes 50% of corporate overhead and D&A attributed to retail segment. (b) Investor Presentation dated October
16, 2013. (c) Based on sales of $315mm for the FY ended Jan. 28, 2012 per Moody's Investors Service. 17

DISCOUNTED CASH FLOW ANALYSIS DISCOUNTED CASH FLOW ANALYSIS ($ in
Millions, Except Per Share Data) Fiscal Period Apr - Jan 2019 2020 2021 2022 Revenue $532.7 $476.6 $478.8 $481.1 EBITDA ($33.2) $26.3 $27.1 $27.2 Depreciation & Amortization (17.9) (4.5) (4.8) (4.5) EBIT ($51.1) $21.8 $22.3 $22.7 Taxes (0.7)
(0.3) (0.3) (0.3) Depreciation & Amortization $17.9 $4.5 $4.8 $4.5 Other-Non Cash Charges to EBITDA (a) 17.4 -- -- -- Net Capital Expenditures (b) (1.6) (5.6) (5.6) (5.6) Decrease / (Increase) in NWC (c) 142.1 (6.0) (2.3) (0.3) Unlevered Free
Cash Flow $123.9 $14.4 $18.9 $21.0 Terminal Value / EBITDA Multiple 5.5 x 5.5 x 5.5 x 6.5 x 6.5 x 6.5 x 7.5 x 7.5 x 7.5 x Discount Rate 11.0% 12.0% 13.0% 11.0% 12.0% 13.0% 11.0% 12.0% 13.0% Present Value of Free Cash Flow $161.9 $160.6 $159.4 $161.9
$160.6 $159.4 $161.9 $160.6 $159.4 Present Value of Terminal Value 100.3 96.9 93.7 118.5 114.5 110.7 136.8 132.1 127.7 Total Enterprise Value $262.1 $257.5 $253.0 $280.4 $275.1 $270.1 $298.6 $292.7 $287.1 Net Debt 115.9 115.9 115.9 115.9 115.9 115.9
115.9 115.9 115.9 Total Equity Value $146.2 $141.6 $137.1 $164.5 $159.2 $154.2 $182.7 $176.8 $171.2 Total Equity Value Per Share $6.44 $6.24 $6.04 $7.25 $7.01 $6.79 $8.05 $7.79 $7.54 Terminal Value as a % of Total Value 38.3% 37.6% 37.0% 42.3% 41.6%
41.0% 45.8% 45.1% 44.5% Note: Reflects plan to liquidate Hometown segment beginning in April 2019. Note: Values for 2022 are based on extrapolations, holding 2021 revenue growth, adj. EBITDA margin, D&A as a % of sales, Capital Expenditures as a
% of sales and Net Working Capital as a % of sales constant. Net debt is as of end of March 2019. (a) Includes inventory write-offs and revaluation charges on inventory transferred during the Hometown liquidation. (b) Net of cash proceeds from
planned asset sales. (c) 2019 working capital cash flow impacted by liquidation of Hometown segment. 18DISCOUNTED CASH FLOW ANALYSIS DISCOUNTED CASH FLOW ANALYSIS ($ in Millions, Except Per Share Data) Fiscal Period Apr - Jan 2019 2020 2021 2022
Revenue $532.7 $476.6 $478.8 $481.1 EBITDA ($33.2) $26.3 $27.1 $27.2 Depreciation & Amortization (17.9) (4.5) (4.8) (4.5) EBIT ($51.1) $21.8 $22.3 $22.7 Taxes (0.7) (0.3) (0.3) (0.3) Depreciation & Amortization $17.9 $4.5 $4.8 $4.5 Other-Non
Cash Charges to EBITDA (a) 17.4 -- -- -- Net Capital Expenditures (b) (1.6) (5.6) (5.6) (5.6) Decrease / (Increase) in NWC (c) 142.1 (6.0) (2.3) (0.3) Unlevered Free Cash Flow $123.9 $14.4 $18.9 $21.0 Terminal Value / EBITDA Multiple 5.5 x 5.5 x 5.5
x 6.5 x 6.5 x 6.5 x 7.5 x 7.5 x 7.5 x Discount Rate 11.0% 12.0% 13.0% 11.0% 12.0% 13.0% 11.0% 12.0% 13.0% Present Value of Free Cash Flow $161.9 $160.6 $159.4 $161.9 $160.6 $159.4 $161.9 $160.6 $159.4 Present Value of Terminal Value 100.3 96.9 93.7
118.5 114.5 110.7 136.8 132.1 127.7 Total Enterprise Value $262.1 $257.5 $253.0 $280.4 $275.1 $270.1 $298.6 $292.7 $287.1 Net Debt 115.9 115.9 115.9 115.9 115.9 115.9 115.9 115.9 115.9 Total Equity Value $146.2 $141.6 $137.1 $164.5 $159.2 $154.2
$182.7 $176.8 $171.2 Total Equity Value Per Share $6.44 $6.24 $6.04 $7.25 $7.01 $6.79 $8.05 $7.79 $7.54 Terminal Value as a % of Total Value 38.3% 37.6% 37.0% 42.3% 41.6% 41.0% 45.8% 45.1% 44.5% Note: Reflects plan to liquidate Hometown segment
beginning in April 2019. Note: Values for 2022 are based on extrapolations, holding 2021 revenue growth, adj. EBITDA margin, D&A as a % of sales, Capital Expenditures as a % of sales and Net Working Capital as a % of sales constant. Net debt is
as of end of March 2019. (a) Includes inventory write-offs and revaluation charges on inventory transferred during the Hometown liquidation. (b) Net of cash proceeds from planned asset sales. (c) 2019 working capital cash flow impacted by
liquidation of Hometown segment. 18
ADDITIONAL ANALYSES 19ADDITIONAL ANALYSES 19

HOMETOWN WINDDOWN ANALYSIS LIQUIDATION EXPENSE SENSITIVITY ANALYSIS
Book Inventory $176.4 Management Projection Book Inventory $176.4 $176.4 $176.4 $176.4 $176.4 Transfers to Outlet (34.8) Transfers to Outlet (34.8) (34.8) (34.8) (34.8) (34.8) Inventory avl. for Liquidation $141.6 Inventory avl. for Liquidation
$141.6 $141.6 $141.6 $141.6 $141.6 Est. Inventory Writeoffs / Revaluation (17.4) Liquidation Expenses ($52.2) ($46.5) (42.3) ($38.0) ($32.4) Realization Above (Below) Cost 0.0 Net Realization of Liquidation $89.4 $95.1 $99.3 $103.6 $109.2
Liquidation Expenses (24.9) Net Realization % 63.1% 67.1% 70.1% 73.1% 77.1% Net Realization on Transf. Inv. 35.8 35.8 35.8 35.8 35.8 Net Realization of Liquidation $99.3 Net Proceeds Subtotal $125.2 $130.9 $135.1 $139.4 $145.0 Net Realization on
Transferred Inventory 35.8 Additional Liquidation Expense (16.3) (15.3) ($14.3) (13.3) (12.3) Net Proceeds Subtotal $135.1 Minimum proceeds balance (5.6) (5.6) (5.6) (5.6) (5.6) Additional Liquidation Expense (14.3) Balance Sheet Clearing (103.4)
(110.0) (115.3) (120.5) (127.2) Balance Sheet Clearing (115.3) Incremental Impact on Equity Value (Sensitivity) ($11.9) ($5.2) -- $5.2 $11.9 Net Proceeds $5.6 Funded Debt left as of Jan 2020 $30.6 $24.0 $18.7 $13.5 $6.8 % Realization 3.2% Per Share
$0.25 Additional Liquidation Expense Lease settlements (through expiration) $4.9 GTT Early Termination Fees 1.0 Outside Legal Expense 4.7 Field overhead, severance and retention 3.7 Additional Expense $14.3 Note: Treatment of protection agreement to
be confirmed with management. Source: Management Liquidation Plan. 20HOMETOWN WINDDOWN ANALYSIS LIQUIDATION EXPENSE SENSITIVITY ANALYSIS Book Inventory $176.4 Management Projection Book Inventory $176.4 $176.4 $176.4 $176.4 $176.4 Transfers to
Outlet (34.8) Transfers to Outlet (34.8) (34.8) (34.8) (34.8) (34.8) Inventory avl. for Liquidation $141.6 Inventory avl. for Liquidation $141.6 $141.6 $141.6 $141.6 $141.6 Est. Inventory Writeoffs / Revaluation (17.4) Liquidation Expenses ($52.2)
($46.5) (42.3) ($38.0) ($32.4) Realization Above (Below) Cost 0.0 Net Realization of Liquidation $89.4 $95.1 $99.3 $103.6 $109.2 Liquidation Expenses (24.9) Net Realization % 63.1% 67.1% 70.1% 73.1% 77.1% Net Realization on Transf. Inv. 35.8 35.8
35.8 35.8 35.8 Net Realization of Liquidation $99.3 Net Proceeds Subtotal $125.2 $130.9 $135.1 $139.4 $145.0 Net Realization on Transferred Inventory 35.8 Additional Liquidation Expense (16.3) (15.3) ($14.3) (13.3) (12.3) Net Proceeds Subtotal
$135.1 Minimum proceeds balance (5.6) (5.6) (5.6) (5.6) (5.6) Additional Liquidation Expense (14.3) Balance Sheet Clearing (103.4) (110.0) (115.3) (120.5) (127.2) Balance Sheet Clearing (115.3) Incremental Impact on Equity Value (Sensitivity)
($11.9) ($5.2) -- $5.2 $11.9 Net Proceeds $5.6 Funded Debt left as of Jan 2020 $30.6 $24.0 $18.7 $13.5 $6.8 % Realization 3.2% Per Share $0.25 Additional Liquidation Expense Lease settlements (through expiration) $4.9 GTT Early Termination Fees 1.0
Outside Legal Expense 4.7 Field overhead, severance and retention 3.7 Additional Expense $14.3 Note: Treatment of protection agreement to be confirmed with management. Source: Management Liquidation Plan. 20
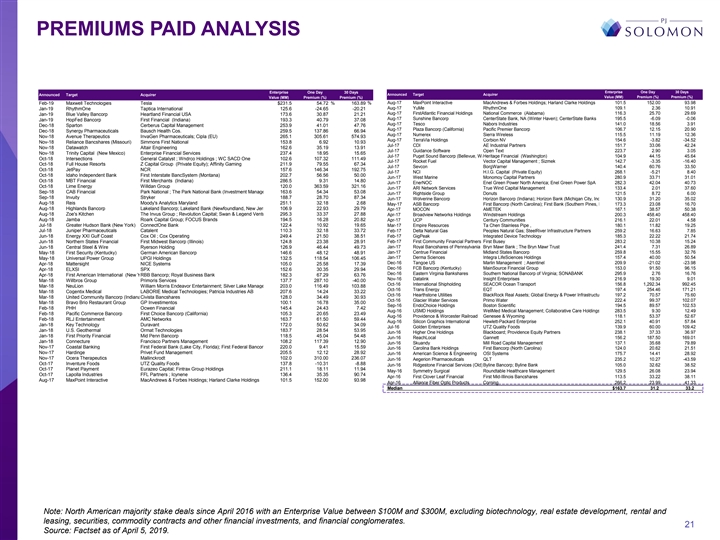
PREMIUMS PAID ANALYSIS Enterprise One Day 30 Days Enterprise One Day
30 Days Announced Target Acquirer Announced Target Acquirer Value (MM) Premium (%) Premium (%) Value (MM) Premium (%) Premium (%) Aug-17 MaxPoint Interactive MacAndrews & Forbes Holdings; Harland Clarke Holdings 101.5 152.00 93.98 Feb-19 Maxwell
Technologies Tesla $231.5 54.72 % 163.89 % Jan-19 RhythmOne Taptica International 125.6 -24.65 -20.21 Aug-17 YuMe RhythmOne 109.1 2.36 10.91 Aug-17 FirstAtlantic Financial Holdings National Commerce (Alabama) 116.3 25.70 29.69 Jan-19 Blue Valley
Bancorp Heartland Financial USA 173.6 30.87 21.21 Aug-17 Sunshine Bancorp CenterState Bank, NA (Winter Haven); CenterState Banks 195.5 -6.09 -0.06 Jan-19 HopFed Bancorp First Financial (Indiana) 193.3 40.79 37.08 Aug-17 Tesco Nabors Industries 141.0
18.56 3.91 Dec-18 Sparton Cerberus Capital Management 253.9 41.01 47.76 Aug-17 Plaza Bancorp (California) Pacific Premier Bancorp 106.7 12.15 20.90 Dec-18 Synergy Pharmaceuticals Bausch Health Cos. 259.5 137.86 66.94 Aug-17 Numerex Sierra Wireless
115.5 11.19 12.36 Nov-18 Avenue Therapeutics InvaGen Pharmaceuticals; Cipla (EU) 265.1 305.61 574.93 Aug-17 TerraVia Holdings Corbion NV 154.6 -3.82 -34.52 Nov-18 Reliance Bancshares (Missouri) Simmons First National 153.8 6.92 10.93 Jul-17 CDI AE
Industrial Partners 151.7 33.06 42.24 Nov-18 Datawatch Altair Engineering 162.6 35.19 13.91 Jul-17 Guidance Software Open Text 223.7 2.90 3.05 Nov-18 Trinity Capital (New Mexico) Enterprise Financial Services 237.4 18.95 15.65 Jul-17 Puget Sound
Bancorp (Bellevue, Wash Heritag ington e Fi ) nancial (Washington) 104.9 44.15 45.64 Oct-18 Intersections General Catalyst ; Wndrco Holdings ; WC SACD One 102.6 107.32 111.49 Jul-17 Rocket Fuel Vector Capital Management ; Sizmek 142.7 -3.35 -16.40
Oct-18 Full House Resorts Z Capital Group (Private Equity); Affinity Gaming 211.9 79.55 67.34 Jul-17 Sevcon BorgWarner 140.4 60.76 33.50 Oct-18 JetPay NCR 157.6 146.34 192.75 Jul-17 NCI H.I.G. Capital (Private Equity) 268.1 -5.21 8.40 Oct-18 Idaho
Independent Bank First Interstate BancSystem (Montana) 202.7 56.56 50.00 Jun-17 West Marine Monomoy Capital Partners 280.9 33.71 31.01 Oct-18 MBT Financial First Merchants (Indiana) 286.5 9.31 14.80 Jun-17 EnerNOC Enel Green Power North America;
Enel Green Power SpA 282.3 42.04 40.73 Oct-18 Lime Energy Willdan Group 120.0 363.59 321.16 Jun-17 ARI Network Services True Wind Capital Management 133.4 2.01 37.60 Sep-18 CAB Financial Park National ; The Park National Bank (Investment Management)
163.6 54.34 53.08 Jun-17 Rightside Group Donuts 121.5 8.72 6.00 Sep-18 Invuity Stryker 188.7 28.70 87.34 Jun-17 Wolverine Bancorp Horizon Bancorp (Indiana); Horizon Bank (Michigan City, Indiana) 130.9 31.20 35.02 Aug-18 Reis Moody's Analytics
Maryland 251.1 32.18 2.68 May-17 ASB Bancorp First Bancorp (North Carolina); First Bank (Southern Pines, North Ca 17 rol 3.3 ina) 23.08 16.70 Aug-18 Highlands Bancorp Lakeland Bancorp; Lakeland Bank (Newfoundland, New Jersey) 106.9 22.93 29.79
Apr-17 MOCON AMETEK 167.1 38.57 50.38 Aug-18 Zoe's Kitchen The Invus Group ; Revolution Capital; Swan & Legend Venture Partne 29r5.3 s; Cava Group 33.37 27.88 Apr-17 Broadview Networks Holdings Windstream Holdings 200.3 458.40 458.40 Aug-18
Jamba Roark Capital Group; FOCUS Brands 194.5 16.28 20.82 Apr-17 UCP Century Communities 216.1 22.01 4.58 Jul-18 Greater Hudson Bank (New York) ConnectOne Bank 122.4 10.92 19.65 Mar-17 Empire Resources Ta Chen Stainless Pipe , 180.1 11.82 19.25
Jul-18 Juniper Pharmaceuticals Catalent 110.3 32.18 33.72 Feb-17 Delta Natural Gas Peoples Natural Gas; SteelRiver Infrastructure Partners 259.2 16.63 7.85 Jun-18 Energy XXI Gulf Coast Cox Oil ; Cox Operating 249.4 21.50 38.51 Feb-17 GigPeak
Integrated Device Technology 185.3 22.22 21.74 Jun-18 Northern States Financial First Midwest Bancorp (Illinois) 124.8 23.38 28.91 Feb-17 First Community Financial Partners First Busey 283.2 10.38 15.24 Jan-17 Royal Bancshares of Pennsylvania Bryn
Mawr Bank ; The Bryn Mawr Trust 241.4 7.31 26.89 Jun-18 Central Steel & Wire Ryerson Holding 126.9 46.44 49.73 May-18 First Security (Kentucky) German American Bancorp 146.6 48.12 48.91 Jan-17 Centrue Financial Midland States Bancorp 259.8 15.55
32.76 Jan-17 Derma Sciences Integra LifeSciences Holdings 157.4 40.00 50.54 May-18 Universal Power Group UPGI Holdings 132.5 118.54 106.45 Dec-16 Tangoe US Marlin Management ; Asentinel 209.9 -21.02 -23.98 Apr-18 Mattersight NICE Systems 105.0 25.58
17.39 Dec-16 FCB Bancorp (Kentucky) MainSource Financial Group 153.0 91.50 96.15 Apr-18 ELXSI SPX 152.6 30.35 29.94 Dec-16 Eastern Virginia Bankshares Southern National Bancorp of Virginia; SONABANK 295.9 2.76 16.76 Apr-18 First American
International (New York RB) B Bancorp; Royal Business Bank 182.3 67.29 63.76 Nov-16 Datalink Insight Enterprises 216.9 19.30 9.01 Mar-18 Willbros Group Primoris Services 137.7 287.10 -40.00 Oct-16 International Shipholding SEACOR Ocean Transport
156.8 1,292.34 992.45 Mar-18 NeuLion William Morris Endeavor Entertainment; Silver Lake Management 203.0 116.49 103.88 Oct-16 Trans Energy EQT 197.4 254.46 171.21 Mar-18 Cogentix Medical LABORIE Medical Technologies; Patricia Industries AB 207.6
14.24 33.22 Oct-16 Hearthstone Utilities BlackRock Real Assets; Global Energy & Power Infrastructure Group 197.2 70.57 75.60 Mar-18 United Community Bancorp (Indiana) Civista Bancshares 128.0 34.49 30.93 Oct-16 Glacier Water Services Primo Water
222.4 99.37 102.07 Mar-18 Bravo Brio Restaurant Group GP Investimentos 100.1 16.78 35.00 Sep-16 EndoChoice Holdings Boston Scientific 194.5 89.57 102.53 Feb-18 PHH Ocwen Financial 145.4 24.43 7.42 Aug-16 USMD Holdings WellMed Medical Management;
Collaborative Care Holdings 283.5 9.30 12.49 Feb-18 Pacific Commerce Bancorp First Choice Bancorp (California) 105.3 20.65 23.49 Aug-16 Providence & Worcester Railroad Genesee & Wyoming 118.1 53.37 52.67 Feb-18 RLJ Entertainment AMC Networks
163.7 61.50 59.44 Aug-16 Silicon Graphics International Hewlett-Packard Enterprise 252.1 40.91 57.84 Jan-18 Key Technology Duravant 172.0 50.62 34.09 Jul-16 Golden Enterprises UTZ Quality Foods 139.9 60.00 109.42 Jan-18 U.S. Geothermal Ormat
Technologies 183.7 28.54 53.95 Jun-16 Higher One Holdings Blackboard; Providence Equity Partners 238.1 37.33 36.97 Jan-18 First Priority Financial Mid Penn Bancorp 118.5 45.04 54.48 Jun-16 ReachLocal Gannett 156.2 187.50 169.01 Jan-18 Connecture
Francisco Partners Management 108.2 117.39 12.90 Jun-16 Skuandy Mill Road Capital Management 137.1 35.68 79.89 Nov-17 Coastal Banking First Federal Bank (Lake City, Florida); First Federal Bancorp (Lake Ci 22t0.0 y, Florida) 9.41 15.59 Jun-16
Carolina Bank Holdings First Bancorp (North Carolina) 124.0 20.62 21.51 Nov-17 Hardinge Privet Fund Management 205.5 12.12 28.92 Jun-16 American Science & Engineering OSI Systems 175.7 14.41 28.92 Nov-17 Ocera Therapeutics Mallinckrodt 102.0
310.00 236.07 Jun-16 Aegerion Pharmaceuticals QLT 235.2 10.27 -43.59 Oct-17 Inventure Foods UTZ Quality Foods 137.8 -10.31 -8.88 Jun-16 Ridgestone Financial Services (Old) Byline Bancorp; Byline Bank 105.0 32.62 38.52 Oct-17 Planet Payment Eurazeo
Capital; Fintrax Group Holdings 211.1 18.11 11.94 May-16 Symmetry Surgical Roundtable Healthcare Management 129.5 26.08 23.94 Oct-17 Lapolla Industries FFL Partners ; Icynene 136.4 35.35 90.74 Apr-16 First Clover Leaf Financial First Mid-Illinois
Bancshares 113.5 33.22 38.11 Aug-17 MaxPoint Interactive MacAndrews & Forbes Holdings; Harland Clarke Holdings 101.5 152.00 93.98 Apr-16 Alliance Fiber Optic Products Corning 266.2 23.99 41.33 Median $163.7 31.2 33.2 Note: North American
majority stake deals since April 2016 with an Enterprise Value between $100M and $300M, excluding biotechnology, real estate development, rental and leasing, securities, commodity contracts and other financial investments, and financial
conglomerates. 21 Source: Factset as of April 5, 2019.PREMIUMS PAID ANALYSIS Enterprise One Day 30 Days Enterprise One Day 30 Days Announced Target Acquirer Announced Target Acquirer Value (MM) Premium (%) Premium (%) Value (MM) Premium (%) Premium
(%) Aug-17 MaxPoint Interactive MacAndrews & Forbes Holdings; Harland Clarke Holdings 101.5 152.00 93.98 Feb-19 Maxwell Technologies Tesla $231.5 54.72 % 163.89 % Jan-19 RhythmOne Taptica International 125.6 -24.65 -20.21 Aug-17 YuMe RhythmOne
109.1 2.36 10.91 Aug-17 FirstAtlantic Financial Holdings National Commerce (Alabama) 116.3 25.70 29.69 Jan-19 Blue Valley Bancorp Heartland Financial USA 173.6 30.87 21.21 Aug-17 Sunshine Bancorp CenterState Bank, NA (Winter Haven); CenterState
Banks 195.5 -6.09 -0.06 Jan-19 HopFed Bancorp First Financial (Indiana) 193.3 40.79 37.08 Aug-17 Tesco Nabors Industries 141.0 18.56 3.91 Dec-18 Sparton Cerberus Capital Management 253.9 41.01 47.76 Aug-17 Plaza Bancorp (California) Pacific Premier
Bancorp 106.7 12.15 20.90 Dec-18 Synergy Pharmaceuticals Bausch Health Cos. 259.5 137.86 66.94 Aug-17 Numerex Sierra Wireless 115.5 11.19 12.36 Nov-18 Avenue Therapeutics InvaGen Pharmaceuticals; Cipla (EU) 265.1 305.61 574.93 Aug-17 TerraVia
Holdings Corbion NV 154.6 -3.82 -34.52 Nov-18 Reliance Bancshares (Missouri) Simmons First National 153.8 6.92 10.93 Jul-17 CDI AE Industrial Partners 151.7 33.06 42.24 Nov-18 Datawatch Altair Engineering 162.6 35.19 13.91 Jul-17 Guidance Software
Open Text 223.7 2.90 3.05 Nov-18 Trinity Capital (New Mexico) Enterprise Financial Services 237.4 18.95 15.65 Jul-17 Puget Sound Bancorp (Bellevue, Wash Heritag ington e Fi ) nancial (Washington) 104.9 44.15 45.64 Oct-18 Intersections General
Catalyst ; Wndrco Holdings ; WC SACD One 102.6 107.32 111.49 Jul-17 Rocket Fuel Vector Capital Management ; Sizmek 142.7 -3.35 -16.40 Oct-18 Full House Resorts Z Capital Group (Private Equity); Affinity Gaming 211.9 79.55 67.34 Jul-17 Sevcon
BorgWarner 140.4 60.76 33.50 Oct-18 JetPay NCR 157.6 146.34 192.75 Jul-17 NCI H.I.G. Capital (Private Equity) 268.1 -5.21 8.40 Oct-18 Idaho Independent Bank First Interstate BancSystem (Montana) 202.7 56.56 50.00 Jun-17 West Marine Monomoy Capital
Partners 280.9 33.71 31.01 Oct-18 MBT Financial First Merchants (Indiana) 286.5 9.31 14.80 Jun-17 EnerNOC Enel Green Power North America; Enel Green Power SpA 282.3 42.04 40.73 Oct-18 Lime Energy Willdan Group 120.0 363.59 321.16 Jun-17 ARI Network
Services True Wind Capital Management 133.4 2.01 37.60 Sep-18 CAB Financial Park National ; The Park National Bank (Investment Management) 163.6 54.34 53.08 Jun-17 Rightside Group Donuts 121.5 8.72 6.00 Sep-18 Invuity Stryker 188.7 28.70 87.34
Jun-17 Wolverine Bancorp Horizon Bancorp (Indiana); Horizon Bank (Michigan City, Indiana) 130.9 31.20 35.02 Aug-18 Reis Moody's Analytics Maryland 251.1 32.18 2.68 May-17 ASB Bancorp First Bancorp (North Carolina); First Bank (Southern Pines, North
Ca 17 rol 3.3 ina) 23.08 16.70 Aug-18 Highlands Bancorp Lakeland Bancorp; Lakeland Bank (Newfoundland, New Jersey) 106.9 22.93 29.79 Apr-17 MOCON AMETEK 167.1 38.57 50.38 Aug-18 Zoe's Kitchen The Invus Group ; Revolution Capital; Swan & Legend
Venture Partne 29r5.3 s; Cava Group 33.37 27.88 Apr-17 Broadview Networks Holdings Windstream Holdings 200.3 458.40 458.40 Aug-18 Jamba Roark Capital Group; FOCUS Brands 194.5 16.28 20.82 Apr-17 UCP Century Communities 216.1 22.01 4.58 Jul-18
Greater Hudson Bank (New York) ConnectOne Bank 122.4 10.92 19.65 Mar-17 Empire Resources Ta Chen Stainless Pipe , 180.1 11.82 19.25 Jul-18 Juniper Pharmaceuticals Catalent 110.3 32.18 33.72 Feb-17 Delta Natural Gas Peoples Natural Gas; SteelRiver
Infrastructure Partners 259.2 16.63 7.85 Jun-18 Energy XXI Gulf Coast Cox Oil ; Cox Operating 249.4 21.50 38.51 Feb-17 GigPeak Integrated Device Technology 185.3 22.22 21.74 Jun-18 Northern States Financial First Midwest Bancorp (Illinois) 124.8
23.38 28.91 Feb-17 First Community Financial Partners First Busey 283.2 10.38 15.24 Jan-17 Royal Bancshares of Pennsylvania Bryn Mawr Bank ; The Bryn Mawr Trust 241.4 7.31 26.89 Jun-18 Central Steel & Wire Ryerson Holding 126.9 46.44 49.73
May-18 First Security (Kentucky) German American Bancorp 146.6 48.12 48.91 Jan-17 Centrue Financial Midland States Bancorp 259.8 15.55 32.76 Jan-17 Derma Sciences Integra LifeSciences Holdings 157.4 40.00 50.54 May-18 Universal Power Group UPGI
Holdings 132.5 118.54 106.45 Dec-16 Tangoe US Marlin Management ; Asentinel 209.9 -21.02 -23.98 Apr-18 Mattersight NICE Systems 105.0 25.58 17.39 Dec-16 FCB Bancorp (Kentucky) MainSource Financial Group 153.0 91.50 96.15 Apr-18 ELXSI SPX 152.6 30.35
29.94 Dec-16 Eastern Virginia Bankshares Southern National Bancorp of Virginia; SONABANK 295.9 2.76 16.76 Apr-18 First American International (New York RB) B Bancorp; Royal Business Bank 182.3 67.29 63.76 Nov-16 Datalink Insight Enterprises 216.9
19.30 9.01 Mar-18 Willbros Group Primoris Services 137.7 287.10 -40.00 Oct-16 International Shipholding SEACOR Ocean Transport 156.8 1,292.34 992.45 Mar-18 NeuLion William Morris Endeavor Entertainment; Silver Lake Management 203.0 116.49 103.88
Oct-16 Trans Energy EQT 197.4 254.46 171.21 Mar-18 Cogentix Medical LABORIE Medical Technologies; Patricia Industries AB 207.6 14.24 33.22 Oct-16 Hearthstone Utilities BlackRock Real Assets; Global Energy & Power Infrastructure Group 197.2 70.57
75.60 Mar-18 United Community Bancorp (Indiana) Civista Bancshares 128.0 34.49 30.93 Oct-16 Glacier Water Services Primo Water 222.4 99.37 102.07 Mar-18 Bravo Brio Restaurant Group GP Investimentos 100.1 16.78 35.00 Sep-16 EndoChoice Holdings Boston
Scientific 194.5 89.57 102.53 Feb-18 PHH Ocwen Financial 145.4 24.43 7.42 Aug-16 USMD Holdings WellMed Medical Management; Collaborative Care Holdings 283.5 9.30 12.49 Feb-18 Pacific Commerce Bancorp First Choice Bancorp (California) 105.3 20.65
23.49 Aug-16 Providence & Worcester Railroad Genesee & Wyoming 118.1 53.37 52.67 Feb-18 RLJ Entertainment AMC Networks 163.7 61.50 59.44 Aug-16 Silicon Graphics International Hewlett-Packard Enterprise 252.1 40.91 57.84 Jan-18 Key Technology
Duravant 172.0 50.62 34.09 Jul-16 Golden Enterprises UTZ Quality Foods 139.9 60.00 109.42 Jan-18 U.S. Geothermal Ormat Technologies 183.7 28.54 53.95 Jun-16 Higher One Holdings Blackboard; Providence Equity Partners 238.1 37.33 36.97 Jan-18 First
Priority Financial Mid Penn Bancorp 118.5 45.04 54.48 Jun-16 ReachLocal Gannett 156.2 187.50 169.01 Jan-18 Connecture Francisco Partners Management 108.2 117.39 12.90 Jun-16 Skuandy Mill Road Capital Management 137.1 35.68 79.89 Nov-17 Coastal
Banking First Federal Bank (Lake City, Florida); First Federal Bancorp (Lake Ci 22t0.0 y, Florida) 9.41 15.59 Jun-16 Carolina Bank Holdings First Bancorp (North Carolina) 124.0 20.62 21.51 Nov-17 Hardinge Privet Fund Management 205.5 12.12 28.92
Jun-16 American Science & Engineering OSI Systems 175.7 14.41 28.92 Nov-17 Ocera Therapeutics Mallinckrodt 102.0 310.00 236.07 Jun-16 Aegerion Pharmaceuticals QLT 235.2 10.27 -43.59 Oct-17 Inventure Foods UTZ Quality Foods 137.8 -10.31 -8.88
Jun-16 Ridgestone Financial Services (Old) Byline Bancorp; Byline Bank 105.0 32.62 38.52 Oct-17 Planet Payment Eurazeo Capital; Fintrax Group Holdings 211.1 18.11 11.94 May-16 Symmetry Surgical Roundtable Healthcare Management 129.5 26.08 23.94
Oct-17 Lapolla Industries FFL Partners ; Icynene 136.4 35.35 90.74 Apr-16 First Clover Leaf Financial First Mid-Illinois Bancshares 113.5 33.22 38.11 Aug-17 MaxPoint Interactive MacAndrews & Forbes Holdings; Harland Clarke Holdings 101.5 152.00
93.98 Apr-16 Alliance Fiber Optic Products Corning 266.2 23.99 41.33 Median $163.7 31.2 33.2 Note: North American majority stake deals since April 2016 with an Enterprise Value between $100M and $300M, excluding biotechnology, real estate
development, rental and leasing, securities, commodity contracts and other financial investments, and financial conglomerates. 21 Source: Factset as of April 5, 2019.
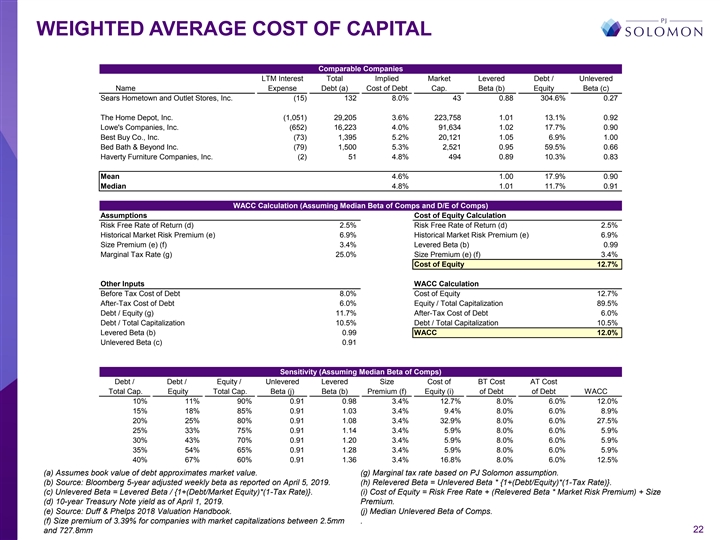
WEIGHTED AVERAGE COST OF CAPITAL Comparable Companies LTM Interest
Total Implied Market Levered Debt / Unlevered Name Expense Debt (a) Cost of Debt Cap. Beta (b) Equity Beta (c) Sears Hometown and Outlet Stores, Inc. (15) 132 8.0% 43 0.88 304.6% 0.27 The Home Depot, Inc. (1,051) 29,205 3.6% 223,758 1.01 13.1% 0.92
Lowe's Companies, Inc. (652) 16,223 4.0% 91,634 1.02 17.7% 0.90 Best Buy Co., Inc. (73) 1,395 5.2% 20,121 1.05 6.9% 1.00 Bed Bath & Beyond Inc. (79) 1,500 5.3% 2,521 0.95 59.5% 0.66 Haverty Furniture Companies, Inc. (2) 51 4.8% 494 0.89 10.3%
0.83 Mean 4.6% 1.00 17.9% 0.90 Median 4.8% 1.01 11.7% 0.91 WACC Calculation (Assuming Median Beta of Comps and D/E of Comps) Assumptions Cost of Equity Calculation Risk Free Rate of Return (d) 2.5% Risk Free Rate of Return (d) 2.5% Historical Market
Risk Premium (e) 6.9% Historical Market Risk Premium (e) 6.9% Size Premium (e) (f) 3.4% Levered Beta (b) 0.99 Marginal Tax Rate (g) 25.0% Size Premium (e) (f) 3.4% Cost of Equity 12.7% Other Inputs WACC Calculation Before Tax Cost of Debt 8.0% Cost
of Equity 12.7% After-Tax Cost of Debt 6.0% Equity / Total Capitalization 89.5% Debt / Equity (g) 11.7% After-Tax Cost of Debt 6.0% Debt / Total Capitalization 10.5% Debt / Total Capitalization 10.5% Levered Beta (b) 0.99 WACC 12.0% Unlevered Beta
(c) 0.91 Sensitivity (Assuming Median Beta of Comps) Debt / Debt / Equity / Unlevered Levered Size Cost of BT Cost AT Cost Total Cap. Equity Total Cap. Beta (j) Beta (b) Premium (f) Equity (i) of Debt of Debt WACC 10% 11% 90% 0.91 0.98 3.4% 12.7%
8.0% 6.0% 12.0% 15% 18% 85% 0.91 1.03 3.4% 9.4% 8.0% 6.0% 8.9% 20% 25% 80% 0.91 1.08 3.4% 32.9% 8.0% 6.0% 27.5% 25% 33% 75% 0.91 1.14 3.4% 5.9% 8.0% 6.0% 5.9% 30% 43% 70% 0.91 1.20 3.4% 5.9% 8.0% 6.0% 5.9% 35% 54% 65% 0.91 1.28 3.4% 5.9% 8.0% 6.0%
5.9% 40% 67% 60% 0.91 1.36 3.4% 16.8% 8.0% 6.0% 12.5% (a) Assumes book value of debt approximates market value. (g) Marginal tax rate based on PJ Solomon assumption. (b) Source: Bloomberg 5-year adjusted weekly beta as reported on April 5, 2019. (h)
Relevered Beta = Unlevered Beta * {1+(Debt/Equity)*(1-Tax Rate)}. (c) Unlevered Beta = Levered Beta / {1+(Debt/Market Equity)*(1-Tax Rate)}. (i) Cost of Equity = Risk Free Rate + (Relevered Beta * Market Risk Premium) + Size (d) 10-year Treasury
Note yield as of April 1, 2019. Premium. (e) Source: Duff & Phelps 2018 Valuation Handbook. (j) Median Unlevered Beta of Comps. (f) Size premium of 3.39% for companies with market capitalizations between 2.5mm . and 727.8mm 22WEIGHTED AVERAGE
COST OF CAPITAL Comparable Companies LTM Interest Total Implied Market Levered Debt / Unlevered Name Expense Debt (a) Cost of Debt Cap. Beta (b) Equity Beta (c) Sears Hometown and Outlet Stores, Inc. (15) 132 8.0% 43 0.88 304.6% 0.27 The Home Depot,
Inc. (1,051) 29,205 3.6% 223,758 1.01 13.1% 0.92 Lowe's Companies, Inc. (652) 16,223 4.0% 91,634 1.02 17.7% 0.90 Best Buy Co., Inc. (73) 1,395 5.2% 20,121 1.05 6.9% 1.00 Bed Bath & Beyond Inc. (79) 1,500 5.3% 2,521 0.95 59.5% 0.66 Haverty
Furniture Companies, Inc. (2) 51 4.8% 494 0.89 10.3% 0.83 Mean 4.6% 1.00 17.9% 0.90 Median 4.8% 1.01 11.7% 0.91 WACC Calculation (Assuming Median Beta of Comps and D/E of Comps) Assumptions Cost of Equity Calculation Risk Free Rate of Return (d)
2.5% Risk Free Rate of Return (d) 2.5% Historical Market Risk Premium (e) 6.9% Historical Market Risk Premium (e) 6.9% Size Premium (e) (f) 3.4% Levered Beta (b) 0.99 Marginal Tax Rate (g) 25.0% Size Premium (e) (f) 3.4% Cost of Equity 12.7% Other
Inputs WACC Calculation Before Tax Cost of Debt 8.0% Cost of Equity 12.7% After-Tax Cost of Debt 6.0% Equity / Total Capitalization 89.5% Debt / Equity (g) 11.7% After-Tax Cost of Debt 6.0% Debt / Total Capitalization 10.5% Debt / Total
Capitalization 10.5% Levered Beta (b) 0.99 WACC 12.0% Unlevered Beta (c) 0.91 Sensitivity (Assuming Median Beta of Comps) Debt / Debt / Equity / Unlevered Levered Size Cost of BT Cost AT Cost Total Cap. Equity Total Cap. Beta (j) Beta (b) Premium
(f) Equity (i) of Debt of Debt WACC 10% 11% 90% 0.91 0.98 3.4% 12.7% 8.0% 6.0% 12.0% 15% 18% 85% 0.91 1.03 3.4% 9.4% 8.0% 6.0% 8.9% 20% 25% 80% 0.91 1.08 3.4% 32.9% 8.0% 6.0% 27.5% 25% 33% 75% 0.91 1.14 3.4% 5.9% 8.0% 6.0% 5.9% 30% 43% 70% 0.91 1.20
3.4% 5.9% 8.0% 6.0% 5.9% 35% 54% 65% 0.91 1.28 3.4% 5.9% 8.0% 6.0% 5.9% 40% 67% 60% 0.91 1.36 3.4% 16.8% 8.0% 6.0% 12.5% (a) Assumes book value of debt approximates market value. (g) Marginal tax rate based on PJ Solomon assumption. (b) Source:
Bloomberg 5-year adjusted weekly beta as reported on April 5, 2019. (h) Relevered Beta = Unlevered Beta * {1+(Debt/Equity)*(1-Tax Rate)}. (c) Unlevered Beta = Levered Beta / {1+(Debt/Market Equity)*(1-Tax Rate)}. (i) Cost of Equity = Risk Free Rate
+ (Relevered Beta * Market Risk Premium) + Size (d) 10-year Treasury Note yield as of April 1, 2019. Premium. (e) Source: Duff & Phelps 2018 Valuation Handbook. (j) Median Unlevered Beta of Comps. (f) Size premium of 3.39% for companies with
market capitalizations between 2.5mm . and 727.8mm 22
DISCLAIMER This presentation has been prepared by PJ Solomon
Securities, LLC (together with its affiliates, “SOLOMON”), in its capacity as financial advisor to the special committee (the “Committee”) of the board of directors of Sears Hometown & Outlet Stores, Inc. (the
“Company”), for the exclusive use of the Committee and the board of directors of the Company (the “Board”), each in their respective capacities as such, solely in connection with the Committee’s and Board’s
consideration of the potential transaction referenced herein. This presentation is for discussion purposes only and is incomplete without reference to, and should be viewed solely in conjunction with, the oral briefing provided by SOLOMON. This
presentation is based on materials and information available from publicly available sources or supplied (whether orally or in writing) by or at the request of the Company or its representatives. SOLOMON has assumed and relied upon the accuracy and
completeness of such information and does not assume any responsibility for independent verification of such information. This presentation includes certain statements, estimates and projections provided by the Company and selected public sources
with respect to the historical and anticipated future performance of the Company. Such statements, estimates and projections contain or are based on significant assumptions and subjective judgments made by management of the Company and such public
sources. For the purposes of this presentation and the opinion being issued by SOLOMON, SOLOMON has assumed the reasonableness, accuracy and completeness of all such information, including, with respect to any Company projections, that such
projections have been reasonably prepared on bases reflecting the best currently available estimates and judgments of management of the Company as to the future financial performance of the Company. SOLOMON assumes no responsibility for, and
expresses no view as to, any such forecasts or the assumptions on which they are based. These assumptions and judgments may or may not be correct, and there can be no assurance that any projected results are attainable or will be realized. SOLOMON
has not attempted to verify any such statements, estimates and projections, and as such SOLOMON makes no representation or warranty as to, and assumes no responsibility for, their accuracy or completeness and for the effect which any such inaccuracy
or incompleteness may have on the results or judgments contained in this presentation. This presentation is not intended to provide the sole basis for any decision on a transaction and does not represent a fairness opinion, recommendation, valuation
or opinion of any kind with respect to any transaction. The financial analysis in this presentation is complex and not susceptible to partial analysis or summary descriptions. SOLOMON has viewed the results of the analysis as a whole, and has not
necessarily attributed any particular weight to any specific portion of the analysis considered. Viewing any individual portion or portions of the analysis without considering the analysis as a whole would create an incomplete view of
SOLOMON’s financial analysis. Except where otherwise indicated, this analysis speaks as of the date hereof. Under no circumstances should the delivery of this document imply that the analysis would be the same if made as of any other date.
This presentation and the information contained herein do not constitute an offer to sell or the solicitation of an offer to buy any security, commodity or instrument or related derivative, nor do they constitute an offer or commitment to lend,
syndicate or arrange a financing, underwrite or purchase or act as an agent or advisor or in any other capacity with respect to any transaction, or commit capital, or to participate in any trading strategies. SOLOMON does not provide legal,
regulatory, accounting or tax advice. We recommend that the recipient seek independent third party legal, regulatory, accounting and tax advice regarding the contents of this presentation. This presentation is not a research report and was not
prepared by the research department of SOLOMON or any of its affiliates. SOLOMON expresses no view or opinion as to the price or range of prices at which the shares of common stock or other securities of the Company may trade at any time, including,
without limitation, subsequent to the announcement or consummation of any transaction with Buyer. SOLOMON provides mergers and acquisitions, restructuring and other advisory services to clients. At any given time, SOLOMON or its affiliates may be
engaged by one or more entities that may be competitors with, or otherwise adverse to, the Company in connection with matters unrelated to any transaction. As a result, it is possible that SOLOMON or its affiliates may from time to time be involved
in one or more capacities that, directly or indirectly, may be or may be perceived as being adverse to the Company’s interests. Moreover, SOLOMON or its affiliates may, in the course of other client relationships, have or in the future acquire
information material to the Company’s interests which, by virtue of such other client relationships, SOLOMON or its affiliates are or will not be at liberty to disclose to the Company. SOLOMON is an affiliate of Natixis, which engages globally
in a wide variety of financing, commodities, derivatives, commercial banking, investment banking, securities trading and brokerage activities, asset management and financial advisory services. In the ordinary course of its activities Natixis may at
any time (i) be in possession of non-public information that it does not disclose to the Company and (ii) hold long or short positions, or trade or otherwise effect transactions, for its own account or customer accounts, in the debt or equity of (or
other financial instruments relating to) persons or entities that may be involved or otherwise have interests in a transaction involving the Company or may provide investment banking and other services or financing to such persons or entities. The
Company further understands and agrees that Natixis may exercise voting power or other types of discretion over loans or securities of (or other financial instruments relating to) persons or entities that may be involved in a transaction involving
the Company and that Natixis may exercise such powers or discretion and otherwise perform its functions in connection with any fiduciary and other relationships without regard to its relationship to the Company. THIS PRESENTATION IS FOR THE
INFORMATION AND ASSISTANCE OF THE COMMITTEE AND THE BOARD, EACH IN THEIR RESPECTIVE CAPACITIES AS SUCH. IT IS NOT INTENDED TO BE USED OR RELIED UPON, AND SHOULD NOT AND CANNOT BE USED OR RELIED UPON, BY ANY OTHER PERSON. THIS PRESENTATION IS
CONFIDENTIAL AND SHOULD NOT, WITHOUT PRIOR WRITTEN CONSENT OF SOLOMON, BE COPIED OR MADE AVAILABLE TO ANY PERSONOTHER THAN THE COMMITTEE AND THE BOARD. NOTWITHSTANDING ANYTHING THAT MAY APPEAR HEREIN OR IN OTHER MATERIALS TO THE CONTRARY, THE
COMPANY SHALL BE PERMITTEDTO DISCLOSE THE TAX TREATMENT AND TAX STRUCTURE OF A TRANSACTION (INCLUDING ANY MATERIALS, OPINIONS OR ANALYSES RELATING TO SUCH TAX TREATMENT OR TAX STRUCTURE, BUT WITHOUT DISCLOSURE OF IDENTIFYING INFORMATION OR, EXCEPT
TO THE EXTENT RELATING TO SUCH TAX STRUCTURE OR TAX TREATMENT, ANY NONPUBLIC COMMERCIAL OR FINANCIAL INFORMATION) ON AND AFTER THE EARLIEST TO OCCUR OF THE DATE OF (I) PUBLIC ANNOUNCEMENT OF DISCUSSIONS RELATING TO SUCH TRANSACTION, (II) PUBLIC
ANNOUNCEMENT OF SUCH TRANSACTION OR (III) EXECUTION OF A DEFINITIVE AGREEMENT (WITH OR WITHOUT CONDITIONS) TO ENTER INTO SUCH TRANSACTION; PROVIDED, HOWEVER, THAT IF SUCH TRANSACTION IS NOT CONSUMMATED FOR ANY REASON, THE PROVISIONS OF THIS SENTENCE
SHALL CEASE TO APPLY. NOTHING CONTAINED IN THIS PRESENTATION IS, OR SHALL BE RELIED UPON AS, A REPRESENTATION OR WARRANTY, WHETHER AS TO THE PAST, THE PRESENTOR THE FUTURE.DISCLAIMER This presentation has been prepared by PJ Solomon Securities, LLC
(together with its affiliates, “SOLOMON”), in its capacity as financial advisor to the special committee (the “Committee”) of the board of directors of Sears Hometown & Outlet Stores, Inc. (the “Company”), for
the exclusive use of the Committee and the board of directors of the Company (the “Board”), each in their respective capacities as such, solely in connection with the Committee’s and Board’s consideration of the potential
transaction referenced herein. This presentation is for discussion purposes only and is incomplete without reference to, and should be viewed solely in conjunction with, the oral briefing provided by SOLOMON. This presentation is based on materials
and information available from publicly available sources or supplied (whether orally or in writing) by or at the request of the Company or its representatives. SOLOMON has assumed and relied upon the accuracy and completeness of such information
and does not assume any responsibility for independent verification of such information. This presentation includes certain statements, estimates and projections provided by the Company and selected public sources with respect to the historical and
anticipated future performance of the Company. Such statements, estimates and projections contain or are based on significant assumptions and subjective judgments made by management of the Company and such public sources. For the purposes of this
presentation and the opinion being issued by SOLOMON, SOLOMON has assumed the reasonableness, accuracy and completeness of all such information, including, with respect to any Company projections, that such projections have been reasonably prepared
on bases reflecting the best currently available estimates and judgments of management of the Company as to the future financial performance of the Company. SOLOMON assumes no responsibility for, and expresses no view as to, any such forecasts or
the assumptions on which they are based. These assumptions and judgments may or may not be correct, and there can be no assurance that any projected results are attainable or will be realized. SOLOMON has not attempted to verify any such statements,
estimates and projections, and as such SOLOMON makes no representation or warranty as to, and assumes no responsibility for, their accuracy or completeness and for the effect which any such inaccuracy or incompleteness may have on the results or
judgments contained in this presentation. This presentation is not intended to provide the sole basis for any decision on a transaction and does not represent a fairness opinion, recommendation, valuation or opinion of any kind with respect to any
transaction. The financial analysis in this presentation is complex and not susceptible to partial analysis or summary descriptions. SOLOMON has viewed the results of the analysis as a whole, and has not necessarily attributed any particular weight
to any specific portion of the analysis considered. Viewing any individual portion or portions of the analysis without considering the analysis as a whole would create an incomplete view of SOLOMON’s financial analysis. Except where otherwise
indicated, this analysis speaks as of the date hereof. Under no circumstances should the delivery of this document imply that the analysis would be the same if made as of any other date. This presentation and the information contained herein do not
constitute an offer to sell or the solicitation of an offer to buy any security, commodity or instrument or related derivative, nor do they constitute an offer or commitment to lend, syndicate or arrange a financing, underwrite or purchase or act as
an agent or advisor or in any other capacity with respect to any transaction, or commit capital, or to participate in any trading strategies. SOLOMON does not provide legal, regulatory, accounting or tax advice. We recommend that the recipient seek
independent third party legal, regulatory, accounting and tax advice regarding the contents of this presentation. This presentation is not a research report and was not prepared by the research department of SOLOMON or any of its affiliates. SOLOMON
expresses no view or opinion as to the price or range of prices at which the shares of common stock or other securities of the Company may trade at any time, including, without limitation, subsequent to the announcement or consummation of any
transaction with Buyer. SOLOMON provides mergers and acquisitions, restructuring and other advisory services to clients. At any given time, SOLOMON or its affiliates may be engaged by one or more entities that may be competitors with, or otherwise
adverse to, the Company in connection with matters unrelated to any transaction. As a result, it is possible that SOLOMON or its affiliates may from time to time be involved in one or more capacities that, directly or indirectly, may be or may be
perceived as being adverse to the Company’s interests. Moreover, SOLOMON or its affiliates may, in the course of other client relationships, have or in the future acquire information material to the Company’s interests which, by virtue
of such other client relationships, SOLOMON or its affiliates are or will not be at liberty to disclose to the Company. SOLOMON is an affiliate of Natixis, which engages globally in a wide variety of financing, commodities, derivatives, commercial
banking, investment banking, securities trading and brokerage activities, asset management and financial advisory services. In the ordinary course of its activities Natixis may at any time (i) be in possession of non-public information that it does
not disclose to the Company and (ii) hold long or short positions, or trade or otherwise effect transactions, for its own account or customer accounts, in the debt or equity of (or other financial instruments relating to) persons or entities that
may be involved or otherwise have interests in a transaction involving the Company or may provide investment banking and other services or financing to such persons or entities. The Company further understands and agrees that Natixis may exercise
voting power or other types of discretion over loans or securities of (or other financial instruments relating to) persons or entities that may be involved in a transaction involving the Company and that Natixis may exercise such powers or
discretion and otherwise perform its functions in connection with any fiduciary and other relationships without regard to its relationship to the Company. THIS PRESENTATION IS FOR THE INFORMATION AND ASSISTANCE OF THE COMMITTEE AND THE BOARD, EACH
IN THEIR RESPECTIVE CAPACITIES AS SUCH. IT IS NOT INTENDED TO BE USED OR RELIED UPON, AND SHOULD NOT AND CANNOT BE USED OR RELIED UPON, BY ANY OTHER PERSON. THIS PRESENTATION IS CONFIDENTIAL AND SHOULD NOT, WITHOUT PRIOR WRITTEN CONSENT OF SOLOMON,
BE COPIED OR MADE AVAILABLE TO ANY PERSONOTHER THAN THE COMMITTEE AND THE BOARD. NOTWITHSTANDING ANYTHING THAT MAY APPEAR HEREIN OR IN OTHER MATERIALS TO THE CONTRARY, THE COMPANY SHALL BE PERMITTEDTO DISCLOSE THE TAX TREATMENT AND TAX STRUCTURE OF
A TRANSACTION (INCLUDING ANY MATERIALS, OPINIONS OR ANALYSES RELATING TO SUCH TAX TREATMENT OR TAX STRUCTURE, BUT WITHOUT DISCLOSURE OF IDENTIFYING INFORMATION OR, EXCEPT TO THE EXTENT RELATING TO SUCH TAX STRUCTURE OR TAX TREATMENT, ANY NONPUBLIC
COMMERCIAL OR FINANCIAL INFORMATION) ON AND AFTER THE EARLIEST TO OCCUR OF THE DATE OF (I) PUBLIC ANNOUNCEMENT OF DISCUSSIONS RELATING TO SUCH TRANSACTION, (II) PUBLIC ANNOUNCEMENT OF SUCH TRANSACTION OR (III) EXECUTION OF A DEFINITIVE AGREEMENT
(WITH OR WITHOUT CONDITIONS) TO ENTER INTO SUCH TRANSACTION; PROVIDED, HOWEVER, THAT IF SUCH TRANSACTION IS NOT CONSUMMATED FOR ANY REASON, THE PROVISIONS OF THIS SENTENCE SHALL CEASE TO APPLY. NOTHING CONTAINED IN THIS PRESENTATION IS, OR SHALL BE
RELIED UPON AS, A REPRESENTATION OR WARRANTY, WHETHER AS TO THE PAST, THE PRESENTOR THE FUTURE.