Hawaii | 001-35492 | 45-4849780 |
(State or other jurisdiction of incorporation) | (Commission File Number) | (I.R.S. Employer Identification No.) |
o | Written communications pursuant to Rule 425 under the Securities Act (17 CFR 230.425) |
o | Soliciting material pursuant to Rule 14a-12 under the Exchange Act (17 CFR 240.14a-12) |
o | Pre-commencement communications pursuant to Rule 14d-2(b) under the Exchange Act (17 CFR 240.14d-2(b)) |
o | Pre-commencement communications pursuant to Rule 13e-4(c) under the Exchange Act (17 CFR 240.13e-4(c)) |
• | Net income available to A&B shareholders and diluted earnings per share for the third quarter of 2018 were $14.8 million and $0.20 per share, respectively, compared to $6.6 million and $0.13 per share in the same quarter of 2017. |
• | Net income available to A&B shareholders and diluted earnings per share for the first nine months of 2018 were $64.6 million and $0.89 per share, respectively, compared to $17.9 million and $0.36 per share in 2017. |
• | Commercial Real Estate ("CRE") operating profit was $15.9 million in the third quarter of 2018, as compared to $13.6 million in the same period of 2017. CRE operating profit was $45.0 million in the first nine months of 2018, as compared to $41.3 million in the same period of 2017. |
• | Same-store cash NOI1 increased 5.4% in the third quarter of 2018, as compared to the prior year third quarter, largely due to increased retail rents. Year-to-date same-store cash NOI growth1 was 3.9%. |
• | 58 leases, covering 128,000 square feet of gross leasable area ("GLA"), were executed during the third quarter of 2018, bringing the Company to 87% of its 2018 leasing goals measured by annualized base rent. Comparable leasing spreads for signed leases were 3.3% portfolio wide for the third quarter of 2018 and 4.6% for retail spaces. Year-to-date comparable leasing spreads stand at 8.4% portfolio wide, above the range of full-year guidance. |
• | Occupancy decreased to 91.9% as of September 30, 2018, a reduction of 110 basis points compared to September 30, 2017, primarily due to the termination of a lease at Komohana Industrial Park in the first quarter. |
• | Occupancy in the Hawai`i retail portfolio was 92.7% as of September 30, 2018, an increase of 10 basis points as compared to the second quarter, and an increase of 20 basis points compared to the quarter ended September 30, 2017, primarily due to the addition of Hokulei Village and Laulani Village to the retail portfolio. |
• | Subsequent to the end of the quarter, the Company closed on the sale of the Lahaina Square Center and three adjacent parcels on Maui for gross proceeds of $11.3 million. |
• | Major strategic lease transactions in the third quarter include: |
◦ | Advanced strategic re-merchandising of the 411,300 square-foot Pearl Highlands Center with the opening of ULTA, a 93% leased Food Court, and a new lease with Guitar Center. Occupancy increased to 93.1% as of September 30, 2018 and will increase to 98.0% with commencement of the Guitar Center lease in the first quarter of 2019. |
◦ | Early renewal of an auto dealership ground lease in Windward Oahu, with a new 30-year term and at a 43% initial increase in base rent. |
◦ | Nine leases were executed at Kailua Retail and Aikahi Park Shopping Center in the third quarter of 2018 at an aggregate leasing spread of 8.6%. |
◦ | Six leases were executed at Kaka`ako Commerce Center in the third quarter of 2018 to bring occupancy above 90%, for a year-over-year occupancy increase of 9.3%. |
◦ | Achieved 100% occupancy at the recently acquired Honokohau Industrial property with the execution of three leases in the third quarter of 2018 at an aggregate comparable leasing spread of 30%. |
• | Recent highlights in redevelopment and development for hold include: |
◦ | The 51,700-square-foot Lau Hala Shops in Kailua is nearing the completion of tenant build-outs with first tenants set to open during the upcoming holiday season. The center was 89% leased as of September 30, 2018, and 57% of the space is set to open in the fourth quarter of 2018. Rents have exceeded underwriting, which is leading to an estimated return on cost exceeding 11%. |
◦ | Construction continues on schedule at the 94,000-square-foot, Safeway-anchored Ho`okele Shopping Center, adjacent to Maui Business Park in Kahului. As of September 30, the center was 64% pre-leased, and the Company is in discussions for the remaining 36% of GLA. |
• | Land Operations operating profit was $13.1 million in the third quarter of 2018, as compared to a $10.4 million profit in the prior year third quarter. Land Operations operating profit was $9.3 million in the first nine months of 2018, as compared to $9.7 million in the same period of 2017. |
• | The Company continued to monetize land and non-CRE investments including the following transactions that closed in the third quarter of 2018: |
◦ | Sales of 22 units at the Kamalani workforce housing development on Maui, and joint venture distributions from the sales of 24 units at the sold-out Keala `o Wailea Maui residential development generating $11.4 million; |
◦ | Sale of the Company’s joint venture interest in the Ka Milo residential development on the Island of Hawai`i for $5.5 million; and |
◦ | Sale of 313 acres to the State of Hawai`i for the expansion of the Kahului Airport on Maui for $8.6 million. |
• | Materials & Construction operating profit was $3.4 million in the third quarter of 2018, as compared to a $6.5 million profit in the prior year third quarter. Materials & Construction operating profit was $7.2 million in the first nine months of 2018, as compared to $18.8 million in the same period of 2017. |
• | Adjusted EBITDA1 was $5.6 million for the third quarter of 2018, as compared to $9.1 million for the prior year third quarter. Paving profitability improved as a result of higher margin work acquired and executed during the quarter. Quarry operations weighed on overall profitability due to lower volumes of production, which increased unit costs. Certain operational changes are in progress and these are expected to contribute to improved operating margins in future periods. |
• | Backlog2 for the Company’s Materials & Construction segment was $157.4 million as of September 30, 2018, as compared to $211.3 million for the comparable prior year period. |
• | As of September 30, 2018, the Company had $778.4 million in total debt which represents 32.3% of the Company’s total capitalization. Maturities for the next three years average $34.3 million, or 4.4% of total debt per year. The Company's debt has a weighted-average maturity of 5.3 years with a weighted-average interest rate of 4.4%. Seventy-six percent of debt was at fixed rates. |
Three Months Ended September 30, | Nine Months Ended September 30, | ||||||||||||||
2018 | 2017 | 2018 | 2017 | ||||||||||||
Operating Revenue: | |||||||||||||||
Commercial Real Estate | $ | 35.9 | $ | 33.9 | $ | 104.9 | $ | 101.4 | |||||||
Land Operations | 24.0 | 22.6 | 72.6 | 45.7 | |||||||||||
Materials & Construction | 59.5 | 55.0 | 167.3 | 155.7 | |||||||||||
Total operating revenue | 119.4 | 111.5 | 344.8 | 302.8 | |||||||||||
Operating Profit (Loss): | |||||||||||||||
Commercial Real Estate | 15.9 | 13.6 | 45.0 | 41.3 | |||||||||||
Land Operations | 13.1 | 10.4 | 9.3 | 9.7 | |||||||||||
Materials & Construction | 3.4 | 6.5 | 7.2 | 18.8 | |||||||||||
Total operating profit (loss) | 32.4 | 30.5 | 61.5 | 69.8 | |||||||||||
Interest expense | (9.1 | ) | (6.1 | ) | (26.4 | ) | (18.5 | ) | |||||||
General corporate expenses | (6.5 | ) | (8.9 | ) | (20.5 | ) | (20.5 | ) | |||||||
REIT evaluation/conversion costs | — | (4.4 | ) | — | (11.4 | ) | |||||||||
Income (Loss) from Continuing Operations Before Income Taxes and Net Gain (Loss) on Sale of Improved Properties and Ground Leased Land | 16.8 | 11.1 | 14.6 | 19.4 | |||||||||||
Income tax benefit (expense) | (1.0 | ) | (3.7 | ) | 1.8 | (6.4 | ) | ||||||||
Income (Loss) from Continuing Operations Before Net Gain (Loss) on Sale of Improved Properties and Ground Leased Land | 15.8 | 7.4 | 16.4 | 13.0 | |||||||||||
Net gain (loss) on the sale of improved properties and ground leased land | — | — | 49.8 | 3.0 | |||||||||||
Income (Loss) from Continuing Operations | 15.8 | 7.4 | 66.2 | 16.0 | |||||||||||
Income (loss) from discontinued operations, net of income taxes | (0.2 | ) | (0.8 | ) | (0.2 | ) | 2.4 | ||||||||
Net Income (Loss) | 15.6 | 6.6 | 66.0 | 18.4 | |||||||||||
Income attributable to noncontrolling interest | (0.8 | ) | (0.5 | ) | (1.4 | ) | (1.7 | ) | |||||||
Net Income (Loss) Attributable to A&B Shareholders | $ | 14.8 | $ | 6.1 | $ | 64.6 | $ | 16.7 | |||||||
Basic Earnings (Loss) Per Share of Common Stock: | |||||||||||||||
Continuing operations available to A&B shareholders | $ | 0.21 | $ | 0.15 | $ | 0.92 | $ | 0.32 | |||||||
Discontinued operations available to A&B shareholders | — | (0.02 | ) | — | 0.04 | ||||||||||
Net income (loss) available to A&B shareholders | $ | 0.21 | $ | 0.13 | $ | 0.92 | $ | 0.36 | |||||||
Diluted Earnings (Loss) Per Share of Common Stock: | |||||||||||||||
Continuing operations available to A&B shareholders | $ | 0.20 | $ | 0.15 | $ | 0.89 | $ | 0.31 | |||||||
Discontinued operations available to A&B shareholders | — | (0.02 | ) | — | 0.05 | ||||||||||
Net income (loss) available to A&B shareholders | $ | 0.20 | $ | 0.13 | $ | 0.89 | $ | 0.36 | |||||||
Weighted-Average Number of Shares Outstanding: | |||||||||||||||
Basic | 72.0 | 49.2 | 70.2 | 49.1 | |||||||||||
Diluted | 72.4 | 49.6 | 72.4 | 49.6 | |||||||||||
Amounts Available to A&B Shareholders: | |||||||||||||||
Continuing operations available to A&B shareholders | $ | 15.0 | $ | 7.4 | $ | 64.8 | $ | 15.5 | |||||||
Discontinued operations available to A&B shareholders | (0.2 | ) | (0.8 | ) | (0.2 | ) | 2.4 | ||||||||
Net income (loss) available to A&B shareholders | $ | 14.8 | $ | 6.6 | $ | 64.6 | $ | 17.9 |
September 30, 2018 | December 31, 2017 | ||||||
ASSETS | |||||||
Current Assets | $ | 174.6 | $ | 274.8 | |||
Investments in Affiliates | 379.2 | 401.7 | |||||
Real Estate Developments | 141.9 | 151.0 | |||||
Property – Net | 1,322.3 | 1,147.5 | |||||
Intangible Assets – Net | 75.9 | 46.9 | |||||
Deferred Tax Asset | 17.6 | 16.5 | |||||
Goodwill | 102.3 | 102.3 | |||||
Restricted Cash | 0.2 | 34.3 | |||||
Other Assets | 62.2 | 56.2 | |||||
Total Assets | $ | 2,276.2 | $ | 2,231.2 | |||
LIABILITIES AND EQUITY | |||||||
Current Liabilities | $ | 120.7 | $ | 926.8 | |||
Long-term Liabilities: | |||||||
Long-term debt | 741.3 | 585.2 | |||||
Accrued retirement benefits | 23.1 | 22.7 | |||||
Other non-current liabilities | 34.5 | 37.4 | |||||
Redeemable Noncontrolling Interest | 8.0 | 8.0 | |||||
Equity | 1,348.6 | 651.1 | |||||
Total Liabilities and Equity | $ | 2,276.2 | $ | 2,231.2 |
Nine Months Ended September 30, | |||||||
2018 | 2017 | ||||||
Cash Flows from Operating Activities: | |||||||
Net income (loss) | $ | 66.0 | $ | 18.4 | |||
Adjustments to reconcile net income (loss) to net cash provided by (used in) operations: | |||||||
Depreciation and amortization | 31.6 | 31.4 | |||||
Deferred income taxes | (2.4 | ) | 19.1 | ||||
Gains on asset transactions and other | (62.1 | ) | (22.2 | ) | |||
Share-based compensation expense | 4.0 | 3.4 | |||||
Investments in affiliates, net of distributions of income | 2.0 | 3.2 | |||||
Changes in operating assets and liabilities: | |||||||
Trade, contracts retention, and other contract receivables | (4.9 | ) | (4.2 | ) | |||
Inventories | (0.3 | ) | 13.2 | ||||
Prepaid expenses, income tax receivable and other assets | (4.1 | ) | (19.8 | ) | |||
Accrued pension and post-retirement benefits | 2.5 | (48.0 | ) | ||||
Accounts payable | (8.3 | ) | (3.0 | ) | |||
Accrued and other liabilities | (7.3 | ) | (38.2 | ) | |||
Real estate inventory sales (real estate developments held for sale) | 41.0 | 16.5 | |||||
Expenditures for real estate inventory (real estate developments held for sale) | (20.0 | ) | (15.0 | ) | |||
Net cash provided by (used in) operations | 37.7 | (45.2 | ) | ||||
Cash Flows from Investing Activities: | |||||||
Capital expenditures for acquisitions | (201.6 | ) | (10.1 | ) | |||
Capital expenditures for property, plant and equipment | (40.0 | ) | (23.6 | ) | |||
Proceeds from disposal of property and other assets | 169.3 | 16.7 | |||||
Payments for purchases of investments in affiliates and other investments | (21.3 | ) | (31.5 | ) | |||
Distributions of capital from investments in affiliates and other investments | 32.8 | 3.9 | |||||
Net cash provided by (used in) investing activities | (60.8 | ) | (44.6 | ) | |||
Cash Flows from Financing Activities: | |||||||
Proceeds from issuance of long-term debt | 533.5 | 145.5 | |||||
Payments of long-term debt and deferred financing costs | (433.6 | ) | (46.4 | ) | |||
Borrowings (payments) on line-of-credit agreement, net | (14.2 | ) | 9.8 | ||||
Distribution to noncontrolling interests | (0.2 | ) | (0.2 | ) | |||
Cash dividends paid | (156.6 | ) | (10.3 | ) | |||
Proceeds from issuance (repurchase) of capital stock and other, net | (1.3 | ) | (4.1 | ) | |||
Net cash provided by (used in) financing activities | (72.4 | ) | 94.3 | ||||
Cash, Cash Equivalents and Restricted Cash: | |||||||
Net increase (decrease) in cash, cash equivalents, and restricted cash | (95.5 | ) | 4.5 | ||||
Balance, beginning of period | 103.2 | 12.3 | |||||
Balance, end of period | $ | 7.7 | $ | 16.8 |
Three Months Ended September 30, | Nine Months Ended September 30, | ||||||||||||||||||||
(in millions, unaudited) | 2018 | 2017 | Change | 2018 | 2017 | Change | |||||||||||||||
Commercial Real Estate Operating Profit (Loss) | $ | 15.9 | $ | 13.6 | $ | 45.0 | $ | 41.3 | |||||||||||||
Plus: Depreciation and amortization | 7.2 | 6.6 | 20.5 | 19.7 | |||||||||||||||||
Less: Straight-line lease adjustments | (2.0 | ) | (0.3 | ) | (2.7 | ) | (1.3 | ) | |||||||||||||
Less: Favorable/(unfavorable) lease amortization | (0.4 | ) | (0.7 | ) | (1.4 | ) | (2.2 | ) | |||||||||||||
Less: Termination income | — | — | (1.1 | ) | — | ||||||||||||||||
Plus: Other (income)/expense, net | — | 0.1 | 0.1 | 0.4 | |||||||||||||||||
Plus: Selling, general, administrative and other expenses | 1.4 | 1.9 | 4.7 | 5.9 | |||||||||||||||||
Commercial Real Estate Cash NOI | 22.1 | 21.2 | 4.3% | 65.1 | 63.8 | 2.0% | |||||||||||||||
Acquisitions / dispositions and other adjustments | (3.3 | ) | (3.4 | ) | (9.2 | ) | (10.0 | ) | |||||||||||||
Commercial Real Estate Same-Store Cash NOI | $ | 18.8 | $ | 17.8 | 5.4% | $ | 55.9 | $ | 53.8 | 3.9% |
Three Months Ended September 30, | Nine Months Ended September 30, | ||||||||||||||
(in millions, unaudited) | 2018 | 2017 | 2018 | 2017 | |||||||||||
Operating Profit (Loss) | $ | 3.4 | $ | 6.5 | $ | 7.2 | $ | 18.8 | |||||||
Depreciation and amortization | 3.0 | 3.1 | 9.1 | 9.2 | |||||||||||
EBITDA | 6.4 | 9.6 | 16.3 | 28.0 | |||||||||||
Income attributable to noncontrolling interest | (0.8 | ) | (0.5 | ) | (1.4 | ) | (1.7 | ) | |||||||
Adjusted EBITDA | $ | 5.6 | $ | 9.1 | $ | 14.9 | $ | 26.3 |
1 | See above for a discussion of management's use of non-GAAP financial measures and reconciliations from GAAP to non-GAAP measures. |
2 | Backlog represents the amount of revenue that Grace Pacific and Maui Paving, LLC, a 50-percent-owned unconsolidated affiliate, expect to realize on contracts awarded and government contracts in which Grace Pacific has been confirmed to be the lowest bidder and formal communication of the award is perfunctory. |
Contact: |
Kenneth Kan |
(808) 525-8475 |
kkan@abhi.com |
Company Overview | |
Company Profile | |
Glossary of Terms | |
Statement on Management's Use of Non-GAAP Financial Measures | |
Financial Summary | |
Table 1 – Condensed Consolidated Balance Sheets | |
Table 2 – Condensed Consolidated Statements of Operations | |
Table 3 – Segment Results | |
Table 4 – Condensed Consolidated Statements of Cash Flows | |
Table 5 – Debt Summary | |
Table 6 – Capitalization & Financial Ratios | |
Table 7 – Consolidated Metrics | |
Commercial Real Estate | |
Table 8 – Statement of Operating Profit, Cash NOI and Same-Store Cash NOI | |
Table 9 – Occupancy | |
Table 10 – Cash NOI and Same-Store Cash NOI by Type | |
Table 11 – Property Report | |
Table 12 – Ground Lease Report | |
Table 13 – Portfolio Summary | |
Table 14 – Top 10 Tenants Ranked by ABR | |
Table 15 – Lease Expiration Schedule | |
Table 16 – New & Renewal Lease Summary | |
Table 17 – Portfolio Repositioning, Redevelopment & Development Summary | |
Table 18 – Transactional Activity (2013- 2018) | |
Table 19 – Commercial Real Estate EBITDA | |
Land Operations | |
Table 20 – Statement of Operating Profit & EBITDA | |
Table 21 – Key Active Development-for-sale Projects | |
Materials & Construction | |
Table 22 – Statement of Operating Profit, EBITDA and Adjusted EBITDA |
Page | Schedule | Description |
Commercial Real Estate | ||
Statement of Operating Profit, Cash NOI and Same-Store Cash NOI | Summary of CRE Operating Profit, Cash NOI, and Same-Store Cash NOI. | |
Portfolio Repositioning, Redevelopment & Development Summary | Provides an overview of the Company's ongoing and planned developments for hold. | |
Land Operations | ||
Key Active Development-for-sale Projects | Provides an overview of the Company's ongoing and planned developments for sale. | |
Materials & Construction | ||
Statement of Operating Profit, EBITDA and Adjusted EBITDA | Summary of Materials & Construction Operating Profit, EBITDA, and Adjusted EBITDA. | |
Other | ||
Debt Summary | Provides an overview of the Company's notes payable and long-term debt. |
• | A 3.4 million-square-foot portfolio of commercial real estate and 109 acres of ground leases throughout the Hawaiian islands, including 2.3 million square feet of largely grocery/drugstore-anchored retail centers; |
• | More than 86,000 acres of landholdings, making us the fourth largest private landowner in Hawai`i. In addition, we are engaged in residential and commercial development-for-sale activities in select Hawai`i locations; and |
• | Hawai`i's most significant materials and construction operations, including strategic quarry and asphalt importation sites that supply the Hawaiian islands, paving activities and certain complementary operations. |
Executive Officers | ||
Christopher Benjamin | James Mead | |
President & Chief Executive Officer | Executive Vice President & Chief Financial Officer | |
Lance Parker | Nelson Chun | |
Executive Vice President & Chief Real Estate Officer | Executive Vice President & Chief Legal Officer | |
Pike Riegert | Meredith Ching | |
President, Grace Pacific | Executive Vice President, Government & Community Relations | |
Contact Information | Equity Research | |
Corporate Headquarters | Evercore ISI | |
822 Bishop Street | Sheila McGrath | |
Honolulu, HI 96813 | (212) 425-3389 | |
sheila.mcgrath@evercore.com | ||
Investor Relations | ||
Kenneth Kan | JMP Securities LLC | |
Vice President, Capital Markets | Peter Martin | |
(808) 525-8475 | (415) 835-8904 | |
kkan@abhi.com | pmartin@jmpsecurities.com | |
Transfer Agent & Registrar | Sidoti & Company, LLC | |
Computershare | Stephen O'Hara | |
P.O. Box 505000 | (212) 894-3329 | |
Louisville, KY 40233-5000 | sohara@sidoti.com | |
(866) 522-6645 | ||
Other Company Information | ||
Overnight Correspondence | ||
Computershare | Stock exchange listing: NYSE: ALEX | |
462 South 4th Street, Suite 1600 | Corporate website: www.alexanderbaldwin.com | |
Louisville, KY 40202 | Grace website: www.gracepacific.com | |
Market capitalization at September 30, 2018: $1.6B | ||
Shareholder website: www.computershare.com/investor | 3-month average trading volume: 335K | |
Online inquiries: www.us-computershare.com/investor/contact | Independent auditors: Deloitte & Touche LLP |
ABR | Annualized Base Rent (ABR) is the current month's contractual base rent multiplied by 12. Base rent is presented without consideration of percentage rent that may, in some cases, be significant. |
Adjusted EBITDA | Adjusted EBITDA is calculated for the Materials & Construction segment by adjusting for income attributable to noncontrolling interests from EBITDA. |
Backlog | Backlog represents the amount of revenue that Grace Pacific and Maui Paving, LLC, a 50-percent-owned unconsolidated affiliate, expect to realize on contracts awarded or government contracts in which Grace Pacific has been confirmed to be the lowest bidder and formal communication of the award is believed to be perfunctory. |
Cash NOI | Cash Net Operating Income (Cash NOI) is calculated as total Commercial Real Estate operating revenues less direct property-related operating expenses. Cash NOI excludes straight-line lease adjustments, amortization of favorable/unfavorable leases, amortization of lease incentives, selling, general and administrative expenses, impairment of commercial real estate assets, lease termination income, and depreciation and amortization (including amortization of maintenance capital, tenant improvements and leasing commissions). |
Comparable Lease | Renewals and leases executed for units that have been vacated in the previous 12 months. Expansions, contractions and strategic short-term renewals are excluded from the comparable lease pool. |
Net Debt | Net Debt is calculated as the Company's total notional debt, excluding unamortized premium, discount and capitalized loan fees, less cash, cash equivalents and restricted cash. |
EBITDA | 
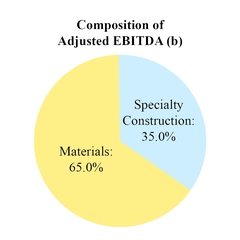
Earnings Before Interest, Taxes, Depreciation and Amortization (EBITDA) is calculated on a consolidated basis by adjusting the Company’s consolidated net income (loss) to exclude the impact of interest expense, income taxes, and depreciation and amortization. EBITDA is calculated for each segment by adjusting segment operating profit (which excludes interest and tax expenses), as applicable, by adding back depreciation and amortization. |
Fixed-charge Coverage Ratio | The ratio of EBITDA to the sum of debt service (which includes interest payments and principal amortization of mortgage debt, excluding balloon payments), for the trailing twelve months. |
GAAP | Generally accepted accounting principles (GAAP) in the United States of America. |
GLA | Gross Leasable Area (GLA) is periodically adjusted based on remeasurement or reconfiguration of space, measured in square feet (SF). |
Maintenance Capital Expenditures | Capital expenditures necessary to maintain building value, the current income stream and position in the market (including building improvements, and tenant improvements allowances). |
Occupancy | The percentage of square footage leased and commenced to gross leasable space properties at the end of the period reported. |
Rent Spread | Percentage change in ABR in the first year of a signed lease relative to the ABR in the last year of the prior lease. |
Same-Store | The Company reports Cash NOI and Occupancy on a same-store basis, which includes the results of properties that were owned and operated for the entirety of the prior calendar year. The same-store pool excludes properties under development or redevelopment and also excludes properties acquired or sold during the comparable reporting periods. While there is management judgment involved in classifications, new developments and redevelopments are moved into the same-store pool after one full calendar year of stabilized operation. Properties included in held for sale are excluded from same-store. |
Stabilization | New developments and redevelopments are generally considered stabilized upon the initial attainment of 90% occupancy. |
Straight-line Rent | Non-cash revenue related to a GAAP requirement to average tenant rents over the life of the lease, regardless of the actual cash collected in the reporting period. |
TTM | Trailing twelve months. |
Year Built | Year of most recent repositioning/redevelopment or year built if no repositioning/redevelopment has occurred. |
• | Consolidated EBITDA |
• | Commercial Real Estate Cash NOI and Same-Store Cash NOI |
• | Commercial Real Estate EBITDA |
• | Land Operations EBITDA |
• | Materials & Construction EBITDA and Adjusted EBITDA |
• | Refer to Table 7 for a reconciliation of consolidated net income to EBITDA. |
• | Refer to Table 8 for a reconciliation of Commercial Real Estate operating profit to Cash NOI. |
• | Refer to Table 19 for a reconciliation of Commercial Real Estate operating profit to EBITDA. |
• | Refer to Table 20 for a reconciliation of Land Operations operating profit to EBITDA. |
• | Refer to Table 22 for a reconciliation of Materials & Construction operating profit to EBITDA. |
September 30, | December 31, | ||||||
2018 | 2017 | ||||||
ASSETS | |||||||
Current Assets: | |||||||
Cash and cash equivalents | $ | 7.5 | $ | 68.9 | |||
Accounts receivable, net | 60.3 | 47.3 | |||||
Costs and estimated earnings in excess of billings on uncompleted contracts | 9.6 | 20.2 | |||||
Inventories | 32.2 | 31.9 | |||||
Real estate development inventory and property held for sale | 23.7 | 67.4 | |||||
Prepaid expenses and other assets | 41.3 | 39.1 | |||||
Total current assets | 174.6 | 274.8 | |||||
Investments in Affiliates | 379.2 | 401.7 | |||||
Real Estate Developments | 141.9 | 151.0 | |||||
Property – Net | 1,322.3 | 1,147.5 | |||||
Intangible Assets – Net | 75.9 | 46.9 | |||||
Deferred Tax Asset | 17.6 | 16.5 | |||||
Goodwill | 102.3 | 102.3 | |||||
Restricted Cash | 0.2 | 34.3 | |||||
Other Assets | 62.2 | 56.2 | |||||
Total assets | $ | 2,276.2 | $ | 2,231.2 | |||
LIABILITIES AND EQUITY | |||||||
Current Liabilities: | |||||||
Notes payable and current portion of long-term debt | $ | 37.1 | $ | 46.0 | |||
Accounts payable | 33.7 | 43.3 | |||||
Billings in excess of costs and estimated earnings on uncompleted contracts | 3.6 | 5.7 | |||||
Accrued dividends(a) | — | 783.0 | |||||
Accrued and other liabilities | 46.3 | 48.8 | |||||
Total current liabilities | 120.7 | 926.8 | |||||
Long-term Liabilities: | |||||||
Long-term debt | 741.3 | 585.2 | |||||
Accrued retirement benefits | 23.1 | 22.7 | |||||
Other non-current liabilities | 34.5 | 37.4 | |||||
Total long-term liabilities | 798.9 | 645.3 | |||||
Total liabilities | 919.6 | 1,572.1 | |||||
Redeemable Noncontrolling Interest | 8.0 | 8.0 | |||||
Equity: | |||||||
Common stock - no par value; authorized, 150 million shares; outstanding, 72.0 million and 49.3 million shares at September 30, 2018 and December 31, 2017, respectively | 1,792.1 | 1,161.7 | |||||
Accumulated other comprehensive loss | (38.3 | ) | (42.3 | ) | |||
Distributions in excess of accumulated earnings | (410.5 | ) | (473.0 | ) | |||
Total A&B shareholders' equity | 1,343.3 | 646.4 | |||||
Noncontrolling interest | 5.3 | 4.7 | |||||
Total equity | 1,348.6 | 651.1 | |||||
Total liabilities and equity | $ | 2,276.2 | $ | 2,231.2 |
(a) | Amount as of December 31, 2017 represents the Company's Special Distribution, consisting of $156.6 million of cash and $626.4 million of shares, which was settled on January 23, 2018. |
Three Months Ended September 30, | Nine Months Ended September 30, | |||||||||||||||
2018 | 2017 | 2018 | 2017 | |||||||||||||
Operating Revenue: | ||||||||||||||||
Commercial Real Estate | $ | 35.9 | $ | 33.9 | $ | 104.9 | $ | 101.4 | ||||||||
Land Operations | 24.0 | 22.6 | 72.6 | 45.7 | ||||||||||||
Materials & Construction | 59.5 | 55.0 | 167.3 | 155.7 | ||||||||||||
Total operating revenue | 119.4 | 111.5 | 344.8 | 302.8 | ||||||||||||
Operating Costs and Expenses: | ||||||||||||||||
Cost of Commercial Real Estate | 19.2 | 19.2 | 57.0 | 56.9 | ||||||||||||
Cost of Land Operations | 17.4 | 11.7 | 67.0 | 29.1 | ||||||||||||
Cost of Materials & Construction | 50.5 | 44.3 | 143.5 | 125.1 | ||||||||||||
Selling, general and administrative | 14.6 | 18.4 | 44.7 | 47.9 | ||||||||||||
REIT evaluation/conversion costs | — | 4.4 | — | 11.4 | ||||||||||||
Total operating costs and expenses | 101.7 | 98.0 | 312.2 | 270.4 | ||||||||||||
Operating Income (Loss) | 17.7 | 13.5 | 32.6 | 32.4 | ||||||||||||
Income (loss) related to joint ventures | 4.5 | 4.3 | 6.3 | 7.5 | ||||||||||||
Reductions in solar investments, net | (0.1 | ) | (0.4 | ) | (0.4 | ) | (2.6 | ) | ||||||||
Interest and other income (expense), net | 3.8 | (0.2 | ) | 2.5 | 0.6 | |||||||||||
Interest expense | (9.1 | ) | (6.1 | ) | (26.4 | ) | (18.5 | ) | ||||||||
Income (Loss) from Continuing Operations Before Income Taxes and Net Gain (Loss) on Sale of Improved Properties and Ground Leased Land | 16.8 | 11.1 | 14.6 | 19.4 | ||||||||||||
Income tax benefit (expense) | (1.0 | ) | (3.7 | ) | 1.8 | (6.4 | ) | |||||||||
Income (Loss) from Continuing Operations Before Net Gain (Loss) on Sale of Improved Properties and Ground Leased Land | 15.8 | 7.4 | 16.4 | 13.0 | ||||||||||||
Net gain (loss) on the sale of improved properties and ground leased land | — | — | 49.8 | 3.0 | ||||||||||||
Income (Loss) from Continuing Operations | 15.8 | 7.4 | 66.2 | 16.0 | ||||||||||||
Income (loss) from discontinued operations, net of income taxes | (0.2 | ) | (0.8 | ) | (0.2 | ) | 2.4 | |||||||||
Net Income (Loss) | 15.6 | 6.6 | 66.0 | 18.4 | ||||||||||||
Income attributable to noncontrolling interest | (0.8 | ) | (0.5 | ) | (1.4 | ) | (1.7 | ) | ||||||||
Net Income (Loss) Attributable to A&B Shareholders | $ | 14.8 | $ | 6.1 | $ | 64.6 | $ | 16.7 | ||||||||
Basic Earnings (Loss) Per Share of Common Stock: | ||||||||||||||||
Continuing operations available to A&B shareholders | $ | 0.21 | $ | 0.15 | $ | 0.92 | $ | 0.32 | ||||||||
Discontinued operations available to A&B shareholders | — | (0.02 | ) | — | 0.04 | |||||||||||
Net income (loss) available to A&B shareholders | $ | 0.21 | $ | 0.13 | $ | 0.92 | $ | 0.36 | ||||||||
Diluted Earnings Per Share of Common Stock: | ||||||||||||||||
Continuing operations available to A&B shareholders | $ | 0.20 | $ | 0.15 | $ | 0.89 | $ | 0.31 | ||||||||
Discontinued operations available to A&B shareholders | — | (0.02 | ) | — | 0.05 | |||||||||||
Net income (loss) available to A&B shareholders | $ | 0.20 | $ | 0.13 | $ | 0.89 | $ | 0.36 | ||||||||
Weighted-Average Number of Shares Outstanding: | ||||||||||||||||
Basic | 72.0 | 49.2 | 70.2 | 49.1 | ||||||||||||
Diluted | 72.4 | 49.6 | 72.4 | 49.6 | ||||||||||||
Amounts Available to A&B Shareholders: | ||||||||||||||||
Continuing operations available to A&B shareholders, net of income taxes | $ | 15.0 | $ | 7.4 | $ | 64.8 | $ | 15.5 | ||||||||
Discontinued operations available to A&B shareholders, net of income taxes | (0.2 | ) | (0.8 | ) | (0.2 | ) | 2.4 | |||||||||
Net income (loss) available to A&B shareholders | $ | 14.8 | $ | 6.6 | $ | 64.6 | $ | 17.9 |
Three Months Ended September 30, | Nine Months Ended September 30, | |||||||||||||||
2018 | 2017 | 2018 | 2017 | |||||||||||||
Operating Revenue: | ||||||||||||||||
Commercial Real Estate | $ | 35.9 | $ | 33.9 | $ | 104.9 | $ | 101.4 | ||||||||
Land Operations | 24.0 | 22.6 | 72.6 | 45.7 | ||||||||||||
Materials & Construction | 59.5 | 55.0 | 167.3 | 155.7 | ||||||||||||
Total operating revenue | 119.4 | 111.5 | 344.8 | 302.8 | ||||||||||||
Operating Profit (Loss): | ||||||||||||||||
Commercial Real Estate1 | 15.9 | 13.6 | 45.0 | 41.3 | ||||||||||||
Land Operations2 | 13.1 | 10.4 | 9.3 | 9.7 | ||||||||||||
Materials & Construction | 3.4 | 6.5 | 7.2 | 18.8 | ||||||||||||
Total operating profit (loss) | 32.4 | 30.5 | 61.5 | 69.8 | ||||||||||||
Interest expense | (9.1 | ) | (6.1 | ) | (26.4 | ) | (18.5 | ) | ||||||||
General corporate expenses | (6.5 | ) | (8.9 | ) | (20.5 | ) | (20.5 | ) | ||||||||
REIT evaluation/conversion costs | — | (4.4 | ) | — | (11.4 | ) | ||||||||||
Income (Loss) from Continuing Operations Before Income Taxes and Net Gain (Loss) on Sale of Improved Properties and Ground Leased Land | 16.8 | 11.1 | 14.6 | 19.4 | ||||||||||||
Income tax benefit (expense) | (1.0 | ) | (3.7 | ) | 1.8 | (6.4 | ) | |||||||||
Income (Loss) from Continuing Operations Before Net Gain (Loss) on Sale of Improved Properties and Ground Leased Land | 15.8 | 7.4 | 16.4 | 13.0 | ||||||||||||
Net gain on the sale of improved properties and ground leased land | — | — | 49.8 | 3.0 | ||||||||||||
Income (Loss) from Continuing Operations | 15.8 | 7.4 | 66.2 | 16.0 | ||||||||||||
Income (loss) from discontinued operations, net of income taxes | (0.2 | ) | (0.8 | ) | (0.2 | ) | 2.4 | |||||||||
Net Income (Loss) | 15.6 | 6.6 | 66.0 | 18.4 | ||||||||||||
Income attributable to noncontrolling interest | (0.8 | ) | (0.5 | ) | (1.4 | ) | (1.7 | ) | ||||||||
Net Income (Loss) Attributable to A&B Shareholders | $ | 14.8 | $ | 6.1 | $ | 64.6 | $ | 16.7 |
Nine Months Ended September 30, | |||||||
2018 | 2017 | ||||||
Cash Flows from Operating Activities: | |||||||
Net income (loss) | $ | 66.0 | $ | 18.4 | |||
Adjustments to reconcile net income (loss) to net cash provided by (used in) operations: | |||||||
Depreciation and amortization | 31.6 | 31.4 | |||||
Deferred income taxes | (2.4 | ) | 19.1 | ||||
Gains on asset transactions and other | (62.1 | ) | (22.2 | ) | |||
Share-based compensation expense | 4.0 | 3.4 | |||||
Investments in affiliates, net of distributions of income | 2.0 | 3.2 | |||||
Changes in operating assets and liabilities: | |||||||
Trade, contracts retention, and other contract receivables | (4.9 | ) | (4.2 | ) | |||
Inventories | (0.3 | ) | 13.2 | ||||
Prepaid expenses, income tax receivable and other assets | (4.1 | ) | (19.8 | ) | |||
Accrued pension and post-retirement benefits | 2.5 | (48.0 | ) | ||||
Accounts payable | (8.3 | ) | (3.0 | ) | |||
Accrued and other liabilities | (7.3 | ) | (38.2 | ) | |||
Real estate inventory sales (real estate developments held for sale) | 41.0 | 16.5 | |||||
Expenditures for real estate inventory (real estate developments held for sale) | (20.0 | ) | (15.0 | ) | |||
Net cash provided by (used in) operations | 37.7 | (45.2 | ) | ||||
Cash Flows from Investing Activities: | |||||||
Capital expenditures for acquisitions | (201.6 | ) | (10.1 | ) | |||
Capital expenditures for property, plant and equipment | (40.0 | ) | (23.6 | ) | |||
Proceeds from disposal of property and other assets | 169.3 | 16.7 | |||||
Payments for purchases of investments in affiliates and other investments | (21.3 | ) | (31.5 | ) | |||
Distributions of capital from investments in affiliates and other investments | 32.8 | 3.9 | |||||
Net cash provided by (used in) investing activities | (60.8 | ) | (44.6 | ) | |||
Cash Flows from Financing Activities: | |||||||
Proceeds from issuance of long-term debt | 533.5 | 145.5 | |||||
Payments of long-term debt and deferred financing costs | (433.6 | ) | (46.4 | ) | |||
Borrowings (payments) on line-of-credit agreement, net | (14.2 | ) | 9.8 | ||||
Distribution to noncontrolling interests | (0.2 | ) | (0.2 | ) | |||
Cash dividends paid | (156.6 | ) | (10.3 | ) | |||
Proceeds from issuance (repurchase) of capital stock and other, net | (1.3 | ) | (4.1 | ) | |||
Net cash provided by (used in) financing activities | (72.4 | ) | 94.3 | ||||
Cash, Cash Equivalents and Restricted Cash: | |||||||
Net increase (decrease) in cash, cash equivalents, and restricted cash | (95.5 | ) | 4.5 | ||||
Balance, beginning of period | 103.2 | 12.3 | |||||
Balance, end of period | $ | 7.7 | $ | 16.8 |
Scheduled principal payments | ||||||||||||||||||||||||||||||||||
Debt | Stated Rate (%) | Weighted- average Interest Rate (%) | Maturity Date | Weighted- average Maturity (Years) | 2018 | 2019 | 2020 | 2021 | 2022 | Thereafter | Total Principal | Unamort Deferred Fin Cost/ (Discount) Premium | Total | |||||||||||||||||||||
Secured: | ||||||||||||||||||||||||||||||||||
Kailua Town Center | ( a ) | 5.95% | 2021 | 2.9 | 0.1 | 0.3 | 0.4 | 9.8 | — | — | 10.6 | (0.2 | ) | 10.4 | ||||||||||||||||||||
Kailua Town Center #2 | 3.15% | 3.15% | 2021 | 2.7 | — | 0.1 | 0.1 | 4.6 | — | — | 4.8 | — | 4.8 | |||||||||||||||||||||
Laulani Village | 3.93% | 3.93% | 2024 | 5.5 | — | — | 0.7 | 1.1 | 1.1 | 59.1 | 62.0 | (0.9 | ) | 61.1 | ||||||||||||||||||||
Pearl Highlands | 4.15% | 4.15% | 2024 | 5.7 | 0.5 | 1.9 | 1.9 | 2.0 | 2.1 | 77.3 | 85.7 | 1.0 | 86.7 | |||||||||||||||||||||
Manoa Marketplace | ( b ) | 3.14% | 2029 | 9.5 | — | 0.5 | 1.6 | 1.7 | 1.7 | 54.5 | 60.0 | (0.3 | ) | 59.7 | ||||||||||||||||||||
Subtotal | 3.88% | 6.4 | $ | 0.6 | $ | 2.8 | $ | 4.7 | $ | 19.2 | $ | 4.9 | $ | 190.9 | $ | 223.1 | $ | (0.4 | ) | $ | 222.7 | |||||||||||||
Unsecured: | ||||||||||||||||||||||||||||||||||
Term Loan 3 | 5.19% | 5.19% | 2019 | 0.4 | $ | 0.7 | $ | 2.3 | $ | — | $ | — | $ | — | $ | — | $ | 3.0 | $ | — | $ | 3.0 | ||||||||||||
Series D Note | 6.90% | 6.90% | 2020 | 0.7 | — | 16.3 | 16.2 | — | — | — | 32.5 | — | 32.5 | |||||||||||||||||||||
Term Loan 4 | ( c ) | 4.26% | 2021 | 3.2 | — | — | — | 9.4 | — | — | 9.4 | — | 9.4 | |||||||||||||||||||||
Bank Syndicated Loan | ( d ) | 4.06% | 2023 | 4.4 | — | — | — | — | — | 50.0 | 50.0 | — | 50.0 | |||||||||||||||||||||
Series A Note | 5.53% | 5.53% | 2024 | 4.3 | — | — | — | 7.1 | 7.1 | 14.3 | 28.5 | — | 28.5 | |||||||||||||||||||||
Series J Note | 4.66% | 4.66% | 2025 | 6.6 | — | — | — | — | — | 10.0 | 10.0 | — | 10.0 | |||||||||||||||||||||
Series B Note | 5.55% | 5.55% | 2026 | 5.1 | — | — | — | 1.0 | 9.0 | 36.0 | 46.0 | — | 46.0 | |||||||||||||||||||||
Series C Note | 5.56% | 5.56% | 2026 | 4.4 | — | 1.0 | 1.0 | 9.0 | 2.0 | 11.0 | 24.0 | — | 24.0 | |||||||||||||||||||||
Series F Note | 4.35% | 4.35% | 2026 | 5.2 | — | — | 2.4 | 4.5 | — | 15.1 | 22.0 | — | 22.0 | |||||||||||||||||||||
Series H Note | 4.04% | 4.04% | 2026 | 8.2 | — | — | — | — | — | 50.0 | 50.0 | — | 50.0 | |||||||||||||||||||||
Series K Note | 4.81% | 4.81% | 2027 | 8.6 | — | — | — | — | — | 34.5 | 34.5 | (0.1 | ) | 34.4 | ||||||||||||||||||||
Series G Note | 3.88% | 3.88% | 2027 | 4.3 | 7.5 | 7.5 | 5.4 | 1.5 | 6.0 | 22.1 | 50.0 | — | 50.0 | |||||||||||||||||||||
Series L Note | 4.89% | 4.89% | 2028 | 9.6 | — | — | — | — | — | 18.0 | 18.0 | (0.6 | ) | 17.4 | ||||||||||||||||||||
Series I Note | 4.16% | 4.16% | 2028 | 10.3 | — | — | — | — | — | 25.0 | 25.0 | — | 25.0 | |||||||||||||||||||||
Term Loan 5 | 4.30% | 4.30% | 2029 | 11.3 | — | — | — | — | — | 25.0 | 25.0 | (0.1 | ) | 24.9 | ||||||||||||||||||||
Subtotal | 4.75% | 5.0 | $ | 8.2 | $ | 27.1 | $ | 25.0 | $ | 32.5 | $ | 24.1 | $ | 311.0 | $ | 427.9 | $ | (0.8 | ) | $ | 427.1 | |||||||||||||
Revolving Credit Facilities: | ||||||||||||||||||||||||||||||||||
GLP Asphalt Revolving Credit Facility | ( e ) | 3.51% | 2020 | 1.9 | $ | — | $ | — | $ | 4.5 | $ | — | $ | — | $ | — | $ | 4.5 | $ | — | $ | 4.5 | ||||||||||||
Revolving credit facility | ( f ) | 4.13% | 2022 | 4.3 | $ | — | $ | — | $ | — | $ | — | $ | 124.1 | $ | — | $ | 124.1 | $ | — | $ | 124.1 | ||||||||||||
Subtotal | 4.10% | 4.2 | $ | — | $ | — | $ | 4.5 | $ | — | $ | 124.1 | $ | — | $ | 128.6 | $ | — | $ | 128.6 | ||||||||||||||
Total | 4.40% | 5.3 | $ | 8.8 | $ | 29.9 | $ | 34.2 | $ | 51.7 | $ | 153.1 | $ | 501.9 | $ | 779.6 | $ | (1.2 | ) | $ | 778.4 | |||||||||||||
(a) Loan has a stated interest rate of LIBOR plus 1.50%, and is swapped through maturity to a 5.95% fixed rate. | ||||||||||||||||||||||||||||||||||
(b) Loan has a stated interest rate of LIBOR plus 1.35%, and is swapped through maturity to a 3.14% fixed rate. | ||||||||||||||||||||||||||||||||||
(c) Loan has a stated interest rate of LIBOR plus 2.00%, and is secured by a letter of credit. | ||||||||||||||||||||||||||||||||||
(d) Loan has a stated interest rate of LIBOR plus 1.80%, based on pricing grid | ||||||||||||||||||||||||||||||||||
(e) Loan has a stated interest rate of LIBOR plus 1.25%. | ||||||||||||||||||||||||||||||||||
(f) Loan has a stated interest rate of LIBOR plus 1.85%, based on pricing grid. |
Debt | |||||
Secured debt | $ | 222.7 | |||
Unsecured term debt | 427.1 | ||||
Unsecured revolving credit facility | 128.6 | ||||
Total debt | 778.4 | ||||
Add: Net unamortized deferred financing cost / discount premium | 1.2 | ||||
Less: cash, cash equivalents and restricted cash | (7.7 | ) | |||
Net debt | $ | 771.9 | |||
Market Capitalization | Shares | Stock Price | Market Value | ||
Common stock (NYSE:ALEX) | 72,027,109 | $22.69 | $ | 1,634.3 | |
Total market capitalization | $ | 1,634.3 | |||
Total Capitalization | $ | 2,412.7 | |||
Debt to total capitalization | 32.3 | % | |||
Liquidity | |||||
Cash on hand | $ | 7.5 | |||
Unused committed line of credit | 314.1 | ||||
Total liquidity | $ | 321.6 | |||
Financial Ratios | |||||
Net debt to TTM EBITDA | 6.1 x | ||||
Fixed-charge coverage ratio | 3.4 x | ||||
Fixed-rate debt to total debt | 75.9 | % | |||
Unencumbered CRE assets as a percent of total CRE assets (gross book value) | 70.3 | % |
Consolidated EBITDA | ||||||||||||||||||||
Three Months Ended September 30, | Nine Months Ended September 30, | TTM September 30, | ||||||||||||||||||
2018 | 2017 | 2018 | 2017 | 2018 | ||||||||||||||||
Net Income (Loss) | $ | 15.6 | $ | 6.6 | $ | 66.0 | $ | 18.4 | $ | 278.1 | ||||||||||
Adjustments: | ||||||||||||||||||||
Depreciation and amortization | 10.7 | 10.4 | 31.6 | 31.4 | 41.6 | |||||||||||||||
Interest expense | 9.1 | 6.1 | 26.4 | 18.5 | 33.5 | |||||||||||||||
Income tax expense (benefit) | 0.9 | 3.2 | (1.9 | ) | 7.8 | (226.6 | ) | |||||||||||||
EBITDA | $ | 36.3 | $ | 26.3 | $ | 122.1 | $ | 76.1 | $ | 126.6 | ||||||||||
Other discrete items impacting the respective periods: | ||||||||||||||||||||
Income attributable to noncontrolling interests | (0.8 | ) | (0.5 | ) | (1.4 | ) | (1.7 | ) | (1.9 | ) | ||||||||||
(Income) loss from discontinued operations before interest, income taxes and depreciation and amortization | 0.3 | 1.3 | 0.3 | (3.8 | ) | 0.4 | ||||||||||||||
REIT evaluation/conversion costs | — | 4.4 | — | 11.4 | 3.8 | |||||||||||||||
Reduction in solar investments, net | 0.1 | 0.4 | 0.4 | 2.6 | 0.4 | |||||||||||||||
Impairment of real estate assets | — | — | — | — | 22.4 | |||||||||||||||
Gain on sales of improved properties and ground leases | — | — | (49.8 | ) | (3.0 | ) | (56.1 | ) |
Consolidated SG&A | ||||||||||||||||
Three Months Ended September 30, | Nine Months Ended September 30, | |||||||||||||||
2018 | 2017 | 2018 | 2017 | |||||||||||||
Commercial Real Estate | $ | 1.4 | $ | 1.9 | $ | 4.7 | $ | 4.9 | ||||||||
Land Operations | 1.7 | 4.3 | 4.7 | 10.3 | ||||||||||||
Materials & Construction | 5.2 | 5.0 | 15.4 | 14.2 | ||||||||||||
Corporate and Other | 6.3 | 7.2 | 19.9 | 18.5 | ||||||||||||
Selling, general and administrative | $ | 14.6 | $ | 18.4 | $ | 44.7 | $ | 47.9 |
Three Months Ended September 30, | Nine Months Ended September 30, | |||||||||||||||
2018 | 2017 | 2018 | 2017 | |||||||||||||
Operating Revenues: | ||||||||||||||||
Base rents | $ | 24.3 | $ | 23.4 | $ | 68.8 | $ | 69.7 | ||||||||
Recoveries from tenants | 8.9 | 8.1 | 26.7 | 24.4 | ||||||||||||
Other revenues | 2.7 | 2.4 | 9.4 | 7.3 | ||||||||||||
Total Commercial Real Estate revenues | 35.9 | 33.9 | 104.9 | 101.4 | ||||||||||||
Operating Costs and Expenses: | ||||||||||||||||
Property operations | 8.9 | 9.4 | 27.3 | 28.1 | ||||||||||||
Property taxes | 3.1 | 3.2 | 9.2 | 9.1 | ||||||||||||
Depreciation and amortization | 7.2 | 6.6 | 20.5 | 19.7 | ||||||||||||
Total Cost of Commercial Real Estate | 19.2 | 19.2 | 57.0 | 56.9 | ||||||||||||
Selling, general and administrative | (1.4 | ) | (1.9 | ) | (4.7 | ) | (4.9 | ) | ||||||||
Intersegment operating revenues (a) | 0.6 | 0.9 | 1.9 | 2.1 | ||||||||||||
Interest and other income (expense), net | — | (0.1 | ) | (0.1 | ) | (0.4 | ) | |||||||||
Operating Profit (Loss) | 15.9 | 13.6 | 45.0 | 41.3 | ||||||||||||
Plus: Depreciation and amortization | 7.2 | 6.6 | 20.5 | 19.7 | ||||||||||||
Less: Straight-line lease adjustments | (2.0 | ) | (0.3 | ) | (2.7 | ) | (1.3 | ) | ||||||||
Less: Favorable/(unfavorable) lease amortization | (0.4 | ) | (0.7 | ) | (1.4 | ) | (2.2 | ) | ||||||||
Less: Termination income | — | — | (1.1 | ) | — | |||||||||||
Plus: Other (income)/expense, net | — | 0.1 | 0.1 | 0.4 | ||||||||||||
Plus: Selling, general, administrative and other expenses | 1.4 | 1.9 | 4.7 | 5.9 | ||||||||||||
Cash NOI | 22.1 | 21.2 | 65.1 | 63.8 | ||||||||||||
Acquisitions / dispositions and other adjustments | (3.3 | ) | (3.4 | ) | (9.2 | ) | (10.0 | ) | ||||||||
Same-Store Cash NOI | $ | 18.8 | $ | 17.8 | $ | 55.9 | $ | 53.8 | ||||||||
Maintenance Capital Expenditures: | ||||||||||||||||
Building improvements | $ | 1.9 | $ | 1.4 | $ | 5.3 | $ | 3.7 | ||||||||
Tenant improvements | 1.9 | 2.5 | 6.7 | 4.0 | ||||||||||||
Total maintenance capital expenditures | $ | 3.8 | $ | 3.9 | $ | 12.0 | $ | 7.7 | ||||||||
Leasing Commissions: | 0.5 | 1.0 | 2.2 | 4.6 | ||||||||||||
(a) Represents intersegment revenues, primarily base rents and expense recoveries from leases to tenants that operate as part of the Materials & Construction segment. These operating revenues, and the related rental expense incurred by these tenants, are eliminated in the consolidated results of operations. |
Occupancy* | |||||
As of | As of | Percentage Point Change | |||
September 30, 2018 | September 30, 2017 | ||||
Retail | 92.7% | 92.5% | 0.2 | ||
Industrial | 90.2% | 94.2% | (4.0) | ||
Office | 91.7% | 91.9% | (0.2) | ||
Total | 91.9% | 93.0% | (1.1) |
Same-Store Occupancy | |||||
As of | As of | Percentage Point Change | |||
September 30, 2018 | September 30, 2017 | ||||
Retail | 92.7% | 92.8% | (0.1) | ||
Industrial | 89.2% | 94.3% | (5.1) | ||
Office | 91.7% | 93.5% | (1.8) | ||
Total | 91.5% | 93.3% | (1.8) |
Total Portfolio Cash NOI | |||||||||||
Three Months Ended September 30, 2018 | Three Months Ended September 30, 2017 | Quarter Change | |||||||||
Hawai`i | Mainland | Total | Hawai`i | Mainland | Total | Hawai`i | Mainland | Total | |||
Retail | $14,953 | $(3) | $14,950 | $11,212 | $560 | $11,772 | 33.4% | (100.5)% | 27.0% | ||
Industrial | 3,238 | 12 | 3,250 | 3,159 | 1,209 | 4,368 | 2.5% | (99.0)% | (25.6)% | ||
Office | 1,040 | (42) | 998 | 1,093 | 940 | 2,033 | (4.9)% | (104.5)% | (50.9)% | ||
Ground | 2,905 | — | 2,905 | 3,025 | — | 3,025 | (4.0)% | N/A | (4.0)% | ||
Total | $22,136 | $(33) | $22,103 | $18,489 | $2,709 | $21,198 | 19.7% | (101.2)% | 4.3% |
Nine Months Ended September 30, 2018 | Nine Months Ended September 30, 2017 | YTD Change | |||||||||
Hawai`i | Mainland | Total | Hawai`i | Mainland | Total | Hawai`i | Mainland | Total | |||
Retail | $41,998 | $533 | $42,531 | $34,604 | $1,665 | $36,269 | 21.4% | (68.0)% | 17.3% | ||
Industrial | 9,611 | 493 | 10,104 | 8,823 | 3,514 | 12,337 | 8.9% | (86.0)% | (18.1)% | ||
Office | 3,186 | 435 | 3,621 | 3,233 | 3,080 | 6,313 | (1.5)% | (85.9)% | (42.7)% | ||
Ground | 8,797 | — | 8,797 | 8,862 | — | 8,862 | (0.7)% | N/A | (0.7)% | ||
Total | $63,592 | $1,461 | $65,053 | $55,522 | $8,259 | $63,781 | 14.5% | (82.3)% | 2.0% |
Same-Store Cash NOI | |||||
Three Months Ended September 30, 2018 | Three Months Ended September 30, 2017 | Change | |||
Retail | $11,828 | $11,111 | 6.5% | ||
Industrial | 3,023 | 2,972 | 1.7% | ||
Office | 1,036 | 929 | 11.6% | ||
Ground | 2,907 | 2,823 | 3.0% | ||
Total | $18,794 | $17,835 | 5.4% |
Nine Months Ended September 30, 2018 | Nine Months Ended September 30, 2017 | Change | |||
Retail | $35,276 | $34,248 | 3.0% | ||
Industrial | 8,975 | 8,583 | 4.6% | ||
Office | 3,049 | 2,725 | 11.9% | ||
Ground | 8,584 | 8,255 | 4.0% | ||
Total | $55,884 | $53,811 | 3.9% |
Property | Island | Year Built/ Renovated | Current GLA (SF) | Occupancy | ABR | ABR PSF | Q3 2018 Cash NOI | Q3 2018 % Cash NOI to Total Portfolio Cash NOI | Retail Anchor Tenants | |||||||||
Retail: | ||||||||||||||||||
1 | Pearl Highlands Center | * | Oahu | 1992-1994 | 411,300 | 93.1% | $ | 9,796 | $ | 26.16 | $ | 2,271 | 11.8% | Sam's Club, Regal Cinemas, 24 Hour Fitness | ||||
2 | Kailua Retail | *** | Oahu | 1947-2014, 2018 | 365,500 | 95.0% | 9,808 | 33.97 | 2,654 | 13.8% | Whole Foods Market, Foodland, CVS/Longs Drugs, Ulta Salon | |||||||
3 | Laulani Village | Oahu | 2012 | 175,600 | 93.9% | 6,005 | 36.70 | 1,592 | 8.3% | Safeway, Ross, Walgreens, Petco | ||||||||
4 | Waianae Mall | * | Oahu | 1975 | 170,300 | 86.0% | 3,018 | 20.62 | 648 | 3.4% | CVS/Longs Drugs, City Mill | |||||||
5 | Manoa Marketplace | * | Oahu | 1977 | 140,200 | 90.1% | 4,169 | 33.57 | 1,062 | 5.5% | Safeway, CVS/Longs Drugs | |||||||
6 | Kaneohe Bay Shopping Center (Leasehold) | * | Oahu | 1971 | 125,400 | 100.0% | 3,027 | 24.14 | 679 | 3.5% | Safeway, CVS/Longs Drugs | |||||||
7 | Hokulei Village | Kauai | 2015 | 119,200 | 98.4% | 4,121 | 35.36 | 1,028 | 5.3% | Safeway, Petco | ||||||||
8 | Waipio Shopping Center | * | Oahu | 1986, 2004 | 113,800 | 93.8% | 3,088 | 28.92 | 839 | 4.4% | Foodland | |||||||
9 | Aikahi Park Shopping Center | * | Oahu | 1971 | 98,000 | 79.2% | 1,651 | 21.27 | 573 | 3.0% | Safeway | |||||||
10 | The Shops at Kukui`ula | * | Kauai | 2009 | 89,100 | 97.9% | 4,285 | 51.71 | 1,291 | 6.7% | CVS/Longs Drugs, Eating House, Living Foods Market | |||||||
11 | Lanihau Marketplace | * | Hawai`i Island | 1987 | 88,300 | 99.9% | 1,844 | 20.89 | 390 | 2.0% | Sak' N Save, CVS/Longs Drugs | |||||||
12 | Kunia Shopping Center | * | Oahu | 2004 | 60,600 | 88.3% | 2,092 | 39.13 | 534 | 2.8% | ||||||||
13 | Kahului Shopping Center | * | Maui | 1951 | 45,300 | 98.5% | 425 | 13.93 | 50 | 0.3% | ||||||||
14 | Napili Plaza | * | Maui | 1991 | 45,600 | 83.1% | 1,160 | 30.61 | 205 | 1.1% | Napili Market | |||||||
15 | Lahaina Square | Maui | 1973 | 44,800 | 75.2% | 658 | 19.55 | 23 | 0.1% | Ace Hardware | ||||||||
16 | Gateway at Mililani Mauka | * | Oahu | 2008, 2013 | 34,900 | 97.7% | 1,759 | 53.68 | 480 | 2.5% | CVS/Longs Drugs (shadow-anchored) | |||||||
17 | Port Allen Marina Center | * | Kauai | 2002 | 23,600 | 92.0% | 565 | 26.07 | 137 | 0.7% | ||||||||
18 | The Collection | Oahu | 2017 | 12,000 | 93.0% | 98 | 54.02 | (4 | ) | —% | ||||||||
19 | Pu`unene Shopping Center | ** | Maui | 2017 | 120,100 | N/A | — | — | 501 | 2.6% | Planet Fitness, Petco, Ulta Salon, Target (shadow-anchored) | |||||||
Subtotal – Retail | 2,283,600 | 92.7% | $ | 57,569 | $ | 30.19 | $ | 14,953 | 77.8% | |||||||||
Industrial: | ||||||||||||||||||
20 | Komohana Industrial Park | * | Oahu | 1990 | 238,300 | 81.2% | $ | 2,422 | $ | 12.52 | $ | 1,030 | 5.4% | |||||
21 | Kaka`ako Commerce Center | * | Oahu | 1969 | 193,900 | 91.1% | 2,618 | 14.89 | 534 | 2.8% | ||||||||
22 | Waipio Industrial | * | Oahu | 1988-1989 | 158,400 | 100.0% | 2,504 | 15.81 | 623 | 3.2% | ||||||||
23 | P&L Warehouse | * | Maui | 1970 | 104,100 | 87.1% | 1,289 | 14.21 | 306 | 1.6% | ||||||||
24 | Honokohau Industrial | Hawai`i Island | 2004-2006, 2008 | 85,500 | 100.0% | 972 | 11.37 | 215 | 1.1% | |||||||||
25 | Kailua Industrial/Other | * | Oahu | 1951-1974 | 68,800 | 92.6% | 878 | 14.79 | 169 | 0.9% | ||||||||
26 | Port Allen | * | Kauai | 1983, 1993 | 63,800 | 100.0% | 695 | 10.89 | 214 | 1.1% | ||||||||
27 | Harbor Industrial | * | Maui | 1930 | 51,100 | 72.2% | 425 | 11.53 | 147 | 0.8% | ||||||||
Subtotal – Industrial | 963,900 | 90.2% | $ | 11,803 | $ | 13.66 | $ | 3,238 | 16.9% |
Property | Island | Year Built/ Renovated | Current GLA (SF) | Occupancy | ABR | ABR PSF | Q3 2018 Cash NOI | Q3 2018 % Cash NOI to Total Portfolio Cash NOI | Retail Anchor Tenants | |||||||||
Office: | ||||||||||||||||||
28 | Kahului Office Building | * | Maui | 1974 | 59,400 | 91.5% | $ | 1,579 | $ | 29.47 | $ | 373 | 1.9% | |||||
29 | Gateway at Mililani Mauka South | * | Oahu | 1992, 2006 | 37,100 | 100.0% | 1,638 | 44.10 | 431 | 2.2% | ||||||||
30 | Kahului Office Center | * | Maui | 1991 | 33,400 | 79.5% | 692 | 26.02 | 176 | 0.9% | ||||||||
31 | Lono Center | * | Maui | 1973 | 13,700 | 100.0% | 310 | 22.69 | 56 | 0.3% | ||||||||
Stangenwald and Judd Buildings (disposed March 2018) | 4 | —% | ||||||||||||||||
Subtotal – Office | 143,600 | 91.7% | $ | 4,219 | $ | 32.21 | $ | 1,040 | 5.3% | |||||||||
Total – Hawai`i Portfolio | 3,391,100 | 91.9% | $ | 73,591 | $ | 25.36 | $ | 19,231 | 100.0% |
* Included in Same-Store portfolio. | ||||||||||
** Development completed but not yet stabilized. Upon initial stabilization the property will be included in Occupancy. NOI not included in Same-Store portfolio. | ||||||||||
***Lau Hala Shops - development completed but not yet stabilized. Upon initial stabilization the property will be included in Occupancy. NOI not included in Same-Store portfolio. |
Ground Leases (a) | Location (City, Island) | Acres | Property Type | Exp. Year | Current ABR | Q3 2018 Cash NOI | Next Rent Step | Step Type | Next ABR ($ in $000) | Previous Rent Step | Previous Step Type | Previous ABR ($ in $000) | |||||||
#1 | * | Kaneohe, Oahu | 15.4 | Retail | 2035 | $ | 2,800 | $ | 701 | 2023 | FMV Reset | FMV | 2017 | Fixed Step | 2,100 | ||||
#2 | * | Honolulu, Oahu | 2.8 | Retail | 2040 | 1,344 | 337 | 2020 | FMV Reset | FMV | 2016 | Fixed Step | 1,296 | ||||||
#3 | * | Kaneohe, Oahu | 3.7 | Retail | 2048 | 990 | 246 | 2023 | Fixed Step | 1,059 | 2018 | Option | 694 | ||||||
#4 | * | Kailua, Oahu | 3.4 | Retail | 2062 | 753 | 188 | 2022 | Fixed Step | 963 | 2012 | FMV Reset | 160 | ||||||
#5 | * | Pu`unene, Maui | 52.0 | Heavy Industrial | 2034 | 751 | 217 | 2019 | FMV Reset | FMV | 2014 | Fixed Step | 626 | ||||||
#6 | * | Kailua, Oahu | 1.6 | Retail | 565 | 141 | MTM | MTM | — | 2017 | Option | 538 | |||||||
#7 | * | Kailua, Oahu | 2.2 | Retail | 2062 | 485 | 122 | 2022 | Fixed Step | 621 | 2012 | FMV Reset | unknown | ||||||
#8 | * | Honolulu, Oahu | 0.5 | Retail | 2028 | 340 | 86 | 2019 | Fixed Step | 348 | 2018 | Fixed Step | 252 | ||||||
#9 | * | Honolulu, Oahu | 0.5 | Parking | 2023 | 310 | 74 | 2019 | Fixed Step | 319 | 2018 | Fixed Step | 270 | ||||||
#10 | * | Kailua, Oahu | 1.2 | Retail | 2022 | 237 | 56 | 2013 | FMV Reset | 120 | |||||||||
#11 | * | Kahului, Maui | 0.8 | Retail | 2026 | 228 | 57 | 2018 | Fixed Step | 235 | 2017 | Fixed Step | 221 | ||||||
#12 | * | Kahului, Maui | 0.4 | Retail | 2020 | 207 | 52 | 2019 | Fixed Step | 214 | 2018 | Fixed Step | 201 | ||||||
#13 | * | Kailua, Oahu | 3.3 | Office | 2037 | 200 | 63 | 2022 | FMV Reset | FMV | 2012 | *Negotiated | 100 | ||||||
#14 | * | Kahului, Maui | 0.8 | Industrial | 2020 | 192 | 48 | 2019 | Fixed Step | 200 | 2018 | Fixed Step | 183 | ||||||
#15 | * | Kailua, Oahu | 0.9 | Retail | 2033 | 181 | 45 | 2019 | FMV Reset | FMV | 2014 | Fixed Step | 167 | ||||||
#16 | * | Kahului, Maui | 0.5 | Retail | 2029 | 168 | 71 | 2019 | Fixed Step | 173 | 2018 | Fixed Step | 163 | ||||||
#17 | * | Kahului, Maui | 0.4 | Retail | 2027 | 158 | 61 | 2022 | Fixed Step | 181 | 2017 | *Negotiated | 128 | ||||||
#18 | * | Kailua, Oahu | 0.4 | Retail | 2022 | 144 | 36 | 2019 | Fixed Step | 151 | 2018 | *Negotiated | 130 | ||||||
#19 | * | Kailua, Oahu | 0.4 | Retail | 2026 | 126 | 32 | — | 2017 | *Negotiated | 63 | ||||||||
#20 | * | Kailua, Oahu | 0.3 | Retail | 2026 | 110 | 28 | — | 2017 | *Negotiated | 77 | ||||||||
Remainder | * | Various | 17.3 | Various | Various | 1,268 | 244 | Various | Various | ||||||||||
Total - Ground Leases | 108.8 | $ | 11,557 | $ | 2,905 | ||||||||||||||
(a) Excludes intersegment ground leases, primarily from our Materials & Construction segment, which are eliminated in our consolidated results of operations. | |||||||||||||||||||
* Included in Same-Store portfolio. |
Portfolio Summary | Current GLA (SF) | Occupancy | Q3 2018 Cash NOI | Q3 2018 % Cash NOI to Total Portfolio Cash NOI | ||||
Portfolio | 3,391,100 | 91.9% | $ | 19,231 | 87.0% | |||
Ground Leases | 2,905 | 13.2% | ||||||
Mainland Portfolio | (33 | ) | (0.2)% | |||||
Total Portfolio | 3,391,100 | 91.9% | $ | 22,103 | 100.0% |
Dispositions | Additions | |||
Date | Property | Date | Property | |
7/18 | Lahaina Square Shopping Center (Held for Sale) | 1/16 | Manoa Marketplace | |
3/18 | Stangenwald Building | 2/16 | Gateway at Mililani Mauka South | |
3/18 | Judd Building | |||
3/18 | Kaiser Permanente Ground Lease | |||
3/18 | Royal MacArthur Center | |||
3/18 | Little Cottonwood Center | |||
3/18 | Sparks Business Center | |||
3/18 | Preston Park | |||
2/18 | Deer Valley Financial Center | |||
1/18 | Concorde Commerce Center |
Tenant (a) | ABR | % of Total Portfolio ABR | GLA (SF) | % of Total Portfolio GLA | ||||||||
Albertsons Companies (including Safeway) | $ | 4,470 | 6.1 | % | 226,208 | 6.7 | % | |||||
Sam's Club | 3,308 | 4.6 | % | 180,908 | 5.3 | % | ||||||
CVS Corporation (including Longs Drugs) | 2,697 | 3.7 | % | 150,411 | 4.4 | % | ||||||
Foodland Supermarket & related companies | 1,941 | 2.6 | % | 113,879 | 3.4 | % | ||||||
Ross Dress for Less | 1,795 | 2.4 | % | 65,484 | 1.9 | % | ||||||
24 Hour Fitness USA | 1,375 | 1.9 | % | 45,870 | 1.4 | % | ||||||
Petco Animal Supplies Stores | 1,316 | 1.8 | % | 34,282 | 1.0 | % | ||||||
Whole Foods Market | 1,210 | 1.6 | % | 31,647 | 0.9 | % | ||||||
Office Depot | 1,138 | 1.5 | % | 75,824 | 2.2 | % | ||||||
Liberty Dialysis Hawaii LLC | 1,028 | 1.4 | % | 23,271 | 0.7 | % | ||||||
Total | $ | 20,278 | 27.6 | % | 947,784 | 27.9 | % | |||||
(a) Excludes intersegment ground leases, primarily from the Materials & Construction segment, which are eliminated in the consolidated results of operations. |
Total Portfolio | |||||||||
Expiration Year | Number of Leases | Square Footage of Expiring Leases | % of Total Portfolio Leased GLA | ABR Expiring | % of Total Portfolio Expiring ABR | ||||
2018 | 23 | 30,629 | 1.0% | $792 | 1.0% | ||||
2019 | 140 | 381,387 | 12.9% | 9,987 | 12.3% | ||||
2020 | 147 | 444,158 | 15.0% | 10,883 | 13.4% | ||||
2021 | 128 | 505,681 | 17.1% | 11,608 | 14.3% | ||||
2022 | 100 | 286,517 | 9.7% | 9,702 | 11.9% | ||||
2023 | 88 | 243,640 | 8.2% | 7,624 | 9.4% | ||||
2024 | 18 | 237,084 | 8.0% | 5,841 | 7.2% | ||||
2025 | 22 | 90,348 | 3.0% | 3,450 | 4.2% | ||||
2026 | 12 | 40,023 | 1.4% | 1,829 | 2.3% | ||||
2027 | 11 | 105,447 | 3.6% | 2,856 | 3.5% | ||||
Thereafter | 39 | 406,101 | 13.6% | 13,326 | 16.4% | ||||
Month-to-month | 83 | 192,736 | 6.5% | 3,326 | 4.1% | ||||
Total | 811 | 2,963,751 | 100.0% | $81,224 | 100.0% | ||||
Retail Portfolio | |||||||||
Expiration Year | Number of Leases | Square Footage of Expiring Leases | % of Total Retail Leased GLA | ABR Expiring | % of Total Retail Expiring ABR | ||||
2018 | 10 | 12,038 | 0.6% | $485 | 0.8% | ||||
2019 | 77 | 217,424 | 11.1% | 7,002 | 11.0% | ||||
2020 | 95 | 235,329 | 12.0% | 7,390 | 11.6% | ||||
2021 | 81 | 279,948 | 14.3% | 8,057 | 12.7% | ||||
2022 | 76 | 172,332 | 8.8% | 7,579 | 11.9% | ||||
2023 | 71 | 188,442 | 9.6% | 6,772 | 10.6% | ||||
2024 | 17 | 235,381 | 12.0% | 5,779 | 9.1% | ||||
2025 | 21 | 66,828 | 3.4% | 3,012 | 4.7% | ||||
2026 | 10 | 19,189 | 1.0% | 886 | 1.4% | ||||
2027 | 9 | 27,855 | 1.4% | 1,315 | 2.1% | ||||
Thereafter | 37 | 403,989 | 20.6% | 13,267 | 20.9% | ||||
Month-to-month | 49 | 104,178 | 5.2% | 2,050 | 3.2% | ||||
Total | 553 | 1,962,933 | 100.0% | $63,594 | 100.0% | ||||
Industrial Portfolio | |||||||||
Expiration Year | Number of Leases | Square Footage of Expiring Leases | % of Total Industrial Leased GLA | ABR Expiring | % of Total Industrial Expiring ABR | ||||
2018 | 11 | 17,461 | 2.0% | $280 | 2.1% | ||||
2019 | 48 | 123,568 | 14.2% | 1,767 | 13.5% | ||||
2020 | 43 | 182,388 | 21.0% | 2,591 | 19.8% | ||||
2021 | 35 | 206,798 | 23.8% | 2,978 | 22.8% | ||||
2022 | 18 | 104,058 | 12.0% | 1,750 | 13.4% | ||||
2023 | 12 | 44,359 | 5.1% | 570 | 4.4% | ||||
2024 | — | — | —% | — | —% | ||||
2025 | 1 | 23,520 | 2.7% | 438 | 3.4% | ||||
2026 | 1 | 6,750 | 0.8% | 130 | 1.0% | ||||
2027 | 1 | 75,824 | 8.7% | 1,438 | 11.0% | ||||
Thereafter | 1 | 431 | —% | 20 | 0.2% | ||||
Month-to-month | 31 | 83,941 | 9.7% | 1,107 | 8.4% | ||||
Total | 202 | 869,098 | 100.0% | $13,069 | 100.0% |
Comparable Leases Only (a) | ||||||||||||||||
Total - New and Renewal Leases | Leases | GLA (SF) | New ABR PSF | TI PSF | Weighted- Average Lease Term (Years) | Leases | GLA (SF) | New ABR PSF | Old ABR PSF | Rent Spread (b) | ||||||
3rd Quarter - 2018 | 58 | 128,091 | $ | 28.28 | $ | 8.42 | 5.3 | 36 | 49,552 | $33.69 | $32.60 | 3.3% | ||||
2nd Quarter - 2018 | 66 | 132,219 | $ | 30.43 | $ | 2.33 | 3.8 | 50 | 108,923 | $30.71 | $28.13 | 9.2% | ||||
1st Quarter - 2018 | 61 | 305,920 | $ | 13.65 | $ | 0.27 | 4.1 | 48 | 267,365 | $12.81 | $11.63 | 10.2% | ||||
4th Quarter - 2017 | 65 | 141,418 | $ | 29.25 | $ | 18.83 | 5.2 | 42 | 82,760 | $23.56 | $22.05 | 6.9% | ||||
Trailing four quarters | 250 | 707,648 | $ | 22.55 | $ | 5.84 | 4.5 | 176 | 508,600 | $20.43 | $18.90 | 8.1% | ||||
Total - New Leases | Leases | GLA (SF) | New ABR PSF | TI PSF | Weighted- Average Lease Term (Years) | Leases | GLA (SF) | New ABR PSF | Old ABR PSF | Rent Spread (b) | ||||||
3rd Quarter - 2018 | 30 | 74,424 | $ | 27.75 | $ | 14.15 | 6.4 | 12 | 12,706 | $30.61 | $26.23 | 16.7% | ||||
2nd Quarter - 2018 | 30 | 54,312 | $ | 27.96 | $ | 5.10 | 3.5 | 15 | 32,084 | $27.12 | $26.47 | 2.5% | ||||
1st Quarter - 2018 | 19 | 50,755 | $ | 18.81 | $ | 0.82 | 3.5 | 7 | 14,645 | $16.25 | $13.86 | 17.3% | ||||
4th Quarter - 2017 | 30 | 72,616 | $ | 33.01 | $ | 36.23 | 6.7 | 10 | 17,799 | $19.40 | $17.36 | 11.8% | ||||
Trailing four quarters | 109 | 252,107 | $ | 27.51 | $ | 15.88 | 5.3 | 44 | 77,234 | $23.85 | $21.94 | 8.7% | ||||
Total - Renewal Leases | Leases | GLA (SF) | New ABR PSF | TI PSF | Weighted- Average Lease Term (Years) | Leases | GLA (SF) | New ABR PSF | Old ABR PSF | Rent Spread (b) | ||||||
3rd Quarter - 2018 | 28 | 53,667 | $ | 29.02 | $ | 0.49 | 3.9 | 24 | 36,846 | $34.75 | $34.80 | (0.1)% | ||||
2nd Quarter - 2018 | 36 | 77,907 | $ | 32.14 | $ | 0.39 | 4.1 | 35 | 76,839 | $32.22 | $28.82 | 11.8% | ||||
1st Quarter - 2018 | 42 | 255,165 | $ | 12.63 | $ | 0.16 | 4.2 | 41 | 252,720 | $12.62 | $11.50 | 9.7% | ||||
4th Quarter - 2017 | 35 | 68,802 | $ | 25.28 | $ | 0.46 | 3.6 | 32 | 64,961 | $24.69 | $23.33 | 5.9% | ||||
Trailing four quarters | 141 | 455,541 | $ | 19.81 | $ | 0.29 | 4.1 | 132 | 431,366 | $19.82 | $18.36 | 8.0% | ||||
Three Months Ended September 30, 2018 | TTM Ended September 30, 2018 | |||||||||||||||
Leases | GLA (SF) | ABR PSF | Rent Spread (b) | Leases | GLA (SF) | ABR PSF | Rent Spread (b) | |||||||||
Hawai`i | Hawai`i | |||||||||||||||
Retail | 38 | 64,337 | $ | 42.09 | 4.6% | Retail | 137 | 242,165 | $43.94 | 6.5% | ||||||
Industrial | 16 | 56,274 | $ | 13.44 | 16.7% | Industrial | 86 | 243,970 | $14.33 | 14.3% | ||||||
Office | 4 | 7,480 | $ | 21.12 | (22.2)% | Office | 17 | 24,799 | $26.93 | (4.6)% | ||||||
Mainland | ||||||||||||||||
Retail | 2 | 3,869 | $22.40 | 9.2% | ||||||||||||
Industrial | 2 | 172,820 | $4.28 | 13.4% | ||||||||||||
Office | 6 | 20,025 | $16.32 | 13.2% |
Leasing Activity | ||||||||||||
Project | Phase | Target In-service | Target Stabilization | Book Value of Land & Related Costs Contributed to Project | Total Estimated Project Capital Costs, Inclusive of Land Basis | Project Capital Costs Incurred to Date | Estimated Incremental Stabilized Cash NOI | Estimated Stabilized Yield on Total Project Capital Costs | Projected GLA (SF) | % Leased | % Under Letter of Intent (b) | Total |
Development for Hold | ||||||||||||
Ho`okele Shopping Center (a) (b) | Construction | Late 2019 | 2Q20 | $4.3 | $41.9 | $13.7 | $3.1 - $3.6 | 7.4 - 8.6% | 94,000 | 64 | 24 | 88 |
(a) The center is being developed on a parcel adjacent to Maui Business Park. The carrying value of this parcel, including certain previously incurred infrastructure improvements and related costs, was $4.3 million at project inception. The stabilized yield on cost was determined utilizing this book value. | ||||||||||||
(b) As of the date the Supplemental was furnished, there were no leases 'under letter of intent' due to cancellations subsequent to Q3 2018. |
Dispositions | |||||||||
Property | Type | Location (Island/City, State) | Date (Month/Year) | Sales Price | GLA (SF) | ||||
Judd Building | Office | Oahu, HI | 3/18 | $ | 6.0 | 20,200 | |||
Stangenwald Building | Office | Oahu, HI | 3/18 | 7.2 | 27,100 | ||||
Sparks Business Center | Industrial | Sparks, Nevada | 3/18 | 38.3 | 396,100 | ||||
Kaiser Permanente | Ground Lease | Maui, HI | 3/18 | 21.5 | N/A | ||||
Royal MacArthur Center | Retail | Dallas, TX | 3/18 | 14.2 | 44,900 | ||||
Little Cottonwood Shopping Center | Grocery Anchored | Sandy, UT | 3/18 | 23.4 | 141,500 | ||||
1800 and 1820 Preston Park | Office | Plano, TX | 3/18 | 24.1 | 198,800 | ||||
Deer Valley Financial Center | Office | Phoenix, AZ | 2/18 | 15.0 | 126,600 | ||||
Concorde Commerce Center | Office | Phoenix, AZ | 1/18 | 9.5 | 138,700 | ||||
Midstate 99 Distribution Center | Industrial | Visalia, CA | 11/17 | 33.4 | 790,200 | ||||
The Maui Clinic Building | Office | Maui, HI | 1/17 | 3.4 | 16,600 | ||||
Ninigret Office Park | Office | Salt Lake City, UT | 6/16 | 30.4 | 185,500 | ||||
Gateway Oaks | Office | Sacramento, CA | 6/16 | 8.0 | 59,700 | ||||
Prospect Park | Office | Sacramento, CA | 6/16 | 22.3 | 163,300 | ||||
Union Bank | Office | Everett, WA | 12/15 | 10.0 | 84,000 | ||||
San Pedro Plaza | Office | San Antonio, TX | 5/15 | 16.7 | 171,900 | ||||
Wilshire Shopping Center | Retail | Greeley, CO | 3/15 | 4.3 | 46,500 | ||||
Maui Mall | Retail | Maui, HI | 1/14 | 64.1 | 185,700 | ||||
Activity Distribution Center | Industrial | San Diego, CA | 12/13 | 32.5 | 252,300 | ||||
Heritage Business Park | Industrial | Dallas, TX | 12/13 | 93.4 | 1,316,400 | ||||
Savannah Logistics Park | Industrial | Savannah, GA | 12/13 | 39.2 | 1,035,700 | ||||
Broadlands Marketplace | Retail | Broomfield, CO | 12/13 | 11.0 | 103,900 | ||||
Meadows on the Parkway | Retail/Office | Boulder, CO | 12/13 | 33.0 | 216,400 | ||||
Rancho Temecula Town Center | Retail | Temecula, CA | 12/13 | 57.0 | 165,500 | ||||
Republic Distribution Center | Industrial | Houston, TX | 10/13 | 19.4 | 312,500 | ||||
Centennial Plaza | Industrial | Salt Lake City, UT | 9/13 | 15.0 | 244,000 | ||||
Issaquah Office Center | Office | Issaquah, WA | 9/13 | 22.3 | 146,900 | ||||
Northpoint Industrial | Industrial | Fullerton, CA | 1/13 | 14.9 | 119,400 | ||||
Total | $ | 689.5 | 6,710,300 | ||||||
Acquisitions | |||||||||
Property | Type | Location (Island/City, State) | Date (Month/Year) | Purchase Price | GLA (SF) | ||||
The Collection | Retail | Oahu, HI | 7/18 | $ | 6.9 | 12,000 | |||
Laulani Village | Retail | Oahu, HI | 2/18 | 124.4 | 175,600 | ||||
Hokulei Village | Retail | Kauai, HI | 2/18 | 68.7 | 119,200 | ||||
Pu`unene Shopping Center | Retail | Maui, HI | 2/18 | 63.6 | 120,400 | ||||
Honokohau Industrial | Industrial | Hawai`i Island, HI | 6/17 | 10.1 | 73,200 | ||||
2927 East Manoa Road | Ground Lease | Oahu, HI | 12/16 | 2.8 | N/A | ||||
Manoa Marketplace | Retail | Oahu, HI | 1/16 | 82.4 | 139,300 | ||||
Aikahi Park Shopping Center (Leasehold) | Retail | Oahu, HI | 5/15 | 1.6 | 98,000 | ||||
Kaka`ako Commerce Center | Industrial | Oahu, HI | 12/14 | 39.1 | 204,400 | ||||
Kailua Portfolio | Retail/Industrial/ Ground Lease | Oahu, HI | 12/13 | 372.6 | 386,200 | ||||
The Shops at Kukui`ula | Retail | Kauai, HI | 9/13 | — | 78,900 | ||||
Pearl Highlands Center | Retail | Oahu, HI | 9/13 | 141.5 | 415,400 | ||||
Napili Plaza | Retail | Maui, HI | 5/13 | 19.2 | 45,100 | ||||
Waianae Mall | Retail | Oahu, HI | 1/13 | 29.8 | 170,300 | ||||
Total | $ | 962.7 | 2,038,000 |
Three Months Ended September 30, | Nine Months Ended September 30, | TTM September 30, | ||||||||||||||||||
2018 | 2017 | 2018 | 2017 | 2018 | ||||||||||||||||
Commercial Real Estate Operating Profit (Loss) | $ | 15.9 | $ | 13.6 | $ | 45.0 | $ | 41.3 | $ | 38.1 | ||||||||||
Depreciation and amortization | 7.2 | 6.6 | 20.5 | 19.7 | 26.8 | |||||||||||||||
EBITDA | $ | 23.1 | $ | 20.2 | $ | 65.5 | $ | 61.0 | $ | 64.9 |
Three Months Ended September 30, | Nine Months Ended September 30, | |||||||||||||||
2018 | 2017 | 2018 | 2017 | |||||||||||||
Development sales revenue | $ | 9.0 | $ | 1.5 | $ | 42.8 | $ | 6.1 | ||||||||
Unimproved/other property sales revenue | 9.1 | 15.4 | 11.5 | 21.4 | ||||||||||||
Other operating revenues1 | 5.9 | 5.7 | 18.3 | 18.2 | ||||||||||||
Total Land Operations operating revenue | $ | 24.0 | $ | 22.6 | $ | 72.6 | $ | 45.7 | ||||||||
Land operations costs and operating expenses | (19.3 | ) | (17.4 | ) | (71.8 | ) | (40.7 | ) | ||||||||
Earnings (loss) from joint ventures | 4.5 | 2.9 | 6.0 | 3.6 | ||||||||||||
Reductions in solar investments, net | (0.1 | ) | (0.4 | ) | (0.4 | ) | (2.6 | ) | ||||||||
Interest and other income (expense), net | 4.0 | 2.7 | 2.9 | 3.7 | ||||||||||||
Total Land Operations operating profit (loss) | $ | 13.1 | $ | 10.4 | $ | 9.3 | $ | 9.7 |
Three Months Ended September 30, | Nine Months Ended September 30, | TTM September 30, | ||||||||||||||||||
2018 | 2017 | 2018 | 2017 | 2018 | ||||||||||||||||
Land Operations Operating Profit (Loss) | $ | 13.1 | $ | 10.4 | $ | 9.3 | $ | 9.7 | $ | 13.8 | ||||||||||
Depreciation and amortization | 0.4 | 0.2 | 1.4 | 1.1 | 1.9 | |||||||||||||||
EBITDA | $ | 13.5 | $ | 10.6 | $ | 10.7 | $ | 10.8 | $ | 15.7 |
Construction Timing | Sales Closing Timing | ||||||||||||||||||||||||||||
Project | Location | Product Type | Est. Economic Interest | Planned Units or Saleable Acres | Avg Size of Remaining Units (SF) or Lots (Acres) | Units/ Acres Closed | Unit/ Acres Remaining | Target Sales Price Range (PSF) of Remaining | Est. Total Project Cost | A&B Projected Capital Commitment (JVs Only) | Total Project Costs Incurred to Date | A&B Gross Investment (Life to Date) | A&B Net Book Value | Start / Est. Start | Est. Substantial Completion | Start / Est. Start | Est. End | ||||||||||||
(a) | (b) | (c) | (d) | ||||||||||||||||||||||||||
Kahala Avenue Portfolio | Honolulu, Oahu | Residential | 100% | 17 acres | 0.5 acres | 14.0 acres | 3.0 acres | $150-$385 | $ | 135 | N/A | $ | 134 | $ | 134 | $ | 19 | N/A | N/A | 2013 | 2018 | ||||||||
The Collection | Honolulu, Oahu | Primary residential | 90% +/-5% | 465 units | 1,881 SF | 462 units | 3 units | $775-$850 | $ | 285 | $ | 54 | $ | 285 | $ | 54 | $ | 2 | 2014 | 2016 | 2016 | 2018 | |||||||
Keala o Wailea (MF-11) | Wailea, Maui | Resort residential | 65% +/-5% | 70 units | 1,380 SF | 63 unit | 7 units | $647 (e) | $ | 67 | $ | 9 | $ | 64 | $ | 9 | $ | 2 | 2015 | 2018 | 2017 | 2018 | |||||||
Kamalani (Increment 1) | Kihei, Maui | Primary residential | 100% | 170 units | 975 SF | 103 units | 67 units | $430 | $ | 64 | N/A | $ | 48 | $ | 48 | $ | 13 | 2016 | 2019 | 2017 | 2019 | ||||||||
Maui Business Park (Phase II) | Kahului, Maui | Light industrial lots | 100% | 125 acres | 2.0 acres | 34 acres | 91 acres | $38-$60 | $ | 77 | N/A | $ | 59 | $ | 59 | $ | 38 | 2011 | 2021 | 2012 | 2030+ | ||||||||
Kukui`ula (f) | Poipu, Kauai | Resort residential | (f) | (f) | (f) | (f) | (f) | (f) | (f) | (f) | $ | 613 | $ | 323 | $ | 314 | 2006 | (f) | 2006 | (f) | |||||||||
(a) Estimated economic interest represents the Company's estimated share of distributions after return of capital contributions based on current forecasts of sales activity. Actual results could differ materially from projected results due to the timing of expected sales, increases or decreases in estimated sales prices or costs and other factors. As a result, estimated economic interests are subject to change. Further, as it relates to certain of our joint venture projects, information disclosed herein is obtained from our joint venture partners, who maintain the books and records of the related ventures. | |||||||||||||||||||||||||||||
(b) Includes land cost at book value, including capitalized interest, but excluding sales commissions and closing costs. | |||||||||||||||||||||||||||||
(c) Includes land cost at contribution value and total expected A&B capital to be contributed. The estimate includes due diligence costs and capitalized interest, but excludes capital projected to be contributed by equity partners, third-party debt, and amounts expected to be funded from project cash flows and/or buyer deposits. | |||||||||||||||||||||||||||||
(d) The book value of active development projects includes land stated at its acquisition value. In the case of development projects on A&B's historical landholdings, such as Kamalani and Maui Business Park, the value of land would be approximately $150 per acre. | |||||||||||||||||||||||||||||
(e) The entirety of remaining units are under bound commitments by buyers and the sale price per square foot shown reflect that average actual sales price under contract. | |||||||||||||||||||||||||||||
(f) The Company and its partner are in the process of evaluating a range of alternatives including, but not limited to, seeking third party capital to accelerate the absorption of the project. A revised execution plan will be considered depending upon the result of the process, and so key milestones will be revisited in the future to reflect the revised project plans. There can be no assurances that any of the options evaluated will be pursued or completed. |
Three Months Ended September 30, | Nine Months Ended September 30, | TTM September 30, | ||||||||||||||||||
2018 | 2017 | 2018 | 2017 | 2018 | ||||||||||||||||
Operating Profit (Loss) (a) | $ | 3.4 | $ | 6.5 | $ | 7.2 | $ | 18.8 | $ | 10.4 | ||||||||||
Depreciation and amortization | 3.0 | 3.1 | 9.1 | 9.2 | 12.1 | |||||||||||||||
EBITDA | 6.4 | 9.6 | 16.3 | 28.0 | 22.5 | |||||||||||||||
Income attributable to noncontrolling interest | (0.8 | ) | (0.5 | ) | (1.4 | ) | (1.7 | ) | (1.9 | ) | ||||||||||
Adjusted EBITDA | $ | 5.6 | $ | 9.1 | $ | 14.9 | $ | 26.3 | $ | 20.6 | ||||||||||
Three Months Ended September 30, | Nine Months Ended September 30, | TTM September 30, | ||||||||||||||||||
2018 | 2017 | 2018 | 2017 | 2018 | ||||||||||||||||
Adjusted EBITDA margin | 9.4% | 16.5% | 8.9% | 16.9% | 9.6% | |||||||||||||||
Aggregate tons delivered (tons in thousands) | 191.2 | 179.7 | 542.0 | 526.3 | 707.3 | |||||||||||||||
Asphalt tons delivered (tons in thousands) | 152.3 | 165.8 | 412.6 | 442.9 | 523.5 | |||||||||||||||
Oahu crew days lost to weather | 71.0 | 38.5 | 237.5 | 154.5 | 323.5 | |||||||||||||||
Total Oahu available crew days | 457.0 | 443.0 | 1,314.0 | 1,337.0 | 1,736.0 | |||||||||||||||
% days lost to weather | 15.5% | 8.7% | 18.1% | 11.6% | 18.6% | |||||||||||||||
Backlog (as of period end, in millions) | $157.4 | $211.3 | ||||||||||||||||||
Materials: The Company owns centrally located quarries and an asphalt import terminal, which provide products that include hot mix asphalt, ready-mix concrete, construction aggregate, and asphalt. | ||||||||||||||||||||
Specialty Construction: The Company is vertically integrated and is a contractor that engages in road maintenance and construction, manufactures and sells prestressed and precast concrete products, roadway signage and guardrails, and provides traffic control services and related equipment. | ||||||||||||||||||||
The Company operates under brand names that include Grace Pacific, GP Roadway Solutions (including GP Maintenance Solutions), GPRM Prestress, and GLP Asphalt (Asphalt Hawai`i). |
L=WUF/R.[.N=B;HR&)IHJ
M+%5VXMH;?S=9C*."5IX*3'U62Q]3/1TT,[ETCC945R2!<^_=:H#QZG;JV!L3
M?5+14.]ME;2WC18V5I\=1[JVWA]PTM!,\8A>:BI\M1U<5+*T0"ED"DKQ]/?N
MO4!X]1\3UKUU@*#'8O!;!V5A<9A\Y_>?$8[$[5P6.H,7N7[26@_O#CJ.CH(:
M>ASGV,[P_=Q*M1XG9->DD>_=>H.GZCV]@,=ELSG\?@\/0YW<:XU=PYJCQM%3
M9;.KAJ>2DQ"YG)00I691<52S/'3"=W\$;E4T@D>_=;Z9*CKKKZLJ,S5U>Q-F
MU55N*IQM;N"IJ-L82>HSM9AJJ*NQ%7F9I*%I,G4XJM@2:FDG+O!*BNA5@#[]
MUJ@ZY[LZ^V%OZ.BAWULC:&](L8\\F-BW9MK#;CCQ\E4L2U,E$F8HJQ:1ZA8$
M#F,*7"+>]A[]UZ@/'J=CMH[4P]1CJS$[8V]BZO#X1]M8FJQV%QM#48O;DE13
M5 WUELFWG<'G?0F7X/115F:BI6FE33![J5Q6AE8>[=W.91-;QDI&[(H.AI'"T
M2-/$E"U+LM:D54$#)!ZUA.^_^%./S8Z\S>%HMA]0?&?(XW^!BMS[[NZV[5BS
MQJQD*FHGJL;@<'\BY)*/'4.V)*.6KAGDDJZ2MF>.4"&/S''S<>9)(9=-HFBJ
MJ0LZE6.L'0P97II>F P5A6E">,D6&\[G<74ME<1QUB;1XB'4I?3J8.H8^&1J
M"A2S5*L:@E5Z0F _X4Y?S*,]EC5T/2WPKR&PEHZW(3;KQVQ.\9\?04U+115D
M$>6R4/?]3%B*C)+-&L#55/!3&254:57!'L-2\^7\=N4,2+ JLUD FJ1 &@@+
MW7=[#Q[GDRPD._R*D(NO"/TUO$\ &6F::#;EUO)XJ(:^%XS'^RI#-2L"GEG"15,GR7
MR"1,_CL"8''];?7VSNNX26.WR745-2TI4%AD@9&I*\?4=&.R[;#N.Y161RV$I,CJJ\9M+
M%5N6KV<0P4]65P
[7L;2
M6E^Y)<)-/(QI(L+N9+:VJ*Z6NG)D<5[(BZ#^R0$@N=CH*/*34IE$U/B<1L3P
M1U+EJNNQTB9"FR$U9'IC:/S19M)XDE19?$Z#3
.4TN
M=0J.-=1IGCG^?^7JI#%_R<_F%O?$Y3&U_5> V O7G1._/CO21KEJ.IS?9>1S
M>1K=V[,[%P-3EV59 .VA$DBB-"P4A<1LQ\0:BO $Y4H?+_#K?V