|
OMB APPROVAL
|
|
OMB Number: 3235-0570
Expires: January 31, 2017
Estimated average burden hours per response: 20.6
|
|
Investment Company Act file number
|
811-22680
|
|
Ultimus Managers Trust
|
|
(Exact name of registrant as specified in charter)
|
|
225 Pictoria Drive, Suite 450 Cincinnati, Ohio
|
45246
|
|
(Address of principal executive offices)
|
(Zip code)
|
|
Ultimus Fund Solutions, LLC 225 Pictoria Drive, Suite 450 Cincinnati, Ohio 45246
|
|
(Name and address of agent for service)
|
|
Registrant's telephone number, including area code:
|
(513) 587-3400
|
|
Date of fiscal year end:
|
May 31
|
|
|
Date of reporting period:
|
May 31, 2015
|
| Item 1. | Reports to Stockholders. |

APEXcm SMALL/MID-CAP GROWTH FUND
(APSGX)
Annual Report
May 31, 2015
|
APEXcm SMALL/MID-CAP GROWTH FUND |
May 31, 2015 |
Dear APEXcm Small/Mid-Cap Growth Fund Shareholder,
APEX INVESTMENT PHILOSOPHY
We believe that the best way to provide value-added returns is to identify companies that exhibit certain favorable fundamental advantages and benefit from secular growth trends, allowing us to structure the portfolio in high-conviction areas of longer-term sustainable growth. Embedded in our portfolio construction is the recognition of companies at different stages of their growth cycle, which we designate as “stable” and “emerging” growth stocks. We are confident that having the spectrum of growth companies that are truly innovative and growing rapidly, combined with established growth companies, can provide relative stability while allowing the opportunity to drive outperformance versus our benchmark and peers over time. In addition, the SMID style provides the opportunity to invest in higher-growth companies and capture a longer period of growth as these companies mature.
FUND PERFORMANCE
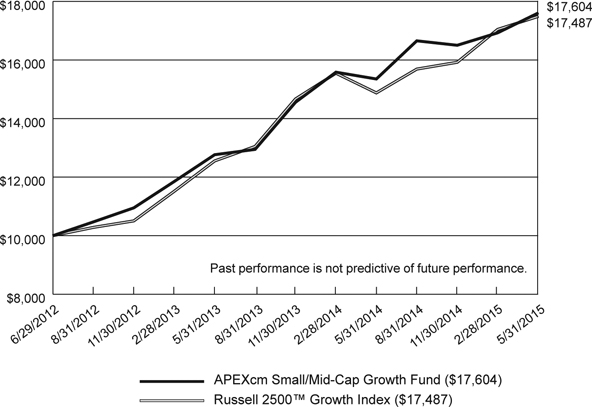
The APEXcm Small/Mid-Cap Growth Fund (the “Fund”) underperformed the Fund’s benchmark, the Russell 2500TM Growth Index (the “Index”), for the 12-month period ended May 31, 2015. The Fund’s total return was 14.67% (net of fees), while the total return of the benchmark was 17.55%. While the environment has been challenging for our performance over the past year—a time period in which small-cap growth stocks outperformed mid-cap growth stocks by approximately 3%--we think our measured approach is appropriate in this more volatile setting.
MARKET ENVIRONMENT
Most domestic stock indices delivered double–digit gains in the past 12 months. The U.S. economy began to exhibit sufficient strength to allow the Federal Reserve Board (the “Fed”) to end its easing monetary policy and turn its attention to its first interest rate increase in nearly a decade. With many of the world’s economies, currencies, central banks and interest rates on very diverse paths, the advance was not consistent across sectors. Investors wrestled with the implications of a dramatic collapse of oil prices, which then punished the Energy sector, while the rapid ascent of the U.S. dollar put pressure on the earnings outlooks of many multinational firms. While these late-2014 and early-2015 macroeconomic factors hurt sectors such as Energy, Materials and Industrials, the Health Care sector delivered very strong returns that far outpaced the rest of the market. The Health Care sector was powered by a vigorous mergers and acquisitions (M&A) environment, especially within the biotechnology and specialty pharmaceutical industries.
During the first five months of 2015, the U.S. economy appeared to have hit a soft patch, restrained by an unusually harsh winter across much of the Midwest and Northeast, accompanied by a prolonged stoppage at West Coast ports, with the impact resonating in Q1 2015 as GDP output decreased to a 0.7% annualized
PORTFOLIO REVIEW
While the Index was up 17.55% for the reporting period, its performance was predominately driven by three sectors; Consumer Discretionary (up approximately 19%), Health Care (up approximately 46%), and Information Technology (up approximately 24%). These gains offset relative weakness within Financials, Materials, Consumer Staples, and Industrials, along with the dismal performance of Energy (down approximately 29%). Our portfolio structure was solid during the period as we were either equal or overweight the three best performing sectors of Health Care, Information Technology and Consumer Discretionary, which collectively added 60 basis points to the Fund’s performance versus the Index. Of equal importance was the underweight in Consumer Staples, Financials, Industrials, and Materials, which added approximately another 90 basis points to the Fund’s performance versus the Index. The Fund’s underperformance was due, in part, to our slight overweight in Energy compared to the Index, which detracted approximately 38 basis points.
Although we had strong stock selection in the Consumer Discretionary and Financials sectors, the underperformance is directly attributed to stock selection in Energy, Materials, Industrials, Health Care and Information Technology. We have noted some of the highlights below.
The Consumer Discretionary sector was a standout performer, benefitting from continued M&A activity across multiple industries. Expedia, with its acquisition of Orbitz, and Signet Jewelers acquiring Zales were cheered by investors, as these solid business models continue to deliver and add scale. PetSmart preferred the private equity path, with the intent of unlocking tremendous value in this dominant franchise. Such excellent performance was offset by unacceptable performance from Zulily. The fast growing leader in “flash sales” faced scale and distribution headwinds in maintaining the high-level growth pace. Also, Decker’s Outdoor, which manages popular footwear brands like UGGS and Teva, missed estimates and struggled with their direct-to-consumer offering. We have exited both companies given the lackluster execution.
The Financials sector contributed excess returns driven by CBRE Group, Inc. The company provides commercial real estate services and is benefitting from its ability to grow market share in an industry that is very fragmented with smaller market operators increasingly unable to compete with CBRE’s reach and service capabilities. The company also continues to benefit from increased M&A activity with its March 2015 acquisition of Johnson Controls’ Global Workplace Solutions.
The Materials sector was the Fund’s largest detractor from relative performance, as earnings prospects for most Materials sector companies diminished with the rising U.S. dollar and signs of global, especially Chinese, economic deterioration. Although
The Energy sector also detracted from performance. Energy was the only segment of the market to post negative absolute returns in the past 12 months. Although less than 5% of our holdings, we were not immune to the carnage as oil prices declined dramatically. Significant selloffs occurred in companies that support our U.S. energy independence theme, as seen with oil service companies possessing next generation technology, as well as in oil exploration companies that have key geological assets in fast growing energy regions. Our holdings in key strategic companies such as Whiting Petroleum and Helmerich & Payne underperformed the sector. With the oil rig count down approximately 50% and a slowing domestic oil supply, we proceeded with exiting the positions. We maintained positions in Carrizo Oil & Gas, favoring their key reserves in the Eagle Ford area and the low transport costs to the gulf, as well as Core Labs with their diversified business focused on reservoir monitoring and services.
The Industrials sector also detracted from relative performance. We lowered our exposure in this multifaceted sector, as companies within global-oriented industries and those tied to energy infrastructure lagged. Employment services such as our investment in Robert Half performed very well in this environment. Our biggest disappointment was United Rentals, a long-time holding of the Fund which has had stellar performance until late 2014. The timing of the Company’s decision to enhance their tool rental business into a more focused offering in energy services exacerbated the uncertainty of sustainable growth, and we reluctantly sold the position.
The Information Technology (“IT”) sector continued to contribute positively to strong relative returns, and the Fund benefitted from its overweight positioning. However, stock selection within the sector was not up to our standards, and late in the year we adjusted our holdings. During this time period where the IT sector was up in excess of 20%, we had a few names that underperformed. Capital expenditures have been choppy for companies tied to telecom and cable/digital distribution which impacted both Finisar and Rovi (down in excess of 25%). We sold Finisar, and although we continue to see expanded breadth and applicability of the patent portfolio of Rovi in the evolution of digital content, that holding was eliminated as well. Yelp was also down in excess of 25%, as the opportunity associated with relatively unpenetrated local advertising became more competitive driving up costs. Additionally, its reliance on traffic from Google added volatility to results, and we moved on to better opportunities elsewhere. As strong advocates to the value of secular themes, it is hard to argue the importance of big data, business intelligence and now cybersecurity. Our biggest winner for the time period was business intelligence software provider Tableau with its unique dashboard and pricing approach to making the mountains of data more useful. Not only has the explosion of data and our online existence provided tremendous efficiencies to individuals and businesses, the risks continue to mount to exploit the interconnectedness to our disadvantage. Cybersecurity safeguards are becoming one
The Health Care sector was the runaway winner during this one-year period. The sector continued to be fueled by M&A activity, and although stock selection was a slight detractor from performance, we are pleased with the performance of our more diverse sector holdings. Half of our top ten contributors to performance came from this sector. Two beneficiaries of the Affordable Care Act, Medicaid health care providers and hospitals, were well represented in the portfolio with Centene and Universal Health Services, respectively. Biotechnology continues to provide long-term opportunity, and our best performer for the time period was ISIS Pharmaceuticals. The strategic antisense platform continues to build its pipeline of potentially effective drugs and partnerships. Along with ISIS, Medivation partnered with Astellas in providing commercially relevant Xtandi, which provides a very attractive profile to urologists and oncologists for pre-chemo prostate cancer. Lastly, Akorn, a niche generic manufacturer in high barrier-to-entry markets (injectable, ophthalmology, etc.), has positioned itself for long-term sustainable growth.
OUTLOOK
We believe the economic weakness noted in Q1 2015 will prove to be transient, and that economic growth will resume, fueled by low inflation, a benign interest rate environment, and improving consumer spending. Some of this strength is showing up in improving home prices, employment and consumer sentiment. We continue to have faith in the strength of the U.S. economy, as well as indications of an improving recovery in Europe. We would expect higher levels of volatility to continue, as the market perceives stocks to be expensive and earnings growth weak. With the rising U.S. dollar and the associated corresponding cheaper imports, we would anticipate inflation expectations to remain subdued, allowing the Fed to be more patient in raising interest rates.
At Apex, one of the foundations of our success is focusing on the long-term sustainability of secular growth trends. The performance dichotomy across sectors highlights the importance of sharpening the focus on those industries that are able to deliver sustained earnings growth within an uncertain economic backdrop. During challenging times, we remain committed to the opportunities provided in such areas as consumer mobility, big data and cloud computing, cybersecurity, the U.S. manufacturing renaissance, personalized medicine and genomics, and energy independence. As we navigate through the early stages of the self-sustaining U.S. economy, coupled with global growth anxieties, our focus will continue to be on selective opportunities that could benefit in this environment.
Sincerely,
Nitin N. Kumbhani
President and Chief Investment Officer
Past performance is not predictive of future performance. Investment results and principal value will fluctuate so that shares, when redeemed, may be worth more or less than their original cost. Current performance may be higher or lower than the performance data quoted. Performance data current to the most recent month-end are available by calling 1-888-575-4800.
An investor should consider the investment objectives, risks, charges and expenses of the Fund carefully before investing. The Fund’s prospectus contains this and other important information. To obtain a copy of the Fund’s prospectus, please visit our website at www.apexcmfund.com or call 1-888-575-4800 and a copy will be sent to you free of charge. Please read the prospectus carefully before you invest. The APEXcm Small/Mid-Cap Growth Fund is distributed by Ultimus Fund Distributors, LLC.
The Letter to Shareholders seeks to describe some of the Adviser’s current opinions and views of the financial markets. Although the Adviser believes it has a reasonable basis for any opinions or views expressed, actual results may differ, sometimes significantly so, from those expected or expressed. The securities held by the Fund that are discussed in the Letter to Shareholders were held during the period covered by this Report. They do not comprise the entire investment portfolio of the Fund, may be sold at any time and may no longer be held by the Fund. The opinions of the Fund’s Adviser with respect to those securities may change at any time.
APEXcm SMALL/MID-CAP GROWTH FUND
PERFORMANCE INFORMATION
May 31, 2015 (Unaudited)
Comparison of the Change in Value of a $10,000
Investment in APEXcm Small/Mid-Cap Growth Fund
versus the Russell 2500TM Growth Index
|
Average Annual Total Returns |
|||
|
1 Year |
Since |
||
|
APEXcm Small/Mid-Cap Growth Fund(a) |
14.67% |
21.37% |
|
|
Russell 2500TM Growth Index |
17.55% |
21.09% |
|
|
(a) |
The Fund’s total return does not reflect the deduction of taxes a shareholder would pay on Fund distributions or the redemption of Fund shares. |
|
(b) |
The Fund commenced operations on June 29, 2012. |
APEXcm SMALL/MID-CAP GROWTH FUND
PORTFOLIO INFORMATION
May 31, 2015 (Unaudited)
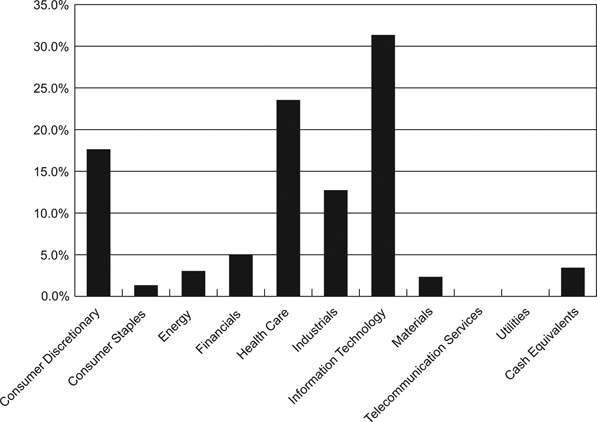
Sector Diversification (% of Net Assets)
Top 10 Equity Holdings
|
Security Description |
% of |
|
Universal Health Services, Inc. - Class B |
2.6% |
|
Wabtec Corp. |
2.3% |
|
Tableau Software, Inc. - Class A |
2.3% |
|
Autoliv, Inc. |
2.2% |
|
IAC/InterActiveCorp |
2.2% |
|
Total System Services, Inc. |
2.1% |
|
CBRE Group, Inc. - Class A |
2.1% |
|
Medivation, Inc. |
2.1% |
|
Williams-Sonoma, Inc. |
2.1% |
|
Foot Locker, Inc. |
2.1% |
|
APEXcm SMALL/MID-CAP GROWTH FUND |
||||||||
|
COMMON STOCKS — 96.6% |
Shares |
Value |
||||||
|
Consumer Discretionary — 17.6% |
||||||||
|
Auto Components — 2.2% |
||||||||
|
Autoliv, Inc. |
42,474 |
$ |
5,358,095 |
|||||
|
Hotels, Restaurants & Leisure — 2.4% |
||||||||
|
Dunkin' Brands Group, Inc. |
45,048 |
2,403,761 |
||||||
|
Wyndham Worldwide Corp. |
40,419 |
3,431,977 |
||||||
|
5,835,738 |
||||||||
|
Internet & Catalog Retail — 2.0% |
||||||||
|
Expedia, Inc. |
45,373 |
4,866,708 |
||||||
|
Media — 1.1% |
||||||||
|
IMAX, Corp. * |
64,798 |
2,613,951 |
||||||
|
Multi-Line Retail — 2.3% |
||||||||
|
Burlington Stores, Inc. * |
62,960 |
3,322,399 |
||||||
|
Dillard's, Inc. - Class A |
19,431 |
2,254,190 |
||||||
|
5,576,589 |
||||||||
|
Specialty Retail — 5.6% |
||||||||
|
Foot Locker, Inc. |
79,670 |
5,035,144 |
||||||
|
Signet Jewelers Ltd. |
25,257 |
3,266,488 |
||||||
|
Williams-Sonoma, Inc. |
64,214 |
5,047,863 |
||||||
|
13,349,495 |
||||||||
|
Textiles, Apparel & Luxury Goods — 2.0% |
||||||||
|
Carter's, Inc. |
23,520 |
2,427,735 |
||||||
|
Skechers U.S.A., Inc. - Class A * |
22,991 |
2,434,057 |
||||||
|
4,861,792 |
||||||||
|
Consumer Staples — 1.3% |
||||||||
|
Food Products — 1.3% |
||||||||
|
Hain Celestial Group, Inc. (The) * |
50,018 |
3,164,639 |
||||||
|
Energy — 2.9% |
||||||||
|
Energy Equipment & Services — 0.7% |
||||||||
|
Core Laboratories N.V. |
13,744 |
1,614,645 |
||||||
|
Oil, Gas & Consumable Fuels — 2.2% |
||||||||
|
Carrizo Oil & Gas, Inc. * |
61,063 |
3,062,920 |
||||||
|
Diamondback Energy, Inc. * |
30,153 |
2,346,205 |
||||||
|
5,409,125 |
||||||||
|
APEXcm SMALL/MID-CAP GROWTH FUND |
||||||||
|
COMMON STOCKS — 96.6% (Continued) |
Shares |
Value |
||||||
|
Financials — 4.9% |
||||||||
|
Banks — 1.7% |
||||||||
|
First Republic Bank/CA |
64,586 |
$ |
3,910,682 |
|||||
|
Diversified Financial Services — 1.1% |
||||||||
|
Interactive Brokers Group, Inc. - Class A |
39,988 |
1,427,571 |
||||||
|
MarketAxess Holdings, Inc. |
13,993 |
1,237,681 |
||||||
|
2,665,252 |
||||||||
|
Real Estate Management & Development — 2.1% |
||||||||
|
CBRE Group, Inc. - Class A * |
134,282 |
5,134,944 |
||||||
|
Health Care — 23.5% |
||||||||
|
Biotechnology — 8.3% |
||||||||
|
Agios Pharamceuticals, Inc. * |
10,952 |
1,336,363 |
||||||
|
AMAG Pharmaceuticals, Inc. * |
17,900 |
1,245,482 |
||||||
|
Enanta Pharmaceuticals, Inc. * |
64,175 |
2,623,474 |
||||||
|
Isis Pharmaceuticals, Inc. * |
62,643 |
4,217,127 |
||||||
|
Keryx Biopharmaceuticals, Inc. * |
115,693 |
1,203,207 |
||||||
|
Medivation, Inc. * |
38,837 |
5,128,426 |
||||||
|
Momenta Pharmaceuticals, Inc. * |
54,867 |
1,089,110 |
||||||
|
Receptos, Inc. * |
4,969 |
819,338 |
||||||
|
United Therapeutics Corp. * |
12,655 |
2,324,977 |
||||||
|
19,987,504 |
||||||||
|
Health Care Equipment & Supplies — 2.7% |
||||||||
|
Align Technology, Inc. * |
50,875 |
3,086,586 |
||||||
|
DexCom, Inc. * |
37,625 |
2,698,465 |
||||||
|
Tandem Diabetes Care, Inc. * |
50,017 |
603,705 |
||||||
|
6,388,756 |
||||||||
|
Health Care Providers & Services — 4.3% |
||||||||
|
Centene Corp. * |
55,648 |
4,192,520 |
||||||
|
Universal Health Services, Inc. - Class B |
47,496 |
6,154,532 |
||||||
|
10,347,052 |
||||||||
|
Health Care Technology — 1.3% |
||||||||
|
Medidata Solutions, Inc. * |
52,121 |
3,023,539 |
||||||
|
Life Sciences Tools & Services — 2.7% |
||||||||
|
ICON plc * |
43,654 |
2,831,835 |
||||||
|
WuXi PharmaTech (Cayman), Inc. - ADR * |
86,208 |
3,708,668 |
||||||
|
6,540,503 |
||||||||
|
APEXcm SMALL/MID-CAP GROWTH FUND |
||||||||
|
COMMON STOCKS — 96.6% (Continued) |
Shares |
Value |
||||||
|
Health Care — 23.5% (Continued) |
||||||||
|
Pharmaceuticals — 4.2% |
||||||||
|
Akorn, Inc. * |
93,545 |
$ |
4,293,716 |
|||||
|
Horizon Pharma plc * |
40,545 |
1,314,874 |
||||||
|
Jazz Pharmaceuticals plc * |
18,656 |
3,345,954 |
||||||
|
Supernus Pharmaceuticals, Inc. * |
88,023 |
1,251,687 |
||||||
|
10,206,231 |
||||||||
|
Industrials — 12.7% |
||||||||
|
Aerospace & Defense — 0.8% |
||||||||
|
B/E Aerospace, Inc. |
32,836 |
1,882,816 |
||||||
|
Machinery — 4.0% |
||||||||
|
Nordson Corp. |
36,555 |
2,957,665 |
||||||
|
Proto Labs, Inc. * |
15,187 |
1,050,637 |
||||||
|
Wabtec Corp. |
55,827 |
5,599,448 |
||||||
|
9,607,750 |
||||||||
|
Professional Services — 3.3% |
||||||||
|
Robert Half International, Inc. |
68,168 |
3,842,630 |
||||||
|
Towers Watson & Co. - Class A |
30,511 |
4,208,992 |
||||||
|
8,051,622 |
||||||||
|
Road & Rail — 2.8% |
||||||||
|
Avis Budget Group, Inc. * |
49,674 |
2,533,374 |
||||||
|
Old Dominion Freight Line, Inc. * |
60,423 |
4,109,368 |
||||||
|
6,642,742 |
||||||||
|
Trading Companies & Distributors — 1.8% |
||||||||
|
HD Supply Holdings, Inc. * |
136,548 |
4,430,983 |
||||||
|
Information Technology — 31.3% |
||||||||
|
Communications Equipment — 4.4% |
||||||||
|
Ciena Corp. * |
124,420 |
3,001,010 |
||||||
|
F5 Networks, Inc. * |
32,602 |
4,097,746 |
||||||
|
Infinera Corp. * |
173,341 |
3,577,758 |
||||||
|
10,676,514 |
||||||||
|
Electronic Equipment, |
||||||||
|
Dolby Laboratories, Inc. - Class A |
53,232 |
2,084,033 |
||||||
|
Internet Software & Services — 5.6% |
||||||||
|
Bitauto Holdings Ltd. - ADR * |
38,862 |
2,352,706 |
||||||
|
IAC/InterActiveCorp |
70,960 |
5,326,967 |
||||||
|
MercadoLibre, Inc. |
21,656 |
3,142,935 |
||||||
|
YY, Inc. - ADR * |
41,768 |
2,708,237 |
||||||
|
13,530,845 |
||||||||
|
APEXcm SMALL/MID-CAP GROWTH FUND |
||||||||
|
COMMON STOCKS — 96.6% (Continued) |
Shares |
Value |
||||||
|
Information Technology — 31.3% (Continued) |
||||||||
|
IT Services — 6.3% |
||||||||
|
Gartner, Inc. * |
27,354 |
$ |
2,392,928 |
|||||
|
Global Payments, Inc. |
43,861 |
4,578,211 |
||||||
|
Heartland Payment Systems, Inc. |
58,211 |
3,111,378 |
||||||
|
Total System Services, Inc. |
124,889 |
5,145,427 |
||||||
|
15,227,944 |
||||||||
|
Semiconductors & Semiconductor Equipment — 1.8% |
||||||||
|
Entegris, Inc. * |
162,211 |
2,259,599 |
||||||
|
Power Integrations, Inc. |
39,428 |
2,001,365 |
||||||
|
4,260,964 |
||||||||
|
Software — 12.3% |
||||||||
|
ACI Worldwide, Inc. * |
72,793 |
1,733,201 |
||||||
|
Advent Software, Inc. |
67,736 |
2,964,127 |
||||||
|
BroadSoft, Inc. * |
27,323 |
997,563 |
||||||
|
FireEye, Inc. * |
53,697 |
2,500,669 |
||||||
|
Fortinet, Inc. * |
96,884 |
3,881,173 |
||||||
|
Informatica Corp. * |
76,588 |
3,706,859 |
||||||
|
Manhattan Associates, Inc. * |
34,521 |
1,893,477 |
||||||
|
NetScout Systems, Inc. * |
3,664 |
146,853 |
||||||
|
Splunk, Inc.* |
57,172 |
3,865,971 |
||||||
|
Tableau Software, Inc. - Class A * |
47,888 |
5,421,401 |
||||||
|
Verint Systems, Inc. * |
37,946 |
2,453,968 |
||||||
|
29,565,262 |
||||||||
|
Materials — 2.4% |
||||||||
|
Containers & Packaging — 1.2% |
||||||||
|
Silgan Holdings, Inc. |
53,940 |
2,931,100 |
||||||
|
Paper & Forest Products — 1.2% |
||||||||
|
KapStone Paper and Packaging Corp. |
101,207 |
2,727,529 |
||||||
|
Total Common Stocks (Cost $200,912,620) |
$ |
232,475,344 |
||||||
|
APEXcm SMALL/MID-CAP GROWTH FUND |
||||||||
|
MONEY MARKET FUNDS — 4.6% |
Shares |
Value |
||||||
|
Fidelity Institutional Money Market Portfolio - Class I, 0.10% (a) (Cost $11,174,521) |
11,174,521 |
$ |
11,174,521 |
|||||
|
Total Investments at Value — 101.2% (Cost $212,087,141) |
$ |
243,649,865 |
||||||
|
Liabilities in Excess of Other Assets — (1.2%) |
(2,904,734 |
) |
||||||
|
Net Assets — 100.0% |
$ |
240,745,131 |
||||||
|
ADR - American Depositary Receipt.
|
|
|
* |
Non-income producing security. |
|
(a) |
The rate shown is the 7-day effective yield as of May 31, 2015.
|
|
See accompanying notes to financial statements. |
|
|
APEXcm SMALL/MID-CAP GROWTH FUND |
||||
|
ASSETS |
||||
|
Investments in securities: |
||||
|
At acquisition cost |
$ |
212,087,141 |
||
|
At value (Note 2) |
$ |
243,649,865 |
||
|
Dividends receivable |
152,057 |
|||
|
Receivable for capital shares sold |
1,399,249 |
|||
|
Receivable for investment securities sold |
8,057,355 |
|||
|
Other assets |
18,790 |
|||
|
Total assets |
253,277,316 |
|||
|
LIABILITIES |
||||
|
Payable for investment securities purchased |
12,310,573 |
|||
|
Payable for capital shares redeemed |
4,997 |
|||
|
Payable to Adviser (Note 4) |
165,902 |
|||
|
Payable to administrator (Note 4) |
27,890 |
|||
|
Other accrued expenses |
22,823 |
|||
|
Total liabilities |
12,532,185 |
|||
|
NET ASSETS |
$ |
240,745,131 |
||
|
NET ASSETS CONSIST OF: |
||||
|
Paid-in capital |
$ |
209,204,785 |
||
|
Accumulated net investment loss |
(395,464 |
) |
||
|
Undistributed net realized gains from security transactions |
373,086 |
|||
|
Net unrealized appreciation on investments |
31,562,724 |
|||
|
NET ASSETS |
$ |
240,745,131 |
||
|
Shares of beneficial interest outstanding |
13,808,259 |
|||
|
Net asset value, offering price and redemption price per share (Note 2) |
$ |
17.43 |
||
|
See accompanying notes to financial statements. |
|
APEXcm SMALL/MID-CAP GROWTH FUND |
||||
|
INVESTMENT INCOME |
||||
|
Dividend income (net of foreign taxes of $3,525) |
$ |
836,621 |
||
|
EXPENSES |
||||
|
Investment advisory fees (Note 4) |
1,468,496 |
|||
|
Administration fees (Note 4) |
147,153 |
|||
|
Registration and filing fees |
46,227 |
|||
|
Custody and bank service fees |
45,338 |
|||
|
Fund accounting fees (Note 4) |
44,466 |
|||
|
Professional fees |
32,861 |
|||
|
Transfer agent fees (Note 4) |
19,813 |
|||
|
Compliance fees (Note 4) |
16,773 |
|||
|
Postage and supplies |
8,690 |
|||
|
Trustees' fees and expenses (Note 4) |
7,366 |
|||
|
Insurance expense |
3,102 |
|||
|
Other expenses |
18,722 |
|||
|
Total expenses |
1,859,007 |
|||
|
Less fee waivers by the Adviser (Note 4) |
(317,860 |
) |
||
|
Net expenses |
1,541,147 |
|||
|
NET INVESTMENT LOSS |
(704,526 |
) |
||
|
REALIZED AND UNREALIZED GAINS ON INVESTMENTS |
||||
|
Net realized gains from security transactions |
830,411 |
|||
|
Net change in unrealized appreciation/depreciation on investments |
21,795,162 |
|||
|
NET REALIZED AND UNREALIZED GAINS ON INVESTMENTS |
22,625,573 |
|||
|
NET INCREASE IN NET ASSETS RESULTING FROM OPERATIONS |
$ |
21,921,047 |
||
|
See accompanying notes to financial statements. |
|
APEXcm SMALL/MID-CAP GROWTH FUND |
||||||||
|
|
Year |
Year |
||||||
|
FROM OPERATIONS |
||||||||
|
Net investment loss |
$ |
(704,526 |
) |
$ |
(192,714 |
) |
||
|
Net realized gains (losses) from security transactions |
830,411 |
(197,613 |
) |
|||||
|
Net change in unrealized appreciation on investments |
21,795,162 |
8,704,592 |
||||||
|
Net increase in net assets resulting from operations |
21,921,047 |
8,314,265 |
||||||
|
DISTRIBUTIONS TO SHAREHOLDERS |
||||||||
|
From net realized gains |
— |
(226,268 |
) |
|||||
|
CAPITAL SHARE TRANSACTIONS |
||||||||
|
Proceeds from shares sold |
154,037,822 |
74,662,709 |
||||||
|
Net asset value of shares issued in reinvestment of distributions to shareholders |
— |
162,061 |
||||||
|
Payments for shares redeemed |
(23,690,438 |
) |
(7,589,046 |
) |
||||
|
Net increase in net assets from capital share transactions |
130,347,384 |
67,235,724 |
||||||
|
TOTAL INCREASE IN NET ASSETS |
152,268,431 |
75,323,721 |
||||||
|
NET ASSETS |
||||||||
|
Beginning of year |
88,476,700 |
13,152,979 |
||||||
|
End of year |
$ |
240,745,131 |
$ |
88,476,700 |
||||
|
ACCUMULATED NET |
$ |
(395,464 |
) |
$ |
(105,388 |
) |
||
|
CAPITAL SHARE ACTIVITY |
||||||||
|
Shares sold |
9,429,777 |
5,289,946 |
||||||
|
Shares reinvested |
— |
10,768 |
||||||
|
Shares redeemed |
(1,443,740 |
) |
(515,199 |
) |
||||
|
Net increase in shares outstanding |
7,986,037 |
4,785,515 |
||||||
|
Shares outstanding at beginning of year |
5,822,222 |
1,036,707 |
||||||
|
Shares outstanding at end of year |
13,808,259 |
5,822,222 |
||||||
|
See accompanying notes to financial statements. |
|
APEXcm SMALL/MID-CAP GROWTH FUND |
||||||||||||
|
Per Share Data for a Share Outstanding Throughout Each Period |
||||||||||||
|
|
Year |
Year |
Period |
|||||||||
|
Net asset value at beginning of period |
$ |
15.20 |
$ |
12.69 |
$ |
10.00 |
||||||
|
Income (loss) from investment operations: |
||||||||||||
|
Net investment income (loss) |
(0.04 |
) |
(0.03 |
) |
0.04 |
(b) |
||||||
|
Net realized and unrealized gains on investments |
2.27 |
2.60 |
2.72 |
|||||||||
|
Total from investment operations |
2.23 |
2.57 |
2.76 |
|||||||||
|
Less distributions: |
||||||||||||
|
From net investment income |
— |
— |
(0.07 |
) |
||||||||
|
From net realized gains |
— |
(0.06 |
) |
— |
||||||||
|
Total distributions |
— |
(0.06 |
) |
(0.07 |
) |
|||||||
|
Net asset value at end of period |
$ |
17.43 |
$ |
15.20 |
$ |
12.69 |
||||||
|
Total return (c) |
14.67 |
% |
20.26 |
% |
27.65 |
%(d) |
||||||
|
Net assets at end of period (000's) |
$ |
240,745 |
$ |
88,477 |
$ |
13,153 |
||||||
|
Ratios/supplementary data: |
||||||||||||
|
Ratio of total expenses to average net assets |
1.26 |
% |
1.49 |
% |
4.87 |
%(e) |
||||||
|
Ratio of net expenses to average net assets (f) |
1.05 |
% |
1.05 |
% |
1.05 |
%(e) |
||||||
|
Ratio of net investment income (loss) to average net assets (f) |
(0.48 |
%) |
(0.38 |
%) |
0.26 |
%(e) |
||||||
|
Portfolio turnover rate |
58 |
% |
47 |
% |
18 |
%(d) |
||||||
|
(a) |
Represents the period from the commencement of operations (June 29, 2012) through May 31, 2013. |
|
(b) |
Calculated using weighted average shares outstanding during the period. |
|
(c) |
Total return is a measure of the change in value of an investment in the Fund over the periods covered. The returns shown do not reflect the deduction of taxes a shareholder would pay on Fund distributions, if any, or the redemption of Fund shares. The total returns would be lower if the Adviser had not waived advisory fees and/or reimbursed expenses (Note 4). |
|
(d) |
Not annualized. |
|
(e) |
Annualized. |
|
(f) |
Ratio was determined after advisory fee waivers and/or expense reimbursements (Note 4).
|
|
See accompanying notes to financial statements. |
|
APEXcm SMALL/MID-CAP GROWTH FUND
NOTES TO FINANCIAL STATEMENTS
May 31, 2015
1. Organization
APEXcm Small/Mid-Cap Growth Fund (the “Fund”) is a diversified series of Ultimus Managers Trust (the “Trust”), an open-end investment company established as an Ohio business trust under a Declaration of Trust dated February 28, 2012. Other series of the Trust are not incorporated in this report. The Fund commenced operations on June 29, 2012.
The investment objective of the Fund is long-term capital growth.
2. Significant Accounting Policies
The following is a summary of the Fund’s significant accounting policies. The policies are in conformity with accounting principles generally accepted in the United States of America (“GAAP”). As an investment company, as defined in Financial Accounting Standards Board (“FASB”) Accounting Standards Update 2013-08, the Fund follows accounting and reporting guidance under FASB Accounting Standards Codification Topic 946, “Financial Services – Investment Companies.”
Securities valuation – The Fund values its portfolio securities at market value as of the close of regular trading on the New York Stock Exchange (the “NYSE”) (normally 4:00 p.m. Eastern time) on each business day the NYSE is open for business. The pricing and valuation of portfolio securities is determined in good faith in accordance with procedures established by and under the direction of the Board of Trustees (the “Board”) of the Trust. The Fund values its listed securities on the basis of the security’s last sale price on the security’s primary exchange, if available, otherwise at the exchange’s most recently quoted bid price. NASDAQ-listed securities are valued at the NASDAQ Official Closing Price. In the event that market quotations are not readily available or are considered unreliable due to market or other events, the Fund values its securities and other assets at fair value in accordance with procedures established by and under the general supervision of the Board. Under these procedures, the securities will be classified as Level 2 or 3 within the fair value hierarchy (see below), depending on the inputs used. Unavailable or unreliable market quotes may be due to the following factors: a substantial bid-ask spread; infrequent sales resulting in stale prices; insufficient trading volume; small trade sizes; a temporary lapse in any reliable pricing source; and actions of the securities or futures markets, such as the suspension or limitation of trading. As a result, the prices of securities used to calculate the Fund’s net asset value may differ from quoted or published prices for the same securities.
GAAP establishes a single authoritative definition of fair value, sets out a framework for measuring fair value, and requires additional disclosures about fair value measurements.
APEXcm SMALL/MID-CAP GROWTH FUND
NOTES TO FINANCIAL STATEMENTS (Continued)
Various inputs are used in determining the value of the Fund’s investments. These inputs are summarized in the three broad levels listed below:
|
● |
Level 1 – quoted prices in active markets for identical securities |
|
● |
Level 2 – other significant observable inputs |
|
● |
Level 3 – significant unobservable inputs |
The inputs or methods used for valuing securities are not necessarily an indication of the risks associated with investing in those securities. The inputs used to measure fair value may fall into different levels of the fair value hierarchy. In such cases, for disclosure purposes, the level in the fair value hierarchy within which the fair value measurement falls in its entirety is determined based on the lowest level input that is significant to the fair value measurement.
The following is a summary of the inputs used to value the Fund’s investments as of May 31, 2015:
|
|
Level 1 |
Level 2 |
Level 3 |
Total |
||||||||||||
|
Common Stocks |
$ |
232,475,344 |
$ |
— |
$ |
— |
$ |
232,475,344 |
||||||||
|
Money Market Funds |
11,174,521 |
— |
— |
11,174,521 |
||||||||||||
|
Total |
$ |
243,649,865 |
$ |
— |
$ |
— |
$ |
243,649,865 |
||||||||
Refer to the Fund’s Schedule of Investments for a listing of the common stocks by industry type. As of May 31, 2015, the Fund did not have any transfers into and out of any Level. In addition, the Fund did not hold derivative instruments or any assets or liabilities that were measured at fair value on a recurring basis using significant unobservable inputs (Level 3) as of May 31, 2015. It is the Fund’s policy to recognize transfers into and out of any Level at the end of the reporting period.
Share valuation – The net asset value per share of the Fund is calculated daily by dividing the total value of the Fund’s assets, less liabilities, by the number of shares outstanding. The offering price and redemption price per share of the Fund is equal to the net asset value per share.
Investment income – Dividend income is recorded on the ex-dividend date. Interest income is accrued as earned.
Security transactions – Security transactions are accounted for on the trade date. Gains and losses on securities sold are determined on a specific identification basis.
Common expenses – Common expenses of the Trust are allocated among the Fund and the other series of the Trust based on the relative net assets of each series or the nature of the services performed and the relative applicability to each series.
APEXcm SMALL/MID-CAP GROWTH FUND
NOTES TO FINANCIAL STATEMENTS (Continued)
Distributions to shareholders – The Fund will distribute to shareholders any net investment income dividends and net realized capital gains distributions at least once each year. The amount of such dividends and distributions are determined in accordance with federal income tax regulations, which may differ from GAAP. Dividends and distributions are recorded on the ex-dividend date. The tax character of the Fund’s distributions paid during the years ended May 31, 2015 and May 31, 2014 was as follows:
|
Year Ended |
Ordinary Income |
Long-Term Capital Gains |
Total Distributions |
|||||||||
|
May 31, 2015 |
$ |
— |
$ |
— |
$ |
— |
||||||
|
May 31, 2014 |
$ |
212,871 |
$ |
13,397 |
$ |
226,268 |
||||||
Estimates – The preparation of financial statements in conformity with GAAP requires management to make estimates and assumptions that affect the reported amounts of assets and liabilities and disclosure of contingent assets and liabilities as of the date of the financial statements and the reported amounts of income and expenses during the reporting period. Actual results could differ from those estimates.
Federal income tax – The Fund has qualified and intends to continue to qualify as a regulated investment company under the Internal Revenue Code of 1986 (the “Code”). Qualification generally will relieve the Fund of liability for federal income taxes to the extent 100% of its net investment income and net realized capital gains are distributed in accordance with the Code. Accordingly, no provision for income tax has been made.
In order to avoid imposition of the excise tax applicable to regulated investment companies, it is also the Fund’s intention to declare as dividends in each calendar year at least 98% of its net investment income (earned during the calendar year) and 98.2% of its net realized capital gains (earned during the twelve months ended October 31) plus undistributed amounts from prior years.
The following information is computed on a tax basis for each item as of May 31, 2015:
|
Tax cost of portfolio investments |
$ |
212,099,228 |
||
|
Gross unrealized appreciation |
$ |
35,041,342 |
||
|
Gross unrealized depreciation |
(3,490,705 |
) |
||
|
Net unrealized appreciation |
31,550,637 |
|||
|
Qualified late year losses |
(395,464 |
) |
||
|
Undistributed long term gains |
385,173 |
|||
|
Accumulated earnings |
$ |
31,540,346 |
APEXcm SMALL/MID-CAP GROWTH FUND
NOTES TO FINANCIAL STATEMENTS (Continued)
The value of the federal income tax cost of portfolio investments and the tax components of accumulated earnings and the financial statement cost of portfolio investments and components of net assets may be temporarily different (“book/tax difference”). These book/tax differences are due to the recognition of capital gains or losses under income tax regulations and GAAP, primarily due to the tax deferral of losses on wash sales.
Qualified late year losses incurred after December 31, 2014 and within the taxable year are deemed to arise on the first day of the Fund’s next taxable year. For the year ended May 31, 2015, the Fund intends to defer $395,464 of late year ordinary losses to June 1, 2015 for federal income tax purposes.
For the year ended May 31, 2015, the Fund reclassified $414,450 of accumulated net investment loss against paid-in capital on its Statement of Assets and Liabilities. Such reclassification, the result of permanent differences between financial statement and income tax reporting requirements, had no effect on the Fund’s total net assets or net asset value per share.
The Fund recognizes the tax benefits or expenses of uncertain tax positions only when the position is “more likely than not” to be sustained assuming examination by tax authorities. Management has reviewed the Fund’s tax positions for all open tax periods (periods ended May 31, 2013 through May 31, 2015) and has concluded that no provision for unrecognized tax benefits or expenses is required in these financial statements. The Fund identifies its major tax jurisdiction as U.S. Federal.
3. Investment Transactions
During the year ended May 31, 2015, cost of purchases and proceeds from sales of investment securities, other than short-term investments, were $208,711,369 and $82,463,546, respectively.
4. Transactions with Related Parties
INVESTMENT ADVISORY AGREEMENT
The Fund’s investments are managed by Apex Capital Management, Inc. (the “Adviser”) pursuant to the terms of an Investment Advisory Agreement. Under the Investment Advisory Agreement, the Fund pays the Adviser an advisory fee, computed and accrued daily and paid monthly, at the annual rate of 1.00% of its average daily net assets.
Pursuant to an Expense Limitation Agreement between the Fund and the Adviser, the Adviser has contractually agreed, until October 1, 2016, to waive investment advisory fees and reimburse other expenses to limit Total Annual Fund Operating Expenses (exclusive of brokerage costs, taxes, interest, acquired fund fees and expenses, extraordinary expenses such as litigation and merger or reorganization
APEXcm SMALL/MID-CAP GROWTH FUND
NOTES TO FINANCIAL STATEMENTS (Continued)
costs, and other expenses not incurred in the ordinary course of the Fund’s business) to an amount not exceeding 1.05% of the Fund’s average daily net assets. Accordingly, during the year ended May 31, 2015 the Adviser waived its advisory fees in the amount of $317,860.
Under the terms of the Expense Limitation Agreement, investment advisory fee waivers and expense reimbursements by the Adviser are subject to recoupment by the Adviser for a period of three years after such fees and expenses were incurred, provided the recoupments do not cause Total Annual Fund Operating Expenses to exceed the foregoing expense limitations. As of May 31, 2015, the Adviser may seek recoupment of investment advisory fee reductions and expense reimbursements no later than the dates as stated below:
|
May 31, 2016 |
May 31, 2017 |
May 31, 2018 |
||
|
$144,876 |
$223,293 |
$317,860 |
Certain officers of the Fund are also officers of the Adviser.
OTHER SERVICE PROVIDERS
Ultimus Fund Solutions, LLC (“Ultimus”) provides fund administration, fund accounting, compliance and transfer agency services to the Fund. The Fund pays Ultimus fees in accordance with the agreements for such services. In addition, the Fund pays out-of-pocket expenses including but not limited to postage, supplies and costs of pricing the Fund’s portfolio securities.
DISTRIBUTION AGREEMENT
Under the terms of a Distribution Agreement with the Trust, Ultimus Fund Distributors, LLC (the “Distributor”) serves as principal underwriter to the Fund. The Distributor is a wholly-owned subsidiary of Ultimus. The Distributor is compensated by the Adviser (not the Fund) for acting as principal underwriter.
Certain Trustees and officers of the Trust are also officers of Ultimus and the Distributor.
TRUSTEE COMPENSATION
Each Trustee who is not an “interested person” of the Trust (“Independent Trustee”) receives from the Fund a fee of $500 for each Board meeting attended plus reimbursement of travel and other meeting-related expenses. In addition, effective January 1, 2015, each Independent Trustee also receives a $500 annual retainer from the Fund. Trustees affiliated with the Adviser or Ultimus are not compensated by the Trust for their services.
APEXcm SMALL/MID-CAP GROWTH FUND
NOTES TO FINANCIAL STATEMENTS (Continued)
PRINICIPAL HOLDERS OF FUND SHARES
As of May 31, 2015, the following shareholders owned of record 5% or more of the outstanding shares of the Fund:
|
Name of Record Owner |
% Ownership |
|
UBS Financial Services, Inc. (for the benefit of its customers) |
31% |
|
Charles Schwab & Company, Inc. (for the benefit of its customers) |
28% |
A beneficial owner of 25% or more of a Fund’s outstanding shares may be considered a controlling person. That shareholder’s vote could have a more significant effect on matters presented at a shareholder’s meeting.
5. Sector Risk
If a Fund has significant investments in the securities of issuers within a particular sector, any development affecting that sector will have a greater impact on the value of the net assets of the Fund than would be the case if the Fund did not have significant investments in that sector. In addition, this may increase the risk of loss in the Fund and increase the volatility of the Fund’s net asset value per share. Occasionally, market conditions, regulatory changes or other developments may negatively impact this sector, and therefore the value of the Fund’s portfolio will be adversely affected. As of May 31, 2015, the Fund had 31.3% of the value of its net assets invested in stocks within the Information Technology sector.
6. Contingencies and Commitments
The Fund indemnifies the Trust’s officers and Trustees for certain liabilities that might arise from their performance of their duties to the Fund. Additionally, in the normal course of business the Fund enters into contracts that contain a variety of representations and warranties and which provide general indemnifications. The Fund’s maximum exposure under these arrangements is unknown, as this would involve future claims that may be made against the Fund that have not yet occurred. However, based on experience, the Fund expects the risk of loss to be remote.
7. Subsequent Events
The Fund is required to recognize in the financial statements the effects of all subsequent events that provide additional evidence about conditions that existed as of the date of the Statement of Assets and Liabilities. For non-recognized subsequent events that must be disclosed to keep the financial statements from being misleading, the Fund is required to disclose the nature of the event as well as an estimate of its financial effect, or a statement that such an estimate cannot be made. Management has evaluated subsequent events through the issuance of these financial statements and has noted no such events.
APEXcm SMALL/MID-CAP GROWTH FUND
REPORT OF INDEPENDENT REGISTERED
PUBLIC ACCOUNTING FIRM
To the Board of Trustees of Ultimus Managers Trust
and the Shareholders of APEXcm Small/Mid Cap Growth Fund
We have audited the accompanying statement of assets and liabilities of APEXcm Small/Mid Cap Growth Fund (the “Fund”), a series of shares of beneficial interest in Ultimus Managers Trust, including the schedule of investments, as of May 31, 2015, and the related statement of operations for the year then ended, the statements of changes in net assets for each of the years in the two-year period then ended, and the financial highlights for each of the years in the two-year period then ended and for the period June 29, 2012 (commencement of operations) through May 31, 2013. These financial statements and financial highlights are the responsibility of the Fund’s management. Our responsibility is to express an opinion on these financial statements and financial highlights based on our audits.
We conducted our audits in accordance with the standards of the Public Company Accounting Oversight Board (United States). Those standards require that we plan and perform the audits to obtain reasonable assurance about whether the financial statements and financial highlights are free of material misstatement. An audit includes examining, on a test basis, evidence supporting the amounts and disclosures in the financial statements. Our procedures included confirmation of securities owned as of May 31, 2015 by correspondence with the custodian and brokers. An audit also includes assessing the accounting principles used and significant estimates made by management, as well as evaluating the overall financial statement presentation. We believe that our audits provide a reasonable basis for our opinion.
In our opinion, the financial statements and financial highlights referred to above present fairly, in all material respects, the financial position of APEXcm Small/Mid Cap Growth Fund as of May 31, 2015, and the results of its operations for the year then ended, the changes in its net assets for each of the years in the two-year period then ended and its financial highlights for each of the years in the two-year period then ended and for the period June 29, 2012 through May 31, 2013, in conformity with accounting principles generally accepted in the United States of America.
 |
|
|
BBD, LLP |
Philadelphia, Pennsylvania
July 27, 2015
APEXcm SMALL/MID-CAP GROWTH FUND
ABOUT YOUR FUND’S EXPENSES (Unaudited)
We believe it is important for you to understand the impact of costs on your investment. As a shareholder of the Fund, you incur ongoing costs, including management fees and other operating expenses. The following examples are intended to help you understand your ongoing costs (in dollars) of investing in the Fund and to compare these costs with the ongoing costs of investing in other mutual funds.
A mutual fund’s ongoing costs are expressed as a percentage of its average net assets. This figure is known as the expense ratio. The expenses in the table below are based on an investment of $1,000 made at the beginning of the most recent period (December 1, 2014) and held until the end of the period (May 31, 2015).
The table below illustrates the Fund’s ongoing costs in two ways:
Actual fund return – This section helps you to estimate the actual expenses that you paid over the period. The “Ending Account Value” shown is derived from the Fund’s actual return, and the third column shows the dollar amount of operating expenses that would have been paid by an investor who started with $1,000 in the Fund. You may use the information here, together with the amount you invested, to estimate the expenses that you paid over the period.
To do so, simply divide your account value by $1,000 (for example, an $8,600 account value divided by $1,000 = 8.6), then multiply the result by the number given for the Fund under the heading “Expenses Paid During Period.”
Hypothetical 5% return – This section is intended to help you compare the Fund’s ongoing costs with those of other mutual funds. It assumes that the Fund had an annual return of 5% before expenses during the period shown, but that the expense ratio is unchanged. In this case, because the return used is not the Fund’s actual return, the results do not apply to your investment. The example is useful in making comparisons because the U.S. Securities and Exchange Commission (“SEC”) requires all mutual funds to calculate expenses based on a 5% return. You can assess the Fund’s ongoing costs by comparing this hypothetical example with the hypothetical examples that appear in shareholder reports of other funds.
Note that expenses shown in the table are meant to highlight and help you compare ongoing costs only. The Fund does not charge transaction fees, such as purchase or redemption fees, nor does it carry a “sales load.”
The calculations assume no shares were bought or sold during the period. Your actual costs may have been higher or lower, depending on the amount of your investment and the timing of any purchases or redemptions.
APEXcm SMALL/MID-CAP GROWTH FUND
ABOUT YOUR FUND’S EXPENSES (Unaudited) (Continued)
More information about the Fund’s expenses can be found in this report. For additional information on operating expenses and other shareholder costs, please refer to the Fund’s prospectus.
|
|
Beginning |
Ending |
Expenses |
|
Based on Actual Fund Return |
$ 1,000.00 |
$ 1,066.70 |
$ 5.41 |
|
Based on Hypothetical 5% Return (before expenses) |
$ 1,000.00 |
$ 1,019.70 |
$ 5.29 |
|
* |
Expenses are equal to the Fund’s annualized expense ratio of 1.05% for the period, multiplied by the average account value over the period, multiplied by 182/365 (to reflect the one-half year period). |
OTHER INFORMATION (Unaudited)
A description of the policies and procedures that the Fund uses to vote proxies relating to portfolio securities is available without charge upon request by calling toll-free 1-888-575-4800, or on the SEC’s website at http://www.sec.gov. Information regarding how the Fund voted proxies relating to portfolio securities during the most recent 12-month period ended June 30 is available without charge upon request by calling toll-free 1-888-575-4800, or on the SEC’s website at http://www.sec.gov.
The Trust files a complete listing of portfolio holdings for the Fund with the SEC as of the end of the first and third quarters of each fiscal year on Form N-Q. These filings are available upon request by calling 1-888-575-4800. Furthermore, you may obtain a copy of the filings on the SEC’s website at http://www.sec.gov. The Trust’s Forms N-Q may also be reviewed and copied at the SEC’s Public Reference Room in Washington, DC, and information on the operation of the Public Reference Room may be obtained by calling 1-800-SEC-0330.
APEXcm SMALL/MID-CAP GROWTH FUND
BOARD OF TRUSTEES AND EXECUTIVE OFFICERS
(Unaudited)
The Board of Trustees has overall responsibility for management of the Trust’s affairs. The Trustees serve during the lifetime of the Trust and until its termination, or until death, resignation, retirement, or removal. The Trustees, in turn, elect the officers of the Fund to actively supervise its day-to-day operations. The officers have been elected for an annual term. Unless otherwise noted, each Trustee’s and officer’s address is 225 Pictoria Drive, Suite 450, Cincinnati, Ohio 45246. The following are the Trustees and executive officers of the Fund:
|
Name and |
Length of Time Served |
Position(s) Held with Trust |
Principal Occupation(s) During Past 5 Years |
Number of Funds in Trust Overseen by Trustee |
Directorships of Public Companies Held by Trustee During Past 5 Years |
|
Interested Trustees: |
|||||
|
Robert G. Dorsey* Year of Birth: 1957 |
Since February 2012 |
Trustee (February 2012 to present) President (June 2012 to October 2013) |
Managing Director of Ultimus Fund Solutions, LLC and Ultimus Fund Distributors, LLC (1999 to present) |
11 |
n/a |
|
Independent Trustees: |
|||||
|
John C. Davis Year of Birth: 1952 |
Since June 2012 |
Chairman (July 2014 to present) Trustee (June 2012 to present) |
Consultant ( government services) since May 2011; Retired Partner of PricewaterhouseCoopers LLP (1974-2010) |
11 |
n/a |
|
David M. Deptula Year of Birth: 1958 |
Since June 2012 |
Trustee |
Vice President of Tax at The Standard Register Company since November 2011; Tax Partner at Deloitte Tax LLP from 1984 to 2011 |
11 |
n/a |
|
John J. Discepoli Year of Birth: 1963 |
Since June 2012 |
Trustee |
Owner of Discepoli Financial Planning, LLC (personal financial planning company) since November 2004 |
11 |
n/a |
|
* |
Mr. Dorsey is considered an “interested person” of the Trust within the meaning of Section 2(a)(19) of the 1940 Act because of his relationship with the Trust’s administrator, transfer agent and distributor. Mr. Dorsey was President of the Trust from June 2012 to October 2013. |
APEXcm SMALL/MID-CAP GROWTH FUND
BOARD OF TRUSTEES AND EXECUTIVE OFFICERS
(Unaudited) (Continued)
|
Name and |
Length of Time Served |
Position(s) Held with Trust |
Principal Occupation(s) During Past 5 Years |
|
Executive Officers: |
|||
|
Nitin N. Kumbhani 8163 Old Yankee Road, Suite E Dayton, Ohio 45458 Year of Birth: 1948 |
Since June 2012 |
Principal Executive Officer of APEXcm Small/Mid-Cap Growth Fund |
President and Chief Investment Officer of Apex Capital Management, Inc. (1987 to present) |
|
Michael Kalbfleisch 8163 Old Yankee Road, Suite E Dayton, Ohio 45458 Year of Birth: 1959 |
Since June 2012 |
Vice President of APEXcm Small/Mid-Cap Growth Fund |
Vice President and Chief Compliance Officer of Apex Capital Management, Inc. (2001 to present) |
|
David R. Carson Year of Birth: 1958 |
Since April 2013 |
President (October 2013 to present) Vice President (April 2013 to October 2013) |
Vice President and Director of Client Strategies of Ultimus Fund Solutions, LLC (2013 to present); Chief Compliance Officer, The Huntington Funds (2005 to 2013), The Flex-Funds (2006 to 2011), Meeder Financial (2007 to 2011), Huntington Strategy Shares (2012 to 2013), and Huntington Asset Advisors (2013); Vice President, Huntington National Bank (2001 to 2013) |
|
Jennifer L. Leamer Year of Birth: 1976 |
Since April 2014 |
Treasurer (October 2014 - present) Assistant Treasurer (April 2014 - October 2014) |
Mutual Fund Controller of Ultimus Fund Solutions, LLC (2014 to present); Business Analyst of Ultimus Fund Solutions, LLC (2007 to 2014) |
|
Bo J. Howell Year of Birth: 1981 |
Since October 2014 |
Secretary (April 2015 to present) Assistant Secretary (October 2014 to April 2015) |
V.P., Director of Fund Administration for Ultimus Fund Solutions, LLC (2014 to present); Counsel – Securities and Mutual Funds for Western & Southern Financial Group (2012 to 2014); U.S. Securities and Exchange Commission, Senior Counsel (2009 to 2012) |
|
Stephen L. Preston Year of Birth: 1966 |
Since June 2012 |
Chief Compliance Officer |
Vice President and Chief Compliance Officer of Ultimus Fund Distributors, LLC and Vice President of Ultimus Fund Solutions, LLC (2011 to present); Senior Consultant at Mainstay Capital Markets Consultants (2010 to 2011); Chief Compliance Officer at INTL Trading, Inc. (2008 to 2010) |
Additional information about members of the Board and executive officers is available in the Fund’s Statement of Additional Information (“SAI”). To obtain a free copy of the SAI, please call 1-888-575-4800.
APEXcm SMALL/MID-CAP GROWTH FUND
DISCLOSURE REGARDING APPROVAL OF INVESTMENT ADVISORY AGREEMENT (Unaudited)
The Board of Trustees (the “Board”), including the Independent Trustees voting separately, has reviewed and approved the Fund’s Investment Advisory Agreement with Apex Capital Management, Inc. (the “Adviser”) for an additional annual term. Approval took place at an in-person meeting held on April 20, 2015, at which all of the Trustees were present.
In the course of their deliberations, the Board was advised by legal counsel. The Board received and reviewed information provided by the Adviser in response to requests of the Board and counsel.
In considering the Investment Advisory Agreement and reaching their conclusions with respect thereto, the Board reviewed and analyzed various factors that they determined were relevant, including the factors described below.
The nature, extent, and quality of the services provided by the Adviser. In this regard, the Board reviewed the services being provided by the Adviser to the Fund including, without limitation, its investment advisory services since the Fund’s inception, the Adviser’s compliance procedures and practices, and its efforts to promote the Fund and assist in its distribution. The Board also noted that a principal of the Adviser serves as the Fund’s Principal Executive Officer without additional compensation. After reviewing the foregoing information and further information regarding the Adviser’s business, the Board concluded that the quality, extent, and nature of the services provided by the Adviser were satisfactory and adequate for the Fund.
The investment performance of the Fund. In this regard, the Board compared the performance of the Fund with the performance of its benchmark index and related Morningstar category. The Board also considered the consistency of the Adviser’s management with the Fund’s investment objective and policies. Following discussion of the investment performance of the Fund and its performance relative to its Morningstar category, the Adviser’s experience in managing mutual funds, its historical investment performance, and other factors, the Board concluded that the investment performance of the Fund has been satisfactory.
The costs of the services provided and profits realized by the Adviser and its affiliates from its relationship with the Fund. In this regard, the Board considered the Adviser’s staffing, personnel, and methods of operations; the education and experience of its personnel; compliance program, policies, and procedures; financial condition and the level of commitment to the Fund, and, generally, the Adviser’s advisory business; the asset level of the Fund; the overall expenses of the Fund, including the advisory fee; and the differences in fees and services to the Adviser’s other clients that may be similar to the Fund. The Board considered the Adviser’s Expense Limitation Agreement (the “ELA”) with the Fund, and considered the Adviser’s current and
APEXcm SMALL/MID-CAP GROWTH FUND
DISCLOSURE REGARDING APPROVAL OF INVESTMENT ADVISORY AGREEMENT (Unaudited) (Continued)
past fee reductions and expense reimbursements for the Fund. The Board further took into account the Adviser’s commitment to continue the ELA for the Fund until at least October 1, 2016.
The Board also considered potential benefits for the Adviser in managing the Fund, including promotion of the Adviser’s name and the potential for it to receive research, statistical, or other services from the Fund’s trades. The Board compared the Fund’s advisory fee and overall expense ratio to the average advisory fees and average expense ratios for its Morningstar category. The Board noted that the advisory fee for the Fund was above the average and the median for the Morningstar Mid Cap Growth category. The Board further noted that the overall annual expense ratio of 1.05 percent for the Fund with the Adviser’s ELA is lower than the Morningstar category’s average expense ratio (1.33 percent) and median expense ratio (1.23 percent). The Board also noted that the Fund had significantly less assets than the average or median fund in its Morningstar category. The Board also compared the fees paid by the Fund to the fees paid by other clients of the Adviser, and considered the similarities and differences of services received by such other clients as compared to the service provided to the Fund. Following these comparisons and upon further consideration and discussion of the foregoing, the Board concluded that the advisory fee paid to the Adviser by the Fund is fair and reasonable.
The extent to which economies of scale would be realized as the Fund grows and whether advisory fee levels reflect these economies of scale for the benefit of the Fund’s investors. In this regard, the Board considered that the Fund’s fee arrangements with the Adviser involve both the advisory fee and the ELA. The Board determined that while the advisory fee remained the same as asset levels increased, the shareholders of the Fund have experienced benefits from the ELA. Following further discussion of the Fund’s asset level, expectations for growth, and level of fees, the Board determined that the Fund’s fee arrangements with the Adviser would continue to provide benefits. The Board also determined that the fee arrangements were fair and reasonable given the Fund’s projected asset levels for the next year.
Brokerage and portfolio transactions. In this regard, the Board considered the Adviser’s trading policies, procedures, and performance in seeking best execution for the Fund. The Board also considered the historical portfolio turnover rate for the Fund; the process by which evaluations are made of the overall reasonableness of commissions paid; the method and basis for selecting and evaluating the broker-dealers used; any anticipated allocation of portfolio business to persons affiliated with the Adviser; and the extent to which the Fund’s trades are allocated to soft-dollar arrangements. After further review and discussion, the Board determined that the Adviser’s practices regarding brokerage and portfolio transactions were satisfactory.
APEXcm SMALL/MID-CAP GROWTH FUND
DISCLOSURE REGARDING APPROVAL OF INVESTMENT ADVISORY AGREEMENT (Unaudited) (Continued)
Possible conflicts of interest. In evaluating the possibility for conflicts of interest, the Board considered such matters as the experience and abilities of the advisory personnel assigned to the Fund, the Adviser’s process for allocating trades among its different clients, and the substance and administration of the Adviser’s code of ethics. Following further consideration and discussion, the Board found that the Adviser’s standards and practices relating to the identification and mitigation of potential conflicts of interests were satisfactory.
Conclusion
After consideration of the above factors as well as other factors, the Board unanimously concluded that approval of the Investment Advisory Agreement was in the best interests of the Fund and its shareholders.

BARROW VALUE OPPORTUNITY FUND
INSTITUTIONAL CLASS (BALIX)
INVESTOR CLASS (BALAX)
BARROW LONG/SHORT OPPORTUNITY FUND
INSTITUTIONAL CLASS (BFSLX)
INVESTOR CLASS (BFLSX)
Annual Report
May 31, 2015
|
BARROW VALUE OPPORTUNITY FUND |
June 26, 2015 |
Dear Shareholder,
We are pleased to report on the status and performance of Barrow Value Opportunity Fund (“the Fund”) for the fiscal year ended May 31, 2015. On May 1, 2015 the Fund changed its name from Barrow All-Cap Core Fund.
We believe that the Fund owns a well-positioned portfolio of equity interests in excellent businesses at attractive valuations. This portfolio is highly diversified by market capitalization segments (large, middle, small), industry sectors, and issuers. The underlying businesses feature high returns on capital, wide operating margins, and low debt loads. Based on our estimates of intrinsic value, our portfolio’s valuation is attractively low on an absolute basis and less expensive than the U.S. stock market as represented by the S&P 500® Index (the “S&P 500”).
On August 30, 2013, the Fund was reorganized as a mutual fund from a private limited partnership, which had commenced operations on December 31, 2008. Please refer to the Performance Information on pages 4 and 5 for a summary of Fund performance versus the S&P 500 over various periods of time since the Fund’s inception.
The Fund’s long-term performance has been excellent relative to the S&P 500. The Fund has exceeded the total return of the S&P 500 in five of the past six calendar years1. During the fiscal year ended May 31, 2015, the Institutional Class of the Fund returned 10.10% net of all fees and expenses, which lagged the S&P 500 by 1.71%. This lag is attributable to the Fund’s large-cap and small-cap positions, which underperformed the S&P 500, while its mid-cap positions outperformed. We are confident the Fund’s large-cap and small-cap holdings will make meaningful contributions to the Fund’s performance over time, as they have in the past, and the Fund continues to hold substantial positions in each market capitalization segment.
Barrow Street Advisors, LLC (the “Adviser”) continued using its proprietary private-equity approach to uncover companies that exhibit its Quality-meets-Value criteria. Based on extensive research by the Adviser, the Fund seeks to invest in companies with fundamental operating and financial attributes representative of both quality and value. To increase the Fund’s chances for success, we harness these opportunities by investing in a variety of positions diversified across market capitalization and industry sectors.
Over the past fiscal year, we uncovered 114 new investment opportunities, composed of 53 small caps, 28 mid caps, and 33 large caps, and representing six different industry sectors. We believe all of these new additions to the Fund’s portfolio are excellent companies with strong balance sheets. These companies are generally using their ample free cash flow to: a) re-invest in growth opportunities at high rates of return; b) pay dividends; c) repurchase stock at attractive valuations; and/or d) retire outstanding debt.
In keeping with our practice since the beginning of 2009, over the past year the Fund’s investments were sourced by taking account of the opportunity set of all companies in our broad investment universe each time we committed capital to a new position. We think this approach allows us to uncover excellent investment opportunities that arise from temporary market inefficiencies and to gather up the most compelling investments across a wide array of industries and market capitalizations, while avoiding the destructive behavioral biases inherent in concentrated-stock and sector-specialized investing.
Seven of the Fund’s holdings were announced as take-over targets over the past year, which was approximately 1.4x the market average. The Fund has had investments in 67 take-overs since December 31, 2008, or roughly 4x the market average2. The control premiums we have captured by virtue of holding stocks that end up being merger targets have made repeated and meaningful contributions to the Fund’s total returns, and we expect continued benefits from this effect going forward. We sell companies from the Fund’s portfolio soon after they are announced as take-over targets and re-invest that capital.
Over the past fiscal year, the Fund’s portfolio generated a total return, before fees and expenses, of +11.24%, including +8.03% for large caps, +14.98% for mid caps and +9.45% for small caps. This compares to +11.81% for the S&P 500 (for large caps), +12.28% for the S&P 400 Midcap (for mid caps), and +11.32% for the Russell 2000 (for small caps) over the same period. The Fund’s sectors with the best absolute performance were Health Care and Consumer Staples, which generated total returns of +28.80% and +21.15%, respectively. The Fund’s sectors with the worst absolute performance were Energy and Materials, which returned -20.84% and +7.32%, respectively.
You can find additional commentary and reports about the Adviser’s management of the Fund’s portfolio on the Barrow Funds’ website (www.barrowfunds.com), including our unique quarterly “consolidated look-through” report in which we compare the portfolio of the Fund with the S&P 500 as if they were both public holding companies like Berkshire Hathaway. The consolidated look-through analysis is another example of how we look at our portfolio through a private equity lens. We focus on the key characteristics of good business, such as total enterprise value (not just equity market capitalization), unleveraged cash flow, return on capital, leverage, growth, and insider ownership. At the same time, we are buying a diverse group of these high quality companies at attractive valuation levels. This unique approach has served our investors well, and we remain confident in the future.
Sincerely,
|
Nicholas Chermayeff |
Robert F. Greenhill, Jr. |
David R. Bechtel |
|
Co-Portfolio Manager, |
Co-Portfolio Manager, |
Principal, |
|
Investment Committee |
Investment Committee |
Investment Committee |
|
1 |
The investment related and performance information discussed above for periods prior to Barrow Value Opportunity Fund’s reorganization date (August 30, 2013) are based on the activities of the Fund’s predecessor, the Barrow Street Fund L.P. (the “Predecessor Private Fund”), an unregistered limited partnership managed by the portfolio managers of Barrow Value Opportunity Fund. The Predecessor Private Fund was reorganized into the Institutional Class shares of the Barrow Value Opportunity Fund on August 30, 2013, the date that the Fund commenced operations (the “Reorganization”). Barrow Value Opportunity Fund has been managed in the same style and by the same portfolio managers since the Predecessor Private Fund’s inception on December 31, 2008. The performance information shows the Predecessor Private Fund’s returns calculated using the actual fees and expenses charged by the Predecessor Private Fund. This prior performance is net of management fees and other expenses, but does not include the effect of the Predecessor Private Fund’s performance fee, which was in place until October 7, 2012. Prior to the Reorganization, the Predecessor Private Fund was not subject to certain investment restrictions, diversification requirements, and other restrictions of the Investment Company Act of 1940, as amended, or Subchapter M of the Internal Revenue Code of 1986, as amended, which, if they had been applicable, might have adversely affected Barrow Value Opportunity Fund’s performance. |
|
2 |
The frequency of merger and acquisition (“M&A”) activity in the Fund’s portfolio is calculated on a quarterly basis by dividing the cumulative number of portfolio holdings that have been announced as merger or acquisition targets by the cumulative number of unique holdings held in the Fund’s portfolio. The frequency of M&A activity in the market is calculated on a quarterly basis by dividing the cumulative number of publicly-traded U.S. common stocks that have been announced as acquisition targets per Bloomberg by the total universe of publicly-traded U.S. common stocks as identified by Bloomberg (approximately 10,000). |
Past performance is not predictive of future performance. Investment results and principal value will fluctuate so that shares, when redeemed, may be worth more or less than their original cost. Current performance may be higher or lower than the performance data quoted. Performance data current to the most recent month end are available by calling 1-877-767-6633.
An investor should consider the investment objectives, risks, charges and expenses of the Fund carefully before investing. The Fund’s prospectus contains this and other important information. To obtain a copy of the Fund’s prospectus please visit our website at www.barrowfunds.com or call 1-877-767-6633 and a copy will be sent to you free of charge. Please read the prospectus carefully before you invest. The Fund is distributed by Ultimus Fund Distributors, LLC.
The Letter to Shareholders seeks to describe some of the Adviser’s current opinions and views of the financial markets. Although the Adviser believes it has a reasonable basis for any opinions or views expressed, actual results may differ, sometimes significantly so, from those expected or expressed. The securities held by the Fund that are discussed in the Letter to Shareholders were held during the period covered by this Report. They do not comprise the entire investment portfolio of the Fund, may be sold at any time and may no longer be held by the Fund. The opinions of the Fund’s Adviser with respect to those securities may change at any time.
BARROW VALUE OPPORTUNITY FUND
PERFORMANCE INFORMATION
May 31, 2015 (Unaudited)
Comparison of the Change in Value of a $250,000 Investment in
Barrow Value Opportunity Fund - Institutional Class(a)
versus the S&P 500® Index
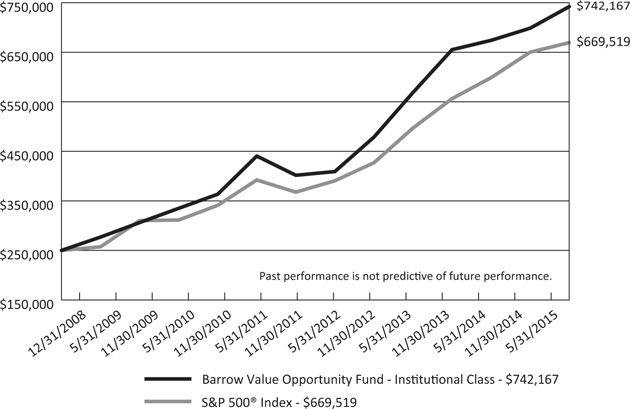
|
Average Annual Total Returns(a)(b) For the periods ended May 31, 2015(a) |
||||
|
1 Year |
5 Years |
Since |
||
|
Barrow Value Opportunity Fund - Institutional Class |
10.10% |
17.24% |
18.49% |
|
|
Barrow Value Opportunity Fund - Investor Class |
9.81% |
n/a |
14.54% |
|
|
S&P 500® Index |
11.81% |
16.54% |
16.60%(d) |
|
BARROW VALUE OPPORTUNITY FUND
PERFORMANCE INFORMATION
May 31, 2015 (Unaudited) (Continued)
|
Comparison of Yearly Total Returns with the S&P 500® Index |
||||
|
Barrow Value Opportunity Fund - Institutional Class(a) |
S&P 500® Index |
Difference |
||
|
Yearly Total Returns for the Calendar Years: |
||||
|
2009 |
30.10% |
26.46% |
3.64% |
|
|
2010 |
18.75% |
15.06% |
3.69% |
|
|
2011 |
5.50% |
2.11% |
3.39% |
|
|
2012 |
18.77% |
16.00% |
2.77% |
|
|
2013 |
36.69% |
32.39% |
4.30% |
|
|
2014 |
5.13% |
13.69% |
(8.56%) |
|
|
Total Return Since Inception (not annualized, through 5/31/15) |
196.87% |
167.81% |
29.06% |
|
|
(a) |
The Barrow Value Opportunity Fund - Institutional Class (the "Fund") performance includes the performance of the Barrow Street Fund L.P. (the "Predecessor Private Fund"), the Fund's predecessor, for the periods before the Fund's registration statement became effective. The Predecessor Private Fund was reorganized into the Institutional Class shares of the Fund at the close of business on August 30, 2013 (the "Reorganization"), the date the Fund commenced operations. The Fund has been managed in the same style and by the same portfolio managers since the Predecessor Private Fund’s inception on December 31, 2008. The Fund’s investment goals, policies, guidelines and restrictions are, in all material respects, equivalent to those of the Predecessor Private Fund. The performance of the Predecessor Private Fund is net of management fees of 1.50% of assets but does not include the effect of a 20% performance fee which was in place until October 7, 2012. Prior to the Reorganization, the Predecessor Private Fund was not subject to certain investment restrictions, diversification requirements and other restrictions of the Investment Company Act of 1940, as amended, or Subchapter M of the Internal Revenue Code of 1986, as amended. If such restrictions had been applicable, they might have adversely affected the Predecessor Private Fund’s performance. |
|
(b) |
The Fund’s total returns do not reflect the deduction of taxes a shareholder would pay on Fund distributions, if any, or the redemption of Fund shares. |
|
(c) |
Represents the period from December 31, 2008(a) and August 30, 2013 for the Institutional and Investor Classes, respectively, through May 31, 2015. |
|
(d) |
Represents the period from December 31, 2008(a) (the commencement of operations for the Predecessor Private Fund) through May 31, 2015. |
|
BARROW LONG/SHORT OPPORTUNITY FUND |
June 26, 2015 |
Dear Shareholder,
We are pleased to report on the status and performance of Barrow Long/Short Opportunity Fund (“the Fund”) for the fiscal year ended May 31, 2015. On May 1, 2015, the Fund changed its name from Barrow All-Cap Long/Short Fund.
We believe the Fund owns a well-positioned long portfolio of equity positions in excellent businesses at attractive valuations that feature high returns on capital, wide operating margins, and low debt load. The Fund also sells short the common stock of companies with poor business characteristics that are trading at high prices. The Fund’s long and short portfolios are highly diversified by market cap segments (large, mid, small), industry sectors, and issuers.
We believe the Fund is well positioned to do well in any future market condition, especially a bear market. We believe the Fund’s long and short portfolios are cheap and expensive, respectively, on an absolute basis and in relation to the U.S. stock market as represented by the S&P 500 Index. We believe the Fund’s short portfolio provides a meaningful hedge against the market’s potential downside volatility.
On August 30, 2013, Barrow Street Advisors, LLC (“the Adviser”) launched the Barrow Long/Short Opportunity Fund (the “Fund”). For the fiscal year ended May 31, 2015, the Institutional Class of the Fund posted a total return of 4.01%, which compares to 11.81% for the S&P 500 Index and 5.31% for the HFRI Equity Hedge Index. The Fund lagged the performance of the S&P 500 due to the successful implementation of its mission to hedge a significant amount of market exposure.
The Fund maintains a gross exposure of approximately 220% of its net capital with long exposure of 130%, short exposure of 90%, and net exposure of 40%. For the fiscal year ended May 31, 2015, the Fund’s long portfolio generated an unleveraged total return before fees and expenses of +11.24%, which trailed the S&P 500 by 57 basis points largely because the Fund’s large-cap and small-cap positions underperformed the S&P 500. With respect to its short book, the Fund experienced attractive performance as the companies that the Fund sold short returned less than the Fund’s long book. The Fund’s short portfolio generated an unleveraged total return before fees and expenses of +9.87%, or 194 bps less than the S&P 500 with strong contributions from the small cap segment.
The Adviser continued using its proprietary private equity approach to uncover companies that exhibit its Quality-meets-Value criteria. Based on extensive research by the Adviser, the Fund seeks to invest in companies with fundamental operating and financial attributes representative of both quality and value. Using this approach the Fund continued to uncover potential opportunities to: 1) purchase quality companies trading at temporary discounts to their intrinsic values; and 2) sell short the stock of
lower quality companies trading at prices well above their intrinsic values. To increase the Fund’s chances for success, we harness these opportunities by investing in a variety of positions diversified across market capitalization and industry sectors.
Over the past year, we uncovered 114 new long opportunities in six industry sectors, including 53 small caps, 28 mid caps, and 33 large caps. We believe all of these new additions to the Fund’s portfolio are excellent companies with strong balance sheets. They are generally using their ample free cash flow to: a) re-invest in growth opportunities at high rates of return; b) pay dividends; c) repurchase stock at attractive valuations; and/or d) retire outstanding debt. In tandem, we initiated 194 new short positions, including 95 small caps, 50 mid caps and 49 large caps. We believe these companies are overpriced and exhibit weak quality characteristics.
In keeping with our practice, over the past year the Fund’s investments were sourced by taking account of the opportunity set of all companies in our broad investment universe each time we committed capital to a new position. We think this approach allows us to uncover excellent investment opportunities that arise from temporary market inefficiencies and to gather up the most compelling investments across a wide array of industries and market capitalizations while avoiding the destructive behavioral biases inherent in concentrated-stock and sector-specialized investing.
Seven of the Fund’s long positions were announced as take-over targets since May 31, 2014, which was approximately 1.4x the market average. On the short side, 35 of the Fund’s positions were announced as take-over targets since May 31, 2014, which was approximately 1.7x the market average1.
Since May 31, 2014, the long portfolio generated an unleveraged total return before fees and expenses of +11.24%, including +8.03% for large caps, +14.98% for mid caps and +9.45% for small caps. This compares to +11.81% for the S&P 500, +12.28% for the S&P 400 Midcap, and +11.32% for the Russell 2000. The Fund’s sectors with the best absolute performance were Health Care and Consumer Staples, which generated total returns of +28.80% and +21.15%, respectively. The Fund’s sectors that did least well were Energy and Materials, which returned -20.84% and +7.32%, respectively.
Over the same period, the Fund’s short portfolio generated an unleveraged total return before fees and expenses of +9.87%, including +11.87% for large caps, +12.36% for mid caps and +6.95% for small caps. The Fund’s sectors with the best performance were Energy and Materials, which returned -16.30% and -2.66%, respectively. Our sectors that did least well were Health Care and Consumer Discretionary, which generated total returns of +33.04% and +16.33%, respectively.
You can find more information about the Fund’s portfolio on the Barrow Funds website (www.barrowfunds.com), including our unique quarterly “consolidated look-through” report in which we compare the portfolio of the Fund with the S&P 500 as if they were public holding companies like Bershire Hathaway. The consolidated look-through analysis is another example of how we look at our portfolio through a private equity lens. We focus on the key characteristics of good business, such as total enterprise value (not just equity market capitalization), unleveraged cash flow, return on capital, leverage, growth, and insider ownership. At the same time, we are buying a diverse
group of these high quality companies at attractive valuation levels and selling short the stock of companies with fewer of these characteristics at high prices. This unique approach has served our investors well, and we remain confident in the future.
Sincerely,
|
Nicholas Chermayeff |
Robert F. Greenhill, Jr. |
David R. Bechtel |
|
Co-Portfolio Manager, |
Co-Portfolio Manager, |
Principal, |
|
Investment Committee |
Investment Committee |
Investment Committee |
|
1 |
The frequency of merger and acquisition (“M&A”) activity in the Fund’s portfolio is calculated on a quarterly basis by dividing the cumulative number of portfolio holdings that have been announced as merger or acquisition targets by the cumulative number of unique holdings held in the Fund’s portfolio. The frequency of M&A activity in the market is calculated on a quarterly basis by dividing the cumulative number of publicly-traded U.S. common stocks that have been announced as acquisition targets per Bloomberg by the total universe of publicly-traded U.S. common stocks as identified by Bloomberg (approximately 10,000). |
Past performance is not predictive of future performance. Investment results and principal value will fluctuate so that shares, when redeemed, may be worth more or less than their original cost. Current performance may be higher or lower than the performance data quoted. Performance data current to the most recent month end are available by calling 1-877-767-6633.
An investor should consider the investment objectives, risks, charges and expenses of the Fund carefully before investing. The Fund’s prospectus contains this and other important information. To obtain a copy of the Fund’s prospectus please visit our website at www.barrowfunds.com or call 1-877-767-6633 and a copy will be sent to you free of charge. Please read the prospectus carefully before you invest. The Fund is distributed by Ultimus Fund Distributors, LLC.
The Letter to Shareholders seeks to describe some of the Adviser’s current opinions and views of the financial markets. Although the Adviser believes it has a reasonable basis for any opinions or views expressed, actual results may differ, sometimes significantly so, from those expected or expressed. The securities held by the Fund that are discussed in the Letter to Shareholders were held during the period covered by this Report. They do not comprise the entire investment portfolio of the Fund, may be sold at any time and may no longer be held by the Fund. The opinions of the Fund’s Adviser with respect to those securities may change at any time.
BARROW LONG/SHORT OPPORTUNITY FUND
PERFORMANCE INFORMATION
May 31, 2015 (Unaudited)
Comparison of the Change in Value of a $250,000 Investment in
Barrow Long/Short Opportunity Fund - Institutional Class
versus the S&P 500® Index
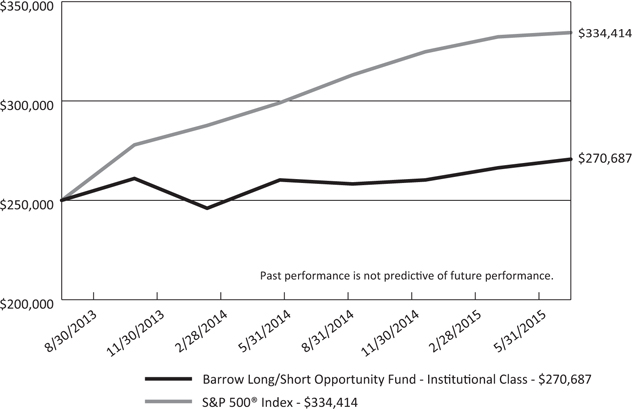
|
Average Annual Total Returns(a) |
|||
|
1 Year |
Since |
||
|
Barrow Long/Short Opportunity Fund - Institutional Class |
4.01% |
4.65% |
|
|
Barrow Long/Short Opportunity Fund - Investor Class |
3.82% |
4.42% |
|
|
S&P 500® Index |
11.81% |
18.08% |
|
|
(a) |
The Fund's total returns do not reflect the deduction of taxes a shareholder would pay on Fund distributions, if any, or the redemption of Fund shares. |
|
(b) |
The Fund commenced operations on August 30, 2013. |
BARROW VALUE OPPORTUNITY FUND
PORTFOLIO INFORMATION
May 31, 2015 (Unaudited)
Sector Diversification
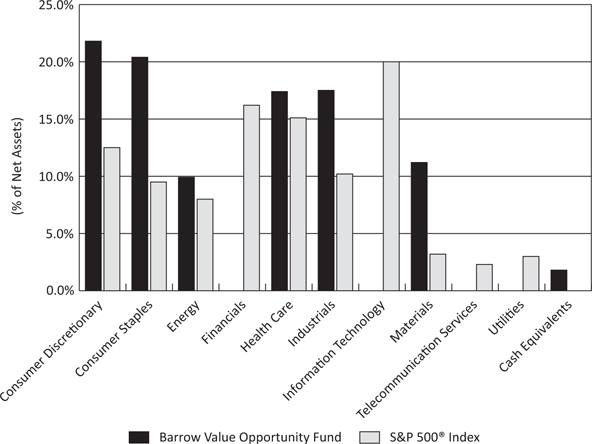
Top 10 Equity Holdings
|
Security Description |
% of |
|
Starz - Series A |
1.92% |
|
USANA Health Sciences, Inc. |
1.92% |
|
Outerwall, Inc. |
1.72% |
|
GameStop Corporation - Class A |
1.71% |
|
RPX Corporation |
1.67% |
|
Omnicom Group, Inc. |
1.64% |
|
Steven Madden Ltd. |
1.58% |
|
WD-40 Company |
1.56% |
|
H&R Block, Inc. |
1.52% |
|
Deluxe Corporation |
1.46% |
BARROW LONG/SHORT OPPORTUNITY FUND
PORTFOLIO INFORMATION
May 31, 2015 (Unaudited)
Net Sector Exposure Diversification*
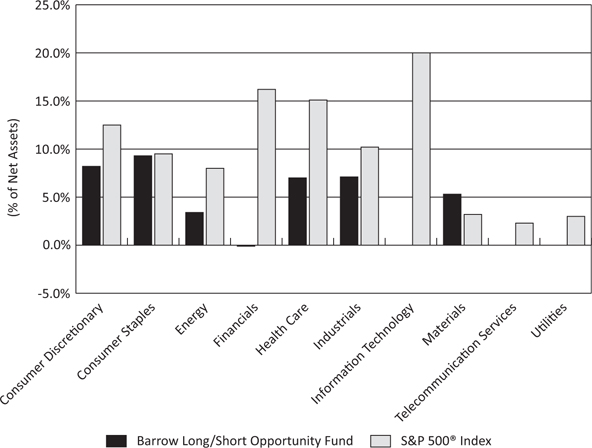
|
* |
The net percentages are computed by taking the net dollar exposure, including short positions, and dividing by the net assets of the Fund. Consequently, the percentages will not total to 100%. |
|
Top 10 Long Equity Holdings |
Top 10 Short Equity Holdings |
|||
|
Security Description |
% of |
Security Description |
% of |
|
|
Starz - Series A |
2.55% |
Dean Foods Company |
0.73% |
|
|
USANA Health Sciences, Inc. |
2.54% |
Diamond Foods, Inc. |
0.65% |
|
|
Outerwall, Inc. |
2.28% |
Coca-Cola Bottling Company Consolidated |
0.64% |
|
|
GameStop Corporation - Class A |
2.27% |
Fresh Del Monte Produce, Inc. |
0.57% |
|
|
RPX Corporation |
2.21% |
Boston Beer Company, Inc. - Class A |
0.54% |
|
|
Omnicom Group, Inc. |
2.18% |
Anderson's, Inc. (The) |
0.53% |
|
|
Steven Madden Ltd. |
2.10% |
Boulder Brands, Inc. |
0.49% |
|
|
WD-40 Company |
2.07% |
United Natural Foods, Inc. |
0.49% |
|
|
H&R Block, Inc. |
2.02% |
Snyder's-Lance, Inc. |
0.48% |
|
|
Deluxe Corporation |
1.93% |
DexCom, Inc. |
0.47% |
|
|
BARROW VALUE OPPORTUNITY FUND |
||||||||
|
COMMON STOCKS — 98.2% |
Shares |
Value |
||||||
|
Consumer Discretionary — 21.8% |
||||||||
|
Auto Components — 0.4% |
||||||||
|
Dorman Products, Inc. (a) |
786 |
$ |
36,675 |
|||||
|
Motorcar Parts of America, Inc. (a) |
3,317 |
95,430 |
||||||
|
132,105 |
||||||||
|
Automobiles — 0.8% |
||||||||
|
Thor Industries, Inc. |
2,926 |
178,749 |
||||||
|
Winnebago Industries, Inc. |
4,255 |
92,461 |
||||||
|
271,210 |
||||||||
|
Diversified Consumer Services — 1.5% |
||||||||
|
H&R Block, Inc. (b) |
15,455 |
490,387 |
||||||
|
Hotels, Restaurants & Leisure — 1.2% |
||||||||
|
DineEquity, Inc. |
403 |
39,333 |
||||||
|
Interval Leisure Group, Inc. (b) |
13,235 |
344,374 |
||||||
|
383,707 |
||||||||
|
Household Durables — 0.9% |
||||||||
|
NVR, Inc. (a) |
98 |
133,339 |
||||||
|
Tupperware Brands Corporation (b) |
2,117 |
139,171 |
||||||
|
272,510 |
||||||||
|
Internet & Catalog Retail — 0.5% |
||||||||
|
Lands' End, Inc. (a) |
5,482 |
161,226 |
||||||
|
Leisure Products — 1.2% |
||||||||
|
Arctic Cat, Inc. |
730 |
24,149 |
||||||
|
Nautilus, Inc. (a) |
1,770 |
37,382 |
||||||
|
Smith & Wesson Holding Corporation (a) |
9,917 |
145,879 |
||||||
|
Sturm, Ruger & Company, Inc. |
3,105 |
166,863 |
||||||
|
374,273 |
||||||||
|
Media — 5.5% |
||||||||
|
CBS Corporation - Class B |
984 |
60,733 |
||||||
|
Entravision Communications Corporation - Class A |
12,335 |
83,261 |
||||||
|
Interpublic Group of Companies, Inc. (b) |
13,213 |
269,809 |
||||||
|
National CineMedia, Inc. |
9,492 |
151,208 |
||||||
|
Omnicom Group, Inc. |
7,099 |
529,088 |
||||||
|
Starz - Series A (a) |
14,757 |
619,204 |
||||||
|
Time Warner, Inc. |
333 |
28,132 |
||||||
|
Time, Inc. |
977 |
21,992 |
||||||
|
1,763,427 |
||||||||
|
BARROW VALUE OPPORTUNITY FUND |
||||||||
|
COMMON STOCKS — 98.2% (Continued) |
Shares |
Value |
||||||
|
Consumer Discretionary — 21.8% (Continued) |
||||||||
|
Specialty Retail — 7.7% |
||||||||
|
AutoZone, Inc. (a) |
49 |
$ |
33,007 |
|||||
|
Bed Bath & Beyond, Inc. (a) (b) |
3,836 |
273,584 |
||||||
|
Buckle, Inc. (The) (b) |
515 |
21,929 |
||||||
|
Cato Corporation (The) - Class A (b) |
3,499 |
130,478 |
||||||
|
Express, Inc. (a) (b) |
6,269 |
110,585 |
||||||
|
Finish Line, Inc. (The) - Class A |
1,352 |
35,382 |
||||||
|
Foot Locker, Inc. (b) |
2,036 |
128,675 |
||||||
|
Francesca's Holdings Corporation (a) |
5,547 |
86,921 |
||||||
|
GameStop Corporation - Class A (b) |
12,684 |
550,612 |
||||||
|
GNC Holdings, Inc. - Class A |
5,730 |
255,214 |
||||||
|
Hibbett Sports, Inc. (a) |
2,798 |
130,247 |
||||||
|
Outerwall, Inc. (b) |
7,227 |
554,022 |
||||||
|
Ross Stores, Inc. |
326 |
31,514 |
||||||
|
Select Comfort Corporation (a) |
3,614 |
112,576 |
||||||
|
Winmark Corporation |
307 |
28,223 |
||||||
|
2,482,969 |
||||||||
|
Textiles, Apparel & Luxury Goods — 2.1% |
||||||||
|
Coach, Inc. |
1,601 |
56,627 |
||||||
|
Deckers Outdoor Corporation (a) |
751 |
51,181 |
||||||
|
Iconix Brand Group, Inc. (a) (b) |
2,380 |
61,452 |
||||||
|
Steven Madden Ltd. (a) (b) |
13,491 |
509,690 |
||||||
|
678,950 |
||||||||
|
Consumer Staples — 20.4% |
||||||||
|
Beverages — 1.7% |
||||||||
|
Dr Pepper Snapple Group, Inc. (b) |
3,838 |
294,144 |
||||||
|
National Beverage Corporation (a) (b) |
6,552 |
135,627 |
||||||
|
PepsiCo, Inc. |
1,109 |
106,941 |
||||||
|
536,712 |
||||||||
|
Food & Staples Retailing — 0.5% |
||||||||
|
CVS Health Corporation |
557 |
57,026 |
||||||
|
Fresh Market, Inc. (The) (a) |
816 |
25,908 |
||||||
|
Village Super Market, Inc. - Class A |
2,358 |
75,503 |
||||||
|
158,437 |
||||||||
|
Food Products — 7.1% |
||||||||
|
B&G Foods, Inc. (b) |
9,841 |
304,481 |
||||||
|
Calavo Growers, Inc. |
1,298 |
65,484 |
||||||
|
Cal-Maine Foods, Inc. |
5,851 |
331,693 |
||||||
|
General Mills, Inc. |
88 |
4,941 |
||||||
|
J & J Snack Foods Corporation |
1,156 |
124,617 |
||||||
|
BARROW VALUE OPPORTUNITY FUND |
||||||||
|
COMMON STOCKS — 98.2% (Continued) |
Shares |
Value |
||||||
|
Consumer Staples — 20.4% (Continued) |
||||||||
|
Food Products — 7.1% (Continued) |
||||||||
|
J.M. Smucker Company (The) |
44 |
$ |
5,216 |
|||||
|
John B. Sanfilippo & Son, Inc. |
1,307 |
66,147 |
||||||
|
Kellogg Company |
3,961 |
248,632 |
||||||
|
Lancaster Colony Corporation (b) |
2,772 |
247,373 |
||||||
|
Pilgrim's Pride Corporation (b) |
9,862 |
252,270 |
||||||
|
Pinnacle Foods, Inc. |
7,179 |
302,595 |
||||||
|
Sanderson Farms, Inc. |
2,709 |
220,865 |
||||||
|
Seaboard Corporation (a) |
31 |
106,330 |
||||||
|
2,280,644 |
||||||||
|
Household Products — 2.3% |
||||||||
|
Clorox Company (The) |
1,319 |
142,003 |
||||||
|
Energizer Holdings, Inc. (b) |
39 |
5,526 |
||||||
|
Spectrum Brands Holdings, Inc. |
974 |
94,137 |
||||||
|
WD-40 Company |
5,970 |
503,689 |
||||||
|
745,355 |
||||||||
|
Personal Products — 3.6% |
||||||||
|
Herbalife Ltd. (a) |
6,009 |
312,649 |
||||||
|
Inter Parfums, Inc. |
4,728 |
158,057 |
||||||
|
Nu Skin Enterprises, Inc. - Class A |
1,670 |
84,502 |
||||||
|
USANA Health Sciences, Inc. (a) (b) |
4,824 |
617,906 |
||||||
|
1,173,114 |
||||||||
|
Tobacco — 5.2% |
||||||||
|
Altria Group, Inc. (b) |
7,596 |
388,915 |
||||||
|
Philip Morris International, Inc. (b) |
3,711 |
308,273 |
||||||
|
Reynolds American, Inc. (b) |
5,599 |
429,723 |
||||||
|
Universal Corporation |
1,760 |
90,622 |
||||||
|
Vector Group Ltd. (b) |
20,815 |
460,220 |
||||||
|
1,677,753 |
||||||||
|
Energy — 9.9% |
||||||||
|
Energy Equipment & Services — 3.6% |
||||||||
|
Cameron International Corporation (a) |
2,381 |
122,217 |
||||||
|
CARBO Ceramics, Inc. |
168 |
7,165 |
||||||
|
Dril-Quip, Inc. (a) |
3,173 |
239,815 |
||||||
|
FMC Technologies, Inc. (a) |
5,172 |
216,138 |
||||||
|
Halliburton Company |
1,794 |
81,447 |
||||||
|
Helmerich & Payne, Inc. |
298 |
21,751 |
||||||
|
Oceaneering International, Inc. |
4,007 |
203,556 |
||||||
|
Oil States International, Inc. (a) |
403 |
16,475 |
||||||
|
RPC, Inc. |
605 |
8,748 |
||||||
|
BARROW VALUE OPPORTUNITY FUND |
||||||||
|
COMMON STOCKS — 98.2% (Continued) |
Shares |
Value |
||||||
|
Energy — 9.9% (Continued) |
||||||||
|
Energy Equipment & Services — 3.6% (Continued) |
||||||||
|
Schlumberger Ltd. |
706 |
$ |
64,084 |
|||||
|
US Silica Holdings, Inc. |
5,515 |
170,138 |
||||||
|
1,151,534 |
||||||||
|
Oil, Gas & Consumable Fuels — 6.3% |
||||||||
|
Alliance Holdings GP, L.P. |
4,577 |
220,611 |
||||||
|
Alon USA Partners, L.P. (b) |
11,926 |
242,813 |
||||||
|
BP Prudhoe Bay Royalty Trust |
1,122 |
74,871 |
||||||
|
CVR Energy, Inc. (b) |
1,397 |
54,148 |
||||||
|
Exxon Mobil Corporation |
290 |
24,708 |
||||||
|
Green Plains, Inc. |
1,996 |
65,589 |
||||||
|
HollyFrontier Corporation (b) |
2,055 |
85,591 |
||||||
|
Marathon Oil Corporation (b) |
1,462 |
39,752 |
||||||
|
Marathon Petroleum Corporation (b) |
2,192 |
226,784 |
||||||
|
Northern Tier Energy, L.P. (b) |
3,266 |
79,788 |
||||||
|
Permian Basin Royalty Trust |
1,467 |
12,162 |
||||||
|
REX American Resources Corporation (a) |
2,057 |
131,381 |
||||||
|
Sabine Royalty Trust |
6,732 |
265,779 |
||||||
|
Valero Energy Corporation |
1,734 |
102,722 |
||||||
|
Western Refining, Inc. (b) |
9,631 |
423,571 |
||||||
|
2,050,270 |
||||||||
|
Health Care — 17.4% |
||||||||
|
Health Care Equipment & Supplies — 2.0% |
||||||||
|
Edwards Lifesciences Corporation (a) |
663 |
86,667 |
||||||
|
Globus Medical, Inc. - Class A (a) (b) |
12,482 |
323,783 |
||||||
|
Medtronic plc (b) |
2,627 |
200,493 |
||||||
|
Thoratec Corporation (a) |
678 |
30,775 |
||||||
|
641,718 |
||||||||
|
Health Care Providers & Services — 10.8% |
||||||||
|
Accretive Health, Inc. (a) |
5,085 |
27,357 |
||||||
|
AMN Healthcare Services, Inc. (a) (b) |
4,632 |
123,165 |
||||||
|
AmSurg Corporation (a) (b) |
6,855 |
461,616 |
||||||
|
Cardinal Health, Inc. (b) |
1,529 |
134,812 |
||||||
|
Chemed Corporation (b) |
2,679 |
332,705 |
||||||
|
CorVel Corporation (a) |
797 |
28,612 |
||||||
|
DaVita HealthCare Partners, Inc. (a) |
1,424 |
119,303 |
||||||
|
Ensign Group, Inc. (The) |
1,631 |
75,629 |
||||||
|
HCA Holdings, Inc. (a) |
354 |
28,968 |
||||||
|
HealthSouth Corporation (b) |
7,151 |
308,637 |
||||||
|
BARROW VALUE OPPORTUNITY FUND |
||||||||
|
COMMON STOCKS — 98.2% (Continued) |
Shares |
Value |
||||||
|
Health Care — 17.4% (Continued) |
||||||||
|
Health Care Providers & Services — 10.8% (Continued) |
||||||||
|
IPC Healthcare, Inc. (a) |
811 |
$ |
40,039 |
|||||
|
Laboratory Corporation of America Holdings (a) (b) |
1,361 |
160,530 |
||||||
|
MEDNAX, Inc. (a) (b) |
6,040 |
429,927 |
||||||
|
Patterson Companies, Inc. (b) |
2,828 |
135,291 |
||||||
|
Premier, Inc. - Class A (a) |
7,106 |
272,302 |
||||||
|
Quest Diagnostics, Inc. (b) |
5,761 |
433,400 |
||||||
|
Select Medical Holdings Corporation |
3,819 |
62,441 |
||||||
|
Surgical Care Affiliates, Inc. (a) |
6,232 |
236,754 |
||||||
|
U.S. Physical Therapy, Inc. |
558 |
27,822 |
||||||
|
VCA, Inc. (a) (b) |
770 |
40,394 |
||||||
|
3,479,704 |
||||||||
|
Health Care Technology — 0.3% |
||||||||
|
Computer Programs & Systems, Inc. |
1,579 |
82,629 |
||||||
|
Pharmaceuticals — 4.3% |
||||||||
|
DepoMed, Inc. (a) |
15,236 |
317,823 |
||||||
|
Johnson & Johnson |
2,374 |
237,733 |
||||||
|
Lannett Company, Inc. (a) |
1,549 |
86,171 |
||||||
|
Pfizer, Inc. (b) |
4,791 |
166,487 |
||||||
|
Prestige Brands Holdings, Inc. (a) (b) |
3,312 |
145,463 |
||||||
|
SciClone Pharmaceuticals, Inc. (a) |
21,619 |
200,192 |
||||||
|
Supernus Pharmaceuticals, Inc. (a) |
17,274 |
245,636 |
||||||
|
1,399,505 |
||||||||
|
Industrials — 17.5% |
||||||||
|
Aerospace & Defense — 2.1% |
||||||||
|
B/E Aerospace, Inc. |
436 |
25,000 |
||||||
|
Cubic Corporation (b) |
591 |
28,250 |
||||||
|
Engility Holdings, Inc. (b) |
699 |
19,516 |
||||||
|
Northrop Grumman Corporation (b) |
2,515 |
400,338 |
||||||
|
Raytheon Company (b) |
1,822 |
188,140 |
||||||
|
Vectrus, Inc. (a) (b) |
344 |
8,631 |
||||||
|
669,875 |
||||||||
|
Air Freight & Logistics — 0.1% |
||||||||
|
Expeditors International of Washington, Inc. |
1,027 |
47,078 |
||||||
|
Commercial Services & Supplies — 1.9% |
||||||||
|
Deluxe Corporation (b) |
7,353 |
469,342 |
||||||
|
Pitney Bowes, Inc. (b) |
6,199 |
135,448 |
||||||
|
604,790 |
||||||||
|
BARROW VALUE OPPORTUNITY FUND |
||||||||
|
COMMON STOCKS — 98.2% (Continued) |
Shares |
Value |
||||||
|
Industrials — 17.5% (Continued) |
||||||||
|
Construction & Engineering — 1.4% |
||||||||
|
Argan, Inc. |
9,137 |
$ |
326,922 |
|||||
|
Fluor Corporation |
2,423 |
136,221 |
||||||
|
463,143 |
||||||||
|
Electrical Equipment — 3.2% |
||||||||
|
Babcock & Wilcox Company (The) |
9,580 |
318,918 |
||||||
|
Emerson Electric Company (b) |
4,292 |
258,851 |
||||||
|
Generac Holdings, Inc. (a) |
2,639 |
110,257 |
||||||
|
Rockwell Automation, Inc. |
814 |
100,032 |
||||||
|
Thermon Group Holdings, Inc. (a) |
10,966 |
249,038 |
||||||
|
1,037,096 |
||||||||
|
Machinery — 2.4% |
||||||||
|
Actuant Corporation - Class A |
347 |
8,154 |
||||||
|
Douglas Dynamics, Inc. |
1,235 |
25,071 |
||||||
|
Dover Corporation |
2,507 |
189,028 |
||||||
|
Graco, Inc. |
390 |
28,310 |
||||||
|
Greenbrier Companies, Inc. (The) |
4,181 |
251,822 |
||||||
|
Hillenbrand, Inc. |
1,393 |
42,793 |
||||||
|
Lindsay Corporation (b) |
1,093 |
88,030 |
||||||
|
Oshkosh Corporation (b) |
1,313 |
65,860 |
||||||
|
PACCAR, Inc. (b) |
472 |
30,000 |
||||||
|
Valmont Industries, Inc. (b) |
484 |
60,234 |
||||||
|
789,302 |
||||||||
|
Professional Services — 4.8% |
||||||||
|
Dun & Bradstreet Corporation (The) (b) |
2,843 |
363,705 |
||||||
|
Huron Consulting Group, Inc. (a) (b) |
1,520 |
97,736 |
||||||
|
Insperity, Inc. |
4,931 |
259,469 |
||||||
|
Korn/Ferry International |
2,978 |
95,564 |
||||||
|
Navigant Consulting, Inc. (a) (b) |
1,606 |
21,857 |
||||||
|
Resources Connection, Inc. (b) |
10,672 |
167,444 |
||||||
|
RPX Corporation (a) (b) |
33,780 |
537,440 |
||||||
|
1,543,215 |
||||||||
|
Road & Rail — 0.4% |
||||||||
|
Landstar System, Inc. |
1,764 |
115,366 |
||||||
|
Trading Companies & Distributors — 1.2% |
||||||||
|
United Rentals, Inc. (a) |
1,883 |
167,417 |
||||||
|
WESCO International, Inc. (a) |
2,967 |
213,209 |
||||||
|
380,626 |
||||||||
|
BARROW VALUE OPPORTUNITY FUND |
||||||||
|
COMMON STOCKS — 98.2% (Continued) |
Shares |
Value |
||||||
|
Materials — 11.2% |
||||||||
|
Chemicals — 8.2% |
||||||||
|
Albemarle Corporation |
3,266 |
$ |
196,450 |
|||||
|
Celanese Corporation - Series A |
1,776 |
122,278 |
||||||
|
CF Industries Holdings, Inc. (b) |
1,234 |
389,796 |
||||||
|
Chemtura Corporation (a) |
4,074 |
113,094 |
||||||
|
CVR Partners, L.P. |
971 |
13,837 |
||||||
|
Ferro Corporation (a) |
18,184 |
275,851 |
||||||
|
Flotek Industries, Inc. (a) |
7,245 |
83,245 |
||||||
|
FutureFuel Corporation |
6,907 |
82,884 |
||||||
|
Innophos Holdings, Inc. |
212 |
11,047 |
||||||
|
Innospec, Inc. |
3,606 |
154,625 |
||||||
|
LSB Industries, Inc. (a) |
1,057 |
44,954 |
||||||
|
LyondellBasell Industries N.V. - Class A |
2,873 |
290,460 |
||||||
|
NewMarket Corporation (b) |
285 |
131,217 |
||||||
|
OCI Partners, L.P. |
6,089 |
106,192 |
||||||
|
Olin Corporation (b) |
4,171 |
121,960 |
||||||
|
Scotts Miracle-Gro Company (The) - Class A |
1,489 |
91,216 |
||||||
|
Terra Nitrogen Company, L.P. |
710 |
92,982 |
||||||
|
Valspar Corporation (The) |
590 |
49,242 |
||||||
|
W.R. Grace & Company (a) |
179 |
17,530 |
||||||
|
Westlake Chemical Corporation |
2,849 |
200,883 |
||||||
|
Westlake Chemical Partners, L.P. |
1,362 |
29,746 |
||||||
|
2,619,489 |
||||||||
|
Containers & Packaging — 1.7% |
||||||||
|
Avery Dennison Corporation |
5,877 |
363,845 |
||||||
|
Owens-Illinois, Inc. (a) |
3,142 |
75,094 |
||||||
|
Sonoco Products Company |
2,573 |
115,836 |
||||||
|
554,775 |
||||||||
|
Metals & Mining — 1.2% |
||||||||
|
Compass Minerals International, Inc. |
2,860 |
246,418 |
||||||
|
Hi-Crush Partners, L.P. |
2,869 |
85,496 |
||||||
|
Kaiser Aluminum Corporation (b) |
172 |
13,954 |
||||||
|
OCI Resources, L.P. |
1,162 |
27,272 |
||||||
|
Southern Copper Corporation (b) |
589 |
17,682 |
||||||
|
390,822 |
||||||||
|
Paper & Forest Products — 0.1% |
||||||||
|
Boise Cascade Company (a) |
332 |
11,766 |
||||||
|
Schweitzer-Mauduit International, Inc. (b) |
678 |
27,364 |
||||||
|
39,130 |
||||||||
|
Total Common Stocks (Cost $26,998,915) |
$ |
31,642,846 |
||||||
|
BARROW VALUE OPPORTUNITY FUND |
||||||||
|
MONEY MARKET FUNDS — 1.9% |
Shares |
Value |
||||||
|
Fidelity Institutional Money Market Government Portfolio - Class I, 0.01% (c) (Cost $605,368) |
605,368 |
$ |
605,368 |
|||||
|
Total Investments at Value — 100.1% (Cost $27,604,283) |
$ |
32,248,214 |
||||||
|
Liabilities in Excess of Other Assets — (0.1%) |
(27,640 |
) |
||||||
|
Net Assets — 100.0% |
$ |
32,220,574 |
||||||
|
(a) |
Non-income producing security. |
|
(b) |
All or a portion of the shares have been pledged as collateral for the bank line of credit (Note 5). |
|
(c) |
The rate shown is the 7-day effective yield as of May 31, 2015.
|
|
See accompanying notes to financial statements. |
|
|
BARROW LONG/SHORT OPPORTUNITY FUND |
||||||||
|
COMMON STOCKS — 128.7% |
Shares |
Value |
||||||
|
Consumer Discretionary — 28.8% |
||||||||
|
Auto Components — 0.5% |
||||||||
|
Dorman Products, Inc. (a) (b) |
314 |
$ |
14,651 |
|||||
|
Motorcar Parts of America, Inc. (a) (b) |
1,333 |
38,351 |
||||||
|
53,002 |
||||||||
|
Automobiles — 1.1% |
||||||||
|
Thor Industries, Inc. (b) |
1,195 |
73,003 |
||||||
|
Winnebago Industries, Inc. (b) |
1,739 |
37,788 |
||||||
|
110,791 |
||||||||
|
Diversified Consumer Services — 2.0% |
||||||||
|
H&R Block, Inc. (b) |
6,285 |
199,423 |
||||||
|
Hotels, Restaurants & Leisure — 1.6% |
||||||||
|
DineEquity, Inc. (b) |
159 |
15,518 |
||||||
|
Interval Leisure Group, Inc. (b) |
5,380 |
139,988 |
||||||
|
155,506 |
||||||||
|
Household Durables — 1.1% |
||||||||
|
NVR, Inc. (a) (b) |
38 |
51,703 |
||||||
|
Tupperware Brands Corporation (b) |
870 |
57,194 |
||||||
|
108,897 |
||||||||
|
Internet & Catalog Retail — 0.7% |
||||||||
|
Lands' End, Inc. (a) (b) |
2,213 |
65,084 |
||||||
|
Leisure Products — 1.6% |
||||||||
|
Arctic Cat, Inc. (b) |
290 |
9,593 |
||||||
|
Nautilus, Inc. (a) (b) |
723 |
15,270 |
||||||
|
Smith & Wesson Holding Corporation (a) (b) |
4,088 |
60,135 |
||||||
|
Sturm, Ruger & Company, Inc. (b) |
1,257 |
67,551 |
||||||
|
152,549 |
||||||||
|
Media — 7.2% |
||||||||
|
CBS Corporation - Class B (b) |
398 |
24,565 |
||||||
|
Entravision Communications Corporation - Class A (b) |
5,019 |
33,878 |
||||||
|
Interpublic Group of Companies, Inc. (b) |
5,344 |
109,125 |
||||||
|
National CineMedia, Inc. (b) |
3,861 |
61,506 |
||||||
|
Omnicom Group, Inc. (b) |
2,882 |
214,795 |
||||||
|
Starz - Series A (a) (b) |
5,999 |
251,718 |
||||||
|
Time Warner, Inc. (b) |
132 |
11,151 |
||||||
|
Time, Inc. |
295 |
6,640 |
||||||
|
713,378 |
||||||||
|
BARROW LONG/SHORT OPPORTUNITY FUND |
||||||||
|
COMMON STOCKS — 128.7% (Continued) |
Shares |
Value |
||||||
|
Consumer Discretionary — 28.8% (Continued) |
||||||||
|
Specialty Retail — 10.2% |
||||||||
|
AutoZone, Inc. (a) (b) |
20 |
$ |
13,472 |
|||||
|
Bed Bath & Beyond, Inc. (a) (b) |
1,551 |
110,617 |
||||||
|
Buckle, Inc. (The) (b) |
207 |
8,814 |
||||||
|
Cato Corporation (The) - Class A (b) |
1,423 |
53,064 |
||||||
|
Express, Inc. (a) (b) |
2,565 |
45,247 |
||||||
|
Finish Line, Inc. (The) - Class A (b) |
542 |
14,184 |
||||||
|
Foot Locker, Inc. (b) |
821 |
51,887 |
||||||
|
Francesca's Holdings Corporation (a) (b) |
2,267 |
35,524 |
||||||
|
GameStop Corporation - Class A (b) |
5,159 |
223,952 |
||||||
|
GNC Holdings, Inc. - Class A (b) |
2,320 |
103,333 |
||||||
|
Hibbett Sports, Inc. (a) (b) |
1,134 |
52,788 |
||||||
|
Outerwall, Inc. (b) |
2,934 |
224,920 |
||||||
|
Ross Stores, Inc. (b) |
131 |
12,664 |
||||||
|
Select Comfort Corporation (a) |
1,473 |
45,884 |
||||||
|
Winmark Corporation |
122 |
11,215 |
||||||
|
1,007,565 |
||||||||
|
Textiles, Apparel & Luxury Goods — 2.8% |
||||||||
|
Coach, Inc. (b) |
665 |
23,521 |
||||||
|
Deckers Outdoor Corporation (a) (b) |
303 |
20,649 |
||||||
|
Iconix Brand Group, Inc. (a) (b) |
967 |
24,968 |
||||||
|
Steven Madden Ltd. (a) (b) |
5,492 |
207,488 |
||||||
|
276,626 |
||||||||
|
Consumer Staples — 25.9% |
||||||||
|
Beverages — 2.2% |
||||||||
|
Brown-Forman Corporation - Class B (b) |
2 |
188 |
||||||
|
Dr Pepper Snapple Group, Inc. (b) |
1,562 |
119,712 |
||||||
|
National Beverage Corporation (a) (b) |
2,654 |
54,938 |
||||||
|
PepsiCo, Inc. (b) |
444 |
42,815 |
||||||
|
217,653 |
||||||||
|
Food & Staples Retailing — 0.5% |
||||||||
|
CVS Health Corporation (b) |
223 |
22,831 |
||||||
|
Village Super Market, Inc. - Class A (b) |
939 |
30,067 |
||||||
|
52,898 |
||||||||
|
Food Products — 8.8% |
||||||||
|
B&G Foods, Inc. (b) |
4,009 |
124,038 |
||||||
|
Cal-Maine Foods, Inc. (b) |
2,255 |
127,836 |
||||||
|
General Mills, Inc. (b) |
33 |
1,853 |
||||||
|
J & J Snack Foods Corporation (b) |
469 |
50,558 |
||||||
|
John B. Sanfilippo & Son, Inc. (b) |
543 |
27,481 |
||||||
|
Kellogg Company (b) |
1,497 |
93,967 |
||||||
|
BARROW LONG/SHORT OPPORTUNITY FUND |
||||||||
|
COMMON STOCKS — 128.7% (Continued) |
Shares |
Value |
||||||
|
Consumer Staples — 25.9% (Continued) |
||||||||
|
Food Products — 8.8% (Continued) |
||||||||
|
Lancaster Colony Corporation (b) |
1,117 |
$ |
99,681 |
|||||
|
Pilgrim's Pride Corporation (b) |
3,994 |
102,167 |
||||||
|
Pinnacle Foods, Inc. (b) |
2,936 |
123,752 |
||||||
|
Sanderson Farms, Inc. (b) |
1,100 |
89,683 |
||||||
|
Seaboard Corporation (a) (b) |
7 |
24,010 |
||||||
|
865,026 |
||||||||
|
Household Products — 3.0% |
||||||||
|
Clorox Company (The) (b) |
533 |
57,383 |
||||||
|
Spectrum Brands Holdings, Inc. (b) |
394 |
38,080 |
||||||
|
WD-40 Company (b) |
2,417 |
203,922 |
||||||
|
299,385 |
||||||||
|
Personal Products — 4.6% |
||||||||
|
Herbalife Ltd. (a) (b) |
2,443 |
127,109 |
||||||
|
Inter Parfums, Inc. (b) |
1,140 |
38,110 |
||||||
|
Nu Skin Enterprises, Inc. - Class A (b) |
681 |
34,459 |
||||||
|
USANA Health Sciences, Inc. (a) (b) |
1,957 |
250,672 |
||||||
|
450,350 |
||||||||
|
Tobacco — 6.8% |
||||||||
|
Altria Group, Inc. (b) |
3,076 |
157,491 |
||||||
|
Philip Morris International, Inc. (b) |
1,508 |
125,270 |
||||||
|
Reynolds American, Inc. (b) |
2,272 |
174,376 |
||||||
|
Universal Corporation (b) |
434 |
22,347 |
||||||
|
Vector Group Ltd. (b) |
8,437 |
186,542 |
||||||
|
666,026 |
||||||||
|
Energy — 13.3% |
||||||||
|
Energy Equipment & Services — 4.7% |
||||||||
|
Cameron International Corporation (a) (b) |
968 |
49,687 |
||||||
|
CARBO Ceramics, Inc. |
68 |
2,900 |
||||||
|
Dril-Quip, Inc. (a) |
1,287 |
97,271 |
||||||
|
FMC Technologies, Inc. (a) (b) |
2,097 |
87,634 |
||||||
|
Halliburton Company |
742 |
33,687 |
||||||
|
Helmerich & Payne, Inc. |
125 |
9,124 |
||||||
|
Oceaneering International, Inc. (b) |
1,621 |
82,347 |
||||||
|
Oil States International, Inc. (a) (b) |
166 |
6,786 |
||||||
|
RPC, Inc. |
244 |
3,528 |
||||||
|
Schlumberger Ltd. (b) |
293 |
26,596 |
||||||
|
US Silica Holdings, Inc. |
2,243 |
69,197 |
||||||
|
468,757 |
||||||||
|
BARROW LONG/SHORT OPPORTUNITY FUND |
||||||||
|
COMMON STOCKS — 128.7% (Continued) |
Shares |
Value |
||||||
|
Energy — 13.3% (Continued) |
||||||||
|
Oil, Gas & Consumable Fuels — 8.6% |
||||||||
|
Alliance Holdings GP, L.P. (b) |
1,863 |
$ |
89,797 |
|||||
|
Alon USA Energy, Inc. (b) |
492 |
8,674 |
||||||
|
Alon USA Partners, L.P. (b) |
4,870 |
99,153 |
||||||
|
BP Prudhoe Bay Royalty Trust (b) |
455 |
30,362 |
||||||
|
CVR Energy, Inc. (b) |
557 |
21,589 |
||||||
|
Exxon Mobil Corporation (b) |
120 |
10,224 |
||||||
|
Green Plains, Inc. (b) |
826 |
27,142 |
||||||
|
HollyFrontier Corporation (b) |
837 |
34,861 |
||||||
|
Marathon Oil Corporation (b) |
550 |
14,954 |
||||||
|
Marathon Petroleum Corporation (b) |
894 |
92,493 |
||||||
|
Northern Tier Energy, L.P. (b) |
1,334 |
32,590 |
||||||
|
Permian Basin Royalty Trust (b) |
595 |
4,933 |
||||||
|
Phillips 66 (b) |
57 |
4,510 |
||||||
|
REX American Resources Corporation (a) (b) |
836 |
53,395 |
||||||
|
Sabine Royalty Trust (b) |
2,725 |
107,583 |
||||||
|
Valero Energy Corporation (b) |
705 |
41,764 |
||||||
|
Western Refining, Inc. (b) |
3,923 |
172,534 |
||||||
|
846,558 |
||||||||
|
Financials — 0.0% (c) |
||||||||
|
Insurance — 0.0% (c) |
||||||||
|
Gerova Financial Group Ltd. (a) (b) (d) |
2 |
0 |
||||||
|
Health Care — 23.0% |
||||||||
|
Health Care Equipment & Supplies — 2.7% |
||||||||
|
Align Technology, Inc. (a) (b) |
68 |
4,126 |
||||||
|
Edwards Lifesciences Corporation (a) (b) |
271 |
35,425 |
||||||
|
Globus Medical, Inc. - Class A (a) (b) |
5,075 |
131,645 |
||||||
|
Medtronic plc (b) |
1,062 |
81,052 |
||||||
|
Thoratec Corporation (a) (b) |
197 |
8,942 |
||||||
|
261,190 |
||||||||
|
Health Care Providers & Services — 14.3% |
||||||||
|
Accretive Health, Inc. (a) (b) |
2,062 |
11,094 |
||||||
|
AmerisourceBergen Corporation (b) |
4 |
450 |
||||||
|
AMN Healthcare Services, Inc. (a) (b) |
1,850 |
49,192 |
||||||
|
AmSurg Corporation (a) (b) |
2,789 |
187,811 |
||||||
|
Cardinal Health, Inc. (b) |
607 |
53,519 |
||||||
|
Chemed Corporation (b) |
1,080 |
134,125 |
||||||
|
BARROW LONG/SHORT OPPORTUNITY FUND |
||||||||
|
COMMON STOCKS — 128.7% (Continued) |
Shares |
Value |
||||||
|
Health Care — 23.0% (Continued) |
||||||||
|
Health Care Providers & Services — 14.3% (Continued) |
||||||||
|
CorVel Corporation (a) (b) |
331 |
$ |
11,883 |
|||||
|
DaVita HealthCare Partners, Inc. (a) (b) |
583 |
48,844 |
||||||
|
Ensign Group, Inc. (The) (b) |
664 |
30,790 |
||||||
|
HCA Holdings, Inc. (a) |
140 |
11,456 |
||||||
|
HealthSouth Corporation (b) |
2,909 |
125,552 |
||||||
|
IPC Healthcare, Inc. (a) (b) |
335 |
16,539 |
||||||
|
Laboratory Corporation of America Holdings (a) (b) |
524 |
61,806 |
||||||
|
MEDNAX, Inc. (a) (b) |
2,448 |
174,249 |
||||||
|
Patterson Companies, Inc. (b) |
1,136 |
54,346 |
||||||
|
Premier, Inc. - Class A (a) (b) |
2,910 |
111,511 |
||||||
|
Quest Diagnostics, Inc. (b) |
2,341 |
176,113 |
||||||
|
Select Medical Holdings Corporation (b) |
1,542 |
25,212 |
||||||
|
Surgical Care Affiliates, Inc. (a) |
2,529 |
96,077 |
||||||
|
U.S. Physical Therapy, Inc. |
221 |
11,019 |
||||||
|
VCA, Inc. (a) (b) |
305 |
16,000 |
||||||
|
1,407,588 |
||||||||
|
Health Care Technology — 0.3% |
||||||||
|
Computer Programs & Systems, Inc. (b) |
638 |
33,387 |
||||||
|
Pharmaceuticals — 5.7% |
||||||||
|
DepoMed, Inc. (a) (b) |
6,186 |
129,040 |
||||||
|
Johnson & Johnson (b) |
969 |
97,036 |
||||||
|
Lannett Company, Inc. (a) (b) |
634 |
35,269 |
||||||
|
Pfizer, Inc. (b) |
1,932 |
67,137 |
||||||
|
Prestige Brands Holdings, Inc. (a) (b) |
1,342 |
58,941 |
||||||
|
SciClone Pharmaceuticals, Inc. (a) |
8,792 |
81,414 |
||||||
|
Supernus Pharmaceuticals, Inc. (a) |
7,007 |
99,639 |
||||||
|
568,476 |
||||||||
|
Industrials — 23.1% |
||||||||
|
Aerospace & Defense — 2.6% |
||||||||
|
B/E Aerospace, Inc. (b) |
76 |
4,358 |
||||||
|
Cubic Corporation (b) |
149 |
7,122 |
||||||
|
Engility Holdings, Inc. (b) |
279 |
7,790 |
||||||
|
Northrop Grumman Corporation (b) |
1,019 |
162,205 |
||||||
|
Raytheon Company (b) |
736 |
75,999 |
||||||
|
Vectrus, Inc. (a) (b) |
137 |
3,437 |
||||||
|
260,911 |
||||||||
|
Air Freight & Logistics — 0.2% |
||||||||
|
Expeditors International of Washington, Inc. (b) |
423 |
19,390 |
||||||
|
BARROW LONG/SHORT OPPORTUNITY FUND |
||||||||
|
COMMON STOCKS — 128.7% (Continued) |
Shares |
Value |
||||||
|
Industrials — 23.1% (Continued) |
||||||||
|
Commercial Services & Supplies — 2.5% |
||||||||
|
Deluxe Corporation (b) |
2,987 |
$ |
190,660 |
|||||
|
Pitney Bowes, Inc. (b) |
2,519 |
55,040 |
||||||
|
245,700 |
||||||||
|
Construction & Engineering — 1.9% |
||||||||
|
Argan, Inc. (b) |
3,710 |
132,744 |
||||||
|
Fluor Corporation (b) |
991 |
55,714 |
||||||
|
188,458 |
||||||||
|
Electrical Equipment — 4.2% |
||||||||
|
Babcock & Wilcox Company (The) (b) |
3,826 |
127,368 |
||||||
|
Emerson Electric Company (b) |
1,729 |
104,276 |
||||||
|
Generac Holdings, Inc. (a) (b) |
1,076 |
44,955 |
||||||
|
Rockwell Automation, Inc. (b) |
337 |
41,414 |
||||||
|
Thermon Group Holdings, Inc. (a) (b) |
4,440 |
100,832 |
||||||
|
418,845 |
||||||||
|
Machinery — 3.3% |
||||||||
|
Actuant Corporation - Class A (b) |
114 |
2,679 |
||||||
|
Douglas Dynamics, Inc. (b) |
504 |
10,231 |
||||||
|
Dover Corporation (b) |
1,028 |
77,511 |
||||||
|
Graco, Inc. |
155 |
11,252 |
||||||
|
Greenbrier Companies, Inc. (The) (b) |
1,710 |
102,993 |
||||||
|
Hillenbrand, Inc. (b) |
531 |
16,312 |
||||||
|
Joy Global, Inc. (b) |
86 |
3,349 |
||||||
|
Lindsay Corporation (b) |
443 |
35,679 |
||||||
|
Oshkosh Corporation (b) |
546 |
27,388 |
||||||
|
PACCAR, Inc. (b) |
190 |
12,077 |
||||||
|
Valmont Industries, Inc. (b) |
196 |
24,392 |
||||||
|
323,863 |
||||||||
|
Professional Services — 6.3% |
||||||||
|
Dun & Bradstreet Corporation (The) (b) |
1,155 |
147,759 |
||||||
|
Huron Consulting Group, Inc. (a) (b) |
619 |
39,802 |
||||||
|
Insperity, Inc. (b) |
1,971 |
103,714 |
||||||
|
Korn/Ferry International (b) |
1,220 |
39,150 |
||||||
|
Navigant Consulting, Inc. (a) (b) |
145 |
1,973 |
||||||
|
Resources Connection, Inc. (b) |
4,359 |
68,393 |
||||||
|
RPX Corporation (a) (b) |
13,725 |
218,365 |
||||||
|
619,156 |
||||||||
|
Road & Rail — 0.5% |
||||||||
|
Landstar System, Inc. |
713 |
46,630 |
||||||
|
BARROW LONG/SHORT OPPORTUNITY FUND |
||||||||
|
COMMON STOCKS — 128.7% (Continued) |
Shares |
Value |
||||||
|
Industrials — 23.1% (Continued) |
||||||||
|
Trading Companies & Distributors — 1.6% |
||||||||
|
United Rentals, Inc. (a) (b) |
765 |
$ |
68,016 |
|||||
|
WESCO International, Inc. (a) (b) |
1,200 |
86,232 |
||||||
|
154,248 |
||||||||
|
Materials — 14.6% |
||||||||
|
Chemicals — 10.6% |
||||||||
|
Albemarle Corporation (b) |
1,233 |
74,165 |
||||||
|
Celanese Corporation - Series A (b) |
693 |
47,713 |
||||||
|
CF Industries Holdings, Inc. (b) |
499 |
157,624 |
||||||
|
Chemtura Corporation (a) (b) |
1,470 |
40,807 |
||||||
|
CVR Partners, L.P. |
390 |
5,557 |
||||||
|
Ferro Corporation (a) (b) |
7,091 |
107,570 |
||||||
|
Flotek Industries, Inc. (a) |
2,948 |
33,873 |
||||||
|
FutureFuel Corporation (b) |
2,809 |
33,708 |
||||||
|
Innophos Holdings, Inc. |
84 |
4,377 |
||||||
|
Innospec, Inc. (b) |
1,462 |
62,691 |
||||||
|
Koppers Holdings, Inc. (b) |
196 |
5,061 |
||||||
|
LSB Industries, Inc. (a) |
272 |
11,568 |
||||||
|
LyondellBasell Industries N.V. - Class A (b) |
1,168 |
118,085 |
||||||
|
NewMarket Corporation (b) |
117 |
53,868 |
||||||
|
OCI Partners, L.P. (b) |
2,486 |
43,356 |
||||||
|
Olin Corporation (b) |
1,685 |
49,269 |
||||||
|
Scotts Miracle-Gro Company (The) - Class A (b) |
595 |
36,450 |
||||||
|
Terra Nitrogen Company, L.P. (b) |
284 |
37,193 |
||||||
|
Valspar Corporation (The) |
236 |
19,697 |
||||||
|
W.R. Grace & Company (a) |
72 |
7,051 |
||||||
|
Westlake Chemical Corporation (b) |
1,151 |
81,157 |
||||||
|
Westlake Chemical Partners, L.P. |
541 |
11,815 |
||||||
|
1,042,655 |
||||||||
|
Containers & Packaging — 2.3% |
||||||||
|
Avery Dennison Corporation (b) |
2,386 |
147,717 |
||||||
|
Owens-Illinois, Inc. (a) (b) |
1,274 |
30,449 |
||||||
|
Sonoco Products Company (b) |
1,037 |
46,686 |
||||||
|
224,852 |
||||||||
|
Metals & Mining — 1.6% |
||||||||
|
Compass Minerals International, Inc. (b) |
1,166 |
100,462 |
||||||
|
Hi-Crush Partners, L.P. |
1,170 |
34,866 |
||||||
|
Kaiser Aluminum Corporation (b) |
54 |
4,381 |
||||||
|
OCI Resources, L.P. |
461 |
10,820 |
||||||
|
Reliance Steel & Aluminum Company (b) |
7 |
446 |
||||||
|
BARROW LONG/SHORT OPPORTUNITY FUND |
||||||||
|
COMMON STOCKS — 128.7% (Continued) |
Shares |
Value |
||||||
|
Materials — 14.6% (Continued) |
||||||||
|
Metals & Mining — 1.6% (Continued) |
||||||||
|
Southern Copper Corporation (b) |
236 |
$ |
7,085 |
|||||
|
158,060 |
||||||||
|
Paper & Forest Products — 0.1% |
||||||||
|
Boise Cascade Company (a) |
131 |
4,643 |
||||||
|
Schweitzer-Mauduit International, Inc. (b) |
270 |
10,897 |
||||||
|
15,540 |
||||||||
|
Total Common Stocks (Cost $11,189,124) |
$ |
12,698,423 |
||||||
|
|
||||||||
|
MONEY MARKET FUNDS — 8.3% |
Shares |
Value |
||||||
|
Fidelity Institutional Money Market Government Portfolio - Class I, 0.01% (e) (Cost $816,934) |
816,934 |
$ |
816,934 |
|||||
|
Total Investments at Value — 137.0% (Cost $12,006,058) |
$ |
13,515,357 |
||||||
|
Liabilities in Excess of Other Assets (f) — (37.0%) |
(3,653,308 |
) |
||||||
|
Net Assets — 100.0% |
$ |
9,862,049 |
||||||
|
(a) |
Non-income producing security. |
|
(b) |
All or a portion of the shares have been pledged as collateral for open short positions and any outstanding borrowings for investment purposes (Note 2). |
|
(c) |
Percentage rounds to less than 0.1%. |
|
(d) |
Security value has been determined in good faith pursuant to procedures adopted by the Board of Trustees. The total value of such securities is $0 at May 31, 2015, representing 0.0%(c) of net assets (Note 2). |
|
(e) |
The rate shown is the 7-day effective yield as of May 31, 2015. |
|
(f) |
Includes cash held as margin deposits for open short positions.
|
|
See accompanying notes to financial statements. |
|
|
BARROW LONG/SHORT OPPORTUNITY FUND |
||||||||
|
COMMON STOCKS — 88.5% |
Shares |
Value |
||||||
|
Consumer Discretionary — 20.7% |
||||||||
|
Auto Components — 0.5% |
||||||||
|
Allison Transmission Holdings, Inc. |
97 |
$ |
2,968 |
|||||
|
BorgWarner, Inc. |
75 |
4,511 |
||||||
|
Federal Mogul Holdings Corporation |
125 |
1,554 |
||||||
|
Gentherm, Inc. |
114 |
5,844 |
||||||
|
Goodyear Tire & Rubber Company (The) |
112 |
3,567 |
||||||
|
Modine Manufacturing Company |
1,045 |
11,693 |
||||||
|
Remy International, Inc. |
203 |
4,486 |
||||||
|
Superior Industries International, Inc. |
587 |
11,323 |
||||||
|
Visteon Corporation |
59 |
6,462 |
||||||
|
52,408 |
||||||||
|
Automobiles — 0.2% |
||||||||
|
General Motors Company |
294 |
10,575 |
||||||
|
Harley-Davidson, Inc. |
27 |
1,444 |
||||||
|
Tesla Motors, Inc. |
55 |
13,794 |
||||||
|
25,813 |
||||||||
|
Distributors — 0.2% |
||||||||
|
Core-Mark Holding Company, Inc. |
271 |
14,555 |
||||||
|
LKQ Corporation |
329 |
9,400 |
||||||
|
23,955 |
||||||||
|
Diversified Consumer Services — 0.6% |
||||||||
|
Carriage Services, Inc. |
49 |
1,219 |
||||||
|
Liberty Tax, Inc. |
37 |
880 |
||||||
|
LifeLock, Inc. |
1,047 |
15,935 |
||||||
|
Matthews International Corporation - Class A |
252 |
12,512 |
||||||
|
Regis Corporation |
952 |
15,384 |
||||||
|
Service Corporation International |
283 |
8,224 |
||||||
|
Sotheby's |
29 |
1,300 |
||||||
|
55,454 |
||||||||
|
Hotels, Restaurants & Leisure — 6.6% |
||||||||
|
Aramark |
420 |
13,167 |
||||||
|
Biglari Holdings, Inc. |
39 |
13,778 |
||||||
|
BJ's Restaurants, Inc. |
369 |
16,893 |
||||||
|
Bloomin' Brands, Inc. |
772 |
17,339 |
||||||
|
Bob Evans Farms, Inc. |
313 |
14,376 |
||||||
|
Brinker International, Inc. |
208 |
11,477 |
||||||
|
Buffalo Wild Wings, Inc. |
101 |
15,420 |
||||||
|
Carnival Corporation |
289 |
13,389 |
||||||
|
Cedar Fair, L.P. |
244 |
14,716 |
||||||
|
BARROW LONG/SHORT OPPORTUNITY FUND |
||||||||
|
COMMON STOCKS — 88.5% (Continued) |
Shares |
Value |
||||||
|
Consumer Discretionary — 20.7% (Continued) |
||||||||
|
Hotels, Restaurants & Leisure — 6.6% (Continued) |
||||||||
|
Cheesecake Factory, Inc. (The) |
292 |
$ |
15,058 |
|||||
|
Chipotle Mexican Grill, Inc. |
18 |
11,079 |
||||||
|
Churchill Downs, Inc. |
162 |
20,198 |
||||||
|
Chuy's Holdings, Inc. |
209 |
5,432 |
||||||
|
ClubCorp Holdings, Inc. |
753 |
17,116 |
||||||
|
Cracker Barrel Old Country Store, Inc. |
63 |
8,888 |
||||||
|
Darden Restaurants, Inc. |
220 |
14,419 |
||||||
|
Dave & Buster's Entertainment, Inc. |
210 |
6,642 |
||||||
|
Del Frisco's Restaurant Group, Inc. |
608 |
11,309 |
||||||
|
Diamond Resorts International, Inc. |
633 |
19,686 |
||||||
|
Extended Stay America, Inc. |
713 |
13,982 |
||||||
|
Fiesta Restaurant Group, Inc. |
278 |
12,935 |
||||||
|
Hilton Worldwide Holdings, Inc. |
257 |
7,443 |
||||||
|
Hyatt Hotels Corporation - Class A |
199 |
11,435 |
||||||
|
International Speedway Corporation - Class A |
470 |
17,498 |
||||||
|
Jack in the Box, Inc. |
219 |
19,011 |
||||||
|
Krispy Kreme Doughnuts, Inc. |
642 |
11,164 |
||||||
|
La Quinta Holdings, Inc. |
481 |
11,958 |
||||||
|
Las Vegas Sands Corporation |
123 |
6,252 |
||||||
|
Marcus Corporation (The) |
747 |
14,641 |
||||||
|
Marriott International, Inc. - Class A |
155 |
12,088 |
||||||
|
Marriott Vacations Worldwide Corporation |
239 |
21,099 |
||||||
|
MGM Resorts International |
554 |
11,108 |
||||||
|
Norwegian Cruise Line Holdings Ltd. |
302 |
16,477 |
||||||
|
Papa John's International, Inc. |
69 |
4,741 |
||||||
|
Penn National Gaming, Inc. |
136 |
2,262 |
||||||
|
Red Robin Gourmet Burgers, Inc. |
217 |
18,096 |
||||||
|
Royal Caribbean Cruises Ltd. |
173 |
13,145 |
||||||
|
Ruby Tuesday, Inc. |
678 |
4,231 |
||||||
|
Ruth's Hospitality Group, Inc. |
398 |
5,862 |
||||||
|
SeaWorld Entertainment, Inc. |
463 |
10,001 |
||||||
|
Six Flags Entertainment Corporation |
399 |
19,495 |
||||||
|
Sonic Corporation |
573 |
17,270 |
||||||
|
Speedway Motorsports, Inc. |
604 |
13,240 |
||||||
|
Starbucks Corporation |
222 |
11,535 |
||||||
|
Starwood Hotels & Resorts Worldwide, Inc. |
147 |
12,166 |
||||||
|
Texas Roadhouse, Inc. |
447 |
15,654 |
||||||
|
Vail Resorts, Inc. |
190 |
19,711 |
||||||
|
Wendy's Company (The) |
1,787 |
20,086 |
||||||
|
Wynn Resorts Ltd. |
67 |
6,746 |
||||||
|
BARROW LONG/SHORT OPPORTUNITY FUND |
||||||||
|
COMMON STOCKS — 88.5% (Continued) |
Shares |
Value |
||||||
|
Consumer Discretionary — 20.7% (Continued) |
||||||||
|
Hotels, Restaurants & Leisure — 6.6% (Continued) |
||||||||
|
Yum! Brands, Inc. |
50 |
$ |
4,505 |
|||||
|
Zoe's Kitchen, Inc. |
42 |
1,331 |
||||||
|
647,550 |
||||||||
|
Household Durables — 2.8% |
||||||||
|
Cavco Industries, Inc. |
100 |
7,253 |
||||||
|
D.R. Horton, Inc. |
453 |
11,832 |
||||||
|
GoPro, Inc. - Class A |
36 |
1,997 |
||||||
|
Harman International Industries, Inc. |
103 |
12,414 |
||||||
|
Installed Building Products, Inc. |
612 |
13,121 |
||||||
|
Jarden Corporation |
270 |
14,326 |
||||||
|
Leggett & Platt, Inc. |
336 |
15,886 |
||||||
|
Lennar Corporation - Class A |
278 |
12,963 |
||||||
|
Libbey, Inc. |
384 |
15,168 |
||||||
|
M/I Homes, Inc. |
660 |
15,358 |
||||||
|
MDC Holdings, Inc. |
559 |
15,630 |
||||||
|
Meritage Homes Corporation |
100 |
4,386 |
||||||
|
Mohawk Industries, Inc. |
78 |
14,558 |
||||||
|
Newell Rubbermaid, Inc. |
274 |
10,831 |
||||||
|
PulteGroup, Inc. |
566 |
10,856 |
||||||
|
Ryland Group, Inc. (The) |
94 |
3,955 |
||||||
|
Standard Pacific Corporation |
1,512 |
12,459 |
||||||
|
Stanley Black & Decker, Inc. |
47 |
4,815 |
||||||
|
Taylor Morrison Home Corporation - Class A |
235 |
4,521 |
||||||
|
Tempur Sealy International, Inc. |
56 |
3,337 |
||||||
|
Toll Brothers, Inc. |
343 |
12,406 |
||||||
|
TRI Pointe Homes, Inc. |
987 |
14,233 |
||||||
|
Universal Electronics, Inc. |
267 |
13,836 |
||||||
|
WCI Communities, Inc. |
764 |
17,763 |
||||||
|
Whirlpool Corporation |
18 |
3,316 |
||||||
|
William Lyon Homes - Class A |
301 |
6,812 |
||||||
|
274,032 |
||||||||
|
Internet & Catalog Retail — 0.9% |
||||||||
|
1-800-FLOWERS.COM, Inc. - Class A |
825 |
7,846 |
||||||
|
Amazon.com, Inc. |
36 |
15,452 |
||||||
|
Expedia, Inc. |
8 |
858 |
||||||
|
Groupon, Inc. |
2,189 |
13,966 |
||||||
|
HomeAway, Inc. |
188 |
5,277 |
||||||
|
Liberty Interactive Corporation - Series A |
180 |
5,035 |
||||||
|
Liberty TripAdvisor Holdings, Inc. - Class A |
42 |
1,175 |
||||||
|
Liberty Ventures - Series A |
18 |
747 |
||||||
|
BARROW LONG/SHORT OPPORTUNITY FUND |
||||||||
|
COMMON STOCKS — 88.5% (Continued) |
Shares |
Value |
||||||
|
Consumer Discretionary — 20.7% (Continued) |
||||||||
|
Internet & Catalog Retail — 0.9% (Continued) |
||||||||
|
NetFlix, Inc. |
26 |
$ |
16,226 |
|||||
|
NutriSystem, Inc. |
238 |
5,417 |
||||||
|
Overstock.com, Inc. |
211 |
4,564 |
||||||
|
TripAdvisor, Inc. |
146 |
11,134 |
||||||
|
zulily, Inc. - Class A |
77 |
1,018 |
||||||
|
88,715 |
||||||||
|
Leisure Products — 0.2% |
||||||||
|
Callaway Golf Company |
1,857 |
17,530 |
||||||
|
Mattel, Inc. |
31 |
800 |
||||||
|
18,330 |
||||||||
|
Media — 2.5% |
||||||||
|
AMC Entertainment Holdings, Inc. - Class A |
367 |
10,610 |
||||||
|
Carmike Cinemas, Inc. |
421 |
11,716 |
||||||
|
Charter Communications, Inc. - Class A |
47 |
8,414 |
||||||
|
Cinemark Holdings, Inc. |
20 |
811 |
||||||
|
DISH Network Corporation - Class A |
175 |
12,388 |
||||||
|
E.W. Scripps Company (The) - Class A |
784 |
18,369 |
||||||
|
Global Eagle Entertainment, Inc. |
553 |
7,504 |
||||||
|
Journal Media Group, Inc. |
165 |
1,320 |
||||||
|
Lamar Advertising Company - Class A |
158 |
9,578 |
||||||
|
Liberty Broadband - Class A |
15 |
809 |
||||||
|
Liberty Broadband - Class C |
6 |
321 |
||||||
|
Liberty Media Corporation - Class A |
271 |
10,383 |
||||||
|
Liberty Media Corporation - Class C |
27 |
1,025 |
||||||
|
Lions Gate Entertainment Corporation |
42 |
1,390 |
||||||
|
Live Nation, Inc. |
531 |
15,187 |
||||||
|
Madison Square Garden Company (The) - Class A |
148 |
12,644 |
||||||
|
Media General, Inc. |
429 |
7,104 |
||||||
|
Morningstar, Inc. |
131 |
10,126 |
||||||
|
New Media Investment Group, Inc. |
554 |
12,199 |
||||||
|
New York Times Company (The) - Class A |
906 |
12,593 |
||||||
|
News Corporation - Class A |
639 |
9,681 |
||||||
|
Nexstar Broadcasting Group, Inc. - Class A |
52 |
2,958 |
||||||
|
Regal Entertainment Group - Class A |
673 |
14,106 |
||||||
|
Rentrak Corporation |
259 |
17,589 |
||||||
|
Scholastic Corporation |
430 |
19,113 |
||||||
|
Sirius XM Holdings, Inc. |
2,468 |
9,526 |
||||||
|
Tribune Media Company - Class A |
183 |
9,699 |
||||||
|
Tribune Publishing Company |
5 |
75 |
||||||
|
Twenty-First Century Fox, Inc. - Class A |
28 |
941 |
||||||
|
248,179 |
||||||||
|
BARROW LONG/SHORT OPPORTUNITY FUND |
||||||||
|
COMMON STOCKS — 88.5% (Continued) |
Shares |
Value |
||||||
|
Consumer Discretionary — 20.7% (Continued) |
||||||||
|
Multiline Retail — 0.8% |
||||||||
|
Big Lots, Inc. |
188 |
$ |
8,253 |
|||||
|
Burlington Stores, Inc. |
395 |
20,844 |
||||||
|
Fred's, Inc. - Class A |
956 |
16,749 |
||||||
|
Kohl's Corporation |
67 |
4,388 |
||||||
|
Nordstrom, Inc. |
36 |
2,615 |
||||||
|
Target Corporation |
177 |
14,040 |
||||||
|
Tuesday Morning Corporation |
833 |
10,679 |
||||||
|
77,568 |
||||||||
|
Specialty Retail — 3.9% |
||||||||
|
Aaron's, Inc. |
458 |
16,044 |
||||||
|
Abercrombie & Fitch Company - Class A |
519 |
10,624 |
||||||
|
Advance Auto Parts, Inc. |
65 |
9,959 |
||||||
|
American Eagle Outfitters, Inc. |
895 |
14,651 |
||||||
|
America's Car-Mart, Inc. |
48 |
2,547 |
||||||
|
Asbury Automotive Group, Inc. |
34 |
2,894 |
||||||
|
Ascena Retail Group, Inc. |
341 |
5,040 |
||||||
|
AutoNation, Inc. |
206 |
12,856 |
||||||
|
Barnes & Noble, Inc. |
614 |
14,441 |
||||||
|
Cabela's, Inc. |
267 |
13,617 |
||||||
|
CarMax, Inc. |
214 |
15,203 |
||||||
|
Chico's FAS, Inc. |
615 |
10,215 |
||||||
|
Children's Place, Inc. (The) |
16 |
1,046 |
||||||
|
CST Brands, Inc. |
421 |
16,743 |
||||||
|
Five Below, Inc. |
347 |
11,538 |
||||||
|
Haverty Furniture Companies, Inc. |
105 |
2,206 |
||||||
|
Home Depot, Inc. (The) |
15 |
1,671 |
||||||
|
Lithia Motors, Inc. - Class A |
191 |
20,332 |
||||||
|
Lowe's Companies, Inc. |
200 |
13,996 |
||||||
|
MarineMax, Inc. |
467 |
11,171 |
||||||
|
Mattress Firm Holding Corporation |
232 |
13,707 |
||||||
|
Men's Wearhouse, Inc. (The) |
334 |
19,375 |
||||||
|
Monro Muffler Brake, Inc. |
217 |
12,805 |
||||||
|
O'Reilly Automotive, Inc. |
8 |
1,756 |
||||||
|
Penske Automotive Group, Inc. |
310 |
15,999 |
||||||
|
Pep Boys - Manny Moe & Jack (The) |
1,594 |
16,147 |
||||||
|
Rent-A-Center, Inc. |
235 |
7,109 |
||||||
|
Restoration Hardware Holdings, Inc. |
174 |
15,827 |
||||||
|
Sears Hometown and Outlet Stores, Inc. |
131 |
924 |
||||||
|
Shoe Carnival, Inc. |
184 |
5,086 |
||||||
|
Stage Stores, Inc. |
685 |
11,090 |
||||||
|
BARROW LONG/SHORT OPPORTUNITY FUND |
||||||||
|
COMMON STOCKS — 88.5% (Continued) |
Shares |
Value |
||||||
|
Consumer Discretionary — 20.7% (Continued) |
||||||||
|
Specialty Retail — 3.9% (Continued) |
||||||||
|
Staples, Inc. |
273 |
$ |
4,495 |
|||||
|
Stein Mart, Inc. |
648 |
6,882 |
||||||
|
Systemax, Inc. |
86 |
718 |
||||||
|
Tiffany & Company |
104 |
9,748 |
||||||
|
Tile Shop Holdings, Inc. (The) |
82 |
1,023 |
||||||
|
Tractor Supply Company |
143 |
12,461 |
||||||
|
TravelCenters of America, LLC |
278 |
4,376 |
||||||
|
Ulta Salon Cosmetics & Fragrance, Inc. |
99 |
15,109 |
||||||
|
Williams-Sonoma, Inc. |
11 |
865 |
||||||
|
382,296 |
||||||||
|
Textiles, Apparel & Luxury Goods — 1.5% |
||||||||
|
Columbia Sportswear Company |
288 |
16,142 |
||||||
|
CROCS, Inc. |
1,197 |
18,003 |
||||||
|
G-III Apparel Group Ltd. |
91 |
5,174 |
||||||
|
Hanesbrands, Inc. |
440 |
14,018 |
||||||
|
Kate Spade & Company |
544 |
13,480 |
||||||
|
NIKE, Inc. - Class B |
127 |
12,912 |
||||||
|
PVH Corporation |
103 |
10,778 |
||||||
|
Sequential Brands Group, Inc. |
85 |
1,188 |
||||||
|
Skechers U.S.A., Inc. - Class A |
126 |
13,340 |
||||||
|
Under Armour, Inc. - Class A |
179 |
14,035 |
||||||
|
Unifi, Inc. |
451 |
14,667 |
||||||
|
VF Corporation |
108 |
7,607 |
||||||
|
Wolverine World Wide, Inc. |
235 |
6,904 |
||||||
|
148,248 |
||||||||
|
Consumer Staples — 16.6% |
||||||||
|
Beverages — 2.5% |
||||||||
|
Boston Beer Company, Inc. - Class A |
203 |
53,547 |
||||||
|
Brown-Forman Corporation - Class B |
234 |
22,059 |
||||||
|
Coca-Cola Bottling Company Consolidated |
556 |
63,145 |
||||||
|
Coca-Cola Company (The) |
389 |
15,934 |
||||||
|
Coca-Cola Enterprises, Inc. |
306 |
13,535 |
||||||
|
Constellation Brands, Inc. - Class A |
291 |
34,306 |
||||||
|
Molson Coors Brewing Company - Class B |
353 |
25,903 |
||||||
|
Monster Beverage Corporation |
129 |
16,419 |
||||||
|
244,848 |
||||||||
|
Food & Staples Retailing — 5.3% |
||||||||
|
Anderson's, Inc. (The) |
1,173 |
52,011 |
||||||
|
Casey's General Stores, Inc. |
512 |
44,641 |
||||||
|
Chefs' Warehouse, Inc. (The) |
1,590 |
29,812 |
||||||
|
BARROW LONG/SHORT OPPORTUNITY FUND |
||||||||
|
COMMON STOCKS — 88.5% (Continued) |
Shares |
Value |
||||||
|
Consumer Staples — 16.6% (Continued) |
||||||||
|
Food & Staples Retailing — 5.3% (Continued) |
||||||||
|
Costco Wholesale Corporation |
212 |
$ |
30,229 |
|||||
|
Diplomat Pharmacy, Inc. |
205 |
7,923 |
||||||
|
Fresh Market, Inc. (The) |
648 |
20,574 |
||||||
|
Ingles Markets, Inc. - Class A |
100 |
4,888 |
||||||
|
Kroger Company (The) |
482 |
35,090 |
||||||
|
Natural Grocers by Vitamin Cottage, Inc. |
1,651 |
39,971 |
||||||
|
PriceSmart, Inc. |
229 |
18,673 |
||||||
|
Rite Aid Corporation |
2,815 |
24,547 |
||||||
|
SpartanNash Company |
520 |
16,255 |
||||||
|
Sprouts Farmers Market, Inc. |
1,288 |
38,627 |
||||||
|
Sysco Corporation |
752 |
27,944 |
||||||
|
United Natural Foods, Inc. |
720 |
48,290 |
||||||
|
Walgreens Boots Alliance, Inc. |
394 |
33,821 |
||||||
|
Wal-Mart Stores, Inc. |
90 |
6,684 |
||||||
|
Weis Markets, Inc. |
305 |
13,167 |
||||||
|
Whole Foods Market, Inc. |
648 |
26,724 |
||||||
|
519,871 |
||||||||
|
Food Products — 7.6% |
||||||||
|
Archer-Daniels-Midland Company |
537 |
28,380 |
||||||
|
Boulder Brands, Inc. |
5,250 |
48,405 |
||||||
|
Bunge Ltd. |
336 |
31,100 |
||||||
|
Calavo Growers, Inc. |
102 |
5,146 |
||||||
|
ConAgra Foods, Inc. |
831 |
32,085 |
||||||
|
Darling Ingredients, Inc. |
2,902 |
45,561 |
||||||
|
Dean Foods Company |
3,923 |
72,262 |
||||||
|
Diamond Foods, Inc. |
2,262 |
64,377 |
||||||
|
Farmer Brothers Company |
801 |
19,665 |
||||||
|
Flowers Foods, Inc. |
526 |
11,814 |
||||||
|
Fresh Del Monte Produce, Inc. |
1,489 |
56,046 |
||||||
|
Hain Celestial Group, Inc. (The) |
688 |
43,530 |
||||||
|
Hershey Company (The) |
80 |
7,429 |
||||||
|
Ingredion, Inc. |
138 |
11,312 |
||||||
|
JM Smucker Company (The) |
5 |
593 |
||||||
|
Keurig Green Mountain, Inc. |
203 |
17,507 |
||||||
|
Kraft Foods Group, Inc. |
26 |
2,196 |
||||||
|
McCormick & Company, Inc. |
362 |
28,417 |
||||||
|
Mead Johnson Nutrition Company |
78 |
7,589 |
||||||
|
Mondelēz International, Inc. - Class A |
780 |
32,440 |
||||||
|
Snyder's-Lance, Inc. |
1,597 |
47,702 |
||||||
|
Tootsie Roll Industries, Inc. |
1,337 |
41,099 |
||||||
|
BARROW LONG/SHORT OPPORTUNITY FUND |
||||||||
|
COMMON STOCKS — 88.5% (Continued) |
Shares |
Value |
||||||
|
Consumer Staples — 16.6% (Continued) |
||||||||
|
Food Products — 7.6% (Continued) |
||||||||
|
TreeHouse Foods, Inc. |
621 |
$ |
44,296 |
|||||
|
Tyson Foods, Inc. - Class A |
372 |
15,791 |
||||||
|
WhiteWave Foods Company (The) |
781 |
37,511 |
||||||
|
752,253 |
||||||||
|
Household Products — 0.4% |
||||||||
|
Colgate-Palmolive Company |
248 |
16,564 |
||||||
|
Energizer Holdings, Inc. |
4 |
567 |
||||||
|
Kimberly Clark Corporation |
164 |
17,853 |
||||||
|
Procter & Gamble Company (The) |
59 |
4,625 |
||||||
|
39,609 |
||||||||
|
Personal Products — 0.8% |
||||||||
|
Avon Products, Inc. |
2,948 |
19,810 |
||||||
|
Coty, Inc. - Class A |
1,320 |
32,908 |
||||||
|
Estèe Lauder Companies, Inc. (The) - Class A |
81 |
7,082 |
||||||
|
IGI Laboratories, Inc. |
2,544 |
16,536 |
||||||
|
76,336 |
||||||||
|
Energy — 9.9% |
||||||||
|
Energy Equipment & Services — 1.1% |
||||||||
|
Basic Energy Services, Inc. |
183 |
1,594 |
||||||
|
Bristow Group, Inc. |
78 |
4,524 |
||||||
|
C&J Energy Services Ltd. |
90 |
1,353 |
||||||
|
Era Group, Inc. |
252 |
5,292 |
||||||
|
Exterran Holdings, Inc. |
408 |
13,489 |
||||||
|
Exterran Partners, L.P. |
123 |
3,185 |
||||||
|
Key Energy Services, Inc. |
685 |
1,541 |
||||||
|
McDermott International, Inc. |
2,435 |
13,295 |
||||||
|
Patterson-UTI Energy, Inc. |
246 |
4,969 |
||||||
|
Pioneer Energy Services Corporation |
679 |
4,767 |
||||||
|
RigNet, Inc. |
84 |
2,981 |
||||||
|
Rowan Companies plc - Class A |
430 |
9,236 |
||||||
|
SEACOR Holdings, Inc. |
133 |
9,326 |
||||||
|
Superior Energy Services, Inc. |
322 |
7,435 |
||||||
|
TETRA Technologies, Inc. |
1,074 |
6,755 |
||||||
|
Unit Corporation |
55 |
1,734 |
||||||
|
USA Compression Partners, L.P. |
834 |
18,590 |
||||||
|
110,066 |
||||||||
|
Oil, Gas & Consumable Fuels — 8.8% |
||||||||
|
Alon USA Energy, Inc. |
925 |
16,308 |
||||||
|
Anadarko Petroleum Corporation |
25 |
2,090 |
||||||
|
Antero Resources Corporation |
285 |
11,403 |
||||||
|
BARROW LONG/SHORT OPPORTUNITY FUND |
||||||||
|
COMMON STOCKS — 88.5% (Continued) |
Shares |
Value |
||||||
|
Energy — 9.9% (Continued) |
||||||||
|
Oil, Gas & Consumable Fuels — 8.8% (Continued) |
||||||||
|
Apache Corporation |
72 |
$ |
4,309 |
|||||
|
Atlas Energy Group, LLC |
194 |
1,261 |
||||||
|
Bill Barrett Corporation |
87 |
768 |
||||||
|
Boardwalk Pipeline Partners, L.P. |
849 |
13,601 |
||||||
|
Bonanza Creek Energy, Inc. |
398 |
8,270 |
||||||
|
Buckeye Partners, L.P. |
154 |
11,909 |
||||||
|
Cabot Oil & Gas Corporation |
277 |
9,407 |
||||||
|
Callon Petroleum Company |
829 |
6,516 |
||||||
|
Calumet Specialty Products Partners, L.P. |
159 |
4,234 |
||||||
|
Carrizo Oil & Gas, Inc. |
293 |
14,697 |
||||||
|
Cheniere Energy Partners, L.P. |
311 |
10,322 |
||||||
|
Cheniere Energy, Inc. |
183 |
13,877 |
||||||
|
Chesapeake Energy Corporation |
62 |
875 |
||||||
|
Cimarex Energy Company |
8 |
924 |
||||||
|
Cloud Peak Energy, Inc. |
304 |
1,754 |
||||||
|
Cobalt International Energy, Inc. |
1,603 |
16,287 |
||||||
|
Concho Resources, Inc. |
112 |
13,474 |
||||||
|
ConocoPhillips |
14 |
892 |
||||||
|
CONSOL Energy, Inc. |
375 |
10,440 |
||||||
|
Contango Oil & Gas Company |
215 |
2,963 |
||||||
|
Crestwood Equity Partners, L.P. |
1,213 |
6,065 |
||||||
|
Crestwood Midstream Partners, L.P. |
136 |
1,825 |
||||||
|
CrossAmerica Partners, L.P. |
250 |
8,358 |
||||||
|
DCP Midstream Partners, L.P. |
136 |
5,141 |
||||||
|
Devon Energy Corporation |
14 |
913 |
||||||
|
Diamondback Energy, Inc. |
258 |
20,075 |
||||||
|
Dominion Midstream Partners, L.P. |
53 |
2,234 |
||||||
|
Eclipse Resources Corporation |
1,656 |
10,433 |
||||||
|
Enbridge Energy Partners, L.P. |
327 |
12,128 |
||||||
|
Energen Corporation |
221 |
15,293 |
||||||
|
Energy Transfer Equity, L.P. |
224 |
15,382 |
||||||
|
Energy Transfer Partners, L.P. |
134 |
7,535 |
||||||
|
EnLink Midstream Partners, L.P. |
461 |
11,442 |
||||||
|
EnLink Midstream, LLC |
366 |
12,118 |
||||||
|
Enterprise Products Partners, L.P. |
330 |
10,699 |
||||||
|
EQT Corporation |
120 |
10,208 |
||||||
|
EQT Midstream Partners, L.P. |
81 |
6,777 |
||||||
|
EV Energy Partners, L.P. |
208 |
2,939 |
||||||
|
Gastar Exploration, Inc. |
300 |
915 |
||||||
|
Genesis Energy, L.P. |
387 |
18,820 |
||||||
|
BARROW LONG/SHORT OPPORTUNITY FUND |
||||||||
|
COMMON STOCKS — 88.5% (Continued) |
Shares |
Value |
||||||
|
Energy — 9.9% (Continued) |
||||||||
|
Oil, Gas & Consumable Fuels — 8.8% (Continued) |
||||||||
|
Gulfport Energy Corporation |
286 |
$ |
12,344 |
|||||
|
Hess Corporation |
37 |
2,498 |
||||||
|
Jones Energy, Inc. - Class A |
682 |
6,622 |
||||||
|
Kinder Morgan, Inc. |
271 |
11,244 |
||||||
|
Kosmos Energy Ltd. |
223 |
1,982 |
||||||
|
Laredo Petroleum, Inc. |
324 |
4,413 |
||||||
|
Magellan Midstream Partners, L.P. |
50 |
3,986 |
||||||
|
MarkWest Energy Partners, L.P. |
183 |
11,827 |
||||||
|
Matador Resources Company |
417 |
11,484 |
||||||
|
Memorial Production Partners, L.P. |
115 |
1,718 |
||||||
|
Memorial Resource Development Corporation |
219 |
4,141 |
||||||
|
MPLX, L.P. |
192 |
14,016 |
||||||
|
Newfield Exploration Company |
129 |
4,878 |
||||||
|
NGL Energy Partners, L.P. |
588 |
17,675 |
||||||
|
Noble Energy, Inc. |
190 |
8,318 |
||||||
|
NuStar Energy, L.P. |
229 |
14,292 |
||||||
|
Occidental Petroleum Corporation |
12 |
938 |
||||||
|
ONEOK, Inc. |
222 |
9,306 |
||||||
|
Par Petroleum Corporation |
690 |
15,732 |
||||||
|
Parsley Energy, Inc. - Class A |
480 |
8,395 |
||||||
|
PBF Energy, Inc. - Class A |
202 |
5,418 |
||||||
|
PDC Energy, Inc. |
394 |
23,498 |
||||||
|
Phillips 66 |
115 |
9,099 |
||||||
|
Phillips 66 Partners, L.P. |
30 |
2,182 |
||||||
|
Pioneer Natural Resources Company |
77 |
11,383 |
||||||
|
Plains All American Pipeline, L.P. |
152 |
7,136 |
||||||
|
Plains GP Holdings, L.P. - Class A |
84 |
2,349 |
||||||
|
QEP Resources, Inc. |
591 |
11,129 |
||||||
|
Range Resources Corporation |
85 |
4,710 |
||||||
|
Rentech, Inc. |
2,255 |
2,661 |
||||||
|
Rex Energy Corporation |
136 |
683 |
||||||
|
Rice Energy, Inc. |
567 |
12,434 |
||||||
|
RSP Permian, Inc. |
489 |
13,927 |
||||||
|
SemGroup Corporation - Class A |
242 |
19,045 |
||||||
|
Seventy Seven Energy, Inc. |
52 |
307 |
||||||
|
Shell Midstream Partners, L.P. |
25 |
1,123 |
||||||
|
Spectra Energy Corporation |
342 |
12,028 |
||||||
|
Sprague Resources, L.P. |
295 |
8,172 |
||||||
|
Stone Energy Corporation |
85 |
1,154 |
||||||
|
Summit Midstream Partners, L.P. |
211 |
7,096 |
||||||
|
BARROW LONG/SHORT OPPORTUNITY FUND |
||||||||
|
COMMON STOCKS — 88.5% (Continued) |
Shares |
Value |
||||||
|
Energy — 9.9% (Continued) |
||||||||
|
Oil, Gas & Consumable Fuels — 8.8% (Continued) |
||||||||
|
Sunoco Logistics Partners, L.P. |
308 |
$ |
12,197 |
|||||
|
Sunoco, L.P. |
287 |
13,259 |
||||||
|
Synergy Resources Corporation |
1,902 |
21,892 |
||||||
|
Tallgrass Energy Partners, L.P. |
384 |
19,004 |
||||||
|
Targa Resources Corporation |
115 |
10,574 |
||||||
|
Targa Resources Partners, L.P. |
21 |
908 |
||||||
|
Tesoro Logistics, L.P. |
304 |
17,574 |
||||||
|
Valero Energy Partners, L.P. |
149 |
7,630 |
||||||
|
W&T Offshore, Inc. |
67 |
362 |
||||||
|
Western Gas Equity Partners, L.P. |
128 |
8,198 |
||||||
|
Western Gas Partners, L.P. |
189 |
12,947 |
||||||
|
Western Refining Logistics, L.P. |
497 |
14,666 |
||||||
|
Whiting Petroleum Corporation |
127 |
4,190 |
||||||
|
Williams Companies, Inc. (The) |
260 |
13,286 |
||||||
|
Williams Partners, L.P. |
257 |
14,336 |
||||||
|
WPX Energy, Inc. |
1,219 |
15,713 |
||||||
|
863,960 |
||||||||
|
Financials — 0.0% (a) |
||||||||
|
Real Estate Investment Trusts (REITs) - 0.0% (a) |
||||||||
|
Iron Mountain, Inc. |
119 |
4,340 |
||||||
|
OUTFRONT Media, Inc. |
9 |
250 |
||||||
|
4,590 |
||||||||
|
Health Care — 16.0% |
||||||||
|
Biotechnology — 0.0% (a) |
||||||||
|
Asterias Biotherapeutics, Inc. |
1 |
1 |
||||||
|
Health Care Equipment & Supplies — 8.7% |
||||||||
|
Abaxis, Inc. |
59 |
3,133 |
||||||
|
Abiomed, Inc. |
544 |
32,488 |
||||||
|
Accuray, Inc. |
2,403 |
14,766 |
||||||
|
Align Technology, Inc. |
68 |
4,125 |
||||||
|
Analogic Corporation |
197 |
16,668 |
||||||
|
AngioDynamics, Inc. |
839 |
13,466 |
||||||
|
AtriCure, Inc. |
740 |
16,976 |
||||||
|
Baxter International, Inc. |
312 |
20,782 |
||||||
|
Becton, Dickinson and Company |
149 |
20,936 |
||||||
|
Boston Scientific Corporation |
1,747 |
31,918 |
||||||
|
Cardiovascular Systems, Inc. |
597 |
16,704 |
||||||
|
BARROW LONG/SHORT OPPORTUNITY FUND |
||||||||
|
COMMON STOCKS — 88.5% (Continued) |
Shares |
Value |
||||||
|
Health Care — 16.0% (Continued) |
||||||||
|
Health Care Equipment & Supplies — 8.7% (Continued) |
||||||||
|
CONMED Corporation |
310 |
$ |
17,217 |
|||||
|
Cooper Companies, Inc. (The) |
149 |
27,084 |
||||||
|
Cynosure, Inc. - Class A |
318 |
11,353 |
||||||
|
DENTSPLY International, Inc. |
409 |
21,282 |
||||||
|
DexCom, Inc. |
648 |
46,474 |
||||||
|
Endologix, Inc. |
1,297 |
21,647 |
||||||
|
Entellus Medical, Inc. |
128 |
2,989 |
||||||
|
GenMark Diagnostics, Inc. |
1,122 |
10,289 |
||||||
|
Greatbatch, Inc. |
35 |
1,819 |
||||||
|
Haemonetics Corporation |
775 |
32,023 |
||||||
|
Halyard Health, Inc. |
8 |
331 |
||||||
|
HeartWare International, Inc. |
227 |
16,746 |
||||||
|
Hill-Rom Holdings, Inc. |
588 |
30,317 |
||||||
|
Hologic, Inc. |
888 |
31,764 |
||||||
|
IDEXX Laboratories, Inc. |
161 |
21,832 |
||||||
|
Inogen, Inc. |
327 |
12,223 |
||||||
|
Insulet Corporation |
810 |
22,899 |
||||||
|
Integra LifeSciences Holdings Corporation |
432 |
29,017 |
||||||
|
Intuitive Surgical, Inc. |
36 |
17,559 |
||||||
|
Invacare Corporation |
890 |
19,340 |
||||||
|
K2M Group Holdings, Inc. |
141 |
3,686 |
||||||
|
LDR Holding Corporation |
411 |
16,654 |
||||||
|
Merit Medical Systems, Inc. |
1,080 |
22,205 |
||||||
|
Neogen Corporation |
100 |
4,674 |
||||||
|
NuVasive, Inc. |
600 |
30,330 |
||||||
|
NxStage Medical, Inc. |
1,172 |
18,998 |
||||||
|
OraSure Technologies, Inc. |
861 |
5,330 |
||||||
|
Quidel Corporation |
732 |
15,862 |
||||||
|
ResMed, Inc. |
51 |
3,000 |
||||||
|
Spectranetics Corporation (The) |
628 |
15,593 |
||||||
|
St. Jude Medical, Inc. |
153 |
11,284 |
||||||
|
STAAR Surgical Company |
198 |
1,849 |
||||||
|
STERIS Corporation |
153 |
10,225 |
||||||
|
Stryker Corporation |
272 |
26,147 |
||||||
|
Teleflex, Inc. |
73 |
9,398 |
||||||
|
West Pharmaceutical Services, Inc. |
685 |
37,086 |
||||||
|
Wright Medical Group, Inc. |
649 |
17,783 |
||||||
|
ZELTIQ Aesthetics, Inc. |
689 |
18,920 |
||||||
|
BARROW LONG/SHORT OPPORTUNITY FUND |
||||||||
|
COMMON STOCKS — 88.5% (Continued) |
Shares |
Value |
||||||
|
Health Care — 16.0% (Continued) |
||||||||
|
Health Care Equipment & Supplies — 8.7% (Continued) |
||||||||
|
Zimmer Holdings, Inc. |
32 |
$ |
3,651 |
|||||
|
858,842 |
||||||||
|
Health Care Providers & Services — 3.5% |
||||||||
|
Acadia Healthcare Company, Inc. |
586 |
43,446 |
||||||
|
Adeptus Health, Inc. - Class A |
448 |
31,382 |
||||||
|
Air Methods Corporation |
269 |
11,341 |
||||||
|
Amedisys, Inc. |
799 |
24,785 |
||||||
|
AmerisourceBergen Corporation |
111 |
12,494 |
||||||
|
BioScrip, Inc. |
732 |
2,599 |
||||||
|
Brookdale Senior Living, Inc. |
607 |
22,878 |
||||||
|
Capital Senior Living Corporation |
622 |
16,023 |
||||||
|
Envision Healthcare Holdings, Inc. |
551 |
20,359 |
||||||
|
ExamWorks Group, Inc. |
339 |
13,858 |
||||||
|
Express Scripts Holding Company |
25 |
2,179 |
||||||
|
Genesis Healthcare, Inc. |
681 |
4,345 |
||||||
|
Healthways, Inc. |
1,028 |
15,585 |
||||||
|
Henry Schein, Inc. |
78 |
11,050 |
||||||
|
HMS Holdings Corporation |
865 |
14,740 |
||||||
|
Kindred Healthcare, Inc. |
67 |
1,535 |
||||||
|
LifePoint Hospitals, Inc. |
474 |
35,687 |
||||||
|
McKesson Corporation |
115 |
27,281 |
||||||
|
Omnicare, Inc. |
99 |
9,434 |
||||||
|
Owens & Minor, Inc. |
162 |
5,398 |
||||||
|
PharMerica Corporation |
504 |
16,763 |
||||||
|
Team Health Holdings, Inc. |
133 |
7,778 |
||||||
|
350,940 |
||||||||
|
Health Care Technology — 1.7% |
||||||||
|
Allscripts Healthcare Solutions, Inc. |
2,460 |
34,612 |
||||||
|
athenahealth, Inc. |
244 |
28,450 |
||||||
|
Cerner Corporation |
395 |
26,580 |
||||||
|
IMS Health Holdings, Inc. |
538 |
16,011 |
||||||
|
MedAssets, Inc. |
244 |
5,092 |
||||||
|
Medidata Solutions, Inc. |
741 |
42,985 |
||||||
|
Quality Systems, Inc. |
627 |
9,932 |
||||||
|
Veeva Systems, Inc. - Class A |
99 |
2,685 |
||||||
|
166,347 |
||||||||
|
Pharmaceuticals — 2.1% |
||||||||
|
Abbott Laboratories |
556 |
27,022 |
||||||
|
Actavis plc |
123 |
37,738 |
||||||
|
Akorn, Inc. |
260 |
11,934 |
||||||
|
BARROW LONG/SHORT OPPORTUNITY FUND |
||||||||
|
COMMON STOCKS — 88.5% (Continued) |
Shares |
Value |
||||||
|
Health Care — 16.0% (Continued) |
||||||||
|
Pharmaceuticals — 2.1% (Continued) |
||||||||
|
Bristol-Myers Squibb Company |
140 |
$ |
9,044 |
|||||
|
ContraVir Pharmaceuticals, Inc. |
1 |
1 |
||||||
|
Eli Lilly & Company |
306 |
24,143 |
||||||
|
Jazz Pharmaceuticals plc |
47 |
8,429 |
||||||
|
Mallinckrodt plc |
270 |
34,949 |
||||||
|
Merck & Company, Inc. |
501 |
30,506 |
||||||
|
Mylan N.V. |
19 |
1,380 |
||||||
|
Ocular Therapeutix, Inc. |
51 |
1,233 |
||||||
|
Zoetis, Inc. |
399 |
19,858 |
||||||
|
206,237 |
||||||||
|
Industrials — 16.0% |
||||||||
|
Aerospace & Defense — 1.9% |
||||||||
|
AAR Corporation |
194 |
5,731 |
||||||
|
Aerojet Rocketdyne Holdings, Inc. |
475 |
9,856 |
||||||
|
AeroVironment, Inc. |
337 |
8,711 |
||||||
|
American Science & Engineering, Inc. |
24 |
939 |
||||||
|
Astronics Corporation |
154 |
10,763 |
||||||
|
Boeing Company (The) |
86 |
12,085 |
||||||
|
Curtiss-Wright Corporation |
152 |
10,958 |
||||||
|
DigitalGlobe, Inc. |
537 |
16,110 |
||||||
|
Esterline Technologies Corporation |
142 |
15,360 |
||||||
|
HEICO Corporation |
49 |
2,808 |
||||||
|
Hexcel Corporation |
373 |
18,366 |
||||||
|
Huntington Ingalls Industries, Inc. |
9 |
1,116 |
||||||
|
KLX, Inc. |
40 |
1,754 |
||||||
|
L-3 Communications Holdings, Inc. |
23 |
2,710 |
||||||
|
MOOG, Inc. - Class A |
225 |
15,442 |
||||||
|
Rockwell Collins, Inc. |
135 |
12,851 |
||||||
|
Spirit Aerosystems Holdings, Inc. - Class A |
301 |
16,431 |
||||||
|
TASER International, Inc. |
165 |
5,211 |
||||||
|
Teledyne Technologies, Inc. |
53 |
5,370 |
||||||
|
Textron, Inc. |
288 |
13,023 |
||||||
|
Triumph Group, Inc. |
71 |
4,735 |
||||||
|
United Technologies Corporation |
14 |
1,640 |
||||||
|
191,970 |
||||||||
|
Air Freight & Logistics — 0.8% |
||||||||
|
Air Transport Services Group, Inc. |
1,115 |
11,730 |
||||||
|
Echo Global Logistics, Inc. |
271 |
8,721 |
||||||
|
FedEx Corporation |
69 |
11,952 |
||||||
|
Hub Group, Inc. - Class A |
163 |
6,914 |
||||||
|
BARROW LONG/SHORT OPPORTUNITY FUND |
||||||||
|
COMMON STOCKS — 88.5% (Continued) |
Shares |
Value |
||||||
|
Industrials — 16.0% (Continued) |
||||||||
|
Air Freight & Logistics — 0.8% (Continued) |
||||||||
|
United Parcel Service, Inc. - Class B |
116 |
$ |
11,509 |
|||||
|
UTi Worldwide, Inc. |
900 |
8,658 |
||||||
|
XPO Logistics, Inc. |
392 |
19,271 |
||||||
|
78,755 |
||||||||
|
Building Products — 1.9% |
||||||||
|
A.O. Smith Corporation |
77 |
5,496 |
||||||
|
Advanced Drainage Systems, Inc. |
117 |
3,398 |
||||||
|
Apogee Enterprises, Inc. |
233 |
12,519 |
||||||
|
Armstrong World Industries, Inc. |
305 |
16,751 |
||||||
|
Builders FirstSource, Inc. |
1,238 |
15,203 |
||||||
|
Continental Building Products, Inc. |
402 |
8,964 |
||||||
|
Fortune Brands Home & Security, Inc. |
273 |
12,520 |
||||||
|
Gibraltar Industries, Inc. |
501 |
8,978 |
||||||
|
Griffon Corporation |
134 |
2,140 |
||||||
|
Lennox International, Inc. |
76 |
8,558 |
||||||
|
Masco Corporation |
175 |
4,737 |
||||||
|
Masonite International Corporation |
209 |
14,258 |
||||||
|
NCI Building Systems, Inc. |
544 |
8,149 |
||||||
|
Nortek, Inc. |
43 |
3,552 |
||||||
|
Owens Corning |
416 |
17,622 |
||||||
|
Quanex Building Products Corporation |
509 |
9,055 |
||||||
|
Simpson Manufacturing Company, Inc. |
118 |
4,002 |
||||||
|
Trex Company, Inc. |
185 |
9,361 |
||||||
|
Universal Forest Products, Inc. |
48 |
2,657 |
||||||
|
USG Corporation |
570 |
16,439 |
||||||
|
184,359 |
||||||||
|
Commercial Services & Supplies — 2.5% |
||||||||
|
ABM Industries, Inc. |
218 |
7,072 |
||||||
|
ADT Corporation (The) |
300 |
10,944 |
||||||
|
ARC Document Solutions, Inc. |
167 |
1,251 |
||||||
|
Brady Corporation - Class A |
210 |
5,313 |
||||||
|
Brink's Company (The) |
373 |
11,921 |
||||||
|
Cintas Corporation |
64 |
5,510 |
||||||
|
Clean Harbors, Inc. |
304 |
17,127 |
||||||
|
Covanta Holding Corporation |
738 |
16,310 |
||||||
|
Healthcare Services Group, Inc. |
532 |
16,072 |
||||||
|
Herman Miller, Inc. |
233 |
6,454 |
||||||
|
HNI Corporation |
78 |
3,782 |
||||||
|
InnerWorkings, Inc. |
89 |
566 |
||||||
|
Interface, Inc. |
495 |
10,657 |
||||||
|
KAR Auction Services, Inc. |
442 |
16,469 |
||||||
|
BARROW LONG/SHORT OPPORTUNITY FUND |
||||||||
|
COMMON STOCKS — 88.5% (Continued) |
Shares |
Value |
||||||
|
Industrials — 16.0% (Continued) |
||||||||
|
Commercial Services & Supplies — 2.5% (Continued) |
||||||||
|
Kimball International, Inc. - Class B |
93 |
$ |
1,134 |
|||||
|
Knoll, Inc. |
412 |
9,377 |
||||||
|
McGrath RentCorp |
267 |
8,128 |
||||||
|
Mobile Mini, Inc. |
245 |
9,722 |
||||||
|
MSA Safety, Inc. |
173 |
7,733 |
||||||
|
Multi-Color Corporation |
52 |
3,331 |
||||||
|
R.R. Donnelley & Sons Company |
151 |
2,896 |
||||||
|
Republic Services, Inc. |
298 |
12,006 |
||||||
|
Rollins, Inc. |
66 |
1,638 |
||||||
|
Steelcase, Inc. - Class A |
128 |
2,202 |
||||||
|
Stericycle, Inc. |
94 |
12,906 |
||||||
|
Team, Inc. |
97 |
3,861 |
||||||
|
Tetra Tech, Inc. |
63 |
1,648 |
||||||
|
Tyco International plc |
136 |
5,489 |
||||||
|
US Ecology, Inc. |
146 |
6,732 |
||||||
|
Viad Corporation |
57 |
1,530 |
||||||
|
Waste Connections, Inc. |
248 |
12,035 |
||||||
|
Waste Management, Inc. |
239 |
11,866 |
||||||
|
243,682 |
||||||||
|
Construction & Engineering — 0.8% |
||||||||
|
AECOM |
288 |
9,513 |
||||||
|
Aegion Corporation |
404 |
7,199 |
||||||
|
Comfort Systems USA, Inc. |
436 |
9,788 |
||||||
|
Dycom Industries, Inc. |
266 |
15,316 |
||||||
|
Granite Construction, Inc. |
248 |
8,891 |
||||||
|
Great Lakes Dredge & Dock Company |
502 |
2,791 |
||||||
|
Jacobs Engineering Group, Inc. |
113 |
4,889 |
||||||
|
KBR, Inc. |
446 |
8,541 |
||||||
|
MasTec, Inc. |
52 |
918 |
||||||
|
Quanta Services, Inc. |
351 |
10,291 |
||||||
|
78,137 |
||||||||
|
Electrical Equipment — 0.7% |
||||||||
|
Acuity Brands, Inc. |
66 |
11,648 |
||||||
|
Eaton Corporation plc |
170 |
12,170 |
||||||
|
Encore Wire Corporation |
56 |
2,446 |
||||||
|
Enphase Energy, Inc. |
513 |
4,858 |
||||||
|
Franklin Electric Company, Inc. |
144 |
5,068 |
||||||
|
GrafTech International Ltd. |
176 |
892 |
||||||
|
Powell Industries, Inc. |
36 |
1,306 |
||||||
|
Power Solutions International, Inc. |
161 |
8,855 |
||||||
|
Regal-Beloit Corporation |
190 |
14,856 |
||||||
|
BARROW LONG/SHORT OPPORTUNITY FUND |
||||||||
|
COMMON STOCKS — 88.5% (Continued) |
Shares |
Value |
||||||
|
Industrials — 16.0% (Continued) |
||||||||
|
Electrical Equipment — 0.7% (Continued) |
||||||||
|
Vicor Corporation |
353 |
$ |
4,812 |
|||||
|
66,911 |
||||||||
|
Industrial Conglomerates — 0.1% |
||||||||
|
Carlisle Companies, Inc. |
21 |
2,082 |
||||||
|
Danaher Corporation |
23 |
1,986 |
||||||
|
General Electric Company |
60 |
1,636 |
||||||
|
Raven Industries, Inc. |
69 |
1,329 |
||||||
|
7,033 |
||||||||
|
Machinery — 3.3% |
||||||||
|
Alamo Group, Inc. |
54 |
2,860 |
||||||
|
Albany International Corporation - Class A |
252 |
9,974 |
||||||
|
Altra Industrial Motion Corporation |
44 |
1,210 |
||||||
|
Astec Industries, Inc. |
239 |
9,883 |
||||||
|
Barnes Group, Inc. |
319 |
12,843 |
||||||
|
Blount International, Inc. |
531 |
6,144 |
||||||
|
Briggs & Stratton Corporation |
484 |
9,239 |
||||||
|
Caterpillar, Inc. |
102 |
8,703 |
||||||
|
Chart Industries, Inc. |
71 |
2,305 |
||||||
|
CIRCOR International, Inc. |
32 |
1,706 |
||||||
|
CLARCOR, Inc. |
237 |
14,602 |
||||||
|
Colfax Corporation |
201 |
10,128 |
||||||
|
Cummins, Inc. |
11 |
1,491 |
||||||
|
Donaldson Company, Inc. |
279 |
9,949 |
||||||
|
EnPro Industries, Inc. |
146 |
8,830 |
||||||
|
ESCO Technologies, Inc. |
26 |
970 |
||||||
|
Flowserve Corporation |
51 |
2,805 |
||||||
|
Gorman-Rupp Company (The) |
203 |
5,690 |
||||||
|
Harsco Corporation |
562 |
9,054 |
||||||
|
Ingersoll-Rand plc |
102 |
7,015 |
||||||
|
ITT Corporation |
138 |
5,890 |
||||||
|
John Bean Technologies Corporation |
282 |
10,595 |
||||||
|
Joy Global, Inc. |
171 |
6,659 |
||||||
|
Kennametal, Inc. |
391 |
14,099 |
||||||
|
Lydall, Inc. |
299 |
8,196 |
||||||
|
Manitowoc Company, Inc. (The) |
2 |
38 |
||||||
|
Meritor, Inc. |
240 |
3,434 |
||||||
|
Middleby Corporation (The) |
79 |
8,587 |
||||||
|
Mueller Industries, Inc. |
82 |
2,858 |
||||||
|
Mueller Water Products, Inc. - Class A |
94 |
867 |
||||||
|
Nordson Corporation |
11 |
890 |
||||||
|
Pall Corporation |
120 |
14,933 |
||||||
|
BARROW LONG/SHORT OPPORTUNITY FUND |
||||||||
|
COMMON STOCKS — 88.5% (Continued) |
Shares |
Value |
||||||
|
Industrials — 16.0% (Continued) |
||||||||
|
Machinery — 3.3% (Continued) |
||||||||
|
Parker Hannifin Corporation |
53 |
$ |
6,383 |
|||||
|
Proto Labs, Inc. |
133 |
9,201 |
||||||
|
RBC Bearings, Inc. |
34 |
2,383 |
||||||
|
Rexnord Corporation |
207 |
5,303 |
||||||
|
SPX Corporation |
161 |
11,964 |
||||||
|
Tennant Company |
102 |
6,503 |
||||||
|
Terex Corporation |
58 |
1,434 |
||||||
|
Timken Company (The) |
218 |
8,524 |
||||||
|
Titan International, Inc. |
843 |
8,978 |
||||||
|
TriMas Corporation |
115 |
3,323 |
||||||
|
Trinity Industries, Inc. |
44 |
1,320 |
||||||
|
WABCO Holdings, Inc. |
106 |
13,400 |
||||||
|
Watts Water Technologies, Inc. - Class A |
253 |
13,442 |
||||||
|
Westinghouse Air Brake Technologies Corporation |
49 |
4,915 |
||||||
|
Woodward, Inc. |
218 |
11,105 |
||||||
|
Xylem, Inc. |
305 |
11,154 |
||||||
|
331,779 |
||||||||
|
Marine — 0.1% |
||||||||
|
Kirby Corporation |
49 |
3,759 |
||||||
|
Matson, Inc. |
235 |
9,466 |
||||||
|
Scorpio Bulkers, Inc. |
538 |
1,275 |
||||||
|
14,500 |
||||||||
|
Professional Services — 1.2% |
||||||||
|
Acacia Research Corporation |
656 |
6,698 |
||||||
|
Advisory Board Company (The) |
283 |
14,368 |
||||||
|
CEB, Inc. |
227 |
19,202 |
||||||
|
Equifax, Inc. |
10 |
1,003 |
||||||
|
FTI Consulting, Inc. |
22 |
865 |
||||||
|
IHS, Inc. - Class A |
93 |
11,476 |
||||||
|
Kelly Services, Inc. - Class A |
568 |
8,815 |
||||||
|
Kforce, Inc. |
287 |
6,317 |
||||||
|
Mistras Group, Inc. |
488 |
9,033 |
||||||
|
Nielsen N.V. |
244 |
10,977 |
||||||
|
Paylocity Holding Corporation |
386 |
12,923 |
||||||
|
TriNet Group, Inc. |
232 |
6,944 |
||||||
|
TrueBlue, Inc. |
33 |
940 |
||||||
|
WageWorks, Inc. |
200 |
8,576 |
||||||
|
118,137 |
||||||||
|
Road & Rail — 2.0% |
||||||||
|
AMERCO |
7 |
2,303 |
||||||
|
ArcBest Corporation |
220 |
7,522 |
||||||
|
BARROW LONG/SHORT OPPORTUNITY FUND |
||||||||
|
COMMON STOCKS — 88.5% (Continued) |
Shares |
Value |
||||||
|
Industrials — 16.0% (Continued) |
||||||||
|
Road & Rail — 2.0% (Continued) |
||||||||
|
Celadon Group, Inc. |
384 |
$ |
8,955 |
|||||
|
Con-Way, Inc. |
293 |
11,858 |
||||||
|
Covenant Transportation Group, Inc. - Class A |
133 |
4,111 |
||||||
|
CSX Corporation |
319 |
10,871 |
||||||
|
Genesee & Wyoming, Inc. - Class A |
139 |
11,445 |
||||||
|
Heartland Express, Inc. |
617 |
13,111 |
||||||
|
J.B. Hunt Transport Services, Inc. |
144 |
12,099 |
||||||
|
Kansas City Southern |
101 |
9,140 |
||||||
|
Knight Transportation, Inc. |
558 |
15,959 |
||||||
|
Marten Transport Ltd. |
410 |
9,299 |
||||||
|
Norfolk Southern Corporation |
109 |
10,028 |
||||||
|
Old Dominion Freight Line, Inc. |
161 |
10,950 |
||||||
|
Ryder System, Inc. |
137 |
12,556 |
||||||
|
Saia, Inc. |
168 |
6,878 |
||||||
|
Swift Transportation Company |
596 |
13,869 |
||||||
|
Union Pacific Corporation |
110 |
11,100 |
||||||
|
Werner Enterprises, Inc. |
486 |
13,375 |
||||||
|
195,429 |
||||||||
|
Trading Companies & Distributors — 0.5% |
||||||||
|
Aceto Corporation |
155 |
3,653 |
||||||
|
Beacon Roofing Supply, Inc. |
275 |
8,624 |
||||||
|
DXP Enterprises, Inc. |
53 |
2,174 |
||||||
|
Fastenal Company |
225 |
9,340 |
||||||
|
H&E Equipment Services, Inc. |
126 |
2,751 |
||||||
|
HD Supply Holdings, Inc. |
162 |
5,257 |
||||||
|
Kaman Corporation |
122 |
5,168 |
||||||
|
MRC Global, Inc. |
251 |
3,843 |
||||||
|
MSC Industrial Direct Company, Inc. - Class A |
31 |
2,150 |
||||||
|
Rush Enterprises, Inc. - Class A |
143 |
3,799 |
||||||
|
Stock Building Supply Holdings, Inc. |
169 |
2,824 |
||||||
|
49,583 |
||||||||
|
Transportation Infrastructure — 0.2% |
||||||||
|
Macquarie Infrastructure Corporation |
204 |
17,267 |
||||||
|
Wesco Aircraft Holdings, Inc. |
212 |
3,129 |
||||||
|
20,396 |
||||||||
|
Materials — 9.3% |
||||||||
|
Chemicals — 3.7% |
||||||||
|
A. Schulman, Inc. |
156 |
6,672 |
||||||
|
Advanced Emissions Solutions, Inc. |
339 |
4,644 |
||||||
|
Air Products & Chemicals, Inc. |
111 |
16,290 |
||||||
|
Airgas, Inc. |
141 |
14,374 |
||||||
|
BARROW LONG/SHORT OPPORTUNITY FUND |
||||||||
|
COMMON STOCKS — 88.5% (Continued) |
Shares |
Value |
||||||
|
Materials — 9.3% (Continued) |
||||||||
|
Chemicals — 3.7% (Continued) |
||||||||
|
Ashland, Inc. |
81 |
$ |
10,319 |
|||||
|
Axiall Corporation |
449 |
16,932 |
||||||
|
Balchem Corporation |
183 |
10,332 |
||||||
|
Cabot Corporation |
71 |
2,944 |
||||||
|
Cytec Industries, Inc. |
117 |
7,077 |
||||||
|
Dow Chemical Company (The) |
144 |
7,498 |
||||||
|
E.I. du Pont de Nemours and Company |
225 |
15,977 |
||||||
|
Eastman Chemical Company |
50 |
3,839 |
||||||
|
Ecolab, Inc. |
109 |
12,497 |
||||||
|
FMC Corporation |
141 |
8,061 |
||||||
|
H.B. Fuller Company |
355 |
14,949 |
||||||
|
Huntsman Corporation |
659 |
14,788 |
||||||
|
International Flavors & Fragrances, Inc. |
23 |
2,738 |
||||||
|
Intrepid Potash, Inc. |
1,096 |
12,736 |
||||||
|
Koppers Holdings, Inc. |
263 |
6,791 |
||||||
|
Kraton Performance Polymers, Inc. |
760 |
18,050 |
||||||
|
Kronos Worldwide, Inc. |
766 |
9,345 |
||||||
|
Minerals Technologies, Inc. |
285 |
19,183 |
||||||
|
Monsanto Company |
9 |
1,053 |
||||||
|
Mosaic Company (The) |
265 |
12,150 |
||||||
|
OM Group, Inc. |
541 |
14,358 |
||||||
|
Platform Specialty Products Corporation |
89 |
2,329 |
||||||
|
PolyOne Corporation |
540 |
21,001 |
||||||
|
PPG Industries, Inc. |
5 |
1,144 |
||||||
|
Praxair, Inc. |
123 |
15,112 |
||||||
|
Sensient Technologies Corporation |
430 |
29,111 |
||||||
|
Tredegar Corporation |
103 |
2,045 |
||||||
|
Trinseo S.A. |
41 |
1,198 |
||||||
|
Tronox Ltd. - Class A |
981 |
16,540 |
||||||
|
Valhi, Inc. |
1,980 |
12,652 |
||||||
|
364,729 |
||||||||
|
Construction Materials — 0.7% |
||||||||
|
Eagle Materials, Inc. |
232 |
19,367 |
||||||
|
Headwaters, Inc. |
825 |
15,659 |
||||||
|
Martin Marietta Materials, Inc. |
121 |
18,030 |
||||||
|
Vulcan Materials Company |
228 |
20,504 |
||||||
|
73,560 |
||||||||
|
Containers & Packaging — 0.7% |
||||||||
|
Berry Plastics Group, Inc. |
238 |
7,966 |
||||||
|
Graphic Packaging Holding Company |
1,416 |
20,164 |
||||||
|
Myers Industries, Inc. |
720 |
12,449 |
||||||
|
BARROW LONG/SHORT OPPORTUNITY FUND |
||||||||
|
COMMON STOCKS — 88.5% (Continued) |
Shares |
Value |
||||||
|
Materials — 9.3% (Continued) |
||||||||
|
Containers & Packaging — 0.7% (Continued) |
||||||||
|
Packaging Corporation of America |
142 |
$ |
9,824 |
|||||
|
Rock-Tenn Company - Class A |
145 |
9,445 |
||||||
|
Sealed Air Corporation |
203 |
9,886 |
||||||
|
69,734 |
||||||||
|
Metals & Mining — 3.2% |
||||||||
|
Alcoa, Inc. |
1,056 |
13,200 |
||||||
|
Allegheny Technologies, Inc. |
716 |
23,270 |
||||||
|
Carpenter Technology Corporation |
536 |
21,890 |
||||||
|
Century Aluminum Company |
757 |
8,463 |
||||||
|
Coeur Mining, Inc. |
2,041 |
11,123 |
||||||
|
Commercial Metals Company |
468 |
7,521 |
||||||
|
Freeport-McMoRan, Inc. |
356 |
6,995 |
||||||
|
Globe Specialty Metals, Inc. |
827 |
15,986 |
||||||
|
Haynes International, Inc. |
323 |
15,229 |
||||||
|
Hecla Mining Company |
5,250 |
16,328 |
||||||
|
Horsehead Holding Corporation |
1,005 |
12,482 |
||||||
|
Materion Corporation |
403 |
14,988 |
||||||
|
Newmont Mining Corporation |
698 |
19,014 |
||||||
|
NN, Inc. |
177 |
4,823 |
||||||
|
Nucor Corporation |
220 |
10,406 |
||||||
|
Reliance Steel & Aluminum Company |
38 |
2,424 |
||||||
|
Royal Gold, Inc. |
359 |
23,252 |
||||||
|
Schnitzer Steel Industries, Inc. - Class A |
548 |
9,815 |
||||||
|
Steel Dynamics, Inc. |
1,007 |
21,963 |
||||||
|
Stillwater Mining Company |
985 |
14,273 |
||||||
|
SunCoke Energy, Inc. |
788 |
12,813 |
||||||
|
TimkenSteel Corporation |
8 |
238 |
||||||
|
United States Steel Corporation |
508 |
12,395 |
||||||
|
Worthington Industries, Inc. |
457 |
12,435 |
||||||
|
311,326 |
||||||||
|
Paper & Forest Products — 1.0% |
||||||||
|
Clearwater Paper Corporation |
192 |
11,522 |
||||||
|
Deltic Timber Corporation |
236 |
15,231 |
||||||
|
International Paper Company |
279 |
14,461 |
||||||
|
KapStone Paper and Packaging Corporation |
67 |
1,806 |
||||||
|
Louisiana-Pacific Corporation |
1,643 |
29,722 |
||||||
|
P.H. Glatfelter Company |
450 |
10,570 |
||||||
|
Wausau Paper Corporation |
1,181 |
11,550 |
||||||
|
94,862 |
||||||||
|
Total Common Stocks (Proceeds $8,176,578) |
$ |
8,731,330 |
||||||
|
BARROW LONG/SHORT OPPORTUNITY FUND |
||||||||
|
WARRANTS — 0.0% (a) |
Shares |
Value |
||||||
|
BioTime, Inc. |
1 |
$ |
2 |
|||||
|
Magnum Hunter Resources Corporation (b) |
97 |
0 |
||||||
|
Total Warrants (Proceeds $2) |
$ |
2 |
||||||
|
Total Securities Sold Short — 88.5% (Proceeds $8,176,580) |
$ |
8,731,332 |
||||||
|
(a) |
Percentage rounds to less than 0.1%. |
|
(b) |
Security value has been determined in good faith pursuant to procedures adopted by the Board of Trustees. The total value of such securities is $0 at May 31, 2015, representing 0.0% of net assets. (Note 1).
|
|
See accompanying notes to financial statements. |
|
|
BARROW FUNDS |
||||||||
|
|
Barrow Value Opportunity Fund |
Barrow Long/Short Opportunity Fund |
||||||
|
ASSETS |
||||||||
|
Investments in securities: |
||||||||
|
At acquisition cost |
$ |
27,604,283 |
$ |
12,006,058 |
||||
|
At value (Note 2) |
$ |
32,248,214 |
$ |
13,515,357 |
||||
|
Deposits with brokers for securities sold short (Note 2) |
— |
5,090,108 |
||||||
|
Cash |
— |
19 |
||||||
|
Dividends and interest receivable |
36,703 |
15,129 |
||||||
|
Receivable for capital shares sold |
— |
100 |
||||||
|
Receivable for investment securities sold |
5,222,173 |
2,125,640 |
||||||
|
Receivable from Adviser (Note 4) |
— |
5,286 |
||||||
|
Other assets |
10,317 |
8,842 |
||||||
|
TOTAL ASSETS |
37,517,407 |
20,760,481 |
||||||
|
LIABILITIES |
||||||||
|
Securities sold short, at value (Note 2) (proceeds $— and $8,176,580, respectively) |
— |
8,731,332 |
||||||
|
Payable for investment securities purchased |
5,265,774 |
2,141,503 |
||||||
|
Dividends payable on securities sold short (Note 2) |
— |
6,853 |
||||||
|
Payable to Adviser (Note 4) |
12,908 |
— |
||||||
|
Payable to administrator (Note 4) |
8,730 |
8,080 |
||||||
|
Accrued brokerage expense on securities sold short (Note 2) |
— |
648 |
||||||
|
Other accrued expenses and liabilities |
9,421 |
10,016 |
||||||
|
TOTAL LIABILITIES |
5,296,833 |
10,898,432 |
||||||
|
NET ASSETS |
$ |
32,220,574 |
$ |
9,862,049 |
||||
|
Net assets consist of: |
||||||||
|
Paid-in capital |
$ |
27,229,517 |
$ |
9,354,980 |
||||
|
Undistributed net investment income |
198,721 |
12,858 |
||||||
|
Accumulated undistributed net realized gains (losses) from security transactions |
148,405 |
(460,336 |
) |
|||||
|
Net unrealized appreciation (depreciation) on: |
||||||||
|
Investments |
4,643,931 |
1,509,299 |
||||||
|
Short positions |
— |
(554,752 |
) |
|||||
|
Net assets |
$ |
32,220,574 |
$ |
9,862,049 |
||||
|
NET ASSET VALUE PER SHARE: |
||||||||
|
INSTITUTIONAL CLASS |
||||||||
|
Net assets applicable to Institutional Class |
$ |
31,944,944 |
$ |
9,670,643 |
||||
|
Institutional Class shares of beneficial interest outstanding (unlimited number of shares authorized, no par value) |
1,201,742 |
909,832 |
||||||
|
Net asset value, offering price and redemption price per share (Note 2) |
$ |
26.58 |
$ |
10.63 |
||||
|
INVESTOR CLASS |
||||||||
|
Net assets applicable to Investor Class |
$ |
275,630 |
$ |
191,406 |
||||
|
Investor Class shares of beneficial interest outstanding (unlimited number of shares authorized, no par value) |
10,392 |
18,074 |
||||||
|
Net asset value, offering price and redemption price per share (Note 2) |
$ |
26.52 |
$ |
10.59 |
||||
|
See accompanying notes to financial statements. |
|
BARROW FUNDS |
||||||||
|
|
Barrow Value Opportunity Fund |
Barrow Long/Short Opportunity Fund |
||||||
|
INVESTMENT INCOME |
||||||||
|
Dividends |
$ |
584,360 |
$ |
251,508 |
||||
|
Interest |
— |
22,813 |
||||||
|
TOTAL INVESTMENT INCOME |
584,360 |
274,321 |
||||||
|
EXPENSES |
||||||||
|
Investment advisory fees (Note 4) |
236,138 |
112,568 |
||||||
|
Dividend expense on securities sold short (Note 2) |
— |
87,044 |
||||||
|
Professional fees |
34,279 |
34,279 |
||||||
|
Accounting services fees (Note 4) |
34,637 |
32,995 |
||||||
|
Brokerage expense on securities sold short (Note 2) |
— |
60,379 |
||||||
|
Registration and filing fees |
27,447 |
26,589 |
||||||
|
Administration fees (Note 4) |
26,907 |
26,250 |
||||||
|
Transfer agent fees (Note 4) |
24,000 |
24,000 |
||||||
|
Custodian and bank service fees |
22,661 |
24,560 |
||||||
|
Pricing fees |
4,227 |
20,048 |
||||||
|
Compliance service fees (Note 4) |
12,000 |
12,000 |
||||||
|
Trustees’ fees and expenses (Note 4) |
7,366 |
7,366 |
||||||
|
Printing of shareholder reports |
6,409 |
5,397 |
||||||
|
Postage and supplies |
4,455 |
4,431 |
||||||
|
Insurance expense |
2,968 |
2,968 |
||||||
|
Distribution fees, Investor Class (Note 4) |
634 |
441 |
||||||
|
Borrowing costs (Note 5) |
913 |
— |
||||||
|
Other expenses |
10,949 |
9,775 |
||||||
|
TOTAL EXPENSES |
455,990 |
491,090 |
||||||
|
Investment advisory fee waivers and expense reimbursements by Adviser (Note 4) |
(180,140 |
) |
(212,647 |
) |
||||
|
NET EXPENSES |
275,850 |
278,443 |
||||||
|
NET INVESTMENT INCOME (LOSS) |
308,510 |
(4,122 |
) |
|||||
|
REALIZED AND UNREALIZED GAINS (LOSSES) ON INVESTMENTS AND SECURITIES SOLD SHORT |
||||||||
|
Net realized gains (losses) from: |
||||||||
|
Investments |
163,178 |
133,151 |
||||||
|
Securities sold short |
— |
(474,610 |
) |
|||||
|
Net change in unrealized appreciation (depreciation) on: |
||||||||
|
Investments |
1,815,680 |
1,169,975 |
||||||
|
Securities sold short |
— |
(313,893 |
) |
|||||
|
NET REALIZED AND UNREALIZED GAINS ON INVESTMENTS |
1,978,858 |
514,623 |
||||||
|
NET INCREASE IN NET ASSETS RESULTING FROM OPERATIONS |
$ |
2,287,368 |
$ |
510,501 |
||||
|
See accompanying notes to financial statements. |
|
BARROW VALUE OPPORTUNITY FUND |
||||||||
|
|
Year Ended |
Period Ended |
||||||
|
FROM OPERATIONS |
||||||||
|
Net investment income |
$ |
308,510 |
$ |
147,458 |
||||
|
Net realized gains from security transactions |
163,178 |
2,033,616 |
||||||
|
Net change in unrealized appreciation (depreciation) on investments |
1,815,680 |
550,715 |
||||||
|
Net increase in net assets resulting from operations |
2,287,368 |
2,731,789 |
||||||
|
DISTRIBUTIONS TO SHAREHOLDERS (Note 2) |
||||||||
|
Investment income, Institutional Class |
(166,316 |
) |
(48,373 |
) |
||||
|
Investment income, Investor Class |
(1,730 |
) |
(223 |
) |
||||
|
Realized gains, Institutional Class |
(1,701,605 |
) |
(360,767 |
) |
||||
|
Realized gains, Investor Class |
(24,232 |
) |
(2,390 |
) |
||||
|
Decrease in net assets from distributions to shareholders |
(1,893,883 |
) |
(411,753 |
) |
||||
|
CAPITAL SHARE TRANSACTIONS |
||||||||
|
Institutional Class |
||||||||
|
Proceeds from shares sold |
9,208,231 |
2,180,472 |
||||||
|
Net asset value of shares issued in reinvestment of distributions |
1,843,520 |
409,139 |
||||||
|
Proceeds from tax-free reorganization (Note 1) |
— |
16,732,894 |
||||||
|
Payments for shares redeemed |
(881,565 |
) |
(243,555 |
) |
||||
|
Net increase in Institutional Class net assets from capital share transactions |
10,170,186 |
19,078,950 |
||||||
|
Investor Class |
||||||||
|
Proceeds from shares sold |
293,091 |
337,567 |
||||||
|
Net asset value of shares issued in reinvestment of distributions |
25,962 |
2,613 |
||||||
|
Payments for shares redeemed |
(401,316 |
) |
— |
|||||
|
Net increase (decrease) in Investor Class net assets from capital share transactions |
(82,263 |
) |
340,180 |
|||||
|
TOTAL INCREASE IN NET ASSETS |
10,481,408 |
21,739,166 |
||||||
|
NET ASSETS |
||||||||
|
Beginning of period |
21,739,166 |
— |
||||||
|
End of period |
$ |
32,220,574 |
$ |
21,739,166 |
||||
|
UNDISTRIBUTED NET INVESTMENT INCOME |
$ |
148,405 |
$ |
98,862 |
||||
|
(a) |
Represents the period from the commencement of operations (close of business August 30, 2013) through May 31, 2014 (Note 1).
|
|
See accompanying notes to financial statements. |
|
|
BARROW VALUE OPPORTUNITY FUND |
||||||||
|
|
Year Ended |
Period Ended |
||||||
|
CAPITAL SHARE ACTIVITY |
||||||||
|
Institutional Class |
||||||||
|
Shares sold |
352,569 |
85,541 |
||||||
|
Shares reinvested |
73,284 |
15,791 |
||||||
|
Shares issued from tax-free reorganization (Note 1) |
— |
718,150 |
||||||
|
Shares redeemed |
(33,824 |
) |
(9,769 |
) |
||||
|
Net increase in shares outstanding |
392,029 |
809,713 |
||||||
|
Shares outstanding, beginning of period |
809,713 |
— |
||||||
|
Shares outstanding, end of period |
1,201,742 |
809,713 |
||||||
|
Investor Class |
||||||||
|
Shares sold |
11,054 |
13,501 |
||||||
|
Shares reinvested |
1,035 |
101 |
||||||
|
Shares redeemed |
(15,299 |
) |
— |
|||||
|
Net increase (decrease) in shares outstanding |
(3,210 |
) |
13,602 |
|||||
|
Shares outstanding, beginning of period |
13,602 |
— |
||||||
|
Shares outstanding, end of period |
10,392 |
13,602 |
||||||
|
(a) |
Represents the period from the commencement of operations (close of business August 30, 2013) through May 31, 2014 (Note 1).
|
|
See accompanying notes to financial statements. |
|
|
BARROW LONG/SHORT OPPORTUNITY FUND |
||||||||
|
|
Year Ended |
Period Ended |
||||||
|
FROM OPERATIONS |
||||||||
|
Net investment loss |
$ |
(4,122 |
) |
$ |
(10,870 |
) |
||
|
Net realized gains (losses) from: |
||||||||
|
Investments |
133,151 |
253,094 |
||||||
|
Securities sold short |
(474,610 |
) |
(188,254 |
) |
||||
|
Net change in unrealized appreciation (depreciation) on: |
||||||||
|
Investments |
1,169,975 |
339,324 |
||||||
|
Securities sold short |
(313,893 |
) |
(240,859 |
) |
||||
|
Net increase in net assets resulting from operations |
510,501 |
152,435 |
||||||
|
DISTRIBUTIONS TO SHAREHOLDERS (Note 2) |
||||||||
|
Realized gains, Institutional Class |
(169,448 |
) |
— |
|||||
|
Realized gains, Investor Class |
(3,197 |
) |
— |
|||||
|
Decrease in net assets from distributions to shareholders |
(172,645 |
) |
— |
|||||
|
CAPITAL SHARE TRANSACTIONS |
||||||||
|
Institutional Class |
||||||||
|
Proceeds from shares sold |
5,065,056 |
5,510,279 |
||||||
|
Net asset value of shares issued in reinvestment of distributions |
165,696 |
— |
||||||
|
Payments for shares redeemed |
(106,526 |
) |
(1,444,928 |
) |
||||
|
Net increase in Institutional Class net assets from capital share transactions |
5,124,226 |
4,065,351 |
||||||
|
Investor Class |
||||||||
|
Proceeds from shares sold |
10,500 |
201,389 |
||||||
|
Net asset value of shares issued in reinvestment of distributions |
3,197 |
— |
||||||
|
Payments for shares redeemed |
— |
(32,905 |
) |
|||||
|
Net increase in Investor Class net assets from capital share transactions |
13,697 |
168,484 |
||||||
|
TOTAL INCREASE IN NET ASSETS |
5,475,779 |
4,386,270 |
||||||
|
NET ASSETS |
||||||||
|
Beginning of period |
4,386,270 |
— |
||||||
|
End of period |
$ |
9,862,049 |
$ |
4,386,270 |
||||
|
UNDISTRIBUTED NET INVESTMENT INCOME |
$ |
12,858 |
$ |
11,721 |
||||
|
(a) |
Represents the period from the commencement of operations (close of business August 30, 2013) through May 31, 2014 (Note 1).
|
|
See accompanying notes to financial statements. |
|
|
BARROW LONG/SHORT OPPORTUNITY FUND |
||||||||
|
|
Year Ended |
Period Ended |
||||||
|
CAPITAL SHARE ACTIVITY |
||||||||
|
Institutional Class |
||||||||
|
Shares sold |
499,343 |
546,033 |
||||||
|
Shares reinvested |
16,134 |
— |
||||||
|
Shares redeemed |
(10,410 |
) |
(141,268 |
) |
||||
|
Net increase in shares outstanding |
505,067 |
404,765 |
||||||
|
Shares outstanding, beginning of period |
404,765 |
— |
||||||
|
Shares outstanding, end of period |
909,832 |
404,765 |
||||||
|
Investor Class |
||||||||
|
Shares sold |
1,004 |
19,972 |
||||||
|
Shares reinvested |
312 |
— |
||||||
|
Shares redeemed |
— |
(3,214 |
) |
|||||
|
Net increase in shares outstanding |
1,316 |
16,758 |
||||||
|
Shares outstanding, beginning of period |
16,758 |
— |
||||||
|
Shares outstanding, end of period |
18,074 |
16,758 |
||||||
|
(a) |
Represents the period from the commencement of operations (close of business August 30, 2013) through May 31, 2014 (Note 1).
|
|
See accompanying notes to financial statements. |
|
|
BARROW VALUE OPPORTUNITY FUND |
||||||||
|
Per share data for a share outstanding throughout each period: |
||||||||
|
|
Year Ended |
Period Ended |
||||||
|
Net asset value at beginning of period |
$ |
26.40 |
$ |
23.30 |
||||
|
Income from investment operations: |
||||||||
|
Net investment income |
0.27 |
0.18 |
||||||
|
Net realized and unrealized gains on investments |
2.25 |
3.47 |
||||||
|
Total from investment operations |
2.52 |
3.65 |
||||||
|
Less distributions: |
||||||||
|
From net investment income |
(0.20 |
) |
(0.06 |
) |
||||
|
From net realized gains from investments |
(2.14 |
) |
(0.49 |
) |
||||
|
Total from investment operations |
(2.34 |
) |
(0.55 |
) |
||||
|
Net asset value at end of period |
$ |
26.58 |
$ |
26.40 |
||||
|
Total return (b) |
10.10 |
% |
15.73 |
%(c) |
||||
|
Ratios and supplemental data: |
||||||||
|
Net assets at end of period (000’s) |
$ |
31,945 |
$ |
21,380 |
||||
|
Ratio of total expenses to average net assets |
1.79 |
% |
1.86 |
%(d) |
||||
|
Ratio of net expenses to average net assets (e) |
1.15 |
% |
1.15 |
%(d) |
||||
|
Ratio of net investment income to average net assets (e) |
1.29 |
% |
1.01 |
%(d) |
||||
|
Portfolio turnover rate |
112 |
% |
45 |
%(c) |
||||
|
(a) |
Represents the period from the commencement of operations (close of business August 30, 2013) through May 31, 2014 (Note 1). |
|
(b) |
Total return is a measure of the change in value of an investment in the Fund over the periods covered, which assumes any dividends or capital gains distributions are reinvested in shares of the Fund. The returns shown do not reflect the deduction of taxes a shareholder would pay on Fund distributions or the redemption of Fund shares. The total returns would have been lower if the Adviser had not waived advisory fees and reimbursed expenses. |
|
(c) |
Not annualized. |
|
(d) |
Annualized. |
|
(e) |
Ratio was determined after fee waivers and expense reimbursements by the Adviser (Note 4).
|
|
See accompanying notes to financial statements. |
|
|
BARROW VALUE OPPORTUNITY FUND |
||||||||
|
Per share data for a share outstanding throughout each period: |
||||||||
|
|
Year Ended |
Period Ended |
||||||
|
Net asset value at beginning of period |
$ |
26.37 |
$ |
23.30 |
||||
|
Income from investment operations: |
||||||||
|
Net investment income |
0.28 |
0.09 |
||||||
|
Net realized and unrealized gains on investments |
2.16 |
3.51 |
||||||
|
Total from investment operations |
2.44 |
3.60 |
||||||
|
Less distributions: |
||||||||
|
From net investment income |
(0.15 |
) |
(0.04 |
) |
||||
|
From net realized gains from investments |
(2.14 |
) |
(0.49 |
) |
||||
|
Total from investment operations |
(2.29 |
) |
(0.53 |
) |
||||
|
Net asset value at end of period |
$ |
26.52 |
$ |
26.37 |
||||
|
Total return (b) |
9.81 |
% |
15.51 |
%(c) |
||||
|
Ratios and supplemental data: |
||||||||
|
Net assets at end of period (000’s) |
$ |
276 |
$ |
359 |
||||
|
Ratio of total expenses to average net assets |
13.03 |
% |
16.03 |
%(d) |
||||
|
Ratio of net expenses to average net assets (e) |
1.40 |
% |
1.40 |
%(d) |
||||
|
Ratio of net investment income to average net assets (e) |
1.15 |
% |
0.76 |
%(d) |
||||
|
Portfolio turnover rate |
112 |
% |
45 |
%(c) |
||||
|
(a) |
Represents the period from the commencement of operations (close of business August 30, 2013) through May 31, 2014 (Note 1). |
|
(b) |
Total return is a measure of the change in value of an investment in the Fund over the periods covered, which assumes any dividends or capital gains distributions are reinvested in shares of the Fund. The returns shown do not reflect the deduction of taxes a shareholder would pay on Fund distributions or the redemption of Fund shares. The total returns would have been lower if the Adviser had not waived advisory fees and reimbursed expenses. |
|
(c) |
Not annualized. |
|
(d) |
Annualized. |
|
(e) |
Ratio was determined after fee waivers and expense reimbursements by the Adviser (Note 4).
|
|
See accompanying notes to financial statements. |
|
|
BARROW LONG/SHORT OPPORTUNITY FUND |
||||||||
|
Per share data for a share outstanding throughout each period: |
||||||||
|
|
Year Ended |
Period Ended |
||||||
|
Net asset value at beginning of period |
$ |
10.41 |
$ |
10.00 |
||||
|
Income (loss) from investment operations: |
||||||||
|
Net investment loss |
(0.02 |
) |
(0.03 |
) |
||||
|
Net realized and unrealized gains on investments |
0.43 |
0.44 |
||||||
|
Total from investment operations |
0.41 |
0.41 |
||||||
|
Less distributions: |
||||||||
|
From net realized gains from investments |
(0.19 |
) |
— |
|||||
|
Net asset value at end of period |
$ |
10.63 |
$ |
10.41 |
||||
|
Total return (b) |
4.01 |
% |
4.10 |
%(c) |
||||
|
Ratios and supplemental data: |
||||||||
|
Net assets at end of period (000’s) |
$ |
9,671 |
$ |
4,212 |
||||
|
Ratio of total expenses to average net assets (d) |
6.16 |
% |
8.69 |
%(e) |
||||
|
Ratio of net expenses to average net assets (d) (f) |
3.70 |
% |
3.51 |
%(e) |
||||
|
Ratio of net expenses to average net assets excluding dividend expense (d) (f) |
2.54 |
% |
2.51 |
%(e) |
||||
|
Ratio of net expenses to average net assets excluding dividend expense and brokerage expense on securities sold short (f) |
1.74 |
% |
1.74 |
%(e) |
||||
|
Ratio of net investment loss to average net assets (f) |
(0.05 |
%) |
(0.37% |
)(e) |
||||
|
Portfolio turnover rate |
111 |
% |
76 |
%(c) |
||||
|
(a) |
Represents the period from the commencement of operations (close of business August 30, 2013) through May 31, 2014 (Note 1). |
|
(b) |
Total return is a measure of the change in value of an investment in the Fund over the periods covered, which assumes any dividends or capital gains distributions are reinvested in shares of the Fund. The returns shown do not reflect the deduction of taxes a shareholder would pay on Fund distributions or the redemption of Fund shares. The total returns would have been lower if the Adviser had not waived advisory fees and reimbursed expenses. |
|
(c) |
Not annualized. |
|
(d) |
The Fund earns interest income on the margin account balance that is associated with securities sold short. The ratio of interest income to average net assets for the periods ended May 31, 2015 and May 31, 2014 is 0.30% and 0.28%(e), respectively. |
|
(e) |
Annualized. |
|
(f) |
Ratio was determined after fee waivers and expense reimbursements by the Adviser (Note 4).
|
|
See accompanying notes to financial statements. |
|
|
BARROW LONG/SHORT OPPORTUNITY FUND |
||||||||
|
Per share data for a share outstanding throughout each period: |
||||||||
|
|
Year Ended |
Period Ended |
||||||
|
Net asset value at beginning of period |
$ |
10.39 |
$ |
10.00 |
||||
|
Income (loss) from investment operations: |
||||||||
|
Net investment loss |
(0.04 |
) |
(0.04 |
) |
||||
|
Net realized and unrealized gains on investments |
0.43 |
0.43 |
||||||
|
Total from investment operations |
0.39 |
0.39 |
||||||
|
Less distributions: |
||||||||
|
From net realized gains from investments |
(0.19 |
) |
— |
|||||
|
Net asset value at end of period |
$ |
10.59 |
$ |
10.39 |
||||
|
Total return (b) |
3.82 |
% |
3.90 |
%(c) |
||||
|
Ratios and supplemental data: |
||||||||
|
Net assets at end of period (000’s) |
$ |
191 |
$ |
174 |
||||
|
Ratio of total expenses to average net assets (d) |
22.16 |
% |
21.15 |
%(e) |
||||
|
Ratio of net expenses to average net assets (d) (f) |
3.95 |
% |
3.76 |
%(e) |
||||
|
Ratio of net expenses to average net assets excluding dividend expense (d) (f) |
2.79 |
% |
2.76 |
%(e) |
||||
|
Ratio of net expenses to average net assets excluding dividend expense and brokerage expense on securities sold short (f) |
1.99 |
% |
1.99 |
%(e) |
||||
|
Ratio of net investment loss to average net assets (f) |
(0.37 |
%) |
(0.62% |
)(e) |
||||
|
Portfolio turnover rate |
111 |
% |
76 |
%(c) |
||||
|
(a) |
Represents the period from the commencement of operations (close of business August 30, 2013) through May 31, 2014 (Note 1). |
|
(b) |
Total return is a measure of the change in value of an investment in the Fund over the periods covered, which assumes any dividends or capital gains distributions are reinvested in shares of the Fund. The returns shown do not reflect the deduction of taxes a shareholder would pay on Fund distributions or the redemption of Fund shares. The total returns would have been lower if the Adviser had not waived advisory fees and reimbursed expenses. |
|
(c) |
Not annualized. |
|
(d) |
The Fund earns interest income on the margin account balance that is associated with securities sold short. The ratio of interest income to average net assets for the periods ended May 31, 2015 and May 31, 2014 is 0.30% and 0.28%(f), respectively. |
|
(e) |
Annualized. |
|
(f) |
Ratio was determined after fee waivers and expense reimbursements by the Adviser (Note 4).
|
|
See accompanying notes to financial statements. |
|
BARROW FUNDS
NOTES TO FINANCIAL STATEMENTS
May 31, 2015
1. Organization
Barrow Value Opportunity Fund (formerly Barrow All-Cap Core Fund) and Barrow Long/Short Opportunity Fund (formerly Barrow All-Cap Long/Short Fund) (individually, a “Fund” and collectively, the “Funds”) are each a diversified series of Ultimus Managers Trust (the “Trust”), an open-end investment company established as an Ohio business trust under a Declaration of Trust dated February 28, 2012. Other series of the Trust are not incorporated in this report. The Funds commenced operations at the close of business on August 30, 2013.
The investment objective of Barrow Value Opportunity Fund is to generate long-term capital appreciation. The investment objective of Barrow Long/Short Opportunity Fund is to generate above-average returns through capital appreciation, while also attempting to reduce volatility and preserve capital during market downturns.
Barrow Value Opportunity Fund acquired the assets and liabilities of Barrow Street Fund L.P., a Delaware limited partnership (the “Predecessor Private Fund”), in a tax-free reorganization completed at the close of business on August 30, 2013, the date the Barrow Value Opportunity Fund commenced operations. The Predecessor Private Fund had an investment objective and investment policies that were, in all material respects, equivalent to those of Barrow Value Opportunity Fund. However, the Predecessor Private Fund was not a registered investment company under the Investment Company Act of 1940, as amended (the “1940 Act”), and was not subject to certain investment limitations, diversification requirements, liquidity requirements, and other restrictions imposed by the 1940 Act and the Internal Revenue Code of 1986, as amended (the “Code”). These requirements and restrictions would have affected the Predecessor Private Fund’s performance. In addition, the Predecessor Private Fund charged an annual management fee of 1.50% of assets and, until October 7, 2012, a 20% performance fee after it reached certain performance benchmarks. Barrow Value Opportunity Fund pays a management fee equal to 0.99% of average daily net assets and does not charge a performance fee.
Upon completion of the reorganization, the net assets of Barrow Value Opportunity Fund were $16,732,894. The number of shares of Barrow Value Opportunity Fund issued in connection with the reorganization was 718,150, and the amount of net unrealized gains on the portfolio securities transferred to Barrow Value Opportunity Fund was $2,277,536.
|
BARROW FUNDS |
2. Significant Accounting Policies
The following is a summary of the Funds’ significant accounting policies. The policies are in conformity with accounting principles generally accepted in the United States of America (“GAAP”). As an investment company, as defined in Financial Accounting Standards Board (“FASB”) Accounting Standards Update 2013-08, the Funds follow accounting and reporting guidance under FASB Accounting Standards Codification Topic 946, “Financial Services – Investment Companies.”
Securities valuation – Each Fund values its portfolio securities at market value as of the close of regular trading on the New York Stock Exchange (the “NYSE”) (normally 4:00 p.m. Eastern time) on each business day the NYSE is open for business. The Funds value their listed securities on the basis of the security’s last sale price on the security’s primary exchange, if available, otherwise at the exchange’s most recently quoted bid price. NASDAQ-listed securities are valued at the NASDAQ Official Closing Price. In the event that market quotations are not readily available or are considered unreliable due to market or other events, the Funds value their securities and other assets at fair value in accordance with procedures established by and under the general supervision of the Board of Trustees (the “Board”). Under these procedures, the securities will be classified as Level 2 or 3 within the fair value hierarchy (see below), depending on the inputs used. Unavailable or unreliable market quotes may be due to the following factors: a substantial bid-ask spread; infrequent sales resulting in stale prices; insufficient trading volume; small trade sizes; a temporary lapse in any reliable pricing source; and actions of the securities or futures markets, such as the suspension or limitation of trading. As a result, the prices of securities used to calculate each Fund’s net asset value may differ from quoted or published prices for the same securities.
GAAP establishes a single authoritative definition of fair value, sets out a framework for measuring fair value, and requires additional disclosures about fair value measurements.
Various inputs are used in determining the value of each Fund’s investments and other financial instruments. These inputs are summarized in the three broad levels listed below:
|
● |
Level 1 – quoted prices in active markets for identical securities |
|
● |
Level 2 – other significant observable inputs |
|
● |
Level 3 – significant unobservable inputs |
The inputs or methods used for valuing securities are not necessarily an indication of the risks associated with investing in those securities. The inputs used to measure fair value may fall into different levels of the fair value hierarchy. In such cases, for disclosure purposes, the level in the fair value hierarchy within which the fair value measurement falls in its entirety is determined based on the lowest level input that is significant to the fair value measurement.
|
BARROW FUNDS |
The following is a summary of the inputs used to value the Funds’ investments and other financial instruments as of May 31, 2015:
|
Barrow Value Opportunity Fund |
Level 1 |
Level 2 |
Level 3 |
Total |
||||||||||||
|
Investments in Securities: |
||||||||||||||||
|
Common Stocks |
$ |
31,642,846 |
$ |
— |
$ |
— |
$ |
31,642,846 |
||||||||
|
Money Market Funds |
605,368 |
— |
— |
605,368 |
||||||||||||
|
Total |
$ |
32,248,214 |
$ |
— |
$ |
— |
$ |
32,248,214 |
||||||||
|
Barrow Long/Short Opportunity Fund |
Level 1 |
Level 2 |
Level 3 |
Total |
||||||||||||
|
Investments in Securities: |
||||||||||||||||
|
Common Stocks |
$ |
12,698,423 |
$ |
0 |
(a) |
$ |
— |
$ |
12,698,423 |
|||||||
|
Money Market Funds |
816,934 |
— |
— |
816,934 |
||||||||||||
|
Total |
$ |
13,515,357 |
$ |
0 |
(a) |
$ |
— |
$ |
13,515,357 |
|||||||
|
Other Financial Instruments: |
||||||||||||||||
|
Common Stocks – Sold Short |
$ |
(8,731,330 |
) |
$ |
— |
$ |
— |
$ |
(8,731,330 |
) |
||||||
|
Warrants – Sold Short |
(2 |
) |
0 |
(a) |
— |
(2 |
) |
|||||||||
|
Total |
$ |
(8,731,332 |
) |
$ |
0 |
(a) |
$ |
— |
$ |
(8,731,332 |
) |
|||||
|
(a) |
Barrow Long/Short Opportunity Fund holds Level 2 securities which are valued at $0. |
Refer to each Fund’s Schedule of Investments and Schedule of Securities Sold Short, as applicable, for a listing of securities by industry type. As of May 31, 2015, the Funds did not have any transfers into and out of any Level. There were no Level 3 securities or derivative instruments held by the Funds as of May 31, 2015. It is the Funds’ policy to recognize transfers into and out of any Level at the end of the reporting period.
Share valuation – The net asset value per share of each class of each Fund is calculated daily by dividing the total value of the assets attributable to that class, less liabilities attributable to that class, by the number of shares of that class outstanding. The offering price and redemption price per share of each class of each Fund is equal to the net asset value per share of such class.
Investment income/expense – Dividend income and expense are recorded on the ex-dividend date. Interest income is accrued as earned.
Security transactions – Security transactions are accounted for on the trade date. Gains and losses on securities sold are determined on a specific identification basis.
Allocation between classes – Investment income earned, realized capital gains and losses, and unrealized appreciation and depreciation are allocated daily to each class of shares based upon its proportionate share of total net assets of each Fund. Class specific expenses are charged directly to the class incurring the expense. Fund-level
|
BARROW FUNDS |
expenses of each Fund that are not attributable to a specific class are allocated daily to each class of shares of that Fund based upon its proportionate share of total net assets of the Fund.
Common expenses – Common expenses of the Trust are allocated among the Funds and the other series of the Trust based on the relative net assets of each series or the nature of the services performed and the relative applicability to each series.
Distributions to shareholders – The Funds distribute to shareholders any net investment income dividends and net realized capital gains distributions at least once each year. The amount of such dividends and distributions are determined in accordance with federal income tax regulations, which may differ from GAAP. Dividends and distributions to shareholders are recorded on the ex-dividend date. The tax character of distributions paid to shareholders during the year/period ended May 31, 2015 and May 31, 2014 was as follows:
|
Year/Period Ended |
Ordinary Income |
Long-Term Capital Gains |
Total Distributions |
|
|
Barrow Value Opportunity Fund |
||||
|
Institutional Class |
||||
|
May 31, 2015 |
$ 272,298 |
$ 1,595,623 |
$ 1,867,921 |
|
|
May 31, 2014 |
$ 193,861 |
$ 215,279 |
$ 409,140 |
|
|
Investor Class |
||||
|
May 31, 2015 |
$ 3,239 |
$ 22,723 |
$ 25,962 |
|
|
May 31, 2014 |
$ 1,187 |
$ 1,426 |
$ 2,613 |
|
|
Barrow Long/Short Opportunity Fund |
||||
|
Institutional Class |
||||
|
May 31, 2015 |
$ 169,448 |
$ — |
$ 169,448 |
|
|
May 31, 2014 |
$ — |
$ — |
$ — |
|
|
Investor Class |
||||
|
May 31, 2015 |
$ 3,197 |
$ — |
$ 3,197 |
|
|
May 31, 2014 |
$ — |
$ — |
$ — |
|
Short Sales – Barrow Long/Short Opportunity Fund may sell securities short. For financial statement purposes, an amount equal to the settlement amount is included in the Statements of Assets and Liabilities as an asset and an equivalent liability is then subsequently marked-to-market daily to reflect the current value of the short position. Subsequent fluctuations in the market prices of securities sold, but not yet purchased, may require purchasing the securities at prices which may differ from the market value reflected on the Statements of Assets and Liabilities. The Fund is liable for any dividends payable on securities while those securities are in a short position and will also bear
|
BARROW FUNDS |
other costs, such as charges for the prime brokerage accounts, in connection with the short positions. These costs are reported as dividend expense and brokerage expense on securities sold short, respectively, in the Statements of Operations. As collateral for its short positions, the Fund is required under the 1940 Act to maintain assets consisting of cash, cash equivalents or other liquid securities equal to the market value of the securities sold short. The cash deposits with brokers for securities sold short are reported on the Statements of Assets and Liabilities. The amount of collateral is required to be adjusted daily to reflect changes in the value of the securities sold short. To the extent Barrow Long/Short Opportunity Fund invests the proceeds received from selling securities short, the Fund is engaging in a form of leverage. The use of leverage by the Fund may make any change in the Fund’s net asset value greater than it would be without the use of leverage. Short sales are speculative transactions and involve special risks, including greater reliance on the ability of Barrow Street Advisers, LLC (the “Adviser”) to accurately anticipate the future value of a security.
Estimates – The preparation of financial statements in conformity with GAAP requires management to make estimates and assumptions that affect the reported amounts of assets and liabilities and disclosure of contingent assets and liabilities as of the date of the financial statements and the reported amounts of income and expenses during the reporting period. Actual results could differ from those estimates.
Federal income tax – Each Fund has qualified and intends to continue to qualify each year as a regulated investment company under the Code. Qualification generally will relieve each Fund of liability for federal income taxes to the extent 100% of its net investment income and net realized capital gains are distributed in accordance with the Code. Accordingly, no provision for income tax has been made.
In order to avoid imposition of the excise tax applicable to regulated investment companies, it is also each Fund’s intention to declare as dividends in each calendar year at least 98% of its net investment income (earned during the calendar year) and 98.2% of its net realized capital gains (earned during the twelve months ended October 31) plus undistributed amounts from prior years.
|
BARROW FUNDS |
The following information is computed on a tax basis for each item as of May 31, 2015:
|
|
Barrow Value Opportunity Fund |
Barrow Long/Short Opportunity Fund |
||||||
|
Cost of portfolio investments |
$ |
27,651,593 |
$ |
12,029,416 |
||||
|
Gross unrealized appreciation |
$ |
4,893,841 |
$ |
1,621,409 |
||||
|
Gross unrealized depreciation |
(297,220 |
) |
(135,468 |
) |
||||
|
Net unrealized appreciation |
4,596,621 |
1,485,941 |
||||||
|
Net unrealized depreciation on securities sold short |
— |
(743,976 |
) |
|||||
|
Undistributed ordinary income |
112,802 |
— |
||||||
|
Undistributed long-term gains |
281,634 |
— |
||||||
|
Capital loss carryforward |
— |
(218,049 |
) |
|||||
|
Qualified late year losses |
— |
(16,847 |
) |
|||||
|
Accumulated earnings |
$ |
4,991,057 |
$ |
507,069 |
||||
As of May 31, 2015, the proceeds of securities sold short on a tax basis is $7,987,356 for Barrow Long/Short Opportunity Fund.
The value of the federal income tax cost of portfolio investments, securities sold short, tax components of accumulated earnings, and financial statement cost of portfolio investments and securities sold short and components of net assets may be temporarily different (“book/tax differences”). These book/tax differences are due to the recognition of capital gains or losses under income tax regulations and GAAP, primarily the tax deferral of losses on wash sales and the tax treatment of income and capital gains on publicly-traded partnerships held by the Funds.
As of May 31, 2015, Barrow Long/Short Opportunity Fund had a short-term capital loss carryforward of $218,049 for federal income tax purposes. This capital loss carryforward, which does not expire, may be utilized in future years to offset net realized capital gains, if any, prior to distributing such gains to shareholders.
Qualified late year losses for Barrow Long/Short Opportunity Fund incurred after December 31, 2014 and within the taxable year are deemed to arise on the first day of the Fund’s next taxable year. For the year ended May 31, 2015, the Fund intends to defer $16,847 of late year ordinary losses to June 1, 2015 for federal income tax purposes.
|
BARROW FUNDS |
For the year ended May 31, 2015, the following reclassifications were made as a result of permanent differences between financial statement and income tax reporting requirements:
|
|
Barrow Value Opportunity Fund |
Barrow Long/Short Opportunity Fund |
||||||
|
Undistributed net investment income |
$ |
(40,605 |
) |
$ |
5,259 |
|||
|
Accumulated net realized gain from securities transactions |
$ |
40,605 |
$ |
11,519 |
||||
|
Paid-in capital |
$ |
— |
$ |
(16,778 |
) |
|||
Such reclassifications had no effect on either Fund’s total net assets or net asset value per share.
The Funds recognize tax benefits or expenses of uncertain tax positions only when the position is “more likely than not” of being sustained assuming examination by tax authorities. Management has reviewed the tax positions taken on Federal income tax returns for all open tax years (tax years ended May 31, 2014 and May 31, 2015) and has concluded that no provision for unrecognized tax benefits or expenses is required in these financial statements. The Funds identify their major tax jurisdiction as U.S. Federal.
3. Investment Transactions
During the year ended May 31, 2015, cost of purchases and proceeds from sales of investment securities, other than short-term investments and short positions, amounted to $35,329,183 and $26,933,268, respectively, for Barrow Value Opportunity Fund and $16,446,333 and $10,792,189, respectively, for Barrow Long/Short Opportunity Fund.
4. Transactions with Related Parties
INVESTMENT ADVISORY AGREEMENT
Each Fund’s investments are managed by the Adviser pursuant to the terms of an Investment Advisory Agreement. Barrow Value Opportunity Fund pays the Adviser an investment advisory fee, computed and accrued daily and paid monthly, at the annual rate of 0.99% of its average daily net assets. Barrow Long/Short Opportunity Fund pays the Adviser an investment advisory fee, computed and accrued daily and paid monthly, at the annual rate of 1.50% of its average daily net assets.
Pursuant to an Expense Limitation Agreement between the Funds and the Adviser, the Adviser has agreed, until October 1, 2016, to waive investment advisory fees and reimburse Other Expenses to limit Total Annual Fund Operating Expenses (exclusive of brokerage costs, taxes, borrowing costs such as interest and dividend expenses on securities sold short, interest, acquired fund fees and expenses, extraordinary
|
BARROW FUNDS |
expenses such as litigation and merger or reorganization costs, and other expenses not incurred in the ordinary course of the Funds’ business) to an amount not exceeding the following percentages of average daily net assets attributable to each respective Class:
|
|
Institutional Class |
Investor Class |
|
Barrow Value Opportunity Fund |
1.15% |
1.40% |
|
Barrow Long/Short Opportunity Fund |
1.74% |
1.99% |
Accordingly, during the year ended May 31, 2015, the Adviser waived investment advisory fees and reimbursed expenses as follows:
|
|
Investment Advisory Fees Waived |
Expense Reimbursements |
Total |
|||||||||
|
Barrow Value Opportunity Fund |
$ |
133,153 |
$ |
46,987 |
$ |
180,140 |
||||||
|
Barrow Long/Short Opportunity Fund |
$ |
112,065 |
$ |
100,582 |
$ |
212,647 |
||||||
Under the terms of the Expense Limitation Agreement, investment advisory fee waivers and expense reimbursements by the Adviser are subject to recoupment by the Adviser for a period of three years after such fees and expenses were incurred, provided that the recoupments do not cause Total Annual Fund Operating Expenses to exceed the foregoing expense limitations. As of May 31, 2015, the Adviser may seek recoupment of investment advisory fee waivers and expense reimbursements no later than the dates as stated below:
|
|
May 31, |
May 31, |
Total |
|||||||||
|
Barrow Value Opportunity Fund |
$ |
118,161 |
$ |
180,140 |
$ |
298,301 |
||||||
|
Barrow Long/Short Opportunity Fund |
$ |
156,927 |
$ |
212,647 |
$ |
369,574 |
||||||
The Principle Executive Officer of the Funds is also an officer of the Adviser.
OTHER SERVICE PROVIDERS
Ultimus Fund Solutions, LLC (“Ultimus”) provides fund administration, fund accounting, compliance, and transfer agency services to the Funds. Each Fund pays Ultimus fees in accordance with the agreements for such services. In addition, each Fund pays out-of-pocket expenses including, but not limited to, postage, supplies, and costs of pricing its portfolio securities.
DISTRIBUTION AGREEMENT
Under the terms of a Distribution Agreement with the Trust, Ultimus Fund Distributors, LLC (the “Distributor”) serves as principal underwriter to each Fund. The Distributor is a wholly-owned subsidiary of Ultimus.
|
BARROW FUNDS |
Certain Trustees and officers of the Trust are also officers of Ultimus and the Distributor.
DISTRIBUTION PLAN
Each Fund has adopted a distribution plan under Rule 12b-1 under the 1940 Act (the “Plan”) pursuant to which each Fund may pay intermediaries and other persons for rendering distribution and shareholder services and for bearing any related expenses with respect to the Investor Class of each Fund. These distribution and shareholder service fees will not exceed the annual rate of 0.25% of each Fund's average daily net assets allocable to Investor Class Shares. During the year ended May 31, 2015, the Investor Class of Barrow Value Opportunity Fund and Barrow Long/Short Opportunity Fund incurred $634 and $441, respectively, of distribution fees under the Plan.
TRUSTEE COMPENSATION
Each Trustee who is not an “interested person” of the Trust (“Independent Trustee”) receives from each Fund a fee of $500 for each Board meeting attended plus reimbursement of travel and other meeting-related expenses. In addition, effective January 1, 2015, each Independent Trustee also receives a $500 annual retainer from each Fund. Trustees affiliated with the Adviser or Ultimus are not compensated by the Funds for their services.
PRINCIPAL HOLDERS OF FUND SHARES
As of May 31, 2015, the following shareholders owned of record 5% or more of the outstanding shares of each class of each Fund:
|
Name of Record Owner |
% Ownership |
|
Barrow Value Opportunity Fund – Institutional Class: |
|
|
Socatean Partners |
50% |
|
Charles Schwab & Company, Inc. (for the benefit of its customers) |
30% |
|
Robert F. Greenhill, Jr. (a principal of the Adviser) |
14% |
|
Barrow Value Opportunity Fund – Investor Class: |
|
|
Robert F. Greenhill, Jr. |
39% |
|
National Financial Services Corporation (for the benefit of its customers) |
15% |
|
Charles Schwab & Company, Inc. (for the benefit of its customers) |
13% |
|
Peter Jennings |
10% |
|
Seshadri Narasimhan |
10% |
|
Nicholas Chermayeff (a principal of the Adviser) |
6% |
|
Barrow Long/Short Opportunity Fund – Institutional Class: |
|
|
Socatean Partners |
55% |
|
Robert F. Greenhill, Jr. |
25% |
|
Charles Schwab & Company, Inc. (for the benefit of its customers) |
6% |
|
BARROW FUNDS |
|
Name of Record Owner |
% Ownership |
|
Barrow Long/Short Opportunity Fund – Investor Class: |
|
|
Robert F. Greenhill, Jr. |
50% |
|
Charles Schwab & Company, Inc. (for the benefit of its customers) |
28% |
|
James E. King |
11% |
|
Nicholas Chermayeff |
6% |
5. Borrowing Costs
Barrow Value Opportunity Fund has a secured bank line of credit with BNP Paribas that provides a maximum borrowing of up to one-third of its net assets. The line of credit may be used to maintain necessary liquidity to make payments for redemptions of Fund shares or for temporary emergency purposes. Borrowings under this arrangement bear interest at an annual rate equal to the one-month LIBOR at the time of borrowing plus 0.85%. During the year ended May 31, 2015, Barrow Value Opportunity Fund incurred $913 of borrowing costs. As of May 31, 2015, Barrow Value Opportunity Fund did not have outstanding borrowings. The average outstanding borrowings and average interest rate on such borrowings by Barrow Value Opportunity Fund during the year ended May 31, 2015 were $87,672 and 1.04%, respectively. Barrow Long/Short Opportunity Fund does not have a bank line of credit.
6. Contingencies and Commitments
The Funds indemnify the Trust’s officers and Trustees for certain liabilities that might arise from their performance of their duties to the Funds. Additionally, in the normal course of business the Funds enter into contracts that contain a variety of representations and warranties and which provide general indemnifications. The Funds’ maximum exposure under these arrangements is unknown, as this would involve future claims that may be made against the Funds that have not yet occurred. However, based on experience, the Funds expect the risk of loss to be remote.
7. Sector Risk
If a Fund has significant investments in the securities of issuers within a particular sector, any development affecting that sector will have a greater impact on the value of the net assets of the Fund than would be the case if the Fund did not have significant investments in that sector. In addition, this may increase the risk of loss in the Fund and increase the volatility of the Fund’s net asset value per share. Occasionally, market conditions, regulatory changes, or other developments may negatively impact
|
BARROW FUNDS |
a particular sector, and therefore the value of the Fund’s portfolio will be adversely affected. As of May 31, 2015, Barrow Long/Short Opportunity Fund had the following percentages of the value of its net assets invested or sold short in stocks within the following sectors:
|
Sector |
Long |
Short |
Net |
|
Consumer Discretionary |
28.8% |
(20.6%) |
8.2% |
|
Consumer Staples |
25.9% |
(16.6%) |
9.3% |
As shown above, although the Fund has greater than 25% of the Fund’s net assets invested in long positions in the sectors noted, each sector exposure is mitigated by short positions. As part of the Fund’s principal investment strategies, the Adviser monitors the Fund’s sector exposure to ensure the Fund’s portfolio is significantly diversified.
8. Subsequent Events
The Funds are required to recognize in the financial statements the effects of all subsequent events that provide additional evidence about conditions that existed as of the date of the Statements of Assets and Liabilities. For non-recognized subsequent events that must be disclosed to keep the financial statements from being misleading, the Funds are required to disclose the nature of the event as well as an estimate of its financial effect, or a statement that such an estimate cannot be made. Management has evaluated subsequent events through the issuance of these financial statements and has noted the following:
Until June 30, 2015, each Fund offered two classes of shares: Institutional Class shares (sold without any sales loads or distribution fees and requires a $250,000 initial investment) and Investor Class shares (sold without any sales loads, but subject to a distribution fee of up to 0.25% of the average daily net assets attributable to Investor Class shares and requires a $2,500 initial investment). Each class of shares represented an ownership interest in the same investment portfolio. On June 30, 2015, all existing Investor Class Shares of each Fund converted into Institutional Class Shares and the initial minimum investment was reduced to $2,500 (the “Conversion”). After the Conversion, the Funds each offer a single class of shares.
Management has noted no other such events.
|
BARROW FUNDS |
To the Board of Trustees of Ultimus Managers Trust
and the Shareholders of Barrow Value Opportunity Fund and
Barrow Long/Short Opportunity Fund
We have audited the accompanying statements of assets and liabilities of Barrow Value Opportunity Fund (formerly Barrow All-Cap Core Fund) and Barrow Long/Short Opportunity Fund (formerly Barrow All-Cap Long/Short Fund) (the "Funds"), each a series of shares of beneficial interest in Ultimus Managers Trust, including the schedules of investments, as of May 31, 2015, and the related statements of operations for the year then ended, and the statements of changes in net assets and the financial highlights for the year then ended and for the period August 30, 2013 (commencement of operations) through May 31, 2014. These financial statements and financial highlights are the responsibility of the Funds' management. Our responsibility is to express an opinion on these financial statements and financial highlights based on our audits.
We conducted our audits in accordance with the standards of the Public Company Accounting Oversight Board (United States). Those standards require that we plan and perform the audits to obtain reasonable assurance about whether the financial statements and financial highlights are free of material misstatement. An audit includes examining, on a test basis, evidence supporting the amounts and disclosures in the financial statements. Our procedures included confirmation of securities owned as of May 31, 2015 by correspondence with the custodian and brokers. An audit also includes assessing the accounting principles used and significant estimates made by management, as well as evaluating the overall financial statement presentation. We believe that our audits provide a reasonable basis for our opinion.
In our opinion, the financial statements and financial highlights referred to above present fairly, in all material respects, the financial position of Barrow Value Opportunity Fund and Barrow Long/Short Opportunity Fund as of May 31, 2015, and the results of their operations for the year then ended, and the changes in their net assets and their financial highlights for the year then ended and for the period August 30, 2013 through May 31, 2014, in conformity with accounting principles generally accepted in the United States of America.
 |
|
|
BBD, LLP |
Philadelphia, Pennsylvania
July 30, 2015
|
BARROW FUNDS |
We believe it is important for you to understand the impact of costs on your investment. As a shareholder of the Funds, you incur ongoing costs, including management fees, class specific fees (such as Rule 12b-1 distribution fees) and other operating expenses. The following examples are intended to help you understand your ongoing costs (in dollars) of investing in the Funds and to compare these costs with the ongoing costs of investing in other mutual funds.
A mutual fund’s ongoing costs are expressed as a percentage of its average net assets. This figure is known as the expense ratio. The expenses in the table below are based on an investment of $1,000 made at the beginning of the most recent period (December 1, 2014) and held until the end of the period (May 31, 2015).
The table below illustrates each Fund’s ongoing costs in two ways:
Actual fund return – This section helps you to estimate the actual expenses that you paid over the period. The “Ending Account Value” shown is derived from each Fund’s actual return, and the third column shows the dollar amount of operating expenses that would have been paid by an investor who started with $1,000 in the Funds. You may use the information here, together with the amount you invested, to estimate the expenses that you paid over the period.
To do so, simply divide your account value by $1,000 (for example, an $8,600 account value divided by $1,000 = 8.6), then multiply the result by the number given for the Funds under the heading “Expenses Paid During Period.”
Hypothetical 5% return – This section is intended to help you compare the Funds’ ongoing costs with those of other mutual funds. It assumes that each Fund had an annual return of 5% before expenses during the period shown, but that the expense ratio is unchanged. In this case, because the return used is not the Funds’ actual return, the results do not apply to your investment. The example is useful in making comparisons because the U.S. Securities and Exchange Commission (the “SEC”) requires all mutual funds to calculate expenses based on a 5% return. You can assess each Fund’s ongoing costs by comparing this hypothetical example with the hypothetical examples that appear in shareholder reports of other funds.
Note that expenses shown in the table are meant to highlight and help you compare ongoing costs only. The Funds do not charge transaction fees, such as purchase or redemption fees, nor do they carry a “sales load.”
The calculations assume no shares were bought or sold during the period. Your actual costs may have been higher or lower, depending on the amount of your investment and the timing of any purchases or redemptions.
|
BARROW FUNDS |
More information about the Funds’ expenses can be found in this report. For additional information on operating expenses and other shareholder costs, please refer to the Funds’ prospectus.
|
|
Beginning |
Ending |
Net |
Expenses Period(b) |
|
Barrow Value Opportunity Fund |
||||
|
Institutional Class |
||||
|
Actual |
$1,000.00 |
$1,062.30 |
1.15% |
$ 5.91 |
|
Hypothetical 5% Return (before expenses) |
$1,000.00 |
$1,019.20 |
1.15% |
$ 5.79 |
|
Investor Class |
||||
|
Actual |
$1,000.00 |
$1,061.00 |
1.40% |
$ 7.19 |
|
Hypothetical 5% Return (before expenses) |
$1,000.00 |
$1,017.95 |
1.40% |
$ 7.04 |
|
Barrow Long/Short Opportunity Fund |
||||
|
Institutional Class |
||||
|
Actual |
$1,000.00 |
$1,040.10 |
3.72% |
$ 18.92 |
|
Hypothetical 5% Return (before expenses) |
$1,000.00 |
$1,006.38 |
3.72% |
$ 18.61 |
|
Investor Class |
||||
|
Actual |
$1,000.00 |
$1,039.20 |
3.97% |
$ 20.18 |
|
Hypothetical 5% Return (before expenses) |
$1,000.00 |
$1,005.14 |
3.97% |
$ 19.85 |
|
(a) |
Annualized, based on the Fund's most recent one-half year expenses. |
|
(b) |
Expenses are equal to the Funds' annualized expense ratio multiplied by the average account value over the period, multiplied by 182/365 (to reflect the one-half year period). |
|
BARROW FUNDS |
A description of the policies and procedures that the Funds use to vote proxies relating to portfolio securities is available without charge upon request by calling toll-free 1-877-767-6633, or on the SEC’s website at http://www.sec.gov. Information regarding how the Funds voted proxies relating to portfolio securities during the most recent period ended June 30 is also available without charge upon request by calling toll-free 1-877-767-6633, or on the SEC’s website at http://www.sec.gov.
The Trust files a complete listing of portfolio holdings for each of the Funds with the SEC as of the end of the first and third quarters of each fiscal year on Form N-Q. These filings are available upon request by calling 1-877-767-6633. Furthermore, you may obtain a copy of the filings on the SEC’s website at http://www.sec.gov. The Trust’s Forms N-Q may also be reviewed and copied at the SEC’s Public Reference Room in Washington, DC, and information on the operation of the Public Reference Room may be obtained by calling 1-800-SEC-0330.
FEDERAL TAX INFORMATION (Unaudited)
In accordance with federal tax requirements, the following provides shareholders with information concerning distributions from ordinary income and net realized capital gains made by each Fund during the fiscal year ended May 31, 2015. Certain dividends paid by the Funds may be subject to a maximum tax rate of 23.8%. Barrow Value Opportunity Fund and Barrow Long/Short Opportunity Fund intend to designate up to a maximum amount of $275,513 and $131,654, respectively, as taxed at a maximum rate of 23.8%. Additionally, Barrow Value Opportunity Fund intends to designate up to a maximum amount of $1,618,370 as a long-term capital gain distribution. As required by federal regulations, complete information was computed and reported in conjunction with your 2014 Form 1099-DIV.
|
BARROW FUNDS |
The Board of Trustees has overall responsibility for management of the Trust’s affairs. The Trustees serve during the lifetime of the Trust and until its termination, or until death, resignation, retirement, or removal. The Trustees, in turn, elect the officers of the Fund to actively supervise its day-to-day operations. The officers have been elected for an annual term. Unless otherwise noted, each Trustee’s and officer’s address is 225 Pictoria Drive, Suite 450, Cincinnati, OH 45246. The following are the Trustees and executive officers of the Fund:
|
Name and |
Length of Time Served |
Position(s) Held with Trust |
Principal Occupation(s) During Past 5 Years |
Number of Funds in Trust Overseen by Trustee |
Directorships of Public Companies Held by Trustee During Past 5 Years |
|
Interested Trustees: |
|||||
|
Robert G. Dorsey* Year of Birth: 1957 |
Since February 2012 |
Trustee (February 2012 to present) President (July 2012 to October 2013) |
Managing Director of Ultimus Fund Solutions, LLC and Ultimus Fund Distributors, LLC (1999 to present) |
11 |
None |
|
Independent Trustees: |
|||||
|
John C. Davis Year of Birth: 1952 |
Since |
Chairman (July 2014 Trustee (June 2012 |
Consultant (government services) since May 2011; Retired Partner of PricewaterhouseCoopers LLP (1974-2010) |
11 |
None |
|
John J. Discepoli Year of Birth: 1963 |
Since June 2012 |
Trustee |
Owner of Discepoli Financial Planning, LLC (personal financial planning company) since November 2004 |
11 |
None |
|
David M. Deptula Year of Birth: 1958 |
Since June 2012 |
Trustee |
Vice President of Tax at The Standard Register Company since November 2011; Tax Partner at Deloitte Tax LLP from 1984 to 2011 |
11 |
None |
|
* |
Mr. Dorsey is considered an “interested person” of the Trust within the meaning of Section 2(a)(19) of the 1940 Act because of his relationship with the Trust’s administrator, transfer agent and distributor. |
|
BARROW FUNDS |
|
Name and |
Length of Time Served |
Position(s) Held with Trust |
Principal Occupation(s) During Past 5 Years |
|
Executive Officers: |
|||
|
Nicholas Chermayeff 300 First Stamford Place 3rd Floor East Stamford, CT 06902 Year of Birth: 1969 |
Since April 2013 |
Principal Executive Officer of Barrow All-Cap Core Fund and Barrow All-Cap Long/Short Fund |
Co-Chief Executive Officer and Principal of Barrow Street Capital LLC (since 1997) |
|
David R. Carson Year of Birth: 1958 |
Since April 2013 |
President (October 2013 Vice (April 2013 to October 2013) |
Vice President and Director of Client Strategies of Ultimus Fund Solutions, LLC (2013 to present); Chief Compliance Officer, The Huntington Funds (2005 to 2013), The Flex-Funds (2006 to 2011), Meeder Financial (2007 to 2011), Huntington Strategy Shares (2012 to 2013), and Huntington Asset Advisors (2013); Vice President, Huntington National Bank (2001 to 2013) |
|
Jennifer L. Leamer Year of Birth: 1976 |
Since February 2014 |
Treasurer (October 2014 to present) Assistant Treasurer (April 2014 to October 2014) |
Mutual Fund Controller of Ultimus Fund Solutions, LLC (2014 to present); Business Analyst of Ultimus Fund Solutions (2007 to 2014) |
|
Bo J. Howell Year of Birth: 1981 |
Since October 2014 |
Secretary (April 2015 to present) Assistant Secretary (October 2014 to April 2015) |
V.P., Director of Fund Administration for Ultimus Fund Solutions, LLC (2014 to present); Counsel – Securities and Mutual Funds for Western & Southern Financial Group (2012 to 2014); U.S. Securities and Exchange Commission, Senior Counsel (2009 to 2012) |
|
Stephen L. Preston Year of Birth: 1966 |
Since October 2014 |
Chief |
Assistant Vice President and Chief Compliance Officer of Ultimus Fund Distributors, LLC and Assistant Vice President of Ultimus Fund Solutions, LLC since 2011; Senior Consultant at Mainstay Capital Markets Consultants (2010 to 2011); Chief Compliance Officer at INTL Trading, Inc. (2008 to 2010) |
Additional information about members of the Board and executive officers is available in the Funds’ Statement of Additional Information (“SAI”). To obtain a free copy of the SAI, please call 1-877-767-6633.
|
BARROW FUNDS ADVISORY AGREEMENT (Unaudited) |
The Board of Trustees (the “Board”), including the Independent Trustees voting separately, has reviewed and approved the Funds’ Investment Advisory Agreement with the Barrow Street Advisors LLC (the “Adviser”) for an additional annual term. Approval took place at an in-person meeting held on January 26, 2015, at which all of the Trustees were present.
In the course of their deliberations, the Board was advised by legal counsel. The Board received and reviewed information provided by the Adviser in response to requests of the Board and counsel.
In considering the Investment Advisory Agreement and reaching their conclusions with respect thereto, the Board reviewed and analyzed various factors that they determined were relevant, including the factors described below.
The nature, extent, and quality of the services provided by the Adviser. In this regard, the Board reviewed the services being provided by the Adviser to the Funds including, without limitation, its investment advisory services since the Funds’ inception, the Adviser’s compliance procedures and practices, and its efforts to promote the Funds and assist in their distribution. The Board also noted that a principal of the Adviser serves as the Funds’ Principal Executive Officer without additional compensation. After reviewing the foregoing information and further information regarding the Adviser’s business, the Board concluded that the quality, extent, and nature of the services provided by the Adviser were satisfactory and adequate for the Funds.
The investment performance of the Funds. In this regard, the Board compared the performance of each Fund with the performance of its benchmark indexes and related Morningstar categories. The Board also considered the consistency of the Adviser’s management with each Fund’s investment objective and policies. Following consideration of the investment performance of each Fund and its performance relative to its respective Morningstar categories, the Adviser’s experience in managing mutual funds, its historical investment performance, and other factors, the Board concluded that the investment performance of the Funds has been satisfactory.
The costs of the services provided and profits realized by the Adviser and its affiliates from its relationship with the Funds. In this regard, the Board considered the Adviser’s staffing, personnel, and methods of operations; the education and experience of its personnel; its compliance program, policies, and procedures; its financial condition and the level of commitment to each Fund, and, generally, the Adviser’s advisory business; the asset level of each Fund; the overall expenses of each Fund, including the advisory fee; and the differences in fees and services to the Adviser’s other clients that may be similar to the Funds. The Board considered the Adviser’s Expense Limitation Agreement (the “ELA”) with the Funds, and considered the Adviser’s current and past fee waivers and expense reimbursements for each Fund. The Board further took into account the Adviser’s commitment to continue the ELA for each Fund until at least October 1, 2016.
|
BARROW FUNDS ADVISORY AGREEMENT (Unaudited) (Continued) |
The Board also considered potential benefits for the Adviser in managing the Funds, including promotion of the Adviser’s name and the potential for it to receive research, statistical, or other services from the Funds’ trades. The Board compared each Fund’s advisory fee and overall expense ratio to the average advisory fees and average expense ratios for its Morningstar category. In addition, the Board compared each Fund to the other mutual funds in its Morningstar category in terms of the style of investment management, the size of the fund, and the nature of the investment strategy. The Board noted that the advisory fee for Barrow Value Opportunity Fund was slightly above the 25th percentile for its Morningstar category and the overall expense ratio for the Institutional Class was at the median for its Morningstar category and the overall expense ratio for the Investor Class was at the 25th percentile for its Morningstar category. The Board noted that the advisory fee for Barrow Long/Short Opportunity Fund was at the 25th percentile for its Morningstar category and the overall expense ratio for the Institutional Class was at the median for its Morningstar category and the overall expense ratio for the Investor Class was at the 25th percentile for its Morningstar category. The Board also noted that both Funds had significantly less assets than most funds in their respective peer groups. The Board also compared the fees paid by each Fund to the fees paid by other clients of the Adviser, and considered the similarities and differences of services received by such other clients as compared to the services provided to each Fund. Following these comparisons and upon further consideration of the foregoing, the Board concluded that the advisory fee paid to the Adviser by each Fund is fair and reasonable.
The extent to which economies of scale would be realized as each Fund grows and whether advisory fee levels reflect these economies of scale for the benefit of the Funds’ investors. In this regard, the Board considered that each Fund’s fee arrangements with the Adviser involve both the advisory fee and the ELA. The Board determined that while the advisory fee remains the same as asset levels increase, the shareholders of each Fund have experienced benefits from the ELA. Following consideration of each Fund’s asset levels, expectations for growth, and level of fees, the Board determined that each Fund’s fee arrangements with the Adviser would continue to provide benefits. The Board also determined that the fee arrangements were fair and reasonable given each Fund’s projected asset levels for the next year.
Brokerage and portfolio transactions. In this regard, the Board considered the Adviser’s trading policies, procedures, and performance in seeking best execution for the Funds. The Board also considered the historical portfolio turnover rate for each Fund; the process by which evaluations are made of the overall reasonableness of commissions paid; the method and basis for selecting and evaluating the broker-dealers used; and any anticipated allocation of brokerage business to persons affiliated with Barrow. After further review and discussion, the Board determined that the Adviser’s practices regarding brokerage and portfolio transactions were satisfactory.
|
BARROW FUNDS ADVISORY AGREEMENT (Unaudited) (Continued) |
Possible conflicts of interest. In evaluating the possibility for conflicts of interest, the Board considered such matters as the experience and abilities of the advisory personnel assigned to each Fund, the Adviser’s process for allocating trades among its different clients, and the substance and administration of the Adviser’s code of ethics. The Board found that the Adviser’s standards and practices relating to the identification and mitigation of potential conflicts of interests were satisfactory.
Conclusion
After consideration of the above factors as well as other factors, the Board unanimously concluded that approval of the Investment Advisory Agreement was in the best interests of each Fund and its shareholders.

CINCINNATI ASSET MANAGEMENT FUNDS:
BROAD MARKET STRATEGIC INCOME FUND
Annual Report
May 31, 2015
|
CINCINNATI ASSET MANAGEMENT FUNDS: |
July 2, 2015 |
Dear Fellow Shareholders,
Our Annual report for the Cincinnati Asset Management Funds: Broad Market Strategic Income Fund (the “Fund”) presents data and performance for the 12 months ended May 31, 2015. All of us at Cincinnati Asset Management, Inc. want to thank you for your investment with us, and we appreciate your confidence in our investment management.
The Fund is currently invested primarily in investment-grade and high-yield corporate bonds that we consider undervalued. We believe that our proprietary analysis enhances our ability to identify such opportunities and enables us to sell securities when more attractive opportunities present themselves. These investment decisions are made with the important discipline of maintaining portfolio diversification and with the dual objectives of achieving a high level of income while preserving capital. Our objective is to improve quality, increase yield and shorten maturity.
Our disciplined investing strategy resulted in the Fund holding 86 positions in the bonds of 78 different corporations on May 31, 2015. The Fund continues to be fully invested, as is its objective. The Fund outperformed the Barclays U.S. Corporate BAA Index (the “Benchmark”) for the 12-month fiscal period ended May 31, 2015, with a total return of 2.99% compared to a return of 2.39% for the Benchmark. We attribute this outperformance primarily to security selection.
During the past year, interest rates have been volatile. On May 1, 2014, the yield on the 10-year Treasury Bond was 2.65%; on January 1, 2015 it was 2.17%; on April 1, 2015 it was 1.92%; and on May 31, 2015, it was at 2.12%. (As of the date of this Letter, that rate is slightly over 2.35%.) Bond prices generally decline as rates increase, and the net asset value of the Fund will reflect those changes in interest rates. Many economists now believe that the Federal Reserve Board (the “FED”) won’t increase rates until late 2015 or, perhaps, not until 2016. At this time, the timing of rate increases is less critical than the questions of “how high” and “how fast.” As of May 31, 2015, bonds that the Fund owns were yielding 4.17%, on average, around 2.0% more than U.S. Treasury yields. We believe that the Fund’s positions will continue to provide excellent value relative to other investment-grade rated fixed-income alternatives.
During the second half of the Fund’s fiscal year, revised gross domestic product (“GDP”) for the fourth calendar quarter of 2014 was +2.2%, while revised first calendar quarter of 2015 was -0.20%. Current consensus forecast for GDP growth in the second half of 2015 is 3%. Unemployment settled at 5.4% on May 31, 2015, while continuing jobless claims and initial jobless claims showed improvement. The FED’s measure of inflation was +1.3%, well below their target of 2.0%. Although interest rates will be impacted by “headline” news and the so-called “risk-off/risk-on” trades that cause short-term volatility, we intend to focus on the relative value of corporate and high-yield bonds and will maintain our focus on the intermediate-term maturity of the portfolio. It is the underlying credit quality of the companies we purchase that influences our investment decisions, not short-term interest rate fluctuations.
A predominant theme for the last six months has been the rapid decline of oil prices, falling from over $100 per barrel to less than $50 per barrel, before rebounding to the $60 range. Many corporations engaged in exploration and production, as well as many corporations providing services to the Energy sector, have experienced a significant impact on their performance and their bonds have underperformed market averages. The Fund holds several positions in these companies as well as issues of coal companies that have been adversely impacted by the pressures of a struggling coal market. We continue to actively monitor these credits to determine how they may perform over a full market cycle, always seeking to be rewarded for the risks we assume.
We continue to expect increased volatility in fixed-income markets as some participants continually readjust positioning, trying to time the expected moves by the FED. Additionally, we expect new issue volume to remain quite strong as companies try to complete financing before the expected rise in interest rates. As always, we will continue to search for value and adjust positions as we uncover compelling situations.
Thank you again for your confidence in our Fund. Our fellow investors are very important to us and if you have any questions regarding market conditions or the Fund, please don’t hesitate to call us (513.554.8500).
Sincerely,
Cincinnati Asset Management Funds:
Broad Market Strategic Income Fund
Managed by Cincinnati Asset Management, Inc.
Past performance is not predictive of future performance. Investment results and principal value will fluctuate so that shares, when redeemed, may be worth more or less than their original cost. Current performance may be higher or lower than the performance data quoted. Performance data current to the most recent month-end are available by calling 1-866-738-1128.
An investor should consider the investment objectives, risks, charges and expenses of the Fund carefully before investing. The Fund’s prospectus contains this and other important information. To obtain a copy of the Fund’s prospectus please call 1-866-738-1128 and a copy will be sent to you free of charge. Please read the prospectus carefully before you invest. Cincinnati Asset Management Funds: Broad Market Strategic Income Fund is distributed by Ultimus Fund Distributors, LLC.
The Letter to Shareholders seeks to describe some of the adviser’s current opinions and views of the financial markets. Although the adviser believes it has a reasonable basis for any opinions or views expressed, actual results may differ, sometimes significantly so, from those expected or expressed. The securities held by the Fund that are discussed in the Letter to Shareholders were held during the period covered by this Report. They do not comprise the entire investment portfolio of the Fund, may be sold at any time and may no longer be held by the Fund. The opinions of the Fund’s adviser with respect to those securities may change at any time.
CINCINNATI ASSET MANAGEMENT FUNDS:
BROAD MARKET STRATEGIC INCOME FUND
PERFORMANCE INFORMATION
May 31, 2015 (Unaudited)
Comparison of the Change in Value of a $10,000 Investment
in Cincinnati Asset Management Funds: Broad Market Strategic
Income Fund versus the Barclays U.S. Corporate BAA Index
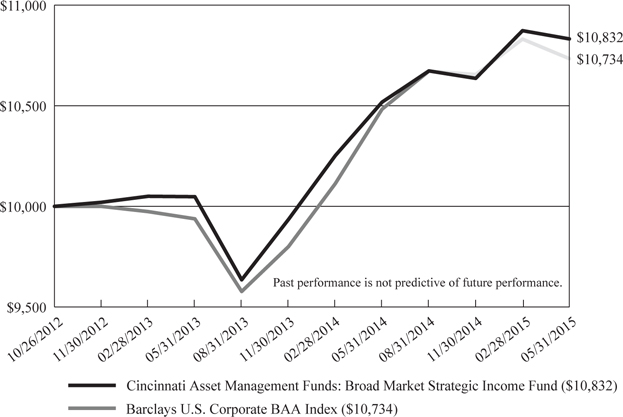
|
Average Annual Total Returns For Periods Ended May 31, 2015 |
|||
|
1 Year |
Since |
||
|
Cincinnati Asset Management Funds: Broad Market Strategic Income Fund (a) |
2.99% |
3.13% |
|
|
Barclays U.S. Corporate BAA Index |
2.39% |
2.77% |
|
|
(a) |
The Fund’s total return does not reflect the deduction of taxes a shareholder would pay on Fund distributions or the redemption of Fund shares. |
|
(b) |
The Fund commenced operations on October 26, 2012. |
CINCINNATI ASSET MANAGEMENT FUNDS:
BROAD MARKET STRATEGIC INCOME FUND
PORTFOLIO INFORMATION
May 31, 2015 (Unaudited)
Sector Diversification (% of Net Assets)
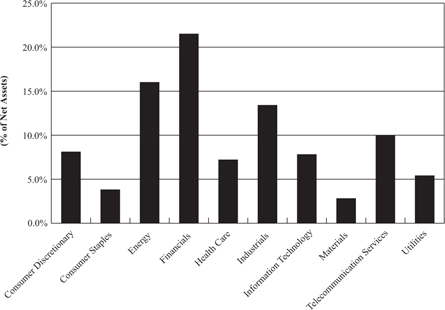
Top 10 Investments
|
Security Description |
% of Net Assets |
|
L-3 Communications Corp., 3.950%, due 05/28/24 |
2.7% |
|
Toll Brothers Finance Corp., 5.875%, due 02/15/22 |
2.6% |
|
Wells Fargo & Co., 4.125%, due 08/15/23 |
2.6% |
|
Bristol-Myers Squibb Co., 3.250%, due 11/01/23 |
2.5% |
|
U.S. Bancorp, 2.950%, due 07/15/22 |
2.4% |
|
Qwest Corp., 6.750%, due 12/01/21 |
2.3% |
|
US Airways, Inc., Class A Pass-Through Certificates, Series 2012-2, 4.625%, 06/03/25 |
2.3% |
|
PerkinElmer, Inc., 5.000%, due 11/15/21 |
2.3% |
|
International Lease Finance Corp., 5.875%, due 08/15/22 |
2.3% |
|
Ford Motor Credit Co., LLC, 4.250%, due 09/20/22 |
2.2% |
|
Credit Rating Allocation |
||
|
S&P Credit Quality |
% of Portfolio |
|
|
AA |
6.1% |
|
|
A |
43.0% |
|
|
BBB |
17.4% |
|
|
BB |
22.6% |
|
|
B |
10.9% |
|
|
CINCINNATI ASSET MANAGEMENT FUNDS: |
|||||||||||||
|
CORPORATE BONDS — 96.0% |
Coupon |
Maturity |
Par Value |
Value |
|||||||||
|
Consumer Discretionary — 8.1% |
|||||||||||||
|
Avis Budget Car Rental, LLC |
5.500 |
% |
04/01/23 |
$ |
50,000 |
$ |
51,438 |
||||||
|
CHC Helicopter S.A. |
9.250 |
% |
10/15/20 |
51,300 |
43,733 |
||||||||
|
Cinemark USA, Inc. |
4.875 |
% |
06/01/23 |
65,000 |
65,484 |
||||||||
|
Penske Auto Group, Inc. |
5.375 |
% |
12/01/24 |
60,000 |
62,250 |
||||||||
|
R.R. Donnelley & Sons Co. |
6.500 |
% |
11/15/23 |
60,000 |
63,975 |
||||||||
|
Regal Entertainment Group |
5.750 |
% |
02/01/25 |
61,000 |
61,610 |
||||||||
|
Royal Caribbean Cruises Ltd. |
5.250 |
% |
11/15/22 |
60,000 |
63,600 |
||||||||
|
Service Corp. International |
5.375 |
% |
05/15/24 |
9,000 |
9,585 |
||||||||
|
Service Corp. International |
7.500 |
% |
04/01/27 |
50,000 |
58,750 |
||||||||
|
Tenneco, Inc. |
5.375 |
% |
12/15/24 |
4,000 |
4,180 |
||||||||
|
Walt Disney Co. (The) |
2.350 |
% |
12/01/22 |
100,000 |
98,867 |
||||||||
|
583,472 |
|||||||||||||
|
Consumer Staples — 3.8% |
|||||||||||||
|
Anheuser-Busch InBev SA/NV |
2.625 |
% |
01/17/23 |
100,000 |
97,649 |
||||||||
|
B&G Foods, Inc. |
4.625 |
% |
06/01/21 |
58,000 |
58,145 |
||||||||
|
Spectrum Brands, Inc. |
6.625 |
% |
11/15/22 |
50,000 |
53,875 |
||||||||
|
Wal-Mart Stores, Inc. |
2.550 |
% |
04/11/23 |
65,000 |
64,853 |
||||||||
|
274,522 |
|||||||||||||
|
Energy — 16.0% |
|||||||||||||
|
Apache Corp. |
3.250 |
% |
04/15/22 |
109,000 |
109,830 |
||||||||
|
Bristow Group, Inc. |
6.250 |
% |
10/15/22 |
65,000 |
65,000 |
||||||||
|
Chesapeake Energy Corp. |
5.750 |
% |
03/15/23 |
7,000 |
6,948 |
||||||||
|
Chevron Corp. |
2.355 |
% |
12/05/22 |
150,000 |
146,238 |
||||||||
|
Cloud Peak Energy Resources, LLC |
8.500 |
% |
12/15/19 |
12,000 |
11,460 |
||||||||
|
Cloud Peak Energy Resources, LLC |
6.375 |
% |
03/15/24 |
29,000 |
23,780 |
||||||||
|
ConocoPhillips Co. |
2.400 |
% |
12/15/22 |
150,000 |
146,181 |
||||||||
|
Denbury Resources, Inc. |
4.625 |
% |
07/15/23 |
56,000 |
51,380 |
||||||||
|
Halliburton Co. |
3.500 |
% |
08/01/23 |
150,000 |
155,174 |
||||||||
|
Offshore Group Investment Ltd. |
7.500 |
% |
11/01/19 |
20,000 |
14,550 |
||||||||
|
Offshore Group Investment Ltd. |
7.125 |
% |
04/01/23 |
42,000 |
29,610 |
||||||||
|
Peabody Energy Corp. |
7.875 |
% |
11/01/26 |
50,000 |
24,500 |
||||||||
|
Range Resources Corp. |
5.000 |
% |
08/15/22 |
56,000 |
56,000 |
||||||||
|
Rosetta Resources, Inc. |
5.875 |
% |
06/01/22 |
65,000 |
69,713 |
||||||||
|
Sabine Pass Liquefaction, LLC |
5.625 |
% |
04/15/23 |
59,000 |
60,328 |
||||||||
|
Schlumberger Ltd. |
3.650 |
% |
12/01/23 |
125,000 |
131,958 |
||||||||
|
Williams Partners, L.P. |
4.875 |
% |
05/15/23 |
55,000 |
56,236 |
||||||||
|
1,158,886 |
|||||||||||||
|
Financials — 21.5% |
|||||||||||||
|
Aircastle Ltd. |
5.500 |
% |
02/15/22 |
35,000 |
37,100 |
||||||||
|
Bank of America Corp. |
3.300 |
% |
01/11/23 |
150,000 |
150,531 |
||||||||
|
CINCINNATI ASSET MANAGEMENT FUNDS: |
|||||||||||||
|
CORPORATE BONDS — 96.0% (Continued) |
Coupon |
Maturity |
Par Value |
Value |
|||||||||
|
Financials — 21.5% (Continued) |
|||||||||||||
|
Bank of New York Mellon Corp. (The) |
3.000 |
% |
02/24/25 |
$ |
100,000 |
$ |
99,523 |
||||||
|
Ford Motor Credit Co., LLC |
4.250 |
% |
09/20/22 |
150,000 |
159,902 |
||||||||
|
General Electric Capital Corp. |
3.150 |
% |
09/07/22 |
80,000 |
82,295 |
||||||||
|
International Lease Finance Corp. |
5.875 |
% |
08/15/22 |
150,000 |
166,125 |
||||||||
|
PNC Financial Services Group, Inc. (The) (a) |
2.854 |
% |
11/09/22 |
150,000 |
149,925 |
||||||||
|
Simon Property Group, L.P. |
3.750 |
% |
02/01/24 |
150,000 |
157,434 |
||||||||
|
Toll Brothers Finance Corp. |
5.875 |
% |
02/15/22 |
175,000 |
191,625 |
||||||||
|
U.S. Bancorp |
2.950 |
% |
07/15/22 |
175,000 |
175,865 |
||||||||
|
Wells Fargo & Co. |
4.125 |
% |
08/15/23 |
175,000 |
185,592 |
||||||||
|
1,555,917 |
|||||||||||||
|
Health Care — 7.2% |
|||||||||||||
|
Bristol-Myers Squibb Co. |
3.250 |
% |
11/01/23 |
175,000 |
180,773 |
||||||||
|
Community Health Systems, Inc. |
6.875 |
% |
02/01/22 |
54,000 |
57,780 |
||||||||
|
HCA Holdings, Inc. |
5.375 |
% |
02/01/25 |
60,000 |
61,950 |
||||||||
|
HealthSouth Corp. |
5.750 |
% |
11/01/24 |
54,000 |
55,957 |
||||||||
|
PerkinElmer, Inc. |
5.000 |
% |
11/15/21 |
150,000 |
167,183 |
||||||||
|
523,643 |
|||||||||||||
|
Industrials — 13.4% |
|||||||||||||
|
Continental Resources, Inc. |
5.000 |
% |
09/15/22 |
61,000 |
60,924 |
||||||||
|
General Dynamics Corp. |
2.250 |
% |
11/15/22 |
150,000 |
145,503 |
||||||||
|
Hawaiian Airlines, Inc., Series 2013-1A |
3.900 |
% |
01/15/26 |
72,578 |
73,123 |
||||||||
|
Iron Mountain, Inc. |
5.750 |
% |
08/15/24 |
57,000 |
58,639 |
||||||||
|
Raytheon Co. |
2.500 |
% |
12/15/22 |
150,000 |
149,166 |
||||||||
|
Stanley Black & Decker, Inc. |
2.900 |
% |
11/01/22 |
150,000 |
151,028 |
||||||||
|
Teekay Corp. |
8.500 |
% |
01/15/20 |
55,000 |
61,875 |
||||||||
|
United Airlines, Inc., Class B Pass-Through Certificates, Series 2013-1 |
5.375 |
% |
02/15/23 |
41,096 |
43,048 |
||||||||
|
United Rentals North America, Inc. |
5.500 |
% |
07/15/25 |
60,000 |
60,075 |
||||||||
|
US Airways, Inc., Class A Pass-Through Certificates, Series 2012-2 |
4.625 |
% |
06/03/25 |
158,495 |
168,004 |
||||||||
|
971,385 |
|||||||||||||
|
Information Technology — 7.8% |
|||||||||||||
|
Equinix, Inc. |
5.375 |
% |
04/01/23 |
55,000 |
56,925 |
||||||||
|
Hewlett-Packard Co. |
4.375 |
% |
09/15/21 |
150,000 |
159,697 |
||||||||
|
Intel Corp. |
2.700 |
% |
12/15/22 |
150,000 |
149,626 |
||||||||
|
L-3 Communications Corp. |
3.950 |
% |
05/28/24 |
195,000 |
193,735 |
||||||||
|
559,983 |
|||||||||||||
|
CINCINNATI ASSET MANAGEMENT FUNDS: |
|||||||||||||
|
CORPORATE BONDS — 96.0% (Continued) |
Coupon |
Maturity |
Par Value |
Value |
|||||||||
|
Materials — 2.8% |
|||||||||||||
|
Graphic Packaging International, Inc. |
4.750 |
% |
04/15/21 |
$ |
55,000 |
$ |
57,337 |
||||||
|
Praxair, Inc. |
2.200 |
% |
08/15/22 |
150,000 |
146,451 |
||||||||
|
203,788 |
|||||||||||||
|
Telecommunication Services — 10.0% |
|||||||||||||
|
AT&T, Inc. |
2.625 |
% |
12/01/22 |
140,000 |
134,703 |
||||||||
|
CCO Holdings, LLC/CCO Holdings Capital Corp. |
5.750 |
% |
01/15/24 |
6,000 |
6,195 |
||||||||
|
CenturyLink, Inc. |
5.800 |
% |
03/15/22 |
5,000 |
5,144 |
||||||||
|
Comcast Corp. |
3.600 |
% |
03/01/24 |
80,000 |
82,874 |
||||||||
|
Frontier Communications Corp. |
9.000 |
% |
08/15/31 |
55,000 |
54,450 |
||||||||
|
Intelsat Jackson Holdings S.A. |
5.500 |
% |
08/01/23 |
60,000 |
55,331 |
||||||||
|
Mediacom, LLC/Mediacom Capital Corp. |
5.500 |
% |
04/15/21 |
17,000 |
16,979 |
||||||||
|
Mediacom, LLC/Mediacom Capital Corp. |
7.250 |
% |
02/15/22 |
43,000 |
45,795 |
||||||||
|
Qwest Corp. |
6.750 |
% |
12/01/21 |
150,000 |
168,975 |
||||||||
|
Qwest Corp. |
6.875 |
% |
09/15/33 |
55,000 |
55,716 |
||||||||
|
Sprint Corp. |
7.875 |
% |
09/15/23 |
8,000 |
8,155 |
||||||||
|
Sprint Corp. |
7.625 |
% |
02/15/25 |
60,000 |
59,006 |
||||||||
|
Verizon Communications, Inc. |
5.150 |
% |
09/15/23 |
25,000 |
27,968 |
||||||||
|
721,291 |
|||||||||||||
|
Utilities — 5.4% |
|||||||||||||
|
AES Corp. (The) |
5.500 |
% |
03/15/24 |
43,000 |
43,430 |
||||||||
|
AES Corp. (The) |
5.500 |
% |
04/15/25 |
30,000 |
29,625 |
||||||||
|
Amerigas Finance, LLC |
7.000 |
% |
05/20/22 |
55,000 |
59,400 |
||||||||
|
Calpine Corp. |
5.750 |
% |
01/15/25 |
60,000 |
60,600 |
||||||||
|
Ferrellgas, L.P. |
6.500 |
% |
05/01/21 |
55,000 |
55,963 |
||||||||
|
Ferrellgas, L.P. |
6.750 |
% |
01/15/22 |
2,000 |
2,055 |
||||||||
|
GenOn Americas Generation, LLC |
8.500 |
% |
10/01/21 |
28,000 |
27,090 |
||||||||
|
NRG Energy, Inc. |
6.625 |
% |
03/15/23 |
46,000 |
48,300 |
||||||||
|
Suburban Propane Partners, L.P. |
5.500 |
% |
06/01/24 |
60,000 |
62,250 |
||||||||
|
388,713 |
|||||||||||||
|
Total Investments at Value — 96.0% (Cost $6,947,077) |
$ |
6,941,600 |
|||||||||||
|
Other Assets in Excess of Liabilities — 4.0% |
290,651 |
||||||||||||
|
Net Assets — 100.0% |
$ |
7,232,251 |
|||||||||||
|
(a) |
Step coupon security. The rate shown is the effective interest rate as of May 31, 2015.
|
|
See accompanying notes to financial statements. |
|
|
CINCINNATI ASSET MANAGEMENT FUNDS: |
||||
|
ASSETS |
||||
|
Investments in securities: |
||||
|
At acquisition cost |
$ |
6,947,077 |
||
|
At value (Note 2) |
$ |
6,941,600 |
||
|
Cash |
28,520 |
|||
|
Interest receivable |
83,599 |
|||
|
Receivable from Adviser (Note 4) |
13,238 |
|||
|
Receivable for investment securities sold |
227,954 |
|||
|
Other assets |
13,258 |
|||
|
Total assets |
7,308,169 |
|||
|
LIABILITIES |
||||
|
Payable to administrator (Note 4) |
7,000 |
|||
|
Payable for investment securities purchased |
62,418 |
|||
|
Other accrued expenses |
6,500 |
|||
|
Total liabilities |
75,918 |
|||
|
NET ASSETS |
$ |
7,232,251 |
||
|
NET ASSETS CONSIST OF: |
||||
|
Paid-in capital |
$ |
7,197,981 |
||
|
Undistributed net investment income |
41,585 |
|||
|
Accumulated net realized losses from security transactions |
(1,838 |
) |
||
|
Net unrealized depreciation on investments |
(5,477 |
) |
||
|
NET ASSETS |
$ |
7,232,251 |
||
|
Shares of beneficial interest outstanding |
721,498 |
|||
|
Net asset value, offering price and redemption price per share (Note 2) |
$ |
10.02 |
||
|
See accompanying notes to financial statements. |
|
CINCINNATI ASSET MANAGEMENT FUNDS: |
||||
|
INVESTMENT INCOME |
||||
|
Interest |
$ |
276,323 |
||
|
EXPENSES |
||||
|
Investment advisory fees (Note 4) |
51,815 |
|||
|
Professional fees |
33,162 |
|||
|
Fund accounting fees (Note 4) |
29,383 |
|||
|
Administration fees (Note 4) |
28,750 |
|||
|
Registration and filing fees |
21,475 |
|||
|
Pricing fees |
21,024 |
|||
|
Distribution fees (Note 4) |
17,272 |
|||
|
Compliance fees (Note 4) |
12,000 |
|||
|
Transfer agent fees (Note 4) |
12,000 |
|||
|
Custody and bank service fees |
8,551 |
|||
|
Trustees' fees and expenses (Note 4) |
7,366 |
|||
|
Postage and supplies |
3,488 |
|||
|
Insurance expense |
3,010 |
|||
|
Other expenses |
7,293 |
|||
|
Total expenses |
256,589 |
|||
|
Less fee waivers and expense reimbursements by the Adviser (Note 4) |
(211,682 |
) |
||
|
Net expenses |
44,907 |
|||
|
NET INVESTMENT INCOME |
231,416 |
|||
|
REALIZED AND UNREALIZED GAINS |
||||
|
Net realized gains from security transactions |
2,330 |
|||
|
Net change in unrealized appreciation/depreciation on investments |
(28,468 |
) |
||
|
NET REALIZED AND UNREALIZED LOSSES ON INVESTMENTS |
(26,138 |
) |
||
|
NET INCREASE IN NET ASSETS RESULTING FROM OPERATIONS |
$ |
205,278 |
||
|
See accompanying notes to financial statements. |
|
CINCINNATI ASSET MANAGEMENT FUNDS: |
||||||||
|
|
Year |
Year |
||||||
|
FROM OPERATIONS |
||||||||
|
Net investment income |
$ |
231,416 |
$ |
178,886 |
||||
|
Net realized gains (losses) from security transactions |
2,330 |
(3,453 |
) |
|||||
|
Net change in unrealized appreciation/depreciation on investments |
(28,468 |
) |
80,934 |
|||||
|
Net increase in net assets resulting from operations |
205,278 |
256,367 |
||||||
|
DISTRIBUTIONS TO SHAREHOLDERS |
||||||||
|
From net investment income |
(221,564 |
) |
(175,744 |
) |
||||
|
FROM CAPITAL SHARE TRANSACTIONS |
||||||||
|
Proceeds from shares sold |
1,022,639 |
1,179,992 |
||||||
|
Net asset value of shares issued in reinvestment of distributions to shareholders |
221,564 |
175,744 |
||||||
|
Payments for shares redeemed |
(403,078 |
) |
(248,777 |
) |
||||
|
Net increase in net assets from capital share transactions |
841,125 |
1,106,959 |
||||||
|
TOTAL INCREASE IN NET ASSETS |
824,839 |
1,187,582 |
||||||
|
NET ASSETS |
||||||||
|
Beginning of year |
6,407,412 |
5,219,830 |
||||||
|
End of year |
$ |
7,232,251 |
$ |
6,407,412 |
||||
|
UNDISTRIBUTED NET INVESTMENT INCOME |
$ |
41,585 |
$ |
31,733 |
||||
|
CAPITAL SHARE ACTIVITY |
||||||||
|
Shares sold |
102,166 |
119,978 |
||||||
|
Shares reinvested |
22,290 |
18,333 |
||||||
|
Shares redeemed |
(40,361 |
) |
(25,837 |
) |
||||
|
Net increase in shares outstanding |
84,095 |
112,474 |
||||||
|
Shares outstanding at beginning of year |
637,403 |
524,929 |
||||||
|
Shares outstanding at end of year |
721,498 |
637,403 |
||||||
|
See accompanying notes to financial statements. |
|
CINCINNATI ASSET MANAGEMENT FUNDS: |
||||||||||||
|
Per Share Data for a Share Outstanding Throughout Each Period |
||||||||||||
|
|
Year |
Year |
Period |
|||||||||
|
Net asset value at beginning of period |
$ |
10.05 |
$ |
9.94 |
$ |
10.00 |
||||||
|
Income (loss) from investment operations: |
||||||||||||
|
Net investment income |
0.33 |
0.33 |
0.16 |
|||||||||
|
Net realized and unrealized gains (losses) on investments |
(0.04 |
) |
0.11 |
(0.11 |
) |
|||||||
|
Total from investment operations |
0.29 |
0.44 |
0.05 |
|||||||||
|
Less distributions: |
||||||||||||
|
From net investment income |
(0.32 |
) |
(0.33 |
) |
(0.11 |
) |
||||||
|
Net asset value at end of period |
$ |
10.02 |
$ |
10.05 |
$ |
9.94 |
||||||
|
Total return (b) |
2.99 |
% |
4.68 |
% |
0.48 |
%(c) |
||||||
|
Net assets at end of period |
$ |
7,232,251 |
$ |
6,407,412 |
$ |
5,219,830 |
||||||
|
Ratios/supplementary data: |
||||||||||||
|
Ratio of total expenses to average net assets |
3.71 |
% |
4.53 |
% |
3.69 |
%(d) |
||||||
|
Ratio of net expenses to average net assets (e) |
0.65 |
% |
0.65 |
% |
0.65 |
%(d) |
||||||
|
Ratio of net investment income to average net assets (e) |
3.35 |
% |
3.41 |
% |
2.81 |
%(d) |
||||||
|
Portfolio turnover rate |
23 |
% |
11 |
% |
13 |
%(c) |
||||||
|
(a) |
Represents the period from the commencement of operations (October 26, 2012) through May 31, 2013. |
|
(b) |
Total return is a measure of the change in value of an investment in the Fund over the periods covered. The returns shown do not reflect the deduction of taxes a shareholder would pay on Fund distributions, if any, or the redemption of Fund shares. The total returns would be lower if the Adviser had not waived advisory fees and reimbursed expenses. |
|
(c) |
Not annualized. |
|
(d) |
Annualized. |
|
(e) |
Ratio was determined after advisory fee waivers and expense reimbursements (Note 4).
|
|
See accompanying notes to financial statements. |
|
CINCINNATI ASSET MANAGEMENT FUNDS:
BROAD MARKET STRATEGIC INCOME FUND
NOTES TO FINANCIAL STATEMENTS
May 31, 2015
1. Organization
Cincinnati Asset Management Funds: Broad Market Strategic Income Fund (the “Fund”) is a diversified series of Ultimus Managers Trust (the “Trust”), an open-end investment company established as an Ohio business trust under a Declaration of Trust dated February 28, 2012. Other series of the Trust are not incorporated in this report. The Fund commenced operations on October 26, 2012.
The investment objective of the Fund is to achieve a high level of income consistent with a secondary goal of capital preservation.
2. Significant Accounting Policies
The following is a summary of the Fund’s significant accounting policies. The policies are in conformity with accounting principles generally accepted in the United States of America (“GAAP”). As an investment company, as defined in Financial Accounting Standards Board (“FASB”) Accounting Standards Update 2013-08, the Fund follows accounting and reporting guidance under FASB Accounting Standards Codification Topic 946, “Financial Services – Investment Companies.”
Securities valuation – The Fund’s fixed income securities are generally valued using prices provided by an independent pricing service approved by the Trust’s Board of Trustees (the “Board”). The independent pricing service uses information with respect to transactions in bonds, quotations from bond dealers, market transactions in comparable securities, and various relationships between securities in determining these prices. The methods used by the independent pricing service and the quality of valuations so established are reviewed by Cincinnati Asset Management, Inc. (the “Adviser”), under the general supervision of the Board. Securities for which market quotations are not readily available are valued at fair value as determined in good faith under procedures adopted by the Board.
GAAP establishes a single authoritative definition of fair value, sets out a framework for measuring fair value, and requires additional disclosures about fair value measurements.
Various inputs are used in determining the value of the Fund’s investments. These inputs are summarized in the three broad levels listed below:
|
● |
Level 1 – quoted prices in active markets for identical securities |
|
● |
Level 2 – other significant observable inputs |
|
● |
Level 3 – significant unobservable inputs |
Corporate bonds are classified as Level 2 since values are based on prices provided by an independent pricing service that utilizes various “other significant observable inputs” including bid and ask quotations, prices of similar securities, and interest rates, among other factors. The inputs or methods used for valuing securities are not necessarily an indication of the risks associated with investing in those securities. The inputs used to measure fair
|
CINCINNATI ASSET MANAGEMENT FUNDS: |
value may fall into different levels of the fair value hierarchy. In such cases, for disclosure purposes, the level in the fair value hierarchy within which the fair value measurement falls in its entirety is determined based on the lowest level input that is significant to the fair value measurement.
The following is a summary of the inputs used to value the Fund’s investments as of May 31, 2015:
|
|
Level 1 |
Level 2 |
Level 3 |
Total |
||||||||||||
|
Corporate Bonds |
$ |
— |
$ |
6,941,600 |
$ |
— |
$ |
6,941,600 |
||||||||
Refer to the Fund’s Schedule of Investments for a listing of the securities by sector type. As of May 31, 2015, the Fund did not have any transfers into and out of any Level. In addition, the Fund did not have derivative instruments or any assets or liabilities that were measured at fair value on a recurring basis using significant unobservable inputs (Level 3) as of May 31, 2015. It is the Fund’s policy to recognize transfers into and out of any Level at the end of the reporting period.
Share valuation – The net asset value per share of the Fund is calculated daily by dividing the total value of the Fund’s assets, less liabilities, by the number of shares outstanding. The offering price and redemption price per share of the Fund is equal to the net asset value per share.
Investment income – Interest income is accrued as earned. Discounts and premiums on fixed income securities purchased are accreted or amortized using the effective interest method. Dividend income is recorded on the ex-dividend date.
Security transactions – Security transactions are accounted for on the trade date. Gains and losses on securities sold are determined on a specific identification basis.
Common expenses – Common expenses of the Trust are allocated among the Fund and other series of the Trust based on the relative net assets of each series or the nature of the services performed and the relative applicability to each series.
Distributions to shareholders – Dividends from net investment income are declared and paid quarterly to shareholders. Net realized capital gains, if any, are distributed at least once each year. The amount of distributions from net investment income and net realized gains are determined in accordance with federal income tax regulations, which may differ from GAAP. Dividends and distributions to shareholders are recorded on the ex-dividend date. The tax character of the Fund’s distributions during the years ended May 31, 2015 and May 31, 2014 was ordinary income. On June 30, 2015, the Fund paid an ordinary income dividend of $0.0858 per share to shareholders of record on June 29, 2015.
|
CINCINNATI ASSET MANAGEMENT FUNDS: |
Estimates – The preparation of financial statements in conformity with GAAP requires management to make estimates and assumptions that affect the reported amounts of assets and liabilities and disclosure of contingent assets and liabilities as of the date of the financial statements and the reported amounts of income and expenses during the reporting period. Actual results could differ from those estimates.
Federal income tax – The Fund has qualified and intends to continue to qualify as a regulated investment company under the Internal Revenue Code of 1986 (the “Code”). Qualification generally will relieve the Fund of liability for federal income taxes to the extent 100% of its net investment income and net realized gains are distributed in accordance with the Code. Accordingly, no provision for income tax has been made.
In order to avoid imposition of the excise tax applicable to regulated investment companies, it is also the Fund’s intention to declare as dividends in each calendar year at least 98% of its net investment income (earned during the calendar year) and 98.2% of its net realized capital gains (earned during the twelve months ended October 31) plus undistributed amounts from prior years.
The following information is computed on a tax basis for each item as of May 31, 2015:
|
Tax cost of portfolio investments |
$ |
6,947,077 |
||
|
Gross unrealized appreciation |
$ |
117,737 |
||
|
Gross unrealized depreciation |
(123,214 |
) |
||
|
Net unrealized depreciation on investments |
(5,477 |
) |
||
|
Undistributed ordinary income |
41,585 |
|||
|
Capital loss carryforwards |
(1,838 |
) |
||
|
Accumulated earnings |
$ |
34,270 |
As of May 31, 2015, the Fund had a short-term capital loss carryforward of $1,838. This capital loss carryforward, which does not expire, may be utilized in future years to offset net realized capital gains, if any, prior to distributing such gains to shareholders.
The Fund recognizes the tax benefits or expenses of uncertain tax positions only when the position is “more likely than not” to be sustained assuming examination by tax authorities. Management has reviewed the Fund’s tax positions for all open tax periods (periods ended May 31, 2013 through May 31, 2015) and has concluded that no provision for unrecognized tax benefits or expenses is required in these financial statements. The Fund identifies its major tax jurisdiction as U.S. Federal.
3. Investment Transactions
During the year ended May 31, 2015, cost of purchases and proceeds from sales of investment securities, other than short-term investments, were $2,312,970 and $1,514,320, respectively.
|
CINCINNATI ASSET MANAGEMENT FUNDS: |
4. Transactions with Related Parties
INVESTMENT ADVISORY AGREEMENT
The Fund’s investments are managed by the Adviser pursuant to the terms of an Investment Advisory Agreement. Under the Investment Advisory Agreement, the Fund pays the Adviser an advisory fee, computed and accrued daily and paid monthly, at the annual rate of 0.75% of its average daily net assets.
Pursuant to an expense limitation agreement between the Fund and the Adviser, the Adviser has contractually agreed until October 1, 2016, to waive investment advisory fees and reimburse certain Other Expenses to limit Total Annual Fund Operating Expenses (exclusive of brokerage costs; taxes; interest; acquired fund fees and expenses; extraordinary expenses such as litigation and merger or reorganization costs; and other expenses not incurred in the ordinary course of the Fund’s business) to an amount not exceeding 0.65% of the Fund’s average daily net assets. Accordingly, the Adviser did not collect any of its advisory fees and, in addition, reimbursed other operating expenses totaling $159,867 during the year ended May 31, 2015.
Certain officers of the Fund are also officers of the Adviser.
DISTRIBUTION PLAN
The Fund has adopted a distribution plan pursuant to Rule 12b-1 under the Investment Company Act of 1940 (the “Rule 12b-1 Plan”), pursuant to which the Fund may incur certain costs for distribution and/or shareholder servicing expenses not to exceed 0.25% per annum of the Fund’s average daily net assets. During the year ended May 31, 2015, the Fund incurred $17,272 in distribution and service fees under the Rule 12b-1 Plan.
OTHER SERVICE PROVIDERS
Ultimus Fund Solutions, LLC (“Ultimus”) provides fund administration, fund accounting, compliance and transfer agency services to the Fund. The Fund pays Ultimus fees in accordance with the agreements for such services. In addition, the Fund pays out-of-pocket expenses including, but not limited to postage, supplies and costs of pricing the Fund’s portfolio securities.
DISTRIBUTION AGREEMENT
Under the terms of a Distribution Agreement with the Trust, Ultimus Fund Distributors, LLC (the “Distributor”) serves as principal underwriter to the Fund. The Distributor is a wholly-owned subsidiary of Ultimus.
Certain Trustees and officers of the Trust are also officers of Ultimus and the Distributor.
TRUSTEE COMPENSATION
Each Trustee who is not an “Interested person” of the Trust (“Independent Trustee”) receives from the Fund a fee of $500 for each Board meeting attended plus reimbursement of travel and other meeting-related expenses. In addition, effective January 1, 2015, each Independent Trustee also receives a $500 annual retainer from the Fund. Trustees affiliated with the Adviser or Ultimus are not compensated by the Trust for their services.
|
CINCINNATI ASSET MANAGEMENT FUNDS: |
PRINCIPAL HOLDERS OF FUND SHARES
As of May 31, 2015, the following shareholders owned of record 5% or more of the outstanding shares of the Fund:
|
Name of Record Owner |
% Ownership |
|
Mary S. Sloneker |
44% |
|
Cincinnati Asset Management, Inc. |
26% |
|
William S. Sloneker |
19% |
|
Charles Schwab (for the benefit of its customers) |
6% |
A beneficial owner of 25% or more of the Fund’s outstanding shares may be considered a controlling person. That shareholder’s vote could have a more significant effect on matters presented at a shareholder’s meeting.
5. Contingencies and Commitments
The Fund indemnifies the Trust’s officers and Trustees for certain liabilities that might arise from their performance of their duties to the Fund. Additionally, in the normal course of business, the Fund enters into contracts that contain a variety of representations and warranties and which provide general indemnifications. The Fund’s maximum exposure under these arrangements is unknown, as this would involve future claims that may be made against the Fund that have not yet occurred. However, based on experience, the Fund expects the risk of loss to be remote.
6. Subsequent Events
The Fund is required to recognize in the financial statements the effects of all subsequent events that provide additional evidence about conditions that existed as of the date of the Statement of Assets and Liabilities. For non-recognized subsequent events that must be disclosed to keep the financial statements from being misleading, the Fund is required to disclose the nature of the event as well as an estimate of its financial effect, or a statement that such an estimate cannot be made. Management has evaluated subsequent events through the issuance of these financial statements and has noted no such events.
CINCINNATI ASSET MANAGEMENT FUNDS:
BROAD MARKET STRATEGIC INCOME FUND
REPORT OF INDEPENDENT REGISTERED
PUBLIC ACCOUNTING FIRM
To the Board of Trustees of Ultimus Managers Trust
and the Shareholders of Cincinnati Asset Management Funds:
Broad Market Strategic Income Fund
We have audited the accompanying statement of assets and liabilities of Cincinnati Asset Management Funds: Broad Market Strategic Income Fund (the “Fund”), a series of shares of beneficial interest in Ultimus Managers Trust, including the schedule of investments, as of May 31, 2015, and the related statement of operations for the year then ended, the statements of changes in net assets for each of the years in the two-year period then ended, and the financial highlights for each of the years in the two-year period then ended and for the period October 26, 2012 (commencement of operations) through May 31, 2013. These financial statements and financial highlights are the responsibility of the Fund’s management. Our responsibility is to express an opinion on these financial statements and financial highlights based on our audits.
We conducted our audits in accordance with the standards of the Public Company Accounting Oversight Board (United States). Those standards require that we plan and perform the audits to obtain reasonable assurance about whether the financial statements and financial highlights are free of material misstatement. An audit includes examining, on a test basis, evidence supporting the amounts and disclosures in the financial statements. Our procedures included confirmation of securities owned as of May 31, 2015 by correspondence with the custodian and brokers. An audit also includes assessing the accounting principles used and significant estimates made by management, as well as evaluating the overall financial statement presentation. We believe that our audits provide a reasonable basis for our opinion.
In our opinion, the financial statements and financial highlights referred to above present fairly, in all material respects, the financial position of Cincinnati Asset Management Funds: Broad Market Strategic Income Fund as of May 31, 2015, and the results of its operations for the year then ended, the changes in its net assets for each of the years in the two-year period then ended and its financial highlights for each of the years in the two-year period then ended and for the period October 26, 2012 through May 31, 2013, in conformity with accounting principles generally accepted in the United States of America.
|
|
 |
|
|
BBD, LLP |
Philadelphia, Pennsylvania
July 27, 2015
|
CINCINNATI ASSET MANAGEMENT FUNDS: |
We believe it is important for you to understand the impact of costs on your investment. As a shareholder of the Fund, you incur ongoing costs, including management fees, distribution (12b-1) fees and other operating expenses. The following examples are intended to help you understand your ongoing costs (in dollars) of investing in the Fund and to compare these costs with the ongoing costs of investing in other mutual funds.
A mutual fund’s ongoing costs are expressed as a percentage of its average net assets. This figure is known as the expense ratio. The expenses in the table below are based on an investment of $1,000 made at the beginning of the most recent period (December 1, 2014) and held until the end of the period (May 31, 2015).
The table below illustrates the Fund’s ongoing costs in two ways:
Actual fund return – This section helps you to estimate the actual expenses that you paid over the period. The “Ending Account Value” shown is derived from the Fund’s actual return, and the third column shows the dollar amount of operating expenses that would have been paid by an investor who started with $1,000 in the Fund. You may use the information here, together with the amount you invested, to estimate the expenses that you paid over the period.
To do so, simply divide your account value by $1,000 (for example, an $8,600 account value divided by $1,000 = 8.6), then multiply the result by the number given for the Fund under the heading “Expenses Paid During Period.”
Hypothetical 5% return – This section is intended to help you compare the Fund’s ongoing costs with those of other mutual funds. It assumes that the Fund had an annual return of 5% before expenses during the period shown, but that the expense ratio is unchanged. In this case, because the return used is not the Fund’s actual return, the results do not apply to your investment. The example is useful in making comparisons because the U.S. Securities and Exchange Commission (“SEC”) requires all mutual funds to calculate expenses based on a 5% return. You can assess the Fund’s ongoing costs by comparing this hypothetical example with the hypothetical examples that appear in shareholder reports of other funds.
Note that expenses shown in the table are meant to highlight and help you compare ongoing costs only. The Fund does not charge transaction fees, such as purchase or redemption fees, nor does it carry a “sales load.” The calculations assume no shares were bought or sold during the period. Your actual costs may have been higher or lower, depending on the amount of your investment and the timing of any purchases or redemptions.
|
CINCINNATI ASSET MANAGEMENT FUNDS: |
More information about the Fund’s expenses can be found in this report. For additional information on operating expenses and other shareholder costs, please refer to the Fund’s prospectus.
|
|
Beginning |
Ending |
Expenses Period* |
|
Based on Actual Fund Return |
$1,000.00 |
$1,018.40 |
$3.27 |
|
Based on Hypothetical 5% Return (before expenses) |
$1,000.00 |
$1,021.69 |
$3.28 |
|
* |
Expenses are equal to the Fund’s annualized expense ratio of 0.65% for the period, multiplied by the average account value over the period, multiplied by 182/365 (to reflect the one-half year period). |
OTHER INFORMATION (Unaudited)
A description of the policies and procedures that the Fund uses to vote proxies relating to portfolio securities is available without charge upon request by calling toll-free 1-866-738-1128, or on the SEC’s website at http://www.sec.gov. Information regarding how the Fund voted proxies relating to portfolio securities during the most recent 12-month period ended June 30 is available without charge upon request by calling toll-free 1-866-738-1128, or on the SEC’s website at http://www.sec.gov.
The Trust files a complete listing of portfolio holdings for the Fund with the SEC as of the end of the first and third quarters of each fiscal year on Form N-Q. These filings are available upon request by calling 1-866-738-1128. Furthermore, you may obtain a copy of the filings on the SEC’s website at http://www.sec.gov. The Trust’s Forms N-Q may also be reviewed and copied at the SEC’s Public Reference Room in Washington, DC, and information on the operation of the Public Reference Room may be obtained by calling 1-800-SEC-0330.
CINCINNATI ASSET MANAGEMENT FUNDS:
BROAD MARKET STRATEGIC INCOME FUND
BOARD OF TRUSTEES AND EXECUTIVE OFFICERS
(Unaudited)
The Board of Trustees has overall responsibility for management of the Trust’s affairs. The Trustees serve during the lifetime of the Trust and until its termination, or until death, resignation, retirement, or removal. The Trustees, in turn, elect the officers of the Fund to actively supervise its day-to-day operations. The officers have been elected for an annual term. Unless otherwise noted, each Trustee’s and officer’s address is 225 Pictoria Drive, Suite 450, Cincinnati, OH 45246. The following are the Trustees and executive officers of the Fund:
|
Name and |
Length of Time Served |
Position(s) Held with Trust |
Principal Occupation(s) During Past 5 Years |
Number of Funds in Trust Overseen by Trustee |
Directorships of Public Companies Held by Trustee During Past 5 Years |
|
Interested Trustees: |
|||||
|
Robert G. Dorsey* Year of Birth: 1957 |
Since February 2012 |
Trustee (February 2012 to present) President (June 2012 to October 2013) |
Managing Director of Ultimus Fund Solutions, LLC and Ultimus Fund Distributors, LLC (1999 to present) |
11 |
None |
|
Independent Trustees: |
|||||
|
John C. Davis Year of Birth: 1952 |
Since |
Chairman (July 2014 to present) Trustee (June 2012 to present) |
Consultant ( government services) since May 2011; Retired Partner of PricewaterhouseCoopers LLP (1974-2010) |
11 |
None |
|
John J. Discepoli Year of Birth: 1963 |
Since June 2012 |
Trustee |
Owner of Discepoli Financial Planning, LLC (personal financial planning company) since November 2004 |
11 |
None |
|
David M. Deptula Year of Birth: 1958 |
Since June 2012 |
Trustee |
Vice President of Tax at The Standard Register Company since November 2011; Tax Partner at Deloitte Tax LLP from 1984 to 2011 |
11 |
None |
|
* |
Mr. Dorsey is considered an “interested person” of the Trust within the meaning of Section 2(a)(19) of the 1940 Act because of his relationship with the Trust’s administrator, transfer agent and distributor. |
CINCINNATI ASSET MANAGEMENT FUNDS:
BROAD MARKET STRATEGIC INCOME FUND
BOARD OF TRUSTEES AND EXECUTIVE OFFICERS
(Unaudited) (Continued)
|
Name and |
Length of Time Served |
Position(s) |
Principal Occupation(s) |
|
Executive Officers: |
|||
|
William S. Sloneker 8845 Governor’s Hill Drive, Cincinnati, Ohio 45249 Year of Birth: 1953 |
Since |
Principal Executive Officer of Cincinnati Asset Management Funds: Broad Market Strategic Income Fund |
Chairman, Chief Executive Office and Portfolio Manager of Cincinnati Asset Management, Inc. (1989 to present) |
|
David R. Carson Year of Birth: 1958 |
Since |
President Vice President |
Vice President and Director of Client Strategies of Ultimus Fund Solutions, LLC (2013 to present); Chief Compliance Officer, The Huntington Funds (2005 to 2013), The Flex-Funds (2006 to 2011), Meeder Financial (2007 to 2011), Huntington Strategy Shares (2012 to 2013), and Huntington Asset Advisors (2013); Vice President, Huntington National Bank (2001 to 2013) |
|
Jennifer L. Leamer Year of Birth: 1976 |
Since |
Treasurer Assistant Treasurer (April 2014 to October 2014) |
Mutual Fund Controller of Ultimus Fund Solutions, LLC (2014 to present); Business Analyst of Ultimus Fund Solutions, LLC (2007 to 2014) |
|
Bo J. Howell Year of Birth: 1981 |
Since |
Secretary Assistant Secretary (October 2014 to April 2015) |
V.P., Director of Fund Administration for Ultimus Fund Solutions, LLC (2014 to present); Counsel – Securities and Mutual Funds for Western & Southern Financial Group (2012 to 2014); U.S. Securities and Exchange Commission, Senior Counsel (2009 to 2012) |
|
Stephen L. Preston Year of Birth: 1966 |
Since |
Chief Compliance Officer |
Assistant Vice President and Chief Compliance Officer of Ultimus Fund Distributors, LLC and Assistant Vice President of Ultimus Fund Solutions, LLC since 2011; Senior Consultant at Mainstay Capital Markets Consultants (2010 to 2011); Chief Compliance Officer at INTL Trading, Inc. (2008 to 2010) |
Additional information about members of the Board and executive officers is available in the Fund’s Statement of Additional Information (“SAI”). To obtain a free copy of the SAI, please call 1-866-738-1128.
CINCINNATI ASSET MANAGEMENT FUNDS:
BROAD MARKET STRATEGIC INCOME FUND
DISCLOSURE REGARDING APPROVAL OF INVESTMENT ADVISORY AGREEMENT (Unaudited)
The Board of Trustees (the “Board”), including the Independent Trustees voting separately, has reviewed and approved the Fund’s Investment Advisory Agreement with Cincinnati Asset Management, Inc. (the “Adviser”) for an additional annual term. Approval took place at an in-person meeting held on April 21, 2015, at which all of the Trustees were present.
In the course of their deliberations, the Board was advised by legal counsel. The Board received and reviewed information provided by the Adviser in response to requests of the Board and counsel.
In considering the Investment Advisory Agreement and reaching their conclusions with respect thereto, the Board reviewed and analyzed various factors that they determined were relevant, including the factors described below.
The nature, extent, and quality of the services provided by the Adviser. In this regard, the Board reviewed the services being provided by the Adviser to the Fund including, without limitation, its investment advisory services since the Fund’s inception, the Adviser’s compliance procedures and practices, and its efforts to promote the Fund and assist in its distribution. The Board also noted that a principal of the Adviser serves as the Fund’s Principal Executive Officer without additional compensation. After reviewing the foregoing information and further information regarding the Adviser’s business, the Board concluded that the quality, extent, and nature of the services provided by the Adviser were satisfactory and adequate for the Fund.
The investment performance of the Fund. In this regard, the Board compared the performance of the Fund with the performance of its benchmark index and related Morningstar category. The Board also considered the consistency of the Adviser’s management with the Fund’s investment objective and policies. Following discussion of the investment performance of the Fund and its performance relative to its Morningstar category, the Adviser’s experience in managing a mutual fund, its historical investment performance, and other factors, the Board concluded that the investment performance of the Fund has been satisfactory.
The costs of the services provided and profits realized by the Adviser and its affiliates from its relationship with the Fund. In this regard, the Board considered the Adviser’s staffing, personnel, and methods of operations; the education and experience of its personnel; compliance program, policies, and procedures; financial condition and the level of commitment to the Fund, and, generally, the Adviser’s advisory business; the asset level of the Fund; and the overall expenses of the Fund, including the advisory fee. The Board considered the Adviser’s Expense Limitation Agreement (the “ELA”) with the Fund, and considered the Adviser’s current and past fee reductions and expense reimbursements for the Fund. The Board further took into account the Adviser’s commitment to continue the ELA for the Fund until at least October 1, 2016.
The Board also considered potential benefits for the Adviser in managing the Fund, including promotion of the Adviser’s name and the potential for it to receive research, statistical, or other services from the Fund’s trades. The Board compared the Fund’s advisory fee
CINCINNATI ASSET MANAGEMENT FUNDS:
BROAD MARKET STRATEGIC INCOME FUND
DISCLOSURE REGARDING APPROVAL OF INVESTMENT ADVISORY AGREEMENT (Unaudited) (Continued)
and overall expense ratio to the average advisory fees and average expense ratios for its Morningstar category. The Board noted that while the advisory fee for the Fund was above the average and the median for the Morningstar Multisector Bond Fund category, it was less than the highest advisory fee in the category. The Board further noted that the overall annual expense ratio of 0.65 percent for the Fund with the ELA is lower than the Morningstar category’s average expense ratio (1.05 percent) and median expense ratio (0.95 percent). The Board also noted that the Fund had significantly less assets than the average or median fund in its Morningstar category. Following these comparisons and upon further consideration and discussion of the foregoing, the Board concluded that the advisory fee paid to the Adviser by the Fund is fair and reasonable.
The extent to which economies of scale would be realized as the Fund grows and whether advisory fee levels reflect these economies of scale for the benefit of the Fund’s investors. In this regard, the Board considered that the Fund’s fee arrangements with the Adviser involve both the advisory fee and the ELA. The Board determined that while the advisory fee remained the same as asset levels increased, the shareholders of the Fund have experienced benefits from the ELA. Following further discussion of the Fund’s asset level, expectations for growth, and level of fees, the Board determined that the Fund’s fee arrangements with the Adviser would continue to provide benefits. The Board also determined that the fee arrangements were fair and reasonable given the Fund’s projected asset levels for the next year.
Brokerage and portfolio transactions. In this regard, the Board considered the Adviser’s trading policies, procedures, and performance in seeking best execution for the Fund. The Board also considered the historical portfolio turnover rate for the Fund; the process by which evaluations are made of the overall reasonableness of commissions paid; the method and basis for selecting and evaluating the broker-dealers used; and any anticipated allocation of portfolio business to persons affiliated with the Adviser. After further review and discussion, the Board determined that the Adviser’s practices regarding brokerage and portfolio transactions were satisfactory.
Possible conflicts of interest. In evaluating the possibility for conflicts of interest, the Board considered such matters as the experience and abilities of the advisory personnel assigned to the Fund, the Adviser’s process for allocating trades among its different clients, and the substance and administration of the Adviser’s code of ethics. Following further consideration and discussion, the Board found that the Adviser’s standards and practices relating to the identification and mitigation of potential conflicts of interests were satisfactory.
Conclusion
After consideration of the above factors as well as other factors, the Board unanimously concluded that approval of the Investment Advisory Agreement was in the best interests of the Fund and its shareholders.
This page intentionally left blank.
This page intentionally left blank.
|
WAVELENGTH INTEREST RATE NEUTRAL FUND |
July 15, 2015 |
Dear Fellow Shareholders:
In the months since our last letter, heightened levels of uncertainty persisted in global financial markets. Concerns over the future path of interest rates and the resurgence of European sovereign debt issues pushed many investors to the sidelines, often as a reaction to short-term headlines. This cycle of investor sentiment has created both risks and opportunities, and through it we have maintained our investment discipline, focusing on the forces that matter most: growth and inflation.
What follows is designed to provide context around returns in a way that builds a deeper understanding of the investment process that supports them. Through this we hope to build on the partnership your investment creates.
PERFORMANCE SUMMARY
For the fiscal year ended May 31, 2015, the Wavelength Interest Rate Neutral Fund (the “Fund”) delivered a return of -0.17% versus a benchmark return of +0.02% for the S&P / BGCantor 0-3 Month US Treasury Bill Index (which seeks to represent the return from not taking risk in financial markets). The Fund’s relatively muted performance came at a time when many investors moved out of markets and into cash instruments. Throughout this period the Fund maintained a disciplined balance to changing growth and inflation conditions in line with its long-term investment objectives.
WAVELENGTH PHILOSOPHY
We believe that macroeconomic conditions drive asset prices and central banks use interest rates to manage macroeconomic conditions. Based on this fundamental logic, we seek to build a portfolio that is hedged to changes in interest rates by balancing investment exposure between instruments we expect to outperform in rising and falling macroeconomic conditions.
INVESTMENT ENVIRONMENT
As an extension of our investment philosophy we believe that changing expectations for macroeconomic conditions drive investment decisions, which in turn drive market prices. This logic held true over the period, as changing growth and inflation expectations resulted in a wide range of market pricing.
After a series of positive growth surprises toward the end of 2014, economic data turned less optimistic at the beginning of 2015. Downside surprises to growth were logically followed by a rally in government bonds and other markets linked to falling growth conditions. Conversely, credit and equities underperformed throughout January of 2015 in response to these changing expectations.
While this trend in data continued into February, growth assets began to rebound from their lows as many market participants considered the sell-off over-extended. As additional data came in below expectations in March, however, growth-related markets fell further and government bonds outperformed. April and May brought a reversal in these conditions, and
markets that had underperformed for the year started to bounce back. Credit and equities benefited from these circumstances through mid-May, and government bonds began their decline led by longer-dated issues. This price action was significant as it resulted in the first prolonged yield curve steepening in months.
Inflation conditions remained subdued over the first calendar quarter, and nominal bonds outperformed inflation-linked bonds in their total returns. A modest uptick for inflation in April then reversed this underperformance, and breakeven inflation remained on the rise into May. In this context, commodity prices also came back from their lows and built momentum as the early signs of rising inflation took hold.
PERFORMANCE DISCUSSION
The Fund maintained its targeted balance to growth and inflation conditions during the period, in line with its investment objectives. As a result of its hedged structure, changing expectations that drove market volatility were less impactful and the portfolio produced relatively muted returns.
The portfolio benefited most from the recovery of assets directly linked to growth, as convertible bonds generated meaningful positive returns. High-yield credit and bank loans also contributed to performance, as expectations of better-than-expected growth were recognized across the capital structure. Performance was limited by a downturn in government bond returns, and this was extended by the fear of rising rates. The reversal was also driven by a change in expectations for inflation, and a bear steepening of the yield curve took hold as longer-dated U.S. Treasuries underperformed through April and May.
On the inflation side of the portfolio, inflation-linked bonds responded in line with the pickup in expectations, generating outperformance in May after underperforming in prior months. Futures contracts performed similarly and extended their recovery from mid-March onwards, generating positive returns to offset losses experienced by falling inflation assets.
OUTLOOK
Markets remain in transition, and as prices adjust to a new set of conditions we expect related uncertainty to produce heightened levels of volatility. In this environment we expect growth and inflation to maintain their position as the drivers of asset prices, re-setting prices to logical, fundamental levels over long-term time horizons. With this backing as the consistent foundation of our investment process, we believe that targeting a balance to potential macroeconomic outcomes remains a prudent approach to investing that will deliver value to our investors through absolute returns.
Thank you for your trust and commitment through investment.
Sincerely,

Andrew Dassori
Founding Partner & Chief Investment Officer
Wavelength Capital Management
Past performance is not predictive of future performance. Investment results and principal value will fluctuate so that shares, when redeemed, may be worth more or less than their original cost. Current performance may be higher or lower than the performance data quoted. Performance data current to the most recent month end are available by calling 1-866-896-9292.
An investor should consider the investment objectives, risks, charges and expenses of the Fund carefully before investing. The Fund’s prospectus contains this and other important information. To obtain a copy of the Fund’s prospectus please call 1-866-896-9292 and a copy will be sent to you free of charge. Please read the prospectus carefully before you invest. The Wavelength Interest Rate Neutral Fund is distributed by Ultimus Fund Distributors, LLC.
The Letter to Shareholders seeks to describe some of the Adviser’s current opinions and views of the financial markets. Although the Adviser believes it has a reasonable basis for any opinions or views expressed, actual results may differ, sometimes significantly so, from those expected or expressed.
WAVELENGTH INTEREST RATE NEUTRAL FUND
PERFORMANCE INFORMATION
May 31, 2015 (Unaudited)
Comparison of the Change in Value of a $10,000 Investment in
Wavelength Interest Rate Neutral Fund versus the
S&P/BGCantor 0-3 Month U.S. Treasury Bill Index
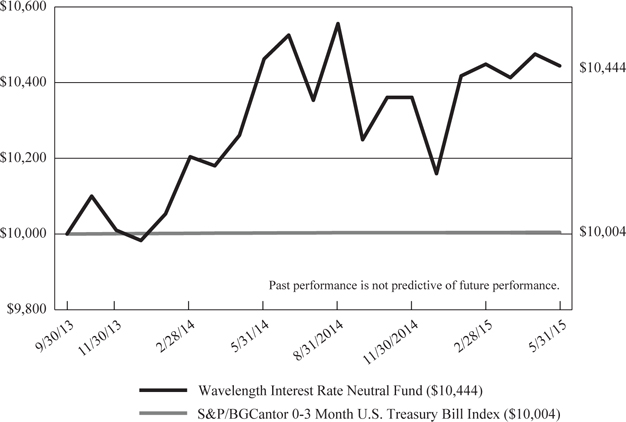
|
Average Annual Total Returns |
|||
|
1 Year |
Since |
||
|
Wavelength Interest Rate Neutral Fund(a) |
(0.17%) |
2.64% |
|
|
S&P/BGCantor 0-3 Month U.S. Treasury Bill Index |
0.02% |
0.03% |
|
|
(a) |
The Fund’s total return does not reflect the deduction of taxes a shareholder would pay on Fund distributions or the redemption of Fund shares. |
|
(b) |
The Fund commenced operations on September 30, 2013. |
WAVELENGTH INTEREST RATE NEUTRAL FUND
PORTFOLIO INFORMATION
May 31, 2015 (Unaudited)
Portfolio Allocation (% of Net Assets)

Top 10 Equity Holdings
|
Security Description |
% of |
|
iShares® TIPS Bond ETF |
17.4% |
|
SPDR® Barclays Convertible Securities ETF |
16.0% |
|
SPDR® Barclays Short Term High Yield Bond ETF |
12.4% |
|
PowerShares Senior Loan Portfolio |
8.4% |
|
iShares® J.P. Morgan USD Emerging Markets Bond ETF |
8.2% |
|
PowerShares Emerging Markets Sovereign Debt Portfolio |
6.1% |
|
iShares® iBoxx $ Investment Grade Corporate Bond ETF |
5.7% |
|
iShares® iBoxx $ High Yield Corporate Bond ETF |
4.3% |
|
Market Vectors Emerging Markets High Yield Bond ETF |
3.2% |
|
SPDR® Barclays High Yield Bond ETF |
1.7% |
|
WAVELENGTH INTEREST RATE NEUTRAL FUND |
||||||||
|
EXCHANGE-TRADED FUNDS — 85.7% |
Shares |
Value |
||||||
|
Emerging Markets Debt — 17.5% |
||||||||
|
iShares® J.P. Morgan USD Emerging Markets Bond ETF |
13,017 |
$ |
1,462,720 |
|||||
|
Market Vectors Emerging Markets High Yield Bond ETF |
22,891 |
564,263 |
||||||
|
PowerShares Emerging Markets Sovereign Debt Portfolio |
38,454 |
1,092,863 |
||||||
|
3,119,846 |
||||||||
|
Large Cap Index — 0.1% |
||||||||
|
SPDR® S&P 500® ETF |
35 |
7,389 |
||||||
|
Real Estate Investment Trusts (REIT) — 1.7% |
||||||||
|
SPDR® Dow Jones REIT ETF |
1,175 |
104,540 |
||||||
|
Vanguard REIT ETF |
2,550 |
201,807 |
||||||
|
306,347 |
||||||||
|
U.S. Fixed Income — 66.4% |
||||||||
|
iShares® 3-7 Year Treasury Bond ETF |
25 |
3,092 |
||||||
|
iShares® 7-10 Year Treasury Bond ETF |
40 |
4,277 |
||||||
|
iShares® 20+ Year Treasury Bond ETF |
875 |
107,397 |
||||||
|
iShares® iBoxx $ High Yield Corporate Bond ETF |
8,410 |
764,553 |
||||||
|
iShares® iBoxx $ Investment Grade |
8,540 |
1,010,026 |
||||||
|
iShares® TIPS Bond ETF |
27,426 |
3,105,172 |
||||||
|
PowerShares Senior Loan Portfolio |
61,838 |
1,491,533 |
||||||
|
SPDR® Barclays Convertible Securities ETF |
57,759 |
2,842,320 |
||||||
|
SPDR® Barclays High Yield Bond ETF |
7,610 |
299,986 |
||||||
|
SPDR® Barclays Short Term High Yield Bond ETF |
75,377 |
2,207,039 |
||||||
|
11,835,395 |
||||||||
|
Total Exchange-Traded Funds (Cost $15,315,113) |
$ |
15,268,977 |
||||||
|
WAVELENGTH INTEREST RATE NEUTRAL FUND |
||||||||
|
MONEY MARKET FUNDS — 8.0% |
Shares |
Value |
||||||
|
Fidelity Institutional Money Market Government Portfolio - Class I, 0.01%(a) (Cost $1,430,846) |
1,430,846 |
$ |
1,430,846 |
|||||
|
Total Investments at Value — 93.7% (Cost $16,745,959) |
$ |
16,699,823 |
||||||
|
Other Assets in Excess of Liabilities — 6.3% |
1,115,354 |
|||||||
|
Net Assets — 100.0% |
$ |
17,815,177 |
||||||
|
(a) |
The rate shown is the 7-day effective yield as of May 31, 2015.
|
|
See accompanying notes to financial statements. |
|
|
WAVELENGTH INTEREST RATE NEUTRAL FUND |
|||||||||||||
|
FUTURES CONTRACTS |
Expiration Date |
Contracts |
Aggregate Market Value of Contracts |
Unrealized Appreciation (Depreciation) |
|||||||||
|
Commodity Futures |
|||||||||||||
|
Bloomberg Commodity Index Future |
6/17/2015 |
33 |
$ |
333,630 |
$ |
(4,790 |
) |
||||||
|
COMEX miNY Gold Future |
7/29/2015 |
5 |
297,687 |
517 |
|||||||||
|
S&P® GSCI® Future |
6/15/2015 |
1 |
109,838 |
(4,965 |
) |
||||||||
|
Total Commodity Futures |
741,155 |
(9,238 |
) |
||||||||||
|
Index Futures |
|||||||||||||
|
E-Mini Dow CBOT DJIA Future |
6/19/2015 |
7 |
630,630 |
(3,614 |
) |
||||||||
|
E-Mini Nasdaq 100 Future |
6/19/2015 |
6 |
540,930 |
(262 |
) |
||||||||
|
E-Mini S&P 500® Future |
6/19/2015 |
8 |
841,800 |
(5,289 |
) |
||||||||
|
Total Index Futures |
2,013,360 |
(9,165 |
) |
||||||||||
|
Treasury Futures |
|||||||||||||
|
5-Year U.S. Treasury Note Future |
9/30/2015 |
14 |
1,674,750 |
5,127 |
|||||||||
|
10-Year U.S. Treasury Note Future |
9/21/2015 |
20 |
2,549,688 |
6,813 |
|||||||||
|
U.S. Treasury Long Bond Future |
9/21/2015 |
16 |
2,479,000 |
(1,712 |
) |
||||||||
|
Total Treasury Futures |
6,703,438 |
10,228 |
|||||||||||
|
Total Futures Contracts |
$ |
9,457,953 |
$ |
(8,175 |
) |
||||||||
|
See accompanying notes to financial statements. |
|
WAVELENGTH INTEREST RATE NEUTRAL FUND |
||||
|
ASSETS |
||||
|
Investments in securities: |
||||
|
At acquisition cost |
$ |
16,745,959 |
||
|
At value (Note 2) |
$ |
16,699,823 |
||
|
Cash |
4,853 |
|||
|
Margin deposits for futures contracts (Notes 2 and 5) |
413,295 |
|||
|
Dividends receivable |
16 |
|||
|
Receivable for investment securities sold |
841,757 |
|||
|
Other assets |
1,410 |
|||
|
Total assets |
17,961,154 |
|||
|
LIABILITIES |
||||
|
Payable for investment securities purchased |
123,241 |
|||
|
Payable to Adviser (Note 4) |
2,879 |
|||
|
Payable to administrator (Note 4) |
6,900 |
|||
|
Variation margin payable (Notes 2 and 5) |
7,562 |
|||
|
Other accrued expenses |
5,395 |
|||
|
Total liabilities |
145,977 |
|||
|
NET ASSETS |
$ |
17,815,177 |
||
|
NET ASSETS CONSIST OF: |
||||
|
Paid-in capital |
$ |
17,992,213 |
||
|
Accumulated net investment income |
48,086 |
|||
|
Accumulated net realized losses from security transactions and other financial instruments |
(170,811 |
) |
||
|
Net unrealized depreciation on: |
||||
|
Investments |
(46,136 |
) |
||
|
Futures contracts |
(8,175 |
) |
||
|
NET ASSETS |
$ |
17,815,177 |
||
|
Shares of beneficial interest outstanding |
1,765,676 |
|||
|
Net asset value, offering price and redemption price per share (Note 2) |
$ |
10.09 |
||
|
See accompanying notes to financial statements. |
|
WAVELENGTH INTEREST RATE NEUTRAL FUND |
||||
|
INVESTMENT INCOME |
||||
|
Dividends |
$ |
458,279 |
||
|
EXPENSES |
||||
|
Investment advisory fees (Note 4) |
123,908 |
|||
|
Professional fees |
35,173 |
|||
|
Fund accounting fees (Note 4) |
27,308 |
|||
|
Administration fees (Note 4) |
26,000 |
|||
|
Custody and bank service fees |
16,553 |
|||
|
Transfer agent fees (Note 4) |
14,250 |
|||
|
Compliance fees (Note 4) |
12,000 |
|||
|
Registration and filing fees |
9,010 |
|||
|
Trustees' fees and expenses (Note 4) |
7,764 |
|||
|
Postage and supplies |
3,200 |
|||
|
Insurance expense |
3,010 |
|||
|
Other expenses |
8,624 |
|||
|
Total expenses |
286,800 |
|||
|
Less fee reductions and expense reimbursements by the Adviser (Note 4) |
(157,675 |
) |
||
|
Net expenses |
129,125 |
|||
|
NET INVESTMENT INCOME |
329,154 |
|||
|
REALIZED AND UNREALIZED LOSSES ON INVESTMENTS AND OPTION AND FUTURES CONTRACTS |
||||
|
Net realized losses from: |
||||
|
Investments |
(168,620 |
) |
||
|
Option contracts (Note 5) |
(8,464 |
) |
||
|
Futures contracts (Note 5) |
(14,863 |
) |
||
|
Capital gain distributions from regulated investment companies |
37,148 |
|||
|
Net change in unrealized appreciation/depreciation on: |
||||
|
Investments |
(153,547 |
) |
||
|
Futures contracts (Note 5) |
(18,308 |
) |
||
|
NET REALIZED AND UNREALIZED LOSSES ON INVESTMENTS |
(326,654 |
) |
||
|
NET INCREASE IN NET ASSETS RESULTING FROM OPERATIONS |
$ |
2,500 |
||
|
See accompanying notes to financial statements. |
|
WAVELENGTH INTEREST RATE NEUTRAL FUND |
||||||||
|
|
Year |
Period |
||||||
|
FROM OPERATIONS |
||||||||
|
Net investment income |
$ |
329,154 |
$ |
41,316 |
||||
|
Net realized gains (losses) from: |
||||||||
|
Investments |
(168,620 |
) |
22,444 |
|||||
|
Option contracts (Note 5) |
(8,464 |
) |
— |
|||||
|
Futures contracts (Note 5) |
(14,863 |
) |
13,061 |
|||||
|
Capital gain distributions from regulated investment companies |
37,148 |
39 |
||||||
|
Net change in unrealized appreciation/depreciation on: |
||||||||
|
Investments |
(153,547 |
) |
107,411 |
|||||
|
Futures contracts (Note 5) |
(18,308 |
) |
10,133 |
|||||
|
Net increase in net assets from operations |
2,500 |
194,404 |
||||||
|
DISTRIBUTIONS TO SHAREHOLDERS |
||||||||
|
From net investment income |
(293,521 |
) |
(27,944 |
) |
||||
|
From net realized gains |
(48,557 |
) |
(3,918 |
) |
||||
|
Decrease in net assets from distributions to shareholders |
(342,078 |
) |
(31,862 |
) |
||||
|
CAPITAL SHARE TRANSACTIONS |
||||||||
|
Proceeds from shares sold |
13,413,165 |
4,572,557 |
||||||
|
Net asset value of shares issued in reinvestment of distributions to shareholders |
339,021 |
31,862 |
||||||
|
Payments for shares redeemed |
(314,392 |
) |
(50,000 |
) |
||||
|
Net increase in net assets from capital share transactions |
13,437,794 |
4,554,419 |
||||||
|
TOTAL INCREASE IN NET ASSETS |
13,098,216 |
4,716,961 |
||||||
|
NET ASSETS |
||||||||
|
Beginning of period |
4,716,961 |
— |
||||||
|
End of period |
$ |
17,815,177 |
$ |
4,716,961 |
||||
|
ACCUMULATED NET INVESTMENT INCOME |
$ |
48,086 |
$ |
13,372 |
||||
|
CAPITAL SHARE ACTIVITY |
||||||||
|
Shares sold |
1,308,050 |
456,307 |
||||||
|
Shares issued in reinvestment of distributions to shareholders |
34,071 |
3,190 |
||||||
|
Shares redeemed |
(31,083 |
) |
(4,859 |
) |
||||
|
Net increase in shares outstanding |
1,311,038 |
454,638 |
||||||
|
Shares outstanding at beginning of period |
454,638 |
— |
||||||
|
Shares outstanding at end of period |
1,765,676 |
454,638 |
||||||
|
(a) |
Represents the period from the commencement of operations (September 30, 2013) through May 31, 2014.
|
|
See accompanying notes to financial statements. |
|
|
WAVELENGTH INTEREST RATE NEUTRAL FUND |
||||||||
|
Per Share Data for a Share Outstanding Throughout Each Period |
||||||||
|
|
Year |
Period |
||||||
|
Net asset value at beginning of period |
$ |
10.38 |
$ |
10.00 |
||||
|
Income (loss) from investment operations: |
||||||||
|
Net investment income |
0.23 |
0.10 |
||||||
|
Net realized and unrealized gains (losses) on investments and futures contracts |
(0.25 |
) |
0.36 |
|||||
|
Total from investment operations |
(0.02 |
) |
0.46 |
|||||
|
Less distributions: |
||||||||
|
Distributions from net investment income |
(0.23 |
) |
(0.07 |
) |
||||
|
Distributions from net realized gains |
(0.04 |
) |
(0.01 |
) |
||||
|
Total distributions |
(0.27 |
) |
(0.08 |
) |
||||
|
Net asset value at end of period |
$ |
10.09 |
$ |
10.38 |
||||
|
Total return (b) |
(0.17 |
%) |
4.62 |
%(c) |
||||
|
Net assets at end of period (000's) |
$ |
17,815 |
$ |
4,717 |
||||
|
Ratios/supplementary data: |
||||||||
|
Ratio of total expenses to average net assets (d) |
2.19 |
% |
4.42 |
%(e) |
||||
|
Ratio of net expenses to average net assets (d) (f) |
0.99 |
% |
0.99 |
%(e) |
||||
|
Ratio of net investment income to |
2.52 |
% |
1.55 |
%(e) |
||||
|
Portfolio turnover rate |
107 |
% |
114 |
%(c) |
||||
|
(a) |
Represents the period from the commencement of operations (September 30, 2013) through May 31, 2014. |
|
(b) |
Total return is a measure of the change in value of an investment in the Fund over the periods covered. The returns shown do not reflect the deduction of taxes a shareholder would pay on Fund distributions, if any, or the redemption of Fund shares. The total returns would be lower if the Adviser had not reduced advisory fees and reimbursed expenses. |
|
(c) |
Not annualized. |
|
(d) |
The ratios of expenses to average net assets do not reflect the Fund's proportionate share of expenses of the underlying investment companies in which the Fund invests. |
|
(e) |
Annualized. |
|
(f) |
Ratio was determined after advisory fee reductions and expense reimbursements (Note 4). |
|
(g) |
Recognition of net investment income by the Fund is affected by the timing of the declarations of dividends by the underlying investment companies in which the Fund invests.
|
|
See accompanying notes to financial statements. |
|
WAVELENGTH INTEREST RATE NEUTRAL FUND
NOTES TO FINANCIAL STATEMENTS
May 31, 2015
1. Organization
Wavelength Interest Rate Neutral Fund (the “Fund”) is a non-diversified series of Ultimus Managers Trust (the “Trust”), an open-end investment company established as an Ohio business trust under a Declaration of Trust dated February 28, 2012. Other series of the Trust are not incorporated in this report. The Fund commenced operations on September 30, 2013.
The investment objective of the Fund is total return.
2. Significant Accounting Policies
The following is a summary of the Fund’s significant accounting policies. The policies are in conformity with accounting principles generally accepted in the United States of America (“GAAP”). As an investment company, as defined in Financial Accounting Standards Board (“FASB”) Accounting Standards Update 2013-08, the Fund follows accounting and reporting guidance under FASB Accounting Standards Codification Topic 946, “Financial Services – Investment Companies.”
Securities and futures valuation – The Fund values its portfolio securities at market value as of the close of regular trading on the New York Stock Exchange (the “NYSE”) (normally 4:00 p.m. Eastern time) on each business day the NYSE is open. The Fund values its listed securities on the basis of the security’s last sale price on the security’s primary exchange, if available, otherwise at the exchange’s most recently quoted bid price. NASDAQ-listed securities are valued at the NASDAQ Official Closing Price. Option contracts are valued at the closing price as quoted on the exchanges in which they are primarily traded. If no closing price is readily available at the time of valuation, the option will be valued at the closing bid price for that day. The Fund values its exchange-traded futures contracts at their last sale price as of the close of regular trading on the NYSE. Prices for these futures contracts are monitored daily by the Adviser until the close of regular trading to determine if fair valuation is required.
In the event that market quotations are not readily available or are considered unreliable due to market or other events, the Fund values its securities and other assets at fair value pursuant to the procedures adopted by the Trust’s Board of Trustees (the “Board”). Under these procedures, the securities will be classified as Level 2 or 3 within the fair value hierarchy (see below), depending on the inputs used. Unreliable market quotes may be due to the following factors: a substantial bid-ask spread; infrequent sales resulting in stale prices; insufficient trading volume; small trade sizes; a temporary lapse in any reliable pricing source; and actions of the securities or futures markets, such as the suspension or limitation of trading.
GAAP establishes a single authoritative definition of fair value, sets out a framework for measuring fair value, and requires additional disclosures about fair value measurements.
WAVELENGTH INTEREST RATE NEUTRAL FUND
NOTES TO FINANCIAL STATEMENTS (Continued)
Various inputs are used in determining the value of the Fund’s investments. These inputs are summarized in the three broad levels listed below:
|
● |
Level 1 – quoted prices in active markets for identical securities |
|
● |
Level 2 – other significant observable inputs |
|
● |
Level 3 – significant unobservable inputs |
The inputs or methods used for valuing securities are not necessarily an indication of the risks associated with investing in those securities. The inputs used to measure fair value may fall into different levels of the fair value hierarchy. In such cases, for disclosure purposes, the level in the fair value hierarchy within which the fair value measurement falls in its entirety is determined based on the lowest level input that is significant to the fair value measurement.
The following is a summary of the inputs used to value the Fund’s investments as of May 31, 2015:
|
|
Level 1 |
Level 2 |
Level 3 |
Total |
||||||||||||
|
Investments in Securities |
||||||||||||||||
|
Exchange-Traded Funds |
$ |
15,268,977 |
$ |
— |
$ |
— |
$ |
15,268,977 |
||||||||
|
Money Market Funds |
1,430,846 |
— |
— |
1,430,846 |
||||||||||||
|
Total |
$ |
16,699,823 |
$ |
— |
$ |
— |
$ |
16,699,823 |
||||||||
|
Other Financial Instruments |
||||||||||||||||
|
Futures Contracts |
$ |
(8,175 |
) |
$ |
— |
$ |
— |
$ |
(8,175 |
) |
||||||
As of May 31, 2015, the Fund did not have any transfers into and out of any Level. In addition, the Fund did not have any assets or liabilities that were measured at fair value on a recurring basis using significant unobservable inputs (Level 3) as of May 31, 2015. It is the Fund’s policy to recognize transfers into and out of any Level at the end of the reporting period.
Share valuation – The net asset value per share of the Fund is calculated daily by dividing the total value of the Fund’s assets, less liabilities, by the number of shares outstanding. The offering price and redemption price per share of the Fund is equal to the net asset value per share.
Investment income – Dividend income is recorded on the ex-dividend date. Interest income is accrued as earned.
Security transactions – Security transactions are accounted for on the trade date. Gains and losses on securities sold are determined on a specific identification basis.
Common expenses – Common expenses of the Trust are allocated among the Fund and the other series of the Trust based on the relative net assets of each series or the nature of the services performed and the relative applicability to each series.
WAVELENGTH INTEREST RATE NEUTRAL FUND
NOTES TO FINANCIAL STATEMENTS (Continued)
Distributions to shareholders – The Fund will distribute to shareholders any net investment income dividends on a quarterly basis and any net realized capital gains distributions at least annually. The amount of such dividends and distributions are determined in accordance with federal income tax regulations, which may differ from GAAP. Dividends and distributions are recorded on the ex-dividend date. Dividends and distributions to shareholders are recorded on the ex-dividend date. The tax character of distributions paid during the periods ended May 31, 2015 and 2014 was as follows:
|
Periods Ended |
Ordinary Income |
Long-Term Capital Gains |
Total Distributions |
|||||||||
|
May 31, 2015 |
$ |
328,122 |
$ |
13,956 |
$ |
342,078 |
||||||
|
May 31, 2014 |
$ |
31,862 |
$ |
— |
$ |
31,862 |
||||||
On June 30, 2015, the Fund paid an ordinary income dividend of $0.0435 per share to shareholders of record on June 29, 2015.
Option contracts – The Fund may use option contracts in any manner consistent with its investment objective and as long as the use is consistent with relevant provisions of the 1940 Act. The Fund may use options for speculative investment purposes as well as for the purpose of seeking to reduce the overall investment risk that would otherwise be associated with the securities in which a Fund invests. When a Fund purchases an option, an amount equal to the total premium (the premium plus the commission) paid by the Fund is recorded as an asset in the Fund’s Statement of Assets and Liabilities and is subsequently marked-to-market daily. Premiums paid in the purchase of options which expire are treated as realized losses. Premiums paid in the purchase of call options which are exercised increase the cost of the security purchased. If a closing sale transaction is used to terminate a Fund’s obligation on an option, a gain or loss will be realized depending upon whether the price of the closing sale transaction is more or less than the premium previously paid on the option purchased.
Futures contracts – The Fund may use futures contracts to gain exposure to or to hedge against changes in the value of equities, real estate, interest rates or commodities. A futures contract represents a commitment for the future purchase or sale of an asset at a specified price on a specified date. When the Fund purchases or sells a futures contract, no price is paid to or received by the Fund. Instead, the Fund is required to deposit in a segregated asset account an amount of cash or qualifying securities currently ranging from 2% to 10% of the contract amount. This is called the “initial margin deposit.” Subsequent payments, known as “variation margin,” are made or received by the Fund each day, depending on the daily fluctuations in the fair value of the underlying asset. The Fund recognizes an unrealized gain or loss equal to the daily variation margin. If market conditions move unexpectedly, the Fund may not achieve the anticipated benefits of the futures contracts and may realize a loss. The margin deposits for futures contracts and the variation margin payable are reported on the Statement of Assets and Liabilities.
WAVELENGTH INTEREST RATE NEUTRAL FUND
NOTES TO FINANCIAL STATEMENTS (Continued)
Estimates – The preparation of financial statements in conformity with GAAP requires management to make estimates and assumptions that affect the reported amounts of assets and liabilities and disclosure of contingent assets and liabilities as of the date of the financial statements and the reported amounts of income and expenses during the reporting period. Actual results could differ from those estimates.
Federal income tax – The Fund has qualified and intends to continue to qualify as a regulated investment company under the Internal Revenue Code of 1986 (the “Code”). Qualification generally will relieve the Fund of liability for federal income taxes to the extent 100% of its net investment income and net realized gains are distributed in accordance with the Code. Accordingly, no provision for income tax has been made.
In order to avoid imposition of the excise tax applicable to regulated investment companies, it is also the Fund’s intention to declare as dividends in each calendar year at least 98% of its net investment income (earned during the calendar year) and 98.2% of its net realized capital gains (earned during the twelve months ended October 31) plus undistributed amounts from prior years.
The following information is computed on a tax basis for each item as of May 31, 2015:
|
Tax cost of portfolio investments |
$ |
16,886,192 |
||
|
Gross unrealized appreciation |
$ |
64,970 |
||
|
Gross unrealized depreciation |
(251,339 |
) |
||
|
Net unrealized depreciation |
(186,369 |
) |
||
|
Accumulated ordinary income |
48,086 |
|||
|
Capital loss carryforward |
(38,753 |
) |
||
|
Total accumulated deficit |
$ |
(177,036 |
) |
The value of the federal income tax cost of portfolio investments and the tax components of the accumulated deficit and the financial statement cost and components of net assets may be temporarily different (“book/tax difference”). These book/tax differences are due to the recognition of capital gains or losses under income tax regulations and GAAP, primarily the tax deferral of losses on wash sales and the tax treatment of realized and unrealized gains and losses on futures contracts.
As of May 31, 2015, the Fund had a short-term capital loss carryforward of $38,753 for federal income tax purposes. This capital loss carryforward, which does not expire, may be utilized in future years to offset net realized capital gains, if any, prior to distributing such gains to shareholders.
For the year ended May 31, 2015, the Fund reclassified $919 of accumulated net investment income against accumulated net realized losses on its Statement of Assets and Liabilities. Such reclassification, the result of permanent differences between financial statement and income tax reporting requirements, had no effect on the Fund’s total net assets or net asset value per share.
WAVELENGTH INTEREST RATE NEUTRAL FUND
NOTES TO FINANCIAL STATEMENTS (Continued)
The Fund recognizes the tax benefits or expenses of uncertain tax positions only when the position is “more likely than not” to be sustained assuming examination by tax authorities. Management has reviewed the Fund’s tax positions for all open tax periods (periods ended May 31, 2014 and May 31, 2015) and has concluded that no provision for unrecognized tax benefits or expenses is required in these financial statements. The Fund identifies its major tax jurisdiction as U.S. Federal.
3. Investment Transactions
During the year ended May 31, 2015, cost of purchases and proceeds from sales of investment securities, other than short-term investments, were $24,045,752 and $12,707,165, respectively.
4. Transactions with Related Parties
INVESTMENT ADVISORY AGREEMENT
The Fund’s investments are managed by Wavelength Capital Management, LLC (the “Adviser”) pursuant to the terms of an Investment Advisory Agreement. Under the Investment Advisory Agreement, the Fund pays the Adviser an advisory fee, computed and accrued daily and paid monthly, at the annual rate of 0.95% of its average daily net assets.
Pursuant to an expense limitation agreement between the Fund and the Adviser (the “Expense Limitation Agreement”), the Adviser has contractually agreed, until October 1, 2016, to waive investment advisory fees and reimburse certain Other Expenses to limit Total Annual Fund Operating Expenses (exclusive of brokerage costs; taxes; interest; borrowing costs such as interest and dividend expenses on securities sold short; acquired fund fees and expenses; extraordinary expenses such as litigation and merger or reorganization costs; and other expenses not incurred in the ordinary course of the Fund’s business) to an amount not exceeding 0.99% of the Fund’s average daily net assets. During the year ended May 31, 2015, the Adviser did not collect any of its investment advisory fees and, in addition, reimbursed the Fund for other operating expenses totaling $33,767.
Under the terms of the Expense Limitation Agreement, investment advisory fees waived and expense reimbursements by the Adviser are subject to recoupment by the Adviser for a period of three years after such fees and expenses were incurred, provided that the repayments do not cause Total Annual Fund Operating Expenses to exceed the foregoing expense limitations. As of May 31, 2015, the Adviser may seek recoupment of investment advisory fees waived and expense reimbursements no later than the dates as stated below:
|
May 31, 2017 |
May 31, 2018 |
Total |
|
$91,664 |
$157,675 |
$249,339 |
An officer of the Fund is also an officer of the Adviser.
WAVELENGTH INTEREST RATE NEUTRAL FUND
NOTES TO FINANCIAL STATEMENTS (Continued)
OTHER SERVICE PROVIDERS
Ultimus Fund Solutions, LLC (“Ultimus”) provides fund administration, fund accounting, compliance and transfer agency services to the Fund. The Fund pays Ultimus fees in accordance with the agreements for such services. In addition, the Fund pays out-of-pocket expenses including, but not limited to, postage, supplies and costs of pricing the Fund’s portfolio securities.
DISTRIBUTION AGREEMENT
Under the terms of a Distribution Agreement with the Trust, Ultimus Fund Distributors, LLC (the “Distributor”) serves as the principal underwriter to the Fund. The Distributor is a wholly-owned subsidiary of Ultimus. The Distributor is compensated by the Adviser (not the Fund) for acting as principal underwriter.
Certain Trustees and officers of the Trust are also officers of Ultimus and the Distributor.
TRUSTEE COMPENSATION
Each Trustee who is not an “interested person” of the Trust (“Independent Trustee”) receives from the Fund a fee of $500 for each Board meeting attended plus reimbursement of travel and other meeting-related expenses. In addition, effective January 1, 2015, each Independent Trustee also receives a $500 annual retainer from the Fund. Trustees affiliated with the Adviser or Ultimus are not compensated by the Trust for their services.
PRINCIPAL HOLDER OF FUND SHARES
As of May 31, 2015, the following shareholders owned of record more than 5% of the outstanding shares of the Fund:
|
Name of Record Owner |
% Ownership |
|
Interactive Brokers, LLC (for the benefit of its customers) |
69% |
|
R&T Partners, LLC (for the benefit of its customers) |
11% |
A shareholder owning of record or beneficially more than 25% of a Fund’s outstanding shares may be considered a controlling person. That shareholder’s vote could have a more significant effect on matters presented at a shareholders’ meeting.
5. Derivatives Transactions
The Fund’s position in derivative instruments as of May 31, 2015 is recorded in the following location in the Statement of Assets and Liabilities:
|
Derivative Investment Type |
Location |
|
Futures contracts |
Variation margin payable |
WAVELENGTH INTEREST RATE NEUTRAL FUND
NOTES TO FINANCIAL STATEMENTS (Continued)
The following table sets forth the values of variation margin of the Fund as of May 31, 2015:
|
Variation Margin |
||||||||||||
|
|
Receivable |
(Payable) |
Total |
|||||||||
|
Asset Derivatives |
||||||||||||
|
Futures contracts |
||||||||||||
|
Commodity |
$ |
5,970 |
$ |
— |
$ |
5,970 |
||||||
|
Index |
— |
(23,707 |
) |
(23,707 |
) |
|||||||
|
Treasury |
10,837 |
(662 |
) |
10,175 |
||||||||
|
Total Asset Derivatives |
$ |
16,807 |
$ |
(24,369 |
) |
$ |
(7,562 |
) |
||||
|
Derivative Investment Type |
Location |
|
Call options purchased |
Net realized losses from option contracts |
|
Futures contracts |
Net realized losses from futures contracts |
|
Net change in unrealized appreciation/depreciation on futures contracts |
The following is a summary of the Fund’s net realized gains (losses) and net change in unrealized appreciation/depreciation on derivative instruments recognized in the Statement of Operations during the year ended May 31, 2015:
|
Type of Derivative |
Net Realized Gains (Losses) |
Net Change in Unrealized Appreciation/ Depreciation |
||||||
|
Index call options purchased |
$ |
(8,464 |
) |
$ |
— |
|||
|
Futures contracts |
||||||||
|
Commodity |
(218,618 |
) |
(9,238 |
) |
||||
|
Index |
123,273 |
(16,611 |
) |
|||||
|
Treasury |
80,482 |
7,541 |
||||||
|
|
(14,863 |
) |
(18,308 |
) |
||||
|
Total |
$ |
(23,327 |
) |
$ |
(18,308 |
) |
||
WAVELENGTH INTEREST RATE NEUTRAL FUND
NOTES TO FINANCIAL STATEMENTS (Continued)
In the ordinary course of business, the Fund may enter into transactions subject to enforceable netting agreements or other similar arrangements (“netting agreements”). Generally, the right to offset in netting agreements allows the Fund to offset any exposure to a specific counterparty with any collateral received or delivered to that counterparty based on the terms of the agreements. Generally, the Fund manages its cash collateral securities and securities collateral on a counterparty basis. As of May 31, 2015, the offsetting of financial assets and derivatives assets is as follows:
|
Description |
Gross Amounts of Recognized Assets |
Gross Amounts Offset in Statement of Assets and Liabilities |
Net Amounts of Liabilities Presented in Statement of |
Collateral Pledged |
Net Amount |
|||||||||||||||
|
Variation margin payable - futures contracts |
$ |
16,807 |
$ |
(24,369 |
) |
$ |
(7,562 |
) |
$ |
413,295 |
$ |
405,733 |
||||||||
|
Total subject to a master netting or similar arrangement |
$ |
16,807 |
$ |
(24,369 |
) |
$ |
(7,562 |
) |
$ |
413,295 |
$ |
405,733 |
||||||||
6. Certain Investments and Risks
The securities in which the Fund invests, as well as the risks associated with these securities, are described in the Fund’s prospectus. Among these risks are those associated with investments in exchange-traded funds (“ETFs”). ETFs provide their shares to authorized participants in return for a specific basket of securities. The authorized participant then sells the ETF’s shares on the secondary market. In other words, ETF shares are traded on a securities exchange based on their market value. Investments in ETFs are subject to the risk that the ETF’s shares may trade at a premium (creating the risk that the Fund pays more than net asset value (“NAV”) for an ETF when making a purchase) or discount (creating the risk that the Fund receives less than NAV when selling an ETF) to the ETF’s NAV. Investments in ETFs are also subject to index-tracking risk because the total return generated by the securities will be reduced by transaction costs and expenses not incurred by the indices. Certain securities comprising the index tracked by an ETF may, from time to time, temporarily be unavailable, which may further impede the ETF’s ability to track their applicable index or match the index’s performance. To the extent that the Fund invests in an ETF, the Fund incurs additional expenses because the Fund bears its pro-rata portion of such ETF’s advisory fees and operational expenses. Finally, ETF shares are also subject to the risks applicable to the underlying basket of securities. As of May 31, 2015, the Fund had 85.7% of the value of its net assets invested in ETFs.
WAVELENGTH INTEREST RATE NEUTRAL FUND
NOTES TO FINANCIAL STATEMENTS (Continued)
7. Contingencies and Commitments
The Fund indemnifies the Trust’s officers and Trustees for certain liabilities that might arise from their performance of their duties to the Fund. Additionally, in the normal course of business, the Fund enters into contracts that contain a variety of representations and warranties and which provide general indemnifications. The Fund’s maximum exposure under these arrangements is unknown, as this would involve future claims that may be made against the Fund that have not yet occurred. However, based on experience, the Fund expects the risk of loss to be remote.
8. Subsequent Events
The Fund is required to recognize in the financial statements the effects of all subsequent events that provide additional evidence about conditions that existed as of the date of the Statement of Assets and Liabilities. For non-recognized subsequent events that must be disclosed to keep the financial statements from being misleading, the Fund is required to disclose the nature of the event as well as an estimate of its financial effect, or a statement that such an estimate cannot be made. Management has evaluated subsequent events through the issuance of these financial statements and has noted no such events.
WAVELENGTH INTEREST RATE NEUTRAL FUND
REPORT OF INDEPENDENT REGISTERED
PUBLIC ACCOUNTING FIRM
To the Board of Trustees of Ultimus Managers Trust
and the Shareholders of Wavelength Interest Rate Neutral Fund
We have audited the accompanying statement of assets and liabilities of Wavelength Interest Rate Neutral Fund (the “Fund”), a series of shares of beneficial interest in Ultimus Managers Trust, including the schedule of investments, as of May 31, 2015, and the related statement of operations for the year then ended, and the statements of changes in net assets and the financial highlights for the year then ended and for the period September 30, 2013 (commencement of operations) through May 31, 2014. These financial statements and financial highlights are the responsibility of the Fund’s management. Our responsibility is to express an opinion on these financial statements and financial highlights based on our audits.
We conducted our audits in accordance with the standards of the Public Company Accounting Oversight Board (United States). Those standards require that we plan and perform the audits to obtain reasonable assurance about whether the financial statements and financial highlights are free of material misstatement. An audit includes examining, on a test basis, evidence supporting the amounts and disclosures in the financial statements. Our procedures included confirmation of securities owned as of May 31, 2015 by correspondence with the custodian and brokers. An audit also includes assessing the accounting principles used and significant estimates made by management, as well as evaluating the overall financial statement presentation. We believe that our audits provide a reasonable basis for our opinion.
In our opinion, the financial statements and financial highlights referred to above present fairly, in all material respects, the financial position of the Wavelength Interest Rate Neutral Fund as of May 31, 2015, and the results of its operations for the year then ended, and the changes in its net assets and its financial highlights for the year then ended and for the period September 30, 2013 through May 31, 2014, in conformity with accounting principles generally accepted in the United States of America.
 |
|
|
BBD, LLP |
Philadelphia, Pennsylvania
July 27, 2015
WAVELENGTH INTEREST RATE NEUTRAL FUND
ABOUT YOUR FUND’S EXPENSES (Unaudited)
We believe it is important for you to understand the impact of costs on your investment. As a shareholder of the Fund, you incur ongoing costs, including management fees and other operating expenses. The following examples are intended to help you understand your ongoing costs (in dollars) of investing in the Fund and to compare these costs with the ongoing costs of investing in other mutual funds.
A mutual fund’s ongoing costs are expressed as a percentage of its average net assets. This figure is known as the expense ratio. The expenses in the table below are based on an investment of $1,000 made at the beginning of the most recent period (December 1, 2014) and held until the end of the period (May 31, 2015).
The table below illustrates the Fund’s ongoing costs in two ways:
Actual fund return – This section helps you to estimate the actual expenses that you paid over the period. The “Ending Account Value” shown is derived from the Fund’s actual return, and the third column shows the dollar amount of operating expenses that would have been paid by an investor who started with $1,000 in the Fund. You may use the information here, together with the amount you invested, to estimate the expenses that you paid over the period.
To do so, simply divide your account value by $1,000 (for example, an $8,600 account value divided by $1,000 = 8.6), then multiply the result by the number given for the Fund under the heading “Expenses Paid During Period.”
Hypothetical 5% return – This section is intended to help you compare the Fund’s ongoing costs with those of other mutual funds. It assumes that the Fund had an annual return of 5% before expenses during the period shown, but that the expense ratio is unchanged. In this case, because the return used is not the Fund’s actual return, the results do not apply to your investment. The example is useful in making comparisons because the SEC requires all mutual funds to calculate expenses based on a 5% return. You can assess the Fund’s ongoing costs by comparing this hypothetical example with the hypothetical examples that appear in shareholder reports of other funds.
Note that expenses shown in the table are meant to highlight and help you compare ongoing costs only. The Fund does not charge transaction fees, such as purchase or redemption fees, nor does it carry a “sales load.”
The calculations assume no shares were bought or sold during the period. Your actual costs may have been higher or lower, depending on the amount of your investment and the timing of any purchases or redemptions.
WAVELENGTH INTEREST RATE NEUTRAL FUND
ABOUT YOUR FUND’S EXPENSES (Unaudited)
More information about the Fund’s expenses can be found in this report. For additional information on operating expenses and other shareholder costs, please refer to the Fund’s prospectus.
|
|
Beginning Account Value December 1, 2014 |
Ending Account Value May 31, 2015 |
Expenses Paid During Period* |
|
Based on Actual Fund Return |
$ 1,000.00 |
$ 1,008.00 |
$ 4.96 |
|
Based on Hypothetical 5% Return (before expenses) |
$ 1,000.00 |
$ 1,020.00 |
$ 4.99 |
|
* |
Expenses are equal to the Fund’s annualized expense ratio of 0.99% for the period, multiplied by the average account value over the period, multiplied by 182/365 (to reflect the one-half year period). |
OTHER INFORMATION (Unaudited)
A description of the policies and procedures that the Fund uses to vote proxies relating to portfolio securities is available without charge upon request by calling toll-free 1-866-896-9292, or on the SEC’s website at http://www.sec.gov. Information regarding how the Fund voted proxies relating to portfolio securities during the most recent period ended June 30 is available without charge upon request by calling toll-free 1-866-896-9292, or on the SEC’s website at http://www.sec.gov.
The Trust files a complete listing of portfolio holdings for the Fund with the SEC as of the end of the first and third quarters of each fiscal year on Form N-Q. These filings are available upon request by calling 1-866-896-9292. Furthermore, you may obtain a copy of the filings on the SEC’s website at http://www.sec.gov. The Trust’s Forms N-Q may also be reviewed and copied at the SEC’s Public Reference Room in Washington, DC, and information on the operation of the Public Reference Room may be obtained by calling 1-800-SEC-0330.
WAVELENGTH INTEREST RATE NEUTRAL FUND
FEDERAL TAX INFORMATION (Unaudited)
In accordance with federal tax requirements, the following provides shareholders with information concerning distributions from ordinary income and net realized gains made by the Fund during the fiscal year ended May 31, 2015. Certain dividends paid by the fund may be subject to a maximum tax rate of 23.8%, as provided by the Jobs and Growth Tax Relief Reconciliation Act of 2003. The Fund intends to designate up to a maximum amount of $11,809 as taxed at a maximum rate of 23.8%. Additionally, the Fund intends to designate up to a maximum amount of $14,012 as a long-term gain distribution. As required by federal regulations, complete information was computed and reported in conjunction with your 2014 Form 1099-DIV.
WAVELENGTH INTEREST RATE NEUTRAL FUND
BOARD OF TRUSTEES AND EXECUTIVE OFFICERS (Unaudited)
The Board of Trustees has overall responsibility for management of the Trust’s affairs. The Trustees serve during the lifetime of the Trust and until its termination, or until death, resignation, retirement, or removal. The Trustees, in turn, elect the officers of the Fund to actively supervise its day-to-day operations. The officers have been elected for an annual term. Unless otherwise noted, each Trustee’s and officer’s address is 225 Pictoria Drive, Suite 450, Cincinnati, OH 45246. The following are the Trustees and executive officers of the Fund:
|
Name and |
Length of Time Served |
Position(s) Held with Trust |
Principal Occupation(s) During Past 5 Years |
Number of Funds in Trust Overseen by Trustee |
Directorships of Public Companies Held by Trustee During Past 5 Years |
|
Interested Trustees: |
|||||
|
Robert G. Dorsey* Year of Birth: 1957 |
Since February 2012 |
Trustee (February 2012 to present) President (June 2012 to October 2013) |
Managing Director of Ultimus Fund Solutions, LLC and Ultimus Fund Distributors, LLC (1999 to present) |
11 |
None |
|
Independent Trustees: |
|||||
|
John C. Davis Year of Birth: 1952 |
Since |
Chairman (July 2014 to present) Trustee (June 2012 to present) |
Consultant ( government services) since May 2011; Retired Partner of PricewaterhouseCoopers LLP (1974-2010) |
11 |
None |
|
John J. Discepoli Year of Birth: 1963 |
Since |
Trustee |
Owner of Discepoli Financial Planning, LLC (personal financial planning company) since November 2004 |
11 |
None |
|
David M. Deptula Year of Birth: 1958 |
Since |
Trustee |
Vice President of Tax at The Standard Register Company since November 2011; Tax Partner at Deloitte Tax LLP from 1984 to 2011 |
11 |
None |
|
* |
Mr. Dorsey is considered an “interested person” of the Trust within the meaning of Section 2(a)(19) of the 1940 Act because of his relationship with the Trust’s administrator, transfer agent and distributor. Mr. Dorsey was President of the Trust from June 2012 to October 2013. |
WAVELENGTH INTEREST RATE NEUTRAL FUND
BOARD OF TRUSTEES AND EXECUTIVE OFFICERS (Unaudited) (Continued)
|
Name and |
Length of Time Served |
Position(s) |
Principal Occupation(s) |
|
Executive Officers: |
|||
|
Andrew Dassori 215 Park Avenue South, Suite 1902 New York, NY 10003 Year of Birth: 1984 |
Since |
Principal Executive Officer of Wavelength Interest Rate Neutral Fund |
Managing Member and Chief Compliance Officer of Wavelength Capital Management, LLC (2013 to present); Formerly, Portfolio Manager, Credit Suisse Asset Management LLC (2007 to 2013) |
|
David R. Carson Year of Birth: 1958 |
Since |
President Vice President (April 2013 to October 2013) |
Vice President and Director of Client Strategies of Ultimus Fund Solutions, LLC (2013 to present); Chief Compliance Officer, The Huntington Funds (2005 to 2013), The Flex-Funds (2006 to 2011), Meeder Financial (2007 to 2011), Huntington Strategy Shares (2012 to 2013), and Huntington Asset Advisors (2013); Vice President, Huntington National Bank (2001 to 2013) |
|
Jennifer L. Leamer Year of Birth: 1976 |
Since |
Treasurer Assistant Treasurer (April 2014 to October 2014) |
Mutual Fund Controller of Ultimus Fund Solutions, LLC (2014 to present); Business Analyst of Ultimus Fund Solutions, LLC (2007 to 2014) |
|
Bo J. Howell Year of Birth: 1981 |
Since October 2014 |
Secretary Assistant Secretary (October 2014 to April 2015) |
V.P., Director of Fund Administration for Ultimus Fund Solutions, LLC (2014 to present); Counsel – Securities and Mutual Funds for Western & Southern Financial Group (2012 to 2014); U.S. Securities and Exchange Commission, Senior Counsel (2009 to 2012) |
|
Stephen L. Preston Year of Birth: 1966 |
Since |
Chief Compliance Officer |
Vice President and Chief Compliance Officer of Ultimus Fund Distributors, LLC and Vice President of Ultimus Fund Solutions, LLC (2011 to present); Senior Consultant at Mainstay Capital Markets Consultants (2010 to 2011); Chief Compliance Officer at INTL Trading, Inc. (2008 to 2010) |
Additional information about members of the Board and executive officers is available in the Fund’s Statement of Additional Information (“SAI”). To obtain a free copy of the SAI, please call 1-866-896-9292.
WAVELENGTH INTEREST RATE NEUTRAL FUND
DISCLOSURE REGARDING APPROVAL OF INVESTMENT ADVISORY AGREEMENT (Unaudited)
The Board of Trustees (the “Board”), including the Independent Trustees voting separately, has reviewed and approved the Fund’s Investment Advisory Agreement with the Advisor for an additional annual term. Approval took place at an in-person meeting held on April 20, 2015, at which all of the Trustees were present.
In the course of their deliberations, the Board was advised by legal counsel. The Board received and reviewed information provided by the Advisor in response to requests of the Board and counsel.
In considering the Investment Advisory Agreement and reaching their conclusions with respect thereto, the Board reviewed and analyzed various factors that they determined were relevant, including the factors described below.
The nature, extent, and quality of the services provided by the Adviser. In this regard, the Board reviewed the services being provided by the Adviser to the Fund including, without limitation, its investment advisory services since the Fund’s inception, the Adviser’s compliance procedures and practices, and its efforts to promote the Fund and assist in its distribution. The Board also noted that an Adviser’s principal serves as the Fund’s Principal Executive Officer without additional compensation. After reviewing the foregoing information and further information about the Adviser’s business, the Board concluded that the quality, extent, and nature of the services provided by the Adviser were satisfactory and adequate for the Fund.
The investment performance of the Fund. In this regard, the Board compared the performance of the Fund with the performance of its benchmark index and related Morningstar category. The Board also considered the consistency of the Adviser’s management with the Fund’s investment objective and policies. Following discussion of the investment performance of the Fund and its performance relative to its Morningstar category, the Adviser’s experience in managing a mutual fund, its historical investment performance, and other factors, the Board concluded that the investment performance of the Fund has been satisfactory.
The costs of the services provided and profits realized by the Adviser and its affiliates from its relationship with the Fund. In this regard, the Board considered the Adviser’s staffing, personnel, and methods of operations; the education and experience of its personnel; compliance program, policies, and procedures; financial condition and the level of commitment to the Fund, and, generally, the Adviser’s advisory business; the asset level of the Fund; and the overall expenses of the Fund, including the advisory fee. The Board considered the Adviser’s Expense Limitation Agreement (the “ELA”) with the Fund, and considered the Adviser’s current and past fee reductions and expense reimbursements for the Fund. The Board further took into account the Adviser’s commitment to continue the ELA for the Fund until at least October 1, 2016.
The Board also considered potential benefits for the Adviser in managing the Fund, including promotion of the Adviser’s name and the potential for it to receive research, statistical, or other services from the Fund’s trades. The Board compared the Fund’s advisory fee and overall expense ratio to the average advisory fees and average expense ratios for its
WAVELENGTH INTEREST RATE NEUTRAL FUND
DISCLOSURE REGARDING APPROVAL OF INVESTMENT ADVISORY AGREEMENT (Unaudited) (Continued)
Morningstar category. The Board noted that the advisory fee for the Fund was above the average and the median for the Morningstar Nontraditional Bond Funds category but was less than the highest advisory fee in the category. The Board further noted that the overall annual expense ratio of 0.99 percent for the Fund with the ELA is lower than the Morningstar category’s average expense ratio (1.36 percent) and median expense ratio (1.25 percent). The Board also noted that the Fund had significantly less assets than the average or median fund in its Morningstar category. Following these comparisons and upon further consideration and discussion of the foregoing, the Board concluded that the advisory fee paid to the Adviser by the Fund is fair and reasonable.
The extent to which economies of scale would be realized as the Fund grows and whether advisory fee levels reflect these economies of scale for the benefit of the Fund’s investors. In this regard, the Board considered that the Fund’s fee arrangements with the Adviser involve both the advisory fee and the ELA. The Board determined that while the advisory fee remained the same as asset levels increased, the shareholders of the Fund have experienced benefits from the ELA. Following further discussion of the Fund’s asset level, expectations for growth, and level of fees, the Board determined that the Fund’s fee arrangements with the Adviser would continue to provide benefits. The Board also determined that the fee arrangements were fair and reasonable given the Fund’s projected asset levels for the next year.
Brokerage and portfolio transactions. In this regard, the Board considered the Adviser’s trading policies, procedures, and performance in seeking best execution for the Fund. The Board also considered the historical portfolio turnover rate for the Fund; the process by which evaluations are made of the overall reasonableness of commissions paid; the method and basis for selecting and evaluating the broker-dealers used; and any anticipated allocation of portfolio business to persons affiliated with the Adviser. After further review and discussion, the Board determined that the Adviser’s practices regarding brokerage and portfolio transactions were satisfactory.
Possible conflicts of interest. In evaluating the possibility for conflicts of interest, the Board considered such matters as the experience and abilities of the advisory personnel assigned to the Fund, the Adviser’s process for allocating trades among its different clients, and the substance and administration of the Adviser’s code of ethics. Following further consideration and discussion, the Board found that the Adviser’s standards and practices relating to the identification and mitigation of potential conflicts of interests were satisfactory.
Conclusion
After consideration of the above factors as well as other factors, the Board unanimously concluded that approval of the Investment Advisory Agreement was in the best interests of the Fund and its shareholders.
| Item 2. | Code of Ethics. |
| Item 3. | Audit Committee Financial Expert. |
| Item 4. | Principal Accountant Fees and Services. |
| (a) | Audit Fees. The aggregate fees billed for professional services rendered by the principal accountant for the audit of the registrant’s annual financial statements or for services that are normally provided by the accountant in connection with statutory and regulatory filings or engagements were $67,500 and $65,000 with respect to the registrant’s fiscal years ended May 31, 2015 and 2014, respectively. |
| (b) | Audit-Related Fees. No fees were billed in either of the last two fiscal years for assurance and related services by the principal accountant that are reasonably related to the performance of the audit of the registrant’s financial statements and are not reported under paragraph (a) of this Item. |
| (c) | Tax Fees. The aggregate fees billed for professional services rendered by the principal accountant for tax compliance, tax advice, and tax planning were $10,000 and $10,000 with respect to the registrant’s fiscal years ended May 31, 2015 and 2014, respectively. The services comprising these fees are the preparation of the registrant’s federal income and excise tax returns. |
| (d) | All Other Fees. No fees were billed in either of the last two fiscal years for products and services provided by the principal accountant, other than the services reported in paragraphs (a) through (c) of this Item. |
| (e)(1) | The audit committee has not adopted pre-approval policies and procedures described in paragraph (c)(7) of Rule 2-01 of Regulation S-X. |
| (e)(2) | None of the services described in paragraph (b) through (d) of this Item were approved by the audit committee pursuant to paragraph (c)(7)(i)(C) of Rule 2-01 of Regulation S-X. |
| (f) | Less than 50% of hours expended on the principal accountant’s engagement to audit the registrant’s financial statements for the most recent fiscal year were attributed to work performed by persons other than the principal accountant’s full-time, permanent employees. |
| (g) | During the fiscal years ended May 31, 2015 and 2014, aggregate non-audit fees of $10,000 and $10,000, respectively, were billed by the registrant’s accountant for services rendered to the registrant. No non-audit fees were billed in either of the last two fiscal years by the registrant’s accountant for services rendered to the registrant’s investment adviser (not including any sub-adviser whose role is primarily portfolio management and is subcontracted with or overseen by another investment adviser), and any entity controlling, controlled by, or under common control with the adviser that provides ongoing services to the registrant. |
| (h) | The principal accountant has not provided any non-audit services to the registrant’s investment adviser (not including any sub-adviser whose role is primarily portfolio management and is subcontracted with or overseen by another investment adviser), and any entity controlling, controlled by, or under common control with the investment adviser that provides ongoing services to the registrant. |
| Item 5. | Audit Committee of Listed Registrants. |
| Item 6. | Schedule of Investments. |
| (a) | Not applicable [schedule filed with Item 1] |
| (b) | Not applicable |
| Item 7. | Disclosure of Proxy Voting Policies and Procedures for Closed-End Management Investment Companies. |
| Item 8. | Portfolio Managers of Closed-End Management Investment Companies. |
| Item 9. | Purchases of Equity Securities by Closed-End Management Investment Company and Affiliated Purchasers. |
| Item 11. | Controls and Procedures. |
| Item 12. | Exhibits. |
| Exhibit 99.CODE ETH | Code of Ethics |
| Exhibit 99.CERT | Certifications required by Rule 30a-2(a) under the Act |
| Exhibit 99.906CERT | Certifications required by Rule 30a-2(b) under the Act |
|
(Registrant)
|
Ultimus Managers Trust
|
||
|
By (Signature and Title)*
|
/s/ Frank L. Newbauer
|
||
|
Frank L. Newbauer, Assistant Secretary
|
|||
|
Date
|
August 10, 2015
|
||
|
Pursuant to the requirements of the Securities Exchange Act of 1934 and the Investment Company Act of 1940, this report has been signed below by the following persons on behalf of the registrant and in the capacities and on the dates indicated.
|
|
By (Signature and Title)*
|
/s/ Nitin N. Kumbhani
|
||
|
Nitin N. Kumbhani, Principal Executive Officer of APEXcm Small/Mid Cap Growth Fund
|
|||
|
Date
|
August 10, 2015
|
||
|
By (Signature and Title)*
|
/s/ William S. Sloneker
|
||
|
William S. Sloneker, Principal Executive Officer of Cincinnati Asset Management Funds: Broadmarket Strategic Income Fund
|
|||
|
Date
|
August 10, 2015
|
||
|
By (Signature and Title)*
|
/s/ Nicholas Chermayeff
|
||
|
Nicholas Chermayeff, Principal Executive Officer of Barrow Value Opportunity Fund and Barrow Long/Short Opportunity Fund
|
|||
|
Date
|
August 10, 2015
|
||
|
By (Signature and Title)*
|
/s/ Andrew G. Dassori
|
||
|
Andrew G. Dassori, Principal Executive Officer of Wavelength Interest Rate Neutral Fund
|
|||
|
Date
|
August 10, 2015
|
||
|
By (Signature and Title)*
|
/s/ Jennifer L. Leamer
|
||
|
Jennifer L. Leamer, Treasurer
|
|||
|
Date
|
August 10, 2015
|
||