Exhibit 99.1

For Immediate Release
February 27, 2018
TCG BDC, Inc. Announces Fourth Quarter 2017 Financial Results and Declares First Quarter 2018 Dividend of $0.37 Per Share
New York - TCG BDC, Inc. (together with its consolidated subsidiaries, “we,” “us,” “our,” “TCG BDC” or the “Company”) (NASDAQ: CGBD) today announced its financial results for its fourth quarter ended December 31, 2017.
Selected Financial Highlights
(dollar amounts in thousands, except per share data) | December 31, 2017 | September 30, 2017 | |||||
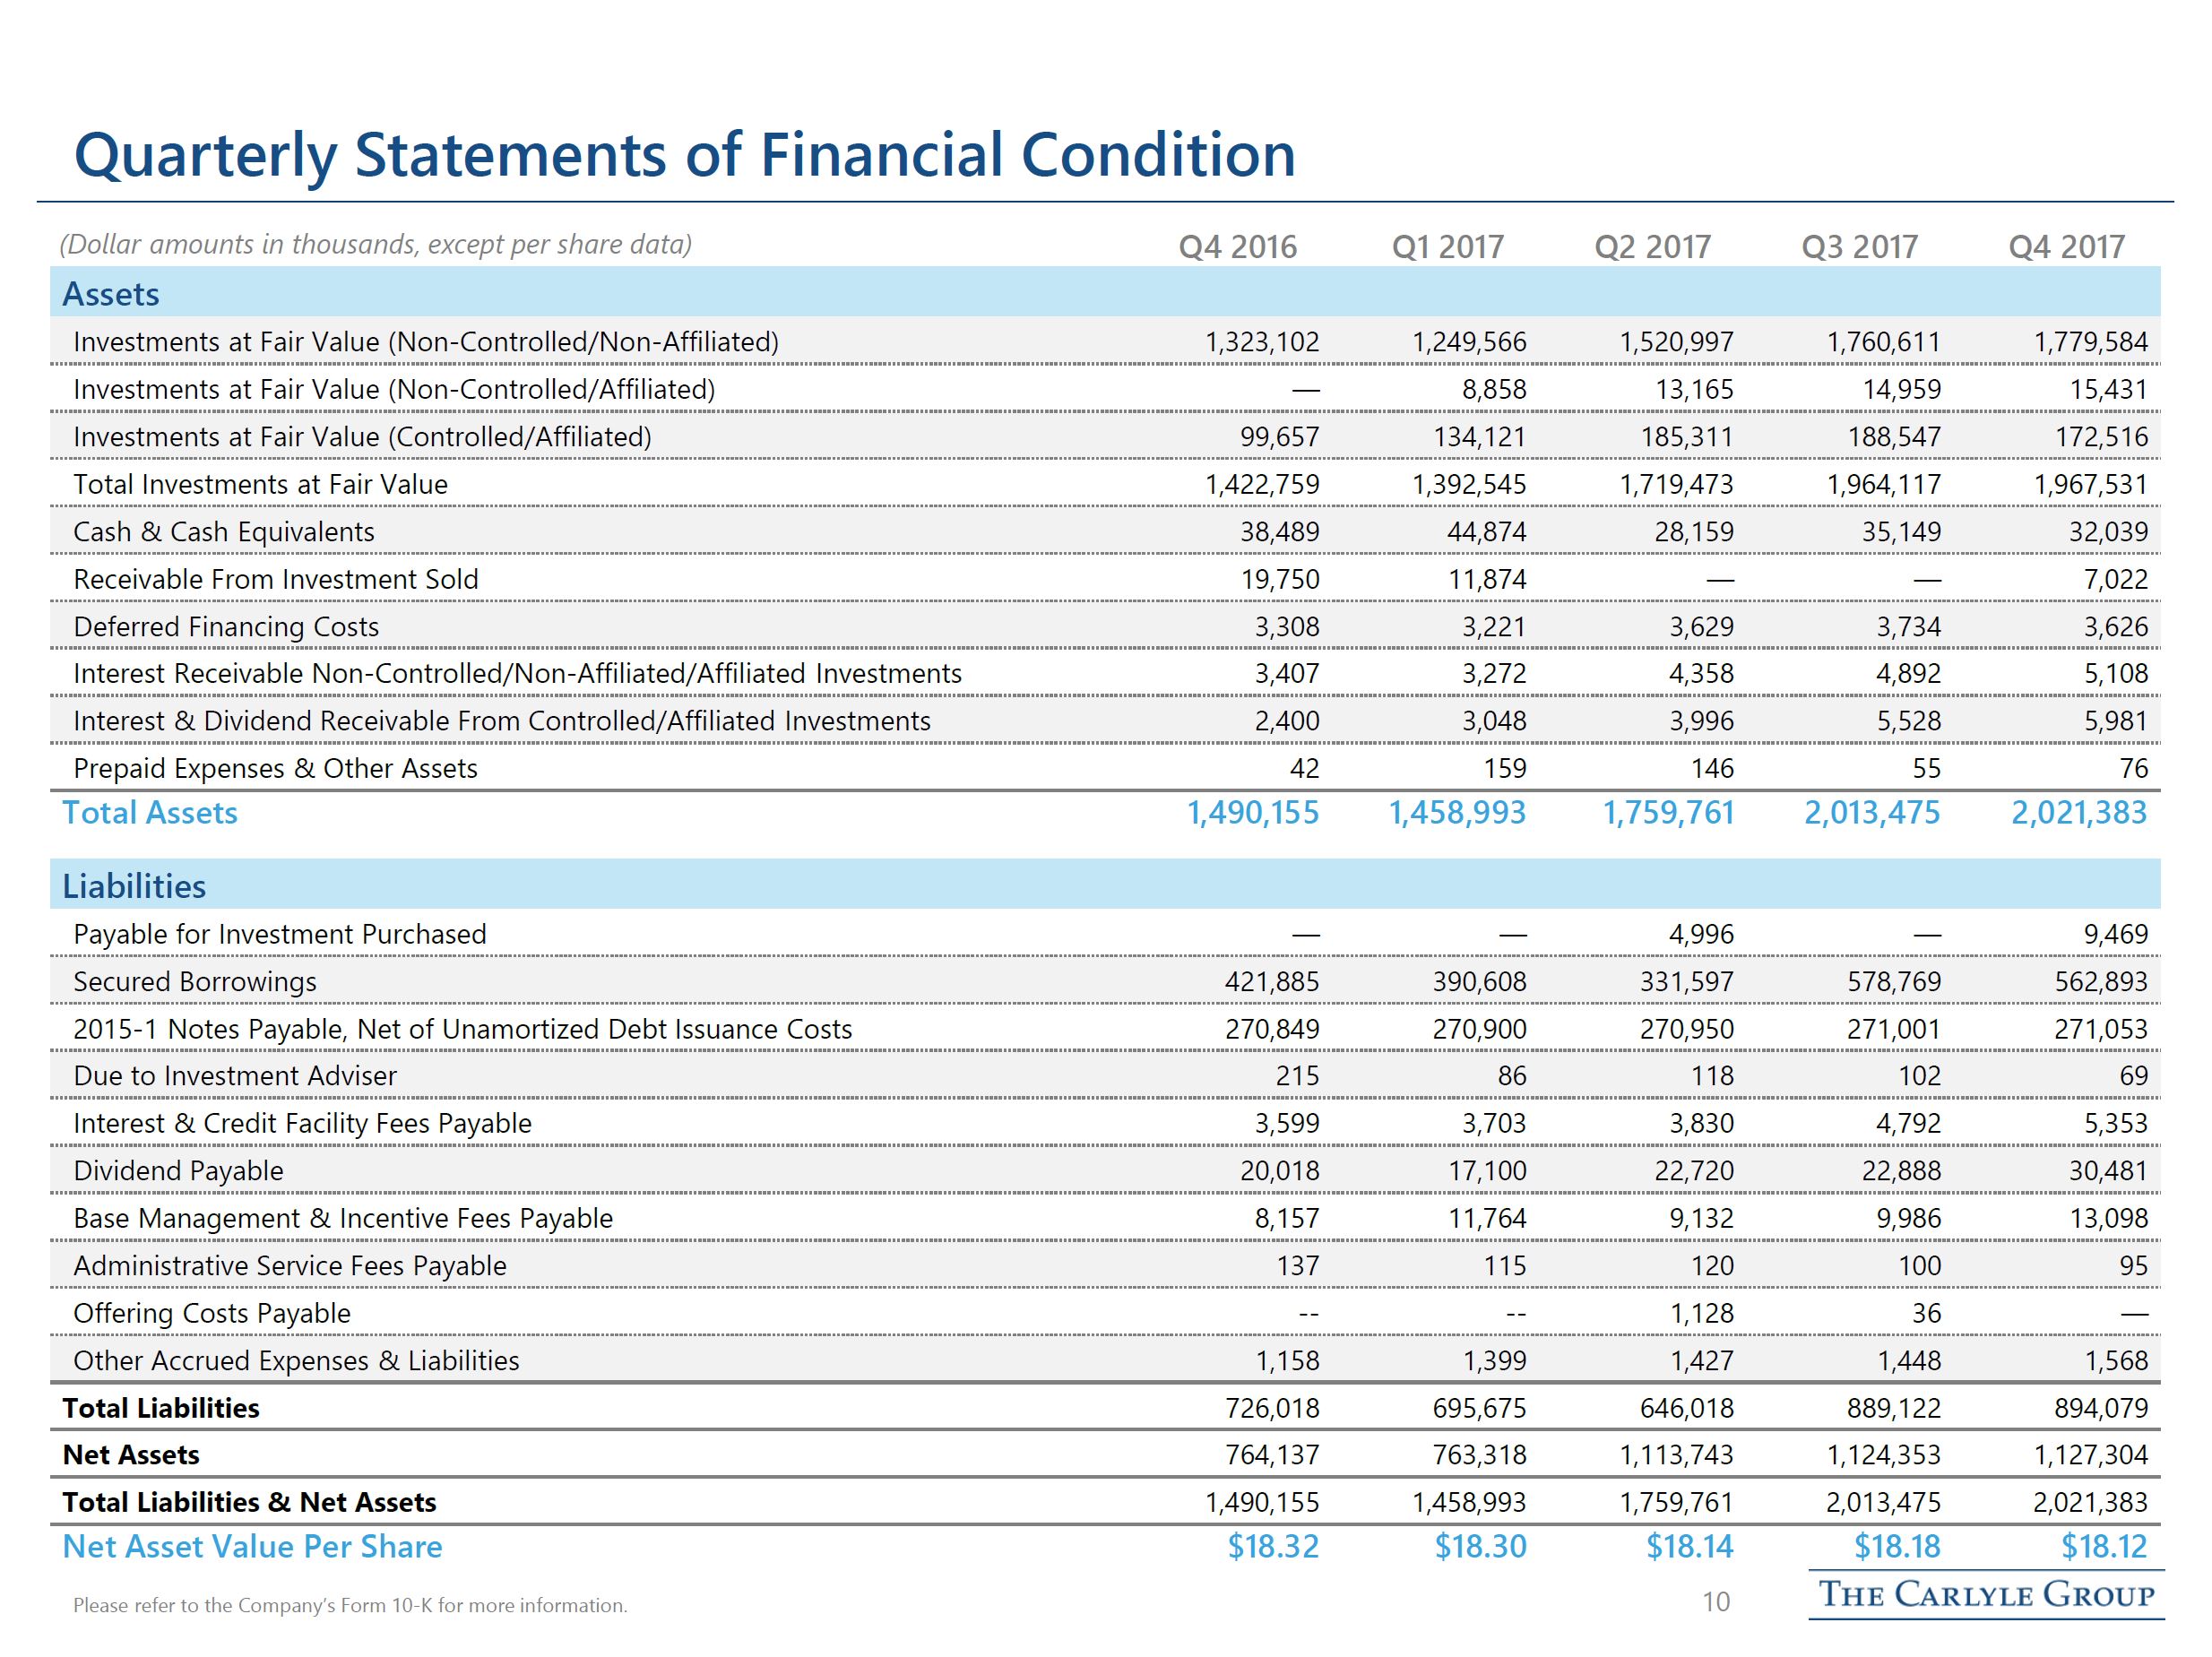
Total investments, at fair value | $ | 1,967,531 | $ | 1,964,117 | |||
Total assets | 2,021,383 | 2,013,475 | |||||
Total debt and notes payable | 833,946 | 849,770 | |||||
Total net assets | $ | 1,127,304 | $ | 1,124,353 | |||
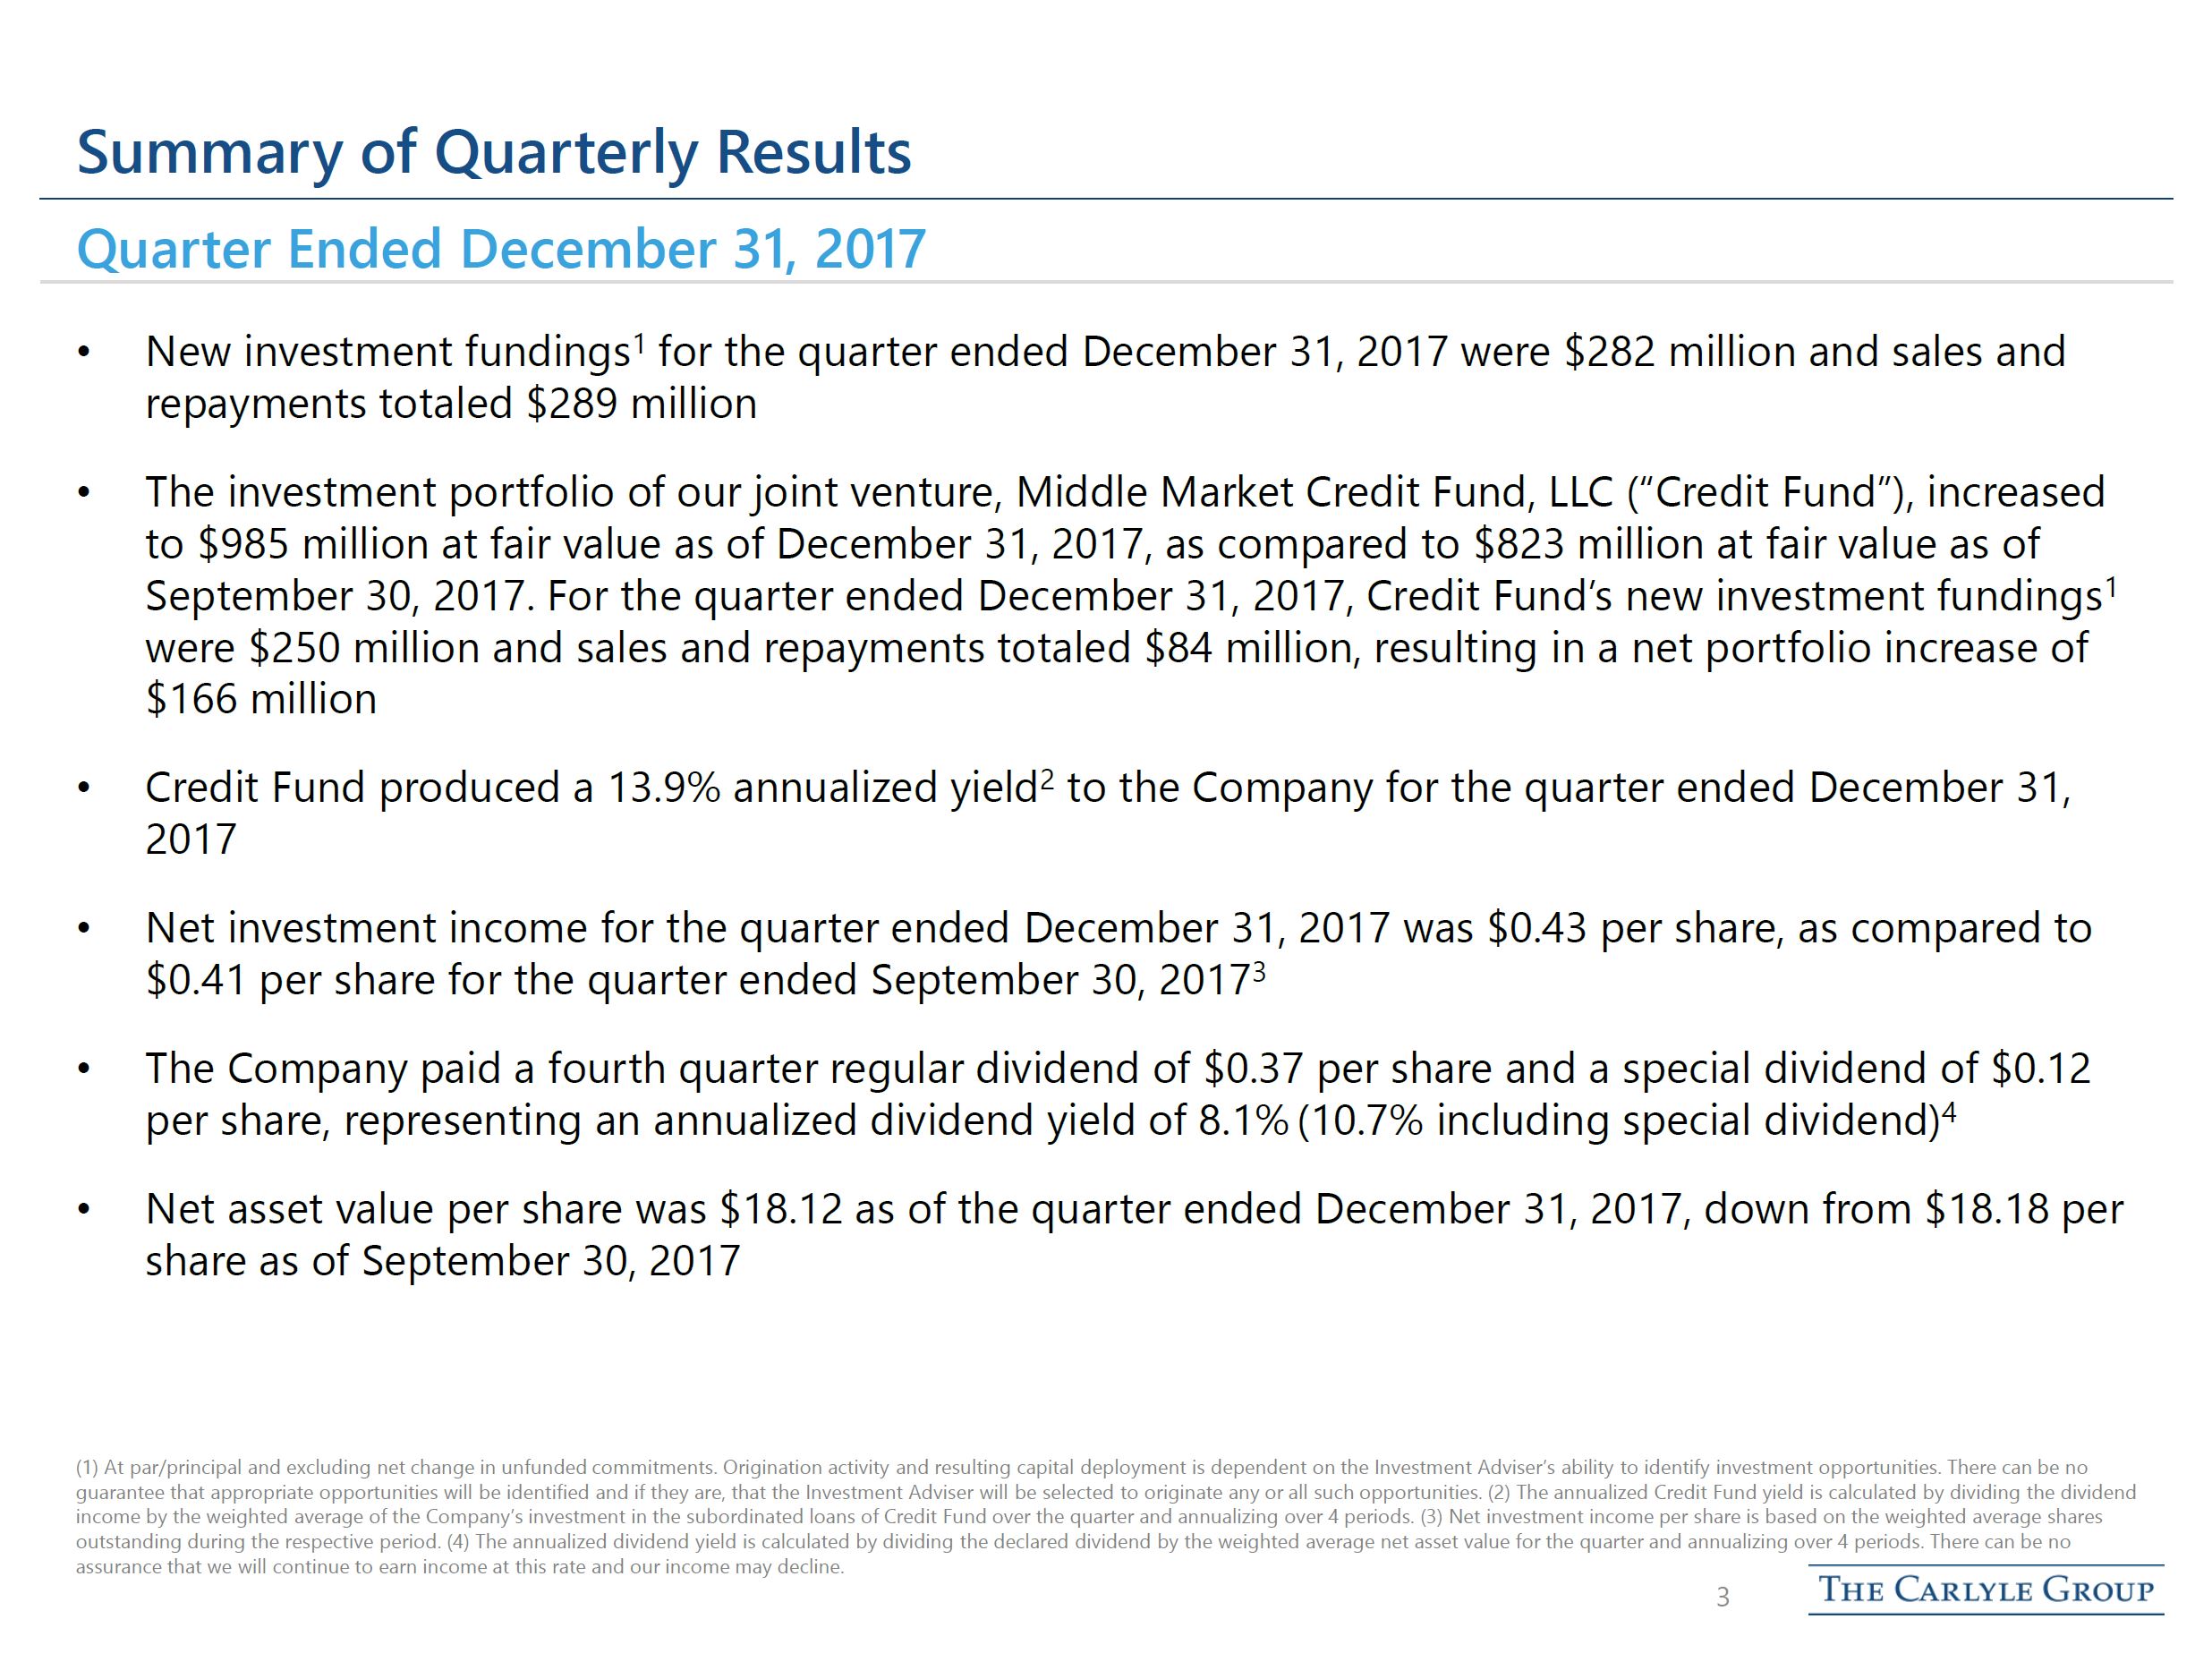
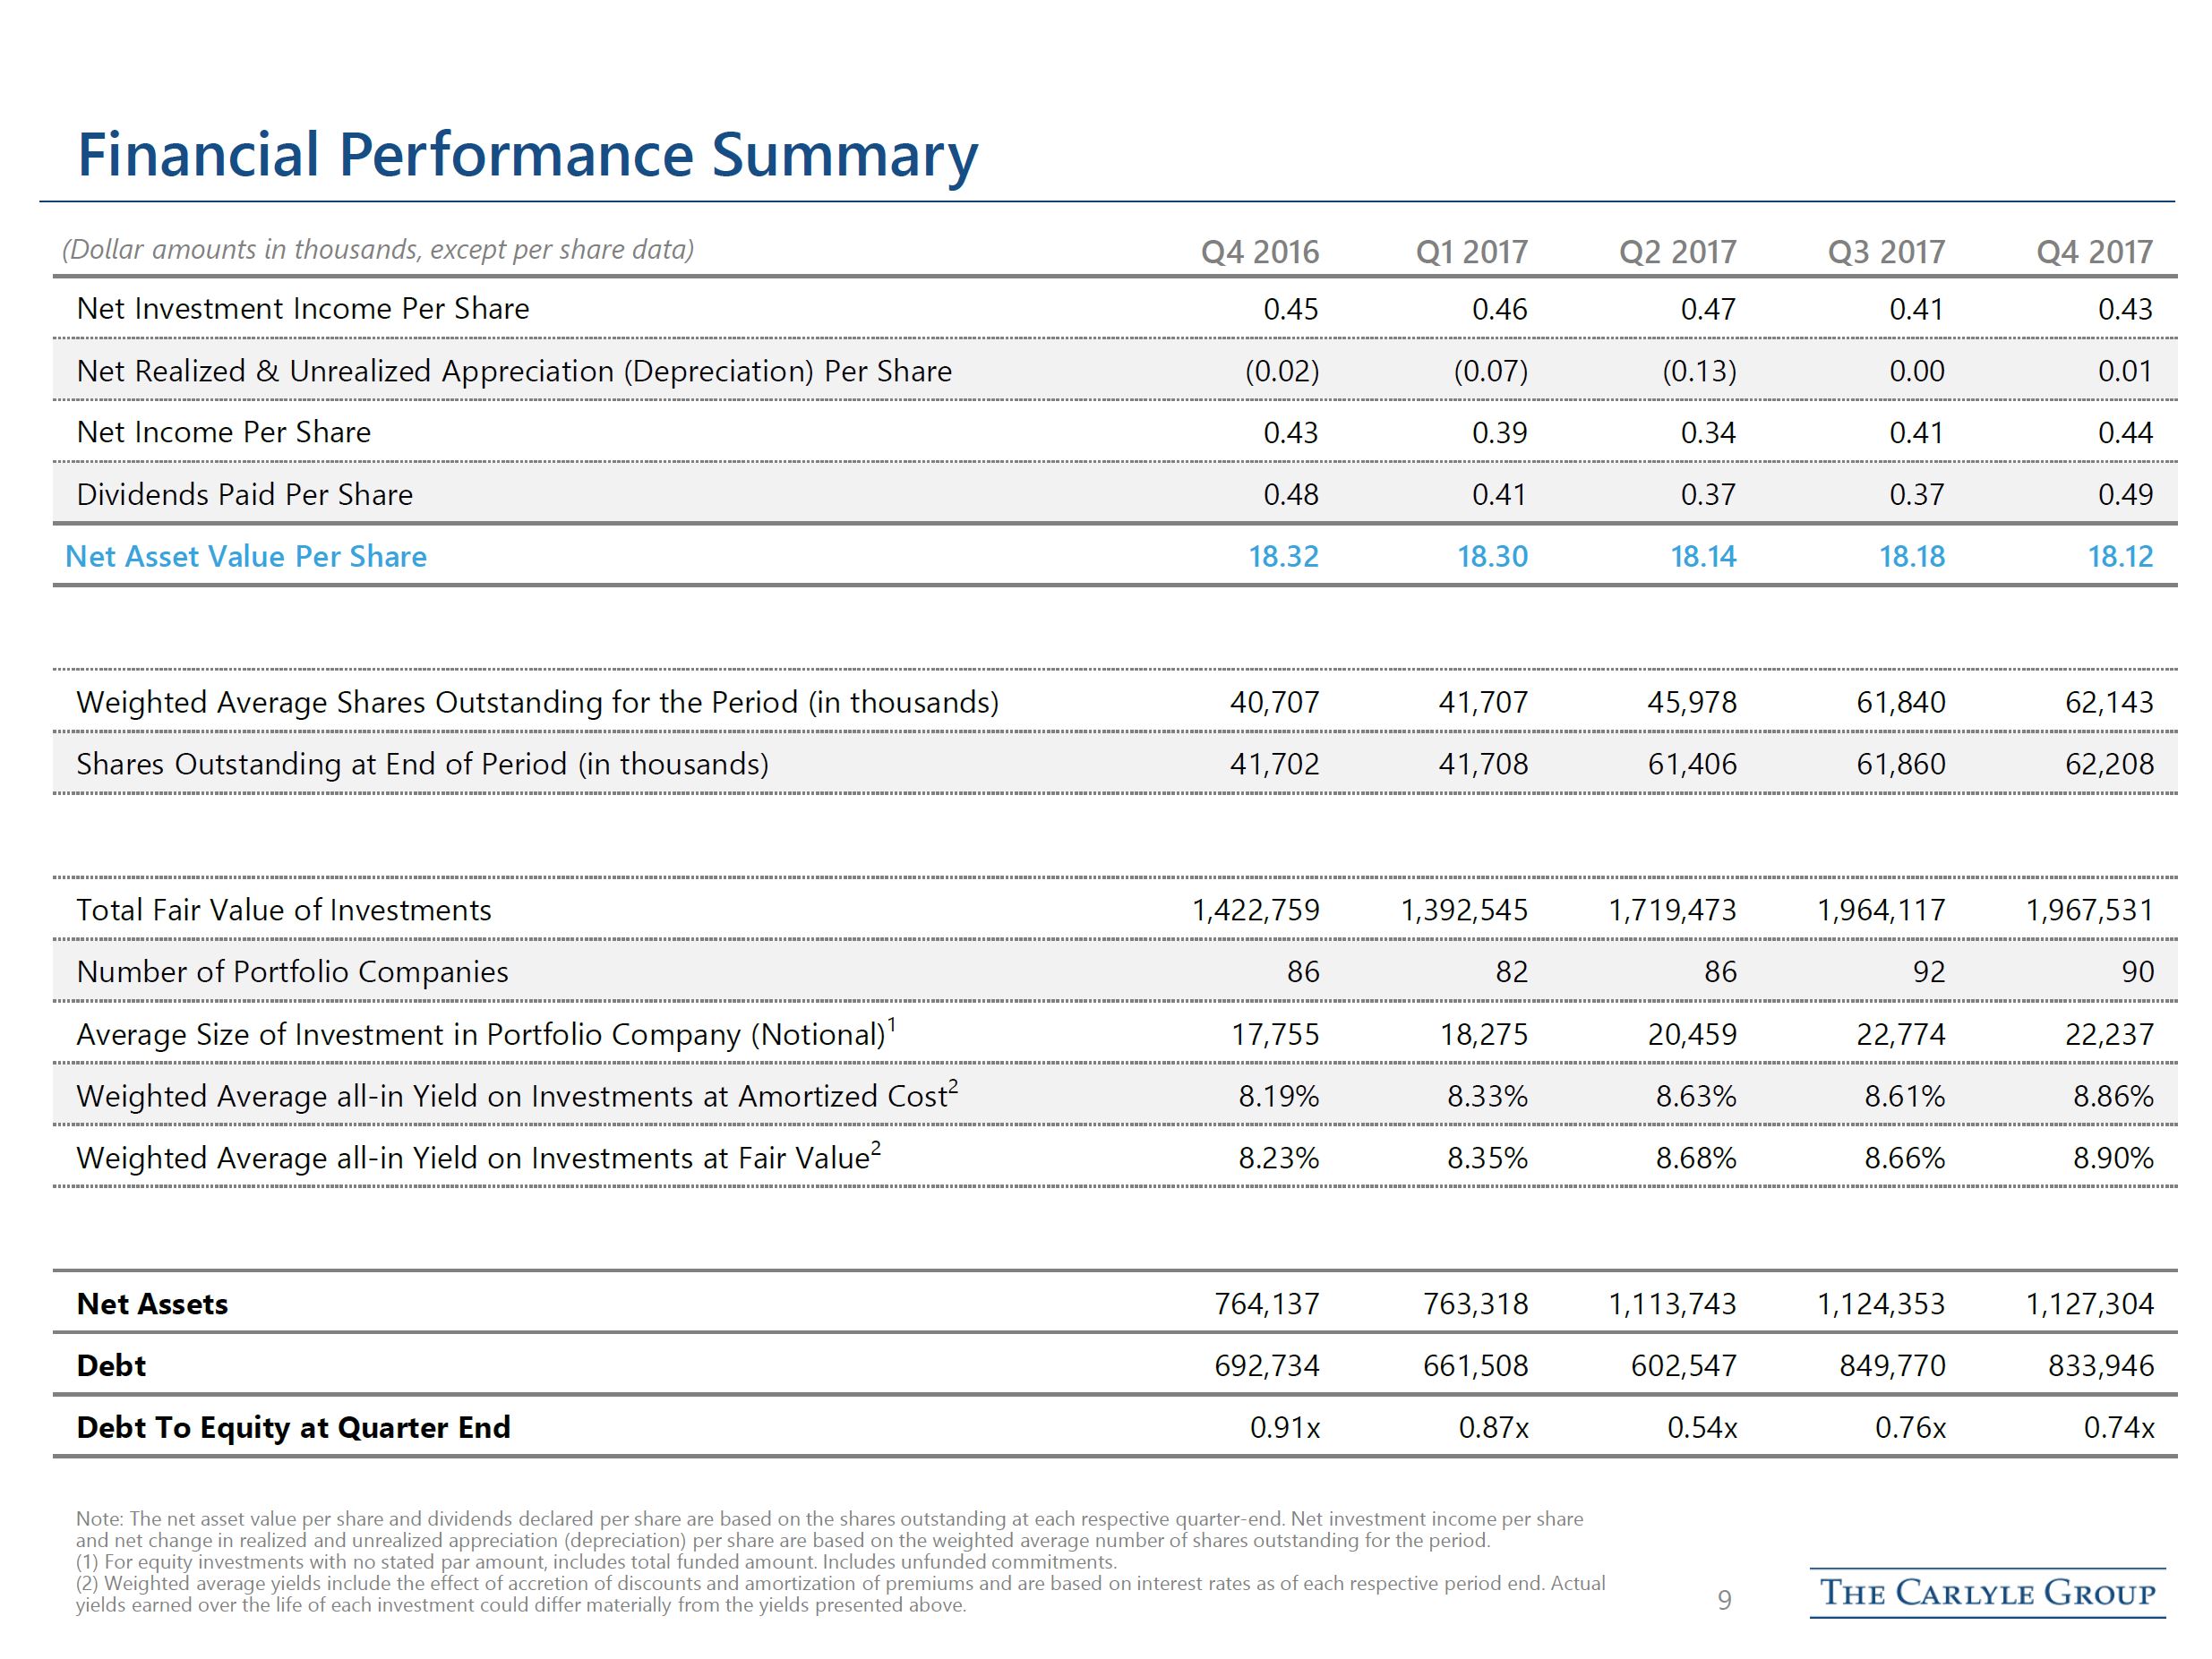
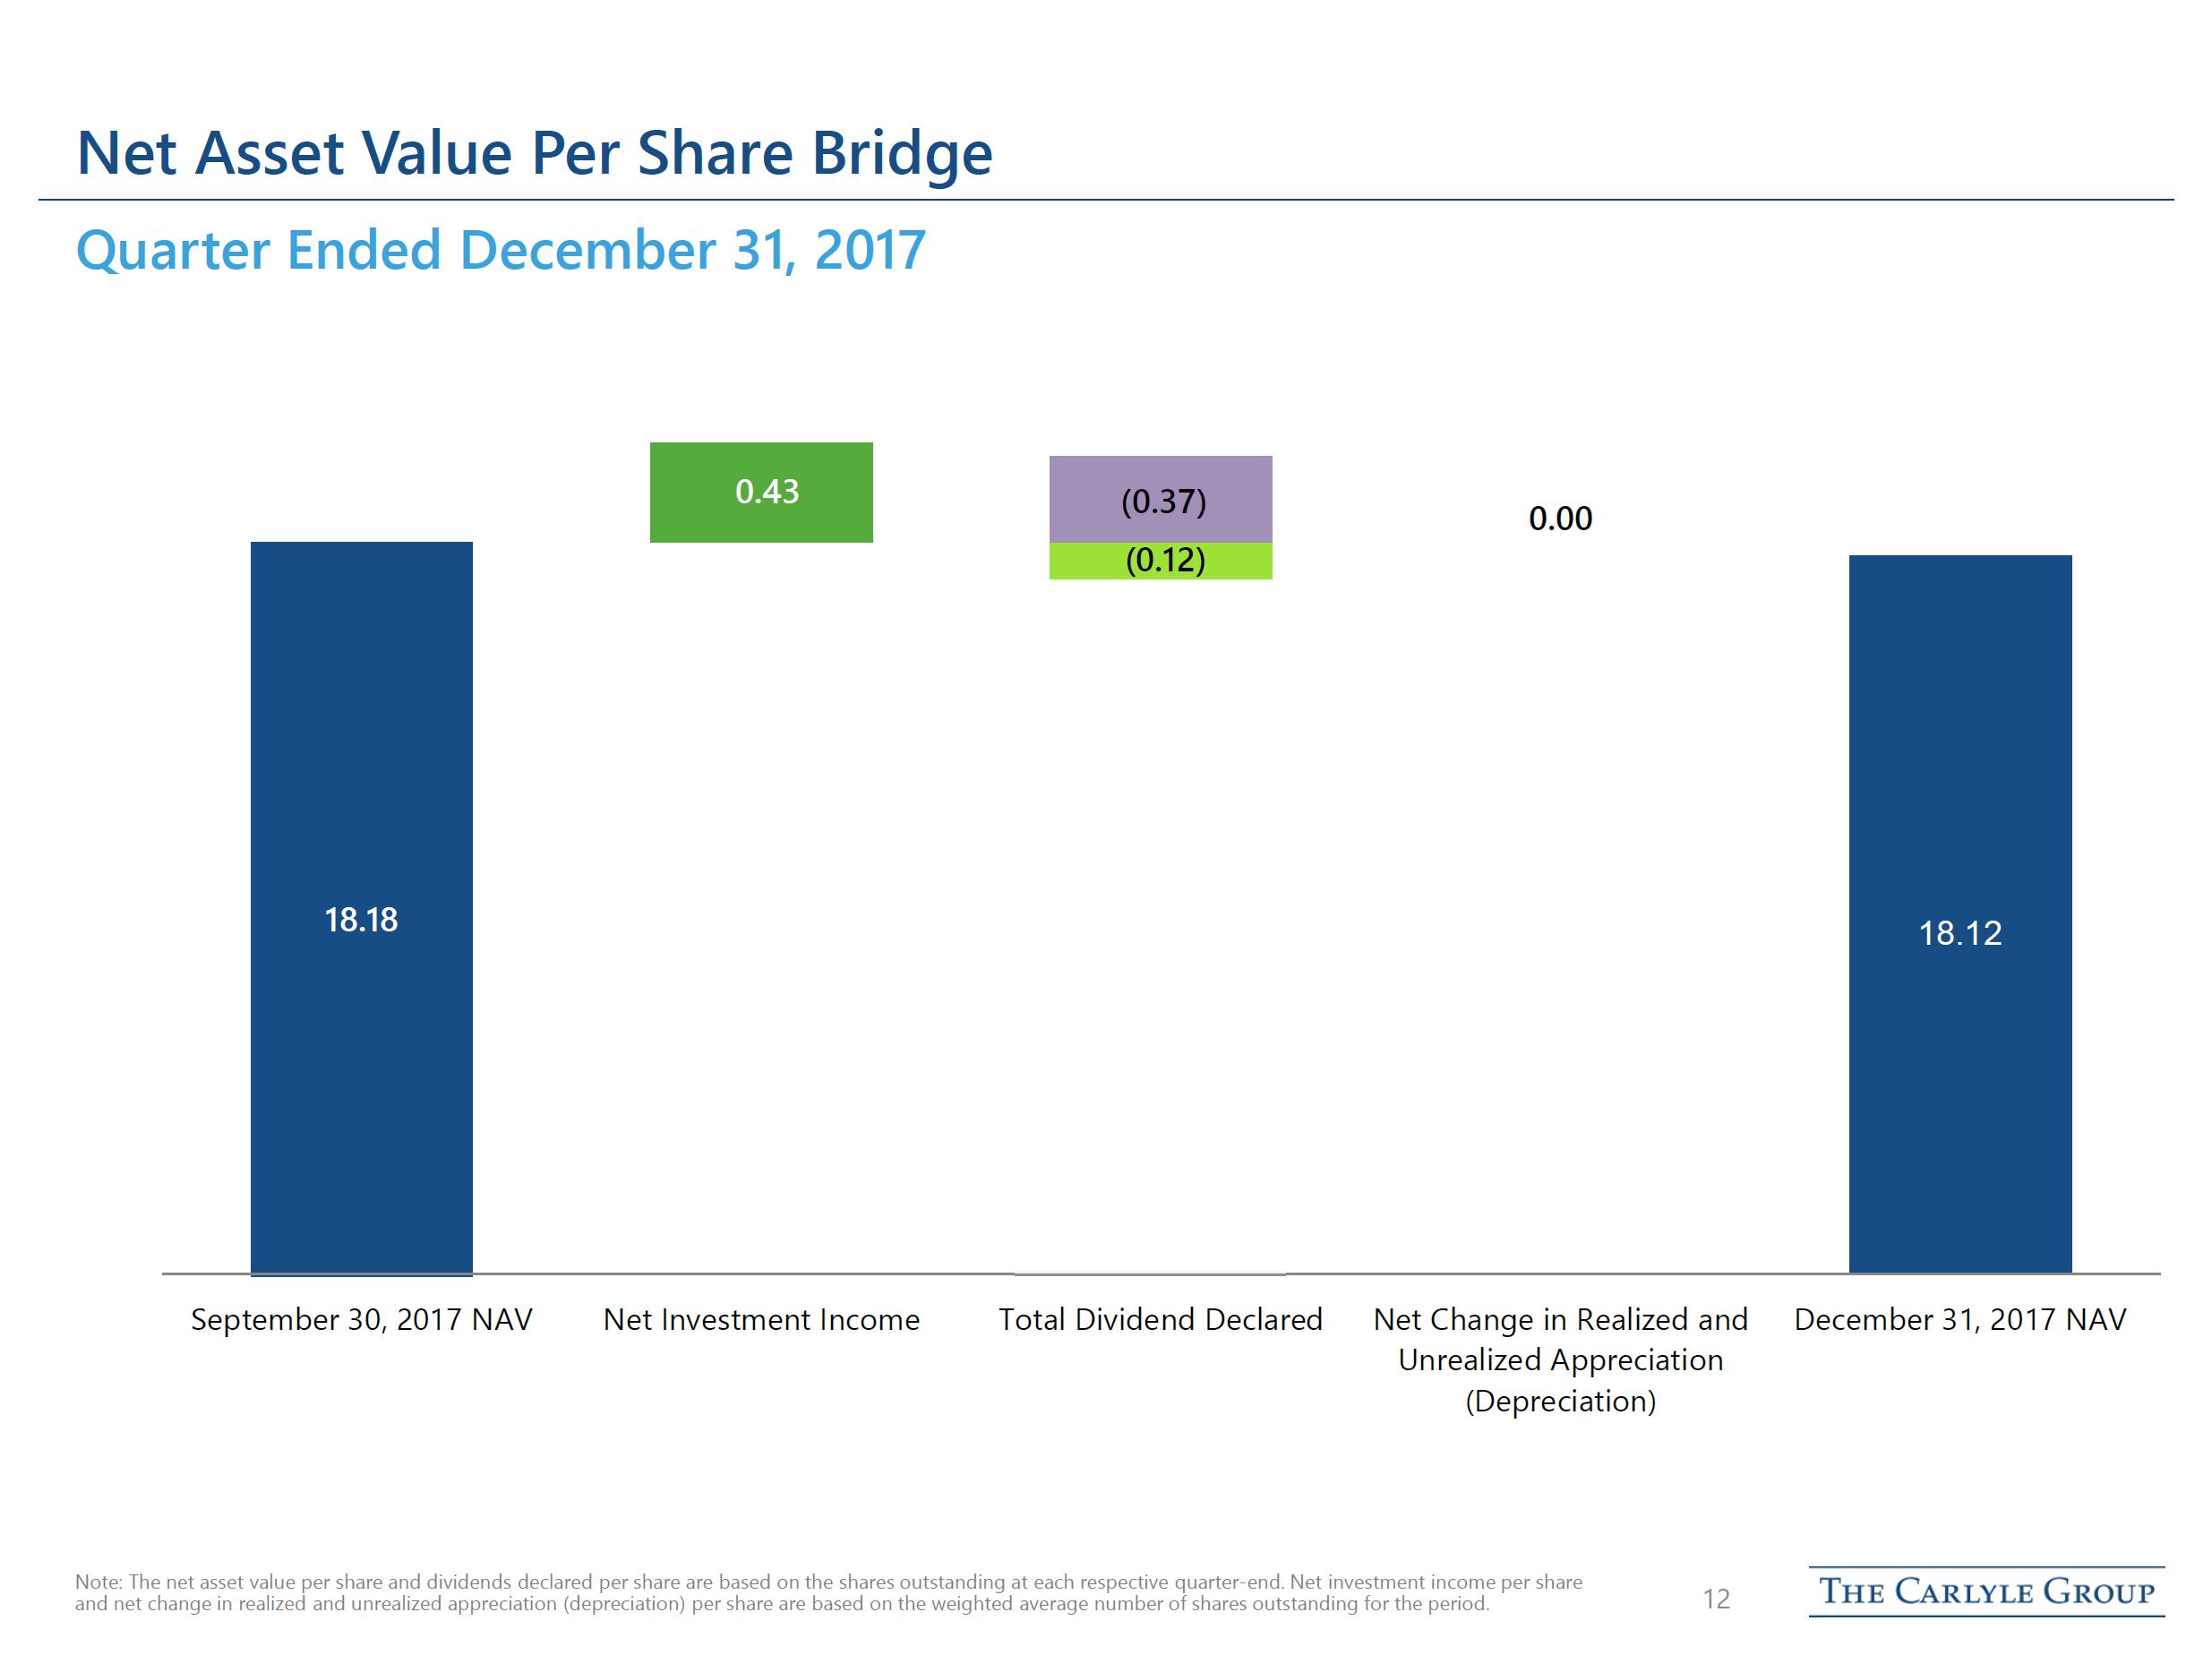
Net assets per share | $ | 18.12 | $ | 18.18 | |||
For the three month periods ended | ||||||||
December 31, 2017 | September 30, 2017 | |||||||
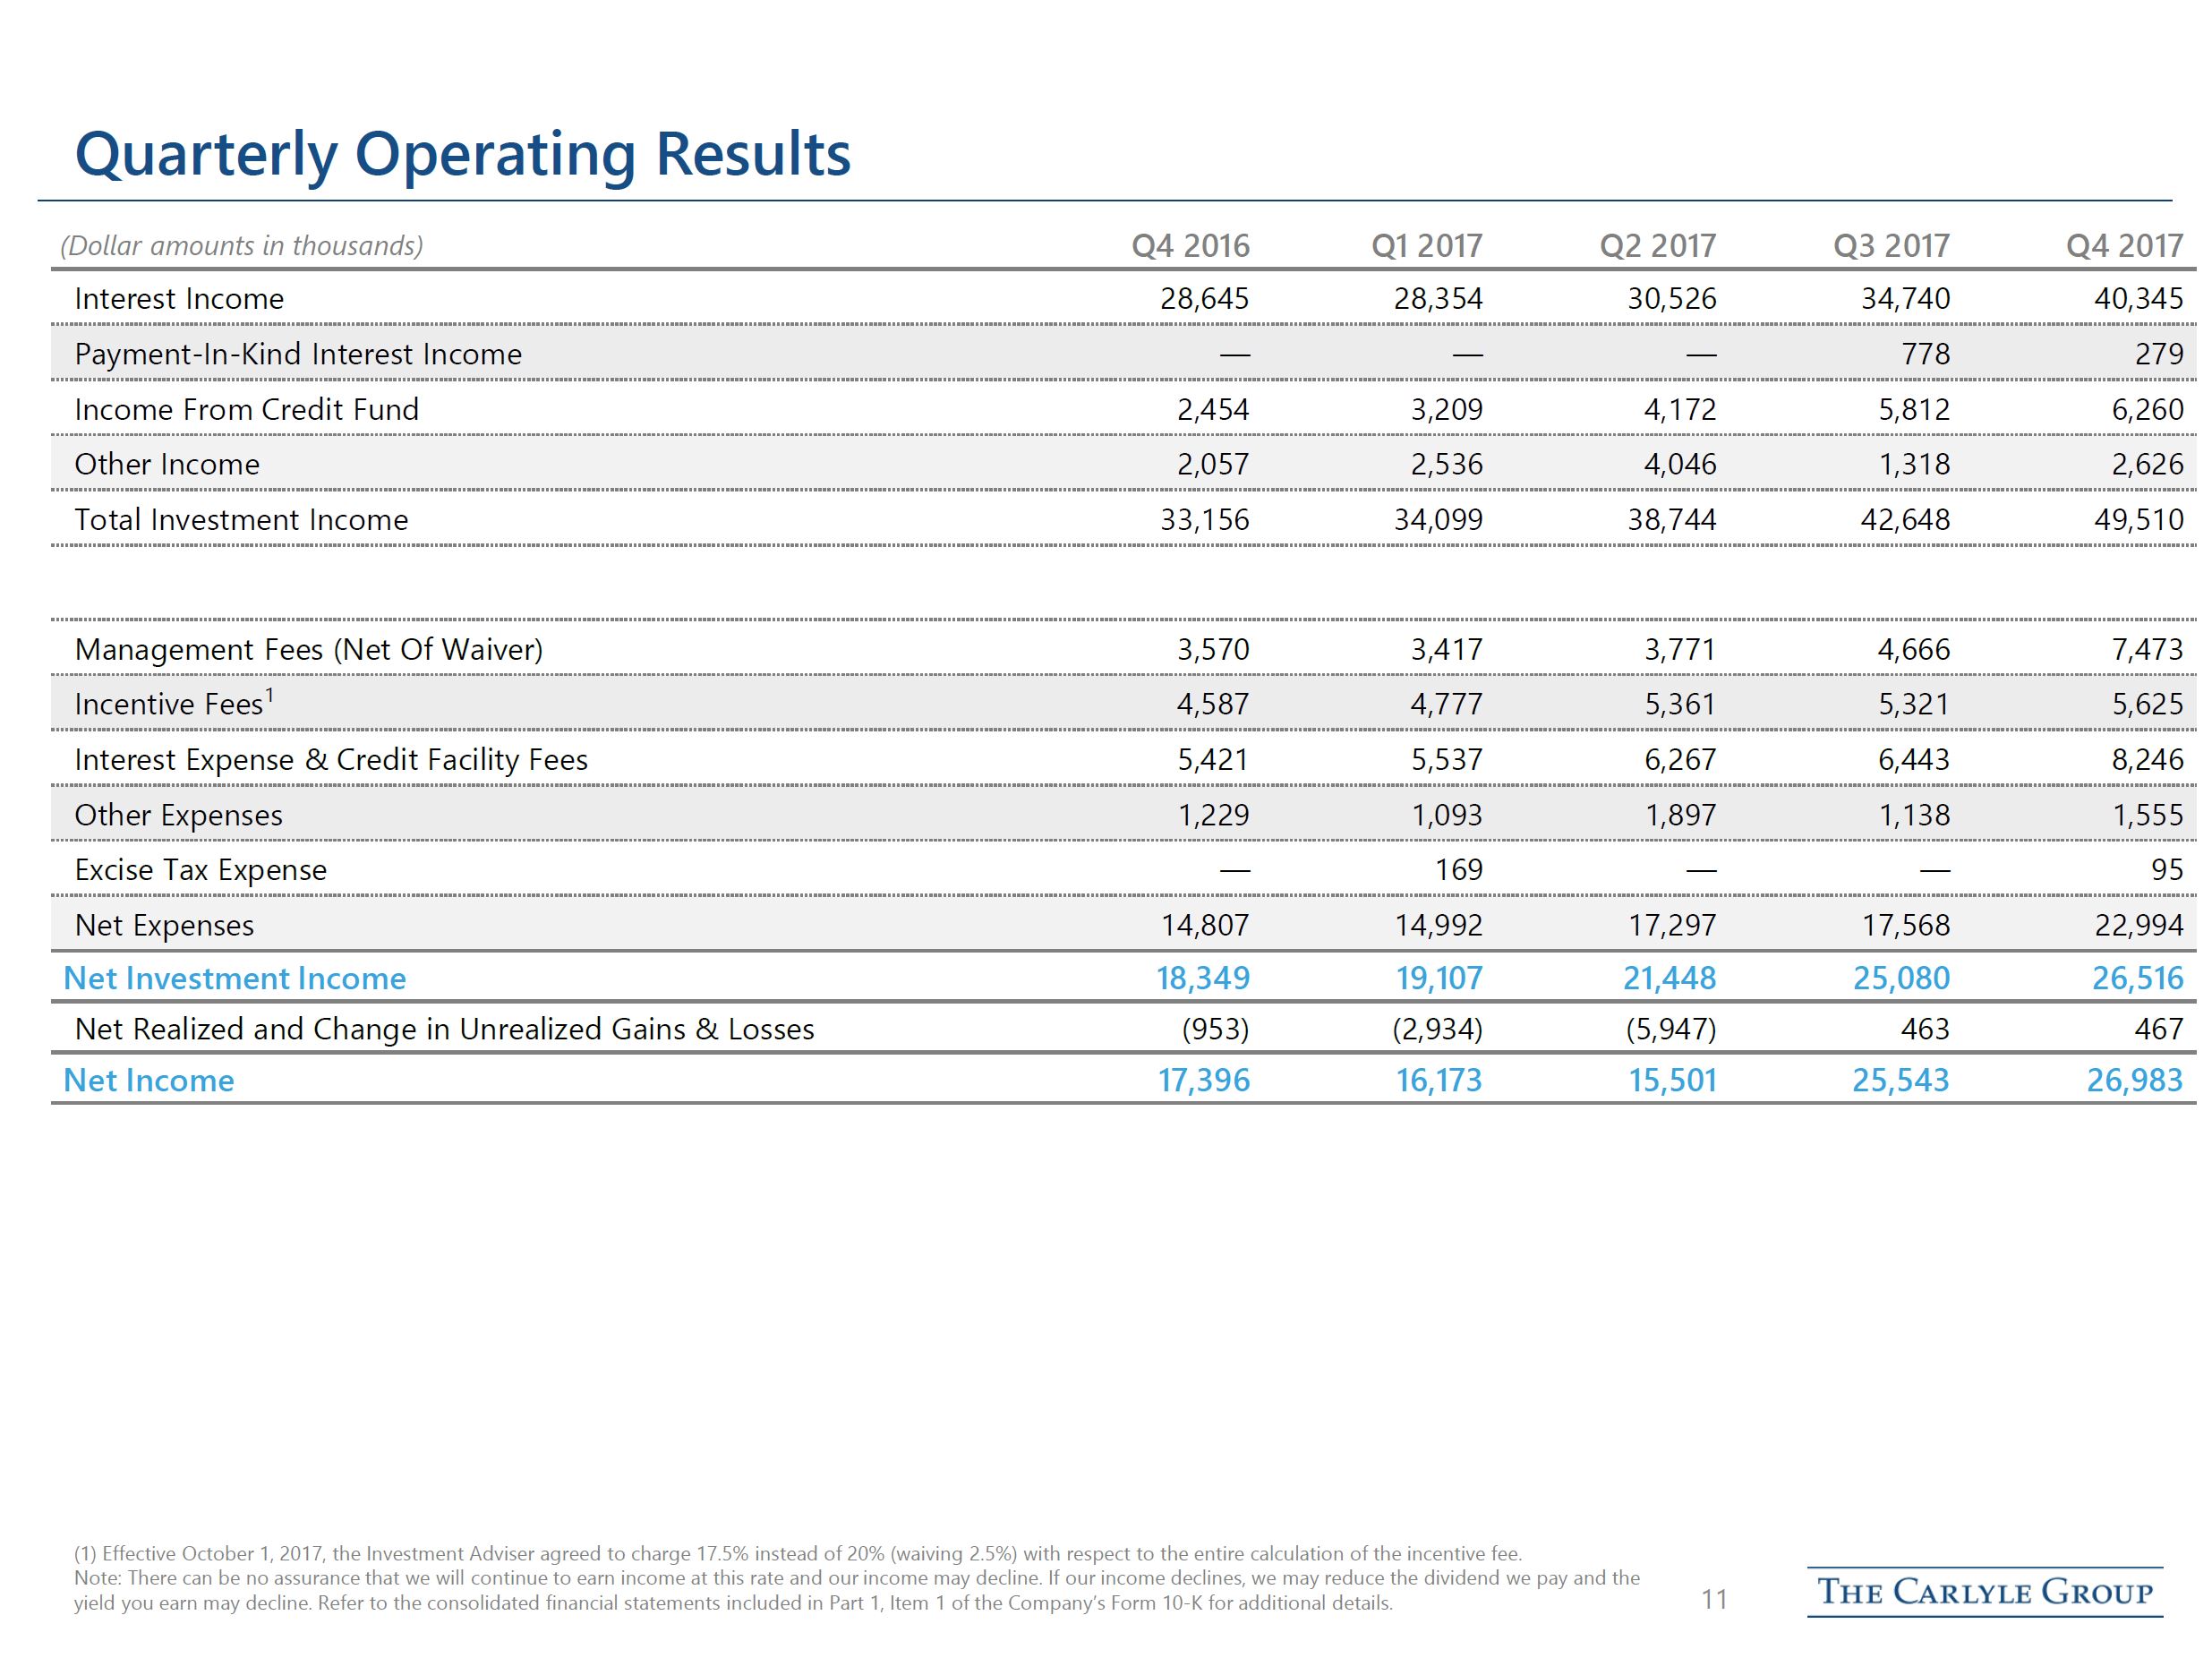
Total investment income | $ | 49,510 | $ | 42,648 | ||||
Net investment income (loss) | 26,516 | 25,080 | ||||||
Net realized gain (loss) and net change in unrealized appreciation (depreciation) on investments | 467 | 463 | ||||||
Net increase (decrease) in net assets resulting from operations | $ | 26,983 | $ | 25,543 | ||||
Basic and diluted per weighted-average common share: | ||||||||
Net investment income (loss) | $ | 0.43 | $ | 0.41 | ||||
Net realized gain (loss) and net change in unrealized appreciation (depreciation) on investments | 0.01 | — | ||||||
Net increase (decrease) in net assets resulting from operations | $ | 0.44 | $ | 0.41 | ||||
Weighted-average shares of common stock outstanding—Basic and Diluted | 62,143,344 | 61,840,100 | ||||||
Dividends declared per common share | $ | 0.49 | $ | 0.37 | ||||
Fourth Quarter 2017 Highlights
(dollar amounts in thousands, except per share data)
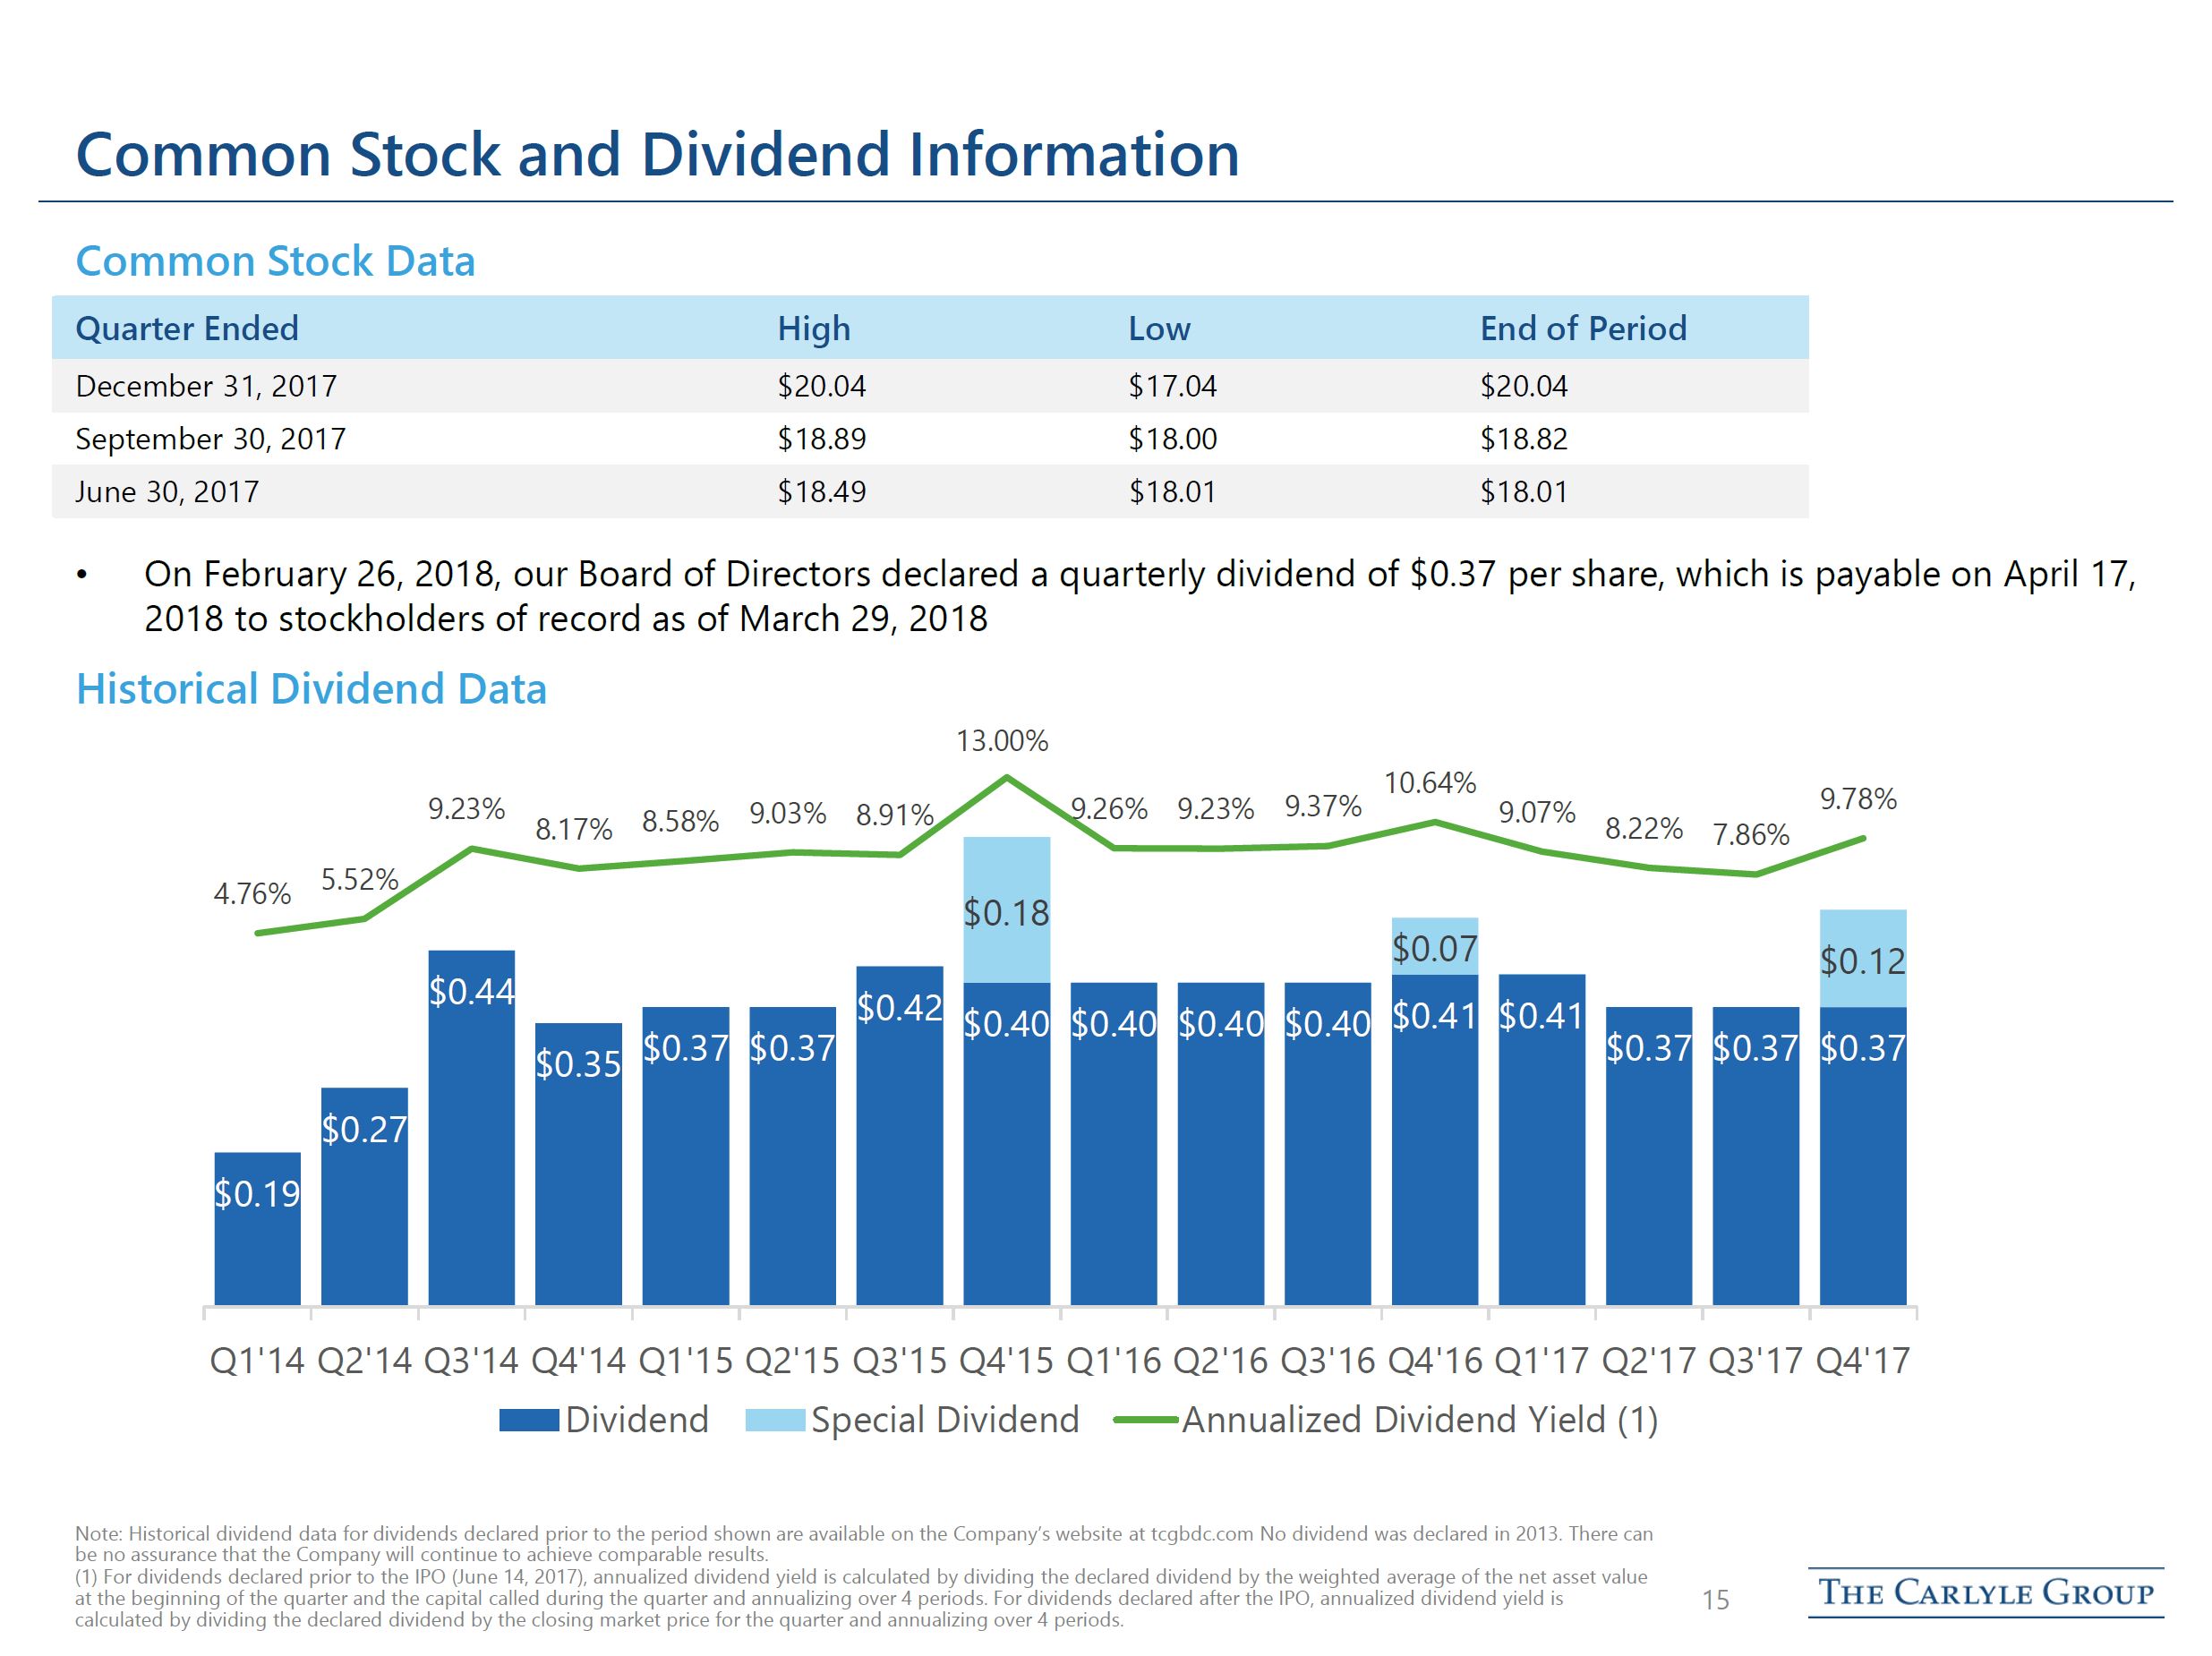
• | On February 26, 2018, our Board of Directors declared a quarterly dividend of $0.37 per share, which is payable on April 17, 2018 to stockholders of record as of March 29, 2018; |
• | Net investment income for the three month period ended December 31, 2017 was $26,516, or $0.43 per share, as compared to $25,080, or $0.41 per share, for the three month period ended September 30, 2017; |
• | Net realized gain (loss) and net change in unrealized appreciation (depreciation) on investments for the three month period ended December 31, 2017 was $467, or $0.01 per share, as compared to $463, or $0.00 per share, for the three month period ended September 30, 2017; and |
• | Net increase in net assets resulting from operations for the three month period ended December 31, 2017 was $26,983, or $0.44 per share, as compared to $25,543, or $0.41 per share, for the three month period ended September 30, 2017. |
Page | 1
Portfolio and Investment Activity
(dollar amounts in thousands, except per share data, unless otherwise noted)
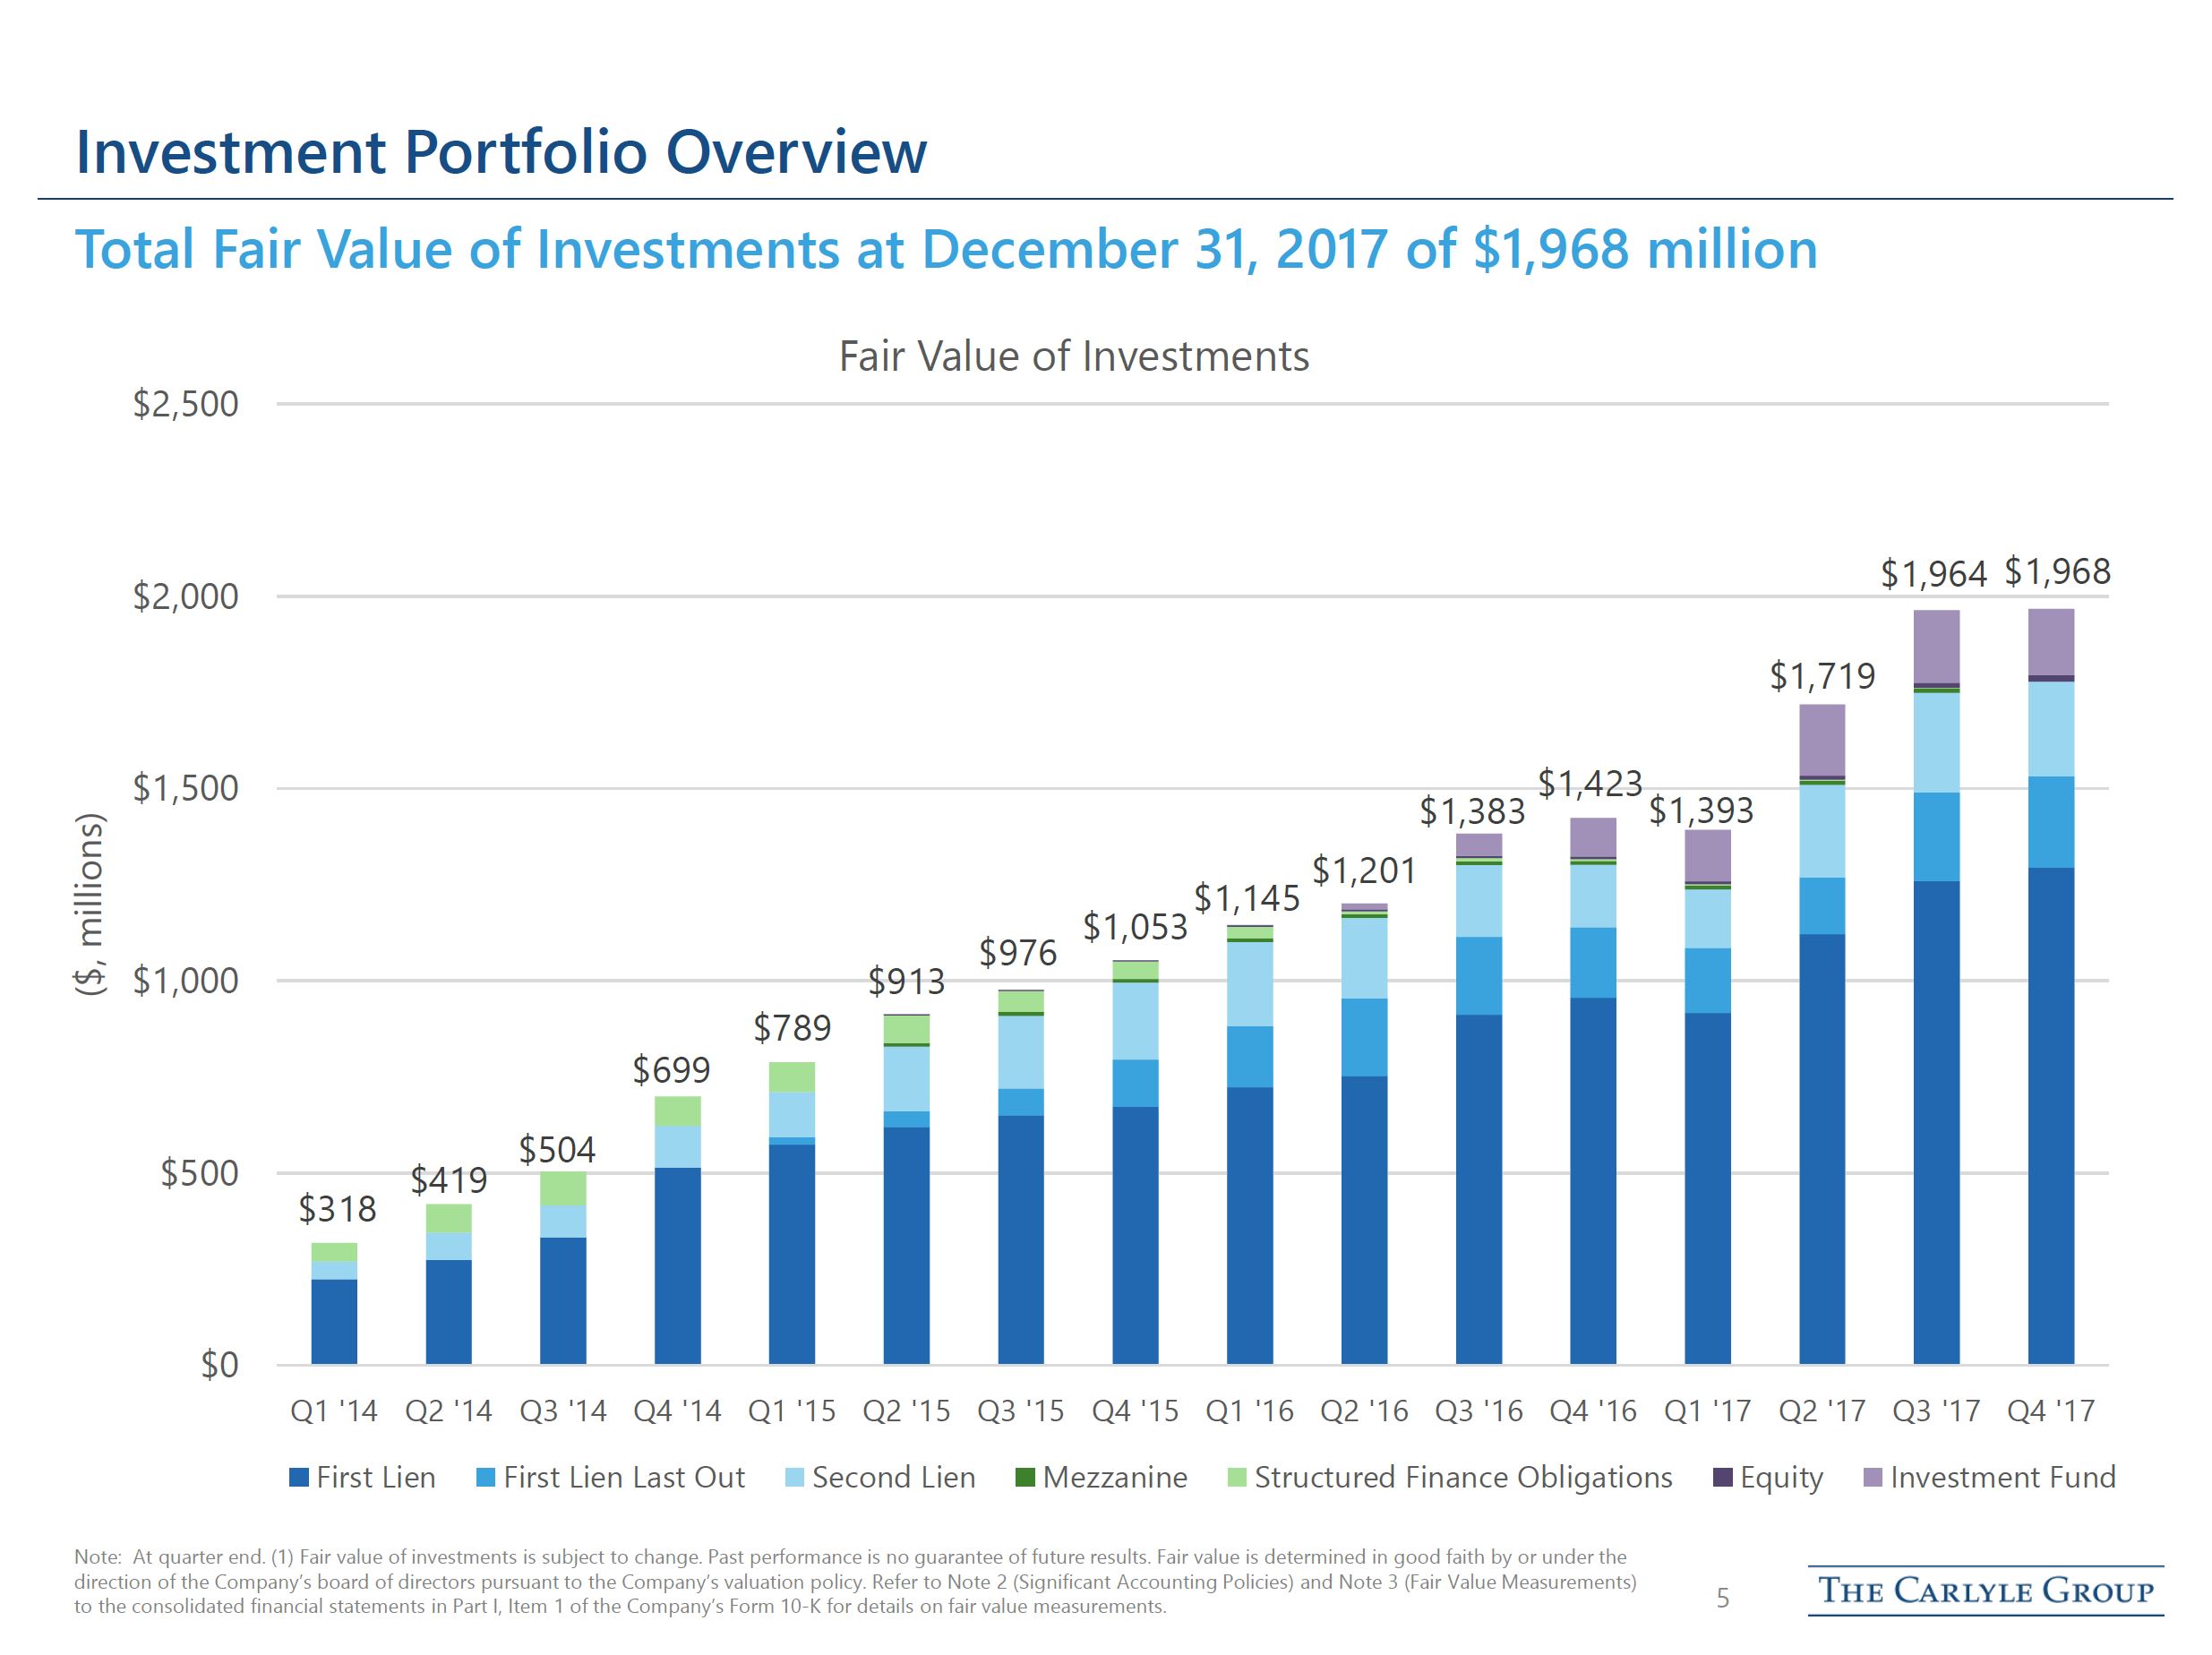
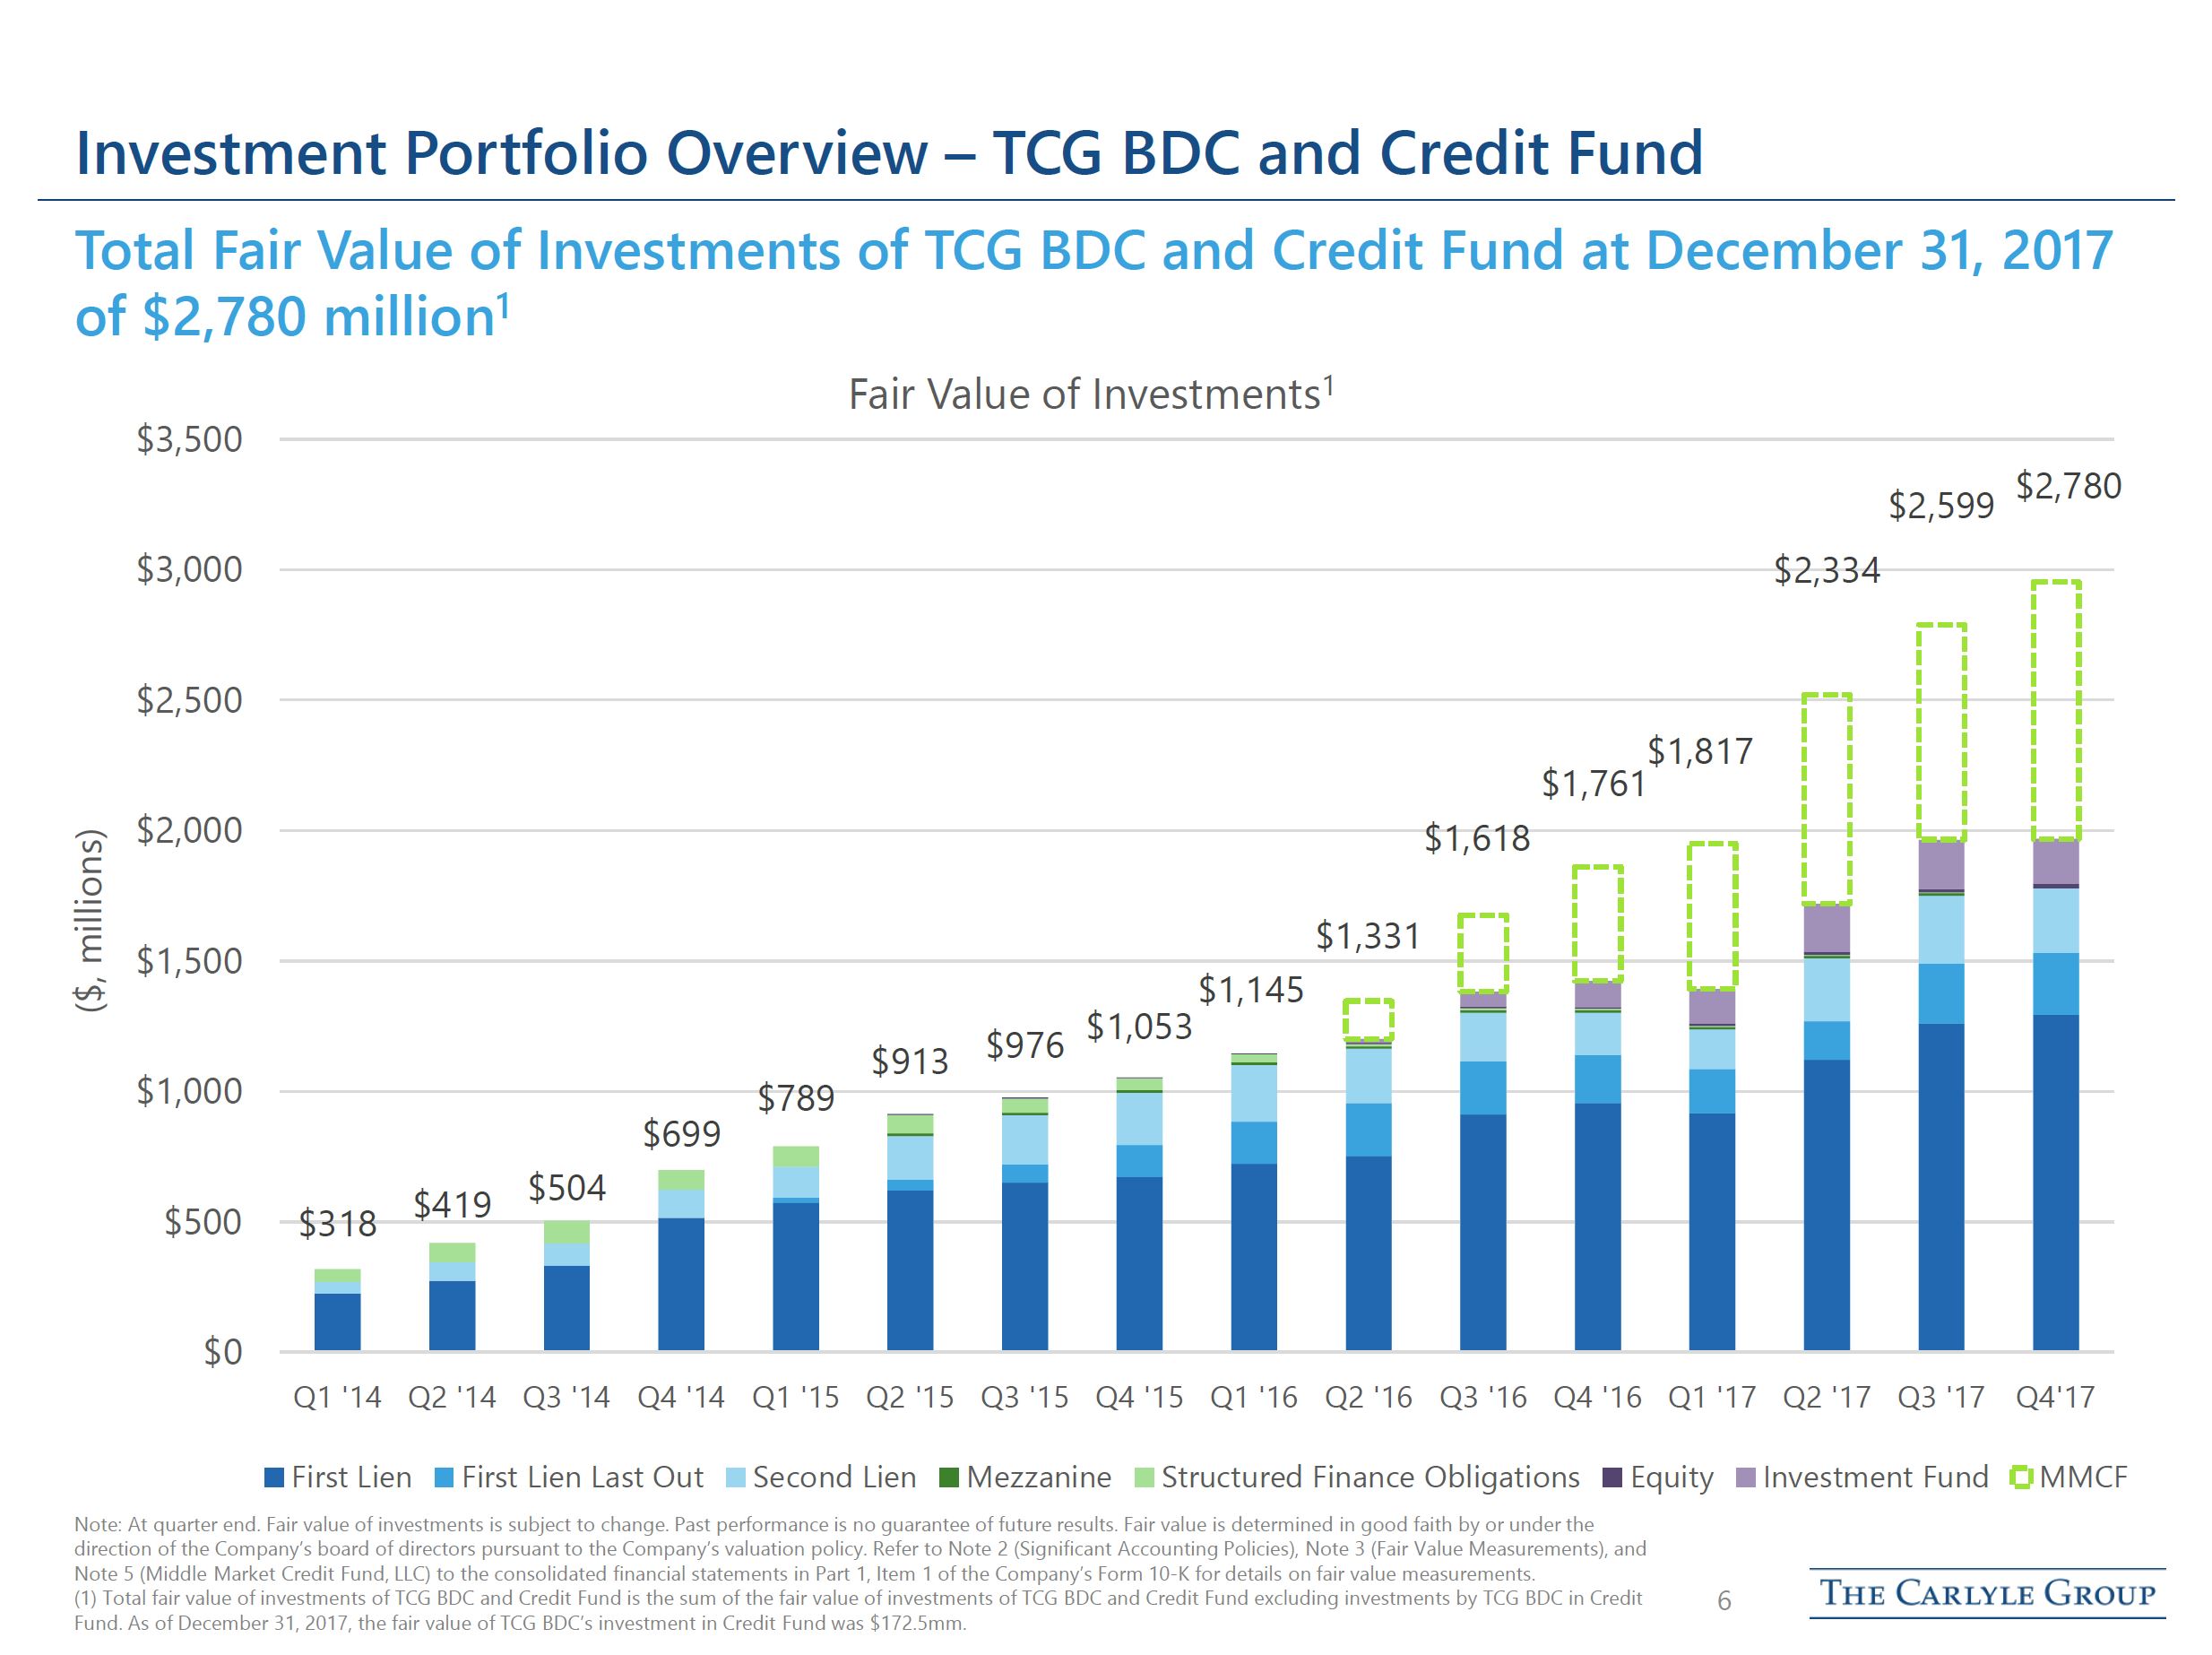
As of December 31, 2017, the fair value of our investments was approximately $1,967,531, comprised of 107 investments in 90 portfolio companies/investment fund across 28 industries with 57 sponsors. This compares to the Company’s portfolio as of September 30, 2017, as of which date the fair value of our investments was approximately $1,964,117, comprised of 108 investments in 92 portfolio companies/structured finance obligations/investment fund across 29 industries with 59 sponsors.
As of December 31, 2017 and September 30, 2017, investments consisted of the following:
December 31, 2017 | September 30, 2017 | ||||||||||||
Type—% of Fair Value | Fair Value | % of Fair Value | Fair Value | % of Fair Value | |||||||||
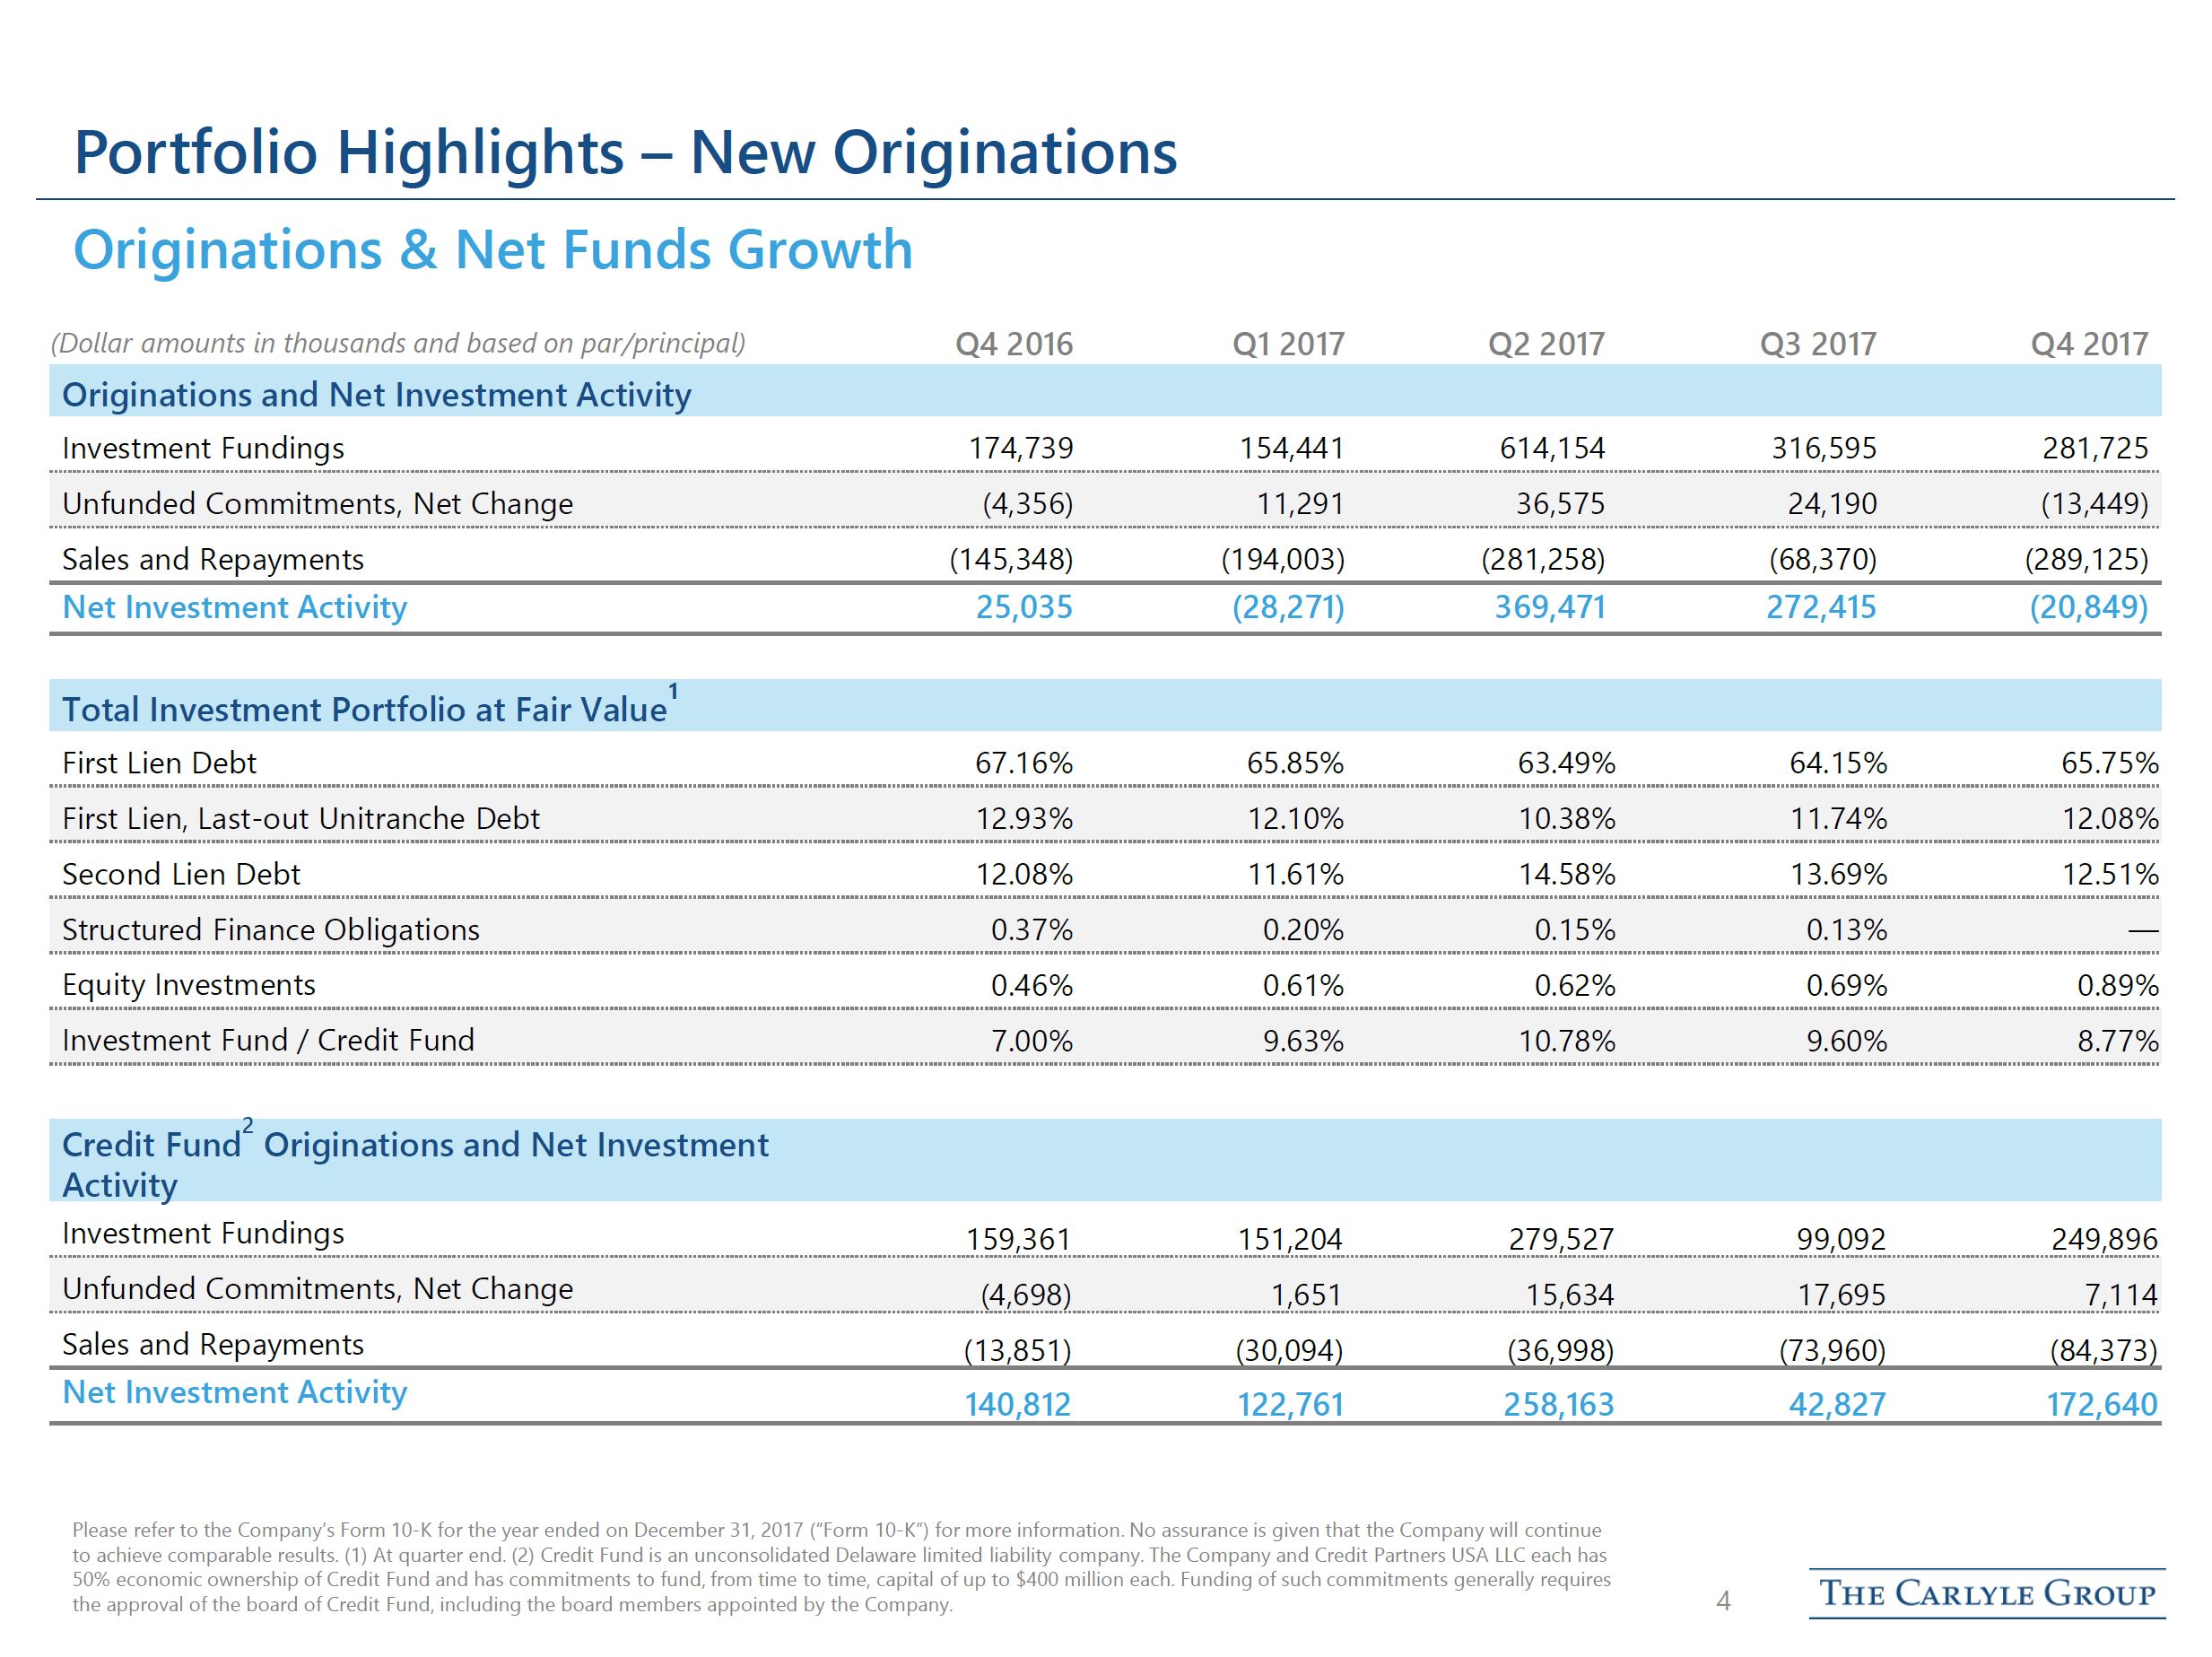
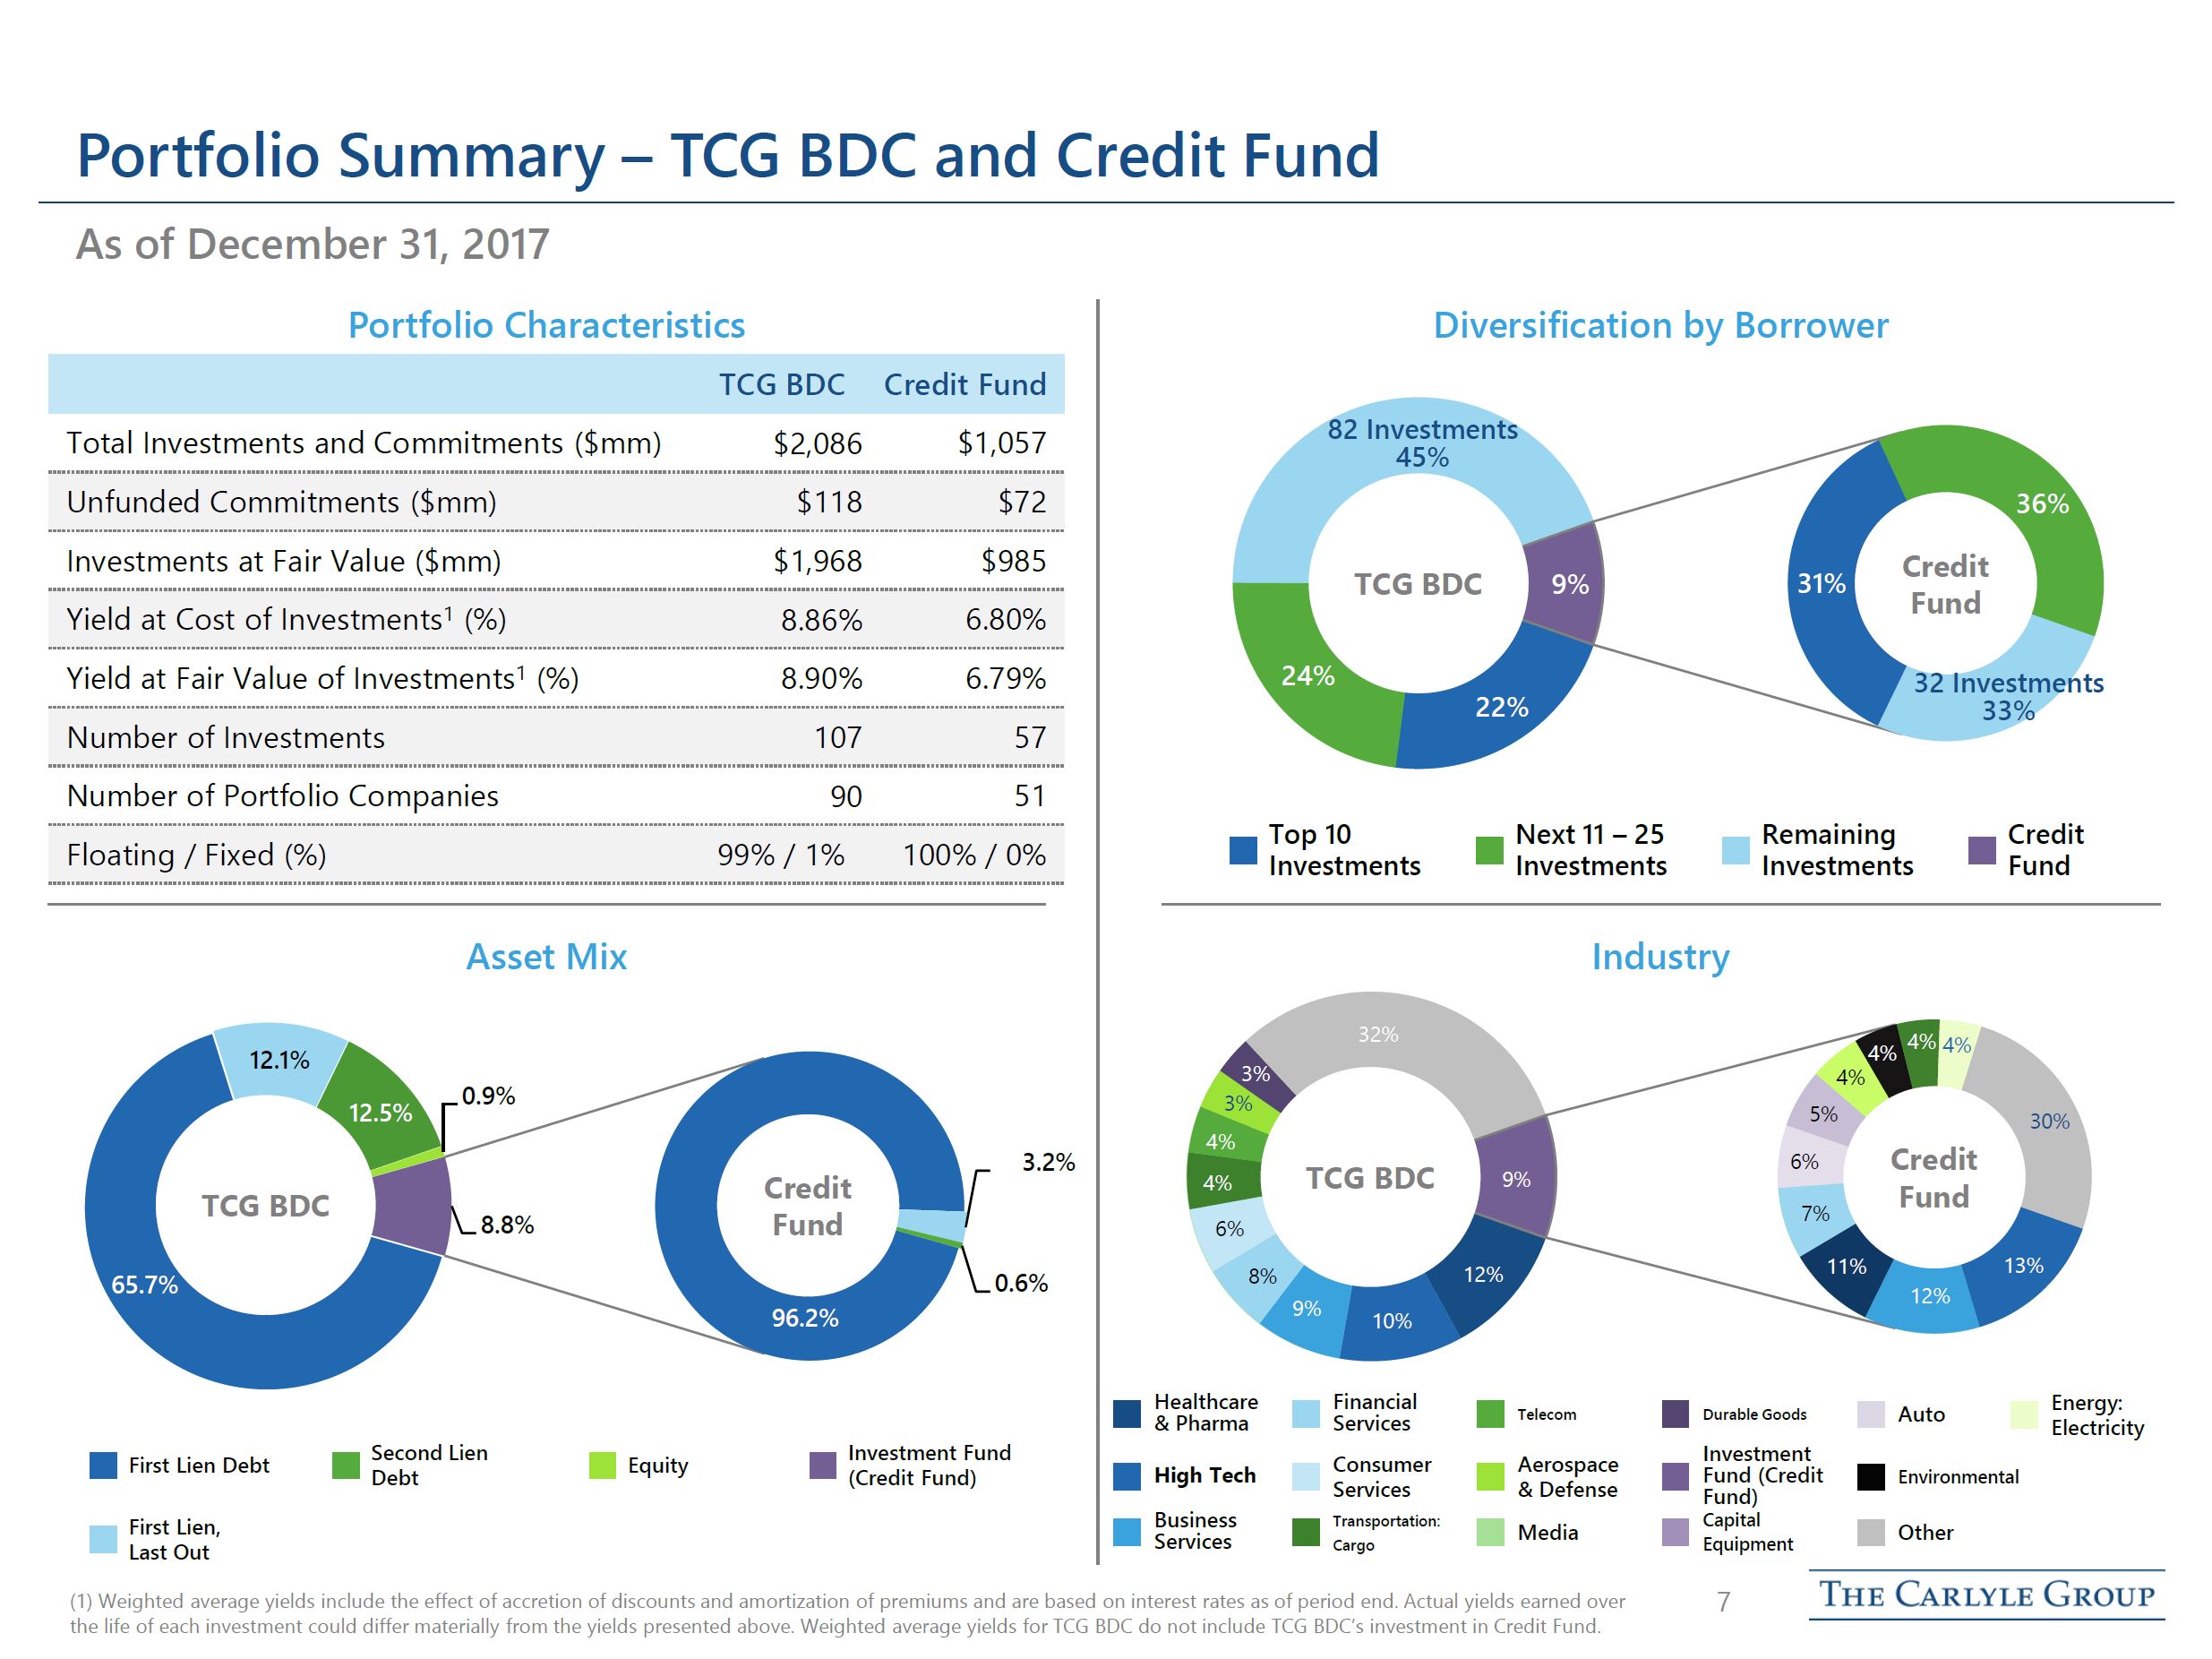
First Lien Debt (excluding First Lien/Last Out) | $ | 1,293,641 | 65.75 | % | $ | 1,259,983 | 64.15 | % | |||||
First Lien/Last Out Unitranche | 237,635 | 12.08 | 230,667 | 11.74 | |||||||||
Second Lien Debt | 246,233 | 12.51 | 268,783 | 13.69 | |||||||||
Structured Finance Obligations | — | — | 2,585 | 0.13 | |||||||||
Equity Investments | 17,506 | 0.89 | 13,552 | 0.69 | |||||||||
Investment Fund | 172,516 | 8.77 | 188,547 | 9.60 | |||||||||
Total | $ | 1,967,531 | 100.00 | % | $ | 1,964,117 | 100.00 | % | |||||
The following table shows our investment activity for the three month period ended December 31, 2017:
Funded | Sold/Repaid | ||||||||||||
Principal amount of investments: | Amount | % of Total | Amount | % of Total | |||||||||
First Lien Debt | $ | 171,724 | 60.96 | % | $ | (131,771 | ) | 45.58 | % | ||||
Second Lien Debt | 50,239 | 17.83 | (74,854 | ) | 25.89 | ||||||||
Structured Finance Obligations | — | — | (11,750 | ) | 4.06 | ||||||||
Equity Investments | 3,562 | 1.26 | — | — | |||||||||
Investment Fund | 56,200 | 19.95 | (70,750 | ) | 24.47 | ||||||||
Total | $ | 281,725 | 100.00 | % | $ | (289,125 | ) | 100.00 | % | ||||
Overall, total investments at fair value increased by 0.2%, or $3,414, during the three month period ended December 31, 2017 after factoring in repayments, sales, net fundings on revolvers and delayed draws and net change in unrealized appreciation (depreciation).
Total investments at fair value held by Middle Market Credit Fund (“Credit Fund”) increased by 19.6%, or $161,644, during the three month period ended December 31, 2017 after factoring in repayments, sales, net fundings on revolvers and delayed draws and net change in unrealized appreciation (depreciation). As of December 31, 2017, Credit Fund had total investments at fair value of $984,773, which was comprised 99.4% of first lien senior secured loans and 0.6% of second lien senior secured loans at fair value. All investments in the Credit Fund portfolio were floating rate debt investments with an interest rate floor.
As of December 31, 2017, the weighted average yields for our first and second lien debt investments on an amortized cost basis were 8.62% and 10.44%, respectively, with a total weighted average yield of 8.86%. Weighted average yields include the effect of accretion of discounts and amortization of premiums and are based on interest rates as of December 31, 2017. As of December 31, 2017, on a fair value basis, approximately 1% of our debt investments bear interest at a fixed rate and approximately 99% of our debt investments bear interest at a floating rate, which primarily are subject to interest rate floors.
As part of the monitoring process, our Investment Adviser has developed risk policies pursuant to which it regularly assesses the risk profile of each of our debt investments and rates each of them based on the following categories, which we refer to as “Internal Risk Ratings”:
Page | 2
Internal Risk Ratings Definitions
Rating | Definition | |
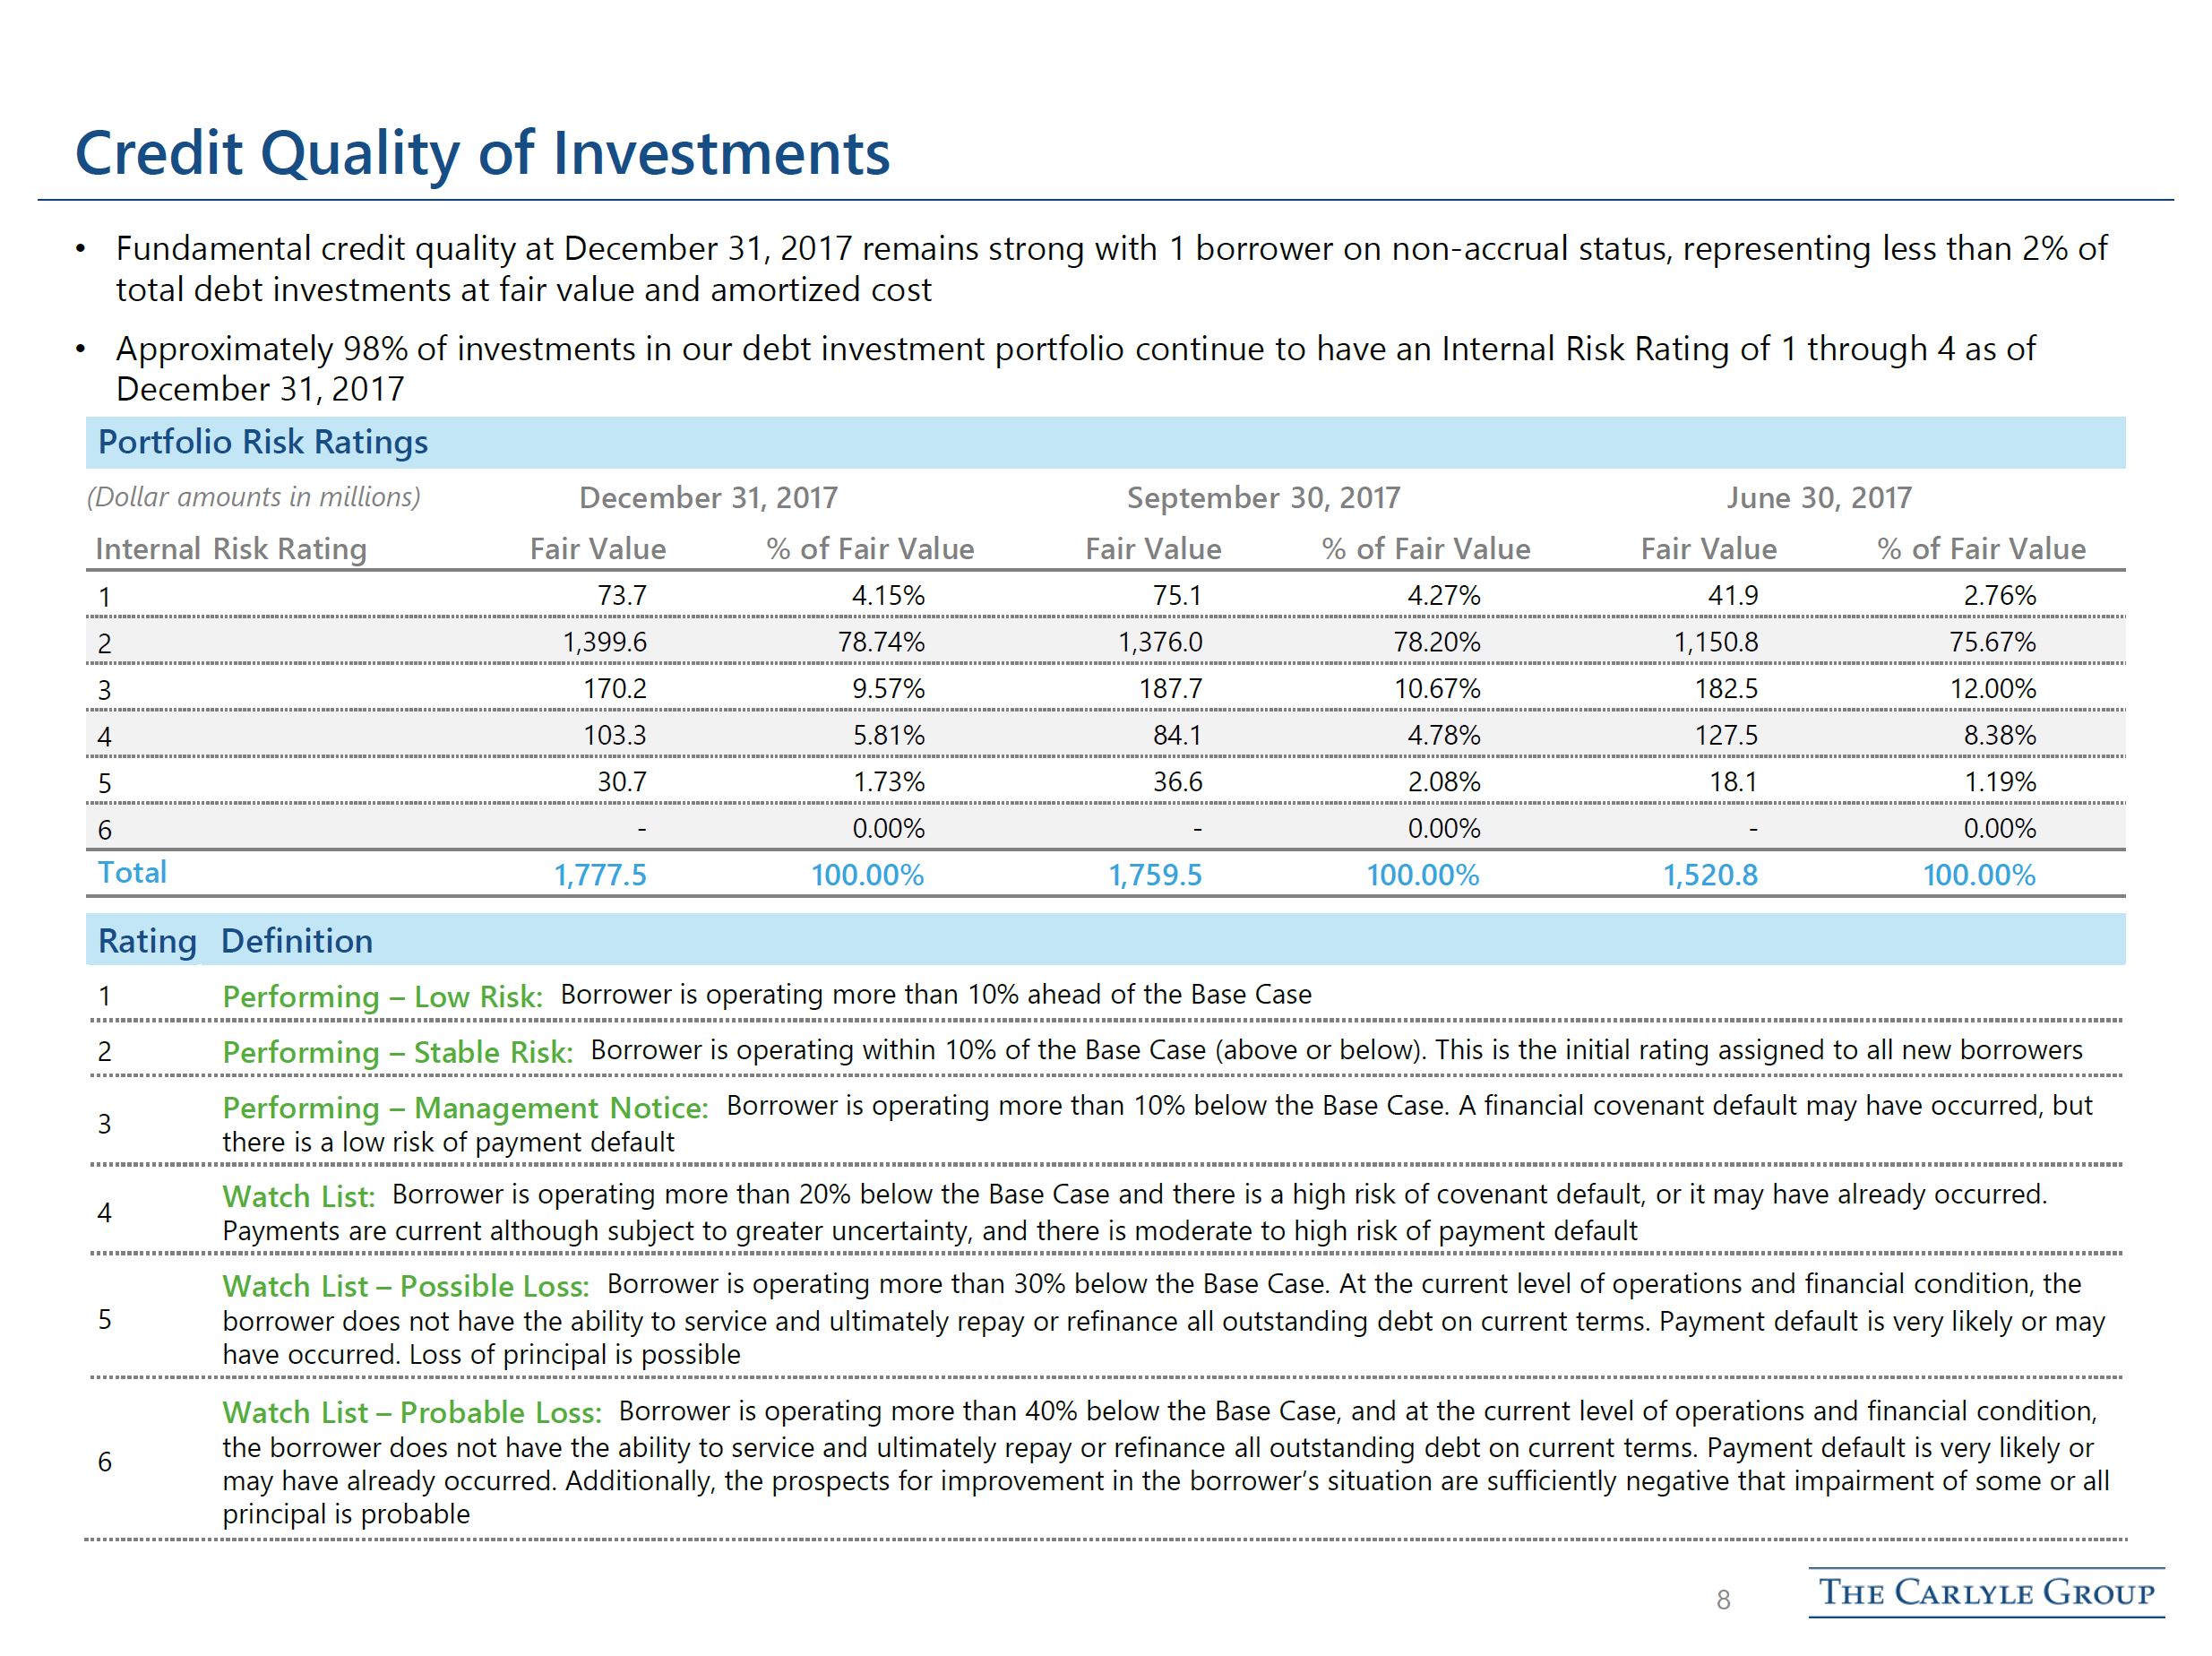
1 | Performing—Low Risk: Borrower is operating more than 10% ahead of the base case. | |
2 | Performing—Stable Risk: Borrower is operating within 10% of the base case (above or below). This is the initial rating assigned to all new borrowers. | |
3 | Performing—Management Notice: Borrower is operating more than 10% below the base case. A financial covenant default may have occurred, but there is a low risk of payment default. | |
4 | Watch List: Borrower is operating more than 20% below the base case and there is a high risk of covenant default, or it may have already occurred. Payments are current although subject to greater uncertainty, and there is moderate to high risk of payment default. | |
5 | Watch List—Possible Loss: Borrower is operating more than 30% below the base case. At the current level of operations and financial condition, the borrower does not have the ability to service and ultimately repay or refinance all outstanding debt on current terms. Payment default is very likely or may have occurred. Loss of principal is possible. | |
6 | Watch List—Probable Loss: Borrower is operating more than 40% below the base case, and at the current level of operations and financial condition, the borrower does not have the ability to service and ultimately repay or refinance all outstanding debt on current terms. Payment default is very likely or may have already occurred. Additionally, the prospects for improvement in the borrower’s situation are sufficiently negative that impairment of some or all principal is probable. | |
Our Investment Adviser’s risk rating model is based on evaluating portfolio company performance in comparison to the base case when considering certain credit metrics including, but not limited to, adjusted EBITDA and net senior leverage as well as specific events including, but not limited to, default and impairment.
Our Investment Adviser monitors and, when appropriate, changes the investment ratings assigned to each debt investment in our portfolio. In connection with our quarterly valuation process, our Investment Adviser reviews our investment ratings on a regular basis. The following table summarizes the Internal Risk Ratings of our debt portfolio as of December 31, 2017 and September 30, 2017:
December 31, 2017 | September 30, 2017 | ||||||||||||
Fair Value | % of Fair Value | Fair Value | % of Fair Value | ||||||||||
(dollar amounts in millions) | |||||||||||||
Internal Risk Rating 1 | $ | 73.7 | 4.15 | % | $ | 75.1 | 4.27 | % | |||||
Internal Risk Rating 2 | 1,399.6 | 78.74 | 1,376.0 | 78.20 | |||||||||
Internal Risk Rating 3 | 170.2 | 9.57 | 187.7 | 10.67 | |||||||||
Internal Risk Rating 4 | 103.3 | 5.81 | 84.1 | 4.78 | |||||||||
Internal Risk Rating 5 | 30.7 | 1.73 | 36.6 | 2.08 | |||||||||
Internal Risk Rating 6 | — | — | — | — | |||||||||
Total | $ | 1,777.5 | 100.00 | % | $ | 1,759.5 | 100.00 | % | |||||
As of December 31, 2017 and September 30, 2017, the weighted average Internal Risk Ratings of our debt investment portfolio were 2.2.
Consolidated Results of Operations
(dollar amounts in thousands, except per share data)
Total investment income for the three month periods ended December 31, 2017 and September 30, 2017 was $49,510 and $42,648, respectively. This $6,862 net increase was primarily due to an increase in interest income from our debt portfolio, an increase in other income from higher prepayment fees resulting from full paydowns on select investments, and an increase in interest income and dividend income from Credit Fund during the three month period ended December 31, 2017.
Total expenses (net of management fee waiver) for the three month periods ended December 31, 2017 and September 30, 2017 were $22,994 and $17,568, respectively. This $5,426 net increase during the three month period ended December 31, 2017 was primarily attributable due to an increase in management fees as a result of an increase in investments and termination of the fee waiver and an increase in interest expense as a result of an increase in LIBOR.
Page | 3
During the three month period ended December 31, 2017, the Company recorded a net realized gain and change in unrealized appreciation of $467. This was primarily due to net change in unrealized appreciation on our debt investments from changes in various inputs utilized under our valuation methodology, including, but not limited to, market spreads, leverage multiples and borrower ratings, and the impact of exits.
Liquidity and Capital Resources
(dollar amounts in thousands, except per share data)
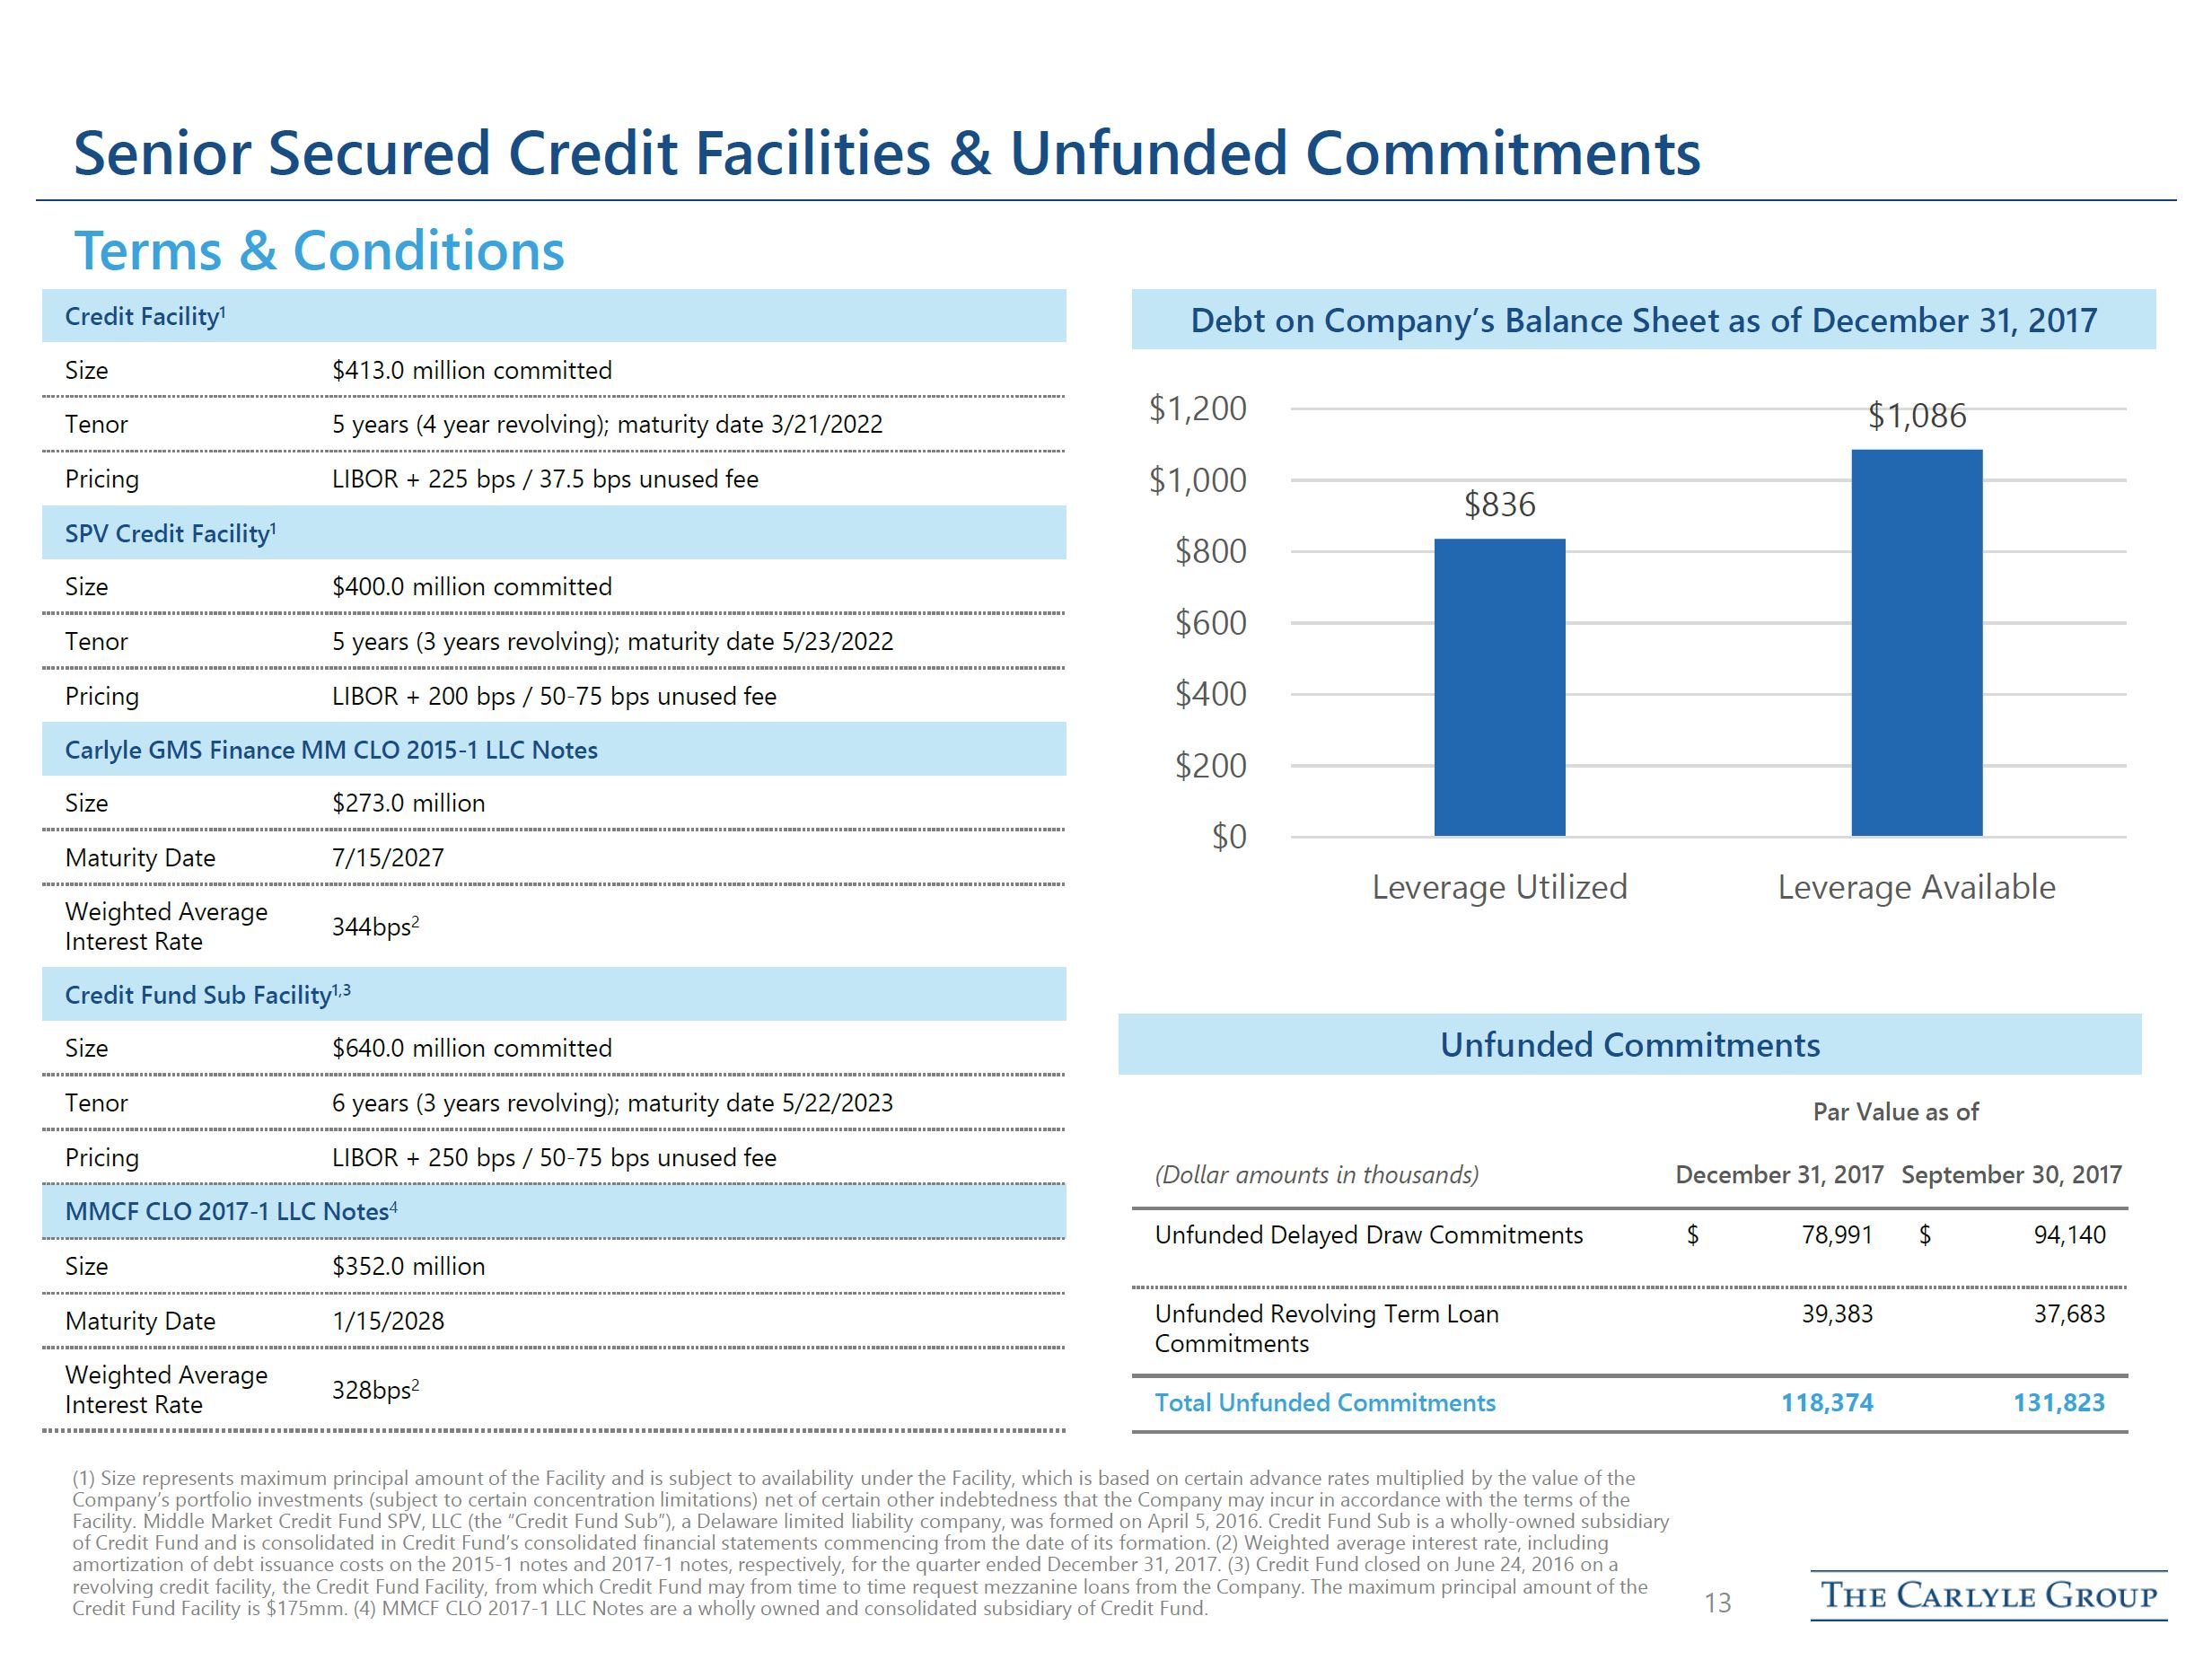
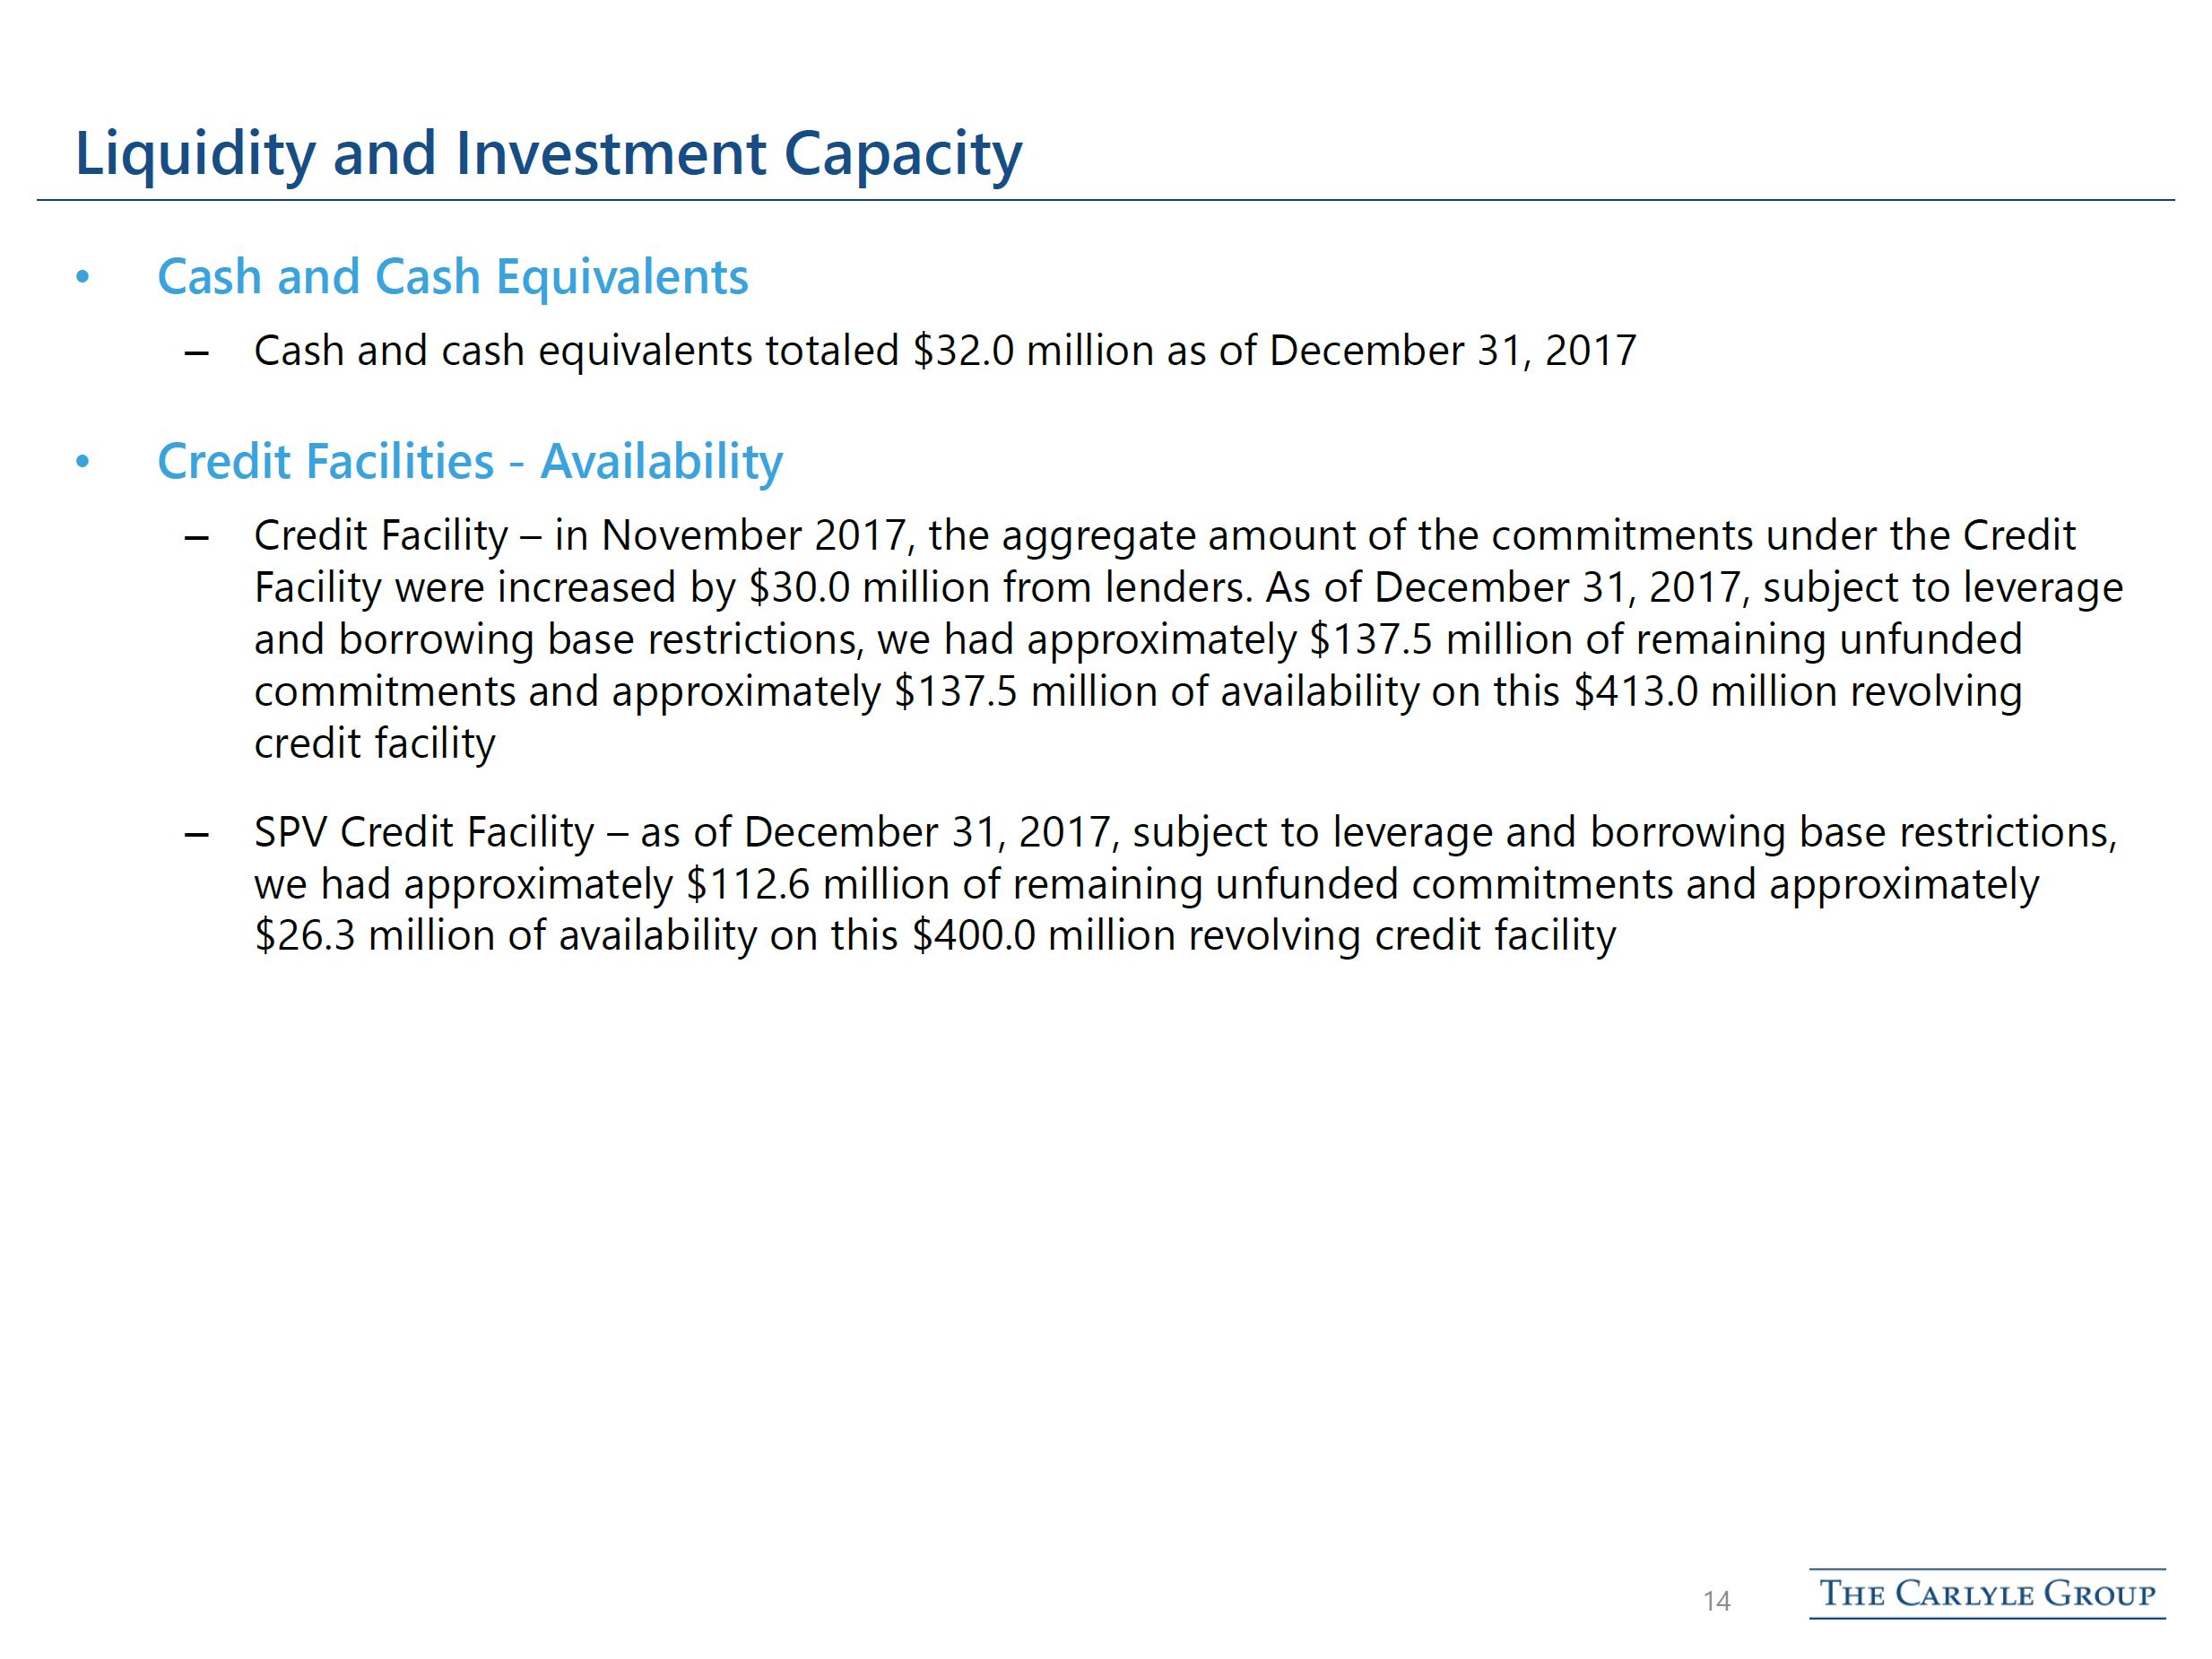
As of December 31, 2017, the Company had cash and cash equivalents of $32,039, notes payable (before debt issuance costs) of $273,000, and secured borrowings outstanding of $562,893. As of December 31, 2017, the Company had $250,107 of remaining commitments and $164,647 available for additional borrowings on its revolving credit facilities, subject to leverage and borrowing base restrictions.
Dividend
On February 26, 2018, our Board of Directors declared a quarterly dividend of $0.37 per share, which is payable on April 17, 2018 to stockholders of record as of March 29, 2018.
Conference Call
The Company will host a conference call at 9:00 a.m. EST on Wednesday, February 28, 2018 to discuss these quarterly financial results. The call and webcast will be available on the TCG BDC website at tcgbdc.com. The call may be accessed by dialing +1 (866) 394-4623 (U.S.) or +1 (409) 350-3158 (international) and referencing “TCG BDC Financial Results Call.” The conference call will be webcast simultaneously via a link on TCG BDC’s website and an archived replay of the webcast also will be available on the website soon after the live call for 21 days.
Page | 4
TCG BDC, INC.
CONSOLIDATED STATEMENTS OF ASSETS AND LIABILITIES
(dollar amounts in thousands, except per share data)
December 31, 2017 | September 30, 2017 | ||||||
(unaudited) | |||||||
ASSETS | |||||||
Investments, at fair value | |||||||
Investments—non-controlled/non-affiliated, at fair value (amortized cost of $1,782,632 and $1,769,297, respectively) | $ | 1,779,584 | $ | 1,760,611 | |||
Investments—non-controlled/affiliated, at fair value (amortized cost of $16,273 and $15,935, respectively) | 15,431 | 14,959 | |||||
Investments—controlled/affiliated, at fair value (amortized cost of $172,251 and $186,801, respectively) | 172,516 | 188,547 | |||||
Total investments, at fair value (amortized cost of $1,971,015 and $1,972,033, respectively) | 1,967,531 | 1,964,117 | |||||
Cash and cash equivalents | 32,039 | 35,149 | |||||
Receivable for investment sold | 7,022 | — | |||||
Deferred financing costs | 3,626 | 3,734 | |||||
Interest receivable from non-controlled/non-affiliated investments | 5,066 | 4,892 | |||||
Interest receivable from non-controlled/affiliated investments | 42 | ||||||
Interest and dividend receivable from controlled/affiliated investments | 5,981 | 5,528 | |||||
Prepaid expenses and other assets | 76 | 55 | |||||
Total assets | $ | 2,021,383 | $ | 2,013,475 | |||
LIABILITIES | |||||||
Secured borrowings | $ | 562,893 | $ | 578,769 | |||
2015-1 Notes payable, net of unamortized debt issuance costs of $1,947 and $1,999, respectively | 271,053 | 271,001 | |||||
Payable for investments purchased | 9,469 | — | |||||
Due to Investment Adviser | 69 | 102 | |||||
Interest and credit facility fees payable | 5,353 | 4,792 | |||||
Dividend payable | 30,481 | 22,888 | |||||
Base management and incentive fees payable | 13,098 | 9,986 | |||||
Administrative service fees payable | 95 | 100 | |||||
Other accrued expenses and liabilities | 1,568 | 1,484 | |||||
Total liabilities | 894,079 | 889,122 | |||||
NET ASSETS | |||||||
Common stock, $0.01 par value; 200,000,000 shares authorized; 62,207,603 shares and 61,859,848 shares issued and outstanding at December 31, 2017 and September 30, 2017, respectively | 622 | 619 | |||||
Paid-in capital in excess of par value | 1,172,807 | 1,166,599 | |||||
Offering costs | (1,618 | ) | (1,588 | ) | |||
Accumulated net investment income (loss), net of cumulative dividends of $222,254 and $191,773 at December 31, 2017 and September 30, 2017, respectively | 2,522 | (280 | ) | ||||
Accumulated net realized gain (loss) | (43,548 | ) | (33,081 | ) | |||
Accumulated net unrealized appreciation (depreciation) | (3,481 | ) | (7,916 | ) | |||
Total net assets | $ | 1,127,304 | $ | 1,124,353 | |||
NET ASSETS PER SHARE | $ | 18.12 | $ | 18.18 | |||
Page | 5
TCG BDC, INC.
CONSOLIDATED STATEMENTS OF OPERATIONS
(dollar amounts in thousands, except per share data)
(unaudited)
For the three month periods ended | ||||||||
December 31, 2017 | September 30, 2017 | |||||||
Investment income: | ||||||||
From non-controlled/non-affiliated investments: | ||||||||
Interest income | $ | 40,243 | $ | 34,684 | ||||
Other income | 2,626 | 1,318 | ||||||
Total investment income from non-controlled/non-affiliated investments | 42,869 | 36,002 | ||||||
From non-controlled/affiliated investments: | ||||||||
Interest income | 381 | 834 | ||||||
Total investment income from non-controlled/affiliated investments | 381 | 834 | ||||||
From controlled/affiliated investments: | ||||||||
Interest income | 3,420 | 3,012 | ||||||
Dividend income | 2,840 | 2,800 | ||||||
Total investment income from controlled/affiliated investments | 6,260 | 5,812 | ||||||
Total investment income | 49,510 | 42,648 | ||||||
Expenses: | ||||||||
Base management fees | 7,473 | 6,999 | ||||||
Incentive fees | 5,625 | 5,321 | ||||||
Professional fees | 938 | 361 | ||||||
Administrative service fees | 139 | 184 | ||||||
Interest expense | 7,816 | 5,922 | ||||||
Credit facility fees | 430 | 521 | ||||||
Directors’ fees and expenses | 88 | 121 | ||||||
Other general and administrative | 390 | 472 | ||||||
Total expenses | 22,899 | 19,901 | ||||||
Waiver of base management fees | — | 2,333 | ||||||
Net expenses | 22,899 | 17,568 | ||||||
Net investment income (loss) before taxes | 26,611 | 25,080 | ||||||
Excise tax expense | 95 | — | ||||||
Net investment income (loss) | 26,516 | 25,080 | ||||||
Net realized gain (loss) and net change in unrealized appreciation (depreciation) on investments: | ||||||||
Net realized gain (loss) from: | ||||||||
Non-controlled/non-affiliated investments | (3,968 | ) | 172 | |||||
Net change in unrealized appreciation (depreciation): | ||||||||
Non-controlled/non-affiliated | 5,782 | 279 | ||||||
Non-controlled/affiliated | 134 | 976 | ||||||
Controlled/affiliated | (1,481 | ) | (964 | ) | ||||
Net realized gain (loss) and net change in unrealized appreciation (depreciation) on investments | 467 | 463 | ||||||
Net increase (decrease) in net assets resulting from operations | $ | 26,983 | $ | 25,543 | ||||
Basic and diluted earnings per common share | $ | 0.44 | $ | 0.41 | ||||
Weighted-average shares of common stock outstanding—Basic and Diluted | 62,143,344 | 61,840,100 | ||||||
Dividends declared per common share | $ | 0.49 | $ | 0.37 | ||||
Page | 6
About TCG BDC, Inc.
TCG BDC is an externally managed specialty finance company focused on lending to middle-market companies. TCG BDC is managed by Carlyle Global Credit Investment Management L.L.C., an SEC-registered investment adviser and a wholly owned subsidiary of The Carlyle Group L.P. Since it commenced investment operations in May 2013 through December 31, 2017, TCG BDC has invested approximately $3.6 billion in aggregate principal amount of debt and equity investments prior to any subsequent exits or repayments. TCG BDC’s investment objective is to generate current income and capital appreciation primarily through debt investments in U.S. middle market companies. TCG BDC has elected to be regulated as a business development company under the Investment Company Act of 1940, as amended.
Web: tcgbdc.com
CAUTIONARY STATEMENT REGARDING FORWARD-LOOKING STATEMENTS
This press release may contain forward-looking statements that involve substantial risks and uncertainties. You can identify these statements by the use of forward-looking terminology such as “anticipates,” “believes,” “expects,” “intends,” “will,” “should,” “may,” “plans,” “continue,” “believes,” “seeks,” “estimates,” “would,” “could,” “targets,” “projects,” “outlook,” “potential,” “predicts” and variations of these words and similar expressions to identify forward-looking statements, although not all forward-looking statements include these words. You should read statements that contain these words carefully because they discuss our plans, strategies, prospects and expectations concerning our business, operating results, financial condition and other similar matters. We believe that it is important to communicate our future expectations to our investors. There may be events in the future, however, that we are not able to predict accurately or control. You should not place undue reliance on these forward-looking statements, which speak only as of the date on which we make it. Factors or events that could cause our actual results to differ, possibly materially from our expectations, include, but are not limited to, the risks, uncertainties and other factors we identify in the sections entitled “Risk Factors” and “Cautionary Statement Regarding Forward-Looking Statements” in filings we make with the Securities and Exchange Commission, and it is not possible for us to predict or identify all of them. We undertake no obligation to update or revise publicly any forward-looking statements, whether as a result of new information, future events or otherwise, except as required by law.
Contacts:
Investors: | Media: |
Daniel Harris | Jordan DeJarnette |
+1-212-813-4527 daniel.harris@carlyle.com | +1-202-729-5025 jordan.dejarnette@carlyle.com |
Page | 7