united
states
securities and exchange commission
washington, d.c. 20549
form n-csr
certified shareholder report of registered management
investment companies
Investment Company Act file number 811-22669
AmericaFirst Quantitative Funds
(Exact name of registrant as specified in charter)
17605 Wright Street, Omaha, Nebraska 68130
(Address of principal executive offices) (Zip code)
James Ash, Gemini Fund Services, LLC.
80 Arkay Drive, Hauppauge, NY 11788
(Name and address of agent for service)
Registrant's telephone number, including area code: 631-470-2619
Date of fiscal year end: 6/30
Date of reporting period: 6/30/16
Item 1. Reports to Stockholders.
ANNUAL REPORT
AmericaFirst Defensive Growth Fund
AmericaFirst Income Trends Fund
AmericaFirst Tactical Alpha Fund (Formerly AmericaFirst Absolute Return Fund)
AmericaFirst Quantitative Strategies Fund
AmericaFirst Seasonal Trends Fund
June 30, 2016

AmericaFirst Quantitative Funds
c/o Gemini Fund Services, LLC
17605 Wright Street, Suite 2
Omaha, NE 68130
AmericaFirst Capital Management, LLC is located at 8150 Sierra College Blvd (Suite 290), Roseville, CA.The Funds’ distributor is Northern Lights Distributors, LLC. AmericaFirst Capital Management, LLC is an owner of Matrix Capital Group, Inc. AmericaFirst is not affiliated with Burlington Capital Group, LLC (formerly America First Companies) or any of its subsidiaries.

Dear Shareholder:
AmericaFirst Capital Management is pleased to announce the Fiscal Year 2016 annual report and performance for the AmericaFirst family of mutual funds.
Market Summary
The fiscal year ending 6/30/2016 was negative for most equity and commodity indices.
While domestic magna-cap stocks (as represented by the S&P 100) gained 4.62%, broader stock indices such as the Value Line Composite Index lost 8.34%. Small cap stocks (S&P 600) lost 6.73%, Europe (MSCI Europe NTR) lost 11.22%, Asia (MSCI AC Asia Pacific GTR) lost 9.35%, and Latin America (MSCI EM Latin America) lost 7.38%. In other words, stock investors were likely negative the last 12 months unless they owned very large domestic stocks.
Bonds continued to provide positive returns. Domestic Corporate Bonds (as represented by the Barclays Credit Bond Index) gained 7.55%, High Yield Bonds (Barclays US Corp High Yield Index) gained 1.62%, and Foreign Bonds (Barclays Global Aggregate Bond) gained 11.54%.
Commodities (as represented by the S&P GSCI Index) lost 26.08% led by Agricultural and Energy Futures. Bucking the trend was Gold (London PM), which earned 12.79%.
Fund Performance (load waived) as of 6/30/2016[1]
| Fund Name | Symbol |
Return 1 Yr. |
Return 3 Yr. |
Return 5 Yr. |
Return Incep | Since Reformulation |
| AmericaFirst Defensive Growth A | DGQAX | -5.12 | 5.74 | 8.17 | 7.97 | |
| AmericaFirst Income Trends A | AFPAX | -11.80 | -3.51 | -1.25 | 0.29 | |
| AmericaFirst Tactical Alpha A | ABRFX | 1.37 | 8.51 | 3.31 | 3.85 | |
| AmericaFirst Quantitative Strgy A | AFIAX | -8.64 | 1.00 | 3.42 | -0.41 | 10.84 7 |
| AmericaFirst Seasonal Trends A | STQAX | 0.42 | - | - | 0.63 |
America First’s philosophy is centered on the belief that investment markets are never fully efficient. These market inefficiencies are derived from informational and emotional sources. We believe market inefficiencies can be exploited via the use of rigidly tested rules-based strategies.
[1] The performance data quoted here represents past performance. Current performance may be lower or higher than the performance data quoted. Past performance is no guarantee of future results. The investment return and principal value of an investment will fluctuate so that investors’ shares, when redeemed, may be worth more or less than their original cost. Review the Funds’ prospectus for more information regarding the Funds’ fees and expenses, including other share classes. For performance information current to the most recent month-end, call toll free (866) 960-1355.
| 1 |
Rules-based strategies are based on an objective set of fundamental and/or technical criteria. In most cases, there is no discretion as to what to buy and sell. Exceptions may exist in extraordinary circumstances (e.g. delisting, corporate merger, illiquidity, etc.).
AmericaFirst Defensive Growth Fund
(A Shares: DGQAX, U Shares: DGQUX, I Shares: DGQIX)
Objective: The AmericaFirst Defensive Growth Fund seeks long-term capital appreciation while attempting to reduce exposure to general equity market risk.
Description: The Defensive Growth Fund provides a unique approach to equity investing by combining a portfolio of defensive, non-cyclical stocks with a portfolio of short positions designed to provide capital appreciation when equities are down.
Narrative: The AmericaFirst Defensive Growth Fund has nearly quadrupled the cumulative returns of its peer benchmark (the Lipper Long/Short Equity Index) since inception.
Despite strong performance from its Utilities and Consumer Staples positions, the Defensive Growth Fund lost 5.12% for the fiscal year ending June 30, 2016. This compares to its benchmark category return of -2.63%. The Fund was negatively impacted by its Healthcare positions as well as its short positions in Mining stocks (April, 2016). In addition, the Fund’s exposure to small-caps negatively impacted its performance. The Russell Global Total Return Index lost 3.33% for the fiscal year-end.
Defensive stocks continue to look attractive in light of today’s volatile economic environment. Regardless of the economy, we need essentials such as soap, pharmaceuticals, food, and utilities to carry on our daily lives. The constant demand for these goods and services often result in more stable earnings growth – which may result in better stock performance with less economic risk.
Returns (load waived):
| Fund Name | Symbol |
Return 1 Yr. |
Return 3 Yr. |
Return 5 Yr. |
Return Incep |
| AmericaFirst Defensive Growth A | DGQAX | -5.12 | 5.74 | 8.17 | 7.97 |
| AmericaFirst Defensive Growth I | DGQIX | -4.12 | 6.89 | 9.15 | 8.91 |
| AmericaFirst Defensive Growth U | DGQUX | -5.59 | 5.23 | 7.62 | 7.40 |
| Lipper Long/Short Equity Index | - | -2.63 | 2.07 | 2.59 | 2.28 |
| Class A versus Benchmark Index | -2.49 | 3.67 | 5.58 | 5.69 |
The adviser has contractually agreed to waive management fees and reimburse expenses through 2/4/2017, to the extent that total annual Fund operating expenses exceed 2.45% (A shares, excluding short sale dividend expense). Operating expenses include management fees, distribution fees and administrative, legal, registration and other expenses. If fee waivers and reimbursements had not been included performance would have been lower. There are additional costs associated with the use of short sales. Short-sale dividends generally reduce the market value of the securities by the amount of the dividend declared; thus increasing the Fund’s unrealized gain or reducing the Fund’s unrealized loss on the securities sold short.
AmericaFirst Income Trends Fund
(A Shares: AFPAX, U Shares: AFPUX, I Shares: AFPIX)
AmericaFirst Capital Management
Roseville, CA
866-960-1355
www.AmericaFirstFunds.com
| 2 |
Objective: The Fund seeks to maximize income, while maintaining prospects for capital appreciation, by investing in a diversified portfolio of stocks and bonds.
Description: The Fund selects from an expansive universe of income-generating sectors and asset classes to provide a unique and diversified portfolio.
Narrative: Despite strong performance from its Utilities and Real Estate Investment Trust (REIT) positions, the Income Trends Fund suffered an 11.80% loss due to poor performance from its Energy/MLP, Financial Services and Basic Materials stocks and bonds. Global and small-cap exposure also contributed to the Fund’s fiscal year loss. Though no suitable benchmark index exists for the Fund, it is worth noting the Barclays Intermediate Government Bond Index gained 3.89% during the last twelve months ending 6/30/2016.
It is the Portfolio Manager’s strong opinion the Income Trends Fund represents an outstanding opportunity as the primary contributors to its 12-month decline have reversed their downward trend to provide strong returns the last quarter (Q2, 2016). In addition, the Fund pays a very attractive monthly distribution rate while investors wait for the Fund to rally.
Returns (load waived):
| Fund Name | Symbol |
Return 1 Yr. |
Return 3 Yr. |
Return 5 Yr. |
Return Incep |
| AmericaFirst Income Trends A | AFPAX | -11.80 | -3.51 | -1.25 | 0.29 |
| AmericaFirst Income Trends I | AFPIX | -10.91 | -2.68 | -0.55 | 0.96 |
| AmericaFirst Income Trends U | AFPUX | -12.14 | -3.95 | -1.71 | -0.20 |
| Morningstar Tactical Allocation Index | - | -2.30 | 2.32 | 2.46 | 4.77 |
| Class A versus Benchmark Index | -9.51 | -5.87 | -3.94 | -4.66 |
The adviser has contractually agreed to waive management fees and reimburse expenses through 2/4/2017, to the extent that total annual Fund operating expenses exceed 2.20% (A shares, excluding short sale dividend expense). Operating expenses include management fees, distribution fees and administrative, legal, registration and other expenses. If fee waivers and reimbursements had not been included performance would have been lower. There are additional costs associated with the use of short sales. Short-sale dividends generally reduce the market value of the securities by the amount of the dividend declared; thus increasing the Fund’s unrealized gain or reducing the Fund’s unrealized loss on the securities sold short.
AmericaFirst Tactical Alpha Fund
(A Shares: ABRFX, U Shares: ABRUX, I Shares: ABRWX)
Objective: The AmericaFirst Tactical Alpha Fund seeks capital appreciation through long/short positions in global equity, credit, commodity and interest rate markets.
Description: The Tactical Alpha Fund selects from a starting universe of over thirty indices by utilizing a data-driven “all asset” approach that combines top-down technical analysis with bottom-up fundamental analysis.
Narrative: Since its inception, the AmericaFirst Tactical Alpha Fund has more-than-doubled its benchmark category returns.
The “goes anywhere, at any time” Fund earned 1.37% for the fiscal year ended 6/30/2016 while its benchmark category (the Lipper Absolute Return Fund Index) lost 1.72%.
AmericaFirst Capital Management
Roseville, CA
866-960-1355
www.AmericaFirstFunds.com
| 3 |
The Fund benefited by its diversified positions in Precious Metals, Utilities, and Bonds (domestic and global). Working against the Fund were international, energy and small cap positions.
We continue to believe the Tactical Alpha Fund represents an excellent selection for long-term investors that seek a total return vehicle that invests beyond just stocks and bonds.
Returns (load-waived):
| Fund Name | Symbol |
Return 1 Yr. |
Return 3 Yr. |
Return 5 Yr. |
Return Incep |
| AmericaFirst Tactical Alpha A | ABRFX | 1.37 | 8.51 | 3.31 | 3.85 |
| AmericaFirst Tactical Alpha I | ABRWX | 2.83 | 9.62 | 4.14 | 6.61 |
| AmericaFirst Tactical Alpha U | ABRUX | 0.79 | 7.98 | 2.78 | 3.31 |
| Lipper Absolute Return Funds Index | - | -1.72 | 0.81 | 1.21 | 1.59 |
| Class A versus Benchmark Index | 3.09 | 7.70 | 2.10 | 2.26 |
The adviser has contractually agreed to waive management fees and reimburse expenses through 2/4/17, to the extent that total annual Fund operating expenses exceed 2.45% (A shares, excluding short sale dividend expense). Operating expenses include management fees, distribution fees and administrative, legal, registration and other expenses. If fee waivers and reimbursements had not been included performance would have been lower. There are additional costs associated with the use of short sales. Short-sale dividends generally reduce the market value of the securities by the amount of the dividend declared; thus increasing the Fund’s unrealized gain or reducing the Fund’s unrealized loss on the securities sold short.
AmericaFirst Quantitative Strategies Fund
(A Shares: AFIAX, C Shares: AFISX, I Shares AFIIX)
Objective: The Fund seeks to provide capital appreciation with a focus on producing positive returns regardless of the directions of financial markets.
Description: The AmericaFirst Quantitative Strategies Fund is a compilation of AmericaFirst strategies that are lowly correlated to each other.
Narrative: The Quantitative Strategies Fund changed its name and investment objective on November 3rd, 2008. Since this change, the Fund has substantially outperformed its category benchmark (the Morningstar Tactical Allocation Index).
The Fund underperformed its benchmark for the fiscal year ending 6/30/2016 as it lost 8.64% (versus a 2.30% loss for the benchmark). The Fund was hurt by its positions in Energy, Small-Cap, and international stocks. High yield bonds also contributed to the Fund’s negative returns. The Fund rebalanced its portfolio in January, 2016 and has earned positive returns the first half of 2016 seemingly reversing the negative trend of 2015. Over the same period of time, the Russell Global Total Return Index lost 3.33%.
We are very excited about the Fund’s allocation in 2016. The Fund is allocated amongst several low-correlated strategies ranging from long/short commodities and bonds to defensive and share buyback equity strategies.
Returns (load waived):
| Fund Name | Symbol | Return 1 Yr. | Return 3 Yr. |
Return 5 Yr. |
Return Incep | Since Reformulation |
| AmericaFirst Quantitative Strgy A | AFIAX | -8.64 | 1.00 | 3.42 | -0.41 | 10.84 |
AmericaFirst Capital Management
Roseville, CA
866-960-1355
www.AmericaFirstFunds.com
| 4 |
| AmericaFirst Quantitative Strgy C | AFISX | -9.43 | 0.26 | 2.66 | -1.15 | 10.20 |
| AmericaFirst Quantitative Strgy I | AFIIX | -8.68 | - | - | -7.39 | - |
| Morningstar Tactical Allocation Index | - | -2.30 | 2.32 | 2.46 | 5.18 | 5.94 |
| Class A versus Benchmark Index | -6.34 | -1.32 | 0.96 | -5.60 | 4.90 |
The adviser has contractually agreed to waive management fees and reimburse expenses through 2/4/2017, to the extent that total annual Fund operating expenses exceed 1.50% (A shares, excluding short sale dividend expense). Operating expenses include management fees, distribution fees and administrative, legal, registration and other expenses. If fee waivers and reimbursements had not been included performance would have been lower. There are additional costs associated with the use of short sales. Short-sale dividends generally reduce the market value of the securities by the amount of the dividend declared; thus increasing the Fund’s unrealized gain or reducing the Fund’s unrealized loss on the securities sold short.
AmericaFirst Seasonal Trends Fund
(A Shares: STQAX, U Shares: STQUX, I Shares: STQIX)
Objective: The Fund seeks to achieve capital appreciation with a focus on producing positive returns regardless of the direction of the financial markets.
Description: The Fund employs a “Seasonal” strategy to allocate assets between equity and fixed income securities. This strategy is based on the Advisor’s study of seasonal price patterns in asset classes over various time periods. The Advisor anticipates rebalancing Fund holdings to reduce equity exposure in May and increasing it in November.
Narrative: AmericaFirst’s version of “Sell in May & Walk Away” yielded positive returns the fiscal year ending 6/30/2016.
The Seasonal Trends Fund earned a positive 0.42% the last 12 months thanks largely to a cyclical bull run in February, March and April of 2016. The Fund’s category benchmark (the Morningstar Tactical Allocation Index) lost 2.30% the last 12 months. Over the same period of time, the Russell Global Total Return Index lost 3.33%.
Over 200 years of global stock market data supports the “Sell in May & Walk Away” adage. Through its own research, AmericaFirst has observed substantial outperformance of stocks during the November through April versus the May through October timeframe.
While we do not expect this to be the case every year (as no strategy is 100%), we anticipate this trend to remain the predominance of the time for the disciplined buy-and-hold investor of this Fund.
Returns (load waived):
| Fund Name | Symbol |
Return 1 Yr. |
Return 3 Yr. |
Return 5 Yr. |
Return Incept. |
| AmericaFirst Seasonal Trends A | STQAX | 0.42 | - | - | 0.63 |
| AmericaFirst Seasonal Trends I | STQIX | 0.93 | - | - | 1.13 |
| AmericaFirst Seasonal Trends U | STQUX | -0.11 | - | - | 0.13 |
| Morningstar Tactical Allocation Index | - | -2.30 | - | - | 0.52 |
| Class A versus Benchmark Index | 2.72 | - | - | 0.11 |
AmericaFirst Capital Management
Roseville, CA
866-960-1355
www.AmericaFirstFunds.com
| 5 |
The adviser has contractually agreed to waive management fees and reimburse expenses through 2/4/2017, to the extent that total annual Fund operating expenses exceed 2.45% (A shares, excluding short sale dividend expense). Operating expenses include management fees, distribution fees and administrative, legal, registration and other expenses. If fee waivers and reimbursements had not been included performance would have been lower. There are additional costs associated with the use of short sales. Short-sale dividends generally reduce the market value of the securities by the amount of the dividend declared; thus increasing the Fund’s unrealized gain or reducing the Fund’s unrealized loss on the securities sold short.
Summary:
As an industry, we have dangerously adopted a “what’s working now?” philosophy by keeping short-term winners and scrapping short-term underperformers. Ultimately, the danger to such an approach is that we end up with a portfolio of investments that all move the same – and even though the investments may be positive currently, the odds are strong they will move in lockstep when the Markets turn south. I’ve often reminded Investors the losers of today often become the winners of tomorrow as they start to rally to their historical mean.
Investors (and their Advisors) can easily fall into a trap of comparing investments to the S&P 500 without learning what is moving the index. As I mentioned earlier, the largest of the large cap stocks were the primary contributors to positive returns this year. Investors that held a diversified portfolio of stocks (in other words, not just huge companies) likely felt some pain these last 12 months. Yes, there are years in which diversification can result in lower returns – nothing is 100%.
It is important to remember small and medium cap companies have historically outperformed large companies…and stocks have historically outperformed bonds. There is danger in owning only what has worked recently - think about those that bought technology stocks at the end of 1999 just because of short-term performance (the Nasdaq 100 lost over 73% the next three years).
It is my very strong position our worst performers the last 12 months will be among our top performers the next 12 months. We have already begun to see the losers of last year rally the last couple quarters.
Thank you again for placing your trust in AmericaFirst. Please know we have a vested interest in your success.
Sincerely,

Rick Gonsalves
President, Portfolio Manager and CEO

AmericaFirst Capital Management
Roseville, CA
866-960-1355
www.AmericaFirstFunds.com
| 6 |
Definitions:
| 1. | Beta is a measure of a security's volatility relative to the market. Up Beta measures the relative volatility in positive markets while Down Beta measures the relative volatility in down markets. |
| 2. | Correlation is a statistical measure of how investments move in relation to each other. Up Correlation measures the relationship of the Fund to stocks in positive markets while Down Correlation measures the relationship of the Fund to stocks in down markets. |
| 3. | Up-capture compares an investment’s performance against its benchmark during periods when the benchmark’s performance is positive, while Down-capture compares the investment’s performance against the benchmark during periods when the benchmark’s performance is negative. A value of 100% for either ratio implies that the investment fully captures, or matches, the benchmark return during the period evaluated. A value of greater than 100% indicates that the investment captured more upside or downside than the benchmark. |
| 4. | Standard Deviation shows how much variation or "dispersion" exists from the average (mean, or expected value). A low standard deviation indicates that the data points tend to be very close to the mean (or less volatile); whereas high standard deviation indicates that the data points are spread out over a large range of values (more volatile). |
| 5. | S&P 500 Index - The S&P 500® has been widely regarded as the best single gauge of the large cap U.S. equities market since the index was first published in 1957. The index has over US$ 5.58 trillion benchmarked, with index assets comprising approximately US$ 1.31 trillion of this total. The index includes 500 leading companies in leading industries of the U.S. economy, capturing 75% coverage of U.S. equities. |
| 6. | Dow Jones US Moderately Conservative Portfolio Index: This index is a weighted average of other stock, bond, and cash indexes. It is reconstructed monthly and represents 40% of the risk of the U.S. equities market. The equities position (which is close to 40% of the portfolio) is constructed by equally weighting six Dow Jones U.S. Style Indexes (Large Growth, Large Value, Mid Growth, Mid Value, Small Growth and Small Value). The bond and cash position (which is close to 60% of the portfolio) is composed of various Barclays U.S. fixed income indexes. |
| 7. | Lipper Absolute Return: Absolute Return portfolios seek to achieve an absolute return in the reference currency within a certain value at risk quintile relative to that reference currency group. |
| 8. | Lipper Long Short Equity: Long Short portfolios employ strategies combining long holdings of equities with short sales of equity, equity options, or equity index options. The funds may be either net long or net short, depending on the portfolio manager’s view of the market. |
| 9. | Lipper Flexible Income – Funds that emphasize income generation by investing at least 85% of their assets in debt issues and preferred and convertible securities. Common stocks and warrants cannot exceed 15%. |
| 10. | Lipper Alternative Multi-Strategy-- Funds that, by prospectus language, seek total returns through the management of several different hedge-like strategies. These funds are typically quantitatively driven to measure the existing relationship between instruments and in some cases to identify positions in which the risk-adjusted spread between these instruments represents an opportunity for the investment manager. |
| 11. | The Barclays Aggregate Bond Index, which used to be called the "Lehman Aggregate Bond Index," is a broad base index, maintained by Barclays Capital, which took over the index business of the now defunct Lehman Brothers, and is often used to represent investment grade bonds being traded in United States. Index funds and exchange-traded funds are available that track this bond index. |
4570-NLD-7/29/2016
AmericaFirst Capital Management
Roseville, CA
866-960-1355
www.AmericaFirstFunds.com
| 7 |
| AMERICAFIRST QUANTITATIVE FUNDS | ANNUAL REPORT |
June 30, 2016
COMPARISON OF A $10,000 INVESTMENT IN THE AMERICAFIRST DEFENSIVE GROWTH FUND CLASS A SHARES AND THE S&P 500 TOTAL RETURN INDEX (Unaudited)

Average Annual Total Return
| One Year | Three Year | Five Year | Commencement of Operations | |||
| through June 30, 2016 (1) | ||||||
| Class A | Without sales load | (5.12)% | 5.74% | 8.17% | 7.97% | |
| With sales load | (9.86)% | 3.95% | 7.06% | 6.89% | ||
| Class U | Without sales load | (5.59)% | 5.23% | 7.62% | 7.40% | |
| With sales load | (7.96)% | 4.35% | 7.07% | 6.86% | ||
| Class I | (4.12)% | 6.89% | 9.15% | 8.91% | ||
| S&P 500 Total Return Index | 3.99% | 11.66% | 12.10% | 11.94% | ||
| (1) | AmericaFirst Defensive Growth Fund Class A, Class U and Class I shares commenced operations on May 23, 2011. Redemption fees are a 1% of amount redeemed, if sold within 90 days. |
The performance information quoted in this annual report assumes the reinvestment of all dividend and capital gain distributions, if any, and represents past performance, which is not a guarantee of future results. The returns shown do not reflect taxes that a shareholder would pay on Fund distributions or on the redemption of Fund shares. The investment return and principal value of an investment will fluctuate and, therefore, an investor’s shares, when redeemed, may be worth more or less than their original cost. Updated performance data current to the most recent month-end can be obtained by calling 1-877-217-8363.
The above graph depicts the performance of the AmericaFirst Defensive Growth Fund Class A shares versus the S&P 500 Total Return Index. The S&P 500 Total Return Index by Standard and Poor’s Corp. is a capitalization-weighted index comprising 500 issues listed on various exchanges, representing the performance of the stock market generally. Please note that indices do not take into account any fees and expenses of investing in the individual securities that they track and individuals cannot invest directly in any index.
As with any fund, save an index fund, that commonly compares its performance to the S&P 500 Total Return Index, such a comparison may be said to be inappropriate because of the dissimilarity between the Fund’s investments and the securities comprising the index; so too with the AmericaFirst Defensive Growth Fund, which will not invest in certain securities comprising this index.
| 8 |
| AMERICAFIRST QUANTITATIVE FUNDS | ANNUAL REPORT |
June 30, 2016
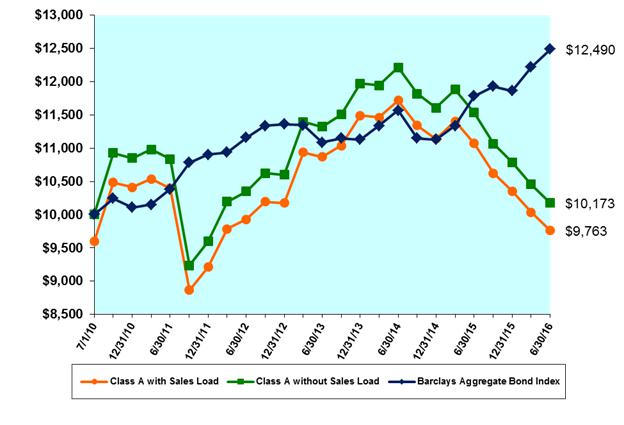
COMPARISON OF A $10,000 INVESTMENT IN THE AMERICAFIRST INCOME TRENDS FUND CLASS A SHARES AND THE BARCLAYS AGGREGATE BOND INDEX (Unaudited)
Average Annual Total Return
| One Year | Three Year | Five Year | Commencement of Operations | |||
| through June 30, 2016 (1) | ||||||
| Class A | Without sales load | (11.80)% | (3.51)% | (1.25)% | 0.29% | |
| With sales load | (15.34)% | (4.80)% | (2.08)% | (0.40)% | ||
| Class U | Without sales load | (12.14)% | (3.95)% | (1.71)% | (0.20)% | |
| With sales load | (13.94)% | (4.60)% | (2.13)% | (0.53)% | ||
| Class I | (10.91)% | (2.68)% | (0.55)% | 0.96% | ||
| Barclays Aggregate Bond Index | 6.00% | 4.06% | 3.76% | 3.78% | ||
| (1) | AmericaFirst Income Trends Fund Class A, Class U and Class I shares commenced operations on July 1, 2010. |
The performance information quoted in this annual report assumes the reinvestment of all dividend and capital gain distributions, if any, and represents past performance, which is not a guarantee of future results. The returns shown do not reflect taxes that a shareholder would pay on Fund distributions or on the redemption of Fund shares. The investment return and principal value of an investment will fluctuate and, therefore, an investor’s shares, when redeemed, may be worth more or less than their original cost. Updated performance data current to the most recent month-end can be obtained by calling 1-877-217-8363.
The above graph depicts the performance of the AmericaFirst Income Trends Fund Class A shares versus the Barclays Aggregate Bond Index. The Barclays Aggregate Bond Index is an unmanaged index which represents the U.S. investment-grade fixed-rate bond market (including government and corporate securities, mortgage pass-through securities and asset-backed securities). Investors cannot invest directly in an index or benchmark.
As with any fund, save an index fund, that commonly compares its performance to the Barclays Aggregate Bond Index, such a comparison may be said to be inappropriate because of the dissimilarity between the Fund’s investments and the securities comprising the index; so too with the AmericaFirst Income Trends Fund, which will not invest in certain securities comprising this index.
| 9 |
| AMERICAFIRST QUANTITATIVE FUNDS | ANNUAL REPORT |
June 30, 2016
COMPARISON OF A $10,000 INVESTMENT IN THE AMERICAFIRST TACTICAL ALPHA FUND* CLASS A SHARES AND THE S&P 500 TOTAL RETURN INDEX (Unaudited)
Average Annual Total Return
| 1 Year | 3 Year |
5 Year |
Commencement of Operations | |||
| through June 30, 2016 (1) | ||||||
| Class A | Without sales load | 1.37% | 8.51% | 3.31% | 3.85% | |
| With sales load | (3.73)% | 6.67% | 2.25% | 3.01% | ||
| Class U | Without sales load | 0.79% | 7.98% | 2.78% | 3.31% | |
| With sales load | (1.71)% | 7.09% | 2.27% | 2.90% | ||
| Class I (2) | 2.83% | 9.62% | 4.14% | 6.61% | ||
| S&P 500 Total Return Index | 3.99% | 11.66% | 12.10% | 13.02% | ||
| (1) | AmericaFirst Tactical Alpha Fund Class A and Class U shares commenced operations on February 26, 2010. Benchmark since inception return assumes inception date of February 26, 2010. |
| (2) | AmericaFirst Tactical Alpha Fund Class I commenced operations on July 12, 2010. |
* Formerly known as AmericaFirst Absolute Return Fund.
The performance information quoted in this annual report assumes the reinvestment of all dividend and capital gain distributions, if any, and represents past performance, which is not a guarantee of future results. The returns shown do not reflect taxes that a shareholder would pay on Fund distributions or on the redemption of Fund shares. The investment return and principal value of an investment will fluctuate and, therefore, an investor’s shares, when redeemed, may be worth more or less than their original cost. Updated performance data current to the most recent month-end can be obtained by calling 1-877-217-8363.
The above graph depicts the performance of the AmericaFirst Tactical Alpha Fund Class A shares versus the S&P 500 Total Return Index. The S&P 500 Total Return Index by Standard and Poor’s Corp. is a capitalization-weighted index comprising 500 issues listed on various exchanges, representing the performance of the stock market generally. Please note that indices do not take into account any fees and expenses of investing in the individual securities that they track and individuals cannot invest directly in any index.
As with any fund, save an index fund, that commonly compares its performance to the S&P 500 Total Return Index, such a comparison may be said to be inappropriate because of the dissimilarity between the Fund’s investments and the securities comprising the index; so too with the AmericaFirst Tactical Alpha Fund, which will not invest in certain securities comprising this index.
| 10 |
| AMERICAFIRST QUANTITATIVE FUNDS | ANNUAL REPORT |
June 30, 2016
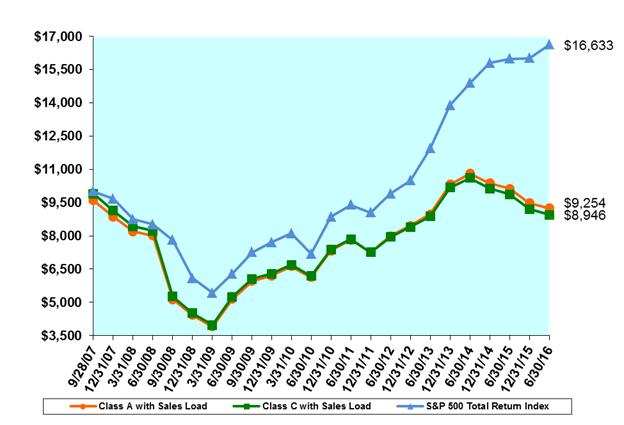
COMPARISON OF A $10,000 INVESTMENT IN THE AMERICAFIRST QUANTITATIVE STRATEGIES FUND AND THE S&P 500 TOTAL RETURN INDEX (Unaudited)
Average Annual Total Return
|
Commencement of Operations | ||||||
| One Year | Three Year | Five Year | through June 30, 2016 | |||
| Class A (1) | Without sales load | (8.64)% | 1.00% | 3.42% | (0.41)% | |
| With sales load | (12.31)% | (0.35)% | 2.58% | (0.88)% | ||
| Class C (1) | Without sales load | (9.43)% | 0.26% | 2.66% | (1.15)% | |
| With sales load | (10.33)% | (0.06)% | 2.41% | (1.26)% | ||
| Class I (2) | (8.68)% | N/A | N/A | (7.39)% | ||
| S&P 500 Total Return Index | 3.99% | 11.66% | 12.10% | 5.98% | ||
| (1) | AmericaFirst Quantitative Strategies Fund Class A and Class C shares commenced operations on September 28, 2007. Benchmark since inception return assumes inception date of September 28, 2007. |
| (2) | AmericaFirst Quantitative Strategies Fund Class I shares commenced operations on December 31, 2014. |
The performance information quoted in this annual report assumes the reinvestment of all dividend and capital gain distributions, if any, and represents past performance, which is not a guarantee of future results. The returns shown do not reflect taxes that a shareholder would pay on Fund distributions or on the redemption of Fund shares. The investment return and principal value of an investment will fluctuate and, therefore, an investor’s shares, when redeemed, may be worth more or less than their original cost. Updated performance data current to the most recent month-end can be obtained by calling 1-877-217-8363.
The above graph depicts the performance of the AmericaFirst Quantitative Strategies Fund Class A and C Shares versus the S&P 500 Total Return Index. The S&P 500 Total Return Index by Standard and Poor’s Corp. is a capitalization-weighted index comprising 500 issues listed on various exchanges, representing the performance of the stock market generally. Please note that indices do not take into account any fees and expenses of investing in the individual securities that they track and individuals cannot invest directly in any index.
As with any fund, save an index fund, that commonly compares its performance to the S&P 500 Total Return Index, such a comparison may be said to be inappropriate because of the dissimilarity between the Fund’s investments and the securities comprising the index; so too with the AmericaFirst Quantitative Strategies Fund, which will not invest in certain securities comprising this index.
| 11 |
| AMERICAFIRST QUANTITATIVE FUNDS | ANNUAL REPORT |
June 30, 2016
COMPARISON OF A $10,000 INVESTMENT IN THE AMERICAFIRST SEASONAL TRENDS FUND CLASS A SHARES AND THE DOW JONES U.S. MODERATELY CONSERVATIVE PORTFOLIO INDEX (Unaudited)
Average Annual Total Return
|
Commencement of Operations | ||||
| 1 Year | through June 30, 2016 (1) | |||
| Class A | Without sales load | 0.42% | 0.63% | |
| With sales load | (4.61)% | (1.31)% | ||
| Class U | Without sales load | (0.11)% | 0.13% | |
| With sales load | (2.64)% | (0.83)% | ||
| Class I (2) | 0.93% | 1.13% | ||
|
Dow Jones U.S. Moderately Conservative Portfolio Index
|
3.97% | 5.52% | ||
| (1) | AmericaFirst Seasonal Trends Fund Class A, Class U, and Class I shares commenced operations on October 31, 2013. Benchmark since inception return assumes inception date of October 31, 2013. |
The performance information quoted in this annual report assumes the reinvestment of all dividend and capital gain distributions, if any, and represents past performance, which is not a guarantee of future results. The returns shown do not reflect taxes that a shareholder would pay on Fund distributions or on the redemption of Fund shares. The investment return and principal value of an investment will fluctuate and, therefore, an investor’s shares, when redeemed, may be worth more or less than their original cost. Updated performance data current to the most recent month-end can be obtained by calling 1-877-217-8363.
The above graph depicts the performance of the AmericaFirst Seasonal Trends Fund Class A shares versus the Dow Jones U.S. Moderately Conservative Portfolio Index. The Dow Jones U.S. Moderately Conservative Portfolio Index This index is a weighted average of other stock, bond, and cash indexes. It is reconstructed monthly and represents 40% of the risk of the U.S. equities market. The equities position (which is close to 40% of the portfolio) is constructed by equally weighting six Dow Jones U.S. Style Indexes (Large Growth, Large Value, Mid Growth, Mid Value, Small Growth and Small Value). The bond and cash position (which is close to 60% of the portfolio) is composed of various Barclays U.S. fixed income indexes.
As with any fund, save an index fund, that commonly compares its performance to the Dow Jones U.S. Moderately Conservative Portfolio Index, such a comparison may be said to be inappropriate because of the dissimilarity between the Fund’s investments and the securities comprising the index; so too with the AmericaFirst Seasonal Trends Fund, which will not invest in certain securities comprising this index.
| 12 |
| AMERICAFIRST QUANTITATIVE FUNDS | ANNUAL REPORT |
EXPENSE EXAMPLE
Information About Your Fund’s Expenses (Unaudited)
|
Total Fund operating expense ratios as stated in the Fund’s prospectus dated June 6, 2016 were as follows:
| |
| AmericaFirst Defensive Growth Fund Class A, gross of fee waivers or expense reimbursements | 2.94% |
| AmericaFirst Defensive Growth Fund Class A, after waiver and reimbursement | 2.94% |
| AmericaFirst Defensive Growth Fund Class U, gross of fee waivers or expense reimbursements | 3.68% |
| AmericaFirst Defensive Growth Fund Class U, after waiver and reimbursement | 3.64% |
| AmericaFirst Defensive Growth Fund Class I, gross of fee waivers or expense reimbursements | 2.68% |
| AmericaFirst Defensive Growth Fund Class I, after waiver and reimbursement | 2.63% |
| AmericaFirst Income Trends Fund Class A, gross of fee waivers or expense reimbursements | 2.42% |
| AmericaFirst Income Trends Fund Class A, after waiver and reimbursement | 2.42% |
| AmericaFirst Income Trends Fund Class U, gross of fee waivers or expense reimbursements | 3.17% |
| AmericaFirst Income Trends Fund Class U, after waiver and reimbursement | 2.95% |
| AmericaFirst Income Trends Fund Class I, gross of fee waivers or expense reimbursements | 2.17% |
| AmericaFirst Income Trends Fund Class I, after waiver and reimbursement | 1.65% |
|
AmericaFirst Tactical Alpha Fund Class A, gross of fee waivers or expense reimbursements AmericaFirst Tactical Alpha Fund Class A, after fee waiver and reimbursements AmericaFirst Tactical Alpha Fund Class U, gross of fee waivers or expense reimbursements AmericaFirst Tactical Alpha Fund Class U, after fee waiver and reimbursements AmericaFirst Tactical Alpha Fund Class I, gross of fee waivers or expense reimbursements AmericaFirst Tactical Alpha Fund Class I, after fee waiver and reimbursements
|
3.38% 2.89% 4.13% 3.39% 3.10% 2.18%
|
| AmericaFirst Quantitative Strategies Fund Class A, gross of fee waivers or expense reimbursements | 1.92% |
| AmericaFirst Quantitative Strategies Fund Class A, after waiver and reimbursement | 1.77% |
| AmericaFirst Quantitative Strategies Fund Class C, gross of fee waivers or expense reimbursements | 2.67% |
| AmericaFirst Quantitative Strategies Fund Class C, after waiver and reimbursement | 2.52% |
|
AmericaFirst Quantitative Strategies Fund Class I, gross of fee waivers or expense reimbursements AmericaFirst Quantitative Strategies Fund Class I, after fee waiver and reimbursements
AmericaFirst Seasonal Trends Fund Class A, gross of fee waivers or expense reimbursements AmericaFirst Seasonal Trends Fund Class A, after fee waiver and reimbursements AmericaFirst Seasonal Trends Fund Class U, gross of fee waivers or expense reimbursements AmericaFirst Seasonal Trends Fund Class U, after fee waiver and reimbursements AmericaFirst Seasonal Trends Fund Class I, gross of fee waivers or expense reimbursements AmericaFirst Seasonal Trends Fund Class I, after fee waiver and reimbursements
|
1.63% 1.63%
2.51% 2.47% 3.25% 2.97% 2.24% 1.97% |
| The Manager has contractually agreed to waive fees and/or reimburse expenses but only to the extent necessary to maintain the AmericaFirst Defensive Growth Fund’s total annual operating expenses (excluding brokerage costs; borrowing costs, such as (a) interest and (b) dividends on securities sold short; taxes; costs of investing in underlying funds, and extraordinary expenses) at 2.45% for Class A shares, 2.95% for Class U shares, and 1.94% for Class I shares of the AmericaFirst Defensive Growth Fund’s average daily net assets through February 4, 2017. Total Gross Operating Expenses during the year ended June 30, 2016 were 3.11% for Class A, 3.63% for Class U, and 2.62% for Class I of the AmericaFirst Defensive Growth Fund. The Manager has contractually agreed to waive fees and/or reimburse expenses but only to the extent necessary to maintain the AmericaFirst Income Trends Fund’s total annual operating expenses (excluding brokerage costs; borrowing costs, such as (a) interest and (b) dividends on securities sold short; taxes; costs of investing in underlying funds, and extraordinary expenses) at 2.20% for Class A shares, 2.70% for Class U shares, and 1.40% for Class I shares of the AmericaFirst Income Trends Fund’s average daily net assets through February 4, 2017. Total Gross Operating Expenses during the year ended June 30, 2016 were 3.27% for Class A, 3.73% for Class U, and 2.68% for Class I of the AmericaFirst Income Trends Fund. The Manager has contractually agreed to waive fees and/or reimburse expenses but only to the extent necessary to maintain the Tactical Alpha Fund’s total annual operating expenses (excluding brokerage costs; borrowing costs, such as (a) interest and (b) dividends on securities sold short; taxes; costs of investing in underlying funds, and extraordinary expenses) at 2.45% for Class A shares, 2.95% for Class U shares, and 1.74% for Class I shares of the AmericaFirst Tactical Alpha Fund’s average daily net assets through February 4, 2017. Total Gross Operating Expenses during the year ended June 30, 2016 were 4.68% for Class A, 5.20% for Class U, and 4.21% for Class I of the AmericaFirst Tactical Alpha Fund. The Manager has contractually agreed to waive fees and/or reimburse expenses but only to the extent necessary to maintain the Quantitative Strategies Fund’s total annual operating expenses (excluding brokerage costs; borrowing costs, such as (a) interest and (b) dividends on securities sold short; taxes; costs of investing in underlying funds, and extraordinary expenses) at 1.50% for Class A shares, 2.25% for Class C shares, and 1.95% for Class I shares of the AmericaFirst Quantitative Strategies Fund’s average daily net assets through February 4, 2017. Total Gross Operating Expenses during the year ended June 30, 2016 were 2.29% for Class A, 3.05% for Class C, and 2.23% for Class I of the AmericaFirst Quantitative Strategies Fund. The Manager has contractually agreed to waive fees and/or reimburse expenses but only to the extent necessary to maintain the Seasonal Trends Fund’s total annual operating expenses (excluding brokerage costs; borrowing costs, such as (a) interest and (b) dividends on securities sold short; taxes; costs of investing in underlying funds, and extraordinary expenses) at 2.45% for Class A shares, 2.95% for Class U shares, and 1.95% for Class I shares of the AmericaFirst Seasonal Trends Fund’s average daily net assets through February 4, 2017. Total Gross Operating Expenses during the year ended June 30, 2016 were 3.57% for Class A, 4.10% for Class U, and 3.01% for Class I of the AmericaFirst Seasonal Trends Fund. Class I shares for all Funds except AmericaFirst Seasonal Trends do not exclude borrowing costs from the expense limitations noted. Please see the Information About Your Fund’s Expenses, the Financial Highlights and Notes to Financial Statements (Note 3) sections of this report for gross and net expense related disclosure during the year ended June 30, 2016. | |
| 13 |
| AMERICAFIRST QUANTITATIVE FUNDS | ANNUAL REPORT |
EXPENSE EXAMPLE
Information About Your Fund’s Expenses (Unaudited)(Continued)
As a shareholder of the Funds, you incur two types of costs: (1) transaction costs, including sales charges (loads) on purchase payments, and redemption fees; and (2) ongoing costs, including management fees, distribution and/or service (12b-1) fees; and other Fund expenses. The example below is intended to help you understand your ongoing costs (in dollars) of investing in the Fund and to compare these costs with the ongoing costs of investing in other mutual funds.
The example below is based on an investment of $1,000 invested at the beginning of the period (1/1/16) and held for the entire period through 6/30/16.
Actual Expenses
The first section of each table provides information about actual account values and actual expenses. You may use the information in this section, together with the amount you invested, to estimate the expenses that you paid over the period. Simply divide your account value by $1,000 (for example, an $8,600 account value divided by $1,000 = 8.6), then multiply the result by the number in the first section under the heading entitled “Expenses Paid During Period” to estimate the expenses you paid on your account during this period/year.
Hypothetical Example for Comparison Purposes
The second section of each table provides information about the hypothetical account values and hypothetical expenses based on the Fund’s actual expense ratio and an assumed rate of return of 5% per year before expenses, which is not the Fund’s actual return. The hypothetical account values and expenses may not be used to estimate the actual ending account balance or expenses you paid for the period. You may use this information to compare the ongoing costs of investing in the Fund and other funds. To do so, compare this 5% hypothetical example with the 5% hypothetical examples that appear in the shareholder reports of the other funds.
Please note that the expenses shown in the tables are meant to highlight your ongoing costs only and do not reflect any transactional costs, such as sales charges (loads), redemption fees, or exchange fees. Therefore, the second section of the table is useful in comparing ongoing costs only, and will not help you determine the relative total costs of owning different funds. In addition, if these transactional costs were included, your costs would have been higher. For more information on transactional costs, please refer to the Fund’s prospectus.
Expenses and Value of a $1,000 Investment for the six month period from January 1, 2016 through June 30, 2016
|
Actual Fund Return (in parentheses) |
Beginning Account Value 1/1/16 |
Ending Account Value 6/30/16 |
Expenses Paid During Period*
|
| AmericaFirst Defensive Growth Fund Class A (-1.57%) | $ 1,000.00 | $ 984.30 | $ 16.63 |
| AmericaFirst Defensive Growth Fund Class U (-1.79%) | 1,000.00 | 982.10 | 18.69 |
| AmericaFirst Defensive Growth Fund Class I (-1.00%) | 1,000.00 | 990.00 | 11.78 |
|
Hypothetical 5% Fund Return |
Beginning Account Value 1/1/16 |
Ending Account Value 6/30/16 |
Expenses Paid During Period*
|
| AmericaFirst Defensive Growth Fund Class A | $ 1,000.00 | $ 1,008.10 | $ 16.83 |
| AmericaFirst Defensive Growth Fund Class U | 1,000.00 | 1,006.00 | 18.92 |
| AmericaFirst Defensive Growth Fund Class I | 1,000.00 | 1,013.02 | 11.92 |
| * | Expenses are equal to the Fund’s annualized expense ratios of 3.37%, 3.79% and 2.38% for the AmericaFirst Defensive Growth Fund Class A, Class U and Class I shares, respectively; multiplied by the average account value over the period, multiplied by 182/366 to reflect the one-half year period. |
| 14 |
| AMERICAFIRST QUANTITATIVE FUNDS | ANNUAL REPORT |
EXPENSE EXAMPLE
Information About Your Fund’s Expenses (Unaudited)(Continued)
Expenses and Value of a $1,000 Investment for the six month period from January 1, 2016 through June 30, 2016
|
Actual Fund Return (in parentheses) |
Beginning Account Value 1/1/16 |
Ending Account Value 6/30/16 |
Expenses Paid During Period*
|
| AmericaFirst Income Trends Fund Class A (-5.71%) | $ 1,000.00 | $ 942.90 | $ 13.73 |
| AmericaFirst Income Trends Fund Class U (-5.83%) | 1,000.00 | 941.70 | 14.47 |
| AmericaFirst Income Trends Fund Class I (-5.17%) | 1,000.00 | 948.30 | 7.39 |
|
Hypothetical 5% Fund Return |
Beginning Account Value 1/1/16 |
Ending Account Value 6/30/16 |
Expenses Paid During Period*
|
| AmericaFirst Income Trends Fund Class A | $ 1,000.00 | $ 1,010.73 | $ 14.21 |
| AmericaFirst Income Trends Fund Class U | 1,000.00 | 1,010.96 | 14.98 |
| AmericaFirst Income Trends Fund Class I | 1,000.00 | 1,017.28 | 7.65 |
| * | Expenses are equal to the Fund’s annualized expense ratios of 2.84%, 3.00% and 1.52% for the AmericaFirst Income Trends Fund Class A, Class U and Class I shares, respectively; multiplied by the average account value over the period, multiplied by 182/366 to reflect the one-half year period. |
Expenses and Value of a $1,000 Investment for the six month period from January 1, 2016 through June 30, 2016
|
Actual Fund Return (in parentheses) |
Beginning Account Value 1/1/16 |
Ending Account Value 6/30/16 |
Expenses Paid During Period*
|
| AmericaFirst Tactical Alpha Fund Class A (4.31%) | $ 1,000.00 | $1,043.10 | $ 14.07 |
| AmericaFirst Tactical Alpha Fund Class U (3.97%) | 1,000.00 | 1,039.70 | 15.65 |
| AmericaFirst Tactical Alpha Fund Class I (5.37%) | 1,000.00 | 1,053.70 | 11.07 |
|
Hypothetical 5% Fund Return |
Beginning Account Value 1/1/16 |
Ending Account Value 6/30/16 |
Expenses Paid During Period*
|
| AmericaFirst Tactical Alpha Fund Class A | $ 1,000.00 | $ 1,011.09 | $ 13.85 |
| AmericaFirst Tactical Alpha Fund Class U | 1,000.00 | 1,009.52 | 15.42 |
| AmericaFirst Tactical Alpha Fund Class I | 1,000.00 | 1,014.08 | 10.86 |
| * | Expenses are equal to the Fund’s annualized expense ratios of 2.77%, 3.09% and 2.17% for the AmericaFirst Tactical Alpha Fund Class A, Class U and Class I shares, respectively; multiplied by the average account value over the period, multiplied by 182/366 to reflect the one-half year period. |
| 15 |
| AMERICAFIRST QUANTITATIVE FUNDS | ANNUAL REPORT |
EXPENSE EXAMPLE
Information About Your Fund’s Expenses (Unaudited) (Continued)
Expenses and Value of a $1,000 Investment for the six month period from January 1, 2016 through June 30, 2016
|
Actual Fund Return (in parentheses) |
Beginning Account Value 1/1/16 |
Ending Account Value 6/30/16 |
Expenses Paid During Period*
|
| AmericaFirst Quantitative Strategies Fund Class A (-2.44%) | $ 1,000.00 | $ 975.60 | $ 9.86 |
| AmericaFirst Quantitative Strategies Fund Class C (-2.82%) | 1,000.00 | 971.80 | 12.94 |
| AmericaFirst Quantitative Strategies Fund Class I (-2.39%) | 1,000.00 | 976.10 | 13.50 |
|
Hypothetical 5% Fund Return |
Beginning Account Value 1/1/16 |
Ending Account Value 6/30/16 |
Expenses Paid During Period*
|
| AmericaFirst Quantitative Strategies Fund Class A | $ 1,000.00 | $ 1,014.88 | $ 10.06 |
| AmericaFirst Quantitative Strategies Fund Class C | 1,000.00 | 1,011.74 | 13.20 |
| AmericaFirst Quantitative Strategies Fund Class I | 1,000.00 | 1,011.20 | 13.74 |
| * | Expenses are equal to the Fund’s annualized expense ratios of 2.01%, 2.64%, and 2.75% for the AmericaFirst Quantitative Strategies Fund Class A, Class C, and Class I shares, respectively; multiplied by the average account value over the period, multiplied by 182/366 to reflect the one-half year period. |
Expenses and Value of a $1,000 Investment for the six month period from January 1, 2016 through June 30, 2016
|
Actual Fund Return (in parentheses) |
Beginning Account Value 1/1/16 |
Ending Account Value 6/30/16 |
Expenses Paid During Period*
|
| AmericaFirst Seasonal Trends Fund Class A (9.09%) | $ 1,000.00 | $ 1,090.90 | $ 12.25 |
| AmericaFirst Seasonal Trends Fund Class U (8.83%) | 1,000.00 | 1,088.30 | 14.84 |
| AmericaFirst Seasonal Trends Fund Class I (9.43%) | 1,000.00 | 1,094.30 | 7.12 |
|
Hypothetical 5% Fund Return |
Beginning Account Value 1/1/16 |
Ending Account Value 6/30/16 |
Expenses Paid During Period*
|
| AmericaFirst Seasonal Trends Fund Class A | $ 1,000.00 | $ 1,013.14 | $ 11.80 |
| AmericaFirst Seasonal Trends Fund Class U | 1,000.00 | 1,010.65 | 14.29 |
| AmericaFirst Seasonal Trends Fund Class I | 1,000.00 | 1,018.07 | 6.86 |
| * | Expenses are equal to the Fund’s annualized expense ratios of 2.36%, 2.86% and 1.37% for the AmericaFirst Seasonal Trends Fund Class A, Class U and Class I shares, respectively; multiplied by the average account value over the period, multiplied by 182/366 to reflect the one-half year period. |
For more information on Fund expenses, please refer to the Fund’s prospectus, which can be obtained from your investment representative or by calling 1-877-217-8363. Please read it carefully before you invest or send money.
| 16 |
| AmericaFirst Defensive Growth Fund | ||||
| SCHEDULE OF INVESTMENTS | ||||
| June 30, 2016 | ||||
| Shares | Value | |||
| COMMON STOCK - 98.0 % | ||||
| BEVERAGES - 11.4% | ||||
| 9,669 | Boston Beer Co., Inc. * (a) | $ 1,653,689 | ||
| 10,646 | Coca-Cola Bottling Co. (a) | 1,569,966 | ||
| 43,863 | Coca-Cola Co. (a) | 1,988,310 | ||
| 38,322 | Coca-Cola Enterprises, Inc. (a) | 1,367,712 | ||
| 20,421 | Dr Pepper Snapple Group, Inc. (a) | 1,973,281 | ||
| 18,939 | PepsiCo, Inc. (a) | 2,006,398 | ||
| 10,559,356 | ||||
| BIOTECHNOLOGY - 6.3 % | ||||
| 6,345 | Biogen, Inc. * (a) | 1,534,348 | ||
| 19,141 | Gilead Sciences, Inc. (a) | 1,596,742 | ||
| 45,216 | Myriad Genetics, Inc. * (a) | 1,383,610 | ||
| 12,762 | United Therapeutics Corp. * (a) | 1,351,751 | ||
| 5,866,451 | ||||
| COMMERCIAL SERVICES - 1.6 % | ||||
| 39,835 | INC Research Holdings, Inc. * (a) | 1,518,909 | ||
| COSMETICS/PERSONAL CARE - 2.1 % | ||||
| 21,359 | Estee Lauder Cos., Inc. (a) | 1,944,096 | ||
| ELECTRIC - 7.7 % | ||||
| 36,384 | Black Hills Corp. (a) | 2,293,647 | ||
| 228,400 | Calpine Corp. * (a) | 3,368,900 | ||
| 43,610 | OGE Energy Corp. (a) | 1,428,228 | ||
| 7,090,775 | ||||
| ELECTRONICS - 2.2 % | ||||
| 45,558 | Agilent Technologies, Inc. (a) | 2,020,953 | ||
| ENGINEERING & CONSTRUCTION - 0.4 % | ||||
| 3,194 | SBA Communications Corp. * (a) | 344,760 | ||
| FOOD - 15.9 % | ||||
| 40,328 | Cal-Maine Foods, Inc. (a) | 1,787,337 | ||
| 35,109 | Campbell Soup Co. (a) | 2,335,802 | ||
| 90,847 | Flowers Foods, Inc. (a) | 1,703,381 | ||
| 32,583 | General Mills, Inc. (a) | 2,323,820 | ||
| 21,168 | Hershey Co. (a) | 2,402,356 | ||
| 15,310 | JM Smucker Co. (a) | 2,333,397 | ||
| 57,361 | Whole Foods Market, Inc. (a) | 1,836,699 | ||
| 14,722,792 | ||||
| GAS - 6.6 % | ||||
| 24,261 | AGL Resources, Inc. (a) | 1,600,498 | ||
| 12,458 | Sempra Energy (a) | 1,420,461 | ||
| 68,356 | UGI Corp. (a) | 3,093,109 | ||
| 6,114,068 | ||||
The accompanying notes are an integral part of these financial statements.
| 17 |
| AmericaFirst Defensive Growth Fund | ||||
| SCHEDULE OF INVESTMENTS (Continued) | ||||
| June 30, 2016 | ||||
| Shares | Value | |||
| HEALTHCARE-SERVICES - 18.0 % | ||||
| 13,621 | Anthem, Inc. (a) | $ 1,788,982 | ||
| 45,185 | Centene Corp. * (a) | 3,224,853 | ||
| 27,494 | HCA Holdings, Inc. * (a) | 2,117,313 | ||
| 24,881 | ICON PLC * (a) | 1,741,919 | ||
| 26,225 | LifePoint Health, Inc. * (a) | 1,714,328 | ||
| 26,704 | MEDNAX, Inc. * (a) | 1,934,171 | ||
| 31,818 | Molina Healthcare, Inc. * (a) | 1,587,718 | ||
| 23,617 | WellCare Health Plans, Inc. * (a) | 2,533,632 | ||
| 16,642,916 | ||||
| PHARMACEUTICALS - 16.3 % | ||||
| 18,998 | AmerisourceBergen Corp. (a) | 1,506,921 | ||
| 21,568 | Cardinal Health, Inc. (a) | 1,682,520 | ||
| 22,517 | Express Scripts Holding Co. * (a) | 1,706,789 | ||
| 34,995 | Herbalife Ltd. * (a) | 2,048,257 | ||
| 23,966 | Mead Johnson Nutrition Co. (a) | 2,174,915 | ||
| 56,947 | Natural Health Trends Corp. (a) | 1,605,336 | ||
| 58,948 | Pfizer, Inc. (a) | 2,075,559 | ||
| 34,192 | VCA, Inc. * (a) | 2,311,721 | ||
| 15,112,018 | ||||
| RETAIL - 2.5 % | ||||
| 50,401 | Nu Skin Enterprises, Inc. (a) | 2,328,022 | ||
| TELECOMMUNICATIONS - 7.0 % | ||||
| 111,907 | CenturyLink, Inc. (a) | 3,246,422 | ||
| 21,304 | Level 3 Communications, Inc. * (a) | 1,096,943 | ||
| 39,119 | Verizon Communications, Inc. (a) | 2,184,405 | ||
| 6,527,770 | ||||
| TOTAL COMMON STOCK (Cost - $87,539,834) | 90,792,886 | |||
| SHORT-TERM INVESTMENT - 1.2 % | ||||
| MONEY MARKET FUND - 1.2 % | ||||
| 1,154,184 | Dreyfus Cash Management, Institutional Shares - 0.30% ** | |||
| TOTAL SHORT-TERM INVESTMENT (Cost - $1,154,184) | 1,154,184 | |||
| TOTAL INVESTMENTS IN SECURITIES HELD LONG - 99.2 % (Cost - $88,694,018) (b) | $ 91,947,070 | |||
| TOTAL INVESTMENTS IN SECURITIES SOLD SHORT - (24.4) % (Proceeds - $18,499,110) (b) | (22,577,235) | |||
| OTHER ASSETS LESS LIABILITIES - 25.2 % | 23,301,932 | |||
| NET ASSETS - 100.0 % | $ 92,671,767 | |||
The accompanying notes are an integral part of these financial statements.
| 18 |
| AmericaFirst Defensive Growth Fund | ||||
| SCHEDULE OF INVESTMENTS (Continued) | ||||
| June 30, 2016 | ||||
| Shares | Value | |||
| INVESTMENTS IN SECURITIES SOLD SHORT* - (24.4) % | ||||
| COMMON STOCK - (24.4) % | ||||
| INTERNET - (1.7) % | ||||
| (476,023) | Groupon, Inc. | $ (1,547,075) | ||
| IRON/STEEL - (2.0) % | ||||
| (112,408) | United States Steel Corp. | (1,895,199) | ||
| LODGING - (1.9) % | ||||
| (19,669) | Wynn Resorts Ltd. | (1,782,798) | ||
| MINING - (17.2) % | ||||
| (188,178) | Freeport McMoran, Inc. | (2,096,303) | ||
| (116,052) | Goldcorp, Inc. | (2,220,074) | ||
| (36,106) | Royal Gold, Inc. | (2,600,354) | ||
| (113,322) | Silver Wheaton Corp. | (2,666,467) | ||
| (239,683) | Teck Resources Ltd. | (3,156,625) | ||
| (600,557) | Yamaha Gold, Inc. | (3,122,896) | ||
| (15,862,719) | ||||
| RETAIL - (1.6) % | ||||
| (72,268) | Kate Spade & Co. * | (1,489,444) | ||
| TOTAL INVESTMENTS IN SECURITIES SOLD SHORT (Proceeds $18,499,110) | $ (22,577,235) | |||
| PLC - Public Limited Company | ||||
| * Non-income producing security. | ||||
| ** The rate shown represents the rate at June 30, 2016 and is subject to change daily. | ||||
| (a) All or a portion of the security is segregated as collateral for securities sold short at June 30, 2016. | ||||
| (b) Represents cost for financial reporting purposes. Aggregate cost for federal tax purposes, including short sales, is $70,326,612 and differs from market value by net unrealized appreciation (depreciation) of securities as follows: | ||||
| Unrealized appreciation: | $ 8,671,842 | |||
| Unrealized depreciation: | (9,628,619) | |||
| Net unrealized depreciation: | $ (956,777) | |||
The accompanying notes are an integral part of these financial statements.
| 19 |
| AmericaFirst Defensive Growth Fund | ||||
| June 30, 2016 | ||||
| The Fund’s holdings were divided among the following economic sectors (Unaudited): | ||||
| Value | Percentage | |||
| HEALTHCARE-SERVICES | $ 16,642,916 | 24.0% | ||
| PHARMACEUTICALS | 15,112,018 | 21.8% | ||
| FOOD | 14,722,792 | 21.2% | ||
| BEVERAGES | 10,559,356 | 15.2% | ||
| ELECTRIC | 7,090,775 | 10.2% | ||
| TELECOMMUNICATIONS | 6,527,770 | 9.4% | ||
| GAS | 6,114,068 | 8.8% | ||
| BIOTECHNOLOGY | 5,866,451 | 8.5% | ||
| ELECTRONICS | 2,020,953 | 2.9% | ||
| COSMETICS/PERSONAL CARE | 1,944,096 | 2.8% | ||
| COMMERICAL SERVICES | 1,518,909 | 2.2% | ||
| MONEY MARKET FUND | 1,154,184 | 1.7% | ||
| RETAIL, NET | 838,578 | 1.2% | ||
| ENGINEERING & CONSTRUCTION | 344,760 | 0.5% | ||
| INTERNET | (1,547,075) | -2.2% | ||
| LODGING | (1,782,798) | -2.6% | ||
| IRON/STEEL | (1,895,199) | -2.7% | ||
| MINING | (15,862,719) | -22.9% | ||
| Total Portfolio Holdings | $ 69,369,835 | 100.0% | ||
| The percentages in the above table are based on market value of the Fund's portfolio holdings as of June 30, 2016 and are subject to change. | ||||
The accompanying notes are an integral part of these financial statements.
| 20 |
| AmericaFirst Income Trends Fund | ||||
| SCHEDULE OF INVESTMENTS | ||||
| June 30, 2016 | ||||
| Shares | Value | |||
| COMMON STOCK - 72.9 % | ||||
| ADVERTISING - 0.5 % | ||||
| 1,017 | Omnicom Group | $ 82,875 | ||
| AEROSPACE/DEFENSE 1.8 % | ||||
| 765 | Boeing Co. | 99351 | ||
| 414 | Lockheed Martin Corp | 102742 | ||
| 855 | United Tech Corp. | 87,680 | ||
| 289,773 | ||||
| AGRICULTURE - 2.4 % | ||||
| 1,961 | Altria Group, Inc. | 135,230 | ||
| 1,504 | Philip Morris International, Inc. | 152,987 | ||
| 2,014 | Reynolds American Inc. | 108,615 | ||
| 396,832 | ||||
| BANKS - 6.1 % | ||||
| 1,278 | Bank of Hawaii Corp. | 87,926 | ||
| 2,284 | Bank of Montreal | 144,783 | ||
| 1,317 | JP Morgan Chase | 81,838 | ||
| 2,347 | Royal Bank of Canada | 138,684 | ||
| 1,741 | Wells Fargo and Co. | 82,402 | ||
| 35,000 | UBS Group * | 453,600 | ||
| 989,233 | ||||
| BEVERAGES -1.2 % | ||||
| 2,191 | Coca Cola Co. | 99,318 | ||
| 891 | Pepsi Co. | 94,393 | ||
| 193,711 | ||||
| CHEMICALS - 4.1 % | ||||
| 3,406 | CF Industries Holdings, Inc. | 82,085 | ||
| 2,247 | Dow Chemical Co. | 111,698 | ||
| 1,418 | LyondellBasell Industries NV | 105,527 | ||
| 17,307 | Potash Corp of Saskatchewan, Inc. | 281,066 | ||
| 815 | Praxair, Inc. | 91,598 | ||
| 671,974 | ||||
| COMMERCIAL SERVICES - 0.6 % | ||||
| 5,691 | Western Union Co. | 109,153 | ||
| COMPUTERS - 2.9 % | ||||
| 789 | International Business Machines Corp. | 119,754 | ||
| 9,761 | Seagate Technology PLC | 237,778 | ||
| 2,277 | Western Digital Corp. | 107,611 | ||
| 465,143 | ||||
| COSMETICS/PERSONAL CARE - 0.7 % | ||||
| 1,322 | Procter & Gamble Co. | 111,934 | ||
| DISTRIBUTION/WHOLESALE - 0.5 % | ||||
| 1,893 | Fastenal Co. | 84,030 | ||
| DIVERSIFIED FINANCIAL SERVICES - 3.4 % | ||||
| 2,882 | Eaton Vance Corp | 101,850 | ||
| 3,498 | Federated Investors, Inc. | 100,672 | ||
| 8,660 | NorthStar Asset Management Group, Inc. | 88,418 | ||
| 1,207 | T Rowe Price Group, Inc. | 88,075 | ||
| 9,753 | Waddell & Reed Financial, Inc. | 167,947 | ||
| 546,962 | ||||
The accompanying notes are an integral part of these financial statements.
| 21 |
| AmericaFirst Income Trends Fund | ||||
| SCHEDULE OF INVESTMENTS (Continued) | ||||
| June 30, 2016 | ||||
| Shares | Value | |||
| ELECTRIC - 2.7 % | ||||
| 2,895 | Public Service Enterprise Group, Inc. | $ 134,936 | ||
| 2,445 | Emerson Electric Co. | 127,531 | ||
| 4,154 | Garmin Ltd | 176,213 | ||
| 438,680 | ||||
| FOOD - 3.1 % | ||||
| 4,604 | Cal-Maine Foods, Inc. | 204,049 | ||
| 4,585 | Flowers Foods, Inc. | 85,969 | ||
| 1,557 | General Mills, Inc. | 111,045 | ||
| 900 | Hershey Co. | 102,141 | ||
| 503,204 | ||||
| HOME FURNISHINGS - 0.6 % | ||||
| 1,945 | Leggett & Platt, Inc. | 99,409 | ||
| HOUSEWARES - 1.0 % | ||||
| 2,789 | Tupperware Brands Corp. | 156,965 | ||
| INSURANCE - 5.0 % | ||||
| 1,272 | Aflac, Inc. | 91,788 | ||
| 2,340 | First American Financial Corp. | 94,115 | ||
| 2,197 | MetLife, Inc. | 87,507 | ||
| 6,641 | Old Republic International Corp. | 128,105 | ||
| 2,431 | Principal Financial Group, Inc. | 99,938 | ||
| 1,397 | Prudential Financial, Inc. | 99,662 | ||
| 3,346 | Sun Life Financial, Inc. | 109,849 | ||
| 5,291 | Symantec Corp. | 108,677 | ||
| 819,641 | ||||
| LODGING - 1.1 % | ||||
| 4,151 | Las Vegas Sands Corp. | 180,527 | ||
| MACHINERY-DIVERSIFIED - 1.4 % | ||||
| 1,234 | Cummins, Inc. | 138,751 | ||
| 781 | Rockwell Automation, Inc. | 89,674 | ||
| 228,425 | ||||
| MANUFACTURING - 1.1 % | ||||
| 518 | 3M Co. | 90,712 | ||
| 1,323 | Dover Corp. | 91,710 | ||
| 182,422 | ||||
| MINING - 0.7 % | ||||
| 1,450 | Compass Minerals International, Inc. | 107,576 | ||
| OFFICE EQUIPMENT - 0.7 % | ||||
| 6,258 | Pitney Bowes, Inc. | 111,392 | ||
The accompanying notes are an integral part of these financial statements.
| 22 |
| AmericaFirst Income Trends Fund | ||||
| SCHEDULE OF INVESTMENTS (Continued) | ||||
| June 30, 2016 | ||||
| Shares | Value | |||
| OIL & GAS - 3.9 % | ||||
| 4,004 | HollyFrontier Corp. | $ 95,175 | ||
| 2,814 | Oceaneering International, Inc. | 84,026 | ||
| 1,099 | Phillips 66 | 87,195 | ||
| 1658 | Valero Energy Corp. | 84,558 | ||
| 13,944 | Western Refining, Inc. | 287,668 | ||
| 638,622 | ||||
| PACKAGING & CONTAINERS - 0.7 % | ||||
| 1,640 | Packaing Corp. of America | 109,765 | ||
| PHARMACEUTICALS - 2.8 % | ||||
| 1,965 | AbbVie, Inc. | 121,653 | ||
| 836 | Johnson & Johnson | 101,407 | ||
| 1,988 | Merck & Co., Inc. | 114,529 | ||
| 3,428 | Pfizer, Inc. | 120,700 | ||
| 458,289 | ||||
| PIPELINES - 2.9 % | ||||
| 1,625 | EQT Midstream Partners LP | 130,488 | ||
| 5,131 | MPLX LP | 172,556 | ||
| 2,118 | Magellan Midstream Partners LP | 160,968 | ||
| 464,012 | ||||
| REITS - 0.6 % | ||||
| 1,391 | Taubman Centers, Inc. | 103,212 | ||
| RETAIL - 12.1 % | ||||
| 6,626 | American Eagle Outfitters, Inc. | 105,552 | ||
| 3,038 | Best Buy Co. | 92,963 | ||
| 1,912 | Brinker International, Inc. | 87,053 | ||
| 3,435 | Coach, Inc. | 139,942 | ||
| 746 | Cracker Barrel Old Country Store, Inc. | 127,917 | ||
| 5,064 | DSW, Inc. | 107,256 | ||
| 5,625 | Game Stop Corp. | 149,513 | ||
| 6,546 | Gap, Inc. | 138,906 | ||
| 954 | Genuine Parts Co. | 96,593 | ||
| 1,304 | MSC Insutrial Direct Co. | 92,010 | ||
| 3,971 | Macy's, Inc. | 133,465 | ||
| 791 | McDonalds Corp. | 95,189 | ||
| 2,511 | Nordstrom, Inc. | 95,544 | ||
| 2,985 | NuSkin Enterprises, Inc. | 137,877 | ||
| 2,512 | Outerwall, Inc. | 105,504 | ||
| 31,963 | Pier 1 Imports, Inc. | 164,290 | ||
| 1,447 | WalMart Stores, Inc. | 105,660 | ||
| 1,975,234 | ||||
| SEMICONDUCTORS - 3.5 % | ||||
| 1,570 | Analog Devices, Inc. | 88,925 | ||
| 2,833 | Intel Corp. | 92,922 | ||
| 1,891 | Linear Tech Corp. | 87,988 | ||
| 2,251 | Qualcomm Corp. | 120,586 | ||
| 1,438 | Texas Instruments, Inc. | 90,091 | ||
| 1,764 | Xilinx, Inc. | 81,373 | ||
| 561,885 | ||||
The accompanying notes are an integral part of these financial statements.
| 23 |
| AmericaFirst Income Trends Fund | ||||
| SCHEDULE OF INVESTMENTS (Continued) | ||||
| June 30, 2016 | ||||
| Shares | Value | |||
| SOFTWARE - 1.4 % | ||||
| 3,461 | CA, Inc. | $ 113,625 | ||
| 1,868 | Paychex, Inc. | 111,146 | ||
| 224,771 | ||||
| TELECOMMUNICATIONS - 0.6 % | ||||
| 3,405 | Cisco Systems, Inc. | 97,689 | ||
| TOYS - 0.5 % | ||||
| 1,012 | Hasbro, Inc. | 84,998 | ||
| TRANSPORTATION - 2.3 % | ||||
| 1,194 | CH Robinson Worldwide, Inc. | 88,655 | ||
| 3,431 | CSX Corp. | 89,480 | ||
| 1,077 | Union Pacific Corp. | 93,968 | ||
| 948 | UPS, Inc. | 102,119 | ||
| 374,222 | ||||
| TOTAL COMMON STOCK (Cost - $11,916,035) | 11,862,560 | |||
| Principal | ||||
| BONDS & NOTES - 26.9 % | ||||
| COMMERCIAL SERVICES - 2.4 % | ||||
| $ 400,000 | Rent-A-Center, Inc., 6.625%, 11/15/20 (a) | 383,000 | ||
| DIVERSIFIED FINANCIAL SERVICES - 1.9 % | ||||
| 315,000 | Navient Corp., 5.50%, 1/15/19 (a) | 316,780 | ||
| ELECTRIC - 6.2 % | ||||
| 330,000 | Calpine Corp., 5.75%, 1/15/25 (a) | 322,162 | ||
| 400,000 | GenOn Energy, Inc., 9.875%, 10/15/20 | 286,000 | ||
| 400,000 | NRG Energy, Inc., 6.625%, 3/15/23 | 396,000 | ||
| 1,004,162 | ||||
| ENTERTAINMENT - 1.8 % | ||||
| 300,000 | AMC Entertainment, Inc., 5.75%, 6/15/25 (a) | 300,000 | ||
| HEALTHCARE-SERVICES - 1.9 % | ||||
| 300,000 | Tenet Healthcare Corp., 8.125%, 4/1/22 | 308,940 | ||
| HOLDING COMPANIES-DIVERSIFIED - 1.9 % | ||||
| 300,000 | Leucadia National Corp., 5.50%, 10/18/23 (a) | 305,782 | ||
| LODGING - 2.0 % | ||||
| 300,000 | MGM Resorts International, 6.625%, 12/15/21 (a) | 327,750 | ||
The accompanying notes are an integral part of these financial statements.
| 24 |
| AmericaFirst Income Trends Fund | ||||
| SCHEDULE OF INVESTMENTS (Continued) | ||||
| June 30, 2016 | ||||
| Principal | Value | |||
| OIL & GAS - 2.9 % | ||||
| $ 660,000 | Chesapeake Energy Corp., 6.625%, 8/15/20 (a) | $ 466,950 | ||
| RETAIL - 1.9 % | ||||
| 300,000 | QVC, Inc, 4.375%, 3/15/23 (a) | 302,293 | ||
| TELECOMMUNICATIONS - 4.0 % | ||||
| 370,000 | Sprint Corp., 7.25%, 9/15/21 (a) | 317,275 | ||
| 340,000 | Windstream Services LLC, 7.75%, 10/15/20 (a) | 334,900 | ||
| 652,175 | ||||
| TOTAL BONDS & NOTES (Cost - $3,948,812) | 4,367,832 | |||
| Shares | SHORT-TERM INVESTMENT - 0.4 % | |||
| MONEY MARKET FUND - 0.4 % | ||||
| 66,276 | Dreyfus Cash Management, Institutional Shares - 0.30% ** | 66,276 | ||
| TOTAL SHORT-TERM INVESTMENT ( Cost - $66,276) | ||||
| TOTAL INVESTMENTS IN SECURITIES HELD LONG - 100.2 % (Cost - $15,931,123) (b) | $ 16,296,668 | |||
| TOTAL INVESTMENTS IN SECURITIES SOLD SHORT - (10.3) % (Proceeds - $1,469,280) (b) | (1,680,630) | |||
| OTHER ASSETS LESS LIABILITIES - 10.1 % | 1,650,582 | |||
| NET ASSETS - 100.0 % | $ 16,266,620 | |||
| INVESTMENTS IN SECURITIES SOLD SHORT* - (10.3) % | ||||
| COMMON STOCK - (1.6) % | ||||
| TRANSPORTATION - (1.6) | ||||
| (17,000) | Golar LNG Ltd | (263,500) | ||
| TOTAL COMMON STOCK SOLD SHORT (Proceeds $283,038) | ||||
| REAL ESTATE INVESTMENT TRUSTS - (8.7) % | ||||
| (16,000) | American Capital Agency Corp. | (317,120) | ||
| (21,000) | Hatteras Financial Corp. | (344,400) | ||
| (26,000) | New Residential Investment Corp. | (359,840) | ||
| (19,000) | Senior Housing Properties Trust | (395,770) | ||
| TOTAL REAL ESTATE INVESTMENT TRUSTS SOLD SHORT (Proceeds $1,186,242) | (1,417,130) | |||
| TOTAL INVESTMENTS IN SECURITIES SOLD SHORT (Proceeds $1,469,280) | $ (1,680,630) | |||
| LLC - Limited Liability Company. | ||||
| LP - Limited Partnership. | ||||
| * Non-income producing security. | ||||
| ** The rate shown represents the rate at June 30, 2016 and is subject to change daily. | ||||
| (a) All or a portion of the security is segregated as collateral for securities sold short at June 30, 2016. | ||||
| (b) Represents cost for financial reporting purposes. Aggregate cost for federal tax purposes, including short sales, is $14,460,018 and differs from market value by net unrealized appreciation (depreciation) of securities as follows: | ||||
| Unrealized appreciation: | $ 740,780 | |||
| Unrealized depreciation: | (584,760) | |||
| Net unrealized appreciation: | $ 156,020 | |||
The accompanying notes are an integral part of these financial statements.
| 25 |
| AmericaFirst Income Trends Fund | ||||
| June 30, 2016 | ||||
| The Fund’s holdings were divided among the following economic sectors (Unaudited): | ||||
| Value | Percentage | |||
| RETAIL, NET | $ 2,277,527 | 15.6% | ||
| ELECTRIC, NET | 1,442,842 | 9.9% | ||
| OIL & GAS, NET | 1,105,572 | 7.6% | ||
| BANKS | 989,233 | 6.8% | ||
| DIVERSIFIED FINANCIAL SERVICES, NET | 863,742 | 5.9% | ||
| INSURANCE | 819,641 | 5.6% | ||
| TELECOMMUNICATIONS, NET | 749,864 | 5.1% | ||
| CHEMICALS | 671,974 | 4.6% | ||
| SEMICONDUCTORS | 561,885 | 3.8% | ||
| LODGING, NET | 508,277 | 3.5% | ||
| FOOD | 503,204 | 3.4% | ||
| PHARMACEUTICALS | 458,289 | 3.1% | ||
| COMMERCIAL SERVICES, NET | 492,153 | 3.4% | ||
| COMPUTERS | 465,143 | 3.2% | ||
| PIPELINES | 464,012 | 3.2% | ||
| AGRICULTURE | 396,832 | 2.7% | ||
| HEALTHCARE-SERVICES | 308,940 | 2.1% | ||
| HOLDING COMPANIES-DIVERSIFIED | 305,782 | 2.1% | ||
| ENTERTAINMENT | 300,000 | 2.1% | ||
| AEROSPACE/DEFENSE | 289,773 | 2.0% | ||
| MACHINERY-DIVERSIFIED | 228,425 | 1.6% | ||
| SOFTWARE | 224,771 | 1.5% | ||
| BEVERAGES | 193,711 | 1.3% | ||
| MANUFACTURING | 182,422 | 1.3% | ||
| HOUSEWARES | 156,965 | 1.1% | ||
| COSMETICS/PERSONAL CARE | 111,934 | 0.8% | ||
| OFFICE EQUIPMENT | 111,392 | 0.8% | ||
| TRANSPORTATION, NET | 110,722 | 0.8% | ||
| PACKAGING & CONTAINERS | 109,765 | 0.8% | ||
| MINING | 107,576 | 0.7% | ||
| HOME FURNISHINGS | 99,409 | 0.7% | ||
| TOYS | 84,998 | 0.6% | ||
| DISTRIBUTION/WHOLESALE | 84,030 | 0.6% | ||
| ADVERTISING | 82,875 | 0.6% | ||
| MONEY MARKET FUND | 66,276 | 0.5% | ||
| REAL ESTATE INVESTMENT TRUST, NET | (1,313,918) | -9.0% | ||
| Total Portfolio Holdings | $ 14,616,038 | 100.0% | ||
| The percentages in the above table are based on market value of the Fund's portfolio holdings as of June 30, 2016 and are subject to change. | ||||
The accompanying notes are an integral part of these financial statements.
| 26 |
| AmericaFirst Tactical Alpha Fund (Formerly AmericaFirst Absolute Return Fund) | ||||
| SCHEDULE OF INVESTMENTS | ||||
| June 30, 2016 | ||||
| Shares | Value | |||
| COMMON STOCK - 71.9 % | ||||
| BEVERAGES - 6.1% | ||||
| 14,204 | Cia Cervercias Unidas SA - ADR (a) | $ 331,521 | ||
| 3,796 | Coca Cola - ADR (a) | 314,916 | ||
| 646,437 | ||||
| CHEMICALS - 9.1 % | ||||
| 2,204 | Air Product and Chemicals, Inc. (a) | 313,056 | ||
| 2,832 | PPG Industries, Inc. (a) | 294,952 | ||
| 16,451 | Ultrapar Participacoes SA - ADR (a) | 362,087 | ||
| 970,095 | ||||
| DIVERSIFIED FINANCIAL SERVICES - 7.0 % | ||||
| 4,194 | American Express Co. (a) | 254,827 | ||
| 4,986 | Discover Financial Services (a) | 267,200 | ||
| 6,414 | Nelnet, Inc. (a) | 222,887 | ||
| 744,914 | ||||
| ELECTRIC - 2.4 % | ||||
| 9,994 | Korea Electric Power Corp. - ADR (a) | 259,144 | ||
| ELECTRONICS - 2.2 % | ||||
| 21,826 | GoPro Inc. (a)* | 235,939 | ||
| ENGINEERING & CONSTRUCTION - 8.4 % | ||||
| 12,121 | Aegion Corp. (a)* | 236,481 | ||
| 3,622 | Grupo Aeroportuario - ADR (a) | 371,726 | ||
| 12,654 | MasTec, Inc. (a)* | 282,437 | ||
| 890,644 | ||||
| HOME FURNISHINGS -2.6 % | ||||
| 13,067 | Select Comfort Corp. (a)* | 279,372 | ||
| INSURANCE - 5.3 % | ||||
| 1,286 | Everest Re Group Ltd (a) | 234,914 | ||
| 5,784 | Primerica, Inc. (a) | 331,076 | ||
| 565,990 | ||||
| INTERNET - 2.0 % | ||||
| 65,366 | Groupon, Inc. (a)* | 212,440 | ||
| METAL FABRICATION - 2.2 % | ||||
| 7,610 | Timken Co. (a) | 233,323 | ||
| MANUFACTURING - 1.8 % | ||||
| 4,374 | EnPro Industries, Inc. (a) | 194,162 | ||
| OIL & GAS - 5.2 % | ||||
| 3,921 | China Petroleum and Chemicals - ADR (a) | 282,312 | ||
| 3,910 | PetroChina Co. Ltd. - ADR (a) | 265,567 | ||
| 547,879 | ||||
| PACKAGING & CONTAINERS - 6.4 % | ||||
| 4,473 | Ball Corp. (a) | 323,353 | ||
| 5,274 | Packaging Corp of America (a) | 352,989 | ||
| 676,342 | ||||
The accompanying notes are an integral part of these financial statements.
| 27 |
| AmericaFirst Tactical Alpha Fund (Formerly AmericaFirst Absolute Return Fund) | ||||
| SCHEDULE OF INVESTMENTS (Continued) | ||||
| June 30, 2016 | ||||
| Shares | Value | |||
| RETAIL - 4.7 % | ||||
| 3,080 | Childrens Place, Inc. (a) | $ 246,954 | ||
| 12,263 | Finish Line, Inc. (a) | 247,590 | ||
| 494,544 | ||||
| TELECOMMUNICATIONS - 4.0 % | ||||
| 4,877 | China Telecom Corp. Ltd. - ADR (a) | 219,416 | ||
| 19,650 | China Unicom Hong Kong Ltd. - ADR (a) | 204,557 | ||
| 423,973 | ||||
| TRANSPORTATION - 2.5 % | ||||
| 6,218 | Atlas Air Worldwide Holdings (a)* | 257,550 | ||
| TOTAL COMMON STOCK (Cost - $7,499,281) | 7,632,748 | |||
| EXCHANGE-TRADED FUNDS - 13.0 % | ||||
| 50,643 | iShares Silver Trust (a)* | 904,990 | ||
| 16,096 | PowerShares Emerging Markets Sovereign Debt Portfolio | 476,120 | ||
| 10 | United States Natural Gas Fund LP (a)* | 86 | ||
| TOTAL EXCHANGE-TRADED FUNDS (Cost - $1,161,451) | 1,381,196 | |||
| REAL ESTATE INVESTMENT TRUSTS - 13.8% | ||||
| 5,496 | American Campus Communities, Inc. (a) | 290,573 | ||
| 6,207 | DuPont Fabros Technology, Inc. (a) | 295,081 | ||
| 5,540 | National Retail Properties, Inc. (a) | 286,529 | ||
| 13,964 | Physicians Realty Trust (a) | 293,383 | ||
| 10,017 | STORE Capital Corp. (a) | 295,001 | ||
| TOTAL REAL ESTATE INVESTMENT TRUSTS (Cost - $1,280,609) | 1,460,567 | |||
| SHORT-TERM INVESTMENT - 1.7% | ||||
| MONEY MARKET FUND - 1.7% | ||||
| 185,583 | Dreyfus Cash Management, Institutional Shares - 0.30% ** | |||
| TOTAL SHORT-TERM INVESTMENT (Cost - $185,583) | 185,583 | |||
| TOTAL INVESTMENTS IN SECURITIES HELD LONG - 100.4 % (Cost - $10,126,924) (b) | $ 10,660,094 | |||
| TOTAL INVESTMENTS IN SECURITIES SOLD SHORT - (10.6) % (Proceeds - $1,046,779) (b) | (1,121,417) | |||
| OTHER ASSETS LESS LIABILITIES - 10.2 % | 1,075,604 | |||
| NET ASSETS - 100.0 % | $ 10,614,281 | |||
The accompanying notes are an integral part of these financial statements.
| 28 |
| AmericaFirst Tactical Alpha Fund (Formerly AmericaFirst Absolute Return Fund) | ||||
| SCHEDULE OF INVESTMENTS (Continued) | ||||
| June 30, 2016 | ||||
| Shares | Value | |||
| INVESTMENTS IN SECURITIES SOLD SHORT* - (10.6) % | ||||
| COMMON STOCK - (10.6) % | ||||
| AUTO MANUFACTURERS - (2.5) % | ||||
| (7,706) | Tata Motors Ltd - ADR | $ (267,167) | ||
| ELECTRIC - (2.1) % | ||||
| (8,632) | Korea Electric Power Corp. - ADR | (223,828) | ||
| IRON/STEEL - (2.0 )% | ||||
| (4,710) | POSCO -ADR | (209,595) | ||
| TELECOMMUNICATIONS - (4.0) % | ||||
| (16,972) | China Unicom Hong Kong Ltd. - ADR | (176,678) | ||
| (5,184) | Nippon Telegraph & Telephone Corp. - ADR | (244,063) | ||
| (420,741) | ||||
| TOTAL COMMON STOCK (Proceeds - $1,046,646) | (1,121,331) | |||
| EXCHANGE-TRADED FUND - (0.0) % | ||||
| (10) | United States Natural Gas Fund LP * | (86) | ||
| TOTAL EXCHANGE-TRADED FUND (Proceeds - $133) | ||||
| TOTAL INVESTMENTS IN SECURITIES SOLD SHORT (10.5%) (Proceeds - $1,046,779) | (1,121,417) | |||
| ADR - American Depositary Receipt. | ||||
| LP - Limited Partnership. | ||||
| * Non-income producing security. | ||||
| ** The rate shown represents the rate at June 30, 2016 and is subject to change daily. | ||||
| (a) All or a portion of the security is segregated as collateral for securities sold short at June 30, 2016. | ||||
| (b) Represent cost for financial reporting purposes. Aggregate cost for federal tax purposes, including short sales, is $9,101,510 and differs from market value by new unrealized appreciation (depreciation) of securities as follows: | ||||
| Unrealized appreciation: | $ 931,202 | |||
| Unrealized depreciation: | (494,035) | |||
| Net unrealized appreciation: | $ 437,167 | |||
The accompanying notes are an integral part of these financial statements.
| 29 |
| AmericaFirst Tactical Alpha Fund (Formerly AmericaFirst Absolute Return Fund) | ||||
| June 30, 2016 | ||||
| The Fund’s holdings were divided among the following economic sectors (Unaudited): | ||||
| Value | Percentage | |||
| REITS | $ 1,460,567 | 15.3% | ||
| EXCHANGE-TRADED FUNDS, NET | 1,381,110 | 14.5% | ||
| CHEMICALS | 970,095 | 10.2% | ||
| ENGINEERING & CONSTRUCTION | 890,644 | 9.3% | ||
| DIVERSIFIED FINANCIAL SERVICES | 744,914 | 7.8% | ||
| PACKAGING & CONTAINERS | 676,342 | 7.1% | ||
| BEVERAGES | 646,437 | 6.8% | ||
| INSURANCE | 565,990 | 5.9% | ||
| OIL & GAS | 547,879 | 5.7% | ||
| RETAIL | 494,544 | 5.2% | ||
| HOME FURNISHINGS | 279,372 | 2.9% | ||
| TRANSPORTATION | 257,550 | 2.7% | ||
| ELECTRONICS | 235,939 | 2.5% | ||
| METAL FABRICATION | 233,323 | 2.4% | ||
| INTERNET | 212,440 | 2.2% | ||
| MANUFACTURING | 194,162 | 2.0% | ||
| MONEY MARKET FUND | 185,583 | 1.9% | ||
| ELECTRIC, NET | 35,316 | 0.4% | ||
| TELECOMMUNICATIONS, NET | 3,232 | 0.0% | ||
| IRON/STEEL | (209,595) | -2.2% | ||
| AUTO MANUFACTURERS | (267,167) | -2.8% | ||
| Total Portfolio Holdings | $ 9,538,677 | 100.0% | ||
| The percentages in the above table are based on market value of the Fund's portfolio holdings as of June 30, 2016 and are subject to change. | ||||
The accompanying notes are an integral part of these financial statements.
| 30 |
| AmericaFirst Quantitative Strategies Fund | |||||
| SCHEDULE OF INVESTMENTS | |||||
| June 30, 2016 | |||||
| Shares | Value | ||||
| COMMON STOCK - 72.0 % | |||||
| AIRLINES - 1.9 % | |||||
| 80,929 | American Airlines Group, Inc. * | $ 40,465 | |||
| 17,132 | American Airlines Group, Inc. (a) | 485,007 | |||
| 525,472 | |||||
| BIOTECHNOLOGY - 4.3 % | |||||
| 1,669 | Biogen, Inc. * | 403,598 | |||
| 4,620 | Gilead Sciences, Inc. | 385,400 | |||
| 3,848 | United Therapeautics Corp. * | 407,580 | |||
| 1,196,578 | |||||
| COMPUTERS - 1.2 % | |||||
| 12,905 | NetApp, Inc. (a) | 317,334 | |||
| DIVERSIFIED FINANCIAL SERVICES - 3.7 % | |||||
| 5,691 | American Express Co. (a) | 345,785 | |||
| 6,770 | Discover Financial Services (a) | 362,804 | |||
| 8,699 | Nelnet Inc. | 302,290 | |||
| 1,010,879 | |||||
| ELECTRIC - 6.7 % | |||||
| 25,320 | Atlantica Yield PLC | 470,446 | |||
| 29,173 | Dynegy, Inc. * | 502,942 | |||
| 12,072 | First Energy Corp. | 421,433 | |||
| 12,879 | PNM Resources, Inc. | 456,432 | |||
| 1,851,253 | |||||
| ELECTRONICS - 5.0 % | |||||
| 29,605 | GoPro, Inc. * | 320,030 | |||
| 14,910 | Sanmina Corp. * (a) | 399,737 | |||
| 9,119 | Tech Data Corp. * | 655,200 | |||
| 1,374,967 | |||||
| ENGINEERING & CONSTRUCTION - 1.3 % | |||||
| 3,410 | SBA Communications Corp. * | 368,075 | |||
| FOOD - 6.9 % | |||||
| 8,352 | Cal-Maine Foods, Inc. (a) | 370,161 | |||
| 3,953 | Ingredion, Inc. | 511,558 | |||
| 6,167 | Post Holdings, Inc. * (a) | 509,949 | |||
| 4,890 | TreeHouse Foods, Inc. * (a) | 501,959 | |||
| 1,893,627 | |||||
| GAS - 1.8 % | |||||
| 8,660 | National Fuel Gas Co. (a) | 492,581 | |||
| HEALTHCARE-PRODUCTS - 1.5 % | |||||
| 6,280 | LifePoint Health, Inc. * | 410,524 | |||
| HOME FURNISHINGS - 1.4 % | |||||
| 17,731 | Select Comfort Corp. * | 379,089 | |||
| INSURANCE - 5.3 % | |||||
| 27,807 | Assured Guaranty Ltd. | 705,464 | |||
| 1,745 | Everest Re Group Ltd. (a) | 318,759 | |||
| 7,856 | Primerica, Inc. | 449,677 | |||
| 1,473,900 | |||||
| INTERNET - 2.4 % | |||||
| 3,295 | F5 Networks, Inc. * | 375,103 | |||
| 88,717 | Groupon, Inc. * | 288,330 | |||
| 663,433 | |||||
The accompanying notes are an integral part of these financial statements.
| 31 |
| AmericaFirst Quantitative Strategies Fund | |||||
| SCHEDULE OF INVESTMENTS (Continued) | |||||
| June 30, 2016 | |||||
| Shares | Value | ||||
| OIL & GAS - 4.0 % | |||||
| 6,911 | Tesoro Corp. (a) | $ 517,772 | |||
| 11,321 | Valero Energy Corp. | 577,371 | |||
| 1,095,143 | |||||
| RETAIL - 14.2 % | |||||
| 42,921 | American Eagle Outfitters, Inc. | 683,731 | |||
| 22,218 | Best Buy Co. | 679,871 | |||
| 15,761 | Big Lots, Inc. | 789,784 | |||
| 4,187 | Childrens Place, Inc. | 335,714 | |||
| 16,644 | Finish Line, Inc. | 336,042 | |||
| 11,173 | Nu Skin Enterprises, Inc. (a) | 516,081 | |||
| 20,798 | Urban Outfitters, Inc. * | 571,945 | |||
| 3,913,168 | |||||
| TECHNOLOGY - 3.7 % | |||||
| 32,061 | Allscripts Healthcare Solutions, Inc. * | 407,175 | |||
| 11,227 | CA, Inc. | 368,582 | |||
| 4,480 | Synaptics, Inc. * | 240,800 | |||
| 1,016,557 | |||||
| TELECOMMUNICATIONS- 6.7 % | |||||
| 4,474 | ATN International, Inc. | 348,122 | |||
| 10,447 | CenturyLink, Inc. | 303,067 | |||
| 6,557 | Level 3 Communications, Inc. * | 337,620 | |||
| 12,566 | Shenandoah Telecommunications Co. (a) | 490,828 | |||
| 6,443 | Verizon Communications, Inc. | 359,777 | |||
| 1,839,414 | |||||
| TOTAL COMMON STOCK (Cost - $20,528,595) | 19,821,994 | ||||
| EXCHANGE-TRADED NOTE - 3.2 % | |||||
| 18,989 | iPath Bloomberg Sugar Subindex Total Return ETN * | 889,255 | |||
| TOTAL EXCHANGE-TRADED NOTE (Cost - $676,599) | 889,255 | ||||
| EXCHANGE-TRADED FUNDS - 17.5 % | |||||
| 30,000 | iShares 20+ Year Treasury Bond ETF (a) | 4,167,000 | |||
| 56,331 | United States Oil Fund LP * (a) | 651,750 | |||
| TOTAL EXCHANGE-TRADED FUNDS (Cost - $4,697,086) | 4,818,750 | ||||
| REAL ESTATE INVESTMENT TRUSTS - 7.2 % | |||||
| 7,469 | American Campus Communities, Inc. | 394,886 | |||
| 8,426 | DuPont Fabros Technology, Inc. | 400,572 | |||
| 7,524 | National Retail Properties, Inc. | 389,141 | |||
| 18,971 | Physicians Realty Trust | 398,581 | |||
| 13,600 | STORE Capital Corp. | 400,520 | |||
| TOTAL REAL ESTATE INVESTMENT TRUSTS (Cost - $1,739,214) | 1,983,700 | ||||
The accompanying notes are an integral part of these financial statements.
| 32 |
| AmericaFirst Quantitative Strategies Fund | |||||
| SCHEDULE OF INVESTMENTS (Continued) | |||||
| June 30, 2016 | |||||
| Shares | Value | ||||
| SHORT-TERM INVESTMENTS - 0.6 % | |||||
| MONEY MARKET FUND - 0.6 % | |||||
| 166,318 | Dreyfus Cash Management, Institutional Shares, 0.30% ** | $ 166,318 | |||
| TOTAL SHORT-TERM INVESTMENTS (Cost - $166,318) | |||||
| TOTAL INVESTMENTS IN SECURITIES HELD LONG - 100.5 % (Cost - $27,807,812) (b) | $ 27,680,017 | ||||
| TOTAL INVESTMENTS IN SECURITIES SOLD SHORT - (15.2) % (Proceeds - $3,772,543) (b) | (4,179,538) | ||||
| OTHER ASSETS LESS LIABILITIES - 14.7 % | 4,053,452 | ||||
| NET ASSETS - 100.0 % | $ 27,553,931 | ||||
| INVESTMENTS IN SECURITIES SOLD SHORT* - (15.2) % | |||||
| COMMON STOCK - (6.9) % | |||||
| ELECTRIC - (1.8) % | |||||
| (32,219) | NRG Energy, Inc. | (482,963) | |||
| HEALTHCARE-PRODUCTS - (1.4) % | |||||
| (5,591) | STERIS PLC | (384,381) | |||
| MINING - (2.1) % | |||||
| (39,216) | Tahoe Resources, Inc. | (587,064) | |||
| OIL & GAS - (1.6) % | |||||
| (8,136) | Royal Dutch Shell PLC - ADR | (449,270) | |||
| TOTAL COMMON STOCK (Proceeds - $1,574,917) | (1,903,678) | ||||
| EXCHANGE-TRADED NOTES - (5.1) % | |||||
| (34,000) | iPath Bloomberg Coffee Subindex Total Return ETN * | (753,100) | |||
| (59,000) | iPath S&P 500 VIX Mid-Term Futures ETN * | (636,610) | |||
| EXCHANGE-TRADED NOTES (Proceeds - $1,396,058) | (1,389,710) | ||||
| REAL ESTATE INVESTMENT TRUSTS (3.2) % | |||||
| (21,500) | American Capital Agency Corp. | (426,130) | |||
| (28,050) | Hatteras Financial Corp. | (460,020) | |||
| TOTAL REAL ESTATE INVESTMENT TRUSTS (Proceeds - $801,568) | (886,150) | ||||
| TOTAL INVESTMENTS IN SECURITIES SOLD SHORT (Proceeds - $3,772,543) | (4,179,538) | ||||
| ADR - American Depositary Receipt. | |||||
| LP - Limited Partnership. | |||||
| PLC - Public Limited Company. | |||||
| ETF - Exchange Traded Fund. | |||||
| ETN - Exchange Traded Note. | |||||
| * Non-income producing security. | |||||
| ** The rate shown represents the rate at June 30, 2016 and is subject to change daily. | |||||
| (a) All or a portion of the security is segregated as collateral for securities sold short at June 30, 2016. | |||||
| (b) Represents cost for financial reporting purposes. Aggregate cost for federal tax purposes, including short sales, is $24,827,404 and differs from market value by net unrealized appreciation (depreciation) of securities as follows: | |||||
| Unrealized appreciation: | $ 1,998,012 | ||||
| Unrealized depreciation: | (3,324,937) | ||||
| Net unrealized depreciation: | $ (1,326,925) | ||||
The accompanying notes are an integral part of these financial statements.
| 33 |
| AmericaFirst Quantitative Strategies Fund | |||||
| June 30, 2016 | |||||
| The Fund’s holdings were divided among the following economic sectors (Unaudited): | |||||
| Value | Percentage | ||||
| EXCHANGE-TRADED FUNDS | $ 4,818,750 | 20.5% | |||
| RETAIL | 3,913,168 | 16.7% | |||
| FOOD | 1,893,627 | 8.1% | |||
| TELECOMMUNICATIONS | 1,839,414 | 7.8% | |||
| INSURANCE | 1,473,900 | 6.3% | |||
| ELECTRONICS | 1,374,967 | 5.9% | |||
| ELECTRIC, NET | 1,368,290 | 5.8% | |||
| BIOTECHNOLOGY | 1,196,578 | 5.1% | |||
| REAL ESTATE INVESTMENT TRUSTS, NET | 1,097,550 | 4.7% | |||
| TECHNOLOGY | 1,016,557 | 4.3% | |||
| DIVERSIFIED FINANCIAL SERVICES | 1,010,879 | 4.3% | |||
| INTERNET | 663,433 | 2.8% | |||
| OIL & GAS, NET | 645,873 | 2.8% | |||
| AIRLINES | 525,472 | 2.2% | |||
| GAS | 492,581 | 2.1% | |||
| HOME FURNISHINGS | 379,089 | 1.6% | |||
| ENGINEERING & CONSTRUCTION | 368,075 | 1.6% | |||
| COMPUTERS | 317,334 | 1.4% | |||
| MONEY MARKET FUND | 166,318 | 0.7% | |||
| HEALTHCARE-PRODUCTS | 26,143 | 0.1% | |||
| MINING | (587,064) | -2.5% | |||
| EXCHANGE-TRADED NOTES, NET | (500,455) | -2.1% | |||
| Total Portfolio Holdings | $ 23,500,479 | 100.0% | |||
| The percentages in the above table are based on market value of the Fund's portfolio holdings as of June 30, 2016 and are subject to change. | |||||
The accompanying notes are an integral part of these financial statements.
| 34 |
| AmericaFirst Seasonal Trends Fund | ||||
| SCHEDULE OF INVESTMENTS | ||||
| June 30, 2016 | ||||
| Principal | Value | |||
| BONDS & NOTES - 93.7 % | ||||
| CORPORATE BONDS - 25.9 % | ||||
| BANKS - 17.7 % | ||||
| $ 775,000 | Credit Suisse Nassau, 4.00%, 4/28/31 | $ 783,733 | ||
| 800,000 | HSBC Holdings PLC, 4.25%, 3/14/24 | 810,748 | ||
| 1,594,481 | ||||
| COMPUTERS - 8.2 % | ||||
| 775,000 | EMC Corp., 2.65%, 6/1/20 | 740,178 | ||
| TOTAL CORPORATE BONDS (Cost - $2,311,589) | 2,334,659 | |||
| GOVERNMENT BONDS - 67.8 % | ||||
| AGENCY - 19.1% | ||||
| 1,000,000 | Fannie Mae, 2.125%, 4/24/26 | 1,028,418 | ||
| 685,000 | Fannie Mae, 2.375%, 7/9/27 | 687,400 | ||
| 1,715,818 | ||||
| SOVEREIGN - 48.7 % | ||||
| 1,000,000 | U.S. Treasury Bond, 7.625%, 2/15/25 | 1,508,847 | ||
| 1,000,000 | U.S. Treasury Bond, 6.75%, 8/15/26 | 1,498,086 | ||
| 900,000 | U.S. Treasury Bond, 6.125%, 8/15/29 | 1,377,387 | ||
| 4,384,320 | ||||
| TOTAL GOVERNMENT BONDS (Cost - $5,972,675) | 6,100,138 | |||
| TOTAL BONDS & NOTES (Cost - $8,284,264) | 8,434,797 | |||
| Shares | SHORT-TERM INVESTMENT - 5.1 % | |||
| MONEY MARKET FUND - 5.1 % | ||||
| 457,060 | Dreyfus Cash Management, Institutional Shares - 0.30% * | 457,060 | ||
| TOTAL SHORT-TERM INVESTMENT (Cost - $457,060) | ||||
| TOTAL INVESTMENTS - 98.8 % (Cost - $8,741,324) (a) | $ 8,891,857 | |||
| OTHER ASSETS LESS LIABILITIES - 1.2 % | 109,397 | |||
| NET ASSETS - 100.0% | $ 9,001,254 | |||
| * The rate shown represents the rate at June 30, 2016 and is subject to change daily. | ||||
| (a) Represents cost for financial reporting purposes. Aggregate cost for federal tax purposes is $8,741,324 and differs from market value by net unrealized appreciation (depreciation) of securities as follows: | ||||
| Unrealized appreciation: | $ 150,679 | |||
| Unrealized depreciation: | (146) | |||
| Net unrealized appreciation | $ 150,533 | |||
| The Fund’s holdings were divided among the following economic sectors (Unaudited): | ||||
| Value | Percentage | |||
| SOVEREIGN BONDS | $ 4,384,320 | 49.3% | ||
| AGENCY BONDS | 1,715,818 | 19.3% | ||
| BANKS | 1,594,481 | 17.9% | ||
| COMPUTERS | 740,178 | 8.3% | ||
| MONEY MARKET FUND | 457,060 | 5.1% | ||
| Total Portfolio Holdings | $ 8,891,857 | 100.0% | ||
| The percentages in the above table are based on market value of the Fund's portfolio holdings as of June 30, 2016 and are subject to change. | ||||
The accompanying notes are an integral part of these financial statements.
| 35 |
| AmericaFirst Quantitative Funds | ||||||||||
| Statements of Assets and Liabilities | ||||||||||
| June 30, 2016 | ||||||||||
| Defensive Growth Fund | Income Trends Fund | Tactical Alpha Fund* | Quantitative Strategies Fund | Seasonal Trends Fund | ||||||
| ASSETS: | ||||||||||
| Investments in securities, at value: | $ 91,947,070 | $ 16,296,668 | $ 10,660,094 | $ 27,680,017 | $ 8,891,857 | |||||
| Cash | 561,866 | - | - | - | - | |||||
| Foreign Currency, at value | - | - | - | 607,245 | - | |||||
| Deposit at broker for securities sold short | 22,669,344 | 1,325,390 | 1,300,340 | 3,083,678 | 23,697 | |||||
| Receivables: | ||||||||||
| Capital shares sold | 167,763 | - | - | 100 | - | |||||
| Securities sold | 8,666 | 369,030 | - | 722,433 | - | |||||
| Dividends | 104,606 | 27,597 | 29,194 | 29,948 | 1,312 | |||||
| Interest | 240 | 76,306 | 20 | 56 | 103,662 | |||||
| Due from manager | - | 9,381 | 1,557 | 2,303 | - | |||||
| Prepaid expenses | 34,380 | 28,267 | 32,164 | 25,118 | 15,870 | |||||
| Total assets | 115,493,935 | 18,132,639 | 12,023,369 | 32,150,898 | 9,036,398 | |||||
| LIABILITIES: | ||||||||||
| Securities sold short, at value | 22,577,235 | 1,680,630 | 1,121,417 | 4,179,538 | - | |||||
| Payables: | ||||||||||
| Distribution and/or service (12b-1) fees | 15,975 | 3,411 | 4,946 | 18,134 | 2,857 | |||||
| Due to manager | 7,300 | - | - | - | 1,115 | |||||
| Securities purchased | - | - | - | 313,782 | - | |||||
| Due to custodian | - | - | 257,643 | 2,343 | - | |||||
| Capital shares redeemed | 129,162 | 134,212 | - | 7,249 | 4,901 | |||||
| Dividends on securities sold short | - | 13,500 | 3,273 | 24,570 | - | |||||
| Payable to related parties | 9,043 | 4,252 | 4,213 | 5,854 | 4,710 | |||||
| Commissions Payable | - | - | - | 12,223 | ||||||
| Other liabilities and accrued expenses | 83,453 | 30,014 | 17,596 | 33,274 | 21,561 | |||||
| Total liabilities | 22,822,168 | 1,866,019 | 1,409,088 | 4,596,967 | 35,144 | |||||
| NET ASSETS | $ 92,671,767 | $ 16,266,620 | $ 10,614,281 | $ 27,553,931 | $ 9,001,254 | |||||
| Investments in securities, at cost | $ 88,694,018 | $ 15,931,123 | $ 10,126,924 | $ 27,807,812 | $ 8,741,324 | |||||
| Securities sold short, at proceeds | (18,499,110) | (1,469,280) | (1,046,779) | (3,772,543) | - | |||||
| Foreign currency, at cost | - | - | - | 603,064 | - | |||||
| NET ASSETS CONSIST OF: | ||||||||||
| Paid-in capital | $ 94,352,484 | $ 26,705,893 | $ 16,069,055 | $ 37,271,060 | $ 10,205,763 | |||||
| Undistributed/accumulated net investment income (loss) | (18,664) | 13,108 | (76,929) | 399,314 | (6,999) | |||||
| Accumulated net realized loss | (837,176) | (10,606,576) | (5,847,400) | (9,585,834) | (1,347,987) | |||||
| Net unrealized appreciation (depreciation) on investments and foreign currency | (824,877) | 154,195 | 469,555 | (530,609) | 150,477 | |||||
| NET ASSETS | $ 92,671,767 | $ 16,266,620 | $ 10,614,281 | $ 27,553,931 | $ 9,001,254 | |||||
| * | Formerly known as AmericaFirst Absolute Return Fund |
The accompanying notes are an integral part of these financial statements.
| 36 |
| AmericaFirst Quantitative Funds | ||||||||||
| Statements of Assets and Liabilities (Continued) | ||||||||||
| June 30, 2016 | ||||||||||
| Defensive Growth Fund | Income Trends Fund | Tactical Alpha Fund* | Quantitative Strategies Fund | Seasonal Trends Fund | ||||||
| Net Asset Value Per Share | ||||||||||
| Class A Shares | ||||||||||
| Net Assets | $ 31,272,662 | $ 7,821,292 | $ 6,044,703 | $ 12,287,551 | $ 2,758,960 | |||||
| Shares of Beneficial Interest Outstanding (no par value; unlimited shares authorized) | 2,766,370 | 1,166,614 | 509,339 | 2,287,747 | 273,594 | |||||
| Net Asset Value per share | $ 11.30 | $ 6.70 | $ 11.87 | $ 5.37 | $ 10.08 | |||||
| Maximum offering price per share (maximum sales load of 5%, 4%, 5%, 4% and 5%, respectively) | $ 11.89 | $ 6.98 | $ 12.49 | $ 5.59 | $ 10.61 | |||||
| Minimum redemption price per share (1) | $ 11.19 | $ 6.63 | $ 11.75 | $ 5.32 | $ 9.98 | |||||
| Class I Shares | ||||||||||
| Net Assets | $ 44,160,823 | $ 2,780,613 | $ 307,507 | $ 41,066 | $ 3,736,750 | |||||
| Shares of Beneficial Interest Outstanding (no par value; unlimited shares authorized) | 3,723,900 | 410,168 | 24,858 | 7,708 | 369,921 | |||||
| Net Asset Value and offering price per share | $ 11.86 | $ 6.78 | $ 12.37 | $ 5.33 | $ 10.10 | |||||
| Minimum redemption price per share (3) | $ 11.74 | $ 6.71 | $ 12.25 | $ 5.27 | $ 10.00 | |||||
| Class U Shares | ||||||||||
| Net Assets | $ 17,238,282 | $ 5,664,715 | $ 4,262,071 | $ - | $ 2,505,544 | |||||
| Shares of Beneficial Interest Outstanding (no par value; unlimited shares authorized) | 1,572,528 | 844,806 | 369,823 | - | 251,038 | |||||
| Net Asset Value per share | $ 10.96 | $ 6.71 | $ 11.52 | $ - | $ 9.98 | |||||
| Maximum offering price per share (maximum sales load of 2.50%, 2.00%, 2.50%, 0% and 2.50%, respectively) | $ 11.24 | $ 6.85 | $ 11.82 | $ - | $ 10.24 | |||||
| Minimum redemption price per share (1) | $ 10.85 | $ 6.64 | $ 11.40 | $ - | $ 9.88 | |||||
| Class C Shares | ||||||||||
| Net Assets | $ - | $ - | $ - | $ 15,225,314 | $ - | |||||
| Shares of Beneficial Interest Outstanding (no par value; unlimited shares authorized) | - | - | - | 2,844,059 | - | |||||
| Net Asset Value per share | $ - | $ - | $ - | $ 5.35 | $ - | |||||
| Maximum offering price per share (maximum sales load of 0%, 0%, 0% 1%, and 0% respectively) | $ - | $ - | $ - | $ 5.41 | $ - | |||||
| Minimum redemption price per share (2)(3) | $ - | $ - | $ - | $ 5.30 | $ - | |||||
| (1) | Investment in Class A and Class U shares made at or above the $1 million breakpoint are not subject to an initial sales charge and may be subject to a 1% contingent deferred sales |
| charge ("CDSC") on shares redeemed less than one year after the date of purchase (excluding shares purchased with reinvested dividends and/or distributions). | |
| The Fund charges a fee of 1.00% on redemptions of shares held less than 90 days. | |
| (2) | A CDSC of 1.00% is imposed in the event of certain redemption transactions of Class C shares less than one year after the date of purchase (excluding shares purchased with |
| reinvested dividends and/or distributions). | |
| (3) | The Fund charges a fee of 1.00% on redemptions of shares held less than 90 days. |
| * | Formerly known as AmericaFirst Absolute Return Fund |
The accompanying notes are an integral part of these financial statements.
| 37 |
| AmericaFirst Quantitative Funds | ||||||||||
| Statements of Operations | ||||||||||
| For the Year Ended June 30, 2016 | ||||||||||
| Defensive Growth Fund | Income Trends Fund | Tactical Alpha Fund* | Quantitative Strategies Fund | Seasonal Trends Fund | ||||||
| INVESTMENT INCOME: | ||||||||||
| Dividend income (net of foreign withholding taxes of $218, $3,049, $3,085, $1,886, and $0, respectively) | $ 1,736,082 | $ 942,239 | $ 205,751 | $ 1,025,122 | $ 98,177 | |||||
| Interest income | 2,893 | 365,375 | 280 | 284,545 | 189,263 | |||||
| Total investment income | 1,738,975 | 1,307,614 | 206,031 | 1,309,667 | 287,440 | |||||
| EXPENSES: | ||||||||||
| Management fees | 1,255,606 | 263,351 | 178,516 | 423,273 | 182,375 | |||||
| Distribution and/or service (12b-1) fees - Class A | 132,777 | 42,352 | 32,403 | 47,996 | 15,339 | |||||
| Distribution and/or service (12b-1) fees - Class C | - | - | - | 230,496 | - | |||||
| Distribution and/or service (12b-1) fees - Class U | 155,087 | 78,510 | 48,032 | - | 28,444 | |||||
| Administrator and related party fees | 82,238 | 64,290 | 65,475 | 75,404 | 69,652 | |||||
| Interest expense | 256,653 | 5,885 | 74,636 | 34,238 | 4,134 | |||||
| Dividend expenses | 224,391 | 72,607 | 59,679 | 111,852 | 7,012 | |||||
| Legal fees | 78,798 | 21,181 | 11,030 | 42,600 | 12,242 | |||||
| Registration fees | 49,401 | 45,664 | 45,659 | 41,712 | 30,094 | |||||
| Printing fees | 38,711 | 20,689 | 5,588 | 16,799 | 4,324 | |||||
| Custody fees | 17,475 | 10,616 | 12,491 | 16,700 | 9,018 | |||||
| Compliance officer compensation | 16,045 | 16,159 | 16,157 | 16,159 | 16,159 | |||||
| Trustees' fees | 13,643 | 3,031 | 2,358 | 6,630 | 376 | |||||
| Audit and tax fees | 13,538 | 13,538 | 13,538 | 13,538 | 13,538 | |||||
| Insurance fees | 8,064 | 3,129 | 1,161 | 8,186 | 2,583 | |||||
| Miscellaneous | 65,204 | 22,991 | 4,690 | 29,433 | 10,154 | |||||
| Total expenses | 2,407,631 | 683,993 | 571,413 | 1,115,016 | 405,444 | |||||
| Less: fees waived | (218,979) | (153,552) | (129,521) | (153,271) | (115,708) | |||||
| Net expenses | 2,188,652 | 530,441 | 441,892 | 961,745 | 289,736 | |||||
| Net investment income (loss) | (449,677) | 777,173 | (235,861) | 347,922 | (2,296) | |||||
| Legal fees incurred outside expense limitation agreement | 78,838 | 15,574 | 8,651 | 30,381 | 9,165 | |||||
| Net investment income (loss) (after fees outside expense limitation) | (528,515) | 761,599 | (244,512) | 317,541 | (11,461) | |||||
| REALIZED AND UNREALIZED GAIN (LOSS) ON INVESTMENTS: | ||||||||||
| Net realized gain (loss) on: | ||||||||||
| Investments and foreign currency transactions | (641,152) | (4,053,561) | (992,008) | (7,261,650) | (1,155,623) | |||||
| Securities sold short | 624,825 | (78,908) | 258,731 | (162,915) | 37,170 | |||||
| Change in net unrealized appreciation (depreciation) on: | ||||||||||
| Investments and translation of assets and liabilities in foreign currencies | (1,716,789) | 915,787 | 1,121,493 | 2,447,074 | 504,413 | |||||
| Securities sold short | (1,741,265) | (211,350) | (81,426) | (406,995) | - | |||||
| Net realized and unrealized gain (loss) on investments | (3,474,381) | (3,428,032) | 306,790 | (5,384,486) | (614,040) | |||||
| NET INCREASE (DECREASE) IN NET ASSETS RESULTING FROM OPERATIONS | $ (4,002,896) | $ (2,666,433) | $ 62,278 | $ (5,066,945) | $ (625,501) | |||||
| * Formerly known as AmericaFirst Absolute Return Fund | ||||||||||
The accompanying notes are an integral part of these financial statements.
| 38 |
| AmericaFirst Quantitative Funds | ||||||||||
| Statements of Changes in Net Assets | ||||||||||
| Defensive Growth Fund | Income Trends Fund | |||||||||
| Year | Year | Year | Year | |||||||
| Ended | Ended | Ended | Ended | |||||||
| June 30, 2016 | June 30, 2015 | June 30, 2016 | June 30, 2015 | |||||||
| INCREASE (DECREASE) IN NET ASSETS | ||||||||||
| OPERATIONS: | ||||||||||
| Net investment income (loss) | $ (528,515) | $ (300,359) | $ 761,599 | $ 1,011,022 | ||||||
| Net realized gain (loss) on investments, foreign currency transactions and securities sold short | (16,327) | 3,282,107 | (4,132,469) | (2,154,995) | ||||||
| Change in net unrealized appreciation (depreciation) on investments, translation of assets and liabilities in foreign currencies and securities sold short | (3,458,054) | 1,141,606 | 704,437 | (898,949) | ||||||
| Net increase (decrease) in net assets resulting from operations | (4,002,896) | 4,123,354 | (2,666,433) | (2,042,922) | ||||||
| DISTRIBUTIONS TO SHAREHOLDERS FROM: | ||||||||||
| Net realized gain - Class A | (190,089) | (1,816,351) | - | - | ||||||
| Net realized gain - Class I | (266,302) | (2,788,172) | - | - | ||||||
| Net realized gain - Class U | (103,292) | (1,164,901) | - | - | ||||||
| Net investment income - Class A | - | - | (260,596) | (296,157) | ||||||
| Net investment income - Class I | - | - | (142,326) | (181,641) | ||||||
| Net investment income - Class U | - | - | (215,684) | (246,920) | ||||||
| Return of capital - Class A | - | - | (332,895) | (715,961) | ||||||
| Return of capital - Class I | - | - | (181,811) | (439,116) | ||||||
| Return of capital - Class U | - | - | (275,523) | (596,929) | ||||||
| Total distributions to shareholders | (559,683) | (5,769,424) | (1,408,835) | (2,476,724) | ||||||
| CAPITAL SHARE TRANSACTIONS: | ||||||||||
| Class A Shares | ||||||||||
| Proceeds from shares sold | 18,840,714 | 12,277,208 | 2,442,296 | 3,158,464 | ||||||
| Reinvestment of distributions | 155,248 | 1,553,487 | 370,156 | 734,964 | ||||||
| Cost of shares redeemed | (7,178,549) | (5,952,149) | (4,823,457) | (5,896,049) | ||||||
| Redemption fees | 4,952 | 3,348 | 193 | 1,693 | ||||||
| Total Class A Transactions | 11,822,365 | 7,881,894 | (2,010,812) | (2,000,928) | ||||||
| Class I | ||||||||||
| Proceeds from shares sold | 28,383,866 | 29,097,335 | 213,258 | 1,340,641 | ||||||
| Reinvestment of distributions | 232,928 | 1,934,117 | 237,194 | 513,460 | ||||||
| Cost of shares redeemed | (16,128,857) | (10,988,670) | (3,212,248) | (9,418,316) | ||||||
| Redemption fees | 7,111 | 5,306 | 83 | 1,013 | ||||||
| Total Class I Transactions | 12,495,048 | 20,048,088 | (2,761,713) | (7,563,202) | ||||||
| Class U | ||||||||||
| Proceeds from shares sold | 8,948,077 | 5,718,916 | 370,331 | 2,305,949 | ||||||
| Reinvestment of distributions | 99,180 | 1,112,914 | 336,603 | 607,013 | ||||||
| Cost of shares redeemed | (4,519,777) | (1,769,656) | (4,016,751) | (5,101,719) | ||||||
| Redemption fees | 2,769 | 2,216 | 134 | 1,510 | ||||||
| Total Class U Transactions | 4,530,249 | 5,064,390 | (3,309,683) | (2,187,247) | ||||||
| Net increase (decrease) from capital share transactions | 28,847,662 | 32,994,372 | (8,082,208) | (11,751,377) | ||||||
| TOTAL INCREASE (DECREASE) IN NET ASSETS | 24,285,083 | 31,348,302 | (12,157,476) | (16,271,023) | ||||||
| NET ASSETS: | ||||||||||
| Beginning of year | 68,386,684 | 37,038,382 | 28,424,096 | 44,695,119 | ||||||
| End of year** | $ 92,671,767 | $ 68,386,684 | $ 16,266,620 | $ 28,424,096 | ||||||
| ** Includes undistributed/accumulated net investment income (loss) of: | $ (18,664) | $ - | $ 13,108 | $ (26,400) | ||||||
The accompanying notes are an integral part of these financial statements.
| 39 |
| AmericaFirst Quantitative Funds | ||||||||||
| Statements of Changes in Net Assets (Continued) | ||||||||||
| Defensive Growth Fund | Income Trends Fund | |||||||||
| Year | Year | Year | Year | |||||||
| Ended | Ended | Ended | Ended | |||||||
| June 30, 2016 | June 30, 2015 | June 30, 2016 | June 30, 2015 | |||||||
| SHARE ACTIVITY: | ||||||||||
| Class A | ||||||||||
| Shares sold | 1,626,603 | 1,011,066 | 339,898 | 358,340 | ||||||
| Reinvested distributions | 13,595 | 134,969 | 50,553 | 84,698 | ||||||
| Shares redeemed | (628,544) | (494,641) | (638,189) | (683,951) | ||||||
| Net increase (decrease) | 1,011,654 | 651,394 | (247,738) | (240,913) | ||||||
| Class I | ||||||||||
| Shares sold | 2,360,141 | 2,321,256 | 28,593 | 153,662 | ||||||
| Reinvested distributions | 19,541 | 162,668 | 31,615 | 58,762 | ||||||
| Shares redeemed | (1,359,949) | (884,423) | (429,023) | (1,054,829) | ||||||
| Net increase (decrease) | 1,019,733 | 1,599,501 | (368,815) | (842,405) | ||||||
| Class U | ||||||||||
| Shares sold | 798,808 | 486,582 | 48,582 | 265,458 | ||||||
| Reinvested distributions | 8,927 | 98,926 | 45,615 | 69,974 | ||||||
| Shares redeemed | (406,190) | (150,009) | (542,557) | (594,829) | ||||||
| Net increase (decrease) | 401,545 | 435,499 | (448,360) | (259,397) | ||||||
The accompanying notes are an integral part of these financial statements.
| 40 |
| AmericaFirst Quantitative Funds | ||||||||||||||||
| Statements of Changes in Net Assets (Continued) | ||||||||||||||||
| Tactical Alpha Fund** | Quantitative Strategies Fund | Seasonal Trends Fund | ||||||||||||||
| Year | Year | Year | Year | Year | Year | |||||||||||
| Ended | Ended | Ended | Ended | Ended | Ended | |||||||||||
| June 30, 2016 | June 30, 2015 | June 30, 2016 | June 30, 2015 | June 30, 2016 | June 30, 2015 | |||||||||||
| DECREASE IN NET ASSETS | ||||||||||||||||
| OPERATIONS: | ||||||||||||||||
| Net investment income (loss) | $ (244,512) | $ (45,813) | $ 317,541 | $ 1,045,904 | $ (11,461) | $ 213,700 | ||||||||||
| Net realized gain (loss) on investments, foreign currency transactions and securities sold short | (733,277) | 901,288 | (7,424,565) | (2,336,052) | (1,118,453) | (173,345) | ||||||||||
| Change in net unrealized appreciation (depreciation) on investments, translation of assets and liabilities in foreign currencies and securities sold short | 1,040,067 | (1,235,378) | 2,040,079 | (3,959,159) | 504,413 | (636,091) | ||||||||||
| Net increase (decrease) in net assets resulting from operations | 62,278 | (379,903) | (5,066,945) | (5,249,307) | (625,501) | (595,736) | ||||||||||
| DISTRIBUTIONS TO SHAREHOLDERS FROM: | ||||||||||||||||
| Net realized gain - Class A | - | - | - | (2,933,920) | - | - | ||||||||||
| Net realized gain - Class C | - | - | - | (2,748,430) | - | - | ||||||||||
| Net investment income - Class A | - | - | (326,660) | (628,951) | (7,244) | (64,859) | ||||||||||
| Net investment income - Class I | - | - | (2,166) | (322) | (71,198) | (128,161) | ||||||||||
| Net investment income - Class U | - | - | - | - | (2,556) | (18,881) | ||||||||||
| Net investment income - Class C | - | - | (90,002) | (412,721) | - | - | ||||||||||
| Total distributions to shareholders | - | - | (418,828) | (6,724,344) | (80,998) | (211,901) | ||||||||||
| CAPITAL SHARE TRANSACTIONS: | ||||||||||||||||
| Class A Shares | ||||||||||||||||
| Proceeds from shares sold | 660,454 | 930,747 | 999,141 | 11,574,533 | 683,291 | 3,242,326 | ||||||||||
| Reinvestment of distributions | - | - | 304,926 | 3,361,659 | 6,605 | 44,115 | ||||||||||
| Cost of shares redeemed | (1,872,943) | (2,234,725) | (14,854,949) | (20,832,036) | (1,790,256) | (9,243,648) | ||||||||||
| Redemption fees | 383 | 719 | 748 | 5,279 | 534 | 5,910 | ||||||||||
| Total Class A Transactions | (1,212,106) | (1,303,259) | (13,550,134) | (5,890,565) | (1,099,826) | (5,951,297) | ||||||||||
| Class I * | ||||||||||||||||
| Proceeds from shares sold | 36,637 | 288,319 | 77,348 | 45,006 | 1,076,094 | 8,777,749 | ||||||||||
| Reinvestment of distributions | - | - | 1,112 | 322 | 32,699 | 113,413 | ||||||||||
| Cost of shares redeemed | (386,446) | (738,066) | (74,873) | - | (6,513,042) | (16,237,945) | ||||||||||
| Redemption fees | - | 72 | - | - | 755 | 8,704 | ||||||||||
| Total Class I Transactions | (349,809) | (449,675) | 3,587 | 45,328 | (5,403,494) | (7,338,079) | ||||||||||
| Class U | ||||||||||||||||
| Proceeds from shares sold | 77,724 | 222,220 | - | - | 615,401 | 540,384 | ||||||||||
| Reinvestment of distributions | - | - | - | - | 2,303 | 18,515 | ||||||||||
| Cost of shares redeemed | (1,819,598) | (1,992,729) | - | - | (1,247,451) | (1,340,104) | ||||||||||
| Redemption fees | - | 625 | - | - | - | 2,367 | ||||||||||
| Total Class U Transactions | (1,741,874) | (1,769,884) | - | - | (629,747) | (778,838) | ||||||||||
| Class C | ||||||||||||||||
| Proceeds from shares sold | - | - | 336,328 | 6,973,043 | - | - | ||||||||||
| Reinvestment of distributions | - | - | 84,813 | 3,037,290 | - | - | ||||||||||
| Cost of shares redeemed | - | - | (14,246,529) | (9,976,009) | - | - | ||||||||||
| Redemption fees | - | - | 28 | 4,901 | - | - | ||||||||||
| Total Class C Transactions | - | - | (13,825,360) | 39,225 | - | - | ||||||||||
| Net decrease from capital share transactions | (3,303,789) | (3,522,818) | (27,371,907) | (5,806,012) | (7,133,067) | (14,068,214) | ||||||||||
| TOTAL DECREASE IN NET ASSETS | (3,241,511) | (3,902,721) | (32,857,680) | (17,779,663) | (7,839,566) | (14,875,851) | ||||||||||
| NET ASSETS: | ||||||||||||||||
| Beginning of year | 13,855,792 | 17,758,513 | 60,411,611 | 78,191,274 | 16,840,820 | 31,716,671 | ||||||||||
| End of year*** | $ 10,614,281 | $ 13,855,792 | $ 27,553,931 | $ 60,411,611 | $ 9,001,254 | $ 16,840,820 | ||||||||||
| *** Includes undistributed/accumulated net investment income (loss) of: | $ (76,929) | $ (267,941) | $ 399,314 | $ 359,511 | $ (6,999) | $ 80,975 | ||||||||||
| * Class I of AmericaFirst Quantitative Strategies Fund commenced operations on December 31, 2014. | ||||||||||||||||
| ** Formerly known as the AmericaFirst Absolute Return Fund | ||||||||||||||||
The accompanying notes are an integral part of these financial statements.
| 41 |
| AmericaFirst Quantitative Funds | ||||||||||||||||
| Statements of Changes in Net Assets (Continued) | ||||||||||||||||
| Tactical Alpha Fund** | Quantitative Strategies Fund | Seasonal Trends Fund | ||||||||||||||
| Year | Year | Year | Year | Year | Year | |||||||||||
| Ended | Ended | Ended | Ended | Ended | Ended | |||||||||||
| June 30, 2016 | June 30, 2015 | June 30, 2016 | June 30, 2015 | June 30, 2016 | June 30, 2015 | |||||||||||
| SHARE ACTIVITY: | ||||||||||||||||
| Class A | ||||||||||||||||
| Shares sold | 58,301 | 77,252 | 175,793 | 1,738,047 | 69,154 | 316,190 | ||||||||||
| Reinvested distributions | - | - | 55,448 | 542,705 | 661 | 4,366 | ||||||||||
| Shares redeemed | (162,955) | (185,375) | (2,690,668) | (3,330,475) | (187,162) | (899,633) | ||||||||||
| Net decrease | (104,654) | (108,123) | (2,459,427) | (1,049,723) | (117,347) | (579,077) | ||||||||||
| Class I * | ||||||||||||||||
| Shares sold | 3,085 | 23,458 | 14,061 | 7,348 | 110,724 | 848,100 | ||||||||||
| Reinvested distributions | - | - | 203 | 53 | 3,438 | 11,190 | ||||||||||
| Shares redeemed | (32,541) | (60,913) | (13,957) | - | (704,787) | (1,586,611) | ||||||||||
| Net increase (decrease) | (29,456) | (37,455) | 307 | 7,401 | (590,625) | (727,321) | ||||||||||
| Class U | ||||||||||||||||
| Shares sold | 6,996 | 18,876 | - | - | 63,310 | 53,246 | ||||||||||
| Reinvested distributions | - | - | - | - | 232 | 1,837 | ||||||||||
| Shares redeemed | (163,131) | (169,155) | - | - | (132,188) | (131,317) | ||||||||||
| Net decrease | (156,135) | (150,279) | - | - | (68,646) | (76,234) | ||||||||||
| Class C | ||||||||||||||||
| Shares sold | - | - | 59,886 | 1,058,265 | - | - | ||||||||||
| Reinvested distributions | - | - | 15,466 | 495,477 | - | - | ||||||||||
| Shares redeemed | - | - | (2,622,390) | (1,617,119) | - | - | ||||||||||
| Net decrease | - | - | (2,547,038) | (63,377) | - | - | ||||||||||
| * Class I of AmericaFirst Quantitative Strategies Fund commenced operations on December 31, 2014. | ||||||||||||||||
| ** Formerly known as the AmericaFirst Absolute Return Fund | ||||||||||||||||
The accompanying notes are an integral part of these financial statements.
| 42 |
| AmericaFirst Defensive Growth Fund | ||||||||||||
| Financial Highlights | ||||||||||||
| For a Fund Share Outstanding Throughout Each Year | ||||||||||||
| Class A | ||||||||||||
| For the Year | For the Year | For the Year | For the Year | For the Year | ||||||||
| Ended | Ended | Ended | Ended | Ended | ||||||||
| June 30, 2016 | June 30, 2015 | June 30, 2014 | June 30, 2013 | June 30, 2012 | ||||||||
| Net asset value, beginning of year | $ 11.99 | $ 12.53 | $ 11.58 | $ 10.70 | $ 9.99 | |||||||
| Investment operations: | ||||||||||||
| Net investment loss (1) | (0.10) | (0.12) | (0.14) | (0.06) | (0.16) | |||||||
| Net legal fees incurred outside expense limitation agreement | (0.01) | - | - | - | - | |||||||
| Net realized and unrealized gain (loss) on investments | (0.50) | 0.97 | 1.96 | 1.72 | 0.92 | |||||||
| Total from investment operations | (0.61) | 0.85 | 1.82 | 1.66 | 0.76 | |||||||
| Distributions from: | ||||||||||||
| Net investment income | - | - | - | (0.07) | - | |||||||
| Net realized gain | (0.08) | (1.39) | (0.87) | (0.71) | (0.05) | |||||||
| Total distributions | (0.08) | (1.39) | (0.87) | (0.78) | (0.05) | |||||||
| Paid in Capital from Redemption Fees | - | (c) | - | (c) | - | (c) | - | (c) | - | |||
| Net asset value, end of year | $ 11.30 | $ 11.99 | $ 12.53 | $ 11.58 | $ 10.70 | |||||||
| Total return (a) | (5.12)% | (3) | 7.23% | 16.22% | 16.35% | 7.64% | ||||||
| Ratios/Supplemental Data | ||||||||||||
| Net assets, end of year (in 000's) | $ 31,273 | $ 21,040 | $ 13,826 | $ 10,754 | $ 5,818 | |||||||
| Ratio of expenses to average net assets:(b) | ||||||||||||
| Before fees waived and expenses absorbed (d) | 3.11% | (2) | 3.18% | 3.59% | 3.38% | 4.06% | ||||||
| After fees waived and expenses absorbed (d) | 3.07% | (2) | 3.13% | 3.33% | 2.92% | 3.43% | ||||||
| Ratio of net investment loss to average net assets:(b) | ||||||||||||
| Before fees waived and expenses absorbed (d) | (1.00)% | (2) | (1.04)% | (1.41)% | (1.02)% | (2.20)% | ||||||
| After fees waived and expenses absorbed (d) | (0.96)% | (2) | (0.99)% | (1.15)% | (0.57)% | (1.57)% | ||||||
| Portfolio turnover rate | 118.13% | 254.20% | 586.64% | 330.29% | 492.70% | |||||||
| (a) | Aggregate total return, not annualized. Total return in the above table represents the rate that the investor would have earned or lost on an investment in the Fund assuming reinvestment of distributions and excludes all sales charges. | |||||||||||
| (b) | These ratios exclude the impact of the expenses of the underlying exchange-traded funds. | |||||||||||
| (c) | Less than $0.01 per share. | |||||||||||
| (d) | The ratios include 0.31% for the year ended June 30, 2016, 0.24% for the year ended June 30, 2015, 0.61% for the year ended June 30, 2014, 0.40% for the year ended June 30, 2013, and 0.82% for the year ended June 30, 2012 attributed to interest expense. The ratios include 0.27% for the year ended June 30, 2016, 0.44% for the year ended June 30, 2015, 0.28% for the year ended June 30, 2014, 0.07% for the year ended June 30, 2013, and 0.08% for the year ended June 30, 2012 attributed to dividends on securities sold short. | |||||||||||
| (1) | Per share amounts are calculated using the average shares method, which more appropriately presents the per share data for the period. | |||||||||||
| (2) | The ratios include 0.09% for the year ended June 30, 2016 attributed to legal fees outside the expense limitation (see note 8). | |||||||||||
| (3) | Includes the effects of legal fees incurred outside of the expense limitation agreement. Excluding these expenses, total return would have been (5.03)% | |||||||||||
The accompanying notes are an integral part of these financial statements.
| 43 |
| AmericaFirst Defensive Growth Fund | ||||||||||||||||||
| Financial Highlights | ||||||||||||||||||
| For a Fund Share Outstanding Throughout Each Year | ||||||||||||||||||
| Class I | ||||||||||||||||||
| For the Year | For the Year | For the Year | For the Year | For the Year | ||||||||||||||
| Ended | Ended | Ended | Ended | Ended | ||||||||||||||
| June 30, 2016 | June 30, 2015 | June 30, 2014 | June 30, 2013 | June 30, 2012 | ||||||||||||||
| Net asset value, beginning of year | $ 12.45 | $ 12.82 | $ 11.71 | $ 10.77 | $ 9.98 | |||||||||||||
| Investment operations: | ||||||||||||||||||
| Net investment income (loss) (1) | - | (c) | 0.02 | - | (0.06) | (0.12) | ||||||||||||
| Net legal fees incurred outside expense limitation agreement | (0.01) | |||||||||||||||||
| Net realized and unrealized gain (loss) on investments | (0.50) | 1.00 | 1.98 | 1.79 | 0.93 | |||||||||||||
| Total from investment operations | (0.51) | 1.02 | 1.98 | 1.73 | 0.81 | |||||||||||||
| Distributions from: | ||||||||||||||||||
| Net investment income | - | - | - | (0.09) | - | |||||||||||||
| Net realized gain | (0.08) | (1.39) | (0.87) | (0.71) | (0.05) | |||||||||||||
| Total distributions | (0.08) | (1.39) | (0.87) | (0.80) | (0.05) | |||||||||||||
| Paid in Capital from Redemption Fees | - | (c) | - | (c) | - | (c) | 0.01 | 0.03 | ||||||||||
| Net asset value, end of year | $ 11.86 | $ 12.45 | $ 12.82 | $ 11.71 | $ 10.77 | |||||||||||||
| Total return (a) | (4.12)% | (3) | 8.45% | 17.46% | 16.97% | 8.45% | ||||||||||||
| Ratios/Supplemental Data | ||||||||||||||||||
| Net assets, end of year (in 000's) | $ 44,161 | $ 33,660 | $ 14,160 | $ 8,406 | $ 2,681 | |||||||||||||
| Ratio of expenses to average net assets:(b) | ||||||||||||||||||
| Before fees waived and expenses absorbed (d) | 2.62% | (2) | 2.67% | 3.09% | 2.83% | 3.36% | ||||||||||||
| After fees waived and expenses absorbed (d) | 2.13% | (2) | 2.07% | 2.01% | 2.41% | 2.76% | ||||||||||||
| Ratio of net investment income (loss) to average net assets:(b) | ||||||||||||||||||
| Before fees waived and expenses absorbed (d) | (0.56)% | (2) | (0.47)% | (0.87)% | (0.93)% | (1.74)% | ||||||||||||
| After fees waived and expenses absorbed (d) | (0.07)% | (2) | 0.13% | 0.00% | (0.50)% | (1.14)% | ||||||||||||
| Portfolio turnover rate | 118.13% | 254.20% | 586.64% | 330.29% | 492.70% | |||||||||||||
| (a) | Aggregate total return, not annualized. Total return in the above table represents the rate that the investor would have earned or lost on an investment in the Fund assuming reinvestment of distributions and excludes all sales charges. | |||||||||||||||||
| (b) | These ratios exclude the impact of the expenses of the underlying exchange-traded funds. | |||||||||||||||||
| (c) | Less than $0.01 per share. | |||||||||||||||||
| (d) | The ratios include 0.31% for the year ended June 30, 2016, 0.24% for the year ended June 30, 2015, 0.61% for the year ended June 30, 2014, 0.40% for the year ended June 30, 2013, and 0.82% for the year ended June 30, 2012 attributed to interest expense. The ratios include 0.27% for year ended June 30, 2016, 0.44% for the year ended June 30, 2015, 0.28% for the year ended June 30, 2014, 0.07% for the year ended June 30, 2013 and 0.08% for the year ended June 30, 2012 attributed to dividends on securities sold short. For the period November 8, 2013 to May 18, 2016, these ratios were included in the expense cap for Class I (See Note 3). | |||||||||||||||||
| (1) | Per share amounts are calculated using the average shares method, which more appropriately presents the per share data for the period. | |||||||||||||||||
| (2) | The ratios include 0.09% for the year ended June 30, 2016 attributed to legal fees outside the expense limitation (see note 8). | |||||||||||||||||
| (3) | Includes the effects of legal fees incurred outside of the expense limitation agreement. Excluding these expenses, total return would have been (4.03)% | |||||||||||||||||
The accompanying notes are an integral part of these financial statements.
| 44 |
| AmericaFirst Defensive Growth Fund | ||||||||||||
| Financial Highlights | ||||||||||||
| For a Fund Share Outstanding Throughout Each Year | ||||||||||||
| Class U | ||||||||||||
| For the Year | For the Year | For the Year | For the Year | For the Year | ||||||||
| Ended | Ended | Ended | Ended | Ended | ||||||||
| June 30, 2016 | June 30, 2015 | June 30, 2014 | June 30, 2013 | June 30, 2012 | ||||||||
| Net asset value, beginning of year | $ 11.69 | $ 12.31 | $ 11.44 | $ 10.62 | $ 9.97 | |||||||
| Investment operations: | ||||||||||||
| Net investment loss (1) | (0.16) | (0.18) | (0.19) | (0.09) | (0.21) | |||||||
| Net legal fees incurred outside expense limitation agreement | (0.01) | - | - | - | - | |||||||
| Net realized and unrealized gain (loss) on investments | (0.48) | 0.95 | 1.93 | 1.68 | 0.90 | |||||||
| Total from investment operations | (0.65) | 0.77 | 1.74 | 1.59 | 0.69 | |||||||
| Distributions from: | ||||||||||||
| Net investment income | - | - | - | (0.06) | - | |||||||
| Net realized gain | (0.08) | (1.39) | (0.87) | (0.71) | (0.05) | |||||||
| Total distributions | (0.08) | (1.39) | (0.87) | (0.77) | (0.05) | |||||||
| Paid in Capital from Redemption Fees | - | (c) | - | (c) | - | (c) | - | (c) | 0.01 | |||
| Net asset value, end of year | $ 10.96 | $ 11.69 | $ 12.31 | $ 11.44 | $ 10.62 | |||||||
| Total return (a) | (5.59)% | (3) | 6.68% | 15.70% | 15.74% | 7.05% | ||||||
| Ratios/Supplemental Data | ||||||||||||
| Net assets, end of year (in 000's) | $ 17,238 | $ 13,687 | $ 9,052 | $ 6,146 | $ 5,661 | |||||||
| Ratio of expenses to average net assets:(b) | ||||||||||||
| Before fees waived and expenses absorbed (d) | 3.63% | (2) | 3.67% | 4.09% | 3.90% | 4.47% | ||||||
| After fees waived and expenses absorbed (d) | 3.57% | (2) | 3.62% | 3.83% | 3.43% | 3.85% | ||||||
| Ratio of net investment loss to average net assets:(b) | ||||||||||||
| Before fees waived and expenses absorbed (d) | (1.56)% | (2) | (1.56)% | (1.89)% | (1.32)% | (2.73)% | ||||||
| After fees waived and expenses absorbed (d) | (1.51)% | (2) | (1.51)% | (1.63)% | (0.86)% | (2.11)% | ||||||
| Portfolio turnover rate | 118.13% | 254.20% | 586.64% | 330.29% | 492.70% | |||||||
| (a) | Aggregate total return, not annualized. Total return in the above table represents the rate that the investor would have earned or lost on an investment in the Fund assuming reinvestment of distributions and excludes all sales charges. | |||||||||||
| (b) | These ratios exclude the impact of the expenses of the underlying exchange-traded funds. | |||||||||||
| (c) | Less than $0.01 per share. | |||||||||||
| (d) | The ratios include 0.31% for the year ended June 30, 2016, 0.24% for the year ended June 30, 2015, 0.61% for the year ended June 30, 2014, 0.40% for the year ended June 30, 2013, and 0.82% for the year ended June 30, 2012 attributed to interest expense. The ratios include 0.27% for the year ended June 30, 2016, 0.44% for the year ended June 30, 2015, 0.28% for the year ended June 30, 2014, 0.07% for the year ended June 30, 2013 and 0.08% for the year ended June 30, 2012 attributed to dividends on securities sold short. | |||||||||||
| (1) | Per share amounts are calculated using the average shares method, which more appropriately presents the per share data for the period. | |||||||||||
| (2) | The ratios include 0.09% for the year ended June 30, 2016 attributed to legal fees outside the expense limitation (see note 8). | |||||||||||
| (3) | Includes the effects of legal fees incurred outside of the expense limitation agreement. Excluding these expenses, total return would have been (5.50)% | |||||||||||
The accompanying notes are an integral part of these financial statements.
| 45 |
| AmericaFirst Income Trends Fund | |||||||||||||||
| Financial Highlights | |||||||||||||||
| For a Fund Share Outstanding Throughout Each Year | |||||||||||||||
| Class A | |||||||||||||||
| For the Year | For the Year | For the Year | For the Year | For the Year | |||||||||||
| Ended | Ended | Ended | Ended | Ended | |||||||||||
| June 30, 2016 | June 30, 2015 | June 30, 2014 | June 30, 2013 | June 30, 2012 | |||||||||||
| Net asset value, beginning of year | $ 8.14 | $ 9.25 | $ 9.21 | $ 9.05 | $ 10.09 | ||||||||||
| Investment operations: | |||||||||||||||
| Net investment income (1) | 0.27 | 0.25 | 0.36 | 0.60 | 0.52 | ||||||||||
| Net legal fees incurred outside expense limitation agreement | (0.01) | - | - | - | - | ||||||||||
| Net realized and unrealized gain (loss) on investments | (1.19) | (0.75) | 0.34 | 0.23 | (1.00) | ||||||||||
| Total from investment operations | (0.93) | (0.50) | 0.70 | 0.83 | (0.48) | ||||||||||
| Distributions from: | |||||||||||||||
| Net investment income | (0.22) | (0.18) | (0.25) | (0.56) | (0.55) | ||||||||||
| Net realized gain | - | - | - | - | (0.01) | ||||||||||
| Return of capital | (0.29) | (0.43) | (0.41) | (0.11) | - | ||||||||||
| Total distributions | (0.51) | (0.61) | (0.66) | (0.67) | (0.56) | ||||||||||
| Paid in Capital from Affiliate Payment | - | - | - | - | - | ||||||||||
| Paid in Capital from Redemption Fees | - | (c) | - | (c) | - | (c) | - | (c) | - | ||||||
| Net asset value, end of year | $ 6.70 | $ 8.14 | $ 9.25 | $ 9.21 | $ 9.05 | ||||||||||
| Total return (a) | (11.80)% | (3) | (5.54)% | 7.83% | 9.44% | (4.51)% | |||||||||
| Ratios/Supplemental Data | |||||||||||||||
| Net assets, end of year (in 000's) | $ 7,821 | $ 11,517 | $ 15,309 | $ 10,325 | $ 5,539 | ||||||||||
| Ratio of expenses to average net assets:(b) | |||||||||||||||
| Before fees waived and expenses absorbed (d) | 3.27% | (2) | 2.43% | 2.44% | 2.52% | 2.43% | |||||||||
| After fees waived and expenses absorbed (d) | 2.63% | (2) | 2.21% | 2.20% | 2.21% | 2.25% | |||||||||
| Ratio of net investment income to average net assets:(b) | |||||||||||||||
| Before fees waived and expenses absorbed (d) | 2.92% | (2) | 2.60% | 3.71% | 6.23% | 5.64% | |||||||||
| After fees waived and expenses absorbed (d) | 3.56% | (2) | 2.82% | 3.94% | 6.54% | 5.82% | |||||||||
| Portfolio turnover rate | 349.38% | 226.22% | 336.01% | 315.48% | 411.30% | ||||||||||
| (a) | Aggregate total return, not annualized. Total return in the above table represents the rate that the investor would have earned or lost on an investment in the Fund | ||||||||||||||
| assuming reinvestment of distributions and excludes all sales charges. | |||||||||||||||
| (b) | These ratios exclude the impact of the expenses of the underlying exchange-traded funds. | ||||||||||||||
| (c) | Less than $0.01 per share. | ||||||||||||||
| (d) | The ratios include 0.03% for the year ended June 30, 2016, 0.01% for the year ended June 30, 2015, 0.01% for the year ended June 30, 2014, 0.01% for the year ended June 30, 2013, and 0.04% for the year ended June 30, 2012 attributed to interest expense. The ratios include 0.34% for the year ended June 30, 2016 attributed to dividends on securities sold short. | ||||||||||||||
| (1) | Per share amounts are calculated using the average shares method, which more appropriately presents the per share data for the period. | ||||||||||||||
| (2) | The ratios include 0.07% for the year ended June 30, 2016 attributed to legal fees outside the expense limitation (see note 8). | ||||||||||||||
| (3) | Includes the effects of legal fees incurred outside of the expense limitation agreement. Excluding these expenses, total return would have been (11.73)% | ||||||||||||||
The accompanying notes are an integral part of these financial statements.
| 46 |
AmericaFirst Income Trends Fund |
|||||||||||||||
| Financial Highlights | |||||||||||||||
| For a Fund Share Outstanding Throughout Each Year | |||||||||||||||
| Class I | |||||||||||||||
| For the Year | For the Year | For the Year | For the Year | For the Year | |||||||||||
| Ended | Ended | Ended | Ended | Ended | |||||||||||
| June 30, 2016 | June 30, 2015 | June 30, 2014 | June 30, 2013 | June 30, 2012 | |||||||||||
| Net asset value, beginning of year | $ 8.19 | $ 9.27 | $ 9.21 | $ 9.05 | $ 10.09 | ||||||||||
| Investment operations: | |||||||||||||||
| Net investment income (1) | 0.35 | 0.31 | 0.43 | 0.65 | 0.52 | ||||||||||
| Net legal fees incurred outside expense limitation agreement | ( - ) | (c) | - | - | - | - | |||||||||
| Net realized and unrealized gain (loss) on investments | (1.22) | (0.73) | 0.34 | 0.23 | (0.96) | ||||||||||
| Total from investment operations | (0.87) | (0.42) | 0.77 | 0.88 | (0.44) | ||||||||||
| Distributions from: | |||||||||||||||
| Net investment income | (0.19) | (0.21) | (0.26) | (0.60) | (0.59) | ||||||||||
| Net realized gain | - | - | - | - | (0.01) | ||||||||||
| Return of capital | (0.35) | (0.45) | (0.45) | (0.12) | - | ||||||||||
| Total distributions | (0.54) | (0.66) | (0.71) | (0.72) | (0.60) | ||||||||||
| Paid in Capital from Affiliate Payment | - | - | - | - | - | ||||||||||
| Paid in Capital from Redemption Fees | - | (c) | - | (c) | - | (c) | - | (c) | - | ||||||
| Net asset value, end of year | $ 6.78 | $ 8.19 | $ 9.27 | $ 9.21 | $ 9.05 | ||||||||||
| Total return (a) | (10.91)% | (3) | (4.72)% | 8.58% | 9.96% | (4.01)% | |||||||||
| Ratios/Supplemental Data | |||||||||||||||
| Net assets, end of year (in 000's) | $ 2,781 | $ 6,380 | $ 15,033 | $ 8,900 | $ 4,749 | ||||||||||
| Ratio of expenses to average net assets:(b) | |||||||||||||||
| Before fees waived and expenses absorbed (d) | 2.68% | (2) | 1.93% | 1.95% | 2.02% | 1.93% | |||||||||
| After fees waived and expenses absorbed (d) | 1.64% | (2) | 1.40% | 1.49% | 1.71% | 1.73% | |||||||||
| Ratio of net investment income to average net assets:(b) | |||||||||||||||
| Before fees waived and expenses absorbed (d) | 3.51% | (2) | 3.04% | 4.27% | 6.76% | 5.53% | |||||||||
| After fees waived and expenses absorbed (d) | 4.56% | (2) | 3.57% | 4.73% | 7.07% | 5.73% | |||||||||
| Portfolio turnover rate | 349.38% | 226.22% | 336.01% | 315.48% | 411.30% | ||||||||||
| (a) | Aggregate total return, not annualized. Total return in the above table represents the rate that the investor would have earned or lost on an investment in the Fund | ||||||||||||||
| assuming reinvestment of distributions and excludes all sales charges. | |||||||||||||||
| (b) | These ratios exclude the impact of the expenses of the underlying exchange-traded funds. | ||||||||||||||
| (c) | Less than $0.01 per share. | ||||||||||||||
| (d) | The ratios include 0.03% for the year ended June 30, 2016, 0.01% for the year ended June 30, 2015, 0.01% for the year ended June 30, 2014, 0.01% for the year ended June 30, 2013, and 0.04% for the year ended June 30, 2012 attributed to interest expense. The ratios include 0.34% for the year ended June 30, 2016 attributed to dividends on securities sold short. For the period November 8, 2013 to May 18, 2016, these ratios were included in the expense cap for Class I. (See Note 3) | ||||||||||||||
| (1) | Per share amounts are calculated using the average shares method, which more appropriately presents the per share data for the period. | ||||||||||||||
| (2) | The ratios include 0.07% for the year ended June 30, 2016 attributed to legal fees outside the expense limitation (see note 8). | ||||||||||||||
| (3) | Includes the effects of legal fees incurred outside of the expense limitation agreement. Excluding these expenses, total return would have been (10.84)% | ||||||||||||||
The accompanying notes are an integral part of these financial statements.
| 47 |
| AmericaFirst Income Trends Fund | |||||||||||||||
| Financial Highlights | |||||||||||||||
| For a Fund Share Outstanding Throughout Each Year | |||||||||||||||
| Class U | |||||||||||||||
| For the Year | For the Year | For the Year | For the Year | For the Year | |||||||||||
| Ended | Ended | Ended | Ended | Ended | |||||||||||
| June 30, 2016 | June 30, 2015 | June 30, 2014 | June 30, 2013 | June 30, 2012 | |||||||||||
| Net asset value, beginning of year | $ 8.14 | $ 9.25 | $ 9.21 | $ 9.04 | $ 10.07 | ||||||||||
| Investment operations: | |||||||||||||||
| Net investment income (1) | 0.24 | 0.20 | 0.31 | 0.55 | 0.46 | ||||||||||
| Net legal fees incurred outside expense limitation agreement | (0.01) | - | - | - | - | ||||||||||
| Net realized and unrealized gain (loss) on investments | (1.19) | (0.74) | 0.34 | 0.24 | (0.99) | ||||||||||
| Total from investment operations | (0.96) | (0.54) | 0.65 | 0.79 | (0.53) | ||||||||||
| Distributions from: | |||||||||||||||
| Net investment income | (0.18) | (0.17) | (0.23) | (0.52) | (0.49) | ||||||||||
| Net realized gain | - | - | - | - | (0.01) | ||||||||||
| Return of capital | (0.29) | (0.40) | (0.38) | (0.10) | - | ||||||||||
| Total distributions | (0.47) | (0.57) | (0.61) | (0.62) | (0.50) | ||||||||||
| Paid in Capital from Affiliate Payment | - | - | - | - | - | ||||||||||
| Paid in Capital from Redemption Fees | - | (c) | - | (c) | - | (c) | - | (c) | - | ||||||
| Net asset value, end of year | $ 6.71 | $ 8.14 | $ 9.25 | $ 9.21 | $ 9.04 | ||||||||||
| Total return (a) | (12.14)% | (3) | (6.01)% | 7.30% | 8.98% | (4.99)% | |||||||||
| Ratios/Supplemental Data | |||||||||||||||
| Net assets, end of year (in 000's) | $ 5,665 | $ 10,526 | $ 14,354 | $ 10,825 | $ 10,349 | ||||||||||
| Ratio of expenses to average net assets:(b) | |||||||||||||||
| Before fees waived and expenses absorbed (d) | 3.73% | (2) | 2.93% | 2.94% | 3.02% | 2.93% | |||||||||
| After fees waived and expenses absorbed (d) | 3.09% | (2) | 2.71% | 2.70% | 2.71% | 2.75% | |||||||||
| Ratio of net investment income to average net assets:(b) | |||||||||||||||
| Before fees waived and expenses absorbed (d) | 2.48% | (2) | 2.10% | 3.21% | 5.71% | 4.88% | |||||||||
| After fees waived and expenses absorbed (d) | 3.13% | (2) | 2.32% | 3.44% | 6.01% | 5.06% | |||||||||
| Portfolio turnover rate | 349.38% | 226.22% | 336.01% | 315.48% | 411.30% | ||||||||||
| (a) | Aggregate total return, not annualized. Total return in the above table represents the rate that the investor would have earned or lost on an investment in the Fund | ||||||||||||||
| assuming reinvestment of distributions and excludes all sales charges. | |||||||||||||||
| (b) | These ratios exclude the impact of the expenses of the underlying exchange-traded funds. | ||||||||||||||
| (c) | Less than $0.01 per share. | ||||||||||||||
| (d) | The ratios include 0.03% for the year ended June 30, 2016, 0.01% for the year ended June 30, 2015, 0.01% for the year ended June 30, 2014, 0.01% for the year ended June 30, 2013, and 0.04% for the year ended June 30, 2012 attributed to interest expense. The ratios include 0.34% for the year ended June 30, 2016 attributed to dividends on securities sold short. | ||||||||||||||
| (1) | Per share amounts are calculated using the average shares method, which more appropriately presents the per share data for the period. | ||||||||||||||
| (2) | The ratios include 0.07% for the year ended June 30, 2016 attributed to legal fees outside the expense limitation (see note 8). | ||||||||||||||
| (3) | Includes the effects of legal fees incurred outside of the expense limitation agreement. Excluding these expenses, total return would have been (12.07)% | ||||||||||||||
The accompanying notes are an integral part of these financial statements.
| 48 |
| AmericaFirst Tactical Alpha Fund * | ||||||||||||
| Financial Highlights | ||||||||||||
| For a Fund Share Outstanding Throughout Each Year | ||||||||||||
| Class A | ||||||||||||
| For the Year | For the Year | For the Year | For the Year | For the Year | ||||||||
| Ended | Ended | Ended | Ended | Ended | ||||||||
| June 30, 2016 | June 30, 2015 | June 30, 2014 | June 30, 2013 | June 30, 2012 | ||||||||
| Net asset value, beginning of year | $ 11.71 | $ 12.01 | $ 9.29 | $ 9.31 | $ 10.80 | |||||||
| Investment operations: | ||||||||||||
| Net investment income (loss) (1) | (0.20) | (0.01) | (0.04) | 0.03 | (0.11) | |||||||
| Net legal fees incurred outside expense limitation agreement | (0.01) | - | - | - | - | |||||||
| Net realized and unrealized gain (loss) on investments | 0.37 | (0.29) | 2.76 | (0.01) | (0.76) | |||||||
| Total from investment operations | 0.16 | (0.30) | 2.72 | 0.02 | (0.87) | |||||||
| Distributions from: | ||||||||||||
| Net realized gain | - | - | - | - | (0.62) | |||||||
| Return of capital | - | - | - | (0.04) | - | |||||||
| Total distributions | - | - | - | (0.04) | (0.62) | |||||||
| Paid in Capital from Redemption Fees | - | (c) | - | (c) | - | (c) | - | (c) | - | |||
| Net asset value, end of year | $ 11.87 | $ 11.71 | $ 12.01 | $ 9.29 | $ 9.31 | |||||||
| Total return (a) | 1.37% | (3) | (2.50)% | 29.28% | 0.21% | (8.10)% | ||||||
| Ratios/Supplemental Data | ||||||||||||
| Net assets, end of year (in 000's) | $ 6,045 | $ 7,191 | $ 8,672 | $ 8,823 | $ 22,113 | |||||||
| Ratio of expenses to average net assets:(b) | ||||||||||||
| Before fees waived and expenses absorbed (d) | 4.68% | (2) | 3.44% | 3.04% | 3.00% | 3.41% | ||||||
| After fees waived and expenses absorbed (d) | 3.62% | (2) | 2.71% | 2.45% | 2.74% | 3.41% | ||||||
| Ratio of net investment income (loss) to average net assets:(b) | ||||||||||||
| Before fees waived and expenses absorbed (d) | (2.93)% | (2) | (0.84)% | (0.96)% | 0.01% | (1.15)% | ||||||
| After fees waived and expenses absorbed (d) | (1.87)% | (2) | (0.11)% | (0.37)% | 0.28% | (1.15)% | ||||||
| Portfolio turnover rate | 333.49% | 529.08% | 374.70% | 601.59% | 680.35% | |||||||
| (a) | Aggregate total return, not annualized. Total return in the above table represents the rate that the investor would have earned or lost on an investment in the Fund assuming reinvestment of distributions and excludes all sales charges. | |||||||||||
| (b) | These ratios exclude the impact of the expenses of the underlying exchange-traded funds. | |||||||||||
| (c) | Less than $0.01 per share. | |||||||||||
| (d) | The ratios include 0.63% for the year ended June 30, 2016, 0.14% for the year ended June 30, 2015, 0.01% for the year ended June 30, 2014, 0.26% for the year ended June 30, 2013, and 0.77% for the year ended June 30, 2012 attributed to interest expense. The ratios include 0.50% for the year ended June 30, 2016, 0.11% for the year ended June 30, 2015, 0.04% for the year ended June 30, 2013 and 0.17% for the year ended June 30, 2012 attributed to dividends on securities sold short. | |||||||||||
| (1) | Per share amounts are calculated using the average shares method, which more appropriately presents the per share data for the period. | |||||||||||
| (2) | The ratios include 0.07% for the year ended June 30, 2016 attributed to legal fees outside the expense limitation (see note 8). | |||||||||||
| (3) | Includes the effects of legal fees incurred outside of the expense limitation agreement. Excluding these expenses, total return would have been 1.44% | |||||||||||
| * Formerly known as the AmericaFirst Absolute Return Fund | ||||||||||||
The accompanying notes are an integral part of these financial statements.
| 49 |
| AmericaFirst Tactical Alpha Fund * | ||||||||||||
| Financial Highlights | ||||||||||||
| For a Fund Share Outstanding Throughout Each Year | ||||||||||||
| Class I | ||||||||||||
| For the Year | For the Year | For the Year | For the Year | For the Year | ||||||||
| Ended | Ended | Ended | Ended | Ended | ||||||||
| June 30, 2016 | June 30, 2015 | June 30, 2014 | June 30, 2013 | June 30, 2012 | ||||||||
| Net asset value, beginning of year | $ 12.03 | $ 12.22 | $ 9.39 | $ 9.40 | $ 10.85 | |||||||
| Investment operations: | ||||||||||||
| Net investment income (loss) (1) | (0.07) | 0.10 | 0.05 | 0.06 | (0.07) | |||||||
| Net legal fees incurred outside expense limitation agreement | (0.01) | - | - | - | - | |||||||
| Net realized and unrealized gain (loss) on investments | 0.42 | (0.29) | 2.78 | 0.01 | (e) | (0.76) | ||||||
| Total from investment operations | 0.34 | (0.19) | 2.83 | 0.07 | (0.83) | |||||||
| Distributions from: | ||||||||||||
| Net realized gain | - | - | - | - | (0.62) | |||||||
| Return of capital | - | - | - | (0.08) | - | |||||||
| Total distributions | - | - | - | (0.08) | (0.62) | |||||||
| Paid in Capital from Redemption Fees | - | - | (c) | - | (c) | - | (c) | - | ||||
| Net asset value, end of year | $ 12.37 | $ 12.03 | $ 12.22 | $ 9.39 | $ 9.40 | |||||||
| Total return (a) | 2.83% | (3) | (1.55)% | 30.14% | 0.72% | (7.68)% | ||||||
| Ratios/Supplemental Data | ||||||||||||
| Net assets, end of year (in 000's) | $ 308 | $ 653 | $ 1,121 | $ 688 | $ 4,890 | |||||||
| Ratio of expenses to average net assets:(b) | ||||||||||||
| Before fees waived and expenses absorbed (d) | 4.21% | (2) | 2.91% | 2.55% | 2.53% | 2.86% | ||||||
| After fees waived and expenses absorbed (d) | 2.28% | (2) | 1.75% | 1.81% | 2.24% | 2.86% | ||||||
| Ratio of net investment income (loss) to average net assets:(b) | ||||||||||||
| Before fees waived and expenses absorbed (d) | (2.55)% | (2) | (0.33)% | (0.27)% | 0.45% | (0.72)% | ||||||
| After fees waived and expenses absorbed (d) | (0.63)% | (2) | 0.83% | 0.47% | 0.65% | (0.72)% | ||||||
| Portfolio turnover rate | 333.49% | 529.08% | 374.70% | 601.59% | 680.35% | |||||||
| (a) | Aggregate total return, not annualized. Total return in the above table represents the rate that the investor would have earned or lost on an investment in the Fund assuming reinvestment of distributions and excludes all sales charges. | |||||||||||
| (b) | These ratios exclude the impact of the expenses of the underlying exchange-traded funds. | |||||||||||
| (c) | Less than $0.01 per share. | |||||||||||
| (d) | The ratios include 0.63% for the year ended June 30, 2016, 0.14% for the year ended June 30, 2015, 0.01% for the year ended June 30, 2014, 0.26% for the year ended June 30, 2013 and 0.77% for the year ended June 30, 2012 attributed to interest expense. The ratios include 0.50% for the year ended June 30, 2016, 0.11% for the year ended June 30, 2015, 0.04% for the year ended June 30, 2013 and 0.17% for the year ended June 30, 2012 attributed to dividends on securities sold short. For the period November 8, 2013 to May 18, 2016, these ratios were included in the expense cap for Class I (See Note 3). | |||||||||||
| (e) | As required by SEC standard per share data calculation methodology, this represents a balancing figure derived from the other amounts in the financial highlights tables that captures all other changes affecting net asset value per share. This per share gain amount does not correlate to the aggregate of the net realized and unrealized loss in the Statement of Operations for the year ended June 30, 2013, primarily due to the timing of sales and repurchases of the Fund's shares in relation to fluctuating market values for the Fund's portfolio. | |||||||||||
| (1) | Per share amounts are calculated using the average shares method, which more appropriately presents the per share data for the period. | |||||||||||
| (2) | The ratios include 0.07% for the year ended June 30, 2016 attributed to legal fees outside the expense limitation (see note 8). | |||||||||||
| (3) | Includes the effects of legal fees incurred outside of the expense limitation agreement. Excluding these expenses, total return would have been 2.90% | |||||||||||
| * Formerly known as the AmericaFirst Absolute Return Fund | ||||||||||||
The accompanying notes are an integral part of these financial statements.
| 50 |
| AmericaFirst Tactical Alpha Fund * | ||||||||||||
| Financial Highlights | ||||||||||||
| For a Fund Share Outstanding Throughout Each Year | ||||||||||||
| Class U | ||||||||||||
| For the Year | For the Year | For the Year | For the Year | For the Year | ||||||||
| Ended | Ended | Ended | Ended | Ended | ||||||||
| June 30, 2016 | June 30, 2015 | June 30, 2014 | June 30, 2013 | June 30, 2012 | ||||||||
| Net asset value, beginning of year | $ 11.43 | $ 11.78 | $ 9.15 | $ 9.19 | $ 10.72 | |||||||
| Investment operations: | ||||||||||||
| Net investment loss (1) | (0.26) | (0.07) | (0.09) | (0.02) | (0.16) | |||||||
| Net legal fees incurred outside expense limitation agreement | (0.01) | - | - | - | - | |||||||
| Net realized and unrealized gain (loss) on investments | 0.36 | (0.28) | 2.72 | (0.02) | (0.75) | |||||||
| Total from investment operations | 0.09 | (0.35) | 2.63 | (0.04) | (0.91) | |||||||
| Distributions from: | ||||||||||||
| Net realized gain | - | - | - | - | (0.62) | |||||||
| Total distributions | - | - | - | - | (0.62) | |||||||
| Paid in Capital from Redemption Fees | - | (c) | - | (c) | - | (c) | - | (c) | - | |||
| Net asset value, end of year | $ 11.52 | $ 11.43 | $ 11.78 | $ 9.15 | $ 9.19 | |||||||
| Total return (a) | 0.79% | (3) | (2.97)% | 28.74% | (0.38)% | (8.54)% | ||||||
| Ratios/Supplemental Data | ||||||||||||
| Net assets, end of year (in 000's) | $ 4,262 | $ 6,012 | $ 7,966 | $ 8,759 | $ 21,385 | |||||||
| Ratio of expenses to average net assets:(b) | ||||||||||||
| Before fees waived and expenses absorbed (d) | 5.20% | (2) | 3.94% | 3.54% | 3.52% | 3.90% | ||||||
| After fees waived and expenses absorbed (d) | 4.15% | (2) | 3.20% | 2.95% | 3.25% | 3.90% | ||||||
| Ratio of net investment loss to average net assets:(b) | ||||||||||||
| Before fees waived and expenses absorbed (d) | (3.47)% | (2) | (1.34)% | (1.47)% | (0.48)% | (1.68)% | ||||||
| After fees waived and expenses absorbed (d) | (2.42)% | (2) | (0.61)% | (0.88)% | (0.21)% | (1.68)% | ||||||
| Portfolio turnover rate | 333.49% | 529.08% | 374.70% | 601.59% | 680.35% | |||||||
| (a) | Aggregate total return, not annualized. Total return in the above table represents the rate that the investor would have earned or lost on an investment in the Fund assuming reinvestment of distributions and excludes all sales charges. | |||||||||||
| (b) | These ratios exclude the impact of the expenses of the underlying exchange-traded funds. | |||||||||||
| (c) | Less than $0.01 per share. | |||||||||||
| (d) | The ratios include 0.63% for the year ended June 30, 2016, 0.14% for the year ended June 30, 2015, 0.01% for the year ended June 30, 2014, 0.26% for the year ended June 30, 2013, and 0.77% for the year ended June 30, 2012 attributed to interest expense. The ratios include 0.50% for the year ended June 30, 2016, 0.11% for the year ended June 30, 2015, 0.04% for the year ended June 30, 2013 and 0.17% for the year ended June 30, 2012 attributed to dividends on securities sold short. | |||||||||||
| (1) | Per share amounts are calculated using the average shares method, which more appropriately presents the per share data for the period. | |||||||||||
| (2) | The ratios include 0.07% for the year ended June 30, 2016 attributed to legal fees outside the expense limitation (see note 8). | |||||||||||
| (3) | Includes the effects of legal fees incurred outside of the expense limitation agreement. Excluding these expenses, total return would have been 0.86% | |||||||||||
| * Formerly known as the AmericaFirst Absolute Return Fund | ||||||||||||
The accompanying notes are an integral part of these financial statements.
| 51 |
| AmericaFirst Quantitative Strategies Fund | ||||||||||||||
| Financial Highlights | ||||||||||||||
| For a Fund Share Outstanding Throughout Each Year | ||||||||||||||
| Class A | ||||||||||||||
| For the Year | For the Year | For the Year | For the Year | For the Year | ||||||||||
| Ended | Ended | Ended | Ended | Ended | ||||||||||
| June 30, 2016 | June 30, 2015 | June 30, 2014 | June 30, 2013 | June 30, 2012 | ||||||||||
| Net asset value, beginning of year | $ 5.98 | $ 6.97 | $ 6.29 | $ 5.77 | $ 6.67 | |||||||||
| Investment operations: | ||||||||||||||
| Net investment income (1) | 0.07 | 0.11 | 0.14 | 0.19 | 0.17 | |||||||||
| Net legal fees incurred outside expense limitation agreement | ( - ) | (c) | - | - | - | - | ||||||||
| Net realized and unrealized gain (loss) on investments | (0.58) | (0.53) | 1.10 | 0.52 | (0.13) | |||||||||
| Total from investment operations | (0.51) | (0.42) | 1.24 | 0.71 | 0.04 | |||||||||
| Distributions from: | ||||||||||||||
| Net investment income | (0.10) | (0.11) | (0.11) | (0.19) | (0.18) | |||||||||
| Net realized gain | - | (0.46) | (0.45) | - | (0.77) | |||||||||
| Total distributions | (0.10) | (0.57) | (0.56) | (0.19) | (0.95) | |||||||||
| Paid in Capital from Affiliate Payment | - | - | - | - | 0.01 | |||||||||
| Paid in Capital from Redemption Fees | - | (c) | - | (c) | - | (c) | - | (c) | - | (c) | ||||
| Net asset value, end of year | $ 5.37 | $ 5.98 | $ 6.97 | $ 6.29 | $ 5.77 | |||||||||
| Total return (a) | (8.64)% | (3) | (6.29)% | 20.34% | 12.43% | 2.16% | (e) | |||||||
| Ratios/Supplemental Data | ||||||||||||||
| Net assets, end of year (in 000's) | $ 12,288 | $ 28,403 | $ 40,419 | $ 23,521 | $ 17,566 | |||||||||
| Ratio of expenses to average net assets:(b) | ||||||||||||||
| Before fees waived and expenses absorbed (d) | 2.29% | (2) | 1.66% | 1.76% | 1.73% | 1.74% | ||||||||
| After fees waived and expenses absorbed (d) | 1.93% | (2) | 1.51% | 1.50% | 1.50% | 1.52% | ||||||||
| Ratio of net investment income to average net assets:(b) | ||||||||||||||
| Before fees waived and expenses absorbed (d) | 0.77% | (2) | 1.59% | 1.88% | 2.86% | 2.69% | ||||||||
| After fees waived and expenses absorbed (d) | 1.13% | (2) | 1.74% | 2.14% | 3.09% | 2.91% | ||||||||
| Portfolio turnover rate | 418.06% | 349.12% | 306.73% | 228.87% | 346.05% | |||||||||
| (a) | Aggregate total return, not annualized. Total return in the above table represents the rate that the investor would have earned or lost on an investment in the Fund assuming reinvestment of distributions and excludes all sales charges. | |||||||||||||
| (b) | These ratios exclude the impact of the expenses of the underlying exchange-traded funds. | |||||||||||||
| (c) | Less than $0.01 per share. | |||||||||||||
| (d) | The ratios include 0.08% for the year ended June 30, 2016, 0.01% for the year ended June 30, 2015, 0.00% for the year ended June 30, 2014, 0.00% for the year ended June 30, 2013 and 0.02% for the year ended June 30, 2012 attributed to interest expense. The ratios include 0.26% for the year ended June 30, 2016 attributed to dividends on securities sold short. | |||||||||||||
| (e) | For the year ended June 30, 2012, 0.27% of the Fund's Class A shares' total return consists of a voluntary reimbursement by the Advisor of a realized investment loss incurred on a trading error. Excluding this item, total return would have been 1.89%. | |||||||||||||
| (1) | Per share amounts are calculated using the average shares method, which more appropriately presents the per share data for the period. | |||||||||||||
| (2) | The ratios include 0.07% for the year ended June 30, 2016 attributed to legal fees outside the expense limitation (see note 8). | |||||||||||||
| (3) | Includes the effects of legal fees incurred outside of the expense limitation agreement. Excluding these expenses, total return would have been (8.57)% | |||||||||||||
The accompanying notes are an integral part of these financial statements.
| 52 |
| AmericaFirst Quantitative Strategies Fund | ||||||||||||||
| Financial Highlights | ||||||||||||||
| For a Fund Share Outstanding Throughout Each Year | ||||||||||||||
| Class C | ||||||||||||||
| For the Year | For the Year | For the Year | For the Year | For the Year | ||||||||||
| Ended | Ended | Ended | Ended | Ended | ||||||||||
| June 30, 2016 | June 30, 2015 | June 30, 2014 | June 30, 2013 | June 30, 2012 | ||||||||||
| Net asset value, beginning of year | $ 5.93 | $ 6.93 | $ 6.26 | $ 5.74 | $ 6.64 | |||||||||
| Investment operations: | ||||||||||||||
| Net investment income (1) | 0.03 | 0.06 | 0.09 | 0.15 | 0.14 | |||||||||
| Net legal fees incurred outside expense limitation agreement | ( - ) | (c) | - | - | - | - | ||||||||
| Net realized and unrealized gain (loss) on investments | (0.59) | (0.53) | 1.11 | 0.52 | (0.14) | |||||||||
| Total from investment operations | (0.56) | (0.47) | 1.20 | 0.67 | 0.00 | |||||||||
| Distributions from: | ||||||||||||||
| Net investment income | (0.02) | (0.07) | (0.08) | (0.15) | (0.13) | |||||||||
| Net realized gain | - | (0.46) | (0.45) | - | (0.77) | |||||||||
| Total distributions | (0.02) | (0.53) | (0.53) | (0.15) | (0.90) | |||||||||
| Paid in Capital from Redemption Fees | - | - | (c) | - | (c) | - | (c) | - | (c) | |||||
| Net asset value, end of year | $ 5.35 | $ 5.93 | $ 6.93 | $ 6.26 | $ 5.74 | |||||||||
| Total return (a) | (9.43)% | (3) | (6.99)% | 19.62% | 11.68% | 1.32% | ||||||||
| Ratios/Supplemental Data | ||||||||||||||
| Net assets, end of year (in 000's) | $ 15,225 | $ 31,964 | $ 37,773 | $ 25,848 | $ 25,030 | |||||||||
| Ratio of expenses to average net assets:(b) | ||||||||||||||
| Before fees waived and expenses absorbed (d) | 3.05% | (2) | 2.41% | 2.50% | 2.48% | 2.49% | ||||||||
| After fees waived and expenses absorbed (d) | 2.69% | (2) | 2.26% | 2.25% | 2.25% | 2.27% | ||||||||
| Ratio of net investment income to average net assets:(b) | ||||||||||||||
| Before fees waived and expenses absorbed (d) | 0.07% | (2) | 0.84% | 1.09% | 2.16% | 2.08% | ||||||||
| After fees waived and expenses absorbed (d) | 0.43% | (2) | 0.99% | 1.34% | 2.39% | 2.30% | ||||||||
| Portfolio turnover rate | 418.06% | 349.12% | 306.73% | 228.87% | 346.05% | |||||||||
| (a) | Aggregate total return, not annualized. Total return in the above table represents the rate that the investor would have earned or lost on an investment in the Fund assuming reinvestment of distributions and excludes all sales charges. | |||||||||||||
| (b) | These ratios exclude the impact of the expenses of the underlying exchange-traded funds. | |||||||||||||
| (c) | Less than $0.01 per share. | |||||||||||||
| (d) | The ratios include 0.08% for the year ended June 30, 2016, 0.01% for the year ended June 30, 2015, 0.00% for the year ended June 30, 2014, 0.00% for the year ended June 30, 2013 and 0.02% for the year ended June 30, 2012 attributed to interest expense. The ratios include 0.26% for the year ended June 30, 2016 attributed to dividends on securities sold short. | |||||||||||||
| (1) | Per share amounts are calculated using the average shares method, which more appropriately presents the per share data for the period. | |||||||||||||
| (2) | The ratios include 0.07% for the year ended June 30, 2016 attributed to legal fees outside the expense limitation (see note 8). | |||||||||||||
| (3) | Includes the effects of legal fees incurred outside of the expense limitation agreement. Excluding these expenses, total return would have been (9.36)% | |||||||||||||
The accompanying notes are an integral part of these financial statements.
| 53 |
| AmericaFirst Quantitative Strategies Fund | ||||||
| Financial Highlights | ||||||
| For a Fund Share Outstanding Throughout Each Year or Period | ||||||
| Class I | ||||||
| For the Year | For the Period | |||||
| Ended | Ended | |||||
| June 30, 2016 | June 30, 2015 (1) | |||||
| Net asset value, beginning of period | $ 5.97 | $ 6.19 | ||||
| Investment operations: | ||||||
| Net investment income (2) | 0.08 | 0.03 | ||||
| Net legal fees incurred outside expense limitation agreement | (0.01) | - | ||||
| Net realized and unrealized gain (loss) on investments | (0.59) | (0.18) | ||||
| Total from investment operations | (0.52) | (0.15) | ||||
| Distributions from: | ||||||
| Net investment income | (0.12) | (0.07) | ||||
| Total distributions | (0.12) | (0.07) | ||||
| Paid in Capital from Redemption Fees | - | - | ||||
| Net asset value, end of period | $ 5.33 | $ 5.97 | ||||
| Total return (a) | (8.68)% | (4) | (2.37)% | (e) | ||
| Ratios/Supplemental Data | ||||||
| Net assets, end of period (in 000's) | $ 41 | $ 44 | ||||
| Ratio of expenses to average net assets:(b) | ||||||
| Before fees waived and expenses absorbed (c) | 2.23% | (3) | 1.37% | (d) | ||
| After fees waived and expenses absorbed (c) | 2.09% | (3) | 1.37% | (d) | ||
| Ratio of net investment income to average net assets:(b) | (d) | |||||
| Before fees waived and expenses absorbed (c) | 1.20% | (3) | 1.08% | (d) | ||
| After fees waived and expenses absorbed (c) | 1.34% | (3) | 1.08% | (d) | ||
| Portfolio turnover rate | 418.06% | 349.12% | (e) | |||
| (a) | Aggregate total return, not annualized. Total return in the above table represents the rate that the investor | |||||||||||
| would have earned or lost on an investment in the Fund assuming reinvestment of distributions and excludes | ||||||||||||
| all sales charges. | ||||||||||||
| (b) | These ratios exclude the impact of the expenses of the underlying exchange-traded funds. | |||||||||||
| (c) | The ratios include 0.08% for the year ended June 30, 2016, 0.01% for the year ended June 30, 2015, attributed to interest expense. The ratios include 0.26% for the year ended June 30, 2016 attributed to dividends on securities sold short. For the period December 31, 2014 to May 18, 2016, these ratios were included in the expense cap for Class I (See Note 3). | |||||||||||
| (d) | Annualized. | |||||||||||
| (e) | Not annualized. | |||||||||||
| (1) | The AmericaFirst Quantitative Strategies Fund Class I commenced operations on December 31, 2014. | |||||||||||
| (2) | Per share amounts are calculated using the average shares method, which more appropriately presents the | |||||||||||
| per share data for the period. | ||||||||||||
| (3) | The ratios include 0.07% for the year ended June 30, 2016 attributed to legal fees outside the expense limitation (see note 8). | |||||||||||
| (4) | Includes the effects of legal fees incurred outside of the expense limitation agreement. Excluding these expenses, total return would have been (8.61)% | |||||||||||
The accompanying notes are an integral part of these financial statements.
| 54 |
| AmericaFirst Seasonal Trends Fund | |||||||||||
| Financial Highlights | |||||||||||
| For a Fund Share Outstanding Throughout Each Year or Period | |||||||||||
| Class A | |||||||||||
| For the Year | For the Year | For the Period | |||||||||
| Ended | Ended | Ended | |||||||||
| June 30, 2016 | June 30, 2015 | June 30, 2014(1) | |||||||||
| Net asset value, beginning of period | $ 10.06 | $ 10.37 | $ 10.00 | ||||||||
| Investment operations: | |||||||||||
| Net investment income (loss) (2) | (0.02) | 0.05 | (0.02) | ||||||||
| Net legal fees incurred outside expense limitation agreement | (0.01) | - | - | ||||||||
| Net realized and unrealized gain (loss) on investments | 0.07 | (g) | (0.29) | 0.39 | |||||||
| Total from investment operations | 0.04 | (0.24) | 0.37 | ||||||||
| Distributions from: | |||||||||||
| Net investment income | (0.02) | (0.07) | - | ||||||||
| Total distributions | (0.02) | (0.07) | - | ||||||||
| Paid in Capital from Redemption Fees | - | (c) | - | (c) | - | (c) | |||||
| Net asset value, end of period | $ 10.08 | $ 10.06 | $ 10.37 | ||||||||
| Total return (a) | 0.42% | (4) | (2.36)% | 3.70% | (f) | ||||||
| Ratios/Supplemental Data | |||||||||||
| Net assets, end of period (in 000's) | $ 2,759 | $ 3,934 | $ 10,060 | ||||||||
| Ratio of expenses to average net assets:(b) | |||||||||||
| Before fees waived and expenses absorbed (d) | 3.57% | (3) | 2.74% | 2.74% | (e) | ||||||
| After fees waived and expenses absorbed (d) | 2.60% | (3) | 2.45% | 2.45% | (e) | ||||||
| Ratio of net investment income (loss) to average net assets:(b) | |||||||||||
| Before fees waived and expenses absorbed (d) | (1.32)% | (3) | 0.19% | (0.51)% | (e) | ||||||
| After fees waived and expenses absorbed (d) | (0.34)% | (3) | 0.48% | (0.22)% | (e) | ||||||
| Portfolio turnover rate | 445.44% | 429.87% | 317.87% | (f) | |||||||
| (a) | Aggregate total return, not annualized. Total return in the above table represents the rate that the investor would have earned or lost on an investment in the Fund assuming reinvestment of distributions and excludes all sales charges. | ||||||||||
| (b) | These ratios exclude the impact of the expenses of the underlying exchange-traded funds. | ||||||||||
| (c) | Less than $0.01 per share. | ||||||||||
| (d) | The ratios include 0.03% and 0.06% for the year ended June 30, 2016 attributed to interest expense and dividend expense, respectively. | ||||||||||
| (e) | Annualized. | ||||||||||
| (f) | Not annualized. | ||||||||||
| (g) | The amount of net realized and unrealized gain on investments per share does not accord with amount reported in the Statement of Operations | ||||||||||
| (1) | The AmericaFirst Seasonal Trends Fund commenced operations on October 31, 2013. | ||||||||||
| (2) | Per share amounts are calculated using the average shares method, which more appropriately presents the per share data for the period. | ||||||||||
| (3) | The ratios include 0.08% for the year ended June 30, 2016 attributed to legal fees outside the expense limitation (see note 8). | ||||||||||
| (4) | Includes the effects of legal fees incurred outside of the expense limitation agreement. Excluding these expenses, total return would have been 0.50%
|
||||||||||
The accompanying notes are an integral part of these financial statements.
| 55 |
| AmericaFirst Seasonal Trends Fund | |||||||||||
| Financial Highlights | |||||||||||
| For a Fund Share Outstanding Throughout Each Year or Period | |||||||||||
| Class I | |||||||||||
| For the Year | For the Year | For the Period | |||||||||
| Ended | Ended | Ended | |||||||||
| June 30, 2016 | June 30, 2015 | June 30, 2014(1) | |||||||||
| Net asset value, beginning of period | $ 10.11 | $ 10.41 | $ 10.00 | ||||||||
| Investment operations: | |||||||||||
| Net investment income (2) | 0.04 | 0.13 | 0.02 | ||||||||
| Net legal fees incurred outside expense limitation agreement | (0.01) | - | - | ||||||||
| Net realized and unrealized gain (loss) on investments | 0.06 | (h) | (0.33) | (g) | 0.39 | ||||||
| Total from investment operations | 0.09 | (0.20) | 0.41 | ||||||||
| Distributions from: | |||||||||||
| Net investment income | (0.10) | (0.10) | - | ||||||||
| Total distributions | (0.10) | (0.10) | - | ||||||||
| Paid in Capital from Redemption Fees | - | (c) | - | (c) | - | (c) | |||||
| Net asset value, end of period | $ 10.10 | $ 10.11 | $ 10.41 | ||||||||
| Total return (a) | 0.93% | (4) | (1.93)% | 4.10% | (f) | ||||||
| Ratios/Supplemental Data | |||||||||||
| Net assets, end of period (in 000's) | $ 3,737 | $ 9,712 | $ 17,563 | ||||||||
| Ratio of expenses to average net assets:(b) | |||||||||||
| Before fees waived and expenses absorbed (d) | 3.01% | (3) | 2.22% | 2.04% | (e) | ||||||
| After fees waived and expenses absorbed (d) | 2.10% | (3) | 1.95% | 1.95% | (e) | ||||||
| Ratio of net investment income (loss) to average net assets:(b) | |||||||||||
| Before fees waived and expenses absorbed (d) | (0.52)% | (3) | 1.02% | 0.17% | (e) | ||||||
| After fees waived and expenses absorbed (d) | 0.39% | (3) | 1.29% | 0.26% | (e) | ||||||
| Portfolio turnover rate | 445.44% | 429.87% | 317.87% | (f) | |||||||
| (a) | Aggregate total return, not annualized. Total return in the above table represents the rate that the investor would have earned or lost on an investment in the Fund assuming reinvestment of distributions and excludes all sales charges. | ||||||||||
| (b) | These ratios exclude the impact of the expenses of the underlying exchange-traded funds. | ||||||||||
| (c) | Less than $0.01 per share. | ||||||||||
| (d) | The ratios include 0.03% and 0.06% for the year ended June 30, 2016 attributed to interest expense and dividend expense, respectively. | ||||||||||
| (e) | Annualized. | ||||||||||
| (f) | Not annualized. | ||||||||||
| (g) | The amount of net investment income (loss) per share does not accord with the amounts reported in the Statements of Operations due to the timing of purchases and redemptions of Fund shares during the year. | ||||||||||
| (h) | The amount of net realized and unrealized gain on investments per share does not accord with amount reported in the Statement of Operations | ||||||||||
| (1) | The AmericaFirst Seasonal Trends Fund commenced operations on October 31, 2013. | ||||||||||
| (2) | Per share amounts are calculated using the average shares method, which more appropriately presents the per share data for the period. | ||||||||||
| (3) | The ratios include 0.08% for the year ended June 30, 2016 attributed to legal fees outside the expense limitation (see note 8). | ||||||||||
| (4) | Includes the effects of legal fees incurred outside of the expense limitation agreement. Excluding these expenses, total return would have been 1.01%
|
||||||||||
The accompanying notes are an integral part of these financial statements.
| 56 |
| AmericaFirst Seasonal Trends Fund | |||||||||||
| Financial Highlights | |||||||||||
| For a Fund Share Outstanding Throughout Each Year or Period | |||||||||||
| Class U | |||||||||||
| For the Year | For the Year | For the Period | |||||||||
| Ended | Ended | Ended | |||||||||
| June 30, 2016 | June 30, 2015 | June 30, 2014(1) | |||||||||
| Net asset value, beginning of year | $ 10.00 | $ 10.34 | $ 10.00 | ||||||||
| Investment operations: | |||||||||||
| Net investment gain (loss) (2) | (0.07) | 0.01 | (0.06) | ||||||||
| Net legal fees incurred outside expense limitation agreement | (0.01) | - | - | ||||||||
| Net realized and unrealized gain (loss) on investments | 0.07 | (g) | (0.30) | 0.40 | |||||||
| Total from investment operations | (0.01) | (0.29) | 0.34 | ||||||||
| Distributions from: | |||||||||||
| Net investment income | (0.01) | (0.05) | - | ||||||||
| Total distributions | (0.01) | (0.05) | - | ||||||||
| Paid in Capital from Redemption Fees | - | - | (c) | - | (c) | ||||||
| Net asset value, end of year | $ 9.98 | $ 10.00 | $ 10.34 | ||||||||
| Total return (a) | (0.11)% | (4) | (2.84)% | 3.40% | (f) | ||||||
| Ratios/Supplemental Data | |||||||||||
| Net assets, end of year (in 000's) | $ 2,506 | $ 3,196 | $ 4,093 | ||||||||
| Ratio of expenses to average net assets:(b) | |||||||||||
| Before fees waived and expenses absorbed (d) | 4.10% | (3) | 3.23% | 3.15% | (e) | ||||||
| After fees waived and expenses absorbed (d) | 3.10% | (3) | 2.95% | 2.95% | (e) | ||||||
| Ratio of net investment income (loss) to average net assets:(b) | |||||||||||
| Before fees waived and expenses absorbed (d) | (1.86)% | (3) | (0.18)% | (1.01)% | (e) | ||||||
| After fees waived and expenses absorbed (d) | (0.86)% | (3) | 0.10% | (0.81)% | (e) | ||||||
| Portfolio turnover rate | 445.44% | 429.87% | 317.87% | (f) | |||||||
| (a) | Aggregate total return, not annualized. Total return in the above table represents the rate that the investor would have earned or lost on an investment in the Fund assuming reinvestment of distributions and excludes all sales charges. | ||||||||||
| (b) | These ratios exclude the impact of the expenses of the underlying exchange-traded funds. | ||||||||||
| (c) | Less than $0.01 per share. | ||||||||||
| (d) | The ratios include 0.03% and 0.06% for the year ended June 30, 2016 attributed to interest expense and dividend expense, respectively. | ||||||||||
| (e) | Annualized. | ||||||||||
| (f) | Not annualized. | ||||||||||
| (g) | The amount of net realized and unrealized gain on investments per share does not accord with amount reported in the Statement of Operations | ||||||||||
| (1) | The AmericaFirst Seasonal Trends Fund commenced operations on October 31, 2013. | ||||||||||
| (2) | Per share amounts are calculated using the average shares method, which more appropriately presents the per share data for the period. | ||||||||||
| (3) | The ratios include 0.08% for the year ended June 30, 2016 attributed to legal fees outside the expense limitation (see note 8). | ||||||||||
| (4) | Includes the effects of legal fees incurred outside of the expense limitation agreement. Excluding these expenses, total return would have been (0.03)% | ||||||||||
The accompanying notes are an integral part of these financial statements.
| 57 |
AMERICAFIRST QUANTITATIVE FUNDS
NOTES TO FINANCIAL STATEMENTS
| June 30, 2016 | ANNUAL REPORT |
(1) ORGANIZATION AND SIGNIFICANT ACCOUNTING POLICIES
AmericaFirst Quantitative Funds (the “Trust”) was reorganized as a Delaware statutory trust on January 4, 2013. Prior to January 4, 2013, the series of the Trust, other than AmericaFirst Seasonal Trends Fund, were each a part of the Mutual Fund Series Trust, an Ohio business trust organized on February 27, 2006. The Trust is registered as an open-end management investment company under the Investment Company Act of 1940, as amended (the “1940 Act”). The Trust currently consists of five series. These financial statements include the following five series: AmericaFirst Defensive Growth Fund, AmericaFirst Income Trends Fund, AmericaFirst Tactical Alpha Fund (formerly AmericaFirst Absolute Return Fund), AmericaFirst Quantitative Strategies Fund and AmericaFirst Seasonal Trends Fund (each a “Fund” and collectively, the “Funds”). The Funds, except for AmericaFirst Defensive Growth Fund, are registered as diversified series of the Trust. The investment objectives of each Fund are set forth below. AmericaFirst Capital Management, LLC (the “Manager”) is investment advisor to the Funds.
AmericaFirst Defensive Growth Fund (“Defensive Growth Fund”) commenced operations on May 23, 2011. The Fund’s investment objective is to achieve capital appreciation through all market cycles.
AmericaFirst Income Trends Fund (“Income Trends Fund”) commenced operations on July 1, 2010. The Fund’s investment objective is to achieve a high rate of current income with less volatility than common stocks as measured by standard deviation. The Fund seeks total return as a secondary investment objective.
AmericaFirst Tactical Alpha Fund (“Tactical Alpha Fund”) commenced operations on February 26, 2010. The Fund’s investment objective is to achieve capital appreciation with a focus on producing positive returns regardless of the direction of financial markets.
AmericaFirst
Quantitative Strategies Fund (“Quantitative Strategies Fund”)
commenced operations on
September 28, 2007. Prior to November 3, 2008, the Fund was named the
AmericaFirst Income Strategies Fund. The Fund’s investment objective is to achieve long-term capital appreciation and to
achieve positive returns through all market cycles.
AmericaFirst Seasonal Trends Fund (“Seasonal Trends Fund”) commenced operations on October 31, 2013. The Fund’s investment objective is to achieve capital appreciation with a focus on producing positive returns regardless of the direction of the financial markets.
The Defensive Growth Fund, Income Trends Fund, Tactical Alpha Fund and Seasonal Trends Fund each offer three classes of shares, Class A, Class I, and Class U. The Quantitative Strategies Fund offers three classes of shares, Class A, Class C, and Class I. Each class differs as to sales and redemption charges and ongoing fees.
The following is a summary of significant accounting policies consistently followed by the Funds and are in accordance with accounting principles generally accepted in the United States of America (“GAAP”). The Funds follow the specialized accounting and reporting requirements under GAAP that are applicable to investment companies.
a) Securities Valuation - Securities listed on an exchange are valued at the last reported sale price at the close of the regular trading session of the primary exchange on the business day the value is being determined, or in the case of securities listed on NASDAQ at the NASDAQ Official Closing Price. In the absence of a sale, such securities shall be valued at the mean between the current bid and ask prices on the day of valuation. Debt securities (other than short-term obligations) are valued each day by an independent pricing service approved by the Board of Trustees (the “Board”) based on methods which include consideration of: yields or prices of securities of comparable quality, coupon, maturity and type, indications as to values from dealers, and general market conditions or market quotations from a major market maker in the securities. Short-term debt obligations having 60 days or less remaining until maturity, at time of purchase, may be valued at amortized cost. The Funds may invest in portfolios of open-end or closed-end investment companies and exchange traded funds (the “underlying funds”). Open-end funds are valued at their respective net asset values as reported by such investment companies. The underlying funds value securities in their portfolios for which market quotations are readily available at their market values (generally the last reported sale price) and all other securities and assets at their fair value by the methods established by the Boards of the underlying funds. The shares of many closed-end investment companies and exchange traded funds, after their initial public offering, frequently trade at a price per share, which is different than the net asset value per share. The difference represents a market premium or market discount of such shares. There can be no assurances that the market discount or market premium on shares of any closed-end investment company or exchange traded fund purchased by the Funds will not change.
In unusual circumstances, instead of valuing securities in the usual manner, the Funds may value securities at “fair value” as determined in good faith by the Funds’ Board of Trustees, pursuant to the procedures (the “Procedures”) approved by the Board. The Procedures consider, among others, the following factors to determine a security’s fair value: the nature and pricing history (if any) of the security; whether any dealer quotations for the security are available; and possible valuation methodologies that could be used to determine the fair value of the security. Fair value may also be used by the Board if extraordinary events occur after the close of the relevant world market but prior to the NYSE close (generally 4:00pm eastern time).
Exchange Traded Funds (“ETF”) – The Funds may invest in exchange traded funds. ETFs are a type of index fund bought and sold on a securities exchange. An ETF trades like common stock and represents a fixed portfolio of securities designed to track the performance and dividend yield of a particular domestic or foreign market index. The Funds may purchase an ETF to temporarily gain exposure to a portion of the U.S. or a foreign market while awaiting purchase of underlying securities. There are risks of owning the underlying securities the ETFs are designed to track, and the lack of liquidity of an ETF may result in it being more volatile. Additionally, ETFs have fees and expenses that reduce their value.
| 58 |
AMERICAFIRST QUANTITATIVE FUNDS
NOTES TO FINANCIAL STATEMENTS (Continued)
| June 30, 2016 | ANNUAL REPORT |
(1) ORGANIZATION AND SIGNIFICANT ACCOUNTING POLICIES (continued)
ETF, Mutual Fund and Exchange Traded Note (“ETN”) Risk - ETFs, mutual funds and ETNs are subject to investment advisory or management and other expenses, which will be indirectly paid by each Fund. Each is subject to specific risks, depending on investment strategy. Also, each may be subject to leverage risk, which will magnify losses. ETNs are subject to default risks.
Each Fund utilizes various methods to measure the fair value of its investments on a recurring basis. GAAP establishes a hierarchy that prioritizes inputs to valuation methods. The three levels of input are:
Level 1 – Unadjusted quoted prices in active markets for identical assets and liabilities that the Funds have the ability to access.
Level 2 – Observable inputs other than quoted prices included in Level 1 that are observable for the asset or liability, either directly or indirectly. These inputs may include quoted prices for the identical instrument in an inactive market, prices for similar instruments, interest rates, prepayment speeds, credit risk, yield curves, default rates and similar data.
Level 3 – Unobservable inputs for the asset or liability, to the extent relevant observable inputs are not available, representing the Funds’ own assumptions about the assumptions a market participant would use in valuing the asset or liability, and would be based on the best information available.
The availability of observable inputs can vary from security to security and is affected by a wide variety of factors, including, for example, the type of security, whether the security is new and not yet established in the marketplace, the liquidity of markets, and other characteristics particular to the security. To the extent that valuation is based on models or inputs that are less observable or unobservable in the market, the determination of fair value requires more judgment. Accordingly, the degree of judgment exercised in determining fair value is greatest for instruments categorized in Level 3.
The inputs used to measure fair value may fall into different levels of the fair value hierarchy. In such cases, for disclosure purposes, the level in the fair value hierarchy within which the fair value measurement falls in its entirety, is determined based on the lowest level input that is significant to the fair value measurement in its entirety.
The inputs or methodology used for valuing securities are not necessarily an indication of the risk associated with investing in those securities. The following tables summarize the inputs used as of June 30, 2016 for each Fund’s assets and liabilities measured at fair value:
Defensive Growth Fund
| Assets | ||||||||
| Security Classification (1) | Value | Level 1 | Level 2 | Level 3 | ||||
| Common Stock (2) | $ 90,792,886 | $ 90,792,886 | $ - | $ - | ||||
| Short Term Investment | 1,154,184 | 1,154,184 | - | - | ||||
| Total | $ 91,947,070 | $ 91,947,070 | $ - | $ - | ||||
| Liabilities | ||||||||
| Security Classification (1) | Value | Level 1 | Level 2 | Level 3 | ||||
| Common Stock (2) | $ 22,577,235 | $ 22,577,235 | $ - | $ - | ||||
| Total | $ 22,577,235 | $ 22,577,235 | $ - | $ - |
Income Trends Fund
| Assets | ||||||||
| Security Classification (1) | Value | Level 1 | Level 2 | Level 3 | ||||
| Common Stock (2) | $ 11,862,560 | $ 11,862,560 | $ - | $ - | ||||
| Bonds & Notes (2) | 4,367,832 | - | 4,367,832 | - | ||||
| Short Term Investment | 66,276 | 66,276 | - | - | ||||
| Total | $ 16,296,668 | $ 11,928,836 | $ 4,367,832 | $ - | ||||
| Liabilities | ||||||||
| Security Classification (1) | Value | Level 1 | Level 2 | Level 3 | ||||
| Common Stock (2) | $ 263,500 | $ 263,500 | $ - | $ - | ||||
| Real Estate Investment Trusts | 1,417,130 | 1,417,130 | ||||||
| Total | $ 1,680,630 | $ 1,680,630 | $ - | $ - |
| 59 |
AMERICAFIRST QUANTITATIVE FUNDS
NOTES TO FINANCIAL STATEMENTS (Continued)
| June 30, 2016 | ANNUAL REPORT |
(1) ORGANIZATION AND SIGNIFICANT ACCOUNTING POLICIES (continued)
Tactical Alpha Fund
| Assets | |||||||||||||
| Security Classification (1) | Value | Level 1 | Level 2 | Level 3 | |||||||||
| Common Stock (2) | $ 7,632,748 | $ 7,632,748 | $ - | $ - | |||||||||
| Exchange-Traded Funds | 1,381,196 | 1,381,196 | |||||||||||
| Real Estate Investment Trusts | 1,460,567 | 1,460,567 | - | - | |||||||||
| Short Term Investment | 185,583 | 185,583 | - | - | |||||||||
| Total | $ 10,660,094 | $ 10,660,094 | $ - | $ - | |||||||||
| Liabilities | ||||||||
| Security Classification (1) | Value | Level 1 | Level 2 | Level 3 | ||||
| Common Stock (2) | $ 1,121,331 | $ 1,121,331 | $ - | $ - | ||||
| Exchange-Traded Fund | 86 | 86 | - | - | ||||
| Total | $ 1,121,417 | $ 1,121,417 | $ - | $ - |
Quantitative Strategies Fund
| Security Classification (1) | Value | Level 1 | Level 2 | Level 3 | ||||
| Common Stock (2) | $ 19,821,994 | $ 19,781,529 | $ 40,465 | $ - | ||||
| Exchange-Traded Note | 889,255 | 889,255 | - | - | ||||
| Exchange-Traded Funds | 4,818,750 | 4,818,750 | ||||||
| Real Estate Investment Trusts | 1,983,700 | 1,983,700 | - | - | ||||
| Short Term Investment | 166,318 | 166,318 | - | - | ||||
| Total | $ 27,680,017 | $ 27,639,552 | $ 40,465 | $ - |
| Liabilities | ||||||||
| Security Classification (1) | Value | Level 1 | Level 2 | Level 3 | ||||
| Common Stock (2) | $ 1,903,678 | $ 1,903,678 | $ - | $ - | ||||
| Exchange-Traded Notes | 1,389,710 | 1,389,710 | ||||||
| Real Estate Investment Trusts | 886,150 | 886,150 | - | - | ||||
| Total | $ 4,179,538 | $ 4,179,538 | $ - | $ - |
Seasonal Trends Fund
| Security Classification (1) | Value | Level 1 | Level 2 | Level 3 | ||||
| Bonds & Notes (2) | $ 8,434,797 | $ - | $ 8,434,797 | $ - | ||||
| Short Term Investment | 457,060 | 457,060 | - | - | ||||
| Total | $ 8,891,857 | $ 457,060 | $ 8,434,797 | $ - |
(1) As of and during the year ended June 30, 2016, the Funds held no securities that were considered to be “Level 3” securities (those valued using significant unobservable inputs). Therefore, a reconciliation of assets in which significant unobservable inputs (Level 3) were used in determining fair value is not applicable.
(2) For a detailed break-out of common stocks and bonds & notes by investment industry please refer to the Schedules of Investments.
The Funds had no transfers between Level 1 and Level 2 during the year ended June 30, 2016. It is the Funds’ policy to record transfers into or out of Level 1 and Level 2 at the end of the reporting period.
b) Short Sales – A "short sale" is a transaction in which a Fund sells a security it does not own, but has borrowed in anticipation that the market price of that security will decline. A Fund is obligated to replace the security borrowed by purchasing it on the open market at a later date. If the price of the security sold short increases between the time of the short sale and the time a Fund replaces the borrowed security, the Fund will incur a loss, unlimited in size. Conversely, if the price declines, the Fund will realize a gain, limited to the price at which a fund sold the security short.
c) Federal Income Tax - The Funds intend to continue to comply with the requirements of Subchapter M of the Internal Revenue Code applicable to regulated investment companies and will distribute all of their taxable income, if any, to shareholders. Accordingly, no provision for Federal income taxes is required in the financial statements. The Funds recognize the tax benefits of uncertain tax positions only when the position is “more likely than not” to be sustained assuming examination by tax authorities. Management has analyzed the Funds’ tax positions,
| 60 |
AMERICAFIRST QUANTITATIVE FUNDS
NOTES TO FINANCIAL STATEMENTS (Continued)
| June 30, 2016 | ANNUAL REPORT |
(1) ORGANIZATION AND SIGNIFICANT ACCOUNTING POLICIES (continued)
and has concluded that no liability for unrecognized tax benefits should be recorded related to uncertain tax positions on returns filed for open tax years (2013-2015) or expected to be taken in the Funds’ 2016 tax returns. The Funds identified their major tax jurisdictions as U.S. Federal and foreign jurisdictions where the Funds make significant investments; however, the Funds are not aware of any tax positions for which it is reasonably possible that the total amounts of unrecognized tax benefits will change materially in the next twelve months.
d) Distribution to Shareholders - Distributions from investment income and net realized capital gains, if any, are declared and paid at least annually and are recorded on the ex-dividend date. The character of income and gains to be distributed is determined in accordance with income tax regulations, which may differ from GAAP. These “book/tax” differences are considered either temporary (e.g., deferred losses, mark-to-market on open Section 1256 contracts) or permanent in nature. To the extent these differences are permanent in nature, such amounts are reclassified within the composition of net assets based on their federal tax-basis treatment; temporary differences do not require reclassification.
e) Other - Investment and shareholder transactions are recorded on trade date. The Funds determine the gain or loss realized from the investment transactions by comparing the original cost of the security lot sold with the net sales proceeds. Cost is determined and gains and losses are based upon the specific identification method for both financial statement and Federal income tax purposes. Dividend income is recognized on the ex-dividend date or as soon as information is available to the Funds and interest income is recognized on an accrual basis using the effective interest method. Discounts and premiums on debt securities are amortized over their respective lives. Withholding taxes on foreign dividends have been provided for in accordance with the Funds’ understanding of the applicable country’s tax rules and rates.
f) Multiple Class Allocations – Income, non-class specific expenses and realized/unrealized gains or losses are allocated to each class based on average net assets. Distribution fees are charged to each respective share class in accordance with the distribution plan. Expenses of the Trust that are directly identifiable to a specific fund are charged to that fund. Expenses, which are not readily identifiable to a specific fund, are allocated in such a manner as deemed equitable, taking into consideration the nature and type of expense and the relative sizes of the Funds in the Trust.
g) Foreign Currency – The accounting records of each Fund is maintained in U.S. dollars. Investment securities and other assets and liabilities denominated in a foreign currency, and income receipts and expense payments are translated into U.S. dollars using the prevailing exchange rate at the London market close. Purchases and sales of securities are translated into U.S. dollars at the contractual currency rates established at the approximate time of the trade. Net realized gains and losses on foreign currency transactions represent net gains and losses from currency realized between the trade and settlement dates on securities transactions and the difference between income accrued versus income received. The effects of changes in foreign currency exchange rates on investments in securities are included with the net realized and unrealized gain or loss on investment securities.
h) Use of Estimates - The preparation of financial statements in conformity with GAAP requires management to make estimates and assumptions that affect the reported amounts of assets and liabilities and disclosure of contingent assets and liabilities at the date of the financial statements and the reported amounts of revenues and expenses during the reporting period. Actual results could differ from those estimates.
i) Commitments and Contingencies - In the normal course of business, the Trust may enter into contracts that contain a variety of representations and warranties and provide general indemnifications. The Funds’ maximum exposure under these arrangements is dependent on future claims that may be made against the Funds and, therefore, cannot be estimated; however, management considers the risk of loss from such claims to be remote.
j) Credit Facility – The Defensive Growth, Income Trends, Quantitative Strategies, Tactical Alpha and Seasonal Trends Funds entered into a revolving line of credit agreement with MUFG Union Bank for the purpose of covering redemptions in the Funds subject to the limitations of the 1940 Act for borrowings. The maximum amount of borrowing allowed in total under the agreement was $5,000,000. The Funds were charged an interest rate of 3.25%. The Funds did not utilize the line of credit during the year ended June 30, 2016 and closed the facility effective November 16, 2015.
(2) INVESTMENT TRANSACTIONS
For the year ended June 30, 2016, aggregate purchases and sales of investment securities (excluding short-term investments and government securities) for the Funds were as follows:
| Purchases | Sales | ||
| Defensive Growth Fund | $ 118,604,877 | $ 93,358,181 | |
| Income Trends Fund | 72,363,165 | 81,223,300 | |
| Tactical Alpha Fund | 38,827,373 | 42,348,084 | |
| Quantitative Strategies Fund | 170,576,318 | 197,710,986 | |
| Seasonal Trends Fund | 53,741,331 | 63,079,287 |
The Seasonal Trends Fund purchased and sold $8,895,069 and $8,689,595, respectively, of government securities during the year.
| 61 |
AMERICAFIRST QUANTITATIVE FUNDS
NOTES TO FINANCIAL STATEMENTS (Continued)
| June 30, 2016 | ANNUAL REPORT |
(3) INVESTMENT MANAGEMENT AGREEMENT AND OTHER RELATED PARTY TRANSACTIONS
AmericaFirst Capital Management, LLC (“AFCM” or the “Manager”) acts as investment advisor for the Funds pursuant to the terms of an Investment Management Agreement with the Trust (the “Management Agreement”). Under the terms of the Management Agreement, AFCM is responsible for formulating the Funds’ investment policies, making ongoing investment decisions and engaging in portfolio transactions. The Management Agreement provides that the Manager will provide the Funds with investment advice and supervision and will continuously furnish an investment program for the Funds consistent with the investment objectives and policies of the Funds. For its services under the Management Agreement, the Manager is paid a bi-monthly management fee at the annual rate of 1.50%, 1.25%, 1.50%, 1.00% and 1.50% of the average daily net assets of the Defensive Growth Fund, Income Trends Fund, Tactical Alpha Fund, Quantitative Strategies Fund and Seasonal Trends Fund, respectively. For the year ended June 30, 2016, the Defensive Growth Fund, Income Trends Fund, Tactical Alpha Fund, Quantitative Strategies Fund and Seasonal Trends Fund incurred $1,255,606, $263,351, $178,516, $423,273 and $182,375 of management fees, before waiver and reimbursements described below.
AFCM and the Funds have entered into Expense Limitation Agreements (“Expense Limits”) under which the Manager has contractually agreed to waive fees and/or reimburse expenses but only to the extent necessary to maintain total annual operating expenses (exclusive of any front-end or contingent deferred loads, taxes, leverage interest, brokerage commissions, expenses incurred in connection with any merger or reorganization, dividend expense on securities sold short, acquired fund fees and expenses or extraordinary expenses such as litigation) at 2.45%
for Class A, 1.94% for Class I, and 2.95% for Class U of the Defensive Growth Fund’s average daily net assets through February 4, 2017; at 2.20% for Class A, 1.40% for Class I, and 2.70% for Class U of the Income Trends Fund’s average daily net assets through February 4, 2017; at 2.45% for Class A, 1.74% for Class I, and 2.95% for the Class U of the Tactical Alpha Fund’s average daily net assets through February 4, 2017; at 1.50% for Class A, 2.25% for Class C, and 1.95% for Class I of the Quantitative Strategies Fund’s average daily net assets through February 4, 2017; at 2.45% for Class A, 1.95% for Class I, and 2.95% for the Class U of the Seasonal Trends Fund’s average daily net assets through February 4, 2017. Through November 7, 2013, the Expense Limits for Class I under which the Manager had contractually agreed to waive fees and/or reimburse expenses but only to the extent necessary to maintain total annual operating expenses (excluding brokerage costs; borrowing costs, such as (a) interest and (b) dividends on securities sold short; taxes; underlying fund expenses and extraordinary expenses) were 1.95%, 1.95% and 1.70% of the average daily net assets of the Tactical Alpha Fund, Defensive Growth Fund and Income Trends Fund, respectively. However, from November 8, 2013 to May 18, 2016, Class I shares of the Defensive Growth Fund, Income Trends Fund, Quantitative Strategies Fund and Tactical Alpha Fund did not exclude borrowing costs or dividends on securities sold short from the Expense Limits.
Each waiver or reimbursement by the Manager is subject to repayment by the Funds within the three fiscal years following the fiscal year in which those particular expenses are incurred, if the Funds are able to make the repayments without exceeding the expense limitations in effect at that time and the repayments are approved by the Board of Trustees. For the year ended June 30, 2016, the Manager waived management fees of $218,979 for the Defensive Growth Fund. The Manager may recapture $147,212, $168,314, and $218,979 no later than June 30, 2017, June 30, 2018, and June 30, 2019 respectively, subject to the terms of the Expense Limitation Agreement. For the year ended June 30, 2016, the Manager waived management fees of $153,552 for the Income Trends Fund. The Manager may recapture $114,214, $105,800, and $153,552 no later than June 30, 2017, June 30, 2018, and June 30, 2019 respectively, subject to the terms of the Expense Limitation Agreement. For the year ended June 30, 2016, the Manager waived management fees of $129,521 for the Tactical Alpha Fund. The Manager may recapture $107,501, $122,737, and $129,521 no later than June 30, 2017, June 30, 2018, and June 30, 2019 respectively, subject to the terms of the Expense Limitation Agreement. For the year ended June 30, 2016, the Manager waived management fees of $153,271 for the Quantitative Strategies Fund. The Manager may recapture $149,121, $112,655, $153,271 no later than June 30, 2017, June 30, 2018 and June 30, 2019, respectively, subject to the terms of the Expense Limitation Agreement. For the year ended June 30, 2016, the Manager waived management fees of $115,708 for the Seasonal Trends Fund. The Manager may recapture $25,579, $73,744, and $115,708 no later than June 30, 2017, June 30, 2018, and June 30, 2019, respectively, subject to the terms of the Expense Limitation Agreement.
Distributor – The Trust has adopted a Distribution Plan (“Plan”), pursuant to rule 12b-1 under the 1940 Act for each class of shares, other than class I, which allows the Funds to pay to the distributor a monthly fee for distribution and shareholder servicing expenses. Under the Plan, the Funds may pay up to 0.50% for Class A and 1.00% for Class U, per year of its average daily net assets of the Defensive Growth Fund, the Income Trends Fund, the Tactical Alpha Fund and the Seasonal Trends Fund for such distribution and shareholder service activities. The Quantitative Strategies Fund may pay up to 0.25% for Class A and 1.00% for Class C, respectively, per year of its average daily net assets for such distribution and shareholder service activities. The Distribution Plan is a compensation plan, which means that compensation is provided regardless of 12b-1 expenses incurred. During the year ended June 30, 2016, $287,864, $120,862, $80,435, $278,492, and $43,783 were incurred under the Plan for the Defensive Growth Fund, the Income Trends Fund, the Tactical Alpha Fund, Quantitative Strategies Fund and Seasonal Trends Fund, respectively, of which, $183,169 were paid by the Distributor to AmericaFirst Securities, Inc., an entity affiliated with the Manager. Effective June 6, 2016, Class A shares pay 0.25%.
The distributor of the Funds is Northern Lights Distributors, LLC (the “Distributor). The Distributor acts as the Funds’ principal underwriter in a continuous public offering of the Funds’ shares. For the year ended June 30, 2016, the Distributor received underwriter commissions of $665,622 for sales of Class A, Class C and Class U shares, of which $79,740 was retained by the principal underwriter or other affiliated broker-dealers.
In addition, certain affiliates of the Distributor provide services to the Funds as follows:
Gemini Fund Services, LLC (“GFS”), an affiliate of the Distributor and Blue Giant, provides administration, fund accounting, and transfer agent services to the Trust. Pursuant to separate servicing agreements with GFS, the Funds pay GFS customary fees for providing administration, fund accounting and transfer agency services to the Funds. Certain officers of the Trust are also officers of GFS, and are not paid any fees directly by the Funds for serving in such capacities.
| 62 |
AMERICAFIRST QUANTITATIVE FUNDS
NOTES TO FINANCIAL STATEMENTS (Continued)
| June 30, 2016 | ANNUAL REPORT |
(3) INVESTMENT MANAGEMENT AGREEMENT AND OTHER RELATED PARTY TRANSACTIONS (continued)
In addition, Blu Giant, LLC (“Blu Giant”) – Blu Giant, an affiliate of GFS and the Distributor, provides EDGAR conversion and filing services as well as print management services for the Funds on an ad-hoc basis. For the provision of these services, Blu Giant receives customary fees from the Funds.
Officers of the Trust and Trustees who are "interested persons" of the Trust or the Manager will receive no salary or fees from the Trust. Trustees who are not "interested persons" as that term is defined in the 1940 Act, will be paid $2,500 per meeting attended in-person or $100 per telephonic meeting attended, at the discretion of the Chairman of the Trust. The Trust reimburses each Trustee and officer for his or her travel and other expenses relating to attendance at such meetings.
Through December 31, 2015, Garfield Holdings, LLC (“Garfield”), an affiliate of the Manager, provided compliance services to the Funds. Garfield charged a monthly fee of $1,250 per Fund. For the second half of the year, Alaric Compliance Services (“Alaric”) resumed the compliance services duties. Alaric charges a monthly fee of $1,250 per Fund.
(4) REDEMPTION FEES
The Funds may assess a short-term redemption fee of 1.00% of the total redemption amount if a shareholder sells their shares after holding them for less than 90 days. The redemption fee is paid directly to the specific Fund in which the short-term redemption occurs. For the year ended June 30, 2016, the Defensive Growth Fund, Income Trends Fund, Tactical Alpha Fund, Quantitative Strategies Fund, and Seasonal Trends Fund assessed $14,832, $410, $383, $776, and $1,289, respectively, in redemption fees.
(5) DISTRIBUTIONS TO SHAREHOLDERS AND TAX COMPONENTS OF CAPITAL
The tax character of fund distributions paid for the years ended June 30, 2016 and June 30, 2015 was as follows:

As of June 30, 2016, the components of accumulated earnings/(deficit) on a tax basis were as follows:

The difference between book basis and tax basis unrealized appreciation/ (depreciation), undistributed net investment income/loss and accumulated net realized gains/ (losses) from investments is primarily attributable to the tax deferral of losses on wash sales and straddles, and adjustments for real estate investment trusts, partnerships, grantor trusts and constructive sales of securities held short. In addition, the amount listed under other book/tax differences is primarily attributable to the tax deferral of losses on straddles and adjustments for constructive sales of securities held short.
| 63 |
AMERICAFIRST QUANTITATIVE FUNDS
NOTES TO FINANCIAL STATEMENTS (Continued)
| June 30, 2016 | ANNUAL REPORT |
(5) DISTRIBUTIONS TO SHAREHOLDERS AND TAX COMPONENTS OF CAPITAL (continued)
Late year losses incurred after December 31 within the fiscal year are deemed to arise on the first business day of the following fiscal year for tax purposes. The Funds incurred and elected to defer such late year losses as follows:
Capital losses incurred after October 31 within the fiscal year are deemed to arise on the first business day of the following fiscal year for tax purposes. The Funds incurred and elected to defer such capital losses as follows:

At June 30, 2016, the Funds below had capital loss carry forwards for federal income tax purposes available to offset future capital gains as follows:

Permanent book and tax differences, primarily attributable to the book/tax basis treatment of foreign currency gains/(losses), net operating losses, non-deductible expenses, the reclass of Fund distributions and equalization debits, and adjustments for C-corporation return of capital distributions, capitalization in lieu of dividend payments, real estate investment trusts, grantor trusts and partnerships, resulted in reclassifications for the fiscal year ended June 30, 2016 as follows:
(6) NEW ACCOUNTING PRONOUNCEMENT
In May 2015, the Financial Accounting Standards Board (“FASB”) issued Accounting Standards Update (“ASU”) 2015-07, “Disclosures for Investments in Certain Entities That Calculate Net Asset Value per Share (or Its Equivalent)”, modifying ASC 946 “Financial Services – Investment Companies”. Under the modifications, investments in affiliated and private investment funds valued at Net Asset Value are no longer included in the fair value hierarchy disclosed in Footnote 2. ASU 2015-07 is effective for fiscal years beginning on or after December 15, 2015, and interim periods within those annual periods. Early application is permitted. Management is currently evaluating the implications of ASU 2015-07 and its impact on financial statement disclosures.
| 64 |
AMERICAFIRST QUANTITATIVE FUNDS
NOTES TO FINANCIAL STATEMENTS (Continued)
| June 30, 2016 | ANNUAL REPORT |
(7) SUBSEQUENT EVENTS
Subsequent events after the Statements of Assets and Liabilities date have been evaluated through the date the financial statements were issued. Management has concluded that there is no impact requiring adjustment or disclosure in the financial statements.
(8) EXTRAORDINARY EXPENSES
Certain costs incurred by the Funds were deemed to be extraordinary for expense limitation agreement purposes and were not included in the amounts subject to advisory fee waiver or expense reimbursement pursuant to the agreement. Such fees relative to the Defensive Growth Fund, Income Trends Fund, Tactical Alpha Fund, Quantitative Strategies Fund, and Seasonal Trends Fund, amounted to $78,838, $15,574, $8,651, $30,381, and $9,165, respectively, for the year ended June 30, 2016, and can be found on the Statement of Operations.
(9) SUBSEQUENT DISTRIBUTIONS
On July 28, 2016, the Income Trends Fund paid an ordinary income dividend of $0.036945, $0.0330, and $0.0382 per share for Class A, U, and I, respectively.
| 65 |

REPORT OF INDEPENDENT REGISTERED PUBLIC ACCOUNTING FIRM
To the Board of Trustees of AmericaFirst Quantitative Funds
and the Shareholders of AmericaFirst Defensive Growth Fund, AmericaFirst Income Trends Fund, AmericaFirst Tactical Alpha Fund, AmericaFirst Quantitative Strategies Fund, and AmericaFirst Seasonal Trends Fund
We have audited the accompanying statements of assets and liabilities of the AmericaFirst Defensive Growth Fund, AmericaFirst Income Trends Fund, AmericaFirst Tactical Alpha Fund (formerly AmericaFirst Absolute Return Fund), AmericaFirst Quantitative Strategies Fund, and AmericaFirst Seasonal Trends Fund (the "Funds"), each a series of shares of beneficial interest in the AmericaFirst Quantitative Funds, including the schedules of investments as of June 30, 2016, the related statements of operations for the year then ended, the statements of changes in net assets for each of the years in the two-year period then ended and the financial highlights for each of the respective years or periods presented. These financial statements and financial highlights are the responsibility of the Funds' management. Our responsibility is to express an opinion on these financial statements and financial highlights based on our audits.
We conducted our audits in accordance with the standards of the Public Company Accounting Oversight Board (United States). Those standards require that we plan and perform the audits to obtain reasonable assurance about whether the financial statements and financial highlights are free of material misstatement. An audit includes examining, on a test basis, evidence supporting the amounts and disclosures in the financial statements. Our procedures included confirmation of securities owned as of June 30, 2016 by correspondence with the custodian and brokers. An audit also includes assessing the accounting principles used and significant estimates made by management, as well as evaluating the overall financial statement presentation. We believe that our audits provide a reasonable basis for our opinion.
In our opinion, the financial statements and financial highlights referred to above present fairly, in all material respects, the financial position of the AmericaFirst Defensive Growth Fund, AmericaFirst Income Trends Fund, AmericaFirst Tactical Alpha Fund, AmericaFirst Quantitative Strategies Fund, and AmericaFirst Seasonal Trends Fund as of June 30, 2016, and the results of their operations for the year then ended, the changes in their net assets for each of the years in the two-year period then ended and their financial highlights for each of the years or periods presented, in conformity with accounting principles generally accepted in the United States of America.

BBD, LLP
Philadelphia, Pennsylvania
August 29, 2016
| 66 |
TRUSTEES AND OFFICERS (Unaudited)
Management Information. Following are the Trustees and Officers of the Trust, their address and year of birth, their present position with the Trust, and their principal occupation during the past five years. In case a vacancy or an anticipated vacancy on the Board of Trustees shall for any reason exist, the vacancy shall be filled by the affirmative vote of a majority of the remaining Trustees, subject to certain restrictions under the 1940 Act. Those Trustees and Officers, who are “interested persons” (as defined in the 1940 Act) by virtue of their affiliation with either the Trust or the Manager, are indicated in the table. The address of each Trustee and Officer is 17605 Wright Street, Suite 2, Omaha, Nebraska 68130 unless otherwise noted.
Disinterested Trustees
| Name, Address and Year of Birth | Position(s) Held with AmericaFirst Term of Office Length of Time Served | Principal Occupation(s) During Past 5 Years | Number of Portfolios in AmericaFirst Overseen by AmericaFirst Trustee | Other Directorships Held by AmericaFirst Trustee During the Past Five Years |
| DISINTERESTED TRUSTEES | ||||
|
Michael G. Dencavage Year of Birth: 1954 |
Trustee – 2012 to present
|
Retired, formerly Chief Financial Officer, San Juan Unified School District, (2004 to 2011) | 5 | None |
|
Kathleen T. Barr Year of Birth: 1955
|
Independent Chair of the Board of Trustees – 2012 to present
|
Retired: formerly, President, Productive Capital Management, Inc. (registered investment adviser to public entities) and owner, KT Barr Consulting, LLC (mutual fund and investment management consulting) 2010 to 2013; prior thereto, Chief Administrative Officer, Senior Managing Director of Allegiant Asset Management Company (merged with PNC Capital Advisors, LLC in 2009) from 2004 to 2010; Chief Administrative Officer and Chief Compliance Officer and Senior Vice Present of PNC Funds and PNC Advantage Funds (f/k/a Allegiant Funds 2003 to 2010 | 5 | William Blair Funds (25 Portfolios) |
|
Michael A. Gunning Year of Birth: 1958 |
Trustee – Feb. 2015 to present
|
Vice President, Personal Insurance Federation of California (legislative and regulatory advisory firm representing members to California State Legislature and Governor’s Office), 2001 to present | 5 | None |
| 67 |
Interested Trustees** and Officers of the Trust
| Name, Address and Year of Birth | Position(s) Held with AmericaFirst Term of Office Length of Time Served | Principal Occupation(s) During Past 5 Years | Number of Portfolios in AmericaFirst Overseen by AmericaFirst Trustee | Other Directorships Held by AmericaFirst Trustee During the Past Five Years |
| INTERESTED TRUSTEE | ||||
|
Rick A. Gonsalves 8150 Sierra College Blvd., Suite 290, Roseville, CA 95661 Year of Birth: 1968 |
Trustee – 2012 to present
|
President & Chief Executive Officer, AmericaFirst Capital Management, LLC (2007 – present) (investment adviser to the Funds and New Funds; President & Chief Executive Officer, Renaissance Investment Services (2005 to 2008); Registered Broker Representative for various Broker/Dealers from 1994 to 2007 | 5 | None |
| OFFICERS OF THE TRUST | ||||
|
Andrew Rogers Year of Birth: 1969
|
President – 2012 to present | Chief Executive Officer, Gemini Fund Services, LLC (since 2012); President and Manager, Gemini Fund Services, LLC (2006 - 2012); Formerly Manager, Northern Lights Compliance Services, LLC (2006 - 2008); and President and Manager, GemCom LLC (2004-2011) | n/a | n/a |
|
Ann Marie Swanson Year of Birth: 1962 |
Chief Compliance Officer of the Trust – 2016 to present |
Director, Alaric Compliance Services, LLC (June 2015 to present); V.P. and Chief Compliance Officer, Thomas Partners Investment Management (May 2013 to March 2015); S.V.P. and Chief Compliance Officer, Aletheia Research and Management, Inc. (August 2010 to January 2013) |
n/a | n/a |
|
James Colantino Year of Birth: 1969 |
Treasurer – 2012 to present |
Senior Vice President from 2004 to Present; Senior Fund Administrator from 1999 to 2004, Gemini Fund Services, LLC. | n/a | n/a |
|
Dawn M. Dennis Year of Birth: 1966 |
Secretary 2014 –present | Senior Paralegal, Gemini Fund Services (since May 2013), Paralegal (from July 2011 through April 2013); | n/a | n/a |
* The term of office of each Trustee is indefinite.
** The Trustee who is an “interested person” of the Trust as defined in the 1940 Act is an interested person by virtue of being an officer of an advisor that manages a series of the Trust.
The Trust’s Statement of Additional Information includes additional information about the Trustees and Officers and is available, without charge, upon request by calling 1-877-217-8363.
| 68 |
AMERICAFIRST QUANTITATIVE FUNDS
Additional Information (Unaudited) (Continued)
Reference is made to the Prospectus and the Statements of Additional Information for descriptions of the Management Agreements, Services Agreements and Distribution (12b-1) Plans, tax aspects of the Funds and the calculations of the net asset value of shares of the Funds.
PORTFOLIO HOLDINGS
The Funds file their complete
schedule of portfolio holdings with the Securities and Exchange Commission
(the “Commission”) for the first and third quarters of each fiscal year on Form N-Q. The Funds’ Forms N-Q are
available on the Commission’s website at http://www.sec.gov. The Funds’ Form N-Qs may be reviewed and copied at the
Commission’s Public Reference Room in Washington, DC. Information on the operation of the Commission’s Public Reference
Room may be obtained by calling 1-800-SEC-0330.
PROXY VOTE
A description of the policies and procedures that the Funds use to determine how to vote proxies relating to portfolio securities is available without charge, upon request, by calling 1-877-217-8363; and on the Commission’s website at http://www.sec.gov.
Information regarding how the Funds voted proxies relating to portfolio securities during the most recent 12-month period ended June 30 is available without charge, upon request, by calling 1-877-217-8363; and on the Commission’s website at http://www.sec.gov.
| 69 |
| PRIVACY notice |
Rev. Jan 2013
| FACTS | WHAT DOES AMERICAFIRST QUANTITATIVE FUNDS DO WITH YOUR PERSONAL INFORMATION? |
| Why? | Financial companies choose how they share your personal information. Federal law gives consumers the right to limit some but not all sharing. Federal law also requires us to tell you how we collect, share, and protect your personal information. Please read this notice carefully to understand what we do. |
| What? | The
types of personal information we collect and share depend on the product or service you have with us. This information can
include: ■ Social Security number ■ Purchase History ■ Assets ■ Account Balances ■ Retirement Assets ■ Account Transactions ■ Transaction History ■ Wire Transfer Instructions ■ Checking Account Information When you are no longer our customer, we continue to share your information as described in this notice. |
| How? | All financial companies need to share customers’ personal information to run their everyday business. In the section below, we list the reasons financial companies can share their customers’ personal information; the reasons AmericaFirst Quantitative Funds chooses to share; and whether you can limit this sharing. |
| Reasons we can share your personal information | Does
AmericaFirst Quantitative Funds share? |
Can
you limit this sharing? |
For our everyday business purposes – such as to process your transactions, maintain your account(s), respond to court orders and legal investigations, or report to credit bureaus |
Yes | No |
For our marketing purposes – to offer our products and services to you |
No | We don’t share |
| For joint marketing with other financial companies | No | We don’t share |
For our affiliates’ everyday business purposes – information about your transactions and experiences |
No | We don’t share |
For our affiliates’ everyday business purposes – information about your creditworthiness |
No | We don’t share |
| For nonaffiliates to market to you | No | We don’t share |
| Questions? | Call 1-877-217-8363 |
| 70 |
| Who we are | |
| Who is providing this notice? | AmericaFirst Quantitative Funds
|
| What we do | |
| How does AmericaFirst Quantitative Funds protect my personal information? | To protect your personal information from unauthorized access and use, we use security measures that comply with federal law. These measures include computer safeguards and secured files and buildings.
Our service providers are held accountable for adhering to strict policies and procedures to prevent any misuse of your nonpublic personal information. |
| How does AmericaFirst Quantitative Funds collect my personal information? | We collect your personal information, for example, when you
■ Open an account
■ Provide account information
■ Give us your contact information
■ Make deposits or withdrawals from your account
■ Make a wire transfer
■ Tell us where to send the money
■ Tells us who receives the money
■ Show your government-issued ID
■ Show your driver’s license
We also collect your personal information from other companies. |
| Why can’t I limit all sharing? | Federal law gives you the right to limit only
■ Sharing for affiliates’ everyday business purposes – information about your creditworthiness
■ Affiliates from using your information to market to you
■ Sharing for nonaffiliates to market to you
State laws and individual companies may give you additional rights to limit sharing. |
| Definitions | |
| Affiliates | Companies related by common ownership or control. They can be financial and nonfinancial companies.
■ AmericaFirst Quantitative Funds doesn’t share with our affiliates. |
| Nonaffiliates | Companies not related by common ownership or control. They can be financial and nonfinancial companies
■ AmericaFirst Quantitative Funds doesn’t share with nonaffiliates so they can market to you. |
| Joint marketing | A formal agreement between nonaffiliated financial companies that together market financial products or services to you.
■ AmericaFirst Quantitative Funds doesn’t jointly market. |
| 71 |
| AmericaFirst Quantitative Funds |
| MANAGER |
| AmericaFirst Capital Management, LLC |
| 8150 Sierra College Blvd. |
| Suite 290 |
| Roseville, CA 95661 |
| ADMINISTRATOR |
| Gemini Fund Services, LLC |
| 17605 Wright Street, Suite 2 |
| Omaha, NE 68130 |
| 72 |
Item 2. Code of Ethics.
(a) As of the end of the period covered by this report, the registrant has adopted a code of ethics that applies to the registrant's principal executive officer, principal financial officer, principal accounting officer or controller, or persons performing similar functions, regardless of whether these individuals are employed by the registrant or a third party.
(b) For purposes of this item, “code of ethics” means written standards that are reasonably designed to deter wrongdoing and to promote:
| (1) | Honest and ethical conduct, including the ethical handling of actual or apparent conflicts of interest between personal and professional relationships; |
| (2) | Full, fair, accurate, timely, and understandable disclosure in reports and documents that a registrant files with, or submits to, the Commission and in other public communications made by the registrant; |
| (3) | Compliance with applicable governmental laws, rules, and regulations; |
| (4) | The prompt internal reporting of violations of the code to an appropriate person or persons identified in the code; and |
| (5) | Accountability for adherence to the code. |
(c) Amendments: During the period covered by the report, there have not been any amendments to the provisions of the code of ethics.
(d) Waivers: During the period covered by the report, the registrant has not granted any express or implicit waivers from the provisions of the code of ethics.
(e) The Code of Ethics is not posted on Registrant’ website.
(f) A copy of the Code of Ethics is attached as an exhibit.
Item 3. Audit Committee Financial Expert.
(a)(1)ii The board of directors of the fund has determined that the fund does not have an audit committee financial expert serving on its audit committee.
(a)(2) Not applicable.
(a)(3) In this regard, no member of the audit committee was identified as having all of the required technical attributes identified in instruction 2 (b) to item 3 of Form N-CSR to qualify as an “audit committee financial expert,” whether through the type of specialized education or experience required by that instruction. At this time, the board believes the experience provided by each member of the audit committee collectively offers the fund adequate oversight by its audit committee given the fund’s level of financial complexity. The board will from time to time reexamine such belief.
Item 4. Principal Accountant Fees and Services.
| (a) | Audit Fees |
| 2016 – $56,250 |
| 2015 – $55,700 |
| (b) | Audit-Related Fees |
| 2016 – None |
2014 – None
| (c) | Tax Fees |
2016 – $12,500
2015 – $12,500
Preparation of Federal & State income tax returns, assistance with calculation of required income, capital gain and excise distributions and preparation of Federal excise tax returns.
| (d) | All Other Fees |
2016 - None
2015 - None
(e) (1) Audit Committee’s Pre-Approval Policies
| The registrant’s Audit Committee is required to pre-approve all audit services and, when appropriate, any non-audit services (including audit-related, tax and all other services) to the registrant. The registrant’s Audit Committee also is required to pre-approve, when appropriate, any non-audit services (including audit-related, tax and all other services) to its adviser, or any entity controlling, controlled by or under common control with the adviser that provides ongoing services to the registrant, to the extent that the services may be determined to have an impact on the operations or financial reporting of the registrant. Services are reviewed on an engagement by engagement basis by the Audit Committee. |
| (2) | Percentages of Services Approved by the Audit Committee |
2016 2015
Audit-Related Fees: 0.00% 0.00%
Tax Fees: 0.00% 0.00%
All Other Fees: 0.00% 0.00%
| (f) | During the audit of registrant's financial statements for the most recent fiscal year, less than 50 percent of the hours expended on the principal accountant's engagement were attributed to work performed by persons other than the principal accountant's full-time, permanent employees. |
| (g) | The aggregate non-audit fees billed by the registrant's accountant for services rendered to the registrant, and rendered to the registrant's investment adviser (not including any sub-adviser whose role is primarily portfolio management and is subcontracted with or overseen by another investment adviser), and any entity controlling, controlled by, or under common control with the adviser that provides ongoing services to the registrant: |
| 2016 - $12,500 |
| 2015 - $12,500 |
(h) The registrant's audit committee has considered whether the provision of non-audit services to the registrant's investment adviser (not including any sub-adviser whose role is primarily portfolio management and is subcontracted with or overseen by another investment adviser), and any entity controlling, controlled by, or under common control with the investment adviser that provides ongoing services to the registrant, that were not pre-approved pursuant to paragraph (c)(7)(ii) of Rule 2-01 of Regulation S-X, is compatible with maintaining the principal accountant's independence.
Item 5. Audit Committee of Listed Companies. Not applicable to open-end investment companies.
Item 6. Schedule of Investments. Schedule of investments in securities of unaffiliated issuers is included under Item 1.
Item 7. Disclosure of Proxy Voting Policies and Procedures for Closed-End Funds. Not applicable to open-end investment companies.
Item 8. Portfolio Managers of Closed-End Management Investment Companies. Not applicable to open-end investment companies.
Item 9. Purchases of Equity Securities by Closed-End Funds. Not applicable to open-end investment companies.
Item 10. Submission of Matters to a Vote of Security Holders. None
Item 11. Controls and Procedures.
(a) Based on an evaluation of the Registrant’s disclosure controls and procedures as of a date within 90 days of filing date of this Form N-CSR, the principal executive officer and principal financial officer of the Registrant have concluded that the disclosure controls and procedures of the Registrant are reasonably designed to ensure that the information required in filings on Form N-CSR is recorded, processed, summarized, and reported by the filing date, including that information required to be disclosed is accumulated and communicated to the Registrant’s management, including the Registrant’s principal executive officer and principal financial officer, as appropriate to allow timely decisions regarding required disclosure.
(b) There were no significant changes in the Registrant’s internal control over financial reporting that occurred during the Registrant’s last fiscal half-year that have materially affected, or are reasonably likely to materially affect, the Registrant’s internal control over financial reporting.
Item 12. Exhibits.
(a)(1) Code of Ethics filed herewith.
(a)(2) Certifications required by Section 302 of the Sarbanes-Oxley Act of 2002 (and Item 11(a)(2) of Form N-CSR) are filed herewith.
(a)(3) Not applicable for open-end investment companies.
(b) Certifications required by Section 906 of the Sarbanes-Oxley Act of 2002 (and Item 11(b) of Form N-CSR) are filed herewith.
SIGNATURES
Pursuant to the requirements of the Securities Exchange Act of 1934 and the Investment Company Act of 1940, the registrant has duly caused this report to be signed on its behalf by the undersigned, thereunto duly authorized.
(Registrant) AmericaFirst Quantitative Funds
By (Signature and Title)
/s/ Andrew B. Rogers
Andrew B. Rogers, Principal Executive Officer/President
Date 9/7/16
Pursuant to the requirements of the Securities Exchange Act of 1934 and the Investment Company Act of 1940, this report has been signed below by the following persons on behalf of the registrant and in the capacities and on the dates indicated.
By (Signature and Title)
/s/ Andrew B. Rogers
Andrew B. Rogers, Principal Executive Officer/President
Date 9/7/16
By (Signature and Title)
/s/ Jim Colantino
James Colantino, Principal Financial Officer/Treasurer
Date 9/7/16