united
states
securities and exchange commission
washington, d.c. 20549
form n-csr
certified shareholder report of registered management
investment companies
Investment Company Act file number 811-22655
Northern Lights Fund Trust III
(Exact name of registrant as specified in charter)
225 Pictoria Drive, Suite 450, Cincinnati, OH 45246
(Address of principal executive offices) (Zip code)
The Corporation Trust Company
1209 Orange Street, Wilmington, DE 19801
(Name and address of agent for service)
Registrant's telephone number, including area code: 631-470-2600
Date of fiscal year end: 6/30
Date of reporting period: 6/30/23
Item 1. Reports to Stockholders.
Swan Defined Risk Fund
Class A – SDRAX
Class C – SDRCX
Class I – SDRIX
Swan Defined Risk Emerging Markets Fund
Class A – SDFAX
Class C – SDFCX
Class I – SDFIX
Swan Defined Risk Foreign Fund
Class A – SDJAX
Class C – SDJCX
Class I – SDJIX
Swan Defined Risk Growth Fund
Class A – SDAAX
Class C – SDACX
Class I – SDAIX
Swan Defined Risk U.S. Small Cap Fund
Class A – SDCAX
Class C – SDCCX
Class I – SDCIX
Annual Report
June 30, 2023
1-877-896-2590
www.swandefinedriskfunds.com
Distributed by Northern Lights Distributors, LLC
Member FINRA
Swan Defined Risk Fund
Swan Defined Risk Emerging Markets Fund
Swan Defined Risk Foreign Fund
Swan Defined Risk U.S. Small Cap Fund
Swan Defined Risk Growth Fund
SHAREHOLDER LETTER
June
30, 2023
Fiscal Year Annual Review
Dear Shareholders,
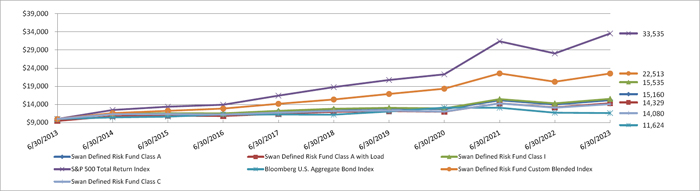
The flagship Swan Defined Risk Fund Class I (SDRIX) shares posted a 8.66% net-of-fees return (including the reinvestment of dividends and capital gains) for the fiscal year ended June 30, 2023, compared to the S&P 500 Total Return Index1 with its 19.59% return. The S&P 500 bottomed out on October 12th, having dropped 24.5% peak-to-trough in 2022. Since then, the market has rallied 26%. Although the S&P 500 has yet to completely recover all its losses, some are heralding the start of a new bull market. The market rally has been heavily concentrated in the large tech companies that already dominate the heights of the U.S. market; the broader market has displayed much less vigor. In this environment the Fund captured roughly 44% of the market’s upward move, within expectations. The core equity portion of the Fund tracked the market upward and had a 19.0% gain. As markets increase in value the put options used to hedge the portfolio will lose value; over the last year the hedge portion of the Fund had a return of -9.5%. The Fund did take the opportunity to re-hedge the Fund twice in the previous 12 months. In mid-October near the bottom of the market the Fund opportunistically re-balanced half of its put options, effectively “selling high and buying low” during a moment of market weakness. In late December the Fund re-hedged its entire portfolio to enter 2023 with a refreshed set of two-year put options, per standard operating procedure. Helping offset some of the losses in the hedge section of the portfolio were positive returns of 1.95% in the additional return/income generation segment of the Fund.
| 1 | A total return index is a type of equity index that tracks the capital gains of a group of stocks over time, and assumes that any cash distributions, such as dividends, are reinvested back into the index. |
1
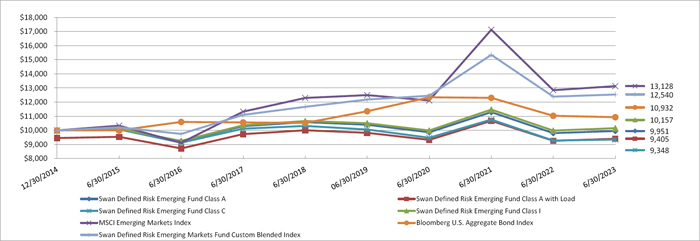
The Swan Defined Risk Emerging Markets Fund Class I (SDFIX) shares had a return of 1.75% net-of-fees (includes reinvestment of dividends and capital gains) for the fiscal year ended June 30, 2023. The benchmark MSCI Emerging Markets (Gross) Index returned 2.22% over the same time frame. The Fund performed within expectations, capturing most of the emerging market’s meager 12-month returns. Emerging markets have been dragged down by China’s poor performance; China makes up roughly 30% of the index and over the last year the MSCI China Index had a -16.7% return. This was due to numerous factors like the “zero-COVID” policy, high youth unemployment, an unresolved bad debt and property problem, and an attack on the country’s most successful entrepreneurs. On the positive side, the large emerging market countries like Taiwan, India, South Korea, and Brazil all had very healthy one-year returns. The Fund’s exposure to emerging market ETFs tracked the market up, as expected. However, the Fund’s put options did lose value due to the passage of time; the one-year decline in this section of the fund was -3.3%. These losses were more than offset by the additional trades/income sleeve of the Fund, which had a positive contribution of 3.5%. The Fund did re-hedge its portfolio twice in the previous 12 months; once in mid-September to take advantage of market weakness and then again near year-end to re-set the hedge levels going in to 2023.
The Swan Defined Risk Foreign Fund Class I (SDJIX) had a gain of 10.56% net-of-fees (includes reinvestment of dividends and capital gains) for the fiscal year ended June 30, 2023. This is over half of the MSCI EAFE (Gross) Index (EAFE – Europe, Australia, Far East) gains of 19.41%. European countries rallied as it became clear Vladimir Putin’s winter blackmail scheme using Russian oil and gas would fail. On the other side of the globe Japan was one of the few countries in the world that benefitted from a bit of inflation after a generation of deflation. The Fund’s performance was driven by its MSCI EAFE-based ETFs, which followed the market upwards. Conversely the put options used to hedge the Fund’s equity holdings declined in value by -6.5%, as expected. The decline in the Fund’s hedges was partially offset by profitable premium collection/income trades, which generated positive returns of 1.54% over the last 12 months. The Fund did re-hedge its portfolio twice in this time frame. In mid-September half of the existing put options were re-set as the Fund took advantage of market weakness, effectively “selling high and buying low.” In late December 2022 all of the Fund put options were replaced with new put options with a two year expiration date, as part of the normal re-hedge process.
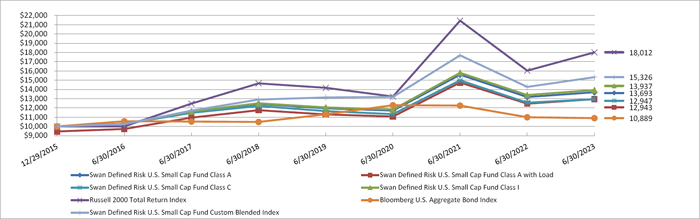
The Swan Defined Risk U.S. Small Cap Fund Class I (SDCIX) shares returned 4.07% net-of-fees (includes the reinvestment of dividends and capital gains) for the fiscal year ended June 30, 2023. This return trailed that of the Russell 2000 Total Return Index, which had a gain of 12.31%. This capture ratio of one-third was on the low end of expectations. While small cap stocks have staged a modest rally since bottoming out, most of the U.S. market’s returns have been driven by the A.I. hype associated with large tech stocks like Amazon, NVIDIA, and Meta. Moreover, the small cap market was negatively impacted by the regional bank crisis during the first half of 2023. The
2
positive returns in the Fund were driven by its exposure to Russell 2000 ETFs, which tracked the market upwards. However, the put options used to hedge the Fund’s equity exposure declined in value due to 1) the rise in the small cap markets, 2) the passage of time, 3) a decline in overall volatility, and 4) some re-hedges implemented in August that occurred before the market bottomed out. These factors contributed to the -7.8% return for the hedge portion of the Fund. Helping offset some of these losses were positive returns via the premium collection/income trades. This segment of the Fund was able to generate positive returns of 2.66%.
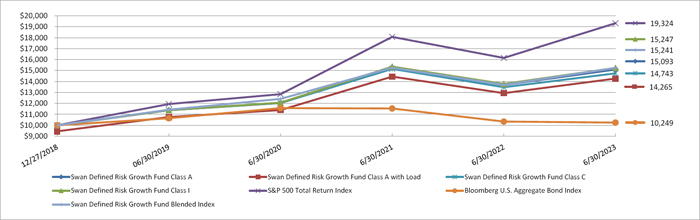
The Swan Defined Risk Growth Fund Class I (SDAIX) shares returned 10.66% net-of-fees (includes the reinvestment of dividends and capital gains) for the fiscal year ended June 30, 2023. This is just over half the S&P 500 Total Return Index2 return of 19.59% over the same period. While within the realm of expectations, the Fund aspires to have a capture ratio modestly higher than what was generated over the last 12 months. The drag on up capture can be attributed solely to the decline in value of the put options, which had a -8.9% return. The decline in the value of the put options was driven by the strong rally off the bottom of the market and a decline in the “fear premium” or volatility as investors started to believe the bear market is over. The other components of the Fund did well. The S&P 500 ETFs and the call spread positions used to augment the upside capture benefitted from the market rally. A re-hedge that occurred near market lows in October 2022 benefited the Fund. And finally, the premium collection, income trades added just over 2% to the Fund’s overall one-year return.
Strategy
The investment objective of the Swan Defined Risk Strategy (DRS) is to seek long term capital appreciation by balancing the upside potential of equity markets with downside risk mitigation. The “Always Invested, Always Hedged” strategy follows a three-step process. First, we purchase and hold an ETF or basket of ETFs that represent a broad range of stocks to ensure diversification. Second, we hedge the notional value of the ETFs through the purchase of corresponding LEAPS put options.3 At certain times, we may even buy additional shorter-term puts to supplement the long-term LEAPs put options. We allocate roughly 10% of the portfolio to the hedge at the time of initial purchase. Finally, we can proportionally write shorter-term options premium against the long ETFs and LEAPS puts in an effort to mitigate the cost of carry associated with the hedge. Premiums received from writing short-term options represent income-type positions that are designed to take advantage
| 2 | A total return index is a type of equity index that tracks the capital gains of a group of stocks over time, and assumes that any cash distributions, such as dividends, are reinvested back into the index. |
| 3 | LEAPS - Long-term Equity AnticiPation Securities have the same characteristics as standard options, but with expiration dates up to three years in the future. |
3
of risk premia4 and time decay5.
This balanced approach featuring three different drivers of returns carries an explicit trade-off. The DRS will rarely capture 100% of a strong, upward move in the markets due to the allocation to defensive put options. During bear markets those put options are countercyclical and should benefit the strategy. However, it is important to remember the hedges are designed to offset a portion of the losses, not eliminate downside risk entirely.
It is also important to keep in mind that the various components of the DRS are meant to be complementary. The fact that losses in one portion of the strategy are intended to be offset by gains in another portion is by design. During the 12-month period ended June 30, 2023 the “additional return” component of premium collection trades performed this role admirably, as all five Swan Funds had positive returns in this sleeve. We believe a smoother ride with lower volatility and greater absolute downside risk management may help investors to stay the course towards reaching their long-term investment goals.
In short, our goal at Swan is to provide investors with a proven solution to managing non-diversifiable market risk across all asset classes, which we feel provides Swan DRS investors a superior investment experience. We take a long-term view and define success as greater absolute and risk-adjusted returns over a full market cycle (i.e., a bull and bear market).
Outlook
The “bull case” and the “bear case” for the market remains evenly balanced. On one hand, the S&P 500 is up over 25% off its lowest point in October 2022. This optimism was fueled by hopes that the Fed would soon end its tightening cycle, a last-minute compromise that avoided a Treasury debt default, and exuberance regarding artificial intelligence’s potential to transform the economy.
The “bear case” argues that most of the market gains have been driven by only a handful of stocks. The valuations of those stocks have become quite stretched, while other segments of the markets remain mired in uncertainty. The full impact of the Fed’s tightening cycle has yet to be felt and a “soft landing” or “no landing” scenario that avoids a recession is by no means guaranteed.
The unique “Always Invested, Always Hedged” investment approach utilized by the Swan Funds alleviates the need to accurately forecast the future direction of the markets. If this is truly a new bull market, the equity portion of the Funds should benefit. If the markets reverse and take a downward turn again, the put options are designed to offset some of those losses. By mixing upside
| 4 | Risk Premia as it relates to options is a condition in which implied volatility is greater than historical volatility. |
| 5 | All options lose value as they get closer to expiration. By writing options or taking a “short” position in an option, the strategy hopes to collect a premium, and then close out that position as the option approaches expiration. |
4
potential with downside risk mitigation, the investor in the Swan Funds needn’t spend their time asking questions like “Has the market peaked?” or “Is this the bottom of the bear?”
We appreciate your trust and confidence in the Swan Funds and look forward to our next communication with our shareholders. We are working diligently toward our primary objectives of managing risks to investment capital and seeking better than average returns in the hedged equity fund class.
3272-NLD-08/01/2023
Best Regards,

Randy
Swan
President
5
| SWAN DEFINED RISK FUND |
| PORTFOLIO REVIEW (Unaudited) |
| June 30, 2023 |
The Fund’s performance figures* for the year ended June 30, 2023, as compared to its benchmarks:
| Annualized | Annualized | ||
| One Year | Five Year | Ten Year | |
| Swan Defined Risk Fund - Class A | 8.49% | 3.70% | 4.25% |
| Swan Defined Risk Fund - Class A with Load | 2.54% | 2.53% | 3.66% |
| Swan Defined Risk Fund - Class C | 7.64% | 2.92% | 3.48% |
| Swan Defined Risk Fund - Class I | 8.66% | 3.93% | 4.50% |
| S&P 500 Total Return Index (a) | 19.59% | 12.31% | 12.86% |
| Bloomberg U.S. Aggregate Bond Index (b) | (0.94)% | 0.77% | 1.52% |
| Swan Defined Risk Fund Blended Index (c) | 11.24% | 7.94% | 8.45% |
Comparison of the Change in Value of a $10,000 Investment
| * | The performance data quoted is historical. Past performance is no guarantee of future results. Current performance may be higher or lower than the performance data quoted. The principal value and investment return of an investment will fluctuate so that your shares, when redeemed, may be worth more or less than their original cost. The returns shown do not reflect the deduction of taxes that a shareholder would pay on Fund distributions or on the redemptions of Fund shares. The total operating expenses as stated in the fee table to the Fund’s prospectus dated November 1, 2022 are 1.51%, 2.26%, and 1.26% for the Class A, C, and I shares respectively. Class A shares are subject to a maximum sales charge of up to 5.50% imposed on purchases. For performance information current to the most recent month-end, please call 1-877-896-2590. |
| (a) | The S&P 500 Total Return Index is an unmanaged free-float capitalization-weighted index which measures the performance of 500 large-cap common stocks actively traded in the United States. Index returns assume reinvestment of dividends. Investors may not invest in the Index directly. Unlike the Fund’s returns, the Index does not reflect any fees or expenses. |
| (b) | The Bloomberg U.S. Aggregate Bond Index is an unmanaged index comprised of U.S. investment grade, fixed rate bond market securities, including government, government agency, corporate and mortgage-backed securities between one and ten years. Index returns assume reinvestment of dividends. Investors may not invest in the Index directly. Unlike the Fund’s returns, the Index does not reflect any fees or expenses. |
| (c) | The Swan Defined Risk Fund Blended Index is a composite of 60% S&P 500 Total Return Index and 40% Bloomberg U.S. Aggregate Bond Index. |
| Portfolio Composition as of June 30, 2023 | ||||
| Holdings by Asset Type | % of Net Assets | |||
| Exchange-Traded Funds | 99.5 | % | ||
| Put Options Purchased | 3.1 | % | ||
| Short-Term Investments | 2.2 | % | ||
| Call Options Purchased | 0.0 | % | ||
| Put Options Written | (1.0 | )% | ||
| Call Options Written | (3.8 | )% | ||
| Liabilities in Excess of other Assets | (0.0 | )% | ||
| 100.0 | % | |||
Please refer to the Schedule of Investments in this shareholder report for a detailed listing of the Fund’s holdings.
6
| SWAN DEFINED RISK EMERGING MARKETS FUND |
| PORTFOLIO REVIEW (Unaudited) |
| June 30, 2023 |
The Fund’s performance figures* for the year ended June 30, 2023, as compared to its benchmarks:
| Annualized | Annualized | ||
| One Year | Five Year | Since Inception (a) | |
| Swan Defined Risk Emerging Markets Fund - Class A | 1.52% | (1.22)% | (0.06)% |
| Swan Defined Risk Emerging Markets Fund - Class A with Load | (4.11)% | (2.34)% | (0.72)% |
| Swan Defined Risk Emerging Markets Fund - Class C | 0.75% | (1.95)% | (0.79)% |
| Swan Defined Risk Emerging Markets Fund - Class I | 1.75% | (0.97)% | 0.18% |
| MSCI Emerging Markets Index (b) | 2.22% | 1.32% | 3.25% |
| Bloomberg U.S. Aggregate Bond Index (c) | (0.94)% | 0.77% | 1.05% |
| Swan Defined Risk Emerging Markets Fund Blended Index (d) | 1.24% | 1.45% | 2.70% |
Comparison of the Change in Value of a $10,000 Investment
| * | The performance data quoted is historical. Past performance is no guarantee of future results. Current performance may be higher or lower than the performance data quoted. The principal value and investment return of an investment will fluctuate so that your shares, when redeemed, may be worth more or less than their original cost. The returns shown do not reflect the deduction of taxes that a shareholder would pay on Fund distributions or on the redemptions of Fund shares. The Fund’s total operating expenses, before any fee waivers, as stated in the fee table to the Fund’s prospectus dated November 1, 2022 are 2.04%, 2.79%, and 1.79% for the Class A, C, and I shares, respectively. Class A shares are subject to a maximum sales charge of up to 5.50% imposed on purchases. The Fund’s adviser has contractually agreed to waive its fees and reimburse expenses of the Fund, at least until October 31, 2023 to ensure that Total Annual Fund Operating Expenses After Fee Waiver and Reimbursement (excluding (i) any front-end or contingent deferred loads; (ii) brokerage fees and commissions, (iii) acquired fund fees and expenses; (iii) borrowing costs (such as interest and dividend expense on securities sold short); (iv) taxes; and (v) extraordinary expenses, such as litigation expenses (which may include indemnification of Fund officers and Trustees, contractual indemnification of Fund service providers (other than the Adviser))) will not exceed 1.65%, 2.40%, and 1.40% of average daily net assets attributable to Class A, Class C, and Class I shares, respectively. These fee waivers and expense reimbursements are subject to possible recoupment from the Fund within three years after the fees have been waived or reimbursed, if such recoupment can be achieved within the foregoing expense limits or the expense limits in place at the time of recoupment, whichever is less. This agreement may be terminated by the Trust’s Board of Trustees only on 60 days’ written notice to the Fund’s adviser. For performance information current to the most recent month-end, please call 1-877-896-2590. |
| (a) | Inception date is December 30, 2014. |
| (b) | The MSCI Emerging Markets Index captures large and mid cap representation across 23 Emerging Markets (EM) countries. With 822 constituents, the Index covers approximately 85% of the free float-adjusted market capitalization in each country. Index returns assume reinvestment of dividends. Investors may not invest in the Index directly. Unlike the Fund’s returns, the Index does not reflect any fees or expenses. |
| (c) | The Bloomberg U.S. Aggregate Bond Index is an unmanaged index comprised of U.S. investment grade, fixed rate bond market securities, including government, government agency, corporate and mortgage-backed securities between one and ten years. Index returns assume reinvestment of dividends. Investors may not invest in the Index directly. Unlike the Fund’s returns, the Index does not reflect any fees or expenses. |
| (d) | The Swan Defined Risk Emerging Markets Fund Blended Index is a composite of 60% MSCI Emerging Markets Index and 40% Bloomberg U.S. Aggregate Bond Index. |
| Portfolio Composition as of June 30, 2023 | ||||
| Holdings by Asset Type | % of Net Assets | |||
| Exchange-Traded Funds | 93.5 | % | ||
| Put Options Purchased | 5.2 | % | ||
| Short-Term Investment | 1.2 | % | ||
| Call Options Written | (0.1 | )% | ||
| Put Options Written | (0.4 | )% | ||
| Other Assets in Excess of Liabilities | 0.6 | % | ||
| 100.0 | % | |||
Please refer to the Schedule of Investments in this shareholder report for a detailed listing of the Fund’s holdings.
7
| SWAN DEFINED RISK FOREIGN FUND |
| PORTFOLIO REVIEW (Unaudited) |
| June 30, 2023 |
The Fund’s performance figures* for the year ended June 30, 2023, as compared to its benchmarks:
| Annualized | Annualized | ||
| One Year | Five Year | Since Inception (a) | |
| Swan Defined Risk Foreign Fund - Class A | 10.34% | 2.39% | 2.74% |
| Swan Defined Risk Foreign Fund - Class A with Load | 4.23% | 1.23% | 1.97% |
| Swan Defined Risk Foreign Fund - Class C | 9.51% | 1.60% | 1.97% |
| Swan Defined Risk Foreign Fund - Class I | 10.56% | 2.62% | 2.98% |
| MSCI ACWI Ex USA Index USD (b) | 12.72% | 3.52% | 5.61% |
| Bloomberg U.S. Aggregate Bond Index (c) | (0.94)% | 0.77% | 1.14% |
| Swan Defined Risk Foreign Fund Blended Index (d) | 7.26% | 2.72% | 4.06% |
Comparison of the Change in Value of a $10,000 Investment

| * | The performance data quoted is historical. Past performance is no guarantee of future results. Current performance may be higher or lower than the performance data quoted. The principal value and investment return of an investment will fluctuate so that your shares, when redeemed, may be worth more or less than their original cost. The returns shown do not reflect the deduction of taxes that a shareholder would pay on Fund distributions or on the redemptions of Fund shares. The Fund’s total operating expenses, before any fee waivers, as stated in the fee table to the Fund’s prospectus dated November 1, 2022 are 2.23%, 2.98%, and 1.98% for the Class A, C, and I shares, respectively. Class A shares are subject to a maximum sales charge of up to 5.50% imposed on purchases. The Fund’s adviser has contractually agreed to waive its fees and reimburse expenses of the Fund, at least until October 31, 2023 to ensure that Total Annual Fund Operating Expenses After Fee Waiver and Reimbursement (excluding (i) any front-end or contingent deferred loads; (ii) brokerage fees and commissions, (iii) acquired fund fees and expenses; (iii) borrowing costs (such as interest and dividend expense on securities sold short); (iv) taxes; and (v) extraordinary expenses, such as litigation expenses (which may include indemnification of Fund officers and Trustees, contractual indemnification of Fund service providers (other than the Adviser))) will not exceed 1.65%, 2.40%, and 1.40% of average daily net assets attributable to Class A, Class C,and Class I shares, respectively. These fee waivers and expense reimbursements are subject to possible recoupment from the Fund within three years after the fees have been waived or reimbursed, if such recoupment can be achieved within the foregoing expense limits or the expense limits in place at the time of recoupment, whichever is less. This agreement may be terminated by the Trust’s Board of Trustees only on 60 days’ written notice to the Fund’s adviser. For performance information current to the most recent month-end, please call 1-877-896-2590. |
| (a) | Inception date is December 29, 2015. |
| (b) | The MSCI ACWI ex USA Index USD captures large and mid cap representation across 22 of 23 Developed Markets countries (excluding the US) and 26 Emerging Markets countries. With 2,368 constituents, the Index covers approximately 85% of the global equity opportunity set outside the US. Index returns assume reinvestment of dividends. Investors may not invest in the Index directly. Unlike the Fund’s returns, the Index does not reflect any fees or expenses. |
| (c) | The Bloomberg U.S. Aggregate Bond Index is an unmanaged index comprised of U.S. investment grade, fixed rate bond market securities, including government, government agency, corporate and mortgage-backed securities between one and ten years. Index returns assume reinvestment of dividends. Investors may not invest in the Index directly. Unlike the Fund’s returns, the Index does not reflect any fees or expenses. |
| (d) | The Swan Defined Risk Foreign Fund Blended Index is a composite of 60% MSCI ACWI Ex USA Index USD and 40% Bloomberg U.S. Aggregate Bond Index. |
| Portfolio Composition as of June 30, 2023 | ||||
| Holdings by Asset Type | % of Net Assets | |||
| Exchange-Traded Fund | 93.4 | % | ||
| Put Options Purchased | 3.7 | % | ||
| Short-Term Investment | 2.5 | % | ||
| Call Options Written | (0.3 | )% | ||
| Put Options Written | (0.4 | )% | ||
| Other Assets in Excess of Liabilities | 1.1 | % | ||
| 100.0 | % | |||
Please refer to the Schedule of Investments in this shareholder report for a detailed listing of the Fund’s holdings.
8
| SWAN DEFINED RISK GROWTH FUND |
| PORTFOLIO REVIEW (Unaudited) |
| June 30, 2023 |
The Fund’s performance figures* for the year ended June 30, 2023, as compared to its benchmarks:
| Annualized | ||
| One Year | Since Inception (a) | |
| Swan Defined Risk Growth Fund - Class A | 10.30% | 9.56% |
| Swan Defined Risk Growth Fund - Class A with Load | 4.23% | 8.20% |
| Swan Defined Risk Growth Fund - Class C | 9.40% | 9.00% |
| Swan Defined Risk Growth Fund - Class I | 10.61% | 9.81% |
| S&P 500 Total Return Index (b) | 19.59% | 15.74% |
| Bloomberg U.S. Aggregate Bond Index (c) | (0.94)% | 0.55% |
| Swan Defined Risk Growth Fund Blended Index (d) | 11.24% | 9.80% |
Comparison of the Change in Value of a $10,000 Investment
| * | The performance data quoted is historical. Past performance is no guarantee of future results. Current performance may be higher or lower than the performance data quoted. The principal value and investment return of an investment will fluctuate so that your shares, when redeemed, may be worth more or less than their original cost. The returns shown do not reflect the deduction of taxes that a shareholder would pay on Fund distributions or on the redemptions of Fund shares. The Fund’s total operating expenses, before any fee waivers, as stated in the fee table to the Fund’s prospectus dated November 1, 2022 are 1.68%, 2.43%, and 1.43% for the Class A, C, and I shares, respectively. Class A shares are subject to a maximum sales charge of up to 5.50% imposed on purchases. The Fund’s adviser has contractually agreed to waive its fees and reimburse expenses of the Fund, at least until October 31, 2023 to ensure that Total Annual Fund Operating Expenses After Fee Waiver and Reimbursement (excluding (i) any front-end or contingent deferred loads; (ii) brokerage fees and commissions, (iii) acquired fund fees and expenses; (iii) borrowing costs (such as interest and dividend expense on securities sold short); (iv) taxes; and (v) extraordinary expenses, such as litigation expenses (which may include indemnification of Fund officers and Trustees, contractual indemnification of Fund service providers (other than the Adviser))) will not exceed 1.65%, 2.40%, and 1.40% of average daily net assets attributable to Class A, Class C, and Class I shares, respectively. These fee waivers and expense reimbursements are subject to possible recoupment from the Fund within three years after the fees have been waived or reimbursed, if such recoupment can be achieved within the foregoing expense limits or the expense limits in place at the time of recoupment, whichever is less. This agreement may be terminated by the Trust’s Board of Trustees only on 60 days’ written notice to the Fund’s adviser. For performance information current to the most recent month-end, please call 1-877-896-2590. |
| (a) | Inception date is December 27, 2018. |
| (b) | The S&P 500 Total Return Index is an unmanaged free-float capitalization-weighted index which measures the performance of 500 large-cap common stocks actively traded in the United States. Index returns assume reinvestment of dividends. Investors may not invest in the Index directly. Unlike the Fund’s returns, the Index does not reflect any fees or expenses. |
| (c) | The Bloomberg U.S. Aggregate Bond Index is an unmanaged index comprised of U.S. investment grade, fixed rate bond market securities, including government, government agency, corporate and mortgage-backed securities between one and ten years. Index returns assume reinvestment of dividends. Investors may not invest in the Index directly. Unlike the Fund’s returns, the Index does not reflect any fees or expenses. |
| (d) | The Swan Defined Risk Growth Fund Blended Index is a composite of 60% S&P 500 Total Return Index and 40% Bloomberg U.S. Aggregate Bond Index. |
| Portfolio Composition as of June 30, 2023 | ||||
| Holdings by Asset Type | % of Net Assets | |||
| Exchange-Traded Fund | 95.0 | % | ||
| Call Options Purchased | 6.1 | % | ||
| Short-Term Investments | 3.1 | % | ||
| Put Options Purchased | 2.5 | % | ||
| Put Options Written | (0.9 | )% | ||
| Call Options Written | (5.6 | )% | ||
| Liabilities in Excess of other Assets | (0.2 | )% | ||
| 100.0 | % | |||
Please refer to the Schedule of Investments in this shareholder report for a detailed listing of the Fund’s holdings.
9
| SWAN DEFINED RISK U.S. SMALL CAP FUND |
| PORTFOLIO REVIEW (Unaudited) |
| June 30, 2023 |
The Fund’s performance figures* for the year ended June 30, 2023, as compared to its benchmarks:
| Annualized | Annualized | ||
| One Year | Five Year | Since Inception (a) | |
| Swan Defined Risk U.S. Small Cap Fund - Class A | 3.89% | 1.96% | 4.28% |
| Swan Defined Risk U.S. Small Cap Fund - Class A with Load | (1.79)% | 0.81% | 3.50% |
| Swan Defined Risk U.S. Small Cap Fund - Class C | 3.02% | 1.18% | 3.50% |
| Swan Defined Risk U.S. Small Cap Fund - Class I | 4.07% | 2.20% | 4.52% |
| Russell 2000 Total Return Index (b) | 12.31% | 4.21% | 8.16% |
| Bloomberg U.S. Aggregate Bond Index (c) | (0.94)% | 0.77% | 1.14% |
| Swan Defined Risk U.S. Small Cap Fund Blended Index (d) | 7.37% | 3.51% | 5.85% |
Comparison of the Change in Value of a $10,000 Investment
| * | The performance data quoted is historical. Past performance is no guarantee of future results. Current performance may be higher or lower than the performance data quoted. The principal value and investment return of an investment will fluctuate so that your shares, when redeemed, may be worth more or less than their original cost. The returns shown do not reflect the deduction of taxes that a shareholder would pay on Fund distributions or on the redemptions of Fund shares. The Fund’s total operating expenses, before any fee waivers, as stated in the fee table to the Fund’s prospectus dated November 1, 2022 are 2.01%, 2.76%, and 1.76% for the Class A, C, and I shares, respectively. Class A shares are subject to a maximum sales charge of up to 5.50% imposed on purchases. The Fund’s adviser has contractually agreed to waive its fees and reimburse expenses of the Fund, at least until October 31, 2023 to ensure that Total Annual Fund Operating Expenses After Fee Waiver and Reimbursement (excluding (i) any front-end or contingent deferred loads; (ii) brokerage fees and commissions, (iii) acquired fund fees and expenses; (iii) borrowing costs (such as interest and dividend expense on securities sold short); (iv) taxes; and (v) extraordinary expenses, such as litigation expenses (which may include indemnification of Fund officers and Trustees, contractual indemnification of Fund service providers (other than the Adviser))) will not exceed 1.65%, 2.40%, and 1.40% of average daily net assets attributable to Class A, Class C, and Class I shares, respectively. These fee waivers and expense reimbursements are subject to possible recoupment from the Fund within three years after the fees have been waived or reimbursed, if such recoupment can be achieved within the foregoing expense limits or the expense limits in place at the time of recoupment, whichever is less. This agreement may be terminated by the Trust’s Board of Trustees only on 60 days’ written notice to the Fund’s adviser. For performance information current to the most recent month-end, please call 1-877-896-2590. |
| (a) | Inception date is December 29, 2015. |
| (b) | The Russell 2000 Total Return Index is an unmanaged market capitalization-weighted index which measures the performance of the small-cap sector of the U.S. stock market. Index returns assume reinvestment of dividends. Investors may not invest in the Index directly. Unlike the Fund’s returns, the Index does not reflect any fees or expenses. |
| (c) | The Bloomberg U.S. Aggregate Bond Index is an unmanaged index comprised of U.S. investment grade, fixed rate bond market securities, including government, government agency, corporate and mortgage-backed securities between one and ten years. Index returns assume reinvestment of dividends. Investors may not invest in the Index directly. Unlike the Fund’s returns, the Index does not reflect any fees or expenses. |
| (d) | The Swan Defined Risk U.S. Small Cap Fund Blended Index is a composite of 60% Russell 2000 Total Return Index and 40% Bloomberg U.S. Aggregate Bond Index. |
| Portfolio Composition as of June 30, 2023 | ||||
| Holdings by Asset Type | % of Net Assets | |||
| Exchange-Traded Fund | 94.2 | % | ||
| Put Options Purchased | 5.4 | % | ||
| Short-Term Investments | 0.5 | % | ||
| Call Options Purchased | 0.0 | % | ||
| Call Options Written | (0.7 | )% | ||
| Put Options Written | (0.9 | )% | ||
| Other Assets in Excess of Liabilities | 1.5 | % | ||
| 100.0 | % | |||
Please refer to the Schedule of Investments in this shareholder report for a detailed listing of the Fund’s holdings.
10
| SWAN DEFINED RISK FUND |
| SCHEDULE OF INVESTMENTS |
| June 30, 2023 |
| Shares | Fair Value | |||||||
| EXCHANGE-TRADED FUNDS — 99.5% | ||||||||
| EQUITY - 99.5% | ||||||||
| 667,709 | Communication Services Select Sector SPDR Fund(a) | $ | 43,454,502 | |||||
| 322,098 | Consumer Discretionary Select Sector SPDR Fund(a) | 54,695,461 | ||||||
| 460,437 | Consumer Staples Select Sector SPDR Fund(a) | 34,150,612 | ||||||
| 260,212 | Energy Select Sector SPDR Fund(a) | 21,121,408 | ||||||
| 1,888,710 | Financial Select Sector SPDR Fund(a) | 63,668,414 | ||||||
| 518,101 | Health Care Select Sector SPDR Fund(a) | 68,767,546 | ||||||
| 405,614 | Industrial Select Sector SPDR Fund(a) | 43,530,494 | ||||||
| 652,000 | iShares Core S&P 500 ETF | 290,602,920 | ||||||
| 154,659 | Materials Select Sector SPDR Fund(a) | 12,816,591 | ||||||
| 334,637 | Real Estate Select Sector SPDR Fund(a) | 12,612,469 | ||||||
| 836,117 | Technology Select Sector SPDR Fund(a) | 145,367,302 | ||||||
| 202,057 | Utilities Select Sector SPDR Fund(a) | 13,222,610 | ||||||
| TOTAL EXCHANGE-TRADED FUNDS (Cost $392,146,195) | 804,010,329 | |||||||
| SHORT-TERM INVESTMENTS — 2.2% | ||||||||
| MONEY MARKET FUNDS - 2.2% | ||||||||
| 13,397,323 | First American Government Obligations Fund Class X, 5.01%(b) | 13,397,323 | ||||||
| 4,414,016 | Goldman Sachs Financial Square - Treasury Instruments Fund, Institutional Class, 4.83%(b) | 4,414,016 | ||||||
| TOTAL MONEY MARKET FUNDS (Cost $17,811,339) | 17,811,339 | |||||||
| Expiration | Exercise | |||||||||||||||||
| Contracts(c) | Date | Price | Notional Value | |||||||||||||||
| INDEX OPTIONS PURCHASED - 3.1% | ||||||||||||||||||
| CALL OPTIONS PURCHASED - 0.0%(d) | ||||||||||||||||||
| 231 | S&P 500 Index | 07/07/2023 | $ | 4,750 | $ | 102,803,778 | $ | 1,733 | ||||||||||
| 230 | S&P 500 Index | 07/14/2023 | 4,680 | 102,358,740 | 8,227 | |||||||||||||
| 226 | S&P 500 Index | 07/21/2023 | 4,615 | 100,578,588 | 77,150 | |||||||||||||
| 226 | S&P 500 Index | 07/28/2023 | 4,725 | 100,578,588 | 25,990 | |||||||||||||
| TOTAL CALL OPTIONS PURCHASED (Cost - $102,034) | 113,100 | |||||||||||||||||
| PUT OPTIONS PURCHASED - 3.1% | ||||||||||||||||||
| 231 | S&P 500 Index | 07/07/2023 | 4,150 | 102,803,778 | 12,590 | |||||||||||||
| 230 | S&P 500 Index | 07/14/2023 | 4,240 | 102,358,740 | 62,020 | |||||||||||||
| 463 | S&P 500 Index | 07/21/2023 | 3,860 | 206,052,594 | 68,068 | |||||||||||||
| 226 | S&P 500 Index | 07/21/2023 | 4,175 | 100,578,588 | 82,604 | |||||||||||||
| 226 | S&P 500 Index | 07/28/2023 | 4,275 | 100,578,588 | 302,840 | |||||||||||||
| 463 | S&P 500 Index | 08/18/2023 | 3,860 | 206,052,594 | 249,772 | |||||||||||||
| 966 | S&P 500 Index | 09/15/2023 | 3,500 | 429,906,708 | 525,213 | |||||||||||||
| 1,331 | S&P 500 Index | 12/20/2024 | 3,800 | 592,345,578 | 16,070,842 | |||||||||||||
| 494 | S&P 500 Index | 12/20/2024 | 4,000 | 219,848,772 | 7,503,797 | |||||||||||||
| TOTAL PUT OPTIONS PURCHASED (Cost - $80,470,090) | 24,877,746 | |||||||||||||||||
See accompanying notes to financial statements.
11
| SWAN DEFINED RISK FUND |
| SCHEDULE OF INVESTMENTS (Continued) |
| June 30, 2023 |
| Fair Value | ||||||||
| TOTAL INDEX OPTIONS PURCHASED (Cost - $80,572,124) | $ | 24,990,846 | ||||||
| TOTAL INVESTMENTS - 104.8% (Cost $490,529,658) | $ | 846,812,514 | ||||||
| CALL OPTIONS WRITTEN - (3.8)% (Proceeds - $23,867,581) | (30,943,741 | ) | ||||||
| PUT OPTIONS WRITTEN - (1.0)% (Proceeds - $14,327,092) | (7,753,786 | ) | ||||||
| LIABILITIES IN EXCESS OF OTHER ASSETS – (0.0)% | (345,704 | ) | ||||||
| NET ASSETS - 100.0% | $ | 807,769,283 | ||||||
| Expiration | Exercise | |||||||||||||||||
| Contracts(c) | Date | Price | Notional Value | |||||||||||||||
| WRITTEN INDEX OPTIONS - (4.8)% | ||||||||||||||||||
| CALL OPTIONS WRITTEN - (3.8)% | ||||||||||||||||||
| 231 | S&P 500 Index | 07/07/2023 | $ | 4,350 | $ | 102,803,778 | $ | 2,410,107 | ||||||||||
| 230 | S&P 500 Index | 07/14/2023 | 4,460 | 102,358,740 | 726,211 | |||||||||||||
| 226 | S&P 500 Index | 07/21/2023 | 4,395 | 100,578,588 | 1,949,582 | |||||||||||||
| 226 | S&P 500 Index | 07/28/2023 | 4,500 | 100,578,588 | 742,410 | |||||||||||||
| 932 | S&P 500 Index | 08/18/2023 | 4,475 | 414,775,416 | 6,625,570 | |||||||||||||
| 966 | S&P 500 Index | 09/15/2023 | 4,350 | 429,906,708 | 18,489,861 | |||||||||||||
| TOTAL CALL OPTIONS WRITTEN (Proceeds - $23,867,581) | 30,943,741 | |||||||||||||||||
| PUT OPTIONS WRITTEN - (1.0)% | ||||||||||||||||||
| 231 | S&P 500 Index | 07/07/2023 | 4,550 | 102,803,778 | 2,393,160 | |||||||||||||
| 230 | S&P 500 Index | 07/14/2023 | 4,460 | 102,358,740 | 805,944 | |||||||||||||
| 463 | S&P 500 Index | 07/21/2023 | 3,420 | 206,052,594 | 26,805 | |||||||||||||
| 226 | S&P 500 Index | 07/21/2023 | 4,395 | 100,578,588 | 464,095 | |||||||||||||
| 226 | S&P 500 Index | 07/28/2023 | 4,500 | 100,578,588 | 1,659,970 | |||||||||||||
| 463 | S&P 500 Index | 08/18/2023 | 3,420 | 206,052,594 | 95,957 | |||||||||||||
| 966 | S&P 500 Index | 09/15/2023 | 3,100 | 429,906,708 | 257,636 | |||||||||||||
| 902 | S&P 500 Index | 09/15/2023 | 4,085 | 401,424,276 | 2,050,219 | |||||||||||||
| TOTAL PUT OPTIONS WRITTEN (Proceeds - $14,327,092) | 7,753,786 | |||||||||||||||||
| TOTAL INDEX OPTIONS WRITTEN (Proceeds - $38,194,673) | $ | 38,697,527 | ||||||||||||||||
ETF - Exchange-Traded Fund
SPDR - Standard & Poor’s Depositary Receipt
| (a) | All or a portion of the security is held as collateral for written options. As of June 30, 2023 the total value of securities held as collateral is $306,260,517. |
| (b) | Rate disclosed is the seven day effective yield as of June 30, 2023. |
| (c) | Each option contract allows the holder of the option to purchase or sell 100 shares of the underlying security. |
| (d) | Percentage rounds to less than 0.1%. |
See accompanying notes to financial statements.
12
| SWAN DEFINED RISK EMERGING MARKETS FUND |
| SCHEDULE OF INVESTMENTS |
| June 30, 2023 |
| Shares | Fair Value | |||||||
| EXCHANGE-TRADED FUNDS — 93.5% | ||||||||
| EQUITY - 93.5% | ||||||||
| 523,400 | iShares Core MSCI Emerging Markets ETF(a) | $ | 25,798,386 | |||||
| TOTAL EXCHANGE-TRADED FUNDS (Cost $25,159,563) | ||||||||
| SHORT-TERM INVESTMENT — 1.2% | ||||||||
| MONEY MARKET FUND - 1.2% | ||||||||
| 326,667 | First American Government Obligations Fund, Class X, 5.01% (Cost $326,667)(b) | 326,667 | ||||||
| Expiration | Exercise | |||||||||||||||||
| Contracts(c) | Date | Price | Notional Value | |||||||||||||||
| EQUITY OPTIONS PURCHASED - 5.2% | ||||||||||||||||||
| PUT OPTIONS PURCHASED - 5.2% | ||||||||||||||||||
| 6,430 | iShares MSCI Emerging Markets ETF | 12/20/2024 | $ | 38 | $ | 25,437,080 | $ | 1,425,231 | ||||||||||
| TOTAL PUT OPTIONS PURCHASED (Cost - $2,950,862) | ||||||||||||||||||
| TOTAL INVESTMENTS – 99.9% (Cost $28,437,092) | $ | 27,550,284 | ||||||||||||||||
| CALL OPTIONS WRITTEN - (0.1)% (Proceeds - $63,191) | (16,008 | ) | ||||||||||||||||
| PUT OPTIONS WRITTEN - (0.4)% (Proceeds - $112,623) | (111,873 | ) | ||||||||||||||||
| OTHER ASSETS IN EXCESS OF LIABILITIES - 0.6% | 158,391 | |||||||||||||||||
| NET ASSETS - 100.0% | $ | 27,580,794 | ||||||||||||||||
| Expiration | Exercise | |||||||||||||||||
| Contracts(c) | Date | Price | Notional Value | |||||||||||||||
| WRITTEN EQUITY OPTIONS - (0.5)% | ||||||||||||||||||
| CALL OPTIONS WRITTEN - (0.1)% | ||||||||||||||||||
| 3,249 | iShares MSCI Emerging Markets ETF | 08/18/2023 | $ | 43 | $ | 12,853,044 | $ | 16,008 | ||||||||||
| TOTAL CALL OPTIONS WRITTEN (Proceeds - $63,191) | ||||||||||||||||||
| PUT OPTIONS WRITTEN - (0.4)% | ||||||||||||||||||
| 1,625 | iShares MSCI Emerging Markets ETF | 08/18/2023 | 37 | 6,428,500 | 24,279 | |||||||||||||
| 1,624 | iShares MSCI Emerging Markets ETF | 08/18/2023 | 38 | 6,424,544 | 44,796 | |||||||||||||
| 1,623 | iShares MSCI Emerging Markets ETF | 09/15/2023 | 37 | 6,420,588 | 42,798 | |||||||||||||
| TOTAL PUT OPTIONS WRITTEN (Proceeds - $112,623) | 111,873 | |||||||||||||||||
| TOTAL EQUITY OPTIONS WRITTEN (Proceeds - $175,814) | $ | 127,881 | ||||||||||||||||
ETF - Exchange-Traded Fund
MSCI - Morgan Stanley Capital International
| (a) | All or a portion of the security is held as collateral for written options. As of June 30, 2023 the total value of securities held as collateral is $6,900,600 |
| (b) | Rate disclosed is the seven day effective yield as of June 30, 2023. |
| (c) | Each option contract allows the holder of the option to purchase or sell 100 shares of the underlying security. |
See accompanying notes to financial statements.
13
| SWAN DEFINED RISK FOREIGN FUND |
| SCHEDULE OF INVESTMENTS |
| June 30, 2023 |
| Shares | Fair Value | |||||||
| EXCHANGE-TRADED FUNDS — 93.4% | ||||||||
| EQUITY - 93.4% | ||||||||
| 428,600 | iShares MSCI EAFE ETF(a) | $ | 31,073,500 | |||||
| TOTAL EXCHANGE-TRADED FUNDS (Cost $23,933,133) | ||||||||
| SHORT-TERM INVESTMENT — 2.5% | ||||||||
| MONEY MARKET FUND - 2.5% | ||||||||
| 839,462 | First American Government Obligations Fund, Class X, 5.01% (Cost $839,462)(b) | 839,462 | ||||||
| Expiration | Exercise | |||||||||||||||||
| Contracts(c) | Date | Price | Notional Value | |||||||||||||||
| EQUITY OPTIONS PURCHASED - 3.7% | ||||||||||||||||||
| PUT OPTIONS PURCHASED - 3.7% | ||||||||||||||||||
| 3,226 | iShares MSCI EAFE ETF | 12/20/2024 | $ | 65 | $ | 23,388,500 | $ | 847,140 | ||||||||||
| 1,060 | iShares MSCI EAFE ETF | 12/20/2024 | 70 | 7,685,000 | 394,040 | |||||||||||||
| TOTAL PUT OPTIONS PURCHASED (Cost - $2,879,131) | 1,241,180 | |||||||||||||||||
| TOTAL INVESTMENTS - 99.6% (Cost $27,651,726) | $ | 33,154,142 | ||||||||||||||||
| CALL OPTIONS WRITTEN - (0.3)% (Proceeds - $97,458) | (101,885 | ) | ||||||||||||||||
| PUT OPTIONS WRITTEN - (0.4)% (Proceeds - $159,633) | (145,159 | ) | ||||||||||||||||
| OTHER ASSETS IN EXCESS OF LIABILITIES - 1.1% | 363,735 | |||||||||||||||||
| NET ASSETS - 100.0% | $ | 33,270,833 | ||||||||||||||||
| Expiration | Exercise | |||||||||||||||||
| Contracts(c) | Date | Price | Notional Value | |||||||||||||||
| EQUITY OPTIONS WRITTEN - (0.7)% | ||||||||||||||||||
| CALL OPTIONS WRITTEN - (0.3)% | ||||||||||||||||||
| 1,072 | iShares MSCI EAFE ETF | 09/15/2023 | $ | 76 | $ | 7,772,000 | $ | 53,003 | ||||||||||
| 1,072 | iShares MSCI EAFE ETF | 09/15/2023 | 77 | 7,772,000 | 36,448 | |||||||||||||
| 1,072 | iShares MSCI EAFE ETF | 09/15/2023 | 79 | 7,772,000 | 12,434 | |||||||||||||
| TOTAL CALL OPTIONS WRITTEN (Proceeds - $97,458) | 101,885 | |||||||||||||||||
| PUT OPTIONS WRITTEN - (0.4)% | ||||||||||||||||||
| 1,072 | iShares MSCI EAFE ETF | 09/15/2023 | 66 | 7,772,000 | 31,527 | |||||||||||||
| 2,144 | iShares MSCI EAFE ETF | 09/15/2023 | 68 | 15,544,000 | 113,632 | |||||||||||||
| TOTAL PUT OPTIONS WRITTEN (Proceeds - $159,633) | 145,159 | |||||||||||||||||
| TOTAL EQUITY OPTIONS WRITTEN (Proceeds - $257,091) | $ | 247,044 | ||||||||||||||||
EAFE - Europe, Australasia and Far East
ETF - Exchange Traded Fund
MSCI - Morgan Stanley Capital International
| (a) | All or a portion of the security is held as collateral for written options. As of June 30, 2023 the total value of securities held as collateral is $12,252,500. |
| (b) | Rate disclosed is the seven day effective yield as of June 30, 2023. |
| (c) | Each option contract allows the holder of the option to purchase or sell 100 shares of the underlying security. |
See accompanying notes to financial statements.
14
| SWAN DEFINED RISK GROWTH FUND |
| SCHEDULE OF INVESTMENTS |
| June 30, 2023 |
| Shares | Fair Value | |||||||
| EXCHANGE-TRADED FUNDS — 95.1% | ||||||||
| EQUITY - 95.1% | ||||||||
| 187,000 | iShares Core S&P 500 ETF(a) | $ | 83,347,770 | |||||
| TOTAL EXCHANGE-TRADED FUNDS (Cost $55,166,974) | ||||||||
| SHORT-TERM INVESTMENTS — 3.1% | ||||||||
| MONEY MARKET FUNDS - 3.1% | ||||||||
| 2,355,437 | First American Government Obligations Fund Class X, 5.01%(b) | 2,355,437 | ||||||
| 341,832 | Goldman Sachs Financial Square - Treasury Instruments Fund, Institutional Class, 4.83%(b) | 341,832 | ||||||
| TOTAL MONEY MARKET FUNDS (Cost $2,697,269) | 2,697,269 | |||||||
| Expiration | Exercise | |||||||||||||||||
| Contracts(c) | Date | Price | Notional Value | |||||||||||||||
| INDEX OPTIONS PURCHASED - 8.6% | ||||||||||||||||||
| CALL OPTIONS PURCHASED - 6.1% | ||||||||||||||||||
| 600 | Chicago Board Options Exchange Volatility Index | 08/16/2023 | $ | 16 | $ | 815,400 | $ | 118,324 | ||||||||||
| 600 | Chicago Board Options Exchange Volatility Index | 08/16/2023 | 17 | 815,400 | 100,617 | |||||||||||||
| 50 | S&P 500 Index | 07/03/2023 | 4,495 | 22,251,900 | 1,125 | |||||||||||||
| 25 | S&P 500 Index | 07/07/2023 | 4,750 | 11,125,950 | 188 | |||||||||||||
| 25 | S&P 500 Index | 07/14/2023 | 4,680 | 11,125,950 | 894 | |||||||||||||
| 23 | S&P 500 Index | 07/21/2023 | 4,615 | 10,235,874 | 7,852 | |||||||||||||
| 23 | S&P 500 Index | 07/28/2023 | 4,725 | 10,235,874 | 2,645 | |||||||||||||
| 95 | S&P 500 Index | 12/20/2024 | 4,400 | 42,278,610 | 5,075,773 | |||||||||||||
| TOTAL CALL OPTIONS PURCHASED (Cost - $3,314,009) | 5,307,418 | |||||||||||||||||
| PUT OPTIONS PURCHASED - 2.5% | ||||||||||||||||||
| 25 | S&P 500 Index | 07/07/2023 | 4,150 | 11,125,950 | 1,363 | |||||||||||||
| 25 | S&P 500 Index | 07/14/2023 | 4,240 | 11,125,950 | 6,741 | |||||||||||||
| 50 | S&P 500 Index | 07/21/2023 | 3,860 | 22,251,900 | 7,351 | |||||||||||||
| 23 | S&P 500 Index | 07/21/2023 | 4,175 | 10,235,874 | 8,407 | |||||||||||||
| 23 | S&P 500 Index | 07/28/2023 | 4,275 | 10,235,874 | 30,820 | |||||||||||||
| 50 | S&P 500 Index | 08/18/2023 | 3,860 | 22,251,900 | 26,973 | |||||||||||||
| 108 | S&P 500 Index | 09/15/2023 | 3,500 | 48,064,104 | 58,719 | |||||||||||||
| 132 | S&P 500 Index | 12/20/2024 | 3,700 | 58,745,016 | 1,417,146 | |||||||||||||
| 55 | S&P 500 Index | 12/20/2024 | 3,800 | 24,477,090 | 664,084 | |||||||||||||
| TOTAL PUT OPTIONS PURCHASED (Cost - $7,521,954) | 2,221,604 | |||||||||||||||||
| TOTAL INDEX OPTIONS PURCHASED (Cost - $10,835,963) | 7,529,022 | |||||||||||||||||
15
| SWAN DEFINED RISK GROWTH FUND |
| SCHEDULE OF INVESTMENTS (Continued) |
| June 30, 2023 |
| Fair Value | ||||||||
| TOTAL INVESTMENTS - 106.8% (Cost $68,700,206) | $ | 93,574,061 | ||||||
| CALL OPTIONS WRITTEN - (5.6)% (Proceeds - $3,631,303) | (4,883,596 | ) | ||||||
| PUT OPTIONS WRITTEN - (1.0)% (Proceeds - $1,548,651) | (842,466 | ) | ||||||
| LIABILITIES IN EXCESS OF OTHER ASSETS - (0.2)% | (218,108 | ) | ||||||
| NET ASSETS - 100.0% | $ | 87,629,891 | ||||||
| Expiration | Exercise | |||||||||||||||||
| Contracts(c) | Date | Price | Notional Value | |||||||||||||||
| WRITTEN INDEX OPTIONS - (6.6)% | ||||||||||||||||||
| CALL OPTIONS WRITTEN - (5.6)% | ||||||||||||||||||
| 25 | S&P 500 Index | 07/03/2023 | $ | 4,450 | $ | 11,125,950 | $ | 18,000 | ||||||||||
| 25 | S&P 500 Index | 07/07/2023 | 4,350 | 11,125,950 | 260,834 | |||||||||||||
| 25 | S&P 500 Index | 07/14/2023 | 4,460 | 11,125,950 | 78,936 | |||||||||||||
| 23 | S&P 500 Index | 07/21/2023 | 4,395 | 10,235,874 | 198,409 | |||||||||||||
| 23 | S&P 500 Index | 07/28/2023 | 4,500 | 10,235,874 | 75,555 | |||||||||||||
| 100 | S&P 500 Index | 08/18/2023 | 4,475 | 44,503,800 | 710,898 | |||||||||||||
| 108 | S&P 500 Index | 09/15/2023 | 4,350 | 48,064,104 | 2,067,190 | |||||||||||||
| 95 | S&P 500 Index | 12/20/2024 | 5,100 | 42,278,610 | 1,473,774 | |||||||||||||
| TOTAL CALL OPTIONS WRITTEN (Proceeds - $3,631,303) | 4,883,596 | |||||||||||||||||
| PUT OPTIONS WRITTEN - (1.0)% | ||||||||||||||||||
| 1,200 | Chicago Board Options Exchange Volatility Index | 08/16/2023 | 13 | 1,630,800 | 23,977 | |||||||||||||
| 25 | S&P 500 Index | 07/07/2023 | 4,550 | 11,125,950 | 259,000 | |||||||||||||
| 25 | S&P 500 Index | 07/14/2023 | 4,460 | 11,125,950 | 87,603 | |||||||||||||
| 50 | S&P 500 Index | 07/21/2023 | 3,420 | 22,251,900 | 2,895 | |||||||||||||
| 23 | S&P 500 Index | 07/21/2023 | 4,395 | 10,235,874 | 47,231 | |||||||||||||
| 23 | S&P 500 Index | 07/28/2023 | 4,500 | 10,235,874 | 168,935 | |||||||||||||
| 50 | S&P 500 Index | 08/18/2023 | 3,420 | 22,251,900 | 10,362 | |||||||||||||
| 108 | S&P 500 Index | 09/15/2023 | 3,100 | 48,064,104 | 28,804 | |||||||||||||
| 94 | S&P 500 Index | 09/15/2023 | 4,085 | 41,833,572 | 213,659 | |||||||||||||
| TOTAL PUT OPTIONS WRITTEN (Proceeds - $1,548,651) | 842,466 | |||||||||||||||||
| TOTAL INDEX OPTIONS WRITTEN (Proceeds - $5,179,954) | $ | 5,726,062 | ||||||||||||||||
ETF - Exchange-Traded Fund
| (a) | All or a portion of the security is held as collateral for written options. As of June 30, 2023 the total value of securities held as collateral is $41,451,030. |
| (b) | Rate disclosed is the seven day effective yield as of June 30, 2023. |
| (c) | Each option contract allows the holder of the option to purchase or sell 100 shares of the underlying security. |
16
| SWAN DEFINED RISK U.S. SMALL CAP FUND |
| SCHEDULE OF INVESTMENTS |
| June 30, 2023 |
| Shares | Fair Value | |||||||
| EXCHANGE-TRADED FUNDS — 94.2% | ||||||||
| EQUITY - 94.2% | ||||||||
| 181,000 | iShares Russell 2000 ETF(a) | $ | 33,895,870 | |||||
| TOTAL EXCHANGE-TRADED FUNDS (Cost $25,340,751) | ||||||||
| SHORT-TERM INVESTMENTS — 0.5% | ||||||||
| MONEY MARKET FUNDS - 0.5% | ||||||||
| 192,017 | First American Government Obligations Fund, Class X, 5.01% (Cost $192,017)(b) | 192,017 | ||||||
| Expiration | Exercise | |||||||||||||||||
| Contracts(c) | Date | Price | Notional Value | |||||||||||||||
| INDEX OPTIONS PURCHASED - 5.4% | ||||||||||||||||||
| CALL OPTIONS PURCHASED - 0.0%(d) | ||||||||||||||||||
| 10 | S&P 500 Index | 07/07/2023 | $ | 4,750 | $ | 4,450,380 | $ | 75 | ||||||||||
| 10 | S&P 500 Index | 07/14/2023 | 4,680 | 4,450,380 | 358 | |||||||||||||
| 9 | S&P 500 Index | 07/21/2023 | 4,615 | 4,005,342 | 3,072 | |||||||||||||
| 10 | S&P 500 Index | 07/28/2023 | 4,725 | 4,450,380 | 1,150 | |||||||||||||
| TOTAL CALL OPTIONS PURCHASED (Cost - $4,302) | 4,655 | |||||||||||||||||
| PUT OPTIONS PURCHASED - 5.4% | ||||||||||||||||||
| 133 | Russell 2000 Index | 12/20/2024 | 1,750 | 25,120,162 | 1,246,726 | |||||||||||||
| 48 | Russell 2000 Index | 12/20/2024 | 1,900 | 9,065,923 | 655,792 | |||||||||||||
| 10 | S&P 500 Index | 07/07/2023 | 4,150 | 4,450,380 | 545 | |||||||||||||
| 10 | S&P 500 Index | 07/14/2023 | 4,240 | 4,450,380 | 2,696 | |||||||||||||
| 9 | S&P 500 Index | 07/21/2023 | 4,175 | 4,005,342 | 3,290 | |||||||||||||
| 10 | S&P 500 Index | 07/28/2023 | 4,275 | 4,450,380 | 13,400 | |||||||||||||
| TOTAL PUT OPTIONS PURCHASED (Cost - $3,506,074) | 1,922,449 | |||||||||||||||||
| TOTAL INDEX OPTIONS PURCHASED (Cost - $3,510,376) | 1,927,104 | |||||||||||||||||
| TOTAL INVESTMENTS - 100.1% (Cost $29,043,144) | $ | 36,014,991 | ||||||||||||||||
| CALL OPTIONS WRITTEN - (0.7)% (Proceeds - $141,788) | (246,396 | ) | ||||||||||||||||
| PUT OPTIONS WRITTEN - (0.9)% (Proceeds - $398,382) | (316,946 | ) | ||||||||||||||||
| OTHER ASSETS IN EXCESS OF LIABILITIES - 1.5% | 521,735 | |||||||||||||||||
| NET ASSETS - 100.0% | $ | 35,973,384 | ||||||||||||||||
17
| SWAN DEFINED RISK U.S. SMALL CAP FUND |
| SCHEDULE OF INVESTMENTS (Continued) |
| June 30, 2023 |
| Expiration | Exercise | |||||||||||||||||
| Contracts(c) | Date | Price | Notional Value | Fair Value | ||||||||||||||
| WRITTEN INDEX OPTIONS - (1.6)% | ||||||||||||||||||
| CALL OPTIONS WRITTEN - (0.7)% | ||||||||||||||||||
| 10 | S&P 500 Index | 07/07/2023 | $ | 4,350 | $ | 4,450,380 | $ | 104,334 | ||||||||||
| 10 | S&P 500 Index | 07/14/2023 | 4,460 | 4,450,380 | 31,574 | |||||||||||||
| 9 | S&P 500 Index | 07/21/2023 | 4,395 | 4,005,342 | 77,638 | |||||||||||||
| 10 | S&P 500 Index | 07/28/2023 | 4,500 | 4,450,380 | 32,850 | |||||||||||||
| TOTAL CALL OPTIONS WRITTEN (Proceeds - $141,788) | 246,396 | |||||||||||||||||
| PUT OPTIONS WRITTEN - (0.9)% | ||||||||||||||||||
| 10 | S&P 500 Index | 07/07/2023 | 4,550 | 4,450,380 | 103,600 | |||||||||||||
| 10 | S&P 500 Index | 07/14/2023 | 4,460 | 4,450,380 | 35,041 | |||||||||||||
| 9 | S&P 500 Index | 07/21/2023 | 4,395 | 4,005,342 | 18,482 | |||||||||||||
| 10 | S&P 500 Index | 07/28/2023 | 4,500 | 4,450,380 | 73,450 | |||||||||||||
| 38 | S&P 500 Index | 09/15/2023 | 4,085 | 16,911,444 | 86,373 | |||||||||||||
| TOTAL PUT OPTIONS WRITTEN (Proceeds - $398,382) | 316,946 | |||||||||||||||||
| TOTAL INDEX OPTIONS WRITTEN (Proceeds - $540,170) | $ | 563,342 | ||||||||||||||||
ETF - Exchange-Traded Fund
| (a) | All or a portion of the security is held as collateral for written options. As of June 30, 2023 the total value of securities held as collateral is $22,846,940. |
| (b) | Rate disclosed is the seven day effective yield as of June 30, 2023. |
| (c) | Each option contract allows the holder of the option to purchase or sell 100 shares of the underlying security. |
| (d) | Percentage rounds to less than 0.1%. |
18
| SWAN FUNDS |
| STATEMENTS OF ASSETS AND LIABILITIES |
| June 30, 2023 |
| Swan Defined Risk | Swan Defined Risk | Swan Defined Risk | ||||||||||||||||||
| Swan Defined Risk | Emerging Markets | Swan Defined Risk | Growth | U.S. Small Cap | ||||||||||||||||
| Fund | Fund | Foreign Fund | Fund | Fund | ||||||||||||||||
| ASSETS | ||||||||||||||||||||
| Investment securities: | ||||||||||||||||||||
| Investments, at cost | $ | 490,529,658 | $ | 28,437,092 | $ | 27,651,726 | $ | 68,700,206 | $ | 29,043,144 | ||||||||||
| Investments, at value | 846,812,514 | 27,550,284 | 33,154,142 | 93,574,061 | 36,014,991 | |||||||||||||||
| Cash held at broker | 202 | 268,765 | 395,878 | — | 414,644 | |||||||||||||||
| Receivable for securities sold | 4,527,311 | — | 81,409 | 554,332 | 198,294 | |||||||||||||||
| Receivable for Fund shares sold | 41,695 | 752 | 931 | 44,030 | 267,135 | |||||||||||||||
| Dividends and interest receivable | 45,653 | 1,378 | 2,963 | 5,137 | 1,646 | |||||||||||||||
| Prepaid expenses and other assets | 28,677 | 4,873 | 15,584 | 18,876 | 14,299 | |||||||||||||||
| TOTAL ASSETS | 851,456,052 | 27,826,052 | 33,650,907 | 94,196,436 | 36,911,009 | |||||||||||||||
| LIABILITIES | ||||||||||||||||||||
| Options written, at value (Premiums received - $38,194,673, $175,814, $257,091, $5,179,954 and $540,170, respectively) | 38,697,527 | 127,881 | 247,044 | 5,726,062 | 563,342 | |||||||||||||||
| Due to broker | — | — | — | 29 | — | |||||||||||||||
| Investment advisory fees payable | 666,405 | 53,247 | 56,015 | 92,805 | 55,053 | |||||||||||||||
| Payable for investments purchased | 3,110,465 | — | 33,263 | 476,031 | 134,866 | |||||||||||||||
| Payable for Fund shares repurchased | 877,099 | 22,009 | 2,599 | 221,714 | 144,929 | |||||||||||||||
| Distribution (12b-1) fees payable | 107,465 | 926 | 752 | 1,852 | 1,616 | |||||||||||||||
| Payable to related parties | 55,349 | 4,311 | 4,130 | 12,721 | 4,552 | |||||||||||||||
| Accrued expenses and other liabilities | 172,459 | 36,884 | 36,271 | 35,331 | 33,267 | |||||||||||||||
| TOTAL LIABILITIES | 43,686,769 | 245,258 | 380,074 | 6,566,545 | 937,625 | |||||||||||||||
| NET ASSETS | $ | 807,769,283 | $ | 27,580,794 | $ | 33,270,833 | $ | 87,629,891 | $ | 35,973,384 | ||||||||||
| NET ASSETS CONSIST OF: | ||||||||||||||||||||
| Paid in capital | $ | 405,226,243 | $ | 32,048,782 | $ | 32,593,916 | $ | 70,693,658 | $ | 31,589,435 | ||||||||||
| Accumulated earnings (deficits) | 402,543,040 | (4,467,988 | ) | 676,917 | 16,936,233 | 4,383,949 | ||||||||||||||
| NET ASSETS | $ | 807,769,283 | $ | 27,580,794 | $ | 33,270,833 | $ | 87,629,891 | $ | 35,973,384 | ||||||||||
| NET ASSET VALUE PER SHARE: | ||||||||||||||||||||
| Class A Shares: | ||||||||||||||||||||
| Net Assets | $ | 100,212,212 | $ | 665,137 | $ | 752,200 | $ | 2,003,364 | $ | 985,777 | ||||||||||
| Shares of beneficial interest outstanding ($0 par value, unlimited shares authorized) | 6,702,100 | 76,159 | 78,374 | 135,526 | 77,640 | |||||||||||||||
| Net asset value (Net Assets ÷ Shares Outstanding) and offering price per share | $ | 14.95 | $ | 8.73 | $ | 9.60 | $ | 14.78 | $ | 12.70 | ||||||||||
| Maximum offering price per share (maximum sales charge of 5.50%) | $ | 15.82 | $ | 9.24 | $ | 10.16 | $ | 15.64 | $ | 13.44 | ||||||||||
| Class C Shares : | ||||||||||||||||||||
| Net Assets | $ | 104,519,274 | $ | 923,357 | $ | 688,538 | $ | 1,768,349 | $ | 1,733,015 | ||||||||||
| Shares of beneficial interest outstanding ($0 par value, unlimited shares authorized) | 7,272,683 | 109,664 | 73,827 | 122,536 | 144,870 | |||||||||||||||
| Net asset value (Net Assets ÷ Shares Outstanding), redemption price and offering price per share | $ | 14.37 | $ | 8.42 | $ | 9.33 | $ | 14.43 | $ | 11.96 | ||||||||||
| Class I Shares: | ||||||||||||||||||||
| Net Assets | $ | 603,037,797 | $ | 25,992,300 | $ | 31,830,095 | $ | 83,858,178 | $ | 33,254,592 | ||||||||||
| Shares of beneficial interest outstanding ($0 par value, unlimited shares authorized) | 40,035,139 | 2,968,839 | 3,304,000 | 5,625,301 | 2,572,306 | |||||||||||||||
| Net asset value (Net Assets ÷ Shares Outstanding), redemption price and offering price per share | $ | 15.06 | $ | 8.76 | $ | 9.63 | $ | 14.91 | $ | 12.93 | ||||||||||
See accompanying notes to financial statements.
19
| SWAN FUNDS |
| STATEMENTS OF OPERATIONS |
| For the Year Ended June 30, 2023 |
| Swan Defined Risk | Swan Defined Risk | |||||||||||||||||||
| Swan Defined Risk | Emerging Markets | Swan Defined Risk | Swan Defined Risk | U.S. Small Cap | ||||||||||||||||
| Fund | Fund | Foreign Fund | Growth Fund | Fund | ||||||||||||||||
| INVESTMENT INCOME | ||||||||||||||||||||
| Dividends | $ | 13,203,272 | $ | 620,409 | $ | 689,015 | $ | 1,470,943 | $ | 557,681 | ||||||||||
| Interest | 487,505 | 16,991 | 16,016 | 78,293 | 20,068 | |||||||||||||||
| TOTAL INVESTMENT INCOME | 13,690,777 | 637,400 | 705,031 | 1,549,236 | 577,749 | |||||||||||||||
| EXPENSES | ||||||||||||||||||||
| Investment advisory fees | 8,849,719 | 284,306 | 324,215 | 990,221 | 397,283 | |||||||||||||||
| Distribution (12b-1) fees: | ||||||||||||||||||||
| Class A | 304,472 | 1,939 | 1,881 | 4,874 | 2,607 | |||||||||||||||
| Class C | 1,068,407 | 10,230 | 7,247 | 18,085 | 17,692 | |||||||||||||||
| Third party administrative service fees | 537,805 | 13,579 | 19,566 | 64,658 | 21,150 | |||||||||||||||
| Administration fees | 492,484 | 37,217 | 39,212 | 73,513 | 43,366 | |||||||||||||||
| Accounting services fees | 167,226 | 5,694 | 6,193 | 18,742 | 7,504 | |||||||||||||||
| Transfer agent fees | 86,998 | 27,001 | 26,401 | 32,501 | 27,401 | |||||||||||||||
| Custodian fees | 80,001 | 7,501 | 9,001 | 10,108 | 8,501 | |||||||||||||||
| Registration fees | 66,000 | 21,999 | 20,099 | 37,000 | 22,999 | |||||||||||||||
| Printing and postage expenses | 59,999 | 8,001 | 8,001 | 12,001 | 8,001 | |||||||||||||||
| Compliance officer fees | 34,999 | 8,001 | 8,201 | 10,001 | 8,501 | |||||||||||||||
| Audit fees | 21,398 | 21,298 | 21,298 | 21,398 | 21,398 | |||||||||||||||
| Trustees’ fees and expenses | 16,702 | 14,901 | 15,002 | 15,001 | 15,001 | |||||||||||||||
| Insurance expense | 13,002 | 2,599 | 2,599 | 3,201 | 2,701 | |||||||||||||||
| Legal fees | 12,001 | 12,002 | 12,002 | 12,302 | 12,001 | |||||||||||||||
| Interest expense | — | — | 187 | — | 764 | |||||||||||||||
| Other expenses | 4,501 | 4,001 | 4,001 | 3,901 | 14,501 | |||||||||||||||
| TOTAL EXPENSES | 11,815,714 | 480,269 | 525,106 | 1,327,507 | 631,371 | |||||||||||||||
| Fees recouped by the Advisor | — | — | — | 81,143 | — | |||||||||||||||
| Less: Fees waived by the Advisor | — | (70,033 | ) | (61,752 | ) | — | (54,094 | ) | ||||||||||||
| TOTAL NET EXPENSES | 11,815,714 | 410,236 | 463,354 | 1,408,650 | 577,277 | |||||||||||||||
| NET INVESTMENT INCOME | 1,875,063 | 227,164 | 241,677 | 140,586 | 472 | |||||||||||||||
| REALIZED AND UNREALIZED GAIN (LOSS) ON INVESTMENTS, OPTIONS PURCHASED AND OPTIONS WRITTEN | ||||||||||||||||||||
| Net realized gain (loss) on: | ||||||||||||||||||||
| Investments | 138,707,222 | (148,608 | ) | (211,016 | ) | (2,233,633 | ) | (1,167,852 | ) | |||||||||||
| Options purchased | (8,569,663 | ) | 1,360,963 | 788,374 | (5,759,995 | ) | (3,163,908 | ) | ||||||||||||
| Options written | 42,408,158 | 1,080,832 | 945,928 | 6,283,683 | 3,601,517 | |||||||||||||||
| Net realized gain (loss) on investments, options purchased and options written | 172,545,717 | 2,293,187 | 1,523,286 | (1,709,945 | ) | (730,243 | ) | |||||||||||||
| Net change in unrealized appreciation (depreciation) on: | ||||||||||||||||||||
| Investments | (1,141,167 | ) | 443,536 | 4,485,868 | 16,702,261 | 4,391,434 | ||||||||||||||
| Options purchased | (96,443,257 | ) | (2,501,320 | ) | (3,249,906 | ) | (3,140,372 | ) | (2,268,886 | ) | ||||||||||
| Options written | (7,757,721 | ) | 1,487 | (35,707 | ) | (2,455,668 | ) | (127,562 | ) | |||||||||||
| Net change in unrealized appreciation (depreciation) on investments, options purchased and options written | (105,342,145 | ) | (2,056,297 | ) | 1,200,255 | 11,106,221 | 1,994,986 | |||||||||||||
| NET REALIZED AND UNREALIZED GAIN ON INVESTMENTS, OPTIONS PURCHASED AND OPTIONS WRITTEN | 67,203,572 | 236,890 | 2,723,541 | 9,396,276 | 1,264,743 | |||||||||||||||
| NET INCREASE IN NET ASSETS RESULTING FROM OPERATIONS | $ | 69,078,635 | $ | 464,054 | $ | 2,965,218 | $ | 9,536,862 | $ | 1,265,215 | ||||||||||
See accompanying notes to financial statements.
20
| SWAN DEFINED RISK FUND |
| STATEMENTS OF CHANGES IN NET ASSETS |
| For the | For the | |||||||
| Year Ended | Year Ended | |||||||
| June 30, 2023 | June 30, 2022 | |||||||
| FROM OPERATIONS | ||||||||
| Net investment income (loss) | $ | 1,875,063 | $ | (1,251,681 | ) | |||
| Net realized gain (loss) on investments, options purchased and options written | 172,545,717 | (3,394,005 | ) | |||||
| Net change in unrealized depreciation on investments, options purchased and options written | (105,342,145 | ) | (74,530,030 | ) | ||||
| Net increase (decrease) in net assets resulting from operations | 69,078,635 | (79,175,716 | ) | |||||
| FROM SHARES OF BENEFICIAL INTEREST | ||||||||
| Proceeds from shares sold: | ||||||||
| Class A | 11,267,267 | 19,802,946 | ||||||
| Class C | 3,596,672 | 8,099,111 | ||||||
| Class I | 85,181,388 | 141,160,024 | ||||||
| Payments for shares redeemed: | ||||||||
| Class A | (45,636,200 | ) | (29,569,604 | ) | ||||
| Class C | (17,169,398 | ) | (18,535,776 | ) | ||||
| Class I | (270,907,933 | ) | (202,586,835 | ) | ||||
| Class Y (a) | — | (79,203 | ) | |||||
| Net decrease in net assets from shares of beneficial interest | (233,668,204 | ) | (81,709,337 | ) | ||||
| TOTAL DECREASE IN NET ASSETS | (164,589,569 | ) | (160,885,053 | ) | ||||
| NET ASSETS | ||||||||
| Beginning of Year | 972,358,852 | 1,133,243,905 | ||||||
| End of Year | $ | 807,769,283 | $ | 972,358,852 | ||||
| SHARE ACTIVITY | ||||||||
| Class A: | ||||||||
| Shares Sold | 796,505 | 1,287,711 | ||||||
| Shares Redeemed | (3,156,496 | ) | (1,943,625 | ) | ||||
| Net decrease in shares of beneficial interest outstanding | (2,359,991 | ) | (655,914 | ) | ||||
| Class C: | ||||||||
| Shares Sold | 262,486 | 547,557 | ||||||
| Shares Redeemed | (1,255,731 | ) | (1,247,970 | ) | ||||
| Net decrease in shares of beneficial interest outstanding | (993,245 | ) | (700,413 | ) | ||||
| Class I: | ||||||||
| Shares Sold | 5,920,116 | 9,181,656 | ||||||
| Shares Redeemed | (19,059,962 | ) | (13,209,691 | ) | ||||
| Net decrease in shares of beneficial interest outstanding | (13,139,846 | ) | (4,028,035 | ) | ||||
| Class Y: (a) | ||||||||
| Shares Redeemed | — | (5,046 | ) | |||||
| Net decrease in shares of beneficial interest outstanding | — | (5,046 | ) | |||||
| (a) | As of the close of business on September 5, 2021 sales and operations of Class Y were suspended. |
See accompanying notes to financial statements.
21
| SWAN DEFINED RISK EMERGING MARKETS FUND |
| STATEMENTS OF CHANGES IN NET ASSETS |
| For the | For the | |||||||
| Year Ended | Year Ended | |||||||
| June 30, 2023 | June 30, 2022 | |||||||
| FROM OPERATIONS | ||||||||
| Net investment income | $ | 227,164 | $ | 411,825 | ||||
| Net realized gain on investments, options purchased and options written | 2,293,187 | 1,702,280 | ||||||
| Net change in unrealized deprecation on investments, options purchased and options written | (2,056,297 | ) | (6,271,068 | ) | ||||
| Net increase (decrease) in net assets resulting from operations | 464,054 | (4,156,963 | ) | |||||
| DISTRIBUTIONS TO SHAREHOLDERS | ||||||||
| Total distributions paid | ||||||||
| Class A | (7,168 | ) | — | |||||
| Class C | (2,748 | ) | — | |||||
| Class I | (402,046 | ) | (57,530 | ) | ||||
| Net decrease in net assets resulting from distributions to shareholders | (411,962 | ) | (57,530 | ) | ||||
| FROM SHARES OF BENEFICIAL INTEREST | ||||||||
| Proceeds from shares sold: | ||||||||
| Class A | 17,043 | 272,975 | ||||||
| Class C | 42,535 | 73,147 | ||||||
| Class I | 6,142,805 | 3,533,149 | ||||||
| Class Y (a) | — | 35 | ||||||
| Net asset value of shares issued in reinvestment of distributions: | ||||||||
| Class A | 5,779 | — | ||||||
| Class C | 1,756 | — | ||||||
| Class I | 368,395 | 52,428 | ||||||
| Payments for shares redeemed: | ||||||||
| Class A | (408,693 | ) | (420,626 | ) | ||||
| Class C | (174,929 | ) | (398,885 | ) | ||||
| Class I | (4,691,071 | ) | (7,693,816 | ) | ||||
| Class Y (a) | — | (235,377 | ) | |||||
| Net increase (decrease) in net assets from shares of beneficial interest | 1,303,620 | (4,816,970 | ) | |||||
| TOTAL INCREASE (DECREASE) IN NET ASSETS | 1,355,712 | (9,031,463 | ) | |||||
| NET ASSETS | ||||||||
| Beginning of Year | 26,225,082 | 35,256,545 | ||||||
| End of Year | $ | 27,580,794 | $ | 26,225,082 | ||||
| SHARE ACTIVITY | ||||||||
| Class A: | ||||||||
| Shares Sold | 1,940 | 28,721 | ||||||
| Shares Reinvested | 677 | — | ||||||
| Shares Redeemed | (47,843 | ) | (44,443 | ) | ||||
| Net decrease in shares of beneficial interest outstanding | (45,226 | ) | (15,722 | ) | ||||
| Class C: | ||||||||
| Shares Sold | 5,001 | 7,795 | ||||||
| Shares Reinvested | 212 | — | ||||||
| Shares Redeemed | (20,802 | ) | (43,528 | ) | ||||
| Net decrease in shares of beneficial interest outstanding | (15,589 | ) | (35,733 | ) | ||||
| Class I: | ||||||||
| Shares Sold | 702,343 | 375,558 | ||||||
| Shares Reinvested | 43,088 | 5,484 | ||||||
| Shares Redeemed | (538,439 | ) | (812,471 | ) | ||||
| Net increase (decrease) in shares of beneficial interest outstanding | 206,992 | (431,429 | ) | |||||
| Class Y: (a) | ||||||||
| Shares Redeemed | — | (23,843 | ) | |||||
| Net decrease in shares of beneficial interest outstanding | — | (23,843 | ) | |||||
| (a) | As of the close of business on September 5, 2021 sales and operations of Class Y were suspended. |
See accompanying notes to financial statements.
22
| SWAN DEFINED RISK FOREIGN FUND |
| STATEMENTS OF CHANGES IN NET ASSETS |
| For the | For the | |||||||
| Year Ended | Year Ended | |||||||
| June 30, 2023 | June 30, 2022 | |||||||
| FROM OPERATIONS | ||||||||
| Net investment income | $ | 241,677 | $ | 671,798 | ||||
| Net realized gain (loss) on investments, options purchased and options written | 1,523,286 | (507,270 | ) | |||||
| Net change in unrealized appreciation (depreciation) on investments, options purchased and options written | 1,200,255 | (3,273,828 | ) | |||||
| Net increase (decrease) in net assets resulting from operations | 2,965,218 | (3,109,300 | ) | |||||
| DISTRIBUTIONS TO SHAREHOLDERS | ||||||||
| From return of capital | ||||||||
| Class A | — | (119,608 | ) | |||||
| Class C | — | (89,549 | ) | |||||
| Class I | — | (3,403,272 | ) | |||||
| Total distributions paid | ||||||||
| Class A | — | (24,432 | ) | |||||
| Class C | — | (11,973 | ) | |||||
| Class I | — | (782,542 | ) | |||||
| Net decrease in net assets resulting from distributions to shareholders | — | (4,431,376 | ) | |||||
| FROM SHARES OF BENEFICIAL INTEREST | ||||||||
| Proceeds from shares sold: | ||||||||
| Class A | 48,035 | 79,380 | ||||||
| Class C | 27,795 | 51,431 | ||||||
| Class I | 10,604,082 | 4,924,442 | ||||||
| Net asset value of shares issued in reinvestment of distributions: | ||||||||
| Class A | — | 99,052 | ||||||
| Class C | — | 84,827 | ||||||
| Class I | — | 3,907,909 | ||||||
| Payments for shares redeemed: | ||||||||
| Class A | (186,014 | ) | (247,358 | ) | ||||
| Class C | (104,821 | ) | (128,569 | ) | ||||
| Class I | (9,440,833 | ) | (5,463,797 | ) | ||||
| Class Y (a) | — | (137,062 | ) | |||||
| Net increase in net assets from shares of beneficial interest | 948,244 | 3,170,255 | ||||||
| TOTAL INCREASE (DECREASE) IN NET ASSETS | 3,913,462 | (4,370,421 | ) | |||||
| NET ASSETS | ||||||||
| Beginning of Year | 29,357,371 | 33,727,792 | ||||||
| End of Year | $ | 33,270,833 | $ | 29,357,371 | ||||
| SHARE ACTIVITY | ||||||||
| Class A: | ||||||||
| Shares Sold | 5,069 | 7,043 | ||||||
| Shares Reinvested | — | 10,149 | ||||||
| Shares Redeemed | (20,832 | ) | (24,363 | ) | ||||
| Net decrease in shares of beneficial interest outstanding | (15,763 | ) | (7,171 | ) | ||||
| Class C: | ||||||||
| Shares Sold | 3,121 | 5,374 | ||||||
| Shares Reinvested | — | 8,845 | ||||||
| Shares Redeemed | (11,500 | ) | (12,326 | ) | ||||
| Net increase (decrease) in shares of beneficial interest outstanding | (8,379 | ) | 1,893 | |||||
| Class I: | ||||||||
| Shares Sold | 1,177,042 | 497,377 | ||||||
| Shares Reinvested | — | 400,401 | ||||||
| Shares Redeemed | (1,068,373 | ) | (540,754 | ) | ||||
| Net increase in shares of beneficial interest outstanding | 108,669 | 357,024 | ||||||
| Class Y: (a) | ||||||||
| Shares Redeemed | — | (12,037 | ) | |||||
| Net decrease in shares of beneficial interest outstanding | — | (12,037 | ) | |||||
| (a) | As of the close of business on September 5, 2021 sales and operations of Class Y were suspended. |
See accompanying notes to financial statements.
23
| SWAN DEFINED RISK GROWTH FUND |
| STATEMENTS OF CHANGES IN NET ASSETS |
| For the | For the | |||||||
| Year Ended | Year Ended | |||||||
| June 30, 2023 | June 30, 2022 | |||||||
| FROM OPERATIONS | ||||||||
| Net investment income (loss) | $ | 140,586 | $ | (266,216 | ) | |||
| Net realized loss on investments, options purchased and options written | (1,709,945 | ) | (2,547,215 | ) | ||||
| Net change in unrealized appreciation (depreciation) on investments, options purchased and options written | 11,106,221 | (10,722,389 | ) | |||||
| Net increase (decrease) in net assets resulting from operations | 9,536,862 | (13,535,820 | ) | |||||
| FROM SHARES OF BENEFICIAL INTEREST | ||||||||
| Proceeds from shares sold: | ||||||||
| Class A | 288,978 | 780,870 | ||||||
| Class C | 82,161 | 1,081,740 | ||||||
| Class I | 47,323,509 | 101,788,091 | ||||||
| Class Y (a) | — | 12 | ||||||
| Payments for shares redeemed: | ||||||||
| Class A | (301,676 | ) | (2,093,273 | ) | ||||
| Class C | (273,657 | ) | (112,100 | ) | ||||
| Class I | (72,865,776 | ) | (68,800,371 | ) | ||||
| Class Y (a) | — | (1,016,298 | ) | |||||
| Net increase (decrease) in net assets from shares of beneficial interest | (25,746,461 | ) | 31,628,671 | |||||
| TOTAL INCREASE (DECREASE) IN NET ASSETS | (16,209,599 | ) | 18,092,851 | |||||
| NET ASSETS | ||||||||
| Beginning of Year | 103,839,490 | 85,746,639 | ||||||
| End of Year | $ | 87,629,891 | $ | 103,839,490 | ||||
| SHARE ACTIVITY | ||||||||
| Class A: | ||||||||
| Shares Sold | 21,374 | 50,408 | ||||||
| Shares Redeemed | (21,904 | ) | (132,365 | ) | ||||
| Net decrease in shares of beneficial interest outstanding | (530 | ) | (81,957 | ) | ||||
| Class C: | ||||||||
| Shares Sold | 6,127 | 70,018 | ||||||
| Shares Redeemed | (19,975 | ) | (7,276 | ) | ||||
| Net increase (decrease) in shares of beneficial interest outstanding | (13,848 | ) | 62,742 | |||||
| Class I: | ||||||||
| Shares Sold | 3,449,958 | 6,500,829 | ||||||
| Shares Redeemed | (5,262,208 | ) | (4,417,596 | ) | ||||
| Net increase (decrease) in shares of beneficial interest outstanding | (1,812,250 | ) | 2,083,233 | |||||
| Class Y: (a) | ||||||||
| Shares Redeemed | — | (63,958 | ) | |||||
| Net decrease in shares of beneficial interest outstanding | — | (63,958 | ) | |||||
| (a) | As of the close of business on September 5, 2021 sales and operations of Class Y were suspended. |
See accompanying notes to financial statements.
24
| SWAN DEFINED RISK U.S. SMALL CAP FUND |
| STATEMENTS OF CHANGES IN NET ASSETS |
| For the | For the | |||||||
| Year Ended | Year Ended | |||||||
| June 30, 2023 | June 30, 2022 | |||||||
| FROM OPERATIONS | ||||||||
| Net investment income (loss) | $ | 472 | $ | (219,943 | ) | |||
| Net realized gain (loss) on investments, options purchased and options written | (730,243 | ) | 1,177,590 | |||||
| Net change in unrealized appreciation (depreciation) on investments, options purchased and options written | 1,994,986 | (7,331,306 | ) | |||||
| Net increase (decrease) in net assets resulting from operations | 1,265,215 | (6,373,659 | ) | |||||
| DISTRIBUTIONS TO SHAREHOLDERS | ||||||||
| Total distributions paid: | ||||||||
| Class A | (64,537 | ) | — | |||||
| Class C | (136,958 | ) | — | |||||
| Class I | (2,491,470 | ) | — | |||||
| Net decrease in net assets resulting from distributions to shareholders | (2,692,965 | ) | — | |||||
| FROM SHARES OF BENEFICIAL INTEREST | ||||||||
| Proceeds from shares sold: | ||||||||
| Class A | 158,632 | 248,012 | ||||||
| Class C | 202,972 | 121,522 | ||||||
| Class I | 13,462,041 | 8,861,528 | ||||||
| Net asset value of shares issued in reinvestment of distributions: | ||||||||
| Class A | 54,405 | — | ||||||
| Class C | 117,211 | — | ||||||
| Class I | 1,875,353 | — | ||||||
| Payments for shares redeemed: | ||||||||
| Class A | (226,486 | ) | (130,318 | ) | ||||
| Class C | (230,172 | ) | (165,343 | ) | ||||
| Class I | (13,516,932 | ) | (12,401,104 | ) | ||||
| Class Y (a) | — | (333,294 | ) | |||||
| Net increase (decrease) in net assets from shares of beneficial interest | 1,897,024 | (3,798,997 | ) | |||||
| TOTAL INCREASE (DECREASE) IN NET ASSETS | 469,274 | (10,172,656 | ) | |||||
| NET ASSETS | ||||||||
| Beginning of Year | 35,504,110 | 45,676,766 | ||||||
| End of Year | $ | 35,973,384 | $ | 35,504,110 | ||||
| SHARE ACTIVITY | ||||||||
| Class A: | ||||||||
| Shares Sold | 11,918 | 16,847 | ||||||
| Shares Reinvested | 4,511 | — | ||||||
| Shares Redeemed | (16,639 | ) | (8,442 | ) | ||||
| Net increase (decrease) in shares of beneficial interest outstanding | (210 | ) | 8,405 | |||||
| Class C: | ||||||||
| Shares Sold | 15,942 | 8,379 | ||||||
| Shares Reinvested | 10,281 | — | ||||||
| Shares Redeemed | (19,108 | ) | (11,523 | ) | ||||
| Net increase (decrease) in shares of beneficial interest outstanding | 7,115 | (3,144 | ) | |||||
| Class I: | ||||||||
| Shares Sold | 977,902 | 584,001 | ||||||
| Shares Reinvested | 152,966 | — | ||||||
| Shares Redeemed | (1,014,873 | ) | (805,656 | ) | ||||
| Net increase (decrease) in shares of beneficial interest outstanding | 115,995 | (221,655 | ) | |||||
| Class Y: (a) | ||||||||
| Shares Redeemed | — | (21,373 | ) | |||||
| Net decrease in shares of beneficial interest outstanding | — | (21,373 | ) | |||||
| (a) | As of the close of business on September 5, 2021 sales and operations of Class Y were suspended. |
See accompanying notes to financial statements.
25
| SWAN DEFINED RISK FUND |
| FINANCIAL HIGHLIGHTS |
| Per Share Data and Ratios for a Share of Beneficial Interest Outstanding Throughout Each Year |
| Class A | ||||||||||||||||||||
| For the | For the | For the | For the | For the | ||||||||||||||||
| Year Ended | Year Ended | Year Ended | Year Ended | Year Ended | ||||||||||||||||
| June 30, 2023 | June 30, 2022 | June 30, 2021 | June 30, 2020 | June 30, 2019 | ||||||||||||||||
| Net asset value, beginning of year | $ | 13.79 | $ | 14.93 | $ | 12.51 | $ | 12.80 | $ | 12.68 | ||||||||||
| Activity from investment operations: | ||||||||||||||||||||
| Net investment income (loss) (1) | 0.02 | (0.03 | ) | (0.00 | ) (2) | 0.10 | 0.07 | |||||||||||||
| Net realized and unrealized gain (loss) on investments, options purchased and options written | 1.14 | (1.11 | ) | 2.43 | (0.27 | ) | 0.13 | |||||||||||||
| Total from investment operations | 1.16 | (1.14 | ) | 2.43 | (0.17 | ) | 0.20 | |||||||||||||
| Less distributions from: | ||||||||||||||||||||
| Net investment income | — | — | (0.01 | ) | (0.12 | ) | (0.08 | ) | ||||||||||||
| Return of capital | — | — | (0.00 | ) (2) | — | — | ||||||||||||||
| Total distributions | — | — | (0.01 | ) | (0.12 | ) | (0.08 | ) | ||||||||||||
| Net asset value, end of year | $ | 14.95 | $ | 13.79 | $ | 14.93 | $ | 12.51 | $ | 12.80 | ||||||||||
| Total return (3) | 8.41 | % (4) | (7.64 | )% (4) | 19.44 | % | (1.39 | )% | 1.67 | % | ||||||||||
| Net assets, at end of year (000s) | $ | 100,212 | $ | 124,935 | $ | 145,133 | $ | 158,255 | $ | 240,274 | ||||||||||
| Ratio of expenses to average net assets (5) | 1.45 | % | 1.43 | % | 1.42 | % | 1.42 | % | 1.40 | % | ||||||||||
| Ratio of net investment income (loss) to average net assets (5,6) | 0.14 | % | (0.17 | )% | (0.00 | )% | 0.76 | % | 0.59 | % | ||||||||||
| Portfolio Turnover Rate | 22 | % | 3 | % | 11 | % | 13 | % | 14 | % | ||||||||||
| (1) | Per share amounts calculated using the average shares method. |
| (2) | Amount is less than $0.01. |
| (3) | Total return assumes reinvestment of all dividends and distributions, if any. |
| (4) | Includes adjustments in accordance with accounting principles generally accepted in the United States and, consequently, the net asset value for financial reporting purposes and the returns based upon those net asset values may differ from the net asset values and returns for shareholder transactions. |
| (5) | Does not include the expenses of other investment companies in which the Fund invests. |
| (6) | Recognition of investment income (loss) by the Fund is affected by the timing and declaration of dividends by the underlying investment companies in which the Fund invests. |
See accompanying notes to financial statements.
26
| SWAN DEFINED RISK FUND |
| FINANCIAL HIGHLIGHTS |
| Per Share Data and Ratios for a Share of Beneficial Interest Outstanding Throughout Each Year |
| Class C | ||||||||||||||||||||
| For the | For the | For the | For the | For the | ||||||||||||||||
| Year Ended | Year Ended | Year Ended | Year Ended | Year Ended | ||||||||||||||||
| June 30, 2023 | June 30, 2022 | June 30, 2021 | June 30, 2020 | June 30, 2019 | ||||||||||||||||
| Net asset value, beginning of year | $ | 13.35 | $ | 14.57 | $ | 12.29 | $ | 12.58 | $ | 12.46 | ||||||||||
| Activity from investment operations: | ||||||||||||||||||||
| Net investment income (loss) (1) | (0.08 | ) | (0.14 | ) | (0.10 | ) | 0.01 | (0.02 | ) | |||||||||||
| Net realized and unrealized gain (loss) on investments, options purchased and options written | 1.10 | (1.08 | ) | 2.38 | (0.28 | ) | 0.14 | |||||||||||||
| Total from investment operations | 1.02 | (1.22 | ) | 2.28 | (0.27 | ) | 0.12 | |||||||||||||
| Less distributions from: | ||||||||||||||||||||
| Net investment income | — | — | — | (0.02 | ) | — | ||||||||||||||
| Total distributions | — | — | — | (0.02 | ) | — | ||||||||||||||
| Net asset value, end of year | $ | 14.37 | $ | 13.35 | $ | 14.57 | $ | 12.29 | $ | 12.58 | ||||||||||
| Total return (2) | 7.64 | % | (8.37 | )% | 18.55 | % | (2.17 | )% | 0.96 | % | ||||||||||
| Net assets, at end of year (000s) | $ | 104,519 | $ | 110,351 | $ | 130,659 | $ | 150,858 | $ | 204,575 | ||||||||||
| Ratio of expenses to average net assets (3) | 2.20 | % | 2.18 | % | 2.17 | % | 2.17 | % | 2.15 | % | ||||||||||
| Ratio of net investment income (loss) to average net assets (3,4) | (0.57 | )% | (0.93 | )% | (0.75 | )% | 0.07 | % | (0.15 | )% | ||||||||||
| Portfolio Turnover Rate | 22 | % | 3 | % | 11 | % | 13 | % | 14 | % | ||||||||||
| (1) | Per share amounts calculated using the average shares method. |
| (2) | Total return assumes reinvestment of all dividends and distributions, if any. |
| (3) | Does not include the expenses of other investment companies in which the Fund invests. |
| (4) | Recognition of investment income (loss) by the Fund is affected by the timing and declaration of dividends by the underlying investment companies in which the Fund invests. |
See accompanying notes to financial statements.
27
| SWAN DEFINED RISK FUND |
| FINANCIAL HIGHLIGHTS |
| Per Share Data and Ratios for a Share of Beneficial Interest Outstanding Throughout Each Year |
| Class I | ||||||||||||||||||||
| For the | For the | For the | For the | For the | ||||||||||||||||
| Year Ended | Year Ended | Year Ended | Year Ended | Year Ended | ||||||||||||||||
| June 30, 2023 | June 30, 2022 | June 30, 2021 | June 30, 2020 | June 30, 2019 | ||||||||||||||||
| Net asset value, beginning of year | $ | 13.86 | $ | 14.99 | $ | 12.56 | $ | 12.86 | $ | 12.74 | ||||||||||
| Activity from investment operations: | ||||||||||||||||||||
| Net investment income (1) | 0.05 | 0.00 | (2) | 0.03 | 0.14 | 0.10 | ||||||||||||||
| Net realized and unrealized gain (loss) on investments, options purchased and options written | 1.15 | (1.13 | ) | 2.45 | (0.28 | ) | 0.14 | |||||||||||||
| Total from investment operations | 1.20 | (1.13 | ) | 2.48 | (0.14 | ) | 0.24 | |||||||||||||
| Less distributions from: | ||||||||||||||||||||
| Net investment income | — | — | (0.05 | ) | (0.16 | ) | (0.12 | ) | ||||||||||||
| Return of capital | — | — | (0.00 | ) (2) | — | — | ||||||||||||||
| Total distributions | — | — | (0.05 | ) | (0.16 | ) | (0.12 | ) | ||||||||||||
| Net asset value, end of year | $ | 15.06 | $ | 13.86 | $ | 14.99 | $ | 12.56 | $ | 12.86 | ||||||||||
| Total return (3) | 8.66 | % | (7.54 | )% | 19.75 | % | (1.15 | )% | 1.96 | % | ||||||||||
| Net assets, at end of year (000s) | $ | 603,038 | $ | 737,073 | $ | 857,376 | $ | 1,121,879 | $ | 1,622,057 | ||||||||||
| Ratio of expenses to average net assets (4) | 1.20 | % | 1.18 | % | 1.17 | % | 1.17 | % | 1.15 | % | ||||||||||
| Ratio of net investment income to average net assets (4,5) | 0.35 | % | 0.02 | % | 0.24 | % | 1.07 | % | 0.82 | % | ||||||||||
| Portfolio Turnover Rate | 22 | % | 3 | % | 11 | % | 13 | % | 14 | % | ||||||||||
| (1) | Per share amounts calculated using the average shares method. |
| (2) | Amount is less than $0.01. |
| (3) | Total return assumes reinvestment of all dividends and distributions, if any. |
| (4) | Does not include the expenses of other investment companies in which the Fund invests. |
| (5) | Recognition of investment income by the Fund is affected by the timing and declaration of dividends by the underlying investment companies in which the Fund invests. |
See accompanying notes to financial statements.
28
| SWAN DEFINED RISK EMERGING MARKETS FUND |
| FINANCIAL HIGHLIGHTS |
| Per Share Data and Ratios for a Share of Beneficial Interest Outstanding Throughout Each Year |
| Class A | ||||||||||||||||||||
| For the | For the | For the | For the | For the | ||||||||||||||||
| Year Ended | Year Ended | Year Ended | Year Ended | Year Ended | ||||||||||||||||
| June 30, 2023 | June 30, 2022 | June 30, 2021 | June 30, 2020 | June 30, 2019 | ||||||||||||||||
| Net asset value, beginning of year | $ | 8.69 | $ | 10.01 | $ | 8.85 | $ | 9.86 | $ | 10.06 | ||||||||||
| Activity from investment operations: | ||||||||||||||||||||
| Net investment income (1) | 0.03 | 0.11 | 0.01 | 0.09 | 0.03 | |||||||||||||||
| Net realized and unrealized gain (loss) on investments, options purchased and options written | 0.10 | (1.43 | ) | 1.27 | (0.57 | ) | (0.20 | ) | ||||||||||||
| Total from investment operations | 0.13 | (1.32 | ) | 1.28 | (0.48 | ) | (0.17 | ) | ||||||||||||
| Less distributions from: | ||||||||||||||||||||
| Net investment income | (0.09 | ) | — | (0.12 | ) | (0.04 | ) | (0.03 | ) | |||||||||||
| Net realized gains | — | — | — | (0.49 | ) | — | ||||||||||||||
| Total distributions | (0.09 | ) | — | (0.12 | ) | (0.53 | ) | (0.03 | ) | |||||||||||
| Net asset value, end of year | $ | 8.73 | $ | 8.69 | $ | 10.01 | $ | 8.85 | $ | 9.86 | ||||||||||
| Total return (2) | 1.52 | % | (13.19 | )% | 14.47 | % | (5.16 | )% | (1.72 | )% | ||||||||||
| Net assets, at end of year (000s) | $ | 665 | $ | 1,055 | $ | 1,372 | $ | 2,084 | $ | 3,959 | ||||||||||
| Ratio of gross expenses to average net assets (3,5) | 1.90 | % | 1.87 | % | 1.88 | % | 1.93 | % | 1.84 | % | ||||||||||
| Ratio of net expenses to average net assets (3,5) | 1.65 | % | 1.65 | % | 1.65 | % | 1.65 | % | 1.75 | % | ||||||||||
| Ratio of net investment income to average net assets (3,4,5) | 0.33 | % | 1.18 | % | 0.16 | % | 1.03 | % | 0.31 | % | ||||||||||
| Portfolio Turnover Rate | 39 | % | 10 | % | 6 | % | 16 | % | 45 | % | ||||||||||
| (1) | Per share amounts calculated using the average shares method. |
| (2) | Total return assumes reinvestment of all dividends and distributions, if any. Had the advisor not waived a portion of its fees, total returns would have been lower. |
| (3) | Does not include the expenses of other investment companies in which the Fund invests. |
| (4) | Recognition of investment income (loss) by the Fund is affected by the timing and declaration of dividends by the underlying investment companies in which the Fund invests. |
| (5) | Includes interest expense. Excluding interest expense, the following ratios would have been: |
| Gross expenses to average net assets (3) | 1.90 | % | 1.87 | % | 1.88 | % | 1.93 | % | 1.74 | % | ||||||||||
| Net expenses to average net assets (3) | 1.65 | % | 1.65 | % | 1.65 | % | 1.65 | % | 1.65 | % | ||||||||||
| Net investment income to average net assets (3,4) | 0.33 | % | 1.18 | % | 0.16 | % | 1.03 | % | 0.41 | % | ||||||||||
See accompanying notes to financial statements.
29
| SWAN DEFINED RISK EMERGING MARKETS FUND |
| FINANCIAL HIGHLIGHTS |
| Per Share Data and Ratios for a Share of Beneficial Interest Outstanding Throughout Each Year |
| Class C | ||||||||||||||||||||
| For the | For the | For the | For the | For the | ||||||||||||||||
| Year Ended | Year Ended | Year Ended | Year Ended | Year Ended | ||||||||||||||||
| June 30, 2023 | June 30, 2022 | June 30, 2021 | June 30, 2020 | June 30, 2019 | ||||||||||||||||
| Net asset value, beginning of year | $ | 8.38 | $ | 9.72 | $ | 8.58 | $ | 9.60 | $ | 9.84 | ||||||||||
| Activity from investment operations: | ||||||||||||||||||||
| Net investment income (loss) (1) | (0.02 | ) | 0.02 | (0.07 | ) | 0.03 | (0.03 | ) | ||||||||||||
| Net realized and unrealized gain (loss) on investments, options purchased and options written | 0.08 | (1.36 | ) | 1.24 | (0.56 | ) | (0.21 | ) | ||||||||||||
| Total from investment operations | 0.06 | (1.34 | ) | 1.17 | (0.53 | ) | (0.24 | ) | ||||||||||||
| Less distributions from: | ||||||||||||||||||||
| Net investment income | (0.02 | ) | — | (0.03 | ) | — | — | |||||||||||||
| Net realized gains | — | — | — | (0.49 | ) | — | ||||||||||||||
| Total distributions | (0.02 | ) | — | (0.03 | ) | (0.49 | ) | — | ||||||||||||
| Net asset value, end of year | $ | 8.42 | $ | 8.38 | $ | 9.72 | $ | 8.58 | $ | 9.60 | ||||||||||
| Total return (2) | 0.75 | % | (13.79 | )% | 13.60 | % | (5.85 | )% | (2.44 | )% | ||||||||||
| Net assets, at end of year (000s) | $ | 923 | $ | 1,050 | $ | 1,564 | $ | 1,365 | $ | 2,809 | ||||||||||
| Ratio of gross expenses to average net assets (3,5) | 2.65 | % | 2.62 | % | 2.63 | % | 2.68 | % | 2.59 | % | ||||||||||
| Ratio of net expenses to average net assets (3,5) | 2.40 | % | 2.40 | % | 2.40 | % | 2.40 | % | 2.50 | % | ||||||||||
| Ratio of net investment income (loss) to average net assets (3,4,5) | (0.20 | )% | 0.22 | % | (0.72 | )% | 0.28 | % | (0.31 | )% | ||||||||||
| Portfolio Turnover Rate | 39 | % | 10 | % | 6 | % | 16 | % | 45 | % | ||||||||||
| (1) | Per share amounts calculated using the average shares method. |
| (2) | Total return assumes reinvestment of all dividends and distributions, if any. Had the advisor not waived a portion of its fees, total returns would have been lower. |
| (3) | Does not include the expenses of other investment companies in which the Fund invests. |
| (4) | Recognition of investment income (loss) by the Fund is affected by the timing and declaration of dividends by the underlying investment companies in which the Fund invests. |
| (5) | Includes interest expense. Excluding interest expense, the following ratios would have been: |
| Gross expenses to average net assets (3) | 2.65 | % | 2.62 | % | 2.63 | % | 2.68 | % | 2.49 | % | ||||||||||
| Net expenses to average net assets (3) | 2.40 | % | 2.40 | % | 2.40 | % | 2.40 | % | 2.40 | % | ||||||||||
| Net investment income (loss) to average net assets (3,4) | (0.20 | )% | 0.22 | % | (0.72 | )% | 0.28 | % | (0.21 | )% | ||||||||||
See accompanying notes to financial statements.
30
| SWAN DEFINED RISK EMERGING MARKETS FUND |
| FINANCIAL HIGHLIGHTS |
| Per Share Data and Ratios for a Share of Beneficial Interest Outstanding Throughout Each Year |
| Class I | ||||||||||||||||||||
| For the | For the | For the | For the | For the | ||||||||||||||||
| Year Ended | Year Ended | Year Ended | Year Ended | Year Ended | ||||||||||||||||
| June 30, 2023 | June 30, 2022 | June 30, 2021 | June 30, 2020 | June 30, 2019 | ||||||||||||||||
| Net asset value, beginning of year | $ | 8.73 | $ | 10.05 | $ | 8.89 | $ | 9.91 | $ | 10.12 | ||||||||||
| Activity from investment operations: | ||||||||||||||||||||
| Net investment income (1) | 0.07 | 0.13 | 0.02 | 0.13 | 0.06 | |||||||||||||||
| Net realized and unrealized gain (loss) on investments, options purchased and options written | 0.09 | (1.43 | ) | 1.29 | (0.58 | ) | (0.21 | ) | ||||||||||||
| Total from investment operations | 0.16 | (1.30 | ) | 1.31 | (0.45 | ) | (0.15 | ) | ||||||||||||
| Less distributions from: | ||||||||||||||||||||
| Net investment income | (0.13 | ) | (0.02 | ) | (0.15 | ) | (0.08 | ) | (0.06 | ) | ||||||||||
| Net realized gains | — | — | — | (0.49 | ) | — | ||||||||||||||
| Total distributions | (0.13 | ) | (0.02 | ) | (0.15 | ) | (0.57 | ) | (0.06 | ) | ||||||||||
| Net asset value, end of year | $ | 8.76 | $ | 8.73 | $ | 10.05 | $ | 8.89 | $ | 9.91 | ||||||||||
| Total return (2) | 1.86 | % (3) | (12.97 | )% | 14.78 | % | (4.87 | )% | (1.47 | )% | ||||||||||
| Net assets, at end of year (000s) | $ | 25,992 | $ | 24,120 | $ | 32,079 | $ | 30,848 | $ | 39,206 | ||||||||||
| Ratio of gross expenses to average net assets (4,6) | 1.65 | % | 1.62 | % | 1.63 | % | 1.68 | % | 1.59 | % | ||||||||||
| Ratio of net expenses to average net assets (4,6) | 1.40 | % | 1.40 | % | 1.40 | % | 1.40 | % | 1.50 | % | ||||||||||
| Ratio of net investment income to average net assets (5,6) | 0.85 | % | 1.39 | % | 0.20 | % | 1.37 | % | 0.60 | % | ||||||||||
| Portfolio Turnover Rate | 39 | % | 10 | % | 6 | % | 16 | % | 45 | % | ||||||||||
| (1) | Per share amounts calculated using the average shares method. |
| (2) | Total return assumes reinvestment of all dividends and distributions, if any. Had the advisor not waived a portion of its fees, total returns would have been lower. |
| (3) | Includes adjustments in accordance with accounting principles generally accepted in the United States and, consequently, the net asset value for financial reporting purposes and the returns based upon those net asset values may differ from the net asset values and returns for shareholder transactions. |
| (4) | Does not include the expenses of other investment companies in which the Fund invests. |
| (5) | Recognition of investment income (loss) by the Fund is affected by the timing and declaration of dividends by the underlying investment companies in which the Fund invests. |
| (6) | Includes interest expense. Excluding interest expense, the following ratios would have been: |
| Gross expenses to average net assets (3) | 1.65 | % | 1.62 | % | 1.63 | % | 1.68 | % | 1.49 | % | ||||||||||
| Net expenses to average net assets (3) | 1.40 | % | 1.40 | % | 1.40 | % | 1.40 | % | 1.40 | % | ||||||||||
| Net investment income to average net assets (3,4) | 0.85 | % | 1.39 | % | 0.20 | % | 1.37 | % | 0.70 | % | ||||||||||
See accompanying notes to financial statements.
31
| SWAN DEFINED RISK FOREIGN FUND |
| FINANCIAL HIGHLIGHTS |
| Per Share Data and Ratios for a Share of Beneficial Interest Outstanding Throughout Each Year |
| Class A | ||||||||||||||||||||
| For the | For the | For the | For the | For the | ||||||||||||||||
| Year Ended | Year Ended | Year Ended | Year Ended | Year Ended | ||||||||||||||||
| June 30, 2023 | June 30, 2022 | June 30, 2021 | June 30, 2020 | June 30, 2019 | ||||||||||||||||
| Net asset value, beginning of year | $ | 8.70 | $ | 11.11 | $ | 9.83 | $ | 10.24 | $ | 10.42 | ||||||||||
| Activity from investment operations: | ||||||||||||||||||||
| Net investment income (1) | 0.04 | 0.18 | 0.02 | 0.04 | 0.09 | |||||||||||||||
| Net realized and unrealized gain (loss) on investments, options purchased and options written | 0.86 | (1.13 | ) | 1.32 | 0.04 | (0.19 | ) | |||||||||||||
| Total from investment operations | 0.90 | (0.95 | ) | 1.34 | 0.08 | (0.10 | ) | |||||||||||||
| Less distributions from: | ||||||||||||||||||||
| Net investment income | — | (0.13 | ) | — | (0.12 | ) | (0.08 | ) | ||||||||||||
| Net realized gains | — | (0.12 | ) | (0.06 | ) | (0.37 | ) | — | ||||||||||||
| Return of capital | — | (1.21 | ) | — | — | — | ||||||||||||||
| Total distributions | — | (1.46 | ) | (0.06 | ) | (0.49 | ) | (0.08 | ) | |||||||||||
| Net asset value, end of year | $ | 9.60 | $ | 8.70 | $ | 11.11 | $ | 9.83 | $ | 10.24 | ||||||||||
| Total return (2) | 10.34 | % | (9.97 | )% | 13.60 | % | 0.65 | % | (0.91 | )% | ||||||||||
| Net assets, at end of year (000s) | $ | 752 | $ | 819 | $ | 1,126 | $ | 2,150 | $ | 2,454 | ||||||||||
| Ratio of gross expenses to average net assets (3,5) | 1.84 | % | 1.94 | % | 2.03 | % | 2.12 | % | 2.01 | % | ||||||||||
| Ratio of net expenses to average net assets (3,5) | 1.65 | % | 1.69 | % | 1.73 | % | 1.85 | % | 1.85 | % | ||||||||||
| Ratio of net investment income to average net assets (3,4,5) | 0.44 | % | 1.77 | % | 0.20 | % | 0.40 | % | 0.91 | % | ||||||||||
| Portfolio Turnover Rate | 42 | % | 10 | % | 8 | % | 15 | % | 10 | % | ||||||||||
| (1) | Per share amounts calculated using the average shares method. |
| (2) | Total return assumes reinvestment of all dividends and distributions, if any. Had the advisor not waived a portion of its fees, total returns would have been lower. |
| (3) | Does not include the expenses of other investment companies in which the Fund invests. |
| (4) | Recognition of investment income by the Fund is affected by the timing and declaration of dividends by the underlying investment companies in which the Fund invests. |
| (5) | Includes interest expense. Excluding interest expense, the following ratios would have been: |
| Gross expenses to average net assets (3) | 1.84 | % | 1.90 | % | 1.95 | % | 1.92 | % | 1.81 | % | ||||||||||
| Net expenses to average net assets (3) | 1.65 | % | 1.65 | % | 1.65 | % | 1.65 | % | 1.65 | % | ||||||||||
| Net investment income to average net assets (3,4) | 0.44 | % | 1.81 | % | 0.29 | % | 0.60 | % | 1.11 | % | ||||||||||
See accompanying notes to financial statements.
32
| SWAN DEFINED RISK FOREIGN FUND |
| FINANCIAL HIGHLIGHTS |
| Per Share Data and Ratios for a Share of Beneficial Interest Outstanding Throughout Each Year |
| Class C | ||||||||||||||||||||
| For the | For the | For the | For the | For the | ||||||||||||||||
| Year Ended | Year Ended | Year Ended | Year Ended | Year Ended | ||||||||||||||||
| June 30, 2023 | June 30, 2022 | June 30, 2021 | June 30, 2020 | June 30, 2019 | ||||||||||||||||
| Net asset value, beginning of year | $ | 8.52 | $ | 10.90 | $ | 9.73 | $ | 10.12 | $ | 10.31 | ||||||||||
| Activity from investment operations: | ||||||||||||||||||||
| Net investment income (loss) (1) | (0.02 | ) | 0.10 | (0.03 | ) | (0.04 | ) | 0.02 | ||||||||||||
| Net realized and unrealized gain (loss) on investments, options purchased and options written | 0.83 | (1.10 | ) | 1.26 | 0.04 | (0.20 | ) | |||||||||||||
| Total from investment operations | 0.81 | (1.00 | ) | 1.23 | — | (0.18 | ) | |||||||||||||
| Less distributions from: | ||||||||||||||||||||
| Net investment income | — | (0.05 | ) | — | (0.02 | ) | (0.01 | ) | ||||||||||||
| Net realized gains | — | (0.12 | ) | (0.06 | ) | (0.37 | ) | — | ||||||||||||
| Return of capital | — | (1.21 | ) | — | — | — | ||||||||||||||
| Total distributions | — | (1.38 | ) | (0.06 | ) | (0.39 | ) | (0.01 | ) | |||||||||||
| Net asset value, end of year | $ | 9.33 | $ | 8.52 | $ | 10.90 | $ | 9.73 | $ | 10.12 | ||||||||||
| Total return (2) | 9.51 | % | (10.63 | )% | 12.61 | % | (0.07 | )% | (1.69 | )% | ||||||||||
| Net assets, at end of year (000s) | $ | 689 | $ | 700 | $ | 876 | $ | 949 | $ | 1,403 | ||||||||||
| Ratio of gross expenses to average net assets (3,5) | 2.59 | % | 2.69 | % | 2.78 | % | 2.87 | % | 2.76 | % | ||||||||||
| Ratio of net expenses to average net assets (3,5) | 2.40 | % | 2.44 | % | 2.48 | % | 2.60 | % | 2.60 | % | ||||||||||
| Ratio of net investment income (loss) to average net assets (3,4,5) | (0.26 | )% | 0.97 | % | (0.32 | )% | (0.43 | )% | 0.19 | % | ||||||||||
| Portfolio Turnover Rate | 42 | % | 10 | % | 8 | % | 15 | % | 10 | % | ||||||||||
| (1) | Per share amounts calculated using the average shares method. |
| (2) | Total return assumes reinvestment of all dividends and distributions, if any. Had the advisor not waived a portion of its fees, total returns would have been lower. |
| (3) | Does not include the expenses of other investment companies in which the Fund invests. |
| (4) | Recognition of investment income (loss) by the Fund is affected by the timing and declaration of dividends by the underlying investment companies in which the Fund invests. |
| (5) | Includes interest expense. Excluding interest expense, the following ratios would have been: |
| Gross expenses to average net assets (3) | 2.59 | % | 2.65 | % | 2.70 | % | 2.67 | % | 2.56 | % | ||||||||||
| Net expenses to average net assets (3) | 2.40 | % | 2.40 | % | 2.40 | % | 2.40 | % | 2.40 | % | ||||||||||
| Net investment income (loss) to average net assets (3,4) | (0.26 | )% | 1.01 | % | (0.24 | )% | (0.23 | )% | 0.39 | % | ||||||||||
See accompanying notes to financial statements.
33
| SWAN DEFINED RISK FOREIGN FUND |
| FINANCIAL HIGHLIGHTS |
| Per Share Data and Ratios for a Share of Beneficial Interest Outstanding Throughout Each Year |
| Class I | ||||||||||||||||||||
| For the | For the | For the | For the | For the | ||||||||||||||||
| Year Ended | Year Ended | Year Ended | Year Ended | Year Ended | ||||||||||||||||
| June 30, 2023 | June 30, 2022 | June 30, 2021 | June 30, 2020 | June 30, 2019 | ||||||||||||||||
| Net asset value, beginning of year | $ | 8.71 | $ | 11.13 | $ | 9.85 | $ | 10.25 | $ | 10.45 | ||||||||||
| Activity from investment operations: | ||||||||||||||||||||
| Net investment income (1) | 0.07 | 0.22 | 0.07 | 0.07 | 0.12 | |||||||||||||||
| Net realized and unrealized gain (loss) on investments, options purchased and options written | 0.85 | (1.14 | ) | 1.29 | 0.04 | (0.20 | ) | |||||||||||||
| Total from investment operations | 0.92 | (0.92 | ) | 1.36 | 0.11 | (0.08 | ) | |||||||||||||
| Less distributions from: | ||||||||||||||||||||
| Net investment income | — | (0.17 | ) | (0.02 | ) | (0.14 | ) | (0.12 | ) | |||||||||||
| Net realized gains | — | (0.12 | ) | (0.06 | ) | (0.37 | ) | — | ||||||||||||
| Return of capital | — | (1.21 | ) | — | — | — | ||||||||||||||
| Total distributions | — | (1.50 | ) | (0.08 | ) | (0.51 | ) | (0.12 | ) | |||||||||||
| Net asset value, end of year | $ | 9.63 | $ | 8.71 | $ | 11.13 | $ | 9.85 | $ | 10.25 | ||||||||||
| Total return (2) | 10.56 | % | (9.78 | )% | 13.82 | % | 0.97 | % | (0.71 | )% | ||||||||||
| Net assets, at end of year (000s) | $ | 31,830 | $ | 27,838 | $ | 31,591 | $ | 30,829 | $ | 37,596 | ||||||||||
| Ratio of gross expenses to average net assets (3,5) | 1.59 | % | 1.69 | % | 1.78 | % | 1.87 | % | 1.76 | % | ||||||||||
| Ratio of net expenses to average net assets (3,5) | 1.40 | % | 1.44 | % | 1.48 | % | 1.60 | % | 1.60 | % | ||||||||||
| Ratio of net investment income to average net assets (3,4,5) | 0.78 | % | 2.13 | % | 0.69 | % | 0.66 | % | 1.18 | % | ||||||||||
| Portfolio Turnover Rate | 42 | % | 10 | % | 8 | % | 15 | % | 10 | % | ||||||||||
| (1) | Per share amounts calculated using the average shares method. |
| (2) | Total return assumes reinvestment of all dividends and distributions, if any. Had the advisor not waived a portion of its fees, total returns would have been lower. |
| (3) | Does not include the expenses of other investment companies in which the Fund invests. |
| (4) | Recognition of investment income by the Fund is affected by the timing and declaration of dividends by the underlying investment companies in which the Fund invests. |
| (5) | Includes interest expense. Excluding interest expense, the following ratios would have been: |
| Gross expenses to average net assets (3) | 1.59 | % | 1.65 | % | 1.70 | % | 1.67 | % | 1.56 | % | ||||||||||
| Net expenses to average net assets (3) | 1.40 | % | 1.40 | % | 1.40 | % | 1.40 | % | 1.40 | % | ||||||||||
| Net investment income to average net assets (3,4) | 0.78 | % | 2.17 | % | 0.76 | % | 0.86 | % | 1.38 | % | ||||||||||
See accompanying notes to financial statements.
34
| SWAN DEFINED RISK GROWTH FUND |
| FINANCIAL HIGHLIGHTS |
| Per Share Data and Ratios for a Share of Beneficial Interest Outstanding Throughout Each Year/Period |
| Class A | ||||||||||||||||||||
| For the | For the | For the | For the | For the | ||||||||||||||||
| Year Ended | Year Ended | Year Ended | Year Ended | Period Ended | ||||||||||||||||
| June 30, 2023 | June 30, 2022 | June 30, 2021 | June 30, 2020 | June 30, 2019 (1) | ||||||||||||||||
| Net asset value, beginning of year/period | $ | 13.40 | $ | 14.97 | $ | 11.86 | $ | 11.38 | $ | 10.00 | ||||||||||
| Activity from investment operations: | ||||||||||||||||||||
| Net investment income (loss) (2) | 0.01 | (0.06 | ) | (0.05 | ) | 0.09 | 0.00 | (3) | ||||||||||||
| Net realized and unrealized gain (loss) on investments, options purchased and options written | 1.37 | (1.51 | ) | 3.23 | 0.58 | 1.38 | ||||||||||||||
| Total from investment operations | 1.38 | (1.57 | ) | 3.18 | 0.67 | 1.38 | ||||||||||||||
| Less distributions from: | ||||||||||||||||||||
| Net investment income | — | — | — | (0.07 | ) | — | ||||||||||||||
| Net realized gains | — | — | (0.07 | ) | (0.12 | ) | — | |||||||||||||
| Return of capital | — | — | (0.00 | ) (3) | — | — | ||||||||||||||
| Total distributions | — | — | (0.07 | ) | (0.19 | ) | — | |||||||||||||
| Net asset value, end of year/period | $ | 14.78 | $ | 13.40 | $ | 14.97 | $ | 11.86 | $ | 11.38 | ||||||||||
| Total return (4) | 10.30 | % | (10.49 | )% | 26.90 | % | 5.85 | % | 13.80 | % (5) | ||||||||||
| Net assets, at end of year/period (000s) | $ | 2,003 | $ | 1,823 | $ | 3,263 | $ | 5,252 | $ | 11 | ||||||||||
| Ratio of gross expenses to average net assets before waiver/recapture (6) | 1.57 | % | 1.57 | % | 1.63 | % | 2.33 | % | 10.73 | % (8) | ||||||||||
| Ratio of net expenses to average net assets after waiver/recapture (6) | 1.65 | % (7) | 1.65 | % (7) | 1.65 | % (7) | 1.65 | % | 1.65 | % (8) | ||||||||||
| Ratio of net investment income (loss) to average net assets (6,9) | (0.09 | )% | (0.52 | )% | (0.38 | )% | 0.74 | % | 0.00 | % (8) | ||||||||||
| Portfolio Turnover Rate | 21 | % | 3 | % | 27 | % | 11 | % | 0 | % (5) | ||||||||||
| (1) | The Swan Defined Risk Growth Fund Class A commenced operations on December 27, 2018. |
| (2) | Per share amounts calculated using the average shares method. |
| (3) | Amount is less than $0.01. |
| (4) | Total return assumes reinvestment of all dividends and distributions, if any. Had the advisor not waived a portion of its fees, total returns would have been lower. |
| (5) | Not annualized. |
| (6) | Does not include the expenses of other investment companies in which the Fund invests. |
| (7) | Represents the ratio of expenses to average net assets inclusive of the Advisor’s recapture of waived/reimbursed fees from prior periods. |
| (8) | Annualized. |
| (9) | Recognition of investment income (loss) by the Fund is affected by the timing and declaration of dividends by the underlying investment companies in which the Fund invests. |
See accompanying notes to financial statements.
35
SWAN DEFINED RISK GROWTH FUND |
| FINANCIAL HIGHLIGHTS |
| Per Share Data and Ratios for a Share of Beneficial Interest Outstanding Throughout Each Year/Period |
| Class C | ||||||||||||||||||||
| For the | For the | For the | For the | For the | ||||||||||||||||
| Year Ended | Year Ended | Year Ended | Year Ended | Period Ended | ||||||||||||||||
| June 30, 2023 | June 30, 2022 | June 30, 2021 | June 30, 2020 | June 30, 2019 (1) | ||||||||||||||||
| Net asset value, beginning of year/period | $ | 13.19 | $ | 14.83 | $ | 11.84 | $ | 11.38 | $ | 10.00 | ||||||||||
| Activity from investment operations: | ||||||||||||||||||||
| Net investment income (loss) (2) | (0.09 | ) | (0.16 | ) | (0.12 | ) | (0.03 | ) (3) | 0.00 | (4) | ||||||||||
| Net realized and unrealized gain (loss) on investments, options purchased and options written | 1.33 | (1.48 | ) | 3.18 | 0.68 | 1.38 | ||||||||||||||
| Total from investment operations | 1.24 | (1.64 | ) | 3.06 | 0.65 | 1.38 | ||||||||||||||
| Less distributions from: | ||||||||||||||||||||
| Net investment income | — | — | — | (0.07 | ) | — | ||||||||||||||
| Net realized gains | — | — | (0.07 | ) | (0.12 | ) | — | |||||||||||||
| Total distributions | — | — | (0.07 | ) | (0.19 | ) | — | |||||||||||||
| Net asset value, end of year/period | $ | 14.43 | $ | 13.19 | $ | 14.83 | $ | 11.84 | $ | 11.38 | ||||||||||
| Total return (5) | 9.40 | % | (11.06 | )% | 25.93 | % | 5.73 | % | 13.80 | % (6) | ||||||||||
| Net assets, at end of year/period (000s) | $ | 1,768 | $ | 1,798 | $ | 1,092 | $ | 71 | $ | 11 | ||||||||||
| Ratio of gross expenses to average net assets before waiver/recapture (7) | 2.32 | % | 2.32 | % | 2.38 | % | 3.08 | % | 11.48 | % (9) | ||||||||||
| Ratio of net expenses to average net assets after waiver/recapture (7) | 2.40 | % (8) | 2.40 | % (8) | 2.40 | % (8) | 2.40 | % | 2.40 | % (9) | ||||||||||
| Ratio of net investment income (loss) to average net assets (7,10) | (0.84 | )% | (1.17 | )% | (0.85 | )% | (0.22 | )% (3) | 0.00 | % (9) | ||||||||||
| Portfolio Turnover Rate | 21 | % | 3 | % | 27 | % | 11 | % | 0 | % (6) | ||||||||||
| (1) | The Swan Defined Risk Growth Fund Class C commenced operations on December 27, 2018. |
| (2) | Per share amounts calculated using the average shares method. |
| (3) | The amount of net investment loss on investment per share for the period ended June 30, 2020 does not accord with the amounts in the Statements of Operations due to the timing of purchases and sales of Fund shares in relation to fluctuating market values. |
| (4) | Amount is less than $0.01 |
| (5) | Total return assumes reinvestment of all dividends and distributions, if any. Had the advisor not waived a portion of its fees, total returns would have been lower. |
| (6) | Not annualized. |
| (7) | Does not include the expenses of other investment companies in which the Fund invests. |
| (8) | Represents the ratio of expenses to average net assets inclusive of the Advisor’s recapture of waived/reimbursed fees from prior periods. |
| (9) | Annualized. |
| (10) | Recognition of investment income (loss) by the Fund is affected by the timing and declaration of dividends by the underlying investment companies in which the Fund invests. |
See accompanying notes to financial statements.
36
| SWAN DEFINED RISK GROWTH FUND |
| FINANCIAL HIGHLIGHTS |
| Per Share Data and Ratios for a Share of Beneficial Interest Outstanding Throughout Each Year/Period |
| Class I | ||||||||||||||||||||
| For the | For the | For the | For the | For the | ||||||||||||||||
| Year Ended | Year Ended | Year Ended | Year Ended | Period Ended | ||||||||||||||||
| June 30, 2023 | June 30, 2022 | June 30, 2021 | June 30, 2020 | June 30, 2019 (1) | ||||||||||||||||
| Net asset value, beginning of year/period | $ | 13.47 | $ | 15.02 | $ | 11.88 | $ | 11.38 | $ | 10.00 | ||||||||||
| Activity from investment operations: | ||||||||||||||||||||
| Net investment income (loss) (2) | 0.03 | (0.02 | ) | (0.01 | ) | 0.10 | 0.05 | |||||||||||||
| Net realized and unrealized gain (loss) on investments, options purchased and options written | 1.41 | (1.53 | ) | 3.23 | 0.59 | 1.33 | ||||||||||||||
| Total from investment operations | 1.44 | (1.55 | ) | 3.22 | 0.69 | 1.38 | ||||||||||||||
| Less distributions from: | ||||||||||||||||||||
| Net investment income | — | — | (0.01 | ) | (0.07 | ) | — | |||||||||||||
| Net realized gains | — | — | (0.07 | ) | (0.12 | ) | — | |||||||||||||
| Return of capital | — | — | (0.00 | ) (3) | — | — | ||||||||||||||
| Total distributions | — | — | (0.08 | ) | (0.19 | ) | — | |||||||||||||
| Net asset value, end of year/period | $ | 14.91 | $ | 13.47 | $ | 15.02 | $ | 11.88 | $ | 11.38 | ||||||||||
| Total return (4) | 10.69 | % (5) | (10.32 | )% (5) | 27.23 | % | 6.09 | % | 13.80 | % (6) | ||||||||||
| Net assets, at end of year/period (000s) | $ | 83,858 | $ | 100,218 | $ | 80,421 | $ | 63,250 | $ | 3,610 | ||||||||||
| Ratio of gross expenses to average net assets before waiver/recapture (7) | 1.32 | % | 1.32 | % | 1.38 | % | 2.08 | % | 10.48 | % (9) | ||||||||||
| Ratio of net expenses to average net assets after waiver/recapture (7) | 1.40 | % (8) | 1.40 | % (8) | 1.40 | % (8) | 1.40 | % | 1.40 | % (9) | ||||||||||
| Ratio of net investment income (loss) to average net assets (7,10) | 0.16 | % | (0.23 | )% | (0.08 | )% | 0.87 | % | 0.88 | % (9) | ||||||||||
| Portfolio Turnover Rate | 21 | % | 3 | % | 27 | % | 11 | % | 0 | % (6) | ||||||||||
| (1) | The Swan Defined Risk Growth Fund Class I commenced operations on December 27, 2018. |
| (2) | Per share amounts calculated using the average shares method. |
| (3) | Amount is less than $0.01. |
| (4) | Total return assumes reinvestment of all dividends and distributions, if any. Had the advisor not waived a portion of its fees, total returns would have been lower. |
| (5) | Includes adjustments in accordance with accounting principles generally accepted in the United States and, consequently, the net asset value for financial reporting purposes and the returns based upon those net asset values may differ from the net asset values and returns for shareholder transactions. |
| (6) | Not annualized. |
| (7) | Does not include the expenses of other investment companies in which the Fund invests. |
| (8) | Represents the ratio of expenses to average net assets inclusive of the Advisor’s recapture of waived/reimbursed fees from prior periods. |
| (9) | Annualized. |
| (10) | Recognition of investment income (loss) by the Fund is affected by the timing and declaration of dividends by the underlying investment companies in which the Fund invests. |
See accompanying notes to financial statements.
37
| SWAN DEFINED RISK U.S. SMALL CAP FUND |
| FINANCIAL HIGHLIGHTS |
| Per Share Data and Ratios for a Share of Beneficial Interest Outstanding Throughout Each Year |
| Class A | ||||||||||||||||||||
| For the | For the | For the | For the | For the | ||||||||||||||||
| Year Ended | Year Ended | Year Ended | Year Ended | Year Ended | ||||||||||||||||
| June 30, 2023 | June 30, 2022 | June 30, 2021 | June 30, 2020 | June 30, 2019 | ||||||||||||||||
| Net asset value, beginning of year | $ | 13.14 | $ | 15.55 | $ | 11.67 | $ | 11.92 | $ | 12.39 | ||||||||||
| Activity from investment operations: | ||||||||||||||||||||
| Net investment loss (1) | (0.03 | ) | (0.11 | ) | (0.09 | ) | (0.05 | ) | (0.04 | ) | ||||||||||
| Net realized and unrealized gain (loss) on investments, options purchased and options written | 0.49 | (2.30 | ) | 3.97 | (0.20 | ) | (0.43 | ) | ||||||||||||
| Total from investment operations | 0.46 | (2.41 | ) | 3.88 | (0.25 | ) | (0.47 | ) | ||||||||||||
| Less distributions from: | ||||||||||||||||||||
| Net realized gains | (0.90 | ) | — | — | — | — | ||||||||||||||
| Total distributions | (0.90 | ) | — | — | — | — | ||||||||||||||
| Net asset value, end of year | $ | 12.70 | $ | 13.14 | $ | 15.55 | $ | 11.67 | $ | 11.92 | ||||||||||
| Total return (2) | 3.89 | % | (15.50 | )% | 33.25 | % | (2.10 | )% | (3.79 | )% | ||||||||||
| Net assets, at end of year (000s) | $ | 986 | $ | 1,023 | $ | 1,080 | $ | 2,364 | $ | 2,206 | ||||||||||
| Ratio of gross expenses to average net assets (3,5) | 1.79 | % | 1.84 | % | 1.90 | % | 1.99 | % | 1.88 | % | ||||||||||
| Ratio of net expenses to average net assets (3,5) | 1.65 | % | 1.69 | % | 1.70 | % | 1.73 | % | 1.77 | % | ||||||||||
| Ratio of net investment loss to average net assets (3,4,5) | (0.21 | )% | (0.73 | )% | (0.69 | )% | (0.44 | )% | (0.34 | )% | ||||||||||
| Portfolio Turnover Rate | 46 | % | 14 | % | 26 | % | 22 | % | 17 | % | ||||||||||
| (1) | Per share amounts calculated using the average shares method. |
| (2) | Total return assumes reinvestment of all dividends and distributions, if any. Had the advisor not waived a portion of its fees, total returns would have been lower. |
| (3) | Does not include the expenses of other investment companies in which the Fund invests. |
| (4) | Recognition of investment loss by the Fund is affected by the timing and declaration of dividends by the underlying investment companies in which the Fund invests. |
| (5) | Includes interest expense. Excluding interest expense, the following ratios would have been: |
| Gross expenses to average net assets (3) | 1.79 | % | 1.80 | % | 1.85 | % | 1.91 | % | 1.76 | % | ||||||||||
| Net expenses to average net assets (3) | 1.65 | % | 1.65 | % | 1.65 | % | 1.65 | % | 1.65 | % | ||||||||||
| Net investment loss to average net assets (3,4) | (0.21 | )% | (0.69 | )% | (0.64 | )% | (0.36 | )% | (0.22 | )% | ||||||||||
See accompanying notes to financial statements.
38
| SWAN DEFINED RISK U.S. SMALL CAP FUND |
| FINANCIAL HIGHLIGHTS |
| Per Share Data and Ratios for a Share of Beneficial Interest Outstanding Throughout Each Year |
| Class C | ||||||||||||||||||||
| For the | For the | For the | For the | For the | ||||||||||||||||
| Year Ended | Year Ended | Year Ended | Year Ended | Year Ended | ||||||||||||||||
| June 30, 2023 | June 30, 2022 | June 30, 2021 | June 30, 2020 | June 30, 2019 | ||||||||||||||||
| Net asset value, beginning of year | $ | 12.53 | $ | 14.94 | $ | 11.29 | $ | 11.62 | $ | 12.17 | ||||||||||
| Activity from investment operations: | ||||||||||||||||||||
| Net investment loss (1) | (0.12 | ) | (0.21 | ) | (0.20 | ) | (0.14 | ) | (0.12 | ) | ||||||||||
| Net realized and unrealized gain (loss) on investments, options purchased and options written | 0.45 | (2.20 | ) | 3.85 | (0.19 | ) | (0.43 | ) | ||||||||||||
| Total from investment operations | 0.33 | (2.41 | ) | 3.65 | (0.33 | ) | (0.55 | ) | ||||||||||||
| Less distributions from: | ||||||||||||||||||||
| Net realized gains | (0.90 | ) | — | — | — | — | ||||||||||||||
| Total distributions | (0.90 | ) | — | — | — | — | ||||||||||||||
| Net asset value, end of year | $ | 11.96 | $ | 12.53 | $ | 14.94 | $ | 11.29 | $ | 11.62 | ||||||||||
| Total return (2) | 3.02 | % | (16.13 | )% | 32.33 | % | (2.84 | )% | (4.52 | )% | ||||||||||
| Net assets, at end of year (000s) | $ | 1,733 | $ | 1,726 | $ | 2,104 | $ | 1,720 | $ | 1,744 | ||||||||||
| Ratio of gross expenses to average net assets (3,5) | 2.54 | % | 2.59 | % | 2.65 | % | 2.74 | % | 2.63 | % | ||||||||||
| Ratio of net expenses to average net assets (3,5) | 2.40 | % | 2.44 | % | 2.45 | % | 2.48 | % | 2.52 | % | ||||||||||
| Ratio of net investment loss to average net assets (3,4,5) | (0.95 | )% | (1.49 | )% | (1.52 | )% | (1.22 | )% | (1.05 | )% | ||||||||||
| Portfolio Turnover Rate | 46 | % | 14 | % | 26 | % | 22 | % | 17 | % | ||||||||||
| (1) | Per share amounts calculated using the average shares method. |
| (2) | Total return assumes reinvestment of all dividends and distributions, if any. Had the advisor not waived a portion of its fees, total returns would have been lower. |
| (3) | Does not include the expenses of other investment companies in which the Fund invests. |
| (4) | Recognition of investment loss by the Fund is affected by the timing and declaration of dividends by the underlying investment companies in which the Fund invests. |
| (5) | Includes interest expense. Excluding interest expense, the following ratios would have been: |
| Gross expenses to average net assets (3) | 2.54 | % | 2.55 | % | 2.60 | % | 2.66 | % | 2.51 | % | ||||||||||
| Net expenses to average net assets (3) | 2.40 | % | 2.40 | % | 2.40 | % | 2.40 | % | 2.40 | % | ||||||||||
| Net investment loss to average net assets (3,4) | (0.95 | )% | (1.45 | )% | (1.47 | )% | (1.14 | )% | (0.93 | )% | ||||||||||
See accompanying notes to financial statements.
39
| SWAN DEFINED RISK U.S. SMALL CAP FUND |
| FINANCIAL HIGHLIGHTS |
| Per Share Data and Ratios for a Share of Beneficial Interest Outstanding Throughout Each Year |
| Class I | ||||||||||||||||||||
| For the | For the | For the | For the | For the | ||||||||||||||||
| Year Ended | Year Ended | Year Ended | Year Ended | Year Ended | ||||||||||||||||
| June 30, 2023 | June 30, 2022 | June 30, 2021 | June 30, 2020 | June 30, 2019 | ||||||||||||||||
| Net asset value, beginning of year | $ | 13.34 | $ | 15.74 | $ | 11.78 | $ | 12.01 | $ | 12.45 | ||||||||||
| Activity from investment operations: | ||||||||||||||||||||
| Net investment income (loss) (1) | 0.01 | (0.07 | ) | (0.08 | ) | (0.03 | ) | (0.01 | ) | |||||||||||
| Net realized and unrealized gain (loss) on investments, options purchased and options written | 0.48 | (2.33 | ) | 4.04 | (0.20 | ) | (0.43 | ) | ||||||||||||
| Total from investment operations | 0.49 | (2.40 | ) | 3.96 | (0.23 | ) | (0.44 | ) | ||||||||||||
| Less distributions from: | ||||||||||||||||||||
| Net realized gains | (0.90 | ) | — | — | — | — | ||||||||||||||
| Total distributions | (0.90 | ) | — | — | — | — | ||||||||||||||
| Net asset value, end of year | $ | 12.93 | $ | 13.34 | $ | 15.74 | $ | 11.78 | $ | 12.01 | ||||||||||
| Total return (2) | 4.07 | % | (15.25 | )% | 33.62 | % | (1.92 | )% | (3.53 | )% | ||||||||||
| Net assets, at end of year (000s) | $ | 33,255 | $ | 32,755 | $ | 42,153 | $ | 32,244 | $ | 37,534 | ||||||||||
| Ratio of gross expenses to average net assets (3,5) | 1.54 | % | 1.59 | % | 1.65 | % | 1.74 | % | 1.63 | % | ||||||||||
| Ratio of net expenses to average net assets (3,5) | 1.40 | % | 1.44 | % | 1.45 | % | 1.48 | % | 1.52 | % | ||||||||||
| Ratio of net investment income (loss) to average net assets (3,4,5) | 0.05 | % | (0.48 | )% | (0.54 | )% | (0.23 | )% | (0.06 | )% | ||||||||||
| Portfolio Turnover Rate | 46 | % | 14 | % | 26 | % | 22 | % | 17 | % | ||||||||||
| (1) | Per share amounts calculated using the average shares method. |
| (2) | Total return assumes reinvestment of all dividends and distributions, if any. Had the advisor not waived a portion of its fees, total returns would have been lower. |
| (3) | Does not include the expenses of other investment companies in which the Fund invests. |
| (4) | Recognition of investment loss by the Fund is affected by the timing and declaration of dividends by the underlying investment companies in which the Fund invests. |
| (5) | Includes interest expense. Excluding interest expense, the following ratios would have been: |
| Gross expenses to average net assets (3) | 1.54 | % | 1.55 | % | 1.60 | % | 1.66 | % | 1.51 | % | ||||||||||
| Net expenses to average net assets (3) | 1.40 | % | 1.40 | % | 1.40 | % | 1.40 | % | 1.40 | % | ||||||||||
| Net investment income (loss) to average net assets (3,4) | 0.05 | % | (0.44 | )% | (0.49 | )% | (0.15 | )% | 0.06 | % | ||||||||||
See accompanying notes to financial statements.
40
| SWAN FUNDS |
| NOTES TO FINANCIAL STATEMENTS |
| June 30, 2023 |
| 1. | ORGANIZATION |
The Swan Defined Risk Fund, Swan Defined Risk Emerging Markets Fund, Swan Defined Risk Foreign Fund, Swan Defined Risk Growth Fund and the Swan Defined Risk U.S. Small Cap Fund, each a “Fund” and together, the “Funds”, are each a diversified series of shares of beneficial interest of Northern Lights Fund Trust III (the “Trust”), a Delaware statutory trust organized on December 5, 2011. The Trust is registered under the Investment Company Act of 1940, as amended (the “1940 Act”), as an open-end management investment company.
The investment objectives of the Funds are as follows:
Swan Defined Risk Fund – To seek long term capital appreciation.
Swan Defined Risk Emerging Markets Fund – To seek long term capital appreciation.
Swan Defined Risk Foreign Fund – To seek long term capital appreciation.
Swan Defined Risk Growth Fund – To seek long term capital appreciation.
Swan Defined Risk U.S. Small Cap Fund – To seek long term capital appreciation.
Each Fund offers three classes of shares: Class A, Class C, and Class I shares. The Swan Defined Risk Fund’s Class A shares and Class I shares commenced operations on July 30, 2012, and Class C shares on October 18, 2012. The Swan Defined Risk Emerging Markets Fund commenced operations on December 30, 2014. The Swan Defined Risk Foreign Fund’s and the Swan Defined Risk U.S. Small Cap Fund commenced operations on December 29, 2015. The Swan Defined Risk Growth Fund commenced operations on December 27, 2018. Class A shares of each Fund are offered at net asset value plus a maximum sales charge of 5.50%. Class I and Class C shares of each Fund are offered at net asset value. Each class of the Funds represents an interest in the same assets of the respective Fund and classes are identical except for differences in their distribution charges, sales charges, and minimum investment levels. All classes of shares have equal voting privileges except that each class has exclusive voting rights with respect to its service and/or distribution plans. Fund level income and expenses, and realized and unrealized capital gains and losses are allocated to each class of shares based on their relative net assets within each Fund. Class specific expenses are allocated to that share class.
| 2. | SUMMARY OF SIGNIFICANT ACCOUNTING POLICIES |
The following is a summary of significant accounting policies followed by the Funds in preparation of their financial statements. These policies are in conformity with accounting principles generally accepted in the United States of America (“GAAP”). The preparation of financial statements in conformity with GAAP requires management to make estimates and assumptions that affect the reported amounts of assets and liabilities and disclosure of contingent assets and liabilities at the date of the financial statements and the reported amounts of increases and decreases in net assets from operations during the reporting period. Actual results could differ from those estimates. The Funds are investment companies and accordingly follow the investment company accounting and reporting guidance of the Financial Accounting Standards Board (“FASB”) Accounting Standards Codification Topic 946 “Financial Services – Investment Companies”.
Securities Valuation – Securities listed on an exchange are valued at the last reported sale price at the close of the regular trading session of the primary exchange on the business day the value is being determined, or in the case of securities listed on NASDAQ at the NASDAQ Official Closing Price (“NOCP”). In the absence of a sale, such securities shall be valued at the mean between the current bid and ask prices on the day of valuation. Futures and future options are valued at the final settled price or, in the absence of a settled price, at the last sale price on the day of valuation. Debt securities (other than short-term obligations) are valued each day by an independent pricing service approved by the Trust’s Board of Trustees (the “Board”) based on methods which include consideration of: yields or prices of securities of comparable quality, coupon, maturity and type, indications as to values from dealers, and general market conditions or market quotations from a major market maker in the securities. Investments valued in currencies other than the U.S. dollar are converted to U.S. dollars using exchange rates obtained from pricing services. Short-term debt obligations having 60 days or less remaining until maturity, at time of purchase, may be valued at amortized cost. Equity options contracts listed on a securities exchange or board of trade for which market quotations are readily available shall be valued at the last quoted sales price or, in the absence of a sale, at the mean between the current bid and ask prices on the day of valuation. Equity option contracts not listed on a securities exchange or board of trade for which over-the-counter market quotations are readily available shall be valued at the mean between the current bid and ask prices on the day of valuation. Index options shall be valued at the mean between the current bid and ask prices on the day of valuation.
41
| SWAN FUNDS |
| NOTES TO FINANCIAL STATEMENTS (Continued) |
| June 30, 2023 |
Valuation of Underlying Funds – The Funds may invest in portfolios of open-end or closed-end investment companies (the “underlying funds”). Underlying open-end investment companies are valued at their respective net asset values as reported by such investment companies. The underlying funds value securities in their portfolios for which market quotations are readily available at their market values (generally the last reported sale price) and all other securities and assets at their fair value by the methods established by the boards of the underlying funds. The shares of many closed- end investment companies, after their initial public offering, frequently trade at a price per share, which is different than the net asset value per share. The difference represents a market premium or market discount of such shares. There can be no assurances that the market discount or market premium on shares of any closed-end investment company purchased by the Funds will not change.
The Funds may hold securities, such as private investments, interests in commodity pools, other non-traded securities or temporarily illiquid securities, for which market quotations are not readily available or are determined to be unreliable. These securities will be valued using the “fair value” procedures approved by the Board. The Board has delegated execution of these procedures to the advisor as its valuation designee (the “Valuation Designee”). The Board may also enlist third party consultants such a valuation specialist at a public accounting firm, valuation consultant or financial officer of a security issuer on an as-needed basis to assist the Valuation Designee in determining a security-specific fair value. The Board is responsible for reviewing and approving fair value methodologies utilized by the Valuation Designee, which approval shall be based upon whether the Valuation Designee followed the valuation procedures established by the Board.
Fair Valuation Process – Applicable investments are valued by the Valuation Designee pursuant to valuation procedures established by the Board. For example, fair value determinations are required for the following securities: (i) securities for which market quotations are insufficient or not readily available on a particular business day (including securities for which there is a short and temporary lapse in the provision of a price by the regular pricing source); (ii) securities for which, in the judgment of the Valuation Designee, the prices or values available do not represent the fair value of the instrument; factors which may cause the Valuation Designee to make such a judgment include, but are not limited to, the following: only a bid price or an asked price is available; the spread between bid and asked prices is substantial; the frequency of sales; the thinness of the market; the size of reported trades; and actions of the securities markets, such as the suspension or limitation of trading; (iii) securities determined to be illiquid; and (iv) securities with respect to which an event that will affect the value thereof has occurred (a “significant event”) since the closing prices were established on the principal exchange on which they are traded, but prior to a Fund’s calculation of its net asset value. Specifically, interests in commodity pools or managed futures pools are valued on a daily basis by reference to the closing market prices of each futures contract or other asset held by a pool, as adjusted for pool expenses. Restricted or illiquid investments, such as private investments or non-traded securities are valued based upon the current bid for the security from two or more independent dealers or other parties reasonably familiar with the facts and circumstances of the security (who should take into consideration all relevant factors as may be appropriate under the circumstances). If a current bid from such independent dealers or other independent parties is unavailable, the Valuation Designee shall determine, the fair value of such security using the following factors: (i) the type of security; (ii) the cost at date of purchase; (iii) the size and nature of the Funds’ holdings; (iv) the discount from market value of unrestricted securities of the same class at the time of purchase and subsequent thereto; (v) information as to any transactions or offers with respect to the security; (vi) the nature and duration of restrictions on disposition of the security and the existence of any registration rights; (vii) how the yield of the security compares to similar securities of companies of similar or equal creditworthiness; (viii) the level of recent trades of similar or comparable securities; (ix) the liquidity characteristics of the security; (x) current market conditions; and (xi) the market value of any securities into which the security is convertible or exchangeable.
The Funds utilize various methods to measure the fair value of all of their investments on a recurring basis. GAAP establishes a hierarchy that prioritizes inputs to valuation methods. The three levels of input are:
Level 1 – Unadjusted quoted prices in active markets for identical assets and liabilities that a Fund has the ability to access.
Level 2 – Observable inputs other than quoted prices included in Level 1 that are observable for the asset or liability, either directly or indirectly. These inputs may include quoted prices for the identical instrument in an inactive market, prices for similar instruments, interest rates, prepayment speeds, credit risk, yield curves, default rates and similar data.
Level 3 – Unobservable inputs for the asset or liability, to the extent relevant observable inputs are not available, representing a Fund’s own assumptions about the assumptions a market participant would use in valuing the asset or liability, and would be based on the best information available.
42
| SWAN FUNDS |
| NOTES TO FINANCIAL STATEMENTS (Continued) |
| June 30, 2023 |
The availability of observable inputs can vary from security to security and is affected by a wide variety of factors, including, for example, the type of security, whether the security is new and not yet established in the marketplace, the liquidity of markets, and other characteristics particular to the security. To the extent that valuation is based on models or inputs that are less observable or unobservable in the market, the determination of fair value requires more judgment. Accordingly, the degree of judgment exercised in determining fair value is greatest for instruments categorized in Level 3.
The inputs used to measure fair value may fall into different levels of the fair value hierarchy. In such cases, for disclosure purposes, the level in the fair value hierarchy within which the fair value measurement falls in its entirety, is determined based on the lowest level input that is significant to the fair value measurement in its entirety.
The inputs or methodology used for valuing securities are not necessarily an indication of the risk associated with investing in those securities. The following tables summarize the inputs used as of June 30, 2023 for the Funds’ investments measured at fair value:
Swan Defined Risk Fund
| Assets * | Level 1 | Level 2 | Level 3 | Total | ||||||||||||
| Exchange-Traded Funds | $ | 804,010,329 | $ | — | $ | — | $ | 804,010,329 | ||||||||
| Purchased Call Options | — | 113,100 | — | 113,100 | ||||||||||||
| Purchased Put Options | — | 24,877,746 | — | 24,877,746 | ||||||||||||
| Short-Term Investments | 17,811,339 | — | — | 17,811,339 | ||||||||||||
| Total | $ | 821,821,668 | $ | 24,990,846 | $ | — | $ | 846,812,514 | ||||||||
| Liabilities * | ||||||||||||||||
| Call Option Written | $ | — | $ | 30,943,741 | $ | — | $ | 30,943,741 | ||||||||
| Put Options Written | — | 7,753,786 | — | 7,753,786 | ||||||||||||
| Total | $ | — | $ | 38,697,527 | $ | — | $ | 38,697,527 | ||||||||
Swan Defined Risk Emerging Markets Fund
| Assets * | Level 1 | Level 2 | Level 3 | Total | ||||||||||||
| Exchange-Traded Funds | $ | 25,798,386 | $ | — | $ | — | $ | 25,798,386 | ||||||||
| Purchased Put Options | — | 1,425,231 | — | 1,425,231 | ||||||||||||
| Short-Term Investment | 326,667 | — | — | 326,667 | ||||||||||||
| Total | $ | 26,125,053 | $ | 1,425,231 | $ | — | $ | 27,550,284 | ||||||||
| Liabilities * | ||||||||||||||||
| Call Options Written | $ | — | $ | 16,008 | $ | — | $ | 16,008 | ||||||||
| Put Options Written | — | 111,873 | — | 111,873 | ||||||||||||
| Total | $ | — | $ | 127,881 | $ | — | $ | 127,881 | ||||||||
Swan Defined Risk Foreign Fund
| Assets * | Level 1 | Level 2 | Level 3 | Total | ||||||||||||
| Exchange-Traded Fund | $ | 31,073,500 | $ | — | $ | — | $ | 31,073,500 | ||||||||
| Purchased Put Options | — | 1,241,180 | — | 1,241,180 | ||||||||||||
| Short-Term Investment | 839,462 | — | — | 839,462 | ||||||||||||
| Total | $ | 31,912,962 | $ | 1,241,180 | $ | — | $ | 33,154,142 | ||||||||
| Liabilities * | ||||||||||||||||
| Call Options Written | $ | — | $ | 101,885 | $ | — | $ | 101,885 | ||||||||
| Put Options Written | — | 145,159 | — | 145,159 | ||||||||||||
| Total | $ | — | $ | 247,044 | $ | — | $ | 247,044 | ||||||||
43
| SWAN FUNDS |
| NOTES TO FINANCIAL STATEMENTS (Continued) |
| June 30, 2023 |
Swan Defined Risk Growth Fund
| Assets * | Level 1 | Level 2 | Level 3 | Total | ||||||||||||
| Exchange-Traded Fund | $ | 83,347,770 | $ | — | $ | — | $ | 83,347,770 | ||||||||
| Purchased Call Options | — | 5,307,418 | — | 5,307,418 | ||||||||||||
| Purchased Put Options | — | 2,221,604 | — | 2,221,604 | ||||||||||||
| Short-Term Investments | 2,697,269 | — | — | 2,697,269 | ||||||||||||
| Total | $ | 86,045,039 | $ | 7,529,022 | $ | — | $ | 93,574,061 | ||||||||
| Liabilities * | ||||||||||||||||
| Call Options Written | $ | — | $ | 4,883,596 | $ | — | $ | 4,883,596 | ||||||||
| Put Options Written | — | 842,466 | — | 842,466 | ||||||||||||
| Total | $ | — | $ | 5,726,062 | $ | — | $ | 5,726,062 | ||||||||
Swan Defined Risk U.S. Small Cap Fund
| Assets * | Level 1 | Level 2 | Level 3 | Total | ||||||||||||
| Exchange-Traded Fund | $ | 33,895,870 | $ | — | $ | — | $ | 33,895,870 | ||||||||
| Purchased Call Options | — | 4,655 | — | 4,655 | ||||||||||||
| Purchased Put Options | — | 1,922,449 | — | 1,922,449 | ||||||||||||
| Short-Term Investment | 192,017 | — | — | 192,017 | ||||||||||||
| Total | $ | 34,087,887 | $ | 1,927,104 | $ | — | $ | 36,014,991 | ||||||||
| Liabilities * | ||||||||||||||||
| Call Options Written | $ | — | $ | 246,396 | $ | — | $ | 246,396 | ||||||||
| Put Options Written | — | 316,946 | — | 316,946 | ||||||||||||
| Total | $ | — | $ | 563,342 | $ | — | $ | 563,342 | ||||||||
The Funds did not hold any Level 3 securities during the period.
| * | Please refer to the Schedule of Investments for Classification. |
Security Transactions and Investment Income – Investment security transactions are accounted for on a trade date basis. Cost is determined and gains and losses are based upon the specific identification method for both financial statement and federal income tax purposes. Dividend income is recorded on the ex-dividend date and interest income is recorded on an accrual basis. Purchase discounts and premiums on securities are accreted and amortized over the life of the respective securities.
Option Transactions – The Funds are subject to equity price risk in the normal course of pursuing their investment objectives and may purchase or sell options to help hedge against risk. When a Fund writes an option, an amount equal to the premium received is included in the statement of assets and liabilities as a liability. The amount of the liability is subsequently marked-to-market to reflect the current market value of the option. If an option expires on its stipulated expiration date or if a Fund enters into a closing purchase transaction, a gain or loss is realized. If a written call option is exercised, a gain or loss is realized for the sale of the underlying security and the proceeds from the sale are increased by the premium originally received. If a written put option is exercised, the purchase cost of the underlying security is reduced by the premium originally received. As a writer of an option, the Funds have no control over whether the option will be exercised and, as a result, retains the market risk of an unfavorable change in the price of the security underlying the written option.
The Funds may purchase put and call options. Put options are purchased to hedge against a decline in the value of securities held in a Fund’s portfolio. If such a decline occurs, the put options will permit a Fund to sell the securities underlying such options at the exercise price, or to close out the options at a profit. The premium paid for a put or call option plus any transaction costs will reduce the benefit, if any, realized by a Fund upon exercise of the option, and, unless the price of the underlying security rises or declines sufficiently, the option may expire worthless to the applicable Fund. In addition, in the event that the price of the security in connection with which an option was purchased moves in a direction favorable to a Fund, the benefits realized by the applicable Fund as a result of such favorable movement will be reduced by the amount of the premium paid for the option and related transaction costs. Written and purchased options are non-income producing securities. With purchased options, there is minimal counterparty risk to a Fund since these options are exchange traded and the exchange’s clearinghouse, as counterparty to all exchange traded options, guarantees against a possible default.
44
| SWAN FUNDS |
| NOTES TO FINANCIAL STATEMENTS (Continued) |
| June 30, 2023 |
Option Risk – Purchased put options may expire worthless and may have imperfect correlation to the value of the Funds’ sector ETFs. Written call and put options may limit the Funds’ participation in equity market gains and may amplify losses in market declines. The Funds’ losses are potentially large in a written put or call transaction. If unhedged, written calls expose the Funds to potentially unlimited losses.
Distributions to Shareholders – Distributions from net investment income, if any, are declared and paid at least annually and are recorded on the ex-dividend date. The Funds will declare and pay net realized capital gains, if any, annually. The character of income and gains to be distributed is determined in accordance with federal income tax regulations, which may differ from GAAP. These “book/tax” differences are considered either temporary (i.e., deferred losses, capital loss carry forwards) or permanent in nature. To the extent these differences are permanent in nature, such amounts are reclassified within the composition of net assets based on their federal tax-basis treatment; temporary differences do not require classification.
Federal Income Taxes – It is the Funds’ policy to continue to comply with the requirements of the Internal Revenue Code applicable to regulated investment companies and to distribute all of their taxable income to their shareholders. Therefore, no provision for federal income tax is required. The Funds recognize the tax benefits of uncertain tax positions only where the position is “more likely than not” to be sustained assuming examination by tax authorities. Management has analyzed the Funds’ tax positions and has concluded that no liability for unrecognized tax benefits should be recorded related to uncertain tax positions taken on returns filed for the open tax years 2020 - 2022 for all Funds or expected to be taken by all the Funds in their 2023 tax returns. The Funds identify their major tax jurisdictions as U.S. federal, Ohio and foreign jurisdictions where the Funds make significant investments. The Funds are not aware of any tax positions for which it is reasonably possible that the total amounts of unrecognized tax benefits will change materially in the next twelve months.
Exchange Traded Funds – The Funds may invest in exchange traded funds (“ETFs”). ETFs are a type of fund bought and sold on a securities exchange. An ETF trades like common stock and represents a fixed portfolio of securities. The Funds may purchase an ETF to gain exposure to a portion of the U.S. or a foreign market. The risks of owning an ETF generally reflect the risks of owning the underlying securities they are designed to track, although the lack of liquidity on an ETF could result in it being more volatile. Additionally, ETFs have fees and expenses that reduce their value.
ETF Risk – ETFs are subject to investment advisory and other expenses, which will be indirectly paid by the Funds. As a result, the cost of investing in the Funds will be higher than the cost of investing directly in ETFs and may be higher than other mutual funds that invest directly in stocks. ETFs are subject to specific risks, depending on the nature of the ETF.
Expenses – Expenses of the Trust that are directly identifiable to a specific fund are charged to that fund. Expenses that are not readily identifiable to a specific fund are allocated in such a manner as deemed equitable, taking into consideration the nature and type of expense and the relative sizes of the funds in the Trust.
Indemnification – The Trust indemnifies its officers and Trustees for certain liabilities that may arise from the performance of their duties to the Trust. Additionally, in the normal course of business, the Funds enter into contracts that contain a variety of representations and warranties and which provide general indemnities. The Funds’ maximum exposure under these arrangements is unknown, as this would involve future claims that may be made against the Funds that have not yet occurred. However, based on experience, the Funds expect the risk of loss due to these warranties and indemnities to be remote.
Cash Held at Broker – Cash held at broker includes cash and overnight investments in interest-bearing demand deposits with a financial institution with original maturities of three months or less. The Funds maintain deposits with a high quality financial institution in an amount that is in excess of federally insured limits. Each Fund places deposits only with those counterparties that are believed to be creditworthy and there has been no history of loss.
Cash and Cash Equivalents – Cash and cash equivalents are held with a financial institution. The assets of a Fund may be placed in deposit accounts at U.S. banks and such deposits generally exceed Federal Deposit Insurance Corporation (“FDIC”) insurance limits. The FDIC insures deposit accounts up to $250,000 for each account holder. The counterparty is generally a single bank rather than a group of financial institutions; thus, there may be a greater counterparty credit risk. Each Fund places deposits only with those counterparties that are believed to be creditworthy and there has been no history of loss.
45
| SWAN FUNDS |
| NOTES TO FINANCIAL STATEMENTS (Continued) |
| June 30, 2023 |
Market Risk – Overall market risks may also affect the value of the Funds. The market values of securities or other investments owned by the Funds will go up or down, sometimes rapidly or unpredictably. Factors such as economic growth and market conditions, interest rate levels, exchange rates and political events affect the securities markets. Changes in market conditions and interest rates generally do not have the same impact on all types of securities and instruments. Unexpected local, regional or global events and their aftermath, such as war; acts of terrorism; financial, political or social disruptions; natural, environmental or man-made disasters; climate change and climate related events; the spread of infectious illnesses or other public health issues; recessions and depressions; or other tragedies, catastrophes and events could have a significant impact on the Funds and their investments and could result in increased premiums or discounts to a Fund’s net asset value, and may impair market liquidity, thereby increasing liquidity risk. Such events can cause investor fear and panic, which can adversely affect the economies of many companies, sectors, nations, regions and the market in general, in ways that cannot necessarily be foreseen. The Funds could lose money over short periods due to short-term market movements and over longer periods during more prolonged market downturns. During a general market downturn, multiple asset classes may be negatively affected. In times of severe market disruptions, you could lose your entire investment.
Leveraging Risk – The use of leverage, such as that embedded in options, could magnify the Funds’ gains or losses. Written option positions expose the Funds to potential losses many times the option premium received.
| 3. | INVESTMENT ADVISORY AGREEMENT AND TRANSACTIONS WITH RELATED PARTIES |
Swan Capital Management, LLC (the “Advisor”) serves as investment advisor to the Funds. Subject to the oversight of the Board, the Advisor is responsible for the management of the Funds’ investment portfolios. The Advisor has selected Swan Global Management, LLC, (the “Sub-Advisor”), an affiliate of the Advisor with the same ownership and management as the Advisor, to serve as the Funds’ sub-advisor, effective November 19, 2014 for the Swan Defined Risk Fund and since commencement of the Swan Defined Risk Emerging Markets Fund, Swan Defined Risk Foreign Fund, Swan Defined Risk Growth Fund and Swan Defined Risk U.S. Small Cap Fund.
Pursuant to an advisory agreement with the Trust, on behalf of the Funds, the Advisor, under the oversight of the Board, directs the daily operations of the Funds and supervises the performance of administrative and professional services provided by others. As compensation for its services and the related expenses borne by the Advisor, the Funds pay the Advisor a fee, computed and accrued daily and paid monthly at an annual rate of 1.00% of each Fund’s average daily net assets.
For the year ended June 30, 2023, the advisory fees incurred by each of the Funds were as follows:
| Fund | Advisory Fees | |||
| Swan Defined Risk Fund | $ | 8,849,719 | ||
| Swan Defined Risk Emerging Markets Fund | 284,306 | |||
| Swan Defined Risk Foreign Fund | 324,215 | |||
| Swan Defined Risk Growth Fund | 990,221 | |||
| Swan Defined Risk U.S. Small Cap Fund | 397,283 | |||
Pursuant to a written contract (the “Waiver Agreement”), the Advisor has agreed to waive a portion of its advisory fee and has agreed to reimburse expenses of the Funds until at least October 31, 2023 to the extent necessary so that the total expenses incurred by the applicable Fund (excluding (i) any front-end or contingent deferred loads; (ii) brokerage fees and commissions, (iii) acquired fund fees and expenses; (iii) borrowing costs (such as interest and dividend expense on securities sold short); (iv) taxes; and (v) extraordinary expenses, such as litigation expenses (which may include indemnification of Fund officers and Trustees, contractual indemnification of Fund service providers (other than the Adviser))) do not exceed 1.65%, 2.40%, and 1.40% of the daily average net assets attributable to Class A, Class C, and Class I shares, respectively, of the applicable Fund.
If the Advisor waives any fee or reimburses any expense pursuant to the Waiver Agreement, and a Fund’s Operating Expenses attributable to Class A, Class C, and Class I shares are subsequently less than the expense limitations, the Advisor shall be entitled to reimbursement by the applicable Fund for such waived fees or reimbursed expenses provided that such reimbursement does not cause the Fund’s expenses to exceed the expense limitation in place at the time of waiver
46
| SWAN FUNDS |
| NOTES TO FINANCIAL STATEMENTS (Continued) |
| June 30, 2023 |
or reimbursement or at time of recoupment, whichever is less. If Fund Operating Expenses attributable to Class A, Class C and Class I shares subsequently exceed the expense limitation, the reimbursements shall be suspended. The Advisor may seek reimbursement only for expenses waived or paid by it during the three years prior to such reimbursement; provided, however, that such expenses may only be reimbursed to the extent they were waived or paid after the date of the Waiver Agreement (or any similar agreement).
During the year ended June 30, 2023, the Advisor waived/recaptured advisory fees pursuant to the Waiver Agreement as follows:
| Advisory | Advisory | |||||||
| Fund | Fees Waived | Fees Recaptured | ||||||
| Swan Defined Risk Fund | $ | — | $ | — | ||||
| Swan Defined Risk Emerging Markets Fund | 70,033 | — | ||||||
| Swan Defined Risk Foreign Fund | 61,752 | — | ||||||
| Swan Defined Risk Growth Fund | — | 81,143 | ||||||
| Swan Defined Risk U.S. Small Cap Fund | 54,094 | — | ||||||
As of June 30, 2023, the Advisor may recapture all or a portion of the waived fees no later than the dates stated below:
| Fund | June 30, 2024 | June 30, 2025 | June 30, 2026 | Total | ||||||||||||
| Swan Defined Risk Fund | $ | — | $ | — | $ | — | $ | — | ||||||||
| Swan Defined Risk Emerging Markets Fund | 80,213 | 65,538 | 70,033 | 215,784 | ||||||||||||
| Swan Defined Risk Foreign Fund | 98,037 | 80,922 | 61,752 | 240,711 | ||||||||||||
| Swan Defined Risk Growth Fund | — | — | — | — | ||||||||||||
| Swan Defined Risk U.S. Small Cap Fund | 73,542 | 57,472 | 54,094 | 185,108 | ||||||||||||
Distributor – The distributor of the Funds is Northern Lights Distributors, LLC (the “Distributor”). The Board has adopted, on behalf of the Funds, the Trust’s Master Distribution and Shareholder Servicing Plans for Class A and Class C shares as amended, pursuant to Rule 12b-1 under the 1940 Act (the “Plans”), to pay for certain distribution activities and shareholder services. Under the Plans, the Funds may pay 0.25% per year of the average daily net assets of Class A shares and 1.00% of the average daily net assets for Class C shares for such distribution and shareholder service activities.
For the year ended June 30, 2023, the Funds incurred 12b-1 fees attributable to Class A and C shares as follows:
| Fund | Class A | Class C | ||||||
| Swan Defined Risk Fund | $ | 304,472 | $ | 1,068,407 | ||||
| Swan Defined Risk Emerging Markets Fund | 1,939 | 10,230 | ||||||
| Swan Defined Risk Foreign Fund | 1,881 | 7,247 | ||||||
| Swan Defined Risk Growth Fund | 4,874 | 18,085 | ||||||
| Swan Defined Risk U.S. Small Cap Fund | 2,607 | 17,692 | ||||||
The Distributor acts as the Funds’ principal underwriter in a continuous public offering of the Funds’ shares. During the year ended June 30, 2023, the Distributor received underwriting commissions for sales of Class A shares of each of the Funds as follows:
| Amount Retained | ||||||||
| by Principal | ||||||||
| Fund | Commission | Underwriter | ||||||
| Swan Defined Risk Fund | $ | 108,842 | $ | 13,859 | ||||
| Swan Defined Risk Emerging Markets Fund | 522 | 47 | ||||||
| Swan Defined Risk Foreign Fund | 1,965 | 252 | ||||||
| Swan Defined Risk Growth Fund | 6,215 | 946 | ||||||
| Swan Defined Risk U.S. Small Cap Fund | 2,868 | 361 | ||||||
47
| SWAN FUNDS |
| NOTES TO FINANCIAL STATEMENTS (Continued) |
| June 30, 2023 |
In addition, certain affiliates of the Distributor provide services to the Funds as follows:
Ultimus Fund Solutions, LLC (“UFS”) – an affiliate of the Distributor, provides administration, fund accounting, and transfer agent services to the Trust. Pursuant to separate servicing agreements with UFS, the Funds pay UFS customary fees for providing administration, fund accounting and transfer agency services to the Funds. Certain officers of the Trust are also officers of UFS, and are not paid any fees directly by the Funds for serving in such capacities.
Northern Lights Compliance Services, LLC (“NLCS”) – an affiliate of UFS and the Distributor, provides a Chief Compliance Officer to the Trust, as well as related compliance services, pursuant to a consulting agreement between NLCS and the Trust. Under the terms of such agreement, NLCS receives customary fees from the Funds.
Blu Giant, LLC (“Blu Giant”) – an affiliate of UFS and the Distributor, provides EDGAR conversion and filing services as well as print management services for the Funds on an ad-hoc basis. For the provision of these services, Blu Giant receives customary fees from the Funds.
| 4. | INVESTMENT TRANSACTIONS |
The cost of purchases and proceeds from the sale of securities, other than U.S. government securities and short-term investments, for the year ended June 30, 2023 were as follows:
| Fund | Purchases | Sales | ||||||
| Swan Defined Risk Fund | $ | 98,136,155 | $ | 258,539,904 | ||||
| Swan Defined Risk Emerging Markets Fund | 8,818,993 | 5,093,436 | ||||||
| Swan Defined Risk Foreign Fund | 9,783,382 | 7,574,646 | ||||||
| Swan Defined Risk Growth Fund | 5,315,797 | 23,262,237 | ||||||
| Swan Defined Risk U.S. Small Cap Fund | 12,280,439 | 12,262,477 | ||||||
| 5. | DERIVATIVE TRANSACTIONS |
The following is a summary of the effect of derivative instruments on the Funds’ Statements of Assets and Liabilities as of June 30, 2023.
| Swan Defined Risk Fund | ||||||
| Contract Type/Primary Risk Exposure | Statements of Assets and Liabilities | Value | ||||
| Index contracts/Equity price risk | Investment securities, at value | $ | 24,990,846 | |||
| Index contracts/Equity price risk | Options Written, at value | (38,697,527 | ) | |||
| Swan Defined Risk Emerging Markets Fund | ||||||
| Contract Type/Primary Risk Exposure | Statements of Assets and Liabilities | Value | ||||
| Equity contracts/Equity price risk | Investment securities, at value | $ | 1,425,231 | |||
| Equity contracts/Equity price risk | Options Written, at value | (127,881 | ) | |||
| Swan Defined Risk Foreign Fund | ||||||
| Contract Type/Primary Risk Exposure | Statements of Assets and Liabilities | Value | ||||
| Equity contracts/Equity price risk | Investment securities, at value | $ | 1,241,180 | |||
| Equity contracts/Equity price risk | Options Written, at value | (247,044 | ) | |||
48
| SWAN FUNDS |
| NOTES TO FINANCIAL STATEMENTS (Continued) |
| June 30, 2023 |
| Swan Defined Risk Growth Fund | ||||||
| Contract Type/Primary Risk Exposure | Statements of Assets and Liabilities | Value | ||||
| Index contracts/Equity price risk | Investment securities, at value | $ | 7,529,022 | |||
| Index contracts/Equity price risk | Options Written, at value | (5,726,062 | ) | |||
| Swan Defined Risk U.S. Small Cap Fund | ||||||
| Contract Type/Primary Risk Exposure | Statements of Assets and Liabilities | Value | ||||
| Index contracts/Equity price risk | Investment securities, at value | $ | 1,927,104 | |||
| Index contracts/Equity price risk | Options Written, at value | (563,342 | ) | |||
The following is a summary of the effect of derivative instruments on the Funds’ Statements of Operations for the year ended June 30, 2023.
| Swan Defined Risk Fund | ||||||||
| Change in Unrealized | ||||||||
| Realized Gain/(Loss) | Appreciation/(Depreciation) | |||||||
| Contract Type/Primary Risk Exposure | on Options Purchased | on Options Purchased | ||||||
| Index contracts/Equity price risk | $ | (8,569,663 | ) | $ | (96,443,257 | ) | ||
| Change in Unrealized | ||||||||
| Realized Gain/(Loss) | Appreciation/(Depreciation) | |||||||
| Contract Type/Primary Risk Exposure | on Options Written | on Options Written | ||||||
| Index contracts/Equity price risk | $ | 42,408,158 | $ | (7,757,721 | ) | |||
| Swan Defined Risk Emerging Markets Fund | ||||||||
| Change in Unrealized | ||||||||
| Realized Gain/(Loss) | Appreciation/(Depreciation) | |||||||
| Contract Type/Primary Risk Exposure | on Options Purchased | on Options Purchased | ||||||
| Equity contracts/Equity price risk | $ | 1,477,639 | $ | (2,501,320 | ) | |||
| Index contracts/Equity price risk | (116,676 | ) | — | |||||
| $ | 1,360,963 | $ | (2,501,320 | ) | ||||
| Change in Unrealized | ||||||||
| Realized Gain/(Loss) | Appreciation/(Depreciation) | |||||||
| Contract Type/Primary Risk Exposure | on Options Written | on Options Written | ||||||
| Equity contracts/Equity price risk | $ | 845,082 | $ | 1,487 | ||||
| Index contracts/Equity price risk | 235,750 | — | ||||||
| $ | 1,080,832 | $ | 1,487 | |||||
49
| SWAN FUNDS |
| NOTES TO FINANCIAL STATEMENTS (Continued) |
| June 30, 2023 |
| Swan Defined Risk Foreign Fund | ||||||||
| Change in Unrealized | ||||||||
| Realized Gain/(Loss) | Appreciation/(Depreciation) | |||||||
| Contract Type/Primary Risk Exposure | on Options Purchased | on Options Purchased | ||||||
| Equity contracts/Equity price risk | $ | 909,826 | $ | (3,249,906 | ) | |||
| Index contracts/Equity price risk | (121,453 | ) | — | |||||
| $ | 788,374 | $ | (3,249,906 | ) | ||||
| Change in Unrealized | ||||||||
| Realized Gain/(Loss) | Appreciation/(Depreciation) | |||||||
| Contract Type/Primary Risk Exposure | on Options Written | on Options Written | ||||||
| Equity contracts/Equity price risk | $ | 690,406 | $ | (35,707 | ) | |||
| Index contracts/Equity price risk | 255,522 | — | ||||||
| $ | 945,928 | $ | (35,707 | ) | ||||
| Swan Defined Risk Growth Fund | ||||||||
| Change in Unrealized | ||||||||
| Realized Gain/(Loss) | Appreciation/(Depreciation) | |||||||
| Contract Type/Primary Risk Exposure | on Options Purchased | on Options Purchased | ||||||
| Index contracts/Equity price risk | $ | (5,759,995 | ) | $ | (3,140,372 | ) | ||
| Change in Unrealized | ||||||||
| Realized Gain/(Loss) | Appreciation/(Depreciation) | |||||||
| Contract Type/Primary Risk Exposure | on Options Written | on Options Written | ||||||
| Index contracts/Equity price risk | $ | 6,283,683 | $ | (2,455,668 | ) | |||
| Swan Defined Risk U.S. Small Cap Fund | ||||||||
| Change in Unrealized | ||||||||
| Realized Gain/(Loss) | Appreciation/(Depreciation) | |||||||
| Contract Type/Primary Risk Exposure | on Options Purchased | on Options Purchased | ||||||
| Index contracts/Equity price risk | $ | (3,163,908 | ) | $ | (2,268,886 | ) | ||
| Change in Unrealized | ||||||||
| Realized Gain/(Loss) | Appreciation/(Depreciation) | |||||||
| Contract Type/Primary Risk Exposure | on Options Written | on Options Written | ||||||
| Index contracts/Equity price risk | $ | 3,601,517 | $ | (127,562 | ) | |||
The notional value of the derivative instruments outstanding as of June 30, 2023 as disclosed in the Schedule of Investments and the amounts realized and changes in unrealized gains and losses on derivative instruments during the period as disclosed above and within the Statements of Operations serve as indicators of the volume of derivative activity for the Funds.
50
| SWAN FUNDS |
| NOTES TO FINANCIAL STATEMENTS (Continued) |
| June 30, 2023 |
| 6. | AGGREGATE UNREALIZED APPRECIATION AND DEPRECIATION – TAX BASIS |
| Gross | Gross | Net Unrealized | ||||||||||||||
| Tax | Unrealized | Unrealized | Appreciation | |||||||||||||
| Fund | Cost | Appreciation | Depreciation | (Depreciation) | ||||||||||||
| Swan Defined Risk Fund | $ | 396,630,096 | $ | 411,864,135 | $ | (379,244 | ) | $ | 411,484,891 | |||||||
| Swan Defined Risk Emerging Markets Fund | 28,437,926 | 694,554 | (1,710,077 | ) | (1,015,523 | ) | ||||||||||
| Swan Defined Risk Foreign Fund | 27,920,772 | 7,185,319 | (2,198,993 | ) | 4,986,326 | |||||||||||
| Swan Defined Risk Growth Fund | 59,976,948 | 28,180,796 | (309,745 | ) | 27,871,051 | |||||||||||
| Swan Defined Risk U.S. Small Cap Fund | 27,867,443 | 8,555,119 | (970,913 | ) | 7,584,206 | |||||||||||
| 7. | DISTRIBUTIONS TO SHAREHOLDERS AND TAX COMPONENTS OF CAPITAL |
The tax character of distributions paid for the years ended June 30, 2022, and June 30, 2023, was as follows:
| For the year ended June 30, 2023: | ||||||||||||||||
| Ordinary | Long-Term | Return | ||||||||||||||
| Portfolio | Income | Capital Gains | of Capital | Total | ||||||||||||
| Swan Defined Risk Fund | $ | — | $ | — | $ | — | $ | — | ||||||||
| Swan Defined Risk Emerging Markets Fund | 411,962 | — | — | 411,962 | ||||||||||||
| Swan Defined Risk Foreign Fund | — | — | — | — | ||||||||||||
| Swan Defined Risk Growth Fund | — | — | — | — | ||||||||||||
| Swan Defined Risk U.S. Small Cap Fund | — | 2,692,965 | — | 2,692,965 | ||||||||||||
| For the year ended June 30, 2022: | ||||||||||||||||
| Ordinary | Long-Term | Return | ||||||||||||||
| Portfolio | Income | Capital Gains | of Capital | Total | ||||||||||||
| Swan Defined Risk Fund | $ | — | $ | — | $ | — | $ | — | ||||||||
| Swan Defined Risk Emerging Markets Fund | 57,530 | — | — | 57,530 | ||||||||||||
| Swan Defined Risk Foreign Fund | 818,947 | — | 3,612,429 | 4,431,376 | ||||||||||||
| Swan Defined Risk Growth Fund | — | — | — | — | ||||||||||||
| Swan Defined Risk U.S. Small Cap Fund | — | 357,493 | — | 357,493 | ||||||||||||
As of June 30, 2023, the components of accumulated earnings/(deficit) on a tax basis were as follows:
| Undistributed | Undistributed | Post October Loss | Capital Loss | Other | Unrealized | Total | ||||||||||||||||||||||
| Ordinary | Long-Term | and | Carry | Book/Tax | Appreciation/ | Accumulated | ||||||||||||||||||||||
| Portfolio | Income | Capital Gains | Late Year Loss | Forwards | Differences | (Depreciation) | Earnings/(Deficits) | |||||||||||||||||||||
| Swan Defined Risk Fund | $ | 1,295,059 | $ | — | $ | — | $ | (5,376,704 | ) | $ | (4,860,206 | ) | 411,484,891 | $ | 402,543,040 | |||||||||||||
| Swan Defined Risk Emerging Markets Fund | 226,938 | — | (384,372 | ) | (3,295,031 | ) | — | (1,015,523 | ) | (4,467,988 | ) | |||||||||||||||||
| Swan Defined Risk Foreign Fund | 241,677 | — | (860,422 | ) | (3,277,925 | ) | (412,739 | ) | 4,986,326 | 676,917 | ||||||||||||||||||
| Swan Defined Risk Growth Fund | — | — | (6,408,427 | ) | (3,513,054 | ) | (1,013,337 | ) | 27,871,051 | 16,936,233 | ||||||||||||||||||
| Swan Defined Risk U.S. Small Cap Fund | — | — | (2,440,263 | ) | (230,680 | ) | (529,314 | ) | 7,584,206 | 4,383,949 | ||||||||||||||||||
The difference between book basis and tax basis unrealized appreciation (depreciation) and accumulated net realized gains (losses) from investments is primarily attributable to the tax deferral of losses on wash sales and straddles, the mark-to-market on open 1256 option contracts and foreign tax passthrough basis adjustments. In addition, the amounts listed under other book/tax differences are primarily attributable to the tax deferral of losses on straddles.
Late year losses incurred after December 31 within the fiscal year are deemed to arise on the first business day of the following fiscal year for tax purposes. The Swan Defined Risk U.S. Small Cap Fund incurred and elected to defer such late year losses as follows:
| Late Year | ||||
| Portfolio | Losses | |||
| Swan Defined Risk U.S. Small Cap Fund | $ | 48,161 | ||
51
| SWAN FUNDS |
| NOTES TO FINANCIAL STATEMENTS (Continued) |
| June 30, 2023 |
Capital losses incurred after October 31 within the fiscal year are deemed to arise on the first business day of the following fiscal year for tax purposes. The Funds incurred and elected to defer such capital losses as follows:
| Post October | ||||
| Portfolio | Losses | |||
| Swan Defined Risk Fund | $ | — | ||
| Swan Defined Risk Emerging Markets Fund | 384,362 | |||
| Swan Defined Risk Foreign Fund | 860,422 | |||
| Swan Defined Risk Growth Fund | 6,408,427 | |||
| Swan Defined Risk U.S. Small Cap Fund | 2,392,102 | |||
At June 30, 2023, the Funds had capital loss carry forwards for federal income tax purposes available to offset future capital gains and capital loss carry forwards utilized as follows:
| Non-Expiring | CLCF | |||||||||||||||
| Portfolio | Short-Term | Long-Term | Total | Utilized | ||||||||||||
| Swan Defined Risk Fund | $ | 5,376,704 | $ | — | $ | 5,376,704 | $ | 70,814,122 | ||||||||
| Swan Defined Risk Emerging Markets Fund | 3,295,031 | — | 3,295,031 | 2,090,009 | ||||||||||||
| Swan Defined Risk Foreign Fund | 2,891,560 | 386,365 | 3,277,925 | 1,918,652 | ||||||||||||
| Swan Defined Risk Growth Fund | 1,308,110 | 2,204,944 | 3,513,054 | — | ||||||||||||
| Swan Defined Risk U.S. Small Cap Fund | 92,284 | 138,396 | 230,680 | — | ||||||||||||
Permanent book and tax differences, primarily attributable to the book/tax basis treatment of net operating losses and distributions in excess, resulted in reclassification for the year ended June 30, 2023, as follows:
| Paid | ||||||||
| In | Distributable/ Accumulated | |||||||
| Portfolio | Capital | Earnings (Losses) | ||||||
| Swan Defined Risk Fund | $ | — | $ | — | ||||
| Swan Defined Risk Emerging Markets Fund | — | — | ||||||
| Swan Defined Risk Foreign Fund | — | — | ||||||
| Swan Defined Risk Growth Fund | (42,897 | ) | 42,897 | |||||
| Swan Defined Risk U.S. Small Cap Fund | (71,718 | ) | 71,718 | |||||
| 8. | CONTROL OWNERSHIP |
The beneficial ownership either directly or indirectly, of more than 25% of voting securities of a fund creates a presumption of control of the fund, under Section 2(a)(9) of the 1940 Act. As of June 30, 2023, the shareholders listed below held more than 25% of an individual Fund and may be deemed to control that Fund. The Funds have no knowledge as to whether all or any portion of the shares owned of record within the omnibus accounts listed below are also owned beneficially.
| Shareholder | Fund | Percent | ||
| Charles Schwab & Co., Inc. | Swan Defined Risk Emerging Markets Fund | 28.78% | ||
| Pershing LLC | Swan Defined Risk Emerging Markets Fund | 32.35% | ||
| LPL Financial | Swan Defined Risk Foreign Fund | 49.09% | ||
| TD Ameritrade | Swan Defined Risk Growth Fund | 67.60% | ||
| LPL Financial | Swan Defined Risk U.S. Small Cap Fund | 29.48% | ||
| Pershing LLC | Swan Defined Risk U.S. Small Cap Fund | 27.49% |
52
| SWAN FUNDS |
| NOTES TO FINANCIAL STATEMENTS (Continued) |
| June 30, 2023 |
| 9. | UNDERLYING INVESTMENT IN OTHER INVESTMENT COMPANIES |
The Swan Defined Risk Fund currently invests a portion of its assets in the iShares Core S&P 500 ETF (“iShares S&P ETF”). The Fund may redeem its investment from the iShares S&P ETF at any time if the Advisor determines that it is in the best interest of the Fund and its shareholders to do so. The performance of the Fund will be directly affected by the performance of the iShares S&P ETF. The financial statements of the iShares S&P ETF, including the portfolios of investments, can be found at the SEC’s website, www.sec.gov, and should be read in conjunction with the Fund’s financial statements. As of June 30, 2023, the percentage of the Fund’s net assets invested in the iShares S&P ETF was 36.0%.
The Swan Defined Risk Emerging Markets Fund currently invests a portion of its assets in the iShares Core MSCI Emerging Markets ETF (“iShares Core ETF”). The Fund may redeem its investment from the iShares Core ETF at any time if the Advisor determines that it is in the best interest of the Fund and its shareholders to do so. The performance of the Fund will be directly affected by the performance of the iShares Core ETF. The financial statements of the iShares Core ETF, including the portfolios of investments, can be found at the SEC’s website www.sec.gov and should be read in conjunction with the Fund’s financial statements. As of June 30, 2023, the percentage of the Fund’s net assets invested in the iShares Core ETF was 93.5%.
The Swan Defined Risk Foreign Fund currently invests a portion of its assets in the iShares MSCI EAFE ETF (“iShares EAFE ETF”). The Fund may redeem its investment from the iShares EAFE ETF at any time if the Advisor determines that it is in the best interest of the Fund and its shareholders to do so. The performance of the Fund will be directly affected by the performance of the iShares EAFE ETF. The financial statements of the iShares EAFE ETF, including the portfolios of investments, can be found at the SEC’s website, www.sec.gov, and should be read in conjunction with the Fund’s financial statements. As of June 30, 2023, the percentage of the Fund’s net assets invested in the iShares EAFE ETF was 93.4%.
The Swan Defined Risk Growth Fund currently invests a portion of its assets in the iShares Core S&P 500 ETF (“iShares S&P ETF”). The Fund may redeem its investment from the iShares S&P ETF at any time if the Advisor determines that it is in the best interest of the Fund and its shareholders to do so. The performance of the Fund will be directly affected by the performance of the iShares S&P ETF. The financial statements of the iShares S&P ETF, including the portfolios of investments, can be found at the SEC’s website, www.sec.gov, and should be read in conjunction with the Fund’s financial statements. As of June 30, 2023, the percentage of the Fund’s net assets invested in the iShares S&P ETF was 95.1%.
The Swan Defined Risk U.S. Small Cap Fund currently invests a portion of its assets in the iShares Russell 2000 ETF (“iShares Russell ETF”). The Fund may redeem its investment from the iShares Russell ETF at any time if the Advisor determines that it is in the best interest of the Fund and its shareholders to do so. The performance of the Fund will be directly affected by the performance of the iShares Russell ETF. The financial statements of the iShares Russell ETF, including the portfolios of investments, can be found at the SEC’s website, www.sec.gov, and should be read in conjunction with the Fund’s financial statements. As of June 30, 2023, the percentage of the Fund’s net assets invested in the iShares ETF was 94.2%.
| 10. | SUBSEQUENT EVENTS |
Subsequent events after the date of the Statements of Assets and Liabilities have been evaluated through the date the financial statements were issued. Management has determined that no events or transactions occurred requiring adjustment or disclosure in the financial statements.
53
 |
Deloitte
& Touche LLP
Tel: 714 436 7100
|
REPORT OF INDEPENDENT REGISTERED PUBLIC ACCOUNTING FIRM
To the shareholders and the Board of Trustees of Northern Lights Fund Trust III
Opinion on the Financial Statements and Financial Highlights
We have audited the accompanying statements of assets and liabilities, including the schedules of investments, of Swan Defined Risk Fund, Swan Defined Risk Emerging Markets Fund, Swan Defined Risk Foreign Fund, Swan Defined Risk Growth Fund, and Swan Defined Risk U.S. Small Cap Fund (the “Funds”), five of the funds constituting the Northern Lights Fund Trust III (the “Trust”), as of June 30, 2023, the related statements of operations for the year then ended, the statements of changes in net assets for each of the two years in the period then ended, the financial highlights for each of the five years in the period then ended (as to Swan Defined Risk Growth Fund, the financial highlights for each of the four years in the period ended June 30, 2023 and for the period December 27, 2018 (commencement of operations) through June 30, 2019), and the related notes. In our opinion, the financial statements and financial highlights present fairly, in all material respects, the financial position of the Funds of the Trust as of June 30, 2023, and the results of their operations for the year then ended, the changes in their net assets for each of the two years in the period then ended, and the financial highlights for each of the five years in the period then ended (as to Swan Defined Risk Growth Fund, the financial highlights for each of the four years in the period ended June 30, 2023 and for the period December 27, 2018 (commencement of operations) through June 30, 2019) in conformity with accounting principles generally accepted in the United States of America.
Basis for Opinion
These financial statements and financial highlights are the responsibility of the Funds’ management. Our responsibility is to express an opinion on the Fund’s financial statements and financial highlights based on our audits. We are a public accounting firm registered with the Public Company Accounting Oversight Board (United States) (PCAOB) and are required to be independent with respect to the Funds in accordance with the U.S. federal securities laws and the applicable rules and regulations of the Securities and Exchange Commission and the PCAOB.
We conducted our audits in accordance with the standards of the PCAOB. Those standards require that we plan and perform the audit to obtain reasonable assurance about whether the financial statements and financial highlights are free of material misstatement, whether due to error or fraud. The Funds are not required to have, nor were we engaged to perform, an audit of their internal control over financial reporting. As part of our audits we are required to obtain an understanding of internal control over financial reporting but not for the purpose of expressing an opinion on the effectiveness of the Funds’ internal control over financial reporting. Accordingly, we express no such opinion.
Our audits included performing procedures to assess the risks of material misstatement of the financial statements and financial highlights, whether due to error or fraud, and performing procedures that respond to those risks. Such procedures included examining, on a test basis, evidence regarding the amounts and disclosures in the financial statements and financial highlights. Our audits also included evaluating the accounting principles used and significant estimates made by management, as well as evaluating the overall presentation of the financial statements and financial highlights. Our procedures included confirmation of securities owned as of June 30, 2023, by correspondence with the custodian and brokers; when replies were not received from brokers, we performed other auditing procedures. We believe that our audits provide a reasonable basis for our opinion.

Costa
Mesa, California
August 29, 2023
We have served as the auditor of one or more Swan Funds investment companies since 2018.
54
| SWAN FUNDS |
| 2023 TAX INFORMATION (Unaudited) |
| June 30, 2023 |
For the year ended June 30, 2023, the Swan Defined Risk Emerging Markets Fund earned foreign source income of $541,622 and paid foreign taxes of $81,680 which the Fund intends to pass through to shareholders pursuant to Section 853 of the Internal Revenue Code.
By early 2024, shareholders should receive their Form 1099-DIV from the Fund. For your specific situation, shareholders are recommended to consult a professional tax advisor.
55
| SWAN FUNDS |
| EXPENSE EXAMPLES (Unaudited) |
| June 30, 2023 |
As a shareholder of the Funds, you incur two types of costs: (1) transaction costs, including sales charges (loads) on purchases and redemptions; and redemption fees; and (2) ongoing costs, including management fees; distribution and/or service (12b-1) fees, and other Fund expenses. This example is intended to help you understand your ongoing costs (in dollars) of investing in the Funds and to compare these costs with the ongoing costs of investing in other mutual funds.
The example is based on an investment of $1,000 invested at the beginning of the period and held for the entire period as noted below.
Actual Expenses
The “Actual” table below provides information about actual account values and actual expenses. You may use the information below; together with the amount you invested, to estimate the expenses that you paid over the period. Simply divide your account value by $1,000 (for example, an $8,600 account value divided by $1,000 = 8.6), then multiply the result by the number in the table under the heading entitled “Expenses Paid During Period” to estimate the expenses you paid on your account during this period.
Hypothetical Example for Comparison Purposes
The “Hypothetical” table on the next page provides information about hypothetical account values and hypothetical expenses based on the respective Fund’s actual expense ratio and an assumed rate of return of 5% per year before expenses, which is not the Fund’s actual return. The hypothetical account values and expenses may not be used to estimate the actual ending account balances or expenses you paid for the period. You may use this information to compare this 5% hypothetical example with the 5% hypothetical examples that appear in the shareholder reports of other funds.
Please note that the expenses shown in the table are meant to highlight your ongoing costs only and do not reflect any transactional costs, such as sales charges (loads). Therefore, the table is useful in comparing ongoing costs only, and will not help you determine the relative total costs of owning different funds. In addition, if these transactional costs were included, your costs would have been higher.
| Beginning | Ending | Expenses Paid | Expense Ratio | |
| Account Value | Account Value | During Period | During the Period | |
| Actual | 1/1/23 | 6/30/23 | 1/1/23 – 6/30/23* | 1/1/23 – 6/30/23* |
| Swan Defined Risk Fund | ||||
| Class A | $1,000.00 | $1,070.20 | $7.34 | 1.38% |
| Class C | $1,000.00 | $1,066.80 | $11.17 | 2.18% |
| Class I | $1,000.00 | $1,071.90 | $6.06 | 1.18% |
| Swan Defined Risk Emerging Markets Fund | ||||
| Class A | $1,000.00 | $1,019.90 | $8.26 | 1.65% |
| Class C | $1,000.00 | $1,016.90 | $12.00 | 2.40% |
| Class I | $1,000.00 | $1,021.00 | $7.02 | 1.40% |
| Swan Defined Risk Foreign Fund | ||||
| Class A | $1,000.00 | $1,059.60 | $8.43 | 1.65% |
| Class C | $1,000.00 | $1,055.40 | $12.23 | 2.40% |
| Class I | $1,000.00 | $1,059.40 | $7.15 | 1.40% |
| Swan Defined Risk Growth Fund | ||||
| Class A | $1,000.00 | $1,098.10 | $8.58 | 1.65% |
| Class C | $1,000.00 | $1,094.00 | $12.46 | 2.40% |
| Class I | $1,000.00 | $1,099.60 | $7.29 | 1.40% |
| Swan Defined Risk U.S. Small Cap Fund | ||||
| Class A | $1,000.00 | $1,035.00 | $8.33 | 1.65% |
| Class C | $1,000.00 | $1,031.00 | $12.09 | 2.40% |
| Class I | $1,000.00 | $1,036.10 | $7.07 | 1.40% |
56
| SWAN FUNDS |
| EXPENSE EXAMPLES (Unaudited)(Continued) |
| June 30, 2023 |
| Beginning | Ending | Expenses Paid | Expense Ratio During | |
| Hypothetical | Account Value | Account Value | During Period | the Period |
| (5% return before expenses) | 1/1/23 | 6/30/23 | 1/1/23 – 6/30/23* | 1/1/23 – 6/30/23* |
| Swan Defined Risk Fund | ||||
| Class A | $1,000.00 | $1,017.70 | $7.15 | 1.38% |
| Class C | $1,000.00 | $1,013.98 | $10.89 | 2.18% |
| Class I | $1,000.00 | $1,018.84 | $5.91 | 1.18% |
| Swan Defined Risk Emerging Markets Fund | ||||
| Class A | $1,000.00 | $1,016.61 | $8.25 | 1.65% |
| Class C | $1,000.00 | $1,012.89 | $11.98 | 2.40% |
| Class I | $1,000.00 | $1,017.85 | $7.00 | 1.40% |
| Swan Defined Risk Foreign Fund | ||||
| Class A | $1,000.00 | $1,016.61 | $8.25 | 1.65% |
| Class C | $1,000.00 | $1,012.89 | $11.98 | 2.40% |
| Class I | $1,000.00 | $1,017.85 | $7.00 | 1.40% |
| Swan Defined Risk Growth Fund | ||||
| Class A | $1,000.00 | $1,016.61 | $8.25 | 1.65% |
| Class C | $1,000.00 | $1,012.89 | $11.98 | 2.40% |
| Class I | $1,000.00 | $1,017.85 | $7.00 | 1.40% |
| Swan Defined Risk U.S. Small Cap Fund | ||||
| Class A | $1,000.00 | $1,016.61 | $8.25 | 1.65% |
| Class C | $1,000.00 | $1,012.89 | $11.98 | 2.40% |
| Class I | $1,000.00 | $1,017.85 | $7.00 | 1.40% |
| * | Expenses are equal to the average account value over the period, multiplied by the Fund’s annualized expense ratio, multiplied by the number of days in the period (181) divided by the number of days in the fiscal year (365). |
57
| SWAN FUNDS |
| SUPPLEMENTAL INFORMATION (Unaudited) |
| June 30, 2023 |
LIQUIDITY RISK MANAGEMENT PROGRAM
The Funds have adopted and implemented a written liquidity risk management program as required by Rule 22e-4 (the “Liquidity Rule”) under the 1940 Act. The program is reasonably designed to assess and manage the Funds’ liquidity risk, taking into consideration, among other factors, the Funds’ investment strategies and the liquidity of their portfolio investments during normal and reasonably foreseeable stressed conditions; their short and long-term cash flow projections; and their cash holdings and access to other funding sources.
During the fiscal year ended June 30, 2023, the Trust’s Liquidity Risk Management Program Committee (the “Committee”) reviewed the Funds’ investments and determined that the Funds held adequate levels of cash and highly liquid investments to meet shareholder redemption activities in accordance with applicable requirements. Accordingly, the Committee concluded that (i) the Funds’ liquidity risk management program is reasonably designed to prevent violations of the Liquidity Rule and (ii) the Funds’ liquidity risk management program has been effectively implemented.
58
| SWAN FUNDS |
| SUPPLEMENTAL INFORMATION (Unaudited) |
| June 30, 2023 |
Renewal of Advisory Agreements and Sub-Advisory Agreements – Swan Defined Risk Fund, Swan Defined Risk Emerging Markets Fund, Swan Defined Risk Foreign Fund, Swan Defined Risk U.S. Small Cap Fund and Swan Defined Risk Growth Fund*
In connection with a meeting held on May 24- 25, 2023, the Board, including a majority of the Trustees who are not “interested persons,” as that term is defined in the 1940 Act, discussed the renewal of the investment advisory agreements (the “Advisory Agreements”) between Swan Capital Management, LLC (“SCM” or the “Adviser”) and the Trust, and the renewal of the investment sub-advisory agreements (the “Sub-Advisory Agreements” and together with the Advisory Agreements, the “Agreements”) between the Swan Global Management, LLC (“SGM” or the “Sub-Adviser”) and the Adviser, with respect to the Swan Defined Risk Fund (“Swan DR”), Swan Defined Risk Emerging Markets Fund (“Swan EM”), Swan Defined Risk Foreign Fund (“Swan Foreign”), Swan Defined Risk U.S. Small Cap Fund (“Swan SC”) and Swan Defined Risk Growth Fund (“Swan Growth” and collectively, the “Swan Funds”). In considering the renewal of the Agreements, the Board received materials specifically relating to the Swan Funds and the Agreements.
The Board relied upon the advice of independent legal counsel and its own business judgment in determining the material factors to be considered in evaluating the Agreements and the weight to be given to each such factor. The Board’s conclusions were based on an evaluation of all of the information provided and were not the result of any one factor. Moreover, each Trustee may have afforded different weight to the various factors in reaching conclusions with respect to the Agreements.
Nature, Extent and Quality of Services. The Board noted that the Adviser was founded in 1997, and together with its affiliate and commonly controlled sub-adviser, SGM, managed approximately $2.2 billion in assets. The Board discussed that the Adviser provided wealth management and investment advisory services to high-net-worth individuals, institutions, other investment advisory firms, and mutual funds. The Board reviewed the background information of the Adviser’s key investment personnel servicing the Swan Funds, noting their diverse industry experience in asset management and technology firms. The Board observed that the Adviser had an investment committee that utilized research and a proprietary rules-based system that determined asset allocations for each Swan Fund and included a risk mitigation sub-strategy that utilized options in an effort to minimize downside risk, reduce volatility, and generate option premium income. The Board reviewed the Adviser’s compliance practices, noting that a compliance team monitored each Swan Fund’s investment limitations using risk matrices, compliance calendars and reconciliations, and compliance checklists. The Board discussed the extensive resources required to handle the complexity of integrating an option risk overlay sub-strategy into an equity portfolio. The Board remarked that the Adviser selected brokers based on best execution standards that included the speed and cost of execution, options trading capability and technology capabilities. The Board acknowledged the Adviser’s cybersecurity policies and procedures. The Board concluded that the Adviser could be expected to continue providing quality service to the Swan Funds and their shareholders.
Performance.
Swan EM—The Board discussed that Swan EM was a 1-star Morningstar rated fund. The Board observed that Swan EM outperformed its benchmark over the 1- year period but otherwise underperformed its Morningstar category, peer group and benchmark across all periods. The Board recalled the Adviser’s explanation that Swan EM invested strictly in emerging markets whereas the peer group included funds with a U.S. component, and that the disparity in the performance of U.S. and emerging markets explained Swan EM’s relative underperformance. The Board also acknowledged the Adviser’s assertion that the funds in its peer group were not the best comparison because there were no emerging markets products with a hedge component like that of Swan EM. The Board recognized that Swan EM had ranked in the top quartile among its peer group and Morningstar category for standard deviation over the 1-year, 3-year, and 5-year periods. The Board concluded that the Adviser had managed Swan EM in a manner consistent with its investment mandate and returns were acceptable.
59
| SWAN FUNDS |
| SUPPLEMENTAL INFORMATION (Unaudited) (Continued) |
| June 30, 2023 |
Swan Foreign—The Board acknowledged that Swan Foreign was a 2-star Morningstar rated fund. The Board discussed that Swan Foreign had performed on par with its peer group over the 1-year period and outperformed its Morningstar category and benchmark over the same period. The Board further observed that Swan Foreign had performed on par with its peer group over the 3-year period but underperformed the Morningstar category and benchmark over the same period. The Board noted that Swan Foreign underperformed its peer group, Morningstar category, and benchmark over the 5-year and inception periods. The Board acknowledged that the Adviser attributed relative underperformance to the wide disparity in the performance of U.S. and international markets over the past several years, noting that Swan Foreign was limited to investing in international markets while many of the funds in its peer group were also invested in U.S. markets. The Board also acknowledged the Adviser’s statement that only one fund in the peer group mandated investments in international markets, and that Swan Foreign slightly outperformed that fund across all periods. The Board determined that the Adviser could be expected to continue to provide reasonable returns consistent with the stated objective and strategy for Swan Foreign and its shareholders.
Swan Growth—The Board noted that Swan Growth was a 3-star Morningstar rated fund. The Board acknowledged that Swan Growth underperformed its benchmark, peer group, and Morningstar category over the 1-year period. The Board noted that Swan Growth outperformed its peer group and Morningstar category over the 3- year and since inception periods and had underperformed its benchmark over the same periods. The Board recalled that Swan Growth was designed to outperform other hedged equity funds in bullish markets at the risk of having more downside exposure in bearish markets. The Board noted that Swan Growth was in the first or second quartile for net returns among its peer group and Morningstar category over the 3-year and since inception periods. The Board determined that the Adviser could be expected to continue to provide reasonable returns consistent with the stated objective and strategy for Swan Growth and its shareholders.
Swan DR—The Board observed that Swan DR was a 3-star Morningstar rated fund. The Board noted that Swan DR underperformed its benchmark, Morningstar category and peer group over the 1-year, 3-year, and 5-year periods. The Board further noted that Swan DR performed in line with its Morningstar category over the since inception period while underperforming the benchmark and slightly underperforming the peer group over the same period. The Board discussed that the Adviser attributed Swan DR’s relative underperformance over the 1-year period to the core equity portion of the portfolio and the effect of rising interest rates on the long-term put options used to hedge the portfolio. The Board considered the Adviser’s position that the peer group contained funds with a wide range of options strategies not necessarily comparable to Swan DR. The Board noted that Swan DR’s standard deviation was lower than that of the S&P 500 across all periods, indicating less volatility than the S&P 500 which was consistent with Swan DR’s investment objective. The Board determined that performance was acceptable in light of the objective and stated strategy of Swan DR.
Swan SC—The Board noted that Swan SC was a 2-star Morningstar rated fund. The Board observed that Swan SC had outperformed its peer group, Morningstar category, and benchmark over the 1- year period. The Board noted that Swan SC performed in line with its peer group over the 3-year and 5-year periods and underperformed its Morningstar category and benchmark over the same periods. The Board observed that Swan SC had underperformed its benchmark over the since inception period, performed in line with its peer group and slightly outperformed its Morningstar category over the same period. The Board also acknowledged the Adviser’s position that Swan SC was managed to the calendar year rather than intra-quarter periods and that Swan SC outperformed its benchmark for the calendar year ended 2022. The Board considered the Adviser’s belief that the peer group for Swan SC was not the best comparison because Swan SC’s mandate was to invest in small cap companies and hedge the portfolio whereas the peer group funds could invest in large cap equities and did not have a hedged equity strategy. The Board determined that the Adviser could be expected to continue providing reasonable returns consistent with the stated objective and strategy for Swan SC and its shareholders.
60
| SWAN FUNDS |
| SUPPLEMENTAL INFORMATION (Unaudited) (Continued) |
| June 30, 2023 |
Fees and Expenses.
Swan EM—The Board noted that Swan EM’s advisory fee and net expense ratio were higher than the peer group and Morningstar category averages and medians. The Board noted that Swan EM’s advisory fee and net expense ratio were each below the high of its peer group and Morningstar category. The Board considered that the defined risk strategy required active management which was in contrast with the passive management strategies of many of the funds in the Morningstar category. The Board also recalled the Adviser’s explanation that exposure to emerging markets was more costly than exposure to U.S. markets and that such disparity in the cost could explain Swan EM’s higher expenses relative to the peers. The Board also discussed the average fees of the peer group provided by the Adviser. The Board concluded that the advisory fee for Swan EM was not unreasonable.
Swan Foreign—The Board observed that the Adviser’s advisory fee for Swan Foreign was slightly below the peer group average, on par with the peer group median, and higher than the Morningstar category median and average. The Board noted that the net expense ratio of Swan Foreign was higher than the averages and medians of its Morningstar category and peer group. The Board considered that the Adviser’s active management of Swan Foreign was in contrast with the passive management strategies of many of the funds in the Morningstar category, and that active management generally required more resources. The Board also considered the impact on the Adviser’s fees and expenses from Swan Foreign’s exposure to foreign markets, noting the Adviser’s position that exposure to foreign markets was more costly than exposure to U.S. markets. The Board also considered the average fees of the peer group provided by the Adviser. The Board concluded that the Adviser’s advisory fee for Swan Foreign was not unreasonable.
Swan Growth—The Board considered that Swan Growth’s advisory fee was higher than its Morningstar category median and average, slightly below its peer group average, and equal to its peer group median. The Board noted that Swan Growth’s net expense ratio was higher than the medians and averages of its peer group and Morningstar category but below the highs of each. The Board considered the Adviser’s explanation that many of the funds with lower fees in the Morningstar category were passively managed and that Swan DR’s fees and expenses were in line with those of the peer group that filtered out the passively managed funds. The Board also reviewed the average fees of the peer group provided by the Adviser. The Board concluded that the advisory fee for Swan Growth was not unreasonable.
Swan DR—The Board noted that Swan DR’s advisory fee was higher than the medians and averages of its peer group and Morningstar category. The Board observed that Swan DR’s net expense ratio was higher than its Morningstar category average and median and peer group median but below its peer group average. The Board considered that Swan DR actively managed the hedge and income components of the strategy whereas many of the funds in its peer group were passively managed. The Board also considered the average fees of the peer group provided by the Adviser. The Board concluded that the advisory fee for Swan DR was not unreasonable.
Swan SC—The Board noted that Swan’s advisory fee for Swan SC was equivalent to the peer group median and average but higher than Morningstar category median and average. The Board noted that the net expense ratio for Swan SC was higher the medians and averages its peer group and Morningstar category. The Board considered that the funds in Swan SC’s peer group were either passively managed or invested in large cap equities whereas Swan SC was actively managed, actively hedged, and invested in small cap companies. The Board considered the average fees of the peer group provided by the Adviser. The Board determined that the advisory fee for Swan SC was not unreasonable.
Economies of Scale. The Board considered whether the Adviser had achieved economies of scale with respect to the management of each Swan Fund. The Board noted that the Adviser had indicated its willingness to continue monitoring for opportunities to implement breakpoints as each Swan Fund increased its assets. The Board agreed that in light of the expense limitation agreements, which effectively protected shareholders from high expenses despite lower asset levels, and the Adviser’s willingness to consider breakpoints as each Swan Fund reached higher asset levels, the absence of breakpoints was acceptable.
61
| SWAN FUNDS |
| SUPPLEMENTAL INFORMATION (Unaudited) (Continued) |
| June 30, 2023 |
Profitability. The Board reviewed the Adviser’s profitability analysis in connection with its advisory services for each Swan Fund and noted that the Adviser earned a profit from each Swan Fund before distribution costs. The Board discussed the benefits that the Adviser could derive from its soft dollar arrangements. The Board observed that the Adviser was still recouping waived fees for certain Swan Funds. The Board considered the Adviser’s method of allocating costs and agreed that it was not unreasonable. The Board concluded that the Adviser was not realizing an excessive profit from the advisory services provided to any of the Swan Funds.
Conclusion. Having requested and reviewed such information from the Adviser as the Board believed to be reasonably necessary to evaluate the terms of the Agreements, and as assisted by the advice of independent counsel, the Board concluded that renewal of the Agreements was in the best interests of each Swan Fund and its respective shareholders.
| * | Due to timing of the contract renewal schedule, these deliberations may or may not relate to the current performance results of the Swan Funds. |
62
| SWAN FUNDS |
| SUPPLEMENTAL INFORMATION (Unaudited) |
| June 30, 2023 |
The Trustees and officers of the Trust, together with information as to their principal business occupations during the past five years and other information, are shown below. Unless otherwise noted, the address of each Trustee and officer is 225 Pictoria Drive, Suite 450, Cincinnati, Ohio 45246.
| Independent Trustees | |||||
| Name, Address, Year of Birth |
Position(s) Held with Registrant |
Length
of Service and Term |
Principal
Occupation(s) During Past 5 Years |
Number
of Funds Overseen In The Fund Complex* |
Other
Directorships Held During Past 5 Years** |
| Patricia
Luscombe 1961 |
Trustee | Since January 2015, Indefinite | Managing Director of the Valuations and Opinions Group, Lincoln International LLC (since August 2007). | 5 | Northern Lights Fund Trust III (for series not affiliated with the Fund since 2015); Monetta Mutual Funds (since November 2015). |
| John
V. Palancia 1954 |
Trustee, Chairman | Trustee, since February 2012, Indefinite; Chairman of the Board since May 2014. | Retired (since 2011); formerly, Director of Global Futures Operations Control, Merrill Lynch, Pierce, Fenner & Smith, Inc. (1975-2011). | 5 | Northern Lights Fund Trust III (for series not affiliated with the Fund since 2012); Northern Lights Fund Trust (since 2011); Northern Lights Variable Trust (since 2011); Alternative Strategies Fund (since 2012). |
| Mark
H. Taylor 1964 |
Trustee, Chairman of the Audit Committee | Since February 2012, Indefinite | PhD (Accounting), CPA; Professor and Director, Lynn Pippenger School of Accountancy, Muma College of Business, University of South Florida (2019 – present); Professor and Department of Accountancy Chair, Case Western Reserve University (2009-2019); President, American Accounting Association (AAA) commencing August 2022 (President-Elect 2022-2023,President 2023-2024; Past President 2024-2025). AAA Vice President-Finance (2017-2020); President, Auditing Section of the AAA;Member, AICPA Auditing Standards Board (2009-2012); Academic Fellow, Office of the Chief Accountant, United States Securities Exchange Commission (2005-2006); Center for Audit Quality research grants (2014, 2012). | 5 | Northern Lights Fund Trust III (for series not affiliated with the Fund since 2012); Northern Lights Fund Trust (since 2007); Northern Lights Variable Trust (since 2007); Alternative Strategies Fund (since June 2010). |
| Jeffery
D. Young 1956 |
Trustee | Since January 2015, Indefinite | Co-owner and Vice President, Latin America Agriculture Development Corp. (since May 2015); President, Celeritas Rail Consulting (since June 2014); Asst. Vice President - Transportation Systems, Union Pacific Railroad Company (June 1976 to April 2014). | 5 | Northern Lights Fund Trust III (for series not affiliated with the Fund since 2015). |
| * | As of June 30, 2023, the Trust was comprised of 29 active portfolios managed by 14 unaffiliated investment advisers. The term “Fund Complex” applies only to the Funds. The Funds do not hold themselves out as related to any other series within the Trust for investment purposes, nor do they share the same investment adviser with any other series. |
| ** | Only includes directorships held within the past 5 years in a company with a class of securities registered pursuant to Section 12 of the Securities Exchange Act of 1934 or subject to the requirements of Section 15(d) of the Securities Exchange Act of 1934, or any company registered as an investment company under the 1940 Act. |
6/30/23-NLFT III-v3
63
| SWAN FUNDS |
| SUPPLEMENTAL INFORMATION (Unaudited) (Continued) |
| June 30, 2023 |
Officers of the Trust
| Name, Address, Year of Birth |
Position(s)
Held with Registrant |
Length
of Service and Term |
Principal Occupation(s) During Past 5 Years |
| Brian
Curley 1970 |
President | Since May 2023, indefinite | Vice President, Ultimus Fund Solutions, LLC (since 2020); Vice President, Gemini Fund Services, LLC (2015-2020). |
| Timothy Burdick 1986 |
Vice President | Since May 2023, indefinite | Vice President and Senior Managing Counsel, Ultimus Fund Solutions, LLC (2023 – present); Vice President and Managing Counsel, Ultimus Fund Solutions, LLC (2022 – 2023); Assistant Vice President and Counsel, Ultimus Fund Solutions, LLC (2019 – 2022). |
| Richard Gleason 1977 |
Treasurer | Since May 2023, indefinite | Assistant Vice President, Ultimus Fund Solutions, LLC (since 2020); Assistant Vice President, Gemini Fund Services, LLC (2015-2020). |
| Viktoriya Pallino 1995 |
Secretary | Since August 2022, indefinite | Senior Legal Administrator, Ultimus Fund Solutions, LLC (since 2023); Legal Administrator II, Ultimus Fund Solutions, LLC (2021-2023); Legal Administrator I, Ultimus Fund Solutions, LLC (2019-2021); Legal Administration Associate, Gemini Fund Services, LLC (2017-2019). |
| William Kimme 1962 |
Chief Compliance Officer | Since February 2012, indefinite | Senior Compliance Officer of Northern Lights Compliance Services, LLC (since 2011). |
The Funds’ Statement of Additional Information includes additional information about the Trustees and is available free of charge, upon request, by calling toll-free at 1-877-896-2590.
6/30/23-NLFT III-v3
64
PRIVACY NOTICE | ||||
| Rev. June 2021 | ||||
| FACTS | WHAT DOES NORTHERN LIGHTS FUND TRUST III DO WITH YOUR PERSONAL INFORMATION? | |||
| Why? | Financial companies choose how they share your personal information. Federal law gives consumers the right to limit some but not all sharing. Federal law also requires us to tell you how we collect, share, and protect your personal information. Please read this notice carefully to understand what we do. | |||
| What? | The types of personal information we collect and share depend on the product or service you have with us. This information can include: | |||
■ Social Security number
■ Assets
■ Retirement Assets
■ Transaction History
■ Checking Account Information |
■ Purchase History
■ Account Balances
■ Account Transactions
■ Wire Transfer Instructions
| |||
| When you are no longer our customer, we continue to share your information as described in this notice. | ||||
| How? | All financial companies need to share customers’ personal information to run their everyday business. In the section below, we list the reasons financial companies can share their customers’ personal information; the reasons Northern Lights Fund Trust III chooses to share; and whether you can limit this sharing. | |||
| Reasons we can share your personal information | Does
Northern Lights Fund Trust III share? |
Can
you limit this sharing? | ||
For our everyday business purposes – such as to process your transactions, maintain your account(s), respond to court orders and legal investigations, or report to credit bureaus |
Yes | No | ||
For our marketing purposes – to offer our products and services to you |
No | We don’t share | ||
| For joint marketing with other financial companies | No | We don’t share | ||
For our affiliates’ everyday business purposes – information about your transactions and experiences |
No | We don’t share | ||
For our affiliates’ everyday business purposes – information about your creditworthiness |
No | We don’t share | ||
| For nonaffiliates to market to you | No | We don’t share | ||
| Questions? | Call (631) 490-4300 | |||
65
| Who we are | |
| Who is providing this notice? | Northern Lights Fund Trust III
|
| What we do | |
| How does Northern Lights Fund Trust III protect my personal information? | To protect your personal information from unauthorized access and use, we use security measures that comply with federal law. These measures include computer safeguards and secured files and buildings.
Our service providers are held accountable for adhering to strict policies and procedures to prevent any misuse of your nonpublic personal information. |
| How does Northern Lights Fund Trust III collect my personal information? | We collect your personal information, for example, when you
■ Open an account
■ Provide account information
■ Give us your contact information
■ Make deposits or withdrawals from your account
■ Make a wire transfer
■ Tell us where to send the money
■ Tells us who receives the money
■ Show your government-issued ID
■ Show your driver’s license
We also collect your personal information from other companies. |
| Why can’t I limit all sharing? | Federal law gives you the right to limit only
■ Sharing for affiliates’ everyday business purposes – information about your creditworthiness
■ Affiliates from using your information to market to you
■ Sharing for nonaffiliates to market to you
State laws and individual companies may give you additional rights to limit sharing. |
| Definitions | |
| Affiliates | Companies related by common ownership or control. They can be financial and nonfinancial companies.
■ Northern Lights Fund Trust III does not share with our affiliates. |
| Nonaffiliates | Companies not related by common ownership or control. They can be financial and nonfinancial companies
■ Northern Lights Fund Trust III does not share with nonaffiliates so they can market to you. |
| Joint marketing | A formal agreement between nonaffiliated financial companies that together market financial products or services to you.
■ Northern Lights Fund Trust III doesn’t jointly market. |
66
PROXY VOTING POLICY
Information regarding how the Funds voted proxies relating to portfolio securities for the most recent twelve month period ended June 30 as well as a description of the policies and procedures that the Funds use to determine how to vote proxies is available without charge, upon request, by calling 1-877-896-2590 or by referring to the SEC’s website at http://www.sec.gov.
PORTFOLIO HOLDINGS
The Funds file their complete schedule of portfolio holdings with the SEC for the first and third quarters of each fiscal year as an exhibit to their report on Form N-PORT. Form N-PORT is available on the SEC’s website at http://www.sec.gov. The information on Form N-PORT is available without charge, upon request, by calling 1-877-896-2590.
INVESTMENT ADVISOR
Swan Capital Management, LLC
1099 Main Ave. Suite 206
Durango, CO 81301
INVESTMENT SUB-ADVISOR
Swan Global Management, LLC
20 Ridge Top
Palmas Del Mar
Humacao, PR 00791
ADMINISTRATOR
Ultimus Fund Solutions, LLC
225 Pictoria Drive, Suite 450
Cincinnati, OH 45246
SWAN-AR23
(a) Include a copy of the report transmitted to stockholders pursuant to Rule 30e-1 under the Act (17 CFR 270.30e-1).
(b) Include a copy of each notice transmitted to stockholders in reliance on Rule 30e-3 under the Act (17 CFR 270.30e-3) that contains disclosures specified by paragraph (c)(3) of that rule. Not Applicable
Item 2. Code of Ethics.
(a) As of the end of the period covered by this report, the registrant has adopted a code of ethics that applies to the registrant's principal executive officer, principal financial officer, principal accounting officer or controller, or persons performing similar functions, regardless of whether these individuals are employed by the registrant or a third party.
(b) For purposes of this item, “code of ethics” means written standards that are reasonably designed to deter wrongdoing and to promote:
| (1) | Honest and ethical conduct, including the ethical handling of actual or apparent conflicts of interest between personal and professional relationships; |
| (2) | Full, fair, accurate, timely, and understandable disclosure in reports and documents that a registrant files with, or submits to, the Commission and in other public communications made by the registrant; |
(3) Compliance with applicable governmental laws, rules, and regulations;
| (4) | The prompt internal reporting of violations of the code to an appropriate person or persons identified in the code; and |
(5) Accountability for adherence to the code.
(c) Amendments: During the period covered by the report, there have not been any amendments to the provisions of the code of ethics.
(d) Waivers: During the period covered by the report, the registrant has not granted any express or implicit waivers from the provisions of the code of ethics.
(e) The Code of Ethics is not posted on Registrant’ website.
(f) A copy of the Code of Ethics is attached as an exhibit.
Item 3. Audit Committee Financial Expert.
(a)(1)ii The Registrant’s board of trustees has determined that Mark H. Taylor is an audit committee financial expert, as defined in Item 3 of Form N-CSR. Mr. Taylor is independent for purposes of this Item 3.
(a)(2) Not applicable.
(a)(3) In this regard, no member of the audit committee was identified as having all of the required technical attributes identified in instruction 2 (b) to item 3 of Form N-CSR to qualify as an “audit committee financial expert,” whether through the type of specialized education or experience required by that instruction. At this time, the board believes the experience provided by each member of the audit committee collectively offers the fund adequate oversight by its audit committee given the fund’s level of financial complexity. The board will from time to time reexamine such belief.
Item 4. Principal Accountant Fees and Services.
(a) Audit Fees 2022 2023
Swan Defined Risk Fund $16,220 $16,700
Swan Defined Risk Emerging Markets Fund $16,220 $16,700
Swan Defined Risk Foreign Fund $16,220 $16,700
Swan Defined Risk U.S Small Cap Fund $16,220 $16,700
Swan Defined Risk Growth Fund $16,220 $16,700
(b) Audit-Related Fees 2022 2023
Swan Defined Risk Fund None None
Swan Defined Risk Emerging Markets Fund None None
Swan Defined Risk Foreign Fund None None
Swan Defined Risk U.S Small Cap Fund None None
Swan Defined Risk Growth Fund None None
(c) Tax Fees 2022 2023
Swan Defined Risk Fund $3,350 $3,450
Swan Defined Risk Emerging Markets Fund $3,350 $3,450
Swan Defined Risk Foreign Fund $3,350 $3,450
Swan Defined Risk U.S Small Cap Fund $3,350 $3,450
Swan Defined Risk Growth Fund $3,350 $3,450
Preparation of Federal & State income tax returns, assistance with calculation of required income, capital gain and excise distributions and preparation of Federal excise tax returns.
(d) All Other Fees 2022 2023
Swan Defined Risk Fund None None
Swan Defined Risk Emerging Markets Fund None None
Swan Defined Risk Foreign Fund None None
Swan Defined Risk U.S Small Cap Fund None None
Swan Defined Risk Growth Fund None None
| (e) | (1) Audit Committee’s Pre-Approval Policies |
The registrant’s Audit Committee is required to pre-approve all audit services and, when appropriate, any non-audit services (including audit-related, tax and all other services) to the registrant. The registrant’s Audit Committee also is required to pre-approve, when appropriate, any non-audit services (including audit-related, tax and all other services) to its adviser, or any entity controlling, controlled by or under common control with the adviser that provides ongoing services to the registrant, to the extent that the services may be determined to have an impact on the operations or financial reporting of the registrant. Services are reviewed on an engagement by engagement basis by the Audit Committee.
| (2) | Percentages of Services Approved by the Audit Committee |
Swan Defined Risk Fund 2022 2023
Audit-Related Fees: 0.00% 0.00%
Tax Fees: 0.00% 0.00%
All Other Fees: 0.00% 0.00%
Swan Defined Risk Emerging Markets Fund 2022 2023
Audit-Related Fees: 0.00% 0.00%
Tax Fees: 0.00% 0.00%
All Other Fees: 0.00% 0.00%
Swan Defined Risk Foreign Fund 2022 2023
Audit-Related Fees: 0.00% 0.00%
Tax Fees: 0.00% 0.00%
All Other Fees: 0.00% 0.00%
Swan Defined Risk U.S. Small Cap Fund 2022 2023
Audit-Related Fees: 0.00% 0.00%
Tax Fees: 0.00% 0.00%
All Other Fees: 0.00% 0.00%
Swan Defined Risk Growth Fund 2022 2023
Audit-Related Fees: 0.00% 0.00%
Tax Fees: 0.00% 0.00%
All Other Fees: 0.00% 0.00%
| (f) | During the audit of registrant's financial statements for the most recent fiscal year, less than 50 percent of the hours expended on the principal accountant's engagement were attributed to work performed by persons other than the principal accountant's full-time, permanent employees. |
| (g) | The aggregate non-audit fees billed by the registrant's accountant for services rendered to the registrant, and rendered to the registrant's investment adviser (not including any sub-adviser whose role is primarily portfolio management and is subcontracted with or overseen by another investment adviser), and any entity controlling, controlled by, or under common control with the adviser that provides ongoing services to the registrant: |
2022 2023
Swan Defined Risk Fund $3,350 $3,450
Swan Defined Risk Emerging Markets Fund $3,350 $3,450
Swan Defined Risk Foreign Fund $3,350 $3,450
Swan Defined Risk U.S. Small Cap Fund $3,350 $3,450
Swan Defined Risk Growth Fund $3,350 $3,450
(h) The registrant's audit committee has considered whether the provision of non-audit services to the registrant's investment adviser (not including any sub-adviser whose role is primarily portfolio management and is subcontracted with or overseen by another investment adviser), and any entity controlling, controlled by, or under common control with the investment adviser that provides ongoing services to the registrant, that were not pre-approved pursuant to paragraph (c)(7)(ii) of Rule 2-01 of Regulation S-X, is compatible with maintaining the principal accountant's independence.
(i) Not applicable.
(j) Not applicable.
Item 5. Audit Committee of Listed Companies. Not applicable to open-end investment companies.
Item 6. Schedule of Investments. Schedule of investments in securities of unaffiliated issuers is included under Item 1.
Item 7. Disclosure of Proxy Voting Policies and Procedures for Closed-End Funds. Not applicable to open-end investment companies.
Item 8. Portfolio Managers of Closed-End Management Investment Companies. Not applicable to open-end investment companies.
Item 9. Purchases of Equity Securities by Closed-End Funds. Not applicable to open-end investment companies.
Item 10. Submission of Matters to a Vote of Security Holders. None
Item 11. Controls and Procedures.
(a) Based on an evaluation of the Registrant’s disclosure controls and procedures as of a date within 90 days of filing date of this Form N-CSR, the principal executive officer and principal financial officer of the Registrant have concluded that the disclosure controls and procedures of the Registrant are reasonably designed to ensure that the information required in filings on Form N-CSR is recorded, processed, summarized, and reported by the filing date, including that information required to be
disclosed is accumulated and communicated to the Registrant’s management, including the Registrant’s principal executive officer and principal financial officer, as appropriate to allow timely decisions regarding required disclosure.
(b) There were no significant changes in the Registrant’s internal control over financial reporting that occurred during the period covered by this report that have materially affected, or are reasonably likely to materially affect, the Registrant’s internal control over financial reporting.
Item 12. Disclosure of securities lending activities for closed-end management investment companies.
Not applicable to open-end investment companies.
Item 13. Exhibits.
(a)(1) Code of Ethics filed herewith.
(a)(3) Not applicable for open-end investment companies.
SIGNATURES
Pursuant to the requirements of the Securities Exchange Act of 1934 and the Investment Company Act of 1940, the registrant has duly caused this report to be signed on its behalf by the undersigned, thereunto duly authorized.
(Registrant) Northern Lights Fund Trust III
By (Signature and Title)
/s/ Brian Curley
Brian Curley, Principal Executive Officer/President
Date 9/6/23
Pursuant to the requirements of the Securities Exchange Act of 1934 and the Investment Company Act of 1940, this report has been signed below by the following persons on behalf of the registrant and in the capacities and on the dates indicated.
By (Signature and Title)
/s/ Brian Curley
Brian Curley, Principal Executive Officer/President
Date 9/6/23
By (Signature and Title)
/s/ Richard Gleason
Richard Gleason, Principal Financial Officer/Treasurer
Date 9/6/23