EX-99.2
Exhibit 99.2
Exhibit 99.2
ING U . S . Quarterly Investor
Supplement
S e p t e m b e r 3 0 , 2 0 1 3
This report
should be read in conjunction with ING U.S Inc’s Quarterly Report on Form 10-Q for the period ended September 30, 2013 as filed with the
Securities and Exchange Commission. All financial information is unaudited.
ING U.S.
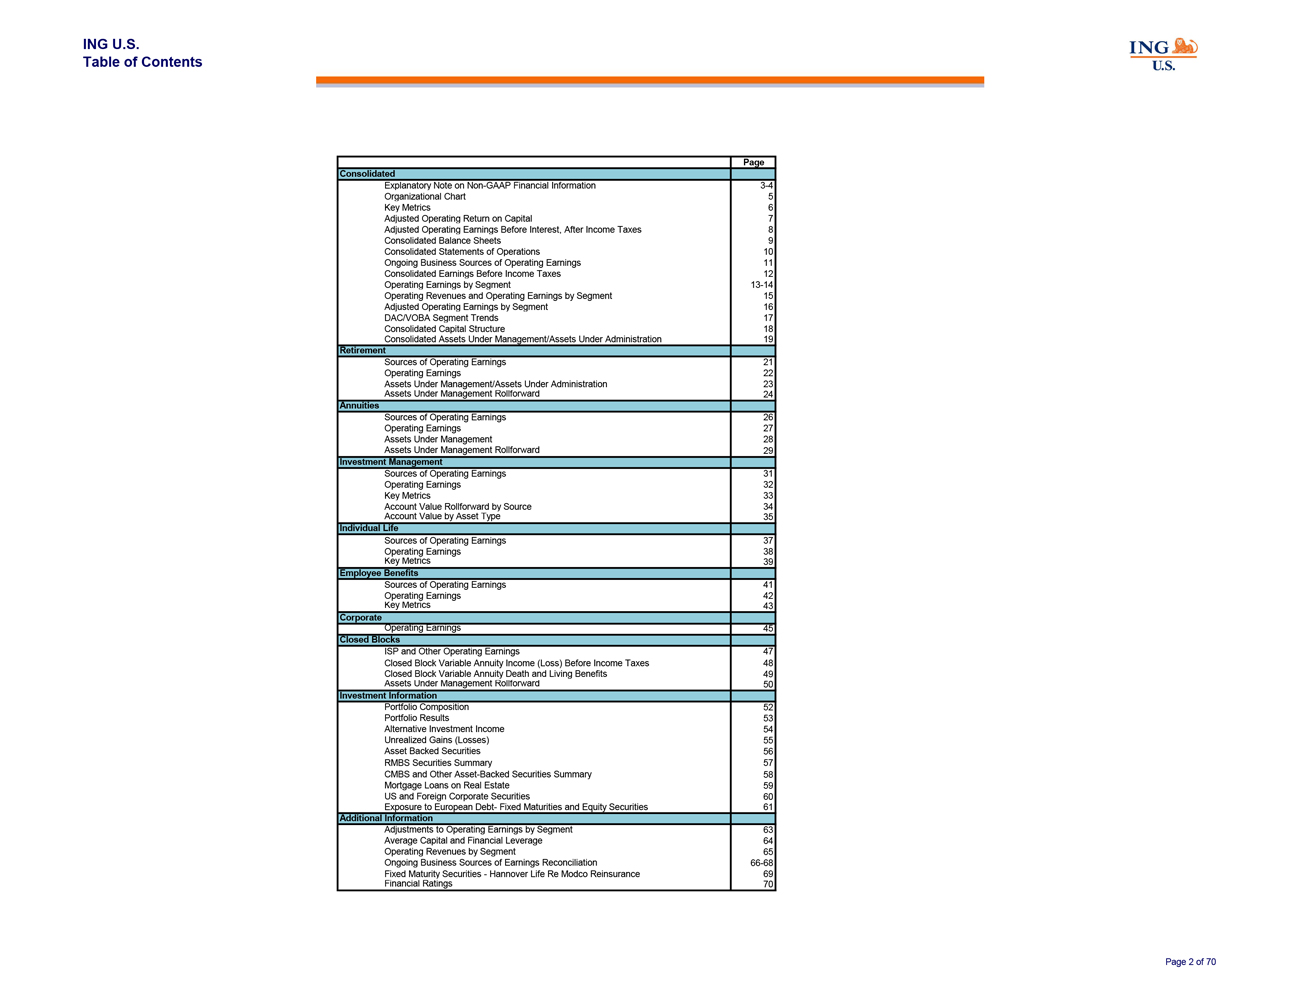
Table of Contents
Page
Consolidated
Explanatory Note on Non-GAAP
Financial Information 3-4
Organizational Chart 5
Key Metrics 6
Adjusted Operating Return on Capital 7
Adjusted
Operating Earnings Before Interest, After Income Taxes 8
Consolidated Balance Sheets 9
Consolidated Statements of Operations 10
Ongoing Business Sources of Operating Earnings 11
Consolidated Earnings Before Income Taxes 12
Operating Earnings by Segment 13-14
Operating
Revenues and Operating Earnings by Segment 15
Adjusted Operating Earnings by Segment 16
DAC/VOBA Segment Trends 17
Consolidated Capital Structure 18
Consolidated
Assets Under Management/Assets Under Administration 19
Retirement
Sources of Operating Earnings 21
Operating Earnings 22
Assets Under
Management/Assets Under Administration 23
Assets Under Management Rollforward 24
Annuities
Sources of Operating Earnings 26
Operating
Earnings 27
Assets Under Management 28
Assets Under Management Rollforward 29
Investment Management
Sources of Operating
Earnings 31
Operating Earnings 32
Key Metrics 33
Account Value Rollforward by
Source 34
Account Value by Asset Type 35
Individual Life
Sources of Operating Earnings 37
Operating
Earnings 38
Key Metrics 39
Employee Benefits
Sources of Operating Earnings
41
Operating Earnings 42
Key Metrics 43
Corporate
Operating Earnings 45
Closed Blocks
ISP and Other Operating Earnings 47
Closed Block Variable Annuity Income (Loss) Before Income Taxes 48
Closed Block Variable Annuity Death and Living Benefits 49
Assets Under Management Rollforward 50
Investment Information
Portfolio Composition 52
Portfolio Results 53
Alternative Investment Income 54
Unrealized Gains
(Losses) 55
Asset Backed Securities 56
RMBS Securities Summary 57
CMBS and Other Asset-Backed Securities Summary 58
Mortgage Loans on Real Estate 59
US and Foreign Corporate Securities 60
Exposure
to European Debt- Fixed Maturities and Equity Securities 61
Additional Information
Adjustments to Operating Earnings by Segment 63
Average Capital and Financial Leverage 64
Operating Revenues by Segment 65
Ongoing Business Sources of Earnings Reconciliation 66-68
Fixed Maturity Securities—Hannover Life Re Modco Reinsurance 69
Financial Ratings 70
Page 2 of 70
ING U.S
Explanatory Note on Non-GAAP Financial
Information
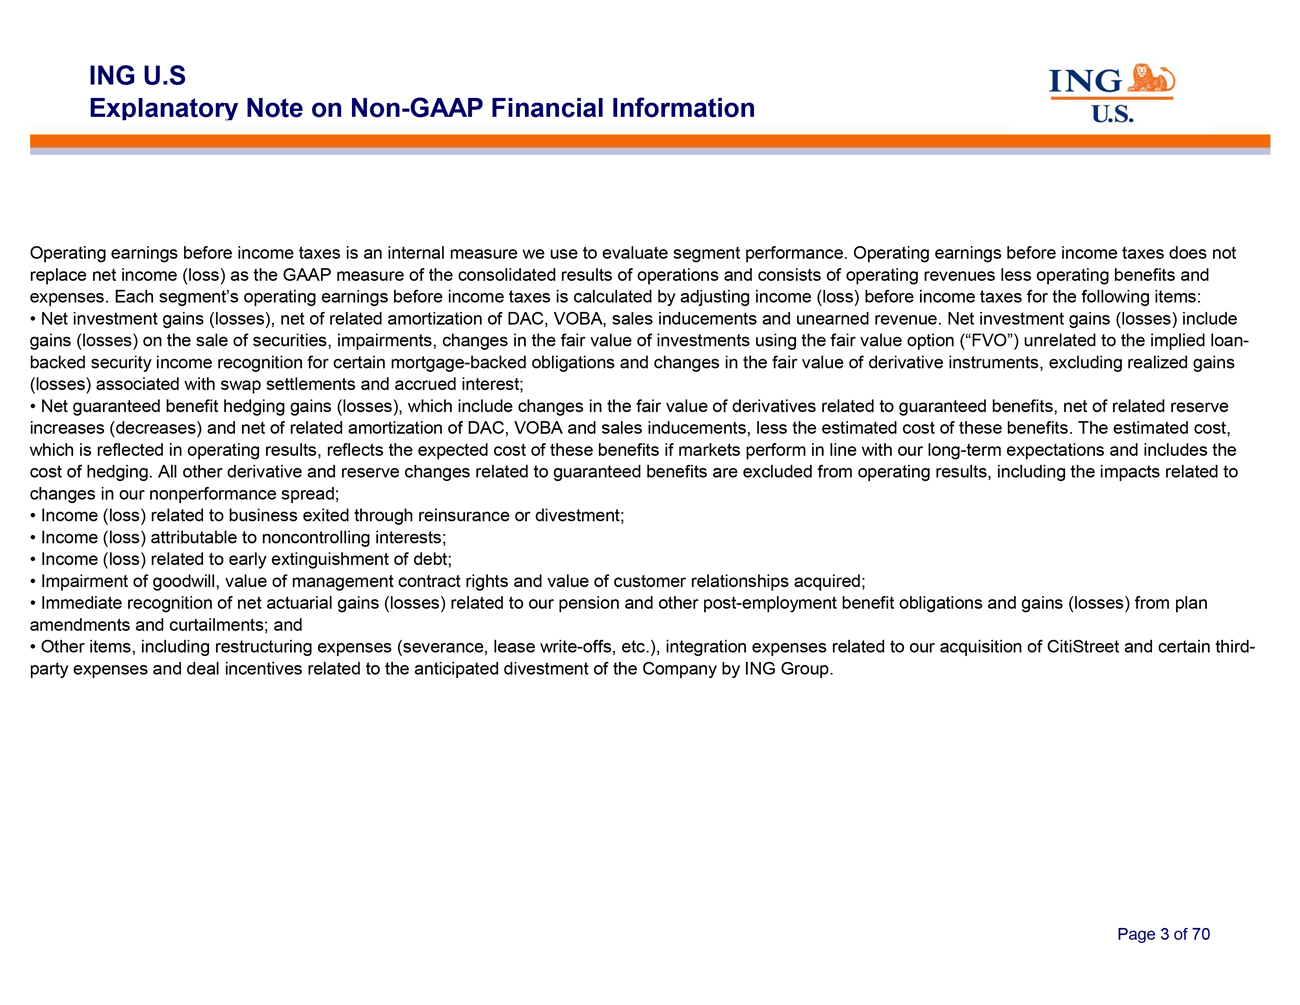
Operating earnings before income taxes is an internal measure we use to evaluate segment
performance. Operating earnings before income taxes does not replace net income (loss) as the GAAP measure of the consolidated results of operations and consists of operating revenues less operating benefits and expenses. Each segment’s
operating earnings before income taxes is calculated by adjusting income (loss) before income taxes for the following items:
Net investment gains (losses), net of related amortization of DAC, VOBA, sales inducements and unearned revenue. Net investment gains (losses) include gains (losses) on the sale of
securities, impairments, changes in the fair value of investments using the fair value option (“FVO”) unrelated to the implied loan-backed security income recognition for certain mortgage-backed obligations and changes in the fair value of
derivative instruments, excluding realized gains (losses) associated with swap settlements and accrued interest;
Net guaranteed benefit hedging gains (losses), which include changes in the fair value of derivatives related to
guaranteed benefits, net of related reserve increases (decreases) and net of related amortization of DAC, VOBA and sales inducements, less the estimated cost of these benefits. The estimated cost, which is reflected in operating results, reflects
the expected cost of these benefits if markets perform in line with our long-term expectations and includes the cost of hedging. All other derivative and reserve changes related to guaranteed benefits are excluded from operating results, including
the impacts related to changes in our nonperformance spread;
Income (loss) related to business exited through
reinsurance or divestment;
Income (loss) attributable to noncontrolling interests;
Income (loss) related to early extinguishment of debt;
Impairment of goodwill, value of management contract rights and value of customer relationships acquired;
Immediate recognition of net actuarial gains (losses) related to our pension and other post-employment benefit obligations
and gains (losses) from plan amendments and curtailments; and
Other items, including restructuring expenses
(severance, lease write-offs, etc.), integration expenses related to our acquisition of CitiStreet and certain third-party expenses and deal incentives related to the anticipated divestment of the Company by ING Group.
Page 3 of 70
ING U.S
Explanatory Note on Non-GAAP Financial
Information
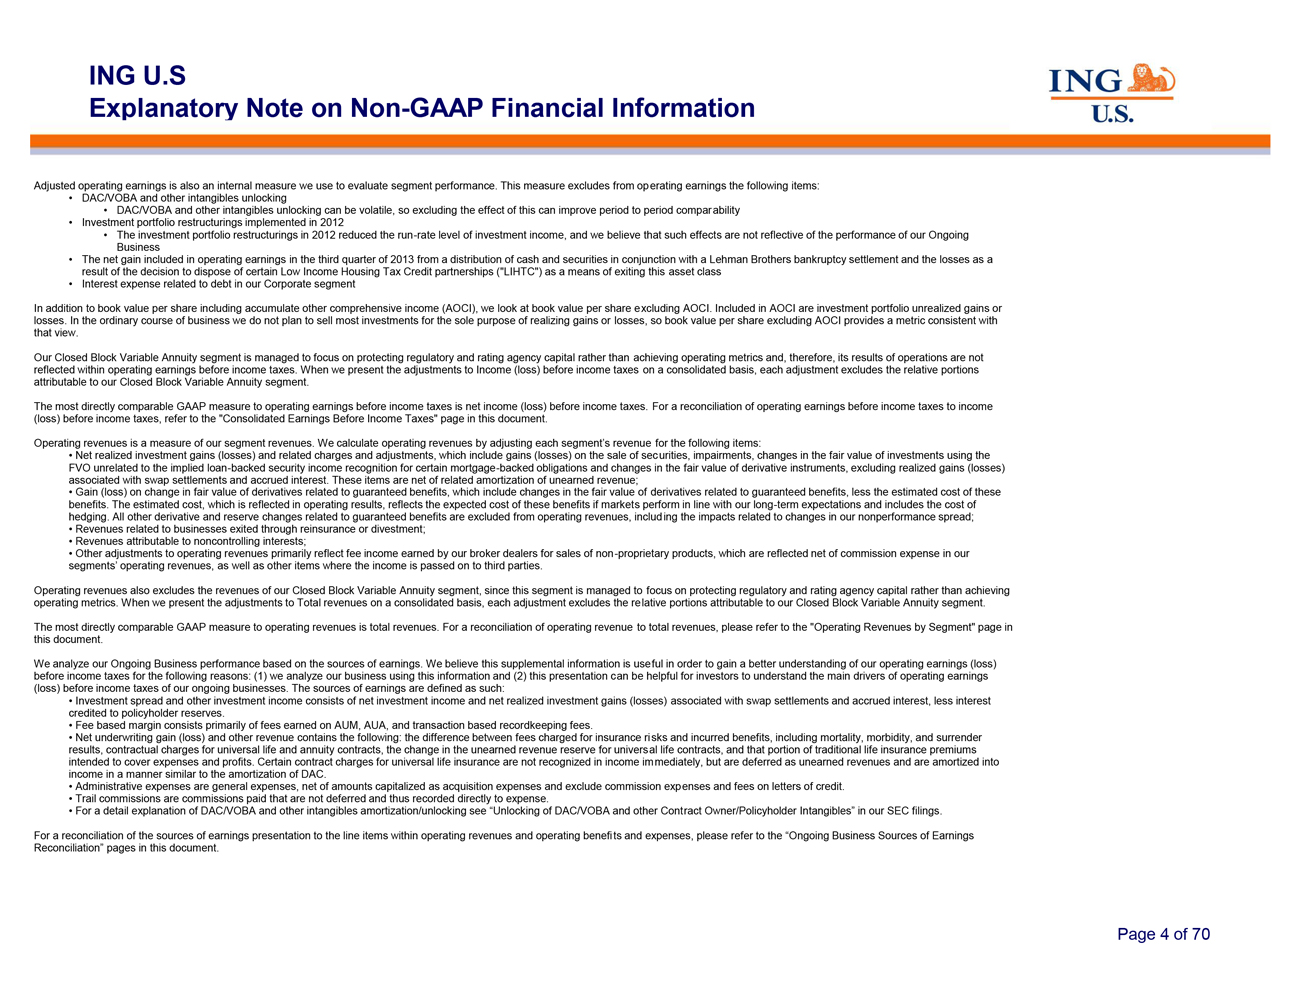
Adjusted operating earnings is also an internal measure we use to evaluate segment performance.
This measure excludes from operating earnings the following items:
DAC/VOBA and other intangibles unlocking
DAC/VOBA and other intangibles unlocking can be volatile, so excluding the effect of this can improve period
to period comparability
Investment portfolio restructurings implemented in 2012
The investment portfolio restructurings in 2012 reduced the run-rate level of investment income, and we believe that such
effects are not reflective of the performance of our Ongoing Business
The net gain included in operating
earnings in the third quarter of 2013 from a distribution of cash and securities in conjunction with a Lehman Brothers bankruptcy settlement and the losses as a result of the decision to dispose of certain Low Income Housing Tax Credit partnerships
(“LIHTC”) as a means of exiting this asset class
Interest expense related to debt in our Corporate
segment
In addition to book value per share including accumulate other comprehensive income (AOCI), we look at
book value per share excluding AOCI. Included in AOCI are investment portfolio unrealized gains or losses. In the ordinary course of business we do not plan to sell most investments for the sole purpose of realizing gains or losses, so book value
per share excluding AOCI provides a metric consistent with that view.
Our Closed Block Variable Annuity
segment is managed to focus on protecting regulatory and rating agency capital rather than achieving operating metrics and, therefore, its results of operations are not reflected within operating earnings before income taxes. When we present the
adjustments to Income (loss) before income taxes on a consolidated basis, each adjustment excludes the relative portions attributable to our Closed Block Variable Annuity segment.
The most directly comparable GAAP measure to operating earnings before income taxes is net income (loss) before income
taxes. For a reconciliation of operating earnings before income taxes to income (loss) before income taxes, refer to the “Consolidated Earnings Before Income Taxes” page in this document.
Operating revenues is a measure of our segment revenues. We calculate operating revenues by adjusting each segment’s
revenue for the following items:
Net realized investment gains (losses) and related charges and adjustments,
which include gains (losses) on the sale of securities, impairments, changes in the fair value of investments using the
FVO unrelated to the implied loan-backed security income recognition for certain mortgage-backed obligations and changes in the fair value of derivative instruments, excluding realized
gains (losses) associated with swap settlements and accrued interest. These items are net of related amortization of unearned revenue;
Gain (loss) on change in fair value of derivatives related to guaranteed benefits, which include changes in the fair value of derivatives related to guaranteed benefits, less the estimated
cost of these benefits. The estimated cost, which is
reflected in operating results, reflects the expected
cost of these benefits if markets perform in line with our long-term expectations and includes the cost of hedging. All other derivative and reserve changes related to guaranteed benefits are excluded from operating revenues, includ ing the impacts
related to changes in our nonperformance spread;
Revenues related to businesses exited through reinsurance or
divestment;
Revenues attributable to noncontrolling interests;
Other adjustments to operating revenues primarily reflect fee income earned by our broker dealers for sales of
non-proprietary products, which are reflected net of commission expense in our segments’ operating revenues, as well as other items where the income is passed on to third parties.
Operating revenues also excludes the revenues of our Closed Block Variable Annuity segment, since this segment is managed
to focus on protecting regulatory and rating agency capital rather than achieving operating metrics. When we present the adjustments to Total revenues on a consolidated basis, each adjustment excludes the relative portions attributable to our Closed
Block Variable Annuity segment.
The most directly comparable GAAP measure to operating revenues is total
revenues. For a reconciliation of operating revenue to total revenues, please refer to the “Operating Revenues by Segment” page in this document.
We analyze our Ongoing Business performance based on the sources of earnings. We believe this supplemental information is useful in order to gain a better understanding of our operating
earnings (loss) before income taxes for the following reasons: (1) we analyze our business using this information and (2) this presentation can be helpful for investors to understand the main drivers of operating earnings (loss) before
income taxes of our ongoing businesses. The sources of earnings are defined as such:
Investment spread and
other investment income consists of net investment income and net realized investment gains (losses) associated with swap settlements and accrued interest, less interest credited to policyholder reserves.
Fee based margin consists primarily of fees earned on AUM, AUA, and transaction based recordkeeping fees.
Net underwriting gain (loss) and other revenue contains the following: the difference between fees charged for insurance
risks and incurred benefits, including mortality, morbidity, and surrender results, contractual charges for universal life and annuity contracts, the change in the unearned revenue reserve for universal life contracts, and that portion of
traditional life insurance premiums intended to cover expenses and profits. Certain contract charges for universal life insurance are not recognized in income immediately, but are deferred as unearned revenues and are amortized into income in a
manner similar to the amortization of DAC.
Administrative expenses are general expenses, net of amounts
capitalized as acquisition expenses and exclude commission expenses and fees on letters of credit.
Trail
commissions are commissions paid that are not deferred and thus recorded directly to expense.
For a detail
explanation of DAC/VOBA and other intangibles amortization/unlocking see “Unlocking of DAC/VOBA and other Contract Owner/Policyholder Intangibles” in our SEC filings.
For a reconciliation of the sources of earnings presentation to the line items within operating revenues and operating benefits and expenses, please refer to the “Ongoing Business
Sources of Earnings Reconciliation” pages in this document.
Page 4 of 70
ING U.S.
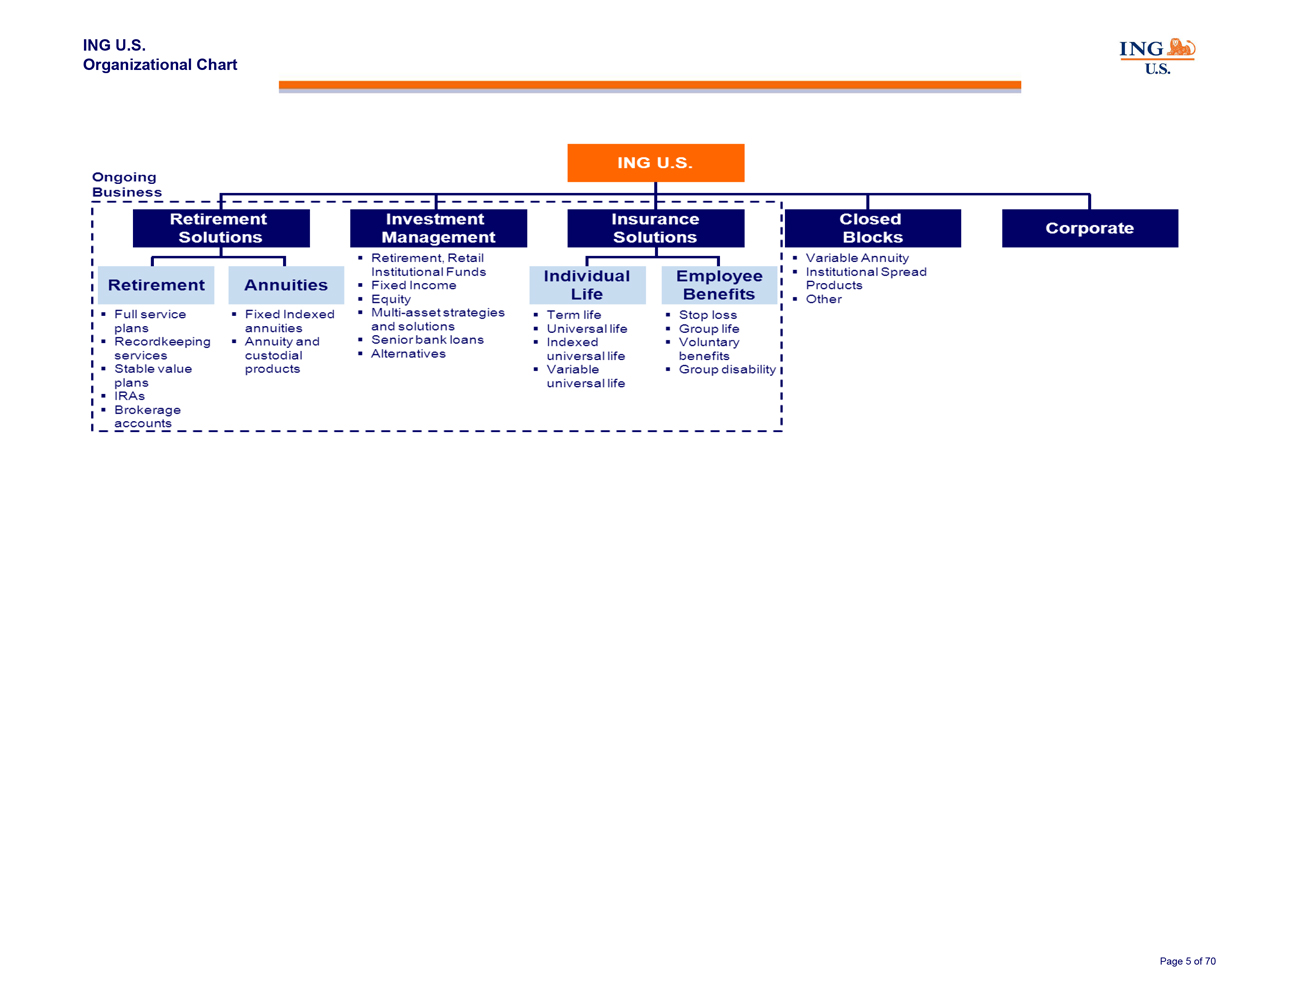
Organizational Chart
Ongoing Business
ING U.S.
Retirement Solutions
Retirement
Full service
plans
Recordkeeping
services
Stable value
plans
IRAs
Brokerage accounts
Annuities
Fixed Indexed annuities
Annuity and custodial
products
Investment Management
Retirement, Retail Institutional Funds Fixed Income
Equity
Multi-asset strategies and solutions
Senior bank
loans
Alternatives
Insurance Solutions
Individual Life
Term life
Universal life
Indexed universal life
Variable universal life
Employee Benefits
Stop loss
Group life
Voluntary benefits
Group disability
Closed Blocks
Variable Annuity
Instructional Spread Products
Other
Corporate
Page 5 of 70
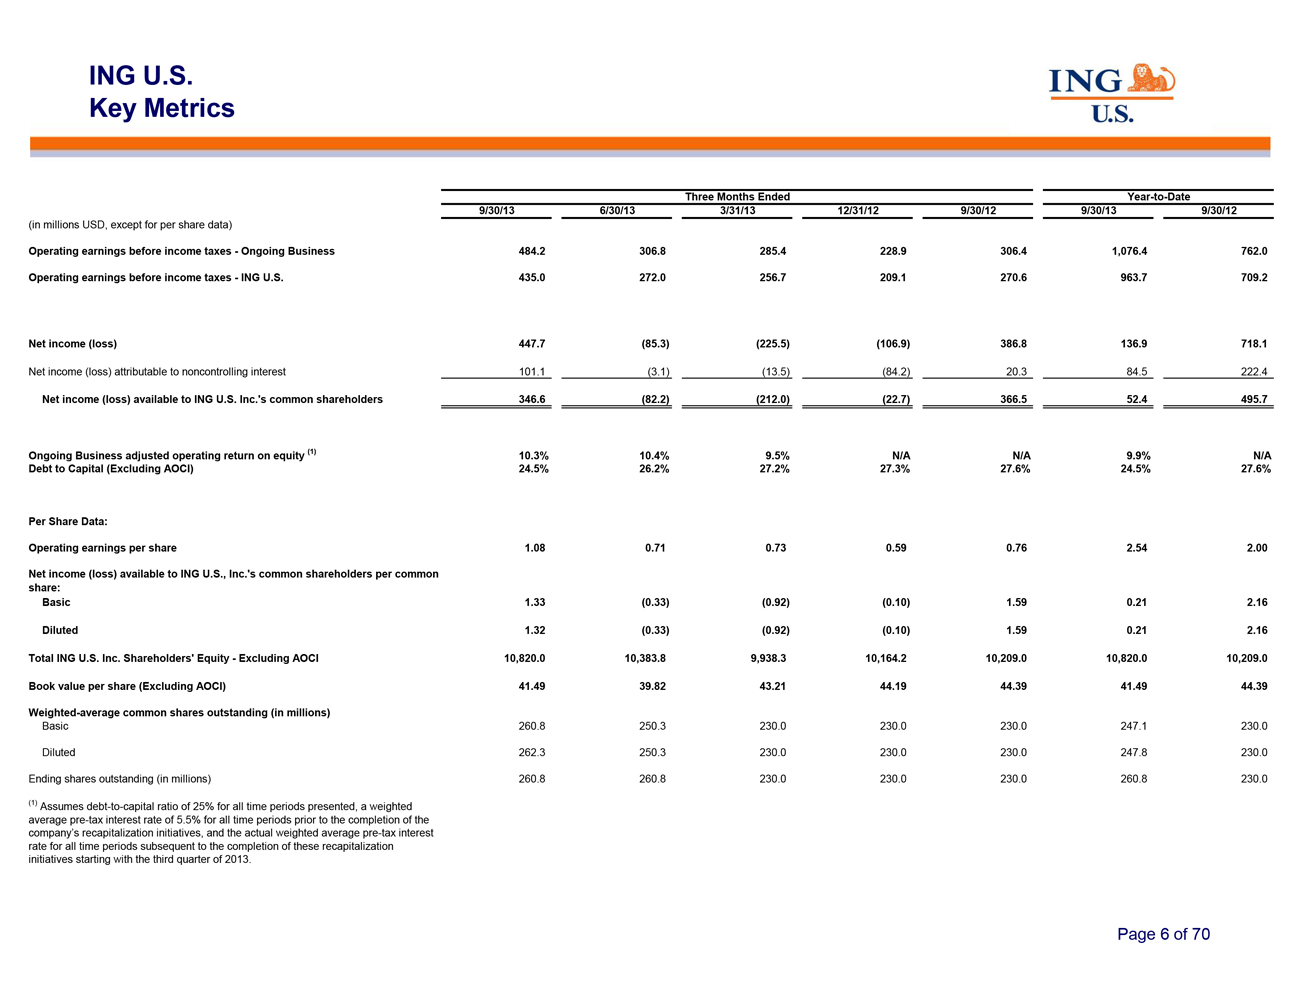
ING U.S. Key Metrics
Three Months Ended
Year-to-Date
9/30/13 6/30/13 3/31/13 12/31/12 9/30/12 9/30/13 9/30/12
(in millions USD, except for per share data)
Operating earnings before income taxes - Ongoing Business 484.2 306.8 285.4 228.9 306.4 1,076.4 762.0
Operating earnings before income taxes - ING U.S. 435.0 272.0 256.7 209.1 270.6 963.7 709.2
Net income (loss) 447.7 (85.3) (225.5) (106.9) 386.8 136.9 718.1
Net income (loss) attributable to noncontrolling interest 101.1 (3.1) (13.5) (84.2) 20.3 84.5 222.4
Net income (loss) available to ING U.S. Inc.’s common shareholders 346.6 (82.2) (212.0) (22.7) 366.5 52.4 495.7
Ongoing Business adjusted operating return on equity (1) 10.3% 10.4% 9.5% N/A N/A 9.9% N/A
Debt to Capital (Excluding AOCI) 24.5% 26.2% 27.2% 27.3% 27.6% 24.5% 27.6%
Per Share Data:
Operating earnings per share 1.08 0.71 0.73 0.59 0.76 2.54 2.00
Net income (loss) available to ING U.S., Inc.’s common shareholders per common
share:
Basic 1.33 (0.33) (0.92) (0.10) 1.59 0.21
2.16
Diluted 1.32 (0.33) (0.92) (0.10) 1.59 0.21 2.16
Total ING U.S. Inc. Shareholders’ Equity - Excluding AOCI 10,820.0 10,383.8 9,938.3 10,164.2 10,209.0 10,820.0
10,209.0
Book value per share (Excluding AOCI) 41.49 39.82 43.21 44.19 44.39 41.49 44.39
Weighted-average common shares outstanding (in millions)
Basic 260.8 250.3 230.0 230.0 230.0 247.1 230.0
Diluted 262.3 250.3 230.0 230.0 230.0 247.8 230.0
Ending shares outstanding (in millions) 260.8 260.8 230.0 230.0 230.0 260.8 230.0
(1) Assumes debt-to-capital ratio of 25% for all time periods presented, a weighted
average pre-tax interest rate of 5.5% for all time periods prior to the completion of the
company’s recapitalization initiatives, and the actual weighted average pre-tax interest
rate for all time periods subsequent to the completion of these recapitalization
initiatives starting with the third quarter of 2013.
Page 6 of 70
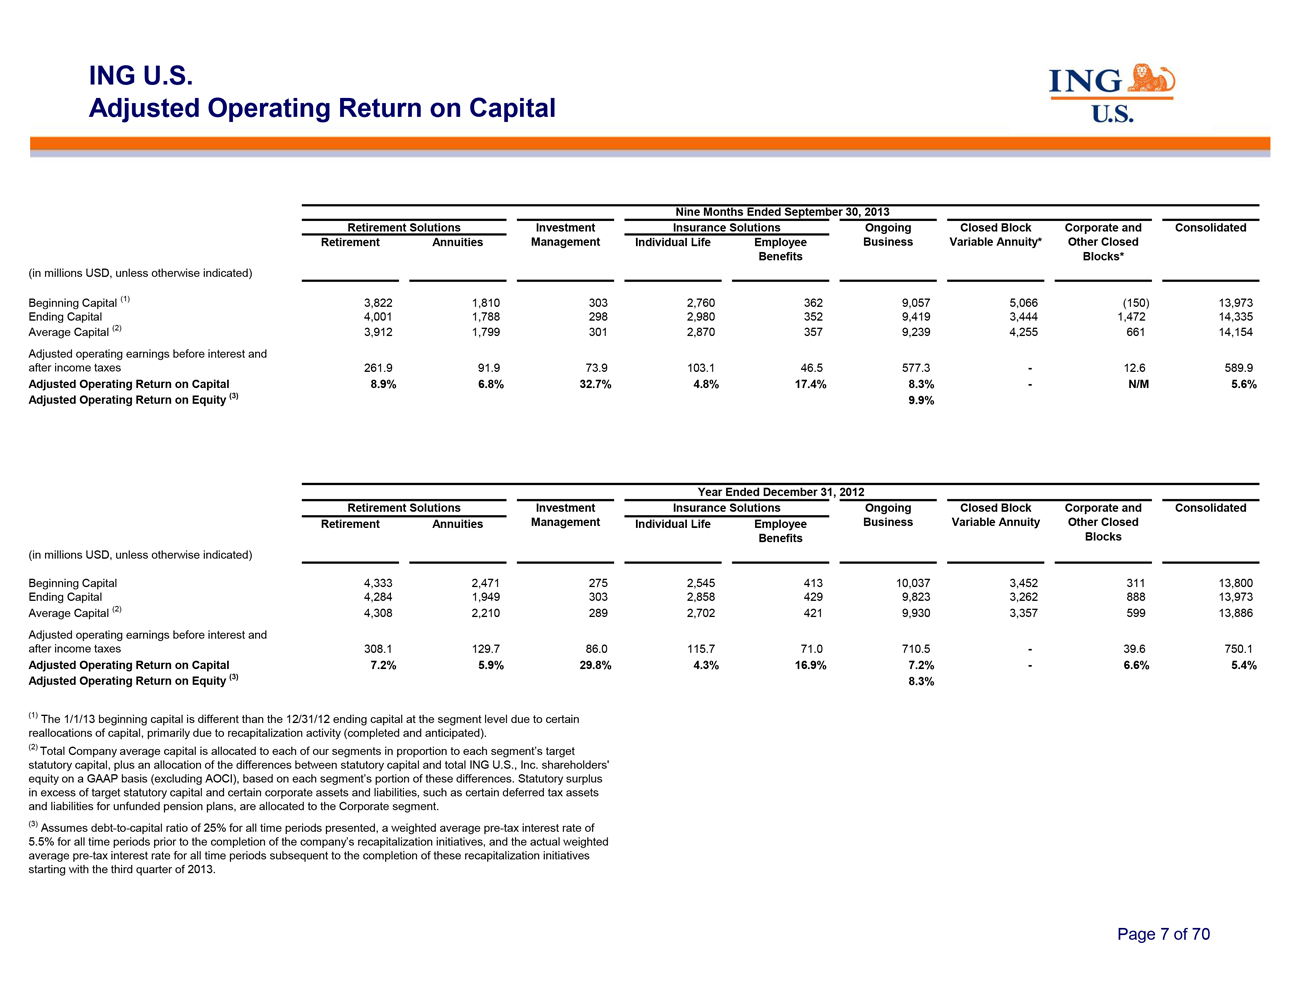
ING U.S.
Adjusted Operating Return on Capital
Nine Months Ended September 30, 2013
Retirement Solutions Investment Insurance Solutions Ongoing Closed Block Corporate and Consolidated
Retirement Annuities Management Individual Life Employee Business Variable Annuity* Other Closed
Benefits Blocks*
(in millions USD, unless otherwise indicated)
Beginning Capital (1) 3,822 1,810 303 2,760 362 9,057 5,066 (150) 13,973
Ending Capital 4,001 1,788 298 2,980 352 9,419 3,444 1,472 14,335
Average Capital (2) 3,912 1,799 301 2,870 357 9,239 4,255 661 14,154
Adjusted operating earnings before interest and
after income taxes 261.9 91.9 73.9 103.1 46.5 577.3 — 12.6 589.9
Adjusted Operating Return on Capital 8.9% 6.8% 32.7% 4.8% 17.4% 8.3% — N/M 5.6%
Adjusted Operating Return on Equity (3) 9.9%
Year Ended December 31, 2012
Retirement Solutions Investment Insurance Solutions Ongoing Closed Block Corporate and Consolidated
Retirement Annuities Management Individual Life Employee Business Variable Annuity Other Closed
Benefits Blocks
(in millions USD, unless
otherwise indicated)
Beginning Capital 4,333 2,471 275 2,545 413 10,037 3,452 311 13,800
Ending Capital 4,284 1,949 303 2,858 429 9,823 3,262 888 13,973
Average Capital (2) 4,308 2,210 289 2,702 421 9,930 3,357 599 13,886
Adjusted operating earnings before interest and
after income taxes 308.1 129.7 86.0 115.7 71.0 710.5 — 39.6 750.1
Adjusted Operating Return on Capital 7.2% 5.9% 29.8% 4.3% 16.9% 7.2% — 6.6% 5.4%
Adjusted Operating Return on Equity (3) 8.3%
(1) The 1/1/13 beginning capital is different than the 12/31/12 ending capital at the segment level due to certain
reallocations of capital, primarily due to recapitalization activity (completed and anticipated).
(2) Total
Company average capital is allocated to each of our segments in proportion to each segment’s target statutory capital, plus an allocation of the differences between statutory capital and total ING U.S., Inc. shareholders’ equity on a GAAP
basis (excluding AOCI), based on each segment’s portion of these differences. Statutory surplus in excess of target statutory capital and certain corporate assets and liabilities, such as certain deferred tax assets and liabilities for unfunded
pension plans, are allocated to the Corporate segment.
(3) Assumes debt-to-capital ratio of 25% for all time
periods presented, a weighted average pre-tax interest rate of
5.5% for all time periods prior to the
completion of the company’s recapitalization initiatives, and the actual weighted average pre-tax interest rate for all time periods subsequent to the completion of these recapitalization initiatives starting with the third quarter of 2013.
Page 7 of 70
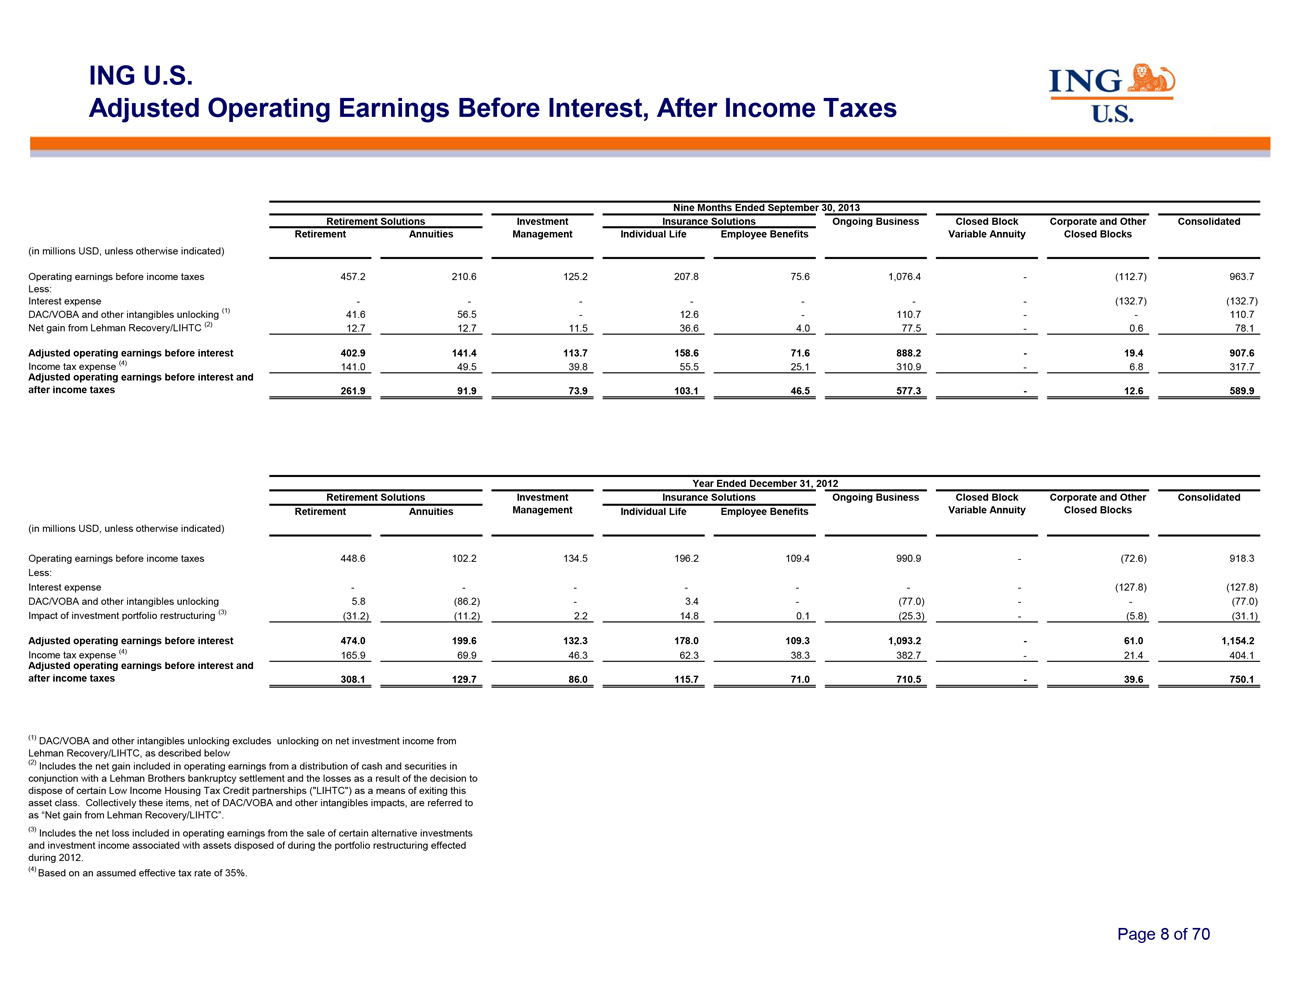
ING U.S.
Adjusted Operating Earnings Before
Interest, After Income Taxes
Nine Months Ended September 30, 2013
Retirement Solutions Investment Insurance Solutions Ongoing Business Closed Block Corporate and Other Consolidated
Retirement Annuities Management Individual Life Employee Benefits Variable Annuity Closed Blocks
(in millions USD, unless otherwise indicated)
Operating earnings before income taxes 457.2 210.6 125.2 207.8 75.6 1,076.4 — (112.7) 963.7
Less:
Interest expense
——————— (132.7) (132.7)
DAC/VOBA and other intangibles unlocking
(1) 41.6 56.5 — 12.6 — 110.7 —— 110.7
Net gain from Lehman Recovery/LIHTC
(2) 12.7 12.7 11.5 36.6 4.0 77.5 — 0.6 78.1
Adjusted operating earnings before interest 402.9 141.4
113.7 158.6 71.6 888.2 — 19.4 907.6
Income tax expense (4) 141.0 49.5 39.8 55.5 25.1 310.9 —
6.8 317.7
Adjusted operating earnings before interest and
after income taxes 261.9 91.9 73.9 103.1 46.5 577.3 — 12.6 589.9
Year Ended December 31, 2012
Retirement Solutions Investment Insurance Solutions Ongoing Business Closed Block Corporate and Other Consolidated
Retirement Annuities Management Individual Life Employee Benefits Variable Annuity Closed Blocks
(in millions USD, unless otherwise indicated)
Operating earnings before income taxes 448.6 102.2 134.5 196.2 109.4 990.9 — (72.6) 918.3
Less:
Interest expense ——————— (127.8) (127.8)
DAC/VOBA and other intangibles unlocking 5.8 (86.2) — 3.4 — (77.0) —— (77.0)
Impact of investment portfolio restructuring (3) (31.2) (11.2) 2.2 14.8 0.1 (25.3) — (5.8) (31.1)
Adjusted operating earnings before interest 474.0 199.6 132.3 178.0 109.3 1,093.2 — 61.0 1,154.2
Income tax expense (4) 165.9 69.9 46.3 62.3 38.3 382.7 — 21.4 404.1
Adjusted operating earnings before interest and
after income taxes 308.1 129.7 86.0 115.7 71.0 710.5 — 39.6 750.1
(1) DAC/VOBA and other intangibles unlocking excludes unlocking on net investment income from Lehman Recovery/LIHTC, as described below (2) Includes the net gain included in operating
earnings from a distribution of cash and securities in conjunction with a Lehman Brothers bankruptcy settlement and the losses as a result of the decision to dispose of certain Low Income Housing Tax Credit partnerships (“LIHTC”) as a
means of exiting this asset class. Collectively these items, net of DAC/VOBA and other intangibles impacts, are referred to as “Net gain from Lehman Recovery/LIHTC”.
(3) Includes the net loss included in operating earnings from the sale of certain alternative investments and investment income associated with assets disposed of during the portfolio
restructuring effected during 2012.
(4) Based on an assumed effective tax rate of 35%.
Page 8 of 70
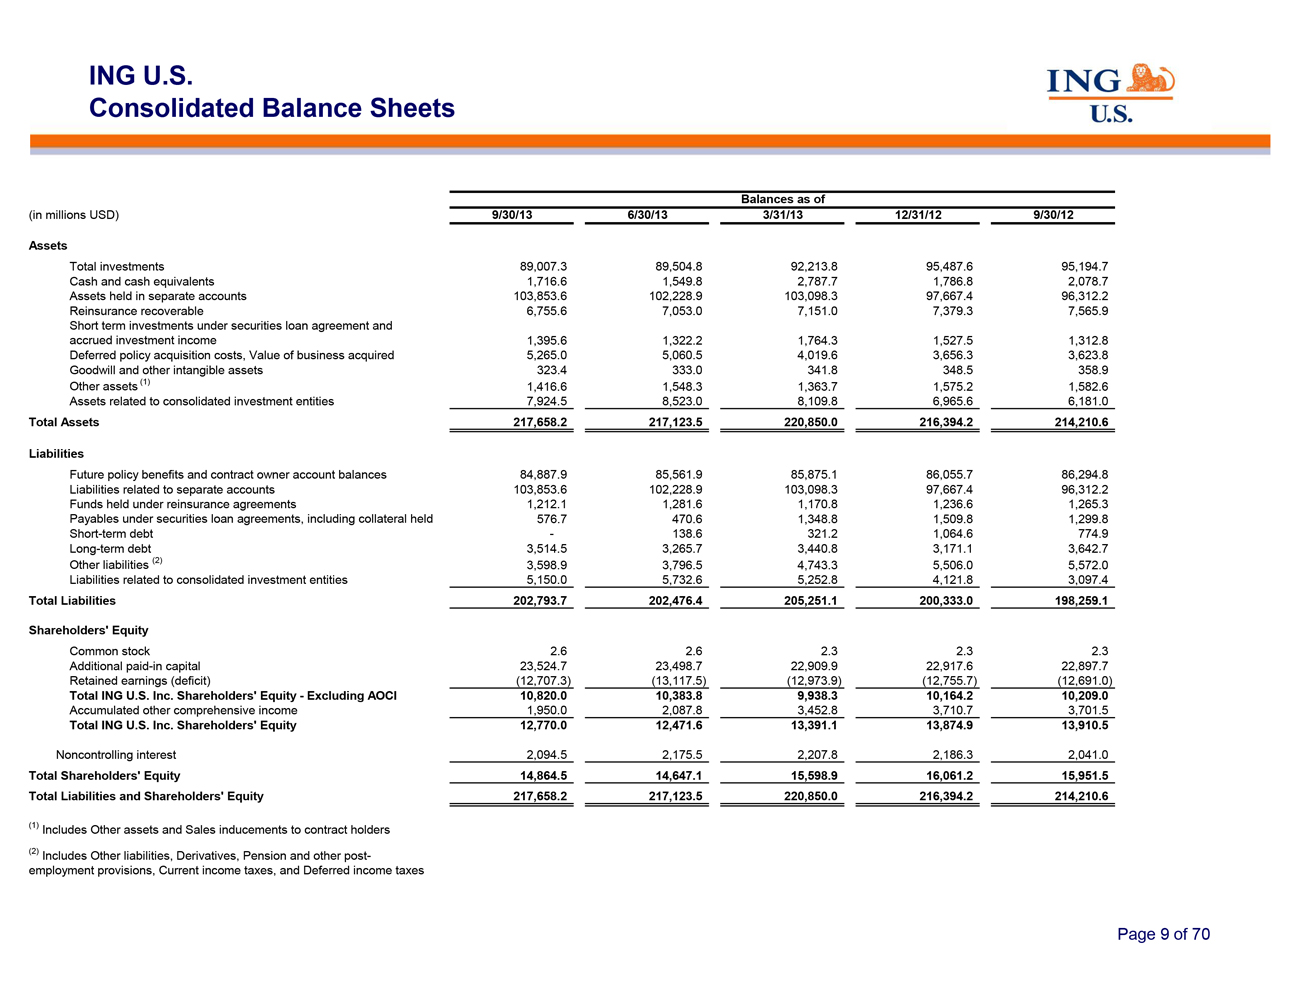
ING U.S.
Consolidated Balance Sheets
Balances as of
(in millions USD) 9/30/13 6/30/13 3/31/13 12/31/12 9/30/12
Assets
Total investments 89,007.3 89,504.8
92,213.8 95,487.6 95,194.7
Cash and cash equivalents 1,716.6 1,549.8 2,787.7 1,786.8 2,078.7
Assets held in separate accounts 103,853.6 102,228.9 103,098.3 97,667.4 96,312.2
Reinsurance recoverable 6,755.6 7,053.0 7,151.0 7,379.3 7,565.9
Short term investments under securities loan agreement and
accrued investment income 1,395.6 1,322.2 1,764.3 1,527.5 1,312.8
Deferred policy acquisition costs, Value of business acquired 5,265.0 5,060.5 4,019.6 3,656.3 3,623.8
Goodwill and other intangible assets 323.4 333.0 341.8 348.5 358.9
Other assets (1) 1,416.6 1,548.3 1,363.7 1,575.2 1,582.6
Assets related to consolidated investment entities 7,924.5 8,523.0 8,109.8 6,965.6 6,181.0
Total Assets 217,658.2 217,123.5 220,850.0 216,394.2 214,210.6
Liabilities
Future policy benefits and contract owner account balances 84,887.9 85,561.9 85,875.1 86,055.7 86,294.8
Liabilities related to separate accounts 103,853.6 102,228.9 103,098.3 97,667.4 96,312.2
Funds held under reinsurance agreements 1,212.1 1,281.6 1,170.8 1,236.6 1,265.3
Payables under securities loan agreements, including collateral held 576.7 470.6 1,348.8 1,509.8 1,299.8
Short-term debt — 138.6 321.2 1,064.6 774.9
Long-term debt 3,514.5 3,265.7 3,440.8 3,171.1 3,642.7
Other liabilities (2) 3,598.9 3,796.5 4,743.3 5,506.0 5,572.0
Liabilities related to consolidated investment entities 5,150.0 5,732.6 5,252.8 4,121.8 3,097.4
Total Liabilities 202,793.7 202,476.4 205,251.1 200,333.0 198,259.1
Shareholders’ Equity
Common stock 2.6 2.6 2.3 2.3 2.3
Additional
paid-in capital 23,524.7 23,498.7 22,909.9 22,917.6 22,897.7
Retained earnings (deficit)
(12,707.3) (13,117.5) (12,973.9) (12,755.7) (12,691.0)
Total ING U.S. Inc.
Shareholders’ Equity—Excluding AOCI 10,820.0 10,383.8 9,938.3 10,164.2 10,209.0
Accumulated other
comprehensive income 1,950.0 2,087.8 3,452.8 3,710.7 3,701.5
Total ING U.S. Inc. Shareholders’ Equity
12,770.0 12,471.6 13,391.1 13,874.9 13,910.5
Noncontrolling interest 2,094.5 2,175.5 2,207.8 2,186.3 2,041.0
Total Shareholders’ Equity 14,864.5 14,647.1 15,598.9 16,061.2 15,951.5
Total Liabilities and Shareholders’ Equity 217,658.2 217,123.5 220,850.0 216,394.2 214,210.6
(1) Includes Other assets and Sales inducements to contract holders (2) Includes Other liabilities, Derivatives,
Pension and other post-employment provisions, Current income taxes, and Deferred income taxes
Page 9 of 70
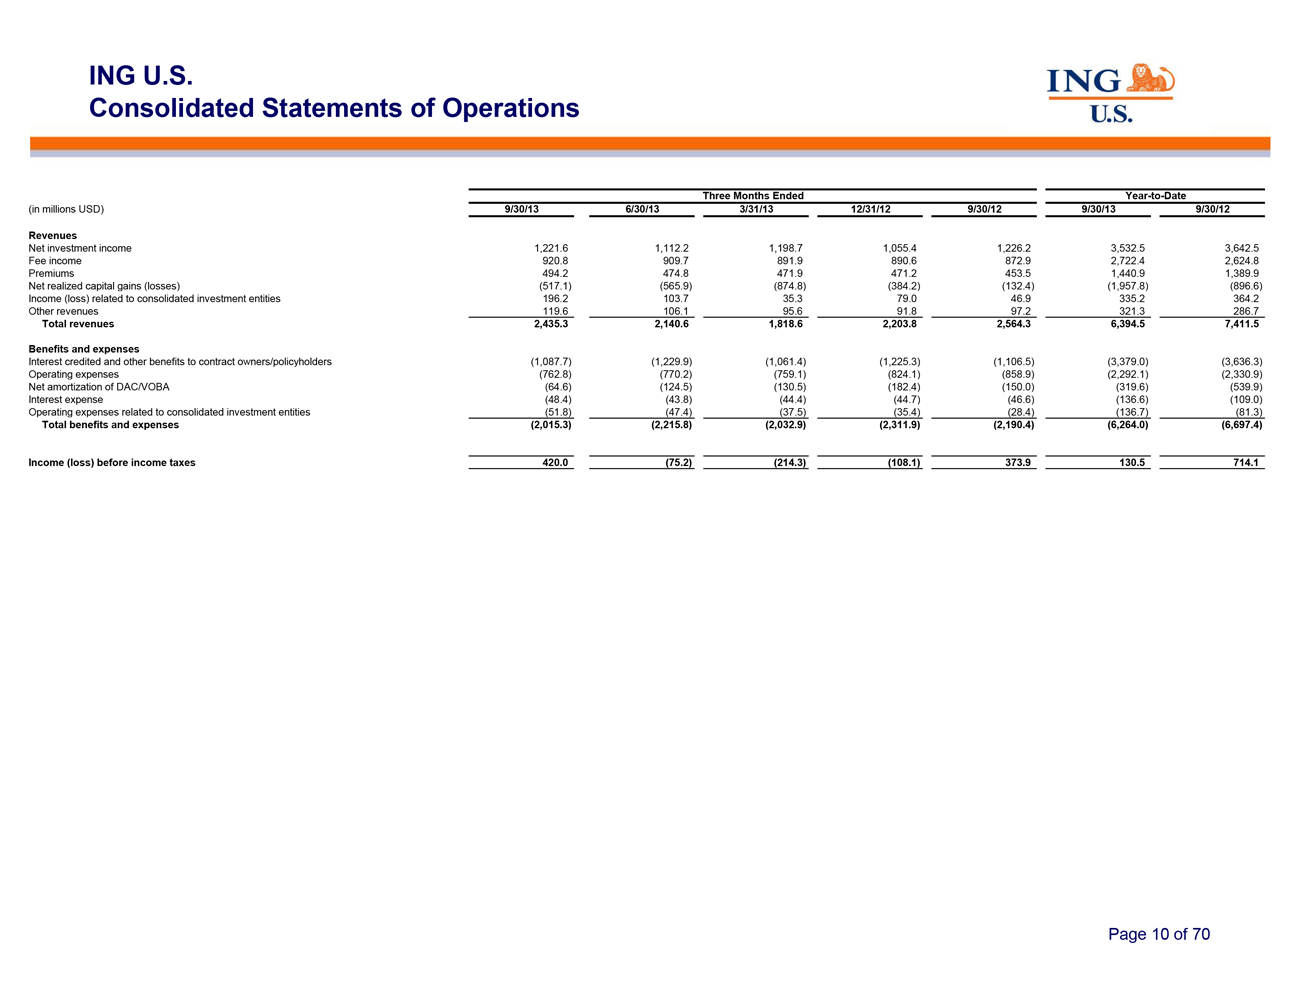
ING U.S.
Consolidated Statements of Operations
Three Months Ended Year-to-Date
(in millions USD) 9/30/13 6/30/13 3/31/13 12/31/12 9/30/12 9/30/13 9/30/12
Revenues
Net investment income 1,221.6 1,112.2
1,198.7 1,055.4 1,226.2 3,532.5 3,642.5
Fee income 920.8 909.7 891.9 890.6 872.9 2,722.4 2,624.8
Premiums 494.2 474.8 471.9 471.2 453.5 1,440.9 1,389.9
Net realized capital gains (losses)
(517.1) (565.9) (874.8) (384.2) (132.4) (1,957.8) (896.6)
Income (loss) related
to consolidated investment entities 196.2 103.7 35.3 79.0 46.9 335.2 364.2
Other revenues 119.6 106.1 95.6
91.8 97.2 321.3 286.7
Total revenues 2,435.3 2,140.6 1,818.6 2,203.8 2,564.3 6,394.5 7,411.5
Benefits and expenses
Interest credited and other benefits to contract owners/policyholders (1,087.7) (1,229.9) (1,061.4) (1,225.3) (1,106.5) (3,379.0) (3,636.3)
Operating expenses (762.8) (770.2) (759.1) (824.1) (858.9) (2,292.1) (2,330.9)
Net amortization of DAC/VOBA (64.6) (124.5) (130.5) (182.4) (150.0) (319.6) (539.9)
Interest expense (48.4) (43.8) (44.4) (44.7) (46.6) (136.6) (109.0)
Operating expenses related to consolidated investment entities
(51.8) (47.4) (37.5) (35.4) (28.4) (136.7) (81.3)
Total benefits and expenses
(2,015.3) (2,215.8) (2,032.9) (2,311.9) (2,190.4) (6,264.0) (6,697.4)
Income
(loss) before income taxes 420.0 (75.2) (214.3) (108.1) 373.9 130.5 714.1
Page 10 of 70
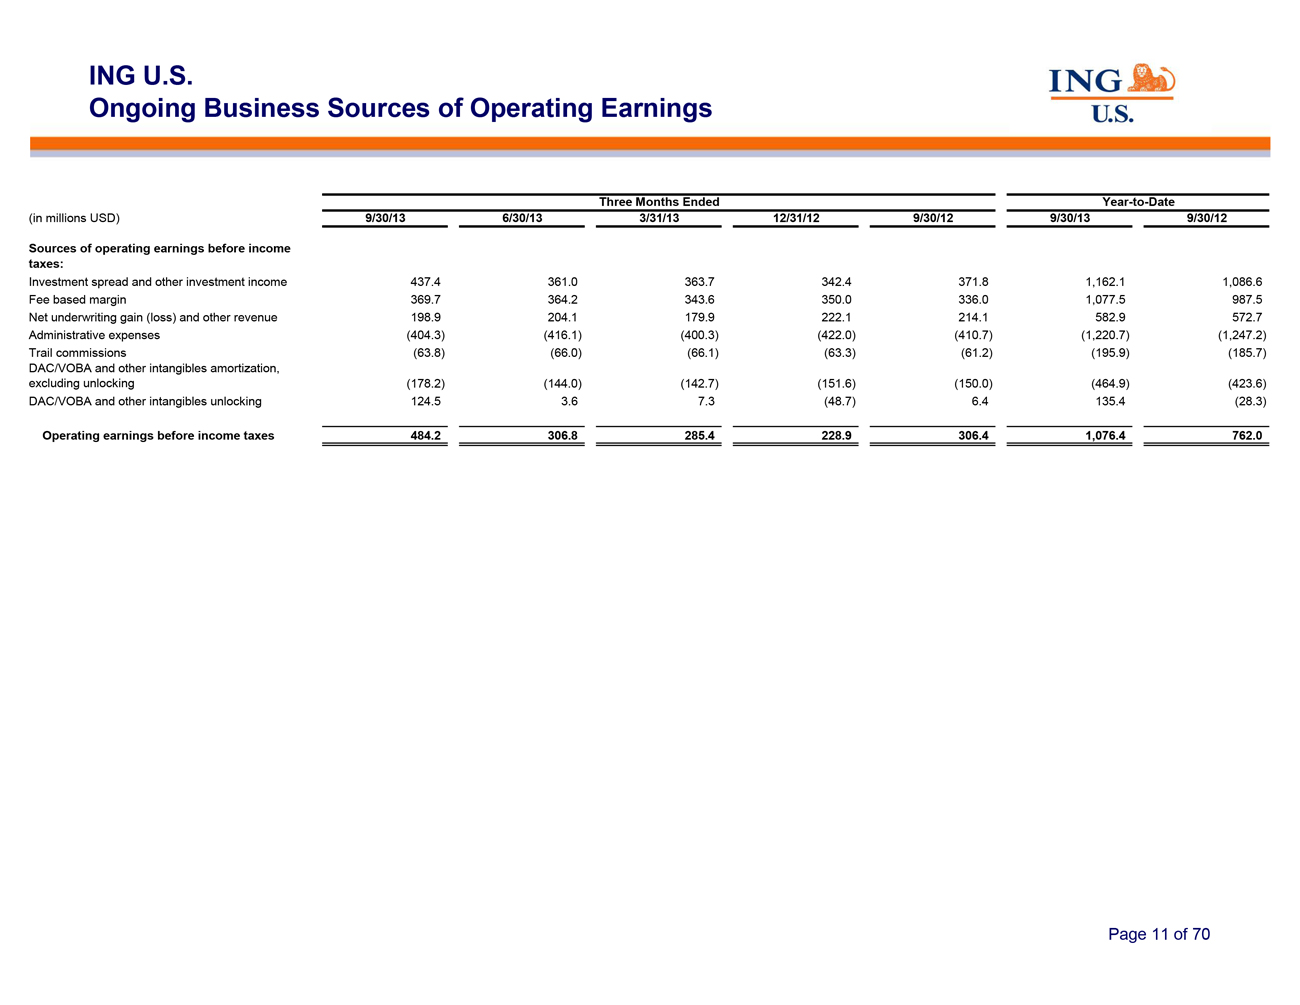
ING U.S.
Ongoing Business Sources of Operating
Earnings
Three Months Ended Year-to-Date
(in millions USD) 9/30/13 6/30/13 3/31/13 12/31/12 9/30/12 9/30/13 9/30/12
Sources of operating earnings before income
taxes:
Investment spread and other investment
income 437.4 361.0 363.7 342.4 371.8 1,162.1 1,086.6
Fee based margin 369.7 364.2 343.6 350.0 336.0 1,077.5
987.5
Net underwriting gain (loss) and other revenue 198.9 204.1 179.9 222.1 214.1 582.9 572.7
Administrative expenses (404.3) (416.1) (400.3) (422.0) (410.7) (1,220.7) (1,247.2)
Trail commissions (63.8) (66.0) (66.1) (63.3) (61.2) (195.9) (185.7)
DAC/VOBA and other intangibles amortization,
excluding unlocking (178.2) (144.0) (142.7) (151.6) (150.0) (464.9) (423.6)
DAC/VOBA and other intangibles unlocking 124.5 3.6 7.3 (48.7) 6.4 135.4 (28.3)
Operating earnings before income taxes 484.2 306.8 285.4 228.9 306.4 1,076.4 762.0
Page 11 of 70
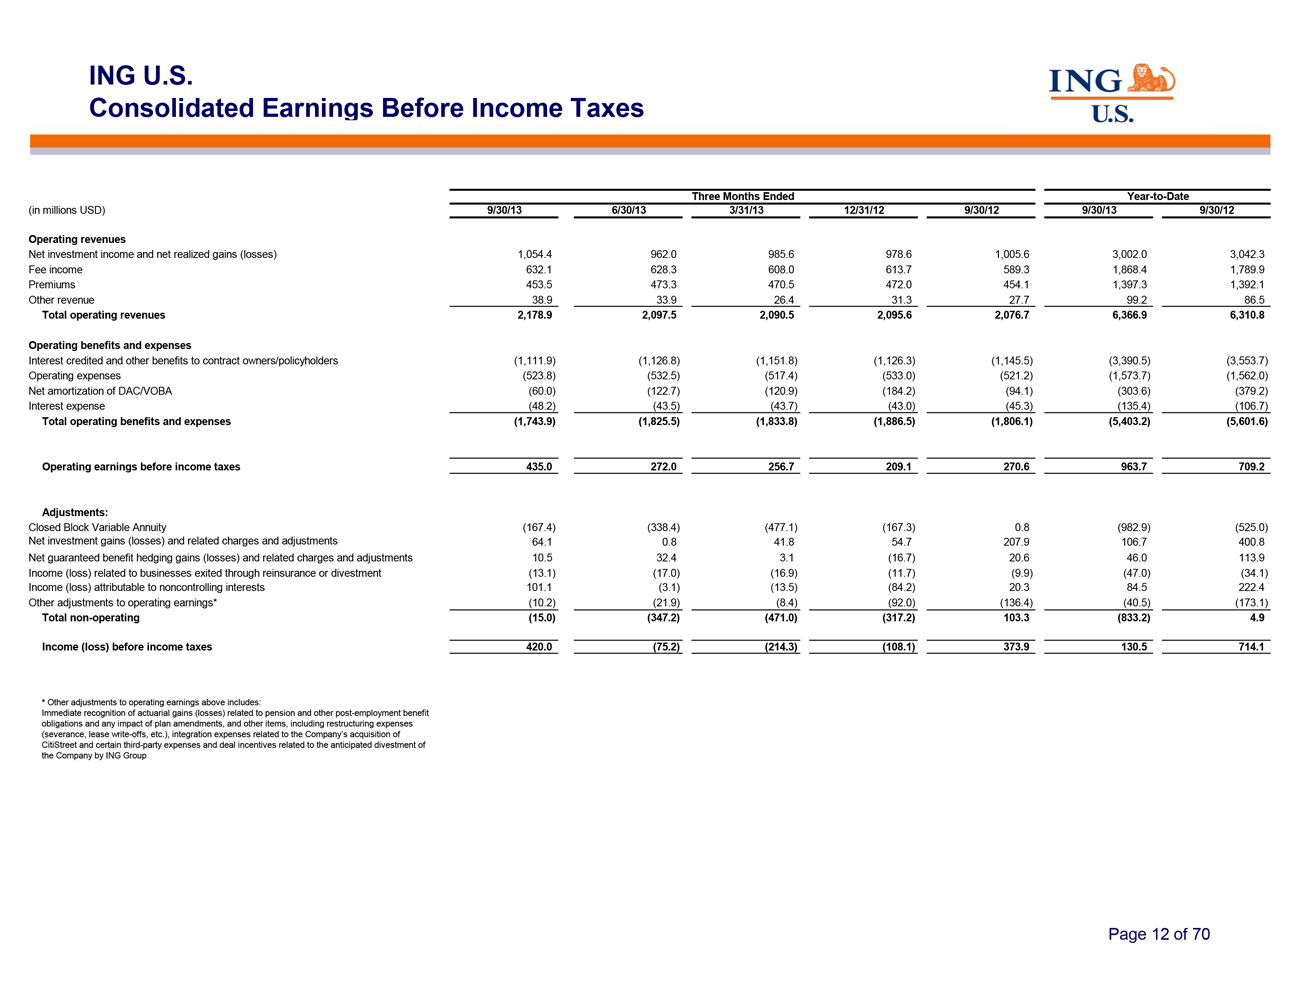
ING U.S.
Consolidated Earnings Before Income
Taxes
Three Months Ended Year-to-Date
(in millions USD) 9/30/13 6/30/13 3/31/13 12/31/12 9/30/12 9/30/13 9/30/12
Operating revenues
Net investment income and net
realized gains (losses) 1,054.4 962.0 985.6 978.6 1,005.6 3,002.0 3,042.3
Fee income 632.1 628.3 608.0 613.7
589.3 1,868.4 1,789.9
Premiums 453.5 473.3 470.5 472.0 454.1 1,397.3 1,392.1
Other revenue 38.9 33.9 26.4 31.3 27.7 99.2 86.5
Total operating revenues 2,178.9 2,097.5 2,090.5 2,095.6 2,076.7 6,366.9 6,310.8
Operating benefits and expenses
Interest credited
and other benefits to contract owners/policyholders (1,111.9) (1,126.8) (1,151.8) (1,126.3) (1,145.5) (3,390.5) (3,553.7)
Operating expenses (523.8) (532.5) (517.4) (533.0) (521.2) (1,573.7) (1,562.0)
Net amortization of DAC/VOBA (60.0) (122.7) (120.9) (184.2) (94.1) (303.6) (379.2)
Interest expense (48.2) (43.5) (43.7) (43.0) (45.3) (135.4) (106.7)
Total operating benefits and expenses (1,743.9) (1,825.5) (1,833.8) (1,886.5) (1,806.1) (5,403.2) (5,601.6)
Operating earnings before income taxes 435.0 272.0 256.7 209.1 270.6 963.7 709.2
Adjustments:
Closed Block Variable Annuity (167.4) (338.4) (477.1) (167.3) 0.8 (982.9) (525.0)
Net investment gains (losses) and related charges and adjustments 64.1 0.8 41.8 54.7 207.9 106.7 400.8
Net guaranteed benefit hedging gains (losses) and related charges and adjustments 10.5 32.4 3.1 (16.7) 20.6 46.0 113.9
Income (loss) related to businesses exited through reinsurance or divestment
(13.1) (17.0) (16.9) (11.7) (9.9) (47.0) (34.1)
Income (loss) attributable to
noncontrolling interests 101.1 (3.1) (13.5) (84.2) 20.3 84.5 222.4
Other adjustments to
operating earnings* (10.2) (21.9) (8.4) (92.0) (136.4) (40.5) (173.1)
Total
non-operating (15.0) (347.2) (471.0) (317.2) 103.3 (833.2) 4.9
Income (loss) before
income taxes 420.0 (75.2) (214.3) (108.1) 373.9 130.5 714.1
| * |
|
Other adjustments to operating earnings above includes: |
Immediate recognition of actuarial gains (losses) related to pension and other post-employment benefit obligations and any
impact of plan amendments, and other items, including restructuring expenses
(severance, lease write-offs,
etc.), integration expenses related to the Company’s acquisition of
CitiStreet and certain third-party
expenses and deal incentives related to the anticipated divestment of the Company by ING Group
Page 12 of 70
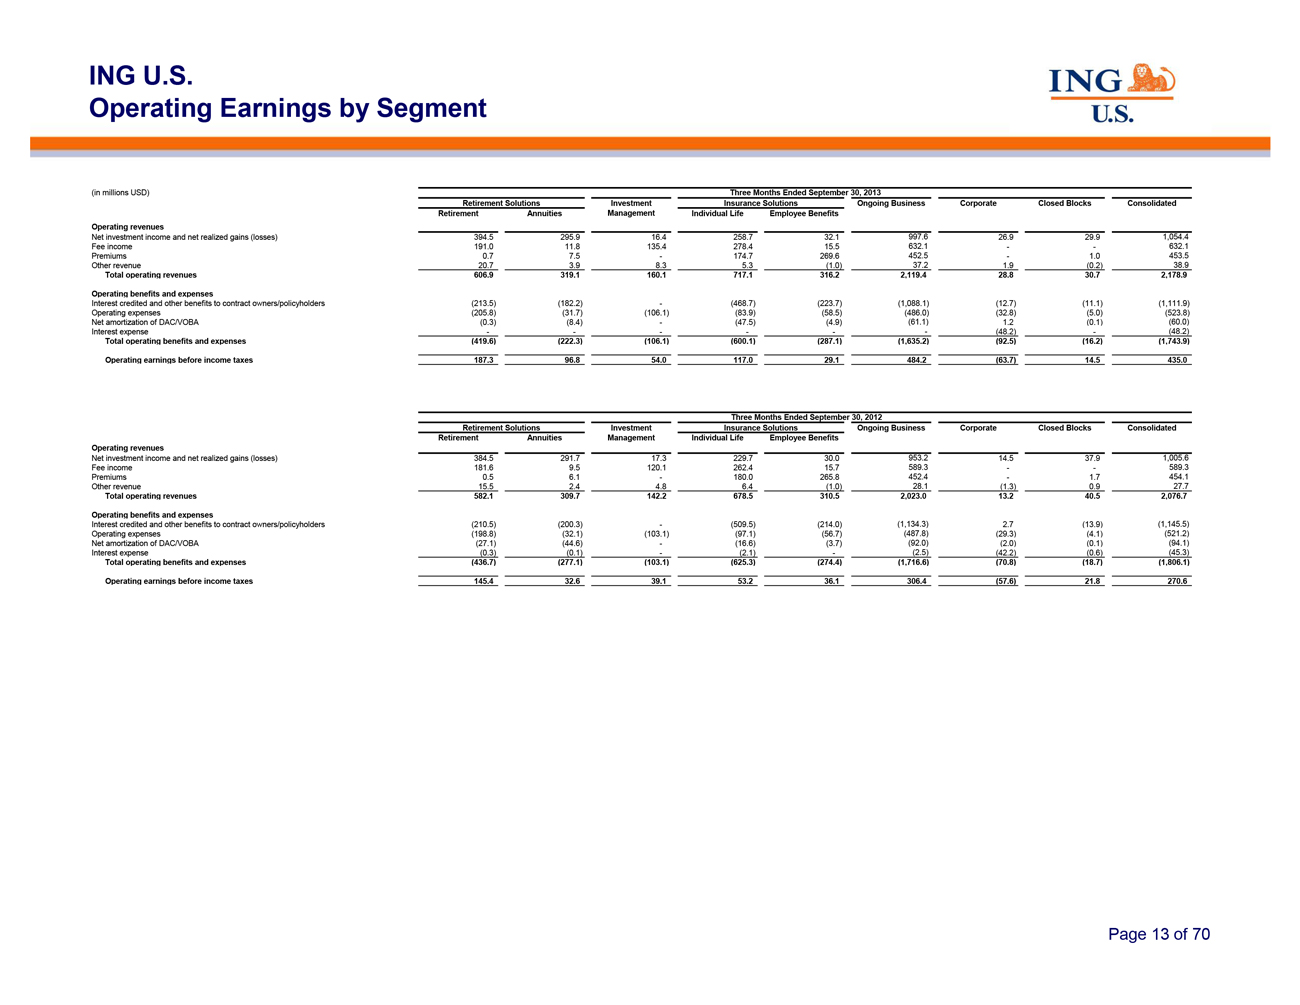
ING U.S.
Operating Earnings by Segment
(in millions USD) Three Months Ended September 30, 2013
Retirement Solutions Investment Insurance Solutions Ongoing Business Corporate Closed Blocks Consolidated
Retirement Annuities Management Individual Life Employee Benefits
Operating revenues
Net investment income and net realized gains (losses) 394.5 295.9 16.4 258.7 32.1 997.6 26.9 29.9 1,054.4
Fee income 191.0 11.8 135.4 278.4 15.5 632.1 —— 632.1
Premiums 0.7 7.5 — 174.7 269.6 452.5 — 1.0 453.5
Other revenue 20.7 3.9 8.3 5.3 (1.0) 37.2 1.9 (0.2) 38.9
Total operating revenues 606.9 319.1 160.1 717.1 316.2 2,119.4 28.8 30.7 2,178.9
Operating benefits and expenses
Interest credited
and other benefits to contract owners/policyholders (213.5) (182.2) — (468.7) (223.7) (1,088.1) (12.7) (11.1) (1,111.9)
Operating expenses (205.8) (31.7) (106.1) (83.9) (58.5) (486.0) (32.8) (5.0) (523.8)
Net amortization of DAC/VOBA (0.3) (8.4) — (47.5) (4.9) (61.1) 1.2 (0.1) (60.0)
Interest expense —————— (48.2) — (48.2)
Total operating benefits and expenses
(419.6) (222.3) (106.1) (600.1) (287.1) (1,635.2) (92.5) (16.2) (1,743.9)
Operating earnings before income taxes 187.3 96.8 54.0 117.0 29.1 484.2 (63.7) 14.5 435.0
Three Months Ended September 30, 2012
Retirement Solutions Investment Insurance Solutions Ongoing Business Corporate Closed Blocks Consolidated
Retirement Annuities Management Individual Life Employee Benefits
Operating revenues
Net investment income and net realized gains (losses) 384.5 291.7 17.3 229.7 30.0 953.2 14.5 37.9 1,005.6
Fee income 181.6 9.5 120.1 262.4 15.7 589.3 —— 589.3
Premiums 0.5 6.1 — 180.0 265.8 452.4 — 1.7 454.1
Other revenue 15.5 2.4 4.8 6.4 (1.0) 28.1 (1.3) 0.9 27.7
Total operating revenues 582.1 309.7 142.2 678.5 310.5 2,023.0 13.2 40.5 2,076.7
Operating benefits and expenses
Interest credited
and other benefits to contract owners/policyholders (210.5) (200.3) — (509.5) (214.0) (1,134.3) 2.7 (13.9) (1,145.5)
Operating expenses (198.8) (32.1) (103.1) (97.1) (56.7) (487.8) (29.3) (4.1) (521.2)
Net amortization of DAC/VOBA (27.1) (44.6) — (16.6) (3.7) (92.0) (2.0) (0.1) (94.1)
Interest expense (0.3) (0.1) — (2.1) — (2.5) (42.2) (0.6) (45.3)
Total operating benefits and expenses
(436.7) (277.1) (103.1) (625.3) (274.4) (1,716.6) (70.8) (18.7) (1,806.1)
Operating earnings before income taxes 145.4 32.6 39.1 53.2 36.1 306.4 (57.6) 21.8 270.6
Page 13 of 70
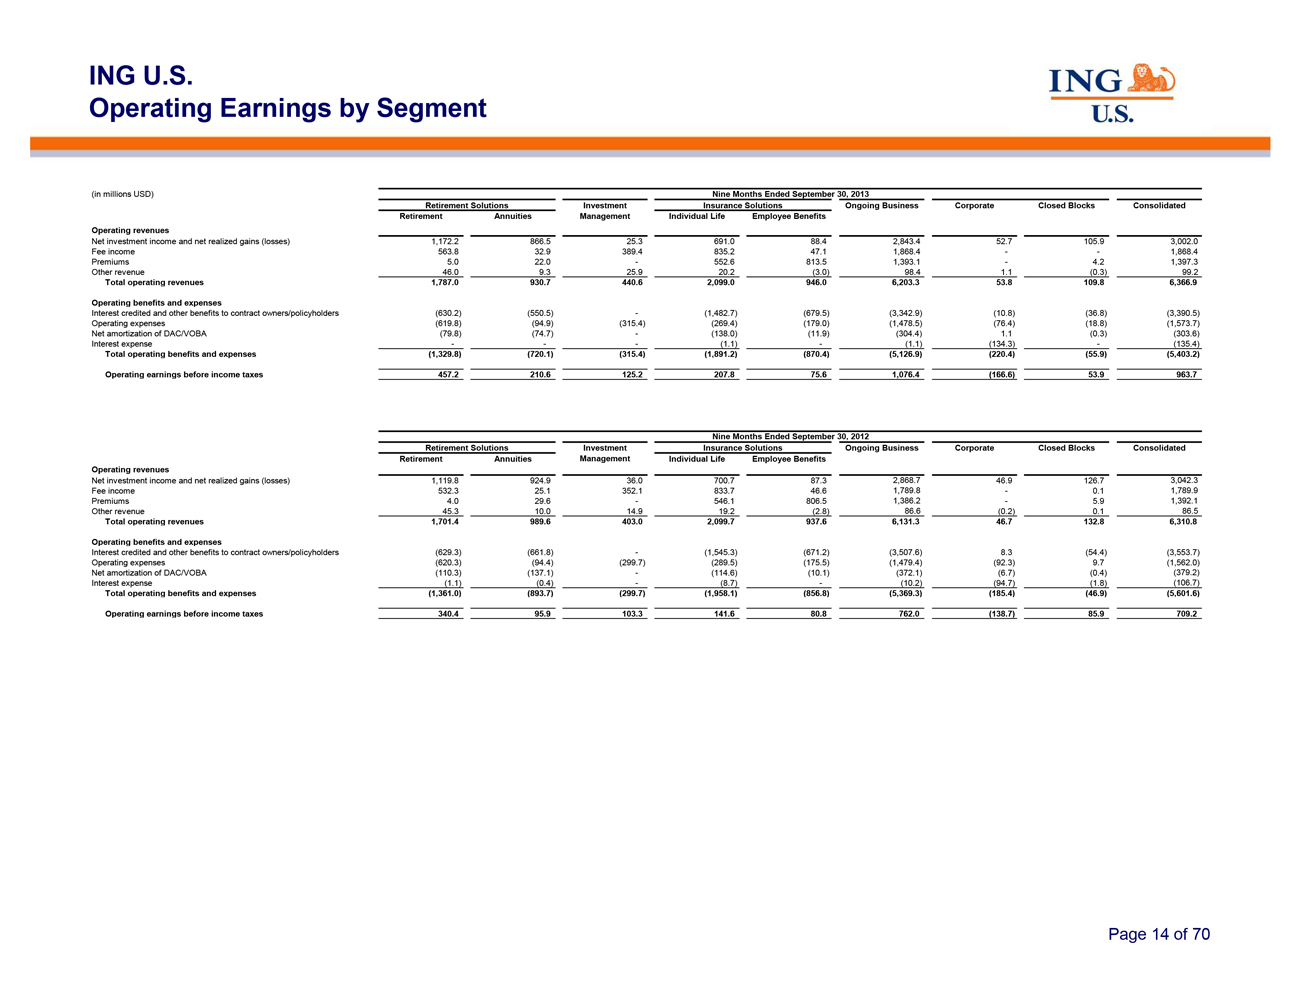
ING U.S.
Operating Earnings by Segment
(in millions USD) Nine Months Ended September 30, 2013
Retirement Solutions Investment Insurance Solutions Ongoing Business Corporate Closed Blocks Consolidated
Retirement Annuities Management Individual Life Employee Benefits
Operating revenues
Net investment income and net realized gains (losses) 1,172.2 866.5 25.3 691.0 88.4 2,843.4 52.7 105.9 3,002.0
Fee income 563.8 32.9 389.4 835.2 47.1 1,868.4 —— 1,868.4
Premiums 5.0 22.0 — 552.6 813.5 1,393.1 — 4.2 1,397.3
Other revenue 46.0 9.3 25.9 20.2 (3.0) 98.4 1.1 (0.3) 99.2
Total operating revenues 1,787.0 930.7 440.6 2,099.0 946.0 6,203.3 53.8 109.8 6,366.9
Operating benefits and expenses
Interest credited
and other benefits to contract owners/policyholders (630.2) (550.5) — (1,482.7) (679.5) (3,342.9) (10.8) (36.8) (3,390.5)
Operating expenses (619.8) (94.9) (315.4) (269.4) (179.0) (1,478.5) (76.4) (18.8) (1,573.7)
Net amortization of DAC/VOBA (79.8) (74.7) — (138.0) (11.9) (304.4) 1.1 (0.3) (303.6)
Interest expense ——— (1.1) — (1.1) (134.3) — (135.4)
Total operating benefits and expenses
(1,329.8) (720.1) (315.4) (1,891.2) (870.4) (5,126.9) (220.4) (55.9) (5,403.2)
Operating earnings before income taxes 457.2 210.6 125.2 207.8 75.6 1,076.4 (166.6) 53.9 963.7
Nine Months Ended September 30, 2012
Retirement Solutions Investment Insurance Solutions Ongoing Business Corporate Closed Blocks Consolidated
Retirement Annuities Management Individual Life Employee Benefits
Operating revenues
Net investment income and net realized gains (losses) 1,119.8 924.9 36.0 700.7 87.3 2,868.7 46.9 126.7 3,042.3
Fee income 532.3 25.1 352.1 833.7 46.6 1,789.8 — 0.1 1,789.9
Premiums 4.0 29.6 — 546.1 806.5 1,386.2 — 5.9 1,392.1
Other revenue 45.3 10.0 14.9 19.2 (2.8) 86.6 (0.2) 0.1 86.5
Total operating revenues 1,701.4 989.6 403.0 2,099.7 937.6 6,131.3 46.7 132.8 6,310.8
Operating benefits and expenses
Interest credited
and other benefits to contract owners/policyholders (629.3) (661.8) — (1,545.3) (671.2) (3,507.6) 8.3 (54.4) (3,553.7)
Operating expenses (620.3) (94.4) (299.7) (289.5) (175.5) (1,479.4) (92.3) 9.7 (1,562.0)
Net amortization of DAC/VOBA (110.3) (137.1) — (114.6) (10.1) (372.1) (6.7) (0.4)
(379.2)
Interest expense (1.1) (0.4) — (8.7) — (10.2) (94.7) (1.8) (106.7)
Total operating benefits and expenses
(1,361.0) (893.7) (299.7) (1,958.1) (856.8) (5,369.3) (185.4) (46.9) (5,601.6)
Operating earnings before income taxes 340.4 95.9 103.3 141.6 80.8 762.0 (138.7) 85.9 709.2
Page 14 of 70
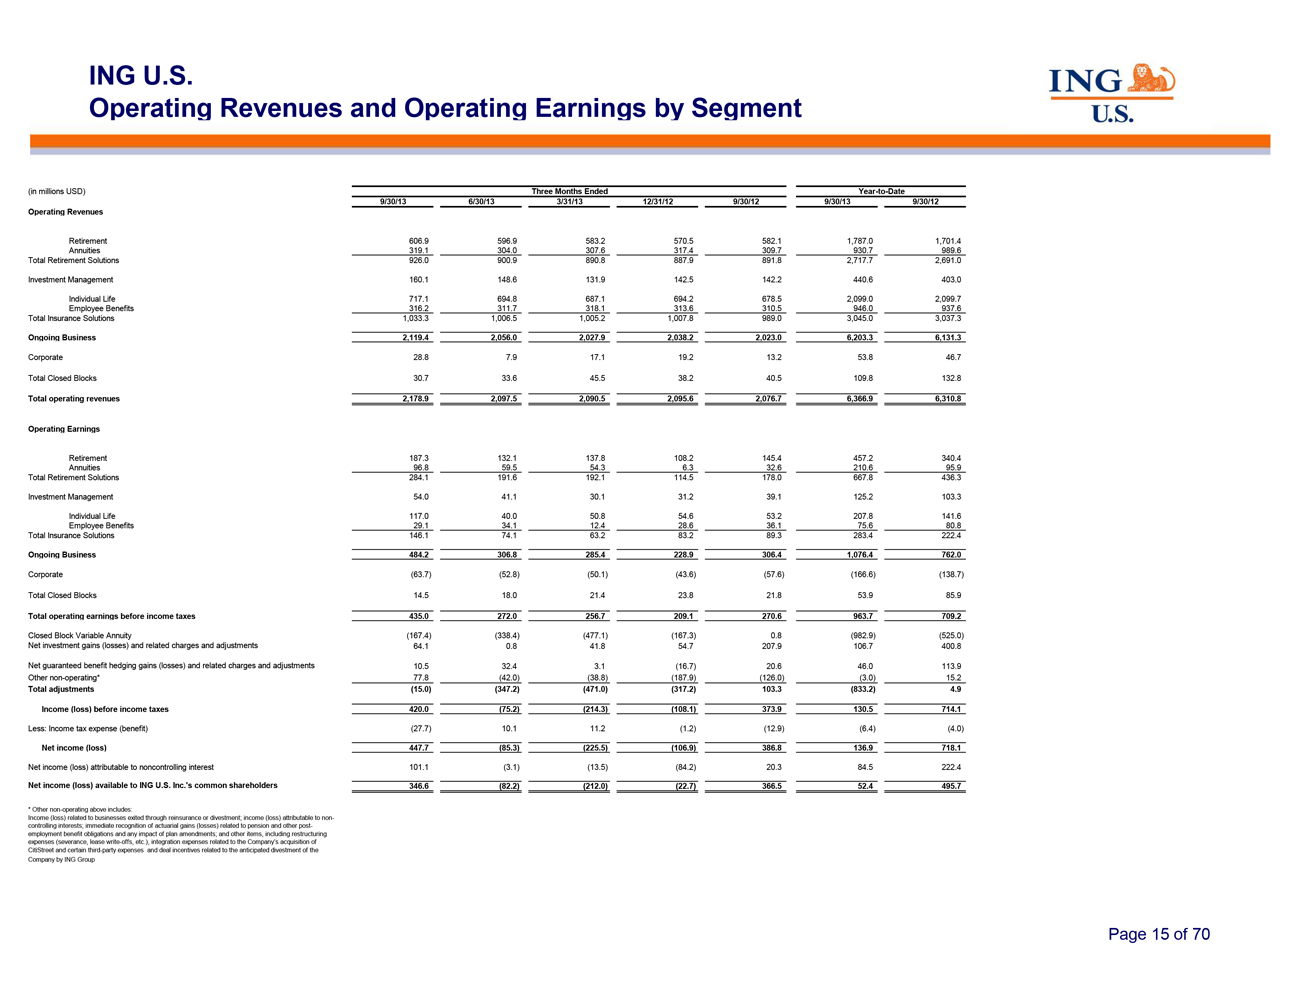
ING U.S.
Operating Revenues and Operating
Earnings by Segment
(in millions USD) Three Months Ended Year-to-Date
9/30/13 6/30/13 3/31/13 12/31/12 9/30/12 9/30/13 9/30/12
Operating Revenues
Retirement 606.9 596.9 583.2 570.5 582.1 1,787.0 1,701.4
Annuities 319.1 304.0 307.6 317.4 309.7 930.7 989.6
Total Retirement Solutions 926.0 900.9 890.8 887.9 891.8 2,717.7 2,691.0
Investment Management 160.1 148.6 131.9 142.5 142.2 440.6 403.0
Individual Life 717.1 694.8 687.1 694.2 678.5 2,099.0 2,099.7
Employee Benefits 316.2 311.7 318.1 313.6 310.5 946.0 937.6
Total Insurance Solutions 1,033.3 1,006.5 1,005.2 1,007.8 989.0 3,045.0 3,037.3
Ongoing Business 2,119.4 2,056.0 2,027.9 2,038.2 2,023.0 6,203.3 6,131.3
Corporate 28.8 7.9 17.1 19.2 13.2 53.8 46.7
Total Closed Blocks 30.7 33.6 45.5 38.2 40.5 109.8 132.8
Total operating revenues 2,178.9 2,097.5 2,090.5 2,095.6 2,076.7 6,366.9 6,310.8
Operating Earnings
Retirement 187.3 132.1 137.8
108.2 145.4 457.2 340.4
Annuities 96.8 59.5 54.3 6.3 32.6 210.6 95.9
Total Retirement Solutions 284.1 191.6 192.1 114.5 178.0 667.8 436.3
Investment Management 54.0 41.1 30.1 31.2 39.1 125.2 103.3
Individual Life 117.0 40.0 50.8 54.6 53.2 207.8 141.6
Employee Benefits 29.1 34.1 12.4 28.6 36.1 75.6 80.8
Total Insurance Solutions 146.1 74.1 63.2 83.2 89.3 283.4 222.4
Ongoing Business 484.2 306.8 285.4 228.9 306.4 1,076.4 762.0
Corporate (63.7) (52.8) (50.1) (43.6) (57.6) (166.6) (138.7)
Total Closed Blocks 14.5 18.0 21.4 23.8 21.8 53.9 85.9
Total operating earnings before income taxes 435.0 272.0 256.7 209.1 270.6 963.7 709.2
Closed Block Variable Annuity (167.4) (338.4) (477.1) (167.3) 0.8 (982.9) (525.0)
Net investment gains (losses) and related charges and adjustments 64.1 0.8 41.8 54.7 207.9 106.7 400.8
Net guaranteed benefit hedging gains (losses) and related charges and adjustments 10.5 32.4 3.1 (16.7) 20.6 46.0
113.9
Other non-operating* 77.8 (42.0) (38.8) (187.9) (126.0) (3.0) 15.2
Total adjustments (15.0) (347.2) (471.0) (317.2) 103.3 (833.2) 4.9
Income (loss) before income taxes 420.0 (75.2) (214.3) (108.1) 373.9 130.5 714.1
Less: Income tax expense (benefit) (27.7) 10.1 11.2 (1.2) (12.9) (6.4) (4.0)
Net income (loss) 447.7 (85.3) (225.5) (106.9) 386.8 136.9 718.1
Net income (loss) attributable to noncontrolling interest 101.1 (3.1) (13.5) (84.2) 20.3 84.5 222.4
Net income (loss) available to ING U.S. Inc.‘s common shareholders 346.6
(82.2) (212.0) (22.7) 366.5 52.4 495.7
| * |
|
Other non-operating above includes: |
Income (loss) related to businesses exited through reinsurance or divestment; income (loss) attributable to
non-controlling interests; immediate recognition of actuarial gains (losses) related to pension and other post-employment benefit obligations and any impact of plan amendments; and other items, including restructuring expenses (severance, lease
write-offs, etc.), integration expenses related to the Company’s acquisition of
CitiStreet and certain
third-party expenses and deal incentives related to the anticipated divestment of the Company by ING Group
Page 15 of 70
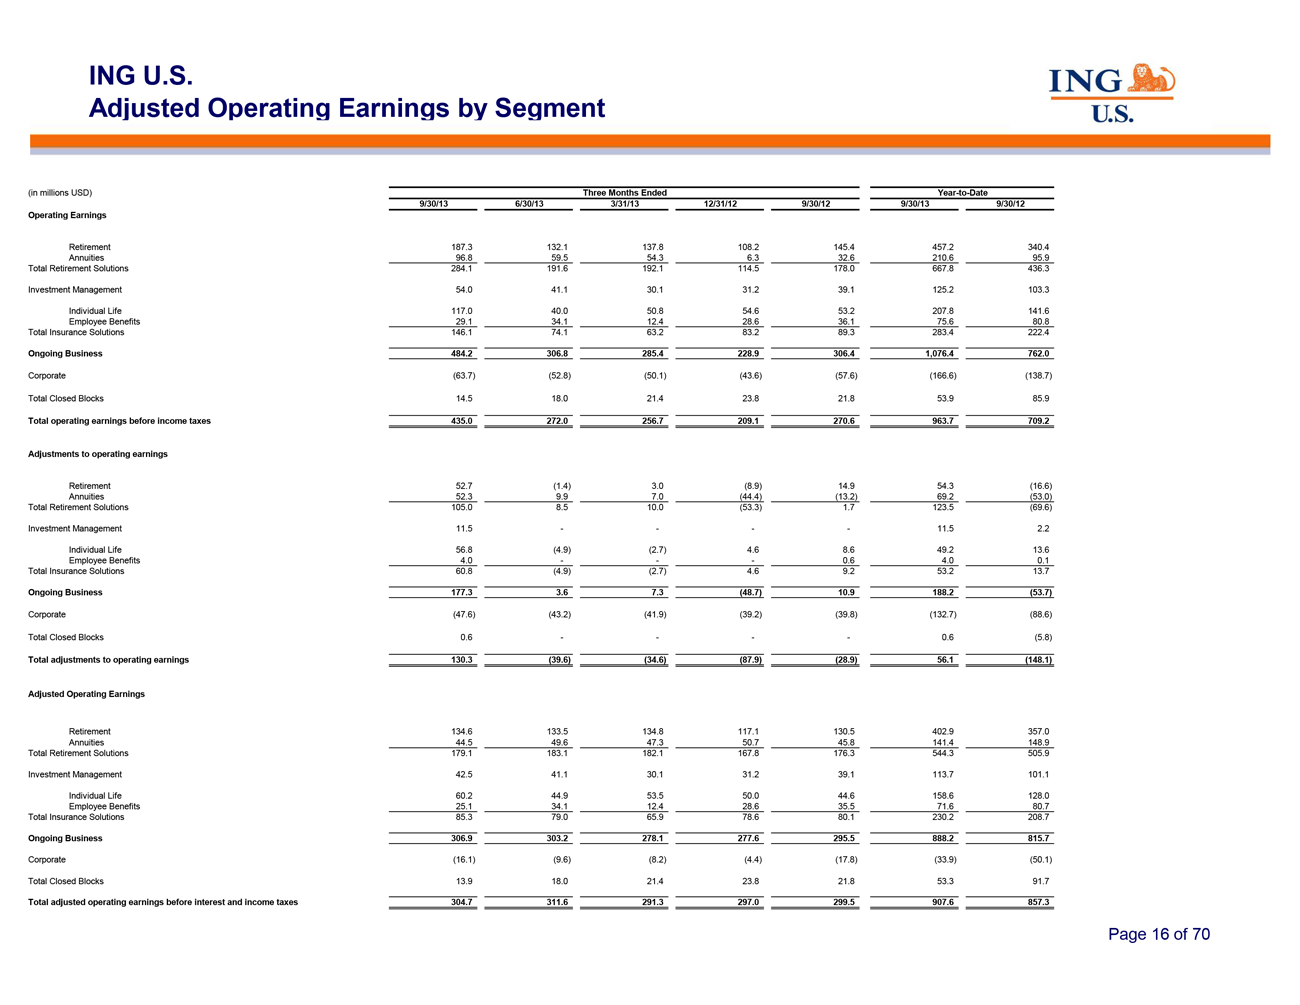
ING U.S.
Adjusted Operating Earnings by Segment
(in millions USD) Three Months Ended Year-to-Date
9/30/13 6/30/13 3/31/13 12/31/12 9/30/12 9/30/13 9/30/12
Operating Earnings
Retirement 187.3 132.1 137.8 108.2 145.4 457.2 340.4
Annuities 96.8 59.5 54.3 6.3 32.6 210.6 95.9
Total Retirement Solutions 284.1 191.6 192.1 114.5 178.0 667.8 436.3
Investment Management 54.0 41.1 30.1 31.2 39.1 125.2 103.3
Individual Life 117.0 40.0 50.8 54.6 53.2 207.8 141.6
Employee Benefits 29.1 34.1 12.4 28.6 36.1 75.6 80.8
Total Insurance Solutions 146.1 74.1 63.2 83.2 89.3 283.4 222.4
Ongoing Business 484.2 306.8 285.4 228.9 306.4 1,076.4 762.0
Corporate (63.7) (52.8) (50.1) (43.6) (57.6) (166.6) (138.7)
Total Closed Blocks 14.5 18.0 21.4 23.8 21.8 53.9 85.9
Total operating earnings before income taxes 435.0 272.0 256.7 209.1 270.6 963.7 709.2
Adjustments to operating earnings
Retirement 52.7 (1.4) 3.0 (8.9) 14.9 54.3 (16.6)
Annuities 52.3 9.9 7.0 (44.4) (13.2) 69.2 (53.0)
Total Retirement Solutions 105.0 8.5 10.0 (53.3) 1.7 123.5 (69.6)
Investment Management 11.5 —— — — 11.5 2.2
Individual Life 56.8 (4.9) (2.7) 4.6 8.6 49.2 13.6
Employee Benefits 4.0 —— — 0.6 4.0 0.1
Total Insurance Solutions 60.8 (4.9) (2.7) 4.6 9.2 53.2 13.7
Ongoing Business 177.3 3.6 7.3 (48.7) 10.9 188.2 (53.7)
Corporate (47.6) (43.2) (41.9) (39.2) (39.8) (132.7) (88.6)
Total Closed Blocks 0.6 —— — — 0.6 (5.8)
Total adjustments to operating earnings 130.3 (39.6) (34.6) (87.9) (28.9) 56.1 (148.1)
Adjusted Operating Earnings
Retirement 134.6
133.5 134.8 117.1 130.5 402.9 357.0
Annuities 44.5 49.6 47.3 50.7 45.8 141.4 148.9
Total Retirement Solutions 179.1 183.1 182.1 167.8 176.3 544.3 505.9
Investment Management 42.5 41.1 30.1 31.2 39.1 113.7 101.1
Individual Life 60.2 44.9 53.5 50.0 44.6 158.6 128.0
Employee Benefits 25.1 34.1 12.4 28.6 35.5 71.6 80.7
Total Insurance Solutions 85.3 79.0 65.9 78.6 80.1 230.2 208.7
Ongoing Business 306.9 303.2 278.1 277.6 295.5 888.2 815.7
Corporate (16.1) (9.6) (8.2) (4.4) (17.8) (33.9) (50.1)
Total Closed Blocks 13.9 18.0 21.4 23.8 21.8 53.3 91.7
Total adjusted operating earnings before interest and income taxes 304.7 311.6 291.3 297.0 299.5 907.6 857.3
Page 16 of 70
ING U.S.
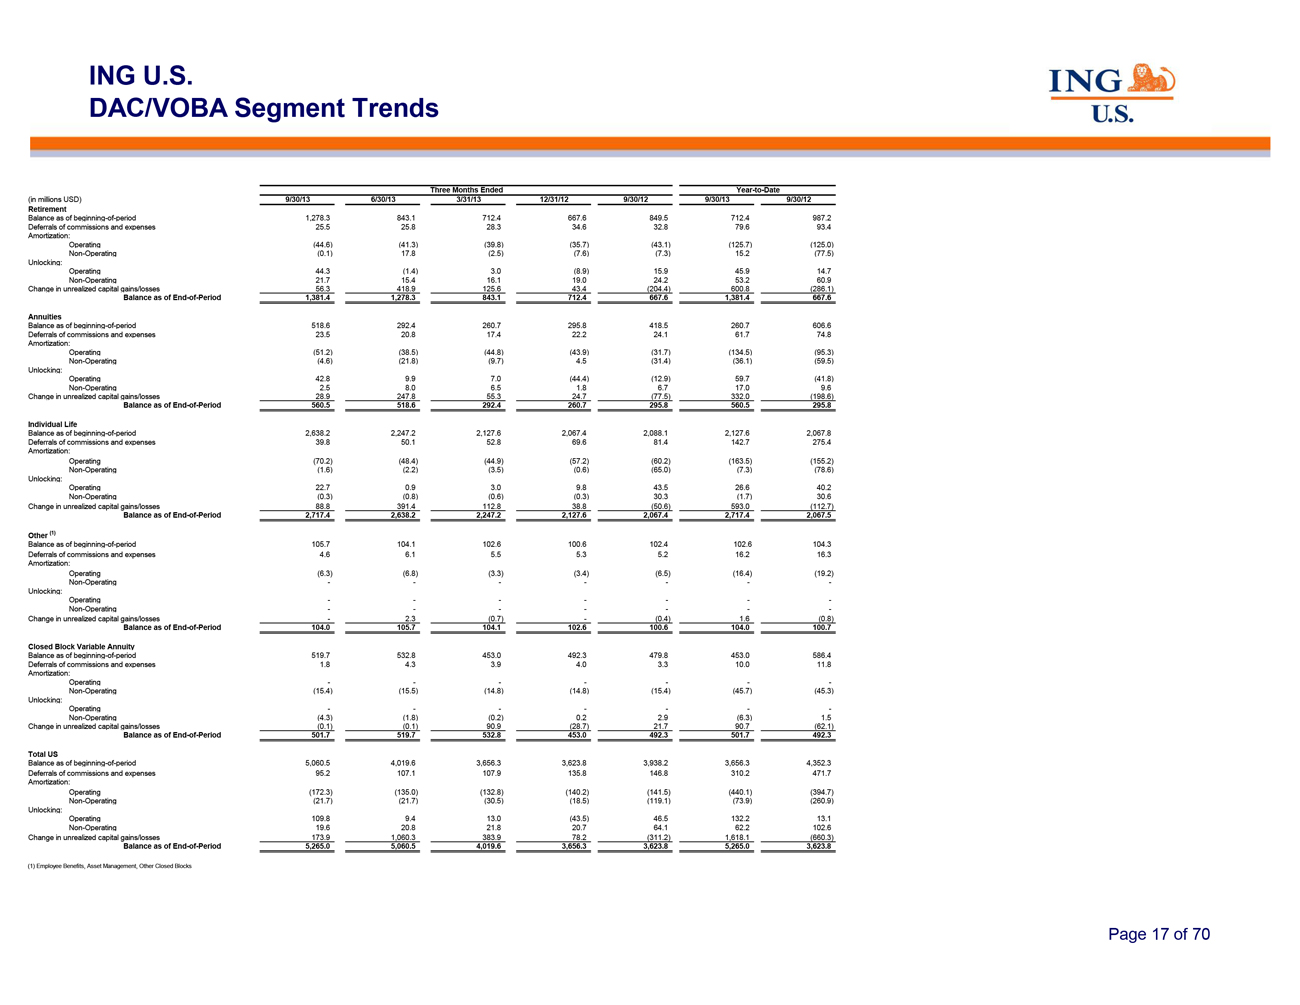
DAC/VOBA Segment Trends
Three Months Ended Year-to-Date
(in millions USD) 9/30/13 6/30/13 3/31/13 12/31/12 9/30/12 9/30/13 9/30/12
Retirement
Balance as of beginning-of-period
1,278.3 843.1 712.4 667.6 849.5 712.4 987.2
Deferrals of commissions and expenses 25.5 25.8 28.3 34.6 32.8
79.6 93.4
Amortization:
Operating (44.6) (41.3) (39.8) (35.7) (43.1) (125.7) (125.0)
Non-Operating (0.1) 17.8 (2.5) (7.6) (7.3) 15.2 (77.5)
Unlocking:
Operating 44.3 (1.4) 3.0
(8.9) 15.9 45.9 14.7
Non-Operating 21.7 15.4 16.1 19.0 24.2 53.2 60.9
Change in unrealized capital gains/losses 56.3 418.9 125.6 43.4 (204.4) 600.8 (286.1)
Balance as of End-of-Period 1,381.4 1,278.3 843.1 712.4 667.6 1,381.4 667.6
Annuities
Balance as of beginning-of-period 518.6 292.4 260.7 295.8 418.5 260.7 606.6
Deferrals of commissions and expenses 23.5 20.8 17.4 22.2 24.1 61.7 74.8
Amortization:
Operating
(51.2) (38.5) (44.8) (43.9) (31.7) (134.5) (95.3)
Non-Operating
(4.6) (21.8) (9.7) 4.5 (31.4) (36.1) (59.5)
Unlocking:
Operating 42.8 9.9 7.0 (44.4) (12.9) 59.7 (41.8)
Non-Operating 2.5 8.0 6.5 1.8 6.7 17.0 9.6
Change in unrealized capital gains/losses 28.9 247.8 55.3 24.7 (77.5) 332.0 (198.6)
Balance as of End-of-Period 560.5 518.6 292.4 260.7 295.8 560.5 295.8
Individual Life
Balance as of beginning-of-period
2,638.2 2,247.2 2,127.6 2,067.4 2,088.1 2,127.6 2,067.8
Deferrals of commissions and expenses 39.8 50.1 52.8
69.6 81.4 142.7 275.4
Amortization:
Operating (70.2) (48.4) (44.9) (57.2) (60.2) (163.5) (155.2)
Non-Operating (1.6) (2.2) (3.5) (0.6) (65.0) (7.3) (78.6)
Unlocking:
Operating 22.7 0.9 3.0 9.8 43.5 26.6
40.2
Non-Operating (0.3) (0.8) (0.6) (0.3) 30.3 (1.7) 30.6
Change in unrealized capital gains/losses 88.8 391.4 112.8 38.8 (50.6) 593.0 (112.7)
Balance as of End-of-Period 2,717.4 2,638.2 2,247.2 2,127.6 2,067.4 2,717.4 2,067.5
Other (1)
Balance as of beginning-of-period 105.7 104.1 102.6 100.6 102.4 102.6 104.3
Deferrals of commissions and expenses 4.6 6.1 5.5 5.3 5.2 16.2 16.3
Amortization:
Operating
(6.3) (6.8) (3.3) (3.4) (6.5) (16.4) (19.2)
Non-Operating
—————— -
Unlocking:
Operating —————— -
Non-Operating —————— -
Change in unrealized capital gains/losses — 2.3 (0.7) — (0.4) 1.6 (0.8)
Balance as of End-of-Period 104.0 105.7 104.1 102.6 100.6 104.0 100.7
Closed Block Variable Annuity
Balance as of
beginning-of-period 519.7 532.8 453.0 492.3 479.8 453.0 586.4
Deferrals of commissions and expenses 1.8 4.3
3.9 4.0 3.3 10.0 11.8
Amortization:
Operating —————— -
Non-Operating (15.4) (15.5) (14.8) (14.8) (15.4) (45.7) (45.3)
Unlocking:
Operating —————— -
Non-Operating (4.3) (1.8) (0.2) 0.2 2.9 (6.3) 1.5
Change in unrealized capital gains/losses (0.1) (0.1) 90.9 (28.7) 21.7 90.7 (62.1)
Balance as of End-of-Period 501.7 519.7 532.8 453.0 492.3 501.7 492.3
Total US
Balance as of beginning-of-period 5,060.5 4,019.6 3,656.3 3,623.8 3,938.2 3,656.3 4,352.3
Deferrals of commissions and expenses 95.2 107.1 107.9 135.8 146.8 310.2 471.7
Amortization:
Operating
(172.3) (135.0) (132.8) (140.2) (141.5) (440.1) (394.7)
Non-Operating
(21.7) (21.7) (30.5) (18.5) (119.1) (73.9) (260.9)
Unlocking:
Operating 109.8 9.4 13.0 (43.5) 46.5 132.2 13.1
Non-Operating 19.6 20.8 21.8 20.7 64.1 62.2 102.6
Change in unrealized capital gains/losses 173.9 1,060.3 383.9 78.2 (311.2) 1,618.1 (660.3)
Balance as of End-of-Period 5,265.0 5,060.5 4,019.6 3,656.3 3,623.8 5,265.0 3,623.8
| (1) |
|
Employee Benefits, Asset Management, Other Closed Blocks |
Page 17 of 70
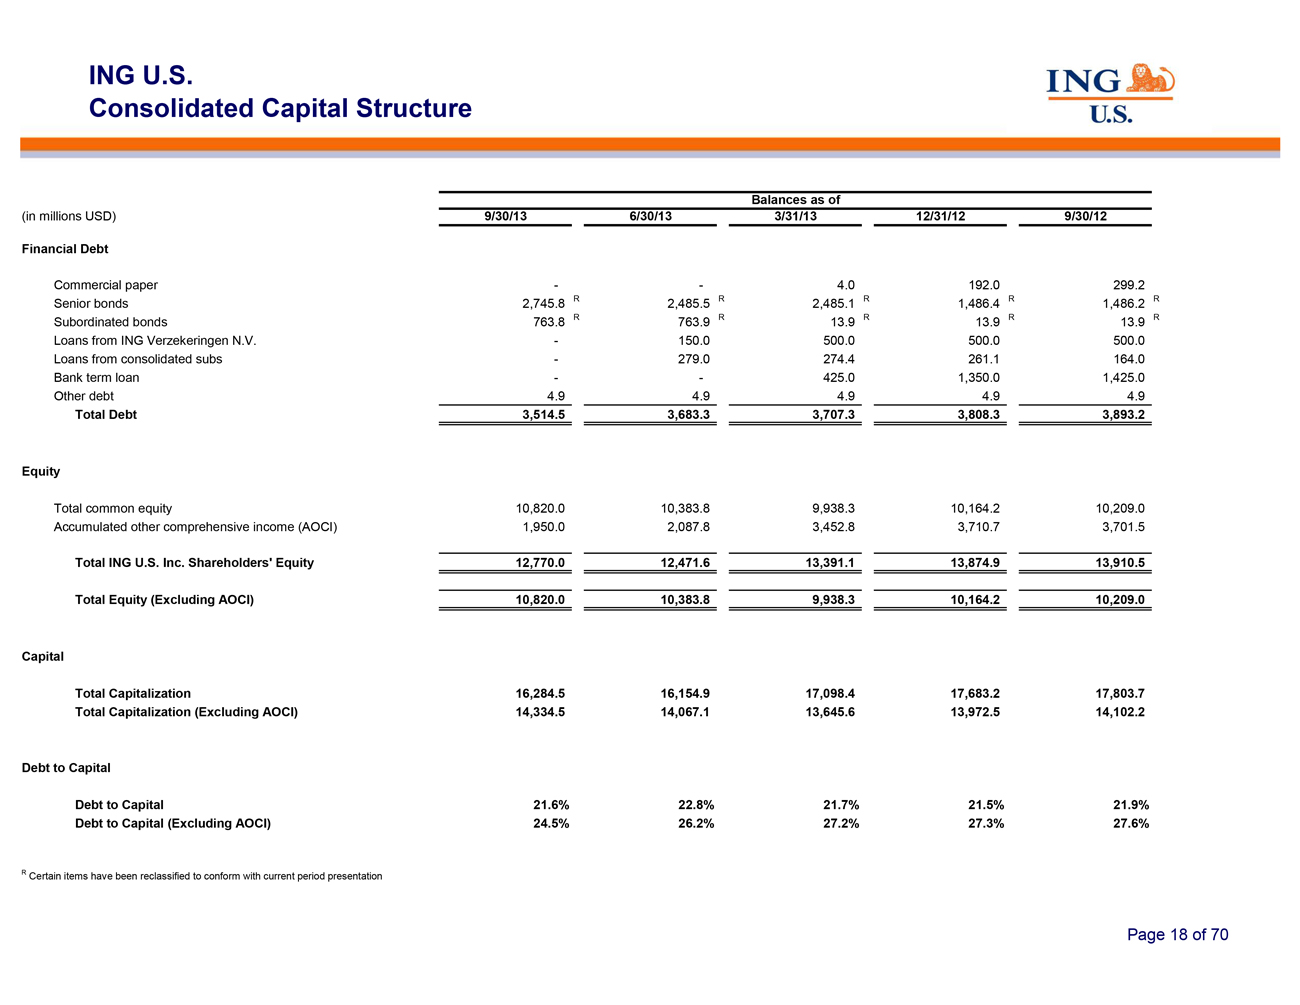
ING U.S.
Consolidated Capital Structure
Balances as of
(in millions USD) 9/30/13 6/30/13 3/31/13 12/31/12 9/30/12
Financial Debt
Commercial paper - - 4.0 192.0
299.2
Senior bonds 2,745.8 R 2,485.5 R 2,485.1 R 1,486.4 R 1,486.2 R
Subordinated bonds 763.8 R 763.9 R 13.9 R 13.9 R 13.9 R
Loans from ING Verzekeringen N.V. - 150.0 500.0 500.0 500.0
Loans from consolidated subs - 279.0 274.4 261.1 164.0
Bank term loan - - 425.0 1,350.0 1,425.0
Other debt 4.9 4.9 4.9 4.9 4.9
Total Debt 3,514.5
3,683.3 3,707.3 3,808.3 3,893.2
Equity
Total common equity 10,820.0 10,383.8 9,938.3 10,164.2 10,209.0
Accumulated other comprehensive income (AOCI) 1,950.0 2,087.8 3,452.8 3,710.7 3,701.5
Total ING U.S. Inc. Shareholders’ Equity 12,770.0 12,471.6 13,391.1 13,874.9 13,910.5
Total Equity (Excluding AOCI) 10,820.0 10,383.8 9,938.3 10,164.2 10,209.0
Capital
Total Capitalization 16,284.5 16,154.9 17,098.4 17,683.2 17,803.7
Total Capitalization (Excluding AOCI) 14,334.5 14,067.1 13,645.6 13,972.5 14,102.2
Debt to Capital
Debt to Capital 21.6% 22.8% 21.7%
21.5% 21.9%
Debt to Capital (Excluding AOCI) 24.5% 26.2% 27.2% 27.3% 27.6%
R Certain items have been reclassified to conform with current period presentation
page 18 of 70
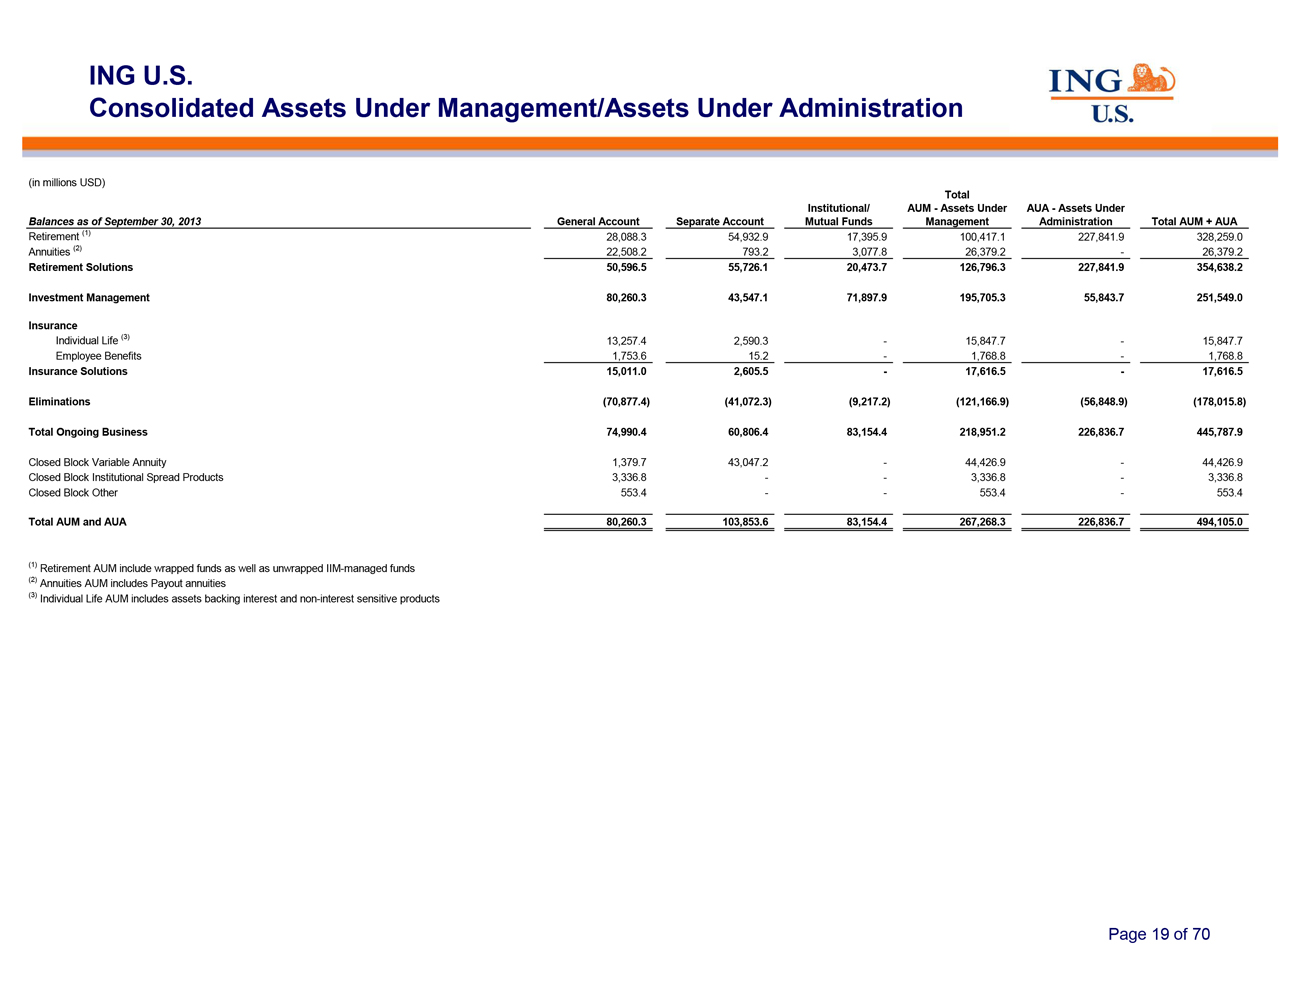
ING U.S.
Consolidated Assets Under
Management/Assets Under Administration
(in millions USD)
Total
Institutional/ AUM—Assets Under AUA—Assets Under
Balances as of September 30, 2013 General Account Separate Account Mutual Funds Management Administration Total AUM + AUA
Retirement (1) 28,088.3 54,932.9 17,395.9 100,417.1 227,841.9 328,259.0
Annuities (2) 22,508.2 793.2 3,077.8 26,379.2 — 26,379.2
Retirement Solutions 50,596.5 55,726.1 20,473.7 126,796.3 227,841.9 354,638.2
Investment Management 80,260.3 43,547.1 71,897.9 195,705.3 55,843.7 251,549.0
Insurance
Individual Life (3) 13,257.4 2,590.3 — 15,847.7 — 15,847.7
Employee Benefits 1,753.6 15.2 — 1,768.8 — 1,768.8
Insurance Solutions 15,011.0 2,605.5 — 17,616.5 — 17,616.5
Eliminations (70,877.4) (41,072.3) (9,217.2) (121,166.9) (56,848.9) (178,015.8)
Total Ongoing Business 74,990.4 60,806.4 83,154.4 218,951.2 226,836.7 445,787.9
Closed Block Variable Annuity 1,379.7 43,047.2 — 44,426.9 — 44,426.9
Closed Block Institutional Spread Products 3,336.8 —— 3,336.8 — 3,336.8
Closed Block Other 553.4 —— 553.4 — 553.4
Total AUM and AUA 80,260.3 103,853.6 83,154.4 267,268.3 226,836.7 494,105.0
| (1) |
|
Retirement AUM include wrapped funds as well as unwrapped IIM-managed funds |
| (2) |
|
Annuities AUM includes Payout annuities |
| (3) |
|
Individual Life AUM includes assets backing interest and non-interest sensitive products
|
Page 19 of 70
ING U.S. Retirement
Page 20 of 70
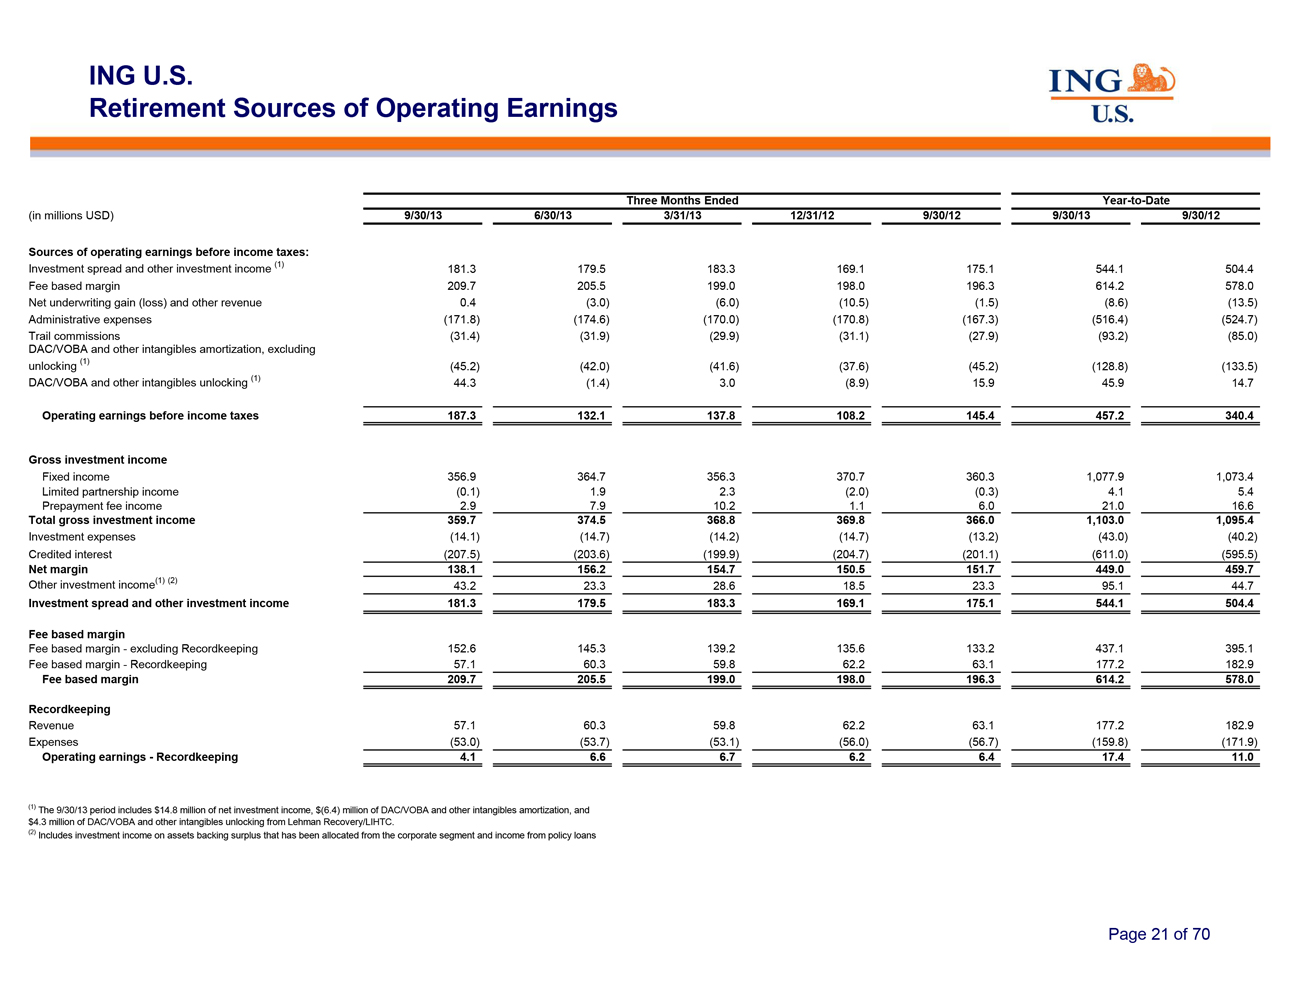
ING U.S.
Retirement Sources of Operating Earnings
Three Months Ended Year-to-Date
(in millions USD) 9/30/13 6/30/13 3/31/13 12/31/12 9/30/12 9/30/13 9/30/12
Sources of operating earnings before income taxes:
Investment spread and other investment income (1) 181.3 179.5 183.3 169.1 175.1 544.1 504.4
Fee based margin 209.7 205.5 199.0 198.0 196.3 614.2 578.0
Net underwriting gain (loss) and other revenue 0.4 (3.0) (6.0) (10.5) (1.5) (8.6) (13.5)
Administrative expenses (171.8) (174.6) (170.0) (170.8) (167.3) (516.4) (524.7)
Trail commissions (31.4) (31.9) (29.9) (31.1) (27.9) (93.2) (85.0)
DAC/VOBA and other intangibles amortization, excluding
unlocking (1) (45.2) (42.0) (41.6) (37.6) (45.2) (128.8) (133.5)
DAC/VOBA and other intangibles unlocking (1) 44.3 (1.4) 3.0 (8.9) 15.9 45.9 14.7
Operating earnings before income taxes 187.3 132.1 137.8 108.2 145.4 457.2 340.4
Gross investment income
Fixed income 356.9 364.7 356.3 370.7 360.3 1,077.9 1,073.4
Limited partnership income (0.1) 1.9 2.3 (2.0) (0.3) 4.1 5.4
Prepayment fee income 2.9 7.9 10.2 1.1 6.0 21.0 16.6
Total gross investment income 359.7 374.5 368.8 369.8 366.0 1,103.0 1,095.4
Investment expenses (14.1) (14.7) (14.2) (14.7) (13.2) (43.0) (40.2)
Credited interest (207.5) (203.6) (199.9) (204.7) (201.1) (611.0) (595.5)
Net margin 138.1 156.2 154.7 150.5 151.7 449.0 459.7
Other investment income(1) (2) 43.2 23.3 28.6 18.5 23.3 95.1 44.7
Investment spread and other investment income 181.3 179.5 183.3 169.1 175.1 544.1 504.4
Fee based margin
Fee based margin—excluding
Recordkeeping 152.6 145.3 139.2 135.6 133.2 437.1 395.1
Fee based margin—Recordkeeping 57.1 60.3 59.8
62.2 63.1 177.2 182.9
Fee based margin 209.7 205.5 199.0 198.0 196.3 614.2 578.0
Recordkeeping
Revenue 57.1 60.3 59.8 62.2 63.1 177.2 182.9
Expenses (53.0) (53.7) (53.1) (56.0) (56.7) (159.8) (171.9)
Operating earnings—Recordkeeping 4.1 6.6 6.7 6.2 6.4 17.4 11.0
(1) The 9/30/13 period includes $14.8 million of net investment income, $(6.4) million of DAC/VOBA and other intangibles
amortization, and
$4.3 million of DAC/VOBA and other intangibles unlocking from Lehman Recovery/LIHTC.
(2) Includes investment income on assets backing surplus that has been allocated from the corporate segment
and income from policy loans
Page 21 of 70
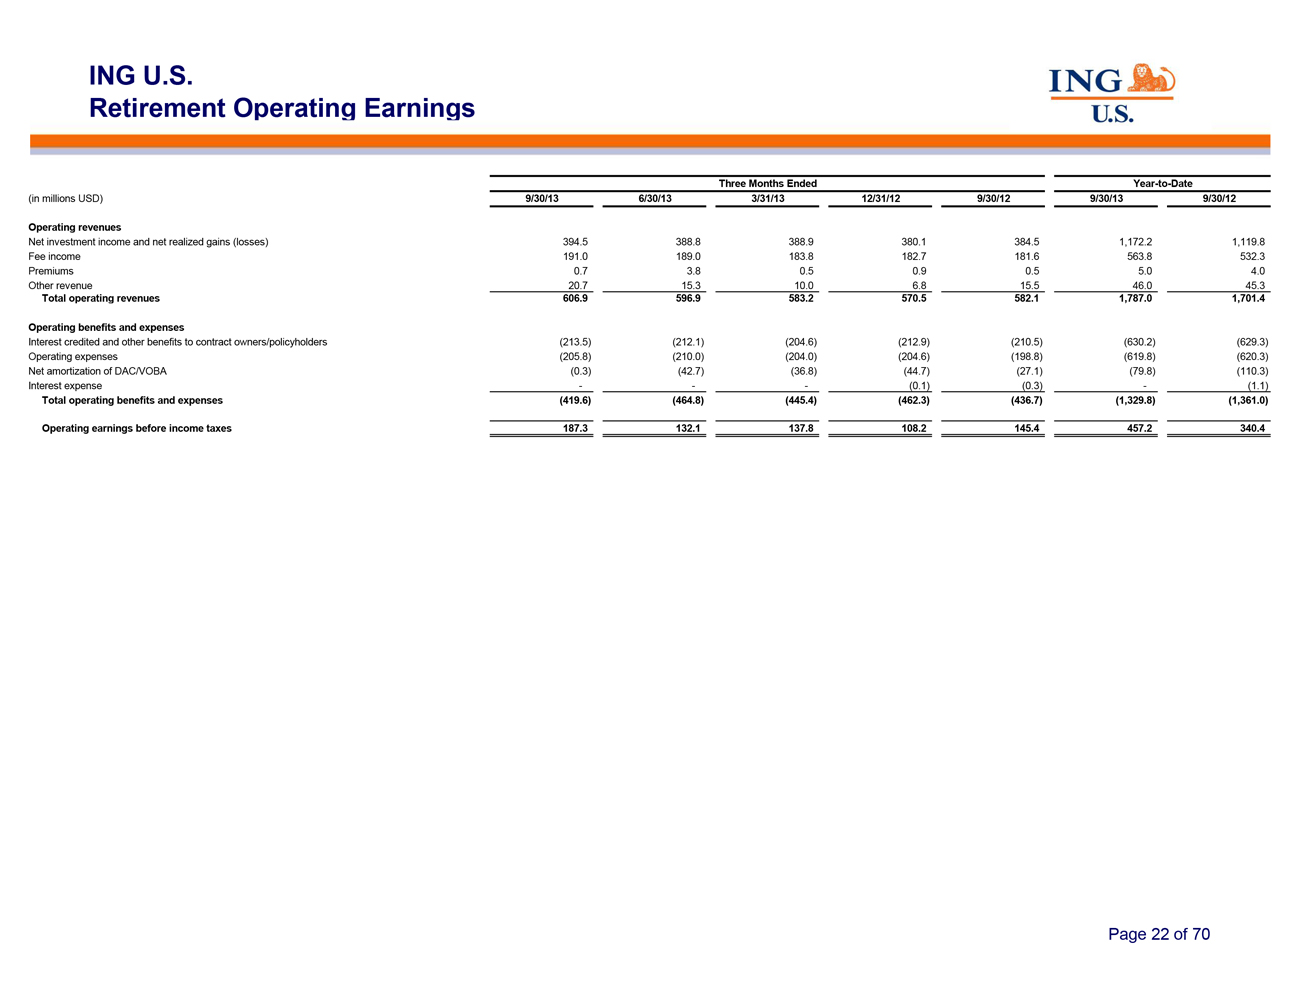
ING U.S.
Retirement Operating Earnings
Three Months Ended Year-to-Date
(in millions USD) 9/30/13 6/30/13 3/31/13 12/31/12 9/30/12 9/30/13 9/30/12
Operating revenues
Net investment income and net
realized gains (losses) 394.5 388.8 388.9 380.1 384.5 1,172.2 1,119.8
Fee income 191.0 189.0 183.8 182.7 181.6
563.8 532.3
Premiums 0.7 3.8 0.5 0.9 0.5 5.0 4.0
Other revenue 20.7 15.3 10.0 6.8 15.5 46.0 45.3
Total operating revenues 606.9 596.9 583.2 570.5 582.1 1,787.0 1,701.4
Operating benefits and expenses
Interest credited
and other benefits to contract owners/policyholders (213.5) (212.1) (204.6) (212.9) (210.5) (630.2) (629.3)
Operating expenses (205.8) (210.0) (204.0) (204.6) (198.8) (619.8) (620.3)
Net amortization of DAC/VOBA (0.3) (42.7) (36.8) (44.7) (27.1) (79.8) (110.3)
Interest expense — —— (0.1) (0.3) — (1.1)
Total operating benefits and expenses (419.6) (464.8) (445.4) (462.3) (436.7) (1,329.8) (1,361.0)
Operating earnings before income taxes 187.3 132.1 137.8 108.2 145.4 457.2 340.4
Page 22 of 70
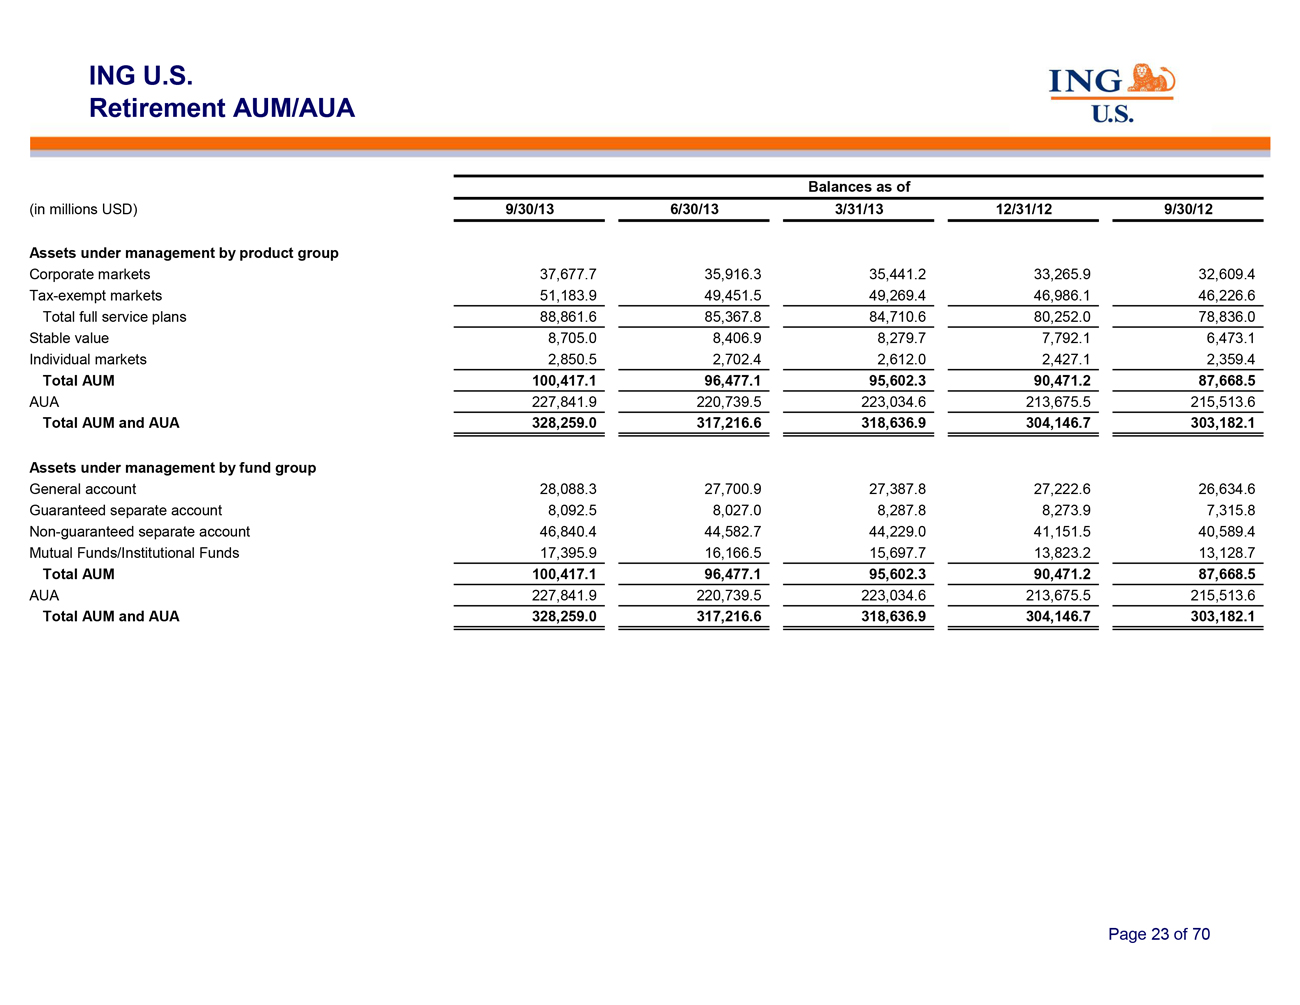
ING U.S.
Retirement AUM/AUA
Balances as of
(in millions USD) 9/30/13 6/30/13 3/31/13 12/31/12 9/30/12
Assets under management by product group
Corporate markets 37,677.7 35,916.3 35,441.2 33,265.9 32,609.4
Tax-exempt markets 51,183.9 49,451.5 49,269.4 46,986.1 46,226.6
Total full service plans 88,861.6 85,367.8 84,710.6 80,252.0 78,836.0
Stable value 8,705.0 8,406.9 8,279.7 7,792.1 6,473.1
Individual markets 2,850.5 2,702.4 2,612.0 2,427.1 2,359.4
Total AUM 100,417.1 96,477.1 95,602.3 90,471.2 87,668.5
AUA 227,841.9 220,739.5 223,034.6 213,675.5 215,513.6
Total AUM and AUA 328,259.0 317,216.6 318,636.9 304,146.7 303,182.1
Assets under management by fund group
General account 28,088.3 27,700.9 27,387.8 27,222.6 26,634.6
Guaranteed separate account 8,092.5 8,027.0 8,287.8 8,273.9 7,315.8
Non-guaranteed separate account 46,840.4 44,582.7 44,229.0 41,151.5 40,589.4
Mutual Funds/Institutional Funds 17,395.9 16,166.5 15,697.7 13,823.2 13,128.7
Total AUM 100,417.1 96,477.1 95,602.3 90,471.2 87,668.5
AUA 227,841.9 220,739.5 223,034.6 213,675.5 215,513.6
Total AUM and AUA 328,259.0 317,216.6 318,636.9 304,146.7 303,182.1
Page 23 of 70
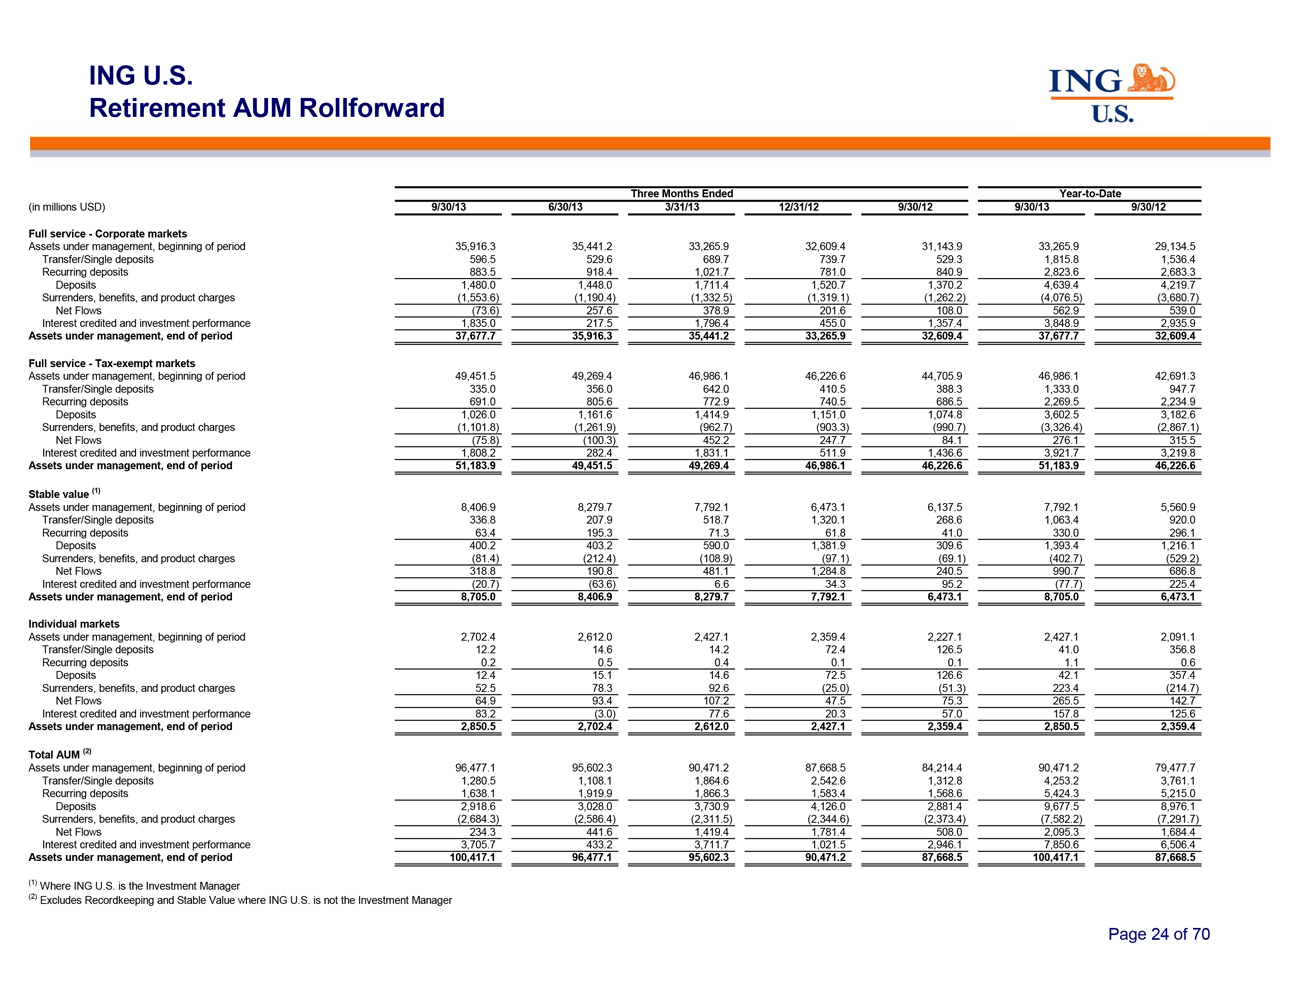
ING U.S.
Retirement AUM Rollforward
Three Months Ended Year-to-Date
(in millions USD) 9/30/13 6/30/13 3/31/13 12/31/12 9/30/12 9/30/13 9/30/12
Full service—Corporate markets
Assets under
management, beginning of period 35,916.3 35,441.2 33,265.9 32,609.4 31,143.9 33,265.9 29,134.5
Transfer/Single
deposits 596.5 529.6 689.7 739.7 529.3 1,815.8 1,536.4
Recurring deposits 883.5 918.4 1,021.7 781.0 840.9
2,823.6 2,683.3
Deposits 1,480.0 1,448.0 1,711.4 1,520.7 1,370.2 4,639.4 4,219.7
Surrenders, benefits, and product charges
(1,553.6) (1,190.4) (1,332.5) (1,319.1) (1,262.2) (4,076.5) (3,680.7)
Net Flows
(73.6) 257.6 378.9 201.6 108.0 562.9 539.0
Interest credited and investment performance 1,835.0 217.5
1,796.4 455.0 1,357.4 3,848.9 2,935.9
Assets under management, end of period 37,677.7 35,916.3 35,441.2
33,265.9 32,609.4 37,677.7 32,609.4
Full service—Tax-exempt markets
Assets under management, beginning of period 49,451.5 49,269.4 46,986.1 46,226.6 44,705.9 46,986.1 42,691.3
Transfer/Single deposits 335.0 356.0 642.0 410.5 388.3 1,333.0 947.7
Recurring deposits 691.0 805.6 772.9 740.5 686.5 2,269.5 2,234.9
Deposits 1,026.0 1,161.6 1,414.9 1,151.0 1,074.8 3,602.5 3,182.6
Surrenders, benefits, and product charges
(1,101.8) (1,261.9) (962.7) (903.3) (990.7) (3,326.4) (2,867.1)
Net Flows
(75.8) (100.3) 452.2 247.7 84.1 276.1 315.5
Interest credited and investment performance 1,808.2
282.4 1,831.1 511.9 1,436.6 3,921.7 3,219.8
Assets under management, end of period 51,183.9 49,451.5 49,269.4
46,986.1 46,226.6 51,183.9 46,226.6
Stable value (1)
Assets under management, beginning of period 8,406.9 8,279.7 7,792.1 6,473.1 6,137.5 7,792.1 5,560.9
Transfer/Single deposits 336.8 207.9 518.7 1,320.1 268.6 1,063.4 920.0
Recurring deposits 63.4 195.3 71.3 61.8 41.0 330.0 296.1
Deposits 400.2 403.2 590.0 1,381.9 309.6 1,393.4 1,216.1
Surrenders, benefits, and product charges
(81.4) (212.4) (108.9) (97.1) (69.1) (402.7) (529.2)
Net Flows 318.8 190.8 481.1
1,284.8 240.5 990.7 686.8
Interest credited and investment performance (20.7) (63.6) 6.6 34.3 95.2
(77.7) 225.4
Assets under management, end of period 8,705.0 8,406.9 8,279.7 7,792.1 6,473.1 8,705.0
6,473.1
Individual markets
Assets under management, beginning of period 2,702.4 2,612.0 2,427.1 2,359.4 2,227.1 2,427.1 2,091.1
Transfer/Single deposits 12.2 14.6 14.2 72.4 126.5 41.0 356.8
Recurring deposits 0.2 0.5 0.4 0.1 0.1 1.1 0.6
Deposits 12.4 15.1 14.6 72.5 126.6 42.1 357.4
Surrenders, benefits, and product charges 52.5 78.3 92.6 (25.0) (51.3) 223.4 (214.7)
Net Flows 64.9 93.4 107.2 47.5 75.3 265.5 142.7
Interest credited and investment performance 83.2 (3.0) 77.6 20.3 57.0 157.8 125.6
Assets under management, end of period 2,850.5 2,702.4 2,612.0 2,427.1 2,359.4 2,850.5 2,359.4
Total AUM (2)
Assets under management, beginning of period 96,477.1 95,602.3 90,471.2 87,668.5 84,214.4 90,471.2 79,477.7
Transfer/Single deposits 1,280.5 1,108.1 1,864.6 2,542.6 1,312.8 4,253.2 3,761.1
Recurring deposits 1,638.1 1,919.9 1,866.3 1,583.4 1,568.6 5,424.3 5,215.0
Deposits 2,918.6 3,028.0 3,730.9 4,126.0 2,881.4 9,677.5 8,976.1
Surrenders, benefits, and product charges (2,684.3) (2,586.4) (2,311.5) (2,344.6) (2,373.4) (7,582.2) (7,291.7)
Net Flows 234.3 441.6 1,419.4 1,781.4 508.0 2,095.3 1,684.4
Interest credited and investment performance 3,705.7 433.2 3,711.7 1,021.5 2,946.1 7,850.6 6,506.4
Assets under management, end of period 100,417.1 96,477.1 95,602.3 90,471.2 87,668.5 100,417.1 87,668.5
| (1) |
|
Where ING U.S. is the Investment Manager |
| (2) |
|
Excludes Recordkeeping and Stable Value where ING U.S. is not the Investment Manager
|
Page 24 of 70
ING U.S. Annuities
Page 25 of 70
ING U.S.
Annuities Sources of Operating Earnings
Three Months Ended Year-to-Date
(in millions USD) 9/30/13 6/30/13 3/31/13 12/31/12 9/30/12 9/30/13 9/30/12
Sources of operating earnings before income taxes:
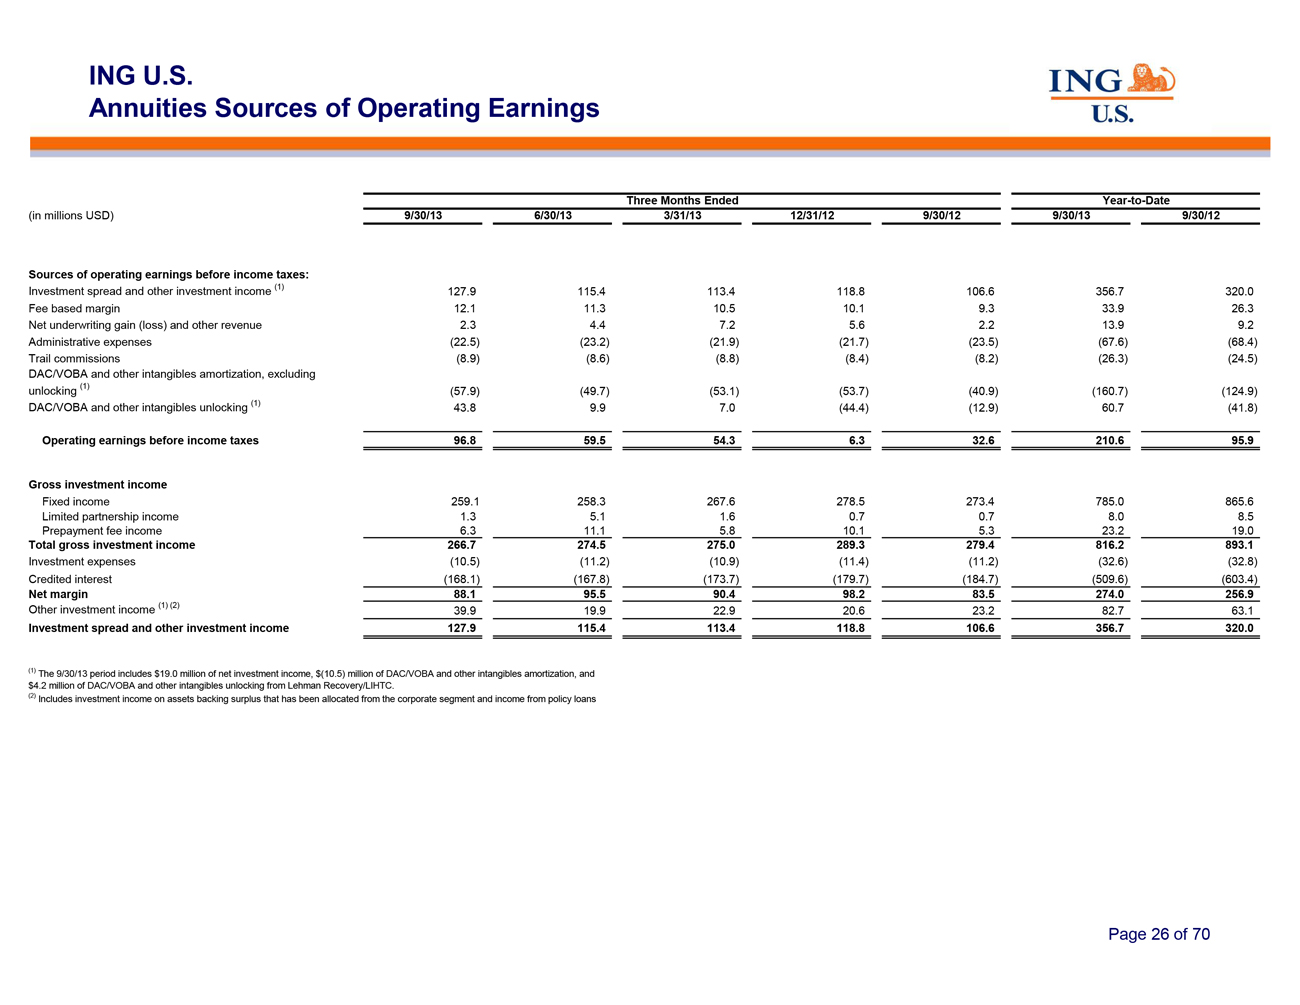
Investment spread and other investment income (1) 127.9 115.4 113.4 118.8 106.6 356.7 320.0
Fee based margin 12.1 11.3 10.5 10.1 9.3 33.9 26.3
Net underwriting gain (loss) and other revenue 2.3 4.4 7.2 5.6 2.2 13.9 9.2
Administrative expenses (22.5) (23.2) (21.9) (21.7) (23.5) (67.6) (68.4)
Trail commissions (8.9) (8.6) (8.8) (8.4) (8.2) (26.3) (24.5)
DAC/VOBA and other intangibles amortization, excluding
unlocking (1) (57.9) (49.7) (53.1) (53.7) (40.9) (160.7) (124.9)
DAC/VOBA and other intangibles unlocking (1) 43.8 9.9 7.0 (44.4) (12.9) 60.7 (41.8)
Operating earnings before income taxes 96.8 59.5 54.3 6.3 32.6 210.6 95.9
Gross investment income
Fixed income 259.1 258.3 267.6 278.5 273.4 785.0 865.6
Limited partnership income 1.3 5.1 1.6 0.7 0.7 8.0 8.5
Prepayment fee income 6.3 11.1 5.8 10.1 5.3 23.2 19.0
Total gross investment income 266.7 274.5 275.0 289.3 279.4 816.2 893.1
Investment expenses (10.5) (11.2) (10.9) (11.4) (11.2) (32.6) (32.8)
Credited interest (168.1) (167.8) (173.7) (179.7) (184.7) (509.6) (603.4)
Net margin 88.1 95.5 90.4 98.2 83.5 274.0 256.9
Other investment income (1) (2) 39.9 19.9 22.9 20.6 23.2 82.7 63.1
Investment spread and other investment income 127.9 115.4 113.4 118.8 106.6 356.7 320.0
(1) The 9/30/13 period includes $19.0 million of net investment income, $(10.5) million of DAC/VOBA and other intangibles
amortization, and
$4.2 million of DAC/VOBA and other intangibles unlocking from Lehman Recovery/LIHTC.
(2) Includes investment income on assets backing surplus that has been allocated from the corporate segment
and income from policy loans
Page 26 of 70
ING U.S.
Annuities Operating Earnings
Three Months Ended Year-to-Date
(in millions USD) 9/30/13 6/30/13 3/31/13 12/31/12 9/30/12 9/30/13 9/30/12
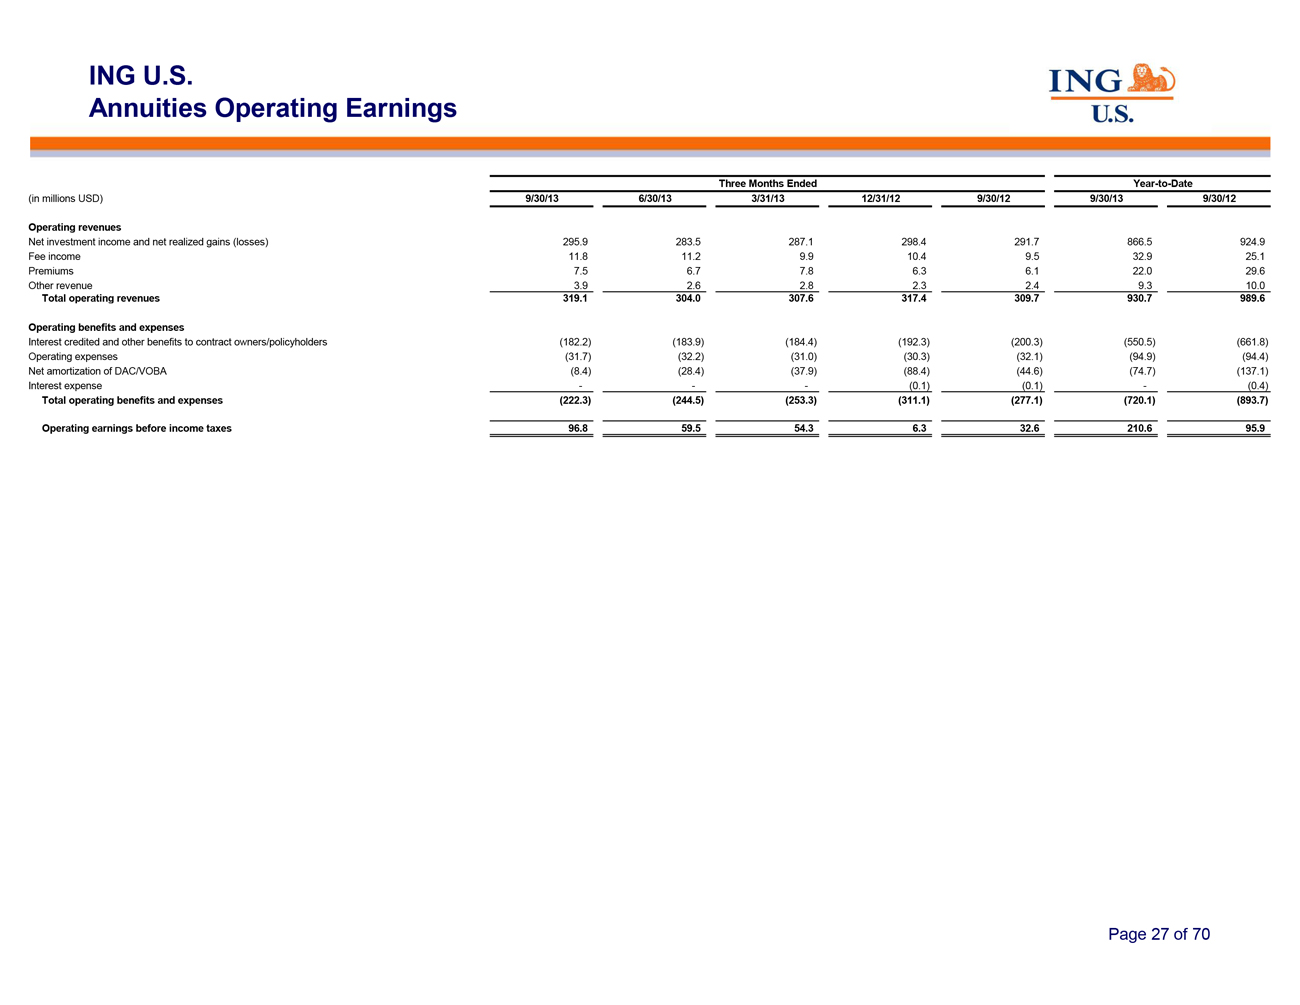
Operating revenues
Net investment income and net
realized gains (losses) 295.9 283.5 287.1 298.4 291.7 866.5 924.9
Fee income 11.8 11.2 9.9 10.4 9.5 32.9 25.1
Premiums 7.5 6.7 7.8 6.3 6.1 22.0 29.6
Other revenue 3.9 2.6 2.8 2.3 2.4 9.3 10.0
Total operating revenues 319.1 304.0 307.6 317.4 309.7 930.7 989.6
Operating benefits and expenses
Interest credited
and other benefits to contract owners/policyholders (182.2) (183.9) (184.4) (192.3) (200.3) (550.5) (661.8)
Operating expenses (31.7) (32.2) (31.0) (30.3) (32.1) (94.9) (94.4)
Net amortization of DAC/VOBA (8.4) (28.4) (37.9) (88.4) (44.6) (74.7) (137.1)
Interest expense — —— (0.1) (0.1) — (0.4)
Total operating benefits and expenses (222.3) (244.5) (253.3) (311.1) (277.1) (720.1) (893.7)
Operating earnings before income taxes 96.8 59.5 54.3 6.3 32.6 210.6 95.9
Page 27 of 70
ING U.S. Annuities AUM
Balances as of
(in millions USD) 9/30/13 6/30/13 3/31/13 12/31/12 9/30/12
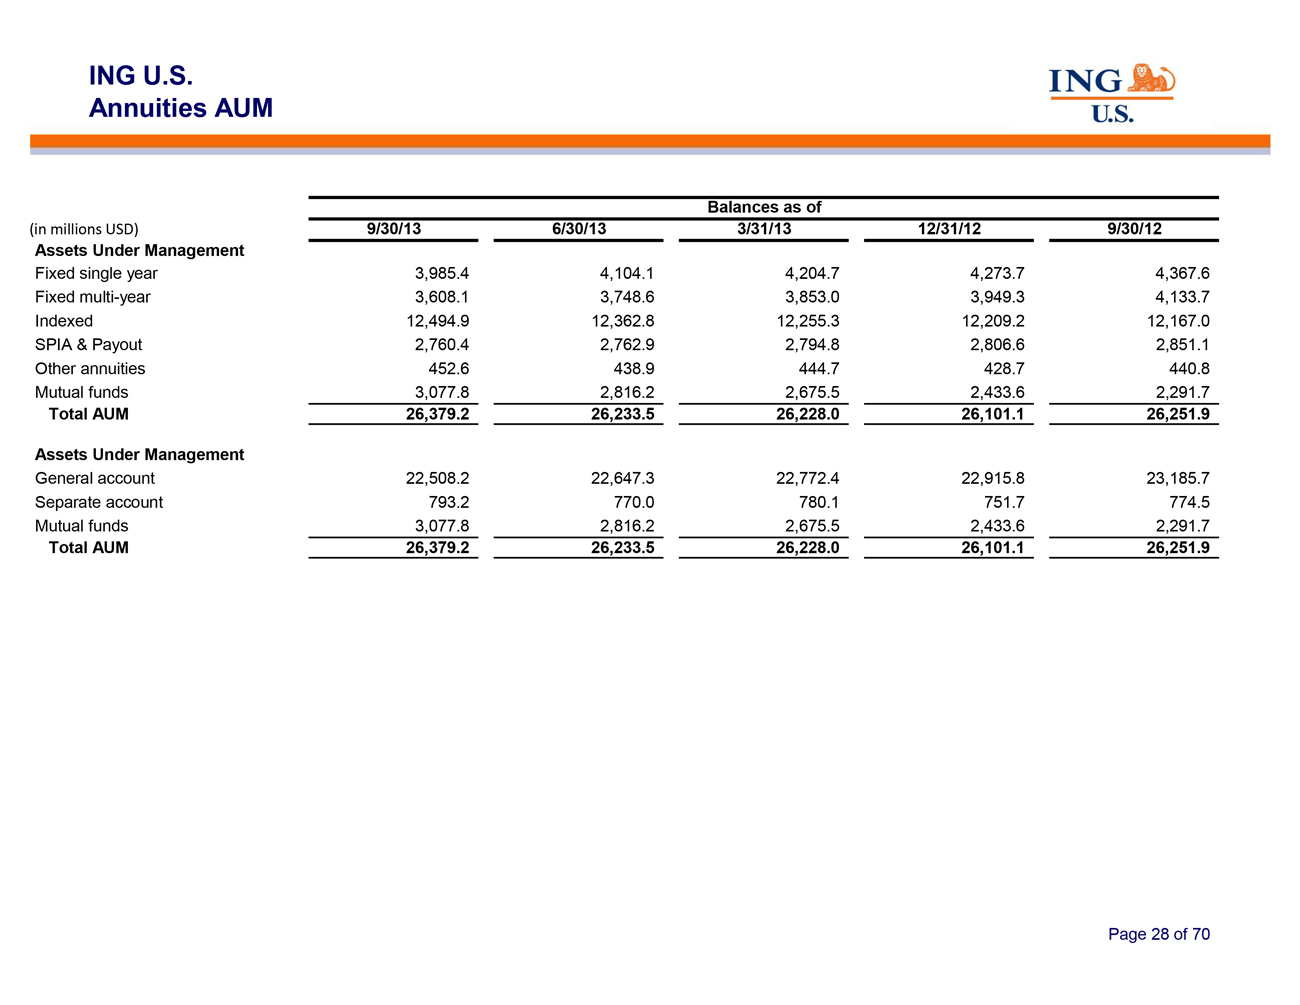
Assets Under Management
Fixed single year 3,985.4 4,104.1 4,204.7 4,273.7 4,367.6
Fixed multi-year 3,608.1 3,748.6 3,853.0 3,949.3 4,133.7
Indexed 12,494.9 12,362.8 12,255.3 12,209.2 12,167.0
SPIA & Payout 2,760.4 2,762.9 2,794.8 2,806.6 2,851.1
Other annuities 452.6 438.9 444.7 428.7 440.8
Mutual funds 3,077.8 2,816.2 2,675.5 2,433.6 2,291.7
Total AUM 26,379.2 26,233.5 26,228.0 26,101.1 26,251.9
Assets Under Management
General account 22,508.2 22,647.3 22,772.4 22,915.8 23,185.7
Separate account 793.2 770.0 780.1 751.7 774.5
Mutual funds 3,077.8 2,816.2 2,675.5 2,433.6 2,291.7
Total AUM 26,379.2 26,233.5 26,228.0 26,101.1 26,251.9
Page 28 of 70
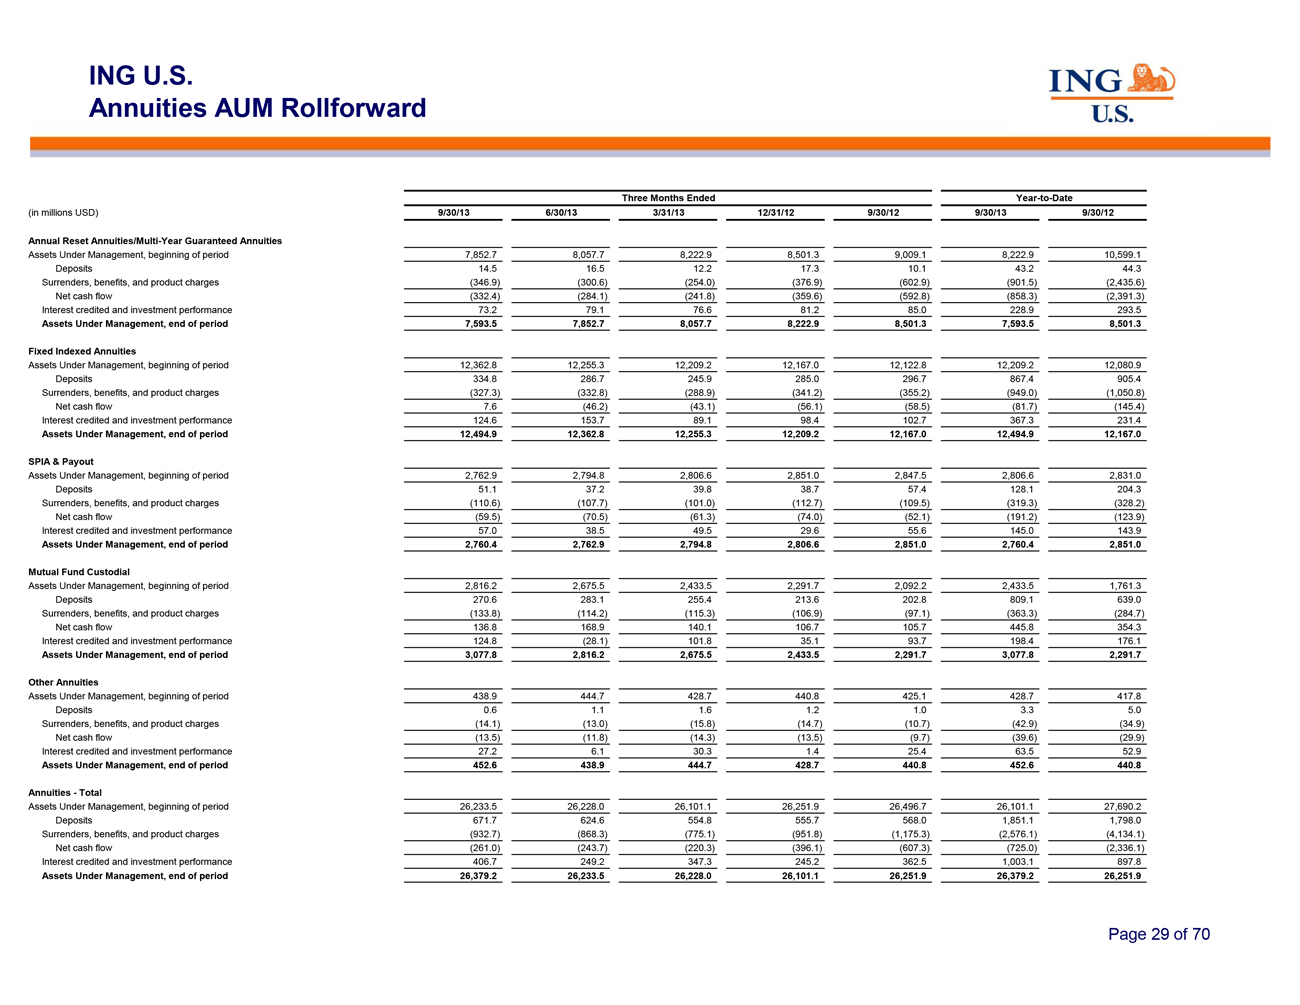
ING U.S.
Annuities AUM Rollforward
Three Months Ended Year-to-Date
(in millions USD) 9/30/13 6/30/13 3/31/13 12/31/12 9/30/12 9/30/13 9/30/12
Annual Reset Annuities/Multi-Year Guaranteed Annuities
Assets Under Management, beginning of period 7,852.7 8,057.7 8,222.9 8,501.3 9,009.1 8,222.9 10,599.1
Deposits 14.5 16.5 12.2 17.3 10.1 43.2 44.3
Surrenders, benefits, and product charges
(346.9) (300.6) (254.0) (376.9) (602.9) (901.5) (2,435.6)
Net cash flow
(332.4) (284.1) (241.8) (359.6) (592.8) (858.3) (2,391.3)
Interest credited and
investment performance 73.2 79.1 76.6 81.2 85.0 228.9 293.5
Assets Under Management, end of period 7,593.5
7,852.7 8,057.7 8,222.9 8,501.3 7,593.5 8,501.3
Fixed Indexed Annuities
Assets Under Management, beginning of period 12,362.8 12,255.3 12,209.2 12,167.0 12,122.8 12,209.2 12,080.9
Deposits 334.8 286.7 245.9 285.0 296.7 867.4 905.4
Surrenders, benefits, and product charges
(327.3) (332.8) (288.9) (341.2) (355.2) (949.0) (1,050.8)
Net cash flow 7.6
(46.2) (43.1) (56.1) (58.5) (81.7) (145.4)
Interest credited and investment
performance 124.6 153.7 89.1 98.4 102.7 367.3 231.4
Assets Under Management, end of period 12,494.9 12,362.8
12,255.3 12,209.2 12,167.0 12,494.9 12,167.0
SPIA & Payout
Assets Under Management, beginning of period 2,762.9 2,794.8 2,806.6 2,851.0 2,847.5 2,806.6 2,831.0
Deposits 51.1 37.2 39.8 38.7 57.4 128.1 204.3
Surrenders, benefits, and product charges (110.6) (107.7) (101.0) (112.7) (109.5) (319.3) (328.2)
Net cash flow (59.5) (70.5) (61.3) (74.0) (52.1) (191.2) (123.9)
Interest credited and investment performance 57.0 38.5 49.5 29.6 55.6 145.0 143.9
Assets Under Management, end of period 2,760.4 2,762.9 2,794.8 2,806.6 2,851.0 2,760.4 2,851.0
Mutual Fund Custodial
Assets Under Management, beginning of period 2,816.2 2,675.5 2,433.5 2,291.7 2,092.2 2,433.5 1,761.3
Deposits 270.6 283.1 255.4 213.6 202.8 809.1 639.0
Surrenders, benefits, and product charges
(133.8) (114.2) (115.3) (106.9) (97.1) (363.3) (284.7)
Net cash flow 136.8 168.9
140.1 106.7 105.7 445.8 354.3
Interest credited and investment performance 124.8 (28.1) 101.8 35.1 93.7
198.4 176.1
Assets Under Management, end of period 3,077.8 2,816.2 2,675.5 2,433.5 2,291.7 3,077.8 2,291.7
Other Annuities
Assets Under Management, beginning of period 438.9 444.7 428.7 440.8 425.1 428.7 417.8
Deposits 0.6 1.1 1.6 1.2 1.0 3.3 5.0
Surrenders,
benefits, and product charges (14.1) (13.0) (15.8) (14.7) (10.7) (42.9) (34.9)
Net cash flow (13.5) (11.8) (14.3) (13.5) (9.7) (39.6) (29.9)
Interest credited and investment performance 27.2 6.1 30.3 1.4 25.4 63.5 52.9
Assets Under Management, end of period 452.6 438.9 444.7 428.7 440.8 452.6 440.8
Annuities—Total
Assets Under Management, beginning of period 26,233.5 26,228.0 26,101.1 26,251.9 26,496.7 26,101.1 27,690.2
Deposits 671.7 624.6 554.8 555.7 568.0 1,851.1 1,798.0
Surrenders, benefits, and product charges (932.7) (868.3) (775.1) (951.8) (1,175.3) (2,576.1) (4,134.1)
Net cash flow (261.0) (243.7) (220.3) (396.1) (607.3) (725.0) (2,336.1)
Interest credited and investment performance 406.7 249.2 347.3 245.2 362.5 1,003.1 897.8
Assets Under Management, end of period 26,379.2 26,233.5 26,228.0 26,101.1 26,251.9 26,379.2 26,251.9
Page 29 of 70
ING U.S.
Investment Management
Page 30 of 70
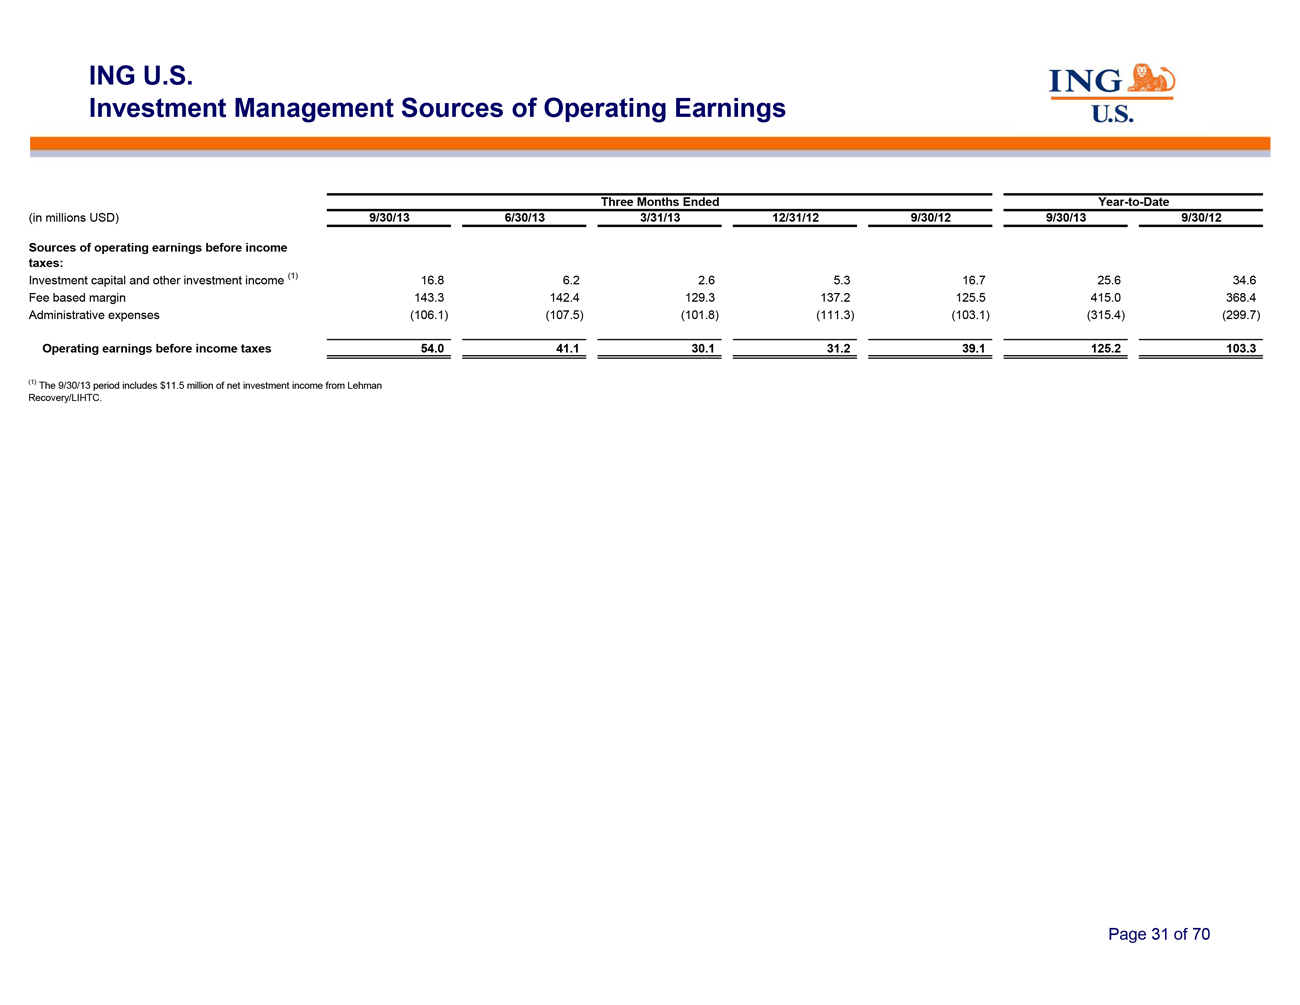
ING U.S.
Investment Management Sources of
Operating Earnings
Three Months Ended Year-to-Date
(in millions USD) 9/30/13 6/30/13 3/31/13 12/31/12 9/30/12 9/30/13 9/30/12
Sources of operating earnings before income
taxes:
Investment capital and other investment
income (1) 16.8 6.2 2.6 5.3 16.7 25.6 34.6
Fee based margin 143.3 142.4 129.3 137.2 125.5 415.0 368.4
Administrative expenses (106.1) (107.5) (101.8) (111.3) (103.1) (315.4) (299.7)
Operating earnings before income taxes 54.0 41.1 30.1 31.2 39.1 125.2 103.3
| (1) |
|
The 9/30/13 period includes $11.5 million of net investment income from Lehman |
Recovery/LIHTC.
Page 31 of 70
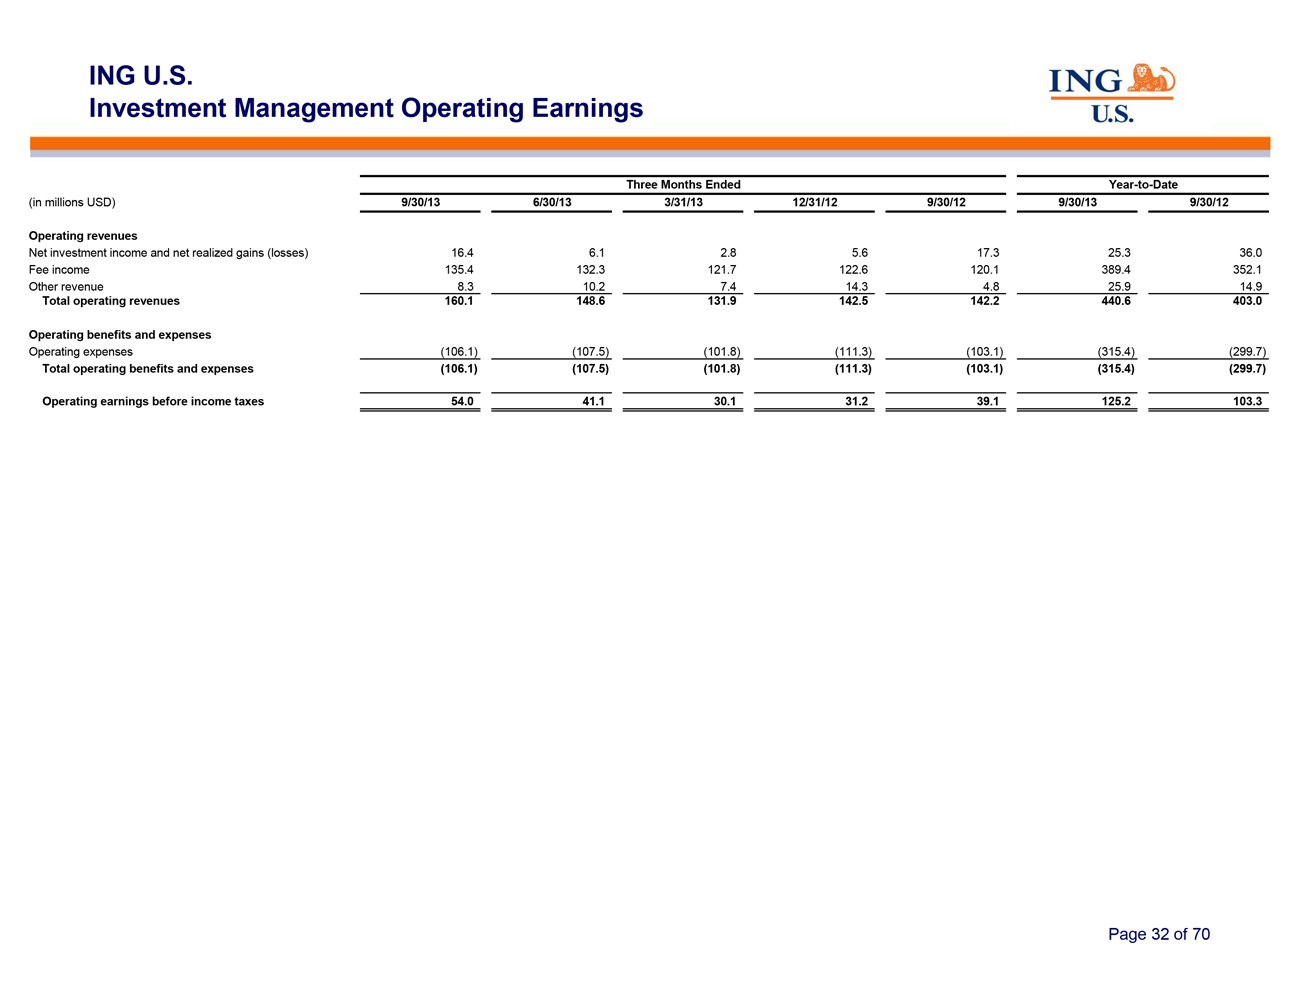
ING U.S.
Investment Management Operating Earnings
Three Months Ended Year-to-Date
(in millions USD) 9/30/13 6/30/13 3/31/13 12/31/12 9/30/12 9/30/13 9/30/12
Operating revenues
Net investment income and net
realized gains (losses) 16.4 6.1 2.8 5.6 17.3 25.3 36.0
Fee income 135.4 132.3 121.7 122.6 120.1 389.4 352.1
Other revenue 8.3 10.2 7.4 14.3 4.8 25.9 14.9
Total operating revenues 160.1 148.6 131.9 142.5 142.2 440.6 403.0
Operating benefits and expenses
Operating expenses (106.1) (107.5) (101.8) (111.3) (103.1) (315.4) (299.7)
Total operating benefits and expenses (106.1) (107.5) (101.8) (111.3) (103.1) (315.4) (299.7)
Operating earnings before income taxes 54.0 41.1 30.1 31.2 39.1 125.2 103.3
Page 32 of 70
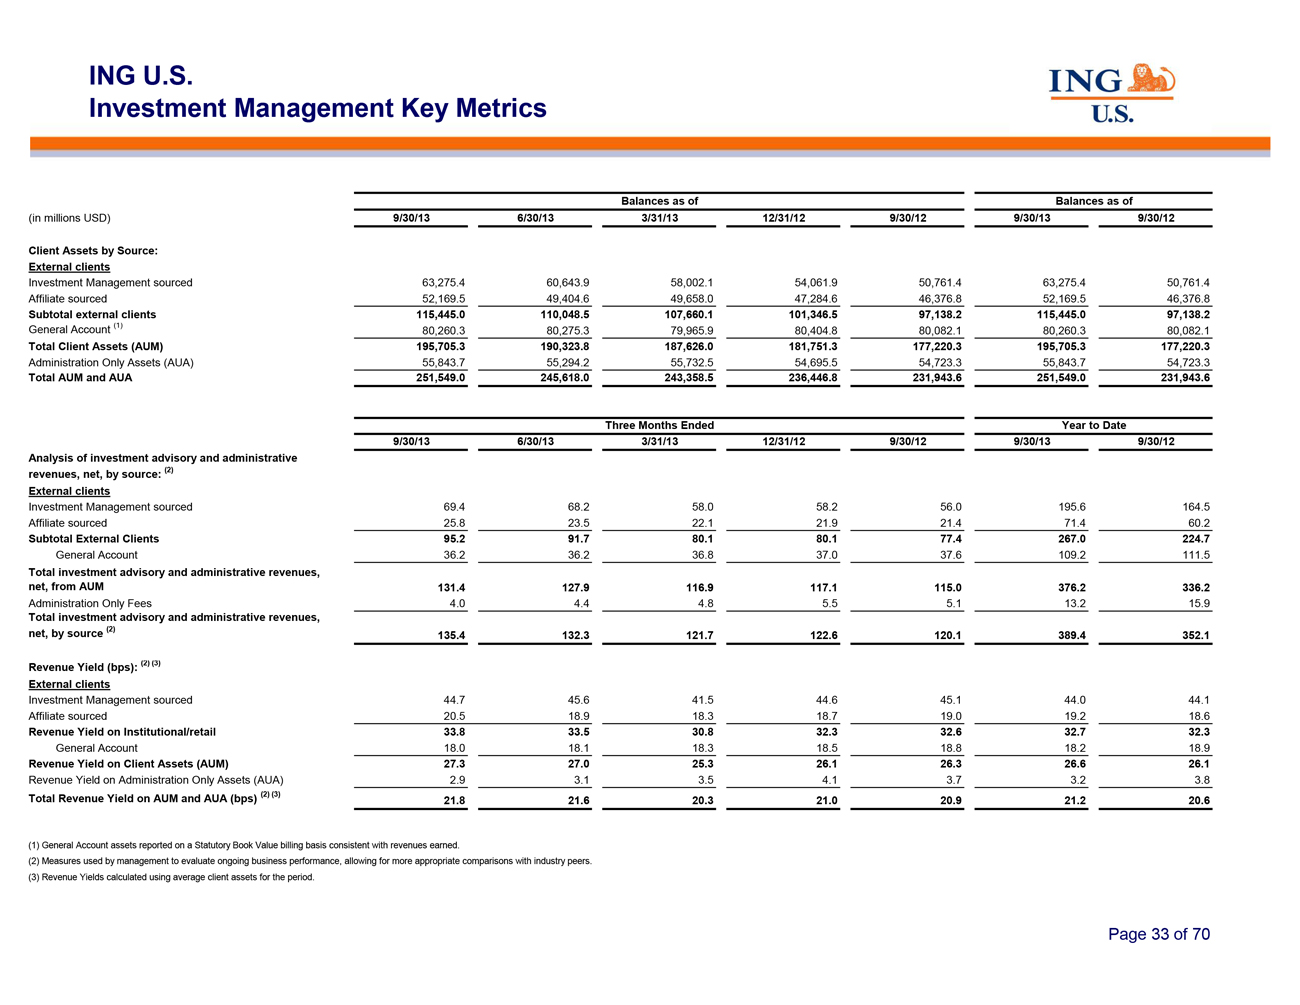
ING U.S.
Investment Management Key Metrics
Balances as of Balances as of
(in millions USD) 9/30/13 6/30/13 3/31/13 12/31/12 9/30/12 9/30/13 9/30/12
Client Assets by Source:
External clients
Investment Management sourced 63,275.4 60,643.9 58,002.1 54,061.9 50,761.4 63,275.4 50,761.4
Affiliate sourced 52,169.5 49,404.6 49,658.0 47,284.6 46,376.8 52,169.5 46,376.8
Subtotal external clients 115,445.0 110,048.5 107,660.1 101,346.5 97,138.2 115,445.0 97,138.2
General Account (1) 80,260.3 80,275.3 79,965.9 80,404.8 80,082.1 80,260.3 80,082.1
Total Client Assets (AUM) 195,705.3 190,323.8 187,626.0 181,751.3 177,220.3 195,705.3 177,220.3
Administration Only Assets (AUA) 55,843.7 55,294.2 55,732.5 54,695.5 54,723.3 55,843.7 54,723.3
Total AUM and AUA 251,549.0 245,618.0 243,358.5 236,446.8 231,943.6 251,549.0 231,943.6
Three Months Ended Year to Date
9/30/13 6/30/13 3/31/13 12/31/12 9/30/12 9/30/13 9/30/12
Analysis of investment advisory and administrative
revenues, net, by source: (2)
External clients
Investment Management sourced
69.4 68.2 58.0 58.2 56.0 195.6 164.5
Affiliate sourced 25.8 23.5 22.1 21.9 21.4 71.4 60.2
Subtotal External Clients 95.2 91.7 80.1 80.1 77.4 267.0 224.7
General Account 36.2 36.2 36.8 37.0 37.6 109.2 111.5
Total investment advisory and administrative revenues,
net, from AUM 131.4 127.9 116.9 117.1 115.0 376.2 336.2
Administration Only Fees 4.0 4.4 4.8 5.5 5.1 13.2 15.9
Total investment advisory and administrative revenues,
net, by source (2) 135.4 132.3 121.7 122.6 120.1 389.4 352.1
Revenue Yield (bps): (2) (3)
External clients
Investment Management sourced
44.7 45.6 41.5 44.6 45.1 44.0 44.1
Affiliate sourced 20.5 18.9 18.3 18.7 19.0 19.2 18.6
Revenue Yield on Institutional/retail 33.8 33.5 30.8 32.3 32.6 32.7 32.3
General Account 18.0 18.1 18.3 18.5 18.8 18.2 18.9
Revenue Yield on Client Assets (AUM) 27.3 27.0 25.3 26.1 26.3 26.6 26.1
Revenue Yield on Administration Only Assets (AUA) 2.9 3.1 3.5 4.1 3.7 3.2 3.8
Total Revenue Yield on AUM and AUA (bps) (2) (3) 21.8 21.6 20.3 21.0 20.9 21.2 20.6
| (1) |
|
General Account assets reported on a Statutory Book Value billing basis consistent with revenues earned.
|
(2) Measures used by management to evaluate ongoing business performance, allowing for more
appropriate comparisons with industry peers.
| (3) |
|
Revenue Yields calculated using average client assets for the period. |
Page 33 of 70
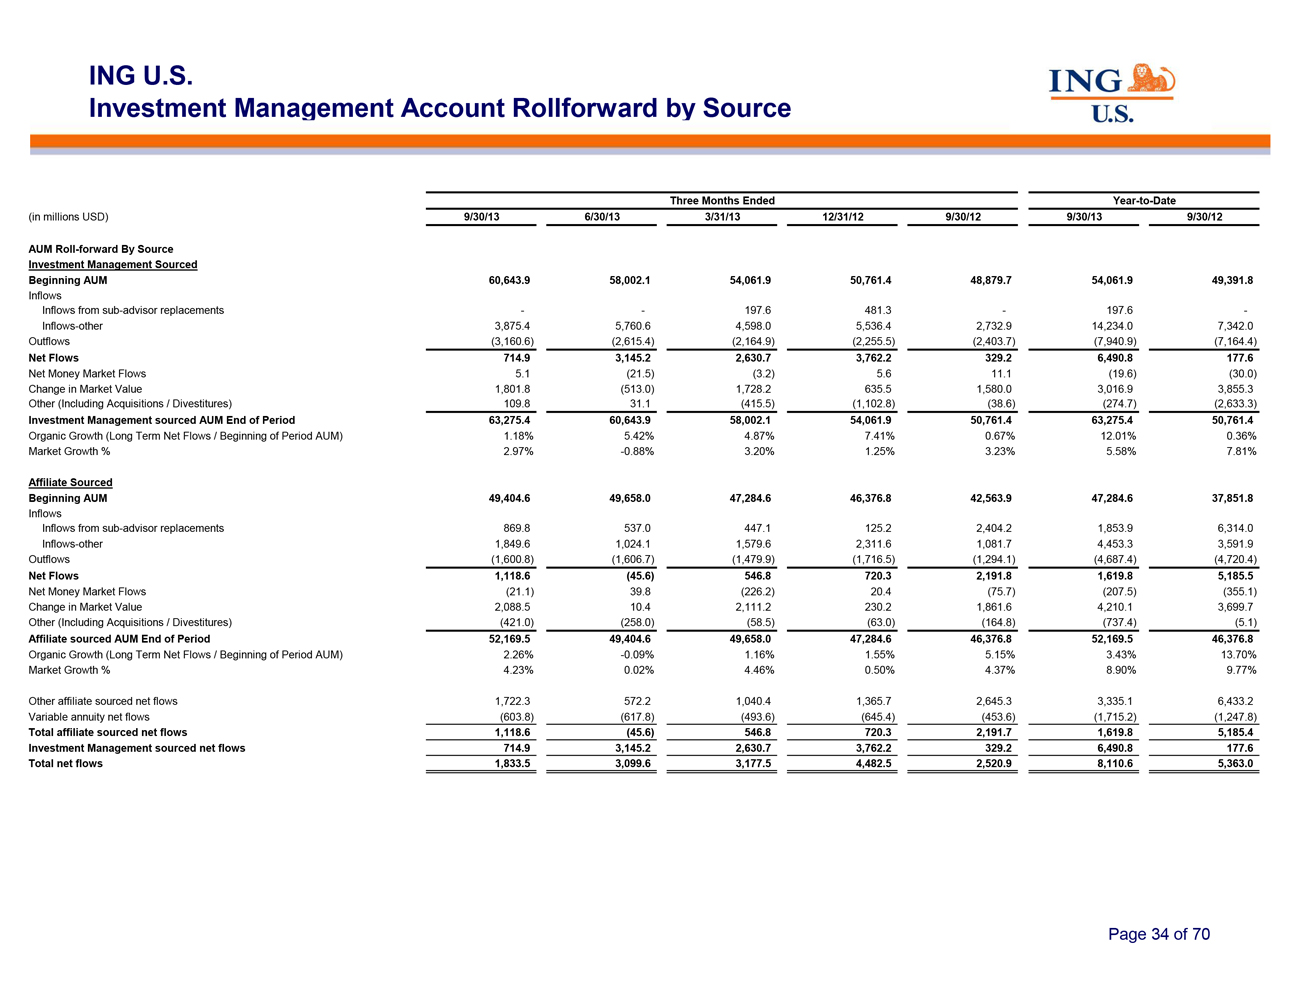
ING U.S.
Investment Management Account
Rollforward by Source
Three Months Ended Year-to-Date
(in millions USD) 9/30/13 6/30/13 3/31/13 12/31/12 9/30/12 9/30/13 9/30/12
AUM Roll-forward By Source
Investment Management Sourced
Beginning AUM
60,643.9 58,002.1 54,061.9 50,761.4 48,879.7 54,061.9 49,391.8
Inflows
Inflows from sub-advisor replacements —— 197.6 481.3 — 197.6 -
Inflows-other 3,875.4 5,760.6 4,598.0 5,536.4 2,732.9 14,234.0 7,342.0
Outflows (3,160.6) (2,615.4) (2,164.9) (2,255.5) (2,403.7) (7,940.9) (7,164.4)
Net Flows 714.9 3,145.2 2,630.7 3,762.2 329.2 6,490.8 177.6
Net Money Market Flows 5.1 (21.5) (3.2) 5.6 11.1 (19.6) (30.0)
Change in Market Value 1,801.8 (513.0) 1,728.2 635.5 1,580.0 3,016.9 3,855.3
Other (Including Acquisitions / Divestitures) 109.8 31.1 (415.5) (1,102.8) (38.6) (274.7) (2,633.3)
Investment Management sourced AUM End of Period 63,275.4 60,643.9 58,002.1 54,061.9 50,761.4 63,275.4 50,761.4
Organic Growth (Long Term Net Flows / Beginning of Period AUM) 1.18% 5.42% 4.87% 7.41% 0.67% 12.01% 0.36%
Market Growth % 2.97% -0.88% 3.20% 1.25% 3.23% 5.58% 7.81%
Affiliate Sourced
Beginning AUM 49,404.6 49,658.0 47,284.6 46,376.8 42,563.9 47,284.6 37,851.8
Inflows
Inflows from sub-advisor replacements
869.8 537.0 447.1 125.2 2,404.2 1,853.9 6,314.0
Inflows-other 1,849.6 1,024.1 1,579.6 2,311.6 1,081.7 4,453.3
3,591.9
Outflows
(1,600.8) (1,606.7) (1,479.9) (1,716.5) (1,294.1) (4,687.4) (4,720.4)
Net Flows
1,118.6 (45.6) 546.8 720.3 2,191.8 1,619.8 5,185.5
Net Money Market Flows (21.1) 39.8
(226.2) 20.4 (75.7) (207.5) (355.1)
Change in Market Value 2,088.5 10.4 2,111.2 230.2 1,861.6
4,210.1 3,699.7
Other (Including Acquisitions / Divestitures)
(421.0) (258.0) (58.5) (63.0) (164.8) (737.4) (5.1)
Affiliate sourced AUM End of
Period 52,169.5 49,404.6 49,658.0 47,284.6 46,376.8 52,169.5 46,376.8
Organic Growth (Long Term Net Flows /
Beginning of Period AUM) 2.26% -0.09% 1.16% 1.55% 5.15% 3.43% 13.70%
Market Growth % 4.23% 0.02% 4.46% 0.50%
4.37% 8.90% 9.77%
Other affiliate sourced net flows 1,722.3 572.2 1,040.4 1,365.7 2,645.3 3,335.1 6,433.2
Variable annuity net flows
(603.8) (617.8) (493.6) (645.4) (453.6) (1,715.2) (1,247.8)
Total affiliate
sourced net flows 1,118.6 (45.6) 546.8 720.3 2,191.7 1,619.8 5,185.4
Investment Management sourced net
flows 714.9 3,145.2 2,630.7 3,762.2 329.2 6,490.8 177.6
Total net flows 1,833.5 3,099.6 3,177.5 4,482.5
2,520.9 8,110.6 5,363.0
Page 34 of 70
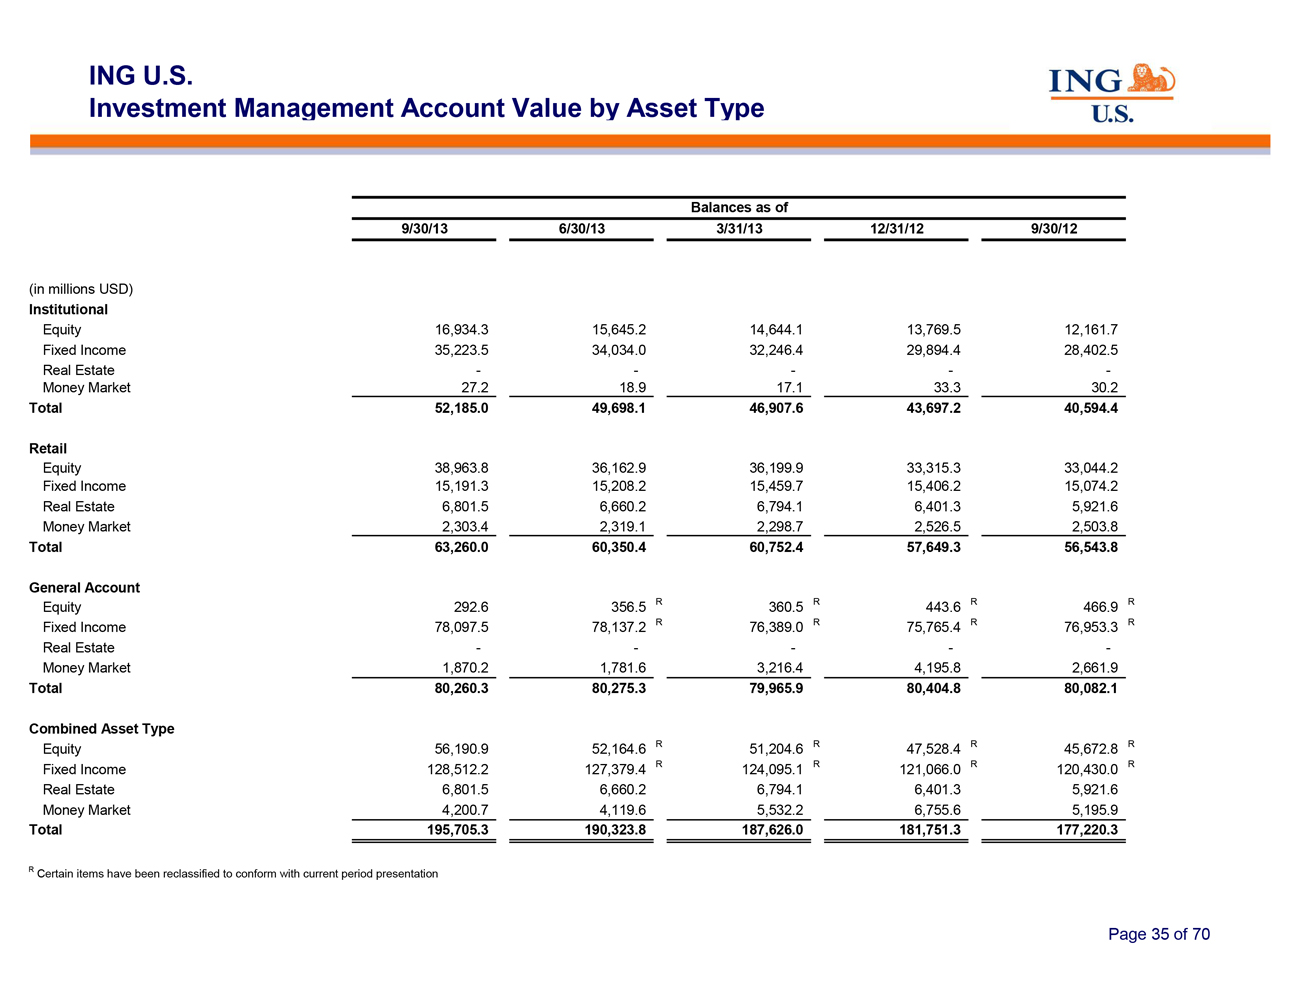
ING U.S.
Investment Management Account Value by
Asset Type
Balances as of
9/30/13 6/30/13 3/31/13 12/31/12 9/30/12
(in
millions USD)
Institutional
Equity 16,934.3 15,645.2 14,644.1 13,769.5 12,161.7
Fixed Income 35,223.5 34,034.0 32,246.4 29,894.4 28,402.5
Real Estate —— — — —
Money Market 27.2 18.9 17.1 33.3 30.2
Total
52,185.0 49,698.1 46,907.6 43,697.2 40,594.4
Retail
Equity 38,963.8 36,162.9 36,199.9 33,315.3 33,044.2
Fixed Income 15,191.3 15,208.2 15,459.7 15,406.2 15,074.2
Real Estate 6,801.5 6,660.2 6,794.1 6,401.3 5,921.6
Money Market 2,303.4 2,319.1 2,298.7 2,526.5 2,503.8
Total 63,260.0 60,350.4 60,752.4 57,649.3 56,543.8
General Account
Equity 292.6 356.5 R 360.5 R 443.6 R 466.9 R
Fixed Income 78,097.5 78,137.2 R 76,389.0 R 75,765.4 R 76,953.3 R
Real Estate —— — — —
Money Market 1,870.2 1,781.6 3,216.4 4,195.8 2,661.9
Total 80,260.3 80,275.3 79,965.9 80,404.8 80,082.1
Combined Asset Type
Equity 56,190.9 52,164.6 R 51,204.6 R 47,528.4 R 45,672.8 R
Fixed Income 128,512.2 127,379.4 R 124,095.1 R 121,066.0 R 120,430.0 R
Real Estate 6,801.5 6,660.2 6,794.1 6,401.3 5,921.6
Money Market 4,200.7 4,119.6 5,532.2 6,755.6 5,195.9
Total 195,705.3 190,323.8 187,626.0 181,751.3 177,220.3
R Certain items have been reclassified to conform with current period presentation
Page 35 of 70
ING U.S. Individual Life
Page 36 of 70
ING U.S.
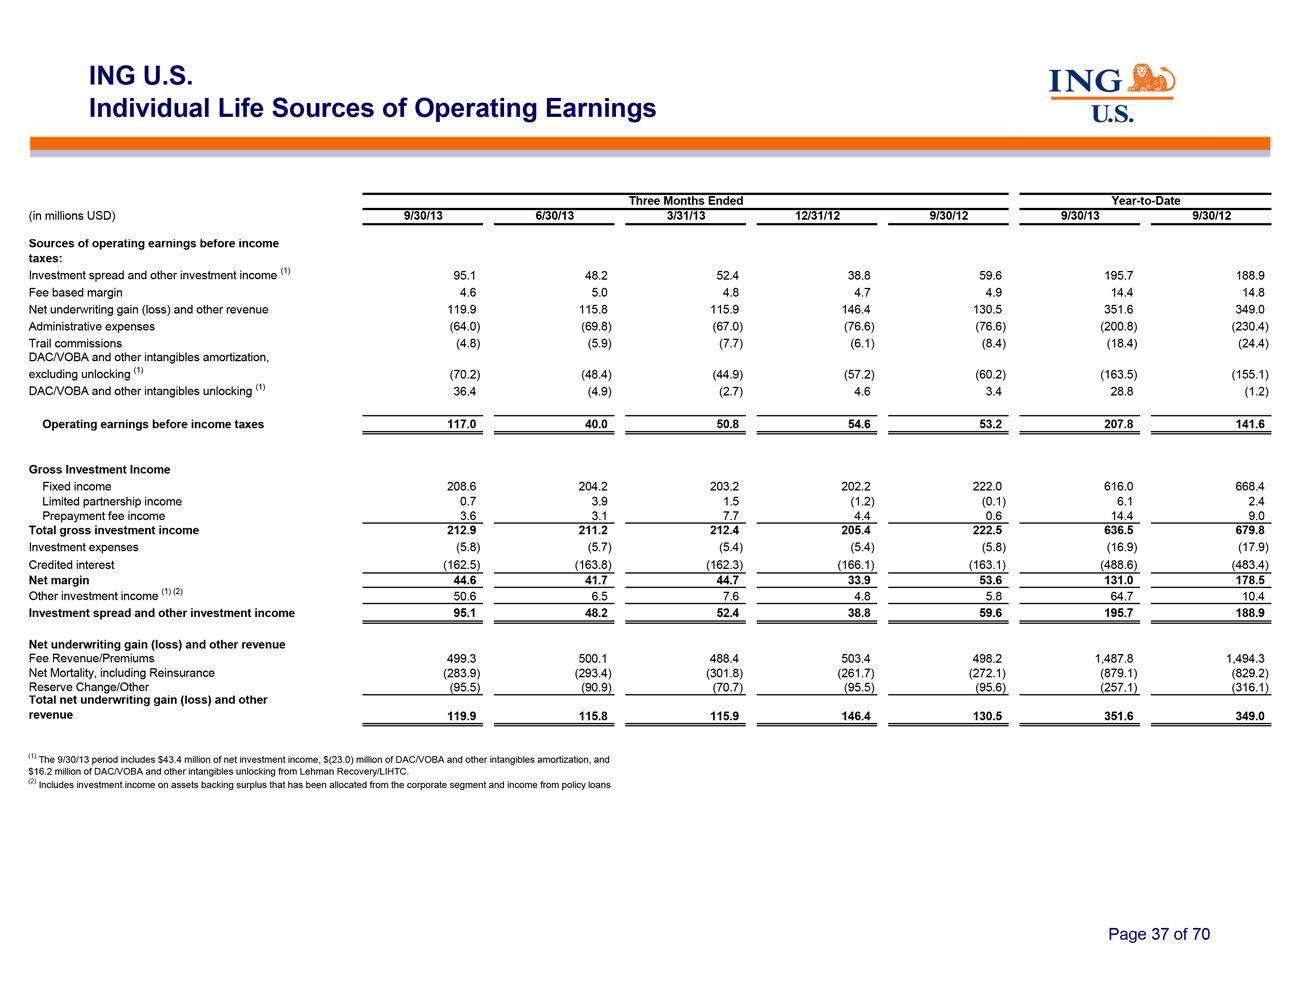
Individual Life Sources of Operating
Earnings
Three Months Ended Year-to-Date
(in millions USD) 9/30/13 6/30/13 3/31/13 12/31/12 9/30/12 9/30/13 9/30/12
Sources of operating earnings before income
taxes:
Investment spread and other investment
income (1) 95.1 48.2 52.4 38.8 59.6 195.7 188.9
Fee based margin 4.6 5.0 4.8 4.7 4.9 14.4 14.8
Net underwriting gain (loss) and other revenue 119.9 115.8 115.9 146.4 130.5 351.6 349.0
Administrative expenses (64.0) (69.8) (67.0) (76.6) (76.6) (200.8) (230.4)
Trail commissions (4.8) (5.9) (7.7) (6.1) (8.4) (18.4) (24.4)
DAC/VOBA and other intangibles amortization,
excluding unlocking (1) (70.2) (48.4) (44.9) (57.2) (60.2) (163.5) (155.1)
DAC/VOBA and other intangibles unlocking (1) 36.4 (4.9) (2.7) 4.6 3.4 28.8 (1.2)
Operating earnings before income taxes 117.0 40.0 50.8 54.6 53.2 207.8 141.6
Gross Investment Income
Fixed income 208.6 204.2
203.2 202.2 222.0 616.0 668.4
Limited partnership income 0.7 3.9 1.5 (1.2) (0.1) 6.1 2.4
Prepayment fee income 3.6 3.1 7.7 4.4 0.6 14.4 9.0
Total gross investment income 212.9 211.2 212.4 205.4 222.5 636.5 679.8
Investment expenses (5.8) (5.7) (5.4) (5.4) (5.8) (16.9) (17.9)
Credited interest (162.5) (163.8) (162.3) (166.1) (163.1) (488.6) (483.4)
Net margin 44.6 41.7 44.7 33.9 53.6 131.0 178.5
Other investment income (1) (2) 50.6 6.5 7.6 4.8 5.8 64.7 10.4
Investment spread and other investment income 95.1 48.2 52.4 38.8 59.6 195.7 188.9
Net underwriting gain (loss) and other revenue
Fee Revenue/Premiums 499.3 500.1 488.4 503.4 498.2 1,487.8 1,494.3
Net Mortality, including Reinsurance (283.9) (293.4) (301.8) (261.7) (272.1) (879.1) (829.2)
Reserve Change/Other (95.5) (90.9) (70.7) (95.5) (95.6) (257.1) (316.1)
Total net underwriting gain (loss) and other
revenue 119.9 115.8 115.9 146.4 130.5 351.6 349.0
(1) The 9/30/13 period includes $43.4 million of net investment income, $(23.0) million of DAC/VOBA and other intangibles amortization, and
$16.2 million of DAC/VOBA and other intangibles unlocking from Lehman Recovery/LIHTC.
(2) Includes investment income on assets backing surplus that has been allocated from the corporate segment and income
from policy loans
Page 37 of 70
ING U.S.
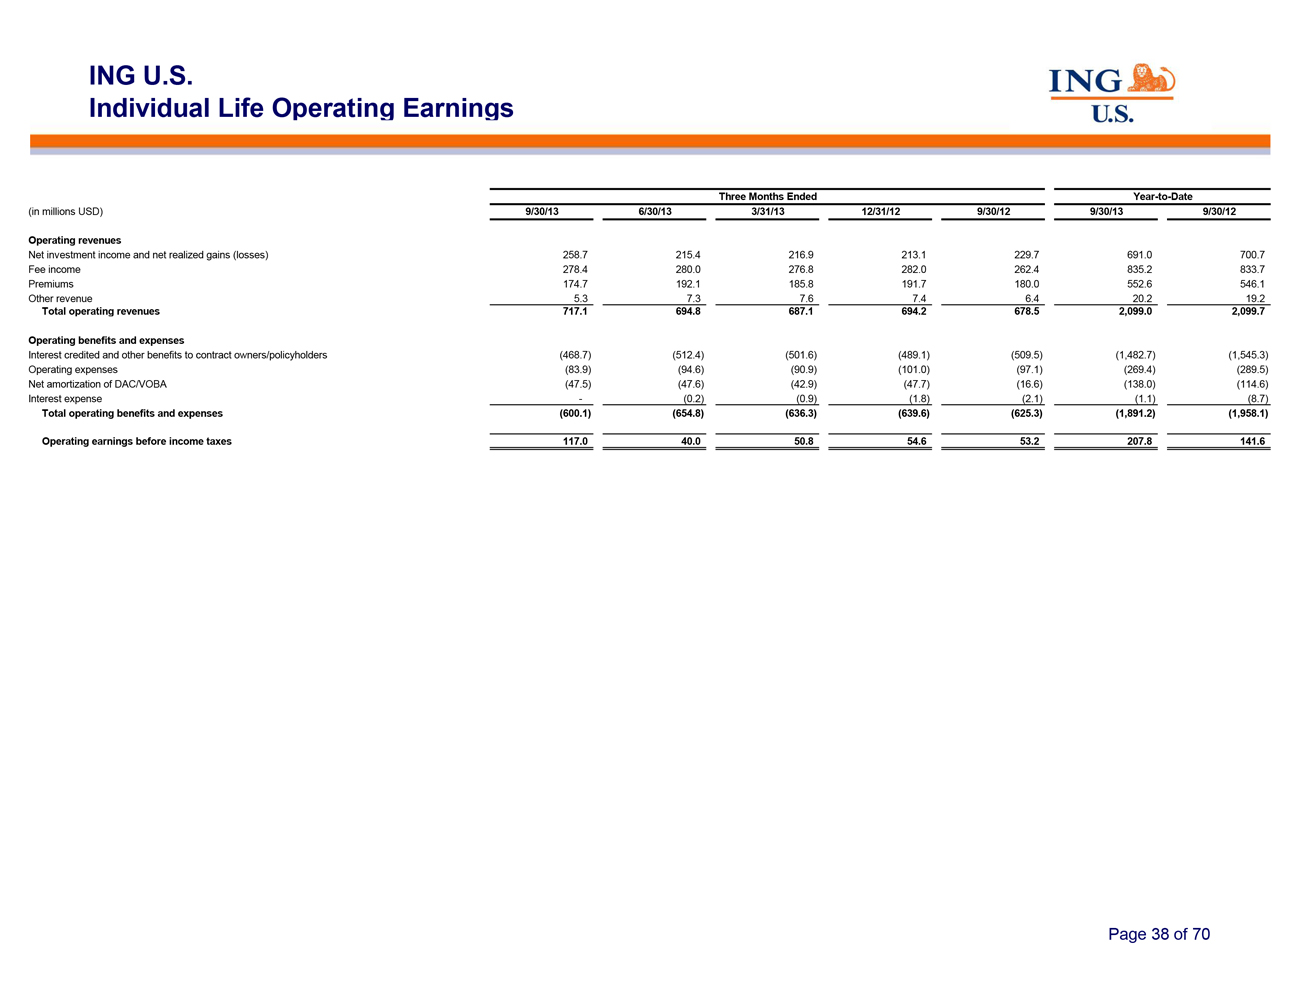
Individual Life Operating Earnings
Three Months Ended Year-to-Date
(in millions USD) 9/30/13 6/30/13 3/31/13 12/31/12 9/30/12 9/30/13 9/30/12
Operating revenues
Net investment income and net
realized gains (losses) 258.7 215.4 216.9 213.1 229.7 691.0 700.7
Fee income 278.4 280.0 276.8 282.0 262.4
835.2 833.7
Premiums 174.7 192.1 185.8 191.7 180.0 552.6 546.1
Other revenue 5.3 7.3 7.6 7.4 6.4 20.2 19.2
Total operating revenues 717.1 694.8 687.1 694.2 678.5 2,099.0 2,099.7
Operating benefits and expenses
Interest credited
and other benefits to contract owners/policyholders (468.7) (512.4) (501.6) (489.1) (509.5) (1,482.7) (1,545.3)
Operating expenses (83.9) (94.6) (90.9) (101.0) (97.1) (269.4) (289.5)
Net amortization of DAC/VOBA (47.5) (47.6) (42.9) (47.7) (16.6) (138.0) (114.6)
Interest expense — (0.2) (0.9) (1.8) (2.1) (1.1) (8.7)
Total operating benefits and expenses (600.1) (654.8) (636.3) (639.6) (625.3) (1,891.2) (1,958.1)
Operating earnings before income taxes 117.0 40.0 50.8 54.6 53.2 207.8 141.6
Page 38 of 70
ING U.S.
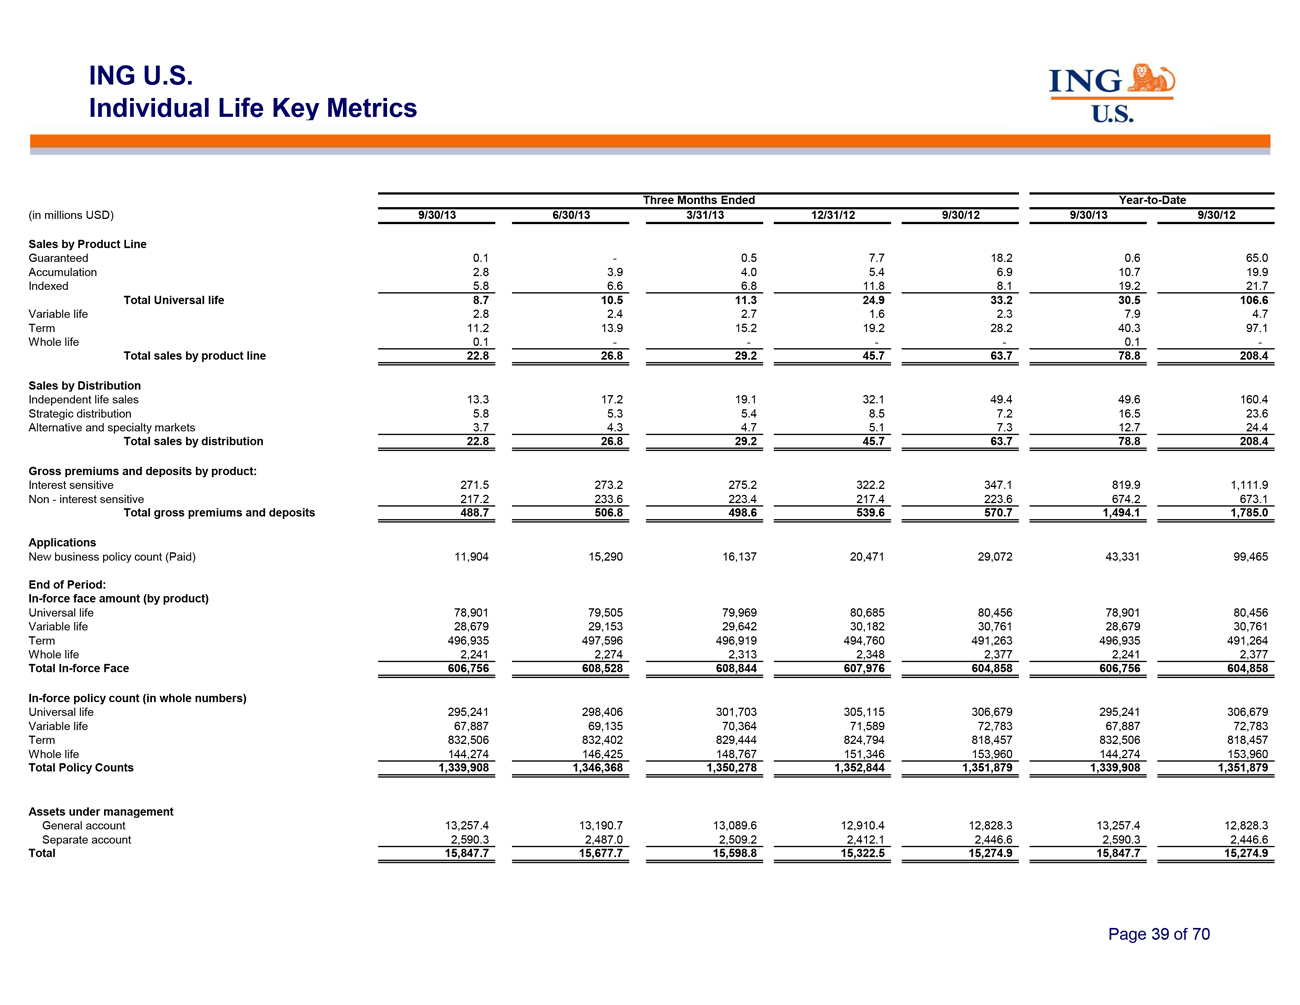
Individual Life Key Metrics
Three Months Ended Year-to-Date
(in millions USD) 9/30/13 6/30/13 3/31/13 12/31/12 9/30/12 9/30/13 9/30/12
Sales by Product Line
Guaranteed 0.1 — 0.5
7.7 18.2 0.6 65.0
Accumulation 2.8 3.9 4.0 5.4 6.9 10.7 19.9
Indexed 5.8 6.6 6.8 11.8 8.1 19.2 21.7
Total Universal life 8.7 10.5 11.3 24.9 33.2 30.5 106.6
Variable life 2.8 2.4 2.7 1.6 2.3 7.9 4.7
Term
11.2 13.9 15.2 19.2 28.2 40.3 97.1
Whole life 0.1 ———— 0.1 -
Total sales by product line 22.8 26.8 29.2 45.7 63.7 78.8 208.4
Sales by Distribution
Independent life sales 13.3 17.2 19.1 32.1 49.4 49.6 160.4
Strategic distribution 5.8 5.3 5.4 8.5 7.2 16.5 23.6
Alternative and specialty markets 3.7 4.3 4.7 5.1 7.3 12.7 24.4
Total sales by distribution 22.8 26.8 29.2 45.7 63.7 78.8 208.4
Gross premiums and deposits by product:
Interest
sensitive 271.5 273.2 275.2 322.2 347.1 819.9 1,111.9
Non—interest sensitive 217.2 233.6 223.4 217.4
223.6 674.2 673.1
Total gross premiums and deposits 488.7 506.8 498.6 539.6 570.7 1,494.1 1,785.0
Applications
New business policy count (Paid) 11,904 15,290 16,137 20,471 29,072 43,331 99,465
End of Period:
In-force face amount (by product)
Universal life 78,901 79,505 79,969 80,685 80,456 78,901 80,456
Variable life 28,679 29,153 29,642 30,182 30,761 28,679 30,761
Term 496,935 497,596 496,919 494,760 491,263 496,935 491,264
Whole life 2,241 2,274 2,313 2,348 2,377 2,241 2,377
Total In-force Face 606,756 608,528 608,844 607,976 604,858 606,756 604,858
In-force policy count (in whole numbers)
Universal life 295,241 298,406 301,703 305,115 306,679 295,241 306,679
Variable life 67,887 69,135 70,364 71,589 72,783 67,887 72,783
Term 832,506 832,402 829,444 824,794 818,457 832,506 818,457
Whole life 144,274 146,425 148,767 151,346 153,960 144,274 153,960
Total Policy Counts 1,339,908 1,346,368 1,350,278 1,352,844 1,351,879 1,339,908 1,351,879
Assets under management
General account 13,257.4
13,190.7 13,089.6 12,910.4 12,828.3 13,257.4 12,828.3
Separate account 2,590.3 2,487.0 2,509.2 2,412.1 2,446.6
2,590.3 2,446.6
Total 15,847.7 15,677.7 15,598.8 15,322.5 15,274.9 15,847.7 15,274.9
Page 39 of 70
ING U.S.
Employee Benefits
Page 40 of 70
ING U.S.
Employee Benefits Sources of Operating
Earnings
Three Months Ended Year-to-Date
(in millions USD) 9/30/13 6/30/13 3/31/13 12/31/12 9/30/12 9/30/13 9/30/12
Sources of operating earnings before income taxes:
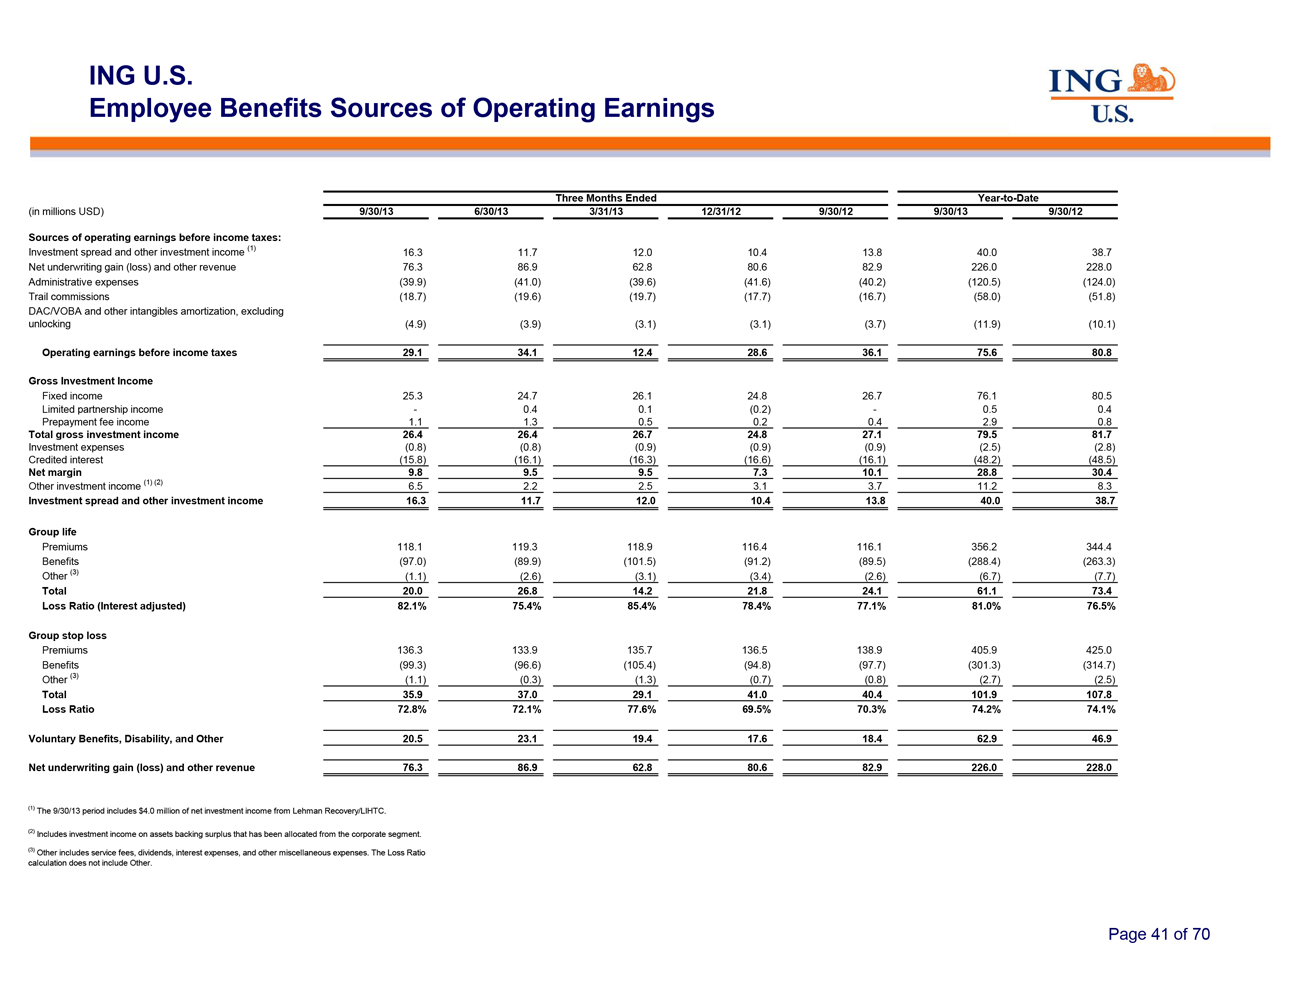
Investment spread and other investment income (1) 16.3 11.7 12.0 10.4 13.8 40.0 38.7
Net underwriting gain (loss) and other revenue 76.3 86.9 62.8 80.6 82.9 226.0 228.0
Administrative expenses (39.9) (41.0) (39.6) (41.6) (40.2) (120.5) (124.0)
Trail commissions (18.7) (19.6) (19.7) (17.7) (16.7) (58.0) (51.8)
DAC/VOBA and other intangibles amortization, excluding
unlocking (4.9) (3.9) (3.1) (3.1) (3.7) (11.9) (10.1)
Operating earnings before income taxes 29.1 34.1 12.4 28.6 36.1 75.6 80.8
Gross Investment Income
Fixed income 25.3 24.7 26.1 24.8 26.7 76.1 80.5
Limited partnership income — 0.4 0.1 (0.2) — 0.5 0.4
Prepayment fee income 1.1 1.3 0.5 0.2 0.4 2.9 0.8
Total gross investment income 26.4 26.4 26.7 24.8 27.1 79.5 81.7
Investment expenses (0.8) (0.8) (0.9) (0.9) (0.9) (2.5) (2.8)
Credited interest (15.8) (16.1) (16.3) (16.6) (16.1) (48.2) (48.5)
Net margin 9.8 9.5 9.5 7.3 10.1 28.8 30.4
Other
investment income (1) (2) 6.5 2.2 2.5 3.1 3.7 11.2 8.3
Investment spread and other investment income
16.3 11.7 12.0 10.4 13.8 40.0 38.7
Group life
Premiums 118.1 119.3 118.9 116.4 116.1 356.2 344.4
Benefits (97.0) (89.9) (101.5) (91.2) (89.5) (288.4) (263.3)
Other (3) (1.1) (2.6) (3.1) (3.4) (2.6) (6.7) (7.7)
Total 20.0 26.8 14.2 21.8 24.1 61.1 73.4
Loss Ratio (Interest adjusted) 82.1% 75.4% 85.4% 78.4% 77.1% 81.0% 76.5%
Group stop loss
Premiums 136.3 133.9 135.7 136.5
138.9 405.9 425.0
Benefits (99.3) (96.6) (105.4) (94.8) (97.7) (301.3) (314.7)
Other (3) (1.1) (0.3) (1.3) (0.7) (0.8) (2.7) (2.5)
Total 35.9 37.0 29.1 41.0 40.4 101.9 107.8
Loss Ratio 72.8% 72.1% 77.6% 69.5% 70.3% 74.2% 74.1%
Voluntary Benefits, Disability, and Other 20.5 23.1 19.4 17.6 18.4 62.9 46.9
Net underwriting gain (loss) and other revenue 76.3 86.9 62.8 80.6 82.9 226.0 228.0
| (1) |
|
The 9/30/13 period includes $4.0 million of net investment income from Lehman Recovery/LIHTC.
|
| (2) |
|
Includes investment income on assets backing surplus that has been allocated from the corporate segment.
|
| (3) |
|
Other includes service fees, dividends, interest expenses, and other miscellaneous expenses. The Loss Ratio
|
calculation does not include Other.
Page 41 of 70
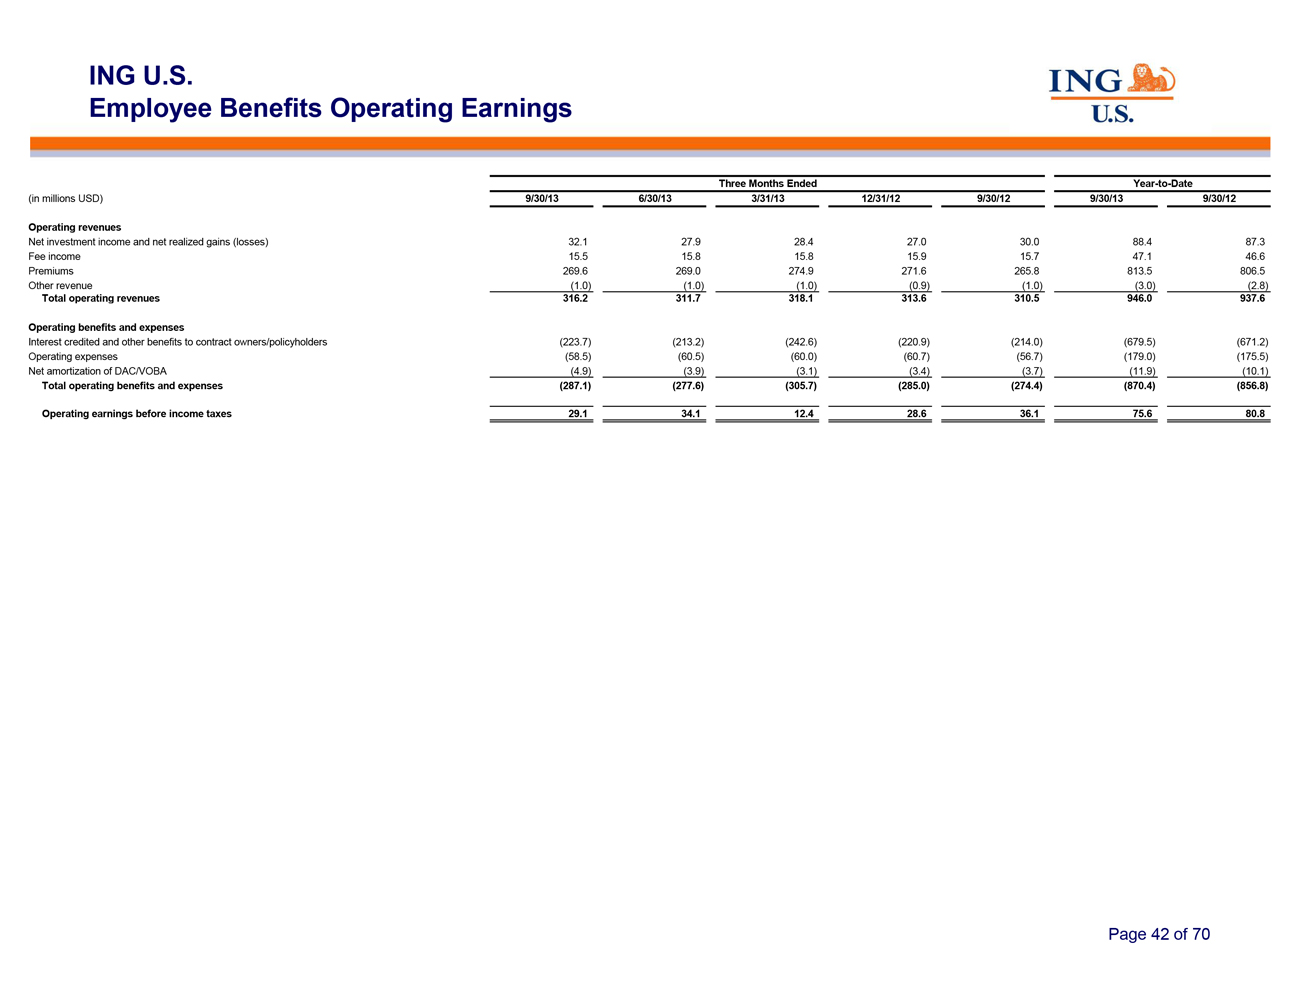
ING U.S.
Employee Benefits Operating Earnings
Three Months Ended Year-to-Date
(in millions USD) 9/30/13 6/30/13 3/31/13 12/31/12 9/30/12 9/30/13 9/30/12
Operating revenues
Net investment income and net
realized gains (losses) 32.1 27.9 28.4 27.0 30.0 88.4 87.3
Fee income 15.5 15.8 15.8 15.9 15.7 47.1 46.6
Premiums 269.6 269.0 274.9 271.6 265.8 813.5 806.5
Other revenue (1.0) (1.0) (1.0) (0.9) (1.0) (3.0) (2.8)
Total operating revenues 316.2 311.7 318.1 313.6 310.5 946.0 937.6
Operating benefits and expenses
Interest credited and other benefits to contract owners/policyholders (223.7) (213.2) (242.6) (220.9) (214.0) (679.5) (671.2)
Operating expenses (58.5) (60.5) (60.0) (60.7) (56.7) (179.0) (175.5)
Net amortization of DAC/VOBA (4.9) (3.9) (3.1) (3.4) (3.7) (11.9) (10.1)
Total operating benefits and expenses
(287.1) (277.6) (305.7) (285.0) (274.4) (870.4) (856.8)
Operating earnings
before income taxes 29.1 34.1 12.4 28.6 36.1 75.6 80.8
Page 42 of 70
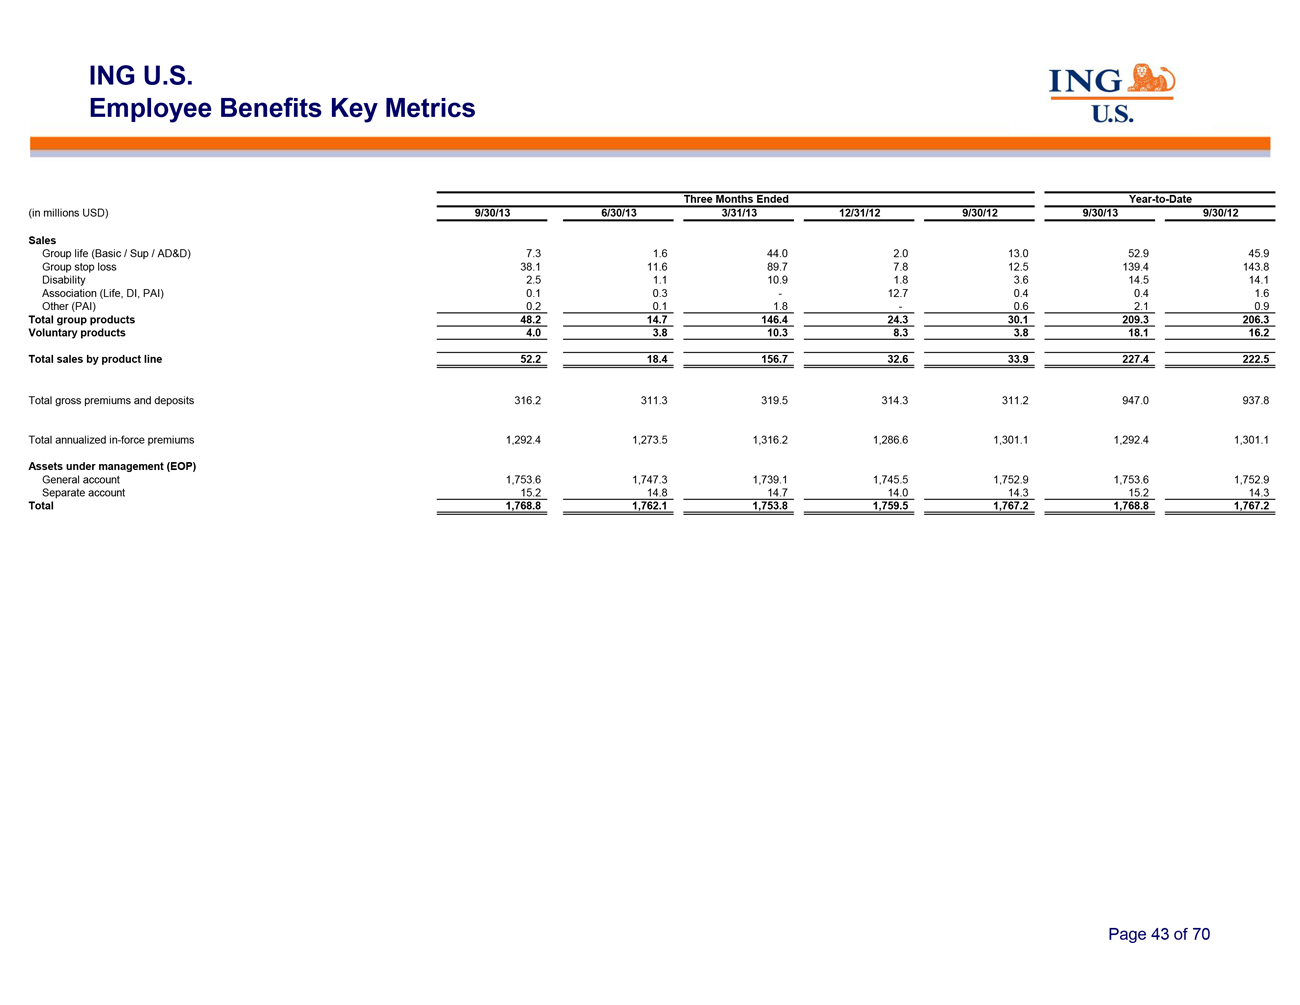
ING U.S.
Employee Benefits Key Metrics
Three Months Ended Year-to-Date
(in millions USD) 9/30/13 6/30/13 3/31/13 12/31/12 9/30/12 9/30/13 9/30/12
Sales
Group life (Basic / Sup / AD&D) 7.3 1.6
44.0 2.0 13.0 52.9 45.9
Group stop loss 38.1 11.6 89.7 7.8 12.5 139.4 143.8
Disability 2.5 1.1 10.9 1.8 3.6 14.5 14.1
Association (Life, DI, PAI) 0.1 0.3 — 12.7 0.4 0.4 1.6
Other (PAI) 0.2 0.1 1.8 — 0.6 2.1 0.9
Total
group products 48.2 14.7 146.4 24.3 30.1 209.3 206.3
Voluntary products 4.0 3.8 10.3 8.3 3.8 18.1 16.2
Total sales by product line 52.2 18.4 156.7 32.6 33.9 227.4 222.5
Total gross premiums and deposits 316.2 311.3 319.5 314.3 311.2 947.0 937.8
Total annualized in-force premiums 1,292.4 1,273.5 1,316.2 1,286.6 1,301.1 1,292.4 1,301.1
Assets under management (EOP)
General account 1,753.6 1,747.3 1,739.1 1,745.5 1,752.9 1,753.6 1,752.9
Separate account 15.2 14.8 14.7 14.0 14.3 15.2 14.3
Total 1,768.8 1,762.1 1,753.8 1,759.5 1,767.2 1,768.8 1,767.2
Page 43 of 70
ING U.S. Corporate
Page 44 of 70
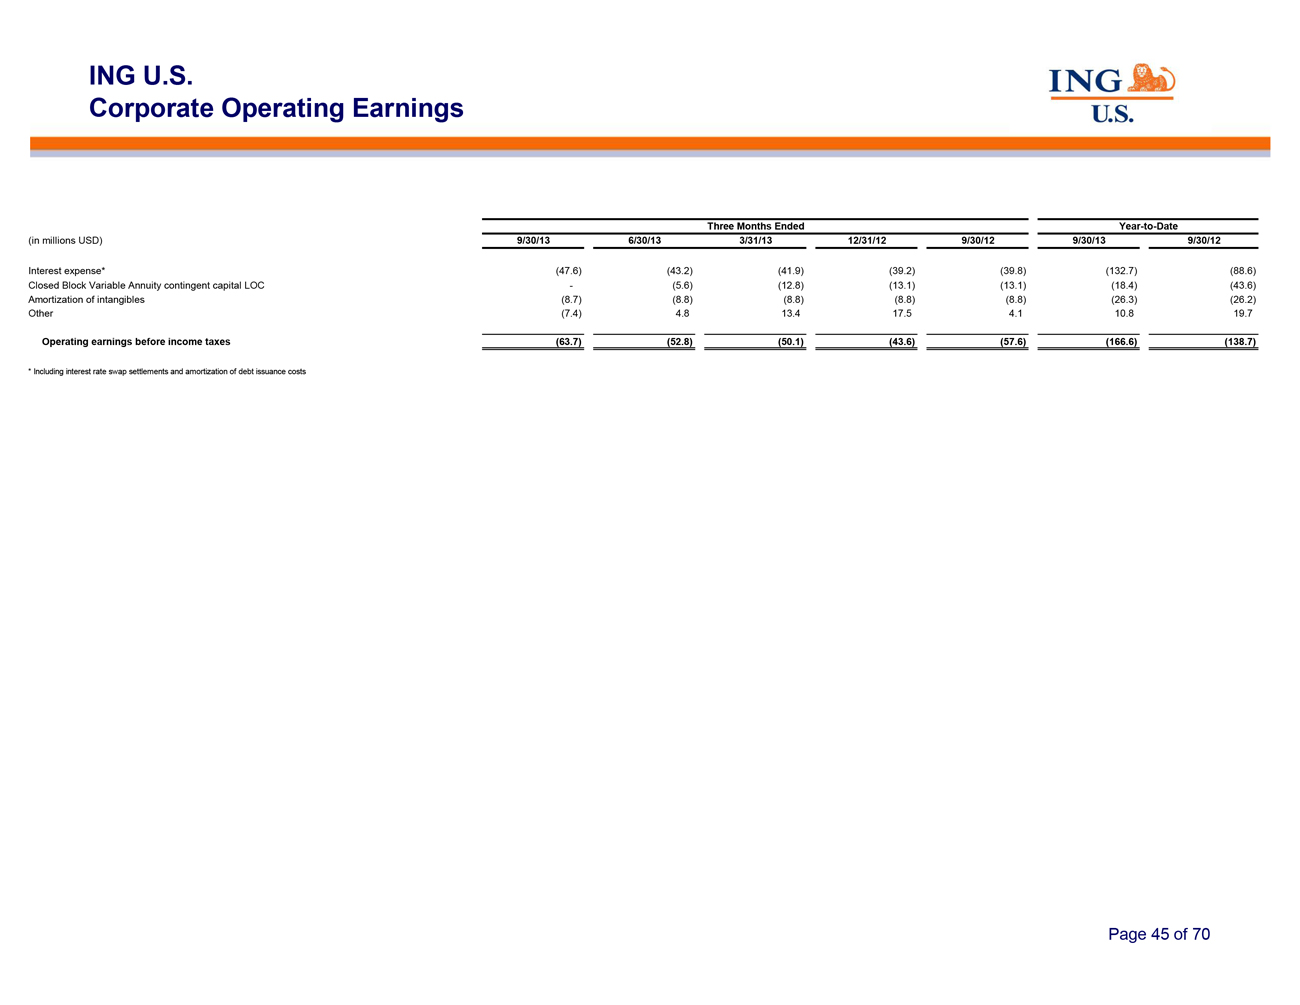
ING U.S.
Corporate Operating Earnings
Three Months Ended Year-to-Date
(in millions USD) 9/30/13 6/30/13 3/31/13 12/31/12 9/30/12 9/30/13 9/30/12
Interest expense* (47.6) (43.2) (41.9) (39.2) (39.8) (132.7) (88.6)
Closed Block Variable Annuity contingent capital LOC — (5.6) (12.8) (13.1) (13.1) (18.4) (43.6)
Amortization of intangibles (8.7) (8.8) (8.8) (8.8) (8.8) (26.3) (26.2)
Other (7.4) 4.8 13.4 17.5 4.1 10.8 19.7
Operating earnings before income taxes (63.7) (52.8) (50.1) (43.6) (57.6) (166.6) (138.7)
| * |
|
Including interest rate swap settlements and amortization of debt issuance costs |
Page 45 of 70
ING U.S.
Closed Blocks (Variable Annuity and
Other)
Page 46 of 70
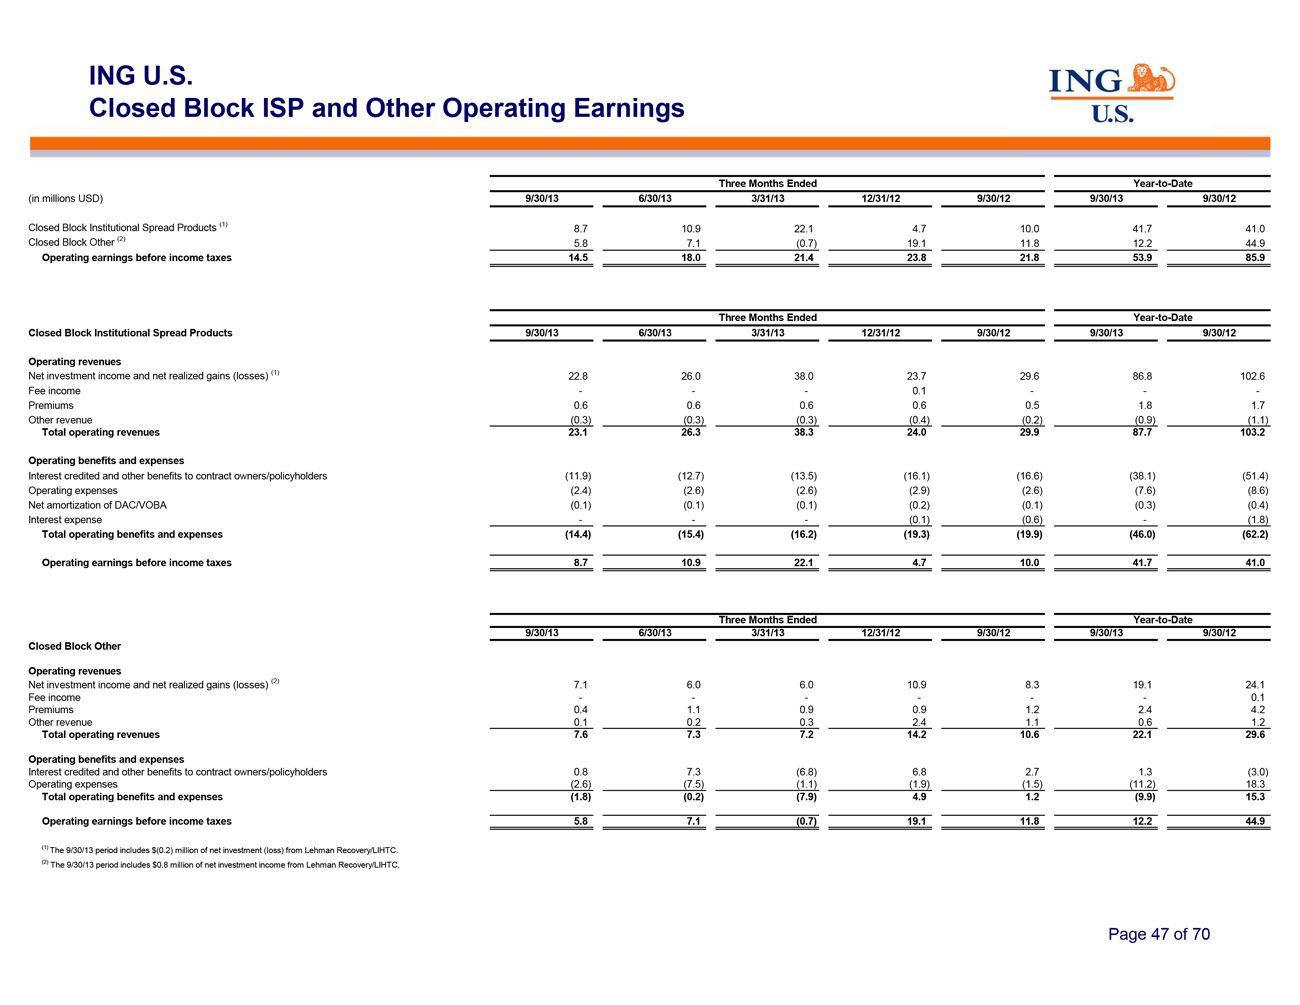
ING U.S.
Closed Block ISP and Other Operating
Earnings
Three Months Ended Year-to-Date
(in millions USD) 9/30/13 6/30/13 3/31/13 12/31/12 9/30/12 9/30/13 9/30/12
Closed Block Institutional Spread Products (1) 8.7 10.9 22.1 4.7 10.0 41.7 41.0
Closed Block Other (2) 5.8 7.1 (0.7) 19.1 11.8 12.2 44.9
Operating earnings before income taxes 14.5 18.0 21.4 23.8 21.8 53.9 85.9
Three Months Ended Year-to-Date
Closed Block Institutional Spread Products 9/30/13 6/30/13 3/31/13 12/31/12 9/30/12 9/30/13 9/30/12
Operating revenues
Net investment income and net
realized gains (losses) (1) 22.8 26.0 38.0 23.7 29.6 86.8 102.6
Fee income — —— 0.1 —
— -
Premiums 0.6 0.6 0.6 0.6 0.5 1.8 1.7
Other revenue (0.3) (0.3) (0.3) (0.4) (0.2) (0.9) (1.1)
Total operating revenues 23.1 26.3 38.3 24.0 29.9 87.7 103.2
Operating benefits and expenses
Interest credited and other benefits to contract owners/policyholders (11.9) (12.7) (13.5) (16.1) (16.6) (38.1) (51.4)
Operating expenses (2.4) (2.6) (2.6) (2.9) (2.6) (7.6) (8.6)
Net amortization of DAC/VOBA (0.1) (0.1) (0.1) (0.2) (0.1) (0.3) (0.4)
Interest expense — —— (0.1) (0.6) — (1.8)
Total operating benefits and expenses (14.4) (15.4) (16.2) (19.3) (19.9) (46.0) (62.2)
Operating earnings before income taxes 8.7 10.9 22.1 4.7 10.0 41.7 41.0
Three Months Ended Year-to-Date
9/30/13 6/30/13 3/31/13 12/31/12 9/30/12 9/30/13 9/30/12
Closed Block Other
Operating revenues
Net investment income and net realized gains (losses) (2) 7.1 6.0 6.0 10.9 8.3 19.1 24.1
Fee income — —— — — — 0.1
Premiums 0.4 1.1 0.9 0.9 1.2 2.4 4.2
Other revenue 0.1 0.2 0.3 2.4 1.1 0.6 1.2
Total
operating revenues 7.6 7.3 7.2 14.2 10.6 22.1 29.6
Operating benefits and expenses
Interest credited and other benefits to contract owners/policyholders 0.8 7.3 (6.8) 6.8 2.7 1.3 (3.0)
Operating expenses (2.6) (7.5) (1.1) (1.9) (1.5) (11.2) 18.3
Total operating benefits and expenses (1.8) (0.2) (7.9) 4.9 1.2 (9.9) 15.3
Operating earnings before income taxes 5.8 7.1 (0.7) 19.1 11.8 12.2 44.9
| (1) |
|
The 9/30/13 period includes $(0.2) million of net investment (loss) from Lehman Recovery/LIHTC.
|
| (2) |
|
The 9/30/13 period includes $0.8 million of net investment income from Lehman Recovery/LIHTC.
|
Page 47 of 70
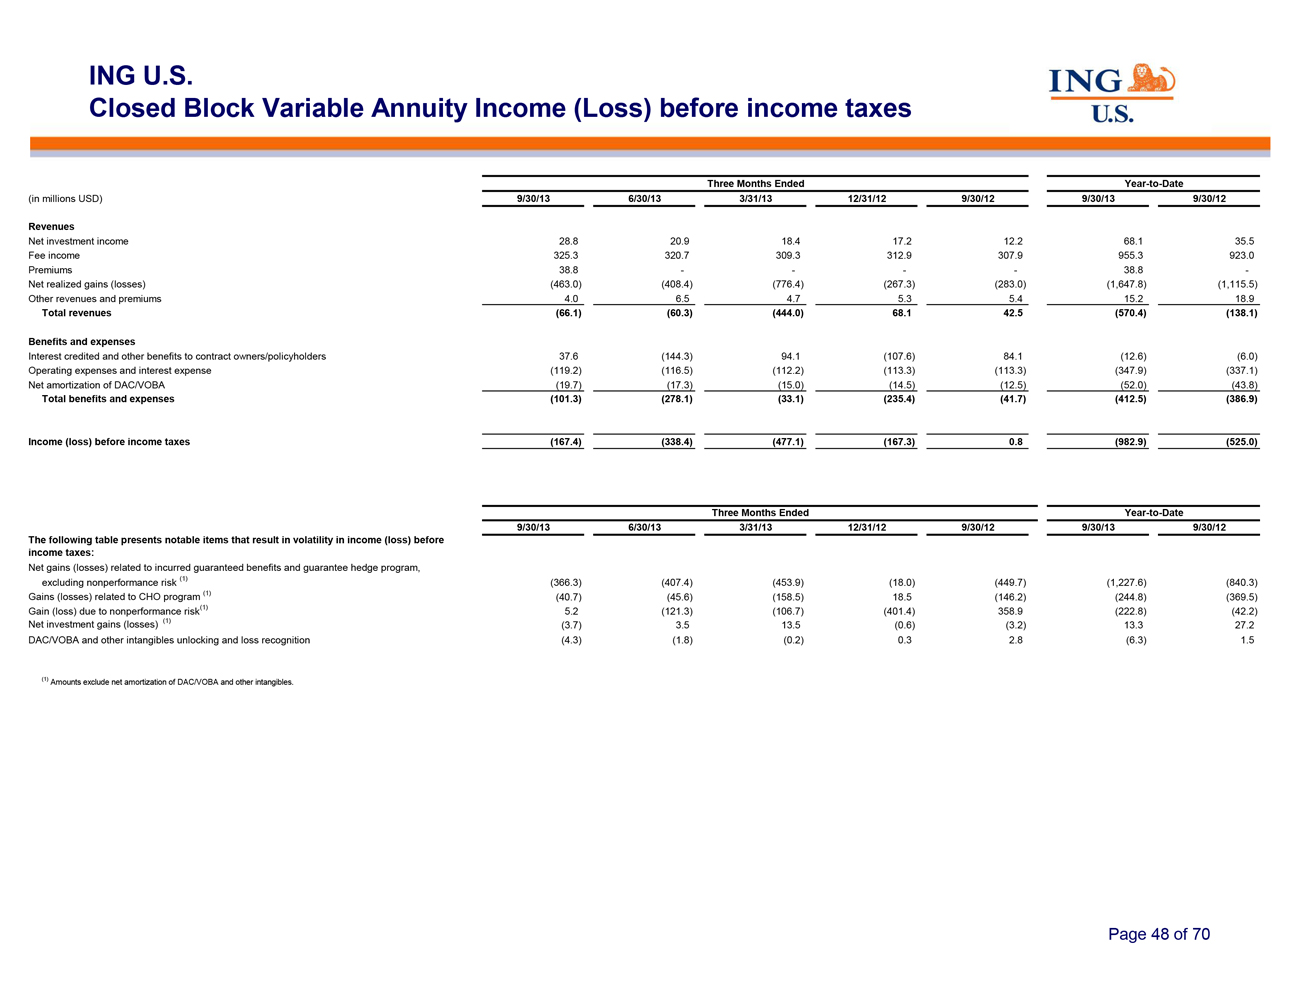
ING U.S.
Closed Block Variable Annuity Income
(Loss) before income taxes
Three Months Ended Year-to-Date
(in millions USD) 9/30/13 6/30/13 3/31/13 12/31/12 9/30/12 9/30/13 9/30/12
Revenues
Net investment income 28.8 20.9 18.4 17.2 12.2 68.1 35.5
Fee income 325.3 320.7 309.3 312.9 307.9 955.3 923.0
Premiums 38.8 ——— — 38.8 -
Net realized gains (losses) (463.0) (408.4) (776.4) (267.3) (283.0) (1,647.8) (1,115.5)
Other revenues and premiums 4.0 6.5 4.7 5.3 5.4 15.2 18.9
Total revenues (66.1) (60.3) (444.0) 68.1 42.5 (570.4) (138.1)
Benefits and expenses
Interest credited and other benefits to contract owners/policyholders 37.6 (144.3) 94.1 (107.6) 84.1 (12.6) (6.0)
Operating expenses and interest expense
(119.2) (116.5) (112.2) (113.3) (113.3) (347.9) (337.1)
Net amortization of
DAC/VOBA (19.7) (17.3) (15.0) (14.5) (12.5) (52.0) (43.8)
Total benefits and
expenses (101.3) (278.1) (33.1) (235.4) (41.7) (412.5) (386.9)
Income (loss)
before income taxes (167.4) (338.4) (477.1) (167.3) 0.8 (982.9) (525.0)
Three Months
Ended Year-to-Date
9/30/13 6/30/13 3/31/13 12/31/12 9/30/12 9/30/13 9/30/12
The following table presents notable items that result in volatility in income (loss) before
income taxes:
Net gains (losses) related to incurred guaranteed benefits and guarantee hedge program,
excluding nonperformance risk (1) (366.3) (407.4) (453.9) (18.0) (449.7) (1,227.6) (840.3)
Gains (losses) related to CHO program (1) (40.7) (45.6) (158.5) 18.5 (146.2) (244.8) (369.5)
Gain (loss) due to nonperformance risk(1) 5.2 (121.3) (106.7) (401.4) 358.9 (222.8) (42.2)
Net investment gains (losses) (1) (3.7) 3.5 13.5 (0.6) (3.2) 13.3 27.2
DAC/VOBA and other intangibles unlocking and loss recognition (4.3) (1.8) (0.2) 0.3 2.8 (6.3) 1.5
| (1) |
|
Amounts exclude net amortization of DAC/VOBA and other intangibles. |
Page 48 of 70
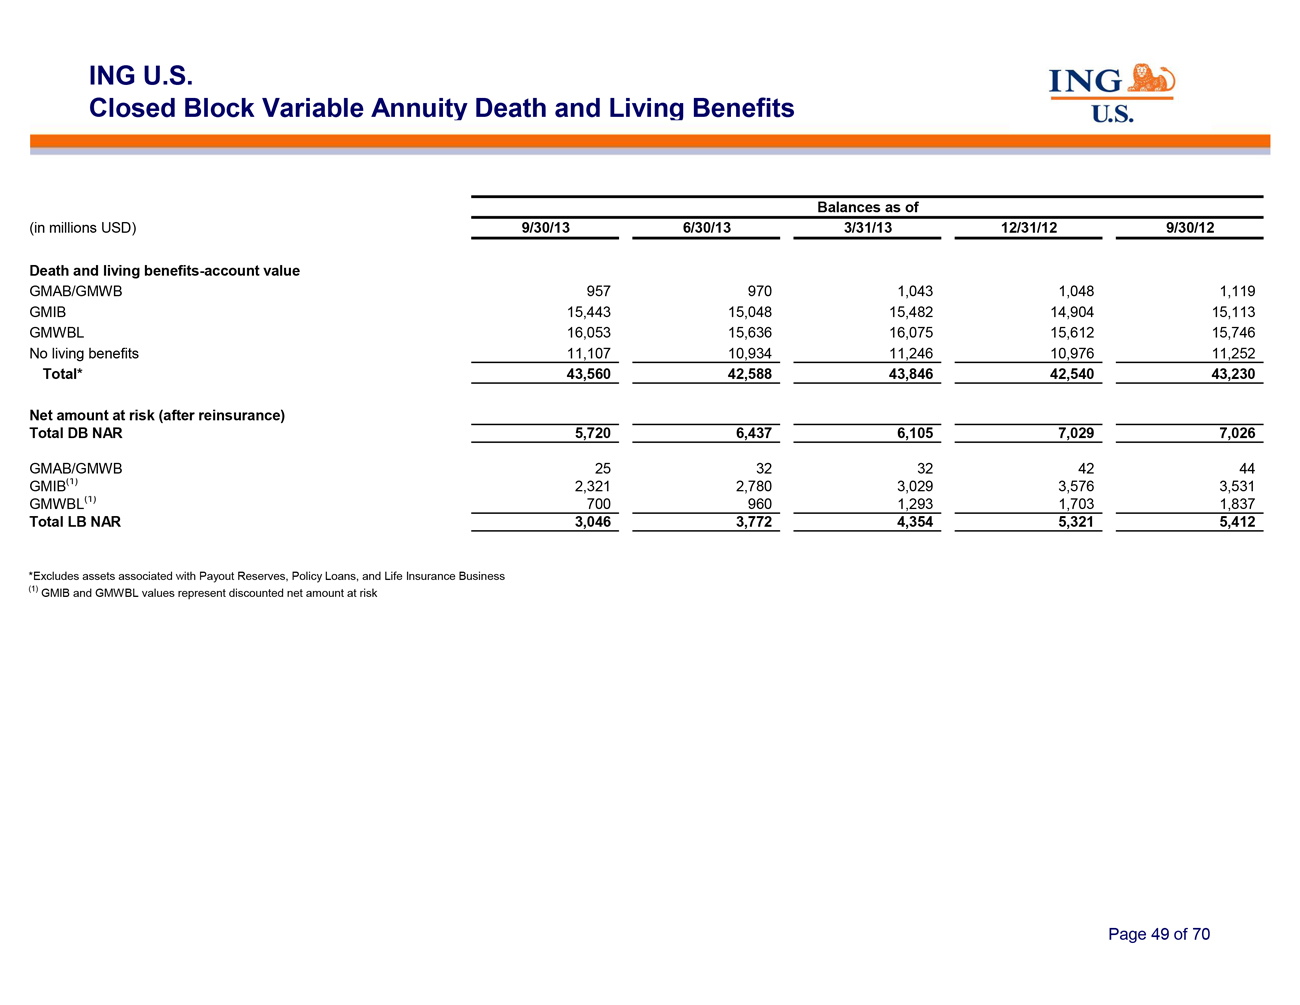
ING U.S.
Closed Block Variable Annuity Death and
Living Benefits
Balances as of
(in millions USD) 9/30/13 6/30/13 3/31/13 12/31/12 9/30/12
Death and living benefits-account value
GMAB/GMWB
957 970 1,043 1,048 1,119
GMIB 15,443 15,048 15,482 14,904 15,113
GMWBL 16,053 15,636 16,075 15,612 15,746
No living benefits 11,107 10,934 11,246 10,976 11,252
Total* 43,560 42,588 43,846 42,540 43,230
Net
amount at risk (after reinsurance)
Total DB NAR 5,720 6,437 6,105 7,029 7,026
GMAB/GMWB 25 32 32 42 44
GMIB(1) 2,321 2,780 3,029 3,576 3,531
GMWBL(1)
700 960 1,293 1,703 1,837
Total LB NAR 3,046 3,772 4,354 5,321 5,412
*Excludes assets associated with Payout Reserves, Policy Loans, and Life Insurance Business
| (1) |
|
GMIB and GMWBL values represent discounted net amount at risk |
Page 49 of 70
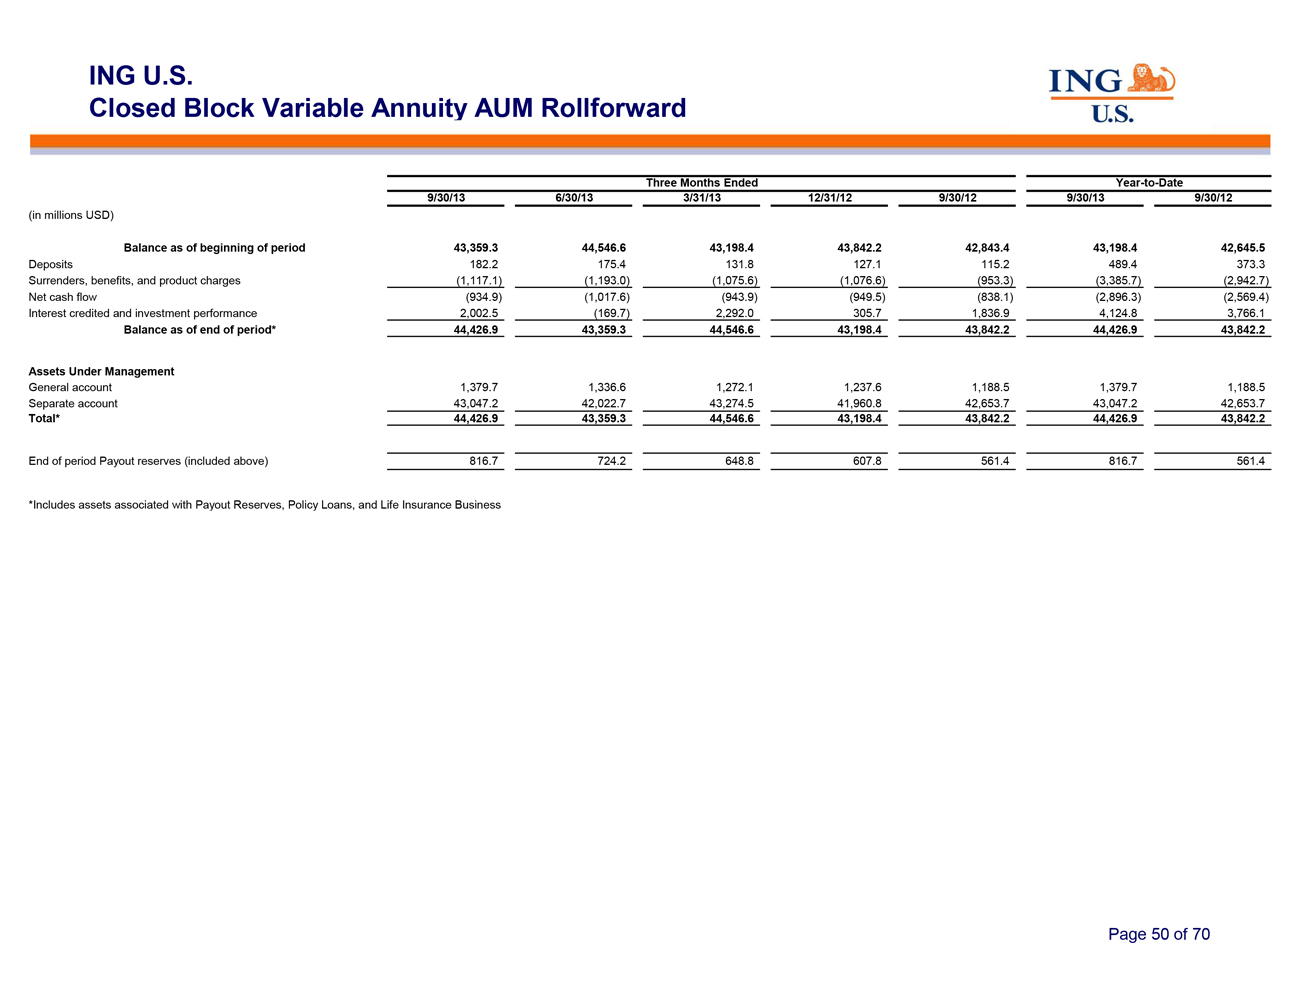
ING U.S.
Closed Block Variable Annuity AUM
Rollforward
Three Months Ended Year-to-Date
9/30/13 6/30/13 3/31/13 12/31/12 9/30/12 9/30/13 9/30/12
(in millions USD)
Balance as of beginning of period 43,359.3 44,546.6 43,198.4 43,842.2 42,843.4 43,198.4 42,645.5
Deposits 182.2 175.4 131.8 127.1 115.2 489.4 373.3
Surrenders, benefits, and product charges
(1,117.1) (1,193.0) (1,075.6) (1,076.6) (953.3) (3,385.7) (2,942.7)
Net cash
flow (934.9) (1,017.6) (943.9) (949.5) (838.1) (2,896.3) (2,569.4)
Interest
credited and investment performance 2,002.5 (169.7) 2,292.0 305.7 1,836.9 4,124.8 3,766.1
Balance as of
end of period* 44,426.9 43,359.3 44,546.6 43,198.4 43,842.2 44,426.9 43,842.2
Assets Under Management
General account 1,379.7 1,336.6 1,272.1 1,237.6 1,188.5 1,379.7 1,188.5
Separate account 43,047.2 42,022.7 43,274.5 41,960.8 42,653.7 43,047.2 42,653.7
Total* 44,426.9 43,359.3 44,546.6 43,198.4 43,842.2 44,426.9 43,842.2
End of period Payout reserves (included above) 816.7 724.2 648.8 607.8 561.4 816.7 561.4
*Includes assets associated with Payout Reserves, Policy Loans, and Life Insurance Business
Page 50 of 70
ING U.S.
Investment Information
Page 51 of 70
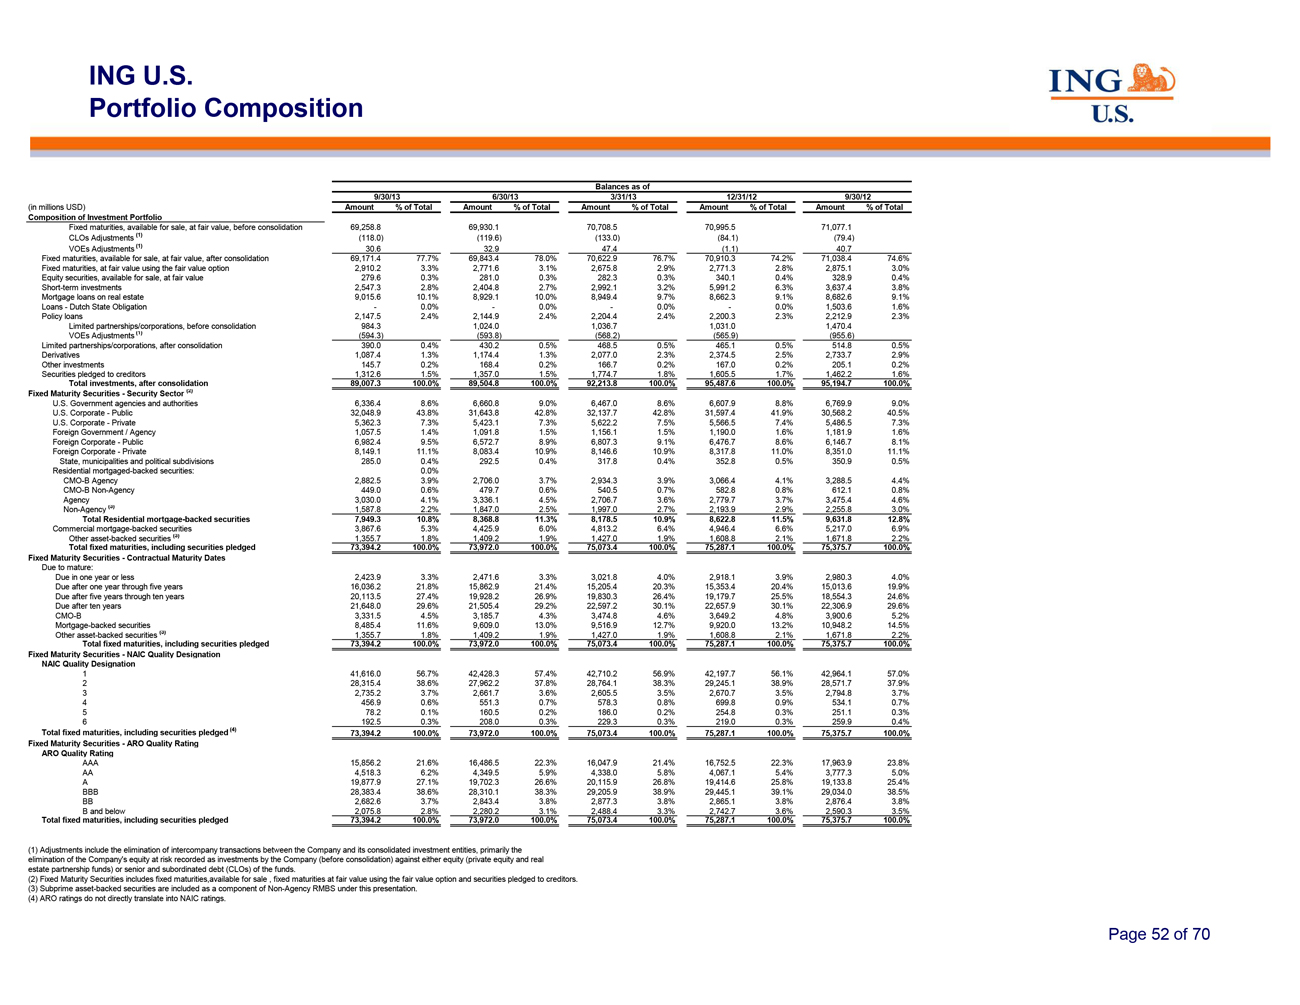
ING U.S.
Portfolio Composition
Balances as of
9/30/13 6/30/13 3/31/13 12/31/12 9/30/12
(in
millions USD) Amount % of Total Amount % of Total Amount % of Total Amount % of Total Amount % of Total
Composition of Investment Portfolio
Fixed maturities, available for sale, at fair value, before consolidation 69,258.8 69,930.1 70,708.5 70,995.5 71,077.1
CLOs Adjustments (1) (118.0) (119.6) (133.0) (84.1) (79.4)
VOEs Adjustments (1) 30.6 32.9 47.4 (1.1) 40.7
Fixed maturities, available for sale, at fair value, after consolidation 69,171.4 77.7% 69,843.4 78.0% 70,622.9 76.7%
70,910.3 74.2% 71,038.4 74.6%
Fixed maturities, at fair value using the fair value option 2,910.2 3.3% 2,771.6
3.1% 2,675.8 2.9% 2,771.3 2.8% 2,875.1 3.0%
Equity securities, available for sale, at fair value 279.6 0.3%
281.0 0.3% 282.3 0.3% 340.1 0.4% 328.9 0.4%
Short-term investments 2,547.3 2.8% 2,404.8 2.7% 2,992.1 3.2%
5,991.2 6.3% 3,637.4 3.8%
Mortgage loans on real estate 9,015.6 10.1% 8,929.1 10.0% 8,949.4 9.7% 8,662.3 9.1%
8,682.6 9.1%
Loans—Dutch State Obligation — 0.0% — 0.0% — 0.0% — 0.0% 1,503.6 1.6%
Policy loans 2,147.5 2.4% 2,144.9 2.4% 2,204.4 2.4% 2,200.3 2.3% 2,212.9 2.3%
Limited partnerships/corporations, before consolidation 984.3 1,024.0 1,036.7 1,031.0 1,470.4
VOEs Adjustments (1) (594.3) (593.8) (568.2) (565.9) (955.6)
Limited partnerships/corporations, after consolidation 390.0 0.4% 430.2 0.5% 468.5 0.5% 465.1 0.5% 514.8 0.5%
Derivatives 1,087.4 1.3% 1,174.4 1.3% 2,077.0 2.3% 2,374.5 2.5% 2,733.7 2.9%
Other investments 145.7 0.2% 168.4 0.2% 166.7 0.2% 167.0 0.2% 205.1 0.2%
Securities pledged to creditors 1,312.6 1.5% 1,357.0 1.5% 1,774.7 1.8% 1,605.5 1.7% 1,462.2 1.6%
Total investments, after consolidation 89,007.3 100.0% 89,504.8 100.0% 92,213.8 100.0% 95,487.6 100.0% 95,194.7 100.0%
Fixed Maturity Securities—Security Sector (2)
U.S. Government agencies and authorities 6,336.4 8.6% 6,660.8 9.0% 6,467.0 8.6% 6,607.9 8.8% 6,769.9 9.0%
U.S. Corporate—Public 32,048.9 43.8% 31,643.8 42.8% 32,137.7 42.8% 31,597.4 41.9% 30,568.2 40.5%
U.S. Corporate—Private 5,362.3 7.3% 5,423.1 7.3% 5,622.2 7.5% 5,566.5 7.4% 5,486.5 7.3%
Foreign Government / Agency 1,057.5 1.4% 1,091.8 1.5% 1,156.1 1.5% 1,190.0 1.6% 1,181.9 1.6%
Foreign Corporate—Public 6,982.4 9.5% 6,572.7 8.9% 6,807.3 9.1% 6,476.7 8.6% 6,146.7 8.1%
Foreign Corporate—Private 8,149.1 11.1% 8,083.4 10.9% 8,146.6 10.9% 8,317.8 11.0% 8,351.0 11.1%
State, municipalities and political subdivisions 285.0 0.4% 292.5 0.4% 317.8 0.4% 352.8 0.5% 350.9 0.5%
Residential mortgaged-backed securities: 0.0%
CMO-B Agency 2,882.5 3.9% 2,706.0 3.7% 2,934.3 3.9% 3,066.4 4.1% 3,288.5 4.4%
CMO-B Non-Agency 449.0 0.6% 479.7 0.6% 540.5 0.7% 582.8 0.8% 612.1 0.8%
Agency 3,030.0 4.1% 3,336.1 4.5% 2,706.7 3.6% 2,779.7 3.7% 3,475.4 4.6%
Non-Agency (3) 1,587.8 2.2% 1,847.0 2.5% 1,997.0 2.7% 2,193.9 2.9% 2,255.8 3.0%
Total Residential mortgage-backed securities 7,949.3 10.8% 8,368.8 11.3% 8,178.5 10.9% 8,622.8 11.5% 9,631.8 12.8%
Commercial mortgage-backed securities 3,867.6 5.3% 4,425.9 6.0% 4,813.2 6.4% 4,946.4 6.6% 5,217.0 6.9%
Other asset-backed securities (3) 1,355.7 1.8% 1,409.2 1.9% 1,427.0 1.9% 1,608.8 2.1% 1,671.8 2.2%
Total fixed maturities, including securities pledged 73,394.2 100.0% 73,972.0 100.0% 75,073.4 100.0% 75,287.1 100.0% 75,375.7 100.0%
Fixed Maturity Securities—Contractual Maturity Dates
Due to mature:
Due in one year or less 2,423.9 3.3% 2,471.6 3.3% 3,021.8 4.0% 2,918.1 3.9% 2,980.3 4.0%
Due after one year through five years 16,036.2 21.8% 15,862.9 21.4% 15,205.4 20.3% 15,353.4 20.4% 15,013.6 19.9%
Due after five years through ten years 20,113.5 27.4% 19,928.2 26.9% 19,830.3 26.4% 19,179.7 25.5% 18,554.3 24.6%
Due after ten years 21,648.0 29.6% 21,505.4 29.2% 22,597.2 30.1% 22,657.9 30.1% 22,306.9 29.6%
CMO-B 3,331.5 4.5% 3,185.7 4.3% 3,474.8 4.6% 3,649.2 4.8% 3,900.6 5.2%
Mortgage-backed securities 8,485.4 11.6% 9,609.0 13.0% 9,516.9 12.7% 9,920.0 13.2% 10,948.2 14.5%
Other asset-backed securities (3) 1,355.7 1.8% 1,409.2 1.9% 1,427.0 1.9% 1,608.8 2.1% 1,671.8 2.2%
Total fixed maturities, including securities pledged 73,394.2 100.0% 73,972.0 100.0% 75,073.4 100.0% 75,287.1 100.0% 75,375.7 100.0%
Fixed Maturity Securities—NAIC Quality Designation
NAIC Quality Designation
| 1 |
|
41,616.0 56.7% 42,428.3 57.4% 42,710.2 56.9% 42,197.7 56.1% 42,964.1 57.0% |
| 2 |
|
28,315.4 38.6% 27,962.2 37.8% 28,764.1 38.3% 29,245.1 38.9% 28,571.7 37.9% |
| 3 |
|
2,735.2 3.7% 2,661.7 3.6% 2,605.5 3.5% 2,670.7 3.5% 2,794.8 3.7% |
| 4 |
|
456.9 0.6% 551.3 0.7% 578.3 0.8% 699.8 0.9% 534.1 0.7% |
| 5 |
|
78.2 0.1% 160.5 0.2% 186.0 0.2% 254.8 0.3% 251.1 0.3% |
| 6 |
|
192.5 0.3% 208.0 0.3% 229.3 0.3% 219.0 0.3% 259.9 0.4% |
Total fixed maturities, including securities pledged (4) 73,394.2 100.0% 73,972.0 100.0% 75,073.4 100.0% 75,287.1
100.0% 75,375.7 100.0%
Fixed Maturity Securities—ARO Quality Rating
ARO Quality Rating
AAA 15,856.2 21.6% 16,486.5 22.3% 16,047.9 21.4% 16,752.5 22.3% 17,963.9 23.8%
AA 4,518.3 6.2% 4,349.5 5.9% 4,338.0 5.8% 4,067.1 5.4% 3,777.3 5.0%
A 19,877.9 27.1% 19,702.3 26.6% 20,115.9 26.8% 19,414.6 25.8% 19,133.8 25.4%
BBB 28,383.4 38.6% 28,310.1 38.3% 29,205.9 38.9% 29,445.1 39.1% 29,034.0 38.5%
BB 2,682.6 3.7% 2,843.4 3.8% 2,877.3 3.8% 2,865.1 3.8% 2,876.4 3.8%
B and below 2,075.8 2.8% 2,280.2 3.1% 2,488.4 3.3% 2,742.7 3.6% 2,590.3 3.5%
Total fixed maturities, including securities pledged 73,394.2 100.0% 73,972.0 100.0% 75,073.4 100.0% 75,287.1 100.0% 75,375.7 100.0%
(1) Adjustments include the elimination of intercompany transactions between the Company and its consolidated investment
entities, primarily the
elimination of the Company’s equity at risk recorded as investments by the
Company (before consolidation) against either equity (private equity and real
estate partnership funds) or
senior and subordinated debt (CLOs) of the funds.
(2) Fixed Maturity Securities includes fixed
maturities,available for sale , fixed maturities at fair value using the fair value option and securities pledged to creditors.
| (3) |
|
Subprime asset-backed securities are included as a component of Non-Agency RMBS under this presentation.
|
| (4) |
|
ARO ratings do not directly translate into NAIC ratings. |
Page 52 of 70
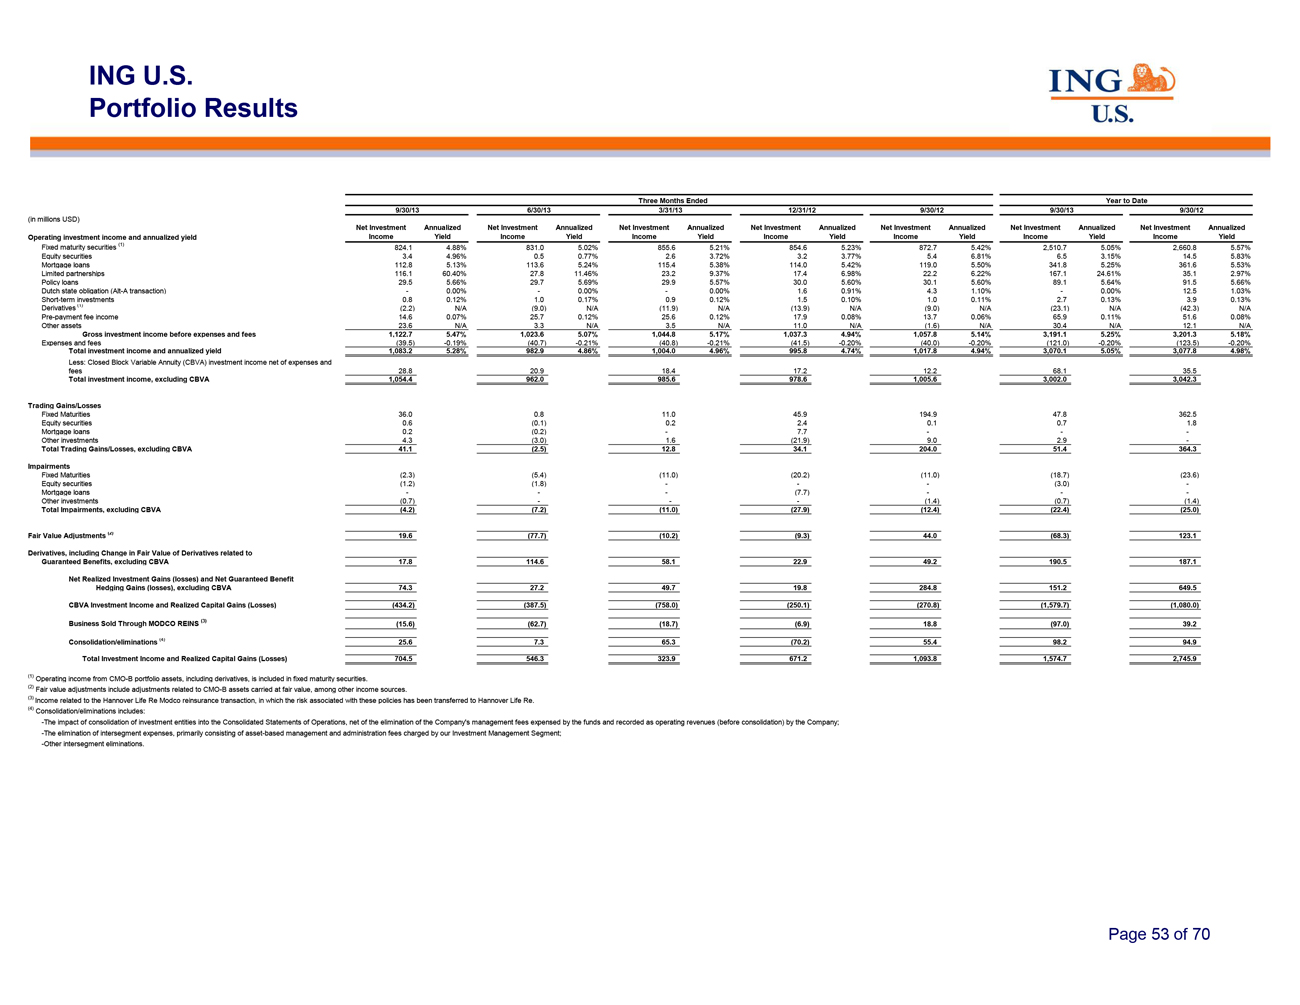
ING U.S.
Portfolio Results
Three Months Ended Year to Date
9/30/13 6/30/13 3/31/13 12/31/12 9/30/12 9/30/13 9/30/12
(in millions USD)
Net Investment Annualized Net
Investment Annualized Net Investment Annualized Net Investment Annualized Net Investment Annualized Net Investment Annualized Net Investment Annualized
Operating investment income and annualized yield Income Yield Income Yield Income Yield Income Yield Income Yield Income Yield Income Yield
Fixed maturity securities (1) 824.1 4.88% 831.0 5.02% 855.6 5.21% 854.6 5.23% 872.7 5.42% 2,510.7 5.05% 2,660.8 5.57%
Equity securities 3.4 4.96% 0.5 0.77% 2.6 3.72% 3.2 3.77% 5.4 6.81% 6.5 3.15% 14.5 5.83%
Mortgage loans 112.8 5.13% 113.6 5.24% 115.4 5.38% 114.0 5.42% 119.0 5.50% 341.8 5.25% 361.6 5.53%
Limited partnerships 116.1 60.40% 27.8 11.46% 23.2 9.37% 17.4 6.98% 22.2 6.22% 167.1 24.61% 35.1 2.97%
Policy loans 29.5 5.66% 29.7 5.69% 29.9 5.57% 30.0 5.60% 30.1 5.60% 89.1 5.64% 91.5 5.66%
Dutch state obligation (Alt-A transaction) — 0.00% — 0.00% — 0.00% 1.6 0.91% 4.3 1.10% — 0.00% 12.5
1.03%
Short-term investments 0.8 0.12% 1.0 0.17% 0.9 0.12% 1.5 0.10% 1.0 0.11% 2.7 0.13% 3.9 0.13%
Derivatives (1) (2.2) N/A (9.0) N/A (11.9) N/A (13.9) N/A (9.0) N/A (23.1) N/A
(42.3) N/A
Pre-payment fee income 14.6 0.07% 25.7 0.12% 25.6 0.12% 17.9 0.08% 13.7 0.06% 65.9 0.11% 51.6
0.08%
Other assets 23.6 N/A 3.3 N/A 3.5 N/A 11.0 N/A (1.6) N/A 30.4 N/A 12.1 N/A
Gross investment income before expenses and fees 1,122.7 5.47% 1,023.6 5.07% 1,044.8 5.17% 1,037.3 4.94% 1,057.8 5.14%
3,191.1 5.25% 3,201.3 5.18%
Expenses and fees (39.5) -0.19% (40.7) -0.21% (40.8) -0.21%
(41.5) -0.20% (40.0) -0.20% (121.0) -0.20% (123.5) -0.20%
Total investment income and
annualized yield 1,083.2 5.28% 982.9 4.86% 1,004.0 4.96% 995.8 4.74% 1,017.8 4.94% 3,070.1 5.05% 3,077.8 4.98%
Less: Closed Block Variable Annuity (CBVA) investment income net of expenses and
fees 28.8 20.9 18.4 17.2 12.2 68.1 35.5
Total investment income, excluding CBVA 1,054.4 962.0 985.6 978.6 1,005.6 3,002.0 3,042.3
Trading Gains/Losses
Fixed Maturities 36.0 0.8
11.0 45.9 194.9 47.8 362.5
Equity securities 0.6 (0.1) 0.2 2.4 0.1 0.7 1.8
Mortgage loans 0.2 (0.2) — 7.7 — — —
Other investments 4.3 (3.0) 1.6 (21.9) 9.0 2.9 —
Total Trading Gains/Losses, excluding CBVA 41.1 (2.5) 12.8 34.1 204.0 51.4 364.3
Impairments
Fixed Maturities (2.3) (5.4) (11.0) (20.2) (11.0) (18.7) (23.6)
Equity securities (1.2) (1.8) — — — (3.0) —
Mortgage loans — — — (7.7) — — —
Other investments (0.7) — — — (1.4) (0.7) (1.4)
Total Impairments, excluding CBVA (4.2) (7.2) (11.0) (27.9) (12.4) (22.4) (25.0)
Fair Value Adjustments (2) 19.6 (77.7) (10.2) (9.3) 44.0 (68.3) 123.1
Derivatives, including Change in Fair Value of Derivatives related to
Guaranteed Benefits, excluding CBVA 17.8 114.6 58.1 22.9 49.2 190.5 187.1
Net Realized Investment Gains (losses) and Net Guaranteed Benefit
Hedging Gains (losses), excluding CBVA 74.3 27.2 49.7 19.8 284.8 151.2 649.5
CBVA Investment Income and Realized Capital Gains (Losses) (434.2) (387.5) (758.0) (250.1) (270.8) (1,579.7) (1,080.0)
Business Sold Through MODCO REINS (3) (15.6) (62.7) (18.7) (6.9) 18.8 (97.0) 39.2
Consolidation/eliminations (4) 25.6 7.3 65.3 (70.2) 55.4 98.2 94.9
Total Investment Income and Realized Capital Gains (Losses) 704.5 546.3 323.9 671.2 1,093.8 1,574.7 2,745.9
| (1) |
|
Operating income from CMO-B portfolio assets, including derivatives, is included in fixed maturity securities.
|
(2) Fair value adjustments include adjustments related to CMO-B assets carried at fair
value, among other income sources.
(3) Income related to the Hannover Life Re Modco reinsurance transaction,
in which the risk associated with these policies has been transferred to Hannover Life Re.
| (4) |
|
Consolidation/eliminations includes: |
-The impact of consolidation of investment entities into the Consolidated Statements of Operations, net of the elimination
of the Company’s management fees expensed by the funds and recorded as operating revenues (before consolidation) by the Company;
-The elimination of intersegment expenses, primarily consisting of asset-based management and administration fees charged by our Investment Management Segment;
-Other intersegment eliminations.
Page 53 of 70
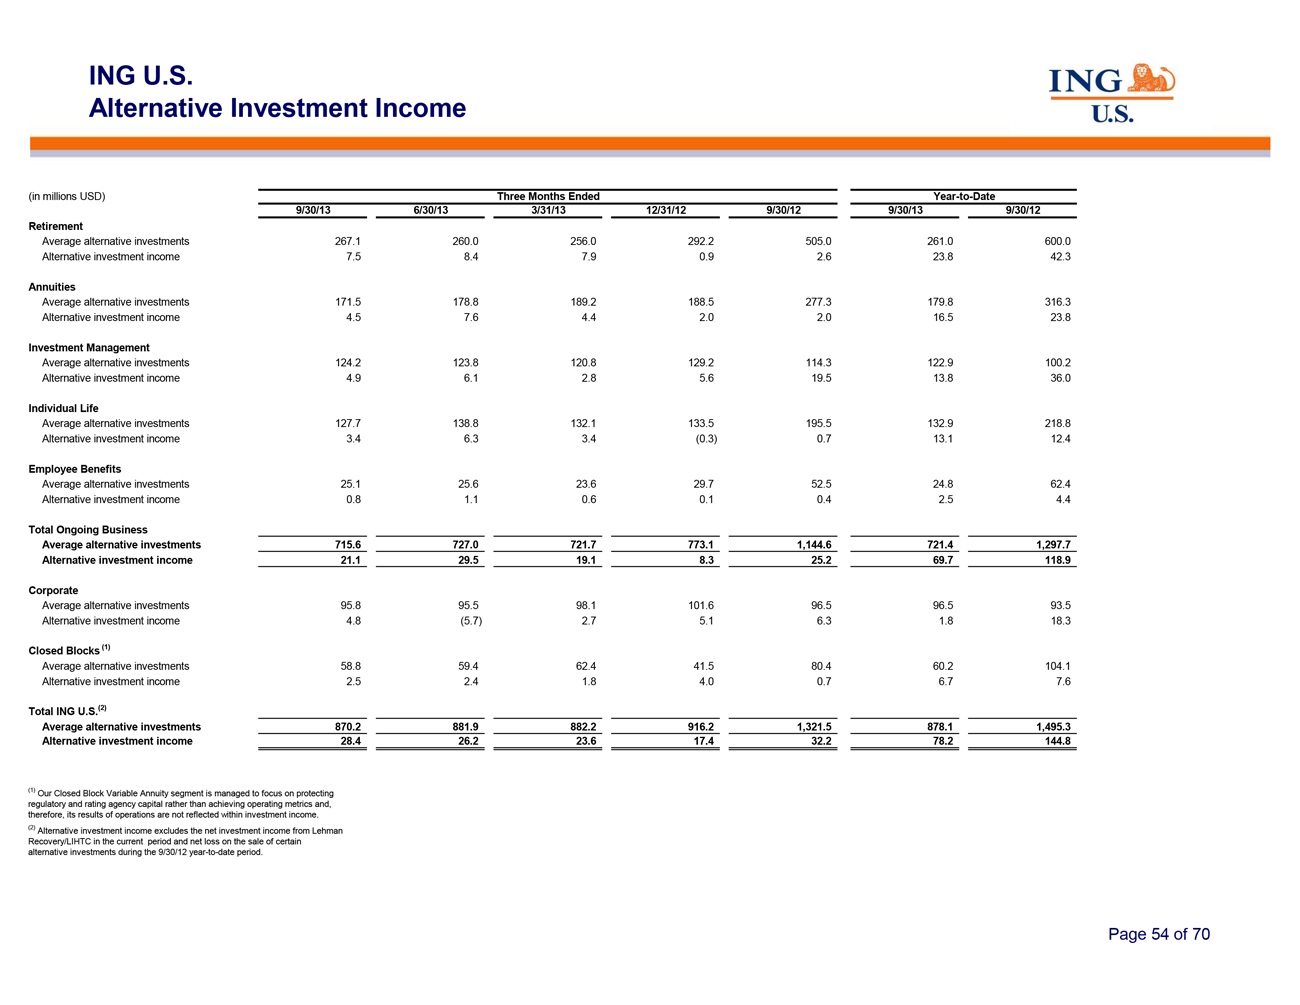
ING U.S.
Alternative Investment Income
(in millions USD) Three Months Ended Year-to-Date
9/30/13 6/30/13 3/31/13 12/31/12 9/30/12 9/30/13 9/30/12
Retirement
Average alternative investments 267.1 260.0 256.0 292.2 505.0 261.0 600.0
Alternative investment income 7.5 8.4 7.9 0.9 2.6 23.8 42.3
Annuities
Average alternative investments 171.5
178.8 189.2 188.5 277.3 179.8 316.3
Alternative investment income 4.5 7.6 4.4 2.0 2.0 16.5 23.8
Investment Management
Average alternative investments 124.2 123.8 120.8 129.2 114.3 122.9 100.2
Alternative investment income 4.9 6.1 2.8 5.6 19.5 13.8 36.0
Individual Life
Average alternative investments
127.7 138.8 132.1 133.5 195.5 132.9 218.8
Alternative investment income 3.4 6.3 3.4 (0.3) 0.7 13.1 12.4
Employee Benefits
Average alternative investments 25.1 25.6 23.6 29.7 52.5 24.8 62.4
Alternative investment income 0.8 1.1 0.6 0.1 0.4 2.5 4.4
Total Ongoing Business
Average alternative
investments 715.6 727.0 721.7 773.1 1,144.6 721.4 1,297.7
Alternative investment income 21.1 29.5 19.1 8.3
25.2 69.7 118.9
Corporate
Average alternative investments 95.8 95.5 98.1 101.6 96.5 96.5 93.5
Alternative investment income 4.8 (5.7) 2.7 5.1 6.3 1.8 18.3
Closed Blocks (1)
Average alternative investments
58.8 59.4 62.4 41.5 80.4 60.2 104.1
Alternative investment income 2.5 2.4 1.8 4.0 0.7 6.7 7.6
Total ING U.S.(2)
Average alternative investments 870.2 881.9 882.2 916.2 1,321.5 878.1 1,495.3
Alternative investment income 28.4 26.2 23.6 17.4 32.2 78.2 144.8
| (1) |
|
Our Closed Block Variable Annuity segment is managed to focus on protecting |
regulatory and rating agency capital rather than achieving operating metrics and,
therefore, its results of operations are not reflected within investment income.
| (2) |
|
Alternative investment income excludes the net investment income from Lehman |
Recovery/LIHTC in the current period and net loss on the sale of certain
alternative investments during the 9/30/12 year-to-date period.
Page 54 of 70
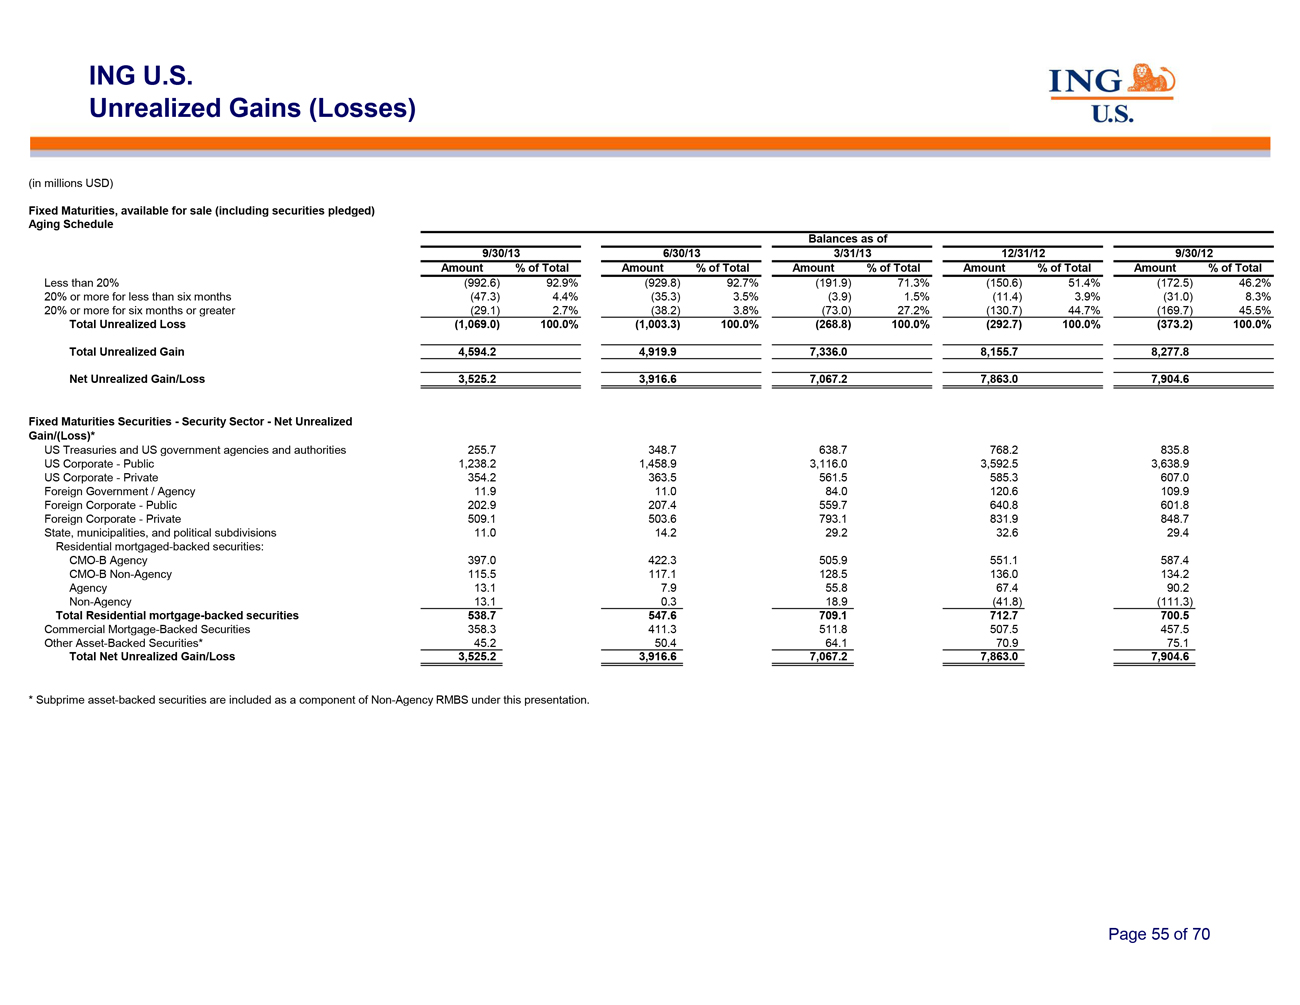
ING U.S.
Unrealized Gains (Losses)
(in millions USD)
Fixed Maturities, available for sale (including securities pledged)
Aging Schedule
Balances as of
9/30/13 6/30/13 3/31/13 12/31/12 9/30/12
Amount % of Total Amount % of Total Amount % of Total Amount % of Total Amount % of Total
Less than 20% (992.6) 92.9% (929.8) 92.7% (191.9) 71.3% (150.6) 51.4% (172.5) 46.2%
20% or more for less than six months (47.3) 4.4% (35.3) 3.5% (3.9) 1.5% (11.4) 3.9% (31.0) 8.3%
20% or more for six months or greater (29.1) 2.7% (38.2) 3.8% (73.0) 27.2% (130.7) 44.7%
(169.7) 45.5%
Total Unrealized Loss (1,069.0) 100.0% (1,003.3) 100.0% (268.8) 100.0%
(292.7) 100.0% (373.2) 100.0%
Total Unrealized Gain 4,594.2 4,919.9 7,336.0 8,155.7 8,277.8
Net Unrealized Gain/Loss 3,525.2 3,916.6 7,067.2 7,863.0 7,904.6
Fixed Maturities Securities—Security Sector—Net Unrealized
Gain/(Loss)*
US Treasuries and US government agencies and authorities 255.7 348.7 638.7 768.2 835.8
US Corporate—Public 1,238.2 1,458.9 3,116.0 3,592.5 3,638.9
US Corporate—Private 354.2 363.5 561.5 585.3 607.0
Foreign Government / Agency 11.9 11.0 84.0 120.6 109.9
Foreign Corporate—Public 202.9 207.4 559.7 640.8 601.8
Foreign Corporate—Private 509.1 503.6 793.1 831.9 848.7
State, municipalities, and political subdivisions 11.0 14.2 29.2 32.6 29.4
Residential mortgaged-backed securities:
CMO-B
Agency 397.0 422.3 505.9 551.1 587.4
CMO-B Non-Agency 115.5 117.1 128.5 136.0 134.2
Agency 13.1 7.9 55.8 67.4 90.2
Non-Agency 13.1 0.3 18.9 (41.8) (111.3)
Total
Residential mortgage-backed securities 538.7 547.6 709.1 712.7 700.5
Commercial Mortgage-Backed Securities
358.3 411.3 511.8 507.5 457.5
Other Asset-Backed Securities* 45.2 50.4 64.1 70.9 75.1
Total Net Unrealized Gain/Loss 3,525.2 3,916.6 7,067.2 7,863.0 7,904.6
* Subprime asset-backed securities are included as a component of Non-Agency RMBS under this presentation.
Page 55 of 70
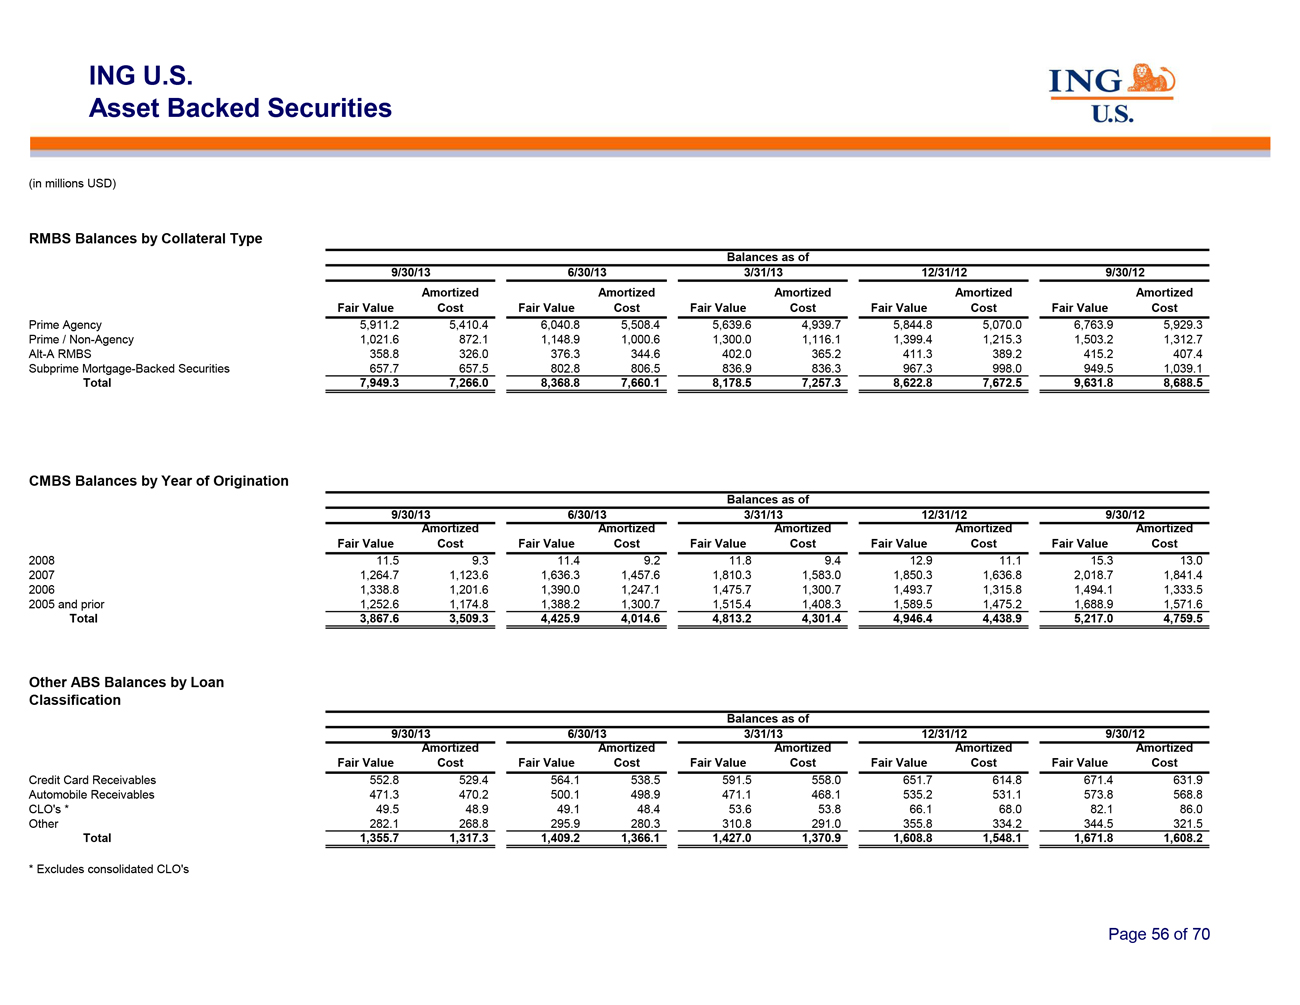
ING U.S.
Asset Backed Securities
(in millions USD)
RMBS Balances by Collateral Type
Balances as of
9/30/13 6/30/13 3/31/13 12/31/12 9/30/12
Amortized Amortized Amortized Amortized Amortized
Fair Value Cost Fair Value Cost Fair Value Cost Fair Value Cost Fair Value Cost
Prime Agency 5,911.2 5,410.4 6,040.8 5,508.4 5,639.6 4,939.7 5,844.8 5,070.0 6,763.9 5,929.3
Prime / Non-Agency 1,021.6 872.1 1,148.9 1,000.6 1,300.0 1,116.1 1,399.4 1,215.3 1,503.2 1,312.7
Alt-A RMBS 358.8 326.0 376.3 344.6 402.0 365.2 411.3 389.2 415.2 407.4
Subprime Mortgage-Backed Securities 657.7 657.5 802.8 806.5 836.9 836.3 967.3 998.0 949.5 1,039.1
Total 7,949.3 7,266.0 8,368.8 7,660.1 8,178.5 7,257.3 8,622.8 7,672.5 9,631.8 8,688.5
CMBS Balances by Year of Origination
Balances as
of
9/30/13 6/30/13 3/31/13 12/31/12 9/30/12
Amortized Amortized Amortized Amortized Amortized
Fair Value Cost Fair Value Cost Fair Value Cost Fair Value Cost Fair Value Cost
2008 11.5 9.3 11.4 9.2 11.8 9.4 12.9 11.1 15.3 13.0
2007 1,264.7 1,123.6 1,636.3 1,457.6 1,810.3 1,583.0 1,850.3 1,636.8 2,018.7 1,841.4
2006 1,338.8 1,201.6 1,390.0 1,247.1 1,475.7 1,300.7 1,493.7 1,315.8 1,494.1 1,333.5
2005 and prior 1,252.6 1,174.8 1,388.2 1,300.7 1,515.4 1,408.3 1,589.5 1,475.2 1,688.9 1,571.6
Total 3,867.6 3,509.3 4,425.9 4,014.6 4,813.2 4,301.4 4,946.4 4,438.9 5,217.0 4,759.5
Other ABS Balances by Loan
Classification
Balances as of
9/30/13 6/30/13 3/31/13 12/31/12 9/30/12
Amortized Amortized Amortized Amortized Amortized
Fair Value Cost Fair Value Cost Fair Value Cost Fair Value Cost Fair Value Cost
Credit Card Receivables 552.8 529.4 564.1 538.5 591.5 558.0 651.7 614.8 671.4 631.9
Automobile Receivables 471.3 470.2 500.1 498.9 471.1 468.1 535.2 531.1 573.8 568.8
CLO’s * 49.5 48.9 49.1 48.4 53.6 53.8 66.1 68.0 82.1 86.0
Other 282.1 268.8 295.9 280.3 310.8 291.0 355.8 334.2 344.5 321.5
Total 1,355.7 1,317.3 1,409.2 1,366.1 1,427.0 1,370.9 1,608.8 1,548.1 1,671.8 1,608.2
* Excludes consolidated CLO’s
Page 56 of 70
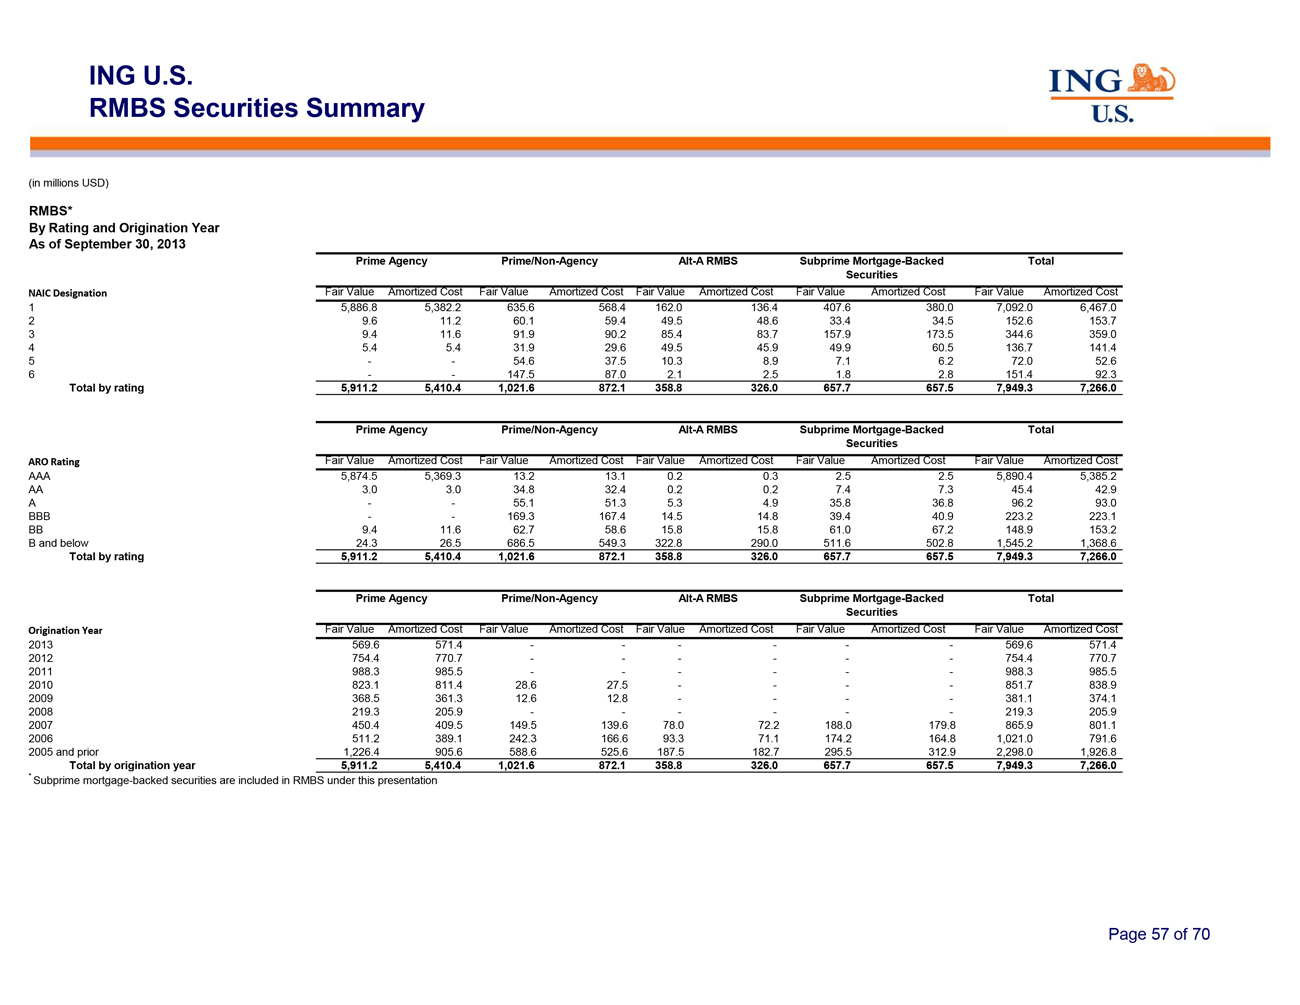
ING U.S.
RMBS Securities Summary
(in millions USD)
RMBS*
By Rating and Origination Year
As of September 30, 2013
Prime Agency Prime/Non-Agency Alt-A RMBS Subprime Mortgage-Backed Total
Securities
NAIC Designation Fair Value Amortized
Cost Fair Value Amortized Cost Fair Value Amortized Cost Fair Value Amortized Cost Fair Value Amortized Cost
1
5,886.8 5,382.2 635.6 568.4 162.0 136.4 407.6 380.0 7,092.0 6,467.0
2 9.6 11.2 60.1 59.4 49.5 48.6 33.4 34.5
152.6 153.7
3 9.4 11.6 91.9 90.2 85.4 83.7 157.9 173.5 344.6 359.0
4 5.4 5.4 31.9 29.6 49.5 45.9 49.9 60.5 136.7 141.4
5 —— 54.6 37.5 10.3 8.9 7.1 6.2 72.0 52.6
6 —— 147.5 87.0 2.1 2.5 1.8 2.8 151.4 92.3
Total by rating 5,911.2 5,410.4 1,021.6 872.1 358.8 326.0 657.7 657.5 7,949.3 7,266.0
Prime Agency Prime/Non-Agency Alt-A RMBS Subprime Mortgage-Backed Total
Securities
ARO Rating Fair Value Amortized Cost Fair Value Amortized Cost Fair Value Amortized Cost Fair Value Amortized Cost Fair Value Amortized Cost
AAA 5,874.5 5,369.3 13.2 13.1 0.2 0.3 2.5 2.5 5,890.4 5,385.2
AA 3.0 3.0 34.8 32.4 0.2 0.2 7.4 7.3 45.4 42.9
A —— 55.1 51.3 5.3 4.9 35.8 36.8 96.2 93.0
BBB —— 169.3 167.4 14.5 14.8 39.4 40.9 223.2 223.1
BB 9.4 11.6 62.7 58.6 15.8 15.8 61.0 67.2 148.9 153.2
B and below 24.3 26.5 686.5 549.3 322.8 290.0 511.6 502.8 1,545.2 1,368.6
Total by rating 5,911.2 5,410.4 1,021.6 872.1 358.8 326.0 657.7 657.5 7,949.3 7,266.0
Prime Agency Prime/Non-Agency Alt-A RMBS Subprime Mortgage-Backed Total
Securities
Origination Year Fair Value Amortized
Cost Fair Value Amortized Cost Fair Value Amortized Cost Fair Value Amortized Cost Fair Value Amortized Cost
2013 569.6 571.4 —————— 569.6 571.4
2012 754.4 770.7 —————— 754.4 770.7
2011 988.3 985.5 —————— 988.3 985.5
2010 823.1 811.4 28.6 27.5 ———— 851.7 838.9
2009 368.5 361.3 12.6 12.8 ———— 381.1 374.1
2008 219.3 205.9 —————— 219.3 205.9
2007 450.4 409.5 149.5 139.6 78.0 72.2 188.0 179.8 865.9 801.1
2006 511.2 389.1 242.3 166.6 93.3 71.1 174.2 164.8 1,021.0 791.6
2005 and prior 1,226.4 905.6 588.6 525.6 187.5 182.7 295.5 312.9 2,298.0 1,926.8
Total by origination year 5,911.2 5,410.4 1,021.6 872.1 358.8 326.0 657.7 657.5 7,949.3 7,266.0
* Subprime mortgage-backed securities are included in RMBS under this presentation
Page 57 of 70
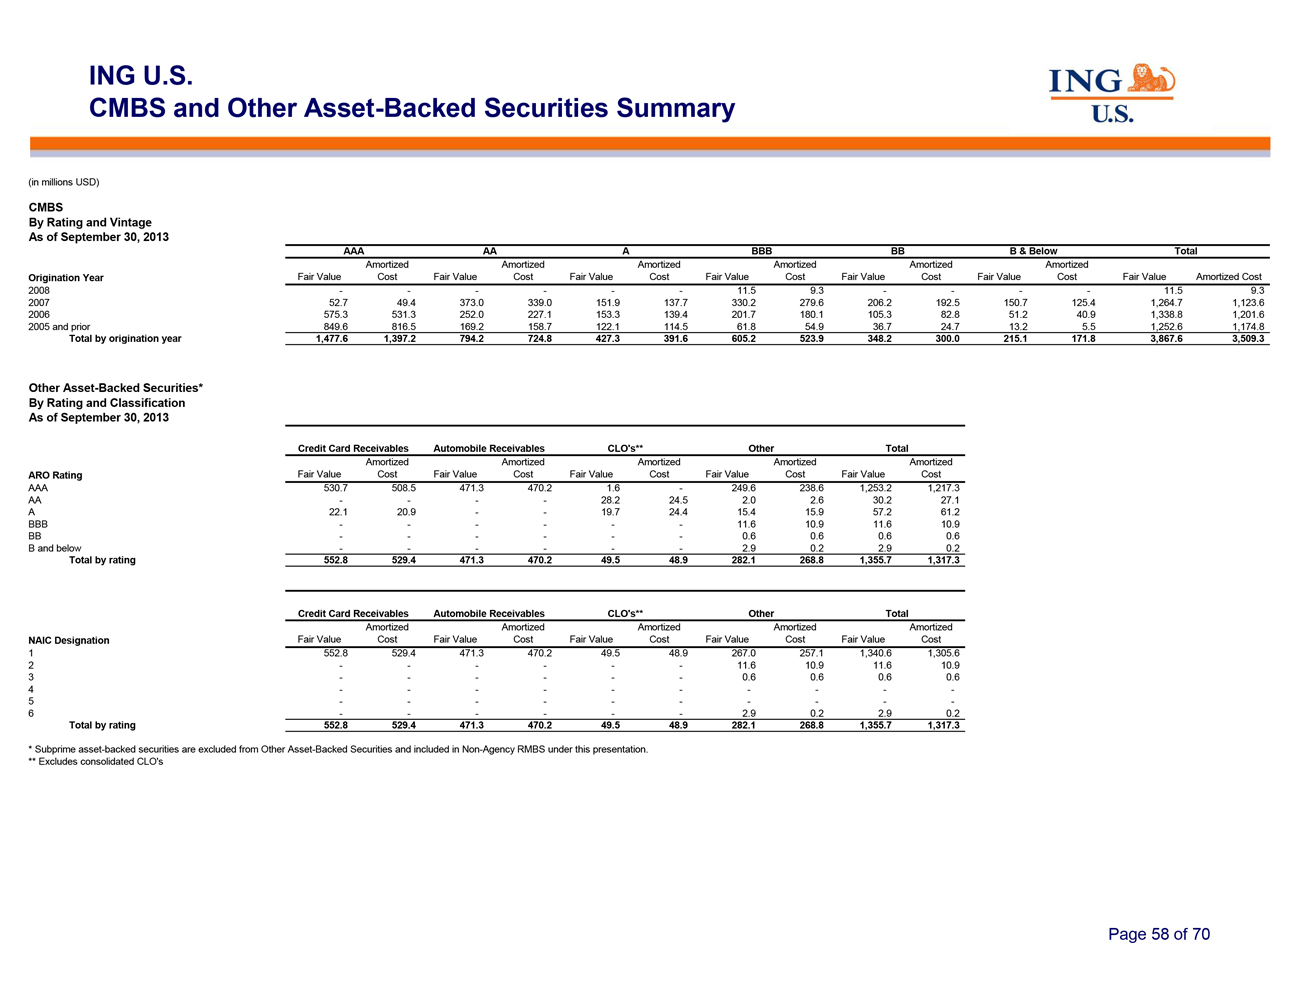
ING U.S.
CMBS and Other Asset-Backed Securities
Summary
(in millions USD)
CMBS
By Rating and Vintage
As of September 30, 2013
AAA AA A BBB BB B & Below Total
Amortized
Amortized Amortized Amortized Amortized Amortized
Origination Year Fair Value Cost Fair Value Cost Fair Value
Cost Fair Value Cost Fair Value Cost Fair Value Cost Fair Value Amortized Cost
2008
—————— 11.5 9.3 ———— 11.5 9.3
2007 52.7 49.4 373.0 339.0
151.9 137.7 330.2 279.6 206.2 192.5 150.7 125.4 1,264.7 1,123.6
2006 575.3 531.3 252.0 227.1 153.3 139.4 201.7
180.1 105.3 82.8 51.2 40.9 1,338.8 1,201.6
2005 and prior 849.6 816.5 169.2 158.7 122.1 114.5 61.8 54.9 36.7
24.7 13.2 5.5 1,252.6 1,174.8
Total by origination year 1,477.6 1,397.2 794.2 724.8 427.3 391.6 605.2 523.9
348.2 300.0 215.1 171.8 3,867.6 3,509.3
Other Asset-Backed Securities*
By Rating and Classification
As of September 30, 2013
Credit Card
Receivables Automobile Receivables CLO’s** Other Total
Amortized Amortized Amortized Amortized Amortized
ARO Rating Fair Value Cost Fair Value Cost Fair Value Cost Fair Value Cost Fair Value Cost
AAA 530.7 508.5 471.3 470.2 1.6 — 249.6 238.6 1,253.2 1,217.3
AA ———— 28.2 24.5 2.0 2.6 30.2 27.1
A 22.1 20.9 —— 19.7 24.4 15.4 15.9 57.2 61.2
BBB —————— 11.6 10.9 11.6 10.9
BB —————— 0.6 0.6 0.6 0.6
B and below —————— 2.9 0.2 2.9 0.2
Total by rating 552.8 529.4 471.3 470.2 49.5 48.9 282.1 268.8 1,355.7 1,317.3
Credit Card Receivables Automobile Receivables CLO’s** Other Total
Amortized Amortized Amortized Amortized Amortized
NAIC Designation Fair Value Cost Fair Value Cost Fair Value Cost Fair Value Cost Fair Value Cost
1 552.8 529.4 471.3 470.2 49.5 48.9 267.0 257.1 1,340.6 1,305.6
2 —————— 11.6 10.9 11.6 10.9
3 —————— 0.6 0.6 0.6 0.6
4 ——————————
5 ——————————
6 —————— 2.9 0.2 2.9 0.2
Total by rating 552.8 529.4 471.3 470.2 49.5 48.9 282.1 268.8 1,355.7 1,317.3
* Subprime asset-backed securities are excluded from Other Asset-Backed Securities and included in Non-Agency RMBS under this presentation.
** Excludes consolidated CLO’s
Page 58 of 70
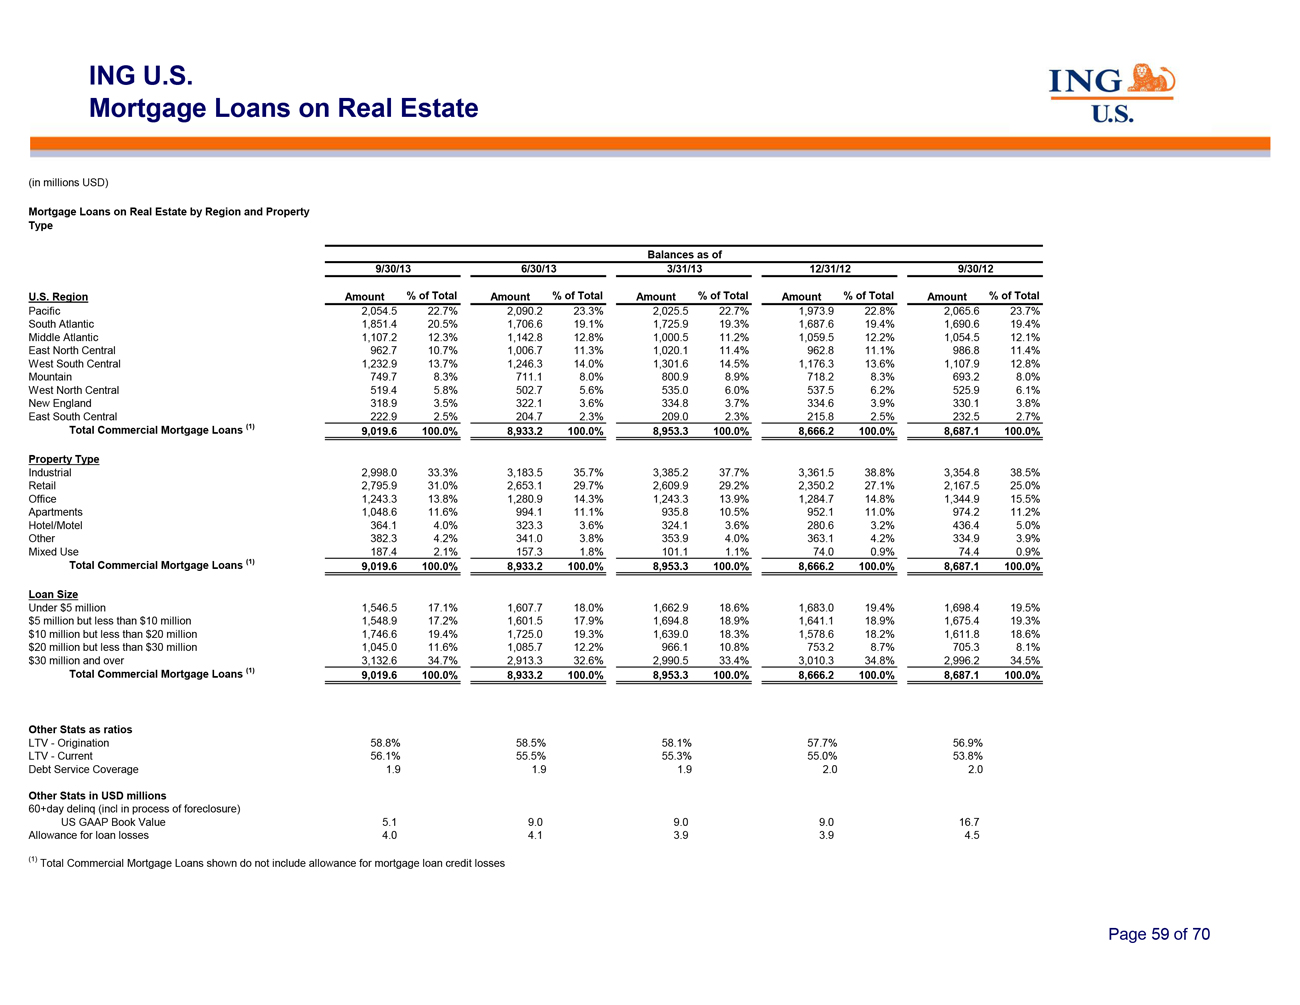
ING U.S.
Mortgage Loans on Real Estate
(in millions USD)
Mortgage Loans on Real Estate by Region and Property
Type
Balances as of
9/30/13 6/30/13 3/31/13 12/31/12 9/30/12
U.S. Region Amount % of Total Amount % of Total Amount % of Total Amount % of Total Amount % of Total
Pacific 2,054.5 22.7% 2,090.2 23.3% 2,025.5 22.7% 1,973.9 22.8% 2,065.6 23.7%
South Atlantic 1,851.4 20.5% 1,706.6 19.1% 1,725.9 19.3% 1,687.6 19.4% 1,690.6 19.4%
Middle Atlantic 1,107.2 12.3% 1,142.8 12.8% 1,000.5 11.2% 1,059.5 12.2% 1,054.5 12.1%
East North Central 962.7 10.7% 1,006.7 11.3% 1,020.1 11.4% 962.8 11.1% 986.8 11.4%
West South Central 1,232.9 13.7% 1,246.3 14.0% 1,301.6 14.5% 1,176.3 13.6% 1,107.9 12.8%
Mountain 749.7 8.3% 711.1 8.0% 800.9 8.9% 718.2 8.3% 693.2 8.0%
West North Central 519.4 5.8% 502.7 5.6% 535.0 6.0% 537.5 6.2% 525.9 6.1%
New England 318.9 3.5% 322.1 3.6% 334.8 3.7% 334.6 3.9% 330.1 3.8%
East South Central 222.9 2.5% 204.7 2.3% 209.0 2.3% 215.8 2.5% 232.5 2.7%
Total Commercial Mortgage Loans (1) 9,019.6 100.0% 8,933.2 100.0% 8,953.3 100.0% 8,666.2 100.0% 8,687.1 100.0%
Property Type
Industrial 2,998.0 33.3% 3,183.5
35.7% 3,385.2 37.7% 3,361.5 38.8% 3,354.8 38.5%
Retail 2,795.9 31.0% 2,653.1 29.7% 2,609.9 29.2% 2,350.2 27.1%
2,167.5 25.0%
Office 1,243.3 13.8% 1,280.9 14.3% 1,243.3 13.9% 1,284.7 14.8% 1,344.9 15.5%
Apartments 1,048.6 11.6% 994.1 11.1% 935.8 10.5% 952.1 11.0% 974.2 11.2%
Hotel/Motel 364.1 4.0% 323.3 3.6% 324.1 3.6% 280.6 3.2% 436.4 5.0%
Other 382.3 4.2% 341.0 3.8% 353.9 4.0% 363.1 4.2% 334.9 3.9%
Mixed Use 187.4 2.1% 157.3 1.8% 101.1 1.1% 74.0 0.9% 74.4 0.9%
Total Commercial Mortgage Loans (1) 9,019.6 100.0% 8,933.2 100.0% 8,953.3 100.0% 8,666.2 100.0% 8,687.1 100.0%
Loan Size
Under $5 million 1,546.5 17.1% 1,607.7 18.0% 1,662.9 18.6% 1,683.0 19.4% 1,698.4 19.5%
$5 million but less than $10 million 1,548.9 17.2% 1,601.5 17.9% 1,694.8 18.9% 1,641.1 18.9% 1,675.4 19.3%
$10 million but less than $20 million 1,746.6 19.4% 1,725.0 19.3% 1,639.0 18.3% 1,578.6 18.2% 1,611.8 18.6%
$20 million but less than $30 million 1,045.0 11.6% 1,085.7 12.2% 966.1 10.8% 753.2 8.7% 705.3 8.1%
$30 million and over 3,132.6 34.7% 2,913.3 32.6% 2,990.5 33.4% 3,010.3 34.8% 2,996.2 34.5%
Total Commercial Mortgage Loans (1) 9,019.6 100.0% 8,933.2 100.0% 8,953.3 100.0% 8,666.2 100.0% 8,687.1 100.0%
Other Stats as ratios
LTV—Origination 58.8%
58.5% 58.1% 57.7% 56.9%
LTV—Current 56.1% 55.5% 55.3% 55.0% 53.8%
Debt Service Coverage 1.9 1.9 1.9 2.0 2.0
Other Stats in USD millions
60+day delinq (incl
in process of foreclosure)
US GAAP Book Value 5.1 9.0 9.0 9.0 16.7
Allowance for loan losses 4.0 4.1 3.9 3.9 4.5
(1) Total Commercial Mortgage Loans shown do not include allowance for mortgage loan credit losses
Page 59 of 70
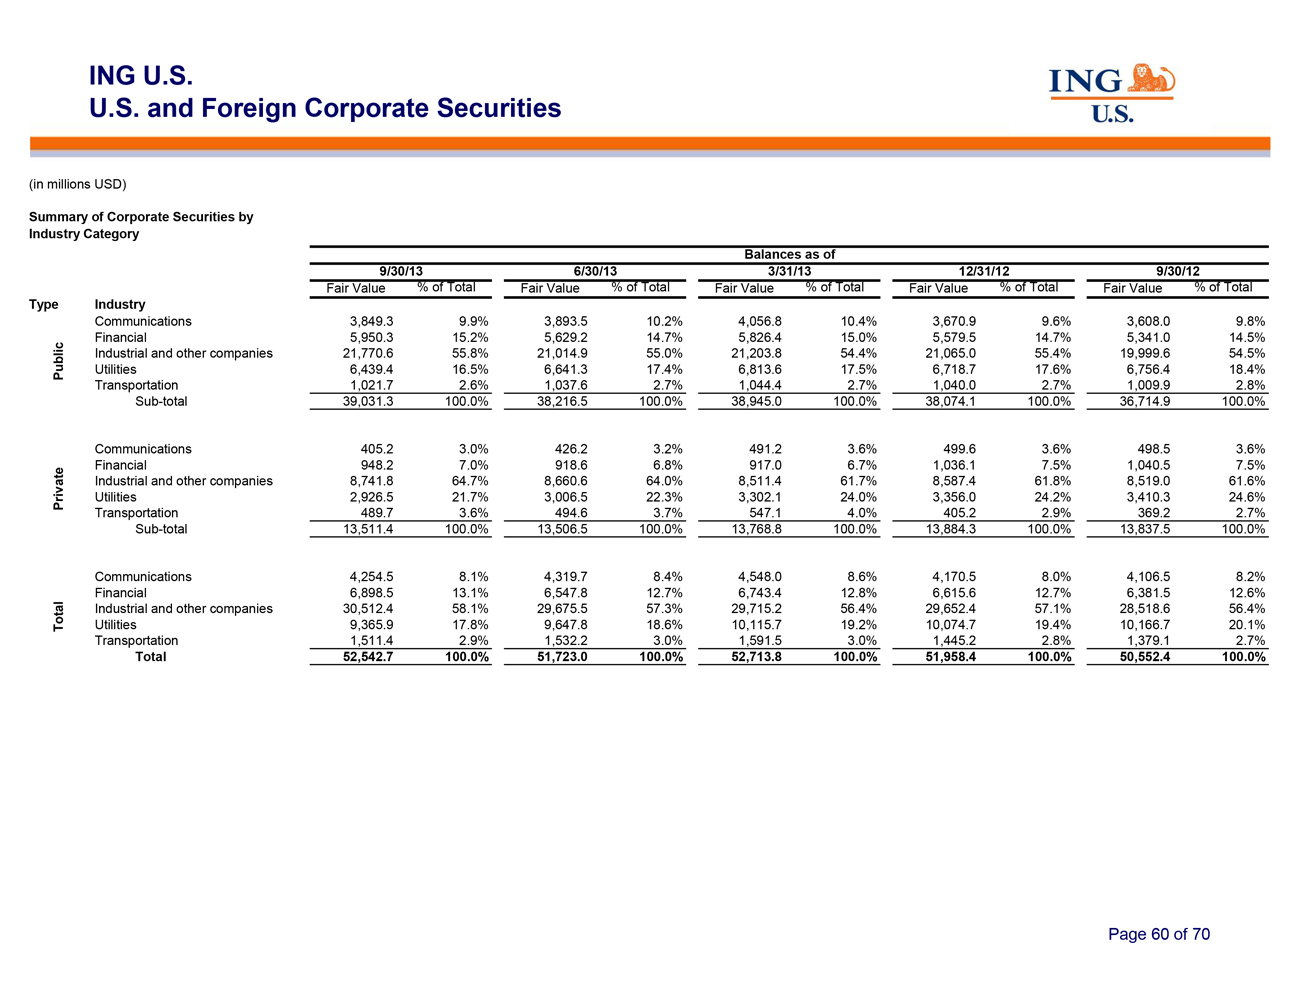
ING U.S.
U.S. and Foreign Corporate Securities
(in millions USD)
Summary of Corporate Securities by
Industry
Category
Balances as of
9/30/13 6/30/13 3/31/13 12/31/12 9/30/12
Fair
Value % of Total Fair Value % of Total Fair Value % of Total Fair Value % of Total Fair Value % of Total
Type
Industry
Communications 3,849.3 9.9% 3,893.5 10.2% 4,056.8 10.4% 3,670.9 9.6% 3,608.0 9.8%
Financial 5,950.3 15.2% 5,629.2 14.7% 5,826.4 15.0% 5,579.5 14.7% 5,341.0 14.5%
Industrial and other companies 21,770.6 55.8% 21,014.9 55.0% 21,203.8 54.4% 21,065.0 55.4% 19,999.6 54.5%
Public Utilities 6,439.4 16.5% 6,641.3 17.4% 6,813.6 17.5% 6,718.7 17.6% 6,756.4 18.4%
Transportation 1,021.7 2.6% 1,037.6 2.7% 1,044.4 2.7% 1,040.0 2.7% 1,009.9 2.8%
Sub-total 39,031.3 100.0% 38,216.5 100.0% 38,945.0 100.0% 38,074.1 100.0% 36,714.9 100.0%
Communications 405.2 3.0% 426.2 3.2% 491.2 3.6% 499.6 3.6% 498.5 3.6%
Financial 948.2 7.0% 918.6 6.8% 917.0 6.7% 1,036.1 7.5% 1,040.5 7.5%
Industrial and other companies 8,741.8 64.7% 8,660.6 64.0% 8,511.4 61.7% 8,587.4 61.8% 8,519.0 61.6%
Private Utilities 2,926.5 21.7% 3,006.5 22.3% 3,302.1 24.0% 3,356.0 24.2% 3,410.3 24.6%
Transportation 489.7 3.6% 494.6 3.7% 547.1 4.0% 405.2 2.9% 369.2 2.7%
Sub-total 13,511.4 100.0% 13,506.5 100.0% 13,768.8 100.0% 13,884.3 100.0% 13,837.5 100.0%
Communications 4,254.5 8.1% 4,319.7 8.4% 4,548.0 8.6% 4,170.5 8.0% 4,106.5 8.2%
Financial 6,898.5 13.1% 6,547.8 12.7% 6,743.4 12.8% 6,615.6 12.7% 6,381.5 12.6%
Industrial and other companies 30,512.4 58.1% 29,675.5 57.3% 29,715.2 56.4% 29,652.4 57.1% 28,518.6 56.4%
Total Utilities 9,365.9 17.8% 9,647.8 18.6% 10,115.7 19.2% 10,074.7 19.4% 10,166.7 20.1%
Transportation 1,511.4 2.9% 1,532.2 3.0% 1,591.5 3.0% 1,445.2 2.8% 1,379.1 2.7%
Total 52,542.7 100.0% 51,723.0 100.0% 52,713.8 100.0% 51,958.4 100.0% 50,552.4 100.0%
Page 60 of 70
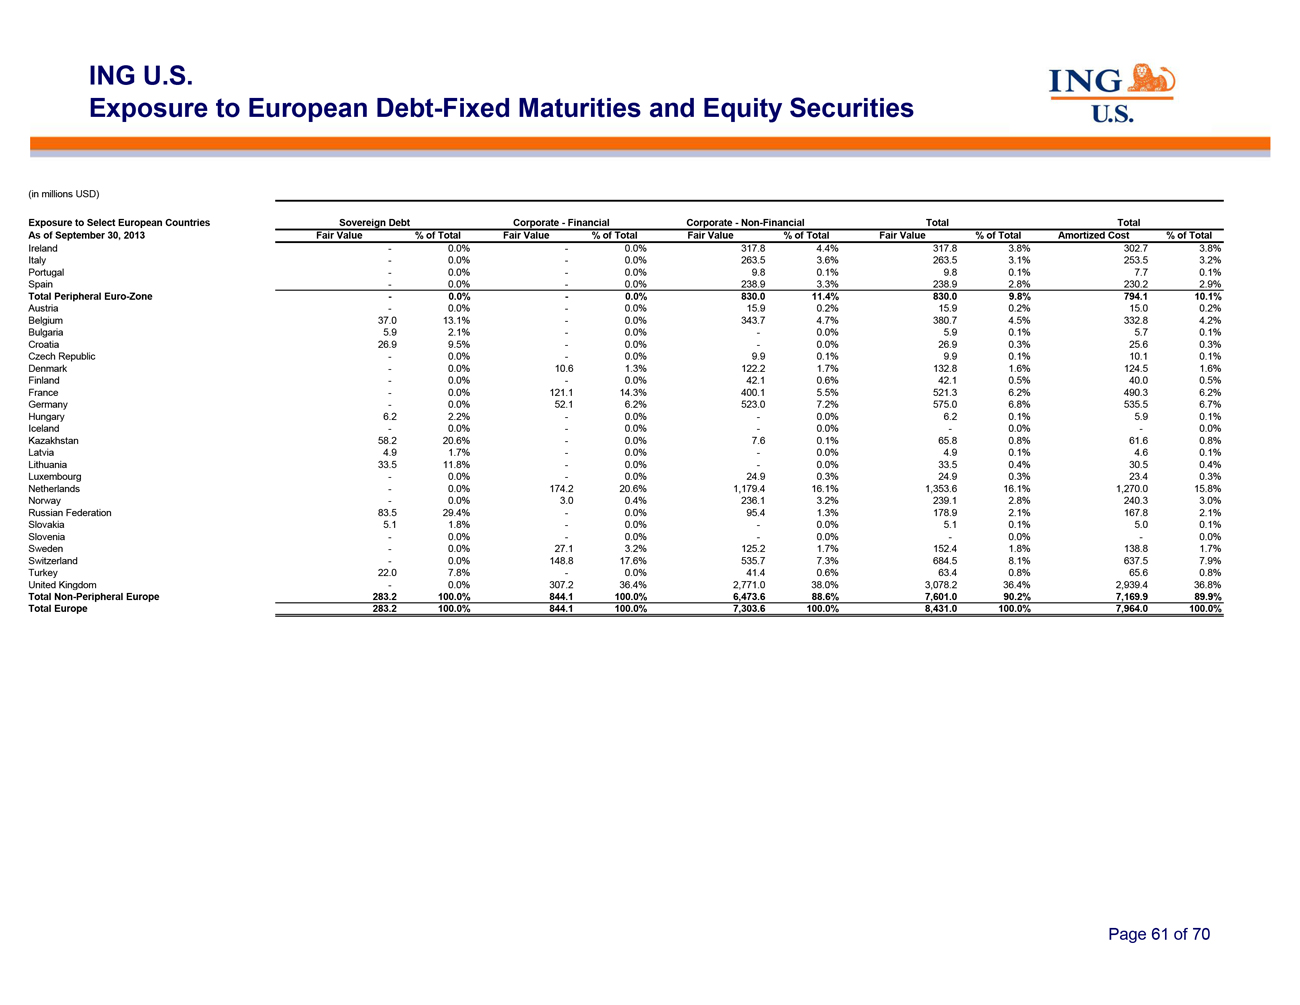
ING U.S.
Exposure to European Debt-Fixed
Maturities and Equity Securities
(in millions USD)
Exposure to Select European Countries Sovereign Debt Corporate—Financial Corporate—Non-Financial Total Total
As of September 30, 2013 Fair Value % of Total Fair Value % of Total Fair Value % of Total Fair Value %
of Total Amortized Cost % of Total
Ireland — 0.0% — 0.0% 317.8 4.4% 317.8 3.8% 302.7 3.8%
Italy — 0.0% — 0.0% 263.5 3.6% 263.5 3.1% 253.5 3.2%
Portugal — 0.0% — 0.0% 9.8 0.1% 9.8 0.1% 7.7 0.1%
Spain — 0.0% — 0.0% 238.9 3.3% 238.9 2.8% 230.2 2.9%
Total Peripheral Euro-Zone — 0.0% — 0.0% 830.0 11.4% 830.0 9.8% 794.1 10.1%
Austria — 0.0% — 0.0% 15.9 0.2% 15.9 0.2% 15.0 0.2%
Belgium 37.0 13.1% — 0.0% 343.7 4.7% 380.7 4.5% 332.8 4.2%
Bulgaria 5.9 2.1% — 0.0% — 0.0% 5.9 0.1% 5.7 0.1%
Croatia 26.9 9.5% — 0.0% — 0.0% 26.9 0.3% 25.6 0.3%
Czech Republic — 0.0% — 0.0% 9.9 0.1% 9.9 0.1% 10.1 0.1%
Denmark — 0.0% 10.6 1.3% 122.2 1.7% 132.8 1.6% 124.5 1.6%
Finland — 0.0% — 0.0% 42.1 0.6% 42.1 0.5% 40.0 0.5%
France — 0.0% 121.1 14.3% 400.1 5.5% 521.3 6.2% 490.3 6.2%
Germany — 0.0% 52.1 6.2% 523.0 7.2% 575.0 6.8% 535.5 6.7%
Hungary 6.2 2.2% — 0.0% — 0.0% 6.2 0.1% 5.9 0.1%
Iceland — 0.0% — 0.0% — 0.0% — 0.0% — 0.0%
Kazakhstan 58.2 20.6% — 0.0% 7.6 0.1% 65.8 0.8% 61.6 0.8%
Latvia 4.9 1.7% — 0.0% — 0.0% 4.9 0.1% 4.6 0.1%
Lithuania 33.5 11.8% — 0.0% — 0.0% 33.5 0.4% 30.5 0.4%
Luxembourg — 0.0% — 0.0% 24.9 0.3% 24.9 0.3% 23.4 0.3%
Netherlands — 0.0% 174.2 20.6% 1,179.4 16.1% 1,353.6 16.1% 1,270.0 15.8%
Norway — 0.0% 3.0 0.4% 236.1 3.2% 239.1 2.8% 240.3 3.0%
Russian Federation 83.5 29.4% — 0.0% 95.4 1.3% 178.9 2.1% 167.8 2.1%
Slovakia 5.1 1.8% — 0.0% — 0.0% 5.1 0.1% 5.0 0.1%
Slovenia — 0.0% — 0.0% — 0.0% — 0.0% — 0.0%
Sweden — 0.0% 27.1 3.2% 125.2 1.7% 152.4 1.8% 138.8 1.7%
Switzerland — 0.0% 148.8 17.6% 535.7 7.3% 684.5 8.1% 637.5 7.9%
Turkey 22.0 7.8% — 0.0% 41.4 0.6% 63.4 0.8% 65.6 0.8%
United Kingdom — 0.0% 307.2 36.4% 2,771.0 38.0% 3,078.2 36.4% 2,939.4 36.8%
Total Non-Peripheral Europe 283.2 100.0% 844.1 100.0% 6,473.6 88.6% 7,601.0 90.2% 7,169.9 89.9%
Total Europe 283.2 100.0% 844.1 100.0% 7,303.6 100.0% 8,431.0 100.0% 7,964.0 100.0%
Page 61 of 70
ING U.S.
Additional Information
Page 62 of 70
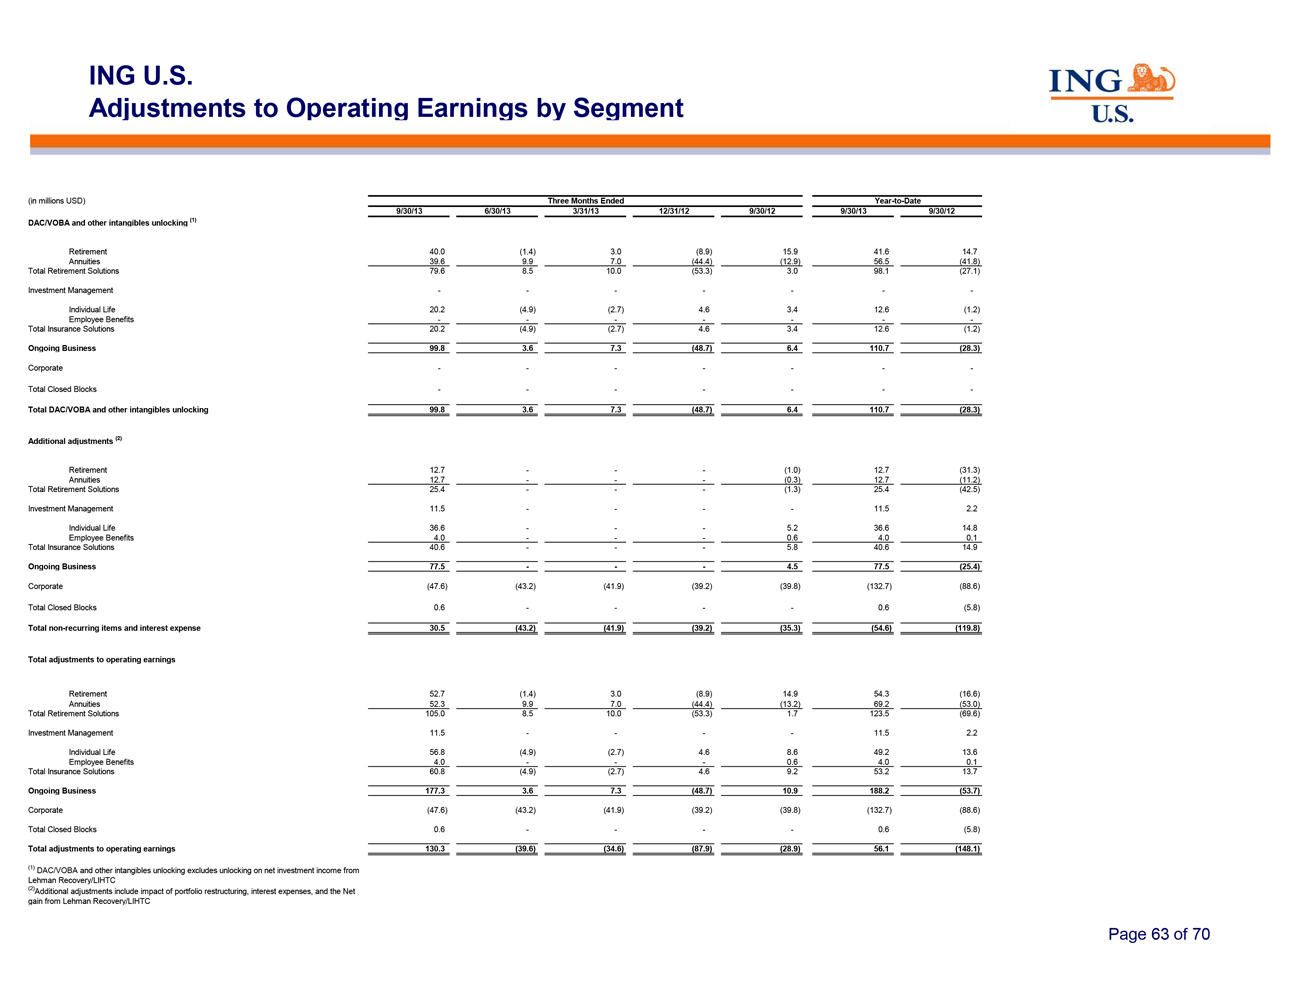
ING U.S.
Adjustments to Operating Earnings by
Segment
(in millions USD) Three Months Ended Year-to-Date
9/30/13 6/30/13 3/31/13 12/31/12 9/30/12 9/30/13 9/30/12
DAC/VOBA and other intangibles unlocking (1)
Retirement 40.0 (1.4) 3.0 (8.9) 15.9 41.6 14.7
Annuities 39.6 9.9 7.0 (44.4) (12.9) 56.5 (41.8)
Total Retirement Solutions 79.6 8.5 10.0 (53.3) 3.0 98.1 (27.1)
Investment Management — —— — — — -
Individual Life 20.2 (4.9) (2.7) 4.6 3.4 12.6 (1.2)
Employee Benefits — —— — — — -
Total Insurance Solutions 20.2 (4.9) (2.7) 4.6 3.4 12.6 (1.2)
Ongoing Business 99.8 3.6 7.3 (48.7) 6.4 110.7 (28.3)
Corporate — —— — — — -
Total Closed Blocks — —— — — — -
Total DAC/VOBA and other intangibles unlocking 99.8 3.6 7.3 (48.7) 6.4 110.7 (28.3)
Additional adjustments (2)
Retirement 12.7
—— — (1.0) 12.7 (31.3)
Annuities 12.7 —— — (0.3) 12.7 (11.2)
Total Retirement Solutions 25.4 —— — (1.3) 25.4 (42.5)
Investment Management 11.5 —— — — 11.5 2.2
Individual Life 36.6 —— — 5.2 36.6 14.8
Employee Benefits 4.0 —— — 0.6 4.0 0.1
Total Insurance Solutions 40.6 —— — 5.8 40.6 14.9
Ongoing Business 77.5 —— — 4.5 77.5 (25.4)
Corporate (47.6) (43.2) (41.9) (39.2) (39.8) (132.7) (88.6)
Total Closed Blocks 0.6 —— — — 0.6 (5.8)
Total non-recurring items and interest expense 30.5 (43.2) (41.9) (39.2) (35.3) (54.6) (119.8)
Total adjustments to operating earnings
Retirement 52.7 (1.4) 3.0 (8.9) 14.9 54.3 (16.6)
Annuities 52.3 9.9 7.0 (44.4) (13.2) 69.2 (53.0)
Total Retirement Solutions 105.0 8.5 10.0 (53.3) 1.7 123.5 (69.6)
Investment Management 11.5 —— — — 11.5 2.2
Individual Life 56.8 (4.9) (2.7) 4.6 8.6 49.2 13.6
Employee Benefits 4.0 —— — 0.6 4.0 0.1
Total Insurance Solutions 60.8 (4.9) (2.7) 4.6 9.2 53.2 13.7
Ongoing Business 177.3 3.6 7.3 (48.7) 10.9 188.2 (53.7)
Corporate (47.6) (43.2) (41.9) (39.2) (39.8) (132.7) (88.6)
Total Closed Blocks 0.6 —— — — 0.6 (5.8)
Total adjustments to operating earnings 130.3 (39.6) (34.6) (87.9) (28.9) 56.1 (148.1)
(1) DAC/VOBA and other intangibles unlocking excludes unlocking on net investment income from
Lehman Recovery/LIHTC
(2) Additional adjustments include impact of portfolio restructuring, interest expenses, and the Net
gain from Lehman Recovery/LIHTC
Page 63 of 70
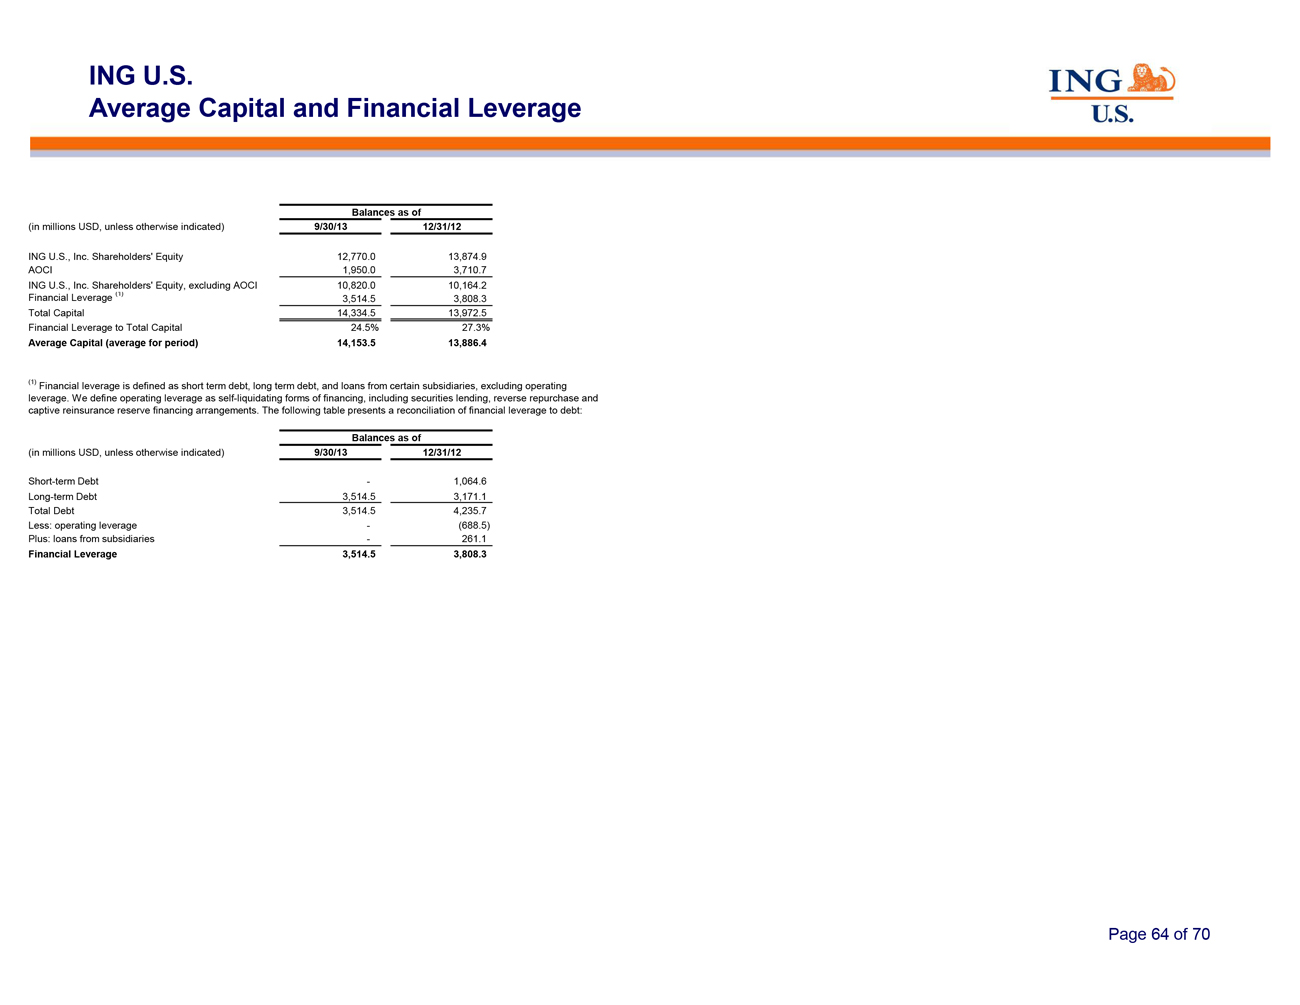
ING U.S.
Average Capital and Financial Leverage
Balances as of
(in millions USD, unless otherwise indicated) 9/30/13 12/31/12
ING U.S., Inc. Shareholders’ Equity 12,770.0 13,874.9
AOCI 1,950.0 3,710.7
ING U.S., Inc.
Shareholders’ Equity, excluding AOCI 10,820.0 10,164.2
Financial Leverage (1) 3,514.5 3,808.3
Total Capital 14,334.5 13,972.5
Financial Leverage to Total Capital 24.5% 27.3%
Average Capital (average for period) 14,153.5 13,886.4
(1) Financial leverage is defined as short term debt, long term debt, and loans from certain subsidiaries, excluding
operating
leverage. We define operating leverage as self-liquidating forms of financing, including securities
lending, reverse repurchase and
captive reinsurance reserve financing arrangements. The following table
presents a reconciliation of financial leverage to debt:
Balances as of
(in millions USD, unless otherwise indicated) 9/30/13 12/31/12
Short-term Debt — 1,064.6
Long-term Debt 3,514.5 3,171.1
Total Debt 3,514.5
4,235.7
Less: operating leverage — (688.5)
Plus: loans from subsidiaries — 261.1
Financial Leverage 3,514.5 3,808.3
Page 64 of 70
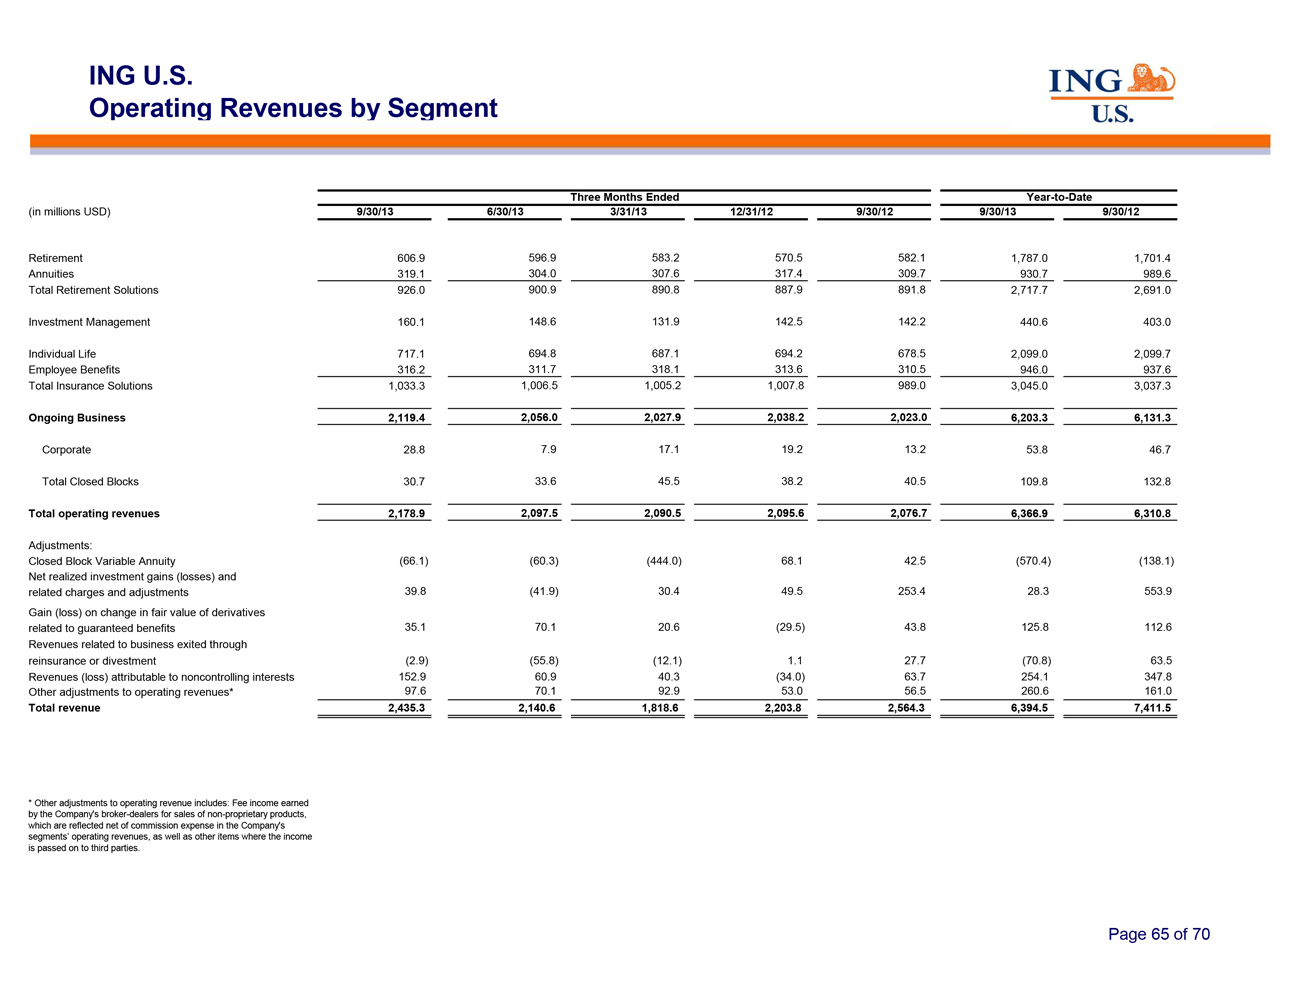
ING U.S.
Operating Revenues by Segment
Three Months Ended Year-to-Date
(in millions USD) 9/30/13 6/30/13 3/31/13 12/31/12 9/30/12 9/30/13 9/30/12
Retirement 606.9 596.9 583.2 570.5 582.1 1,787.0 1,701.4
Annuities 319.1 304.0 307.6 317.4 309.7 930.7 989.6
Total Retirement Solutions 926.0 900.9 890.8 887.9 891.8 2,717.7 2,691.0
Investment Management 160.1 148.6 131.9 142.5 142.2 440.6 403.0
Individual Life 717.1 694.8 687.1 694.2 678.5 2,099.0 2,099.7
Employee Benefits 316.2 311.7 318.1 313.6 310.5 946.0 937.6
Total Insurance Solutions 1,033.3 1,006.5 1,005.2 1,007.8 989.0 3,045.0 3,037.3
Ongoing Business 2,119.4 2,056.0 2,027.9 2,038.2 2,023.0 6,203.3 6,131.3
Corporate 28.8 7.9 17.1 19.2 13.2 53.8 46.7
Total Closed Blocks 30.7 33.6 45.5 38.2 40.5 109.8 132.8
Total operating revenues 2,178.9 2,097.5 2,090.5 2,095.6 2,076.7 6,366.9 6,310.8
Adjustments:
Closed Block Variable Annuity
(66.1) (60.3) (444.0) 68.1 42.5 (570.4) (138.1)
Net realized investment gains (losses) and
related charges and adjustments 39.8 (41.9) 30.4 49.5 253.4 28.3 553.9
Gain (loss) on change in fair value of derivatives
related to guaranteed benefits 35.1 70.1 20.6 (29.5) 43.8 125.8 112.6
Revenues related to business exited through
reinsurance or divestment (2.9) (55.8) (12.1) 1.1 27.7 (70.8) 63.5
Revenues (loss) attributable to noncontrolling interests 152.9 60.9 40.3 (34.0) 63.7 254.1 347.8
Other adjustments to operating revenues* 97.6 70.1 92.9 53.0 56.5 260.6 161.0
Total revenue 2,435.3 2,140.6 1,818.6 2,203.8 2,564.3 6,394.5 7,411.5
* Other adjustments to operating revenue includes: Fee income earned
by the Company’s broker-dealers for sales of non-proprietary products,
which are reflected net of commission expense in the Company’s
segments’ operating revenues, as well as other items where the income
is passed on to third parties.
Page 65 of 70
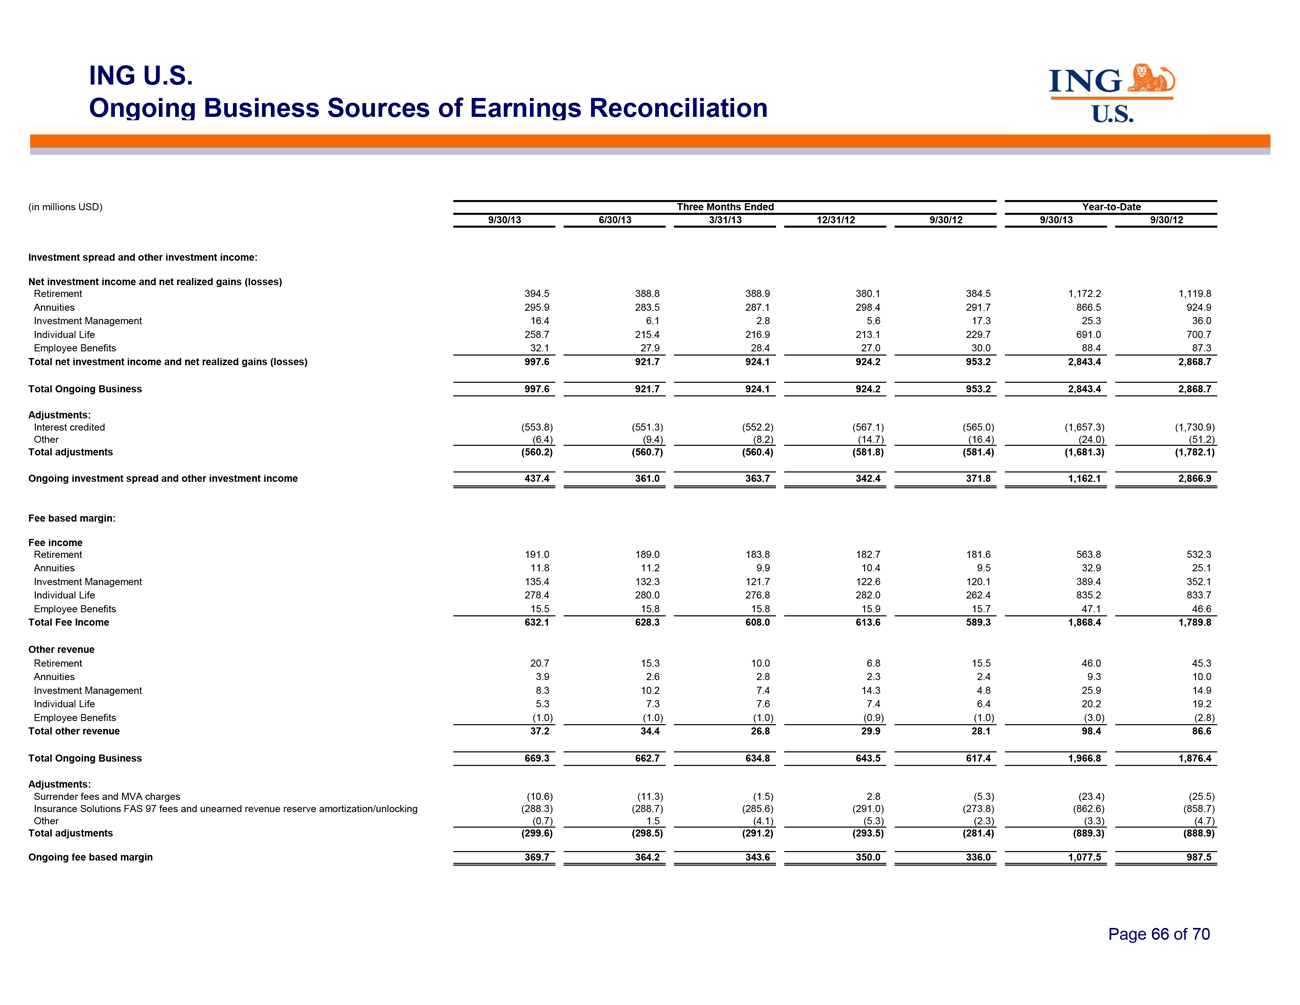
ING U.S.
Ongoing Business Sources of Earnings
Reconciliation
(in millions USD) Three Months Ended Year-to-Date
9/30/13 6/30/13 3/31/13 12/31/12 9/30/12 9/30/13 9/30/12
Investment spread and other investment income:
Net investment income and net realized gains (losses)
Retirement 394.5 388.8 388.9 380.1 384.5 1,172.2 1,119.8
Annuities 295.9 283.5 287.1 298.4 291.7 866.5 924.9
Investment Management 16.4 6.1 2.8 5.6 17.3 25.3 36.0
Individual Life 258.7 215.4 216.9 213.1 229.7 691.0 700.7
Employee Benefits 32.1 27.9 28.4 27.0 30.0 88.4 87.3
Total net investment income and net realized gains (losses) 997.6 921.7 924.1 924.2 953.2 2,843.4 2,868.7
Total Ongoing Business 997.6 921.7 924.1 924.2 953.2 2,843.4 2,868.7
Adjustments:
Interest credited (553.8) (551.3) (552.2) (567.1) (565.0) (1,657.3) (1,730.9)
Other (6.4) (9.4) (8.2) (14.7) (16.4) (24.0) (51.2)
Total adjustments (560.2) (560.7) (560.4) (581.8) (581.4) (1,681.3) (1,782.1)
Ongoing investment spread and other investment income 437.4 361.0 363.7 342.4 371.8 1,162.1 2,866.9
Fee based margin:
Fee income
Retirement 191.0 189.0 183.8 182.7 181.6 563.8 532.3
Annuities 11.8 11.2 9.9 10.4 9.5 32.9 25.1
Investment Management 135.4 132.3 121.7 122.6 120.1 389.4 352.1
Individual Life 278.4 280.0 276.8 282.0 262.4 835.2 833.7
Employee Benefits 15.5 15.8 15.8 15.9 15.7 47.1 46.6
Total Fee Income 632.1 628.3 608.0 613.6 589.3 1,868.4 1,789.8
Other revenue
Retirement 20.7 15.3 10.0 6.8 15.5
46.0 45.3
Annuities 3.9 2.6 2.8 2.3 2.4 9.3 10.0
Investment Management 8.3 10.2 7.4 14.3 4.8 25.9 14.9
Individual Life 5.3 7.3 7.6 7.4 6.4 20.2 19.2
Employee Benefits (1.0) (1.0) (1.0) (0.9) (1.0) (3.0) (2.8)
Total other revenue 37.2 34.4 26.8 29.9 28.1 98.4 86.6
Total Ongoing Business 669.3 662.7 634.8 643.5 617.4 1,966.8 1,876.4
Adjustments:
Surrender fees and MVA charges
(10.6) (11.3) (1.5) 2.8 (5.3) (23.4) (25.5)
Insurance Solutions FAS 97 fees and
unearned revenue reserve amortization/unlocking (288.3) (288.7) (285.6) (291.0) (273.8) (862.6) (858.7)
Other (0.7) 1.5 (4.1) (5.3) (2.3) (3.3) (4.7)
Total adjustments (299.6) (298.5) (291.2) (293.5) (281.4) (889.3) (888.9)
Ongoing fee based margin 369.7 364.2 343.6 350.0 336.0 1,077.5 987.5
Page 66 of 70
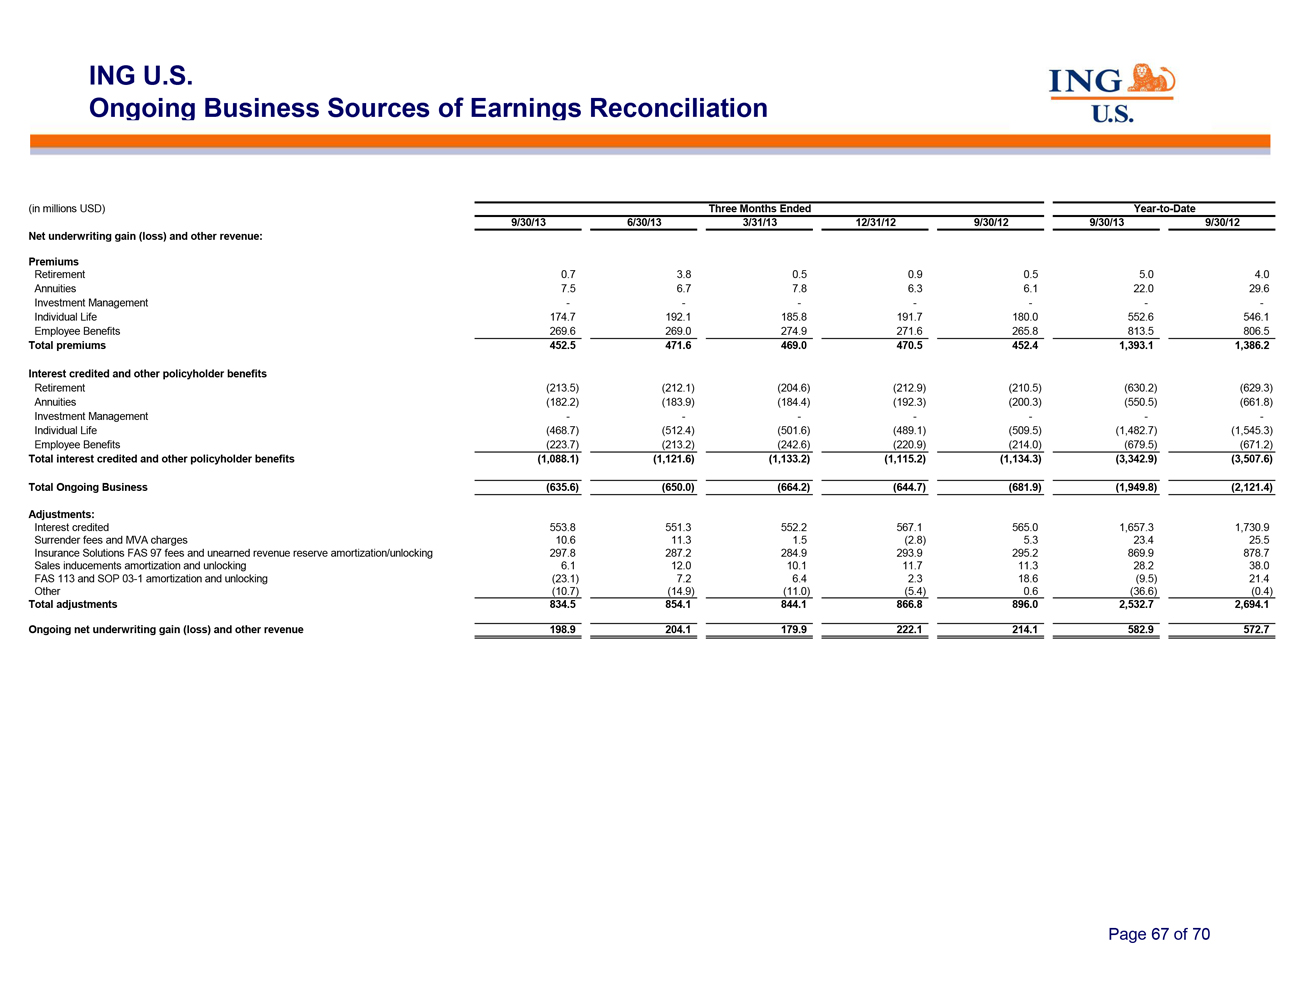
ING U.S.
Ongoing Business Sources of Earnings
Reconciliation
(in millions USD) Three Months Ended Year-to-Date
9/30/13 6/30/13 3/31/13 12/31/12 9/30/12 9/30/13 9/30/12
Net underwriting gain (loss) and other revenue:
Premiums
Retirement 0.7 3.8 0.5 0.9 0.5 5.0 4.0
Annuities 7.5 6.7 7.8 6.3 6.1 22.0 29.6
Investment Management —————— -
Individual Life 174.7 192.1 185.8 191.7 180.0 552.6 546.1
Employee Benefits 269.6 269.0 274.9 271.6 265.8 813.5 806.5
Total premiums 452.5 471.6 469.0 470.5 452.4 1,393.1 1,386.2
Interest credited and other policyholder benefits
Retirement (213.5) (212.1) (204.6) (212.9) (210.5) (630.2) (629.3)
Annuities (182.2) (183.9) (184.4) (192.3) (200.3) (550.5) (661.8)
Investment Management —————— -
Individual Life (468.7) (512.4) (501.6) (489.1) (509.5) (1,482.7) (1,545.3)
Employee Benefits (223.7) (213.2) (242.6) (220.9) (214.0) (679.5) (671.2)
Total interest credited and other policyholder benefits (1,088.1) (1,121.6) (1,133.2) (1,115.2) (1,134.3) (3,342.9) (3,507.6)
Total Ongoing Business (635.6) (650.0) (664.2) (644.7) (681.9) (1,949.8) (2,121.4)
Adjustments:
Interest credited 553.8 551.3 552.2 567.1 565.0 1,657.3 1,730.9
Surrender fees and MVA charges 10.6 11.3 1.5 (2.8) 5.3 23.4 25.5
Insurance Solutions FAS 97 fees and unearned revenue reserve amortization/unlocking 297.8 287.2 284.9 293.9 295.2 869.9 878.7
Sales inducements amortization and unlocking 6.1 12.0 10.1 11.7 11.3 28.2 38.0
FAS 113 and SOP 03-1 amortization and unlocking (23.1) 7.2 6.4 2.3 18.6 (9.5) 21.4
Other (10.7) (14.9) (11.0) (5.4) 0.6 (36.6) (0.4)
Total adjustments 834.5 854.1 844.1 866.8 896.0 2,532.7 2,694.1
Ongoing net underwriting gain (loss) and other revenue 198.9 204.1 179.9 222.1 214.1 582.9 572.7
Page 67 of 70
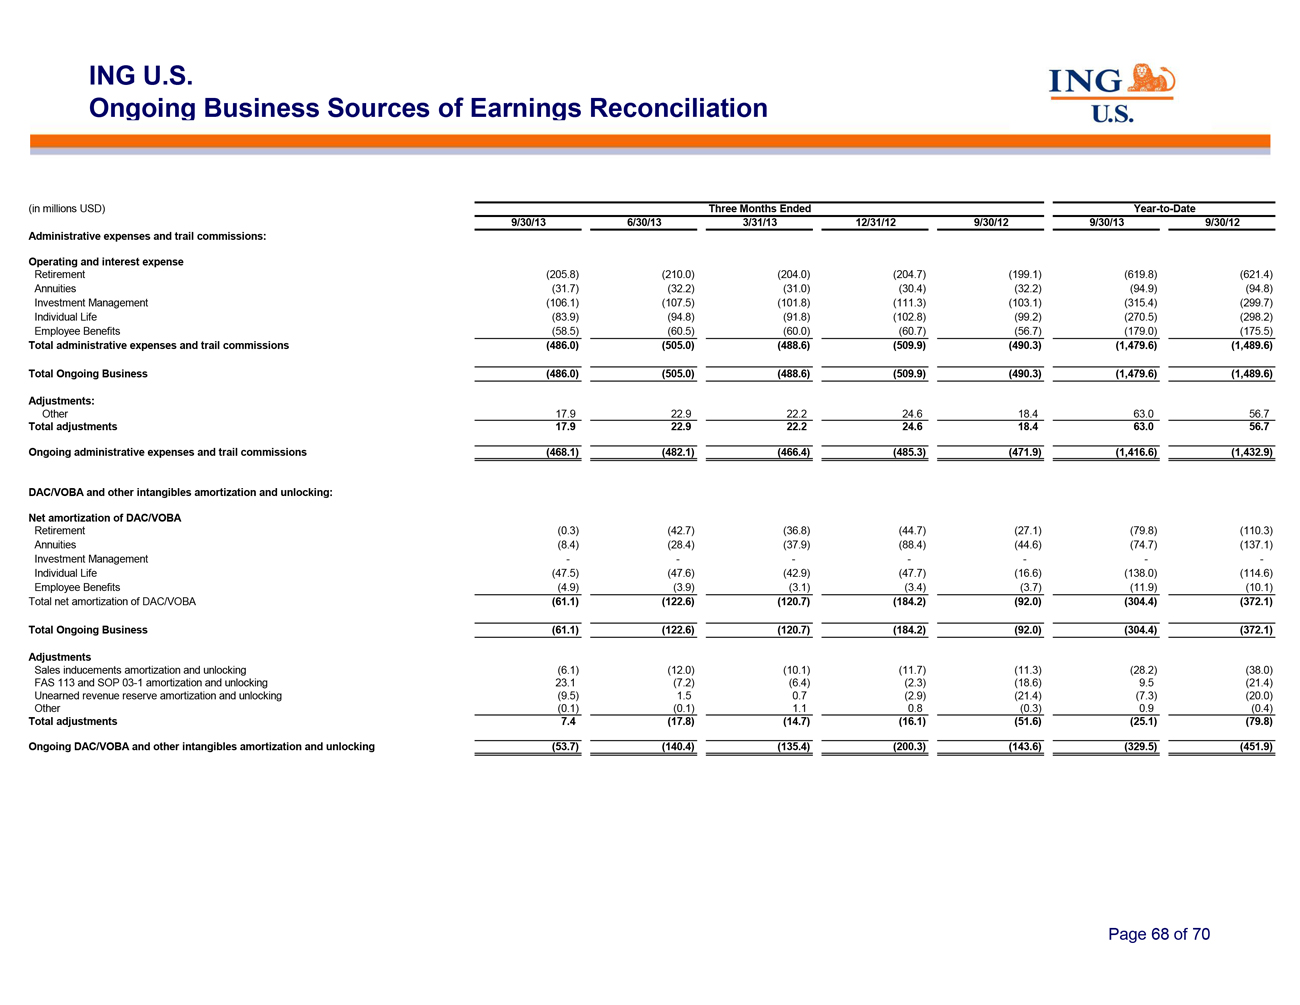
ING U.S.
Ongoing Business Sources of Earnings
Reconciliation
(in millions USD) Three Months Ended Year-to-Date
9/30/13 6/30/13 3/31/13 12/31/12 9/30/12 9/30/13 9/30/12
Administrative expenses and trail commissions:
Operating and interest expense
Retirement
(205.8) (210.0) (204.0) (204.7) (199.1) (619.8) (621.4)
Annuities
(31.7) (32.2) (31.0) (30.4) (32.2) (94.9) (94.8)
Investment Management
(106.1) (107.5) (101.8) (111.3) (103.1) (315.4) (299.7)
Individual Life
(83.9) (94.8) (91.8) (102.8) (99.2) (270.5) (298.2)
Employee Benefits
(58.5) (60.5) (60.0) (60.7) (56.7) (179.0) (175.5)
Total administrative expenses
and trail commissions (486.0) (505.0) (488.6) (509.9) (490.3) (1,479.6) (1,489.6)
Total Ongoing Business (486.0) (505.0) (488.6) (509.9) (490.3) (1,479.6) (1,489.6)
Adjustments:
Other 17.9 22.9 22.2 24.6 18.4 63.0 56.7
Total
adjustments 17.9 22.9 22.2 24.6 18.4 63.0 56.7
Ongoing administrative expenses and trail commissions
(468.1) (482.1) (466.4) (485.3) (471.9) (1,416.6) (1,432.9)
DAC/VOBA and other
intangibles amortization and unlocking:
Net amortization of DAC/VOBA
Retirement (0.3) (42.7) (36.8) (44.7) (27.1) (79.8) (110.3)
Annuities (8.4) (28.4) (37.9) (88.4) (44.6) (74.7) (137.1)
Investment Management — ——— —— -
Individual Life (47.5) (47.6) (42.9) (47.7) (16.6) (138.0) (114.6)
Employee Benefits (4.9) (3.9) (3.1) (3.4) (3.7) (11.9) (10.1)
Total net amortization of DAC/VOBA (61.1) (122.6) (120.7) (184.2) (92.0) (304.4) (372.1)
Total Ongoing Business (61.1) (122.6) (120.7) (184.2) (92.0) (304.4) (372.1)
Adjustments
Sales inducements amortization and unlocking (6.1) (12.0) (10.1) (11.7) (11.3) (28.2) (38.0)
FAS 113 and SOP 03-1 amortization and unlocking 23.1 (7.2) (6.4) (2.3) (18.6) 9.5 (21.4)
Unearned revenue reserve amortization and unlocking (9.5) 1.5 0.7 (2.9) (21.4) (7.3) (20.0)
Other (0.1) (0.1) 1.1 0.8 (0.3) 0.9 (0.4)
Total adjustments 7.4 (17.8) (14.7) (16.1) (51.6) (25.1) (79.8)
Ongoing DAC/VOBA and other intangibles amortization and unlocking
(53.7) (140.4) (135.4) (200.3) (143.6) (329.5) (451.9)
Page 68 of 70
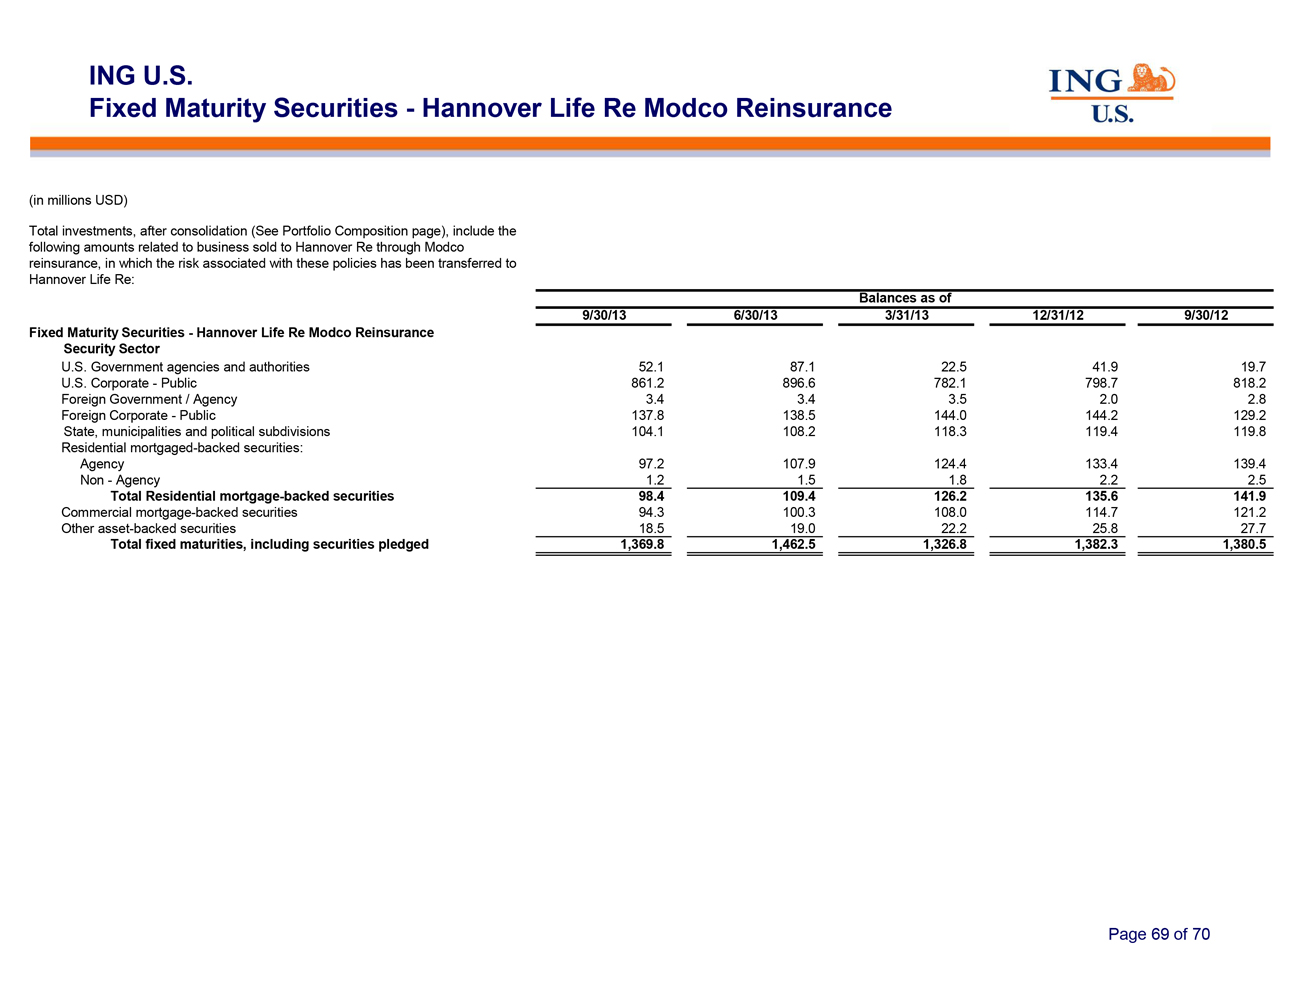
ING U.S.
Fixed Maturity Securities—Hannover
Life Re Modco Reinsurance
(in millions USD)
Total investments, after consolidation (See Portfolio Composition page), include the
following amounts related to business sold to Hannover Re through Modco
reinsurance, in which the risk associated with these policies has been transferred to
Hannover Life Re:
Balances as of
9/30/13 6/30/13 3/31/13 12/31/12
9/30/12
Fixed Maturity Securities—Hannover Life Re Modco Reinsurance
Security Sector
U.S. Government agencies and authorities 52.1 87.1 22.5 41.9 19.7
U.S. Corporate—Public 861.2 896.6 782.1 798.7 818.2
Foreign Government / Agency 3.4 3.4 3.5 2.0 2.8
Foreign Corporate—Public 137.8 138.5 144.0 144.2 129.2
State, municipalities and political subdivisions 104.1 108.2 118.3 119.4 119.8
Residential mortgaged-backed securities:
Agency 97.2 107.9 124.4 133.4 139.4
Non—Agency 1.2 1.5 1.8 2.2 2.5
Total Residential mortgage-backed securities 98.4 109.4 126.2 135.6 141.9
Commercial mortgage-backed securities 94.3 100.3 108.0 114.7 121.2
Other asset-backed securities 18.5 19.0 22.2 25.8 27.7
Total fixed maturities, including securities pledged 1,369.8 1,462.5 1,326.8 1,382.3 1,380.5
Page 69 of 70
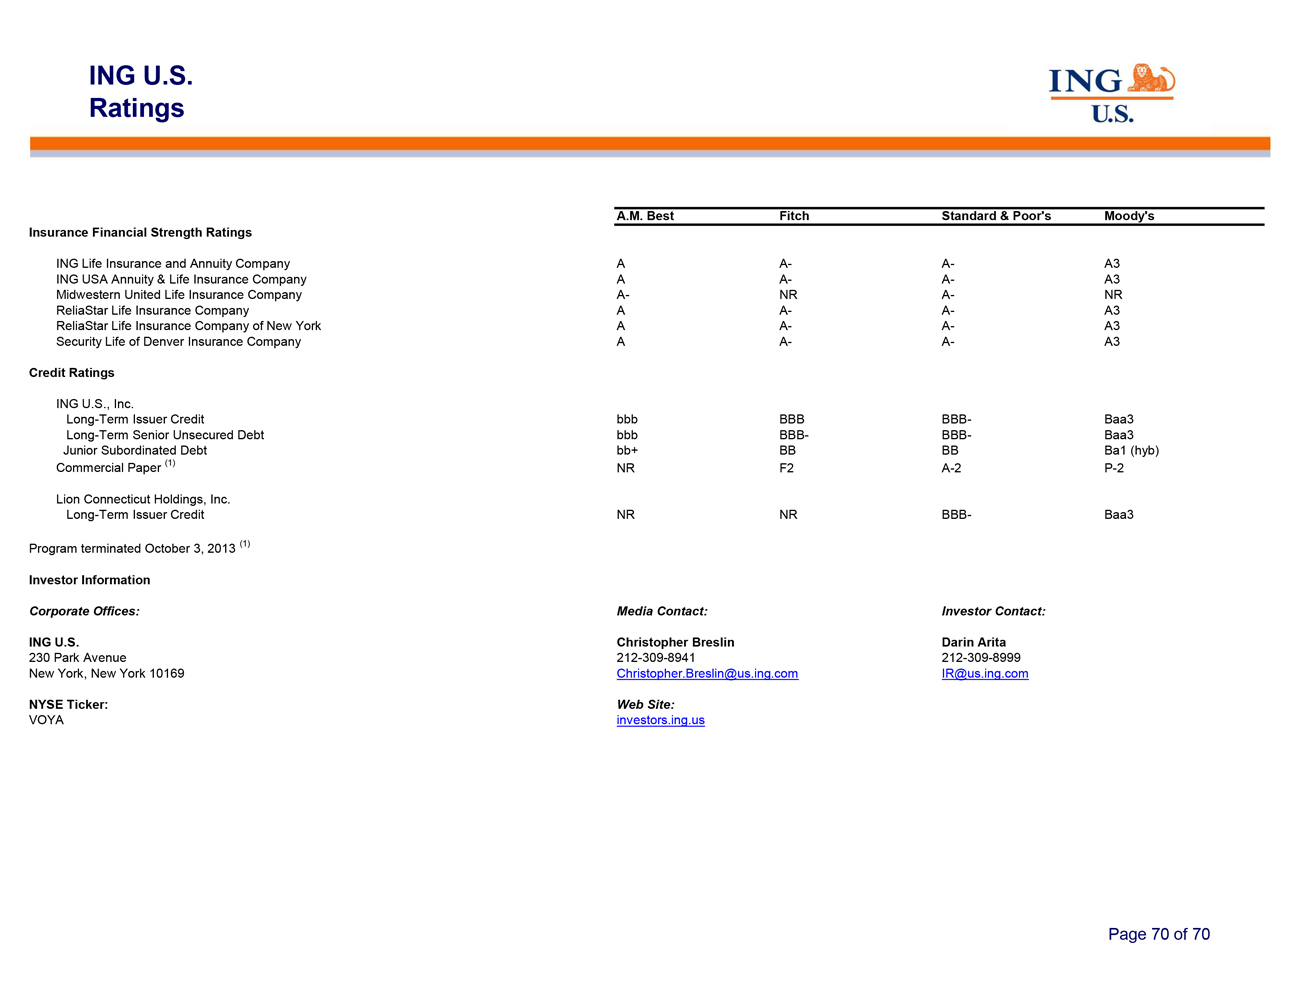
ING U.S. Ratings
A.M. Best Fitch
Standard & Poor’s Moody’s
Insurance Financial Strength Ratings
ING Life Insurance and Annuity Company A A- A- A3
ING USA Annuity & Life Insurance Company A A- A- A3
Midwestern United Life Insurance Company A- NR A- NR
ReliaStar Life Insurance Company A A- A- A3
ReliaStar Life Insurance Company of New York A A- A- A3
Security Life of Denver Insurance Company A A- A- A3
Credit Ratings
ING U.S., Inc.
Long-Term Issuer Credit bbb BBB
BBB- Baa3
Long-Term Senior Unsecured Debt bbb BBB- BBB- Baa3
Junior Subordinated Debt bb+ BB BB Ba1 (hyb)
Commercial Paper (1) NR F2 A-2 P-2
Lion
Connecticut Holdings, Inc.
Long-Term Issuer Credit NR NR BBB- Baa3
Program terminated October 3, 2013 (1)
Investor Information
Corporate Offices: Media
Contact: Investor Contact:
ING U.S. Christopher Breslin Darin Arita
230 Park Avenue 212-309-8941 212-309-8999
New York, New York 10169 Christopher.Breslin@us.ing.com IR@us.ing.com
NYSE Ticker: Web Site:
VOYA investors.ing.us
Page 70 of 70