Exhibit 99.1

CION INVESTMENT CORPORATION REPORTS SEPTEMBER 30, 2021 FINANCIAL RESULTS AND ANNOUNCES FIRST QUARTER 2022 DISTRIBUTION OF $0.28 PER SHARE
For Immediate Release
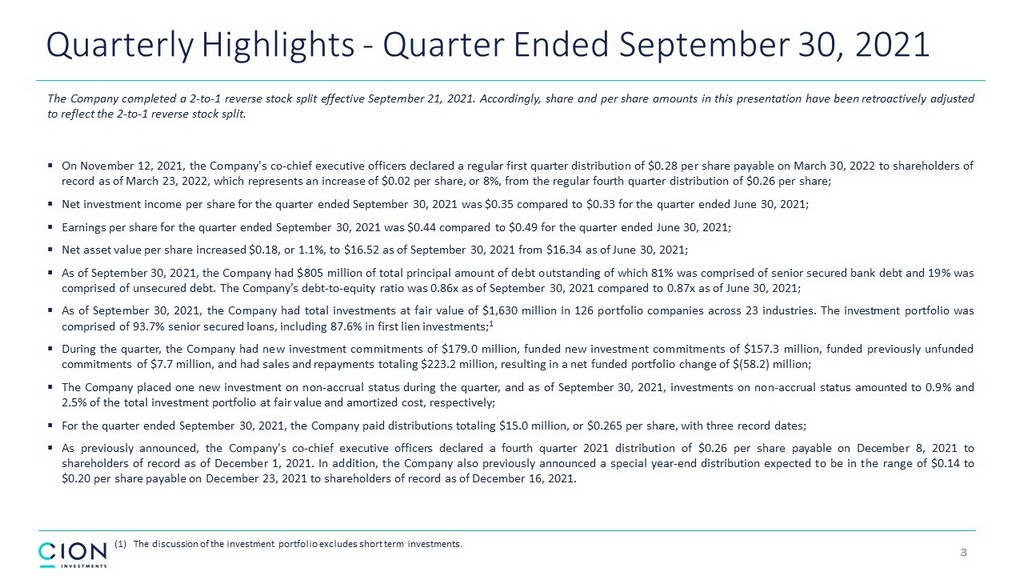
NEW YORK, November 15, 2021 — CION Investment Corporation (NYSE: CION) (“CION” or the “Company”) today reported its financial results for the third quarter ended September 30, 2021 and filed its Form 10-Q with the U.S. Securities and Exchange Commission. The Company completed a previously announced 2-to-1 reverse stock split effective September 21, 2021. Accordingly, share and per share amounts in this press release have been retroactively adjusted to reflect the 2-to-1 reverse stock split.
CION also announced that, on November 12, 2021, its co-chief executive officers declared a regular first quarter distribution of $0.28 per share payable on March 30, 2022 to shareholders of record as of March 23, 2022, which represents an increase of $0.02 per share, or 8%, from the regular fourth quarter distribution of $0.26 per share.
QUARTERLY HIGHLIGHTS
| • | Net investment income per share for the quarter ended September 30, 2021 was $0.35 compared to $0.33 for the quarter ended June 30, 2021; |
| • | Earnings per share for the quarter ended September 30, 2021 was $0.44 compared to $0.49 for the quarter ended June 30, 2021; |
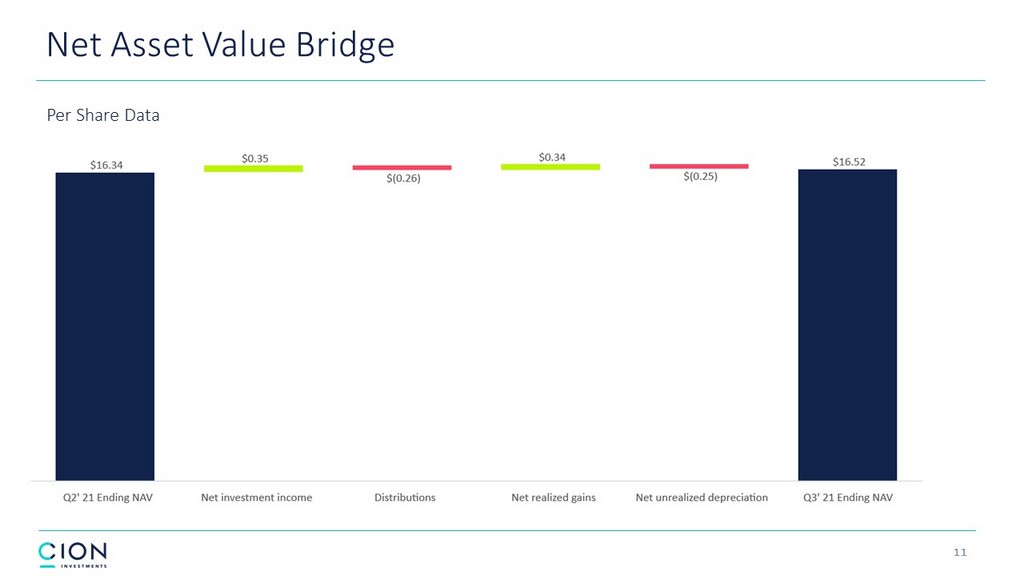
| • | Net asset value per share increased $0.18, or 1.1%, to $16.52 as of September 30, 2021 from $16.34 as of June 30, 2021; |
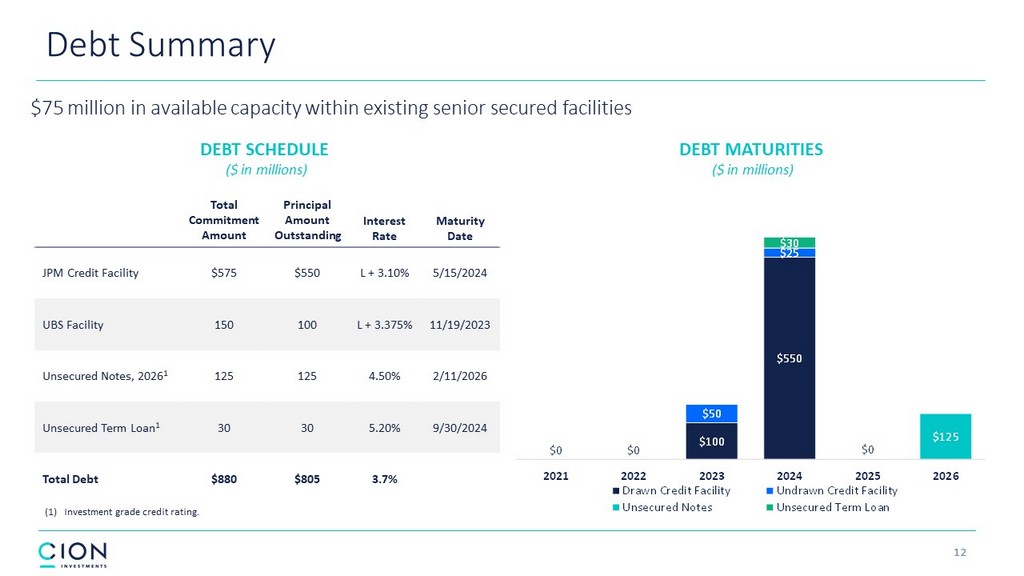
| • | As of September 30, 2021, the Company had $805 million of total principal amount of debt outstanding of which 81% was comprised of senior secured bank debt and 19% was comprised of unsecured debt. The Company’s debt-to-equity ratio was 0.86x as of September 30, 2021 compared to 0.87x as of June 30, 2021; |
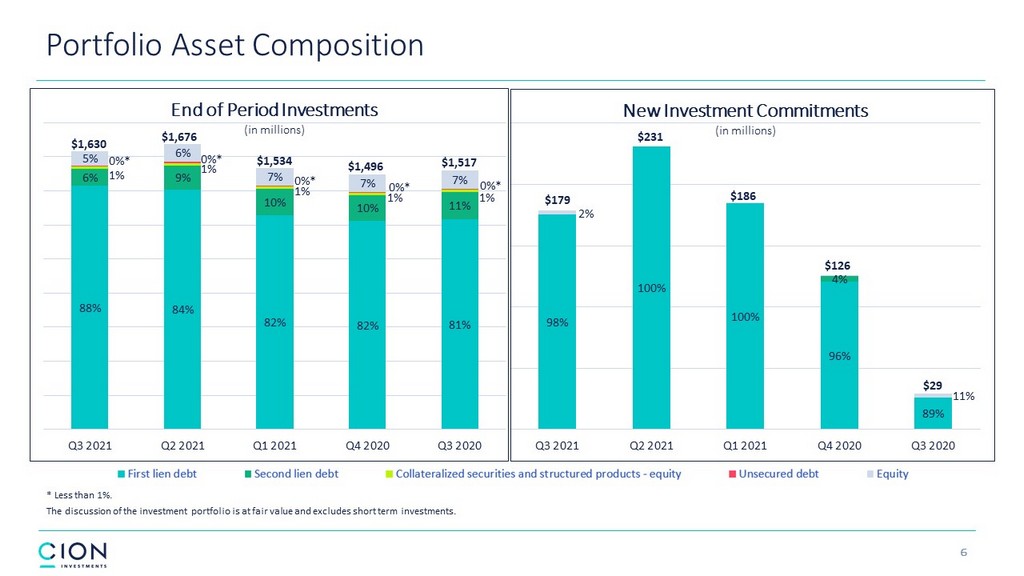
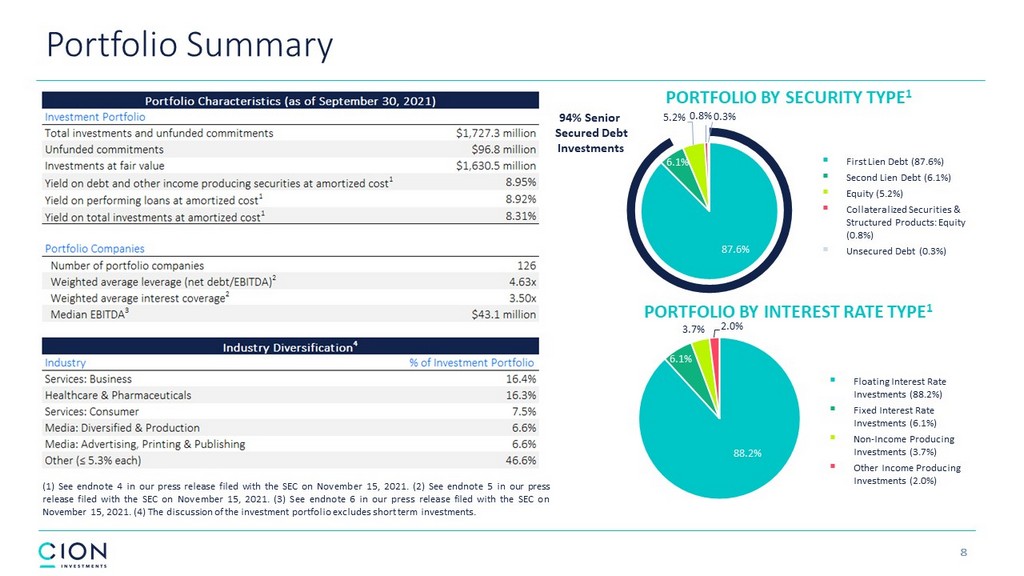
| • | As of September 30, 2021, the Company had total investments at fair value of $1,630 million in 126 portfolio companies across 23 industries. The investment portfolio was comprised of 93.7% senior secured loans, including 87.6% in first lien investments;1 |
| • | During the quarter, the Company had new investment commitments of $179.0 million, funded new investment commitments of $157.3 million, funded previously unfunded commitments of $7.7 million, and had sales and repayments totaling $223.2 million, resulting in a net funded portfolio change of $(58.2) million; |
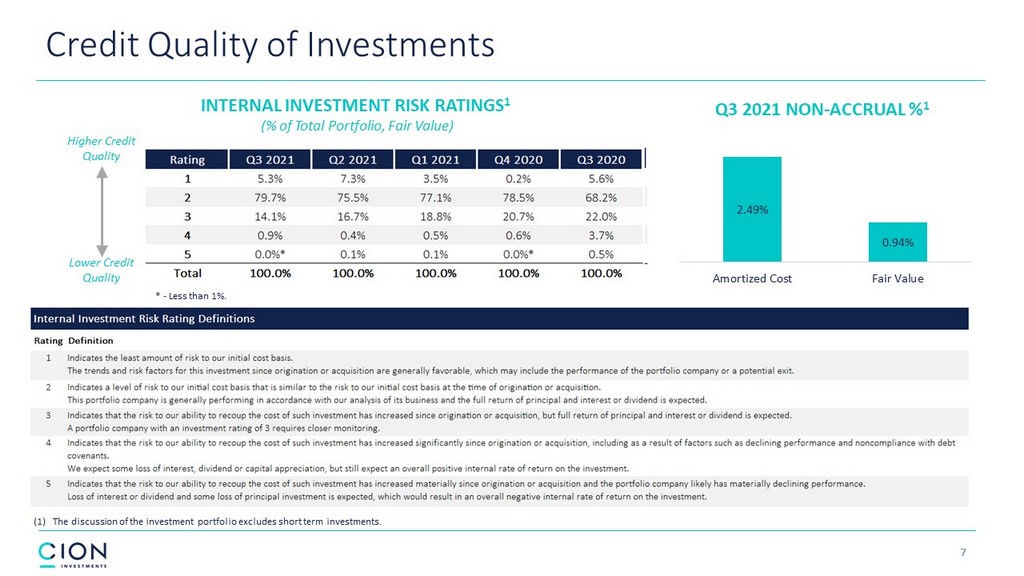
| • | The Company placed one new investment on non-accrual status during the quarter, and as of September 30, 2021, investments on non-accrual status amounted to 0.9% and 2.5% of the total investment portfolio at fair value and amortized cost, respectively; |
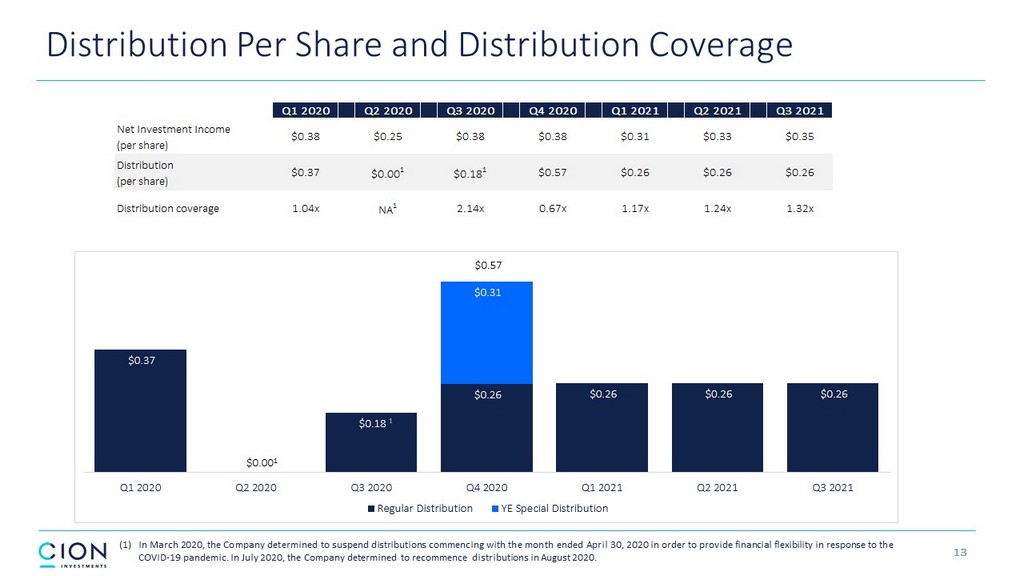
| • | For the quarter ended September 30, 2021, the Company paid distributions totaling $15.0 million, or $0.265 per share, with three record dates; |
| • | As previously announced, the Company's co-chief executive officers declared a fourth quarter 2021 distribution of $0.26 per share payable on December 8, 2021 to shareholders of record as of December 1, 2021. In addition, the Company also previously announced a special year-end distribution expected to be in the range of $0.14 to $0.20 per share payable on December 23, 2021 to shareholders of record as of December 16, 2021. |
“We are reporting solid third quarter results highlighted by consistent earnings, distribution coverage and net realized gains of $19.7 million. Net asset value per share increased to $16.52, marking the sixth straight quarter-to-quarter increase,” said Mark Gatto, co-Chief Executive Officer of CION.
“Looking ahead, we seek to optimize our balance sheet for added flexibility and growth opportunities. We continue to have a favorable outlook for the remainder of the year and believe we are well positioned to execute on our initiatives as we seek to generate value for shareholders,” added Michael A. Reisner, co-Chief Executive Officer of CION.
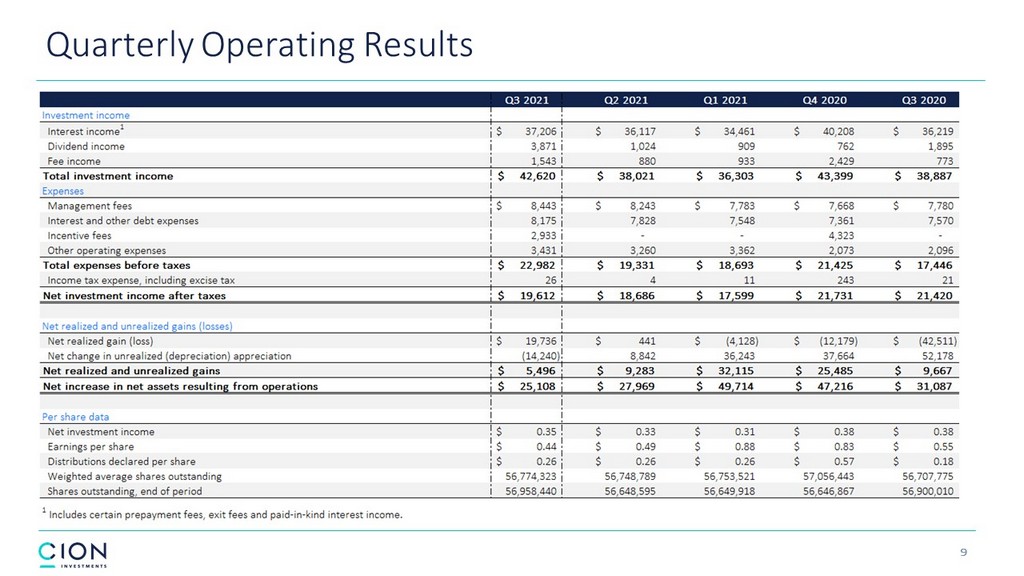
SELECTED FINANCIAL HIGHLIGHTS
| As of | As of | |||||||
| (in thousands, except per share data) | September 30, 2021 | June 30, 2021 | ||||||
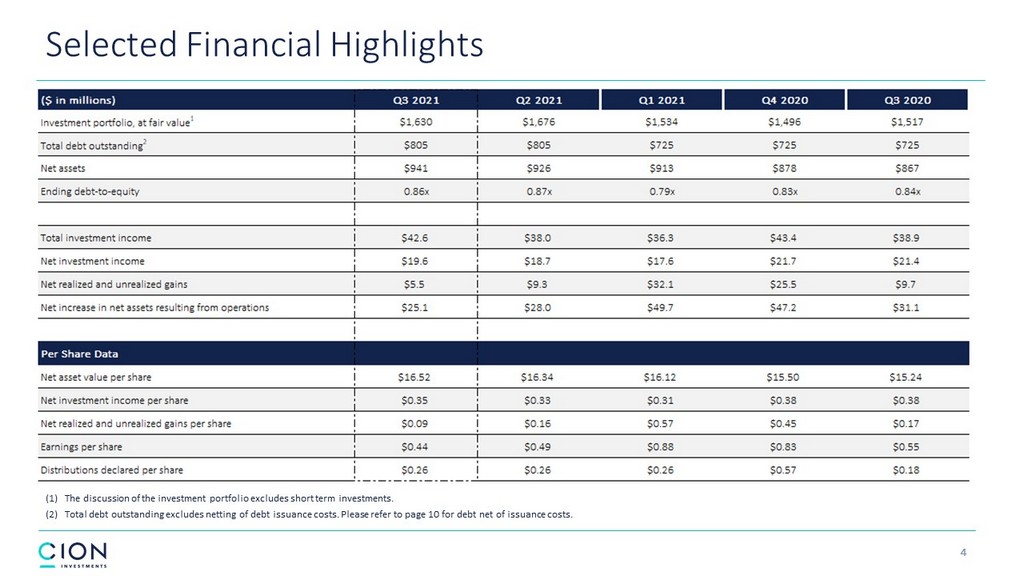
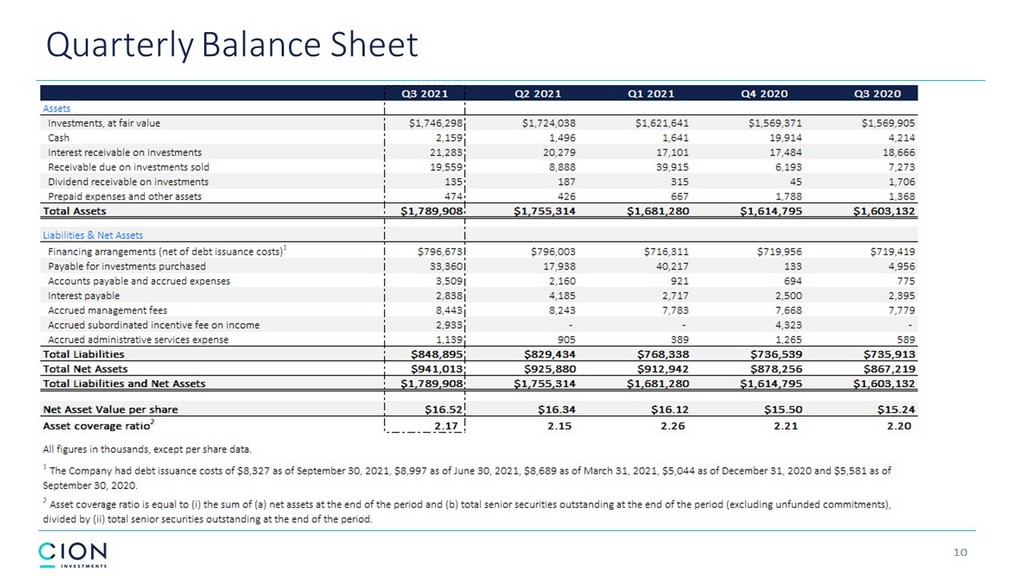
| Investment portfolio, at fair value1 | $ | 1,630,464 | $ | 1,675,554 | ||||
| Total debt outstanding2 | $ | 805,000 | $ | 805,000 | ||||
| Net assets | $ | 941,013 | $ | 925,880 | ||||
| Net asset value per share | $ | 16.52 | $ | 16.34 | ||||
| Debt-to-equity | 0.86 | x | 0.87 | x | ||||
| (in thousands, except share and per share data) | Three Months Ended September 30, 2021 | Three Months Ended June 30, 2021 | ||||||
| Total investment income | $ | 42,620 | $ | 38,021 | ||||
| Net investment income | $ | 19,612 | $ | 18,686 | ||||
| Net realized gains | $ | 19,736 | $ | 441 | ||||
| Net unrealized (losses) gains | $ | (14,240 | ) | $ | 8,842 | |||
| Net increase in net assets resulting from operations | $ | 25,108 | $ | 27,969 | ||||
| Net investment income per share | $ | 0.35 | $ | 0.33 | ||||
| Earnings per share | $ | 0.44 | $ | 0.49 | ||||
| Weighted average shares outstanding | 56,774,323 | 56,747,683 | ||||||
| Distributions declared per share | $ | 0.26 | $ | 0.26 | ||||
Total investment income for the three months ended September 30, 2021 and June 30, 2021 was $42.6 million and $38.0 million, respectively. The increase in investment income was primarily driven by an increase in dividend income related to the exit of the Conisus Holdings, Inc. investment.
Operating expenses for the three months ended September 30, 2021 and June 30, 2021 were $23.0 million and $19.3 million, respectively. Operating expenses increased by $3.7 million primarily due to a change in the calculation of the incentive fee during the quarter, higher interest expense as a result of higher average borrowings, non-recurring expenses associated with the listing of the Company's common stock on the New York Stock Exchange and non-recurring shareholder proxy solicitation costs.
PORTFOLIO AND INVESTMENT ACTIVITY1
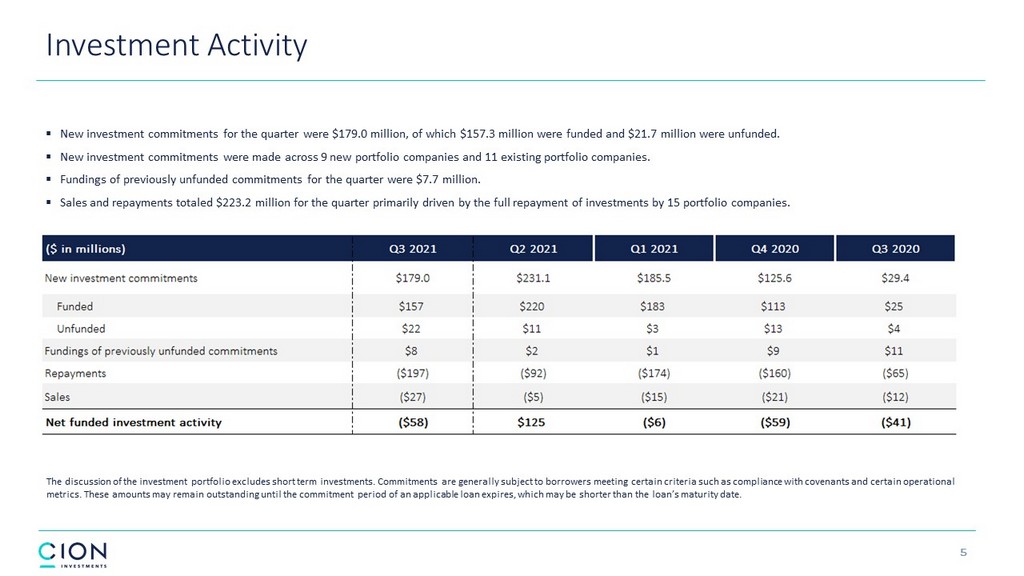
A summary of the Company's investment activity for the three months ended September 30, 2021 is as follows:
| New Investment Commitments | Sales and Repayments | |||||||||||||||
| Investment Type | $ in Thousands | % of Total | $ in Thousands | % of Total | ||||||||||||
| Senior secured first lien debt | $ | 175,395 | 98 | % | $ | 144,379 | 65 | % | ||||||||
| Senior secured second lien debt | — | — | 42,785 | 19 | % | |||||||||||
| Collateralized securities and structured products - equity | — | — | 900 | — | ||||||||||||
| Equity | 3,560 | 2 | % | 35,150 | 16 | % | ||||||||||
| Total | $ | 178,955 | 100 | % | $ | 223,214 | 100 | % | ||||||||
During the three months ended September 30, 2021, new investment commitments were made across 9 new portfolio companies and 11 existing portfolio companies. Sales and repayments were primarily driven by the full repayment of investments by 15 portfolio companies. As a result, the number of portfolio companies decreased from 132 as of June 30, 2021 to 126 as of September 30, 2021.
PORTFOLIO SUMMARY1
As of September 30, 2021, the Company’s investments consisted of the following:
| Investments at Fair Value | ||||||||
| Investment Type | $ in Thousands | % of Total | ||||||
| Senior secured first lien debt | $ | 1,428,556 | 87.6 | % | ||||
| Senior secured second lien debt | 99,499 | 6.1 | % | |||||
| Collateralized securities and structured products - equity | 13,012 | 0.8 | % | |||||
| Unsecured debt | 5,551 | 0.3 | % | |||||
| Equity | 83,846 | 5.2 | % | |||||
| Total | $ | 1,630,464 | 100.0 | % | ||||
The following table presents certain selected information regarding the Company’s investments:
| As of | ||||||||
| September 30, 2021 | June 30, 2021 | |||||||
| Number of portfolio companies | 126 | 132 | ||||||
| Percentage of performing loans bearing a floating rate3 | 93.1 | % | 92.6 | % | ||||
| Percentage of performing loans bearing a fixed rate3 | 6.9 | % | 7.4 | % | ||||
| Yield on debt and other income producing investments at amortized cost4 | 8.95 | % | 9.03 | % | ||||
| Yield on performing debt at amortized cost4 | 8.92 | % | 8.95 | % | ||||
| Yield on total investments at amortized cost | 8.31 | % | 8.50 | % | ||||
| Weighted average leverage (net debt/EBITDA)5 | 4.63 | x | 4.59 | x | ||||
| Weighted average interest coverage5 | 3.50 | x | 3.14 | x | ||||
| Median EBITDA6 | $43.1 million | $49.0 million | ||||||
As of September 30, 2021, investments on non-accrual status represented 0.9% and 2.5% of the total investment portfolio at fair value and amortized cost, respectively.
LIQUIDITY AND CAPITAL RESOURCES
As of September 30, 2021, the Company had $805 million of total principal amount of debt outstanding, comprised of $650 million outstanding borrowings under its senior secured credit facilities, $125 million of senior unsecured notes due 2026, and $30 million of unsecured notes due 2024. The combined weighted average interest rate on debt outstanding was 3.68% for the quarter ended September 30, 2021. As of September 30, 2021, the Company had $118 million in cash and short term investments and $75 million available under its financing arrangements.2
EARNING CONFERENCE CALL
CION will host an earnings conference call on Monday, November 15, 2021 at 11:00 am Eastern Time to discuss its financial results for the quarter ended September 30, 2021. Please visit the Investor Resources - Events and Presentations section of the Company’s website at www.cionbdc.com for a slide presentation that complements the earnings conference call.
All interested parties are invited to participate via telephone or listen via the live webcast, which can be accessed by clicking the following link: CION Investment Corporation Third Quarter 2021 Financial Results Webcast. Domestic callers can access the conference call by dialing (877) 445-9755. International callers can access the conference call by dialing +1 (201) 493-6744. All callers are asked to dial in approximately 10 minutes prior to the call. An archived replay will be available on a webcast link located in the Investor Resources - Events and Presentations section of CION’s website.
ENDNOTES
| 1) | The discussion of the investment portfolio excludes short-term investments. |
| 2) | Total debt outstanding excludes netting of debt issuance costs of $8.3 million and $9.0 million as of September 30, 2021 and June 30, 2021, respectively. |
| 3) | The fixed versus floating composition has been calculated as a percentage of performing debt investments measured on a fair value basis, including income producing preferred stock investments and excludes investments, if any, placed on non-accrual status. |
| 4) | Computed based on the (a) annual actual interest rate or yield earned plus amortization of fees and discounts on the performing debt and other income producing investments as of the reporting date, divided by (b) the total performing debt and other income producing investments (excluding investments on non-accrual status) at amortized cost or fair value, respectively. This calculation excludes exit fees that are receivable upon repayment of the investment. |
| 5) | For a particular portfolio company, we calculate the level of contractual indebtedness net of cash (“net debt”) owed by the portfolio company and compare that amount to measures of cash flow available to service the net debt. To calculate net debt, we include debt that is both senior and pari passu to the tranche of debt owned by us but exclude debt that is legally and contractually subordinated in ranking to the debt owned by us. We believe this calculation method assists in describing the risk of our portfolio investments, as it takes into consideration contractual rights of repayment of the tranche of debt owned by us relative to other senior and junior creditors of a portfolio company. We typically calculate cash flow available for debt service at a portfolio company by taking EBITDA for the trailing twelve-month period. Weighted average net debt to EBITDA is weighted based on the fair value of our debt investments and excluding investments where net debt to EBITDA may not be the appropriate measure of credit risk, such as cash collateralized loans and investments that are underwritten and covenanted based on recurring revenue. |
For a particular portfolio company, we also calculate the level of contractual interest expense owed by the portfolio company, and compare that amount to EBITDA (“interest coverage ratio”). We believe this calculation method assists in describing the risk of our portfolio investments, as it takes into consideration contractual interest obligations of the portfolio company. Weighted average interest coverage is weighted based on the fair value of our performing debt investments, excluding investments where interest coverage may not be the appropriate measure of credit risk, such as cash collateralized loans and investments that are underwritten and covenanted based on recurring revenue.
Portfolio company statistics, including EBITDA, are derived from the financial statements most recently provided to us for each portfolio company as of the reported end date. Statistics of the portfolio companies have not been independently verified by us and may reflect a normalized or adjusted amount.
| 6) | Median EBITDA is calculated based on the portfolio company's EBITDA as of our initial investment. |
CĪON Investment Corporation
Consolidated Balance Sheets
(in thousands, except share and per share amounts)
| September 30, 2021 | December 31, 2020 | |||||||
| (unaudited) | ||||||||
| Assets | ||||||||
| Investments, at fair value: | ||||||||
| Non-controlled, non-affiliated investments (amortized cost of $1,658,592 and $1,501,529, respectively) | $ | 1,629,201 | $ | 1,440,004 | ||||
| Non-controlled, affiliated investments (amortized cost of $138,742 and $134,184, respectively) | 117,097 | 116,895 | ||||||
| Controlled investments (amortized cost of $0 and $15,539, respectively) | — | 12,472 | ||||||
| Total investments, at fair value (amortized cost of $1,797,334 and $1,651,252, respectively) | 1,746,298 | 1,569,371 | ||||||
| Cash | 2,159 | 19,914 | ||||||
| Interest receivable on investments | 21,283 | 17,484 | ||||||
| Receivable due on investments sold and repaid | 19,559 | 6,193 | ||||||
| Dividends receivable on investments | 135 | 45 | ||||||
| Prepaid expenses and other assets | 474 | 1,788 | ||||||
| Total assets | $ | 1,789,908 | $ | 1,614,795 | ||||
| Liabilities and Shareholders' Equity | ||||||||
| Liabilities | ||||||||
| Financing arrangements (net of unamortized debt issuance costs of $8,327 and $5,044, respectively) | $ | 796,673 | $ | 719,956 | ||||
| Payable for investments purchased | 33,360 | 133 | ||||||
| Accounts payable and accrued expenses | 3,509 | 694 | ||||||
| Interest payable | 2,838 | 2,500 | ||||||
| Accrued management fees | 8,443 | 7,668 | ||||||
| Accrued subordinated incentive fee on income | 2,933 | 4,323 | ||||||
| Accrued administrative services expense | 1,139 | 1,265 | ||||||
| Total liabilities | 848,895 | 736,539 | ||||||
| Commitments and contingencies | ||||||||
| Shareholders' Equity | ||||||||
| Common stock, $0.001 par value; 500,000,000 shares authorized; | ||||||||
| 56,958,440 and 56,646,867 shares issued and outstanding, respectively | 57 | 57 | ||||||
| Capital in excess of par value | 1,059,989 | 1,054,967 | ||||||
| Accumulated distributable losses | (119,033 | ) | (176,768 | ) | ||||
| Total shareholders' equity | 941,013 | 878,256 | ||||||
| Total liabilities and shareholders' equity | $ | 1,789,908 | $ | 1,614,795 | ||||
| Net asset value per share of common stock at end of period | $ | 16.52 | $ | 15.50 | ||||
CĪON Investment Corporation
Consolidated Statements of Operations
(in thousands, except share and per share amounts)
| Three Months Ended September 30, | Nine Months Ended September 30, | Year Ended December 31, | ||||||||||||||||||
| 2021 | 2020 | 2021 | 2020 | 2020 | ||||||||||||||||
| (unaudited) | (unaudited) | (unaudited) | (unaudited) | |||||||||||||||||
| Investment income | ||||||||||||||||||||
| Non-controlled, non-affiliated investments | ||||||||||||||||||||
| Interest income | $ | 31,036 | $ | 30,477 | $ | 87,305 | $ | 98,055 | $ | 125,395 | ||||||||||
| Paid-in-kind interest income | 3,969 | 5,001 | 13,957 | 9,953 | 17,078 | |||||||||||||||
| Fee income | 1,543 | 773 | 3,356 | 2,114 | 4,393 | |||||||||||||||
| Dividend income | 81 | 95 | 254 | 404 | 331 | |||||||||||||||
| Non-controlled, affiliated investments | ||||||||||||||||||||
| Interest income | 1,425 | 610 | 3,867 | 2,879 | 7,883 | |||||||||||||||
| Paid-in-kind interest income | 776 | 131 | 2,655 | 1,343 | 2,082 | |||||||||||||||
| Dividend income | 3,790 | 444 | 5,550 | 1,392 | 3,012 | |||||||||||||||
| Fee income | — | — | — | — | 150 | |||||||||||||||
| Controlled investments | ||||||||||||||||||||
| Dividend income | — | 1,356 | — | 4,303 | 3,518 | |||||||||||||||
| Total investment income | 42,620 | 38,887 | 116,944 | 120,443 | 163,842 | |||||||||||||||
| Operating expenses | ||||||||||||||||||||
| Management fees | 8,443 | 7,780 | 24,469 | 24,160 | 31,828 | |||||||||||||||
| Administrative services expense | 722 | 593 | 2,103 | 1,793 | 2,465 | |||||||||||||||
| Subordinated incentive fee on income | 2,933 | — | 2,933 | 3,308 | 7,631 | |||||||||||||||
| General and administrative | 2,709 | 1,503 | 7,950 | 4,684 | 6,085 | |||||||||||||||
| Interest expense | 8,175 | 7,570 | 23,551 | 29,476 | 36,837 | |||||||||||||||
| Total operating expenses | 22,982 | 17,446 | 61,006 | 63,421 | 84,846 | |||||||||||||||
| Net investment income before taxes | 19,638 | 21,441 | 55,938 | 57,022 | 78,996 | |||||||||||||||
| Income tax expense, including excise tax | 26 | 21 | 41 | 25 | 268 | |||||||||||||||
| Net investment income after taxes | 19,612 | 21,420 | 55,897 | 56,997 | 78,728 | |||||||||||||||
| Realized and unrealized gains (losses) | ||||||||||||||||||||
| Net realized gain (loss) on: | ||||||||||||||||||||
| Non-controlled, non-affiliated investments | 873 | (42,543 | ) | 1,344 | (57,506 | ) | (69,687 | ) | ||||||||||||
| Non-controlled, affiliated investments | 18,856 | — | 17,776 | (211 | ) | (211 | ) | |||||||||||||
| Controlled investments | — | — | (3,067 | ) | — | — | ||||||||||||||
| Foreign currency | 7 | 32 | (4 | ) | 24 | 26 | ||||||||||||||
| Net realized gains (losses) | 19,736 | (42,511 | ) | 16,049 | (57,693 | ) | (69,872 | ) | ||||||||||||
| Net change in unrealized (depreciation) appreciation on: | ||||||||||||||||||||
| Non-controlled, non-affiliated investments | 6,937 | 58,572 | 32,132 | (38,611 | ) | 1,110 | ||||||||||||||
| Non-controlled, affiliated investments | (21,177 | ) | (7,401 | ) | (4,354 | ) | (15,947 | ) | (17,945 | ) | ||||||||||
| Controlled investments | — | 1,007 | 3,067 | (2,984 | ) | (3,043 | ) | |||||||||||||
| Net change in unrealized (depreciation) appreciation | (14,240 | ) | 52,178 | 30,845 | (57,542 | ) | (19,878 | ) | ||||||||||||
| Net realized and unrealized gains (losses) | 5,496 | 9,667 | 46,894 | (115,235 | ) | (89,750 | ) | |||||||||||||
| Net increase (decrease) in net assets resulting from operations | $ | 25,108 | $ | 31,087 | $ | 102,791 | $ | (58,238 | ) | $ | (11,022 | ) | ||||||||
| Per share information—basic and diluted(1) | ||||||||||||||||||||
| Net increase (decrease) in net assets per share resulting from operations | $ | 0.44 | $ | 0.55 | $ | 1.81 | $ | (1.03 | ) | $ | (0.19 | ) | ||||||||
| Weighted average shares of common stock outstanding | 56,774,323 | 56,707,775 | 56,758,586 | 56,737,832 | 56,817,920 | |||||||||||||||
ABOUT CION INVESTMENT CORPORATION
CION Investment Corporation is a leading publicly listed business development company that had approximately $1.8 billion in assets as of September 30, 2021. CION seeks to generate current income and, to a lesser extent, capital appreciation for investors by focusing primarily on senior secured loans to U.S. middle-market companies. CION is advised by CION Investment Management, LLC, a registered investment adviser and an affiliate of CION. For more information, please visit www.cionbdc.com.
FORWARD-LOOKING STATEMENTS
This press release may contain forward-looking statements that involve substantial risks and uncertainties. You can identify these statements by the use of forward-looking terminology such as “may,” “will,” “should,” “expect,” “anticipate,” “project,” “target,” “estimate,” “intend,” “continue,” or “believe” or the negatives thereof or other variations thereon or comparable terminology. You should read statements that contain these words carefully because they discuss CION’s plans, strategies, prospects and expectations concerning its business, operating results, financial condition and other similar matters. These statements represent CION’s belief regarding future events that, by their nature, are uncertain and outside of CION’s control. There are likely to be events in the future, however, that CION is not able to predict accurately or control. Any forward-looking statement made by CION in this press release speaks only as of the date on which it is made. Factors or events that could cause CION’s actual results to differ, possibly materially from its expectations, include, but are not limited to, the risks, uncertainties and other factors CION identifies in the sections entitled “Risk Factors” and “Forward-Looking Statements” in filings CION makes with the SEC, and it is not possible for CION to predict or identify all of them. CION undertakes no obligation to update or revise publicly any forward-looking statements, whether as a result of new information, future events or otherwise, except as required by law.
OTHER INFORMATION
The information in this press release is summary information only and should be read in conjunction with CION’s Quarterly Report on Form 10-Q, which CION filed with the SEC on November 15, 2021, as well as CION’s other reports filed with the SEC. A copy of CION’s Quarterly Report on Form 10-Q and CION’s other reports filed with the SEC can be found on CION’s website at www.cionbdc.com and the SEC’s website at www.sec.gov.
CONTACTS
Media
Alexander Cavalieri
acavalieri@cioninvestments.com
Investor Relations
1-800-343-3736
Analysts and Institutional Investors
Jeehae Linford
The Equity Group
jlinford@equityny.com
212-836-9615