UNITED STATES
SECURITIES AND EXCHANGE COMMISSION
Washington, D.C. 20549
FORM 8-K
CURRENT REPORT
Pursuant to Section 13 or 15(d) of the
Securities Exchange Act of 1934
Date of Report (Date of earliest event reported): May 13, 2013
Northern Tier Energy LP
(Exact name of registrant as specified in its charter)
Delaware | 001-35612 | 80-0763623 | ||||
(State or other jurisdiction of incorporation or organization) |
(Commission File Number) |
(I.R.S. Employer Identification No.) | ||||
38C Grove Street, Suite 100 Ridgefield, Connecticut |
06877 | |||||
(Address of principal executive offices) | (Zip Code) |
Registrants telephone number, including area code: (203) 244-6550
Not Applicable
(Former name or former address, if changed since last report)
Check the appropriate box below if the Form 8-K filing is intended to simultaneously satisfy the filing obligation of the registrant under any of the following provisions (see General Instruction A.2. below):
¨ | Written communications pursuant to Rule 425 under the Securities Act (17 CFR 230.425) |
¨ | Soliciting material pursuant to Rule 14a-12 under the Exchange Act (17 CFR 240.14a-12) |
¨ | Pre-commencement communications pursuant to Rule 14d-2(b) under the Exchange Act (17 CFR 240.14d-2(b)) |
¨ | Pre-commencement communications pursuant to Rule 13e-4(c) under the Exchange Act (17 CFR 240.13e-4(c)) |
ITEM 2.02 | Results of Operations and Financial Condition. |
On May 13, 2013, Northern Tier Energy LP (the Partnership) issued a press release reporting results for the quarter ended March 31, 2013, the text of which is attached hereto as Exhibit 99.1 to this Current Report on Form 8-K and is incorporated herein by reference.
The information in Item 2.02 of this Current Report on Form 8-K (the Report) and Exhibit 99.1 attached hereto is being furnished and is not deemed filed by the partnership for purposes of Section 18 of the Securities Exchange Act of 1934, as amended (the Exchange Act), or otherwise subject to the liabilities of the Section, nor is it deemed incorporated by reference into any filing under the Securities Act of 1933, as amended (the Securities Act), or the Exchange Act.
ITEM 7.01 | Regulation FD Disclosure. |
Financial information and operating data supplemental to the Partnerships first quarter earnings conference call is available on the Partnerships website at www.ntenergy.com. The conference call is scheduled on May 14, 2013 at 11:00 a.m. ET. The financial information and operating data supplemental to the conference call is furnished herewith as Exhibit 99.2 to this Report and is incorporated herein by reference.
The information in Item 7.01 of this Report and Exhibit 99.2 attached hereto is being furnished and is not deemed filed by the Partnership for purposes of Section 18 of the Exchange Act, or otherwise subject to the liabilities of the Section, nor is it deemed incorporated by reference into any filing under the Securities Act or the Exchange Act.
ITEM 9.01 | Financial Statements and Exhibits. |
(d) Exhibits
Exhibit No. |
Description of Exhibit | |
99.1 | Press release dated May 13, 2013. | |
99.2 | Supplemental conference call financial information and operating data dated as of May 14, 2013. |
SIGNATURE
Pursuant to the requirements of the Securities Exchange Act of 1934, the Registrants have duly caused this report to be signed on their behalf by the undersigned thereunto duly authorized.
Northern Tier Energy LP | ||||||
By: | Northern Tier Energy GP LLC, | |||||
its general partner | ||||||
Date: May 14, 2013 |
By: | /s/ Peter T. Gelfman | ||||
Peter T. Gelfman | ||||||
Vice President, General Counsel & Secretary |
EXHIBIT INDEX
Exhibit No. |
Description of Exhibit | |
99.1 | Press release dated May 13, 2013. | |
99.2 | Supplemental conference call financial information and operating data dated as of May 14, 2013. |
Exhibit 99.1
Northern Tier Energy Reports First Quarter 2013 Results and
Declares Quarterly Cash Distribution
| Declares first quarter distribution of $1.23 per common unit |
| Adjusted EBITDA of $156.6 million for the first quarter of 2013 represents an increase of $75.1 million compared to the first quarter of 2012 |
| Net income was $119.4 million for the first quarter of 2013 compared to a loss of $193.6 million for the first quarter of 2012 |
RIDGEFIELD, Conn., May 13, 2013 /PRNewswire/ Northern Tier Energy LP and its subsidiaries (NYSE:NTI) (Northern Tier Energy) today reported first quarter 2013 net income of $119.4 million compared to a loss of $193.6 million for the first quarter of 2012.
Net income for a respective reporting period may include the following special items: (i) contingent consideration loss (income), (ii) unrealized gains (losses) from derivative activities and (iii) a loss on early extinguishment of derivatives. Excluding these special items, first quarter 2013 Adjusted Net Income was $108.2 million compared to first quarter 2012 Adjusted Net Income of $5.1 million.
Adjusted EBITDA for the first quarter 2013 was $156.6 million, an increase of $75.1 million compared to $81.5 million for the first quarter 2012. This increase is primarily driven by favorable operating results in the Refining segment.
Quarterly Distribution
The Board of Directors of Northern Tier Energy GP LLC, the general partner of Northern Tier Energy LP, has approved a first quarter distribution of $1.23 per unit that will be paid in cash on May 30, 2013 to common unit holders of record as of the close of business on May 23, 2013. Cash available for distribution totaled $113.2 million for the first quarter 2013.
This will be the third quarterly cash distribution paid by Northern Tier Energy since its initial public offering (IPO) in July 2012 and will result in cumulative cash distributions since the IPO of $3.98 per common unit. Northern Tier Energy LP is a variable distribution master limited partnership. As a result, its quarterly distributions, if any, will vary from quarter to quarter as a result of variations in, among other factors, (i) its operating performance, (ii) cash flows caused by fluctuations in the prices it pays for crude oil and other feedstocks and the prices it receives for finished products, (iii) capital expenditures, and (iv) other cash reserves deemed necessary or appropriate by the board of directors of its general partner.
First Quarter Operating Segment Highlights
Refining Segment
The Refining segments operating income was $141.8 million for the first quarter 2013 compared to $78.7 million for the first quarter 2012. Refining gross product margins were $25.81 per barrel of throughput for the first quarter 2013 compared to $17.71 per barrel for the first quarter 2012. This increase is primarily due to favorable benchmark crack spreads as well as favorable crude oil price differentials versus the benchmark WTI crude oil prices in the 2013 first quarter compared to the 2012 first quarter.
In addition to higher product margins per barrel, throughput and sales volumes increased compared to the prior year quarter. Total throughput was 85,365 barrels per day for the first quarter 2013 compared to 76,004 barrels per day for the prior year quarter. Sales volumes increased to 84,694 barrels per day for the first quarter 2013 from 77,923 barrels per day for the first quarter 2012.
Retail Segment
Retail operating income was $0.6 million in the first quarter 2013 compared to an operating loss of $0.4 million in the first quarter 2012. Fuel margins were $0.16 per gallon for the first quarter 2013 compared to $0.18 per gallon for the first quarter 2012. Fuel gallons sold at company-operated retail stores increased by 0.7% from the prior year period.
1
Liquidity and Capital Spending
Northern Tier Energys primary sources of liquidity are cash generated from operating activities and its asset-backed revolving credit facility (the ABL Facility). As of March 31, 2013, Northern Tier Energys cash on hand and availability under the ABL Facility amounted to $373 million as compared to $405 million as of December 31, 2012.
Cash provided by operating activities for the first quarter 2013 was $41.5 million compared to cash used in operating activities of $54.8 million for the first quarter 2012. The cash provided in the 2013 period relates primarily to the strength of the Refining segments operating results partially offset by an increase in our refined products inventory in anticipation of a planned major turnaround in April 2013. Capital expenditures for the first quarter 2013 were $26.9 million.
Conference Call Information
The Northern Tier Energy conference call to discuss financial results for the first quarter ending March 31, 2013 is scheduled for Tuesday, May 14, 2013 at 11:00 a.m. eastern time. Callers may listen to the live presentation, which will be followed by a question and answer segment, by dialing 877-280-4956 or 857-244-7313 and the passcode 65355947. An audio webcast of the call along with a slide presentation will be available at www.ntenergy.com within the Investor section of the site. This audio webcast will be available on the website for fourteen days after the conference call. A replay will also be available by teleconference for seven days from the conference call. The replay teleconference will be available by dialing 888-286-8010 or 617-801-6888 and the passcode 54074181.
2
About Northern Tier Energy
Northern Tier Energy LP (NYSE:NTI) is an independent downstream energy company with refining, retail and pipeline operations that serves the PADD II region of the United States. Northern Tier Energy operates an 84,500 barrels per stream day refinery located in St. Paul Park, Minnesota. Northern Tier Energy also operates 166 convenience stores and supports 73 franchised convenience stores, primarily in Minnesota and Wisconsin, under the SuperAmerica trademark, and owns a bakery and commissary under the SuperMoms brand. Northern Tier Energy is headquartered in Ridgefield, Connecticut.
Non-GAAP Measures
This earnings release includes non-GAAP measures including Adjusted EBITDA, Adjusted Net Income and Cash Available for Distribution. Northern Tier Energy believes that these non-GAAP financial measures provide useful information about its operating performance. However, these measures have important limitations as analytical tools and should not be viewed in isolation or considered as alternatives to comparable GAAP financial measures. Northern Tier Energys non-GAAP financial measures may also differ from similarly named measures used by other companies. See the accompanying tables and footnotes in this release for additional information on the non-GAAP measures used in this release and reconciliations to the most directly comparable GAAP measures.
Forward-Looking Statements
This press release contains certain forward-looking statements which reflect Northern Tier Energys views and assumptions on the date of this press release regarding future events. They involve known and unknown risks, uncertainties and other factors, many of which may be beyond its control, that may cause actual results to differ materially from any future results, performance or achievements expressed or implied by the forward-looking statements. All forward-looking statements speak only as of the date hereof. Northern Tier Energy undertakes no obligation to update or revise publicly any such forward-looking statements. Northern Tier Energy cautions you not to place undue reliance on these forward-looking statements. Please refer to Northern Tier Energys filings with the SEC for more detailed information regarding these risks, uncertainties and assumptions.
This release serves as a qualified notice to nominees and brokers as provided for under Treasury Regulation Section 1.1446-4(b). Please note that 100 percent of Northern Tier Energy LPs distributions to foreign investors are attributable to income that is effectively connected with a United States trade or business. Accordingly, Northern Tier Energy LPs distributions to foreign investors are subject to federal income tax withholding at the highest effective tax rate.
For Further Information, Contact:
Maria Testani
Director, Planning and Strategy
(203) 244-6550
3
NORTHERN TIER ENERGY LP
CONSOLIDATED STATEMENTS OF OPERATIONS
(in millions except per unit amounts, unaudited)
Three Months Ended March 31, |
||||||||
2013 | 2012 | |||||||
Revenue |
$ | 1,115.0 | $ | 999.1 | ||||
Costs, expenses and other: |
||||||||
Cost of sales |
879.5 | 839.8 | ||||||
Direct operating expenses |
64.3 | 60.7 | ||||||
Turnaround and related expenses |
9.7 | 3.5 | ||||||
Depreciation and amortization |
8.6 | 8.5 | ||||||
Selling, general and administrative |
25.5 | 20.3 | ||||||
Formation and offering costs |
0.4 | | ||||||
Contingent consideration loss |
| 65.7 | ||||||
Other income, net |
(4.9 | ) | (2.1 | ) | ||||
|
|
|
|
|||||
Operating income |
131.9 | 2.7 | ||||||
Realized losses from derivative activities |
(17.4 | ) | (52.9 | ) | ||||
Loss on early extinguishment of derivatives |
| (44.6 | ) | |||||
Unrealized gains (losses) from derivative activities |
11.2 | (88.4 | ) | |||||
Interest expense, net |
(6.4 | ) | (10.4 | ) | ||||
|
|
|
|
|||||
Income (loss) before income taxes |
119.3 | (193.6 | ) | |||||
Income tax benefit |
0.1 | | ||||||
|
|
|
|
|||||
Net income (loss) |
$ | 119.4 | $ | (193.6 | ) | |||
|
|
|
|
|||||
Earnings per common unit, basic and diluted |
$ | 1.30 | ||||||
|
|
4
NORTHERN TIER ENERGY LP
SELECTED OPERATING SEGMENT DATA
(in millions, unaudited)
Three Months Ended March 31, |
||||||||
2013 | 2012 | |||||||
OPERATING INCOME: |
||||||||
Refining |
$ | 141.8 | $ | 78.7 | ||||
Retail |
0.6 | (0.4 | ) | |||||
Corporate and unallocated costs |
(10.5 | ) | (75.6 | ) | ||||
|
|
|
|
|||||
TOTAL OPERATING INCOME |
131.9 | 2.7 | ||||||
Net losses on derivative activities |
(6.2 | ) | (185.9 | ) | ||||
Interest expense, net |
(6.4 | ) | (10.4 | ) | ||||
Income tax benefit |
0.1 | | ||||||
|
|
|
|
|||||
NET INCOME (LOSS) |
$ | 119.4 | $ | (193.6 | ) | |||
|
|
|
|
5
NORTHERN TIER ENERGY LP
SELECTED BALANCE SHEET AND CASH FLOW DATA
(in millions, unaudited)
March 31, 2013 |
December 31, 2012 |
|||||||
Cash and Cash Equivalents |
$ | 172.3 | $ | 272.9 | ||||
Total Assets |
$ | 1,123.2 | $ | 1,136.8 | ||||
Total Debt and Financing Obligations |
$ | 282.4 | $ | 282.5 | ||||
Equity |
$ | 491.9 | $ | 483.8 | ||||
Three Months Ended March 31, | ||||||||
2013 | 2012 | |||||||
Net cash provided by (used in) operating activities |
$ | 41.5 | $ | (54.8 | ) | |||
Net cash used in investing activities |
(25.4 | ) | (4.6 | ) | ||||
Net cash used in financing activities |
(116.7 | ) | | |||||
|
|
|
|
|||||
Net decrease in cash and cash equivalents |
$ | (100.6 | ) | $ | (59.4 | ) | ||
|
|
|
|
6
NORTHERN TIER ENERGY LP
SUPPLEMENTAL OPERATING DATA
(unaudited)
Three Months Ended March 31, |
||||||||
2013 | 2012 | |||||||
REFINING SEGMENT | ||||||||
Key Operating Statistics |
||||||||
Total refinery production (bpd) |
86,079 | 76,437 | ||||||
Total refinery throughput (bpd) |
85,365 | 76,004 | ||||||
Refined products sold (bpd) |
84,694 | 77,923 | ||||||
Per barrel of throughput: |
||||||||
Refining gross margin |
$ | 25.81 | $ | 17.71 | ||||
Direct operating expenses |
$ | 4.89 | $ | 4.53 | ||||
Per barrel of refined products sold: |
||||||||
Refining gross margin |
$ | 26.02 | $ | 17.28 | ||||
Direct operating expenses |
$ | 4.93 | $ | 4.41 | ||||
Refinery product yields (bpd): |
||||||||
Gasoline |
40,996 | 38,902 | ||||||
Distillate |
28,656 | 24,160 | ||||||
Asphalt |
10,629 | 8,323 | ||||||
Other |
5,798 | 5,052 | ||||||
|
|
|
|
|||||
Total |
86,079 | 76,437 | ||||||
|
|
|
|
|||||
RETAIL SEGMENT | ||||||||
Company operated stores: |
||||||||
Fuel gallons sold (in millions) |
74.6 | 74.1 | ||||||
Fuel margin per gallon |
$ | 0.16 | $ | 0.18 | ||||
Merchandise sales (in millions) |
$ | 75.8 | $ | 78.8 | ||||
Merchandise margin % |
27.3 | % | 25.8 | % | ||||
Number of stores at period end |
166 | 166 |
Note: See Managements Discussion and Analysis of Financial Condition and Results of Operations included within Northern Tier Energys quarterly report on Form 10-Q for further information on operating statistic definitions.
7
NORTHERN TIER ENERGY LP
ADJUSTED EBITDA RECONCILIATION
(in millions, unaudited)
Three Months Ended March 31, 2013 | ||||||||||||||||
Refining | Retail | Other | Total | |||||||||||||
(in millions) |
||||||||||||||||
Net income (loss) |
$ | 141.8 | $ | 0.6 | $ | (23.0 | ) | $ | 119.4 | |||||||
Adjustments: |
||||||||||||||||
Interest expense |
| | 6.4 | 6.4 | ||||||||||||
Income tax benefit |
| | (0.1 | ) | (0.1 | ) | ||||||||||
Depreciation and amortization |
6.7 | 1.8 | 0.1 | 8.6 | ||||||||||||
|
|
|
|
|
|
|
|
|||||||||
EBITDA subtotal |
148.5 | 2.4 | (16.6 | ) | 134.3 | |||||||||||
Minnesota Pipe Line proportionate EBITDA |
0.7 | | | 0.7 | ||||||||||||
Turnaround and related expenses |
9.7 | | | 9.7 | ||||||||||||
Equity-based compensation expense |
| | 5.3 | 5.3 | ||||||||||||
Unrealized gains on derivative activities |
| | (11.2 | ) | (11.2 | ) | ||||||||||
Formation and offering costs |
| | 0.4 | 0.4 | ||||||||||||
Realized losses on derivative activities |
| | 17.4 | 17.4 | ||||||||||||
|
|
|
|
|
|
|
|
|||||||||
Adjusted EBITDA (a) |
$ | 158.9 | $ | 2.4 | $ | (4.7 | ) | $ | 156.6 | |||||||
|
|
|
|
|
|
|
|
|||||||||
Three Months Ended March 31, 2012 | ||||||||||||||||
Refining | Retail | Other | Total | |||||||||||||
(in millions) |
||||||||||||||||
Net income (loss) |
$ | 78.7 | $ | (0.4 | ) | $ | (271.9 | ) | $ | (193.6 | ) | |||||
Adjustments: |
||||||||||||||||
Interest expense |
| | 10.4 | 10.4 | ||||||||||||
Depreciation and amortization |
5.8 | 1.8 | 0.9 | 8.5 | ||||||||||||
|
|
|
|
|
|
|
|
|||||||||
EBITDA subtotal |
84.5 | 1.4 | (260.6 | ) | (174.7 | ) | ||||||||||
Minnesota Pipe Line proportionate EBITDA |
0.7 | | | 0.7 | ||||||||||||
Turnaround and related expenses |
3.5 | | | 3.5 | ||||||||||||
Equity-based compensation expense |
| | 0.4 | 0.4 | ||||||||||||
Unrealized losses on derivative activities |
| | 88.4 | 88.4 | ||||||||||||
Contingent consideration loss |
| | 65.7 | 65.7 | ||||||||||||
Loss on early extinguishment of derivatives |
| | 44.6 | 44.6 | ||||||||||||
Realized losses on derivative activities |
| | 52.9 | 52.9 | ||||||||||||
|
|
|
|
|
|
|
|
|||||||||
Adjusted EBITDA (a) |
$ | 88.7 | $ | 1.4 | $ | (8.6 | ) | $ | 81.5 | |||||||
|
|
|
|
|
|
|
|
(a) | Adjusted EBITDA is not a presentation made in accordance with GAAP and Northern Tier Energys computation of Adjusted EBITDA may vary from others in its industry. In addition, Adjusted EBITDA contains some, but not all, adjustments that are taken into account in the calculation of the components of various covenants in the agreements governing the Secured Notes, ABL Facility, and contingent consideration arrangements. Adjusted EBITDA should not be considered as an alternative to operating income or net income as measures of operating performance. In addition, Adjusted EBITDA is not presented as, and should not be considered, an alternative to cash flow from operations as a measure of liquidity. Adjusted EBITDA is defined as net income (loss) before interest expense, income taxes and depreciation and amortization, adjusted for EBITDA from the Minnesota Pipe Line operations, turnaround and related expenses, equity-based compensation expense, gains or losses from derivative activities, fair value adjustments for contingent consideration arrangements and costs related to Northern Tier Energys formation and equity offerings. Adjusted EBITDA has limitations as an analytical tool and should not be considered in isolation, or as a substitute for analysis of the results as reported under GAAP. |
8
NORTHERN TIER ENERGY LP
CASH AVAILABLE FOR DISTRIBUTION RECONCILIATION
For the Three Months Ended March 31, 2013
(in millions, unaudited)
Net income |
$ | 119.4 | ||
Adjustments: |
||||
Interest expense |
6.4 | |||
Income tax provision |
(0.1 | ) | ||
Depreciation and amortization |
8.6 | |||
|
|
|||
EBITDA subtotal |
134.3 | |||
Minnesota Pipe Line proportionate EBITDA |
0.7 | |||
Turnaround and related expenses |
9.7 | |||
Equity-based compensation impacts |
5.3 | |||
Unrealized gains on derivative activities |
(11.2 | ) | ||
Formation and offering costs |
0.4 | |||
Realized losses on derivative activities |
17.4 | |||
|
|
|||
Adjusted EBITDA (a) |
156.6 | |||
Cash interest expense |
(5.8 | ) | ||
Minnesota Pipe Line proportionate EBITDA |
(0.7 | ) | ||
Realized losses on derivative activities |
(17.4 | ) | ||
Capital expenditures (b) |
(9.1 | ) | ||
Formation and offering costs |
(0.4 | ) | ||
Reserve for turnaround and related expenses |
(10.0 | ) | ||
|
|
|||
Cash Available for Distribution (c) |
$ | 113.2 | ||
|
|
(b) | Capital expenditures include maintenance, replacement, and regulatory capital projects. Expansion capital projects are not included. |
(c) | Cash available for distribution is a non-GAAP performance measure that Northern Tier Energy believes is important to investors in evaluating its overall cash generation performance. Cash available for distribution should not be considered as an alternative to operating income or net income (loss) as measures of operating performance. In addition, cash available for distribution is not presented as, and should not be considered, an alternative to cash flow from operations as a measure of liquidity. Northern Tier Energy has reconciled cash available for distribution to adjusted EBITDA and in addition reconciled adjusted EBITDA to net income. Cash available for distribution has limitations as an analytical tool and should not be considered in isolation, or as a substitute for analysis of the results as reported under GAAP. Northern Tier Energys calculation of cash available for distribution may differ from similar calculations of other companies in its industry, thereby limiting its usefulness as a comparative measure. Cash available for distribution for each quarter will be determined by the board of directors of Northern Tier Energys general partner following the end of such quarter. |
9
NORTHERN TIER ENERGY LP
OTHER NON-GAAP PERFORMANCE MEASURES
(in millions, unaudited)
Three Months Ended March 31, |
||||||||
2013 | 2012 | |||||||
Refining revenue |
$ | 1,018.6 | $ | 894.5 | ||||
Refining cost of sales |
820.3 | 772.0 | ||||||
|
|
|
|
|||||
Refining gross product margin (d) |
$ | 198.3 | $ | 122.5 | ||||
|
|
|
|
|||||
Three Months Ended March 31, |
||||||||
2013 | 2012 | |||||||
Retail gross margin: |
||||||||
Fuel margin |
$ | 11.9 | $ | 13.3 | ||||
Merchandise margin |
20.7 | 20.3 | ||||||
Other margin |
4.4 | 3.2 | ||||||
|
|
|
|
|||||
Retail gross margin |
37.0 | 36.8 | ||||||
Expenses: |
||||||||
Direct operating expenses |
28.3 | 29.4 | ||||||
Depreciation and amortization |
1.8 | 1.8 | ||||||
Selling, general and administrative |
6.3 | 6.0 | ||||||
|
|
|
|
|||||
Retail segment operating income (loss) (e) |
$ | 0.6 | $ | (0.4 | ) | |||
|
|
|
|
|||||
Three Months Ended March 31, |
||||||||
2013 | 2012 | |||||||
Net income (loss) |
$ | 119.4 | $ | (193.6 | ) | |||
Adjusted for special items: |
||||||||
Contingent consideration loss |
| 65.7 | ||||||
Unrealized (gains) losses from derivative activities |
(11.2 | ) | 88.4 | |||||
Loss on early extinguishment of derivatives |
| 44.6 | ||||||
|
|
|
|
|||||
Adjusted Net Income (f) |
$ | 108.2 | $ | 5.1 | ||||
|
|
|
|
(d) | Refining gross product margin per barrel is a financial measurement calculated by subtracting refining costs of sales from total refining revenues and dividing the difference by the total throughput or total refined products sold for the respective periods presented. Refining gross product margin is a non-GAAP performance measure that Northern Tier Energy believes is important to investors in evaluating its refining segment performance as a general indication of the amount above its cost of products that it is able to sell refined products. Each of the components used in these calculations (revenues and cost of sales) can be reconciled directly to Northern Tier Energys statements of operations. Northern Tier Energys calculation of refining gross product margin may differ from similar calculations of other companies in its industry, thereby limiting its usefulness as a comparative measure. |
10
(e) | Retail fuel gross margin and retail merchandise gross margin are non-GAAP performance measures that Northern Tier Energy believes are important to investors in evaluating its retail performance. Northern Tier Energys calculation of retail fuel margin and retail merchandise margin may differ from similar calculations of other companies in its industry, thereby limiting their usefulness as comparative measures. |
(f) | Adjusted Net Income is a non-GAAP performance measure that Northern Tier Energy believes is important to investors in evaluating its operating performance. Northern Tier Energys calculation of Adjusted Net Income may differ from similar calculations of other companies in its industry, thereby limiting their usefulness as comparative measures. |
11
Exhibit 99.2
NORTHERN TIER ENERGY First Quarter 2013 Earnings Conference Call and Webcast May 14, 2013
Forward Looking Statements NORTHERN TIER Energy 1 The following information contains forward-looking statements within the meaning of the Private Securities Litigation Reform Act of 1995. These forward-looking statements are based on managements current expectations and beliefs, as well as a number of assumptions concerning future events. You can identify forward-looking statements by words such as anticipate, believe, estimate, forecast, project, could, may, should, would, will or other similar expression that convey the uncertainty of future events or outcomes. These forward-looking statements are based on our current expectations and beliefs concerning future developments and their potential effect on us. While management believes that these forward-looking statements are reasonable as and when made, there can be no assurance that future developments affecting us will be those that we anticipate. All comments concerning our expectations for future revenues and operating results are based on our forecasts for our existing operations and do not include the potential impact of any future acquisitions. Our forward-looking statements involve significant risks and uncertainties (some of which are beyond our control) and assumptions that could cause actual results to differ materially from our historical experience and our present expectations or projections. Important factors that could cause actual results to differ materially from those in the forward-looking statements include, but are not limited to, the overall demand for hydrocarbon products, fuels and other refined products; our ability to produce products and fuels that meet our customers unique and precise specifications; the impact of fluctuations and rapid increases or decreases in crude oil, refined products, fuel and utility services prices and crack spreads, including the impact of these factors on our liquidity; fluctuations in refinery capacity; accidents or other unscheduled shutdowns or disruptions affecting our refinery, machinery, or equipment, or those of our suppliers or customers; changes in the cost or availability of transportation for feedstocks and refined products; the results of our hedging and other risk management activities; our ability to comply with covenants contained in our debt instruments; labor relations; relationships with our partners and franchisees; successful integration and future performance of acquired assets, businesses or third-party product supply and processing relationships; our access to capital to fund expansions, acquisitions and our working capital needs and our ability to obtain debt or equity financing on satisfactory terms; currently unknown liabilities in connection with the Marathon Acquisition (as defined herein); environmental liabilities or events that are not covered by an indemnity, insurance or existing reserves; dependence on one principal supplier for merchandise; maintenance of our credit ratings and ability to receive open credit lines from our suppliers; the effects of competition; continued creditworthiness of, and performance by, counterparties; the impact of current and future laws, rulings and governmental regulations, including guidance related to the Dodd-Frank Wall Street Reform and Consumer Protection Act; shortages or cost increases of power supplies, natural gas, materials or labor; weather interference with business operations; seasonal trends in the industries in which we operate; fluctuations in the debt markets; potential product liability claims and other litigation; and changes in economic conditions, generally, and in the markets we serve, consumer behavior, and travel and tourism trends. For additional information regarding known material factors that could cause our actual results to differ from our projected results, please see Part I, Item 1A. Risk Factors and elsewhere in our Form 10-Q, dated May 14, 2013 (File No. 001-35612). The presentation also includes non-GAAP measures. We believe that these non-GAAP financial measures provide useful information about our operating performance and should not be viewed in isolation or considered as alternatives to comparable GAAP measures. Our non-GAAP financial measures may also differ from similarly names measures used by other companies. See the disclosures in the Managements Discussion and Analysis of Financial Condition and Results of Operations included in our quarterly report on Form 10-Q for the three ended March 31, 2013 for additional information on the nonGAAP measures used in this presentation and reconciliations to the most directly comparable GAAP measures.
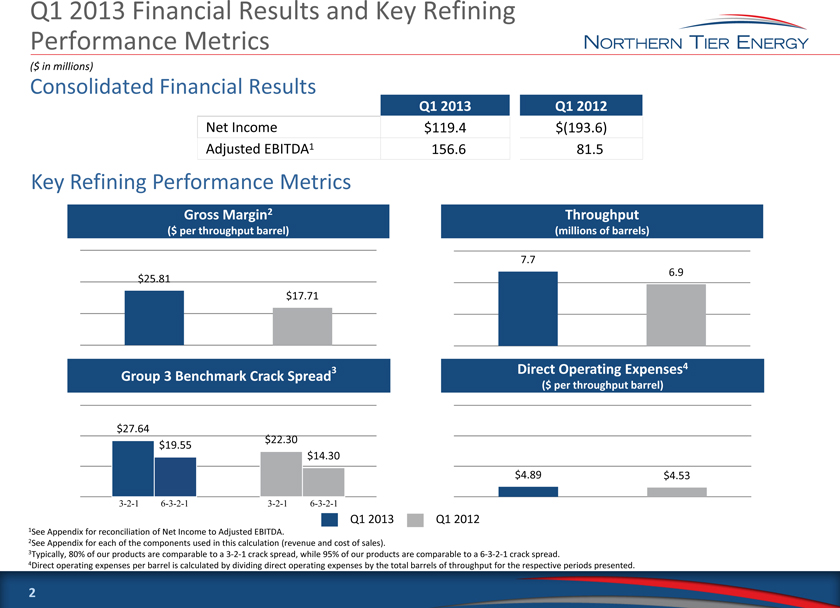
Q1 2013 Financial Results and Key Refining Performance Metrics NORTHERN TIER Energy 2 Q1 2013 Q1 2012 Net Income $119.4 $(193.6) Adjusted EBITDA1 156.6 81.5 Consolidated Financial Results Key Refining Performance Metrics 1 See Appendix for reconciliation of Net Income to Adjusted EBITDA. 2 See Appendix for each of the components used in this calculation (revenue and cost of sales). 3 Typically, 80% of our products are comparable to a 3-2-1 crack spread, while 95% of our products are comparable to a 6-3-2-1 crack spread. 4 Direct operating expenses per barrel is calculated by dividing direct operating expenses by the total barrels of throughput for the respective periods presented. ($ in millions) Gross Margin 2 ($ per throughput barrel) Group 3 Benchmark Crack Spread 3 Direct Operating Expenses 4 ($ per throughput barrel) Throughput (millions of barrels) Q1 2013 Q1 2012 $25.81 $17.71 $4.89 $4.53 7.7 6.9 $27.64 $22.30 $23.10 $18.34 3-2-1 3-2-1 6-3-2-1 6-3-2-1 $22.30 $14.30 $27.64 $19.55
1See Appendix for reconciliation of Net Income to Adjusted EBITDA.
2See Appendix for each of the components used in this calculation (revenue and cost of sales).
3Typically, 80% of our products are comparable to a 3-2-1 crack spread, while 95% of our products are comparable to a 6-3-2-1 crack spread.
4Direct operating expenses per barrel is calculated by dividing direct operating expenses by the total barrels of throughput for the respective periods presented. 2
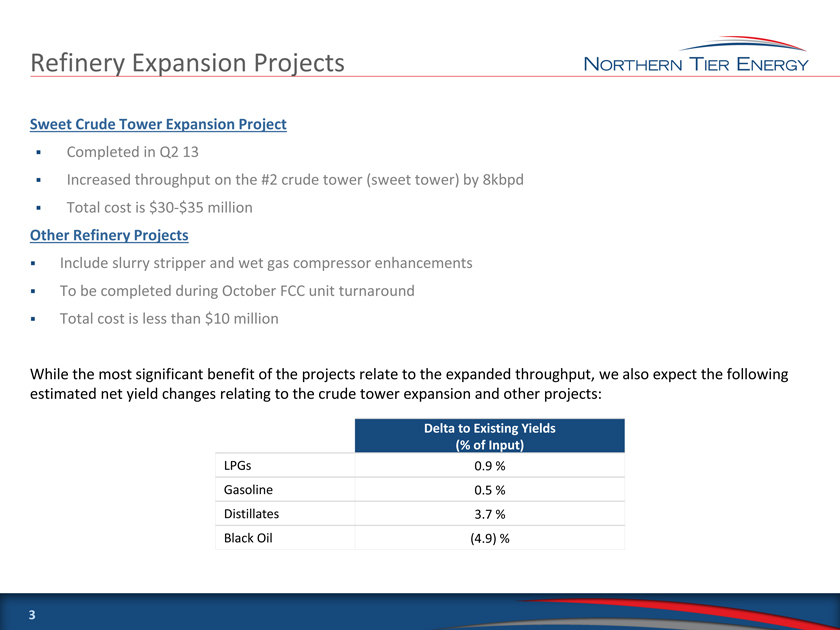
Refinery Expansion Projects Sweet Crude Tower Expansion Project Completed in NORTHERN TIER Energy Q2 13 Increased throughput on the #2 crude tower (sweet tower) by 8kbpd Total cost is $30-$35 million Other Refinery Projects Include slurry stripper and wet gas compressor enhancements To be completed during October FCC unit turnaround Total cost is less than $10 million While the most significant benefit of the projects relate to the expanded throughput, we also expect the following estimated net yield changes relating to the crude tower expansion and other projects: 3 Delta to Existing Yields (% of Input) LPGs 0.9 % Gasoline 0.5 % Distillates 3.7 % Black Oil (4.9) %
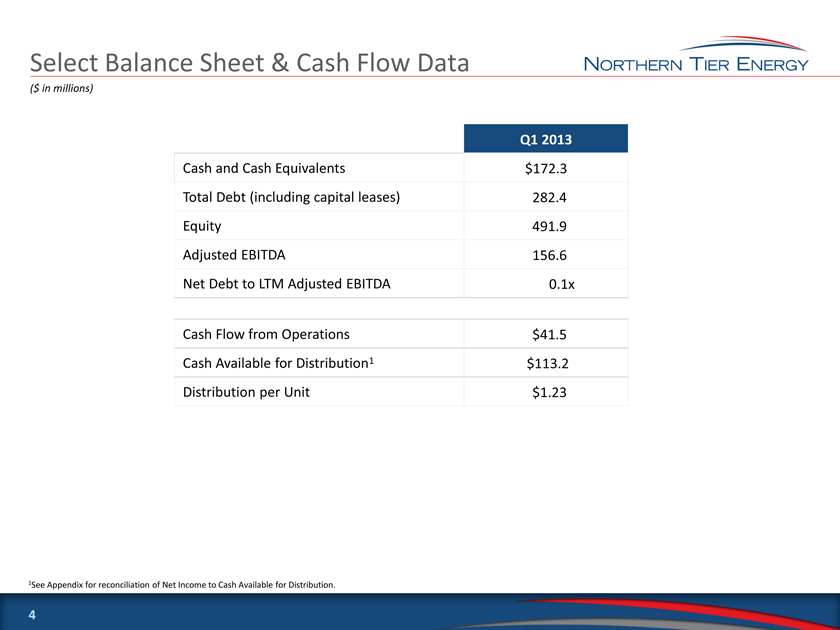
Select Balance Sheet & Cash Flow Data 4 Q1 2013 Cash and Cash Equivalents $172.3 Total Debt (including capital leases) 282.4 Equity 491.9 Adjusted EBITDA 156.6 Net Debt to LTM Adjusted EBITDA 0.1x Cash Flow from Operations $41.5 Cash Available for Distribution 1 $113.2 Distribution per Unit $1.23 ($ in millions) 1 See Appendix for reconciliation of Net Income to Cash Available for Distribution. NORTHERN TIER Energy
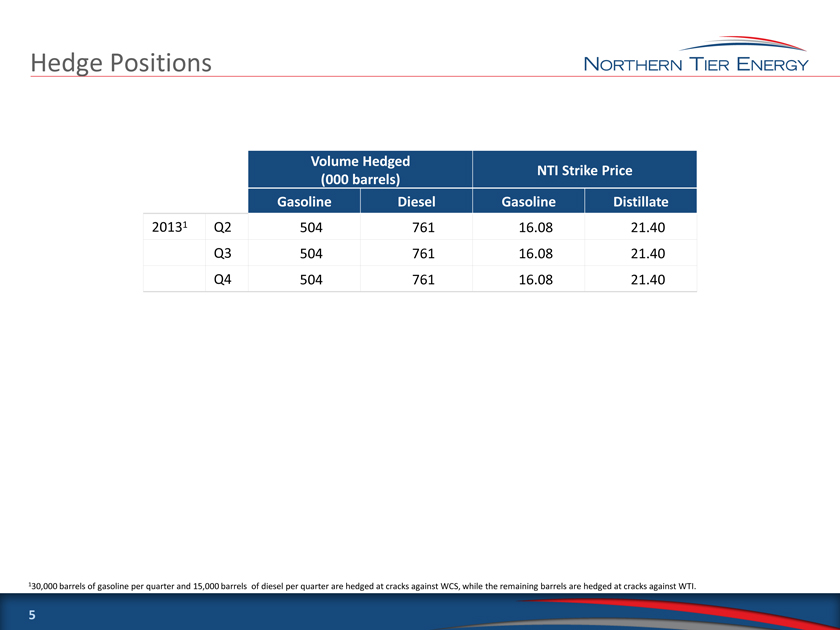
Hedge Positions 5 Volume Hedged (000 barrels) NTI Strike Price Gasoline Diesel Gasoline Distillate 20131 Q2 504 761 16.08 21.40 Q3 504 761 16.08 21.40 Q4 504 761 16.08 21.40 130,000 barrels of gasoline per quarter and 15,000 barrels of diesel per quarter are hedged at cracks against WCS, while the remaining barrels are hedged at cracks against WTI. NORTHERN TIER Energy
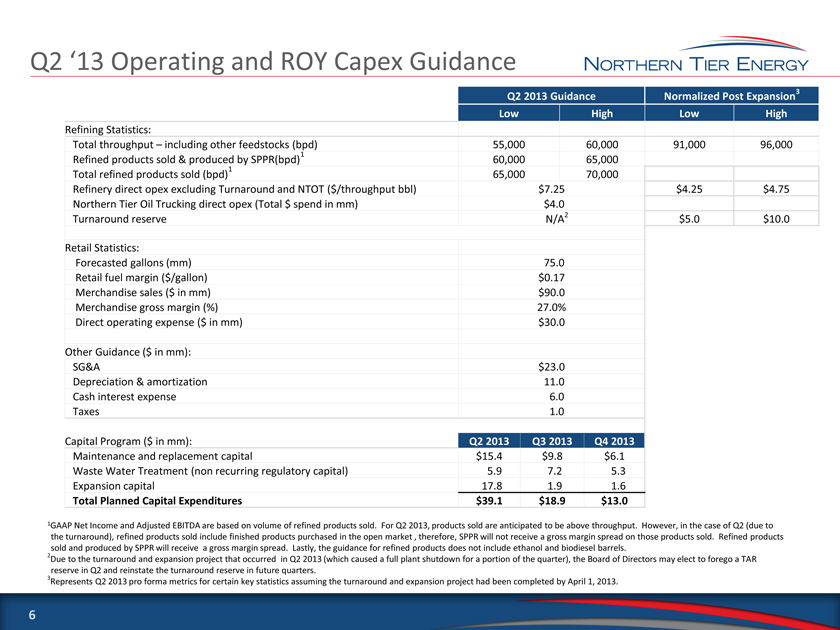
Q2 13 Operating and ROY Capex Guidance 6 Q2 2013 Guidance Normalized Post Expansion 3 Low High Low High Refining Statistics: Total throughput including other feedstocks (bpd) 55,000 60,000 91,000 96,000 Refined products sold & produced by SPPR(bpd) 1 60,000 65,000 Total refined products sold (bpd)1 65,000 70,000 Refinery direct opex excluding Turnaround and NTOT ($/throughput bbl) $7.25 $4.25 $4.75 Northern Tier Oil Trucking direct opex (Total $ spend in mm) $4.0 Turnaround reserve N/A2 $5.0 $10.0 Retail Statistics: Forecasted gallons (mm) 75.0 Retail fuel margin ($/gallon) $0.17 Merchandise sales ($ in mm) $90.0 Merchandise gross margin (%) 27.0% Direct operating expense ($ in mm) $30.0 Other Guidance ($ in mm): SG&A $23.0 Depreciation & amortization 11.0 Cash interest expense 6.0 Taxes 1.0 Capital Program ($ in mm): Q2 2013 Q3 2013 Q4 2013 Maintenance and replacement capital $15.4 $9.8 $6.1 Waste Water Treatment (non recurring regulatory capital) 5.9 7.2 5.3 Expansion capital 17.8 1.9 1.6 Total Planned Capital Expenditures $39.1 $18.9 $13.0 1GAAP Net Income and Adjusted EBITDA are based on volume of refined products sold. For Q2 2013, products sold are anticipated to be above throughput. However, in the case of Q2 (due to the turnaround), refined products sold include finished products purchased in the open market , therefore, SPPR will not receive a gross margin spread on those products sold. Refined products sold and produced by SPPR will receive a gross margin spread. Lastly, the guidance for refined products does not include ethanol and biodiesel barrels. 2 Due to the turnaround and expansion project that occurred in Q2 2013 (which caused a full plant shutdown for a portion of the quarter), the Board of Directors may elect to forego a TAR reserve in Q2 and reinstate the turnaround reserve in future quarters. 3 Represents Q2 2013 pro forma metrics for certain key statistics assuming the turnaround and expansion project had been completed by April 1, 2013. NORTHERN TIER Energy
APPENDIX NORTHERN TIER Energy
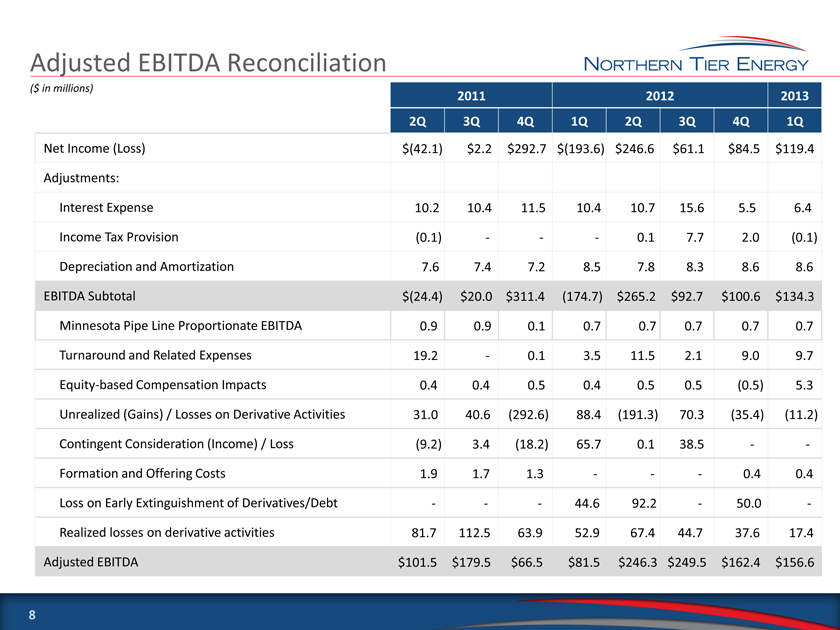
Adjusted EBITDA Reconciliation 8 2011 2012 2013 2Q 3Q 4Q 1Q 2Q 3Q 4Q 1Q Net Income (Loss) $(42.1) $2.2 $292.7 $(193.6) $246.6 $61.1 $84.5 $119.4 Adjustments: Interest Expense 10.2 10.4 11.5 10.4 10.7 15.6 5.5 6.4 Income Tax Provision (0.1) - - - 0.1 7.7 2.0 (0.1) Depreciation and Amortization 7.6 7.4 7.2 8.5 7.8 8.3 8.6 8.6 EBITDA Subtotal $(24.4) $20.0 $311.4 (174.7) $265.2 $92.7 $100.6 $134.3 Minnesota Pipe Line Proportionate EBITDA 0.9 0.9 0.1 0.7 0.7 0.7 0.7 0.7 Turnaround and Related Expenses 19.2 - 0.1 3.5 11.5 2.1 9.0 9.7 Equity-based Compensation Impacts 0.4 0.4 0.5 0.4 0.5 0.5 (0.5) 5.3 Unrealized (Gains) / Losses on Derivative Activities 31.0 40.6 (292.6) 88.4 (191.3) 70.3 (35.4) (11.2) Contingent Consideration (Income) / Loss (9.2) 3.4 (18.2) 65.7 0.1 38.5 - - Formation and Offering Costs 1.9 1.7 1.3 - - - 0.4 0.4 Loss on Early Extinguishment of Derivatives/Debt - - - 44.6 92.2 - 50.0 - Realized losses on derivative activities 81.7 112.5 63.9 52.9 67.4 44.7 37.6 17.4 Adjusted EBITDA $101.5 $179.5 $66.5 $81.5 $246.3 $249.5 $162.4 $156.6 ($ in millions) NORTHERN TIER Energy
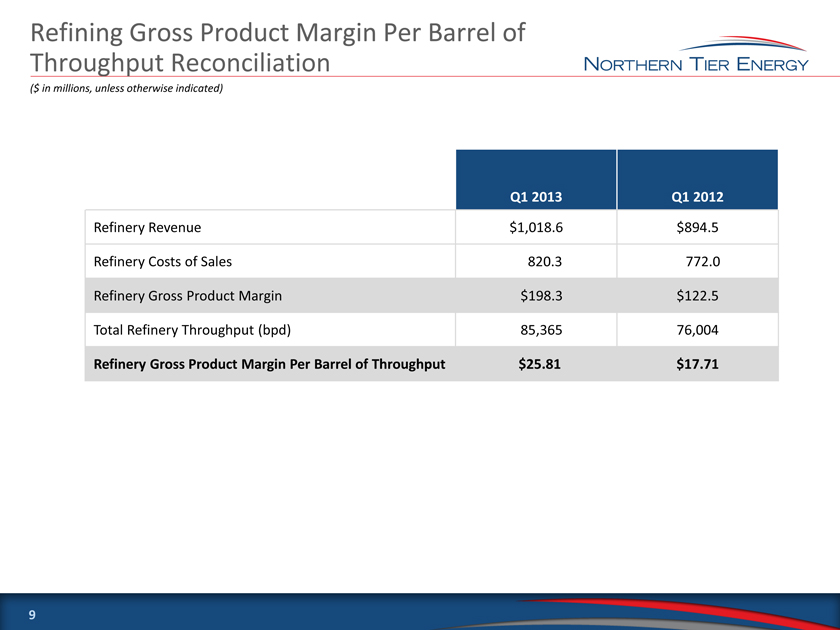
Refining Gross Product Margin Per Barrel of Throughput Reconciliation 9 Q1 2013 Q1 2012 Refinery Revenue $1,018.6 $894.5 Refinery Costs of Sales 820.3 772.0 Refinery Gross Product Margin $198.3 $122.5 Total Refinery Throughput (bpd) 85,365 76,004 Refinery Gross Product Margin Per Barrel of Throughput $25.81 $17.71 ($ in millions, unless otherwise indicated) NORTHERN TIER Energy
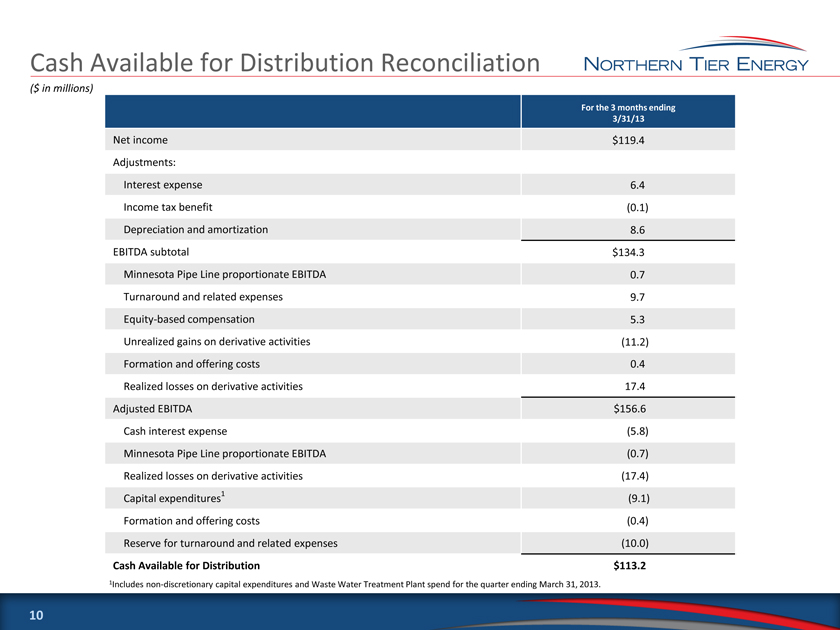
Cash Available for Distribution Reconciliation For the 3 months ending 3/31/13 Net income $119.4 Adjustments: Interest expense 6.4 Income tax benefit (0.1) Depreciation and amortization 8.6 EBITDA subtotal $134.3 Minnesota Pipe Line proportionate EBITDA 0.7 Turnaround and related expenses 9.7 Equity-based compensation 5.3 Unrealized gains on derivative activities (11.2) Formation and offering costs 0.4 Realized losses on derivative activities 17.4 Adjusted EBITDA $156.6 Cash interest expense (5.8) Minnesota Pipe Line proportionate EBITDA (0.7) Realized losses on derivative activities (17.4) Capital expenditures 1 (9.1) Formation and offering costs (0.4) Reserve for turnaround and related expenses (10.0) Cash Available for Distribution $113.2 ($ in millions) 10 1 Includes non-discretionary capital expenditures and Waste Water Treatment Plant spend for the quarter ending March 31, 2013. NORTHERN TIER Energy
,>
M[N"7'NRT^2D9C^M.@C5+57.>K8V2. LJTE;A&>339/G=Y<(%&5DC0Q-.REU+'/":D6D)A.UXCQ@1[Z"V2;K?34.+!
MX*]N[>PQ>1DEN[BYCB1'6RQHU)'(U7ZNE=736NFFWE0ERYC,VEK/>Y"P9';0
M6\DBJVX1ZJK&JY&TZ)M-5*:J[.13'W#E1S1CL)567(^!L='"6B,F35]^B?+B
M'ODM*C"-KV]N1[,POU7PYF=79,UEC&!*<[(@'##V-'!WO6\[F8'=F:Z2QARS
M^M.?H;KM'M9J5=*(KFRO5$5>-&.IPT.IV:WABMEO)L8SJ[6:W:;IKG:42JT:
MZ-B*M.)7)7E-ZZ]G+!9\!@]E10U2?%K#A\:G,:/6)AHE9S!+&5$_LYJI&9O9
MB128W.!>QE"^,6+>P[]NLU6\M9K&[ELKBB3PR.8ZBU34QRM6B\:51=ILMK 23^3Q-U@L:@"5F^DS#
M(H5'F=.K$YC4B4Z$>$PW>^T`1FUWV[^#3)93=/ZLBBQMCBW31WM).F61L;'M
MD=(KM#FR. ])V]N8$0GZ4<*:Y98W8\
M:8W0TMMV0J:W]MG6D.P:``8RT(0=Y[.N=^+W4W6OTM\[H/'^77J/7IQM%7O(*,1RG
MZ_C_`#&D-'Q\F!JJ7KMZ7G,T4"XEI#DOTI7K.T:2$(-&B%K>M"Z[W[,VSR\&
M[6'FW>PMK>]-9N=-(ZS;.[I$FD:E7TK72B;%XCR9UUBI]X,I%G
MGJ1%E:WK
MIVL`U/Y6TG5U0<_;#Y$+KAR+XP7]6\%0$3)EK!;;QU(VC`T*6.*02"+M:
M5P>FYCE3`A)'XT@@81&=@&M;V49K0&WO")1P6DEI2!UXF\0Y#5ZIEAJOQEW+
M>.CM4$3<4SB[-*0&-T3FKJ">/3@%*TNZE
M6PM;<1T4;6[&`JZQ&:P^$EM,7;W,
(AO:TA
M*%$2(\\9AYPBDQ`0[&,0ABZ==[WOVY1RROFE=-(M9'N5R^-5JOPEU'&R&-L4
M:48UJ(GB1*(73.LS&`:RW#5=AK++KZ\Z<713Z>PF/RB"OL4G*AU;8Q.X!+%;
M,[JFP;^R('AQCCZRO\>3*T*G2)62+M&E&E]D>AA`PR3UQR-DC]5ERGDTZ3:%
M7/L]3(J^3/DP#"G2NK"CS(UN;.LGI\<.=P31`[,1*PE<6QEHQ%]4PB>F]J-@
M8\W\9['6.#-.9,\0X$\?>5\7Y"SYN95#P*-,T;BU=*JW:(A%ERML)7OKHC9T
MR(9RM4G0`5J!GB[!0`E@V!-%+>0\D;'B%F*U3F!*UID=
M=U]$C@2,138<8F.&XQ10/6DP%.NY&7O>^UL00@1@ZL-ZO]\\UHU4Q%<^7S-C
MJ**N;G/E4F;3XTK=JF.;M2ME`SL[NCEB=`C4CT8UF;0;&H++WXL(!##H#(Y-
MPI