OUR OPERATIONS
We invest in renewable power and sustainable solutions assets directly, as well as with institutional partners, joint venture partners and through other arrangements. Across our business, we leverage our extensive operating experience to maintain and enhance the value of assets, grow cash flows on an annual basis and cultivate positive relations with local stakeholders. We include assets for which we have access to a priority growth pipeline that if funded would provide us the opportunity to own a near-majority share of the business.
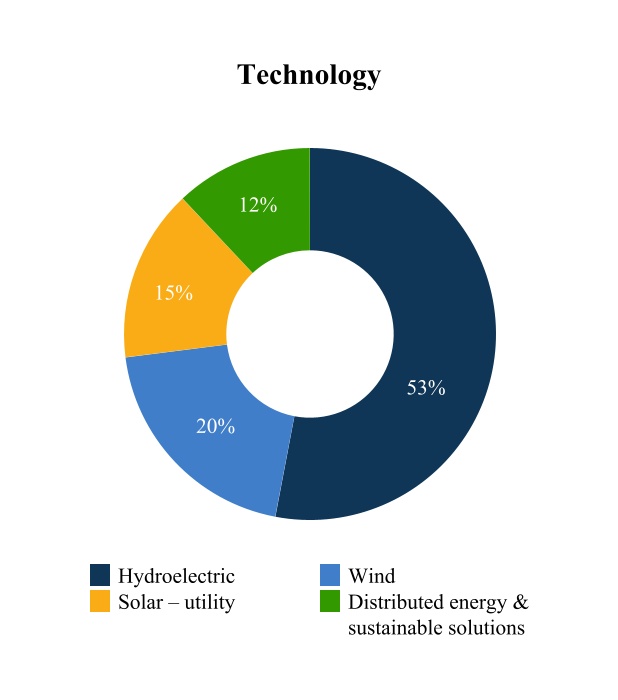
Our global diversified portfolio of renewable power assets, which makes up over 98% of our business, has approximately 25,700 MW of operating capacity and annualized LTA generation of approximately 71,200 GWh and a development pipeline of approximately 126,000 MW.
The table below outlines our portfolio as at March 31, 2023:
River Systems | Facilities | Capacity (MW) | LTA(1) (GWh) | Storage Capacity (GWh) | |||||||||||||||||||||||||
| Hydroelectric | |||||||||||||||||||||||||||||
| North America | |||||||||||||||||||||||||||||
United States(2) | 30 | 136 | 2,905 | 11,963 | 2,543 | ||||||||||||||||||||||||
| Canada | 19 | 33 | 1,361 | 5,178 | 1,261 | ||||||||||||||||||||||||
| 49 | 169 | 4,266 | 17,141 | 3,804 | |||||||||||||||||||||||||
Colombia(3) | 11 | 17 | 2,953 | 15,891 | 3,703 | ||||||||||||||||||||||||
| Brazil | 27 | 43 | 940 | 4,811 | — | ||||||||||||||||||||||||
| 87 | 229 | 8,159 | 37,843 | 7,507 | |||||||||||||||||||||||||
| Wind | |||||||||||||||||||||||||||||
| North America | |||||||||||||||||||||||||||||
United States(4) | — | 39 | 3,652 | 11,934 | — | ||||||||||||||||||||||||
| Canada | — | 4 | 483 | 1,438 | — | ||||||||||||||||||||||||
| — | 43 | 4,135 | 13,372 | — | |||||||||||||||||||||||||
| Europe | — | 42 | 1,118 | 2,551 | — | ||||||||||||||||||||||||
| Brazil | — | 24 | 582 | 2,390 | — | ||||||||||||||||||||||||
| Asia | — | 22 | 1,353 | 3,727 | — | ||||||||||||||||||||||||
| — | 131 | 7,188 | 22,040 | — | |||||||||||||||||||||||||
| Utility-scale solar | — | 156 | 4,266 | 8,787 | — | ||||||||||||||||||||||||
| Distributed energy & sustainable solutions | |||||||||||||||||||||||||||||
Distributed generation(5) | — | 6,251 | 2,101 | 2,577 | — | ||||||||||||||||||||||||
Storage & other(6) | 2 | 23 | 4,004 | — | 5,220 | ||||||||||||||||||||||||
| 2 | 6,274 | 6,105 | 2,577 | 5,220 | |||||||||||||||||||||||||
| 89 | 6,790 | 25,718 | 71,247 | 12,727 | |||||||||||||||||||||||||
(1)LTA is calculated based on our portfolio as at March 31, 2023, reflecting all facilities on a consolidated and an annualized basis from the beginning of the year, regardless of the acquisition, disposition or commercial operation date. See "Part 8 – Presentation to Stakeholders and Performance Measurement" for an explanation on our methodology in computing LTA and why we do not consider LTA for our pumped storage and certain of our other facilities.
(2)Includes a battery storage facility in North America (20 MW).
(3)Includes two wind plants in Colombia (32 MW).
(4)Includes a battery storage facility in North America (10 MW).
(5)Includes nine fuel cell facilities in North America (10 MW).
(6)Includes pumped storage in North America (667 MW) and Europe (2,088 MW), four biomass facilities in Brazil (175 MW), 12 cogeneration plants in Latin America (846 MW), one cogeneration plant in North America (105 MW) and two cogeneration plants in Europe (124 MW).
Recently, we have been making prudent and structured investments in sustainable solutions portfolio which is comprised of renewable power and emerging transition asset classes where our initial investment positions us for potential future large-scale decarbonization investment. This portfolio includes investments in businesses that have an operating portfolio of 47 thousand metric tonnes per annum (“TMTPA”) of carbon capture and storage (“CCS”), 3 million Metric Million British thermal units (“MMBtu”) of agricultural renewable natural gas (“RNG”) operating production capacity annually, over 1 million tons of recycled materials and 4 GW of operating renewable power assets. Our sustainable solutions development pipeline includes opportunities to invest in projects with up to 12 million metric tonnes per annum (“MMTPA”) of CCS, 19 materials recovery facilities (“MRFs”) that would result in 2 million tons of recycled materials, 70 digesters that would produce more than 4 million MMBtu of RNG production capacity annually, a solar manufacturing facility capable of producing 5,000 MW of panels annually and 1 MMTPA green ammonia facility powered entirely by renewable energy.
The following table presents the annualized long-term average generation of our portfolio as at March 31, 2023 on a consolidated and quarterly basis:
GENERATION (GWh)(1) | Q1 | Q2 | Q3 | Q4 | Total | ||||||||||||||||||||||||
| Hydroelectric | |||||||||||||||||||||||||||||
| North America | |||||||||||||||||||||||||||||
| United States | 3,402 | 3,469 | 2,171 | 2,921 | 11,963 | ||||||||||||||||||||||||
| Canada | 1,235 | 1,489 | 1,236 | 1,218 | 5,178 | ||||||||||||||||||||||||
| 4,637 | 4,958 | 3,407 | 4,139 | 17,141 | |||||||||||||||||||||||||
| Colombia | 3,632 | 3,985 | 3,881 | 4,393 | 15,891 | ||||||||||||||||||||||||
| Brazil | 1,183 | 1,198 | 1,214 | 1,216 | 4,811 | ||||||||||||||||||||||||
| 9,452 | 10,141 | 8,502 | 9,748 | 37,843 | |||||||||||||||||||||||||
| Wind | |||||||||||||||||||||||||||||
| North America | |||||||||||||||||||||||||||||
| United States | 3,212 | 3,138 | 2,631 | 2,953 | 11,934 | ||||||||||||||||||||||||
| Canada | 400 | 345 | 273 | 420 | 1,438 | ||||||||||||||||||||||||
| 3,612 | 3,483 | 2,904 | 3,373 | 13,372 | |||||||||||||||||||||||||
| Europe | 772 | 553 | 496 | 730 | 2,551 | ||||||||||||||||||||||||
| Brazil | 438 | 549 | 756 | 647 | 2,390 | ||||||||||||||||||||||||
| Asia | 914 | 940 | 881 | 992 | 3,727 | ||||||||||||||||||||||||
| 5,736 | 5,525 | 5,037 | 5,742 | 22,040 | |||||||||||||||||||||||||
| Utility-scale solar | 1,940 | 2,447 | 2,564 | 1,836 | 8,787 | ||||||||||||||||||||||||
| Distributed generation | 528 | 760 | 752 | 537 | 2,577 | ||||||||||||||||||||||||
| Total | 17,656 | 18,873 | 16,855 | 17,863 | 71,247 | ||||||||||||||||||||||||
(1)LTA is calculated based on our portfolio as at March 31, 2023 reflecting all facilities on an annualized basis from the beginning of the year, regardless of the acquisition, disposition or commercial operation date. See "Part 8 – Presentation to Stakeholders and Performance Measurement" for an explanation on our methodology in computing LTA and why we do not consider LTA for our pumped storage and certain of our other facilities.
The following table presents the annualized long-term average generation of our portfolio as at March 31, 2023 on a proportionate and quarterly basis:
GENERATION (GWh)(1) | Q1 | Q2 | Q3 | Q4 | Total | ||||||||||||||||||||||||
| Hydroelectric | |||||||||||||||||||||||||||||
| North America | |||||||||||||||||||||||||||||
| United States | 2,225 | 2,357 | 1,466 | 1,951 | 7,999 | ||||||||||||||||||||||||
| Canada | 1,010 | 1,210 | 980 | 959 | 4,159 | ||||||||||||||||||||||||
| 3,235 | 3,567 | 2,446 | 2,910 | 12,158 | |||||||||||||||||||||||||
| Colombia | 846 | 928 | 904 | 1,024 | 3,702 | ||||||||||||||||||||||||
| Brazil | 1,008 | 1,020 | 1,034 | 1,035 | 4,097 | ||||||||||||||||||||||||
| 5,089 | 5,515 | 4,384 | 4,969 | 19,957 | |||||||||||||||||||||||||
| Wind | |||||||||||||||||||||||||||||
| North America | |||||||||||||||||||||||||||||
| United States | 1,049 | 1,039 | 854 | 983 | 3,925 | ||||||||||||||||||||||||
| Canada | 330 | 288 | 230 | 347 | 1,195 | ||||||||||||||||||||||||
| 1,379 | 1,327 | 1,084 | 1,330 | 5,120 | |||||||||||||||||||||||||
| Europe | 277 | 208 | 174 | 252 | 911 | ||||||||||||||||||||||||
| Brazil | 143 | 182 | 248 | 207 | 780 | ||||||||||||||||||||||||
| Asia | 224 | 232 | 217 | 241 | 914 | ||||||||||||||||||||||||
| 2,023 | 1,949 | 1,723 | 2,030 | 7,725 | |||||||||||||||||||||||||
| Utility-scale solar | 597 | 849 | 878 | 550 | 2,874 | ||||||||||||||||||||||||
| Distributed generation | 192 | 288 | 279 | 182 | 941 | ||||||||||||||||||||||||
| Total | 7,901 | 8,601 | 7,264 | 7,731 | 31,497 | ||||||||||||||||||||||||
(1)LTA is calculated based on our portfolio as at March 31, 2023 reflecting all facilities on an annualized basis from the beginning of the year, regardless of the acquisition, disposition or commercial operation date. See "Part 8 – Presentation to Stakeholders and Performance Measurement" for an explanation on our methodology in computing LTA and why we do not consider LTA for our pumped storage and certain of our other facilities.
Statement Regarding Forward-Looking Statements and Use of Non-IFRS Measures
This Interim Report contains forward-looking information within the meaning of U.S. and Canadian securities laws. We may make such statements in this Interim Report and in other filings with the U.S. Securities and Exchange Commission ("SEC") and with securities regulators in Canada – see "Part 8 – Presentation to Stakeholders and Performance Measurement". We make use of non-IFRS measures in this Interim Report – see "Part 8 – Presentation to Stakeholders and Performance Measurement". This Interim Report, our Form 20-F and additional information filed with the SEC and with securities regulators in Canada are available on our website at https://bep.brookfield.com, on the SEC's website at www.sec.gov or on SEDAR's website at www.sedar.com.
.Letter to Unitholders . | ||||||||
We had an excellent start to the year with strong financial performance resulting in low-teens annual FFO per unit growth. These results represent the progression to higher run-rate earnings as our investments in new generation and commercial initiatives come online. We were also successful in our growth activities, signing transactions for almost $8 billion of equity investment alongside our institutional partners while also commissioning 700 megawatts of capacity through our development program.
During the quarter, together with our institutional partners, we announced a landmark transaction to acquire Origin’s Energy Markets business, Australia’s largest integrated power generator and energy retailer. The acquisition and planned decarbonization of the business should provide excellent financial returns and showcase the type of investment that is necessary to meet global net zero targets. We are uniquely capable of executing such large scale power transformations, leveraging our development and operating expertise, knowledge of power markets, and access to capital to generate attractive returns for our investors.
Over the last few months we all witnessed significant market and interest rate volatility on the back of persistent inflationary pressures, and stress across the banking system. Yet, our business continues to be resilient. Our generation portfolio is currently 90% contracted and has a weighted average remaining contract duration of 14 years. Approximately 70% of our revenues are linked to inflation and 97% of our debt has fixed interest rates. We operate essential, low-cost infrastructure with gross margins of over 70%. Taken together, we are confident that our business will continue to perform across all economic cycles.
Our financial position also remains strong, with almost $4 billion of available liquidity. We have always prioritized financing our business on an investment grade basis with a focus on long duration, matched currency, and fixed rate debt. As a result, we do not have meaningful exposure to interest rate variability or any material debt maturities over the next three years. We have also avoided funding our investments with substantial amounts of non-investment grade or holding company debt structures. So, while overall market liquidity may be challenged, lender appetite for high grade issuers, especially for those supporting renewables or decarbonization initiatives, remains robust as demonstrated by our recently completed issuance of C$400 million of 10-year medium term notes, which was three times oversubscribed.
Additional highlights for the quarter:
•Generated FFO of $275 million, or $0.43 per unit, a 13% increase over the same period last year. The results reflect robust hydro generation across our portfolio, strong realized power pricing and asset availability, and contributions from growth;
•Advanced key commercial priorities including signing contracts to deliver an incremental 2,500 gigawatt hours per year of generation with current and new customers while further diversifying future revenues for our business;
•Continued to advance development activities, commissioning approximately 700 megawatts of capacity in the quarter and are on track to commission approximately 5,000 megawatts of capacity in 2023, which we expect to contribute an additional $70 million of FFO net to Brookfield Renewable. We also progressed the other approximately 19,000 megawatts of projects in our advanced stage pipeline, maintaining our targeted commissioning dates; and
•Completed or are advancing asset recycling initiatives which in aggregate will contribute approximately $4 billion of proceeds (~$1.5 billion net to Brookfield Renewable) when completed.
| Brookfield Renewable Partners L.P. | Interim Report | March 31, 2023 | ||||||
Page 6 | ||||||||
Growth Initiatives
To date this year we have committed to invest almost $8 billion (over $1 billion net to Brookfield Renewable) across multiple transactions. This included investments in power technologies and regions where we have deep operating and development expertise, leveraging our access to capital to acquire businesses and projects that offer compelling risk adjusted returns. Together with prior transactions, these investments position us well to achieve, and likely outperform, our $6-7 billion capital deployment target over the next five years.
The investment environment for renewables and decarbonization assets remains highly compelling. Demand for clean energy from corporates, an increasing focus on energy security, and government supported electrification and decarbonization targets continue to be key trends accelerating investment.
Through our acquisition of Origin’s Energy Markets business, in which we expect to invest up to $750 million for Brookfield Renewable, we have added a strategic platform in Australia. We intend to leverage our deep development expertise to invest a further A$20 billion enabling us to build 14,000 megawatts of new renewable generation and storage facilities. This investment in clean replacement generation capacity will enable the responsible retirement of one of Australia’s largest coal-fire power generation plants and make a material difference to achieving the country’s net zero goals. This investment meets all of our target criteria of large-scale, material decarbonization impact, and attractive risk-adjusted returns.
Brookfield’s success in attracting co-investor capital has been critical in allowing us to further diversify our business and take on larger-scale investments with less competition. As an example, in our recently announced investment in Westinghouse, we have received exceptional interest from our institutional partners, validating our investment thesis and the high-quality nature of the business. Due to the significant interest, we expect Brookfield Renewable’s investment in the business to be approximately $450 million.
With Brookfield’s first transition fund nearly fully committed, we are preparing to participate in the second Fund. Based on the positive feedback received to date, we are optimistic that the second fund will both broaden the number of institutional partnerships as well as provide a larger pool of capital to invest alongside. While beneficial in all instances, our continued and increasing access to meaningful partner capital is particularly advantageous in the current environment and positions us to execute scale transactions at very attractive risk-adjusted returns.
As an example of this, during the quarter, with our institutional partners we agreed to acquire the 50% of X-Elio that we currently do not own for $900 million ($75 million net to Brookfield Renewable). We acquired a scarce platform which we know well and remains well-positioned to continue to deliver returns within or above our target range. Based on our acquisition price for the remaining 50%, which we expect will deliver mid-to-high teen returns, our initial investment has generated an IRR of almost 30% and over two times invested capital in our three years of ownership.
X-Elio is a fully integrated global solar development platform with 1,200 megawatts of operating and in construction assets, 1,500 megawatts of late-stage development projects, and an additional approximately 12,000 megawatt development pipeline with at least land and/or grid connection secured. Since our initial investment in 2019, we have evolved X-Elio into a self-funding business, progressing over $1 billion from asset sales, which is more than double the invested capital in those projects. Proceeds from these sales has been used to return almost half of our initial invested capital, while at the same time re-invest into accretive future development, as demonstrated by X-Elio increasing its development pipeline by 9,000 megawatts over the same time period.
We also made significant progress in growing our business in India, which includes approximately 15,000 megawatts of capacity. We entered the Indian market in 2017, and have been growing steadily, only
| Brookfield Renewable Partners L.P. | Interim Report | March 31, 2023 | ||||||
Page 7 | ||||||||
investing in high quality assets and platforms at attractive risk-adjusted returns. In March, we signed an agreement with Avaada, a leading renewable platform in India with operating and development assets, to provide a structured U.S. dollar financing in the form of convertible securities of up to $1 billion ($200 million net to Brookfield Renewable). The investment, which will be drawn down over time subject to pre-agreed risk-adjusted returns criteria, will be used to grow Avaada’s renewables portfolio as well as investing in solar panel and green ammonia production. We also agreed to invest up to $360 million ($72 million net to Brookfield Renewable) to acquire a 55% stake in CleanMax, a leading C&I renewable platform based in India with 4,500 megawatts of operating and development pipeline.
Operating Results
We generated FFO of $275 million, or $0.43 per unit, a 13% increase on a per unit basis over the same period last year. Our business continues to perform well, and we are seeing the benefits of the increasing diversification of our business, growth, and our commercial initiatives.
During the quarter, our hydroelectric segment delivered FFO of $219 million. Our hydro assets continue to exhibit strong cash flow resiliency given the diversified asset base and the ability to capture higher power prices both through inflation linked power purchase agreements and a robust energy price environment. Across our fleet, reservoirs are generally at or above long-term averages, positioning the portfolio well for the remainder of the year.
Our wind and solar segment generated a combined $119 million of FFO. We continue to benefit from contributions from acquisitions and the diversification of our fleet, which are underpinned by long duration power purchase agreements that provide stable revenues. Over the last 12 months, we added approximately 4,500 megawatts of installed capacity in our wind and solar operating fleet through acquisitions and organic development initiatives.
Our distributed energy and sustainable solutions segment generated $43 million of FFO, as we continue to grow our portfolio through acquisitions and organic development to meet growing demand from commercial and industrial customers looking to decarbonize.
Our renewable power development pipeline is now 126,000 megawatts with approximately 5,000 megawatts of new capacity on track for commissioning this year. Once completed this will add approximately $70 million of incremental FFO to Brookfield Renewable. We have another approximately 19,000 megawatts in our advanced stage development pipeline that has been materially de-risked and together with our sustainable solutions pipeline is expected to contribute approximately $235 million of incremental run-rate FFO once commissioned.
Our Financial Position Remains Strong
Our balance sheet is in an excellent position and our available liquidity remains robust at almost $4 billion, providing significant flexibility to fund growth. We remain protected from higher interest rates, with 90% of our borrowings being project level non-recourse debt, with an average remaining term of 12 years, and only 3% exposure to floating rate debt.
We are also advancing non-recourse financing initiatives and our asset recycling programs which will generate additional capital to fund our growth. Despite persistent inflation and higher interest rates, we continue to see strong demand for renewable energy assets globally and we are seeing strong interest across our capital recycling processes.
So far this year, we have generated over $300 million (almost $200 million net to Brookfield Renewable) of proceeds from our asset recycling program, returning more than double our invested capital. We are also advancing numerous capital recycling opportunities across our fleet that together with year-to-date activities could generate up to $4 billion (~$1.5 billion net to Brookfield Renewable) of proceeds when closed and provide significant incremental liquidity in the coming quarter.
| Brookfield Renewable Partners L.P. | Interim Report | March 31, 2023 | ||||||
Page 8 | ||||||||
Outlook
We remain focused on our goal of delivering 12-15% long-term total returns for investors and believe our access to broad capital sources, disciplined investment process and operational capabilities provide us with a structural advantage to achieve our targets.
On behalf of the Board and management of Brookfield Renewable, we thank all our unitholders and shareholders for their ongoing support.
Sincerely,

Connor Teskey
Chief Executive Officer
May 5, 2023
| Brookfield Renewable Partners L.P. | Interim Report | March 31, 2023 | ||||||
Page 9 | ||||||||
OUR COMPETITIVE STRENGTHS
Brookfield Renewable Partners L.P. (together with its controlled entities, "Brookfield Renewable") is a globally diversified, multi-technology, owner and operator of renewable power and sustainable solutions assets.
Our business model is to utilize our global reach to acquire and develop high quality renewable power asset below intrinsic value, finance them on a long-term, low-risk and investment grade basis through a conservative financing strategy and then optimize cash flows by applying our operating expertise to enhance value. For our sustainable solutions portfolio, our strategy is to make small upfront investments with experienced partners that are structured with downside protection, discretion over future investment and significant potential upside returns on our capital.
One of the largest, public decarbonization businesses globally. Brookfield Renewable has a 23-year track record as a publicly traded operator and investor in renewable power and sustainable solution assets. Today we have a large, multi-technology and globally diversified portfolio that is supported by approximately 3,400 experienced employees. Brookfield Renewable invests in assets directly, as well as with institutional partners, joint venture partners and through other arrangements. Recently, we have been making investments in our sustainable solutions portfolio which is comprised of emerging transition asset classes where our initial investment positions us for future large-scale decarbonization investments.
Our portfolio of renewable power assets consists of approximately 25,700 MW of installed capacity largely across four continents that produces annualized long-term average generation on a proportionate basis of approximately 31,500 GWh, and a development pipeline of approximately 126,000 MW. Our portfolio of sustainable solutions includes investment in businesses with an operating portfolio of 47 thousand metric tons per annum (“TMTPA”) of carbon capture and storage (“CCS”), 3 million Metric Million British thermal units (“MMBtu”) of agricultural renewable natural gas (“RNG”) annual production capacity, over 1 million tons of recycled materials.
The following charts illustrate revenue on a proportionate basis(1):

(1) Figures based on normalized revenue for the last twelve months, proportionate to Brookfield Renewable.
Helping to accelerate the decarbonization and stability of the electricity grids. Climate change and energy security are viewed as two of the most significant and urgent issues facing the global economy, posing immense risks to the safety and security of communities and to our collective and economic prosperity. In response, governments and businesses have adopted ambitious plans to support a transition to a decarbonized economy. We believe that our scale and global operating,
| Brookfield Renewable Partners L.P. | Interim Report | March 31, 2023 | ||||||
Page 10 | ||||||||
development and investing capabilities make us well positioned to partner with governments and businesses to help them achieve their decarbonization goals.
Diverse and high-quality portfolio of renewable power and sustainable solutions assets. Brookfield Renewable has a complementary portfolio of hydroelectric, wind, utility-scale solar, and other sustainable solutions assets, including distributed generation solar and storage:
•Hydroelectric Power. Today, hydroelectric power is the largest segment in our portfolio and continues to be a premium technology as one of the longest life, lowest-cost and cleanest most environmentally-preferred forms of power generation. Hydroelectric plants have high cash margins, storage capacity with the ability to dispatch power at all hours of the day.
•Wind & Solar Power. Our wind, utility-scale solar, and distributed generation facilities provide exposure to two of the fastest growing renewable power sectors, with high cash margins, zero fuel input cost, and diverse and scalable applications including distributed generation. Wind and solar are now among the lowest cost forms of power generation available.
•Energy Storage & Sustainability Solutions. Our storage facilities provide the markets in which they are located with critical services to the grid and dispatchable generation. Our other sustainable solutions assets, such as carbon capture, are helping businesses and countries achieve their net-zero goals.
With our scale, diversity and the quality of our assets, we are competitively positioned relative to other renewable power and transition companies, providing significant scarcity value to our investors.
Strong financial profile and conservative financing strategy. Brookfield Renewable maintains a robust balance sheet, strong investment grade rating, and access to global capital markets to ensure cash flow resiliency through the cycle. Our approach to financing is to raise the majority of our debt in the form of asset-specific, non-recourse borrowings at our subsidiaries on an investment grade basis with no financial maintenance covenants. Approximately 90% of our debt is either investment grade rated or sized to investment grade metrics. Our corporate debt to total capitalization is approximately 10%, and approximately 90% of our borrowings are non-recourse. Corporate borrowings and proportionate non-recourse borrowings each have weighted-average terms of approximately 11 years and 12 years, respectively, with no material maturities over the next five years. Approximately 90% of our financings are effectively fixed rate and only 7% of our debt outside North America and Europe is exposed to changes in interest rates. Our available liquidity as at March 31, 2023 was almost $4 billion of cash and cash equivalents, investments in marketable securities and the available portion of credit facilities.
Best-in class operators and developers. Brookfield Renewable has approximately 3,400 experienced operators and approximately 120 power marketing experts that are located across the globe to help optimize the performance and maximize the returns of all our assets. Our experience operating, developing, and managing power generation facilities span over 120 years. We continue to accelerate our development activities as we build out our approximately 126,000 MW renewable power pipeline, and further enhance our decarbonization offering to our customers through the build out of our sustainable solutions assets, which includes opportunities to invest in projects with up to 8 MMTPA of CCS, 19 materials recovery facilities MRFs that would result in 2 million tonnes of recycled materials, 70 digesters that would produce more than 3 million MMBtu of RNG of production capacity annually, a solar manufacturing facility capable of producing 5 GW of panels annually, and 1 MMTPA green ammonia facility powered entirely by renewable energy.
Well positioned for cash flow growth and an attractive long term distribution profile. We are focused on delivering resilient, stable distributions with meaningful growth of 5% to 9% annually through all market cycles from existing operations and new investment. We are fully funded by internally generated cash flows, with inflation escalations in the vast majority of our contracts, potential margin expansion through revenue growth and cost reduction initiatives, and the building out our development pipeline at premium returns. While we do not rely on acquisitions to achieve our growth targets, our business seeks upside through mergers and acquisitions on an opportunistic basis.
Disciplined and contrarian investment strategy. Our global scale and multi-technology capabilities allow us to rotate capital where it is scarce in order to earn strong risk-adjusted returns. We take a disciplined approach to allocating capital into development and acquisitions with a focus on downside protection and preservation of capital. Our ability to develop and acquire assets is strengthened by our operating and project development teams across the globe, strategic relationship with Brookfield, and our liquidity and capitalization profile.
| Brookfield Renewable Partners L.P. | Interim Report | March 31, 2023 | ||||||
Page 11 | ||||||||
| Management’s Discussion and Analysis | ||
| For the three months ended March 31, 2023 | ||
This Management’s Discussion and Analysis for the three months ended March 31, 2023 is provided as of May 5, 2023. Unless the context indicates or requires otherwise, the terms “Brookfield Renewable”, “we”, “us”, and “our company” mean Brookfield Renewable Partners L.P. and its controlled entities. The ultimate parent of Brookfield Renewable is Brookfield Corporation (“Brookfield Corporation”). Brookfield Corporation and its subsidiaries, other than Brookfield Renewable, and unless the context otherwise requires, includes Brookfield Asset Management Ltd (“Brookfield Asset Management”), are also individually and collectively referred to as “Brookfield” in this Management’s Discussion and Analysis.
Brookfield Renewable’s consolidated equity interests include the non-voting publicly traded limited partnership units (“LP units”) held by public unitholders and Brookfield, class A BEPC exchangeable subordinate voting shares ("BEPC exchangeable shares") of Brookfield Renewable Corporation ("BEPC") held by public shareholders and Brookfield, redeemable/exchangeable partnership units ("Redeemable/Exchangeable partnership units") in Brookfield Renewable Energy L.P. (“BRELP”), a holding subsidiary of Brookfield Renewable, held by Brookfield, and general partnership interest (“GP interest”) in BRELP held by Brookfield. Holders of the LP units, Redeemable/Exchangeable partnership units, GP interest, and BEPC exchangeable shares will be collectively referred to throughout as “Unitholders” unless the context indicates or requires otherwise. LP units, Redeemable/Exchangeable partnership units, GP interest, and BEPC exchangeable shares will be collectively referred to throughout as “Units”, or as “per Unit”, unless the context indicates or requires otherwise. The LP units, BEPC exchangeable shares and Redeemable/Exchangeable partnership units have the same economic attributes in all respects. See – “Part 8 – Presentation to Stakeholders and Performance Measurement”.
Brookfield Renewable’s financial statements are prepared in accordance with International Financial Reporting Standards (“IFRS”) as issued by the International Accounting Standards Board (“IASB”), which require estimates and assumptions that affect the reported amounts of assets and liabilities and disclosure of contingent liabilities as at the date of the financial statements and the amounts of revenue and expense during the reporting periods.
Certain comparative figures have been reclassified to conform to the current year’s presentation.
References to $, C$, €, R$, £, and COP are to United States (“U.S.”) dollars, Canadian dollars, Euros, Brazilian reais, British pounds sterling, and Colombian pesos, respectively. Unless otherwise indicated, all dollar amounts are expressed in U.S. dollars.
For a description on our operational and segmented information and for the non-IFRS financial measures we use to explain our financial results see “Part 8 – Presentation to Stakeholders and Performance Measurement”. For a reconciliation of the non-IFRS financial measures to the most comparable IFRS financial measures, see “Part 4 – Financial Performance Review on Proportionate Information – Reconciliation of non-IFRS measures”. This Management’s Discussion and Analysis contains forward-looking information within the meaning of U.S. and Canadian securities laws. Refer to – “Part 9 – Cautionary Statements” for cautionary statements regarding forward-looking statements and the use of non-IFRS measures. Our Annual Report and additional information filed with the Securities Exchange Commission (“SEC”) and with securities regulators in Canada are available on our website (https://bep.brookfield.com), on the SEC’s website (www.sec.gov/edgar.shtml), or on SEDAR (www.sedar.com).
| Part 1 – Q1 2023 Highlights | Part 5 – Liquidity and Capital Resources (continued) | |||||||||||||
| Capital expenditures | ||||||||||||||
| Part 2 – Financial Performance Review on Consolidated Information | Consolidated statements of cash flows | |||||||||||||
| Shares and units outstanding | ||||||||||||||
| Dividends and distributions | ||||||||||||||
| Part 3 – Additional Consolidated Financial Information | Contractual obligations | |||||||||||||
| Summary consolidated statements of financial position | Supplemental guarantor financial information | |||||||||||||
| Related party transactions | Off-statement of financial position arrangements | |||||||||||||
| Equity | ||||||||||||||
| Part 6 – Selected Quarterly Information | ||||||||||||||
| Part 4 – Financial Performance Review on Proportionate Information | Summary of historical quarterly results | |||||||||||||
| Proportionate results for the three months ended March 31 | Part 7 – Critical Estimates, Accounting Policies and Internal Controls | |||||||||||||
| Reconciliation of non-IFRS measures | ||||||||||||||
| Contract profile | Part 8 – Presentation to Stakeholders and Performance Measurement | |||||||||||||
| Part 5 – Liquidity and Capital Resources | Part 9 – Cautionary Statements | |||||||||||||
| Capitalization and available liquidity | ||||||||||||||
| Borrowings | ||||||||||||||
| Brookfield Renewable Partners L.P. | Interim Report | March 31, 2023 | ||||||
Page 12 | ||||||||
PART 1 – Q1 2023 HIGHLIGHTS
| Three months ended March 31 | |||||||||||
(MILLIONS, EXCEPT AS NOTED) | 2023 | 2022 | |||||||||
| Select financial information | |||||||||||
| Revenues | $ | 1,331 | $ | 1,136 | |||||||
| Net loss attributable to Unitholders | (32) | (78) | |||||||||
Basic and diluted loss per LP unit(1) | (0.09) | (0.16) | |||||||||
Proportionate Adjusted EBITDA(2) | 559 | 499 | |||||||||
Funds From Operations(2) | 275 | 243 | |||||||||
Funds From Operations per Unit(2)(3) | 0.43 | 0.38 | |||||||||
| Distribution per LP unit | 0.34 | 0.32 | |||||||||
| Operational information | |||||||||||
| Capacity (MW) | 25,718 | 20,884 | |||||||||
| Total generation (GWh) | |||||||||||
| Long-term average generation | 17,550 | 15,097 | |||||||||
| Actual generation | 19,030 | 15,196 | |||||||||
| Proportionate generation (GWh) | |||||||||||
| Long-term average generation | 7,874 | 7,414 | |||||||||
| Actual generation | 8,240 | 7,425 | |||||||||
| Average revenue ($ per MWh) | 87 | 86 | |||||||||
(1)For the three months ended March 31, 2023, average LP units totaled 275.4 million (2022: 275.1 million).
(2)Non-IFRS measures. For reconciliations to the most directly comparable IFRS measure, See “Part 4 – Financial Performance Review on Proportionate Information – Reconciliation of non-IFRS measures” and “Part 9 – Cautionary Statements”.
(3)Average Units outstanding for the three months ended March 31, 2023 were 646.0 million (2022: 645.8 million), being inclusive of our LP units, Redeemable/Exchangeable partnership units, BEPC exchangeable shares and GP interest.
| (MILLIONS, EXCEPT AS NOTED) | March 31, 2023 | December 31, 2022 | |||||||||||||||
| Liquidity and Capital Resources | |||||||||||||||||
| Available liquidity | $ | 3,859 | $ | 3,695 | |||||||||||||
| Debt to capitalization – Corporate | 10 | % | 11 | % | |||||||||||||
| Debt to capitalization – Consolidated | 36 | % | 39 | % | |||||||||||||
| Non-recourse borrowings – Consolidated | 90 | % | 91 | % | |||||||||||||
Fixed rate debt exposure on a proportionate basis(1) | 97 | % | 97 | % | |||||||||||||
| Corporate borrowings | |||||||||||||||||
| Average debt term to maturity | 11 years | 11 years | |||||||||||||||
| Average interest rate | 4.3 | % | 4.1 | % | |||||||||||||
| Non-recourse borrowings on a proportionate basis | |||||||||||||||||
| Average debt term to maturity | 12 years | 12 years | |||||||||||||||
| Average interest rate | 5.3 | % | 4.9 | % | |||||||||||||
(1)Total floating rate exposure is 10% (2022: 10%) of which 7% (2022: 7%) is related to floating rate debt exposure of certain regions outside of North America and Europe due to the high cost of hedging associated with those regions.
| Brookfield Renewable Partners L.P. | Interim Report | March 31, 2023 | ||||||
Page 13 | ||||||||
Operations
Funds From Operations of $275 million or $0.43 on a per Unit basis is higher than the prior year driven by:
•Favorable hydroelectric generation across our portfolio;
•Higher realized prices across most markets on the back of inflation escalation and commercial initiatives;
•Strong asset availability across our fleet; and
•Contributions from growth, both from acquisitions and 3,600 MW of new development projects reaching commercial operations in the past 12 months;
After deducting non-cash depreciation, foreign exchange and derivative gains and other, net loss attributable to Unitholders for the three months ended March 31, 2023 was $32 million.
We continued to focus on being the partner of choice to procure power
•Secured contracts to deliver approximately 2,500 GWh of clean energy annually including approximately 700 GWh to corporate offtakers
Liquidity and Capital Resources
Our access to diverse pools of capital, including private institutional capital, backed by our investment grade balance sheet, continues to provide resiliency and a strategic advantage particularly during market volatility
•Liquidity position remains robust, with almost $4 billion of total available liquidity, providing significant flexibility to fund growth, and no meaningful near-term maturities
•During the quarter, issued C$400 million of 10-year medium-term notes
•So far this year, we have generated over $300 million (approximately $200 million net to Brookfield Renewable) of proceeds from our asset recycling program, returning more than double our invested capital. We are also advancing numerous capital recycling opportunities across our fleet that together with year-to-date activities could generate up to $4 billion (~$1.5 billion net to Brookfield Renewable) of proceeds when closed and provide significant incremental liquidity in the coming quarter
Growth and Development
During the quarter, together with our institutional partners and our global institutional investors, we have committed to invest almost $8 billion (over $1 billion net to Brookfield Renewable) of capital across various investments, including:
•Announced a landmark transaction to acquire Origin’s Energy Markets business, Australia’s largest integrated power generator and energy retailer, in which we expect to invest up to $750 million for Brookfield Renewable. We intend to leverage our deep development expertise to invest a further A$20 billion enabling us to build 14,000 megawatts of new renewable generation and storage facilities. The transaction is subject to shareholder, court and regulatory approvals, as well as other customary closing conditions, with closing expected to occur in the first quarter of 2024;
•Agreed to acquire 50% of X-Elio that we currently do not own for total consideration of $900 million ($75 million net to Brookfield Renewable for approximately 4% interest). Upon closing, Brookfield Renewable is expected to hold an approximate 17% interest in the investment. X-Elio’s diversified portfolio includes approximately 1,200 MW of operating and under construction assets, 1,500 MW of late-stage development projects and an approximate 12,000 MW development pipeline with at least land and/or grid connection secured. The transaction is subject to customary closing conditions, with closing expected to occur in the second half of 2023;
•Invested in a leading renewable platform in India with operating and development assets, to provide a structured U.S. dollar financing solution in the form of convertible securities with an initial investment of $400 million ($80 million net to Brookfield Renewable) and the option to invest up to $600 million ($120 million net to Brookfield Renewable) in additional convertible securities to finance the company’s renewables development pipeline, as well as investing in a solar panel manufacturing facility and a green ammonia production facility; and
•Subsequent to the quarter, agreed to invest up to $360 million ($72 million net to Brookfield Renewable) to acquire a 55% stake in a leading C&I renewable platform based in India with 4,500 megawatts of operating and development pipeline
| Brookfield Renewable Partners L.P. | Interim Report | March 31, 2023 | ||||||
Page 14 | ||||||||
We continued to accelerate our development activities
•Commissioned 3,600 MW of development projects in the last twelve months (including 700 MW commissioned in the current quarter). We also continue to advance the construction of approximately 23,000 MW of development projects that, together with our commissioned projects in the last twelve months, are expected to generate Funds From Operations of approximately $344 million once completed.
| Brookfield Renewable Partners L.P. | Interim Report | March 31, 2023 | ||||||
Page 15 | ||||||||
PART 2 – FINANCIAL PERFORMANCE REVIEW ON CONSOLIDATED INFORMATION
The following table reflects key financial data for the three months ended March 31:
| Three months ended March 31 | |||||||||||
| (MILLIONS, EXCEPT AS NOTED) | 2023 | 2022 | |||||||||
| Revenues | $ | 1,331 | $ | 1,136 | |||||||
| Direct operating costs | (401) | (350) | |||||||||
| Management service costs | (57) | (76) | |||||||||
| Interest expense | (394) | (266) | |||||||||
| Depreciation | (429) | (401) | |||||||||
| Income tax (expense) | (24) | (16) | |||||||||
| Net income | $ | 177 | $ | 33 | |||||||
| Average FX rates to USD | |||||||||||
| C$ | 1.35 | 1.27 | |||||||||
| € | 0.93 | 0.89 | |||||||||
| R$ | 5.19 | 5.23 | |||||||||
| COP | 4762 | 3,914 | |||||||||
Variance Analysis For The Three Months Ended March 31, 2023
Revenues totaling $1,331 million represents an increase of $195 million over the same period in the prior year due to the growth of our business, favorable hydroelectric generation across our portfolio and higher realized pricing. Recently acquired and commissioned facilities contributed 1,823 GWh of generation and $54 million to revenues, which was partly offset by recently completed asset sales that reduced generation by 72 GWh and revenues by $3 million. On a same store, constant currency basis, revenues increased by $206 million as we benefited from higher realized prices across most markets on the back of inflation escalation and commercial initiatives.
The strengthening of the U.S. dollar relative to the same period in the prior year across most currencies decreased revenues by $62 million, which was partly offset by $34 million favorable foreign exchange impact on our operating and interest expense for the quarter.
Direct operating costs totaling $401 million represents an increase of $51 million over the same period in the prior year due to higher variable costs across our hydroelectric assets due to above average generation and additional costs from our recently acquired and commissioned facilities including the growth of our business partly offset by the above noted strengthening of the U.S. dollar.
Management service costs totaling $57 million represents a decrease of $19 million over the same period in the prior year.
Interest expense totaling $394 million represents an increase of $128 million over the same period in the prior year due to growth in our portfolio, upfinancings completed in the prior year at our North America hydroelectric assets and accelerated financing activities in South America completed in the prior year to fund the growth of our business.
Depreciation expense totaling $429 million represents an increase of $28 million over the same period in the prior year due to the growth of our business.
Net income totaling $177 million increased by $144 million over the same period in the prior year due to the above noted items.
| Brookfield Renewable Partners L.P. | Interim Report | March 31, 2023 | ||||||
Page 16 | ||||||||
PART 3 – ADDITIONAL CONSOLIDATED FINANCIAL INFORMATION
SUMMARY CONSOLIDATED STATEMENTS OF FINANCIAL POSITION
The following table provides a summary of the key line items on the unaudited interim consolidated statements of financial position:
| (MILLIONS) | March 31, 2023 | December 31, 2022 | |||||||||
| Assets held for sale | $ | 262 | $ | 938 | |||||||
| Current assets | 3,508 | 4,183 | |||||||||
| Equity-accounted investments | 1,603 | 1,392 | |||||||||
| Property, plant and equipment, at fair value | 54,977 | 54,283 | |||||||||
| Total assets | 64,797 | 64,111 | |||||||||
| Liabilities directly associated with assets held for sale | 155 | 351 | |||||||||
| Corporate borrowings | 2,779 | 2,548 | |||||||||
| Non-recourse borrowings | 22,409 | 22,302 | |||||||||
| Deferred income tax liabilities | 6,615 | 6,507 | |||||||||
| Total liabilities and equity | 64,797 | 64,111 | |||||||||
| Spot FX rates to USD | |||||||||||
| C$ | 1.35 | 1.35 | |||||||||
| € | 0.92 | 0.93 | |||||||||
| R$ | 5.08 | 5.22 | |||||||||
| COP | 4,627 | 4,810 | |||||||||
Property, plant and equipment
Property, plant and equipment totaled $55.0 billion as at March 31, 2023 compared to $54.3 billion as at December 31, 2022, representing an increase of $0.7 billion. During the quarter, the acquisition of a 136 MW portfolio of operating wind assets in Brazil, as well as our continued investments in the development of power generating assets increased property, plant and equipment by $0.7 billion. The weakening of the U.S. dollar versus the Colombian Peso and Brazilian Reais increased property, plant and equipment by $0.4 billion. The increase was partly offset by depreciation expense associated with property, plant and equipment of $0.4 billion.
Assets held for sale and Liabilities directly associated with assets held for sale
Assets held for sale and Liabilities directly associated with assets held for sale totaled $262 million and $155 million, respectively, as at March 31, 2023 compared to $938 million and $351 million, respectively, as at December 31, 2022.
During the quarter, Brookfield Renewable’s institutional partners completed the sale of a 378 MW operating hydroelectric portfolio in the U.S., of which 28% was sold to affiliates of Brookfield Corporation. Brookfield Renewable retained its 22% interest in the investment and accordingly, did not receive any proceeds from the sale. Subsequent to the completion of the sale, Brookfield Renewable no longer consolidates this investment and recognized its interest as an equity-accounted investment.
As at March 31, 2023, Assets held for sale and Liabilities directly associated with assets held for sale include wind assets in the U.S. that were acquired in 2022 as part of the acquisition of a renewables developer that had a pre-existing sale and purchase agreement at the time of acquisition.
RELATED PARTY TRANSACTIONS
Brookfield Renewable's related party transactions are in the normal course of business and are recorded at the exchange amount. Brookfield Renewable's related party transactions are primarily with Brookfield Corporation.
Brookfield Renewable sells electricity to Brookfield through a single long-term PPA across Brookfield Renewable’s New York hydroelectric facilities.
| Brookfield Renewable Partners L.P. | Interim Report | March 31, 2023 | ||||||
Page 17 | ||||||||
Brookfield Renewable has entered into voting agreements with Brookfield, whereby Brookfield Renewable gained control of the entities that own certain renewable power generating facilities. Brookfield Renewable has also entered into a voting agreement with its consortium partners in respect of the Colombian business. The voting agreements provide Brookfield Renewable the authority to direct the election of the Boards of Directors of the relevant entities, among other things, and therefore provide Brookfield Renewable with control. Accordingly, Brookfield Renewable consolidates the accounts of these entities.
Brookfield Renewable participates with institutional partners in Brookfield Americas Infrastructure Fund, Brookfield Infrastructure Fund II, Brookfield Infrastructure Fund III, Brookfield Infrastructure Fund IV, Brookfield Infrastructure Fund V, Brookfield Infrastructure Income Fund, Brookfield Global Transition Fund I, Brookfield Global Transition Fund II and Brookfield Infrastructure Debt Fund (“Private Funds”), each of which is a Brookfield sponsored fund, and in connection therewith, Brookfield Renewable, together with our institutional partners, has access to financing using the Private Funds’ credit facilities.
From time to time, in order to facilitate investment activities in a timely and efficient manner, Brookfield Renewable will fund deposits or incur other costs and expenses (including by use of loan facilities to consummate, support, guarantee or issue letters of credit) in respect of an investment that ultimately will be shared with or made entirely by Brookfield sponsored vehicles, consortiums and/or partnerships (including private funds, joint ventures and similar arrangements), Brookfield Renewable, or by co-investors.
Brookfield Corporation has provided a $400 million committed unsecured revolving credit facility maturing in December 2023 and the draws bear interest at the Secured Overnight Financing Rate (“SOFR”) plus a margin. During the current period, there were no draws on the committed unsecured revolving credit facility provided by Brookfield Corporation. Brookfield Corporation may from time to time place funds on deposit with Brookfield Renewable which are repayable on demand including any interest accrued. There were nil funds placed on deposit with Brookfield Renewable as at March 31, 2023 (December 31, 2022: nil). The interest expense on the Brookfield Corporation revolving credit facility and deposit for the three months ended March 31, 2023, totaled nil (2022: less than $1 million).
In addition, our company has executed, amended, or terminated other agreements with Brookfield that are described in Note 30 - Related party transactions in Brookfield Renewable’s December 31, 2022 audited consolidated financial statements.
The following table reflects the related party agreements and transactions in the unaudited interim consolidated statements of income for the three months ended March 31:
| Three months ended March 31 | |||||||||||
| (MILLIONS) | 2023 | 2022 | |||||||||
| Revenues | |||||||||||
| Power purchase and revenue agreements | $ | 44 | $ | 13 | |||||||
| Direct operating costs | |||||||||||
| Energy marketing fee and other services | (1) | (3) | |||||||||
| $ | (1) | $ | (3) | ||||||||
| Interest expense | |||||||||||
| Borrowings | $ | (5) | $ | — | |||||||
| Contract balance accretion | (8) | (6) | |||||||||
| $ | (13) | $ | (6) | ||||||||
| Other | |||||||||||
| Distribution income | $ | 1 | $ | — | |||||||
| Other related party cost | $ | — | $ | (1) | |||||||
| Management service costs | $ | (57) | $ | (76) | |||||||
| Brookfield Renewable Partners L.P. | Interim Report | March 31, 2023 | ||||||
Page 18 | ||||||||
The following table reflects the impact of the related party agreements and transactions on the consolidated statements of
financial position:
| (MILLIONS) | Related party | March 31, 2023 | December 31, 2022 | ||||||||||||||
| Current assets | |||||||||||||||||
| Trade receivables and other current assets | |||||||||||||||||
| Contract asset | Brookfield | $ | 57 | $ | 54 | ||||||||||||
| Due from related parties | |||||||||||||||||
| Amounts due from | Brookfield | 197 | 105 | ||||||||||||||
| Equity-accounted investments and other | 22 | 18 | |||||||||||||||
| 219 | 123 | ||||||||||||||||
| Non-current assets | |||||||||||||||||
| Other long-term assets | |||||||||||||||||
| Contract asset | Brookfield | 333 | 341 | ||||||||||||||
| Amounts due from | Equity-accounted investments and other | 132 | 128 | ||||||||||||||
| Current liabilities | |||||||||||||||||
| Contract liability | Brookfield | 27 | 24 | ||||||||||||||
| Financial instrument liabilities | Brookfield Reinsurance | 3 | 3 | ||||||||||||||
| Due to related parties | |||||||||||||||||
| Amounts due to | Brookfield | 160 | 166 | ||||||||||||||
| Equity-accounted investments and other | 158 | 62 | |||||||||||||||
| Brookfield Reinsurance | 328 | 321 | |||||||||||||||
| Non-recourse borrowings | Brookfield | 44 | 18 | ||||||||||||||
| Accrued distributions payable on LP units, BEPC exchangeable shares, Redeemable/Exchangeable partnership units and GP interest | Brookfield | 37 | 38 | ||||||||||||||
| 727 | 605 | ||||||||||||||||
| Non-current liabilities | |||||||||||||||||
| Financial instrument liabilities | Brookfield Reinsurance | 3 | 3 | ||||||||||||||
| Corporate borrowings | Brookfield Reinsurance | 7 | 7 | ||||||||||||||
| Non-recourse borrowings | Brookfield Reinsurance and associates | 98 | 93 | ||||||||||||||
| Other long-term liabilities | |||||||||||||||||
| Amounts due to | Equity-accounted investments, Brookfield Reinsurance and associates and other | 1 | 1 | ||||||||||||||
| Contract liability | Brookfield | 666 | 662 | ||||||||||||||
| $ | 667 | $ | 663 | ||||||||||||||
| Equity | |||||||||||||||||
| Preferred limited partners equity | Brookfield Reinsurance and associates | $ | 12 | $ | 12 | ||||||||||||
| Brookfield Renewable Partners L.P. | Interim Report | March 31, 2023 | ||||||
Page 19 | ||||||||
EQUITY
General partnership interest in a holding subsidiary held by Brookfield
Brookfield, as the owner of the 1% GP interest in BRELP, is entitled to regular distributions plus an incentive distribution based on the amount by which quarterly LP unit distributions exceed specified target levels. As at March 31, 2023, to the extent that LP unit distributions exceed $0.20 per LP unit per quarter, the incentive is 15% of distributions above this threshold. To the extent that quarterly LP unit distributions exceed $0.2253 per LP unit per quarter, the incentive distribution is equal to 25% of distributions above this threshold. Incentive distributions of $27 million were declared during the three months ended March 31, 2023 (2022: $24 million).
Preferred equity
The Class A Preference Shares of Brookfield Renewable Power Preferred Equity Inc. (“BRP Equity”) do not have a fixed maturity date and are not redeemable at the option of the holders. As at March 31, 2023, none of the issued Class A, Series 5 and 6 Preference Shares have been redeemed by BRP Equity.
In December 2022, the Toronto Stock Exchange accepted notice of BRP Equity's intention to renew the normal course issuer bid in connection with its outstanding Class A Preference Shares for another year to December 15, 2023, or earlier should the repurchases be completed prior to such date. Under this normal course issuer bid, BRP Equity is permitted to repurchase up to 10% of the total public float for each respective series of the Class A Preference Shares. Shareholders may receive a copy of the notice, free of charge, by contacting Brookfield Renewable. There were no repurchases of Class A Preference Shares during the three months ended March 31, 2023 and 2022.
Perpetual subordinated notes
The perpetual subordinated notes are classified as a separate class of non-controlling interest on Brookfield Renewable's consolidated statements of financial position. Brookfield Renewable incurred interest of $7 million (2022: $7 million) on the perpetual subordinated notes during the three months ended March 31, 2023. Interest incurred on the perpetual subordinated notes are presented as distributions in the consolidated statements of changes in equity.
Preferred limited partners' equity
The Class A Preferred Limited Partnership Units (“Preferred units”) of Brookfield Renewable do not have a fixed maturity date and are not redeemable at the option of the holders.
In December 2022, the Toronto Stock Exchange accepted notice of Brookfield Renewable's intention to renew the normal course issuer bid in connection with the outstanding Class A Preferred Limited Partnership Units for another year to December 15, 2023, or earlier should the repurchases be completed prior to such date. Under this normal course issuer bid, Brookfield Renewable is permitted to repurchase up to 10% of the total public float for each respective series of its Class A Preferred Limited Partnership Units. Unitholders may receive a copy of the notice, free of charge, by contacting Brookfield Renewable. No shares were repurchased during the three months ended March 31, 2023 and 2022.
Limited partners' equity, Redeemable/Exchangeable partnership units, and exchangeable shares
As at March 31, 2023, Brookfield Corporation owns, directly and indirectly, 308,051,190 LP units, Redeemable/Exchangeable partnership units and BEPC exchangeable shares, on a combined basis, representing approximately 48% of Brookfield Renewable on a fully-exchanged basis (assuming the exchange of Redeemable/Exchangeable partnership units and BEPC exchangeable shares) and the remaining approximately 52% is held by public investors.
During the three months ended March 31, 2023, Brookfield Renewable issued 72,119 LP units, (2022: 68,865 LP units) under the distribution reinvestment plan at a total value of $2 million (2022: $3 million).
During the three months ended March 31, 2023, holders of BEPC exchangeable shares exchanged 1,742 exchangeable shares (2022: 3,341 exchangeable shares) for an equivalent number of LP units amounting to less than $1 million LP units (2022: less than $1 million).
In December 2022, Brookfield Renewable renewed its normal course issuer bid in connection with its LP units and outstanding BEPC exchangeable shares. Brookfield Renewable is authorized to repurchase up to 13,764,352 LP units and 8,610,905 BEPC exchangeable shares, representing 5% of each of its issued and outstanding LP units and BEPC exchangeable shares. The bids will expire on December 15, 2023, or earlier should Brookfield Renewable complete its repurchases prior to such date. There were no LP units or BEPC exchangeable shares repurchased during the three months ended March 31, 2023 and 2022.
| Brookfield Renewable Partners L.P. | Interim Report | March 31, 2023 | ||||||
Page 20 | ||||||||
PART 4 – FINANCIAL PERFORMANCE REVIEW ON PROPORTIONATE INFORMATION
SEGMENTED DISCLOSURES
Segmented information is prepared on the same basis that Brookfield Renewable's Chief Executive Officer and Chief Financial Officer (collectively, the chief operating decision maker or "CODM") manages the business, evaluates financial results, and makes key operating decisions. See "Part 8 – Presentation to Stakeholders and Performance Measurement" for information on segments and an explanation on the calculation and relevance of proportionate information, Adjusted EBITDA and Funds From Operations which are non-IFRS measures.
PROPORTIONATE RESULTS FOR THE THREE MONTHS ENDED MARCH 31
The following chart reflects the generation and summary financial figures on a proportionate basis for the three months ended March 31:
| (GWh) | (MILLIONS) | ||||||||||||||||||||||||||||||||||||||||||||||||||||||||||||||||||||||
| Actual Generation | LTA Generation | Revenues | Adjusted EBITDA(2) | Funds From Operations | |||||||||||||||||||||||||||||||||||||||||||||||||||||||||||||||||||
| 2023 | 2022 | 2023 | 2022 | 2023 | 2022 | 2023 | 2022 | 2023 | 2022 | ||||||||||||||||||||||||||||||||||||||||||||||||||||||||||||||
| Hydroelectric | |||||||||||||||||||||||||||||||||||||||||||||||||||||||||||||||||||||||
| North America | 3,576 | 3,144 | 3,237 | 3,237 | $ | 335 | $ | 236 | $ | 230 | $ | 141 | $ | 158 | $ | 94 | |||||||||||||||||||||||||||||||||||||||||||||||||||||||
| Brazil | 1,207 | 1,081 | 1,008 | 988 | 61 | 48 | 45 | 53 | 38 | 45 | |||||||||||||||||||||||||||||||||||||||||||||||||||||||||||||
| Colombia | 1,010 | 972 | 853 | 865 | 66 | 73 | 48 | 53 | 23 | 35 | |||||||||||||||||||||||||||||||||||||||||||||||||||||||||||||
| 5,793 | 5,197 | 5,098 | 5,090 | 462 | 357 | 323 | 247 | 219 | 174 | ||||||||||||||||||||||||||||||||||||||||||||||||||||||||||||||
| Wind | |||||||||||||||||||||||||||||||||||||||||||||||||||||||||||||||||||||||
| North America | 1,130 | 1,147 | 1,379 | 1,193 | 85 | 86 | 61 | 60 | 43 | 44 | |||||||||||||||||||||||||||||||||||||||||||||||||||||||||||||
| Europe | 253 | 244 | 277 | 277 | 40 | 51 | 32 | 46 | 26 | 41 | |||||||||||||||||||||||||||||||||||||||||||||||||||||||||||||
| Brazil | 133 | 101 | 133 | 126 | 8 | 6 | 6 | 4 | 5 | 3 | |||||||||||||||||||||||||||||||||||||||||||||||||||||||||||||
| Asia | 175 | 134 | 223 | 133 | 10 | 9 | 9 | 7 | 5 | 4 | |||||||||||||||||||||||||||||||||||||||||||||||||||||||||||||
| 1,691 | 1,626 | 2,012 | 1,729 | 143 | 152 | 108 | 117 | 79 | 92 | ||||||||||||||||||||||||||||||||||||||||||||||||||||||||||||||
| Utility-scale solar | 486 | 354 | 571 | 423 | 88 | 81 | 69 | 90 | 40 | 64 | |||||||||||||||||||||||||||||||||||||||||||||||||||||||||||||
Distributed energy & sustainable solutions(1) | 270 | 248 | 193 | 172 | 79 | 59 | 56 | 48 | 43 | 37 | |||||||||||||||||||||||||||||||||||||||||||||||||||||||||||||
| Corporate | — | — | — | — | — | — | 3 | (3) | (106) | (124) | |||||||||||||||||||||||||||||||||||||||||||||||||||||||||||||
| Total | 8,240 | 7,425 | 7,874 | 7,414 | $ | 772 | $ | 649 | $ | 559 | $ | 499 | $ | 275 | $ | 243 | |||||||||||||||||||||||||||||||||||||||||||||||||||||||
(1)Actual generation includes 121 GWh (2022: 105 GWh) from facilities that do not have a corresponding LTA. See 'Presentation to Stakeholders' for why we do not consider LTA for our pumped storage and certain of our other facilities.
(2)Non-IFRS measures. For reconciliations to the most directly comparable IFRS measure see “Reconciliation of Non-IFRS Measures” in this Management’s Discussion and Analysis.
| Brookfield Renewable Partners L.P. | Interim Report | March 31, 2023 | ||||||
Page 21 | ||||||||
HYDROELECTRIC OPERATIONS ON PROPORTIONATE BASIS
The following table presents our proportionate results for hydroelectric operations for the three months ended March 31:
| (MILLIONS, EXCEPT AS NOTED) | 2023 | 2022 | |||||||||
| Revenue | $ | 462 | $ | 357 | |||||||
| Other income | 6 | $ | 20 | ||||||||
| Direct operating costs | (145) | (130) | |||||||||
Adjusted EBITDA(1) | 323 | 247 | |||||||||
| Interest expense | (94) | (60) | |||||||||
| Current income taxes | (10) | (13) | |||||||||
| Funds From Operations | $ | 219 | $ | 174 | |||||||
Generation (GWh) – LTA | 5,098 | 5,090 | |||||||||
Generation (GWh) – actual | 5,793 | 5,197 | |||||||||
(1)Non-IFRS measures. For reconciliations to the most directly comparable IFRS measure see “Reconciliation of Non-IFRS Measures” in this Management’s Discussion and Analysis.
The following table presents our proportionate results by geography for hydroelectric operations for the three months ended March 31:
Actual Generation (GWh) | Average revenue per MWh(1) | Adjusted EBITDA(2) | Funds From Operations | ||||||||||||||||||||||||||||||||||||||||||||
| (MILLIONS, EXCEPT AS NOTED) | 2023 | 2022 | 2023 | 2022 | 2023 | 2022 | 2023 | 2022 | |||||||||||||||||||||||||||||||||||||||
| North America | |||||||||||||||||||||||||||||||||||||||||||||||
| United States | 2,390 | 2,053 | $ | 82 | $ | 79 | $ | 149 | $ | 77 | $ | 108 | $ | 55 | |||||||||||||||||||||||||||||||||
| Canada | 1,186 | 1,091 | 63 | 61 | 81 | 64 | 50 | 39 | |||||||||||||||||||||||||||||||||||||||
| 3,576 | 3,144 | 76 | 73 | 230 | 141 | 158 | 94 | ||||||||||||||||||||||||||||||||||||||||
| Brazil | 1,207 | 1,081 | 51 | 44 | 45 | 53 | 38 | 45 | |||||||||||||||||||||||||||||||||||||||
| Colombia | 1,010 | 972 | 65 | 75 | 48 | 53 | 23 | 35 | |||||||||||||||||||||||||||||||||||||||
| Total | 5,793 | 5,197 | $ | 69 | $ | 67 | $ | 323 | $ | 247 | $ | 219 | $ | 174 | |||||||||||||||||||||||||||||||||
(1)Average revenue per MWh was adjusted to net the impact of power purchases and any revenue with no corresponding generation.
(2)Non-IFRS measures. For reconciliations to the most directly comparable IFRS measure see “Reconciliation of Non-IFRS Measures” in this Management’s Discussion and Analysis.
North America
Funds From Operations at our North American business was $158 million versus $94 million in the prior year due to favorable hydrology conditions across most regions (14% above prior year and 10% above long-term average) as well as higher revenue per MWh due to inflation indexation on our contracted generation and commercial initiatives.
Brazil
Funds From Operations at our Brazilian business was $38 million versus $45 million in the prior year. Excluding a positive ruling that benefited the prior year ($15 million), Funds From Operations was 27% higher than the prior year as the benefit from favorable generation (12% above prior year and 20% above long-term average), higher average revenue per MWh due to inflation indexation and recontracting initiatives.
| Brookfield Renewable Partners L.P. | Interim Report | March 31, 2023 | ||||||
Page 22 | ||||||||
Colombia
Funds From Operations at our Colombian business was $23 million versus $35 million in the prior year as the benefit from higher generation that was 4% above prior year and 18% above long-term average, as well as higher average revenue per MWh on a local currency basis, due to inflation indexation on contracted generation was more than offset by higher interest expense as a result of accelerated refinancing initiatives completed in the prior year and the weakening of the Colombian peso versus the U.S. dollar.
WIND OPERATIONS ON PROPORTIONATE BASIS
The following table presents our proportionate results for wind operations for the three months ended March 31:
| (MILLIONS, EXCEPT AS NOTED) | 2023 | 2022 | |||||||||
| Revenue | $ | 143 | $ | 152 | |||||||
| Other income | 1 | 4 | |||||||||
| Direct operating costs | (36) | (39) | |||||||||
Adjusted EBITDA(1) | 108 | 117 | |||||||||
| Interest expense | (26) | (24) | |||||||||
| Current income taxes | (3) | (1) | |||||||||
| Funds From Operations | $ | 79 | $ | 92 | |||||||
Generation (GWh) – LTA | 2,012 | 1,729 | |||||||||
Generation (GWh) – actual | 1,691 | 1,626 | |||||||||
(1)Non-IFRS measures. For reconciliations to the most directly comparable IFRS measure see “Reconciliation of Non-IFRS Measures” in this Management’s Discussion and Analysis.
The following table presents our proportionate results by geography for wind operations for the three months ended March 31:
Actual Generation (GWh) | Average revenue per MWh | Adjusted EBITDA(2) | Funds From Operations | ||||||||||||||||||||||||||||||||||||||||||||
| (MILLIONS, EXCEPT AS NOTED) | 2023 | 2022 | 2023 | 2022 | 2023 | 2022 | 2023 | 2022 | |||||||||||||||||||||||||||||||||||||||
| North America | |||||||||||||||||||||||||||||||||||||||||||||||
| United States | 835 | 773 | $ | 69 | $ | 66 | $ | 39 | $ | 29 | $ | 26 | $ | 19 | |||||||||||||||||||||||||||||||||
| Canada | 295 | 374 | 92 | 94 | 22 | 31 | 17 | 25 | |||||||||||||||||||||||||||||||||||||||
| 1,130 | 1,147 | 75 | 75 | 61 | 60 | 43 | 44 | ||||||||||||||||||||||||||||||||||||||||
Europe(1) | 253 | 244 | 188 | 152 | 32 | 46 | 26 | 41 | |||||||||||||||||||||||||||||||||||||||
| Brazil | 133 | 101 | 60 | 59 | 6 | 4 | 5 | 3 | |||||||||||||||||||||||||||||||||||||||
| Asia | 175 | 134 | 57 | 67 | 9 | 7 | 5 | 4 | |||||||||||||||||||||||||||||||||||||||
| Total | 1,691 | 1,626 | $ | 89 | $ | 85 | $ | 108 | $ | 117 | $ | 79 | $ | 92 | |||||||||||||||||||||||||||||||||
(1)Average revenue per MWh was adjusted to normalize the quarterly impact of the market pricing on our regulated assets in Spain.
(2)Non-IFRS measures. For reconciliations to the most directly comparable IFRS measure see “Reconciliation of Non-IFRS Measures” in this Management’s Discussion and Analysis.
| Brookfield Renewable Partners L.P. | Interim Report | March 31, 2023 | ||||||
Page 23 | ||||||||
North America
Funds From Operations at our North American business was $43 million versus $44 million in the prior year as the benefit from growth, including the completion of our 850-megawatt repowering project in the U.S ($3 million and 211 GWh), higher average revenue per MWh due to inflation indexation and generation mix was offset by lower resources and the weakening of the Canadian dollar versus the U.S. dollar.
Europe
Funds From Operations at our European business was $26 million versus $41 million in the prior year as the benefit from higher resources and higher market prices in Spain was more than offset by the timing of revenue collection under our rate regulated Spanish assets that benefited the prior year.
Brazil
Funds From Operations at our Brazilian business of $5 million was versus $3 million in the prior year primarily due to stronger resources and higher average revenue per MWh due to inflation indexation on our contracts.
Asia
Funds From Operations at our Asian business was $5 million versus $4 million primarily due to growth from our newly acquired and commissioned facilities in China ($1 million and 22 GWh).
UTILITY-SCALE SOLAR OPERATIONS ON PROPORTIONATE BASIS
The following table presents our proportionate results for utility-scale solar operations for the three months ended March 31:
| (MILLIONS, EXCEPT AS NOTED) | 2023 | 2022 | |||||||||
| Revenue | $ | 88 | $ | 81 | |||||||
| Other income | 8 | 36 | |||||||||
| Direct operating costs | (27) | (27) | |||||||||
Adjusted EBITDA(1) | 69 | 90 | |||||||||
| Interest expense | (27) | (26) | |||||||||
| Current income taxes | (2) | — | |||||||||
| Funds From Operations | $ | 40 | $ | 64 | |||||||
| Generation (GWh) – LTA | 571 | 423 | |||||||||
| Generation (GWh) – actual | 486 | 354 | |||||||||
(1)Non-IFRS measures. For reconciliations to the most directly comparable IFRS measure see “Reconciliation of Non-IFRS Measures” in this Management’s Discussion and Analysis.
Funds From Operations at our utility-scale solar business was $40 million versus $64 million in the prior year. Excluding a gain on sale of a solar development project in North America that benefited the prior year ($12 million), Funds From Operations was below prior year as the benefit from higher resources and higher market prices in Spain was offset by the timing of revenue collection under our rate regulated Spanish assets that benefited the prior year.
| Brookfield Renewable Partners L.P. | Interim Report | March 31, 2023 | ||||||
Page 24 | ||||||||
DISTRIBUTED ENERGY & SUSTAINABLE SOLUTIONS OPERATIONS ON PROPORTIONATE BASIS
The following table presents our proportionate results for distributed energy & sustainable solutions business for the three months ended March 31:
| (MILLIONS, EXCEPT AS NOTED) | 2023 | 2022 | |||||||||
| Revenue | $ | 79 | $ | 59 | |||||||
| Other income | 5 | 13 | |||||||||
| Direct operating costs | (28) | (24) | |||||||||
Adjusted EBITDA(1) | 56 | 48 | |||||||||
| Interest expense | (12) | (10) | |||||||||
| Current income taxes | (1) | (1) | |||||||||
| Funds From Operations | $ | 43 | $ | 37 | |||||||
| Generation (GWh) – LTA | 193 | 172 | |||||||||
Generation (GWh) – actual(2) | 270 | 248 | |||||||||
(1)Non-IFRS measures. For reconciliations to the most directly comparable IFRS measure see “Reconciliation of Non-IFRS Measures” in this Management’s Discussion and Analysis.
(2)Actual generation includes 121 GWh (2022: 105 GWh) from facilities that do not have a corresponding LTA. See 'Presentation to Stakeholders' for why we do not consider LTA for our pumped storage and certain of our other facilities.
Funds From Operations at our distributed energy & sustainable solutions business was $43 million versus $37 million in the prior year primarily due to the benefit of growth and higher pricing for grid stability services provided by our pumped storage facilities.
CORPORATE
The following table presents our results for Corporate for the three months ended March 31:
| (MILLIONS, EXCEPT AS NOTED) | 2023 | 2022 | |||||||||
| Other income | $ | 12 | $ | 5 | |||||||
| Direct operating costs | (9) | (8) | |||||||||
Adjusted EBITDA(1) | 3 | (3) | |||||||||
| Management service costs | (57) | (76) | |||||||||
| Interest expense | (28) | (20) | |||||||||
| Distributions on Preferred LP units, Preferred Shares and Perpetual Subordinated Notes | (24) | (25) | |||||||||
| Funds From Operations | $ | (106) | $ | (124) | |||||||
(1)Non-IFRS measures. For reconciliations to the most directly comparable IFRS measure see “Reconciliation of Non-IFRS Measures” in this Management’s Discussion and Analysis.
| Brookfield Renewable Partners L.P. | Interim Report | March 31, 2023 | ||||||
Page 25 | ||||||||
RECONCILIATION OF NON-IFRS MEASURES
The following table reconciles the non-IFRS financial measures to the most directly comparable IFRS measures. Net income (loss) is reconciled to Adjusted EBITDA for the three months ended March 31, 2023:
| Attributable to Unitholders | |||||||||||||||||||||||||||||||||||||||||||||||||||||||||||||||||
| Hydroelectric | Wind | Utility-scale solar | Distributed energy & sustainable solutions | Corporate | Total | ||||||||||||||||||||||||||||||||||||||||||||||||||||||||||||
| (MILLIONS) | North America | Brazil | Colombia | North America | Europe | Brazil | Asia | ||||||||||||||||||||||||||||||||||||||||||||||||||||||||||
| Net income (loss) | $ | 161 | $ | 10 | $ | 67 | $ | 13 | $ | 15 | $ | 6 | $ | 12 | $ | (46) | $ | 34 | $ | (95) | $ | 177 | |||||||||||||||||||||||||||||||||||||||||||
| Add back or deduct the following: | |||||||||||||||||||||||||||||||||||||||||||||||||||||||||||||||||
| Depreciation | 103 | 23 | 28 | 116 | 10 | 11 | 18 | 83 | 37 | — | 429 | ||||||||||||||||||||||||||||||||||||||||||||||||||||||
| Deferred income tax expense (recovery) | 23 | — | 2 | (4) | 11 | (3) | (3) | (1) | (14) | (30) | (19) | ||||||||||||||||||||||||||||||||||||||||||||||||||||||
| Foreign exchange and financial instrument loss (gain) | (93) | (1) | — | (39) | (1) | — | — | 2 | (9) | 8 | (133) | ||||||||||||||||||||||||||||||||||||||||||||||||||||||
Other(1) | 19 | 4 | 2 | (7) | 8 | 4 | — | 12 | 3 | 16 | 61 | ||||||||||||||||||||||||||||||||||||||||||||||||||||||
| Management service costs | — | — | — | — | — | — | — | — | — | 57 | 57 | ||||||||||||||||||||||||||||||||||||||||||||||||||||||
| Interest expense | 92 | 12 | 79 | 45 | 3 | 6 | 13 | 66 | 28 | 50 | 394 | ||||||||||||||||||||||||||||||||||||||||||||||||||||||
| Current income tax expense | 1 | 2 | 31 | — | 1 | 1 | 2 | 5 | — | — | 43 | ||||||||||||||||||||||||||||||||||||||||||||||||||||||
Amount attributable to equity accounted investments and non-controlling interests(2) | (76) | (5) | (161) | (63) | (15) | (19) | (33) | (52) | (23) | (3) | (450) | ||||||||||||||||||||||||||||||||||||||||||||||||||||||
| Adjusted EBITDA | $ | 230 | $ | 45 | $ | 48 | $ | 61 | $ | 32 | $ | 6 | $ | 9 | $ | 69 | $ | 56 | $ | 3 | $ | 559 | |||||||||||||||||||||||||||||||||||||||||||
(1)Other corresponds to amounts that are not related to the revenue earning activities and are not normal, recurring cash operating expenses necessary for business operations. Other balance also includes derivative and other revaluations and settlements, gains or losses on debt extinguishment/modification, transaction costs, legal, provisions, amortization of concession assets and Brookfield Renewable’s economic share of foreign currency hedges and realized disposition gains and losses on assets that we developed and/or did not intend to hold over the long-term that are included within Adjusted EBITDA.
(2)Amount attributable to equity accounted investments corresponds to the Adjusted EBITDA to Brookfield Renewable that are generated by its investments in associates and joint ventures accounted for using the equity method. Amounts attributable to non-controlling interest are calculated based on the economic ownership interest held by non-controlling interests in consolidated subsidiaries. By adjusting Adjusted EBITDA attributable to non-controlling interest, our partnership is able to remove the portion of Adjusted EBITDA earned at non-wholly owned subsidiaries that are not attributable to our partnership.
| Brookfield Renewable Partners L.P. | Interim Report | March 31, 2023 | ||||||
Page 26 | ||||||||
The following table reconciles the non-IFRS financial measures to the most directly comparable IFRS measures. Net income (loss) is reconciled to Adjusted EBITDA for the three months ended March 31, 2022:
| Attributable to Unitholders | |||||||||||||||||||||||||||||||||||||||||||||||||||||||||||||||||
| Hydroelectric | Wind | Utility-scale solar | Distributed energy & sustainable solutions | Corporate | Total | ||||||||||||||||||||||||||||||||||||||||||||||||||||||||||||
| (MILLIONS) | North America | Brazil | Colombia | North America | Europe | Brazil | Asia | ||||||||||||||||||||||||||||||||||||||||||||||||||||||||||
| Net income (loss) | $ | (57) | $ | 22 | $ | 121 | $ | (38) | $ | 26 | $ | (6) | $ | 4 | $ | 8 | $ | 37 | $ | (84) | $ | 33 | |||||||||||||||||||||||||||||||||||||||||||
| Add back or deduct the following: | |||||||||||||||||||||||||||||||||||||||||||||||||||||||||||||||||
| Depreciation | 106 | 22 | 29 | 100 | 22 | 11 | 15 | 66 | 30 | — | 401 | ||||||||||||||||||||||||||||||||||||||||||||||||||||||
| Deferred income tax expense (recovery) | (21) | — | 15 | (2) | 13 | 2 | (2) | (11) | (3) | (17) | (26) | ||||||||||||||||||||||||||||||||||||||||||||||||||||||
| Foreign exchange and financial instrument loss (gain) | 80 | (1) | (19) | (5) | — | 1 | — | 7 | (7) | (19) | 37 | ||||||||||||||||||||||||||||||||||||||||||||||||||||||
Other(1) | 5 | 3 | — | 13 | 6 | 4 | — | 21 | 7 | 17 | 76 | ||||||||||||||||||||||||||||||||||||||||||||||||||||||
| Management service costs | — | — | — | — | — | — | — | — | — | 76 | 76 | ||||||||||||||||||||||||||||||||||||||||||||||||||||||
| Interest expense | 72 | 10 | 42 | 39 | 4 | 6 | 13 | 40 | 16 | 24 | 266 | ||||||||||||||||||||||||||||||||||||||||||||||||||||||
| Current income tax expense | 1 | 4 | 32 | — | 1 | 1 | 2 | 1 | — | — | 42 | ||||||||||||||||||||||||||||||||||||||||||||||||||||||
Amount attributable to equity accounted investments and non-controlling interests(2) | (45) | (7) | (167) | (47) | (26) | (15) | (25) | (42) | (32) | — | (406) | ||||||||||||||||||||||||||||||||||||||||||||||||||||||
| Adjusted EBITDA | $ | 141 | $ | 53 | $ | 53 | $ | 60 | $ | 46 | $ | 4 | $ | 7 | $ | 90 | $ | 48 | $ | (3) | $ | 499 | |||||||||||||||||||||||||||||||||||||||||||
(1)Other corresponds to amounts that are not related to the revenue earning activities and are not normal, recurring cash operating expenses necessary for business operations. Other balance also includes derivative and other revaluations and settlements, gains or losses on debt extinguishment/modification, transaction costs, legal, provisions, amortization of concession assets and Brookfield Renewable’s economic share of foreign currency hedges and realized disposition gains and losses on assets that we developed and/or did not intend to hold over the long-term that are included within Adjusted EBITDA.
(2)Amount attributable to equity accounted investments corresponds to the Adjusted EBITDA to Brookfield Renewable that are generated by its investments in associates and joint ventures accounted for using the equity method. Amounts attributable to non-controlling interest are calculated based on the economic ownership interest held by non-controlling interests in consolidated subsidiaries. By adjusting Adjusted EBITDA attributable to non-controlling interest, our partnership is able to remove the portion of Adjusted EBITDA earned at non-wholly owned subsidiaries that are not attributable to our partnership.
| Brookfield Renewable Partners L.P. | Interim Report | March 31, 2023 | ||||||
Page 27 | ||||||||
The following table reconciles the non-IFRS financial measures to the most directly comparable IFRS measures. Net income (loss) is reconciled to Funds From Operations for the three months ended March 31:
| (MILLIONS) | 2023 | 2022 | |||||||||
| Net income | $ | 177 | $ | 33 | |||||||
| Add back or deduct the following: | |||||||||||
| Depreciation | 429 | 401 | |||||||||
| Deferred income tax recovery | (19) | (26) | |||||||||
| Foreign exchange and financial instruments (gain) loss | (133) | 37 | |||||||||
Other(1) | 61 | 76 | |||||||||
Amount attributable to equity accounted investments and non-controlling interest(2) | (240) | (278) | |||||||||
| Funds From Operations | $ | 275 | $ | 243 | |||||||
(1)Other corresponds to amounts that are not related to the revenue earning activities and are not normal, recurring cash operating expenses necessary for business operations. Other balance also includes derivative and other revaluations and settlements, gains or losses on debt extinguishment/modification, transaction costs, legal, provisions, amortization of concession assets and Brookfield Renewable’s economic share of foreign currency hedges and realized disposition gains and losses on assets that we developed and/or did not intend to hold over the long-term that are included in Funds From Operations.
(2)Amount attributable to equity accounted investments corresponds to the Funds From Operations that are generated by its investments in associates and joint ventures accounted for using the equity method. Amounts attributable to non-controlling interest are calculated based on the economic ownership interest held by non-controlling interests in consolidated subsidiaries. By adjusting Funds From Operations attributable to non-controlling interest, our partnership is able to remove the portion of Funds From Operations earned at non-wholly owned subsidiaries that are not attributable to our partnership.
The following table reconciles the per unit non-IFRS financial measures to the most directly comparable IFRS measures. Basic earnings (loss) per LP unit is reconciled to Funds From Operations per Unit, for the three months ended March 31:
| 2023 | 2022 | ||||||||||
Basic loss per LP unit(1) | $ | (0.09) | $ | (0.16) | |||||||
| Depreciation | 0.37 | 0.38 | |||||||||
| Foreign exchange and financial instruments (gain) loss | (0.04) | 0.04 | |||||||||
| Deferred income tax (recovery) expense | — | (0.05) | |||||||||
| Other | 0.19 | 0.17 | |||||||||
Funds From Operations per Unit(2) | $ | 0.43 | $ | 0.38 | |||||||
(1)During the three months ended March 31, 2023, on average there were 275.4 million LP units outstanding (2022: 275.1 million).
(2)Average units outstanding, for the three months ended March 31, 2023, were 646.0 million (2022: 645.8 million), being inclusive of GP interest, Redeemable/Exchangeable partnership units, BEPC exchangeable shares and LP units.
| Brookfield Renewable Partners L.P. | Interim Report | March 31, 2023 | ||||||
Page 28 | ||||||||
CONTRACT PROFILE
We operate the business on a largely contracted basis to provide a high degree of predictability in Funds From Operations. We maintain a long-term view that electricity prices and the demand for electricity from renewable sources will rise due to a growing level of acceptance around climate change, the legislated requirements in some areas to diversify away from fossil fuel based generation and because they are becoming increasingly cost competitive.
In Brazil and Colombia, we also expect power prices will continue to be supported by the need to build new supply over the medium-to-long term to serve growing demand. In these markets, contracting for power is the only current mechanism to buy and sell power, and therefore we would expect to capture rising prices as we re-contract our power over the medium-term.
The following table sets out our contracts over the next five years for generation output in North America, Brazil, Europe and certain other countries, assuming long-term average on a proportionate basis. The table excludes Brazil and Colombia hydroelectric portfolios, where we would expect the energy associated with maturing contracts to be re-contracted in the normal course given the construct of the respective power markets. In these countries, we currently have a contracted profile of approximately 90% and 71%, respectively, of the long-term average and we would expect to maintain this going forward. Overall, our portfolio has a weighted-average remaining contract duration of 14 years on a proportionate basis.
| (GWh, except as noted) | Balance of 2023 | 2024 | 2025 | 2026 | 2027 | ||||||||||||||||||||||||
| Hydroelectric | |||||||||||||||||||||||||||||
| North America | |||||||||||||||||||||||||||||
United States(1) | 5,211 | 6,704 | 6,643 | 5,593 | 5,081 | ||||||||||||||||||||||||
| Canada | 3,014 | 3,991 | 3,991 | 3,991 | 3,991 | ||||||||||||||||||||||||
| 8,225 | 10,695 | 10,634 | 9,584 | 9,072 | |||||||||||||||||||||||||
| Wind | |||||||||||||||||||||||||||||
| North America | |||||||||||||||||||||||||||||
| United States | 2,318 | 2,912 | 2,914 | 2,866 | 2,735 | ||||||||||||||||||||||||
| Canada | 865 | 1,195 | 1,195 | 1,118 | 962 | ||||||||||||||||||||||||
| 3,183 | 4,107 | 4,109 | 3,984 | 3,697 | |||||||||||||||||||||||||
| Brazil | 528 | 758 | 821 | 821 | 821 | ||||||||||||||||||||||||
| Europe | 615 | 931 | 937 | 936 | 927 | ||||||||||||||||||||||||
| Asia | 571 | 652 | 652 | 652 | 661 | ||||||||||||||||||||||||
| 4,897 | 6,448 | 6,519 | 6,393 | 6,106 | |||||||||||||||||||||||||
| Utility-scale solar | 2,088 | 2,640 | 2,627 | 2,619 | 2,613 | ||||||||||||||||||||||||
| Distributed energy & sustainable solutions | 757 | 936 | 921 | 909 | 891 | ||||||||||||||||||||||||
| Contracted on a proportionate basis | 15,967 | 20,719 | 20,701 | 19,505 | 18,682 | ||||||||||||||||||||||||
| Uncontracted on a proportionate basis | 1,673 | 2,963 | 2,981 | 4,177 | 5,000 | ||||||||||||||||||||||||
| Long-term average on a proportionate basis | 17,640 | 23,682 | 23,682 | 23,682 | 23,682 | ||||||||||||||||||||||||
| Non-controlling interests | 20,068 | 26,873 | 26,873 | 26,873 | 26,873 | ||||||||||||||||||||||||
| Total long-term average | 37,708 | 50,555 | 50,555 | 50,555 | 50,555 | ||||||||||||||||||||||||
| Contracted generation as a % of total generation on a proportionate basis | 91 | % | 88 | % | 87 | % | 82 | % | 79 | % | |||||||||||||||||||
| Price per MWh – total generation on a proportionate basis | $ | 86 | $ | 84 | $ | 83 | $ | 85 | $ | 86 | |||||||||||||||||||
(1)Includes generation of 1,482 GWh for 2023, 1,520 GWh for 2024, and 1,461 GWh for 2025, 938 GWh for 2026, and 404 GWh for 2027 secured under financial contracts.
Weighted-average remaining contract durations on a proportionate basis are 16 years in North America, 13 years in Europe, 10 years in Brazil, 5 years in Colombia, and 15 years across our remaining jurisdictions.
In North America, over the next five years, a number of contracts will expire at our hydroelectric facilities. Based on current market prices for energy and ancillary products, we expect a net positive impact to cash flows.
In our Colombian portfolio, we continue to focus on securing long-term contracts while maintaining a certain percentage of uncontracted generation to mitigate hydrology risk.
The majority of Brookfield Renewable’s long-term power purchase agreements within our North American and European businesses are with investment-grade rated or creditworthy counterparties. The economic exposure of our contracted generation on a proportionate basis is distributed as follows: power authorities (41%), distribution companies (21%), commercial & industrial users (23%) and Brookfield (15%).
| Brookfield Renewable Partners L.P. | Interim Report | March 31, 2023 | ||||||
Page 29 | ||||||||
PART 5 – LIQUIDITY AND CAPITAL RESOURCES
CAPITALIZATION
A key element of our financing strategy is to raise the majority of our debt in the form of asset-specific, non-recourse borrowings at our subsidiaries on an investment-grade basis with no maintenance covenants. Substantially all of our debt is either investment grade rated or sized to investment grade and approximately 90% of debt is non-recourse.
The following table summarizes our capitalization:
| Corporate | Consolidated | ||||||||||||||||||||||
| (MILLIONS, EXCEPT AS NOTED) | March 31, 2023 | December 31, 2022 | March 31, 2023 | December 31, 2022 | |||||||||||||||||||
Commercial paper(1) | 180 | 249 | 180 | 249 | |||||||||||||||||||
| Debt | |||||||||||||||||||||||
Medium term notes(2) | 2,607 | 2,307 | 2,607 | 2,307 | |||||||||||||||||||
Non-recourse borrowings(3) | — | — | 22,439 | 22,321 | |||||||||||||||||||
| 2,607 | 2,307 | 25,046 | 24,628 | ||||||||||||||||||||
Deferred income tax liabilities, net(4) | — | — | 6,406 | 6,331 | |||||||||||||||||||
| Equity | |||||||||||||||||||||||
| Non-controlling interest | — | — | 15,526 | 14,755 | |||||||||||||||||||
| Preferred equity | 573 | 571 | 573 | 571 | |||||||||||||||||||
| Perpetual subordinated notes | 592 | 592 | 592 | 592 | |||||||||||||||||||
| Preferred limited partners' equity | 760 | 760 | 760 | 760 | |||||||||||||||||||
| Unitholders' equity | 9,461 | 9,608 | 9,461 | 9,608 | |||||||||||||||||||
| Total capitalization | $ | 13,993 | $ | 13,838 | $ | 58,364 | $ | 57,245 | |||||||||||||||
Debt-to-total capitalization(1) | 19 | % | 17 | % | 43 | % | 43 | % | |||||||||||||||
Debt-to-total capitalization (market value)(1)(5) | 10 | % | 11 | % | 36 | % | 39 | % | |||||||||||||||
(1)Draws on corporate credit facilities and commercial paper issuances are excluded from the debt to total capitalization ratios as they are not permanent sources of capital.
(2)Medium term notes are unsecured and guaranteed by Brookfield Renewable and exclude $8 million (2022: $8 million) of deferred financing fees, net of unamortized premiums.
(3)Consolidated non-recourse borrowings include $1,496 million (2022: $1,838 million) borrowed under a subscription facility of a Brookfield sponsored private fund and exclude $131 million (2022: $124 million) of deferred financing fees and $101 million (2022: $105 million) of unamortized premiums.
(4)Deferred income tax liabilities less deferred income tax assets.
(5)Based on market values of Preferred equity, Perpetual subordinated notes, Preferred limited partners’ equity and Unitholders’ equity.
| Brookfield Renewable Partners L.P. | Interim Report | March 31, 2023 | ||||||
Page 30 | ||||||||
AVAILABLE LIQUIDITY
The following table summarizes the available liquidity:
| (MILLIONS) | March 31, 2023 | December 31, 2022 | |||||||||
| Brookfield Renewable's share of cash and cash equivalents | $ | 511 | $ | 444 | |||||||
| Investments in marketable securities | 221 | 211 | |||||||||
| Corporate credit facilities | |||||||||||
| Authorized credit facilities | 2,375 | 2,375 | |||||||||
| Authorized letter of credit facility | 500 | 500 | |||||||||
| Issued letters of credit | (349) | (344) | |||||||||
| Available portion of corporate credit facilities | 2,526 | 2,531 | |||||||||
| Available portion of subsidiary credit facilities on a proportionate basis | 601 | 509 | |||||||||
| Available liquidity | $ | 3,859 | $ | 3,695 | |||||||
We operate with sufficient liquidity to enable us to fund growth initiatives, capital expenditures, distributions and withstand sudden adverse changes in economic circumstances or short-term fluctuations in generation. We maintain a strong, investment grade balance sheet characterized by a conservative capital structure, access to multiple funding levers including a focus on capital recycling on an opportunistic basis, and diverse sources of capital. Principal sources of liquidity are cash flows from operations, our credit facilities, upfinancings on non-recourse borrowings and proceeds from the issuance of various securities through public markets.
BORROWINGS
The composition of debt obligations, overall maturity profile, and average interest rates associated with our borrowings and credit facilities on a proportionate basis is presented in the following table:
| March 31, 2023 | December 31, 2022 | ||||||||||||||||||||||||||||||||||
| Weighted-average | Weighted-average | ||||||||||||||||||||||||||||||||||
| (MILLIONS EXCEPT AS NOTED) | Interest rate (%)(1) | Term (years) | Total | Interest rate (%)(1) | Term (years) | Total | |||||||||||||||||||||||||||||
| Corporate borrowings | |||||||||||||||||||||||||||||||||||
| Credit facilities | N/A | 4 | — | N/A | 5 | — | |||||||||||||||||||||||||||||
| Commercial paper | 5.7 | <1 | 180 | 5.1 | <1 | 249 | |||||||||||||||||||||||||||||
| Medium term notes | 4.3 | 11 | $ | 2,607 | 4.1 | 11 | $ | 2,307 | |||||||||||||||||||||||||||
Proportionate non-recourse borrowings(2)(3) | |||||||||||||||||||||||||||||||||||
| Hydroelectric | 5.9 | 12 | 4,980 | 5.7 | 13 | 5,150 | |||||||||||||||||||||||||||||
| Wind | 4.9 | 9 | 2,047 | 4.6 | 9 | 1,935 | |||||||||||||||||||||||||||||
| Utility-scale solar | 4.7 | 13 | 2,301 | 3.6 | 13 | 2,367 | |||||||||||||||||||||||||||||
| Distributed energy & sustainable solutions | 4.5 | 9 | 931 | 4.3 | 9 | 897 | |||||||||||||||||||||||||||||
| 5.3 | 12 | 10,259 | 4.9 | 12 | 10,349 | ||||||||||||||||||||||||||||||
| 13,046 | 12,905 | ||||||||||||||||||||||||||||||||||
| Proportionate unamortized financing fees, net of unamortized premiums | (69) | (64) | |||||||||||||||||||||||||||||||||
| 12,977 | 12,841 | ||||||||||||||||||||||||||||||||||
| Equity-accounted borrowings | (424) | (373) | |||||||||||||||||||||||||||||||||
| Non-controlling interests | 12,635 | 12,382 | |||||||||||||||||||||||||||||||||
| As per IFRS Statements | $ | 25,188 | $ | 24,850 | |||||||||||||||||||||||||||||||
(1)Includes cash yields on tax equity.
(2)Includes adjustments for project-level refinancing subsequent to March 31, 2023.
(3)See “Part 8 – Presentation to Stakeholders and Performance Measurement” for information on proportionate debt.
| Brookfield Renewable Partners L.P. | Interim Report | March 31, 2023 | ||||||
Page 31 | ||||||||
The following table summarizes our undiscounted principal repayments and scheduled amortization on a proportionate basis as at March 31, 2023:
| (MILLIONS) | Balance of 2023 | 2024 | 2025 | 2026 | 2027 | Thereafter | Total | |||||||||||||||||||||||||||||||||||||
Debt Principal repayments(1)(2) | ||||||||||||||||||||||||||||||||||||||||||||
Medium term notes(3) | $ | — | $ | — | $ | 296 | $ | — | $ | 370 | $ | 1,941 | $ | 2,607 | ||||||||||||||||||||||||||||||
| Non-recourse borrowings | ||||||||||||||||||||||||||||||||||||||||||||
| Hydroelectric | 49 | 113 | 342 | 321 | 164 | 1,244 | 2,233 | |||||||||||||||||||||||||||||||||||||
| Wind | 19 | 30 | — | 77 | — | 500 | 626 | |||||||||||||||||||||||||||||||||||||
| Utility-scale solar | 18 | 3 | 6 | 45 | — | 431 | 503 | |||||||||||||||||||||||||||||||||||||
Distributed energy & sustainable solutions | — | — | 153 | — | — | 257 | 410 | |||||||||||||||||||||||||||||||||||||
| 86 | 146 | 501 | 443 | 164 | 2,432 | 3,772 | ||||||||||||||||||||||||||||||||||||||
| Amortizing debt principal repayments | ||||||||||||||||||||||||||||||||||||||||||||
| Non-recourse borrowings | ||||||||||||||||||||||||||||||||||||||||||||
| Hydroelectric | 109 | 156 | 156 | 166 | 141 | 2,019 | 2,747 | |||||||||||||||||||||||||||||||||||||
| Wind | 105 | 139 | 146 | 141 | 141 | 749 | 1,421 | |||||||||||||||||||||||||||||||||||||
| Utility-scale solar | 98 | 119 | 129 | 123 | 127 | 1,202 | 1,798 | |||||||||||||||||||||||||||||||||||||
Distributed energy & sustainable solutions | 42 | 37 | 38 | 28 | 30 | 346 | 521 | |||||||||||||||||||||||||||||||||||||
| 354 | 451 | 469 | 458 | 439 | 4,316 | 6,487 | ||||||||||||||||||||||||||||||||||||||
| Total | $ | 440 | $ | 597 | $ | 1,266 | $ | 901 | $ | 973 | $ | 8,689 | $ | 12,866 | ||||||||||||||||||||||||||||||
(1)Draws on corporate credit facilities and commercial paper issuances are excluded from the debt repayment schedule as they are not a permanent source of capital.
(2)Includes adjustments for project-level refinancing subsequent to March 31, 2023.
(3)Medium term notes are unsecured and guaranteed by Brookfield Renewable and excludes $8 million (2022: $8 million) of deferred financing fees, net of unamortized premiums.
We remain focused on refinancing near-term facilities on acceptable terms and maintaining a manageable maturity ladder. We do not anticipate material issues in refinancing our borrowings through 2027 on acceptable terms and will do so opportunistically based on the prevailing interest rate environment.
CAPITAL EXPENDITURES
We fund growth capital expenditures with cash flow generated from operations, supplemented by non-recourse debt sized to investment grade coverage and covenant thresholds. This is designed to ensure that our investments have stable capital structures supported by a substantial level of equity and that cash flows at the asset level can be remitted freely to our company. This strategy also underpins our investment grade profile.
To fund large scale development projects and acquisitions, we will evaluate a variety of capital sources including proceeds from selling mature businesses, in addition to raising money in the capital markets through equity, debt and preferred share issuances. Furthermore, we have $2.38 billion committed revolving credit facilities available for investments and acquisitions, as well as funding the equity component of organic growth initiatives. The facilities are intended, and have historically been used, as a bridge to a long-term financing strategy rather than a permanent source of capital.
| Brookfield Renewable Partners L.P. | Interim Report | March 31, 2023 | ||||||
Page 32 | ||||||||
CONSOLIDATED STATEMENTS OF CASH FLOWS
The following table summarizes the key items in the unaudited interim consolidated statements of cash flows:
| Three months ended March 31 | |||||||||||
| (MILLIONS) | 2023 | 2022 | |||||||||
| Cash flow provided by (used in): | |||||||||||
| Operating activities before changes in due to or from related parties and net working capital change | $ | 480 | $ | 458 | |||||||
| Changes in due to or from related parties | 32 | 23 | |||||||||
| Net change in working capital balances | 151 | (178) | |||||||||
| 663 | 303 | ||||||||||
| Financing activities | 640 | 910 | |||||||||
| Investing activities | (1,176) | (1,203) | |||||||||
| Foreign exchange gain (loss) on cash | 14 | (1) | |||||||||
| Increase in cash and cash equivalents | $ | 141 | $ | 9 | |||||||
Operating Activities
Cash flows provided by operating activities before changes in due to or from related parties and net working capital changes for the three months ended March 31, 2023 totaled $480 million, compared to $458 million in 2022, reflecting the strong operating performance of our business during the period.
The net change in working capital balances shown in the unaudited interim consolidated statements of cash flows is comprised of the following:
| Three months ended March 31 | |||||||||||
| (MILLIONS) | 2023 | 2022 | |||||||||
| Trade receivables and other current assets | $ | 289 | $ | (103) | |||||||
| Accounts payable and accrued liabilities | (71) | (83) | |||||||||
| Other assets and liabilities | (67) | 8 | |||||||||
| $ | 151 | $ | (178) | ||||||||
Financing Activities
Cash flows provided by financing activities totaled $640 million for the three months ended March 31, 2023. The strength of our balance sheet and disciplined access to diverse sources of capital allowed us to fund our growth as discussed below and generate $31 million of net proceeds from corporate, non-recourse financings and related party borrowings for the three months ended March 31, 2023, including the issuance of C$400 million ($293 million) of medium term notes.
Distributions paid during the three months ended March 31, 2023 to Unitholders were $243 million (2022: $230 million). We increased our distributions to $1.35 per LP unit in 2023 on an annualized basis (2022: $1.28), representing a 5.5% increase per LP unit, which took effect in the first quarter of 2023. The distributions paid during the three months ended March 31, 2023, to preferred shareholders, preferred limited partners' unitholders, perpetual subordinate notes, and participating non-controlling interests in operating subsidiaries totaled $142 million (2022: $191 million). Our non-controlling interest contributed capital were $994 million in the three months ended March 31, 2023 (2022: $106 million).
Cash flows provided by financing activities totaled $910 million for the three months ended March 31, 2022. The strength of our balance sheet and disciplined access to diverse sources of capital allowed us to fund our growth as discussed below and generate $1,279 million of net proceeds from related party borrowings and corporate and non-recourse upfinancings.
| Brookfield Renewable Partners L.P. | Interim Report | March 31, 2023 | ||||||
Page 33 | ||||||||
Investing Activities
Cash flows used in investing activities totaled $1,176 million for the three months ended March 31, 2023. During the quarter, we invested $626 million into growth, including an initial investment in the form of convertible securities in a leading renewable platform in India with 11,000 megawatts of operating and development assets and a 136 MW portfolio of operating wind assets in Brazil. Our continued investment in our property, plant and equipment, including the construction of over 200 MW of our utility-scale solar facility in Brazil and 100 MW of wind assets in China, as well as the continued advancement of over 100 MW of distributed energy portfolio in the United States and 400 MW of wind assets in Brazil and United States was $572 million for the three months ended March 31, 2023.
Cash flows used in investing activities totaled $1,203 million for the three months ended March 31, 2022. During the quarter, we invested $780 million into growth, including a 20 GW portfolio of utility solar and energy storage development platform in the United States, a 1.7 GW portfolio of utility-scale solar developments assets in Germany and an 83% interest in a 437 MW distributed generation portfolio of high quality operating and development assets in Chile. Our continued investment in our property, plant and equipment, including the construction of 1,200 MW solar facility in Brazil and the repowering of an 845 MW wind farm in Oregon, was $452 million.
SHARES, UNITS AND NOTES OUTSTANDING
Shares, units and notes outstanding are as follows:
| March 31, 2023 | December 31, 2022 | ||||||||||
Class A Preference Shares(1) | 31,035,967 | 31,035,967 | |||||||||
| Perpetual Subordinated Notes | 24,400,000 | 24,400,000 | |||||||||
Preferred Units(2)(3) | 38,000,000 | 38,000,000 | |||||||||
| GP interest | 3,977,260 | 3,977,260 | |||||||||
| Redeemable/Exchangeable partnership units | 194,487,939 | 194,487,939 | |||||||||
| BEPC exchangeable shares | 172,228,249 | 172,218,098 | |||||||||
| LP units | |||||||||||
| Balance, beginning of year | 275,358,750 | 275,084,265 | |||||||||
| Distribution reinvestment plan | 72,119 | 262,177 | |||||||||
| Exchanged for BEPC exchangeable shares | 1,742 | 12,308 | |||||||||
| Balance, end of period | 275,432,611 | 275,358,750 | |||||||||
Total LP units on a fully-exchanged basis(3) | 642,148,799 | 642,064,787 | |||||||||
(1)Class A Preference Shares are broken down by series as follows: 6,849,533 Series 1 Class A Preference Shares are outstanding; 3,110,531 Series 2 Class A Preference Shares are outstanding; 9,961,399 Series 3 Class A Preference Shares are outstanding; 4,114,504 Series 5 Class A Preference Shares are outstanding; and 7,000,000 Series 6 Class A Preference Shares are outstanding.
(2)Preferred Units are broken down by series and certain series are convertible on a one for one basis at the option of the holder as follows: 7,000,000 Series 7 Preferred Units are outstanding (convertible for Series 8 Preferred Units beginning on January 31, 2026); 10,000,000 Series 13 Preferred Units are outstanding (convertible for Series 14 Preferred Units beginning on April 30, 2023); 7,000,000 Series 15 Preferred Units are outstanding (convertible for Series 16 Preferred Units beginning on April 30, 2024); 8,000,000 Series 17 Preferred Units are outstanding; and 6,000,000 Series 18 Preferred Units are outstanding.
(3)The fully-exchange amounts assume the exchange of all Redeemable/Exchangeable partnership units and BEPC exchangeable shares for LP Units
| Brookfield Renewable Partners L.P. | Interim Report | March 31, 2023 | ||||||
Page 34 | ||||||||
DIVIDENDS AND DISTRIBUTIONS
The following table summarizes the dividends and distributions declared and paid for the three months ended:
| March 31 | |||||||||||||||||||||||
| Declared | Paid | ||||||||||||||||||||||
| (MILLIONS) | 2023 | 2022 | 2023 | 2022 | |||||||||||||||||||
| Class A Preference Shares | $ | 7 | $ | 7 | $ | 7 | $ | 7 | |||||||||||||||
| Perpetual Subordinated Notes | 7 | 7 | 7 | 4 | |||||||||||||||||||
| Class A Preferred LP units | 10 | 11 | 10 | 11 | |||||||||||||||||||
Participating non-controlling interests – in operating subsidiaries | 158 | 169 | 118 | 169 | |||||||||||||||||||
| GP interest and incentive distributions | 28 | 25 | 28 | 24 | |||||||||||||||||||
Redeemable/Exchangeable partnership units | 67 | 63 | 66 | 62 | |||||||||||||||||||
| BEPC Exchangeable shares | 58 | 55 | 58 | 55 | |||||||||||||||||||
| LP units | 97 | 91 | 91 | 89 | |||||||||||||||||||
CONTRACTUAL OBLIGATIONS
Please see Note 19 – Commitments, contingencies and guarantees in the unaudited interim consolidated financial statements, for further details on the following:
•Commitments – Water, land, and dam usage agreements, and agreements and conditions on committed acquisitions of operating portfolios and development projects;
•Contingencies – Legal proceedings, arbitrations and actions arising in the normal course of business, and providing for letters of credit; and
•Guarantees – Nature of all the indemnification undertakings and guarantees to third-parties for certain transactions.
SUPPLEMENTAL FINANCIAL INFORMATION
In April 2021 and December 2021, Brookfield BRP Holdings (Canada) Inc., a wholly-owned subsidiary of Brookfield Renewable, issued $350 million and $260 million, respectively, of perpetual subordinated notes at a fixed rate of 4.625% and 4.875%, respectively.
These notes are fully and unconditionally guaranteed, on a subordinated basis by each of Brookfield Renewable Partners L.P., BRELP, BRP Bermuda Holdings I Limited, Brookfield BRP Europe Holdings Limited, Brookfield Renewable Investments Limited and BEP Subco Inc (together, the "guarantor subsidiaries"). The other subsidiaries of Brookfield Renewable do not guarantee the securities and are referred to below as the “non-guarantor subsidiaries”.
Pursuant to Rule 13-01 of the SEC's Regulation S-X, the following table provides combined summarized financial information of Brookfield BRP Holdings (Canada) Inc. and the guarantor subsidiaries:
| Three months ended March 31 | |||||||||||
| (MILLIONS) | 2023 | 2022 | |||||||||
Revenues(1) | $ | — | $ | — | |||||||
| Gross profit | — | — | |||||||||
| Dividend income from non-guarantor subsidiaries | 18 | 60 | |||||||||
| Net income | (12) | 51 | |||||||||
(1)Brookfield Renewable's total revenues for the three months ended March 31, 2023 were $1,331 million (2022: $1,136 million).
| Brookfield Renewable Partners L.P. | Interim Report | March 31, 2023 | ||||||
Page 35 | ||||||||
| (MILLIONS) | March 31, 2023 | December 31, 2022 | |||||||||
Current assets(1) | $ | 1,112 | $ | 820 | |||||||
Total assets(2)(3) | 2,555 | 2,253 | |||||||||
Current liabilities(4) | 8,241 | 7,862 | |||||||||
Total liabilities(5) | 8,258 | 7,877 | |||||||||
(1)Amount due from non-guarantor subsidiaries was $1,096 million (2022: $809 million).
(2)Brookfield Renewable's total assets as at March 31, 2023 and December 31, 2022 were $64,797 million and $64,111 million.
(3)Amount due from non-guarantor subsidiaries was $2,458 million (2022: $2,167 million).
(4)Amount due to non-guarantor subsidiaries was $7,841 million (2022: $7,408 million).
(5)Amount due to non-guarantor subsidiaries was $7,841 million (2022: $7,408 million).
OFF-STATEMENT OF FINANCIAL POSITION ARRANGEMENTS
Brookfield Renewable does not have any off-statement of financial position arrangements that have or are reasonably likely to have a material current or future effect on our financial condition, changes in financial condition, revenues or expenses, results of operations, liquidity, capital expenditures or capital resources that are material to investors.
Brookfield Renewable issues letters of credit from its corporate credit facilities for general corporate purposes which include, but are not limited to, security deposits, performance bonds and guarantees for reserve accounts. As at March 31, 2023, letters of credit issued amounted to $1,588 million (2022: $1,609 million).
| Brookfield Renewable Partners L.P. | Interim Report | March 31, 2023 | ||||||
Page 36 | ||||||||
PART 6 – SELECTED QUARTERLY INFORMATION
SUMMARY OF HISTORICAL QUARTERLY RESULTS
The following is a summary of unaudited quarterly financial information for the last eight consecutive quarters:
| 2023 | 2022 | 2021 | |||||||||||||||||||||||||||||||||||||||||||||
| (MILLIONS, EXCEPT AS NOTED) | Q1 | Q4 | Q3 | Q2 | Q1 | Q4 | Q3 | Q2 | |||||||||||||||||||||||||||||||||||||||
Total Generation (GWh) – LTA | 17,636 | 17,692 | 15,097 | 16,280 | 15,097 | 14,946 | 13,776 | 16,092 | |||||||||||||||||||||||||||||||||||||||
Total Generation (GWh) – actual | 18,875 | 16,450 | 14,906 | 16,488 | 15,196 | 14,585 | 13,533 | 14,683 | |||||||||||||||||||||||||||||||||||||||
Proportionate Generation (GWh) – LTA | 7,899 | 7,655 | 6,905 | 8,152 | 7,414 | 7,197 | 6,697 | 8,356 | |||||||||||||||||||||||||||||||||||||||
Proportionate Generation (GWh) – actual | 8,243 | 6,826 | 6,440 | 7,978 | 7,425 | 6,637 | 6,125 | 7,013 | |||||||||||||||||||||||||||||||||||||||
| Revenues | $ | 1,331 | $ | 1,196 | $ | 1,105 | $ | 1,274 | $ | 1,136 | $ | 1,091 | $ | 966 | $ | 1,019 | |||||||||||||||||||||||||||||||
| Net income (loss) to Unitholders | (32) | (82) | (136) | 1 | (78) | (57) | (115) | (63) | |||||||||||||||||||||||||||||||||||||||
| Basic and diluted loss per LP unit | (0.09) | (0.16) | (0.25) | (0.03) | (0.16) | (0.12) | (0.21) | (0.13) | |||||||||||||||||||||||||||||||||||||||
| Funds From Operations | 275 | 225 | 243 | 294 | 243 | 214 | 210 | 268 | |||||||||||||||||||||||||||||||||||||||
| Funds From Operations per Unit | 0.43 | 0.35 | 0.38 | 0.46 | 0.38 | 0.33 | 0.33 | 0.42 | |||||||||||||||||||||||||||||||||||||||
| Distribution per LP Unit | 0.34 | 0.32 | 0.32 | 0.32 | 0.32 | 0.30 | 0.30 | 0.30 | |||||||||||||||||||||||||||||||||||||||
| Brookfield Renewable Partners L.P. | Interim Report | March 31, 2023 | ||||||
Page 37 | ||||||||
PART 7 – CRITICAL ESTIMATES, ACCOUNTING POLICIES AND INTERNAL CONTROLS
CRITICAL ESTIMATES AND CRITICAL JUDGMENTS IN APPLYING ACCOUNTING POLICIES
The unaudited interim consolidated financial statements are prepared in accordance with IFRS, which require the use of estimates and judgments in reporting assets, liabilities, revenues, expenses and contingencies. In the judgment of management, none of the estimates outlined in Note 1 – Basis of preparation and significant accounting policies in our audited consolidated financial statements are considered critical accounting estimates as defined in Canadian National Instrument 51-102 – Continuous Disclosure Obligations with the exception of the estimates related to the valuation of property, plant and equipment, financial instruments, deferred income tax liabilities, decommissioning liabilities and impairment of goodwill. These assumptions include estimates of future electricity prices, discount rates, expected long-term average generation, inflation rates, terminal year, the amount and timing of operating and capital costs and the income tax rates of future income tax provisions. Estimates also include determination of accruals, provisions, purchase price allocations, useful lives, asset valuations, asset impairment testing and those relevant to the defined benefit pension and non-pension benefit plans. Estimates are based on historical experience, current trends and various other assumptions that are believed to be reasonable under the circumstances.
In making estimates, management relies on external information and observable conditions where possible, supplemented by internal analysis, as required. These estimates have been applied in a manner consistent with that in the prior year and there are no known trends, commitments, events or uncertainties that we believe will materially affect the methodology or assumptions utilized in this report. These estimates are impacted by, among other things, future power prices, movements in interest rates, foreign exchange volatility and other factors, some of which are highly uncertain, as described in the “Risk Factors” section. The interrelated nature of these factors prevents us from quantifying the overall impact of these movements on Brookfield Renewable’s financial statements in a meaningful way. These sources of estimation uncertainty relate in varying degrees to substantially all asset and liability account balances. Actual results could differ from those estimates.
NEW ACCOUNTING STANDARDS
IFRS Interpretations Committee Agenda Decision - Demand Deposits with Restriction on Use Arising from a Contract with a Third Party (IAS 7 Statement of Cash Flows)
In April 2022, the IFRS Interpretations Committee (“IFRS IC”) concluded that restrictions on the use of a demand deposit arising from a contract with a third party do not result in the deposit no longer being cash, unless those restrictions change the nature of the deposit in a way that it would no longer meet the definition of cash in IAS 7 Statement of Cash Flows. In the fact pattern described in the request, the contractual restrictions on the use of the amounts held in the demand deposit did not change the nature of the deposit — the entity can access those amounts on demand. Therefore, the entity should include the demand deposit as a component of “cash and cash equivalents” in its statement of financial position and in its statement of cash flows. Brookfield Renewable has completed the assessment and implemented its transition plan that addresses the impact of this IFRS IC agenda decision. The effect on the consolidated statements of cash flows is an increase to Cash and cash equivalents of $176 million and a decrease of $40 million to cash used in investing activities for the three months ended March 31, 2022.
FUTURE CHANGES IN ACCOUNTING POLICIES
Amendments to IAS 1 – Presentation of Financial Statements (“IAS 1”)
The amendments clarify how to classify debt and other liabilities as current or non-current. The amendments to IAS 1 apply to annual reporting periods beginning on or after January 1, 2024. Brookfield Renewable is currently assessing the impact of these amendments.
There are currently no other future changes to IFRS with potential impact on Brookfield Renewable.
INTERNAL CONTROL OVER FINANCIAL REPORTING
No changes were made in our internal control over financial reporting during the three months ended March 31, 2023, that have materially affected, or are reasonably likely to materially affect, our internal control over financial reporting.
| Brookfield Renewable Partners L.P. | Interim Report | March 31, 2023 | ||||||
Page 38 | ||||||||
SUBSEQUENT EVENTS
Subsequent to the quarter, Brookfield Renewable declared the fixed quarterly distributions on the Class A Preferred Limited Partnership Series 13 Units during the five years commencing May 1, 2023 will be paid at an annual rate of 6.05%.
Subsequent to the quarter, Brookfield Renewable, together with institutional investors, agreed to invest up to $360 million ($72 million net to Brookfield Renewable) to acquire a 55% stake in a leading C&I renewable platform based in India with 4,500 megawatts of operating and development pipeline. The transaction is subject to customary closing conditions and is expected to close in the second half of 2023.
| Brookfield Renewable Partners L.P. | Interim Report | March 31, 2023 | ||||||
Page 39 | ||||||||
PART 8 – PRESENTATION TO STAKEHOLDERS AND PERFORMANCE MEASUREMENT
PRESENTATION TO PUBLIC STAKEHOLDERS
Equity
Brookfield Renewable’s consolidated equity interests include (i) non-voting publicly traded LP units, held by public unitholders and Brookfield, (ii) BEPC exchangeable shares, held by public shareholders and Brookfield, (iii) Redeemable/Exchangeable Limited partnership units in BRELP, a holding subsidiary of Brookfield Renewable, held by Brookfield, and (iv) the GP interest in BRELP, held by Brookfield.
The LP units, the BEPC exchangeable shares and the Redeemable/Exchangeable partnership units have the same economic attributes in all respects, except that the BEPC exchangeable shares provide the holder, and the Redeemable/Exchangeable partnership units provide Brookfield, the right to request that all or a portion of such shares or units be redeemed for cash consideration. Brookfield Renewable, however, has the right, at its sole discretion, to satisfy any such redemption request with LP units, rather than cash, on a one-for-one basis. The public holders of BEPC exchangeable shares, and Brookfield, as holder of BEPC exchangeable shares and Redeemable/Exchangeable partnership units, participates in earnings and distributions on a per unit basis equivalent to the per unit participation of the LP units. Because Brookfield Renewable, at its sole discretion, has the right to settle any redemption request in respect of BEPC exchangeable shares and Redeemable/Exchangeable partnership units with LP units, the BEPC exchangeable shares and Redeemable/Exchangeable partnership units are classified under equity, and not as a liability.
Given the exchange feature referenced above, we are presenting LP units, BEPC exchangeable shares, Redeemable/Exchangeable partnership units, and GP Interest as separate components of consolidated equity. This presentation does not impact the total income (loss), per unit or share information, or total consolidated equity.
Actual and Long-term Average Generation
For assets acquired, disposed or reached commercial operation during the year, reported generation is calculated from the acquisition, disposition or commercial operation date and is not annualized. Generation on a same store basis refers to the generation of assets that were owned during both periods presented. As it relates to Colombia only, generation includes both hydroelectric and cogeneration facilities. Distributed energy & sustainable solutions includes generation from our distributed generation, pumped storage, North America cogeneration and Brazil biomass assets.
North America hydroelectric long-term average is the expected average level of generation based on the results of a simulation based on historical inflow data performed over a period of typically 30 years. Colombia hydroelectric long-term average is the expected average level of generation based on the results of a simulation based on historical inflow data performed over a period of typically 20 years. For substantially all of our hydroelectric assets in Brazil the long-term average is based on the reference amount of electricity allocated to our facilities under the market framework which levelizes generation risk across producers. Wind long-term average is the expected average level of generation based on the results of simulated historical wind speed data performed over a period of typically 10 years. Utility-scale solar long-term average is the expected average level of generation based on the results of a simulation using historical irradiance levels in the locations of our projects from the last 14 to 20 years combined with actual generation data during the operational period.
We compare actual generation levels against the long-term average to highlight the impact of an important factor that affects the variability of our business results. In the short-term, we recognize that hydrology, wind and irradiance conditions will vary from one period to the next; over time however, we expect our facilities will continue to produce in line with their long-term averages, which have proven to be reliable indicators of performance.
Our risk of a generation shortfall in Brazil continues to be minimized by participation in the MRE administered by the government of Brazil. This program mitigates hydrology risk by assuring that all participants receive, at any particular point in time, an assured energy amount, irrespective of the actual volume of energy generated. The program reallocates energy, transferring surplus energy from those who generated an excess to those who generate less than their assured energy, up to the total generation within the pool. Periodically, low precipitation across the entire country’s system could result in a temporary reduction of generation available for sale. During these periods, we expect that a higher proportion of thermal generation would be needed to balance supply and demand in the country, potentially leading to higher overall spot market prices.
| Brookfield Renewable Partners L.P. | Interim Report | March 31, 2023 | ||||||
Page 40 | ||||||||
Generation from our pumped storage and cogeneration facilities in North America is highly dependent on market price conditions rather than the generating capacity of the facilities. Our pumped storage facility in Europe generates on a dispatchable basis when required by our contracts for ancillary services. Generation from our biomass facilities in Brazil is dependent on the amount of sugar cane harvested in a given year. For these reasons, we do not consider a long-term average for these facilities.
Voting Agreements with Affiliates
Brookfield Renewable has entered into voting agreements with Brookfield, whereby Brookfield Renewable gained control or have significant influence over the entities that own certain renewable power and sustainable solution investments. Brookfield Renewable has also entered into a voting agreement with its consortium partners in respect of the Colombian business. The voting agreements provide Brookfield Renewable the authority to direct the election of the Boards of Directors of the relevant entities, among other things, and therefore provide Brookfield Renewable with control. Accordingly, Brookfield Renewable consolidates the accounts of these entities.
For entities previously controlled by Brookfield Corporation, the voting agreements entered into do not represent business combinations in accordance with IFRS 3, as all combining businesses are ultimately controlled by Brookfield Corporation both before and after the transactions were completed. Brookfield Renewable accounts for these transactions involving entities under common control in a manner similar to a pooling of interest, which requires the presentation of pre-voting agreement financial information as if the transactions had always been in place. Refer to Note 1(s)(ii) – Critical judgments in applying accounting policies – Common control transactions in our December 31, 2022 audited consolidated financial statements for our policy on accounting for transactions under common control.
PERFORMANCE MEASUREMENT
Segment Information
Our operations are segmented by – 1) hydroelectric, 2) wind, 3) utility-scale solar, 4) distributed energy & sustainable solutions (distributed generation, pumped storage, renewable natural gas, carbon capture and storage, recycling, cogeneration and biomass), and 5) corporate – with hydroelectric and wind further segmented by geography (i.e., North America, Colombia, Brazil, Europe and Asia). This best reflects the way in which the CODM reviews results of our company..
We report our results in accordance with these segments and present prior period segmented information in a consistent manner. See Note 6 – Segmented information in our unaudited interim consolidated financial statements.
One of our primary business objectives is to generate stable and growing cash flows while minimizing risk for the benefit of all stakeholders. We monitor our performance in this regard through three key metrics – i) Net Income (Loss), ii) Adjusted Earnings Before Interest, Taxes, Depreciation and Amortization (“Adjusted EBITDA”), and iii) Funds From Operations.
It is important to highlight that Adjusted EBITDA and Funds From Operations do not have any standardized meaning prescribed by IFRS and therefore are unlikely to be comparable to similar measures presented by other companies and have limitations as analytical tools. We provide additional information below on how we determine Adjusted EBITDA and Funds From Operations. We also provide reconciliations to Net income (loss). See “Part 4 – Financial Performance Review on Proportionate Information – Reconciliation of Non-IFRS Measures” and “Part 6 – Selected Quarterly Information – Reconciliation of Non-IFRS measures”.
Proportionate Information
Reporting to the CODM on the measures utilized to assess performance and allocate resources has been provided on a proportionate basis. Information on a proportionate basis reflects Brookfield Renewable’s share from facilities which it accounts for using consolidation and the equity method whereby Brookfield Renewable either controls or exercises significant influence or joint control over the investment, respectively. Proportionate information provides a Unitholder perspective that the CODM considers important when performing internal analyses and making strategic and operating decisions. The CODM also believes that providing proportionate information helps investors understand the impacts of decisions made by management and financial results that can be allocated to Unitholders.
Proportionate financial information is not, and is not intended to be, presented in accordance with IFRS. Tables reconciling IFRS data with data presented on a proportionate basis have been disclosed. Segment revenues, other income, direct operating costs, interest expense, depreciation, current and deferred income taxes, and other are items that will differ from results presented in accordance with IFRS as these items (1) include Brookfield Renewable’s proportionate share of
| Brookfield Renewable Partners L.P. | Interim Report | March 31, 2023 | ||||||
Page 41 | ||||||||
earnings from equity-accounted investments attributable to each of the above-noted items, and (2) exclude the proportionate share of earnings (loss) of consolidated investments not held by us apportioned to each of the above-noted items.
The presentation of proportionate results has limitations as an analytical tool, including the following:
•The amounts shown on the individual line items were derived by applying our overall economic ownership interest percentage and do not necessarily represent our legal claim to the assets and liabilities, or the revenues and expenses; and
•Other companies may calculate proportionate results differently than we do.
Because of these limitations, our proportionate financial information should not be considered in isolation or as a substitute for our financial statements as reported under IFRS.
Brookfield Renewable does not control those entities that have not been consolidated and as such, have been presented as equity-accounted investments in its financial statements. The presentation of the assets and liabilities and revenues and expenses do not represent Brookfield Renewable’s legal claim to such items, and the removal of financial statement amounts that are attributable to non-controlling interests does not extinguish Brookfield Renewable’s legal claims or exposures to such items.
Unless the context indicates or requires otherwise, information with respect to the megawatts ("MW") attributable to Brookfield Renewable’s facilities, including development assets, is presented on a consolidated basis, including with respect to facilities whereby Brookfield Renewable either controls or jointly controls the applicable facility.
Net Income (Loss)
Net income (loss) is calculated in accordance with IFRS.
Net income (loss) is an important measure of profitability, in particular because it has a standardized meaning under IFRS. The presentation of net income (loss) on an IFRS basis for our business will often lead to the recognition of a loss even though the underlying cash flows generated by the assets are supported by strong margins and stable, long-term power purchase agreements. The primary reason for this is that accounting rules require us to recognize a significantly higher level of depreciation for our assets than we are required to reinvest in the business as sustaining capital expenditures.
Adjusted EBITDA
Adjusted EBITDA is a non-IFRS measure used by investors to analyze the operating performance of companies.
Brookfield Renewable uses Adjusted EBITDA to assess the performance of Brookfield Renewable before the effects of interest expense, income taxes, depreciation, management service costs, non-controlling interests, unrealized gain or loss on financial instruments, non-cash income or loss from equity-accounted investments, distributions to preferred shareholders, preferred limited partnership unit holders, perpetual subordinated noteholders and other typical non-recurring items. Brookfield Renewable adjusts for these factors as they may be non-cash, unusual in nature and/or are not factors used by management for evaluating operating performance. Brookfield Renewable includes realized disposition gains and losses on assets that we developed and/or did not intend to hold over the long-term within Adjusted EBITDA in order to provide additional insight regarding the performance of investments on a cumulative realized basis, including any unrealized fair value adjustments that were recorded in equity and not otherwise reflected in current period Adjusted EBITDA.
Brookfield Renewable believes that presentation of this measure will enhance an investor’s ability to evaluate its financial and operating performance on an allocable basis.
Funds From Operations
Funds From Operations is a non-IFRS measure used by investors to analyze net earnings from operations without the effects of certain volatile items that generally have no current financial impact or items not directly related to the performance of Brookfield Renewable.
Brookfield Renewable uses Funds From Operations to assess the performance of Brookfield Renewable before the effects of certain cash items (e.g. acquisition costs and other typical non-recurring cash items) and certain non-cash items (e.g. deferred income taxes, depreciation, non-cash portion of non-controlling interests, unrealized gain or loss on financial instruments, non-cash gain or loss from equity-accounted investments, and other non-cash items) as these are not reflective of the performance of the underlying business. In the unaudited interim consolidated financial statements of Brookfield
| Brookfield Renewable Partners L.P. | Interim Report | March 31, 2023 | ||||||
Page 42 | ||||||||
Renewable, the revaluation approach is used in accordance with IAS 16, Property, Plant and Equipment, whereby depreciation is determined based on a revalued amount, thereby reducing comparability with peers who do not report under IFRS as issued by the IASB or who do not employ the revaluation approach to measuring property, plant and equipment. Management adds back deferred income taxes on the basis that they do not believe this item reflects the present value of the actual tax obligations that they expect Brookfield Renewable to incur over the long-term investment horizon of Brookfield Renewable.
Brookfield Renewable believes that analysis and presentation of Funds From Operations on this basis will enhance an investor’s understanding of the performance of Brookfield Renewable. Funds From Operations is not a substitute measure of performance for earnings per share and does not represent amounts available for distribution.
Funds From Operations is not a generally accepted accounting measure under IFRS and therefore may differ from definitions of Funds From Operations used by other entities, as well as the definition of funds from operations used by the Real Property Association of Canada (“REALPAC”) and the National Association of Real Estate Investment Trusts, Inc. (“NAREIT”). Furthermore, this measure is not used by the CODM to assess Brookfield Renewable’s liquidity.
Proportionate Debt
Proportionate debt is presented based on the proportionate share of borrowings obligations relating to the investments of Brookfield Renewable in various portfolio businesses. The proportionate financial information is not, and is not intended to be, presented in accordance with IFRS. Proportionate debt measures are provided because management believes it assists investors and analysts in estimating the overall performance and understanding the leverage pertaining specifically to Brookfield Renewable's share of its invested capital in a given investment. When used in conjunction with Proportionate Adjusted EBITDA, proportionate debt is expected to provide useful information as to how Brookfield Renewable has financed its businesses at the asset-level. Management believes that the proportionate presentation, when read in conjunction with Brookfield Renewable’s reported results under IFRS, including consolidated debt, provides a more meaningful assessment of how the operations of Brookfield Renewable are performing and capital is being managed. The presentation of proportionate results has limitations as an analytical tool, including the following:
•Proportionate debt amounts do not represent the consolidated obligation for debt underlying a consolidated investment. If an individual project does not generate sufficient cash flows to service the entire amount of its debt payments, management may determine, in their discretion, to pay the shortfall through an equity injection to avoid defaulting on the obligation. Such a shortfall may not be apparent from or may not equal the difference between aggregate Proportionate Adjusted EBITDA for all of the portfolio investments of Brookfield Renewable and aggregate proportionate debt for all of the portfolio investments of Brookfield Renewable; and
•Other companies may calculate proportionate debt differently.
Because of these limitations, the proportionate financial information of Brookfield Renewable should not be considered in isolation or as a substitute for the financial statements of Brookfield Renewable as reported under IFRS.
| Brookfield Renewable Partners L.P. | Interim Report | March 31, 2023 | ||||||
Page 43 | ||||||||
PART 9 – CAUTIONARY STATEMENTS
CAUTIONARY STATEMENT REGARDING FORWARD-LOOKING STATEMENTS
This report contains forward-looking statements and information, within the meaning of Canadian securities laws and “forward-looking statements” within the meaning of Section 27A of the U.S. Securities Act of 1933, as amended, Section 21E of the U.S. Securities Exchange Act of 1934, as amended, “safe harbor” provisions of the United States Private Securities Litigation Reform Act of 1995 and in any applicable Canadian securities regulations, concerning the business and operations of Brookfield Renewable. Forward-looking statements may include estimates, plans, expectations, opinions, forecasts, projections, guidance or other statements that are not statements of fact. Forward-looking statements in this report include, but are not limited to, statements regarding the quality of Brookfield Renewable’s assets and the resiliency of the cash flow they will generate, our anticipated financial performance, future commissioning of assets, contracted portfolio, technology diversification, acquisition opportunities, expected completion of acquisitions and dispositions, future energy prices and demand for electricity, economic recovery, achieving long-term average generation, project development and capital expenditure costs, energy policies, economic growth, growth potential of the renewable asset class, our future growth prospects and distribution profile, our access to capital and future dividends and distributions made to holders of LP units and BEPC's exchangeable shares. In some cases, forward-looking statements can be identified by the use of words such as “plans”, “expects”, “scheduled”, “estimates”, “intends”, “anticipates”, “believes”, “potentially”, “tends”, “continue”, “attempts”, “likely”, “primarily”, “approximately”, “endeavors”, “pursues”, “strives”, “seeks”, “targets”, “believes”, or variations of such words and phrases, or statements that certain actions, events or results “may”, “could”, “would”, “should”, “might” or “will” be taken, occur or be achieved. Although we believe that our anticipated future results, performance or achievements expressed or implied by the forward-looking statements and information in this report are based upon reasonable assumptions and expectations, we cannot assure you that such expectations will prove to have been correct. You should not place undue reliance on forward-looking statements and information as such statements and information involve known and unknown risks, uncertainties and other factors which may cause our actual results, performance or achievements to differ materially from anticipated future results, performance or achievements expressed or implied by such forward-looking statements and information.
Factors that could cause actual results to differ materially from those contemplated or implied by forward-looking statements include, but are not limited to, the following: general economic conditions and risks relating to the economy, including unfavorable changes in interest rates, foreign exchange rates, inflation and volatility in the financial markets; changes to resource availability, as a result of climate change or otherwise, at any of our facilities; supply, demand, volatility and marketing in the energy markets; our inability to re-negotiate or replace expiring power purchase agreements on similar terms; an increase in the amount of uncontracted generation in our portfolio or adverse changes to the hydrological balancing pool administered by the government of Brazil (“MRE”); availability and access to interconnection facilities and transmission systems; our ability to comply with, secure, replace or renew concessions, licenses, permits and other governmental approvals needed for our operating and development projects; our real property rights for our facilities being adversely affected by the rights of lienholders and leaseholders that are superior to those granted to us; increases in the cost of operating our existing facilities and of developing new projects; equipment failures and procurement challenges; dam failures and the costs and potential liabilities associated with such failures; uninsurable losses and higher insurance premiums; changes in regulatory, political, economic and social conditions in the jurisdictions in which we operate; force majeure events; adverse changes in currency exchange rates and our inability to effectively manage foreign currency exposure; health, safety, security and environmental risks; energy marketing risks; the termination of, or a change to, the MRE balancing pool in Brazil; involvement in litigation and other disputes, and governmental and regulatory investigations; counterparties to our contracts not fulfilling their obligations; the time and expense of enforcing contracts against non-performing counterparties and the uncertainty of success; foreign laws or regulation to which we become subject as a result of future acquisitions in new markets; our operations being affected by local communities; our reliance on computerized business systems, which could expose us to cyber-attacks; newly developed technologies in which we invest not performing as anticipated; advances in technology that impair or eliminate the competitive advantage of our projects; increases in water rental costs (or similar fees) or changes to the regulation of water supply; labor disruptions and economically unfavorable collective bargaining agreements; fraud, bribery, corruption, other illegal acts or inadequate or failed internal processes or systems; the COVID-19 pandemic, as well as the direct and indirect impacts that a pandemic may have, or any other pandemic; our inability to finance our operations and fund growth due to the status of the capital markets or our ability to complete capital recycling initiatives; operating and financial restrictions imposed on us by our loan, debt and security agreements; changes to our credit ratings; the incurrence of debt at multiple levels within our organizational structure; adverse changes in currency exchange rates and our inability to effectively manage foreign currency exposure through our hedging strategy or otherwise; our inability to identify sufficient investment opportunities and complete transactions; the growth of our portfolio and our inability to realize the expected benefits of our transactions or acquisitions; changes to our current business, including through future sustainable solutions investments; our inability to develop the projects in our development pipeline; delays, cost overruns and other problems associated with the construction and operation of generating facilities and risks associated with the arrangements we enter into with communities and joint venture partners; Brookfield’s election not to source acquisition opportunities for us and our lack of access to all renewable power acquisitions that Brookfield identifies, including by reason of conflicts of interest; we do not have control over all of our operations or investments, including certain investments made through joint ventures, partnerships, consortiums or structured arrangements; political instability or changes in government policy negatively impacting our business or assets;some of our acquisitions may be of distressed companies, which may subject us to increased risks; a decline in the value of our investments in securities, including publicly traded securities of other companies; we are not subject to the same disclosure requirements as a U.S. domestic issuer; the separation of economic interest from control within our organizational structure; future sales and issuances of LP Units, preferred limited partnership units in the capital of Brookfield Renewable or securities exchangeable for LP Units, including BEPC exchangeable shares, or the perception of such sales or issuances, could depress the trading price of the LP Units or BEPC exchangeable shares; our dependence on Brookfield and Brookfield’s significant influence over us; the departure of some or all of Brookfield’s key professionals; our lack of independent means of generating revenue; changes in how Brookfield elects to hold its ownership interests in Brookfield Renewable; Brookfield acting in a way that is not in our best interests or our shareholders or our unitholders; being deemed an “investment company” under the Investment Company Act; the effectiveness of our internal controls over financial reporting; failure of our systems technology; any changes in the market price of the LP Units and BEPC exchangeable shares; and the redemption of BEPC
| Brookfield Renewable Partners L.P. | Interim Report | March 31, 2023 | ||||||
Page 44 | ||||||||
exchangeable shares by us at any time or upon notice from the holders of the BEPC class B shares; and other factors described in our most recent Annual Report on Form 20-F, including those set forth under Item 3.D “Risk Factors”.
We caution that the foregoing list of important factors that may affect future results is not exhaustive. The forward-looking statements represent our views as of the date of this report and should not be relied upon as representing our views as of any date subsequent to the date of this report. While we anticipate that subsequent events and developments may cause our views to change, we disclaim any obligation to update the forward- looking statements, other than as required by applicable law. For further information on these known and unknown risks, please see “Risk Factors” included in our most recent Annual Report on Form 20-F and other risks and factors that are described therein.
CAUTIONARY STATEMENT REGARDING USE OF NON-IFRS MEASURES
This report contains references to Adjusted EBITDA, Funds From Operations and Funds From Operations per Unit which are not generally accepted accounting measures under IFRS and therefore may differ from definitions of Adjusted EBITDA, Funds From Operations and Funds From Operations per Unit used by other entities. In particular, our definition of Funds From Operations may differ from the definition of funds from operations used by other organizations, as well as the definition of funds from operations used by the Real Property Association of Canada and the National Association of Real Estate Investment Trusts, Inc. (“NAREIT”). We believe that Adjusted EBITDA, Funds From Operations and Funds From Operations per Unit are useful supplemental measures that may assist investors in assessing our financial performance. None of Adjusted EBITDA, Funds From Operations or Funds From Operations per Unit should be considered as the sole measure of our performance and should not be considered in isolation from, or as a substitute for, analysis of our financial statements prepared in accordance with IFRS. These non-IFRS measures reflect how we manage our business and, in our opinion, enable the reader to better understand our business.
Reconciliations of each of Adjusted EBITDA, Funds From Operations and Funds From Operations per Unit to net income (loss) are presented in our Management’s Discussion and Analysis. We have also provided a reconciliation of Adjusted EBITDA and Funds From Operations to net income in Note 6 – Segmented information in the audited annual consolidated financial statements.
| Brookfield Renewable Partners L.P. | Interim Report | March 31, 2023 | ||||||
Page 45 | ||||||||
BROOKFIELD RENEWABLE PARTNERS L.P.
CONSOLIDATED STATEMENTS OF FINANCIAL POSITION
UNAUDITED (MILLIONS) | Notes | March 31, 2023 | December 31, 2022 | ||||||||||||||
| Assets | |||||||||||||||||
| Current assets | |||||||||||||||||
| Cash and cash equivalents | 15 | $ | 1,140 | $ | 998 | ||||||||||||
| Restricted cash | 16 | 124 | 139 | ||||||||||||||
| Trade receivables and other current assets | 17 | 1,624 | 1,860 | ||||||||||||||
| Financial instrument assets | 5 | 139 | 125 | ||||||||||||||
| Due from related parties | 20 | 219 | 123 | ||||||||||||||
| Assets held for sale | 4 | 262 | 938 | ||||||||||||||
| 3,508 | 4,183 | ||||||||||||||||
| Financial instrument assets | 5 | 1,942 | 1,500 | ||||||||||||||
| Equity-accounted investments | 14 | 1,603 | 1,392 | ||||||||||||||
| Property, plant and equipment, at fair value | 8 | 54,977 | 54,283 | ||||||||||||||
| Intangible assets | 205 | 209 | |||||||||||||||
| Goodwill | 13 | 1,559 | 1,526 | ||||||||||||||
| Deferred income tax assets | 7 | 209 | 176 | ||||||||||||||
| Other long-term assets | 794 | 842 | |||||||||||||||
| Total Assets | $ | 64,797 | $ | 64,111 | |||||||||||||
| Liabilities | |||||||||||||||||
| Current liabilities | |||||||||||||||||
| Accounts payable and accrued liabilities | 18 | $ | 1,089 | $ | 1,086 | ||||||||||||
| Financial instrument liabilities | 5 | 482 | 559 | ||||||||||||||
| Due to related parties | 20 | 683 | 588 | ||||||||||||||
| Corporate borrowings | 9 | 180 | 249 | ||||||||||||||
| Non-recourse borrowings | 9 | 2,211 | 2,027 | ||||||||||||||
| Provisions | 27 | 83 | |||||||||||||||
| Liabilities directly associated with assets held for sale | 4 | 155 | 351 | ||||||||||||||
| 4,827 | 4,943 | ||||||||||||||||
| Financial instrument liabilities | 5 | 1,544 | 1,670 | ||||||||||||||
| Corporate borrowings | 9 | 2,599 | 2,299 | ||||||||||||||
| Non-recourse borrowings | 9 | 20,198 | 20,275 | ||||||||||||||
| Deferred income tax liabilities | 7 | 6,615 | 6,507 | ||||||||||||||
| Provisions | 627 | 600 | |||||||||||||||
| Other long-term liabilities | 1,475 | 1,531 | |||||||||||||||
| Equity | |||||||||||||||||
| Non-controlling interests | |||||||||||||||||
| Participating non-controlling interests – in operating subsidiaries | 10 | 15,526 | 14,755 | ||||||||||||||
| General partnership interest in a holding subsidiary held by Brookfield | 10 | 58 | 59 | ||||||||||||||
| Participating non-controlling interests – in a holding subsidiary – Redeemable/Exchangeable units held by Brookfield | 10 | 2,848 | 2,892 | ||||||||||||||
| BEPC exchangeable shares | 10 | 2,522 | 2,561 | ||||||||||||||
| Preferred equity | 10 | 573 | 571 | ||||||||||||||
| Perpetual subordinated notes | 10 | 592 | 592 | ||||||||||||||
| Preferred limited partners' equity | 11 | 760 | 760 | ||||||||||||||
| Limited partners' equity | 12 | 4,033 | 4,096 | ||||||||||||||
| Total Equity | 26,912 | 26,286 | |||||||||||||||
| Total Liabilities and Equity | $ | 64,797 | $ | 64,111 | |||||||||||||
The accompanying notes are an integral part of these interim consolidated financial statements.
| Approved on behalf of Brookfield Renewable Partners L.P.: | |||||
 |  | ||||
Patricia Zuccotti Director | David Mann Director | ||||
| Brookfield Renewable Partners L.P. | Interim Report | March 31, 2023 | ||||||
Page 46 | ||||||||
BROOKFIELD RENEWABLE PARTNERS L.P.
CONSOLIDATED STATEMENTS OF INCOME (LOSS)
UNAUDITED (MILLIONS, EXCEPT PER UNIT INFORMATION) | Three months ended March 31 | ||||||||||||||||
| Notes | 2023 | 2022 | |||||||||||||||
| Revenues | 20 | $ | 1,331 | $ | 1,136 | ||||||||||||
| Other income | 26 | 71 | |||||||||||||||
Direct operating costs(1) | (401) | (350) | |||||||||||||||
| Management service costs | 20 | (57) | (76) | ||||||||||||||
| Interest expense | 9 | (394) | (266) | ||||||||||||||
| Share of earnings (loss) from equity-accounted investments | 14 | 33 | 19 | ||||||||||||||
| Foreign exchange and financial instruments gain (loss) | 5 | 133 | (37) | ||||||||||||||
| Depreciation | 8 | (429) | (401) | ||||||||||||||
| Other | (41) | (47) | |||||||||||||||
| Income tax (expense) recovery | |||||||||||||||||
| Current | 7 | (43) | (42) | ||||||||||||||
| Deferred | 7 | 19 | 26 | ||||||||||||||
| (24) | (16) | ||||||||||||||||
| Net income | $ | 177 | $ | 33 | |||||||||||||
| Net income attributable to: | |||||||||||||||||
| Non-controlling interests | |||||||||||||||||
| Participating non-controlling interests – in operating subsidiaries | 10 | $ | 185 | $ | 86 | ||||||||||||
| General partnership interest in a holding subsidiary held by Brookfield | 10 | 28 | 24 | ||||||||||||||
| Participating non-controlling interests – in a holding subsidiary – Redeemable/Exchangeable units held by Brookfield | 10 | (18) | (31) | ||||||||||||||
| BEPC exchangeable shares | 10 | (16) | (27) | ||||||||||||||
| Preferred equity | 10 | 7 | 7 | ||||||||||||||
| Perpetual subordinated notes | 10 | 7 | 7 | ||||||||||||||
| Preferred limited partners' equity | 11 | 10 | 11 | ||||||||||||||
| Limited partners' equity | 12 | (26) | (44) | ||||||||||||||
| $ | 177 | $ | 33 | ||||||||||||||
| Basic and diluted loss per LP unit | $ | (0.09) | $ | (0.16) | |||||||||||||
(1)Direct operating costs exclude depreciation expense disclosed below.
The accompanying notes are an integral part of these interim consolidated financial statements.
| Brookfield Renewable Partners L.P. | Interim Report | March 31, 2023 | ||||||
Page 47 | ||||||||
BROOKFIELD RENEWABLE PARTNERS L.P.
CONSOLIDATED STATEMENTS OF COMPREHENSIVE INCOME
UNAUDITED (MILLIONS) | Three months ended March 31 | ||||||||||||||||
| Notes | 2023 | 2022 | |||||||||||||||
| Net income | $ | 177 | $ | 33 | |||||||||||||
| Other comprehensive income (loss) that will not be reclassified to net income (loss) | |||||||||||||||||
| Revaluations of property, plant and equipment | (42) | (2) | |||||||||||||||
| Actuarial gain (loss) on defined benefit plans | (1) | 5 | |||||||||||||||
| Deferred tax recovery on above item | — | (4) | |||||||||||||||
| Unrealized gain (loss) on investments in equity securities | 5 | — | (5) | ||||||||||||||
| Equity-accounted investments | 14 | 10 | — | ||||||||||||||
Total items that will not be reclassified to net income | (33) | (6) | |||||||||||||||
| Other comprehensive income that may be reclassified to net income | |||||||||||||||||
| Foreign currency translation | 272 | 784 | |||||||||||||||
| Gain (loss) arising during the period on financial instruments designated as cash-flow hedges | 5 | 128 | (33) | ||||||||||||||
| Gain on foreign exchange swaps net investment hedge | 5 | (19) | (45) | ||||||||||||||
| Reclassification adjustments for amounts recognized in net income (loss) | 5 | (49) | 56 | ||||||||||||||
| Deferred income taxes on above items | (11) | (16) | |||||||||||||||
| Equity-accounted investments | 14 | (7) | 22 | ||||||||||||||
| Total items that may be reclassified subsequently to net income (loss) | 314 | 768 | |||||||||||||||
| Other comprehensive income | 281 | 762 | |||||||||||||||
| Comprehensive income | $ | 458 | $ | 795 | |||||||||||||
| Comprehensive income attributable to: | |||||||||||||||||
| Non-controlling interests | |||||||||||||||||
| Participating non-controlling interests – in operating subsidiaries | 10 | $ | 354 | $ | 458 | ||||||||||||
| General partnership interest in a holding subsidiary held by Brookfield | 10 | 29 | 26 | ||||||||||||||
| Participating non-controlling interests – in a holding subsidiary – Redeemable/Exchangeable units held by Brookfield | 10 | 15 | 85 | ||||||||||||||
| BEPC exchangeable shares | 10 | 13 | 75 | ||||||||||||||
| Preferred equity | 10 | 9 | 13 | ||||||||||||||
| Perpetual subordinated notes | 10 | 7 | 7 | ||||||||||||||
| Preferred limited partners' equity | 11 | 10 | 11 | ||||||||||||||
| Limited partners' equity | 12 | 21 | 120 | ||||||||||||||
| $ | 458 | $ | 795 | ||||||||||||||
The accompanying notes are an integral part of these interim consolidated financial statements.
| Brookfield Renewable Partners L.P. | Interim Report | March 31, 2023 | ||||||
Page 48 | ||||||||
BROOKFIELD RENEWABLE PARTNERS L.P.
CONSOLIDATED STATEMENTS OF CHANGES IN EQUITY
| Accumulated other comprehensive income | Non-controlling interests | ||||||||||||||||||||||||||||||||||||||||||||||||||||||||||||||||||||||||||||||||||||||||
UNAUDITED THREE MONTHS ENDED MARCH 31 (MILLIONS) | Limited partners' equity | Foreign currency translation | Revaluation surplus | Actuarial losses on defined benefit plans | Cash flow hedges | Investments in equity securities | Total limited partners' equity | Preferred limited partners' equity | Preferred equity | Perpetual subordinated notes | BEPC exchangeable shares | Participating non-controlling interests – in operating subsidiaries | General partnership interest in a holding subsidiary held by Brookfield | Participating non-controlling interests – in a holding subsidiary – Redeemable/Exchangeable units held by Brookfield | Total equity | ||||||||||||||||||||||||||||||||||||||||||||||||||||||||||||||||||||||||||
Balance, as at December 31, 2022 | $ | (1,898) | $ | (845) | $ | 6,817 | $ | 4 | $ | 17 | $ | 1 | $ | 4,096 | $ | 760 | $ | 571 | $ | 592 | $ | 2,561 | $ | 14,755 | $ | 59 | $ | 2,892 | $ | 26,286 | |||||||||||||||||||||||||||||||||||||||||||||||||||||||||||
| Net income (loss) | (26) | — | — | — | — | — | (26) | 10 | 7 | 7 | (16) | 185 | 28 | (18) | 177 | ||||||||||||||||||||||||||||||||||||||||||||||||||||||||||||||||||||||||||
| Other comprehensive income (loss) | — | 38 | (4) | 1 | 12 | — | 47 | — | 2 | — | 29 | 169 | 1 | 33 | 281 | ||||||||||||||||||||||||||||||||||||||||||||||||||||||||||||||||||||||||||
| Capital contributions | — | — | — | — | — | — | — | — | — | — | — | 994 | — | — | 994 | ||||||||||||||||||||||||||||||||||||||||||||||||||||||||||||||||||||||||||
Disposals (Note 3) | 14 | — | (14) | — | — | — | — | — | — | — | — | (388) | — | — | (388) | ||||||||||||||||||||||||||||||||||||||||||||||||||||||||||||||||||||||||||
| Distributions or dividends declared | (97) | — | — | — | — | — | (97) | (10) | (7) | (7) | (58) | (158) | (28) | (67) | (432) | ||||||||||||||||||||||||||||||||||||||||||||||||||||||||||||||||||||||||||
| Distribution reinvestment plan | 2 | — | — | — | — | — | 2 | — | — | — | — | — | — | — | 2 | ||||||||||||||||||||||||||||||||||||||||||||||||||||||||||||||||||||||||||
| Other | (3) | 11 | 2 | — | 1 | — | 11 | — | — | — | 6 | (31) | (2) | 8 | (8) | ||||||||||||||||||||||||||||||||||||||||||||||||||||||||||||||||||||||||||
| Change in period | (110) | 49 | (16) | 1 | 13 | — | (63) | — | 2 | — | (39) | 771 | (1) | (44) | 626 | ||||||||||||||||||||||||||||||||||||||||||||||||||||||||||||||||||||||||||
Balance, as at March 31, 2023 | $ | (2,008) | $ | (796) | $ | 6,801 | $ | 5 | $ | 30 | $ | 1 | $ | 4,033 | $ | 760 | $ | 573 | $ | 592 | $ | 2,522 | $ | 15,526 | $ | 58 | $ | 2,848 | $ | 26,912 | |||||||||||||||||||||||||||||||||||||||||||||||||||||||||||
Balance, as at December 31, 2021 | $ | (1,516) | $ | (842) | $ | 6,494 | $ | — | $ | (48) | $ | 4 | $ | 4,092 | $ | 881 | $ | 613 | $ | 592 | $ | 2,562 | $ | 12,303 | $ | 59 | $ | 2,894 | 23,996 | ||||||||||||||||||||||||||||||||||||||||||||||||||||||||||||
| Net income (loss) | (44) | — | — | — | — | — | (44) | 11 | 7 | 7 | (27) | 86 | 24 | (31) | 33 | ||||||||||||||||||||||||||||||||||||||||||||||||||||||||||||||||||||||||||
| Other comprehensive income (loss) | — | 152 | (1) | 1 | 14 | (2) | 164 | — | 6 | — | 102 | 372 | 2 | 116 | 762 | ||||||||||||||||||||||||||||||||||||||||||||||||||||||||||||||||||||||||||
| Capital contributions | — | — | — | — | — | — | — | — | — | — | — | 106 | — | — | 106 | ||||||||||||||||||||||||||||||||||||||||||||||||||||||||||||||||||||||||||
| Redemption of Preferred LP Units | — | — | — | — | — | — | — | (49) | — | — | — | — | — | — | (49) | ||||||||||||||||||||||||||||||||||||||||||||||||||||||||||||||||||||||||||
| Distributions or dividends declared | (91) | — | — | — | — | — | (91) | (11) | (7) | (7) | (55) | (169) | (25) | (63) | (428) | ||||||||||||||||||||||||||||||||||||||||||||||||||||||||||||||||||||||||||
| Distribution reinvestment plan | 3 | — | — | — | — | — | 3 | — | — | — | — | — | — | — | 3 | ||||||||||||||||||||||||||||||||||||||||||||||||||||||||||||||||||||||||||
| Other | 7 | — | 5 | — | — | — | 12 | — | — | — | 6 | 10 | — | 7 | 35 | ||||||||||||||||||||||||||||||||||||||||||||||||||||||||||||||||||||||||||
| Change in period | (125) | 152 | 4 | 1 | 14 | (2) | 44 | (49) | 6 | — | 26 | 405 | 1 | 29 | 462 | ||||||||||||||||||||||||||||||||||||||||||||||||||||||||||||||||||||||||||
Balance, as at March 31, 2022 | $ | (1,641) | $ | (690) | $ | 6,498 | $ | 1 | $ | (34) | $ | 2 | $ | 4,136 | $ | 832 | $ | 619 | $ | 592 | $ | 2,588 | $ | 12,708 | $ | 60 | $ | 2,923 | $ | 24,458 | |||||||||||||||||||||||||||||||||||||||||||||||||||||||||||
The accompanying notes are an integral part of these interim consolidated financial statements.
| Brookfield Renewable Partners L.P. | Interim Report | March 31, 2023 | ||||||
Page 49 | ||||||||
BROOKFIELD RENEWABLE PARTNERS L.P.
CONSOLIDATED STATEMENTS OF CASH FLOWS
| UNAUDITED | Three months ended March 31 | ||||||||||||||||
| (MILLIONS) | Notes | 2023 | 2022 | ||||||||||||||
| Operating activities | |||||||||||||||||
| Net income | $ | 177 | $ | 33 | |||||||||||||
| Adjustments for the following non-cash items: | |||||||||||||||||
| Depreciation | 8 | 429 | 401 | ||||||||||||||
| Unrealized foreign exchange and financial instruments (gain) losses | 5 | (130) | 50 | ||||||||||||||
| Share of earnings from equity-accounted investments | 14 | (33) | (19) | ||||||||||||||
| Deferred income tax recovery) | 7 | (19) | (26) | ||||||||||||||
| Other non-cash items | 37 | — | |||||||||||||||
| Dividends received from equity-accounted investments | 14 | 19 | 19 | ||||||||||||||
| 480 | 458 | ||||||||||||||||
| Changes in due to or from related parties | 32 | 23 | |||||||||||||||
| Net change in working capital balances | 151 | (178) | |||||||||||||||
| 663 | 303 | ||||||||||||||||
| Financing activities | |||||||||||||||||
| Proceeds from medium term notes | 9 | 293 | — | ||||||||||||||
| Commercial paper, net | 9 | (69) | 120 | ||||||||||||||
| Proceeds from non-recourse borrowings | 9,20 | 1,528 | 1,113 | ||||||||||||||
| Repayment of non-recourse borrowings | 9,20 | (1,622) | (899) | ||||||||||||||
| Capital contributions from participating non-controlling interests – in operating subsidiaries | 10 | 994 | 106 | ||||||||||||||
| Redemption and repurchase of equity instruments | 11 | — | (49) | ||||||||||||||
| Distributions paid: | |||||||||||||||||
To participating non-controlling interests – in operating subsidiaries, preferred shareholders, preferred limited partners unitholders, and perpetual subordinate notes | 10,11 | (142) | (191) | ||||||||||||||
| To unitholders of Brookfield Renewable or BRELP and shareholders of Brookfield Renewable Corporation | 10,12 | (243) | (230) | ||||||||||||||
| Borrowings from related party | — | 940 | |||||||||||||||
| Repayments to related party | (99) | — | |||||||||||||||
| 640 | 910 | ||||||||||||||||
| Investing activities | |||||||||||||||||
| Acquisitions, net of cash and cash equivalents, in acquired entity | 2 | (81) | (780) | ||||||||||||||
| Investment in property, plant and equipment | 8 | (572) | (452) | ||||||||||||||
| Investment in equity-accounted investments | (93) | (20) | |||||||||||||||
| Proceeds from disposal of assets, net of cash and cash equivalents disposed | 3 | 3 | — | ||||||||||||||
| Purchases of financial assets | 5 | (452) | — | ||||||||||||||
| Proceeds from financial assets | 5 | 3 | 59 | ||||||||||||||
| Restricted cash and other | 16 | (10) | |||||||||||||||
| (1,176) | (1,203) | ||||||||||||||||
| Foreign exchange (gain) loss on cash | 14 | (1) | |||||||||||||||
| Cash and cash equivalents | |||||||||||||||||
| Increase | 141 | 9 | |||||||||||||||
| Net change in cash classified within assets held for sale | 1 | 1 | |||||||||||||||
| Balance, beginning of period | 998 | 900 | |||||||||||||||
| Balance, end of period | $ | 1,140 | $ | 910 | |||||||||||||
| Supplemental cash flow information: | |||||||||||||||||
| Interest paid | $ | 295 | $ | 237 | |||||||||||||
| Interest received | $ | 16 | $ | 6 | |||||||||||||
| Income taxes paid | $ | 31 | $ | 12 | |||||||||||||
The accompanying notes are an integral part of these interim consolidated financial statements.
| Brookfield Renewable Partners L.P. | Interim Report | March 31, 2023 | ||||||
Page 50 | ||||||||
BROOKFIELD RENEWABLE PARTNERS L.P.
NOTES TO THE UNAUDITED INTERIM CONSOLIDATED FINANCIAL STATEMENTS
The business activities of Brookfield Renewable Partners L.P. (“Brookfield Renewable”) consist of owning a portfolio of renewable power and sustainable solution assets primarily in North America, South America, Europe and Asia.
Unless the context indicates or requires otherwise, the term “Brookfield Renewable” means Brookfield Renewable Partners L.P. and its controlled entities, including Brookfield Renewable Corporation (“BEPC”). Unless the context indicates or requires otherwise, the term “the partnership” means Brookfield Renewable Partners L.P. and its controlled entities, excluding BEPC.
Brookfield Renewable’s consolidated equity interests include the non-voting publicly traded limited partnership units (“LP units”) held by public unitholders and Brookfield, class A exchangeable subordinate voting shares (“BEPC exchangeable shares”) of BEPC held by public shareholders and Brookfield, redeemable/exchangeable partnership units (“Redeemable/Exchangeable partnership units”) in Brookfield Renewable Energy L.P. (“BRELP”), a holding subsidiary of Brookfield Renewable, held by Brookfield, and general partnership interest (“GP interest”) in BRELP held by Brookfield. Holders of the LP units, Redeemable/Exchangeable partnership units, GP interest, and BEPC exchangeable shares will be collectively referred to throughout as “Unitholders” unless the context indicates or requires otherwise. LP units, Redeemable/Exchangeable partnership units, GP interest, and BEPC exchangeable shares will be collectively referred to throughout as "Units", or as "per Unit", unless the context indicates or requires otherwise.
Brookfield Renewable is a publicly traded limited partnership established under the laws of Bermuda pursuant to an amended and restated limited partnership agreement dated November 20, 2011 as thereafter amended from time to time.
The registered office of Brookfield Renewable is 73 Front Street, Fifth Floor, Hamilton HM12, Bermuda.
The immediate parent of Brookfield Renewable is its general partner, Brookfield Renewable Partners Limited (“BRPL”). The ultimate parent of Brookfield Renewable is Brookfield Corporation (“Brookfield Corporation”). Brookfield Corporation and its subsidiaries, other than Brookfield Renewable, and unless the context otherwise requires, includes Brookfield Asset Management Ltd (“Brookfield Asset Management”), are also individually and collectively referred to as “Brookfield” in these financial statements.
The BEPC exchangeable shares are traded under the symbol “BEPC” on the New York Stock Exchange and the Toronto Stock Exchange.
The LP units are traded under the symbol “BEP” on the New York Stock Exchange and under the symbol “BEP.UN” on the Toronto Stock Exchange. Brookfield Renewable's Class A Series 7, Series 13, Series 15, and Series 18 preferred limited partners’ equity are traded under the symbols “BEP.PR.E”, “BEP.PR.G”, “BEP.PR.I”, “BEP.PR.K”, “BEP.PR.M”, “BEP.PR.O”, and “BEP.PR.R”, respectively, on the Toronto Stock Exchange. Brookfield Renewable's Class A Series 17 preferred limited partners’ equity is traded under the symbol “BEP.PR.A” on the New York Stock Exchange. The perpetual subordinated notes are traded under the symbol “BEPH” and “BEPI” on the New York Stock Exchange.
| Notes to the consolidated financial statements | Page | |||||||
| 1. | Basis of preparation and significant accounting policies | |||||||
| 2. | Acquisitions | |||||||
| 3. | Disposal of assets | |||||||
| 4. | Assets held for sale | |||||||
| 5. | Risk management and financial instruments | |||||||
| 6. | Segmented information | |||||||
| 7. | Income taxes | |||||||
| 8. | Property, plant and equipment | |||||||
| 9. | Borrowings | |||||||
| 10. | Non-controlling interests | |||||||
| 11. | Preferred limited partners' equity | |||||||
| 12. | Limited partners' equity | |||||||
| 13. | Goodwill | |||||||
| 14. | Equity-accounted investments | |||||||
| 15. | Cash and cash equivalents | |||||||
| 16. | Restricted cash | |||||||
| 17. | Trade receivables and other current assets | |||||||
| 18. | Accounts payable and accrued liabilities | |||||||
| 19. | Commitments, contingencies and guarantees | |||||||
| 20. | Related party transactions | |||||||
| 21. | Subsidiary public issuers | |||||||
| 22. | Subsequent events | |||||||
| Brookfield Renewable Partners L.P. | Interim Report | March 31, 2023 | ||||||
Page 51 | ||||||||
1. BASIS OF PREPARATION AND SIGNIFICANT ACCOUNTING POLICIES
(a) Statement of compliance
The interim consolidated financial statements have been prepared in accordance with IAS 34, Interim Financial Reporting.
Certain information and footnote disclosures normally included in the annual audited consolidated financial statements prepared in accordance with International Financial Reporting Standards (“IFRS”), as issued by the International Accounting Standards Board (“IASB”), have been omitted or condensed. These interim consolidated financial statements should be read in conjunction with Brookfield Renewable’s December 31, 2022 audited consolidated financial statements. The interim consolidated statements have been prepared on a basis consistent with the accounting policies disclosed in the December 31, 2022 audited consolidated financial statements.
The interim consolidated financial statements are unaudited and reflect adjustments (consisting of normal recurring adjustments) that are, in the opinion of management, necessary to provide a fair statement of results for the interim periods in accordance with IFRS.
The results reported in these interim consolidated financial statements should not be regarded as necessarily indicative of results that may be expected for an entire year. The policies set out below are consistently applied to all periods presented, unless otherwise noted.
These consolidated financial statements have been authorized for issuance by the Board of Directors of Brookfield Renewable’s general partner, BRPL, on May 5, 2023.
Certain comparative figures have been reclassified to conform to the current year’s presentation.
References to $, C$, €, £, R$, COP, INR, and CNY are to United States (“U.S.”) dollars, Canadian dollars, Euros, British pound, Brazilian reais, Colombian pesos, Indian rupees, Malaysian ringgit and Chinese yuan, respectively.
All figures are presented in millions of U.S. dollars unless otherwise noted.
(b) Basis of preparation
The interim consolidated financial statements have been prepared on the basis of historical cost, except for the revaluation of property, plant and equipment and certain assets and liabilities which have been measured at fair value. Cost is recorded based on the fair value of the consideration given in exchange for assets.
(c) Consolidation
These consolidated financial statements include the accounts of Brookfield Renewable and its subsidiaries, which are the entities over which Brookfield Renewable has control. An investor controls an investee when it is exposed, or has rights, to variable returns from its involvement with the investee and has the ability to affect those returns through its power over the investee. Non-controlling interests in the equity of Brookfield Renewable’s subsidiaries are shown separately in equity in the combined statements of financial position.
(d) Recently adopted accounting standards
IFRS Interpretations Committee Agenda Decision - Demand Deposits with Restriction on Use Arising from a Contract with a Third Party (IAS 7 Statement of Cash Flows)
In April 2022, the IFRS Interpretations Committee (“IFRS IC”) concluded that restrictions on the use of a demand deposit arising from a contract with a third party do not result in the deposit no longer being cash, unless those restrictions change the nature of the deposit in a way that it would no longer meet the definition of cash in IAS 7 Statement of Cash Flows. In the fact pattern described in the request, the contractual restrictions on the use of the amounts held in the demand deposit did not change the nature of the deposit — the entity can access those amounts on demand. Therefore, the entity should include the demand deposit as a component of “cash and cash equivalents” in its statement of financial position and in its statement of cash flows. Brookfield Renewable has completed the assessment and implemented its transition plan that addresses the impact of this IFRS IC agenda decision. The effect on the consolidated statements of cash flows is an
| Brookfield Renewable Partners L.P. | Interim Report | March 31, 2023 | ||||||
Page 52 | ||||||||
increase to Cash and cash equivalents of $176 million and a decrease of $40 million to cash used in investing activities for the three months ended March 31, 2022.
(e) Future changes in accounting policies
Amendments to IAS 1 – Presentation of Financial Statements (“IAS 1”)
The amendments clarify how to classify debt and other liabilities as current or non-current. The amendments to IAS 1 apply to annual reporting periods beginning on or after January 1, 2024. Brookfield Renewable is currently assessing the impact of these amendments.
There are currently no other future changes to IFRS with potential impact on Brookfield Renewable.
2. ACQUISITIONS
Brazil Wind Portfolio
On March 3, 2023, Brookfield Renewable, together with its institutional partners, completed the acquisition of 100% interest in a 136 MW portfolio of operating wind assets in Brazil. The purchase price of this acquisition, including working capital and closing adjustments was $95 million. Brookfield Renewable holds an approximately 25% economic interest.
The preliminary purchase price allocations, at fair value, as at March 31, 2023, with respect to the acquisitions are as follows:
| (MILLIONS) | Brazil Wind Portfolio | ||||
| Cash and cash equivalents | $ | 10 | |||
| Trade receivables and other current assets | 9 | ||||
| Property, plant and equipment, at fair value | 125 | ||||
| Other non-current assets | 19 | ||||
| Accounts payable and accrued liabilities | (16) | ||||
| Current portion of non-recourse borrowings | (4) | ||||
| Non-recourse borrowings | (46) | ||||
| Provisions | (2) | ||||
| Fair value of net assets acquired | 95 | ||||
| Purchase price | $ | 95 | |||
3. DISPOSAL OF ASSETS
On March 17, 2023, Brookfield Renewable’s institutional partners completed the sale of a 78% interest in a 378 MW operating hydroelectric portfolio in the U.S., of which 28% was sold to affiliates of Brookfield Corporation. Brookfield Renewable retained its 22% interest in the investment and accordingly, did not receive any proceeds from the sale. Subsequent to the completion of the sale, Brookfield Renewable no longer consolidates this investment and recognized its interest as an equity-accounted investment. As a result of the disposition, Brookfield Renewable derecognized $667 million of total assets and $191 million of total liabilities from the consolidated statements of financial positions. Brookfield Renewable’s post-tax portion of the accumulated revaluation surplus of $34 million was reclassified from accumulated other comprehensive income directly to equity and presented as a Disposals item in the consolidated statements of changes in equity.
| Brookfield Renewable Partners L.P. | Interim Report | March 31, 2023 | ||||||
Page 53 | ||||||||
4. ASSETS HELD FOR SALE
As at March 31, 2023, assets held for sale include wind assets in the U.S. that were acquired in 2022 as part of the acquisition of a renewables developer that had a pre-existing sale and purchase agreement at the time of acquisition.
The following is a summary of the major items of assets and liabilities classified as held for sale:
| (MILLIONS) | March 31, 2023 | December 31, 2022 | |||||||||
| Assets | |||||||||||
| Cash and cash equivalents | $ | 1 | $ | 9 | |||||||
| Restricted cash | 3 | 5 | |||||||||
| Trade receivables and other current assets | 2 | 4 | |||||||||
| Financial instrument assets | — | 3 | |||||||||
| Property, plant and equipment, at fair value | 249 | 911 | |||||||||
| Other long-term assets | 7 | 6 | |||||||||
| Assets held for sale | $ | 262 | $ | 938 | |||||||
| Liabilities | |||||||||||
| Current liabilities | $ | 2 | $ | 9 | |||||||
| Non-recourse borrowings | — | 171 | |||||||||
| Financial instrument liabilities | 130 | 167 | |||||||||
| Other long-term liabilities | 20 | 1 | |||||||||
| Provisions | 3 | $ | 3 | ||||||||
| Liabilities directly associated with assets held for sale | $ | 155 | $ | 351 | |||||||
5. RISK MANAGEMENT AND FINANCIAL INSTRUMENTS
RISK MANAGEMENT
Brookfield Renewable`s activities expose it to a variety of financial risks, including market risk (i.e., commodity price risk, interest rate risk, and foreign currency risk), credit risk and liquidity risk. Brookfield Renewable uses financial instruments primarily to manage these risks.
There have been no other material changes in exposure to the risks Brookfield Renewable is exposed to since the December 31, 2022 audited consolidated financial statements.
Fair value disclosures
Fair value is the price that would be received to sell an asset or paid to transfer a liability in an orderly transaction between market participants at the measurement date.
Fair values determined using valuation models require the use of assumptions concerning the amount and timing of estimated future cash flows and discount rates. In determining those assumptions, management looks primarily to external readily observable market inputs such as interest rate yield curves, currency rates, commodity prices and, as applicable, credit spreads.
A fair value measurement of a non-financial asset is the consideration that would be received in an orderly transaction between market participants, considering the highest and best use of the asset.
Assets and liabilities measured at fair value are categorized into one of three hierarchy levels, described below. Each level is based on the transparency of the inputs used to measure the fair values of assets and liabilities.
Level 1 – inputs are based on unadjusted quoted prices in active markets for identical assets and liabilities;
Level 2 – inputs, other than quoted prices in Level 1, that are observable for the asset or liability, either directly or indirectly; and
Level 3 – inputs for the asset or liability that are not based on observable market data.
| Brookfield Renewable Partners L.P. | Interim Report | March 31, 2023 | ||||||
Page 54 | ||||||||
The following table presents Brookfield Renewable's assets and liabilities including energy derivative contracts, power purchase agreements accounted for under IFRS 9 (“IFRS 9 PPAs”), interest rate swaps, foreign exchange swaps and tax equity measured and disclosed at fair value classified by the fair value hierarchy:
| March 31, 2023 | December 31, 2022 | ||||||||||||||||||||||||||||
| (MILLIONS) | Level 1 | Level 2 | Level 3 | Total | Total | ||||||||||||||||||||||||
| Assets measured at fair value: | |||||||||||||||||||||||||||||
| Cash and cash equivalents | $ | 1,140 | $ | — | $ | — | $ | 1,140 | $ | 998 | |||||||||||||||||||
Restricted cash(1) | 178 | — | — | 178 | 191 | ||||||||||||||||||||||||
Financial instrument assets(1) | |||||||||||||||||||||||||||||
| IFRS 9 PPAs | — | — | 9 | 9 | 2 | ||||||||||||||||||||||||
| Energy derivative contracts | — | 60 | — | 60 | 37 | ||||||||||||||||||||||||
| Interest rate swaps | — | 295 | — | 295 | 335 | ||||||||||||||||||||||||
| Foreign exchange swaps | — | 15 | — | 15 | 16 | ||||||||||||||||||||||||
| Investments in debt and equity securities | 161 | 40 | 1,501 | 1,702 | 1,235 | ||||||||||||||||||||||||
| Property, plant and equipment | — | — | 54,977 | 54,977 | 54,283 | ||||||||||||||||||||||||
| Liabilities measured at fair value: | |||||||||||||||||||||||||||||
Financial instrument liabilities(1) | |||||||||||||||||||||||||||||
| IFRS 9 PPAs | — | — | (578) | (578) | (670) | ||||||||||||||||||||||||
| Energy derivative contracts | — | (103) | — | (103) | (236) | ||||||||||||||||||||||||
| Interest rate swaps | — | (99) | — | (99) | (82) | ||||||||||||||||||||||||
| Foreign exchange swaps | — | (124) | — | (124) | (110) | ||||||||||||||||||||||||
| Tax equity | — | — | (1,122) | (1,122) | (1,131) | ||||||||||||||||||||||||
Contingent consideration(1)(2) | — | — | (75) | (75) | (68) | ||||||||||||||||||||||||
Liabilities for which fair value is disclosed: | |||||||||||||||||||||||||||||
Corporate borrowings(1) | (2,628) | — | — | (2,628) | (2,362) | ||||||||||||||||||||||||
Non-recourse borrowing(1) | (2,145) | (19,576) | — | (21,721) | (21,117) | ||||||||||||||||||||||||
| Total | $ | (3,294) | $ | (19,492) | $ | 54,712 | $ | 31,926 | $ | 31,321 | |||||||||||||||||||
(1)Includes both the current amount and long-term amounts.
(2)Amount relates to business combinations completed in 2022 with obligations lapsing from 2023 to 2027.
There were no transfers between levels during the three months ended March 31, 2023.
| Brookfield Renewable Partners L.P. | Interim Report | March 31, 2023 | ||||||
Page 55 | ||||||||
Financial instruments disclosures
The aggregate amount of Brookfield Renewable's net financial instrument positions are as follows:
| March 31, 2023 | December 31, 2022 | ||||||||||||||||||||||
| (MILLIONS) | Assets | Liabilities | Net Assets (Liabilities) | Net Assets (Liabilities) | |||||||||||||||||||
| IFRS 9 PPAs | 9 | 578 | (569) | (668) | |||||||||||||||||||
| Energy derivative contracts | $ | 60 | $ | 103 | $ | (43) | $ | (199) | |||||||||||||||
| Interest rate swaps | 295 | 99 | 196 | 253 | |||||||||||||||||||
| Foreign exchange swaps | 15 | 124 | (109) | (94) | |||||||||||||||||||
| Investments in debt and equity securities | 1,702 | — | 1,702 | 1,235 | |||||||||||||||||||
| Tax equity | — | 1,122 | (1,122) | (1,131) | |||||||||||||||||||
| Total | 2,081 | 2,026 | 55 | (604) | |||||||||||||||||||
| Less: current portion | 139 | 482 | (343) | (434) | |||||||||||||||||||
| Long-term portion | $ | 1,942 | $ | 1,544 | $ | 398 | $ | (170) | |||||||||||||||
(a) Energy derivative contracts and IFRS 9 PPAs
Brookfield Renewable has entered into long-term energy derivative contracts primarily to stabilize or eliminate the price risk on the sale of certain future power generation. Certain energy contracts are recorded in Brookfield Renewable's interim consolidated financial statements at an amount equal to fair value, using quoted market prices or, in their absence, a valuation model using both internal and third-party evidence and forecasts.
(b) Interest rate hedges
Brookfield Renewable has entered into interest rate hedge contracts primarily to minimize exposure to interest rate fluctuations on its variable rate debt or to lock in interest rates on future debt refinancing. All interest rate hedge contracts are recorded in the interim consolidated financial statements at fair value.
(c) Foreign exchange swaps
Brookfield Renewable has entered into foreign exchange swaps to minimize its exposure to currency fluctuations impacting its investments and earnings in foreign operations, and to fix the exchange rate on certain anticipated transactions denominated in foreign currencies.
(d) Tax equity
Brookfield Renewable owns and operates certain projects in the United States under tax equity structures to finance the construction of utility-scale solar, and wind projects. In accordance with the substance of the contractual agreements, the amounts paid by the tax equity investors for their equity stakes are classified as financial instrument liabilities on the consolidated statements of financial position.
Gains or loss on the tax equity liabilities are recognized within the foreign exchange and financial instruments gain (loss) in the consolidated statements of income (loss).
(e) Investments in debt and equity securities
Brookfield Renewable's investments in debt and equity securities consist of investments in securities which are recorded on the statement of financial position at fair value.
| Brookfield Renewable Partners L.P. | Interim Report | March 31, 2023 | ||||||
Page 56 | ||||||||
The following table reflects the gains (losses) included in Foreign exchange and financial instrument gain (loss) in the interim consolidated statements of income (loss) for the three months ended March 31:
| Three months ended March 31 | |||||||||||
| (MILLIONS) | 2023 | 2022 | |||||||||
| Energy derivative contracts | $ | 66 | $ | (194) | |||||||
| IFRS 9 PPAs | 57 | 78 | |||||||||
| Interest rate swaps | (6) | 50 | |||||||||
| Foreign exchange swaps | (5) | 8 | |||||||||
| Tax equity | 8 | 30 | |||||||||
| Foreign exchange (loss) gain | 13 | (9) | |||||||||
| $ | 133 | $ | (37) | ||||||||
For the three months ended March 31, 2023, the gains associated with debt and equity securities of $13 million (2022: nil) was recorded in Other on the interim consolidated statements of income (loss).
The following table reflects the gains (losses) included in other comprehensive income in the interim consolidated statements of comprehensive income (loss) for the three months ended March 31:
| Three months ended March 31 | |||||||||||
| (MILLIONS) | 2023 | 2022 | |||||||||
| Energy derivative contracts | $ | 166 | $ | (186) | |||||||
| IFRS 9 PPAs | 12 | 37 | |||||||||
| Interest rate swaps | (46) | 127 | |||||||||
| Foreign exchange swaps | (4) | (11) | |||||||||
| 128 | (33) | ||||||||||
| Foreign exchange swaps – net investment | (19) | (45) | |||||||||
| Investments in debt and equity securities | 10 | (5) | |||||||||
| $ | 119 | $ | (83) | ||||||||
The following table reflects the reclassification adjustments recognized in net income (loss) in the interim consolidated statements of comprehensive income (loss) for the three months ended March 31:
| Three months ended March 31 | |||||||||||
| (MILLIONS) | 2023 | 2022 | |||||||||
| Energy derivative contracts | $ | (48) | $ | 55 | |||||||
| IFRS 9 PPAs | — | (2) | |||||||||
| Interest rate swaps | (1) | 3 | |||||||||
| $ | (49) | $ | 56 | ||||||||
6. SEGMENTED INFORMATION
Brookfield Renewable’s Chief Executive Officer and Chief Financial Officer (collectively, the chief operating decision maker or “CODM”) review the results of the business, manage operations, and allocate resources based on the type of technology.
Brookfield Renewable’s operations are segmented by – 1) hydroelectric, 2) wind, 3) utility-scale solar, 4) distributed energy & sustainable solutions (distributed generation, pumped storage, renewable natural gas, carbon capture and storage, recycling, cogeneration and biomass), and 5) corporate – with hydroelectric and wind further segmented by geography (i.e. North America, Colombia, Brazil, Europe and Asia). This best reflects the way in which the CODM reviews results of our company.
Reporting to the CODM on the measures utilized to assess performance and allocate resources is provided on a proportionate basis. Information on a proportionate basis reflects Brookfield Renewable’s share from facilities which it
| Brookfield Renewable Partners L.P. | Interim Report | March 31, 2023 | ||||||
Page 57 | ||||||||
accounts for using consolidation and the equity method whereby Brookfield Renewable either controls or exercises significant influence or joint control over the investment, respectively. Proportionate information provides a Unitholder (holders of the GP interest, Redeemable/Exchangeable partnership units, BEPC exchangeable shares and LP units) perspective that the CODM considers important when performing internal analyses and making strategic and operating decisions. The CODM also believes that providing proportionate information helps investors understand the impacts of decisions made by management and financial results allocable to Brookfield Renewable’s Unitholders.
Proportionate financial information is not, and is not intended to be, presented in accordance with IFRS. Tables reconciling IFRS data with data presented on a proportionate consolidation basis have been disclosed. Segment revenues, other income, direct operating costs, interest expense, depreciation, current and deferred income taxes, and other are items that will differ from results presented in accordance with IFRS as these items include Brookfield Renewable’s proportionate share of earnings from equity-accounted investments attributable to each of the above-noted items, and exclude the proportionate share of earnings (loss) of consolidated investments not held by us apportioned to each of the above-noted items.
Brookfield Renewable does not control those entities that have not been consolidated and as such, have been presented as equity-accounted investments in its consolidated financial statements. The presentation of the assets and liabilities and revenues and expenses does not represent Brookfield Renewable’s legal claim to such items, and the removal of financial statement amounts that are attributable to non-controlling interests does not extinguish Brookfield Renewable’s legal claims or exposures to such items.
Brookfield Renewable reports its results in accordance with these segments and presents prior period segmented information in a consistent manner.
The accounting policies of the reportable segments are the same as those described in Note 1 – Basis of preparation and significant accounting policies. Brookfield Renewable analyzes the performance of its operating segments based on Funds From Operations. Funds From Operations is not a generally accepted accounting measure under IFRS and therefore may differ from definitions of Funds From Operations used by other entities, as well as the definition of funds from operations used by the Real Property Association of Canada (“REALPAC”) and the National Association of Real Estate Investment Trusts, Inc. (“NAREIT”).
Brookfield Renewable uses Funds From Operations to assess the performance of Brookfield Renewable before the effects of certain cash items (e.g., acquisition costs and other typical non-recurring cash items) and certain non-cash items (e.g., deferred income taxes, depreciation, non-cash portion of non-controlling interests, unrealized gain or loss on financial instruments, non-cash gain or loss from equity-accounted investments, and other non-cash items) as these are not reflective of the performance of the underlying business. Brookfield Renewable includes realized disposition gains and losses on assets that we developed and/or did not intend to hold over the long-term within Funds From Operations in order to provide additional insight regarding the performance of investments on a cumulative realized basis, including any unrealized fair value adjustments that were recorded in equity and not otherwise reflected in current period net income.
| Brookfield Renewable Partners L.P. | Interim Report | March 31, 2023 | ||||||
Page 58 | ||||||||
The following table provides each segment's results in the format that management organizes its segments to make operating decisions and assess performance and reconciles Brookfield Renewable's proportionate results to the consolidated statements of income (loss) on a line by line basis by aggregating the components comprising the earnings from Brookfield Renewable's investments in associates and reflecting the portion of each line item attributable to non-controlling interests for the three months ended March 31, 2023:
| Attributable to Unitholders | Contribution from equity-accounted investments | Attributable to non- controlling interests | As per IFRS financials(1) | ||||||||||||||||||||||||||||||||||||||||||||||||||||||||||||||||||||||||||||||||
| Hydroelectric | Wind | Utility-scale solar | Distributed energy & sustainable solutions | Corporate | Total | ||||||||||||||||||||||||||||||||||||||||||||||||||||||||||||||||||||||||||||||
| (MILLIONS) | North America | Brazil | Colombia | North America | Europe | Brazil | Asia | ||||||||||||||||||||||||||||||||||||||||||||||||||||||||||||||||||||||||||||
| Revenues | $ | 335 | $ | 61 | $ | 66 | $ | 85 | $ | 40 | $ | 8 | $ | 10 | $ | 88 | $ | 79 | $ | — | $ | 772 | $ | (79) | $ | 638 | $ | 1,331 | |||||||||||||||||||||||||||||||||||||||||||||||||||||||
| Other income | 4 | 1 | 1 | 1 | — | — | — | 8 | 5 | 12 | 32 | (5) | (1) | 26 | |||||||||||||||||||||||||||||||||||||||||||||||||||||||||||||||||||||
| Direct operating costs | (109) | (17) | (19) | (25) | (8) | (2) | (1) | (27) | (28) | (9) | (245) | 34 | (190) | (401) | |||||||||||||||||||||||||||||||||||||||||||||||||||||||||||||||||||||
| Share of revenue, other income and direct operating costs from equity-accounted investments | — | — | — | — | — | — | — | — | — | — | — | 50 | — | 50 | |||||||||||||||||||||||||||||||||||||||||||||||||||||||||||||||||||||
| 230 | 45 | 48 | 61 | 32 | 6 | 9 | 69 | 56 | 3 | 559 | — | 447 | |||||||||||||||||||||||||||||||||||||||||||||||||||||||||||||||||||||||
| Management service costs | — | — | — | — | — | — | — | — | — | (57) | (57) | — | — | (57) | |||||||||||||||||||||||||||||||||||||||||||||||||||||||||||||||||||||
| Interest expense | (71) | (5) | (18) | (18) | (4) | (1) | (3) | (27) | (12) | (28) | (187) | 10 | (217) | (394) | |||||||||||||||||||||||||||||||||||||||||||||||||||||||||||||||||||||
| Current income taxes | (1) | (2) | (7) | — | (2) | — | (1) | (2) | (1) | — | (16) | 3 | (30) | (43) | |||||||||||||||||||||||||||||||||||||||||||||||||||||||||||||||||||||
| Distributions attributable to | |||||||||||||||||||||||||||||||||||||||||||||||||||||||||||||||||||||||||||||||||||
Preferred limited partners equity | — | — | — | — | — | — | — | — | — | (10) | (10) | — | — | (10) | |||||||||||||||||||||||||||||||||||||||||||||||||||||||||||||||||||||
Preferred equity | — | — | — | — | — | — | — | — | — | (7) | (7) | — | — | (7) | |||||||||||||||||||||||||||||||||||||||||||||||||||||||||||||||||||||
| Perpetual subordinated notes | — | — | — | — | — | — | — | — | — | (7) | (7) | — | — | (7) | |||||||||||||||||||||||||||||||||||||||||||||||||||||||||||||||||||||
Share of interest and cash taxes from equity accounted investments | — | — | — | — | — | — | — | — | — | — | — | (13) | — | (13) | |||||||||||||||||||||||||||||||||||||||||||||||||||||||||||||||||||||
Share of Funds From Operations attributable to non-controlling interests | — | — | — | — | — | — | — | — | — | — | — | — | (200) | (200) | |||||||||||||||||||||||||||||||||||||||||||||||||||||||||||||||||||||
Funds From Operations | 158 | 38 | 23 | 43 | 26 | 5 | 5 | 40 | 43 | (106) | 275 | — | — | ||||||||||||||||||||||||||||||||||||||||||||||||||||||||||||||||||||||
Depreciation | (241) | 13 | (201) | (429) | |||||||||||||||||||||||||||||||||||||||||||||||||||||||||||||||||||||||||||||||
| Foreign exchange and financial instrument gain (loss) | 29 | 18 | 86 | 133 | |||||||||||||||||||||||||||||||||||||||||||||||||||||||||||||||||||||||||||||||
Deferred income tax expense | 3 | 3 | 13 | 19 | |||||||||||||||||||||||||||||||||||||||||||||||||||||||||||||||||||||||||||||||
Other | (98) | (30) | 87 | (41) | |||||||||||||||||||||||||||||||||||||||||||||||||||||||||||||||||||||||||||||||
Share of earnings from equity-accounted investments | — | (4) | — | (4) | |||||||||||||||||||||||||||||||||||||||||||||||||||||||||||||||||||||||||||||||
| Net income attributable to non-controlling interests | — | — | 15 | 15 | |||||||||||||||||||||||||||||||||||||||||||||||||||||||||||||||||||||||||||||||
Net income (loss) attributable to Unitholders(2) | $ | (32) | $ | — | $ | — | $ | (32) | |||||||||||||||||||||||||||||||||||||||||||||||||||||||||||||||||||||||||||
(1)Share of earnings from equity-accounted investments of $33 million is comprised of amounts found on the share of revenue, other income and direct operating costs, share of interest and cash taxes and share of earnings lines. Net income attributable to participating non-controlling interests – in operating subsidiaries of $185 million is comprised of amounts found on share of Funds From Operations attributable to non-controlling interests and Net loss attributable to non-controlling interests.
(2)Net income (loss) attributable to Unitholders includes net income (loss) attributable to GP interest, Redeemable/Exchangeable partnership units, BEPC exchangeable shares and LP units. Total net income (loss) includes amounts attributable to Unitholders, non-controlling interests, preferred limited partners equity, preferred equity and perpetual subordinated notes.
| Brookfield Renewable Partners L.P. | Interim Report | March 31, 2023 | ||||||
Page 59 | ||||||||
The following table provides each segment's results in the format that management organizes its segments to make operating decisions and assess performance and reconciles Brookfield Renewable's proportionate results to the consolidated statements of income on a line by line basis by aggregating the components comprising the earnings from Brookfield Renewable's investments in associates and reflecting the portion of each line item attributable to non-controlling interests for the three months ended March 31, 2022:
| Attributable to Unitholders | Contribution from equity-accounted investments | Attributable to non- controlling interests | As per IFRS financials(1) | ||||||||||||||||||||||||||||||||||||||||||||||||||||||||||||||||||||||||||||||||
| Hydroelectric | Wind | Utility-scale solar | Distributed energy & sustainable solutions | Corporate | Total | ||||||||||||||||||||||||||||||||||||||||||||||||||||||||||||||||||||||||||||||
| (MILLIONS) | North America | Brazil | Colombia | North America | Europe | Brazil | Asia | ||||||||||||||||||||||||||||||||||||||||||||||||||||||||||||||||||||||||||||
| Revenues | $ | 236 | $ | 48 | $ | 73 | $ | 86 | $ | 51 | $ | 6 | $ | 9 | $ | 81 | $ | 59 | $ | — | $ | 649 | $ | (49) | $ | 536 | $ | 1,136 | |||||||||||||||||||||||||||||||||||||||||||||||||||||||
| Other income | 2 | 18 | — | — | 4 | — | — | 36 | 13 | 5 | 78 | (12) | 5 | 71 | |||||||||||||||||||||||||||||||||||||||||||||||||||||||||||||||||||||
| Direct operating costs | (97) | (13) | (20) | (26) | (9) | (2) | (2) | (27) | (24) | (8) | (228) | 21 | (143) | (350) | |||||||||||||||||||||||||||||||||||||||||||||||||||||||||||||||||||||
| Share of revenue, other income and direct operating costs from equity-accounted investments | — | — | — | — | — | — | — | — | — | — | — | 40 | 2 | 42 | |||||||||||||||||||||||||||||||||||||||||||||||||||||||||||||||||||||
| 141 | 53 | 53 | 60 | 46 | 4 | 7 | 90 | 48 | (3) | 499 | — | 400 | |||||||||||||||||||||||||||||||||||||||||||||||||||||||||||||||||||||||
| Management service costs | — | — | — | — | — | — | — | — | — | (76) | (76) | — | — | (76) | |||||||||||||||||||||||||||||||||||||||||||||||||||||||||||||||||||||
| Interest expense | (45) | (5) | (10) | (16) | (4) | (1) | (3) | (26) | (10) | (20) | (140) | 6 | (132) | (266) | |||||||||||||||||||||||||||||||||||||||||||||||||||||||||||||||||||||
| Current income taxes | (2) | (3) | (8) | — | (1) | — | — | — | (1) | — | (15) | 3 | (30) | (42) | |||||||||||||||||||||||||||||||||||||||||||||||||||||||||||||||||||||
| Distributions attributable to | |||||||||||||||||||||||||||||||||||||||||||||||||||||||||||||||||||||||||||||||||||
Preferred limited partners equity | — | — | — | — | — | — | — | — | — | (11) | (11) | — | — | (11) | |||||||||||||||||||||||||||||||||||||||||||||||||||||||||||||||||||||
Preferred equity | — | — | — | — | — | — | — | — | — | (7) | (7) | — | — | (7) | |||||||||||||||||||||||||||||||||||||||||||||||||||||||||||||||||||||
| Perpetual subordinated notes | (7) | (7) | — | — | (7) | ||||||||||||||||||||||||||||||||||||||||||||||||||||||||||||||||||||||||||||||
Share of interest and cash taxes from equity accounted investments | — | — | — | — | — | — | — | — | — | — | — | (9) | (2) | (11) | |||||||||||||||||||||||||||||||||||||||||||||||||||||||||||||||||||||
Share of Funds From Operations attributable to non-controlling interests | — | — | — | — | — | — | — | — | — | — | — | — | (236) | (236) | |||||||||||||||||||||||||||||||||||||||||||||||||||||||||||||||||||||
Funds From Operations | 94 | 45 | 35 | 44 | 41 | 3 | 4 | 64 | 37 | (124) | 243 | — | — | ||||||||||||||||||||||||||||||||||||||||||||||||||||||||||||||||||||||
Depreciation | (246) | 9 | (164) | (401) | |||||||||||||||||||||||||||||||||||||||||||||||||||||||||||||||||||||||||||||||
| Foreign exchange and financial instrument gain (loss) | (24) | 1 | (14) | (37) | |||||||||||||||||||||||||||||||||||||||||||||||||||||||||||||||||||||||||||||||
Deferred income tax expense | 30 | — | (4) | 26 | |||||||||||||||||||||||||||||||||||||||||||||||||||||||||||||||||||||||||||||||
Other | (81) | 2 | 32 | (47) | |||||||||||||||||||||||||||||||||||||||||||||||||||||||||||||||||||||||||||||||
| Share of loss from equity-accounted investments | — | (12) | — | (12) | |||||||||||||||||||||||||||||||||||||||||||||||||||||||||||||||||||||||||||||||
| Net loss attributable to non-controlling interests | — | — | 150 | 150 | |||||||||||||||||||||||||||||||||||||||||||||||||||||||||||||||||||||||||||||||
Net income (loss) attributable to Unitholders(2) | $ | (78) | $ | — | $ | — | $ | (78) | |||||||||||||||||||||||||||||||||||||||||||||||||||||||||||||||||||||||||||
(1)Share of loss from equity-accounted investments of $19 million is comprised of amounts found on the share of revenue, other income and direct operating costs, share of interest and cash taxes and share of earnings lines. Net loss attributable to participating non-controlling interests – in operating subsidiaries of $86 million is comprised of amounts found on Share of Funds From Operations attributable to non-controlling interests and Net loss attributable to non-controlling interests.
(2)Net income (loss) attributable to Unitholders includes net income (loss) attributable to GP interest, Redeemable/Exchangeable partnership units, BEPC exchangeable shares and LP units. Total net income (loss) includes amounts attributable to Unitholders, non-controlling interests, preferred limited partners equity, preferred equity and perpetual subordinated notes.
| Brookfield Renewable Partners L.P. | Interim Report | March 31, 2023 | ||||||
Page 60 | ||||||||
The following table provides information on each segment's statement of financial position in the format that management organizes its segments to make operating decisions and assess performance and reconciles Brookfield Renewable's proportionate results to the consolidated statements of financial position by aggregating the components comprising from Brookfield Renewable's investments in associates and reflecting the portion of each line item attributable to non-controlling interests:
| Attributable to Unitholders | Contribution from equity-accounted investments | Attributable to non- controlling interests | As per IFRS financials | ||||||||||||||||||||||||||||||||||||||||||||||||||||||||||||||||||||||||||||||||
| Hydroelectric | Wind | Utility-scale solar | Distributed energy & sustainable solutions | Corporate | Total | ||||||||||||||||||||||||||||||||||||||||||||||||||||||||||||||||||||||||||||||
| (MILLIONS) | North America | Brazil | Colombia | North America | Europe | Brazil | Asia | ||||||||||||||||||||||||||||||||||||||||||||||||||||||||||||||||||||||||||||
| As at March 31, 2023 | |||||||||||||||||||||||||||||||||||||||||||||||||||||||||||||||||||||||||||||||||||
| Cash and cash equivalents | $ | 97 | $ | 42 | $ | 56 | $ | 53 | $ | 45 | $ | 18 | $ | 31 | $ | 86 | $ | 64 | $ | 19 | $ | 511 | $ | (43) | $ | 672 | $ | 1,140 | |||||||||||||||||||||||||||||||||||||||||||||||||||||||
| Property, plant and equipment | 15,396 | 1,765 | 1,898 | 3,591 | 655 | 399 | 298 | 3,064 | 2,343 | — | 29,409 | (767) | 26,335 | 54,977 | |||||||||||||||||||||||||||||||||||||||||||||||||||||||||||||||||||||
| Total assets | 16,596 | 1,938 | 2,150 | 4,008 | 801 | 433 | 406 | 3,603 | 2,823 | 626 | 33,384 | (497) | 31,910 | 64,797 | |||||||||||||||||||||||||||||||||||||||||||||||||||||||||||||||||||||
| Total borrowings | 4,158 | 264 | 558 | 1,343 | 362 | 96 | 246 | 2,301 | 931 | 2,787 | 13,046 | (424) | 12,566 | 25,188 | |||||||||||||||||||||||||||||||||||||||||||||||||||||||||||||||||||||
| Other liabilities | 5,214 | 114 | 678 | 1,095 | 208 | 21 | 78 | 685 | 555 | 302 | 8,950 | (61) | 3,808 | 12,697 | |||||||||||||||||||||||||||||||||||||||||||||||||||||||||||||||||||||
| As at December 31, 2022 | |||||||||||||||||||||||||||||||||||||||||||||||||||||||||||||||||||||||||||||||||||
| Cash and cash equivalents | $ | 55 | $ | 15 | $ | 14 | $ | 48 | $ | 56 | $ | 22 | $ | 24 | $ | 139 | $ | 72 | $ | — | $ | 445 | $ | (43) | $ | 596 | $ | 998 | |||||||||||||||||||||||||||||||||||||||||||||||||||||||
| Property, plant and equipment | 15,331 | 1,743 | 1,826 | 3,563 | 650 | 346 | 294 | 3,046 | 2,337 | — | 29,136 | (1,165) | 26,312 | 54,283 | |||||||||||||||||||||||||||||||||||||||||||||||||||||||||||||||||||||
| Total assets | 16,971 | 1,880 | 2,036 | 3,969 | 816 | 381 | 399 | 3,520 | 2,794 | 581 | 33,347 | (587) | 31,351 | 64,111 | |||||||||||||||||||||||||||||||||||||||||||||||||||||||||||||||||||||
| Total borrowings | 4,206 | 258 | 526 | 1,356 | 358 | 83 | 238 | 2,382 | 928 | 2,556 | 12,891 | (373) | 12,332 | 24,850 | |||||||||||||||||||||||||||||||||||||||||||||||||||||||||||||||||||||
| Other liabilities | 5,250 | 99 | 634 | 1,344 | 244 | 15 | 71 | 492 | 507 | 271 | 8,927 | (204) | 4,252 | 12,975 | |||||||||||||||||||||||||||||||||||||||||||||||||||||||||||||||||||||
| Brookfield Renewable Partners L.P. | Interim Report | March 31, 2023 | ||||||
Page 61 | ||||||||
Geographical Information
The following table presents consolidated revenue split by reportable segment for the three months ended March 31:
| Three months ended March 31 | |||||||||||
| (MILLIONS) | 2023 | 2022 | |||||||||
| Hydroelectric | |||||||||||
| North America | $ | 422 | $ | 285 | |||||||
| Brazil | 67 | 47 | |||||||||
| Colombia | 283 | 305 | |||||||||
| 772 | 637 | ||||||||||
| Wind | |||||||||||
| North America | 186 | 164 | |||||||||
| Europe | 61 | 77 | |||||||||
| Brazil | 23 | 17 | |||||||||
| Asia | 49 | 38 | |||||||||
| 319 | 296 | ||||||||||
| Utility-scale solar | 164 | 142 | |||||||||
| Distributed energy & sustainable solutions | 76 | 61 | |||||||||
| Total | $ | 1,331 | $ | 1,136 | |||||||
The following table presents consolidated property, plant and equipment and equity-accounted investments split by geography region:
| (MILLIONS) | March 31, 2023 | December 31, 2022 | |||||||||
| United States | $ | 29,242 | $ | 29,056 | |||||||
| Colombia | 8,569 | 8,264 | |||||||||
| Canada | 7,518 | 7,560 | |||||||||
| Brazil | 5,029 | 4,754 | |||||||||
| Europe | 3,987 | 3,963 | |||||||||
| Asia | 2,079 | 1,932 | |||||||||
| Other | 156 | 146 | |||||||||
| $ | 56,580 | $ | 55,675 | ||||||||
7. INCOME TAXES
Brookfield Renewable's effective income tax rate was 12% for the three months ended March 31, 2023 (2022: 33%). The effective tax rate is different than the statutory rate primarily due to rate differentials and non-controlling interests' income or loss not subject to tax.
| Brookfield Renewable Partners L.P. | Interim Report | March 31, 2023 | ||||||
Page 62 | ||||||||
8. PROPERTY, PLANT AND EQUIPMENT
The following table presents a reconciliation of property, plant and equipment at fair value:
| (MILLIONS) | Hydroelectric | Wind | Solar | Other(1) | Total | ||||||||||||||||||||||||
Property, plant and equipment, at fair value | |||||||||||||||||||||||||||||
| As at December 31, 2022 | $ | 31,168 | $ | 11,302 | $ | 8,239 | $ | 242 | $ | 50,951 | |||||||||||||||||||
| Additions, net | 1 | 4 | 3 | — | 8 | ||||||||||||||||||||||||
| Transfer from construction work-in-progress | 5 | 141 | 318 | — | 464 | ||||||||||||||||||||||||
| Acquisitions through business combinations | — | 125 | — | — | 125 | ||||||||||||||||||||||||
| Disposals | — | — | — | (5) | (5) | ||||||||||||||||||||||||
Items recognized through OCI: | |||||||||||||||||||||||||||||
Foreign exchange | 382 | 23 | 56 | 3 | 464 | ||||||||||||||||||||||||
Items recognized through net income: | |||||||||||||||||||||||||||||
Depreciation | (153) | (158) | (111) | (7) | (429) | ||||||||||||||||||||||||
As at March 31, 2023 | $ | 31,403 | $ | 11,437 | $ | 8,505 | $ | 233 | $ | 51,578 | |||||||||||||||||||
| Construction work-in-progress | |||||||||||||||||||||||||||||
| As at December 31, 2022 | 299 | 1,132 | 1,897 | 4 | 3,332 | ||||||||||||||||||||||||
| Additions | 15 | 269 | 245 | — | 529 | ||||||||||||||||||||||||
| Transfer to property, plant and equipment | (5) | (141) | (318) | — | (464) | ||||||||||||||||||||||||
Items recognized through OCI: | |||||||||||||||||||||||||||||
| Change in fair value | — | — | 7 | — | 7 | ||||||||||||||||||||||||
Foreign exchange | 1 | 10 | (16) | — | (5) | ||||||||||||||||||||||||
As at March 31, 2023 | $ | 310 | $ | 1,270 | $ | 1,815 | $ | 4 | $ | 3,399 | |||||||||||||||||||
| Total property, plant and equipment, at fair value | |||||||||||||||||||||||||||||
As at December 31, 2022(2) | $ | 31,467 | $ | 12,434 | $ | 10,136 | $ | 246 | $ | 54,283 | |||||||||||||||||||
As at March 31, 2023(2) | $ | 31,713 | $ | 12,707 | $ | 10,320 | $ | 237 | $ | 54,977 | |||||||||||||||||||
(1)Includes biomass and cogeneration.
(2)Includes right-of-use assets not subject to revaluation of $65 million (2022: $64 million) in hydroelectric, $239 million (2022: $242 million) in wind, $216 million (2022: $215 million) in solar, and nil (2022: nil) in other.
During the quarter, Brookfield Renewable, together with its institutional partners, completed the acquisitions of the following investments. They are accounted for as asset acquisitions as they do not constitute business combinations under IFRS 3:
•A 7 MW a portfolio of distributed generation assets in the U.S., with $32 million of property, plant and equipment included in the consolidated statements of financial position at the acquisition date. Brookfield Renewable holds a 25% economic interest.
| Brookfield Renewable Partners L.P. | Interim Report | March 31, 2023 | ||||||
Page 63 | ||||||||
9. BORROWINGS
Corporate Borrowings
The composition of corporate borrowings is presented in the following table:
| March 31, 2023 | December 31, 2022 | ||||||||||||||||||||||||||||||||||||||||||||||
| Weighted-average | Weighted- average | ||||||||||||||||||||||||||||||||||||||||||||||
| (MILLIONS EXCEPT AS NOTED) | Interest rate (%) | Term (years) | Carrying value | Estimated fair value | Interest rate (%) | Term (years) | Carrying value | Estimated fair value | |||||||||||||||||||||||||||||||||||||||
| Credit facilities | N/A | 4 | $ | — | — | N/A | 5 | $ | — | $ | — | ||||||||||||||||||||||||||||||||||||
| Commercial paper | 5.7 | <1 | 180 | 180 | 5.1 | <1 | 249 | 249 | |||||||||||||||||||||||||||||||||||||||
| Medium Term Notes: | |||||||||||||||||||||||||||||||||||||||||||||||
Series 4 (C$150) | 5.8 | 14 | 111 | 115 | 5.8 | 14 | 111 | 114 | |||||||||||||||||||||||||||||||||||||||
Series 9 (C$400) | 3.8 | 2 | 296 | 289 | 3.8 | 2 | 295 | 286 | |||||||||||||||||||||||||||||||||||||||
Series 10 (C$500) | 3.6 | 4 | 370 | 355 | 3.6 | 4 | 369 | 350 | |||||||||||||||||||||||||||||||||||||||
Series 11 (C$475) | 4.3 | 6 | 351 | 343 | 4.3 | 6 | 351 | 338 | |||||||||||||||||||||||||||||||||||||||
Series 12 (C$475) | 3.4 | 7 | 351 | 323 | 3.4 | 7 | 351 | 316 | |||||||||||||||||||||||||||||||||||||||
Series 13 (C$300) | 4.3 | 27 | 222 | 188 | 4.3 | 27 | 221 | 184 | |||||||||||||||||||||||||||||||||||||||
Series 14 (C$425) | 3.3 | 27 | 314 | 223 | 3.3 | 28 | 314 | 218 | |||||||||||||||||||||||||||||||||||||||
Series 15 (C$400)(1) | 5.9 | 10 | 296 | 314 | 5.9 | 10 | 295 | 307 | |||||||||||||||||||||||||||||||||||||||
Series 16 (C$400) | 5.3 | 11 | 296 | 298 | — | — | — | — | |||||||||||||||||||||||||||||||||||||||
| 4.3 | 11 | 2,607 | 2,448 | 4.1 | 11 | 2,307 | 2,113 | ||||||||||||||||||||||||||||||||||||||||
| Total corporate borrowings | 2,787 | $ | 2,628 | 2,556 | $ | 2,362 | |||||||||||||||||||||||||||||||||||||||||
Add: Unamortized premiums(2) | 2 | 2 | |||||||||||||||||||||||||||||||||||||||||||||
Less: Unamortized financing fees(2) | (10) | (10) | |||||||||||||||||||||||||||||||||||||||||||||
| Less: Current portion | (180) | (249) | |||||||||||||||||||||||||||||||||||||||||||||
| $ | 2,599 | $ | 2,299 | ||||||||||||||||||||||||||||||||||||||||||||
(1)Includes 7 million (2022: $7 million) outstanding to an associate of Brookfield. Refer to Note 20 - Related party transactions for more details.
(2)Unamortized premiums and unamortized financing fees are amortized over the terms of the borrowing.
Credit facilities and commercial paper
Brookfield Renewable had $180 million commercial paper outstanding as at March 31, 2023 (2022: $249 million).
Brookfield Renewable issues letters of credit from its corporate credit facilities for general corporate purposes which include, but are not limited to, security deposits, performance bonds and guarantees for debt service reserve accounts. See Note 19 – Commitments, contingencies and guarantees for letters of credit issued by subsidiaries.
The following table summarizes the available portion of corporate credit facilities:
| (MILLIONS) | March 31, 2023 | December 31, 2022 | |||||||||
Authorized corporate credit facilities and related party credit facilities(1) | $ | 2,375 | $ | 2,375 | |||||||
| Authorized letter of credit facility | 500 | 500 | |||||||||
| Issued letters of credit | (349) | (344) | |||||||||
Available portion of corporate credit facilities(3) | $ | 2,526 | $ | 2,531 | |||||||
(1)Amounts are guaranteed by Brookfield Renewable.
Medium term notes
Corporate borrowings are obligations of a finance subsidiary of Brookfield Renewable, Brookfield Renewable Partners ULC (“Canadian Finco”) (Note 21 – Subsidiary public issuers). Canadian Finco may redeem some or all of the borrowings from time to time, pursuant to the terms of the indenture. The balance is payable upon maturity, and interest on corporate
| Brookfield Renewable Partners L.P. | Interim Report | March 31, 2023 | ||||||
Page 64 | ||||||||
borrowings is paid semi-annually. The term notes payable by Canadian Finco are unconditionally guaranteed by Brookfield Renewable, Brookfield Renewable Energy L.P. (“BRELP”) and certain other subsidiaries.
During the first quarter of 2023, Brookfield Renewable issued C$400 million of Series 16 medium-term notes. The medium-term notes have a fixed interest rate of 5.29% and a maturity date of October 28, 2033. The Series 16 medium-term notes are corporate-level green bonds.
Non-recourse borrowings
Non-recourse borrowings are typically asset-specific, long-term, non-recourse borrowings denominated in the domestic currency of the subsidiary. Non-recourse borrowings in North America and Europe consist of both fixed and floating interest rate debt indexed to the Secured Overnight Financing Rate (“SOFR”), the Sterling Overnight Index Average (“SONIA”), the London Interbank Offered Rate (“LIBOR”), the Euro Interbank Offered Rate (“EURIBOR”) and the Canadian Dollar Offered Rate (“CDOR”). Brookfield Renewable uses interest rate swap agreements in North America and Europe to minimize its exposure to floating interest rates. Non-recourse borrowings in Brazil consist of floating interest rates of Taxa de Juros de Longo Prazo (“TJLP”), the Brazil National Bank for Economic Development’s long-term interest rate, or Interbank Deposit Certificate rate (“CDI”), plus a margin. Non-recourse borrowings in Colombia consist of both fixed and floating interest rates indexed to Indicador Bancario de Referencia rate (IBR), the Banco Central de Colombia short-term interest rate, and Colombian Consumer Price Index (IPC), Colombia inflation rate, plus a margin. Non-Recourse borrowings in India consist of both fixed and floating interest indexed to Prime lending rate of lender (“MCLR”). Non-recourse borrowings in China consist of floating interest rates of People's Bank of China (“PBOC”).
Effective January 1, 2022, SONIA replaced £ LIBOR, and Euro Short-term Rate (“€STR”) replaced € LIBOR. It is also currently expected that SOFR will replace US$ LIBOR prior to June 30, 2023 and the Canadian Overnight Repo Rate Average (“CORRA”) is expected to replace CDOR after June 28, 2024.
As at March 31, 2023, Brookfield Renewable’s floating rate borrowings have not been materially impacted by SONIA and €STR reforms. Brookfield Renewable has a transition plan for the replacement of US$ LIBOR with the Secured Overnight Financing Rate (“SOFR”) benchmark on June 30, 2023. This plan involves certain amendments to the contractual terms of US$ LIBOR referenced floating rate borrowings, interest rate swaps, interest rate caps and updates to hedge designations. Our transition plan is materially complete. These amendments are not expected to have a material impact.
The composition of non-recourse borrowings is presented in the following table:
| March 31, 2023 | December 31, 2022 | ||||||||||||||||||||||||||||||||||||||||||||||
| Weighted-average | Weighted-average | ||||||||||||||||||||||||||||||||||||||||||||||
| (MILLIONS EXCEPT AS NOTED) | Interest rate (%) | Term (years)(4) | Carrying value | Estimated fair value | Interest rate (%) | Term (years) | Carrying value | Estimated fair value | |||||||||||||||||||||||||||||||||||||||
Non-recourse borrowings(1)(2) | |||||||||||||||||||||||||||||||||||||||||||||||
| Hydroelectric | 7.6 | 10 | $ | 8,906 | $ | 8,521 | 7.2 | 10 | $ | 8,813 | $ | 8,104 | |||||||||||||||||||||||||||||||||||
| Wind | 5.6 | 9 | 5,184 | $ | 5,133 | 5.4 | 8 | 5,943 | 5,824 | ||||||||||||||||||||||||||||||||||||||
| Utility-scale solar | 6.0 | 13 | 4,699 | $ | 4,628 | 5.6 | 13 | 4,625 | 4,502 | ||||||||||||||||||||||||||||||||||||||
Distributed energy & sustainable solutions | 5.8 | 6 | 3,650 | 3,439 | 5.1 | 7 | 2,940 | 2,687 | |||||||||||||||||||||||||||||||||||||||
| Total | 6.5 | 10 | $ | 22,439 | $ | 21,721 | 6.1 | 10 | $ | 22,321 | $ | 21,117 | |||||||||||||||||||||||||||||||||||
Add: Unamortized premiums(3) | 101 | 105 | |||||||||||||||||||||||||||||||||||||||||||||
Less: Unamortized financing fees(3) | (131) | (124) | |||||||||||||||||||||||||||||||||||||||||||||
| Less: Current portion | (2,211) | (2,027) | |||||||||||||||||||||||||||||||||||||||||||||
| $ | 20,198 | $ | 20,275 | ||||||||||||||||||||||||||||||||||||||||||||
(1)Includes $1,496 million (2022: 1,838 million ) borrowed under a subscription facility of a Brookfield sponsored private fund.
(2)Includes $98 million (2022: $93 million) outstanding to an associate of Brookfield. Refer to Note 20 - Related party transactions for more details.
(3)Unamortized premiums and unamortized financing fees are amortized over the terms of the borrowing.
(4)Excluding credit facilities, total weighted-average term is 11 years.
Brookfield Renewable’s financing and refinancing completed for the three months ended March 31, 2023 are as follows:
| Brookfield Renewable Partners L.P. | Interim Report | March 31, 2023 | ||||||
Page 65 | ||||||||
| Period Closed | Region | Technology | Average Interest rate1 | Maturity | Carrying Value | ||||||||||||||||||||||||||||||||||||
| Q1 2023 | US | Distributed generation | 7.03% | Financing | 2026 | $100 million | |||||||||||||||||||||||||||||||||||
| Q1 2023 | China | Wind | 4.4% | Financing | 2040 | CNY 971 million ($141 million) | |||||||||||||||||||||||||||||||||||
| Q1 2023 | China | Wind | 4.6% | Financing | 2030 | CNY 200 million ($29 million) | |||||||||||||||||||||||||||||||||||
| Q1 2023 | China | Wind | 4.6% | Financing | 2039 | CNY 70 million ($10 million) | |||||||||||||||||||||||||||||||||||
| Q1 2023 | China | Wind | 4.4% | Financing | 2039 | CNY 97 million ($14 million) | |||||||||||||||||||||||||||||||||||
(1)Benchmarked financings bear a variable interest at the applicable rate plus a margin.
10. NON-CONTROLLING INTERESTS
Brookfield Renewable`s non-controlling interests are comprised of the following:
| (MILLIONS) | March 31, 2023 | December 31, 2022 | |||||||||
| Participating non-controlling interests – in operating subsidiaries | $ | 15,526 | $ | 14,755 | |||||||
| General partnership interest in a holding subsidiary held by Brookfield | 58 | 59 | |||||||||
Participating non-controlling interests – in a holding subsidiary – Redeemable/Exchangeable units held by Brookfield | 2,848 | 2,892 | |||||||||
| BEPC exchangeable shares | 2,522 | 2,561 | |||||||||
| Preferred equity | 573 | 571 | |||||||||
| Perpetual subordinated notes | 592 | 592 | |||||||||
| $ | 22,119 | $ | 21,430 | ||||||||
| Brookfield Renewable Partners L.P. | Interim Report | March 31, 2023 | ||||||
Page 66 | ||||||||
Participating non-controlling interests – in operating subsidiaries
The net change in participating non-controlling interests – in operating subsidiaries is as follows:
(MILLIONS) | Brookfield Americas Infrastructure Fund | Brookfield Infrastructure Fund II | Brookfield Infrastructure Fund III | Brookfield Infrastructure Fund IV | Brookfield Infrastructure Income Fund | Brookfield Global Transition Fund I | Canadian Hydroelectric Portfolio | The Catalyst Group | Isagen institutional investors | Isagen public non-controlling interests | Other | Total | |||||||||||||||||||||||||||||||||||||||||||||||||||||||||||
| As at December 31, 2022 | $ | 477 | $ | 2,617 | $ | 3,490 | $ | 2,134 | $ | 481 | $ | 1,461 | $ | 1,148 | $ | 115 | $ | 2,159 | $ | 14 | $ | 659 | $ | 14,755 | |||||||||||||||||||||||||||||||||||||||||||||||
| Net income (loss) | 33 | 44 | 56 | (5) | — | — | 8 | 4 | 35 | — | 10 | 185 | |||||||||||||||||||||||||||||||||||||||||||||||||||||||||||
Other comprehensive income(loss) | (30) | 37 | 62 | 19 | 4 | 4 | 2 | — | 84 | 1 | (14) | 169 | |||||||||||||||||||||||||||||||||||||||||||||||||||||||||||
| Capital contributions | — | — | — | 44 | — | 915 | — | — | — | — | 35 | 994 | |||||||||||||||||||||||||||||||||||||||||||||||||||||||||||
| Disposal | (388) | — | — | — | — | — | — | — | — | — | — | (388) | |||||||||||||||||||||||||||||||||||||||||||||||||||||||||||
| Distributions | (14) | (25) | (40) | (14) | (6) | — | (17) | — | (26) | — | (16) | (158) | |||||||||||||||||||||||||||||||||||||||||||||||||||||||||||
| Other | 27 | 1 | (4) | 3 | (34) | (48) | — | — | — | (1) | 25 | (31) | |||||||||||||||||||||||||||||||||||||||||||||||||||||||||||
As at March 31, 2023 | $ | 105 | $ | 2,674 | $ | 3,564 | $ | 2,181 | $ | 445 | $ | 2,332 | $ | 1,141 | $ | 119 | $ | 2,252 | $ | 14 | $ | 699 | $ | 15,526 | |||||||||||||||||||||||||||||||||||||||||||||||
| Interests held by third parties | 75% - 78% | 43% - 60% | 23% - 71% | 75 | % | 1.5% -24% | 77% - 80% | 50 | % | 25 | % | 53 | % | 0.3 | % | 0.3% - 71% | |||||||||||||||||||||||||||||||||||||||||||||||||||||||
| Brookfield Renewable Partners L.P. | Interim Report | March 31, 2023 | ||||||
Page 67 | ||||||||
General partnership interest in a holding subsidiary held by Brookfield, Participating non-controlling interests – in a holding subsidiary – Redeemable/Exchangeable units held by Brookfield and BEPC Class A exchangeable shares of Brookfield Renewable Corporation held by public shareholders and Brookfield
Brookfield, as the owner of the 1% GP interest in BRELP, is entitled to regular distributions plus an incentive distribution based on the amount by which quarterly distributions exceed specified target levels. As at March 31, 2023, to the extent that LP unit distributions exceed $0.20 per LP unit per quarter, the incentive is 15% of distributions above this threshold. To the extent that quarterly LP unit distributions exceed $0.2253 per LP unit per quarter, the incentive distribution is equal to 25% of distributions above this threshold. Incentive distributions of $27 million were declared during the three months ended March 31, 2023 (2022: $24 million).
Consolidated equity includes Redeemable/Exchangeable partnership units, BEPC exchangeable shares and the GP interest. The Redeemable/Exchangeable partnership units and the GP interest are held 100% by Brookfield and the BEPC exchangeable shares are held 26% by Brookfield with the remainder held by public shareholders. The Redeemable/Exchangeable partnership units and BEPC exchangeable shares provide the holder, at its discretion, with the right to redeem these units or shares, respectively, for cash consideration. Since this redemption right is subject to Brookfield Renewable’s right, at its sole discretion, to satisfy the redemption request with LP units of Brookfield Renewable on a one-for-one basis, the Redeemable/Exchangeable partnership units and BEPC exchangeable shares are classified as equity in accordance with IAS 32, Financial Instruments: Presentation.
The Redeemable/Exchangeable partnership units, BEPC exchangeable shares and the GP interest are presented as non-controlling interests since they relate to equity in a subsidiary that is not attributable, directly or indirectly, to Brookfield Renewable. During the three months ended March 31, 2023, exchangeable shareholders of BEPC exchanged 1,742 BEPC exchangeable shares (2022: 3,341 shares during the same period) for an equivalent number of LP units amounting to less than $1 million (2022: less than $1 million). No Redeemable/Exchangeable partnership units have been redeemed.
The Redeemable/Exchangeable partnership units issued by BRELP and the BEPC exchangeable shares issued by BEPC have the same economic attributes in all respects to the LP units issued by Brookfield Renewable, except for the redemption rights described above. The Redeemable/Exchangeable partnership units, BEPC exchangeable shares and the GP interest, excluding incentive distributions, participate in earnings and distributions on a per unit basis equivalent to the per unit participation of the LP units of Brookfield Renewable.
As at March 31, 2023, Redeemable/Exchangeable partnership units, BEPC exchangeable shares and units of GP interest outstanding were 194,487,939 units (December 31, 2022: 194,487,939 units), 172,228,249 shares (December 31, 2022: 172,218,098 shares), and 3,977,260 units (December 31, 2022: 3,977,260 units), respectively.
In December 2022, Brookfield Renewable renewed its normal course issuer bid in connection with its LP units and entered into a normal course issuer bid for its outstanding BEPC exchangeable shares. Brookfield Renewable is authorized to repurchase up to 13,764,352 LP units and 8,610,905 BEPC exchangeable shares, representing 5% of its issued and outstanding LP units and BEPC exchangeable shares. The bids will expire on December 15, 2023, or earlier should Brookfield Renewable complete its repurchases prior to such date. There were no LP units or BEPC exchangeable shares repurchased during the three months ended March 31, 2023 and 2022 .
Distributions
The composition of the distributions for the three months ended March 31 is presented in the following table:
| Three months ended March 31 | |||||||||||
| (MILLIONS) | 2023 | 2022 | |||||||||
General partnership interest in a holding subsidiary held by Brookfield | $ | 1 | $ | 1 | |||||||
Incentive distribution | 27 | 24 | |||||||||
| 28 | 25 | ||||||||||
Participating non-controlling interests – in a holding subsidiary – Redeemable/Exchangeable units held by Brookfield | 67 | 63 | |||||||||
| BEPC exchangeable shares held by | |||||||||||
| Brookfield | 16 | 15 | |||||||||
| External shareholders | 42 | 40 | |||||||||
| Total BEPC exchangeable shares | 58 | 55 | |||||||||
| $ | 153 | $ | 143 | ||||||||
| Brookfield Renewable Partners L.P. | Interim Report | March 31, 2023 | ||||||
Page 68 | ||||||||
Preferred equity
Brookfield Renewable's preferred equity consists of Class A Preference Shares of Brookfield Renewable Power Preferred Equity Inc. ("BRP Equity") as follows:
| (MILLIONS EXCEPT AS NOTED) | Shares outstanding | Cumulative distribution rate (%) | Earliest permitted redemption date | Distributions declared for the three months ended March 31 | Carrying value as at | ||||||||||||||||||||||||||||||||||||
| 2023 | 2022 | March 31, 2023 | December 31, 2022 | ||||||||||||||||||||||||||||||||||||||
Series 1 (C$136) | 6.85 | 3.1 | April 2025 | $ | 1 | $ | 1 | $ | 126 | $ | 126 | ||||||||||||||||||||||||||||||
Series 2 (C$113)(1) | 3.11 | 6.9 | April 2025 | 1 | 1 | 57 | 57 | ||||||||||||||||||||||||||||||||||
Series 3 (C$249) | 9.96 | 4.4 | July 2024 | 2 | 2 | 183 | 183 | ||||||||||||||||||||||||||||||||||
Series 5 (C$103) | 4.11 | 5.0 | April 2018 | 1 | 1 | 76 | 76 | ||||||||||||||||||||||||||||||||||
Series 6 (C$175) | 7.00 | 5.0 | July 2018 | 2 | 2 | 131 | 129 | ||||||||||||||||||||||||||||||||||
| 31.03 | $ | 7 | $ | 7 | $ | 573 | $ | 571 | |||||||||||||||||||||||||||||||||
(1)Dividend rate represents annualized distribution based on the most recent quarterly floating rate.
Distributions paid during the three months ended March 31, 2023, totaled $7 million (2022: $7 million).
The Class A Preference Shares do not have a fixed maturity date and are not redeemable at the option of the holders. As at March 31, 2023, none of the issued Class A, Series 5 and 6 Preference Shares have been redeemed by BRP Equity.
In December 2022, the Toronto Stock Exchange accepted notice of BRP Equity's intention to renew the normal course issuer bid in connection with its outstanding Class A Preference Shares for another year to December 15, 2023, or earlier should the repurchases be completed prior to such date. Under this normal course issuer bid, BRP Equity is permitted to repurchase up to 10% of the total public float for each respective series of the Class A Preference Shares. Shareholders may receive a copy of the notice, free of charge, by contacting Brookfield Renewable. There were no repurchases of Class A Preference Shares during the three months ended March 31, 2023 and 2022.
Perpetual subordinated notes
In April 2021 and December 2021, Brookfield BRP Holdings (Canada) Inc., a wholly-owned subsidiary of Brookfield Renewable, issued $350 million and $260 million, respectively, of perpetual subordinated notes at a fixed rate of 4.625% and 4.875%, respectively.
The interest expense on the perpetual subordinated notes during the three months ended March 31, 2023 of $7 million (2022: $7 million) are presented as distributions in the consolidated statements of changes in equity. The carrying value of the perpetual subordinated notes, net of transaction cost, is $592 million as at March 31, 2023 (December 31, 2022: $592 million).
Distributions paid during the three months ended March 31, 2023, totaled $7 million (2022: $4 million).
11. PREFERRED LIMITED PARTNERS' EQUITY
Brookfield Renewable’s preferred limited partners’ equity comprises of Class A Preferred units as follows:
| (MILLIONS, EXCEPT AS NOTED) | Shares outstanding | Cumulative distribution rate (%) | Earliest permitted redemption date | Distributions declared for the three months ended March 31 | Carrying value as at | |||||||||||||||||||||||||||||||||||||||
| 2023 | 2022 | March 31, 2023 | December 31, 2022 | |||||||||||||||||||||||||||||||||||||||||
Series 7 (C$175) | 7.00 | 5.50 | January 2026 | 2 | 2 | 128 | 128 | |||||||||||||||||||||||||||||||||||||
Series 11 (C$250)(1) | — | 5.00 | April 2022 | — | 2 | — | — | |||||||||||||||||||||||||||||||||||||
Series 13 (C$250) | 10.00 | 5.00 | April 2028 | 2 | 2 | 196 | 196 | |||||||||||||||||||||||||||||||||||||
Series 15 (C$175) | 7.00 | 5.75 | April 2024 | 2 | 2 | 126 | 126 | |||||||||||||||||||||||||||||||||||||
Series 17 ($200) | 8.00 | 5.25 | March 2025 | 2 | 3 | 195 | 195 | |||||||||||||||||||||||||||||||||||||
Series 18 (C$150) | 6.00 | 5.50 | April 2027 | 2 | — | 115 | 115 | |||||||||||||||||||||||||||||||||||||
| 38.00 | $ | 10 | $ | 11 | $ | 760 | $ | 760 | ||||||||||||||||||||||||||||||||||||
| Brookfield Renewable Partners L.P. | Interim Report | March 31, 2023 | ||||||
Page 69 | ||||||||
(1)In the second quarter of 2022, Brookfield Renewable redeemed all of the outstanding units of Series 11 Preferred Limited Partnership units.
Distributions paid during the three months ended March 31, 2023, totaled $10 million (2022: $11 million).
Subsequent to the quarter, Brookfield Renewable declared the fixed quarterly distributions on the Class A Preferred Limited Partnership Series 13 Units during the five years commencing May 1, 2023 will be paid at an annual rate of 6.05%.
Class A Preferred LP Units - Normal Course Issuer Bid
In December 2022, the Toronto Stock Exchange accepted notice of Brookfield Renewable's intention to renew the normal course issuer bid in connection with the outstanding Class A Preferred Limited Partnership Units for another year to December 15, 2023, or earlier should the repurchases be completed prior to such date. Under this normal course issuer bid, Brookfield Renewable is permitted to repurchase up to 10% of the total public float for each respective series of its Class A Preferred Limited Partnership Units. Unitholders may receive a copy of the notice, free of charge, by contacting Brookfield Renewable. No shares were repurchased during the three months ended March 31, 2023 and 2022.
12. LIMITED PARTNERS' EQUITY
Limited partners’ equity
As at March 31, 2023, 275,432,611 LP units were outstanding (December 31, 2022: 275,358,750 LP units) including 68,749,416 LP units (December 31, 2022: 68,749,416 LP units) held by Brookfield. Brookfield owns all general partnership interests in Brookfield Renewable representing a 0.01% interest.
During the three months ended March 31, 2023, 72,119 LP units (2022: 68,865 LP units, respectively) were issued under the distribution reinvestment plan at a total cost of $2 million (2022: $3 million).
During the three months ended March 31, 2023, exchangeable shareholders of BEPC exchanged 1,742 exchangeable shares (2022: 3,341 exchangeable shares) for an equivalent number of LP units amounting to less than $1 million (2022: less than $1 million).
As at March 31, 2023, Brookfield Corporation’s direct and indirect interest of 308,051,190 LP units, Redeemable/Exchangeable partnership units and BEPC exchangeable shares represents approximately 48% of Brookfield Renewable on a fully-exchanged basis and the remaining approximate 52% is held by public investors.
On an unexchanged basis, Brookfield Corporation holds a 25% direct limited partnership interest in Brookfield Renewable, a 41% direct interest in BRELP through the ownership of Redeemable/Exchangeable partnership units, a 1% direct GP interest in BRELP and a 26% direct interest in the exchangeable shares of BEPC as at March 31, 2023.
In December 2022, Brookfield Renewable renewed its normal course issuer bid in connection with its LP units and outstanding BEPC exchangeable shares. Brookfield Renewable is authorized to repurchase up to 13,764,352 LP units and 8,610,905 BEPC exchangeable shares, representing 5% of each of its issued and outstanding LP units and BEPC exchangeable shares. The bids will expire on December 15, 2023, or earlier should Brookfield Renewable complete its repurchases prior to such date. There were no LP units or BEPC exchangeable shares repurchased during the three months ended March 31, 2023 and 2022.
Distributions
The composition of distributions for the three months ended March 31 are presented in the following table:
| Three months ended March 31 | |||||||||||
| (MILLIONS) | 2023 | 2022 | |||||||||
| Brookfield | $ | 24 | $ | 23 | |||||||
| External LP unitholders | 73 | 68 | |||||||||
| $ | 97 | $ | 91 | ||||||||
In February 2023, Unitholder distributions were increased to $1.35 per LP unit on an annualized basis, an increase of $0.07 per LP unit, which took effect with the distribution paid in March 2023.
Distributions paid during the three months ended March 31, 2023 totaled $91 million (2022: $89 million).
| Brookfield Renewable Partners L.P. | Interim Report | March 31, 2023 | ||||||
Page 70 | ||||||||
13. GOODWILL
The following table provides a reconciliation of goodwill:
| (MILLIONS) | Total | ||||
| Balance, as at December 31, 2022 | 1,526 | ||||
| Foreign exchange and other | 33 | ||||
| Balance, as at March 31, 2023 | $ | 1,559 | |||
14. EQUITY-ACCOUNTED INVESTMENTS
The following are Brookfield Renewable’s equity-accounted investments for the three months ended March 31, 2023:
| (MILLIONS) | March 31, 2023 | ||||
| Balance, beginning of year | $ | 1,392 | |||
| Investment | 198 | ||||
| Share of net income | 33 | ||||
| Share of other comprehensive income | 3 | ||||
| Dividends received | (19) | ||||
| Foreign exchange translation and other | (4) | ||||
Balance as at March 31, 2023 | $ | 1,603 | |||
On March 17, 2023, Brookfield Renewable’s institutional partners completed the sale of a 78% interest in a 378 MW operating hydroelectric portfolio in the U.S., of which 28% was sold to affiliates of Brookfield Corporation. Brookfield Renewable retained its 22% interest in the investment and accordingly, did not receive any proceeds from the sale. Subsequent to the completion of the sale, Brookfield Renewable no longer consolidates this investment and recognized $105 million as an equity-accounted investment for its interest.
During the quarter, Brookfield Renewable, together with institutional partners, acquired an approximately 4% equity interest in a sustainable agricultural solutions company in India for INR 7 billion ($86 million) (approximately INR 1.4 billion ($17 million) net to Brookfield Renewable).
15. CASH AND CASH EQUIVALENTS
Brookfield Renewable’s cash and cash equivalents are as follows:
| (MILLIONS) | March 31, 2023 | December 31, 2022 | |||||||||
| Cash | $ | 802 | $ | 728 | |||||||
| Cash subject to restriction | 235 | 268 | |||||||||
| Short-term deposits | 103 | 2 | |||||||||
| $ | 1,140 | $ | 998 | ||||||||
16. RESTRICTED CASH
Brookfield Renewable’s restricted cash is as follows:
| (MILLIONS) | March 31, 2023 | December 31, 2022 | |||||||||
| Operations | $ | 104 | $ | 93 | |||||||
| Credit obligations | 50 | 56 | |||||||||
| Capital expenditures and development projects | 24 | 42 | |||||||||
| Total | 178 | 191 | |||||||||
| Less: non-current | (54) | (52) | |||||||||
| Current | $ | 124 | $ | 139 | |||||||
| Brookfield Renewable Partners L.P. | Interim Report | March 31, 2023 | ||||||
Page 71 | ||||||||
17. TRADE RECEIVABLES AND OTHER CURRENT ASSETS
Brookfield Renewable's trade receivables and other current assets are as follows:
| (MILLIONS) | March 31, 2023 | December 31, 2022 | |||||||||
| Trade receivables | $ | 697 | $ | 672 | |||||||
Collateral deposits(1) | 289 | 609 | |||||||||
| Short-term deposits and advances | 160 | 113 | |||||||||
| Prepaids and other | 101 | 86 | |||||||||
| Sales taxes receivable | 76 | 73 | |||||||||
| Income tax receivable | 63 | 74 | |||||||||
| Current portion of contract asset | 57 | 54 | |||||||||
| Inventory | 46 | 42 | |||||||||
| Other short-term receivables | 135 | 137 | |||||||||
| $ | 1,624 | $ | 1,860 | ||||||||
(1)Collateral deposits are related to energy derivative contracts that Brookfield Renewable enters into in order to mitigate the exposure to wholesale market electricity prices on the future sale of uncontracted generation, as part of Brookfield Renewable's risk management strategy.
Brookfield Renewable primarily receives monthly payments for invoiced power purchase agreement revenues and has no significant aged receivables as of the reporting date. Receivables from contracts with customers are reflected in Trade receivables.
18. ACCOUNTS PAYABLE AND ACCRUED LIABILITIES
Brookfield Renewable's accounts payable and accrued liabilities are as follows:
| (MILLIONS) | March 31, 2023 | December 31, 2022 | |||||||||
| Operating accrued liabilities | $ | 404 | $ | 440 | |||||||
| Accounts payable | 231 | 276 | |||||||||
| Interest payable on borrowings | 200 | 153 | |||||||||
| Income tax payable | 85 | 78 | |||||||||
LP Unitholders distributions, preferred limited partnership unit distributions, preferred dividends payable , perpetual subordinate notes distributions and exchange shares dividends(1) | 55 | 53 | |||||||||
| Current portion of lease liabilities | 34 | 33 | |||||||||
| Current portion of contract liability | 27 | 24 | |||||||||
| Other | 53 | 29 | |||||||||
| $ | 1,089 | $ | 1,086 | ||||||||
(1)Includes amounts payable only to external LP unitholders and BEPC exchangeable shareholders. Amounts payable to Brookfield are included in due to related parties.
19. COMMITMENTS, CONTINGENCIES AND GUARANTEES
Commitments
In the course of its operations, Brookfield Renewable and its subsidiaries have entered into agreements for the use of water, land and dams. Payment under those agreements varies with the amount of power generated. The various agreements can be renewed and are extendable up to 2089.
In the normal course of business, Brookfield Renewable will enter into capital expenditure commitments which primarily relate to contracted project costs for various growth initiatives. As at March 31, 2023, Brookfield Renewable had $967 million (2022: $1,126 million) of capital expenditure commitments outstanding of which $790 million is payable in 2023, $163 million is payable in 2024, $7 million is payable in 2025 to 2027, and $7 million thereafter.
| Brookfield Renewable Partners L.P. | Interim Report | March 31, 2023 | ||||||
Page 72 | ||||||||
The following table lists the assets and portfolio of assets that Brookfield Renewable, together with institutional partners have agreed to acquire which are subject to customary closing conditions as at March 31, 2023:
| Region | Technology | Capacity | Consideration | Brookfield Renewable Economic Interest | Expected Close | |||||||||||||||||||||||||||
| China | Wind | 102 MW development | CNY 255 million ($38 million) | 20 | % | Q4 2023 | ||||||||||||||||||||||||||
| U.S. | Nuclear Services | N/A | $4.5 billion | approximately $450 million | Second half of 2023 | |||||||||||||||||||||||||||
| U.S. | Utility-scale solar | 473 MW operating | $135 million | 20 | % | First of three projects in Q4 2023 | ||||||||||||||||||||||||||
| China | Wind | 350 MW development | CNY 853 million ($125 million) | 20 | % | First of two projects in Q4 2023 | ||||||||||||||||||||||||||
| Europe | Utility-scale solar | 649 MW operating 531 MW development | $900 million | 17 | % | Second half of 2023 | ||||||||||||||||||||||||||
| Australia | Integrated power generator and energy retailer | 7 GW of operating and contracted assets with 4.5 million customer accounts | A$8.91 per share, implying an enterprise value of A$18.7 billion for entire Origin | Up to $750 million | Q1 2024 | |||||||||||||||||||||||||||
| U.S | Distributed energy & sustainable solutions | 220 MW development | $14 million | 20 | % | Q3 2023 | ||||||||||||||||||||||||||
An integral part of Brookfield Renewable’s strategy is to participate with institutional partners in Brookfield-sponsored private equity funds that target acquisitions that suit Brookfield Renewable’s profile. In the normal course of business, Brookfield Renewable has made commitments to Brookfield-sponsored private equity funds to participate in these target acquisitions in the future, if and when identified. From time to time, in order to facilitate investment activities in a timely and efficient manner, Brookfield Renewable will fund deposits or incur other costs and expenses (including by use of loan facilities to consummate, support, guarantee or issue letters of credit) in respect of an investment that ultimately will be shared with or made entirely by Brookfield sponsored vehicles, consortiums and/or partnerships (including private funds, joint ventures and similar arrangements), Brookfield Renewable, or by co-investors.
Contingencies
Brookfield Renewable and its subsidiaries are subject to various legal proceedings, arbitrations and actions arising in the normal course of business. While the final outcome of such legal proceedings and actions cannot be predicted with certainty, it is the opinion of management that the resolution of such proceedings and actions will not have a material impact on Brookfield Renewable’s consolidated financial position or results of operations.
Brookfield Renewable, on behalf of Brookfield Renewable’s subsidiaries, and the subsidiaries themselves have provided letters of credit, which include, but are not limited to, guarantees for debt service reserves, capital reserves, construction completion and performance. The activity on the issued letters of credit by Brookfield Renewable can be found in Note 9 – Borrowings.
Brookfield Renewable, along with institutional partners, has provided letters of credit, which include, but are not limited to, guarantees for debt service reserves, capital reserves, construction completion and performance as it relates to interests in the Brookfield Americas Infrastructure Fund, the Brookfield Infrastructure Fund II, Brookfield Infrastructure Fund III, Brookfield Infrastructure Fund IV, Brookfield Infrastructure Fund V, Brookfield Infrastructure Income Fund, Brookfield Global Transition Fund I and Brookfield Global Transition Fund II. Brookfield Renewable’s subsidiaries have similarly provided letters of credit, which include, but are not limited to, guarantees for debt service reserves, capital reserves, construction completion and performance.
| Brookfield Renewable Partners L.P. | Interim Report | March 31, 2023 | ||||||
Page 73 | ||||||||
Letters of credit issued by Brookfield Renewable along with institutional partners and its subsidiaries were as at the following dates:
| (MILLIONS) | March 31, 2023 | December 31, 2022 | |||||||||
| Brookfield Renewable along with institutional partners | $ | 100 | $ | 99 | |||||||
| Brookfield Renewable's subsidiaries | 1,488 | 1,510 | |||||||||
| $ | 1,588 | $ | 1,609 | ||||||||
Guarantees
In the normal course of operations, Brookfield Renewable and its subsidiaries execute agreements that provide for indemnification and guarantees to third-parties of transactions such as business dispositions, capital project purchases, business acquisitions, power marketing activities such as purchase and sale agreements, swap agreements, credit facilities of certain Brookfield private funds and that are also secured by committed capital of our third-party institutional partners, and sales and purchases of assets and services. Brookfield Renewable has also agreed to indemnify its directors and certain of its officers and employees. The nature of substantially all of the indemnification undertakings prevents Brookfield Renewable from making a reasonable estimate of the maximum potential amount that Brookfield Renewable could be required to pay third parties as the agreements do not always specify a maximum amount and the amounts are dependent upon the outcome of future contingent events, the nature and likelihood of which cannot be determined at this time. Historically, neither Brookfield Renewable nor its subsidiaries have made material payments under such indemnification agreements.
20. RELATED PARTY TRANSACTIONS
Brookfield Renewable’s related party transactions are recorded at the exchange amount. Brookfield Renewable`s related party transactions are primarily with Brookfield and Brookfield Reinsurance Ltd (“Brookfield Reinsurance”).
Brookfield Corporation has provided a $400 million committed unsecured revolving credit facility maturing in December 2023 and the draws bear interest at Secured Overnight Financing Rate plus a margin. During the current period, there were no draws on the committed unsecured revolving credit facility provided by Brookfield Corporation. Brookfield Corporation may from time to time place funds on deposit with Brookfield Renewable which are repayable on demand including any interest accrued. There were nil funds placed on deposit with Brookfield Renewable as at March 31, 2023 (December 31, 2022: nil). The interest expense on the Brookfield Corporation revolving credit facility and deposit for the three months ended March 31, 2023 totaled nil (2022: less than $1 million).
The following table reflects the related party agreements and transactions for the three months ended March 31 in the interim consolidated statements of income (loss):
| Three months ended March 31 | |||||||||||
| (MILLIONS) | 2023 | 2022 | |||||||||
| Revenues | |||||||||||
| Power purchase and revenue agreements | $ | 44 | $ | 13 | |||||||
| Direct operating costs | |||||||||||
| Energy marketing fee & other services | (1) | (3) | |||||||||
| $ | (1) | $ | (3) | ||||||||
| Interest expense | |||||||||||
| Borrowings | $ | (5) | $ | — | |||||||
| Contract balance accretion | $ | (8) | $ | (6) | |||||||
| $ | (13) | $ | (6) | ||||||||
| Other | |||||||||||
| Distribution income | $ | 1 | $ | — | |||||||
| Other related party cost | $ | — | $ | (1) | |||||||
| Management service costs | $ | (57) | $ | (76) | |||||||
| Brookfield Renewable Partners L.P. | Interim Report | March 31, 2023 | ||||||
Page 74 | ||||||||
The following table reflects the impact of the related party agreements and transactions on the consolidated statements of financial position:
| (MILLIONS) | Related party | March 31, 2023 | December 31, 2022 | ||||||||||||||
| Current assets | |||||||||||||||||
| Trade receivables and other current assets | |||||||||||||||||
| Contract asset | Brookfield | $ | 57 | $ | 54 | ||||||||||||
| Due from related parties | |||||||||||||||||
| Amounts due from | Brookfield | 197 | 105 | ||||||||||||||
| Equity-accounted investments and other | 22 | 18 | |||||||||||||||
| 219 | 123 | ||||||||||||||||
| Non-current assets | |||||||||||||||||
| Other long-term assets | |||||||||||||||||
| Contract asset | Brookfield | 333 | 341 | ||||||||||||||
| Amounts due from | Equity-accounted investments and other | 132 | 128 | ||||||||||||||
| Current liabilities | |||||||||||||||||
| Contract liability | Brookfield | 27 | 24 | ||||||||||||||
| Financial instrument liabilities | Brookfield Reinsurance | 3 | 3 | ||||||||||||||
| Due to related parties | |||||||||||||||||
| Amounts due to | Brookfield | 160 | 166 | ||||||||||||||
| Equity-accounted investments and other | 158 | 62 | |||||||||||||||
| Brookfield Reinsurance | 328 | 321 | |||||||||||||||
| Non-recourse borrowings | Brookfield | 44 | 18 | ||||||||||||||
| Accrued distributions payable on LP units, BEPC exchangeable shares, Redeemable/Exchangeable partnership units and GP interest | Brookfield | 37 | 38 | ||||||||||||||
| 727 | 605 | ||||||||||||||||
| Non-current liabilities | |||||||||||||||||
| Financial instrument liabilities | Brookfield Reinsurance | 3 | 3 | ||||||||||||||
| Corporate borrowings | Brookfield Reinsurance | 7 | 7 | ||||||||||||||
| Non-recourse borrowings | Brookfield Reinsurance and associates | 98 | 93 | ||||||||||||||
| Other long-term liabilities | |||||||||||||||||
| Amounts due to | Equity-accounted investments, Brookfield Reinsurance and associates and other | 1 | 1 | ||||||||||||||
| Contract liability | Brookfield | 666 | 662 | ||||||||||||||
| $ | 667 | $ | 663 | ||||||||||||||
| Equity | |||||||||||||||||
| Preferred limited partners equity | Brookfield Reinsurance and associates | $ | 12 | $ | 12 | ||||||||||||
| Brookfield Renewable Partners L.P. | Interim Report | March 31, 2023 | ||||||
Page 75 | ||||||||
21. SUBSIDIARY PUBLIC ISSUERS
The following tables provide consolidated summary financial information for Brookfield Renewable, BRP Equity, and Canadian Finco:
| (MILLIONS) | Brookfield Renewable(1) | BRP Equity | Canadian Finco | Subsidiary Credit Supporters(2) | Other Subsidiaries(1)(3) | Consolidating adjustments(4) | Brookfield Renewable consolidated | ||||||||||||||||||||||||||||||||||
As at March 31, 2023 | |||||||||||||||||||||||||||||||||||||||||
| Current assets | $ | 65 | $ | 392 | $ | 2,645 | $ | 1,120 | $ | 3,492 | $ | (4,206) | $ | 3,508 | |||||||||||||||||||||||||||
| Long-term assets | 4,797 | 241 | 3 | 43,616 | 61,214 | (48,582) | 61,289 | ||||||||||||||||||||||||||||||||||
| Current liabilities | 64 | 7 | 36 | 8,250 | 4,396 | (7,926) | 4,827 | ||||||||||||||||||||||||||||||||||
| Long-term liabilities | — | — | 2,599 | 16 | 30,443 | — | 33,058 | ||||||||||||||||||||||||||||||||||
Participating non-controlling interests – in operating subsidiaries | — | — | — | — | 15,526 | — | 15,526 | ||||||||||||||||||||||||||||||||||
Participating non-controlling interests – in a holding subsidiary – Redeemable/Exchangeable units held by Brookfield | — | — | — | 2,848 | — | — | 2,848 | ||||||||||||||||||||||||||||||||||
| BEPC exchangeable shares | — | — | — | — | 2,522 | — | 2,522 | ||||||||||||||||||||||||||||||||||
| Preferred equity | — | 573 | — | — | — | — | 573 | ||||||||||||||||||||||||||||||||||
| Perpetual subordinated notes | — | — | — | 592 | — | — | 592 | ||||||||||||||||||||||||||||||||||
Preferred limited partners' equity | 761 | — | — | 765 | — | (766) | 760 | ||||||||||||||||||||||||||||||||||
| As at December 31, 2022 | |||||||||||||||||||||||||||||||||||||||||
| Current assets | $ | 61 | $ | 391 | $ | 2,336 | $ | 834 | $ | 4,172 | $ | (3,611) | $ | 4,183 | |||||||||||||||||||||||||||
| Long-term assets | 4,860 | 241 | 3 | 33,830 | 59,860 | (38,866) | 59,928 | ||||||||||||||||||||||||||||||||||
| Current liabilities | 60 | 7 | 30 | 7,877 | 4,455 | (7,486) | 4,943 | ||||||||||||||||||||||||||||||||||
| Long-term liabilities | — | — | 2,299 | 16 | 30,567 | — | 32,882 | ||||||||||||||||||||||||||||||||||
Participating non-controlling interests – in operating subsidiaries | — | — | — | — | 14,755 | — | 14,755 | ||||||||||||||||||||||||||||||||||
Participating non-controlling interests – in a holding subsidiary – Redeemable/Exchangeable units held by Brookfield | — | — | — | 2,892 | — | — | 2,892 | ||||||||||||||||||||||||||||||||||
| BEPC exchangeable shares | — | — | — | — | 2,561 | — | 2,561 | ||||||||||||||||||||||||||||||||||
| Preferred equity | — | 571 | — | — | — | — | 571 | ||||||||||||||||||||||||||||||||||
| Perpetual subordinated notes | — | — | — | 592 | — | — | 592 | ||||||||||||||||||||||||||||||||||
Preferred limited partners' equity | 761 | — | — | 765 | — | (766) | 760 | ||||||||||||||||||||||||||||||||||
(1)Includes investments in subsidiaries under the equity method.
(2)Includes BRELP, BRP Bermuda Holdings I Limited, Brookfield BRP Holdings (Canada) Inc., Brookfield BRP Europe Holdings Limited, Brookfield Renewable Investments Limited and BEP Subco Inc., collectively the "Subsidiary Credit Supporters".
(3)Includes subsidiaries of Brookfield Renewable, other than BRP Equity, Canadian Finco and the Subsidiary Credit Supporters.
(4)Includes elimination of intercompany transactions and balances necessary to present Brookfield Renewable on a consolidated basis.
| Brookfield Renewable Partners L.P. | Interim Report | March 31, 2023 | ||||||
Page 76 | ||||||||
| (MILLIONS) | Brookfield Renewable(1) | BRP Equity | Canadian Finco | Subsidiary Credit Supporters(2) | Other Subsidiaries(1)(3) | Consolidating adjustments(4) | Brookfield Renewable consolidated | ||||||||||||||||||||||||||||||||||
Three months ended March 31, 2023 | |||||||||||||||||||||||||||||||||||||||||
| Revenues | $ | — | $ | — | $ | — | $ | — | $ | 1,331 | $ | — | $ | 1,331 | |||||||||||||||||||||||||||
| Net income (loss) | (16) | — | 1 | (186) | 353 | 25 | 177 | ||||||||||||||||||||||||||||||||||
Three months ended March 31, 2022 | |||||||||||||||||||||||||||||||||||||||||
| Revenues | $ | — | $ | — | $ | — | $ | — | $ | 1,136 | $ | — | $ | 1,136 | |||||||||||||||||||||||||||
| Net income (loss) | (33) | — | (3) | (283) | 175 | 177 | 33 | ||||||||||||||||||||||||||||||||||
(1)Includes investments in subsidiaries under the equity method.
(2)Includes BRELP, BRP Bermuda Holdings I Limited, Brookfield BRP Holdings (Canada) Inc., Brookfield BRP Europe Holdings Limited, Brookfield Renewable Investments Limited and BEP Subco Inc., collectively the "Subsidiary Credit Supporters".
(3)Includes subsidiaries of Brookfield Renewable, other than BRP Equity, Canadian Finco, and the Subsidiary Credit Supporters.
(4)Includes elimination of intercompany transactions and balances necessary to present Brookfield Renewable on a consolidated basis.
See Note 9 – Borrowings for additional details regarding the medium-term borrowings issued by Canadian Finco. See Note 10 – Non-controlling interests for additional details regarding Class A Preference Shares issued by BRP Equity.
22. SUBSEQUENT EVENTS
Subsequent to the quarter, Brookfield Renewable declared the fixed quarterly distributions on the Class A Preferred Limited Partnership Series 13 Units during the five years commencing May 1, 2023 will be paid at an annual rate of 6.05%.
Subsequent to the quarter, Brookfield Renewable, together with institutional investors, agreed to invest up to $360 million ($72 million net to Brookfield Renewable) to acquire a 55% stake in a leading C&I renewable platform based in India with 4,500 megawatts of operating and development pipeline. The transaction is subject to customary closing conditions and is expected to close in the second half of 2023.
| Brookfield Renewable Partners L.P. | Interim Report | March 31, 2023 | ||||||
Page 77 | ||||||||
GENERAL INFORMATION | ||||||||
Corporate Office 73 Front Street Fifth Floor Hamilton, HM12 Bermuda Tel: (441) 294-3304 https://bep.brookfield.com Officers of Brookfield Renewable Partners L.P.'s Service Provider, Brookfield Canada Renewable Manager LP. Connor Teskey Chief Executive Officer Wyatt Hartley Chief Financial Officer Transfer Agent & Registrar Computershare Trust Company of Canada 100 University Avenue 9th floor Toronto, Ontario, M5J 2Y1 Tel Toll Free: (800) 564-6253 Fax Toll Free: (888) 453-0330 www.computershare.com | Directors of the General Partner of Brookfield Renewable Partners L.P. Jeffrey Blidner Scott Cutler Nancy Dorn David Mann Lou Maroun Stephen Westwell Patricia Zuccotti Dr. Sarah Deasley Exchange Listing NYSE: BEP (LP units) TSX: BEP.UN (LP units) NYSE: BEPC (exchangeable shares) TSX: BEPC (exchangeable shares) TSX: BEP.PR.G (Preferred LP Units - Series 7) TSX: BEP.PR.M (Preferred LP Units - Series 13) TSX: BEP.PR.O (Preferred LP Units - Series 15) NYSE: BEP.PR.A (Preferred LP Units - Series 17) TSX: BEP.PR.R (Preferred LP Units - Series 18) TSX: BRF.PR.A (Preferred shares - Series 1) TSX: BRF.PR.B (Preferred shares - Series 2) TSX: BRF.PR.C (Preferred shares - Series 3) TSX: BRF.PR.E (Preferred shares - Series 5) TSX: BRF.PR.F (Preferred shares - Series 6) NYSE: BEPH (Perpetual subordinated notes) NYSE: BEPI (Perpetual subordinated notes) Investor Information Visit Brookfield Renewable online at https://bep.brookfield.com for more information. The 2022 Annual Report and Form 20-F are also available online. For detailed and up-to-date news and information, please visit the News Release section. Additional financial information is filed electronically with various securities regulators in United States and Canada through EDGAR at www.sec.gov and through SEDAR at www.sedar.com. Shareholder enquiries should be directed to the Investor Relations Department at (416) 649-8172 or enquiries@brookfieldrenewable.com | |||||||