0001102624-14-001788.txt : 20141104 0001102624-14-001788.hdr.sgml : 20141104 20141104161646 ACCESSION NUMBER: 0001102624-14-001788 CONFORMED SUBMISSION TYPE: 6-K PUBLIC DOCUMENT COUNT: 14 CONFORMED PERIOD OF REPORT: 20140930 FILED AS OF DATE: 20141104 DATE AS OF CHANGE: 20141104 FILER: COMPANY DATA: COMPANY CONFORMED NAME: Brookfield Renewable Energy Partners L.P. CENTRAL INDEX KEY: 0001533232 STANDARD INDUSTRIAL CLASSIFICATION: ELECTRIC SERVICES [4911] IRS NUMBER: 000000000 STATE OF INCORPORATION: D0 FISCAL YEAR END: 1231 FILING VALUES: FORM TYPE: 6-K SEC ACT: 1934 Act SEC FILE NUMBER: 001-35530 FILM NUMBER: 141193399 BUSINESS ADDRESS: STREET 1: 73 FRONT STREET STREET 2: FIFTH FLOOR CITY: HAMILTON STATE: D0 ZIP: HM 12 BUSINESS PHONE: 441-294-3304 MAIL ADDRESS: STREET 1: 73 FRONT STREET STREET 2: FIFTH FLOOR CITY: HAMILTON STATE: D0 ZIP: HM 12 6-K 1 brep6k.htm BROOKFIELD RENEWABLE ENERGY PARTNERS L.P. 6-K brep6k.htm


UNITED STATES
SECURITIES AND EXCHANGE COMMISSION
Washington, D.C. 20549


Form 6-K


REPORT OF FOREIGN PRIVATE ISSUER
PURSUANT TO RULE 13A-16 OR 15D-16
OF THE SECURITIES EXCHANGE ACT OF 1934
 
For the month of November, 2014
 
Commission File Number: 001-35530
 
 
BROOKFIELD RENEWABLE ENERGY
PARTNERS L.P.
(Translation of registrant’s name into English)


73 Front Street, 5th Floor
Hamilton HM 12
Bermuda
(Address of principal executive offices)


Indicate by check mark whether the registrant files or will file annual reports under cover Form 20-F or Form 40-F.
 
 Form 20-F x     Form 40-F o
 
Indicate by check mark if the registrant is submitting the Form 6-K in paper as permitted by Regulation S-T Rule 101(b) (1): o
 
Indicate by check mark if the registrant is submitting the Form 6-K in paper as permitted by Regulation S-T Rule 101(b) (7): o


EXHIBIT LIST
 
Exhibit
 
 
99.1 Q3 2014 Interim Report
   
99.2 Interim Consolidated Financial Statements and Notes for the Three and Nine Months Ended September 30, 2014 and 2013
   
99.3 Management’s Discussion and Analysis for the Three and Nine Months Ended September 30, 2014 and 2013
   
99.4 Form 52-109F2 – Certification of Interim Filings – CEO
   
99.5 Form 52-109F2 – Certification of Interim Filings – CFO


SIGNATURES
 
Pursuant to the requirements of the Securities Exchange Act of 1934, the registrant has duly caused this report to be signed on its behalf by the undersigned, thereunto duly authorized.
 
 
  BROOKFIELD RENEWABLE ENERGY PARTNERS, L.P.
  by its general partner, Brookfield Renewable Partners Limited
   
   
Date: November 4, 2014 By: /s/ Jane Sheere                                                                                           
 
Name: Jane Sheere
 
Title: Secretary


EX-99.1 2 exh99_1.htm EXHIBIT 99.1  


Brookfield Renewable Energy Partners L.P.

Q3 2014 INTERIM REPORT


TABLE OF CONTENTS


Letter To Shareholders  

1

Generation and Financial Review for The Three Months Ended September 30, 2014

9

Generation and Financial Review for The Nine Months Ended September 30, 2014

15

Unaudited Interim Consolidated Financial Statements

40


our operations

We operate our facilities through regional operating centers in the United States, Canada, Brazil and Europe which are designed to maintain and enhance the value of our assets, while cultivating positive relations with local stakeholders. We own and manage 204 hydroelectric generating stations, 28 wind facilities, and two natural gas-fired plants. Overall, the assets we own or manage have 6,707 MW of generating capacity and annual generation of 24,023 GWh based on long-term averages. The table below outlines our portfolio as at September 30, 2014:


River

Generating

Generating

Capacity(1)

LTA(1)(2)

Storage


Systems

Facilities

Units

(MW)

(GWh)

(GWh)

Hydroelectric generation


United States(3)


30


136


421


3,191


11,464


3,582


Canada(3)


19


33


73


1,361


5,184


1,261


Brazil(4)


23


35


75


670


3,614


N/A


72


204


569


5,222


20,262


4,843

Wind energy


United States


-


8


724


538


1,394


-


Canada


-


3


220


406


1,197


-


Europe


-


17


171


326


821


-


-


28


1,115


1,270


3,412


-

Other


-


2


6


215


349


-


72


234


1,690


6,707


24,023


4,843

(1)            Includes 100% of capacity and generation from equity-accounted investments.

(2)            Long-term average (“LTA”) is calculated on an annualized basis from the beginning of the year, regardless of the acquisition or commercial operation date.

(3)            Long-term average is the expected average level of generation, as obtained from the results of a simulation based on historical inflow data performed over a period of typically 30 years.

(4)            Brazilian hydroelectric assets benefit from a market framework which levelizes generation risk across producers.


The following table presents the annualized long-term average generation of our portfolio as at September 30, 2014 on a quarterly basis:


GENERATION (GWh)(1)(2)


Q1


Q2


Q3


Q4


Total

Hydroelectric generation


United States(3)


3,193


3,276


2,199


2,796


11,464


Canada(3)


1,241


1,492


1,233


1,218


5,184


Brazil(4)


929


898


887


900


3,614


5,363


5,666


4,319


4,914


20,262

Wind energy


United States


311


468


341


274


1,394


Canada


324


292


238


343


1,197


Europe


251


180


160


230


821


886


940


739


847


3,412

Other


219


79


46


5


349

Total


6,468


6,685


5,104


5,766


24,023

(1)            Includes 100% of generation from equity-accounted investments.

(2)            Long-term average is calculated on an annualized basis from the beginning of the year, regardless of the acquisition or commercial operation date.

(3)            Long-term average is the expected average level of generation, as obtained from the results of a simulation based on historical inflow data performed over a period of typically 30 years.

(4)            Brazilian hydroelectric assets benefit from a market framework which levelizes generation risk across producers.


Statement Regarding Forward-Looking Statements and Use of Non-IFRS Measures


This Interim Report contains  forward-looking information within the meaning of U.S. and Canadian securities laws. We may make such statements in this Interim Report, in other filings with the U.S. Securities and Exchange Commission (“SEC”) or in other communications with Canadian regulators - see “Cautionary Statement Regarding Forward-Looking Statements”. We make use of non-IFRS measures in this Interim Report  - see “Cautionary Statement Regarding Use Of Non-IFRS Measures”. This Interim Report, our Form 20-F  and additional information filed with the SEC and with securities regulators in Canada are available on our website at www.brookfieldrenewable.com, on the SEC’s website at www.sec.gov or on SEDAR’s website at www.sedar.com.


BREP_FINAL_black


Letter to SHAREHOLDERS

This month, Brookfield Renewable marks the completion of its 15th year as a leading owner, operator and developer of renewable energy assets. Over this time, we have built a world-class portfolio underpinned by more than 200 hydroelectric facilities, while expanding into new markets and technologies and positioning ourselves to build on this strong track record of growth. Since our initial public offering in November 1999, we have delivered a compounded annualized total return of 16 percent. To put this into perspective, a $10,000 investment in our units at inception would be worth more than $80,000 today assuming the reinvestment of distributions.

Organic Growth Potential and Distribution Increase

At our recent investor day, we outlined our growth strategy for the next several years, centered on organic cash flow growth tied to an improving economy and rising energy prices, a robust development pipeline of projects with premium return potential, and attractive inflation-linked pricing for our contracted assets. These initiatives, which do not require the issuance of additional shares, have the potential to add $200-$300 million in incremental annual cash flows by 2019 and represent an increase of approximately 45% to our current annual funds from operation ─ without factoring in growth from mergers and acquisitions. In light of this embedded cash flow growth, we believe there is approximately $7 to $10 of incremental value on a per-share basis that is not reflected in our stock price today.

Accordingly, we have raised our target for annual distribution increases to 5-9% (from 3-5% previously) reflecting the positive long-term fundamentals and growth prospects of our business.

A Focus on Development

We continue to advance our development efforts and are focused on bringing 500 MW to 750 MW of development projects into operation over the next five years, representing an equity investment of $500-$700 million. Our proprietary development pipeline includes projects throughout BREP’s geographic footprint. Our most mature projects are situated in Brazil, a growing market in need of new supply, and in Ireland, where energy policies and contractual frameworks continue to support the development of renewables. We have significant in-house development expertise with local teams in each of the operating platforms who have successfully developed projects in their markets. With a proven ability to take hydro and wind projects from concept to commissioning, we are able to prudently manage risk while achieving premium returns on development capital.

In Brazil, we have started construction of the 25 MW Serra dos Cavalinhos I hydro project in the state of Rio Grande do Sul, having received the necessary regulatory and environmental approvals. We are working with an experienced project contractor to build this small hydro facility which is expected to enter commercial operation by year-end 2016. Additionally, we have two hydro projects totalling 43 MW which we expect to move beyond the advanced stage next year.

In Ireland, three wind projects totalling 137 MW are presently under construction and all are proceeding on scope, schedule and budget. The largest of these is the 88 MW Knockacummer project which is nearing completion and now has all 35 turbines in operation and generating revenue. The 37 MW Killhills project is expected to be completed by year-end and construction of the 12 MW Glentane 2 project is just underway with completion targeted for July 2015. We are also progressing additional projects within our

Brookfield Renewable Energy Partners L.P.                                                                      Interim Report                                                                                         September 30, 2014                                

Page 1 


200 MW development pipeline; nearly 60 MW of this has received planning consent and we expect to break ground on some of this capacity in 2015. 

In addition to building out our proprietary pipeline of projects, we also intend to supplement this with renewable projects acquired from other developers. This will allow us to actively replenish our development pipeline at reasonable prices given current market conditions.

 Financial Results and Liquidity

Our full-year results continue to track annual plans and are supported by a strong first half in which results exceeded expectations. The third quarter, which is seasonally our lowest generation quarter, was characterized by less favourable wind conditions across the portfolio, and lower inflows in Canada and Brazil which were only partially offset by strong hydrology in our U.S. portfolio. As a result, third quarter FFO of $61 million was below expectations and below the prior year in which generation was well above average. From a capital expenditure basis, we generally use the third quarter to implement the majority of our maintenance projects, in particular given the low seasonal volumes, to ensure higher reliability throughout the full year.

We continue to fund the business on a long-term, conservative basis, and recently completed a number of important financing initiatives, including the extension of our $1.3 billion revolving credit facility to June 2019; the $480 million financing of our 417 MW Safe Harbor hydro acquisition; and a €160 million term financing of a portion of the Irish wind portfolio. Our liquidity position remains strong at approximately $1.1 billion.

Looking Ahead

As we look out to the rest of the year and into 2015, we are very encouraged with our prospects for continued growth. In North America, an improving economy combined with coal plant retirements, among other factors, are expected to result in supply constraints, short-term power price volatility and meaningful long-term upside for our existing portfolio. In Brazil, we continue to leverage our marketing capabilities to sell uncontracted generation at attractive prices, and to enter long-term contracts at compelling values. In Europe, we completed the first full quarter of operations of our Irish wind portfolio and continue to be impressed with the quality of the assets, pipeline and team. The European continent represents a large and attractive market and we are making great strides in developing a strategy and platform that will allow us to take advantage of these long-term growth opportunities.    


Thank you for your continued support.


Sincerely,


Description: Sign_RLegault copy


Richard Legault

President and Chief Executive Officer


November 4, 2014

Brookfield Renewable Energy Partners L.P.                                                                      Interim Report                                                                                         September 30, 2014                                

Page 2 


Our Competitive Strengths

Brookfield Renewable is one of the largest publicly-traded, pure-play renewable power businesses in the world. As the owner and operator of a diversified portfolio of high quality assets that produce electricity from renewable resources, our track record is strong.

Our assets generate high quality, stable cash flows derived from a highly contracted portfolio. Our business model is simple: utilize our global reach to identify and acquire high quality renewable power assets at favorable valuations, finance them on a long-term, low-risk basis, and enhance the cash flows and values of these assets using our experienced operating teams to earn reliable, attractive, long-term total returns for the benefit of our shareholders.

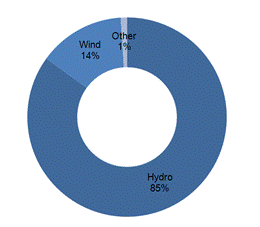
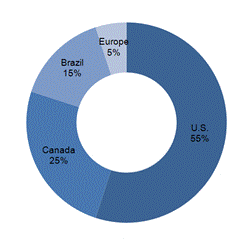
One of the largest, listed pure-play renewable platforms. We own one of the world’s largest, publicly-traded, pure-play renewable power portfolios with approximately $19 billion in assets, 6,707 MW of installed capacity, and long-term average generation from operating assets of 24,023 GWh. Our portfolio includes 204 hydroelectric generating stations on 72 river systems and 28 wind facilities, diversified across 13 power markets in the United States, Canada, Brazil and Europe.

.

.


Generation by Technology


Generation by Market


Focus on attractive hydroelectric asset class.  Our assets are predominantly hydroelectric and represent one of the longest life, lowest cost and most environmentally preferred forms of power generation. Our North American assets have the ability to store water in reservoirs approximating 29% of their annualized long-term average generation. Our assets in Brazil benefit from a framework in that country that levelizes generation risk across hydroelectric producers. The ability to store water in reservoirs in North America and to benefit from levelized generation in Brazil provides partial protection against short-term changes in water supply. As a result of our scale and the quality of our assets, we are competitively positioned compared to other listed renewable power platforms, providing significant scarcity value to investors.

Well positioned for global growth mandate. We have strong organic growth potential with an approximate 2,000 MW development pipeline spread across all of our operating jurisdictions, combined with the ability to capture operating efficiencies and the value of rising power prices for the market-based portion of our portfolio. Our organic growth is complemented by our strong acquisition ability. Over the

Brookfield Renewable Energy Partners L.P.                                                                      Interim Report                                                                                         September 30, 2014                                

Page 3 


last ten years we have acquired or commissioned approximately 80 hydroelectric assets totaling approximately 2,600 MW and 28 wind generating assets totaling approximately 1,270 MW. For the nine months ended September 30, 2014, we acquired or commissioned hydroelectric assets and wind generating assets that have an installed capacity of 547 MW and 326 MW, respectively. Our ability to develop and acquire assets is strengthened by our established operating and project development teams, strategic relationship with Brookfield Asset Management, and our strong liquidity and capitalization profile. We have, in the past, and may continue in the future to pursue the acquisition or development of assets through arrangements with institutional investors in Brookfield sponsored or co-sponsored partnerships. 

Attractive distribution profile.  We pursue a strategy which we expect will provide for highly stable, predictable cash flows sourced from predominantly long-life hydroelectric assets ensuring an attractive distribution yield. We target a distribution payout ratio in the range of approximately 60% to 70% of funds from operations and recently announced an increase in our long-term distribution growth rate target to a range of 5% to 9% annually.

Stable, high quality cash flows with attractive long-term value for limited partnership unitholders.  We intend to maintain a highly stable, predictable cash flow profile sourced from a diversified portfolio of low operating cost, long-life hydroelectric and wind power assets that sell electricity under long-term, fixed price contracts with creditworthy counterparties. Approximately 92% of our remaining 2014 generation output is sold pursuant to power purchase agreements to public power authorities, load-serving utilities, industrial users or to affiliates of Brookfield Asset Management. The power purchase agreements for our assets have a weighted-average remaining duration of 18 years, providing long-term cash flow stability.

Strong financial profile. With approximately $19 billion of assets and a conservative leverage profile, our consolidated debt-to-capitalization is approximately 41%. Our liquidity position remains strong with approximately $1.1 billion of cash and unutilized portion of committed bank lines. Approximately 75% of our borrowings are non-recourse to Brookfield Renewable. Corporate borrowings and subsidiary borrowings have weighted-average terms of approximately 7 and 11 years, respectively.

Brookfield Renewable Energy Partners L.P.                                                                      Interim Report                                                                                         September 30, 2014                                

Page 4 


Management’s Discussion and Analysis

For the three and nine months ended September 30, 2014

HIGHLIGHTS FOR THE THREE MONTHS ENDED SEPTEMBER 30, 2014

Operating Results

Generation from the portfolio was 4,383 GWh and revenues were $342 million.

        Performance of the U.S. hydroelectric portfolio was in line with the long-term average but below the prior year which experienced above average inflows.

        The Canadian hydroelectric portfolio was impacted by below average inflows.

        In Brazil, our full year generation is largely consistent with assured energy levels. However, the in-quarter variance reflects our strategy of shifting generation into the first quarter from the third quarter to take advantage of favorable pricing.

        The wind portfolio maintained high availability but conditions were below the long-term average across the entire portfolio.

Adjusted EBITDA was $223 million and funds from operations was $61 million.

Growth and Development

On August 8, 2014, we, together with our institutional partners, acquired the remaining 67% interest in the 417 MW Safe Harbor hydroelectric facility. Brookfield Renewable owns a 40% interest in the entire facility.

Construction of an 88 MW wind project in the Republic of Ireland is in the final stages of commercialization and is receiving payments under a power purchase agreement. During this quarter, we recognized 60 GWh in generation tied to production.

Construction of a 37 MW wind project in the Republic of Ireland is expected to enter commercial operations by the end of 2014.

On September 15, 2014 we announced an increased distribution growth target of 5% - 9% annually, up from 3% - 5% previously. We expect to maintain our target payout ratio of 60% to 70% of funds from operations.

Liquidity and Capital Resources

Our available liquidity remains strong.

        We extended the maturity of our corporate credit facilities to June 2019, reduced the margin by five basis points, and added an option to borrow in Euro (€) and British Pound Sterling (£).

        As part of our recently-acquired wind portfolio in Ireland, we completed a €160 million ($210 million) financing with an initial fixed interest rate of 2.9%, including the related interest rate swaps, maturing in December 2026.

        On October 1, 2014, as part of the acquisition of the remaining interests in the 417 MW Safe Harbor hydroelectric facility, $480 million of financing was secured with a floating rate LIBOR plus 1.75%, and maturing in June 2018.

Brookfield Renewable Energy Partners L.P.                                                                      Interim Report                                                                                         September 30, 2014                                

Page 5 


HISTORICAL OPERATIONAL AND FINANCIAL INFORMATION


Three months ended Sep 30

Nine months ended Sep 30

(MILLIONS, EXCEPT AS NOTED)


2014

2013

2014

2013

Operational information:(1)


Capacity (MW)


6,707


5,849


6,707


5,849

Long-term average generation (GWh)(2)


5,065


4,960


17,526


16,456

Actual generation (GWh)(2)


4,383


5,154


16,709


16,954

Average revenue ($ per MWh)


78


76


80


77

Selected financial information:


Revenues

$

342

$

392

$

1,296

$

1,313

Adjusted EBITDA(3)


223


260


943


936

Funds from operations(3)


61


108


444


457

Adjusted funds from operations(3)


46


94


401


415

Net (loss) income


(25)


28


172


191

Distributions per LP Unit(4)(5)


1.53


1.43


1.53


1.43


Sep 30

Dec 31

(MILLIONS, EXCEPT AS NOTED)


2014


2013

Balance sheet data:


Property, plant and equipment, at fair value

$

17,364

$

15,741

Equity-accounted investments


232


290

Total assets


18,555


16,979


Long-term debt and credit facilities


7,322


6,623

Deferred income tax liabilities


2,332


2,265

Total liabilities


10,285


9,443

Preferred equity


756


796

Participating non-controlling interests - in operating subsidiaries


2,202


1,303

General partnership interest in a holding subsidiary held by Brookfield


51


54

Participating non-controlling interests -  in a holding  subsidiary


- Redeemable/Exchangeable units held by Brookfield


2,499


2,657

Limited partners' equity


2,762


2,726

Total liabilities and equity


18,555


16,979

Debt to total capitalization(6)


41%


41%

(1)           Includes 100% of capacity and generation from equity-accounted investments.

(2)           For assets acquired or reaching commercial operation during the year, this figure is calculated from the acquisition or commercial operation date.

(3)           Non-IFRS measures. See “Cautionary Statement Regarding Use of Non-IFRS Measures”, “Financial Review by Segments for the Three Months Ended September 30, 2014”, and “Financial Review by Segments for the Nine Months Ended September 30, 2014”.

(4)           Figure is based on the last twelve months of operations.

(5)           Represents distributions per share to holders of Redeemable/Exchangeable Units, LP Units and general partnership interest.

(6)           Total capitalization is calculated as total debt plus deferred income tax liabilities, net of deferred income tax assets, and equity.

Brookfield Renewable Energy Partners L.P.                                                                      Interim Report                                                                                         September 30, 2014                                

Page 6 


Basis of Presentation

This Management’s Discussion and Analysis for the three and nine months ended September 30, 2014 is provided as of November 4, 2014. Unless the context indicates or requires otherwise, the terms “Brookfield Renewable”, “we”, “us”, and “our” mean Brookfield Renewable Energy Partners L.P. and its controlled entities.

Brookfield Renewable’s financial statements are prepared in accordance with International Financial Reporting Standards (“IFRS”) as issued by the International Accounting Standards Board (“IASB”), which require estimates and assumptions that affect the reported amounts of assets and liabilities and disclosure of contingent liabilities as at the date of the financial statements and the amounts of revenue and expense during the reporting periods.

Certain comparative figures have been reclassified to conform to the current year’s presentation.

Unless otherwise indicated, all dollar amounts are expressed in United States (“U.S.”) dollars.

PRESENTATION TO PUBLIC STAKEHOLDERS

Brookfield Renewable’s consolidated equity interests include LP Units held by public unitholders and Redeemable/Exchangeable partnership units in Brookfield Renewable Energy L.P. (“BRELP”), a holding subsidiary of Brookfield Renewable, held by Brookfield (see “Participating non-controlling interests – in a holding subsidiary – Redeemable/Exchangeable units held by Brookfield”). The LP Units and the Redeemable/Exchangeable partnership units have the same economic attributes in all respects, except that the Redeemable/Exchangeable partnership units provide Brookfield the right to request that their units be redeemed for cash consideration. In the event that Brookfield exercises this right, Brookfield Renewable has the right, at its sole discretion, to satisfy the redemption request with LP Units, rather than cash, on a one-for-one basis. Brookfield, as holder of Redeemable/Exchangeable partnership units, participates in earnings and distributions on a per unit basis equivalent to the per unit participation of the LP Units. As Brookfield Renewable, at its sole discretion, has the right to settle the obligation with LP Units, the Redeemable/Exchangeable partnership units are classified under equity, and not as a liability. 

Given the exchange feature referenced above, we are presenting the LP Units and the Redeemable/Exchangeable partnership units as separate components of consolidated equity. This presentation does not impact the total income, per unit or share information, or total consolidated equity.

As at the date of this report, Brookfield Asset Management owns an approximate 62% limited partnership interest, on a fully-exchanged basis, and all general partnership units totaling a 0.01% general partnership interest in Brookfield Renewable, while the remaining 38% is held by the public.

Performance Measurement

We present our key financial metrics based on total results prior to distributions made to LP Unitholders, the Redeemable/Exchangeable unitholders and general partnership unitholders. In addition, our operations are segmented by geography and asset type (i.e. hydroelectric and wind), as that is how we review our results, manage operations and allocate resources. Accordingly, we report our results in accordance with these segments.

One of our primary business objectives is to generate reliable and growing cash flows while minimizing risk for the benefit of all stakeholders. We monitor our performance in this regard through four key metrics — i) Net Income, ii) Adjusted Earnings Before Interest, Taxes, Depreciation and Amortization, iii) Funds From Operations,  and iv) Adjusted Funds from Operations.

Brookfield Renewable Energy Partners L.P.                                                                      Interim Report                                                                                         September 30, 2014                                

Page 7 


It is important to highlight that adjusted EBITDA, funds from operations, and adjusted funds from operations do not have any standardized meaning prescribed by IFRS and therefore are unlikely to be comparable to similar measures presented by other companies. We provide additional information on how we determine adjusted EBITDA, funds from operations, and adjusted funds from operations, and we provide reconciliations to net income and cash flows from operating activities. See “Generation and Financial Review for the Three Months Ended September 30, 2014” and “Generation and Financial Review for the Nine Months Ended September 30, 2014”.

Net Income

Net income is calculated in accordance with IFRS.

Adjusted Earnings Before Interest, Taxes, Depreciation, and Amortization (adjusted EBITDA)

Adjusted EBITDA means revenues less direct costs (including energy marketing costs), plus our share of cash earnings from equity-accounted investments and other income, before interest, income taxes, depreciation, management service costs and the cash portion of non-controlling interests.

Funds From Operations

Funds from operations is defined as adjusted EBITDA less interest, current income taxes and management service costs, which is then adjusted for the cash portion of non-controlling interests. For the nine months ended September 30, 2014, funds from operations include the earnings received from the wind portfolio we acquired in Ireland, reflecting our economic interest from January 1, 2014 to June 30, 2014.

Our payout ratio is defined as distributions to Redeemable/Exchangeable Units, LP Units and general partnership interest, including general partner incentive distributions, divided by funds from operations.

Adjusted Funds From Operations

Adjusted funds from operations is defined as funds from operations less Brookfield Renewable’s share of levelized sustaining capital expenditures (based on long term capital expenditure plans).

Brookfield Renewable Energy Partners L.P.                                                                      Interim Report                                                                                         September 30, 2014                                

Page 8 


GENERATION AND FINANCIAL REVIEW FOR THE THREE MONTHS ENDED SEPTEMBER 30, 2014

The following table reflects the actual and long-term average generation for the three months ended September 30:


Variance of Results


Actual vs.


Actual Generation(1)

LTA Generation(1)

Actual vs. LTA

Prior Year

GENERATION (GWh)

2014

2013

2014

2013

2014

2013


Hydroelectric generation


United States

2,183

2,353

2,160

2,013

23

340

(170)


Canada

987

1,292

1,233

1,234

(246)

58

(305)


Brazil

633

894

887

894

(254)

  -

(261)


3,803

4,539

4,280

4,141

(477)

398

(736)

Wind energy


United States

240

295

341

341

(101)

(46)

(55)


Canada

152

146

238

238

(86)

(92)

6


Europe

174

  -

160

  -

14

  -

174


566

441

739

579

(173)

(138)

125

Other

14

174

46

240

(32)

(66)

(160)

Total(2)

4,383

5,154

5,065

4,960

(682)

194

(771)

(1)         For assets acquired or reaching commercial operation during the year, this figure is calculated from the acquisition or commercial operation date.

(2)         Includes 100% of generation from equity-accounted investments.

We compare actual generation levels against the long-term average to highlight the impact of one of the important factors that affect the variability of our business results. In the short-term, we recognize that hydrology will vary from one period to the next; over time however, we expect our facilities will continue to produce in line with their long-term averages, which have proven to be reliable indicators of performance.

Our risk of a generation shortfall in Brazil continues to be minimized by participation in a hydrological balancing pool administered by the government of Brazil. This program mitigates hydrology risk by assuring that all participants receive, at any particular point in time, a balanced amount of electricity, irrespective of the actual volume of energy generated. The program reallocates energy, transferring surplus energy from those who generated an excess to those who generate less than their assured energy, up to the total generation within the pool. Periodically, low precipitation across the entire country’s system could result in a temporary reduction of generation available for sale. The second and third quarters of 2014 were such periods. During these periods, we expect that a higher proportion of thermal generation would be needed to balance supply and demand in the country potentially leading to higher overall spot market prices. In anticipation of lower hydrology, we maintained a lower level of contracted generation, allowing us to capture the strong power prices in the prior and current quarters.

In Brazil, our contracts allow the flexibility to periodically sell more than the assured level of generation. The opportunity is most attractive during periods of high demand, and resulting stronger prices.  As a result, we delivered more power to our customers in the first quarter of 2014 and secured favorable pricing. While this resulted in the delivery of lower assured energy in the second and third quarters of 2014, this initiative locked in revenue upside for 2014.


Brookfield Renewable Energy Partners L.P.                                                                      Interim Report                                                                                         September 30, 2014                                

Page 9 


Generation levels during the three months ended September 30, 2014 totaled 4,383 GWh, lower than the long-term average of 5,065 GWh, and a decrease of 771 GWh as compared to the prior year in which generation was above the long-term average.

The hydroelectric portfolio generated 3,803 GWh, below the long-term average of 4,280 GWh and a decrease of 736 GWh from the prior year. Generation from existing hydroelectric assets was 3,677 GWh compared to 4,539 GWh for the prior year. Our recently acquired and commissioned facilities contributed 126 GWh. The variance in year-over-year results from existing facilities reflects the return to more normal generation levels in the United States after experiencing very strong hydrological conditions across much of the portfolio in the prior year, as well as generation levels that were below the long-term average in Canada in the current quarter. In Brazil, our full year generation is largely consistent with assured levels, as shown in “Generation and Financial Review for the Nine Months Ended September 30, 2014”, however the in-quarter variance reflects our strategy of shifting generation into the first quarter from the third quarter to take advantage of favorable pricing.

The wind portfolio generated 566 GWh which was 125 GWh higher compared to the prior year. The wind portfolio in Ireland contributed 174 GWh, partly offsetting the lower than average wind conditions across the rest of the wind portfolio.

Our 110 MW natural gas-fired plant in Ontario had nominal generation in the period as a result of low power prices relative to gas market prices.

Brookfield Renewable Energy Partners L.P.                                                                      Interim Report                                                                                         September 30, 2014                                

Page 10 


The following table reflects adjusted EBITDA, funds from operations, adjusted funds from operations, and provides a reconciliation to net (loss) income for the three months ended September 30:

(MILLIONS, EXCEPT AS NOTED)


2014


2013

Revenues


$

342

$

392

Other income


3


1

Share of cash earnings from equity-accounted investments


10


7

Direct operating costs


(132)


(140)

Adjusted EBITDA(1)


223


260

Interest expense – borrowings


(106)


(105)

Management service costs


(14)


(9)

Current income taxes


(5)


(4)

Less: cash portion of non-controlling interests


Preferred equity


(10)


(10)


Participating non-controlling interests - in operating subsidiaries


(27)


(24)

Funds from operations(1)


61


108

Less: sustaining capital expenditures(2)


(15)


(14)

Adjusted funds from operations(1)


46


94

Add: cash portion of non-controlling interests


37


34

Add: sustaining capital expenditures


15


14

Other items:


Depreciation


(145)


(133)


Unrealized financial instruments gain


9


11


Share of non-cash loss from equity-accounted investments


(3)


(4)

Deferred income tax recovery


27


10

Other


(11)


2

Net (loss) income

$

(25)

$

28


Basic and diluted (loss) earnings per LP Unit(3)

$

(0.13)

$

0.04

(1)       Non-IFRS measures.  See “Cautionary Statement Regarding Use of Non-IFRS Measures”.

(2)       Based on long-term capital expenditure plans.

(3)       Average LP Units outstanding during the period totaled 143.3 million (2013: 133.0 million).

Net income is one important measure of profitability, in particular because it has a standardized meaning under IFRS. The presentation of net income on an IFRS basis for our business will often lead to the recognition of a loss even though the underlying cash flow generated by the assets is supported by strong margins and stable, long-term contracts. The primary reason for this is that we recognize a significantly higher level of depreciation for our assets than we are required to reinvest in the business as sustaining capital expenditures.

As a result, we also measure our financial results based on adjusted EBITDA, funds from operations, and adjusted funds from operations to provide readers with an assessment of the cash flow generated by our assets and the residual cash flow retained to fund distributions and growth initiatives.

Revenues totaled $342 million, $50 million lower than prior year in which generation was above average. The $30 million contribution from the growth in the portfolio was offset by the lower same store generation. The average realized price in the current period of $78/MWh is slightly higher than the $76/MWh realized in the prior year and consistent with the largely contracted nature of the portfolio.

Direct operating costs totaled $132 million representing a year-over-year decrease of $8 million primarily attributable to the growth in our portfolio ($14 million) being offset by the savings achieved from the cost

Brookfield Renewable Energy Partners L.P.                                                                      Interim Report                                                                                         September 30, 2014                                

Page 11 


efficiencies at our operations and the reduction in power purchased in the open market for our co-generation facilities.

Interest expense totaled $106 million representing a year-over-year increase of $1 million. The financing relating to the growth in our portfolio was partly offset by the decrease in borrowing costs due to repayments in the normal course on existing subsidiary borrowings and on our credit facilities.

Management service costs totaled $14 million representing a year-over-year increase of $5 million primarily attributable to the increase in the market value of our LP Units and the issuance of LP Units in the second quarter of 2014.

The cash portion of non-controlling interests totaled $37 million representing a year-over-year increase of $3 million. The increase attributable to the growth in our portfolio was partly offset by the decrease in performance from existing interests.

Funds from operations totaled $61 million representing a year-over-year decrease of $47 million, and reflecting the changes described above.

Net loss was $25 million for the three months ended September 30, 2014 (2013: net income of $28 million).

HYDROELECTRIC

The following table reflects the results of our hydroelectric operations for the three months ended September 30:

(MILLIONS, EXCEPT AS NOTED)

2014


United States

Canada

Brazil

Total

Generation (GWh) – LTA(1)(2)


2,160


1,233


887


4,280

Generation (GWh) – actual(1)(2)


2,183


987


633


3,803

Revenues

$

151

$

64

$

60

$

275

Adjusted EBITDA(3)


104


50


44


198

Funds from operations(3)

$

53

$

31

$

30

$

114


(MILLIONS, EXCEPT AS NOTED)

2013


United States

Canada

Brazil

Total

Generation (GWh) – LTA(1)(2)


2,013


1,234


894


4,141

Generation (GWh) – actual(1)(2)


2,353


1,292


894


4,539

Revenues

$

160

$

93

$

69

$

322

Adjusted EBITDA(3)


111


76


47


234

Funds from operations(3)

$

58

$

59

$

36

$

153


(1)            Includes 100% of generation from equity-accounted investments.

(2)           For assets acquired or reaching commercial operation during the year, this figure is calculated from the acquisition or commercial operation date.

(3)            Non-IFRS measures. See “Cautionary Statement Regarding Use of Non-IFRS Measures”, and “Financial Review By Segments For the Three Months Ended September 30, 2014”.

United States

Generation from the portfolio was 2,183 GWh, consistent with the long-term average of 2,160 GWh and a decrease from prior year generation of 2,353 GWh which was above the long-term average. The growth in our portfolio contributed an incremental 126 GWh. Generation from existing facilities was 2,057 GWh, a decrease of 296 GWh from the prior year but consistent with the long-term average. Inflows at our

Brookfield Renewable Energy Partners L.P.                                                                      Interim Report                                                                                         September 30, 2014                                

Page 12 


facilities in New York, Louisiana, and Tennessee were lower than in the prior year, which experienced generation levels significantly above the long-term average.

Revenues totaling $151 million represent a year-over-year decrease of $9 million as the $12 million contribution from the growth in our portfolio was offset by the decrease in generation.

Funds from operations totaling $53 million represent a year-over-year decrease of $5 million. The increase in performance from our equity-accounted investments was offset by the decrease in revenues.

Canada

Generation from the portfolio of 987 GWh was below the long-term average of 1,233 GWh and a decrease from prior year of 1,292 GWh, attributable to below average inflows.

Revenues totaling $64 million represent a year-over-year decrease of $29 million attributable to the decrease in generation.

Funds from operations totaling $31 million represent a year-over-year decrease of $28 million attributable to the decrease in revenues.

Brazil

Generation from the portfolio was 633 GWh, a decrease from prior year of 894 GWh. Our full year generation is largely consistent with assured energy levels, as shown in ”Generation and Financial Review for the Nine Months Ended September 30, 2014”, however, the in-quarter variance reflects our strategy of shifting generation into the first quarter from the third quarter to take advantage of favorable pricing.

Revenues totaling $60 million represent a year-over-year decrease of $9 million. The decrease was primarily attributable to shifting generation from the third quarter of 2014 to the first quarter of 2014.

Funds from operations totaling $30 million represent a year-over-year decrease of $6 million attributable to the decrease in revenues. 

Brookfield Renewable Energy Partners L.P.                                                                      Interim Report                                                                                         September 30, 2014                                

Page 13 


WIND

The following table reflects the results of our wind operations for the three months ended September 30:

(MILLIONS, EXCEPT AS NOTED)

2014


United States

Canada

Europe

Total

Generation (GWh) – LTA(1)(2)


341


238


160


739

Generation (GWh) – actual(1)(2)


240


152


174


566

Revenues

$

28

$

19

$

18

$

65

Adjusted EBITDA(3)


18


14


11


43

Funds from operations(3)

$

4

$

5

$

2

$

11

(MILLIONS, EXCEPT AS NOTED)

2013


United States

Canada

Europe

Total

Generation (GWh) – LTA(1)(2)


341


238


N/A


579

Generation (GWh) – actual(1)(2)


295


146


N/A


441

Revenues

$

34

$

19

$

N/A

$

53

Adjusted EBITDA(3)


24


14


N/A


38

Funds from operations(3)

$

6

$

4

$

N/A

$

10

(1)            Includes 100% of generation from equity-accounted investments.

(2)           For assets acquired or reaching commercial operation during the year, this figure is calculated from the acquisition or commercial operation date.

(3)            Non-IFRS measures. See “Cautionary Statement Regarding Use of Non-IFRS Measures”, and “Financial Review By Segments For the Three Months Ended September 30, 2014”.

United States

Generation from the portfolio of 240 GWh was below the long-term average of 341 GWh and prior year generation of 295 GWh, primarily attributable to lower than average wind conditions across the portfolio.

Revenues totaling $28 million represent a year-over-year decrease of $6 million attributable to the decrease in generation.

Funds from operations totaling $4 million represent a year-over-year decrease of $2 million primarily attributable to the decrease in revenues. Partly offsetting this decrease is the cash portion of non-controlling interests.

Canada

Generation from the portfolio was 152 GWh, consistent with the prior year generation of 146 GWh but below the long-term average of 238 GWh due to lower wind conditions.

Revenues totaling $19 million were consistent with the prior year.

Funds from operations totaling $5 million were consistent with the prior year.

Europe

Generation from our wind portfolio in Ireland was 174 GWh in the quarter, which includes 60 GWh from a recently built project which is in the final stages of commercialization but which is receiving payments under its power purchase agreement, tied to production.

Revenues totaled $18 million for the quarter, reflecting the lower than average wind conditions partly offset by the $6 million contribution from the additional 60 GWh referenced above. Funds from operations totaled $2 million.

Brookfield Renewable Energy Partners L.P.                                                                      Interim Report                                                                                         September 30, 2014                                

Page 14 


GENERATION AND FINANCIAL REVIEW FOR THE NINE MONTHS ENDED SEPTEMBER 30, 2014

The following table reflects the actual and long-term average generation for the nine months ended September 30:


Variance of Results


Actual vs.


Actual Generation(1)

LTA Generation(1)

Actual vs. LTA

Prior Year

GENERATION (GWh)

2014

2013

2014

2013

2014

2013


Hydroelectric generation


United States

7,859

7,856

7,989

7,231

(130)

625

3


Canada

3,856

4,093

3,914

3,891

(58)

202

(237)


Brazil

2,576

2,733

2,714

2,733

(138)

  -

(157)


14,291

14,682

14,617

13,855

(326)

827

(391)

Wind energy


United States

940

970

1,120

1,067

(180)

(97)

(30)


Canada

731

747

854

854

(123)

(107)

(16)


Europe(2)

592

  -

591

  -

1

  -

592


2,263

1,717

2,565

1,921

(302)

(204)

546

Other

155

555

344

680

(189)

(125)

(400)

Total(3)

16,709

16,954

17,526

16,456

(817)

498

(245)

(1)         For assets acquired or reaching commercial operation during the year, this figure is calculated from the acquisition or commercial operation date.

(2)         We completed the acquisition of the wind portfolio in Ireland on June 30, 2014. Pursuant to the terms of the purchase and sale agreement, Brookfield Renewable acquired an economic interest in the wind portfolio from January 1, 2014. Accordingly, generation from January 1, 2014 to June 30, 2014 was recorded in the second quarter of 2014.

(3)         Includes 100% of generation from equity-accounted investments.

Generation levels during the nine months ended September 30, 2014 totaled 16,709 GWh, compared to the long-term average of 17,526 GWh, and a decrease of 245 GWh as compared to the prior year in which generation was above the long-term average.

The hydroelectric portfolio generated 14,291 GWh, below the long-term average of 14,617 GWh and a decrease of 391 GWh as compared to the prior year. Generation from existing facilities was 13,558 GWh, compared to 14,682 GWh for the prior year. The recent growth in our portfolio and a full period’s contribution from facilities acquired in the first quarter of 2013 resulted in incremental generation of 733 GWh. Lower inflows across much of the United States and Canada resulted in a decrease in generation levels compared to the prior year, which experienced strong hydrological conditions and generation. In Brazil, generation is largely consistent with assured levels.

The wind portfolio generated 2,263 GWh, 546 GWh higher compared to the prior year. The recent growth in our portfolio and a full period’s contributions from the facilities acquired in the first quarter of 2013 resulted in incremental generation of 619 GWh. The increase from portfolio growth was partly offset by lower than average wind conditions across the rest of the wind portfolio.

Our co-generation facility in Ontario has been operating on an uncontracted basis since April 2014. Since then, the facility has had nominal generation as a result of low power prices relative to gas market prices.

Brookfield Renewable Energy Partners L.P.                                                                      Interim Report                                                                                         September 30, 2014                                

Page 15 


The following table reflects adjusted EBITDA, funds from operations, adjusted funds from operations, and provides a reconciliation to net income for the nine months ended September 30:

(MILLIONS, EXCEPT AS NOTED)


2014


2013

Revenues


$

1,296

$

1,313

Other income


8


5

Share of cash earnings from equity-accounted investments


25


19

Direct operating costs


(386)


(401)

Adjusted EBITDA(1)


943


936

Fixed earnings adjustment(2)


11


-

Interest expense – borrowings


(309)


(313)

Management service costs


(38)


(32)

Current income taxes


(19)


(15)

Less: cash portion of non-controlling interests


Preferred equity


(29)


(27)


Participating non-controlling interests - in operating subsidiaries


(115)


(92)

Funds from operations(1)


444


457

Less: sustaining capital expenditures(3)


(43)


(42)

Adjusted funds from operations(1)


401


415

Add: cash portion of non-controlling interests


144


119

Add: sustaining capital expenditures


43


42

Less: fixed earnings adjustment


(11)


-

Other items:


Depreciation


(400)


(398)


Unrealized financial instruments gain


5


30


Share of non-cash loss from equity-accounted investments


(15)


(10)

Deferred income tax recovery (expense)


8


(1)

Other


(3)


(6)

Net income

$

172

$

191


Basic and diluted earnings per LP Unit(4)

$

0.31

$

0.44

(1)       Non-IFRS measures.  See “Cautionary Statement Regarding Use of Non-IFRS Measures”.

(2)       The fixed earnings adjustment relates to Brookfield Renewable’s investment in the acquisition of the wind portfolio in Ireland. Pursuant to the terms of the purchase and sale agreement, Brookfield Renewable acquired an economic interest in the wind portfolio from January 1, 2014. The transaction closed on June 30, 2014, and accordingly under IFRS, the $11 million net funds from operations contribution was recorded as part of the purchase price.

(3)       Based on long-term capital expenditure plans.

(4)       Average LP Units outstanding during the period totaled 137.2 million (2013: 132.9 million).

Revenues totaled $1,296 million which represented a year-over-year decrease of $17 million. The recent growth in our portfolio and a full period’s contribution from facilities acquired or commissioned in the first quarter of 2013 resulted in a contribution of $95 million.  The decrease in generation across the entire portfolio, and a contractual decrease in price at one of our facilities located in the Midwestern United States collectively amounted to $65 million.

The appreciation of the U.S. dollar impacted revenues by $47 million but also affected costs and other expenses resulting in a year-over-year decrease to funds from operations by $23 million.

Direct operating costs totaling $386 million represent a year-over-year decrease of $15 million attributable to the savings achieved from the cost efficiencies at our operations and the reduction in power purchased in the open market for our co-generation facilities. The expense related to the growth in our portfolio was $29 million.

Brookfield Renewable Energy Partners L.P.                                                                      Interim Report                                                                                         September 30, 2014                                

Page 16 


Pursuant to the terms of the purchase and sale agreement, our acquisition of the wind portfolio in Ireland provided us with the economic benefit as of January 1, 2014, despite the transaction closing on June 30, 2014. Accordingly, we have included $11 million in funds from operations for the first six months of the year.

Interest expense totaling $309 million represents a year-over-year decrease of $4 million. The financing relating to the growth in our portfolio was partly offset by the decrease in borrowing costs due to repayments in the normal course on existing subsidiary borrowings and on our credit facilities.

Management service costs totaling $38 million represent a year-over-year increase of $6 million primarily attributable to the increase in the market value of our LP Units and the issuance of LP Units in the second quarter of 2014.

The cash portion of non-controlling interests totaling $144 million represents a year-over-year increase of $25 million. An increase of $45 million related to the growth in our portfolio and the partial sale of hydroelectric facilities in New England to institutional investors in the third quarter of 2013 was partly offset by the overall decrease in performance from existing interests.

Funds from operations totaling $444 million represents a year-over-year decrease of $13 million.

Net income was $172 million for the nine months ended September 30, 2014 (2013: $191 million).

HYDROELECTRIC

The following table reflects the results of our hydroelectric operations for the nine months ended September 30:

(MILLIONS, EXCEPT AS NOTED)

2014


United States

Canada

Brazil

Total

Generation (GWh) – LTA(1)(2)


7,989


3,914


2,714


14,617

Generation (GWh) – actual(1)(2)


7,859


3,856


2,576


14,291

Revenues

$

575

$

269

$

216

$

1,060

Adjusted EBITDA(3)


431


224


168


823

Funds from operations(3)

$

243

$

171

$

127

$

541


(MILLIONS, EXCEPT AS NOTED)

2013


United States

Canada

Brazil

Total

Generation (GWh) – LTA(1)(2)


7,231


3,891


2,733


13,855

Generation (GWh) – actual(1)(2)


7,856


4,093


2,733


14,682

Revenues

$

546

$

294

$

223

$

1,063

Adjusted EBITDA(3)


407


243


160


810

Funds from operations(3)

$

236

$

193

$

120

$

549


(1)            Includes 100% of generation from equity-accounted investments.

(2)           For assets acquired or reaching commercial operation during the year, this figure is calculated from the acquisition or commercial operation date.

(3)            Non-IFRS measures. See “Cautionary Statement Regarding Use of Non-IFRS Measures”, and “Financial Review By Segments For the Nine Months Ended September 30, 2014”.

United States

Generation from the portfolio was 7,859 GWh for the nine months ended September 30, 2014, in line with the long-term average of 7,989 GWh and consistent with prior year generation of 7,856 GWh. The recent growth in our portfolio and a full period’s contribution from facilities acquired in the first quarter of 2013 resulted in incremental generation of 659 GWh. Generation from existing facilities decreased 656 GWh,

Brookfield Renewable Energy Partners L.P.                                                                      Interim Report                                                                                         September 30, 2014                                

Page 17 


due primarily to lower inflows at our facilities in North Carolina, Louisiana, and the mid-western United States as compared to the prior year. Partly offsetting were the strong inflows at our New York facilities. Generation levels in the prior year benefited from strong hydrological conditions at the facilities in Louisiana and North Carolina.

Revenues totaling $575 million represent a year-over-year increase of $29 million. The recent growth in our portfolio and a full period’s contribution from facilities acquired in the first quarter of 2013 resulted in incremental revenues of $66 million. We also benefited from selling generation at favorable market prices in part due to the extended winter in the New England region. The increases were partly offset by the decrease in generation from existing facilities, and a contractual decrease in price at our Louisiana facility.

Funds from operations totaling $243 million represent a year-over-year increase of $7 million. The increase in revenues was partly offset by costs associated with the growth in our portfolio.

Canada

Generation from the portfolio was 3,856 GWh for the nine months ended September 30, 2014, compared to the long-term average of 3,914 GWh and below prior year generation of 4,093 GWh. Although in line with long-term average, inflows across the portfolio were lower than in the prior year, which benefited from strong hydrological conditions.

Revenues totaling $269 million represent a year-over-year decrease of $25 million. The contribution of $5 million from growth in our portfolio since the first quarter of 2013 was offset by the $13 million impact from the decrease in generation.

The appreciation of the U.S. dollar impacted revenues by $18 million but also affected costs and other expenses resulting in a year-over-year decrease to funds from operations by $13 million.

Funds from operations totaling $171 million represent a year-over-year decrease of $22 million attributable to the decrease in revenues partly offset by the cost efficiencies at our operations and the effects of non-recurring finance costs incurred in 2013.

Brazil

Generation from the portfolio was 2,576 GWh for the nine months ended September 30, 2014 compared to prior year generation of 2,733 GWh. The decrease is primarily attributable to the drought-like conditions experienced in the year. A full period’s contribution from a facility commissioned in the first quarter of 2013 provided an incremental 59 GWh of generation.

Revenues totaling $216 million represent a year-over-year decrease of $7 million. Strong power pricing was offset by the decrease in generation attributable to the drought-like conditions and the $21 million foreign exchange impact.

Funds from operations totaling $127 million represent a year-over-year increase of $7 million. 

Brookfield Renewable Energy Partners L.P.                                                                      Interim Report                                                                                         September 30, 2014                                

Page 18 


WIND

The following table reflects the results of our wind operations for the nine months ended September 30:

(MILLIONS, EXCEPT AS NOTED)

2014


United States

Canada

Europe

Total

Generation (GWh) – LTA(1)(2)


1,120


854


591


2,565

Generation (GWh) – actual(1)(2)


940


731


592


2,263

Revenues

$

106

$

87

$

18

$

211

Adjusted EBITDA(3)


74


75


11


160

Funds from operations(3)

$

16

$

46

$

13

$

75

(MILLIONS, EXCEPT AS NOTED)

2013


United States

Canada

Europe

Total

Generation (GWh) – LTA(1)(2)


1,067


854


N/A


1,921

Generation (GWh) – actual(1)(2)


970


747


N/A


1,717

Revenues

$

107

$

93

$

N/A

$

200

Adjusted EBITDA(3)


77


78


N/A


155

Funds from operations(3)

$

22

$

44

$

N/A

$

66

(1)            Includes 100% of generation from equity-accounted investments.

(2)           For assets acquired or reaching commercial operation during the year, this figure is calculated from the acquisition or commercial operation date.

(3)            Non-IFRS measures. See “Cautionary Statement Regarding Use of Non-IFRS Measures”, and “Financial Review By Segments For the Nine Months Ended September 30, 2014”.

United States

Generation from the portfolio of 940 GWh for the nine months ended September 30, 2014 was below the long-term average of 1,120 GWh and prior year generation of 970 GWh, primarily attributable to lower than average wind conditions. A full period’s contribution from the facilities acquired in the first quarter of 2013 resulted in incremental generation of 27 GWh.

Revenues totaling $106 million represent a year-over-year decrease of $1 million. The full period’s contribution from the facilities acquired in the first quarter of 2013 was offset by the decrease in generation.

Funds from operations totaling $16 million represent a year-over-year decrease of $6 million, primarily attributable to the lower revenues, increases in direct operating costs and interest expense associated with the growth in our portfolio, and the cash portion of non-controlling interests.

Canada

Generation from our Canadian wind portfolio was 731 GWh, below the long-term average of 854 GWh and prior year generation of 747 GWh all attributable to lower than average wind conditions.

Revenues totaling $87 million represent a year-over-year decrease of $6 million.  The appreciation of the U.S. dollar impacted revenues by $7 million.

Funds from operations totaling $46 million represent a year-over-year increase of $2 million. The decrease in revenues was offset by cost efficiencies at our operations and the effects of non-recurring finance costs incurred in 2013.

Brookfield Renewable Energy Partners L.P.                                                                      Interim Report                                                                                         September 30, 2014                                

Page 19 


Europe

Generation from our wind portfolio in Ireland was 592 GWh in the period, which includes 60 GWh from a recently built project which is in the final stages of commercialization but which is receiving payments under its power purchase agreement, tied to production.

Revenues totaled $18 million for the period, reflecting the lower than average wind conditions partly offset by the $6 million contribution from the additional 60 GWh referenced above.

Funds from operations totaling $13 million includes an $11 million fixed earnings adjustment amount for the period from January 1, 2014 to June 30, 2014.

Brookfield Renewable Energy Partners L.P.                                                                      Interim Report                                                                                         September 30, 2014                                

Page 20 


Analysis Of Consolidated Financial Statements and Other Information

Property, Plant and Equipment

In accordance with IFRS, Brookfield Renewable has elected to revalue its property, plant and equipment at a minimum on an annual basis, as at December 31st of each year.  As a result, certain of Brookfield Renewable’s property, plant and equipment, are carried at fair value as opposed to historical cost, using a 20-year discounted cash flow model. This model incorporates future cash flows from long-term power purchase agreements that are in place where it is determined that the power purchase agreements are linked specifically to the related power generating assets. The model also includes estimates of future electricity prices, anticipated long-term average generation, estimated operating and capital expenditures, and assumptions about future inflation rates and discount rates by geographical location.

Property, plant and equipment, at fair value totaled $17.4 billion as at September 30, 2014 as compared to $15.7 billion as at December 31, 2013. During the nine months ended September 30, 2014, the acquisition of 502 MW of hydroelectric facilities, a 326 MW wind portfolio and the development and construction of renewable power generating assets totaled $2.5 billion. Property, plant and equipment were impacted by foreign currency changes related to the U.S. dollar in the amount of $496 million. We also recognized depreciation expense of $400 million which is significantly higher than what we are required to reinvest in the business as sustaining capital expenditures. 

Fair value of property, plant and equipment can vary with discount and terminal capitalization rates. The following table summarizes the impact of a change in discount rates and terminal capitalization rates on the fair value of property, plant and equipment as at December 31, 2013:

(BILLIONS)


2013


2012

50 bps increase in discount rates


$

(1.1)

$

(1.2)

50 bps decrease in discount rates


1.3


1.4


50 bps increase in terminal capitalization rate(1)


(0.3)


(0.4)

50 bps decrease in terminal capitalization rate(1)


0.3


0.3

(1)            The terminal capitalization rate applies only to hydroelectric assets in the United States and Canada.

Terminal values are included in the valuation of hydroelectric assets in the United States and Canada.  For the hydroelectric assets in Brazil, cash flows have been included based on the duration of the authorization or useful life of a concession asset without consideration of potential renewal value. The weighted-average remaining duration at December 31, 2013, was 16 years (2012: 17 years). Consequently, there is no terminal value attributed to the hydroelectric assets in Brazil. If an additional 20 years of cash flows were included, the fair value of property, plant and equipment would increase by approximately $1 billion. See Note 11 - Property, plant and equipment, at fair value in our December 31, 2013 audited consolidated financial statements.

Brookfield Renewable Energy Partners L.P.                                                                      Interim Report                                                                                         September 30, 2014                                

Page 21 


liquidity and capital Resources

A key element of our financing strategy is to raise the majority of our debt in the form of asset-specific, non-recourse borrowings at our subsidiaries on an investment grade basis. As at September 30, 2014, long-term indebtedness increased from December 31, 2013 as a result of the portfolio growth. The debt to capitalization ratio was unchanged from December 31, 2013 and was 41% as at September 30, 2014.

Capitalization

The following table summarizes the capitalization using book values:


Sep 30

Dec 31

(MILLIONS, EXCEPT AS NOTED)


2014


2013

Credit facilities(1)


$

512

$

311

Corporate borrowings(1)


1,334


1,406

Subsidiary borrowings(2)


5,476


4,906

Long-term indebtedness


7,322


6,623

Deferred income tax liabilities, net of deferred income tax assets


2,183


2,148

Equity


8,270


7,536

Total capitalization

$

17,775

$

16,307

Debt to total capitalization


41%


41%

(1)            Issued by a subsidiary of Brookfield Renewable and guaranteed by Brookfield Renewable. The amounts are unsecured.

(2)            Issued by subsidiaries of Brookfield Renewable and secured against their respective assets. The amounts are not guaranteed.

During the nine months ended September 30, 2014 we completed the following financings:

·          In January 2014, the $279 million bridge loan associated with a 360 MW hydroelectric portfolio located in New England was refinanced to 2017 at LIBOR plus 2.25%. 

·          In February 2014, as part of the acquisition of the 70 MW hydroelectric portfolio in New England, $140 million of financing was obtained through a bond issuance with a 5.5% interest rate maturing in 2024.

·         In March 2014, we up-financed indebtedness associated with a 349 MW Ontario hydroelectric portfolio through the issuance of C$90 million of senior and C$60 million of subordinate bonds with interest rates of  3.8% and 5.0%, respectively, maturing in June 2023.

·         In June 2014, we refinanced a $125 million debt facility associated with a 167 MW hydroelectric portfolio in New England through the issuance of 8-year notes maturing in January 2022 at a fixed rate of 4.59%.

·          On June 30, 2014, as part of the acquisition of the 326 MW Irish wind portfolio, we assumed a €169 million ($232 million) loan with a fixed interest rate of 4.6%, including the related interest rate swaps, maturing in December 2026.

·          The maturity of the $250 million facility associated with a hydroelectric portfolio in the southeastern United States was extended by six months to November 2014. We are in the process of extending this facility prior to its expiry.

·          In August 2014, we extended the maturity of our corporate credit facilities to June 2019 and reduced the applicable margin from 1.25% to 1.20%. The credit facilities now also provide us with an option to borrow in Euro (€) and British Pound Sterling (£).

Brookfield Renewable Energy Partners L.P.                                                                      Interim Report                                                                                         September 30, 2014                                

Page 22 


·          In August 2014, as part of the acquisition of the remaining 67% economic and 50% voting interest in a 417 MW hydroelectric facility, we assumed a $65 million loan with an interest rate of 7.1% maturing in June 2018.

·          In August 2014, we secured a €160 million ($210 million) loan for 153 MW of our wind facilities in Ireland with an initial fixed rate of 2.9%, including the related interest rate swaps, maturing in December 2026.

On June 10, 2014, we completed a bought deal LP Unit offering of 10.25 million LP Units at a price of C$31.70 per LP Unit for gross proceeds of C$325 million ($297 million). The net proceeds were used to repay outstanding indebtedness and for general corporate purposes.

Available liquidity

We operate with substantial liquidity which enables us to fund growth initiatives, capital expenditures, distributions, withstand sudden adverse changes in economic circumstances or short-term fluctuations in generation, and to finance the business on an investment grade basis. Principal sources of liquidity are cash flows from operations and access to public and private capital markets.

The following table summarizes the available liquidity:  


As of the date

Sep 30

Dec 31

(MILLIONS)

of this report

2014

2013

Cash and cash equivalents

$

196

$

196

$

203

Credit facilities


Authorized credit facilities


1,480


1,480


1,480


Draws on credit facilities


(339)


(512)


(311)


Issued letters of credit


(230)


(226)


(212)

Available portion of credit facilities


911


742


957

Available liquidity

$

1,107

$

938

$

1,160

Long-term debt and credit facilities

The following table summarizes our principal repayment obligations and maturities as at September 30, 2014:

(MILLIONS)

Balance of 2014

2015

2016

2017

2018

Thereafter

Total

Principal repayments


Subsidiary borrowings(1)


United States

$

 274 

$

 147 

$

 97 

$

 785 

$

 283 

$

 1,412 

$

 2,998 


Canada


 15 


 54 


 140 


 52 


 55 


 1,565 


 1,881 


Brazil


 6 


 25 


 23 


 23 


 22 


 112 


 211 


Europe


 6 


 23 


 24 


 27 


 29 


 305 


 414 


 301 


 249 


 284 


 887 


 389 


 3,394 


 5,504 


Corporate borrowings and


credit facilities(1)


 - 


 - 


 268 


 - 


 179 


 1,405 


 1,852 


Equity-accounted investments

 - 


 31 


 - 


 125 


 - 


 - 


 156 


$

 301 

$

 280 

$

 552 

$

 1,012 

$

 568 

$

 4,799 

$

 7,512 

(1)            Subsidiary borrowings and corporate borrowings and credit facilities include $55 million and $21 million of unamortized deferred financing fees and premiums, respectively.

Brookfield Renewable Energy Partners L.P.                                                                      Interim Report                                                                                         September 30, 2014                                

Page 23 


Subsidiary borrowings maturing in 2014 include $250 million on a hydroelectric portfolio in the southeastern United States. We are in the process of extending this facility prior to its expiry.

We remain focused on refinancing near term facilities at acceptable terms and maintaining a manageable maturity ladder and will do so opportunistically based on the prevailing interest rate environment.

The overall maturity profile and average interest rates associated with our borrowings and credit facilities are as follows:


 Average term (years)

Average interest rate (%)


Sep 30


Dec 31


Sep 30


Dec 31


2014


2013


2014


2013

Corporate borrowings


7.0


7.7

5.3


5.3

Subsidiary borrowings


11.2


11.8

5.7


6.0

Credit facilities


4.8


3.8

1.4


1.4

Brookfield Renewable Energy Partners L.P.                                                                      Interim Report                                                                                         September 30, 2014                                

Page 24 


CONTRACT PROFILE

We have a predictable profile driven by both long-term power purchase agreements with a weighted-average remaining duration of 18 years combined with a well-diversified portfolio that reduces variability in our generation volumes. We operate the business on a largely contracted basis to ensure a high degree of predictability in funds from operations. We do however maintain a long-term view that electricity prices and the demand for electricity from renewable sources will rise due to a growing level of acceptance around climate change and the legislated requirements in some areas to diversify away from fossil fuel based generation.

The following table sets out contracts over the next five years for generation output assuming long-term average:

FOR THE YEAR ENDED DECEMBER 31

Balance of 2014


2015


2016


2017


2018


Generation (GWh)


Contracted(1)


Hydroelectric


United States


2,035


7,146


7,018


7,018


7,018


Canada


1,220


5,185


5,185


5,185


5,185


Brazil


962


2,891


2,674


1,936


1,704


4,217


15,222


14,877


14,139


13,907


Wind energy


United States


252


1,293


1,292


1,292


1,292


Canada


343


1,197


1,197


1,197


1,197


Europe


310


1,129


1,146


1,094


1,041


905


3,619


3,635


3,583


3,530


5,122


18,841


18,512


17,722


17,437


Uncontracted


938


5,252


5,580


6,360


6,645


Total long-term average


6,060


24,093


24,092


24,082


24,082


Long-term average on a proportionate basis(2)

4,725


18,660


18,650


18,640


18,640


Contracted generation - as at September 30, 2014

% of total generation

85

%

78

%

77

%

74

%

72

%

% of total generation on a proportionate basis(2)

92

%

87

%

86

%

82

%

81

%


Price per MWh

$

79

$

84

$

85

$

84

$

85


(1)            Assets under construction are included when long-term average and pricing details are available and the commercial operation date is established in a definitive construction contract.

(2)            Long-term average on a proportionate basis includes wholly-owned assets, and our share of partially-owned assets and equity-accounted investments.

The majority of the long-term power sales agreements are with investment-rated or creditworthy counterparties. At the beginning of 2014 the composition of our contracted generation for 2014 was comprised of: affiliates of Brookfield Asset Management (42%), public power authorities (22%), industrial users (30%) and distribution companies (6%).

Brookfield Renewable Energy Partners L.P.                                                                      Interim Report                                                                                         September 30, 2014                                

Page 25 


SUMMARY CONSOLIDATED BALANCE SHEETS

The following table provides a summary of the key line items on the interim consolidated balance sheets:


Sep 30

Dec 31

(MILLIONS)


2014

2013

Property, plant and equipment, at fair value


$

17,364

$

15,741

Equity-accounted investments


232


290

Total assets


18,555


16,979

Long-term debt and credit facilities


7,322


6,623

Deferred income tax liabilities


2,332


2,265

Total liabilities


10,285


9,443

Preferred equity


756


796

Participating non-controlling interests - in operating subsidiaries


2,202


1,303

General partnership interest in a holding subsidiary held by Brookfield


51


54

Participating non-controlling interests - in a holding subsidiary -


Redeemable/Exchangeable units held by Brookfield


2,499


2,657

Limited partners' equity


2,762


2,726

Total liabilities and equity


18,555


16,979

Contractual obligations

Capital expenditures and development and construction

Brookfield Renewable categorizes its capital spending as either sustaining or development and construction expenditures. Sustaining capital expenditures relate to maintaining power generating assets, whereas development and construction expenditures include project costs for new facilities. Total sustaining capital expenditures for 2014 are expected to be approximately $96 million.

Guarantees

Brookfield Renewable, on behalf of its subsidiaries, and subsidiaries themselves have provided letters of credit, which include, but are not limited to, guarantees for debt service reserves, capital reserves, construction completion and performance. As at September 30, 2014 letters of credit issued by subsidiaries of Brookfield Renewable amounted to $119 million.

In the normal course of operations, we execute agreements that provide for indemnification and guarantees to third parties in transactions such as acquisitions, construction projects, capital projects, and purchases of assets. We have also agreed to indemnify our directors and certain of our officers and employees. The nature of the indemnifications prevents us from making a reasonable estimate of the maximum potential amount that could be required to pay third parties, as many of the agreements do not specify a maximum amount and the amounts are dependent upon the outcome of future contingent events, the nature and likelihood of which cannot be determined at this time. Historically, we have made no significant payments under indemnification agreements.

Off-Balance Sheet Arrangements

Brookfield Renewable has no off-balance sheet financing arrangements.

Brookfield Renewable Energy Partners L.P.                                                                      Interim Report                                                                                         September 30, 2014                                

Page 26 


Related Party Transactions

Brookfield Renewable’s related party transactions are in the normal course of business, and are recorded at the exchange amount. Brookfield Renewable’s related party transactions are primarily with Brookfield Asset Management and its affiliates.

Brookfield Renewable sells electricity to subsidiaries of Brookfield Asset Management through long-term power purchase agreements to provide stable cash flow and reduce Brookfield Renewable’s exposure to electricity prices in deregulated power markets. Brookfield Renewable also benefits from a wind levelization agreement with a subsidiary of Brookfield Asset Management which reduces the exposure to the fluctuation of wind generation at certain facilities and thus improves the stability of its cash flow.

In addition to these agreements, Brookfield Renewable and Brookfield Asset Management have executed other agreements that are fully described in Note 9 - Related Party Transactions in our December 31, 2013 audited consolidated financial statements.

The following table reflects the related party agreements and transactions on the interim consolidated statements of (loss) income:


Three months ended Sep 30

Nine months ended Sep 30

(MILLIONS)


2014


2013


2014


2013

Revenues


Purchase and revenue support agreements

$

99

$

102

$

280

$

339


Wind levelization agreement


2


3


5


5


$

101

$

105

$

285

$

344

Direct operating costs


Energy purchases

$

(1)

$

(8)

$

(8)

$

(26)


Energy marketing fee


(6)


(5)


(16)


(15)


Insurance services


(7)


(6)


(21)


(19)


$

(14)

$

(19)

$

(45)

$

(60)

Management service costs

$

(14)

$

(9)

$

(38)

$

(32)

Revenues from long-term power purchase agreements and revenue agreements for the nine months ended September 30, 2014 were lower as compared to the prior year. This decrease is primarily due to the reduction in the level of price support and reflects the strong pricing environment which we benefited from in the first quarter of 2014.   

Brookfield Renewable Energy Partners L.P.                                                                      Interim Report                                                                                         September 30, 2014                                

Page 27 


CONSOLIDATED STATEMENTS OF CASH FLOWS

The following table summarizes the key items on the consolidated statements of cash flows:


Three months ended Sep 30

Nine months ended Sep 30

(MILLIONS)


2014

2013

2014

2013

Cash flow provided by (used in):


Operating activities

$

188

$

249

$

640

$

669

Financing activities


510


(275)


1,323


(246)

Investing activities


(716)


(20)


(1,962)


(369)

Foreign exchange loss on cash


(11)


-


(8)


(6)

(Decrease) increase in cash and cash equivalents

$

(29)

$

(46)

$

(7)

$

48

Cash and cash equivalents as at September 30, 2014 totaled $196 million, representing a decrease of $7 million since December 31, 2013.

Operating Activities

Cash flows provided by operating activities totaling $188 million for the third quarter of 2014, represent a year-over-year decrease of $61 million primarily attributable to the decrease in funds generated from operations.

Cash flows provided by operating activities totaling $640 million for the nine months ended September 30, 2014 represent a year-over-year decrease of $29 million primarily attributable to net changes in working capital balances and funds generated from operations.

Financing Activities

Cash flows provided by financing activities totaled $510 million for the third quarter of 2014. Long-term debt – borrowings increased due to a €160 million ($210 million) financing related to our recently acquired wind portfolio in Ireland. The capital provided by participating non-controlling interests - in operating

Brookfield Renewable Energy Partners L.P.                                                                      Interim Report                                                                                         September 30, 2014                                

Page 28 


subsidiaries relates to the acquisition of the remaining 67% economic and 50% voting interest in a 417 MW hydroelectric facility.

For the third quarter of 2014, distributions paid to unitholders were $107 million (2013: $95 million). The distributions paid to preferred shareholders and participating non-controlling interests - in operating subsidiaries were $54 million (2013: $44 million). See “Dividends and Distributions” for further details.

Cash flows provided by financing activities totaled $1,323 million for the nine months ended September 30, 2014. Long-term debt – borrowings increased due to the growth in our portfolio, up-financing indebtedness associated with a 349 MW Ontario hydroelectric portfolio and a €160 million ($210 million) financing at recently acquired wind portfolio in Ireland. Long-term debt – repayments related to subsidiary borrowings and credit facilities were $556 million. The issuance of 10,250,000 LP Units at a price of C$31.70 per LP Unit resulted in net proceeds of $285 million. The capital provided by participating non-controlling interests – in operating subsidiaries relates to the growth in our portfolio.

For the nine months ended September 30, 2014, distributions paid to unitholders were $374 million (2013: $282 million). With the change in timing of our quarterly distributions taking effect in the first quarter of 2014 resulting in a distribution on January 31, 2014 and on March 31, 2014, the amounts paid in the first quarter of 2014 included distributions declared in both the fourth quarter of 2013 and the first quarter of 2014. Distributions paid in the first quarter of 2013 included only those declared in the preceding quarter. The distributions paid to preferred shareholders and participating non-controlling interests - in operating subsidiaries were $125 million (2013: $138 million). See “Dividends and Distributions” for further details.

Investing Activities

Cash flows used in investing activities for the third quarter of 2014 totaled $716 million. In the third quarter of 2014, we acquired the remaining 67% economic and 50% voting interest in a 417 MW hydroelectric facility. In addition, our continued investment in the construction of renewable power generating assets was $36 million and sustainable capital expenditures totaled $42 million.

Cash flows used in investing activities for the nine months ended September 30, 2014 totaled $1,962 million. Our investments in the growth of our portfolio totaled $1,827 million. In addition, our continued investment in the construction of renewable power generating assets was $53 million and sustainable capital expenditures totaled $69 million.

NON-CONTROLLING INTERESTS

Preferred equity

As at September 30, 2014, no preference shares have been redeemed.

General partnership interest in a holding subsidiary held by Brookfield

Brookfield, as the owner of the 1% general partnership interest in BRELP, is entitled to regular distributions plus an incentive distribution based on the amount by which quarterly distributions exceed specified target levels. To the extent that distributions exceed $0.375 per unit per quarter, the incentive is 15% of distributions above this threshold. To the extent that quarterly distributions exceed $0.4225 per unit, the incentive distribution is equal to 25% of distributions above this threshold. Accordingly, incentive distributions of $2 million were made during the nine months ended September 30, 2014.

Brookfield Renewable Energy Partners L.P.                                                                      Interim Report                                                                                         September 30, 2014                                

Page 29 


Participating non-controlling interests - in a holding subsidiary - Redeemable/Exchangeable units held by Brookfield

BRELP has issued Redeemable/Exchangeable partnership units to Brookfield Asset Management, which may at the request of the holder, require BRELP to redeem these units for cash consideration. The right is subject to Brookfield Renewable’s right of first refusal which entitles it, at its sole discretion, to elect to acquire all of the units presented to BRELP that are tendered for redemption in exchange for LP Units. If Brookfield Renewable elects not to exchange the Redeemable/Exchangeable partnership units for LP Units, the Redeemable/Exchangeable partnership units are required to be redeemed for cash. As Brookfield Renewable, at its sole discretion, has the right to settle the obligation with LP Units, the Redeemable/Exchangeable partnership units are classified as equity, and not as a liability.


LIMITED PARTNERS’ EQUITY

On June 10, 2014, Brookfield Renewable completed a bought deal LP Unit offering which included 10,250,000 LP Units at a price of C$31.70 per LP Unit for gross proceeds of C$325 million ($297 million). Brookfield Renewable incurred C$13 million ($12 million) in transaction costs associated with the offering. As a result, Brookfield Asset Management now owns, directly and indirectly, 169,685,609 LP Units and Redeemable/Exchangeable partnership units, representing approximately 62% of Brookfield Renewable on a fully-exchanged basis.

SHARES AND UNITS OUTSTANDING

The shares and units outstanding are presented in the following table:


Nine months ended

Year ended


Sep 30, 2014

Dec 31, 2013

Class A Preference Shares


Series 1

10,000,000

10,000,000


Series 3

10,000,000

10,000,000


Series 5

7,000,000

7,000,000


Series 6

7,000,000

7,000,000


34,000,000

34,000,000


General partnership units held by Brookfield

2,651,506

2,651,506


Redeemable/Exchangeable units held by Brookfield

129,658,623

129,658,623


LP Units


Balance, beginning of year

132,984,913

132,901,916


Issuance of LP Units

10,250,000

 - 


Distribution reinvestment plan

95,112

82,997

Balance, end of period/year

143,330,025

132,984,913


Total LP Units on a fully-exchanged basis

272,988,648

262,643,536


LP Units held by


Brookfield Asset Management

40,026,986

40,026,986

External LP Unitholders

103,303,039

92,957,927


143,330,025

132,984,913

Brookfield Renewable Energy Partners L.P.                                                                      Interim Report                                                                                         September 30, 2014                                

Page 30 


DIVIDENDS AND DISTRIBUTIONS

The composition of the dividends and distributions are presented in the following table:


Three months ended Sep 30

Nine months ended Sep 30


Declared


Paid


Declared


Paid

(MILLIONS, EXCEPT AS NOTED)


2014


2013


2014


2013


2014


2013


2014


2013

Class A Preference Shares


Series 1

$

3

$

3

$

3

$

3

$

9

$

10

$

9

$

10


Series 3


3


3


3


3


8


8


8


8


Series 5


2


2


2


2


6


6


6


5


Series 6


2


2


2


2


6


3


6


2


$

10

$

10

$

10

$

10

$

29

$

27

$

29

$

25


Participating non-controlling


interests - in operating


subsidiaries

$

44

$

33

$

44

$

34

$

96

$

113

$

96

$

113


General partnership interest in a


holding subsidiary


 held by Brookfield

$

1

$

1

$

1

$

1

$

3

$

3

$

3

$

3


Incentive distribution


1


  -


1


  -


2


  -


2


  -


$

2

$

1

$

2

$

1

$

5

$

3

$

5

$

3


Participating non-controlling


interests - in a holding subsidiary


 - Redeemable/Exchangeable


units held by Brookfield

$

50

$

47

$

50

$

46

$

151

$

141

$

181

$

138


Limited partners' equity


Brookfield Asset Management


16


15


16


14


47


44


56


42


External LP Unitholders


40


34


39


34


113


101


132


99


$

56

$

49

$

55

$

48

$

160

$

145

$

188

$

141


$

162

$

140

$

161

$

139

$

441

$

429

$

499

$

420

In February 2014, unitholder distributions were increased to $1.55 per unit on an annualized basis, an increase of ten cents per unit, which took effect with the distribution payable in March 2014.

Brookfield Renewable Energy Partners L.P.                                                                      Interim Report                                                                                         September 30, 2014                                

Page 31 


Critical ESTIMATES AND CRITICAL JUDGMENTS in applying accounting policies

The consolidated financial statements are prepared in accordance with IFRS, which require the use of estimates and judgments in reporting assets, liabilities, revenues, expenses and contingencies. In the judgment of management, none of the estimates outlined in Note 2 –  Significant accounting policies in our December 31, 2013 audited consolidated financial statements are considered critical accounting estimates as defined in NI 51-102 with the exception of the estimates related to the valuation of property, plant and equipment and the related deferred income tax liabilities. These assumptions include estimates of future electricity prices, discount rates, expected long-term average generation, inflation rates, terminal year and operating and capital costs, the amount, the timing and the income tax rates of future income tax provisions. Estimates also include determination of accruals, purchase price allocations, useful lives, asset valuations, asset impairment testing, deferred tax liabilities, decommissioning retirement obligations and those relevant to the defined benefit pension and non-pension benefit plans. Estimates are based on historical experience, current trends and various other assumptions that are believed to be reasonable under the circumstances.

In making estimates, management relies on external information and observable conditions where possible, supplemented by internal analysis, as required. These estimates have been applied in a manner consistent with that in the prior year and there are no known trends, commitments, events or uncertainties that we believe will materially affect the methodology or assumptions utilized in this report. These estimates are impacted by, among other things, future power prices, movements in interest rates, foreign exchange and other factors, some of which are highly uncertain, as described in the “Risk Factors” section of our 2013 Annual Report. The interrelated nature of these factors prevents us from quantifying the overall impact of these movements on Brookfield Renewable’s financial statements in a meaningful way. These sources of estimation uncertainty relate in varying degrees to virtually all asset and liability account balances. Actual results could differ from those estimates.

Future changes in accounting policies

(i)         Financial Instruments

IFRS 9, Financial Instruments (“IFRS 9”) was issued by the IASB on October 28, 2010, and will replace IAS 39. IFRS 9 uses a single approach to determine whether a financial asset is measured at amortized cost or fair value, replacing the multiple rules in IAS 39. The approach in IFRS 9 is based on how an entity manages its financial instruments in the context of its business model and the contractual cash flow characteristics of the financial assets. Two measurement categories continue to exist to account for financial liabilities in IFRS 9, fair value through profit or loss (“FVTPL”) and amortized cost. Financial liabilities held for trading are measured at FVTPL, and all other financial liabilities are measured at amortized cost unless the fair value option is applied. The treatment of embedded derivatives under the new standard is consistent with IAS 39 and is applied to financial liabilities and non-derivative hosts not within the scope of the standard. IFRS 9 is effective for annual periods beginning on or after January 1, 2018. Management is currently evaluating the impact of IFRS 9 on the consolidated financial statements.

(ii)      Revenue recognition

IFRS 15, Revenue from Contracts with Customers (“IFRS 15”) was issued by IASB on May 28, 2014.  IFRS 15 outlines a single comprehensive model to account for revenue arising from contracts with customers and will replace the majority of existing IFRS requirements on revenue recognition including IAS 18, Revenue,  IAS 11, Construction Contracts and related interpretations. The core principle of the standard is to recognize revenue to depict the transfer of goods and services to customers in an amount that reflects the consideration to which the entity expects to be entitled in exchange for those goods and

Brookfield Renewable Energy Partners L.P.                                                                      Interim Report                                                                                         September 30, 2014                                

Page 32 


services. The standard has prescribed a five-step model to apply the principles. The standard also specifies how to account for the incremental costs of obtaining a contract and the costs directly related to fulfilling a contract. IFRS 15 is effective for annual periods beginning on or after January 1, 2017. Management is currently evaluating the impact of IFRS 15 on the consolidated financial statements.

ADOPTION OF ACCOUNTING STANDARDS

IFRIC 21, Levies  was adopted and applied by Brookfield Renewable on  January 1, 2014 and had no material impact on the interim consolidated financial statements. See Note 2 (c) - Significant accounting policies in our interim consolidated financial statements and Note 2 (q) - Future changes in accounting policies in our December 31, 2013 audited consolidated financial statements.  

Brookfield Renewable Energy Partners L.P.                                                                      Interim Report                                                                                         September 30, 2014                                

Page 33 


SUMMARY OF HISTORICAL QUARTERLY RESULTS ON A CONSOLIDATED BASIS

The following is a summary of unaudited quarterly financial information for the last eight consecutive quarters:


2014

2013

2012

(MILLIONS, EXCEPT AS NOTED)


Q3


Q2


Q1


Q4


Q3


Q2


Q1


Q4

Generation (GWh) - LTA(1)(2)


5,065

6,691

5,770

5,380

4,960

6,171

5,325

4,606

Generation (GWh) - actual(1)(2)

4,383

6,615

5,711

5,268

5,154

6,265

5,535

4,053

Revenues

$

342

$

474

$

480

$

393

$

392

$

484

$

437

$

317

Adjusted EBITDA(3)


223


360


360


272


260


357


319


195

Funds from operations(3)


61


198


185


137


108


187


162


74

Net (loss) income


Non-controlling interests


Preferred equity


10


10


9


10


10


10


7


6


Participating non-controlling


interests - in operating subsidiaries


(2)


21


40


(7)


8


24


16


(14)


General partnership interest in a


holding subsidiary held by Brookfield


-


-


1


-


-


-


1


(1)


Participating non-controlling


interests - in a holding subsidiary


Redeemable/Exchangeable units


held by Brookfield


(16)


20


37


10


5


22


30


(27)


Limited partners' equity


(17)


21


38


11


5


22


31


(28)


(25)


72


125


24


28


78


85


(64)

Basic and diluted (loss) earnings


per LP Unit(4)


(0.13)


0.15


0.29


0.08


0.04


0.17


0.23


(0.20)

Distributions:


Preferred equity


10


10


9


10


10


10


7


6


General partnership interest in a


holding subsidiary held by Brookfield


2


1


2


1


1


1


1


1


Participating non-controlling


interests - in a holding subsidiary -


Redeemable/Exchangeable units


 held by Brookfield


50


51


50


47


47


47


47


45


Limited partners' equity


56


53


51


48


49


48


48


45

(1)            Includes 100% of generation from equity-accounted investments.

(2)            For assets acquired or reaching commercial operation during the year, this figure is calculated from the acquisition or commercial operation date.

(3)            Non-IFRS measures. See "Cautionary Statement Regarding Use of Non-IFRS Measures".

(4)            Average LP Units outstanding totaled 143.3 million during the quarter, 135.3 million in the second quarter and 133.0 million in the first quarter (2013 and 2012: 132.9 million).

Brookfield Renewable Energy Partners L.P.                                                                      Interim Report                                                                                         September 30, 2014                                

Page 34 


ADDITIONAL INFORMATION

Risk factors about our business and additional information, including our Form 20-F filed with the SEC and securities regulators in Canada are available on our website at www.brookfieldrenewable.com, on SEC’s website at www.sec.gov and on SEDAR’s website at www.sedar.com

Subsequent event

On October 1, 2014 we secured financing in the amount of $480 million related to the acquisition of a 417 MW hydroelectric facility in Pennsylvania. The debt bears interest at LIBOR plus 1.75%, and matures in June 2018.

Brookfield Renewable Energy Partners L.P.                                                                      Interim Report                                                                                         September 30, 2014                                

Page 35 


FINANCIAL REVIEW BY SEGMENTS FOR THE THREE MONTHS ENDED SEPTEMBER 30, 2014

The following table reflects adjusted EBITDA, funds from operations, adjusted funds from operations, and provides a reconciliation to net (loss) income and cash flows from operating activities for the three months ended September 30:


Co-generation


(MILLIONS)

Hydroelectric

Wind

 and Other

2014

2013

Revenues

$

275

$

65

$

2

$

342

$

392

Other income


3


  -


  -


3


1

Share of cash earnings from equity-accounted


 investments 


10


  -


  -


10


7

Direct operating costs


(90)


(22)


(20)


(132)


(140)

Adjusted EBITDA(1)


198


43


(18)


223


260

Interest expense - borrowings


(61)


(23)


(22)


(106)


(105)

Management service costs


  -


  -


(14)


(14)


(9)

Current income taxes


(5)


  -


  -


(5)


(4)

Less: cash portion of non-controlling interests


Preferred equity


  -


  -


(10)


(10)


(10)


Participating non-controlling interests - in


operating subsidiaries


(18)


(9)


  -


(27)


(24)

Funds from operations(1)

$

114

$

11

$

(64)

$

61

$

108

Less: sustaining capital expenditures(2)


(15)


(14)

Adjusted funds from operations(1)


46


94

Add: sustaining capital expenditures  


15


14

Add: cash portion of non-controlling interests


37


34

Other items:


Depreciation and amortization


(145)


(133)


Unrealized financial instruments gain


9


11


Share of non-cash loss from equity-


accounted investments


(3)


(4)

Deferred income tax recovery


27


10

Other


(11)


2

Net (loss) income


$

(25)

$

28

Adjustments for non-cash items


107


110

Dividends received from equity accounted


investments


10


8

Changes in due to or from related parties


8


24

Net change in working capital balances


88


79

Cash flows from operating activities


$

188

$

249

(1)       Non-IFRS measures.  See “Cautionary Statement Regarding Use of Non-IFRS Measures”.

(2)       Based on long-term capital expenditure plans.

Brookfield Renewable Energy Partners L.P.                                                                      Interim Report                                                                                         September 30, 2014                                

Page 36 


FINANCIAL REVIEW BY SEGMENTS FOR THE NINE MONTHS ENDED SEPTEMBER 30, 2014

The following table reflects adjusted EBITDA, funds from operations, adjusted funds from operations, and provides a reconciliation to net income and cash flows from operating activities for the nine months ended September 30:


Co-generation


(MILLIONS)

Hydroelectric

Wind

 and Other

2014

2013

Revenues

$

1,060

$

211

$

25

$

1,296

$

1,313

Other income


8


  -


  -


8


5

Share of cash earnings from equity-accounted


 investments 


25


  -


  -


25


19

Direct operating costs


(270)


(51)


(65)


(386)


(401)

Adjusted EBITDA(1)


823


160


(40)


943


936

Fixed earnings adjustment(2)


  -


11


  -


11


  -

Interest expense - borrowings


(181)


(63)


(65)


(309)


(313)

Management service costs


  -


  -


(38)


(38)


(32)

Current income taxes


(19)


  -


  -


(19)


(15)

Less: cash portion of non-controlling interests


Preferred equity


  -


  -


(29)


(29)


(27)


Participating non-controlling interests - in


operating subsidiaries


(82)


(33)


  -


(115)


(92)

Funds from operations(1)

$

541

$

75

$

(172)

$

444

$

457

Less: sustaining capital expenditures(3)


(43)


(42)

Adjusted funds from operations(1)


401


415

Add: sustaining capital expenditures  


43


42

Add: cash portion of non-controlling interests


144


119

Less: fixed earnings adjustment


(11)


  -

Other items:


Depreciation and amortization


(400)


(398)


Unrealized financial instruments gain


5


30


Share of non-cash loss from equity-


accounted investments


(15)


(10)

Deferred income tax recovery (expense)


8


(1)

Other


(3)


(6)

Net income


$

172

$

191

Adjustments for non-cash items


379


363

Dividends received from equity accounted


investments


28


14

Changes in due to or from related parties


14


14

Net change in working capital balances


47


87

Cash flows from operating activities


$

640

$

669

(1)       Non-IFRS measures.  See “Cautionary Statement Regarding Use of Non-IFRS Measures”.

(2)       The fixed earnings adjustment relates to Brookfield Renewable’s investment in the acquisition of the wind portfolio in Ireland. Pursuant to the terms of the purchase and sale agreement, Brookfield Renewable acquired an economic interest in the wind portfolio from January 1, 2014. The transaction closed on June 30, 2014, and accordingly under IFRS, the $11 million net funds from operations contribution was recorded as part of the purchase price.

(3)       Based on long-term capital expenditure plans.

Brookfield Renewable Energy Partners L.P.                                                                      Interim Report                                                                                         September 30, 2014                                

Page 37 


cautionary statement regarding forward-looking statements

This Interim Report contains forward-looking statements and information, within the meaning of Canadian securities laws and “forward-looking statements” within the meaning of Section 27A of the U.S. Securities Act of 1933, as amended, Section 21E of the U.S. Securities Exchange Act of 1934, as amended, “safe harbor” of the United States Private Securities Litigation Reform Act of 1995 and in any applicable Canadian securities regulations, concerning the business and operations of Brookfield Renewable. Forward-looking statements may include estimates, plans, expectations, opinions, forecasts, projections, guidance or other statements that are not statements of fact. Forward-looking statements in this Interim Report include statements regarding the quality of Brookfield Renewable’s assets and the resiliency of the cash flow they will generate, Brookfield Renewable’s anticipated financial performance, future commissioning of assets, contracted portfolio, technology diversification, acquisition opportunities, expected completion of acquisitions, future energy prices and demand for electricity, economic recovery, achievement of long term average generation, project development and capital expenditure costs, diversification of shareholder base,  energy policies, economic growth, growth potential of the renewable asset class, the future growth prospects and distribution profile of Brookfield Renewable and Brookfield Renewable’s access to capital. Forward-looking statements can be identified by the use of words such as “plans”, “expects”, “scheduled”, “estimates”, “intends”, “anticipates”, “believes”, “potentially”, “tends”, “continue”, “attempts”, “likely”, “primarily”, “approximately”, “endeavours”, “pursues”, “strives”, “seeks”, or variations of such words and phrases, or statements that certain actions, events or results “may”, “could”, “would”, “might” or “will” be taken, occur or be achieved. Although we believe that our anticipated future results, performance or achievements expressed or implied by the forward-looking statements and information in this Interim Report are based upon reasonable assumptions and expectations, we cannot assure you that such expectations will prove to have been correct. You should not place undue reliance on forward-looking statements and information as such statements and information involve known and unknown risks, uncertainties and other factors which may cause our actual results, performance or achievements to differ materially from anticipated future results, performance or achievement expressed or implied by such forward-looking statements and information.

Factors that could cause actual results to differ materially from those contemplated or implied by forward-looking statements include, but are not limited to: our limited operating history; the risk that we may be deemed an “investment company” under the Investment Company Act; the fact that we are not subject to the same disclosure requirements as a U.S. domestic issuer; the risk that the effectiveness of our internal controls over financial reporting could have a material effect on our business; changes to hydrology at our hydroelectric stations or in wind conditions at our wind energy facilities; the risk that counterparties to our contracts do not fulfill their obligations, and as our contracts expire, we may not be able to replace them with agreements on similar terms; increases in water rental costs (or similar fees) or changes to the regulation of water supply; volatility in supply and demand in the energy market; exposure to additional costs as a result of our operations being highly regulated and exposed to increased regulation; the risk that our concessions and licenses will not be renewed; increases in the cost of operating our plants; our failure to comply with conditions in, or our inability to maintain, governmental permits; equipment failure; dam failures and the costs of repairing such failures; exposure to force majeure events; exposure to uninsurable losses; adverse changes in currency exchange rates; availability and access to interconnection facilities and transmission systems; health, safety, security and environmental risks; disputes, governmental and regulatory investigations and litigation; local communities affecting our operations; losses resulting from fraud, bribery, corruption, other illegal acts, inadequate or failed internal processes or systems, or from external events; risks relating to our reliance on computerized business systems; general industry risks relating to operating in the North American, Brazilian and European power market sectors; advances in technology that impair or eliminate the competitive advantage of our projects; newly developed technologies in which we invest not performing as anticipated; labour disruptions and economically unfavourable collective bargaining agreements; our inability to finance our operations due to the status of the capital markets; the operating and financial restrictions imposed on us by our loan, debt and security agreements; changes in our credit ratings; changes to government regulations that provide incentives for renewable energy; our inability to identify sufficient investment opportunities and complete transactions; risks related to the growth of our portfolio and our inability to realize the expected benefits of our transactions; our inability to develop existing sites or find new sites

Brookfield Renewable Energy Partners L.P.                                                                      Interim Report                                                                                         September 30, 2014                                

Page 38 


suitable for the development of greenfield projects; risks associated with the development of our generating facilities and the various types of arrangements we enter into with communities and joint venture partners; Brookfield Asset Management’s election not to source acquisition opportunities for us and our lack of access to all renewable power acquisitions that Brookfield Asset Management identifies; our lack of control over our operations conducted through joint ventures, partnerships and consortium arrangements; our ability to issue equity or debt for future acquisitions and developments will be dependent on capital markets; foreign laws or regulation to which we become subject as a result of future acquisitions in new markets; and the departure of some or all of Brookfield’s key professionals.

We caution that the foregoing list of important factors that may affect future results is not exhaustive. The forward-looking statements represent our views as of the date of this Interim Report and should not be relied upon as representing our views as of any date subsequent to November 4, 2014, the date of this Interim Report. While we anticipate that subsequent events and developments may cause our views to change, we disclaim any obligation to update the forward-looking statements, other than as required by applicable law. For further information on these known and unknown risks, please see “Risk Factors” included in our Form 20-F.

cautionary statement regarding use of non-ifrs measures

This Interim Report contains references to adjusted EBITDA, funds from operations and adjusted funds from operations which are not generally accepted accounting measures under IFRS and therefore may differ from definitions of adjusted EBITDA, funds from operations and adjusted funds from operations used by other entities. We believe that adjusted EBITDA, funds from operations and adjusted funds from operations are useful supplemental measures that may assist investors in assessing the financial performance and the cash anticipated to be generated by our operating portfolio. Neither adjusted EBITDA, funds from operations nor adjusted funds from operations should be considered as the sole measure of our performance and should not be considered in isolation from, or as a substitute for, analysis of our financial statements prepared in accordance with IFRS.

A reconciliation of adjusted EBITDA, funds from operations and adjusted funds from operations to net (loss) income and cash flows from operating activities is presented in our Management’s Discussion and Analysis. We have also provided a reconciliation of adjusted EBITDA and funds from operations to net (loss) income in Note 14 - Segmented information in our interim consolidated financial statements.    

Brookfield Renewable Energy Partners L.P.                                                                      Interim Report                                                                                         September 30, 2014                                

Page 39 


BROOKFIELD RENEWABLE ENERGY PARTNERS L.P.

CONSOLIDATED BALANCE SHEETS


UNAUDITED


Sep 30


Dec 31

(MILLIONS)

Notes


2014


2013

Assets


Current assets


Cash and cash equivalents


$

196

$

203


Restricted cash


212


169


Trade receivables and other current assets


178


184


Financial instrument assets

4


51


2


Due from related parties


46


48


683


606

Financial instrument assets

4


6


15

Equity-accounted investments

6


232


290

Property, plant and equipment, at fair value

7


17,364


15,741

Deferred income tax assets

10


149


117

Other long-term assets


121


210


$

18,555

$

16,979

Liabilities


Current liabilities


Accounts payable and accrued liabilities

8

$

280

$

209


Financial instrument liabilities

4


90


64


Due to related parties


83


110


Current portion of long-term debt

9


494


517


947


900

Financial instrument liabilities

4


55


9

Long-term debt and credit facilities

9


6,828


6,106

Deferred income tax liabilities

10


2,332


2,265

Other long-term liabilities


123


163


10,285


9,443

Equity


Non-controlling interests


Preferred equity

11


756


796


Participating non-controlling interests - in operating


subsidiaries

11


2,202


1,303


General partnership interest in a holding subsidiary


held by Brookfield

11


51


54


Participating non-controlling interests - in a holding subsidiary


 - Redeemable/Exchangeable units held by Brookfield

11


2,499


2,657

Limited partners' equity

12


2,762


2,726


8,270


7,536


$

18,555

$

16,979


The accompanying notes are an integral part of these interim consolidated financial statements.

Approved on behalf of Brookfield Renewable Energy Partners L.P.:


Patricia Zuccotti

Director

David Mann

Director


Brookfield Renewable Energy Partners L.P.                                                                      Interim Report                                                                                         September 30, 2014                                

Page 40 


BROOKFIELD RENEWABLE ENERGY PARTNERS L.P.


CONSOLIDATED STATEMENTS OF (LOSS) INCOME


UNAUDITED

Notes

Three months ended Sep 30

Nine months ended Sep 30

(MILLIONS, EXCEPT AS NOTED)


2014


2013


2014


2013

Revenues


5

$

342

$

392

$

1,296

$

1,313

Other income


3


1


8


5

Direct operating costs


(132)


(140)


(386)


(401)

Management service costs

5


(14)


(9)


(38)


(32)

Interest expense – borrowings

9


(106)


(105)


(309)


(313)

Share of earnings from equity-accounted


investments

6


7


3


10


9

Unrealized financial instruments gain

4


9


11


5


30

Depreciation

7


(145)


(133)


(400)


(398)

Other

3


(11)


2


(3)


(6)

(Loss) income before income taxes


(47)


22


183


207

Income tax recovery (expense)


Current

10


(5)


(4)


(19)


(15)


Deferred

10


27


10


8


(1)


22


6


(11)


(16)

Net (loss) income


$

(25)

$

28

$

172

$

191

Net (loss) income attributable to:


Non-controlling interests


Preferred equity

11

$

10

$

10

$

29

$

27


Participating non-controlling interests - in


operating subsidiaries

11


(2)


8


59


48


General partnership interest in a holding


subsidiary held by Brookfield

11


-


-


1


1


Participating non-controlling interests - in a


holding subsidiary - Redeemable/


Exchangeable units held by Brookfield

11


(16)


5


41


57

Limited partners' equity

12


(17)


5


42


58


$

(25)

$

28

$

172

$

191

Basic and diluted (loss) earnings per LP Unit


$

(0.13)

$

0.04

$

0.31

$

0.44


The accompanying notes are an integral part of these interim consolidated financial statements.


Brookfield Renewable Energy Partners L.P.                                                                      Interim Report                                                                                         September 30, 2014                                

Page 41 


BROOKFIELD RENEWABLE ENERGY PARTNERS L.P.


CONSOLIDATED STATEMENTS OF COMPREHENSIVE (LOSS) INCOME


UNAUDITED

Three months ended Sep 30

Nine months ended Sep 30

(MILLIONS)

Notes


2014


2013


2014


2013

Net (loss) income

$

(25)

$

28

$

172

$

191

Other comprehensive (loss) income that will not be


reclassified to net (loss) income


Actuarial (losses) gains on defined benefit plans


(10)


9


(10)


9


Deferred income taxes on above items


3


(2)


3


(2)

Total items that will not be reclassified to net income (loss)


(7)


7


(7)


7

Other comprehensive (loss) income that may be


reclassified to net (loss) income


Financial instruments designated as cash-flow


hedges


(Losses) gains arising during the period

4


(2)


(1)


(55)


49


Reclassification adjustments for amounts


 recognized in net (loss) income

4


(3)


(9)


5


(5)


Foreign currency translation


(304)


31


(201)


(316)


Deferred income taxes on above items


(3)


(1)


7


(13)

Total items that may be reclassified subsequently to


net (loss) income


(312)


20


(244)


(285)

Other comprehensive (loss) income


(319)


27


(251)


(278)

Comprehensive (loss) income


$

(344)

$

55

$

(79)

$

(87)

Comprehensive (loss) income attributable to:


Non-controlling interests


Preferred equity

11

$

(27)

$

27

$

(12)

$

(1)


Participating non-controlling interests - in


operating subsidiaries

11


(38)


6


29


34


General partnership interest in a holding subsidiary


held by Brookfield

11


(3)


-


(1)


(1)


Participating non-controlling interests - in a holding


subsidiary - Redeemable/Exchangeable


units held by Brookfield

11


(135)


11


(46)


(59)

Limited partners' equity

12


(141)


11


(49)


(60)


$

(344)

$

55

$

(79)

$

(87)


The accompanying notes are an integral part of these interim consolidated financial statements. 

Brookfield Renewable Energy Partners L.P.                                                                      Interim Report                                                                                         September 30, 2014                                

Page 42 


BROOKFIELD RENEWABLE ENERGY PARTNERS L.P.

CONSOLIDATED STATEMENTS OF CHANGES IN EQUITY


Accumulated other comprehensive income


Participating


General

non-controlling


partnership

interests - in a


Actuarial


Participating

interest in

holding subsidiary


losses on


Total


non-controlling

a holding

- Redeemable


THREE MONTHS ENDED SEPTEMBER 30

Limited

Foreign


defined


limited


interests - in

subsidiary

/Exchangeable


UNAUDITED

partners'

currency

Revaluation

benefit

Cash flow

partners'

Preferred

operating

held by

units held by

Total

(MILLIONS)


equity

translation

surplus

plans

hedges

equity

equity

subsidiaries

Brookfield

Brookfield

equity

Balance, as at June 30, 2013


$

(258)

$

(15)

$

3,271

$

(11)

$

(9)

$

2,978

$

804

$

1,019

$

59

$

2,904

$

7,764

Net income


5


  -


  -


  -


  -


5


10


8


  -


5


28

Other comprehensive income (loss)


  -


4


  -


4


(2)


6


17


(2)


  -


6


27

Acquisitions


  -


  -


  -


  -


  -


  -


  -


205


  -


  -


205

Distributions or dividends declared


(49)


  -


  -


  -


  -


(49)


(10)


(33)


(1)


(47)


(140)

Other


2


  -


  -


  -


  -


2


  -


(9)


1


1


(5)

Change in period


(42)


4


  -


4


(2)


(36)


17


169


  -


(35)


115

Balance, as at September 30, 2013

$

(300)

$

(11)

$

3,271

$

(7)

$

(11)

$

2,942

$

821

$

1,188

$

59

$

2,869

$

7,879


Balance, as at June 30, 2014

$

(131)

$

(37)

$

3,158

$

(7)

$

(20)

$

2,963

$

793

$

2,011

$

55

$

2,681

$

8,503

Net (loss) income


(17)


  -


  -


  -


  -


(17)


10


(2)


  -


(16)


(25)

Other comprehensive loss


  -


(120)


  -


(3)


(1)


(124)


(37)


(36)


(3)


(119)


(319)

Acquisitions (Note 3)


  -


  -


  -


  -


  -


  -


  -


273


  -


  -


273

Distributions or dividends declared


(56)


  -


  -


  -


  -


(56)


(10)


(45)


(2)


(50)


(163)

Other


(4)


  -


  -


  -


  -


(4)


  -


1


1


3


1

Change in period


(77)


(120)


  -


(3)


(1)


(201)


(37)


191


(4)


(182)


(233)

Balance, as at September 30, 2014

$

(208)

$

(157)

$

3,158

$

(10)

$

(21)

$

2,762

$

756

$

2,202

$

51

$

2,499

$

8,270


The accompanying notes are an integral part of these interim consolidated financial statements.

Brookfield Renewable Energy Partners L.P.                                                                      Interim Report                                                                                         September 30, 2014                                

Page 43 


BROOKFIELD RENEWABLE ENERGY PARTNERS L.P.

CONSOLIDATED STATEMENTS OF CHANGES IN EQUITY


Accumulated other comprehensive income


Participating


General

non-controlling


partnership

interests - in a


Actuarial


Participating

interest in

holding subsidiary


losses on


Total


non-controlling

a holding

- Redeemable


NINE MONTHS ENDED SEPTEMBER 30

Limited

Foreign


defined


limited


interests - in

subsidiary

/Exchangeable


UNAUDITED

partners'

currency

Revaluation

benefit

Cash flow

partners'

Preferred

operating

held by

units held by

Total

(MILLIONS)


equity

translation

surplus

plans

hedges

equity

equity

subsidiaries

Brookfield

Brookfield

equity

Balance, as at December 31, 2012


$

(227)

$

125

$

3,285

$

(11)

$

(25)

$

3,147

$

500

$

1,028

$

63

$

3,070

$

7,808

Net income


58


  -


  -


  -


  -


58


27


48


1


57


191

Other comprehensive income (loss)


  -


(136)


  -


4


14


(118)


(28)


(14)


(2)


(116)


(278)

Preferred shares issued


  -


  -


  -


  -


  -


  -


349


  -


  -


  -


349

Acquisitions


14


  -


(14)


  -


  -


  -


  -


205


  -


  -


205

Distributions or dividends declared


(145)


  -


  -


  -


  -


(145)


(27)


(113)


(3)


(141)


(429)

Distribution reinvestment plan


1


  -


  -


  -


  -


1


  -


  -


  -


  -


1

Other


(1)


  -


  -


  -


  -


(1)


  -


34


  -


(1)


32

Change in period


(73)


(136)


(14)


4


14


(205)


321


160


(4)


(201)


71

Balance, as at September 30, 2013

$

(300)

$

(11)

$

3,271

$

(7)

$

(11)

$

2,942

$

821

$

1,188

$

59

$

2,869

$

7,879


Balance, as at December 31, 2013

$

(337)

$

(83)

$

3,160

$

(7)

$

(7)

$

2,726

$

796

$

1,303

$

54

$

2,657

$

7,536

Net income


42


  -


  -


  -


  -


42


29


59


1


41


172

Other comprehensive loss


  -


(74)


  -


(3)


(14)


(91)


(41)


(30)


(2)


(87)


(251)

LP Unit issued (Note 11)


Net proceeds


285


  -


  -


  -


  -


285


  -


  -


  -


  -


285


Adjustment


(38)


  -


  -


  -


  -


(38)


  -


  -


1


37


  -

Acquisitions (Note 3)


2


  -


(2)


  -


  -


  -


  -


967


  -


  -


967

Distributions or dividends declared


(160)


  -


  -


  -


  -


(160)


(29)


(97)


(5)


(151)


(442)

Distribution reinvestment plan


2


  -


  -


  -


  -


2


  -


  -


  -


  -


2

Other


(4)


  -


  -


  -


  -


(4)


1


  -


2


2


1

Change in period


129


(74)


(2)


(3)


(14)


36


(40)


899


(3)


(158)


734

Balance, as at September 30, 2014

$

(208)

$

(157)

$

3,158

$

(10)

$

(21)

$

2,762

$

756

$

2,202

$

51

$

2,499

$

8,270


The accompanying notes are an integral part of these interim consolidated financial statements.

Brookfield Renewable Energy Partners L.P.                                                                      Interim Report                                                                                         September 30, 2014                                

Page 44 


BROOKFIELD RENEWABLE ENERGY PARTNERS L.P.


CONSOLIDATED STATEMENTS OF CASH FLOWS


Notes

Three months ended

Nine months ended

UNAUDITED


Sep 30


Sep 30

(MILLIONS)


2014


2013


2014


2013

Operating activities


Net (loss) income


$

(25)

$

28

$

172

$

191

Adjustments for the following non-cash items:


Depreciation

7


145


133


400


398


Unrealized financial instrument loss

4


(9)


(11)


(5)


(30)


Share of earnings from equity accounted investments

6


(7)


(3)


(10)


(9)


Deferred income tax expense

10


(27)


(10)


(8)


1


Other non-cash items


5


1


2


3

Dividends received from equity-accounted investments

6


10


8


28


14

Changes in due to or from related parties


8


24


14


14

Net change in working capital balances


88


79


47


87


188


249


640


669

Financing activities


Long-term debt - borrowings

9


420


-


1,126


1,222

Long-term debt - repayments

9


(22)


(341)


(556)


(1,631)

Capital provided by participating non-controlling interests -


in operating subsidiaries

11


273


205


967


246

Issuance of preferred shares

11


-


-


-


337

Issuance of LP Units

12


-


-


285


-

Distributions paid:


To participating non-controlling interests - in operating


subsidiaries and preferred equity

11


(54)


(44)


(125)


(138)


To unitholders of Brookfield Renewable or BRELP

12


(107)


(95)


(374)


(282)


510


(275)


1,323


(246)

Investing activities


Acquisitions

3


(599)


-


(1,827)


(243)

Investment in:


Sustaining capital expenditures


(42)


(23)


(69)


(44)


Development and construction of renewable power


generating assets


(36)


(33)


(53)


(113)

Investment tax credits related to renewable power


generating assets


11


-


23


-

Restricted cash


(50)


36


(36)


31


(716)


(20)


(1,962)


(369)

Foreign exchange loss on cash


(11)


-


(8)


(6)

Cash and cash equivalents


(Decrease) increase


(29)


(46)


(7)


48


Balance, beginning of period


225


231


203


137


Balance, end of period


$

196

$

185

$

196

$

185

Supplemental cash flow information:


Interest paid


$

54

$

52

$

251

$

249


Interest received


3


1


8


5


Income taxes paid


6


5


28


24


The accompanying notes are an integral part of these interim consolidated financial statements.


Brookfield Renewable Energy Partners L.P.                                                                      Interim Report                                                                                         September 30, 2014                                

Page 45 


brookfield renewable energy partners l.p.

notes to the consolidated financial statements

1.  organization and description of the business

The business activities of Brookfield Renewable Energy Partners L.P. (“Brookfield Renewable”) consist of owning a portfolio of renewable power generating facilities in the United States, Canada, Brazil and Europe.

Brookfield Renewable is a publicly traded limited partnership established under the laws of Bermuda pursuant to an amended and restated limited partnership agreement dated November 20, 2011.

The registered office of Brookfield Renewable is 73 Front Street, Fifth Floor, Hamilton HM12, Bermuda.

The immediate parent of Brookfield Renewable is its general partner. The ultimate parent of Brookfield Renewable is Brookfield Asset Management Inc. (“Brookfield Asset Management”).

2.  BASIS OF PREPARATION AND SIGNIFICANT ACCOUNTING POLICIES

(a) Statement of compliance

The interim consolidated financial statements have been prepared in accordance with IAS 34, Interim Financial Reporting on a basis consistent with the accounting policies disclosed in the audited consolidated financial statements for the fiscal year ended December 31, 2013.

Certain information and footnote disclosure normally included in the annual audited consolidated financial statements prepared in accordance with International Financial Reporting Standards (“IFRS”), as issued by the International Accounting Standards Board (“IASB”) have been omitted or condensed.  These interim consolidated financial statements should be read in conjunction with Brookfield Renewable’s December 31, 2013 audited consolidated financial statements.

The interim consolidated financial statements are unaudited and reflect any adjustments (consisting of normal recurring adjustments) that are, in the opinion of management, necessary to a fair statement of results for the interim periods in accordance with IFRS.

The results reported in these interim consolidated financial statements should not be regarded as necessarily indicative of results that may be expected for an entire year. Certain comparative figures have been reclassified to conform to the current year’s presentation.

These interim consolidated financial statements have been authorized for issuance by the Board of Directors of its general partner, Brookfield Renewable Partners Limited, on November 4, 2014.  

All figures are presented in millions of United States (“U.S.”) dollars unless otherwise noted.

(b) Basis of preparation

The interim consolidated financial statements have been prepared on the basis of historical cost, except for the revaluation of property, plant and equipment and certain assets and liabilities which have been measured at fair value.  Cost is recorded based on the fair value of the consideration given in exchange for assets.

Consolidation

These interim consolidated financial statements include the accounts of Brookfield Renewable and its subsidiaries, which are the entities over which Brookfield Renewable has control. An investor controls an investee when it is exposed, or has rights, to variable returns from its involvement with the investee and has the ability to affect those returns through its power over the investee. Non-controlling interests in the

Brookfield Renewable Energy Partners L.P.                                                                      Interim Report                                                                                         September 30, 2014                                

Page 46 


equity of Brookfield Renewable’s subsidiaries are shown separately in equity in the consolidated balance sheets.

(c) New interpretation adopted by Brookfield Renewable

IFRIC 21, Levies  was adopted and applied by Brookfield Renewable on January 1, 2014, which had no material impact on the interim consolidated financial statements.

(d) Future changes

IFRS 15, Revenue from Contracts with Customers (“IFRS 15”)

IFRS 15 was issued by the IASB on May 28, 2014. IFRS 15 outlines a single comprehensive model to account for revenue arising from contracts with customers and will replace the majority of existing IFRS requirements on revenue recognition including IAS 18, Revenue,  IAS 11, Construction Contracts and related interpretations. The core principle of the standard is to recognize revenue to depict the transfer of goods and services to customers in an amount that reflects the consideration to which the entity expects to be entitled in exchange for those goods and services. The standard has prescribed a five-step model to apply the principles. The standard also specifies how to account for the incremental costs of obtaining a contract and the costs directly related to fulfilling a contract. IFRS 15 is effective for annual periods beginning on or after January 1, 2017. Management is currently evaluating the impact of IFRS 15 on the consolidated financial statements.

Please refer to the December 31, 2013 audited consolidated financial statements for other future changes to IFRS with potential impact on Brookfield Renewable.

3.  BUSINESS COMBINATIONS  

The following investments were accounted for using the acquisition method, and the results of operations have been included in the consolidated financial statements since the respective dates of acquisition.

Maine Hydroelectric Generation Facilities

In January 2014, Brookfield Renewable acquired a 70 MW hydroelectric portfolio of generation facilities that are expected to generate approximately 400 GWh annually (“Maine Hydro”). The acquisition was completed with institutional partners, and Brookfield Renewable retains an approximate 40% controlling interest in the portfolio. Total cash consideration was $244 million. The acquisition costs of $2 million were expensed as incurred. 

California Hydroelectric Generation Facility

In February 2014, Brookfield Renewable acquired the remaining 50% interest in a 30 MW hydroelectric generation facility in California. The total cash consideration was $11 million (the “California Hydro Step Acquisition”). The acquisition was completed with institutional partners, and Brookfield Renewable retains an approximate 22% controlling interest in the facility.

Pennsylvania Hydroelectric Generation Facility   

In March 2014, Brookfield Renewable acquired a 33% economic and 50% voting interest in a 417 MW hydroelectric generation facility in Pennsylvania (“Pennsylvania Hydro”) which is expected to generate approximately 1,100 GWh annually. Total cash consideration was $295 million.  Brookfield Renewable accounted for its acquired 33% economic interest using the equity method.  

In August 2014, Brookfield Renewable acquired the remaining 67% economic and 50% voting interest in Pennsylvania Hydro (the “Pennsylvania Hydro Step Acquisition”) for additional cash consideration of $614 million, and began consolidating the operating results, cash flows and net assets of Pennsylvania Hydro.

Brookfield Renewable Energy Partners L.P.                                                                      Interim Report                                                                                         September 30, 2014                                

Page 47 


Prior to the Pennsylvania Hydro Step Acquisition, Brookfield Renewable re-measured its previously held 33% economic interest to fair value, and the net impact of this re-measurement was not material. The Pennsylvania Hydro Step Acquisition was completed with institutional partners, and Brookfield Renewable retains an approximate 40% controlling interest. Total acquisition costs of $2 million relating to both the Pennsylvania Hydro and Pennsylvania Hydro Step Acquisition were expensed as incurred.

Ireland Wind Portfolio   

In June 2014, Brookfield Renewable acquired the wind portfolio of Bord Gáis Energy comprising 326 MW of operating wind capacity across 17 wind projects in  Ireland. The acquisition was completed with institutional partners, and Brookfield Renewable retains an approximate 40% controlling interest. Total consideration of €516 million ($707 million) included €521 million ($713 million) in cash reduced for post-closing working capital adjustments and a deferred consideration amount. The acquisition costs of $12 million were expensed as incurred. 

Voting Agreements

In January 2014 and March 2014, Brookfield Renewable entered into voting agreements with subsidiaries of Brookfield Asset Management whereby these subsidiaries, as managing members of entities related to Brookfield Infrastructure Fund II (the “BIF II Entities”), in which Brookfield Renewable holds its investments in the Maine Hydro, Pennsylvania Hydro and the Irish wind portfolio with institutional investors, agreed to assign to Brookfield Renewable their voting rights to appoint the directors of the BIF II Entities. 

Preliminary price allocations, at fair values, with respect to the acquisitions were as follows:  

(MILLIONS)

Maine

Pennsylvania

Ireland

Cash and cash equivalents

$

7

$

15

$

35

Restricted cash


-


-


12

Trade receivables and other current assets


13


11


10

Property, plant and equipment, at fair value


220


1,034


1,061

Other long-term assets


6


-


-

Current liabilities


(1)


(4)


(72)

Long-term debt


-


(77)


(232)

Other long-term liabilities


(1)


(70)


(107)

Net assets acquired

$

244

$

909

$

707

The estimated fair values of the assets acquired and liabilities assumed are expected to be finalized within 12 months of the acquisition date.

4.  risk management and financial instruments

Risk management

Brookfield Renewable’s activities expose it to a variety of financial risks, including market risk (i.e., commodity price risk, interest rate risk, and foreign currency risk), credit risk and liquidity risk.  Brookfield Renewable uses financial instruments primarily to manage these risks.

There have been no material changes in exposure to these risks since the December 31, 2013 audited consolidated financial statements.

Brookfield Renewable Energy Partners L.P.                                                                      Interim Report                                                                                         September 30, 2014                                

Page 48 


Financial instruments disclosures

Fair value is the price that would be received to sell an asset or paid to transfer a liability in an orderly transaction between market participants at the measurement date.

Fair values determined using valuation models require the use of assumptions concerning the amount and timing of estimated future cash flows and discount rates. In determining those assumptions, management looks primarily to external readily observable market inputs such as interest rate yield curves, currency rates, and price, as applicable.  The fair value of interest rate swap contracts, which form part of financing arrangements, is calculated by way of discounted cash flows, using market interest rates and applicable credit spreads.

A fair value measurement of a non-financial asset is the consideration that would be received in an orderly transaction between market participants, considering the highest and best use of the asset.

Assets and liabilities  measured at fair value are categorized into one of three hierarchy levels, described below.  Each level is based on the transparency of the inputs used to measure the fair values of assets and liabilities.

Level 1 –  inputs are based on unadjusted quoted prices in active markets for identical assets and liabilities;

Level 2 – inputs, other than quoted prices in Level 1, that are observable for the asset or liability, either directly or indirectly; and

Level 3 – inputs for the asset or liability that are not based on observable market data.

The following table presents Brookfield Renewable’s assets and liabilities measured and disclosed at fair value classified by the fair value hierarchy:


Sep 30, 2014

Dec 31

(MILLIONS)

Level 1

Level 2

Level 3

Total

2013

Assets measured at fair value:


Cash and cash equivalents

$

196

$

-

$

-

$

196

$

203

Restricted cash


212


-


-


212


169

Financial instrument assets


Interest rate swaps


-


3


-


3


17


Foreign exchange swaps


-


54


-


54


-

Property, plant and equipment(1)


-


-


17,364


17,364


15,741

Liabilities measured at fair value:


Financial instrument liabilities


Energy derivative contracts


-


(5)


-


(5)


(3)


Interest rate swaps


-


(140)


-


(140)


(70)

Liabilities for which fair value is disclosed:


Long-term debt and credit facilities


-


(8,207)


-


(8,207)


(7,128)

Total

$

408

$

(8,295)

$

17,364

$

9,477

$

8,929

(1)       Refer to Note 7 - Property, plant and equipment, at fair value for further information.


There were no transfers between levels during the nine months ended September 30, 2014.

Brookfield Renewable Energy Partners L.P.                                                                      Interim Report                                                                                         September 30, 2014                                

Page 49 


The aggregate amount of Brookfield Renewable’s net financial instrument positions are as follows:


Sep 30, 2014

Dec 31, 2013

(MILLIONS)

Assets

Liabilities

Net Liabilities

Net Liabilities

Energy derivative contracts

$

-

$

5

$

5

$

3

Interest rate swaps


3


140


137


53

Foreign exchange swaps


54


-


(54)


-

Total


57


145


88


56

Less: current portion


51


90


39


62

Long-term portion

$

6

$

55

$

49

$

(6)

Energy derivative contracts

Brookfield Renewable has entered into long-term energy derivative contracts primarily to stabilize the price of gas purchases or eliminate the price risk on the sale of certain future power generation.  Certain energy contracts are recorded in Brookfield Renewable’s interim consolidated financial statements at an amount equal to fair value, using quoted market prices or, in their absence, a valuation model using both internal and third-party evidence and forecasts.

Interest rate swaps

Brookfield Renewable has entered into interest rate swap contracts primarily to minimize exposure to interest rate fluctuations on its variable rate debt or to lock in interest rates on future debt refinancing.  All interest rate swap contracts are recorded in the interim consolidated financial statements at an amount equal to fair value.

Foreign exchange swaps

Brookfield Renewable has entered into foreign exchange swaps to minimize its exposure to currency fluctuations impacting its investments in foreign operations, and to fix the exchange rate on certain anticipated transactions denominated in foreign currencies.

The following table reflects the unrealized gains (losses) included in the consolidated statements of (loss) income:


Three months ended Sep 30

Nine months ended Sep 30

(MILLIONS)


2014


2013


2014


2013

Energy derivative contracts

$

(1)

$

2

$

(1)

$

12

Interest rate swaps


  -


9


1


18

Foreign exchange swaps


10


  -


5


  -


$

9

$

11

$

5

$

30

Brookfield Renewable Energy Partners L.P.                                                                      Interim Report                                                                                         September 30, 2014                                

Page 50 


The following table reflects the unrealized gains (losses) included in the consolidated statements of comprehensive (loss) income:


Three months ended Sep 30

Nine months ended Sep 30

(MILLIONS)


2014


2013


2014


2013

Energy derivative contracts

$

(3)

$

  -

$

(4)

$

  -

Interest rate swaps(1)


(9)


(1)


(63)


49

Foreign exchange swaps


10


  -


12


  -


$

(2)

$

(1)

$

(55)

$

49

(1)       Included in the nine months ended September 30, 2013 are unrealized gains of $2 million relating to equity-accounted investments.

The following table reflects the reclassification adjustments recognized in net (loss) income in the consolidated statements of comprehensive (loss) income:


Three months ended Sep 30

Nine months ended Sep 30

(MILLIONS)


2014


2013


2014


2013

Energy derivative contracts

$

(3)

$

-

$

3

$

-

Interest rate swaps


-


(9)


2


(5)


$

(3)

$

(9)

$

5

$

(5)

5.  related party transactions

Brookfield Renewable’s related party transactions are recorded at the exchange amount.  Brookfield Renewable’s related party transactions are primarily with Brookfield Asset Management and its subsidiaries.

The following table reflects the related party agreements and transactions on the consolidated statements of (loss) income:


Three months ended Sep 30

Nine months ended Sep 30

(MILLIONS)


2014


2013


2014


2013

Revenues


Purchase and revenue support agreements

$

99

$

102

$

280

$

339


Wind levelization agreement


2


3


5


5


$

101

$

105

$

285

$

344

Direct operating costs


Energy purchases

$

(1)

$

(8)

$

(8)

$

(26)


Energy marketing fee


(6)


(5)


(16)


(15)


Insurance services


(7)


(6)


(21)


(19)


$

(14)

$

(19)

$

(45)

$

(60)

Management service costs

$

(14)

$

(9)

$

(38)

$

(32)

Brookfield Renewable Energy Partners L.P.                                                                      Interim Report                                                                                         September 30, 2014                                

Page 51 


6. EQUITY-ACCOUNTED INVESTMENTS

The following table outlines the changes in Brookfield Renewable’s equity-accounted investments:


Three months ended

Nine months ended

Year ended

(MILLIONS)

Sep 30, 2014

Sep 30, 2014

Dec 31, 2013

Balance, beginning of period

$

542

$

290

$

344

Acquisitions (see Note 3):


California Hydro Step Acquisition


-


(39)


-


Pennsylvania Hydro Step Acquisition


(301)


-


-


Canada Hydroelectric Step Acquisition


-


-


(19)

Revaluation recognized through OCI


-


-


(15)

Share of OCI


1


1


1

Share of net income


7


10


9

Dividends declared


(10)


(25)


(18)

Foreign exchange loss


(8)


(5)


(12)

Other


1


-


-

Balance, end of period

$

232

$

232

$

290

The following table summarizes certain financial information of equity-accounted investments:


Three months ended Sep 30

Nine months ended Sep 30

(MILLIONS)


2014


2013


2014


2013

Revenue

$

30

$

28

$

95

$

87

Net income


14


5


20


17

Share of net income (loss)


Cash earnings


10


7


25


19


Non-cash loss


(3)


(4)


(15)


(10)


Brookfield Renewable Energy Partners L.P.                                                                      Interim Report                                                                                         September 30, 2014                                

Page 52 


7.   PROPERTY, PLANT AND EQUIPMENT, AT FAIR VALUE   

The following table presents a reconciliation of property, plant and equipment at fair value:


Co-


(MILLIONS)


Hydroelectric

Wind energy

CWIP

generation

Total

As at December 31, 2013


$

12,806

$

2,448

$

441

$

46

$

15,741

Foreign exchange


(347)


(142)


(6)


(1)


(496)

Additions(1)


1,320


1,075


124


-


2,519

Transfers


281


(1)


(280)


-


-

Depreciation(2)


(282)


(115)


-


(3)


(400)

As at September 30, 2014

$

13,778

$

3,265

$

279

$

42

$

17,364

(1)       Includes acquisitions of $2,396 million.

(2)       Assets not subject to depreciation include construction work in process (“CWIP”) and land.

8.  accounts payable and accrued liabilities

Brookfield Renewable’s accounts payable and accrued liabilities are as follows:  


Sep 30


Dec 31

(MILLIONS)


2014


2013

Operating accrued liabilities

$

133

$

101

Interest payable on corporate and subsidiary borrowings


93


49

Accounts payable


23


11

LP Unitholders’ distribution(1) and preferred dividends payable


20


40

Other


11


8


$

280

$

209

(1)       Includes amounts payable to external LP Unitholders. Amounts payable to Brookfield Asset Management are included in due to related parties.

Brookfield Renewable Energy Partners L.P.                                                                      Interim Report                                                                                         September 30, 2014                                

Page 53 


9LONG-TERM DEBT AND CREDIT FACILITIES

The composition of debt obligations is presented in the following table:


Sep 30, 2014

Dec 31, 2013


Weighted-average


Weighted-average


Interest

Term


Interest

Term


(MILLIONS EXCEPT AS NOTED)

rate (%)

(years)


rate (%)

(years)


Corporate borrowings


Series 3

5.3

4.1

$

179

5.3

4.8

$

188


Series 4

5.8

22.1


134

5.8

22.9


141


Series 6

6.1

2.2


268

6.1

2.9


282


Series 7

5.1

6.0


402

5.1

6.8


424


Series 8

4.8

7.4


357

4.8

8.1


377


5.3

7.0

$

1,340

5.3

7.7

$

1,412

Subsidiary borrowings


United States

5.9

9.3

$

2,998

6.0

9.7

$

2,826


Canada

5.7

14.0


1,881

5.8

15.2


1,877


Brazil

7.3

10.5


211

7.4

11.1


238


Europe

3.8

12.3


414

-

-


-


5.7

11.2

$

5,504

6.0

11.8

$

4,941

Credit facilities

1.4

4.8

$

512

1.4

3.8

$

311

Total debt


$

7,356


$

6,664

Add: Unamortized premiums(1)


21


11

Less: Unamortized financing fees(1)


(55)


(52)

Less: Current portion


(494)


(517)


$

6,828


$

6,106

(1)            Unamortized premiums and unamortized financing fees are amortized to interest expense over the terms of the borrowing.

Corporate borrowings

Corporate borrowings are obligations of a finance subsidiary of Brookfield Renewable (Note 13  - Subsidiary public issuers).  The finance subsidiary may redeem some or all of the borrowings from time to time, pursuant to the terms of the indenture. The balance is payable upon maturity, and interest on corporate borrowings is paid semi-annually.

Subsidiary borrowings

Subsidiary borrowings are generally asset-specific, long-term, non-recourse borrowings denominated in the domestic currency of the subsidiary. Subsidiary borrowings in the United States and Canada consist of both fixed and floating interest rate debt.  Brookfield Renewable uses interest rate swap agreements to minimize its exposure to floating interest rates.  Subsidiary borrowings in Brazil consist of floating interest rates of Taxa de Juros de Longo Prazo, the Brazil National Bank for Economic Development’s long-term interest rate, or Interbank Deposit Certificate rate, plus a margin.

In January 2014, the $279 million bridge loan associated with a 360 MW operating hydroelectric portfolio located in New England was refinanced to 2017 at LIBOR plus 2.25%. 

In February 2014, as part of the Maine Hydro acquisition, $140 million of financing was obtained through a bond issuance with a 5.5% interest rate maturing in 2024.

Brookfield Renewable Energy Partners L.P.                                                                      Interim Report                                                                                         September 30, 2014                                

Page 54 


In March 2014, Brookfield Renewable up-financed indebtedness associated with a 349 MW Ontario hydroelectric portfolio through the issuance of C$90 million of senior and C$60 million of subordinate bonds with interest rates of 3.8% and 5.0%, respectively, maturing in June 2023.

In June 2014, Brookfield Renewable refinanced a $125 million debt facility associated with a 167 MW hydroelectric portfolio in New England through the issuance of 8-year notes maturing in January 2022 at a fixed rate of 4.59%.

In June 2014, as part of the acquisition of the 326 MW Irish wind portfolio, Brookfield Renewable assumed a €169 million ($232 million) loan with a fixed interest rate of 4.6%, including the related interest rate swaps, maturing in December 2026.

The maturity of the $250 million credit facility associated with a hydroelectric portfolio in the southeastern United States was extended by six months to November 2014. Brookfield Renewable is in the process of extending this facility prior to its expiry.

In August 2014, as part of the of Pennsylvania Hydro Step Acquisition, Brookfield Renewable assumed a $65 million loan with an interest rate of 7.1% maturing in June 2018.

In August 2014, Brookfield Renewable secured a €160 million ($210 million) loan associated with 153 MW of its wind facilities in Ireland with an initial fixed interest rate of 2.9%, including the related interest rate swaps, maturing in December 2026.

Cash received from borrowings net of repayments was $369 million during the nine months ended September 30, 2014.

Credit facilities

Brookfield Renewable and its subsidiaries issue letters of credit from its credit facilities for general corporate purposes, which include, but are not limited to, security deposits, performance bonds and guarantees for debt service reserve accounts.

In August 2014, Brookfield Renewable extended the maturity of all corporate credit facilities to June 2019 and reduced the applicable margin by five basis points from 1.25% to 1.20%. The credit facilities now also provide Brookfield Renewable with an option to borrow in Euro (€) and British Pound Sterling (£).


Sep 30

Dec 31

(MILLIONS)


2014


2013

Available revolving credit facilities

$

1,480

$

1,480

Drawings(1)


(512)


(311)

Issued letters of credit


(226)


(212)

Unutilized revolving credit facilities

$

742

$

957

(1)            Amounts are unsecured and revolving. Interest rate is at the LIBOR plus 1.20% (December 31, 2013: 1.25%).

Net draws of $201 million were made during the nine months ended September 30, 2014.

Brookfield Renewable Energy Partners L.P.                                                                      Interim Report                                                                                         September 30, 2014                                

Page 55 


10.  Income taxes

Brookfield Renewable’s effective income tax rate was 6% for the nine months ended September 30, 2014 (2013: 7.7%). The effective tax rate is less than the statutory rate primarily due to rate differentials and non-controlling interests income not subject to tax.

11. Non-controlling interests

Brookfield Renewable’s non-controlling interests are comprised of the following:


Sep 30

Dec 31

(MILLIONS)


2014


2013

Preferred equity

$

756

$

796

Participating non-controlling interests - in operating subsidiaries


2,202


1,303

General partnership interest in a holding subsidiary held by Brookfield


51


54

Participating non-controlling interests - in a holding subsidiary -


 Redeemable/Exchangeable units held by Brookfield


2,499


2,657

Total

$

5,508

$

4,810

Preferred equity

Brookfield Renewable’s preferred equity consists of Class A Preference Shares as follows:


Earliest

Dividends declared


Cumulative

permitted

for the nine months


Shares

dividend

redemption

ended September 30

Sep 30

Dec 31

(MILLIONS)

outstanding

rate

date

2014

2013

2014

2013

Series 1

10

5.25%

Apr 30, 2015

$

9

$

10

$

222

$

234

Series 3

10

4.40%

Jul 31, 2019


8


8


222


234

Series 5

7

5.00%

Apr 30, 2018


6


6


156


164

Series 6

7

5.00%

Jul 31, 2018


6


3


156


164


34


$

29

$

27

$

756

$

796

As at September 30, 2014, none of the issued Class A Preference Shares have been redeemed by Brookfield Renewable Power Preferred Equity Inc. (“BRP Equity”).

Brookfield Renewable Energy Partners L.P.                                                                      Interim Report                                                                                         September 30, 2014                                

Page 56 


Participating non-controlling interests – in operating subsidiaries

The net change in participating non-controlling interests – in operating entities is as follows:


Brookfield


Americas

Brookfield


Brookfield


Infrastructure

Infrastructure

The Catalyst

Energia


(MILLIONS)

Fund

Fund II

Group

Renovável

Other

Total

As at December 31, 2012

$

806

$

-

$

123

$

58

$

41

$

1,028

Net income


21


1


18


1


-


41

OCI


133


(2)


(26)


(10)


4


99

Acquisitions


51


214


-


-


-


265

Distributions


(119)


-


-


(3)


-


(122)

Other


(1)


(6)


1


-


(2)


(8)

As at December 31, 2013

$

891

$

207

$

116

$

46

$

43

$

1,303

Net income


20


22


17


-


-


59

OCI


(21)


(5)


-


(2)


(2)


(30)

Acquisitions (Note 3)


-


967


-


-


-


967

Distributions


(29)


(53)


(12)


(2)


-


(96)

Other


-


-


-


-


(1)


(1)

As at September 30, 2014

$

861

$

1,138

$

121

$

42

$

40

$

2,202

Interests held by third parties


75-80%


50-60%


25%


20-30%


23-50%


General partnership interest in a holding subsidiary held by Brookfield and Participating non-controlling interests – in a holding subsidiary - Redeemable/Exchangeable units held by Brookfield

Brookfield, as the owner of the 1% general partnership interest in Brookfield Renewable Energy L.P. (“BRELP”), is entitled to regular distributions plus an incentive distribution based on the amount by which quarterly distributions exceed specified target levels. To the extent that distributions exceed $0.375 per unit per quarter, the incentive is 15% of distributions above this threshold. To the extent that quarterly distributions exceed $0.4225 per unit, the incentive distribution is equal to 25% of distributions above this threshold.

Consolidated equity includes Redeemable/Exchangeable Partnership Units issued by BRELP. The Redeemable/Exchangeable Partnership Units are held 100% by Brookfield Asset Management, which at its discretion has the right to redeem these units for cash consideration. No Redeemable/Exchangeable Partnership Units have been redeemed for cash consideration. Since this redemption right is subject to Brookfield Renewable’s right, at its sole discretion, to satisfy the redemption request with LP Units of Brookfield Renewable, the Redeemable/Exchangeable Partnership Units are classified as equity in accordance with IAS 32, Financial Instruments: Presentation. The Redeemable/Exchangeable Partnership Units are presented as non-controlling interests since they provide Brookfield the direct economic benefits and exposures to the underlying performance of BRELP. Both the LP Units issued by Brookfield Renewable and the Redeemable/Exchangeable Partnership Units issued by its subsidiary BRELP have the same economic attributes in all respects, except for the redemption right described above. The Redeemable/Exchangeable Partnership Units participate in earnings and distributions on a per unit basis equivalent to the per unit participation of the LP Units of Brookfield Renewable.

Brookfield Renewable Energy Partners L.P.                                                                      Interim Report                                                                                         September 30, 2014                                

Page 57 


Issuance of LP Units

On June 10, 2014, Brookfield Renewable completed a bought deal LP Unit offering which included 10,250,000 LP Units at a price of C$31.70 per LP Unit for gross proceeds of C$325 million ($297 million) (the “Offering”).  Brookfield Renewable incurred C$13 million ($12 million) in transaction costs associated with the Offering. Proceeds from the Offering were used to purchase additional limited partnership units of BRELP. The excess of the consideration paid over the carrying value of the additional limited partnership units of BRELP purchased by Brookfield Renewable resulted in adjustments to the General partnership interest in a holding subsidiary held by Brookfield and Participating non-controlling interests – in a holding subsidiary - Redeemable/Exchangeable units held by Brookfield of $1 million and $37 million, respectively. BRELP ultimately used the net proceeds to repay outstanding indebtedness and for general corporate purposes.

As at September 30, 2014, General Partnership Units and Redeemable/Exchangeable Partnership Units outstanding were 2,651,506 (December 31, 2013: 2,651,506) and 129,658,623 (December 31, 2013: 129,658,623), respectively.

Distributions

For the three and nine months ended September 30, 2014, BRELP declared $1 million and $3 million, respectively in distributions on the general partnership interest (2013: $1 million and $3 million, respectively) and an incentive distribution of $1 million and $2 million, respectively (2013: $nil). For the three and nine months ended September 30, 2014, BRELP declared distributions on the Redeemable/Exchangeable Partnership Units held by Brookfield of $50 million and $151 million, respectively (2013: $47 million and $141 million, respectively).

12. LIMITED PARTNERS’ EQUITY

Limited partners’ equity

As at September 30, 2014, LP Units outstanding were 143,330,025 (December 31, 2013: 132,984,913) including 40,026,986 (December 31, 2013: 40,026,986) held by Brookfield Asset Management. General partnership interests represent 0.01% of Brookfield Renewable.

During the three and nine months ended September 30, 2014, 25,874 and 95,112 LP Units, respectively (2013: 21,832 and 57,785 LP Units, respectively) were issued under the distribution reinvestment plan.

As a result of the Offering (Note 11), Brookfield Asset Management’s direct and indirect interest of  169,685,609 LP Units and Redeemable/Exchangeable partnership units, now represents  approximately 62%  of Brookfield Renewable on a fully-exchanged basis.

Distributions

Distributions may be made by the general partner of Brookfield Renewable with the exception of instances that there is insufficient cash available, payment rends Brookfield Renewable unable to pay its debt or payment of which might leave Brookfield Renewable unable to meet any future contingent obligations.

For the three and nine months ended September 30, 2014, Brookfield Renewable declared distributions on its LP Units of $56 million and $160 million or $0.3875 per LP Unit and $1.1625 per LP Unit, respectively (2013: $49 million and $145 million or $0.3625 per LP Unit and $1.09 per LP Unit, respectively).

Brookfield Renewable Energy Partners L.P.                                                                      Interim Report                                                                                         September 30, 2014                                

Page 58 


The composition of the distribution is presented in the following table:


Three months ended Sep 30

Nine months ended Sep 30

(MILLIONS)


2014


2013


2014


2013

Brookfield Asset Management

$

16

$

15

$

47

$

44

External LP Unitholders


40


34


113


101


$

56

$

49

$

160

$

145

In February 2014, unitholder distributions were increased to $1.55 per unit on an annualized basis, an increase of ten cents per unit, and took effect with the distribution paid in March 2014.

13.  subsidiary public issuers

See Note 9 – Long-term debt and credit facilities for additional details regarding corporate notes. See Note 11 – Non-controlling interests for additional details regarding Class A Preference Shares.

The following tables provide consolidated summary financial information for Brookfield Renewable, BRP Equity, and Brookfield Renewable Energy Partners ULC (“BREP Finance”):


Brookfield


Brookfield

BRP

BREP

Other

Consolidating

Renewable

(MILLIONS)


Renewable

Equity

Finance

Subsidiaries(1)

adjustments(2)

consolidated

As at September 30, 2014:


Current assets

$

22

$

-

$

1,365

$

685

$

(1,389)

$

683

Long-term assets


2,762


744


-


17,865


(3,499)


17,872

Current liabilities


22


9


26


2,261


(1,371)


947

Long-term liabilities


-


-


1,334


8,742


(738)


9,338

Preferred equity


-


756


-


-


-


756

Participating non-controlling interests -


 in operating subsidiaries


-


-


-


2,202


-


2,202

Participating non-controlling interests -


in a holding subsidiary - Redeemable/


Exchangeable units held by Brookfield


-


-


-


2,499


-


2,499

As at December 31, 2013:


Current assets

$

48

$

-

$

1,429

$

612

$

(1,483)

$

606

Long-term assets


2,728


785


-


16,365


(3,505)


16,373

Current liabilities


50


10


17


2,258


(1,435)


900

Long-term liabilities


-


-


1,406


7,914


(777)


8,543

Preferred equity


-


796


-


-


-


796

Participating non-controlling interests -


in operating subsidiaries


-


-


-


1,303


-


1,303

Participating non-controlling interests -


in a holding subsidiary - Redeemable/


Exchangeable units held by Brookfield


-


-


-


2,657


-


2,657

(1)            Includes subsidiaries of Brookfield Renewable, other than BRP Equity and BREP Finance.

(2)            Includes elimination of intercompany transactions and balances necessary to present Brookfield Renewable on a consolidated basis.

Brookfield Renewable Energy Partners L.P.                                                                      Interim Report                                                                                         September 30, 2014                                

Page 59 


Brookfield


Brookfield

BRP

BREP

Other

Consolidating

Renewable

(MILLIONS)

Renewable

Equity

Finance

Subsidiaries(1)

adjustments(2)

consolidated

For the three months ended Sep 30, 2014


Revenues

$

-

$

-

$

-

$

342

$

-

$

342

Net (loss) income


(17)


-


(1)


(24)


17


(25)

For the three months ended Sep 30, 2013


Revenues

$

-

$

-

$

-

$

392

$

-

$

392

Net income (loss)


5


-


-


28


(5)


28

For the nine months ended Sep 30, 2014


Revenues

$

-

$

-

$

-

$

1,296

$

-

$

1,296

Net income (loss)


42


-


(1)


173


(42)


172

For the nine months ended Sep 30, 2013


Revenues

$

-

$

-

$

-

$

1,313

$

-

$

1,313

Net income (loss)


58


-


1


190


(58)


191

(1)            Includes subsidiaries of Brookfield Renewable, other than BRP Equity and BREP Finance.

(2)            Includes elimination of intercompany transactions and balances necessary to present Brookfield Renewable on a consolidated basis.

Brookfield Renewable Energy Partners L.P.                                                                      Interim Report                                                                                         September 30, 2014                                

Page 60 


14.  segmented information

Brookfield Renewable operates renewable power assets, which include conventional hydroelectric generating assets located in the United States, Canada and Brazil, and wind farms located in the United States, Canada and Europe. Brookfield Renewable also operates two co-generation (“Co-gen”) facilities. Management evaluates the business based on the type of power generation (Hydroelectric, Wind and Co-gen). Hydroelectric and wind are further evaluated by geography (United States, Canada, Brazil and Europe). The “Other” segment includes CWIP and corporate.

In accordance with IFRS 8, Operating Segments, Brookfield Renewable discloses information about its reportable segments based upon the measures used by management in assessing performance. The accounting policies of the reportable segments are the same as those described in Note 2 of the December 31, 2013 audited consolidated financial statements. Brookfield Renewable analyzes the performance of its operating segments based on revenues, adjusted EBITDA, and funds from operations.

Adjusted EBITDA means revenues less direct costs (including energy marketing costs), plus Brookfield Renewable’s share of cash earnings from equity-accounted investments and other income, before interest, income taxes, depreciation, management service costs and the cash portion of non-controlling interests.

Funds from operations is defined as adjusted EBITDA less interest, current income taxes and management service costs, which is then adjusted for the cash portion of non-controlling interests. For the nine months ended September 30, 2014, funds from operations include the earnings received from the wind portfolio Brookfield Renewable acquired in Ireland, reflecting its economic interest from January 1, 2014 to June 30, 2014. This amount represents an acquisition price adjustment under IFRS 3, Business Combinations (see note 3) but is included in funds from operations for purposes of reporting operating results to Brookfield Renewable’s chief operating decision maker.

Transactions between the reportable segments occur at fair value.

Brookfield Renewable Energy Partners L.P.                                                                      Interim Report                                                                                         September 30, 2014                                

Page 61 


Hydroelectric

Wind energy

Co-gen

Other

Total

(MILLIONS)

U.S.

Canada

Brazil

U.S.

Canada

Europe


For the three months ended


September 30, 2014:


Revenues

$

151

$

64

$

60

$

28

$

19

$

18

$

2

$

  -

$

342

Adjusted EBITDA


104


50


44


18


14


11


(1)


(17)


223

Interest expense - borrowings


(37)


(19)


(5)


(10)


(9)


(4)


  -


(22)


(106)

Funds from operations prior to


 non-controlling interests


67


31


34


8


5


7


(1)


(53)


98

Cash portion of non-controlling


 interests 


(14)


  -


(4)


(4)


  -


(5)


  -


(10)


(37)

Funds from operations


53


31


30


4


5


2


(1)


(63)


61

Depreciation


(40)


(19)


(37)


(16)


(19)


(13)


(1)


  -


(145)

For the three months ended


September 30, 2013:


Revenues

$

160

$

93

$

69

$

34

$

19

$

  -

$

17

$

  -

$

392

Adjusted EBITDA


111


76


47


24


14


  -


4


(16)


260

Interest expense - borrowings


(38)


(17)


(5)


(11)


(10)


  -


  -


(24)


(105)

Funds from operations prior to


 non-controlling interests


73


59


38


13


4


  -


4


(49)


142

Cash portion of non-controlling


 interests 


(15)


  -


(2)


(7)


  -


  -


  -


(10)


(34)

Funds from operations


58


59


36


6


4


  -


4


(59)


108

Depreciation


(37)


(20)


(37)


(17)


(19)


  -


(3)


  -


(133)

Brookfield Renewable Energy Partners L.P.                                                                      Interim Report                                                                                         September 30, 2014                                

Page 62 


Hydroelectric

Wind energy

Co-gen

Other

Total

(MILLIONS)

U.S.

Canada

Brazil

U.S.

Canada

Europe


For the nine months ended


September 30, 2014:


Revenues

$

575

$

269

$

216

$

106

$

87

$

18

$

25

$

  -

$

1,296

Adjusted EBITDA


431


224


168


74


75


11


11


(51)


943

Interest expense - borrowings


(113)


(53)


(15)


(30)


(29)


(4)


  -


(65)


(309)

Funds from operations prior to


 non-controlling interests


314


171


138


44


46


18


11


(154)


588

Cash portion of non-controlling


interests


(71)


  -


(11)


(28)


  -


(5)


  -


(29)


(144)

Funds from operations


243


171


127


16


46


13


11


(183)


444

Depreciation


(112)


(61)


(109)


(47)


(55)


(13)


(3)


  -


(400)

For the nine months ended


September 30, 2013:


Revenues

$

546

$

294

$

223

$

107

$

93

$

  -

$

50

$

  -

$

1,313

Adjusted EBITDA


407


243


160


77


78


  -


15


(44)


936

Interest expense - borrowings


(111)


(50)


(18)


(29)


(34)


  -


  -


(71)


(313)

Funds from operations prior to


 non-controlling interests


293


193


129


48


44


  -


15


(146)


576

Cash portion of non-controlling


interests


(57)


  -


(9)


(26)


  -


  -


  -


(27)


(119)

Funds from operations


236


193


120


22


44


  -


15


(173)


457

Depreciation


(104)


(64)


(118)


(46)


(57)


  -


(9)


  -


(398)

Brookfield Renewable Energy Partners L.P.                                                                      Interim Report                                                                                         September 30, 2014                                

Page 63 


The following table reconciles adjusted EBITDA and funds from operations, presented in the above tables, to net (loss) income as presented in the interim consolidated statements of (loss) income:


Three months ended Sep 30

Nine months ended Sep 30

(MILLIONS)


2014


2013


2014


2013

Revenues


$

342

$

392

$

1,296

$

1,313

Other income


3


1


8


5

Share of cash earnings from equity-accounted investments


10


7


25


19

Direct operating costs


(132)


(140)


(386)


(401)

Adjusted EBITDA


223


260


943


936

Fixed earnings adjustment(1)


-


-


11


-

Interest expense - borrowings


(106)


(105)


(309)


(313)

Management service costs


(14)


(9)


(38)


(32)

Current income tax expense


(5)


(4)


(19)


(15)

Funds from operations prior to non-controlling interests


98


142


588


576

Less: cash portion of non-controlling interests


Preferred equity


(10)


(10)


(29)


(27)


Participating non-controlling interests - in operating


subsidiaries


(27)


(24)


(115)


(92)

Funds from operations


61


108


444


457

Add: cash portion of non-controlling interests


37


34


144


119

Less: fixed earnings adjustment


-


-


(11)


-

Depreciation


(145)


(133)


(400)


(398)

Unrealized financial instruments gain


9


11


5


30

Share of non-cash loss from equity-accounted investments


(3)


(4)


(15)


(10)

Deferred income tax recovery (expense)


27


10


8


(1)

Other


(11)


2


(3)


(6)

Net (loss) income

$

(25)

$

28

$

172

$

191

(1)            The fixed earnings adjustment relates to Brookfield Renewable’s investment in the acquisition of the wind portfolio in Ireland. Pursuant to the terms of the purchase and sale agreement, Brookfield Renewable acquired an economic interest in the wind portfolio from January 1, 2014. The transaction closed on June 30, 2014, and accordingly under IFRS, the $11 million net funds from operations contribution was recorded as part of the purchase price.

Brookfield Renewable Energy Partners L.P.                                                                      Interim Report                                                                                         September 30, 2014                                

Page 64 


The following table presents information about Brookfield Renewable’s certain balance sheet items on a segmented basis:


 Hydroelectric 

Wind energy


Co-gen

Other(1)

Total


(MILLIONS)

U.S.

Canada

Brazil

U.S.

Canada

Europe


As at September 30, 2014:


Property, plant and


 equipment, at fair value

$

6,979

$

4,788

$

2,011

$

1,151

$

1,134

$

980

$

42

$

279

$

17,364

Total assets


7,415


4,884


2,224


1,249


1,159


1,099


43


482


18,555

Total borrowings


2,362


1,205


211


627


662


409


-


1,846


7,322

Total liabilities


3,642


2,194


304


706


886


579


-


1,974


10,285

For the nine months ended


September 30, 2014:


Additions to property, plant


 and equipment


1,320


-


-


-


-


1,075


-


124


2,519

As at December 31, 2013:


Property, plant and


 equipment, at fair value

$

5,771

$

4,830

$

2,205

$

1,198

$

1,250

$

-

$

46

$

441

$

15,741

Total assets


6,246


4,998


2,484


1,282


1,297


-


62


610


16,979

Total borrowings


2,157


1,143


238


647


721


-


-


1,717


6,623

Total liabilities


3,328


2,144


398


720


995


-


4


1,854


9,443

For the year ended


December 31, 2013:


Additions to property, plant


 and equipment


715


206


-


430


-


-


-


255


1,606

(1)            Includes CWIP and corporate.

Brookfield Renewable Energy Partners L.P.                                                                      Interim Report                                                                                         September 30, 2014                                

Page 65 


15.  Commitments, contingencies and guarantees

Commitments

In the course of its operations, Brookfield Renewable and its subsidiaries have entered into agreements for the use of water, land and dams. Payment under those agreements varies with the amount of power generated. The various agreements are renewable and extend up to 2054.

Contingencies

Brookfield Renewable and its subsidiaries are subject to various legal proceedings, arbitrations and actions arising in the normal course of business. While the final outcome of such legal proceedings and actions cannot be predicted with certainty, it is the opinion of management that the resolution of such proceedings and actions will not have a material impact on Brookfield Renewable’s consolidated financial position or results of operations.

Guarantees

Brookfield Renewable, on behalf of Brookfield Renewable’s subsidiaries, and the subsidiaries themselves have provided letters of credit, which include, but are not limited to, guarantees for debt service reserves, capital reserves, construction completion and performance. The activity on the issued letters of credit by Brookfield Renewable can be found in Note 9 – Long-term debt and credit facilities. As at September 30, 2014, letters of credit issued by subsidiaries of Brookfield Renewable amounted to $119 million.

In the normal course of operations, Brookfield Renewable and its subsidiaries execute agreements that provide for indemnification and guarantees to third parties of transactions such as business dispositions, capital project purchases, business acquisitions, and sales and purchases of assets and services. Brookfield Renewable has also agreed to indemnify its directors and certain of its officers and employees. The nature of substantially all of the indemnification undertakings prevents Brookfield Renewable from making a reasonable estimate of the maximum potential amount that Brookfield Renewable could be required to pay third parties as the agreements do not always specify a maximum amount and the amounts are dependent upon the outcome of future contingent events, the nature and likelihood of which cannot be determined at this time. Historically, neither Brookfield Renewable nor its subsidiaries have made material payments under such indemnification agreements.  

16.  subsequent event

On October 1, 2014 Brookfield Renewable secured financing in the amount of $480 million related to the acquisition of a 417 MW hydroelectric facility in Pennsylvania. The debt bears interest at LIBOR plus 1.75%, and matures in June 2018.


Brookfield Renewable Energy Partners L.P.                                                                      Interim Report                                                                                         September 30, 2014                                

Page 66 


GENERAL INFORMATION 


Corporate Office


73 Front Street

Fifth Floor

Hamilton, HM12

Bermuda

Tel:  (441) 294-3304

Fax: (441) 516-1988

www.brookfieldrenewable.com


Officers of Brookfield Renewable Energy Partners L.P.’s Service Provider, BRP Energy Group L.P.


Harry Goldgut

Chairman of BRE Group


Richard Legault

President and Chief Executive Officer


Sachin Shah

Chief Financial Officer


Transfer Agent & Registrar

Computershare Trust Company of Canada

100 University Avenue

9th floor

Toronto, Ontario, M5J 2Y1

Tel  Toll Free: (800) 564-6253

Fax Toll Free: (888) 453-0330

www.computershare.com


Directors of the General Partner of

Brookfield Renewable Energy Partners L.P.

Jeffrey Blidner

Eleazar de Carvalho Filho

John Van Egmond

David Mann

Lou Maroun

Patricia Zuccotti

Lars Josefsson


Exchange Listing

TSX:    BEP.UN (LP Units)

NYSE: BEP (LP Units)

TSX:    BRF.PR.A (Preferred shares – Series 1)

TSX:    BRF.PR.C (Preferred shares – Series 3)

TSX:    BRF.PR.E (Preferred shares – Series 5)

TSX:    BRF.PR.F (Preferred shares – Series 6)


Investor Information


Visit Brookfield Renewable online at
www.brookfieldrenewable.com  for more information. The 2013 Annual Report and Form 20-F is also available online. For detailed and up-to-date news and information, please visit the News Release section.


Additional financial information is filed electronically with various securities regulators in United States and Canada through EDGAR at www.sec.gov  and  through SEDAR at www.sedar.com


Shareholder enquiries should be directed to the Investor Relations Department at (416) 359-1955 or
unitholderenquiries@brookfieldrenewable.com 


TSX:


BEP.UN


NYSE:


BEP


www.brookfieldrenewable.com


EX-99.2 3 exh99_2.htm EXHIBIT 99.2  


Brookfield Renewable Energy Partners L.P.

INTERIM CONSOLIDATED FINANCIAL STATEMENTS AND NOTES

AS AT SEPTEMBER 30, 2014 AND DECEMBER 31, 2013 AND

FOR THE THREE AND NINE MONTHS ENDED SEPTEMBER 30, 2014 AND 2013


BROOKFIELD RENEWABLE ENERGY PARTNERS L.P.

CONSOLIDATED BALANCE SHEETS


UNAUDITED


Sep 30


Dec 31

(MILLIONS)

Notes


2014


2013

Assets


Current assets


Cash and cash equivalents


$

196

$

203


Restricted cash


212


169


Trade receivables and other current assets


178


184


Financial instrument assets

4


51


2


Due from related parties


46


48


683


606

Financial instrument assets

4


6


15

Equity-accounted investments

6


232


290

Property, plant and equipment, at fair value

7


17,364


15,741

Deferred income tax assets

10


149


117

Other long-term assets


121


210


$

18,555

$

16,979

Liabilities


Current liabilities


Accounts payable and accrued liabilities

8

$

280

$

209


Financial instrument liabilities

4


90


64


Due to related parties


83


110


Current portion of long-term debt

9


494


517


947


900

Financial instrument liabilities

4


55


9

Long-term debt and credit facilities

9


6,828


6,106

Deferred income tax liabilities

10


2,332


2,265

Other long-term liabilities


123


163


10,285


9,443

Equity


Non-controlling interests


Preferred equity

11


756


796


Participating non-controlling interests - in operating


subsidiaries

11


2,202


1,303


General partnership interest in a holding subsidiary


held by Brookfield

11


51


54


Participating non-controlling interests - in a holding subsidiary


 - Redeemable/Exchangeable units held by Brookfield

11


2,499


2,657

Limited partners' equity

12


2,762


2,726


8,270


7,536


$

18,555

$

16,979


The accompanying notes are an integral part of these interim consolidated financial statements.

Approved on behalf of Brookfield Renewable Energy Partners L.P.:


Patricia Zuccotti

Director

David Mann

Director


Brookfield Renewable Energy Partners L.P                                Q3 2014 Interim Consolidated Financial Statements and Notes

Page 1 


BROOKFIELD RENEWABLE ENERGY PARTNERS L.P.


CONSOLIDATED STATEMENTS OF (LOSS) INCOME


UNAUDITED

Notes

Three months ended Sep 30

Nine months ended Sep 30

(MILLIONS, EXCEPT AS NOTED)


2014


2013


2014


2013

Revenues


5

$

342

$

392

$

1,296

$

1,313

Other income


3


1


8


5

Direct operating costs


(132)


(140)


(386)


(401)

Management service costs

5


(14)


(9)


(38)


(32)

Interest expense – borrowings

9


(106)


(105)


(309)


(313)

Share of earnings from equity-accounted


investments

6


7


3


10


9

Unrealized financial instruments gain

4


9


11


5


30

Depreciation

7


(145)


(133)


(400)


(398)

Other

3


(11)


2


(3)


(6)

(Loss) income before income taxes


(47)


22


183


207

Income tax recovery (expense)


Current

10


(5)


(4)


(19)


(15)


Deferred

10


27


10


8


(1)


22


6


(11)


(16)

Net (loss) income


$

(25)

$

28

$

172

$

191

Net (loss) income attributable to:


Non-controlling interests


Preferred equity

11

$

10

$

10

$

29

$

27


Participating non-controlling interests - in


operating subsidiaries

11


(2)


8


59


48


General partnership interest in a holding


subsidiary held by Brookfield

11


-


-


1


1


Participating non-controlling interests - in a


holding subsidiary - Redeemable/


Exchangeable units held by Brookfield

11


(16)


5


41


57

Limited partners' equity

12


(17)


5


42


58


$

(25)

$

28

$

172

$

191

Basic and diluted (loss) earnings per LP Unit


$

(0.13)

$

0.04

$

0.31

$

0.44


The accompanying notes are an integral part of these interim consolidated financial statements.


Brookfield Renewable Energy Partners L.P                                Q3 2014 Interim Consolidated Financial Statements and Notes

Page 2 


BROOKFIELD RENEWABLE ENERGY PARTNERS L.P.


CONSOLIDATED STATEMENTS OF COMPREHENSIVE (LOSS) INCOME


UNAUDITED

Three months ended Sep 30

Nine months ended Sep 30

(MILLIONS)

Notes


2014


2013


2014


2013

Net (loss) income

$

(25)

$

28

$

172

$

191

Other comprehensive (loss) income that will not be


reclassified to net (loss) income


Actuarial (losses) gains on defined benefit plans


(10)


9


(10)


9


Deferred income taxes on above items


3


(2)


3


(2)

Total items that will not be reclassified to net income (loss)


(7)


7


(7)


7

Other comprehensive (loss) income that may be


reclassified to net (loss) income


Financial instruments designated as cash-flow


hedges


(Losses) gains arising during the period

4


(2)


(1)


(55)


49


Reclassification adjustments for amounts


 recognized in net (loss) income

4


(3)


(9)


5


(5)


Foreign currency translation


(304)


31


(201)


(316)


Deferred income taxes on above items


(3)


(1)


7


(13)

Total items that may be reclassified subsequently to


net (loss) income


(312)


20


(244)


(285)

Other comprehensive (loss) income


(319)


27


(251)


(278)

Comprehensive (loss) income


$

(344)

$

55

$

(79)

$

(87)

Comprehensive (loss) income attributable to:


Non-controlling interests


Preferred equity

11

$

(27)

$

27

$

(12)

$

(1)


Participating non-controlling interests - in


operating subsidiaries

11


(38)


6


29


34


General partnership interest in a holding subsidiary


held by Brookfield

11


(3)


-


(1)


(1)


Participating non-controlling interests - in a holding


subsidiary - Redeemable/Exchangeable


units held by Brookfield

11


(135)


11


(46)


(59)

Limited partners' equity

12


(141)


11


(49)


(60)


$

(344)

$

55

$

(79)

$

(87)


The accompanying notes are an integral part of these interim consolidated financial statements. 

Brookfield Renewable Energy Partners L.P                                Q3 2014 Interim Consolidated Financial Statements and Notes

Page 3 


BROOKFIELD RENEWABLE ENERGY PARTNERS L.P.

CONSOLIDATED STATEMENTS OF CHANGES IN EQUITY


Accumulated other comprehensive income


Participating


General

non-controlling


partnership

interests - in a


Actuarial


Participating

interest in

holding subsidiary


losses on


Total


non-controlling

a holding

- Redeemable


THREE MONTHS ENDED SEPTEMBER 30

Limited

Foreign


defined


limited


interests - in

subsidiary

/Exchangeable


UNAUDITED

partners'

currency

Revaluation

benefit

Cash flow

partners'

Preferred

operating

held by

units held by

Total

(MILLIONS)


equity

translation

surplus

plans

hedges

equity

equity

subsidiaries

Brookfield

Brookfield

equity

Balance, as at June 30, 2013


$

(258)

$

(15)

$

3,271

$

(11)

$

(9)

$

2,978

$

804

$

1,019

$

59

$

2,904

$

7,764

Net income


5


  -


  -


  -


  -


5


10


8


  -


5


28

Other comprehensive income (loss)


  -


4


  -


4


(2)


6


17


(2)


  -


6


27

Acquisitions


  -


  -


  -


  -


  -


  -


  -


205


  -


  -


205

Distributions or dividends declared


(49)


  -


  -


  -


  -


(49)


(10)


(33)


(1)


(47)


(140)

Other


2


  -


  -


  -


  -


2


  -


(9)


1


1


(5)

Change in period


(42)


4


  -


4


(2)


(36)


17


169


  -


(35)


115

Balance, as at September 30, 2013

$

(300)

$

(11)

$

3,271

$

(7)

$

(11)

$

2,942

$

821

$

1,188

$

59

$

2,869

$

7,879


Balance, as at June 30, 2014

$

(131)

$

(37)

$

3,158

$

(7)

$

(20)

$

2,963

$

793

$

2,011

$

55

$

2,681

$

8,503

Net (loss) income


(17)


  -


  -


  -


  -


(17)


10


(2)


  -


(16)


(25)

Other comprehensive loss


  -


(120)


  -


(3)


(1)


(124)


(37)


(36)


(3)


(119)


(319)

Acquisitions (Note 3)


  -


  -


  -


  -


  -


  -


  -


273


  -


  -


273

Distributions or dividends declared


(56)


  -


  -


  -


  -


(56)


(10)


(45)


(2)


(50)


(163)

Other


(4)


  -


  -


  -


  -


(4)


  -


1


1


3


1

Change in period


(77)


(120)


  -


(3)


(1)


(201)


(37)


191


(4)


(182)


(233)

Balance, as at September 30, 2014

$

(208)

$

(157)

$

3,158

$

(10)

$

(21)

$

2,762

$

756

$

2,202

$

51

$

2,499

$

8,270


The accompanying notes are an integral part of these interim consolidated financial statements.

Brookfield Renewable Energy Partners L.P                                Q3 2014 Interim Consolidated Financial Statements and Notes

Page 4 


BROOKFIELD RENEWABLE ENERGY PARTNERS L.P.

CONSOLIDATED STATEMENTS OF CHANGES IN EQUITY


Accumulated other comprehensive income


Participating


General

non-controlling


partnership

interests - in a


Actuarial


Participating

interest in

holding subsidiary


losses on


Total


non-controlling

a holding

- Redeemable


NINE MONTHS ENDED SEPTEMBER 30

Limited

Foreign


defined


limited


interests - in

subsidiary

/Exchangeable


UNAUDITED

partners'

currency

Revaluation

benefit

Cash flow

partners'

Preferred

operating

held by

units held by

Total

(MILLIONS)


equity

translation

surplus

plans

hedges

equity

equity

subsidiaries

Brookfield

Brookfield

equity

Balance, as at December 31, 2012


$

(227)

$

125

$

3,285

$

(11)

$

(25)

$

3,147

$

500

$

1,028

$

63

$

3,070

$

7,808

Net income


58


  -


  -


  -


  -


58


27


48


1


57


191

Other comprehensive income (loss)


  -


(136)


  -


4


14


(118)


(28)


(14)


(2)


(116)


(278)

Preferred shares issued


  -


  -


  -


  -


  -


  -


349


  -


  -


  -


349

Acquisitions


14


  -


(14)


  -


  -


  -


  -


205


  -


  -


205

Distributions or dividends declared


(145)


  -


  -


  -


  -


(145)


(27)


(113)


(3)


(141)


(429)

Distribution reinvestment plan


1


  -


  -


  -


  -


1


  -


  -


  -


  -


1

Other


(1)


  -


  -


  -


  -


(1)


  -


34


  -


(1)


32

Change in period


(73)


(136)


(14)


4


14


(205)


321


160


(4)


(201)


71

Balance, as at September 30, 2013

$

(300)

$

(11)

$

3,271

$

(7)

$

(11)

$

2,942

$

821

$

1,188

$

59

$

2,869

$

7,879


Balance, as at December 31, 2013

$

(337)

$

(83)

$

3,160

$

(7)

$

(7)

$

2,726

$

796

$

1,303

$

54

$

2,657

$

7,536

Net income


42


  -


  -


  -


  -


42


29


59


1


41


172

Other comprehensive loss


  -


(74)


  -


(3)


(14)


(91)


(41)


(30)


(2)


(87)


(251)

LP Unit issued (Note 11)


Net proceeds


285


  -


  -


  -


  -


285


  -


  -


  -


  -


285


Adjustment


(38)


  -


  -


  -


  -


(38)


  -


  -


1


37


  -

Acquisitions (Note 3)


2


  -


(2)


  -


  -


  -


  -


967


  -


  -


967

Distributions or dividends declared


(160)


  -


  -


  -


  -


(160)


(29)


(97)


(5)


(151)


(442)

Distribution reinvestment plan


2


  -


  -


  -


  -


2


  -


  -


  -


  -


2

Other


(4)


  -


  -


  -


  -


(4)


1


  -


2


2


1

Change in period


129


(74)


(2)


(3)


(14)


36


(40)


899


(3)


(158)


734

Balance, as at September 30, 2014

$

(208)

$

(157)

$

3,158

$

(10)

$

(21)

$

2,762

$

756

$

2,202

$

51

$

2,499

$

8,270


The accompanying notes are an integral part of these interim consolidated financial statements.

Brookfield Renewable Energy Partners L.P                                Q3 2014 Interim Consolidated Financial Statements and Notes

Page 5 


BROOKFIELD RENEWABLE ENERGY PARTNERS L.P.


CONSOLIDATED STATEMENTS OF CASH FLOWS


Notes

Three months ended

Nine months ended

UNAUDITED


Sep 30


Sep 30

(MILLIONS)


2014


2013


2014


2013

Operating activities


Net (loss) income


$

(25)

$

28

$

172

$

191

Adjustments for the following non-cash items:


Depreciation

7


145


133


400


398


Unrealized financial instrument loss

4


(9)


(11)


(5)


(30)


Share of earnings from equity accounted investments

6


(7)


(3)


(10)


(9)


Deferred income tax expense

10


(27)


(10)


(8)


1


Other non-cash items


5


1


2


3

Dividends received from equity-accounted investments

6


10


8


28


14

Changes in due to or from related parties


8


24


14


14

Net change in working capital balances


88


79


47


87


188


249


640


669

Financing activities


Long-term debt - borrowings

9


420


-


1,126


1,222

Long-term debt - repayments

9


(22)


(341)


(556)


(1,631)

Capital provided by participating non-controlling interests -


in operating subsidiaries

11


273


205


967


246

Issuance of preferred shares

11


-


-


-


337

Issuance of LP Units

12


-


-


285


-

Distributions paid:


To participating non-controlling interests - in operating


subsidiaries and preferred equity

11


(54)


(44)


(125)


(138)


To unitholders of Brookfield Renewable or BRELP

12


(107)


(95)


(374)


(282)


510


(275)


1,323


(246)

Investing activities


Acquisitions

3


(599)


-


(1,827)


(243)

Investment in:


Sustaining capital expenditures


(42)


(23)


(69)


(44)


Development and construction of renewable power


generating assets


(36)


(33)


(53)


(113)

Investment tax credits related to renewable power


generating assets


11


-


23


-

Restricted cash


(50)


36


(36)


31


(716)


(20)


(1,962)


(369)

Foreign exchange loss on cash


(11)


-


(8)


(6)

Cash and cash equivalents


(Decrease) increase


(29)


(46)


(7)


48


Balance, beginning of period


225


231


203


137


Balance, end of period


$

196

$

185

$

196

$

185

Supplemental cash flow information:


Interest paid


$

54

$

52

$

251

$

249


Interest received


3


1


8


5


Income taxes paid


6


5


28


24


The accompanying notes are an integral part of these interim consolidated financial statements.


Brookfield Renewable Energy Partners L.P                                Q3 2014 Interim Consolidated Financial Statements and Notes

Page 6 


brookfield renewable energy partners l.p.

notes to the consolidated financial statements

1.  organization and description of the business

The business activities of Brookfield Renewable Energy Partners L.P. (“Brookfield Renewable”) consist of owning a portfolio of renewable power generating facilities in the United States, Canada, Brazil and Europe.

Brookfield Renewable is a publicly traded limited partnership established under the laws of Bermuda pursuant to an amended and restated limited partnership agreement dated November 20, 2011.

The registered office of Brookfield Renewable is 73 Front Street, Fifth Floor, Hamilton HM12, Bermuda.

The immediate parent of Brookfield Renewable is its general partner. The ultimate parent of Brookfield Renewable is Brookfield Asset Management Inc. (“Brookfield Asset Management”).

2.  BASIS OF PREPARATION AND SIGNIFICANT ACCOUNTING POLICIES

(a) Statement of compliance

The interim consolidated financial statements have been prepared in accordance with IAS 34, Interim Financial Reporting on a basis consistent with the accounting policies disclosed in the audited consolidated financial statements for the fiscal year ended December 31, 2013.

Certain information and footnote disclosure normally included in the annual audited consolidated financial statements prepared in accordance with International Financial Reporting Standards (“IFRS”), as issued by the International Accounting Standards Board (“IASB”) have been omitted or condensed.  These interim consolidated financial statements should be read in conjunction with Brookfield Renewable’s December 31, 2013 audited consolidated financial statements.

The interim consolidated financial statements are unaudited and reflect any adjustments (consisting of normal recurring adjustments) that are, in the opinion of management, necessary to a fair statement of results for the interim periods in accordance with IFRS.

The results reported in these interim consolidated financial statements should not be regarded as necessarily indicative of results that may be expected for an entire year. Certain comparative figures have been reclassified to conform to the current year’s presentation.

These interim consolidated financial statements have been authorized for issuance by the Board of Directors of its general partner, Brookfield Renewable Partners Limited, on November 4, 2014.  

All figures are presented in millions of United States (“U.S.”) dollars unless otherwise noted.

(b) Basis of preparation

The interim consolidated financial statements have been prepared on the basis of historical cost, except for the revaluation of property, plant and equipment and certain assets and liabilities which have been measured at fair value.  Cost is recorded based on the fair value of the consideration given in exchange for assets.

Consolidation

These interim consolidated financial statements include the accounts of Brookfield Renewable and its subsidiaries, which are the entities over which Brookfield Renewable has control. An investor controls an investee when it is exposed, or has rights, to variable returns from its involvement with the investee and has the ability to affect those returns through its power over the investee. Non-controlling interests in the

Brookfield Renewable Energy Partners L.P                                Q3 2014 Interim Consolidated Financial Statements and Notes

Page 7 


equity of Brookfield Renewable’s subsidiaries are shown separately in equity in the consolidated balance sheets.

(c) New interpretation adopted by Brookfield Renewable

IFRIC 21, Levies  was adopted and applied by Brookfield Renewable on January 1, 2014, which had no material impact on the interim consolidated financial statements.

(d) Future changes

IFRS 15, Revenue from Contracts with Customers (“IFRS 15”)

IFRS 15 was issued by the IASB on May 28, 2014. IFRS 15 outlines a single comprehensive model to account for revenue arising from contracts with customers and will replace the majority of existing IFRS requirements on revenue recognition including IAS 18, Revenue,  IAS 11, Construction Contracts and related interpretations. The core principle of the standard is to recognize revenue to depict the transfer of goods and services to customers in an amount that reflects the consideration to which the entity expects to be entitled in exchange for those goods and services. The standard has prescribed a five-step model to apply the principles. The standard also specifies how to account for the incremental costs of obtaining a contract and the costs directly related to fulfilling a contract. IFRS 15 is effective for annual periods beginning on or after January 1, 2017. Management is currently evaluating the impact of IFRS 15 on the consolidated financial statements.

Please refer to the December 31, 2013 audited consolidated financial statements for other future changes to IFRS with potential impact on Brookfield Renewable.

3.  BUSINESS COMBINATIONS  

The following investments were accounted for using the acquisition method, and the results of operations have been included in the consolidated financial statements since the respective dates of acquisition.

Maine Hydroelectric Generation Facilities

In January 2014, Brookfield Renewable acquired a 70 MW hydroelectric portfolio of generation facilities that are expected to generate approximately 400 GWh annually (“Maine Hydro”). The acquisition was completed with institutional partners, and Brookfield Renewable retains an approximate 40% controlling interest in the portfolio. Total cash consideration was $244 million. The acquisition costs of $2 million were expensed as incurred. 

California Hydroelectric Generation Facility

In February 2014, Brookfield Renewable acquired the remaining 50% interest in a 30 MW hydroelectric generation facility in California. The total cash consideration was $11 million (the “California Hydro Step Acquisition”). The acquisition was completed with institutional partners, and Brookfield Renewable retains an approximate 22% controlling interest in the facility.

Pennsylvania Hydroelectric Generation Facility   

In March 2014, Brookfield Renewable acquired a 33% economic and 50% voting interest in a 417 MW hydroelectric generation facility in Pennsylvania (“Pennsylvania Hydro”) which is expected to generate approximately 1,100 GWh annually. Total cash consideration was $295 million.  Brookfield Renewable accounted for its acquired 33% economic interest using the equity method.  

In August 2014, Brookfield Renewable acquired the remaining 67% economic and 50% voting interest in Pennsylvania Hydro (the “Pennsylvania Hydro Step Acquisition”) for additional cash consideration of $614 million, and began consolidating the operating results, cash flows and net assets of Pennsylvania Hydro. Prior to the Pennsylvania Hydro Step Acquisition, Brookfield Renewable re-measured its previously held

Brookfield Renewable Energy Partners L.P                                Q3 2014 Interim Consolidated Financial Statements and Notes

Page 8 


33% economic interest to fair value, and the net impact of this re-measurement was not material. The Pennsylvania Hydro Step Acquisition was completed with institutional partners, and Brookfield Renewable retains an approximate 40% controlling interest. Total acquisition costs of $2 million relating to both the Pennsylvania Hydro and Pennsylvania Hydro Step Acquisition were expensed as incurred.

Ireland Wind Portfolio   

In June 2014, Brookfield Renewable acquired the wind portfolio of Bord Gáis Energy comprising 326 MW of operating wind capacity across 17 wind projects in  Ireland. The acquisition was completed with institutional partners, and Brookfield Renewable retains an approximate 40% controlling interest. Total consideration of €516 million ($707 million) included €521 million ($713 million) in cash reduced for post-closing working capital adjustments and a deferred consideration amount. The acquisition costs of $12 million were expensed as incurred. 

Voting Agreements

In January 2014 and March 2014, Brookfield Renewable entered into voting agreements with subsidiaries of Brookfield Asset Management whereby these subsidiaries, as managing members of entities related to Brookfield Infrastructure Fund II (the “BIF II Entities”), in which Brookfield Renewable holds its investments in the Maine Hydro, Pennsylvania Hydro and the Irish wind portfolio with institutional investors, agreed to assign to Brookfield Renewable their voting rights to appoint the directors of the BIF II Entities. 

Preliminary price allocations, at fair values, with respect to the acquisitions were as follows:  

(MILLIONS)

Maine

Pennsylvania

Ireland

Cash and cash equivalents

$

7

$

15

$

35

Restricted cash


-


-


12

Trade receivables and other current assets


13


11


10

Property, plant and equipment, at fair value


220


1,034


1,061

Other long-term assets


6


-


-

Current liabilities


(1)


(4)


(72)

Long-term debt


-


(77)


(232)

Other long-term liabilities


(1)


(70)


(107)

Net assets acquired

$

244

$

909

$

707

The estimated fair values of the assets acquired and liabilities assumed are expected to be finalized within 12 months of the acquisition date.

4.  risk management and financial instruments

Risk management

Brookfield Renewable’s activities expose it to a variety of financial risks, including market risk (i.e., commodity price risk, interest rate risk, and foreign currency risk), credit risk and liquidity risk.  Brookfield Renewable uses financial instruments primarily to manage these risks.

There have been no material changes in exposure to these risks since the December 31, 2013 audited consolidated financial statements.

Financial instruments disclosures

Fair value is the price that would be received to sell an asset or paid to transfer a liability in an orderly transaction between market participants at the measurement date.

Brookfield Renewable Energy Partners L.P                                Q3 2014 Interim Consolidated Financial Statements and Notes

Page 9 


Fair values determined using valuation models require the use of assumptions concerning the amount and timing of estimated future cash flows and discount rates. In determining those assumptions, management looks primarily to external readily observable market inputs such as interest rate yield curves, currency rates, and price, as applicable.  The fair value of interest rate swap contracts, which form part of financing arrangements, is calculated by way of discounted cash flows, using market interest rates and applicable credit spreads.

A fair value measurement of a non-financial asset is the consideration that would be received in an orderly transaction between market participants, considering the highest and best use of the asset.

Assets and liabilities  measured at fair value are categorized into one of three hierarchy levels, described below.  Each level is based on the transparency of the inputs used to measure the fair values of assets and liabilities.

Level 1 –  inputs are based on unadjusted quoted prices in active markets for identical assets and liabilities;

Level 2 – inputs, other than quoted prices in Level 1, that are observable for the asset or liability, either directly or indirectly; and

Level 3 – inputs for the asset or liability that are not based on observable market data.

The following table presents Brookfield Renewable’s assets and liabilities measured and disclosed at fair value classified by the fair value hierarchy:


Sep 30, 2014

Dec 31

(MILLIONS)

Level 1

Level 2

Level 3

Total

2013

Assets measured at fair value:


Cash and cash equivalents

$

196

$

-

$

-

$

196

$

203

Restricted cash


212


-


-


212


169

Financial instrument assets


Interest rate swaps


-


3


-


3


17


Foreign exchange swaps


-


54


-


54


-

Property, plant and equipment(1)


-


-


17,364


17,364


15,741

Liabilities measured at fair value:


Financial instrument liabilities


Energy derivative contracts


-


(5)


-


(5)


(3)


Interest rate swaps


-


(140)


-


(140)


(70)

Liabilities for which fair value is disclosed:


Long-term debt and credit facilities


-


(8,207)


-


(8,207)


(7,128)

Total

$

408

$

(8,295)

$

17,364

$

9,477

$

8,929

(1)       Refer to Note 7 - Property, plant and equipment, at fair value for further information.


There were no transfers between levels during the nine months ended September 30, 2014.

Brookfield Renewable Energy Partners L.P                                Q3 2014 Interim Consolidated Financial Statements and Notes

Page 10 


The aggregate amount of Brookfield Renewable’s net financial instrument positions are as follows:


Sep 30, 2014

Dec 31, 2013

(MILLIONS)

Assets

Liabilities

Net Liabilities

Net Liabilities

Energy derivative contracts

$

-

$

5

$

5

$

3

Interest rate swaps


3


140


137


53

Foreign exchange swaps


54


-


(54)


-

Total


57


145


88


56

Less: current portion


51


90


39


62

Long-term portion

$

6

$

55

$

49

$

(6)

Energy derivative contracts

Brookfield Renewable has entered into long-term energy derivative contracts primarily to stabilize the price of gas purchases or eliminate the price risk on the sale of certain future power generation.  Certain energy contracts are recorded in Brookfield Renewable’s interim consolidated financial statements at an amount equal to fair value, using quoted market prices or, in their absence, a valuation model using both internal and third-party evidence and forecasts.

Interest rate swaps

Brookfield Renewable has entered into interest rate swap contracts primarily to minimize exposure to interest rate fluctuations on its variable rate debt or to lock in interest rates on future debt refinancing.  All interest rate swap contracts are recorded in the interim consolidated financial statements at an amount equal to fair value.

Foreign exchange swaps

Brookfield Renewable has entered into foreign exchange swaps to minimize its exposure to currency fluctuations impacting its investments in foreign operations, and to fix the exchange rate on certain anticipated transactions denominated in foreign currencies.

The following table reflects the unrealized gains (losses) included in the consolidated statements of (loss) income:


Three months ended Sep 30

Nine months ended Sep 30

(MILLIONS)


2014


2013


2014


2013

Energy derivative contracts

$

(1)

$

2

$

(1)

$

12

Interest rate swaps


  -


9


1


18

Foreign exchange swaps


10


  -


5


  -


$

9

$

11

$

5

$

30

Brookfield Renewable Energy Partners L.P                                Q3 2014 Interim Consolidated Financial Statements and Notes

Page 11 


The following table reflects the unrealized gains (losses) included in the consolidated statements of comprehensive (loss) income:


Three months ended Sep 30

Nine months ended Sep 30

(MILLIONS)


2014


2013


2014


2013

Energy derivative contracts

$

(3)

$

  -

$

(4)

$

  -

Interest rate swaps(1)


(9)


(1)


(63)


49

Foreign exchange swaps


10


  -


12


  -


$

(2)

$

(1)

$

(55)

$

49

(1)       Included in the nine months ended September 30, 2013 are unrealized gains of $2 million relating to equity-accounted investments.

The following table reflects the reclassification adjustments recognized in net (loss) income in the consolidated statements of comprehensive (loss) income:


Three months ended Sep 30

Nine months ended Sep 30

(MILLIONS)


2014


2013


2014


2013

Energy derivative contracts

$

(3)

$

-

$

3

$

-

Interest rate swaps


-


(9)


2


(5)


$

(3)

$

(9)

$

5

$

(5)

5.  related party transactions

Brookfield Renewable’s related party transactions are recorded at the exchange amount.  Brookfield Renewable’s related party transactions are primarily with Brookfield Asset Management and its subsidiaries.

The following table reflects the related party agreements and transactions on the consolidated statements of (loss) income:


Three months ended Sep 30

Nine months ended Sep 30

(MILLIONS)


2014


2013


2014


2013

Revenues


Purchase and revenue support agreements

$

99

$

102

$

280

$

339


Wind levelization agreement


2


3


5


5


$

101

$

105

$

285

$

344

Direct operating costs


Energy purchases

$

(1)

$

(8)

$

(8)

$

(26)


Energy marketing fee


(6)


(5)


(16)


(15)


Insurance services


(7)


(6)


(21)


(19)


$

(14)

$

(19)

$

(45)

$

(60)

Management service costs

$

(14)

$

(9)

$

(38)

$

(32)

Brookfield Renewable Energy Partners L.P                                Q3 2014 Interim Consolidated Financial Statements and Notes

Page 12 


6. EQUITY-ACCOUNTED INVESTMENTS

The following table outlines the changes in Brookfield Renewable’s equity-accounted investments:


Three months ended

Nine months ended

Year ended

(MILLIONS)

Sep 30, 2014

Sep 30, 2014

Dec 31, 2013

Balance, beginning of period

$

542

$

290

$

344

Acquisitions (see Note 3):


California Hydro Step Acquisition


-


(39)


-


Pennsylvania Hydro Step Acquisition


(301)


-


-


Canada Hydroelectric Step Acquisition


-


-


(19)

Revaluation recognized through OCI


-


-


(15)

Share of OCI


1


1


1

Share of net income


7


10


9

Dividends declared


(10)


(25)


(18)

Foreign exchange loss


(8)


(5)


(12)

Other


1


-


-

Balance, end of period

$

232

$

232

$

290

The following table summarizes certain financial information of equity-accounted investments:


Three months ended Sep 30

Nine months ended Sep 30

(MILLIONS)


2014


2013


2014


2013

Revenue

$

30

$

28

$

95

$

87

Net income


14


5


20


17

Share of net income (loss)


Cash earnings


10


7


25


19


Non-cash loss


(3)


(4)


(15)


(10)


Brookfield Renewable Energy Partners L.P                                Q3 2014 Interim Consolidated Financial Statements and Notes

Page 13 


7.   PROPERTY, PLANT AND EQUIPMENT, AT FAIR VALUE   

The following table presents a reconciliation of property, plant and equipment at fair value:


Co-


(MILLIONS)


Hydroelectric

Wind energy

CWIP

generation

Total

As at December 31, 2013


$

12,806

$

2,448

$

441

$

46

$

15,741

Foreign exchange


(347)


(142)


(6)


(1)


(496)

Additions(1)


1,320


1,075


124


-


2,519

Transfers


281


(1)


(280)


-


-

Depreciation(2)


(282)


(115)


-


(3)


(400)

As at September 30, 2014

$

13,778

$

3,265

$

279

$

42

$

17,364

(1)       Includes acquisitions of $2,396 million.

(2)       Assets not subject to depreciation include construction work in process (“CWIP”) and land.

8.  accounts payable and accrued liabilities

Brookfield Renewable’s accounts payable and accrued liabilities are as follows:  


Sep 30


Dec 31

(MILLIONS)


2014


2013

Operating accrued liabilities

$

133

$

101

Interest payable on corporate and subsidiary borrowings


93


49

Accounts payable


23


11

LP Unitholders’ distribution(1) and preferred dividends payable


20


40

Other


11


8


$

280

$

209

(1)       Includes amounts payable to external LP Unitholders. Amounts payable to Brookfield Asset Management are included in due to related parties.

Brookfield Renewable Energy Partners L.P                                Q3 2014 Interim Consolidated Financial Statements and Notes

Page 14 


9LONG-TERM DEBT AND CREDIT FACILITIES

The composition of debt obligations is presented in the following table:


Sep 30, 2014

Dec 31, 2013


Weighted-average


Weighted-average


Interest

Term


Interest

Term


(MILLIONS EXCEPT AS NOTED)

rate (%)

(years)


rate (%)

(years)


Corporate borrowings


Series 3

5.3

4.1

$

179

5.3

4.8

$

188


Series 4

5.8

22.1


134

5.8

22.9


141


Series 6

6.1

2.2


268

6.1

2.9


282


Series 7

5.1

6.0


402

5.1

6.8


424


Series 8

4.8

7.4


357

4.8

8.1


377


5.3

7.0

$

1,340

5.3

7.7

$

1,412

Subsidiary borrowings


United States

5.9

9.3

$

2,998

6.0

9.7

$

2,826


Canada

5.7

14.0


1,881

5.8

15.2


1,877


Brazil

7.3

10.5


211

7.4

11.1


238


Europe

3.8

12.3


414

-

-


-


5.7

11.2

$

5,504

6.0

11.8

$

4,941

Credit facilities

1.4

4.8

$

512

1.4

3.8

$

311

Total debt


$

7,356


$

6,664

Add: Unamortized premiums(1)


21


11

Less: Unamortized financing fees(1)


(55)


(52)

Less: Current portion


(494)


(517)


$

6,828


$

6,106

(1)            Unamortized premiums and unamortized financing fees are amortized to interest expense over the terms of the borrowing.

Corporate borrowings

Corporate borrowings are obligations of a finance subsidiary of Brookfield Renewable (Note 13  - Subsidiary public issuers).  The finance subsidiary may redeem some or all of the borrowings from time to time, pursuant to the terms of the indenture. The balance is payable upon maturity, and interest on corporate borrowings is paid semi-annually.

Subsidiary borrowings

Subsidiary borrowings are generally asset-specific, long-term, non-recourse borrowings denominated in the domestic currency of the subsidiary. Subsidiary borrowings in the United States and Canada consist of both fixed and floating interest rate debt.  Brookfield Renewable uses interest rate swap agreements to minimize its exposure to floating interest rates.  Subsidiary borrowings in Brazil consist of floating interest rates of Taxa de Juros de Longo Prazo, the Brazil National Bank for Economic Development’s long-term interest rate, or Interbank Deposit Certificate rate, plus a margin.

In January 2014, the $279 million bridge loan associated with a 360 MW operating hydroelectric portfolio located in New England was refinanced to 2017 at LIBOR plus 2.25%. 

In February 2014, as part of the Maine Hydro acquisition, $140 million of financing was obtained through a bond issuance with a 5.5% interest rate maturing in 2024.

Brookfield Renewable Energy Partners L.P                                Q3 2014 Interim Consolidated Financial Statements and Notes

Page 15 


In March 2014, Brookfield Renewable up-financed indebtedness associated with a 349 MW Ontario hydroelectric portfolio through the issuance of C$90 million of senior and C$60 million of subordinate bonds with interest rates of 3.8% and 5.0%, respectively, maturing in June 2023.

In June 2014, Brookfield Renewable refinanced a $125 million debt facility associated with a 167 MW hydroelectric portfolio in New England through the issuance of 8-year notes maturing in January 2022 at a fixed rate of 4.59%.

In June 2014, as part of the acquisition of the 326 MW Irish wind portfolio, Brookfield Renewable assumed a €169 million ($232 million) loan with a fixed interest rate of 4.6%, including the related interest rate swaps, maturing in December 2026.

The maturity of the $250 million credit facility associated with a hydroelectric portfolio in the southeastern United States was extended by six months to November 2014. Brookfield Renewable is in the process of extending this facility prior to its expiry.

In August 2014, as part of the of Pennsylvania Hydro Step Acquisition, Brookfield Renewable assumed a $65 million loan with an interest rate of 7.1% maturing in June 2018.

In August 2014, Brookfield Renewable secured a €160 million ($210 million) loan associated with 153 MW of its wind facilities in Ireland with an initial fixed interest rate of 2.9%, including the related interest rate swaps, maturing in December 2026.

Cash received from borrowings net of repayments was $369 million during the nine months ended September 30, 2014.

Credit facilities

Brookfield Renewable and its subsidiaries issue letters of credit from its credit facilities for general corporate purposes, which include, but are not limited to, security deposits, performance bonds and guarantees for debt service reserve accounts.

In August 2014, Brookfield Renewable extended the maturity of all corporate credit facilities to June 2019 and reduced the applicable margin by five basis points from 1.25% to 1.20%. The credit facilities now also provide Brookfield Renewable with an option to borrow in Euro (€) and British Pound Sterling (£).


Sep 30

Dec 31

(MILLIONS)


2014


2013

Available revolving credit facilities

$

1,480

$

1,480

Drawings(1)


(512)


(311)

Issued letters of credit


(226)


(212)

Unutilized revolving credit facilities

$

742

$

957

(1)            Amounts are unsecured and revolving. Interest rate is at the LIBOR plus 1.20% (December 31, 2013: 1.25%).

Net draws of $201 million were made during the nine months ended September 30, 2014.

Brookfield Renewable Energy Partners L.P                                Q3 2014 Interim Consolidated Financial Statements and Notes

Page 16 


10.  Income taxes

Brookfield Renewable’s effective income tax rate was 6% for the nine months ended September 30, 2014 (2013: 7.7%). The effective tax rate is less than the statutory rate primarily due to rate differentials and non-controlling interests income not subject to tax.

11. Non-controlling interests

Brookfield Renewable’s non-controlling interests are comprised of the following:


Sep 30

Dec 31

(MILLIONS)


2014


2013

Preferred equity

$

756

$

796

Participating non-controlling interests - in operating subsidiaries


2,202


1,303

General partnership interest in a holding subsidiary held by Brookfield


51


54

Participating non-controlling interests - in a holding subsidiary -


 Redeemable/Exchangeable units held by Brookfield


2,499


2,657

Total

$

5,508

$

4,810

Preferred equity

Brookfield Renewable’s preferred equity consists of Class A Preference Shares as follows:


Earliest

Dividends declared


Cumulative

permitted

for the nine months


Shares

dividend

redemption

ended September 30

Sep 30

Dec 31

(MILLIONS)

outstanding

rate

date

2014

2013

2014

2013

Series 1

10

5.25%

Apr 30, 2015

$

9

$

10

$

222

$

234

Series 3

10

4.40%

Jul 31, 2019


8


8


222


234

Series 5

7

5.00%

Apr 30, 2018


6


6


156


164

Series 6

7

5.00%

Jul 31, 2018


6


3


156


164


34


$

29

$

27

$

756

$

796

As at September 30, 2014, none of the issued Class A Preference Shares have been redeemed by Brookfield Renewable Power Preferred Equity Inc. (“BRP Equity”).

Brookfield Renewable Energy Partners L.P                                Q3 2014 Interim Consolidated Financial Statements and Notes

Page 17 


Participating non-controlling interests – in operating subsidiaries

The net change in participating non-controlling interests – in operating entities is as follows:


Brookfield


Americas

Brookfield


Brookfield


Infrastructure

Infrastructure

The Catalyst

Energia


(MILLIONS)

Fund

Fund II

Group

Renovável

Other

Total

As at December 31, 2012

$

806

$

-

$

123

$

58

$

41

$

1,028

Net income


21


1


18


1


-


41

OCI


133


(2)


(26)


(10)


4


99

Acquisitions


51


214


-


-


-


265

Distributions


(119)


-


-


(3)


-


(122)

Other


(1)


(6)


1


-


(2)


(8)

As at December 31, 2013

$

891

$

207

$

116

$

46

$

43

$

1,303

Net income


20


22


17


-


-


59

OCI


(21)


(5)


-


(2)


(2)


(30)

Acquisitions (Note 3)


-


967


-


-


-


967

Distributions


(29)


(53)


(12)


(2)


-


(96)

Other


-


-


-


-


(1)


(1)

As at September 30, 2014

$

861

$

1,138

$

121

$

42

$

40

$

2,202

Interests held by third parties


75-80%


50-60%


25%


20-30%


23-50%


General partnership interest in a holding subsidiary held by Brookfield and Participating non-controlling interests – in a holding subsidiary - Redeemable/Exchangeable units held by Brookfield

Brookfield, as the owner of the 1% general partnership interest in Brookfield Renewable Energy L.P. (“BRELP”), is entitled to regular distributions plus an incentive distribution based on the amount by which quarterly distributions exceed specified target levels. To the extent that distributions exceed $0.375 per unit per quarter, the incentive is 15% of distributions above this threshold. To the extent that quarterly distributions exceed $0.4225 per unit, the incentive distribution is equal to 25% of distributions above this threshold.

Consolidated equity includes Redeemable/Exchangeable Partnership Units issued by BRELP. The Redeemable/Exchangeable Partnership Units are held 100% by Brookfield Asset Management, which at its discretion has the right to redeem these units for cash consideration. No Redeemable/Exchangeable Partnership Units have been redeemed for cash consideration. Since this redemption right is subject to Brookfield Renewable’s right, at its sole discretion, to satisfy the redemption request with LP Units of Brookfield Renewable, the Redeemable/Exchangeable Partnership Units are classified as equity in accordance with IAS 32, Financial Instruments: Presentation. The Redeemable/Exchangeable Partnership Units are presented as non-controlling interests since they provide Brookfield the direct economic benefits and exposures to the underlying performance of BRELP. Both the LP Units issued by Brookfield Renewable and the Redeemable/Exchangeable Partnership Units issued by its subsidiary BRELP have the same economic attributes in all respects, except for the redemption right described above. The Redeemable/Exchangeable Partnership Units participate in earnings and distributions on a per unit basis equivalent to the per unit participation of the LP Units of Brookfield Renewable.

Brookfield Renewable Energy Partners L.P                                Q3 2014 Interim Consolidated Financial Statements and Notes

Page 18 


Issuance of LP Units

On June 10, 2014, Brookfield Renewable completed a bought deal LP Unit offering which included 10,250,000 LP Units at a price of C$31.70 per LP Unit for gross proceeds of C$325 million ($297 million) (the “Offering”).  Brookfield Renewable incurred C$13 million ($12 million) in transaction costs associated with the Offering. Proceeds from the Offering were used to purchase additional limited partnership units of BRELP. The excess of the consideration paid over the carrying value of the additional limited partnership units of BRELP purchased by Brookfield Renewable resulted in adjustments to the General partnership interest in a holding subsidiary held by Brookfield and Participating non-controlling interests – in a holding subsidiary - Redeemable/Exchangeable units held by Brookfield of $1 million and $37 million, respectively. BRELP ultimately used the net proceeds to repay outstanding indebtedness and for general corporate purposes.

As at September 30, 2014, General Partnership Units and Redeemable/Exchangeable Partnership Units outstanding were 2,651,506 (December 31, 2013: 2,651,506) and 129,658,623 (December 31, 2013: 129,658,623), respectively.

Distributions

For the three and nine months ended September 30, 2014, BRELP declared $1 million and $3 million, respectively in distributions on the general partnership interest (2013: $1 million and $3 million, respectively) and an incentive distribution of $1 million and $2 million, respectively (2013: $nil). For the three and nine months ended September 30, 2014, BRELP declared distributions on the Redeemable/Exchangeable Partnership Units held by Brookfield of $50 million and $151 million, respectively (2013: $47 million and $141 million, respectively).

12. LIMITED PARTNERS’ EQUITY

Limited partners’ equity

As at September 30, 2014, LP Units outstanding were 143,330,025 (December 31, 2013: 132,984,913) including 40,026,986 (December 31, 2013: 40,026,986) held by Brookfield Asset Management. General partnership interests represent 0.01% of Brookfield Renewable.

During the three and nine months ended September 30, 2014, 25,874 and 95,112 LP Units, respectively (2013: 21,832 and 57,785 LP Units, respectively) were issued under the distribution reinvestment plan.

As a result of the Offering (Note 11), Brookfield Asset Management’s direct and indirect interest of  169,685,609 LP Units and Redeemable/Exchangeable partnership units, now represents  approximately 62%  of Brookfield Renewable on a fully-exchanged basis.

Distributions

Distributions may be made by the general partner of Brookfield Renewable with the exception of instances that there is insufficient cash available, payment rends Brookfield Renewable unable to pay its debt or payment of which might leave Brookfield Renewable unable to meet any future contingent obligations.

For the three and nine months ended September 30, 2014, Brookfield Renewable declared distributions on its LP Units of $56 million and $160 million or $0.3875 per LP Unit and $1.1625 per LP Unit, respectively (2013: $49 million and $145 million or $0.3625 per LP Unit and $1.09 per LP Unit, respectively).

Brookfield Renewable Energy Partners L.P                                Q3 2014 Interim Consolidated Financial Statements and Notes

Page 19 


The composition of the distribution is presented in the following table:


Three months ended Sep 30

Nine months ended Sep 30

(MILLIONS)


2014


2013


2014


2013

Brookfield Asset Management

$

16

$

15

$

47

$

44

External LP Unitholders


40


34


113


101


$

56

$

49

$

160

$

145

In February 2014, unitholder distributions were increased to $1.55 per unit on an annualized basis, an increase of ten cents per unit, and took effect with the distribution paid in March 2014.

13.  subsidiary public issuers

See Note 9 – Long-term debt and credit facilities for additional details regarding corporate notes. See Note 11 – Non-controlling interests for additional details regarding Class A Preference Shares.

The following tables provide consolidated summary financial information for Brookfield Renewable, BRP Equity, and Brookfield Renewable Energy Partners ULC (“BREP Finance”):


Brookfield


Brookfield

BRP

BREP

Other

Consolidating

Renewable

(MILLIONS)


Renewable

Equity

Finance

Subsidiaries(1)

adjustments(2)

consolidated

As at September 30, 2014:


Current assets

$

22

$

-

$

1,365

$

685

$

(1,389)

$

683

Long-term assets


2,762


744


-


17,865


(3,499)


17,872

Current liabilities


22


9


26


2,261


(1,371)


947

Long-term liabilities


-


-


1,334


8,742


(738)


9,338

Preferred equity


-


756


-


-


-


756

Participating non-controlling interests -


 in operating subsidiaries


-


-


-


2,202


-


2,202

Participating non-controlling interests -


in a holding subsidiary - Redeemable/


Exchangeable units held by Brookfield


-


-


-


2,499


-


2,499

As at December 31, 2013:


Current assets

$

48

$

-

$

1,429

$

612

$

(1,483)

$

606

Long-term assets


2,728


785


-


16,365


(3,505)


16,373

Current liabilities


50


10


17


2,258


(1,435)


900

Long-term liabilities


-


-


1,406


7,914


(777)


8,543

Preferred equity


-


796


-


-


-


796

Participating non-controlling interests -


in operating subsidiaries


-


-


-


1,303


-


1,303

Participating non-controlling interests -


in a holding subsidiary - Redeemable/


Exchangeable units held by Brookfield


-


-


-


2,657


-


2,657

(1)            Includes subsidiaries of Brookfield Renewable, other than BRP Equity and BREP Finance.

(2)            Includes elimination of intercompany transactions and balances necessary to present Brookfield Renewable on a consolidated basis.

Brookfield Renewable Energy Partners L.P                                Q3 2014 Interim Consolidated Financial Statements and Notes

Page 20 


Brookfield


Brookfield

BRP

BREP

Other

Consolidating

Renewable

(MILLIONS)

Renewable

Equity

Finance

Subsidiaries(1)

adjustments(2)

consolidated

For the three months ended Sep 30, 2014


Revenues

$

-

$

-

$

-

$

342

$

-

$

342

Net (loss) income


(17)


-


(1)


(24)


17


(25)

For the three months ended Sep 30, 2013


Revenues

$

-

$

-

$

-

$

392

$

-

$

392

Net income (loss)


5


-


-


28


(5)


28

For the nine months ended Sep 30, 2014


Revenues

$

-

$

-

$

-

$

1,296

$

-

$

1,296

Net income (loss)


42


-


(1)


173


(42)


172

For the nine months ended Sep 30, 2013


Revenues

$

-

$

-

$

-

$

1,313

$

-

$

1,313

Net income (loss)


58


-


1


190


(58)


191

(1)            Includes subsidiaries of Brookfield Renewable, other than BRP Equity and BREP Finance.

(2)            Includes elimination of intercompany transactions and balances necessary to present Brookfield Renewable on a consolidated basis.

Brookfield Renewable Energy Partners L.P                                Q3 2014 Interim Consolidated Financial Statements and Notes

Page 21 


14.  segmented information

Brookfield Renewable operates renewable power assets, which include conventional hydroelectric generating assets located in the United States, Canada and Brazil, and wind farms located in the United States, Canada and Europe. Brookfield Renewable also operates two co-generation (“Co-gen”) facilities. Management evaluates the business based on the type of power generation (Hydroelectric, Wind and Co-gen). Hydroelectric and wind are further evaluated by geography (United States, Canada, Brazil and Europe). The “Other” segment includes CWIP and corporate.

In accordance with IFRS 8, Operating Segments, Brookfield Renewable discloses information about its reportable segments based upon the measures used by management in assessing performance. The accounting policies of the reportable segments are the same as those described in Note 2 of the December 31, 2013 audited consolidated financial statements. Brookfield Renewable analyzes the performance of its operating segments based on revenues, adjusted EBITDA, and funds from operations.

Adjusted EBITDA means revenues less direct costs (including energy marketing costs), plus Brookfield Renewable’s share of cash earnings from equity-accounted investments and other income, before interest, income taxes, depreciation, management service costs and the cash portion of non-controlling interests.

Funds from operations is defined as adjusted EBITDA less interest, current income taxes and management service costs, which is then adjusted for the cash portion of non-controlling interests. For the nine months ended September 30, 2014, funds from operations include the earnings received from the wind portfolio Brookfield Renewable acquired in Ireland, reflecting its economic interest from January 1, 2014 to June 30, 2014. This amount represents an acquisition price adjustment under IFRS 3, Business Combinations (see note 3) but is included in funds from operations for purposes of reporting operating results to Brookfield Renewable’s chief operating decision maker.

Transactions between the reportable segments occur at fair value.

Brookfield Renewable Energy Partners L.P                                Q3 2014 Interim Consolidated Financial Statements and Notes

Page 22 


Hydroelectric

Wind energy

Co-gen

Other

Total

(MILLIONS)

U.S.

Canada

Brazil

U.S.

Canada

Europe


For the three months ended


September 30, 2014:


Revenues

$

151

$

64

$

60

$

28

$

19

$

18

$

2

$

  -

$

342

Adjusted EBITDA


104


50


44


18


14


11


(1)


(17)


223

Interest expense - borrowings


(37)


(19)


(5)


(10)


(9)


(4)


  -


(22)


(106)

Funds from operations prior to


 non-controlling interests


67


31


34


8


5


7


(1)


(53)


98

Cash portion of non-controlling


 interests 


(14)


  -


(4)


(4)


  -


(5)


  -


(10)


(37)

Funds from operations


53


31


30


4


5


2


(1)


(63)


61

Depreciation


(40)


(19)


(37)


(16)


(19)


(13)


(1)


  -


(145)

For the three months ended


September 30, 2013:


Revenues

$

160

$

93

$

69

$

34

$

19

$

  -

$

17

$

  -

$

392

Adjusted EBITDA


111


76


47


24


14


  -


4


(16)


260

Interest expense - borrowings


(38)


(17)


(5)


(11)


(10)


  -


  -


(24)


(105)

Funds from operations prior to


 non-controlling interests


73


59


38


13


4


  -


4


(49)


142

Cash portion of non-controlling


 interests 


(15)


  -


(2)


(7)


  -


  -


  -


(10)


(34)

Funds from operations


58


59


36


6


4


  -


4


(59)


108

Depreciation


(37)


(20)


(37)


(17)


(19)


  -


(3)


  -


(133)

Brookfield Renewable Energy Partners L.P                                Q3 2014 Interim Consolidated Financial Statements and Notes

Page 23 


Hydroelectric

Wind energy

Co-gen

Other

Total

(MILLIONS)

U.S.

Canada

Brazil

U.S.

Canada

Europe


For the nine months ended


September 30, 2014:


Revenues

$

575

$

269

$

216

$

106

$

87

$

18

$

25

$

  -

$

1,296

Adjusted EBITDA


431


224


168


74


75


11


11


(51)


943

Interest expense - borrowings


(113)


(53)


(15)


(30)


(29)


(4)


  -


(65)


(309)

Funds from operations prior to


 non-controlling interests


314


171


138


44


46


18


11


(154)


588

Cash portion of non-controlling


interests


(71)


  -


(11)


(28)


  -


(5)


  -


(29)


(144)

Funds from operations


243


171


127


16


46


13


11


(183)


444

Depreciation


(112)


(61)


(109)


(47)


(55)


(13)


(3)


  -


(400)

For the nine months ended


September 30, 2013:


Revenues

$

546

$

294

$

223

$

107

$

93

$

  -

$

50

$

  -

$

1,313

Adjusted EBITDA


407


243


160


77


78


  -


15


(44)


936

Interest expense - borrowings


(111)


(50)


(18)


(29)


(34)


  -


  -


(71)


(313)

Funds from operations prior to


 non-controlling interests


293


193


129


48


44


  -


15


(146)


576

Cash portion of non-controlling


interests


(57)


  -


(9)


(26)


  -


  -


  -


(27)


(119)

Funds from operations


236


193


120


22


44


  -


15


(173)


457

Depreciation


(104)


(64)


(118)


(46)


(57)


  -


(9)


  -


(398)

Brookfield Renewable Energy Partners L.P                                Q3 2014 Interim Consolidated Financial Statements and Notes

Page 24 


The following table reconciles adjusted EBITDA and funds from operations, presented in the above tables, to net (loss) income as presented in the interim consolidated statements of (loss) income:


Three months ended Sep 30

Nine months ended Sep 30

(MILLIONS)


2014


2013


2014


2013

Revenues


$

342

$

392

$

1,296

$

1,313

Other income


3


1


8


5

Share of cash earnings from equity-accounted investments


10


7


25


19

Direct operating costs


(132)


(140)


(386)


(401)

Adjusted EBITDA


223


260


943


936

Fixed earnings adjustment(1)


-


-


11


-

Interest expense - borrowings


(106)


(105)


(309)


(313)

Management service costs


(14)


(9)


(38)


(32)

Current income tax expense


(5)


(4)


(19)


(15)

Funds from operations prior to non-controlling interests


98


142


588


576

Less: cash portion of non-controlling interests


Preferred equity


(10)


(10)


(29)


(27)


Participating non-controlling interests - in operating


subsidiaries


(27)


(24)


(115)


(92)

Funds from operations


61


108


444


457

Add: cash portion of non-controlling interests


37


34


144


119

Less: fixed earnings adjustment


-


-


(11)


-

Depreciation


(145)


(133)


(400)


(398)

Unrealized financial instruments gain


9


11


5


30

Share of non-cash loss from equity-accounted investments


(3)


(4)


(15)


(10)

Deferred income tax recovery (expense)


27


10


8


(1)

Other


(11)


2


(3)


(6)

Net (loss) income

$

(25)

$

28

$

172

$

191

(1)            The fixed earnings adjustment relates to Brookfield Renewable’s investment in the acquisition of the wind portfolio in Ireland. Pursuant to the terms of the purchase and sale agreement, Brookfield Renewable acquired an economic interest in the wind portfolio from January 1, 2014. The transaction closed on June 30, 2014, and accordingly under IFRS, the $11 million net funds from operations contribution was recorded as part of the purchase price.

Brookfield Renewable Energy Partners L.P                                Q3 2014 Interim Consolidated Financial Statements and Notes

Page 25 


The following table presents information about Brookfield Renewable’s certain balance sheet items on a segmented basis:


 Hydroelectric 

Wind energy


Co-gen

Other(1)

Total


(MILLIONS)

U.S.

Canada

Brazil

U.S.

Canada

Europe


As at September 30, 2014:


Property, plant and


 equipment, at fair value

$

6,979

$

4,788

$

2,011

$

1,151

$

1,134

$

980

$

42

$

279

$

17,364

Total assets


7,415


4,884


2,224


1,249


1,159


1,099


43


482


18,555

Total borrowings


2,362


1,205


211


627


662


409


-


1,846


7,322

Total liabilities


3,642


2,194


304


706


886


579


-


1,974


10,285

For the nine months ended


September 30, 2014:


Additions to property, plant


 and equipment


1,320


-


-


-


-


1,075


-


124


2,519

As at December 31, 2013:


Property, plant and


 equipment, at fair value

$

5,771

$

4,830

$

2,205

$

1,198

$

1,250

$

-

$

46

$

441

$

15,741

Total assets


6,246


4,998


2,484


1,282


1,297


-


62


610


16,979

Total borrowings


2,157


1,143


238


647


721


-


-


1,717


6,623

Total liabilities


3,328


2,144


398


720


995


-


4


1,854


9,443

For the year ended


December 31, 2013:


Additions to property, plant


 and equipment


715


206


-


430


-


-


-


255


1,606

(1)            Includes CWIP and corporate.

Brookfield Renewable Energy Partners L.P                                Q3 2014 Interim Consolidated Financial Statements and Notes

Page 26 


15.  Commitments, contingencies and guarantees

Commitments

In the course of its operations, Brookfield Renewable and its subsidiaries have entered into agreements for the use of water, land and dams. Payment under those agreements varies with the amount of power generated. The various agreements are renewable and extend up to 2054.

Contingencies

Brookfield Renewable and its subsidiaries are subject to various legal proceedings, arbitrations and actions arising in the normal course of business. While the final outcome of such legal proceedings and actions cannot be predicted with certainty, it is the opinion of management that the resolution of such proceedings and actions will not have a material impact on Brookfield Renewable’s consolidated financial position or results of operations.

Guarantees

Brookfield Renewable, on behalf of Brookfield Renewable’s subsidiaries, and the subsidiaries themselves have provided letters of credit, which include, but are not limited to, guarantees for debt service reserves, capital reserves, construction completion and performance. The activity on the issued letters of credit by Brookfield Renewable can be found in Note 9 – Long-term debt and credit facilities. As at September 30, 2014, letters of credit issued by subsidiaries of Brookfield Renewable amounted to $119 million.

In the normal course of operations, Brookfield Renewable and its subsidiaries execute agreements that provide for indemnification and guarantees to third parties of transactions such as business dispositions, capital project purchases, business acquisitions, and sales and purchases of assets and services. Brookfield Renewable has also agreed to indemnify its directors and certain of its officers and employees. The nature of substantially all of the indemnification undertakings prevents Brookfield Renewable from making a reasonable estimate of the maximum potential amount that Brookfield Renewable could be required to pay third parties as the agreements do not always specify a maximum amount and the amounts are dependent upon the outcome of future contingent events, the nature and likelihood of which cannot be determined at this time. Historically, neither Brookfield Renewable nor its subsidiaries have made material payments under such indemnification agreements.  

16.  subsequent event

On October 1, 2014 Brookfield Renewable secured financing in the amount of $480 million related to the acquisition of a 417 MW hydroelectric facility in Pennsylvania. The debt bears interest at LIBOR plus 1.75%, and matures in June 2018.


Brookfield Renewable Energy Partners L.P                                Q3 2014 Interim Consolidated Financial Statements and Notes

Page 27 


EX-99.3 4 exh99_3.htm EXHIBIT 99.3  


Brookfield Renewable Energy Partners L.P.

MANAGEMENT’S DISCUSSION AND ANALYSIS  

FOR THE THREE AND NINE MONTHS ENDED SEPTEMBER 30, 2014 AND 2013


HIGHLIGHTS FOR THE THREE MONTHS ENDED SEPTEMBER 30, 2014

Operating Results

Generation from the portfolio was 4,383 GWh and revenues were $342 million.

        Performance of the U.S. hydroelectric portfolio was in line with the long-term average but below the prior year which experienced above average inflows.

        The Canadian hydroelectric portfolio was impacted by below average inflows.

        In Brazil, our full year generation is largely consistent with assured energy levels. However, the in-quarter variance reflects our strategy of shifting generation into the first quarter from the third quarter to take advantage of favorable pricing.

        The wind portfolio maintained high availability but conditions were below the long-term average across the entire portfolio.

Adjusted EBITDA was $223 million and funds from operations was $61 million.

Growth and Development

On August 8, 2014, we, together with our institutional partners, acquired the remaining 67% interest in the 417 MW Safe Harbor hydroelectric facility. Brookfield Renewable owns a 40% interest in the entire facility.

Construction of an 88 MW wind project in the Republic of Ireland is in the final stages of commercialization and is receiving payments under a power purchase agreement. During this quarter, we recognized 60 GWh in generation tied to production.

Construction of a 37 MW wind project in the Republic of Ireland is expected to enter commercial operations by the end of 2014.

On September 15, 2014 we announced an increased distribution growth target of 5% - 9% annually, up from 3% - 5% previously. We expect to maintain our target payout ratio of 60% to 70% of funds from operations.

Liquidity and Capital Resources

Our available liquidity remains strong.

        We extended the maturity of our corporate credit facilities to June 2019, reduced the margin by five basis points, and added an option to borrow in Euro (€) and British Pound Sterling (£).

        As part of our recently-acquired wind portfolio in Ireland, we completed a €160 million ($210 million) financing with an initial fixed interest rate of 2.9%, including the related interest rate swaps, maturing in December 2026.

        On October 1, 2014, as part of the acquisition of the remaining interests in the 417 MW Safe Harbor hydroelectric facility, $480 million of financing was secured with a floating rate LIBOR plus 1.75%, and maturing in June 2018.

Brookfield Renewable Energy Partners L.P.                                      Q3 2014 Management’s Discussion and Analysis                                             September 30, 2014               

Page 1 


HISTORICAL OPERATIONAL AND FINANCIAL INFORMATION


Three months ended Sep 30

Nine months ended Sep 30

(MILLIONS, EXCEPT AS NOTED)


2014

2013

2014

2013

Operational information:(1)


Capacity (MW)


6,707


5,849


6,707


5,849

Long-term average generation (GWh)(2)


5,065


4,960


17,526


16,456

Actual generation (GWh)(2)


4,383


5,154


16,709


16,954

Average revenue ($ per MWh)


78


76


80


77

Selected financial information:


Revenues

$

342

$

392

$

1,296

$

1,313

Adjusted EBITDA(3)


223


260


943


936

Funds from operations(3)


61


108


444


457

Adjusted funds from operations(3)


46


94


401


415

Net (loss) income


(25)


28


172


191

Distributions per LP Unit(4)(5)


1.53


1.43


1.53


1.43


Sep 30

Dec 31

(MILLIONS, EXCEPT AS NOTED)


2014


2013

Balance sheet data:


Property, plant and equipment, at fair value

$

17,364

$

15,741

Equity-accounted investments


232


290

Total assets


18,555


16,979


Long-term debt and credit facilities


7,322


6,623

Deferred income tax liabilities


2,332


2,265

Total liabilities


10,285


9,443

Preferred equity


756


796

Participating non-controlling interests - in operating subsidiaries


2,202


1,303

General partnership interest in a holding subsidiary held by Brookfield


51


54

Participating non-controlling interests -  in a holding  subsidiary


- Redeemable/Exchangeable units held by Brookfield


2,499


2,657

Limited partners' equity


2,762


2,726

Total liabilities and equity


18,555


16,979

Debt to total capitalization(6)


41%


41%

(1)           Includes 100% of capacity and generation from equity-accounted investments.

(2)           For assets acquired or reaching commercial operation during the year, this figure is calculated from the acquisition or commercial operation date.

(3)           Non-IFRS measures. See “Cautionary Statement Regarding Use of Non-IFRS Measures”, “Financial Review by Segments for the Three Months Ended September 30, 2014”, and “Financial Review by Segments for the Nine Months Ended September 30, 2014”.

(4)           Figure is based on the last twelve months of operations.

(5)           Represents distributions per share to holders of Redeemable/Exchangeable Units, LP Units and general partnership interest.

(6)           Total capitalization is calculated as total debt plus deferred income tax liabilities, net of deferred income tax assets, and equity.

Brookfield Renewable Energy Partners L.P.                                      Q3 2014 Management’s Discussion and Analysis                                             September 30, 2014               

Page 2 


Basis of Presentation

This Management’s Discussion and Analysis for the three and nine months ended September 30, 2014 is provided as of November 4, 2014. Unless the context indicates or requires otherwise, the terms “Brookfield Renewable”, “we”, “us”, and “our” mean Brookfield Renewable Energy Partners L.P. and its controlled entities.

Brookfield Renewable’s financial statements are prepared in accordance with International Financial Reporting Standards (“IFRS”) as issued by the International Accounting Standards Board (“IASB”), which require estimates and assumptions that affect the reported amounts of assets and liabilities and disclosure of contingent liabilities as at the date of the financial statements and the amounts of revenue and expense during the reporting periods.

Certain comparative figures have been reclassified to conform to the current year’s presentation.

Unless otherwise indicated, all dollar amounts are expressed in United States (“U.S.”) dollars.

PRESENTATION TO PUBLIC STAKEHOLDERS

Brookfield Renewable’s consolidated equity interests include LP Units held by public unitholders and Redeemable/Exchangeable partnership units in Brookfield Renewable Energy L.P. (“BRELP”), a holding subsidiary of Brookfield Renewable, held by Brookfield (see “Participating non-controlling interests – in a holding subsidiary – Redeemable/Exchangeable units held by Brookfield”). The LP Units and the Redeemable/Exchangeable partnership units have the same economic attributes in all respects, except that the Redeemable/Exchangeable partnership units provide Brookfield the right to request that their units be redeemed for cash consideration. In the event that Brookfield exercises this right, Brookfield Renewable has the right, at its sole discretion, to satisfy the redemption request with LP Units, rather than cash, on a one-for-one basis. Brookfield, as holder of Redeemable/Exchangeable partnership units, participates in earnings and distributions on a per unit basis equivalent to the per unit participation of the LP Units. As Brookfield Renewable, at its sole discretion, has the right to settle the obligation with LP Units, the Redeemable/Exchangeable partnership units are classified under equity, and not as a liability. 

Given the exchange feature referenced above, we are presenting the LP Units and the Redeemable/Exchangeable partnership units as separate components of consolidated equity. This presentation does not impact the total income, per unit or share information, or total consolidated equity.

As at the date of this report, Brookfield Asset Management owns an approximate 62% limited partnership interest, on a fully-exchanged basis, and all general partnership units totaling a 0.01% general partnership interest in Brookfield Renewable, while the remaining 38% is held by the public.

Performance Measurement

We present our key financial metrics based on total results prior to distributions made to LP Unitholders, the Redeemable/Exchangeable unitholders and general partnership unitholders. In addition, our operations are segmented by geography and asset type (i.e. hydroelectric and wind), as that is how we review our results, manage operations and allocate resources. Accordingly, we report our results in accordance with these segments.

One of our primary business objectives is to generate reliable and growing cash flows while minimizing risk for the benefit of all stakeholders. We monitor our performance in this regard through four key metrics — i) Net Income, ii) Adjusted Earnings Before Interest, Taxes, Depreciation and Amortization, iii) Funds From Operations,  and iv) Adjusted Funds from Operations.

Brookfield Renewable Energy Partners L.P.                                      Q3 2014 Management’s Discussion and Analysis                                             September 30, 2014               

Page 3 


It is important to highlight that adjusted EBITDA, funds from operations, and adjusted funds from operations do not have any standardized meaning prescribed by IFRS and therefore are unlikely to be comparable to similar measures presented by other companies. We provide additional information on how we determine adjusted EBITDA, funds from operations, and adjusted funds from operations, and we provide reconciliations to net income and cash flows from operating activities. See “Generation and Financial Review for the Three Months Ended September 30, 2014” and “Generation and Financial Review for the Nine Months Ended September 30, 2014”.

Net Income

Net income is calculated in accordance with IFRS.

Adjusted Earnings Before Interest, Taxes, Depreciation, and Amortization (adjusted EBITDA)

Adjusted EBITDA means revenues less direct costs (including energy marketing costs), plus our share of cash earnings from equity-accounted investments and other income, before interest, income taxes, depreciation, management service costs and the cash portion of non-controlling interests.

Funds From Operations

Funds from operations is defined as adjusted EBITDA less interest, current income taxes and management service costs, which is then adjusted for the cash portion of non-controlling interests. For the nine months ended September 30, 2014, funds from operations include the earnings received from the wind portfolio we acquired in Ireland, reflecting our economic interest from January 1, 2014 to June 30, 2014.

Our payout ratio is defined as distributions to Redeemable/Exchangeable Units, LP Units and general partnership interest, including general partner incentive distributions, divided by funds from operations.

Adjusted Funds From Operations

Adjusted funds from operations is defined as funds from operations less Brookfield Renewable’s share of levelized sustaining capital expenditures (based on long term capital expenditure plans).


Statement Regarding Forward-Looking Statements and Use of Non-IFRS Measures


This Management's Discussion and Analysis contains  forward-looking information within the meaning of U.S. and Canadian securities laws. We may make such statements in this Management's Discussion and Analysis, in other filings with the U.S. Securities and Exchange Commission (“SEC”) or in other communications with Canadian regulators - see “Cautionary Statement Regarding Forward-Looking Statements”. We make use of non-IFRS measures in this Management's Discussion and Analysis  - see “Cautionary Statement Regarding Use Of Non-IFRS Measures”. This Management's Discussion and Analysis, our Form 20-F  and additional information filed with the SEC and with securities regulators in Canada are available on our website at www.brookfieldrenewable.com, on the SEC’s website at www.sec.gov or on SEDAR’s website at www.sedar.com.


Brookfield Renewable Energy Partners L.P.                                      Q3 2014 Management’s Discussion and Analysis                                             September 30, 2014               

Page 4 


GENERATION AND FINANCIAL REVIEW FOR THE THREE MONTHS ENDED SEPTEMBER 30, 2014

The following table reflects the actual and long-term average generation for the three months ended September 30:


Variance of Results


Actual vs.


Actual Generation(1)

LTA Generation(1)

Actual vs. LTA

Prior Year

GENERATION (GWh)

2014

2013

2014

2013

2014

2013


Hydroelectric generation


United States

2,183

2,353

2,160

2,013

23

340

(170)


Canada

987

1,292

1,233

1,234

(246)

58

(305)


Brazil

633

894

887

894

(254)

  -

(261)


3,803

4,539

4,280

4,141

(477)

398

(736)

Wind energy


United States

240

295

341

341

(101)

(46)

(55)


Canada

152

146

238

238

(86)

(92)

6


Europe

174

  -

160

  -

14

  -

174


566

441

739

579

(173)

(138)

125

Other

14

174

46

240

(32)

(66)

(160)

Total(2)

4,383

5,154

5,065

4,960

(682)

194

(771)

(1)         For assets acquired or reaching commercial operation during the year, this figure is calculated from the acquisition or commercial operation date.

(2)         Includes 100% of generation from equity-accounted investments.

We compare actual generation levels against the long-term average to highlight the impact of one of the important factors that affect the variability of our business results. In the short-term, we recognize that hydrology will vary from one period to the next; over time however, we expect our facilities will continue to produce in line with their long-term averages, which have proven to be reliable indicators of performance.

Our risk of a generation shortfall in Brazil continues to be minimized by participation in a hydrological balancing pool administered by the government of Brazil. This program mitigates hydrology risk by assuring that all participants receive, at any particular point in time, a balanced amount of electricity, irrespective of the actual volume of energy generated. The program reallocates energy, transferring surplus energy from those who generated an excess to those who generate less than their assured energy, up to the total generation within the pool. Periodically, low precipitation across the entire country’s system could result in a temporary reduction of generation available for sale. The second and third quarters of 2014 were such periods. During these periods, we expect that a higher proportion of thermal generation would be needed to balance supply and demand in the country potentially leading to higher overall spot market prices. In anticipation of lower hydrology, we maintained a lower level of contracted generation, allowing us to capture the strong power prices in the prior and current quarters.

In Brazil, our contracts allow the flexibility to periodically sell more than the assured level of generation. The opportunity is most attractive during periods of high demand, and resulting stronger prices.  As a result, we delivered more power to our customers in the first quarter of 2014 and secured favorable pricing. While this resulted in the delivery of lower assured energy in the second and third quarters of 2014, this initiative locked in revenue upside for 2014.


Brookfield Renewable Energy Partners L.P.                                      Q3 2014 Management’s Discussion and Analysis                                             September 30, 2014               

Page 5 


Generation levels during the three months ended September 30, 2014 totaled 4,383 GWh, lower than the long-term average of 5,065 GWh, and a decrease of 771 GWh as compared to the prior year in which generation was above the long-term average.

The hydroelectric portfolio generated 3,803 GWh, below the long-term average of 4,280 GWh and a decrease of 736 GWh from the prior year. Generation from existing hydroelectric assets was 3,677 GWh compared to 4,539 GWh for the prior year. Our recently acquired and commissioned facilities contributed 126 GWh. The variance in year-over-year results from existing facilities reflects the return to more normal generation levels in the United States after experiencing very strong hydrological conditions across much of the portfolio in the prior year, as well as generation levels that were below the long-term average in Canada in the current quarter. In Brazil, our full year generation is largely consistent with assured levels, as shown in “Generation and Financial Review for the Nine Months Ended September 30, 2014”, however the in-quarter variance reflects our strategy of shifting generation into the first quarter from the third quarter to take advantage of favorable pricing.

The wind portfolio generated 566 GWh which was 125 GWh higher compared to the prior year. The wind portfolio in Ireland contributed 174 GWh, partly offsetting the lower than average wind conditions across the rest of the wind portfolio.

Our 110 MW natural gas-fired plant in Ontario had nominal generation in the period as a result of low power prices relative to gas market prices.

Brookfield Renewable Energy Partners L.P.                                      Q3 2014 Management’s Discussion and Analysis                                             September 30, 2014               

Page 6 


The following table reflects adjusted EBITDA, funds from operations, adjusted funds from operations, and provides a reconciliation to net (loss) income for the three months ended September 30:

(MILLIONS, EXCEPT AS NOTED)


2014


2013

Revenues


$

342

$

392

Other income


3


1

Share of cash earnings from equity-accounted investments


10


7

Direct operating costs


(132)


(140)

Adjusted EBITDA(1)


223


260

Interest expense – borrowings


(106)


(105)

Management service costs


(14)


(9)

Current income taxes


(5)


(4)

Less: cash portion of non-controlling interests


Preferred equity


(10)


(10)


Participating non-controlling interests - in operating subsidiaries


(27)


(24)

Funds from operations(1)


61


108

Less: sustaining capital expenditures(2)


(15)


(14)

Adjusted funds from operations(1)


46


94

Add: cash portion of non-controlling interests


37


34

Add: sustaining capital expenditures


15


14

Other items:


Depreciation


(145)


(133)


Unrealized financial instruments gain


9


11


Share of non-cash loss from equity-accounted investments


(3)


(4)

Deferred income tax recovery


27


10

Other


(11)


2

Net (loss) income

$

(25)

$

28


Basic and diluted (loss) earnings per LP Unit(3)

$

(0.13)

$

0.04

(1)       Non-IFRS measures.  See “Cautionary Statement Regarding Use of Non-IFRS Measures”.

(2)       Based on long-term capital expenditure plans.

(3)       Average LP Units outstanding during the period totaled 143.3 million (2013: 133.0 million).

Net income is one important measure of profitability, in particular because it has a standardized meaning under IFRS. The presentation of net income on an IFRS basis for our business will often lead to the recognition of a loss even though the underlying cash flow generated by the assets is supported by strong margins and stable, long-term contracts. The primary reason for this is that we recognize a significantly higher level of depreciation for our assets than we are required to reinvest in the business as sustaining capital expenditures.

As a result, we also measure our financial results based on adjusted EBITDA, funds from operations, and adjusted funds from operations to provide readers with an assessment of the cash flow generated by our assets and the residual cash flow retained to fund distributions and growth initiatives.

Revenues totaled $342 million, $50 million lower than prior year in which generation was above average. The $30 million contribution from the growth in the portfolio was offset by the lower same store generation. The average realized price in the current period of $78/MWh is slightly higher than the $76/MWh realized in the prior year and consistent with the largely contracted nature of the portfolio.

Direct operating costs totaled $132 million representing a year-over-year decrease of $8 million primarily attributable to the growth in our portfolio ($14 million) being offset by the savings achieved from the cost

Brookfield Renewable Energy Partners L.P.                                      Q3 2014 Management’s Discussion and Analysis                                             September 30, 2014               

Page 7 


efficiencies at our operations and the reduction in power purchased in the open market for our co-generation facilities.

Interest expense totaled $106 million representing a year-over-year increase of $1 million. The financing relating to the growth in our portfolio was partly offset by the decrease in borrowing costs due to repayments in the normal course on existing subsidiary borrowings and on our credit facilities.

Management service costs totaled $14 million representing a year-over-year increase of $5 million primarily attributable to the increase in the market value of our LP Units and the issuance of LP Units in the second quarter of 2014.

The cash portion of non-controlling interests totaled $37 million representing a year-over-year increase of $3 million. The increase attributable to the growth in our portfolio was partly offset by the decrease in performance from existing interests.

Funds from operations totaled $61 million representing a year-over-year decrease of $47 million, and reflecting the changes described above.

Net loss was $25 million for the three months ended September 30, 2014 (2013: net income of $28 million).

HYDROELECTRIC

The following table reflects the results of our hydroelectric operations for the three months ended September 30:

(MILLIONS, EXCEPT AS NOTED)

2014


United States

Canada

Brazil

Total

Generation (GWh) – LTA(1)(2)


2,160


1,233


887


4,280

Generation (GWh) – actual(1)(2)


2,183


987


633


3,803

Revenues

$

151

$

64

$

60

$

275

Adjusted EBITDA(3)


104


50


44


198

Funds from operations(3)

$

53

$

31

$

30

$

114


(MILLIONS, EXCEPT AS NOTED)

2013


United States

Canada

Brazil

Total

Generation (GWh) – LTA(1)(2)


2,013


1,234


894


4,141

Generation (GWh) – actual(1)(2)


2,353


1,292


894


4,539

Revenues

$

160

$

93

$

69

$

322

Adjusted EBITDA(3)


111


76


47


234

Funds from operations(3)

$

58

$

59

$

36

$

153


(1)            Includes 100% of generation from equity-accounted investments.

(2)           For assets acquired or reaching commercial operation during the year, this figure is calculated from the acquisition or commercial operation date.

(3)            Non-IFRS measures. See “Cautionary Statement Regarding Use of Non-IFRS Measures”, and “Financial Review By Segments For the Three Months Ended September 30, 2014”.

United States

Generation from the portfolio was 2,183 GWh, consistent with the long-term average of 2,160 GWh and a decrease from prior year generation of 2,353 GWh which was above the long-term average. The growth in our portfolio contributed an incremental 126 GWh. Generation from existing facilities was 2,057 GWh, a decrease of 296 GWh from the prior year but consistent with the long-term average. Inflows at our

Brookfield Renewable Energy Partners L.P.                                      Q3 2014 Management’s Discussion and Analysis                                             September 30, 2014               

Page 8 


facilities in New York, Louisiana, and Tennessee were lower than in the prior year, which experienced generation levels significantly above the long-term average.

Revenues totaling $151 million represent a year-over-year decrease of $9 million as the $12 million contribution from the growth in our portfolio was offset by the decrease in generation.

Funds from operations totaling $53 million represent a year-over-year decrease of $5 million. The increase in performance from our equity-accounted investments was offset by the decrease in revenues.

Canada

Generation from the portfolio of 987 GWh was below the long-term average of 1,233 GWh and a decrease from prior year of 1,292 GWh, attributable to below average inflows.

Revenues totaling $64 million represent a year-over-year decrease of $29 million attributable to the decrease in generation.

Funds from operations totaling $31 million represent a year-over-year decrease of $28 million attributable to the decrease in revenues.

Brazil

Generation from the portfolio was 633 GWh, a decrease from prior year of 894 GWh. Our full year generation is largely consistent with assured energy levels, as shown in ”Generation and Financial Review for the Nine Months Ended September 30, 2014”, however, the in-quarter variance reflects our strategy of shifting generation into the first quarter from the third quarter to take advantage of favorable pricing.

Revenues totaling $60 million represent a year-over-year decrease of $9 million. The decrease was primarily attributable to shifting generation from the third quarter of 2014 to the first quarter of 2014.

Funds from operations totaling $30 million represent a year-over-year decrease of $6 million attributable to the decrease in revenues. 

Brookfield Renewable Energy Partners L.P.                                      Q3 2014 Management’s Discussion and Analysis                                             September 30, 2014               

Page 9 


WIND

The following table reflects the results of our wind operations for the three months ended September 30:

(MILLIONS, EXCEPT AS NOTED)

2014


United States

Canada

Europe

Total

Generation (GWh) – LTA(1)(2)


341


238


160


739

Generation (GWh) – actual(1)(2)


240


152


174


566

Revenues

$

28

$

19

$

18

$

65

Adjusted EBITDA(3)


18


14


11


43

Funds from operations(3)

$

4

$

5

$

2

$

11

(MILLIONS, EXCEPT AS NOTED)

2013


United States

Canada

Europe

Total

Generation (GWh) – LTA(1)(2)


341


238


N/A


579

Generation (GWh) – actual(1)(2)


295


146


N/A


441

Revenues

$

34

$

19

$

N/A

$

53

Adjusted EBITDA(3)


24


14


N/A


38

Funds from operations(3)

$

6

$

4

$

N/A

$

10

(1)            Includes 100% of generation from equity-accounted investments.

(2)           For assets acquired or reaching commercial operation during the year, this figure is calculated from the acquisition or commercial operation date.

(3)            Non-IFRS measures. See “Cautionary Statement Regarding Use of Non-IFRS Measures”, and “Financial Review By Segments For the Three Months Ended September 30, 2014”.

United States

Generation from the portfolio of 240 GWh was below the long-term average of 341 GWh and prior year generation of 295 GWh, primarily attributable to lower than average wind conditions across the portfolio.

Revenues totaling $28 million represent a year-over-year decrease of $6 million attributable to the decrease in generation.

Funds from operations totaling $4 million represent a year-over-year decrease of $2 million primarily attributable to the decrease in revenues. Partly offsetting this decrease is the cash portion of non-controlling interests.

Canada

Generation from the portfolio was 152 GWh, consistent with the prior year generation of 146 GWh but below the long-term average of 238 GWh due to lower wind conditions.

Revenues totaling $19 million were consistent with the prior year.

Funds from operations totaling $5 million were consistent with the prior year.

Europe

Generation from our wind portfolio in Ireland was 174 GWh in the quarter, which includes 60 GWh from a recently built project which is in the final stages of commercialization but which is receiving payments under its power purchase agreement, tied to production.

Revenues totaled $18 million for the quarter, reflecting the lower than average wind conditions partly offset by the $6 million contribution from the additional 60 GWh referenced above. Funds from operations totaled $2 million.

Brookfield Renewable Energy Partners L.P.                                      Q3 2014 Management’s Discussion and Analysis                                             September 30, 2014               

Page 10 


GENERATION AND FINANCIAL REVIEW FOR THE NINE MONTHS ENDED SEPTEMBER 30, 2014

The following table reflects the actual and long-term average generation for the nine months ended September 30:


Variance of Results


Actual vs.


Actual Generation(1)

LTA Generation(1)

Actual vs. LTA

Prior Year

GENERATION (GWh)

2014

2013

2014

2013

2014

2013


Hydroelectric generation


United States

7,859

7,856

7,989

7,231

(130)

625

3


Canada

3,856

4,093

3,914

3,891

(58)

202

(237)


Brazil

2,576

2,733

2,714

2,733

(138)

  -

(157)


14,291

14,682

14,617

13,855

(326)

827

(391)

Wind energy


United States

940

970

1,120

1,067

(180)

(97)

(30)


Canada

731

747

854

854

(123)

(107)

(16)


Europe(2)

592

  -

591

  -

1

  -

592


2,263

1,717

2,565

1,921

(302)

(204)

546

Other

155

555

344

680

(189)

(125)

(400)

Total(3)

16,709

16,954

17,526

16,456

(817)

498

(245)

(1)         For assets acquired or reaching commercial operation during the year, this figure is calculated from the acquisition or commercial operation date.

(2)         We completed the acquisition of the wind portfolio in Ireland on June 30, 2014. Pursuant to the terms of the purchase and sale agreement, Brookfield Renewable acquired an economic interest in the wind portfolio from January 1, 2014. Accordingly, generation from January 1, 2014 to June 30, 2014 was recorded in the second quarter of 2014.

(3)         Includes 100% of generation from equity-accounted investments.

Generation levels during the nine months ended September 30, 2014 totaled 16,709 GWh, compared to the long-term average of 17,526 GWh, and a decrease of 245 GWh as compared to the prior year in which generation was above the long-term average.

The hydroelectric portfolio generated 14,291 GWh, below the long-term average of 14,617 GWh and a decrease of 391 GWh as compared to the prior year. Generation from existing facilities was 13,558 GWh, compared to 14,682 GWh for the prior year. The recent growth in our portfolio and a full period’s contribution from facilities acquired in the first quarter of 2013 resulted in incremental generation of 733 GWh. Lower inflows across much of the United States and Canada resulted in a decrease in generation levels compared to the prior year, which experienced strong hydrological conditions and generation. In Brazil, generation is largely consistent with assured levels.

The wind portfolio generated 2,263 GWh, 546 GWh higher compared to the prior year. The recent growth in our portfolio and a full period’s contributions from the facilities acquired in the first quarter of 2013 resulted in incremental generation of 619 GWh. The increase from portfolio growth was partly offset by lower than average wind conditions across the rest of the wind portfolio.

Our co-generation facility in Ontario has been operating on an uncontracted basis since April 2014. Since then, the facility has had nominal generation as a result of low power prices relative to gas market prices.

Brookfield Renewable Energy Partners L.P.                                      Q3 2014 Management’s Discussion and Analysis                                             September 30, 2014               

Page 11 


The following table reflects adjusted EBITDA, funds from operations, adjusted funds from operations, and provides a reconciliation to net income for the nine months ended September 30:

(MILLIONS, EXCEPT AS NOTED)


2014


2013

Revenues


$

1,296

$

1,313

Other income


8


5

Share of cash earnings from equity-accounted investments


25


19

Direct operating costs


(386)


(401)

Adjusted EBITDA(1)


943


936

Fixed earnings adjustment(2)


11


-

Interest expense – borrowings


(309)


(313)

Management service costs


(38)


(32)

Current income taxes


(19)


(15)

Less: cash portion of non-controlling interests


Preferred equity


(29)


(27)


Participating non-controlling interests - in operating subsidiaries


(115)


(92)

Funds from operations(1)


444


457

Less: sustaining capital expenditures(3)


(43)


(42)

Adjusted funds from operations(1)


401


415

Add: cash portion of non-controlling interests


144


119

Add: sustaining capital expenditures


43


42

Less: fixed earnings adjustment


(11)


-

Other items:


Depreciation


(400)


(398)


Unrealized financial instruments gain


5


30


Share of non-cash loss from equity-accounted investments


(15)


(10)

Deferred income tax recovery (expense)


8


(1)

Other


(3)


(6)

Net income

$

172

$

191


Basic and diluted earnings per LP Unit(4)

$

0.31

$

0.44

(1)       Non-IFRS measures.  See “Cautionary Statement Regarding Use of Non-IFRS Measures”.

(2)       The fixed earnings adjustment relates to Brookfield Renewable’s investment in the acquisition of the wind portfolio in Ireland. Pursuant to the terms of the purchase and sale agreement, Brookfield Renewable acquired an economic interest in the wind portfolio from January 1, 2014. The transaction closed on June 30, 2014, and accordingly under IFRS, the $11 million net funds from operations contribution was recorded as part of the purchase price.

(3)       Based on long-term capital expenditure plans.

(4)       Average LP Units outstanding during the period totaled 137.2 million (2013: 132.9 million).

Revenues totaled $1,296 million which represented a year-over-year decrease of $17 million. The recent growth in our portfolio and a full period’s contribution from facilities acquired or commissioned in the first quarter of 2013 resulted in a contribution of $95 million.  The decrease in generation across the entire portfolio, and a contractual decrease in price at one of our facilities located in the Midwestern United States collectively amounted to $65 million.

The appreciation of the U.S. dollar impacted revenues by $47 million but also affected costs and other expenses resulting in a year-over-year decrease to funds from operations by $23 million.

Direct operating costs totaling $386 million represent a year-over-year decrease of $15 million attributable to the savings achieved from the cost efficiencies at our operations and the reduction in power purchased in the open market for our co-generation facilities. The expense related to the growth in our portfolio was $29 million.

Brookfield Renewable Energy Partners L.P.                                      Q3 2014 Management’s Discussion and Analysis                                             September 30, 2014               

Page 12 


Pursuant to the terms of the purchase and sale agreement, our acquisition of the wind portfolio in Ireland provided us with the economic benefit as of January 1, 2014, despite the transaction closing on June 30, 2014. Accordingly, we have included $11 million in funds from operations for the first six months of the year.

Interest expense totaling $309 million represents a year-over-year decrease of $4 million. The financing relating to the growth in our portfolio was partly offset by the decrease in borrowing costs due to repayments in the normal course on existing subsidiary borrowings and on our credit facilities.

Management service costs totaling $38 million represent a year-over-year increase of $6 million primarily attributable to the increase in the market value of our LP Units and the issuance of LP Units in the second quarter of 2014.

The cash portion of non-controlling interests totaling $144 million represents a year-over-year increase of $25 million. An increase of $45 million related to the growth in our portfolio and the partial sale of hydroelectric facilities in New England to institutional investors in the third quarter of 2013 was partly offset by the overall decrease in performance from existing interests.

Funds from operations totaling $444 million represents a year-over-year decrease of $13 million.

Net income was $172 million for the nine months ended September 30, 2014 (2013: $191 million).

HYDROELECTRIC

The following table reflects the results of our hydroelectric operations for the nine months ended September 30:

(MILLIONS, EXCEPT AS NOTED)

2014


United States

Canada

Brazil

Total

Generation (GWh) – LTA(1)(2)


7,989


3,914


2,714


14,617

Generation (GWh) – actual(1)(2)


7,859


3,856


2,576


14,291

Revenues

$

575

$

269

$

216

$

1,060

Adjusted EBITDA(3)


431


224


168


823

Funds from operations(3)

$

243

$

171

$

127

$

541


(MILLIONS, EXCEPT AS NOTED)

2013


United States

Canada

Brazil

Total

Generation (GWh) – LTA(1)(2)


7,231


3,891


2,733


13,855

Generation (GWh) – actual(1)(2)


7,856


4,093


2,733


14,682

Revenues

$

546

$

294

$

223

$

1,063

Adjusted EBITDA(3)


407


243


160


810

Funds from operations(3)

$

236

$

193

$

120

$

549


(1)            Includes 100% of generation from equity-accounted investments.

(2)           For assets acquired or reaching commercial operation during the year, this figure is calculated from the acquisition or commercial operation date.

(3)            Non-IFRS measures. See “Cautionary Statement Regarding Use of Non-IFRS Measures”, and “Financial Review By Segments For the Nine Months Ended September 30, 2014”.

United States

Generation from the portfolio was 7,859 GWh for the nine months ended September 30, 2014, in line with the long-term average of 7,989 GWh and consistent with prior year generation of 7,856 GWh. The recent growth in our portfolio and a full period’s contribution from facilities acquired in the first quarter of 2013 resulted in incremental generation of 659 GWh. Generation from existing facilities decreased 656 GWh,

Brookfield Renewable Energy Partners L.P.                                      Q3 2014 Management’s Discussion and Analysis                                             September 30, 2014               

Page 13 


due primarily to lower inflows at our facilities in North Carolina, Louisiana, and the mid-western United States as compared to the prior year. Partly offsetting were the strong inflows at our New York facilities. Generation levels in the prior year benefited from strong hydrological conditions at the facilities in Louisiana and North Carolina.

Revenues totaling $575 million represent a year-over-year increase of $29 million. The recent growth in our portfolio and a full period’s contribution from facilities acquired in the first quarter of 2013 resulted in incremental revenues of $66 million. We also benefited from selling generation at favorable market prices in part due to the extended winter in the New England region. The increases were partly offset by the decrease in generation from existing facilities, and a contractual decrease in price at our Louisiana facility.

Funds from operations totaling $243 million represent a year-over-year increase of $7 million. The increase in revenues was partly offset by costs associated with the growth in our portfolio.

Canada

Generation from the portfolio was 3,856 GWh for the nine months ended September 30, 2014, compared to the long-term average of 3,914 GWh and below prior year generation of 4,093 GWh. Although in line with long-term average, inflows across the portfolio were lower than in the prior year, which benefited from strong hydrological conditions.

Revenues totaling $269 million represent a year-over-year decrease of $25 million. The contribution of $5 million from growth in our portfolio since the first quarter of 2013 was offset by the $13 million impact from the decrease in generation.

The appreciation of the U.S. dollar impacted revenues by $18 million but also affected costs and other expenses resulting in a year-over-year decrease to funds from operations by $13 million.

Funds from operations totaling $171 million represent a year-over-year decrease of $22 million attributable to the decrease in revenues partly offset by the cost efficiencies at our operations and the effects of non-recurring finance costs incurred in 2013.

Brazil

Generation from the portfolio was 2,576 GWh for the nine months ended September 30, 2014 compared to prior year generation of 2,733 GWh. The decrease is primarily attributable to the drought-like conditions experienced in the year. A full period’s contribution from a facility commissioned in the first quarter of 2013 provided an incremental 59 GWh of generation.

Revenues totaling $216 million represent a year-over-year decrease of $7 million. Strong power pricing was offset by the decrease in generation attributable to the drought-like conditions and the $21 million foreign exchange impact.

Funds from operations totaling $127 million represent a year-over-year increase of $7 million. 

Brookfield Renewable Energy Partners L.P.                                      Q3 2014 Management’s Discussion and Analysis                                             September 30, 2014               

Page 14 


WIND

The following table reflects the results of our wind operations for the nine months ended September 30:

(MILLIONS, EXCEPT AS NOTED)

2014


United States

Canada

Europe

Total

Generation (GWh) – LTA(1)(2)


1,120


854


591


2,565

Generation (GWh) – actual(1)(2)


940


731


592


2,263

Revenues

$

106

$

87

$

18

$

211

Adjusted EBITDA(3)


74


75


11


160

Funds from operations(3)

$

16

$

46

$

13

$

75

(MILLIONS, EXCEPT AS NOTED)

2013


United States

Canada

Europe

Total

Generation (GWh) – LTA(1)(2)


1,067


854


N/A


1,921

Generation (GWh) – actual(1)(2)


970


747


N/A


1,717

Revenues

$

107

$

93

$

N/A

$

200

Adjusted EBITDA(3)


77


78


N/A


155

Funds from operations(3)

$

22

$

44

$

N/A

$

66

(1)            Includes 100% of generation from equity-accounted investments.

(2)           For assets acquired or reaching commercial operation during the year, this figure is calculated from the acquisition or commercial operation date.

(3)            Non-IFRS measures. See “Cautionary Statement Regarding Use of Non-IFRS Measures”, and “Financial Review By Segments For the Nine Months Ended September 30, 2014”.

United States

Generation from the portfolio of 940 GWh for the nine months ended September 30, 2014 was below the long-term average of 1,120 GWh and prior year generation of 970 GWh, primarily attributable to lower than average wind conditions. A full period’s contribution from the facilities acquired in the first quarter of 2013 resulted in incremental generation of 27 GWh.

Revenues totaling $106 million represent a year-over-year decrease of $1 million. The full period’s contribution from the facilities acquired in the first quarter of 2013 was offset by the decrease in generation.

Funds from operations totaling $16 million represent a year-over-year decrease of $6 million, primarily attributable to the lower revenues, increases in direct operating costs and interest expense associated with the growth in our portfolio, and the cash portion of non-controlling interests.

Canada

Generation from our Canadian wind portfolio was 731 GWh, below the long-term average of 854 GWh and prior year generation of 747 GWh all attributable to lower than average wind conditions.

Revenues totaling $87 million represent a year-over-year decrease of $6 million.  The appreciation of the U.S. dollar impacted revenues by $7 million.

Funds from operations totaling $46 million represent a year-over-year increase of $2 million. The decrease in revenues was offset by cost efficiencies at our operations and the effects of non-recurring finance costs incurred in 2013.

Brookfield Renewable Energy Partners L.P.                                      Q3 2014 Management’s Discussion and Analysis                                             September 30, 2014               

Page 15 


Europe

Generation from our wind portfolio in Ireland was 592 GWh in the period, which includes 60 GWh from a recently built project which is in the final stages of commercialization but which is receiving payments under its power purchase agreement, tied to production.

Revenues totaled $18 million for the period, reflecting the lower than average wind conditions partly offset by the $6 million contribution from the additional 60 GWh referenced above.

Funds from operations totaling $13 million includes an $11 million fixed earnings adjustment amount for the period from January 1, 2014 to June 30, 2014.

Brookfield Renewable Energy Partners L.P.                                      Q3 2014 Management’s Discussion and Analysis                                             September 30, 2014               

Page 16 


Analysis Of Consolidated Financial Statements and Other Information

Property, Plant and Equipment

In accordance with IFRS, Brookfield Renewable has elected to revalue its property, plant and equipment at a minimum on an annual basis, as at December 31st of each year.  As a result, certain of Brookfield Renewable’s property, plant and equipment, are carried at fair value as opposed to historical cost, using a 20-year discounted cash flow model. This model incorporates future cash flows from long-term power purchase agreements that are in place where it is determined that the power purchase agreements are linked specifically to the related power generating assets. The model also includes estimates of future electricity prices, anticipated long-term average generation, estimated operating and capital expenditures, and assumptions about future inflation rates and discount rates by geographical location.

Property, plant and equipment, at fair value totaled $17.4 billion as at September 30, 2014 as compared to $15.7 billion as at December 31, 2013. During the nine months ended September 30, 2014, the acquisition of 502 MW of hydroelectric facilities, a 326 MW wind portfolio and the development and construction of renewable power generating assets totaled $2.5 billion. Property, plant and equipment were impacted by foreign currency changes related to the U.S. dollar in the amount of $496 million. We also recognized depreciation expense of $400 million which is significantly higher than what we are required to reinvest in the business as sustaining capital expenditures. 

Fair value of property, plant and equipment can vary with discount and terminal capitalization rates. The following table summarizes the impact of a change in discount rates and terminal capitalization rates on the fair value of property, plant and equipment as at December 31, 2013:

(BILLIONS)


2013


2012

50 bps increase in discount rates


$

(1.1)

$

(1.2)

50 bps decrease in discount rates


1.3


1.4


50 bps increase in terminal capitalization rate(1)


(0.3)


(0.4)

50 bps decrease in terminal capitalization rate(1)


0.3


0.3

(1)            The terminal capitalization rate applies only to hydroelectric assets in the United States and Canada.

Terminal values are included in the valuation of hydroelectric assets in the United States and Canada.  For the hydroelectric assets in Brazil, cash flows have been included based on the duration of the authorization or useful life of a concession asset without consideration of potential renewal value. The weighted-average remaining duration at December 31, 2013, was 16 years (2012: 17 years). Consequently, there is no terminal value attributed to the hydroelectric assets in Brazil. If an additional 20 years of cash flows were included, the fair value of property, plant and equipment would increase by approximately $1 billion. See Note 11 - Property, plant and equipment, at fair value in our December 31, 2013 audited consolidated financial statements.

Brookfield Renewable Energy Partners L.P.                                      Q3 2014 Management’s Discussion and Analysis                                             September 30, 2014               

Page 17 


liquidity and capital Resources

A key element of our financing strategy is to raise the majority of our debt in the form of asset-specific, non-recourse borrowings at our subsidiaries on an investment grade basis. As at September 30, 2014, long-term indebtedness increased from December 31, 2013 as a result of the portfolio growth. The debt to capitalization ratio was unchanged from December 31, 2013 and was 41% as at September 30, 2014.

Capitalization

The following table summarizes the capitalization using book values:


Sep 30

Dec 31

(MILLIONS, EXCEPT AS NOTED)


2014


2013

Credit facilities(1)


$

512

$

311

Corporate borrowings(1)


1,334


1,406

Subsidiary borrowings(2)


5,476


4,906

Long-term indebtedness


7,322


6,623

Deferred income tax liabilities, net of deferred income tax assets


2,183


2,148

Equity


8,270


7,536

Total capitalization

$

17,775

$

16,307

Debt to total capitalization


41%


41%

(1)            Issued by a subsidiary of Brookfield Renewable and guaranteed by Brookfield Renewable. The amounts are unsecured.

(2)            Issued by subsidiaries of Brookfield Renewable and secured against their respective assets. The amounts are not guaranteed.

During the nine months ended September 30, 2014 we completed the following financings:

·          In January 2014, the $279 million bridge loan associated with a 360 MW hydroelectric portfolio located in New England was refinanced to 2017 at LIBOR plus 2.25%. 

·          In February 2014, as part of the acquisition of the 70 MW hydroelectric portfolio in New England, $140 million of financing was obtained through a bond issuance with a 5.5% interest rate maturing in 2024.

·         In March 2014, we up-financed indebtedness associated with a 349 MW Ontario hydroelectric portfolio through the issuance of C$90 million of senior and C$60 million of subordinate bonds with interest rates of  3.8% and 5.0%, respectively, maturing in June 2023.

·         In June 2014, we refinanced a $125 million debt facility associated with a 167 MW hydroelectric portfolio in New England through the issuance of 8-year notes maturing in January 2022 at a fixed rate of 4.59%.

·          On June 30, 2014, as part of the acquisition of the 326 MW Irish wind portfolio, we assumed a €169 million ($232 million) loan with a fixed interest rate of 4.6%, including the related interest rate swaps, maturing in December 2026.

·          The maturity of the $250 million facility associated with a hydroelectric portfolio in the southeastern United States was extended by six months to November 2014. We are in the process of extending this facility prior to its expiry.

·          In August 2014, we extended the maturity of our corporate credit facilities to June 2019 and reduced the applicable margin from 1.25% to 1.20%. The credit facilities now also provide us with an option to borrow in Euro (€) and British Pound Sterling (£).

Brookfield Renewable Energy Partners L.P.                                      Q3 2014 Management’s Discussion and Analysis                                             September 30, 2014               

Page 18 


·          In August 2014, as part of the acquisition of the remaining 67% economic and 50% voting interest in a 417 MW hydroelectric facility, we assumed a $65 million loan with an interest rate of 7.1% maturing in June 2018.

·          In August 2014, we secured a €160 million ($210 million) loan for 153 MW of our wind facilities in Ireland with an initial fixed rate of 2.9%, including the related interest rate swaps, maturing in December 2026.

On June 10, 2014, we completed a bought deal LP Unit offering of 10.25 million LP Units at a price of C$31.70 per LP Unit for gross proceeds of C$325 million ($297 million). The net proceeds were used to repay outstanding indebtedness and for general corporate purposes.

Available liquidity

We operate with substantial liquidity which enables us to fund growth initiatives, capital expenditures, distributions, withstand sudden adverse changes in economic circumstances or short-term fluctuations in generation, and to finance the business on an investment grade basis. Principal sources of liquidity are cash flows from operations and access to public and private capital markets.

The following table summarizes the available liquidity:  


As of the date

Sep 30

Dec 31

(MILLIONS)

of this report

2014

2013

Cash and cash equivalents

$

196

$

196

$

203

Credit facilities


Authorized credit facilities


1,480


1,480


1,480


Draws on credit facilities


(339)


(512)


(311)


Issued letters of credit


(230)


(226)


(212)

Available portion of credit facilities


911


742


957

Available liquidity

$

1,107

$

938

$

1,160

Long-term debt and credit facilities

The following table summarizes our principal repayment obligations and maturities as at September 30, 2014:

(MILLIONS)

Balance of 2014

2015

2016

2017

2018

Thereafter

Total

Principal repayments


Subsidiary borrowings(1)


United States

$

 274 

$

 147 

$

 97 

$

 785 

$

 283 

$

 1,412 

$

 2,998 


Canada


 15 


 54 


 140 


 52 


 55 


 1,565 


 1,881 


Brazil


 6 


 25 


 23 


 23 


 22 


 112 


 211 


Europe


 6 


 23 


 24 


 27 


 29 


 305 


 414 


 301 


 249 


 284 


 887 


 389 


 3,394 


 5,504 


Corporate borrowings and


credit facilities(1)


 - 


 - 


 268 


 - 


 179 


 1,405 


 1,852 


Equity-accounted investments

 - 


 31 


 - 


 125 


 - 


 - 


 156 


$

 301 

$

 280 

$

 552 

$

 1,012 

$

 568 

$

 4,799 

$

 7,512 

(1)            Subsidiary borrowings and corporate borrowings and credit facilities include $55 million and $21 million of unamortized deferred financing fees and premiums, respectively.

Brookfield Renewable Energy Partners L.P.                                      Q3 2014 Management’s Discussion and Analysis                                             September 30, 2014               

Page 19 


Subsidiary borrowings maturing in 2014 include $250 million on a hydroelectric portfolio in the southeastern United States. We are in the process of extending this facility prior to its expiry.

We remain focused on refinancing near term facilities at acceptable terms and maintaining a manageable maturity ladder and will do so opportunistically based on the prevailing interest rate environment.

The overall maturity profile and average interest rates associated with our borrowings and credit facilities are as follows:


 Average term (years)

Average interest rate (%)


Sep 30


Dec 31


Sep 30


Dec 31


2014


2013


2014


2013

Corporate borrowings


7.0


7.7

5.3


5.3

Subsidiary borrowings


11.2


11.8

5.7


6.0

Credit facilities


4.8


3.8

1.4


1.4

Brookfield Renewable Energy Partners L.P.                                      Q3 2014 Management’s Discussion and Analysis                                             September 30, 2014               

Page 20 


CONTRACT PROFILE

We have a predictable profile driven by both long-term power purchase agreements with a weighted-average remaining duration of 18 years combined with a well-diversified portfolio that reduces variability in our generation volumes. We operate the business on a largely contracted basis to ensure a high degree of predictability in funds from operations. We do however maintain a long-term view that electricity prices and the demand for electricity from renewable sources will rise due to a growing level of acceptance around climate change and the legislated requirements in some areas to diversify away from fossil fuel based generation.

The following table sets out contracts over the next five years for generation output assuming long-term average:

FOR THE YEAR ENDED DECEMBER 31

Balance of 2014


2015


2016


2017


2018


Generation (GWh)


Contracted(1)


Hydroelectric


United States


2,035


7,146


7,018


7,018


7,018


Canada


1,220


5,185


5,185


5,185


5,185


Brazil


962


2,891


2,674


1,936


1,704


4,217


15,222


14,877


14,139


13,907


Wind energy


United States


252


1,293


1,292


1,292


1,292


Canada


343


1,197


1,197


1,197


1,197


Europe


310


1,129


1,146


1,094


1,041


905


3,619


3,635


3,583


3,530


5,122


18,841


18,512


17,722


17,437


Uncontracted


938


5,252


5,580


6,360


6,645


Total long-term average


6,060


24,093


24,092


24,082


24,082


Long-term average on a proportionate basis(2)

4,725


18,660


18,650


18,640


18,640


Contracted generation - as at September 30, 2014

% of total generation

85

%

78

%

77

%

74

%

72

%

% of total generation on a proportionate basis(2)

92

%

87

%

86

%

82

%

81

%


Price per MWh

$

79

$

84

$

85

$

84

$

85


(1)            Assets under construction are included when long-term average and pricing details are available and the commercial operation date is established in a definitive construction contract.

(2)            Long-term average on a proportionate basis includes wholly-owned assets, and our share of partially-owned assets and equity-accounted investments.

The majority of the long-term power sales agreements are with investment-rated or creditworthy counterparties. At the beginning of 2014 the composition of our contracted generation for 2014 was comprised of: affiliates of Brookfield Asset Management (42%), public power authorities (22%), industrial users (30%) and distribution companies (6%).

Brookfield Renewable Energy Partners L.P.                                      Q3 2014 Management’s Discussion and Analysis                                             September 30, 2014               

Page 21 


SUMMARY CONSOLIDATED BALANCE SHEETS

The following table provides a summary of the key line items on the interim consolidated balance sheets:


Sep 30

Dec 31

(MILLIONS)


2014

2013

Property, plant and equipment, at fair value


$

17,364

$

15,741

Equity-accounted investments


232


290

Total assets


18,555


16,979

Long-term debt and credit facilities


7,322


6,623

Deferred income tax liabilities


2,332


2,265

Total liabilities


10,285


9,443

Preferred equity


756


796

Participating non-controlling interests - in operating subsidiaries


2,202


1,303

General partnership interest in a holding subsidiary held by Brookfield


51


54

Participating non-controlling interests - in a holding subsidiary -


Redeemable/Exchangeable units held by Brookfield


2,499


2,657

Limited partners' equity


2,762


2,726

Total liabilities and equity


18,555


16,979

Contractual obligations

Capital expenditures and development and construction

Brookfield Renewable categorizes its capital spending as either sustaining or development and construction expenditures. Sustaining capital expenditures relate to maintaining power generating assets, whereas development and construction expenditures include project costs for new facilities. Total sustaining capital expenditures for 2014 are expected to be approximately $96 million.

Guarantees

Brookfield Renewable, on behalf of its subsidiaries, and subsidiaries themselves have provided letters of credit, which include, but are not limited to, guarantees for debt service reserves, capital reserves, construction completion and performance. As at September 30, 2014 letters of credit issued by subsidiaries of Brookfield Renewable amounted to $119 million.

In the normal course of operations, we execute agreements that provide for indemnification and guarantees to third parties in transactions such as acquisitions, construction projects, capital projects, and purchases of assets. We have also agreed to indemnify our directors and certain of our officers and employees. The nature of the indemnifications prevents us from making a reasonable estimate of the maximum potential amount that could be required to pay third parties, as many of the agreements do not specify a maximum amount and the amounts are dependent upon the outcome of future contingent events, the nature and likelihood of which cannot be determined at this time. Historically, we have made no significant payments under indemnification agreements.

Off-Balance Sheet Arrangements

Brookfield Renewable has no off-balance sheet financing arrangements.

Brookfield Renewable Energy Partners L.P.                                      Q3 2014 Management’s Discussion and Analysis                                             September 30, 2014               

Page 22 


Related Party Transactions

Brookfield Renewable’s related party transactions are in the normal course of business, and are recorded at the exchange amount. Brookfield Renewable’s related party transactions are primarily with Brookfield Asset Management and its affiliates.

Brookfield Renewable sells electricity to subsidiaries of Brookfield Asset Management through long-term power purchase agreements to provide stable cash flow and reduce Brookfield Renewable’s exposure to electricity prices in deregulated power markets. Brookfield Renewable also benefits from a wind levelization agreement with a subsidiary of Brookfield Asset Management which reduces the exposure to the fluctuation of wind generation at certain facilities and thus improves the stability of its cash flow.

In addition to these agreements, Brookfield Renewable and Brookfield Asset Management have executed other agreements that are fully described in Note 9 - Related Party Transactions in our December 31, 2013 audited consolidated financial statements.

The following table reflects the related party agreements and transactions on the interim consolidated statements of (loss) income:


Three months ended Sep 30

Nine months ended Sep 30

(MILLIONS)


2014


2013


2014


2013

Revenues


Purchase and revenue support agreements

$

99

$

102

$

280

$

339


Wind levelization agreement


2


3


5


5


$

101

$

105

$

285

$

344

Direct operating costs


Energy purchases

$

(1)

$

(8)

$

(8)

$

(26)


Energy marketing fee


(6)


(5)


(16)


(15)


Insurance services


(7)


(6)


(21)


(19)


$

(14)

$

(19)

$

(45)

$

(60)

Management service costs

$

(14)

$

(9)

$

(38)

$

(32)

Revenues from long-term power purchase agreements and revenue agreements for the nine months ended September 30, 2014 were lower as compared to the prior year. This decrease is primarily due to the reduction in the level of price support and reflects the strong pricing environment which we benefited from in the first quarter of 2014.   

Brookfield Renewable Energy Partners L.P.                                      Q3 2014 Management’s Discussion and Analysis                                             September 30, 2014               

Page 23 


CONSOLIDATED STATEMENTS OF CASH FLOWS

The following table summarizes the key items on the consolidated statements of cash flows:


Three months ended Sep 30

Nine months ended Sep 30

(MILLIONS)


2014

2013

2014

2013

Cash flow provided by (used in):


Operating activities

$

188

$

249

$

640

$

669

Financing activities


510


(275)


1,323


(246)

Investing activities


(716)


(20)


(1,962)


(369)

Foreign exchange loss on cash


(11)


-


(8)


(6)

(Decrease) increase in cash and cash equivalents

$

(29)

$

(46)

$

(7)

$

48

Cash and cash equivalents as at September 30, 2014 totaled $196 million, representing a decrease of $7 million since December 31, 2013.

Operating Activities

Cash flows provided by operating activities totaling $188 million for the third quarter of 2014, represent a year-over-year decrease of $61 million primarily attributable to the decrease in funds generated from operations.

Cash flows provided by operating activities totaling $640 million for the nine months ended September 30, 2014 represent a year-over-year decrease of $29 million primarily attributable to net changes in working capital balances and funds generated from operations.

Financing Activities

Cash flows provided by financing activities totaled $510 million for the third quarter of 2014. Long-term debt – borrowings increased due to a €160 million ($210 million) financing related to our recently acquired wind portfolio in Ireland. The capital provided by participating non-controlling interests - in operating

Brookfield Renewable Energy Partners L.P.                                      Q3 2014 Management’s Discussion and Analysis                                             September 30, 2014               

Page 24 


subsidiaries relates to the acquisition of the remaining 67% economic and 50% voting interest in a 417 MW hydroelectric facility.

For the third quarter of 2014, distributions paid to unitholders were $107 million (2013: $95 million). The distributions paid to preferred shareholders and participating non-controlling interests - in operating subsidiaries were $54 million (2013: $44 million). See “Dividends and Distributions” for further details.

Cash flows provided by financing activities totaled $1,323 million for the nine months ended September 30, 2014. Long-term debt – borrowings increased due to the growth in our portfolio, up-financing indebtedness associated with a 349 MW Ontario hydroelectric portfolio and a €160 million ($210 million) financing at recently acquired wind portfolio in Ireland. Long-term debt – repayments related to subsidiary borrowings and credit facilities were $556 million. The issuance of 10,250,000 LP Units at a price of C$31.70 per LP Unit resulted in net proceeds of $285 million. The capital provided by participating non-controlling interests – in operating subsidiaries relates to the growth in our portfolio.

For the nine months ended September 30, 2014, distributions paid to unitholders were $374 million (2013: $282 million). With the change in timing of our quarterly distributions taking effect in the first quarter of 2014 resulting in a distribution on January 31, 2014 and on March 31, 2014, the amounts paid in the first quarter of 2014 included distributions declared in both the fourth quarter of 2013 and the first quarter of 2014. Distributions paid in the first quarter of 2013 included only those declared in the preceding quarter. The distributions paid to preferred shareholders and participating non-controlling interests - in operating subsidiaries were $125 million (2013: $138 million). See “Dividends and Distributions” for further details.

Investing Activities

Cash flows used in investing activities for the third quarter of 2014 totaled $716 million. In the third quarter of 2014, we acquired the remaining 67% economic and 50% voting interest in a 417 MW hydroelectric facility. In addition, our continued investment in the construction of renewable power generating assets was $36 million and sustainable capital expenditures totaled $42 million.

Cash flows used in investing activities for the nine months ended September 30, 2014 totaled $1,962 million. Our investments in the growth of our portfolio totaled $1,827 million. In addition, our continued investment in the construction of renewable power generating assets was $53 million and sustainable capital expenditures totaled $69 million.

NON-CONTROLLING INTERESTS

Preferred equity

As at September 30, 2014, no preference shares have been redeemed.

General partnership interest in a holding subsidiary held by Brookfield

Brookfield, as the owner of the 1% general partnership interest in BRELP, is entitled to regular distributions plus an incentive distribution based on the amount by which quarterly distributions exceed specified target levels. To the extent that distributions exceed $0.375 per unit per quarter, the incentive is 15% of distributions above this threshold. To the extent that quarterly distributions exceed $0.4225 per unit, the incentive distribution is equal to 25% of distributions above this threshold. Accordingly, incentive distributions of $2 million were made during the nine months ended September 30, 2014.

Brookfield Renewable Energy Partners L.P.                                      Q3 2014 Management’s Discussion and Analysis                                             September 30, 2014               

Page 25 


Participating non-controlling interests - in a holding subsidiary - Redeemable/Exchangeable units held by Brookfield

BRELP has issued Redeemable/Exchangeable partnership units to Brookfield Asset Management, which may at the request of the holder, require BRELP to redeem these units for cash consideration. The right is subject to Brookfield Renewable’s right of first refusal which entitles it, at its sole discretion, to elect to acquire all of the units presented to BRELP that are tendered for redemption in exchange for LP Units. If Brookfield Renewable elects not to exchange the Redeemable/Exchangeable partnership units for LP Units, the Redeemable/Exchangeable partnership units are required to be redeemed for cash. As Brookfield Renewable, at its sole discretion, has the right to settle the obligation with LP Units, the Redeemable/Exchangeable partnership units are classified as equity, and not as a liability.


LIMITED PARTNERS’ EQUITY

On June 10, 2014, Brookfield Renewable completed a bought deal LP Unit offering which included 10,250,000 LP Units at a price of C$31.70 per LP Unit for gross proceeds of C$325 million ($297 million). Brookfield Renewable incurred C$13 million ($12 million) in transaction costs associated with the offering. As a result, Brookfield Asset Management now owns, directly and indirectly, 169,685,609 LP Units and Redeemable/Exchangeable partnership units, representing approximately 62% of Brookfield Renewable on a fully-exchanged basis.

SHARES AND UNITS OUTSTANDING

The shares and units outstanding are presented in the following table:


Nine months ended

Year ended


Sep 30, 2014

Dec 31, 2013

Class A Preference Shares


Series 1

10,000,000

10,000,000


Series 3

10,000,000

10,000,000


Series 5

7,000,000

7,000,000


Series 6

7,000,000

7,000,000


34,000,000

34,000,000


General partnership units held by Brookfield

2,651,506

2,651,506


Redeemable/Exchangeable units held by Brookfield

129,658,623

129,658,623


LP Units


Balance, beginning of year

132,984,913

132,901,916


Issuance of LP Units

10,250,000

 - 


Distribution reinvestment plan

95,112

82,997

Balance, end of period/year

143,330,025

132,984,913


Total LP Units on a fully-exchanged basis

272,988,648

262,643,536


LP Units held by


Brookfield Asset Management

40,026,986

40,026,986

External LP Unitholders

103,303,039

92,957,927


143,330,025

132,984,913

Brookfield Renewable Energy Partners L.P.                                      Q3 2014 Management’s Discussion and Analysis                                             September 30, 2014               

Page 26 


DIVIDENDS AND DISTRIBUTIONS

The composition of the dividends and distributions are presented in the following table:


Three months ended Sep 30

Nine months ended Sep 30


Declared


Paid


Declared


Paid

(MILLIONS, EXCEPT AS NOTED)


2014


2013


2014


2013


2014


2013


2014


2013

Class A Preference Shares


Series 1

$

3

$

3

$

3

$

3

$

9

$

10

$

9

$

10


Series 3


3


3


3


3


8


8


8


8


Series 5


2


2


2


2


6


6


6


5


Series 6


2


2


2


2


6


3


6


2


$

10

$

10

$

10

$

10

$

29

$

27

$

29

$

25


Participating non-controlling


interests - in operating


subsidiaries

$

44

$

33

$

44

$

34

$

96

$

113

$

96

$

113


General partnership interest in a


holding subsidiary


 held by Brookfield

$

1

$

1

$

1

$

1

$

3

$

3

$

3

$

3


Incentive distribution


1


  -


1


  -


2


  -


2


  -


$

2

$

1

$

2

$

1

$

5

$

3

$

5

$

3


Participating non-controlling


interests - in a holding subsidiary


 - Redeemable/Exchangeable


units held by Brookfield

$

50

$

47

$

50

$

46

$

151

$

141

$

181

$

138


Limited partners' equity


Brookfield Asset Management


16


15


16


14


47


44


56


42


External LP Unitholders


40


34


39


34


113


101


132


99


$

56

$

49

$

55

$

48

$

160

$

145

$

188

$

141


$

162

$

140

$

161

$

139

$

441

$

429

$

499

$

420

In February 2014, unitholder distributions were increased to $1.55 per unit on an annualized basis, an increase of ten cents per unit, which took effect with the distribution payable in March 2014.

Brookfield Renewable Energy Partners L.P.                                      Q3 2014 Management’s Discussion and Analysis                                             September 30, 2014               

Page 27 


Critical ESTIMATES AND CRITICAL JUDGMENTS in applying accounting policies

The consolidated financial statements are prepared in accordance with IFRS, which require the use of estimates and judgments in reporting assets, liabilities, revenues, expenses and contingencies. In the judgment of management, none of the estimates outlined in Note 2 –  Significant accounting policies in our December 31, 2013 audited consolidated financial statements are considered critical accounting estimates as defined in NI 51-102 with the exception of the estimates related to the valuation of property, plant and equipment and the related deferred income tax liabilities. These assumptions include estimates of future electricity prices, discount rates, expected long-term average generation, inflation rates, terminal year and operating and capital costs, the amount, the timing and the income tax rates of future income tax provisions. Estimates also include determination of accruals, purchase price allocations, useful lives, asset valuations, asset impairment testing, deferred tax liabilities, decommissioning retirement obligations and those relevant to the defined benefit pension and non-pension benefit plans. Estimates are based on historical experience, current trends and various other assumptions that are believed to be reasonable under the circumstances.

In making estimates, management relies on external information and observable conditions where possible, supplemented by internal analysis, as required. These estimates have been applied in a manner consistent with that in the prior year and there are no known trends, commitments, events or uncertainties that we believe will materially affect the methodology or assumptions utilized in this report. These estimates are impacted by, among other things, future power prices, movements in interest rates, foreign exchange and other factors, some of which are highly uncertain, as described in the “Risk Factors” section of our 2013 Annual Report. The interrelated nature of these factors prevents us from quantifying the overall impact of these movements on Brookfield Renewable’s financial statements in a meaningful way. These sources of estimation uncertainty relate in varying degrees to virtually all asset and liability account balances. Actual results could differ from those estimates.

Future changes in accounting policies

(i)         Financial Instruments

IFRS 9, Financial Instruments (“IFRS 9”) was issued by the IASB on October 28, 2010, and will replace IAS 39. IFRS 9 uses a single approach to determine whether a financial asset is measured at amortized cost or fair value, replacing the multiple rules in IAS 39. The approach in IFRS 9 is based on how an entity manages its financial instruments in the context of its business model and the contractual cash flow characteristics of the financial assets. Two measurement categories continue to exist to account for financial liabilities in IFRS 9, fair value through profit or loss (“FVTPL”) and amortized cost. Financial liabilities held for trading are measured at FVTPL, and all other financial liabilities are measured at amortized cost unless the fair value option is applied. The treatment of embedded derivatives under the new standard is consistent with IAS 39 and is applied to financial liabilities and non-derivative hosts not within the scope of the standard. IFRS 9 is effective for annual periods beginning on or after January 1, 2018. Management is currently evaluating the impact of IFRS 9 on the consolidated financial statements.

(ii)      Revenue recognition

IFRS 15, Revenue from Contracts with Customers (“IFRS 15”) was issued by IASB on May 28, 2014.  IFRS 15 outlines a single comprehensive model to account for revenue arising from contracts with customers and will replace the majority of existing IFRS requirements on revenue recognition including IAS 18, Revenue,  IAS 11, Construction Contracts and related interpretations. The core principle of the standard is to recognize revenue to depict the transfer of goods and services to customers in an amount that reflects the consideration to which the entity expects to be entitled in exchange for those goods and

Brookfield Renewable Energy Partners L.P.                                      Q3 2014 Management’s Discussion and Analysis                                             September 30, 2014               

Page 28 


services. The standard has prescribed a five-step model to apply the principles. The standard also specifies how to account for the incremental costs of obtaining a contract and the costs directly related to fulfilling a contract. IFRS 15 is effective for annual periods beginning on or after January 1, 2017. Management is currently evaluating the impact of IFRS 15 on the consolidated financial statements.

ADOPTION OF ACCOUNTING STANDARDS

IFRIC 21, Levies  was adopted and applied by Brookfield Renewable on  January 1, 2014 and had no material impact on the interim consolidated financial statements. See Note 2 (c) - Significant accounting policies in our interim consolidated financial statements and Note 2 (q) - Future changes in accounting policies in our December 31, 2013 audited consolidated financial statements.  

Brookfield Renewable Energy Partners L.P.                                      Q3 2014 Management’s Discussion and Analysis                                             September 30, 2014               

Page 29 


SUMMARY OF HISTORICAL QUARTERLY RESULTS ON A CONSOLIDATED BASIS

The following is a summary of unaudited quarterly financial information for the last eight consecutive quarters:


2014

2013

2012

(MILLIONS, EXCEPT AS NOTED)


Q3


Q2


Q1


Q4


Q3


Q2


Q1


Q4

Generation (GWh) - LTA(1)(2)


5,065

6,691

5,770

5,380

4,960

6,171

5,325

4,606

Generation (GWh) - actual(1)(2)

4,383

6,615

5,711

5,268

5,154

6,265

5,535

4,053

Revenues

$

342

$

474

$

480

$

393

$

392

$

484

$

437

$

317

Adjusted EBITDA(3)


223


360


360


272


260


357


319


195

Funds from operations(3)


61


198


185


137


108


187


162


74

Net (loss) income


Non-controlling interests


Preferred equity


10


10


9


10


10


10


7


6


Participating non-controlling


interests - in operating subsidiaries


(2)


21


40


(7)


8


24


16


(14)


General partnership interest in a


holding subsidiary held by Brookfield


-


-


1


-


-


-


1


(1)


Participating non-controlling


interests - in a holding subsidiary


Redeemable/Exchangeable units


held by Brookfield


(16)


20


37


10


5


22


30


(27)


Limited partners' equity


(17)


21


38


11


5


22


31


(28)


(25)


72


125


24


28


78


85


(64)

Basic and diluted (loss) earnings


per LP Unit(4)


(0.13)


0.15


0.29


0.08


0.04


0.17


0.23


(0.20)

Distributions:


Preferred equity


10


10


9


10


10


10


7


6


General partnership interest in a


holding subsidiary held by Brookfield


2


1


2


1


1


1


1


1


Participating non-controlling


interests - in a holding subsidiary -


Redeemable/Exchangeable units


 held by Brookfield


50


51


50


47


47


47


47


45


Limited partners' equity


56


53


51


48


49


48


48


45

(1)            Includes 100% of generation from equity-accounted investments.

(2)            For assets acquired or reaching commercial operation during the year, this figure is calculated from the acquisition or commercial operation date.

(3)            Non-IFRS measures. See "Cautionary Statement Regarding Use of Non-IFRS Measures".

(4)            Average LP Units outstanding totaled 143.3 million during the quarter, 135.3 million in the second quarter and 133.0 million in the first quarter (2013 and 2012: 132.9 million).

Brookfield Renewable Energy Partners L.P.                                      Q3 2014 Management’s Discussion and Analysis                                             September 30, 2014               

Page 30 


ADDITIONAL INFORMATION

Risk factors about our business and additional information, including our Form 20-F filed with the SEC and securities regulators in Canada are available on our website at www.brookfieldrenewable.com, on SEC’s website at www.sec.gov and on SEDAR’s website at www.sedar.com

Subsequent event

On October 1, 2014 we secured financing in the amount of $480 million related to the acquisition of a 417 MW hydroelectric facility in Pennsylvania. The debt bears interest at LIBOR plus 1.75%, and matures in June 2018.

Brookfield Renewable Energy Partners L.P.                                      Q3 2014 Management’s Discussion and Analysis                                             September 30, 2014               

Page 31 


FINANCIAL REVIEW BY SEGMENTS FOR THE THREE MONTHS ENDED SEPTEMBER 30, 2014

The following table reflects adjusted EBITDA, funds from operations, adjusted funds from operations, and provides a reconciliation to net (loss) income and cash flows from operating activities for the three months ended September 30:


Co-generation


(MILLIONS)

Hydroelectric

Wind

 and Other

2014

2013

Revenues

$

275

$

65

$

2

$

342

$

392

Other income


3


  -


  -


3


1

Share of cash earnings from equity-accounted


 investments 


10


  -


  -


10


7

Direct operating costs


(90)


(22)


(20)


(132)


(140)

Adjusted EBITDA(1)


198


43


(18)


223


260

Interest expense - borrowings


(61)


(23)


(22)


(106)


(105)

Management service costs


  -


  -


(14)


(14)


(9)

Current income taxes


(5)


  -


  -


(5)


(4)

Less: cash portion of non-controlling interests


Preferred equity


  -


  -


(10)


(10)


(10)


Participating non-controlling interests - in


operating subsidiaries


(18)


(9)


  -


(27)


(24)

Funds from operations(1)

$

114

$

11

$

(64)

$

61

$

108

Less: sustaining capital expenditures(2)


(15)


(14)

Adjusted funds from operations(1)


46


94

Add: sustaining capital expenditures  


15


14

Add: cash portion of non-controlling interests


37


34

Other items:


Depreciation and amortization


(145)


(133)


Unrealized financial instruments gain


9


11


Share of non-cash loss from equity-


accounted investments


(3)


(4)

Deferred income tax recovery


27


10

Other


(11)


2

Net (loss) income


$

(25)

$

28

Adjustments for non-cash items


107


110

Dividends received from equity accounted


investments


10


8

Changes in due to or from related parties


8


24

Net change in working capital balances


88


79

Cash flows from operating activities


$

188

$

249

(1)       Non-IFRS measures.  See “Cautionary Statement Regarding Use of Non-IFRS Measures”.

(2)       Based on long-term capital expenditure plans.

Brookfield Renewable Energy Partners L.P.                                      Q3 2014 Management’s Discussion and Analysis                                             September 30, 2014               

Page 32 


FINANCIAL REVIEW BY SEGMENTS FOR THE NINE MONTHS ENDED SEPTEMBER 30, 2014

The following table reflects adjusted EBITDA, funds from operations, adjusted funds from operations, and provides a reconciliation to net income and cash flows from operating activities for the nine months ended September 30:


Co-generation


(MILLIONS)

Hydroelectric

Wind

 and Other

2014

2013

Revenues

$

1,060

$

211

$

25

$

1,296

$

1,313

Other income


8


  -


  -


8


5

Share of cash earnings from equity-accounted


 investments 


25


  -


  -


25


19

Direct operating costs


(270)


(51)


(65)


(386)


(401)

Adjusted EBITDA(1)


823


160


(40)


943


936

Fixed earnings adjustment(2)


  -


11


  -


11


  -

Interest expense - borrowings


(181)


(63)


(65)


(309)


(313)

Management service costs


  -


  -


(38)


(38)


(32)

Current income taxes


(19)


  -


  -


(19)


(15)

Less: cash portion of non-controlling interests


Preferred equity


  -


  -


(29)


(29)


(27)


Participating non-controlling interests - in


operating subsidiaries


(82)


(33)


  -


(115)


(92)

Funds from operations(1)

$

541

$

75

$

(172)

$

444

$

457

Less: sustaining capital expenditures(3)


(43)


(42)

Adjusted funds from operations(1)


401


415

Add: sustaining capital expenditures  


43


42

Add: cash portion of non-controlling interests


144


119

Less: fixed earnings adjustment


(11)


  -

Other items:


Depreciation and amortization


(400)


(398)


Unrealized financial instruments gain


5


30


Share of non-cash loss from equity-


accounted investments


(15)


(10)

Deferred income tax recovery (expense)


8


(1)

Other


(3)


(6)

Net income


$

172

$

191

Adjustments for non-cash items


379


363

Dividends received from equity accounted


investments


28


14

Changes in due to or from related parties


14


14

Net change in working capital balances


47


87

Cash flows from operating activities


$

640

$

669

(1)       Non-IFRS measures.  See “Cautionary Statement Regarding Use of Non-IFRS Measures”.

(2)       The fixed earnings adjustment relates to Brookfield Renewable’s investment in the acquisition of the wind portfolio in Ireland. Pursuant to the terms of the purchase and sale agreement, Brookfield Renewable acquired an economic interest in the wind portfolio from January 1, 2014. The transaction closed on June 30, 2014, and accordingly under IFRS, the $11 million net funds from operations contribution was recorded as part of the purchase price.

(3)       Based on long-term capital expenditure plans.

Brookfield Renewable Energy Partners L.P.                                      Q3 2014 Management’s Discussion and Analysis                                             September 30, 2014               

Page 33 


cautionary statement regarding forward-looking statements

This Management's Discussion and Analysis contains forward-looking statements and information, within the meaning of Canadian securities laws and “forward-looking statements” within the meaning of Section 27A of the U.S. Securities Act of 1933, as amended, Section 21E of the U.S. Securities Exchange Act of 1934, as amended, “safe harbor” of the United States Private Securities Litigation Reform Act of 1995 and in any applicable Canadian securities regulations, concerning the business and operations of Brookfield Renewable. Forward-looking statements may include estimates, plans, expectations, opinions, forecasts, projections, guidance or other statements that are not statements of fact. Forward-looking statements in this Management's Discussion and Analysis include statements regarding the quality of Brookfield Renewable’s assets and the resiliency of the cash flow they will generate, Brookfield Renewable’s anticipated financial performance, future commissioning of assets, contracted portfolio, technology diversification, acquisition opportunities, expected completion of acquisitions, future energy prices and demand for electricity, economic recovery, achievement of long term average generation, project development and capital expenditure costs, diversification of shareholder base,  energy policies, economic growth, growth potential of the renewable asset class, the future growth prospects and distribution profile of Brookfield Renewable and Brookfield Renewable’s access to capital. Forward-looking statements can be identified by the use of words such as “plans”, “expects”, “scheduled”, “estimates”, “intends”, “anticipates”, “believes”, “potentially”, “tends”, “continue”, “attempts”, “likely”, “primarily”, “approximately”, “endeavours”, “pursues”, “strives”, “seeks”, or variations of such words and phrases, or statements that certain actions, events or results “may”, “could”, “would”, “might” or “will” be taken, occur or be achieved. Although we believe that our anticipated future results, performance or achievements expressed or implied by the forward-looking statements and information in this Management's Discussion and Analysis are based upon reasonable assumptions and expectations, we cannot assure you that such expectations will prove to have been correct. You should not place undue reliance on forward-looking statements and information as such statements and information involve known and unknown risks, uncertainties and other factors which may cause our actual results, performance or achievements to differ materially from anticipated future results, performance or achievement expressed or implied by such forward-looking statements and information.

Factors that could cause actual results to differ materially from those contemplated or implied by forward-looking statements include, but are not limited to: our limited operating history; the risk that we may be deemed an “investment company” under the Investment Company Act; the fact that we are not subject to the same disclosure requirements as a U.S. domestic issuer; the risk that the effectiveness of our internal controls over financial reporting could have a material effect on our business; changes to hydrology at our hydroelectric stations or in wind conditions at our wind energy facilities; the risk that counterparties to our contracts do not fulfill their obligations, and as our contracts expire, we may not be able to replace them with agreements on similar terms; increases in water rental costs (or similar fees) or changes to the regulation of water supply; volatility in supply and demand in the energy market; exposure to additional costs as a result of our operations being highly regulated and exposed to increased regulation; the risk that our concessions and licenses will not be renewed; increases in the cost of operating our plants; our failure to comply with conditions in, or our inability to maintain, governmental permits; equipment failure; dam failures and the costs of repairing such failures; exposure to force majeure events; exposure to uninsurable losses; adverse changes in currency exchange rates; availability and access to interconnection facilities and transmission systems; health, safety, security and environmental risks; disputes, governmental and regulatory investigations and litigation; local communities affecting our operations; losses resulting from fraud, bribery, corruption, other illegal acts, inadequate or failed internal processes or systems, or from external events; risks relating to our reliance on computerized business systems; general industry risks relating to operating in the North American, Brazilian and European power market sectors; advances in technology that impair or eliminate the competitive advantage of our projects; newly developed technologies in which we invest not performing as anticipated; labour disruptions and economically unfavourable collective bargaining agreements; our inability to finance our operations due to the status of the capital markets; the operating and financial restrictions imposed on us by our loan, debt and security agreements; changes in our credit ratings; changes to government regulations that provide incentives for renewable energy; our inability to identify sufficient investment opportunities and complete transactions; risks related to the growth of our portfolio and our inability to

Brookfield Renewable Energy Partners L.P.                                      Q3 2014 Management’s Discussion and Analysis                                             September 30, 2014               

Page 34 


realize the expected benefits of our transactions; our inability to develop existing sites or find new sites suitable for the development of greenfield projects; risks associated with the development of our generating facilities and the various types of arrangements we enter into with communities and joint venture partners; Brookfield Asset Management’s election not to source acquisition opportunities for us and our lack of access to all renewable power acquisitions that Brookfield Asset Management identifies; our lack of control over our operations conducted through joint ventures, partnerships and consortium arrangements; our ability to issue equity or debt for future acquisitions and developments will be dependent on capital markets; foreign laws or regulation to which we become subject as a result of future acquisitions in new markets; and the departure of some or all of Brookfield’s key professionals.

We caution that the foregoing list of important factors that may affect future results is not exhaustive. The forward-looking statements represent our views as of the date of this Management's Discussion and Analysis and should not be relied upon as representing our views as of any date subsequent to November 4, 2014, the date of this Management's Discussion and Analysis. While we anticipate that subsequent events and developments may cause our views to change, we disclaim any obligation to update the forward-looking statements, other than as required by applicable law. For further information on these known and unknown risks, please see “Risk Factors” included in our Form 20-F.

cautionary statement regarding use of non-ifrs measures

This Management's Discussion and Analysis contains references to adjusted EBITDA, funds from operations and adjusted funds from operations which are not generally accepted accounting measures under IFRS and therefore may differ from definitions of adjusted EBITDA, funds from operations and adjusted funds from operations used by other entities. We believe that adjusted EBITDA, funds from operations and adjusted funds from operations are useful supplemental measures that may assist investors in assessing the financial performance and the cash anticipated to be generated by our operating portfolio. Neither adjusted EBITDA, funds from operations nor adjusted funds from operations should be considered as the sole measure of our performance and should not be considered in isolation from, or as a substitute for, analysis of our financial statements prepared in accordance with IFRS.

A reconciliation of adjusted EBITDA, funds from operations and adjusted funds from operations to net (loss) income and cash flows from operating activities is presented in our Management’s Discussion and Analysis. We have also provided a reconciliation of adjusted EBITDA and funds from operations to net (loss) income in Note 14 - Segmented information in our interim consolidated financial statements.    


Brookfield Renewable Energy Partners L.P.                                      Q3 2014 Management’s Discussion and Analysis                                             September 30, 2014               

Page 35 


GENERAL INFORMATION 


Corporate Office


73 Front Street

Fifth Floor

Hamilton, HM12

Bermuda

Tel:  (441) 294-3304

Fax: (441) 516-1988

www.brookfieldrenewable.com


Officers of Brookfield Renewable Energy Partners L.P.’s Service Provider, BRP Energy Group L.P.


Harry Goldgut

Chairman of BRE Group


Richard Legault

President and Chief Executive Officer


Sachin Shah

Chief Financial Officer


Transfer Agent & Registrar

Computershare Trust Company of Canada

100 University Avenue

9th floor

Toronto, Ontario, M5J 2Y1

Tel  Toll Free: (800) 564-6253

Fax Toll Free: (888) 453-0330

www.computershare.com


Directors of the General Partner of

Brookfield Renewable Energy Partners L.P.

Jeffrey Blidner

Eleazar de Carvalho Filho

John Van Egmond

David Mann

Lou Maroun

Patricia Zuccotti

Lars Josefsson


Exchange Listing

TSX:    BEP.UN (LP Units)

NYSE: BEP (LP Units)

TSX:    BRF.PR.A (Preferred shares – Series 1)

TSX:    BRF.PR.C (Preferred shares – Series 3)

TSX:    BRF.PR.E (Preferred shares – Series 5)

TSX:    BRF.PR.F (Preferred shares – Series 6)


Investor Information


Visit Brookfield Renewable online at
www.brookfieldrenewable.com  for more information. The 2013 Annual Report and Form 20-F is also available online. For detailed and up-to-date news and information, please visit the News Release section.


Additional financial information is filed electronically with various securities regulators in United States and Canada through EDGAR at www.sec.gov  and  through SEDAR at www.sedar.com


Shareholder enquiries should be directed to the Investor Relations Department at (416) 359-1955 or
unitholderenquiries@brookfieldrenewable.com 


TSX:


BEP.UN


NYSE:


BEP


www.brookfieldrenewable.com


EX-99.4 5 exh99_4.htm EXHIBIT 99.4 exh99_4.htm


Exhibit 99.4
 
FORM 52-109F2
 
CERTIFICATION OF INTERIM FILINGS
 
I, Richard Legault, President and Chief Executive Officer of the service provider of Brookfield Renewable Energy Partners L.P., BRP Energy Group L.P., certify the following:
 
 
1 Review: I have reviewed the interim financial report and interim MD&A (together, the “interim filings”) of Brookfield Renewable Energy Partners L.P., (the “issuer”) for the interim period ended September 30, 2014.
   
2 No misrepresentations: Based on my knowledge, having exercised reasonable diligence, the interim filings do not contain any untrue statement of a material fact or omit to state a material fact required to be stated or that is necessary to make a statement not misleading in light of the circumstances under which it was made, with respect to the period covered by the interim filings.
   
3 Fair presentation: Based on my knowledge, having exercised reasonable diligence, the interim financial report together with the other financial information included in the interim filings fairly present in all material respects the financial condition, financial performance and cash flows of the issuer, as of the date of and for the periods presented in the interim filings.
   
4 Responsibility: The issuer's other certifying officer and I are responsible for establishing and maintaining disclosure controls and procedures (DC&P) and internal control over financial reporting (ICFR), as those terms are defined in National Instrument 52-109 Certification of Disclosure in Issuers’ Annual and Interim Filings, for the issuer.
   
5 Design: Subject to the limitations, if any, described in paragraphs 5.2 and 5.3, the issuer’s other certifying officer and I have, as at the end of the period covered by the interim filings
 
  (a) designed DC&P, or caused it to be designed under our supervision, to provide reasonable assurance that
     
    i. material information relating to the issuer is made known to us by others, particularly during the period in which the interim filings are being prepared; and
       
    ii. information required to be disclosed by the issuer in its annual filings, interim filings or other reports filed or submitted by it under securities legislation is recorded, processed, summarized and reported within the time periods specified in securities legislation; and
       
  (b) designed ICFR, or caused it to be designed under our supervision, to provide reasonable assurance regarding the reliability of financial reporting and the preparation of financial statements for external purposes in accordance with the issuer’s GAAP.
 
5.1 Control framework: The control framework the issuer’s other certifying officer and I used to design the issuer’s ICFR is the Internal Control – Integrated Framework published by The Committee of Sponsoring Organizations of the Treadway Commission.


5.2 N/A
   
5.3 N/A
   
6 Reporting changes in ICFR: The issuer has disclosed in its interim MD&A any change in the issuer’s ICFR that occurred during the period beginning on July 1, 2014 and ended on September 30, 2014 that has materially affected, or is reasonably likely to materially affect, the issuer’s ICFR.
 
 
Date: November 4, 2014
 
/s/ Richard Legault                                                                                             
Richard Legault
President and Chief Executive Officer
Brookfield Renewable Energy Partners L.P.’s service provider,
BRP Energy Group L.P.


EX-99.5 6 exh99_5.htm EXHIBIT 99.5 exh99_5.htm


Exhibit 99.5
 
FORM 52-109F2
 
CERTIFICATION OF INTERIM FILINGS
 
I, Sachin Shah, Chief Financial Officer of the service provider of Brookfield Renewable Energy Partners L.P., BRP Energy Group L.P., certify the following:
 
 
1 Review: I have reviewed the interim financial report and interim MD&A (together, the “interim filings”) of Brookfield Renewable Energy Partners L.P., (the “issuer”) for the interim period ended September 30, 2014.
   
2 No misrepresentations: Based on my knowledge, having exercised reasonable diligence, the interim filings do not contain any untrue statement of a material fact or omit to state a material fact required to be stated or that is necessary to make a statement not misleading in light of the circumstances under which it was made, with respect to the period covered by the interim filings.
   
3 Fair presentation: Based on my knowledge, having exercised reasonable diligence, the interim financial report together with the other financial information included in the interim filings fairly present in all material respects the financial condition, financial performance and cash flows of the issuer, as of the date of and for the periods presented in the interim filings.
   
4 Responsibility: The issuer's other certifying officer and I are responsible for establishing and maintaining disclosure controls and procedures (DC&P) and internal control over financial
reporting (ICFR), as those terms are defined in National Instrument 52-109 Certification of Disclosure in Issuers’ Annual and Interim Filings, for the issuer.
   
5 Design: Subject to the limitations, if any, described in paragraphs 5.2 and 5.3, the issuer’s other certifying officer and I have, as at the end of the period covered by the interim filings
   
  (a) designed DC&P, or caused it to be designed under our supervision, to provide reasonable assurance that
     
    i. material information relating to the issuer is made known to us by others, particularly during the period in which the interim filings are being prepared; and
       
    ii. information required to be disclosed by the issuer in its annual filings, interim filings or other reports filed or submitted by it under securities legislation is recorded, processed, summarized and reported within the time periods specified in securities legislation; and
       
  (b) designed ICFR, or caused it to be designed under our supervision, to provide reasonable assurance regarding the reliability of financial reporting and the preparation of financial statements for external purposes in accordance with the issuer’s GAAP.
     
5.1 Control framework: The control framework the issuer’s other certifying officer and I used to design the issuer’s ICFR is the Internal Control – Integrated Framework published by The Committee of Sponsoring Organizations of the Treadway Commission.


5.2 N/A
   
5.3 N/A
   
6 Reporting changes in ICFR: The issuer has disclosed in its interim MD&A any change in the issuer’s ICFR that occurred during the period beginning on July 1, 2014 and ended on September 30, 2014 that has materially affected, or is reasonably likely to materially affect, the issuer’s ICFR.
 
Date: November 4, 2014
 
 
/s/ Sachin Shah                                                                                           
Sachin Shah
Chief Financial Officer
Brookfield Renewable Energy Partners L.P.’s service provider,
BRP Energy Group L.P.


GRAPHIC 7 maindocument001x3x0.jpg IMAGE begin 644 maindocument001x3x0.jpg M_]C_X``02D9)1@`!`0$`8`!@``#_VP!#``H'!PD'!@H)"`D+"PH,#QD0#PX. M#QX6%Q(9)"`F)2,@(R(H+3DP*"HV*R(C,D0R-CL]0$!`)C!&2T4^2CD_0#W_ MVP!#`0L+"P\-#QT0$!T]*2,I/3T]/3T]/3T]/3T]/3T]/3T]/3T]/3T]/3T] M/3T]/3T]/3T]/3T]/3T]/3T]/3T]/3W_P``1"``R`*T#`2(``A$!`Q$!_\0` M'P```04!`0$!`0$```````````$"`P0%!@<("0H+_\0`M1```@$#`P($`P4% M!`0```%]`0(#``01!1(A,4$&$U%A!R)Q%#*!D:$((T*QP152T?`D,V)R@@D* M%A<8&1HE)B7J#A(6&AXB)BI*3E)66EYB9FJ*CI*6FIZBIJK*SM+6VM[BYNL+#Q,7& MQ\C)RM+3U-76U]C9VN'BX^3EYN?HZ>KQ\O/T]?;W^/GZ_\0`'P$``P$!`0$! M`0$!`0````````$"`P0%!@<("0H+_\0`M1$``@$"!`0#!`<%!`0``0)W``$" M`Q$$!2$Q!A)!40=A<1,B,H$(%$*1H;'!"2,S4O`58G+1"A8D-.$E\1<8&1HF M)R@I*C4V-S@Y.D-$149'2$E*4U155E=865IC9&5F9VAI:G-T=79W>'EZ@H.$ MA8:'B(F*DI.4E9:7F)F:HJ.DI::GJ*FJLK.TM;:WN+FZPL/$Q<;'R,G*TM/4 MU=;7V-G:XN/DY>;GZ.GJ\O/T]?;W^/GZ_]H`#`,!``(1`Q$`/P#L?$GQ1TGP MQKR31JK%HE4J0PR.K"LP?'#0">;+4@/7RT_\`BJX+XM8_X61=9Z>7 M#GZ;179:A?\`PJ.GSA8K!VV'"P0.)"<<;3C@T`=KX9\9Z/XMCD.ESL98N9(9 M5V.H/?'<>XS6]7@WP9TR^F\8"_CBD6S@@=992"%8MC"Y[G//X5TWBWXJ:EX: M\:7&F):6DMC`T98D-YC*5#-@YQGDXXH`]3HKSWP?\29];M]9U'6+6*QTZPC6 M1&0,20=V?F/#'@=!WKFG^*GBSQ#?RQ^&-)7RH^=HA,SA>Q8Y`'T_G0![/17E M7A7XLWDFN)H_BJS2VF>01"95,91ST#J>F?7_`/773^/?'L'@RTB1(1)_\+'\?+9?VLVEQ_V;C=YALV\O;Z[MV<>]>@^`_'5O MXSL9)*1I?A#3;:[B8[4E MG#?/CJ_!&U/KS^>*`/0?$&OV/AG2)=1U)V6!"%`099V/10/6N:\*_%'3_%>N M#3+>QNH)&1I%>0J00/H:Y3XNZIK;6,>F7VG)]A1XI#?QA@CR[3E0"3QR?RJ7 MX0W-\IM8%\/1"R82DZML^=CD_+N^OR_A0!UOASXEZ7XFU]M)M+:[CG578M*% M"_*<'HQ-=C7DOP^\7MK'CB2Q.BZ-:`),?.M;;9(<$?Q9[]ZU?'?Q.ET+5AHN MA6J7>H_*)&<%E1FZ*%'+-R/S%`'HM9'B;Q%;>%M%?4KR*:6%'5"L0!;+'`ZD M5YI)\1_&GAFY@?Q/H\?V68\#R_+8^H5@2,^QK>^)NIVVL_"K^T+)]]O<20NA MZ'!<<'W'2@#J?"GBBU\7:2VH64,T42RM$5F`#9`![$\*-?UAX?"^E1O"F66(Q&1RGJQR`O^>30!V^K? M$C3-(\5KH$]K>/MV4]0PD(_+-`& M3\.O$VI:1XTM=(BO9+K39IVM_++$ICG#J/X>@/':E\<1I-\9_+E4.CW5JK*P MR""$R#7H7@GX76GA2]&H75T;V^52L;;-B19X)`R23CC)JEKWPSO]7\?C7XK^ MVC@$\,OE,C%L(%R,].=M`&A\74D'P[NA`,(LL6\+T";Q^F<5G?`][8^%;Q(R MOVD79,P_BP57;GVX/ZUZ#?V-OJ=A/9WD0EMYT,1XI`OH64$-^E`&-\9F@?QT@M,&X%K&)=O7?N;;^.-OZ5'\7!,OC:V- M]N*?8H<^XRV['XYKL/"7PB;3M835?$-ZE[/&_F)$F2I?LS,W+$'G&.M=/XW\ M#6?C.RC$DAM[R#/DW"KG`/56'<&@#_X5'XM^S?V>=B>"?!%GX, MT^2.*0W%W.09[AEQNQT`'91D_G0!X-)IE[K/C2^T_349[FXNYD"AL#;O;.3_ M`'<=:Z;X9:T?"/C2XTG58EB%T_V:1V`S%*I^7G^ZG&:=X^^%[>*]6BU'3KJ&TG9-EQYBDB3'W6&.^./P'I M0`?&W_D2K?\`Z_H__07J]\(O^2>67_767_T8:3Q'X-U?Q+X'L=(N]0MC?V\J MO)<%6VR!0P!QUR01GWS6QX)\/3>%O#$&EW,T,$`[F)[_6@#R/X3_\ ME-E_ZY7'_H0K,D@U&[^*UW#:7B66HR:C,L4\O1&RV.QZC@<=Q7H_@SX9WWAG MQ8^K7%_;31,DB^7&K!OF(/>G^._A8/$FHG5=)NDM+]\>:L@.R0CHV1RK<#GG MI0!SWB?P;XMDT=F\2^+-/-A&ZL3.6"AN@/">_P"M2Z]HT^@_!!K*>\MKP"[1 MXY;9RR%6D!&#]2:1/A5XJUJ6&/Q'X@WVD1X`F>9A_NA@`#[FNS\0^!8KWP(O MAO1FBM(HV0HT@)'#9)..23Z^]`'!^'/,/P%U_P`K.[SI,X]/W>?TS6C\"##] MCUD#'G^;'GUV;3C\,[JZ[P1X.?PWX6N-'U*6&[6>61GV*0I5E`(.?H:XN7X0 MZ[I&K23^%]<6WA?*AGD>.15/\)*@[A^5`&'XQ:%OC9&8"I`O+4/M_O\`R9_' MI7O=>1VOP9U"TURQOAK$,PAFCGF,B-N=PP9L'_&O7*`.?F\17QU:^LM/T62\ M%DR+)(+E(\ED#X`;V(K0TW6[/4])M=0CD\J&Y'R"8A6W9P5/N""/PKF[_P`) MW>J:CXCFCN;RQFN&C^R2Q7+HCXB4?,JGD9!!SSCI6?0,V]?GX`;(PX_N\XH`]`>>*-U5Y45F.U06`)/I0T\23)$TJ+(_* MH6`+?0=ZX:Y\*33V.K^?I_GW?]EV\-K)*RR2>:B/G#O&:P--TQ=/OKJ6\\/ZS M-<_VA-.DT$^(V4RED.WS0.F."*`.[\^+S1%YJ>802$W#)QUXH$\33-"LJ&51 MED##*;=^%;:TLKJZLK>>^U!+:1+=+R\ED&64@@%F^7/0D8..XH M`WX[F"9"\4T;JIVDJP(!]/K5=-6LWU)[!9U-Q'")F7/`4DC.?JIK@/[!U"XM MM1@CTRX6&[LX(P/)CMU+)-EAL5N/E;@DDD`\\"M76_#FR^U5--TA`EQHK6\# MPQHJB3,F5SP02&7Z_A0!V<<\4H;RY$?8=K;6!VGT-)'<0S1B2*:-T)P&5@03 M]:XO5_"]POV^'1[)8(9M/MT98=J"5DE)=3V+%,C)X.<$U"GAR6\AF'V&Y^SS MWEF9(YXXH0RH^7;RTQCY<`D\MCIQR`=T+F`RI&)HS(Z[E7<,L/4#N*EK@]1T M2XB\1,]AI;$&X@:-&B1H"B!!N608>$J`?EY!QP#N(KO*0!1110`4444`%%%% M`!1110`4444`%%%%`&1XGMH+G1)C/#'*8R'3>H;:V<9&>AY/-4H+"TCU?1`E GK`HAMG>,",#82!DCT/)_,T44P.DHHHI`%%%%`!1110`4444`?__9 ` end GRAPHIC 8 maindocument001x4x0.jpg IMAGE begin 644 maindocument001x4x0.jpg M_]C_X``02D9)1@`!`0$`8`!@``#_VP!#``H'!PD'!@H)"`D+"PH,#QD0#PX. M#QX6%Q(9)"`F)2,@(R(H+3DP*"HV*R(C,D0R-CL]0$!`)C!&2T4^2CD_0#W_ MP``+"``K`*$!`1$`_\0`'P```04!`0$!`0$```````````$"`P0%!@<("0H+ M_\0`M1```@$#`P($`P4%!`0```%]`0(#``01!1(A,4$&$U%A!R)Q%#*!D:$( M(T*QP152T?`D,V)R@@D*%A<8&1HE)B7J#A(6&AXB)BI*3E)66EYB9FJ*CI*6FIZBI MJK*SM+6VM[BYNL+#Q,7&Q\C)RM+3U-76U]C9VN'BX^3EYN?HZ>KQ\O/T]?;W M^/GZ_]H`"`$!```_`/9.@YK$E\3PS2M!H]M-JDRG:QM\")#Z-(?E_+)]J:+? MQ)>G,U[9::A_@MXC.X^KO@?^.U6U31I+/2KN\N/$>KJ8(7D,@DC4+@9SM"8_ M"K>C:OM) MX?@^:TMV6?4W'3`Y2'ZL0"1_='O72R2)#$\DC*D:*69B6:/3M0MKEX>9%CD M!*CU^GOTKG]4\53:SJ2Z#X5?S+B0$W&H!<$J>C/V`'&?H:Z32=)M=$T MV*QLD*PQCJ3EG)Y+,>[$\DU[!\F)C\L:CK+)CH@ M_4\"L?0=(2;Q7)>&5KHZ:K0R7CCYKBY<#?CT5%PH4<#)':FZMJ=MXAU"2WN; MR*U\.64F+J>24(+R4?\`+)2>J+_%ZGCUJ\?'>ER'R])M]0U0C@"QM&9!_P`# M.%_6IH-7\0WC`Q>'$M8S_%>7JAL?[J!OYUI;]5_YX67_`'^?_P")J]7-^()Y M=1\0:7H5JS*-XOKUU.-L*'Y5_P"!/@?132ZIXAFN[J72O#I26]3BXNVYALAW M+'HS^B#\<"I=-;1?"\=GI0OHQ649$$@7?LW#.WIG'I7`ZKXGA\27TD4$3S>'--D#7\ZG'VB0`E(U4\LI8+G' M4E1TZR:=IMQKM_\_=C#0#[S$ MGB*)5&V,=6Z]#747/C:*%H)ULY?[-E?8MRY*O,<'`BBP6?MS@>M6;#Q6EWK< M6ESZ=>6=Q/"T\0F"Y**<$L%)*]>,]:MQ>(]+FN+Z&.[0_8%S=2<^7%[%^F1W M&>*H2>-M-D\/'5-.,EVLDWV>UC"%#<2YP%7(Y&>_3`/I68D%SI9=7.,K:Q],X[(O15_B/XU5D34+[6%\*>')VLM)T^,#4+Y,-*SMR45O[YS MDGJ"?SZ/3/!?A_2$C6TTNWS&,*\J^8P^A;)'X5N````#`'8445P^LZ[;7FKW M]I?ZA=06UD?+6PL0_P!HNFVABS%1N"1TK2D@U;Q!HFF6VB:"++PY,H::W\]8GGRN?F M(Y$9/7'S,/3-9NIZ7J&@07.LZKI=JVI6DY>"_:349VLR[U'&%PH%6K'P;K"ZXUR?L>G0" M)8;=K:4R/:0CED0,N-['[TA]^*NVWAK58=-UN.9EN+Z[)5;R6?+S1`_+'@*- M@V9''=B:3P?X;O5M()]:@BM0LS72649W?O"?E9STRJX55'`QGKC%O33J>B7& MI6PT:>Z\^\EN8[B*6,)(KG(W;F!!'3IVINMZ3XC\1:1=VLES9Z;'-&56&(&5 MVSV:0@`#_=7//6K,G@[3Y/#J:7;1M8)OCE;RB')=2"-Q8'>.._I61=:5K-CX MPTR2WUE+Z>:&9#]MMU/V=!@ETV;><[1[^M7(_!M^D]_*=>D66^_UUU';J+@C M&`H;)"J.P"CKUSS5&Y\`7K>'X=,BU*W:U@D1_L2V_DPW`!RPE8$N2W4G/7L: M91SEY7/+.Q[DG MFK]%%%(%`8L`,GJ<WGN]'O;>T95N)H'CC9^@8@@$T[3K-=.TRULT.5M MX4B!]=H`_I5AD5\;E!PQ-%)=J$MH7&&A@'*@CLS'YB/H.U;E%%%%%%%%%%%%%%% M%%%>;Z/_`*7\2;_0K@F32K$FYM[5C\B2$ALX[\DD`Y`/0"O2**********__ !V3\_ ` end GRAPHIC 9 maindocument001x5x0.gif IMAGE begin 644 maindocument001x5x0.gif M1TE&.#=A!`'C`'<``"'^&E-O9G1W87)E.B!-:6-R;W-O9G0@3V9F:6-E`"P` M````!`'C`(?___]":YQ*A+TQ6I0Z6I2MM=8Z:Y2,G,7FYN^,YN8ZYN8ZYJTZ MM>8ZM:T0YN80YJT0M>80M:W>O>]2:Z52A,5CE%H0WEICWA`0WA!C&5IC&1", MO=Y[A*4ZA*T04EIC6EI:E*TZ:Z6$6G.,E.:UQ>^,[ZUCE.]C[^9C[ZV,Q:UC MQ>9CQ:TZ&1",6A!C6A`0&Z7.YN:UC(SF4N_F4FOF4JWF4BGFC._F M&>_F&6OF&:WF&2GFC*WFC&OFC"D04GNUC*VU4N^U4FNU4JVU4BFUC.^U&>^U M&6NU&:VU&2FUC&NUC"E:*>9:*:WFO<[F4L[F4DKF4HSF4@CFC,[F&<[F&4KF M&8SF&0CFC(SFC$KFC`BU4LZU4DJU4HRU4@BUC,ZU&:,*:UC6C$0&>]:2JTQ&[40(1"$:ZU::^80 M.J40$*6,SEHZC%J,C!`ZC!!CSEH0C%ICC!`0C!#F[W/F[S'F[[40*7.U[S&U M[W.U[[402N^M[]XQ2L[F[U+F[Y2U[U*U[Y0("!`Q&>_>[_^,:^8Z8WLZ8UH0 M6IP0$%(ZC.\Z*7LQ.J4Q$*40C.^,SGLZC'N,C#$ZC#%CSGL0C'MCC#$0C#$Z M8Q",I5H08Q`Z[UJ,[Q`Z[Q",*5J,*1#O[]80"'N,[UHZK5J,K1`ZK1!C[UH0 MK5ICK1`0K1`Z"'L0C,XZ0A",A%H00A`ZSEJ,SA`ZSA","%J,"!`("#$Q2N]* M>[UCG,6,[WLZK7N,K3$ZK3%C[WL0K7MCK3$0K3$9:ZTQ6IQ*A*49:Y0Z6JU" M:Y3_YO]"+=O)[Z=MC'MV]?$`5"BXYA($``?J8#&$@<`/%J?(X/1)Y`&'$`#F]M2P?`"Y`[=_LV96XG@`*%[N`]"?\0 M[TD[H-#G`>5;;/KX<>3PVZO&-R"`/S8%$$SWRJN`.\^^D>?==P*VXUUYGG@R M7&AM%1`#>\N91D"$[B77GG./Z;>?5?W]YUE??'G73CZ9A6@@!20>N`D()!"G M'@'*A9":C,K)YYZ,!H2`(2"T;>B46IUQ=Z)OXW4G'H'Y$&B@@0G^Y=9Y!4QP M7`@PRF=:"%/"2"66%B;'G#\'`.+C4AUVT)<`3*)H8)%'&IADB=V=V!L%+A:0 MSWL6LD<`C5V:!J&5?AH00P%C&H7`!B`(D!V(GB0Y'H%&/HI@G,&-E^1WL@'2 M8`Q[3G@EGC7VF=H^%2*'6`P':%BH3X>VPQEP1"+_:&*(;`97:9LFMA,F>G;F M&`"->W9I0+#&!1M?>WRJMIH!^:2ZZDZMAB#B@(T>2$$,2!)(*ZZ60MK.6U`Z M6*6P\-%(Y:_)<9FE<3,FAA@;JCX[$R\;;!TE@:>S;" M"*IJ#EO(;GN&Q2`FS2@=NANU159:*;9R:MMMFAQ[9X`>NCQB0'`#N+/'!QNT MR"F7#XOJLM+(1:SRE*GA__ENO%B'!$AG`D_[+Z5=QU`KKK!2X(LN^O@#R3K[ MY*-'.S-T@EX,,BJ\6(6^)AU`L,F"RG3H>>9S=>`?\>(AFM]!6NV2M]9:-G?! M)1DP!6L0DYL)D$#R>".N+-^Y@/Y:Y>?) M*08OZQT!`H)V!BJ>(*5>XWHOK)'*2N(FSX/+(/GNPX,X,:G_RBB^? M&,`XU":J82$'=I)49UX,M(/S;@%Z^MR8*R"Z(0@^+08NLDH:G2S'JC.E4/Z'*!'$8P( M`O_<$8(YT>YG'@N1R-;7'1(]*A\Z6T,G-N&.&.AA``)X!`7V`(,-<-$7ZR`` M:<[F@:B-CD_;:UC?6J.<*DV-7*J)&>""V!!`G&E:MQCW)/2K]Q2&4'1T"`6Y MLT'9#>A1VAH0MKR6HMCA2SL[H\`_?`&)Y'G''[XX`!O@PH8[>0`2`_"'(`C@ M#QHV#6K94Y@!]H<0DK:N[!!\5"N1`/;9!2;0K`I9CEG1#X(P"UFI,``M`. ML/EFE6Q2T"G%,QPHD8!3!S--/BSI,'6%JH`S&M>Y0#?_`!#,D9H`&")G$.<; M)][K$8*@@#^:YPY_Z,$`D-C$@+PS,CW<@Z(F,BB"`AFG,*G00C:I:E'@%Z\P02`>\0H*\*,3[0A!#$XCB!,) MP@".O!:M=J8SFX8@!&_A``>.-H`]/H,`C]AI"4Y*R?49RG"Y"4``1_.(# M57QHWW`D(Z:I;*LIPQ[JI#8C3A;0`&2-8#]H@28!=2QDL7R>/SJ1#V!"8A^C M]846_0$#^E$`!.NX*$&S18&R__F"D%!%K`A"\`$@F,NRGSK6)MD8W"YI:6K, MM%`.O]H:`X`RB';DSGA@R:]'71!;OED#)'KZBTY,,1"=`*\)1HO3W#S4.^;+ M67"`([1\=(*PD8C!!^@P#-:L3)G=DYJQ)EM9^"Q-:I4T#CZ>RSH29"Q`!R)H M$GVJBP%!+&)0-2R$]>"@0!^ MH8M.6'1`:PJD1B5UO[:TR,@3?D0\X7@Z'$%,@0P\Z0+QQAZF[;<]`R"PO``! M/\/]QO]GGJW6.4])T=X0:6C7$L#(QC:KW7WX$?=P!UQ$X`[PT@]8='/LE:JD MU;I=:6%:-:/UK$HU-1=*!DWZURN5"C(?=RU%X'%EX]!;.WP!-I">@$$^AK,' M7SBH$S``P@06QE^6M:=Z;TR8TL[\XNXY5UX(V`3N`)G@4B9QCTG$ULCD5"20 M;?A('$;3@D(3`WZ@!E"8'!WH4-;243E0N9"5;#[=@]E5(>`W1W*B@#H,9SVG MFW8*E>@WW01%L4%[B>2!Y9*FK1Y%&Q"E55+:2M6HFN36F+BIJ9Z8S;@T?_RS M-OWXCV\XANQJ=8U)?KP7D/$QH%^LHQUT\*Z#(<%Q5%.\PXW_\S`%PH4TY-S0 MDL[$GMWHIL]<'[QNGGIL:1Y.&0_M3%9LTHZ4GSTR?C!/A%9\Q"8@,8S1QJ"G MD+)5K#J-[':P"#WK\1*`#XCP&$'6ZPD7.$H+GO!'QT?`(.C'?C90;XU9RX,^ MWI;N&M.)M5$`$AZ`P28((+S@V=W>/0[.[=X,@I)%J53%3=?+'AWPD;HXGY3] MNO8@[RZUUQBF@Y7NXW&3@_2XD="E0Z"[?+C?S*D*.,DVCCQ^,M`HNGW M8M7HM.0V4%2(OK6D\SO[F]M(Q+8Y-[S#QB8-=GI]JG<'H$$`84@@U#LF^`7] M8O#>6V6YC+)4QIBB_X^N@R`FLSRQ^?IW7#G M>UQQ5(80!,/8*PPE&HA7@$#5,"!"UL5I[H,K2R(;!9-UD1;)&M89/BU4]L,%S67$`?[54'>0=U"5_`8,K_\<9_V`"(`!4W@$)TM)='K!L M8J,SXF1QF6%X+<`0P2:(X2H5J MTS5UI98/>F8K,0`<)!(@$S`@?M0UGC4K;;(KLK=&QG(Z7,=K^+1,O:8:)W52 M)(4W;C1@7X$`)Q,#;\)A!6(DUU=L7(A*RA8K$\=>J.9'(>-'8=,7-JAH"_.# M+1-C[/*#[_^Q0RP5&T",K$#'%&VA]QR M/GDF'F"#@"^24J'B6&B82<'"0`F$3#;73`_8-]5C*FG'%8#@&IRT2IKW'7TX M-J4T)'VD>N&4.[/BA<87=6MBB'`1)3'6)8T&1_M$8[:67.S!0P&W@XZ60P-P M8UF!``K8)7N1>1?G-3ZC1`?"B8S31$N43@.H:6XR;7@%0=0'YDD5.D3*7U&@W4X.]DR*17".5=N&>!+R>%PE5B"0%8"P+!*()ZOD9WD6.[O_@V^+8RWY M!APU&31)9%"'TP[XZ(I;QX.5%'8PASIG%CJ[1F;6@P_N%Q7]``($J7-TR!?J M)0!@TWGJY8'99RW%9WU*)"D<\R&N@H^*H1CN`HPKR77*=7Z4]4;>B"==Q8.1 MY2FE@@_YH(%,L0$*&8OZ12..$2+J=GQK=9@",HQ,.()&$F5:N1U]<1T;T!:2 MP0MA`1=PL18@,%1K:78?J88%%(%C)GGA6",$B4.X:!H#,$U3(8>(F&W)D87- M6(KK9I'WYFX_5EL",GB1XAF;P`9O@0!JIW8-T0\(``@'``+SX1S]]1X_F"S> M:($P9R.+J&W(X9=)<0#;!G;^A81",XQ4_SA3^6*8ZW:>;.(9%"!HQHD1R2`U"$48$`@Q%Y9B96R2&,97--W=*5*)=*Z`DP MDPD(VDD1R2O!0HL(/_I".&+2, MN*-NI@0[T:@[9W4`(DH2:M%<&PIN!R2=5O(T\FDEL-@G^,`!_RF;,M=B,L:0 M7HA*R?@;[<.;(/,FA.,L*8$`!]`:SFFAUZFAU:CV@AJV10[A@<%P29[,,M??%#+H$`;&!?_&@LNU@W>H(P8%=)32F!>4*D M3H$`F(2A5]58IO]QC:91A>.#?64I9Q[#E3W3%TE2IBXA`58IA(O7I3#GD?YV MG12()9JZG9\CTI$U=:&F:$:S.VHS4" M*JCCD;78&JZI%+S@#X^'/5MR)ODB.7B M>"@C*.>Z$X"@#Z*SB\PUFM^:<(T!C7\D2*[G":>J$S+`1O]E*AYJH?S_!2IN M!$TBV3=2J10$FX;0V:?5F1IAR4&7:B`D$!3](`,GDWC>=IV*&+5?VJ4^^I)( M@0"K<2P,"$U<-[.SUR5M2JU+1"(OVQ,`ZEAFF(8IXRLWHFO>:1H?2['3DZ,H M65S<"$YED,)9)<^N$,WUYI(D8\6BXBL2K/`U:/@ MF2(D8B!E"Q0QFYIIRJ?M,9]C-W-*>;*"Y+KKV!+L^<0"S2ZB0.YJ?"[QKM!CY`*_?PA2_^+4VYV5.B7Y" M."QHM'O&:A16R:Q=):S%I8A:U7@1$EG8T@$"_XNJV--57")SMF=2CJ9XV3-^ M-A(#12$#0MM?:3JT5N(P?0HC[I"K2Q$#"CFT[?JU2DE[$*@L$D`4Z4J?7,JK M.6=/O/HTJRM<#_405G8HNJ>NT#-.=QY*# M7!K=K7H=?8$7%.,&[6F=/ M&MJ-I+I5E"@J1&@58EPCC=:-\6MK-K2+XI88_OD3'LQ5OW6Z@@DH)IPL$+(8 M$4P4`,J/2^EEZ^JVM/]&(WQ9PWF;H3*VJ".5B,*:PE'1QD,,EY@DEQ_9P&<( M><*4C@7KS.:),%+S0M-T#J,$[RY\[LVPX'V!<$X");5[U M'B2;-RW#JY?D-W?,QD$\M&F,O2UI(8K[$QR0M6LKOZOY6PM[Q9I;B5HQP;/, MMK\K.A>H0#S*+C/\$U6Y&&6F?BOVEF$*?E[B"5R!B0-GO?;KP+LXJC#VJ*V< M$C'[K]AF68QI/;+9)S$LB<-L M'_E\%"=3NU^GB-4XB9Q<;CU1`(&IM5VB4I);JMZ<0-+D%0G9H[77N8^EI?C_ M9<@":LDV\=+I%Y*L"L=E)]&F(S43>Q4QZL6CHBPX71-GRL_0 M:YT-)&F352$93;I-VZ]P^6]0C,5G-\X]D77(5\;-S>;A) MS4F*BHV3S!AF.U0$IXM@)C6V!R'QZZ-/;16[K->SK$QF!&:,*BR>DM4DD:P0 M72XZ"G/`LK`Y9QP$/14Q"=G5F8T(6W[9RS<&P-@C`;^H>=(`"SHQ_)2,=RZB M;12O[,(&A$!QS))\.MD%#++<1K=,<[>>RJ56'0.M;10;GK%B&->V++UP"++#_[6^D/5&Y(>]>CF]=:'3 M\-%HD]RL6+4PW.,I^,#!.\&=JTDL]OW/,CV_#\.V>QP`S4P7!9"UCBMI^^5X MN(;(ZMO2\YVE&JJO*Z/,9^PTOU87OWAP/HI[#V,NAHMXJQ'8,4'?R"2]_G6D MOTNL2M.S%$Z!!H?$P2K+3!V\`SPN"JX3;%`?'LTT>B*$RT MYZ?A6HH]`_#C6*'-\@PJ\VG&DIW%;)T3[K!)8?;$21K%5;[4RH$/9GX56*O0 MXFW5!2["C;HW'@X38CS18_^LT.EK7&_4W*]IQ"TSQT&[J.I[TF\>QM!,B;OG M*VYTX/J-$^C=>`EGU$CM8J8LTG0A`5Y= MZ8M&KKP>B6MK`(:J$]Q)Z\6=WS8=FB"<-_B-RY11U!&XE#V(BP:.(TBL(X7^ M$AL05BYW563X,/%;KEME`-=.%08M8U0]Z%FRL?)KU>/>$GM@9@/\XK8&L%J+ MX&S4ZBXMLJ><>^L*X6>':P<$?"`+S:>^KL]*-Y2]Z]USZ5UQW;"^SCN]:#F$ MP_?GU=NAOQ.+!2M'#$0Y5O1\0-;ELN'C1K<@FL[R'BBB_A1'Z#*U M#6[X>G;"98UZ'=P@\=I,[L)U@^="[E_M#A4'?%^(_N+BAK?=Z'`]`0(E*\[` MNZ8+Z&7*5-U=\K.".MTZC,+H"M*31L1XN3>L M^?5-T<9H^JUCSWOL6[Y6)>X^4=20^XA)Z2L#S/5@;0#^\+=7@32"J:ZYJ(9I MK.J6M/G08K%V$]&G/C7#A>-+KQ05OC+@_L)U/;PZ5_,^_X'7;+]`JWF4A+W- M)QWL&UC2WZ;2-I*4:4RLK3$!A1\2/^O1LGG!5^S9<-3SJQ'_RS\UV-/M`+$O M0``"!@:&(#!P(#Z%`1`V;&A0(3X0`"Q>Q)A1XT:.'3UV/&#`8`B(#1D&,$"R MY,"4$54:(*`RHD`#^`Y\Q)E3YTZ>("6B5"BS)="@!!7^9%DTZ5")-GL^A>J1 MULFC0!,&O16L100RN#U>Z%:MPWT^W$P]F53@` M4%J^.Q$098B0)-B5`EF2_!JSI`'#*%^&<-I7\F2-&P:LW*IX,5&Q2.,N-BB# M\NB,_4!0Q4RT*M:5$2$^_&G`7_]9TK71QM!*,`3=@5?O.KQ*4B+GI*S8B%6PV0?;MD0+FYBG5[ MTNWNH'%/SF6]6Z3H]?TY_J7K,ZQ&HNLJ_`YJ[2Z9]"G`/\D0\&>A@1I#B<($ M%;M*L];BJBD&!S^\"`3O>GMIJ8;`&JHKWQ(LB380T>(`O/#J"XM%KFH,X,"? M!FCPQ?[:$R^]WW(4*[&JAGO.*K'PB<%%'Z.RS$3&I"01.*$>T^VP+.VJTC#-AKU;0`>>TG\.0[LM9!YQ3P*/5TU4D& M.)LJ23/#"'--J?O>XBP`&91#%BH9J@WR1I,F7$E#U:9T3$M\GD,(3"D>CJAQ7R*7<4@PF MF090M6"<\BVL7,\$HY(FF4[2D$.2CK6XH[]."I0UX`0U%$\[V>U*-CY+O@@! M$:E\S>43XYJUL!OALI?FCC@0*6$9QZSN*,.8VJPE)H,6&F/5_TIT;E*6+$7S M2EK/3,]#H7$B`;4RWYN062$)G1$UD%>6$-VH_4D99'?A;:W=>57>L,>O/_*' M-Z)"QM3"?1=^.36W+>8UMM>.3"A%KA=?>%37I*O)'U[VQJD`?.BD6\$:AY,3 M]%XG#U:D`V;6-21\O'UUR,%`)=UAF%\=++C&V<3<(P"O'A-KAG_7LLJAA-,L MIII`0+U/FU&SNG#8@Q<7O7`3-"CYW"]J%4&'4ZZSV]_@R]"AUAC2>U5`8AB1 MP[*+VWG#Z88=^UW&.+@>)V4EIK[<2H42-WJ=NQK/`$!P+4?)@&B)`E>YHJ<] MKYR'8?W3&KFR9`"HU4\C?VK:D!!&H_^WL.YG7\'1ZD[7I@.D)U/.4YA16K<^ M]]UM?!6QX$=D@$!@64AV!G%.R/Q'F`6.1S8;L%YM$'"`OA4M>&93C:3$MZ6- ME4M&2KS1N6*($S85D'*`/PQPC7,\1\P*E$6J3."G6F.`U: MJ4AL2P_]IO@1!-1D*2M"(,,,HD/,E"AA>/H72_#A#S8`XG)@`@01[9BBZ#'2 M3`";H`TW!*VQ4'".5%Q=FI#".5*5:$GM`^#*(#,NAN3C`(`(HE]D<(`RK@XI M/>N9W9:(*J#`IH4I)`[H]B''2^I.)!1BXU$0HS]QI0@\DG,BTK:"0WX$(`9L M.(`,4IF1L@#_H@!LR(\-'43;13"DE548IWC)(4AA^RE1[(GN\`,YW_L M`XZ>8`"`$(&J)0F`OQIS0.P`00Q"(`^\'$T>G[+-2OB M(MX8:B25764`N$NG1_KVR$DZS%`G2DH/Q1060-X*):O#ASX&8$?JB*0F"^W, MON+'(=\0QI.42F$H337-=+;'6P-JHPL)EZ99!8=RX%+)JP9'R8BX%(=PLA5( MM:>RE(V,6#F#8R#Q\YD##4J*&"8"0[!>3';L>F7K'F(W0OUT6#2B"7:2Y+"MNHJ-_[.BBNW@ MY4ZDK1"+$J+L8!O'/GSPM*^:PYFDF*H4#4G*-X)3$5PO5*$MKE6JP8-9OX"2 MJ&("$'\C31!D,-K7CYA&7^R"Z&%OB:#6M76J#FTI3ND6V8:E225X"@$6P1(? M86%50+(4(&]YLBWFC=:V0V5B_)CXW&`)$[9,L^)4J8(/A'3B*I!X13ZTE!+X MQN",2.O>33]:+VQI-R<%&-%SD1(HS2;UITM4F0/K9KP[V8HXB*JEZ"#BCT"L M(R7YT,,KDGJ0$$`"!M'5'F(D["OI_<8MG..1?WM21?@HMUE_/(K.(D92L(BT M(38.W^2BZXM'M*03'AY`/N#+CT^LXQ&"@/^$'M8Q`$BL0Q>"2!ALE3*WV?)5 MQ?A:5\ITA%FR9'FY?<.N8>^*^TPL<$/'MEB_"*K!(T%_6(5Q7`B=1QAU;P>*S*+E_H`0C\ MX(<>/,`/"_?X$2'P!'S7\`H*_.(1[CLJ[<2G@P$MFRE^GZY<4-3M@$NC%( M/R.151L@'X(80#O>'0)_^*/?(/<%E.,-@TX\FKA^-LI/F31HA==L7>_!4,;7 MS5$%U@K1+>WA*S&UV$<_1LBZ`.-@2/ZZ@>1#OBV5";IK&:U!TKSF-6,LQ5T, MQW:G)I9O,9#0[4:[B.[O,TC&KV"]GG%#/. MB&RVCY"#'`[_'MUK$Q[$3$?3'M7=DI>$[*MQCTI[:HVVT7$=-8/-;/X0/*R) M7S6J5`]*DY\M9"7W.!"/T'``(*$OF_[LC2C"1_D@#Y4"B"1#A+GM4#MO_^[5 M*+[OVLMY2_QNWFW:]!?K\/";-2T(01B@QWK0QR]>P2*J1*I6BR%`[&>?%LU] MYIX-QUN=(%XD0D$7(HU=T7S*%`(>M\/4`4`])/(A;^=[6$^D4NMJC&<`;V^? M52PE$]S3F+_JKACC.]A4ZB:AA^[XE,C.Z MR8?CR[=.2+,)I`D8V`=IXT']P[CKJHD]*$/*.$,%/)*$49_1*D'&HY92B:N= MH[9.Z(0`R`<"L,1X"P!!`(((V<*7:`R;.B(AD;U#Y`N,>3#+"[_Y"*;O^;PD MQ)D[H0^\.)%K0ZB!F("G0S8.TRN=8YZ#D#543,5L0L#G(2N&04.>2PRJ$1_` M:;'6B`D;2PVS<3F4J1AB'(U^:(Z1"!_+XB+N*0DZZ4'\PJH_>Q68HQ*NTCR3 M0!YM7(X2LJ(4"2<[49\SV1?^B;(9*;@6*9 M2$Q#,(,7&_J?`TQ&$Q+"KDQ*K1@QE,WS$ZU1FM4!`:X4SC;I!P."*;QPEQ:L MOA8LP9:L&R322[O(!PFH3IHQ(,@8,%I!-!2!&=O"DG#"GWG$#)CB`.H\3V09 M(MRHM<7BDN$S&Q74(.IZ+11<(;5AB&C*S^M!@`)0RBA<0(O<.?R:1[!`T%0I M@-5<4$ZYS@/`C9J0L+*T"P&YS:>LD4=0(!_(JB"X@`.``%' M=50V@*8#V(!^DB;,--1,U=1-Y=1.]=1/!=50%=51)=52-=531=545=55_;:` #```[ ` end GRAPHIC 10 maindocument001x5x1.gif IMAGE begin 644 maindocument001x5x1.gif M1TE&.#=A^@#S`'<``"'^&E-O9G1W87)E.B!-:6-R;W-O9G0@3V9F:6-E`"P` M````^@#S`(?___\Z8Y1*>[5[G,ZMQ=:$G,Y":ZTQ:Z5SE,64M=XA4HQ":Y3F M[^\Q4HS%SN8Z4G.,6A!SYK6]Q1"]4A"]C!"]&1`04G/%[^9KWCI"WA"4WA!K MWA`Z4A!KE&,04A!"WF.4&1!K6IQ:6N]:*>804E):6LY:".89:]YKA*T90N^, M*:4I&9P9$.\0WH1C&3%C*6.]:Z6]*:6][V.,"*4(&9QC"&.]2J6]"*4Q2C$Q M*6-KE(1SYN;FQ9SFE)PQ&1",G+5SO;5C6A#OQ1#O4A#OC!#O&1"USN:,6E*4 ME(2,6G.,6N^,*>:,6C&4YK5"M;6]Q3&]4C&]C#&]&3&]Q7.]:^:]4G.]*>:] MC'.]&7.,6LZ,".:]Q5*]2N:]4E*]".:]C%*]&5)"UK40G+40UK4Q&3%:6G,0 M4C$Z4E):6E)"WH3O[V.4&3&4*6/O:Z7O*:40"&,Z"&.4"&/O2J7O"*5*>[U* M4IRUE+6,C.9SM>9KC.:]Q9P0C#H0C!`0C&.]E.:4YN;FQ;WFK>;FE+VUM=[F MC.9"UN9"G.80UN80G.9:4C&UQ;V4K<7OQ7/O:^;O4G/OQ3'O4C'O*>;OC#'O M&3'OC'/O&7/OQ5+O2N;O4E+O".;OC%+O&5*42J40(3$0(1!"E+5"][40O;40 M][5"C#J4C#IKC#I"C!"4C!!KC!"4SF-"C&-KSF.UE)2,A*WFSN8Q4I00*6L0 MK3H0[SH0K1`0[Q`0C(0I0LXI$,X0[V-C*1!KE*T0K6.][Q"][YP0SCH0SA`( M0LX($,X0SF-C"!#F[_\("#$("!!:*;5:"+40*4I:*91:")0A>Z5"]^9"O>80 M]^80O>:,A&.4:Z49A,Z4M:U"[SJ4[SI"K3J4K3IKK3I"K1"4K1!KK1"4SH1" MC(1KSH24I6.4[V-"K6/O[Q#O[YQK[V-"SCJ4SCH0K82][S&][[T(2IQ*A.80 M:ZT9A.]2>Z64[X1"K83O[S'O[[UK[X0A8XR]Q=92>[6USM9KA,YKG,XZ8XPZ M:XQ[I<[_[_]*A+4(_P`!"!Q(L*#!@P@3*ES(L*'#AQ`C2IQ(L:+%BQ@S:MS( ML:/'CR!#BAQ)LJ3)DRA3JES)LJ7+ES!CRIQ)LZ;-FSASZMS)LZ?/GT"#"AU* MM*C1HTB3*EW*M*G3IU"C2IU*M:K5JUBS:MW*M:O7KV##BAU+MJS9LVC3TB1& MC`$Q5\0NP,7W8Y%=`@3P.7#`0*U?A0Q<7=B+;U!AO'@'$1CT0T&#QPH<-]BW M8,$[!'7QN?I[]JT#(X@'B2Y,6K3A00[Z!5B]@/*^U:LG-U"P^AV*?@0V<^;J MR@&^T(4-XRM-G#2^10U@*U\>8$&`??MD-T>0>W=55Z`3GRYM9/1VX:<=(/]W MWIRU0N\$B!Y`0H8&W34+?@3,?CT,T`^/Q10 MP&+%#7)AAAE22)H#/RSG7(;`%&U\`"/RAHXDT-_I`/`@,P.0""&%8H MH8TR?F?$>,V]BCSP`#_-`FFP,4D!^5-6YW M891Z;=CF-/PS)(9B;EMG'K;VV#L.C+L1,00T MV6B<3*Z[+)P)#Z`/:D;L%3&>TU99F`/?B;?/OIGNB"VN/H;L,7K[U%%>=+KH M)G!%#KB*V;GLGKMLS,O:4Y<=B[BKUW;V\!<>EGU^R67']^;:9;\A+Z?``HNL M/!$QBS2,,)Q3)_OFH\L6$(TQGI!A#`)[68S:9X1![)MAXB67Y:<_\IIKB'R& MV=P^"@#L]$/R*JOLNDV^_WRNWH_B@<8"*-ZWB`/V+#*(S8K7A3$!B_P`L1TH M6%N9OG$'W:O;VVKN*;C[_'#W0E#G= M@AN8/$1`H8%H:,W[T&2:9CV!^`,?"8O@Z<+'.DTK@4:#'J?\!#*2-0`!PA(8 M`_]4E*Z%'8M)+UL8!=WD-X,5``W):(4.0I``5G2B%3AH@/N*1X9W)"('P'M` M-))!`#24`06=&%(!ZS4T!/J(P7P;:L1$@%6 MAH\FL6M[VK.@$@&WMZLUJ1\)B-AG[(.Q6F)(8HH@0\0N))[61*]3^'*CKCB& M.0!U"CH-$-VP"E;$-RGL>Q5TIM0H^"8$Q+)*,MI/<+JC""K>)T^V^E`Q1=8M M3?XR:7#\W&KJ@8(@[@9J!DOBL>"DKO!138G;8V+,6"7_+1F=C9;A^2?:^J'& MD6TN@<2LH:#&R:L#=C(`#6CGD:*VJ@M.\(()R^/!+)JLO'S'+J=9Q'T\6IJT MJ3..;>-DT0X*,EPU%$A+4QEGAIB/`K"KB5=S4A-C=LHE4NVFBL.0(GS@@]WA M`PTNM-T`[$$<''7.I6U\*0Z?EU"4\NBA"["C7QCPO;]M=%6G=)35+KI1[T7( M-\4CGGVNT+X'+*(,8L/0AKQ53&_%45!LY!:0SMG2YF@5+5Q=6!,7IL][%E9F M4]NI*=FT&-0@@0QG6(`1[/"`)"P@"0.8I<5,RC98L$*6V=F-WN'79'D4",Y8K`B!T8P M`@/*H+X?K#!#G"W/)4T+57O]R;2JD/8 M/%LT@,78+AF\X\=GD+"`$5(#O>"Y$J:$J4ZJ!BVZXM26`$$YH`6XLRNENRXJ MF>B]G!XQO(6MIVR3J*Q%%,8>1^C$`NQCCV@DP'9E^,$W43,OO=XUNB*>JAN] M5-4=AJQN)][*(G+J7;!:<(]3\]Z55]E':+KH1AT437=08Y\):8Q?+"V:A_%J M56#J]_]#=),H6`J&7:K-$V'[U&FJ9N;:\,K8>SJ#U6B(DSBU.32=^#KRY<09 M*/J^;;_G68`"4``6!RSIM:?3A;'Z(5CO,MB4CI+@EJGI)I$*FD(T`EI]09FI MYG[88\/$9%[]-#+D)M,K#NBSG@X@Q$2&':NG#'M4H*EDG)9!9\3.M3:WKBWSAH*]Y6K^ M6`/`316N^I%UCRI`!B'\#AR\0@!Q=TK0M MZPJ0CQ]/"C42TE!R'*]DQ+]17VGN^K4XR=<01<>_3EG$I9UH07KN%N,Y&/H# MABY#'"Q`D)WPQ#[.6(::@D]F[,KS_P^H/J49"<>I;]3A[V7N9"8KU\CP'RVB MT4,HJI32TX25X-159"X&(QWO2-`B%A5U!D,U`A8^9&9U5J(G'5-`C#=S MCL=<:78T[S=*-,4$$,V@5U%84L=\8J/.4BUR56W15^U11>BV)CHV%^ M-F)X+N5J1@-B`^1^,;=<.^1)VC(W!P<5RM='5C-6Y.8DZU(`>)``S**$*#A6 M1!AX+:8Z+E)Q>C'\*!)=FR)X\G:^1$:P"W9D<#>7.$*]"16DB!<]>5AH7%AZD">F1@ M`&QX!@5P!PD`>@@064>W8`A(B2Q66$JT+!A#&OHV&@5@`8\A&QM#&=*&@T\% M-Z&%3CTH*.P'&_6@"TSA"D4H6]UEBK6%!IEXB3YW#T^4`]OG;ANU1YA74?NT M1P4P(=[107(1&`X`.3\`*2A00XX1'88(0'S%:LMU0QD(()H$2I.W%`F`=GRH MAWO&-P6``YGX#B$P/LE`6V]7!G`8)Y0X-:9X@,O&+BYH'X)!#/[_\!"N\!L( M\`Y"\AH3^#%K]%(6&5I2)8$<%B+UEQ0.$$$C")!>%2?]\`(+$$COD`!(D`QQ M\@,:E`,_L'0M]DRGXY1(I%TH\&-PD1$)B0#@,AD5B8Z)]TF>HR-+IFCFT0"/ M:!2<=E/4.(*"I4_]0)()<(DQ%`#F4@;)=`9E,'TTYE,N"5M\PT1VR!<-H=GV0K[@(== MY831!"?Z\`,)P(L?<0$_T)8N57Q[558!IB``LE!+$\)MJ_P.:NU*.[.=RP<29%=@<9+@3I1E; M6)8L83E-J-0F+I(NF6=O3BF3&T4=[2D24).9T--&S95.S,6#`+>%7:(`>0D4 M0]1W>O.!>QAXBS6A%;ILZ/)''W=/(\>;*L$`*."6,YA?X=A[C%=74P51[_"? M2&*$%31;""B6JY1/I,9:5891Q%43^&``H=(\?26+!IJ1#_660NHAT=&@/D%$ MK6)@?MB'=N:D.%6A,/E]V]4DB\"B*Z$+&Y-)."B.$YF!).I)A)*30.&.0MB? MKQ5J_0B38^F26%9O894/9:(3!`!13C9S7GB@PO29.40WE.<3'0F">.:2$_HR M?^=W3=I51K1=1O^H+)B!I2_A`.\P&7PJ7VQFCC.X?B(640[*:5^E<].4<*TU M3?XX8V45JN-W*#T!HK2!5_GU9M*V-MN2D45S?#\!06$)>U6Z2HKU1U#)1[NJ M)(N@JC[!`+HPG@F4CE4:(UG'@I`#3]1FTW(91?U@0DVB?168*Z2`$51 M*T!96B>E!`(:F@S%7540# M7:YJ6AO)$[@J003&4:[59Z)&6[1%:HTR&UQQ*DZ\0]TH&G!QDH@F*TV*ZJC""FM0E8(,*=- M00`&PG7BVJ7+PZ\2NQKJ"A,[:@!T8`#OH`OA$[78-4]Z:+74]*[Q)*Q1@:_@ MV%FN=I3HZ3G;=KGK]*=-:P`&\`^".[C_P&X$R*T"1JHZ>YN>]BC$ZA23"J9: M:$PLE[1S0[8W8;:?F[N"Z[F%&S[0Z*M_9*';>4_(MQ3XL'M%ZUR.MK*]%THF M=A,,D+MT\`Z?2[V@2P>#2P?\*&RQY[$&6Z,#_\"T3H$`K7JB(>8E04F[W/8* M=$L3"<"[H!N_A`NZNDNX^:`+]SE@48I3:%>-?[L4#``=>/I^.=A0>EN>X"*^ M+]$/GGN][Q"_=""_\4N_VJL]":8W<(O!-PHI)6(5#DBK`=2WL49,1ML<8U<3 M()J[[Y"]A`N_\]O`]/NY*("_5GNH(,NH6EL4#/"OM69`XXBYW:)7E)'#(L$` M$6R]U9N[9DN]$:S$GTO!]S"Z+;*S87512L*Y5#%7-IA<2#9\),8<#="^,4$` M!_"Y@[O"U4N_N/L/:(S$,7P/V/L/%MR_1V1G1*S#0JR)5H>%D3#.S$ M\MO$H,O$2#R]3XS$GO]+N,;R::@Y=%A<%0ZH=4TF6CX*ER#3`.Q($PB@PH6, MNRN,QA+\P()\QFR\QG*<<*686>'V'&\)Q#07Q%[;4$LY$_0;Q=*KR&R&[3K!;IRF+L$OC@P+V,R-G[RZ,LN!1PR_/,R[[LRX-,O4S]5) M?-4'<-!9<;S=1G!$*IR:NAKMO!+2#-30T6>XV.[E><)5J#Y`'2+Y$`!W#$3LS8AHS;+JW;3RS,++WA!_X5R(%<(JR> M%"@RY!$="*#?O6W*_=W6+`[4$'S7/]W"H`O36:%J.E24`C245O59^[#)$7X` MGXW5VWS8`([2+7S5%A[!].NM8F&WTD-B81IS`@U1\.T2!3#A/=W0#_S6HOS6 M+B[C]/O`D3T6!/``R'V#YNRRYK'./Q03@9S;67W(ATS2T3WC2VS5]"O96C'. MYYI#^VK<`PT64N%O9`SEOGO"^U(Y5A`'IU MD9Q3Z#`ATO)[TO+Y&:N1@2=)0]`0P'P`#F@'`_0"9V0`P%W MJ4'CZ2^QWQ%-URL\YKHMNFSLT]8-[!--N`=@XUBQ"'?+Z0M`<080Z\FS&@]0 M#"20`YY`0Y#VF%D"#C@1T!LFP``?P M`,E#[V?0"0'`H\BK7[!XXF_^Z=Y<[#]MT=8]R.;NT'3MR1;]X5[1&+E8'@:` M`["@Z;5NG#&$/!L]BR;,["7AW$C.VX5LQFZTW3W$'0.\4M^_Y;@#A^O*Z*-XP802YC.$/S>'"?.$;CN[RS,05/MA5 ML=P#5UOP_)8-;(N0`6P.+PN_3/3?`J M/]3^W<(7$!8.,+EJ1NAH[AS040<+\`"5OP\/<-]450>TG1(,,/(=#MR[J]5T M?OI$?N2F3P>1_A4RC9PN=0!`@BFTKZF,^!RACQ(,<`_8[-G_W<*__^)'3=J^ M/+@#$!:UDKS.JG[EW"<4+L&C#N`KW]BB_Z[2[6T`!R!G7E$Y MZ/0QT?$`:M,`Z!]*MH(ISBJV21)E2 MY4J6*?L9^/?.`)U_,V7^HW,3YLZ<,VO2]"FS9T^<.V/.-'"`0$NF39T^A1KU M)#X%!5\E)(@U(0X+!A+F(&%@P0&N9V"=R=$QZT"#;`DV0"%5;M1%!G;JK/F. MSMV:?6'J-0!8L-^\@?<"KFF@WUS&C1T[_:'`HU:.!?>1Z=1)L@0;$(L."`>G`X8T%#-`(-!)R<(NMA;IKP('] M&+O-**$2D^VGW6R"[:8->9+)I@,&N#!%X1#PS[3O"GK`$UAPZ(2Y8B22;`&N M1MM.0H]^7.BXX%2,2I?YX`OLO+_8(^RNO0Z#,DF8WD/*%2*OE(N!?8ZC["`7 M$[)(,^,R\\RXM/;!`1;*`@@IP@9(PO*I!`[`2R;>:!/J+PUGTQ,GOX"2+:<# M%HNS4*;_^O,NPLD6%4LY1P.H(RNQUD*N39'B,O30`X#JBTG`XH,IIR.-"HPO M]PXS:LA,5RV)@07\\Y'2Y+)2+M*/:(TUT0`4$(_5E1BP"\2A>.L31#X!W7!$ MW$KEU(!>?T*=LCV8OC7455AC_?$[(*_-5]O*.&I@`7I5>FDHVO@<+1E2\VPRMIH>".#/ M.A4;&$M$J:VTK0AQ[=>JCC=&"*Z*42+@@+L6IN.>YRQX+F5TSYW279C.Q>6>[7((5;X#$'AZO\B,MG3C+OOE=T*0M#K. MV[@1@[>H?QZPH.=S'P#+F`8D>H`,6/[)#C,Z.GG0&)$2M^!=O93T.V[A\,'U MUB]')ZC-?RVE]D=B/`>@'_,^)`KQG$T>#0=C%/`FAT]&HV.[3J`C@PY]<#CH M(F-R^$E*N^[YF77&@D.AQ5S;2MVMY+S$U_J]W<348^;VG]"YY2!ZRY:+#O@O M%^UC*:P+5ZE^8Y>82"0SR@BZ0.07 MI02P,:#C$LB2EC3O'&U-:L'8HNIA)>?]@$F@0M?\Z@&4!PPH,`MXUP+^,;_2 M!(8?^Z!@$8/5,,#<@X3)QE@ M9^U!#U)`M;,C=4I>NC!)\_*($A1415%=Q"&;N+BOC.G+="$1$A9?PJ=$"FN) M/%D0!1=4$DH(2#-6)-LD4!&Q)5Q^S'@W_54"BK2DA"NA>`!W`+BH!#C?/ M\80"!N<)8W3_@@X:"V",JH=R#.71X0#%Z)\V9P"\'"GC``SJ4F]T01C=V`:`X2T+.&!;D=!WC MB""K]4M!HD8D"]`DZ^H"+_J,2C?6?$X.]H%/YR`./=V\"9-PV9<%%$"A`&#` M`)%#3'7B$'OY&B;(U-FT70*+*%(CU3W^008%(&A&Q0B``1X`4.QT16(+W%='4"=)CX+'0+@=@,OE0$$I+Q$@^[$('0Z1)'WLA`>+, M@B[$`!%)?.F9`5`05A*-`^1PB@A9G`<+)K$D'_Z_:5D*.!E%K>160/K+66@JI MT`P9!57_V(CF@DT5#9VP?&E^[ M.?24%'H6;9W4MO9P\Y94HJ"2RA'CM+#WD3^> M9I3Z"B1"]K&`U66W9`2URX?,JZZGQB94N5$7J7Z:F'<00,%$8@`!C-/%^D;8 MJWB++3K-F6/DJ":[)0D7N="ETG6E!S$%YO_H?,;US:+@)2G_<'&]9)R1&%X8 MP];-BE8_2=A%+21@'?XQ`6ZIWJEQ:EC@DV0M'^M*%9MW)N_2ZR*NF")7+.(= M`K(Q*3/63NG*ZH^LO9;3?ER2O!#&DB+R%($;IM(E=[?04N+03,R#`'R\N#$Q M1L&K?%E,K""P:`H9I"GU7-A^87?0)OG>GH:5/#NN^I-#G900+4R>63] M@8LMW10&N((`/WB'`H[3T$3E%)`Y)25.91CJ@O#JU"628)/ M7?O+DS[YMV&!$=`"4)!K!^RZ50QP`#Y^@((#-$`!Y2SLE;-'P(%4N$U\GM5# MW_3LDSC`/*H^F)K_F25KWY2HED0IZ$[@[#\]Z>4>[QC(/MSM7!2,>Q&+($#& M[7'Q'ZP[TUL2]I8V_9%9(:W8Z\2RW2PZTP3N0P'OY'?K*'A<13/I/*!R#\T7 M>60CDPM>,%F4AG(*>+?$%05A6=&M(WI6FL=NC+J0U`U@R8PY,=#+ M2MBL52:(5/&=]O1M--*:H`B_QW/9LF&1^_(X3->5*`_[RWH+%N4LMV[)$0M6 ME9C;>263$JCH0T4"CVK`I;*-,\T:+\`$[AV>CG?D9\K.YYI.ZBL'M3F;?O?J M^3CF*='%V'TC++&35U1VM"VK5UVL"=XC[1MNNK*-B3&23VB^0-J;3;GL_\6' MEEQC&L;HYU,2-=LBGF>LEB#.!>Q?*>G$V\5O;)>Q*OD:5X_3%H[[RBFL]X\- M-BL-8*_P`3`G$=T4%<]1;GI[F-<_EK^I_ M41*'&_%3"10@,DAK,BB!(WFI-FF[C4=S0,.3B0T#)5&+/.E[K:A#.:@+K/ZC M+CX+@#?QNU.[`(`S%B=C,;YPOK$3,39C.`^9+IVRO],0IOKBJJUJNNEQK1=T MJ.\`/P%DB0^+)&?R$R;CF=Y8#_?8F4-KM.1QK#"RH02*NW;*MPQ[+97;OM*Q M0+E#"&?S0998I7A9OSOZ$PX!,?):H:`XP]8S#O_NF[K+P["H,[GK2S9\,QUD M0R"/D#BLZT*4B*#G4Q+D6C.Q8\(_+*O#:S((4SLL0T1/"[7K`32GJ[\-U+^O M"I@0%#Y@H2+V0\,Y&L/R<[(S,S&$V[^K<#I2K#P:S#T.I![XXL#Z(YI9H:SP MVT.4P`>3$41$\C9%8R;#@[3B:[*^>!<)5(L)*[9BM+!U8L0<[+\;`R0/+*4/ MS*]9_,%-R8F:`+MR*2]66C.'$3U7>X?N<\2:HK>HT\!E@\$]*R7="QW/D\:F M&"LT:R94$;M/<2:?:RPD.<)?_,8P,D;?60(`0 M`\6N^[:&=+,.$9:'"YC__GLH'DM%'1)$9.D--!3%&QI( M?Y0]URMO+-(*H0M.=RJ#$2LM0S)!4A, MQ5Q,#IF@TG0RKFO`_9(8L!RUI>&]`QI,O-NQDND3L",2,3L=@`'9SHWS$2DWL.994(;J"O6,KS,NPQ/1<"==9JQ.42(0C/?:#G7T$SSQ#Q3@4)MC$EM2*2=YC MBW]Q.1084`(M4/9;OA_RQ?A0O)AP%&*\O:/$4"DL-M>4OK7$0@02D!\`,P]] M##%#3?`1L0\9$2.SB23B,63;*J0DN>_LDLYT1NP#D-FR4>'P*Z0X0D&$ONS\ M0V19Q.O[JAHDG?C",9S2*@G3/I!XSB8=#P9P'5L:EO^&-+^R@[BQS"J\NTUE MA,0QXB+56D[C0*8.)5.G6(2>^45[;+*363[YLSN+`B8M942YHZ[,4\5$792, MB,8])0X'"#U<(D$2:4&?0*UPE#[.4T3Q_*3:>T&LX@B7>P?HE-36>`G<:)+V M'$3!2[ONJSOM&:;RW,`MK552O;$9K=%4W0_&]*X129:A9#C_Z\@"RKZ`G#IP M]%0W60!4]57BV"AL](M=5(0`6V\K"FXW'LS[\),O\HT`772!&94J/ M"#>8N]=H(:T%):^?>#T;I"C_6>VCOZQ).5Q%\`B82%W83"&&1:@M;;,3;.72 MUYS#D_U("$74D/$/0>O8@0'9`"L5_LH)4YS7"/,C8VS4\,RA1)&X!?@!/7U9 M%5F$Z?23$DF\;%TMK]*;F`R=+JVNK)"X#5N$7AU:H,&'A329ZDP9=TV.C)V^ M=*K05$S*D,B(%K/:JXT;!XC93?D+O1E(&E311IQ)196M<$.`T%1;0\K:GS`. M9&U-SH.N"X2\ZQ(V%(BRO.-2'U&V.X5"G44M`:G71=!;Q7<9T.W1?@X8?./*ONT^Z+5ILT(S%V` M=UB$DDIKW81\713XQHF;VE>H,CFEGMG-73Q[!Q3H7:']77YC`'SX->&%L*++ MB*1;7NQUN7+:713H!T7`AZF,7C)UA70C@$7H.%U`@(IK7@1@WX[#.'P87^@M MW_O%W_S5W_WEW_[UW_\%X``6X`$FX`(VX`-&X`16X`5FX`9VX`>&X`B6X`.V 1WPFVX`O&X`S6X`V.FX```#L_ ` end GRAPHIC 11 maindocument001x42x0.jpg IMAGE begin 644 maindocument001x42x0.jpg M_]C_X``02D9)1@`!`0$`D`"0``#_VP!#``H'!PD'!@H)"`D+"PH,#QD0#PX. M#QX6%Q(9)"`F)2,@(R(H+3DP*"HV*R(C,D0R-CL]0$!`)C!&2T4^2CD_0#W_ MP``+"``N`-\!`1$`_\0`'P```04!`0$!`0$```````````$"`P0%!@<("0H+ M_\0`M1```@$#`P($`P4%!`0```%]`0(#``01!1(A,4$&$U%A!R)Q%#*!D:$( M(T*QP152T?`D,V)R@@D*%A<8&1HE)B7J#A(6&AXB)BI*3E)66EYB9FJ*CI*6FIZBI MJK*SM+6VM[BYNL+#Q,7&Q\C)RM+3U-76U]C9VN'BX^3EYN?HZ>KQ\O/T]?;W M^/GZ_]H`"`$!```_`/9J**HWNI>0TMO:0FZODB$JVX;9N4MMSN/`[_E7/76D M>,]4+F3Q!9Z5&WW8[.U\UEY[NY&?RK/?P5XQ@1FL_'4[RG^&>U4J?U./RJ"R M\U6J*X#XR^0_@N.W?'VJ>[B2V]0^>H_#-=U;1O%:Q1R/O=$"LQ_B(')J6B MBBBBBL[7=2N-*TQKBSTZ?49]P5((<`DGN2>@]37(R7OQ,O,M!IFBV*XR$EF+ MM^8.*J:GXG\=>$+?[?KVGZ7?::A`E>T-?%$GAFRL?LL*S7=[=QVT2-G')^8\<]/U(KI***** M**XKQ3"NI_$3PMI\Q/D0^=>E<9#,@`7/XDUVM>9O\\.ZK*P M:6XR3:2G)'/H<_D#Z5WFL:Y8:%I,NI7]PL=M&N[<#DOZ!?4GM7D*^.=,U7Q9 M!KWBJ5H;6T)_L[3DCWNN?^6LF.G;'^`YZZT^*=C?>.!IL,]F-(^R>:;N23:2 M^`<<\=\8ZYS3/^%Q:='=1BZTC5+>QE<+%>/$-C9.,]>GTS7H(=68J&!9<$@' MD9Z5%/>VUJ\:7%Q#$\APBR.%+'VSUJ>BN8\<^,5\'V%I((XI)KNX6%!(^U5' M\3'V`_G1-\2?"4&=^NVA(.#L);^0K/\`^%N^&))7BM)+R[=>UO:NV?IQ67K7 MQ)\0Q6$UW8>%IK2TC3?]JU)O+`';Y?4\8&34?AKPW<>*I],\0>*]<6]\]1-: MZ>@V1';SRIQNQUZ?C7H\%]:7$#RV]S#)%&2'='!5<=02.F*S]*\6Z%K:3OIV MIV\RV^/-.[:$STSG'7%2:[XBT_PYI8O]1E98"RHOEJ7+L>@`'6N*\#>)[+Q' M\1?$-Y!>?NY(8([6*3Y&95!W84^A_G5[QE"+_P"(G@VT?F-))[D@=;^RV=;J-.6:W<88@=RI`-='I>JV>M:?%>Z=<)/;RC*NO M\CZ'VJ/7-&M?$&C7.FWR;H9TVD]U/8CW!YKQ*73;N&S\06VO:A/>S>&(0EC; MN/W6&X60CN0",`^WI5?XAZ%9^'?!_A^&%4FO;W=1MHXSZ?-^E+X;\ M,>%]9^(LVF(\L^F+9^8#YF,2!5+?,.P)-2:5Y^I>&O#7A-67[+J=]+<2'=R( M4?&!Z?=<_E78R^)M,\-?&"Z6\O8XK.ZT^*(.'RD;J>`WIQGGWIGA#3=-\>^( M-;U_662^%O=&WM+=Y-R0QCD,![]C[&NI803.^Y M;5,G,BCIT'7WK6\._9-)^+5EIVB^(+K4+:2VD(FXSVVR!P@[\#!^G/-59=7L_B;;WVGWTOV+4? M*86&F7`*!7V\2$\;V/.!V'8]:Y#Q+XM(\+Z%HJ6MUI^N:2QBDV[WO@'4[MRIC^UZ+?$?,@1L@ M?52/7IGVKG/#^A:5XC\2ZWIGB:8V'B7[7NAFMGV!B!SL'0\C..O/%6[S5M4\ M%_$/1X_$]V-1M+"%Q'=QQXD6*7Y`9/H1_P#KKVE65T#*0589!'<4ZBBBBBD( M!&",@UQNH?#Q(KF:\\+:G;5K_P`2SP:A?:LH2X1$Q$L8&`H!Z_\`UA5!/@UH#7(: M[N-1NK6,$06LMP=D(/4+CG%=1IOA+0](EAET_3+:"2%&C1T7G:W4$]\^]9NJ M?#;PYJME:VKV;6Z6F[R6MY"C(&))&?3))J71_A]XU@TV&=9"#(]RHE9 MR.F2?Z5GZC\*/#FH7S7*1W%D'`$L-I+Y<K%NN3ZUFQ?"7PC%*7_LUV!_@>XD*_EFDT^SC\3:JOE1QQ^&=)?R[6", M`)6('!1#P!W8$]JO^-_#NEZUHLDVH2I9S6P\R&^SM:!AR#GTSV_K69IF MAV/Q#\#Z5=^);)9+MX<^>AV2<$@,&'/(`..G-'_"H?"[6LD,L-W*7.[S)+IR MRGU';]*CN?A'I%S"@?4M8::+'V>9[LL8#_LCH.WY5?T3P37][*)HKR\"'SXWPT+I]UT]#Z^M5M*^& MUK']HD\0WLVN7$RI'ON>`(T;%_&N@V,6GZ/KNF&SA)6,3VIWA22>2,Y/-6$^ M'UWK$T GRAPHIC 12 maindocument001x42x1.jpg IMAGE begin 644 maindocument001x42x1.jpg M_]C_X``02D9)1@`!`0$`D`"0``#_VP!#``H'!PD'!@H)"`D+"PH,#QD0#PX. M#QX6%Q(9)"`F)2,@(R(H+3DP*"HV*R(C,D0R-CL]0$!`)C!&2T4^2CD_0#W_ MVP!#`0L+"P\-#QT0$!T]*2,I/3T]/3T]/3T]/3T]/3T]/3T]/3T]/3T]/3T] M/3T]/3T]/3T]/3T]/3T]/3T]/3T]/3W_P``1"``R`*X#`2(``A$!`Q$!_\0` M'P```04!`0$!`0$```````````$"`P0%!@<("0H+_\0`M1```@$#`P($`P4% M!`0```%]`0(#``01!1(A,4$&$U%A!R)Q%#*!D:$((T*QP152T?`D,V)R@@D* M%A<8&1HE)B7J#A(6&AXB)BI*3E)66EYB9FJ*CI*6FIZBIJK*SM+6VM[BYNL+#Q,7& MQ\C)RM+3U-76U]C9VN'BX^3EYN?HZ>KQ\O/T]?;W^/GZ_\0`'P$``P$!`0$! M`0$!`0````````$"`P0%!@<("0H+_\0`M1$``@$"!`0#!`<%!`0``0)W``$" M`Q$$!2$Q!A)!40=A<1,B,H$(%$*1H;'!"2,S4O`58G+1"A8D-.$E\1<8&1HF M)R@I*C4V-S@Y.D-$149'2$E*4U155E=865IC9&5F9VAI:G-T=79W>'EZ@H.$ MA8:'B(F*DI.4E9:7F)F:HJ.DI::GJ*FJLK.TM;:WN+FZPL/$Q<;'R,G*TM/4 MU=;7V-G:XN/DY>;GZ.GJ\O/T]?;W^/GZ_]H`#`,!``(1`Q$`/P#V:BBB@`HH MHH`***S=>U9M%TX78B$B"5$?)QM5F`+?AFFDY.R#8TJ*3(]:6D`451U;4#IM MEYB)YD\CK%#'G&]V.`,^G<^P-54T*2X3?J=_=3S-R1%*T4:>RJI_4Y-4HZ78 MKFQ16+)8:IIY,NG7C7:#K:W9SG_=DZ@_7(^E7=,U2'5+8R1!D=&V2Q2##Q,. MJD4..ET%Q+/5(;S4+ZS0,);-E5\CKN7((_SVJ]7&_:9=,\=:E?%?]!'M3GO8;BVOQB_LY3',`N`0>58>Q&*V*N3L[20EY$5O<0 MW<"36\BRQ.,JRG(-8_C6-9/".H*_0H.AQ_$*-0M6T2235--3]UG?>6R])%[N MH[..OOCUJ/Q7,E[X>@C@<.M]<01QL.0P9@<_D":<(VG%K:XF]&16T.8CX;U: M20_*&M+@-M::-2#U[.O0^W-=*HVJ`,X`QR@%A8W M*7+J.I4'#?D"3^%;$LSPS M97FG:3]CO2A\F1UA9.ABS\OTXXQ[4MX>@=37K#U!/[-\065]"`%O7%KPEM0SABQ:&0EC'RFSLK)T_$8IR>%+!;J>Y'F+<3.)!(C$-&V,':W7!_NG(]J M.6/<+LVZ*SYM0BTF&VAO)Y)[B7*H%CS)*1R3M4>E7D;>BL`1N&<,,$5+36HQ MU%%%(!"0H))``ZDTM9^N64^I:/<6=O(D;3H8RSKD`'KQ5*T\-2I!'%>ZM?7$ M:*%$:/Y2X`Q_#\Q_$U:BK7;%=EN>'3K35?[2GG2"?R?*;=*%5ESD9'4W-GZGFK]#:`Q9KC5-5CD@MK M,V4+@J;BY(+8/7:@[X]2/I5L:+:B#3X1OV6#*T(SW"E1GUX-:%%+G?30+!4, M]I!*=`9<_ M;0GD*; GRAPHIC 13 maindocument001x1x0.jpg IMAGE begin 644 maindocument001x1x0.jpg M_]C_X``02D9)1@`!`0$`D`"0``#_VP!#``H'!PD'!@H)"`D+"PH,#QD0#PX. M#QX6%Q(9)"`F)2,@(R(H+3DP*"HV*R(C,D0R-CL]0$!`)C!&2T4^2CD_0#W_ MP``+"``N`-\!`1$`_\0`'P```04!`0$!`0$```````````$"`P0%!@<("0H+ M_\0`M1```@$#`P($`P4%!`0```%]`0(#``01!1(A,4$&$U%A!R)Q%#*!D:$( M(T*QP152T?`D,V)R@@D*%A<8&1HE)B7J#A(6&AXB)BI*3E)66EYB9FJ*CI*6FIZBI MJK*SM+6VM[BYNL+#Q,7&Q\C)RM+3U-76U]C9VN'BX^3EYN?HZ>KQ\O/T]?;W M^/GZ_]H`"`$!```_`/9J**HWNI>0TMO:0FZODB$JVX;9N4MMSN/`[_E7/76D M>,]4+F3Q!9Z5&WW8[.U\UEY[NY&?RK/?P5XQ@1FL_'4[RG^&>U4J?U./RJ"R M\U6J*X#XR^0_@N.W?'VJ>[B2V]0^>H_#-=U;1O%:Q1R/O=$"LQ_B(')J6B MBBBBBL[7=2N-*TQKBSTZ?49]P5((<`DGN2>@]37(R7OQ,O,M!IFBV*XR$EF+ MM^8.*J:GXG\=>$+?[?KVGZ7?::A`E>T-?%$GAFRL?LL*S7=[=QVT2-G')^8\<]/U(KI***** M**XKQ3"NI_$3PMI\Q/D0^=>E<9#,@`7/XDUVM>9O\\.ZK*P M:6XR3:2G)'/H<_D#Z5WFL:Y8:%I,NI7]PL=M&N[<#DOZ!?4GM7D*^.=,U7Q9 M!KWBJ5H;6T)_L[3DCWNN?^6LF.G;'^`YZZT^*=C?>.!IL,]F-(^R>:;N23:2 M^`<<\=\8ZYS3/^%Q:='=1BZTC5+>QE<+%>/$-C9.,]>GTS7H(=68J&!9<$@' MD9Z5%/>VUJ\:7%Q#$\APBR.%+'VSUJ>BN8\<^,5\'V%I((XI)KNX6%!(^U5' M\3'V`_G1-\2?"4&=^NVA(.#L);^0K/\`^%N^&))7BM)+R[=>UO:NV?IQ67K7 MQ)\0Q6$UW8>%IK2TC3?]JU)O+`';Y?4\8&34?AKPW<>*I],\0>*]<6]\]1-: MZ>@V1';SRIQNQUZ?C7H\%]:7$#RV]S#)%&2'='!5<=02.F*S]*\6Z%K:3OIV MIV\RV^/-.[:$STSG'7%2:[XBT_PYI8O]1E98"RHOEJ7+L>@`'6N*\#>)[+Q' M\1?$-Y!>?NY(8([6*3Y&95!W84^A_G5[QE"+_P"(G@VT?F-))[D@=;^RV=;J-.6:W<88@=RI`-='I>JV>M:?%>Z=<)/;RC*NO M\CZ'VJ/7-&M?$&C7.FWR;H9TVD]U/8CW!YKQ*73;N&S\06VO:A/>S>&(0EC; MN/W6&X60CN0",`^WI5?XAZ%9^'?!_A^&%4FO;W=1MHXSZ?-^E+X;\ M,>%]9^(LVF(\L^F+9^8#YF,2!5+?,.P)-2:5Y^I>&O#7A-67[+J=]+<2'=R( M4?&!Z?=<_E78R^)M,\-?&"Z6\O8XK.ZT^*(.'RD;J>`WIQGGWIGA#3=-\>^( M-;U_662^%O=&WM+=Y-R0QCD,![]C[&NI803.^Y M;5,G,BCIT'7WK6\._9-)^+5EIVB^(+K4+:2VD(FXSVVR!P@[\#!^G/-59=7L_B;;WVGWTOV+4? M*86&F7`*!7V\2$\;V/.!V'8]:Y#Q+XM(\+Z%HJ6MUI^N:2QBDV[WO@'4[MRIC^UZ+?$?,@1L@ M?52/7IGVKG/#^A:5XC\2ZWIGB:8V'B7[7NAFMGV!B!SL'0\C..O/%6[S5M4\ M%_$/1X_$]V-1M+"%Q'=QQXD6*7Y`9/H1_P#KKVE65T#*0589!'<4ZBBBBBD( M!&",@UQNH?#Q(KF:\\+:G;5K_P`2SP:A?:LH2X1$Q$L8&`H!Z_\`UA5!/@UH#7(: M[N-1NK6,$06LMP=D(/4+CG%=1IOA+0](EAET_3+:"2%&C1T7G:W4$]\^]9NJ M?#;PYJME:VKV;6Z6F[R6MY"C(&))&?3))J71_A]XU@TV&=9"#(]RHE9 MR.F2?Z5GZC\*/#FH7S7*1W%D'`$L-I+Y<K%NN3ZUFQ?"7PC%*7_LUV!_@>XD*_EFDT^SC\3:JOE1QQ^&=)?R[6", M`)6('!1#P!W8$]JO^-_#NEZUHLDVH2I9S6P\R&^SM:!AR#GTSV_K69IF MAV/Q#\#Z5=^);)9+MX<^>AV2<$@,&'/(`..G-'_"H?"[6LD,L-W*7.[S)+IR MRGU';]*CN?A'I%S"@?4M8::+'V>9[LL8#_LCH.WY5?T3P37][*)HKR\"'SXWPT+I]UT]#Z^M5M*^& MUK']HD\0WLVN7$RI'ON>`(T;%_&N@V,6GZ/KNF&SA)6,3VIWA22>2,Y/-6$^ M'UWK$T GRAPHIC 14 maindocument001x1x1.jpg IMAGE begin 644 maindocument001x1x1.jpg M_]C_X``02D9)1@`!`0$`D`"0``#_VP!#``H'!PD'!@H)"`D+"PH,#QD0#PX. M#QX6%Q(9)"`F)2,@(R(H+3DP*"HV*R(C,D0R-CL]0$!`)C!&2T4^2CD_0#W_ MVP!#`0L+"P\-#QT0$!T]*2,I/3T]/3T]/3T]/3T]/3T]/3T]/3T]/3T]/3T] M/3T]/3T]/3T]/3T]/3T]/3T]/3T]/3W_P``1"``R`*X#`2(``A$!`Q$!_\0` M'P```04!`0$!`0$```````````$"`P0%!@<("0H+_\0`M1```@$#`P($`P4% M!`0```%]`0(#``01!1(A,4$&$U%A!R)Q%#*!D:$((T*QP152T?`D,V)R@@D* M%A<8&1HE)B7J#A(6&AXB)BI*3E)66EYB9FJ*CI*6FIZBIJK*SM+6VM[BYNL+#Q,7& MQ\C)RM+3U-76U]C9VN'BX^3EYN?HZ>KQ\O/T]?;W^/GZ_\0`'P$``P$!`0$! M`0$!`0````````$"`P0%!@<("0H+_\0`M1$``@$"!`0#!`<%!`0``0)W``$" M`Q$$!2$Q!A)!40=A<1,B,H$(%$*1H;'!"2,S4O`58G+1"A8D-.$E\1<8&1HF M)R@I*C4V-S@Y.D-$149'2$E*4U155E=865IC9&5F9VAI:G-T=79W>'EZ@H.$ MA8:'B(F*DI.4E9:7F)F:HJ.DI::GJ*FJLK.TM;:WN+FZPL/$Q<;'R,G*TM/4 MU=;7V-G:XN/DY>;GZ.GJ\O/T]?;W^/GZ_]H`#`,!``(1`Q$`/P#V:BBB@`HH MHH`***S=>U9M%TX78B$B"5$?)QM5F`+?AFFDY.R#8TJ*3(]:6D`451U;4#IM MEYB)YD\CK%#'G&]V.`,^G<^P-54T*2X3?J=_=3S-R1%*T4:>RJI_4Y-4HZ78 MKFQ16+)8:IIY,NG7C7:#K:W9SG_=DZ@_7(^E7=,U2'5+8R1!D=&V2Q2##Q,. MJD4..ET%Q+/5(;S4+ZS0,);-E5\CKN7((_SVJ]7&_:9=,\=:E?%?]!'M3GO8;BVOQB_LY3',`N`0>58>Q&*V*N3L[20EY$5O<0 MW<"36\BRQ.,JRG(-8_C6-9/".H*_0H.AQ_$*-0M6T2235--3]UG?>6R])%[N MH[..OOCUJ/Q7,E[X>@C@<.M]<01QL.0P9@<_D":<(VG%K:XF]&16T.8CX;U: M20_*&M+@-M::-2#U[.O0^W-=*HVJ`,X`QR@%A8W M*7+J.I4'#?D"3^%;$LSPS M97FG:3]CO2A\F1UA9.ABS\OTXXQ[4MX>@=37K#U!/[-\065]"`%O7%KPEM0SABQ:&0EC'RFSLK)T_$8IR>%+!;J>Y'F+<3.)!(C$-&V,':W7!_NG(]J M.6/<+LVZ*SYM0BTF&VAO)Y)[B7*H%CS)*1R3M4>E7D;>BL`1N&<,,$5+36HQ MU%%%(!"0H))``ZDTM9^N64^I:/<6=O(D;3H8RSKD`'KQ5*T\-2I!'%>ZM?7$ M:*%$:/Y2X`Q_#\Q_$U:BK7;%=EN>'3K35?[2GG2"?R?*;=*%5ESD9'4W-GZGFK]#:`Q9KC5-5CD@MK M,V4+@J;BY(+8/7:@[X]2/I5L:+:B#3X1OV6#*T(SW"E1GUX-:%%+G?30+!4, M]I!*=`9<_ M;0GD*;