0001188112-11-002766.txt : 20111003 0001188112-11-002766.hdr.sgml : 20111003 20110930200757 ACCESSION NUMBER: 0001188112-11-002766 CONFORMED SUBMISSION TYPE: S-1 PUBLIC DOCUMENT COUNT: 31 FILED AS OF DATE: 20111003 FILER: COMPANY DATA: COMPANY CONFORMED NAME: FS Bancorp, Inc. CENTRAL INDEX KEY: 0001530249 IRS NUMBER: 000000000 STATE OF INCORPORATION: WA FISCAL YEAR END: 1231 FILING VALUES: FORM TYPE: S-1 SEC ACT: 1933 Act SEC FILE NUMBER: 333-177125 FILM NUMBER: 111118209 BUSINESS ADDRESS: STREET 1: 6920 220TH STREET SW STREET 2: SUITE 300 CITY: MOUNTLAKE TERRACE STATE: WA ZIP: 98043 BUSINESS PHONE: 800-683-0973 MAIL ADDRESS: STREET 1: 6920 220TH STREET SW STREET 2: SUITE 300 CITY: MOUNTLAKE TERRACE STATE: WA ZIP: 98043 S-1 1 t71441_s1.htm FORM S-1 t71441_s1.htm
As filed with the Securities and Exchange Commission on September 30, 2011
Registration No. 333-______


UNITED STATES
SECURITIES AND EXCHANGE COMMISSION
WASHINGTON, D.C. 20549

FORM S-1 REGISTRATION STATEMENT
UNDER
THE SECURITIES ACT OF 1933


FS BANCORP, INC

(Exact Name of Registrant as Specified in Its Charter)


Washington
(State or Other Jurisdiction
of Incorporation or Organization)
6036
(Primary Standard Industrial
Classification Code Number)
Applied For
(I.R.S. Employer
Identification Number)

6920 220th Street SW, Suite 200, Mountlake Terrace, Washington  98043; (425) 771-8840

 (Address, Including Zip Code, and Telephone Number, Including Area Code, of Registrant's Principal Executive Offices)

Joseph C. Adams, Chief Executive Officer
1ST Security Bank of Washington
6920 220th Street SW, Suite 200, Mountlake Terrace, Washington  98043; (425) 771-8840

(Address, Including Zip Code, and Telephone Number, Including Area Code, of Agent for Service)

Copies to:
Michael S. Sadow, P.C.
Martin L. Meyrowitz, P.C.
Silver, Freedman & Taff, L.L.P.
3299 K Street, N.W., Suite 100
Washington, D.C. 20007
(202) 295-4500
Steven T. Lanter, Esq.
Luse Gorman Pomerenk & Schick
5535 Wisconsin Avenue, NW, Suite 780
Washington, D.C. 20015
(202) 274-4000

Approximate date of commencement of proposed sale to the public: As soon as practicable after this registration statement becomes effective.
 
If any of the securities being registered on this Form are to be offered on a delayed or continuous basis pursuant to Rule 415 under the Securities Act of 1933, check the following box:  :
 
If this Form is filed to register additional shares for an offering pursuant to Rule 462(b) under the Securities Act, please check the following box and list the Securities Act registration statement number of the earlier effective registration statement for the same offering:  o
 
If this Form is a post-effective amendment filed pursuant to Rule 462(c) under the Securities Act, check the following box and list the Securities Act registration statement number of the earlier effective registration statement for the same offering:  o
 
If this Form is a post-effective amendment filed pursuant to Rule 462(d) under the Securities Act, check the following box and list the Securities Act registration statement number of the earlier effective registration statement for the same offering:   o
 
Indicate by check mark whether the registrant is a large accelerated filer, an accelerated filer, a non-acclerated filer, or a smaller reporting company.  See the definitions of "large accelerated filer," "accelerated filer" and "smaller reporting company" in Rule 12b-2 of the Exchange Act.
 
 
Large accelerated filer  o
Accelerated filer  o
 
 
Non-accelerated filer  o (Do not check if a smaller reporting company)
Smaller reporting company x


CALCULATION OF REGISTRATION FEE

Title of each class of
securities to be registered
Amount
to be
registered
Proposed
maximum
offering price
per share
Proposed
maximum
aggregate
offering price(1)
Amount of
registration fee
Common Stock, par value $.01 per shares
3,240,125 shares
$10.00
$32,401,250
$3,762(1)
 
(1) Estimated solely for the purpose of calculating the registration fee.
 
    The Registrant hereby amends this registration statement on such date or dates as may be necessary to delay its effective date until the Registrant shall file a further amendment which specifically states that this registration shall thereafter become effective in accordance with Section 8(a) of the Securities Act of 1933 or until the registration statement shall become effective on such date as the Commission, acting pursuant to said Section 8(a), may determine.


PROSPECTUS
Up to 2,817,500 Shares of Common Stock
(Subject to increase to up to 3,240,125 shares)
 
 FS BANCORP, INC.
 (Proposed Holding Company for 1st Security Bank of Washington)
 
We are offering up to 2,817,500 shares of our common stock for sale in connection with our conversion from a mutual savings bank structure to a stock holding company structure.  As part of the conversion, 1st Security Bank of Washington will become our wholly owned subsidiary.  We may increase the maximum number of shares that we sell in the offering by up to 15%, to 3,240,125 shares, as a result of the demand for shares or changes in market and financial conditions.  The shares of our common stock are being offered for sale at a price of $10.00 per share.  We expect our common stock will be listed on the Nasdaq Capital Market under the symbol “FSBW.”  We cannot predict, however, whether an active and liquid trading market for our common stock will develop.
 
We are offering these shares for sale first to our depositors and other eligible subscribers in a subscription offering.  Concurrently with or immediately after the subscription offering, any shares not subscribed for in the subscription offering will be offered to the general public in a direct community offering and/or a syndicated community offering (collectively referred to as the “offering”).  In order to complete the offering, we must sell, in the aggregate, at least 2,082,500 shares.  The minimum purchase is 25 shares.  The subscription offering is scheduled to end at 12:00 Noon, Pacific time, on _________ __, 2011.  However, we may extend this expiration date, without notice to you, until _________ __, 2012, unless the Washington Department of Financial Institutions and the Federal Deposit Insurance Corporation approve a later date, which may not be extended beyond _________ __, 2013.  Once submitted, orders are irrevocable unless the offering is terminated or extended beyond _________ __, 2012.  If the offering is extended beyond _________ __, 2012, subscribers will have the right to modify or rescind their purchase orders.  FS Bancorp, Inc. will hold all subscribers’ funds received before the completion of the conversion in a segregated account at 1st Security Bank of Washington until the conversion is completed or terminated.  We will pay interest on all funds received at a rate equal to 1st Security Bank of Washington’s passbook (statement savings) rate, which is currently ____% per annum.  Funds will be returned promptly with interest if the conversion is terminated.
 
                                                                                        Investing in our common stock involves risks.  See “Risk Factors” beginning on page 18.
TERMS OF THE OFFERING
Price Per Share: $10.00; Minimum Subscription: 25 shares or $250
 
   
Minimum
   
Maximum
   
Maximum
as adjusted
 
                   
Number of Shares
    2,082,500       2,817,500       3,240,125  
Gross Offering Proceeds
  $ 20,825,000     $ 28,175,000     $ 32,401,250  
Estimated Selling Agent Fees and Expenses(1)
  $ 331,000     $ 421,000     $ 473,000  
Estimated Other Expenses(2) 
  $ 1,679,000     $ 1,679,000     $ 1,679,000  
Estimated Net Proceeds to FS Bancorp, Inc.
  $ 18,815,000     $ 26,075,000     $ 30,249,250  
Estimated Net Proceeds Per Share
  $ 9.03     $ 9.25     $ 9.34  
 

(1)
For additional information regarding selling agent fees, including the assumptions regarding the number of shares sold in the offering that we used to determine the estimated offering expenses, see “Pro Forma Data” and “The Conversion and Stock Offering - Marketing Arrangements.”  If shares are sold in a syndicated community offering, we have agreed to pay Keefe, Bruyette & Woods, Inc. and any other broker-dealers participating in the syndicated community offering selling commission in an amount up to 5.50% of the aggregate amount of common stock sold in the syndicated community offering, which would result in higher selling commissions and lower net proceeds and net proceeds per share.  If all shares were sold in the syndicated community offering, the maximum commission payable to participating members would be $1.1 million, $1.5 million and $1.8 million at the minimum, maximum and adjusted maximum of the offering range.
(2) Includes $853,000 of deferred conversion-related costs. 
 
Keefe, Bruyette & Woods will use its best efforts to assist us in our selling efforts, but is not required to purchase any of the common stock that is being offered for sale.  Subscribers will not pay any commissions to purchase shares of common stock in the offering.
 
These securities are not deposits or accounts and are not insured or guaranteed by the Federal Deposit Insurance Corporation or any other governmental agency.
 
Neither the Securities and Exchange Commission, the Federal Deposit Insurance Corporation, the Board of Governors of the Federal Reserve System, the Washington Department of Financial Institutions, nor any other federal agency or state securities regulator has approved or disapproved these securities or determined if this prospectus is accurate or complete.  Any representation to the contrary is a criminal offense.
 
For information on how to subscribe, call the stock information center at (___) ___-____.
 
 
KEEFE, BRUYETTE & WOODS
 
________ __, 2011


(MAP)


TABLE OF CONTENTS
   
Page
     
 
1
 
18
 
31
 
33
 
34
 
34
 
35
 
36
 
37
 
38
 
39
 
40
 
47
 
48
 
69
 
69
 
97
 
106
 
117
 
118
 
140
 
143
 
145
 
145
 
145
 
145
 
F-1


This summary provides an overview of the key aspects of the stock offering as described in more detail elsewhere in this prospectus and may not contain all the information that is important to you.  To completely understand the stock offering, you should read the entire prospectus carefully, including the sections entitled “Risk Factors” and “The Conversion and Stock Offering” beginning on pages 18 and 118, respectively, and the financial statements and the notes to the financial statements beginning on page F-1, before making a decision to invest in our common stock.
 
Overview
 
As part of the conversion to stock ownership, FS Bancorp, Inc., hereafter referred to as FS Bancorp, is conducting this offering of between 2,082,500 and 2,817,500 shares of common stock to raise additional capital to support operational growth.  We may increase the maximum number of shares that we sell in the offering by up to 15% to 3,240,125 shares, as a result of the demand for shares or changes in market and financial conditions.  The offering includes a subscription offering in which certain persons, including depositors of 1st Security Bank of Washington, have prioritized subscription rights.  There are limitations on how many shares a person may purchase.  The amount of capital being raised is based on an appraisal of FS Bancorp and a decision by management to offer all of our shares of common stock to the public.  Most of the terms and requirements of this offering are required by regulations of the Washington Department of Financial Institutions and the Federal Deposit Insurance Corporation, which is also referred to in this document as the FDIC.
 
The following tables show how many shares of common stock may be issued in the offering and subsequently issued if our proposed stock-based equity incentive plan is adopted.
 
   
Shares to be sold
to the
public in
this offering
   
Shares to be sold
to the employee stock
ownership plan(2)
   
Shares proposed
to be sold
to directors
and officers
   
Total shares of
common stock to be
outstanding after the
offering
 
   
Amount
    %(1)    
Amount
    %(1)    
Amount
    %(1)    
Amount
   
%
 
                                                       
Minimum
    1,839,900       88.4 %     166,600       8.0 %     76,000       3.7 %     2,082,500       100.0 %
Midpoint
    2,178,000       88.9 %     196,000       8.0 %     76,000       3.1 %     2,450,000       100.0 %
Maximum
    2,516,100       89.3 %     225,400       8.0 %     76,000       2.7 %     2,817,500       100.0 %
Maximum, as adjusted
    2,904,915       89.7 %     259,210       8.0 %     76,000       2.3 %     3,240,125       100.0 %
 
   
Shares that may be awarded under an
equity incentive plan
 
   
Restricted Stock
   
Stock Option
 
   
Amount
    %(1)     Amount     %(1)  
                                 
Minimum
    83,300       4.0 %     208,250       10.0 %
Midpoint
    98,000       4.0 %     245,000       10.0 %
Maximum
    112,700       4.0 %     281,750       10.0 %
Maximum, as adjusted
    129,605        4.0 %     324,013       10.0 %
 

(1) As a percentage of total shares sold in the offering.
(2) Assumes 8% of the shares sold in the offering are sold to the employee stock ownership plan.
 
 
1


FS Bancorp, Inc.
6920 220th Street SW
Mountlake Terrace, Washington 98043
(425) 771-5299
 
FS Bancorp is a newly formed Washington corporation that will hold all of the outstanding shares of 1st Security Bank of Washington following the conversion to stock ownership.  FS Bancorp is conducting the stock offering in connection with the conversion of 1st Security Bank of Washington from the mutual to the stock form of organization.  Upon completion of the offering, FS Bancorp will be a bank holding company and its primary regulator will be the Board of Governors of the Federal Reserve System.
 
1st Security Bank of Washington
6920 220th Street SW
Mountlake Terrace, Washington 98043
(425) 771-5299
 
1st Security Bank of Washington is a relationship-driven community bank.  We deliver banking and financial services to local families, local and regional businesses and industry niches within distinct Puget Sound area communities.  We emphasize long-term relationships with families and businesses within the communities we serve, working with them to meet their financial needs.  We are also actively involved in community activities and events within these market areas, which further strengthens our relationships within these markets.  We have been serving the Puget Sound area since 1936.  Originally chartered as a credit union, previously known as Washington’s Credit Union, we served various select employment groups.  On April 1, 2004, we converted from a credit union to a Washington state-chartered mutual savings bank.  Upon completion of the conversion, 1st Security Bank of Washington will be a Washington state-chartered stock savings bank and the wholly owned subsidiary of FS Bancorp.
 
At the time of our conversion to a mutual savings bank in 2004, we operated 14 branch locations in the Puget Sound area, along with our Mountlake Terrace headquarters, and had 132 employees.  Our assets at December 31, 2004 totaled $261.4 million.  Since then, in an effort to address a number of operational deficiencies facing 1st Security Bank of Washington, primarily related to differences between operating a credit union and operating a bank, we restructured the board of trustees (hereafter referred to throughout this document as the board of directors) and added a number of seasoned bankers to the organization.  In 2008, we determined that a number of cost cutting measures were needed due to the deepening recession in order to return the institution to profitability, including salary reductions or freezes for a number of our senior officers, reduced employee benefits and a consolidation of our branch network.  We initiated a number of these measures in 2009.  At June 30, 2011, we maintained six branch locations, along with our headquarters, had approximately 79 full time equivalent employees, total assets of $272.8 million and total deposits of $241.5 million.  This compared to 12 branch locations, along with our headquarters, 112 full-time equivalent employees, total assets of $255.4 million and total deposits of $216.1 million, at December 31, 2008.
 
Since January 2006, 1st Security Bank of Washington has been operating under some form of regulatory agreement, either with the Washington Department of Financial Institutions, the Federal Deposit Insurance Corporation, or both.  These regulatory agreements placed numerous requirements on us and limited our operating flexibility, which affected our ability to grow.  As of September 2011, we are no longer subject to any formal or informal regulatory agreements with either the Washington Department of Financial Institutions or the Federal Deposit Insurance Corporation.
 
 
2


1st Security Bank of Washington is a diversified lender with a focus on the origination of home improvement loans, commercial real estate mortgage loans, commercial business loans and second mortgage/home equity loan products.  Consumer loans, in particular indirect home improvement loans, represent the largest portion of the loan portfolio and have traditionally been the mainstay of the bank’s lending strategy.  Going forward, an emphasis will be placed on diversifying our lending products, such as commercial real estate, commercial business and residential construction lending, while maintaining the size of our consumer loan portfolio.  We also intend to reintroduce in-house originations of residential mortgage loans, primarily for sale into the secondary market, through a mortgage banking program.  Our lending strategies are intended to take advantage of: (1) our historical strength in indirect consumer lending, (2) recent market dislocation that has created new lending opportunities and the availability of experienced bankers, and (3) our strength in relationship lending. Retail deposits will continue to serve as an important funding source.  See “Risk Factors - Risks Related to Our Business.”
 
Operating Strategy
 
Our primary objective is to operate 1st Security Bank of Washington as a well-capitalized, profitable, independent, community-oriented financial institution, serving customers in our primary market area.  Our strategy is to provide innovative products and superior service to small businesses, industry and geographic niches, and individuals in our primary market area.  Our primary market area is defined generally as the greater Puget Sound market area.  After the conversion and offering, we plan to continue our strategy of:
 
 
Growing and diversifying our loan portfolio and revenue streams by expanding our commercial real estate, commercial business and residential construction lending operations, and reintroducing in-house originations of residential mortgage loans through a mortgage banking program.
 
 
Maintaining and improving asset quality, including actively managing our delinquent loans and non-performing assets by aggressively pursuing the collection of consumer debts and marketing saleable properties upon which we foreclosed or repossessed.
 
 
Emphasizing lower cost core deposits to reduce the costs of funding our loan growth. In order to build our core deposit base, we provide sales promotions on savings and checking accounts and diligently attempt to recruit all commercial loan customers to maintain a deposit relationship with us, generally a business checking account relationship, for the term of their loan.
 
 
Capturing our customers’ full relationship by offering a wide range of products and services.  As part of our commercial lending process we cross-sell the entire business banking relationship, including deposit relationships and business banking products, such as online cash management, treasury management, wires, direct deposit, payment processing and remote deposit capture.  Our mortgage banking program also will provide us with opportunities to cross-sell products to new customers.
 
 
Expanding our reach, by leveraging our well-established involvement in the community and by selectively emphasizing products and services designed to meet our customers’ banking needs.  We also intend to pursue expansion in our market area through selective growth of our branch network.  We currently intend to open a branch in the Capitol Hill area of Seattle within the next 12 months, although no specific location has been identified at this time.
 
For a more detailed description of our products and services, as well as our business operating strategy and goals, see “Business of 1st Security Bank of Washington” beginning on page 18.
 
 
3


The Conversion and Stock Offering
 
We do not have public shareholders in our current mutual form of ownership.  The conversion is a series of transactions by which we are reorganizing from a mutual savings bank structure to a stock holding company which will be 100% owned by public shareholders.  As a result of the conversion, 1st Security Bank of Washington will be owned directly by FS Bancorp.  Voting rights in FS Bancorp will be vested solely in the public shareholders following the conversion.
 
The chart below shows our structure before the conversion and offering:


Depositors


1st Security Bank of Washington


The chart below shows our structure after the conversion and offering:


Shareholders


  100%


FS Bancorp, Inc.


  100%


 1st Security Bank of Washington


Terms of the Offering
 
We are offering between 2,082,500 and 2,817,500 shares of common stock to those with subscription rights in the following order of priority:
 
 
(1)
Depositors who held at least $50 with us as of the close of business on June 30, 2007.
 
 
(2)
The FS Bancorp, Inc. employee stock ownership plan.
 
 
(3)
Depositors who held at least $50 with us as of the close of business on ________ __, 2011.
 
 
(4)
Depositors with us as of the close of business on ________ __, 2011 to the extent not already included in a prior category.
 
 
4


We may increase the maximum number of shares that we sell in the offering by up to 15% to 3,240,125 shares with the approval of the Washington Department of Financial Institutions and the Federal Deposit Insurance Corporation and without any notice to you as a result of market demand, regulatory considerations or changes in financial conditions.  If we increase the offering, you will not have the opportunity to change or cancel your stock order.  The offering price is $10.00 per share.  All purchasers will pay the same purchase price per share.  No commission will be charged to purchasers in the offering.
 
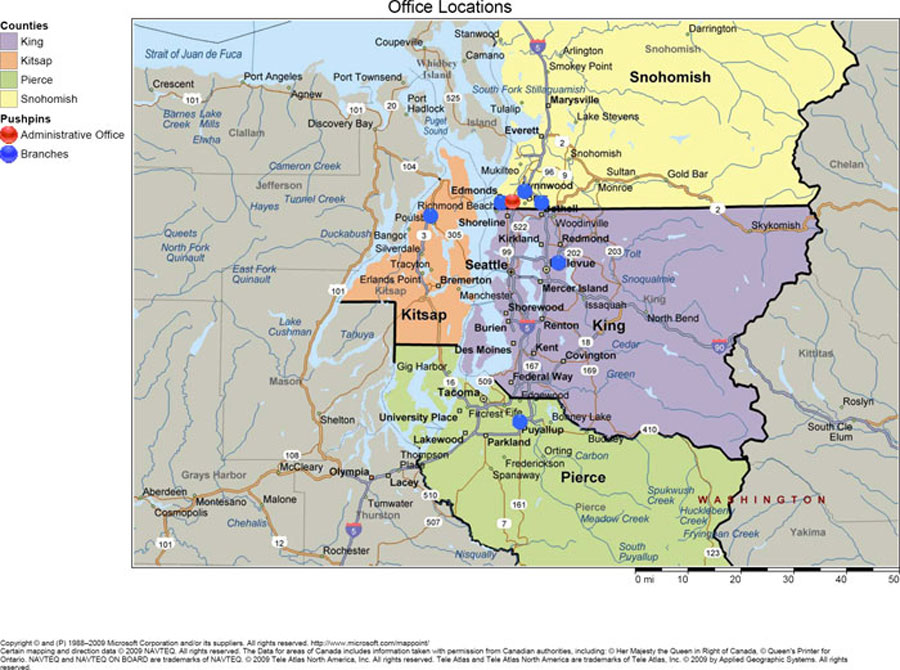
If we receive subscriptions for more shares than are to be sold in the subscription offering, shares will be allocated in order of the priorities described above under a formula outlined in the plan of conversion. Shares of common stock not subscribed for in the subscription offering will be offered to the general public in a direct community offering with a preference to natural persons residing in King, Kitsap, Pierce and Snohomish Counties, Washington and, if necessary, a syndicated community offering.  The direct community offering, if any, shall begin at the same time as, during or promptly after the subscription offering.  See “The Conversion and Stock Offering - Subscription Offering and Subscription Rights,” “- Direct Community Offering” and “- Syndicated Community Offering.”
 
Keefe, Bruyette & Woods, our financial advisor and selling agent in connection with the offering, will use its best efforts to assist us in selling our common stock in the offering.  Keefe, Bruyette & Woods is not obligated to purchase any shares of common stock in the offering.  For further information about the role of Keefe, Bruyette & Woods in the offering, see “The Conversion and Stock Offering - Marketing Arrangements.”
 
Reasons for the Conversion and Offering
 
The primary reasons for the conversion and our decision to conduct the offering are to:
 
 
increase our capital to support future growth; and
 
 
provide us with greater operating flexibility and allow us to better compete with other financial institutions.
 
The conversion and the capital raised in the offering are expected to:
 
 
give us the financial strength to grow our bank;
 
 
better enable us to serve our customers in our market area;
 
 
enable us to increase lending and support our emphasis on commercial business and commercial real estate lending and the development of new products and services;
 
 
help us attract and retain qualified management through stock-based compensation plans; and
 
 
structure our business in a form that will enable us to access the capital markets.
 
We anticipate adding one branch in the Capitol Hill area of Seattle, Washington during the next 12 months although no specific site has been identified at this time; otherwise, we do not have any specific plans or arrangements for expanding our branch network and/or any specific acquisition plans.
 
How We Determined the Offering Range and the $10.00 Price Per Share
 
Valuation Range and Background.  The amount of common stock we are offering is based on an independent appraisal by RP Financial, LC. (“RP Financial”) of the estimated pro forma market value of FS Bancorp, assuming the conversion and offering are completed.  The appraisal was based in part on our consolidated financial condition and results of operations, the pro forma effect of the additional capital raised by the sale of shares of our common stock in the offering, and an analysis of a peer group of publicly-traded companies utilized by RP Financial in its appraisal that RP Financial considers comparable to FS Bancorp.
 
 
5


RP Financial concluded that, as of September 2, 2011, the estimated pro forma market value of FS Bancorp was $24.5 million.  This pro forma market value is the midpoint of a valuation range established by regulation with a minimum of $20.8 million and a maximum of $28.2 million.  Based on this market value and a $10.00 per share purchase price, the number of shares of our common stock that will be offered for sale will range from 2,082,500 to 2,817,500 with a midpoint of 2,450,000.  The $10.00 per share price was selected primarily because it is the price most commonly used in mutual-to-stock conversions of financial institutions.  If a greater demand for shares of our common stock or a change in financial or market conditions warrant, the offering range may be increased by 15.0%, which would result in an adjusted maximum pro forma market value of $32.4 million and total shares offered of 3,240,125.
 
RP Financial advised the board of directors that the appraisal was prepared in conformance with the regulatory appraisal methodology.  That methodology requires a valuation based on an analysis of trading prices of comparable companies whose stocks have traded for at least one year prior to the valuation date.  RP Financial selected a group of comparable public companies for this analysis.
 
In preparing its appraisal, RP Financial considered the information in this prospectus, including our financial statements.  RP Financial also considered the following factors, among others.
 
 
the present results and financial condition of 1st Security Bank of Washington, and the projected results and financial condition of FS Bancorp;
 
 
the economic and demographic conditions in our existing market area;
 
 
certain historical, financial and other information relating to 1st Security Bank of Washington;
 
 
a comparative evaluation of the operating and financial characteristics of 1st Security Bank of Washington with the peer group companies, which are headquartered in the states of Washington (two companies), Tennessee (two companies) and Montana, Michigan, Indiana, Illinois, Louisiana and Ohio (one company);
 
 
the impact of the conversion and the offering on FS Bancorp’s shareholders’ equity and earnings potential;
 
 
the proposed dividend policy of FS Bancorp; and
 
 
the trading market for the securities of the peer group institutions and general conditions in the stock market for the peer group institutions and all publicly traded thrift institutions.
 
Furthermore, RP Financial had various discussions with management.  RP Financial did not perform a detailed analysis of the separate components of our assets and liabilities.  We did not impose any limitations on RP Financial in connection with its appraisal.
 
 
6


RP Financial relied primarily on a comparative market value methodology in determining the pro forma market value of our common stock.  In applying this methodology, RP Financial analyzed financial and operational comparisons of 1st Security Bank of Washington with a selected peer group of publicly traded savings institutions.  The peer group used by RP Financial consists of ten companies listed in the table below.  The pro forma market value of FS Bancorp’s common stock was determined by RP Financial based on the market pricing ratios of the peer group, subject to certain valuation adjustments based on fundamental differences between 1st Security Bank of Washington and the institutions comprising the peer group.  RP Financial took into account the significant volatility in the broader stock market and the after market pricing characteristics of recently converted savings institutions.  RP Financial utilized the results of this overall analysis to establish pricing ratios that resulted in the determination of the pro forma market value.
 
The selection criteria for the peer group included consideration of geographic location, earnings and asset size.  The peer group companies are:
 
Peer Group (Ticker Symbol)
 
City and State
 
Assets
 
       
(In millions)
 
           
Riverview Bancorp, Inc. (RVSB)
 
Vancouver, WA
  $ 886  
Timberland Bancorp, Inc. (TSBK)
 
Hoquiam, WA
    735  
LSB Financial Corp. (LSBI)
 
Lafayette, IN
    360  
First Advantage Bancorp (FABK)
 
Clarksville, TN
    350  
Eagle Bancorp Montana (EBMT)
 
Helena, MT
    331  
Louisiana Bancorp, Inc. (LABC)
 
Metairie, LA
    320  
Jacksonville Bancorp, Inc. (JXSB)
 
Jacksonville, IL
    305  
Athens Bancshares, Inc. (AFCB)
 
Athens, TN
    283  
First Federal of Northern Michigan (FFNM)
 
Alpena, MI
    219  
FFD Financial Corp. (FFDF)
 
Dover, OH
    211  
 
Two of the measures investors use to analyze whether a stock might be a good investment are the ratio of the offering price to the issuer’s “book value” and the ratio of the offering price to the issuer’s annual net income.  RP Financial considered these ratios, among other factors, in preparing its appraisal.  Book value is the same as total shareholders’ equity, and represents the difference between the issuer’s assets and liabilities.  Tangible book value is equal to total shareholders’ equity less intangible assets.  Reported earnings reflect net income recorded by 1st Security Bank of Washington during the 12 month period ended June 30, 2011.  Core earnings represent 1st Security Bank of Washington’s earnings, adjusted for non-operating items and adjusted to reflect a normalized assumed tax rate.  RP Financial’s appraisal also incorporates an analysis of a peer group of publicly traded companies that RP Financial considered to be comparable to us.
 
The following table presents a summary of selected pricing ratios for the peer group companies and 1st Security Bank of Washington (on a pro forma basis).  The pricing ratios are based on book value, earnings and other information as of and for the 12 months ended June 30, 2011, stock price information as September 2, 2011 as reflected in RP Financial’s appraisal report, dated September 2, 2011, and the number of shares assumed to be outstanding as described in “Pro Forma Data.”  Compared to the average pricing of the peer group, our pro forma pricing ratios at the maximum of the offering range indicated a discount of 3.8% on a price-to-reported earnings basis, a premium of 59.8% on a price-core earnings basis, a discount of 14.2% on a price-to-book value basis, and a discount of 17.6% on a price-to-tangible book value basis.
 
 
7


Price-to-
earnings multiple
   
Price-to-core
earnings multiple
   
Price-to-book
value ratio
   
Price-to-tangible
book value ratio
 
                         
FS Bancorp, Inc.
                       
   Minimum of offering range
    11.86 x     21.37 x     49.26 %     49.26 %
   Midpoint of offering range
    14.11 x     25.68 x     53.88 %     53.88 %
   Maximum of offering range
    16.43 x     30.19 x     57.90 %     57.90 %
   Maximum of offering range, as adjusted
    19.16 x     35.62 x     61.88 %     61.88 %
                                 
Valuation of peer group companies using stock market prices as of September 2, 2011
                               
   Average
    17.08 x     18.89 x     67.44 %     70.29 %
   Median
    17.27 x     19.71 x     69.11 %     72.48 %
 
Our board of directors reviewed the appraisal report of RP Financial, including the methodology and the assumptions used, and determined that the valuation range was reasonable and adequate.  Given that the shares are to be sold at $10.00 per share in the offering, the estimated number of shares would be between 2,082,500 at the minimum of the valuation range and 2,817,500 at the maximum of the valuation range, with a midpoint of 2,450,000.
 
The independent appraisal does not indicate per share market value.  Do not assume or expect that the valuation of FS Bancorp as indicated above means that, after the conversion and the offering, the shares of common stock will trade at or above the $10.00 offering price.  Furthermore, the pricing ratios presented above were utilized by RP Financial to estimate our market value and not to compare the relative value of shares of our common stock with the value of the capital stock of the peer group.  The value of the capital stock of a particular company may be affected by a number of factors such as financial performance, asset size and market location.
 
For a more complete discussion of the amount of common stock we are offering for sale and the independent appraisal, including a comparison of selected pro forma pricing ratios compared to pricing ratios of the peer group, see “The Conversion and Offering—Share Pricing and Number of Shares to be Issued.”
 
RP Financial will update its appraisal before we complete the offering.  If, as a result of demand for the shares or changes in market conditions, RP Financial determines that our pro forma market value has increased, we may sell up to 3,240,125 shares in the offering without notice to you.  If our pro forma market value at that time is either below $20.8 million or above $32.4 million, then, after consulting with the Washington Department of Financial Institutions and the Federal Deposit Insurance Corporation, we may:
 
 
set a new offering range;
 
 
take such other actions as may be permitted by the Washington Department of Financial Institutions, the FDIC and the Securities and Exchange Commission; or
 
 
terminate the offering and promptly return all funds.
 
If we set a new offering range, we will be required to cancel your stock order and promptly return your subscription funds, with interest calculated at the statement savings rate, and cancel any authorization to withdraw funds from your deposit accounts for the purchase of shares of common stock. You will have the opportunity to place a new stock order.
 
 
8


After-Market Performance Information Provided by the Independent Appraiser
 
The following table, prepared by our independent appraiser, presents for all full stock conversions that began trading from July 1, 2010 to September 2, 2011, the percentage change in the trading price from the initial trading date of the offering to the dates shown in the table.  The table also presents the average and median trading prices and percentage change in trading prices for the same dates.  This information relates to stock performance experienced by other companies that may have no similarities to us with regard to market capitalization, offering size, earnings quality and growth potential, among other factors.
 
The table is not intended to indicate how our common stock may perform.  Data represented in the table reflects a small number of transactions and is not indicative of general stock market performance trends or of price performance trends of companies that undergo conversions.  Furthermore, this table presents only short-term price performance and may not be indicative of the longer-term stock price performance of these companies.  There can be no assurance that our stock price will appreciate or that our stock price will not trade below $10.00 per share.  The movement of any particular company’s stock price is subject to various factors, including, but not limited to, the amount of proceeds a company raises, the company’s historical and anticipated operating results, the nature and quality of the company’s assets, the company’s market area and the quality of management and management’s ability to deploy proceeds (such as through loans and investments, the acquisition of other financial institutions or other businesses, the payment of dividends and common stock repurchases).  In addition, stock prices may be affected by general market and economic conditions, the interest rate environment, the market for financial institutions and merger or takeover transactions and the presence of professional and other investors who purchase stock on speculation, as well as other unforeseeable events not in the control of management. Before you make an investment decision, please carefully read this prospectus, including “Risk Factors.”
 
After Market Trading Activity
Initial Stock Offerings - Standard Conversions
Completed Closing Dates between July 1, 2010 and September 2, 2011
 
       
Change from Initial Trading Date Offering Price
 
Transaction (Ticker Symbol)
 
IPO Date
 
After One
Day (%)
   
After One
Week (%)
   
After One
Month
(%)
   
Through
September
2, 2011 (%)
 
                             
IF Bancorp, Inc. (IROQ)
 
07/08/11
    16.70 %     16.50 %     8.50 %     8.10 %
State Investors Bancorp, Inc. (SIBC)
 
07/07/11
    18.50       16.60       16.00       15.00  
First Connecticut Bancorp, Inc. (FBNK)
 
06/30/11
    10.80       11.60       11.10       4.70  
Franklin Financial Corp. (FRNK)
 
04/28/11
    19.70       17.70       19.60       11.40  
Sunshine Financial, Inc. (SSNF)
 
04/06/11
    12.50       10.00       14.00       (5.00 )
Fraternity Comm. Bancorp (FRTR)
 
04/01/11
    10.00       11.70       10.00       (10.00 )
Anchor Bancorp (ANCB)
 
01/26/11
    0.00       0.40       4.50       (20.50 )
Wolverine Bancorp, Inc. (WBKC)
 
01/20/11
    24.50       22.40       35.00       40.00  
SP Bancorp, Inc. (SPBC)
 
11/01/10
    (6.00 )     (6.60 )     (8.00 )     13.50  
Standard Financial Corp. (STND)
 
10/07/10
    19.00       18.90       29.50       47.50  
Madison Bancorp, Inc. (MDSN)
 
10/07/10
    25.00       25.00       25.00       (7.00 )
Century Next Fin. Corp. (CTUY)
 
10/01/10
    25.00       15.00       10.00       45.00  
Peoples Fed Bncshres, Inc. (PEOP)
 
07/07/10
    4.00       6.90       4.20       40.00  
                                     
Average:
        13.82 %     12.78 %     13.80 %     14.05 %
Median:
        16.70 %     15.00 %     11.10 %     11.40 %
 
 
9


Termination of the Offering
 
The subscription offering will end at 12:00 Noon, Pacific time, on _________ __, 2011, unless extended.  The direct community offering and syndicated community offering, if any, may continue for up to 45 days after the end of the subscription offering, ______ ___, 2012, if necessary.  If fewer than the minimum number of shares are subscribed for in the subscription offering and we do not get orders for at least the minimum number of shares by _________ __, 2012, we will either:
 
(1)           promptly return any payment you made to us, with interest, or cancel any withdrawal authorization you gave us; or
 
(2)           extend the offering, if allowed, and give you notice of the extension and of your rights to cancel, change or confirm your order.  If we extend the offering and you do not respond to the notice, then we will cancel your order and return your payment, with interest, or cancel any withdrawal authorization you gave us.  We must complete or terminate the offering by _________ __, 2013.
 
How We Will Use the Proceeds Raised From the Sale of Common Stock
 
We intend to use the net proceeds received from the stock offering as follows:
 
   
Minimum
   
Maximum
   
Maximum,
as adjusted


Retained by FS Bancorp                                                               
  $ 7,741,500     $ 10,783,500     $ 12,532,525  
Loan to employee stock ownership plan
    1,666,000       2,254,000       2,592,100  
Contributed to 1st Security Bank of Washington
    9,407,500       13,037,500       15,124,625  
Net proceeds from stock offering                                                               
  $ 18,815,000     $ 26,075,000     $ 30,249,250  
                         
FS Bancorp will purchase all of the capital stock of 1st Security Bank of Washington to be issued in the offering in exchange for an amount of net proceeds sufficient for 1st Security Bank of Washington to have at least 10% tangible capital upon completion of the offering.  In no event will less than 50% of the net proceeds be transferred to 1st Security Bank of Washington in exchange for its shares.  The portion of the net proceeds used by FS Bancorp to purchase the capital stock of 1st Security Bank of Washington will be added to the bank’s general funds for general corporate purposes.  The net proceeds 1st Security Bank of Washington receives from FS Bancorp are initially intended to be invested into short-term liquid investments.  In addition, a majority of the net proceeds retained by FS Bancorp, excluding the amount needed to fund the loan to the employee stock ownership plan, is expected to be deposited with 1st Security Bank of Washington as an interest-earning deposit, providing additional funds for reinvestment in earning assets.  See “How We Intend to Use the Proceeds of the Offering.”
 
Except as described above, neither FS Bancorp nor 1st Security Bank of Washington has any specific plans for the investment of the proceeds of this offering, nor have they allocated a specific portion of the proceeds to any particular use.  For a discussion of our business reasons for undertaking the conversion, see “The Conversion and Stock Offering - Our Reasons for the Conversion.”
 
We Intend to Pay a Cash Dividend in the Future
 
We currently plan to pay cash dividends in the future.  The amount and timing of any dividends, however, has not yet been determined.  Future dividends are not guaranteed and will depend upon our ability to pay them.  Although future dividends are not guaranteed, based on our pro forma shareholders’ equity and the cash to be retained by FS Bancorp, we believe FS Bancorp will be capable of paying a dividend after completion of this offering.  See “Our Policy Regarding Dividends.”
 
 
10


Plans to List the Common Stock for Trading on the Nasdaq Capital Market
 
We plan to list our common stock for trading on the Nasdaq Capital Market under the symbol “FSBW” and have submitted an application to The Nasdaq Stock Market LLC for this purpose.  Keefe, Bruyette & Woods currently intends to become a market maker in the common stock, but it is under no obligation to do so.  We cannot assure you that other market makers will be obtained or that an active and liquid trading market for the shares of common stock will develop, or if developed will be maintained.  After shares of the common stock begin trading, you may contact a stockbroker to buy or sell shares.  Due to the unpredictability of the stock market and other factors, persons purchasing shares may not be able to sell their shares when they want to, or at a price equal to or above $10.00.
 
Limitations on the Purchase of Common Stock in the Conversion
 
The minimum purchase is 25 shares.
 
The maximum purchase in the subscription offering by any person or group of persons through a single deposit account is $250,000 of common stock, which equals 25,000 shares.
 
The maximum purchase by any person in the community offering is $250,000 of common stock, which equals 25,000 shares.
 
The maximum purchase in the subscription offering and community offering combined by any person, related persons or persons acting together is $500,000 of common stock, which equals 50,000 shares.
 
If any of the following persons purchase common stock, their purchases when combined with your purchases cannot exceed $500,000 or 50,000 shares:
 
 
(1)
your spouse, or your relatives or your spouse’s relatives living in your house;
 
 
(2)
companies or other entities in which you have a 10% or greater equity or substantial beneficial interest or in which you serve as a senior officer or partner;
 
 
(3)
a trust or other estate if you have a substantial beneficial interest in the trust or estate or you are a trustee or fiduciary for the trust or other estate; or
 
 
(4)
other persons who may be acting together with you (including, but not limited to, persons who file jointly a Schedule 13G or Schedule 13D Beneficial Ownership Report with the Securities and Exchange Commission (“SEC”), persons living at the same address or persons exercising subscription rights through qualifying deposits registered at the same address, whether or not related).
 
Subject to Washington Department of Financial Institutions and Federal Deposit Insurance Corporation approval, we may increase or decrease the purchase limitations in the offering at any time.  Our tax-qualified benefit plans, including our employee stock ownership plan, are authorized to purchase up to 8% of the shares sold in the offering without regard to these purchase limitations, which is the amount intended to be purchased.  See “The Conversion and Stock Offering - Limitations on Stock Purchases.”
 
 
11


How to Purchase Common Stock
 
Note: Once we receive your order, you cannot cancel or change it without our consent.  If FS Bancorp changes the offering range to fewer than 2,082,500 shares or more than 3,240,125 shares, all subscribers will be notified and given the opportunity to change or cancel their orders.  If you do not respond to the notice, we will return your funds promptly with interest or cancel your withdrawal authorization.
 
You must complete and return the enclosed Stock Order and Certification Form (“stock order form”) along with full payment.  Instructions for completing your stock order form are included with the form.  Your order must be received by us (not postmarked) by 12:00 Noon, Pacific time, on ________.  Delivery of an original stock order form (we reserve the right to reject copies or facsimiles) and full payment may be made by overnight courier to the address listed on the top of the stock order form, by hand-delivery to any of our full service banking locations, or by mail, using the Stock Order Reply Envelope provided.  Please do not mail stock order forms to any 1st Security Bank of Washington branch office. You must sign the certification that is part of the stock order form.  We must receive your stock order form before the end of the offering period.
 
You may pay for shares in any of the following ways:
 
 
By personal check, bank check or money order made payable to FS Bancorp, Inc.
 
 
By authorizing a withdrawal from a savings or certificate of deposit account at 1st Security Bank of Washington, designated on the stock order form.  To use funds in an individual retirement account (“IRA”) at 1st Security Bank of Washington, you must transfer your account to a self-directed IRA at an unaffiliated institution or broker.  Because transferring your account will take time, please contact the stock information center as soon as possible for assistance.
 
 
In cash, if delivered in person to a full-service banking office of 1st Security Bank of Washington, although we request that you exchange cash for a check with any of our tellers.
 
1st Security Bank of Washington is not permitted to lend funds to anyone for the purpose of purchasing shares of common stock in the offering.  Additionally, you may not use a 1st Security Bank of Washington line of credit or third party check to pay for shares of our common stock.
 
We will pay interest on your subscription funds at the rate 1st Security Bank of Washington pays on passbook (statement savings) accounts from the date it receives your funds until the date the conversion is completed or terminated.  All funds received before the completion of the conversion will be held in a segregated account at 1st Security Bank of Washington.  All funds authorized for withdrawal from deposit accounts with 1st Security Bank of Washington will earn interest at the applicable account rate until the conversion is completed.  There will be no early withdrawal penalty for withdrawals from certificates of deposit at 1st Security Bank of Washington used to pay for stock.
 
It may be possible for you to subscribe for shares of common stock using funds you hold within an IRA.  However, only a self-directed retirement account may hold common stock.  1st Security Bank of Washington’s IRAs are not self-directed, so they cannot be invested in common stock.  If you wish to use some or all of the funds in your 1st Security Bank of Washington IRA, the applicable funds must be transferred to a self-directed account reinvested by an independent trustee, such as a brokerage firm.  If you do not have such an account, you will need to establish one before placing your stock order.  An annual administrative fee may be payable to the independent trustee.  Because individual circumstances differ and processing of retirement fund orders takes additional time, we recommend that you contact the stock information center promptly, preferably at least two weeks before the end of the offering period, for assistance with purchases using your IRA or other retirement account that you may have.  Whether you may use these funds for the purchase of shares in the stock offering may depend on timing constraints and possible limitations imposed by the institution where the funds are held.
 
 
12


Purchases of Common Stock by Our Officers and Directors
 
Collectively, our directors and executive officers intend to subscribe for 76,000 shares regardless of the number of shares sold in the offering.  This number equals 2.7% of the 2,817,500 shares that would be sold at the maximum of the offering range.  If fewer shares are sold in the offering, then officers and directors will own a greater percentage of FS Bancorp.  These shares do not include any shares that may be awarded or issued in the future under any stock-based equity incentive plan we intend to adopt or any shares that may be earned by employees under the employee stock ownership plan.  Directors and executive officers will pay the same $10.00 per share price for these shares as everyone else who purchases shares in the conversion.
 
These proposed purchases of common stock by our directors and executive officers (3.7% and 2.7% of the aggregate shares sold in the offering at the minimum and maximum of the offering range, respectively), together with the purchase by the employee stock ownership plan (8% of the aggregate shares sold in the offering), as well as the potential acquisition of common stock through the proposed equity incentive plan (an amount equal to 14% of the aggregate shares sold in the offering) will result in ownership by insiders of FS Bancorp in excess of 25.6% and 24.7% of the total shares sold in the offering at the minimum and maximum of the offering range, respectively.  As a result, it could be more difficult to obtain majority support for shareholder proposals opposed by the board and management.  See “Risk Factors - Risks Related to This Offering - The amount of common stock we will control, our articles of incorporation and bylaws, and state and federal law could discourage hostile acquisitions of control of FS Bancorp.”
 
Tax Consequences of the Conversion
 
As a general matter, the conversion and offering will not be taxable transactions for federal or state income tax purposes to FS Bancorp, 1st Security Bank of Washington, or persons eligible to subscribe in the subscription offering.  Silver Freedman & Taff, L.L.P. has issued an opinion to us to the effect that consummation of transactions contemplated by the conversion and offering qualifies as a tax-free transaction for federal income tax purposes and should not result in the imposition of income taxes to FS Bancorp, 1st Security Bank of Washington, or persons eligible to subscribe in the subscription offering.  Harlowe & Falk LLP has issued an opinion to us to the effect that consummation of transactions contemplated by the conversion and offering should qualify as a tax-free transaction for Washington State income tax purposes and should not result in the imposition of income taxes to FS Bancorp, 1st Security Bank of Washington or persons eligible to subscribe in the subscription offering.  See “The Conversion and Stock Offering - Effects of the Conversion - Tax Effects of the Conversion.”
 
Benefits to Management from the Offering
 
We intend to establish an employee stock ownership plan, which will purchase 8% of the aggregate shares sold in the offering, or, alternatively, in the open market after the conversion.  A loan from FS Bancorp to the employee stock ownership plan, funded by a portion of the proceeds from this offering, will be used to purchase these shares.  The loan will accrue interest at the applicable long-term federal interest rate as published by the Internal Revenue Service (“IRS”) in effect at the time the employee stock ownership loan is entered into.  The employee stock ownership plan will provide a retirement benefit to all employees eligible to participate in the plan.
 
Currently, we intend to adopt, within one year after completion of the offering, an equity incentive plan that will provide for grants of stock options and restricted stock awards to directors, officers and employees.  Implementation of the equity incentive plan would be subject to prior shareholder approval.  If we adopt the equity incentive plan, some of these individuals will be awarded shares of our common stock at no cost to them.  As a result, both the employee stock ownership plan and the equity incentive plan will increase the voting control of management without any cash being paid by the recipient.
 
 
13


If we adopt an equity incentive plan within one year of the closing of the conversion, the number of options granted or restricted shares awarded under the proposed equity incentive plan may not, pursuant to Federal regulations, exceed 10% and 4%, respectively, of the total shares sold in this offering (including shares sold to our employee stock ownership plan).
 
The employee stock ownership plan and our proposed equity incentive plan will increase our future compensation costs, thereby reducing our earnings.  We cannot determine the actual amount of these new stock-related compensation and benefit expenses at this time because applicable accounting practices generally require that they be based on the fair market value of the options or shares of common stock at the date of the grant; however, we expect them to be significant.  We will recognize expenses for our employee stock ownership plan when shares are committed to be released to participants’ accounts, and will recognize expenses for restricted stock awards and stock options generally over the vesting period of awards made to recipients.  We estimate, once these plans are adopted, the increase in compensation expense will be approximately $443,000 per year on an after-tax basis, based on the maximum of the valuation range.  Additionally, shareholders will experience a reduction in their ownership interest if newly issued shares of common stock are used to fund stock options and restricted stock awards.  In the event newly issued shares of our common stock are used to fund stock options and restricted stock offering awards in an amount equal to 10% and 4%, respectively, of the total shares sold in this offering, shareholders would experience dilution in their ownership interest of 9.1% and 3.9%, respectively, or 12.3% in the aggregate.  See “Risk Factors - Risks Related to this Offering - After this offering, our compensation expenses will increase and our return on equity will be low compared to other companies.  These factors could negatively impact the price of our stock.” and “Management - Benefits.”
 
The following table summarizes the stock benefits that our officers, directors and employees may receive following the offering at the minimum and maximum of the offering range.  It assumes that the proposed equity incentive plan is approved by shareholders within one year after completion of the offering to permit the (i) granting of options to purchase a number of shares equal to 10% of the shares outstanding after the offering and (ii) awarding of a number of shares of common stock equal to 4% of the shares sold in the offering.  It further assumes that, at the maximum of the offering range, a total of 2,817,500 shares will be sold to the public and that our tangible regulatory capital is 10% or more following the offering.
 
Plan/Awards
 
Individuals
Eligible to
Receive Awards
 
Number
of Shares Based
on Minimum of
Offering Range
   
Number
of Shares Based
on Maximum of
Offering Range
   
As a % of
Outstanding
Shares Issued in
the Offering
   
Value of
Benefits Based
on Minimum of
Offering Range(1)
   
Value of
Benefits Based
on Maximum of
Offering Range(1)
 
                         
(Dollars in thousands)
 
Employee stock ownership plan
 
Employees
    166,600       225,400       8.0 %   $ 1,666     $ 2,254  
                                             
Restricted stock
 
Directors/
Employees
    83,300       112,700       4.0 %     833       1,127  
                                             
Stock options
 
Directors/
Employees
    208,250       281,750       10.0 %     585       792  
          458,150       619,850       22.0 %   $ 3,084     $ 4,173  


(1)
For purposes of this table, fair value of shares held in the employee stock ownership plan and the restricted stock awards is assumed to be the offering price of $10.00 per share.  The actual value of the shares held in the employee stock ownership plan and restricted stock awards will be determined based on their fair value as of the allocation date and the date the grants are made, respectively.  The fair value of stock options has been estimated at $2.81 per option using the Black-Scholes option pricing model with the following assumptions: a grant-date share price and option exercise price of $10.00; dividend yield of 0.0%; expected option life of 7.5 years; risk free interest rate of 3.18% (based on the ten-year Treasury Note rate); and a volatility rate of 15.79% based on an index of publicly traded thrift holding company institutions.  The actual expense of the stock options will be determined by the grant-date fair value of the options, which will depend on a number of factors, including the valuation assumptions used in the option pricing model ultimately adopted.
 
 
14


The value of the restricted stock awards will be based on the price of FS Bancorp’s common stock at the time those shares are granted, which, subject to shareholder approval, cannot occur until at least six months after the offering is completed.  The following table presents the total value of all restricted shares to be available for award and issuance under the equity incentive plan, assuming the shares for the plan are issued in a range of market prices from $8.00 per share to $14.00 per share.
 
  Share Price  
83,300
Shares
Awarded at
Minimum of
Range
   
98,000
Shares
Awarded at
Midpoint of
Range
   
112,700
Shares
Awarded at
Maximum of
Range
   
129,605
Shares
Awarded at
Maximum of
Range,
as adjusted
 
 
(Dollars in thousands, except per share price)
 
$ 8.00   $ 666     $ 784     $ 902     $ 1,037  
$ 10.00   $ 833     $ 980     $ 1,127     $ 1,296  
$ 12.00   $ 1,000     $ 1,176     $ 1,352     $ 1,555  
$ 14.00   $ 1,166     $ 1,372     $ 1,577     $ 1,814  
                                   
 
The grant-date fair value of the options granted under the equity incentive plan will be based in part on the price of FS Bancorp’s common stock at the time the options are granted, which, subject to shareholder approval, cannot occur until at least six months after the offering is completed.  The value also will depend on the various assumptions utilized in estimating the value using the Black-Scholes option pricing model.  The following table presents the total estimated value of the options to be available for grant under the equity incentive plan, assuming the market price and exercise price for the stock options are equal, with a range of market prices for the shares from $8.00 per share to $14.00 per share.
 
  Market/ Exercise Price Per Share  
Grant-Date
Fair Value
Per Option
   
208,250
Options
at Minimum
of Range
   
245,000
Options
at Midpoint
of Range
   
281,750
Options
at Maximum
of Range
   
324,013
Options
at Maximum of Range,
as adjusted
 
 
(Dollars in thousands, except per share information)
 
$ 8.00   $ 2.25     $ 469     $ 551     $ 634     $ 729  
$ 10.00   $ 2.81     $ 585     $ 688     $ 792     $ 910  
$ 12.00   $ 3.37     $ 702     $ 826     $ 949     $ 1,092  
$ 14.00   $ 3.93     $ 818     $ 963     $ 1,107     $ 1,273  
                                           
For a further discussion of benefits to management, see “Management.”
 
Conditions to Completing the Conversion and Offering
 
We are conducting the conversion and offering under the terms of our plan of conversion.  We cannot complete the conversion and offering unless:
 
 
our plan of conversion is approved by at least a majority of votes eligible to be cast by depositors of 1st Security Bank of Washington;
 
 
we sell at least the minimum number of shares of common stock offered;
 
 
15


we receive approval from the Washington Department of Financial Institutions and no objection from the Federal Deposit Insurance Corporation to complete the conversion and offering; and
 
 
We receive approval from the Board of Governors of the Federal Reserve System for the formation of the bank holding company.
 
Stock Information Center
 
If you have any questions regarding the offering or our conversion to stock form, please call us, toll free, at (___) ___-____, Monday through Friday, between 7:00 a.m. and 4:00 p.m., Pacific time.  You can also stop into our Stock Information Center located at 6920 220th Street SW, Mountlake Terrace, Washington, Tuesday through Thursday from 8:00 a.m. to 5:00 p.m. to speak with a stock center representative.  The Stock Information Center will be closed weekends and bank holidays.  The banking operations portion of our office is separate and apart from the Stock Information Center and will not have offering materials.
 
To ensure that you receive a prospectus at least 48 hours before the offering deadline, we may not mail prospectuses any later than five days prior to such date or hand-deliver any prospectus later than two days prior to the date.  Stock order forms may only be distributed with or preceded by a prospectus.
 
By signing the stock order form, you are acknowledging your receipt of a prospectus and your understanding that the shares are not a deposit account and are not insured or guaranteed by FS Bancorp or 1st Security Bank of Washington, or the Federal Deposit Insurance Corporation or any other federal or state governmental agency.
 
We will make reasonable attempts to provide a prospectus and offering materials to holders of subscription rights.  The subscription offering and all subscription rights will expire at 12:00 Noon, Pacific time, on _________ __, 2011, whether or not we have been able to locate each person entitled to subscription rights.
 
Delivery of Stock Certificates
 
Certificates representing shares of common stock issued in the offering will be mailed to the persons entitled to receive these certificates at the certificate registration address noted on the order form, as soon as practicable following completion of the offering.  Until certificates for the shares of common stock are available and delivered to purchasers, purchasers may not be able to sell the shares of common stock which they ordered, even though the common stock will have begun trading.
 
Subscription Rights
 
Subscription rights are not allowed to be transferred, and we will act to ensure that you do not do so.  We will not accept any stock orders that we believe involve the transfer of subscription rights.
 
 
16


Restrictions on the Acquisition of FS Bancorp, Inc.
 
Federal regulations, as well as provisions contained in the articles of incorporation, restrict the ability of any person, firm or entity to acquire FS Bancorp or a controlling interest in its capital stock.  These restrictions include the requirement that a potential acquirer of common stock obtain the prior approval of the Board of Governors of the Federal Reserve System before acquiring in excess of 10% of the voting stock of FS Bancorp.  Additionally, Washington Department of Financial Institutions regulations prohibit anyone from acquiring FS Bancorp for a period of three years following the offering, unless this prohibition is waived by the Washington Department of Financial Institutions.  See “Risk Factors - Risks Related to the Offering - The amount of common stock we will control, our articles of incorporation and bylaws, and state and federal law could discourage hostile acquisitions of control of FS Bancorp.”
 
Important Risks in Owning FS Bancorp’s Common Stock
 
Before you decide to purchase stock, you should read the “Risk Factors” beginning on page 18 of this prospectus.

 
17


You should consider these risk factors, in addition to the other information in this prospectus, in deciding whether to make an investment in FS Bancorp’s stock.
 
Risks Related to Our Business
 
Our financial condition and results of operations are dependent on the economy, particularly in 1st Security Bank of Washington’s market area.  The current economic conditions in the market area we serve may continue to impact our earnings adversely and could increase the credit risk of our loan portfolio.
 
Our primary market area is concentrated in the Puget Sound region of Washington.  Our business is directly affected by market conditions, trends in industry and finance, legislative and regulatory changes, and changes in governmental monetary and fiscal policies and inflation, all of which are beyond our control.  Adverse economic conditions in that region have reduced our rate of growth, affected our customers’ ability to repay loans and adversely impacted our financial condition and earnings.  General economic conditions, including inflation, unemployment and money supply fluctuations, also may affect our profitability adversely.  Weak economic conditions and ongoing strains in the financial and housing markets have resulted in higher levels of loan delinquencies, problem assets and foreclosures and a decline in the values of the collateral securing our loans.
 
A further deterioration in economic conditions in the market area we serve could result in the following consequences, any of which could have a material adverse effect on our business, financial condition and results of operations:
 
 
demand for our products and services may decline;
 
 
loan delinquencies, problem assets and foreclosures may increase;
 
 
collateral for our loans may further decline in value; and
 
 
the amount of our low-cost or non-interest-bearing deposits may decrease.
 
 
Our loan portfolio possesses increased risk due to our large percentage of consumer loans.
 
Our consumer loans accounted for approximately $124.7 million or 58.1% of our total loan portfolio as of June 30, 2011, of which $87.2 million (70.0% of total consumer loans) consisted of indirect home improvement loans (some of which were not secured by a lien on the real property), $25.3 million (20.3% of total consumer loans) consisted of recreational loans, predominantly boats, and $8.9 million (7.1% of total consumer loans) consisted of automobile loans.  Generally, we consider these types of loans to involve a higher degree of risk compared to first mortgage loans on owner-occupied, one- to four-family residential properties.  As a result of our large portfolio of consumer loans, it may become necessary to increase the level of our provision for loan losses, which would reduce our profits.  Consumer loans generally entail greater risk than do one to four-family residential mortgage loans, particularly in the case of loans that are secured by rapidly depreciable assets, such as automobiles and boats.  In these cases, any repossessed collateral for a defaulted loan may not provide an adequate source of repayment of the outstanding loan balance.  In addition, most of our consumer loans are originated indirectly by or through third parties, which presents greater risk than our direct lending products which involves direct contact between us and the borrower.  See “Business of 1st Security Bank of Washington - Lending Activities - Consumer Lending” and “- Asset Quality.”
 
 
18


Our business could suffer if we are unsuccessful in making, continuing and growing relationships with home improvement contractors and dealers.
 
Our indirect home improvement lending, which is the largest component of our loan portfolio, is reliant on our relationships with home improvement contractors and dealers.  In particular, our indirect home improvement loan operations depend in large part upon our ability to establish and maintain relationships with reputable contractors and dealers who originate loans at the point of sale.  Our indirect home improvement contractor/dealer network is currently comprised of approximately 130 active contractors and dealers with businesses located throughout Washington and Oregon, with approximately 10 contractors/dealers responsible for more than half of this loan volume.  Indirect home improvement loans totaled $87.2 million, or 40.7% of our gross loan portfolio, as of June 30, 2011, reflecting approximately 11,000 loans with an average balance of approximately $8,000.
 
Although we have relationships with home improvement contractors/dealers, our relationships generally are not exclusive, some of them are newly established and they may be terminated at any time. As a result of the recent economic downturn and contraction of credit to both contractors/dealers and their customers, there has been an increase in business closures and our existing contractor/dealer base has experienced decreased sales and loan volume, and may continue to experience decreased sales and loan volume in the future, which may have an adverse effect on our business, results of operations and financial condition.  In addition, if a competitor were to offer better service or more attractive loan products to our contractor/dealer partners, it is possible that our partners would terminate their relationships with us or recommend customers to our competitors. If we are unable to continue to grow our existing relationships and develop new relationships, our results of operations and financial condition could be adversely affected.
 
In order to maintain our indirect home improvement loan volume, we are considering expanding this line of business into the States of California and Texas.  We are in the process of testing these markets with a limited number of contractors/dealers and a limited volume in each state and without increasing current staffing.  To the extent we determine to move forward with our indirect home improvement lending program in California and Texas, we will need to add contractors and dealers and will require more account executives and contractor/dealer management resources to manage existing and solicit new contractor/dealer relationships.  As application volume for loans increases, we also will require more processing and underwriting staff and, as the portfolio grows, we will require more servicing and collections staff.  The additional staff will increase our noninterest expense.  If we cannot generate a sufficient volume of loans our results of operations may be adversely affected.
 
A significant portion of our business involves commercial business and commercial real estate lending which is subject to various risks that could adversely impact our results of operations and financial condition.
 
At June 30, 2011, our loan portfolio included $55.3 million of commercial and multi-family real estate loans and commercial business loans, or approximately 25.8% of our total loan portfolio, compared to $18.7 million, or 8.5%, at December 31, 2006.  We have been increasing and intend to continue to increase, subject to market demand, our origination of commercial real estate and commercial business loans after this offering.  The credit risk related to these types of loans is considered to be greater than the risk related to one- to four-family residential loans because the repayment of commercial real estate loans and commercial business loans typically is dependent on the successful operations and income stream of the borrowers’ business and the value of the real estate securing the loan as collateral, which can be significantly affected by economic conditions.
 
 
19


Our renewed focus on these types of lending will increase our risk profile relative to traditional one- to four-family lenders as we continue to implement our business strategy.  Although commercial business and commercial real estate loans are intended to enhance the average yield of our earning assets, they do involve a different, and possibly higher, level of risk of delinquency or collection than generally associated with one- to four-family loans for a number of reasons.  Among other factors, these loans involve larger balances to a single borrower or groups of related borrowers.  Since commercial business and commercial real estate loans generally have large balances, if we make any errors in judgment in the collectibility of these loans, we may need to significantly increase our provision for loan losses since any resulting charge-offs will be larger on a per loan basis.  Consequently, this could materially adversely affect our future earnings.  Collateral evaluation and financial statement analysis in these types of loans also requires a more detailed analysis at the time of loan underwriting and on an ongoing basis.  Finally, if we foreclose on a commercial real estate loan, our holding period for the collateral, if any, typically is longer than for a one- to four-family residence because the secondary market for most types of commercial real estate is not readily liquid, so we have less opportunity to mitigate credit risk by selling part or all of our interest in these assets.  See “Business of 1st Security Bank of Washington - Lending Activities -- Commercial Real Estate Lending” and “-- Commercial Business Lending.”  At June 30, 2011, we had $558,000 of non-performing commercial business loans and no non-performing commercial real estate loans in our portfolio.
 
We are expanding our mortgage warehouse lending program which is subject to various risks that could adversely impact our results of operations and financial condition.
 
  In October 2009, we commenced a mortgage warehouse lending program.  As of June 30, 2011, we had approved warehouse lending lines of up to $4.0 million with eight companies, for an aggregate limit of $29.8 million.  During the year ended December 31, 2010, we processed approximately 1,300 loans and funded approximately $326.4 million under this program.  For the six months ended June 30, 2011, we processed approximately 350 loans and funded approximately $86.2 million.  Our mortgage warehouse related gross revenues totaled $671,000 for the year ended December 31, 2010 and $168,000 for the six months ended June 30, 2011.
 
Following completion of the stock offering, we will be able to increase the maximum warehouse line from $4.0 million to approximately 20% of capital based on our current internal policy limits, or approximately $7.7 million (at the adjusted maximum of the offering range).  This will allow us to increase funding capacity for selected existing customers and enable us to attract additional mortgage banking clients for our warehouse lending business, which we are actively pursuing.
 
There are numerous risks associated with this type of lending, which include, without limitation, (i) credit risks relating to the mortgage bankers that borrow from us, (ii) the risk of intentional misrepresentation or fraud by any of these mortgage bankers, (iii) changes in the market value of mortgage loans originated by the mortgage banker, the sale of which is the expected source of repayment of the borrowings under the warehouse line of credit, due to changes in interest rates during the time in warehouse, (iv) unsalable or impaired mortgage loans so originated, which could lead to decreased collateral value and the failure of a purchaser of the mortgage loan to purchase the loan from the mortgage banker, and (v) the volatility of mortgage loan originations.
 
Additionally, the impact of interest rates on our mortgage warehouse lending business can be significant. Changes in interest rates can impact the number of residential mortgages originated and initially funded under mortgage warehouse lines of credit and thus our mortgage warehouse related revenues.  A decline in mortgage rates generally increases the demand for mortgage loans. Conversely, in a constant or increasing rate environment, we would expect fewer loans to be originated.
 
 
20


Our lending limit may limit our growth.
 
At June 30, 2011, there was no specified maximum amount that we could have loaned to any one borrower and the borrower’s related entities under applicable State of Washington regulations.  Our internal policy, however, limits loans to one borrower and the borrower’s related entities to 20% of our unimpaired capital and surplus, or approximately $5.2 million at June 30, 2011, without the express prior consent of our board of directors.  These amounts are significantly less than that of many of our competitors and may discourage potential commercial borrowers who have credit needs in excess of our lending limit from doing business with us. Our lending limit also impacts the efficiency of our commercial lending operation because it tends to lower our average loan size, which means we have to generate a higher number of transactions to achieve the same portfolio volume.  We can accommodate larger loans by selling participations in those loans to other financial institutions, but this strategy is not efficient or always available. We may not be able to attract or maintain clients seeking larger loans or may not be able to sell participations in these loans on terms we consider favorable.
 
We are expanding our residential construction lending which is subject to various risks that could adversely impact our results of operations and financial condition.
 
To assist us in expanding our residential construction lending program, we have recently hired several new experienced construction lenders.  Our residential construction lending program will focus on the origination of loans, both pre-sold and speculative, for the purpose of constructing and selling primarily one to four-family residences within our market area.  Our construction and development loans totaled $6.3 million, or 2.9%, of total loans at June 30, 2011.
 
Construction and development lending contains the inherent difficulty in estimating both a property’s value at completion of the project and the estimated cost (including interest) of the project.  If the estimate of construction cost proves to be inaccurate, we may be required to advance funds beyond the amount originally committed to permit completion of the project.  If the estimate of value upon completion proves to be inaccurate, we may be confronted at, or prior to, the maturity of the loan with a project the value of which is insufficient to assure full repayment.  Speculative construction loans to a builder are often associated with homes that are not pre-sold, and thus pose a greater potential risk to us than construction loans to individuals on their personal residences.  Loans on land under development or held for future construction pose additional risk because of the lack of income being produced by the property and the potential illiquid nature of the collateral.  These risks can be significantly impacted by supply and demand.  As a result, this type of lending often involves the disbursement of substantial funds with repayment dependent on the success of the ultimate project and the ability of the borrower to sell or lease the property, rather than the ability of the borrower or guarantor themselves to repay principal and interest.
 
Revenue from mortgage banking operations are sensitive to changes in economic conditions, decreased economic activity, a slowdown in the housing market, higher interest rates or new legislation and may adversely impact our financial condition and results of operations.
 
In an effort to diversify our revenue streams and to generate additional income, we recently hired several experienced bankers to reintroduce in-house originations of residential mortgage loans through a mortgage banking program.  We expect to hire additional staff as loan volume increases.  Our mortgage banking program, which is expected to go on-line during the fourth quarter of 2011, will be dependent upon our ability to originate and sell loans to investors.  We expect to generate mortgage revenues primarily from gains on the sale of one-to four-family residential loans underwritten to programs currently offered by Fannie Mae, Freddie Mac, FHA, VA, USDA Rural Housing and other non-GSE investors.  These entities account for a substantial portion of the secondary market in residential mortgage loans.  We will be selling loans on both a servicing retained and servicing released basis utilizing market execution analysis and customer relationships as the criteria.  Any future changes in these programs, our eligibility to participate in these programs, the criteria for loans to be accepted or laws that significantly affect the activity of these entities could, in turn, materially adversely affect the success of our mortgage banking program and, consequently, our results of operations.
 
 
21


Mortgage loan production levels are sensitive to changes in economic conditions and can suffer from decreased economic activity, a slowdown in the housing market or higher interest rates. Generally, any sustained period of decreased economic activity or higher interest rates could adversely affect mortgage originations and, consequently, adversely effect income from mortgage lending activities.
 
Currently, as a result of government actions and other economic factors related to the economic downturn, interest rates are at historically low levels. It is unknown how long interest rates will remain at these historically low levels.  To the extent that market interest rates increase in the future, our ability to originate mortgage loans may decrease, resulting in fewer loans that are available to be sold to investors. This would adversely affect our ability to generate mortgage revenues, and consequently noninterest income.  Because interest rates depend on factors outside of our control, we cannot eliminate the interest rate risk associated with our mortgage operations.
 
Our results of operations will also be affected by the amount of noninterest expense associated with mortgage banking activities, such as salaries and employee benefits, occupancy, equipment and data processing expense and other operating costs.  If we cannot generate a sufficient volume of loans for sale our results of operations may be adversely affected.  In addition, during periods of reduced loan demand, our results of operations may be adversely affected to the extent that we are unable to reduce expenses commensurate with the decline in loan originations.
 
Finally, deteriorating economic conditions may also increase the potential for home buyers to default on their mortgages. In certain of these cases where we have originated loans and sold them to investors, we may be required to repurchase loans or provide a financial settlement to investors if it is proven that the borrower failed to provide full and accurate information on or related to their loan application or for which appraisals have not been acceptable or when the loan was not underwritten in accordance with the loan program specified by the loan investor. Such repurchases or settlements would also adversely affect our net income.
 
If our allowance for loan losses is not sufficient to cover actual loan losses, our earnings could be reduced.
 
We make various assumptions and judgments about the collectibility of our loan portfolio, including the creditworthiness of our borrowers and the value of the real estate and other assets serving as collateral for the repayment of many of our loans.  In determining the amount of the allowance for loan losses, we review our loans and our loss and delinquency experience, and evaluate economic conditions.  Management recognizes that significant new growth in loan portfolios, new loan products and the refinancing of existing loans can result in portfolios comprised of unseasoned loans that may not perform in a historical or projected manner.  If our assumptions are incorrect, our allowance for loan losses may not be sufficient to cover actual losses, resulting in additions to our allowance.  Material additions to our allowance could materially decrease our net income.  Our allowance for loan losses was 2.3% of total gross loans, and 247.0% of non-performing loans at June 30, 2011, compared to 2.5% and 3.1% of total gross loans, and 93.7% and 99.3% of non-performing loans at December 31, 2010 and 2009, respectively.  In addition, bank regulators periodically review our allowance for loan losses and may require us to increase our provision for loan losses or recognize additional loan charge-offs.  Any increase in our allowance for loan losses or loan charge-offs as required by these regulatory authorities could have a material adverse effect on our financial condition and results of operations.
 
The unseasoned nature of our commercial business and commercial real estate portfolios may result in difficulties judging collectibility, which may lead to additional provisions or charge-offs, which would reduce our profits.
 
During the periods from January 1, 2008 through June 30, 2011, we originated in the aggregate $122.0 million in commercial business and commercial real estate (including multi-family) loans of which $47.6 million, or 39.0%, are included in our gross loan portfolio at June 30, 2011.  As a result, a significant portion of our portfolio is relatively unseasoned and, although these loans are not to subprime borrowers, they may not have had sufficient time to perform to properly indicate the magnitude of potential losses.  These loans may have delinquency or charge-off levels above our historical experience, which could adversely affect our future performance.
 
 
22


New lines of business or new products and services may subject us to additional risk.
 
From time to time, we may implement new lines of business or offer new products and services within existing lines of business.  Currently, we are expanding our existing commercial real estate, commercial business and residential construction lending programs.  We are also reintroducing in-house originations of residential mortgage loans through a mortgage banking program.  There are substantial risks and uncertainties associated with these efforts, particularly in instances where the markets are not fully developed. In developing and marketing new lines of business and/or new products and services, we may invest significant time and resources. Initial timetables for the introduction and development of new lines of business and/or new products or services may not be achieved and price and profitability targets may not prove feasible. External factors, such as compliance with regulations, competitive alternatives and shifting market preferences, may also impact the successful implementation of a new line of business and/or a new product or service. Furthermore, any new line of business and/or new product or service could have a significant impact on the effectiveness of our system of internal controls. Failure to successfully manage these risks in the development and implementation of new lines of business and/or new products or services could have a material adverse effect on our business, results of operations and financial condition.
 
If we are unable to successfully integrate new personnel hired to grow our residential construction lending program, or our mortgage banking operations, our business may be adversely affected.
 
We have recently hired a number of experienced bankers in the areas of residential construction lending and residential mortgage banking.  We expect to hire additional personnel in these areas in order to successfully carryout our business plan.  The difficulties in hiring and training new personnel include integrating personnel with different business backgrounds, and combining different corporate cultures, while retaining other key employees.  The process of integrating personnel could cause an interruption of, or loss of momentum in, our operations and the loss of customers and key personnel.  In addition, we may not realize expected revenue increases and other projected benefits from the increased emphasis in these lending areas.  Any delays or difficulties encountered in connection with integrating and growing of this portion of our operations could have an adverse effect on our business and results of operations or otherwise adversely affect our ability to achieve the anticipated results.
 
We are subject to interest rate risk.
 
 Our earnings and cash flows are largely dependent upon our net interest income. Interest rates are highly sensitive to many factors that are beyond our control, including general economic conditions and policies of various governmental and regulatory agencies and, in particular, the Federal Reserve. Changes in monetary policy, including changes in interest rates, could influence not only the interest we receive on loans and investments and the amount of interest we pay on deposits and borrowings, but these changes could also affect (i) our ability to originate loans and obtain deposits, (ii) the fair value of our financial assets and liabilities and (iii) the average duration of our mortgage-backed securities portfolio and other interest-earning assets. If the interest rates paid on deposits and other borrowings increase at a faster rate than the interest rates received on loans and other investments, our net interest income, and therefore earnings, could be adversely affected. Earnings could also be adversely affected if the interest rates received on loans and other investments fall more quickly than the interest rates paid on deposits and other borrowings.
 
 
23


 Although management believes it has implemented effective asset and liability management strategies to reduce the potential effects of changes in interest rates on our results of operations, any substantial, unexpected, prolonged change in market interest rates could have a material adverse effect on our financial condition and results of operations. Also, our interest rate risk modeling techniques and assumptions likely may not fully predict or capture the impact of actual interest rate changes on our balance sheet.  See “Management’s Discussion and Analysis of Financial Condition and Results of Operations - Asset and Liability Management and Market Risk.”
 
Liquidity risk could impair our ability to fund operations and jeopardize our financial condition.
 
Liquidity is essential to our business.  An inability to raise funds through deposits, borrowings, the sale of loans or other sources could have a substantial negative effect on our liquidity.  Our access to funding sources in amounts adequate to finance our activities or the terms of which are acceptable to us could be impaired by factors that affect us specifically or the financial services industry or economy in general.  Factors that could detrimentally impact our access to liquidity sources include a decrease in the level of our business activity as a result of a downturn in the Washington markets in which our loans are concentrated or adverse regulatory action against us.  Our ability to borrow could also be impaired by factors that are not specific to us, such as a disruption in the financial markets or negative views and expectations about the prospects for the financial services industry in light of the recent turmoil faced by banking organizations and the continued deterioration in credit markets.  See “Management’s Discussion and Analysis of Financial Condition and Results of Operations – Liquidity.”
 
Loss of key employees may disrupt relationships with certain customers.
 
Our business is primarily relationship-driven in that some of our business development and relationship managers have extensive customer relationships.  Loss of such key personnel could result in the loss of some of our customers.  While we believe our relationship with our key producers is good, we cannot guarantee that all of our key personnel will remain with our organization.
 
We operate in a highly competitive industry and market area.
 
 We face substantial competition in all areas of our operations from a variety of different competitors, many of which are larger and may have more financial resources.  These competitors primarily include national, regional and internet banks within the various markets in which we operate. We also face competition from many other types of financial institutions, including, without limitation, savings and loans, credit unions, mortgage banking finance companies, brokerage firms, insurance companies and other financial intermediaries. The financial services industry could become even more competitive as a result of legislative, regulatory and technological changes and continued consolidation.  Banks, securities firms and insurance companies can merge under the umbrella of a financial holding company, which can offer virtually any type of financial service, including banking, securities underwriting, insurance (both agency and underwriting) and merchant banking.  Also, technology has lowered barriers to entry and made it possible for nonbanks to offer products and services traditionally provided by banks, such as automatic transfer and automatic payment systems.  Many of our competitors have fewer regulatory constraints and may have lower cost structures.  Additionally, due to their size, many competitors may be able to achieve economies of scale and, as a result, may offer a broader range of products and services as well as better pricing for those products and services than we can.
 
 Our ability to compete successfully depends on a number of factors including the following:  
 
 
the ability to develop, maintain and build upon long-term customer relationships based on top-quality service, high ethical standards and safe, sound assets;
 
 
the ability to expand our market position;
 
 
24


the scope, relevance and pricing of products and services offered to meet customer needs and demands;
 
 
the rate at which we introduce new products and services relative to our competitors;
 
 
customer satisfaction with our level of service; and
 
 
industry and general economic trends.
 
Failure to perform in any of these areas could significantly weaken our competitive position, which could adversely affect our growth and profitability, which, in turn, could have a material adverse effect on our financial condition and results of operations. See “Business of 1st Security Bank of Washington - Competition.”
 
We operate in a highly regulated environment and may be adversely affected by changes in federal and state laws and regulations, including new financial reform legislation recently enacted by Congress that is expected to increase our costs of operations.
 
We are currently subject to extensive examination, supervision and comprehensive regulation by the Federal Deposit Insurance Corporation and the Washington Department of Financial Institutions.  The Federal Deposit Insurance Corporation and the Washington Department of Financial Institutions govern the activities in which we may engage, primarily for the protection of depositors and the Deposit Insurance Fund.  These regulatory authorities have extensive discretion in connection with their supervisory and enforcement activities, including the ability to impose restrictions on an institution’s operations, reclassify assets, determine the adequacy of an institution’s allowance for loan losses and determine the level of deposit insurance premiums assessed.
 
Additionally,  the Dodd-Frank Wall Street Reform and Consumer Protection Act (the “Dodd-Frank Act”) has significantly changed the bank regulatory structure and will affect the lending, deposit, investment, trading and operating activities of financial institutions and their holding companies.  The Dodd-Frank Act requires various federal agencies to adopt a broad range of new implementing rules and regulations, and to prepare numerous studies and reports for Congress.  The federal agencies are given significant discretion in drafting the implementing rules and regulations, and consequently, many of the details and much of the impact of the Dodd-Frank Act may not be known for many months or years.
 
Certain provisions of the Dodd-Frank Act are expected to have a near term impact on 1st Security Bank of Washington.  For example, a provision of the Dodd-Frank Act eliminates the federal prohibitions on paying interest on demand deposits, thus allowing businesses to have interest bearing checking accounts.  Depending on competitive responses, this significant change to existing law could have an adverse impact on our interest expense.
 
The Dodd-Frank Act also broadens the base for Federal Deposit Insurance Corporation insurance assessments.  Assessments are now based on the average consolidated total assets less tangible equity capital of a financial institution.  The Dodd-Frank Act also permanently increased the maximum amount of deposit insurance for banks, savings institutions and credit unions to $250,000 per depositor, and non-interest-bearing transaction accounts have unlimited deposit insurance through December 31, 2013.
 
The Dodd-Frank Act requires publicly traded companies to give stockholders a non-binding vote on executive compensation and so-called “golden parachute” payments and authorizes the Securities and Exchange Commission to promulgate rules that would allow stockholders to nominate their own candidate using a company’s proxy materials.  The legislation also directs the Federal Reserve to promulgate rules prohibiting excessive compensation paid to bank holding company executives, regardless of whether the company is publicly traded or not.
 
 
25


The Dodd-Frank Act creates a new Consumer Financial Protection Bureau with broad powers to supervise and enforce consumer protection laws.  The Consumer Financial Protection Bureau has broad rule-making authority for a wide range of consumer protection laws that apply to all banks and savings institutions, including the authority to prohibit “unfair, deceptive or abusive” acts and practices.  The Consumer Financial Protection Bureau has examination and enforcement authority over all banks and savings institutions with more than $10 billion in assets.  Financial institutions such as 1st Security Bank of Washington with $10 billion or less in assets will continue to be examined for compliance with the consumer laws by their primary bank regulators.
 
It is difficult to predict at this time what specific impact the Dodd-Frank Act and the yet to be written implementing rules and regulations will have on community banks.  However, it is expected that at minimum they will increase our operating and compliance costs and could increase our interest expense.  Any additional changes in our regulation and oversight, whether in the form of new laws, rules and regulations could make compliance more difficult or expensive or otherwise materially adversely affect our business, financial condition or prospects.
 
If our investment in the Federal Home Loan Bank of Seattle becomes impaired, our earnings and shareholders’ equity could decrease.
 
At June 30, 2011, we owned $1.8 million in Federal Home Loan Bank of Seattle stock.  We are required to own this stock to be a member of and to obtain advances from our Federal Home Loan Bank.  This stock is not marketable and can only be redeemed by our Federal Home Loan Bank, which currently is not redeeming any excess member stock.  Our Federal Home Loan Bank’s financial condition is linked, in part, to the eleven other members of the Federal Home Loan Bank System and to accounting rules and asset quality risks that could materially lower their capital, which would cause our Federal Home Loan Bank stock to be deemed impaired, resulting in a decrease in our earnings and assets.
 
Risks Related to this Offering
 
Our operating expenses are high as a percentage of our net interest income, making it more difficult to maintain profitability.  After this offering, our expenses will increase.  Our return on equity also will be low compared to other companies.  These factors could negatively impact the price of our stock.
 
Like many smaller financial institutions, our non-interest expense, which consists primarily of the costs associated with operating our business, represents a high percentage of the income we generate.  The cost of generating our income is measured by our efficiency ratio, which represents non-interest expense divided by the sum of our net interest income and our non-interest income.  The lower our efficiency ratio is, the more effective our ability to generate income from our operations.  For the six months ended June 30, 2011 and the years ended December 31, 2010 and 2009, our efficiency ratios were 73.0%, 69.9% and 84.3%, respectively.  Generally, this means that we spent approximately $0.73, $0.70 and $0.84 during the six months ended June 30, 2011 and the years ended December 31, 2010 and 2009, respectively, to generate $1.00 of income.
 
The proceeds we will receive from the sale of our common stock will increase our capital substantially.  It will take us a significant period of time to fully deploy these proceeds in our business operations.  Our compensation expenses will increase as a result of the costs associated with the employee stock ownership plan, the proposed stock-based equity incentive plan and the other costs of being a public company.  In addition the Federal Deposit Insurance Corporation could increase insurance premiums, which would increase non-interest expense.  See “How We Are Regulated – Insurance of Accounts and Regulation by the Federal Deposit Insurance Corporation.”  Therefore, we expect our return on equity to be less than many of our regional and national peers.  This low return on equity could hurt our stock price.  We do not know when or if we will achieve returns on equity that are comparable to industry peers.  For further information regarding pro forma income and expenses, see “Pro Forma Data.”
 
 
26


While we have been profitable recently, we recorded a loss in each of the years in the three year period ended December 31, 2009, and if we cannot continue to generate and increase our income our stock price may be adversely affected.
 
Net income for the six months ended June 30, 2011 and for the year ended December 31, 2010 totaled $1.0 million and $1.6 million, respectively.  However, we experienced a $4.6 million net loss for the year ended December 31, 2009, a $3.8 million net loss for the year ended December 31, 2008 and a $4.1 million net loss for the year ended December 31, 2007.  See “Management’s Discussion and Analysis of Financial Condition and Results of Operations.”  While we have identified and implemented various strategic initiatives to reduce costs and improve earnings, and intend to increase our interest-earning assets by leveraging the proceeds of this offering, our strategic initiatives may not succeed in generating and increasing income.  If we are unable to generate and increase income, our stock price may be adversely affected.  For a description of our strategic initiatives to improve earnings, see “Management’s Discussion and Analysis of Financial Condition and Results of Operations - Business and Operating Strategy and Goals.”
 
Our net operating loss carryforwards could be substantially limited or eliminated if we experience an ownership change as defined in the Internal Revenue Code.
 
As of June 30, 2011, we had approximately $10.7 million of federal and state operating losses (“NOLs”). Our ability to use our NOLs and other pre-ownership change losses (collectively, “Pre-Change Losses”) to offset future taxable income will be limited, and may be eliminated, if we experience an “ownership change” as defined in Section 382 of the Internal Revenue Code of 1986, as amended from time to time (the “Code”). Although we do not expect that the offering itself will result in an ownership change, without taking into account the effects or likelihood of future transactions in our common stock, we could be close to the “ownership change” threshold upon completion of the offering.
 
In general, an ownership change will occur if there is a cumulative increase in our ownership by “5% shareholders” (as defined in the Code) that exceeds 50% over a rolling three-year period. If we experience an ownership change our Pre-Change Losses will be subject to an annual limitation of their use, which is generally equal to the fair market value of our outstanding stock immediately before the ownership change multiplied by the long-term tax-exempt rate, which is currently 3.82% for ownership changes occurring in September 2011. Depending on the size of the annual limitation (which is in part a function of our market capitalization at the time of the ownership change) and the remaining carryforward period for our Pre-Change Losses (U.S. federal net operating losses generally may be carried forward for a period of 20 years), we could realize a permanent loss of some or all of our Pre-Change Losses, which could have a material adverse effect on our results of operations and financial condition.
 
The determination of an ownership change under Section 382 of the Code is often complex, particularly in our case, because of the absence of precedents involving mutual to stock conversions.
 
The market for stock of financial institutions has been unusually volatile lately and our stock price may decline when trading commences.
 
If you purchase shares in the offering you might not be able to sell them later at or above the $10.00 purchase price.  Publicly traded stock, including stock of financial institutions, has recently experienced substantial market price volatility.  In several recent transactions, shares of common stock issued by newly converted savings institutions have traded below the price at which the shares were sold in the offering conducted by those companies.
 
 
27


The final aggregate purchase price of the shares of common stock in the offering will be based on an independent appraisal and may not be indicative of the actual value of FS Bancorp.
 
The appraisal is not intended, and should not be construed, as a recommendation of any kind as to the advisability of purchasing shares of common stock.  The valuation is based on estimates and projections of a number of matters, all of which are subject to change from time to time.  After our shares begin trading, the trading price of our common stock will be determined by the marketplace and may be influenced by many factors, including prevailing interest rates, the overall performance of the economy, investor perceptions of FS Bancorp and the outlook for the financial institutions industry in our region and in general.
 
There may be a limited trading market in our common stock, which would hinder your ability to sell our common stock and may lower the market price of the stock.
 
FS Bancorp has never issued stock and, therefore, there is no current trading market for the shares of common stock.  While we expect our common stock to be quoted on the Nasdaq Capital Market under the symbol “FSBW,” we cannot predict whether an active and liquid trading market for our common stock will develop.  Persons purchasing shares may not be able to sell their shares when they desire if a liquid trading market does not develop or sell them at a price equal to or above the initial purchase price of $10.00 per share even if a liquid trading market develops.  A limited trading market for our common stock may reduce the market value of the common stock and make it difficult to buy or sell our shares on short notice.  A limited trading market could also result in a wider spread between the bid and ask price for the stock, meaning the highest price being offered for shares for sale at any particular time may be further from the lowest price being offered by buyers for the stock at that moment than if the stock were more actively traded (the difference between the bid and ask price being the “spread” for the stock).  This could make it more difficult to sell a large number of shares at one time and could mean the sale of a large number of shares at one time could depress the market price.  See “Market for the Common Stock.”
 
The cost of additional finance and accounting systems, procedures and controls in order to satisfy our new public company reporting requirements will increase our expenses.
 
As a result of the completion of this offering, we will become a public reporting company.  We expect that the obligations of being a public company, including the substantial public reporting obligations, will require significant expenditures and place additional demands on our management team.  Compliance with the Sarbanes-Oxley Act of 2002, particularly Section 404 of the Sarbanes-Oxley Act regarding required internal controls and procedures, and the related rules and regulations of the SEC will require us to assess our internal controls and procedures and evaluate our accounting systems.  In addition, we may need to hire additional compliance, accounting and financial staff with appropriate public company experience and technical knowledge, and we may not be able to do so in a timely fashion.  As a result, we may need to rely on outside consultants to provide these services for us until qualified personnel are hired.  These obligations will increase our operating expenses and could divert our management’s attention from our operations.
 
 
28


Management and the board of directors have significant discretion over the investment of the offering proceeds and may not be able to achieve acceptable returns on the proceeds from the offering.
 
The board of directors and management of FS Bancorp will have discretion in the investment of the capital raised in this offering.  We will use a portion of the net proceeds retained to finance the purchase of common stock in the offering by the employee stock ownership plan and may use the remaining net proceeds to pay dividends to shareholders, repurchase shares of common stock, purchase securities, deposit funds in 1st Security Bank of Washington or other financial institutions, acquire other financial services companies or for other general corporate purposes.  1st Security Bank of Washington may use the proceeds it receives to fund new loans, purchase securities, or for general corporate purposes.  We have not, however, identified specific amounts of proceeds for any of these purposes and we will have significant flexibility in determining the amount of net proceeds we apply to different uses and the timing of these applications.  Our failure to utilize these funds effectively could reduce our profitability.  We have not established a timetable for the effective deployment of the proceeds, and we cannot predict how long we will need to effectively deploy the proceeds.  Investing the offering proceeds in securities until we are able to deploy the proceeds will provide lower margins than we generally earn on loans, potentially adversely affecting shareholder returns, including earnings per share, return on assets and return on equity.
 
The amount of common stock we will control, our articles of incorporation and bylaws, and state and federal law could discourage hostile acquisitions of control of FS Bancorp.
 
Our board of directors and executive officers intend to purchase in the aggregate approximately 3.7% and 2.7% of our common stock at the minimum and maximum of the offering range, respectively.  These purchases, together with the purchase by the employee stock ownership plan of 8.0% of the aggregate shares sold in the offering, as well as the potential acquisition of common stock through the proposed equity incentive plan will result in ownership by insiders of FS Bancorp in excess of 24.0% of the total shares issued in the offering at the maximum of the offering range.  This insider ownership and provisions in our articles of incorporation and bylaws may discourage attempts to acquire FS Bancorp, pursue a proxy contest for control of FS Bancorp, assume control of FS Bancorp by a holder of a large block of common stock, and remove FS Bancorp’s management, all of which shareholders might think are in their best interests.  These provisions include a prohibition on any holder of common stock voting more than 10% of the outstanding common stock.  See “Restrictions on Acquisition of FS Bancorp, Inc. and 1st Security Bank of Washington - Anti-takeover Provisions in FS Bancorp’s Articles of Incorporation and Bylaws.”
 
In addition, the business corporation law of Washington, the state where FS Bancorp is incorporated, provides for certain restrictions on acquisition of FS Bancorp.  Furthermore, federal law restricts acquisitions of control of bank holding companies such as FS Bancorp.
 
The implementation of an equity incentive plan may dilute your ownership interest.
 
We intend to adopt an equity incentive plan following the offering.  This stock-based incentive plan will be funded through either open market purchases, if permitted, or from the issuance of authorized but unissued shares of our common stock.  In the event authorized but unissued shares of our common stock are used to fund stock options or awards of shares of common stock under the plan in amounts equal to 10.0% and 4.0%, respectively, of the shares to be outstanding after the offering, shareholders would experience dilution in their ownership interest of 9.1% and 3.9%, respectively, or 12.3% in the aggregate.  See “Pro Forma Data” and “Management - Benefits to Be Considered Following Completion of the Conversion.”
 
 
29


Our growth or future losses may require us to raise additional capital in the future, but that capital may not be available when it is needed or the cost of that capital may be very high.
 
We are required by federal and state regulatory authorities to maintain adequate levels of capital to support our operations.  We believe the net proceeds of this offering will be sufficient to permit 1st  Security Bank of Washington to maintain regulatory capital compliance for the foreseeable future.  Nonetheless, we may at some point need to raise additional capital to support continued growth.
 
Our ability to raise additional capital, if needed, will depend on conditions in the capital markets at that time, which are outside our control, and on our financial condition and performance.  Accordingly, we may not be able to raise additional capital if needed on terms that are acceptable to us, or at all.  If we cannot raise additional capital when needed, our operations could be materially impaired and our financial condition and liquidity could be materially and adversely affected.  In addition, if we are unable to raise additional capital when required by Federal Deposit Insurance Corporation and the Washington Department of Financial Institutions, we may be subject to additional adverse regulatory action.  See “How We Are Regulated.”
 
 
30


The Financial Condition Data as of December 31, 2010 and 2009 and the Operating Data for the years ended December 31, 2010, 2009 and 2008 presented below are derived from the audited financial statements and related notes included elsewhere in the prospectus.  The unaudited financial information presented below as of June 30, 2011 and for the six months ended June 30, 2011 and 2010, reflect all normal recurring adjustments that are, in the opinion of management, necessary for a fair presentation of the results for the interim periods presented.  Historical results are not necessarily indicative of results to be expected in any future period, and results for the six months ended June 30, 2011 are not necessarily indicative of the results to be expected for the year ended December 31, 2011.  The following information is only a summary and you should read it in conjunction with our financial statements and related notes beginning on page F-1 and with “Management’s Discussion and Analysis of Financial Condition and Results of Operations” included elsewhere in this prospectus.
 
   
  June 30,
2011
   
December 31,
 
       
2010
   
2009
   
2008
   
2007
   
2006
 
   
(In thousands)
 
Selected Financial Condition Data:
                                   
                                                 
Total assets
  $ 272,784     $ 292,334     $ 281,836     $ 255,368     $ 263,066     $ 256,385  
Loans receivable, net(1) 
    210,184       230,822       231,441       222,974       237,807       218,078  
Investment securities available-for-sale, at fair value
    11,689       7,642       603       2,834       4,485       15,369  
Investment securities, at amortized cost:
                                               
Corporate debt securities
    -       -       -       -       136       134  
Federal Home Loan Bank stock
    1,797       1,797       1,797       1,797       1,797       1,797  
Deposits
    241,475       243,957       230,985       216,056       208,863       204,816  
Borrowings
    3,900       21,900       25,900       9,400       19,800       13,400  
Total equity
    25,977       24,795       23,315       27,862       31,689       34,779  


Six Months Ended
June 30,
   
Years Ended December 31,
 
   
2011
   
2010
   
2010
   
2009
   
2008
   
2007
   
2006
 
   
(In thousands)
 
Selected Operations Data:
                                         
                                                         
Total interest and dividend income
  $ 8,263     $ 8,467     $ 17,333     $ 16,404     $ 16,899     $ 17,619     $ 16,951  
Total interest expense
    1,627       1,993       3,886       4,521       5,798       6,942       5,536  
Net interest income
    6,636       6,474       13,447       11,883       11,101       10,677       11,415  
Provision for loan losses
    1,030       1,905       3,480       7,067       4,937       578       246  
Net interest income after provision for loan losses
    5,606       4,569       9,967       4,816       6,164       10,099       11,169  
Fees and service charges
    1,019       1,196       2,444       2,839       2,667       2,718       2,989  
Gain on sale on assets
    -       797       1,006       1,398       (306 )     7       1,109  
Other noninterest income
    82       95       217       252       552       640       815  
Total noninterest income
    1,101       2,088       3,667       4,489       2,913       3,365       4,913  
Total noninterest expense
    5,699       5,941       12,032       13,879       12,881       17,322       14,263  
Income (loss) before provision for taxes
    1,008       716       1,602       (4,574 )     (3,804 )     (3,858 )     1,819  
Income tax provision
    -       -       -       -       -       271       573  
  Net income (loss)
  $ 1,008     $ 716     $ 1,602     $ (4,574 )   $ (3,804 )   $ (4,129 )   $ 1,246  
 

(1)
Net of allowances for loan losses, loans in process and deferred loan fees.
 
 
31


At or For the
 
   
Six Months
Ended
June 30,
   
Years Ended December 31,
 
   
2011
   
2010
   
2010
   
2009
   
2008
   
2007
   
2006
 
                                           
Selected Financial Ratios and Other Data:
                                         
Performance ratios:
                                         
Return on assets (ratio of net income (loss) to average total assets)(1)
    0.73 %     0.54 %     0.60 %     (1.75 )%     (1.55 )%     (1.60 )%     0.48 %
Return on equity (ratio of net income (loss) to average equity)(1)
    7.88 %     5.92 %     6.54 %     (16.84 )%     (11.95 )%     (11.82 )%      3.65 %
Yield on average interest-earning assets(1)
    6.42 %     6.75 %     6.86 %     6.62 %     7.30 %     7.28 %     7.04 %
Rate paid on average interest-bearing liabilities(1)
    1.42 %     1.82 %     1.75 %     2.12 %     2.99 %     3.50 %     2.85 %
Interest rate spread information:
                                                       
Average during
period(1)
    5.00 %     4.93 %     5.11 %     4.50 %     4.31 %     3.79 %     4.19 %
End of period(1)
    5.04 %     5.03 %     4.99 %     4.17 %     4.24 %     3.78 %     4.08 %
Net interest margin(1) (2)
    5.15 %     5.16 %     5.32 %     4.79 %     4.80 %     4.41 %     4.74 %
Operating expense to average total
assets(1)
    4.15 %     4.45 %     4.49 %     5.32 %     5.24 %     6.69 %     5.54 %
Average interest-earning assets to average interest-bearing liabilities
    112.13 %     114.40 %     113.98 %     116.01 %     119.50 %     121.83 %      124.06 %
Efficiency ratio(3)
    72.95 %     68.24 %     69.86 %     84.29 %     89.41 %     125.15 %     86.26 %
                                                         
Asset quality ratios:
                                                       
Non-performing assets to total assets at end of period(4)
    2.92 %     4.27 %     3.45 %     4.64 %     0.99 %     0.08 %     0.10 %
Non-performing loans to total gross loans(5)
    0.91 %     2.65 %     2.66 %     3.12 %     1.09 %     0.08 %     0.10 %
Allowance for loan losses to non-performing loans(5)
    246.99 %     100.11 %     93.70 %     99.34 %     225.00 %     1499.45 %     1181.66 %
Allowance for loan losses to gross loans receivable
    2.25 %     2.65 %     2.50 %     3.10 %     2.45 %     1.14 %     1.22 %
                                                         
Capital ratios:
                                                       
Equity to total assets at end of period
    9.52 %     8.63 %     8.48 %     8.27 %     10.91 %     12.05 %     13.57 %
Average equity to average assets
    9.31 %     9.07 %     9.13 %     10.40 %     12.95 %     13.50 %     13.27 %
                                                         
Other data:
                                                       
Number of full service offices
    6       6       6       8       12       12       12  
Full-time equivalent employees
    79       80       79       84       112       125       130  
 

(1)
Performance ratios for the six month periods ended June 30, 2011 and 2010 are annualized.
(2)
Net interest income divided by average interest earning assets.
(3)
Total non-interest expense as a percentage of net interest income and total other non-interest income.
(4)
Non-performing assets consists of non-performing loans (which include non-accruing loans and accruing loans more than 90 days past due), foreclosed real estate and other repossessed assets.
(5)
Non-performing loans consists of non-accruing loans and accruing loans more than 90 days past due.
 
 
32


This prospectus contains forward-looking statements, which can be identified by the use of words such as “believes,” “expects,” “anticipates,” “estimates” or similar expressions.  Forward-looking statements include:
 
 
statements of our goals, intentions and expectations;
 
 
statements regarding our business plans, prospects, growth and operating strategies;
 
 
statements regarding the quality of our loan and investment portfolios; and
 
 
estimates of our risks and future costs and benefits.
 
These forward-looking statements are subject to significant risks and uncertainties.  Actual results may differ materially from those contemplated by the forward-looking statements due to, among others, the following factors:
 
 
general economic conditions, either nationally or in our market area, that are worse than expected;
 
 
the credit risks of lending activities, including changes in the level and trend of loan delinquencies and write offs and changes in our allowance for loan losses and provision for loan losses that may be impacted by deterioration in the housing and commercial real estate markets;
 
 
fluctuations in the demand for loans, the number of unsold homes, land and other properties and fluctuations in real estate values in our market area;
 
 
increases in premiums for deposit insurance;
 
 
the use of estimates in determining fair value of certain of our assets, which estimates may prove to be incorrect and result in significant declines in valuation;
 
 
changes in the interest rate environment that reduce our interest margins or reduce the fair value of financial instruments;
 
 
increased competitive pressures among financial services companies;
 
 
our ability to execute our plans to grow our residential construction lending, our mortgage banking operations and our warehouse lending and the geographic expansion of our indirect home improvement lending;
 
 
our ability to attract and retain deposits;
 
 
our ability to control operating costs and expenses;
 
 
changes in consumer spending, borrowing and savings habits;
 
 
our ability to successfully manage our growth;
 
 
legislative or regulatory changes that adversely affect our business, including the effect of the Dodd-Frank Act, changes in regulation policies and principles, or the interpretation of regulatory capital or other rules;
 
 
adverse changes in the securities markets;
 
 
changes in accounting policies and practices, as may be adopted by the bank regulatory agencies, the Public Company Accounting Oversight Board or the Financial Accounting Standards Board;
 
 
costs and effects of litigation, including settlements and judgments;
 
 
33


inability of key third-party vendors to perform their obligations to us; and
 
 
other economic, competitive, governmental, regulatory and technical factors affecting our operations, pricing, products and services and other risks described elsewhere in this prospectus.
 
Any of the forward-looking statements that we make in this prospectus and in other public statements we make may turn out to be wrong because of inaccurate assumptions we might make, because of the factors illustrated above or because of other factors that we cannot foresee.  Because of these and other uncertainties, our actual future results may be materially different from the results indicated by these forward-looking statements and you should not rely on such statements.
 
 
We are a newly formed Washington corporation.  We are conducting the stock offering in connection with the conversion of 1st Security Bank of Washington from the mutual to the stock form of organization.  Following the completion of the offering, we will be a bank holding company and our primary regulator will be the Board of Governors of the Federal Reserve System.  See “How We Are Regulated - Regulation and Supervision of FS Bancorp, Inc.”
 
Following the conversion we will have no significant assets other than all of the outstanding shares of common stock of 1st Security Bank of Washington, the net proceeds we keep from the offering and a loan to the FS Bancorp employee stock ownership plan.  We will have no significant liabilities.  See “How We Intend to Use the Proceeds From this Offering.”  Our board of directors and management, and the board of directors and management of 1st Security Bank of Washington, are substantially the same.  We utilize the support staff and offices of 1st Security Bank of Washington and pay 1st Security Bank of Washington for these services.  If we expand or change our business in the future, we may hire our own employees.
 
The principal executive offices of FS Bancorp are located at 6920 220th Street SW, Mountlake Terrace, Washington 98043 and its telephone number is (425) 771-5299.
 
 
1st Security Bank of Washington is a relationship-driven community bank.  We deliver banking and financial services to local families, local and regional businesses and industry niches within distinct Puget Sound area communities.  We emphasize long-term relationships with families and businesses within the communities we serve, working with them to meet their financial needs.  We are also actively involved in community activities and events within these market areas, which further strengthens our relationships within these markets.  We have been serving the Puget Sound area since 1936.  Originally chartered as a credit union, previously known as Washington’s Credit Union, we served various select employment groups.  On April 1, 2004, we converted from a credit union to a Washington state-chartered mutual savings bank.  Upon completion of the conversion, 1st Security Bank of Washington will be a Washington state-chartered stock savings bank and the wholly owned subsidiary of FS Bancorp.  At June 30, 2011, we maintained six branch locations, along with our headquarters, and had total assets of $272.8 million, total deposits of $241.5 million and total equity of $26.0 million.
 
1st Security Bank of Washington is a diversified lender with a focus on the origination of home improvement loans, commercial real estate mortgage loans, commercial business loans and second mortgage/home equity loan products.  Consumer loans, in particular indirect home improvement loans, represent the largest portion of the loan portfolio and have traditionally been the mainstay of the bank’s lending strategy, a carryover from its days as a credit union.  Going forward, we plan to place more emphasis on certain lending products, such as commercial real estate, commercial business and residential construction lending, while maintaining the size of our consumer loan portfolio.  We also intend to reintroduce in-house originations of residential mortgage loans, primarily for sale into the secondary market, through a mortgage banking program.  Our future lending strategies are intended to take advantage of: (1) our historical strength in indirect consumer lending, (2) recent market dislocation that has created new lending opportunities, and (3) relationship lending. Retail deposits will continue to serve as an important funding source.  See “Risk Factors - Risks Related to Our Business.”  For more information regarding the business and operations of 1st Security Bank of Washington, see “Management’s Discussion and Analysis of Financial Condition and Results of Operations” and “Business of 1st Security Bank of Washington.”
 
 
34


1st Security Bank of Washington is examined and regulated by the Washington Department of Financial Institutions, its primary regulator, and by the Federal Deposit Insurance Corporation.  1st Security Bank of Washington is required to have certain reserves set by the Board of Governors of the Federal Reserve System and is a member of the Federal Home Loan Bank of Seattle, which is one of the 12 regional banks in the Federal Home Loan Bank System.
 
The principal executive offices of 1st Security Bank of Washington are located at 6920 220th Street SW, Mountlake Terrace, Washington 98043 and its telephone number is (425) 771-5299.
 
 
Although the actual net proceeds from the sale of the shares of common stock cannot be determined until the conversion is completed, we presently anticipate that the net proceeds will be between $18.8 million at the minimum of the offering range and $26.1 million at the maximum of the offering range and may be up to $30.2 million assuming an increase in the estimated offering range by 15%.  See “Pro Forma Data” and “The Conversion and Stock Offering - How We Determined Our Price and the Number of Shares to Be Issued in the Stock Offering” as to the assumptions used to arrive at these amounts.
 
We intend to use the net proceeds received from the stock offering as follows:
 
   
Minimum
   
Maximum
   
Maximum,
as adjusted


Retained by FS Bancorp                                                               
  $ 7,741,500     $ 10,783,500     $ 12,532,525  
Loan to employee stock ownership plan
    1,666,000       2,254,000       2,592,100  
Contributed to 1st Security Bank of Washington
    9,407,500       13,037,500       15,124,625  
Net proceeds from stock offering                                                               
  $ 18,815,000     $ 26,075,000     $ 30,249,250  
                         
FS Bancorp will purchase all of the capital stock of 1st Security Bank of Washington to be issued in the offering in exchange for an amount of net proceeds sufficient for the bank to have at least 10% tangible capital upon completion of the offering.  In no event will less than 50% of the net proceeds be transferred to 1st Security Bank of Washington in exchange for its shares.  The portion of the net proceeds used by FS Bancorp to purchase the capital stock of 1st Security Bank of Washington will be added to the bank’s general funds for general corporate purposes.  The net proceeds 1st Security Bank of Washington receives from FS Bancorp are initially intended to be invested into short-term liquid investments.  In addition, a majority of the net proceeds retained by FS Bancorp, excluding the amount needed to fund the loan to the employee stock ownership plan, is expected to be deposited with 1st Security Bank of Washington as deposits, providing additional funds for reinvestment in earning assets.
 
Except as described above, neither FS Bancorp nor 1st Security Bank of Washington has any specific plans for the investment of the proceeds of this offering, nor have they allocated a specific portion of the proceeds to any particular use.  For a discussion of our business reasons for undertaking the conversion, see “The Conversion and Stock Offering - Our Reasons for the Conversion.”
 
 
35


FS Bancorp intends to use a portion of the net proceeds to make a loan directly to the employee stock ownership plan to enable it to purchase up to 8% of the aggregate shares of common stock sold in the offering; or, alternatively, in the open market after the conversion.  Based upon the sale of 2,082,500 and 2,817,500 shares of common stock in the offering at the minimum and maximum of the estimated offering range, respectively, the loan to the FS Bancorp employee stock ownership plan would be $1.7 million and $2.3 million, respectively.  See “Management - Benefits to Be Considered Following Completion of the Conversion - Employee Stock Ownership Plan.”
 
Within one year after completion of the offering, FS Bancorp intends to adopt an equity incentive plan, subject to shareholder approval, and use a portion of its proceeds to fund the purchase of shares in the open market for the plan.  The equity incentive plan intends to purchase in the open market 4% of the aggregate shares sold in the offering, or $833,000 and $1.1 million at the minimum and maximum of the estimated offering range, respectively.
 
The net proceeds may vary because total expenses of the conversion may be more or less than those estimated.  The net proceeds will also vary if the number of shares to be issued in the conversion is adjusted to reflect a change in the estimated pro forma market value of 1st Security Bank of Washington. Payments for shares made through withdrawals from existing deposit accounts at 1st Security Bank of Washington will not result in the receipt of new funds for investment by 1st Security Bank of Washington but will result in a reduction of 1st Security Bank of Washington’s interest expense and liabilities as funds are transferred from interest-bearing certificates or other deposit accounts.
 
 
The board of directors of FS Bancorp intends to pay cash dividends on the common stock in the future.  However, the amount and timing of any dividends has not yet been determined.  The payment of dividends will depend upon a number of factors, including capital requirements, FS Bancorp’s and 1st Security Bank of Washington’s financial condition and results of operations, tax considerations, statutory and regulatory limitations and general economic conditions.  No assurances can be given that any dividends will be paid or that, if paid, dividends will not be reduced or eliminated in future periods.  FS Bancorp may file consolidated tax returns with 1st Security Bank of Washington.  Accordingly, it is anticipated that any cash distributions made by FS Bancorp to its shareholders would be treated as cash dividends and not as a return of capital for federal and state tax purposes.
 
Dividends from FS Bancorp will depend, in large part, upon receipt of dividends from 1st Security Bank of Washington, because FS Bancorp initially will have limited sources of funds other than the portion of the proceeds retained from this offering, dividends from 1st Security Bank of Washington, earnings from the investment of proceeds retained by FS Bancorp from the sale of shares of common stock and interest payments with respect to FS Bancorp’s loan to the FS Bancorp employee stock ownership plan.  Under Washington law, FS Bancorp is prohibited from paying a dividend if, as a result of its payment, it would be unable to pay its debts as they become due in the normal course of business, or if its total liabilities would exceed its total assets.  In addition, as a bank holding company, banking regulations prohibit a return of capital during the three-year term of the business plan submitted by FS Bancorp in connection with the stock offering.  See “How We Are Regulated – Limitations on Dividends and Stock Repurchases.”
 
 
36


FS Bancorp has never issued capital stock, and, consequently, there is no established market for the common stock at this time.  FS Bancorp has applied to have its common stock listed on the Nasdaq Capital Market under the symbol “FSBW.”  There can be no assurance, however, that FS Bancorp will meet Nasdaq’s listing requirements.  The development of a liquid public market depends on the existence of willing buyers and sellers, the presence of which is not within the control of FS Bancorp, 1st Security Bank of Washington or any market maker.  Accordingly, the number of active buyers and sellers of the common stock at any particular time may be limited.  There can be no assurance, however, that purchasers will be able to sell their shares at or above the initial purchase price of $10.00 per share.
 
 
37


The following table presents the capitalization of 1st Security Bank of Washington at June 30, 2011, and the pro forma consolidated capitalization of FS Bancorp after giving effect to the conversion, excluding assumed earnings on the net proceeds, based upon the sale of the number of shares shown below and the other assumptions set forth under “Pro Forma Data.”
                                             
   
  1st Security
Bank of Washington
Capitalization
At
June 30,
2011
     
FS Bancorp – Pro Forma
Based Upon Sale at $10.00 Per Share
 
         
2,082,500
Shares
(Minimum of
 Range)
     
2,450,000
Shares
(Midpoint
of Range)
   
2,817,500
Shares
(Maximum
of Range)
   
3,240,125
Shares(1)
(Maximum of
Range, as
Adjusted)
 
   
(Dollars in thousands)
 
                                             
Deposits(2) 
  $ 241,475       $ 241,475       $ 241,475     $ 241,475     $ 241,475  
Borrowings
    3,900         3,900         3,900       3,900       3,900  
     Total deposits and borrowings
  $ 245,375       $ 245,375       $ 245,375     $ 245,375     $ 245,375  
                                             
Shareholders’ equity
                                           
     Preferred stock, $0.01 par value,
        5,000,000 shares authorized,
        none issued
  $ ---       $ ---       $ ---     $ ---     $ ---  
     Common stock, $0.01 par value, 45,000,000 shares authorized; shares to be issued as reflected
    ---         21         25       28       32  
     Additional paid-in capital
    ---         18,794         22,420       26,047       30,217  
     Retained earnings(3) 
    25,914         25,914         25,914       25,914       25,914  
     Accumulated other
                                           
        comprehensive income
    63         63         63       63       63  
                                             
Less:
                                           
     Common stock to be acquired by the employee stock ownership plan(4)
    ---         (1,666 )       (1,960 )     (2,254 )     (2,592 )
     Common stock to be acquired for restricted stock awards (5)
    ---         (833 )       (980 )     (1,127 )     (1,296 )
                                             
Total shareholders’ equity
  $ 25,977       $ 42,293       $ 45,482     $ 48,671     $ 52,338  
                                             
Total shareholders’ equity as a percentage of total assets
    9.52 %       14.63 %       15.56 %     16.47 %     17.50 %
 

(1)
As adjusted to give effect to an increase in the number of shares of common stock which would be offered as a result of a 15% increase in the estimated offering range to reflect demand for shares, changes in market and general financial conditions following the commencement of the subscription and community offerings or regulatory considerations.
(2)
Does not reflect withdrawals from deposit accounts for the purchase of shares of common stock in the conversion.  These withdrawals would reduce pro forma deposits by the amount of the withdrawals.
(3)
The retained earnings of 1st Security Bank of Washington will be substantially restricted after the conversion.  Additionally, 1st Security Bank of Washington will be prohibited from paying any dividend that would reduce its regulatory capital below the amount required for the liquidation account that will be set up in connection with the conversion.  See “The Conversion and Stock Offering - Effects of the Conversion - Depositors’ Rights if We Liquidate.”
(4)
Assumes that 8% of the shares sold in the offering will be purchased by the employee stock ownership plan financed by a loan from FS Bancorp.  The loan will be repaid principally from 1st Security Bank of Washington’s contributions to the employee stock ownership plan. Since FS Bancorp will finance the employee stock ownership plan debt, this debt will be eliminated through consolidation and no liability will be reflected on FS Bancorp’s consolidated financial statements. Accordingly, the amount of shares of common stock acquired by the employee stock ownership plan is shown in this table as a reduction of total shareholders’ equity.
(5)
Assumes that a number of shares equal to 4.0% of the shares outstanding after the offering are purchased in the open market by the stock-based incentive plan, with funding from FS Bancorp, subsequent to the offering at the purchase price of $10.00 per share.  The stock-based incentive plan is subject to shareholder approval.
 
 
38


1st SECURITY BANK OF WASHINGTON
EXCEEDS ALL
 
At June 30, 2011, 1st Security Bank of Washington exceeded all of its applicable regulatory capital requirements.  The following table sets forth the regulatory capital of 1st Security Bank of Washington at June 30, 2011 and the pro forma regulatory capital of 1st Security Bank of Washington after giving effect to the conversion and offering, based upon the sale of the number of shares shown in the table.  The pro forma regulatory capital amounts reflect the receipt by 1st Security Bank of Washington of 50% of the net stock proceeds.  The pro forma risk-based capital amounts assume the investment of the net proceeds received by 1st Security Bank of Washington in assets that have a risk-weight of 20% or higher under applicable regulations, as if the net proceeds had been received and so applied at June 30, 2011.
 
         
Pro Forma at June 30, 2011
 
   
At
June 30, 2011
   
2,082,500 shares
Sold at $10.00 per Share
(Minimum of Range)
   
2,450,000 Shares
Sold at $10.00 per Share
(Midpoint of Range)
   
2,817,500 Shares
Sold at $10.00 per Share
(Maximum of Range)
   
3,240,125 Shares
Sold at $10.00 per Share
(Maximum of Range,
as Adjusted)
 
   
Amount
   
Percent of
Assets(1)
   
Amount
   
Percent of
Assets
   
Amount
   
Percent of
Assets
   
Amount
   
Percent of
Assets
   
Amount
   
Percent of
Assets
 
   
(Dollars in thousands)
 
Equity capital under generally
   accepted accounting
   principles (“GAAP”)
  $ 25,977       9.52 %   $ 33,719       11.95 %   $ 35,240       12.41 %   $ 36,761       12.86 %   $ 38,510       13.38 %
                                                                                 
Tier I leverage
  $ 25,894       9.37 %   $ 33,636       11.77 %   $ 35,157       12.23 %   $ 36,678       12.68 %   $ 38,427       13.18 %
Requirement
    11,053       4.00       11,430       4.00       11,502       4.00       11,575       4.00       11,658       4.00  
Excess
  $ 14,841       5.37 %   $ 22,206       7.77 %   $ 23,655       8.23 %   $ 25,103       8.68 %   $ 26,769       9.18 %
                                                                                 
Tier I risk based
  $ 25,894       11.31 %   $ 33,636       14.57 %   $ 35,157       15.20 %   $ 36,678       15.84 %   $ 38,427       16.56 %
Requirement
    9,160       4.00       9,235       4.00       9,250       4.00       9,264       4.00       9,281       4.00  
Excess
  $ 16,734       7.31 %   $ 24,401       10.57 %   $ 25,907       11.20 %   $ 27,414       11.84 %   $ 29,146       12.56 %
                                                                                 
Total risk based
  $ 28,781       12.57 %   $ 36,523       15.82 %   $ 38,044       16.45 %   $ 39,565       17.08 %   $ 41,314       17.81 %
Risk based requirement
    18,320       8.00       18,471       8.00       18,500       8.00       18,529       8.00       18,562       8.00  
Excess                                         
  $ 10,461       4.57 %   $ 18,052       7.82 %   $ 19,544       8.45 %   $ 21,036       9.08 %   $ 22,752       9.81 %
                                                                                 
Reconciliation of capital infused into 1st Security Bank of Washington:
                                                                               
Net proceeds infused
                  $ 9,407             $ 11,223             $ 13,038             $ 15,125          
   Common stock acquired by employee stock ownership plan
                    (1,666 )             (1,960 )             (2,254 )             (2,592 )        
Pro forma increase in GAAP and
   regulatory capital
                  $ 7,741             $ 9,263             $ 10,784             $ 12,533          
 

(1) Adjusted total or adjusted risk-weighted assets, as appropriate.

 
39


We cannot determine the actual net proceeds from the sale of our common stock until the conversion is completed.  However, we estimate that net proceeds will be between $18.8 million and $26.1 million, or $30.2 million if the estimated offering range is increased by 15%, based upon the following assumptions:
 
 
all shares of common stock will be sold through non-transferable rights to subscribe for the common stock, in order of priority, to:
 
 
eligible account holders, who are depositors of 1st Security Bank of Washington with account balances of at least $50.00 as of the close of business on June 30, 2007,
 
 
the proposed employee stock ownership plan, which will purchase 8% of the shares of common stock sold in the offering,
 
 
supplemental eligible account holders, who are depositors of 1st Security Bank of Washington (other than directors and executive officers and their associates) with account balances of at least $50.00 as of the close of business on ____________ __, 2011, and
 
 
other members, who are depositors of 1st Security Bank of Washington as of the close of business on _______ __, 2011, other than eligible account holders or supplemental eligible account holders.
 
 
Keefe, Bruyette & Woods will receive a success fee equal to 1.0% of the gross proceeds from the subscription offering (estimated to be 70% of the shares sold), excluding shares of common stock sold to directors, officers, employees and the employee stock ownership plan and a success fee equal to 2.0% of the gross proceeds from the direct community offering (estimated to be 30% of the shares sold); and
 
 
total expenses, excluding the success fee paid to Keefe, Bruyette & Woods, are estimated to be approximately $1.8 million.  Actual expenses may vary from those estimated; and
 
 
FS Bancorp will grant options under the equity incentive plan to acquire common stock equal to 10.0% of the shares of common stock outstanding after the offering, and will grant restricted stock awards in an amount equal to 4.0% of such shares.  FS Bancorp will acquire common stock underlying these awards through open market purchases.  The estimated fair value of the options, estimated using an application of the Black-Scholes option pricing model, is recognized as an expense over the requisite service period of the options.  The expense recorded in the pro forma financial information assumes the retrospective method under U.S. generally accepted accounting principles.
 
Pro forma net income and shareholders’ equity of FS Bancorp have been calculated for the year ended December 31, 2010 and the six months ended June 30, 2011, respectively, as if the common stock to be issued in the conversion had been sold at the beginning of the period and the net proceeds had been invested at 2.01% and 1.76%, respectively, which represent the yields on five-year U.S. Government securities at December 31, 2010 and June 30, 2011, respectively.  We believe that this rate more accurately reflects a pro forma reinvestment rate than the arithmetic average method, which assumes reinvestment of the net proceeds at a rate equal to the average of the yield on interest-earning assets and the cost of deposits for these periods.  The effect of withdrawals from deposit accounts for the purchase of common stock has not been reflected.  A tax rate of 34% has been assumed for the periods resulting in an after-tax yield of 1.33% and 1.16% for the year ended December 31, 2010 and the six months ended June 30, 2011, respectively.  Historical and pro forma per share amounts have been calculated by dividing historical and pro forma amounts by the indicated number of shares of common stock, as adjusted to give effect to the shares purchased by the employee stock ownership plan.  See Note 2 to the following tables.  As discussed under “How We Intend to Use the Proceeds From this Offering,” FS Bancorp intends to make a loan to fund the purchase of 8% of the common stock sold in the offering by the employee stock ownership plan and intends to retain 50% of the net proceeds from the conversion.
 
 
40


No effect has been given in the tables to the issuance of additional shares of common stock pursuant to any stock options available for grant under the equity incentive plan.  The table below gives effect to the restricted stock awards that would be available for grant under the equity incentive plan and which is expected to be adopted by FS Bancorp following the conversion and presented to shareholders for approval at an annual or special meeting of shareholders to be held at least six months following the completion of the conversion.  If the equity incentive plan is approved by shareholders, FS Bancorp intends to acquire an amount of common stock equal to 4% of the shares of common stock issued in the conversion, either through open market purchases or from authorized but unissued shares of common stock, if permissible.  See “Management - Benefits – Equity Incentive Plan.”  The following tables assume that shareholder approval has been obtained, as to which there can be no assurance, and that the shares acquired by FS Bancorp are purchased in the open market at $10.00 per share.  No effect has been given to FS Bancorp’s results of operations after the conversion, the market price of the common stock after the conversion, or a less than 4% purchase by FS Bancorp.
 
The following pro forma information may not be representative of the financial effects of the foregoing transactions at the dates on which the transactions actually occur and should not be taken as indicative of future results of operations.  Pro forma shareholders’ equity represents the difference between the stated amount of assets and liabilities of FS Bancorp computed in accordance with GAAP.  Shareholders’ equity does not give effect to intangible assets in the event of a liquidation to 1st Security Bank of Washington’s bad debt reserve or to the liquidation account to be maintained by 1st Security Bank of Washington.  The pro forma shareholders’ equity is not intended to represent the fair market value of the common stock and may be different than amounts that would be available for distribution to shareholders in the event of liquidation.
 
The tables on the following pages summarize historical data of FS Bancorp’s pro forma data at or for the dates and periods indicated based on the assumptions set forth above and in the tables and should not be used as a basis for projection of the market value of our common stock following the conversion and the offering.
 
 
41


At or For the Six Months Ended June 30, 2011
 
   
2,082,500
Shares Sold at
$10.00 Per
Share
(Minimum
of Range)
   
2,450,000
Shares Sold at
$10.00 Per
Share
(Midpoint
of Range)
   
2,817,500
Shares Sold at
$10.00 Per
Share
(Maximum
of Range)
   
3,240,125
Shares Sold at
$10.00 Per Share
(Maximum of
Range, as
Adjusted)(1)
 
   
(Dollars in thousands)
 
                         
Pro forma market capitalization:
                       
Gross proceeds of offering
  $ 20,825     $ 24,500     $ 28,175     $ 32,401  
    Less expenses
    (2,010 )     (2,055 )     (2,100 )     (2,152 )
Estimated net proceeds
    18,815       22,445       26,075       30,249  
   Less: common stock acquired by employee stock ownership plan(2)
    (1,666 )     (1,960 )     (2,254 )     (2,592 )
   Less: common stock acquired for restricted stock awards(3)
    (833 )     (980 )     (1,127 )     (1,296 )
Estimated investable net proceeds
  $ 16,316     $ 19,505     $ 22,694     $ 26,361  
Pro forma net income for the six months ended June 30, 2011:
                               
Historical    
  $ 1,008     $ 1,008     $ 1,008     $ 1,008  
Pro forma income on net proceeds
    95       114       132       153  
   Less: pro forma employee stock ownership plan adjustment(2)
    (55 )     (65 )     (75 )     (86 )
   Less: pro forma restricted stock award adjustment(3)                                               
    (55 )     (65 )     (75 )     (86 )
   Less: pro forma stock option adjustment(4)
    (54 )     (63 )     (73 )     (84 )
Pro forma net income      
  $ 939     $ 929     $ 917     $ 905  
                                 
Per share net income for the six months ended June 30, 2011:
                               
Historical      
  $ 0.52     $ 0.45     $ 0.39     $ 0.34  
Pro forma income on net proceeds
    0.05       0.05       0.05       0.05  
   Less: pro forma employee stock ownership plan adjustment(2)
    (0.03 )     (0.03 )     (0.03 )     (0.03 )
   Less: pro forma restricted stock award adjustment(3)                                               
    (0.03 )     (0.03 )     (0.03 )     (0.03 )
   Less: pro forma stock option adjustment(4)                                               
    (0.03 )     (0.03 )     (0.03 )     (0.03 )
 Pro forma net income per share(5)
  $ 0.48     $ 0.41     $ 0.35     $ 0.30  
                                 
Offering price as a multiple of pro forma net income per share                                               
  $ 10.42     $ 12.20     $ 14.29     $ 16.67  
                                 
Number of shares outstanding for pro forma income per share calculations
    1,924,230       2,263,800       2,603,370       2,993,876  
 
 
(table continued on following page)
(Footnotes on page 46)
 
 
42


At or For the Six Months Ended June 30, 2011
 
   
2,082,500
Shares Sold at
$10.00 Per
Share
(Minimum
of Range)
   
2,450,000
Shares Sold at
$10.00 Per
Share
(Midpoint
of Range)
   
2,817,500
Shares Sold at
$10.00 Per
Share
(Maximum
of Range)
   
3,240,125
Shares Sold at
$10.00 Per
Share
(Maximum of
Range, as
Adjusted)(1)
 
   
(Dollars in thousands)
 
                         
Pro forma shareholders’ equity at June 30, 2011:
                       
Historical  
  $ 25,977     $ 25,977     $ 25,977     $ 25,977  
Estimated net proceeds
    18,815       22,445       26,075       30,249  
   Less: common stock acquired by the employee stock ownership plan(2)
    (1,666 )     (1,960 )     (2,254 )     (2,592 )
   Less: common stock acquired for restricted stock awards(3)
    (833 )     (980 )     (1,127 )     (1,296 )
Pro forma shareholders’ equity
  $ 42,293     $ 45,482     $ 48,671     $ 52,338  
                                 
Pro forma shareholders’ equity per share at June 30, 2011:
                               
Historical
  $ 12.47     $ 10.60     $ 9.22     $ 8.02  
Estimated net proceeds
    9.03       9.16       9.25       9.34  
   Less: common stock acquired by the employee stock ownership plan(2)
    (0.80 )     (0.80 )     (0.80 )     (0.80 )
   Less: common stock acquired for restricted stock awards(3)
    (0.40 )     (0.40 )     (0.40 )     (0.40 )
Pro forma shareholders’ equity per share(5)
  $ 20.30     $ 18.56     $ 17.27     $ 16.16  
                                 
Offering price as a percentage of pro forma shareholders’ equity
    49.26 %     53.88 %     57.90 %     61.88 %
                                 
Number of shares outstanding for pro forma book value per share calculations
    2,082,500       2,450,000       2,817,500       3,240,125  
 
 
(table continued on following page)
(Footnotes on page 46)
 
 
43


At or For the Year Ended December 31, 2010
 
   
2,082,500
Shares Sold at
$10.00 Per
Share
(Minimum
of Range)
   
2,450,000
Shares Sold at
$10.00 Per
Share
(Midpoint
of Range)
   
2,817,500
Shares Sold at
$10.00 Per
Share
(Maximum
of Range)
   
3,240,125
Shares Sold at
$10.00 Per Share
(Maximum of
Range, as
Adjusted)(1)
 
   
(Dollars in thousands)
 
                         
Pro forma market capitalization:
                       
Gross proceeds of offering
  $ 20,825     $ 24,500     $  28,175     $ 32,401  
    Less expenses
    (2,010 )     (2,055 )     (2,100 )     (2,152 )
Estimated net proceeds
    18,815       22,445       26,075       30,249  
   Less: common stock acquired by employee stock ownership plan(2)
    (1,666 )     (1,960 )     (2,254 )     (2,592 )
   Less: common stock acquired for restricted stock awards(3)
    (833 )     (980 )     (1,127 )     (1,296 )
Estimated investable net proceeds
  $ 16,316     $ 19,505     $ 22,694     $ 26,361  
Pro forma net income for the year ended December 31, 2010:
                               
Historical
  $  1,602     $  1,602     $  1,602     $ 1,602  
Pro forma income on net proceeds
    216       259       301       350  
   Less: pro forma employee stock ownership plan adjustment(2)
    (110 )     (129 )     (149 )     (171 )
   Less: pro forma restricted stock award adjustment(3)                                               
    (110 )     (129 )     (149 )     (171 )
   Less: pro forma stock option adjustment(4)                                               
    (107 )     (126 )     (145 )     (167 )
Pro forma net income
  $ 1,491     $ 1,477     $ 1,460     $ 1,443  
                                 
Per share net income for the year ended December 31, 2010:
                               
Historical            
  $ 0.83     $ 0.70     $ 0.61     $ 0.53  
Pro forma income on net proceeds
    0.11       0.11       0.12       0.12  
   Less: pro forma employee stock ownership plan adjustment(2)
    (0.06 )     (0.06 )     (0.06 )     (0.06 )
   Less: pro forma restricted stock award adjustment(3)                                               
    (0.06 )     (0.06 )     (0.06 )     (0.06 )
   Less: pro forma stock option adjustment(4)                                               
    (0.06 )     (0.06 )     (0.06 )     (0.06 )
Pro forma net income  per share(5)
  $ 0.76     $ 0.63     $ 0.55     $ 0.47  
                                 
Offering price as a multiple of pro forma net income per share                                               
  $ 13.16     $ 15.87     $ 18.18     $ 21.28  
                                 
Number of shares outstanding for pro forma income per share calculations
    1,932,560       2,273,600       2,614,640       3,006,836  
 
 
(table continued on following page)
(Footnotes on page 46)
 
 
44


At or For the Year Ended December 31, 2010
 
   
2,082,500
Shares Sold at
$10.00 Per
Share
(Minimum
of Range)
   
2,450,000
Shares Sold at
$10.00 Per
Share
(Midpoint
of Range)
   
2,817,500
Shares Sold at
$10.00 Per
Share
(Maximum
of Range)
   
3,240,125
Shares Sold at
$10.00 Per
Share
(Maximum of
Range, as
Adjusted)(1)
 
   
(Dollars in thousands)
 
                         
Pro forma shareholders’ equity at December 31, 2010:
                       
Historical
  $ 24,795     $ 24,795     $ 24,795     $ 24,795  
Estimated net proceeds
    18,815       22,445       26,075       30,249  
   Less: common stock acquired by the employee stock ownership plan(2)
    (1,666 )     (1,960 )     (2,254 )     (2,592 )
   Less: common stock acquired for restricted stock awards(3)
    (833 )     (980 )     (1,127 )     (1,296 )
Pro forma shareholders’ equity
  $ 41,111     $ 44,300     $ 47,489     $ 51,156  
                                 
Pro forma shareholders’ equity per share at December 31, 2010:
                               
Historical
  $  11.91     $ 10.12     $ 8.80     $ 7.65  
Estimated net proceeds
    9.03       9.16       9.25       9.34  
   Less: common stock acquired by the employee stock ownership plan(2)
    (0.80 )     (0.80 )     (0.80 )     (0.80 )
   Less: common stock acquired for restricted stock awards(3)
    (0.40 )     (0.40 )     (0.40 )     (0.40 )
Pro forma shareholders’ equity per share(5)
  $ 19.74     $ 18.08     $ 16.85     $ 15.79  
                                 
Offering price as a percentage of pro forma shareholders’ equity
    50.66 %     55.31 %     59.35 %     63.33 %
                                 
Number of shares outstanding for pro forma book value per share calculations
    2,082,500       2,450,000       2,817,500       3,240,125  
 
   
(Footnotes on following page)

 
45


(1)
As adjusted to give effect to an increase in the number of shares which could occur as a result of a 15% increase in the offering range to reflect demand for the shares, changes in market and financial conditions following the commencement of the offering or regulatory considerations.
   
(2)
Assumes that 8% of shares of common stock sold in the offering will be purchased by the employee stock ownership plan. For purposes of this table, the funds used to acquire these shares are assumed to have been borrowed by the employee stock ownership plan from FS Bancorp.  1st Security Bank of Washington intends to make annual contributions to the employee stock ownership plan in an amount at least equal to the required principal and interest payments on the debt. 1st Security Bank of Washington’s total annual payments on the employee stock ownership plan debt are based upon a 10 year loan.  The pro forma adjustments assume that the employee stock ownership plan shares are allocated in equal annual installments based on the number of loan repayment installments assumed to be paid by 1st Security Bank of Washington, the fair value of the common stock remains equal to the subscription price and the employee stock ownership plan expense reflects an effective combined federal and state tax rate of 34%. The unallocated employee stock ownership plan shares are reflected as a reduction of shareholders’ equity. No reinvestment is assumed on proceeds contributed to fund the employee stock ownership plan. The pro forma net income further assumes that 8,330, 9,800, 11,270 and 12,961 shares were committed to be released during the six months ended June 30, 2011; and 16,660, 19,600, 22,540 and 25,921 shares were committed to be released during the year ended December 31, 2010, at the minimum, midpoint, maximum, and adjusted maximum of the offering range, respectively, and only the employee stock ownership plan shares committed to be released during the period were considered outstanding for purposes of income per share calculations.  See “Management - Benefits - Employee Stock Ownership Plan.”
   
(3)
If the stock-based incentive plan is approved by FS Bancorp’s shareholders, FS Bancorp may purchase an aggregate number of shares of common stock equal to 4.0% of the shares outstanding after the offering (or possibly a greater number of shares if the plan is implemented more than one year after completion of the conversion), to be awarded as restricted stock to officers and directors under the stock-based incentive plan.  Shareholder approval of the stock-based incentive plan and purchases of stock for grant under the plan may not occur earlier than six months after the completion of the offering.  The shares may be issued directly by FS Bancorp or acquired through open market purchases.  The funds to be used to purchase the shares to be awarded by the stock-based incentive plan will be provided by FS Bancorp.  The table assumes that (i) the shares to be awarded under the stock-based incentive plan are acquired through open market purchases at $10.00 per share, (ii) 20.0% of the amount contributed for restricted stock awards is expensed during the year ended December 31, 2010 and 10% of the amount contributed for restricted stock awards is expensed during the six months ended June 30, 2011 (based on a five-year vesting period), and (iii) the stock-based incentive plan expense reflects an estimated marginal federal and state effective tax rate of 34%.  Assuming shareholder approval of the stock-based incentive plan and that shares of common stock (equal to 4.0% of the shares outstanding after the offering) are awarded through the use of authorized but unissued shares of common stock, shareholders would have their ownership and voting interests diluted by approximately 3.9%.
   
(4)
Gives effect to the options we expect to grant under the stock-based incentive plan, which is expected to be adopted by FS Bancorp following the offering and presented for shareholder approval not earlier than six months after the completion of the offering.  We have assumed that options will be granted to acquire a number of shares equal to 10% of the shares outstanding after the offering.  In calculating the pro forma effect of the stock options, it is assumed that the exercise price of the stock options and the trading price of the stock at the date of grant were $10.00 per share, the estimated grant-date fair value pursuant to the application of the Black-Scholes option pricing model (see “Summary – Benefits to Management from the Offering” for applicable assumptions) was $2.81 for each option and the aggregate grant-date fair value of the stock options was amortized to expense on a straight line basis over a five-year vesting period of options with a ten-year term.  Finally, we assumed that 25.0% of the stock options were non-qualified options granted to directors, resulting in a tax benefit (at an assumed rate of 34%) for a deduction equal to the grant date fair value of the option.  Under the above assumptions, the granting of options under the stock-based incentive plan will result in no additional shares under the treasury stock method for purposes of calculating earnings per share.  There can be no assurance that the actual exercise price of the stock options will be equal to the $10.00 price per share.  If a portion of the shares to satisfy the exercise options under the stock-based incentive plan are obtained from the issuance of authorized but unissued shares, our net income per share and shareholders’ equity per share will decrease.  This will also have a dilutive effect of up to 9.1% on the ownership interest of persons who purchase common stock in the offering.
   
(5)
Adjusted shares used for the pro-forma net income per share computations are determined by taking the number of shares assumed to be sold in the offering and subtracting the employee stock ownership plan shares that have not been committed for release during the period. See note 2, above.

 
46


The following table sets forth for each of the directors and executive officers of FS Bancorp and 1st Security Bank of Washington and for all of the directors and executive officers as a group, the proposed purchases of common stock, assuming sufficient shares are available to satisfy their subscriptions.  The amounts include shares that may be purchased through individual retirement accounts and by associates.  These purchases are intended for investment purposes only, and not for resale.  Directors, officers, their associates and employees will pay the same price as all other subscribers for the shares for which they subscribe.
 
               
As a Percent of Shares Offered
 
Name
 
Amount
   
Number
of Shares
   
At the
Minimum
of
Estimated
Offering
Range
   
At the
Maximum
of
Estimated Offering
Range
 
                         
Directors:
                       
                         
Ted A. Leech
  $ 100,000       10,000       0.48 %     0.35 %
Joseph C. Adams
    250,000       25,000       1.20       0.89  
Judith A. Cochrane
    25,000       2,500       0.12       0.09  
Michael J. Mansfield
    100,000       10,000       0.48       0.35  
Margaret R. Piesik
    10,000       1,000       0.05       0.04  
Joseph P. Zavaglia
    50,000       5,000       0.24       0.18  
                                 
Executive officers who are not directors:
                               
                                 
Matthew D. Mullet
    100,000       10,000       0.48       0.35  
Steven L. Haynes
    100,000       10,000       0.48       0.35  
Drew B. Ness
    25,000       2,500       0.12       0.09  
                                 
All directors and executive officers as a group (9 persons)
  $ 760,000       76,000       3.65 %     2.70
%(1)
 

(1)  Difference is the result of rounding.
 
 
47


FINANCIAL CONDITION AND RESULTS OF OPERATIONS
 
Overview
 
1st Security Bank of Washington has been serving the Puget Sound area since 1936.  Originally chartered as a credit union, previously known as Washington’s Credit Union, we served various select employment groups.  On April 1, 2004, we converted from a credit union to a Washington state-chartered mutual savings bank.  The charter conversion enabled us to more effectively compete in the local market area with commercial banks and thrifts, and provided us with the ability to raise capital for growth purposes.  This offering will position us to take advantage of the business opportunities that we believe exist in our market area.  In particular, the added capital will allow us to pursue portfolio growth and product diversification, as well as provide 1st Security Bank of Washington with the ability to further attract and retain a qualified Board and management.
 
At the time of our conversion to a mutual savings bank in 2004, we operated 14 branch locations in the Puget Sound area, along with our Mountlake Terrace headquarters, and had 132 employees.  Our assets at December 31, 2004 totaled $261.4 million.  Since then, in an effort to address a number of operational deficiencies facing the bank, primarily related to the differences between the way a credit union is run and the way a bank operates, we restructured the board of directors and added a number of seasoned bankers to the organization.  In 2008, we determined that a number of cost cutting measures were needed to combat the deepening recession and return the institution to profitability, including salary reductions or freezes for a number of our senior officers, reduced employee benefits and a consolidation of our branch network, which commenced in 2009.  At June 30, 2011, we maintained six branch locations, along with our headquarters, had approximately 79 full time equivalent employees, total assets of $272.8 million and total deposits of $241.5 million.  This compared to 12 branch locations, along with our headquarters, 112 full-time equivalent employees, total assets of $255.4 million and total deposits of $216.1 million, at December 31, 2008.
 
Since January 2006, 1st Security Bank of Washington has been operating under some form of regulatory agreement, either with the Washington Department of Financial Institutions, the Federal Deposit Insurance Corporation, or both.  These regulatory agreements placed numerous requirements on us and limited our operating flexibility, which affected our ability to grow.  As of September 2011, we are no longer subject to any formal or informal regulatory agreements with either the Washington Department of Financial Institutions or the Federal Deposit Insurance Corporation.
 
We are a relationship-driven community bank.  We deliver banking and financial services to local families, local and regional businesses and industry niches within distinct Puget Sound area communities.  We emphasize long-term relationships with families and businesses within the communities we serve, working with them to meet their financial needs.  We are also actively involved in community activities and events within these market areas, which further strengthens our relationships within these markets.
 
1st Security Bank of Washington is a diversified lender with a focus on the origination of consumer loans, commercial real estate mortgage loans, commercial business loans and second mortgage/home equity loan products.  Consumer loans, in particular indirect home improvement loans, represent the largest portion of the loan portfolio and have traditionally been the mainstay of the bank’s lending strategy, a carryover from its days as a credit union.  Consumer loans totaled $124.7 million, or 58.1% of total loans as of June 30, 2011. Going forward, we plan to place more emphasis on commercial real estate, commercial business and residential construction lending, while maintaining the size of our consumer loan portfolio.  We also intend to reintroduce in-house originations of residential mortgage loans, primarily for sale into the secondary market, through a mortgage banking program.
 
Our lending strategies are intended to take advantage of: (1) our historical strength in indirect consumer lending, (2) recent market dislocation that has created new lending opportunities and the availability of experienced bankers, and (3) our strength in relationship lending. Retail deposits will continue to serve as the primary funding source.
 
 
48


1st Security Bank of Washington is significantly affected by prevailing economic conditions, as well as government policies and regulations concerning, among other things, monetary and fiscal affairs.  Deposit flows are influenced by a number of factors, including interest rates paid on time deposits, other investments, account maturities, and the overall level of personal income and savings.  Lending activities are influenced by the demand for funds, the number and quality of lenders, and regional economic cycles.  Sources of funds for lending activities of 1st Security Bank of Washington include primarily deposits, including brokered deposits, borrowings, payments on loans and income provided from operations.
 
Our earnings are primarily dependent upon our net interest income, the difference between interest income and interest expense.  Interest income is a function of the balances of loans and investments outstanding during a given period and the yield earned on these loans and investments.  Interest expense is a function of the amount of deposits and borrowings outstanding during the same period and interest rates paid on these deposits and borrowings.  Our earnings are also affected by our provision for loan losses, service charges and fees, gains from sales of assets, other income, operating expenses and income taxes.
 
Critical Accounting Policies and Estimates
 
Certain of our accounting policies are important to the portrayal of our financial condition, since they require management to make difficult, complex or subjective judgments, some of which may relate to matters that are inherently uncertain.  Estimates associated with these policies are susceptible to material changes as a result of changes in facts and circumstances.  Facts and circumstances which could affect these judgments include, but are not limited to, changes in interest rates, changes in the performance of the economy and changes in the financial condition of borrowers.  Management believes that its critical accounting policies include determining the allowance for loan losses, estimation of fair value, accounting for the fair value of mortgage servicing rights and accounting for income taxes.  Our accounting policies are discussed in detail in Note 1 of the Notes to Financial Statements included in this prospectus.
 
Allowance for Loan Loss.  The allowance for loan losses is the amount estimated by management as necessary to cover losses inherent in the loan portfolio at the balance sheet date.  The allowance is established through the provision for loan losses, which is charged to income.  Determining the amount of the allowance for loan losses necessarily involves a high degree of judgment.  Among the material estimates required to establish the allowance are: loss exposure at default; the amount and timing of future cash flows on impacted loans; value of collateral; and determination of loss factors to be applied to the various elements of the portfolio.  All of these estimates are susceptible to significant change.  Management reviews the level of the allowance at least quarterly and establishes the provision for loan losses based upon an evaluation of the portfolio, past loss experience, current economic conditions and other factors related to the collectibility of the loan portfolio.  Although we believe that we use the best information available to establish the allowance for loan losses, future adjustments to the allowance may be necessary if economic conditions differ substantially from the assumptions used in making the evaluation. As we add new products, increase the complexity of the loan portfolio, and expand our market area, we intend to enhance and adapt our methodology to keep pace with the size and complexity of the loan portfolio. Changes in any of the above factors could have a significant effect on the calculation of the allowance for loan losses in any given period. Management believes that its systematic methodology continues to be appropriate given our size and level of complexity.
 
Other Real Estate Owned: Property acquired by foreclosure or deed in lieu of foreclosure is recorded at fair value, less cost to sell.  Development and improvement costs relating to the property are capitalized.  The carrying value of the property is periodically evaluated by management and, if necessary, allowances are established to reduce the carrying value to net realizable value.  Gains or losses at the time the property is sold are charged or credited to operations in the period in which they are realized.  The amounts that we will ultimately realize from the sale of other real estate owned may differ substantially from the carrying value of the assets because of market factors beyond our control or because of changes in management’s strategies for recovering the investment.
 
 
49


Income Taxes.  Income taxes are reflected in our financial statements to show the tax effects of the operations and transactions reported in the financial statements and consist of taxes currently payable plus deferred taxes.  Accounting Standards Codification, ASC 740, “Accounting for Income Taxes,” requires the asset and liability approach for financial accounting and reporting for deferred income taxes.  Deferred tax assets and liabilities result from differences between the financial statement carrying amounts and the tax bases of assets and liabilities.  They are reflected at currently enacted income tax rates applicable to the period in which the deferred tax assets or liabilities are expected to be realized or settled and are determined using the assets and liability method of accounting.  The deferred income provision represents the difference between net deferred tax asset/liability at the beginning and end of the reported period.  In formulating our deferred tax asset, we are required to estimate our income and taxes in the jurisdiction in which we operate.  This process involves estimating our actual current tax exposure for the reported period together with assessing temporary differences resulting from differing treatment of items, such as depreciation and the provision for loan losses, for tax and financial reporting purposes.
 
Deferred tax assets are deferred tax liabilities attributable to deductible temporary differences and carryforwards. After the deferred tax asset has been measured using the applicable enacted tax rate and provisions of the enacted tax law, it is then necessary to assess the need for a valuation allowance. A valuation allowance is needed when, based on the weight of the available evidence, it is more likely than not that some portion of the deferred tax asset will not be realized. As required by generally accepted accounting principles, available evidence is weighted heavily on cumulative losses with less weight placed on future projected profitability. Realization of the deferred tax asset is dependent on whether there will be sufficient future taxable income of the appropriate character in the period during which deductible temporary differences reverse or within the carryback and carryforward periods available under tax law. Based upon the available evidence, management determined that a full valuation allowance to offset the net deferred tax assets at June 30, 2011 and June 30, 2010, respectively, was required.
 
Our Business and Operating Strategy and Goals
 
Our primary objective is to operate 1st Security Bank of Washington as a well-capitalized, profitable, independent, community-oriented financial institution, serving customers in our primary market area.  Our strategy is to provide innovative products and superior service to small businesses, industry and geographic niches, and individuals in our primary market area.  Our primary market area is defined generally as the greater Puget Sound market area.  We currently provide services to communities through our main office and 6 full-service banking centers.  We support these banking centers with 24/7 access to on-line banking and participation in a worldwide ATM network.  This offering is a critical component of our business strategy because of the increased capital base, lending and deposit opportunities it will provide 1st Security Bank of Washington.
 
The board of directors has sought to accomplish our objective through the adoption of a strategy designed to improve profitability, a strong capital position and high asset quality.  This strategy primarily involves:
 
Growing and diversifying our loan portfolio and revenue streams.  We intend to transition our lending activities from a predominantly consumer-driven model to a more diversified consumer and business model by emphasizing three key lending initiatives: expansion of commercial business lending programs, including our warehouse lending program, through which we fund third party mortgage bankers; reintroduction of in-house originations of residential mortgage loans, primarily for sale into the secondary market; through a mortgage banking program and commercial real estate lending.  Additionally, we will seek to diversify our loan portfolio by increasing secured lending to small businesses in our market area, as well as residential construction lending.
 
 
50


Maintaining and improving asset quality.   We believe that strong asset quality is a key to long-term financial success.  Historically, our asset quality has been very strong, however, like most financial institutions in our market area, our asset quality began to deteriorate in 2008, and in particular during 2009 and 2010. Our percentage of non-performing loans to total loans was 0.9% at June 30, 2011, down from 2.7% at December 31, 2010 and 3.1% at December 31, 2009.  Our percentage of non-performing assets to total assets was 2.9% at June 30, 2011, down from 3.5% at December 31, 2010 and 4.6% at December 31, 2009.  We have actively managed our delinquent loans and non-performing assets by aggressively pursuing the collection of consumer debts and marketing saleable properties upon which we foreclosed or repossessed, work-outs of classified assets and loan charge-offs.  In the past several years, we also began emphasizing loan originations to consumers with higher credit scores, generally credit scores over 720, which has led to lower charge-offs in recent periods.  Although we intend to grow our loan portfolio, including through commercial real estate and commercial business lending, we intend to manage our credit exposures through the use of experienced bankers in this area and a conservative approach to lending.
 
Emphasizing lower cost core deposits to reduce the costs of funding our loan growth.   We offer personal and business checking accounts, NOW accounts and savings and money market accounts, which generally are lower-cost sources of funds than certificates of deposit, and are less sensitive to withdrawal when interest rates fluctuate.  In order to build our core deposit base, we are pursuing a number of strategies.  First, we provide sales promotions on savings and checking accounts to encourage the growth of these types of deposits.  Second, we diligently attempt to recruit all commercial loan customers to maintain a deposit relationship with us, generally a business checking account relationship to the extent practicable, for the term of their loan.
 
Capturing our customers’ full relationship.  We offer a wide range of products and services that provide diversification of revenue sources and solidify our relationship with our customers.  We focus on core retail and business deposits, including savings and checking accounts, that lead to long-term customer retention.  As part of our commercial lending process we cross-sell the entire business banking relationship, including deposit relationships and business banking products, such as online cash management, treasury management, wires, direct deposit, payment processing and remote deposit capture.  Our mortgage banking program also will provide us with opportunities to cross-sell products to new customers.
 
Expanding our reach.  In addition to deepening our relationships with existing customers, we intend to expand our business to new customers by leveraging our well-established involvement in the community and by selectively emphasizing products and services designed to meet their banking needs.  We also intend to pursue expansion in our market area through selective growth of our branch network.  We currently intend to open a branch in the Capitol Hill area of Seattle within the next 12 months, although no specific location has been identified at this time.  We may also consider the acquisition of other financial institutions or branches of other banks in the Puget Sound market area, although currently no specific transactions are planned.
 
Comparison of Financial Condition at June 30, 2011 and December 31, 2010
 
Assets. Total assets decreased $19.6 million, or 6.7%, to $272.8 million at June 30, 2011 from $292.3 million at December 31, 2010, primarily as a result of a $20.6 million, or 8.9%, decrease in loans receivable and a $5.3 million, or 16.0%, decrease in interest-bearing deposits at other financial institutions.  The decrease in assets during the period was partially offset by a $4.0 million, or 53.0%, increase in securities available for sale and a $2.2 million, 32.5%, increase in other assets, consisting primarily of other real estate owned.
 
 
51


Loans receivable, net, decreased $20.6 million, or 8.9%, to $210.2 million at June 30, 2011 from $230.8 million at December 31, 2010, primarily as a result of low loan demand in our market area, coupled with loan repayments, foreclosures and repossession of assets.  Real estate secured loans decreased $6.5 million, or 9.5%, to $61.4 million at June 30, 2011 from $67.9 million at December 31, 2010, primarily as a result of a $2.4 million, or 8.5%, decrease in commercial real estate loans and a $3.5 million, or 35.7%, decrease in construction and development loans. Consumer loans decreased $11.1 million, or 8.2%, to $124.6 million at June 30, 2011 from $135.8 million at December 31, 2010, including a $7.6 million, or 8.0%, decrease in indirect home improvement loans and a $3.7 million, or 29.4%, decrease in automobile loans.  Commercial business loans decreased $4.4 million, or 13.4%, to $28.4 million at June 30, 2011 from $32.8 million at December 31, 2010.  The low loan demand has been attributable primarily to the current weakness in the economy, as well as management’s strategic decision to compete less aggressively for commercial real estate loans as we focused on improving asset quality during the economic downturn. During the six months ended June 30, 2011, we had net charge-offs of $2.1 million and foreclosed on or repossessed $2.2 million of loans.
 
Our allowance for loan losses at June 30, 2011 was $4.8 million, or 2.3% of gross loans receivable, compared to $5.9 million, or 2.5% of gross loans receivable, at December 31, 2010.  Non-performing loans, consisting of nonaccruing loans and accruing loans more than 90 days delinquent, decreased to $2.0 million at June 30, 2011 from $6.3 million at December 31, 2010.  At June 30, 2011, our non-performing loans consisted of $234,000 of one-to four-family loans, $662,000 of home equity loans, $504,000 of consumer loans and $558,000 of commercial business loans.  Non-performing loans to total loans decreased to 0.9% at June 30, 2011 from 2.7% at December 31, 2010.  Real estate owned and repossessed assets totaled $6.0 million at June 30, 2011, compared to $3.8 million at December 31, 2010.  The increase reflected the migration of problem loans through the foreclosure process into real estate owned.  At June 30, 2011, we also had $1.5 million in restructured loans which were performing in accordance with their revised terms.  See “Business of 1st Security Bank of Washington - Asset Quality” for additional information regarding our non-performing loans.
 
Liabilities. Total liabilities decreased $20.7 million, or 7.7%, to $246.8 million at June 30, 2011, from $267.5 million at December 31, 2010.  Deposits decreased $2.5 million, or 1.0%, to $241.5 million at June 30, 2011 from $244.0 million at December 31, 2010.  The decrease in deposits was due to a $5.6 million, or 5.0%, decrease in time deposits, a $3.5 million, or 9.2%, decrease interest-bearing and noninterest-bearing checking accounts and an $843,000, or 6.5%, decrease in savings accounts, partially offset by a $7.5 million, or 9.2%, increase in money market accounts.  The decrease in deposits primarily was due to the disintermediation of funds back into the equity and residential markets.
 
Our total borrowings, which consisted of Federal Home Loan Bank advances, decreased $18.0 million, or 82.2%, to $3.9 million at June 30, 2011 from $21.9 million at December 31, 2010. The decrease in borrowings was related to our continued focus on reducing our reliance on non-core funding and reflects the reduction in our assets.
 
Equity. Total equity increased $1.2 million, or 4.8%, to $26.0 million at June 30, 2011 from $24.8 million at December 31, 2010. The increase primarily was a result of net income of $1.0 million for the six months ended June 30, 2011. 
 
Comparison of Financial Condition at December 31, 2010 and December 31, 2009
 
Assets.  Total assets increased $10.5 million, or 3.7%, to $292.3 million at December 31, 2010 from $281.8 million at December 31, 2009, primarily as a result of a $7.0 million, or 26.9%, increase in interest-bearing deposits at other financial institutions and a $7.0 million, or 1,167%, increase in securities available for sale.  The increase in assets during the period was partially offset by a $2.1 million, or 24.2%, decrease in other assets, primarily other real estate owned, a $619,000, or 0.3%, decrease in the loans receivable, and a $472,000, or 4.9%, decrease in premises and equipment.  The increases in interest-bearing deposits and securities, which were funded by increased deposits, provided additional on-balance sheet liquidity.
 
 
52


Loans receivable, net, decreased slightly to $230.8 million at December 31, 2010 from $231.4 million at December 31, 2009, due to loan repayments exceeding loan originations by $2.0 million during the year, partially offset by a $1.5 million decrease in the allowance for loan losses, which was the result of net charge-offs of $5.0 million and a $3.5 million provision for loan losses during 2010.  Real estate secured loans decreased $3.7 million, or 5.1%, to $67.9 million at December 31, 2010 from $71.6 million at December 31, 2009, primarily as a result of a $7.6 million, or 43.6%, decrease in construction and development loans and a $1.0 million, or 3.6%, decrease in commercial real estate loans, partially offset by a $5.0 million, or 60.5%, increase in one- to four-family loans. Consumer loans decreased $1.5 million, or 1.1%, to $135.8 million at December 31, 2010 from $137.3 million at December 31, 2009, including a $10.7 million, or 45.9%, decrease in automobile loans, partially offset by a $6.1 million, or 33.8%, increase in recreational loans and a $5.0 million, or 5.5%, increase in indirect home improvement loans.  Commercial business loans increased $3.1 million, or 10.6%, to $32.8 million at December 31, 2010 from $29.7 million at December 31, 2009.
 
Our allowance for loan losses at December 31, 2010 was $5.9 million, or 2.5% of gross loans receivable, compared to $7.4 million, or 3.1% of gross loans receivable, at December 31, 2009.  Non-performing loans, consisting of nonaccruing loans and accruing loans more than 90 days delinquent, decreased to $6.3 million at December 31, 2010 from $7.5 million at December 31, 2009.  At December 31, 2010, non-performing loans consisted of $211,000 of one-to four-family loans, $636,000 of home equity loans, $1.2 million of commercial real estate loans, $2.2 million of construction and development loans, $692,000 of consumer loans and $1.4 million of commercial business loans.  Non-performing loans to total loans decreased to 2.7% at December 31, 2010 from 3.1% at December 31, 2009.  Real estate owned and repossessed assets totaled $3.8 million at December 31, 2010, compared to $5.6 million at December 31, 2009.  This decrease reflected the disposition of foreclosed properties during the year. At December 31, 2010, we also had $1.5 million in restructured loans which were performing in accordance with their revised terms.  See “Business of 1st Security Bank of Washington - Asset Quality” for additional information regarding our non-performing loans.
 
Liabilities. Total liabilities increased $9.0 million, or 3.5%, to $267.5 million at December 31, 2010, compared to $258.5 million at December 31, 2009.  Deposits increased $13.0 million, or 5.6%, to $244.0 million at December 31, 2010 from $231.0 million at December 31, 2009.  The increase in deposits was primarily due to a $27.9 million, or 52.0%, increase in money market accounts balances due primarily to a money market promotional rate offered in February 2010 and a $4.0 million, or 6.8%, increase in jumbo certificates of deposit due to three separate promotions during the year.  These increases were partially offset by a $5.2 million, or 9.8%, decrease in non-jumbo time deposits, a $9.9 million, or 20.6%, decrease interest-bearing and noninterest-bearing checking accounts and a $3.9 million, or 23.1%, decrease in savings accounts.  These decreases primarily were due to run-off from branch consolidations.
 
Our total borrowings, which consisted of Federal Home Loan Bank advances, decreased $4.0 million, or 15.4%, to $21.9 million at December 31, 2010 from $25.9 million at December 30, 2009, primarily due to the increase in deposits and the decision to reduce reliance on non-core funding.
 
Equity. Total equity increased $1.5 million, or 6.3%, to $24.8 million at December 31, 2010 from $23.3 million at December 31, 2009. The increase primarily was a result of net income of $1.6 million for the 2010 year.
 
 
53


Average Balances, Interest and Average Yields/Cost
 
The following table sets forth for the periods indicated, information regarding average balances of assets and liabilities as well as the total dollar amounts of interest income from average interest-earning assets and interest expense on average interest-bearing liabilities, resultant yields, interest rate spread, net interest margin (otherwise known as net yield on interest-earning assets), and the ratio of average interest-earning assets to average interest-bearing liabilities.  Also presented is the weighted average yield on interest-earning assets, rates paid on interest-bearing liabilities and the resultant spread at June 30, 2011.  Income and all average balances are monthly average balances.  Non-accruing loans have been included in the table as loans carrying a zero yield.
 
   
At
   
Six Months Ended
June 30,
 
   
June 30, 2011
    2011     2010  
   
Yield/
Rate
   
Average
Balance
Outstanding
   
Interest
Earned
Paid
   
Yield/
Rate
   
Average
Balance
Outstanding
   
Interest
Earned
Paid
   
Yield/
Rate
 
   
(Dollars in thousand)
 
Interest-earning assets:
                                         
Loans receivable, net (1)
    7.70 %   $ 218,462     $ 8,150       7.46 %   $ 232,215     $ 8,442       7.27 %
Mortgage-backed securities
    2.82       429       6       2.80       587       8       2.73  
Investment securities
    1.45       9,530       78       1.64       ---       ---       ---  
Federal Home Loan Bank stock
    ---       1,797       ---       ---       1,797       ---       ---  
Other(2)
    0.19       27,355       29       0.21       16,119       17       0.21  
Total interest-earning assets(1)
    6.46       257,573       8,263       6.42       250,718       8,467       6.75  
                                                         
Interest-bearing liabilities:
                                                       
Savings and money market
    0.86       100,471       442       0.88       71,205       330       0.93  
Interest-bearing checking
    0.61       17,546       53       0.60       20,697       102       0.99  
Certificates of deposit
    1.97       107,591       1,044       1.94       117,125       1,434       2.45  
Borrowings
    4.51       4,099       88       4.29       10,137       127       2.51  
Total interest-bearing liabilities
    1.42       229,707       1,627       1.42       219,164       1,993       1.82  
                                                         
Net interest income
                  $ 6,636                     $ 6,474          
Net interest rate spread
    5.04 %                     5.00 %                     4.93 %
Net earning assets
          $ 27,866                     $ 31,554                  
Net yield on average interest-earning assets
    5.18 %                     5.15 %                     5.16 %
Average interest-earning assets to
average interest-bearing liabilities
            112.13 %                     114.40 %                
 

(1)  The average loans receivable, net balances include non-accruing loans.
(2)  Includes interest-bearing deposits (cash) at other financial institutions.
 
(table continued on next page)
 
 
54


Years Ended December 31,
 
   
2010
   
2009
   
2008
 
   
Average Balance Outstanding
   
Interest
Earned
Paid
   
Yield/
Rate
   
Average Balance Outstanding
   
Interest
Earned
Paid
   
Yield/
Rate
   
Average Balance Outstanding
   
Interest
Earned
Paid
   
Yield/
Rate
 
   
(Dollars in thousands)
             
Interest-earning assets:
                                                     
Loans receivable, net (1)
  $ 236,238     $ 17,270       7.31 %   $ 231,965     $ 16,289       7.02 %   $ 216,383     $ 16,251       7.51 %
Mortgage-backed securities
    546       15       2.75       988       38       3.85       3,135       347       11.07  
Investment securities
    1,390       19       1.37       1,267       52       4.10       4,035       181       4.49  
Federal Home Loan Bank stock
    1,797       ---       ---       1,797       ---       ---       1,797       17       0.95  
Other(2)
    12,585       29       0.23       11,807       25       0.21       5,999       103       1.72  
Total interest-earning assets (1) 
    252,556       17,333       6.86       247,824       16,404       6.62       231,349       16,899       7.30  
                                                                         
Interest-bearing liabilities:
                                                                       
Savings and money market
    76,065       711       0.94       74,407       705       0.95       78,100       1,204       1.54  
Interest-bearing checking
    19,798       187       0.94       20,977       246       1.17       13,644       235       1.72  
Certificates of deposit
    118,217       2,770       2.34       101,802       3,281       3.22       91,069       3,930       4.32  
Borrowings
    7,499       218       2.91       16,436       289       1.76       10,779       429       3.98  
Total interest-bearing liabilities
    221,579       3,886       1.75       213,622       4,521       2.12       193,592       5,798       2.99  
                                                                         
Net interest income
          $ 13,447                     $ 11,883                     $ 11,101          
Net interest rate spread
                    5.11 %                     4.50 %                     4.31 %
Net earning assets
  $ 30,977                     $ 34,202                     $ 37,757                  
Net yield on average interest-earning assets
                    5.32 %                     4.79 %                     4.80 %
Average interest-earning assets to average interest-bearing liabilities
    113.98 %                     116.01 %                     119.50 %                
 

(1)  The average loans receivable, net balances include non-accruing loans.
(2)  Includes interest-bearing deposits (cash) at other financial institutions.
 
 
55


Rate/Volume Analysis
 
The following table presents the dollar amount of changes in interest income and interest expense for major components of interest-earning assets and interest-bearing liabilities.  It distinguishes between the changes related to outstanding balances and that due to the changes in interest rates.  For each category of interest-earning assets and interest-bearing liabilities, information is provided on changes attributable to (i) changes in volume (i.e., changes in volume multiplied by old rate) and (ii) changes in rate (i.e., changes in rate multiplied by old volume).  For purposes of this table, changes attributable to both rate and volume, which cannot be segregated, have been allocated proportionately to the change due to volume and the change due to rate.
 
   
Six Months Ended
June 30,
2011 vs. 2010
   
Years Ended
December 31,
2010 vs. 2009
   
Years Ended
December 31,
2009 vs. 2008
 
   
Increase
(Decrease)
Due To
   
Total
Increase
   
Increase
(Decrease)
Due To
   
Total
Increase
   
Increase
(Decrease)
Due To
   
Total
Increase
 
   
Volume
    Rate    
(Decrease)
   
Volume
    Rate    
(Decrease)
   
Volume
   
Rate
   
(Decrease)
 
   
(In thousands)
 
Interest-earning assets:
                                                                       
Loans receivable
  $ (500 )   $ 208     $ (292 )   $ 300     $ 681     $ 981     $ 1,170     $ (1,132 )   $ 38  
Mortgage-backed securities
    (2 )     ---       (2 )     (17 )     (6 )     (23 )     (238 )     (71 )     (309 )
Investment securities
    78       ---       78       5       (38 )     (33 )     (124 )     (5 )     (129 )
Federal home loan bank stock
    ---       ---       ---       ---       ---       ---       ---       (17 )     (17 )
Other(1)
    12       ---       12       2       2       4       100       (178 )     (78 )
                                                                         
Total interest-earning assets
  $ (412 )   $ 208       (204 )   $ 290     $ 639     $ 929     $ 908     $ (1,403 )     (495 )
                                                                         
Interest-bearing liabilities:
                                                                       
Savings and money market
    136     $ (24 )   $ 112       16     $ (9 )     7       (57 )   $ (442 )   $ (499 )
Interest-bearing checking
    (16 )     (33 )     (49 )     (14 )     (46 )     (60 )     126       (115 )     11  
Certificates of deposit
    (117 )     (273 )     (390 )     529       (1,040 )     (511 )     463       (1,112 )     (649 )
Borrowings
    (76 )     37       (39 )     (157 )     86       (71 )     225       (240 )     (15 )
                                                                         
Total interest-bearing liabilities
  $ (73 )   $ (293 )     (366 )   $ 374     $ (1,009 )     (635 )   $ 757     $ (1,909 )   $ (1,152 )
                                                                         
Net change in interest income
                  $ 162                     $ 1,564                     $ 657  
 

(1)  Includes interest-bearing deposits (cash) at other financial institutions.
 
 
56


Comparison of Results of Operations for the Six Months Ended June 30, 2011 and June 30, 2010
 
General. Net income for the six months ended June 30, 2011 was $1.0 million compared to net income of $716,000 for the six months ended June 30, 2010.  The increase in net income was attributable to a $162,000, or 2.5%, increase in net interest income, coupled with a $242,000, or 4.1%, decrease in noninterest expense, partially offset by a $987,000, or 47.3%, decrease in noninterest income.
 
Net Interest Income. Net interest income increased $162,000, or 2.5%, to $6.6 million for the six months ended June 30, 2011, from $6.5 million for the six months ended June 30, 2010. The increase in net interest income was attributable to $366,000 decrease in interest expenses, primarily due to a reduction of our overall cost of funds, partially offset by a reduction in interest income resulting from a decrease in average loans outstanding.
 
Our net interest margin remained relatively consistent at 5.15% for the six months ended June 30, 2011 compared to 5.16% for the same period of the prior year. The cost of interest-bearing liabilities decreased 40 basis points to 1.42% for the six months ended June 30, 2011 compared to 1.82% for the same period of the prior year primarily due to a lower cost of certificates of deposit, partially offset by higher average balances in savings and money market accounts.
 
Interest Income. Total interest income for the six months ended June 30, 2011 decreased $204,000, or 2.4%, to $8.3 million, from $8.5 million for the six months ended June 30, 2010. The decrease during the period was primarily attributable to the decline in net loans receivable over the last year, partially offset by a 19 basis point increase in the yield earned on loans receivable.
 
The following table compares average earning asset balances, associated yields, and resulting changes in interest income for the six months ended June 30, 2011 and 2010:
 
   
Six Months Ended June 30,


2011
   
2010
       
   
Average
Balance Outstanding
   
Yield
   
Average
Balance Outstanding
   
Yield
   
Increase/
(Decrease) in Interest Income
 
   
(Dollars in thousands)
 
                                         
Loans receivable, net
 
$
218,462
     
7.46
%
 
$
232,215
     
7.27
%
 
$
(292
)
Mortgage-backed securities
   
429
     
2.80
     
587
     
2.73
     
(2
)
Investment securities
   
9,530
     
1.64
     
---
     
---
     
78
 
Federal Home Loan Bank stock
   
1,797
     
---
     
1,797
     
---
     
---
 
Other(1) 
   
27,355
     
0.21
     
16,119
     
0.21
     
12
 
Total interest-earning assets
 
$
257,573
     
6.42
%
 
$
250,718
     
6.75
%
 
$
(204
)
 

(1)  Includes interest-bearing deposits (cash) at other financial institutions.
 
Interest Expense. Interest expense decreased $366,000, or 18.4%, to $1.6 million for the six months ended June 30, 2011, from $2.0 million for the six months ended June 30, 2010.  As a result of general market rate decreases, the average cost of funds for total interest-bearing liabilities decreased 40 basis points to 1.42% for the six months ended June 30, 2011, compared to 1.82% for the six months ended June 30, 2010.  The decrease was primarily due to a decline in rates paid on our certificates of deposits, partially offset by the higher average balances for savings and money market accounts.  The average balance of total interest-bearing liabilities increased $10.5 million, or 4.8%, to $229.7 million for the six months ended June 30, 2011, from $219.2 million for the six months ended June 30, 2010.
 
 
57


The following table compares coverage balances, cost of funds and the change in interest expense for the six months ended June 30, 2011 and 2010:
 
    Six Months Ended June 30,  
                   
   
2011
   
2010
       
   
Average
Balance
Outstanding
   
Yield
   
Average
Balance
Outstanding
   
Yield
   
Increase/
(Decrease) in
Interest
Expense
 
   
(Dollars in thousands)
 
                                         
Savings and money market 
  $ 100,471       0.88 %   $ 71,205       0.93 %   $ 112  
Interest-bearing checking 
    17,546       0.60       20,697       0.99       (49 )
Certificates of deposit 
    107,591       1.94       117,125       2.45       (390 )
Borrowings 
    4,099       4.29       10,137       2.51       (39 )
Total interest-bearing liabilities 
  $ 229,707       1.42 %   $ 219,164       1.82 %   $ (366 )
 
Provision for Loan Losses. In connection with its analysis of the loan portfolio for the six months ended June 30, 2011, management determined that a provision for loan losses of $1.0 million was required for the six months ended June 30, 2011, compared to a provision for loan losses of $1.9 million established for the six months ended June 30, 2010. The $875,000 decrease in the provision primarily relates to the $18.4 million decrease in net loans.  Non-performing loans were $2.0 million or 0.9% of total loans at June 30, 2011, compared to $6.2 million, or 2.7% of total loans at June 30, 2010. Management considers the allowance for loan losses at June 30, 2011 to be adequate to cover probable losses inherent in the loan portfolio based on the assessment of the above-mentioned factors affecting the loan portfolio. While management believes the estimates and assumptions used in its determination of the adequacy of the allowance are reasonable, there can be no assurance that such estimates and assumptions will not be proven incorrect in the future, or that the actual amount of future provisions will not exceed the amount of past provisions or that any increased provisions that may be required will not adversely impact our financial condition and results of operations. In addition, the determination of the amount of our allowance for loan losses is subject to review by bank regulators, as part of the routine examination process, which may result in the establishment of additional reserves based upon their judgment of information available to them at the time of their examination.
   
The following table details activity and information related to the allowance for loan losses for the six months ended June 30, 2011 and 2010:
 
   
At or For the Six Months
Ended June 30,
 
   
2011
   
2010
 
   
(Dollars in thousands)
 
             
Provision for loan losses
 
$
1,030
   
$
1,905
 
Net charge-offs
 
$
2,099
   
$
3,085
 
Allowance for loan losses
 
$
4,836
   
$
6,225
 
Allowance for losses as a percentage of gross loans receivable at the end of this period
   
2.25
%
   
2.65
%
Nonaccrual and 90 days or more past due loans
 
$
1,958
   
$
6,218
 
Allowance for loan losses as a percentage of non-performing loans at end of period
   
246.99
%
   
100.11
%
Nonaccrual and 90 days or more past due loans as a percentage of total gross loans at the end of the period
   
0.91
%
   
2.65
%
Total gross loans
 
$
214,509
   
$
234,621


58


Noninterest Income. Noninterest income decreased $987,000, or 47.3%, to $1.1 million for the six months ended June 30, 2011, from $2.1 million for the six months ended June 30, 2010. The following table provides a detailed analysis of the changes in the components of noninterest income:
 
   
Six Months Ended June 30,


Six Months Ended June 30
   
Increase (Decrease)


2011
   
2010
   
Amount
    Percent  
   
(Dollars in thousands)
 
                                 
Service charges and fee income
  $ 1,019     $ 1,196     $ (177 )     (14.8 )%
Gain (loss) on sales of branches
    ---       797       (797 )     (100.0 )
Other noninterest income
    82       95       (13 )     (13.7 )
   Total noninterest income
  $ 1,101     $ 2,088     $ (987 )     (47.3 )%
 
Noninterest income decreased during the six months ended June 30, 2011 primarily as a result of regulatory changes that occurred in August 2010 affecting the amount of non-sufficient fees (“NSF”) we can charge on deposit accounts and the one-time gains associated with the sale of two branches during 2010. The decrease of loans sold in the secondary market contributed to the decrease in service charges and fee income.
 
Noninterest Expense. Noninterest expense decreased $242,000, or 4.1%, to $5.7 million for the six months ended June 30, 2011, from $5.9 million for the six months ended June 30, 2010. The following table provides an analysis of the changes in the components of noninterest expense:
 
   
At or For the
Six Months
Ended June, 30
   
Increase (Decrease)
 
   
2011
   
2010
   
Amount
   
Percent
 
   
(Dollars in thousands)
 
                         
Salaries and benefits
 
$
2,706
   
$
2,657
   
$
49
     
1.8
 %
Operations
   
606
     
655
     
(49
)
   
(7.5
)
Occupancy
   
770
     
815
     
(45
)
   
(5.5
Data Processing
   
417
     
363
     
54
     
14.9
 
Loan costs
   
391
     
712
     
(321
)
   
(45.1
FDIC insurance
   
280
     
257
     
23
     
8.9
 
OREO fair value write-downs
   
117
     
1
     
116
     
NM
 
ATM costs
   
104
     
130
     
(26
)
   
(20.0
Marketing and advertising
   
98
     
142
     
(44
)
   
(31.0
)
Excise taxes
   
146
     
118
     
28
     
23.7
 
Professional fees
   
64
     
91
     
(27
)
   
(29.7
)
Total noninterest expense
 
$
5,699
   
$
5,941
   
$
(242
)
   
(4.1
)%
 

NM – Not meaningful.
 
            A $321,000, or 45.1%, decrease in loan costs, which include costs associated with maintaining, managing and disposing of other real estate owned, was the primary reason for the decrease in noninterest expense. Increased write-downs to fair value of our other real estate owned partially offset the decrease in loan costs.
 
 
59


Our efficiency ratio, which is our noninterest expense as a percentage of net interest income and noninterest income, was 73.0% for the six months ended June 30, 2011 compared to 68.2% for the six months ended June 30, 2010. The increase in efficiency ratio was primarily attributable to the decrease in fee income and the increase in expenses. By definition, a lower efficiency ratio would be an indication that we are more efficiently utilizing resources to generate income.
 
Provision for Income Tax. There was no provision for income tax for the six months ended June 30, 2011 and 2010. Management has established a full valuation allowance related to the net deferred tax assets, based on the weight of available evidence.
 
Comparison of Results of Operations for the Years Ended December 31, 2010 and 2009
 
General. Net income for the year ended December 31, 2010 was $1.6 million compared to a net loss of $4.6 million for the year ended December 31, 2009.  The increase in net income was attributable to a $1.6 million, or 13.2%, increase in net interest income, coupled with a $3.6 million, or 50.8% decrease in the provision for loan losses and a $1.8 million, or 13.3%, decrease in noninterest expense, partially offset by a $822,000, or 18.3%, decrease in noninterest income.
 
Net Interest Income. Net interest income increased $1.6 million, or 13.2%, to $13.4 million for the year ended December 31, 2010, from $11.9 million for the year ended December 31, 2009. The increase in net interest income was primarily attributable to the higher volume of and yield earned on our loan portfolio and a decline in the rates paid on deposits, primarily certificates of deposit.
 
Our net interest margin increased 53 basis points to 5.32% for the year ended December 31, 2010, from 4.79% for the same period of the prior year. The cost of average interest-bearing liabilities decreased 37 basis points to 1.75% for the year ended December 31, 2010 compared to 2.12% for the same period of the prior year primarily due to a lower cost of funds. The decline was related to the repricing of our money market accounts and certificates of deposit to lower current rates during the year ended December 31, 2010. 
 
Interest Income. Total interest income for the year ended December 31, 2010 increased $929,000, or 5.7%, to $17.3 million, from $16.4 million for the year ended December 31, 2009. The increase during the period was primarily attributable to the 29 basis point increase in the yield earned on loans receivable and a higher average balance of loans receivable over the prior year.
 
 
60


The following table compares average earning asset balances, associated yields, and resulting changes in interest income for the years ended December 31, 2010 and 2009:
 
    Year Ended December 31,  
   
2010
    2009        
   
Average
Balance
Outstanding
   
Yield
   
Average
Balance
Outstanding
   
Yield
   
Increase/ 
 (Decrease) in Interest Income
 
    (Dollars in thousands)  
       
Loans receivable, net
  $ 236,238       7.31 %   $ 231,965       7.02 %   $ 981  
Mortgage-backed securities
    546       2.75       988       3.85       (23
Investment securities
    1,390       1.37       1,267       4.10       (33 )
Federal Home Loan Bank stock
    1,797       ---       1,797       ---       ---  
Cash and due from banks
    12,585       0.23       11,807       0.21       4  
   Total interest-earning assets
  $ 252,556       6.86 %   $ 247,824       6.62 %   $ 929  
 
Interest Expense. Interest expense decreased $635,000, or 14.0%, to $3.9 million for the year ended December 31, 2010, from $4.5 million for the year ended December 31, 2009, primarily due to a decline in our cost of funds. The average rate paid on interest-bearing liabilities declined 37 basis points to 1.75% during the year ended December 31, 2010, from 2.12% for the year ended December 31, 2009.  The decrease was primarily a result of a decline in rates paid on certificates of deposits. The average balance of total interest-bearing liabilities increased $8.0 million, or 3.7%, to $221.6 million for the year ended December 31, 2010 from $213.6 million for the year ended December 31, 2009, primarily due to higher average balances of certificates of deposit.
  
The following table details average balances, cost of funds and the change in interest expense for the year ended December 31, 2010 and 2009:
 
    Years Ended December 31,  
   
2010
 
2009
       
   
Average
Balance
Outstanding
    Yield    
Average
Balance
Outstanding
   
Yield
   
Increase/ 
 (Decrease) in Interest Expense
 
 
(Dollars in thousands)
 
                       
Savings and money market
  $ 76,065       0.94 %   $ 74,407       0.95 %   $ 7  
Interest-bearing checking
    19,798       0.94       20,977       1.17       (60
Certificates of deposit
    118,217       2.34       101,802       3.22       (511 )
Borrowings
    7,499       2.91       16,436       1.76       (71 )
   Total interest-bearing liabilities
  $ 221,579       1.75 %   $ 213,622       2.12 %   $ (635 )
 
Provision for Loan Losses. In connection with its analysis of the loan portfolio for the year ended December 31, 2010, management determined that a provision for loan losses of $3.5 million was required for the year ended December 31, 2010, compared to a provision for loan losses of $7.1 million established for the year ended December 31, 2009. The $3.6 million decrease in the provision primarily reflects the decrease in our non-performing loans. Non-performing loans were $6.3 million or 2.7% of total loans at December 31, 2010, compared to $7.5 million, or 3.1% of total loans at December 31, 2009. Management considers the allowance for loan losses at December 31, 2010 to be adequate to cover probable losses inherent in the loan portfolio based on the assessment of the above-mentioned factors affecting the loan portfolio. While management believes the estimates and assumptions used in its determination of the adequacy of the allowance are reasonable, there can be no assurance that such estimates and assumptions will not be proven incorrect in the future, or that the actual amount of future provisions will not exceed the amount of past provisions or that any increased provisions that may be required will not adversely impact our financial condition and results of operations. In addition, the determination of the amount of our allowance for loan losses is subject to review by bank regulators, as part of the routine examination process, which may result in the establishment of additional reserves based upon their judgment of information available to them at the time of their examination.
 
 
61


The following table details activity and information related to the allowance for loan losses for the year ended December 31, 2010 and 2009:
 
   
At or For the Year
 Ended December 31,
 
   
2010
   
2009
 
   
(Dollars in thousands)
 
             
Provision for loan losses
 
$
3,480
   
$
7,067
 
Net charge-offs
 
$
4,980
   
$
5,260
 
Allowance for loan losses
 
$
5,905
   
$
7,405
 
Allowance for losses as a percentage of total gross loans receivable at the end of this period
   
2.50
%
   
3.10
%
Nonaccrual and 90 days or more past due loans
 
$
6,302
   
$
7,454
 
Allowance for loan losses as a percentage of non-performing loans at end of period
   
93.7
%
   
99.3
%
Nonaccrual and 90 days or more past due loans as a percentage of gross loans receivable at the end of the period
   
2.66
%
   
3.12
%
Total gross loans
 
$
236,504
  
 
$
238,533
 
 
Noninterest Income. Noninterest income decreased $822,000, or 18.3%, to $3.7 million for the year ended December 31, 2010 from $4.5 million for the year ended December 31, 2009. The following table provides a detailed analysis of the changes in the components of noninterest income:
 
   
Year Ended December 31
 
 
Increase (Decrease)
 
   
2010
   
2009
   
Amount
   
Percent
 
   
(Dollars in thousands)
 
                         
Service charges and fee income
 
$
2,444
   
$
2,839
   
$
(395
)
   
(13.9
)%
Gain on sales of branches
   
1,006
     
1,335
     
(329
)
   
(24.6
)%
Gain on sales of investments
   
---
     
63
     
(63
)
   
(100.0
)%
Other noninterest income
   
217
     
252
     
(35
)
   
(13.9
)%
   Total noninterest income
 
$
3,667
   
$
4,489
   
$
(822
)
   
(18.3
)%
 
Noninterest income decreased during the year ended December 31, 2010, primarily as a result of lower services charges and fee income resulting from regulatory changes related to NSF fees and fewer gains related to sales of branches and deposits.  In 2009, we sold one branch compared to the three branches sold in 2010.
 
Noninterest Expense. Noninterest expense decreased $1.8 million, or 13.3%, to $12.0 million for the year ended December 31, 2010 from $13.9 million for the year ended December 31, 2009. The following table provides an analysis of the changes in the components of noninterest expense:
 
 
62


At or For the
 Year Ended December 31,
   
Increase (Decrease)
 
   
2010
   
2009
   
Amount
   
Percent
 
   
(Dollars in thousands)
 
                         
Salaries and benefits
 
$
5,159
   
$
6,619
   
$
(1,460
)
   
(22.1
)%
Operations
   
1,579
     
1,686
     
(107
)
   
(6.3
)
Occupancy
   
1,622
     
1,863
     
(241
)
   
(12.9
)
Data processing
   
740
     
755
     
(15
)
   
(2.0
)
Loan costs
   
1,350
     
917
     
433
     
47.2
 
FDIC insurance
   
556
     
560
     
(4
)
   
(0.7
)
OREO fair value write-downs, (gain)
   
(79
   
387
     
(466
)
   
(120.4
)
ATM Costs
   
238
     
311
     
(73
)
   
(23.5
)
Marketing and advertising
   
344
     
285
     
59
     
20.7
 
Excise taxes
   
284
     
255
     
29
     
11.4
 
Professional fees
   
239
     
241
     
(2
)
   
(0.8
)
Total noninterest expense
 
$
12,032
   
$
13,879
   
$
(1,847
)
   
(13.3
)%
 
Compensation and benefits decreased $1.5 million, or 22.1%, to $5.1 million for the year ended December 31, 2010 from $6.6 million for the same period a year ago as a result of the closure of two branches in 2009 and sale of two branches in August 2009, which resulted in a reduction of employees. At December 31, 2010 we employed 79 full-time equivalent employees compared to 84 at December 31, 2009. Our other real estate owned expenses decreased $466,000 for the year ended December 31, 2010 as a result of the write-down in real estate owned values during the prior year.  Declines in operations and occupancy expenses were also related to the branch closings and sales that occurred in 2009.
 
Our efficiency ratio was 69.9% for the year ended December 31, 2010, compared to 84.3% for the year ended December 31, 2009. The decrease in efficiency ratio was primarily attributable to the decrease in expenses.
 
Provision (Benefit) for Income Tax. There was no income tax provision for the years ended December 31, 2010 and 2009. Management has established a full valuation allowance related to the deferred tax asset, due to previous years operating losses.
 
Asset and Liability Management and Market Risk
 
Our Risk When Interest Rates Change.  The rates of interest we earn on assets and pay on liabilities generally is established contractually for a period of time.  Market rates change over time.  Like other financial institutions, our results of operations are impacted by changes in interest rates and the interest rate sensitivity of our assets and liabilities.  The risk associated with changes in interest rates and our ability to adapt to these changes is known as interest rate risk and is our most significant market risk.
 
How We Measure Our Risk of Interest Rate Changes.  As part of our attempt to manage our exposure to changes in interest rates and comply with applicable regulations, we monitor our interest rate risk.  In doing so, we analyze and manage assets and liabilities based on their interest rates and payment streams, timing of maturities, repricing opportunities, and sensitivity to actual or potential changes in market interest rates.
 
1st Security Bank of Washington is subject to interest rate risk to the extent that its interest-bearing liabilities, primarily deposits and Federal Home Loan Bank advances, reprice more rapidly or at different rates than our interest-earning assets.  In order to minimize the potential for adverse effects of material prolonged increases or decreases in interest rates on our results of operations, we have adopted an asset and liability management policy.  The board of directors sets the asset and liability policy for 1st  Security Bank of Washington, which is implemented by the asset/liability committee (“ALCO”), an internal management committee.  The board level oversight for ALCO is performed by the audit committee of the board of directors.
 
 
63


The purpose of the ALCO committee is to communicate, coordinate, and control asset/liability management consistent with our business plan and board-approved policies.  The committee establishes and monitors the volume and mix of assets and funding sources, taking into account relative costs and spreads, interest rate sensitivity and liquidity needs.  The objectives are to manage assets and funding sources to produce results that are consistent with liquidity, capital adequacy, growth, risk and profitability goals.
 
The committee generally meets monthly to, among other things, protect capital through earnings stability over the interest rate cycle; maintain our well-capitalized status; and provide a reasonable return on investment.  The committee recommends appropriate strategy changes based on this review.  The committee is responsible for reviewing and reporting the effects of the policy implementations and strategies to the board of directors at least quarterly.  The Chief Financial Officer oversees the process on a daily basis.
 
A key element of our asset/liability management plan is to protect net earnings by managing the maturity or repricing mismatch between our interest-earning assets and rate-sensitive liabilities.  We seek to accomplish this by extending funding maturities through wholesale funding sources, including the use of Federal Home Loan Bank advances, and through asset management, including the use of adjustable-rate loans and selling certain fixed-rate loans in the secondary market.
 
As part of our efforts to monitor and manage interest rate risk, we use a number of indicators to monitor overall risk.  Among the measurements are:
 
Market Risk.  Market risk is the potential change in the value of investment securities if interest rates change. This change in value impacts the value of 1st Security Bank of Washington and the liquidity of the securities.  We control market risk by setting a maximum average maturity/average life of the securities portfolio to 7 years.
 
Economic Risk.  Economic risk is the risk that the underlying value of a bank will change when rates change.  This can be caused by a change in value of the existing assets and liabilities (this is called Economic Value of Equity or EVE) or a change in the earnings stream (this is caused by interest rate risk).  We take economic risk primarily when we make fixed rate loans, or purchase fixed-rate investments, or issue long term certificates of deposit or take fixed rate Federal Home Loan Bank advances.  It is the risk that interest rates will change and these fixed-rate assets and liabilities will change in value.  This change in value usually is not recognized in the earnings, or equity (other than marking to market available for sale securities).  The change is recognized only when the assets and liabilities are liquidated.  Although the change in market value is usually not recognized in earnings or in capital, the impact is real to the long-term value of 1st Security Bank of Washington.  Therefore, we will control the level of economic risk by limiting the amount of long-term, fixed-rate assets we will have and by setting a limit on concentrations and maturities of securities.
 
Interest Rate Risk. If the Federal Reserve Board changes the Federal Funds rate 100 or 200 basis points, our policy dictates that our change in net interest income should not change more that 7.5% and 15%, respectively.
 
The table presented below, as of June 30, 2011, is an analysis prepared for 1st Security Bank of Washington by Olson Research Associates, Inc. utilizing various market and actual experience-based assumptions.  The table represents a static shock to the net interest income using instantaneous and sustained shifts in the yield curve, in 100 basis point increments, up and down 300 basis points.
 
 
64


As illustrated in the table, 1st Security Bank of Washington is currently balanced in both a rising and falling rate environment.  The results reflect a projected income statement with minimal exposure to instantaneous changes in interest rates.  These results are primarily based upon historical prepayment speeds within the consumer lending portfolio in combination with the above average yields associated with the consumer portfolio if those prepayments do not occur.
 
   
June 30, 2011
 
Change in Interest Rates in
 
Net Interest Income
 
Basis Points
 
$ Amount
   
$ Change
   
% Change
 
   
Dollars in thousands
       
300bp
  $ 13,533     $ 164       1.22 %
200bp
  $ 13,485     $ 96       0.71 %
100bp
  $ 13,350     $ (40 )     (0.30 )%
0bp
  $ 13,390             --- %
(100)bp
  $ 13,849     $ 459       3.43 %
(200)bp
  $ 13,784     $ 394       2.94 %
(300)bp
  $ 13,305     $ (85 )     (0.63 )%
 
In managing our assets/liability mix, depending on the relationship between long and short term interest rates, market conditions and consumer preference, we may place somewhat greater emphasis on maximizing our net interest margin than on strictly matching the interest rate sensitivity of our assets and liabilities.   Management also believes that the increased net income which may result from an acceptable mismatch in the actual maturity or repricing of our asset and liability portfolios can, during periods of declining or stable interest rates, provide sufficient returns to justify the increased exposure to sudden and unexpected increases in interest rates which may result from such a mismatch.  Management believes that 1st Security Bank of Washington’s level of interest rate risk is acceptable under this approach.
 
In evaluating 1st Security Bank of Washington’s exposure to interest rate movements, certain shortcomings inherent in the method of analysis presented in the foregoing table must be considered.  For example, although certain assets and liabilities may have similar maturities or repricing periods, they may react in different degrees to changes in market interest rates.  Also, the interest rates on certain types of assets and liabilities may fluctuate in advance of changes in market interest rates, while interest rates on other types may lag behind changes in interest rates.  Additionally, certain assets, such as adjustable rate mortgages, have features which restrict changes in interest rates on a short-term basis and over the life of the asset.  Further, in the event of a significant change in interest rates, prepayment and early withdrawal levels would likely deviate significantly from those assumed above.  Finally, the ability of many borrowers to service their debt may decrease in the event of an interest rate increase.  1st Security Bank of Washington considers all of these factors in monitoring its exposure to interest rate risk.
 
Liquidity
 
Management maintains a liquidity position that it believes will adequately provide funding for loan demand and deposit run-off that may occur in the normal course of business.  We rely on a number of different sources in order to meet our potential liquidity demands.  The primary sources are increases in deposit accounts, Federal Home Loan Bank advances and cash flows from loan payments and maturing securities.
 
As of June 30, 2011, our total borrowing capacity was $26.3 million with the Federal Home Loan Bank of Seattle, with unused borrowing capacity of $22.4 million at that date.  In addition to the availability of liquidity from the Federal Home Loan Bank of Seattle, we maintained a short-term borrowing line, with a current limit of $90.2 million at June 30, 2011, with the Federal Reserve Bank.  As of June 30, 2011, $3.9 million in Federal Home Loan Bank advances were outstanding and no advances were outstanding against the Federal Reserve Bank line of credit.  Our board of directors has authorized management to utilize brokered deposits up to 20% of deposits or $48.3 million as of June 30, 2011.  Total brokered deposits as of June 30, 2011 were $10.1 million.
 
 
65


Liquidity management is both a daily and long-term function of business management.  Excess liquidity is generally invested in short-term investments, such as overnight deposits and federal funds.  On a longer-term basis, we maintain a strategy of investing in various lending products and investment securities, including U.S. Government obligations and federal agency securities.  We use our sources of funds primarily to meet ongoing commitments, pay maturing deposits and fund withdrawals, and to fund loan commitments.  At June 30, 2011, the approved outstanding loan commitments, including unused lines of credit, amounted to $59.1 million.  Certificates of deposit scheduled to mature in one year or less at June 30, 2011, totaled $50.7 million.  It is management’s policy to offer deposit rates that are competitive with other local financial institutions.  Based on this management strategy, we believe that a majority of maturing deposits will remain with 1st Security Bank of Washington.
 
For the six months ended June 30, 2011, cash and cash equivalents decreased $4.9 million, or 13.9%, from $35.3 million as of December 31, 2010 to $30.3 million as of June 30, 2011.  Cash from operating activities of $2.6 million and cash from investing activities of $13.0 million were offset by cash used for financing activities of $20.5 million for the six months ended June 30, 2011.  Primary sources of cash included $17.0 million from principal collections.  Primary uses of cash included the maturity of $2.5 million of term certificates of deposits, which were intentionally not renewed, and the paying down of $18.0 million of Federal Home Loan Bank advances. Cash and cash equivalents increased $6.7 million, or 23.5%, from $28.5 million as of December 31, 2009 to $35.3 million as of December 31, 2010.  Cash from operating activities of $11.6 million and cash from financing activities of $9.0 million were offset by cash used for investing activities of $13.9 million for the year ended December 31, 2010.  Primary sources of cash for 2010 included a $13.0 million increase in deposits.  Primary uses of cash included originating loans for our portfolio totaling $7.4 million and the purchase of $7.3 million in investments.
 
Except as set forth above, management is not aware of any trends, events, or uncertainties that will have, or that are reasonably likely to have a material impact on liquidity, capital resources or operations.  Further, management is not aware of any current recommendations by regulatory agencies, which, if they were to be implemented, would have this effect.
 
Off-Balance Sheet Activities
 
In the normal course of operations, 1st Security Bank of Washington engages in a variety of financial transactions that are not recorded in our financial statements.  These transactions involve varying degrees of off-balance sheet credit, interest rate and liquidity risks.  These transactions are used primarily to manage customers’ requests for funding and take the form of loan commitments and lines of credit.  For the year ended December 31, 2010 and the six months ended June 30, 2011, we engaged in no off-balance sheet transactions likely to have a material effect on our financial condition, results of operations or cash flows.
 
A summary of our off-balance sheet commitments to extend credit at June 30, 2011, was as follows:
 
Off-balance sheet loan commitments:
     
       
Home equity loans and lines of credit
  $ 11,791  
Real estate secured                                                       
    1,340  
Commercial business loans                                                       
    38,198  
Other                                                       
    7,798  
   Total loan commitments                                                       
  $ 59,127  
 
Capital Resources
 
1st Security Bank of Washington is subject to minimum capital requirements imposed by the FDIC.  Based on its capital levels at June 30, 2011, 1st Security Bank of Washington exceeded these requirements as of that date and continues to exceed them as of the date of this prospectus.  Consistent with our goals to operate a sound and profitable organization, our policy is for 1st Security Bank of Washington to maintain a “well-capitalized” status under the capital categories of the FDIC.  Based on capital levels at June 30, 2011, 1st Security Bank of Washington was considered to be well-capitalized.  See “How We Are Regulated - Regulatory Capital Requirements.”
 
 
66


At June 30, 2011, equity totaled $26.0 million.  Management monitors the capital levels of 1st Security Bank of Washington to provide for current and future business opportunities and to meet regulatory guidelines for “well-capitalized” institutions.  The Bank’s actual capital ratios are presented in the following table:
 
   
Actual
   
For Capital
Adequacy Purposes
   
To be Well Capitalized
Under Prompt Corrective
Action Provisions


Ratio
   
Ratio
   
Ratio
 
                   
As of June 30, 2011
                 
Total Risk-based Capital
                 
(to Risk-Weighted Assets)                                           
    12.57 %     8.00 %     10.00 %
Tier 1 Risk-based Capital
                       
(to Risk-Weighted Assets)                                           
    11.31 %     4.00 %     6.00 %
Tier 1 Leverage Capital
                       
(to Average Assets)                                           
    9.37 %     4.00 %     5.00 %
                         
As of December 31, 2010
                       
Total Risk-based Capital
                       
(to Risk-Weighted Assets)                                           
    11.06 %     8.00 %     10.00 %
Tier 1 Risk-based Capital
                       
(to Risk-Weighted Assets)                                           
    9.79 %     4.00 %     6.00 %
Tier 1 Leverage Capital
                       
(to Average Assets)                                           
    9.09 %     4.00 %     5.00 %
                         
As of December 31, 2009
                       
Total Risk-based Capital
                       
(to Risk-Weighted Assets)                                           
    10.35 %     8.00 %     10.00 %
Tier 1 Risk-based Capital
                       
(to Risk-Weighted Assets)                                           
    9.08 %     4.00 %     6.00 %
Tier 1 Leverage Capital
                       
(to Average Assets)                                           
    8.36 %     4.00 %     5.00 %
 
The capital raised in this offering, with net proceeds estimated to be between $18.8 million and $26.1 million, will significantly increase our regulatory capital levels and ratios.  Based upon our existing capital, and the capital to be raised in this offering, we believe that we will have sufficient capital to carry out our proposed business plan for at least the next year and to meet any applicable regulatory capital requirements during that period.
 
Recent Accounting Pronouncements
 
In June 2011, the FASB issued Accounting Standard Update No. 2011-05, Comprehensive Income (Topic 220): Presentation of Comprehensive Income (the “ASU”). The objective of this ASU is to improve the comparability, consistency, and transparency of financial reporting and to increase the prominence of items reported in other comprehensive income. The new guidance eliminates the option to present components of other comprehensive income as part of the statement of changes in stockholder’s equity. The ASU requires that all non owner changes in stockholders’ equity be presented either in a single continuous statement of comprehensive income or in two separate but consecutive statements. In the two statement approach, the first statement should present total net income and its components followed consecutively by a second statement that should present total other comprehensive income (OCI), the components of other comprehensive income, and the total of comprehensive income.  The new guidance will be effective for annual and interim periods beginning after December 15, 2011.  We do not expect the adoption of this guidance to have a material impact on our financial statements.
 
 
67


In May 2011, the FASB issued Accounting Standards Update No. 2011-04, Amendments to Achieve Common Fair Value Measurement and Disclosure Requirements in U.S. GAAP and IFRS. Since 2006, the FASB and IASB have been working closely together to develop common requirements for measuring fair value and for disclosing information about fair value measurements in accordance with U.S. GAAP and IFRSs and to ensure that fair value has the same meaning in U.S. GAAP and IFRSs. The Amendments in this Update explain how to measure fair value – they do not require additional fair value measurements and are not intended to establish valuation standards or affect valuation practices outside of financial reporting. The new guidance will be effective for annual and interim periods beginning after December 15, 2011.  We do not expect the adoption of this guidance to have a material impact on our financial statements.
 
In April 2011, the FASB issued Accounting Standards Update No. 2011-03, Transfers and Servicing (Topic 860): Reconsideration of Effective Control for Repurchase Agreements. The objective is to improve the accounting for repurchase agreements and other agreements that both entitle and obligate a transferor to repurchase or redeem financial assets before their maturity. Topic 860, Transfers and Servicing, prescribes when an entity may or may not recognize a sale upon the transfer of financial assets subject to repurchase agreements. That determination is based, in part, on whether the entity has maintained effective control over the transferred financial assets.  The new guidance will be effective for annual and interim periods beginning after December 15, 2011.  We do not expect the adoption of this guidance to have a material impact on our financial statements.
 
On April 5, 2011, the Financial Accounting Standards Board (“FASB”) issued Accounting Standard Update No. 2011-02, Receivables (Topic 310): A Creditor’s Determination of Whether a Restructuring is a Troubled Debt Restructuring (the “ASU”). The ASU provides additional guidance to creditors for evaluating whether a modification or restructuring of a receivable is a troubled debt restructuring (“TDR”). The new guidance will require creditors to evaluate modifications and restructurings of receivables using a more principles-based approach, which may result in more modifications and restructurings being considered troubled debt restructurings. The financial reporting implications s of being classified as a TDR are that the creditor is required to: Consider the receivable impaired when calculating the allowance for credit losses; and provide additional disclosures about its troubled debt restructuring activities in accordance with the requirements of recently-issued ASU 2010-20, Disclosures about the Credit Quality of Financing Receivables and the Allowance for Credit Losses.  The new guidance will be effective for annual and interim periods beginning after June 15, 2011 and should be applied retrospectively to the beginning of the annual period of adoption.  We do not expect the adoption of this guidance to have a material impact on our financial statements.
 
In July 2010, the FASB issued ASU 2010-20, an amendment of Receivables – Disclosures about Credit Quality of Financing Receivables and the Allowance for Credit Losses (Topic 310).  ASU 2010-20 requires new and enhanced disclosure requirements about credit quality of an entity’s financing receivables and its allowance for credit losses.  The new and amended disclosure requirements focus on such areas as nonaccrual and past due financing receivables, allowance for credit losses related to financing receivables, impaired loans, credit quality information and loan modifications.  The ASU requires an entity to disaggregate new and existing disclosures based on how it develops its allowance for credit losses and how it manages credit exposures.  The expanded period-end disclosures became effective for the Bank for the year ended December 31, 2010 (see footnote 3). The expanded disclosures about activity that occurs during a reporting period are effective for interim and annual reporting periods beginning on or after December 15, 2010.  The new guidance did not have a material impact on our financial statements.
 
In January 2010, the FASB issued ASU 2010-06, Fair Value Measurements and Disclosures (Topic 820), which focuses on Improving Disclosures about Fair Value Measurement.  ASU 2010-06 requires new disclosures about transfers in and out of Level 1 and Level 2 fair value measurements and the activity in Level 3 fair value measurements (i.e. purchases, sales, issuances, and settlements).  ASU 2010-06 also amended disclosure requirements related to the level of disaggregation of assets and liabilities, as well as disclosures about input and valuation techniques used to measure fair value for both recurring and nonrecurring fair value measurements.  The new guidance became effective for interim and annual reporting periods beginning after December 15, 2009.  The new guidance did not have a material impact on our financial statements.
 
 
68


FS Bancorp was formed at the direction of 1st Security Bank of Washington in September 2011 for the purpose of owning all of the outstanding stock of 1st Security Bank of Washington issued in the conversion and stock offering.  FS Bancorp is incorporated under the laws of the State of Washington, and generally is authorized to engage in any activity that is permitted by the Washington Business Corporation Act.  The business of FS Bancorp initially will consist only of the business of 1st Security Bank of Washington.  The holding company structure will, however, provide FS Bancorp with greater flexibility than 1st Security Bank of Washington has to diversify its business activities, through existing or newly formed subsidiaries, or through acquisitions or mergers of both mutual and stock thrift institutions as well as other companies.  Although there are no current arrangements, understandings or agreements regarding any such activity or acquisition, FS Bancorp will be in a position after the conversion, subject to regulatory restrictions, to take advantage of any favorable acquisition opportunities that may arise.
 
The assets of FS Bancorp will consist initially of the stock of 1st Security Bank of Washington, the loan to the Employee Stock Ownership Plan (“ESOP”) and up to 50% of the net proceeds from the conversion and stock offering (less the amount loaned to the ESOP).  Initially, any activities of FS Bancorp are anticipated to be funded by the retained proceeds and the income thereon and dividends from 1st Security Bank of Washington, if any.  See “Our Policy Regarding Dividends” and “How We Are Regulated – Limitations on Dividends and Stock Repurchases.”  Thereafter, activities of FS Bancorp may also be funded through sales of additional securities, through borrowings and through income generated by other activities of FS Bancorp.  At this time, there are no plans regarding such other activities other than the intended loan to the ESOP to facilitate its purchase of common stock in the conversion.  See “Management – Benefit Plans – Employee Stock Ownership Plan.”
 
The executive offices of FS Bancorp are located at 6920 220th Street SW, Mountlake Terrace, Washington  98043.  Its telephone number at that address is (425) 771-5299.
 
 
General
 
1st Security Bank of Washington is a relationship-driven community bank.  We deliver banking and financial services to local families, local and regional businesses and industry niches within distinct Puget Sound area communities.  We emphasize long-term relationships with families and businesses within the communities we serve, working with them to meet their financial needs.  We are also actively involved in community activities and events within these market areas, which further strengthens our relationships within these markets.  We have been serving the Puget Sound area since 1936.  Originally chartered as a credit union, previously known as Washington’s Credit Union, we served various select employment groups.  On April 1, 2004, we converted from a credit union to a Washington state-chartered mutual savings bank.
 
1st Security Bank of Washington is a diversified lender with a focus on the origination of home improvement loans, commercial real estate mortgage loans, commercial business loans and 2nd mortgage/home equity loan products.  Consumer loans, in particular indirect home improvement loans, represent the largest portion of the loan portfolio and have traditionally been the mainstay of the bank’s lending strategy, a carryover from its days as a credit union.  Going forward, we plan to place more emphasis on commercial real estate, commercial business and residential construction lending, while maintaining the size of our consumer loan portfolio.  We also intend to reintroduce in-house originations of residential mortgage loans, primarily for sale into the secondary market, through a mortgage banking program.  Our lending strategies are intended to take advantage of: (1) our historical strength in indirect consumer lending, (2) recent market dislocation that we believe has created new lending opportunities and the availability of experienced lenders, and (3) our strength in relationship lending. Retail deposits will continue to serve as an important funding source.
 
 
69


Market Area  
 
We conduct our operations out of our main administrative office and 6 full-service branch offices in the Puget Sound region of Washington.  The administrative office is located in Mountlake Terrace, in Snohomish County, Washington.  Three branch offices are located in Snohomish County, while there is one office each in King and Pierce Counties to the south and Kitsap County to the west.
 
The primary market area for business operations is the Seattle-Tacoma-Bellevue, WA Metropolitan Statistical Area (the “Seattle MSA”).  Kitsap County, though not in the Seattle MSA, is also part of our market area.  This overall region is typically known as the “Puget Sound” region.  The population of the Puget Sound region was an estimated 3.4 million in 2010, approximately one-half of the state’s population, representing a large population base for potential business.  The region has a well-developed urban area in the western portion along Puget Sound, with the central and eastern portions remaining undeveloped, rural and mountainous.
 
The Puget Sound region is the largest business center in both the state of Washington and the Pacific Northwest.  Currently, key elements of the economy are aerospace, military bases, clean technology, biotechnology, education, information technology, logistics, international trade and tourism.  The region is well known for the long presence of The Boeing Corporation and Microsoft, two major industry leaders, and for its leadership in technology.  The workforce in general is well-educated and strong in technology.  Washington state’s location with regard to the Pacific Rim, along with a deepwater port has made international trade a significant part of the regional economy (approximately one in three jobs in Washington is tied to foreign exports).  Tourism has also developed into a major industry for the area, due to the scenic beauty, temperate climate and easy accessibility.
 
King County, the location of the city of Seattle, has the largest employment base and overall level of economic activity.  King County’s largest employers include The Boeing Company, Microsoft Corporation, and the University of Washington.  Companies that are headquartered in King County include Alaska Airlines, Amazon.com, Attachmate, Costco, Starbucks and Microsoft.  Pierce County’s economy is also well diversified with the presence of military related government employment (Joint Base Lewis-McChord), along with health care (the Franciscan Health System and the Multicare Health System).  In addition, there is a large employment base in the economic sectors of shipping (the Port of Tacoma) and aerospace employment (Boeing).  Snohomish County to the north has an economy based on aerospace employment (Boeing), military (the Everett Naval Station) along with additional employment concentrations in biotechnology, electronics/computers, and wood products.  Eight of the largest employers in the state are headquartered in King County.
 
The United States Navy is a key element for Kitsap County’s economy.  The United States Navy is the largest employer in the county, with installations at Puget Sound Naval Shipyard, Naval Undersea Warfare Center Keyport and Naval Base Kitsap (which comprises former Naval Submarine Base Bangor, and Naval Station Bremerton).  The largest private employers in the county are the Harrison Medical Center, Wal-Mart, and Port Madison Enterprises.
 
The 2010 median household income and per capita income levels in King, Snohomish, and Kitsap Counties were higher than the state and national averages, while Pierce County reported income levels slightly below the Washington state average.  King and Snohomish Counties contain a larger percentage of white-collar professional employment.  Approximately 86.6% of King County households had income levels in excess of $50,000 annually in 2010, compared to 82.5% for the state of Washington and 79.2% for the United States.  In 2008, the U.S. Census Bureau determined that Seattle has the highest percentage of college and university graduates of any U.S. city; it was listed as the most literate or second most literate city of the country every year since 2005.  Seattle’s high income and education levels, especially compared to other major cities, result in King County ranking in the top 100 wealthiest counties in the United States.
 
 
70


Unemployment rates in Pierce, Kitsap, King, Snohomish counties have roughly stabilized in the last 12 months after dropping from their 2010 first quarter highs.  Overall unemployment in Washington was 9.0% as of July 2011, down from a high of 10.9% in January 2010, closely paralleling national trends.  As of July 2011, Kitsap County and King County reported rates slightly lower than the state and national averages, at 7.7% and 8.6%, respectively.  In the same time period, unemployment in Pierce County was 9.6%, and unemployment in Snohomish County was slightly higher at 10%, both consistently tracking the overall unemployment levels of Washington by within 1% since the beginning of the 2008 recession.
 
According to the Washington Center for Real Estate Research, home values in the state of Washington have suffered declines in the last year.  For the quarter ended June 30, 2011, the average home value was $241,500 in Snohomish County, $197,000 in Pierce County, $348,300 in King County, and $235,000 in Kitsap County.  Compared to the statewide average decline in home values of 8% over the last year, Snohomish and Pierce counties have performed worse, with 14% and 11% declines, respectively.  King County’s decline of 7% is slightly better than the state average.  Only Kitsap County avoided any decrease, with average home values this year approximately unchanged since the year prior.
 
For a discussion regarding the competition in our primary market area, see “Business of 1st Security Bank of Washington - Competition.”    
 
Lending Activities
 
General.  Historically, while operating as a credit union, our primary emphasis was the origination of consumer loans (primarily indirect home improvement and automobile-secured loans), one-to four-family residential first mortgages, and second mortgage/home equity loan products.  More recently, while maintaining the active indirect consumer lending program, we have shifted our lending focus to non-mortgage commercial business loans, as well as commercial real estate and residential construction and development loans.  We are also in the process of reintroducing in-house originations of residential mortgage loans, primarily for sale in the secondary market, through a mortgage banking program.  While maintaining our historical strength in consumer lending, we recently added management and personnel in the commercial lending area to take advantage of the relatively favorable long-term business and economic environments prevailing in our markets for small business lending.
 
 
71


Loan Portfolio Analysis. The following table sets forth the composition of our loan portfolio by type of loan at the dates indicated.
 
         
December 31,
 
   
June 30, 2011
   
2010
   
2009
   
2008
   
2007
   
2006
 
   
Amount
   
Percent
   
Amount
   
Percent
   
Amount
   
Percent
   
Amount
   
Percent
   
Amount
   
Percent
   
Amount
   
Percent
 
   
(Dollars in thousands)
 
Real estate loans:
                                                                       
   Commercial
  $ 25,675       11.97 %   $ 28,061       11.86 %   $ 29,099       12.20 %   $ 25,872       11.33 %   $ 17,309       7.19 %   $ 10,454       4.73 %
   Multi-family
    1,168       0.54       1,159       0.49       409       0.17       408       0.18       972       0.41       592       0.27  
   One- to four-family
    12,833       5.98       13,218       5.59       8,233       3.45       6,969       3.05       60,556       25.15       67,684       30.64  
   Home equity
    15,439       7.20       15,655       6.62       16,448       6.90       18,689       8.19       19,721       8.19       22,600       10.23  
   Construction and development
    6,304       2.94       9,805       4.15       17,390       7.29       23,861       10.45       6,520       2.71       2,601       1.18  
      Total real estate loans
    61,419       28.63       67,898       28.71       71,579       30.01       75,799       33.20       105,078       43.65       103,931       47.05  
                                                                                                 
Consumer Loans:
                                                                                               
   Indirect home improvement
    87,232       40.67       94,833       40.10       89,883       37.68       75,203       32.94       69,559       28.89       62,099       28.11  
   Recreational
    25,341       11.81       24,105       10.19       18,011       7.55       12,165       5.33       11,727       4.87       13,182       5.97  
   Automobile
    8,927       4.16       12,645       5.35       23,359       9.79       30,514       13.37       25,991       10.80       28,473       12.89  
   Home improvement
    1,070       0.50       1,295       0.55       1,725       0.72       2,203       0.96       2,952       1.23       1,005       0.45  
   Other
    2,090       0.97       2,887       1.21       4,277       1.80       6,190       2.71       6,251       2.59       4,561       2.07  
      Total consumer loans
    124,660       58.11       135,765       57.40       137,255       57.54       126,275       55.31       116,480       48.38       109,320       49.49  
                                                                                                 
Commercial business loans
    28,430       13.26       32,841       13.89       29,699       12.45       26,218       11.49       19,197       7.97       7,649       3.46  
                                                                                                 
      Total gross loans receivable
    214,509       100.00 %     236,504       100.00 %     238,533       100.00 %     228,292       100.00 %     240,755       100.00 %     220,900       100.00 %
                                                                                                 
Less:
                                                                                               
   Deferred fees and discounts
    511               223               313               280               (204 )             (116 )        
   Allowance for losses
    (4,836 )             (5,905 )             (7,405 )             (5,598 )             (2,744 )             (2,706 )        
   Total loans receivable, net
  $ 210,184             $ 230,822             $ 231,441             $ 222,974             $ 237,807             $ 218,078          
 
 
72


The following table shows the composition of our loan portfolio by fixed- and adjustable-rate loans at the dates indicated.
 
               
December 31,
 
   
June 30, 2011
   
2010
   
2009
   
2008
   
2007
   
2006
 
   
Amount
   
Percent
   
Amount
   
Percent
   
Amount
   
Percent
   
Amount
   
Percent
   
Amount
   
Percent
   
Amount
   
Percent
 
   
(Dollars in thousands)
 
Fixed-rate loans:
                                                                       
Real estate loans:
                                                                       
   Commercial
  $ 14,223       6.63 %   $ 16,333       6.90 %   $ 15,729       6.59 %   $ 16,449       7.20 %   $ 15,852       6.58 %   $ 8,959       4.06 %
   Multi-family
    1,168       0.54       1,159       0.49       409       0.17       405       0.17       968       0.40       592       0.27  
   One- to four-family
    6,305       2.94       6,585       2.79       4,552       1.91       6,159       2.70       57,610       23.93       64,919       29.39  
   Home equity
    2,516       1.17       2,784       1.18       3,839       1.61       5,399       2.36       6,616       2.75       6,812       3.08  
   Construction and development
    1,825       0.85       1,556       0.66       501       0.21       105       0.05       110       0.05       196       0.09  
      Total real estate loans
    26,037       12.13       28,417       12.02       25,030       10.49       28,517       12.48       81,156       33.71       81,478       36.89  
                                                                                                 
Consumer
    124,650       58.10       135,752       57.39       137,231       57.53       126,221       55.29       116,329       48.32       108,756       49.23  
Commercial business
    2,422       1.14       1,049       0.45       870       0.36       454       0.20       165       0.07       ---       ---  
      Total fixed-rate loans
    153,109       71.37       165,218       69.86       163,131       68.38       155,192       67.97       197,650       82.10       190,234       86.12  
                                                                                                 
Adjustable-rate loans:
                                                                                               
Real estate loans:
                                                                                               
   Commercial
    11,452       5.34       11,728       4.96       13,370       5.61       9,423       4.13       1,457       0.61       1,495       0.67  
   Multi-family
    ---       ---       ---       ---       ---       ---       3       0.01       4       0.01       ---       ---  
   One- to four-family
    6,528       3.04       6,633       2.80       3,681       1.54       810       0.35       2,946       1.22       2,765       1.25  
   Home equity
    12,923       6.03       12,871       5.44       12,609       5.29       13,290       5.83       13,105       5.44       15,788       7.15  
   Construction and development
    4,479       2.09       8,249       3.49       16,889       7.08       23,756       10.40       6,410       2.66       2,405       1.09  
      Total real estate loans
    35,382       16.50       39,481       16.69       46,549       19.52       47,282       20.72       23,922       9.94       22,453       10.16  
                                                                                                 
Consumer
    10       0.01       13       0.01       24       0.01       54       0.02       151       0.06       564       0.26  
Commercial business
    26,008       12.12       31,792       13.44       28,829       12.09       25,764       11.29       19,032       7.90       7,649       3.46  
      Total adjustable-rate loans
    61,400       28.63       71,286       30.14       75,402       31.62       73,100       32.03       43,105       17.90       30,666       13.88  
                                                                                                 
         Total gross loans receivable
    214,509       100.00 %     236,504       100.00 %     238,533       100.00 %     228,292       100.00 %     240,755       100.00 %     220,900       100.00 %
                                                                                                 
Less:
                                                                                               
   Deferred fees and discounts
    511               223               313               280               (204 )             (116 )        
   Allowance for losses
    (4,836 )             (5,905 )             (7,405 )             (5,598 )             (2,744 )             (2,706 )        
   Total loans receivable, net
  $ 210,184             $ 230,822             $ 231,441             $ 222,974             $ 237,807             $ 218,078          

 
73


Loan Maturity and Repricing.  The following table sets forth certain information at December 31, 2010 regarding the dollar amount of loans maturing in our portfolio based on their contractual terms to maturity, but does not include scheduled payments or potential prepayments.  Loan balances do not include undisbursed loan proceeds, unearned discounts, unearned income and allowance for loan losses.
 
    
Real Estate
                                     
   
One- to Four Family
   
Home Equity
   
Multi-family
   
Commercial
   
Construction and
Development
   
Consumer
   
Commercial
Business
   
Total
 
   
Amount
   
Weighted
Average
Rate
   
Amount
   
Weighted
Average
Rate
   
Amount
   
Weighted
Average
Rate
   
Amount
   
Weighted
Average
Rate
   
Amount
   
Weighted
Average
Rate
   
Amount
   
Weighted
Average
Rate
   
Amount
   
Weighted
Average
Rate
   
Amount
   
Weighted
Average
Rate
 
   
(Dollars in thousands)
 
Due During
Years Ending
December 31,
                                                                                               
2011(1) 
  $ 393       4.00 %   $ 12,875       6.02 %   $ ---       --- %   $ 6,087       6.57 %   $ 6,742       6.01 %   $ 2,729       10.41 %   $ 27,583       5.24 %   $ 56,409       5.89 %
2012
    7,064       5.40       ---       ---       381       6.57       1,520       7.00       1,902       6.00       2,576       9.06       91       6.22       13,534       6.40  
2013
    10       9.79       6       7.75       ---       ---       3,591       3.11       ---       ---       5,215       9.19       506       6.44       9,328       6.70  
2014 and 2015
    505       6.25       ---       ---       690       6.00       12,978       5.20       ---       ---       10,967       8.98       4,661       5.48       29,801       6.67  
2016 to 2020
    1,613       4.36       352       7.12       13       5.55       3,885       4.96       1,161       6.64       51,554       9.46       ---       ---       58,578       8.95  
2021 to 2025
    388       5.95       2,339       8.16       5       6.33       ---       ---       ---       ---       51,423       7.27       ---       ---       54,155       7.30  
2026 and following
    3,245       5.16       83       7.75       70       5.55       ---       ---       ---       ---       11,301       7.50       ---       ---       14,699       6.98  
 Total
  $ 13,218       5.22 %   $ 15,655       6.37 %   $ 1,159       6.16 %   $ 28,061       5.30 %   $ 9,805       6.08 %   $ 135,765       8.43 %   $ 32,841       5.29 %   $ 236,504       7.20 %
 

(1) Includes demand loans, loans having no stated maturity and overdraft loans.
 
 
74


The total amount of loans due after December 31, 2011 which have predetermined interest rates is $156.3 million, while the total amount of loans due after this date which have floating or adjustable interest rates is $23.8 million.
 
Lending Authority.  The Chief Executive Officer and Chief Lending Officer have the authority to approve loans up to $1.5 million.  Loans in excess of $1.5 million require approval of the Loan Committee, which includes members of the board of directors of 1st Security Bank of Washington.  The Chief Lending Officer may delegate lending authority to other individuals at levels consistent with their responsibilities.
 
At June 30, 2011, the maximum amount we would lend to any one borrower and the borrower’s related entities was $4.0 million.  Our largest loan or lending relationship at June 30, 2011, totaled $4.0 million and consisted of three separate commercial real estate loans to related parties, the largest of which was $2.8 million secured by a commercial retail building located in Seattle, WA.  Our next largest lending relationship at June 30, 2011, totaled $3.7 million and consisted of two lines of credit to related parties.  One of these lines had an outstanding balance of $2.8 million secured by 16 rental homes and the other line had an outstanding balance of $934,000 secured by 6 rental homes.  The next three largest lending relationships at June 30, 2011, were as follows: a $3.5 million loan secured by an owner-occupied commercial office building in Kirkland, WA; a $3.4 million loan secured by five commercial retail condominium units located in Seattle, WA, and the personal guarantee of the owners; and a $3.0 million loan used to purchase a participation interest in a $1.8 billion loan secured by the assets of the borrower and guarantor.  At June 30, 2011, we had five additional relationships that exceeded $2.0 million.  All of the foregoing loans were current at June 30, 2011.
 
Commercial Real Estate Lending.  We offer a variety of commercial real estate loans.  Most of these loans are secured by income producing properties, including retail centers, warehouses and office buildings located in our market areas.  We also have a limited amount of loans secured by multi-family residences.  At June 30, 2011, commercial real estate loans (including multi-family residential loans) totaled $26.8 million, or 12.5%, of our gross loan portfolio.
 
Our loans secured by commercial real estate are originated with a fixed or variable interest rate for up to a 10-year term and a 25-year amortization.  The variable rate loans are indexed to the prime rate of interest or a short-term LIBOR rate, with rates ranging from 0.5% below the prevailing index rate to 3.0% above the prevailing rate.  Loan-to-value ratios on our commercial real estate loans typically do not exceed 80% of the appraised value of the property securing the loan.  In addition, personal guarantees are obtained from the primary borrowers on substantially all credits.
 
Loans secured by commercial real estate are generally underwritten based on the net operating income of the property and the financial strength of the borrower.  The net operating income, which is the income derived from the operation of the property less all operating expenses, must be sufficient to cover the payments related to the outstanding debt plus an additional coverage requirement.  We generally require an assignment of rents or leases in order to be assured that the cash flow from the project will be sufficient to repay the debt.  Appraisals on properties securing commercial real estate loans are performed by independent state certified or licensed fee appraisers.  We do not generally maintain insurance or tax escrows for loans secured by commercial real estate.  In order to monitor the adequacy of cash flows on income-producing properties, the borrower is required to provide financial information on at least an annual basis.
 
Loans secured by commercial real estate properties generally involve a greater degree of credit risk than one- to four-family residential mortgage loans.  These loans typically involve large balances to single borrowers or groups of related borrowers.  Because payments on loans secured by commercial and multi-family real estate properties are often dependent on the successful operation or management of the properties, repayment of these loans may be subject to adverse conditions in the real estate market or the economy.  If the cash flow from the project is reduced, or if leases are not obtained or renewed, the borrower’s ability to repay the loan may be impaired.
 
 
75


We intend to continue to emphasize commercial real estate lending and, as a result, we have assembled a highly experienced team, with an average of over 20 years experience.  Our Chief Lending Officer has over 23 years of commercial lending experience in the northwestern U.S. region, and other experienced commercial loan officers have recently been hired to support our commercial real estate lending objectives.  As the commercial loan portfolio expands, we intend to bring in additional experienced personnel in the areas of loan analysis and commercial deposit relationship management, as needed.
 
One- to Four-Family Real Estate Lending.  We have historically originated loans secured by first mortgages on one- to four-family residences, primarily in our market area.  We will originate one- to four-family residential mortgage loans through referrals from real estate agents, builders and from existing customers.  Walk-in customers have also been an important source of loan originations in the past. During 2008, we securitized into mortgage-backed securities $50.2 million of one- to four-family residential loans, selling $48.6 million of these securities.  The securitization and sale was done to provide liquidity for operations and future lending activities, to repay a portion of our outstanding borrowings, and to limit our overall exposure to the real estate mortgage market.  This transaction also allowed us to reduce the amount of lower yielding, long-term residential loans in our portfolio and to manage our interest rate risk exposure.  At June 30, 2011, one- to four-family residential mortgage loans totaled $12.8 million, or 6.0%, of our gross loan portfolio.
 
In recent years, we have primarily utilized local community mortgage lenders to provide home loans to our customers. This origination structure allowed us to devote internal resources to commercial and consumer lending, while continuing to serve the needs of our customers.  In order to control the complete customer experience, as well as to increase and diversify our sources of income, we recently hired several experienced bankers to implement and oversee an in-house mortgage banking operation.  We intend to initiate the mortgage banking operation during the fourth quarter of 2011.  The mortgage banking operation will originate residential mortgage loans, primarily for sale into the secondary market. Servicing of these loans will be released in some cases and retained in others, depending on the customer relationship and market execution.
 
We will generally underwrite our one- to four-family loans based on the applicant’s ability to repay.  This includes employment and credit history and the appraised value of the subject property.  We will lend up to 100% of the lesser of the appraised value or purchase price for one- to four-family first mortgage loans.  For first mortgage loans with a loan-to-value ratio in excess of 80%, we generally require either private mortgage insurance or government sponsored insurance in order to mitigate the higher risk level associated with higher loan-to-value loans.  Fixed-rate loans secured by one- to four-family residences have contractual maturities of up to 30 years and are generally fully amortizing, with payments due monthly.  Adjustable-rate mortgage loans generally pose different credit risks than fixed-rate loans, primarily because as interest rates rise the borrower’s payments rise, increasing the potential for default.  Properties securing our one- to four-family loans are appraised by independent fee appraisers who are selected in accordance with industry and regulatory standards. We require our borrowers to obtain title and hazard insurance, and flood insurance, if necessary. We anticipate that the underwriting criteria used for our new one- to four-family loans originated by our mortgage banking division will be similar to our historical underwriting standards and will conform to secondary market guidelines.
 
 Home Equity Lending.  We have been active in second mortgage and home equity lending, with the focus of this lending being conducted in our primary market area.  Our home equity lines of credit generally have adjustable rates tied to the prime rate of interest with a draw term of ten years and a term to maturity of 15 years.  Monthly payments are based on 1.0% of the outstanding balance with a maximum combined loan-to-value ratios of up to 90%, including any underlying first mortgage.  Second mortgage home equity loans are typically fixed rate, amortizing loans with terms of up to 15 years.  Total second mortgage/home equity loans totaled $15.4 million, or 7.2% of the loan portfolio, as of June 30, 2011, $12.9 million of which were adjustable rate home equity lines of credit.
 
 
76


Construction and Development Lending.  Historically, we have originated construction loans secured by commercial real estate and, to a lesser extent, one- to four-family residences.  We have also originated loans secured by tracts of land for development.  Construction and development lending was modest over the last several years.  As the real estate markets weakened, demand for new construction declined and many builders experienced cash flow problems.  Going forward, we intend to increase our residential construction lending and have recently hired a team of three lenders and one operations manager to support this initiative.  This team has over 60 years of combined experience and expertise in acquisition, development and construction (“ADC”) lending in the Puget Sound market area.  We are implementing this strategy to take advantage of what we believe is an unmet demand for construction and ADC loans to experienced, successful and relationship driven builders in our market area after many other banks abandoned this segment because of previous overexposure.  At June 30, 2011, our construction and development loans totaled $6.3 million, or 2.9%, of our total loan portfolio and consisted of loans for commercial construction projects.  These loans were all performing at June 30, 2011, in accordance with their terms.
 
Our residential construction lending program focuses on the origination of loans for the purpose of constructing, on both a pre-sold and speculative basis, and selling primarily one- to four-family residences within our market area.  We generally limit these types of loans to known builders and developers in our market area.  Our construction loans generally provide for the payment of interest only during the construction phase, which is typically up to 12 months.  At the end of the construction phase, the construction loan is generally paid off through the sale of the newly constructed home and a permanent loan from another lender, although commitments to convert to a permanent loan may be made by us.  Construction loans are made with a maximum loan-to-value ratio of the lower of 100% of cost or 80% of appraised value at completion.  These loans generally include an interest reserve of 5% to 7% of the loan commitment amount.
 
Commitments to fund construction loans generally are made subject to an appraisal of the property by an independent licensed appraiser.  We also review and inspect each property before disbursement of funds during the term of the construction loan.  Loan proceeds are disbursed after inspection by a third party inspector based on the percentage of completion method.
 
We may also make land acquisition and development loans to builders or residential lot developers on a limited basis.  These loans involve a higher degree of credit risk, similar to commercial construction loans.  At June 30, 2011, included in the $6.3 million of construction loans, were three land acquisition and development loans totaling $2.8 million.  These land loans also involve additional risks because the loan amount is based on the projected value of the lots after development.  We make these loans for up to 75% of the estimated value with a term of up to two years.  These loans are required to be paid on an accelerated basis as the lots are sold, so that we are repaid before all the lots are sold.
 
Construction financing is generally considered to involve a higher degree of credit risk than longer-term financing on improved, owner-occupied real estate.  Risk of loss on a construction loan depends largely upon the accuracy of the initial estimate of the value of the property at completion of construction compared to the estimated cost (including interest) of construction and other assumptions.  If the estimate of construction costs is inaccurate, we may be required to advance funds beyond the amount originally committed in order to protect the value of the property.  Additionally, if the estimate of value is inaccurate, we may be confronted with a project that, when completed, has a value that is insufficient to generate full payment.
 
 
77


We seek to address the forgoing risks associated with construction development lending by developing and adhering to underwriting policies, disbursement procedures and monitoring practices.  Specifically, we (i) seek to diversify loans among several market areas, (ii) evaluate and document the creditworthiness of the borrower and the viability of the proposed project, (iii) limit loan-to-value ratios to specified levels, (iv) control disbursements on construction loans on the basis of on-site inspections by bank personnel, and (v) monitor economic conditions and the housing inventory in each market.  No assurances, however, can be given that these practices will be successful in mitigating the risks of construction development lending.
 
Consumer Lending.  Consumer lending represents a significant and important historical activity for us, primarily reflecting our indirect lending through home improvement contractors and dealers.  As of June 30, 2011, consumer loans totaled $124.7 million, or 58.1% of our gross loan portfolio.
 
Our indirect home improvement loans, also referred to as fixture secured loans, represent the largest portion of our loan portfolio and have traditionally been the mainstay of our lending strategy.  These loans totaled $87.2 million, or 40.7% of total loans and 70.0% of total consumer loans, at June 30, 2011.  Indirect home improvement loans are originated through a network of approximately 130 home improvement contractors and dealers located in Washington and Oregon.  Approximately 10 dealers are responsible for a majority of the loan volume.  These fixture secured loans consist of loans for a wide variety of products, such as replacement windows, siding, roofs, HVAC systems and roofing materials.
 
In connection with our fixture secured loans, we receive loan applications from the dealers, and originate the loans based on pre-defined lending criteria.  The loans are processed by us through our loan origination software, with approximately 40% of the loan applications receiving an automated approval based on the information provided, and the remaining loans processed by our credit analysts.  We follow our internal underwriting guidelines in evaluating loans obtained through the indirect dealer program, including using FICO credit scores to approve loans.
 
Our fixture secured loans generally range in amounts from $2,500 to $35,000, and generally carry terms of up to 10 years with fixed rates of interest.  In some instances, the participating dealer may receive a premium rate for the amount over our initial interest rate.  Our fixture secured loans are secured by the personal property installed in, on or at the borrower’s real property, and may be perfected with a UCC-2 financing statement filed in the county of the borrower’s residence.  We generally file a UCC-2 financing statement to perfect our security interest in the personal property in situations where the borrower’s credit score is below 720 or the home improvement loan is for an amount in excess of $20,000.  Perfection gives us a claim to the collateral that is superior to someone that obtains a lien through the judicial process subsequent to the perfection of a security interest.  The failure to perfect a security interest does not render the security interest unenforceable against the borrower.  However, failure to perfect a security interest risks avoidance of the security interest in bankruptcy or subordination to the claims of third parties.
 
The decline in home prices experienced in our market area in recent years has resulted in a lower level of demand for home improvement loans, as homeowners are less likely to invest in existing homes if the amount owed on the property exceeds the current fair value.  Thus, we have experienced a modest decline in the balances of these types of loans.  In order to maintain our indirect home improvement loan volume, we are considering expanding this line of business into the States of California and Texas.  We are in the process of testing these markets with a limited number of contractors and dealers in each state, using our existing personnel.  To the extent we determine to move forward with expanding our indirect home improvement lending program into California and Texas, we will need to add contractors and dealers and will require more account executives and contractor/dealer management resources to manage existing and solicit new contractor/dealer relationships.  As application volume for loans increases, we also will require more processing and underwriting staff and as the portfolio grows, we will require more servicing and collections staff.
 
 
78


We also offer other consumer loans, primarily secured by boats and automobiles.  Recreational loans, substantially all of which are boat loans, represent the second largest segment of our consumer loan portfolio, with the balances increasing in recent periods as a replacement for the reduction in auto loans.  As of June 30, 2011, our recreational loan portfolio totaled $25.3 million, or 11.8% of total loans and 20.3% of total consumer loans.  Boat loans are originated with borrowers on both a direct and indirect basis and carry terms of up to 20 years, and generally have fixed rates of interest.  We require a 10% down payment, and the loan amount may be up to the lesser of 120% of factory invoice or 90% of the purchase price.
 
Automobile loans represent a prior lending focus whereby indirect loans were originated through a dealer network throughout the northwest region of the United States for new and used cars.  However, this program has been terminated and auto loans are currently only originated at our branch office locations.  The balance of auto loans has declined substantially in recent years and totaled $8.9 million, or 4.2% of our gross loan portfolio, at June 30, 2011.  It is expected to continue to decline in the future.  Auto loans currently originated by the branches may be written for up to seven years for a new or used car with fixed rates of interest.  We also originate a small number of other consumer loans, including direct home improvement, loans on deposit and other consumer loans, which totaled $3.2 million as of June 30, 2011.  These loans generally carry fixed as well and terms up to five years.
 
In evaluating any consumer loan application, a borrower’s FICO score is utilized as an important indicator of credit risk.  Over the last several years we have emphasized originations of loans to higher credit score borrowers.  This has resulted in a lower level of loan charge-offs in recent periods.  As of June 30, 2011, 64.8% of our consumer loan portfolio was originated with borrowers having a FICO score over 720 at the time of origination, and 93.8% was originated with borrowers having a FICO score over 660 at the time of origination.
 
Consumer loans generally have shorter terms to maturity, which reduces our exposure to changes in interest rates.  In addition, management believes that offering consumer loan products helps to expand and create stronger ties to our existing customer base by increasing the number of customer relationships and providing cross-marketing opportunities.
 
Consumer and other loans generally entail greater risk than do one- to four-family residential mortgage loans, particularly in the case of consumer loans that are secured by rapidly depreciable assets, such as boats, automobiles and other recreational vehicles.  In these cases, any repossessed collateral for a defaulted loan may not provide an adequate source of repayment of the outstanding loan balance.  As a result, consumer loan collections are dependent on the borrower’s continuing financial stability and, thus, are more likely to be adversely affected by job loss, divorce, illness or personal bankruptcy.  In the case of our fixture secured loans, it is very difficult to repossess the personal property securing these loans as they are typically attached to the borrower’s personal residence.  Accordingly, if a borrower defaults on a fixture secured loan our only practical recourse, due to the general small size of these loans, is to wait until the borrower wants to sell or refinance the home, at which time if we have a perfected security interest we generally will be able to collect.
 
Commercial Business Lending.   We originate commercial business loans and lines of credit to local small- and mid-sized businesses in our Puget Sound market area that are secured by accounts receivable, inventory or property, plant and equipment.  Consistent with management’s objectives to expand our commercial business lending, in 2010 we commenced a mortgage warehouse lending program through which we fund third party mortgage bankers.  At June 30, 2011, we had approved warehouse lending lines for eight companies with limits of up to $4.0 million, and an aggregate limit of $29.8 million.  During the year ended December 31, 2010, we processed approximately 1,300 loans and funded approximately $326.4 million under this program.  For the six months ended June 30, 2011, we processed approximately 350 loans and funded approximately $86.2 million, with $6.5 million outstanding at June 30, 2011.  Following completion of the stock offering, we will be able to increase the maximum warehouse line from $4.0 million to approximately 20% of capital based on our current internal policy limits, or approximately $7.7 million at the adjusted maximum of the offering range.  This will allow us to increase funding capacity for selected existing customers and enable us to attract additional mortgage banking clients for our warehouse lending business, which we are actively pursuing.  In addition, we recently started to offer Small Business Administration loans.
 
 
79


Our commercial business loans may be fixed-rate, but are usually adjustable-rate loans indexed to the prime rate of interest, plus a margin.  Some of our commercial business loans, such as those made pursuant to our warehouse lending program, are structured as lines of credit with terms of 12 months and interest only payments required during the term, while other loans may reprice on an annual basis and amortize over a two to five year period.  Due to the current interest rate environment, these loans and lines of credit are generally originated with a floor, which is currently set at 5.5%.  Loan fees are generally charged at origination depending on the credit quality and account relationships of the borrower.  Advance rates on these types of lines are generally limited to 80% of accounts receivable and 50% of inventory.  We also generally require the borrower to establish a deposit relationship with us as part of the loan approval process.  At June 30, 2011, our commercial business loan portfolio totaled $28.4 million, or 13.3%, of our gross loan portfolio.
 
At June 30, 2011, most of our commercial business loans were secured.  Our commercial business lending policy includes credit file documentation and analysis of the borrower’s background, capacity to repay the loan, the adequacy of the borrower’s capital and collateral, as well as an evaluation of other conditions affecting the borrower.  Analysis of the borrower’s past, present and future cash flows is also an important aspect of our credit analysis.  We generally require personal guarantees on our commercial business loans.  Nonetheless, commercial business loans are believed to carry higher credit risk than residential mortgage loans.  At June 30, 2011, our largest commercial business lending relationship consisted of three loans, with an aggregate outstanding balance of $4.0 million, to a single borrower secured by commercial real estate.  These loans were performing in accordance with their terms at June 30, 2011.
 
Unlike residential mortgage loans, commercial business loans, particularly unsecured loans, are made on the basis of the borrower’s ability to make repayment from the cash flow of the borrower’s business and, therefore, are of higher risk.  We make commercial loans secured by business assets, such as accounts receivable, inventory, equipment, real estate and cash as collateral with loan-to-value ratios of up to 80%, based on the type of collateral.  This collateral depreciates over time, may be difficult to appraise and may fluctuate in value based on the specific type of business and equipment used.  As a result, the availability of funds for the repayment of commercial business loans may be substantially dependent on the success of the business itself (which, in turn, is often dependent in part upon general economic conditions).
 
Loan Originations, Servicing, Purchases and Sales
 
We originate both fixed-rate and adjustable-rate loans.  Our ability to originate loans, however, is dependent upon customer demand for loans in our market areas.  Over the past few years, we have continued to originate consumer loans, and increased our emphasis on commercial real estate and commercial business lending, and to a lesser extent construction and development lending.  Demand is affected by competition and the interest rate environment.  In periods of economic uncertainty, the ability of financial institutions, including us, to originate large dollar volumes of commercial business and real estate loans may be substantially reduced or restricted, with a resultant decrease in interest income.  From time to time, we purchase loan participations to supplement our loan originations.
 
In addition to interest earned on loans and loan origination fees, we receive fees for loan commitments, late payments and other miscellaneous services.  The fees vary from time to time, generally depending on the supply of funds and other competitive conditions in the market.
 
 
80


We historically sold long term, fixed rate residential real estate loans in the secondary market.  These loans were sold in order to improve our interest rate risk.  These loans are generally sold for cash in amounts equal to the unpaid principal amount of the loans determined using present value yields to the buyer.  These sales allowed for a servicing fee on loans when the servicing is retained by us.  Most residential real estate loans sold by us were sold with servicing retained.  In addition, during the year ended December 31, 2008, we securitized and sold $48.6 million of our existing portfolio of residential mortgage loans.  We earned mortgage servicing income of $66,000 and $163,000, respectively, for the six months ended June 30, 2011 and the year ended December 31, 2010.  At June 30, 2011, we were servicing a $48.6 million portfolio of residential mortgage loans.  Those servicing rights constituted a $197,000 asset on our books on that date, which is amortized in proportion to and over the period of the net servicing income.  These mortgage servicing rights are periodically evaluated for impairment based on their fair value, which takes into account the rates and potential prepayments of those sold loans being serviced.  The fair value of our mortgage servicing rights at June 30, 2011 was $303,000.  See Note 15 of the Notes to Financial Statements.
 
Sales of whole real estate loans and participations in real estate loans can be beneficial to us since these sales generally generate income at the time of sale, produce future servicing income on loans where servicing is retained, provide funds for additional lending and other investments, and increase liquidity.
 
 
81


The following table shows total loans originated, purchased, sold and repaid during the periods indicated.
 
   
Six Months Ended,
June 30,
   
Years Ended December 31,
 
   
2011
    2010    
2010
   
2009
   
2008
 
   
(In thousands)
 
Originations by type:
                             
Fixed-rate:
                             
One- to four-family
  $ ---     $ 1,202     $ 2,378     $ 7,331     $ 6,668  
Home equity
    ---       ---       ---       148       647  
Multi-family
    14       731       759       6       8  
Commercial
    443       2,028       3,037       3,813       251  
Construction and development
    ---       ---       ---       404       ---  
Consumer
    14,629       28,772       53,043       63,047       68,042  
Commercial business (excluding warehouse lines)
    1,725       270       384       476       570  
      Total fixed-rate
    16,811       33,003       59,601       75,225       76,186  
                                         
Adjustable- rate:
                                       
One- to four-family
    ---       ---       1,221       2,582       3,024  
Home equity
    2,164       1,768       5,266       4,743       5,176  
Multi-family
    ---       ---       ---       ---       ---  
Commercial
    48       3       555       1,122       13,480  
Construction and development
    ---       595       775       3,471       16,131  
Consumer
    ---       ---       3       11       6  
Commercial business (excluding warehouse lines)
    3,763       4,285       15,380       23,853       25,674  
Warehouse lines, net
    6,501       11,416       11,940       8,199       ---  
       Total adjustable-rate
    12,476       18,067       35,140       43,981       63,491  
       Total loans originated
    29,287       51,070       94,741       119,206       139,677  
                                         
Sales and repayments:
                                       
One- to four-family
    ---       ---       ---       6,429       6,669  
      Total loans sold
    ---       ---       ---       6,429       6,669  
Mortgage-backed securities
    ---       ---       ---       ---       48,635  
      Total sales
    ---       ---       ---       6,429       55,304  
      Total principal repayments
    51,282       54,982       96,770       102,536       96,836  
      Total reductions
    51,282       54,982       96,770       108,965       152,140  
      Net increase (decrease)
  $ (21,995 )   $ (3,912 )   $ (2,029 )   $ 10,241     $ (12,463 )
 
Asset Quality
 
When a borrower fails to make a required payment on a residential real estate loan, we attempt to cure the delinquency by contacting the borrower.  In the case of loans secured by residential real estate, a late notice typically is sent 16 days after the due date, and the borrower is contacted by phone within 16 to 25 days after the due date.  When the loan is 30 days past due, an action plan is formulated for the credit under the direction of the Manager of Collection department.  Generally, a delinquency letter is mailed to the borrower.  All delinquent accounts are reviewed by a loan control representative who attempts to cure the delinquency by contacting the borrower once the loan is 30 days past due.  If the account becomes 60 days delinquent and an acceptable repayment plan has not been agreed upon, a loan control representative will generally refer the account to legal counsel with instructions to prepare a notice of intent to foreclose.  The notice of intent to foreclose allows the borrower up to 30 days to bring the account current.  If foreclosed, generally we take title to the property and sell it directly through a real estate broker.
 
Delinquent consumer loans are handled in a similar manner.  Appropriate action is taken in the form of phone calls and notices to collect any loan payment that is delinquent more than 16 days.  Once the loan is 90 days past due, it is classified as nonaccrual.  Generally, credits are charged off if past due 120 days, unless the collections department provides support for continuing its collection efforts.  Our procedures for repossession and sale of consumer collateral are subject to various requirements under the applicable consumer protection laws as well as other applicable laws and the determination by us that it would be beneficial from a cost basis.
 
 
82


Delinquent commercial business loans and loans secured by commercial real estate are handled by the loan officer in charge of the loan, who is responsible for contacting the borrower.  The loan officer works with outside counsel and, in the case of real estate loans, a third party consultant to resolve problem loans.  In addition, management meets as needed and reviews past due and classified loans, as well as other loans that management feels may present possible collection problems, which are reported to the loan committee and the board on a monthly basis.  If an acceptable workout of a delinquent commercial loan cannot be agreed upon, we generally initiate foreclosure or repossession proceedings on any collateral securing the loan.
 
The following table shows our delinquent loans by the type of loan and number of days delinquent as of June 30, 2011.
 
   
Loans Delinquent For:
 
   
60-89 Days
   
90 Days and Over
   
Total Loans Delinquent
60 Days or More
 
               
Percent of
               
Percent of
               
Percent of
 
               
Loan
               
Loan
               
Loan
 
   
Number
   
Amount
   
Category
   
Number
   
Amount
   
Category
   
Number
   
Amount
   
Category
 
   
(Dollars in thousands)
 
Real estate loans:
                                                     
  One- to four-family
    ---     $ ---       --- %     2     $ 234       1.82 %     2     $ 234       1.82 %
  Home equity
    4       133       0.86       14       662       4.29       18       795       5.15  
      Total real estate loans
    4       133       0.22       16       896       1.46       20       1,029       1.68  
                                                                         
Consumer:
                                                                       
  Indirect home improvement
    46       391       0.45       43       421       0.48       89       812       0.93  
  Automobile
    8       72       0.81       4       37       0.41       12       109       1.22  
  Recreational
    1       10       0.04       1       1       ---       2       11       0.04  
  Home improvement
    ---       ---       ---       2       37       3.46       2       37       3.46  
  Other
    3       14       0.68       5       8       0.39       8       22       1.07  
      Total consumer loans
    58       487       0.39       55       504       0.40       113       991       0.79  
Commercial business loans
    ---       ---       ---       5       558       1.96       5       558       1.96  
      Total
    62     $ 620       0.29 %     76     $ 1,958       0.91 %     138     $ 2,578       1.20 %
 
 
83


Non-performing Assets.  The following table sets forth information with respect to our non-performing assets.
 
   
June 30,
   
December 31,
 
   
2011
   
2010
   
2009
   
2008
   
2007
   
2006
 
Non-accruing loans:
 
(Dollars in thousands)
 
Real estate loans:
                                   
                                                 
One- to four-family
  $ 234     $ 211     $ ---     $ ---     $ ---     $ ---  
Home equity
    605       574       40       87       10       22  
Commercial
    ---       1,201       ---       ---       ---       ---  
    Construction and development
    ---       2,175       6,758       1,953       ---       ---  
Total real estate loans
    839       4,161       6,798       2,040       10       22  
                                                 
Consumer loans:
                                               
Indirect home improvement
    421       522       276       308       117       127  
Automobile
    37       54       35       62       50       37  
Recreational
    1       38       119       32       3       29  
Home improvement
    37       75       3       ---       ---       ---  
Other
    8       3       60       16       3       14  
Total consumer loans
    504       692       493       418       173       207  
Commercial  business loans
    558       1,387       ---       ---       ---       ---  
Total non-accruing loans
    1,901       6,240       7,291       2,458       183       229  
                                                 
Accruing loans delinquent more than 90 days:
                                               
Home equity
    57       62       163       30       ---       ---  
Total accruing loans delinquent more than 90 days
    57       62       163       30       ---       ---  
                                                 
Real estate owned
    5,925       3,701       5,484       ---       ---       ---  
                                                 
Repossessed  automobiles, recreational vehicles
    92       78       130       44       16       26  
                                                 
Total non-performing assets
  $ 7,975     $ 10,081     $ 13,068     $ 2,532     $ 199     $ 255  
                                                 
Restructured loans
  $ 1,508     $ 1,508     $ ---     $ ---     $ ---     $ ---  
                                                 
Total non-performing assets as a percentage of total assets
    2.92 %     3.45 %     4.64 %     0.99 %     0.08 %     0.10 %

For the six months ended June 30, 2011 and the year ended December 31, 2010, gross interest income which would have been recorded had the non-accruing loans been current in accordance with their original terms amounted to $10,000 and $84,000 respectively.  The amounts that were included in interest income on such loans were $4,000 and $97,000 respectively.
 
Real Estate Owned and Repossessed Property.  Real estate acquired by us as a result of foreclosure or by deed-in-lieu of foreclosure is classified as real estate owned until it is sold.  When the property is acquired, it is recorded at the lower of its cost, which is the unpaid principal balance of the related loan plus foreclosure costs, or the fair market value of the property less selling costs.  We had four real estate owned properties as of June 30, 2011, totaling $5.9 million, consisting of one $1.4 million residential lot development, one $1.6 million commercial lot development, one $1.9 million condo conversion and one $1.0 million commercial building/lot.  We currently have purchase and sale agreements on one of the four commercial lots and on one of the eight remaining condos.  We had repossessed property totaling $92,000 at June 30, 2011.
 
Restructured Loans.  According to generally accepted accounting principles, we are required to account for certain loan modifications or restructuring as a “troubled debt restructuring.”  In general, the modification or restructuring of a debt is considered a troubled debt restructuring if we, for economic or legal reasons related to the borrower’s financial difficulties, grant a concession to the borrowers that we would not otherwise consider.  We had two restructured loans as of June 30, 2011, totaling $1.5 million each of which has been performing in accordance with its restructured terms.
 
 
84


Other Assets Especially Mentioned.  At June 30, 2011, there was approximately $1.7 million of loans with respect to which known information about the possible credit problems of the borrowers have caused management to have doubts as to the ability of the borrowers to comply with present loan repayment terms and which may result in the future inclusion of such items in the non-performing asset categories.
 
Classified Assets.  Federal regulations provide for the classification of lower quality loans and other assets (such as other real estate owned and repossessed property), debt and equity securities, as substandard, doubtful or loss.  An asset is considered substandard if it is inadequately protected by the current net worth and pay capacity of the borrower or of any collateral pledged.  Substandard assets include those characterized by the distinct possibility that we will sustain some loss if the deficiencies are not corrected.  Assets classified as doubtful have all the weaknesses inherent in those classified substandard with the added characteristic that the weaknesses present make collection or liquidation in full highly questionable and improbable, on the basis of currently existing facts, conditions and values.  Assets classified as loss are those considered uncollectible and of such little value that their continuance as assets without the establishment of a specific loss reserve is not warranted.
 
When we classify problem assets as either substandard or doubtful, we may establish a specific allowance in an amount we deem prudent to address specific impairments.  General allowances represent loss allowances which have been established to recognize the inherent risk associated with lending activities, but which, unlike specific allowances, have not been specifically allocated to particular problem assets.  When an insured institution classifies problem assets as a loss, it is required to charge off those assets in the period in which they are deemed uncollectible.  Our determination as to the classification of our assets and the amount of our valuation allowances is subject to review by the Federal Deposit Insurance Corporation and the Washington Department of Financial Institutions, which can order the establishment of additional loss allowances. Assets which do not currently expose us to sufficient risk to warrant classification in one of the aforementioned categories but possess weaknesses are required to be designated as special mention.
 
In connection with the filing of periodic reports with the Federal Deposit Insurance Corporation and in accordance with our classification of assets policy, we regularly review the problem assets in our portfolio to determine whether any assets require classification in accordance with applicable regulations.  On the basis of our review of our assets, as of June 30, 2011, we had classified $13.0 million of our assets.  The $13.0 million of classified assets, consisting of $6.0 million in other real estate owned and repossessed property and $7.0 million of substandard and restructured loans, represented 50.4% of equity and 4.8% of total assets as of June 30, 2011. With the exception of the classified loans, management is not aware of any loans as of June 30, 2011, where the known credit problems of the borrower would cause us to have serious doubts as to the ability of such borrowers to comply with their present loan repayment terms.  The $1.7 million of under the caption “Other Assets Especially Mentioned” above are not included in our classified assets.
 
Allowance for Loan Losses
 
We maintain an allowance for loan losses to absorb probable incurred credit losses in the loan portfolio.  The allowance is based on ongoing, monthly assessments of the estimated probable incurred losses in the loan portfolio.  In evaluating the level of the allowance for loan losses, management considers the types of loans and the amount of loans in the loan portfolio, peer group information, historical loss experience, adverse situations that may affect the borrower’s ability to repay, estimated value of any underlying collateral, and prevailing economic conditions.  Large groups of smaller balance homogeneous loans, such as residential real estate, small commercial real estate, home equity and consumer loans, are evaluated in the aggregate using historical loss factors and peer group data adjusted for current economic conditions.  More complex loans, such as commercial real estate loans and commercial business loans, are evaluated individually for impairment, primarily through the evaluation of net operating income and available cash flow and their possible impact on collateral values.
 
The allowance is increased by the provision for loan losses, which is charged against current period earnings and decreased by the amount of actual loan charge-offs, net of recoveries.
 
 
85


The provision for loan losses was $1.0 million for the six months ended June 30, 2011 and $3.5 million for the year ended December 31, 2010.  The allowance for loan losses was $4.8 million or 2.3% of total loans at June 30, 2011 as compared to $5.9 million, or 2.5% of total loans outstanding at December 31, 2010. The level of the allowance is based on estimates, and the ultimate losses may vary from the estimates.  Management will continue to review the adequacy of the allowance for loan losses and make adjustments to the provision for loan losses based on loan growth, economic conditions, charge-offs and portfolio composition.
 
Assessing the allowance for loan losses is inherently subjective as it requires making material estimates, including the amount and timing of future cash flows expected to be received on impaired loans that may be susceptible to significant change.  In the opinion of management, the allowance, when taken as a whole, reflects estimated probable loan losses in our loan portfolio.  See Notes 1 and 3 of the Notes to Financial Statements.
 
 
86


The following table summarizes the distribution of the allowance for loan losses by loan category.
 
         
December 31,
   
June 30, 2011
 
2010
 
2009
 
2008
   
2007
 
2006
   
Amount
 
Percent of
loans in each
category to
total loans
 
Amount
 
Percent of
loans in each
category to
total loans
 
Amount
 
Percent of
loans in each
category to
total loans
 
Amount
 
Percent of
loans in each
category to
total loans
 
Amount
 
Percent of
loans in each
category to
total loans
 
Amount
 
Percent of
loans in each
category to
total loans
   
(Dollars in thousands)
 
Allocated at end of period to:
                                                                       
                                                                         
Real estate loans
                                                                       
One- to four-family
  $ 178       5.98 %   $ 170       5.59 %   $ 59       3.45 %   $ 16       3.05 %   $ 347       25.15 %   $ 295       30.64 %
Home equity
    268       7.20       265       6.62       191       6.90       170       8.19       212       8.19       303       10.23  
Multi-family
    7       0.54       5       0.49       2       0.17       1       0.18       7       0.41       ---       0.27  
Commercial
    145       11.97       246       11.86       370       12.20       2,513       11.33       48       7.19       17       4.73  
Construction or development
    713       2.94       670       4.15       1,751       7.29       505       10.45       106       2.71       6       1.18  
Total real estate loans
    1,311       28.63       1,356       28.71       2,373       30.01       3,205       33.20       720       43.65       621       47.05  
                                                                                                 
Consumer loans
                                                                                               
Indirect home improvement
    2,370       40.67       2,580       40.10       2,108       37.68       1,188       32.94       1,069       28.89       1,011       28.11  
Automobile
    270       4.16       405       5.35       931       9.79       583       13.37       435       10.80       402       12.89  
Recreational
    421       11.81       544       10.19       633       7.55       197       5.33       192       4.87       239       5.97  
Home improvement
    28       0.50       47       0.55       64       0.72       54       0.96       126       1.23       202       0.45  
Other
    40       0.97       68       1.21       168       1.80       125       2.71       142       2.59       195       2.07  
Total consumer loans
    3,129       58.11       3,644       57.40       3,904       57.54       2,147       55.31       1,964       48.38       2,049       49.49  
                                                                                                 
Commercial business loans
    396       13.26       905       13.89       1,128       12.45       246       11.49       60       7.97       36       3.46  
                                                                                                 
Total
  $ 4,836       100.00 %   $ 5,905       100.00 %   $ 7,405       100.00 %   $ 5,598       100.00 %   $ 2,744       100.00 %   $ 2,706       100.00 %
 
 
87


Management believes that it uses the best estimate information available to determine the allowance for loan losses.  However, unforeseen market conditions could result in adjustments to the allowance for loan losses and net income could be significantly affected, if circumstances differ substantially from the assumptions used in determining the allowance.  The following table sets forth an analysis of our allowance for loan losses at the dates and for the periods indicated.
 
   
Six Months Ended
June 30,
   
Years Ended December 31,
 
   
2011
   
2010
   
2010
   
2009
   
2008
   
2007
   
2006
 
   
(Dollars in thousands)
 
Balance at beginning of period:
 
$
5,905
   
$
7,405
   
$
7,405
   
$
5,598
   
$
2,744
   
$
2,706
   
$
2,719
 
                                                         
Charge-offs:
                                                       
Real estate loans
                                                       
One- to four-family
   
---
     
---
     
32
     
---
     
---
     
---
     
---
 
Home equity
   
117
     
60
     
163
     
160
     
18
     
1
     
18
 
Commercial
   
612
     
---
     
---
     
---
     
---
     
---
     
---
 
Construction
   
---
     
1,328
     
1,529
     
1,436
     
843
     
---
     
---
 
Total real estate loans
   
729
     
1,388
     
1,724
     
1,596
     
861
     
1
     
18
 
Consumer loans
                                                       
Indirect home improvement
   
1,301
     
1,190
     
2,490
     
2,195
     
1,006
     
600
     
355
 
Automobile
   
253
     
370
     
637
     
1,380
     
615
     
427
     
292
 
Recreational
   
148
     
292
     
413
     
545
     
93
     
108
     
125
 
Home improvement
   
15
     
31
     
76
     
35
     
11
     
13
     
67
 
Other
   
46
     
123
     
178
     
174
     
112
     
61
     
152
 
Total consumer loans
   
1,763
     
2,006
     
3,794
     
4,329
     
1,837
     
1,209
     
991
 
Commercial business loans
   
---
     
74
     
175
     
---
     
---
     
---
     
---
 
Total charge-offs
   
2,492
     
3,468
     
5,693
     
5,925
     
2,698
     
1,210
     
1,009
 
                                                         
Recoveries:
                                                       
Real estate loans
                                                       
Home equity
   
---
     
---
     
---
     
---
     
60
     
---
     
---
 
Total real estate loans
   
---
     
---
     
---
     
---
     
60
     
---
     
---
 
Consumer loans
                                                       
Indirect home improvement
   
220
     
146
     
351
     
262
     
269
     
214
     
143
 
Automobile
   
120
     
166
     
275
     
305
     
178
     
295
     
390
 
Recreational
   
39
     
61
     
70
     
53
     
36
     
70
     
88
 
Home improvement
   
1
     
---
     
---
     
1
     
1
     
16
     
6
 
Other
   
13
     
10
     
17
     
44
     
71
     
129
     
123
 
Total consumer loans
   
393
     
383
     
713
     
665
     
555
     
724
     
750
 
Commercial business loans
   
---
     
---
     
---
     
---
     
---
     
---
     
---
 
                                                         
Total recoveries
   
393
     
383
     
713
     
665
     
615
     
724
     
750
 
                                                         
Net charge-offs
   
2,099
     
3,085
     
4,980
     
5,260
     
2,083
     
486
     
259
 
Additions charged to operations
   
1,030
     
1,905
     
3,480
     
7,067
     
4,937
     
578
     
246
 
Reclassification for off-balance sheet
contingencies
   
---
     
---
     
---
     
---
     
---
     
(54)
     
---
 
Balance at end of period
 
$
4,836
   
$
6,225
   
$
5,905
   
$
7,405
   
$
5,598
   
$
2,744
   
$
2,706
 
                                                         
Net charge-offs during the period to average loans outstanding during the period
   
0.96
%
   
1.33
%
   
2.11
%
   
2.27
%
 
 
1.00
 
%
 
 
0.21
 
%
 
 
0.12
%
                                                         
Net charge-offs during the period to average non-performing assets
   
25.68
%
   
26.83
%
   
47.40
 
%
 
 
89.36
%
 
 
148.57
%
 
 
195.18
 
%
 
 
146.33
%
                                                         
Allowance as a percentage of non-performing loans
   
246.99
%
   
100.11
%
   
93.70
 
%
 
 
99.34
%
 
 
225.00
%
 
 
1499.45
 
%
 
 
1181.66
%
                                                         
Allowance as a percentage of  gross loans receivable (end of period)
   
2.25
%
   
2.65
%
   
2.50
 
%
 
 
3.10
%
 
 
2.45
 
%
 
 
1.14
 
%
 
 
1.22
%
 
 
88


Investment Activities
 
General.  Under Washington law, savings banks are permitted to invest in various types of liquid assets, including U.S. Treasury obligations, securities of various federal agencies, certain certificates of deposit of insured banks and savings institutions, banker’s acceptances, repurchase agreements, federal funds, commercial paper, investment grade corporate debt securities, and obligations of states and their political sub-divisions.
 
Our Chief Financial Officer has the basic responsibility for the management of our investment portfolio, subject to consultation with our Chief Executive Officer, and the direction and guidance of the board of directors.  Various factors are considered when making investment decisions, including the marketability, maturity and tax consequences of the proposed investment.  The maturity structure of investments will be affected by various market conditions, including the current and anticipated slope of the yield curve, the level of interest rates, the trend of new deposit inflows, and the anticipated demand for funds via deposit withdrawals and loan originations and purchases.
 
The general objectives of our investment portfolio will be to provide liquidity when loan demand is high, to assist in maintaining earnings when loan demand is low and to maximize earnings while satisfactorily managing risk, including credit risk, reinvestment risk, liquidity risk and interest rate risk.  See “Management’s Discussion and Analysis of Financial Condition and Results of Operations – Asset and Liability Management and Market Risk.”  We expect that a portion of the net proceeds of this offering initially will be used to invest in US Government and federal agency securities of various maturities, mortgage-backed or other marketable securities, deposits in other financial institutions, or a combination thereof, until they can be deployed in an orderly fashion.
 
As a member of the Federal Home Loan Bank of Seattle, we had $1.8 million in stock of the Federal Home Loan Bank of Seattle at June 30, 2011.  For the six months ended June 30, 2011 and the year ended December 31, 2010, the Bank received no dividends from the Federal Home Loan Bank of Seattle.
 
The table below sets forth information regarding the composition of our securities portfolio and other investments at the dates indicated.  At June 30, 2011, our securities portfolio did not contain securities of any issuer with an aggregate book value in excess of 10% of our equity capital, excluding those issued by the United States Government or its agencies.
 
    June 30,     December 31,  
   
2011
   
2010
   
2009
   
2008
 
   
Book
Value
   
Fair
Value
   
Book
Value
   
Fair
Value
   
Book
Value
   
Fair
Value
   
Book
Value
   
Fair
Value
 
   
(Dollars in thousands)
 
Available-for-sale:
                                               
Federal agency securities
  $ 9,802     $ 9,833     $ 6,175     $ 6,086     $ ---     $ ---     $ 1,475     $ 1,472  
Municipal Bonds
    1,400       1,409       1,144       1,103       ---       ---       ---       ---  
Mortgage-backed
    424       447       434       453       592       603       1,375       1,362  
Total available-for-sale
    11,626       11,689       7,753       7,642       592       603       2,850       2,834  
                                                                 
Federal Home Loan Bank stock
    1,797       1,797       1,797       1,797       1,797       1,797       1,797       1,797  
                                                                 
Total securities
  $ 13,423     $ 13,486     $ 9,550     $ 9,439     $ 2,389     $ 2,400     $ 4,647     $ 4,631  

 
89


The composition and contractual maturities of our investment portfolio at June 30, 2011, excluding Federal Home Loan Bank stock, are indicated in the following table.  The yields on municipal bonds have not been computed on a tax equivalent basis.
 
   
June 30, 2011
 
   
1 year or less
   
Over 1 year to 5 years
   
Over 5 to 10 years
   
Over 10 years
   
Total Securities
 
   
Amortized
Cost
   
Weighted
Average
Yield
   
Amortized
Cost
   
Weighted
Average
Yield
   
Amortized
Cost
   
Weighted
Average
Yield
   
Amortized
Cost
   
Weighted
Average
Yield
   
Amortized
Cost
   
Weighted
Average
Yield
   
Fair
Value
 
Securities available-for-sale:
                                                                 
Federal agency securities
  $ ---       --- %   $ 4,527       2.70 %   $ 1,845       5.28 %   $ 3,430       5.64 %   $ 9,802       1.27 %   $ 9,833  
Municipal Bonds
    ---       ---       ---       ---       868       4.24       532       4.75       1,400       4.43       1,409  
Mortgage-backed
    ---       ---       ---       ---       ---       ---       424       2.62       424       2.62       447  
              ---                                                                          
Total available-for-sale
  $ ---       --- %   $ 4,527       2.70 %   $ 2,713       4.95 %   $ 4,386       5.24 %   $ 11,626       4.18 %   $ 11,689  
 
 
90


Deposit Activities and Other Sources of Funds
 
General.  Deposits, borrowings and loan repayments are the major sources of our funds for lending and other investment purposes.  Scheduled loan repayments are a relatively stable source of funds, while deposit inflows and outflows and loan prepayments are influenced significantly by general interest rates and market conditions.  Borrowings from the Federal Home Loan Bank of Seattle are used to supplement the availability of funds from other sources and also as a source of term funds to assist in the management of interest rate risk.
 
Our deposit composition reflects a mixture with certificates of deposit accounting for approximately 43.9% of the total deposits at June 30, 2011 and interest and noninterest-bearing checking, savings and money market accounts comprising the balance of total deposits.  We rely on marketing activities, convenience, customer service and the availability of a broad range of deposit products and services to attract and retain customer deposits.  We also had $10.1 million of brokered deposits at June 30, 2011.
 
Deposits.  Deposits are attracted from within our market area through the offering of a broad selection of deposit instruments, including checking accounts, money market deposit accounts, savings accounts and certificates of deposit with a variety of rates.  Deposit account terms vary according to the minimum balance required, the time periods the funds must remain on deposit and the interest rate, among other factors.  In determining the terms of our deposit accounts, we consider the development of long term profitable customer relationships, current market interest rates, current maturity structure and deposit mix, our customer preferences and the profitability of acquiring customer deposits compared to alternative sources.
 
The following table sets forth our total deposit activities for the periods indicated.
 
   
Six Months Ended
                   
   
June 30,
    Years Ended December 31,  
   
2011
   
2010
   
2010
   
2009
   
2008
 
    (Dollars in thousands)  
                               
Beginning balance
  $ 243,957     $ 230,985     $ 230,985     $ 216,056     $ 208,863  
Net deposits (withdrawals)
    (4,021 )     1,319       9,304       10,697       1,824  
Interest credited
    1,539       1,866       3,668       4,232       5,369  
Ending balance
  $ 241,475     $ 234,170     $ 243,957     $ 230,985     $ 216,056  
                                         
Net increase (decrease)
  $ (2,482 )   $ 3,185     $ 12,972     $ 14,929     $ 7,193  
                                         
Percent increase (decrease)     (1.02 )%  
1.38
%      5.62      6.91      3.44
 
 
91


The following table sets forth the dollar amount of savings deposits in the various types of deposits programs we offered at the dates indicated.
 
                December 31,  
    June 30, 2011     2010     2009     2008  
         
Percent
         
Percent
         
Percent
         
Percent
 
   
Amount
   
of Total
   
Amount
   
of Total
   
Amount
   
of Total
   
Amount
   
of Total
 
   
(Dollars in thousands)
 
Transactions and Savings Deposits:
                                               
                                                 
Interest-bearing checking
  $ 17,303       7.16 %   $ 19,458       7.98 %   $ 22,764       9.85 %   $ 13,928       6.45 %
Noninterest-bearing checking
    17,212       7.13       18,547       7.60       25,126       10.88       20,072       9.29  
Savings  
    12,118       5.02       12,961       5.31       16,858       7.30       26,312       12.18  
Money market 
    88,930       36.83       81,470       33.40       53,611       23.21       55,799       25.83  
                                                                 
Total transaction and savings deposits
    135,563       56.14       132,436       54.29       118,359       51.24       116,111       53.75  
                                                                 
                                                                 
Certificates:
                                                               
                                                                 
0.00 – 1.99%   
    71,617       29.66       74,366       30.48       38,303       16.58       114       0.05  
2.00 – 3.99%              
    31,051       12.86       33,006       13.53       59,618       25.81       64,901       30.04  
4.00 – 5.99%      
    3,023       1.25       3,720       1.52       14,290       6.19       34,435       15.93  
6.00 – 7.99%    
    ---       ---       ---       ---       18       0.01       130       0.06  
8.00 – 9.99%      
    221       0.09       429       0.18       397       0.17       365       0.17  
10.00 and over  
    ---       ---       ---       ---       ---       ---       ---       ---  
                                                                 
Total certificates
    105,912       43.86       111,521       45.71       112,626       48.76       99,945       46.25  
                                                                 
Total deposits   
  $ 241,475       100.00 %   $ 243,957       100.00 %   $ 230,985       100.00 %   $ 216,056       100.00 %
 
 
92


The following table sets forth the rate and maturity information of our time deposit certificates at June 30, 2011.
 
   
0.00-
1.99%
    2.00-
3.99%
    4.00-
5.99%
    6.00-
7.99%
    8.00-
9.99%
    10.00%
or
greater
    Total     Percent
of
Total
 
    (Dollars in thousands)


Certificate accounts maturing
                                                               
in quarter ending:
                                                               
                                                                 
September 30, 2011
 
$
15,621
   
$
1,394
   
$
157
   
$
---
   
$
181
   
$
---
   
$
17,353
     
16.38
%
December 31, 2011
   
6,700
     
1,263
     
1,583
     
---
     
34
     
---
     
9,580
     
9.05
 
March 31, 2012
   
6,646
     
434
     
293
     
---
     
6
     
---
     
7,379
     
6.97
 
June 30, 2012
   
8,975
     
7,374
     
9
     
---
     
---
     
---
     
16,358
     
15.44
 
September 30, 2012
   
11,668
     
133
     
14
     
---
     
---
     
---
     
11,815
     
11.16
 
December 31, 2012
   
18,910
     
1,079
     
385
     
---
     
---
     
---
     
20,374
     
19.24
 
March 31, 2013
   
576
     
423
     
80
     
---
     
---
     
---
     
1,079
     
1.02
 
June 30, 2013
   
1,149
     
81
     
---
     
---
     
---
     
---
     
1,230
     
1.16
 
September 30, 2013
   
127
     
766
     
128
     
---
     
---
     
---
     
1,021
     
0.96
 
December 31, 2013
   
192
     
1,819
     
203
     
---
     
---
     
---
     
2,214
     
2.09
 
March 31, 2014
   
206
     
322
     
171
     
---
     
---
     
---
     
699
     
0.66
 
June 30, 2014
   
339
     
432
     
---
     
---
     
---
     
---
     
771
     
0.73
 
Thereafter
   
508
     
15,531
     
---
     
---
     
---
     
---
     
16,039
     
15.14
 
                                                                 
Total
 
$
71,617
   
$
31,051
   
$
3,023
   
$
---
   
$
221
   
$
---
   
$
105,912
     
100.00
%
                                                                 
Percent of total
   
67.62
%
   
29.32
%
   
2.85
%
   
---
%
   
0.21
%
   
---
%
   
100.00
%
       
 
The following table indicates the amount of our jumbo certificates of deposit by time remaining until maturity as of June 30, 2011.  Jumbo certificates of deposit are certificates in amounts of $100,000 or more.
 
   
Maturity
       
   
3 Months
or Less
   
Over
3 to 6
Months
   
Over
6 to 12
Months
   
Over
12 Months
   
Total
 
   
(In thousands)
 
                               
Certificates of deposit less than $100,000
  $ 14,705     $ 5,375     $ 10,785     $ 13,789     $ 44,654  
                                         
Certificates of deposit of $100,000 or more
    2,648       4,205       12,952       41,453       61,258  
                                         
  Total certificates of deposit
  $ 17,353     $ 9,580     $ 23,737     $ 55,242     $ 105,912  
 
The Board of Governors of the Federal Reserve System requires 1st Security Bank of Washington to maintain reserves on transaction accounts or non-personal time deposits.  These reserves may be in the form of cash or non-interest-bearing deposits with the Federal Reserve Bank of San Francisco.  Negotiable order of withdrawal (NOW) accounts and other types of accounts that permit payments or transfers to third parties fall within the definition of transaction accounts and are subject to the reserve requirements, as are any non-personal time deposits at a savings bank.  As of June 30, 2011, our deposit with the Federal Reserve Bank of San Francisco and vault cash exceeded our reserve requirements.
 
 
93


Borrowings.  Although customer deposits are the primary source of funds for our lending and investment activities, we do use advances from the Federal Home Loan Bank of Seattle, and to a lesser extent federal funds purchased to supplement our supply of lendable funds, to meet short-term deposit withdrawal requirements and also to provide longer term funding to better match the duration of selected loan and investment maturities.
 
As one of our capital management strategies, we have used advances from the Federal Home Loan Bank of Seattle to fund loan originations in order to increase our net interest income.  Depending upon the retail banking activity and the availability of excess post-conversion capital that may be provided to us, we will consider and may undertake additional leverage strategies within applicable regulatory requirements or restrictions.  These borrowings would be expected to primarily consist of Federal Home Loan Bank of Seattle advances.
 
As a member of the Federal Home Loan Bank of Seattle, we are required to own capital stock in the Federal Home Loan Bank of Seattle and are authorized to apply for advances on the security of that stock and certain of our mortgage loans and other assets (principally securities which are obligations of, or guaranteed by, the U.S. Government) provided certain creditworthiness standards have been met.  Advances are individually made under various terms pursuant to several different credit programs, each with its own interest rate and range of maturities.  Depending on the program, limitations on the amount of advances are based on the financial condition of the member institution and the adequacy of collateral pledged to secure the credit.  We maintain a committed credit facility with the Federal Home Loan Bank of Seattle that provides for immediately available advances up to an aggregate of $26.3 million.  At June 30, 2011, our outstanding advances from the Federal Home Loan Bank of Seattle totaled $3.9 million. At June 30, 2011, we also had $90.2 million in additional short-term borrowing capacity with the Federal Reserve Bank.
 
The following tables set forth information regarding our borrowing at the end of and during the periods indicated.  The tables include both long- and short-term borrowings.
 
 
94


Six Months Ended
June 30,
   
Years Ended December 31,
 
   
2011
   
2010
   
2010
   
2009
   
2008
 
   
(Dollars in thousands)
 
Maximum balance:
                             
Federal Home Loan Bank advances
  $ 21,900     $ 15,900     $ 18,000     $ 11,900     $ 30,400  
Fed Funds Purchased
  $ ---     $ ---     $ ---     $ 600     $ 897  
Federal Reserve Bank
  $ ---     $ 15,000     $ 37,000     $ 30,000     $ ---  
                                         
Average balances:
                                       
Federal Home Loan Bank advances
  $ 4,099     $ 5,535     $ 4,879     $ 6,417     $ 10,796  
Fed Funds Purchased
  $ ---     $ ---     $ ---     $ 5     $ 4  
Federal Reserve Bank
  $ ---     $ 4,602     $ 2,620     $ 9,977     $ ---  
                                         
Weighted average interest rate:
                                       
Federal Home Loan Bank advances
    4.29 %     4.37 %     1.42 %     4.41 %     3.97 %
Fed Funds Purchased
    --- %     --- %     --- %     1.27 %     3.37 %
Federal Reserve Bank
    --- %     0.26 %     0.29 %     0.25 %     --- %
 
    June 30,
2011
    December 31,  
       
2010
   
2009
   
2008
 
    (Dollars in thousands)  
Balance outstanding at end of period:
                       
Federal Home Loan Bank advances
  $ 3,900     $ 21,900     $ 5,900     $ 9,400  
Fed Funds Purchased
    ---       ---       ---       ---  
Federal Reserve Bank
    ---       ---       20,000       ---  
Total borrowings
  $ 3,900     $ 21,900     $ 25,900     $ 9,400  
                                 
Weighted average interest rate of:
                               
Federal Home Loan Bank advances
    4.49 %     1.42 %     4.41 %     3.00 %
Fed Funds Purchased
    --- %     --- %     --- %     --- %
Federal Reserve Bank
    --- %     --- %     0.25 %     --- %
 
Subsidiary and Other Activities
 
We have one inactive subsidiary.  We had no capital investment in that inactive subsidiary as of June 30, 2011.
 
Competition
 
We face strong competition in attracting deposits.  Competition in originating real estate loans comes primarily from other savings institutions, commercial banks, credit unions, life insurance companies and mortgage bankers.  Other savings institutions, commercial banks, credit unions and finance companies provide vigorous competition in consumer lending, including our indirect lending.  Commercial business competition is primarily from local commercial banks.  We compete by delivering high-quality, personal service to our customers that result in a high level of customer satisfaction.
 
Our market area has a high concentration of financial institutions, many of which are branches of large money center and regional banks that have resulted from the consolidation of the banking industry in Washington and other western states.  These include such large national lenders as Wells Fargo, Bank of America, Chase and others in our market area that have greater resources than we do and offer services that we do not provide.  For example, we do not offer trust services.  Customers who seek “one-stop shopping” may be drawn to institutions that offer services that we do not.
 
We attract our deposits through our branch office system.  Competition for those deposits is principally from other savings institutions, commercial banks and credit unions located in the same community, as well as mutual funds and other alternative investments.  We compete for these deposits by offering superior service and a variety of deposit accounts at competitive rates.  Based on the most recent branch deposit data provided by the FDIC, as of June 30, 2010, 1st Security Bank of Washington’s share of deposits in our market areas was approximately 0.7%.
 
 
95


Employees
 
At June 30, 2011, we had 78 full-time employees and 2 part-time employees.  Our employees are not represented by any collective bargaining group.  We consider our employee relations to be good.
 
Properties
 
At June 30, 2011, we had our administrative offices and 6 full-service banking offices with an aggregate net book value of $8.9 million.  The following table sets forth certain information concerning our offices at June 30, 2011.  See also Note 5 of the Notes to Financial Statements.  In the opinion of management, the facilities are adequate and suitable for our needs.
 
Location
 
Square
Footage
 
Owned or
Leased
 
Lease
Expiration Date
   
Net Book Value at
June 30, 2011
 
                 
(In thousands)
 
                         
Canyon Park
    2,997  
Leased
 
May 2015(1)
    $ 28  
22020 17th Ave SE, Suite 100
Bothell, WA  98021
                       
                         
Edmonds
    1,500  
Owned
    ---       319  
620 Edmonds Way
Edmonds, WA  98020
                         
                           
Lynnwood
    3,000  
Leased
 
June 2020
      236  
19002 33rd Ave W
Lynnwood, WA  98036
                         
                           
Mountlake Terrace (Admin)
    39,535  
Owned
    ---       3,436  
6920 220th St SW
Mountlake Terrace, WA  98043
                         
                           
Poulsbo
    3,498  
Owned
    ---       2,988  
21650 Market Place
Poulsbo, WA  98370
                         
                           
Puyallup
    2,474  
Owned
    ---       1,503  
307 W Stewart St
Puyallup, WA  98371
                         
                           
Overlake
    2,331  
Leased
 
June 2016(2)
      394  
14808 NE 24th St, Suite D
Redmond,  WA  98052


(1)  Lease provides for one five-year renewal.
(2)  Lease provides for two five-year renewals.
 
We anticipate adding one branch in the Capitol Hill area of Seattle, Washington during the next 12 months, although no specific site has been identified or secured at this time.
 
We maintain depositor and borrower customer files on an on-line basis, utilizing a telecommunications network, portions of which are leased. The book value of all data processing and computer equipment utilized by 1st Security Bank of Washington at June 30, 2011 was $217,000.  Management has a business continuity plan in place with respect to the data processing system, as well as 1st Security Bank of Washington’s operations as a whole.
 
 
96


Legal Proceedings
 
1st Security Bank of Washington from time to time is involved in various claims and legal actions arising in the ordinary course of business.  Except as set forth below, there are currently no matters that, in the opinion of management, would have material adverse effect on our financial position, results of operation or liquidity.
 
On December 2, 2010, Charles McClain filed a civil lawsuit against 1st Security Bank of Washington in Snohomish County Superior Court located in Everett, Washington, for our refusal to provide him access to funds improperly deposited in his joint account at 1st Security Bank of Washington.
 
As a result of an internet scam, more than $4.0 million of fraudulently obtained funds were deposited into Mr. McClain’s joint account at 1st Security Bank of Washington.  We discovered the fraud almost immediately and refused Mr. McClain access to the funds.  The funds were returned to Comcast and Cox, the entities upon whom the fraud was perpetrated, pursuant to their request for such funds in exchange for an agreement by them to indemnify 1st Security Bank of Washington for its legal costs and any potential liability.  Mr. McClain is claiming actual damages in the amount of $8.8 million, plus interest, consequential damages of $50.0 million, and punitive damages of $35.1 million.  Our litigation counsel has advised us that the risk of liability approaching those amounts is extremely remote.  The pending lawsuit is at the discovery phase with no trial date having been set.  Counsel has prepared a motion for summary judgment seeking dismissal of all claims.  On August 26, 2011, however, Mr. McClain petitioned for bankruptcy protection, resulting in an automatic stay of all proceedings.  At this time, the Snohomish County Superior Court can take no action, including ruling on a motion to dismiss the case.
 
 
The board of directors of FS Bancorp consists of the same six individuals who currently serve as directors of 1st Security Bank of Washington.  Each of the initial directors of FS Bancorp will serve until the first annual meeting of shareholders of FS Bancorp, at which time the directors will stand for re-election.  The board of directors of FS Bancorp will be divided into three classes so that, after the first annual meeting of shareholders, one-third of the directors will be elected at each annual meeting of shareholders.
 
The following individuals are executive officers and hold the offices set forth below opposite their names.
 
Name
 
Age(1)
 
Position   
         
Joseph C. Adams
  52  
Chief Executive Officer
Matthew D. Mullet
   32  
Chief Financial Officer, Treasurer and Secretary
 

(1) As of June 30, 2011.
 
The executive officers of FS Bancorp are appointed annually by the board of directors and hold office until their respective successors have been elected or until death, resignation or removal by the board of directors.
 
 
97


Information concerning the principal occupations, employment and compensation of the directors and executive officers of FS Bancorp is set forth under “- Directors of 1st Security Bank of Washington” and “- Executive Officers Who Are Not Directors.”  Directors of FS Bancorp initially will not be compensated by FS Bancorp; however, they will continue to be compensated by 1st Security Bank of Washington.  It is not anticipated that separate compensation will be paid to directors of FS Bancorp until such time as these persons devote significant time to the separate management of FS Bancorp’s affairs, which is not expected to occur until FS Bancorp becomes actively engaged in additional businesses other than holding the stock of 1st Security Bank of Washington.  FS Bancorp may determine that such compensation is appropriate in the future.
 
Corporate Governance.  FS Bancorp, incorporated under the laws of the State of Washington, was organized by 1st Security Bank of Washington for the purpose of acquiring all of the outstanding capital stock of 1st Security Bank of Washington to be issued in the conversion.  Following its incorporation, the board of directors of FS Bancorp held an organizational meeting at which, among other actions, it established an Audit Committee and Compensation Committee, Governance/Nominating Committee.  The composition of these committees is as follows:
 
Audit
 
Compensation Committee
 
Governance/Nominating
Ted A. Leech (Chair)
 
Michael J. Mansfield (Chair)
 
Margaret R. Piesik (Chair)
Michael J. Mansfield
 
Ted A. Leech
 
Joseph P. Zavaglia
Joseph P. Zavaglia
 
Joseph P. Zavaglia
 
Judith A. Cochrane
 
Each of the directors serving on the Audit, Compensation and Governance/Nominating Committees is independent as defined in the listing standards of The Nasdaq Stock Market.  Five of the six directors of FS Bancorp are independent as defined in the listing standards of The Nasdaq Stock Market.  The independent directors are Ted A. Leech, Judith A. Cochrane, Margaret R. Piesik, Michael J. Mansfield and Joseph P. Zavaglia.  Ted A. Leech will serve on the Audit Committee as the “audit committee financial expert,” as defined in the rules of the SEC.
 
The board also adopted written charters for the Audit, Compensation and Governance/ Nominating Committees, as well as a code of business conduct and ethics.  These charters govern the composition and responsibilities of these committees and also address other matters that are required under applicable Nasdaq listing standards and that the board of directors believes to be good corporate governance practices.  The code of business conduct and ethics, which applies to all employees and directors, addresses conflicts of interest, the treatment of confidential information, general employee conduct and compliance with applicable laws, rules and regulations.  In addition, the code of business conduct and ethics is designed to attempt to deter wrongdoing and to promote: honest and ethical conduct; the avoidance of conflicts of interest; full and accurate disclosure; compliance with all applicable laws, rules and regulations; prompt internal reporting of violations of the code; and accountability for adherence to the code.  We expect to post FS Bancorp’s committee charters and code of business conduct and ethics on our website at www.FSBWA.com following the conversion.
 
Directors of 1st Security Bank of Washington
 
Upon completion of the stock conversion, the directors of 1st Security Bank of Washington immediately prior to the conversion will continue to serve as directors of 1st Security Bank of Washington in stock form.  The board of directors of 1st Security Bank of Washington in stock form will consist of six directors divided into three classes, with approximately one-third of the directors elected at each annual meeting of shareholders.  Currently, one class of directors of 1st Security Bank of Washington are elected annually by the current directors.  Following the conversion, FS Bancorp will elect directors of 1st Security Bank of Washington, as its sole shareholder.
 
 
98


The following table sets forth certain information regarding the board of directors of 1st Security Bank of Washington.
 
Name
 
Age(1)
 
Positions Held With
1st Security Bank of Washington
 
Director
Since(2)
 
Term of
Office
Expires
                 
Ted A. Leech
 
63
 
Chairman of the Board
 
2005
 
2013
Joseph C. Adams
 
52
 
Chief Executive Officer and Director
 
2005
 
2012
Judith A. Cochrane
 
64
 
Director
 
2006
 
    2013(3)
Michael J. Mansfield
 
54
 
Director
 
2008
 
2014
Margaret R. Piesik
 
61
 
Director
 
2006
 
2014
Joseph P. Zavalgia
 
63
 
Director
 
2011
 
2013
 

(1)    As of June 30, 2011.
(2)    Includes service as a director of 1st Security Bank of Washington’s predecessor, Washington’s Credit Union.
(3)    Upon the expiration of her term as a director, it is expected that Ms. Cochrane will be elected for a two year term.
 
The business experience of each director for at least the past five years is set forth below.  The biographies also contain information regarding the person’s experience, qualifications, attributes or skills that caused the Governance and Nominating Committee and the board of directors to determine that the person should serve as a director.  Unless otherwise indicated, directors and executive officers have held their positions for the past five years.
 
Ted A. Leech, Chairman of the Board, is retired from Univar Corporation. From January 2003 to February 2005, Mr. Leech was Vice President of Business Development where he conducted feasibility studies and investigated potential investments in China, Hong Kong, Singapore, Australia, Malaysia, Indonesia and Brazil.  Prior to that Mr. Leech was Senior Vice President of Administration for Univar USA where he was responsible for accounting, payables/receivables, information systems, treasury, legal, human resources and internal audit. As a result of his professional experiences, Mr. Leech brings strong leadership, management, finance, accounting and human resource skills to our board.  Mr. Leech’s expertise also qualifies him as a financial expert, which was the basis of his selection as chairman of the Audit Committee.
 
Joseph C. Adams is a director and has been the Chief Executive Officer of 1st Security Bank of Washington since July 2004.  He joined 1st Security Bank of Washington in April 2003 as its Chief Financial Officer.  Mr. Adams served as Supervisory Committee Chairperson from 1993 to 1999 when the bank was Washington’s Credit Union. Mr. Adams is a lawyer having worked for Deloitte as a tax consultant, K&L Gates as a lawyer and then at Univar USA as a lawyer and Director, Regulatory Affairs. Mr. Adams received a Masters Degree equivalent from the Pacific Coast Banking School.  Mr. Adams’ legal and accounting backgrounds, as well as his duties as Chief Executive Officer of 1st Security Bank of Washington, bring a special knowledge of the financial, economic and regulatory challenges faced by the Bank which makes him as well suited to educating the Board on these matters.
 
Judith A. Cochrane, from May 2006 until her retirement in February 2011, was the Vice President, Public Finance for Seattle-Northwest Securities Corporation.  Prior to that, Ms. Cochrane was Vice President/Manager, Municipal Trading and Underwriting for BancAmerica Securities, LLC., where she was employed for 23 years  Ms. Cochrane is an arbitrator for Financial Industry Regulatory Authority (FINRA).  She also served as Managing Director for Bank of America, in charge of Northwest Capital Markets. Ms. Cochrane is now retired from Seattle Northwest as of February 2011.  Ms. Cochrane’s professional experience brings depth to the Board in the areas of finance and the capital markets.
 
 
99


Michael J. Mansfield joined the board of directors in September 2008.  Mr. Mansfield spent 16 years with Deloitte before joining Moss Adams in 1995 where he was a partner for more than 10 years.  During his time with Moss Adams, Mr. Mansfield served as the lead of the Business Owner Succession Services Practice in the Seattle office and he served as a member of the firm’s Tax Committee.  He provided taxation, business and financial accounting services to a variety of clients in the financial services, construction, manufacturing and distribution, and service industries.  In January 2008, Mr. Mansfield left Moss Adams to start Family Fortunes, LLC., a consulting company aimed at assisting individuals and business owners develop and execute strategic plans, with the goals of enhancing value proposition and creating a legacy vision for families and business owners.  In addition, Mr. Mansfield is a minority owner/part-time CFO for Pacific Pile & Marine, L.P., a construction company, and Columbia Pacific Finance, LLC, a financial services company.  Mr. Mansfield’s 26 years of experience as a public accountant, together with his experience running small businesses, has provided him with strong leadership, management, financial and administrative skills, which brings valuable knowledge and skills to our organization.
 
Margaret R. Piesik was a senior manager for Microsoft Corporation in its PowerPoint Presentation Division.  Ms. Piesik worked at Microsoft for 11 years until retiring in 1998.  She served on the board of directors of the Providence Hospital Foundation from 2001 to 2003 and since 2004 has served as the President of Swedish Medical Center Service League.  She is a co-owner of White Barn Farm, a family owned organic flower and vegetable farm.  She previously served on the boards of Providence Hospital Foundation and the Kirkland Performance Center.  Ms. Piesik is also active in local organizations such as Swedish Hospital Service League and participates in the Grow A Row program for local food banks.  Ms. Piesik’s managerial experience, together with her various board experiences and active participation in the local community, brings valuable knowledge and skills to our organization.
 
Joseph P. Zavaglia, since February 2008, has been the owner and operator of Zavaglia Consulting, L.L.C., which provides retail banking and small business advisory services to community banks. He also runs the Heart of Italy, an Italian cooking school.  In addition, Mr. Zavaglia works part time for Pacific Coast Banking School, serving as the Director of Extension Programs, and for the Washington Bankers Association, overseeing their Executive Development Program.  Mr. Zavaglia started his career with Rainier Bank in 1975 in branch operations and was ultimately promoted to manager, overseeing up to 13 branches.  From 1987 until 2003, he served as a Senior Vice President and Regional Manager with Security Pacific Bank, which acquired Rainier Bank in 1987, and then with Bank of America, which acquired Security Pacific Bank in 1992.  In February 2003, Mr. Zavaglia joined First Mutual Bank as its Executive Vice President, Retail Banking Group manager.  He resigned in 2008 to begin his consulting company and cooking school.  Mr. Zavaglia has formerly held Series 6, 63, and 26 securities licenses and his state insurance license for life and disabilities. He has been a member of the administrative board of Pacific Coast Banking School for the past 9 years, and is a 1986 graduate of the program.  He was a member of the Pete Gross House Board for 14 years, is chair of the Italian Studies board at the University of Washington, is past State Board Chair for the March of Dimes where he served for 15 years, and is a former mentor in the Seattle University mentorship program and a former member of the Dean’s advisory board for the School of Business at Seattle University.  Mr. Zavaglia is a member of the athletic Hall of Fame, a Regent, and a member of the Hall of Fame selection committee at Seattle University.  Additionally, he is a member of the Advisory Board for the Dean of the College of Education at Western Washington University.  Mr. Zavaglia’s extensive banking experience, together with his numerous board experiences, educational background and active participation in the local community, brings valuable knowledge, experience and skills to our organization.
 
Director Compensation
 
The non-employee directors of 1st Security Bank of Washington receive compensation for their service on the board.  In setting their compensation, the board of directors considers the significant amount of time and level of skill required for director service.  Director compensation is reviewed annually by the Compensation Committee, which makes recommendations for approval by the board of directors.  Non-employee directors currently receive $2,000 per month, except for the Chairman of the Board who receives $3,000 per month, for service on the board of directors. No fees currently are paid for service on any board committees.
 
 
100


The following table provides compensation information for each member of the board of directors of 1st Security Bank of Washington during the year ended December 31, 2010 except for Mr. Adams, our Chief Executive Officer, whose compensation is presented in the Summary Compensation table under the caption “Executive Compensation” below.
 
Name
 
Fees Earned or
Paid in Cash
   
All Other
Compensation
   
Total
 
                   
Ted A. Leech
  $ 36,000       ---     $ 36,000  
Judith A. Cochrane
    24,000       ---       24,000  
Michael J. Mansfield
    24,000       ---       24,000  
Margaret R. Piesik
    24,000       ---       24,000  
Joseph P. Zavaglia(1)
    ---       ---       ---  
Michele L. Rozinek(2)
    24,000       ---       24,000  
Kay Cummings(3)
    18,000       ---       18,000  
Joel S. Summer(3)
    10,000       ---       10,000  

(1)  Appointed to the board of directors during 2011.
(2)  Service on the board of directors terminated during 2011.
(3)  Service on the board of directors terminated during 2010.
 
Directors are provided or reimbursed for travel and lodging and other customary out-of-pocket expenses incurred in attending industry conferences and continuing education seminars.
 
Board Leadership Structure
 
1st Security Bank of Washington currently has an independent chairman from the chief executive officer. The chairman leads the board and presides at all board meetings.  The board supports having an independent director in a board leadership position and has had an independent chairman for many years. Having an independent chairman enables non-management directors to raise issues and concerns for board consideration without immediately involving management.  The chairman also serves as a liaison between the board and senior management.
 
Board Role in Risk Oversight
 
As part of its overall responsibility to oversee the management, business and strategy of our company, one of the primary responsibilities of our board of directors is to oversee the amounts and types of risk taken by management in executing the corporate strategy, and to monitor our risk experience against the policies and procedures set to control those risks.  The board’s risk oversight function is carried out through its approval of various policies and procedures, such as our lending and investment polices; ratification or approval of investments and loans exceeding certain thresholds; and regular review of risk elements such as interest rate risk exposure, liquidity and problem assets.  Some oversight functions are delegated to committees of the board, with such committees regularly reporting to the full board the results of their oversight activities.  For example, the Audit Committee is responsible for oversight of the independent auditors and meets directly with the auditors at various times during the course of the year.
 
Meetings and Committees of the Board of Directors of 1st Security Bank of Washington
 
Our board of directors generally meets monthly.  During the year ended December 31, 2010, the board of directors held ten meetings.  No current director attended fewer than 75% of the total meetings of the board of directors and committees on which such board member served during this period.
 
 
101


The Audit Committee’s primary responsibilities were to (i) meet with both the internal and external auditors on behalf of the board of directors to review and discuss their findings, and to make recommendations to the board regarding the selection of the external auditors and (ii) work closely with our compliance officer to monitor 1st Security Bank of Washington’s compliance with all applicable laws and regulations.  During 2010, the Audit Committee was comprised of Directors Leech (Chair) and Cummings.  This committee met 13 times in 2010.  Directors Leech (Chair), Mansfield and Zavaglia are expected to serve on the Audit Committee of FS Bancorp following completion of the stock conversion.  All of those directors will be “independent” as that term is defined for audit committee members in the listing standards of the Nasdaq Marketplace Rules, and Ted Leech will be designated as the “audit committee financial expert” as defined in the rules of the SEC.
 
The Governance and Nomination Committee is responsible for developing and recommending corporate governance policies and guidelines for 1st Security Bank of Washington, identifying and recommending director and committee member candidates, chief executive officer evaluation and succession planning.  During 2010, the Governance and Nomination Committee was comprised of Directors Piesik (Chair), Rozinek (who resigned from the Board in 2011) and Leech.  This committee met six times in 2010.  Directors Piesik (Chair), Cochrane and Zavaglia, all of whom are independent directors, are expected to serve on the Governance and Nomination Committee of FS Bancorp following completion of the stock conversion.
 
The Compensation Committee is responsible for the recommendation to the board of directors of the chief executive officer’s annual compensation package, as well as board compensation, the review and approval of executive incentive packages and perquisite programs, and overseeing and administering our qualified, tax exempt benefit plans.  During 2010, the Compensation Committee was comprised of Directors Cochrane (Chair), Leech and Piesik.  This committee met five times in 2010.  Directors Mansfield (Chair), Leech and Zavaglia, all of whom are independent directors, will serve on the Compensation Committee of FS Bancorp following completion of the stock conversion.
 
Executive Officers of 1st Security Bank of Washington Who Are Not Directors
 
Each of the executive officers of 1st Security Bank of Washington will retain his or her office following the conversion.  Executive officers are appointed annually by the board of directors of 1st Security Bank of Washington.  The business experience for at least the past five years for each of the executive officers of 1st Security Bank of Washington, who do not serve as directors, is set forth below.
 
Matthew D. Mullet, age 32, joined 1st Security Bank of Washington in July 2011 and was appointed Chief Financial Officer in September 2011.  Mr. Mullet started his banking career in June 2000 as a financial examiner with the Washington Department of Financial Institutions, Division of Banks, where he worked until October 2004.  From October 2004 until August 2010, Mr. Mullet was employed at Golf Savings Bank, Mountlake Terrace, WA, where he served in several financial capacities, including as Chief Financial Officer from May 2007 until August 2010.  In August 2010, Golf Savings Bank was merged with Sterling Savings Bank, where Mr. Mullet held the position as Senior Vice President of the Home Loan Division until resigning and commencing work at 1st Security Bank of Washington.
 
Steven L. Haynes, age 61, joined 1st Security Bank of Washington as Chief Lending Officer in November 2005, after a 23 year career at US Bank. His responsibilities currently include commercial, consumer and real estate lending. Mr. Haynes held several senior lending positions at US Bank in commercial lending- middle-market, national and international and credit review. He left as a Senior Vice President - Commercial Lending. Prior to US Bank, Mr. Haynes held international and middle-market lending positions at Rainier Bank and Bank of America.  He has been involved in downtown associations and arts related boards in Seattle and Bellevue. He currently is a member of the Woodland Park Zoo Board where he is chair of the Audit Committee and member of the Executive and Finance Committees.
 
 
102


Drew B. Ness, age 46, joined 1st Security Bank of Washington as Chief Operating Officer in September 2008.  Mr. Ness has 21 years of diverse banking experience, including retail branch sales and service, branch network management, and national customer service training experience.   He served as Vice President and Manager of the Corporate Deposit Operations Department for Washington Federal Savings, Seattle Washington from February 2008 until August 2008, following its acquisition of First Mutual Bank.  Mr. Ness served as Vice-President and Administrative/Operations Manager of the Retail Banking Group at First Mutual Bank, Bellevue, Washington from June 2004 through February 2008, and as Bank Account Executive and Premier Banking Client Manager at Bank of America, Newport Beach, California from June 2002 through June 2004.
 
Executive Compensation
 
We use a combination of salary, bonuses and other employee benefits to attract and retain qualified persons to serve as executive officers 1st Security Bank of Washington.  Executive officers are not compensated for their positions with FS Bancorp at this time.  In setting compensation for executive officers, the Compensation Committee considers the significant amount of time and level of skill required to perform the required duties of each person’s position, taking into account the complexity of our business.  The Compensation Committee establishes executive officer compensation annually.  After the conversion, we intend to add stock-based compensation as a component of our executive compensation program.
 
Summary Compensation Table.  The following table sets forth a summary of certain information concerning the compensation paid by 1st Security Bank of Washington for services rendered in all capacities during the year ended December 31, 2010 to the Chief Executive Officer of 1st Security Bank of Washington and the next two highest paid executive officers of 1st Security Bank of Washington at December 31, 2010, whose total compensation for 2010 exceeded $100,000.  We will use the term “named executive officers” in this prospectus to refer to the persons listed in this table.
 
Name and
Principal Position
 
Year
 
Salary
   
Bonus
   
All Other Compensation
   
Total
 
                             
Joseph C. Adams
   Chief Executive Officer
 
2010
  $ 247,000     $ ---     $ ---     $ 247,000  
                                     
T. Bradford Canfield(1)
   Chief Financial Officer
 
2010
  $ 245,000     $ ---     $ ---     $ 245,000  
                                     
Steven L. Haynes
Chief Loan Officer
 
2010
  $ 191,000     $ ---     $ ---     $ 191,000  
 

(1)  Mr. Canfield resigned from his position with 1st Security Bank of Washington in September, 2011.
 
Severance and Change of Control Agreements
 
Severance Agreement.  On November 30, 2006, 1st Security Bank of Washington entered into a severance agreement with Joseph Adams in his capacity as our Chief Executive Officer. The agreement provides that Mr. Adams would be entitled to receive a lump sum payment equal to 24 months of his base compensation in the event (i) his employment is involuntarily terminated by us, other than “for cause”, or (ii) he terminates his employment with us for “good reason,” as those terms are defined in the agreement.  Mr. Adams would also be entitled to receive the foregoing severance payment in the event there is a change of control of 1st Security Bank of Washington, which either results in his termination of employment or requires him to execute a release of any and all claims arising out of his employment with 1st Security Bank of Washington.  In the event Mr. Adams had been terminated as of December 31, 2010, under circumstances entitling him to the severance payment under his agreement, Mr. Adams would have received a lump sum payment equal to $494,000.
 
 
103


Change of Control Agreements.  1st Security Bank of Washington has entered into a change of control agreement with Matthew Mullet, its Chief Financial Officer, Drew Ness, its Chief Operating Officer, and Steven Haynes, its Chief Lending Officer.  The change in control agreements remain in effect until canceled by either party, upon at least 24 months prior written notice to the other party.  Under these agreements, the executive generally will be entitled to a change of control payment from 1st Security Bank of Washington if he is involuntarily terminated within six months preceding or 12 months after a change in control (as defined in the agreements).  In such an event, Messrs. Mullet, Ness and Haynes would each be entitled to receive a cash payment in an amount equal to 12 months of their then current salary.  Mr. Mullet’s current salary is $180,000, Mr. Ness’s current salary is $175,000 and Mr. Haynes’ current salary is $191,000.  Any payments that would be made in connection with a change in control are subject to cut-back to the extent the payments would result in either the loss of a tax deduction to 1st Security Bank of Washington or the imposition of a penalty tax on the executive.
 
Benefits
 
Medical Benefits. We currently provide health benefits to our employees, including hospitalization and comprehensive medical benefits.  Dental insurance, life and short- and long-term disability insurance are subject to certain deductibles and copayments by employees.
 
401(k) Plan.  We currently offer a qualified, tax-exempt savings plan to our employees with a cash or deferred feature qualifying under Section 401(k) of the Code (the “401(k) Plan”).  Generally, all employees, as of the first day of the month following the commencement of employment, who have attained age 18, are eligible to make 401(k) contributions.
 
During 2010, participants were permitted to make salary reduction contributions to the 401(k) Plan of up to 90% of their annual salary, up to a maximum of $16,500.  In addition, participants who have attained age 50 may defer an additional $5,500 annually as a 401(k) “catch-up” contribution.  All contributions made by participants are either before-tax contributions or after-tax “Roth 401(k) contributions,” as elected by the participant.  We have the ability to match 401(k) contributions.  We did not make any matching contributions during 2010.  We may also make a discretionary profit sharing contribution under the 401(k) Plan, though no such contribution was made in 2010.  A participant must complete at least 501 hours of service during the plan year and be employed as of the last day of the plan year to be eligible to receive any profit sharing contributions that may be made for that plan year.  All participant 401(k) contributions and earnings, as well as all matching and profit sharing contributions and earnings, are fully and immediately vested.
 
Participants may invest amounts contributed by them, as well as employer contributions, to their 401(k) Plan accounts in one or more investment options available under the 401(k) Plan.  Changes in investment directions among the funds are permitted on a periodic basis pursuant to procedures established by the plan administrator.  Each participant receives a quarterly statement which provides information regarding, among other things, the market value of his investments and contributions made to the 401(k) Plan on his behalf.  Participants are permitted to borrow against their account balance in the 401(k) Plan.  Hardship distributions are also permitted as are in-service distributions after attaining age 59½.
 
Distribution of a participant’s vested account may be made upon termination of employment.   Distributions will be made in a lump sum, as and when elected by the participant but subject to plan rules.
 
 
104


Employee Stock Ownership Plan.  We intend to adopt an employee stock ownership plan for employees of FS Bancorp and 1st Security Bank of Washington to become effective upon the conversion.  Employees of FS Bancorp and 1st Security Bank of Washington who have been credited with at least 1,000 hours of service during a twelve month period are eligible to participate in the employee stock ownership plan.
 
As part of the conversion, it is anticipated that the employee stock ownership plan will borrow funds from FS Bancorp.  The employee stock ownership plan will use these funds to purchase a number of shares of common stock up to 8.0% of the shares of common stock to be outstanding after this offering.  It is anticipated that this loan will equal 100% of the aggregate purchase price of the common stock acquired by the employee stock ownership plan.  The loan to the employee stock ownership plan will be repaid primarily from 1st Security Bank of Washington’s contributions to the employee stock ownership plan over a period of ten years, and from dividends on common stock held by the employee stock ownership plan.  Collateral for the loan will be the common stock purchased by the employee stock ownership plan.  The interest rate for the loan is expected to be set at the applicable long-term federal rate as published by the IRS in effect at the time the loan is funded.  FS Bancorp may, in any plan year, make additional discretionary contributions for the benefit of plan participants.  These contributions may be made either in cash or in shares of common stock, which may be acquired through the purchase of outstanding shares in the market or from individual stockholders, upon the original issuance of additional shares by FS Bancorp or upon the sale of treasury shares by FS Bancorp.  The timing, amount and manner of future contributions to the employee stock ownership plan will be affected by various factors, including the terms of the employee stock ownership loan, prevailing regulatory policies, the requirements of applicable laws and regulations and market conditions.
 
Shares purchased by the employee stock ownership plan with the proceeds of the loan will be held in a suspense account and released to participants’ accounts as debt service payments are made. Shares released from the employee stock ownership plan suspense account will be allocated to each eligible participant’s employee stock ownership plan account based on the ratio of each such participant’s eligible compensation to the total eligible compensation of all eligible employee stock ownership plan participants.  An employee is eligible for an employee stock ownership allocation if he is credited with 1,000 or more hours of service during the plan year, and either is actually employed on the last day of the plan year.  Forfeitures will be reallocated among remaining participating employees in the same manner as an employee contribution.  The account balances of participants within the employee stock ownership plan will become 100% vested upon completion of three years of service.  Credit for eligibility and vesting is given for years of service with 1st Security Bank of Washington and its predecessor, Washington’s Credit Union, prior to adoption of the employee stock ownership plan.  In the case of a “change in control,” as defined in the employee stock ownership plan, which triggers a termination of the employee stock ownership plan, participants immediately will become fully vested in their account balances.  Benefits are payable upon retirement or other separation from service, or upon termination of the plan.  FS Bancorp’s contributions to the employee stock ownership plan are not fixed and the value of the common stock cannot be determined in advance, so benefits payable under the employee stock ownership plan cannot be estimated.
 
Bankers Trust Company of South Dakota, Minneapolis, Minnesota, is expected to serve as trustee of the employee stock ownership plan.  Under the employee stock ownership plan, the trustee must vote all allocated shares held in the employee stock ownership plan in accordance with the instructions of the participating employees, and unallocated shares will be voted in the same ratio on any matter as those allocated shares for which instructions are given.
 
Generally accepted accounting principles require that any third party borrowing by the employee stock ownership plan be reflected as a liability on FS Bancorp’s statement of financial condition.  Since the employee stock ownership plan is borrowing from FS Bancorp, such obligation is not treated as a liability, but will be excluded from stockholders’ equity.  If the employee stock ownership plan purchases newly issued shares from FS Bancorp, total stockholders’ equity would neither increase nor decrease, but per share stockholders’ equity and per share net earnings would decrease as the newly issued shares are allocated to the employee stock ownership plan participants.
 
 
105


The employee stock ownership plan will be subject to the requirements of the Internal Revenue Code of 1986, Employment Retirement Income Security Act (“ERISA”), and the regulations of the IRS and the Department of Labor thereunder.
 
Equity Incentive Plan.  Currently, we intend to adopt, within one year after completion of the offering, an equity incentive plan providing for stock options and restricted stock for the benefit of selected directors, officers and employees.  We anticipate that the plan will have reserved a number of shares equal to 10.0% and 4.0% of the common stock to be outstanding after this offering for stock option and restricted stock awards, respectively.  Grants of restricted stock will be issued without cost to the recipient.  If a determination is made to implement a plan for stock options and restricted stock, the plan will be submitted to shareholders for their consideration, at which time the shareholders would be provided with detailed information regarding such plan.  If such plan is approved and effected, it will have a dilutive effect on FS Bancorp’s shareholders as well as affect FS Bancorp’s net income and shareholders’ equity, although the actual results cannot be determined until the plan is implemented.
 
Business Relationships and Transactions with Executive Officers, Directors and Related Persons
 
1st Security Bank of Washington may engage in a transaction or series of transactions with our directors, executive officers and certain persons related to them.  These transactions are subject to the review and approval of the board of directors of 1st Security Bank of Washington.  During 2010, there were no transactions of this nature.
 
1st Security Bank of Washington has followed a policy of granting loans to officers and directors, which fully complies with all applicable federal regulations.  Loans to directors and executive officers are made in the ordinary course of business and on the same terms and conditions, including interest rates and collateral, as those of comparable transactions with persons not related to 1st Security Bank of Washington prevailing at the time, in accordance with our underwriting guidelines, and do not involve more than the normal risk of collectibility or present other unfavorable features.  We had no loans to directors and executive officers and their related persons at June 30, 2011.
 
 
The following is a brief description of certain laws and regulations applicable to FS Bancorp and 1st Security Bank of Washington. Descriptions of laws and regulations here and elsewhere in this prospectus do not purport to be complete and are qualified in their entirety by reference to the actual laws and regulations. Legislation is introduced from time to time in the United States Congress or the Washington State Legislature that may affect the operations of FS Bancorp and 1st Security Bank of Washington. In addition, the regulations governing us may be amended from time to time. Any such legislation or regulatory changes in the future could adversely affect our operations and financial condition. See “Restrictions on Acquisitions of FS Bancorp and 1st Security Bank of Washington” for information on regulatory limits and requirements on persons or companies seeking to acquire control of those entities.
 
On July 21, 2010, the President signed into law the Dodd-Frank Wall Street Reform and Consumer Protection Act (the Dodd-Frank Act). The act imposes new restrictions and an expanded framework of regulatory oversight for financial institutions, including depository institutions. In addition, the new law changes the jurisdictions of existing bank regulatory agencies, but does not change the banking regulatory agencies with jurisdiction over FS Bancorp and 1st Security Bank of Washington. The new law also establishes an independent federal consumer protection bureau within the Federal Reserve Board. The following discussion summarizes significant aspects of the new law that may affect 1st Security Bank of Washington and FS Bancorp. For certain of these changes, implementing regulations have not been promulgated, so we cannot determine the full impact on our business and operations at this time.
 
 
106


The following aspects of the Dodd-Frank Act are related to the operations of 1st Security Bank of Washington:
 
 
A new independent Consumer Financial Protection Bureau (CFPB) is established within the Federal Reserve Board, empowered to exercise broad regulatory, supervisory and enforcement authority with respect to both new and existing consumer financial protection laws. Financial institutions with assets of less than $10 billion, like 1st Security Bank of Washington, will continue to be subject to supervision and enforcement by their primary federal banking regulator with respect to federal consumer financial protection laws.
 
 
The Federal Deposit Insurance Act was amended to direct federal regulators to require depository institution holding companies to serve as a source of strength for their depository institution subsidiaries.
 
 
The prohibition on payment of interest on demand deposits was repealed, effective July 21, 2011.
 
 
Deposit insurance is permanently increased to $250,000 and unlimited deposit insurance for noninterest-bearing transaction accounts is extended through December 31, 2013.
 
 
The deposit insurance assessment base is the depository institution’s total average assets minus the sum of its average tangible equity during the assessment period.
 
 
The minimum reserve ratio of the Deposit Insurance Fund increased to 1.35 percent of estimated annual insured deposits or assessment base; however, the Federal Deposit Insurance Corporation is directed to “offset the effect” of the increased reserve ratio for insured depository institutions with total consolidated assets of less than $10 billion.
 
The following aspects of the Dodd-Frank Act are related to the operations of FS Bancorp:
 
 
Tier 1 capital treatment for “hybrid” capital items is eliminated. The federal banking agencies must promulgate new rules on regulatory capital within 18 months from July 21, 2010, for both depository institutions and their holding companies, to include leverage capital and risk-based capital measures at least as stringent as those now applicable to 1st Security Bank of Washington under the prompt corrective action regulations.
 
 
The Securities and Exchange Commission is authorized to adopt rules requiring public companies to make their proxy materials available to shareholders for nomination of their own candidates for election to the board of directors.
 
 
Public companies are required to provide their shareholders with a non-binding vote: (i) at least once every three years on the compensation paid to executive officers, and (ii) at least once every six years on whether they should have a “say on pay” vote every one, two or three years.
 
 
A separate, non-binding shareholder vote is required regarding golden parachutes for named executive officers when a shareholder vote takes place on mergers, acquisitions, dispositions or other transactions that would trigger the parachute payments.
 
 
107


Securities exchanges are required to prohibit brokers from using their own discretion to vote shares not beneficially owned by them for certain “significant” matters, which include votes on the election of directors, executive compensation matters, and any other matter determined to be significant.
 
 
Stock exchanges, not including the OTC Bulletin Board, are prohibited from listing the securities of any issuer that does not have a policy providing for (i) disclosure of its policy on incentive compensation payable on the basis of financial information reportable under the securities laws, and (ii) the recovery from current or former executive officers, following an accounting restatement triggered by material noncompliance with securities law reporting requirements, of any incentive compensation paid erroneously during the three-year period preceding the date on which the restatement was required that exceeds the amount that would have been paid on the basis of the restated financial information.
 
 
Disclosure in annual proxy materials is required concerning the relationship between the executive compensation paid and the financial performance of the issuer.
 
 
Item 402 of Regulation S-K is amended to require companies to disclose the ratio of the Chief Executive Officer’s annual total compensation to the median annual total compensation of all other employees.
 
 
Smaller reporting companies are exempt from complying with the internal control auditor attestation requirements of Section 404(b) of the Sarbanes-Oxley Act.
 
Regulation of 1st Security Bank of Washington
 
1st Security Bank of Washington, as a state-chartered savings bank, is subject to applicable provisions of Washington law and to regulations and examinations of the Washington Department of Financial Institutions. As an insured institution, it also is subject to examination and regulation by the Federal Deposit Insurance Corporation, which insures the deposits of 1st Security Bank of Washington to the maximum permitted by law. During these state or federal regulatory examinations, the examiners may require 1st Security Bank of Washington to provide for higher general or specific loan loss reserves, which can impact our capital and earnings. This regulation of 1st Security Bank of Washington is intended for the protection of depositors and the Deposit Insurance Fund of the Federal Deposit Insurance Corporation and not for the purpose of protecting shareholders of 1st Security Bank of Washington or FS Bancorp. 1st Security Bank of Washington is required to maintain minimum levels of regulatory capital and is subject to some limitations on the payment of dividends to FS Bancorp. See “- Regulatory Capital Requirements” and “- Limitations on Dividends and Stock Repurchases.”
 
Federal and State Enforcement Authority and Actions. As part of its supervisory authority over Washington-chartered savings banks, the Washington Department of Financial Institutions may initiate enforcement proceedings to obtain a cease-and-desist order against an institution believed to have engaged in unsafe and unsound practices or to have violated a law, regulation, or other regulatory limit, including a written agreement. The Federal Deposit Insurance Corporation also has the authority to initiate enforcement actions against insured institutions for similar reasons and may terminate the deposit insurance if it determines that an institution has engaged in unsafe or unsound practices or is in an unsafe or unsound condition. Both these agencies may utilize less formal supervisory tools to address their concerns about the condition, operations of compliance status of a savings bank.
 
Regulation by the Washington Department of Financial Institutions. State law and regulations govern 1st Security Bank of Washington’s ability to take deposits and pay interest, to make loans on or invest in residential and other real estate, to make consumer loans, to invest in securities, to offer various banking services to its customers, and to establish branch offices. As a state savings bank, 1st Security Bank of Washington must pay semi-annual assessments, examination costs and certain other charges to the Washington Department of Financial Institutions.
 
 
108


Washington law generally provides the same powers for Washington savings banks as federally and other-state chartered savings institutions and banks with branches in Washington, subject to the approval of the Washington Department of Financial Institution. Washington law allows Washington savings banks to charge the maximum interest rates on loans and other extensions of credit to Washington residents which are allowable for a national bank in another state if higher than Washington limits. In addition, the Washington Department of Financial Institutions may approve applications by Washington savings banks to engage in an otherwise unauthorized activity, if it determines that the activity is closely related to banking, and 1st Security Bank of Washington is otherwise qualified under the statute. This additional authority, however, is subject to review and approval by the Federal Deposit Insurance Corporation if the activity is not permissible for national banks.
 
1st Security Bank of Washington is a member of the Deposit Insurance Fund (Deposit Insurance Fund), which is administered by the Federal Deposit Insurance Corporation. Deposits are insured up to the applicable limits by the Federal Deposit Insurance Corporation, backed by the full faith and credit of the United States Government. The basic deposit insurance limit is $250,000, and until December 31, 2012, there is unlimited coverage for non-interest bearing transaction accounts (typically, business checking accounts).
 
As insurer, the FDIC imposes deposit insurance premiums and is authorized to conduct examinations of and to require reporting by FDIC-insured institutions. Our deposit insurance premiums for the six months ended June 30, 2011 and the year ended December 31, 2010 were $280,000 and $556,000, respectively. Those premiums have increased in recent years due to recent strains on the FDIC deposit insurance fund due to the cost of large bank failures and increase in the number of troubled banks.
 
The FDIC assesses deposit insurance premiums on each insured institution quarterly based on annualized rates for one of four risk categories. Each institution is assigned to one of four risk categories based on its capital, supervisory ratings and other factors. Well capitalized institutions that are financially sound with only a few minor weaknesses are assigned to Risk Category I. Risk Categories II, III and IV present progressively greater risks to the DIF. Under the rules in effect through March 31, 2011, a range of initial base assessment rates applied to each Risk Category, subject to adjustments based on an institution’s unsecured debt, secured liabilities and brokered deposits, such that the total base assessment rates assessed on the deposits of an institution ranged, after adjustments, from 7 to 24 basis points for Risk Category I, 17 to 43 basis points for Risk Category II, 27 to 58 basis points for Risk Category III, and 40 to 77.5 basis points for Risk Category IV.
 
As required by the Dodd-Frank Act, the FDIC adopted rules effective April 1, 2011, under which insurance premium assessments are assessed on an institution’s total assets minus its tangible equity (defined as Tier 1 capital) instead of its deposits. Under these rules, an institution with total assets of less than $10 billion is assigned to a Risk Category as described above, and a range of initial base assessment rates applies to each category, subject to adjustment downward based on unsecured debt issued by the institution and, except for an institution in Risk Category I, adjustment upward if the institution’s brokered deposits exceed 10% of its domestic deposits, to produce total base assessment rates. Total base assessment rates range from 2.5 to 9 basis points for Risk Category I, 9 to 24 basis points for Risk Category II, 18 to 33 basis points for Risk Category III, and 30 to 45 basis points for Risk Category IV, all subject to further adjustment upward if the institution holds more than a de minimis amount of unsecured debt issued by another FDIC-insured institution. The FDIC may increase or decrease its rates by 2.0 basis points without further rulemaking. In an emergency, the FDIC may also impose a special assessment.
 
 
109


As a result of a decline in the reserve ratio (the ratio of the net worth of the Deposit Insurance Fund to estimated insured deposits) and concerns about expected failure costs and available liquid assets in the Deposit Insurance Fund, the Federal Deposit Insurance Corporation adopted a rule requiring each insured institution to prepay on December 30, 2009 the estimated amount of its quarterly assessments for the fourth quarter of 2009 and all quarters through the end of 2012 (in addition to the regular quarterly assessment for the third quarter due on December 30, 2009). The prepaid amount is recorded as an asset with a zero risk weight and the institution will continue to record quarterly expenses for deposit insurance. For purposes of calculating the prepaid amount, assessments are measured at the institution’s assessment rate as of September 30, 2009, with a uniform increase of 3 basis points effective January 1, 2011, and are based on the institution’s assessment base for the third quarter of 2009, with growth assumed quarterly at annual rate of 5%. If events cause actual assessments during the prepayment period to vary from the prepaid amount, institutions will pay excess assessments in cash, or receive a rebate of prepaid amounts not exhausted after collection of assessments due on June 13, 2013, as applicable. Collection of the prepayment does not preclude the Federal Deposit Insurance Corporation from changing assessment rates or revising the risk-based assessment system in the future. The balance of 1st Security Bank of Washington’s prepaid assessment at June 30, 2011 was $794,000.
 
The Dodd-Frank Act establishes 1.35% as the minimum reserve ratio. The FDIC has adopted a plan under which it will meet this ratio by September 30, 2020, the deadline imposed by the Dodd-Frank Act. The Dodd-Frank Act requires the FDIC to offset the effect on institutions with assets less than $10 billion of the increase in the statutory minimum reserve ratio to 1.35% from the former statutory minimum of 1.15%. The FDIC has not yet announced how it will implement this offset. In addition to the statutory minimum ratio, the FDIC must designate a reserve ratio, known as the designated reserve ratio or DRR, which may exceed the statutory minimum. The FDIC has established 2.0% as the DRR.
 
In addition to assessments for deposit insurance, institutions are required to make quarterly payments on bonds issued in the late 1980s by the Financing Corporation to recapitalize a predecessor deposit insurance fund. For the four quarters ended June 30, 2011, these payments averaged 1.015 basis points (annualized) of assessable deposits.
 
The Federal Deposit Insurance Corporation conducts examinations of and requires reporting by state non-member banks, such as 1st Security Bank of Washington. The Federal Deposit Insurance Corporation also may prohibit any insured institution from engaging in any activity determined by regulation or order to pose a serious risk to the deposit insurance fund.
 
The Federal Deposit Insurance Corporation may terminate the deposit insurance of any insured depository institution, including 1st Security Bank of Washington, if it determines after a hearing that the institution has engaged or is engaging in unsafe or unsound practices, is in an unsafe or unsound condition to continue operations, or has violated any applicable law, regulation, order or any condition imposed by an agreement with the Federal Deposit Insurance Corporation. It also may suspend deposit insurance temporarily during the hearing process for the permanent termination of insurance, if the institution has no tangible capital. If insurance of accounts is terminated, the accounts at the institution at the time of the termination, less subsequent withdrawals, shall continue to be insured for a period of six months to two years, as determined by the Federal Deposit Insurance Corporation. Management is aware of no existing circumstances which would result in termination of 1st Security Bank of Washington’s deposit insurance.
 
Federal law generally limits the activities, subsidiary investments and activities, and equity investments of 1st Security Bank of Washington, as principal, to those that are permissible for national banks. Our relationship with our depositors and borrowers is regulated to a great extent by federal laws and regulations, especially with respect to disclosure requirements.
 
 
110


The Federal Deposit Insurance Corporation has adopted regulatory guidelines establishing safety and soundness standards on such matters as loan underwriting and documentation, asset quality, earnings standards, internal controls and information systems, audit systems, interest rate risk exposure and compensation and other benefits. If the Federal Deposit Insurance Corporation determines that 1st Security Bank of Washington fails to meet any standard prescribed by these guidelines, it may require 1st Security Bank of Washington to submit an acceptable plan to achieve compliance with the standard.
 
Among these safety and soundness standards are FDIC regulations that require 1st Security Bank of Washington to adopt and maintain written policies that establish appropriate limits and standards for real estate loans. These standards, which must be consistent with safe and sound banking practices, must establish loan portfolio diversification standards, prudent underwriting standards (including loan-to-value ratio limits) that are clear and measurable, loan administration procedures, and documentation, approval and reporting requirements. 1st Security Bank of Washington is obligated to monitor conditions in its real estate markets to ensure that its standards continue to be appropriate for current market conditions. 1st Security Bank of Washington’s board of directors is required to review and approve 1st Security Bank of Washington’s standards at least annually. The FDIC has published guidelines for compliance with these regulations, including supervisory limitations on loan-to-value ratios for different categories of real estate loans. Under the guidelines, the aggregate amount of all loans in excess of the supervisory loan-to-value ratios should not exceed 100% of total capital, and the total of all loans for commercial, agricultural, multifamily or other non-one-to-four-family residential properties should not exceed 30% of total capital. Loans in excess of the supervisory loan-to-value ratio limitations must be identified in 1st Security Bank of Washington’s records and reported at least quarterly to 1st Security Bank of Washington’s board of directors. 1st Security Bank of Washington is in compliance with the record and reporting requirements. As of June 30, 2011, 1st Security Bank of Washington’s aggregate loans in excess of the supervisory loan-to-value ratios were zero.
 
The Comprehensive Environmental Response, Compensation and Liability Act (“CERCLA”) is a federal statute that generally imposes strict liability on, all prior and present “owners and operators” of sites containing hazardous waste. However, Congress asked to protect secured creditors by providing that the term “owner and operator” excludes a person whose ownership is limited to protecting its security interest in the site. Since the enactment of the CERCLA, this “secured creditor exemption” has been the subject of judicial interpretations which have left open the possibility that lenders could be liable for cleanup costs on contaminated property that they hold as collateral for a loan. To the extent that legal uncertainty exists in this area, all creditors, including 1st Security Bank of Washington, that have made loans secured by properties with potential hazardous waste contamination (such as petroleum contamination) could be subject to liability for cleanup costs, which costs often substantially exceed the value of the collateral property.
 
1st Security Bank of Washington is subject to regulations implementing the privacy protection provisions of the Gramm-Leach-Bliley Act of 1999 and the anti-money laundering provisions of the USA Patriot Act. These Gramm-Leach-Bliley privacy requirements place limitations on the sharing of consumer financial information with unaffiliated third parties. They also require 1st Security Bank of Washington to disclose its privacy policy to customers and with an opportunity to “opt-out” of the sharing of their personal information with unaffiliated third parties. The USA Patriot Act significantly expands the responsibilities of banking institutions in preventing the use of the United States financial system to fund terrorist activities. These anti-money laundering provisions require institutions to develop anti-money laundering compliance programs and due diligence polices and controls to ensure the detection and reporting of money laundering. These compliance programs are intended to supplement existing compliance requirements under 1st Security Bank of Washington Secrecy Act and Office of Foreign Assets Control regulations.
 
Transactions between 1st Security Bank of Washington and its affiliates, including FS Bancorp, generally are required to be on terms as favorable to 1st Security Bank of Washington as transactions with non-affiliates, and certain of these transactions, such as loans to an affiliate, are restricted to a percentage of 1st Security Bank of Washington’s capital and may require eligible collateral in specified amounts. With some exceptions, 1st Security Bank of Washington and its affiliates are prohibited from tying the provision of various products and series, such as loans, with other products and services.
 
 
111


1st Security Bank of Washington is subject to a broad array of federal and state consumer protection laws and regulations that govern almost every aspect of its business relationships with consumers. While the list set forth below is not exhaustive, these include the Truth-in-Lending Act, the Truth in Savings Act, the Electronic Fund Transfer Act, the Expedited Funds Availability Act, the Equal Credit Opportunity Act, the Fair Housing Act, the Real Estate Settlement Procedures Act, the Home Mortgage Disclosure Act, the Fair Credit Reporting Act, the Fair Debt Collection Practices Act, the Right to Financial Privacy Act, the Home Ownership and Equity Protection Act, the Consumer Leasing Act, the Fair Credit Billing Act, the Homeowners Protection Act, the Check Clearing for the 21st Century Act, laws governing flood insurance, laws governing consumer protections in connection with the sale of insurance, federal and state laws prohibiting unfair and deceptive business practices, and various regulations that implement some or all of the foregoing. These laws and regulations mandate certain disclosure requirements and regulate the manner in which financial institutions must deal with customers when taking deposits, making loans, collecting loans, and providing other services. Failure to comply with these laws and regulations can subject 1st Security Bank of Washington to various penalties, including but not limited to, enforcement actions, injunctions, fines, civil liability, criminal penalties, punitive damages, and the loss of certain contractual rights.
 
The Federal Reserve Board requires that all depository institutions maintain reserves on transaction accounts or non-personal time deposits. These reserves may be in the form of cash or non-interest-bearing deposits with the regional Federal Reserve Bank. Negotiable order of withdrawal (NOW) accounts and other types of accounts that permit payments or transfers to third parties fall within the definition of transaction accounts and are subject to the reserve requirements, as are any non-personal time deposits at a savings bank. As of June 30, 2011, 1st Security Bank of Washington’s deposit with the Federal Reserve Bank and vault cash exceeded its reserve requirements.
 
Banks are also subject to the provisions of the Community Reinvestment Act of 1977, which requires the appropriate federal bank regulatory agency to assess a bank’s record in meeting the credit needs of the community serviced by 1st Security Bank of Washington, including low and moderate income neighborhoods. The regulatory agency’s assessment of 1st Security Bank of Washington’s record is made available to the public. Further, an assessment is required of any bank which has applied to establish a new branch office that will accept deposits, relocate an existing office or merge or consolidate with, or acquire the assets or assume the liabilities of, a federally regulated financial institution. 1st Security Bank of Washington received a “satisfactory” rating during its most recent examination.
 
1st Security Bank of Washington is a member of the Federal Home Loan Bank of Seattle, which is one of 12 regional Federal Home Loan Banks that administer the home financing credit function of savings institutions. Each Federal Home Loan Bank serves as a reserve or central bank for its members within its assigned region. It is funded primarily from proceeds derived from the sale of consolidated obligations of the Federal Home Loan Bank System. It makes loans or advances to members in accordance with policies and procedures, established by the Board of Directors of the Federal Home Loan Bank, which are subject to the oversight of the Federal Housing Finance Board. All advances from the Federal Home Loan Bank are required to be fully secured by sufficient collateral as determined by the Federal Home Loan Bank. In addition, all long-term advances are required to provide funds for residential home financing.
 
As a member, 1st Security Bank of Washington is required to purchase and maintain stock in the Federal Home Loan Bank of Seattle. At June 30, 2011, 1st Security Bank of Washington had $1.8 million in Federal Home Loan Bank stock, which was in compliance with this requirement. 1st Security Bank of Washington did not receive any dividends from the Federal Home Loan Bank of Seattle for the year ended December 31, 2010. Subsequent to December 31, 2008, the Federal Home Loan Bank of Seattle announced that it was below its regulatory risk-based capital requirement and it is now precluded from paying dividends or repurchasing capital stock. The Federal Home Loan Bank of Seattle is not anticipated to resume dividend payments until its financial results improve. The Federal Home Loan Bank of Seattle has not indicated when dividend payments may resume.
 
 
112


The Federal Home Loan Banks have continued to contribute to low- and moderately-priced housing programs through direct loans or interest subsidies on advances targeted for community investment and low- and moderate-income housing projects. These contributions have affected adversely the level of Federal Home Loan Bank dividends paid and could continue to do so in the future. These contributions could also have an adverse effect on the value of Federal Home Loan Bank stock in the future. A reduction in value of 1st Security Bank of Washington’s Federal Home Loan Bank stock may result in a corresponding reduction in its capital.
 
The Federal Deposit Insurance Corporation and the Washington Department of Financial Institutions must approve any merger transaction involving 1st Security Bank of Washington as the acquirer, including an assumption of deposits from another depository institution. The Federal Deposit Insurance Corporation is authorized to approve interstate merger transactions without regard to whether the transaction is prohibited by the law of any state, unless the home state of one of 1st Security Bank of Washingtons adopted a law prior to June 1, 1997 which applies equally to all out-of-state banks and expressly prohibits merger transactions involving out-of-state banks. Interstate acquisitions of branches will be permitted only if the law of the state in which the branch is located permits such acquisitions. Interstate mergers and branch acquisitions will also be subject to the nationwide and statewide insured deposit concentration amounts described below.
 
Regulation and Supervision of FS Bancorp, Inc.
 
FS Bancorp, as the sole shareholder of 1st Security Bank of Washington, will be a bank holding company registered with the Board of Governors of the Federal Reserve System. Bank holding companies are subject to comprehensive regulation by the Board of Governors of the Federal Reserve System under the Bank Holding Company Act of 1956, as amended, and the regulations promulgated thereunder. This regulation and oversight is generally intended to ensure that FS Bancorp limits its activities to those allowed by law and that it operates in a safe and sound manner without endangering the financial health of 1st Security Bank of Washington.
 
As a bank holding company, FS Bancorp is required to file quarterly and annual reports with the Board of Governors of the Federal Reserve System and any additional information required by the Board of Governors of the Federal Reserve System and is subject to regular examinations by the Board of Governors of the Federal Reserve System. The Board of Governors of the Federal Reserve System also has extensive enforcement authority over bank holding companies, including the ability to assess civil money penalties, to issue cease and desist or removal orders and to require that a holding company divest subsidiaries (including its bank subsidiaries). In general, enforcement actions may be initiated for violations of law and regulations and unsafe or unsound practices.
 
The Dodd-Frank Act requires a bank holding company to serve as a source of financial strength to its subsidiary banks, with the ability to provide financial assistance to a subsidiary bank in financial distress. Regulations to implement this provision are required, but to date, none have been promulgated..
 
Under the Bank Holding Company Act, the Board of Governors of the Federal Reserve System may approve the ownership of shares by a bank holding company in any company the activities of which the Board of Governors of the Federal Reserve System has determined to be so closely related to the business of banking or managing or controlling banks as to be a proper incident thereto. These activities generally include, among others, operating a savings institution, mortgage company, finance company, credit card company or factoring company; performing certain data processing operations; providing certain investment and financial advice; underwriting and acting as an insurance agent for certain types of credit-related insurance; leasing property on a full-payout, non-operating basis; selling money orders, travelers’ checks and U.S. Savings Bonds; real estate and personal property appraising; providing tax planning and preparation services; and, subject to certain limitations, providing securities brokerage services for customers. The Bank Holding Company Act prohibits a bank holding company, with certain exceptions, from acquiring ownership or control of more than 5% of the voting shares of any company that is not a bank or bank holding company and from engaging in activities other than those of banking, managing or controlling banks, or providing services for its subsidiaries. A bank holding company that meets certain supervisory and financial standards and elects to be designed as a financial holding company may also engage in certain securities, insurance and merchant banking activities and other activities determined to be financial in nature or incidental to financial activities.
 
 
113


The Board of Governors of the Federal Reserve System must approve an application of a bank holding company to acquire control of, or acquire all or substantially all of the assets of, a bank, and may approve an acquisition located in a state other than the holding company’s home state, without regard to whether the transaction is prohibited by the laws of any state, but may not approve the acquisition of a bank that has not been in existence for the minimum time period, not exceeding five years, specified by the law of the host state, or an application where the applicant controls or would control more than 10% of the insured deposits in the United States or 30% or more of the deposits in the target bank’s home state or in any state in which the target bank maintains a branch. Federal law does not affect the authority of states to limit the percentage of total insured deposits in the state that may be held or controlled by a bank holding company to the extent such limitation does not discriminate against out-of-state banks or bank holding companies. Individual states may also waive the 30% state-wide concentration limit contained in the federal law. The Bank Holding Company Act prohibits a bank holding company, with certain exceptions, from acquiring ownership or control of more than 5% of the voting shares of any company that is not a bank or bank holding company and from engaging in activities other than those of banking, managing or controlling banks, or providing services for its subsidiaries.
 
Regulatory Capital Requirements
 
Capital Requirements for 1st Security Bank of Washington. 1st Security Bank of Washington is required by Federal Deposit Insurance Corporation regulations to maintain minimum levels of regulatory capital consisting of core (Tier 1) capital and supplementary (Tier 2) capital. Tier 1 capital generally includes common shareholders’ equity and noncumulative perpetual preferred stock, less most intangible assets. Tier 2 capital, which is limited to 100 percent of Tier 1 capital, includes such items as qualifying general loan loss reserves, cumulative perpetual preferred stock, mandatory convertible debt, term subordinated debt and limited life preferred stock; however, the amount of term subordinated debt and intermediate term preferred stock (original maturity of at least five years but less than 20 years) that may be included in Tier 2 capital is limited to 50 percent of Tier 1 capital.
 
The Federal Deposit Insurance Corporation currently measures an institution’s capital using a leverage limit together with certain risk-based ratios. The Federal Deposit Insurance Corporation’s minimum leverage capital requirement for a bank to be considered adequately capitalized specifies a minimum ratio of Tier 1 capital to average total assets of 4%. At June 30, 2011, 1st Security Bank of Washington had a Tier 1 leverage capital ratio to average assets of 9.4%. The Federal Deposit Insurance Corporation retains the right to require a particular institution to maintain a higher capital level based on its particular risk profile.
 
Federal Deposit Insurance Corporation regulations also establish a measure of capital adequacy based on ratios of qualifying capital to risk-weighted assets. Assets are placed in one of four categories and given a percentage weight based on the relative risk of that category. In addition, certain off-balance sheet items are converted to balance-sheet credit equivalent amounts, and each amount is then assigned to one of the four categories. Under the guidelines, for a bank to be considered adequately capitalized the ratio of total capital (Tier 1 capital plus Tier 2 capital) to risk-weighted assets (the total risk-based capital ratio) must be at least 8%, and the ratio of Tier 1 capital to risk-weighted assets (the Tier 1 risk-based capital ratio) must be at least 4%. In evaluating the adequacy of a bank’s capital, the Federal Deposit Insurance Corporation may also consider other factors that may affect the bank’s financial condition, such as interest rate risk exposure, liquidity, funding and market risks, the quality and level of earnings, concentration of credit risk, risks arising from nontraditional activities, loan and investment quality, the effectiveness of loan and investment policies, and management’s ability to monitor and control financial operating risks.
 
 
114


Under prompt corrective action requirements under federal law and regulations, the Federal Deposit Insurance Corporation as the primary federal banking regulator of an institution such as 1st Security Bank of Washington is authorized and, under certain circumstances, required to take certain actions against insured that fail to meet certain designated capital levels. The agency generally is required to take action to restrict the activities of an “undercapitalized institution,” which is an institution with less than a 4.0% Tier 1 capital ratio, a 4.0% Tier 1 risk-based capital ratio or an 8.0% total risk-based capital ratio. Any such institution must submit a capital restoration plan and until such plan is approved by the Federal Deposit Insurance Corporation may not increase its assets, acquire another institution, establish a branch or engage in any new activities, and generally may not make capital distributions. The Federal Deposit Insurance Corporation is authorized to impose the additional restrictions on undercapitalized institutions. In connection with a capital restoration plan, each holding company of the institution submitting a plan must guarantee the institution’s performance of the plan until it has been adequately capitalized during four consecutive quarters. The liability on this guarantee is limited to the lesser of 5% of the institution’s assets when it became undercapitalized or the amount necessary for the institution to meet the capital standards when it fails to comply with the plan. Any institution that fails to comply with its capital plan or has Tier 1 or Tier 1 risk-based capital ratios of less than 3.0% or a total risk-based capital ratio of less than 6.0% is considered “significantly undercapitalized” and must be made subject to one or more additional specified actions and operating restrictions that may cover all aspects of its operations and may include a forced merger or acquisition of the institution. The holding company of such an institution must obtain prior approval of any dividend to its shareholders. An institution with tangible equity to total assets of less than 2.0% is “critically undercapitalized” and becomes subject to further mandatory restrictions on its operations. In general, the FDIC must be appointed receiver for a critically undercapitalized institution whose capital is not restored within the time provided. When the FDIC as receiver liquidates an institution, the claims of depositors and the FDIC as their successor (for deposits covered by the FDIC insurance) have priority over other unsecured claims against the institution.
 
The Federal Deposit Insurance Corporation may impose additional restrictions on institutions that are under capitalized and generally is authorized to reclassify an institution into a lower capital category and impose the restrictions applicable to such category if the institution is engaged in unsafe or unsound practices or is in an unsafe or unsound condition. The imposition by the Federal Deposit Insurance Corporation of any of these measures on 1st Security Bank of Washington may have a substantial adverse effect on its operations and profitability. Institutions with at least a 4.0% Tier 1 capital ratio, a 4.0% Tier 1 risk-based capital ratio and an 8.0% total risk-based capital ratio are considered “adequately capitalized.”  An institution is deemed “well capitalized” if it has at least a 5% Tier 1 capital ratio, a 6.0% Tier 1 risk-based capital ratio and 10.0% total risk-based capital ratio. Institutions that are not well capitalized are subject to certain restrictions on brokered deposits and interest rates on deposits. At June 30, 2011, 1st Security Bank of Washington was considered a “well capitalized” institution.  For a complete description of 1st Security Bank of Washington’s required and actual capital levels on June 30, 2011, see “1st Security Bank of Washington Exceeds All Regulatory Capital Requirements.”
 
Capital Requirements for FS Bancorp, Inc. The Board of Governors of the Federal Reserve System has adopted capital guidelines pursuant to which it assesses the adequacy of capital in examining and supervising a bank holding company and in analyzing applications under the Bank Holding Company Act. These guidelines apply on a consolidated basis to bank holding companies with $500 million or more in assets or with less assets but certain risky activities, and on a bank-only basis to other companies. These bank holding company capital adequacy guidelines are similar to those imposed on 1st Security Bank of Washington by the Federal Deposit Insurance Corporation. For a bank holding company with less than $500 million in assets, the capital guidelines apply on a bank only basis and the Board of Governors of the Federal Reserve System expects the holding company’s subsidiary banks to be well capitalized under the prompt corrective action regulations.
 
 
115


Limitations on Dividends and Stock Repurchases
 
Limits on FS Bancorp, Inc. FS Bancorp’s ability to declare and pay dividends is subject to Board of Governors of the Federal Reserve System limits and Washington law, and it may depend on its ability to receive dividends received from 1st Security Bank of Washington.
 
A policy of the Board of Governors of the Federal Reserve System limits the payment of a cash dividend by a bank holding company if the holding company’s net income for the past year is not sufficient to cover both the cash dividend and a rate of earnings retention that is consistent with capital needs, asset quality and overall financial condition. A bank holding company that does not meet any applicable capital standard would not be able to pay any cash dividends under this policy. A bank holding company not subject to consolidated capital requirements is expected not to pay dividends unless its debt-to-equity ratio is less than 1:1 and it meets certain additional criteria. The Board of Governors of the Federal Reserve System also has indicated that it would be inappropriate for a company experiencing serious financial problems to borrow funds to pay dividends.
 
Except for a company that meets the well-capitalized standard for bank holding companies, is well managed, and is not subject to any unresolved supervisory issues, a bank holding company is required to give the Board of Governors of the Federal Reserve System prior written notice of any purchase or redemption of its outstanding equity securities if the gross consideration for the purchase or redemption, when combined with the net consideration paid for all such purchases or redemptions during the preceding 12 months, is equal to 10% or more of the company’s consolidated net worth. The Board of Governors of the Federal Reserve System may disapprove such a purchase or redemption if it determines that the proposal would constitute an unsafe or unsound practice or would violate any law, regulation or regulatory order, condition, or written agreement. A bank holding company is considered well-capitalized if on a consolidated basis it has a total risk-based capital ratio of at least 10.0% and a Tier 1 risk-based capital ratio of 6.0% or more, and is not subject to an agreement, order, or directive to maintain a specific level for any capital measure.
 
In addition, federal regulations and polices prohibit a return of capital during the three-year term of the business plan submitted by FS Bancorp in connection with the stock offering.
 
Under Washington corporate law, FS Bancorp generally may not pay dividends if after that payment it would not be able to pay its liabilities as they become due in the usual course of business, or its total assets would be less than the sum of its total liabilities.
 
Limits on 1st Security Bank of Washington. The amount of dividends payable by 1st Security Bank of Washington to FS Bancorp depends upon 1st Security Bank of Washington’s earnings and capital position, and is limited by federal and state laws, regulations and policies. Washington law will not permit 1st Security Bank of Washington to declare or pay a cash dividend on its capital stock if the payment would cause its net worth to be reduced below: (1) the amount required for its liquidation account; or (2) its net worth requirements, if any, imposed by the Washington Department of Financial Institutions. Dividends on 1st Security Bank of Washington’s capital stock may not be paid in an aggregate amount greater than the aggregate retained earnings of 1st Security Bank of Washington without the approval of the Washington Department of Financial Institutions.
 
The amount of dividends actually paid during any one period will be strongly affected by 1st Security Bank of Washington’s policy of maintaining a strong capital position. Federal law further provides that without prior approval no insured depository institution may pay a cash dividend if it would cause the institution to be “undercapitalized,” as defined in the prompt corrective action regulations. Moreover, the Federal Deposit Insurance Corporation also has the general authority to limit the dividends paid by insured banks if such payments are deemed to constitute an unsafe and unsound practice. In addition, dividends may not be declared or paid if 1st Security Bank of Washington is in default in payment of any assessment due the Federal Deposit Insurance Corporation.
 
 
116


Federal Securities Law
 
The stock of FS Bancorp will be registered with the SEC under the Securities Exchange Act of 1934, as amended. As a result, FS Bancorp will become subject to the information, proxy solicitation, insider trading restrictions and other requirements under the Securities Exchange Act of 1934.
 
FS Bancorp stock held by persons who are affiliates of FS Bancorp may not be resold without registration unless sold in accordance with certain resale restrictions. Affiliates are generally considered to be officers, directors and principal shareholders. If FS Bancorp meets specified current public information requirements, each affiliate of FS Bancorp will be able to sell in the public market, without registration, a limited number of shares in any three-month period.
 
The SEC has adopted regulations and policies under the Sarbanes-Oxley Act of 2002 that apply to FS Bancorp as a registered company under the Securities Exchange Act of 1934. The stated goals of these Sarbanes-Oxley requirements are to increase corporate responsibility, provide for enhanced penalties for accounting and auditing improprieties at publicly traded companies and to protect investors by improving the accuracy and reliability of corporate disclosures pursuant to the securities laws. The SEC and Sarbanes-Oxley-related regulations and policies include very specific additional disclosure requirements and new corporate governance rules. The Sarbanes-Oxley Act represents significant federal involvement in matters traditionally left to state regulatory systems, such as the regulation of the accounting profession, and to state corporate law, such as the relationship between a board of directors and management and between a board of directors and its committees.
 
 
Federal Taxation
 
General.  FS Bancorp and 1st Security Bank of Washington are subject to federal income taxation in the same general manner as other corporations, with some exceptions discussed below.  The following discussion of federal taxation is intended only to summarize certain pertinent federal income tax matters and is not a comprehensive description of the tax rules applicable to FS Bancorp or 1st Security Bank of Washington.  The income tax returns of FS Bancorp and 1st Security Bank of Washington have not been audited in the past seven years.
 
FS Bancorp anticipates that it will file a consolidated federal income tax return with 1st Security Bank of Washington commencing with the first taxable year after completion of the conversion.  Accordingly, it is anticipated that any cash distributions made by FS Bancorp to its shareholders would be considered to be taxable dividends and not as a non-taxable return of capital to shareholders for federal and state tax purposes.
 
Method of Accounting.  For federal income tax purposes, 1st Security Bank of Washington currently reports its income and expenses on the accrual method of accounting and uses a fiscal year ending on December 31 for filing its federal income tax return.
 
Minimum Tax.  The Internal Revenue Code imposes an alternative minimum tax at a rate of 20% on a base of regular taxable income plus certain tax preferences, called alternative minimum taxable income.  The alternative minimum tax is payable to the extent such alternative minimum taxable income is in excess of an exemption amount.  Net operating losses can offset no more than 90% of alternative minimum taxable income.  Certain payments of alternative minimum tax may be used as credits against regular tax liabilities in future years.  1st Security Bank of Washington has not been subject to the alternative minimum tax, nor does it have any such amounts available as credits for carryover.
 
 
117


Net Operating Loss Carryovers.  A financial institution may carry back net operating losses to the preceding two taxable years and forward to the succeeding 20 taxable years.  This provision applies to losses incurred in taxable years beginning after August 6, 1997.  At June 30, 2011, 1st Security Bank of Washington had a net operating loss carryforward for federal income tax purposes in the amount of $8.0 million.
 
Corporate Dividends-Received Deduction.  FS Bancorp may eliminate from its income dividends received from 1st Security Bank of Washington as a wholly owned subsidiary of FS Bancorp if it elects to file a consolidated return with 1st Security Bank of Washington.  The corporate dividends-received deduction is 100%, or 80%, in the case of dividends received from corporations with which a corporate recipient does not file a consolidated tax return, depending on the level of stock ownership of the payor of the dividend.  Corporations which own less than 20% of the stock of a corporation distributing a dividend may deduct 70% of dividends received or accrued on their behalf.
 
Washington Taxation
 
1st Security Bank of Washington is subject to a business and occupation tax imposed under Washington law at the rate of 1.5% of gross receipts.  Interest received on loans secured by mortgages or deeds of trust on residential properties and certain investment securities are exempt from this tax.
 
 
The board of directors of 1st Security Bank of Washington has adopted the plan of conversion, and an application for approval of the plan of conversion has been filed with the Washington Department of Financial Institutions and the Federal Deposit Insurance Corporation.  The Washington Department of Financial Institutions has approved our application with the condition that the plan of conversion is approved by our members and that certain other conditions imposed are satisfied.  The Washington Department of Financial Institutions’ approval does not constitute a recommendation or endorsement of the plan of conversion.  We also must receive a letter of non-objection to the conversion from the Federal Deposit Insurance Corporation to consummate the conversion.  A holding company application has also been filed with the Federal Reserve Board.
 
General
 
On July 10, 2008, the board of directors of 1st Security Bank of Washington unanimously adopted a plan of conversion from the mutual to the stock form of organization.  Due to market conditions and regulatory issues, the process was put on hold.  On August 18, 2011, the board of directors voted to move forward with the conversion.  Pursuant to the plan of conversion, 1st Security Bank of Washington will convert from the mutual form of organization (meaning no shareholders) to the stock form of organization and will become the wholly owned subsidiary of FS Bancorp, a new Washington corporation.  FS Bancorp will own all of the capital stock of 1st Security upon completion of the conversion.  All of the common stock of FS Bancorp will be owned by public shareholders and our tax qualified employee benefit plans.
 
FS Bancorp anticipates that net proceeds of the offering will be between $18.8 million and $26.1 million, or $30.2 million if the offering range is increased by 15%.  The conversion will be consummated only upon the issuance of at least 2,082,500 shares of our common stock offered pursuant to the plan of conversion.
 
 
118


The plan of conversion provides that we will offer shares of common stock for sale in a subscription offering to eligible members of 1st Security Bank of Washington and to our tax-qualified employee benefit plans, consisting of the employee stock ownership plan, and, if necessary, to members of the general public through a community offering and, possibly, through a syndicate of registered broker-dealers.  In any community offering, we will give a preference to natural persons residing in the Washington Counties of King, Kitsap, Pierce and Snohomish.
 
We have the right to accept or reject, in whole or in part, any orders to purchase shares of common stock in the community offering.  The community offering, if any, may begin at the same time as, during, or after the subscription offering, and must be completed within 45 days after the completion of the subscription offering unless otherwise extended by us with the approval of the Washington Department of Financial Institutions.  See “-Direct Community Offering.”
 
We determined the number of shares of common stock to be offered in the offering based upon an independent appraisal of the estimated consolidated pro forma market value of FS Bancorp.  All shares of common stock to be sold in the offering will be sold at $10.00 per share.  Investors will not be charged a commission to purchase shares of common stock in the offering.  The independent valuation will be updated and the final number of the shares of common stock to be issued in the offering will be determined at the completion of the offering.  See “-How We Determined Our Price and the Number of Shares to be Issued in the Offering” for more information as to the determination of the estimated pro forma market value of the common stock.
 
The following is a brief summary of the pertinent aspects of the conversion and offering.  A copy of the plan of conversion is available from us upon request and is available for inspection at the offices of 1st Security Bank of Washington and at the Washington Department of Financial Institutions.  The plan of conversion is also filed as an exhibit to the registration statement that we have filed with the SEC.  See “Where You Can Find More Information.”
 
Our Reasons for the Conversion
 
The primary reasons for the conversion and our decision to conduct the offering are to:
 
 
increase our capital to support future growth; and
 
 
provide us with greater operating flexibility and allow us to better compete with other financial institutions.
 
The conversion and the capital raised in the offering are expected to:
 
 
give us the financial strength to continue to grow our bank;
 
 
better enable us to serve customers in our market area;
 
 
enable us to increase lending limits and support our emphasis on commercial business and commercial real estate and the development of new products and services;
 
 
help us attract and retain qualified management through stock-based compensation plans; and
 
 
structure our business in a form that will enable us to access the capital markets.
 
In addition, in the stock holding company structure we will have greater flexibility in structuring mergers and acquisitions.  Potential sellers often want an acquiror’s stock for at least part of the acquisition consideration.  Our new stock holding company structure will enable us to offer stock or cash consideration, or a combination thereof, and will therefore enhance our ability to compete with other bidders when acquisition opportunities arise.  We have no current arrangements or agreements to acquire other banks, thrifts or financial service companies or branch offices.
 
 
119


The offering will allow our directors, officers and employees to become shareholders, which we believe will be an effective performance incentive and an effective means of attracting and retaining qualified personnel.  The offering also will provide our customers and local community members with an opportunity to acquire our common stock.
 
Effects of the Conversion
 
General.  The conversion will have no effect on 1st Security Bank of Washington’s present business of accepting deposits and investing its funds in loans and other investments permitted by law.  Following completion of the conversion, 1st Security Bank of Washington will continue to be subject to regulation by the Washington Department of Financial Institutions, and its accounts will continue to be insured by the Federal Deposit Insurance Corporation, up to applicable limits, without interruption.  After the conversion, 1st Security Bank of Washington will continue to provide services for depositors and borrowers under current policies and by its present management and staff.
 
Deposits and Loans.  Each holder of a deposit account in 1st Security Bank of Washington at the time of the conversion will continue as an account holder in 1st Security Bank of Washington after the conversion, and the conversion will not affect the deposit balance, interest rate or other terms of the depositor’s accounts.  Each account will be insured by the Federal Deposit Insurance Corporation to the same extent as before the conversion.  Depositors in 1st Security Bank of Washington will continue to hold their existing certificates, passbooks (statement savings) and other evidence of their accounts.  The conversion will not affect the loan terms of any borrower from 1st Security Bank of Washington.  The amount, interest rate, maturity, security for and obligations under each loan will remain as they existed prior to the conversion.  See “- Voting Rights” and “-Depositors’ Rights if We Liquidate” below for a discussion of the effects of the conversion on the voting and liquidation rights of the depositors of 1st Security Bank of Washington.
 
Continuity.  The board of directors presently serving 1st Security Bank of Washington will serve as the board of directors of 1st Security Bank of Washington after the conversion.  The board of directors of FS Bancorp consists of the same individuals who serve as directors of 1st Security Bank of Washington.  After the conversion, the voting shareholders of FS Bancorp will elect approximately one-third of its directors annually.  All current officers of 1st Security Bank of Washington will retain their positions with 1st Security Bank of Washington after the conversion.
 
Voting Rights.  After completion of the conversion, members will have no voting rights in 1st Security Bank of Washington or FS Bancorp and, therefore, will not be able to elect directors of either entity or to control their affairs.  Currently depositors of 1st Security Bank of Washington do have limited voting rights regarding charter amendments and corporate reorganization, but do not have any voting right with respect to the election of directors.  After the conversion, voting rights in FS Bancorp will be vested exclusively in the shareholders of FS Bancorp.  Each holder of common stock will be entitled to vote on any matter to be considered by the shareholders of FS Bancorp.  After completion of the conversion voting rights in 1st Security Bank of Washington will be vested exclusively in its sole shareholder, FS Bancorp.
 
Depositors’ Rights if We Liquidate.  We have no plans to liquidate.  However, if there should ever be a complete liquidation of 1st Security Bank of Washington, either before or after the conversion, deposit account holders would receive the protection of insurance by the Federal Deposit Insurance Corporation up to applicable limits.  In addition, liquidation rights before and after the conversion would be as follows:
 
 
120


Liquidation Rights in Present Mutual Institution.  In addition to the protection of Federal Deposit Insurance Corporation insurance up to applicable limits, in the event of the complete liquidation of 1st Security Bank of Washington, each holder of a deposit account would receive his or her pro rata share of any assets of 1st Security Bank of Washington remaining after payment of claims of all creditors (including the claims of all depositors in the amount of the withdrawal value of their accounts).  Each holder’s pro rata share of the remaining assets, if any, would be in the same proportion of the assets as the balance in his or her deposit account was to the aggregate balance in all our deposit accounts at the time of liquidation.
 
Liquidation Rights After the Conversion.  In the unlikely event that 1st Security Bank of Washington were to liquidate after the conversion, all claims of creditors, including those of depositors, would be paid first, followed by distribution of the liquidation account (described below) to depositors as of June 30, 2007 and _________ __, 2011, who continue to maintain their deposit accounts as of the date of liquidation, with any assets remaining thereafter distributed to FS Bancorp, as the holder of 1st Security Bank of Washington’s capital stock.
 
1st Security Bank of Washington will, at the time of the conversion, establish a liquidation account in an amount equal to its total equity as of the date of the latest statement of financial condition contained in this prospectus.  The liquidation account will be a memorandum account on the records of 1st Security Bank of Washington and there will be no segregation of assets of 1st Security Bank of Washington related to it.
 
The liquidation account will be maintained subsequent to the conversion for the benefit of eligible account holders and supplemental eligible account holders who retain their deposit accounts in 1st Security Bank of Washington.  Each eligible account holder and supplemental eligible account holder will, with respect to each deposit account held, have a related inchoate interest in a portion of the liquidation account balance called a subaccount.
 
The initial subaccount balance for a deposit account held by an eligible account holder or a supplemental eligible account holder will be determined by multiplying the opening balance in the liquidation account by a fraction of which the numerator is the amount of the holder’s qualifying deposit in the deposit account and the denominator is the total amount of the qualifying deposits of all such holders.  The initial subaccount balance will not be increased, and it will be subject to downward adjustment as provided below.
 
If the balance in any deposit account of an eligible account holder or supplemental eligible account holder at the close of business on any December 31 subsequent to the effective date of the conversion is less than the lesser of (1) the balance in the deposit account at the close of business on any other December 31 subsequent to June 30, 2007 or _________ __, 2011, as applicable, or (2) the amount of the qualifying deposit in the deposit account on June 30, 2007 or _________ __, 2011, as applicable, then the subaccount balance for the deposit account will be adjusted by reducing the subaccount balance in an amount proportionate to the reduction in the deposit balance.  In the event of a downward adjustment, the subaccount balance will not be subsequently increased, notwithstanding any subsequent increase in the deposit balance of the related deposit account.  If any such deposit account is closed, the related subaccount balance will be reduced to zero.
 
In the event of a complete liquidation of 1st Security Bank of Washington (and only in that event), each eligible account holder and supplemental eligible account holder will be entitled to receive a liquidation distribution from the liquidation account in the amount of the then current adjusted subaccount balance(s) for the deposit account(s) then held by the holder before any liquidation distribution may be made to shareholders.  No merger, consolidation, bulk purchase of assets with assumptions of deposit accounts and other liabilities or similar transactions with another federally insured institution in which 1st Security Bank of Washington is not the surviving institution will be considered to be a complete liquidation.  In any such transaction, the liquidation account will be assumed by the surviving institution.
 
 
121


Tax Effects of the Conversion.  We have received an opinion from our special counsel, Silver, Freedman & Taff, L.L.P., Washington, D.C. that the conversion will constitute a tax free reorganization under the Internal Revenue Code and that no gain or loss will be recognized for federal income tax purposes by 1st Security Bank of Washington or FS Bancorp as a result of the completion of the conversion.  However, this opinion is not binding on the IRS or the State of Washington Department of Revenue.
 
If the liquidation rights in 1st Security Bank of Washington or subscription rights to purchase FS Bancorp common stock have a market value when received, or in the case of subscription rights, when exercised, then depositors receiving or exercising these rights may have a taxable gain.  Any gain will be limited to the fair market value of these rights.
 
Liquidation rights are the proportionate interest of certain depositors of 1st Security Bank of Washington in the special liquidation account to be established by FS Bancorp under the plan of conversion.  See “- Depositors’ Rights if We Liquidate.”  Special counsel believes that the liquidation rights will have no fair market or ascertainable value.
 
The subscription rights are the preferential rights of eligible subscribers to purchase shares of FS Bancorp common stock in the conversion.  See “- Subscription Offering and Subscription Rights.”  Because the subscription rights are acquired without cost, are not transferable, last for only a short time period and give the recipients a right to purchase stock in the conversion only at fair market value, special counsel believes these rights do not have any taxable value when they are granted or exercised.  Special counsel’s opinion states that it is not aware of the IRS claiming in any similar conversion transaction that subscription rights have any market value.  Because there are no judicial opinions or official IRS positions on this issue, however, special counsel’s opinion relating to subscription rights comes to a reasoned conclusion instead of an absolute conclusion on this issue.  Special counsel’s conclusion is supported by a letter from RP Financial which states that the subscription rights do not have any value when they are distributed or exercised.
 
If the IRS disagrees and says the subscription rights have value, income may be recognized by recipients of these rights, in certain cases whether or not the rights are exercised.  This income may be capital gain or ordinary income, and FS Bancorp and 1st Security Bank of Washington could recognize gain on the distribution of these rights.  Eligible subscribers are encouraged to consult with their own tax advisor regarding their own circumstances and any tax consequences if subscription rights are deemed to have value.
 
The opinion of special counsel makes certain assumptions consisting solely of factual matters that would be contained in a representation letter of 1st Security Bank of Washington to the IRS if it were seeking a private letter ruling relating to the federal income tax consequences of the conversion.  Special counsel’s opinion is based on the Internal Revenue Code, regulations now in effect or proposed, current administrative rulings and practice and judicial authority, all of which are subject to change.  Any change may be made with retroactive effect.  Unlike private letter rulings received from the IRS, special counsel’s opinion is not binding on the IRS and there can be no assurance that the IRS will not take a position contrary to the positions reflected in special counsel’s opinion, or that special counsel’s opinion will be upheld by the courts if challenged by the IRS.
 
 
122


Special counsel’s opinion does not address whether the “pre-change losses” (as such term is defined in the Income Tax Regulations) of 1st Security Bank of Washington will be subject to limitations on use under Section 382 of the Internal Revenue Code.  These limitations would apply if the issuance of shares in the conversion results in an “ownership change” (as defined in Section 382 of the Internal Revenue Code) of 1st Security Bank of Washington.  Absent the cash issuance exception contained in Section 382 of the Internal Revenue Code, the issuance of shares in the conversion would constitute an ownership change and place limitations on or the elimination of the use of the pre-change losses of 1st Security Bank of Washington under Section 382 of the Internal Revenue Code.  If the cash issuance exception under Section 382 of the Internal Revenue Code applies to a sufficient number of the shares issued in the conversion to preclude an ownership change, the consummation of the conversion will not result in the imposition of limitations on the pre-change losses of 1st Security Bank of Washington under Section 382 of the Internal Revenue Code.  However, in such case, an ownership change could subsequently occur due to the aggregation of the shift in ownership occurring in the conversion and shifts in ownership that occur at any time within the three year period thereafter, at which time the limitations under Section 382 would become applicable if 1st Security Bank of Washington has pre-change losses at such time.
 
1st Security Bank of Washington is required to file an information statement with its federal income tax return for the year ending after the conversion setting forth, among other things, shifts in ownership and whether an ownership change has occurred.  If the independent accountants of 1st Security Bank of Washington concur at the time of the preparation of the information statement that the conversion did not result in an ownership change by reason of the cash issuance exception (after taking into account any applicable post-conversion shifts in ownership), then 1st Security Bank of Washington intends to reflect no ownership change on this information statement.
 
1st Security Bank of Washington has also obtained an opinion from Harlowe & Falk LLP, Tacoma, Washington, that the income tax effects of the conversion under Washington tax laws will be substantially the same as the federal income tax consequences described above.
 
How We Determined Our Price and the Number of Shares to Be Issued in the Stock Offering
 
The plan of conversion requires that the purchase price of the common stock must be based on the appraised pro forma market value of FS Bancorp and 1st Security Bank of Washington, as determined on the basis of an independent valuation.  We have retained RP Financial, a financial services industry consulting firm with over 20 years of experience in valuing financial institutions for mutual to stock conversions, to make this valuation.  We have no prior relationship with RP Financial.  For its services in making this appraisal, RP Financial’s fees and out-of-pocket expenses are estimated to be $40,500 (excluding any fees paid in 2008).  We have agreed to indemnify RP Financial and any employees of RP Financial who act for or on behalf of RP Financial in connection with the appraisal against any and all loss, cost, damage, claim, liability or expense of any kind, including claims under federal and state securities laws, arising out of any misstatement, untrue statement of a material fact or omission to state a material fact in the information we supply to RP Financial, unless RP Financial is determined to be negligent or otherwise at fault.
 
The amount of common stock we are offering is based on an independent appraisal by RP Financial of the estimated pro forma market value of FS Bancorp, assuming the conversion and offering are completed.  The appraisal was based in part on our consolidated financial condition and results of operations, the pro forma effect of the additional capital raised by the sale of shares of our common stock in the offering, and an analysis of a peer group of publicly-traded companies utilized by RP Financial in its appraisal that RP Financial considers comparable to FS Bancorp.
 
RP Financial concluded that, as of September 2, 2011, the estimated pro forma market value of FS Bancorp was $24.5 million.  This pro forma market value is the midpoint of a valuation range established by regulation with a minimum of $20.8 million and a maximum of $28.2 million.  Based on this market value and a $10.00 per share purchase price, the number of shares of our common stock that will be offered for sale will range from 2,082,500 to 2,817,500 with a midpoint of 2,450,000.  The $10.00 per share price was selected primarily because it is the price most commonly used in mutual-to-stock conversions of financial institutions.  If a greater demand for shares of our common stock or a change in financial or market conditions warrant, the offering range may be increased by 15.0%, which would result in an adjusted maximum pro forma market value of $32.4 million and total shares offered of 3,240,125.
 
 
123


RP Financial advised the board of directors that the appraisal was prepared in conformance with the regulatory appraisal methodology.  That methodology requires a valuation based on an analysis of trading prices of comparable companies whose stocks have traded for at least one year prior to the valuation date.  RP Financial selected a group of comparable public companies for this analysis.  RP Financial also advised our board of directors that the after market trading experience of recent transactions was considered in the appraisal as a general indicator of current market value, but was not relied upon as a primary valuation methodology.
 
In preparing its appraisal, RP Financial considered the information in this prospectus, including our financial statements.  RP Financial also considered the following factors, among others.
 
 
the present results and financial condition of 1st Security Bank of Washington, and the projected results and financial condition of FS Bancorp;
 
 
the economic and demographic conditions in our existing market area;
 
 
certain historical, financial and other information relating to 1st Security Bank of Washington;
 
 
a comparative evaluation of the operating and financial characteristics of 1st Security Bank of Washington with the peer group companies, which are headquartered in the states of Washington (two companies), Montana (one company), Tennessee (two companies) and Michigan, Indiana, Illinois, Louisiana and Ohio (one company);
 
 
the impact of the conversion and the offering on FS Bancorp’s shareholders’ equity and earnings potential;
 
 
the proposed dividend policy of FS Bancorp; and
 
 
the trading market for the securities of the peer group institutions and general conditions in the stock market for the peer group institutions and all publicly traded thrift institutions.
 
Furthermore, RP Financial had various discussions with management.  RP Financial did not perform a detailed analysis of the separate components of our assets and liabilities.  We did not impose any limitations on RP Financial in connection with its appraisal.
 
RP Financial relied primarily on a comparative market value methodology in determining the pro forma market value of our common stock.  In applying this methodology, RP Financial analyzed financial and operational comparisons of 1st Security Bank of Washington with a selected peer group of publicly traded savings institutions.  The peer group used by RP Financial consists of ten companies listed in the table below.  The pro forma market value of FS Bancorp’s common stock was determined by RP Financial based on the market pricing ratios of the peer group, subject to certain valuation adjustments based on fundamental differences between 1st Security and the institutions comprising the peer group.  RP Financial took into account the significant volatility in the broader stock market and the after market pricing characteristics of recently converted savings institutions.  RP Financial utilized the results of this overall analysis to establish pricing ratios that resulted in the determination of the pro forma market value.
 
 
124


The selection criteria for the peer group included consideration of geographic location, earnings and asset size.  The peer group companies are:
 
Peer Group (Ticker Symbol)
 
City and State
 
Assets
 
       
(In millions)
 
             
Riverview Bancorp, Inc. (RVSB)
 
Vancouver, WA
  $ 886  
Timberland Bancorp, Inc. (TSBK)
 
Hoquiam, WA
    735  
LSB Financial Corp. (LSBI)
 
Lafayette, IN
    360  
First Advantage Bancorp (FABK)
 
Clarksville, TN
    350  
Eagle Bancorp Montana (EBMT)
 
Helena, MT
    331  
Louisiana Bancorp, Inc. (LABC)
 
Metairie, LA
    320  
Jacksonville Bancorp, Inc. (JXSB)
 
Jacksonville, IL
    305  
Athens Bancshares, Inc. (AFCB)
 
Athens, TN
    283  
First Federal of Northern Michigan (FFNM)
 
Alpena, MI
    219  
FFD Financial Corp. (FFDF)
 
Dover, OH
    211  
 
Two of the measures investors use to analyze whether a stock might be a good investment are the ratio of the offering price to the issuer’s “book value” and the ratio of the offering price to the issuer’s annual net income.  RP Financial considered these ratios, among other factors, in preparing its appraisal.  Book value is the same as total shareholders’ equity, and represents the difference between the issuer’s assets and liabilities.  Tangible book value is equal to total shareholders’ equity less intangible assets.  Reported earnings reflect net income recorded by 1st Security Bank of Washington during the 12 month period ended June 30, 2011.  Core earnings represent 1st Security Bank of Washington’s earnings, adjusted for non-operating items and adjusted to reflect a normalized assumed tax rate.  RP Financial’s appraisal also incorporates an analysis of a peer group of publicly traded companies that RP Financial considered to be comparable to us.
 
The following table presents a summary of selected pricing ratios for the peer group companies and 1st Security Bank of Washington (on a pro forma basis).  The pricing ratios are based on book value, earnings and other information as of and for the 12 months ended June 30, 2011, stock price information as September 2, 2011 as reflected in RP Financial’s appraisal report, dated September 2, 2011, and the number of shares assumed to be outstanding as described in “Pro Forma Data.”  Compared to the average pricing of the peer group, our pro forma pricing ratios at the maximum of the offering range indicated a discount of 3.8% on a price-to-reported earnings basis, a premium of 59.8% on a price-core earnings basis, a discount of 14.2% on a price-to-book value basis, and a discount of 17.6% on a price-to-tangible book value basis.
 
   
Price-to-
earnings multiple
   
Price-to-core
earnings multiple
   
Price –to-book
value ratio
   
Price –to-tangible
book value ratio
 
                         
FS Bancorp, Inc.
                       
Minimum of offering range
    11.86 x     21.37 x     49.26 %     49.26 %
Midpoint of offering range
    14.11 x     25.68 x     53.88 %     53.88 %
Maximum of offering range
    16.43 x     30.19 x     57.90 %     57.90 %
Maximum of offering range, as adjusted
    19.16 x     35.62 x     61.88 %     61.88 %
                                 
Valuation of peer group companies using stock market prices as of September 2, 2011
                               
Average
    17.08 x     18.89 x     67.44 %     70.29 %
Median
    17.27 x     19.71 x     69.11 %     72.48 %
 
Our board of directors reviewed the appraisal report of RP Financial, including the methodology and the assumptions used, and determined that the valuation range was reasonable and adequate.  Given that the shares are to be sold at $10.00 per share in the offering, the estimated number of shares would be between 2,082,500 at the minimum of the valuation range and 2,817,500 at the maximum of the valuation range, with a midpoint of 2,450,000.
 
 
125


The following table, prepared by our independent appraiser, presents for all full stock conversions that began trading from July 1, 2010 to September 2, 2011, the percentage change in the trading price from the initial trading date of the offering to the dates shown in the table.  The table also presents the average and median trading prices and percentage change in trading prices for the same dates.  This information relates to stock performance experienced by other companies that may have no similarities to us with regard to market capitalization, offering size, earnings quality and growth potential, among other factors.
 
The table is not intended to indicate how our common stock may perform.  Data represented in the table reflects a small number of transactions and is not indicative of general stock market performance trends or of price performance trends of companies that undergo conversions.  Furthermore, this table presents only short-term price performance and may not be indicative of the longer-term stock price performance of these companies.  There can be no assurance that our stock price will appreciate or that our stock price will not trade below $10.00 per share.  The movement of any particular company’s stock price is subject to various factors, including, but not limited to, the amount of proceeds a company raises, the company’s historical and anticipated operating results, the nature and quality of the company’s assets, the company’s market area and the quality of management and management’s ability to deploy proceeds (such as through loans and investments, the acquisition of other financial institutions or other businesses, the payment of dividends and common stock repurchases).  In addition, stock prices may be affected by general market and economic conditions, the interest rate environment, the market for financial institutions and merger or takeover transactions and the presence of professional and other investors who purchase stock on speculation, as well as other unforeseeable events not in the control of management. Before you make an investment decision, please carefully read this prospectus, including “Risk Factors.”
 
After Market Trading Activity
Initial Stock Offerings - Standard Conversions
Completed Closing Dates between July 1, 2010 and September 2, 2011
 
       
Change from Initial Trading Date Offering Price
 
Transaction (Ticker Symbol)
 
IPO Date
 
After One Day (%)
   
After One Week (%)
   
After One Month (%)
   
Through
September 2, 2011 (%)
 
                             
IF Bancorp, Inc. (IROQ)
 
07/08/11
    16.70 %     16.50 %     8.50 %     8.10 %
State Investors Bancorp, Inc. (SIBC)
 
07/07/11
    18.50       16.60       16.00       15.00  
First Connecticut Bancorp, Inc. (FBNK)
 
06/30/11
    10.80       11.60       11.10       4.70  
Franklin Financial Corp. (FRNK)
 
04/28/11
    19.70       17.70       19.60       11.40  
Sunshine Financial, Inc. (SSNF)
 
04/06/11
    12.50       10.00       14.00       (5.00 )
Fraternity Comm. Bancorp (FRTR)
 
04/01/11
    10.00       11.70       10.00       (10.00 )
Anchor Bancorp (ANCB)
 
01/26/11
    0.00       0.40       4.50       (20.50 )
Wolverine Bancorp, Inc. (WBKC)
 
01/20/11
    24.50       22.40       35.00       40.00  
SP Bancorp, Inc. (SPBC)
 
11/01/10
    (6.00 )     (6.60 )     (8.00 )     13.50  
Standard Financial Corp. (STND)
 
10/07/10
    19.00       18.90       29.50       47.50  
Madison Bancorp, Inc. (MDSN)
 
10/07/10
    25.00       25.00       25.00       (7.00 )
Century Next Fin. Corp. (CTUY)
 
10/01/10
    25.00       15.00       10.00       45.00  
Peoples Fed Bncshres, Inc. (PEOP)
 
07/07/10
    4.00       6.90       4.20       40.00  
                                     
Average:
        13.82 %     12.78 %     13.80 %     14.05 %
Median:
        16.70 %     15.00 %     11.10 %     11.40 %
 
Data presented in the table reflects a small number of transactions.  There can be no assurance that our stock price will appreciate or that our stock price will not trade below the initial offering price of $10.00 per share.
 
 
126


RP Financial’s valuation is not intended, and must not be construed, as a recommendation of any kind as to the advisability of purchasing these shares.  RP Financial did not independently verify the financial statements and other information we provided, nor did RP Financial value independently our assets or liabilities.  The valuation considers 1st Security Bank of Washington as a going concern and should not be considered as an indication of the liquidation value of 1st Security Bank of Washington.  Moreover, because this valuation is necessarily based upon estimates and projections of a number of matters, all of which are subject to change from time to time, no assurance can be given that persons purchasing common stock in the offering will thereafter be able to sell these shares at prices at or above the purchase price or in the range of the valuation described above.
 
RP Financial will update its appraisal before we complete the offering.  If, as a result of demand for the shares or changes in market conditions, RP Financial determines that our pro forma market value has increased, we may sell up to 3,240,125 shares in the offering without notice to you.  No sale of shares of common stock in the offering may be completed unless, prior to the completion, RP Financial confirms that nothing of a material nature has occurred which, taking into account all relevant factors, would cause it to conclude that the aggregate value of the common stock to be issued is materially incompatible with the estimate of the aggregate consolidated pro forma market value of FS Bancorp.  If our pro forma market value at that time is either below $20.8 million or above $32.4 million, then, after consulting with the Washington Department of Financial Institutions and the FDIC, we may:
 
 
set a new offering range;
 
 
take such other actions as may be permitted by the Washington Department of Financial Institutions, the FDIC and the Securities and Exchange Commission; or
 
 
terminate the offering and promptly return all funds.
 
If we set a new offering range, we will be required to cancel your stock order and promptly return your subscription funds, with interest calculated at the statement savings rate, and cancel any authorization to withdraw funds from your deposit accounts for the purchase of shares of common stock. You will have the opportunity to place a new stock order.
 
An increase in the number of shares of common stock as a result of an increase in the estimated pro forma market value would decrease both a subscriber’s ownership interest and FS Bancorp’s pro forma net income and shareholders’ equity on a per share basis while increasing pro forma net income and shareholders’ equity on an aggregate basis.  A decrease in the number of shares of common stock would increase both a subscriber’s ownership interest and FS Bancorp’s pro forma net income and shareholders’ equity on a per share basis while decreasing pro forma net income and shareholders’ equity on an aggregate basis.  See “Risk Factors - Risks Related to This Offering - The implementation of an equity incentive plan may dilute your ownership interest” and “Pro Forma Data.”
 
Copies of the appraisal report of RP Financial, LC including any amendments, and the detailed report of the appraiser setting forth the method and assumptions for the appraisal are available for inspection at the office of 1st Security Bank of Washington and as specified under “Where You Can Find More Information.”  In addition, the appraisal report is an exhibit to the registration statement of which this prospectus is a part.  The registration statement is available on the SEC’s website (http://www.sec.gov).
 
 
127


Subscription Offering and Subscription Rights
 
Under the plan of conversion, rights to subscribe for the purchase of common stock have been granted to the following persons in the following order of descending priority:
 
 
depositors of 1st Security Bank of Washington with account balances of at least $50 as of the close of business on June 30, 2007 (“Eligible Account Holders”);
 
 
the proposed employee stock ownership plan  (“Tax-Qualified Employee Stock Benefit Plans”);
 
 
depositors of 1st Security Bank of Washington, other than directors and executive officers and their associates, with account balances of at least $50 as of the close of business on _________ __, 2011 (“Supplemental Eligible Account Holders”); and
 
 
depositors of 1st Security Bank of Washington, as of the close of business on _______, 2011, other than Eligible Account Holders or Supplemental Eligible Account Holders (“Other Members”).
 
All subscriptions received will be subject to the availability of common stock after satisfaction of all subscriptions of all persons having prior rights in the subscription offering and to the maximum and minimum purchase limitations set forth in the plan of conversion and as described below under “- Limitations on Stock Purchases.”
 
Preference Category No. 1: Eligible Account Holders.  Each Eligible Account Holder shall receive, without payment, first priority, nontransferable subscription rights to subscribe for shares of common stock in an amount equal to the greater of:
 
(1)           $250,000 or 25,000 shares of common stock;
 
(2)           one-tenth of one percent of the total offering of shares of common stock; or
 
 
(3)
15 times the product (rounded down to the next whole number) obtained by multiplying the total number of shares of common stock to be issued by a fraction, of which the numerator is the amount of the qualifying deposit of the Eligible Account Holder and the denominator is the total amount of qualifying deposits of all Eligible Account Holders in 1st Security Bank of Washington in each case on the close of business on June 30, 2007 (the “Eligibility Record Date”), subject to the overall purchase limitations.
 
See “- Limitations on Stock Purchases.”
 
If there are not sufficient shares available to satisfy all subscriptions, shares first will be allocated among subscribing Eligible Account Holders so as to permit each such Eligible Account Holder, to the extent possible, to purchase a number of shares sufficient to make his total allocation equal to the lesser of the number of shares subscribed for or 100 shares.  Thereafter, any shares remaining will be allocated among the subscribing Eligible Account Holders whose subscriptions remain unfilled pro rata in the proportion that the amounts of their respective qualifying deposits bear to the total amount of qualifying deposits of all subscribing Eligible Account Holders whose subscriptions remain unfilled.  For example, if an Eligible Account Holder with an unfilled subscription has qualifying deposits totaling $100, and the total amount of qualifying deposits for Eligible Account Holders with unfilled subscriptions was $1,000, then the number of shares that may be allocated to fill this Eligible Account Holder’s subscription would be 10% of the shares remaining available, up to the amount subscribed for.
 
 
128


To ensure proper allocation of stock, each Eligible Account Holder must list on his or her subscription order form all accounts in which he or she has an ownership interest.  Failure to list an account could result in fewer shares being allocated than if all accounts had been disclosed.  The subscription rights of Eligible Account Holders who are also directors or officers of 1st Security Bank of Washington or their associates will be subordinated to the subscription rights of other Eligible Account Holders to the extent attributable to increased deposits in the year preceding June 30, 2007.
 
Preference Category No. 2: Tax-Qualified Employee Stock Benefit Plans.  The plan of conversion provides that each Tax-Qualified Employee Stock Benefit Plan , excluding the 401(k) plan, shall receive nontransferable subscription rights to purchase up to 8% of the common stock sold in the offering, provided that individually or in the aggregate these plans (other than that portion of these plans which is self-directed) shall not purchase more than 8% of the shares of common stock, including any increase in the number of shares of common stock after the date hereof as a result of an increase of up to 15% in the maximum of the estimated valuation range.  The proposed employee stock ownership plan intends to purchase 8% of the shares of common stock sold in the offering, or 166,600 shares and 225,400 shares based on the minimum and maximum of the estimated offering range, respectively.  Subscriptions by the Tax-Qualified Employee Stock Benefit Plans will not be aggregated with shares of common stock purchased directly by or which are otherwise attributable to any other participants in the subscription and direct community offerings, including subscriptions of any of 1st Security Bank of Washington’s directors, officers, employees or associates thereof.  Subscription rights received pursuant to this category shall be subordinated to all rights received by Eligible Account Holders to purchase shares pursuant to Preference Category No. 1.  If the employee stock ownership plan’s subscription is not filled in its entirety, the plan may, with the approval of the Washington Department of Financial Institutions and the Federal Deposit Insurance Corporation, purchase shares in the open market.  See “Management - Benefits - Employee Stock Ownership Plan.”
 
Preference Category No. 3: Supplemental Eligible Account Holders.  To the extent that there are sufficient shares remaining after satisfaction of subscriptions by Eligible Account Holders and the Tax-Qualified Employee Stock Benefit Plans, each Supplemental Eligible Account Holder shall be entitled to receive, without payment therefore, third priority, nontransferable subscription rights to subscribe for shares of common stock in an amount equal to the greater of:
 
(1)           $250,000 or 25,000 shares of common stock;
 
(2)           one-tenth of one percent of the total offering of shares of common stock; or
 
 
(3)
15 times the product (rounded down to the next whole number) obtained by multiplying the total number of shares of common stock to be issued by a fraction, of which the numerator is the amount of the qualifying deposit of the Supplemental Eligible Account Holder and the denominator is the total amount of qualifying deposits of all Supplemental Eligible Account Holders in 1st Security Bank of Washington in each case on the close of business on _________ __, 2011 (the “Supplemental Eligibility Record Date”), subject to the overall purchase limitations.
 
See “- Limitations on Stock Purchases.”
 
If there are not sufficient shares available to satisfy all subscriptions of all Supplemental Eligible Account Holders, available shares first will be allocated among subscribing Supplemental Eligible Account Holders so as to permit each such Supplemental Eligible Account Holder, to the extent possible, to purchase a number of shares sufficient to make his or her total allocation equal to the lesser of the number of shares subscribed for or 100 shares.  Thereafter, any shares remaining available will be allocated among the Supplemental Eligible Account Holders whose subscriptions remain unfilled pro rata in the proportion that the amounts of their respective qualifying deposits bear to the total amount of qualifying deposits of all subscribing Supplemental Eligible Account Holders whose subscriptions remain unfilled.
 
 
129


Preference Category No. 4: Other Members.  To the extent that there are sufficient shares remaining after satisfaction of subscriptions by Eligible Account Holders, the Tax-Qualified Employee Stock Benefit Plans and Supplemental Eligible Account Holders, each Other Member shall receive, without payment therefore, fourth priority, nontransferable subscription rights to subscribe for shares of common stock, up to the greater of:
 
(1)           $250,000 or 25,000 shares of common stock; or
 
 
(2)
one-tenth of one percent of the total offering of shares of common stock in the offerings, subject to the overall purchase limitations.
 
See “- Limitations on Stock Purchases.”
 
In the event the Other Members subscribe for a number of shares which, when added to the shares subscribed for by Eligible Account Holders, the Tax-Qualified Employee Stock Benefit Plans and Supplemental Eligible Account Holders, is in excess of the total number of shares of common stock offered in the conversion, available shares will be allocated among the subscribing Other Members pro rata on the basis of the amounts of their respective subscriptions.
 
Expiration Date for the Subscription Offering.  The subscription offering will expire at 12:00 Noon, Pacific time, on _________ __, 2011, unless extended for the full 45 day period to __________ __, 2011, and may be extended an additional 45 days to _________ __, 2012 without the approval of the Washington Department of Financial Institutions.  Any further extensions of the subscription offering must be approved by the Washington Department of Financial Institutions.  The subscription offering may not be extended beyond _________ __, 2013.  Subscription rights which have not been exercised prior to _________ __, 2011 (unless extended) will become void.
 
FS Bancorp and 1st Security Bank of Washington will not execute orders until at least the minimum number of shares of common stock, 2,082,500 shares, have been subscribed for or otherwise sold.  If all shares have not been subscribed for or sold by _________ __, 2011, unless this period is extended with the consent of the Washington Department of Financial Institutions, all funds delivered to 1st Security Bank of Washington pursuant to the subscription offering will be returned promptly to the subscribers with interest and all withdrawal authorizations will be canceled.  If an extension beyond _________ __, 2012 is granted, FS Bancorp and 1st Security Bank of Washington will notify subscribers of the extension of time and of any rights of subscribers to confirm, modify or rescind their subscriptions.  This is commonly referred to as a “resolicitation offering.”
 
In a resolicitation offering, FS Bancorp would mail you a supplement to this prospectus if you subscribed for stock to let you confirm, modify or cancel your subscription.  If you fail to respond to the resolicitation offering, it would be as if you had canceled your order and all subscription funds, together with accrued interest, would be returned to you.  If you authorized payment by withdrawal of funds on deposit at 1st Security Bank of Washington, that authorization would terminate.  If you affirmatively confirm your subscription order during the resolicitation offering, FS Bancorp and 1st Security Bank of Washington would continue to hold your subscription funds until the end of the resolicitation offering.  Your resolicitation order would be irrevocable without the consent of FS Bancorp and 1st Security Bank of Washington until the conversion is completed or terminated.
 
 
130


Direct Community Offering
 
To the extent that shares remain available for purchase after satisfaction of all subscription rights discussed above, we anticipate offering shares pursuant to the plan of conversion to members of the general public who receive a prospectus, with a preference given to natural persons residing in King, Kitsup, Pierce and Snohomish Counties.  These natural persons are referred to as preferred subscribers.  We may limit total subscriptions in the direct community offering to ensure that the number of shares available for the syndicated community offering may be up to a specified percentage of the number of shares of common stock.  The opportunity to subscribe for shares of common stock in any direct community offering will be subject to our right, in our sole discretion, to accept or reject any such orders either at the time of receipt of an order or as soon as practicable following _________ __, 2011.  The direct community offering, if any, will begin at the same time as, during or promptly after the subscription offering and will not be for more than 45 days after the end of the subscription offering.
 
The price at which common stock would be sold in the direct community offering will be the same price at which shares are offered and sold in the subscription offering.  No person, may purchase more than $250,000 of common stock in the direct community offering, and no person together with an associate or group of persons acting in concert, may purchase more than $500,000 of common stock in the direct community offering, subject to the maximum purchase limitations.  See “- Limitations on Stock Purchases.”  In the event of an oversubscription for shares in the direct community offering, shares may be allocated, to the extent shares remain available, on a pro rata basis to such person based on the amount of their respective subscriptions.
 
Syndicated Community Offering
 
As a final step in the conversion, the plan of conversion provides that, if feasible, all shares of common stock not purchased in the subscription offering and direct community offering may be offered for sale to selected members of the general public in a syndicated community offering through a syndicate of registered broker-dealers managed by Keefe, Bruyette & Woods as agent of FS Bancorp.  We call this the syndicated community offering.  Keefe, Bruyette & Woods may enter into agreements with broker-dealers to assist in the sale of the shares in the syndicated community offering, although no such agreements currently exist.  The syndicated community offering, if any, will begin as soon as practicable after termination of the subscription offering and the direct community offering, if any.
 
We, in our sole discretion, have the right to reject orders in whole or in part received in the syndicated community offering.  Neither Keefe, Bruyette & Woods nor any registered broker-dealer shall have any obligation to take or purchase any shares of common stock in the syndicated community offering; however, Keefe, Bruyette & Woods has agreed to use its best efforts in the sale of shares in any syndicated community offering.
 
The syndicated offering will be conducted in accordance with certain Securities and Exchange Commission rules applicable to best efforts offerings.  Under these rules, Keefe, Bruyette &Woods, Inc. or the other broker-dealers participating in the syndicated offering, generally will accept payment for shares of common stock to be purchased in the syndicated offering through a “sweep” arrangement under which a customer’s brokerage account at the applicable participating broker-dealer will be debited in the amount of the purchase price for the shares of common stock that such customer wishes to purchase in the syndicated offering on the settlement date. Customers who authorize participating broker-dealers to debit their brokerage accounts are required to have the funds for the payment in their accounts on, but not before, the settlement date which will only occur if the minimum of the offering range is met. Customers who do not wish to authorize participating broker-dealers to debit their brokerage accounts will not be permitted to purchase shares of common stock in the syndicated offering. Customers without brokerage accounts will not be able to participate in the syndicated offering. Institutional investors will pay Keefe, Bruyette &Woods, Inc., in its capacity as sole book running manager, for shares purchased in the syndicated offering on the settlement date through the services of the Depository Trust Company on a delivery versus payment basis.
 
 
131


Normal customer ticketing will be used for order placement. In the syndicated offering, order forms will not be used. The closing of the syndicated offering is subject to conditions set forth in an agency agreement among and between FS Bancorp, Inc. and 1st Security Bank of Washington on one hand and Keefe, Bruyette & Woods, Inc. on the other hand. If and when all the conditions for the closing are met, funds for common stock sold in the syndicated offering, less fees and commissions payable, will be delivered promptly to us. If the offering is consummated, but some or all of an interested investor’s funds in the syndicated offering are not accepted by us, those funds will be returned to the interested investor promptly after closing, without interest.
 
If for any reason we cannot affect a syndicated offering of shares of common stock not purchased in the subscription and direct community offerings, or in the event that there are an insignificant number of shares remaining unsold after such offerings, we will try to make other arrangements for the sale of unsubscribed shares, if possible.  The Washington Department of Financial Institutions must approve any such arrangements. Any such arrangements will be disclosed in either a prospectus supplement or a post-effective amendment to the registration statement of which this prospectus is a part or in a new registration statement, and any such arrangements must be approved by the Financial Industry Regulatory Authority.
 
The price at which common stock would be sold in the syndicated community offering will be the same price at which shares are offered and sold in the subscription offering and direct community offering.  No person may purchase more than $250,000 of common stock in the syndicated community offering, and no person together with an associate or group of persons acting in concert may purchase more than $500,000 of common stock in the syndicated community offering, subject to the maximum purchase limitations.  See “- Limitations on Stock Purchases.”
 
The syndicated community offering will be completed within 45 days after the termination of the subscription offering, unless extended by 1st Security Bank of Washington with the approval of the Washington Department of Financial Institutions and the Federal Deposit Insurance Corporation.  The syndicated community offering may not be extended past _________ __, 2013.  See “- How We Determined Our Price and the Number of Shares to Be Issued in the Stock Offering” above for a discussion of rights of subscribers, if any, in the event an extension is granted.
 
Persons Who Are Not Permitted to Participate in the Stock Offering
 
We will make reasonable efforts to comply with the securities laws of all states in the United States in which persons entitled to subscribe for stock pursuant to the plan of conversion reside.  However, we are not required to offer stock in the subscription offering to any person who resides in a foreign country or resides in a state of the United States with respect to which:
 
 
the number of persons otherwise eligible to subscribe for shares under the plan of conversion who reside in such state is small;
 
 
the granting of subscription rights or the offer or sale of shares of common stock to such persons would require any of us or our officers, directors or employees, under the laws of such state to register as a broker, dealer, salesperson or selling agent or to register or otherwise qualify the securities of FS Bancorp for sale in such state; or
 
 
such registration, qualification or filing in our judgment would be impracticable or unduly burdensome for reasons of cost or otherwise.
 
Where the number of persons eligible to subscribe for shares in one state is small, we will base our decision as to whether or not to offer the common stock in that state on a number of factors, including but not limited to the size of accounts held by account holders in the state, the cost of registering or qualifying the shares or the need to register us or our officers, directors or employees as brokers, dealers or salespersons.
 
 
132


Limitations on Stock Purchases
 
The plan of conversion includes the following limitations on the number of shares of FS Bancorp common stock which may be purchased in the conversion:
 
 
(1)
No fewer than 25 shares of common stock may be purchased, to the extent shares are available;
 
 
(2)
Each Eligible Account Holder may subscribe for and purchase in the subscription offering up to the greater of:
 
 
a.
$250,000 or 25,000 shares of common stock;
 
 
b.
one-tenth of one percent of the total offering of shares of common stock; or
 
 
c.
15 times the product (rounded down to the next whole number) obtained by multiplying the total number of shares of common stock to be issued by a fraction, of which the numerator is the amount of the qualifying deposit of the Eligible Account Holder and the denominator is the total amount of qualifying deposits of all Eligible Account Holders in 1st Security Bank of Washington in each case as of the close of business on the Eligibility Record Date, subject to the overall limitation in clause (7) below;
 
 
(3)
The Tax-Qualified Employee Stock Benefit Plans, including the employee stock ownership plan, may purchase in the aggregate up to 8% of the shares of common stock issued in the conversion, at this time the employee stock ownership plan intends to purchase all 8% of these shares;
 
 
(4)
Each Supplemental Eligible Account Holder may subscribe for and purchase in the subscription offering up to the greater of:
 
 
a.
$250,000 or 25,000 shares of common stock;
 
 
b.
one-tenth of one percent of the total offering of shares of common stock; or
 
 
c.
15 times the product (rounded down to the next whole number) obtained by multiplying the total number of shares of common stock to be issued by a fraction, of which the numerator is the amount of the qualifying deposit of the Supplemental Eligible Account Holder and the denominator is the total amount of qualifying deposits of all Supplemental Eligible Account Holders in 1st Security Bank of Washington in each case as of the close of business on the Supplemental Eligibility Record Date, subject to the overall limitation in clause (7) below;
 
 
(5)
Each Other Member may subscribe for and purchase in the subscription offering up to the greater of:
 
 
a.
$250,000 or 25,000 shares of common stock; or
 
 
133


b.
one-tenth of one percent of the total offering of shares of common stock, subject to the overall limitation in clause (7) below;
 
 
(6)
Persons purchasing shares of common stock in the direct community offering or syndicated community offering may purchase in the direct community offering or syndicated community offering up to $250,000 or 25,000 shares of common stock, subject to the overall limitation in clause (7) below; and
 
 
(7)
Except for the Tax-Qualified Employee Stock Benefit Plans, and the Eligible Account Holders and Supplemental Eligible Account Holders whose subscription rights are based upon the amount of their deposits, as a result of (2)(c) and (4)(c) above the maximum number of shares of FS Bancorp common stock subscribed for or purchased in all categories of the offerings by any person, together with associates of and groups of persons acting in concert with such persons, shall not exceed $500,000 or 50,000 shares of common stock.
 
Subject to any required Washington Department of Financial Institutions or other regulatory approval and the requirements of applicable laws and regulations, but without further approval of the members of 1st Security Bank of Washington, the boards of directors of FS Bancorp and 1st Security Bank of Washington may, in their sole discretion, increase the maximum individual amount permitted to be subscribed to provide that any person, group of associated persons, or persons otherwise acting in concert subscribing for five percent, may purchase between five and ten percent as long as the aggregate amount that the subscribers purchase does not exceed ten percent of the total stock offering.   Requests to purchase additional shares of common stock will be allocated by the boards of directors on a pro rata basis giving priority in accordance with the preference categories set forth in this prospectus.
 
The term “associate” when used to indicate a relationship with any person means:
 
 
any corporation or organization (other than 1st Security Bank of Washington, FS Bancorp or a majority-owned subsidiary of any of them) of which the person is an officer or partner or is directly or indirectly the beneficial owner of 10% or more of any class of equity securities;
 
 
any trust or other estate in which the person has a substantial beneficial interest or as to which the person serves as trustee or in a similar fiduciary capacity;
 
 
any relative or spouse of the person, or any relative of the spouse, who has the same home as the person or who is a director or officer of 1st Security Bank of Washington, FS Bancorp or any subsidiary of 1st Security Bank of Washington or FS Bancorp; and
 
 
any person acting in concert with any of the persons or entities specified above;
 
provided, however, that Tax-Qualified Employee Plans shall not be deemed to be an associate of any director or officer of 1st Security Bank of Washington or FS Bancorp.  When used to refer to a person other than an officer or director of 1st Security Bank of Washington, the board of directors of 1st Security Bank of Washington or officers delegated by the board of directors in their sole discretion may determine the persons that are associates of other persons.
 
The term “acting in concert” means knowing participation in a joint activity or parallel action towards a common goal whether or not pursuant to an express agreement, or a combination or pooling of voting or other interests in the securities of an issuer for a common purpose pursuant to any arrangement.  A person or company which acts in concert with another person or company shall also be deemed to be acting in concert with any person or company who is also acting in concert with that other party, except that the Tax-Qualified Employee Stock Benefit Plans will not be deemed to be acting in concert with their trustees or a person who serves in a similar capacity solely for the purpose of determining whether stock held by the trustee and stock held by each plan will be aggregated.  The determination of whether a group is acting in concert shall be made solely by the board of directors of 1st Security Bank of Washington or officers delegated by the board of directors and may be based on any evidence upon which the board or delegatees chooses to rely.
 
 
134


Marketing Arrangements
 
We have engaged Keefe, Bruyette & Woods, Inc., a broker-dealer registered with the Financial Industry Regulatory Authority, as a financial advisor in connection with the offering of our common stock.  In its role as financial advisor, Keefe, Bruyette & Woods, Inc., will:
 
 
provide advice on the financial and securities market implications of the plan of conversion and related corporate documents, including our business plan;
 
 
assist in structuring our stock offering, including developing and assisting in implementing a market strategy for the stock offering;
 
 
review all offering documents, including this prospectus, stock order forms and related offering materials (we are responsible for the preparation and filing of such documents);
 
 
assist us in preparing for and scheduling meetings with potential investors and broker-dealers, as necessary;
 
 
assist us in analyzing proposals from outside vendors retained in connection with the stock offering, including printers, transfer agents and appraisal firms;
 
 
assist us in the drafting and distribution of press releases as required or appropriate in connection with the stock offering
 
 
meet with the board of directors and management to discuss any of these services; and
 
 
provide such other financial advisory and investment banking services in connection with the stock offering as may be agreed upon by Keefe, Bruyette & Woods, Inc. and us.
 
 
For its services, Keefe, Bruyette & Woods will receive a management fee of $40,000 (excluding any fees paid in 2008), payable in four consecutive monthly installments commencing October 2011, a success fee of 1.0% of the aggregate purchase price of shares of common stock sold in the subscription offering, less any shares of common stock sold to our directors, officers and employees (or members of their immediate family) and the Tax-Qualified Employee Stock Benefit Plans and a success fee of 2.0% of the aggregate purchase price of shares of common stock sold in the direct community offering.  The success fee paid to Keefe, Bruyette & Woods will be reduced by the amount of the management fee.  If selected dealers are used to assist in the sale of shares of FS Bancorp common stock in the syndicated community offering, these dealers will be paid a fee of up to 5.5% of the total purchase price of the shares sold by the dealers.  We have agreed to indemnify Keefe, Bruyette & Woods against certain claims or liabilities, including certain liabilities under the Securities Act of 1933, as amended, and will contribute to payments Keefe, Bruyette & Woods may be required to make in connection with any such claims or liabilities.  In addition, Keefe, Bruyette & Woods will be reimbursed for the fees and expenses of its legal counsel, and other actual out of pocket expenses, in an amount not to exceed $85,000.  In the event of unusual circumstances or delays or a re-solicitation in connection with the offering, the total expense cap may be increased by up to an additional $10,000.
 
 
135


We have also engaged Keefe, Bruyette & Woods, Inc. to act as our conversion agent in connection with the offering. In its role as conversion agent, Keefe, Bruyette & Woods, Inc. will, among other things:
 
 
consolidate accounts and develop a central file;
 
 
prepare proxy forms and proxy materials;
 
 
tabulate proxies and ballots;
 
 
act as inspector of election at the special meeting of members;
 
 
assist us in establishing and managing the Stock Information Center;
 
 
assist our financial printer with labeling of stock offering materials;
 
 
process stock order forms and certification forms and produce daily reports and analysis;
 
 
assist our transfer agent with the generation and mailing of stock certificates;
 
 
advise us on interest and refund calculations; and
 
 
create tax forms for interest reporting.
 
For these services, Keefe, Bruyette & Woods, Inc. will receive a fee of $25,000, and we have made an advance payment of $10,000 to Keefe, Bruyette & Woods, Inc. with respect to this fee.  We also will reimburse Keefe, Bruyette & Woods, Inc. for its reasonable out-of-pocket expenses associated with its acting as conversion agent up to a maximum of $25,000.  In the event of unusual circumstances or delays or a re-solicitation in connection with the offering, expenses related to the conversion agent services may be increased to an amount not to exceed $40,000.  If the plan of conversion is terminated or if Keefe, Bruyette & Woods, Inc.’s engagement is terminated in accordance with the provisions of the agreement, Keefe, Bruyette & Woods, Inc. will be entitled to the advance payment and also receive reimbursement of its reasonable out-of-pocket expenses. We will indemnify Keefe, Bruyette & Woods, Inc. against liabilities and expenses (including legal fees) related to or arising out of Keefe, Bruyette & Woods, Inc.’s engagement as our conversion agent and performance of services as our conversion agent.
 
Sales of shares of FS Bancorp common stock will be made by registered representatives affiliated with Keefe, Bruyette & Woods or by the broker-dealers managed by Keefe, Bruyette & Woods.  Keefe, Bruyette & Woods has undertaken that the shares of FS Bancorp common stock will be sold in a manner which will ensure that the distribution standards of the Nasdaq Stock Market will be met.  A stock information center will be established at 1st Security Bank of Washington’s executive office located at 6920 220th Street SW, in Mountlake Terrace, Washington.  FS Bancorp will rely on Rule 3a4-1 of the Securities Exchange Act of 1934 and sales of FS Bancorp common stock will be conducted within the requirements of this rule, so as to permit officers, directors and employees to participate in the sale of FS Bancorp common stock in those states where the law permits.  No officer, director or employee of FS Bancorp or 1st Security Bank of Washington will be compensated directly or indirectly by the payment of commissions or other remuneration in connection with his or her participation in the sale of common stock.
 
 
136


Procedure for Purchasing Shares in the Subscription Offering
 
To ensure that each purchaser receives a prospectus at least 48 hours before _________ __, 2011 the subscription expiration date, unless extended, in accordance with Rule 15c2-8 of the Securities Exchange Act of 1934, no prospectus will be mailed any later than five days prior to that date or hand delivered any later than two days prior to that date.  Execution of the stock order form will confirm receipt or delivery in accordance with Rule 15c2-8.  Stock order forms will only be distributed with, or preceded by, a prospectus.
 
To purchase shares in the subscription offering, an executed stock order form with the required payment for each share subscribed for, or with appropriate authorization for withdrawal from a deposit account at 1st Security Bank of Washington must be received by 1st Security Bank of Washington by 12:00 Noon, Pacific time, on _________ __, 2011 unless extended.  In addition, FS Bancorp and 1st Security Bank of Washington will require a prospective purchaser to execute a certification in the form required by the Washington Department of Financial Institutions.  Stock order forms which are not received by this time, are executed defectively, are received without full payment or appropriate withdrawal instructions, or are submitted on photocopied or facsimile stock order forms are not required to be accepted.  In addition, 1st Security Bank of Washington will not accept orders without an executed certification.  1st Security Bank of Washington has the right to waive or permit the correction of incomplete or improperly executed forms, but does not represent that it will do so.  Once received, an executed order form may not be modified, amended or rescinded without the consent of 1st Security Bank of Washington, unless the conversion has not been completed within 45 days after the end of the subscription offering, or this period has been extended.
 
In order to ensure that Eligible Account Holders, Tax-Qualified Employee Stock Benefit Plans, Supplemental Eligible Account Holders and Other Members are properly identified as to their stock purchase priority, depositors as of the close of business on the Eligibility Record Date, June 30, 2007, the Supplemental Eligibility Record Date, ________ __, 2011, or the Other Members Record Date, _______ __, 2011, must list all accounts on the stock order form giving all names in each account and the account numbers.
 
Payment for subscriptions may be made:
 
 
by personal check, bank check or money order;
 
 
by authorization of withdrawal from savings accounts or certificates of deposit maintained with 1st Security Bank of Washington.
 
 
in cash, if delivered in person to a full-service banking office of 1st Security Bank of Washington, although we request that you exchange cash for a check with any of our tellers.
 
No wire transfers will be accepted.  Funds received before the completion of the conversion will be held in a segregated account at the 1st Security Bank of Washington. Interest will be paid on payments made by cash, check or money order at our then-current passbook (statement savings) rate from the date payment is received until completion of the conversion.  If payment is made by authorization of withdrawal from deposit accounts, the funds authorized to be withdrawn from a deposit account will continue to accrue interest at the contractual rate, but may not be used by the subscriber until all of FS Bancorp’s common stock has been sold or the plan of conversion and reorganization is terminated, whichever is earlier.  If a subscriber authorizes 1st Security Bank of Washington to withdraw the amount of the purchase price from his or her deposit account, 1st Security Bank of Washington will do so as of the effective date of the conversion.  1st Security Bank of Washington will waive any applicable penalties for early withdrawal from certificate accounts for the purpose of purchasing stock in the offering.
 
If any amount of a subscription order is unfilled, 1st Security Bank of Washington will make an appropriate refund or cancel an appropriate portion of the related withdrawal authorization, after completion of the conversion.  If the conversion is not consummated, purchasers will have refunded to them all payments made, with interest, and all withdrawal authorizations will be canceled in the case of subscription payments authorized from accounts at 1st Security Bank of Washington.
 
 
137


If any Tax-Qualified Employee Stock Benefit Plans subscribe for shares during the subscription offering, these plans will not be required to pay for the shares subscribed for at the time they subscribe, but rather, they may pay for shares of common stock subscribed for at the purchase price upon completion of the subscription offering and direct community offering, if all shares are sold, or upon completion of the syndicated community offering if shares remain to be sold in that offering.  If, after the completion of the subscription offering, the amount of shares to be issued is increased above the maximum of the estimated valuation range included in this prospectus, the Tax-Qualified Employee Stock Benefit Plans will be entitled to increase their subscriptions by a percentage equal to the percentage increase in the amount of shares to be issued above the maximum of the estimated valuation range, provided that such subscription will continue to be subject to applicable purchase limits and stock allocation procedures.
 
It may be possible for you to subscribe for shares of common stock using funds you hold within an IRA.  However, common stock must be held in a self-directed retirement account.  1st Security Bank of Washington’s IRAs are not self-directed, so they cannot be invested in common stock.  If you wish to use some or all of the funds in your 1st Security Bank of Washington IRA, the applicable funds must be transferred to a self-directed account reinvested by an independent trustee, such as a brokerage firm.  If you do not have this type of account, you will need to establish one before placing your stock order.  An annual administrative fee may be payable to the independent trustee.  Because individual circumstances differ and processing of retirement fund orders takes additional time, we recommend that you contact the stock information center promptly, preferably at least two weeks before the end of the offering period, for assistance with purchases using your IRA or any other retirement account that you may have. Whether you may use these funds for the purchase of shares in the stock offering may depend on timing constraints and possible limitations imposed by the institution where the funds are held.
 
The records of 1st Security Bank of Washington will control all matters related to the existence of subscription rights and/or one’s ability to purchase shares of common stock in the subscription offering.
 
Should an oversubscription result in an allocation of shares, the allocation of shares will be completed in accordance with the plan of conversion.  Our interpretation of the terms and conditions of the plan of conversion and of the acceptability of the order form will be final.  If a partial payment for your shares is required, we will first take the funds from the cash or check you paid with and secondly from any account from which you wanted funds withdrawn.
 
Restrictions on Transfer of Subscription Rights and Shares
 
No person with subscription rights may transfer or enter into any agreement or understanding to transfer the legal or beneficial ownership of the subscription rights issued under the plan of conversion or the shares of common stock to be issued upon their exercise.  These rights may be exercised only by the person to whom they are granted and only for that person’s account.  Each person exercising subscription rights will be required to certify that the person is purchasing shares solely for the person’s own account and that this person has no agreement or understanding regarding the sale or transfer of the shares.  Regulations also prohibit any person from offering or making an announcement of an offer or intent to make an offer to purchase subscription rights or shares of common stock prior to the completion of the conversion.
 
1st Security Bank of Washington will refer to the Washington Department of Financial Institutions and the Federal Deposit Insurance Corporation any situations that it believes may involve a transfer of subscription rights and will not honor orders believed by it to involve the transfer of such rights.
 
 
138


Issuance of FS Bancorp’s Common Stock
 
Certificates representing shares of common stock issued in the conversion will be mailed to the persons entitled thereto at the registration address noted on the order form, as soon as practicable following consummation of the conversion.  Any certificates returned as undeliverable will be held by us until claimed by persons legally entitled thereto or otherwise disposed of in accordance with applicable law.  Until certificates for the shares of common stock are available and delivered to purchasers, purchasers may not be able to sell the shares of common stock which they ordered.
 
Required Approvals
 
In order to complete the conversion, we will need to receive the final approval of the Washington Department of Financial Institutions and a final non-objection letter from the Federal Deposit Insurance Corporation.  We also will need to have our members approve the plan of conversion at a special meeting of members, which will be called for that purpose.  Finally, the Board of Governors of the Federal Reserve System must approve FS Bancorp’s application to become a bank holding company and to acquire all of 1st Security Bank of Washington’s common stock.
 
FS Bancorp may be required to make certain filings with state securities regulatory authorities in connection with the issuance of FS Bancorp common stock in the offerings.
 
Restrictions on Purchase or Transfer of Shares After the Conversion
 
All shares of common stock purchased in connection with the conversion by a director or an executive officer of FS Bancorp and 1st Security Bank of Washington will be subject to a restriction that the shares not be sold for a period of one year following the conversion except in the event of the death of the director or officer or pursuant to a merger or similar transaction approved by the Washington Department of Financial Institutions.  Each certificate for restricted shares will bear a legend giving notice of this restriction, and instructions will be issued to the effect that any transfer within the first year of any certificate or record ownership of the shares other than as provided above is a violation of the restriction.  Any shares of common stock issued at a later date within this one year period as a stock dividend, stock split or otherwise with respect to the restricted stock will be subject to the same restrictions.
 
Purchases of common stock of FS Bancorp by directors, executive officers and their associates during the three-year period following completion of the conversion may be made only through a broker or dealer registered with the SEC, except with the prior written approval of the Washington Department of Financial Institutions.  This restriction does not apply, however, to negotiated transactions involving more than 1% of FS Bancorp’s outstanding common stock or to certain purchases of stock pursuant to an employee stock benefit plan.
 
For information regarding the proposed purchases of common stock by officers and directors of 1st Security Bank of Washington and FS Bancorp, see “Proposed Purchases by Management.”  Any purchases made by the officers and directors of 1st Security Bank of Washington and FS Bancorp are intended for investment purposes only, and not for resale, including any purchases made for the purpose of meeting the minimum of the offering range.
 
Pursuant to regulations of the Washington Department of Financial Institutions, FS Bancorp may not, for a period of one year following completion of this offering, repurchase shares of the common stock except on a pro rata basis, pursuant to an offer approved by the Washington Department of Financial Institutions and made to all shareholders, or through open market purchases of up to five percent of the outstanding stock where extraordinary circumstances exist.
 
 
139


AND 1st SECURITY BANK OF WASHINGTON
 
The principal federal regulatory restrictions which affect the ability of any person, firm or entity to acquire FS Bancorp, 1st Security Bank of Washington or their respective capital stock are summarized below.  Also discussed are certain provisions in FS Bancorp’s articles of incorporation and bylaws which may be deemed to affect the ability of a person, firm or entity to acquire it.  These provisions include a prohibition on any holder of common stock voting more than 10% of the outstanding common stock.
 
Prior Approval of Acquisition of Control
 
Under federal law and Washington law, the written consent of the Washington Department of Financial Institutions and either the Board of Governors of the Federal Reserve System or the Federal Deposit Insurance Corporation is required prior to any person or company acquiring “control” of a Washington-chartered savings bank or its holding company.  Generally, control is conclusively presumed to exist if, among other things, an individual or company or group acting in concert acquires the power to direct the management or policies of FS Bancorp or 1st Security Bank of Washington or to vote 25% or more of any class of voting stock.  Control is rebuttably presumed to exist under federal law if, among other things, a person acquires more than 10% of any class of voting stock, and the issuer’s securities are registered under Section 12 of the Securities and Exchange Act of 1934 or the person would be the single largest shareholder.  A company that acquires control thereby becomes a bank holding company, subject to restrictions applicable to the operations of bank holding companies and any conditions imposed by the Board of Governors of the Federal Reserve System in connection with its approval of such acquisition.  Such restrictions and conditions may deter potential acquirers from seeking to obtain control of FS Bancorp.  See “How We Are Regulated - Regulation and Supervision of FS Bancorp.
 
Anti-takeover Provisions in FS Bancorp’s Articles of Incorporation and Bylaws
 
The articles of incorporation and bylaws of FS Bancorp contain certain provisions that are intended to encourage a potential acquiror to negotiate any proposed acquisition of FS Bancorp directly with its board of directors.  An unsolicited non-negotiated takeover proposal can seriously disrupt the business and management of a corporation and cause it great expense.  Accordingly, the board of directors believes it is in the best interests of FS Bancorp and its shareholders to encourage potential acquirors to negotiate directly with management.  The board of directors believes that the provisions in the articles of incorporation and bylaws will encourage negotiations and discourage hostile takeover attempts.  The board also believes that these provisions should not discourage persons from proposing a merger or transaction at prices reflective of the true value of FS Bancorp and that otherwise is in the best interests of all shareholders.  However, these provisions may have the effect of discouraging offers to purchase FS Bancorp or its securities that are not approved by the board of directors but which certain of FS Bancorp’s shareholders may deem to be in their best interests or pursuant to which shareholders would receive a substantial premium for their shares over then current market prices.  As a result, shareholders who might desire to participate in such a transaction may not have an opportunity to do so.  These provisions will also render the removal of the current board of directors and management more difficult.  The boards of directors of 1st Security Bank of Washington and FS Bancorp believe these provisions are in the best interests of the shareholders because they will assist FS Bancorp’s board of directors in managing the affairs of FS Bancorp in the manner they believe to be in the best interests of shareholders generally and because a company’s board of directors is often best able in terms of knowledge regarding the company’s business and prospects, as well as resources, to negotiate the best transaction for its shareholders as a whole.
 
The following description of certain of the provisions of the articles of incorporation and bylaws of FS Bancorp is necessarily general and reference should be made in each instance to the articles of incorporation and bylaws.  See “Where You Can Find More Information” regarding how to obtain a copy of these documents.
 
 
140


Board of Directors.  The articles of incorporation provide that the number of directors shall not be less than five nor more than 15.  The initial number of directors is six, but this number may be changed by resolution of the board of directors.  The board of directors is divided into three groups, with each group containing one-third of the total number of directors, or as near as may be.  This may make it more difficult for a person seeking to acquire control of FS Bancorp to gain majority representation on the board of directors in a relatively short period of time.  FS Bancorp believes this is important in ensuring continuity in the composition and policies of the board of directors.
 
Cumulative Voting.  The articles of incorporation specifically do not permit cumulative voting for the election of directors.  Cumulative voting in an election of directors entitles a shareholder to cast a total number of votes equal to the number of directors to be elected multiplied by the number of his or her shares and to distribute that number of votes among the number of nominees as the shareholder chooses.  The absence of cumulative voting for directors limits the ability of a minority shareholder to elect directors.  Because the holder of less than a majority of FS Bancorp’s shares cannot be assured representation on the board of directors, the absence of cumulative voting may discourage accumulations of FS Bancorp’s shares or proxy contests that would result in changes in FS Bancorp’s management.  The board of directors believes that elimination of cumulative voting will help to assure continuity and stability of management and policies; directors should be elected by a majority of the shareholders to represent the interests of the shareholders as a whole rather than be the special representatives of particular minority interests; and efforts to elect directors representing specific minority interests are potentially divisive and could impair the operations of FS Bancorp.
 
Special Meetings.  The articles of incorporation of FS Bancorp provide that special meetings of shareholders of FS Bancorp may be called only by the chief executive officer or by a majority of the board of directors.  If a special meeting is not called, shareholder proposals cannot be presented to the shareholders for action until the next annual meeting.  Shareholders are not permitted to call special meetings.
 
Authorized Capital Stock.  The articles of incorporation of FS Bancorp authorize the issuance of 45,000,000 shares of common stock and 5,000,000 shares of preferred stock.  The shares of common stock and preferred stock were authorized in an amount greater than that to be issued in the conversion to provide FS Bancorp’s board of directors with flexibility to effect, among other transactions, financings, acquisitions, stock dividends, stock splits and employee stock options.  However, these additional authorized shares may also be used by the board of directors consistent with its fiduciary duty to deter future attempts to gain control of FS Bancorp.  The board of directors also has sole authority to determine the terms of any one or more series of preferred stock, including voting rights, conversion rates and liquidation preferences.  As a result of the ability to fix voting rights for a series of preferred stock, the board of directors has the power, to the extent consistent with its fiduciary duty, to issue a series of preferred stock to persons friendly to management in order to attempt to block a post tender offer merger or other transaction by which a third party seeks control, and thereby assist management to retain its position.  FS Bancorp’s board of directors currently has no plan to issue additional shares, other than the issuance of additional shares pursuant to the proposed stock-based equity incentive plan.
 
Director Nominations.  The articles of incorporation of FS Bancorp require a shareholder who intends to nominate a candidate for election to the board of directors at a shareholders’ meeting to give written notice to the secretary of FS Bancorp at least 30 days (but not more than 60 days) in advance of the date of the meeting at which such nominations will be made.  The nomination notice is also required to include specified information concerning the nominee and the proposing shareholder.  The board of directors of FS Bancorp believes that it is in the best interests of FS Bancorp and its shareholders to provide sufficient time for the board of directors to study all nominations and to determine whether to recommend to the shareholders that any of these nominees be considered.
 
 
141


Supermajority Voting Provisions.  FS Bancorp’s articles of incorporation require the affirmative vote of 80% of the outstanding shares entitled to vote to approve a merger, consolidation or other business combination, unless the transaction is approved, prior to consummation, by the vote of at least two-thirds of the number of the continuing directors (as defined in the articles of incorporation) on FS Bancorp’s board of directors.  “Continuing directors” generally includes all members of the board of directors who are not affiliated with any individual, partnership, trust or other person or entity (or the affiliates and associates of such person or entity) which is a beneficial owner of 10% or more of the voting shares of FS Bancorp.  This provision could tend to make the acquisition of FS Bancorp more difficult to accomplish without the cooperation or favorable recommendation of FS Bancorp’s board of directors.
 
Amendment of Articles of Incorporation and Bylaws.  FS Bancorp’s articles of incorporation may be amended by the vote of the holders of a majority of the outstanding shares of its common stock, except that the provisions of the articles of incorporation governing the duration of the corporation, the purpose and powers of the corporation, authorized capital stock, denial of preemptive rights, the number and staggered terms of directors, removal of directors, shareholder nominations and proposals, approval of certain business combinations, the evaluation of certain business combinations, limitation of directors’ liability, indemnification of officers and directors, calling of special meetings of shareholders, the authority to repurchase shares and the manner of amending the bylaws and articles of incorporation may not be repealed, altered, amended or rescinded except by the vote of the holders of at least 80% of the outstanding shares of FS Bancorp.  This provision is intended to prevent the holders of a lesser percentage of the outstanding stock of FS Bancorp from circumventing any of the foregoing provisions by amending the articles of incorporation to delete or modify one of such provisions.
 
FS Bancorp’s bylaws may only be amended by a majority vote of the board of directors of FS Bancorp or by the holders of at least 80% of the outstanding stock by FS Bancorp.
 
Purpose and Takeover Defensive Effects of FS Bancorp’s Articles of Incorporation and Bylaws.  The board of directors believes that the provisions described above are prudent and will reduce FS Bancorp’s vulnerability to takeover attempts and certain other transactions that have not been negotiated with and approved by the board.  These provisions will also assist in the orderly deployment of the conversion proceeds into productive assets during the initial period after the conversion.  The board of directors believes these provisions are in the best interest of 1st Security Bank of Washington, and FS Bancorp and its shareholders.  In the judgment of the board of directors, FS Bancorp’s board will be in the best position to determine the true value of FS Bancorp and to negotiate more effectively for what may be in the best interests of its shareholders.  Accordingly, the board of directors believes that it is in the best interest of FS Bancorp and its shareholders to encourage potential acquirors to negotiate directly with the board of directors of FS Bancorp and that these provisions will encourage these negotiations and discourage hostile takeover attempts.  It is also the view of the board of directors that these provisions should not discourage persons from proposing a merger or other transaction at a price reflective of the true value of FS Bancorp and that is in the best interest of all shareholders.
 
Attempts to acquire control of financial institutions and their holding companies have recently become increasingly common.  Takeover attempts that have not been negotiated with and approved by the board of directors present to shareholders the risk of a takeover on terms that may be less favorable than might otherwise be available.  A transaction that is negotiated and approved by the board of directors, on the other hand, can be carefully planned and undertaken at an opportune time in order to obtain maximum value of FS Bancorp for its shareholders, with due consideration given to matters such as the management and business of the acquiring corporation and maximum strategic development of FS Bancorp’s assets.
 
An unsolicited takeover proposal can seriously disrupt the business and management of a corporation and cause great expense.  Although a tender offer or other takeover attempt may be made at a price substantially above current market prices, these offers are sometimes made for less than all of the outstanding shares of a target company.  As a result, shareholders may be presented with the alternative of partially liquidating their investment at a time that may be disadvantageous, or retaining their investment in an enterprise that is under different management and whose objectives may not be similar to those of the remaining shareholders.  The concentration of control, which could result from a tender offer or other takeover attempt, could also deprive FS Bancorp’s remaining shareholders of benefits of certain protective provisions of the Securities Exchange Act of 1934, if the number of beneficial owners became less than 300, thereby allowing for deregistration.
 
 
142


Despite the belief of 1st Security Bank of Washington and FS Bancorp as to the benefits to shareholders of these provisions of FS Bancorp’s articles of incorporation and bylaws, these provisions may also have the effect of discouraging a future takeover attempt that would not be approved by FS Bancorp’s board of directors, but pursuant to which shareholders may receive a substantial premium for their shares over then current market prices.  As a result, shareholders who might desire to participate in such a transaction may not have any opportunity to do so.  These provisions will also render the removal of FS Bancorp’s board of directors and of management more difficult.  The board of directors of 1st Security Bank of Washington and FS Bancorp, however, have concluded that the potential benefits outweigh the possible disadvantages.
 
Following the conversion, pursuant to applicable law and, if required, following the approval by shareholders, FS Bancorp may adopt additional anti-takeover charter provisions or other devices regarding the acquisition of its equity securities that would be permitted for a Washington business corporation.
 
The cumulative effect of the restrictions on acquisition of FS Bancorp contained in the articles of incorporation and bylaws of FS Bancorp and in Federal and Washington law may be to discourage potential takeover attempts and perpetuate incumbent management, even though certain shareholders of FS Bancorp may deem a potential acquisition to be in their best interests, or deem existing management not to be acting in their best interests.
 
 
General
 
FS Bancorp, Inc. is authorized to issue 45,000,000 shares of common stock having a par value of $0.01 per share and 5,000,000 shares of preferred stock having a par value of $0.01 per share.  FS Bancorp currently expects to issue up to 2,817,500 shares of common stock, subject to adjustment up to 3,240,125 shares, and no shares of preferred stock in the conversion.  Each share of FS Bancorp’s common stock will have the same relative rights as, and will be identical in all respects with, each other share of common stock.  Upon payment of the purchase price for the common stock, in accordance with the plan of conversion and reorganization, all the stock will be duly authorized, fully paid and nonassessable.
 
The common stock of FS Bancorp represents nonwithdrawable capital.  The common stock is not a savings or deposit account and is not insured by the Federal Deposit Insurance Corporation or any other government agency.
 
Common Stock
 
Dividends.  FS Bancorp can pay dividends out of statutory surplus or from certain net profits if, as and when declared by its board of directors.  The payment of dividends by FS Bancorp is subject to limitations which are imposed by law and applicable regulation.  See “Our Policy Regarding Dividends” and “How We Are Regulated.”  The holders of common stock of FS Bancorp will be entitled to receive and share equally in the dividends declared by the board of directors of FS Bancorp out of funds legally available therefore.  If FS Bancorp issues preferred stock, the holders of preferred stock may have a priority over the holders of the common stock with respect to dividends.
 
 
143


Stock Repurchases.  Regulations of the Board of Governors of the Federal Reserve System place certain limitations on the repurchase of FS Bancorp’s capital stock.  See “How We Intend to Use the Proceeds From this Offering.”
 
Voting Rights.  Upon conversion, the holders of common stock of FS Bancorp will possess exclusive voting rights in FS Bancorp.  They will elect FS Bancorp’s board of directors and act on other matters as are required to be presented to them under Washington law or as are otherwise presented to them by the board of directors.  Except as discussed in “Restrictions on Acquisition of FS Bancorp, Inc. and 1st Security Bank of Washington,” each holder of common stock will be entitled to one vote per share and will not have any right to cumulate votes in the election of directors.  If FS Bancorp issues preferred stock, holders of the preferred stock may also possess voting rights.  Certain matters require a vote of 80% of the outstanding shares entitled to vote thereon.  See “Restrictions on Acquisition of FS Bancorp, Inc. and 1st Security Bank of Washington.”
 
As a state-chartered stock savings bank that is the subsidiary of a holding company, voting rights are vested exclusively in the owners of the shares of capital stock of 1st Security Bank of Washington, all of which will be owned by FS Bancorp and voted at the direction of FS Bancorp’s board of directors.  Consequently, the holders of the common stock will not have direct control of 1st Security Bank of Washington.
 
Liquidation.  In the event of any liquidation, dissolution or winding up of 1st Security Bank of Washington, FS Bancorp, as holder of 1st Security Bank of Washington’s capital stock would be entitled to receive, after payment or provision for payment of all debts and liabilities of 1st Security Bank of Washington, including all deposit accounts and accrued interest thereon, and after distribution of the balance in the special liquidation account to Eligible Account Holders and Supplemental Eligible Account Holders, all assets of 1st Security Bank of Washington available for distribution.  In the event of liquidation, dissolution or winding up of FS Bancorp, the holders of its common stock would be entitled to receive, after payment or provision for payment of all its debts and liabilities, all of the assets of FS Bancorp available for distribution.  If preferred stock is issued, the holders thereof may have a priority over the holders of the common stock in the event of liquidation or dissolution.
 
Preemptive Rights.  Holders of the common stock of FS Bancorp will not be entitled to preemptive rights with respect to any shares that may be issued.  The common stock is not subject to redemption.
 
Preferred Stock
 
None of the shares of FS Bancorp’s authorized preferred stock will be issued in the conversion and there are no current plans to issue the preferred stock.  Preferred stock may be issued with the designations, powers, preferences and rights as the board of directors may determine.  The board of directors can, without shareholder approval, issue preferred stock with voting, dividend, liquidation and conversion rights that could dilute the voting strength of the holders of the common stock and may assist management in impeding an unfriendly takeover or attempted change in control.
 
Restrictions on Acquisition
 
Acquisitions of FS Bancorp are restricted by provisions in its articles of incorporation and bylaws and by the rules and regulations of various regulatory agencies.  See “How We Are Regulated - Regulation and Supervision of FS Bancorp” and “Restrictions on Acquisition of FS Bancorp, Inc. and 1st Security Bank of Washington.”
 
 
144


The transfer agent and registrar for FS Bancorp common stock is Registrar and Transfer Company, Cranford, New Jersey.
 
 
The balance sheets of 1st Security Bank of Washington as of December 31, 2010 and 2009 and the related statements of operations, equity and comprehensive income (loss), and cash flows for the years then ended included in this prospectus have been audited by Moss Adams LLP, an independent registered public accounting firm, as set forth in its report thereon appearing elsewhere herein and in the registration statement, and are included in reliance upon the report of this firm given upon the authority as experts in accounting and auditing.
 
RP Financial, LC. has consented to the publication herein of the summary of its report to 1st Security Bank of Washington setting forth its opinion as to the estimated pro forma market value of the FS Bancorp common stock upon conversion and its letter with respect to subscription rights.
 
 
The federal income tax consequences of the conversion have been passed upon for 1st Security Bank of Washington.  Silver, Freedman & Taff, L.L.P., Washington, D.C., special counsel to FS Bancorp and 1st Security Bank of Washington.  The legality of the common stock issued in the offering by FS Bancorp and the Washington state income tax consequences of the conversion have been passed upon for FS Bancorp and 1st Security Bank of Washington by Harlowe & Falk LLP.  Certain legal matters will be passed upon for Keefe, Bruyette & Woods, Inc. by Luse Gorman Pomerenk & Schick, P.C.
 
 
FS Bancorp has filed with the SEC a registration statement under the Securities Act of 1933 with respect to the common stock offered hereby.  As permitted by the rules and regulations of the SEC, this prospectus does not contain all the information set forth in the registration statement.  This information, including the appraisal report which is an exhibit to the registration statement, can be examined without charge at the public reference facilities of the SEC located at 100 F Street, N.E., Washington, D.C. 20549, and copies of this material can be obtained from the SEC at prescribed rates.  You may obtain information on the operation of the public reference room by calling the SEC at 1-800-SEC-0330.  In addition, the SEC maintains a website (http://www.sec.gov) that contains reports, proxy and information statements and other information regarding registrants that file electronically with the SEC, including FS Bancorp.  The statements contained in this prospectus as to the contents of any contract or other document filed as an exhibit to the registration statement are, of necessity, brief descriptions thereof and are not necessarily complete; each statement is qualified by reference to the contract or document.  We believe, however, that we have included the material information an investor needs to consider in making an investment decision.  1st Security Bank of Washington also maintains a website (http://www.fsbwa.com), which contains various information about 1st Security Bank of Washington.  In addition, 1st Security Bank of Washington files quarterly call reports with the Federal Deposit Insurance Corporation, which are available at the Federal Deposit Insurance Corporation’s website (http://www.fdic.gov).
 
 
145


1st Security Bank of Washington has filed with the Washington Department of Financial Institutions an Application for Approval of Conversion, which includes proxy materials for the special meeting of members and certain other information.  This prospectus omits certain information contained in the Application for Approval of Conversion.  The Application for Approval of Conversion, including the proxy materials, exhibits and certain other information, may be inspected, without charge, at the office of the Washington Department of Financial Institutions, Division of Banks, Department of Financial Institutions, 150 Israel Road SW, Tumwater, Washington 98501.  A copy of the Application for Approval of Conversion has also been filed with the Federal Deposit Insurance Corporation.
 
In connection with the conversion, FS Bancorp has registered its common stock with the SEC under Section 12 of the Securities Exchange Act of 1934, and, upon that registration, FS Bancorp and the holders of its stock will become subject to the proxy solicitation rules, reporting requirements and restrictions on stock purchases and sales by directors, officers and greater than 10% shareholders, the annual and periodic reporting and certain other requirements of the Securities Exchange Act of 1934.  Under the plan of conversion, FS Bancorp has undertaken that it will not terminate this registration for a period of at least three years following the conversion.
 
A copy of the plan of conversion, the articles of incorporation and bylaws of FS Bancorp and 1st Security Bank of Washington are available without charge from 1st Security Bank of Washington.  Requests for this information should be directed to: Joseph Adams, Chief Executive Officer, 1st Security Bank of Washington, 6920 220th Street SW, Suite 205, Mountlake Terrace, Washington 98043.
 
 
146


1ST SECURITY BANK OF WASHINGTON
Table of Contents
June 30, 2011 (Unaudited) and December 31, 2010 and 2009


Page
     
Report of Independent Registered Public Accounting Firm
 
F-1
     
Financial Statements
   
     
     Balance Sheets as of June 30, 2011 (Unaudited) and December 31, 2010 and 2009
 
F-2
     
     Statements of Operations for the Six Months Ended June 30, 2011 and 2010 (Unaudited) and the Years Ended December 31, 2010 and 2009
 
F-3
     
     Statements of Equity and Comprehensive Income (Loss) for the Six Months Ended June 30, 2011 (Unaudited) and the Years Ended December 31, 2010
         and 2009
  F-4
     
     Statements of Cash Flows for the Six Months Ended June 30, 2011 and 2010 (Unaudited) and the Years Ended December 31, 2010 and 2009
 
F-5
     
     Notes to Financial Statements
 
F-6–F-40
 
All schedules are omitted because the required information is not applicable or is included in the Financial Statements and related Notes.
 
The Financial Statements of FS Bancorp, Inc. have been omitted because FS Bancorp has not yet issued any stock, has no assets or liabilities, and has not conducted any business other than that of an organizational nature.


Report of Independent Registered Public Accounting Firm
 
To the Board of Trustees
1st Security Bank of Washington
Mountlake Terrace, Washington
 
We have audited the accompanying balance sheets of 1st Security Bank of Washington (the “Bank”) as of December 31, 2010 and 2009, and the related statements of operations, equity and comprehensive income (loss), and cash flows for the years then ended. These financial statements are the responsibility of the Bank’s management. Our responsibility is to express an opinion on these financial statements based on our audits.
 
We conducted our audits in accordance with the standards of the Public Company Accounting Oversight Board (United States). Those standards require that we plan and perform the audit to obtain reasonable assurance about whether the financial statements are free of material misstatement. We were not engaged to perform an audit of the Banks internal control over financial reporting. Our audits included consideration of internal control over financial reporting as a basis for designing audit procedures that are appropriate in the circumstances. An audit includes examining evidence, on a test basis, supporting the amounts and disclosures in the financial statements. An audit also includes assessing the accounting principles used, and significant estimates made by management, as well as evaluating the overall financial statements presentation. We believe that our audits provide a reasonable basis for our opinion.
 
In our opinion, the financial statements referred to above present fairly, in all material respects, the financial position of 1st Security Bank of Washington as of December 31, 2010 and 2009, and the results of its operations, and its cash flows for the years then ended, in conformity with accounting principles generally accepted in the United States of America.
 
Bellingham, Washington
September 30, 2011
 
 
F-1


1ST SECURITY BANK OF WASHINGTON
Balance Sheets
June 30, 2011 (Unaudited) and December 31, 2010 and 2009
 
(Dollars in thousands)


June 30,
    December 31,  
    2011     2010     2009  
 
 
(Unaudited)
             
ASSETS
                       
Cash and due from banks
  $ 2,459     $ 2,067     $ 2,372  
Interest-bearing deposits at other financial institutions
    27,882       33,183       26,162  
Total cash and cash equivalents
    30,431       35,250       28,534  
Securities available-for-sale, at fair value
    11,689       7,642       603  
Federal Home Loan Bank stock, at cost
    1,797       1,797       1,797  
Loans receivable, net
    210,184       230,822       231,441  
Accrued interest receivable
    909       914       952  
Premises and equipment, net
    9,040       9,249       9,721  
Other assets
    8,824       6,660       8,788  
TOTAL ASSETS
  $ 272,784     $ 292,334     $ 281,836  
                         
LIABILITIES
                       
Deposits:
                       
Interest-bearing
  $ 224,263     $ 225,410     $ 205,859  
Noninterest-bearing checking
    17,212       18,547       25,126  
Total deposits
    241,475       243,957       230,985  
                         
Borrowings
    3,900       21,900       25,900  
Other liabilities
    1,432       1,682       1,636  
Total liabilities
    246,807       267,539       258,521  
EQUITY
                       
Retained earnings
    25,914       24,906       23,304  
Accumulated other comprehensive income (loss)
    63       (111 )     11  
Total equity
    25,977       24,795       23,315  
TOTAL LIABILITIES AND EQUITY
  $ 272,784     $ 292,334     $ 281,836  
 
 
See accompanying notes to these financial statements.  F-2


1ST SECURITY BANK OF WASHINGTON
Statements of Operations
For The Six Months Ended June 30, 2011 and 2010 (Unaudited)
and the Years Ended December 31, 2010 and 2009
(Dollars in thousands)
 
                         
    Six Months Ended June 30,    
Years Ended December 31,
 
    2011     2010     2010     2009  
   
(Unaudited)
   
(Unaudited)
             
INTEREST INCOME
                       
Loans receivable
  $ 8,150     $ 8,442     $ 17,270     $ 16,289  
Interest and dividends on investments and cash equivalents
    113       25       63       115  
Total interest income
    8,263       8,467       17,333       16,404  
INTEREST EXPENSE
                               
Deposits
    1,539       1,866       3,668       4,232  
Borrowings
    88       127       218       289  
Total interest expense
    1,627       1,993       3,886       4,521  
                                 
NET INTEREST INCOME
    6,636       6,474       13,447       11,883  
                                 
PROVISION FOR LOAN LOSSES
    1,030       1,905       3,480       7,067  
                                 
NET INTEREST INCOME AFTER PROVISION FOR LOAN LOSSES
    5,606       4,569       9,967       4,816  
                                 
NONINTEREST INCOME
                               
Service charges for fee income
    1,019       1,196       2,444       2,839  
Gain on sale of branches
          797       1,006       1,335  
Gain on sale of investment securities
                      63  
Other noninterest income
    82       95       217       252  
Total noninterest income
    1,101       2,088       3,667       4,489  
                                 
NONINTEREST EXPENSE
                               
Salaries and benefits
    2,706       2,657       5,159       6,619  
Occupancy
    770       815       1,622       1,863  
Operations
    606       655       1,579       1,686  
Loan costs
    391       712       1,350       917  
Data processing
    417       363       740       755  
FDIC insurance
    280       257       556       560  
Marketing and advertising
    98       142       344       285  
Excise taxes
    146       118       284       255  
Professional fees
    64       91       239       241  
ATM costs
    104       130       238       311  
OREO fair value write-downs, net of (gain) loss on sales
    117       1       (79 )     387  
Total noninterest expense
    5,699       5,941       12,032       13,879  
                                 
INCOME (LOSS) BEFORE PROVISION FOR INCOME TAX
    1,008       716       1,602       (4,574 )
                                 
PROVISION FOR INCOME TAXES (BENEFIT)
                       
                                 
NET INCOME (LOSS)
  $ 1,008     $ 716     $ 1,602     $ (4,574 )
 
 
See accompanying notes to these financial statements.  F-3


1ST SECURITY BANK OF WASHINGTON
Statements of Equity and Comprehensive Income (Loss)
For The Six Months Ended June 30, 2011 (Unaudited) and the
Years Ended December 31, 2010 and 2009
(Dollars in thousands)
 
   
Retained
Earnings
   
Accumulated Other
Comprehensive
Income (Loss)
   
Total
Equity
   
Total
Comprehensive
Income (Loss)
 
                               
Balance, January 1, 2009
  $ 27,878     $ (16 )   $ 27,862        
Comprehensive loss:
                             
Net loss
    (4,574 )           (4,574 )   $ (4,574 )
Other comprehensive income:
                               
Unrealized gain on securities available-for-sale
          27       27       27  
Total comprehensive loss
                          $ (4,547 )
Balance, December 31, 2009
    23,304       11       23,315          
Comprehensive income:
                               
Net income
    1,602             1,602     $ 1,602  
Other comprehensive loss:
                               
Unrealized loss on securities available-for-sale
          (122 )     (122 )     (122 )
Total comprehensive income
                          $ 1,480  
Balance, December 31, 2010
    24,906       (111 )     24,795          
Comprehensive income:
                               
Net income
  $ 1,008     $     $ 1,008     $ 1,008  
Other comprehensive income:
                               
Unrealized gain on securities available-for-sale
          174       174       174  
Total comprehensive income
                          $ 1,182  
Balance, June 30, 2011 (Unaudited)
  $ 25,914     $ 63     $ 25,977          
 
 
See accompanying notes to these financial statements.  F-4


1ST SECURITY BANK OF WASHINGTON
Statements of Cash Flows
For The Six Months Ended June 30, 2011 and 2010 (Unaudited) 
and the Years Ended December 31, 2010 and 2009
(Dollars in thousands)


Six Months Ended June 30,
   
Years Ended December 31,


2011
   
2010
   
2010
   
2009


(Unaudited)
   
(Unaudited)
             
CASH FLOWS FROM OPERATING ACTIVITIES
                               
Net gain (loss)
  $ 1,008     $ 716     $ 1,602     $ (4,574 )
Adjustments to reconcile net income (loss) to net cash from operating activities
                               
Provision for loan losses
    1,030       1,905       3,480       7,067  
Depreciation and amortization of mortgage servicing rights
    403       459       907       1,003  
Provision (benefit) from deferred income tax
    383       246       552       (1,538 )
Valuation allowance on deferred taxes
    (383     (246     (552 )     1,538  
Gain on sale of investment securities
                      (63 )
Gain on sale of branches
          (797 )     (1,006 )     (1,335 )
Impairment loss on OREO
    120       23       111       387  
Changes in operating assets and liabilities
                               
Accrued interest receivable
    5       81       38       35  
Other assets
    291       3,650       6,458       (948 )
Other liabilities
    (250 )     (218 )     46       (414 )
Net cash flows from operating activities
    2,607       5,819       11,636       1,158  
                                 
CASH FLOWS FROM INVESTING ACTIVITIES
                               
Activity in securities available-for-sale:
                               
Maturities, prepayments, sales and calls
    614       12       158       2,321  
Purchases
    (4,487 )           (7,319 )      
Loan originations and principal collections, net
    16,985       (2,921 )     (7,384 )     (22,185 )
Sale of premises and equipment
          1,642       2,266       775  
Capitalized improvements of OREO
          (13 )     (13 )     (21 )
Purchase of premises and equipment
    (146 )     (487 )     (1,600 )     (200 )
Net cash from investing activities
    12,966       (1,767 )     (13,892 )     (19,310 )
                                 
CASH FLOWS FROM FINANCING ACTIVITIES
                               
Net increase (decrease) in deposits
    (2,482 )     3,185       12,972       49,282  
Sale of deposits
                      (33,553 )
Proceeds from borrowings
          43,000       163,301       87,575  
Repayments of borrowings
    (18,000 )     (50,000 )     (167,301 )     (71,075 )
Net cash from financing activities
    (20,482 )     (3,815 )     8,972       32,229  
                                 
NET INCREASE (DECREASE) IN CASH AND CASH EQUIVALENTS
    (4,909 )     237       6,716       14,077  
                                 
CASH AND CASH EQUIVALENTS, Beginning of period                                
      35,250       28,534       28,534       14,457  
                                 
CASH AND CASH EQUIVALENTS, end of period                                
    $ 30,341     $ 28,771     $ 35,250     $ 28,534  
                                 
SUPPLEMENTARY DISCLOSURES OF CASH FLOW INFORMATION
                               
Cash paid during the period for interest
  $ 1,627     $ 1,991     $ 3,904     $ 4,511  
                                 
SUPPLEMENTARY DISCLOSURES OF NONCASH INVESTING AND FINANCING ACTIVITIES
                               
Change in unrealized gain (loss) on securities, net of deferred taxes
  $ 174     $ 15     $ (122 )   $ 27  
Property taken in settlement of loans
  $ 2,886     $ 3,830     $ 4,523     $ 6,651  
 
 
See accompanying notes to these financial statements.  F-5


1ST SECURITY BANK OF WASHINGTON
Notes to Financial Statements
June 30, 2011 (Unaudited) and December 31, 2010 and 2009
 
(Dollars in thousands)
 
Note 1 – Summary of Significant Accounting Policies
 
Nature of Operations – 1st Security Bank of Washington (the Bank) is a mutually-owned savings bank chartered in the State of Washington with six branches in suburban communities in the greater Puget Sound area. The Bank provides loan and deposit services to customers who are predominantly small and middle-market businesses and individuals in Western Washington. The Bank closed two branches during 2010, and closed a total of four branches during 2009 (see Note 15).
 
Plan of Conversion – The Board of Trustees of the Bank (hereafter referred to as the Board of Directors) approved a Plan of Conversion (the Plan) which provides for the conversion of the Bank from a Washington State chartered mutual savings bank to a Washington State chartered stock savings bank. This Plan is pursuant to the rules and regulations of the Washington State Department of Financial Institutions (DFI) and the Federal Deposit Insurance Corporation (FDIC). As part of the conversion, the Plan provides for the concurrent formation of a holding company (the Holding Company) that will own 100% of the common stock of the Bank. Following receipt of all required regulatory approvals, the approval of the depositors of the Bank eligible to vote on the Plan and the satisfaction of all other conditions precedent to the conversion, the Bank will consummate the conversion, which is anticipated to be completed in the fourth quarter of 2011.
 
Upon the consummation of the conversion, the legal existence of the Bank shall not terminate but the stock bank shall be a continuation of the mutual bank. The stock bank shall have, hold, and enjoy the same in its own right as fully and to the same extent as the same was possessed, held, and enjoyed by the mutual bank. The stock bank at the time and the taking effect of the conversion shall continue to have and succeed to all the rights, obligations, and relations of the mutual bank.
 
At the time of conversion, the Bank will establish a liquidation account in an amount equal to its total net worth as of the latest statement of financial condition appearing in the final prospectus. The liquidation account will be maintained for the benefit of eligible depositors who continue to maintain their accounts at the Bank after the conversion. The liquidation account will be reduced annually to the extent that eligible depositors have reduced their qualifying deposits. Subsequent increases will not restore an eligible holder’s interest in the liquidation account. In the event of a complete liquidation, each eligible depositor will be entitled to receive a distribution from the liquidation account in an amount proportionate to the current adjusted qualifying balances for accounts then held. The liquidation account balance is not available for payment of dividend, and the Bank may not pay dividends if those dividends would reduce equity capital below the required liquidation account amount.
 
Conversion costs will be deferred and deducted from the proceeds of the shares sold in the offering. If the conversion transaction is not completed, all costs will be charged to expense. As of June 30, 2011 (unaudited), there were conversion costs totaling $853, which have been deferred, and are included in other assets.
 
Use of Estimates – The preparation of financial statements in conformity with generally accepted accounting principles (GAAP) in the United States of America requires management to make estimates and assumptions that affect amounts reported in the financial statements. Actual results could differ from these estimates. Material estimates that are particularly susceptible to change in the near term are allowances for loan losses, fair value of other real estate owned and the determination of a need for a valuation allowance on the deferred tax asset.
 
 
   F-6


1ST SECURITY BANK OF WASHINGTON
Notes to Financial Statements
June 30, 2011 (Unaudited) and December 31, 2010 and 2009
 
(Dollars in thousands)
 
Note 1 – Summary of Significant Accounting Policies (Continued)
 
Certain prior year amounts have been reclassified to conform to the 2011 presentation with no change to net income (loss) or equity previously reported.
 
Unaudited Interim Financial Statements – The interim consolidated financial statements at June 30, 2011 and for the six months ended June 30, 2011 and 2010 and the related footnote information are unaudited. Such unaudited interim financial statements have been prepared in accordance with the requirements for presentation of interim financial statements of Regulation S-X and are in accordance with U.S. GAAP. In the opinion of management, the accompanying unaudited financial statements contain all adjustments (consisting only of normal recurring accruals) considered necessary for a fair presentation of the results of operations for the interim periods. The results of operations for the six months ended June 30, 2011 and 2010, are not necessarily indicative of the results that may be expected for the entire year or any other interim period.
 
Cash and Cash Equivalents – Cash and cash equivalents include cash and due from banks, and interest bearing balances due from other banks and the Federal Reserve Bank. Cash and cash equivalents have a maturity of 90 days or less at the time of purchase. As of June 30, 2011 (unaudited), December 31, 2010 and 2009, the Bank has cash deposits at other financial institutions in excess of FDIC insured limits. However, as the Bank places these deposits with major financial institutions and monitors the financial condition of these institutions, management believes the risk of loss to be minimal.
 
Securities Available-for-Sale – Securities available-for-sale consist of debt securities that the Bank has the intent and ability to hold for an indefinite period, but not necessarily to maturity. Such securities may be sold to implement the Bank’s asset/liability management strategies and in response to changes in interest rates and similar factors. Securities available-for-sale are reported at fair value. Unrealized gains and losses, net of the related deferred tax effect, are reported as a net amount in a separate component of equity entitled accumulated other comprehensive gain (loss). Unrealized losses that are deemed to be other than temporary are reflected in results of operations. Any declines in the values of these securities that are considered to be other-than-temporary-impairment (OTTI) and credit-related are recognized in earnings. Noncredit-related OTTI on securities not expected to be sold is recognized in other comprehensive gain (loss). The review for OTTI is conducted on an ongoing basis and takes into account the severity and duration of the impairment, recent events specific to the issuer or industry, fair value in relationship to cost, extent and nature of change in fair value, creditworthiness of the issuer including external credit ratings and recent downgrades, trends and volatility of earnings, current analysts’ evaluations, and other key measures. In addition, the Bank determines that we do not intend to sell the securities and it is not likely that the Bank will be required to sell the securities before recovery of their amortized cost basis. In doing this, the Bank takes into account our balance sheet management strategy and consideration of current and future market conditions. Realized gains and losses on securities available-for-sale, determined using the specific identification method, are included in results of operations. Amortization of premium and accretion of discounts are recognized in interest income over the period to maturity.
 
 
   F-7


1ST SECURITY BANK OF WASHINGTON
Notes to Financial Statements
June 30, 2011 (Unaudited) and December 31, 2010 and 2009
 
(Dollars in thousands)
 
Note 1 – Summary of Significant Accounting Policies (Continued)
 
Federal Home Loan Bank Stock – As a member of the Federal Home Loan Bank (FHLB) system, the Bank is required to maintain an investment in capital stock of the FHLB in an amount equal to the greater of .50% of its outstanding home loans or 4.5% of advances from the FHLB. The Bank’s investment in FHLB stock is carried at par value ($100 dollars per share), which reasonably approximates its fair value. As of June 30, 2011 (unaudited), $148 of FHLB stock was pledged as collateral for FHLB advances, and as of December 31, 2010 and 2009, $947 and $207, respectively, of FHLB stock was pledged as collateral for FHLB advances.
 
The Bank’s investment in Federal Home Loan Bank stock is carried at par value because the shares can only be redeemed with the FHLB at par value. The Company is required to maintain a minimum level of investment in FHLB stock based on specific percentages of its outstanding mortgages and FHLB advances. Stock redemptions are at the discretion of the FHLB or of the Company, upon five years’ prior notice for FHLB Class B stock or six months notice for FHLB Class A stock to the FHLB. FHLB stock is carried at cost and is subject to recoverability testing per the Financial Services – Depository and Lending topic of the FASB Accounting Standards Codification (ASC).
 
Loans Held for Sale – Mortgage loans originated and intended for sale in the secondary market are stated in the aggregate at the lower of cost or estimated fair value. Net unrealized losses, if any, are recognized through a valuation allowance by charges to income. Gains or losses on sales of loans are recognized at the time of sale. The gain or loss is the difference between the net sales proceeds and the recorded value of the loans, including any remaining unamortized deferred loan origination fees.
 
Loans Receivable, Net – Loans receivable, net, are stated at the amount of unpaid principal reduced by an allowance for loan losses and net deferred fees or costs. Interest on loans is calculated using the simple interest method based on the daily balance of the principal amount outstanding and is credited to income as earned. Loan fees, net of direct origination costs, are deferred and amortized over the life of the loan using the effective yield method.
 
Interest on loans is accrued daily based on the principal amount outstanding. Generally, the accrual of interest on loans is discontinued when, in management’s opinion, the borrower may be unable to meet payments as they become due or when they are past due 90 days as to either principal or interest (based on contractual terms), unless they are well secured and in the process of collection. All interest accrued but not collected for loans that are placed on non-accrual status or charged off is reversed against interest income. Subsequent collections on a cash basis are applied proportionately to past due principal and interest, unless collectability of principal is in doubt, in which case all payments are applied to principal. Loans are returned to accrual status when the loan is deemed current, and the collectability of principal and interest is no longer doubtful, or, generally, when the loan is less than 90 days delinquent.
 
The Bank charges fees for originating loans. These fees, net of certain loan origination costs, are deferred and amortized to income, on the level-yield basis, over the loan term. If the loan is repaid prior to maturity, the remaining unamortized net deferred loan origination fee is recognized in income at the time of repayment.
 
 
   F-8


1ST SECURITY BANK OF WASHINGTON
Notes to Financial Statements
June 30, 2011 (Unaudited) and December 31, 2010 and 2009
 
(Dollars in thousands)
 
Note 1 – Summary of Significant Accounting Policies (Continued)
 
Impaired Loans – A loan is considered impaired when it is probable the Bank will be unable to collect all contractual principal and interest payments due in accordance with the original or modified terms of the loan agreement. Impaired loans are measured based on the estimated fair value of the collateral less estimated cost to sell if the loan is considered collateral dependent. Impaired loans not considered to be collateral dependent are measured based on the present value of expected future cash flows.
 
The categories of non-accrual and impaired loans overlap, although they are not coextensive. The Bank considers all circumstances regarding the loan and borrower on an individual basis when determining whether an impaired loan should be placed on non-accrual status. These circumstances include the financial strength of the borrower, the collateral value, reasons for delay, payment record, the amount of past due and the number of days past due. Loans that experience insignificant payment delays and payment shortfalls are generally not classified as impaired. Management determines the significance of payment delays and payment shortfalls on a case-by-case basis, taking into consideration all of the circumstances surrounding the loan and the borrower, including the length of the delay, the reasons for the delay, the borrower’s prior payment record, and the amount of shortfall in relation to the principal and interest owed.
 
Allowance for Loan Losses – The allowance for loan losses is maintained at a level considered adequate to provide for probable losses on existing loans based on evaluating known and inherent risks in the loan portfolio. The allowance is reduced by loans charged-off and increased by provisions charged to earnings and recoveries on loans previously charged-off. The allowance is based on management’s periodic and systematic evaluation of factors underlying the quality of the loan portfolio, including changes in the size and composition of the loan portfolio, the estimated value of any underlying collateral, actual loan loss experience, current economic conditions, and detailed analysis of individual loans for which full collectibility may not be assured. This evaluation is inherently subjective as it requires estimates that are susceptible to significant revision as more information becomes available. While management uses the best information available to make its estimates, future adjustments to the allowance may be necessary if there is a significant change in economic and other conditions. The appropriateness of the allowance for loan losses is estimated based on these factors and trends identified by management at the time the financial statements are prepared.
 
When available information confirms that specific loans or portions thereof are uncollectible, these amounts are charged-off against the allowance for loan losses. The existence of some or all of the following criteria will generally confirm that a loss has been incurred: the loan is significantly delinquent and the borrower has not shown the ability or intent to bring the loan current; the Bank has no recourse to the borrower, or if it does, the borrower has insufficient assets to pay the debt; the estimated fair value of the loan collateral is significantly below the current loan balance and there is little or no near-term prospect for improvement.
 
A provision of loan losses is charged against income and added to the allowance for loan losses based on regular assessment of the loan portfolio. The allowance for loan losses is allocated to certain loan categories based on the relative risk characteristics, asset classifications and actual loss experience within the loan portfolio. Although management has allocated the allowance for loan losses to various loan portfolio segments, the allowance is general in nature and is available for the loan portfolio in its entirety.
 
 
   F-9


1ST SECURITY BANK OF WASHINGTON
Notes to Financial Statements
June 30, 2011 (Unaudited) and December 31, 2010 and 2009
 
(Dollars in thousands)
 
Note 1 – Summary of Significant Accounting Policies (Continued)
 
The ultimate recovery of all loans is susceptible to future market factors beyond the Bank’s control. These factors may result in losses or recoveries differing significantly from those provided for in the financial statements. In addition, regulatory agencies, as an integral part of their examination process, periodically review the Bank’s allowance for loan losses, and may require the Bank to make additions to the allowance based on their judgment about information available to them at the time of their examinations.
 
Reserve for Unfunded Loan Commitments and Letters of Credit – The reserve for unfunded loan commitments is maintained at a level believed by management to be sufficient to absorb estimated probable losses related to these unfunded credit facilities. The determination of the adequacy of the reserve is based on periodic evaluations of the unfunded credit facilities including an assessment of the probability of commitment usage, credit risk factors for loans outstanding to these same customers, and the terms and expiration dates of the unfunded credit facilities. The reserve for unfunded loan commitments is included in other liabilities on the balance sheets, with changes to the balance charged against noninterest expense.
 
Premises and Equipment, Net – Land is carried at cost. Premises and equipment are stated at cost less accumulated depreciation and amortization. Depreciation is computed using the straight-line method over the estimated useful lives of the assets. The estimated useful lives used to compute depreciation include building and building improvements from 20 to 50 years and furniture, fixtures, and equipment from 2 to 10 years. Leasehold and tenant improvements are amortized using the straight-line method over the lesser of useful life or the life of the related lease. For the six months ended June 30, 2011 and 2010 (unaudited), depreciation and amortization expense was $353 and $411, respectively. Depreciation and amortization expenses for these assets totaled $812 and $882 for the years ended December 31, 2010 and 2009, respectively. Gains or losses on dispositions are reflected in results of operations.
 
Other Real Estate Owned and Other Repossessed Items Other real estate owned and other repossessed items consist of properties or assets acquired through or in lieu of foreclosure, and are recorded initially at the lower of carrying amount of the loan or fair value less selling costs. Costs relating to development and improvement of the properties or assets are capitalized while costs relating to holding the properties or assets are expensed. Valuations are periodically performed by management, and a charge to earnings is recorded if the recorded value of a property exceeds its estimated net realizable value.
 
Transfers of Financial Assets – Transfers of financial assets are accounted for as sales when control over the assets has been surrendered. Control over transferred assets is deemed to be surrendered when (1) the assets have been isolated from the Bank; (2) the transferee obtains the right (free of conditions that constrain it from taking advantage of that right) to pledge or exchange the transferred assets; and (3) the Bank does not maintain effective control over the transferred assets.
 
 
   F-10


1ST SECURITY BANK OF WASHINGTON
Notes to Financial Statements
June 30, 2011 (Unaudited) and December 31, 2010 and 2009
 
(Dollars in thousands)
 
Note 1 – Summary of Significant Accounting Policies (Continued)
 
Mortgage Servicing Rights – Servicing assets are recognized as separate assets when rights are acquired through purchase or through sale of financial assets. Generally, purchased servicing rights are capitalized at the cost to acquire the rights. For sales of mortgage loans, a portion of the cost of originating the loan is allocated to the servicing right based on relative fair value. Fair value is based on market prices for comparable mortgage servicing contracts, when available, or alternatively, is based on a valuation model that calculates the present value of estimated future net servicing income. The valuation model incorporates assumptions that market participants would use in estimating future net servicing income, such as the cost to service, the discount rate, the custodial earnings rate, an inflation rate, ancillary income, prepayment speeds, and default rates and losses. Servicing assets are evaluated for impairment based upon the fair value of the rights as compared to amortized cost. Impairment is determined by stratifying rights into tranches based on predominant characteristics, such as interest rate, loan type, and investor type. Impairment is recognized through a valuation allowance for an individual tranche, to the extent that fair value is less than the capitalized amount for the tranches. If the Bank later determines that all or a portion of the impairment no longer exists for a particular tranche, a reduction of the allowance may be recorded as an increase to income. Capitalized servicing rights are reported in other assets and are amortized into non-interest income in proportion to, and over the period of, the estimated future net servicing income of the underlying financial assets.
 
Income Taxes – The Bank files a federal income tax return. Deferred federal income taxes result from temporary differences between the tax basis of assets and liabilities, and their reported amounts in the financial statements. These will result in differences between income for tax purposes and income for financial reporting purposes in future years. As changes in tax laws or rates are enacted, deferred tax assets and liabilities are adjusted through the provision for income taxes. Valuation allowances are established to reduce the net recorded amount of deferred tax assets if it is determined to be more likely than not, that all or some portion of the potential deferred tax asset will not be realized.
 
The Financial Accounting Standards Board (FASB) guidance related to accounting for uncertainty in income taxes prescribes a recognition threshold and measurement attribute for the financial statement recognition and measurement of a tax position taken or expected to be taken in a tax return. It is the Bank’s policy to record any penalties or interest arising from federal or state taxes as a component of non-interest expense.
 
As of June 30, 2011 (unaudited) and December 31, 2010 and 2009, the Bank recorded a valuation allowance of $3,487, $3,891 and $4,401, respectively, based principally on uncertainty about the Bank’s ability to generate sufficient future taxable income to realize the related net deferred tax assets. Management will continue to review the tax criteria related to the recognition of deferred tax assets.
 
Comprehensive Income (Loss) – Comprehensive income (loss) is comprised of net income (loss) and other comprehensive income (loss). Other comprehensive income (loss) includes items recorded directly to equity, such as unrealized gains and losses on securities available-for-sale. Comprehensive income is presented within the statement of equity.
 
 
   F-11


1ST SECURITY BANK OF WASHINGTON
Notes to Financial Statements
June 30, 2011 (Unaudited) and December 31, 2010 and 2009
 
(Dollars in thousands)
 
Note 1 – Summary of Significant Accounting Policies (Continued)
 
The components of other comprehensive income (loss) and related tax effect were as follows:
 
   
Six Months
Ended
   
Years Ended December 31,
 
   
June 30, 2011
   
2010
   
2009
 
   
(Unaudited)
             
Unrealized gains (losses) arising from during the year on securities
  $ 174     $ (122 )   $ 90  
Reclassification adjustment for unrealized (gains) losses realized in net income, net of tax
                (63 )
Net change in unrealized gains (losses) on available-for-sale securities
  $ 174     $ (122 )   $ 27  
 
Financial Instruments – In the ordinary course of business, the Bank has entered into agreements for off-balance-sheet financial instruments consisting of commitments to extend credit and stand-by letters of credit. Such financial instruments are recorded in the financial statements when they are funded or related fees are incurred or received.
 
Restricted Assets – Federal Reserve regulations require that the Bank maintain reserves in the form of cash on hand and deposit balances with the Federal Reserve Bank, based on a percentage of deposits. The amounts of such balances as of June 30, 2011 (unaudited), December 31, 2010 and 2009 were approximately $734, $764 and $892, respectively, included in cash and due from banks on the balance sheet.
 
Marketing and Advertising Costs – The Bank records marketing and advertising costs as expenses as they are incurred. Total marketing and advertising expense was $98 and $142 for the six months ended June 30, 2011 and 2010 (unaudited), respectively. For the years ended December 31, 2010 and 2009 marketing and advertising costs were $344 and $285, respectively.
 
Recently Issued Accounting Pronouncements
 
In July 2010, the FASB issued Accounting Standards Update No. 2010-20, Receivables (Topic 310): Disclosures about the Credit Quality of Financing Receivables and the Allowance for Credit Losses. The ASU expands existing disclosures to require an entity to provide additional information in their disclosures about the credit quality of their financing receivables and the credit reserves held against them. Specifically, entities will be required to present a roll forward of activity in the allowance for credit losses, the nonaccrual status of financing receivables by class of financing receivables, and impaired financing receivables by class of financing receivables, all on a disaggregated basis. The ASU also requires an entity to provide additional disclosures on credit quality indicators of financing receivables at the end of the reporting period by class of financing receivables, the aging of past due financing receivables at the end of the reporting period by class of financing receivables, the nature and extent of troubled debt restructurings that occurred during the period by class of financing receivables and their effect on the allowance for credit losses and significant purchases and sales of financing receivables during the reporting period disaggregated by portfolio segment. The disclosures of period-end balances were effective for interim and annual reporting periods ending after December 15, 2010. The disclosures of activity are effective for interim and annual periods beginning on or after December 15, 2010. The adoption of this ASU in 2011 will not have a material impact on the Bank’s financial statements.
 
 
   F-12


Note 1 – Summary of Significant Accounting Policies (Continued)
 
In December 2010, the FASB issued ASU No. 2010-29—Business Combinations (Topic 805): Disclosure of Supplementary Pro Forma Information for Business Combinations. This ASU requires that if a public entity discloses comparative financial statements, then those disclosures of revenue and earnings of the combined entity should be as though the business combination(s) that occurred during the current year had occurred as of the beginning of the comparable prior annual reporting period only. The ASU also expands the supplemental pro forma disclosures under Topic 805 to include a description of the nature and amount of material, nonrecurring pro forma adjustments directly attributable to the business combination. The ASU will be applied prospectively for business combinations that are consummated on or after the beginning of the first annual reporting period beginning on or after December 15, 2010. The adoption of this ASU will not have an impact on the Bank’s financial statements.
 
In December 2010, the FASB issued ASU No. 2010-28, Intangibles—Goodwill and Other (Topic 350): When to Perform Step 2 of the Goodwill Impairment Test for Reporting Units with Zero or Negative Carrying Amounts . This ASU modifies Step 1 of the goodwill impairment test for reporting units with zero or negative carrying amounts. For those reporting units, an entity will be required to perform Step 2 of the goodwill impairment test if there are adverse qualitative factors that indicate that it is more likely than not that a goodwill impairment exists. The ASU is effective for fiscal years, and interim periods within those years, beginning after December 15, 2010. The adoption of this ASU will not have an impact on the Bank’s financial statements.
 
In April 2011, the FASB issued ASU No. 2011-02, A Creditor’s Determination of Whether a Restructuring is a Troubled Debt Restructuring. This ASU clarifies guidance within Accounting Standards Codification Topic 310,  Receivables—Troubled Debt Restructurings by Creditors , of whether a creditor has granted to the borrower a concession during a loan restructuring and clarifies the guidance applicable to evaluating whether a borrower is experiencing financial difficulties. Both of these evaluations must be performed by a creditor during a loan restructuring to determine if the restructuring qualifies as a troubled debt restructuring. This ASU also requires additional disclosures included in ASU 2010-20, but deferred from the original adoption date, regarding troubled debt restructurings to be disclosed. The effective date of this ASU is for the first interim period beginning after June 15, 2011, and is to be applied retrospectively to restructurings occurring on or after January 1, 2011. Management is evaluating the impact of adoption.
 
In May 2011, the FASB issued ASU No. 2011-03—Reconsideration of Effective Control for Repurchase Agreements impacting FASB ASC 860-40, Transfers and Servicing. Entities that enter into repurchase and similar agreements will be required to account for even more of the transactions as secured borrowings. The amendment changes the assessment of effective control by focusing on the transferor’s contractual rights and obligations and removing the criterion to assess its ability to exercise those rights or honor those obligations. This update becomes effective for the Bank on a prospective basis for new transfers and modifications of existing transactions as of the beginning of the first interim or annual period beginning on or after December 15, 2011. The Bank is currently evaluating the impact of adopting the new guidance on the financial statements.
 
In May 2011, the FASB issued ASU No. 2011-04—Amendments to Achieve Common Fair Value Measurement and Disclosure Requirements in U.S. GAAP and IFRSs.  This update clarifies the methodologies and assumptions to be used by entities applying fair value measures, expands disclosure of qualitative factors used in determining fair values, and provides guidance on measuring the fair value of financial instruments included within shareholders’ equity. This update becomes effective for Bancorp on a prospective basis for the first interim or annual period beginning on or after December 15, 2011. This updated guidance will impact financial statement disclosures, but will not have an effect on the Bank’s financial condition, results of operations, or cash flows.
 
Note 2 – Securities Available-for-Sale
 
The carrying amount of securities available-for-sale and their approximate fair values were as follows, according to management’s intent:
 
   
June 30, 2011 (Unaudited)
 
   
Amortized
Cost
   
Gross
Unrealized
Gains
   
Gross
Unrealized
Losses
(less than 1
year)
   
Gross
Unrealized
Losses
(greater
than 1
Year)
   
Estimated
Fair Values
 
Securities Available-for-sale
                             
Federal agency securities
  $ 9,802     $ 43     $ (12 )   $     $ 9,833  
Municipal bonds
    1,400       28       (19 )           1,409  
Mortgage-backed securities
    424       23                   447  
Total securities available-for-sale
  $ 11,626     $ 94     $ (31 )   $     $ 11,689  
 
 
   F-13


1ST SECURITY BANK OF WASHINGTON
Notes to Financial Statements
June 30, 2011 (Unaudited) and December 31, 2010 and 2009
 
(Dollars in thousands)
 
Note 2 – Securities Available for Sale (Continued)
 
   
December 31, 2010
 
   
Amortized
Cost
   
Gross
Unrealized
Gains
   
Gross
Unrealized
Losses
(less than 1
year)
   
Gross
Unrealized
Losses
(greater
than 1
Year)
   
Estimated
Fair Values
 
Securities Available-for-sale
                             
Federal agency securities
  $ 6,175     $     $ (89 )   $     $ 6,086  
Municipal bonds
    1,144             (41 )           1,103  
Mortgage-backed securities
    434       19                   453  
Total securities available-for-sale
  $ 7,753     $ 19     $ (130 )   $     $ 7,642  


December 31, 2009
 
   
Amortized
Cost
    Gross
Unrealized
Gains
    Gross
Unrealized
Losses
    Estimated
Fair Values
 
Mortgage backed securities
  $ 592     $ 11     $     $ 603  
Total securities available-for-sale
  $ 592     $ 11     $     $ 603  
 
There were 9 investments as of June 30, 2011 (unaudited) and 13 investments with unrealized losses of less than one year at December 31, 2010, respectively. The unrealized losses associated with these investments are believed to be caused by changing market conditions that are considered to be temporary. The Bank has the intent and ability to hold these securities until recovery, and is not likely to be required to sell.
 
No other-than-temporary impairment write-downs were recorded for the six months ended June 30, 2011 (unaudited) and years ended December 31, 2010 and 2009.
 
The contractual maturities of securities available-for-sale were as follows:
                                                 
     June 30, 2011      December 31,  
    (Unaudited)     2010       2009  
   
Amortized
Cost
    Fair Value     Amortized
Cost
    Fair Value     Amortized
Cost
    Fair Value  
No contractual maturity
  $     $     $     $     $     $  
Due in one year or less
                                   
Due in one year to five years
    4,527       4,550       2,678       2,658              
Due in five years to ten years
    2,713       2,728       872       849              
Due in over ten years
    4,386       4,411       4,203       4,135       592       603  
Total
  $ 11,626     $ 11,689     $ 7,753     $ 7,642     $ 592     $ 603  
 
 
   F-14


1ST SECURITY BANK OF WASHINGTON
Notes to Financial Statements
June 30, 2011 (Unaudited) and December 31, 2010 and 2009
 
(Dollars in thousands)
 
Note 3 – Loans Receivable and Allowance for Loan Losses
 
The composition of the loan portfolio was as follows:
 
    June 30,     December 31,  
    2011     2010     2009  
   
(Unaudited)
             
REAL ESTATE LOANS
                 
One- to four-family
  $ 12,833     $ 13,218     $ 8,233  
Home equity
    15,439       15,655       16,448  
Multi-family
    1,168       1,159       409  
Commercial
    25,675       28,061       29,099  
Construction and development
    6,304       9,805     $ 17,390  
Total real estate loans
    61,419       67,898       71,579  
CONSUMER LOANS
                       
Indirect home improvement
    87,232       94,833       89,883  
Automobile
    8,927       12,645       23,359  
Recreational
    25,341       24,105       18,011  
Home improvement
    1,070       1,295       1,725  
Deposit account
    29       32       110  
Other
    2,061       2,855       4,167  
Total consumer loans
    124,660       135,765       137,255  
COMMERCIAL BUSINESS LOANS
    28,430       32,841       29,699  
Total loans
    214,509       236,504       238,533  
Allowance for loan losses
    (4,836 )     (5,905 )     (7,405 )
Deferred fees and discounts, net
    511       223       313  
Total loans receivable, net
  $ 210,184     $ 230,822     $ 231,441  
 
The Bank defined its loan portfolio into three segments that reflect the structure of the lending function, the Bank’s strategic plan and the manner in which management monitors performance and credit quality. The three loan portfolio segments are: (a) Real Estate (secured) Loans, (b) Consumer Loans and (c) Commercial Business Loans. Each of these segments is disaggregated into classes based on the risk characteristics of the borrower and/or the collateral type securing the loan. The following is a summary of each of the Bank’s loan portfolio segments and classes:
 
Real Estate Loans
 
One- to Four-Family Real Estate Lending. Loans originated by the Bank secured by first mortgages on one- to four-family residences, primarily in our market area.
 
Home Equity Lending. Loans originated by the Bank secured by second mortgages on one-to-four family residences, primarily in our market area.
 
Multi-family and Commercial Real Estate Lending. Loans originated by the Bank primarily secured by income producing properties, including retail centers, warehouses and office buildings located in our market areas. The Bank also has a limited amount of loans secured by multi-family residences.
 
 
   F-15


1ST SECURITY BANK OF WASHINGTON
Notes to Financial Statements
June 30, 2011 (Unaudited) and December 31, 2010 and 2009
 
(Dollars in thousands)
 
Note 3 – Loans Receivable and Allowance for Loan Losses (Continued)
 
Construction and Development Lending. Loans originated by the Bank for the construction of and secured by commercial real estate and, to a lesser extent, one- to four-family residences and tracts of land for development.
 
Consumer Lending
 
Indirect Home Improvement. Fixture secured loans are originated by the Bank for home improvement and are secured by the personal property installed in, on or at the borrower’s real property, and may be perfected with a UCC-2 financing statement filed in the county of the borrower’s residence.
 
Automobile and Recreational. Loans originated by the Bank secured by boats and automobiles.
 
Other Consumer Loans. Loans originated by the Bank, including direct home improvement, loans on deposit and other consumer loans.
 
Commercial Business Loans
 
Commercial Business Lending. Commercial business loans originated by the Bank to local small- and mid-sized businesses in our Puget Sound market area that are secured by accounts receivable, inventory or property, plant and equipment. Commercial business loans are made on the basis of the borrower’s ability to make repayment from the cash flow of the borrower’s business.
 
The following table details activity in the allowance for loan losses by loan categories:
 
   
June 30, 2011
 
   
(Unaudited)
 
   
Real Estate
Loans
   
Consumer
   
Commercial Business
   
Unallocated
   
Total
 
                               
Beginning Balance
  $ 1,213     $ 3,361     $ 837     $ 494     $ 5,905  
Provision for loan loss
    634       748       (529 )     177       1,030  
Charge-offs
    (729 )     (1,763 )                 (2,492 )
Recoveries
          393                   393  
Net charge-offs
    (729 )     (1,370 )                 (2,099 )
Ending balance
  $ 1,118     $ 2,739     $ 308     $ 671     $ 4,836  
                                         
Period-end amount allocated to:
                                       
Loans individually evaluated for impairment
  $ 639     $     $ 244     $     $ 883  
Loans collectively evaluated for impairment
    479       2,739       64       671       3,953  
Ending Balance
  $ 1,118     $ 2,739     $ 308     $ 289     $ 4,836  
                                         
LOANS RECEIVABLES
                                       
Loans individually evaluated for impairment
  $ 2,639     $     $ 3,041     $     $ 5,680  
Loans collectively evaluated for impairment
    58,780       124,660       25,389             208,829  
Ending Balance
  $ 61,419     $ 124,660     $ 28,430           $ 214,509  
 
 
   F-16


1ST SECURITY BANK OF WASHINGTON
Notes to Financial Statements
June 30, 2011 (Unaudited) and December 31, 2010 and 2009
 
(Dollars in thousands)
 
Note 3 – Loans Receivable and Allowance for Loan Losses (Continued)
 
   
June 30, 2010
 
   
(Unaudited)
 
   
Real Estate
Loans
   
Consumer
   
Commercial Business
   
Unallocated
   
Total
 
Beginning Balance
  $ 2,230     $ 3,628     $ 1,069     $ 478     $ 7,405  
Provision for loan loss
    514       1,700       (90 )     (219 )     1,905  
Charge-offs
    (1,388 )     (2,006 )     (74 )           (3,468 )
Recoveries
          383                   383  
Net charge-offs
    (1,388 )     (1,623 )     (74 )           (3,085 )
Ending balance
  $ 1,356     $ 3,705     $ 905     $ 259     $ 6,225  
                                         
Period-end amount allocated to:
                                       
Loans individually evaluated for impairment
  $ 926     $     $ 839     $     $ 1,765  
Loans collectively evaluated for impairment
    430       3,705       66       289       4,490  
Ending balance
  $ 1,356     $ 3,705     $ 905     $ 289     $ 6,255  
LOANS RECEIVABLES
                                       
Loans individually evaluated for impairment
  $ 5,702     $     $ 5,180     $     $ 10,882  
Loans collectively evaluated for impairment
    60,337       136,968       26,434             223,739  
Ending balance
  $ 66,039     $ 136,968     $ 31,614     $     $ 234,621  
 
   
December 31, 2010


Real Estate
Loans
   
Consumer
   
Commercial Business
   
Unallocated
   
Total
 
Beginning Balance
  $ 2,230     $ 3,628     $ 1,069     $ 478     $ 7,405  
Provision for loan loss
    707       2,814       (57 )     16       3,480  
Charge-offs
    (1,724 )     (3,794 )     (175 )           (5,693 )
Recoveries
          713                   713  
Net charge-offs
    (1,724 )     (3,081 )     (175 )           (4,980 )
Ending balance
  $ 1,213     $ 3,361     $ 837     $ 494     $ 5,905  
                                         
Period-end amount allocated to:
                                       
Loans individually evaluated for impairment
  $ 685     $     $ 767     $     $ 1,452  
Loans collectively evaluated for impairment
    528       3,361       70       494       4,453  
Ending balance
  $ 1,213     $ 3,361     $ 837     $ 494     $ 5,905  
LOANS RECEIVABLES
                                       
Loans individually evaluated for impairment
  $ 5,403     $     $ 4,720     $     $ 10,123  
Loans collectively evaluated for impairment
    62,495       135,765       28,121             226,381  
Ending balance
  $ 67,898     $ 135,765     $ 32,841     $     $ 236,504  
 
 
   F-17


1ST SECURITY BANK OF WASHINGTON
Notes to Financial Statements
June 30, 2011 (Unaudited) and December 31, 2010 and 2009
 
(Dollars in thousands)
 
Note 3 – Loans Receivable and Allowance for Loan Losses (Continued)
 
   
December 31, 2009


Real Estate
Loans
   
Consumer
   
Commercial Business
   
Unallocated
   
Total
 
Beginning Balance
  $ 3,205     $ 2,147     $ 246     $     $ 5,598  
Provision for loan loss
    621       5,145       823       478       7,067  
Charge-offs
    (1,596 )     (4,329 )                 (5,925 )
Recoveries
          665                   665  
Net charge-offs
    (1,596 )     (3,664 )                 (5,260 )
Ending balance
  $ 2,230     $ 3,628     $ 1,069     $ 478     $ 7,405  
                                         
Period-end amount allocated to:
                                       
Loans individually evaluated for impairment
  $ 1,874     $     $ 1,014     $     $ 2,888  
Loans collectively evaluated for impairment
    356       3,628       55       478       4,517  
Ending Balance
  $ 2,230     $ 3,628     $ 1,069     $ 478     $ 7,405  
                                         
LOANS RECEIVABLES
                                       
Loans individually evaluated for impairment
  $ 10,198     $     $ 7,804             $ 18,002  
Loans collectively evaluated for impairment
    61,381       137,255       21,895           220,531  
Ending Balance
  $ 71,579     $ 137,255     $ 29,699         $ 238,533  
 
 
   F-18


1ST SECURITY BANK OF WASHINGTON
Notes to Financial Statements
June 30, 2011 (Unaudited) and December 31, 2010 and 2009
 
(Dollars in thousands)
 
Note 3 – Loans Receivable and Allowance for Loan Losses (Continued)
 
Information pertaining to aging analysis of past due loans are summarized as follows:
 
   
June 30, 2011


30-50
Days Past
Due
   
60-89
Days Past
Due
   
Greater
Than 90
Days and Accruing
   
Total Past
Due
   
Non-
accrual
   
Current
   
Total
Loans
Receivable
 
Real estate loans
                                         
One- to four-family
  $     $     $     $     $ 234     $ 12,599     $ 12,833  
Home equity
    233       133       57       423       605       14,411       15,439  
Multi-family
                                  1,168       1,168  
Commercial
                                  25,675       25,675  
Construction and development
                                  6,304       6,304  
Total real estate loans
    233       133       57       424       839       60,157       61,419  
Consumer
                                                       
Indirect home improvement
    758       391             1,149       421       85,662       87,232  
Automobile
    291       72             363       37       8,527       8,927  
Recreational
    221       10             231       1       25,109       25,341  
Home improvement
    22                   22       37       1,011       1,070  
Other
    16       14             30       8       2,052       2,090  
Total consumer loans
    1,308       487             1,795       504       122,361       124,660  
Commercial business loans
                            558       27,872       28,430  
Total
  $ 1,541     $ 620     $ 57     $ 2,218     $ 1,901     $ 210,390     $ 214,509  
 
 
   F-19


1ST SECURITY BANK OF WASHINGTON
Notes to Financial Statements
June 30, 2011 (Unaudited) and December 31, 2010 and 2009
 
(Dollars in thousands)
 
Note 3 – Loans Receivable and Allowance for Loan Losses (Continued)
 
   
December 31, 2010


30-50 Days
Past Due
   
60-89 Days
Past Due
   
Greater
Than 90
Days and
Accruing
   
Total Past
Due
   
Non-accrual
   
Current
   
Total Loans
Receivable
 
Real estate loans
                                         
One- to four-family
  $     $     $     $     $ 211     $ 13,007     $ 13,218  
Home equity
    369       120       62       551       574       14,530       15,655  
Multi-family
                                  1,159       1,159  
Commercial
                            1,201       26,860       28,061  
Construction and development
                            2,175       7,630       9,805  
Total real estate loans
    369       120       62       551       4,161       63,186       67,898  
Consumer
                                                       
Indirect home improvement
    919       546             1,465       522       92,846       94,833  
Automobile
    378       113             491       54       12,100       12,645  
Recreational
    141       136             277       38       23,790       24,105  
Home improvement
    19                   19       75       1,201       1,295  
Other
    28       23             51       3       2,833       2,887  
Total consumer loans
    1,485       818             2,303       692       132,770       135,765  
Commercial business loans
                            1,387       31,454       32,841  
Total
  $ 1,854     $ 938     $ 62     $ 2,854     $ 6,240     $ 227,410     $ 236,504  
 
   
December 31, 2009


30-50 Days
Past Due
   
60-89 Days
Past Due
   
Greater
Than 90
Days and
Accruing
   
Total Past
Due
   
Non-accrual
   
Current
   
Total Loans
Receivable
 
Real estate loans
                                         
One- to four-family
  $     $     $     $     $     $ 8,233     $ 8,233  
Home equity
    255       290       163       708       40       15,700       16,448  
Multi-family
                                  409       409  
Commercial
                                  29,099       29,099  
Construction and development
                            6,758       10,632       17,390  
Total real estate loans
    255       290       163       708       6,798       64,073       71,579  
Consumer
                                                       
Indirect home improvement
    1,051       350             1,401       276       88,206       89,883  
Automobile
    646       211             857       35       22,467       23,359  
Recreational
    39       87             126       119       17,766       18,011  
Home improvement
    60       28             88       3       1,634       1,725  
Other
    62       62             124       60       4,093       4,277  
Total consumer loans
    1,858       738             2,596       493       134,166       137,255  
Commercial business loans
    13                   13             29,686       29,699  
Total
  $ 2,126     $ 1,028     $ 163     $ 3,317     $ 7,291     $ 227,925     $ 238,533  
 
 
F-20


1ST SECURITY BANK OF WASHINGTON
Notes to Financial Statements
June 30, 2011 (Unaudited) and December 31, 2010 and 2009
 
(Dollars in thousands)
 
Note 3 – Loans Receivable and Allowance for Loan Losses (Continued)
 
The following table summarizes loans individually evaluated for impairment by loan categories:
 
   
June 30, 2011
 
    (Unaudited)  
   
Unpaid
Principal
Balance
   
Write-
downs
   
Recorded
Investment
   
Specific
Reserve
   
Adjusted
Recorded
Investment
   
YTD
Average
Recorded
Investment
   
YTD
Interest
Income
Recognized
 
Real estate loans
                                         
One- to four-family
  $     $     $     $     $     $     $  
Home equity
                                         
Multi-family
                                         
Commercial
                                         
Construction and development
    2,639             2,639       (639 )     2,000       2,639        
Total real estate loans
    2,639             2,639       (639 )     2,000       2,639        
Consumer
                                                       
Indirect home improvement
                                         
Automobile
                                         
Recreational
                                         
Home improvement
                                         
Other
                                         
Total consumer loans
                                         
Commercial business loans
    3,438       (397 )     3,401       (244 )     2,797       3,341       6  
Total
  $ 6,077     $ (397 )   $ 5,680     $ (883 )   $ 4,797     $ 5,980     $ 6  
 
   
December 31, 2010


Unpaid
Principal
Balance
   
Write-
downs
   
Recorded
Investment
   
Specific
Reserve
   
Adjusted
Recorded
Investment
   
YTD
Average
Recorded
Investment
   
YTD
Interest
Income Recognized
 
Real estate loans
                                         
One- to four-family
  $     $     $     $     $     $     $  
Home equity
                                         
Multi-family
                                         
Commercial
    1,201             1,201       (120 )     1,081       1,504       31  
Construction and development
    4,402       (200 )     4,202       (565 )     3,637       4,404        
Total real estate loans
    5,403       (200 )     5,403       (685 )     4,718       5,908       31  
Consumer
                                                       
Indirect home improvement
                                         
Automobile
                                         
Recreational
                                         
Home improvement
                                         
Other
                                         
Total consumer loans
                                         
Commercial business loans
    4,870       (150 )     4,720       (767 )     3,953       5,072       6  
Total
  $ 10,473     $ (350 )   $ 10,123     $ (1,452 )   $ 8,671     $ 10,980     $ 37  
 
 
F-21


1ST SECURITY BANK OF WASHINGTON
Notes to Financial Statements
June 30, 2011 (Unaudited) and December 31, 2010 and 2009
 
(Dollars in thousands)
 
Note 3 – Loans Receivable and Allowance for Loan Losses (Continued)
 
   
December 31, 2009


Unpaid
Principal
Balance
   
Write-
downs
   
Recorded
Investment
   
Specific
Reserve
   
Adjusted
Recorded
Investment
   
YTD
Average
Recorded
Investment
   
YTD
Interest
Income
Recognized
 
Real estate loans
                                         
One- to four-family
  $     $     $     $     $     $     $  
Home equity
                                         
Multi-family
                                         
Commercial
    1,209             1,209       (242 )     967       336        
Construction and development
    8,989             8,989       (1,632 )     7,357       4,146        
Total real estate loans
    10,198             10,198       (1,874 )     8,324       4,482        
                                                         
Consumer
                                                       
Indirect home improvement
                                         
Automobile
                                         
Recreational
                                         
Home improvement
                                         
Other
                                         
Total consumer loans
                                         
                                                         
Commercial business loans
    7,804             7,804       (1,014 )     6,790       6,073        
Total
  $ 18,002     $     $ 18,002     $ (2,888 )   $ 15,114     $ 10,555     $  
 
 
F-22


1ST SECURITY BANK OF WASHINGTON
Notes to Financial Statements
June 30, 2011 (Unaudited) and December 31, 2010 and 2009
 
(Dollars in thousands)
 
Note 3 – Loans Receivable and Allowance for Loan Losses (Continued)
 
Credit Quality Indicators
 
As part of the Bank’s on-going monitoring of credit quality of the loan portfolio, management tracks certain credit quality indicators including trends related to (i) the risk grading of loans, (ii) the level of classified loans, (iii) net charge-offs, (iv) non-performing loans and (v) the general economic conditions in the Bank’s market.
 
The Bank utilizes a risk grading matrix to assign a risk grade to its commercial real estate and commercial business loans. Loans are graded on a scale of 1 to 10, with loans in risk grades 1 to 6 considered “Pass” and loans in risk grades 7 to 10 are reported as classified loans in our allowance for loan loss analysis.
 
A description of the 10 risk grades is as follows:
 
 
Grades 1 and 2 – These grades include loans to very high quality borrowers with excellent or desirable business credit
 
 
Grade 3 – This grade includes loans to borrowers of good business credit with moderate risk.
 
 
Grades 4 and 5 – These grades include “Pass” grade loans to borrowers of average credit quality and risk.
 
 
Grade 6 – This grade includes loans on management’s “Watch” list and is intended to be utilized on a temporary basis for “Pass” grade borrowers where frequent and thorough monitoring is required due to credit weaknesses and where significant risk-modifying action is anticipated in the near term.
 
 
Grade 7 – This grade is for “Other Assets Especially Mentioned (OAEM)” in accordance with regulatory guidelines and includes borrowers where performance is poor or significantly less than expected.
 
 
Grade 8 – This grade includes “Substandard” loans in accordance with regulatory guidelines which represent an unacceptable business credit where a loss is possible if loan weakness is not corrected.
 
 
Grade 9 – This grade includes “Doubtful” loans in accordance with regulatory guidelines where a loss is highly probable.
 
 
Grade 10 – This grade includes “Loss” loans in accordance with regulatory guidelines for which total loss is expected and when identified are charged-off.
 
Consumer Loans
 
Consumer loans, that represent generally smaller balance, homogenous loans, are evaluated on a pool basis until such time as a loan becomes past due more than 90 days. Loans that are current or less than 90 days past due are graded “Pass” risk grade 4 loans. Loans that are past due more than 90 days are classified “Substandard” risk grade 8.
 
 
F-23


1ST SECURITY BANK OF WASHINGTON
Notes to Financial Statements
June 30, 2011 (Unaudited) and December 31, 2010 and 2009
 
(Dollars in thousands)
 
Note 3 – Loans Receivable and Allowance for Loan Losses (Continued)
 
The following tables summarizes risk rated loan balances by category:
 
   
June 30, 2011
 
   
(Unaudited)
 
   
Pass
   
Watch
   
Special
Mention
   
Substandard
   
Doubtful
   
Total
 
Real estate loans
                                   
One- to four-family
  $ 11,874     $ 582     $     $ 377     $     $ 12,833  
Home equity
    14,595       278             290       276       15,439  
Multi-family
    1,168                               1,168  
Commercial
    19,277       6,398                         25,675  
Construction and development
    3,665             612       2,027             6,304  
Total real estate loans
    50,579       7,258       612       2,694       276       61,419  
                                                 
Consumer
                                               
Indirect home improvement
    86,811                   421             87,232  
Automobile
    8,890                   37             8,927  
Recreational
    25,340                   1             25,341  
Home improvement
    1,033                   37               1,070  
Other
    2,082                   8             2,090  
Total consumer loans
    124,156                   504             124,660  
                                                 
Commercial business loans
    25,319       70       1,065       1,976             28,430  
Total
  $ 200,054     $ 7,328     $ 1,677     $ 5,174     $ 276     $ 214,509  
 
   
December 31, 2010


Pass
   
Watch
   
Special
Mention
   
Substandard
   
Doubtful
   
Total
 
Real estate loans
                                   
One- to four-family
  $ 12,281     $ 558     $     $ 379     $     $ 13,218  
Home equity
    14,658       423             412       162       15,655  
Multi-family
    1,159                               1,159  
Commercial
    25,815       950             1,296             28,061  
Construction and development
    5,603                   4,202             9,805  
Total real estate loans
    59,516       1,931             6,289       162       67,898  
                                                 
Consumer
                                               
Indirect home improvement
    94,311                   522             94,833  
Automobile
    12,591                   54             12,645  
Recreational
    24,067                   38             24,105  
Home improvement
    1,220                   75             1,295  
Other
    2,884                   3             2,887  
Total consumer loans
    135,073                   692             135,765  
                                                 
Commercial business loans
    28,216             370       4,255             32,841  
Total
  $ 222,805     $ 1,931     $ 370     $ 11,236     $ 162     $ 236,504  
 
 
F-24


1ST SECURITY BANK OF WASHINGTON
Notes to Financial Statements
June 30, 2011 (Unaudited) and December 31, 2010 and 2009
 
(Dollars in thousands)
 
Note 3 – Loans Receivable and Allowance for Loan Losses (Continued)
 
   
December 31, 2009
 
   
Pass
   
Watch
   
Special
Mention
   
Substandard
   
Doubtful
   
Non-Rated
   
Total
 
                                           
Real estate loans
                                         
One- to four-family
  $ 8,233     $     $     $     $     $     $ 8,233  
Home equity
    15,954       454             19       21             16,448  
Multi-family
    409                                     409  
Commercial
    27,645                   1,454                   29,099  
Construction and development
    3,640       771       2,231       10,748                   17,390  
Total real estate loans
    55,881       1,225       2,231       12,221       21             71,579  
                                                         
Consumer
                                                       
Indirect home improvement
    89,607                   276                   89,883  
Automobile
    23,324                   35                   23,359  
Recreational
    17,892                   119                   18,011  
Home improvement
    1,722                   3                   1,725  
Other
    4,217                   60                   4,277  
Total consumer loans
                      493             136,762       137,255  
                                                         
Commercial business loans
    22,140             1,500       6,059                   29,699  
Total
  $ 214,783     $ 1,225     $ 3,731     $ 18,773     $ 21     $ 136,762     $ 238,533  
 
The Bank had no troubled debt restructured loans on non-accrual status and included in impaired loans at June 30, 2011 (unaudited), December 31, 2010 and 2009, respectively. The Bank had no commitments to lend additional funds on impaired loans.
 
A summary of troubled debt restructured loans is as follows:
 
          December 31,   
    June 30, 2011    
2010
   
2009
 
    (unaudited)     


Troubled debt restructured loans still on accrual
1,508      $ 1,508     $  
 
Certain directors and executive officers or their related affiliates are customers of and have had banking transactions with the Bank. The amount of loans outstanding to directors, executive officers, and related business entities with which they are associated was none at June 30, 2011 (unaudited), none and $21 at December 31, 2010 and 2009, respectively. All loans and commitments included in such transactions were made in compliance with applicable laws on substantially the same terms (including interest rates and collateral) as those prevailing at the time for comparable transactions with other persons and do not involve more than the normal risk of collectability or present any other unfavorable features.
 
 
F-25


1ST SECURITY BANK OF WASHINGTON
Notes to Financial Statements
June 30, 2011 (Unaudited) and December 31, 2010 and 2009
 
(Dollars in thousands)
 
Note 3 – Loans Receivable and Allowance for Loan Losses (Continued)
 
Related party loan activities are summarized as follows:
 
    Six Months
Ended
June 30,
 2011 
   

Years Ended December 31,
        2010     2009  
     
(Unaudited)
                 
Beginning balance
  $     $ 21     $ 23  
New loans repayments
          (21 )     (2 )
Ending balance
  $     $     $ 21  
 
Note 4 – Mortgage servicing Rights
 
Mortgage loans serviced for others are not included on the accompanying balance sheets. The unpaid principal balances of mortgages serviced for others were $48,554, $55,169 and $67,679, respectively, at June 30, 2011 (unaudited), December 31, 2010 and 2009, respectively. The Bank evaluated the fair market value of the mortgage servicing rights assets of June 30, 2011. The fair market value was $303.
 
Mortgage servicing rights activities are summarized as follows:
 
   
Six Months
Ended June 30,
   
Years Ended
December 31,
 
   
2011
   
2010
   
2009
 
   
(Unaudited)
             
Beginning balance
  $ 245     $ 340     $ 461  
Mortgage servicing rights amortized
    (48 )     (95 )     (121 )
Ending balance
  $ 197     $ 245     $ 340  
 
Note 5 – Bank Premises and Equipment
 
Premises and equipment are summarized as follows:
                   
         
December 31,
 
   
June 30, 2011
   
2010
   
2009
 
   
(Unaudited)
             
Land
  $ 1,767     $ 1,767     $ 2,374  
Buildings
    6,620       6,620       6,509  
Furniture, fixtures, and equipment
    3,768       3,680       4,683  
Leasehold improvements
    867       867       728  
Building improvements
    1,022       1,003       1,439  
Projects in process
    136       98       75  
      14,180       14,035       15,808  
Less accumulated depreciation and amortization
    (5,140 )     (4,786 )     (6,087 )
Total
  $ 9,040     $ 9,249     $ 9,721  
 
 
F-26


1ST SECURITY BANK OF WASHINGTON
Notes to Financial Statements
June 30, 2011 (Unaudited) and December 31, 2010 and 2009
 
(Dollars in thousands)
 
Note 5 – Bank Premises and Equipment (Continued)
 
The Bank leases premises and equipment under operating leases. Rental expense of leased premises and equipment was $109, $221, and $264 for the six months ended June 30, 2011 (unaudited), December 31, 2010 and 2009, respectively, which is included in occupancy expense.
 
Minimum net rental commitments under noncancelable leases having, an original or remaining term of more than one year for future years, are as follows:
 
Periods Ending December 31,
 
As of
June 30, 2011
 
   
(Unaudited)
 
2011
  $ 115  
2012
    234  
2013
    233  
2014
    242  
2015
    187  
Thereafter
    347  
    $ 1,358  
 
Certain leases contain renewal options from five to ten years and escalation clauses based on increases in property taxes and other costs.
 
Note 6 – Other Real Estate Owned (OREO), Net and Repossessed Items
 
OREO activities are summarized as follows:
 
   
Six Months Ended
   
Years Ended December 31,
 
   
June 30, 2011
   
2010
   
2009
 
   
(Unaudited)
             
Beginning balance
  $ 3,701     $ 5,484     $  
Additions, net
    2,623       4,031       5,850  
Capitalized improvements
          13       21  
                         
Fair value write-downs
    (120 )     (111 )     (387 )
Disposition of assets
    (279 )     (5,716 )      
Ending balance
  $ 5,925     $ 3,701     $ 5,484  
 
At June 30, 2011 (unaudited), OREO consisted of four properties in Washington, with balances ranging from $1,063 to $1,863.
 
 
F-27


1ST SECURITY BANK OF WASHINGTON
Notes to Financial Statements
June 30, 2011 (Unaudited) and December 31, 2010 and 2009
 
(Dollars in thousands)
 
Note 6 – Other Real Estate Owned (OREO), Net and Repossessed Items (Continued)
 
Other repossessed items activities are summarized as follows:
 
    For Six Months
Ended
June 30, 2011
   
Years Ended
December 31,
 
       
2010
   
2009
 
   
(Unaudited)
             
                         
Beginning balance
  $ 78     $ 130     $ 44  
Additions
    263       492       801  
Disposition of assets
    (249 )     (544 )     (715 )
Ending balance
  $ 92     $ 78     $ 130  
 
The Bank recorded a loss on other repossessed items, which is included in other noninterest income for six months ended June 30, 2011 (unaudited) and the years ended December 31, 2010 and 2009 of $15, $38 and $65 respectively.
 
Note 7 – Deposits
 
Deposits are summarized as follows:
                   
         
December 31,
 
   
June 30, 2011
   
2010
   
2009


(Unaudited)
             
Interest bearing checking
  $ 17,303     $ 19,458     $ 22,764  
Non-interest bearing demand
    17,212       18,547       25,126  
Savings
    12,118       12,961       16,858  
Money market
    88,930       81,470       53,611  
Certificates of deposits less than $100,000
    44,654       47,469       52,627  
Certificates of deposits $100,000 and over
    61,258       64,052       59,999  
Total
  $ 241,475     $ 243,957     $ 230,985  
 
Scheduled maturities of time deposits for future years ending are as follows:
         
 
Periods Ending
December 31,
 
June 30, 2011


(Unaudited)
 
 
2011
  $ 26,933  
 
2012
    55,926  
 
2013
    5,544  
 
2014
    2,401  
 
2015
    14,243  
 
Thereafter
    865  
      $ 105,912  
 
 
F-28


1ST SECURITY BANK OF WASHINGTON
Notes to Financial Statements
June 30, 2011 (Unaudited) and December 31, 2010 and 2009
 
(Dollars in thousands)
 
Note 7 – Deposits (Continued)
 
The Bank pledged a certificate of deposit at FHLB to secure Washington State public deposits of $979 at June 30, 2011 (unaudited).
 
Interest expense by deposit category is as follows:
 
   
Six Months Ended
June 30,
   
Years Ended
December 31,
 
   
2011
   
2010
   
2010
   
2009
 
   
(Unaudited)
   
(Unaudited)
             
Interest-bearing checking
  $ 53     $ 102     $ 187     $ 246  
Savings and money market
    442       330       711       705  
Certificates of deposit
    1,044       1,434       2,770       3,281  
    $ 1,539     $ 1,866     $ 3,668     $ 4,232  
 
The Bank has related-party deposits of approximately $342, $330 and $239 at June 30 2011 (unaudited), and December 31, 2010 and 2009, respectively, which includes deposits held for directors and executive officers.
 
Note 8 – Borrowings
 
The Bank is a member of the Federal Home Loan Bank (FHLB) of Seattle, which entitles it to certain benefits including a variety of borrowing options. The FHLB borrowings at June 30, 2011 (unaudited), December 31, 2010 and 2009, consisted of a warehouse securities credit line (securities line), which allows advances with interest rates fixed at the time of borrowing and a warehouse cash management advance line (CMA line), which allows daily advances at variable interest rates. Credit capacity is primarily determined by the value of assets collateralized at the FHLB, funds on deposit at the FHLB, and stock owned by the Bank. Credit is limited to 9% of the Bank’s total assets. The Bank entered into an Advanced, Pledges and Security Agreement with the FHLB of Seattle for which specific loans are pledged to secure these credit lines. At June 30, 2011 (unaudited), loans of approximately $51,256 were pledged to the FHLB of Seattle. In addition, FHLB stock owned by the Bank and certain deposits held by the FHLB are collateral for credit lines. The Bank had an agreement with a commercial bank for a line of credit (Fed Funds line) totaling $12,000, none of which was used at December 31, 2009.
 
The Bank also maintains a short-term borrowing line with the Federal Reserve Bank (FRB) with total credit based on eligible collateral. The Bank can borrow under the Term Auction or Term Facility. As of June 30, 2011 (unaudited) and December 31, 2010, the Bank had a borrowing capacity of $90,238 and $96,587, respectively, of which none was outstanding. As of December 31, 2009, the Bank had a borrowing capacity of $94,541, of which $20,000 was outstanding. The borrowing matured on January 14, 2010 with an interest rate of 0.25%.
 
 
F-29


1ST SECURITY BANK OF WASHINGTON
Notes to Financial Statements
June 30, 2011 (Unaudited) and December 31, 2010 and 2009
 
(Dollars in thousands)
 
Note 8 – Borrowings (Continued)
 
Borrowings on these lines were as follows:
 
         
December 31,
 
   
June 30, 2011
   
2010
   
2009
 
   
(Unaudited)
             
Federal Home Loan Bank – CMA line (interest at .75% as of December 31, 2010)
  $     $ 18,000     $  
Federal Home Loan Bank – Securities lines (interest ranging from 4.57% to 4.42%, 4.57% to 4.42% and 4.42% to 4.27% as of June 30, 2011 (unaudited), December 31, 2010 and 2009, respectively)
    3,900       3,900       5,900  
Federal Reserve Bank-Term Auction Facility (interest at .25% as of December 31, 2009)
                20,000  
Total
  $ 3,900     $ 21,900     $ 25,900  
 
The maximum and average outstanding and weighted average interest rates on borrowings were as follows:
 
          December 31,  
   
June 30, 2011
   
2010
   
2009
 
   
(Unaudited)
             
Maximum balance:
                 
Federal Home Loan Bank advances
  $ 21,900     $ 18,000     $ 11,900  
Fed Funds purchased
                600  
Federal Reserve Bank
          37,000       30,000  
Average balance:
                       
Federal Home Loan Bank advances
    4,099       4,879       6,417  
Fed Funds purchased
                5  
Federal Reserve Bank
          2,620       9,877  
Weighted average interest rate:
                       
Federal Home Loan Bank advances
    4.29 %     1.42 %     4.41 %
Federal Reserve Bank
          0.29 %     .25 %
 
 
   F-30


1ST SECURITY BANK OF WASHINGTON
Notes to Financial Statements
June 30, 2011 (Unaudited) and December 31, 2010 and 2009
 
(Dollars in thousands)
 
Note 8 – Borrowings (Continued)
 
Scheduled maturities of the advances are as follows:
 
     
June 30, 2011
(Unaudited)
 
  Periods Ending
December 31
  Amount     Rate  
               
 
2011
           
 
2012
    2,200       4.42 %
 
2013
           
 
2014
           
 
2015
    1,700       4.57 %
 
Thereafter
           
      $ 3,900          
 
Note 9 – Employee Benefits
 
The Bank has a salary deferral 401(k) plan covering substantially all of its employees. Employees are eligible to participate in the Plan if they are 18 years of age and have been employed by the Bank for at least 30 days. Eligible employees may contribute through payroll deductions and are 100% vested at all times in their deferral contributions account. The Bank is allowed to make annual matching contributions at its discretion. There were no contributions for the six months ended June 30, 2011 (unaudited) and year ended December 31, 2010. For year ended December 31, 2009, there was a contribution of $109.
 
The Bank sponsored a defined benefit pension plan (the Plan) for benefit of its employees. The Plan calls for benefits to be paid to eligible employees at retirement, based primarily upon years of service with the Bank and compensation levels at retirement. Contributions to the Plan reflect benefits attributed to employees’ service to date, as well as services expected to be earned in the future.
 
On December 31, 2007, the Plan was terminated. As of December 31, 2008, of the benefits considered payable to Plan participants, $3,962 had been disbursed and $22 remained to be disbursed. On November 30, 2010, the remaining funds were disbursed.
 
 
   F-31


1ST SECURITY BANK OF WASHINGTON
Notes to Financial Statements
June 30, 2011 (Unaudited) and December 31, 2010 and 2009
 
(Dollars in thousands)
 
Note 10 – Income Taxes
 
Provision (benefit) for income tax includes the following components:
 
   
Six Months Ended
June 30,
   
Years Ended
December 31,
 
   
2011
   
2010
   
2010
   
2009
 
   
(Unaudited)
   
(Unaudited)
             
Provision (benefit) for income taxes
                       
Deferred
  $ 345     $ 189     $ 552     $ (1,538 )
Current
                       
      345       189       552       (1,538 )
Less valuation allowance
    (345 )     (189 )     (552 )     1,538  
Total provision for income taxes expense
  $     $     $     $  
 
A reconciliation of the effective income tax rate with the federal statutory tax rates is summarized as follows:
 
   
Six Months Ended June 30,
 
    2011     2010  
   
(Unaudited)
   
(Unaudited)
 
   
Amount
   
Rate
   
Amount
   
Rate
 
Income tax provision (benefit) at statutory rate
  $ 343       34.0 %   $ 186       34.0 %
Increase in tax resulting from nondeductible expenses
    2       0.2       3       0.5  
Valuation allowance
    (345 )     (34.2 )     (189 )     (34.5 )
    $       %   $       %
 
    Years Ended December 31,   
    2010     2009  
   
Amount
   
Rate
   
Amount
   
Rate
 
Income tax provision (benefit) at statutory rate
  $ 547       34.0 %   $ (1,555 )     (34.0 )%
Increase in tax resulting from nondeductible expenses
    5       0.3       17       0.4  
Valuation allowance
    (552 )     (34.3 )     1,538       33.6  
    $       %   $       %
 
 
   F-32


1ST SECURITY BANK OF WASHINGTON
Notes to Financial Statements
June 30, 2011 (Unaudited) and December 31, 2010 and 2009
 
(Dollars in thousands)
 
Note 10 – Income Taxes (Continued)
 
Total deferred tax assets and liabilities were as follows:
 
    June 30,    
December 31,
 
    2011     2010     2009  
                   
   
(Unaudited)
             
Deferred Tax Assets
                 
Net operating loss carryforward
  $ 2,731     $ 3,580     $ 3,848  
Allowance for loan losses
    784       211       734  
OREO costs
    193       161        
Non-accrued loan interest
    177       152       204  
Capital loss on securities
    72       72        
AMT credit carryforward
    60       60       60  
Securities available-for-sale
          38        
Other
    70       17       48  
Total deferred tax assets
    4,015       4,291       4,894  
Deferred Tax Liabilities
                       
Loan origination costs
    (361 )     (263 )     (305 )
Mortgage service rights
    (67 )     (83 )     (116 )
Prepaids
    (72 )     (52 )     (66 )
Stock dividend – FHLB stock
    (2 )     (2 )     (2 )
Securities available-for-sale
    (21 )           (4 )
Total deferred tax liabilities 
    (528 )     (400 )     (493 )
Valuation allowance
    (3,487 )     (3,891 )     (4,401 )
Net deferred tax assets
  $     $     $  
 
At June 30, 2011 (unaudited), December 31, 2010 and 2009, the Bank has net operating loss carryforwards of approximately $8,033, $10,500 and $11,300, respectively, which are scheduled to expire between 2030, 2029 and 2024, respectively. In June 2006, the FASB issued guidance that prescribes a recognition threshold and measurement tax position taken or expected to be taken in a tax return. The interpretation also provides guidance on derecognition, classification, interest and penalties, accounting in interim periods, disclosure and transition. With few exceptions, the Bank is no longer subject to U.S. Federal or State income tax examinations by tax authorities for years before 2007.
 
A valuation of allowance must be used to reduce deferred tax assets if it is “more than likely than not” that some portion of, or all of, the deferred tax assets will not be realized. Both positive and negative evidence must be considered to determine the amount in the valuation allowance. This information includes, but is not limited to taxable income in prior periods, projected future income, and projected future reversals of deferred tax items. The Bank must use judgment to determine whether negative evidence to the ability to objectively verify the evidence. Based on the current economic environment, management believes that a full valuation allowance is appropriate for June 30, 2011, December 31, 2010 and 2009. The Bank may also be subject to certain limitations under Section 382 of the Internal Revenue Code that relates to the utilization of net operating losses and other tax benefits following an ownership change.
 
 
   F-33


1ST SECURITY BANK OF WASHINGTON
Notes to Financial Statements
June 30, 2011 (Unaudited) and December 31, 2010 and 2009
 
(Dollars in thousands)
 
Note 11 – Commitments and Contingencies
 
Commitments – The Bank is party to financial instruments with off-balance-sheet risk in the normal course of business to meet the financing needs of its customers. These financial instruments include commitments to extend credit. These instruments involve, to varying degrees, elements of credit risk in excess of the amount recognized on the balance sheet.
 
The Bank’s exposure to credit loss in the event of nonperformance by the other party to the financial instrument for commitments to extend credit is represented by the contractual amount of those instruments. The Bank uses the same credit policies in making commitments and conditional obligations as it does for on-balance-sheet instruments.
 
A summary of the Bank’s commitments is as follows:
 
   
June 30,
    December 31,  
    2011      2010     2009  
                   
   
(Unaudited)
             
COMMITMENTS TO EXTEND CREDIT
                 
Real estate loans:
                 
Home equity
  $ 11,791     $ 11,973     $ 13,451  
Construction development:
                       
Commercial
    148       447       6,388  
One-to-four-family
    111       76        
Commercial
    1,081       575       1,726  
Multi-family
                3  
Total real estate loans
    13,131       13,071       21,568  
Consumer loans:
                       
Indirect home improvement
    874       1,160       1,658  
Other
    6,924       7,032       7,954  
Total consumer loans
    7,798       8,192       9,612  
Commercial business loans
    38,198       27,128       14,355  
Total commitments to extend credit
  $ 59,127     $ 48,391     $ 45,535  
 
 
   F-34


1ST SECURITY BANK OF WASHINGTON
Notes to Financial Statements
June 30, 2011 (Unaudited) and December 31, 2010 and 2009
 
(Dollars in thousands)
 
Note 11 – Commitments and Contingencies (Continued)
 
Commitments to extend credit are agreements to lend to a customer as long as there is no violation of any condition established in the contract. Since many of the commitments are expected to expire without being drawn upon, the total commitment amounts do not necessarily represent future cash requirements. The Bank evaluates each customer’s creditworthiness on a case-by-case basis. The amount of collateral obtained, if deemed necessary by the Bank upon extension of credit, is based on management’s credit evaluation of the party. Collateral held varies, but may include accounts receivable, inventory, property and equipment, residential real estate, and income-producing commercial properties.
 
Unfunded commitments under commercial lines-of-credit, revolving credit lines and overdraft protection agreements are commitments for possible future extensions of credit to existing customers. These lines-of-credit are uncollateralized and usually do not contain a specified maturity date and ultimately may not be drawn upon to the total extent to which the Bank is committed.
 
Because of the nature of its activities, the Bank is subject to various pending and threatened legal actions which arise in the ordinary course of business. In the opinion of management, liabilities arising from these claims, if any, will not have a material effect on the financial position of the Bank.
 
Note 12 – Significant Concentration of Credit Risk
 
Most of the Bank’s business activity is primarily with customers located in the greater Puget Sound area. The Bank originates real estate and consumer loans. Generally loans are secured by deposit accounts, personal property, or real estate. Rights to collateral vary and are legally documented to the extent practicable. Local economic conditions may affect borrowers’ ability to meet the stated repayment terms.
 
Note 13 – Regulatory Capital
 
The Bank is subject to various regulatory capital requirements administered by the federal banking agencies. Failure to meet minimum capital requirements can initiate certain mandatory – and possibly additional discretionary – actions by regulators that, if undertaken, could have a direct material effect on the Bank’s financial statements. Under capital adequacy guidelines of the regulatory framework for prompt corrective action, the Bank must meet specific capital adequacy guidelines that involve quantitative measures of the Bank’s assets, liabilities, and certain off-balance-sheet items as calculated under regulatory accounting practices. The Bank’s capital classification is also subject to qualitative judgments by the regulators about components, risk weightings, and other factors.
 
Quantitative measures established by regulation to ensure capital adequacy require the Bank to maintain minimum amounts and ratios (set forth in the table below) of Tier 1 capital (as defined in the regulations) to total average assets (as defined), and minimum ratios of Tier 1 and total capital (as defined) to risk-weighted assets (as defined).
 
As of June 30, 2011 (unaudited), December 31, 2010 and 2009, the Bank was in excess of the requirements to be categorized as well capitalized under the regulatory framework for prompt corrective action. To be categorized as well capitalized, the Bank must maintain minimum total risk-based, Tier 1 risk-based, and Tier 1 leverage ratios as set forth in the table below. There are no conditions or events since that notification that management believes have changed the Bank’s category. As of June 30, 2011, the Bank is required to maintain specified capital ratios. The Bank is in compliance with those requirements. There are no conditions or events since that notification that management believes have changed the Bank’s category.
 
 
   F-35


1ST SECURITY BANK OF WASHINGTON
Notes to Financial Statements
June 30, 2011 (Unaudited) and December 31, 2010 and 2009
 
(Dollars in thousands)
 
Note 13 – Regulatory Capital (Continued)
 
The Bank’s actual capital amounts and ratios are also presented in the table.
                                     
    Actual     For Capital
Adequacy Purposes
   
To be Well Capitalized
Under Prompt Corrective
Action Provisions
 
    Amount     Ratio     Amount     Ratio     Amount     Ratio  
As of June 30, 2011 (Unaudited)
                                   
Total Risk-based Capital
                                   
(to Risk-Weighted Assets)
  $ 28,781       12.57 %   $ 18,320       8.00 %   $ 22,900       10.00 %
Tier I Risk-based Capital
                                               
(to Risk-Weighted Assets)
  $ 25,894       11.31 %   $ 9,160       4.00 %   $ 13,740       6.00 %
Tier I Leverage Capital
                                               
(to Average Assets)
  $ 25,894       9.37 %   $ 11,053       4.00 %   $ 13,817       5.00 %
                                                 
As of December 31, 2010
                                               
Total Risk-based Capital
                                               
(to Risk-Weighted Assets)
  $ 28,091       11.06 %   $ 20,326    
≥ 8.00
  $ 25,408    
≥10.00
%
Tier I Risk-based Capital
                                               
(to Risk-Weighted Assets)
  $ 24,881       9.79 %   $ 10,163    
≥ 4.00
%   $ 15,245    
≥ 6.00
%
Tier I Leverage Capital
                                               
(to Average Assets)
  $ 24,881       9.09 %   $ 10,954    
≥ 4.00
%   $ 13,693    
≥ 5.00
%
                                                 
As of December 31, 2009
                                               
Total Risk-based Capital
                                               
(to Risk-Weighted Assets)
  $ 26,526       10.35 %   $ 20,506    
≥ 8.00
%   $ 25,632    
≥10.00
%
Tier I Risk-based Capital
                                               
(to Risk-Weighted Assets)
  $ 23,270       9.08 %   $ 10,253    
≥ 4.00
%   $ 15,379    
≥ 6.00
%
Tier I Leverage Capital
                                               
(to Average Assets)
  $ 23,270       8.36 %   $ 11,140    
≥ 4.00
%   $ 13,925    
≥ 5.00
%
 
Regulatory capital levels reported above differ from the Bank’s total capital, computed in accordance with accounting principles generally accepted (GAAP) in the United States as follows:
 
   
June 30,
    December 31,  
    2011     2010     2009  
   
(Unaudited)
             
Equity
  $ 25,977     $ 24,795     $ 23,315  
Unrealized (gain) loss on AFS securities
    (63 )     111       (11 )
Disallowed servicing assets
    (20 )     (25 )     (34 )
Total Tier 1 capital
    25,894       24,881       23,270  
                         
Allowance for loan and lease losses
    2,887       3,210       3,256  
Total risk-based capital
  $ 28,781     $ 28,091     $ 26,526  
 
 
   F-36


1ST SECURITY BANK OF WASHINGTON
Notes to Financial Statements
June 30, 2011 (Unaudited) and December 31, 2010 and 2009
 
(Dollars in thousands)
 
Note 14 – Fair Values of Financial Instruments
 
The Bank assumes interest rate risk (the risk that general interest rate levels will change) as a result of its normal operations. As a result, the fair value of the Bank’s financial instruments will change when interest rate levels change and that change may either be favorable or unfavorable to the Bank. Management attempts to match maturities of assets and liabilities to the extent believed necessary to minimize interest rate risk. However, borrowers with fixed interest rate obligations are less likely to prepay in a rising interest rate environment and more likely to prepay in a falling interest rate environment. Conversely, depositors who are receiving fixed interest rates are more likely to withdraw funds before maturity in a rising interest rate environment and less likely to do so in a falling interest rate environment. Management monitors interest rates and maturities of assets and liabilities, and attempts to minimize interest rate risk by adjusting terms of new loans, and deposits and by investing in securities with terms that mitigate the Company’s overall interest rate risk.
 
Accounting guidance regarding fair value measurements defines fair value and establishes a framework for measuring fair value in accordance with Generally Accepted Accounting Principles (GAAP). Fair value is the exchange price that would be received for an asset or paid to transfer a liability in an orderly transaction between market participants on the measurement date. The following definitions describe the levels of inputs that may be used to measure fair value:
 
Level 1 – Inputs to the valuation methodology are quoted prices (unadjusted) for identical assets or liabilities in active markets.
 
Level 2 – Inputs to the valuation methodology include quoted prices for similar assets and liabilities in active markets, and inputs that are observable for the asset or liability, either directly or indirectly, for substantially the full term of the financial instrument. 
 
Level 3 – Inputs to the valuation methodology are unobservable and significant to the fair value measurement.
 
Determination of Fair Market Values:
 
Securities – Securities available-for-sale are recorded at fair value on a recurring basis. Fair value is determined by obtaining quoted prices on nationally recognized securities exchanges (Level 1).
 
Impaired Loans – Fair value adjustments to impaired collateral dependent loans are recorded to reflect partial write-downs based on the current appraised value of the collateral or internally developed models, which contain management’s assumptions.
 
Other Real Estate Owned and Other Repossessed Assets – Fair value adjustments to other real estate owned (OREO) and other repossessed assets are recorded at the lower of carrying amount of the loan or fair value less selling costs. Any write-downs based on the asset’s fair value at the date of acquisition are charged to the allowance for loan losses. After foreclosure, management periodically performs valuations such that the real estate is carried at the lower of its new cost basis or fair value, net of estimated costs to sell.
 
 
   F-37


1ST SECURITY BANK OF WASHINGTON
Notes to Financial Statements
June 30, 2011 (Unaudited) and December 31, 2010 and 2009
 
(Dollars in thousands)
 
Note 14 – Fair Values of Financial Instruments (Continued)
 
The following table presents securities available-for-sale measured at fair value on a recurring basis:
 
   
Securities available-for-sale
 
   
Level 1
   
Level 2
   
Level 3
   
Total
 
                         
June 30, 2011 (Unaudited)
                       
Federal agency securities
  $ 9,833     $     $     $ 9,833  
Municipal bonds
    1,409                   1,409  
Mortgage-backed securities
    447                   447  
    $ 11,689     $     $     $ 11,689  
                                 
December 31, 2010
                               
Federal agency securities
  $ 6,086     $     $     $ 6,086  
Municipal bonds
    1,103                   1,103  
Mortgage-backed securities
    453                   453  
    $ 7,642     $     $     $ 7,642  
December 31, 2009
                               
Mortgage-backed securities
  $ 603     $     $     $ 603  
    $ 603     $     $     $ 603  
 
The following tables present the impaired loans measured at fair value on a nonrecurring basis, and the total valuation allowance or charge-offs on these loans, which represents fair value adjustments as of June 30, 2011 (unaudited), December 31, 2010 and 2009.
 
   
Impaired loans
 
   
Level 1
   
Level 2
   
Level 3
   
Total
   
Total
Impairment
 
June 30, 2011 (Unaudited)
  $     $     $ 812     $ 812     $ 477  
December 31, 2010
  $     $     $ 5,140     $ 5,140     $ 1,162  
December 31, 2009
  $     $     $ 5,707     $ 5,707     $ 1,747  
 
The following tables present OREO and other repossessed assets measured at fair value on a nonrecurring basis, and the total losses on these assets, which represents fair value adjustments and other losses for the six months ended June 30, 2011 (unaudited) and years ended December 31, 2010 and 2009.
 
   
OREO and other repossessed assets
 
   
Level 1
   
Level 2
   
Level 3
   
Total
   
Total
Gain (loss)
 
June 30, 2011 (Unaudited)
  $     $ 92     $ 5,925     $ 6,017     $ (132 )
December 31, 2010
  $     $ 78     $ 3,701     $ 3,779     $ 41  
December 31, 2009
  $     $ 130     $ 5,484     $ 5,614     $ (452 )
 
 
   F-38


1ST SECURITY BANK OF WASHINGTON
Notes to Financial Statements
June 30, 2011 (Unaudited) and December 31, 2010 and 2009
 
(Dollars in thousands)
 
Note 14 – Fair Values of Financial Instruments (Continued)
 
Fair Values of Financial Instruments – The following methods and assumptions were used by the Bank in estimating the fair values of financial instruments disclosed in these financial statements:
 
Cash and Due from Banks and Interest-Bearing Deposits at Other Financial Institutions – The carrying amounts of cash and short-term instruments approximate their fair value.
 
Securities Available-for-Sale – Fair values for securities available-for-sale are based on quoted market prices.
 
Federal Home Loan Bank Stock – The carrying value of Federal Home Loan Bank stock approximates its fair value.
 
Loans Receivable – For variable rate loans that re-price frequently and have no significant change in credit risk, fair values are based on carrying values. Fair values for fixed rate loans are estimated using discounted cash flow analyses, using interest rates currently being offered for loans with similar terms to borrowers or similar credit quality. Fair values for impaired loans are estimated using discounted cash flow analyses or underlying collateral values, where applicable.
 
Deposits – The fair value of deposits with no stated maturity date is included at the amount payable on demand. Fair values for fixed rate certificates of deposit are estimated using a discounted cash flow calculation on interest rates currently offered on similar certificates.
 
Borrowings – The carrying amounts of advances maturing within 90 days approximate their fair values. The fair values of long-term advances are estimated using discounted cash flow analyses based on the Bank’s current incremental borrowing rates for similar types of borrowing arrangements.
 
Accrued Interest – The carrying amounts of accrued interest approximate their fair value.
 
Mortgage Servicing Rights – The fair value is determined by calculating the net present value of expected cash flows using a model that incorporates assumptions used in the industry to value such rights.
 
Off-Balance-Sheet Instruments – The fair value of commitments to extend credit are estimated using the fees currently charged to enter into similar agreements, taking into account the remaining terms of the agreement and the present creditworthiness of the customers. Since the majority of the Bank’s off-balance-sheet instruments consist of non-fee producing, variable-rate commitments, the Bank has determined they do not have a distinguishable fair value.
 
 
   F-39


1ST SECURITY BANK OF WASHINGTON
Notes to Financial Statements
June 30, 2011 (Unaudited) and December 31, 2010 and 2009
 
(Dollars in thousands)
 
Note 14 – Fair Values of Financial Instruments (Continued)
 
The estimated fair values of the Bank’s financial instruments were as follows:
 
    June 30, 2011     December 31,  
    (Unaudited)    
2010
    2009  
   
Carrying
Amount
    Fair Value     Carrying
Amount
    Fair Value     Carrying
Amount
    Fair Value  
Financial Assets
                                   
Cash and due from banks and interest bearing deposits in banks at other financial institutions
  $ 30,341     $ 30,341     $ 35,250     $ 35,250     $ 28,534     $ 28,534  
Securities available-for-sale
    11,689       11,689       7,642       7,642       603       603  
Federal Home Loan Bank stock
    1,797       1,797       1,797       1,797       1,797       1,797  
Loans receivable, net
    210,184       223,721       230,822       233,503       231,441       248,575  
Accrued interest receivable
    909       909       914       914       952       952  
Mortgage servicing rights
    197       303       245       286       340       460  
Financial Liabilities
                                               
Deposits
    241,475       244,460       243,957       245,656       230,985       232,703  
Borrowings
    3,900       4,040       21,900       22,201       25,900       26,148  
Accrued interest payable
    17       17       17       17       35       35  
 
The estimated fair value of loan commitments at June 30, 2011 (unaudited), December 31, 2010 and 2009 is considered to be insignificant.
 
Note 15 – Sale of Deposits and Branch Operations
 
The Bank entered into a transaction to sell certain branch deposits and one branch location with Sound Community Bank (the Acquirer) in 2009. The Acquirer assumed $241 and $33,553 of loan and deposit balances, respectively. The Bank recorded a gain on sale of deposits and premises and equipment of $1,335. The sale was completed on August 28, 2009.
 
The Bank sold two previously closed branch premises in 2010. The Bank provided financing for the sales on the properties and recorded gains on these transactions. Both transactions met the guidelines for a full gain recognition, including exceeding minimum initial investments, market loan terms, no exceptions to our internal loan policy and no continuing involvement in the properties by the Bank. The gain on sale of $1,006 is included in gain on sale of branch deposits, premises and equipment.
 
    June 30,     December 31,  
   
2011
    2010    
2010
   
2009
 
    (Unaudited)                  
Gain on sale of branch premises and equipment
  $     $ 797     $ 1,006     $ 535  
Gain on sale of branch deposits
                      800  
Total gain of sales of branch deposits, premises and equipment
  $     $ 797     $ 1,006     $ 1,335  
 
 
   F-40


You should rely only on the information contained in this document or that to which we have referred you.  We have not authorized anyone to provide you with information that is different.  This document does not constitute an offer to sell, or the solicitation of an offer to buy, any of the securities offered hereby to any person in any jurisdiction in which such offer or solicitation would be unlawful.  The affairs of 1st Security Bank of Washington or FS Bancorp, Inc. may change after the date of this prospectus; delivery of this document and the sales of shares made hereunder does not mean otherwise.
 
FS Bancorp, Inc.
 
(Proposed Holding Company for
1st Security Bank of Washington)
 
UP TO
2,817,500 SHARES
(Subject to increase up to 3,240,125 Shares)
 

PROSPECTUS 

 
KEEFE, BRUYETTE & WOODS
 
_______________ __, 2011
 
Dealer Prospectus Delivery Obligation
 
Until  _________ __, 2011 all dealers effecting transactions in the registered securities, whether or not participating in this offering, may be required to deliver a prospectus.  This is in addition to the obligation of dealers to deliver a prospectus when acting as underwriters and with respect to their unsold allotments or subscriptions.


PART II: INFORMATION NOT REQUIRED IN PROSPECTUS
 
Item 13.     Other Expenses of Issuance and Distribution
 
       
Amount(1)
 
*  
Registrant's Legal Fees and Expenses
  $ 290,000  
*  
Registrant's Accounting Fees and Expenses
    100,000  
*  
Conversion Agent and Data Processing Fees
    50,000  
*  
Marketing Agent Fees(1)
    388,000  
*  
Marketing Agent Expenses (including Legal Fees and Expenses)
    85,000  
*  
Appraisal Fees and Expenses
    40,500  
*  
Printing, Postage, Mailing, Copying and EDGAR
    232,000  
*  
Filing Fees (FINRA, NASDAQ and SEC)
    55,000  
*  
Blue Sky Legal Fees and Expenses
    10,000  
*  
Business Plan Fees and Expenses
    30,000  
*  
Stock Certificate Printing
    6,000  
*  
Transfer Agent Services
    7,500  
*  
Other
    5,000  
   
Prior Related Conversion and Offering Expenses
    853,000  
             
*  
Total
  $ 2,152,000  
 

*
Estimated
(1)
FS Bancorp, Inc. has retained Keefe, Bruyette & Woods to assist in the sale of common stock on a best efforts basis in the offerings, and to serve as records management agent in connection with the conversion and offering.  Fees are estimated at the adjusted maximum of the offering range, assuming 70% of the shares are sold in the Subscription Offering (including approximately 10.3% to directors, executive officers and tax-qualified employee benefit plans) and 30% are sold in the Community Offering.

Item 14.    Indemnification of Directors and Officers

In accordance with the Washington Business Corporation Act (“WBCA”) R.C.W. ss. 23B.08.570, Article XIV of the Registrant’s Articles of Incorporation provides the following:

Indemnification: The Corporation shall indemnify and advance expenses to its directors, officers, agents and employees as follows:

A.         Directors and Officers.  In all circumstances and to the full extent permitted by the WBCA, the Corporation shall indemnify any person who is or was a director, officer or agent of the Corporation and who was or is a party or is threatened to be made a party to any threatened, pending or completed action, suit or proceeding, whether civil, criminal, administrative or investigative and whether formal or informal (including an action by or in the right of the Corporation), by reason of the fact that he is or was an agent of the Corporation, against expenses, judgments, fines, and amounts paid in settlement and incurred by him in connection with such action, suit or proceeding.  However, such indemnity shall not apply to: (a) acts or omissions of the director or officer in connection with a proceeding by or in the right of the Corporation in which the director or officer is finally adjudged liable to the Corporation; (b) conduct of the director or officer finally adjudged to violate RCW Section 23B.08.310 (relating to unlawful distributions by the Corporation) or (c) any transaction with respect to which it was finally adjudged that such director and officer personally received a benefit in money, property or services to which the director was not legally entitled.  The Corporation may require, in accordance with Section 23B.08.530 of the WBCA as may be amended from time to time, an indemnified person to furnish the Corporation an undertaking and/or guaranty in a form approved by the Board, prior to advancing expenses to such indemnified person.
 
 
II-1


B.          Implementation.  The Board of Directors may take such action as is necessary to carry out these indemnification and expense advancement provisions.  It is expressly empowered to adopt, approve and amend from time to time such bylaws, resolutions, contracts or further indemnification and expense advancement arrangements as may be permitted by law, implementing these provisions.  Such bylaws, resolutions, contracts or further arrangements shall include, but not be limited to, implementing the manner in which determinations as to any indemnity or advancement of expenses shall be made.

C.          Survival of Indemnification Rights.  No amendment or repeal of this Article XIV shall apply to or have any effect on any right to indemnification provided hereunder with respect to acts or omissions occurring prior to such amendment or repeal.

D.          Service for Other Entities.  The indemnification and advancement of expenses provided under this Article XIV shall apply to directors, officers, employees or agents of the Corporation for both (a) service in such capacities for the Corporation and (b) service at the Corporation’s request as a director, officer, partner, trustee, employee or agent of another foreign or domestic corporation, partnership, joint venture, trust, employee benefit plan or other enterprise.  A person is considered to be serving an employee benefit plan at the Corporation’s request if such person’s duties to the Corporation also impose duties on, or otherwise involve services by, the director to the plan or to participants in or beneficiaries of the plan.

E.          Insurance.  The Corporation may purchase and maintain insurance on behalf of any person who is or was a director, officer, employee or agent of the Corporation, or is or was serving at the request of the Corporation as a director, trustee, officer, employee or agent of another corporation, partnership, joint venture, trust or other enterprise against liability asserted against him and incurred by him in such capacity or arising out of his status as such, whether or not the Corporation would have had the power to indemnify him against such liability under the provisions of this bylaw and the WBCA.

F.          Other Rights.  The indemnification provided by this section shall not be deemed exclusive of any other right to which those indemnified may be entitled under any other bylaw, agreement, vote of shareholders or disinterested directors, or otherwise, both as to action in his official capacity and as to action in another capacity while holding such an office, and shall continue as to a person who has ceased to be a director, trustee, officer, employee or agent and shall inure to the benefit of the heirs executors, and administrators of such person.

Item 15.    Recent Sales of Unregistered Securities

Not Applicable.
 
 
II-2


Item 16.    Exhibits and Financial Statement Schedules:

The exhibits and financial statement schedules filed as part of this registration statement are as follows:

(a)           List of Exhibits

See the Exhibit Index filed as part of this Registration Statement.

 
(b)
Financial Statement Schedules

No financial statement schedules are filed because the required information is not applicable or is included in the consolidated financial statements or related notes.

Item 17.    Undertakings

The undersigned Registrant hereby undertakes:
 
 
(1)           To file, during any period in which offers or sales are being made, a post-effective amendment to this registration statement:

(i)  To include any prospectus required by Section 10(a)(3) of the Securities Act of 1933;

(ii)  To reflect in the prospectus any facts or events arising after the effective date of the registration statement (or the most recent post-effective amendment thereof) which, individually or in the aggregate, represent a fundamental change in the information set forth in the registration statement. Notwithstanding the foregoing, any increase or decrease in volume of securities offered (if the total dollar value of securities offered would not exceed that which was registered) and any deviation from the low or high end of the estimated maximum offering range may be reflected in the form of prospectus filed with the Commission pursuant to Rule 424(b) if, in the aggregate, the changes in volume and price represent no more than a 20 percent change in the maximum aggregate offering price set forth in the “Calculation of Registration Fee” table in the effective registration statement;

(iii)  To include any material information with respect to the plan of distribution not previously disclosed in the registration statement or any material change to such information in the registration statement.

(2)           That, for the purpose of determining any liability under the Securities Act of 1933, each such post-effective amendment shall be deemed to be a new registration statement relating to the securities offered therein, and the offering of such securities at that time shall be deemed to be the initial bona fide offering thereof.

(3)           To remove from registration by means of a post-effective amendment any of the securities being registered which remain unsold at the termination of the offering.

(4)           That, for purposes of determining any liability under the Securities Act of 1933, the information omitted from the form of prospectus filed as part of this registration statement in reliance upon Rule 430A and contained in a form of prospectus filed by the registrant pursuant to Rule 424(b)(1) or (4) or 497(h) under the Securities Act shall be deemed to be part of this registration statement as of the time it was declared effective.
 
 
II-3


(5)           That, for the purpose of determining any liability under the Securities Act of 1933, each post-effective amendment that contains a form of prospectus shall be deemed to be a new registration statement relating to the securities offered therein:

(6)           That, for the purpose of determining liability of the registrant under the Securities Act of 1933 to any purchaser in the initial distribution of the securities, the undersigned registrant undertakes that in a primary offering of securities of the undersigned registrant pursuant to this registration statement, regardless of the underwriting method used to sell the securities to the purchaser, if the securities are offered or sold to such purchaser by means of any of the following communications, the undersigned registrant will be a seller to the purchaser and will be considered to offer or sell such securities to such purchaser:

(i)  Any preliminary prospectus or prospectus of the undersigned registrant relating to the offering required to be filed pursuant to Rule 424 (§230.424 of this chapter);

(ii)  Any free writing prospectus relating to the offering prepared by or on behalf of the undersigned registrant or used or referred to by the undersigned registrant;

(iii)  The portion of any other free writing prospectus relating to the offering containing material information about the undersigned registrant or its securities provided by or on behalf of the undersigned registrant; and

(iv)  Any other communication that is an offer in the offering made by the undersigned registrant to the purchaser.

(7)            The undersigned registrant hereby undertakes to provide to the underwriter at the closing specified in the underwriting agreement certificates in such denominations and registered in such names as required by the underwriter to permit prompt delivery to each purchaser.

Insofar as indemnification for liabilities arising under the Securities Act of 1933 may be permitted to directors, officers and controlling persons of the registrant pursuant to the foregoing provisions, or otherwise, the registrant has been advised that in the opinion of the Securities and Exchange Commission such indemnification is against public policy as expressed in the Act, and is, therefore, unenforceable. In the event that a claim for indemnification against such liabilities (other than the payment by the registrant of expenses incurred or paid by a director, officer or controlling person of the registrant in the successful defense of any action, suit or proceeding) is asserted by such director, officer or controlling person in connection with the securities being registered, the registrant will, unless in the opinion of its counsel the matter has been settled by controlling precedent, submit to a court of appropriate jurisdiction the question whether such indemnification by it is against public policy as expressed in the Act and will be governed by the final adjudication of such issue.
 
 
II-4


SIGNATURES

Pursuant to the requirements of the Securities Act of 1933, the Registrant has duly caused this registration statement to be signed on its behalf by the undersigned, thereunto duly authorized in the City of Mountlake Terrace, State of Washington, on September 28, 2011.
 
  FS BANCORP, INC.
     
     
  By: /s/ Joseph C. Adams      
    Joseph C. Adams, Chief Executive Officer
    (Duly Authorized Representative)
 
KNOW ALL MEN BY THESE PRESENTS, that each person whose signature appears below constitutes and appoints Joseph C. Adams and Matthew D. Mullet, or either of them, his or her true and lawful attorney-in-fact and agent, with full power of substitution and re-substitution, for him or her and in his or her name, place and stead, in any and all capacities, to sign any and all amendments (including post-effective amendments) to this Registration Statement, and to file the same, with all exhibits thereto, and all other documents in connection therewith, with the Securities and Exchange Commission, granting unto said attorney-in-fact and agent full power and authority to do and perform each and every act and thing requisite and necessary to be done, as fully to all intents and purposes as he might or could do in person, hereby ratifying and confirming all said attorney-in-fact and agent or his substitute or substitutes may lawfully do or cause to be done by virtue hereof.
 
Pursuant to the requirements of the Securities Act of 1933, this registration statement has been signed below by the following persons in the capacities and on the dates indicated.
 
/s/ Joseph C. Adams     /s/ Ted A. Leech     
Joseph C. Adams, CEO and Director    Ted A. Leech, Chairman of the Board  
(Duly Authorized Representative and Principal
     
Executive Officer)
     
       
Date:
September 28, 2011.
  Date:
September 28, 2011.
 
       
/s/ Margaret R. Piesik    /s/ Judith A. Cochrane    
Margaret R. Piesik, Director     Judith A. Cochrane, Director  
       
Date:
September 28, 2011.
  Date:
September 28, 2011.
 
       
/s/ Joseph P. Zavaglia    /s/ Michael J. Mansfield   
Joseph P. Zavaglia, Director    Michael J. Mansfield, Director  
       
Date:
September 28, 2011.
  Date:
September 28, 2011.
 
       
/s/ Matthew D. Mullet         
Matthew D. Mullet, CFO, Treasurer and Secretary
     
(Principal Financial and Accounting Officer)
     
       
Date:
September 28, 2011.


EXHIBIT INDEX
 
Exhibits:

 
1.1  Engagement Letter with Keefe, Bruyette & Woods, Inc.
1.2 Agency Agreement with Keefe, Bruyette & Woods, Inc.*
2.0 Plan of Conversion
3.1 Articles of Incorporation for FS Bancorp, Inc.
3.2  Bylaws for FS Security Bancorp, Inc.
4.0   Form of Stock Certificate for FS Bancorp, Inc.
5.0  Opinion of Harlowe & Falk LLP re: Legality of Securities Being Registered
8.1  Opinion of Silver, Freedman & Taff L.L.P. re: Federal Tax Matters
8.2 Opinion of Harlowe & Falk LLP re: State Tax Matters
8.3 Letter of RP Financial, LC. re: Subscription Rights
10.1   Severance Agreement between 1st Security Bank of Washington and Joseph C. Adams
10.2   Form of Change of Control Agreement between 1st Security Bank of Washington and each of Matthew D. Mullet, Steven L. Haynes and Drew B. Ness
10.3 Director Fee Arrangements
10.4  Letter Agreement regarding Appraisal Services
21.0  Subsidiaries of the Registrant
23.1  Consent of Harlowe & Falk LLP (included in Exhibit 5.0)
23.2  Consent of Silver, Freedman & Taff L.L.P. (included in Exhibit 8.1)
23.3   Consent of Harlowe & Falk LLP (included in Exhibits 8.2)
23.4 Consent of Independent Registered Public Accounting Firm
23.5  Consent of RP Financial, LC.
24.0   Power of Attorney, included in signature page
99.1   Appraisal Report of RP Financial, LC.
99.2   Subscription Order Form and Instructions
99.3 Additional Solicitation Material
 
* To be filed by amendment.
 
EX-1.1 2 ex1-1.htm EXHIBIT 1.1 ex1-1.htm

Exhibit 1.1
 

GRAPHIC


September 21, 2011

Joe Adams
Director and CEO
1st Security Bank of Washington
6920 220th Street SW
Mountlake Terrace, WA 98043-2172

Dear Mr. Adams:
 
  This letter confirms the engagement of Keefe, Bruyette & Woods, Inc. (“KBW”) to act as the financial advisor to 1st Security Bank of Washington (the “Bank”) in connection with the Bank’s proposed conversion from the mutual to stock form of organization pursuant to the Bank’s Plan of Conversion (the “Conversion”), including the offer and sale of certain shares of the common stock (the “Common Stock”) of a holding company (the “Holding Company”) to be formed by the Bank  to eligible persons in a Subscription Offering, with any remaining shares offered to the general public in a Direct Community Offering (the Subscription Offering, the Direct Community Offering and any Syndicated Community Offering are collectively referred to herein as the “Offerings”).  In addition, KBW will act as Conversion Agent in connection with the Offerings pursuant to the terms of a separate agreement between the Bank and KBW.  The Bank and the Holding Company are collectively referred to herein as the “Company”  This letter sets forth the terms and conditions of our engagement.

1.           Advisory/Offering Services

As the Company's financial advisor, KBW will provide financial and logistical advice to the Company and will assist the Company’s management, legal counsel, accountants and other advisors in connection with the Conversion and related issues.  We anticipate our services will include the following, each as may be necessary and as the Company may reasonably request:

1.  
Provide advice on the financial and securities market implications of the Plan of Conversion and any related corporate documents, including the Company’s Business Plan;
2.  
Assist in structuring the Offerings, including developing and assisting in implementing a marketing strategy for the Offerings;
3.  
Reviewing all offering documents, including the Prospectus, stock order forms, letters, brochures and other related offering materials (it being understood that preparation and filing of such documents will be the responsibility of the Company and its counsel);
4.  
Assisting the Company in preparing for and scheduling meetings with potential investors and broker-dealers, as necessary;
 
Keefe, Bruyette & Woods 10 South Wacker Drive, Suite 3400   Chicago, IL 60606
312.423.8200 800.929.6113 Fax 312.423.8232


1st Security Bank of Washington
September 21, 2011
Page 2 
 
5.  
Assist the Company in analyzing proposals from outside vendors retained in connection with the Offerings, including printers, transfer agents and appraisal firms;
6.  
Assist the Company in the drafting and distribution of press releases as required or appropriate in connection with the Offerings;
7.  
Meet with the Board of Directors and/or management of the Company to discuss any of the above services; and
8.  
Such other financial advisory and investment banking services in connection with the Offerings as may be agreed upon by KBW and the Company.

2.           Due Diligence Review
 
  The Company acknowledges and agrees that KBW’s obligation to perform the services contemplated by this agreement shall be subject to the satisfactory completion of such investigations and inquiries relating to the Company, and its directors, officers, agents and employees, as KBW and their counsel in their sole discretion my deem appropriate under the circumstances.  The Company agrees  it will make available to KBW all relevant information, whether or not publicly available, which KBW reasonably requests, and will permit KBW to discuss with the board of directors and management the operations and prospects of the Company.  KBW will treat all material non-public information as confidential.  The Company recognizes and confirms that KBW (a) will use and rely on such information in performing the services contemplated by this agreement without having independently verified the same, and (b) does not assume responsibility for the accuracy or completeness of the information or to conduct any independent verification or any appraisal or physical inspection of properties or assets. KBW will assume that all financial forecasts have been reasonably prepared and reflect the best then currently available estimates and judgments of the Company’s management as to the expected future financial performance of the Company.

3.           Regulatory Filings
 
  The Company will cause appropriate Offering documents to be filed with all regulatory agencies including the Securities and Exchange Commission ("SEC"), the Financial Industry Regulatory Authority ("FINRA"), the appropriate federal and/or state bank regulatory agencies.  In addition, the Company and KBW agree that the Company’s counsel shall serve as counsel with respect to blue sky matters in connection with the Offerings, and that the Company shall cause such counsel to prepare a Blue Sky Memorandum related to the Offerings including KBW’s participation therein and shall furnish KBW a copy thereof addressed to KBW or upon which counsel shall state KBW may rely.


1st Security Bank of Washington
September 21, 2011
Page 3
 
4.           Fees

For the services hereunder, the Company shall pay the following fees to KBW at closing unless stated otherwise:

 
(a)
Management Fee:  A Management Fee of $40,000 payable in four consecutive monthly installments of $10,000 commencing with the first month following the execution of this engagement letter.  Such fees shall be deemed to have been earned when due.  Should the Offering be terminated for any reason not attributable to the action or inaction of KBW, KBW shall have earned and be entitled to be paid fees accruing through the stage at which point the termination occurred.

 
(b)
Success Fee:   A Success Fee of  1.00% shall be paid based on the aggregate Purchase Price of Common Stock sold in the Subscription Offering excluding shares purchased by the Company’s officers, directors, or employees (or members of their immediate family) plus any ESOP, tax-qualified or stock based compensation plans or similar plan created by the Company for some or all of their directors or employees, or any charitable foundation established by the Company (or any shares contributed to such a foundation). In addition, a Success Fee of  2.00% shall be paid on the aggregate Purchase Price of Common Stock sold in the Direct Community Offering.  The Management Fee described in 4(a) will be credited against any  Success Fee paid pursuant to this paragraph.
 
 
(c)
Syndicated Community Offering: If any shares of the Company’s stock remain available after the Subscription Offering and Direct Community Offering, at the request of the Company, KBW will seek to form a syndicate of registered broker-dealers to assist in the sale of such common stock on a best efforts basis, subject to the terms and conditions set forth in a selected dealers agreement to be entered into between the Company and KBW.  KBW will endeavor to distribute the common stock among dealers in a fashion which best meets the distribution objectives of the Company and the Plan.  KBW will be paid the normal and customary fee for shares of common stock sold in a Syndicated Community Offering  not to exceed 5.5% of the aggregate Purchase Price of the shares of common stock sold in the Syndicated Community Offering.  From this fee, KBW will pass onto selected broker-dealers, who assist in the syndicated community, an amount competitive with gross underwriting discounts charged at such time for comparable amounts of stock sold at a comparable price per share in a similar market environment.  Fees with respect to purchases affected with the assistance of a broker/dealer other than KBW shall be transmitted by KBW to such broker/dealer.  The decision to utilize selected broker-dealers will be made by the Company upon consultation with KBW.


1st Security Bank of Washington
September 21, 2011
Page 4
 
5.           Additional Services
 
  KBW further agrees to provide financial advisory assistance to the Company for a period of three years following completion of the Offering, including general strategic planning, the creation of a capital management strategy designed to enhance the value of the Company, including the formation of a dividend policy and share repurchase program, assistance with shareholder relations matters, general advice on mergers and acquisitions, and other related financial matters, without the payment by the Company of any fees in addition to those set forth in Section 4 hereof.  Nothing in this letter agreement shall require the Company to obtain such services from KBW.  If KBW acts as a financial advisor to the Company in connection with any specific transactions, the terms of such engagement will be set forth in a separate agreement between the Company and KBW.

6.           Expenses
 
  The Company will bear those expenses of the proposed Offering customarily borne by issuers, including, without limitation, regulatory filing fees, SEC, "Blue Sky," DTCC, and FINRA filing and registration fees; the fees of the Company's accountants, attorneys, appraiser, transfer agent and registrar, printing, mailing and marketing and syndicate expenses associated with the Offering; the fees set forth in Section 4; and fees for "Blue Sky" legal work.  If KBW incurs expenses on behalf of Company, the Company will reimburse KBW for such expenses.
 
  KBW shall be reimbursed for its reasonable out-of-pocket expenses related to the Offering, including costs of travel, meals and lodging, photocopying, telephone, facsimile, and couriers not to exceed $10,000. KBW also will be reimbursed for fees and expenses of its counsel not to exceed $75,000.   These expenses assume no unusual circumstances or delays, or a re-solicitation in connection with the Offerings. KBW and the Company acknowledge that such expense cap may be increased by mutual consent, including in the event of: (i) a material delay in the Offering which would require an update of the financial information in tabular form to reflect a period later than that set forth in the original filing of the offering document; or (ii) a resolicitation of the Offering.  In  the event of such a delay or resolicitation, KBW shall be entitled to additional expense reimbursement not to exceed $10,000.  The provisions of this paragraph are not intended to apply to or in any way impair or limit the indemnification provisions contained herein.

7.           Limitations
 
  The Company acknowledges that all opinions and advice (written or oral) given by KBW to the Company in connection with KBW’s engagement are intended solely for the benefit and use of the Company for the purposes of its evaluation of the proposed Offerings.  Unless otherwise expressly stated in an opinion letter issued by KBW or otherwise expressly agreed, no one other than the Company is authorized to rely upon this engagement of KBW or any statements or conduct by KBW.  The Company agrees that no such opinion or advice shall be used, reproduced, disseminated, quoted or referred to at any time, in any manner, or for any purpose, nor shall any public references to KBW be made by the Company or any of its representatives without the prior written consent of KBW.


1st Security Bank of Washington
September 21, 2011
Page 5
 
  The Company acknowledges and agrees that KBW has been retained to act solely as financial advisor to the Company and not as an advisor to or agent of any other person, and the Company’s engagement of KBW is not intended to confer rights upon any person not a party to this Agreement (including shareholders, employees or creditors of the Company) as against KBW or its affiliates, or their respective directors, officers, employees or agents.  In such capacity, KBW shall act as an independent contractor, and any duties arising out of its engagement shall be owed solely to the Company.  It is understood that KBW’s responsibility to the Company is solely contractual in nature and KBW does not owe the Company, or any other party, any fiduciary duty as a result of this Agreement.

8.           Benefit
 
  This letter agreement shall inure to the benefit of the parties hereto and their respective successors, and the obligations and liabilities assumed hereunder by the parties hereto shall be binding upon their respective successors; provided, however, that this letter agreement shall not be assignable by KBW.

9.           Confidentiality
 
  KBW acknowledges that a portion of the Information may contain confidential and proprietary business information concerning the Company.  KBW agrees that, except as contemplated in connection with the performance of its services under this agreement, as authorized by the Company or as required by law, regulation or legal process, KBW agrees that it will treat as confidential all material, non-public information relating to the Company obtained in connection with its engagement hereunder (the “Confidential Information); provided, however, that KBW may disclose such Confidential Information to its agents and advisors who are assisting or advising KBW in performing its services hereunder and who have agreed to be bound by the terms and conditions of this paragraph.  As used in this paragraph, the term “Confidential Information” shall not include information which (a) is or becomes generally available to the public other than as a result of a disclosure by KBW, (b) was available to KBW on a non-confidential basis prior to its disclosure to KBW by the Company, or (c) becomes available to KBW on a non-confidential basis from a person other than the Company who is not otherwise known to KBW to be bound not to disclose such information pursuant to a contractual, legal or fiduciary obligation.
 
  The Company hereby acknowledges and agrees that the presentation materials and financial models used by KBW in performing its services hereunder have been developed by and are proprietary to KBW.  The Company agrees that it will not reproduce or distribute all or any portion of such models or presentations without the prior consent from KBW in writing.


1st Security Bank of Washington
September 21, 2011
Page 6
 
10.         Indemnification
 
  As KBW will be acting on behalf of the Company in connection with the Offerings, the Company agrees to indemnify and hold harmless KBW and its affiliates, the respective partners, directors, officers, employees and agents of KBW and its affiliates and each other person, if any, controlling KBW or any of its affiliates and each of their successors and assigns (KBW and each such person being an “Indemnified Party”) to the fullest extent permitted by law, from and against any and all losses, claims, damages and liabilities, joint or several,  to which such Indemnified Party may become subject under applicable federal or state law, or otherwise related to or arising out of the Offerings or the engagement of KBW pursuant to, or the performance by KBW of the services contemplated by, this letter, and will reimburse any Indemnified Party for all expenses (including reasonable legal fees and expenses) as they are incurred, including expenses incurred in connection with the investigation, preparing for or defending any such action or claim whether or not in connection with pending or threatened litigation, or any action or proceeding arising therefrom, whether or not KBW is a party; provided, however, that the Company will not be liable in any such case to the extent that any such loss, claim, damage, liability or expense (a) arises out of or is based upon any untrue statement of a material fact or the omission of a material fact required to be stated therein or necessary to make not misleading any statements contained in any final prospectus, or any amendment or supplement thereto, made in reliance on and in conformity with written information furnished to the Company by KBW expressly for use therein or (b) to the extent that any loss, claim, damage, liability or expense is found in a final judgment by a court of competent jurisdiction to have resulted primarily from KBW’s gross negligence or bad faith of KBW.
 
  If the indemnification provided for in the foregoing paragraph is judicially determined to be unavailable (other than in accordance with the terms hereof) to any person otherwise entitled to indemnity in respect of any losses, claims, damages or liabilities referred to herein, then, in lieu of indemnifying such person hereunder, the Company shall contribute to the amount paid or payable by such person as a result of such losses, claims, damages or liabilities (and expenses relating thereto) (i) in such proportion as is appropriate to reflect the relative benefits to the Company, on the one hand, and KBW, on the other hand, of the engagement provided for in this Agreement or (ii) if the allocation provided for in clause (i) above is not available, in such proportion as is appropriate to reflect not only the relative benefits referred to in such clause (i) but also the relative fault of each of the Company and KBW, as well as any other relevant equitable considerations; provided, however, in no event shall KBW's aggregate contribution to the amount paid or payable exceed the aggregate amount of fees actually received by KBW under this Agreement.  For the purposes of this Agreement, the relative benefits to the Company and to KBW of the engagement under this Agreement shall be deemed to be in the same proportion as (a) the total value paid or contemplated to be paid or received or contemplated to be received by the Company in the Conversion and the Offerings that are the subject of the engagement hereunder, whether or not consummated, bears to (b) the fees paid or to be paid to KBW under this Agreement.


1st Security Bank of Washington
September 21, 2011
Page 7
 
11.         Definitive Agreement
 
  This letter agreement supersedes and replaces the prior agreement for financial advisory services dated August 8, 2008, and reflects KBW's present intention of proceeding to work with the Company on its proposed Offerings.  No legal and binding obligation is created on the part of the Company or KBW with respect to the subject matter hereof, except as to (i) the agreement to maintain the confidentiality of Confidential Information set forth in Section 9, (ii) the payment of certain fees as set forth in Section 4, (iii) the payment of expenses as set forth in Section 6, (iv) the limitations set forth in Section  7, (v) the indemnification and contribution provisions set forth in Section 10 and (vi) those terms set forth in a mutually agreed upon Agency Agreement between KBW and the Company to be executed prior to commencement of the Offerings, all of which shall constitute the binding obligations of the parties hereto and which shall survive the termination of this letter agreement or the completion of the services furnished hereunder and shall remain operative and in full force and effect.
 
  KBW’s execution of such Agency Agreement shall also be subject to (a) KBW’s satisfaction with Due Diligence Review, (b) preparation of offering materials that are satisfactory to KBW, (c) compliance with all relevant legal and regulatory requirements to the reasonable satisfaction of KBW and its counsel, (d) agreement that the price established by the independent appraiser is reasonable, and (e) market conditions at the time of the proposed Offering.
 
  This Agreement constitutes the entire agreement between the parties with respect to the subject matter hereof and can be altered only by written consent signed by the parties.  This Agreement shall be construed and enforced in accordance with the laws of the State of New York, without regard to the conflicts of laws principles thereof. Any right to trial by jury with respect to any claim or action arising out of this agreement or conduct in connection with this engagement is hereby waived by the parties hereto.
 
  If the foregoing correctly sets forth our mutual understanding, please so indicate by signing and returning the original copy of this letter to the undersigned.

Very truly yours,
KEEFE, BRUYETTE & WOODS, INC.
 
By: /s/ Patricia A. McJoynt       
 
Patricia A. McJoynt, Managing Director
   
       
1ST SECURITY BANK OF WASHINGTON
 
       
By: /s/ Joe Adams     Date: 09/21/11  
 
Joe Adams, Director and CEO


GRAPHIC


September 21, 2011

Joe Adams
Director and CEO
1st Security Bank of Washington
6920 220th Street SW
Mountlake Terrace, WA 98043-2172

Dear Mr. Adams:

This letter confirms the engagement of Keefe, Bruyette & Woods, Inc. (“KBW”) to act as the Conversion Agent to 1st Security Bank of Washington (the “Bank”) in connection with the Bank’s proposed conversion from the mutual to stock form of organization pursuant to the Bank’s Plan of Conversion (the “Conversion”), including the offer and sale of certain shares of the common stock (the “Common Stock”) of a holding company (the “Holding Company”) to be formed by the Bank  to eligible persons in a Subscription Offering, with any remaining shares offered to the general public in a Direct Community Offering (the Subscription Offering, the Direct Community Offering and any Syndicated Community Offering are collectively referred to herein as the “Offerings”).  In addition, KBW will act as the financial advisor in connection with the Offerings pursuant to the terms of a separate agreement between the Bank and KBW.  The Bank and the Holding Company are collectively referred to herein as the “Company.”  This letter sets forth the terms and conditions of our engagement.

Conversion Agent Services:  As Conversion Agent, and as the Company may reasonably request, KBW will provide the following services:

1.  
Consolidation of Accounts and Development of a Central File, including, but not limited to the following:
·  
Consolidate accounts having the same ownership and separate the consolidated file information into necessary groupings to satisfy mailing requirements;
·  
Create the master file of account holders as of key record dates; and
·  
Provide software for the operation of the Company’s Stock Information Center, including subscription management and proxy solicitation efforts.

2.  
Preparation of Proxy Forms; Proxy Solicitation and Special Meeting Services, including, but not limited to the following:
·  
Assist the Company’s financial printer with labeling of proxy materials for voting and subscribing for stock;
·  
Provide support for any follow-up mailings to members, as needed, including proxy grams and additional solicitation materials;
·  
Proxy and ballot tabulation; and
·  
Act as Inspector of Election for the Company’s special meeting of members, if requested, and the election is not contested.
 
Keefe, Bruyette & Woods 10 South Wacker Drive, Suite 3400   Chicago, IL 60606
312.423.8200 800.929.6113 Fax 312.423.8232


1st Security Bank of Washington
September 21, 2011
Page 2 

3.  
Subscription Services, including, but not limited to the following:

 ·  
Assist the Company in establishing and managing a Stock Information Center;
 ·  
Advise on the physical location of the Stock Information Center including logistical and materials requirements;
 ·  
Assist educating Company personnel;
 ·  
Establish recordkeeping and reporting procedures;
 ·  
Supervise the Stock Information Center during the Offering;
 ·  
Assist the Company’s financial printer with labeling of stock offering materials for subscribing for stock;
 ·  
Provide support for any follow-up mailings to members, as needed, including additional solicitation materials;
 ·  
Stock order form processing and production of daily reports and analysis;
 ·  
Provide supporting account information to the Company’s legal counsel for ‘blue sky’ research and applicable registration;
 ·  
Assist the Company’s transfer agent with the generation and mailing of stock certificates;
 ·  
Perform interest and refund calculations and provide a file to enable the Company or other third party to generate interest and refund checks;
 ·  
Create 1099-INT forms for interest reporting, as well as magnetic media reporting to the IRS, for subscribers paid $10 or more in interest for subscriptions paid by check, if this reporting is not performed by the Company or other third party

Fees:  For the Conversion Agent services outlined above, the Company agrees to pay KBW a fee of $25,000.  This fee is based upon the requirements of current banking regulations, the Company’s Plan of Conversion as currently contemplated, and the expectation that member data will be processed as of three key record dates.  Any material changes in regulations or the Plan of Conversion, or delays requiring duplicate or replacement processing due to changes to record dates, may result in additional fees.  All fees under this agreement shall be payable as follows: (a) $10,000 payable upon execution of this agreement, which shall be non-refundable; and (b) the balance upon the completion of the Offering.

Costs and Expenses:  In addition to any fees that may be payable to KBW hereunder, the Company agrees to reimburse KBW, upon request made from time to time, for its reasonable out-of-pocket expenses incurred in connection with its engagement hereunder, regardless of whether the Offering is consummated, including, without limitation, travel, lodging, food, telephone, postage, listings, forms and other similar expenses not to exceed $25,000; provided, however, that KBW shall document such expenses to the reasonable satisfaction of the Company.  These expenses assume no unusual circumstances or delays, or a re-solicitation in connection with the Offerings.  KBW and the Company acknowledge that such expense cap may be increased by mutual consent in the event a resolicitation of the Offering.  In  the event of such resolicitation, KBW shall be entitled to additional expense reimbursement not to exceed $15,000.  The provisions of this paragraph are not intended to apply to or in any way impair the indemnification provisions of this letter.


1st Security Bank of Washington
September 21, 2011
Page 3 
 
Reliance on Information Provided:  The Company agrees to provide KBW with such information as KBW may reasonably require to carry out its services under this agreement.  The Company recognizes and confirms that KBW (a) will use and rely on such information in performing the services contemplated by this agreement without having independently verified the same, and (b) does not assume responsibility for the accuracy or completeness of the information or to conduct any independent verification or any appraisal or physical inspection of properties or assets.

Limitations:  KBW, as Conversion Agent hereunder, (a) shall have no duties or obligations other than those specifically set forth herein; (b) will be regarded as making no representations and having no responsibilities as to the validity, sufficiency, value or genuineness of any order form or any stock certificates or the shares represented thereby, and will not be required to and will make no representations as to the validity, value or genuineness of the offer; (c) shall not be obliged to take any legal action hereunder which might in its judgment involve any expense or liability, unless it shall have been furnished with reasonable indemnity satisfactory to it; and (d) may rely on and shall be protected in acting in reliance upon any certificate, instrument, opinion, notice, letter, telex, telegram, or other document or security delivered to it and in good faith believed by it to be genuine and to have been signed by the proper party or parties.
 
 
The Company also agrees neither KBW , nor any of its affiliates nor any officer, director, employee or agent of KBW or any of its affiliates, nor any person controlling KBW or any of its affiliates, shall be liable to any person or entity, including the Company, by reason of any error of judgment, or for any act done by it in good faith, or for any mistake of law or fact in connection with this agreement and the performance hereof, unless caused by or arising primarily out of KBW’s bad faith or gross negligence.  The foregoing agreement shall be in addition to any rights that KBW, the Company or any Indemnified Party (as defined herein) may have at common law or otherwise, including, but not limited to, any right to contribution.

Anything in this agreement to the contrary notwithstanding, in no event shall KBW be liable for special, indirect or consequential loss or damage of any kind whatsoever (including but not limited to lost profits), even if KBW has been advised of the likelihood of such loss or damage and regardless of the form of action.


1st Security Bank of Washington
September 21, 2011
Page 4
 
Indemnification:  The Company agrees to indemnify and hold harmless KBW and its affiliates, the respective partners, directors, officers, employees, and agents of KBW and its affiliates and each other person, if any, controlling KBW or any of its affiliates and each of their successors and assigns (KBW and each such person being an “Indemnified Party”) to the fullest extent permitted by law, from and against any and all losses, claims, damages and liabilities, joint or several, to which such Indemnified Party may become subject under applicable federal or state law, or otherwise, related to or arising out of the engagement of KBW pursuant to, and the performance by KBW of the services contemplated by, this letter, and will reimburse any Indemnified Party for all expenses (including reasonable counsel fees and expenses) as they are incurred, including expenses incurred in connection with investigation, preparing for or defending any such action or claim whether or not in connection with pending or threatened litigation, or any action or proceeding arising therefrom, whether or not KBW is a Party.  The Company will not be liable under the foregoing indemnification provision to the extent that any loss, claim, damage, liability or expense is found in a final judgment by a court of competent jurisdiction to have resulted primarily from KBW’s bad faith or gross negligence.

If the indemnification provided for in the foregoing paragraph is judicially determined to be unavailable (other than in accordance with the terms hereof) to any person otherwise entitled to indemnity in respect of any losses, claims, damages or liabilities referred to herein, then, in lieu of indemnifying such person hereunder, the Company shall contribute to the amount paid or payable by such person as a result of such losses, claims, damages or liabilities (and expenses relating thereto) (i) in such proportion as is appropriate to reflect the relative benefits to the Company, on the one hand, and KBW, on the other hand, of the engagement provided for in this Agreement or (ii) if the allocation provided for in clause (i) above is not available, in such proportion as is appropriate to reflect not only the relative benefits referred to in such clause (i) but also the relative fault of each of the Company and KBW, as well as any other relevant equitable considerations; provided, however, in no event shall KBW's aggregate contribution to the amount paid or payable exceed the aggregate amount of fees actually received by KBW under this Agreement.  For the purposes of this Agreement, the relative benefits to the Company and to KBW of the engagement under this Agreement shall be deemed to be in the same proportion as (a) the total value paid or contemplated to be paid or received or contemplated to be received by the Company in the Conversion and the Offerings that are the subject of the engagement hereunder, whether or not consummated, bears to (b) the fees paid or to be paid to KBW under this Agreement.

This letter agreement supersedes and replaces the prior agreement for conversion agent services dated August 8, 2008, and reflects KBW's present intention of proceeding to work with the Company on its proposed Offerings.  This letter constitutes the entire Agreement between the parties with respect to the subject matter hereof and can be altered only by written consent signed by the parties.  This Agreement is governed by the laws of the State of New York applicable to contracts executed in and to be performed in that state, without regard to such state’s rules concerning conflicts of laws.  Any right to trial by jury with respect to any claim or action arising out of this agreement or conduct in connection with the engagement is hereby waived by the parties hereto.


1st Security Bank of Washington
September 21, 2011
Page 5 
 
If the foregoing correctly sets forth our mutual understanding, please so indicate by signing and returning the original copy of this letter to the undersigned.


Very truly yours,

KEEFE, BRUYETTE & WOODS, INC.

By: /s/ Patricia A. McJoynt       
 
Patricia A. McJoynt, Managing Director
   
       
1ST SECURITY BANK OF WASHINGTON
 
       
By: /s/ Joe Adams     Date: 09/21/11  
 
Joe Adams, Director and CEO
   
                                                                                                     
EX-2.0 3 ex2-0.htm EXHIBIT 2.0 ex2-0.htm

Exhibit 2.0
 
1ST SECURITY BANK OF WASHINGTON
MOUNTLAKE TERRACE, WASHINGTON
 
PLAN OF CONVERSION
FROM STATE MUTUAL SAVINGS BANK
TO STATE STOCK SAVINGS BANK
AND FORMATION OF A HOLDING COMPANY
 
INTRODUCTION
 
I.              General
 
On July 10, 2008, the Board of Trustees (“Directors”) of 1ST Security Bank of Washington (“1ST  Security” or the “Savings Bank”) adopted by unanimous vote this Plan of Conversion (“Plan”), which provides for the conversion of the Savings Bank from a state chartered mutual savings bank to a state chartered stock savings bank and the concurrent formation of a holding company for the Savings Bank (“Holding Company”).  The Plan was amended by the Board of Directors on September 15, 2011.  The Board of Directors of the Savings Bank believes that the conversion of 1ST Security Bank to stock form and the formation of the Holding Company is in the best interests of the Savings Bank and its members.  The Board of Directors determined that this Plan equitably provides for the interests of the members through the granting of subscription rights and the establishment of a liquidation account.   The Conversion is intended to provide an additional source of capital not now available in order to allow the Savings Bank and the Holding Company to better serve the needs of the community through increased lending to support continued growth in the Savings Bank’s loan portfolios, expansion of customer services and to facilitate future expansion by the Savings Bank. The Board of Directors further desires to reorganize the Savings Bank as the wholly owned subsidiary of a holding company to enhance flexibility of operations, diversification of business opportunities and financial capability for business and regulatory purposes and to enable the Savings Bank to compete more effectively with other financial service organizations.  In addition, opportunities for stock ownership by officers and other employees of the Savings Bank and the Holding Company will provide an effective performance incentive and means of attracting and retaining qualified personnel.
 
All capitalized terms contained in the Plan shall have the meanings ascribed to them in Section II hereof.
 
Pursuant to the Plan, shares of Conversion Stock will be offered as part of the Conversion in a Subscription Offering pursuant to nontransferable Subscription Rights at a predetermined and uniform price first to the Savings Bank’s Eligible Account Holders, second to Tax-Qualified Employee Stock Benefit Plans, third to Supplemental Eligible Account Holders, and then to Other Members of the Savings Bank.  Concurrently with the Subscription Offering, shares not subscribed for in the Subscription Offering will be offered as part of the Conversion to the general public in a Direct Community Offering.  Shares remaining may then be offered to the general public in a Syndicated Community Offering, an underwritten public offering or otherwise.  The aggregate Purchase Price of the Conversion Stock will be based upon an independent appraisal of the Savings Bank and will reflect the estimated pro forma market value of the Savings Bank as a subsidiary of the Holding Company.  Members as of specified dates will be granted non-transferable Subscription Rights to purchase Conversion Stock, and a liquidation account will be established for the benefit of depositors as of specified dates.
 
Consummation of the Conversion is subject to the approval of this Plan and the Conversion by the Division and must be adopted by a majority of the total number of votes eligible to be cast at a special meeting of the Members of the Savings Bank to be called to consider the Conversion.  In addition, in order to consummate the Conversion, this Plan must be filed with and receive the non-objection of the FDIC in accordance with applicable FDIC regulations.
 
After the Conversion, the Savings Bank will continue to be regulated by the Division, as its chartering authority, and by the FDIC, which insures the Savings Banks deposits.  After the Conversion, the Holding Company will be regulated by the Federal Reserve.  In addition, all insured savings deposits will continue to be insured by the FDIC up to the maximum provided by law.
 
No change will be made in the Board of Directors or management of the Savings Bank as a result of the Conversion.


II.            Definitions
 
As used in this Plan, the terms set forth below have the following meanings:
 
A.          Acting in Concert:  (i) Knowing participation in a joint activity or interdependent conscious parallel action towards a common goal whether or not pursuant to an express agreement; or (ii) a com bination or pooling of voting or other interests in the securities of an issuer for a common purpose pursuant to any contract, understanding, relationship, agreement or other arrangement, whether written or otherwise.  Persons living at the same address as indicated on the records of the Savings Bank, whether or not related, will be deemed to be Acting in Concert, unless otherwise determined by the Board of Directors of the Savings Bank.  A Person who acts in concert with another Person (“other party”) shall also be deemed to be acting in concert with any Person who is also acting in concert with that other party, except that any Tax-Qualified Employee Stock Benefit Plan will not be deemed to be acting in concert with its trustee or a Person who serves in a similar capacity solely for the purpose of determining whether stock held by the trustee and stock held by the Tax-Qualified Employee Benefit Plan will be aggregated, and participants or beneficiaries of any such Tax-Qualified Employee Stock Benefit Plan will not be deemed to be acting in concert solely as a result of their common interests as participants or beneficiaries.  When Persons act together for such purpose, their group is deemed to have acquired their stock.  The determination of whether a group is Acting in Concert shall be made solely by the Board of Director of the Savings Bank or Officers designated by the Board of Directors of the Savings Bank and may be based on any evidence upon which the Board or such Officer chooses to rely, including, without limitation, the fact that such Persons have joint accounts at the Savings Bank or the fact that such Persons have filed joint Schedules 13D or Schedules 13G with the SEC with respect to other companies.  Directors, Officers and employees of the Savings Bank and the Holding Company shall not be deemed to be Acting in Concert solely as a result of their capacities as such.
 
B.           Application:  The application submitted to the Division and the FDIC for approval of the Conversion.
 
C.           Associate:  When used to indicate a relationship with any Person, means (i) any corporation or organization (other than the Savings Bank or a majority-owned subsidiary of the Savings Bank, or the Holding Company) of which such Person is an officer or partner or is, directly or indirectly, the beneficial owner of 10% or more of any class of equity securities, (ii) any trust or other estate in which such Person has a substantial beneficial interest or as to which such Person serves as trustee or in a similar fiduciary capacity, except a Tax-Qualified Employee Stock Benefit Plan, (iii) any relative or spouse of such Person, or any relative of such spouse, who has the same home as such Person or who is a Director or Officer of the Savings Bank, any of its subsidiaries, or the Holding Company and (iv) any person Acting in Concert with any of the persons or entities specified in clauses (i) through (iii) above; provided, however, that any Tax-Qualified or Non-Tax Qualified Employee Plan shall not be deemed to be an Associate of any Director or Officer of the Savings Bank, and of its subsidiaries, or the Holding Company solely as a result of their capacities as such.  When used to refer to a Person other than an Officer or Director of the Savings Bank, the Savings Bank in its sole discretion may determine the Persons that are Associates of other Persons.
 
D.          Capital Stock:  Any and all authorized capital stock in the Converted Savings Bank.
 
E.           Common Stock:  Any and all authorized common stock in the Holding Company subsequent to the Conversion.
 
F.           Conversion: Collectively, (i) amendment of the Savings Bank’s Charter and Bylaws to authorize issuance of shares of Capital Stock by the Converted Savings Bank and to conform to the requirements of a Washington-chartered stock savings bank under the laws of the State of Washington and regulations of the Division; (ii) issuance and sale of Conversion Stock by the Holding Company in the Subscription Offering, Direct Community Offering (if any) and Syndicated Community Offering (if any); and (iii) purchase by the Holding Company of the Capital Stock of the Converted Savings Bank to be issued in the Conversion immediately following or concurrently with the close of the sale of all Conversion Stock.  All such transactions shall occur substantially simultaneously.
 
G.           Conversion Stock:  Holding Company Common Stock to be issued and sold by the Holding Company pursuant to this Plan.
 
H.           Converted Savings Bank: 1ST Security Bank of Washington, in stock form after the Conversion.
 
 
2


I.            Deposit Account:  Any withdrawable account maintained at the Savings Bank, including, without limitation, savings, time, demand, NOW, money market, certificate and passbook accounts.
 
J.            Director:  A member of the Board of Directors of either the Savings Bank or the Holding Company.
 
K.           Direct Community Offering:  The offering for sale of Conversion Stock to the public.
 
L.           Division:  The Washington Department of Financial Institutions, Division of Banks.
 
M.          Eligible Account Holder: Any Person holding a Qualifying Deposit in the Savings Bank on the Eligibility Record Date.
 
N.           Eligibility Record Date: Close of business on June 30, 2007.
 
O.           FDIC:  Federal Deposit Insurance Corporation.
 
P.           Federal Reserve:  The Board of Governors of the Federal Reserve System.
 
Q.           FR Y-3 Application:  The application submitted to the Federal Reserve on FR Y-3, if necessary, for approval of the Holding Company’s acquisition of all of the Capital Stock of the Converted Savings Bank.
 
R.           Holding Company:  A corporation to be formed under state law by the Savings Bank for the purpose of becoming a holding company through the issuance and sale of its stock under the Plan, and concurrent acquisition of 100% of the Capital Stock of the Converted Savings Bank to be issued pursuant to the Plan.
 
S.           Holding Company Stock:  Any and all authorized capital stock of the Holding Company.
 
T.           Local Community: Clallam, King, Kitsap, Pierce and Snohomish  Counties in Washington, the counties in which the Savings Bank maintains offices.
 
U.           Market Maker:  A dealer (i.e., any Person who engages directly or indirectly as agent, broker, or principal in the business of offering, buying, selling, or otherwise dealing or trading in securities issued by another Person) who, with respect to a particular security, (i) regularly publishes bona fide, competitive bid and offer quotations in a recognized inter-dealer quotation system; or (ii) furnishes bona fide competitive bid and offer quotations on request; and (iii) is ready, willing and able to effect transactions in reasonable quantities at his quoted prices with other brokers or dealers.
 
V.           Members:  All Persons or entities who qualify as members of the Savings Bank pursuant to the Savings Bank’s Bylaws and shall include any Person holding a Deposit Account from the Savings Bank as of the close of business on the Record Date.
 
W.         Notice:  The Notice of Intent to Convert to Stock Form, including amendments thereto, as filed by the Savings Bank with the FDIC pursuant to 12 C.F.R. Part 303.
 
X.           Officer:  An executive officer of the Savings Bank or the Holding Company, which includes the President, Executive Vice President, Senior Vice Presidents, Vice Presidents in charge of principal business functions, the Secretary and the Treasurer as well as any other person performing similar functions.
 
Y.           Order Forms:  Forms to be used to order Conversion Stock sent to Eligible Account Holders and other parties eligible to purchase Conversion Stock in the Subscription Offering or Direct Community Offering pursuant to the Plan.
 
Z.           Other Member:  Holder of a Deposit Account (other than Eligible Account Holders or Supplemental Eligible Account Holders) from the Savings Bank as of the Record Date.
 
 
3


AA.       Person:  An individual, a corporation, a limited liability com pany, a partnership, a limited liability partnership, an association, a joint stock company, a trust, an unincorporated organization or a government or any political subdivision thereof.
 
BB.        Plan or Plan of Conversion:  This Plan of Conversion as adopted by the Board of Directors of the Savings Bank and any amendment hereto approved as provided herein.
 
CC.        Qualifying Deposit:  The aggregate balance of all Deposit Accounts of (i) an Eligible Account Holder at the close of business on the Eligibility Record Date and (ii) a Supplemental Eligible Account Holder at the close of business on the Supplemental Eligibility Record Date; provided, however, in either case that no aggregation of Deposit Accounts with a combined balance of less than fifty dollars ($50.00) shall constitute a Qualifying Deposit.
 
DD.        RCW:  Revised Code of Washington, as amended.
 
EE.         Record Date:  Date which determines which Members are entitled to vote at the Special Meeting.
 
FF.         Registration Statement:  The registration statement on Form S-1 or other applicable forms filed by the Holding Company with the SEC for the purpose of registering the Conversion Stock under the Securities Act of 1933, as amended.
 
GG.        Savings Bank: 1ST Security Bank of Washington.
 
HH.        SEC: U.S. Securities and Exchange Commission.
 
II.           Special Meeting:  The special meeting of Members called for the purpose of considering and voting on the Plan, including any adjournments of such meeting.
 
JJ.          Subscription Offering:  The offering of Conversion Stock to Eligible Account Holders, Tax-Qualified Employee Stock Benefit Plans, Supplemental Eligible Account Holders and Other Members under the Plan.
 
KK.        Subscription Rights:  Non-transferable, non-negotiable, personal rights of Eligible Account Holders, Tax-Qualified Employee Stock Benefit Plans, Supplemental Eligible Account Holders and Other Members to purchase Conversion Stock.
 
LL.         Supplemental Eligible Account Holder:  Any Person holding a Qualifying Deposit (other than an Officer or Director or their Associates) on the Supplemental Eligibility Record Date provided, however, that any Director or Officer of the Savings Bank employed, appointed or elected for the first time to such office after the Eligibility Record Date, and his or her Associates, shall not be precluded from being a Supplemental Eligible Account Holder solely by reason of holding such office.
 
MM.     Supplemental Eligibility Record Date:  The date for determining Qualifying Deposits of Supplemental Eligible Account Holders and shall be the last day of the calendar quarter preceding the approval of the Plan by the Division.
 
NN.        Syndicated Community Offering:  The offering for sale by a syndicate of broker-dealers to the general public of shares of Conversion Stock not purchased in the Subscription Offering and the Direct Community Offering.
 
OO.       Tax Qualified Employee Stock Benefit Plan: Any defined benefit plan or defined contribution plan of the Savings Bank or Holding Company, such as an employee stock ownership plan, stock bonus plan, profit-sharing plan or other plan, which is established for the benefit of the employees of the Holding Company and/or the Savings Bank and which, with its related trust meets the requirements to be “qualified” under section 401of the Internal Revenue Code. A “non-tax-qualified employee stock benefit plan” is any defined benefit plan or defined contribution plan that is not so qualified.
 
 
4


III.           General Procedure For Conversion.
 
A.          The Board of Directors of the Savings Bank shall adopt the Plan by a vote of not less than two-thirds of its entire membership.
 
B.          The Holding Company shall be incorporated under state law and the Board of Directors of the Holding Company shall concur in the Plan by at least a two-thirds vote.
 
C.           An Application for Conversion, including the Plan, will be submitted, together with all requisite material, to the Division for approval and the FDIC for its non-objection, and the Holding Company shall file the FR Y-3 Application with the Federal Reserve.  The Savings Bank also will cause notice of the adoption of the Plan by the Board of Directors of the Savings Bank to be given by publication in a newspaper having general circulation in each community in which an office of the Savings Bank is located; and will make available copies of the Plan at each office of the Savings Bank for inspection by Members. After receipt of notice from the Division to do so, the Savings Bank and will again publish, in accordance with the requirements of applicable regulations of the Division, a notice of the filing with the Division of an application to convert the Savings Bank from mutual to stock form.  The Holding Company will also publish such notices as may be required in connection with the FR Y-3 Application and by the regulations and policies of the Federal Reserve.
 
D.           The Holding Company shall file a Registration Statem ent with the SEC to register the Conversion Stock under the Securities Act of 1933, as amended, and shall further register the Conversion Stock under any applicable state securities laws.  Upon registration and after the receipt of all required regulatory approvals, the Conversion Stock shall be first offered for sale in a Subscription Offering to Eligible Account Holders, Tax-Qualified Employee Stock Benefit Plans, Supplemental Eligible Account Holders, if any, and Other Members.  It is anticipated that any shares of Conversion Stock remaining unsold after the Subscription Offering will be sold through a Direct Community Offering and/or a Syndicated Community Offering.  The purchase price per share for the Conversion Stock shall be a uniform price determined in accordance with Section IX hereof.  The Holding Company shall contribute to the Savings Bank an amount of the net proceeds received by the Holding Company from the sale of Conversion Stock as shall be determined by the Boards of Directors of the Holding Company and the Savings Bank and as shall be approved by the Division and the FDIC.
 
E.           Promptly following approval of the Application for Conversion by the Division and receipt of a notice of non-objection from the FDIC, this Plan will be submitted to the Members for their consideration and approval at the Special Meeting.  The Savings Bank may, at its option, mail to all Members as of the Record Date, at their last known address appearing on the records of the Savings Bank, a proxy statement in either long or summary form describing the Plan which will be submitted to a vote of the Members at the Special Meeting.  The Holding Company shall also mail to Eligible Account Holders, Tax Qualified Employee Stock Benefit Plans, Supplemental Eligible Account Holders and Other Members either a Prospectus and Order Form for the purchase of Conversion Stock or a letter informing them of their right to receive a Prospectus and Order Form and a postage prepaid card to request such materials, subject to the provisions of Section IX hereof.  The Plan must be approved by the affirmative vote of at least a majority of the total number of votes eligible to be cast by Members at the Special Meeting.
 
F.           Subscription Rights will be issued without payment therefor to Eligible Account Holders, Tax Qualified Employee Stock Benefit Plans, Supplemental Eligible Account Holders and Other Members as set forth in Section IX hereof.
 
G.          The effective date of the Conversion shall be the date set forth in Section VIII hereof.  Upon the effective date, the following transactions shall occur:
 
   (i)            The Savings Bank shall convert from mutual to stock form;
 
  (ii)           Certain depositors of the Savings Bank will be granted interests in the liquidation account to be established by the Savings Bank pursuant to Section XV hereof;
 
 
5


   (iii)        The Holding Company shall sell an amount of Conversion Stock determined in accordance with Section IX hereof; and
 
  (iv)         The Holding Company shall acquire 100% of the to be outstanding Capital Stock of the Converted Savings Bank in exchange for at least 50% of the net proceeds from the sale of Conversion Stock in the Conversion.
 
H.          The home office and branch offices of the Savings Bank shall be unaffected by the Conversion.
 
I.            The Savings Bank shall obtain an opinion of its tax advisors or a favorable ruling from the United States Internal Revenue Service which shall state that the Conversion w ill not result in any gain or loss for Federal income tax purposes to the Savings Bank or its Eligible Account Holders, Supplemental Eligible Account Holders and Other Members.  Receipt of a favorable opinion or ruling is a condition precedent to completion of the Conversion.
 
J.            The Savings Bank and the Holding Company may retain and pay for the services of financial and other advisors and investment bankers to assist in connection with any or all aspects of the Conversion, including in connection with the Subscription Offering, Direct Community Offering and/or any Syndicated Community Offering, the payment of fees to brokers and investment bankers for assisting Persons in completing and/or submitting Order Forms.
 
IV.           Meeting of Members
 
Upon receipt of approval of the Application by the Division and (i) receipt from the FDIC of a conditional intention to issue a notice of non-objection or (ii) expiration of the time period for FDIC review and objection without receipt of an objection by the FDIC, the Special Meeting shall be scheduled in accordance w ith the Savings Bank’s Bylaws.  Promptly after receipt of approval from the Division and at least 20 days but not more than 45 days prior to the Special Meeting, the Savings Bank shall distribute proxy solicitation materials to all Members and beneficial owners of accounts held in fiduciary capacities where the beneficial owners possess voting rights, as of the Record Date.  The proxy solicitation materials shall include a copy of the proxy statement to be used in connection with such solicitation (“Proxy Statement”) and other documents authorized for use by the regulatory authorities and may also include a copy of the Plan and/or a prospectus (“Prospectus”) as provided in Section VI below.  The Savings Bank shall also advise each Eligible Account Holder and Supplemental Eligible Account Holder not entitled to vote at the Special Meeting of the proposed Conversion and the scheduled Special Meeting, and provide a postage prepaid card on which to indicate whether he wishes to receive the Prospectus, if the Subscription Offering is not held concurrently with the proxy solicitation.
 
At the Special Meeting, an affirmative vote of not less than a majority of the total outstanding votes of the Members is required for approval of the Plan.  For purposes of voting at the Special Meeting, Members who are depositors of the Savings Bank shall be entitled to cast one vote for each $100, or fraction thereof, of the aggregate withdrawable value of all of the depositor’s Deposit Accounts as of the Record Date, and no Member shall be entitled to cast more than 1,000 votes.  Voting may be in person or by proxy.  The Division shall be notified prom ptly of the actions of the Members.
 
V.            Summary Proxy Statement
 
The Proxy Statement furnished to Members may be in summary form, provided that a statement is made in boldface type that a more detailed description of the Conversion may be obtained by returning an enclosed postage prepaid card or other written communication requesting supplemental information.  Without prior approval of the Division, the Special Meeting shall not be held less than 20 days after the last day on which the supplemental information statement is mailed to requesting Members.  The supplemental information statement may be combined with the Prospectus if the Subscription Offering is commenced concurrently with or during the proxy solicitation of Members for the Special Meeting.
 
 
6


VI.           Offering Documents
 
The Holding Company may commence the Subscription Offering and, provided that the Subscription Offering has commenced, may commence the Direct Community Offering concurrently with or during the proxy solicitation of Members.  The Holding Company may close the Subscription Offering before the Special Meeting, provided that the offer and sale of the Conversion Stock shall be conditioned upon approval of the Plan by the Members at the Special Meeting.
 
The timing of the commencement of the Subscription Offering shall be determined by the Savings Bank in consultation with any financial or advisory or investment banking firm retained by them in connection with the Conversion.  The Savings Bank may consider a number of factors in determining such timing, including, but not limited to, their current and projected future earnings, local and national economic conditions, and the prevailing market for stocks in general and stocks of financial institutions in particular.  The Savings Bank shall have the right to withdraw, terminate, suspend, delay, revoke or modify any such Subscription Offering, at any time and from time to time, as they in their sole discretion may determine, without liability to any Person, subject to compliance with applicable securities laws and any necessary regulatory approval or concurrence.
 
The Savings Bank and the Holding Company shall, promptly after the Division has approved the Application and authorized the Proxy Statement and Prospectus for use, the FDIC has issued its non-objection letter, the SEC has declared the Registration Statement, which includes the Prospectus, effective and all other required regulatory approvals have been obtained, distribute or make available the Prospectus, together with Order Forms for the purchase of Conversion Stock, to all Eligible Account Holders, Tax-Qualified Employee Stock Benefit Plans, Supplemental Eligible Account Holders and Other Members, at their last known addresses appearing on the records of the Savings Bank as of the Record Date for the purpose of enabling them to exercise their respective Subscription Rights.
 
The Savings Bank’s proxy solicitation materials may require Eligible Account Holders, Supplemental Eligible Account Holders and Other Members to return to the Savings Bank by a reasonable certain date a postage prepaid card or other written communication requesting receipt of a Prospectus with respect to the Subscription Offering, provided that if the  Prospectus is not mailed concurrently with the proxy solicitation materials, the Subscription Offering shall not be closed until the expiration of 30 days after the mailing of the proxy solicitation materials.  If the Subscription Offering is not commenced within 45 days after the Special Meeting, the Savings Bank may transmit, not more than 30 days prior to the commencement of the Subscription Offering, to each Eligible Account Holder, Supplemental Eligible Account Holder and other eligible subscribers who had been furnished with proxy solicitation materials a notice which shall state that the Savings Bank is not required to furnish a Prospectus to them unless they return by a reasonable date certain a postage prepaid card or other written communication requesting the receipt of the Prospectus.
 
Prior to commencement of the Subscription Offering, the Direct Community Offering and the Syndicated Community Offering, the Holding Company shall file the Registration Statement.  The Holding Company shall not distribute the final Prospectus until the Registration Statement containing same has been declared effective by the SEC.
 
VII.         Combined Subscription and Direct Community Offering
 
Instead of a separate Subscription Offering, all Subscription Rights may be exercised by delivery of properly completed and executed Order Forms to the Savings Bank or the selling group utilized in connection with the Direct Community Offering and the Syndicated Community Offering.  If a separate Subscription Offering is not held, orders for Conversion Stock in the Direct Community Offering shall first be filled pursuant to the priorities and limitations stated in Section IX.C., below.
 
VIII.        Effective Date
 
After receipt of all orders for Conversion Stock, and concurrently with the execution thereof, the amendment of the Savings Bank’s mutual Charter and Bylaws to authorize the issuance of shares of Capital Stock and to conform to the requirements of a Washington-chartered capital stock savings bank will be declared effective by the Division, the amended Articles of Incorporation and Bylaws approved by the Members will become effective.  At such time, the Conversion Stock will be issued and sold by the Holding Company, the Capital Stock to be issued in the Conversion will be issued and sold to the Holding Company, and the Converted Savings Bank will become a wholly owned subsidiary of the Holding Company.  The Converted Savings Bank will issue to the Holding Company 1,000 shares of its common stock, representing all of the shares of Capital Stock to be issued by the Converted Savings Bank, and the Holding Company will make payment to the Converted Savings Bank of that portion of the aggregate net proceeds realized by the Holding Company from the sale of the Conversion Stock under the Plan as may be authorized or required by the Division or the FDIC.
 
 
7


IX.           Stock Offering
 
A.          Number of Shares
 
The number of shares of Conversion Stock to be offered pursuant to the Plan shall be determined initially by the Boards of Directors of the Savings Bank and the Holding Company in conjunction with the determination of the Purchase Price (as that term is defined in Section IX.B. below).  The number of shares to be offered may be subsequently adjusted by the Boards of Directors of the Savings Bank and the Holding Company prior to completion of the offering.
 
B.           Independent Evaluation and Purchase Price of Shares
 
The aggregate price at which the Conversion Stock shall be sold shall be consistent with the estimated pro forma market value of the Conversion Stock, based upon an independent valuation as provided for in this Section IX.B.  The Savings Bank shall cause the independent appraiser to prepare a pro forma valuation of the aggregate market value of the Holding Company Common Stock, giving effect to completion of the Conversion, which shall be submitted to the Division as part of the Application for Conversion, such valuation to be expressed in terms of an estimated valuation range.
 
Prior to the commencement of the Subscription Offering, an estimated valuation range will be established, which shall be equal to the estimated pro forma market value of the Conversion Stock, as determined by the independent appraiser.  The maximum of the estimated valuation range shall be no more than 15% above the average of the minimum and maximum of such range and the minimum of which shall be no more than 15% below such average. The maximum of the estimated valuation range may be increased by up to 15% subsequent to the Subscription Offering to reflect changes in market and financial conditions or demand for the shares.  From time to time, as appropriate or as required by applicable law or the Division, the Savings Bank shall cause the independent appraiser to review developments subsequent to its valuation to determine whether the estimated valuation range should be revised.
 
All shares of Conversion Stock sold in the Conversion, including shares sold in any Direct Community Offering, shall be sold at a uniform price per share, referred to herein as the “Purchase Price.”  Based on the estimated valuation range, the Board of Directors of the Savings Bank shall determine the offering range by fixing the Purchase Price and establishing a range of the number of shares of Conversion Stock to be offered.  The total number of shares of Conversion Stock offered and the Purchase Price shall be subject to increase or decrease at any time prior to any Syndicated Community Offering or other method of sale to reflect changes in market and financial conditions.  If the aggregate purchase price of the Conversion Stock sold in the Subscription Offering, Direct Community Offering and Syndicated Community Offering is below the minimum of the offering range, or materially above the maximum of the offering range, resolicitation of purchasers may be required; provided, that up to a 15%  increase in the number of shares to be issued which is supported by an appropriate change in the estimated pro forma market value of the Conversion Stock, will not be deemed material so as to require a resolicitation.  If a resolicitation of purchasers is required, it shall be effected in such manner and within such time as the Savings Bank shall establish, with the approval of the Division.
 
Notwithstanding the foregoing, shares of Conversion Stock will not be issued unless, prior to the consummation of the Conversion, the independent appraiser confirms to the Savings Bank and the Division that, to the best knowledge of the independent appraiser, nothing of a material nature has occurred which, taking into account all relevant factors, would cause the independent appraiser to conclude that the number of shares of Conversion Stock issued in the Conversion multiplied by the Purchase Price is incompatible with the estimate of the aggregate consolidated pro forma market value of the Conversion Stock.  If such confirmation is not received, the Savings Bank may cancel the offerings, extend the Conversion and establish a new estimated valuation range, hold new offerings, or take such other action as the Division may permit.
 
 
8


C.            Method of Offering Shares
 
Subscription Rights shall be issued at no cost to Eligible Account Holders, Tax-Qualified Employee Stock Benefit Plans, Supplemental Eligible Account Holders and Other Members pursuant to priorities established by this Plan and the requirements of the Division and the FDIC.  In order to effect the Conversion, all shares of Conversion Stock proposed to be issued in connection with the Conversion must be sold and, to the extent that shares are available, no subscriber shall be allowed to purchase less than 25 shares; provided, however, that if the purchase price is greater than $20 per share, the minimum number of shares which must be subscribed for shall be adjusted so that the aggregate actual purchase price required to be paid for such minimum number of shares does not exceed $500.  The priorities established for the purchase of shares are as follows:
 
1.             Category 1:  Eligible Account Holders
 
a.           Each Eligible Account Holder shall receive, without payment, Subscription Rights entitling such Eligible Account Holder to purchase that number of shares of Conversion Stock which is equal to the greater of the maximum purchase limitation established for the Direct Community Offering, one-tenth of one percent of the total offering or 15 times the product (rounded down to the next whole number) obtained by multiplying the total number of shares of Conversion Stock to be issued by a fraction of w hich the numerator is the amount of the Qualifying Deposit of the Eligible Account Holder and the denominator is the total amount of Qualifying Deposits of all Eligible Account Holders, in each case subject to Sections IX.E. and X.J. below.  If the allocation made in this paragraph results in an oversubscription, shares of Conversion Stock shall be allocated among subscribing Eligible Account Holders so as to permit each such account holder, to the extent possible, to purchase a number of shares of Conversion Stock sufficient to make his total allocation equal to 100 shares of Conversion Stock or the total amount of his subscription, whichever is less.  Any shares of Conversion Stock not so allocated shall be allocated among the subscribing Eligible Account Holders on an equitable basis, related to the amounts of their respective Qualifying Deposits as compared to the total Qualifying Deposits of all Eligible Account Holders whose subscriptions remain unfilled.
 
b.           Subscription Rights received by Officers and Directors of the Savings Bank and the Holding Company, and their Associates, as Eligible Account Holders, based on their increased deposits in the Savings Bank in the one-year period preceding the Eligibility Record Date shall be subordinated to all other subscriptions involving the exercise of Subscription Rights pursuant to this Category.
 
2.             Category 2: Tax-Qualified Employee Stock Benefit Plans
 
a.            Tax-Qualified Employee Stock Benefit Plans of the Savings Bank shall receive, without payment, non-transferable Subscription Rights to purchase in the aggregate up to 8%  of the Conversion Stock.  The Subscription Rights granted to Tax-Qualified Stock Benefit Plans of the Savings Bank shall be subject to the availability of shares of Conversion Stock after taking into account the shares of Conversion Stock purchased by Eligible A ccount Holders.  Because the Subscription Rights granted to Tax-Qualified Employee Stock Benefit Plans of the Savings Bank are subordinate to the Subscription Rights granted to Eligible Account Holders, it is possible that the subscription order of Tax-Qualified Employee Stock Benefit Plans of the Savings Bank will not be filled as a result of an oversubscription by Eligible Account Holders.  To the extent that Tax-Qualified Employee Stock Benefit Plans of the Savings Bank are unable to purchase in the aggregate up to 8% of the shares of Conversion Stock issued in the Conversion as a result of such an oversubscription, Tax-Qualified Employee Stock Benefit Plans of the Savings Bank may purchase shares in the open market following the consummation of the Conversion.  Tax-Qualified Employee Stock Benefit Plans m ay use funds contributed by or borrowed from the Holding Company or the Savings Bank and/or borrowed from an independent financial institution to exercise such Subscription Rights, and the Holding Company and the Savings Bank may make scheduled discretionary contributions thereto, provided that such contributions do not cause the Holding Company or the Savings Bank to fail to meet any applicable capital requirements.
 
 
9


b.            Shares of Conversion Stock purchased by any individual participant in a Tax-Qualified Employee Stock Benefit Plan using funds therein pursuant to the exercise of Subscription Rights granted to such participant in his individual capacity as an Eligible Account Holder, Supplemental Eligible Account Holder or Other Member or purchases by such participant in the Direct Community Offering shall not be deemed to be purchases by a Tax-Qualified Employee Stock Benefit Plan for purposes of calculating the maximum amount of Conversion Stock that Tax-Qualified Employee Stock Benefit Plans may purchase pursuant to the first sentence of  subparagraph 2.a. above if the individual participant controls or directs the investment authority with respect to such account or subaccount.
 
3.             Category 3:  Supplemental Eligible Account Holders
 
a.            In the event that the Eligibility Record Date is more than 15 months prior to the date of the latest amendment to the Application filed prior to the Division’s approval, then, and only in that event, each Supplemental Eligible Account Holder shall receive, without payment, Subscription Rights entitling such Supplemental Eligible Account Holder to purchase that number of shares of Conversion Stock which is equal to the greater of the maximum purchase limitation established for the Direct Community Offering, one-tenth of one percent of the total offering or 15 times the product (rounded down to the next whole number) obtained by multiplying the total number of shares of Conversion Stock to be issued by a fraction of which the numerator is the amount of the Qualifying Deposit of the Supplemental Eligible Account Holder and the denom inator is the total amount of the Qualifying Deposits of all Supplemental Eligible Account Holders, in each case subject to Sections  IX.E. and X.J. below.
 
b.            Subscription Rights received pursuant to this category shall be subordinated to Subscription Rights granted to Eligible Account Holders and Tax-Qualified Employee Stock Benefit Plans.
 
c.            Any Subscription Rights to purchase shares of Conversion Stock received by an Eligible Account Holder in accordance with Category Number 1 shall reduce to the extent thereof the Subscription Rights to be distributed pursuant to this Category.
 
d.            In the event of an oversubscription for shares of Conversion Stock pursuant to this Category, shares of Conversion Stock shall be allocated among the subscribing Supplemental Eligible Account Holders as follows:
 
(1)           Shares of Conversion Stock shall be allocated so as to permit each such Supplemental Eligible Account Holder, to the extent possible, to purchase a number of shares of Conversion Stock sufficient to make his total allocation (including the number of shares of Conversion Stock, if any, allocated in accordance with Category Number 1) equal to 100 shares of Conversion Stock or the total amount of his subscription, whichever is less.
 
(2)           Any shares of Conversion Stock not allocated in accordance with subparagraph (1) above shall be allocated among the subscribing Supplem ental Eligible Account Holders on an equitable basis, related to the amounts of their respective Qualifying Deposits as compared to the total Qualifying Deposits of all Supplemental Eligible Account Holders whose subscriptions remain unfilled.
 
4.            Category 4:  Other Members
 
Other Members shall receive Subscription Rights to purchase shares of Conversion Stock, after satisfying the subscriptions of Eligible Account Holders, Tax-Qualified Employee Stock Benefit Plans and Supplemental Eligible Account Holders pursuant to Category Nos. l, 2 and 3 above, subject to the following conditions:
 
 
10


a.           Each such Other Member shall be entitled to subscribe for the greater of the maximum purchase limitation established for the Direct Community Offering or one-tenth of one percent of the total offering.
 
b.           In the event of an oversubscription for shares of Conversion Stock pursuant to Category No. 4, the shares of Conversion Stock available shall be allocated among the subscribing Other Members pro rata on the basis of the amounts of their respective subscriptions.
 
D.            Direct Community Offering and Syndicated Community Offering
 
1.             Any shares of Conversion Stock not purchased through the exercise of Subscription Rights set forth in Category Nos. 1 through 4 above may be sold by the Savings Bank and the Holding Company to Persons under such terms and conditions as may be established by the Savings Bank’s and the Holding Company’s Boards of Directors with the concurrence of the Division.  The Direct Community Offering may commence concurrently with or as soon as possible after the completion of the Subscription Offering and must be completed within 45 days after completion of the Subscription Offering, unless extended with the approval of the Division.  No Person may purchase in the Direct Community Offering shares of Conversion Stock with an aggregate purchase price that exceeds $250,000.  The right to purchase shares of Conversion Stock under the Direct Community Offering is subject to the right of the Savings Bank and the Holding Company to accept or reject such subscriptions in whole or in part.  In the event of an oversubscription for shares in the Direct Community Offering, the shares available shall be allocated among prospective purchasers pro rata on the basis of the amounts of their respective orders.  The offering price for which such shares are sold to the general public in the Direct Community Offering shall be the Purchase Price.
 
2.             Orders received in the Direct Community Offering first shall be filled up to a maximum of 2% of the Conversion Stock and thereafter remaining shares shall be allocated on an equal number of shares basis per order until all orders have been filled.
 
3.            The Conversion Stock offered in the Direct Community Offering shall be offered and sold in a manner that will achieve the widest distribution thereof.  Preference shall be given in the Direct Community Offering to natural Persons residing in the Local Community.
 
4.             Subject to such terms, conditions and procedures as may be determined by the Savings Bank and the Holding Company, all shares of Conversion Stock not subscribed for in the Subscription Offering or ordered in the Direct Community Offering may be sold by a syndicate of broker-dealers to the general public in a Syndicated Community Offering.  Each order for Conversion Stock in the Syndicated Community Offering shall be subject to the absolute right of the Savings Bank and the Holding Company to accept or reject any such order in whole or in part either at the time of receipt of an order or as soon as practicable after completion of the Syndicated Community Offering.  No Person may purchase in the Syndicated Community Offering shares of Conversion Stock with an aggregate purchase price that exceeds $250,000.  The Savings Bank and the Holding Company may commence the Syndicated Community Offering concurrently with, at any time during, or as soon as practicable after the end of the Subscription Offering and/or Direct Community Offering, provided that the Syndicated Community Offering must be com pleted within 45 days after the completion of the Subscription Offering, unless extended by the Savings Bank and the Holding Company with the approval of the Division.
 
5.             If for any reason a Syndicated Community Offering of shares of Conversion Stock not sold in the Subscription Offering and the Direct Community Offering cannot be effected, or in the event that any insignificant residue of shares of Conversion Stock is not sold in the Subscription Offering, Direct Community Offering or Syndicated Community Offering, the Savings Bank and the Holding Company shall use their best efforts to obtain other purchasers for such shares in such manner and upon such conditions as may be satisfactory to the Division.
 
 
11


6.            In the event a Direct Community Offering or Syndicated Community Offering does not appear to be feasible, the Savings Bank and the Holding Company will immediately consult with the Division to determine the most viable alternative available to effect the completion of the Conversion.  Should no viable alternative exist, the Savings Bank and the Holding Company may terminate the Conversion with the concurrence of the Division.
 
E.             Limitations Upon Purchases
 
The following additional limitations and exceptions shall be imposed upon purchases of shares of Conversion Stock:
 
1.            Purchases of shares of Conversion Stock in the Conversion, including purchases in the Direct Community Offering or Syndicated Community Offering by any Person, and Associates thereof, or a group of Persons Acting in Concert, shall not exceed an aggregate purchase price of $500,000, except that Tax-Qualified Employee Stock Benefit Plans may purchase up to 8% of the total Conversion Stock issued and shares held or to be held by the Tax-Qualified Employee Stock Benefit Plans and attributable to a Person shall not be aggregated with other shares purchased directly by or otherwise attributable to such Person.
 
2.            Officers and Directors and Associates thereof may not purchase in the aggregate more than 25% of the shares issued in the Conversion.
 
3.            The members of the Boards of Directors of the Savings Bank and the Holding Company will not be deemed to be Associates or a group of Persons Acting in Concert with other Directors solely as a result of membership on either of the  Boards of Directors.
 
4.            The Savings Bank’s and the Holding Company’s Boards of Directors, with the approval of the Division and without further approval of Members, may, as a result of market conditions and other factors, increase or decrease the purchase limitation in Sections D.1 or E.1 above or the number of shares of Conversion Stock to be sold in the Conversion.  The Boards of Directors of the Savings Bank and the Holding Company may, in their sole discretion, increase the maximum purchase limitation set forth above with Division approval to provide that any Person, group of associated Persons, or Persons otherwise Acting in Concert subscribing for 5%, may purchase between 5% and 10%  as long as the aggregate amount that such subscribers purchase does not exceed 10%  of the total stock offering.  If the maximum purchase limitations or the number of shares of Conversion Stock to be sold in the Conversion are increased, the Savings Bank and Holding Company are only required to resolicit Persons who subscribed for the maximum purchase amount and may, in the sole discretion of the Savings Bank and Holding Company, resolicit certain other large subscribers.  If the Savings Bank and Holding Company decrease the maximum purchase limitations or the number of shares of Conversion Stock to be sold in the Conversion, the orders of any Person who subscribed for the maximum purchase amount shall be decreased by the minimum amount necessary so that such Person shall be in compliance with the then maximum number of shares permitted to be subscribed for by such Person.
 
5.            Notwithstanding any other provisions of this Plan, no person shall be entitled to purchase any Conversion Stock to the extent such purchase would be illegal under any federal law or state law or regulation or would violate regulations or policies of the Financial Industry Regulatory Authority, particularly those regarding free riding and withholding.  The Holding Company and/or its agents may ask for a legal opinion from any purchaser as to the legality of such purchase and may refuse to honor any purchase order if such opinion is not timely furnished or is not deemed acceptable in the sole discretion of the Holding Company.
 
6.            Prior to and during the Offerings, no Person shall (1) transfer, or enter into any agreement or understanding to transfer, the legal or beneficial ownership of any Subscription Rights or shares of Conversion Stock; (2) make any offer, or any announcement of an offer, to purchase any Conversion Stock from anyone but the Holding Company; or (3) knowingly acquire more than the maximum purchase amount allowable under this Plan.
 
 
12


EACH PERSON PURCHASING CONVERSION STOCK IN THE OFFERINGS W ILL BE DEEMED TO CONFIRM THAT SUCH PURCHASE DOES NOT CONFLICT WITH THE PURCHASE LIMITATIONS IN THIS PLAN.  ALL QUESTIONS CONCERNING WHETHER ANY PERSONS ARE ASSOCIATES OR A GROUP ACTING IN CONCERT OR WHETHER ANY PURCHASE CONFLICTS WITH THE PURCHASE LIMITATIONS IN THIS PLAN OR OTHERWISE VIOLATES ANY PROVISION OF THIS PLAN SHALL BE DETERMINED BY THE SAVINGS BANK AND THE HOLDING COMPANY IN THEIR SOLE DISCRETION. SUCH DETERMINATION SHALL BE CONCLUSIVE, FINAL AND BINDING ON ALL PERSONS AND THE SAVINGS BANK AND HOLDING COMPANY MAY TAKE ANY REMEDIAL ACTION, INCLUDING WITHOUT LIMITATION REJECTING THE PURCHASE OR REFERRING THE MATTER TO THE DIVISION FOR INVESTIGATION AND ACTION, AS IN THEIR SOLE DISCRETION THE SAVINGS BANK AND HOLDING COMPANY MAY DEEM APPROPRIATE.
 
F.            Restrictions On and Other Characteristics of the Conversion Stock
 
1.            Transferability.  Conversion Stock purchased by Officers and Directors of the Savings Bank and the Holding Company shall not be sold or otherwise disposed of for value for a period of one year from the effective date of Conversion, except for any disposition following the death of the original purchaser.
 
The Conversion Stock issued by the Holding Com pany to such Officers and Directors shall bear a legend giving appropriate notice of the one-year holding period restriction.  Said legend shall state as follows:
 
“The shares evidenced by this certificate are restricted as to transfer for a period of one year from the date of this certificate pursuant to the laws of the State of Washington.  These shares may not be transferred prior thereto without a legal opinion of counsel that said transfer is permissible under the provisions of applicable laws and regulations.  This restrictive legend shall be deemed null and void after one year from the date of this certificate.”
 
In addition, the Holding Company shall give appropriate instructions to the transfer agent of the Holding Company Stock with respect to the foregoing restrictions.  Any shares of Holding Company Stock subsequently issued as a stock dividend, stock split or otherwise, with respect to any such restricted stock, shall be subject to the same holding period restrictions for such Persons as may be then applicable to such restricted stock.
 
2.            Subsequent Purchases by Officers and Directors.  Without prior approval of the Division, if applicable, Officers and Directors of the Converted Savings Bank and the Holding Company, and their Associates, shall be prohibited for a period of three years following completion of the Conversion from purchasing outstanding shares of Holding Company Stock, except from a broker or dealer registered with the SEC and/or the Secretary of State of the State of W ashington.  Notwithstanding this restriction, purchases involving more than 1% of the total outstanding shares of Holding Company Stock and purchases made and shares held by a Tax-Qualified or non-Tax-Qualified Employee Stock Benefit Plan which may be attributable to such Directors and Officers may be made in negotiated transactions without the Division’s permission or the use of a broker or dealer.
 
3.            Repurchase and Dividend Rights.  The Holding Company may repurchase Holding Company Stock subject to applicable laws and regulations.
 
The Converted Savings Bank may not declare or pay a cash dividend on the Capital Stock if the result thereof would be to reduce the regulatory capital of the Converted Savings Bank below (i) the amount required for the Liquidation Account or (ii) the amount required by the Division.
 
Any dividend declared or paid on, or repurchase of, the Capital Stock shall be in compliance with the rules and regulations of the Division, or other applicable regulations.  The above limitations shall not preclude payment of dividends on, or repurchases of, Capital Stock in the event applicable regulatory limitations are liberalized subsequent to the Conversion.
 
 
13


4.            Voting Rights.  After the Conversion, exclusive voting rights with respect to the Holding Company shall be vested in the holders of Holding Company Stock and the Holding Company will have exclusive voting rights with respect to the Capital Stock.
 
G.            Mailing of Offering Materials and Collation of Subscriptions
 
The sale of all shares of Conversion Stock offered pursuant to the Plan must be completed within 24 months after approval of the Plan at the Special Meeting.  After (i) approval of the Plan by the Division, (ii) the receipt of a notice of non-objection from the FDIC with respect to the Notice or expiration of the time period for FDIC review and objection without receipt of an objection from the FDIC and (iii) the declaration of the effectiveness of the Registration Statement, the Holding Company shall distribute Prospectuses and Order Forms for the purchase of shares of Conversion Stock in accordance with the terms of the Plan.
 
The recipient of an Order Form shall be provided not less than 20 days nor more than 45 days from the date of mailing, unless extended, properly to complete, execute and return the Order Form to the Savings Bank and the Holding Company.  Self-addressed, postage prepaid, return envelopes shall accompany all Order Forms when they are mailed. Failure of any eligible subscriber to return a properly completed and executed Order Form within the prescribed time limits shall be deemed a waiver and a release by such eligible subscriber of any rights to purchase shares of Conversion Stock under the Plan.
 
The sale of all shares of Conversion Stock proposed to be sold in connection with the Conversion must be completed within 45 days after the last day of the Subscription Offering, unless extended by the Savings Bank and the Holding Company with the approval of the Division.
 
H.           Method of Payment
 
Payment for all shares of Conversion Stock may be made by check or by money order, or if a subscriber has a Deposit Account in the Savings Bank such subscriber may authorize the Savings Bank to charge the subscriber’s Deposit Account.  The Holding Company shall pay interest at not less than the passbook rate on all amounts paid in cash or by check or money order to purchase shares of Conversion Stock in the Subscription Offering from the date payment is received until the Conversion is completed or terminated.    All funds received before the completion of the Conversion will be held in a segregated account at the Savings Bank, or at the Savings Bank’s discretion, at an independent insured depository institution.  The Savings Bank is not permitted knowingly to loan funds, and will use its best efforts to insure that credit is not extended, to any Person for the purpose of purchasing Conversion Stock.
 
If a subscriber authorizes the Savings Bank to charge the subscriber’s Deposit Account, the funds shall remain in the subscriber’s Deposit Account and shall continue to earn interest, but may not be used by such subscriber until the Conversion is completed or terminated, whichever is earlier.  The withdrawal shall be given effect only concurrently with the sale of all shares of Conversion Stock proposed to be sold in the Conversion and only to the extent necessary to satisfy the subscription at a price equal to the Purchase Price.  The Savings Bank shall allow subscribers to purchase shares of Conversion Stock by withdrawing funds from certificate accounts held with the Savings Bank without the assessment of early withdrawal penalties, subject to the approval, if necessary, of the applicable regulatory authorities.  In the case of early withdrawal of only a portion of such account, the certificate evidencing such account shall be canceled if the remaining balance of the account is less than the applicable minimum balance requirement.  In that event, the remaining balance shall earn interest at the passbook rate.  This waiver of the early withdrawal penalty is applicable only to withdrawals made in connection with the purchase of Conversion Stock under the Plan.
 
In the event of an unfilled amount of any subscription order, the Savings Bank will make an appropriate refund or cancel an appropriate portion of the related withdrawal authorization, after consummation of the sale of the Conversion Stock.  If for any reason the sale of the Conversion Stock is not consummated, purchasers will have refunded to them all payments made and all withdrawal authorizations will be canceled in the case of subscription payments authorized from accounts at the Savings Bank.
 
 
14


Tax-Qualified Employee Stock Benefit Plans may subscribe for shares by submitting an Order Form, along with evidence of a loan commitment for the purchase of shares, if applicable, during the Subscription Offering and by making payment for the shares on the date of the closing of the Conversion.
 
I.             Order Forms; Insufficient Payment
 
A single Order Form for all Deposit Accounts maintained with the Savings Bank by any Eligible Account Holder, any Supplemental Eligible Account Holder and any Other Member may be furnished, irrespective of the number of Deposit Accounts maintained with the Savings Bank on the applicable record date.  No person holding a Subscription Right may exceed any otherwise applicable purchase limitation by submitting multiple orders for Conversion Stock. Multiple orders are subject to adjustment, as appropriate, on a pro rata basis and deposit balances will be divided equally among such orders in allocating shares in the event of an oversubscription.
 
The Savings Bank and Holding Company shall have the absolute right, in their sole discretion and without liability to any participant or other Person, to reject any Order Form, including, but not limited to, any Order Form that is (i) improperly completed or executed; (ii) not timely received; (iii) not accompanied by the proper payment (or authorization of withdrawal from a Deposit Account with sufficient funds therein); or (iv) submitted by a Person whose representations the Savings Bank and Holding Company believe to be false or who they otherwise believe, either alone, or Acting in Concert with others, is violating, evading or circumventing, or intends to violate, evade or circumvent, the terms and conditions of this Plan.  Furthermore, in the event Order Forms (i) are not delivered and are returned, or notice of non-delivery is given, to the Savings Bank or Holding Company by the United States Postal Service or (ii) are not mailed pursuant to a “no mail” order placed in effect by the account holder, the Subscription Rights of the Person to which such rights have been granted will lapse as though such Person failed to return the contemplated Order Form within the time period specified thereon.  The Savings Bank and Holding Company may, but will not be required to, waive any irregularity on any Order Form or may require the submission of corrected Order Forms or the remittance of full payment for shares of Conversion Stock by such date as they may specify.  Subscription orders once tendered are irrevocable.  The interpretation of the Savings Bank and Holding Company of the terms and conditions of the Order Forms shall be final and conclusive, subject to the authority of the Division.
 
J.             Members in Non-Qualified States or in Foreign Countries
 
The Savings Bank and the Holding Company shall make reasonable efforts to comply with the securities laws of all states of the United States in which Persons entitled to subscribe for shares of Conversion Stock pursuant to the Plan reside.  However, no such Person shall be offered or receive any such shares under the Plan who resides in a foreign country or who resides in a state of the United States with respect to which any of the following apply:  (a) a small number of Persons otherwise eligible to subscribe for shares of Conversion Stock reside in such state; (b) the granting of Subscription Rights or offer or sale of shares of Conversion Stock to such Persons would require the Holding Company to register, under the securities laws of such state, as a broker, dealer, salesperson or selling agent, or to register or otherwise qualify its securities for sale in such state; or (c) such registration or qualification in the judgment of the Savings Bank and Holding Company would be impractical for reasons of cost or otherwise.
 
X.           Articles of Incorporation and Bylaws
 
As part of the Conversion, Articles of Incorporation and Bylaws for the Converted Savings Bank will be adopted to authorize the Converted Savings Bank to operate as a Washington-chartered capital stock savings bank.  By approving the Plan, the Members shall thereby approve such Articles of Incorporation and Bylaws.  Prior to completion of the Conversion, the proposed Articles of Incorporation and Bylaws may be amended in accordance with the provisions and limitations for amending the Plan under Section XVII below.  The effective date of the adoption of the Articles of Incorporation and Bylaws shall be the date of the issuance of the Conversion Stock and the Capital Stock, which shall be the date of consummation of the Conversion.
 
XI.          Post Conversion Filing and Market Making
 
In connection with the Conversion, the Holding Company shall register the Conversion Stock with the SEC pursuant to the Securities Exchange Act of 1934, as amended, and shall undertake not to deregister such Conversion Stock for a period of three years thereafter.  The Holding Company shall use its best efforts to encourage and assist various M arket M akers to establish and maintain a market for the shares of its stock.  The Holding Company shall also use its best efforts to list its stock through The Nasdaq Stock M arket LLC or on any other national or regional securities exchange.
 
 
15


XII.         Status of Deposit Accounts and Loans Subsequent to Conversion
 
All Deposit Accounts shall retain the same status after Conversion (except for voting and liquidation rights) as these accounts had prior to Conversion.  Each Deposit Account holder shall retain, without payment, a withdrawable Deposit Account or accounts after the Conversion, equal in amount to the withdrawable value of such holder’s Deposit Account or accounts prior to Conversion.  All Deposit Accounts will continue to be insured by the Deposit Insurance Fund of the FDIC up to the applicable limits of insurance coverage.  All loans shall retain the same status after the Conversion as they had prior to the Conversion.  See Section IX.F.4. with respect to the termination of voting rights of Members.
 
XIII.        Liquidation Account
 
After the Conversion, holders of Deposit Accounts shall not be entitled to share in any residual assets in the event of liquidation of the Converted Savings Bank.  However, the Savings Bank shall, at the time of the Conversion, establish a liquidation account in an amount equal to its total net worth as of the date of the latest statement of financial condition contained in the final Prospectus.  The function of the liquidation account shall be to establish a priority on liquidation and, except as provided in Section IX.F.3 above, the existence of the liquidation account shall not operate to restrict the use or application of any of the net worth of the Converted Savings Bank.
 
The liquidation account shall be maintained by the Converted Savings Bank subsequent to the Conversion for the benefit of Eligible Account Holders and Supplemental Eligible Account Holders who retain their Deposit Accounts in the Converted Savings Bank.  Each Eligible Account Holder and Supplemental Eligible Account Holder shall, with respect to each Deposit Account held, have a related inchoate interest in a portion of the liquidation account balance (“subaccount”).
 
The initial subaccount balance for a Deposit Account held by an Eligible Account Holder and/or a Supplemental Eligible Account Holder shall be determined by multiplying the opening balance in the liquidation account by a fraction of which the numerator is the amount of such holder’s Qualifying Deposit and the denominator is the total amount of the Qualifying Deposits of all Eligible Account Holders and Supplemental Eligible Account Holders.  Such initial subaccount balance shall not be increased, and it shall be subject to downward adjustment as provided below.
 
If the deposit balance in any Deposit Account of an Eligible Account Holder or Supplemental Eligible Account Holder at the close of business on any annual closing date subsequent to the Eligibility Record Date is less than the lesser of (i) the deposit balance in such Deposit Account at the close of business on any other annual closing date subsequent to the Eligibility Record Date or the Supplemental Eligibility Record Date or (ii) the amount of the deposit balance in such Deposit Account on the Eligibility Record Date or the Supplemental Eligibility Record Date, then the subaccount balance for such Deposit Account shall be adjusted by reducing such subaccount balance in an amount proportionate to the reduction in such deposit balance.  In the event of a downward adjustment, such subaccount balance shall not be subsequently increased, notwithstanding any increase in the deposit balance of the related Deposit Account.  If any such Deposit Account is closed, the related subaccount balance shall be reduced to zero.
 
In the event of a complete liquidation of the Converted Savings Bank, each Eligible Account Holder and Supplemental Eligible Account Holder shall be entitled to receive a liquidation distribution from the liquidation account in the amount of the then current adjusted subaccount balance(s) for Deposit Account(s) then held by such holder before any liquidation distribution may be made to stockholders.  No merger, consolidation, bulk purchase of assets with assumptions of Deposit Accounts and other liabilities or similar transactions with another Federally-insured institution in which the Converted Savings Bank is not the surviving institution shall be considered to be a complete liquidation. In any such transaction, the liquidation account shall be assumed by the surviving institution.
 
 
16


Subsequent to the completion of the Conversion, the Converted Savings Bank may not declare or pay cash dividends on, or repurchase any of, its Capital Stock, if such dividend or repurchase would reduce the Converted Savings Bank’s regulatory capital below the amount then required for the Liquidation Account.  Otherwise the existence of the Converted Savings Bank’s obligation hereunder with respect to the Liquidation Account shall not operate to restrict the use or application of any of the capital accounts of the Savings Bank.  The Converted Savings Bank shall not be required to set aside funds in connection with its obligation hereunder with respect to the Liquidation Account.  Eligible Account Holders and Supplemental Eligible Account Holders do not retain any voting rights in either the Holding Company or the Savings Bank based on their liquidation subaccounts.
 
XIV.       Restrictions on Acquisition of Stock of the Holding Company
 
A.           For a period of three years following completion of the Conversion, no Person may make directly, or indirectly, any offer to acquire or actually acquire Capital Stock of the Converted Savings Bank if, after consummation of such acquisition, such person would be the beneficial owner of more than 10% of the Holding Company’s Common Stock, without the prior approval of the Division.  However, approval is not required for purchases directly from the Holding Company or the underwriters or selling group acting on its behalf with a view towards public resale, or for purchases not exceeding 1% per annum of the shares outstanding.  Civil penalties may be imposed by the Division for willful violation or assistance of any violation.
 
B.            The Holding Company may provide in its articles of incorporation a provision that, for a specified period of up to five years following the date of the completion of the Conversion, no Person shall directly or indirectly offer to acquire or actually acquire the beneficial ownership of m ore than 10%  of any class of equity security of the Holding Company.  Such provisions would not apply to the acquisition of securities by Tax-Qualified Employee Stock Benefit Plans provided that such plans do not have beneficial ownership of more than 25% of any class of equity security of the Holding Company. The Holding Company may provide in its articles of incorporation for such other provisions affecting the acquisition of its stock as shall be determined by its Board of Directors.
 
XV.         Directors and Officers of the Converted Savings Bank
 
The Conversion is not intended to result in any change in the Directors or Officers of the Savings Bank.  Each Person serving as a Director of the Savings Bank at the time of Conversion shall continue to serve as a member of the Converted Savings Bank’s Board of Directors, subject to the Converted Savings Bank’s charter and bylaws. The Persons serving as Officers of the Savings Bank immediately prior to the Conversion will continue to serve at the discretion of the Board of Directors in their respective capacities as Officers of the Converted Savings Bank. In connection with the Conversion, the Savings Bank and the Holding Company may enter into employment agreements and change of control agreements on such terms and with such officers as shall be determined by the Boards of Directors of the Savings Bank and the Holding Company.
 
XVI.       Executive Compensation
 
A.           The Holding Company and the Savings Bank are authorized to adopt Tax-Qualified Employee Stock Benefit Plans in connection with the Conversion, including without limitation an employee stock ownership plan.
 
B.            Subsequent to the Conversion, the Holding Company and the Savings Bank are authorized to adopt executive compensation or other benefit programs, including but not limited to, com pensation plans involving stock options, stock appreciation rights, restricted stock plans, employee recognition programs and similar plans, provided however that, with respect to any such plan im plemented during the one-year period subsequent to the date of consummation of the Conversion, any such plan: (i) shall be disclosed in the proxy solicitation materials for the Special Meeting of Members and in the Registration Statement; (ii) in the case of stock option plans, shall have a total number of shares of common stock for which options may be granted of not more than 10% of the amount of shares issued in the Conversion; (iii) in the case of management or employee recognition or grant plans, shall have a total number of shares of common stock of not more than 4% of the amount of shares issued in the Conversion; (iv) in the case of stock option plans and employee recognition or grant plans, shall be submitted for approval by the holders of the Holding Company Common Stock no earlier than six months following consummation of the Conversion; and (v) shall comply with all other applicable requirements of the Division.
 
 
17


C.           Existing, as well as any newly created, Tax-Qualified Employee Stock Benefit Plans may purchase shares of Conversion Stock in the Subscription Offering and the Direct Community Offering, to the extent permitted by the terms of such benefit plans and this Plan.
 
XVII.      Amendment or Termination of Plan
 
If necessary or desirable, the Plan may be amended by a two-thirds vote of the Savings Bank’s Board of Directors, at any time prior to submission of the Plan and proxy materials to the Members.  At any time after submission of the Plan and proxy materials to the Members, the Plan may be amended by a two-thirds vote of the Board of Directors only with the concurrence of the Division.  The Plan may be terminated by a two-thirds vote of the Board of Directors at any time prior to the Special Meeting, and at any time following such Special M eeting with the concurrence of the Division.  In its discretion, the Board of Directors may modify or terminate the Plan upon the order of the regulatory authorities without a resolicitation of proxies or another meeting of the Members.
 
In the event that mandatory new regulations pertaining to conversions are adopted by the Division prior to the completion of the Conversion, the Plan shall be amended to conform to the new mandatory regulations without a resolicitation of proxies or another meeting of Members.  In the event that new conversion regulations adopted by the Division prior to completion of the Conversion contain optional provisions, the Plan may be amended to utilize such optional provisions at the discretion of the Board of Directors without a resolicitation of proxies or another meeting of Members.
 
By adoption of the Plan, the Members authorize the Board of Directors to amend and/or terminate the Plan under the circumstances set forth above.
 
XVIII.     Expenses of the Conversion
 
The Savings Bank and the Holding Company shall use their best efforts to assure that expenses incurred in connection with the Conversion shall be reasonable.
 
XIX.       Contributions to Tax-Qualified Plans
 
The Holding Company and/or the Converted Savings Bank may make discretionary contributions to the Tax-Qualified Employee Stock Benefit Plans, provided such contributions do not cause the Converted Savings Bank to fail to meet its regulatory capital requirements.
 
XX.         Severability
 
If any term, provision, covenant or restriction contained in this Plan is held by a court or a federal or state regulatory agency of competent jurisdiction to be invalid, void or unenforceable, the remainder of the terms, provisions, covenants and restrictions contained in this Plan shall remain in full force and effect, and shall in no way be affected, impaired or invalidated.
 
XXI.       Miscellaneous
 
This Plan is to be governed by and construed in accordance with the laws of the State of Washington.  All interpretations of this Plan and application of its provisions to particular circumstances shall be made by the Board of Directors of the Savings Bank and all such interpretations shall be final, subject to the authority of the Division.   Section headings are not to be considered a part of this Plan, but are included solely for convenience of reference and shall in no way define, limit, extend, or describe the scope or intent of any of the provisions hereof.  Any reference to a Section or Paragraph shall refer to a Section or Paragraph of this Plan, unless otherwise stated.  Except for such rights as are set forth herein for Eligible Account Holders, Supplemental Eligible Account Holders and Other Members, this Plan shall create no rights in any Person. The terms defined in this Plan have the meanings assigned to them in this Plan and include the plural as well as the singular, and words of any gender shall include each other gender where appropriate.
 
* * * * *
 
18
EX-3.1 4 ex3-1.htm EXHIBIT 3.1 ex3-1.htm

Exhibit 3.1
 
ARTICLES OF INCORPORATION
OF
FS BANCORP, INC.
 
          Pursuant to the provisions of Title 23B of the Revised Code of Washington (“RCW”) (the Washington Business Corporation Act as now in existence or as may hereafter be amended, the “WBCA”), the following shall constitute the Articles of Incorporation of FS Bancorp, Inc., a Washington corporation:
 
ARTICLE I
 
Name
 
          The name of the corporation is FS Bancorp, Inc. (the “Corporation”).
 
ARTICLE II
 
Duration
 
          The duration of the Corporation is perpetual.
 
ARTICLE III
 
Purpose and Powers
 
          The purpose for which the Corporation is organized is to act as a bank holding company and to transact all other lawful business for which corporations may be incorporated under the WBCA. The Corporation shall have all the powers of a corporation organized under the WBCA.
 
ARTICLE IV
 
Capital Stock
 
          The total number of shares of all classes of capital stock which the Corporation has authority to issue is 50,000,000, of which 45,000,000 shall be common stock of par value of $0.01 per share, and of which 5,000,000 shall be serial preferred stock of par value of $0.01 per share. The shares may be issued from time to time as authorized by the Board of Directors without further approval of the shareholders, except to the extent that such approval is required by governing law, rule or regulation. The consideration for the issuance of the shares shall be paid in full before their issuance and shall not be less than the stated par value per share. Upon payment of such consideration, such shares shall be deemed to be fully paid and nonassessable. Upon authorization by its Board of Directors, the Corporation may issue its own shares in exchange for or in conversion of its outstanding shares or distribute its own shares, pro rata to its shareholders or the shareholders of one or more classes or series, to effectuate stock dividends or splits, and any such transaction shall not require consideration.
 
          Except as expressly provided by applicable law, these Articles of Incorporation or by any resolution of the Board of Directors designating and establishing the terms of any series of preferred stock, no holders of any class or series of capital stock shall have any right to vote as a separate class or series or to vote more than one vote per share. The shareholders of the Corporation shall not be entitled to cumulative voting in any election of directors.
 
          A description of the different classes and series (if any) of the Corporation’s capital stock and a statement of the designations, and the relative rights, preferences and limitations of the shares of each class and series (if any) of capital stock are as follows:
 
          A.          Common Stock. On matters on which holders of common stock are entitled to vote, each holder of shares of common stock shall be entitled to one vote for each share held by such holder.


          Whenever there shall have been paid, or declared and set aside for payment, to the holders of the outstanding shares of any class of stock having preference over the common stock as to the payment of dividends, the full amount of dividends and of sinking fund, retirement fund or other retirement payments, if any, to which such holders are respectively entitled in preference to the common stock, then dividends may be paid on the common stock and on any class or series of stock entitled to participate therewith as to dividends, out of any assets legally available for the payment of dividends, but only when and as declared by the Board of Directors.
 
           In the event of any liquidation, dissolution or winding up of the Corporation, the holders of the common stock (and the holders of any class or series of stock entitled to participate with the common stock in the distribution of assets) shall be entitled to receive, in cash or in kind, the assets of the Corporation available for distribution remaining after: (i) payment or provision for payment of the Corporation’s debts and liabilities; (ii) distributions or provision for distributions in settlement of its liquidation account; and (iii) distributions or provision for distributions to holders of any class or series of stock having preference over the common stock in the liquidation, dissolution or winding up of the Corporation. Each share of common stock shall have the same relative rights as and be identical in all respects with all the other shares of common stock.
 
          B.          Serial Preferred Stock. The Board of Directors of the Corporation is authorized by resolution or resolutions from time to time adopted to provide for the issuance of preferred stock in series and to fix and state the voting powers, designations, preferences and relative, participating, optional or other special rights of the shares of each such series and the qualifications, limitations and restrictions thereof, including, but not limited to, determination of any of the following:
 
                       (a) The distinctive serial designation and the number of shares constituting such series;
 
                       (b) The dividend rate or the amount of dividends to be paid on the shares of such series, whether dividends shall be cumulative and, if so, from which date or dates, the paym ent date or dates for dividends, and the participating or other special rights, if any, with respect to dividends;
 
                       (c) The voting powers, full or limited, if any, of shares of such series;
 
                       (d) Whether the shares of such series shall be redeemable and, if so, the price(s) at which, and the terms and conditions on which, such shares may be redeemed;
 
                       (e) The amount(s) payable upon the shares of such series in the event of voluntary or involuntary liquidation, dissolution or winding up of the Corporation;
 
                       (f) Whether the shares or such series shall be entitled to the benefit of a sinking or retirement fund to be applied to the purchase or redemption of such shares, and if so entitled, the amount of such fund and the manner of its application, including the price(s) at which such shares may be redeemed or purchased through the application of such fund;
 
                       (g) Whether the shares of such series shall be convertible into, or exchangeable for, shares of any other class or classes or of any other series of the sam e or any other class or classes of stock of the Corporation, and, if so convertible or exchangeable, the conversion price(s), or the rate or rates of exchange, and the adjustments thereof, if any, at which such conversion or exchange may be made, and any other terms and conditions of such conversion or exchange;
 
                       (h) The price or other consideration for which the shares of such series shall be issued; and
 
                       (i) Whether the shares of such series which are redeemed or converted shall have the status of authorized but unissued shares of serial preferred stock and whether such shares may be reissued as shares of the same or any other series of serial preferred stock.
 
 
2


          Each share of each series of preferred stock shall have the same relative rights as and be identical in all respects with all other shares of the same series.
 
          C.         1.          Notwithstanding any other provision of these Articles of Incorporation, in no event shall any record owner of any outstanding common stock which is beneficially owned, directly or indirectly, by a person who, as of any record date for the determination of shareholders entitled to vote on any matter, beneficially owns in excess of 10% of the then-outstanding shares of common stock (“Limit”), be entitled, or permitted to any vote in respect of the shares held in excess of the Limit, unless a majority of the Whole Board (as hereinafter defined) shall have by resolution granted in advance such entitlement or permission. The number of votes which may be cast by any record owner by virtue of the provisions hereof in respect of common stock beneficially owned by such person owning shares in excess of the Limit shall be a number equal to the total number of votes which a single record owner of all common stock owned by such person would be entitled to cast, multiplied by a fraction, the numerator of which is the number of shares of such class or series which are both beneficially owned by such person and owned of record by such record owner and the denominator of which is the total number of shares of common stock beneficially owned by such person owning shares in excess of the Limit.
 
                       2.          The following definitions shall apply to this Section C of this Article VII.
 
                                    (a)          “Affiliate” shall have the meaning ascribed to it in Rule 12b-2 of the General Rules and Regulations under the Securities Exchange Act of 1934, as in effect on the date of filing of these Articles of Incorporation.
 
                                    (b)          “Beneficial ownership” shall be determined pursuant to Rule 13d-3 of the General Rules and Regulations under the Securities Exchange Act of 1934 (or any successor rule or statutory provision), or, if said Rule 13d-3 shall be rescinded and there shall be no successor rule or provision thereto, pursuant to said Rule 13d-3 as in effect on the date of filing of these Articles of Incorporation; provided, however, that a person shall, in any event, also be deemed the “beneficial owner” of any common stock:
 
                                                   (i)          which such person or any of its Affiliates beneficially owns, directly or indirectly; or
 
                                                   (ii)         which such person or any of its Affiliates has (A) the right to acquire (whether such right is exercisable immediately or only after the passage of time), pursuant to any agreement, arrangement or understanding (but shall not be deemed to be the beneficial owner of any voting shares solely by reason of an agreement, contract, or other arrangement with the Corporation to effect any transaction which is described in any one or more of subparagraphs A(1)(a) through (h) of Article X hereof or upon the exercise of conversion rights, exchange rights, warrants or options or otherwise), or (B) sole or shared voting or investment power with respect thereto pursuant to any agreement, arrangement, understanding, relationship or otherwise (but shall not be deemed to be the beneficial owner of any voting shares solely by reason of a revocable proxy granted for a particular meeting of shareholders, pursuant to a public solicitation of proxies for such meeting, with respect to shares of which neither such person nor any such Affiliate is otherwise deemed the beneficial owner); or
 
                                                   (iii)        which are beneficially owned, directly or indirectly, by any other person with which such first mentioned person or any of its Affiliates acts as a partnership, limited partnership, syndicate or other group pursuant to any agreement, arrangement or understanding for the purpose of acquiring, holding, voting or disposing of any shares of capital stock of the Corporation; and provided further, however, that (i) no director or officer of the Corporation (or any Affiliate of any such director or officer) shall, solely by reason of any or all of such directors or officers acting in their capacities as such, be deemed, for any purposes hereof, to beneficially own any common stock beneficially owned by any other such director or officer (or any Affiliate thereof), and (ii) neither any employee stock ownership or similar plan of the Corporation or any subsidiary of the Corporation, nor any trustee with respect thereto or any Affiliate of such trustee (solely by reason of such capacity of such trustee), shall be deem ed, for any purposes hereof, to beneficially own any common stock held under any such plan. For purposes of computing the percentage beneficial ownership of common stock of a person, the outstanding common stock shall include shares deemed owned by such person through application of this subsection but shall not include any other common stock which may be issuable by the Corporation pursuant to any agreement, or upon exercise of conversion rights, warrants or options, or otherwise. For all other purposes, the outstanding common stock shall include only common stock then outstanding and shall not include any common stock which may be issuable by the Corporation pursuant to any agreement, or upon the exercise of conversion rights, warrants or options, or otherwise.
 
 
3


                                    (c)          A “person” shall mean any individual, firm, corporation or other entity.
 
                                    (d)          “Whole Board” shall mean the total number of directors which the Corporation would have if there were no vacancies on the Board of Directors.
 
                       3.          The Board of Directors shall have the power to construe and apply the provisions of this Section C and to make all determinations necessary or desirable to implement such provisions, including but not limited to matters with respect to (i) the number of shares of common stock beneficially owned by any person, (ii) whether a person is an Affiliate of another, (iii) whether a person has an agreement, arrangement or understanding with another as to the matters referred to in the definition of beneficial ownership, (iv) the application of any other definition or operative provision of this Section C to the given facts or (v) any other matter relating to the applicability or effect of this Section C.
 
                       4.          The Board of Directors shall have the right to demand that any person who is reasonably believed to beneficially own common stock in excess of the Limit (or holds of record common stock beneficially owned by any person in excess of the Limit) supply the Corporation with complete information as to (i) the record owner(s) of all shares beneficially owned by such person who is reasonably believed to own shares in excess of the Limit and (ii) any other factual matter relating to the applicability or effect of this section as may reasonably be required of such person.
 
                       5.          Except as otherwise provided by law or expressly provided in this Section C, the presence, in person or by proxy, of the holders of record of shares of capital stock of the Corporation entitling the holders thereof to cast a majority of the votes (after giving effect, if required, to the provisions of this Section C) entitled to be cast by the holders of shares of capital stock of the Corporation shall constitute a quorum at all meetings of the shareholders, and every reference in these Articles of Incorporation to a majority or other proportion of capital stock (or the holders thereof) for purposes of determining any quorum requirement or any requirement for shareholder consent or approval shall be deemed to refer to such majority or other proportion of the votes (or the holders thereof) then entitled to be cast in respect of such capital stock.
 
                       6.          Any constructions, applications or determinations made by the Board of Directors pursuant to this Section C in good faith and on the basis of such information and assistance as was then reasonably available for such purpose shall be conclusive and binding upon the Corporation and its shareholders.
 
                       7.          In the event any provision (or portion thereof) of this Section C shall be found to be invalid, prohibited or unenforceable for any reason, the remaining provisions (or portions thereof) of this Section C shall remain in full force and effect, and shall be construed as if such invalid, prohibited or unenforceable provision had been stricken herefrom or otherwise rendered inapplicable, it being the intent of the Corporation and its shareholders that each such remaining provision (or portion thereof) of this Section C remain, to the fullest extent permitted by law, applicable and enforceable as to all shareholders, including shareholders owning an amount of stock over the Limit, notwithstanding any such finding.
 
ARTICLE V
 
Preemptive Rights
 
          Holders of the capital stock of the Corporation shall not be entitled to preemptive rights with respect to any shares of the Corporation which may be issued.
 
 
4


ARTICLE VI
 
Initial Directors
 
          The persons who shall serve as the initial directors of the Corporation are: Ted A. Leech, Margaret R. Piesik, Judith Cochrane, Joseph C. Adams, Joseph P. Zavaglia and M ichael M ansfield. The address of each initial director is 6920 - 220th Street, SW , Suite 300, Mountlake Terrace, Washington 98043. The initial directors shall serve until the first annual meeting of shareholders, at which time they may stand for reelection.
 
ARTICLE VII
 
Directors
 
          A.          Number. The Corporation shall be under the direction of a Board of Directors. The number of directors shall be as stated in the Corporation’s Bylaws, but in no event shall be fewer than five nor more than 15.
 
          B.          Classified Board. The Board of Directors, other than those who may be elected by the holders of any class or series of preferred stock, shall be divided into three groups, w ith each group containing one-third of the total number of directors, or as near as may be. The terms of the directors in the first group shall expire at the first annual shareholders’ meeting following their election, the terms of the second group shall expire at the second shareholders’ meeting following their election, and the terms of the third group shall expire at the third annual shareholders’ meeting following their election. At each annual shareholders’ meeting held thereafter, directors shall be chosen for a term of three years to succeed those whose terms expire.
 
          C.          Vacancies. Subject to the rights of the holders of any series of preferred stock then outstanding, any vacancy occurring in the Board of Directors may be filled only by the affirmative vote of a majority of the remaining directors, whether or not there remains a quorum of the Board of Directors. A director elected to fill a vacancy shall be elected for the unexpired term of his predecessor in office, rather than until the next annual meeting of shareholders. A directorship to be filled by reason of an increase in the number of directors m ay be filled, subject to the rights of the holders of any series of preferred stock then outstanding, by election by the Board of Directors for a term continuing only until the next election of directors by the shareholders.
 
ARTICLE VIII
 
Removal of Directors
 
          Notwithstanding any other provisions of these Articles of Incorporation or the Corporation’s Bylaws (and notwithstanding the fact that some lesser percentage may be specified by law, these Articles of Incorporation or the Corporation’s Bylaws), any director or the entire Board of Directors may be removed only for cause and only by the affirmative vote of the holders of at least 80% of the total votes eligible to be cast at a legal meeting called expressly for such purpose. For purpose of this Article VIII, “cause” shall mean fraudulent or dishonest acts, a gross abuse of authority in discharge of duties to the Corporation or acts that are detrimental or hostile to the interests of the Corporation.
 
ARTICLE IX
 
Registered Office and Agent
 
          The registered office of the Corporation shall be located at 6920 - 220th Street, SW , Suite 300, Mountlake Terrace, Washington 98043 6920 - 220th Street, SW, Suite 300, Mountlake Terrace, Washington 98043. The initial registered agent of the Corporation at such address shall be Joseph C. Adams.
 
 
5


ARTICLE X
 
Notice for Shareholder Nominations and Proposals
 
          A.         Nominations for the election of directors and proposals for any new business to be taken up at any annual or special meeting of shareholders may be m ade by the Board of Directors of the Corporation or by any shareholder of the Corporation entitled to vote generally in the election of directors. In order for a shareholder of the Corporation to make any such nominations and/or proposals, he or she shall give notice thereof in writing, that is received by the Secretary of the Corporation not less than 30 days nor more than 60 days prior to any such meeting; provided, however, that if less than 31 days’ notice of the meeting is given to shareholders, such written notice shall be delivered or mailed, as prescribed, to the Secretary of the Corporation not later than the close of the tenth day following the day on which notice of the meeting was mailed to shareholders. Each such notice given by a shareholder with respect to nominations for election of directors shall set forth (i) the name, age, business address and, if known, residence address of each nominee proposed in such notice, (ii) the principal occupation or employment of each such nominee, (iii) the number of shares of stock of the Corporation which are beneficially owned by each such nominee, (iv) such other information as would be required to be included in a proxy statement soliciting proxies for the election of the proposed nominee pursuant to Regulation 14A of the General Rules and Regulations of the Securities Exchange Act of 1934, including, without limitation, such person’s written consent to being named in the proxy statement as a nominee and to serving as a director, if elected, and (v) as to the shareholder giving such notice (a) his or her name and address as they appear on the Corporation’s books and (b) the class and number of shares of the Corporation which are beneficially owned by such shareholder. In addition, the shareholder making such nomination shall promptly provide any other information reasonably requested by the Corporation.
 
          B.          Each such notice given by a shareholder to the Secretary with respect to business proposals to bring before a meeting shall set forth in writing as to each matter: (i) a brief description of the business desired to be brought before the meeting and the reasons for conducting such business at the meeting; (ii) the name and address, as they appear on the Corporation’s books, of the shareholder proposing such business; (iii) the class and number of shares of the Corporation which are beneficially owned by the shareholder; and (iv) any material interest of the shareholder in such business. Notwithstanding anything in these Articles of Incorporation to the contrary, no business shall be conducted at the meeting except in accordance with the procedures set forth in this Article.
 
          C.          The Chairman of the annual or special meeting of shareholders may, if the facts warrant, determine and declare to the meeting that a nomination or proposal was not made in accordance with the foregoing procedure, and, if the Chairman should so determine, the Chairman shall so declare to the meeting and the defective nomination or proposal shall be disregarded and laid over for action at the next succeeding adjourned, special or annual meeting of the shareholders taking place thirty days or more thereafter. This provision shall not require the holding of any adjourned or special meeting of shareholders for the purpose of considering such defective nomination or proposal.
 
ARTICLE XI
 
Approval of Certain Business Combinations
 
          The shareholder vote required to approve Business Combinations (as hereinafter defined) shall be as set forth in this section.
 
          A.         1.         Except as otherwise expressly provided in this Article XI, the affirmative vote of the holders of (i) at least 80% of the outstanding shares entitled to vote thereon (and, if any class or series of shares is entitled to vote thereon separately, the affirmative vote of the holders of at least 80% of the outstanding shares of each such class or series), and (ii) at least a majority of the outstanding shares entitled to vote thereon, not including shares deemed beneficially owned by a Related Person (as hereinafter defined), shall be required to authorize any of the following:
 
                                    (a) any merger or consolidation of the Corporation with or into a Related Person;
 
 
6


                                    (b) any sale, lease, exchange, transfer or other disposition, including without limitation, a mortgage, or any other security device, of all or any Substantial Part (as hereinafter defined) of the assets of the Corporation (including without limitation any voting securities of a subsidiary) or of a subsidiary, to a Related Person;
 
                                    (c) any merger or consolidation of a Related Person w ith or into the Corporation or a subsidiary of the Corporation;
 
                                    (d) any sale, lease, exchange, transfer or other disposition of all or any Substantial Part of the assets of a Related Person to the Corporation or a subsidiary of the Corporation;
 
                                    (e) the issuance of any securities of the Corporation or a subsidiary of the Corporation to a Related Person;
 
                                    (f) the acquisition by the Corporation or a subsidiary of the Corporation of any securities of a Related Person;
 
                                    (g) any reclassification of the common stock of the Corporation, or any recapitalization involving the common stock of the Corporation;
 
                                    (h) any liquidation or dissolution of the Corporation; and
 
                                    (i) any agreement, contract or other arrangement providing for any of the transactions described in this Article XI.
 
                       2.          Such affirmative vote shall be required notwithstanding any other provision of these Articles of Incorporation, any provision of law, or any agreement with any regulatory agency or national securities exchange which might otherwise permit a lesser vote or no vote.
 
                       3.          The term “Business Combination” as used in this Article XI shall mean any transaction which is referred to in any one or more of subparagraphs (a) through (i) above.
 
          B.          The provisions of Part A of this Article XI shall not be applicable to any particular Business Combination, which shall require only such affirmative vote as is required by any other provision of these Articles of Incorporation, any provision of law, or any agreement with any regulatory agency or national securities exchange, if such particular Business Combination shall have been approved by two-thirds of the Continuing Directors (as hereinafter defined); provided, however, that such approval shall only be effective if obtained at a meeting at which a Continuing Director Quorum (as hereinafter defined) is present.
 
          C.          For the purposes of this Article XI the following definitions apply:
 
                       1.          The term “Related Person” shall mean and include (a) any individual, corporation, partnership or other person or entity which together with its “affiliates” (as that term is defined in Rule 12b-2 of the General Rules and Regulations under the Securities Exchange Act of 1934), that “beneficially owns” (as that term is defined in Rule 13d-3 of the General Rules and Regulations under the Securities Act of 1934) in the aggregate 10% or m ore of the outstanding shares of the common stock of the Corporation (excluding tax-qualified benefit plans of the Corporation); and (b) any “affiliate” (as that term is defined in Rule 12b-2 under the Securities Exchange Act of 1934) of any such individual, corporation, partnership or other person or entity. Without limitation, any shares of the common stock of the Corporation which any Related Person has the right to acquire pursuant to any agreement, or upon exercise or conversion rights, warrants or options, or otherwise, shall be deemed “beneficially owned” by such Related Person.
 
                       2.          The term “Substantial Part” shall mean more than 25% of the total assets of the Corporation as of the end of its most recent fiscal year prior to when the determination is made.
 
 
7


                       3.          The term “Continuing Director” shall mean any member of the Board of Directors of the Corporation who is unaffiliated with the Related Person and was a member of the Board of Directors prior to the time the Related Person became a Related Person, and any successor of a Continuing Director who is unaffiliated with the Related Person and is recommended to succeed a Continuing Director by a majority of Continuing Directors then on the Board of Directors.
 
                       4.          The term “Continuing Director Quorum” shall mean seventy-five percent (75%) of the Continuing Directors capable of exercising the powers conferred on them.
 
          D.         Nothing contained in this Article XI shall be construed to relieve a Related Person from any fiduciary obligation im posed by law. In addition, nothing contained in the Article XI shall prevent any shareholders of the Corporation from objecting to any Business Combination and from demanding any appraisal rights which may be available to such shareholder.
 
          E.          No amendment, alteration, change or repeal of any provision of the Article XI may be effected unless it is approved at a meeting of the Corporation’s shareholders called for that purpose. Notwithstanding any other provision of these Articles of Incorporation, the affirmative vote of the holders of not less than 80% of the outstanding shares entitled to vote thereon shall be required to amend, alter, change, or repeal, directly or indirectly, any provision of this Article XI; provided, however, that the preceding provisions of this Part E shall not be applicable to any amendment to this Article XI if such amendment receives this affirmative vote required by law and any other provisions of these Articles of Incorporation and if such amendment has been approved by a majority of the Continuing Directors.
 
ARTICLE XII
 
Evaluation of Business Combinations
 
          In connection with the exercise of its judgment in determining what is in the best interests of the Corporation and of the shareholders, when evaluating a Business Combination (as defined in Article XI) or a tender or exchange offer, the Board of Directors of the Corporation, in addition to considering the adequacy of the amount to be paid in connection with any such transaction, shall consider all of the following factors and any other factors which it deems relevant: (i) the social and economic effects of the transaction on the Corporation and its subsidiaries, employees, depositors, loan and other customers, creditors and other elem ents of the communities in which the Corporation and its subsidiaries operate or are located; (ii) the business and financial condition and earnings prospects of the acquiring person or entity, including, but not limited to, debt service and other existing financial obligations, financial obligations to be incurred in connection with the acquisition and other likely financial obligations of the acquiring person or entity and the possible effect of such conditions upon the Corporation and its subsidiaries and the other elements of the communities in which the Corporation and its subsidiaries operate or are located; and (iii) the competence, experience, and integrity of the acquiring person or entity and its or their management.
 
ARTICLE XIII
 
Limitation of Directors’ Liability
 
          To the fullest extent permitted by the WBCA, a director of the Corporation shall not be personally liable to the Corporation or its shareholders for monetary damages for conduct as a director, except for liability of the director for acts or omissions that involve: (i) intentional misconduct by the director; (ii) a knowing violation of law by the director; (iii) conduct violating RCW Section 23B.08.310 (relating to unlawful distributions by the Corporation); or (iv) any transaction from which the director will personally receive a benefit in money, property or services to which the director is not legally entitled. If the WBCA is amended in the future to authorize corporate action further eliminating or limiting the personal liability of directors, then the liability of a director of the Corporation shall be eliminated or limited to the full extent permitted by the WBCA, as so amended, without any requirement or further action by shareholders. An amendment or repeal of this Article XIII shall not adversely affect any right or protection of a director of the Corporation existing at the time of such amendment or repeal.
 
 
8


ARTICLE XIV
 
Indemnification
 
          The Corporation shall indemnify and advance expenses to its directors, officers, agents and employees as follows:
 
          A.         Directors and Officers. In all circumstances and to the full extent permitted by the WBCA, the Corporation shall indemnify any person who is or was a director, officer or agent of the Corporation and who was or is a party or is threatened to be made a party to any threatened, pending or completed action, suit or proceeding, whether civil, criminal, administrative or investigative and whether formal or informal (including an action by or in the right of the Corporation), by reason of the fact that he is or was an agent of the Corporation, against expenses, judgments, fines, and amounts paid in settlement and incurred by him in connection with such action, suit or proceeding. However, such indemnity shall not apply to: (a) acts or omissions of the director or officer in connection with a proceeding by or in the right of the Corporation in which the director or officer is finally adjudged liable to the Corporation; (b) conduct of the director or officer finally adjudged to violate RCW Section 23B.08.310 (relating to unlawful distributions by the Corporation) or (c) any transaction with respect to which it was finally adjudged that such director and officer personally received a benefit in money, property or services to which the director was not legally entitled. The Corporation may require, in accordance with Section 23B.08.530 of the WBCA as may be amended from time to time, an indemnified person to furnish the Corporation an undertaking and/or guaranty in a form approved by the Board, prior to advancing expenses to such indemnified person.
 
          B.         Implementation. The Board of Directors may take such action as is necessary to carry out these indemnification and expense advancement provisions. It is expressly empowered to adopt, approve and amend from time to time such bylaws, resolutions, contracts or further indemnification and expense advancement arrangements as may be permitted by law, implementing these provisions. Such bylaws, resolutions, contracts or further arrangements shall include, but not be limited to, implementing the manner in which determinations as to any indemnity or advancement of expenses shall be made.
 
          C.         Survival of Indemnification Rights. No amendment or repeal of this Article XIV shall apply to or have any effect on any right to indemnification provided hereunder with respect to acts or omissions occurring prior to such amendment or repeal.
 
          D.         Service for Other Entities. The indemnification and advancement of expenses provided under this Article XIV shall apply to directors, officers, employees or agents of the Corporation for both (a) service in such capacities for the Corporation and (b) service at the Corporations’s request as a director, officer, partner, trustee, employee or agent of another foreign or domestic corporation, partnership, joint venture, trust, employee benefit plan or other enterprise. A person is considered to be serving an employee benefit plan at the Corporation’s request if such person’s duties to the Corporation also impose duties on, or otherwise involve services by, the director to the plan or to participants in or beneficiaries of the plan.
 
          E.          Insurance. The Corporation may purchase and maintain insurance on behalf of any person who is or was a director, officer, employee or agent of the Corporation, or is or was serving at the request of the Corporation as a director, trustee, officer, employee or agent of another corporation, partnership, joint venture, trust or other enterprise against liability asserted against him and incurred by him in such capacity or arising out of his status as such, whether or not the Corporation would have had the power to indemnify him against such liability under the provisions of this bylaw and the WBCA.
 
          F.          Other Rights. The indemnification provided by this section shall not be deemed exclusive of any other right to which those indemnified may be entitled under any other bylaw, agreement, vote of shareholders or disinterested directors, or otherwise, both as to action in his official capacity and as to action in another capacity while holding such an office, and shall continue as to a person who has ceased to be a director, trustee, officer, employee or agent and shall inure to the benefit of the heirs executors, and administrators of such person.
 
 
9


ARTICLE XV
 
Special Meeting of Shareholders
 
          Special meetings of the shareholders for any purpose or purposes may be called only by the Chief Executive Officer or by the Board of Directors. The right of shareholders of the Corporation to call special meetings is specifically denied.
 
ARTICLE XVI
 
Repurchase of Shares
 
          The Corporation may from time to time, pursuant to authorization by the Board of Directors of the Corporation and without action by the shareholders, purchase or otherwise acquire shares of any class, bonds, debentures, notes, scrip, warrants, obligations, evidences of indebtedness or other securities of the Corporation in such manner, upon such terms, and in such amounts as the Board of Directors shall determine; subject, however, to such limitations or restrictions, if any, as are contained in the express terms of any class of shares of the Corporation outstanding at the time of the purchase or acquisition in question or as are imposed by law.
 
ARTICLE XVII
 
Amendment of Bylaws
 
          In furtherance and not in limitation of the powers conferred by statute, the Board of Directors of the Corporation is expressly authorized to make, repeal, alter, amend and rescind the Bylaws of the Corporation by a majority vote of the Board of Directors. Notwithstanding any other provision of these Articles of Incorporation or the Bylaws of the Corporation (and notwithstanding the fact that some lesser percentage may be specified by law), the Bylaws shall not be adopted, repealed, altered, amended or rescinded by the shareholders of the Corporation except by the vote of the holders of not less than 80% of the outstanding shares of capital stock of the Corporation entitled to vote generally in the election of directors (considered for this purpose as one class) cast at a meeting of the shareholders called for that purpose (provided that notice of such proposed adoption, repeal, alteration, amendment or rescission is included in the notice of such meeting), or, as set forth above, by the Board of Directors.
 
ARTICLE XVIII
 
Amendment of Articles of Incorporation
 
          The Corporation reserves the right to repeal, alter, amend or rescind any provision contained in the Articles of Incorporation in the manner now or hereafter prescribed by law, and all rights conferred on shareholders herein are granted subject to this reservation. Notwithstanding the foregoing, the provisions set forth in Articles II, III, IV (other than a change to the number of authorized shares in connection with a split of, or stock dividend in, the Corporation’s own shares, provided the Corporation has only one class of shares outstanding or a change in the par value of such shares), V, VII, VIII, X, XI, XII, XIII, XIV, XV, XVI, XVII and this Article XVIII of these Articles of Incorporation may not be repealed, altered, amended or rescinded in any respect unless the same is approved by the affirmative vote of the holders of not less than 80% of the votes entitled to be cast by each separate voting group entitled to vote thereon, cast at a meeting of the shareholders called for that purpose (provided that notice of such proposed adoption, repeal, alteration, amendment or rescission is included in the notice of such meeting).
 
 
10


ARTICLE XIX
 
Incorporator
 
          The name and mailing address of the incorporator are Joseph C. Adams, 6920 - 220th Street, SW, Suite 300, Mountlake Terrace, Washington 98043.
 
* * *
 
          Executed this 12th day of September 2011.
   
 
/s/ Joseph C. Adams
 
Joseph C. Adams
 
Incorporator
 
 
11


CONSENT TO APPOINTMENT AS REGISTERED AGENT
 
          I, Joseph C. Adams, hereby consent to serve as Registered Agent in the State of Washington for FS Bancorp, Inc. I understand that as agent for the Corporation, it will be my responsibility to accept Service of Process on behalf of the Corporation; to forward license renewals and other mail to the Corporation; and to immediately notify the Office of the Secretary of State in the event of my resignation or of any changes in the Registered Office address.
           
By:
/s/ Joseph C. Adams
 
Joseph C. Adams, Incorporator
 
09/12/11
 
          (Signature of Registered Agent)
 
(Print Name and Title)
 
(Date)
 
 
EX-3.2 5 ex3-2.htm EXHIBIT 3.2 ex3-2.htm

Exhibit 3.2
 
BYLAWS
OF
FS BANCORP, INC.
 
ARTICLE I
 
Principal Office
 
SECTION 1.         Principal Office. The principal office and place of business of the corporation in the state of Washington shall be located in the City of Mountlake Terrace, Snohomish County.
 
SECTION 2.         Other Offices. The corporation may have such other offices as the Board of Directors may designate or the business of the corporation may require from time to time.
 
ARTICLE II
 
Shareholders
 
SECTION 1.         Place of Meetings. All annual and special meetings of the shareholders shall be held at the principal office of the corporation or at such other place within the State of W ashington as the Board of Directors may determine.
 
SECTION 2.         Annual Meeting. A meeting of the shareholders of the corporation for the election of directors and for the transaction of any other business of the corporation shall be held annually on the fourth Wednesday of April, if not a legal holiday, and if a legal holiday, then on the next day following which is not a legal holiday, at 9:00 a.m., Pacific time, or at such other date and time as the Board of Directors may determine.
 
SECTION 3.          Special Meetings. Special meetings of the shareholders for any purpose or purposes shall be called in accordance with the procedures set forth in the Articles of Incorporation.
 
SECTION 4.         Conduct of Meetings. Annual and special meetings shall be conducted in accordance with rules prescribed by the presiding officer of the meeting, unless otherwise prescribed by these Bylaws. The Board of Directors shall designate, when present, either the chairman of the board or the chief executive officer to preside at such meetings.
 
SECTION 5.         Notice of Meeting. W ritten notice stating the place, day and hour of the meeting and, in the case of a special meeting of shareholders, the purpose or purposes for which the meeting is called, shall be delivered not less than 10 nor more than 60 days before the date of the meeting, either personally or by mail, by or at the direction of the chairman of the board, the chief executive officer, the secretary, or the directors calling the meeting, to each shareholder of record entitled to vote at such meeting; provided, however, that notice of a shareholders meeting to act on an amendment to the Articles of Incorporation, a plan of merger or share exchange, a proposed sale of assets pursuant to Chapter 23B.12.020 of the Revised Code of W ashington or its successor, or the dissolution of the corporation shall be given no fewer than 20 nor more than 60 days before the meeting date. If mailed, such notice shall be deemed to be delivered when deposited in the mail, addressed to the shareholder at the address as it appears on the stock transfer books or records of the corporation as of the record date prescribed in Section 6 of this Article II, with postage thereon prepaid. W hen any shareholders’ meeting, either annual or special, is adjourned for 120 days or more, notice of the adjourned meeting shall be given as in the case of an original meeting. It shall not be necessary to give any notice of the time and place of any meeting adjourned for less than 120 days or of the business to be transacted at the meeting, other than an announcement at the meeting at which such adjournment is taken.
 
SECTION 6.         Fixing of Record Date. For the purpose of determining shareholders entitled to notice of or to vote at any meeting of shareholders or any adjournment thereof, or shareholders entitled to receive payment of any dividend, or in order to make a determination of shareholders for any other proper purpose, the Board of Directors shall fix, in advance, a date as the record date for any such determination of shareholders. Such date in any case shall be not more than 60 days, and in case of a meeting of shareholders, not less than 10 days prior to the date on which the particular action, requiring such determination of shareholders, is to be taken. If no record date is fixed for the determination of shareholders entitled to notice of or to vote at a meeting of shareholders, or shareholders entitled to receive payment of a dividend, the day before the date on which notice of the meeting is mailed or the date on which the resolution of the Board of Directors declaring such dividend is adopted, as the case may be, shall be the record date for such determination of shareholders. W hen a determination of shareholders entitled to vote at any meeting of shareholders has been made as provided in this section, such determination shall apply to any adjournment.


SECTION 7.         Voting Lists. At least 10 days before each meeting of the shareholders, the officer or agent having charge of the stock transfer books for shares of the corporation shall make a complete list of the shareholders entitled to vote at such meeting, or any adjournment thereof, arranged in alphabetical order, with the address of and the number of shares held by each. This list of shareholders shall be kept on file at the home office of the corporation and shall be subject to inspection by any shareholder at any time during usual business hours, for a period of 10 days prior to such meeting. Such list shall also be produced and kept open at the time and place of the meeting and shall be subject to inspection by any shareholder during the entire time of the meeting. The original stock transfer book shall be prima facie evidence of the shareholders entitled to examine such list or transfer books or to vote at any meeting of shareholders. Failure to comply with the requirements of this bylaw shall not affect the validity of any action taken at the meeting.
 
SECTION 8.         Quorum. A majority of the outstanding shares of the corporation entitled to vote, represented in person or by proxy, shall constitute a quorum at a meeting of shareholders. The shareholders present at a duly organized meeting may continue to transact business until adjournment, notwithstanding the withdrawal of enough shareholders to leave less than a quorum. If a quorum is present or represented at a meeting, a majority of those present or represented may transact any business which comes before the meeting, unless a greater percentage is required by law, the Articles of Incorporation, or these Bylaws. If less than a quorum of the outstanding shares is represented at a meeting, a majority of the shares so represented may adjourn the meeting from time to time without further notice. At such adjourned meeting at which a quorum shall be present or represented, any business may be transacted which might have been transacted at the meeting as originally notified, and in the case of any adjourned meeting called for the election of directors, those who attend the second of the adjourned meetings, although less than a quorum, shall nevertheless constitute a quorum for the purpose of electing directors.
 
SECTION 9.         Proxies. At all meetings of shareholders, a shareholder may vote by proxy executed in writing by the shareholder or by his duly authorized attorney in fact. Proxies solicited on behalf of the management shall be voted as directed by the shareholder or, in the absence of such direction, as determined by a majority of the Board of Directors. All proxies shall be filed with the secretary of the corporation before or at the commencement of meetings. No proxy may be effectively revoked until notice in writing of such revocation has been given to the secretary of the corporation by the shareholder (or his duly authorized attorney in fact, as the case may be) granting the proxy. No proxy shall be valid after eleven months from the date of its execution unless it is coupled with an interest.
 
SECTION 10.       Voting of Shares by Certain Holders. Shares standing in the name of another corporation may be voted by any officer, agent or proxy as the bylaws of such corporation may prescribe, or, in the absence of such provision, as the board of directors of such corporation may determine. A certified copy of a resolution adopted by such directors shall be conclusive as to their action.
 
Shares held by an administrator, executor, guardian or conservator may be voted by him, either in person or by proxy, without a transfer of such shares into his name. Shares standing in the name of a trustee may be voted by him, either in person or by proxy, but no trustee shall be entitled to vote shares held by him without a transfer of such shares into his name.
 
Shares standing in the name of a receiver may be voted by such receiver, and shares held by or under the control of a receiver may be voted by such receiver without the transfer thereof into his name if authority so to do is contained in an appropriate order of the court or other public authority by which such receiver was appointed.
 
If shares are held jointly by three or more fiduciaries, the will of the majority of the fiduciaries shall control the manner of voting or giving of a proxy, unless the instrument or order appointing such fiduciaries otherwise directs.
 
A shareholder, whose shares are pledged, shall be entitled to vote such shares until the shares have been transferred into the name of the pledgee, and thereafter, the pledgee shall be entitled to vote the shares so transferred.
 
Neither treasury shares of its own stock held by the corporation, nor shares held by another corporation, if a majority of the shares entitled to vote for the election of directors of such other corporation are held by the corporation, shall be voted at any meeting or counted in determining the total number of outstanding shares at any given time for purposes of any meeting.
 
SECTION 11.       Voting. Every holder of outstanding shares of capital stock of the corporation entitled to vote at any meeting shall be entitled to the number of votes (if any) as set forth in the Articles of Incorporation. Shareholders shall not be entitled to cumulative voting rights in the election of directors. Unless otherwise provided in the Articles of Incorporation, by statute, or by these Bylaws, a majority of those votes cast by shareholders at a lawful meeting shall be sufficient to pass on a transaction or matter.
 
SECTION 12.       Informal Action by Shareholders. Any action required to be taken at a meeting of the shareholders, or any other action which may be taken at a meeting of the shareholders, may be taken without a meeting if consent in writing, setting forth the action so taken, shall be given by all of the shareholders entitled to vote with respect to the subject matter.
 
 
2


ARTICLE III
 
Board of Directors
 
SECTION 1.         General Powers. All corporate powers shall be exercised by, or under authority of, and the business and affairs of the corporation shall be managed under the direction of, the Board of Directors. The Board of Directors shall annually elect a chairman of the board and a chief executive officer from among its members and shall designate, when present, either the chairman of the board or the chief executive officer to preside at its meetings.
 
SECTION 2.         Number, Term and Election. The Board of Directors shall consist of six (6) members, divided into three classes as nearly equal in number as possible. The number of directors may be increased or decreased from time to time exclusively by the Board of Directors pursuant to a resolution adopted by a majority of the Board, but shall be no less than and no more than the numbers set forth in the Articles of Incorporation. No decrease, however, shall have the effect of shortening the term of any incumbent director unless such director is removed in accordance with the provisions of the Articles of Incorporation. Unless removed in accordance with the Articles of Incorporation, each director shall hold office until his successor shall have been elected and qualified.
 
SECTION 3.         Regular Meetings. A regular meeting of the Board of Directors shall be held without other notice than this bylaw immediately after the annual meeting of shareholders, and at the same place as other regularly scheduled meetings of the Board of Directors. The Board of Directors may provide, by resolution, the time and place, for the holding of additional regular meetings without other notice than such resolution.
 
SECTION 4.        Qualifications. A person shall not be a Director of the corporation if that individual: (i) is not a resident of a state of the United States; (ii) has been adjudicated a bankrupt or has taken the benefit of any insolvency law or has made a general assignment for the benefit or creditors; (iii) has suffered a judgment for a sum of money which has remained unsatisfied after all legal proceedings have been of record or unsecured on appeal for a period of more than three months; or (iv) is a director of a bank, trust company, or national banking association (other than a bank, trust company, or national banking association that is a direct or indirect subsidiary of this corporation), a majority of the Board of Directors of which are directors of this corporation.
 
SECTION 5.         Special Meetings. Special meetings of the Board of Directors may be called by or at the request of the chairman of the board, the chief executive officer, or one-third of the directors. The persons authorized to call special meetings of the Board of Directors may fix any place, within the corporation’s normal lending territory, as the place for holding any special meeting of the Board of Directors called by such persons.
 
Members of the Board of Directors may participate in special meetings by means of conference telephone or similar communications equipment by which all persons participating in the meeting can hear each other. Such participation shall constitute attendance in person, but shall not constitute attendance for the purpose of compensation pursuant to Section 12 of this Article.
 
SECTION 6.         Notice of Special Meetings. W ritten notice of any special meeting shall be given to each director at least two days prior thereto, when delivered personally or by telegram, or at least five days prior thereto, when delivered by mail at the address at which the director is most likely to be reached. Such notice shall be deemed to be delivered when deposited in the mail so addressed, with postage thereon prepaid if mailed, or when delivered to the telegraph company if sent by telegram. Any director may waive notice of any meeting by a writing filed with the secretary. The attendance of a director at a meeting shall constitute a waiver of notice of such meeting, except where a director attends a meeting for the express purpose of objecting to the transaction of any business because the meeting is not lawfully called or convened. Neither the business to be transacted at, nor the purpose of, any meeting of the Board of Directors need be specified in the notice or waiver of notice of such meeting.
 
SECTION 7.         Quorum. A majority of the number of directors fixed by Section 2 of this Article III shall constitute a quorum for the transaction of business at any meeting of the Board of Directors, but if less than such majority is present at a meeting, a majority of the directors present may adjourn the meeting from time to time. Notice of any adjourned meeting shall be given in the same manner as prescribed by Section 6 of this Article III.
 
SECTION 8.         Manner of Acting. The act of the majority of the directors present at a meeting or adjourned meeting at which a quorum is present shall be the act of the Board of Directors, unless a greater number is prescribed by these Bylaws.
 
 
3


SECTION 9.         Action Without a Meeting. Any action required or permitted to be taken by the Board of Directors at a meeting may be taken without a meeting if a consent in writing, setting forth the action so taken, shall be signed by all of the directors.
 
SECTION 10.      Resignation. Any director may resign at any time by sending a written notice of such resignation to the home office of the corporation addressed to the chairman of the board or the chief executive officer. Unless otherwise specified therein, such resignation shall take effect upon receipt thereof by the chairman of the board or the chief executive officer. More than three (3) absences from regular meetings of the Board of Directors in any twelve (12) month period, unless excused by resolution of the Board of Directors, shall automatically constitute a resignation, effective when such final absence occurs.
 
SECTION 11.       Vacancies. Any vacancy occurring in the Board of Directors may be filled by the affirmative vote of a majority of the remaining directors, although less than a quorum of the Board of Directors. A director elected to fill a vacancy shall be elected for the unexpired term of his predecessor in office. A directorship to be filled by reason of an increase in the number of directors may be filled by election by the Board of Directors for a term continuing only until the next election of directors by the shareholders.
 
SECTION 12.      Compensation. A director may receive, by the affirmative vote of a majority of all the directors, reasonable compensation for (i) attendance at meetings of the Board of Directors; (ii) service as an officer of the corporation, provided his duties as officer require and receive his regular and faithful attendance at the corporation; and (iii) service as a member of a committee of the Board of Directors; provided, however, that a director receiving compensation for services as an officer pursuant to (ii) shall not receive any additional compensation for service under (I) and (iii).
 
SECTION 13.       Presumption of Assent. A director of the corporation who is present at a meeting of the Board of Directors at which action on a corporation matter is taken shall be presumed to have assented to the action taken unless his or her dissent or abstention shall be entered in the minutes of the meeting or unless he or she shall file a written dissent to such action with the person acting as the secretary of the meeting before the adjournment thereof or shall forward such dissent by registered mail to the secretary of the corporation within five (5) days after the date a copy of the minutes of the meeting is received. Such right to dissent shall not apply to a director who voted in favor of such action.
 
SECTION 14.       Performance of Duties. A director shall perform his or her duties as a director, including the duties as a member of any committee of the board upon which he or she may serve, in good faith, in a manner he or she reasonably believes to be in the best interest of the corporation, and with such care as an ordinarily prudent person in a like position would use under similar circumstances. In performing such duties, a director shall be entitled to rely on information, opinion, reports or statements, including financial statements and other financial data, in each case prepared or presented by: (i) one or more officers or employees of the corporation whom the director reasonably believes to be reliable and competent in the matters presented; (ii) counsel, public accountants or other persons as to matters which the director reasonably believes to be within such person’s professional or expert competence; or (iii) a committee of the board upon which he or she does not serve, duly designated in accordance with a provision of these Bylaws, as to matters within it designated authority, which committee the director reasonable believes to merit confidence. However, a director shall not be considered to be acting in good faith if he or she has knowledge concerning the matter in question that would cause such reliance to be unwarranted.
 
ARTICLE IV
 
Committees of the Board of Directors
 
SECTION 1.         Appointment. The board of directors may, by resolution adopted by a majority of the full board, designate an executive officer of the corporation who also serves as a director of the corporation and two (2) or more of the other directors, who do not serve as executive officers of the corporation, to constitute an executive committee. The designation of any committee pursuant to this Article IV, and the delegation of authority thereto, shall not operate to relieve the Board of Directors, or any director, of any responsibility imposed by law or regulation.
 
SECTION 2.         Authority. The executive committee, when the Board of Directors is not in session, shall have and may exercise all of the authority of the Board of Directors, except to the extent, if any, that such authority shall be limited by the resolution appointing the executive committee; and except also that the executive committee shall not have the authority of the Board of Directors with reference to: the declaration of dividends; the amendment of the Articles of Incorporation of the corporation or these Bylaws of the corporation, or recommending to the shareholders a plan of merger, consolidation, or conversion; the sale, lease, or other disposition of all or substantially all of the property and assets of the corporation otherwise than in the usual and regular course of its business; a voluntary dissolution of the corporation; a revocation of any of the foregoing; or the approval of a transaction in which any member of the executive committee, directly or indirectly, has any material beneficial interest.
 
 
4


SECTION 3.         Tenure. Subject to the provisions of Section 8 of this Article IV, each member of the executive committee shall hold office until the next regular annual meeting of the Board of Directors following his or her designation and until his or her successor is designated as a member of the executive committee.
 
SECTION 4.         Meetings. Regular meetings of the executive committee may be held without notice at such times and places as the executive committee may fix from time to time by resolution. Special meetings of the executive committee may be called by any member thereof upon not less than one day’s notice stating the place, date, and hour of the meeting, which notice may be written or oral. Any member of the executive committee may waive notice of any meeting and no notice of any meeting need be given to any member thereof who attends in person. The notice of a meeting of the executive committee need not state the business proposed to be transacted at the meeting.
 
SECTION 5.         Quorum. A majority of the members of the executive committee shall constitute a quorum for the transaction of any business at a meeting thereof, and action of the executive committee must be authorized by the affirmative vote of a majority of the members present at a meeting at which a quorum is present.
 
SECTION 6.         Action Without a Meeting. Any action required or permitted to be taken by the executive committee at a meeting may be taken without a meeting if a consent in writing, setting forth the action so taken, shall be signed by all of the members of the executive committee.
 
SECTION 7.          Vacancies. Any vacancy in the executive committee may be filled by a resolution adopted by a majority of the full Board of Directors.
 
SECTION 8.         Resignations and Removal. Any member of the executive committee may be removed at any time with or without cause by resolution adopted by a majority of the full Board of Directors. Any member of the executive committee may resign from the executive committee at any time by giving written notice to the chief executive officer or secretary of the corporation. Unless otherwise specified thereon, such resignation shall take effect upon receipt. The acceptance of such resignation shall not be necessary to make it effective.
 
SECTION 9.         Procedure. The executive committee shall elect a presiding officer from its members and may fix its own rules of procedure which shall not be inconsistent with these Bylaws. The committee shall keep regular minutes of its proceedings and report the same to the Board of Directors for its information at the meeting held next after the proceedings shall have occurred.
 
SECTION 10.       Audit Committee. At each annual meeting of the Board of Directors, the chairman, with the approval of the Board, shall appoint from among members of the Board, an Audit Committee consisting of not less than three members of the Board, none of whom may be members of management, all of whom shall serve until the next annual meeting and until their successors are appointed and confirmed.
 
SECTION 11.      Other Committees. The Board of Directors may, by resolution, establish such other committees composed of directors as they may determine to be necessary or appropriate for the conduct of the business of the corporation and may prescribe the duties, constitution, and procedures thereof.
 
ARTICLE V
 
Officers
 
SECTION 1.         Positions. The officers of the corporation shall be a chief executive officer, a secretary and a treasurer, each of whom shall be elected by the Board of Directors. The chief executive officer shall be a director of the corporation. The Board of Directors may designate the chairman of the board as chief executive officer. The offices of the secretary and treasurer may be held by the same person and a vice president may also be either the secretary or the treasurer. The Board of Directors may designate a president, who may also be the chief executive officer, and one or more vice presidents as executive vice president or senior vice president. The Board of Directors may also elect or authorize the appointment of such other officers as the business of the corporation may require. The officers shall have such authority and perform such duties as the Board of Directors may from time to time authorize or determine. In the absence of action by the Board of Directors, the officers shall have such powers and duties as generally pertain to their respective offices.
 
 
5


SECTION 2.          Election and Term of Office. The officers of the corporation shall be elected annually by the Board of Directors at the first meeting of the Board of Directors held after each annual meeting of the shareholders. If the election of officers is not held at such meeting, such election shall be held as soon thereafter as possible. Each officer shall hold office until his successor shall have been duly elected and qualified or until his death or until he shall resign or shall have been removed in the manner hereinafter provided. Election or appointment of an officer, employee or agent shall not of itself create contract rights. The Board of Directors may authorize the corporation to enter into an employment contract with any officer in accordance with applicable law.
 
SECTION 3.         Removal. Any officer may be removed by vote of two-thirds of the Board of Directors whenever, in its judgment, the best interests of the corporation will be served thereby, but such removal, other than for cause, shall be without prejudice to the contract rights, if any, of the person so removed.
 
SECTION 4.          Vacancies. A vacancy in any office because of death, resignation, removal, disqualification or otherwise, may be filled by the Board of Directors for the unexpired portion of the term.
 
SECTION 5.         Remuneration. The remuneration of the officers shall be fixed from time to time by the Board of Directors and no officer shall be prevented from receiving such salary by reason of the fact that he is also a director of the corporation.
 
ARTICLE VI
 
Contracts, Loans, Checks and Deposits
 
SECTION 1.         Contracts. Except as otherwise prescribed by these Bylaws with respect to certificates for shares, the Board of Directors may authorize any officer, employee, or agent of the corporation to enter into any contract or execute and deliver any instrument in the name of and on behalf of the corporation. Such authority may be general or confined to specific instances.
 
SECTION 2.         Loans. No loans shall be contracted on behalf of the corporation and no evidence of indebtedness shall be issued in its name, unless authorized by the Board of Directors. Such authority may be general or confined to specific instances.
 
SECTION 3.         Checks, Drafts, Etc. All checks, drafts, or other orders for the payment of money, notes, or other evidences of indebtedness in the name of the corporation shall be signed by one or more officer, employee, or agent of the corporation in such manner as shall from time to time be determined by the Board of Directors.
 
SECTION 4.          Deposits. All funds of the corporation not otherwise employed shall be deposits from time to time to the credit of the corporation in any of its duly authorized depositories as the Board of Directors may select.
 
SECTION 5.         Contracts with Directors and Officers. To the fullest extent authorized by and in conformance with W ashington law, the corporation may enter into contracts with and otherwise transact business as vendor, purchaser, or otherwise, with its directors, officers, employees and shareholders and with corporations, associations, firms, and entities in which they are or may become interested as directors, officers, shareholders, or otherwise, as freely as though such interest did not exist, except that no loans shall be made by the corporation secured by its shares, other than a loan made by the corporation to a tax-qualified employee stock ownership plan of the corporation or any of its affiliates. In the absence of fraud, the fact that any director, officer, employee, shareholder, or any corporation, association, firm or other entity of which any director, officer, employee or shareholder is interested, is in any way interested in any transaction or contract shall not make the transaction or contract void or voidable, or require the director, officer, employee or shareholder to account to this corporation for any profits therefrom if the transaction or contract is or shall be authorized, ratified, or approved by (I) the vote of a majority of the Board of Directors excluding any interested director or directors, (ii) the written consent of the holders of a majority of the shares entitled to vote, or (iii) a general resolution approving the acts of the directors and officers adopted at a shareholders’ meeting by vote of the holders of the majority of the shares entitled to vote. All loans to officers and directors shall be subject to Federal and state laws and regulations. Nothing herein contained shall create or imply any liability in the circumstances above described or prevent the authorization, ratification or approval of such transactions or contracts in any other manner.
 
SECTION 6.         Shares of Another Corporation. Shares of another corporation held by this corporation may be voted by the chief executive officer, president or any vice president, or by proxy appointment form by either of them, unless the directors by resolution shall designate some other person to vote the shares.
 
 
6


ARTICLE VII
 
Certificates for Shares and Their Transfer
 
SECTION 1.        Certificates for Shares and Uncertificated Shares. Certificates representing shares of capital stock of the corporation shall be in such form as shall be determined by the Board of Directors. Such certificates shall be signed by the chief executive officer or by any other officer of the corporation authorized by the Board of Directors, attested by the secretary or an assistant secretary, and may be sealed with the corporate seal or a facsimile thereof. The signatures of such officers upon a certificate may be facsimiles if the certificate is manually signed on behalf of a transfer agent or a registrar, other than the corporation itself or one of its employees. Each certificate for shares of capital stock shall be consecutively numbered or otherwise identified. The name and address of the person to whom the shares are issued, with the number of shares and date of issue, shall be entered on the stock transfer books of the corporation. All certificates surrendered to the corporation for transfer shall be canceled and no new certificate shall be issued until the former certificate for the like number of shares has been surrendered and canceled, except that in case of a lost or destroyed certificate, a new certificate may be issued therefor upon such terms and indemnity to the corporation as the Board of Directors may prescribe. Notwithstanding the foregoing, the Board of Directors may provide by resolution or resolutions that some or all of any or all classes or series of the corporation’s stock shall be uncertificated shares. Any such resolution shall not apply to shares represented by certificates until such certificate is surrendered to the corporation. In addition, notwithstanding the adoption of any such resolution providing for uncertificated shares, every holder of capital stock of the corporation theretofore represented by certificates and, upon request, every holder of uncertificated shares, shall be entitled to have a certificate for shares of capital stock of the corporation signed by, or in the name of the corporation as set forth above, certifying the number of shares owned by such stockholder in the Corporation.
 
SECTION 2.         Transfer of Shares. Stock of the corporation shall be transferable in the manner prescribed by applicable law and in these Bylaws. Transfers of stock shall be made on the books of the corporation, and in the case of certificated shares of stock, only by the person named in the certificate or by such person’s attorney lawfully constituted in writing and upon the surrender of the certificate therefor, properly endorsed for transfer and payment of all necessary transfer taxes; or, in the case of uncertificated shares of stock, upon receipt of proper transfer instructions from the registered holder of the shares or by such person’s attorney lawfully constituted in writing, and upon payment of all necessary transfer taxes and compliance with appropriate procedures for transferring shares in uncertificated form; provided, however, that such surrender and endorsement, compliance or payment of taxes shall not be required in any case in which the officers of the corporation shall determine to waive such requirement. W ith respect to certificated shares of stock, every certificate exchanged, returned or surrendered to the corporation shall be marked “Cancelled,” with the date of cancellation, by the Secretary or Assistant Secretary of the corporation or the transfer agent thereof. No transfer of stock shall be valid as against the corporation for any purpose until it shall have been entered in the stock records of the corporation by an entry showing from and to whom transferred.
 
SECTION 3.         Certification of Beneficial Ownership. The Board of Directors may adopt by resolution a procedure whereby a shareholder of the corporation may certify in writing to the corporation that all or a portion of the shares registered in the name of such shareholder are held for the account of a specified person or persons. Upon receipt by the corporation of a certification complying with such procedure, the persons specified in the certification shall be deemed, for the purpose or purposes set forth in the certification, to be the holders of record of the number of shares specified in place of the shareholder making the certification.
 
SECTION 4.         Lost Certificates. The Board of Directors may direct a new certificate or uncertificated shares to be issued in place of any certificate theretofore issued by the corporation alleged to have been lost, stolen, or destroyed, upon the making of an affidavit of that fact by the person claiming the certificate of stock to be lost, stolen, or destroyed. When authorizing such issuance of a new certificate or uncertificated shares, the corporation may, in its discretion and as a condition precedent to the issuance thereof, require the owner of such lost, stolen, or destroyed certificate, or his legal representative, to give the corporation a bond in such sum as it may direct as indemnity against any claim that may be made against the corporation with respect to the certificate alleged to have been lost, stolen, or destroyed.
 
ARTICLE VIII
 
Fiscal Year; Annual Audit
 
The fiscal year of the corporation shall end on the last day of December of each year. The corporation shall be subject to an annual audit as of the end of its fiscal year by the independent public accountants appointed by and responsible to the Board of Directors.
 
 
7


ARTICLE IX
 
Dividends
 
Subject to the terms of the corporation’s Articles of Incorporation and the laws of the State of W ashington, the Board of Directors may, from time to time, declare, and the corporation may pay, dividends upon its outstanding shares of capital stock.
 
ARTICLE X
 
Corporate Seal
 
The corporation need not have a corporate seal. If the directors adopt a corporate seal, the seal of the corporation shall be circular in form and consist of the name of the corporation, the state and year of incorporation, and the words “Corporate Seal.”
 
ARTICLE XI
 
Amendments
 
In accordance with the corporation’s Articles of Incorporation, these Bylaws may be repealed, altered, amended or rescinded by the shareholders of the corporation only by vote of not less than 80% of the outstanding shares of capital stock of the corporation entitled to vote generally in the election of directors (considered for this purpose as one class) cast at a meeting of the shareholders called for that purpose (provided that notice of such proposed repeal, alteration, amendment or rescission is included in the notice of such meeting). In addition, the Board of Directors may repeal, alter, amend or rescind these Bylaws by vote of a majority of the Board of Directors at a legal meeting held in accordance with the provisions of these Bylaws.
 
* * *


8
EX-4.0 6 ex4-0.htm EXHIBIT 4.0 ex4-0.htm

Exhibit 4.0
 
FS BANCORP, INC.
 
INCORPORATED UNDER THE LAWS OF THE STATE OF WASHINGTON
   
COMMON STOCK
CUSIP
 
See Reverse For
 
Certain Definitions
 
THIS CERTIFIES THAT
 
is the owner of
 
FULLY PAID AND NONASSESSABLE SHARES OF COMMON STOCK, $0.01 PAR VALUE PER SHARE, OF
 
FS Bancorp, Inc. (“Corporation”), a stock corporation incorporated under the laws of the State of Washington. The shares represented by this Certificate are transferable only on the stock transfer books of the Corporation by the holder of record hereof or by such holder’s duly authorized attorney or legal representative upon the surrender of this Certificate properly endorsed. Such shares are non-withdrawable and not insurable. Such shares are not insured by the federal government. The Articles and shares represented hereby are issued and shall be held subject to all provisions of the Articles of Incorporation and Bylaws of the Corporation and any amendments thereto (copies of which are on file with the Transfer Agent), to all of which provisions the holder by acceptance hereof, assents.
 
          IN WITNESS WHEREOF, FS Bancorp, Inc. has caused this Certificate to be executed by the facsimile signatures of its duly authorized officers and has caused a facsimile of its corporate seal to be hereunto affixed.
   
CORPORATE SECRETARY
CHIEF EXECUTIVE OFFICER
   
 
TRANSFER AGENT
   
[SEAL]


FS BANCORP, INC.
 
          The shares represented by this Certificate are issued subject to all the provisions of the Articles of Incorporation and Bylaws of FS Bancorp, Inc. (“Corporation”) as from time to time amended (copies of which are on file with the Transfer Agent and at the principal executive offices of the Corporation).
 
          The shares represented by this Certificate are subject to a limitation contained in the Articles of Incorporation to the effect that in no event shall any record owner of any outstanding common stock which is beneficially owned, directly or indirectly, by a person who beneficially owns in excess of 10% of the outstanding shares of common stock (the “Limit”) be entitled or permitted to vote in respect of the shares held in excess of the Limit, unless a majority of the whole Board of Directors, as defined in the Articles of Incorporation shall have by resolution granted in advance such entitlement or permission.
 
          The Board of Directors of the Corporation is authorized by resolution(s), from time to time adopted, to provide for the issuance of preferred stock in series and to fix and state the powers, designations, preferences and relative, participating, optional or other special rights of the shares of each such series and the qualifications, limitations and restrictions thereof. The Corporation will furnish to any shareholder upon request and without charge a full description of each class of stock and any series thereof.
 
          The shares represented by this Certificate may not be cumulatively voted on any matter. The affirmative vote of the holders of at least 80% of the voting stock of the Corporation, voting together as a single class, shall be required to approve certain business combinations and other transactions, pursuant to the Articles of Incorporation, or to amend certain provisions of the Articles of Incorporation.
 
          The following abbreviations, when used in the inscription on the face of this certificate, shall be construed as through they were written out in full according to applicable laws or regulations.
       
 
TEN COM
-as tenants in common
 
TEN ENT
-as tenants by the entireties
 
JT TEN
-as joint tenants with right of survivorship and not as tenants in common
 
UNIF GIFT MIN ACT
-_______Custodian_______ under Uniform Gifts to Minors Act _________
   
    (Cust)                      (Minor)
    (State)
 
Additional abbreviations may also be used though not in the above list.
 
          For value received, ___________________________________________ hereby sell, assign and transfer unto
 
PLEASE INSERT SOCIAL SECURITY OR OTHER
IDENTIFYING NUMBER OF ASSIGNEE
 
 
Please print or typewrite name and address, including postal zip code, of assignee
 
 
shares of the common stock evidenced by this Certificate, and do hereby irrevocably constitute and appoint __________________________________, Attorney, to transfer the said shares on the books of the within named Corporation, with full power of substitution.
 
Dated         
     
 
Signature


Signature
 
 
NOTICE: The signature to this assignment must correspond with the name as written upon the face of the Certificate in every particular, without alteration or enlargement or any change whatever.


EX-5.0 7 ex5-0.htm EXHIBIT 5.0 ex5-0.htm

Exhibit 5.0
 
GRAPHIC
September 27, 2011
 

Board of Directors
FS Bancorp, Inc.
6920 220th Street SW
Mountlake Terrace, Washington 98043
 
Re:           Registration Statement on Form S-1
 
Ladies and Gentlemen:
 
In connection with the registration under the Securities Act of 1933, as amended (the “Act”), of shares of FS Bancorp, Inc.’s (the “Company”) common stock, par value $0.01 per share (the “Shares”), as described in the Company’s Registration Statement on Form S-1 (the “Registration Statement”), we have examined the Company’s Articles of Incorporation and Bylaws, the Registration Statement, resolutions of the Board of Directors of the Company, and such other documents and matters of law as we deemed appropriate for the purpose of this opinion.
 
In our examination, we have relied on the genuineness of all signatures and the authenticity and conformity to the originals of all documents and instruments submitted to us.  In addition, we have relied on the accuracy and completeness of all records, documents, instruments and materials made available to us by the Company.
 
For purposes of this letter, we have assumed that, prior to the issuance of any shares of Common Stock, (i) the Registration Statement, as finally amended, will have become effective under the Act and (ii) the conversion transaction as described in the Registration Statement will have become effective.
 
Based upon the foregoing, we are of the opinion that, as of the date hereof, the Shares to be issued and sold by the Company, when issued and sold as contemplated in the Registration Statement, will be validly issued and outstanding, fully paid and non-assessable.
 
Our opinion is limited to the matters set forth in this letter, and we express no opinion other than as expressly set forth in this letter. In rendering the opinion set forth above, we express no opinion whatsoever concerning federal law or the laws of any state other than the State of Washington.
 
We assume no obligation to advise you of any event that may hereafter be brought to our attention that may affect any statement made in this letter after the declaration of effectiveness of the Registration Statement.


GRAPHIC


September 27, 2011
Page 2


We hereby consent to the filing of this opinion as an exhibit to the Registration Statement and to the references to Harlowe & Falk LLP under the heading “Legal and Tax Opinions” in the Prospectus contained in the Registration Statement.  In giving this consent, we do not admit that we are within the category of persons whose consent is required under Section 7 of the Act, as amended or the rules and regulations of the Securities and Exchange Commission promulgated thereunder.

Very truly yours,
 
/s/ Michael A. Raskasky
 
HARLOWE & FALK LLP


EX-8.1 8 ex8-1.htm EXHIBIT 8.1 ex8-1.htm

Exhibit 8.1
 
LAW OFFICES
     
Silver, Freedman & Taff, L.L.P.
A LIMITED LIABILITY PARTNERSHIP INCLUDING PROFESSIONAL CORPORATIONS
     
 
3299 K STREET N.W.
 
 
SUITE 100
 
 
WASHINGTON, D.C. 20007
 
 
PHONE: (202) 295-4500
WRITER'S DIRECT DIAL NUMBER
(202) 295-4503
 
FAX:   (202) 337-5502
 
WWW.SFTLAW.COM
 
September 15, 2011
 
Board of Trustees
1st Security Bank of Washington
6920 220th Street, SW
Mountlake Terrace, WA 98043
 
 
RE:
Federal Income Tax Opinion Relating To The Conversion Of 1st Security Bank of Washington From A State-Chartered Mutual Savings Bank To A State-Chartered Stock Savings Bank Under Section 368(a)(1)(F) of the Internal Revenue Code of 1986, As Amended
 
Gentlemen:
 
In accordance with your request set forth hereinbelow is the opinion of this firm relating to the federal income tax consequences of the conversion of 1st Security Bank of Washington (“Mutual”) from a Washington-chartered mutual savings bank to a Washington-chartered stock savings bank (“Stock Bank”) pursuant to the provisions of Section 368(a)(1)(F) of the Internal Revenue Code of 1986, as amended (the “Code”).
 
Capitalized terms used herein which are not expressly defined herein shall have the meaning ascribed to them in the Plan of Conversion adopted by the Board of Trustees of Mutual on July 10, 2008, as amended on September 15, 2011 (the “Plan”).
 
The following assumptions have been made in connection with our opinions hereinbelow:
 
1.          The Conversion is implemented in accordance with the terms of the Plan and all conditions precedent contained in the Plan shall be performed or waived prior to the consummation of the Conversion.
 
2.           No amount or a de minimus amount (i.e. substantially less than 1%) of the savings accounts and deposits of Mutual, as of the Eligibility Record Date or the Supplemental Eligibility Record Date, will be excluded from participating in the liquidation account of Stock Bank.  To the best of the knowledge of the management of Mutual there is not now, nor will there be at the time of the Conversion, any plan or intention, on the part of the depositors in Mutual to withdraw their deposits following the Conversion.  Deposits withdrawn immediately prior to or immediately subsequent to the Conversion (other than maturing deposits) are considered in making these assumptions.


September 15, 2011
Page 2
 
3.           Holding Company and Stock Bank each have no plan or intention to redeem or otherwise acquire any of the Conversion Stock to be issued in the proposed transaction.
 
4.           Immediately following the consummation of the proposed transaction, Stock Bank will possess the same assets and liabilities as Mutual held immediately prior to the proposed transaction, plus substantially all of the net proceeds from the sale of its stock to Holding Company except for assets used to pay expenses of the Conversion.  The liabilities transferred to Stock Bank were incurred by Mutual in the ordinary course of business.
 
5.           No cash or property will be given to deposit account holders in lieu of Subscription Rights or an interest in the liquidation account of Stock Bank.
 
6.           Following the Conversion, Stock Bank will continue to engage in its business in substantially the same manner as Mutual engaged in business prior to the Conversion, and it has no plan or intention to sell or otherwise dispose of any of its assets, except in the ordinary course of business.
 
7.           There is no plan or intention for Stock Bank to be liquidated or merged with another corporation following the consummation of the Conversion.
 
8.            The fair market value of each savings account plus an interest in the liquidation account of Stock Bank will, in each instance, be approximately equal to the fair market value of each savings account of Mutual plus the interest in the residual equity of Mutual surrendered in exchange therefor.
 
9.           Holding Company has no plan or intention to sell or otherwise dispose any of  the stock of Stock Bank received by it in the proposed transaction.
 
10.         Both Stock Bank and Holding Company have no plan or intention, either currently or at the time of Conversion, to issue additional shares of common stock following the proposed transaction, other than shares that may be issued to employees and/or directors pursuant to certain stock option and stock incentive plans or that may be issued to employee benefit plans.
 
11.         Assets used to pay expenses of the Conversion and all distributions (except for regular, normal interest payments and other payments in the normal course of business made by Mutual immediately preceding the transaction) will in the aggregate constitute less than 1% of the net assets of Mutual and any such expenses and distributions will be paid by Stock Bank from the proceeds of the sale of Conversion Stock.


September 15, 2011
Page 3
 
12.        All distributions to deposit account holders in their capacity as deposit account holders (except for regular, normal interest payments made by Mutual), will, in the aggregate, constitute less than 1% of the fair market value of the net assets of Mutual.
 
13.        At the time of the proposed transaction, the fair market value of the assets of Mutual on a going concern basis (including intangibles) will equal or exceed the amount of its liabilities plus the amount of liabilities to which such assets are subject.  Mutual will have a positive regulatory net worth at the time of the Conversion.
 
14.        Mutual’s Eligible Account Holders and Supplemental Eligible Account Holders will pay expenses of the Conversion solely attributable to them, if any.
 
15.        The liabilities of Mutual assumed by Stock Bank plus the liabilities, if any, to which the transferred assets are subject were incurred by Mutual in the ordinary course of its business and are associated with the assets being transferred.
 
16.        There will be no purchase price advantage for Mutual’s deposit account holders who purchase Conversion Stock.
 
17.        None of the compensation to be received by any deposit account holder-employees of Mutual or Holding Company will be separate consideration for, or allocable to, any of their deposits in Mutual.  No interest in the liquidation account of Stock Bank will be received by any deposit account holder-employees as separate consideration for, or will otherwise be allocable to, any employment agreement, and the compensation paid to each deposit account holder-employee, during the twelve-month period preceding or subsequent to the Conversion, will be for services actually rendered and will be commensurate with amounts paid to the third parties bargaining at arm’s-length for similar services.  No shares of Conversion Stock will be issued to or purchased by any deposit account holder-employee of Mutual or Holding Company at a discount or as compensation in the proposed transaction.
 
18.        No creditors of Mutual or the depositors in their role as creditors, have taken any steps to enforce their claims against Mutual by instituting bankruptcy or other legal proceedings, in either a court or appropriate regulatory agency, that would eliminate the proprietary interests of the Members prior to the Conversion of Mutual including depositors as the equity holders of Mutual.
 
19.        The proposed transaction does not involve the payment to Stock Bank or Mutual of financial assistance from federal agencies within the meaning of Notice 89-102, 1989-40 C.B. 1.
 
20.        On a per share basis, the purchase price of Conversion Stock will be equal to the fair market value of such stock at the time of the completion of the proposed transaction.


September 15, 2011
Page 4
 
OPINION
 
Based solely on the assumptions set forth hereinabove and our analysis and examination of applicable federal income tax laws, rulings, regulations, and  judicial precedents, we are of the opinion that if the transaction is undertaken in accordance with the above assumptions:
 
(1)           The Conversion will constitute a reorganization within the meaning of Section 368(a)(1)(F) of the Code.  Neither Mutual nor Stock Bank will recognize any gain or loss as a result of the transaction (Rev. Rul. 80-105, 1980-1 C.B. 78).  Mutual and Stock Bank will each be a party to a re organization within the meaning of Section 368(b) of the Code.
 
(2)           Stock Bank will recognize no gain or loss upon the receipt of money and other property, if any, in the Conversion, in exchange for its shares.  (Section 1032(a) of the Code).
 
(3)           No gain or loss will be recognized by Holding Company upon the receipt of money for Conversion Stock.  (Section 1032(a) of the Code).
 
(4)           The basis of Mutual’s assets in the hands of Stock Bank will be the same as the basis of those assets in the hands of Mutual immediately prior to the transaction.  (Section 362(b) of the Code).
 
(5)           Stock Bank’s holding period of the assets of Mutual will include the period during which such assets were held by Mutual prior to the Conversion.  (Section 1223(2) of the Code).
 
(6)           The creation of the liquidation account on the records of Stock Bank will have no effect on Mutual’s or Stock Bank’s taxable income, deductions, or additions to the reserve for bad debts.
 
(7)           No income will be recognized by Holding Company on the distribution of Subscription Rights unless the issuance of the Subscription Rights results in gain to recipients thereof.  It is more likely than not that no income will be recognized by Holding Company on the distribution of Subscription Rights.
 
(8)           It is more likely than not that the fair market value of the Subscription Rights is zero.  Thus, it is more likely than not that no gain will be recognized by Eligible Account Holders, Supplemental Account Holders or Other Members upon their receipt of Subscription Rights.  Gain, if any, realized by the aforesaid account holders and Other Members will not exceed the fair market value of the Subscription Rights received.  If gain is recognized by account holders and Other Members upon the distribution to them of Subscription Rights, the Holding Company could also recognize income on the distribution of Subscription Rights.  No gain will be recognized by the recipients of Subscription Rights or Holding Company upon the exercise of Subscription Rights.


September 15, 2011
Page 5
 
(9)             A depositor’s basis in his deposit accounts of Stock Bank will be the same as the basis of his deposit accounts in Mutual.  (Section 1012 of the Code).  The basis of the interest in the liquidation account of Stock Bank received by Eligible Account Holders and Supplemental Eligible Account Holders will be equal to the cost of such property, i.e., the fair market value of the proprietary interest in Mutual, which in this transaction we believe to have no fair market or ascertainable value.
 
(10)           The basis of Conversion Stock to its shareholders will be the purchase price thereof.  (Section 1012 of the Code).
 
(11)           A shareholder’s holding period for Conversion Stock acquired through the exercise of the Subscription Rights shall begin on the date on which the Subscription Rights are exercised.  (Section 1223(6) of the Code).  The holding period for the Conversion Stock purchased pursuant to the Direct Community Offering or Syndicated Community Offering will commence on the date following the date on which such stock is purchased.  (Rev. Rul. 70-598, 1970-2 C.B. 168).
 
(12)           Regardless of any book entries that are made for the establishment of a liquidation account, the reorganization will not diminish the accumulated earnings and profits of Mutual available for the subsequent distribution of dividends, within the meaning of Section 316 of the Code.  Section 1.312-11(b) and (c) of the Regulations.  Stock Bank will succeed to and take into account the earnings and profits, or deficit in earnings and profits, of Mutual as of the date of Conversion.
 
(13)           The reasoning in support of our opinions in paragraph 7 and 8 is set forth herein below.  We understand that the Subscription Rights will be granted at no cost to recipients, will be legally non-transferable, will be of short duration, and will only entitle recipients to purchase Conversion Stock at fair market value, being the same price to be paid by the general public in the Direct Community Offering or Syndicated Community Offering.  We also note that the Internal Revenue Service has not in the past concluded that subscription rights in like transactions have any value.  In addition, we are relying on a letter from RP Financial, LC to you stating its belief that the Subscriptions Rights do not have any ascertainable value at the time of distribution or at the time the rights are exercised in the Subscription Offering.  Based on the foregoing, we believe it is more likely than not that the Subscription Rights have no value.
 
 The above opinions are effective to the extent that Mutual is solvent.  Based upon our review of the financial statements of Mutual and related financial information provided to us by Mutual, we have concluded that Mutual is solvent as of the date hereof.  No opinion is expressed about the tax treatment of the transaction if Mutual is not solvent, which determination is made at the end of the tax year in which the transaction is consummated.


September 15, 2011
Page 6
 
No opinion is expressed as to the tax treatment of the transaction under the provisions of any of the other sections of the Code and Income Tax Regulations which may also be applicable thereto, including without limitation, whether the transaction results in an ownership change under Section 382 of the Code subjecting the pre-change losses of Mutual to the restrictions and limitations of Section 382 of the Code, or to the tax treatment of any conditions existing at the time of, or effects resulting from, the transaction which are not specifically covered by the opinions set forth above.
 
We hereby consent to the filing of this opinion as an exhibit to regulatory filings and applications seeking approval of the Conversion from the Division and the FDIC, and to Holding Company’s Registration Statement as filed with SEC.
 
  Respectfully submitted,
   
  SILVER, FREEDMAN & TAFF, L.L.P.
   
  /s/ Barry P. Taff, P.C.
 
 
EX-8.2 9 ex8-2.htm EXHIBIT 8.2 ex8-2.htm

Exhibit 8.2
 
GRAPHIC
September 27, 2011
 
 
Board of Directors
FS Bancorp, Inc.
6920 220th Street SW
Mountlake Terrace, Washington 98043
 
Re:           Washington State Income Tax Opinion Relating to the Proposed Conversion of 1st Security Bank of Washington from a State-Chartered Mutual Savings Bank to a State-Chartered Stock Savings Bank
 
Ladies and Gentlemen:
 
In accordance with your request, set forth herein is the opinion of this firm relating to certain Washington State tax consequences of (a) the proposed conversion of 1st Security Bank of Washington (the “Bank”) from a Washington-chartered mutual savings bank to a Washington-chartered stock savings bank (the “Converted Bank”) and (b) the concurrent acquisition of one-hundred percent (100%) of the outstanding capital stock of the Converted Bank by a holding company to be formed at the direction of the Board of Directors of the Bank, to be known as FS Bancorp, Inc., a Washington corporation (the “Company”), with such transaction being referred to herein as the “Stock Conversion.”  The Stock Conversion is being implemented pursuant to a Plan of Conversion adopted by the Bank’s Board of Directors on July 10, 2008 (the “Plan”).
 
Our opinion is based on the assumption that the Stock Conversion is implemented in accordance with the terms of the Plan and all conditions precedent contained in the Plan shall be performed or waived prior to the consummation of the Stock Conversion.
 
The State of Washington does not impose a per se corporate income tax.  See American Nat’l Can Corp. v. State of Washington, Dept. of Revenue, 114 Wash.2d 236, 242, 787 P.2d 545, 548 (1990).  Rather, Washington State derives revenues from other sources, including an ad valorem property tax, sales and use taxes and a business and occupation (“B & O”) tax.
 
Washington State taxes the value of real property and certain tangible personal property pursuant to an ad valorem property tax.  Expressly exempted from ad valorem property taxation is intangible personal property, including stocks and shares of private corporations.  RCW § 84.36.070(1).
 
Sales of tangible personal property and certain services are subject to the Washington State retail sales tax.  A use tax complements the retail sales tax by imposing a tax of a like amount on the use of tangible personal property purchased or acquired without payment of retail sales tax.  WAC § 458-20-146 (2011).  In a regulation governing business reorganizations, the Washington State Department of Revenue takes the position that a transfer of capital to a corporation in exchange for stock in such corporation is exempt from the retail sales and use taxes.  WAC § 458-20-106 (2011).


GRAPHIC


September 27, 2011
Page 2


Washington State’s B & O tax is “levied and collected from every person that has a substantial nexus with this state for the act or privilege of engaging in business activities.”  RCW § 82.04.220.  This tax is measured by the application of stated rates (varying based on the nature of the business activity) against the gross receipts of the business.  Id.  Banks are generally subject to the B & O tax.  WAC § 458-20-146.  However, in a regulation governing business reorganizations, the Washington State Department of Revenue takes the position that “casual or isolated sales,” which are defined as “sales made by a person who is not engaged in the business of selling the type of property involved” are exempt from the B & O Tax.  WAC § 458-20-106 (2011).   Because the Converted Bank and the Company are not in the business of selling their own stock, and the Stock Conversion is within the scope of the reorganization transactions covered under WAC § 458-20-106 (2011), we are of the opinion that the issuance of shares of stock in exchange for capital contributions fits within this definition, and is, therefore, a casual or isolated sale exempt from B & O tax.
 
 
Based upon the foregoing, we are of the opinion that, as of the date hereof, under the laws of the State of Washington, no adverse income tax consequences will be incurred by the Bank or the Company as a result of the Stock Conversion.
 
 
Various issues concerning the federal income tax effects of the Stock Conversion are addressed in the opinion of Silver, Freedman & Taff, L.L.P. separately provided to you, and we express no opinion with respect to the matters addressed in that opinion.
 
 
Our opinion is limited to the matters set forth in this letter, and we express no opinion other than the Washington State income tax consequences that might result from the implementation of the Stock Conversion as expressly set forth in this letter.  We express no opinion whatsoever concerning federal law or the laws of any state other than the State of Washington in effect as of the date of this letter.
 
 
We assume no obligation to advise you of any event that may hereafter be brought to our attention after the date of this letter that may affect any statement made in this letter.  However, it should be noted that the Washington State Department of Revenue frequently engages in rulemaking activity with regard to property tax, sales and use tax and B & O tax, which may affect our opinion.  While we have reviewed the Washington State Department of Revenue’s rulemaking calendar, and there are no currently scheduled rulemaking hearings, meetings or comment periods with regard to the effect of these state taxes on financial institutions or stock offerings, the Washington State Department of Revenue does occasionally issue emergency rules.


September 27, 2011
Page 3


We hereby consent to the filing of this opinion as an exhibit to the Registration Statement and to the references to Harlowe & Falk LLP under the heading “Legal and Tax Opinions” in the Prospectus contained in the Registration Statement.  In giving this consent, we do not admit that we are within the category of persons whose consent is required under Section 7 of the Securities Act of 1933, as amended or the rules and regulations of the Securities and Exchange Commission thereunder.
 
Very truly yours,
 
/s/ Michael A. Raskasky
 
HARLOWE & FALK LLP


EX-8.3 10 ex8-3.htm EXHIBIT 8.3 ex8-3.htm

Exhibit 8.3
 
RP® FINANCIAL, LC.  
Serving the Financial Services Industry Since 1988  
 
September 15, 2011
 
 
Board of Directors
FS Bancorp, Inc.
1st Security Bank of Washington
6920 220th Street SW, Suite 300
Mountlake Terrace, Washington 98043-2172
 
Re:  Plan of Conversion
  FS Bancorp, Inc.
  1st Security Bank of Washington
 
Members of the Board of Directors:
 
All capitalized terms not otherwise defined in this letter have the meanings given such terms in the plan of conversion adopted by the Board of Directors of 1st Security Bank of Washington (the “Bank”).  Pursuant to the plan of conversion, the Bank will convert from mutual to stock form and issue all of the Bank’s outstanding capital stock to FS Bancorp, Inc. (the “Company”).  Simultaneously, the Company will offer shares of its common stock for sale in a public offering.
 
We understand that in accordance with the plan of conversion, subscription rights to purchase shares of common stock in the Company are to be issued to: (1) Eligible Account Holders; (2) Tax-Qualified Employee Stock Benefit Plans; (3) Supplemental Eligible Account Holders; and, (4) Other Members.  Based solely upon our observation that the subscription rights will be available to such parties without cost, will be legally non-transferable and of short duration, and will afford such parties the right only to purchase shares of common stock at the same price as will be paid by members of the general public in the community offering, but without undertaking any independent investigation of state or federal law or the position of the Internal Revenue Service with respect to this issue, we are of the belief that, as a factual matter:
 
 
(1)
the subscription rights will have no ascertainable market value; and,
 
 
(2)
the price at which the subscription rights are exercisable will not be more or less than the pro forma market value of the shares upon issuance.
 
Changes in the local and national economy, the legislative and regulatory environment, the stock market, interest rates, and other external forces (such as natural disasters or significant world events) may occur from time to time, often with great unpredictability and may materially impact the value of thrift stocks as a whole or the Company’s value alone.  Accordingly, no assurance can be given that persons who subscribe to shares of common stock in the subscription offering will thereafter be able to buy or sell such shares at the same price paid in the subscription offering.
 
  Sincerely,
  RP® FINANCIAL, LC.
   
  graphic 
Washington Headquarters  
Three Ballston Plaza Telephone:  (703) 528-1700
1100 North Glebe Road, Suite 1100  Fax No.:  (703) 528-1788
Arlington, VA 22201 Toll-Free No.:  (866) 723-0594
www.rpfinancial.com E-Mail:  mail@rpfinancial.com
 
EX-10.1 11 ex10-1.htm EXHIBIT 10.1 ex10-1.htm

Exhibit 10.1
 
SEVERANCE AGREEMENT
 
1st Security Bank of Washington (“Bank”) and Joseph C. Adams (“Adams” or “Employee”) agree as follows:
 
 
1.
Consideration. In consideration of loyal and valued service to the Bank, and in further consideration of being a member of the Bank’s Senior Management Team (SMT), and in further consideration of the Bank’s desire that Employee remain a member of the Bank’s SMT now and into the future, Bank and Employee does enter in the following agreement.
 
 
2.
Severance. If Employee is involuntarily terminated by the Bank, other than for Cause, or quits voluntarily for Good Reason, or there is a Change in Control of Ownership of Bank, conditioned on the execution of a Release by Employee of any and all claims arising out of Employee’s employment or Employee’s termination, Employee will receive Severance in an amount equal to 24 months of base compensation (in a lump sum payable within forty-five (45) days after the effective date of the Release). Employee’s voluntary quitting without good reason or termination of Employee by the Bank for cause shall disqualify employee from receiving Severance.
 
 
3.
“Cause” for termination means any one or more of the following:
 
 
a.
Removal or discharge of Employee pursuant to order of any federal banking authority;
 
 
b.
Employee perpetrates fraud, dishonesty, or other act of misconduct in the rendering of services to the Bank or to customers of the Bank, or if Employee engages in conduct which, in the opinion of the Board of Directors, materially interferes with the performance of Employee’s duties or harms the reputation of the Bank by reason of the adverse reaction of the community to such conduct;
 
 
c.
Employee conceals from, or knowingly fails to disclose to, any federal banking regulatory authority, or the Board of Directors any material matters affecting the viability of the Bank; or
 
 
d.
Employee fails (or refuses) to faithfully or diligently perform any of the usual and customary duties of his or her employment and either fails to remedy the lapse or formulate a plan for its correction with the Bank (if such failure is not susceptible to immediate correction) within thirty (30) days after notice to Employee.
 
 
4.
“Good Reason” means only any one or more of the following:
 
 
a.
Reduction of Employee’s salary or elimination of any significant compensation or benefit plan benefiting Employee, unless the reduction or elimination is generally applicable to substantially all similarly situated employees (or similarly situated employees of a successor or controlling entity of the Bank) formerly benefited;


Joseph C. Adams
Severance Agreement
Page 2 of 2
 
 
b.
The assignment to Employee without his or her consent of any authority or duties materially inconsistent with employee’s position as of the date of this Agreement; or
 
 
c.
A relocation or transfer of Employee’s principal place of employment that would materially increase Employee’s commute.
 
 
5.
“Change in Control of Ownership” means only any one or more of the following:
 
 
a.
Consummation by the Bank of reorganization, merger or consolidation or sale or other disposition of all or substantially all of the assets of the Bank.
 
 
b.
The acquisition by any individual, entity or group of beneficial ownership of 51 percent or more of either the then outstanding shares of common stock of the Bank or the combined voting power of the then outstanding voting securities of the Bank entitled to vote generally in the election of directors.
 
 
6.
Other. This Agreement shall be governed by the laws of the State of Washington. This Agreement shall not be interpreted as requiring “cause” for termination. This Agreement may be modified only in a writing signed by Employee and the Bank’s Chief Executive Officer. The provisions of this agreement are severable. In the event any provision of this Agreement is found to be unenforceable, in whole or in part, the remainder of this Agreement will nevertheless be binding and enforceable. If any dispute arises under this Agreement, the parties consent to the exclusive jurisdiction of the Snohomish County Superior Court or the United States District Court for the Western District of Washington, and waive any objection based upon venue, including forum non conveniens.
 
Joseph C. Adams (“Employee”)
 
1st Security Bank of Washington
     
/s/ Joseph C. Adams
  By: 
 /s/Robert E. D’Amicol
     
   
Its: Chairman of the Board
     
Date: 11/30/06
 
Date: 11/27/06
 
 
EX-10.2 12 ex10-2.htm EXHIBIT 10.2 ex10-2.htm

Exhibit 10.2

The following executive officers have a change of control agreement with 1st Security Bank of Washington (the “Bank”), the wholly-owned, operating subsidiary of the Registrant, in the form attached:
 
Matthew Mullet
Steven Haynes
Drew Ness


CHANGE OF CONTROL AGREEMENT
 
THIS AGREEMENT is entered into as of the _____ day of __________, 200__ (the “Effective Date”) by and between 1ST SECURITY BANK OF WASHINGTON (the “Bank”), a Washington chartered savings bank, and _______________________ (the “Executive”).
 
WITNESSETH:
 
WHEREAS, Executive is the ____________________ of the Bank, and as such is a key officer whose continued dedication, availability, advice and counsel to the Bank is deemed important to the Board of Directors of the Bank;
 
WHEREAS, the Bank wish to retain the services of Executive free from any distractions or conflicts that could arise as a result of a change in control of the Bank;
 
NOW, THEREFORE, to assure the Bank of Executive’s continued dedication, the availability of his advice and counsel to the Board of Directors of the Bank free of any distractions resulting from a change of control, and for other good and valuable consideration, the receipt and adequacy whereof each party hereby acknowledges, the Bank and Executive hereby agree as follows:
 
1.           TERM OF AGREEMENT: This Agreement shall remain in effect until cancelled by either party hereto, upon not less than 24 months prior written notice to the other party. The execution of this Agreement shall automatically cancel and void any change in control or severance agreements which otherwise might be in effect between Executive and the Bank.
 
2.           CHANGE OF CONTROL: If there is a Change of Control of the Bank during the term of this Agreement, Executive shall be entitled to a severance payment in the event the Executive suffers an Involuntary Termination within six (6) months preceding or 12 months after the Change in Control, unless such termination is for Cause. The amount of such severance payment shall equal [_________(__)] months of Executive’s then current salary and shall be paid in a lump sum within 45 days of the date of Executive’s Involuntary Termination, subject to the restrictions set forth in paragraph 12 of this Agreement.
 
3.           LIMITATION OF BENEFITS: It is the intention of the parties that no payment be made or benefit provided to the Executive that would constitute an “excess parachute payment” within the meaning of Section 280G of the Code and any regulations thereunder, thereby resulting in a loss of an income tax deduction by the Bank or the imposition of an excise tax on the Executive under Section 4999 of the Code. If the independent accountants serving as auditors for the Bank immediately prior to the date of a Change of Control determine that some or all of the payments or benefits scheduled under this Agreement, when combined with any other payments or benefits provided to the Executive on a Change of Control by the Bank, and any affiliate of the Bank required to be aggregated with the Bank under Section 280G of the Code, would constitute nondeductible excess parachute payments by the Bank under Section 280G of the Code, then the payments or benefits scheduled under this Agreement will be reduced to one dollar less than the maximum amount which may be paid or provided without causing any such payments or benefits scheduled under this Agreement or otherwise provided on a Change of Control to be nondeductible. The determination made as to the reduction of benefits or payments required hereunder by the independent accountants shall be binding on the parties. The Executive shall have the right to designate within a reasonable period which payments or benefits scheduled under this Agreement will be reduced; provided, however, that if no direction is received from the Executive, the Bank shall implement the reductions under this Agreement in its discretion.
 
 
1


4.           LITIGATION - OBLIGATIONS - SUCCESSORS:
 
(a)        If litigation shall be brought or arbitration commenced to challenge, enforce or interpret any provision of this Agreement, and such litigation or arbitration does not end with judgment in favor of the Bank, the Bank hereby agrees to indemnify the Executive for his reasonable attorney’s fees and disbursements incurred in such litigation or arbitration.
 
(b)         The Bank’s obligation to pay the Executive the compensation and benefits and to make the arrangements provided herein shall be absolute and unconditional and shall not be affected by any circumstances, including, without limitation, any set-off, counterclaim, recoupment, defense or other right which the Bank may have against him or anyone else. All amounts payable by the Bank hereunder shall be paid without notice or demand.  The Executive shall not be required to mitigate the amount of any payment provided for in this Agreement by seeking other employment or otherwise.
 
(c)        The Bank will require any successor (whether direct or indirect, by purchase, merger, consolidation or otherwise) to all or substantially all of the business and/or assets of the Bank, by agreement in form and substance satisfactory to the Executive, to expressly assume and agree to perform this Agreement in its entirety.  Failure of the Bank to obtain such agreement prior to the effectiveness of any such succession shall be a breach of this Agreement and shall entitle the Executive to the compensation described in Section 2.  As used in this Agreement, the “Bank” shall mean 1st Security Bank of Washington and any successor to its business and/or assets as aforesaid which executes and delivers the agreement provided for in this Section 4(c) or which otherwise becomes bound by all the terms and provisions of this Agreement by operation of law.
 
5.           NOTICES: For the purposes of this Agreement, notices and all other communications provided for in the Agreement shall be in writing and shall be deemed to have been duly given when delivered or mailed by United States registered or certified mail, return receipt requested, postage prepaid, addressed as follows:
 
 
 If to the Executive:
 
 If to the Bank:
 
or at such other address as any party may have furnished to the other in writing in accordance herewith, except that notices of change of address shall be effective only upon receipt.
 
6.           MODIFICATION - WAIVERS - APPLICABLE LAW: No provisions of this Agreement may be modified, waived or discharged unless such waiver, modification or discharge is agreed to in writing, signed by the Executive and on behalf of the Bank by such officer as may be specifically designated by the Board of Directors of the Bank. No waiver by either party hereto at any time of any breach by the other party hereto of, or in compliance with, any condition or provision of this Agreement to be performed by such other party shall be deemed a waiver of similar or dissimilar provisions or conditions at the same or at any prior or subsequent time. No agreements or representations, oral or otherwise, express or implied, with respect to the subject matter hereof have been made by either party which are not set forth expressly in this Agreement. The validity, interpretation, construction and performance of this Agreement shall be governed by the laws of the state of Washington.
 
 
2


7.           INVALIDITY - ENFORCEABILITY: The invalidity or unenforceability of any provisions of this Agreement shall not affect the validity or enforceability of any other provision of this Agreement, which shall remain in full force and effect. Any provision in this Agreement which is prohibited or unenforceable in any jurisdiction shall, as to such jurisdiction, be ineffective only to the extent of such prohibition or unenforceability without invalidating or affecting the remaining provisions of this Agreement, and any such prohibition or unenforceability in any jurisdiction shall not invalidate or render unenforceable such provision in any other jurisdiction.
 
8.           SUCCESSOR RIGHTS: This Agreement shall inure to the benefit of and be enforceable by the Executive’s personal or legal representatives, executors, administrators, successors, heirs, distributees, devisees and legatees. If the Executive should die while any amounts would still be payable to him hereunder, all such amounts, unless otherwise provided herein, shall be paid in accordance with the terms of this Agreement to his executor or, if there is no such executor, to his estate.
 
9.           HEADINGS: Descriptive headings contained in this Agreement are for convenience only and shall not control or affect the meaning or construction of any provision in this Agreement.
 
10.         ARBITRATION: Any dispute, controversy or claim arising under or in connection with this Agreement shall be settled exclusively by arbitration in Seattle, Washington (or as close thereto as feasible) in accordance with the Commercial Arbitration Rules of the American Arbitration Association then in effect. The Bank shall pay all administrative fees associated with such arbitration. Judgment maybe entered on the arbitrator’s award in any court having jurisdiction. Subject to Section 4(a), unless otherwise provided in the rules of the American Arbitration Association, the arbitrators shall, in their award, allocate between the parties the costs of arbitration, which shall include reasonable attorneys’ fees and expenses of the parties, as well as the arbitrator’s fees and expenses, in such proportions as the arbitrators deem just.
 
11.         CONFIDENTIALITY - NONSOLICITATION:
 
(a)         The Executive acknowledges that the Bank may disclose certain confidential information to the Executive during the term of this Agreement to enable him to perform his duties hereunder.  The Executive hereby covenants and agrees that he will not, without the prior written consent of the Bank, during the term of this Agreement or at any time thereafter, disclose or permit to be disclosed to any third party by any method whatsoever any of the confidential information of the Bank or its affiliates.  For purposes of this Agreement, “confidential information” shall include, but not be limited to, any and all records, notes, memoranda, data, ideas, processes, methods, techniques, systems, formulas, patents, models, devices, programs, computer software, writings, research, personnel information, customer information, the Bank’s financial information, plans, or any other information of whatever nature in the possession or control of the Bank or its affiliates which has not been published or disclosed to the general public, or which gives to the Bank or its affiliates an opportunity to obtain an advantage over competitors who do not know of or use it.  The Executive further agrees that if his employment is terminated for any reason, he will leave with the Bank and will not take originals or copies of any records, papers, programs, computer software and documents and all matter of whatever nature which bears secret or confidential information of the Bank or its affiliates.
 
 
3


(b)        The foregoing paragraph shall not be applicable if and to the extent the Executive is required to testify in a judicial or regulatory proceeding pursuant to an order of a judge or administrative law judge issued after the Executive and his legal counsel urge that the aforementioned confidentiality be preserved.
 
(c)        The foregoing covenants will not prohibit the Executive from disclosing confidential or other information to other employees of the Bank or its affiliates or any third parties to the extent that such disclosure is necessary to the performance of his duties under this Agreement.
 
12.         COMPLIANCE WITH SECTION 409A OF THE CODE: Notwithstanding anything herein to the contrary, any payments to be made in accordance with this Agreement shall not be made prior to the date that is 185 calendar days from the date of termination of employment of the Executive if it is determined by the Bank in good faith that such payments are subject to the limitations set forth at Section 409A of the Code and regulations promulgated thereunder, and payments made in advance of such date would result in the requirement that Executive pay additional interest and taxes in accordance with Section 409A(a)(1)(B)of the Code.
 
13.         DEFINITIONS: The term “Cause” shall mean the Executive’s personal dishonesty, incompetence, willful misconduct, breach of a fiduciary duty involving personal profit, intentional failure to perform stated duties, willful violation of any law, rule, or regulation (other than traffic violations or similar offenses) or final cease-and desist order, or material breach of any provision of this Agreement.  No act or failure to act by the Executive shall be considered willful unless the Executive acted or failed to act with an absence of good faith and without a reasonable belief that his action or failure to act was in the best interest of the Bank or its affiliates.
 
The term “Involuntary Termination” shall mean (i) termination of employment of the Executive without Cause such that the Executive is no longer employed by the Bank or any affiliate thereof; (ii) a reduction in the amount of the Executive’s base salary compared to the amount of Executive’s base salary as of December 31 of the most recent calendar year; (iii) a material adverse change in the Executive’s benefits, contingent benefits or vacation, other than as part of an overall program applied uniformly and with equitable effect on all senior officers of the Bank; (iv) a requirement that the Executive perform services principally at a location more than [50] miles from Mountlake Terrace, Washington; or (v) a material demotion of the Executive, including, but not limited to, a material diminution of the Executive’s title, duties or responsibilities.
 
The term “Change of Control” shall mean any of the following events occurring: (i) the acquisition by any “person” or “group” (as defined in Sections 13(d) and 14(d) of the Securities Exchange Act of 1934 (“Exchange Act”)), other than the Bank, any parent holding company of the Bank (“Affiliate”) or their employee benefit plans, directly or indirectly, as “beneficial owner” (as defined in Rule 13d-3, under the Exchange Act) of securities of the Bank or any Affiliate representing twenty percent (20%) or more of either the then outstanding shares or the combined voting power of the then outstanding securities of the Bank or Affiliate; (ii) either a majority of the directors of the Bank or any Affiliate elected at the annual stockholders meeting shall have been nominated for election other than by or at the direction of the “incumbent directors” of the Bank or any Affiliate, or the “incumbent” directors” shall cease to constitute a majority of the directors of the Bank or any Affiliate.  The term “incumbent director” shall mean any director who was a director of the Bank or any Affiliate on the Effective Date and any individual who becomes a director of the Bank or any Affiliate subsequent to the Effective Date and who is elected or nominated by or at the direction of at least two-thirds of the then incumbent directors; (iii) the stockholders of the Bank or any Affiliate approve (x) a merger, consolidation or other business combination of the Bank or any Affiliate with any other “person” or “group” (as defined in Sections 13(d) and 14(d) of the Exchange Act) or affiliate thereof, other than a merger or consolidation that would result in the outstanding common stock of the Bank or any Affiliate immediately prior thereto continuing to represent (either by remaining outstanding or by being converted into common stock of the surviving entity or a parent or affiliate thereof) at least fifty percent (50%) of the outstanding common stock of the Bank or any Affiliate or such surviving entity or a parent or affiliate thereof outstanding immediately after such merger, consolidation or other business combination, or (y) a plan of complete liquidation of the Bank or an agreement for the sale or disposition by the Bank of all or substantially all of the Bank’s assets; or (iv) any other event or circumstance which is not covered by the foregoing subsections but which the Board of Directors of the Bank or any Affiliate determines to affect control of the Bank or any Affiliate and with respect to which the Board of Directors adopts a resolution that the event or circumstance constitutes a Change of Control for purposes of the Agreement.
 
 
4


The Change of Control Date is the date on which an event described in (i), (ii), (iii) or (iv) occurs.
 
IN WITNESS WHEREOF, the parties have executed this Agreement as of the Effective Date referred to above.
           
    EXECUTIVE  
         
ATTEST: 


    1ST SECURITY BANK OF WASHINGTON  
         
ATTEST:
 
  By: 


5
EX-10.3 13 ex10-3.htm EXHIBIT 10.3 ex10-3.htm

Exhibit 10.3

Director Fee Arrangements

The non-employee directors of 1st Security Bank of Washington (the “Bank”) receive compensation for their service on the board of directors of the Bank.  In setting their compensation, the board of directors considers the significant amount of time and level of skill required for director service.  Director compensation is reviewed annually by the compensation committee, which makes recommendations for approval by the Board of Directors of the Bank.  Non-employee directors of the Bank currently receive $2,000 per month, except for the Chairman of the Board who receives $3,000 per month, for service on the Board of Directors of the Bank. No fees currently are paid for service on any Bank board committees.
 
Directors are provided or reimbursed for travel and lodging and other customary out-of-pocket expenses incurred in attending board and committee meetings, industry conferences and continuing education seminars.
 
The board of directors of FS Bancorp, Inc., the holding company for the Bank, is identical to that of the Bank.  No board fees are paid for service on the board of directors of FS Bancorp, Inc.
 
 
EX-10.4 14 ex10-4.htm EXHIBIT 10.4 ex10-4.htm

Exhibit 10.4
 
RP® FINANCIAL, LC.
 
Serving the Financial Services Industry since 1988  
   
  August 17, 2011
 
Brad Canfield, President
1st Security Bank of Washington
6920 220th Street SW, Suite 300
Mountlake Terrace, Washington  98043-2172
 
Dear Mr. Canfield:
 
This letter sets forth the agreement between 1st Security Bank of Washington, Mountlake Terrace, Washington (the “Bank”), and RP® Financial, LC (“RP Financial”) for independent appraisal services in connection with the stock to be issued concurrent with the Bank’s proposed mutual-to-stock conversion transaction.  The specific appraisal services to be rendered by RP Financial are described below.
 
Description of Appraisal Services
 
Prior to preparing the valuation report, RP Financial will conduct a financial due diligence, including on-site interviews of senior management and reviews of financial and other documents and records, to gain insight into the Bank’s operations, financial condition, profitability, market area, risks and various internal and external factors which impact the pro forma value of the Bank.
 
RP Financial will prepare a written detailed valuation report of the Bank that will be fully consistent with applicable regulatory guidelines and standard pro forma valuation practices.  In this regard, the applicable regulatory guidelines are those set forth in the Office of Thrift Supervision’s (“OTS”) October 21, 1994 “Guidelines for Appraisal Reports for the Valuation of Savings and Loan Associations Converting from Mutual to Stock Form of Organization,” which have been endorsed by the Federal Deposit Insurance Corporation (“FDIC”) and various state banking agencies.
 
The appraisal report will include an in-depth analysis of the Bank’s financial condition and operating results, as well as an assessment of the Bank’s interest rate risk, credit risk and liquidity risk.  The appraisal report will describe the Bank’s business strategies, market area, prospects for the future and the intended use of proceeds both in the short term and over the longer term.  A peer group analysis relative to publicly-traded savings institutions will be conducted for the purpose of determining appropriate valuation adjustments relative to the group.
 
Washington Headquarters
 
1100 North Glebe Road, Suite 1100
Direct:  (703) 647-6549
Arlington, VA  22201
Telephone:  (703) 528-1700
www.rpfinancial.com
Fax No.:  (703) 528-1788
E-Mail:  joren@rpfinancial.com
Toll-Free No.:  (866) 723-0594


Brad Canfield
August 17, 2011
Page 2
 
We will review pertinent sections of the applications and offering documents to obtain necessary data and information for the appraisal, including the impact of key deal elements on the appraised value, such as dividend policy, use of proceeds and reinvestment rate, tax rate, offering expenses, characteristics of stock plans and charitable foundation contribution (if applicable).  The appraisal report will conclude with a midpoint pro forma market value that will establish the range of value, and reflect the offering price per share determined by the Bank’s Board of Directors.  The appraisal report may be periodically updated prior to the commencement of the offering and the appraisal is required to be updated just prior to the closing of the offering.
 
RP Financial agrees to deliver the valuation appraisal and subsequent updates, in writing, to the Bank at the above address in conjunction with the filing of the regulatory application.  Subsequent updates will be filed promptly as certain events occur which would warrant the preparation and filing of such valuation updates.  Further, RP Financial agrees to perform such other services as are necessary or required in connection with the regulatory review of the appraisal and respond to the regulatory comments, if any, regarding the valuation appraisal and subsequent updates.  RP Financial will also prepare the pro forma presentations for inclusion in the prospectus, reflecting the original appraisal and subsequent updates, as appropriate.
 
Fee Structure and Payment Schedule
 
The Bank agrees to pay RP Financial a fixed fee of $37,500 for preparation and delivery of the original appraisal report, plus reimbursable expenses.  Payment of these fees shall be made according to the following schedule:
 
 
$5,000 upon execution of this letter of agreement engaging RP Financial’s appraisal services;
 
 
$32,500 upon delivery of the completed original appraisal report; and,
 
 
$5,000 for each valuation update that may be required, provided that the transaction is not delayed for reasons described below.
 
The Bank will reimburse RP Financial for out-of-pocket expenses incurred in preparation of the valuation.  Such out-of-pocket expenses will likely include travel, printing, shipping, computer and data services.  RP Financial will agree to limit reimbursable expenses to $3,000 in conjunction with this engagement, exclusive of travel related expenses, which will be billed separately.  The reimbursable expenses will be subject to written authorization from the Bank to exceed such level.
 
In the event the Bank shall, for any reason, discontinue the proposed stock offering prior to delivery of the completed documents set forth above and payment of the respective progress payment fees, the Bank agrees to compensate RP Financial according to RP Financial’s standard billing rates for consulting services based on accumulated and verifiable time expenses, not to exceed the respective fee caps noted above, after giving full credit to the initial retainer fee.  RP Financial’s standard billing rates range from $75 per hour for research associates to $350 per hour for managing directors.


Brad Canfield
August 17, 2011
Page 3
 
If during the course of the proposed transaction, unforeseen events occur so as to materially change the nature or the work content of the services described in this contract, the terms of said contract shall be subject to renegotiation by the Bank and RP Financial.  Such unforeseen events shall include, but not be limited to, major changes in the conversion regulations, appraisal guidelines or processing procedures as they relate to appraisals, major changes in management or procedures, operating policies or philosophies, and excessive delays or suspension of processing of applications by the regulators such that completion of the transaction requires the preparation by RP Financial of a new appraisal.
 
Representations and Warranties
 
The Bank and RP Financial agree to the following:
 
1.       The Bank agrees to make available or to supply to RP Financial such information with respect to its business and financial condition as RP Financial may reasonably request in order to provide the aforesaid valuation.  Such information heretofore or hereafter supplied or made available to RP Financial shall include:  annual financial statements, periodic regulatory filings and material agreements, debt instruments, off balance sheet assets or liabilities, commitments and contingencies, unrealized gains or losses and corporate books and records.  All information provided by the Bank to RP Financial shall remain strictly confidential (unless such information is otherwise made available to the public), and if the stock offering is not consummated or the services of RP Financial are terminated hereunder, RP Financial shall upon request promptly return to the Bank the original and any copies of such information.
 
2.       The Bank hereby represents and warrants to RP Financial that any information provided to RP Financial does not and will not, to the best of the Bank’s knowledge, at the times it is provided to RP Financial, contain any untrue statement of a material fact or fail to state a material fact necessary to make the statements therein not false or misleading in light of the circumstances under which they were made.
 
3.       (a)  The Bank agrees that it will indemnify and hold harmless RP Financial, any affiliates of RP Financial, the respective directors, officers, agents and employees of RP Financial or their successors and assigns who act for or on behalf of RP Financial in connection with the services called for under this agreement (hereinafter referred to as “RP Financial”), from and against any and all losses, claims, damages and liabilities (including, but not limited to, all losses and expenses in connection with claims under the federal securities laws) attributable to (i) any untrue statement or alleged untrue statement of a material fact contained in the financial statements or other information furnished or otherwise provided by the Bank to RP Financial, either orally or in writing; (ii) the omission or alleged omission of a material fact from the financial statements or other information furnished or otherwise made available by the Bank to RP Financial; or (iii) any action or omission to act by the Bank, or the Bank’s respective officers, Directors, employees or agents which action or omission is willful or negligent.  The Bank will be under no obligation to indemnify RP Financial hereunder if a court determines that RP Financial was negligent or acted in bad faith with respect to any actions or omissions of RP Financial related to a matter for which indemnification is sought hereunder.  Any time devoted by employees of RP Financial to situations for which indemnification is provided hereunder, shall be an indemnifiable cost payable by the Bank at the normal hourly professional rate chargeable by such employee.


Brad Canfield
August 17, 2011
Page 4
 
(b)        RP Financial shall give written notice to the Bank of such claim or facts within thirty days of the assertion of any claim or discovery of material facts upon which RP Financial intends to base a claim for indemnification hereunder.  In the event the Bank elects, within ten business days of the receipt of the original notice thereof, to contest such claim by written notice to RP Financial, RP Financial will be entitled to be paid any amounts payable by the Bank hereunder within five days after the final determination of such contest either by written acknowledgement of the Bank or a final judgment (including all appeals therefrom) of a court of competent jurisdiction.  If the Bank does not so elect, RP Financial shall be paid promptly and in any event within thirty days after receipt by the Bank of the notice of the claim.
 
(c)         The Bank shall pay for or reimburse the reasonable expenses, including attorneys’ fees, incurred by RP Financial in advance of the final disposition of any proceeding within thirty days of the receipt of such request if RP Financial furnishes the Bank:  (1) a written statement of RP Financial’s good faith belief that it is entitled to indemnification hereunder; and (2) a written undertaking to repay the advance if it ultimately is determined in a final adjudication of such proceeding that it or he is not entitled to such indemnification.  The Bank may assume the defense of any claim (as to which notice is given in accordance with 3(b)) with counsel reasonably satisfactory to RP Financial, and after notice from the Bank to RP Financial of its election to assume the defense thereof, the Bank will not be liable to RP Financial for any legal or other expenses subsequently incurred by RP Financial (other than reasonable costs of investigation and assistance in discovery and document production matters).  Notwithstanding the foregoing, RP Financial shall have the right to employ their own counsel in any action or proceeding if RP Financial shall have concluded that a conflict of interest exists between the Bank and RP Financial which would materially impact the effective representation of RP Financial.  In the event that RP Financial concludes that a conflict of interest exists, RP Financial shall have the right to select counsel reasonably satisfactory to the Bank which will represent RP Financial in any such action or proceeding and the Bank shall reimburse RP Financial for the reasonable legal fees and expenses of such counsel and other expenses reasonably incurred by RP Financial.  In no event shall the Bank be liable for the fees and expenses of more than one counsel, separate from its own counsel, for all indemnified parties in connection with any one action or separate but similar or related actions in the same jurisdiction arising out of the same allegations or circumstances.  The Bank will not be liable under the foregoing indemnification provision in respect of any compromise or settlement of any action or proceeding made without its consent, which consent shall not be unreasonably withheld.
 
(d)         In the event the Bank does not pay any indemnified loss or make advance reimbursements of expenses in accordance with the terms of this agreement, RP Financial shall have all remedies available at law or in equity to enforce such obligation.
 
It is understood that, in connection with RP Financial’s above-mentioned engagement, RP Financial may also be engaged to act for the Bank in one or more additional capacities, and that the terms of the original engagement may be incorporated by reference in one or more separate agreements.  The provisions of Paragraph 3 herein shall apply to the original engagement, any such additional engagement, any modification of the original engagement or such additional engagement and shall remain in full force and effect following the completion or termination of RP Financial’s engagement(s).  This agreement constitutes the entire understanding of the Bank and RP Financial concerning the subject matter addressed herein, and such contract shall be governed and construed in accordance with the laws of the Commonwealth of Virginia.  This agreement may not be modified, supplemented or amended except by written agreement executed by both parties.


Brad Canfield
August 17, 2011
Page 5
 
The Bank and RP Financial are not affiliated, and neither the Bank nor RP Financial has an economic interest in, or is held in common with, the other and has not derived a significant portion of its gross revenues, receipts or net income for any period from transactions with the other.
 
*  *  *  *  *  *  *  *  *  *  *
 
Please acknowledge your agreement to the foregoing by signing as indicated below and returning to RP Financial a signed copy of this letter, together with the initial retainer fee of $5,000.
 
 
Sincerely,
   
 
/s/ James J. Oren
 
James J. Oren
 
Director
 
Agreed To and Accepted By:
/s/ Brad Canfield
 
CFO
 
Upon Authorization by the Board of Directors For:
1st Security Bank of Washington
 
Mountlake Terrace, Washington
 
Date Executed: 
August 17, 2011


EX-21.0 15 ex21-0.htm EXHIBIT 21.0 ex21-0.htm

Exhibit 21
 
Parent
 
Subsidiary
 
Percentage
of
Ownership
 
State of
Incorporation
of
Subsidiary
               
FS Bancorp, Inc.
 
1st Security Bank of Washington
    100%  
Washington
               
1st Security Bank of Washington
 
FS Service Corporation (Inactive)
    100%  
Washington
 
 
EX-23.4 16 ex23-4.htm EXHIBIT 23.4 ex23-4.htm

Exhibit 23.4

CONSENT OF INDEPENDENT REGISTERED PUBLIC ACCOUNTING FIRM

We consent to the reference to our firm under the caption “Experts” and to the use of our report dated September 30, 2011, with respect to the financial statements of 1st Security Bank of Washington as of and for the years ended December 31, 2010 and 2009, which is included in the Registration Statement (Form S-1) of FS Bancorp, Inc. and related Prospectus for the registration of between 2,082,500 and 3,240,125 shares of common stock.


/s/ Moss Adams LLP

Bellingham, Washington
September 30, 2011
EX-23.5 17 ex23-5.htm EXHIBIT 23.5 ex23-5.htm

Exhibit 23.5
 
RP® FINANCIAL, LC.  
Serving the Financial Services Industry Since 1988  


September 15, 2011


Boards of Directors
FS Bancorp, Inc.
1st Security Bank of Washington
6920 220th Street, SW, Suite 300
Mountlake Terrace, Washington 98043-2172
 
Members of the Boards of Directors:
 
We hereby consent to the use of our firm’s name in the Application for Conversion for 1st Security Bank of Washington, and in the Form S-1 Registration Statement for FS Bancorp, Inc., in each case as amended and supplemented.  We also hereby consent to the inclusion of, summary of and reference to our Appraisal and our statements concerning subscription rights in such filings including the prospectus of FS Bancorp, Inc.
 
 
  Sincerely,
  RP® FINANCIAL, LC.
   
  graphic 


Washington Headquarters  
Three Ballston Plaza Telephone:  (703) 528-1700
1100 North Glebe Road, Suite 1100  Fax No.:  (703) 528-1788
Arlington, VA 22201 Toll-Free No.:  (866) 723-0594
  www.rpfinancial.com
EX-99.1 18 ex99-1.htm EXHIBIT 99.1 ex99-1.htm

Exhibit 99.1


PRO FORMA VALUATION REPORT
 
FS BANCORP, INC.
Mountlake Terrace, Washington
 
PROPOSED HOLDING COMPANY FOR:
1st Security Bank of Washington
 
Dated As Of:
September 2, 2011


Prepared By:
 
RP® Financial, LC.
1100 North Glebe Road
Suite 1100
Arlington, Virginia  22201


RP® FINANCIAL, LC.  
Serving the Financial Services Industry Since 1988  
  
September 2, 2011
 
Board of Directors
1st Security Bank of Washington
6920 220th Street SW, Suite 300
Mountlake Terrace, Washington  98043-2172
 
Members of the Board of Directors:
 
At your request, we have completed and hereby provide an independent appraisal (“Appraisal”) of the estimated pro forma market value of the common stock which is to be offered in connection with the plan of conversion described below.  This Appraisal is furnished pursuant to the conversion regulations issued by the Office of Thrift Supervision (“OTS”) and reissued by the Office of the Comptroller of the Currency (“OCC”), and applicable interpretations thereof.  Such Valuation Guidelines are relied upon by the Federal Reserve Board (“FRB”), the Federal Deposit Insurance Corporation (“FDIC”) and the Washington Department of Financial Institutions (“DFI”) in the absence of separate written valuation guidelines.  Specifically, this Appraisal has been prepared in accordance with the “Guidelines for Appraisal Reports for the Valuation of Savings and Loan Associations Converting from Mutual to Stock Form of Organization” as set forth by the OTS, and applicable regulatory interpretations thereof.
 
Description of Plan of Conversion
 
The Board of Trustees of 1st Security Bank of Washington (“1st Security” or the “Bank”) adopted a plan of conversion on July 10, 2008.  On August 18, 2011, the board of directors voted to move forward with the plan of conversion.  Pursuant to the plan of conversion, the Bank will convert from the mutual savings bank form of organization to a stock savings bank form and become a wholly owned subsidiary of FS Bancorp (“FS Bancorp” or the “Company”) a newly formed Washington corporation.  The Company will own all of the outstanding shares of the Bank.  FS Bancorp will offer shares of common stock to eligible depositors of 1st Security, to certain newly-formed stock benefit plans for officers, trustees and employees and others.  Following the completion of the offering, FS Bancorp will be a bank holding company, and its primary regulator will be the Federal Reserve.
 
Pursuant to the plan of conversion, the Company will offer its stock in a subscription offering to Eligible Account Holders of the Bank, Tax-Qualified Employee Stock Benefit Plans, Supplemental Eligible Account Holders, and Other Members.  To the extent that shares remain available for purchase after satisfaction of all subscriptions received in the subscription offering, the shares may be offered for sale in a direct or syndicated community offering.
 
At this time, no other activities are contemplated for FS Bancorp other than the ownership of the Bank, a loan to the newly-formed ESOP and reinvestment of the proceeds that are retained by the Company.  In the future, FS Bancorp may acquire or organize other operating subsidiaries, diversify into other banking-related activities, pay dividends to shareholders and/or repurchase its stock, although there are no specific plans to undertake such activities at the present time.
 
 
Washington Headquarters
 
Three Ballston Plaza
Telephone: (703) 528-1700
1100 North Glebe Road, Suite 1100
Fax No.: (703) 528-1788
Arlington, VA 22201
Toll-Free No.: (866) 723-0594
www.rpfinancial.com
E-Mail: mail@rpfinancial.com


Board of Directors
September 2, 2011
Page 2
 
RP® Financial, LC.
 
RP® Financial, LC. (“RP Financial”) is a financial consulting firm serving the financial services industry nationwide that, among other things, specializes in financial valuations and analyses of business enterprises and securities, including the pro forma valuation for savings institutions converting from mutual-to-stock form.  The background and experience of RP Financial is detailed in Exhibit V-1.  For its appraisal services, RP Financial is being compensated on a fixed fee basis for the original appraisal and for any subsequent updates, and such fees are payable regardless of the valuation conclusion or the completion of the conversion offering transaction.  We believe that we are independent of the Company, the Bank, and the other parties engaged by the Bank or the Company to assist in the stock conversion process.
 
Valuation Methodology
 
In preparing the Appraisal, we have reviewed FS Bancorp’s and the Bank’s regulatory applications, including the prospectus as filed with the as filed with the FRB, the Washington Department of Financial Institutions and the Securities and Exchange Commission (“SEC”).  We have conducted a financial analysis of the Bank, that has included due diligence related discussions with 1st Security’s management; Moss Adams LLP, the Bank’s independent auditor; Silver, Freedman & Taff, L.L.P., 1st Security’s conversion counsel; and Keefe Bruyette & Woods, Inc., which has been retained as the financial and marketing advisor in connection with the stock offering.  All conclusions set forth in the Appraisal were reached independently from such discussions.  In addition, where appropriate, we have considered information based on other available published sources that we believe are reliable.  While we believe the information and data gathered from all these sources are reliable, we cannot guarantee the accuracy and completeness of such information.
 
We have investigated the competitive environment within which 1st Security operates and have assessed the Bank’s relative strengths and weaknesses.  We have monitored all material regulatory and legislative actions affecting financial institutions, generally, and analyzed the potential impact of such developments on 1st Security and the industry as a whole; to the extent we were aware of such matters.  We have analyzed the potential effects of the stock conversion on the Bank’s operating characteristics and financial performance as they relate to the pro forma market value of FS Bancorp.  We have reviewed the economy and demographic characteristics of the primary market area in which the Bank currently operates.  We have compared 1st Security’s financial performance and condition with publicly-traded thrift institutions evaluated and selected in accordance with the Valuation Guidelines, as well as all publicly-traded thrifts and thrift holding companies.  We have reviewed conditions in the securities markets in general and the market for thrifts and thrift holding companies, including the market for new issues.  We have excluded from such analyses thrifts subject to announced or rumored acquisition, and/or institutions that exhibit other unusual characteristics.


Board of Directors
September 2, 2011
Page 3
 
The Appraisal is based on 1st Security’s representation that the information contained in the regulatory applications and additional information furnished to us by the Bank and its independent auditors, legal counsel, investment bankers and other authorized agents are truthful, accurate and complete.  We did not independently verify the financial statements and other information provided by the Bank, or its independent auditors, legal counsel, investment bankers and other authorized agents nor did we independently value the assets or liabilities of the Bank.  The valuation considers 1st Security only as a going concern and should not be considered as an indication of the Bank’s liquidation or control value.
 
Our appraised value is predicated on a continuation of the current operating environment for the Bank and the Company and for all thrifts and their holding companies.  Changes in the local, state and national economy, the federal and state legislative and regulatory environments for financial institutions and mutual holding companies, the stock market, interest rates, and other external forces (such as natural disasters or significant world events) may occur from time to time, often with great unpredictability, and may materially impact the value of thrift stocks as a whole or the Bank’s value alone.  It is our understanding that 1st Security intends to remain an independent institution and there are no current plans for selling control as a converted institution.  To the extent that such factors can be foreseen, they have been factored into our analysis.
 
The estimated pro forma market value is defined as the price at which the Company’s stock, immediately upon completion of the offering, would change hands between a willing buyer and a willing seller, neither being under any compulsion to buy or sell and both having reasonable knowledge of relevant facts.
 
Valuation Conclusion
 
It is our opinion that, as of September 2, 2011, the estimated aggregate pro forma market value of the shares to be issued immediately following the conversion equaled $24,500,000 at the midpoint, equal to 2,450,000 shares offered at a per share value of $10.00.  Pursuant to conversion guidelines, the 15% offering range indicates a minimum value of $20,825,000 and a maximum value of $28,175,000.  Based on the $10.00 per share offering price determined by the Board, this valuation range equates to total shares outstanding of 2,082,500 at the minimum and 2,817,500 at the maximum.  In the event the appraised value is subject to an increase, the aggregate pro forma market value may be increased up to a supermaximum value of $32,401,250 without a resolicitation.  Based on the $10.00 per share offering price, the supermaximum value would result in total shares outstanding of 3,240,125.
 
Limiting Factors and Considerations
 
The valuation is not intended, and must not be construed, as a recommendation of any kind as to the advisability of purchasing shares of the common stock.  Moreover, because such valuation is determined in accordance with applicable regulatory guidelines and is necessarily based upon estimates and projections of a number of matters, all of which are subject to change from time to time, no assurance can be given that persons who purchase shares of common stock in the conversion will thereafter be able to buy or sell such shares at prices related to the foregoing valuation of the estimated pro forma market value thereof.  The appraisal reflects only a valuation range as of this date for the pro forma market value of FS Bancorp immediately upon issuance of the stock and does not take into account any trading activity with respect to the purchase and sale of common stock in the secondary market on the date of issuance of such securities or at anytime thereafter following the completion of the public stock offering.


Board of Directors
September 2, 2011
Page 4
 
The valuation prepared by RP Financial in accordance with applicable regulatory guidelines was based on the consolidated financial condition and operations of FS Bancorp as of or for the periods ended June 30, 2011, the date of the financial data included in the prospectus.
 
RP Financial is not a seller of securities within the meaning of any federal and state securities laws and any report prepared by RP Financial shall not be used as an offer or solicitation with respect to the purchase or sale of any securities.  RP Financial maintains a policy which prohibits RP Financial, its principals or employees from purchasing stock of its financial institution clients.
 
The valuation will be updated as provided for in the conversion regulations and guidelines.  These updates will consider, among other things, any developments or changes in the financial performance and condition of FS Bancorp, management policies, and current conditions in the equity markets for thrift stocks, both existing issues and new issues.  These updates may also consider changes in other external factors which impact value including, but not limited to:  various changes in the federal and state legislative and regulatory environments for financial institutions, the stock market and the market for thrift stocks, and interest rates.  Should any such new developments or changes be material, in our opinion, to the valuation of the shares, appropriate adjustments to the estimated pro forma market value will be made.  The reasons for any such adjustments will be explained in the update at the date of the release of the update.  The valuation will also be updated at the completion of FS Bancorp’s stock offering.
 
  Respectfully submitted,
   
  RP® FINANCIAL, LC.
   
  /s/ James J. Oren  
  James J. Oren
  Director


RP® Financial, LC.
 
TABLE OF CONTENTS
1st Security Bank of Washington
Mountlake Terrace, Washington
 
     PAGE
  DESCRIPTION
 
  NUMBER
       
CHAPTER ONE
OVERVIEW AND FINANCIAL ANALYSIS
   
       
Introduction
   
I.1
Plan of Conversion
 
I.1
Strategic Overview
 
I.2
Balance Sheet Trends
 
I.4
Income and Expense Trends
 
I.7
Interest Rate Risk Management
 
I.11
Lending Activities and Strategy
 
I.11
Asset Quality
 
I.17
Funding Composition and Strategy
 
I.17
Subsidiaries
   
I.18
Legal Proceedings
 
I.18
       
       
CHAPTER TWO
MARKET AREA
   
     
Introduction
 
II.1
National Economic Factors
 
II.2
Interest Rate Environment
 
II.3
Market Area Demographics
 
II.5
Summary of Local Economy
 
II.7
Real Estate Trends in the Puget Sound
 
II.8
Employment Sectors
 
II.8
Unemployment Data and Trends
 
II.9
Market Area Deposit Characteristics/Competition
 
II.10
Market Area Counties Deposit Competitors
 
II.11
Summary
 
II.13
       
       
CHAPTER THREE
PEER GROUP ANALYSIS
   
       
Peer Group Selection
 
III.1
Financial Condition
 
III.6
Income and Expense Components
 
III.9
Loan Composition
 
III.12
Credit Risk
 
III.14
Interest Rate Risk
 
III.14
Summary
 
III.17


RP® Financial, LC.
 
TABLE OF CONTENTS
1st Security Bank of Washington
Mountlake Terrace, Washington
(continued)
 
        PAGE
  DESCRIPTION
 
NUMBER
       
CHAPTER FOUR
VALUATION ANALYSIS
   
     
Introduction
 
IV.1
Appraisal Guidelines
 
IV.1
RP Financial Approach to the Valuation
 
IV.1
Valuation Analysis
 
IV.2
 
1.
Financial Condition
 
IV.2
 
2.
Profitability, Growth and Viability of Earnings
 
IV.4
 
3.
Asset Growth
 
IV.6
 
4.
Primary Market Area
 
IV.6
 
5.
Dividends
 
IV.8
 
6.
Liquidity of the Shares
 
IV.9
 
7.
Marketing of the Issue
 
IV.9
  A.
The Public Market
 
IV.9
  B.
The New Issue Market
 
IV.14
  C.
The Acquisition Market
 
IV.16
 
8.
Management
 
IV.16
 
9.
Effect of Government Regulation and Regulatory Reform
 
IV.18
Summary of Adjustments
 
IV.18
Valuation Approaches
 
IV.18
 
1.
Price-to-Earnings (“P/E”)
 
IV.20
 
2.
Price-to-Book (“P/B”)
 
IV.21
 
3.
Price-to-Assets (“P/A”)
 
IV.23
Comparison to Recent Offerings
 
IV.23
Valuation Conclusion
 
IV.24


RP® Financial, LC.
 
LIST OF TABLES
1st Security Bank of Washington
Mountlake Terrace, Washington
           
TABLE
         
NUMBER
    DESCRIPTION
 
PAGE
         
1.1
 
Historical Balance Sheets
 
I.5
1.2
 
Historical Income Statements
 
I.8
         
2.1
 
Summary Demographic/Economic Information
 
II.6
2.2
 
Primary Market Area Employment Sectors
 
II.9
2.3
 
Market Area Unemployment Trends
 
II.10
2.4
 
Deposit Summary
 
II.11
2.5
 
Market Area Counties Deposit Competitors
 
II.12
         
3.1
 
Peer Group of Publicly-Traded Thrifts
 
III.3
3.2
 
Balance Sheet Composition and Growth Rates
 
III.7
3.3
 
Inc as a % of Average Assets and Yields, Costs, Spreads
 
III.10
3.4
 
Loan Portfolio Composition and Related Information
 
III.13
3.5
 
Credit Risk Measures and Related Information
 
III.15
3.6
 
Interest Rate Risk Measures and Net Interest Income Volatility
 
III.16
         
4.1
 
Market Area Unemployment Rates
 
IV.8
4.2
 
Pricing Characteristics and After-Market Trends
 
IV.15
4.3
 
Market Pricing Comparatives
 
IV.17
4.4
 
Valuation Adjustments
 
IV.18
4.5
 
Derivation of Core Earnings
 
IV.21
4.6
 
Public Market Pricing
 
IV.22


RP® Financial, LC.
OVERVIEW AND FINANCIAL ANALYSIS
I.1
 
I.  OVERVIEW AND FINANCIAL ANALYSIS
 
Introduction
 
1st Security is a Washington-chartered mutual savings bank headquartered in Mountlake Terrace, Snohomish County, Washington.  The Bank serves the Seattle-Tacoma-Bellevue metropolitan area through its main office in Mountlake Terrace and six branch offices, all of which are located in the greater Seattle-Tacoma region.  The Bank’s offices are located in four different counties, as shown in a map provided in Exhibit I-1.  1st Security is a member of the Federal Home Loan Bank (“FHLB”) system, and its deposits are insured up to the regulatory maximums by the Federal Deposit Insurance Corporation (“FDIC”).  At June 30, 2011, 1st Security had $272.8 million in assets, $241.5 million in deposits and total equity of $26.0 million, equal to 9.52% of total assets.  1st Security’s audited financial statements are included by reference as Exhibit I-2.
 
Plan of Conversion
 
On July 10, 2008, the Board of Directors of the Bank adopted a plan of conversion, incorporated herein by reference, in which the Bank will convert from a Washington-chartered mutual savings bank to a Washington-chartered stock savings bank and become a wholly-owned subsidiary of FS Bancorp, Inc. (“FS Bancorp” or the “Company”), a newly formed Washington corporation.  On August 18, 2011, the Board of Directors voted to move forward with the plan of conversion.  FS Bancorp will offer 100% of its common stock to qualifying depositors of the Bank in a subscription offering and, if necessary, to members of the general public through a community offering and/or a syndicated community offering.  Going forward, FS Bancorp will own 100% of the Bank’s stock, and the Bank will initially be the Company’s sole subsidiary.  A portion of the net proceeds received from the sale of common stock will be used to purchase all of the then to be issued and outstanding capital stock of the Bank and the balance of the net proceeds will be retained by the Company.
 
At this time, no other activities are contemplated for the Company other than the ownership of the Bank, extending a loan to the newly-formed employee stock ownership plan (the “ESOP”) and reinvestment of the proceeds that are retained by the Company.  In the future, FS Bancorp may acquire or organize other operating subsidiaries, diversify into other banking-related activities, pay dividends or repurchase its stock, although there are no specific plans to undertake such activities at the present time.


RP® Financial, LC.
OVERVIEW AND FINANCIAL ANALYSIS
I.2
 
Strategic Overview
 
The Bank has been serving the greater Puget Sound area, along Interstate 5 (the “I-5 corridor”), since 1936, and was originally chartered as a credit union.  In 2000, after serving the same Select Employee Groups (“SEGs”) for 64 years, 1st Security implemented an expansion plan and completed three mergers with other credit unions.   On April 1, 2004, 1st Security converted from a credit union to a mutual savings bank with the goal of becoming more competitive with commercial banks and thrifts in the local market area.  Management also wanted to broaden the products and services offered and eventually be able to raise capital for expansion purposes.  Accordingly, the Bank has upgraded its systems, delivery channels, policies and procedures and personnel in key positions.
 
Over the past several years, the Bank has been working through certain regulatory matters which have led to enforcement actions.  The Bank believes that the identified compliance deficiencies have been addressed and that such regulatory enforcement actions will be terminated in the near term future.  The Bank’s general business strategies for the future include expanding the loan and deposit customer base, pursuing efficiencies in both internal operations and the branch office network, emphasizing lower cost core deposits to manage funding costs, and continuing to maintain high asset quality, leverage the increased capital base and improve earnings.
 
The loan portfolio contains a significant balance of indirect home improvement (“replacement-contracting”) loans.  This type of lending was a core strategy for many years prior to the charter conversion to a mutual savings bank in 2004.  The Bank also historically was very active in automobile lending, however in recent periods such lending has been de-emphasized.  As a replacement for automobile lending, the Bank has expanded the loan portfolio in the areas of commercial real estate and commercial business loans.  Going forward, the Bank has identified several different opportunities that will change the profile of the loan portfolio and enhance earnings.  First, the Bank plans to explore the enhancement the replacement contracting business program by expanding its relationships in new states.  Second, the Bank plans to take advantage of some of the market dislocation that has occurred over the past several years and offer construction loans in the primary market area on a selective basis to local contractors and individual borrowers.  Third, the Bank is planning to boost non-interest operating income by developing a mortgage banking program.  Finally, the Bank will once again begin to originate 1-4 family residential mortgages after having outsourced this function to a third party for the past several years.


RP® Financial, LC.
OVERVIEW AND FINANCIAL ANALYSIS
I.3
 
Similar to many savings banks, time deposits constitute the largest portion of the deposit base, with borrowings utilized to a limited extent to supplement the deposit funds, as well as assist in managing funding costs and interest rate risk.  Such borrowings have typically been limited mostly to FHLB advances with fixed rate terms.  While lending has been a continuous focus for the Bank, in recent years the cash and investments portfolio has fluctuated with loan demand and funding sources.  The cash and investment portfolio currently includes balances of investments such as U.S. agencies and municipal bonds.
 
1st Security’s earnings are largely dependent upon net interest income, non-interest income.  In recent periods, income has been negatively impacted by asset quality deterioration which required an increase in provisions for loan losses and reserve levels.  The Bank’s relatively high operating expenses are due primarily to the high costs associated with the indirect lending program.  Recent actions taken to improve profitability have included closing or selling unprofitable branches.
 
The equity from the stock offering will reduce certain risks and increase liquidity, earnings, growth capacity and the overall financial strength at the Bank.  For example, interest rate risk and funding costs will be reduced by an enhanced interest-earning assets to interest-bearing liabilities (“IEA/IBL”) ratio.  The new capital will enable the Bank to consider expansion opportunities as well, such as the establishment or acquisition of additional banking offices in current or nearby markets.  The projected use of proceeds is highlighted below.
 
 
The Company.  The Company is expected to retain up to 50% of the net conversion proceeds.  At present, funds at the holding company level are expected to be initially invested primarily into short-term investment grade securities or a deposit at the Bank.  Over time, the funds may be utilized for various corporate purposes, which may include acquisitions, additional equity investments in the Bank, repurchases of common stock, and the payment of regular and/or special cash dividends.
 
 
The Bank.  A minimum of 50% of the net conversion proceeds will be infused into the Bank.  Cash proceeds (i.e., net proceeds less deposits withdrawn to fund stock purchases) infused into the Bank will initially be invested in short term securities and over time become part of general funds, pending deployment into loans and investment securities.


RP® Financial, LC.
OVERVIEW AND FINANCIAL ANALYSIS
I.4

Balance Sheet Trends
 
Table 1.1 shows the Bank’s historical balance sheet data since year end 2006.  Total assets peaked at $292.3 million at December 31, 2010, but have declined since then as management used loan repayments and prepayments to pay down borrowings in light of low loan demand.  Most of the asset growth achieved during the four and a half year period shown occurred between 2008 and 2010, funded by deposit and borrowings growth.  Between year-end 2006 and June 30, 2011, assets grew by only 1.4% annually, with such funds invested in cash and equivalents and investment securities which was mostly offset by a decline in loans receivable.  Total loans declined primarily as a result of a loan securitization transaction completed in fiscal 2008, whereby approximately $50 million of the Bank’s portfolio of long-term fixed rate residential loans were securitized and sold.  Balance sheet funding trended towards an increasing proportion of deposits, as both borrowings and equity declined.  Equity declined at a 6.3% annual rate due to losses recorded from fiscal 2007 to 2009.  A summary of 1st Security’s key operating ratios for the past three and one-half years is presented in Exhibit I-3.
 
1st Security has recorded a steady decline in the loans to assets ratio since 2007, with the ratio dropping from 90.4% at December 31, 2007 to 77.1% as of June 30, 2011.  The decline is attributable to the previously mentioned loan securitization transaction, and a combination of low loan demand and a slowdown in origination activity during the real estate declines and economic downturn that has occurred during this period.  The decline in loans has been replaced by an increase in short-term, low yielding investment securities (included in “cash and equivalents” in Table 1.1).  The Bank experienced an increase in OREO beginning in 2009 and OREO balances have held steady since that time, amounting to 2.1% of assets at June 30, 2011.  Other assets consisted of fixed assets, mortgage servicing rights, and other miscellaneous items, which have remained in the range of 5.0% and 6.0% of total assets since 2006.


RP® Financial, LC.
OVERVIEW AND FINANCIAL ANALYSIS
I.5
 
Table 1.1
1st Security Bank of Washington, Mountlake Terrace, Washington
Historical Balance Sheet Data
                                                                               
                                                                           
12/31/06-
 
                                                                           
06/30/11
 
    As of December 31,    
At June 30,
   
Annual.
 
   
2006
   
2007
   
2008
   
2009
   
2010
   
2011
   
Growth Rate
 
   
Amount
   
Pct(1)
   
Amount
   
Pct(1)
   
Amount
   
Pct(1)
   
Amount
   
Pct(1)
   
Amount
   
Pct(1)
   
Amount
   
Pct(1)
   
Pct
 
    ($000)  
(%)
    ($000)    
(%)
    ($000)    
(%)
    ($000)    
(%)
    ($000)    
(%)
    ($000)    
(%)
   
(%)
 
Total Amount of:
                                                                                         
Assets
  $ 256,385       100.00 %   $ 263,066       100.00 %   $ 255,368       100.00 %   $ 281,836       100.00 %   $ 292,334       100.00 %   $ 272,784       100.00 %     1.39 %
Loans Receivable (net)
    218,078       85.06 %     237,807       90.40 %     222,974       87.31 %     231,441       82.12 %     230,822       78.96 %     210,184       77.05 %     -0.82 %
Cash and Equivalents
    7,158       2.79 %     5,898       2.24 %     14,457       5.66 %     28,534       10.12 %     35,250       12.06 %     30,341       11.12 %     37.84 %
Investment Securities
    15,503       6.05 %     4,621       1.76 %     2,834       1.11 %     603       0.21 %     7,642       2.61 %     11,689       4.29 %     -6.08 %
FHLB Stock
    1,797       0.70 %     1,797       0.68 %     1,797       0.70 %     1,797       0.64 %     1,797       0.61 %     1,797       0.66 %     0.00 %
Other Real Estate Owned
    0       0.00 %     0       0.00 %     0       0.00 %     5,484       1.95 %     3,701       1.27 %     5,925       2.17 %  
NM
 
Mortgage Servicing Rights
    264       0.10 %     198       0.08 %     461       0.18 %     340       0.12 %     245       0.08 %     197       0.07 %     -6.30 %
Fixed Assets
    8,955       3.49 %     11,302       4.30 %     10,643       4.17 %     9,721       3.45 %     9,249       3.16 %     9,040       3.31 %     0.21 %
Other Assets
    4,630       1.81 %     1,442       0.55 %     2,201       0.86 %     3,916       1.39 %     3,628       1.24 %     3,611       1.32 %     -5.37 %
Deposits
  $ 204,816       79.89 %   $ 208,863       79.40 %   $ 216,056       84.61 %   $ 230,985       81.96 %   $ 243,957       83.45 %   $ 241,475       88.52 %     3.73 %
FHLB Advances, Other Borrowed Funds
    13,400       5.23 %     19,800       7.53 %     9,400       3.68 %     25,900       9.19 %     21,900       7.49 %     3,900       1.43 %     -23.99 %
Other Liabilities
    3,391       1.32 %     2,714       1.03 %     2,050       0.80 %     1,636       0.58 %     1,682       0.58 %     1,432       0.52 %     -17.43 %
                                                                                                         
Equity
  $ 34,779       13.57 %   $ 31,689       12.05 %   $ 27,862       10.91 %   $ 23,315       8.27 %   $ 24,795       8.48 %   $ 25,977       9.52 %     -6.28 %
Accumulated other Comprehensive
Gain/(Loss)
  ($ 1,032 )     -0.40 %   $ 6       0.00 %   ($ 16 )     -0.01 %   $ 11       0.00 %   ($ 111 )     -0.04 %   $ 63       0.02 %        
                                                                                                         
Loans/Deposits
            106.48 %             113.86 %             103.20 %             100.20 %             94.62 %             87.04 %        
                                                                                                         
Offices Open
    12               12               12               8               6               6                  
 
(1) Ratios are as a percent of ending assets.
Source: Audited and unaudited financial statements; RP Financial calculations.


RP® Financial, LC.
OVERVIEW AND FINANCIAL ANALYSIS
I.6
 
The intent of the Bank’s investment policy is to provide adequate liquidity and to generate a favorable return within the context of supporting 1st Security’s overall credit and interest rate risk objectives.  Given the Bank’s historical lending focus, the investment securities portfolio was typically modest in size through fiscal 2009, ranging from a high of 6.75% of assets at year end 2006 to a low of 0.85% of assets at December 31, 2009.  Since that date the investment portfolio has expanded as the Bank has experienced an increase in investable funds due to the decline in the loan portfolio, and sought to improve earning asset yields in the prevailing low interest rate environment.  Concurrent with the increase in the investment securities portfolio through June 30, 2011 has been an increase in cash and short-term overnight funds.  As of June 30, 2011, investment securities consisted of: U.S. federal agency securities ($9.8 million), municipal bonds ($1.4 million) and mortgage-backed securities ($0.4 million), all of which were held as available-for-sale (“AFS”).  Beyond these investments, the Bank held $1.8 million of FHLB stock at June 30, 2011.  Cash and cash equivalents, utilized for daily operations, totaled $30.3 million at that date.  The level of cash and investments maintained by the Bank has also been affected by available liquidity from changes to the balances of borrowings and deposits that have occurred since in recent periods.  Exhibit I-4 provides historical detail of the Bank’s investment portfolio.
 
The Bank’s seven office locations (the headquarters office and six full-service depository branch locations), include four owned offices and three leased offices.  The headquarters office in Mountlake Terrace is a 35,000 square foot, three story building with a net book value of approximately $3.4 million at June 30, 2011.  There are no retail deposit services at this location.  This office, along with investment in the other branch offices (including land, buildings, and furniture, fixtures and equipment), totaled $9.0 million, or 3.31% of assets as of June 30, 2011.  This represents a notable level of investment in fixed assets, reducing the level of interest earning assets on the balance sheet.
 
1st Security’s funding has been derived primarily from deposits since 2006, with the deposits/assets ratio ranging from 79.4% to 88.5% during the period shown in Table 1.1.  From year end 2006 through June 30, 2011, the Bank’s deposits decreased at an annual rate of 3.7%, with deposits increasing steadily between fiscal 2007 and fiscal 2010.  Even though deposits have remained more or less flat during the first six months of 2011, they replaced borrowings as a funding source and had peaked at 88.5% of assets by June 30, 2011.  In comparison to the deposit base of a traditional savings institution, 1st Security maintains a relatively high concentration of deposits in core transaction and savings account deposits.  Core deposits comprised 56.1% of the Bank’s deposits at June 30, 2011, versus 53.8% of total deposits at year end 2008.
 
1st Security has borrowed funds to support asset size and manage funding costs and interest rate risk throughout the period of time shown in Table 1.1.  Borrowings peaked at $25.9 million, or 9.2% of assets, at December 31, 2009, and have since been paid down to $3.9 million, or 1.4% of assets.  Much of the paydown occurred during the first six months of 2011 with the Bank using excess liquidity to reduce the balance.  Borrowings are generally limited to fixed-rate, fixed-maturity instruments and have also included short-term overnight FHLB advances at certain times.


RP® Financial, LC.
OVERVIEW AND FINANCIAL ANALYSIS
I.7
 
Since year end 2006, net losses and the adjustment for accumulated other comprehensive income translated into an annual equity shrinkage rate of 6.28%.  The decline in assets and profitability recorded during the first six months of 2011 resulted in an increase in the equity-to-assets ratio from 8.48% at year end 2010 to 9.52% at June 30, 2011.  All of the Bank’s equity is tangible, and the Bank maintained surpluses relative to all of its regulatory capital requirements at June 30, 2011.  The net stock proceeds will strengthen the Bank’s equity position and support growth opportunities.  The pro forma return of equity (“ROE”) is expected to initially decline given the increased equity position.
 
Income and Expense Trends
 
Table 1.2 presents the Bank’s income and expense trends over the past five and one-half years.  Losses were incurred in fiscal years 2007 through 2009, while the net results have improved in recent periods as evidenced by the net income of $1.6 million recorded for fiscal 2010 and $1.9 million, or 0.69% of average assets, for the trailing twelve months ended June 30, 2011.  The largest loss recorded during this period was a $4.6 million loss in fiscal 2009.  Reported income has been affected to varying degrees by net gains or losses on sale, such as gains or loss on the sale of loans and branch offices.  Net interest income and operating expenses represent the primary components of the Bank’s income statement.  Other revenues for the Bank largely are derived from customer service fees on loans and deposits and other charges for bank services.  Loan loss provisions drove the losses between fiscal 2008 and 2009, having been incurred to address issues in the consumer lending operations (which typically require establishment of reserves for expected loan chargeoffs), and, in 2008, an adverse classification of a single construction/land development loan.
 
The Bank’s net interest income to average assets ratio declined slightly from a high of 5.04% in fiscal 2010 to 4.96% for the twelve months ended June 30, 2011, with this ratio supported by the higher yielding loan portfolio, and a deposit base with a high proportion of lower cost core deposit funds.  The decline in the net interest income ratio during the past six months is attributable to declining asset yields and loan shrinkage.  Since fiscal 2006, the net interest income ratio has improved from 4.40% to 4.96% for the twelve months ended June 30, 2011, as although the income on earning assets declined by 28 basis points (from 6.53% to 6.25% of average assets), the Bank’s cost of funds declined by a greater 85 basis points due to the recent low interest rate environment.  The Bank’s interest rate spreads and yields and costs for the past three and one-half years are set forth in Exhibits I-3 and I-5.


RP® Financial, LC.
OVERVIEW AND FINANCIAL ANALYSIS
I.8
 
Table 1.2
1st Security Bank of Washington
Historical Income Statements
                                                                         
                                                               
12 Months Ended
 
    For the Fiscal Year Ended December 31,    
June 30,
 
   
2006
   
2007
   
2008
   
2009
   
2010
   
2011
 
   
Amount
   
Pct(1)
   
Amount
   
Pct(1)
   
Amount
   
Pct(1)
   
Amount
   
Pct(1)
   
Amount
   
Pct(1)
   
Amount
   
Pct(1)
 
    ($000)    
(%)
    ($000)    
(%)
    ($000)    
(%)
    ($000)    
(%)
    ($000)    
(%)
    ($000)    
(%)
 
                                                                                                 
Interest Income
  $ 16,951       6.53 %   $ 17,619       6.83 %   $ 16,899       6.89 %   $ 16,404       6.28 %   $ 17,333       6.49 %   $ 17,129       6.25 %
Interest Expense
    (5,536 )     -2.13 %     (6,942 )     -2.69 %     (5,798 )     -2.36 %     (4,521 )     -1.73 %     (3,886 )     -1.46 %   ($ 3,520 )     -1.28 %
Net Interest Income
  $ 11,415       4.40 %   $ 10,677       4.14 %   $ 11,102       4.52 %   $ 11,883       4.55 %   $ 13,447       5.04 %   $ 13,609       4.96 %
Provision for Loan Losses
    (246 )     -0.09 %     (578 )     -0.22 %     (4,937 )     -2.01 %     (7,067 )     -2.70 %     (3,480 )     -1.30 %   ($ 2,605 )     -0.95 %
Net Interest Income after Provisions
  $ 11,169       4.30 %   $ 10,099       3.91 %   $ 6,164       2.51 %   $ 4,816       1.84 %   $ 9,967       3.73 %   $ 11,004       4.01 %
                                                                                                 
Other Income
  $ 3,319       1.28 %   $ 3,358       1.30 %   $ 3,025       1.23 %   $ 3,091       1.18 %   $ 2,661       1.00 %   $ 2,471       0.90 %
Operating Expense
    (14,263 )     -5.49 %     (13,326 )     -5.16 %     (12,882 )     -5.25 %     (13,879 )     -5.31 %     (12,032 )     -4.51 %   ($ 11,790 )     -4.30 %
Net Operating Income
  $ 224       0.09 %   $ 131       0.05 %   ($ 3,692 )     -1.50 %   ($ 5,972 )     -2.28 %   $ 596       0.22 %   $ 1,685       0.61 %
                                                                                                 
Gain(Loss) on Sale of Branch & Other Assets
  ($ 13 )     0.00 %   ($ 25 )     -0.01 %   $ 0       0.00 %   $ 1,335       0.51 %   $ 1,006       0.38 %   $ 209       0.08 %
Gain(Loss) on Sale of Investment Securities
  $ 0       0.00 %   $ 0       0.00 %   $ 0       0.00 %   $ 63       0.02 %   $ 0       0.00 %   $ 0       0.00 %
Gain(Loss) on Sale of Loans
    1,122       0.43 %     32       0.01 %     15       0.01 %     0       0.00 %     0       0.00 %     0       0.00 %
Other Non-Operating Items
    485       0.19 %     (3,721 )     -1.44 %     194       0.08 %     0       0.00 %     0       0.00 %     0       0.00 %
Investment Security Impairment
    0       0.00 %     (275 )     -0.11 %     (321 )     -0.13 %     0       0.00 %     0       0.00 %     0       0.00 %
Total Non-Operating Income/(Expense)
  $ 1,594       0.61 %   ($ 3,989 )     -1.55 %   ($ 112 )     -0.05 %   $ 1,398       0.53 %   $ 1,006       0.38 %   $ 209       0.08 %
                                                                                                 
Net Income Before Tax
  $ 1,819       0.70 %   ($ 3,858 )     -1.49 %   ($ 3,804 )     -1.55 %   ($ 4,574 )     -1.75 %   $ 1,602       0.60 %   $ 1,894       0.69 %
Income Tax Provision (Benefit)
    (573 )     -0.22 %     (271 )     -0.11 %     0       0.00 %     0       0.00 %     0       0.00 %   $ 0       0.00 %
Net Income (Loss)
  $ 1,246       0.48 %   ($ 4,129 )     -1.60 %   ($ 3,804 )     -1.55 %   ($ 4,574 )     -1.75 %   $ 1,602       0.60 %   $ 1,894       0.69 %
                                                                                                 
Adjusted Earnings
                                                                                               
Net Income
  $ 1,246       0.48 %   ($ 4,129 )     -1.60 %   ($ 3,804 )     -1.55 %   ($ 4,574 )     -1.75 %   $ 1,602       0.60 %   $ 1,894       0.69 %
Add(Deduct): Net Gain/(Loss) on Sale
    (1,594 )     -0.61 %     3,989       1.55 %     112       0.05 %     (1,398 )     -0.53 %     (1,006 )     -0.38 %   ($ 209 )     -0.08 %
Tax Effect (2)
    542       0.21 %     (1,356 )     -0.53 %     (38 )     -0.02 %     475       0.18 %     342       0.13 %   $ 71       0.03 %
Adjusted Earnings
  $ 194       0.07 %   ($ 1,496 )     -0.58 %   ($ 3,730 )     -1.52 %   ($ 5,497 )     -2.10 %   $ 938       0.35 %   $ 1,756       0.64 %
                                                                                                 
Expense Coverage Ratio
    80.0 %             80.1 %             86.2 %             85.6 %             111.8 %             115.4 %        
Efficiency Ratio
    96.8 %             94.9 %             91.2 %             92.7 %             74.7 %             73.3 %        
Effective Tax Rate (Benefit)
    31.5 %             7.0 %             0.0 %             0.0 %             0.0 %             0.0 %        
 

(1)
Ratios are as a percent of average assets
(2)
Assumes a 34% effective tax rate for federal & state income taxes.
   
Source: Audited & unaudited financial statements & RP Financial calculations


RP® Financial, LC.
OVERVIEW AND FINANCIAL ANALYSIS
I.9
 
Non-interest operating income (“other income”) has contributed significantly to the Bank’s bottom line since 2006, but has steadily decreased both in dollar terms and as a percent of average assets, totaling $2.5 million, or 0.90% of average assets for the 12 months ended June 30, 2011.  Non-interest operating income is dependent upon the level of banking activities, with fees and charges on transaction deposit accounts constituting the primary source of non-interest income for the Bank.  The contribution realized from service fees and charges to non-interest operating income is supported by the Bank’s relatively high concentration of deposits maintained in transaction accounts.  The level of non-interest income has declined in recent periods in part due to regulatory changes that occurred in mid-2010 that affected the level of non-sufficient fees that can be charged on deposit accounts, along with the overall reduction in loan origination activity, as the Bank is no longer generating as much fee income.  Thus, the ratio of non-interest income to average assets has declined to 0.90% of average assets for the 12 months ended June 30, 2011 versus 1.30% of average assets generated during fiscal 2007.
 
Operating expenses represent the other major component of the Bank’s income statement, and ranged from a high of 5.49% of average assets during 2006 to a low of 4.30% of average assets for the twelve months ended June 30, 2011.  Overall, the Bank’s operating expenses are relatively high in comparison to industry norms and reflect in part the staffing and operating costs associated with the consumer loan operations, which require a significant number of employees to support.  The Bank also recently added staffing to implement the construction lending and residential mortgage lending programs.  Since 2006, however, operating expenses have been reduced by closing or consolidating branch offices, which has reduce the level of employees and related costs.  Some upward pressure will be placed on the Bank’s expenses and expense ratio following the stock offering, due to expenses associated with operating as a publicly-traded company, including expenses related to the stock benefit plans.  At the same time, the increase in equity realized from the stock offering will increase the Bank’s capacity to leverage operating expenses through pursuing a more aggressive growth strategy.


RP® Financial, LC.
OVERVIEW AND FINANCIAL ANALYSIS
I.10
 
Because the net interest income ratio has increased and the operating expense ratio has declined since fiscal 2006, the Bank’s expense coverage ratio (net interest income divided by operating expenses) has increased to 1.15x from 0.80x over the past four and a half years.  In addition, 1st Security’s efficiency ratio (operating expenses / (net interest income + other operating income)) of 73.3% during the 12 months ended June 30, 2011 was much more favorable than the 96.8% efficiency ratio recorded in fiscal 2006.  The reduction in the efficiency ratio is an indication of strengthening core earnings.  Going forward, the Bank believes the efficiency ratio could further improve with continued efforts to control operating expenses and reinvestment of the offering proceeds.
 
As noted earlier, loan loss provisions were elevated during 2008 and 2009 and remained elevated in 2010 and to date due to an increase in non-performing loans.  For trailing twelve months ended June 30, 2011, loan loss provisions were $2.6 million, which is lower than the $7.1 million in fiscal 2009 but substantially higher than the level of $0.3 million recorded in 2006, before the financial crisis started.  As of June 30, 2011, 1st Security maintained an allowance for loan losses of $4.8 million, equal to 2.5x non-accruing loans and 2.25% of gross loans receivable.  Exhibit I-6 sets forth the Bank’s allowance for loan loss activity during the past two and one-half years.
 
Non-operating items have had a varying impact on the Bank’s income statement in recent years.  Net gains on loan sales, restructuring costs, and the sale of branches have accounted for most of the non-operating activity since 2006.  For the trailing twelve months ended June 30, 2011, non-operating items were limited to gains on the sale of branches and totaled only $0.2 million, or 0.08% of average assets.  Importantly, any non-operating or non-recurring items will be excluded from the Bank’s income statement for the trailing twelve months ended June 30, 2011 in the calculation of adjusted net income for valuation purposes.
 
The Bank’s tax expense has been zero since fiscal 2008 as a result of prior period adjustments.  As result of the net losses incurred in fiscal years 2007 through 2009, 1st Security had a net deferred tax asset of approximately $3.5 million as of June 30, 2011, of which there was a 100% reserve established at that date.  The Bank’s marginal effective statutory tax rate approximates 34%, and this is the rate utilized to calculate the net reinvestment benefit from the offering proceeds.  While the net deferred tax asset is fully reserved on the balance sheet, the Bank expects to review this status in connection with the December 31, 2011 fiscal year audit.  There is a possibility that a portion of the deferred tax asset reserve may be reversed, resulting in an increase to the Bank’s equity account.  This would imply that the Bank would then be subject to income taxes for financial reporting purposes.  However, due to the uncertainty of this scenario, both in timing and amount, we have not included any impact of a reversal of all or a portion of the deferred tax valuation allowance in our pro forma valuation analysis.


RP® Financial, LC.
OVERVIEW AND FINANCIAL ANALYSIS
I.11
 
Interest Rate Risk Management
 
The Bank’s balance sheet is liability-sensitive in the shorter-term and, thus, the net interest margin will typically be adversely affected during periods of rising and higher interest rates, as well as in the interest rate environment that prevailed during 2006 and the first half of 2007 in which the yield curve was inverted due to short-term interest rates increasing to levels that exceed the yields earned on longer-term Treasury bonds.  As of June 30, 2011 the interest rate risk analysis provided by a third party indicated that a 2.0% instantaneous and sustained increase in interest rates would result in a 0.71% increase in the Bank’s net interest income (see Exhibit I-7).
 
The Bank pursues a number of strategies to manage interest rate risk, particularly with respect to seeking to limit the repricing mismatch between interest rate sensitive assets and liabilities.  The Bank manages interest rate risk from the asset side of the balance sheet by maintaining high liquidity, originating adjustable rate mortgages and other floating rate loans, and diversifying into shorter-term types of lending, such as the home renovation, other consumer and construction lending.  As of June 30, 2011, loans with adjustable rates comprised approximately 28.6% of net loans receivable (see Exhibit I-8).  On the liability side of the balance sheet, management of interest rate risk has been pursued by maintaining a high concentration of deposits in lower cost and less interest-rate sensitive transaction and savings accounts.  Transaction and savings accounts comprised 56.1% of the Bank’s deposits at June 30, 2011.  The infusion of stock proceeds will serve to further limit the Bank’s interest rate risk exposure, as most of the net proceeds will be redeployed into interest-earning assets and the increase in the Bank’s capital will lessen the proportion of interest rate sensitive liabilities funding assets.
 
Lending Activities and Strategy
 
Historically, the Bank’s primary emphasis was the origination of consumer loans (primarily “replacement-contracting” loans and automobile secured loans), 1-4 family residential first mortgages, and 2nd mortgage/home equity loan products.  The consumer loans were originated on an “indirect” basis, using home contractors or automobile dealers as loan sources.  More recently, while maintaining the indirect replacement-contracting consumer lending program, the Bank has shifted away from automobile lending.   With regard to commercial lending, the Bank intends to continue to originate non-mortgage commercial business loans and commercial real estate loans.  1st Security also plans to grow its portfolio of construction loans, and will bring 1-4 family residential mortgage originations back in-house.  To implement the construction and residential mortgage lending strategies, the Bank recently hired experienced management in these areas.  This strategy is expected to improve overall profitability, stability of earnings, increase the products per customer and increase the assets per employee (given the larger average loan size relative to indirect fixture secured and automobile loans).  Details of the Bank’s loan portfolio composition are shown in Exhibit I-9, while Exhibit I-10 provides details of the Bank’s loan portfolio by contractual maturity date.


RP® Financial, LC.
OVERVIEW AND FINANCIAL ANALYSIS
I.12
 
Indirect Consumer Lending
 
Indirect consumer loans (indirect home renovation loans) represent the largest portion of the loan portfolio and have traditionally been the mainstay of the Bank’s lending strategy as a continuation of a lending operation from its days as a credit union.  Such loans totaled $87.2 million, or 40.7% of total loans as of June 30, 2011.  Indirect home renovation loans are originated through a network of approximately 150 home improvement contractors located in Washington, Oregon, Idaho, and Montana.  Approximately 20 dealers are responsible for 50% of the loan volume, and the home renovation contractors are currently concentrated in the areas of replacement windows, siding, HVAC systems and roofing.  These loans are originated by the dealers using loan applications provided by 1st Security.  The loans are processed through loan origination software by the Bank, with approximately 50% of the loan applications receiving an automatic approval based on the information provided.  A borrower’s FICO score is utilized as an important indicator of credit risk, and the Bank has emphasized originations of loans to higher credit score borrowers over the past 2-3 years.  This has led to a lower level of loan chargeoffs in recent periods.  Home renovation loans are generally secured by a lien against the property where the goods are installed and carry terms of up to 10 years with fixed rates of interest.  The average loan balance was $13,000 as of June 30, 2011.
 
The decline in home prices experienced in the Bank’s market area over the past couple of years has resulted in a lower level of demand for home renovation loans, as homeowners are less likely to invest in existing homes if the amount owed on the property exceeds the current fair value.  Thus, the Bank has experienced a modest decline in the balances of such loans, and going forward, the Bank intends to build new relationships with contractors doing business in California and Texas to replace a portion of the lost volume resulting from the slowdown in the Pacific Northwest economy.  The Bank will test those markets with a selected number of contractors, and should this expanded market for home renovation lending be deemed attractive, the Bank intends to add additional loan sources in those states.  Terms and conditions of loans to be originated in California and Texas will be similar to loans currently originated.


RP® Financial, LC.
OVERVIEW AND FINANCIAL ANALYSIS
I.13
 
Other Consumer Lending
 
1st Security also offers non-mortgage consumer loans secured by automobiles, boats, RVs, loans secured by deposits, and unsecured consumer loans.  Automobile loans represent a prior lending focus whereby indirect loans were originated through a dealer network throughout the Northwest for new and used cars.  However, this practice has been ceased, and auto loans are currently only originated at branch office locations.  Thus, the balance of auto loans has declined substantially in recent years, and totaled $8.9 million as of June 30, 2011.  Such balances are expected to continue to decline over the near term future.  Auto loans currently originated by the branches generally carry fixed rates and terms of up to seven years.  Recreational vehicle loans (boat and RV loans) represent a secondary consumer lending focus of the Bank, with the balances increasing in recent periods as a replacement for the reduction in auto loans.  As of June 30, 2011, boat and RV loans equaled $25.3 million, or 11.8% of total loans.  Boat and RV loans are originated directly to the owner of the security, and carry terms of up to 15 years and fixed rates.  1st Security originates a small number of other consumer loans, including home improvement, loans on deposit and other consumer loans, which totaled $3.1 million as of June 30, 2011.  These loans generally carry fixed as well and terms up to five years.
 
Commercial Business Lending
 
1st Security originates commercial business loans to small- and mid-sized businesses local to the Bank’s Puget Sound market area, including loans to fund working capital that are secured by accounts receivable, inventory or property, plant and equipment.  These loans may be fixed-rate but are usually adjustable-rate loans indexed to either the prime rate of interest or the LIBOR rate, plus a margin.  Due to the current interest rate environment, these loans are generally originated with a floor of approximately 5.50%.  Loan fees are generally charged at origination depending on the credit quality and account relationships of the borrower.  The Bank structures some commercial business loans as lines of credit with terms of 12 months and interest only during the term, while other loans may reprice on an annual basis and amortize over a two to five year period.  Loan-to-value ratios for these types of loans are generally limited to 80%.  The typical business loan customer has annual revenue of up to $25 million.


RP® Financial, LC.
OVERVIEW AND FINANCIAL ANALYSIS
I.14
 
A portion of the commercial business loan portfolio consists of “warehouse lines of credit lending” to local mortgage banking companies, a business line that was commenced in 2010.  The Bank currently maintains lines of credit totaling $6.5 million as of June 30, 2011 to a total of eight mortgage banking companies who use the funds to fund loan commitments.  Outstanding balances as of June 30, 2011 were approximately $3.5 million.  The mortgage bankers then sell the loans in the secondary market and repay the loans made by the Bank.  These warehouse lines are secured by the underlying residential mortgage loans and carry variable rates based on prime with a floor of 5.5%.  Following completion of the Conversion, the Bank’s legal lending limit will be increased, allowing the Bank to provide additional financing to the mortgage banking companies.
 
Commercial Real Estate and Multi Family Lending
 
1st Security originates real estate loans to a variety of commercial businesses, along with a modest amount of loans secured by multi-family property.  These loans are generally priced at a higher rate of interest, have larger balances and involve a greater risk profile than 1-4 residential mortgage loans.  Payments on commercial real estate loans are usually dependent on successful operations and management of the property.  The Bank will generally require and obtain loan guarantees from financially capable borrowers.
 
Both fixed- and adjustable-rate commercial real estate mortgage loans are offered, secured by a wide variety of commercial properties located primarily across the Puget Sound region, including retail centers, warehouses, office buildings, and some multi-family residences.  Loans originated are generally adjustable rate loans with balloon payments due after five to ten years.  The loan interest rates are generally indexed to the prime rate of interest or a short-term LIBOR rate.  Terms to maturity extend from 10 to 25 years.  Commercial real estate loans are originated at loan-to-value ratios (“LTV”) generally not above 80%.  In addition, personal guarantees are obtained from the primary borrowers on substantially all credits.
 
The Bank enhanced its commercial lending team in 2008 with personnel that are experienced in commercial real estate lending in the Puget Sound region, including lenders that maintain borrower relationships that assist in building the Bank’s commercial real estate loan portfolio.  1st Security has maintained a portfolio balance of such loans of approximately 12% of total loans since that time.  The Chief Lending Officer has over 23 years of commercial lending experience in the northwestern U.S. region.


RP® Financial, LC.
OVERVIEW AND FINANCIAL ANALYSIS
I.15
 
2nd Mortgage/Home Equity Lending
 
1st Security has been active in 2nd mortgage and home equity lending in the geographic footprint served by the branches, and currently these loans are sourced by the branch offices.  This lending activity is expected to continue, recognizing the risk in this type of lending given that home values have declined and remain precarious.  Home equity lines of credit generally have adjustable rates tied to the prime rate of interest with terms of up to 20 years and maximum combined LTV ratios of up to 90%, including any underlying first mortgage.  These loans totaled $12.9 million, or 83.7% of total second position loans at June 30, 2011.  The Bank also maintains a smaller portfolio of fixed rate, fixed term 2nd mortgage loans, which are underwritten as amortizing loans with terms of up to 20 years.  These loans equaled $2.5 million as of June 30, 2011.  Historically the Bank has priced these loans competitively in the local market area.
 
Residential Real Estate Lending
 
1st Security historically engaged in the origination of first mortgage loans secured by traditional 1-4 family residential owner-occupied property, with such loans both retained in portfolio and selectively sold into the secondary market, generally on a servicing retained basis.  In mid-2007, the Bank shifted from in-house originations to a private label outsourcing arrangement whereby the Bank refers loan customers to the third party originator and receives a fee for the referral.  The third party originator then processed the entire loan application, performed the underwriting, and funded the loan, while 1st Security had the option to invest in the loan.  This origination structure allowed the Bank to devote additional internal resources to commercial and consumer lending.  The private label outsourcing arrangement also allowed the Bank’s name to remain active in the local residential lending market.
 
Going forward, the Bank intends to establish a mortgage banking operation within the Bank by reintroducing in-house originations of residential mortgage loans, primarily for sale into the secondary market.  To achieve this goal, the Bank intends to hire residential lending specialists with regional market area experience who will focus their efforts on generating mortgage loans.  New originations will carry primarily fixed rates with 15 to 30 year terms and will conform to secondary market guidelines that enable their sale.  The loans will be originated with maximum LTVs of 90%, although LTVs over 80% will require private mortgage insurance.  The majority of fixed-rate production will be sold in the secondary market such as Wells Fargo, U.S. Bancorp or Citibank on a servicing retained basis.  The Bank expects to realize gains of approximately 1.5% on the sale of these mortgages.  A minor portion of the fixed rate loan originations may be placed into portfolio by the Bank based on cashflow needs and loan portfolio balance targets.


RP® Financial, LC.
OVERVIEW AND FINANCIAL ANALYSIS
I.16
 
Construction/Land Loans
 
Historically, 1st Security has originated construction loans secured by commercial real estate and, to a lesser extent, one- to four-family residences, along with loans secured by tracts of land for development.  This type of lending has been modest over the last several years as the real estate markets have declined, demand for new construction declined and many builders experienced cash flow problems; as of June 30, 2011 construction/land loans totaled $6.3 million, or 2.9% of loans.  Credit risk is managed by limiting lending activities within the primary market area and to known builders and developers in the regional market area.  These loans are also attractive due to the relatively short average duration and attractive yields.  Representing a lending initiative for the Bank, 1st Security intends to increase the volumes of the residential construction lending program and has hired a team of four construction lenders who ran a successful construction lending operation at another local institution.  This team has expertise in acquisition, development and construction (“ADC”) lending in the Puget Sound market.  The Bank is implementing this strategy to take advantage of what it sees as unmet demand for quality construction and ADC loans after many other banks abandoned this segment because of previous overexposure.
 
Residential construction loans to be originated will include loans to builders for speculative construction loans along with loans to the ultimate homeowner for construction of their primary residence.  These loans will consist of generally have variable rates of interest, terms of up to 2 years (but most typically 9-12 months) and LTV ratios up to 75%.  Construction loans are generally interest-only during the construction period.  At the end of the construction period, the loans are paid off by the borrower, or may convert to permanent financing.  LTVs range from 80% to 100%.
 
Exhibit I-11 provides a summary of the Bank’s lending activities since fiscal 2008.  Lending volumes have fluctuated over this time period, with total originations falling from a high of $139.7 million during 2008 to $72.9 million for the trailing twelve months ended June 30, 2011.  Within the loan categories, indirect consumer loans accounted for the majority of the loan volume, followed by commercial business loans and warehouse lines of credit.  Originations of real estate mortgages has been very low during this period.  No loans were purchased during this period, and no loans have been sold since fiscal 2009.


RP® Financial, LC.
OVERVIEW AND FINANCIAL ANALYSIS
I.17
 
Asset Quality
 
Asset quality issues at 1st Security have been centered around the real estate portfolio, but the quality of the real estate portfolio has improved significantly in recent periods.  At June 30, 2011, the Bank recorded total NPLs of $1.9 million, down from $6.2 million at December 31, 2010.  As shown in Exhibit I-12, the Bank’s portfolio of NPLs consisted of approximately equal proportions of home equity lines of credit (31.8%), consumer loans (26.5%), and commercial business loans (29.4%).  Previous problems in the construction and commercial real estate portfolios had been resolved by June 30, 2011.  Non-performing assets, which includes NPLs, accruing loans past due 90 days or more, OREO, and restructured loans, peaked at $13.1 million, or 4.6% of assets at year end 2009, and had declined to approximately $8.0 million, or 2.9% by June 30, 2011, with the majority comprised of OREO totaling $5.9 million.  The Bank’s policy is to charge off non-performing consumer loans immediately; otherwise, the level of non-performing loans would be higher historically.
 
1st Security has established detailed asset classification policies and procedures which are consistent with regulatory guidelines.  Detailed asset classifications are reviewed quarterly by senior management and the Board.  Pursuant to these procedures, when needed, the Bank establishes additional valuation allowances to cover anticipated losses in classified or non-classified assets.  At June 30, 2011, the Bank maintained valuation allowances of $4.8 million, equal to 2.25% of net loans receivable and 2.5x non-accruing loans.
 
Funding Composition and Strategy
 
Deposits have consistently accounted for the major portion of the Bank’s IBL and at June 30, 2011 deposits equaled 98.4% of total IBL.  Exhibit I-13 sets forth the Bank’s deposit composition for the past two and one-half years and Exhibit I-14 provides the interest rate and maturity composition of the certificate of deposit (“CD”) portfolio at June 30, 2011.  Transaction and savings account deposits constitute the largest portion of the Bank’s deposit base, with the proportion of such deposits increasing since 2008 due to much lower rates on longer-term CDs.  Transaction, money market and savings account deposits equaled $135.5 million, or 56.1% of total deposits, at June 30, 2011, versus $116.1 million, or 53.7% of total deposits, at December 31, 2008.  The largest portion of the core deposit base consists of money market accounts, which totaled $88.9 million, or 36.8% of total deposits.


RP® Financial, LC.
OVERVIEW AND FINANCIAL ANALYSIS
I.18
 
The balance of the Bank’s deposits consists of CDs, with 1st Security’s current CD composition reflecting a higher concentration of short-term CDs (maturities of one year or less).  As of June 30, 2011, the CD portfolio totaled $105.9 million, or 43.9% of total deposits, and 47.8% of the CDs were scheduled to mature in one year or less.  As of June 30, 2011, jumbo CDs (balances exceeding $100,000) amounted to $61.3 million, or 58% of total CDs.  The Bank maintained $10.1 million of brokered CDs as of June 30, 2011.  As noted above, the balances of CDs in recent years has been affected by offering rates, which increases the attractiveness of those deposits relative to lower yielding transaction and savings account deposits.
 
Borrowings have served as an alternative funding source for the Bank to facilitate management of funding costs and interest rate risk.  1st Security maintained $3.9 million of FHLB advances at June 30, 2011 with a weighted average rate of 4.49%, which consisted of advances that had fixed interest rates with maturity dates extending out several years.  Exhibit I-15 provides further detail of the Bank’s borrowings activities during the past three and one-half years.  The overall level of borrowings has declined during 2011, reflecting the previously described increase in deposit funds and the reduction in the asset base in 2011.
 
Subsidiaries
 
1st Security currently has one inactive subsidiary, with an investment of $4,900 as of June 30, 2008.
 
Legal Proceedings
 
The Bank is not involved in any pending legal proceedings other than routine legal proceedings occurring in the ordinary course of business which, in the aggregate, are believed by management to be immaterial to the financial condition of the Bank.


RP® Financial, LC. MARKET AREA
II.1
 
II.  MARKET AREA
 
Introduction
 
1st Security conducts operations out of the main office and six branch offices in the Puget Sound region of Washington State.  The main office is located in Mountlake Terrace, in Snohomish County, Washington, north of the city of Seattle.  The branches extend to King and Pierce Counties to the south and Kitsap Counties to the west.  A map of the branch office network is presented in Exhibit I-1, while descriptions of the office facilities are contained in Exhibit II-1.
 
The primary market area for business operations is the Seattle-Tacoma-Bellevue, WA Metropolitan Statistical Area (the “Seattle MSA”), while Kitsap County is part of the Bremerton-Silverdale Metropolitan Statistical Area (the “Bremerton-Silverdale MSA”).  The overall region is typically known as the “Puget Sound” region.  The population of the Seattle MSA was an estimated 3.4 million in 2010, approximately one-half of the state’s population, representing a large population base for potential business.  The Seattle MSA has a well-developed urban area in the western portion of the state along Puget Sound, with the central and eastern portions remaining undeveloped, rural and mountainous.
 
In recent years, the economy in the Bank’s operating markets has experienced a downturn, reflecting the impact of the nationwide recession.  Unemployment rates have increased, and real estate prices have diminished from peak levels.  However, long-term growth trends are still favorable as the market area continues to maintain a highly educated and motivated workforce, and the Puget Sound region remains a desirable place to live.  Future growth opportunities for 1st Security depend on the growth and stability of the regional economy, demographic growth trends, and the nature and intensity of the competitive environment.  These factors have been briefly examined in the following pages to help determine the growth potential that exists for the Bank and the relative economic health of 1st Security’s market area.  The growth potential and the stability provided by the market area have a direct bearing on the market value of the Bank.


RP® Financial, LC. MARKET AREA
II.2
 
National Economic Factors
 
The business potential of a financial institution is partially dependent on the future operating environment and growth opportunities for the banking industry and the economy as a whole.  The national economy experienced a severe downturn during 2008 and 2009, as the fallout of the housing crisis caused the wider economy to falter, with most significant indicators of economic activity declining by substantial amounts.  The overall economic recession was the worst since the great depression of the 1930s.  Approximately 8 million jobs were lost during the recession, as consumers cut back on spending, causing a reduction in the need for many products and services.  Total personal wealth declined notably due to the housing crisis and the drop in real estate values.  As measured by the nation’s gross domestic product (“GDP”), the recession officially ended in the fourth quarter of 2009, after the national GDP expanded for two consecutive quarters (1.6% annualized growth in the third quarter of 2009 and 5.0% annualized growth in fourth quarter of 2009).  The economic expansion has continued since that date, with GDP growth of 2.8% for calendar year 2010 and1.8% for the first quarter of 2011.  The initial estimate of second quarter GDP growth showed that the economy expanded at a meager 1.3% annual rate, however.  Notably, a large portion of GDP growth during 2009 and into 2010 has been generated through federal stimulus programs, bringing into question the sustainability of the recovery without government support.
 
The economic recession caused the inflation rate to decrease notably during 2009.  Inflation averaged 3.85% for all of 2008 and a negative 0.34% for all of 2009, indicating a deflationary period.  There was a decline in prices during eight of the 12 months during 2009.  Reflecting a measure of recovery of the economy, the national annualized inflation rate was 1.64% for 2010 and an annualized rate of 2.8% for the first half of 2011.  The national unemployment rate also revealed a modest recovery over the past 12 months.  The reduction in employment during the recession led to fears of a prolonged period of economic stagnation, as consumers were unwilling or unable to increase spending.  The unemployment rate totaled 9.2% as of June 2011, a slight decline from 9.4% as of December 2010, but still high compared to recent historical levels.  There remains significant uncertainty about the near term future, particularly in terms of the speed at which the economy will recover, the impact of the housing crisis on longer term economic growth, and the near-term future performance of the real estate industry, including both residential and commercial real estate prices, all of which have the potential to impact future economic growth.  The current and projected size of government spending and deficits also has the ability to impact the longer-term economic performance of the country.
 
The northwestern section of the United States is not immune to national economic trends as the regional residential and commercial real estate markets have felt the impact of the nationwide recession, with lowered housing prices and an almost complete shutdown of the construction industry.  In particular, job losses in rural areas such as served by the Bank have caused a notable portion of loan delinquencies and foreclosures.


RP® Financial, LC. MARKET AREA
II.3
 
The major stock exchange indices have reflected the recent improvement in the downturn in the national economy, reporting significant volatility and an upward trend over the past 12 months.  As an indication of the changes in the nation’s stock markets over the last 12 months, as of June 30, 2011, the Dow Jones Industrial Average closed at 12,414.34, an increase of 27.0% from June 30, 2010, while the NASDAQ Composite Index stood at 2,773.52, an increase of 31.5% over the same time period.  The Standard & Poors 500 Index totaled 1,320.64 as of June 30, 2011, an increase of 28.1% from June 30, 2010.
 
Regarding factors that most directly impact the banking and financial services industries, in the past year the number of housing foreclosures have reached historical highs, median home values have declined by double digits in most areas of the country, and the housing construction industry has been decimated.  These factors have led to substantial losses at many financial institutions, and subsequent failures of institutions.  Despite efforts by the federal and state governments to limit the impact of the housing crisis, there remain concerns about a “double-dip” housing recession, whereby another wave of foreclosures occur.  Therefore, the Bank will employ strict, prudent underwriting for such loans being placed into its portfolio, and will work to aggressively resolve substandard credits.
 
Interest Rate Environment
 
In terms of interest rates, through the first half of 2004, in a reaction to try to avoid a significant slowdown of the economy, the Federal Reserve lowered key market interest rates to historical lows not seen since the 1950s, with the federal funds rate equal to 1.00% and the discount rate equal to 2.00%.  Beginning in June 2004, the Fed began slowly, but steadily increasing the federal funds and overnight interest rates in order to ward off any possibility of inflation.  Through June 2006, the Fed had increased interest rates a total of 17 times, and as of June 2006, the Fed Funds rate was 5.25%, up from 1.00% in early 2004, while the Discount Rate stood at 6.25%, up from 2.00% in early 2004.  The Fed then held these two interest rates steady until mid-2007, at which time the downturn in the economy was evident, and the Fed began reacting to the increasingly negative economic news.  Beginning in August 2007 and through December 2008, the Fed decreased market interest rates a total of 12 times in an effort to stimulate the economy, both for personal and business spending.


RP® Financial, LC. MARKET AREA
II.4
 
As of January 2009, the Discount Rate had been lowered to 0.50%, and the Federal Funds rate target was 0.00% to 0.25%.  These historically low rates were intended to enable a faster recovery of the housing industry, while at the same time lower business borrowing costs, and such rates have remained in effect through early 2010.  In February 2010, the Fed increased the discount rate to 0.75%, reflecting a slight change to monetary strategy.  The effect of the interest rate decreases since mid-2008 has been most evident in short term rates, which decreased more than longer term rates, increasing the slope of the yield curve.  This low interest rate environment has been maintained as part of a strategy to stimulate the economy by keeping both personal and business borrowing costs as low as possible.  The strategy has achieved its goals, as borrowing costs for residential housing have been at historical lows, and the prime rate of interest remains at a low level.  As of June 30, 2011, one- and ten-year U.S. government bonds were yielding 0.19% and 3.18%, respectively, compared to 0.32% and 2.97%, respectively, as of June 30, 2010.  This has had a positive impact on the net interest margins of many financial institutions, as they rely on a spread between the yields on longer term assets and the costs of shorter term funding sources.  However, institutions who originate substantial volumes of prime-based loans have given up some of this pickup in yield as the prime rate declined from 5.00% as of June 30, 2008 to 3.25% as of June 30, 2011.
 
Based on the consensus outlook of 53 economists surveyed by The Wall Street Journal in July 2011, economic growth is expected to bounce back in the second half of 2011 to annualized growth rate of 3.1% and remain around 3.0% through 2012.  Most of the economists expect that the unemployment rate will decrease in 2011, but the pace of job growth will only serve to bring the unemployment rate down slowly.  On average, the economists expect that the unemployment rate will be 8.8% by the end of 2011 and 8.1% by the end of 2012, with the economy adding around 2.2 million jobs over the next twelve months.  On average, the economists did not expect the Federal Reserve to begin raising its target rate until the first half of 2012 and the yield on the 10-year Treasury would reach 3.55% by December 2011 and 4.24% by the end of 2012.  Inflation pressures were forecasted to recede going into 2012, as the price of oil was expected to settle around $100 a barrel.  The economists also forecasted home prices would decline 2.4% in 2011, as measured by the Federal Housing Finance Agency index.  Housing starts were forecasted to tick up through 2012, but remain at historically depressed levels.  Historical interest rate data is presented in Exhibit II-2.


RP® Financial, LC. MARKET AREA
II.5
 
Market Area Demographics
 
Table 2.1 presents information regarding the demographic and economic trends for the Bank’s market area from 2000 to 2010 and projected through 2015, with additional data shown in Exhibit II-3.  Data for the nation, the state of Washington and the Seattle MSA are included for comparative purposes.  The size and scope of the market area is evidenced by the demographic data, which shows that as of 2010 the total population of the Seattle MSA was 3.46 million, approximately 51% of the state population.  Most of the population base is concentrated along the western border of the region, against Puget Sound, resulting in a relatively urban market area for 1st Security.  Between 2000 and 2010 the annual population growth rate of the Seattle MSA was slightly lower than the state rate and higher than the national rate, indicating a moderately growing area, with the more “suburban” counties of Pierce and Snohomish reporting higher growth rates and Kitsap County reporting the slowest growth rate, 0.6%, for the Bank’s market area.  The slower growth in King County reflects the more developed characteristic of western King County, which is one of the older regions in the state.  In most comparative areas, growth in households has paralleled trends with respect to population, as household growth rates for Kitsap County increased at a 0.8% annual rate compared to higher rates for the other counties.
 
The 2010 median household income and per capita income levels in King and Snohomish Counties were higher than the state and national averages, while Pierce County and Kitsap County reported income levels slightly below the Washington state average.  Additional data regarding market area income levels is presented in Exhibit II-3.  King and Snohomish Counties contain a larger percentage of higher income white-collar professional employment.  For example, the King County (the highest income levels) median household income was 124% of the state average and 138% of the national average.  Household income distribution patterns provide support for earlier statements regarding the nature of the Bank’s market as approximately 69% of King County households had income levels in excess of $50,000 annually in 2009 while the ratio was 60% for the state of Washington and 55% for the national average.  In 2009, the city of Seattle was ranked as the seventh most educated city in the country, with a large concentration of residents that hold college degrees.  Seattle’s relatively high income coupled with high education levels for a major city, results in King County placing among the 100 wealthiest counties in the United States, which will favorably influence demand for the products and services offered by financial services providers operating in the market.


RP® Financial, LC. MARKET AREA
II.6
 
Table 2.1
1st Security Bank of Washington
Summary Demographic/Economic Information
                               
                     
Growth
   
Growth
 
    Year    
Rate
   
Rate
 
   
2000
   
2010
   
2015
      2000-2010       2010-2015  
                     
(%)
   
(%)
 
Population(000)
                                 
United States
    281,422       311,213       323,209       1.0 %     0.8 %
Washington
    5,894       6,756       7,176       1.4 %     1.2 %
Seattle MSA
    3,044       3,462       3,672       1.3 %     1.2 %
King County
    1,737       1,937       2,054       1.1 %     1.2 %
Pierce County
    701       813       861       1.5 %     1.2 %
Snohomish County
    606       713       758       1.6 %     1.2 %
Kitsap County
    232       247       251       0.6 %     0.3 %
                                         
Households(000)
                                       
United States
    105,480       116,761       121,360       1.0 %     0.8 %
Washington
    2,271       2,612       2,778       1.4 %     1.2 %
Seattle MSA
    1,197       1,370       1,456       1.4 %     1.2 %
King County
    711       797       847       1.2 %     1.2 %
Pierce County
    261       304       323       1.6 %     1.2 %
Snohomish County
    225       268       286       1.8 %     1.3 %
Kitsap County
    86       93       95       0.8 %     0.4 %
                                         
Median Household Income($)
                                       
United States
  $ 42,164     $ 54,442     $ 61,189       2.6 %     2.4 %
Washington
  $ 45,770     $ 60,311     $ 68,768       2.8 %     2.7 %
Seattle MSA
  $ 51,488     $ 69,015     $ 80,645       3.0 %     3.2 %
King County
  $ 53,383     $ 75,693     $ 88,138       3.6 %     3.1 %
Pierce County
  $ 45,197     $ 57,879     $ 65,288       2.5 %     2.4 %
Snohomish County
  $ 53,219     $ 68,912     $ 79,010       2.6 %     2.8 %
Kitsap County
  $ 46,848     $ 60,066     $ 66,635       2.5 %     2.1 %
                                         
Per Capita Income($)
                                       
United States
  $ 21,587     $ 26,739     $ 30,241       2.2 %     2.5 %
Washington
  $ 22,973     $ 28,691     $ 33,252       2.2 %     3.0 %
Seattle MSA
  $ 26,332     $ 33,821     $ 39,415       2.5 %     3.1 %
King County
  $ 29,521     $ 38,562     $ 45,291       2.7 %     3.3 %
Pierce County
  $ 20,948     $ 25,542     $ 29,389       2.0 %     2.8 %
Snohomish County
  $ 23,417     $ 30,372     $ 34,880       2.6 %     2.8 %
Kitsap County
  $ 22,317     $ 26,450     $ 30,570       1.7 %     2.9 %
                                         
2010 HH Income Dist.(%)
  $ 25,000     $ 50,000     $ 100,000     $ 100,000 +        
United States
    20.8 %     24.7 %     35.7 %     18.8 %        
Washington
    17.5 %     22.8 %     39.2 %     20.5 %        
Seattle MSA
    14.0 %     19.1 %     39.9 %     27.0 %        
King County
    13.6 %     17.2 %     38.3 %     31.1 %        
Pierce County
    17.3 %     23.9 %     41.9 %     16.9 %        
Snohomish County
    11.8 %     19.3 %     42.6 %     26.4 %        
Kitsap County
    16.1 %     24.2 %     41.7 %     18.0 %        
                                         
Source: SNL Financial, LC.


RP® Financial, LC. MARKET AREA
II.7

Summary of Local Economy
 
The Puget Sound region dominates the economy of the Pacific Northwest.  Key employment sectors include aerospace, military, information technology, clean technology, biotechnology, education, logistics, international trade and tourism.  The region is well known for the long-term presence of The Boeing Corporation and Microsoft, two major industry leaders.  The workforce is generally highly educated.  Washington’s geographic proximity to the Pacific Rim and a deepwater port have made it a center for international trade as well, which contributes significantly to the regional economy (one in three jobs in Washington is tied to foreign exports).  The Washington ports handle 6% of all U. S. exports and 7% of all U.S. imports, and the top five trading partners with Washington include Japan, Canada, China, Korea and Ireland.  Tourism has also developed into a major industry for the area, due to the scenic beauty, temperate climate, and easy accessibility.
 
King County, the location of the city of Seattle, has the largest employment base and overall level of economic activity.  King County’s largest employers include The Boeing Company, Microsoft Corporation, and the University of Washington.  Companies that are headquartered in King County include Alaska Airlines, Amazon.com, Attachmate, Costco, Starbucks and Microsoft.  Pierce County’s economy is also well diversified with the presence of military related government employment (Fort Lewis Army Base and McChord Air Force Base), along with health care (the Franciscan Health System and the Multicare Health System).  In addition, there is a large employment base in the economic sectors of shipping (the Port of Tacoma) and aerospace employment (Boeing).  Snohomish County to the north has an economy based on aerospace employment (Boeing), military (the Everett Naval Station) along with additional employment concentrations in biotechnology, electronics/computers, and wood products.  Eight of the largest employers in the state are headquartered in King County.
 
The United States Navy is a key element for Kitsap County’s economy.  The United States Navy is the largest employer in the county, with installations at Puget Sound Naval Shipyard, Naval Undersea Warfare Center Keyport and Naval Base Kitsap (which comprises former Naval Submarine Base Bangor, and Naval Station Bremerton).  The largest private employers in the county are the Harrison Medical Center, Wal-Mart, and Port Madison Enterprises.


RP® Financial, LC. MARKET AREA
II.8
 
Real Estate Trends in the Puget Sound
 
After a period of rapid growth of residential and commercial real estate, the Seattle MSA has the highest portion of troubled loans in the country.  A partner at Foresight Analytics attributes the Seattle area’s sharp drop-off in loan performance to the market entering its economic downturn behind other parts of the country.  Additionally, a sizeable amount of new construction hit the Puget Sound area market just as the local economy really weakened.  In mid-2008, the Seattle area ranked 39th among metropolitan areas in troubled loans and in the second quarter of 2009, the Seattle MSA had the nation’s highest rate of delinquent loans at 32.7%, double the national delinquency rate of 16.3%.
 
Contributing to the sharp rise in delinquent loans was a spike in troubled residential real estate development loans, as the Seattle MSA leads the nation with just under 45% of residential land and construction loans delinquent, which is nearly double the national rate of 24.2%.  However, outside of single-family loans, the Seattle MSA market is more in line with the rest of the country.  Foresight Analytics ranks the Seattle MSA 16th in commercial mortgage delinquencies, with 4.8% of commercial mortgages delinquent, which compares with a national delinquency rate of 4.1%.
 
Given the high level of delinquent loans haunting the Washington-based banks, financial institution failures can be expected.  It is likely that the overbuilt nature of the real estate market in some areas will impact the Bank.
 
Employment Sectors
 
Employment data, presented in Table 2.2 on the next page indicates that similar to many larger, developed areas of the country, services are the most prominent sector for the state of Washington and the four market area counties, comprising approximately 34% of total employment.  Additional detail is presented in Exhibit II-4.  The next largest component of the economy of the market area, on average, is government, at 20.8%, reflecting the military bases throughout the Bank’s market area.  Wholesale and retail trade, at 13.5% on average, was another large component of the market area, reflecting the trade employment in the ports of the Puget Sound region.  Government employment was highest in Kitsap and Pierce Counties, reflecting the military bases previously mentioned, with such employment related to the presence of Boeing.  Manufacturing employment is highest in Snohomish County, the location of Boeing’s largest manufacturing and assembly plant, while information-related employment is highest in King County, due to the impact of Microsoft and other information technology employers.  King County’s levels of employment in the different sectors resembled that of the economy of Washington, which was provided for comparative purposes.  This data indicates that Bank’s market area has a relatively diversified economic base, such that a downturn in any one industry will likely not have a large impact on the regional economy.  This diversification provides a level of stability that is a positive factor for financial institutions such as 1st Security.


RP® Financial, LC. MARKET AREA
II.9
 
Table 2.2
1st Security Bank of Washington
Primary Market Area Employment Sectors
(Percent of Labor Force)(1)


Washington
   
Snohomish
   
King
   
Pierce
   
Kitsap
 
Employment Sector
 
State
   
County
   
County
   
County
   
County
 
    (% of Total Employment)        
                                         
Services
    35.1 %     31.2 %     37.8 %     34.2 %     33.8 %
Manufacturing
    7.3 %     16.9 %     7.4 %     4.4 %     1.6 %
Wholesale/Retail Trade
    13.5 %     14.3 %     13.1 %     13.6 %     12.9 %
Government
    16.5 %     14.1 %     11.9 %     24.8 %     32.2 %
Finance/Insurance/Real Esate
    9.0 %     8.7 %     10.3 %     8.7 %     7.8 %
Construction
    5.8 %     7.4 %     5.1 %     6.7 %     5.4 %
Arts/Entertainment/Rec.
    2.4 %     2.2 %     2.8 %     1.9 %     2.5 %
Transportation/Utility
    3.0 %     1.7 %     3.5 %     3.4 %     1.3 %
Agriculture
    2.2 %     0.7 %     0.2 %     0.5 %     0.5 %
Other
    5.1 %     2.8 %     7.8 %     1.7 %     2.1 %
Total
    100.0 %     100.0 %     100.0 %     100.0 %     100.0 %
(1) As of 2009
                                       
Source: REIS DataSource.
                                       
 
Unemployment Data and Trends
 
Table 2.3 provides unemployment data which shows that the unemployment rates in the Bank’s four county market area and the state of Washington have all increased over the last 12 months, compared to a decrease for the nation as a whole.  While King and Kitsap Counties reported unemployment rates lower than the national and state unemployment rates, Snohomish and Pierce counties exceeded the state rate, indicating additional weakness to those sections of the market area.  The lower unemployment rates in Kitsap and King Counties are reflective of the somewhat more favorable position of the local economies in those areas.


RP® Financial, LC. MARKET AREA
II.10
 
Table 2.3
1st Security Bank of Washington
Market Area Unemployment Trends
 
   
July 2010
   
July 2011
 
Region
 
Unemployment
   
Unemployment
 
                 
United States
    9.5 %     9.1 %
Washington
    8.6 %     9.0 %
Seattle MSA
    8.6 %     9.1 %
Snohomish County
    9.4 %     10.0 %
King County
    8.1 %     8.6 %
Pierce County
    9.0 %     9.6 %
Kitsap County
    7.1 %     7.7 %
           
Source: U.S. Bureau of Labor Statistics.
         
 
Market Area Deposit Characteristics/Competition
 
Table 2.4 displays deposit market trends and deposit market share for commercial banks and savings institutions in the market area from June 30, 2006 to June 30, 2010.  Deposit growth trends are important indicators of a market area’s current and future prospects for growth.  The table indicates that commercial banks hold a large portion of the statewide deposit base, 88.2% as of June 30, 2010.  Since June 30, 2006, commercial banks have increased their deposits at a greater rate than savings institutions, 6.5% on an annual basis versus an annualized net decline of 13.4% for savings institutions.
 
Within the Bank’s four county market area, the table indicates that annualized deposit growth rates in the Bank’s market range from a low of 0.1% per year over the last four years in Kitsap County to a high of 3.5% for Pierce County.  Similar to statewide figures, commercial banks hold in excess of 85% of total financial institution deposits in all four market area counties.  The county deposit growth rate figures indicate that all market area counties except for Kitsap County are increasing at rates close to the state average except for Kitsap County.  In all four market area counties, savings institutions experienced decreases in deposit balances and market share, primarily due to the failure of Washington Mutual, a large thrift that failed in 2009.


RP® Financial, LC. MARKET AREA
II.11
 
Table 2.4
1st Security Bank of Washington
Deposit Summary
                                     
    As of June 30,        
    2006     2010    
Deposit
 
         
Market
   
No. of
         
Market
   
No. of
   
Growth Rate
 
   
Deposits
   
Share
   
Branches
   
Deposits
   
Share
   
Branches
     2006-2010  
    (Dollars in Thousands)    
(%)
 
                                             
Washington
  $ 99,586,000       100.0 %     1,871     $ 109,218,692       100.0 %     1,891       2.3 %
Commercial Banks
    76,640,000       77.0 %     1,484       96,341,512       88.2 %     1,703       5.9 %
Savings Institutions
    22,946,000       23.0 %     387       12,877,180       11.8 %     188       -13.4 %
                                                         
Snohomish County
  $ 8,075,408       100.0 %     180     $ 8,842,804       100.0 %     186       2.3 %
Commercial Banks
    5,786,884       71.7 %     141       7,589,894       85.8 %     169       7.0 %
Savings Institutions
    2,288,524       28.3 %     39       1,252,910       14.2 %     17       -14.0 %
1st Security Bank
    53,574       0.7 %     5       103,785       1.2 %     3       18.0 %
                                                         
King County
  $ 47,373,091       100.0 %     526     $ 51,453,127       100.0 %     540       2.1 %
Commercial Banks
    36,355,822       76.7 %     389       45,710,792       88.8 %     485       5.9 %
Savings Institutions
    11,017,269       23.3 %     137       5,742,335       11.2 %     55       -15.0 %
1st Security Bank
    64,569       0.1 %     4       78,875       0.2 %     2       5.1 %
                                                         
Pierce County
  $ 8,126,385       100.0 %     199     $ 9,322,735       100.0 %     200       3.5 %
Commercial Banks
    6,526,293       80.3 %     156       8,819,650       94.6 %     184       7.8 %
Savings Institutions
    1,600,092       19.7 %     43       503,085       5.4 %     16       -25.1 %
1st Security Bank
    48,055       0.6 %     3       28,826       0.3 %     1       -12.0 %
                                                         
Kitsap County
  $ 2,289,660       100.0 %     74     $ 2,301,538       100.0 %     66       0.1 %
Commercial Banks
    1,807,605       78.9 %     61       2,138,457       92.9 %     61       4.3 %
Savings Institutions
    482,055       21.1 %     13       163,081       7.1 %     5       -23.7 %
1st Security Bank
    9,006       0.4 %     1       23,606       1.0 %     1       27.2 %
                                                         
Source: FDIC.
                                                       
 
Since June 30, 2006, 1st Security has recorded increases in deposits in three of the four market area counties, with annual increases ranging from 5.1% in King County to 27.2% in Kitsap County.  The Bank’s deposits declined in Pierce County, due to the closure of certain offices in that county between 2006 and 2011.  The Bank’s market shares of deposits ranged from 0.3% in Pierce County to a high of 1.2% in Snohomish County.
 
Market Area Counties Deposit Competitors
 
As detailed in the data showing competitor deposits (see Table 2.5), significant competitors for the Bank consist of large nationwide and superregional banks, including Bank of America, Wells Fargo and JPMorgan Chase, all of which maintain a strong presence in the regional market.  This factor, however, allows 1st Security to position itself as a community bank, locally owned and managed.


RP® Financial, LC. MARKET AREA
II.12
 
As of June 30, 2010, 1st Security maintained relatively small deposit market shares in the Seattle MSA counties, representative of the overall large size of the deposit base and indicating that future deposit gains and market share gains are possible.  In the smaller markets such as Kitsap County, the Bank still reported a relatively small market share of 1.0% (however, the Bank only has one office location in Kitsap County).
 
Table 2.5
1st Security Bank of Washington
Market Area Counties Deposit Competitors
       
 
Snohomish County, WA
Bank of America (16.3%)
 
   
JPMorgan Chase Bank (10.7%)
 
   
Union Bank NA (10.4%)
 
   
Cascade Bank (9.1%)
 
   
1st Security (1.2%)


King County, WA
Bank of America (29.9%)
 
   
Wells Fargo (12.6%)
 
   
US Bank NA (11.5%)
 
   
JPMorgan Chase Bank (9.4%)
 
   
1st Security (0.2%)


Pierce County, WA
Columbia State Bank (18.1%)
 
   
Wells Fargo (14.6%)
 
   
Keybank NA (14.3%)
 
   
Bank of America, NA (13.4%)
 
   
1st Security (0.3%)


Kitsap County, WA
Kitsap Bank (22.5%)
 
   
Bank of America, NA (21.0%)
 
   
JPMorgan Chase Bank (12.3%)
 
   
Wells Fargo (9.0%)
 
   
1st Security (1.0%)
 
 
Source: FDIC.


RP® Financial, LC. MARKET AREA
II.13
 
Summary
 
The overall condition of the primary market area can be characterized as positive, with growth potential in all four market area counties based on regional population and economic projections. The overall total population base within the Bank’s market area provides the potential for additional banking customers.  In addition, income levels are relatively high and growing in line with national averages, indicating an increasing amount of personal wealth for residents.  Considering these local demographic and economic trends and the number of formidable competitors in the market area, the competition for deposits is expected to remain substantial, precipitating the need for 1st Security to pay competitive deposit rates, provide high quality service and to continue to provide electronic banking capabilities to increase local market share.


RP® Financial, LC.  PEER GROUP ANALYSIS
 
III.1
 
III.  PEER GROUP ANALYSIS
 
This chapter presents an analysis of 1st Security’s operations versus a group of comparable savings institutions (the “Peer Group”).  The Peer Group was selected from the universe of all publicly-traded savings institutions in a manner consistent with the regulatory valuation guidelines.  The basis of the pro forma market valuation of 1st Security is derived from the pricing ratios of the Peer Group institutions, incorporating valuation adjustments for key differences relative to the Peer Group.  Since no Peer Group can be exactly comparable to 1st Security, key areas examined for differences are:  financial condition; profitability, growth and viability of earnings; asset growth; primary market area; dividends; liquidity of the shares; marketing of the issue; management; and effect of government regulations and regulatory reform.
 
Peer Group Selection
 
The Peer Group selection process is governed by the general parameters set forth in the regulatory valuation guidelines.  Accordingly, the Peer Group is comprised of only those publicly-traded savings institutions whose common stock is either listed on a national exchange (NYSE or AMEX), or is NASDAQ-listed, since trading activity for such stocks is regularly reported and generally more frequent than for non-publicly traded and closely-held institutions.  Institutions that are not listed on a national exchange or on NASDAQ are inappropriate, since the trading activity for thinly-traded or closely-held stocks is typically highly irregular in terms of frequency and price and thus may not be a reliable indicator of market value.  We have also excluded from the Peer Group those companies under acquisition or subject to rumored acquisition, mutual holding companies, and recent conversions, because their pricing ratios are distorted and/or have limited trading history.  A recent listing of the universe of all publicly-traded savings institutions is included as Exhibit III-1.
 
Ideally, the Peer Group, which must have at least 10 members to comply with the regulatory valuation guidelines, should be comprised of locally- or regionally-based institutions with comparable resources, strategies and financial characteristics.  There are approximately 140 publicly-traded institutions nationally and, thus, it is typically the case that the Peer Group will be comprised of institutions with relatively comparable characteristics.  Valuation adjustments will be applied to account for the differences that exist between the converting institution and the Peer Group.  Since 1st Security will be a fully public company upon completion of the offering, we considered only fully public companies to be viable candidates for inclusion in the Peer Group.


RP® Financial, LC.  PEER GROUP ANALYSIS
 
III.2
 
From the universe of publicly-traded thrifts, we selected ten institutions with characteristics similar to those of 1st Security.  In the selection process, we applied two “screens” to the universe of all public companies that were eligible for consideration:
 
 
o
Screen #1  Washington institutions with assets less than $1 billion (In-state Peers).  Two companies met the criteria for Screen #1 and both were included in the Peer Group.
 
 
o
Screen #2  Other institutions with assets less than $400 million and positive core earnings, excluding those in the northeast and mid-Atlantic regions of the country (National Peers).  The northeast and mid-Atlantic regions of the U.S. were excluded because the economic downturn was not as severe in these areas, and this has influenced the pricing ratios of public thrifts operating in these areas.  The remaining eight companies met the criteria for Screen #2.
 
Exhibit III-1 provides financial and public market pricing characteristics of all publicly-traded thrifts, while Exhibit III-2 provides financial and public market pricing characteristics of the Peer Group selection screens.  Table 3.1 shows the general characteristics of each of the 10 Peer Group companies and Exhibit III-3 provides summary demographic and deposit market share data for the primary market areas served by each of the Peer Group companies.  While there are expectedly some differences between the Peer Group companies and 1st Security, we believe that the Peer Group companies, on average, provide a good basis for valuation subject to valuation adjustments.  The following sections compare the Bank’s financial condition, income and expense trends, loan composition, credit risk and interest rate risk to that of the Peer Group using the most recent publicly available financial information.
 
A summary description of the key comparable characteristics of each of the Peer Group companies relative to 1st Security’s characteristics is detailed below.
 
o
Athens Bancshares, Inc. of TN.  Athens Bancshares conducts operations out of 7 offices in southeastern Tennessee, serving suburban areas north of Chattanooga.  Athens reported the second highest GAAP equity to assets of all Peer Group members, and operates with a similar level of loans receivable as the Bank.  Athens recorded a very high level of non-interest income relative to the Bank and the Peer Group.
 
o
Eagle Bancorp of MT.  Eagle Bancorp operates out of 6 offices in southwestern Montana.  Eagle maintains a relatively high level of MBS and relatively low level of cash and equivalents relative to the Bank and the Peer Group, and, like Athens, recorded a high capital ratio.  Eagle funds operations with a higher proportion of borrowings, on average, than the Peer Group.  Earnings at Eagle were derived from significant levels of non-operating income, and although Eagle’s NPAs/assets ratio was lower than the Bank’s the Bank recorded higher reserve levels.


RP® Financial, LC.  PEER GROUP ANALYSIS
 
III.3
 
Table 3.1
Peer Group of Publicly-Traded Thrifts
September 2, 2011

               
Operating
 
Total
         
Fiscal
   
Conv.
   
Stock
   
Market
 
Ticker
 
Financial Institution
 
Exchange
 
Primary Market
 
Strategy(1)
 
Assets(2)
   
Offices
   
Year
   
Date
   
Price
   
Value
 
                                           
($)
   
($Mil)
 
RVSB
 
Riverview Bancorp, Inc. of WA
 
NASDAQ
 
Vancouver, WA
 
Thrift
  $ 886     17     03-31     10/97     $ 2.61     $ 59  
TSBK
 
Timberland Bancorp, Inc. of WA
 
NASDAQ
 
Hoquiam, WA
 
Thrift
  $ 735     22     09-30     01/98     $ 5.05     $ 36  
LSBI
 
LSB Financial Corp. of Lafayette IN
 
NASDAQ
 
Lafayette, IN
 
Thrift
  $ 360     5     12-31     02/95     $ 13.30     $ 21  
FABK
 
First Advantage Bancorp of TN
 
NASDAQ
 
Clarksville, TN
 
Thrift
  $ 350     5     12-31     11/07     $ 12.70     $ 52  
EBMT
 
Eagle Bancorp Montana of MT
 
NASDAQ
 
Helena, MT
 
Thrift
  $ 331     6     06-30     04/10     $ 10.46     $ 41  
LABC
 
Louisiana Bancorp, Inc. of LA
 
NASDAQ
 
Metairie, LA
 
Thrift
  $ 320     3     12-31     07/07     $ 16.03     $ 55  
JXSB
 
Jacksonville Bancorp Inc. of IL
 
NASDAQ
 
Jacksonville, IL
 
Thrift
  $ 305     7     12-31     07/10     $ 13.70     $ 26  
AFCB
 
Athens Bancshares, Inc. of TN
 
NASDAQ
 
Athens, TN
 
Thrift
  $ 283     7     12-31     01/10     $ 12.70     $ 35  
FFNM
 
First Federal of Northern Michigan of MI
 
NASDAQ
 
Alpena, MI
 
Thrift
  $ 219     8     12-31     04/05     $ 3.75     $ 11  
FFDF
 
FFD Financial Corp. of Dover OH
 
NASDAQ
 
Dover, OH
 
Thrift
  $ 211  M   5     06-30     04/96     $ 15.00     $ 15  

NOTES:
(1)
Operating strategies are:  Thrift=Traditional Thrift, M.B.=Mortgage Banker, R.E.=Real Estate Developer, Div.=Diversified and Ret.=Retail Banking.
 
(2)
Most recent quarter end available (E=Estimated and P=Pro Forma).
     
Source:  SNL Financial, LC.


RP® Financial, LC.  PEER GROUP ANALYSIS
 
III.4
 
o
FFD Financial Corp. of Dover OH.  FFD Financial operates out of 5 offices in Dover, which is located in central Ohio between Columbus and Pittsburgh, Pennsylvania.  With $211 million in assets, FFD is the smallest Peer Group member.  It recorded the highest asset growth and the lowest equity/assets ratio in the Peer Group.  FFD has a similar strategy of originating commercial business loans, and its portfolio of commercial business loans was equal in proportion to the Bank’s.  Asset quality at FFD was slightly favorable relative to the Peer Group and the Bank.
 
o
First Advantage Bancorp of TN.  First Advantage operates out of 5 offices in north central Tennessee.  First Advantage recorded the highest not worth among all Peer Group members (19.3% vs. a median of 12.5% for the Peer group). Like Eagle, First Advantage maintains a greater wholesale leveraging strategy than the other Peer Group members by using borrowings to fund investments.  The loan portfolio for First Advantage had significantly higher ratios of construction loans than the Peer Group and the Bank, but First Advantage also recorded substantially below average NPA/Assets ratios.
 
o
First Fed of Northern Michigan.  First Fed operates 8 offices in northern Michigan.  Reflecting the relatively poor economic conditions in that part of the country, First Fed reported the lowest earnings of all Peer Group members and asset quality measures that were less favorable, on average, than the Peer Group and the Bank.  Like the other Peer Group members, First Fed’s loan portfolio mix was more reflective a traditional thrift than the Bank’s.
 
o
Jacksonville Bancorp, Inc. of IL.  Jacksonville is a 7-office institution with a market area in the suburbs west of Springfield, in central Illinois.  Jacksonville has a relatively low loans-to-deposits ratio, and has been reinvesting funds into MBS.  Jacksonville recorded the highest reported and core earnings of all the Peer Group members, which is largely a function of non-interest sources of income.  Jacksonville also recorded the highest consumer loan ratio of all the Peer Group members, although at 5.2% it is much lower than the ratio of 45.7% recorded by the Bank.  Jacksonville’s asset quality measures were moderately better than the Bank’s and the Peer Group average.
 
o
LSB Financial Corp. of IN.  LSB operates out of 5 offices in an around Lafayette, a town in central Indiana northwest of Indianapolis.  LSB has the highest loans to assets ratio among Peer Group members, with a loan portfolio consisting primarily of 1-4 family residential and commercial real estate/multi-family residential mortgages.  LSB maintains the second highest ratio of non-residential mortgages in the Peer Group, with the higher risk of this portfolio reflected in the highest loan loss provisions and second highest NPA/Assets ratio of all Peer Group members.  LSB’s earnings were comparable to Peer Group averages.
 
o
Louisiana Bancorp, Inc. of LA.  Louisiana Bancorp is the southernmost member of the Peer Group and operates out of three offices in the New Orleans/Metairie area of Louisiana.  Louisiana Bancorp’s balance sheet is characterized by wholesale funding (it maintains the highest borrowings level among all the Peer Group companies), which has largely been reinvested into MBS and investments (it maintains the highest ratio of MBS & investments).  The loans to assets ratio is among the lowest at 57.9%.  Nevertheless, Louisiana Bancorp recorded stronger than average earnings due to very low loss provisions and low operating expenses, which is reflective of its low loan ratio and focus on purchasing low risk MBS and investment securities. This strategy of low risk investments has also resulted in more favorable asset quality measures for all the Peer Group companies.


RP® Financial, LC.  PEER GROUP ANALYSIS
 
III.5
 
o
Riverview Bancorp. Inc. of WA.  Riverview is the largest Peer Group member and operates out of 17 offices in the Vancouver area of southwest Washington State.  Riverview reported relatively high ratios of loans/assets deposit funding, along with the highest level of intangible assets of all Peer Group members.  Riverview was less profitable than the Peer Group, on average, due to higher loan loss provisions and operating expenses.  Riverview reported the lowest investment in 1-4 family mortgage loans but had the highest concentration of commercial real estate/multi-family mortgages, resulting in the highest risk-weighted assets-to-assets ratio.  Riverview’s asset quality ratios on balance were somewhat less favorable than the Peer Group and the Bank’s averages.
 
o
Timberland Bancorp, Inc. of WA.  Timberland recorded the second largest asset base in the Peer Group and operates from 22 offices in Seattle, Olympia, and southern suburbs of Seattle.   Timberland maintained the highest ratio of cash and equivalents, which serves to offset their relatively high ratios of commercial real estate/multi-family residential mortgages and construction loans relative to the Peer Group.  However, earnings at Timberland have been negatively impacted by relatively higher levels of loan loss reserves and operating expenses compared to the Peer Group.  Timberland also recorded the least favorable asset quality among all of the Peer Group members, with NPAs/Assets exceeding 8.0% versus an average of 3.2% for all the Peer Group members.
 
In aggregate, the median Peer Group company maintained a higher ratio of tangible equity than the industry average (13.4% of assets versus 10.1% for all non-MHC public companies), generated a similar core earnings ratio (0.37% ROAA versus 0.31% for all non-MHC public companies), and earned a slightly lower core ROE (2.77% ROE versus 3.02% for all non-MHC public companies).  Overall, the Peer Group’s average P/B ratio and average P/Core earnings multiple were below the respective averages for all non-MHC publicly-traded thrifts.


RP® Financial, LC.  PEER GROUP ANALYSIS
 
III.6
 
   
All Fully-Conv.
       
   
Publicly-Traded
   
Peer Group
 
             
Financial Characteristics (Medians)
           
Assets ($Mil)
  $ 902     $ 400  
Market capitalization ($Mil)
  $ 59.7     $ 35.1  
Tangible Equity/assets (%)
    10.10 %     13.35 %
Core Return on average assets (%)
    0.31 %     0.37 %
Core Return on average equity (%)
    3.02 %     2.77 %
                 
Pricing Ratios (Medians)(1)
               
Price/earnings (x)
    14.61 x     17.27 x
Price/book (%)
    79.54 %     69.11 %
Price/assets (%)
    8.06 %     7.94 %
 
(1)  Based on market prices as of September 2, 2011.
 
Ideally, the Peer Group companies would be comparable to 1st Security in terms of all of the selection criteria, but the universe of publicly-traded thrifts does not provide for an appropriate number of such companies.  However, in general, the companies selected for the Peer Group were fairly comparable to 1st Security, as will be highlighted in the following comparative analysis.
 
Financial Condition
 
Table 3.2 shows comparative balance sheet measures for 1st Security and the Peer Group, reflecting the expected similarities and some differences given the selection procedures outlined above.  The Bank’s and the Peer Group’s ratios reflect balances as of June 30, 2011, unless indicated otherwise for the Peer Group companies.  1st Security’s tangible equity-to-assets ratio of 9.5% was below the Peer Group’s median tangible equity to assets ratio of 11.4%.  The Bank’s pro forma capital position will increase with the addition of stock proceeds, providing the Bank with an equity-to-assets ratio that will exceed the Peer Group’s ratio.  The increase in the Bank’s pro forma capital position will be favorable from a risk perspective and in terms of future earnings potential that could be realized through leverage and lower funding costs.  At the same time, the Bank’s higher pro forma capitalization will initially depress return on equity.  Both 1st Security’s and the Peer Group’s capital ratios reflected capital surpluses with respect to the regulatory capital requirements, with the Peer Group’s ratios currently exceeding the Bank’s ratios.  On a pro forma basis, the Bank’s regulatory surpluses will become more significant.


RP® Financial, LC.  PEER GROUP ANALYSIS
 
III.7

Table 3.2
Balance Sheet Composition and Growth Rates
Comparable Institution Analysis
As of June 30, 2011

      Balance Sheet as a Percent of Assets  
     
Cash &
   
MBS &
                     
Borrowed
   
Subd.
   
Net
   
Goodwill
   
Tng Net
 
     
Equivalents
   
Invest
   
BOLI
   
Loans
   
Deposits
   
Funds
   
Debt
   
Worth
   
& Intang
   
Worth
 
                                                               
1st Security Bank of WA
                                                           
June 30, 2011
    11.1 %     5.0 %     0.0 %     77.1 %     88.5 %     1.4 %     0.0 %     9.5 %     0.0 %     9.5 %
                                                                                   
All Public Companies
                                                                               
Averages
    6.2 %     21.4 %     1.5 %     65.9 %     73.5 %     12.5 %     0.5 %     12.4 %     0.7 %     11.7 %
Medians
    4.7 %     19.7 %     1.6 %     67.8 %     73.2 %     11.1 %     0.0 %     11.5 %     0.1 %     10.6 %
                                                                                   
State of WA
                                                                               
Averages
    12.5 %     10.6 %     1.5 %     68.6 %     75.0 %     10.7 %     0.5 %     13.1 %     1.1 %     12.0 %
Medians
    13.0 %     10.7 %     1.8 %     66.6 %     75.9 %     8.1 %     0.0 %     12.2 %     0.8 %     11.8 %
                                                                                   
Comparable Group
                                                                               
Averages
    6.1 %     17.6 %     1.3 %     69.9 %     75.3 %     9.5 %     0.4 %     13.8 %     0.5 %     13.3 %
Medians
    4.7 %     18.2 %     1.6 %     70.3 %     78.8 %     7.1 %     0.0 %     12.5 %     0.1 %     11.4 %
                                                                                   
Comparable Group
                                                                               
AFCB
Athens Bancshares, Inc. of TN
    6.4 %     15.8 %     3.2 %     71.3 %     77.4 %     3.5 %     0.0 %     17.7 %     0.1 %     17.6 %
EBMT
Eagle Bancorp Montana of MT
    2.9 %     31.7 %     2.1 %     56.6 %     63.2 %     18.4 %     1.6 %     15.9 %     0.0 %     15.9 %
FFDF
FFD Financial Corp. of Dover OH (1)
    7.3 %     4.0 %     0.0 %     85.7 %     83.8 %     6.6 %     0.0 %     8.9 %     0.0 %     8.9 %
FABK
First Advantage Bancorp of TN
    5.4 %     20.5 %     0.1 %     69.8 %     64.3 %     15.2 %     0.0 %     19.3 %     0.0 %     19.3 %
FFNM
First Federal of N. Michigan of MI
    1.8 %     24.4 %     0.6 %     66.4 %     71.3 %     16.8 %     0.0 %     11.0 %     0.2 %     10.8 %
JXSB
Jacksonville Bancorp Inc. of IL
    1.8 %     34.5 %     1.4 %     57.4 %     84.2 %     1.4 %     0.0 %     12.7 %     0.9 %     11.8 %
LSBI
LSB Financial Corp. of Lafayette IN
    3.7 %     4.2 %     1.9 %     87.0 %     84.4 %     5.0 %     0.0 %     10.1 %     0.0 %     10.1 %
LABC
Louisiana Bancorp, Inc. of LA
    4.0 %     36.3 %     0.0 %     57.9 %     59.9 %     20.4 %     0.0 %     18.4 %     0.0 %     18.4 %
RVSB
Riverview Bancorp, Inc. of WA
    10.0 %     1.8 %     1.8 %     76.5 %     83.9 %     0.3 %     2.6 %     12.2 %     2.9 %     9.3 %
TSBK
Timberland Bancorp, Inc. of WA
    18.0 %     2.4 %     1.9 %     70.9 %     80.2 %     7.6 %     0.0 %     11.7 %     0.8 %     10.9 %
 
        Balance Sheet Annual Growth Rates    
Regulatory Capital
 
             
MBS, Cash &
               
Borrows.
   
Net
   
Tng Net
                   
      Assets    
Investments
   
Loans
   
Deposits
   
&Subdebt
   
Worth
   
Worth
   
Tangible
   
Core
   
Reg.Cap.
 
                                                                 
1st Security Bank of WA
                                                             
June 30, 2011
    -2.07     40.59 %     -7.69 %     2.72 %     -79.37 %     8.03 %     8.03 %     11.31 %     11.31 %     12.57 %
                                                                                   
All Public Companies
                                                                               
Averages
    1.41     7.71 %     -0.47 %     3.49 %     -17.49 %     1.96 %     1.65 %     10.89 %     10.83 %     18.90 %
Medians
    0.36     6.47 %     -2.88 %     1.76 %     -12.19 %     1.66 %     1.61 %     9.91 %     9.91 %     17.33 %
                                                                                   
State of WA
                                                                               
Averages
    -4.05     25.17 %     -10.49 %     -2.38 %     -29.97 %     13.03 %     15.38 %     12.47 %     12.47 %     18.84 %
Medians
    -2.82     20.47 %     -7.61 %     -1.95 %     -30.06 %     1.34 %     1.61 %     12.47 %     12.47 %     17.10 %
                                                                                   
Comparable Group
                                                                               
Averages
    0.44     12.08 %     0.29 %     2.43 %     -12.11 %     7.36 %     4.22 %     12.64 %     12.64 %     19.16 %
Medians
    1.03     10.04 %     1.09 %     2.84 %     -8.34 %     1.59 %     1.04 %     13.61 %     13.61 %     16.60 %
                                                                                   
Comparable Group
                                                                               
AFCB
Athens Bancshares, Inc. of TN
     0.51     -3.05 %     1.79 %     0.16 %     8.20 %     0.01 %     0.16 %     13.61 %     13.61 %     20.97 %
EBMT
Eagle Bancorp Montana of MT
    1.64     -4.92 %     5.68 %     5.68 %     -8.74 %     0.10 %     0.10 %     16.78 %     16.78 %  
NA
 
FFDF
FFD Financial Corp. of Dover OH (1)
    5.76     43.75 %     2.27 %     7.51 %     -7.93 %     3.47 %     3.47 %  
NA
   
NA
   
NA
 
FABK
First Advantage Bancorp of TN
    1.56     -9.34 %     6.76 %     3.30 %     -6.12 %     -0.46 %     -0.46 %     14.08 %     14.08 %     19.57 %
FFNM
First Federal of N. Michigan of MI
    -3.54     23.52 %     -11.56 %     -1.09 %     -14.80 %     2.41 %     3.78 %     10.04 %     10.04 %     16.53 %
JXSB
Jacksonville Bancorp Inc. of IL
    2.75     7.54 %     0.40 %     -2.25 %     49.39 %     48.61 %  
NM
      9.75 %     9.75 %     15.66 %
LSBI
LSB Financial Corp. of Lafayette IN
    -4.94     17.08 %     -6.17 %     1.02 %     -56.10 %     5.31 %     5.31 %     9.90 %     9.90 %     14.60 %
LABC
Louisiana Bancorp, Inc. of LA
    -2.30     -15.05 %     9.01 %     2.38 %     -5.77 %     -12.35 %     -12.35 %     14.31 %     14.31 %     30.21 %
RVSB
Riverview Bancorp, Inc. of WA
    2.57     48.71 %     -3.00 %     3.81 %     -52.63 %     25.71 %     36.88 %  
NA
   
NA
   
NA
 
TSBK
Timberland Bancorp, Inc. of WA
    0.35     12.55 %     -2.22 %     3.79 %     -26.57 %     0.76 %     1.04 %  
NA
   
NA
      16.60 %
 
(1)  Financial information is for the quarter ending March 31, 2011.
 
Source:  SNL Financial, LC. and RP® Financial, LC. calculations.  The information provided in this table has been obtained from sources we believe are reliable, but we cannot guarantee the accuracy or completeness of such information.
 
Copyright (c) 2011 by RP® Financial, LC.


RP® Financial, LC.  PEER GROUP ANALYSIS
 
III.8
 
The interest-earning asset compositions for the Bank and the Peer Group were somewhat similar, with loans constituting the bulk of interest-earning assets for both.  The Bank’s loans-to-assets ratio of 77.1% modestly exceeded the Peer Group ratio of 70.3%.  Some of the difference was reflected in the Peer Group’s higher proportion of MBS and investments to assets, as measured at 18.2% versus 5.0% for the Bank.  The Bank made up the remainder by of the difference by recording a higher ratio of cash and equivalents (11.1% of assets) than the Peer Group (4.7% of assets).  Overall, 1st Security’s and the Peer Group’s ratios of interest-earning assets to assets were 93.2% and 94.8%, respectively.
 
1st Security’s and the Peer Group’s funding liabilities reflected similar funding strategies.  Both the Bank and the Peer Group relied primarily on deposits for funding, with deposits representing 88.5% and 78.8% of assets, respectively.  The Peer Group relied more heavily on borrowings (7.1% of assets) than the Bank (1.4% of assets).  The Bank’s total interest-bearing liabilities of 89.9% exceeded the Peer Group median of 85.6% due to the Bank’s lower equity-to-assets ratio.  Following the increase in capital provided by the net proceeds of the stock offering, the Bank’s ratio of interest-bearing liabilities as a percent of assets will be lower than the Peer Group’s ratio.
 
A key measure of balance sheet strength for a thrift institution is its IEA/IBL ratio.  Presently, the Bank’s IEA/IBL ratio of 103.7% is lower than the Peer Group’s ratio of 110.2%, which indicates that the Bank currently has lower earnings power than the Peer Group.  The additional capital realized from stock proceeds will provide 1st Security with additional capital and an IEA/IBL ratio that exceeds the Peer Group ratio, as stock proceeds will be deployed into interest-earning assets increase and the asset base will increase, thereby lowering the ratio of interest bearing liabilities.
 
Table 3.2 also displays annual growth rates for key balance sheet items.  1st Security’s and the Peer Group’s growth rates are for the 12 month period from June 30, 2010 to June 30, 2011.  During this period, the Bank recorded modest asset shrinkage of 2.7% versus slight asset growth of 1.0% recorded by the Peer Group.  In practical terms, however, neither the Bank nor the Peer Group experienced significant changes in total assets during this period.  Growth rate differences within the balance sheet were more significant.  The Bank experienced a reallocation of assets from loans to MBS, cash and investments, as limited loan demand and economic conditions warranted such reinvestment of cash flows.  The Peer Group experienced a similar trend, but was able to achieve low loan growth.  Funding trends were very similar for the Bank and Peer Group, as both used deposit inflows to pay down borrowings, with the Bank’s borrowings declining to a greater extent than the Peer Group’s.


RP® Financial, LC.  PEER GROUP ANALYSIS
 
III.9
 
1st Security recorded higher equity growth than the Peer Group due to higher earnings and the lack of capital strategies such as dividend payments and stock repurchases.  The increase in equity realized from stock proceeds will likely depress the Bank’s equity growth rate initially following the stock offering.  Dividend payments and stock repurchases, pursuant to regulatory limitations and guidelines could also potentially slow the Bank’s equity growth rate in the longer term following the stock offering.
 
Income and Expense Components
 
Table 3.3 displays statements of operations for the Bank and the Peer Group, with the income ratios based on earnings for the twelve months ended June 30, 2011, unless otherwise indicated for the Peer Group companies.  1st Security reported net income of 0.69% of average assets compared to median net income of 0.57% for the Peer Group.  The higher net interest income, higher non-interest operating income and lower taxes recorded by the Bank more than offset its higher loss provisions and higher operating expenses relative to the Peer Group.
 
The Bank’s stronger net interest income ratio was realized through maintenance of a higher interest income ratio of 6.25% versus 4.92% for the Peer Group.  1st Security’s higher interest income ratio was supported by its very large proportion of consumer loans, which resulted in a weighted average asset yield of 6.80% versus 5.26% yielded by the more traditional loan portfolios of the Peer Group.  Interest expense ratios were nearly equal at 1.28% and 1.26% for the Bank and the Peer Group, respectively, as reflected in their nearly equal cost of funds.  Overall, 1st Security recorded net interest income of 4.96% versus 3.61% for the Peer Group.
 
In another key area of core earnings strength, the Bank’s advantage in net interest income was nearly erased by its higher operating expenses of 4.30% versus a median of 3.29% for the Peer Group.  The Bank’s relatively high operating expense are attributable in large part to the consumer lending program, which carries higher administrative costs to operate, and to a relatively high cost branch network.  On a post-offering basis, the Bank’s operating expenses can be expected to increase with the addition of stock benefit plans and certain expenses that result from being a publicly-traded company, with such expenses already impacting the Peer Group’s operating expenses.  At the same time, 1st Security’s capacity to leverage operating expenses will be greater than the Peer Group’s leverage capacity following the increase in capital realized from the infusion of net stock proceeds.


RP® Financial, LC.  PEER GROUP ANALYSIS
 
III.10
 
Table 3.3
Income as Percent of Average Assets and Yields, Costs, Spreads
Comparable Institution Analysis
For the 12 Months Ended June 30, 2011

              Net Interest Income          
Other Income
         
                             
Loss
   
NII
                      Total  
     
Net
                     
Provis.
   
After
   
Loan
   
R.E.
   
Other
    Other  
     
Income
   
Income
   
Expense
    NII    
on IEA
   
Provis.
   
Fees
   
Oper.
   
Income
    Income  
                                                                   
1st Security Bank of WA
                                                               
June 30, 2011
    0.69 %     6.25 %     1.28 %     4.96 %     0.95 %     4.01 %     0.00 %     0.00 %     0.90 %     0.90 %
                                                                                   
All Public Companies
                                                                               
Averages
    0.10 %     4.43 %     1.38 %     3.05 %     0.65 %     2.41 %     0.02 %     -0.09 %     0.85 %     0.78 %
Medians
    0.41 %     4.42 %     1.36 %     3.07 %     0.37 %     2.61 %     0.00 %     -0.01 %     0.65 %     0.59 %
                                                                                   
State of WA
                                                                               
Averages
    -0.26 %     4.89 %     1.48 %     3.42 %     1.08 %     2.34 %     0.05 %     -0.35 %     1.22 %     0.92 %
Medians
    0.14 %     4.84 %     1.66 %     3.47 %     0.95 %     2.30 %     0.01 %     -0.36 %     0.94 %     0.89 %
                                                                                   
Comparable Group
                                                                               
Averages
    0.54 %     4.89 %     1.30 %     3.59 %     0.50 %     3.10 %     0.00 %     -0.03 %     0.80 %     0.76 %
Medians
    0.57 %     4.92 %     1.26 %     3.61 %     0.41 %     3.14 %     0.00 %     0.00 %     0.92 %     0.83 %
                                                                                   
Comparable Group
                                                                               
AFCB
Athens Bancshares, Inc. of TN
    0.59 %     5.18 %     1.34 %     3.84 %     0.72 %     3.13 %     0.00 %     0.00 %     1.59 %     1.59 %
EBMT
Eagle Bancorp Montana of MT
    0.73 %     4.52 %     1.23 %     3.28 %     0.29 %     3.00 %     -0.10 %     -0.04 %     0.55 %     0.40 %
FFDF
FFD Financial Corp. of Dover OH (1)
    0.70 %     5.15 %     1.53 %     3.62 %     0.43 %     3.19 %     0.00 %     0.00 %     0.24 %     0.24 %
FABK
First Advantage Bancorp of TN
    0.54 %     5.10 %     1.27 %     3.83 %     0.39 %     3.43 %     0.00 %     0.00 %     0.43 %     0.43 %
FFNM
First Federal of N. Michigan of MI
    0.06 %     4.97 %     1.26 %     3.71 %     0.25 %     3.47 %     0.00 %     0.00 %     0.95 %     0.95 %
JXSB
Jacksonville Bancorp Inc. of IL
    1.00 %     4.60 %     1.14 %     3.46 %     0.31 %     3.15 %     0.12 %     0.00 %     1.04 %     1.16 %
LSBI
LSB Financial Corp. of Lafayette IN
    0.49 %     4.93 %     1.34 %     3.59 %     1.00 %     2.59 %     0.00 %     -0.14 %     0.90 %     0.77 %
LABC
Louisiana Bancorp, Inc. of LA
    0.74 %     4.81 %     1.74 %     3.08 %     0.02 %     3.05 %     0.00 %     -0.10 %     0.37 %     0.27 %
RVSB
Riverview Bancorp, Inc. of WA
    0.38 %     4.92 %     0.86 %     4.06 %     0.62 %     3.44 %     0.00 %     -0.05 %     0.94 %     0.89 %
TSBK
Timberland Bancorp, Inc. of WA
    0.14 %     4.72 %     1.26 %     3.47 %     0.95 %     2.52 %     -0.02 %     0.00 %     0.94 %     0.93 %
 
     
G&A/Other Exp.
   
Non-Op. Items
   
Yields, Costs, and Spreads
             
                                               
MEMO:
   
MEMO:
 
     
G&A
   
Goodwill
   
Net
   
Extrao.
   
Yield
   
Cost
   
Yld-Cost
   
Assets/
   
Effective
 
     
Expense
   
Amort.
   
Gains
   
Items
   
On Assets
   
Of Funds
   
Spread
   
FTE Emp.
   
Tax Rate
 
                                                         
1st Security Bank of WA
                                                     
June 30, 2011
    4.30 %     0.00 %     0.08 %     0.00 %     6.80 %     1.45 %     5.35 %   $ 3,453       0.00 %
                                                                           
All Public Companies
                                                                       
Averages
    2.92 %     0.06 %     0.10 %     0.00 %     4.75 %     1.59 %     3.16 %   $ 5,867       29.76 %
Medians
    2.86 %     0.00 %     0.06 %     0.00 %     4.70 %     1.58 %     3.19 %   $ 4,965       30.31 %
                                                                           
State of WA
                                                                       
Averages
    3.50 %     0.01 %     0.11 %     0.00 %     5.31 %     1.69 %     3.62 %   $ 6,912       29.73 %
Medians
    3.43 %     0.01 %     0.08 %     0.00 %     5.19 %     1.80 %     3.74 %   $ 7,001       32.25 %
                                                                           
Comparable Group
                                                                       
Averages
    3.31 %     0.02 %     0.24 %     0.00 %     5.23 %     1.53 %     3.70 %   $ 3,504       29.56 %
Medians
    3.29 %     0.00 %     0.21 %     0.00 %     5.26 %     1.49 %     3.73 %   $ 3,368       31.14 %
                                                                           
Comparable Group
                                                                       
AFCB
Athens Bancshares, Inc. of TN
    3.91 %     0.03 %     0.00 %     0.00 %     5.55 %     1.66 %     3.90 %   $ 3,015       24.01 %
EBMT
Eagle Bancorp Montana of MT
    3.02 %     0.00 %     0.67 %     0.00 %     4.95 %     1.48 %     3.47 %  
NM
      30.47 %
FFDF
FFD Financial Corp. of Dover OH (1)
    2.73 %     0.00 %     0.36 %     0.00 %     5.30 %     1.70 %     3.61 %  
NM
      34.26 %
FABK
First Advantage Bancorp of TN
    3.39 %     0.00 %     0.34 %     0.00 %     5.33 %     1.59 %     3.74 %   $ 4,075       32.62 %
FFNM
First Federal of N. Michigan of MI
    4.27 %     0.13 %     0.05 %     0.00 %     5.36 %     1.42 %     3.93 %   $ 2,576    
NM
 
JXSB
Jacksonville Bancorp Inc. of IL
    3.20 %     0.00 %     0.22 %     0.00 %     4.92 %     1.31 %     3.61 %   $ 2,932       25.50 %
LSBI
LSB Financial Corp. of Lafayette IN
    2.96 %     0.00 %     0.33 %     0.00 %     5.21 %     1.49 %     3.72 %   $ 3,955       33.88 %
LABC
Louisiana Bancorp, Inc. of LA
    2.41 %     0.00 %     0.16 %     0.00 %     4.91 %     2.18 %     2.72 %   $ 5,003       31.14 %
RVSB
Riverview Bancorp, Inc. of WA
    3.80 %     0.01 %     0.03 %     0.00 %     5.57 %     0.98 %     4.59 %   $ 3,721       32.25 %
TSBK
Timberland Bancorp, Inc. of WA
    3.43 %     0.02 %     0.19 %     0.00 %     5.17 %     1.43 %     3.74 %   $ 2,753       21.94 %
 
(1)  Financial information is for the quarter ending March 31, 2011.
 
Source:  SNL Financial, LC. and RP® Financial, LC. calculations.  The information provided in this table has been obtained from sources we believe are reliable, but we cannot guarantee the accuracy or completeness of such information.
 
Copyright (c) 2011 by RP® Financial, LC.


RP® Financial, LC.  PEER GROUP ANALYSIS
 
III.11
 
When viewed together, net interest income and operating expenses provide considerable insight into a thrift’s earnings strength, since those sources of income and expenses are typically the most prominent components of earnings and are generally more predictable than losses and gains realized from the sale of assets or other non-recurring activities.  In this regard, as measured by their expense coverage ratios (net interest income divided by operating expenses), the Bank’s earnings were nearly equal to the Peer Group’s, based on respective expense coverage ratios of 1.15x for 1st Security and 1.10x for the Peer Group.  A ratio less than 1.00x indicates that an institution depends on non-interest operating income to achieve profitable operations.
 
Sources of non-interest operating income provided a marginally greater contribution to the Bank’s earnings (0.90%), representing a slight advantage over the Peer Group (0.83%).  Taking non-interest operating income into account in comparing the Bank’s and the Peer Group’s earnings, 1st Security’s and the Peer Group’s efficiency ratios (operating expenses, net of amortization of intangibles, as a percent of the sum of non-interest operating income and net interest income) were nearly the same at 73.4% (Bank) and 74.1% (Peer Group).
 
Recurring loan loss provisions had a larger impact on the Bank’s earnings, with loan loss provisions established by the Bank and the Peer Group equaling 0.95% and 0.41% of average assets, respectively.  The impact of loan loss provisions on the Bank’s and the Peer Group’s earnings, particularly when taking into consideration the prevailing credit market environment for mortgage based lenders, were indicative of asset quality factors facing the overall thrift industry in the current operating environment, and are indicative of the higher risk loan portfolio profile maintained by the Bank.
 
For the 12 months ended June 30, 2011, the Bank and the Peer Group reported net non-operating gains of 0.08% and 0.21% of average assets, respectively.  The Bank’s gains were attributable to a branch sale that occurred during the 12 month period.  Typically, gains and losses generated from non-operating items are viewed as non-recurring in nature, particularly to the extent that such gains and losses result from the sale of investments or other assets that are not considered to be part of an institution’s core operations.  Comparatively, to the extent that gains have been derived through selling fixed rate loans into the secondary market, such gains may be considered to be an ongoing activity for an institution and, therefore, warrant some consideration as a core earnings factor for an institution.  However, loan sale gains are still viewed as a more volatile source of income than income generated through the net interest margin and non-interest operating income.  Extraordinary items were not a factor in either the Bank’s or the Peer Group’s earnings.


RP® Financial, LC.  PEER GROUP ANALYSIS
 
III.12
 
Reporting profitable operations, the Peer Group reported an average effective tax rate of 31.1%, while the net loss recorded by 1st Security in past periods resulted in tax loss carryforwards for the Bank, thus the Bank recorded no taxes during the twelve months ended June 30, 2011.  As indicated in the prospectus, the Bank’s effective marginal tax rate is assumed to equal 34.0% when calculating the after tax return on conversion proceeds.
 
Loan Composition
 
Table 3.4 presents data related to the Bank’s and the Peer Group’s loan portfolio compositions (including the investment in MBS).  The Bank’s loan portfolio composition reflected that of a non-traditional thrift strategy, with a much lower concentration of 1-4 family permanent mortgage loans and MBS than maintained by the Peer Group (10.5% of assets versus a median of 37.4% for the Peer Group).  The Peer Group reported higher ratios of both MBS and 1-4 family loans than the Bank.  Loans serviced for others equaled 17.8% and 35.9% of the Bank’s and the Peer Group’s assets, respectively, thereby indicating a greater influence of loan servicing income on the Peer Group’s earnings.
 
Diversification into higher risk and higher yielding types of lending was significantly greater for the Bank than the Peer Group companies on average.  Consumer loans represented the most significant area of lending diversification for the Bank (45.7% of assets), followed by commercial business loans (10.4% of assets) and non-residential mortgages (9.8% of assets).  The Peer Group’s lending diversification consisted primarily of commercial real estate/multi-family loans (26.3% of assets), followed by construction/land loans (4.8% of assets) and commercial business loans (4.1% of assets).  1st Security’s higher concentration of assets in loans and greater diversification into higher risk types of loans translated into a higher risk weighted assets-to-assets ratio for the Bank (84.0% versus 70.2% for the Peer Group).


RP® Financial, LC.  PEER GROUP ANALYSIS
 
III.13

Table 3.4
Loan Portfolio Composition and Related Information
Comparable Institution Analysis
As of June 30, 2011

      Portfolio Composition as a Percent of Assets                    
            1-4    
Constr.
   
5+Unit
   
Commerc.
         
RWA/
   
Serviced
   
Servicing
 
 
Institution
 
MBS
   
Family
   
& Land
   
Comm RE
   
Business
   
Consumer
   
Assets
   
For Others
   
Assets
 
     
(%)
   
(%)
   
(%)
   
(%)
   
(%)
   
(%)
   
(%)
    ($000)     ($000)  
                                                               
1st Security Bank of WA
    0.16 %     10.36 %     2.31 %     9.84 %     10.42 %     45.70 %     83.95 %   $ 48,550     $ 0  
                                                                           
All Public Companies
                                                                       
Averages
    13.02 %     33.76 %     3.68 %     22.90 %     4.52 %     1.92 %     63.56 %   $ 737,798     $ 6,714  
Medians
    10.95 %     32.83 %     2.58 %     22.22 %     3.30 %     0.47 %     63.85 %   $ 39,360     $ 99  
                                                                           
State of WA
                                                                       
Averages
    8.66 %     28.50 %     7.45 %     30.20 %     2.63 %     1.00 %     68.94 %   $ 136,142     $ 745  
Medians
    8.19 %     27.46 %     5.28 %     30.32 %     2.77 %     0.58 %     72.03 %   $ 120,000     $ 364  
                                                                           
Comparable Group
                                                                       
Averages
    7.64 %     27.60 %     6.04 %     30.17 %     5.05 %     1.79 %     69.61 %   $ 137,319     $ 860  
Medians
    5.98 %     31.37 %     4.76 %     26.29 %     4.09 %     0.97 %     70.21 %   $ 116,970     $ 763  
                                                                           
Comparable Group
                                                                       
AFCB
Athens Bancshares, Inc. of TN
    2.96 %     33.78 %     7.10 %     23.52 %     4.06 %     3.59 %     68.40 %   $ 89,850     $ 0  
EBMT
Eagle Bancorp Montana of MT
    8.96 %     29.86 %     4.21 %     16.87 %     3.16 %     2.86 %     64.57 %   $ 343,750     $ 2,142  
FFDF
FFD Financial Corp. of Dover OH (1)
    3.00 %     32.88 %     1.12 %     40.02 %     10.43 %     2.84 %     78.99 %   $ 98,930     $ 732  
FABK
First Advantage Bancorp of TN
    12.21 %     18.45 %     15.16 %     27.82 %     8.55 %     0.82 %     74.02 %   $ 1,320     $ 0  
FFNM
First Federal of N. Michigan of MI
    11.39 %     34.40 %     3.35 %     24.75 %     3.77 %     0.66 %     64.82 %   $ 148,340     $ 969  
JXSB
Jacksonville Bancorp Inc. of IL
    14.83 %     19.13 %     0.83 %     22.19 %     7.70 %     5.15 %     67.62 %   $ 147,200     $ 794  
LSBI
LSB Financial Corp. of Lafayette IN
    0.70 %     36.28 %     5.30 %     42.24 %     4.11 %     0.42 %     74.26 %   $ 113,940     $ 1,042  
LABC
Louisiana Bancorp, Inc. of LA
    20.73 %     35.91 %     0.13 %     22.03 %     0.12 %     0.21 %     48.36 %   $ 14,170     $ 93  
RVSB
Riverview Bancorp, Inc. of WA
    0.20 %     14.96 %     10.23 %     46.74 %     5.77 %     0.26 %     83.04 %   $ 120,000     $ 364  
TSBK
Timberland Bancorp, Inc. of WA
    1.46 %     20.38 %     12.99 %     35.54 %     2.77 %     1.11 %     72.03 %   $ 295,690     $ 2,463  

(1) Financial information is for the quarter ending March 31, 2011.
 
Source:
SNL Financial LC. and RP® Financial, LC. calculations. The information provided in this table has been obtained from sources we believe are reliable, but we cannot guarantee the accuracy or completeness of such information.
 
Copyright (c) 2011 by RP® Financial, LC.


RP® Financial, LC.  PEER GROUP ANALYSIS
 
III.14
 
Credit Risk
 
Overall, based on a comparison of credit quality measures, the Bank’s credit risk exposure was considered to be somewhat less favorable than the Peer Group’s, with the Bank’s higher ratio of NPAs/Assets offset in part by higher reserves.  As shown in Table 3.5, the Bank’s non-performing assets/assets and non-performing loans/loans ratios equaled 2.92% and 0.91%, respectively, versus comparable measures of 2.12% and 2.22% for the Peer Group.  The Bank’s and Peer Group’s general loss reserves as a percent of non-performing loans equaled 247.0% and 72.0%, respectively.  Loss reserves maintained as percent of net loans receivable equaled 2.25% for the Bank, versus 1.68% for the Peer Group.  Net loan charge-offs were higher at the Bank, based on ratios of 1.86% and 0.29% of net loans receivable, respectively.  As noted in the Loan Composition discussion, the Bank’s higher concentration of loans and greater diversification into higher risk types of loans translated into a higher risk weighted assets-to-assets ratio in comparison to the Bank’s ratio, resulting in an implied higher risk loan portfolio.
 
Interest Rate Risk
 
Table 3.6 reflects various key ratios highlighting the relative interest rate risk exposure of the Bank versus the Peer Group.  In terms of balance sheet composition, 1st Security’s interest rate risk characteristics were considered to be somewhat less favorable than the Peer Group’s.  For example, the Bank’s equity-to-assets and IEA/IBL ratios were lower than the comparable Peer Group ratios, thereby implying more dependence on the yield-cost spread to sustain the net interest margin for the Bank.  At the same time, the Bank’s higher level of non-interest earning assets represented a slight disadvantage for the Bank with respect to managing interest rate risk.  On a pro forma basis, the infusion of stock proceeds can be expected to provide the Bank with at least comparable and probably more favorable balance sheet interest rate risk characteristics than currently maintained by the Peer Group, particularly with respect to the increases that will be realized in Bank’s equity-to-assets and IEA/IBL ratios.


RP® Financial, LC.  PEER GROUP ANALYSIS
 
III.15
 
Table 3.5
Credit Risk Measures and Related Information
Comparable Institution Analysis
As of June 30, 2011 or Most Recent Date Available

           
NPAs &
                     
Rsrves/
             
     
REO/
   
90+Del/
   
NPLs/
   
Rsrves/
   
Rsrves/
   
NPAs &
   
Net Loan
   
NLCs/
 
Institution
 
Assets
   
Assets
   
Loans
   
Loans
   
NPLs
   
90+Del
   
Chargoffs
   
Loans
 
     
(%)
   
(%)
   
(%)
   
(%)
   
(%)
   
(%)
    ($000)    
(%)
 
                                                     
1st Security Bank of WA
    2.17 %     2.92 %     0.91 %     2.25 %     246.99 %     60.64 %   $ 3,993       1.86 %
                                                                   
All Public Companies
                                                               
Averages
    0.59 %     3.92 %     4.77 %     1.80 %     61.03 %     49.70 %   $ 1,346       0.66 %
Medians
    0.23 %     2.71 %     3.40 %     1.48 %     41.45 %     35.65 %   $ 459       0.31 %
                                                                   
State of WA
                                                               
Averages
    1.69 %     7.50 %     7.79 %     2.17 %     38.12 %     22.75 %   $ 3,056       2.35 %
Medians
    1.93 %     6.82 %     7.94 %     2.21 %     27.85 %     21.17 %   $ 3,452       2.48 %
                                                                   
Comparable Group
                                                               
Averages
    0.83 %     3.23 %     3.06 %     1.68 %     86.98 %     58.66 %   $ 561       0.56 %
Medians
    0.29 %     2.12 %     2.22 %     1.68 %     71.99 %     51.51 %   $ 242       0.29 %
                                                                   
Comparable Group
                                                               
AFCB
Athens Bancshares, Inc. of TN
    0.23 %     2.71 %     3.39 %     2.20 %     65.00 %     59.33 %   $ 145       0.29 %
EBMT
Eagle Bancorp Montana of MT
    0.36 %     1.24 %     1.55 %     0.95 %     61.25 %     43.69 %   $ 6       0.01 %
FFDF
FFD Financial Corp. of Dover OH (1)
    0.00 %     1.53 %     1.71 %     1.18 %     78.98 %     76.87 %   $ 493       1.07 %
FABK
First Advantage Bancorp of TN
    0.04 %     0.92 %     1.25 %     1.58 %     126.73 %     121.24 %   $ 223       0.37 %
FFNM
First Federal of N. Michigan of MI
    2.11 %     4.71 %     3.62 %     1.48 %     40.98 %     21.25 %   $ 422       1.12 %
JXSB
Jacksonville Bancorp Inc. of IL
    0.18 %     1.27 %     1.86 %     1.77 %     95.30 %     81.68 %   $ 260       -0.30 %
LSBI
LSB Financial Corp. of Lafayette IN
    0.04 %     5.92 %     6.36 %     2.20 %     34.51 %     33.02 %   $ 194       0.24 %
LABC
Louisiana Bancorp, Inc. of LA
    0.35 %     0.57 %     0.37 %     0.92 %     249.57 %     94.73 %   $ 0       0.00 %
RVSB
Riverview Bancorp, Inc. of WA
    3.07 %     5.10 %     2.58 %     2.32 %     89.66 %     35.59 %   $ 459       0.27 %
TSBK
Timberland Bancorp, Inc. of WA
    1.93 %     8.35 %     7.94 %     2.21 %     27.85 %     19.20 %   $ 3,408       2.53 %

(1) Financial information is for the quarter ending March 31, 2011.
 
Source:
Audited and unaudited financial statements, corporate reports and offering circulars, and RP® Financial, LC. calculations. The information provided in this table has been obtained from sources we believe are reliable, but we cannot guarantee the accuracy or completeness of such information.
 
Copyright (c) 2011 by RP® Financial, LC.


RP® Financial, LC.  PEER GROUP ANALYSIS
 
III.16
 
Table 3.6
Interest Rate Risk Measures and Net Interest Income Volatility
Comparable Institution Analysis
As of June 30, 2011 or Most Recent Date Available

     
Balance Sheet Measures
                                     
                 
Non-Earn.
    Quarterly Change in Net Interest Income  
     
Equity/
   
IEA/
   
Assets/
                                     
 
Institution
 
Assets
   
IBL
   
Assets
   
6/30/2011
   
3/31/2011
   
12/31/2010
   
9/30/2010
   
6/30/2010
   
3/31/2010
 
     
(%)
   
(%)
   
(%)
   
(change in net interest income is annualized in basis points)
 
                                                         
1st Security Bank of WA
    9.5 %     103.7 %     6.8 %     -17       -60       30       30       8       54  
                                                                           
All Public Companies
    11.6 %     107.6 %     6.6 %     4       0       1       0       1       6  
State of WA
    11.9 %     106.3 %     8.4 %     1       1       12       -1       2       -6  
                                                                           
Comparable Group
                                                                       
Averages
    13.3 %     110.2 %     6.4 %     5       4       6       4       10       12  
Medians
    11.4 %     108.5 %     6.4 %     0       5       2       4       11       12  
                                                                           
Comparable Group
                                                                       
AFCB
Athens Bancshares, Inc. of TN
    17.6 %     115.6 %     6.5 %     -2       9       28       2       9       21  
EBMT
Eagle Bancorp Montana of MT
    15.9 %     109.6 %     8.9 %     -2       17       -5       12       0    
NA
 
FFDF
FFD Financial Corp. of Dover OH (1)
    8.9 %     107.4 %     2.9 %  
NA
      -15       18       1       5       35  
FABK
First Advantage Bancorp of TN
    19.3 %     120.4 %     4.3 %     9       10       11       5       13       12  
FFNM
First Federal of N. Michigan of MI
    10.8 %     105.1 %     7.4 %     20       0       5       16       15       27  
JXSB
Jacksonville Bancorp Inc. of IL
    11.8 %     109.5 %     6.3 %     27       13       -4       11       23       -1  
LSBI
LSB Financial Corp. of Lafayette IN
    10.1 %     106.1 %     5.1 %     0       17       -7       19       18       17  
LABC
Louisiana Bancorp, Inc. of LA
    18.4 %     122.2 %     1.8 %     -6       -5       -3       -5       1       -4  
RVSB
Riverview Bancorp, Inc. of WA
    9.3 %     101.9 %     11.6 %     -5       -6       13       -22       20       -3  
TSBK
Timberland Bancorp, Inc. of WA
    10.9 %     104.1 %     8.7 %     0       1       -2       -3       -7       1  

(1) Financial information is for the quarter ending March 31, 2011.
NA=Change is greater than 100 basis points during the quarter.
 
Source:
SNL Financial LC. and RP® Financial, LC. calculations. The information provided in this table has been obtained from sources we believe are reliable, but we cannot guarantee the accuracy or completeness of such information.
 
Copyright (c) 2011 by RP® Financial, LC.


RP® Financial, LC.  PEER GROUP ANALYSIS
 
III.17
 
To analyze interest rate risk associated with the net interest margin, we reviewed quarterly changes in net interest income as a percent of average assets for 1st Security and the Peer Group.  In general, the relative fluctuations in the Bank’s net interest income to average assets ratio were considered to be higher than the Peer Group which supports the conclusion that 1st Security maintains a higher degree of interest rate risk exposure in the net interest margin.  The stability of the Bank’s net interest margin should be enhanced by the infusion of stock proceeds, as the increase in capital will reduce the level of interest rate sensitive liabilities funding 1st Security’s assets.
 
Summary
 
Based on the above analysis, RP Financial concluded that the Peer Group forms a reasonable basis for determining the pro forma market value of the Bank.  Such general characteristics as asset size, capital position, interest-earning asset composition, funding composition, core earnings measures, loan composition, credit quality and exposure to interest rate risk all tend to support the reasonability of the Peer Group from a financial standpoint.  Those areas where differences exist will be addressed in the form of valuation adjustments to the extent necessary.


RP® Financial, LC. VALUATION ANALYSIS
IV.1

IV.  VALUATION ANALYSIS
 
Introduction
 
This chapter presents the valuation analysis and methodology, prepared pursuant to the regulatory valuation guidelines, and valuation adjustments and assumptions used to determine the estimated pro forma market value of the common stock to be issued in conjunction with the Bank’s conversion transaction.
 
Appraisal Guidelines
 
The regulatory written appraisal guidelines reissued by the OCC specify the market value methodology for estimating the pro forma market value of an institution pursuant to a mutual-to-stock conversion.  Pursuant to this methodology:  (1) a peer group of comparable publicly-traded institutions is selected; (2) a financial and operational comparison of the subject company to the peer group is conducted to discern key differences; and (3) a valuation analysis in which the pro forma market value of the subject company is determined based on the market pricing of the peer group as of the date of valuation, incorporating valuation adjustments for key differences.  In addition, the pricing characteristics of recent conversions, both at conversion and in the aftermarket, must be considered.
 
RP Financial Approach to the Valuation
 
The valuation analysis herein complies with such regulatory approval guidelines.  Accordingly, the valuation incorporates a detailed analysis based on the Peer Group, discussed in Chapter III, which constitutes “fundamental analysis” techniques.  Additionally, the valuation incorporates a “technical analysis” of recently completed stock conversions, including closing pricing and aftermarket trading of such offerings.  It should be noted that these valuation analyses cannot possibly fully account for all the market forces which impact trading activity and pricing characteristics of a particular stock on a given day.
 
The pro forma market value determined herein is a preliminary value for the Company’s to-be-issued stock.  Throughout the conversion process, RP Financial will:  (1) review changes in 1st Security’s operations and financial condition; (2) monitor 1st Security’s operations and financial condition relative to the Peer Group to identify any fundamental changes; (3) monitor the external factors affecting value including, but not limited to, local and national economic conditions, interest rates, and the stock market environment, including the market for thrift stocks; and (4) monitor pending conversion offerings (including those in the offering phase), both regionally and nationally.  If material changes should occur during the conversion process, RP Financial will evaluate if updated valuation reports should be prepared reflecting such changes and their related impact on value, if any.  RP Financial will also prepare a final valuation update at the closing of the offering to determine if the prepared valuation analysis and resulting range of value continues to be appropriate.


RP® Financial, LC. VALUATION ANALYSIS
IV.2
 
The appraised value determined herein is based on the current market and operating environment for the Bank and for all thrifts.  Subsequent changes in the local and national economy, the legislative and regulatory environment, the stock market, interest rates, and other external forces (such as natural disasters or major world events), which may occur from time to time (often with great unpredictability) may materially impact the market value of all thrift stocks, including 1st Security’s value, or 1st Security’s value alone.  To the extent a change in factors impacting the Bank’s value can be reasonably anticipated and/or quantified, RP Financial has incorporated the estimated impact into the analysis.
 
Valuation Analysis
 
A fundamental analysis discussing similarities and differences relative to the Peer Group was presented in Chapter III.  The following sections summarize the key differences between the Bank and the Peer Group and how those differences affect the pro forma valuation.  Emphasis is placed on the specific strengths and weaknesses of the Bank relative to the Peer Group in such key areas as financial condition, profitability, growth and viability of earnings, asset growth, primary market area, dividends, liquidity of the shares, marketing of the issue, management, and the effect of government regulations and/or regulatory reform.  We have also considered the market for thrift stocks, in particular new issues, to assess the impact on value of the Bank coming to market at this time.
 
1.             Financial Condition
 
The financial condition of an institution is an important determinant in pro forma market value because investors typically look to such factors as liquidity, equity, asset composition and quality, and funding sources in assessing investment attractiveness.  The similarities and differences in the Bank’s and the Peer Groups’ financial strengths are noted as follows:
 
 
Overall A/L Composition.  Loans funded by retail deposits were the primary components of both 1st Security’s and the Peer Group’s balance sheets.  The Bank’s interest-earning asset composition exhibited a higher concentration of loans and a substantially higher degree of diversification into higher risk and higher yielding types of loans (primarily consumer loans).  In comparison to the Peer Group, the Bank’s interest-earning asset composition provided for a higher yield earned on interest-earning assets and a higher risk weighted assets-to-assets ratio.  1st Security’s funding composition indicated a higher proportion of deposits and a lower proportion of borrowings than the comparable Peer Group ratios, resulting in a lower cost of funds than the Peer Group.  As a percent of assets, 1st Security maintained a somewhat lower level of interest-earning assets and higher level of interest-bearing liabilities compared to the Peer Group’s ratios, which resulted in a higher IEA/IBL ratio for the Peer Group compared to the Bank.  After factoring in the impact of the net stock proceeds, the Bank’s IEA/IBL ratio will be more in line with the Peer Group’s ratio.  On balance, RP Financial concluded that asset/liability composition was a neutral factor in our adjustment for financial condition.


RP® Financial, LC. VALUATION ANALYSIS
IV.3
 
 
Credit Quality.  The Bank’s ratio of REO was higher than the Peer Group average, while total NPAs as a percent of total assets were lower than the comparable Peer Group average.  Loss reserves as a percent loans and reserve coverage ratios were higher for 1st Security.  Net loan charge-offs were higher for 1st Security, while the Bank’s risk weighted assets-to-assets ratio was higher than the Peer Group ratio.  1st Security reported higher loan diversification into higher risk loans (commercial business and consumer) than the Peer Group.  The perceived credit risk in 1st Security’s loan portfolio was deemed to be higher than the Peer Group based on loan composition.  Overall, RP Financial concluded that credit quality was a moderately negative factor in our adjustment for financial condition.
 
 
Balance Sheet Liquidity.  1st Security operated with a somewhat lower level of cash and investment securities relative to the Peer Group (16.1% of assets versus 23.7% for the Peer Group).  Following the infusion of stock proceeds, the Bank’s cash and investments ratio is expected to increase as the proceeds will be initially deployed into investments.  The Bank’s future borrowing capacity was considered to be greater than the Peer Group, given the lower level of borrowings currently maintained.  Overall, RP Financial concluded that balance sheet liquidity was a neutral factor in our adjustment for financial condition.
 
 
Funding Liabilities.  1st Security’s interest-bearing funding composition reflected a higher concentration of deposits and a lower concentration of borrowings relative to the comparable Peer Group ratios.  1st Security’s funding costs were lower than the Peer Group average.  The Bank maintained a modest balance of brokered deposits.  Total interest-bearing liabilities as a percent of assets were higher for the Bank compared to the Peer Group’s ratio, which was attributable to 1st Security’s lower equity position.  Following the stock offering, the increase in the Bank’s equity position should provide 1st Security with a lower ratio of interest-bearing liabilities as a percent of assets.  Overall, RP Financial concluded that funding liabilities were a neutral factor in our adjustment for financial condition.
 
 
Equity.  The Peer Group currently operates with a higher equity-to-assets ratio than the Bank.  Following the stock offering, 1st Security’s pro forma equity position is expected to exceed the Peer Group’s equity-to-assets ratio.  The increase in the Bank’s pro forma capital position will result in a greater leverage potential for the Bank and reduce the level of interest-bearing liabilities utilized to fund assets.  At the same time, the Bank’s equity ratio will likely result in a lower ROE.  On balance, RP Financial concluded that equity strength was a neutral factor in our adjustment for financial condition.


RP® Financial, LC. VALUATION ANALYSIS
IV.4
 
On balance, 1st Security’s pro forma financial condition was comparable to the Peer Group’s after considering the above factors and, thus, no valuation adjustment was applied for the Bank’s financial condition.
 
2.             Profitability, Growth and Viability of Earnings
 
Earnings are a key factor in determining pro forma market value, as the level and risk characteristics of an institution’s earnings stream and the prospects and ability to generate future earnings heavily influence the multiple that the investment community will pay for earnings.  The major factors considered in the valuation are described below.
 
 
Reported Earnings.  For the 12 months ended June 30, 2011, 1st Security reported net income of $1,894,000, or 0.69% of average assets, versus average and median net income of 0.54% and 0.57% of average assets for the Peer Group.  The Bank recorded higher levels of net interest income, non-interest operating income and operating expenses, resulting in a higher core earnings stream.  Funding costs were similar between the Bank and the Peer Group.  1st Security’s higher reported net income ratio was largely due to the absence of a tax liability in the income statement, a result of the deferred tax asset that is fully reserved on the balance sheet.  Non-operating items had only a minimal impact on the Peer Group’s earnings (a 0.08% of average assets gain).  Reinvestment and leveraging of stock proceeds into interest-earning assets will serve to increase the Bank’s bottom line income, with the benefit of reinvesting proceeds expected to be somewhat offset by higher operating expenses associated with operating as a publicly-traded company.  The Bank’s higher reserve coverage ratios, which have been established due to higher provisions in the most recent three years, have impacted the income statement through higher loan loss provisions.  However, the Peer Group can also be expected to experience expenses related to loan loss provisions and problem assets.  On balance, RP Financial concluded that the Bank’s reported earnings were a slightly negative factor in our adjustment for profitability, growth and viability of earnings.
 
 
Core Earnings.  As noted above, 1st Security’s income statement was impacted by the lack of a tax liability and from a limited level of non-operating gains.  The Peer Group reported a higher level of non-operating gains (0.24% of average assets on average).  In comparison to the Peer Group, the Bank operates with a higher net interest income ratio, a higher yield/cost spread, a higher operating expense ratio and a higher level of non-interest operating income.  For valuation purposes, we assumed core net income would include the impact of an expected tax burden, should the deferred tax valuation allowance be removed (in whole or in part) from the balance sheet.  Thus, we determined that the Bank’s core net income for the 12 months ended June 30, 2011 approximated $1.1 million, utilizing a 34% effective tax rate.  The Bank’s ratios for net interest income and operating expenses translated into an expense coverage ratio that was more favorable than the Peer Group’s ratio (equal to 1.15x for the Bank and 1.08x for the Peer Group).  Similarly, the Bank’s efficiency ratio of 73.4% was more favorable than the Peer Group’s efficiency ratio of 76.6%.  Total loss provisions had a larger impact on the Bank’s income statement, and as noted above, the current levels of NPAs and/or the reserve coverage ratios for both the Bank and Peer Group will remain as a potential negative factor in future earnings as additional loan loss reserves may be incurred.


RP® Financial, LC. VALUATION ANALYSIS
IV.5
 
Overall, the core earnings potential of the Bank will be impacted by the expected earnings benefits the Bank should realize from the redeployment of stock proceeds into interest-earning assets and the expenses associated with the ESOP and operations as a publicly-traded company.  Based on the current core earnings rate of the Bank, RP Financial concluded that this was a moderately downward factor in our adjustment for profitability, growth and viability of earnings.
 
 
Interest Rate Risk.  Quarterly changes in the Bank’s and the Peer Group’s net interest income to average assets ratios indicated that a higher degree of volatility was associated with the Bank’s net interest income ratios.  Other measures of interest rate risk, such as equity and IEA/IBL ratios were less favorable for the Bank compared to the Peer Group thereby indicating a higher dependence on the yield-cost spread to sustain net interest income.  On a pro forma basis, the infusion of stock proceeds can be expected to provide the Bank with equity-to-assets and IEA/ILB ratios that will be more in line with the Peer Group ratios, as well as enhance the stability of the Bank’s net interest income ratio through the reinvestment of stock proceeds into interest-earning assets.  On balance, RP Financial concluded that interest rate risk was a slightly negative factor in our adjustment for profitability, growth and viability of earnings.
 
 
Credit Risk.  Loan loss provisions were a larger factor in the Bank’s most recent 12 month earnings stream (0.95% of average assets versus 0.50% of average assets for the Peer Group).  In terms of future exposure to credit quality related losses, 1st Security maintained a higher concentration of assets in loans, and lending diversification into higher risk types of loans was greater for the Bank.  The risk weighed assets-to-assets ratio was also higher for the Bank.  Credit quality measures on balance were somewhat favorable for 1st Security, in terms of NPA ratios and reserve coverage ratios.  Taking these factors into consideration, RP Financial concluded that credit risk was a moderately negative factor in our adjustment for profitability, growth and viability of earnings.
 
 
Earnings Growth Potential.  The Bank maintained a higher interest rate spread than the Peer Group, which would tend to provide for a higher level of net interest income ratio going forward based on the prevailing interest rate environment.  The infusion of stock proceeds will provide 1st Security with slightly greater growth potential through leverage than currently maintained by the Peer Group.  The Bank’s higher operating expense ratio is viewed as an unfavorable characteristic to sustain earnings during periods when net interest income ratios come under pressure as the result of adverse changes in interest rates.  Overall, earnings growth potential was considered to be a slightly negative factor in our adjustment for profitability, growth and viability of earnings.
 
 
Return on Equity.  For the most recent 12 month period, the Bank’s ROE on a reported basis (7.60%) was higher than the Peer Group’s ROE, although reported earnings were greatly enhanced by the lack of a tax liability.  Based on a core earnings estimate of $1.1 million, the Bank’s core ROE for the 12 months ended June 30, 2011 was 4.46% which also was above the Peer Group average.  Following the increase in equity that will be realized from the infusion of net stock proceeds into the Bank, 1st Security’s pro forma ROE on a core earnings basis can be expected to be lower than the Peer Group’s ratio.  Accordingly, this was a moderately negative factor in the adjustment for profitability, growth and viability of earnings.


RP® Financial, LC. VALUATION ANALYSIS
IV.6
 
On balance, 1st Security’s pro forma core earnings strength was considered to be less favorable than the Peer Group’s and, thus a moderate downward valuation adjustment was applied for profitability, growth and viability of earnings.
 
3.             Asset Growth
 
1st Security’s assets decreased at an annual rate of 2.07% during the most recent 12 month period, while the Peer Group’s assets increased at an annual rate of 0.44% on average over the same time period.  The Bank’s slightly asset shrinkage reflected a continuation of fluctuation in assets recorded over the past four and one-half fiscal years, as assets increased in fiscal 2007, 2009 and 2010, and decreased in fiscal 2008 and for the most recent 12 month period.  Six of the 10 Peer Group companies reported increases in assets, with loans receivable increasing slightly, on average and cash and investments increasing at a faster pace.  For 1st Security, loans decreased while cash and investments increased substantially.  On a pro forma basis, 1st Security’s tangible equity-to-assets ratio is expected to exceed the Peer Group’s tangible equity-to-assets ratio, indicating a moderate amount of additional leverage capacity for the Bank.  On balance, we concluded that a slightly upward valuation adjustment was warranted for asset growth.
 
4.             Primary Market Area
 
The general condition of an institution’s market area has an impact on value, as future success is in part dependent upon opportunities for profitable activities in the local markets served.  1st Security serves a portion of the Seattle-Tacoma metropolitan area through six office locations in four counties.  The market area served is mainly urban and suburban in nature with a total population of the four county market area of 3.7 million.  The strength of the region’s economy hinges primarily on a diversified mix of high tech, government, manufacturing and services industries.  In recent years, the economies in the Bank’s operating markets have experienced a downturn similar to the rest of the nation, with increases in unemployment, home values, home loan delinquencies, bankruptcies and other adverse reactions to the lower level of economic activity.  The region also experienced somewhat of a “bubble economy” in the areas of land development and construction.  However, the Pacific Northwest region typically lags the nation in terms of an economic cycle, and thus the expectations are that the Bank’s market area will take longer to recover from the current economic downturn.  The demographic characteristics of the Bank’s market areas have also fostered a highly competitive banking environment, in which the Bank competes against other community banks as well as institutions with a regional or national presence.


RP® Financial, LC. VALUATION ANALYSIS
IV.7
 
The Peer Group companies operate in a mix of urban, suburban and rural markets, with four of the Peer Group markets having relatively large population bases in large metropolitan areas, although the Bank’s home office county of Snohomish has a larger population base than all Peer Group members.  The remaining six Peer Group members are headquartered in counties with relatively small populations.  Thus, the markets served by the Peer Group companies, on average, reflect lower population bases for potential customers.  In addition, the Bank’s home office county recorded greater historical population growth from 2000 to 2010 that all but two of the Peer Group companies, with such trends expected to continue through 2015.  1st Security’s home office county also recorded higher per capita income compared to all of the Peer Group members, with the Snohomish County per capita income well above the state of Washington average.  The average and median deposit market shares maintained by the Peer Group companies was well above the Bank’s market share of deposits in Snohomish County, an indication of the larger size of the Bank’s market area in terms of population and economic activity.  The degree of competition faced by the Peer Group companies was viewed to be similar to that faced by 1st Security, while the growth potential in the markets served by the Peer Group companies was viewed to be somewhat less favorable.  Summary demographic and deposit market share data for the Bank and the Peer Group companies is provided in Exhibit III-3.  As shown in Table 4.1, July 2011 unemployment rates for six of the markets served by the Peer Group companies were lower than the comparable unemployment rate for Snohomish County.  On balance, we concluded that a slight downward adjustment was appropriate for the Bank’s market area.


RP® Financial, LC. VALUATION ANALYSIS
IV.8
 
Table 4.1
Market Area Unemployment Rates
1st Security and the Peer Group Companies(1)
 
       
July 2011
 
   
County
 
Unemployment
 
             
1st Security Bank- WA
 
Snohomish
    10.0 %
             
Peer Group Average
        9.4 %
             
Athens Bancshares Corp. – TN
 
McMinn
    11.6 %
Eagle Bancorp Montana - MT
 
Lewis and Clark
    5.8  
FFD Financial Corp. - OH
 
Tuscawaras
    9.1  
First Advantage Bancorp - TN
 
Montgomery
    9.5  
First Federal of N. Michigan – MI
 
Alpena
    10.8  
Jacksonville Bancorp, Inc. – IL
 
Morgan
    8.8  
LSB Financial Corp. - IN
 
Tippecanoe
    8.1  
Louisiana Bancorp, Inc. – LA
 
Jefferson
    7.2  
Riverview Bancorp, Inc. - WA
 
Clark
    10.1  
Timberland Bancorp, Inc. - WA
 
Gray’s Harbor
    12.6  
         
(1) Unemployment rates are not seasonally adjusted.
       
Source: U.S. Bureau of Labor Statistics.
           

5.             Dividends
 
At this time the Bank has not established a dividend policy.  Future declarations of dividends by the Board of Directors will depend upon a number of factors, including investment opportunities, growth objectives, financial condition, profitability, tax considerations, minimum capital requirements, regulatory limitations, stock market characteristics and general economic conditions.
 
Five of the 10 Peer Group companies pay regular cash dividends, with implied dividend yields ranging from 1.57% to 4.53%.  The average dividend yield on the stocks of the Peer Group institutions equaled 1.26% as of September 2, 2011.  As of September 2, 2011, 63% of all publicly-traded thrifts had adopted cash dividend policies (see Exhibit IV-1), exhibiting an average yield of 3.17%.  The dividend paying thrifts generally maintain higher than average profitability ratios, facilitating their ability to pay cash dividends.
 
The Bank has not established a definitive dividend policy prior to converting.  The Bank will have the capacity to pay a dividend comparable to the Peer Group’s average dividend yield based on pro forma capitalization.  On balance, we concluded that no adjustment was warranted for this factor.


RP® Financial, LC. VALUATION ANALYSIS
IV.9
 
6.             Liquidity of the Shares
 
The Peer Group is by definition composed of companies that are traded in the public markets.  All ten of the Peer Group members trade on the NASDAQ.  Typically, the number of shares outstanding and market capitalization provides an indication of how much liquidity there will be in a particular stock.  The market capitalization of the Peer Group companies ranged from $10.8 million to $58.7 million as of September 2, 2011, with average and median market values of $35.1 million and $35.4 million, respectively.  The shares issued and outstanding to the public shareholders of the Peer Group members ranged from 1.0 million to 22.5 million, with average and median shares outstanding of 5.1 million and 3.2 million, respectively.  The Bank’s stock offering is expected to have a pro forma market value and number of shares outstanding that will be less than the average and median market values indicated for the Peer Group companies.  Like the Peer Group companies, the Bank’s stock is expected to be quoted on the NASDAQ Capital Market following the stock offering.  Overall, we anticipate that the Bank’s public stock will have a similar trading market as the Peer Group companies on average and, therefore, concluded that no adjustment was necessary for this factor.
 
7.             Marketing of the Issue
 
We believe that three separate markets exist for thrift stocks, including those coming to market such as 1st Security  (1) the after-market for public companies, in which trading activity is regular and investment decisions are made based upon financial condition, earnings, capital, ROE, dividends and future prospects; (2) the new issue market in which converting thrifts are evaluated on the basis of the same factors, but on a pro forma basis without the benefit of prior operations as a fully-converted publicly-held company and stock trading history;  and (3) the acquisition market for thrift franchises in Washington.  All three of these markets were considered in the valuation of the Bank’s to-be-issued stock.
 
A.      The Public Market
 
The value of publicly-traded thrift stocks is easily measurable, and is tracked by most investment houses and related organizations.  Exhibit IV-1 provides pricing and financial data on all publicly-traded thrifts.  In general, thrift stock values react to market stimuli such as interest rates, inflation, perceived industry health, projected rates of economic growth, regulatory issues and stock market conditions in general.  Exhibit IV-2 displays historical stock market trends for various indices and includes historical stock price index values for thrifts and commercial banks.  Exhibit IV-3 displays historical stock price indices for thrifts only.


RP® Financial, LC. VALUATION ANALYSIS
IV.10
 
In terms of assessing general stock market conditions, the performance of the overall stock market has been mixed in recent quarters. The broader stock market started 2011 on an upswing, fueled by reports of manufacturing activity picking up in December.  Weaker than expected job growth reflected in the December employment report pulled stocks lower to close out the first week in 2011.  A favorable fourth quarter earnings report by J.P. Morgan and data confirming strength in the manufacturing sector helped stocks to rebound in mid-January, with the DJIA moving to its highest close since June 2008.  The positive trend in the broader stock market was sustained in late-January, which was followed by a one day sell-off as political unrest in Egypt rattled markets around the world.  The DJIA ended up 2.7% for the month of January, which was its strongest January in 14 years.  Stocks continued to trade higher through the first two weeks of February, as the DJIA closed higher for eight consecutive trading sessions.  Strong manufacturing data for January, merger news and some favorable fourth quarter earnings reports helped to sustain the rally in the broader stock market.  News that Egypt’s President resigned further boosted stocks heading into mid-February.  A strong report on manufacturing activity in the Mid-Atlantic region lifted the DJIA to a fresh two and one-half year high in mid-February, which was followed by a sell-off as stocks tumbled worldwide on worries over escalating violence in Libya.  Stocks recovered in late-February, as oil prices stabilized.  Volatility was evident in the broader stock market in early-March, as investors reacted to some strong economic reports mixed with concerns about Middle East tensions and surging oil prices.  The DJIA closed below 12000 in the second week of March, as financial markets around the world were shaken by escalating turmoil in the Middle East and surprisingly downbeat economic news out of China.  Stocks climbed to close out the second week of March, as some companies benefited from expectations that the rebuilding efforts in Japan following the earthquake and tsunami would positively impact their earnings.  Announcements by some large banks of intentions to increase dividends, gains in energy companies and encouraging earnings news coming out of the technology sector contributed to gains in the broader market heading into late-March. Telecom stocks led the market higher in late-March, based on expectations of more consolidation in that sector.  Overall, the DJIA gained 6.4% in the first quarter, which was its best first quarter performance in twelve years.


RP® Financial, LC. VALUATION ANALYSIS
IV.11
 
Stocks started out the second quarter of 2011 with gains, as investors were heartened by the March employment report which showed signs of stronger job creation and the lowest unemployment rate in two years.  Investors exercised caution in early-April ahead of the potential shutdown of the U.S. Government, which provided for a narrow trading range in the broader stock market.  Worries about the high cost of raw materials undercutting growth prospects and some favorable economic reports translated into a mixed stock market performance in mid-April.  Strong first quarter earnings reports posted by some large technology stocks helped to lift the DJIA to a multi-year high going into the second half of April.  Stocks rose following the Federal Reserve’s late-April meeting, based on indications that the Federal Reserve would not be increasing rates anytime soon.  Disappointing earnings reports and lackluster economic data pressure stocks lower ahead of the April employment report.  Stronger than expected job growth reflected in April employment data, along with a pick-up in deal activity, helped stocks to rebound heading into mid-May.  Worries about Greece’s debt problems and a slowdown in the global economic recovery pulled stocks lower in mid-May.  A general downward trend prevailed in the broader stock market during the second half of May 2011 into the first half of June, as the Dow Jones Industrial Average (“DJIA”) declined for six consecutive weeks.  Mounting evidence that the economic recovery was losing steam and renewed concerns about a possible Greek default were noted factors contributing to the sell-off in the broader stock market.  Stocks rebounded heading into the second half of June, as worries over Greece’s debt crisis eased following a pledge by European leaders to head off a debt default by Greece.  More signs of progress regarding Greece’s debt crisis and an accord reached by Bank of America with investors that purchased mortgage-backed securities issued by Countrywide helped the DJIA to close out a volatile second quarter on a four day winning streak.  Overall, the DJIA ended up 1.8% for the second quarter.


RP® Financial, LC. VALUATION ANALYSIS
IV.12
 
The rally in the broader stock market continued at the start of the third quarter of 2011, as the DJIA approached a new high for 2011 amid indications the U.S. economy was possibly regaining momentum following a surprising jump in June manufacturing activity.  Stocks reversed course following the disappointing employment report for June, which raised fresh doubt about the strength of the U.S. economy.  Deepening concerns about the euro-zone debt crisis and the fiscal and economic woes of the U.S. further depressed stocks heading into mid-July.  Volatility was evident in the broader stock market heading into the second half of July, as investors weighed generally favorable second earnings reports against threatened debt defaults in the U.S. and Europe.  Stocks closed out July posting their biggest weekly drop in over a year on continuing debt-ceiling worries.  Signs of a weakening global economy accelerated the selloff in the broader stock market at the beginning of August.  The downgrade of the U.S.’s credit rating sparked a global selloff on August 8th, pushing the DJIA to its sharpest one-day decline since the financial crisis in 2008.  Stocks rebounded the following day on hopes that the Federal Reserve would take some action to avert a meltdown in the financial markets.  Significant volatility continued to prevail in the stock market throughout the week, with the DJIA swinging higher or lower by over 400 points for four consecutive trading days.  Stocks concluded the volatile week closing higher, which was supported by a favorable report for July retail sales.  Volatile trading continue over the last two full weeks of trading in August, with the DJIA closing lower for the fourth consecutive week ended August 19th while rebounding modestly for the first time in August during the week ended August 26th.  For the week ended September 2, 2011 the market continued to show volatility, with the DJIA declining by 1.3% for the week, however on three of the five trading days the DJIA experienced a change of more than 100 points.  As of September 2, 2011, the DJIA closed at 11240.26, an increase of 8.9% from one year ago and a decrease of 2.9% year-to-date, and the NASDAQ closed at 2480.33, an increase of 12.7% from one year ago and a decrease of 6.5% year-to-date.  The Standard & Poor’s 500 Index closed at 1173.97 on September 2, 2011, an increase of 7.7% from one year ago and a decrease of 6.7% year-to-date.
 
The market for thrift stocks has been somewhat uneven in recent quarters, but in general has underperformed the broader stock market.  Thrift stocks rallied along with the broader stock market at the start of 2011, as investors were encouraged by data that suggested the economic recovery was strengthening.  A strong fourth quarter earnings report posted by J.P. Morgan supported gains in the financial sector in mid-January, which was followed by a downturn heading into late-January as some large banks reported weaker than expected earnings.  Thrift stocks traded higher along with the broader stock market into mid-February, as financial stocks benefitted from some favorable fourth quarter earnings reports coming out of the financial sector.  Financial stocks also benefitted from a rally in mortgage insurer stocks, which surged on a government proposal to shrink the size of FHA.  Thrift stocks faltered along with the broader market heading into late-February, as investors grew wary of mounting violence in Libya.  A report that December home prices fell to new lows in eleven major metropolitan areas further contributed to the pullback in thrift prices.  Thrift prices rebounded along with the broader market in late-February.  Higher oil prices and profit taking pressured thrift stocks lower in early-March.  News that Bank of America was planning to increase its dividend lifted financial stocks in general in the second week of March, which was followed by a downturn amid a pullback in the broader stock market.  Thrift stocks advanced on announced plans by some large banks to increase their dividends following the Federal Reserve’s completion of its “stress test”, which was followed by a slight pullback in thrift stocks heading into late-March.  Home sales data for February showing sharp drop-offs in new and existing home sales contributed to decline in thrift prices.  An upward revision to fourth quarter GDP helped thrift stocks to rebound slightly in late-March.


RP® Financial, LC. VALUATION ANALYSIS
IV.13
 
The favorable employment report for March 2011 helped thrift stocks advance along with the broader stock at the start of the second quarter of 2011.  Financial stocks outpaced the broader market in early-April, based on improving conditions for the larger banks and then eased lower on growing concerns about the potential shutdown of the U.S. Government.  Mixed first quarter earnings reports, which included lower first quarter revenues reported by nation’s largest banks, pressured thrift stocks lower going into the second half of April.  The Federal Reserve’s announcement that it will keep interest rates low for the foreseeable future helped to lift thrift stocks in late-April.  Thrift stocks lagged the broader stock market heading into mid-May, as weak housing data continued to weigh on the sector.  Most notably, home prices fell 3% in the first quarter of 2011, the steepest drop since 2008. Moody’s continued negative outlook on the American banking system weighed on thrift stocks as well in mid-May.  After trading in a narrow range during the second half of May 2011, bank and thrift stocks led the broader market lower in early-June as economic data suggested that the recovery was losing momentum.  A drop-off in home sales in April hurt the thrift sector as well.  Thrift stocks edged higher in mid-June, following a report that housing starts rose in May.  Concerns about the economic outlook depressed thrift stocks heading into late-June, which was followed by a late-June and early-July rally.  Thrift stocks participated in the rally led by bank stocks on news of Bank of America’s mortgage-backed securities settlement and the Federal Reserve a higher-than-expected interchange fee cap.
 
The thrift sector paralleled trends in the boarder stock at start of the third quarter of 2011, initially rallying on upbeat economic data showing an unexpected increase in June manufacturing activity followed by a pullback on the disappointing employment for June.  Second quarter earnings reports for thrifts were generally better compared to the year period, which along with U.S. debt worries, provided for a narrow range for thrift stocks through mid-July.  Thrift stocks followed the broader market lower in-late July, which was largely related to the ongoing debt stalemate in Washington.  Financial stocks plunged following the downgrade of the U.S.’s credit rating, as fears about the health of the U.S. banking system returned to the market.  The volatility that prevailed in the broader stock market during the week that followed the downgrade of U.S. debt was particularly evident in the financial sector, with bank and thrift stocks underperforming the broader stock market.  Notably, bank and thrift stocks diverged from the broader stock market at the end of the week, as a weak reading for consumer sentiment pressured bank and thrift stocks lower.  Into the latter half of August, the overall market experienced periodic relief from the sharp declines that occurred early on in the month as volatility appeared to be decreasing. The initial recovery from the losses experienced early in the month was very sharp, a typical characteristic of oversold market conditions. The overall market experienced moderate fluctuations heading into the first week of September.  On September 2, 2011, the SNL Index for all publicly-traded thrifts closed at 453.20, a decrease of 14.8% from one year ago and a decrease of 23.5% year-to-date.


RP® Financial, LC. VALUATION ANALYSIS
IV.14
 
B.    The New Issue Market
 
In addition to thrift stock market conditions in general, the new issue market for converting thrifts is also an important consideration in determining the Bank’s pro forma market value.  The new issue market is separate and distinct from the market for seasoned thrift stocks in that the pricing ratios for converting issues are computed on a pro forma basis, specifically:  (1) the numerator and denominator are both impacted by the conversion offering amount, unlike existing stock issues in which price change affects only the numerator; and (2) the pro forma pricing ratio incorporates assumptions regarding source and use of proceeds, effective tax rates, stock plan purchases, etc. which impact pro forma financials, whereas pricing for existing issues are based on reported financials.  The distinction between pricing of converting and existing issues is perhaps no clearer than in the case of the price/book (“P/B”) ratio in that the P/B ratio of a converting thrift will typically result in a discount to book value whereas in the current market for existing thrifts the P/B ratio may reflect a premium to book value.  Therefore, it is appropriate to also consider the market for new issues, both at the time of the conversion and in the aftermarket.
 
As shown in Table 4.2, three standard conversions and one second-step conversions have been completed during the past three months.  The recently completed standard conversion offerings are the most relevant to 1st Security.  All three of these offerings closed their offerings at the supermaximum of the offering range.  The average closing pro forma price/tangible book ratio of these three recent standard conversion offerings equaled 66.5%, and on average, these offerings reflected price appreciation of 11.5% after the first week of trading.  As of September 2, 2011, the three recent standard conversion offerings reflected a 9.3% increase in price on average.


RP® Financial, LC. VALUATION ANALYSIS
IV.15
 
Table 4.2
Pricing Characteristics and After-Market Trends
Recent Conversions Completed in Last 3 Months
 
Institutional Information   Pre-Conversion Data    
Offering Information
   
Contribution to
    Insider Purchases  
           
Financial Info.
   
Asset Quality
                           
Char. Found.
   
% Off Incl. Fdn.+Merger Shares
 
                                  Excluding Foundation        
% of
   
Benefit Plans
       
   
Conversion


Equity/
   
NPAs/
   
Res.
   
Gross
   
%
   
% of
   
Exp./
         
Public Off.
         
Recog.
   
Stk
   
Mgmt.&
 
  Institution
  Date   
Ticker
 
 
Assets
   
Assets
   
Assets
   
Cov.
   
Proc.
   
Offer
   
Mid.
   
Proc.
   
Form
   
Excl. Fdn.
   
ESOP
   
Plans
   
Option
   
Dirs.
 
           
($Mil)
   
(%)
   
(%)
   
(%)
   
($Mil.)
   
(%)
   
(%)
   
(%)
         
(%)
   
(%)
   
(%)
   
(%)
   
(%)(2)
 
                                                                                             
  Standard Conversions
                                                                                   
  IF Bancorp, Inc. - IL*
  7/8/11  
  IROQ-NASDAQ
  $ 409       9.15 %     1.04 %     73 %   $ 45.0       100 %     132 %     3.7 %     C/S       0%/7 %     8.0 %     4.0 %     10.0 %     4.4 %
  State Investors Bancorp, Inc. - LA*
  7/7/11  
  SIBC-NASDAQ
  $ 214       10.03 %     1.03 %     75 %   $ 29.1       100 %     132 %     3.9 %  
NA
   
NA
      8.0 %     4.0 %     10.0 %     6.8 %
  First Connecticut Bancorp, Inc. - CT*
   6/30/11  
  FBNK-NASDAQ
  $ 1,455       6.60 %     1.49 %     96 %   $ 171.9       100 %     132 %     2.0 %     C/S       0%/4 %     8.0 %     4.0 %     10.0 %     1.2 %
Averages - Standard Conversions:   $ 693       8.59 %     1.19 %     82 %   $ 82.0       100 %     132 %     3.2 %  
N.A.
   
N.A.
      8.0 %     4.0 %     10.0 %     4.1 %
Medians - Standard Conversions:   $ 409       9.15 %     1.04 %     75 %   $ 45.0       100 %     132 %     3.7 %  
N.A.
   
N.A.
      8.0 %     4.0 %     10.0 %     4.4 %
                                                                                                                         
  Second Step Conversions
                                                                                                               
  Naugatuck Valley Fin. Corp., - CT*
  6/30/11  
  NVSL-NASDAQ
  $ 564       9.30 %     3.13 %     39 %   $ 33.4       60 %     108 %     5.4 %  
N.A.
   
N.A.
      6.0 %     3.2 %     7.9 %     1.6 %
                                                                                                                         
Averages - All Conversions:   $ 529       8.77 %     1.67 %     71 %   $ 69.8       90 %     126 %     3.8 %  
N.A.
   
N.A.
      7.5 %     3.8 %     9.5 %     3.5 %
Medians - All Conversions:   $ 487       9.23 %     1.27 %     74 %   $ 39.2       100 %     132 %     3.8 %  
N.A.
   
N.A.
      8.0 %     4.0 %     10.0 %     3.0 %
                                                                                                             
 
Institutional Information           Pro Forma Data           Post-IPO Pricing Trends  
                 
Pricing Ratios(3)(6)
   
Financial Charac.
          Closing Price:  
           
Initial
                                             
First
         
After
         
After
                   
   
Conversion
     
Div.
         
Core
         
Core
         
Core
   
IPO
   
Trading
   
%
   
First
   
%
   
First
   
%
   
Thru
   
%
 
  Institution
 
Date
   Ticker    
Yield
   
P/TB
     P/E      P/A    
ROA
   
TE/A
   
ROE
   
Price
   
Day
   
Chge
   
Week(4)
   
Chge
   
Month(5)
   
Chge
   
9/2/11
   
Chge
 
           
(%)
   
(%)
   
(x)
   
(%)
   
(%)
   
(%)
   
(%)
   
($)
   
($)
   
(%)
   
($)
   
(%)
   
($)
   
(%)
   
($)
   
(%)
 
                                                                                                             
  Standard Conversions
                                                                                                   
  IF Bancorp, Inc. - IL*
 
7/8/11
  IROQ-NASDAQ     0.00 %     63.4 %     22.4 x     10.7 %     0.5 %     17.0 %     2.8 %   $ 10.00     $ 11.67       16.7 %   $ 11.65       16.5 %   $ 10.85       8.5 %   $ 10.81       8.1 %
  State Investors Bancorp, Inc. - LA*
 
7/7/11
  SIBC-NASDAQ     0.00 %     63.3 %     42.1 x     12.2 %     0.3 %     19.3 %     1.5 %   $ 10.00     $ 11.85       18.5 %   $ 11.66       16.6 %   $ 11.60       16.0 %   $ 11.50       15.0 %
  First Connecticut Bancorp, Inc. - CT*
 
6/30/11
  FBNK-NASDAQ     0.00 %     72.9 %     121.1 x     11.2 %     0.1 %     15.3 %     0.6 %   $ 10.00     $ 11.08       10.8 %   $ 11.16       11.6 %   $ 11.11       11.1 %   $ 10.47       4.7 %
  Averages - Standard Conversions:     0.00 %     66.5 %     61.9 x     11.4 %     0.3 %     17.2 %     1.6 %   $ 10.00     $ 11.53       15.3 %   $ 11.49       14.9 %   $ 11.19       11.9 %   $ 10.93       9.3 %
  Medians - Standard Conversions:     0.00 %     63.4 %     42.1 x     11.2 %     0.3 %     17.0 %     1.5 %   $ 10.00     $ 11.67       16.7 %   $ 11.65       16.5 %   $ 11.11       11.1 %   $ 10.81       8.1 %
                                                                                                                                         
  Second Step Conversions
                                                                                                                               
  Naugatuck Valley Fin. Corp., - CT*
 
6/30/11
  NVSL-NASDAQ     0.00 %     69.2 %     30.48       9.5 %     0.3 %     13.7 %     2.3 %   $ 8.00     $ 7.90       -1.3 %   $ 7.80       -2.5 %   $ 8.15       1.9 %   $ 7.58       -5.3 %
                                                                                                                                         
  Averages - All Conversions:     0.00 %     67.2 %     54.0 x     10.9 %     0.3 %     16.3 %     1.8 %   $ 9.50     $ 10.63       11.2 %   $ 10.57       10.6 %   $ 10.43       9.4 %   $ 10.09       5.6 %
  Medians - All Conversions:     0.00 %     66.3 %     36.3 x     10.9 %     0.3 %     16.1 %     1.9 %   $ 10.00     $ 11.38       13.8 %   $ 11.41       14.1 %   $ 10.98       9.8 %   $ 10.64       6.4 %
                                                                                                                                 
 Note: * - Appraisal performed by RP Financial; BOLD = RP Fin. Did the business plan, “NT” - Not Traded; “NA” - Not Applicable, Not Available; C/S-Cash/Stock.
 
 (1)
Non-OTS regulated thrift.
  (5)
Latest price if offering is more than one week but less than one month old.
  (9)
Former credit union.
 (2)
As a percent of MHC offering for MHC transactions.
  (6)
Mutual holding company pro forma data on full conversion basis.
     
 (3) 
Does not take into account the adoption of SOP 93-6.
  (7)
Simultaneously completed acquisition of another financial institution.
     
 (4)
Latest price if offering is less than one week old.
  (8)
Simultaneously converted to a commercial bank charter.
   
September 2, 2011


RP® Financial, LC. VALUATION ANALYSIS
IV.16
 
Shown in Table 4.3 are the current pricing ratios for the four companies that have completed fully-converted offerings during the past three months, all of which are traded on NASDAQ.  The current average P/TB ratio of the three publicly-traded recent standard conversions equaled 72.53%, based on closing stock prices as of September 2, 2011.
 
C.            The Acquisition Market
 
Also considered in the valuation was the potential impact on 1st Security’s stock price of recently completed and pending acquisitions of other thrift institutions operating in Washington.  As shown in Exhibit IV-4, there were five Washington thrift acquisitions completed from the beginning of 2000 through September 2, 2011, although there have been no such acquisitions announced since 2007.  To the extent that acquisition speculation may impact the Bank’s offering, we have largely taken this into account in selecting companies for the Peer Group which operate in markets that have experienced a comparable level of acquisition activity as the Bank’s market and, thus, are subject to the same type of acquisition speculation that may influence 1st Security’s stock.  However, since converting thrifts are subject to a three-year regulatory moratorium from being acquired, acquisition speculation in 1st Security’s stock would tend to be less compared to the stocks of the Peer Group companies.
 
In determining our valuation adjustment for marketing of the issue, we considered trends in both the overall thrift market, the new issue market including the new issue market for thrift conversions and the local acquisition market for thrift stocks.  Taking these factors and trends into account, RP Financial concluded that a slight downward adjustment was appropriate in the valuation analysis for purposes of marketing of the issue.
 
8.             Management
 
The Bank’s management team appears to have experience and expertise in all of the key areas of the Bank’s operations.  Exhibit IV-5 provides summary resumes of the Bank’s Board of Directors and senior management.  The Board and senior management have been effective in implementing an operating strategy that can be well managed by the Bank’s present organizational structure.  The Bank currently does not have any senior management positions that are vacant.


RP® Financial, LC. VALUATION ANALYSIS
IV.17
 
Table 4.3
Market Pricing Comparatives
Prices As of September 2, 2011
                                                           
       
Market
   
Per Share Data
                               
       
Capitalization
   
Core
   
Book
                               
       
Price/
   
Market
   
12 Month
   
Value/
    Pricing Ratios(3)  
Financial Institution
 
Share(1)
   
Value
   
EPS(2)
   
Share
      P/E       P/B       P/A    
P/TB
   
P/Core
 
       
($)
   
($Mil)
   
($)
   
($)
   
(x)
   
(%)
   
(%)
   
(%)
   
(x)
 
                                                                 
All Public Companies
  $ 9.92     $ 242.30     ($ 0.05 )   $ 13.11       17.83 x     76.05 %     9.47 %     81.46 %     19.48 x
Converted Last 3 Months (no MHC)
  $ 10.09     $ 81.44     $ 0.26     $ 14.22       27.53 x     70.78 %     11.56 %     70.79 %     26.59 x
                                                                             
Converted Last 3 Months (no MHC)
                                                                       
FBNK
 
First Connecticut Bancorp, Inc. of CT
  $ 10.47     $ 187.20     $ 0.08     $ 13.72    
NM
      76.31 %     11.67 %     76.31 %  
NM
 
IROQ
 
IF Bancorp, Inc. of IL
    10.81       52.01       0.45       15.78       18.96 x     68.50 %     11.61 %     68.50 %     24.02 x
NVSL
 
Naugatuck Valley Fin. Corp. of CT
    7.58       53.08       0.26       11.57       36.10 x     65.51 %     8.96 %     65.57 %     29.15 x
SIBC
 
State Investors Bancorp, Inc. of LA
    11.50       33.47       0.24       15.80    
NM
      72.78 %     14.01 %     72.78 %  
NM


Dividends(4)
    Financial Characteristics(6)  
       
Amount/
         
Payout
   
Total
   
Equity/
   
Tang Eq/
   
NPAs/
   
Reported
      Core  
Financial Institution
 
Share
   
Yield
   
Ratio(5)
   
Assets
   
Assets
   
Assets
   
Assets
   
ROA
   
ROE
   
ROA
   
ROE
 
       
($)
   
(%)
   
(%)
   
($Mil)
   
(%)
   
(%)
   
(%)
   
(%)
   
(%)
   
(%)
   
(%)
 
                                                                       
All Public Companies
  $ 0.21       1.97 %     28.72 %   $ 2,613       11.87 %     11.19 %     3.92 %     0.09 %     0.68 %     0.01 %     -0.21 %
Converted Last 3 Months (no MHC)
  $ 0.03       0.40 %     14.29 %   $ 721       15.08 %     15.08 %     1.74 %     0.33 %     2.81 %     0.29 %     3.48 %
                                                                                             
Converted Last 3 Months (no MHC)
                                                                                       
FBNK
 
First Connecticut Bancorp, Inc. of CT
  $ 0.00       0.00 %     0.00 %   $ 1,604       15.29 %     15.29 %     1.39 %     0.20 %  
NM
      0.09 %  
NM
 
IROQ
 
IF Bancorp, Inc. of IL
    0.00       0.00 %     0.00 %     448       16.95 %     16.95 %     1.36 %     0.61 %  
NM
      0.48 %  
NM
 
NVSL
 
Naugatuck Valley Fin. Corp. of CT
    0.12       1.58 %     57.14 %     593       8.83 %     8.81 %     2.93 %     0.25 %     2.81 %     0.31 %     3.48 %
SIBC
 
State Investors Bancorp, Inc. of LA
    0.00       0.00 %     0.00 %     239       19.25 %     19.25 %     1.28 %     0.24 %  
NM
      0.29 %  
NM
 
 
(1)
Average of High/Low or Bid/Ask price per share.
(2)
EPS (estimate core basis) is based on actual trailing 12 month data, adjusted to omit non-operating items on a tax-effected basis.
(3)
P/E = Price to earnings; P/B = Price to book; P/A = Price to assets; P/TB = Price to tangible book value; and P/Core = Price to core earnings.
(4)
Indicated 12 month dividend, based on last quarterly dividend declared.
(5)
Indicated 12 month dividend as a percent of trailing 12 month estimated core earnings.
(6)
ROA (return on assets) and ROE (return on equity) are indicated ratios based on trailing 12 month common earnings and average common equity and total assets balances.
(7)
Excludes from averages and medians those companies the subject of actual or rumored acquisition activities or unusual operating characteristics.
   
Source: SNL Financial, LC. and RP® Financial, LC. calculations. The information provided in this report has been obtained from sources we believe are reliable, but we cannot guarantee the accuracy or completeness of such information.
   
Copyright (c) 2011 by RP® Financial, LC.


RP® Financial, LC. VALUATION ANALYSIS
IV.18
 
Similarly, the returns, equity positions and other operating measures of the Peer Group companies are indicative of well-managed financial institutions, which have Boards and management teams that have been effective in implementing competitive operating strategies.  Therefore, on balance, we concluded no valuation adjustment relative to the Peer Group was appropriate for this factor.
 
9.            Effect of Government Regulation and Regulatory Reform
 
In summary, as a fully-converted OCC regulated institution, 1st Security will operate in substantially the same regulatory environment as the Peer Group members -- all of whom are adequately capitalized institutions and are operating with no apparent restrictions.  Exhibit IV-6 reflects the Bank’s pro forma regulatory capital ratios.  On balance, no adjustment has been applied for the effect of government regulation and regulatory reform.
 
Summary of Adjustments
 
Overall, based on the factors discussed above, we concluded that the Bank’s pro forma market value should reflect the following valuation adjustments relative to the Peer Group:
 
Table 4.4
Valuation Adjustments
1st Security Bank of Washington
 
Key Valuation Parameters:
 
Valuation Adjustment
     
Financial Condition
 
No Adjustment
Profitability, Growth and Viability of Earnings
 
Moderate Downward
Asset Growth
 
Slight Upward
Primary Market Area
 
Slight Downward
Dividends
 
No Adjustment
Liquidity of the Shares
 
No Adjustment
Marketing of the Issue
 
Slight Downward
Management
 
No Adjustment
Effect of Govt. Regulations and Regulatory Reform
 
No Adjustment
 
Valuation Approaches
 
In applying the accepted valuation methodology promulgated by the OCC and adopted by the FRB, i.e., the pro forma market value approach, we considered the three key pricing ratios in valuing the Bank’s to-be-issued stock -- price/earnings (“P/E”), price/book (“P/B”), and price/assets (“P/A”) approaches -- all performed on a pro forma basis including the effects of the stock proceeds.  In computing the pro forma impact of the conversion and the related pricing ratios, we have incorporated the valuation parameters disclosed in the Bank’s prospectus for the effective tax rate, stock benefit plan assumptions and expenses (summarized in Exhibits IV-7 and IV-8).


RP® Financial, LC. VALUATION ANALYSIS
IV.19
 
In our estimate of value, we assessed the relationship of the pro forma pricing ratios relative to the Peer Group and recent conversion offerings.
 
RP Financial’s valuation placed an emphasis on the following:
 
 
P/E Approach.  The P/E approach is generally the best indicator of long-term value for a stock.  Given the similarities between the Bank’s and the Peer Group’s earnings composition and overall financial condition, the P/E approach was carefully considered in this valuation.  At the same time, recognizing that (1) the earnings multiples will be evaluated on a pro forma basis for the Bank; and (2) the Peer Group on average has had the opportunity to realize the benefit of reinvesting and leveraging the offering proceeds, we also gave weight to the other valuation approaches.
 
 
P/B Approach.  P/B ratios have generally served as a useful benchmark in the valuation of thrift stocks, particularly in the context of an initial public offering, as the earnings approach involves assumptions regarding the use of proceeds.  RP Financial considered the P/B approach to be a valuable indicator of pro forma value, taking into account the pricing ratios under the P/E and P/A approaches.  We have also modified the P/B approach to exclude the impact of intangible assets (i.e., price/tangible book value or “P/TB”), in that the investment community frequently makes this adjustment in its evaluation of this pricing approach.
 
 
P/A Approach.  P/A ratios are generally a less reliable indicator of market value, as investors typically assign less weight to assets and attribute greater weight to book value and earnings.  Furthermore, this approach as set forth in the regulatory valuation guidelines does not take into account the amount of stock purchases funded by deposit withdrawals, thus understating the pro forma P/A ratio.  At the same time, the P/A ratio is an indicator of franchise value, and, in the case of highly capitalized institutions, high P/A ratios may limit the investment community’s willingness to pay market multiples for earnings or book value when ROE is expected to be low.
 
The Bank will adopt Statement of Position (“SOP”) 93-6, which will cause earnings per share computations to be based on shares issued and outstanding excluding unreleased ESOP shares.  For purposes of preparing the pro forma pricing analyses, we have reflected all shares issued in the offering, including all ESOP shares, to capture the full dilutive impact, particularly since the ESOP shares are economically dilutive, receive dividends and can be voted.  However, we did consider the impact of the adoption of SOP 93-6 in the valuation.


RP® Financial, LC. VALUATION ANALYSIS
IV.20
 
Based on the application of the three valuation approaches, taking into consideration the valuation adjustments discussed above, RP Financial concluded that as of September 2, 2011, the pro forma market value of the Bank’s full conversion offering equaled $24,500,000 at the midpoint, equal to 2,450,000 shares at $10.00 per share.  The $10.00 per share price was determined by the 1st Security board of directors.
 
1.           Price-to-Earnings (“P/E”).  The application of the P/E valuation method requires calculating the Bank’s pro forma market value by applying a valuation P/E multiple to the pro forma earnings base.  In attempting to apply this technique, we considered both reported earnings and a recurring earnings base, that is, earnings adjusted to exclude any one-time non-operating items, plus the estimated after-tax earnings benefit of the reinvestment of the net proceeds.  The Bank reported net income of $1,894,000 for the 12 months ended June 30, 2011.  1st Security’s income statement for the latest fiscal year included gains on the sale of former branch offices in the amount of $209,000.  This income was excluded from the core earnings calculation.  In addition, as described in Section One, as result of the net losses incurred in fiscal years 2007 through 2009, 1st Security had a net deferred tax asset of approximately $3.5 million as of June 30, 2011, of which there was a 100% reserve established at that date.  The Bank’s marginal effective statutory tax rate approximates 34%, and this is the rate utilized to calculate the net reinvestment benefit from the offering proceeds.  While the net deferred tax asset is fully reserved on the balance sheet, the Bank expects to review this status in connection with the December 31, 2011 fiscal year audit.  There is a possibility that a portion of the deferred tax asset reserve may be reversed, resulting in an increase to the Bank’s equity account.  This would imply that the Bank would then be subject to income taxes for financial reporting purposes.  For valuation purposes, we assumed core net income would include the impact of an expected tax burden, should the deferred tax valuation allowance be removed (in whole or in part) from the balance sheet.  As shown below, on a tax affected basis, assuming an effective marginal tax rate of 34.0% for the earnings adjustments, the Bank’s core earnings were determined to equal $1,112,000 for the 12 months ended June 30, 2011.  (Note:  see Exhibit IV-9 for the adjustments applied to the Peer Group’s earnings in the calculation of core earnings).


RP® Financial, LC. VALUATION ANALYSIS
IV.21
 
Table 4.5
Derivation of Core Earnings
1st Security Bank of Washington
 
     
Amount 
 
      ($000)  
         
Net income (loss), 12 Mths Ended 6/30/2011
  $ 1,894  
Less: Gain on sale of Branch Offices (1)
    (138 )
Less: Tax Impact at 34%
    (644 )
         
Core earnings estimate
  $ 1,112  
           
(1)
Tax effected at 34.0%.
       
 
Based on the Bank’s reported and estimated core earnings and incorporating the impact of the pro forma assumptions discussed previously, the Bank’s pro forma reported and core P/E multiples at the $24.5 million midpoint value equaled 14.11 times and 25.68 times, respectively, which provided for a discount of 17.39% and a premium of 35.94% relative to the Peer Group’s average reported and core P/E multiples of 17.08 times and 18.89 times, respectively (see Table 4.6).  In comparison to the Peer Group’s median reported and core earnings multiples which equaled 17.27 times and 19.71 times, respectively, the Bank’s pro forma reported and core P/E multiples at the midpoint value indicated a discount of 18.30% and a premium of 30.29%, respectively.  At the top of the super range, the Bank’s reported and core P/E multiples equaled 19.16 times and 35.62 times, respectively.  In comparison to the Peer Group’s average reported and core P/E multiples, the Bank’s P/E multiples at the top of the super range reflected a premium of 12.18% and a premium of 88.57%, respectively.  In comparison to the Peer Group’s median reported and core P/E multiples, the Bank’s P/E multiples at the top of the super range reflected premiums of 10.94% and 80.72%, respectively.
 
2.           Price-to-Book (“P/B”).  The application of the P/B valuation method requires calculating the Bank’s pro forma market value by applying a valuation P/B ratio, as derived from the Peer Group’s P/B ratio, to the Bank’s pro forma book value.  Based on the $24.5 million midpoint valuation, the Bank’s pro forma P/B and P/TB ratios both equaled 53.88% (see Table 4.6).  In comparison to the average P/B and P/TB ratios for the Peer Group of 67.44% and 70.29%, the Bank’s ratios reflected a discount of 20.11% on a P/B basis and a discount of 23.35% on a P/TB basis.  In comparison to the Peer Group’s median P/B and P/TB ratios of 69.11% and 72.48%, the Bank’s pro forma P/B and P/TB ratios at the midpoint value reflected discounts of 22.04% on a P/B basis and 25.66% on a P/TB basis.  At the top of the super range, the Bank’s P/B and P/TB ratios both equaled 61.88%.  In comparison to the Peer Group’s average P/B and P/TB ratios, the Bank’s P/B and P/TB ratios at the top of the super range reflected discounts of 8.24% and 11.96%, respectively.  In comparison to the Peer Group’s median P/B and P/TB ratios, the Bank’s P/B and P/TB ratios at the top of the super range reflected discounts of 10.46% and 14.62%, respectively.  RP Financial considered the resulting discounts under the P/B approach to be reasonable, given the nature of the calculation of the P/B ratio.


RP® Financial, LC. VALUATION ANALYSIS
IV.22
 
Table 4.6
Public Market Pricing
1st Security Bank of Washington and the Comparables
As of September 2, 2011
 
     
Market
   
Per Share Data
                               
     
Capitalization
   
Core
   
Book
                               
     
Price/
   
Market
   
12 Month
   
Value/
      Pricing Ratios(3)  
     
Share(1)
   
Value
   
EPS(2)
   
Share
     P/E      P/B      P/A    
P/TB
   
P/Core
 
     
($)
   
($Mil)
   
($)
   
($)
   
(x)
   
(%)
   
(%)
   
(%)
   
(x)
 
                                                               
1st Security Bank of Washington
                                                           
Superrange
  $ 10.00     $ 32.40     $ 0.28     $ 16.16       19.16 x     61.88 %     10.83 %     61.88 %     35.62 x
Maximum
  $ 10.00     $ 28.18     $ 0.33       17.27       16.43 x     57.90 %     9.54 %     57.90 %     30.19 x
Midpoint
  $ 10.00     $ 24.50     $ 0.39       18.56       14.11 x     53.88 %     8.38 %     53.88 %     25.68 x
Minimum
  $ 10.00     $ 20.83     $ 0.47       20.30       11.86 x     49.26 %     7.20 %     49.26 %     21.37 x
                                                                           
All Non-MHC Public Companies(7)
                                                                       
Averages
  $ 10.30     $ 270.74     ($ 0.09 )   $ 14.14       16.62 x     71.78 %     8.78 %     76.57 %     18.97 x
Medians
  $ 10.76     $ 59.66     $ 0.32     $ 13.66       15.01 x     73.23 %     8.12 %     76.67 %     18.64 x
                                                                           
All Non-MHC State of WA(7)
                                                                       
Averages
  $ 6.83     $ 347.62     ($ 0.40 )   $ 13.11       16.70 x     53.76 %     6.91 %     60.77 %     17.91 x
Medians
  $ 5.05     $ 58.65     ($ 0.13 )   $ 9.99       16.70 x     50.55 %     6.62 %     55.31 %     17.91 x
                                                                           
Comparable Group Averages
                                                                       
Averages
  $ 10.53     $ 35.05     $ 0.47     $ 15.03       17.08 x     67.44 %     9.48 %     70.29 %     18.89 x
Medians
  $ 12.70     $ 35.36     $ 0.44     $ 16.86       17.28 x     69.11 %     7.94 %     72.48 %     19.71 x
                                                                           
Peer Group
                                                                       
AFCB
Athens Bancshares, Inc. of TN
  $ 12.70     $ 35.13     $ 0.61     $ 18.16       20.82 x     69.93 %     12.40 %     70.48 %     20.82 x
EBMT
Eagle Bancorp Montana of MT
  $ 10.46     $ 40.99     $ 0.24     $ 13.39       17.15 x     78.12 %     12.38 %     78.12 %  
NM
 
FFDF
FFD Financial Corp. of Dover OH
  $ 15.00     $ 15.18     $ 0.93     $ 18.50       10.56 x     81.08 %     7.21 %     81.08 %     16.13 x
FABK
First Advantage Bancorp of TN
  $ 12.70     $ 51.90     $ 0.27     $ 16.58       27.61 x     76.60 %     14.81 %     76.60 %  
NM
 
FFNM
First Fed of N. Michigan of MI
  $ 3.75     $ 10.82     $ 0.02     $ 8.34    
NM
      44.96 %     4.94 %     45.84 %  
NM
 
JXSB
Jacksonville Bancorp, Inc. of IL
  $ 13.70     $ 26.45     $ 1.34     $ 20.06       8.73 x     68.30 %     8.68 %     73.46 %     10.22 x
LSBI
LSB Fin. Corp. of Lafayette IN
  $ 13.30     $ 20.67     $ 0.64     $ 23.38       11.47 x     56.89 %     5.74 %     56.89 %     20.78 x
LABC
Louisiana Bancorp, Inc. of LA
  $ 16.03     $ 55.11     $ 0.60     $ 17.13       22.90 x     93.58 %     17.21 %     93.58 %     26.72 x
RVSB
Riverview Bancorp, Inc. of WA
  $ 2.61     $ 58.65     $ 0.14     $ 4.80       17.40 x     54.38 %     6.62 %     71.51 %     18.64 x
TSBK
Timberland Bancorp, Inc. of WA
  $ 5.05     $ 35.58     ($ 0.13 )   $ 9.99    
NM
      50.55 %     4.84 %     55.31 %  
NM
 
 
      Dividends(4)     Financial Characteristics(6)  
     
Amount/
         
Payout
   
Total
   
Equity/
   
Tang. Eq./
   
NPAs/
   
Reported
   
Core
 
     
Share
   
Yield
   
Ratio(5)
   
Assets
   
Assets
   
Assets
   
Assets
   
ROA
   
ROE
   
ROA
   
ROE
 
     
($)
   
(%)
   
(%)
   
($Mil)
   
(%)
   
(%)
   
(%)
   
(%)
   
(%)
   
(%)
   
(%)
 
                                                                     
1st Security Bank of Washington
                                                                 
Superrange
  $ 0.00       0.00 %     0.00 %   $ 299       17.50 %     17.50 %     2.65 %     0.57 %     3.23 %     0.30 %     1.74 %
Maximum
  $ 0.00       0.00 %     0.00 %     295       16.47 %     16.47 %     2.68 %     0.58 %     3.52 %     0.32 %     1.92 %
Midpoint
  $ 0.00       0.00 %     0.00 %     292       15.56 %     15.56 %     2.71 %     0.59 %     3.82 %     0.33 %     2.10 %
Minimum
  $ 0.00       0.00 %     0.00 %     289       14.63 %     14.63 %     2.74 %     0.61 %     4.15 %     0.34 %     2.30 %
                                                                                           
All Non-MHC Public Companies(7)
                                                                                       
Averages
  $ 0.21       1.91 %     28.63 %   $ 2,773       11.62 %     10.97 %     3.70 %     0.06 %     0.48 %     -0.03 %     -0.44 %
Medians
  $ 0.16       1.45 %     0.00 %   $ 902       11.37 %     10.10 %     2.65 %     0.41 %     3.36 %     0.31 %     3.02 %
                                                                                           
All Non-MHC State of WA(7)
                                                                                       
Averages
  $ 0.05       0.34 %     13.79 %   $ 3,317       13.14 %     12.13 %     7.50 %     -0.14 %     -1.38 %     -0.21 %     -1.95 %
Medians
  $ 0.00       0.00 %     0.00 %   $ 886       12.18 %     12.18 %     6.82 %     0.00 %     0.00 %     -0.12 %     -1.06 %
                                                                                           
Comparable Group Averages
                                                                                       
Averages
  $ 0.17       1.26 %     21.20 %   $ 400       13.80 %     13.35 %     3.23 %     0.52 %     4.01 %     0.37 %     2.77 %
Medians
  $ 0.10       0.79 %     19.11 %   $ 326       12.44 %     11.47 %     2.12 %     0.57 %     3.64 %     0.35 %     2.93 %
                                                                                           
Peer Group
                                                                                       
AFCB
Athens Bancshares, Inc. of TN
  $ 0.20       1.57 %     32.79 %   $ 283       17.73 %     17.61 %     2.71 %     0.60 %     3.37 %     0.60 %     3.37 %
EBMT
Eagle Bancorp Montana of MT
  $ 0.29       2.77 %     47.54 %   $ 331       15.85 %     15.85 %     1.24 %     0.72 %     4.51 %     0.28 %     1.78 %
FFDF
FFD Financial Corp. of Dover OH
  $ 0.68       4.53 %     47.89 %   $ 211       8.89 %     8.89 %     1.53 %     0.70 %     7.79 %     0.46 %     5.10 %
FABK
First Advantage Bancorp of TN
  $ 0.20       1.57 %     43.48 %   $ 350       19.34 %     19.34 %     0.92 %     0.54 %     2.79 %     0.32 %     1.64 %
FFNM
First Fed of N. Michigan of MI
  $ 0.00       0.00 %     0.00 %   $ 219       10.99 %     10.80 %     4.71 %     0.07 %     0.61 %     0.03 %     0.24 %
JXSB
Jacksonville Bancorp, Inc. of IL
  $ 0.30       2.19 %     19.11 %   $ 305       12.70 %     11.92 %     1.27 %     1.00 %     8.72 %     0.85 %     7.44 %
LSBI
LSB Fin. Corp. of Lafayette IN
  $ 0.00       0.00 %     0.00 %   $ 360       10.10 %     10.10 %     5.92 %     0.48 %     5.08 %     0.27 %     2.80 %
LABC
Louisiana Bancorp, Inc. of LA
  $ 0.00       0.00 %     0.00 %   $ 320       18.39 %     18.39 %     0.57 %     0.74 %     3.90 %     0.64 %     3.34 %
RVSB
Riverview Bancorp, Inc. of WA
  $ 0.00       0.00 %     0.00 %   $ 886       12.23 %     9.59 %     5.10 %     0.39 %     3.28 %     0.37 %     3.06 %
TSBK
Timberland Bancorp, Inc. of WA
  $ 0.00       0.00 %  
NM
    $ 735       11.74 %     11.01 %     8.35 %     0.00 %     0.00 %     -0.12 %     -1.06 %
 
(1)
Average of High/Low or Bid/Ask price per share.
(2)
EPS (estimate core basis) is based on actual trailing 12 month data, adjusted to omit non-operating items on a tax-effected basis, and is shown on a pro forma basis where appropriate.
(3)
P/E = Price to earnings; P/B = Price to book; P/A = Price to assets; P/TB = Price to tangible book value; and P/Core = Price to core earnings.
(4)
Indicated 12 month dividend, based on last quarterly dividend declared.
(5)
Indicated 12 month dividend as a percent of trailing 12 month estimated core earnings.
(6)
ROA (return on assets) and ROE (return on equity) are indicated ratios based on trailing 12 month common earnings and average common equity and total assets balances.
(7)
Excludes from averages and medians those companies the subject of actual or rumored acquisition activities or unusual operating characteristics.
 
Source: Corporate reports, offering circulars, and RP Financial, LC. calculations. The information provided in this report has been obtained from sources we believe are reliable, but we cannot guarantee the accuracy or completeness of such information.
 
Copyright (c) 2011 by RP® Financial, LC.


RP® Financial, LC. VALUATION ANALYSIS
IV.23
 
3.           Price-to-Assets (“P/A”).  The P/A valuation methodology determines market value by applying a valuation P/A ratio to the Bank’s pro forma asset base, conservatively assuming no deposit withdrawals are made to fund stock purchases.  In all likelihood there will be deposit withdrawals, which results in understating the pro forma P/A ratio which is computed herein.  At the $24.5 million midpoint of the valuation range, the Bank’s value equaled 8.38% of pro forma assets.  Comparatively, the Peer Group companies exhibited an average P/A ratio of 9.48%, which implies a discount of 11.60% has been applied to the Bank’s pro forma P/A ratio.  In comparison to the Peer Group’s median P/A ratio of 7.94%, the Bank’s pro forma P/A ratio at the midpoint value reflects a premium of 5.54%.
 
Comparison to Recent Offerings
 
As indicated at the beginning of this chapter, RP Financial’s analysis of recent conversion offering pricing characteristics at closing and in the aftermarket has been limited to a “technical” analysis and, thus, the pricing characteristics of recent conversion offerings can not be a primary determinate of value.  Particular focus was placed on the P/TB approach in this analysis, since the P/E multiples do not reflect the actual impact of reinvestment and the source of the stock proceeds (i.e., external funds vs. deposit withdrawals).  As discussed previously, there have been three recently completed standard conversion offerings, IF Bancorp, Inc. of IL, State Investors Bancorp, Inc. of LA and First Connecticut Bancorp, Inc. of CT.  In comparison to the average closing pro forma P/TB ratio of these offerings, 66.5%, the Bank’s P/TB ratio of 53.88% at the midpoint value reflects an implied discount of 18.98%.  At the top of the superrange, the Bank’s pro forma P/TB ratio of 61.88% reflects an implied discount of 6.95% relative to the average closing pro forma P/TB ratio.  The three recent standard conversions that are traded on NASDAQ reported an average P/TB ratio, based on closing stock prices as of September 2, 2011, of 72.53%.


RP® Financial, LC. VALUATION ANALYSIS
IV.24
 
Valuation Conclusion
 
Based on the foregoing, it is our opinion that, as of September 2, 2011, the estimated aggregate pro forma market value of the shares to be issued immediately following the conversion, equaled $24,500,000 at the midpoint, equal to 2,450,000 shares offered at a per share value of $10.00.  Pursuant to conversion guidelines, the 15% valuation range indicates a minimum value of $20,825,000 and a maximum value of $28,175,000.  Based on the $10.00 per share offering price determined by the Board, this valuation range equates to total shares outstanding of 2,082,500 at the minimum and 2,817,500 at the maximum.  In the event the appraised value is subject to an increase, the aggregate pro forma market value may be increased up to a supermaximum value of $32,401,250 without a resolicitation.  Based on the $10.00 per share offering price, the supermaximum value would result in total shares outstanding of 3,240,125.  The pro forma valuation calculations relative to the Peer Group are shown in Table 4.6 and are detailed in Exhibit IV-7 and Exhibit IV-8.


EXHIBITS


RP® Financial, LC.

LIST OF EXHIBITS
 
Exhibit    
Number   Description


I-1
 
Map of Branch Office Network
       
 
I-2
 
Audited Financial Statements
       
 
I-3
 
Key Operating Ratios
       
 
I-4
 
Investment Portfolio Composition
       
 
I-5
 
Yields and Costs
       
 
I-6
 
Loan Loss Allowance Activity
       
 
I-7
 
Interest Rate Risk Analysis
       
 
I-8
 
Fixed Rate and Adjustable Rate Loans
       
 
I-9
 
Loan Portfolio Composition
       
 
I-10
 
Contractual Maturity By Loan Type
       
 
I-11
 
Loan Origination Activity
       
 
I-12
 
Non-Performing Assets
       
 
I-13
 
Deposit Composition
       
 
I-14
 
CDs by Rate and Maturity
       
 
I-15
 
Borrowings Activity
       
 
II-1
 
Description of Office Facilities
       
 
II-2
 
Historical Interest Rates
       
 
II-3
 
Market Area Demographic/Economic  Information
       
 
II-4
 
Market Area Employment by Sector


LIST OF EXHIBITS (continued)
 
Exhibit
   
Number
  Description
 
     
III-1
 
General Characteristics of Publicly-Traded Institutions
     
III-2
 
Public Market Pricing of Publicly-Traded Institutions – Northwest Region
   
< $400-Million in
     
III-3
 
Peer Group Summary Demographic and Deposit Market Share Data
     
IV-1
 
Stock Prices:  September 2, 2011
     
IV-2
 
Historical Stock Price Indices
     
IV-3
 
Historical Thrift Stock Indices
     
IV-4
 
Market Area Acquisition Activity
     
IV-5
 
Director and Senior Management Summary Resumes
     
IV-6
 
Pro Forma Regulatory Capital Ratios
     
IV-7
 
Pro Forma Analysis Sheet
     
IV-8
 
Pro Forma Effect of Conversion Proceeds
     
IV-9
 
Peer Group Core Earnings Analysis
     
V-1
 
Firm Qualifications Statement


EXHIBIT I-1
1st Security Bank of Washington
Map of Branch Office Network


Office Locations 
(MAP)
 
Copyright © and (P) 1988–2009 Microsoft Corporation and/or its suppliers. All rights reserved. http://www.microsoft.com/mappoint/
Certain mapping and direction data © 2009 NAVTEQ. All rights reserved. The Data for areas of Canada includes information taken with permission from Canadian authorities, including: © Her Majesty the Queen in Right of Canada, © Queen’s Printer for Ontario. NAVTEQ and NAVTEQ ON BOARD are trademarks of NAVTEQ. © 2009 Tele Atlas North America, Inc. All rights reserved. Tele Atlas and Tele Atlas North America are trademarks of Tele Atlas, Inc. © 2009 by Applied Geographic Systems. All rights reserved.


EXHIBIT I-2
1st Security Bank of Washington
Audited Financial Statements

[Incorporated by Reference]


Exhibit I-3
1st Security Bank of Washington
Key Operating Ratios
 
   
Six Months
Ended
June 30,
   
Years Ended December 31,
 
   
2011
   
2010
   
2010
   
2009
   
2008
   
2007
   
2006
 
                                           
Selected Financial Ratios and Other Data:
                                         
Performance ratios(1):
                                         
Return on assets (ratio of net income (loss) to average total assets)
    0.37 %     0.27 %     0.60 %     (1.75 )%     (1.55 )%     (1.60 )%     0.48 %
Return on equity (ratio of net income (loss) to average equity)
    3.94 %     2.96 %     6.54 %     (16.84 )%     (11.95 )%     (11.82 )%     3.65 %
Yield on average interest-earning assets
    6.42 %     6.75 %     6.86 %     6.62 %     7.30 %     7.28 %     7.04 %
Rate paid on average interest-bearing liabilities
    1.42 %     1.82 %     1.75 %     2.12 %     2.99 %     3.50 %     2.85 %
Interest rate spread information:
                                                       
Average during period
    5.00 %     4.93 %     5.11 %     4.50 %     4.31 %     3.79 %     4.19 %
End of period
    5.04 %     4.73 %     4.64 %     4.20 %     4.58 %     3.78 %     4.19 %
Net interest margin(2)
    5.15 %     5.16 %     5.32 %     4.79 %     4.80 %     4.41 %     4.74 %
Operating expense to average total assets
    4.15 %     4.47 %     4.49 %     5.32 %     5.24 %     6.69 %     5.54 %
Average interest-earning assets to average interest-bearing liabilities
    112.13 %     114.40 %     113.98 %     116.01 %     119.50 %     121.83 %     124.06 %
Efficiency ratio(3)
    72.95 %     68.24 %     69.86 %     84.29 %     89.41 %     125.15 %     86.26 %
                                                         
Asset quality ratios:
                                                       
Non-performing assets to total assets at end of period(4)
    2.92 %     4.27 %     3.45 %     4.64 %     0.99 %     0.08 %     0.10 %
Non-performing loans to total gross loans(4)
    0.91 %     2.67 %     2.66 %     3.12 %     1.09 %     0.08 %     0.10 %
Allowance for loan losses to non-performing loans(4)
    246.99 %     100.11 %     93.70 %     99.34 %     225.00 %     1499.45 %     1181.66 %
Allowance for loan losses to loans receivable, net
    2.30 %     2.72 %     2.56 %     3.20 %     2.51 %     1.15 %     1.24 %
                                                         
Capital ratios:
                                                       
Equity to total assets at end of period
    9.52 %     8.63 %     8.48 %     8.27 %     10.91 %     12.05 %     13.57 %
Average equity to average assets
    9.31 %     9.07 %     9.13 %     10.40 %     12.95 %     13.50 %     13.27 %
                                                         
Other data:
                                                       
Number of full service offices
    6       6       6       8       12       12       12  
Full-time equivalent employees
    79       80       79       84       112       125       130  
 

(1) Performance ratios for the six month periods ended June 30, 2011 and 2010 are annualized as appropriate.
(2) Net interest income divided by average interest earning assets.
(3) Total non-interest expense as a percentage of net interest income and total other non-interest income, excluding net securities transactions.
(4) Non-performing assets consists of non-accruing loans accruing loans more than 90 days past due, foreclosed real estate and other repossessed assets.


Exhibit I-4
1st Security Bank of Washington
Investment Portfolio Composition
 
    June 30,
2011
   
December 31,
 
       
2010
    2009     2008  
   
Book
Value
   
Fair
Value
   
Book
Value
   
Fair
Value
   
Book
Value
   
Fair
Value
   
Book
Value
   
Fair
Value
 
   
(Dollars in thousands)
 
Available-for-sale:
                                               
Federal agency securities
  $ 9,802     $ 9,833     $ 6,175     $ 6,086     $ -     $ -     $ 1,475     $ 1,472  
Municipal Bonds
    1,400       1,409       1,144       1,103       -       -       -       -  
Mortgage-backed
    424       447       434       453       592       603       1,375       1,362  
Total available-for-sale
    11,626       11,689       7,753       7,642       592       603       2,850       2,834  
                                                                 
Federal Home Loan Bank stock
    1,797       1,797       1,797       1,797       1,797       1,797       1,797       1,797  
                                                                 
Total securities available-for-sale
  $ 13,423     $ 13,486     $ 9,550     $ 9,439     $ 2,389     $ 2,400     $ 4,647     $ 4,631  


Exhibit I-5
1st Security Bank of Washington
Yields and Costs
                                           
   
 At
June 30,
2011
   
Six Months Ended
June 30,


2011
   
2010
 
   
Yield/
Rate
   
Average Balance Outstanding
   
Interest
Earned
Paid
   
Yield/
Rate
   
Average Balance Outstanding
   
Interest
Earned
Paid
   
Yield/
Rate
 
   
(Dollars in thousand)
 
Interest-earning assets:
                                         
Loans receivable, net (1)
    7.70 %   $ 218,462     $ 8,150       7.46 %   $ 232,215     $ 8,442       7.27 %
Mortgage-backed securities
    2.82       429       6       2.80       587       8       2.73  
Investment securities
    1.45       9,530       78       1.64       ---       ---       ---  
Federal Home Loan Bank stock
    ---       1,797       ---       ---       1,797       ---       ---  
Other
    0.19       27,355       29       0.21       16,119       17       0.21  
Total interest-earning assets (1)
    6.46       257,573       8,263       6.42       250,718       8,467       6.75  
                                                         
Interest-bearing liabilities:
                                                       
Savings and money market
    0.86       100,471       442       0.88       71,205       330       0.93  
Interest-bearing checking
    0.61       17,546       53       0.60       20,697       102       0.99  
Certificates of deposit
    1.97       107,591       1,044       1.94       117,125       1,434       2.45  
Borrowings
    4.51       4,099       88       4.29       10,137       127       2.51  
Total interest-bearing liabilities
    1.42       229,707       1,627       1.42       219,164       1,993       1.82  
                                                         
Net interest income
                  $ 6,636                     $ 6,474          
Net interest rate spread
    5.04 %                     5.00 %                     4.93 %
Net earning assets
          $ 27,866                     $ 31,554                  
Net yield on average interest-earning assets
    5.18 %                     5.15 %                     5.16 %
Average interest-earning assets to average interest-bearing liabilities
            112.13 %                     114.40 %                
 

(1) The average loans receivable, net balances include non-accruing loans.


Exhibit I-5(continued)
1st Security Bank of Washington
Yields and Costs

   
Years Ended December 31,
 
   
2010
   
2009
   
2008
 
   
Average Balance Outstanding
   
Interest
Earned
Paid
   
Yield/
Rate
   
Average
Balance Outstanding
   
Interest
Earned
Paid
   
Yield/
Rate
   
Average
Balance Outstanding
   
Interest
Earned
Paid
   
Yield/
Rate
 
   
(Dollars in thousands)
 
Interest-earning assets:
                                                     
                                                                         
Loans receivable, net (1)
  $ 236,238     $ 17,270       7.31 %   $ 231,965     $ 16,289       7.02 %   $ 216,383     $ 16,251       7.51 %
Mortgage-backed securities
    546       15       2.75       988       38       3.85       3,135       347       11.07  
Investment securities
    1,390       19       1.37       1,267       52       4.10       4,035       181       4.49  
Federal Home Loan Bank stock
    1,797       ---       ---       1,797       ---       ---       1,797       17       0.95  
Other
    12,585       29       0.23       11,807       25       0.21       5,999       103       1.72  
Total interest-earning assets (1)
    252,556       17,333       6.86       247,824       16,404       6.62       231,349       16,899       7.30  
                                                                         
Interest-bearing liabilities:
                                                                       
Savings and money market
    76,065       711       0.94       74,407       705       0.95       78,100       1,204       1.54  
Interest-bearing checking
    19,798       187       0.94       20,977       246       1.17       13,644       235       1.72  
Certificates of deposit
    118,217       2,770       2.34       101,802       3,281       3.22       91,069       3,930       4.32  
Borrowings
    7,499       218       2.91       16,436       289       1.76       10,779       429       3.98  
Total interest-bearing liabilities
    221,579       3,886       1.75       213,622       4,521       2.12       193,592       5,798       2.99  
                                                                         
Net interest income
          $ 13,447                     $ 11,883                     $ 11,101          
Net interest rate spread
                    5.11 %                     4.50 %                     4.31 %
Net earning assets
  $ 30,977                     $ 34,202                     $ 37,757                  
Net yield on average interest-earning assets
                    5.32 %                     4.79 %                     4.80 %
Average interest-earning assets to average interest-bearing liabilities
    113.98 %                     116.01 %                     119.50 %                
 

(1) The average loans receivable, net balances include non-accruing loans.


Exhibit I-6
1st Security Bank of Washington
Loan Loss Allowance Activity
                                                         
    Six Months Ended
June 30,
   
Years Ended December 31,
 
    2011     2010     2010     2009     2008     2007     2006  
   
(Dollars in thousands)
 
Balance at beginning of period:
  $ 5,905     $ 7,405     $ 7,405     $ 5,598     $ 2,744     $ 2,706     $ 2,719  
                                                         
Charge-offs:
                                                       
Real estate loans
                                                       
One- to four-family
    ---       ---       32       ---       ---       ---       ---  
Home equity
    117       60       163       160       18       1       18  
Commercial
    612       ---       ---       ---       ---       ---       ---  
Construction
    ---       1,328       1,529       1,436       843       ---       ---  
Total real estate loans
    729       1,388       1,724       1,596       861       1       18  
Consumer loans
                                                       
Indirect home improvement
    1,301       1,190       2,490       2,195       1,006       600       355  
Automobile
    253       370       637       1,380       615       427       292  
Recreational
    148       292       413       545       93       108       125  
Home improvement
    15       31       76       35       11       13       67  
Other
    46       123       178       174       112       61       152  
Total consumer loans
    1,763       2,006       3,794       4,329       1,837       1,209       991  
Commercial business loans
    ---       74       175       ---       ---       ---       ---  
Total charge-offs
    2,492       3,468       5,693       5,925       2,698       1,210       1,009  
                                                         
Recoveries:
                                                       
Real estate loans
                                                       
Home equity
    ---       ---       ---       ---       60       ---       ---  
Total real estate loans
    ---       ---       ---       ---       60       ---       ---  
Consumer loans
                                                       
Indirect home improvement
    220       152       351       262       269       214       143  
Automobile
    120       170       275       305       178       295       390  
Recreational
    39       52       70       53       36       70       88  
Home improvement
    1       ---       ---       1       1       16       6  
Other
    13       9       17       44       71       129       123  
Total consumer loans
    393       383       713       665       555       724       750  
Commercial business loans
    ---       ---       ---       ---       ---       ---       ---  
                                                         
 Total recoveries
    393       383       713       665       615       724       750  
                                                         
Net charge-offs
    2,099       3,085       4,980       5,260       2,083       486       259  
Additions charged to operations
    1,030       1,905       3,480       7,067       4,937       578       246  
Reclassification for off-balance sheet contingencies
    ---       ---       ---       ---       ---       (54 )     ---  
Balance at end of period
  $ 4,836     $ 6,225     $ 5,905     $ 7,405     $ 5,598     $ 2,744     $ 2,706  
                                                         
Net charge-offs during the period to average loans outstanding during the period
    0.96 %     1.33 %     2.11 %     2.27  
%
    1.00  
%
    0.21
%
    0.12 %
                                                         
Net charge-offs during the period to  average non-performing assets
    25.68 %     26.83 %     47.40  
%
    89.36  
%
    148.57  
%
    195.18
%
    146.33 %
                                                         
Allowance as a percentage of non-performing loans
    246.99 %     100.11 %     93.70  
%
    99.34  
%
    225.00  
%
    1499.45
%
    1181.66 %
                                                         
Allowance as a percentage of loans receivable, net (end of period)
    2.30 %     2.72 %     2.56  
%
    3.20  
%
    2.51  
%
    1.15
%
    1.24 %


Exhibit I-7
1st Security Bank of Washington
Interest Rate Risk Analysis
 
   
June 30, 2011
 
Change in                         
Interest                          
Rates in    Net Interest Income  
 Basis                        
 Points  
$ Amount
   
$ Change
   
% Change
 
   
Dollars in thousands
 
200bp
  $ 13,485     $ 96       0.71 %
100bp
  $ 13,350     $ (40 )     (0.30 )%
0bp
  $ 13,390             ---  
(100)bp
  $ 13,849     $ 459       3.43 %


Exhibit I-8
1st Security Bank of Washington
Fixed Rate and Adjustable Rate Loans
                                                                         
    June 30, 2011    
2010
    2009    
December 31,
2008
   
2007
   
2006
 
   
Amount
   
Percent
   
Amount
   
Percent
   
Amount
    Percent    
Amount
    Percent     Amount     Percent     Amount     Percent  
    (Dollars in thousands)  
Fixed-rate loans:
                                                                       
Real estate loans:
                                                                       
Commercial
  $ 14,223       6.63 %   $ 16,333       6.90 %   $ 15,729       6.59 %   $ 16,449       7.20 %   $ 15,852       6.58 %   $ 8,959       4.06 %
Multi-family
    1,168       0.54       1,159       0.49       409       0.17       405       0.17       968       0.40       592       0.27  
One- to four-family
    6,305       2.94       6,585       2.79       4,552       1.91       6,159       2.70       57,610       23.93       64,919       29.39  
Home equity
    2,516       1.17       2,784       1.18       3,839       1.61       5,399       2.36       6,616       2.75       6,812       3.08  
Construction and development
    1,825       0.85       1,556       0.66       501       0.21       105       0.05       110       0.05       196       0.09  
Total real estate loans
    26,037       12.13       28,417       12.02       25,030       10.49       28,517       12.48       81,156       33.71       81,478       36.89  
                                                                                                 
Consumer
    124,650       58.10       135,752       57.39       137,231       57.53       126,221       55.29       116,329       48.32       108,756       49.23  
Commercial business
    2,422       1.14       1,049       0.45       870       0.36       454       0.20       165       0.07       -       ---  
Total fixed-rate loans
    153,109       71.37       165,218       69.86       163,131       68.38       155,192       67.97       197,650       82.10       190,234       86.12  
                                                                                                 
Adjustable-rate loans:
                                                                                               
Real estate loans:
                                                                                               
Commercial
    11,452       5.34       11,728       4.96       13,370       5.61       9,423       4.13       1,457       0.61       1,495       0.67  
Multi-family
    ---       ---       ---       ---       ---       ---       3       0.01       4       0.01       ---       ---  
One- to four-family
    6,528       3.04       6,633       2.80       3,681       1.54       810       0.35       2,946       1.22       2,765       1.25  
Home equity
    12,923       6.03       12,871       5.44       12,609       5.29       13,290       5.83       13,105       5.44       15,788       7.15  
Construction and development
    4,479       2.09       8,249       3.49       16,889       7.08       23,756       10.40       6,410       2.66       2,405       1.09  
Total real estate loans
    35,382       16.50       39,481       16.69       46,549       19.52       47,282       20.72       23,922       9.94       22,453       10.16  
                                                                                                 
Consumer
    10       0.01       13       0.01       24       0.01       54       0.02       151       0.06       564       0.26  
Commercial business
    26,008       12.12       31,792       13.44       28,829       12.09       25,764       11.29       19,032       7.90       7,649       3.46  
Total adjustable-rate loans
    61,400       28.63       71,286       30.14       75,402       31.62       73,100       32.03       43,105       17.90       30,666       13.88  
                                                                                                 
Total gross loans receivable
    214,509       100.00 %     236,504       100.00 %     238,533       100.00 %     228,292       100.00 %     240,755       100.00 %     220,900       100.00 %
                                                                                                 
Less:
                                                                                               
Deferred fees and discounts
    511               223               313               280               (204 )             (116 )        
Allowance for losses
    (4,836 )             (5,905 )             (7,405 )             (5,598 )             (2,744 )             (2,706 )        
Total loans receivable, net
  $ 210,184             $ 230,822             $ 231,441             $ 222,974             $ 237,807             $ 218,078          


Exhibit I-9
1st Security Bank of Washington
Loan Portfolio Composition

         
December 31,
 
   
June 30, 2011
   
2010
   
2009
   
2008
   
2007
   
2006
 
   
Amount
   
Percent
   
Amount
   
Percent
   
Amount
   
Percent
   
Amount
   
Percent
   
Amount
   
Percent
   
Amount
   
Percent
 
   
(Dollars in thousands)
 
Real estate loans:
                                                                       
Commercial
  $ 25,675       11.97 %   $ 28,061       11.86 %   $ 29,099       12.20 %   $ 25,872       11.33 %   $ 17,309       7.19 %   $ 10,454       4.73 %
Multi-family
    1,168       0.54       1,159       0.49       409       0.17       408       0.18       972       0.41       592       0.27  
One- to four-family
    12,833       5.98       13,218       5.59       8,233       3.45       6,969       3.05       60,556       25.15       67,684       30.64  
Home equity
    15,439       7.20       15,655       6.62       16,448       6.90       18,689       8.19       19,721       8.19       22,600       10.23  
Construction and development
    6,304       2.94       9,805       4.15       17,390       7.29       23,861       10.45       6,520       2.71       2,601       1.18  
Total real estate loans
    61,419       28.63       67,898       28.71       71,579       30.01       75,799       33.20       105,078       43.65       103,931       47.05  
                                                                                                 
Consumer Loans:
                                                                                               
Indirect home improvement
    87,232       40.67       94,833       40.10       89,883       37.68       75,203       32.94       69,559       28.89       62,099       28.11  
Recreational
    25,341       11.81       24,105       10.19       18,011       7.55       12,165       5.33       11,727       4.87       13,182       5.97  
Automobile
    8,927       4.16       12,645       5.35       23,359       9.79       30,514       13.37       25,991       10.80       28,473       12.89  
Home improvement
    1,070       0.50       1,295       0.55       1,725       0.72       2,203       0.96       2,952       1.23       1,005       0.45  
Other
    2,090       0.97       2,887       1.21       4,277       1.80       6,190       2.71       6,251       2.59       4,561       2.07  
Total consumer loans
    124,660       58.11       135,765       57.40       137,255       57.54       126,275       55.31       116,480       48.38       109,320       49.49  
                                                                                                 
Commercial business loans
    28,430       13.26       32,841       13.89       29,699       12.45       26,218       11.49       19,197       7.97       7,649       3.46  
                                                                                                 
Total gross loans receivable
    214,509       100.00 %     236,504       100.00 %     238,533       100.00 %     228,292       100.00 %     240,755       100.00 %     220,900       100.00 %
                                                                                                 
Less:
                                                                                               
Deferred fees and discounts
    511               223               313               280               (204 )             (116 )        
Allowance for losses
    (4,836 )             (5,905 )             (7,405 )             (5,598 )             (2,744 )             (2,706 )        
Total loans receivable, net
  $ 210,184             $ 230,822             $ 231,441             $ 222,974             $ 237,807             $ 218,078          


Exhibit I-10
1st Security Bank of Washington
Contractual Maturity by Loan Type
 
    Real Estate                    
    One- to Four
Family
   
Home Equity
   
Multi-family
   
Commercial
    Construction and
Development
    Consumer    
Commercial
Business
   
Total


Amount
   
Weighted
Average
Rate
   
Amount
   
Weighted
Average
Rate
   
Amount
   
Weighted
Average
Rate
   
Amount
   
Weighted
Average
Rate
   
Amount
   
Weighted
Average
Rate
   
Amount
   
Weighted
Average
Rate
   
Amount
   
Weighted
Average
Rate
   
Amount
   
Weighted
Average
Rate
 
   
(Dollars in thousands)
 
Due During
Years Ending
December 31,
                                                                                                                               
2011(1)
  $ 393       4.00 %   $ 12,875       6.02 %   $ ---       --- %   $ 6,087       6.57 %   $ 6,742       6.01 %   $ 2,729       10.41 %   $ 27,583       5.24 %   $ 56,409       5.89 %
2012
    7,064       5.40       ---       ---       381       6.57       1,520       7.00       1,902       6.00       2,576       9.06       91       6.22       13,534       6.40  
2013
    10       9.79       6       7.75       ---       ---       3,591       3.11       ---       ---       5,215       9.19       506       6.44       9,328       6.70  
2014 and 2015
    505       6.25       ---       ---       690       6.00       12,978       5.20       ---       ---       10,967       8.98       4,661       5.48       29,801       6.67  
2016 to 2020
    1,613       4.36       352       7.12       13       5.55       3,885       4.96       1,161       6.64       51,554       9.46       ---       ---       58,578       8.95  
2021 to 2025
    388       5.95       2,339       8.16       5       6.33       ---       ---       ---       ---       51,423       7.27       ---       ---       54,155       7.30  
2026 and following
    3,245       5.16       83       7.75       70       5.55       ---       ---       ---       ---       11,301       7.50       ---       ---       14,699       6.98  
  Total
  $ 13,218       5.22 %   $ 15,655       6.37 %   $ 1,159       6.16 %   $ 28,061       5.30 %   $ 9,805       6.08 %   $ 135,765       8.43 %   $ 32,841       5.29 %   $ 236,504       7.20 %
 

(1) Includes demand loans, loans having no stated maturity and overdraft loans.


Exhibit I-11
1st Security Bank of Washington
Loan Origination Activity
                               
    Six Months Ended,
June 30,
   
Years Ended December 31,
 
   
2011
    2010    
2010
   
2009
   
2008
 
   
(In thousands)
 
Originations by type:
                             
Fixed-rate:
                             
One- to four-family
  $ ---     $ 1,202     $ 2,378     $ 7,331     $ 6,668  
Home equity
    ---       ---       ---       148       647  
Multi-family
    14       731       759       6       8  
Commercial
    443       2,028       3,037       3,813       251  
Construction and development
    -       ---       ---       404       ---  
Consumer
    14,629       28,772       53,043       63,047       68,042  
Commercial business (excluding warehouse lines)
    1,725       270       384       476       570  
    Total fixed-rate
    16,811       33,003       59,601       75,225       76,186  
                                         
Adjustable- rate:
                                       
One- to four-family
    ---       ---       1,221       2,582       3,024  
Home equity
    2,164       1,768       5,266       4,743       5,176  
Multi-family
    ---       ---       ---       ---       ---  
Commercial
    48       3       555       1,122       13,480  
Construction and development
    ---       595       775       3,471       16,131  
Consumer
    ---       ---       3       11       6  
Commercial business (excluding warehouse lines)
    3,763       4,285       15,380       23,853       25,674  
Warehouse lines, net
    6,501       11,416       11,940       8,199       ---  
    Total adjustable-rate
    12,476       18,067       35,140       43,981       63,491  
    Total loans originated
    29,287       51,070       94,741       119,206       139,677  
                                         
Sales and repayments:
                                       
One- to four-family
    ---       ---       ---       6,429       6,669  
    Total loans sold
    ---       ---       ---       6,429       6,669  
Mortgage-backed securities
    ---       ---       ---       ---       48,635  
    Total sales
    ---       ---       ---       6,429       55,304  
Total principal repayments
    51,282       54,982       96,770       102,536       96,836  
   Total reductions
    51,282       54,982       96,770       108,965       152,140  
    Net increase (decrease)
  $ (21,995 )   $ (3,912 )   $ (2,029 )   $ 10,241     $ (12,463 )


Exhibit I-12
1st Security Bank of Washington
Non-Performing Assets

   
June 30,
   
December 31,
 
   
2011
   
2010
   
2009
   
2008
   
2007
   
2006
 
Non-accruing loans:
 
(Dollars in thousands)
 
 Real estate loans:
                                   
One- to four-family
  $ 234     $ 211     $ ---     $ ---     $ ---     $ ---  
                                                 
Home equity
    605       574       40       87       10       22  
                                                 
Commercial
    ---       1,201       ---       ---       ---       ---  
                                                 
Construction and development
    ---       2,175       6,758       1,953       ---       ---  
Total real estate loans
    839       4,161       6,798       2,040       10       22  
                                                 
Consumer loans:
                                               
Indirect home improvement
    421       522       276       308       117       127  
Automobile
    37       54       35       62       50       37  
Recreational
    1       38       119       32       3       29  
Home improvement
    37       75       3       ---       ---       ---  
Other
    8       3       60       16       3       14  
Total consumer loans
    504       692       493       418       173       207  
Commercial business loans
    558       1,387       ---       ---       ---       ---  
Total non-accruing loans
    1,901       6,240       7,291       2,458       183       229  
                                                 
Accruing loans delinquent more than 90 days:
                                               
Home equity
    57       62       163       30       ---       ---  
Total accruing loans delinquent more than 90 days
    57       62       163       30       ---       ---  
                                                 
Real estate owned
    5,925       3,701       5,484       ---       ---       ---  
                                                 
Repossessed automobiles, recreational vehicles
    92       78       130       44       16       26  
                                                 
Total non-performing assets
  $ 7,975     $ 10,081     $ 13,068     $ 2,532     $ 199     $ 255  
                                                 
Restructured loans
  $ 1,538     $ 1,538     $ ---     $ ---     $ ---     $ ---  
                                                 
Total non-performing assets as a percentage of total assets
    2.92 %     3.45 %     4.64 %     0.99 %     0.08 %     0.10 %


Exhibit I-13
1st Security Bank of Washington
Deposit Composition
                                                 
         
December 31,
 
    June 30, 2011       2010      2009     2008   
    Amount     Percent
of Total
    Amount     Percent
of Total
    Amount     Percent
of Total
    Amount     Percent
of Total
 
   
(Dollars in thousands)
 
Transactions and Savings Deposits:
                                               
                                                 
Interest-bearing checking
  $ 17,303       7.16 %   $ 19,458       7.98 %   $ 22,764       9.86 %   $ 13,928       6.45 %
Noninterest-bearing checking
    17,212       7.13       18,547       7.58       25,126       10.88       20,072       9.29  
Savings
    12,118       5.02       12,961       5.31       16,858       7.30       26,312       12.18  
Money market
    88,930       36.83       81,470       33.40       53,611       23.21       55,799       25.83  
                                                                 
Total transaction and savings deposits
    135,563       56.14       132,436       54.27       118,359       51.25       116,111       53.75  
                                                                 
Certificates:
                                                               
                                                                 
0.00 – 1.99%
    71,617       29.66       74,366       30.49       38,303       16.58       114       0.05  
2.00 – 3.99%
    31,051       12.86       33,006       13.53       59,618       25.81       64,901       30.04  
4.00 – 5.99%
    3,023       1.25       3,720       1.53       14,290       6.18       34,435       15.93  
6.00 – 7.99%
    ---       ---       ---       ---       18       0.01       130       0.06  
8.00 – 9.99%
    221       0.09       429       0.18       397       0.17       365       0.17  
10.00 and over
    ---       ---       ---       ---       ---       ---       ---       ---  
                                                                 
Total certificates
    105,912       43.86       111,521       45.73       112,626       48.75       99,945       46.25  
                                                                 
Total deposits
  $ 241,475       100.00 %   $ 243,957       100.00 %   $ 230,985       100.00 %   $ 216,056       100.00 %


Exhibit I-14
1st Security Bank of Washington
CDs by Rate and Maturity
                                                                 
   
0.00-
1.99%
   
2.00-
3.99%
   
4.00-
5.99%
   
6.00-
7.99%
   
8.00-
9.99%
   
10.00%
or
greater
   
Total
   
Percent
of Total
 
   
(Dollars in thousands)
 
       
Certificate accounts maturing
in quarter ending:
                                                               
                                                                 
September 30, 2011
 
$
15,621
   
$
1,394
   
$
157
   
$
---
   
$
181
   
$
---
   
$
17,353
     
16.38
%
December 31, 2011
   
6,700
     
1,263
     
1,583
     
---
     
34
     
---
     
9,580
     
9.05
 
March 31, 2012
   
6,646
     
434
     
293
     
---
     
6
     
---
     
7,379
     
6.97
 
June 30, 2012
   
8,975
     
7,374
     
9
     
---
     
---
     
---
     
16,358
     
15.44
 
September 30, 2012
   
11,668
     
133
     
14
     
---
     
---
     
---
     
11,815
     
11.16
 
December 31, 2012
   
18,910
     
1,079
     
385
     
---
     
---
     
---
     
20,374
     
19.24
 
March 31, 2013
   
576
     
423
     
80
     
---
     
---
     
---
     
1,079
     
1.02
 
June 30, 2013
   
1,149
     
81
     
---
     
---
     
---
     
---
     
1,230
     
1.16
 
September 30, 2013
   
127
     
766
     
128
     
---
     
---
     
---
     
1,021
     
0.96
 
December 31, 2013
   
192
     
1,819
     
203
     
---
     
---
     
---
     
2,214
     
2.09
 
March 31, 2014
   
206
     
322
     
171
     
---
     
---
     
---
     
699
     
0.66
 
June 30, 2014
   
339
     
432
     
---
     
---
     
---
     
---
     
771
     
0.73
 
Thereafter
   
508
     
15,531
     
---
     
---
     
---
     
---
     
16,039
     
15.14
 
                                                                 
Total
 
$
71,617
   
$
31,051
   
$
3,023
   
$
---
   
$
221
   
$
---
   
$
105,912
     
100.00
%
                                                                 
Percent of total
   
67.62
%
   
29.32
%
   
2.85
%
   
---
%
   
0.21
%
   
---
%
   
100.00
%


Exhibit I-15
1st Security Bank of Washington
Borrowing Activity
 
   
Six Months Ended
June 30,
   
Years Ended December 31,
 
   
2011
   
2010
   
2010
   
2009
   
2008
 
   
(Dollars in thousands)
 
Maximum balance:
                             
Federal Home Loan Bank advances
  $ 21,900     $ 15,900     $ 23,900     $ 11,900     $ 30,400  
Fed Funds Purchased
  $ ---     $ ---     $ ---     $ 600     $ 897  
Federal Reserve Bank
  $ ---     $ 15,000     $ 37,000     $ 30,000     $ ---  
                                         
Average balances:
                                       
Federal Home Loan Bank advances
  $ 4,099     $ 5,535     $ 4,879     $ 6,404     $ 10,796  
Fed Funds Purchased
  $ ---     $ ---     $ ---     $ 5     $ 4  
Federal Reserve Bank
  $ ---     $ 4,602     $ 2,620     $ 10,027     $ ---  
                                         
Weighted average interest rate:
                                       
Federal Home Loan Bank advances
    4.29 %     4.37 %     4.31 %     4.13 %     3.97 %
Fed Funds Purchased
    --- %     --- %     --- %     1.27 %     3.37 %
Federal Reserve Bank
    --- %     0.26 %     0.29 %     0.25 %     --- %
 
    June 30,
2011
   
December 31,
 
       
2010
   
2009
   
2008
 
   
(Dollars in thousands)
 
Balance outstanding at end of period:
                       
Federal Home Loan Bank advances
  $ 3,900     $ 21,900     $ 5,900     $ 9,400  
Fed Funds Purchased
    ---       ---       ---       ---  
Federal Reserve Bank
    ---       ---       20,000       ---  
Total borrowings
  $ 3,900     $ 21,900     $ 25,900     $ 9,400  
                                 
Weighted average interest rate of:
                               
   Federal Home Loan Bank advances
    4.49 %     1.42 %     4.41 %     3.00 %
   Fed Funds Purchased
    ---       ---       ---       ---  
Federal Reserve Bank
    ---       ---       0.25 %     ---  


Exhibit II-1
1st Security Bank of Washington
Description of Office Facilities
 
Location
 
Square
Footage
   
Owned or
Leased
   
Lease
Expiration Date
   
Net Book Value at
June 30, 2011
 
                     
(In thousands)
 
                             
Canyon Park
    2,997    
Leased
   
May 2015(1)
    $ 27  
22020 17th Ave SE, Suite 100
Bothell, WA  98021
                           
                             
Edmonds
    1,080    
Owned
     ---       319  
620 Edmonds Way
Edmonds, WA  98020
                             
                               
Lynnwood
    3,000    
Leased
   
June 2020
      236  
19002 33rd Ave W
Lynnwood, WA  98036
                             
                               
Mountlake Terrace (Admin)
    39,535    
Owned
     ---       3,436  
6920 220th St SW
Mountlake Terrace, WA  98043
                             
                               
Poulsbo
    2,223    
Owned
     ---       2,988  
21650 Market Place
Poulsbo, WA  98370
                             
                               
Puyallup
    2,474    
Owned
     ---       1,503  
307 W Stewart St
Puyallup, WA  98371
                             
                               
Overlake
    2,331    
Leased
   
June 2016(2)
      394  
14808 NE 24th St, Suite D
Redmond,  WA  98052


(1)  Lease provides for one five-year renewal.
(2)  Lease provides for two five-year renewals.


Exhibit II-2
Historical Interest Rates (1)
                             
     
Prime
   
90 Day
   
One Year
   
10 Year
 
Year/Qtr. Ended
 
 
Rate
   
T-Bill
   
T-Bill
   
T-Bond
 
                           
2003:
Quarter 1
    4.25 %     1.14 %     1.19 %     3.83 %
 
Quarter 2
    4.00 %     0.90 %     1.09 %     3.54 %
 
Quarter 3
    4.00 %     0.95 %     1.15 %     3.96 %
 
Quarter 4
    4.00 %     0.95 %     1.26 %     4.27 %
                                   
2004:
Quarter 1
    4.00 %     0.95 %     1.20 %     3.86 %
 
Quarter 2
    4.00 %     1.33 %     2.09 %     4.62 %
 
Quarter 3
    4.75 %     1.70 %     2.16 %     4.12 %
 
Quarter 4
    5.25 %     2.22 %     2.75 %     4.24 %
                                   
2005:
Quarter 1
    5.75 %     2.80 %     3.43 %     4.51 %
 
Quarter 2
    6.00 %     3.12 %     3.51 %     3.98 %
 
Quarter 3
    6.75 %     3.55 %     4.01 %     4.34 %
 
Quarter 4
    7.25 %     4.08 %     4.38 %     4.39 %
                                   
2006:
Quarter 1
    7.75 %     4.63 %     4.82 %     4.86 %
 
Quarter 2
    8.25 %     5.01 %     5.21 %     5.15 %
 
Quarter 3
    8.25 %     4.88 %     4.91 %     4.64 %
 
Quarter 4
    8.25 %     5.02 %     5.00 %     4.71 %
                                   
2007:
Quarter 1
    8.25 %     5.04 %     4.90 %     4.65 %
 
Quarter 2
    8.25 %     4.82 %     4.91 %     5.03 %
 
Quarter 3
    7.75 %     3.82 %     4.05 %     4.59 %
 
Quarter 4
    7.25 %     3.36 %     3.34 %     3.91 %
                                   
2008:
Quarter 1
    5.25 %     1.38 %     1.55 %     3.45 %
 
Quarter 2
    5.00 %     1.90 %     2.36 %     3.99 %
 
Quarter 3
    5.00 %     0.92 %     1.78 %     3.85 %
 
Quarter 4
    3.25 %     0.11 %     0.37 %     2.25 %
                                   
2009:
Quarter 1
    3.25 %     0.21 %     0.57 %     2.71 %
 
Quarter 2
    3.25 %     0.19 %     0.56 %     3.53 %
 
Quarter 3
    3.25 %     0.14 %     0.40 %     3.31 %
 
Quarter 4
    3.25 %     0.06 %     0.47 %     3.85 %
                                   
2010:
Quarter 1
    3.25 %     0.16 %     0.41 %     3.84 %
 
Quarter 2
    3.25 %     0.18 %     0.32 %     2.97 %
 
Quarter 3
    3.25 %     0.16 %     0.27 %     2.53 %
 
Quarter 4
    3.25 %     0.12 %     0.29 %     3.30 %
                                   
2011:
Quarter 1
    3.25 %     0.09 %     0.30 %     3.47 %
 
Quarter 2
    3.25 %     0.03 %     0.19 %     3.18 %
 
September 2, 2011
    3.25 %     0.02 %     0.10 %     2.02 %
                                   
(1)   End of period data.
                               
                                   
Source:  SNL Financial, LC.


EXHIBIT II-3
1st Security Bank of Washington
Market Area Demographic/Economic Information


Demographic Summary: US


Base
2000
   
Current
2010
   
Projected
2015
   
% Change
2000 - 2010
   
% Change
2010 - 2015
 
Total Population (actual)
    281,421,906       311,212,863       323,209,391       10.59       3.85  
  0-14 Age Group (%)
    21.41       20.08       20.13       3.73       4.12  
  15-34 Age Group (%)
    28.10       27.22       26.97       7.13       2.89  
  35-54 Age Group (%)
    29.43       28.03       26.02       5.33       (3.60 )
  55-69 Age Group (%)
    12.01       15.54       17.31       43.07       15.64  
  70+ Age Group (%)
    9.05       9.12       9.57       11.52       8.98  
  Median Age (actual)
    35.30       37.00       37.30       4.82       0.81  
                                         
Female Population (actual)
    143,368,343       158,066,879       164,008,125       10.25       3.76  
Male Population (actual)
    138,053,563       153,145,984       159,201,266       10.93       3.95  
                                         
Population Density  (#/ sq miles)
    79.52       88.00       91.40       10.59       3.85  
                                         
Diversity Index (actual)
    54.60       61.00       63.40       11.72       3.93  
  Black (%)
    12.32       12.47       12.47       11.95       3.92  
  Asian (%)
    3.64       4.52       4.93       37.44       13.25  
  White (%)
    75.14       71.93       70.71       5.86       2.10  
  Hispanic (%)
    12.55       16.23       17.80       43.08       13.90  
  Pacific Islander (%)
    0.14       0.16       0.16       26.20       2.93  
  American Indian/Alaska Native (%)
    0.88       0.94       0.95       18.14       4.63  
  Multiple races (%)
    2.43       2.99       3.22       36.35       11.72  
  Other (%)
    5.46       6.99       7.55       41.57       12.29  
                                         
Population 25+ w/ Education Attainment (actual)
    182,211,639       205,370,648    
NA
      12.71    
NA
 
  < 9th Grade (%)
    7.55       6.26    
NA
      (6.48 )  
NA
 
  Some High School (%)
    12.05       8.49    
NA
      (20.61 )  
NA
 
  High School Graduate (%)
    28.63       29.55    
NA
      16.35    
NA
 
  Some College (%)
    21.05       19.91    
NA
      6.61    
NA
 
  Associate Degree (%)
    6.32       7.75    
NA
      38.19    
NA
 
  Bachelors Degree (%)
    15.54       17.67    
NA
      28.15    
NA
 
  Graduate Degree (%)
    8.86       10.36    
NA
      31.85    
NA
 
                                         
Total Households (actual)
    105,480,101       116,761,140       121,359,604       10.69       3.94  
  < $25K Households (%)
    28.67       20.78       17.21       (19.76 )     (13.94 )
  $25-49K Households (%)
    29.34       24.73       19.96       (6.70 )     (16.10 )
  $50-99K Households (%)
    29.70       35.65       38.10       32.90       11.08  
  $100-$199K Households (%)
    9.92       15.35       20.29       71.27       37.39  
  $200K+ Households (%)
    2.37       3.48       4.43       62.64       32.30  
                                         
  < 25K Disposable Inc. Households (%)
 
NA
      25.14    
NA
   
NA
   
NA
 
  $25-49K Disposable Inc. Households (%)
 
NA
      31.81    
NA
   
NA
   
NA
 
  $50-99K Disposable Inc. Households (%)
 
NA
      32.05    
NA
   
NA
   
NA
 
  $100-199K Disposable Inc. Households (%)
 
NA
      9.07    
NA
   
NA
   
NA
 
  $200K+ Disposable Inc. Households (%)
 
NA
      1.92    
NA
   
NA
   
NA
 
                                         
Average Household Income ($)
    56,644       70,173       79,340       23.88       13.06  
Median Household Income ($)
    42,164       54,442       61,189       29.12       12.39  
Per Capita Income ($)
    21,587       26,739       30,241       23.87       13.10  
                                         
  < $35K Net Worth HHs (%)
 
NA
      34.96    
NA
   
NA
   
NA
 
  $35-99K Net Worth HHs (%)
 
NA
      16.38    
NA
   
NA
   
NA
 
  $100-249K Net Worth HHs (%)
 
NA
      19.13    
NA
   
NA
   
NA
 
  $250-499K Net Worth HHs (%)
 
NA
      12.97    
NA
   
NA
   
NA
 
  $500K+ Net Worth HHs (%)
 
NA
      16.56    
NA
   
NA
   
NA
 
                                         
Median Household Net Worth ($)
 
NA
      93,084    
NA
   
NA
   
NA
 
Average Household Net Worth ($)
 
NA
      418,865    
NA
   
NA
   
NA
 
                                         
Total Owner Occupied Housing Units (actual)
    69,815,753       76,868,769       80,072,859       10.10       4.17  
  < $100K in Value HUs (%)
    44.57       27.39       21.82       (32.34 )     (17.01 )
  $100-199K in Value HUs (%)
    35.18       34.48       31.82       7.91       (3.86 )
  $200-299K in Value HUs (%)
    11.17       17.08       18.53       68.27       13.06  
  $300-499K in Value HUs (%)
    6.12       12.49       15.57       124.59       29.83  
  $500-749K in Value HUs (%)
    1.71       5.07       6.11       226.81       25.56  
  $750-999K in Value HUs (%)
    0.60       2.10       3.25       283.43       61.43  
  $1M+ in Value HUs (%)
    0.64       1.39       2.89       140.29       115.95  
                                         
Renter Occupied Housing Units (actual)
    35,664,348       39,892,371       41,286,745       11.86       3.50  
Vacant Occupied Housing Units (actual)
    10,424,540       15,846,596       18,246,660       52.01       15.15  
 
                                       
Unemployment Rate (%)
    5.8       10.8       8.8       107.37       (15.44 )
 
Source: ESRI
Demographic data is provided by ESRI based primarily on US Census data. For non-census year data, ESRI uses samples and projections to estimate the demographic data. SNL performs calculations on the underlying data provided by ESRI for some of the data presented on this page.
 
Copyright 2011, SNL Financial LC


Demographic Summary: Washington


Base
2000
   
Current
2010
   
Projected
2015
   
% Change
2000 - 2010
   
% Change
2010 - 2015
 
Total Population (actual)
    5,894,121       6,756,150       7,175,641       14.63       6.21  
  0-14 Age Group (%)
    21.29       19.60       19.69       5.53       6.65  
  15-34 Age Group (%)
    28.15       27.61       27.39       12.43       5.34  
  35-54 Age Group (%)
    30.90       28.58       26.42       6.01       (1.80 )
  55-69 Age Group (%)
    11.41       15.89       17.57       59.53       17.48  
  70+ Age Group (%)
    8.24       8.32       8.94       15.71       14.04  
  Median Age (actual)
    35.30       37.10       37.30       5.10       0.54  
                                         
Female Population (actual)
    2,959,821       3,394,873       3,606,961       14.70       6.25  
Male Population (actual)
    2,934,300       3,361,277       3,568,680       14.55       6.17  
                                         
Population Density  (#/ sq miles)
    88.57       101.50       107.80       14.63       6.21  
                                         
Diversity Index (actual)
    42.00       50.60       53.80       20.48       6.32  
  Black (%)
    3.23       3.61       3.75       28.12       10.46  
  Asian (%)
    5.47       6.92       7.68       45.00       17.94  
  White (%)
    81.81       77.68       75.99       8.84       3.90  
  Hispanic (%)
    7.49       10.61       11.91       62.41       19.23  
  Pacific Islander (%)
    0.41       0.47       0.47       33.49       5.80  
  American Indian/Alaska Native (%)
    1.58       1.66       1.65       20.26       5.58  
  Multiple races (%)
    3.62       4.34       4.63       37.40       13.34  
  Other (%)
    3.88       5.32       5.81       56.88       16.17  
                                         
Population 25+ w/ Education Attainment (actual)
    3,827,507       4,503,749    
NA
      17.67    
NA
 
  < 9th Grade (%)
    4.32       4.25    
NA
      15.86    
NA
 
  Some High School (%)
    8.60       6.37    
NA
      (12.83 )  
NA
 
  High School Graduate (%)
    24.91       24.75    
NA
      16.90    
NA
 
  Some College (%)
    26.41       24.03    
NA
      7.07    
NA
 
  Associate Degree (%)
    8.03       9.83    
NA
      44.02    
NA
 
  Bachelors Degree (%)
    18.41       19.83    
NA
      26.71    
NA
 
  Graduate Degree (%)
    9.32       10.94    
NA
      38.17    
NA
 
                                         
Total Households (actual)
    2,271,398       2,611,662       2,777,964       14.98       6.37  
  < $25K Households (%)
    24.73       17.52       13.69       (18.55 )     (16.90 )
  $25-49K Households (%)
    29.66       22.77       17.55       (11.76 )     (18.00 )
  $50-99K Households (%)
    33.05       39.20       38.77       36.39       5.21  
  $100-$199K Households (%)
    10.39       17.39       25.74       92.37       57.48  
  $200K+ Households (%)
    2.17       3.13       4.25       65.82       44.36  
                                         
  < 25K Disposable Inc. Households (%)
 
NA
      20.46    
NA
   
NA
   
NA
 
  $25-49K Disposable Inc. Households (%)
 
NA
      29.81    
NA
   
NA
   
NA
 
  $50-99K Disposable Inc. Households (%)
 
NA
      36.81    
NA
   
NA
   
NA
 
  $100-199K Disposable Inc. Households (%)
 
NA
      10.96    
NA
   
NA
   
NA
 
  $200K+ Disposable Inc. Households (%)
 
NA
      1.96    
NA
   
NA
   
NA
 
                                         
Average Household Income ($)
    58,653       73,128       84,725       24.68       15.86  
Median Household Income ($)
    45,770       60,311       68,768       31.77       14.02  
Per Capita Income ($)
    22,973       28,691       33,252       24.89       15.90  
                                         
  < $35K Net Worth HHs (%)
 
NA
      32.38    
NA
   
NA
   
NA
 
  $35-99K Net Worth HHs (%)
 
NA
      15.34    
NA
   
NA
   
NA
 
  $100-249K Net Worth HHs (%)
 
NA
      18.47    
NA
   
NA
   
NA
 
  $250-499K Net Worth HHs (%)
 
NA
      15.11    
NA
   
NA
   
NA
 
  $500K+ Net Worth HHs (%)
 
NA
      18.70    
NA
   
NA
   
NA
 
                                         
Median Household Net Worth ($)
 
NA
      112,030    
NA
   
NA
   
NA
 
Average Household Net Worth ($)
 
NA
      447,397    
NA
   
NA
   
NA
 
                                         
Total Owner Occupied Housing Units (actual)
    1,467,009       1,674,990       1,784,225       14.18       6.52  
  < $100K in Value HUs (%)
    21.05       8.30       5.87       (55.01 )     (24.67 )
  $100-199K in Value HUs (%)
    45.69       24.97       16.22       (37.61 )     (30.81 )
  $200-299K in Value HUs (%)
    19.28       26.94       24.70       59.48       (2.32 )
  $300-499K in Value HUs (%)
    10.11       23.96       30.85       170.71       37.17  
  $500-749K in Value HUs (%)
    2.43       10.56       10.75       396.74       8.44  
  $750-999K in Value HUs (%)
    0.75       3.25       7.31       394.18       139.52  
  $1M+ in Value HUs (%)
    0.69       2.03       4.30       237.39       125.73  
                                         
Renter Occupied Housing Units (actual)
    804,389       936,672       993,739       16.45       6.09  
Vacant Occupied Housing Units (actual)
    179,677       258,462       290,566       43.85       12.42  
 
                                       
Unemployment Rate (%)
    6.2       9.9       8.3       85.86       (12.37 )
 
Source: ESRI
Demographic data is provided by ESRI based primarily on US Census data. For non-census year data, ESRI uses samples and projections to estimate the demographic data. SNL performs calculations on the underlying data provided by ESRI for some of the data presented on this page.
 
% Change values are calculated using the underlying actual data.


Demographic Summary: Snohomish, WA


Base
2000
   
Current
2010
   
Projected
2015
   
% Change
2000 - 2010
   
% Change
2010 - 2015
 
Total Population (actual)
    606,024       712,514       757,883       17.57       6.37  
  0-14 Age Group (%)
    22.90       21.16       21.26       8.64       6.87  
  15-34 Age Group (%)
    27.66       26.97       26.91       14.64       6.15  
  35-54 Age Group (%)
    32.62       30.51       28.15       9.96       (1.84 )
  55-69 Age Group (%)
    10.21       14.59       16.31       68.05       18.91  
  70+ Age Group (%)
    6.61       6.77       7.36       20.40       15.63  
  Median Age (actual)
    34.60       36.30       36.30       4.91       0.00  
                                         
Female Population (actual)
    302,815       357,116       380,586       17.93       6.57  
Male Population (actual)
    303,209       355,398       377,297       17.21       6.16  
                                         
Population Density  (#/ sq miles)
    290.09       341.10       362.80       17.57       6.37  
                                         
Diversity Index (actual)
    32.90       45.30       49.20       37.69       8.61  
  Black (%)
    1.67       2.55       2.87       79.31       19.79  
  Asian (%)
    5.78       8.55       9.72       73.82       20.98  
  White (%)
    85.63       79.55       77.44       9.23       3.55  
  Hispanic (%)
    4.72       7.99       9.26       99.12       23.21  
  Pacific Islander (%)
    0.28       0.37       0.37       55.13       5.03  
  American Indian/Alaska Native (%)
    1.36       1.48       1.48       28.23       6.19  
  Multiple races (%)
    3.36       4.35       4.69       52.24       14.75  
  Other (%)
    1.92       3.15       3.43       93.17       15.77  
                                         
Population 25+ w/ Education Attainment (actual)
    388,997       468,863    
NA
      20.53    
NA
 
  < 9th Grade (%)
    2.60       2.63    
NA
      22.23    
NA
 
  Some High School (%)
    8.22       6.15    
NA
      (9.78 )  
NA
 
  High School Graduate (%)
    25.91       26.45    
NA
      23.06    
NA
 
  Some College (%)
    29.73       26.21    
NA
      6.28    
NA
 
  Associate Degree (%)
    9.09       10.85    
NA
      43.74    
NA
 
  Bachelors Degree (%)
    17.55       19.33    
NA
      32.79    
NA
 
  Graduate Degree (%)
    6.90       8.37    
NA
      46.14    
NA
 
                                         
Total Households (actual)
    224,852       268,239       286,226       19.30       6.71  
  < $25K Households (%)
    17.89       11.80       8.64       (21.30 )     (21.92 )
  $25-49K Households (%)
    28.13       19.25       13.72       (18.34 )     (23.96 )
  $50-99K Households (%)
    39.73       42.59       40.28       27.88       0.91  
  $100-$199K Households (%)
    12.54       23.43       33.41       122.90       52.19  
  $200K+ Households (%)
    1.72       2.93       3.95       103.66       44.11  
                                         
  < 25K Disposable Inc. Households (%)
 
NA
      14.12    
NA
   
NA
   
NA
 
  $25-49K Disposable Inc. Households (%)
 
NA
      27.98    
NA
      1,153.58    
NA
 
  $50-99K Disposable Inc. Households (%)
 
NA
      42.41    
NA
   
NA
   
NA
 
  $100-199K Disposable Inc. Households (%)
 
NA
      13.64    
NA
   
NA
   
NA
 
  $200K+ Disposable Inc. Households (%)
 
NA
      1.85    
NA
   
NA
   
NA
 
                                         
Average Household Income ($)
    62,386       79,981       91,618       28.20       14.55  
Median Household Income ($)
    53,219       68,912       79,010       29.49       14.65  
Per Capita Income ($)
    23,417       30,372       34,880       29.70       14.84  
                                         
  < $35K Net Worth HHs (%)
 
NA
      25.83    
NA
   
NA
   
NA
 
  $35-99K Net Worth HHs (%)
 
NA
      15.17    
NA
   
NA
   
NA
 
  $100-249K Net Worth HHs (%)
 
NA
      19.76    
NA
   
NA
   
NA
 
  $250-499K Net Worth HHs (%)
 
NA
      18.16    
NA
   
NA
   
NA
 
  $500K+ Net Worth HHs (%)
 
NA
      21.08    
NA
   
NA
   
NA
 
                                         
Median Household Net Worth ($)
 
NA
      156,028    
NA
   
NA
   
NA
 
Average Household Net Worth ($)
 
NA
      487,194    
NA
   
NA
   
NA
 
                                         
Total Owner Occupied Housing Units (actual)
    152,382       180,654       193,143       18.55       6.91  
  < $100K in Value HUs (%)
    9.12       6.62       5.09       (13.89 )     (17.78 )
  $100-199K in Value HUs (%)
    48.02       11.54       7.28       (71.51 )     (32.59 )
  $200-299K in Value HUs (%)
    29.57       29.54       18.56       18.43       (32.81 )
  $300-499K in Value HUs (%)
    10.88       36.56       45.81       298.58       33.95  
  $500-749K in Value HUs (%)
    1.74       11.74       12.85       698.87       17.01  
  $750-999K in Value HUs (%)
    0.34       2.70       7.40       836.66       192.77  
  $1M+ in Value HUs (%)
    0.34       1.29       3.01       353.29       148.82  
                                         
Renter Occupied Housing Units (actual)
    72,470       87,585       93,083       20.86       6.28  
Vacant Occupied Housing Units (actual)
    11,353       18,045       23,607       58.94       30.82  
 
                                       
Unemployment Rate (%)
    5.0       8.9       7.5       112.57       (12.28 )
 
Source: ESRI
Demographic data is provided by ESRI based primarily on US Census data. For non-census year data, ESRI uses samples and projections to estimate the demographic data. SNL performs calculations on the underlying data provided by ESRI for some of the data presented on this page.
 
% Change values are calculated using the underlying actual data.


Demographic Summary: King, WA


Base
2000
   
Current
2010
   
Projected
2015
   
% Change
2000 - 2010
   
% Change
2010 - 2015
 
Total Population (actual)
    1,737,034       1,936,894       2,053,695       11.51       6.03  
  0-14 Age Group (%)
    18.79       17.68       17.66       4.90       5.89  
  15-34 Age Group (%)
    29.90       28.24       28.41       5.33       6.66  
  35-54 Age Group (%)
    32.70       30.85       28.40       5.20       (2.38 )
  55-69 Age Group (%)
    10.81       15.35       17.02       58.38       17.54  
  70+ Age Group (%)
    7.80       7.88       8.51       12.55       14.61  
  Median Age (actual)
    35.70       37.80       37.90       5.88       0.26  
                                         
Female Population (actual)
    872,577       972,845       1,031,604       11.49       6.04  
Male Population (actual)
    864,457       964,049       1,022,091       11.52       6.02  
                                         
Population Density  (#/ sq miles)
    817.04       911.00       966.00       11.51       6.03  
                                         
Diversity Index (actual)
    47.30       56.40       59.90       19.24       6.21  
  Black (%)
    5.40       6.01       6.23       23.90       10.03  
  Asian (%)
    10.81       13.88       15.58       43.15       19.03  
  White (%)
    75.73       70.05       67.44       3.14       2.07  
  Hispanic (%)
    5.48       8.23       9.39       67.44       20.96  
  Pacific Islander (%)
    0.52       0.61       0.61       31.98       6.17  
  American Indian/Alaska Native (%)
    0.92       0.93       0.92       12.85       4.73  
  Multiple races (%)
    4.06       4.80       5.11       31.79       13.05  
  Other (%)
    2.56       3.73       4.11       62.35       16.88  
                                         
Population 25+ w/ Education Attainment (actual)
    1,188,740       1,341,522    
NA
      12.85    
NA
 
  < 9th Grade (%)
    3.42       3.44    
NA
      13.31    
NA
 
  Some High School (%)
    6.31       4.70    
NA
      (15.94 )  
NA
 
  High School Graduate (%)
    19.17       18.26    
NA
      7.48    
NA
 
  Some College (%)
    23.62       20.83    
NA
      (0.48 )  
NA
 
  Associate Degree (%)
    7.51       8.43    
NA
      26.61    
NA
 
  Bachelors Degree (%)
    26.62       28.24    
NA
      19.70    
NA
 
  Graduate Degree (%)
    13.33       16.10    
NA
      36.29    
NA
 
                                         
Total Households (actual)
    710,916       797,056       846,777       12.12       6.24  
  < $25K Households (%)
    19.98       13.55       9.67       (23.99 )     (24.14 )
  $25-49K Households (%)
    26.51       17.15       11.96       (27.46 )     (25.91 )
  $50-99K Households (%)
    34.79       38.26       35.11       23.29       (2.51 )
  $100-$199K Households (%)
    14.92       24.57       34.73       84.64       50.18  
  $200K+ Households (%)
    3.81       6.48       8.53       90.89       39.89  
                                         
  < 25K Disposable Inc. Households (%)
 
NA
      15.84    
NA
   
NA
   
NA
 
  $25-49K Disposable Inc. Households (%)
 
NA
      23.11    
NA
      742.10    
NA
 
  $50-99K Disposable Inc. Households (%)
 
NA
      40.14    
NA
   
NA
   
NA
 
  $100-199K Disposable Inc. Households (%)
 
NA
      16.92    
NA
   
NA
   
NA
 
  $200K+ Disposable Inc. Households (%)
 
NA
      3.99    
NA
   
NA
   
NA
 
                                         
Average Household Income ($)
    71,101       92,740       108,808       30.43       17.33  
Median Household Income ($)
    53,383       75,693       88,138       41.79       16.44  
Per Capita Income ($)
    29,521       38,562       45,291       30.63       17.45  
                                         
  < $35K Net Worth HHs (%)
 
NA
      29.64    
NA
   
NA
   
NA
 
  $35-99K Net Worth HHs (%)
 
NA
      14.32    
NA
   
NA
   
NA
 
  $100-249K Net Worth HHs (%)
 
NA
      15.72    
NA
   
NA
   
NA
 
  $250-499K Net Worth HHs (%)
 
NA
      14.26    
NA
   
NA
   
NA
 
  $500K+ Net Worth HHs (%)
 
NA
      26.07    
NA
   
NA
   
NA
 
                                         
Median Household Net Worth ($)
 
NA
      144,117    
NA
   
NA
   
NA
 
Average Household Net Worth ($)
 
NA
      633,686    
NA
   
NA
   
NA
 
                                         
Total Owner Occupied Housing Units (actual)
    425,436       471,278       500,866       10.78       6.28  
  < $100K in Value HUs (%)
    6.74       4.23       3.07       (30.45 )     (22.95 )
  $100-199K in Value HUs (%)
    34.39       11.65       6.56       (62.46 )     (40.15 )
  $200-299K in Value HUs (%)
    30.08       22.31       15.81       (17.86 )     (24.68 )
  $300-499K in Value HUs (%)
    20.00       32.38       34.80       79.37       14.21  
  $500-749K in Value HUs (%)
    5.49       18.93       17.92       282.29       0.62  
  $750-999K in Value HUs (%)
    1.78       6.02       13.14       274.21       131.81  
  $1M+ in Value HUs (%)
    1.52       4.47       8.70       226.32       106.73  
                                         
Renter Occupied Housing Units (actual)
    285,480       325,778       345,911       14.12       6.18  
Vacant Occupied Housing Units (actual)
    31,321       58,439       61,667       86.58       5.52  
 
                                       
Unemployment Rate (%)
    4.5       7.7       6.5       95.25       (12.49 )
 
Source: ESRI
Demographic data is provided by ESRI based primarily on US Census data. For non-census year data, ESRI uses samples and projections to estimate the demographic data. SNL performs calculations on the underlying data provided by ESRI for some of the data presented on this page.
 
% Change values are calculated using the underlying actual data.


Demographic Summary: Pierce, WA


Base
2000
   
Current
2010
   
Projected
2015
   
% Change
2000 - 2010
   
% Change
2010 - 2015
 
Total Population (actual)
    700,820       812,577       860,874       15.95       5.94  
  0-14 Age Group (%)
    22.65       20.61       20.80       5.51       6.90  
  15-34 Age Group (%)
    28.76       28.58       28.28       15.24       4.80  
  35-54 Age Group (%)
    30.39       28.35       26.16       8.16       (2.23 )
  55-69 Age Group (%)
    10.87       14.86       16.62       58.50       18.48  
  70+ Age Group (%)
    7.33       7.60       8.15       20.18       13.62  
  Median Age (actual)
    34.10       35.60       35.70       4.40       0.28  
                                         
Female Population (actual)
    352,263       409,045       433,658       16.12       6.02  
Male Population (actual)
    348,557       403,532       427,216       15.77       5.87  
                                         
Population Density  (#/ sq miles)
    417.43       484.00       512.80       15.95       5.94  
                                         
Diversity Index (actual)
    44.30       51.30       53.90       15.80       5.07  
  Black (%)
    6.95       7.02       7.00       17.10       5.61  
  Asian (%)
    5.08       5.90       6.34       34.82       13.70  
  White (%)
    78.39       75.33       74.17       11.43       4.31  
  Hispanic (%)
    5.51       8.44       9.70       77.54       21.73  
  Pacific Islander (%)
    0.85       0.95       0.95       30.21       6.28  
  American Indian/Alaska Native (%)
    1.42       1.53       1.56       24.90       7.76  
  Multiple races (%)
    5.11       6.01       6.40       36.32       12.77  
  Other (%)
    2.20       3.25       3.58       71.21       16.92  
                                         
Population 25+ w/ Education Attainment (actual)
    442,665       528,814    
NA
      19.46    
NA
 
  < 9th Grade (%)
    3.36       3.05    
NA
      8.38    
NA
 
  Some High School (%)
    9.77       7.04    
NA
      (13.94 )  
NA
 
  High School Graduate (%)
    29.78       30.12    
NA
      20.84    
NA
 
  Some College (%)
    28.42       25.99    
NA
      9.25    
NA
 
  Associate Degree (%)
    8.08       10.56    
NA
      56.26    
NA
 
  Bachelors Degree (%)
    13.68       15.35    
NA
      34.07    
NA
 
  Graduate Degree (%)
    6.92       7.89    
NA
      36.21    
NA
 
                                         
Total Households (actual)
    260,800       304,467       323,465       16.74       6.24  
  < $25K Households (%)
    24.19       17.28       13.52       (16.59 )     (16.90 )
  $25-49K Households (%)
    30.99       23.91       18.06       (9.94 )     (19.73 )
  $50-99K Households (%)
    34.39       41.92       42.77       42.31       8.39  
  $100-$199K Households (%)
    8.90       15.28       23.34       100.45       62.33  
  $200K+ Households (%)
    1.53       1.61       2.31       22.91       51.81  
                                         
  < 25K Disposable Inc. Households (%)
 
NA
      19.99    
NA
   
NA
   
NA
 
  $25-49K Disposable Inc. Households (%)
 
NA
      32.28    
NA
      1,659.74    
NA
 
  $50-99K Disposable Inc. Households (%)
 
NA
      37.81    
NA
   
NA
   
NA
 
  $100-199K Disposable Inc. Households (%)
 
NA
      8.88    
NA
   
NA
   
NA
 
  $200K+ Disposable Inc. Households (%)
 
NA
      1.02    
NA
   
NA
   
NA
 
                                         
Average Household Income ($)
    54,972       66,677       76,622       21.29       14.92  
Median Household Income ($)
    45,197       57,879       65,288       28.06       12.80  
Per Capita Income ($)
    20,948       25,542       29,389       21.93       15.06  
                                         
  < $35K Net Worth HHs (%)
 
NA
      33.95    
NA
   
NA
   
NA
 
  $35-99K Net Worth HHs (%)
 
NA
      15.86    
NA
   
NA
   
NA
 
  $100-249K Net Worth HHs (%)
 
NA
      19.03    
NA
   
NA
   
NA
 
  $250-499K Net Worth HHs (%)
 
NA
      15.59    
NA
   
NA
   
NA
 
  $500K+ Net Worth HHs (%)
 
NA
      15.57    
NA
   
NA
   
NA
 
                                         
Median Household Net Worth ($)
 
NA
      100,911    
NA
   
NA
   
NA
 
Average Household Net Worth ($)
 
NA
      367,197    
NA
   
NA
   
NA
 
                                         
Total Owner Occupied Housing Units (actual)
    165,598       192,241       204,923       16.09       6.60  
  < $100K in Value HUs (%)
    20.31       7.85       5.68       (55.10 )     (22.98 )
  $100-199K in Value HUs (%)
    58.26       28.31       16.19       (43.59 )     (39.05 )
  $200-299K in Value HUs (%)
    13.72       33.99       31.91       187.59       0.05  
  $300-499K in Value HUs (%)
    6.03       20.10       31.26       286.95       65.79  
  $500-749K in Value HUs (%)
    1.11       6.60       7.42       593.06       19.92  
  $750-999K in Value HUs (%)
    0.22       2.19       5.19       1,047.81       152.96  
  $1M+ in Value HUs (%)
    0.36       0.96       2.37       213.56       162.16  
                                         
Renter Occupied Housing Units (actual)
    95,202       112,226       118,542       17.88       5.63  
Vacant Occupied Housing Units (actual)
    16,260       26,072       31,536       60.34       20.96  
 
                                       
Unemployment Rate (%)
    6.5       12.0       10.1       113.24       (12.84 )
 
Source: ESRI
Demographic data is provided by ESRI based primarily on US Census data. For non-census year data, ESRI uses samples and projections to estimate the demographic data. SNL performs calculations on the underlying data provided by ESRI for some of the data presented on this page.
 
% Change values are calculated using the underlying actual data.


Demographic Summary: Kitsap, WA


Base
2000
   
Current
2010
   
Projected
2015
   
% Change
2000 - 2010
   
% Change
2010 - 2015
 
Total Population (actual)
    231,969       247,319       251,360       6.62       1.63  
  0-14 Age Group (%)
    22.07       19.34       19.35       (6.60 )     1.71  
  15-34 Age Group (%)
    26.77       27.38       27.44       9.04       1.85  
  35-54 Age Group (%)
    31.99       27.94       25.36       (6.88 )     (7.74 )
  55-69 Age Group (%)
    11.40       17.03       18.59       59.27       10.97  
  70+ Age Group (%)
    7.77       8.32       9.26       14.15       13.09  
  Median Age (actual)
    35.70       37.70       37.60       5.60       (0.27 )
                                         
Female Population (actual)
    114,459       122,447       124,492       6.98       1.67  
Male Population (actual)
    117,510       124,872       126,868       6.26       1.60  
                                         
Population Density  (#/ sq miles)
    585.78       624.60       634.80       6.62       1.63  
                                         
Diversity Index (actual)
    34.30       37.90       39.70       10.50       4.75  
  Black (%)
    2.87       2.74       2.67       1.90       (1.08 )
  Asian (%)
    4.39       4.78       4.97       15.89       5.72  
  White (%)
    84.27       82.94       82.25       4.94       0.78  
  Hispanic (%)
    4.14       5.34       5.99       37.55       13.97  
  Pacific Islander (%)
    0.78       0.78       0.78       6.70       1.35  
  American Indian/Alaska Native (%)
    1.62       1.66       1.68       9.49       2.28  
  Multiple races (%)
    4.64       5.31       5.66       21.90       8.41  
  Other (%)
    1.43       1.79       2.00       33.54       13.74  
                                         
Population 25+ w/ Education Attainment (actual)
    148,704       164,369    
NA
      10.53    
NA
 
  < 9th Grade (%)
    2.18       2.23    
NA
      12.95    
NA
 
  Some High School (%)
    7.05       5.38    
NA
      (15.67 )  
NA
 
  High School Graduate (%)
    25.42       24.55    
NA
      6.75    
NA
 
  Some College (%)
    30.97       28.08    
NA
      0.24    
NA
 
  Associate Degree (%)
    9.05       11.36    
NA
      38.80    
NA
 
  Bachelors Degree (%)
    17.00       18.32    
NA
      19.11    
NA
 
  Graduate Degree (%)
    8.33       10.08    
NA
      33.71    
NA
 
                                         
Total Households (actual)
    86,416       93,321       95,148       7.99       1.96  
  < $25K Households (%)
    22.50       16.09       12.49       (22.79 )     (20.82 )
  $25-49K Households (%)
    31.01       24.21       18.19       (15.68 )     (23.38 )
  $50-99K Households (%)
    34.86       41.72       42.17       29.22       3.07  
  $100-$199K Households (%)
    9.82       16.11       24.47       77.10       54.86  
  $200K+ Households (%)
    1.81       1.88       2.68       12.02       45.32  
                                         
  < 25K Disposable Inc. Households (%)
 
NA
      19.05    
NA
   
NA
   
NA
 
  $25-49K Disposable Inc. Households (%)
 
NA
      32.69    
NA
      1,715.80    
NA
 
  $50-99K Disposable Inc. Households (%)
 
NA
      37.48    
NA
   
NA
   
NA
 
  $100-199K Disposable Inc. Households (%)
 
NA
      9.60    
NA
   
NA
   
NA
 
  $200K+ Disposable Inc. Households (%)
 
NA
      1.18    
NA
   
NA
   
NA
 
                                         
Average Household Income ($)
    57,892       68,589       79,076       18.48       15.29  
Median Household Income ($)
    46,848       60,066       66,635       28.21       10.94  
Per Capita Income ($)
    22,317       26,450       30,570       18.52       15.58  
                                         
  < $35K Net Worth HHs (%)
 
NA
      31.08    
NA
   
NA
   
NA
 
  $35-99K Net Worth HHs (%)
 
NA
      15.11    
NA
   
NA
   
NA
 
  $100-249K Net Worth HHs (%)
 
NA
      19.52    
NA
   
NA
   
NA
 
  $250-499K Net Worth HHs (%)
 
NA
      16.01    
NA
   
NA
   
NA
 
  $500K+ Net Worth HHs (%)
 
NA
      18.28    
NA
   
NA
   
NA
 
                                         
Median Household Net Worth ($)
 
NA
      120,365    
NA
   
NA
   
NA
 
Average Household Net Worth ($)
 
NA
      409,989    
NA
   
NA
   
NA
 
                                         
Total Owner Occupied Housing Units (actual)
    58,279       62,483       63,813       7.21       2.13  
  < $100K in Value HUs (%)
    20.76       6.26       4.03       (67.66 )     (34.27 )
  $100-199K in Value HUs (%)
    52.21       28.58       15.61       (41.31 )     (44.22 )
  $200-299K in Value HUs (%)
    14.88       29.83       27.06       114.88       (7.37 )
  $300-499K in Value HUs (%)
    8.87       19.25       30.20       132.71       60.20  
  $500-749K in Value HUs (%)
    2.23       10.05       10.08       383.15       2.40  
  $750-999K in Value HUs (%)
    0.71       4.18       8.00       534.47       95.33  
  $1M+ in Value HUs (%)
    0.33       1.84       5.02       491.75       179.27  
                                         
Renter Occupied Housing Units (actual)
    28,137       30,838       31,335       9.60       1.61  
Vacant Occupied Housing Units (actual)
    6,228       9,126       11,223       46.53       22.98  
 
                                       
Unemployment Rate (%)
    6.0       9.1       7.6       78.11       (16.21 )
 
Source: ESRI
Demographic data is provided by ESRI based primarily on US Census data. For non-census year data, ESRI uses samples and projections to estimate the demographic data. SNL performs calculations on the underlying data provided by ESRI for some of the data presented on this page.
 
% Change values are calculated using the underlying actual data.


EXHIBIT II-4
1st Security Bank of Washington
Market Area Employment Data by Sector


CA25N Total full-time and part-time employment by NAICS industry 1/
Bureau of Economic Analysis
 
Fips
 
Area
 
LineCode
 
Description
 
2006
   
2007
   
2008
   
2009
 
53000
 
Washington
     
Employment by place of work (number of jobs)
                       
53000
 
Washington
  10  
Total employment
    3796256       3924717       3957397       3826315  
53000
 
Washington
     
By type
                               
53000
 
Washington
  20  
Wage and salary employment
    3080441       3154787       3190631       3053450  
53000
 
Washington
  40  
Proprietors employment
    715815       769930       766766       772865  
53000
 
Washington
  50  
Farm proprietors employment
    30089       34673       34699       34522  
53000
 
Washington
  60  
Nonfarm proprietors employment 2/
    685726       735257       732067       738343  
53000
 
Washington
     
By industry
                               
53000
 
Washington
  70  
Farm employment
    73585       74835       81862       85042  
53000
 
Washington
  80  
Nonfarm employment
    3722671       3849882       3875535       3741273  
53000
 
Washington
  90  
Private employment
    3117932       3240026       3249059       3110993  
53000
 
Washington
  100  
Forestry, fishing, and related activities
    38057       37946       37471       37867  
53000
 
Washington
  200  
Mining
    6080       6541       7174       7962  
53000
 
Washington
  300  
Utilities
    5035       5116       5521       5699  
53000
 
Washington
  400  
Construction
    263070       279311       268459       223603  
53000
 
Washington
  500  
Manufacturing
    300974       310531       307369       280888  
53000
 
Washington
  600  
Wholesale trade
    138603       142365       143533       136087  
53000
 
Washington
  700  
Retail trade
    403892       407545       402933       382284  
53000
 
Washington
  800  
Transportation and warehousing
    112540       116622       115478       109355  
53000
 
Washington
  900  
Information
    108853       113462       116527       114740  
53000
 
Washington
  1000  
Finance and insurance
    149727       156044       160405       163586  
53000
 
Washington
  1100  
Real estate and rental and leasing
    174634       185403       183176       179197  
53000
 
Washington
  1200  
Professional, scientific, and technical services
    247353       270712       280267       274503  
53000
 
Washington
  1300  
Management of companies and enterprises
    34964       36030       36167       33644  
53000
 
Washington
  1400  
Administrative and waste management services
    195377       202261       195836       179429  
53000
 
Washington
  1500  
Educational services
    63537       64480       67039       67569  
53000
 
Washington
  1600  
Health care and social assistance
    349308       361738       373702       383507  
53000
 
Washington
  1700  
Arts, entertainment, and recreation
    84657       88787       91679       91311  
53000
 
Washington
  1800  
Accommodation and food services
    245227       252948       254747       242668  
53000
 
Washington
  1900  
Other services, except public administration
    196044       202184       201576       197094  
53000
 
Washington
  2000  
Government and government enterprises
    604739       609856       626476       630280  
53000
 
Washington
  2001  
Federal, civilian
    69335       68733       70075       72866  
53000
 
Washington
  2002  
Military
    77001       77285       81110       81107  
53000
 
Washington
  2010  
State and local
    458403       463838       475291       476307  
53000
 
Washington
  2011  
State government
    146217       147837       151634       151380  
53000
 
Washington
  2012  
Local government
    312186       316001       323657       324927  
 
Legend / Footnotes:
1/ The estimates of employment for 2001-2006 are based on the 2002 North American Industry Classification System (NAICS). The estimates for 2007 forward are based on the 2007 NAICS.
2/ Excludes limited partners.
Last updated: April 21, 2011


CA25N Total full-time and part-time employment by NAICS industry 1/
Bureau of Economic Analysis
 
Fips
 
Area
 
LineCode
 
Description
 
2006
   
2007
   
2008
   
2009
 
53061
 
Snohomish
     
Employment by place of work (number of jobs)
                       
53061
 
Snohomish
  10  
Total employment
    316283       339900       340272       326310  
53061
 
Snohomish
     
By type
                               
53061
 
Snohomish
  20  
Wage and salary employment
    257541       276537       277421       263179  
53061
 
Snohomish
  40  
Proprietors employment
    58742       63363       62851       63131  
53061
 
Snohomish
  50  
Farm proprietors employment
    1326       1526       1518       1511  
53061
 
Snohomish
  60  
Nonfarm proprietors employment 2/
    57416       61837       61333       61620  
53061
 
Snohomish
     
By industry
                               
53061
 
Snohomish
  70  
Farm employment
    1996       2118       2147       2139  
53061
 
Snohomish
  80  
Nonfarm employment
    314287       337782       338125       324171  
53061
 
Snohomish
  90  
Private employment
    270045       293465       292590       278029  
53061
 
Snohomish
  100  
Forestry, fishing, and related activities
    1374       1297       1301       1194  
53061
 
Snohomish
  200  
Mining
    391       440       488       568  
53061
 
Snohomish
  300  
Utilities
    129       156       170       163  
53061
 
Snohomish
  400  
Construction
    28680       32168       29581       24271  
53061
 
Snohomish
  500  
Manufacturing
    51507       56424       57783       55002  
53061
 
Snohomish
  600  
Wholesale trade
    8856       9804       9706       9531  
53061
 
Snohomish
  700  
Retail trade
    37703       39512       39827       37189  
53061
 
Snohomish
  800  
Transportation and warehousing
    5192       5697       5584       5369  
53061
 
Snohomish
  900  
Information
    5889       6647       6247       5708  
53061
 
Snohomish
  1000  
Finance and insurance
    13047       13852       13937       13991  
53061
 
Snohomish
  1100  
Real estate and rental and leasing
    13955       15011       14696       14310  
53061
 
Snohomish
  1200  
Professional, scientific, and technical services
    15100       17298       17740       17319  
53061
 
Snohomish
  1300  
Management of companies and enterprises
    1532       1673       1673       1681  
53061
 
Snohomish
  1400  
Administrative and waste management services
    15498       17728       16777       15199  
53061
 
Snohomish
  1500  
Educational services
    3682       3816       3762       4008  
53061
 
Snohomish
  1600  
Health care and social assistance
    24913       26673       27833       28548  
53061
 
Snohomish
  1700  
Arts, entertainment, and recreation
    6279       6800       7140       7188  
53061
 
Snohomish
  1800  
Accommodation and food services
    19854       21184       21051       19900  
53061
 
Snohomish
  1900  
Other services, except public administration
    16464       17285       17294       16890  
53061
 
Snohomish
  2000  
Government and government enterprises
    44242       44317       45535       46142  
53061
 
Snohomish
  2001  
Federal, civilian
    2344       2338       2322       2348  
53061
 
Snohomish
  2002  
Military
    7359       7098       6894       6750  
53061
 
Snohomish
  2010  
State and local
    34539       34881       36319       37044  
53061
 
Snohomish
  2011  
State government
    5398       5315       5530       5551  
53061
 
Snohomish
  2012  
Local government
    29141       29566       30789       31493  
 
Legend / Footnotes:
1/ The estimates of employment for 2001-2006 are based on the 2002 North American Industry Classification System (NAICS). The estimates for 2007 forward are based on the 2007 NAICS.
2/ Excludes limited partners.
Last updated: April 21, 2011


CA25N Total full-time and part-time employment by NAICS industry 1/
Bureau of Economic Analysis
 
Fips
 
Area
 
LineCode
 
Description
 
2006
   
2007
   
2008
   
2009
 
53033
 
King
     
Employment by place of work (number of jobs)
                       
53033
 
King
  10  
Total employment
    1480374       1524600       1542584       1479629  
53033
 
King
     
By type
                               
53033
 
King
  20  
Wage and salary employment
    1222588       1246921       1265008       1198521  
53033
 
King
  40  
Proprietors employment
    257786       277679       277576       281108  
53033
 
King
  50  
Farm proprietors employment
    1377       1603       1599       1591  
53033
 
King
  60  
Nonfarm proprietors employment 2/
    256409       276076       275977       279517  
53033
 
King
     
By industry
                               
53033
 
King
  70  
Farm employment
    2055       2264       2422       2429  
53033
 
King
  80  
Nonfarm employment
    1478319       1522336       1540162       1477200  
53033
 
King
  90  
Private employment
    1307729       1350558       1364775       1300849  
53033
 
King
  100  
Forestry, fishing, and related activities
    3498       3474       3542       3427  
53033
 
King
  200  
Mining
    1416       1657       1860       2251  
53033
 
King
  300  
Utilities
    1019       839       961       1038  
53033
 
King
  400  
Construction
    89082       94642       93131       75334  
53033
 
King
  500  
Manufacturing
    118858       121609       119401       110054  
53033
 
King
  600  
Wholesale trade
    68513       69796       70925       66363  
53033
 
King
  700  
Retail trade
    137905       135374       134582       127455  
53033
 
King
  800  
Transportation and warehousing
    54126       55835       55076       51468  
53033
 
King
  900  
Information
    77784       81468       85516       85621  
53033
 
King
  1000  
Finance and insurance
    71803       73403       74890       74770  
53033
 
King
  1100  
Real estate and rental and leasing
    77447       80477       80005       78019  
53033
 
King
  1200  
Professional, scientific, and technical services
    135546       147214       153919       148128  
53033
 
King
  1300  
Management of companies and enterprises
    25131       25835       25795       23887  
53033
 
King
  1400  
Administrative and waste management services
    88624       91905       89310       79007  
53033
 
King
  1500  
Educational services
    29753       30160       31678       31723  
53033
 
King
  1600  
Health care and social assistance
    123886       127074       131689       135704  
53033
 
King
  1700  
Arts, entertainment, and recreation
    38982       41022       42394       42167  
53033
 
King
  1800  
Accommodation and food services
    94075       96615       97481       93251  
53033
 
King
  1900  
Other services, except public administration
    70281       72159       72620       71182  
53033
 
King
  2000  
Government and government enterprises
    170590       171778       175387       176351  
53033
 
King
  2001  
Federal, civilian
    21394       21356       21627       22136  
53033
 
King
  2002  
Military
    7110       6989       7293       7440  
53033
 
King
  2010  
State and local
    142086       143433       146467       146775  
53033
 
King
  2011  
State government
    55592       55866       56929       57378  
53033
 
King
  2012  
Local government
    86494       87567       89538       89397  
 
Legend / Footnotes:
1/ The estimates of employment for 2001-2006 are based on the 2002 North American Industry Classification System (NAICS). The estimates for 2007 forward are based on the 2007 NAICS.
2/ Excludes limited partners.
Last updated: April 21, 2011


CA25N Total full-time and part-time employment by NAICS industry 1/
Bureau of Economic Analysis
 
Fips
 
Area
 
LineCode
 
Description
 
2006
   
2007
   
2008
   
2009
 
53053
 
Pierce
     
Employment by place of work (number of jobs)
                       
53053
 
Pierce
  10  
Total employment
    374825       391072       393176       382995  
53053
 
Pierce
     
By type
                               
53053
 
Pierce
  20  
Wage and salary employment
    310724       322578       325121       314495  
53053
 
Pierce
  40  
Proprietors employment
    64101       68494       68055       68500  
53053
 
Pierce
  50  
Farm proprietors employment
    1182       1336       1334       1328  
53053
 
Pierce
  60  
Nonfarm proprietors employment 2/
    62919       67158       66721       67172  
53053
 
Pierce
     
By industry
                               
53053
 
Pierce
  70  
Farm employment
    1802       1866       1862       1877  
53053
 
Pierce
  80  
Nonfarm employment
    373023       389206       391314       381118  
53053
 
Pierce
  90  
Private employment
    288255       302560       299266       286061  
53053
 
Pierce
  100  
Forestry, fishing, and related activities
    1120       1033       1031       1008  
53053
 
Pierce
  200  
Mining
    374       440       469       513  
53053
 
Pierce
  300  
Utilities
    693       741       808       847  
53053
 
Pierce
  400  
Construction
    30161       32907       30641       25755  
53053
 
Pierce
  500  
Manufacturing
    20497       20658       19909       16906  
53053
 
Pierce
  600  
Wholesale trade
    12000       12882       12913       12417  
53053
 
Pierce
  700  
Retail trade
    41064       42819       41771       39561  
53053
 
Pierce
  800  
Transportation and warehousing
    13094       13255       12900       12342  
53053
 
Pierce
  900  
Information
    4288       4263       4215       3828  
53053
 
Pierce
  1000  
Finance and insurance
    13047       14045       14576       15106  
53053
 
Pierce
  1100  
Real estate and rental and leasing
    17300       18738       18320       18299  
53053
 
Pierce
  1200  
Professional, scientific, and technical services
    15564       16831       16960       17001  
53053
 
Pierce
  1300  
Management of companies and enterprises
    1254       1281       1480       1265  
53053
 
Pierce
  1400  
Administrative and waste management services
    19218       20262       19320       18215  
53053
 
Pierce
  1500  
Educational services
    6883       6953       7016       6992  
53053
 
Pierce
  1600  
Health care and social assistance
    39081       40717       41808       43105  
53053
 
Pierce
  1700  
Arts, entertainment, and recreation
    6859       7126       7374       7370  
53053
 
Pierce
  1800  
Accommodation and food services
    24230       25147       25355       23794  
53053
 
Pierce
  1900  
Other services, except public administration
    21528       22462       22400       21737  
53053
 
Pierce
  2000  
Government and government enterprises
    84768       86646       92048       95057  
53053
 
Pierce
  2001  
Federal, civilian
    10534       10288       10824       11748  
53053
 
Pierce
  2002  
Military
    29551       31091       34489       36606  
53053
 
Pierce
  2010  
State and local
    44683       45267       46735       46703  
53053
 
Pierce
  2011  
State government
    11636       11856       12291       12093  
53053
 
Pierce
  2012  
Local government
    33047       33411       34444       34610  
 
Legend / Footnotes:
1/ The estimates of employment for 2001-2006 are based on the 2002 North American Industry Classification System (NAICS). The estimates for 2007 forward are based on the 2007 NAICS.
2/ Excludes limited partners.
 Last updated: April 21, 2011


CA25N Total full-time and part-time employment by NAICS industry 1/
Bureau of Economic Analysis
 
Fips
 
Area
 
LineCode
 
Description
 
2006
   
2007
   
2008
   
2009
 
53035
 
Kitsap
     
Employment by place of work (number of jobs)
                       
53035
 
Kitsap
  10  
Total employment
    127200       128084       128551       124816  
53035
 
Kitsap
     
By type
                               
53035
 
Kitsap
  20  
Wage and salary employment
    101873       101206       101837       97957  
53035
 
Kitsap
  40  
Proprietors employment
    25327       26878       26714       26859  
53035
 
Kitsap
  50  
Farm proprietors employment
    528       615       613       610  
53035
 
Kitsap
  60  
Nonfarm proprietors employment 2/
    24799       26263       26101       26249  
53035
 
Kitsap
     
By industry
                               
53035
 
Kitsap
  70  
Farm employment
    598       669       671       672  
53035
 
Kitsap
  80  
Nonfarm employment
    126602       127415       127880       124144  
53035
 
Kitsap
  90  
Private employment
    86318       87639       87302       83956  
53035
 
Kitsap
  100  
Forestry, fishing, and related activities
    471       469       472       461  
53035
 
Kitsap
  200  
Mining
    150       181       186       236  
53035
 
Kitsap
  300  
Utilities
    159       177       216       224  
53035
 
Kitsap
  400  
Construction
    8034       8485       8056       6678  
53035
 
Kitsap
  500  
Manufacturing
    2267       2019       2022       1982  
53035
 
Kitsap
  600  
Wholesale trade
    2008       1927       1943       1749  
53035
 
Kitsap
  700  
Retail trade
    15589       15352       15320       14375  
53035
 
Kitsap
  800  
Transportation and warehousing
    1379       1408       1465       1440  
53035
 
Kitsap
  900  
Information
    1944       1881       1843       1694  
53035
 
Kitsap
  1000  
Finance and insurance
    3551       3750       3826       3853  
53035
 
Kitsap
  1100  
Real estate and rental and leasing
    5777       6052       5947       5829  
53035
 
Kitsap
  1200  
Professional, scientific, and technical services
    7559       8169       8231       8497  
53035
 
Kitsap
  1300  
Management of companies and enterprises
    212       225       207       176  
53035
 
Kitsap
  1400  
Administrative and waste management services
    5837       5498       5263       4858  
53035
 
Kitsap
  1500  
Educational services
    1760       1748       1840       1827  
53035
 
Kitsap
  1600  
Health care and social assistance
    12396       12927       13210       13462  
53035
 
Kitsap
  1700  
Arts, entertainment, and recreation
    2938       3094       3130       3074  
53035
 
Kitsap
  1800  
Accommodation and food services
    7666       7506       7499       7133  
53035
 
Kitsap
  1900  
Other services, except public administration
    6621       6771       6626       6408  
53035
 
Kitsap
  2000  
Government and government enterprises
    40284       39776       40578       40188  
53035
 
Kitsap
  2001  
Federal, civilian
    15036       14772       14958       15563  
53035
 
Kitsap
  2002  
Military
    11742       11496       12196       11232  
53035
 
Kitsap
  2010  
State and local
    13506       13508       13424       13393  
53035
 
Kitsap
  2011  
State government
    2282       2240       2293       2295  
53035
 
Kitsap
  2012  
Local government
    11224       11268       11131       11098  
 
Legend / Footnotes:
1/ The estimates of employment for 2001-2006 are based on the 2002 North American Industry Classification System (NAICS). The estimates for 2007 forward are based on the 2007 NAICS.
2/ Excludes limited partners.
 Last updated: April 21, 2011


EXHIBIT III-1
1st Security Bank of Washington
General Characteristics of Publicly-Traded Institutions


RP FINANCIAL, LC.
 
Financial Services Industry Consultants
 
1100 North Glebe Road, Suite 1100
 
Arlington, Virginia 22201
 
(703) 528-1700
 
 
Exhibit III-l
Characteristics of Publicly-Traded Thrifts
September 2, 2011
 
           
Primary
 
Operating
 
Total
         
Fiscal
   
Conv.
   
Stock
   
Market
 
Ticker
 
Financial Institution
 
Exchg.
 
Market
 
Strat (1)
 
Assets (2)
   
Offices
   
Year
   
Date
   
Price
   
Value
 
                   
($Mil)
                     
($)
   
($Mil)
 
                                                         
California Companies                                                    
                                                                     
BOFI
 
Bofi Holding, Inc. Of CA (3)
 
NASDAQ
 
San Diego, CA
 
Thrift
    1,940           1       06-30       03/05       14.08       147  
PROV
 
Provident Fin. Holdings of CA (3)
 
NASDAQ
 
Riverside, CA
 
M.B.
    1,315           14       06-30       06/96       8.25       94  
KFFG
 
Kaiser Federal Fin Group of CA (3)
 
NASDAQ
 
Covina, CA
 
Thrift
    902   M       9       06-30       11/10       11.91       114  
FPTB
 
First PacTrust Bancorp of CA (3)
 
NASDAQ
 
Chula Vista, CA
 
Thrift
    882           9       12-31       08/02       11.37       131  
BYFC
 
Broadway Financial Corp. of CA (3)
 
NASDAQ
 
Los Angeles, CA
 
Thrift
    447           5       12-31       01/96       1.48       3  
                                                                     
Florida Companies                                                                
                                                                     
BKU
 
BankUnited, Inc. (3)
 
NYSE
     
Thrift
    10,846           0                  /       22.97       2,234  
BBX
 
BankAtlantic Bancorp Inc of FL (3)
 
NYSE
 
FortLauderdaleFL
 
M.B.
    3,864           101       12-31       11/83       0.77       60  
                                                                     
Mid-Atlantic Companies                                                                
                                                                     
HCBK
 
Hudson City Bancorp, Inc of NJ (3)
 
NASDAQ
 
Paramus, NJ
 
Thrift
    51,781           135       12-31       06/05       5.77       3,039  
NYB
 
New York Community Bcrp of NY (3)
 
NYSE
 
Westbury, NY
 
Thrift
    40,601           281       12-31       11/93       12.07       5,280  
AF
 
Astoria Financial Corp. of NY (3)
 
NYSE
 
Lake Success, NY
 
Thrift
    17,120           85       12-31       11/93       9.16       902  
ISBC
 
Investors Bcrp MHC of NJ(43.0)
 
NASDAQ
 
Short Hills, NJ
 
Thrift
    10,206           83       06-30       10/05       13.20       1,488  
NWBI
 
Northwest Bancshares Inc of PA (3)
 
NASDAQ
 
Warren, PA
 
Thrift
    8,088           172       06-30       12/09       11.23       1,160  
PFS
 
Provident Fin. Serv. Inc of NJ (3)
 
NYSE
 
Jersey City, NJ
 
Thrift
    6,794   M       83       12-31       01/03       11.44       687  
BNCL
 
Beneficial Mut MHC of PA(43.7)
 
NASDAQ
 
Philadelphia, PA
 
Thrift
    4,712           65       12-31       07/07       7.26       586  
FFIC
 
Flushing Fin. Corp. of NY (3)
 
NASDAQ
 
Lake Success, NY
 
Thrift
    4,323           19       12-31       11/95       10.61       334  
WSFS
 
WSFS Financial Corp. of DE (3)
 
NASDAQ
 
Wilmington, DE
 
Div.
    4,152           38       12-31       11/86       33.62       289  
DCOM
 
Dime Community Bancshars of NY (3)
 
NASDAQ
 
Brooklyn, NY
 
Thrift
    4,093           25       12-31       06/96       11.00       385  
TRST
 
TrustCo Bank Corp NY of NY (3)
 
NASDAQ
 
Glenville, NY
 
Thrift
    4,070           133       12-31           /       4.37       338  
PBNY
 
Provident NY Bncrp, Inc. of NY (3)
 
NASDAQ
 
Montebello, NY
 
Thrift
    2,976           37       09-30       01/04       6.03       229  
KRNY
 
Kearny Fin Cp MHC of NJ (25.1)
 
NASDAQ
 
Fairfield, NJ
 
Thrift
    2,904           40       06-30       02/05       8.20       556  
ORIT
 
Oritani Financial Corp of NJ (3)
 
NASDAQ
 
Twnship of WA NJ
 
Thrift
    2,587           23       06-30       06/10       12.01       667  
NFBK
 
Northfield Bcp MHC of NY(43.4)
 
NASDAQ
 
Avenel, NY
 
Thrift
    2,308           19       12-31       11/07       12.15       515  
OCFC
 
OceanFirst Fin. Corp of NJ (3)
 
NASDAQ
 
Toms River, NJ
 
Thrift
    2,239           23       12-31       07/96       11.25       212  
ESBF
 
ESB Financial Corp. of PA (3)
 
NASDAQ
 
Ellwood City, PA
 
Thrift
    1,968           24       12-31       06/90       10.77       160  
ROMA
 
Roma Fin Corp MHC of NJ (26.2)
 
NASDAQ
 
Robbinsville, NJ
 
Thrift
    1,892           27       12-31       07/06       8.19       248  
PVSA
 
Parkvale Financial Corp of PA (3)
 
NASDAQ
 
Monroeville, PA
 
Thrift
    1,801   M       47       06-30       07/87       17.80       99  
ABBC
 
Abington Bancorp, Inc. of PA (3)
 
NASDAQ
 
Jenkintown, PA
 
Thrift
    1,177           20       12-31       06/07       7.86       159  
CSBK
 
Clifton Svg Bp MHC of NJ(35.8)
 
NASDAQ
 
Clifton, NJ
 
Thrift
    1,135           12       03-31       03/04       9.50       248  
ESSA
 
ESSA Bancorp, Inc. of PA (3)
 
NASDAQ
 
Stroudsburg, PA
 
Thrift
    1,103           18       09-30       04/07       10.76       134  
FXCB
 
Fox Chase Bancorp, Inc. of PA (3)
 
NASDAQ
 
Hatboro, PA
 
Thrift
    1,088           11       12-31       06/10       12.20       178  
CBNJ
 
Cape Bancorp, Inc. of NJ (3)
 
NASDAQ
 
Cape My Ct Hs, NJ
 
Thrift
    1,068           17       12-31       02/08       7.60       101  
BFED
 
Beacon Federal Bancorp of NY (3)
 
NASDAQ
 
East Syracuse NY
 
Thrift
    1,041           8       12-31       10/07       13.50       86  
SVBI
 
Severn Bancorp, Inc. of MD (3)
 
NASDAQ
 
Annapolis, MD
 
Thrift
    937           4       12-31           /       3.03       31  
OSHC
 
Ocean Shore Holding Co. of NJ (3)
 
NASDAQ
 
Ocean City, NJ
 
Thrift
    860           10       12-31       12/09       11.05       81  
HARL
 
Harleysville Svgs Fin Cp of PA (3)
 
NASDAQ
 
Harleysville, PA
 
Thrift
    858           8       09-30       08/87       14.10       53  
THRD
 
TF Fin. Corp. of Newtown PA (3)
 
NASDAQ
 
Newtown, PA
 
Thrift
    692           14       12-31       07/94       21.14       60  
CARV
 
Carver Bancorp, Inc. of NY (3)
 
NASDAQ
 
New York, NY
 
Thrift
    678           9       03-31       10/94       0.69       2  
MLVF
 
Malvern Fed Bncp MHC PA (44.6)
 
NASDAQ
 
Paoli, PA
 
Thrift
    674           9       09-30       05/08       7.45       45  
FSBI
 
Fidelity Bancorp, Inc. of PA (3)
 
NASDAQ
 
Pittsburgh, PA
 
Thrift
    667           13       09-30       06/88       9.48       29  
ONFC
 
Oneida Financial Corp. of NY (3)
 
NASDAQ
 
Oneida, NY
 
Thrift
    658           13       12-31       07/10       8.77       63  
BCSB
 
BCSB Bancorp, Inc. of MD (3)
 
NASDAQ
 
Baltimore, MD
 
Thrift
    630           18       09-30       04/08       12.40       40  
COBK
 
Colonial Financial Serv. of NJ (3)
 
NASDAQ
 
Bridgeton, NJ
 
Thrift
    601           9       12-31       07/10       12.05       50  
GCBC
 
Green Co Bcrp MHC of NY (44.1)
 
NASDAQ
 
Catskill, NY
 
Thrift
    548           14       06-30       12/98       18.84       78  
MGYR
 
Magyar Bancorp MHC of NJ (44.7)
 
NASDAQ
 
NW Brunswick, NJ
 
Thrift
    526           6       09-30       01/06       3.56       21  
ESBK
 
Elmira Svgs Bank, FSB of NY (3)
 
NASDAQ
 
Elmira, NY
 
Thrift
    500           11       12-31       03/85       15.85       31  
PBIP
 
Prudential Bncp MHC PA (25.5)
 
NASDAQ
 
Philadelphia, PA
 
Thrift
    498           7       09-30       03/05       5.18       52  
LSBK
 
Lake Shore Bnp MHC of NY(39.4)
 
NASDAQ
 
Dunkirk, NY
 
Thrift
    483           10       12-31       04/06       10.00       59  
BFSB
 
Brooklyn Fed MHC of NY (28.2)
 
NASDAQ
 
Brooklyn, NY
 
Thrift
    470           5       09-30       04/05       0.79       10  
ALLB
 
Alliance Bancorp, Inc. of PA (3)
 
NASDAQ
 
Broomall, PA
 
Thrift
    467           9       12-31       01/11       10.16       56  
NECB
 
NE Comm Bncrp MHC of NY (44.6)
 
NASDAQ
 
White Plains, NY
 
Thrift
    444           7       12-31       07/06       6.62       85  
STND
 
Standard Financial Corp. of PA (3)
 
NASDAQ
 
Monroeville, PA
 
Thrift
    438           12       09-30       10/10       14.75       51  
PBHC
 
Pathfinder BC MHC of NY (36.3)
 
NASDAQ
 
Oswego, NY
 
Thrift
    419           14       12-31       11/95       9.10       23  
WSB
 
WSB Holdings, Inc. of Bowie MD (3)
 
NASDAQ
 
Bowie, MD
 
Thrift
    390           5       12-31       08/88       2.47       20  


RP FINANCIAL, LC.
 
Financial Services Industry Consultants
1100 North Glebe Road, Suite 1100
Arlington, Virginia 22201
(703) 528-1700
 
Exhibit III-l
Characteristics of Publicly-Traded Thrifts
September 2, 2011
                                                     
Ticker
 
Financial Institution
 
Exchg.
 
Primary
Market
 
Operating
Strat(l)
 
Total
Assets(2)
 
Offices
   
Fiscal
Year
   
Conv.
Date
   
Stock
Price
   
Market
Value
 
               
($Mil)
                   
($)
   
($Mil)
 
Mid-Atlantic Companies (continued)
                                               
                                                 
OBAF
 
OBA Financial Serv. Inc of MD (3)
 
NASDAQ
 
Germantown, MD
 
Thrift
    356 M     5     06-30     01/10     14.30     66  
MSBF
 
MSB Fin Corp MHC of NJ (40.3)
 
NASDAQ
 
Millington, NJ
 
Thrift
    349 M     5     06-30     01/07       5.19       27  
FFCO
 
FedFirst Financial Corp of PA (3)
 
NASDAQ
 
Monessen, PA
 
Thrift
    346       9     12-31     09/10       13.49       40  
CMSB
 
CMS Bancorp Inc of W Plains NY (3)
 
NASDAQ
 
White Plains, NY
 
Thrift
    248       6     09-30     04/07       8.10       15  
WVFC
 
WVS Financial Corp. of PA (3)
 
NASDAQ
 
Pittsburgh, PA
 
Thrift
    247 M     6     06-30     11/93       9.00       19  
                                                             
Mid-West Companies
                                                       
                                                             
FBC
 
Flagstar Bancorp, Inc. of MI (3)
 
NYSE
 
Troy, MI
 
Thrift
    13,017 M     176     12-31     04/97       0.59       327  
TFSL
 
TFS Fin Corp MHC of OH (26.4)
 
NASDAQ
 
Cleveland, OH
 
Thrift
    10,879       39     09-30     04/07       8.35       2,575  
CFFN
 
Capitol Federal Fin Inc. of KS (3)
 
NASDAQ
 
Topeka, KS
 
Thrift
    9,603       47     09-30     12/10       10.48       1,755  
ABCW
 
Anchor BanCorp Wisconsin of WI (3)
 
NASDAQ
 
Madison, WI
 
M.B.
    3,395 M     57     03-31     07/92       0.59       13  
FPFC
 
First Place Fin. Corp. of OH (3)
 
NASDAQ
 
Warren, OH
 
Thrift
    3,153 J     47     06-30     01/99       0.85       14  
BKHU
 
Bank Mutual Corp of WI (3)
 
NASDAQ
 
Milwaukee, WI
 
Thrift
    2,523       80     12-31     10/03       2.89       134  
UCFC
 
United Community Fin. of OH (3)
 
NASDAQ
 
Youngstown, OH
 
Thrift
    2,102       38     12-31     07/98       1.14       35  
FDEF
 
First Defiance Fin. Corp of OH (3)
 
NASDAQ
 
Defiance, OH
 
Thrift
    2,046       33     12-31     10/95       12.96       126  
WSBF
 
Waterstone Fin MHC of WI (26.2)
 
NASDAQ
 
Wauwatosa, WI
 
Thrift
    1,723       10     12-31     10/05       2.60       81  
BFIN
 
BankFinancial Corp. of IL (3)
 
NASDAQ
 
Burr Ridge, IL
 
Thrift
    1,663       21     12-31     06/05       7.24       153  
MFSF
 
MutualFirst Fin. Inc. of IN (3)
 
NASDAQ
 
Muncie, IN
 
Thrift
    1,447 M     33     12-31     12/99       7.52       53  
PULB
 
Pulaski Fin Cp of St. Louis MO (3)
 
NASDAQ
 
St. Louis, MO
 
Thrift
    1,332       12     09-30     12/98       6.50       68  
NASB
 
NASB Fin, Inc. of Grandview MO (3)
 
NASDAQ
 
Grandview, MO
 
Thrift
    1,257       9     09-30     09/85       10.21       80  
HFFC
 
HF Financial Corp. of SD (3)
 
NASDAQ
 
Sioux Falls, SD
 
Thrift
    1,191       33     06-30     04/92       8.27       58  
CITZ
 
CFS Bancorp, Inc of Munster IN (3)
 
NASDAQ
 
Munster, IN
 
Thrift
    1,144 M     22     12-31     07/98       5.23       57  
CASH
 
Meta Financial Group of IA (3)
 
NASDAQ
 
Storm Lake, IA
 
Thrift
    1,074       12     09-30     09/93       18.32       57  
HFBC
 
HopFed Bancorp, Inc. of KY (3)
 
NASDAQ
 
Hopkinsville, KY
 
Thrift
    1,062       18     12-31     02/98       7.40       54  
HMNF
 
HMN Financial, Inc. of MN (3)
 
NASDAQ
 
Rochester, MN
 
Thrift
    807       15     12-31     06/94       2.00       9  
PVFC
 
PVF Capital Corp. of Solon OH (3)
 
NASDAQ
 
Solon, OH
 
R.E.
    777 M     18     06-30     12/92       1.55       40  
CHEV
 
Cheviot Fin Cp MHC of OH (38. 5)
 
NASDAQ
 
Cincinnati, OH
 
Thrift
    597       6     12-31     01/04       8.62       76  
FCLF
 
First Clover Leaf Fin Cp of IL (3)
 
NASDAQ
 
Edwardsville, IL
 
Thrift
    567       4     12-31     07/06       6.40       50  
CZWI
 
Citizens Comm Bncorp Inc of WI (3)
 
NASDAQ
 
Eau Claire, WI
 
Thrift
    552       27     09-30     11/06       5.44       28  
FSFG
 
First Savings Fin. Grp. of IN (3)
 
NASDAQ
 
Clarkaville, IN
 
Thrift
    524       12     09-30     12/08       15.40       36  
UCBA
 
United Comm Bncp MHC IN (40.7)
 
NASDAQ
 
Lawrenceburg, IN
 
Thrift
    476 M     9     06-30     03/06       5.81       46  
LPSB
 
LaPorte Bancrp MHC of IN (45.0)
 
NASDAQ
 
La Porte, IN
 
Thrift
    461       8     12-31     10/07       9.00       41  
IROQ
 
IF Bancorp, Inc. of IL (3)
 
NASDAQ
 
Watseka, IL
 
Thrift
    448 P     5     06-30     07/11       10.81       52  
FCAP
 
First Capital, Inc. of IN (3)
 
NASDAQ
 
Corydon, IN
 
Thrift
    445       13     12-31     01/99       18.41       51  
FFFD
 
North Central Bancshares of LA (3)
 
NASDAQ
 
Fort Dodge, IA
 
Div.
    443       11     12-31     03/96       17.25       23  
WAYN
 
Wayne Savings Bancshares of OH (3)
 
NASDAQ
 
Wooster, OH
 
Thrift
    412       11     03-31     01/03       8.40       25  
RIVR
 
River Valley Bancorp of IN (3)
 
NASDAQ
 
Madison, IN
 
Thrift
    400       10     12-31     12/96       16.10       24  
LSBI
 
LSB Fin. Corp. of Lafayette IN (3)
 
NASDAQ
 
Lafayette, IN
 
Thrift
    360       5     12-31     02/95       13.30       21  
WBKC
 
Wolverine Bancorp, Inc. of MI (3)
 
NASDAQ
 
Midland, MI
 
Thrift
    306       5     12-31     01/11       14.00       35  
JXSB
 
Jacksonville Bancorp Inc of IL (3)
 
NASDAQ
 
Jacksonville, IL
 
Thrift
    305       7     12-31     07/10       13.70       26  
CFBK
 
Central Federal Corp. of OH (3)
 
NASDAQ
 
Fairlawn, OH
 
Thrift
    278       4     12-31     12/98       0.75       3  
KFFB
 
KY Fst Fed Bp MHC of KY (39.3)
 
NASDAQ
 
Hazard, KY
 
Thrift
    229 M     4     06-30     03/05       8.09       63  
FFNM
 
First Fed of N. Michigan of MI (3)
 
NASDAQ
 
Alpena, MI
 
Thrift
    219       8     12-31     04/05       3.75       11  
FFDF
 
FFD Financial Corp of Dover OH (3)
 
NASDAQ
 
Dover, OH
 
Thrift
    211 M     5     06-30     04/96       15.00       15  
PFED
 
Park Bancorp of Chicago IL (3)
 
NASDAQ
 
Chicago, IL
 
Thrift
    208       5     12-31     08/96       2.92       3  
FBSI
 
First Bancshares, Inc. of MO (3)
 
NASDAQ
 
Mntn Grove, MO
 
Thrift
    204 M     11     06-30     12/93       6.95       11  
                                                             
New England Companies
                                                       
                                                             
PBCT
 
Peoples United Financial of CT (3)
 
NASDAQ
 
Bridgeport, CT
 
Div.
    25,323       340     12-31     04/07       11.40       4,047  
BHLB
 
Berkshire Hills Bancorp of MA (3)
 
NASDAQ
 
Pittsfield, MA
 
Thrift
    3,225       44     12-31     06/00       19.24       322  
BRKL
 
Brookline Bancorp, Inc. of MA (3)
 
NASDAQ
 
Brookline, MA
 
Thrift
    3,114       20     12-31     07/02       7.82       462  
EBSB
 
Meridian Fn Serv MHC MA (41.4)
 
NASDAQ
 
East Boston, MA
 
Thrift
    1,924       25     12-31     01/08       11.88       264  
RCKB
 
Rockville Fin New, Inc. of CT (3)
 
NASDAQ
 
Vrn Rockville CT
 
Thrift
    1,747       22     12-31     03/11       9.50       280  
UBNK
 
United Financial Bncrp of MA (3)
 
NASDAQ
 
W Springfield MA
 
Thrift
    1,610       24     12-31     12/07       14.17       228  
FBNK
 
First Connecticut Bncorp of CT (3)
 
NASDAQ
 
Farmington, CT
 
Thrift
    1,604 P     19     12-31     06/11       10.47       187  
WFD
 
WestField Fin. Inc. of  MA (3)
 
NASDAQ
 
WestField, MA
 
Thrift
    1,241 M     11     12-31     01/07       6.90       192  
HIFS
 
Hingham Inst. for Sav. of MA (3)
 
NASDAQ
 
Hingham, MA
 
Thrift
    1,067       10     12-31     12/88       46.94       100  
NHTB
 
NH Thrift Bancshares of NH (3)
 
NASDAQ
 
Newport, NH
 
Thrift
    1,031       27     12-31     05/86       12.81       74  
SIFI
 
SI Financial Group, Inc. of CT (3)
 
NASDAQ
 
Willimantic, CT
 
Thrift
    949       21     12-31     01/11       9.43       100  


RP FINANCIAL, LC.
 
Financial Services Industry Consultants
 
1100 North Glebe Road, Suite 1100
 
Arlington, Virginia 22201
 
(703) 528-1700
 
 
Exhibit III-l
Characteristics of Publicly-Traded Thrifts
September 2, 2011
                                                     
           
Primary
 
Operating
 
Total
       
Fiscal
   
Conv.
   
Stock
   
Market
 
Ticker
 
Financial Institution
 
Exchg.
 
Market
 
Strat(l)
 
Assets(2)
 
Offices
   
Year
   
Date
   
Price
   
Value
 
                   
($Mil)
                   
($)
   
($Mil)
 
New England Companies (continued)
                                               
                                                     
NVSL
 
Naugatuck Valley Fin Crp of CT (3)
 
NASDAQ
 
Naugatuck, CT
 
Thrift
    593 P     10     12-31       06/11       7.58       53  
CBNK
 
Chicopee Bancorp, Inc. of MA (3)
 
NASDAQ
 
Chicopee, MA
 
Thrift
    580       8     12-31       07/06       14.00       82  
HBNK
 
Hampden Bancorp, Inc. of MA (3)
 
NASDAQ
 
Springfield, MA
 
Thrift
    575 M     9     06-30       01/07       12.58       86  
PEOP
 
Peoples Fed Bancshrs Inc of MA (3)
 
NASDAQ
 
Brighton, MA
 
Thrift
    538       6     09-30       07/10       14.00       100  
CEBK
 
Central Bncrp of Somerville MA (3)
 
NASDAQ
 
Somerville, MA
 
Thrift
    497       11     03-31       10/86       17.50       29  
PSBH
 
PSB Hldgs Inc MHC of CT (42.9)
 
NASDAQ
 
Putnam, CT
 
Thrift
    477 M     8     06-30       10/04       5.06       33  
NFSB
 
Newport Bancorp, Inc. of RI (3)
 
NASDAQ
 
Newport, RI
 
Thrift
    454       6     12-31       07/06       13.05       46  
MFLR
 
Mayflower Bancorp, Inc. of MA (3)
 
NASDAQ
 
Middleboro, MA
 
Thrift
    247 M     8     04-30       12/87       8.35       17  
                                                               
North-West Companies
                                                         
                                                               
WFSL
 
Washington Federal, Inc. of WA (3)
 
NASDAQ
 
Seattle, WA
 
Thrift
    13,323       163     09-30       11/82       13.92       1,537  
FFNW
 
First Fin NW, Inc of Renton WA (3)
 
NASDAQ
 
Renton, WA
 
Thrift
    1,151       1     12-31       10/07       4.63       87  
RVSB
 
Riverview Bancorp, Inc. of WA (3)
 
NASDAQ
 
Vancouver, WA
 
Thrift
    886       17     03-31       10/97       2.61       59  
TSBK
 
Timberland Bancorp, Inc. of WA (3)
 
NASDAQ
 
Hoquiam, WA
 
Thrift
    735       22     09-30       01/98       5.05       36  
ANCB
 
Anchor Bancorp of Aberdeen, WA (3)
 
NASDAQ
 
Aberdeen, wa
 
Thrift
    490 M     15     06-30       01/11       7.95       19  
                                                               
South-East Companies
                                                         
                                                               
FFCH
 
First Fin. Holdings Inc. of SC (3)
 
NASDAQ
 
Charleston, SC
 
Thrift
    3,222       67     09-30       11/83       5.82       96  
CSBC
 
Citizens South Bnkg Corp of NC (3)
 
NASDAQ
 
Gastonia, NC
 
Thrift
    1,118       21     12-31       10/02       4.15       48  
FRNK
 
Franklin Financial Corp. of VA (3)
 
NASDAQ
 
Glen Allen, VA
 
Thrift
    1,101 P     9     09-30       04/11       11.14       159  
HBOS
 
Heritage Fin Group, Inc of GA (3)
 
NASDAQ
 
Albany, GA
 
Thrift
    964       16     12-31       11/10       10.89       95  
CHFN
 
Charter Fin Corp MHC GA (49.0)
 
NASDAQ
 
West Point, GA
 
Thrift
    956       17     09-30       09/10       8.46       157  
ACFC
 
Atlantic Coast Fin. Corp of GA (3)
 
NASDAQ
 
Waycross, GA
 
Thrift
    802       12     12-31       02/11       2.69       7  
HBCP
 
Home Bancorp Inc. Lafayette LA (3)
 
NASDAQ
 
Lafayette, LA
 
Thrift
    700 M     18     12-31       10/08       14.11       113  
FFBH
 
First Fed. Bancshares of AR (3)
 
NASDAQ
 
Harrison, AR
 
Thrift
    616       18     12-31       05/96       6.00       116  
JFBI
 
Jefferson Bancshares Inc of TN (3)
 
NASDAQ
 
Morristown, TN
 
Thrift
    578 M     12     06-30       07/03       2.83       19  
CFFC
 
Community Fin. Corp. of VA (3)
 
NASDAQ
 
Staunton, VA
 
Thrift
    523       11     03-31       03/88       3.07       13  
OFED
 
Oconee Fed Fn Cp MHC SC (35.0)
 
NASDAQ
 
Seneca, SC
 
Thrift
    377 M     5     06-30       01/11       10.95       70  
FABK
 
First Advantage Bancorp of TN (3)
 
NASDAQ
 
Clarksville, TN
 
Thrift
    350       5     12-31       11/07       12.70       52  
LABC
 
Louisiana Bancorp, Inc. of LA (3)
 
NASDAQ
 
Metairie, LA
 
Thrift
    320       3     12-31       07/07       16.03       55  
AFCB
 
Athens Bancshares, Inc. of TN (3)
 
NASDAQ
 
Athens, TN
 
Thrift
    283       7     12-31       01/10       12.70       35  
SIBC
 
State Investors Bancorp of LA (3)
 
NASDAQ
 
Metairie, LA
 
Thrift
    239 P     4     12-31       07/11       11.50       33  
HFBL
 
Home Federal Bancorp Inc of LA (3)
 
NASDAQ
 
Shreveport, LA
 
Thrift
    233       5     06-30       12/10       13.30       41  
                                                               
South-West Companies
                                                         
                                                               
VPFG
 
Viewpoint Financial Group of TX (3)
 
NASDAQ
 
Plano, TX
 
Thrift
    2,964       24     12-31       07/10       11.34       395  
OABC
 
OmniAmerican Bancorp Inc of TX (3)
 
NASDAQ
 
Fort Worth, TX
 
Thrift
    1,328       16     12-31       01/10       13.83       161  
SPBC
 
SP Bancorp, Inc. of Plano, TX (3)
 
NASDAQ
 
Plano, TX
 
Thrift
    266       8     12-31       11/10       11.35       20  
                                                               
Western Companies (Excl CA)
                                                         
                                                           
TBNK
 
Territorial Bancorp, Inc of HI (3)
 
NASDAQ
 
Honolulu, HI
 
Thrift
    1,488 M     25     12-31       07/09       19.06       221  
EBMT
 
Eagle Bancorp Montanta of MT (3)
 
NASDAQ
 
Helena, MT
 
Thrift
    331       6     06-30       04/10       10.46       41  
                                                               
Other Areas
                                                         
 
NOTES:
(1)
Operating strategies are: Thrift-Traditional Thrift, M.B.-Mortgage Banker, R.E.-Real Estate Developer, Div.-Diversified, and Ret.-Retail Banking.
 
(2)
Most recent quarter end available (E-Estimated, and P-Pro Forma)
 
Source: SNL Financial, LC.
 
Date of Last Update: 09/02/11


EXHIBIT III-2
1st Security Bank of Washington
Public Market Pricing of Publicly-Traded Institutions – Northwest Region
< $400-Million in Assets


RP FINANCIAL, LC.
 
Financial Services Industry Consultants
 
1100 North Glebe Road, Suite 1100
 
Arlington, Virginia 22201
 
(703) 528-1700
 
 
Exhibit III-2
Market Pricing Comparatives
Prices As of September 2, 2011
                                                                                   
   
Market
 
Per share Data
                                                                 
   
Capitalization
 
Core
 
Book
 
Pricing Ratios(3)
 
Dividends(4)
 
Financial Characteristics(6)
 
   
Price/
 
Market
 
12-Mth
 
Value/
                     
Amount/
     
Payout
 
Total
 
Equity/
 
Tng Eq/
 
NPAs/
 
Reported
 
Core
 
Financial Institution
 
Share(1)
 
Value
 
EPS(2)
 
Share
 
P/E
 
P/B
 
P/A
 
P/TB
 
P/CORE
 
Share
 
Yield
 
Ratio(5)
 
Assets
 
Assets
 
Assets
 
Assets
 
ROA
 
ROE
 
ROA
 
ROE
 
   
($)
 
($Mil)
 
($)
 
($)
 
(x)
 
(%)
 
(%)
 
(%)
 
(x)
 
($)
 
(%)
 
(%)
 
($Mil)
 
(%)
 
(%)
 
(%)
 
(%)
 
(%)
 
(%)
 
(%)
 
                                                                                   
All Public Companies
 
9.92
 
242.30
 
-0.05
 
13.11
 
17. 83
 
76.05
 
9.47
 
81.46
 
19.48
 
0.21
 
1.97
 
28.72
 
2,613
 
11.87
 
11.19
 
3.92
 
0.09
 
0.68
 
0.01
 
-0.21
 
Special Selection Grouping(8)
 
6.83
 
347.62
 
-0.40
 
13.11
 
16.70
 
53.76
 
6.91
 
60.77
 
17.91
 
0.05
 
0.34
 
13.79
 
3,317
 
13.14
 
12.13
 
7.50
 
-0.14
 
-1.38
 
-0.21
 
-1.95
 
                                                                                   
Comparable Group
                                                                                 
                                                                                   
Special Comparative Group(8)
                                                                                 
ANCB     Anchor Bancorp of Aberdeen, WA
 
7.95
 
19.49
 
-2.26
 
24.37
 
NM
 
32.62
 
3.97
 
32.62
 
NM
 
0.00
 
0.00
 
NM
 
490
 
12.18
 
12.18
 
NA
 
-1.10
 
-10.44
 
-1.15
 
-10.92
 
FFNW     First Fin NW, Inc of Renton WA
 
4.63
 
87.07
 
-0.54
 
9.53
 
NM
 
48.58
 
7.56
 
48.58
 
NM
 
0.00
 
0.00
 
NM
 
1,151
 
15.56
 
15.56
 
11.28
 
-0.72
 
-4.96
 
-0.83
 
-5.70
 
RVSB      Riverview Bancorp, Inc. of WA
 
2.61
 
58.65
 
0.14
 
4.80
 
17.40
 
54.38
 
6.62
 
71.51
 
18.64
 
0.00
 
0.00
 
0.00
 
886
 
12.23
 
9.59
 
5.10
 
0.39
 
3.28
 
0.37
 
3.06
 
TSBK      Timberland Bancorp, Inc. of WA
 
5.05
 
35.58
 
-0.13
 
9.99
 
NM
 
50.55
 
4.84
 
55.31
 
NM
 
0.00
 
0.00
 
NM
 
735
 
11.74
 
11.01
 
8.35
 
0.00
 
0.00
 
-0.12
 
-1.06
 
WFSL     Washington Federal, Inc. of WA
 
13.92
 
1537.30
 
0.81
 
16.84
 
16.00
 
82.66
 
11.54
 
95.80
 
17.19
 
0.24
 
1.72
 
27.59
 
13,323
 
13.96
 
12.28
 
5.28
 
0.71
 
5.21
 
0.66
 
4.85
 

(1)
Average of High/Low or Bid/Ask price per share.
(2)
EPS (estimate core basis) is based on actual trailing twelve month data, adjusted to omit non-operating items on a tax effected basis.
(3)
P/E = Price to earnings, P/B = Price to book, P/A = Price to assets, P/TB = Price to tangible book value, and P/CORE = Price to estimated core earnings.
(4)
Indicated twelve month dividend, based on last quarterly dividend declared.
(5)
Indicated dividend as a percent of trailing twelve month estimated core earnings.
(6)
ROA (return on assets) and ROE (return on equity) are indicated ratios based on trailing twelve month earnings and average equity and assets balances.
(7)
Excludes from averages those companies the subject of actual or rumored acquisition activities or unusual operating characteristics.
(8)
Includes North-West Companies,

Source:
SNL Financial, LC. and RP Financial, LC. calculations. The information provided in this report has been obtained from sources we believe are reliable, but we cannot guarantee the accuracy or completeness of such information.
 
Copyright (c) 2010 by RP Financial, LC.


RP FINANCIAL, LC.
 
Financial Services Industry Consultants
 
1100 North Glebe Road, Suite 1100
 
Arlington, Virginia 22201
 
(703) 528-1700
 
 
Exhibit III-2
Market Pricing Comparatives
Prices As of September 2, 2011
                                                                                   
   
Market
 
Per Share Data
                                                                 
   
Capitalization
 
Core
 
Book
 
Pricing Ratios(3)
 
Dividends(4)
 
Financial Characteristics(6)
 
   
Price/
 
Market
 
12-Mth
 
Value/
                     
Amount/
     
Payout
 
Total
 
Equity/
 
Tng Eq/
 
NPAs/
 
Reported
 
Core
 
Financial Institution
 
Share(1)
 
Value
 
EPS(2)
 
Share
 
P/E
 
P/B
 
P/A
 
P/TB
 
P/CORE
 
Share
 
Yield
 
Ratio(5)
 
Assets
 
Assets
 
Assets
 
Assets
 
ROA
 
ROE
 
ROA
 
ROE
 
   
($)
 
($Mil)
 
($)
 
($)
 
(x)
 
(%)
 
(%)
 
(%)
 
(x)
 
($)
 
(%)
 
(%)
 
($Mil)
 
(%)
 
(%)
 
(%)
 
(%)
 
(%)
 
(%)
 
(%)
 
                                                                                   
All Public Companies
 
9.92
 
242.30
 
-0.05
 
13.11
 
17.83
 
76.05
 
9.47
 
81.46
 
19.48
 
0.21
 
1.97
 
28.72
 
2,613
 
11.87
 
11.19
 
3.92
 
0.09
 
0.68
 
0.01
 
-0.21
 
Special Selection Grouping(8)
 
8.70
 
19.04
 
-0.50
 
12.88
 
18.60
 
67.80
 
9.85
 
71.52
 
21.43
 
0.17
 
1.59
 
25.17
 
228
 
11.35
 
10.82
 
3.01
 
-0.10
 
-2.35
 
-0.24
 
-3.64
 
                                                                                   
Comparable Group
                                                                                 
                                                                                   
Special Comparative Group(8)
                                                                                 
CMSB     CMS Bancorp Inc of W Plains NY
 
8.10
 
15.09
 
-0.05
 
11.84
 
NM
 
68.41
 
6.10
 
68.41
 
NM
 
0.00
 
0.00
 
0.00
 
248
 
8.91
 
8.91
 
3.24
 
0.12
 
1.38
 
-0.04
 
-0.43
 
FFDF       FFD Financial Corp of Dover OH
 
15.00
 
15.18
 
0.93
 
18.50
 
10.56
 
81.08
 
7.21
 
81.08
 
16.13
 
0.68
 
4.53
 
47.89
 
211
 
8.89
 
8.89
 
1.53
 
0.70
 
7.79
 
0.46
 
5.10
 
FBSI        First Bancshares, Inc. of MO
 
6.95
 
10.78
 
-2.45
 
12.58
 
NM
 
55.25
 
5.28
 
55.51
 
NM
 
0.00
 
0.00
 
NM
 
204
 
9.56
 
9.52
 
4.17
 
-1.80
 
-17.26
 
-1.81
 
-17.40
 
FFNM     First Fed of N. Michigan of MI
 
3.75
 
10.82
 
0.02
 
8.34
 
NM
 
44.96
 
4.94
 
45.84
 
NM
 
0.00
 
0.00
 
0.00
 
219
 
10.99
 
10.80
 
4.71
 
0.07
 
0.61
 
0.03
 
0.24
 
HFBL     Home Federal Bancorp Inc of LA
 
13.30
 
40.51
 
0.16
 
16.80
 
20.78
 
79.17
 
17.36
 
79.17
 
NM
 
0.24
 
1.80
 
37.50
 
233
 
21.93
 
21.93
 
0.08
 
0.91
 
4.19
 
0.23
 
1.05
 
KFFB     KY Fst Fed Bp MHC of KY (39.3)
 
8.09
 
25.27
 
0.18
 
7.53
 
NM
 
107.44
 
27.39
 
143.44
 
NM
 
0.40
 
4.94
 
NM
 
229
 
25.49
 
20.40
 
2.85
 
0.62
 
2.54
 
0.59
 
2.40
 
MFLR    Mayflower Bancorp, Inc. of MA
 
8.35
 
17.33
 
0.40
 
10.20
 
13.05
 
81.86
 
7.02
 
81.86
 
20.88
 
0.24
 
2.87
 
37.50
 
247
 
8.58
 
8.58
 
NA
 
0.53
 
6.34
 
0.33
 
3.96
 
PFED     Park Bancorp of Chicago IL
 
2.92
 
3.48
 
-4.73
 
13.42
 
NM
 
21.76
 
1.67
 
21.76
 
NM
 
0.00
 
0.00
 
NM
 
208
 
7.69
 
7.69
 
8.22
 
-2.57
 
-28.94
 
-2.67
 
-30.09
 
SIBC       State Investors Bancorp of LA
 
11.50
 
33.47
 
0.24
 
15.80
 
NM
 
72.78
 
14.01
 
72.78
 
NM
 
0.00
 
0.00
 
0.00
 
239
 
0.00
 
0.00
 
1.28
 
0.24
 
NM
 
0.29
 
NM
 
WVFC    WVS Financial Corp. of PA
 
9.00
 
18.52
 
0.33
 
13.78
 
30.00
 
65.31
 
7.49
 
65.31
 
27.27
 
0.16
 
1.78
 
53.33
 
247
 
11.46
 
11.46
 
0.97
 
0.20
 
2.19
 
0.22
 
2.41
 

(1)
Average of High/Low or Bid/Ask price per share.
(2)
EPS (estimate core basis) is based on actual trailing twelve month data, adjusted to omit non-operating items on a tax effected basis.
(3)
P/E = Price to earnings; P/B = Price to book; P/A = Price to assets; P/TB = Price to tangible book value; and P/CORE = Price to estimated core earnings.
(4)
Indicated twelve month dividend, based on last quarterly dividend declared.
(5)
Indicated dividend as a percent of trailing twelve month estimated core earnings.
(6)
ROA (return on assets) and ROE (return on equity) are indicated ratios based on trailing twelve month earnings and average equity and assets balances.
(7)
Excludes from averages those companies the subject of actual or rumored acquisition activities or unusual operating characteristics.
(8)
Includes Assets less than $250 Million;

Source:
SNL Financial, LC. and RP Financial, LC. calculations. The information provided in this report has been obtained from sources we believe are reliable, but we cannot guarantee the accuracy or completeness of such information.
 
Copyright (c) 2010 by RP Financial, LC.


RP FINANCIAL, LC.
 
Financial Services Industry Consultants
 
1100 North Glebe Road, Suite 1100
 
Arlington, Virginia 22201
 
(703) 528-1700
 
 
Exhibit III-2
Market Pricing Comparatives
Prices As of September 2, 2011


Market
 
Per Share Data
                                                         
     
Capitalization
 
Core
 
Book
 
Pricing Ratios (3)
 
Dividends(4)
 
Financial Characteristics (6)
 
     
Price/
 
Market
 
12-Mth
 
Value/
                     
Amount/
     
Payout
 
Total
 
Equity/
 
Tng Eq/
 
NPAs/
 
Reported
 
Core
 
Financial Institution
 
Share(1)
 
Value
 
EPS (2)
 
Share
  P/E   P/B   P/A  
P/TB
 
P/CORE
 
Share
 
Yield
 
Ratio (5)
 
Assets
 
Assets
 
Assets
 
Assets
 
ROA
 
ROE
 
ROA
 
ROE
 
     
($)
 
($Mil)
 
($)
 
($)
 
(X)
 
(%)
 
(%)
 
(%)
 
(x)
 
($)
 
(%)
 
(%)
 
($Mil)
 
(%)
 
(%)
 
(%)
 
(%)
 
(%)
 
(%)
 
(%)
 
                                                                                     
All Public Companies
  9.92   242.30   -0.05   13.11   17.83   76.05   9.47   81.46   19.48   0.21   1.97   28.72   2,613   11.87   11.19   3.92   0.09   0.68   0.01   -0.21  
Special Selection Grouping(8)
  10.51   29.79   0.34   14.56   19.68   71.26   9.53   75.16   19.60   0.18   1.82   24.82   403   12.69   12.32   4.19   0.29   1.37   0.25   0.94  
                                                                                     
Comparable Group
                                                                                 
                                                                                     
Special Comparative Group(8)
                                                                                 
ALLB
Alliance Bancorp, Inc. of PA
  10.16   55.62   0.40   15.70   26.05   64.71   11.91   64.71   25.40   0.20   1.97   51.28   467   18.40   18.40   4.59   0.47   3.36   0.48   3.45  
AFCB
Athens Bancshares, Inc. of TN
  12.70   35.13   0.61   18.16   20.82   69.93   12.40   70.48   20.82   0.20   1.57   32.79   283   17.73   17.61   2.71   0.60   3.37   0.60   3.37  
BYFC
Broadway Financial Corp. of CA
  1.48   2.58   -1.71   8.27  
NM
  17.90   0.58   17.90  
NM
  0.04   2.70  
NM
  447   6.87   6.87   17.14   -0.59   -8.93   -0.60   -9.20  
BFSB
Brooklyn Fed MHC of NY (28.2)
  0.79   2.87   -0.24   3.16  
NM
  25.00   2.17   25.00  
NM
  0.04   5.06  
NM
  470   8.66   8.66   24.93   -1.01   -11.78   -0.65   -7.64  
CEBK
Central Bncrp of Somerville MA
  17.50   29.42   0.04   22.26  
NM
  78.62   5.92   83.61  
NM
  0.20   1.14   55.56   497   9.48   9.07   3.49   0.12   1.30   0.01   0.14  
CFBK
Central Federal Corp. of OH
  0.75   3.10   -1.41   1.26  
NM
  59.52   1.11   60.98  
NM
  0.00   0.00  
NM
  278   4.43   4.39   3.73   -1.87   -34.69   -2.07   -38.21  
EBMT
Eagle Bancorp Montanta of MT
  10.46   40.99   0.24   13.39   17.15   78.12   12.38   78.12  
NM
  0.29   2.77   47.54   331   15.85   15.85   1.24   0.72   4.51   0.28   1.78  
ESBK
Elmira Svgs Bank, FSB of NY
  15.85   31.18   1.25   20.31   8.90   78.04   6.24   115.02   12.68   0.80   5.05   44.94   500   11.71   9.38   0.99   0.70   6.14   0.49   4.31  
FFCO
FedFirst Financial Corp of PA
  13.49   40.35   0.31   19.99  
NM
  67.48   11.66   68.97  
NM
  0.12   0.89  
NM
  346   17.30   16.99   0.99   0.14   0.85   0.27   1.65  
FABK
First Advantage Bancorp of TN
  12.70   51.90   0.27   16.58   27.61   76.60   14.81   76.60  
NM
  0.20   1.57   43.48   350   19.34   19.34   0.92   0.54   2.79   0.32   1.64  
FCAP
First Capital, Inc. of IN
  18.41   51.29   1.18   17.78   13.74   103.54   11.53   116.37   15.60   0.76   4.13   56.72   445   11.15   10.05   1.97   0.83   7.70   0.73   6.78  
IROQ
IF Bancorp, Inc. of IL
  10.81   52.01   0.45   15.78   18.96   68.50   11.61   68.50   24.02   0.00   0.00   0.00   448   0.00   0.00   1.36   0.61  
NM
  0.48  
NM
 
JXSB
Jacksonville Bancorp Inc of IL
  13.70   26.45   1.34   20.06   8.73   68.30   8.68   73.46   10.22   0.30   2.19   19.11   305   12.70   11.92   1.27   1.00   8.72   0.85   7.44  
LSBI
LSB Fin. Corp. of Lafayette IN
  13.30   20.67   0.64   23.38   11.47   56.89   5.74   56.89   20.78   0.00   0.00   0.00   360   10.10   10.10   5.92   0.48   5.08   0.27   2.80  
LPSB
LaPorte Bancrp MHC of IN(45.0)
  9.00   18.60   0.44   11.49   15.79   78.33   8.95   94.44   20.45   0.00   0.00   0.00   461   11.42   9.66   1.75   0.58   5.12   0.45   3.95  
LSBK
Lake Shore Bnp MHC of NY(39.4)
  10.00   24.48   0.46   9.95   16.39   100.50   12.29   100.50   21.74   0.28   2.80   45.90   483   12.22   12.22   0.58   0.76   6.32   0.57   4.77  
LABC
Louisiana Bancorp, Inc. of LA
  16.03   55.11   0.60   17.13   22.90   93.58   17.21   93.58   26.72   0.00   0.00   0.00   320   18.39   18.39   0.57   0.74   3.90   0.64   3.34  
MSBF
MSB Fin Corp MHC of NJ (40.3)
  5.19   11.08   0.14   7.84   37.07   66.20   7.68   66.20   37.07   0.12   2.31  
NM
  349   11.60   11.60   8.27   0.20   1.80   0.20   1.80  
NECB
NE Comm Bncrp MHC of NY (44.6)
  6.62   39.40   0.32   8.40   30.09   78.81   19.07   80.15   20.69   0.12   1.81   54.55   444   24.20   23.89   9.31   0.59   2.61   0.86   3.79  
NFSB
Newport Bancorp, Inc. of RI
  13.05   45.53   0.54   14.58   23.30   89.51   10.03   89.51   24.17   0.00   0.00   0.00   454   11.21   11.21   0.29   0.43   3.91   0.42   3.77  
FFFD
North Central Bancshares of IA
  17.25   23.37   1.40   30.01   12.23   57.48   5.28   58.43   12.32   0.04   0.23   2.84   443   0.00   0.00   4.52   0.42   3.85   0.42   3.82  
OBAF
OBA Financial Serv. Inc of MD
  14.30   65.81   0.17   17.57  
NM
  81.39   18.49   81.39  
NM
  0.00   0.00   0.00   356   22.71   22.71   0.97   0.23   1.03   0.21   0.97  
OFED
Oconee Fed Fn Cp MHC SC (35.0)
  10.95   24.32   0.53   12.50   37.76   87.60   18.44   87.60   20.66   0.40   3.65  
NM
  377   21.05   21.05   1.31   0.49   2.62   0.90   4.78  
PSBH
PSB Hldgs Inc MHC of CT (42.9)
  5.06   14.16   0.32   7.19   25.30   70.38   6.93   83.36   15.81   0.16   3.16  
NM
  477   9.85   8.44   2.18   0.27   2.89   0.43   4.62  
PBHC
Pathfinder BC MHC of NY (36.3)
  9.10   8.21   0.67   10.52   11.97   86.50   5.41   101.34   13.58   0.12   1.32   15.79   419   7.75   6.90   1.39   0.46   6.03   0.41   5.31  
PBIP
Prudential Bncp MHC PA (25.5)
  5.18   15.70   -0.03   5.55  
NM
  93.33   10.43   93.33  
NM
  0.00   0.00  
NM
  498   11.18   11.18   2.80   -0.10   -0.90   -0.06   -0.54  
RIVR
River Valley Bancorp of IN
  16.10   24.38   0.78   18.49   12.58   87.07   6.10   87.36   20.64   0.84   5.22   65.63   400   8.25   8.23   4.92   0.50   6.01   0.30   3.66  
SPBC
SP Bancorp, Inc. of Plano, TX
  11.35   19.58   -0.05   18.84   19.57   60.24   7.36   60.24  
NM
  0.00   0.00   0.00   266   12.22   12.22   4.28   0.41   3.80   -0.04   -0.33  
STND
Standard Financial Corp. of PA
  14.75   51.30   0.93   22.25   22.01   66.29   11.72   75.56   15.86   0.00   0.00   0.00   438   17.68   15.85   0.85   0.55   3.67   0.76   5.10  
UCBA
United Comm Bncp MHC IN (40.7)
  5.81   18.53   -0.16   6.81  
NM
  85.32   9.57   91.50  
NM
  0.44   7.57  
NM
  476   11.22   10.54   5.02   -0.20   -1.71   -0.26   -2.28  
WSB
WSB Holdings, Inc. of Bowie MD
  2.47   19.75   -0.06   6.62  
NM
  37.31   5.06   37.31  
NM
  0.00   0.00  
NM
  390   13.56   13.56   10.18   -0.28   -2.15   -0.12   -0.92  
WAYN     
Wayne Savings Bancshares of OH
  8.40   25.23   0.66   13.15   12.17   63.88   6.13   67.25   12.73   0.24   2.86   34.78   412   9.60   9.16   2.54   0.51   5.39   0.48   5.15  
WBKC
Wolverine Bancorp, Inc. of MI
  14.00   35.11   0.23   25.59  
NM
  54.71   11.48   54.71  
NM
  0.00   0.00   0.00   306   20.99   20.99   5.43   0.23   1.37   0.19   1.09  
 
(1)
Average of High/Low or Bid/Ask price per share.
(2)
EPS (estimate core basis) is based on actual trailing twelve month data, adjusted to omit non-operating items on a tax effected basis.
(3)
P/E = Price to earnings; P/B = Price to book; P/A = Price to assets; P/TB = Price to tangible book value; and P/CORE = Price to estimated core earnings.
(4)
Indicated twelve month dividend, based on last quarterly dividend declared.
(5)
Indicated dividend as a percent of trailing twelve month estimated core earnings.
(6)
ROA (return on assets) and ROE (return on equity) are indicated ratios based on trailing twelve month earnings and average equity and assets balances.
(7)
Excludes from averages those companies the subject of actual or rumored acquisition activities or unusual operating characteristics.
(8)
Includes Assets $250-$500 Million;
 
Source:
SNL Financial, LC. and RP Financial, LC. calculations. The information provided in this report has been obtained from sources we believe are reliable, but we cannot guarantee the accuracy or completeness of such information.
 
Copyright (c) 2010 by RP Financial, LC.


Exhibit III-3
1st Security Bank of Washington
Peer Group Market Area Comparative Analysis
 
                   
Proj.
               
Per Capita Income
   
Deposit
   
Unemployment
 
       
Population
   
Pop.
     2000-2010      2010-2015          
% State
   
Market
   
Rate
 
Institution
 
County
 
2000
   
2010
   
2015
   
% Change
   
% Change
   
Amount
   
Average
   
Share(1)
   
7/31/2011
 
        (000)     (000)     (000)    
(%)
   
(%)
   
($)
   
(%)
   
(%)
   
(%)
 
                                                                     
Athens Bancshares, Inc. of TN
 
McMinn
    49       53       54       7.2 %     3.0 %   $ 20,206       82.87 %     19.84 %     11.6 %
Eagle Bancorp of MT
 
Lewis and Clark
    56       62       65       11.2 %     5.5 %     23,233       113.28 %     9.01 %     5.8 %
FFD Financial Corp of Dover OH
 
Tuscawaras
    91       92       92       0.9 %     -0.2 %     20,646       79.57 %     14.12 %     9.1 %
First Advantage Bancorp of TN
 
Montgomery
    135       164       175       21.4 %     7.2 %     22,987       94.27 %     11.54 %     9.5 %
First Federal of Northern MI
 
Alpena
    31       29       28       -6.2 %     -3.2 %     20,569       78.31 %     26.38 %     10.8 %
Jacksonville Bancorp, Inc. of IL
 
Morgan
    37       35       35       -3.3 %     -1.8 %     22,470       79.59 %     26.06 %     8.8 %
LSB Financial Corp. of Lafayette, LA
 
Tippecanoe
    149       169       180       13.2 %     6.7 %     24,477       127.82 %     15.00 %     8.1 %
Louisiana Bancorp, Inc. of LA
 
Jefferson
    455       435       430       -4.4 %     -1.2 %     21,827       113.98 %     1.83 %     7.2 %
Riverview Bancorp, Inc. of WA
 
Clark
    345       438       475       26.9 %     8.5 %     27,004       94.12 %     11.68 %     10.1 %
Timberland Bancorp, Inc. of WA
 
Grays Harbor
    67       72       73       7.3 %     1.3 %     20,370       71.00 %     22.01 %     12.6 %
                                                                             
   
Averages:
    142       155       161       7.4 %     2.6 %   $ 22,379       93.48 %     15.75 %     9.4 %
   
Medians:
    79       82       82       7.3 %     2.1 %   $ 22,149       88.49 %     14.56 %     9.3 %
                                                                             
1st Security
 
Snohomish
    606       713       758       17.6 %     6.4 %   $ 30,372       105.86 %     1.39 %     10.0 %
 
(1) Total institution deposits in headquarters county as percent of total county deposits as of June 30, 2010.
 
Source:  SNL Financial, LC.


EXHIBIT IV-1
1st Security Bank of Washington
Stock Prices: As of September 2, 2011


RP FINANCIAL, LC.
 
Financial Services Industry Consultants
 
1100 North Glebe Road, Suite 1100
 
Arlington, Virginia 222011
 
(703) 528-1700
 
 
Exhibit IV-1A
Weekly Thrift Market Line - Part One
Prices As Of September 2, 2011
                                                                                     
   
Market Capitalization
   
Price Change Data
   
Current Per Share Financials
 
                                                         
Tangible
       
         
Shares
   
Market
   
52 Week (1)
         
% Change From
   
Trailing
   
12 Mo.
   
Book
   
Book
       
   
Price/
   
Outst-
   
Capital-
               
Last
   
Last
   
52 Wks
   
MostRcnt
   
12 Mo.
   
Core
   
Value/
   
Value/
   
Assets/
 
Financial Institution
 
Share(1)
   
anding
   
ization(9)
   
High
   
Low
   
Week
   
Week
   
Ago(2)
   
YrEnd(2)
   
EPS(3)
   
EPS(3)
   
Share
   
Share(4)
   
Share
 
   
($)
    (000)    
($Mil)
   
($)
   
($)
   
($)
   
(%)
   
(%)
   
(%)
   
($)
   
($)
   
($)
   
($)
   
($)
 
                                                                                     
Market Averages. All Public Companies (no MHC)
                                                                               
                                                                                     
All Public Companies(117)
  10.30     32,745     270.7     13.06     8.57     10.46     -0.45     2.09     -6.50     0.03     -0.09     14.14     13.25     134.44  
NYSE Traded Companies(6)
  9.50     220,914     1,581.6     14.08     8.65     9.54     -1.31     -28.84     -34.38     0.33     0.49     9.74     7.35     94.05  
NASDAQ Listed OTC Companies(111)
  10.34     22,291     197.9     13.00     8.57     10.51     -0.40     3.80     -4.95     0.01     -0.12     14.39     13.58     136.68  
California Companies(5)
  9.42     8,939     97.7     12.17     7.38     9.39     -0.68     11.45     -9.17     0.57     0.09     12.90     12.82     145.61  
Florida Companies(2)
  11.87     87,692     1,147.0     15.75     10.01     11.26     6.18     -22.14     -23.98     -0.20     0.60     7.76     7.32     80.49  
Mid-Atlantic Companies(36)
  11.01     47,843     437.8     14.41     9.49     11.20     -1.59     0.59     -11.03     0.14     0.12     14.18     12.76     138.17  
Mid-West Companies(33)
  8.25     30,230     104.5     10.66     6.71     8.37     0.53     -3.97     -6.11     -0.28     -0.56     13.64     13.01     147.25  
New England Companies(17)
  13.87     33,805     376.8     16.41     11.14     14.33     -1.63     15.04     0.23     0.70     0.67     15.57     14.09     133.47  
North-West Companies(5)
  6.83     32,242     347.6     9.22     5.81     6.83     1.19     12.51     2.67     -0.32     -0.40     13.11     12.24     105.13  
South-East Companies(14)
  9.30     6,843     59.0     11.80     8.00     9.29     0.13     -5.53     -7.70     -0.61     -0.63     14.52     14.39     116.84  
South-West Companies(3)
  12.17     16,075     192.0     14.16     9.54     12.10     0.77     21.07     6.69     0.48     0.16     15.93     15.92     117.72  
Western Companies (Excl CA)(2)
  14.76     7,756     131.0     16.55     12.72     15.22     -2.74     13.13     -3.84     0.85     0.64     16.51     16.51     106.43  
Thrift Strategy(110)
  10.29     30,197     245.8     12.99     8.56     10.46     -0.62     2.23     -5.72     0.02     -0.07     14.15     13.30     131.72  
Mortgage Banker Strategy(3)
  3.20     37,077     55.7     4.08     2.14     3.14     1.40     5.78     -23.31     -0.55     -1.56     4.30     4.19     107.06  
Real Estate Strategy(l)
  1.55     25,670     39.8     2.23     1.27     1.45     6.90     -13.41     -14.84     -0.38     -0.58     2.90     2.90     30.28  
Diversified Strategy(3)
  20.76     121,656     1,453.3     28.08     17.94     20.54     1.36     -1.55     -14.80     1.29     1.16     27.42     24.09     293.50  
Companies Issuing Dividends(73)
  11.90     39,466     404.6     15.17     9.98     12.15     -1.73     3.37     -8.17     0.59     0.48     14.95     13.78     141.67  
Companies Without Dividends(44)
  7.76     22,052     57.8     9.69     6.33     7.77     1.60     0.05     -3.85     -0.85     -0.99     12.86     12.41     122.93  
Equity/Assets <6%(8)
  1.02     18,505     14.8     3.33     0.76     0.98     5.47     -43.65     -33.72     -4.36     -4.73     4.64     4.24     167.40  
Equity/Assets 6-12%(55)
  10.48     30,698     149.4     13.79     8.61     10.66     -0.44     -0.50     -7.17     0.25     0.06     14.70     13.90     169.94  
Equity/Assets >12%(54)
  11.36     36,827     433.5     13.59     9.59     11.51     -1.25     10.98     -2.12     0.39     0.39     14.83     13.78     92.44  
Converted Last 3 Mths (no MHC)(4)
  10.09     8,151     81.4     11.16     9.21     10.10     0.02     10.19     9.98     0.29     0.26     14.22     14.22     87.38  
Actively Traded Companies(4)
  21.05     32,693     440.7     27.53     16.59     22.40     -2.32     12.99     -8.67     0.93     0.86     21.96     20.96     278.38  
Market Value Below $20 Million(17)
  4.71     4,750     11.4     7.27     3.82     4.63     3.72     -23.40     -15.20     -2.25     -2.55     10.32     10.16     159.56  
Holding Company Structure(111)
  9.88     34,228     281.6     12.59     8.25     9.99     -0.39     1.71     -6.63     -0.07     -0.18     13.81     12.94     128.88  
Assets Over $1 Billion(55)
  10.62     64,738     533.9     14.34     9.27     10.95     -1.55     -5.40     -16.10     0.37     0.22     13.28     11.98     129.35  
Assets $500 Million-$l Billion(30)
  8.74     7,250     55.1     10.97     6.96     8.74     0.46     4.42     -2.35     -0.85     -0.86     13.44     12.86     133.83  
Assets $250-$500 Million(23)
  12.13     3,172     35.0     13.68     9.52     12.17     -0.39     17.05     6.61     0.53     0.38     17.27     16.58     150.81  
Assets less than $250 Million(9)
  8.76     2,066     18.4     10.61     7.25     8.70     3.01     0.40     3.17     -0.40     -0.57     13.47     13.45     124.55  
Goodwill Companies(70)
  10.14     38,425     368.5     13.41     8.45     10.28     -0.93     0.93     -7.81     -0.04     -0.11     14.07     12.59     140.05  
Non-Goodwill Companies(46)
  10.75     24,512     128.7     12.72     8.94     10.94     -0.32     5.59     -3.17     0.19     0.01     14.32     14.32     124.82  
Acquirors of FSLIC Cases(1)
  13.92     110,438     1.537.3     18.53     13.73     14.52     -4.13     -4.07     -17.73     0.87     0.81     16.84     14.53     120.64  

(1)
Average of high/low or bid/ask price per share.
(2)
Or since offering price if converted or first listed in the past 52 weeks. Percent change figures are actual year-to-date and are not annualized
(3)
EPS (earnings per share) is based on actual trailing twelve month data and is not shown on a pro forma basis.
(4)
Excludes intangibles (such as goodwill, value of core deposits, etc.).
(5)
ROA (return on assets) and ROE (return on equity) are indicated ratios based on trailing twelve month common earnings and average common equity and assets balances.
(6)
Annualized, based on last regular quarterly cash dividend announcement.
(7)
Indicated dividend as a percent of trailing twelve month earnings.
(8)
Excluded from averages due to actual or rumored acquisition activities or unusual operating characteristics.
(9)
For MHC institutions, market value reflects share price multiplied by public (non-MHC) shares.
   
*
Parentheses following market averages indicate the number of institutions included in the respective averages. All figures have been adjusted for stock splits, stock dividends, and secondary offerings.

Source:
SNL Financial, LC. and RP Financial, LC. calculations. The information provided in this table has been obtained from sources we believe are reliable, but we cannot guarantee the accuracy or completeness of such information.
 
Copyright (c) 2010 by RP Financial, LC.


RP FINANCIAL, LC.
 
Financial Services Industry Consultants
 
1100 North Glebe Road, Suite 1100
 
Arlington, Virginia 222011
 
(703) 528-1700
 
 
Exhibit IV-1A (continued)
Weekly Thrift Market Line - Part One
Prices As Of September 2, 2011
                                                                                     
   
Market Capitalization
   
Price Change Data
   
Current Per Share Financials
 
         
Shares
   
Market
   
52 Week (1)
         
% Change From
   
Trailing
   
12 Mo.
   
Book
   
Book
       
   
Price/
   
Outst-
   
Capital-
               
Last
   
Last
   
52 Wks
   
MostRcnt
   
12 Mo.
   
Core
   
Value/
   
Value/
   
Assets/
 
Financial Institution
 
Share(1)
   
anding
   
ization(9)
   
High
   
Low
   
Week
   
Week
   
Ago(2)
   
YrEnd(2)
   
EPS(3)
   
EPS(3)
   
Share
   
Share(4)
   
Share
 
   
($)
    (000)    
($Mil)
   
($)
   
($)
   
($)
   
(%)
   
(%)
   
(%)
   
($)
   
($)
   
($)
   
($)
   
($)
 
                                                                                     
Market Averages. MHC Institutions
                                                                                   
                                                                                     
All Public Companies(25)
  8.11     34,239     107.2     10.23     6.93     8.35     -2.71     -3.68     -5.67     0.19     0s     8.19     7.64     70.80  
NASDAQ Listed OTC Companies(25)
  8.11     34,239     107.2     10.23     6.93     8.35     -2.71     -3.68     -5.67     0.19     0.13     8.19     7.64     70.80  
Mid-Atlantic Companies(15)
  8.27     28,522     109.6     10.53     7.02     8.57     -3.57     -4.25     -7.13     0.17     0.16     8.17     7.78     77.16  
Mid-West Companies(6)
  7.08     61,454     131.9     8.87     6.13     7.12     -0.72     -8.89     -10.57     0.13     -0.06     7.51     6.57     58.10  
New England Companies(2)
  8.47     14,385     63.2     10.14     6.43     8.88     -2.85     16.86     11.35     0.43     0.41     8.53     7.66     79.75  
South-East Companies(2)
  9.71     12,470     60.6     12.37     9.20     9.93     -2.47     -4.58     2.28     0.23     0.21     9.98     9.85     55.40  
Thrift Strategy(25)
  8.11     34,239     107.2     10.23     6.93     8.35     -2.71     -3.68     -5.67     0.19     0.13     8.19     7.64     70.80  
Companies Issuing Dividends(17)
  8.34     15,374     49.8     10.41     7.06     8.56     -2.56     -3.87     -4.14     0.19     0.19     8.42     7.87     70.75  
Companies Without Dividends(8)
  7.63     71,970     222.2     9.87     6.67     7.92     -3.00     -3.30     -8.71     0.18     0.02     7.73     7.18     70.89  
Equity/Assets 6-12%(15)
  7.63     18,063     69.6     9.62     6.30     7.82     -2.28     -4.51     -7.73     0.19     0.10     8.04     7.55     83.46  
Equity /Assets >12%(10)
  8.90     61,200     169.9     11.26     7.98     9.23     -3.41     -2.30     -2.23     0.19     0.18     8.43     7.78     49.71  
Market Value Below $20 Million(1)
  0.79     12,883     2.9     3.73     0.36     0.80     -1.25     -77.43     -38.76     -0.37     -0.24     3.16     3.16     36.48  
Holding Company Structure(23)
  8.23     35,292     111.2     10.33     7.00     8.47     -2.58     -2.64     -5.29     0.20     0.14     8.30     7.73     71.72  
Assets Over $l Billion(9)
  8.98     86,989     272.6     11.26     8.11     9.63     -5.98     -6.39     -10.00     0.20     0.05     7.60     7.03     60.69  
Assets $500 Million-$l Billion(5)
  9.39     8,698     38.0     11.34     7.97     9.33     -1.13     0.23     -4.60     0.10     0.01     8.96     8.64     90.46  
Assets $250-$500 Million(10)
  6.77     7,460     17.7     8.84     5.51     6.85     -1.07     -1.86     -2.04     0.23     0.25     8.34     7.82     73.19  
Assets less than $250 Million(1)
  8.09     7,741     25.3     10.40     6.51     8.15     -0.74     -19.82     -12.54     0.19     0.18     7.53     5.64     29.54  
Goodwill Companies(16)
  8.29     47,834     152.0     10.15     7.08     8.70     -3.98     -0.56     -4.61     0.24     0.14     8.02     7.19     66.95  
Non-Goodwill Companies(9)
  7.74     7,050     17.8     10.39     6.62     7.64     -0.16     -9.92     -7.78     0.09     0.10     8.53     8.53     78.50  
MHC Institutions(25)
  8.11     34,239     107.2     10.23     6.93     8.35     -2.71     -3.68     -5.67     0.19     0.13     8.19     7.64     70.80  

(1)
Average of high/low or bid/ask price per share.
(2)
Or since offering price if converted or first listed in the past 52 weeks. Percent change figures are actual year-to-date and are not annualized
(3)
EPS (earnings per share) is based on actual trailing twelve month data and is not shown on a  pro forma basis.
(4)
Excludes intangibles (such as goodwill, value of core deposits, etc.).
(5)
ROA (return on assets) and ROE (return on equity) are indicated ratios based on trailing twelve month common earnings and average common equity and assets balances.
(6)
Annualized, based on last regular quarterly cash dividend announcement.
(7)
Indicated dividend as a percent of trailing twelve month earnings.
(8)
Excluded from averages due to actual or rumored acquisition activities or unusual operating characteristics.
(9)
For MHC institutions, market value reflects share price multiplied by public (non-MHC) shares.
   
*
Parentheses following market averages indicate the number of institutions included in the respective averages. All figures have been adjusted for stock splits, stock dividends, and secondary offerings.

Source:
SNL Financial, LC. and RP Financial, LC. calculations. The information provided in this table has been obtained from sources we believe are reliable, but we cannot guarantee the accuracy or completeness of such information.
 
Copyright (c) 2010 by RP Financial, LC.


RP FINANCIAL, LC.
 
Financial Services Industry Consultants
1100 North Glebe Road, Suite 1100
Arlington, Virginia 222011
(703) 528-1700
 
Exhibit IV-1A (continued)
Weekly Thrift Market Line - Part One
Prices As Of September 2, 2011
                                                              
                                         
Current Per Share Financials
 
     
Market Capitalization
 
Price Change Data
             
Tangible
     
         
Shares
 
Market
 
52 week (1)
     
% Change From
 
Trailing
 
12 Mo.
 
Book
 
Book
     
     
Price/
 
Outst-
 
Capital-
         
Last
 
Last
 
52 Wks
 
MostRcnt
 
12 Mo.
 
Core
 
Value/
 
Value/
 
Assets/
 
Financial Institution
 
Share(l)
 
anding
 
ization(9)
 
High
 
Low
 
Week
 
Week
 
Ago(2)
 
YrEnd(2)
 
EPS(3)
 
EPS(3)
 
Share
 
Share(4)
 
Share
 
     
($)
  (000)  
($Mil)
 
($)
 
($)
 
($)
 
(%)
 
(%)
 
(%)
 
($)
 
($)
 
($)
 
($)
 
($)
 
                                                             
NYSE Traded Companies
                                                         
AF
Astoria Financial Corp. of NY*
  9.16   98,488   902.2   15.25   9.08   9.51   -3.68   -26.07   -34.15   0.91   0.87   12.98   11.10   173.83  
BBX
BankAtlantic Bancorp Inc of FL*
  0.77   78,134   60.2   1.59   0.60   0.72   6.94   -29.36   -33.04   -0.91   -0.56   0.33   0.15   49.45  
BKU
BankUnited, Inc.*
  22.97   97,250   2,233.8   29.90   19.41   21.79   5.42   -14.93   -14.93   0.51   1.76   15.18   14.48   111.53  
PBC
Flagstar Bancorp, Inc. of MI*
  0.59   554,163   327.0   2.75   0.45   0.64   -7.81   -76.11   -63.80   -0.59   -0.96   1.78   1.78   23.49  
NYB
New York Community Bcrp of NY*
  12.07   437,414   5,279.6   19.33   11.48   12.50   -3.44   -24.75   -35.97   1.21   0.98   12.71   7.00   92.82  
PFS
Provident Fin. Serv. Inc of NJ*
  11.44   60,034   686.8   15.66   10.87   12.08   -5.30   -1.80   -24.39   0.86   0.86   15.43   9.57   113.17  
                                                           
NASDAQ Listed OTC Companies
                                                         
ABBC
Abington Bancorp, Inc. of PA(8)*
  7.86   20,246   159.1   13.23   7.58   8.16   -3.68   -22.56   -34.12   0.39   0.39   10.68   10.68   58.12  
ALLB
Alliance Bancorp, Inc. of PA*
  10.16   5,474   55.6   11.70   8.54   10.86   -6.45   7.51   -8.96   0.39   0.40   15.70   15.70   85.31  
ABCW
Anchor BanCorp Wisconsin of WI*
  0.59   21,678   12.8   1.90   0.52   0.62   -4.84   -6.35   -50.83   -1.90   -3.53   0.15   0.00   156.60  
ANCB
Anchor Bancorp of Aberdeen, WA*
  7.95   2,451   19.5   11.28   7.18   7.65   3.92   -20.50   -20.50   -2.16   -2.26   24.37   24.37   200.05  
AFCB
Athens Bancshares, Inc. of TN*
  12.70   2,766   35.1   14.05   9.56   12.00   5.83   16.51   1.68   0.61   0.61   18.16   18.02   102.45  
ACFC
Atlantic Coast Fin. Corp of GA*
  2.69   2,629   7.1   12.40   2.22   2.77   -2.89   -78.02   -69.88   -4.68   -5.27   20.57   20.54   304.97  
BCSB
BCSB Bancorp, Inc. of MD*
  12.40   3,192   39.6   14.25   9.50   12.40   0.00   25.51   9.73   0.23   0.24   16.12   16.10   197.23  
BKMU
Bank Mutual Corp of WI*
  2.89   46,229   133.6   5.70   2.86   3.10   -6.77   -44.32   -39.54   -2.72   -2.91   5.76   5.74   54.58  
BFIN
BankFinancial Corp. of IL*
  7.24   21,073   152.6   10.11   7.06   7.80   -7.18   -20.09   -25.74   -0.21   -0.17   11.88   10.60   78.91  
BFED
Beacon Federal Bancorp of NY*
  13.50   6,359   85.8   14.99   10.00   13.47   0.22   31.32   14.41   0.92   1.00   17.84   17.84   163.75  
BNCL
Beneficial Mut MHC of PA(43.7)
  7.26   80,718   261.8   9.40   7.15   7.82   -7.16   -14.39   -17.78   -0.26   -0.22   7.73   6.17   58.38  
BHLB
Berkshire Hills Bancorp of MA*
  19.24   16,721   321.7   24.14   17.50   20.65   -6.83   5.25   -12.98   0.70   1.00   26.61   15.09   192.90  
BOFI
Bofi Holding, Inc. Of CA*
  14.08   10,436   146.9   16.90   11.44   13.83   1.81   16.65   -9.22   1.94   1.57   13.67   13.67   185.90  
BYFC
Broadway Financial Corp. of CA*
  1.48   1,745   2.6   3.77   1.41   1.57   -5.73   -38.33   -39.09   -1.66   -1.71   8.27   8.27   256.20  
BRKL
Brookline Bancorp, Inc. of MA*
  7.82   59,074   462.0   11.68   7.12   7.75   0.90   -16.72   -27.93   0.49   0.50   8.48   7.60   52.72  
BFSB
Brooklyn Fed MHC of NY (28.2)
  0.79   12,883   2.9   3.73   0.36   0.80   -1.25   -77.43   -38.76   -0.37   -0.24   3.16   3.16   36.48  
CITZ
CFS Bancorp, Inc of Munster IN*
  5.23   10,868   56.8   6.10   4.27   5.45   -4.04   14.19   0.00   0.30   0.27   10.47   10.46   105.27  
CMSB
CMS Bancorp Inc of W Plains NY*
  8.10   1,863   15.1   10.65   7.04   7.64   6.02   -23.94   -17.85   0.16   -0.05   11.84   11.84   132.86  
CBNJ
Cape Bancorp, Inc. of NJ*
  7.60   13,314   101.2   10.40   7.25   8.45   -10.06   -1.30   -10.59   0.87   0.93   10.85   9.13   80.20  
CFFN
Capitol Federal Fin Inc. of KS*
  10.48   167,498   1,755.4   12.70   10.16   10.57   -0.85   -7.17   -12.01   0.22   0.38   11.55   11.55   57.33  
CARV
Carver Bancorp, Inc. of NY*
  0.69   2,489   1.7   5.80   0.31   0.65   6.15   -81.40   -63.87   -17.44   -17.43   1.89   -0.02   272.54  
CEBK
Central Bncrp of Somerville MA*
  17.50   1,681   29.4   20.88   10.28   17.39   0.63   70.73   27.00   0.36   0.04   22.26   20.93   295.80  
CFBK
Central Federal Corp. of OH*
  0.75   4,128   3.1   2.26   0.45   0.74   1.35   -25.00   47.06   -1.28   -1.41   1.26   1.23   67.29  
CHFN
Charter Fin Corp MHC GA (49.0)
  8.46   18,592   96.9   11.24   7.50   8.90   -4.94   -18.65   -4.94   0.16   -0.11   7.47   7.20   51.41  
CHEV
Cheviot Fin Cp MHC of OH (38.5)
  8.62   8,865   29.4   9.50   8.00   8.90   -3.15   4.61   -3.15   0.27   0.21   8.05   6.75   67.36  
CBNK
Chicopee Bancorp, Inc. of MA*
  14.00   5,867   82.1   14.70   11.08   14.00   0.00   25.56   10.67   0.13   0.10   15.52   15.52   98.86  
CZWI
Citizens Comm Bncorp Inc of WI*
  5.44   5,123   27.9   6.77   3.51   5.40   0.74   29.52   37.72   -1.43   -1.29   10.33   10.22   107.69  
CSBC
Citizens South Bnkg Corp of NC*
  4.15   11,506   47.7   5.46   3.00   3.85   7.79   -15.82   -4.38   -0.14   0.17   6.45   6.31   97.17  
CSBK
Clifton Svg Bp MHC of NJ(35.8)(8)
  9.50   26,138   91.3   12.18   8.08   9.96   -4.62   14.18   -12.12   0.32   0.32   6.93   6.93   43.42  
COBK
Colonial Financial Serv. of NJ*
  12.05   4,188   50.5   13.09   9.40   11.95   0.84   22.34   -1.23   0.73   0.71   17.15   17.15   143.55  
CFFC
Community Fin. Corp. of VA*
  3.07   4,362   13.4   4.28   2.72   3.07   0.00   -23.25   -11.78   0.08   0.08   8.67   8.67   119.98  
DCOM
Dime Community Bancshars of NY*
  11.00   34,957   384.5   15.89   10.40   11.51   -4.43   -13.45   -24.61   1.30   1.34   9.93   8.34   117.08  
ESBF
ESB Financial Corp. of PA*
  10.77   14,841   159.8   14.35   10.32   11.86   -9.19   -1.82   -20.40   1.05   1.06   12.03   9.18   132.59  
ESSA
ESSA Bancorp, Inc. of PA*
  10.76   12,411   133.5   13.49   10.44   11.02   -2.36   -7.88   -18.61   0.36   0.32   13.26   13.11   88.84  
EBMT
Eagle Bancorp Montanta of MT*
  10.46   3,919   41.0   11.81   8.98   10.65   -1.78   14.07   -3.42   0.61   0.24   13.39   13.39   84.48  
ESBK
Elmira Svgs Bank, FSB of NY*
  15.85   1,967   31.2   18.50   13.14   15.85   0.00   3.19   -13.15   1.78   1.25   20.31   13.78   254.06  
FFDF
FFD Financial Corp of Dover OH*
  15.00   1,012   15.2   16.49   13.00   15.50   -3.23   4.17   5.34   1.42   0.93   18.50   18.50   208.09  
FFCO
FedFirst Financial Corp of PA*
  13.49   2,991   40.3   16.50   9.82   13.55   -0.44   37.37   -1.96   0.16   0.31   19.99   19.56   115.65  
FSBI
Fidelity Bancorp, Inc. of PA*
  9.48   3,063   29.0   12.02   5.05   9.20   3.04   70.50   67.20   0.18   0.49   14.25   13.38   217.92  
FABK
First Advantage Bancorp of TN*
  12.70   4,087   51.9   13.89   10.60   12.75   -0.39   17.05   4.70   0.46   0.27   16.58   16.58   85.75  
FBSI
First Bancshares, Inc. of MO*
  6.95   1,551   10.8   9.49   5.12   6.96   -0.14   -18.24   3.58   -2.43   -2.45   12.58   12.52   131.65  
FCAP
First Capital, Inc. of IN*
  18.41   2,786   51.3   18.82   14.50   18.13   1.54   22.33   10.64   1.34   1.18   17.78   15.82   159.72  
FCLF
First Clover Leaf Fin Cp of IL*
  6.40   7,864   50.3   7.57   5.27   6.50   -1.54   16.36   -5.60   0.44   0.37   10.01   8.44   72.06  
FBNK
First Connecticut Bncorp of CT*
  10.47   17,880   187.2   11.50   10.24   10.57   -0.95   4.70   4.70   0.18   0.08   13.72   13.72   89.70  
FDEF
First Defiance Fin. Corp of OH*
  12.96   9,724   126.0   15.51   9.50   13.69   -5.33   36.42   8.91   1.02   0.55   23.92   17.44   210.38  
FFNM
First Fed of N. Michigan of MI*
  3.75   2,884   10.8   4.01   2.26   3.69   1.63   45.35   33.93   0.05   0.02   8.34   8.18   75.91  
FFBH
First Fed. Bancshares of AR(8)*
  6.00   19,303   115.8   19.50   4.70   6.00   0.00   -33.26   -19.89   -0.52   -0.57   4.30   4.30   31.93  
FFNW
First Fin NW, Inc of Renton WA*
  4.63   18,805   87.1   6.43   3.21   4.30   7.67   12.65   15.75   -0.47   -0.54   9.53   9.53   61.23  
FFCH
First Fin. Holdings Inc. of SC*
  5.82   16,527   96.2   13.19   5.26   5.59   4.11   -38.41   -49.44   -2.86   -2.74   12.20   11.83   194.93  
FPTB
First PacTrust Bancorp of CA*
  11.37   11,536   131.2   16.73   9.16   11.53   -1.39   18.19   -14.32   0.54   0.30   13.91   13.91   76.48  
FPFC
First Place Fin. Corp. of OH*
  0.85   16,974   14.4   3.88   0.52   0.67   26.87   -77.09   -67.43   -2.10   -2.91   10.76   10.24   185.73  
FSFG
First Savings Fin. Grp. of IN*
  15.40   2,365   36.4   18.49   13.05   15.69   -1.85   15.18   4.05   1.57   1.65   24.52   21.07   221.39  
FFIC
Flushing Fin. Corp. of NY*
  10.61   31,520   334.4   15.15   10.51   11.21   -5.35   -3.89   -24.21   1.28   1.32   12.85   12.31   137.16  


RP FINANCIAL, LC.
 
Financial Services Industry Consultants
100 North Glebe Road, Suite 1100
Arlington, Virginia 222011
(703) 528-1700
 
Exhibit IV-1A (continued)
Weekly Thrift Market Line - Part One
Prices As Of September 2, 2011
                                                              
                                         
Current Per Share Financials
 
     
Market Capitalization
 
Price Change Data
             
Tangible
     
         
Shares
 
Market
 
52 week (1)
     
% Change From
 
Trailing
 
12 Mo.
 
Book
 
Book
     
     
Price/
 
Outst-
 
Capital-
         
Last
 
Last
 
52 Wks
 
MostRcnt
 
12 Mo.
 
Core
 
Value/
 
Value/
 
Assets/
 
Financial Institution
 
Share(l)
 
anding
 
ization(9)
 
High
 
Low
 
Week
 
Week
 
Ago(2)
 
YrEnd(2)
 
EPS(3)
 
EPS(3)
 
Share
 
Share(4)
 
Share
 
     
($)
  (000)  
($Mil)
 
($)
 
($)
 
($)
 
(%)
 
(%)
 
(%)
 
($)
 
($)
 
($)
 
($)
 
($)
 
                                                           
NASDAQ Listed OTC Companies (continued)
                                                         
FXCB
Fox Chase Bancorp, Inc. of PA*
  12.20   14,559   177.6   14.03   9.30   12.53   -2.63   27.48   2.95   0.28   0.20   14.41   14.41   74.74  
FRNK
Franklin Financial Corp. of VA*
  11.14   14,303   159.3   12.49   11.09   11.40   -2.28   11.40   11.40   -0.07   0.20   17.44   17.44   76.96  
GCBC
Green Co Bcrp MHC of NY (44.1)
  18.84   4,146   34.2   19.97   16.28   17.65   6.74   9.22   -3.24   1.28   1.24   11.60   11.60   132.06  
HFFC
HF Financial Corp. of SD*
  8.27   6,974   57.7   11.24   8.26   8.75   -5.49   -15.01   -23.43   0.10   0.22   13.54   12.92   170.82  
HMNF
HMN Financial, Inc. of MN*
  2.00   4,388   8.8   4.11   1.50   1.86   7.53   -48.05   -28.83   -5.24   -5.54   9.81   9.81   184.00  
HBNK
Hampden Bancorp, Inc. of MA*
  12.58   6,799   85.5   13.80   9.81   12.60   -0.16   24.55   11.03   0.28   0.24   13.66   13.66   84.57  
HARL
Harleyaville Svgs Fin Cp of PA*
  14.10   3,748   52.8   15.74   11.57   14.14   -0.28   -9.03   -4.79   1.50   1.68   15.09   15.09   228.81  
HBOS
Heritage Fin Group, Inc of GA*
  10.89   8,711   94.9   13.52   9.32   11.76   -7.40   0.83   -12.32   0.14   0.62   14.01   13.51   110.62  
HIFS
Hingham Inst. for Sav. of MA*
  46.94   2,124   99.7   57.50   37.08   52.10   -9.90   23.72   5.48   5.34   5.34   36.54   36.54   502.16  
HBCP
Home Bancorp Inc. Lafayette LA*
  14.11   8,035   113.4   16.19   12.86   13.91   1.44   7.55   2.10   0.58   0.66   16.50   16.29   87.18  
HFBL
Home Federal Bancorp Inc of LA*
  13.30   3,046   40.5   14.00   9.60   13.30   0.00   24.88   15.65   0.64   0.16   16.80   16.80   76.60  
HFBC
HopFed Bancorp, Inc. of KY*
  7.40   7,345   54.4   9.77   7.01   7.50   -1.33   -16.76   -18.14   0.07   -0.31   12.67   12.58   144.63  
HCBK
Hudson City Bancorp, Inc of NJ*
  5.77   526,708   3,039.1   13.26   5.38   5.92   -2.53   -51.18   -54.71   -0.41   -0.40   9.28   8.98   98.31  
IROQ
IF Bancorp, Inc. of IL*
  10.81   4,811   52.0   11.79   10.70   10.86   -0.46   8.10   8.10   0.57   0.45   15.78   15.78   93.10  
ISBC
Investors Bcrp MHC of NJ(43.0)
  13.20   112,716   660.6   15.09   10.80   14.19   -6.98   20.11   0.61   0.63   0.58   8.34   8.08   90.55  
JXSB
Jacksonville Bancorp Inc of IL*
  13.70   1,931   26.5   13.98   9.79   13.70   0.00   42.71   27.09   1.57   1.34   20.06   18.65   157.90  
JFBI
Jefferson Bancshares Inc of TN*
  2.83   6,635   18.8   5.02   2.70   2.99   -5.35   -20.28   -12.65   -3.54   -3.74   8.41   8.10   87.04  
KFFB
KY Fst Fed Bp MHC of KY (39.3)
  8.09   7,741   25.3   10.40   6.51   8.15   -0.74   -19.82   -12.54   0.19   0.18   7.53   5.64   29.54  
KFFG
Kaiser Federal Fin Group of CA*
  11.91   9,559   113.8   14.70   9.58   11.93   -0.17   7.69   2.85   0.87   0.87   16.25   15.83   94.36  
KRNY
Kearny Fin Cp MHC of NJ (25.1)
  8.20   67,851   147.0   10.43   7.99   8.60   -4.65   -8.28   -4.65   0.12   0.14   7.19   5.58   42.80  
LSBI
LSB Fin. Corp. of Lafayette IN*
  13.30   1,554   20.7   16.36   8.90   13.75   -3.27   37.11   -2.06   1.16   0.64   23.38   23.38   231.57  
LPSB
LaPorte Bancrp MHC of IN(45.0)
  9.00   4,586   18.6   10.01   7.00   8.20   9.76   27.66   -0.44   0.57   0.44   11.49   9.53   100.59  
LSBK
Lake Shore Bnp MHC of NY (39.4)
  10.00   5,939   24.5   14.00   7.95   10.00   0.00   25.79   8.34   0.61   0.46   9.95   9.95   81.40  
LABC
Louisiana Bancorp, Inc. of LA*
  16.03   3,438   55.1   16.66   13.92   15.90   0.82   10.63   9.79   0.70   0.60   17.13   17.13   93.14  
MSBF
MSB Fin Corp MHC of NJ (40.3)
  5.19   5,173   11.1   7.94   4.23   5.03   3.18   -24.78   -12.03   0.14   0.14   7.84   7.84   67.56  
MGYR
Magyar Bancorp MHC of NJ(44.7)
  3.56   5,783   9.2   7.00   3.02   3.70   -3.78   3.49   -11.00   -0.02   -0.10   7.68   7.68   91.04  
MLVF
Malvern Fed Bncp MHC PA(44.6)
  7.45   6,103   20.3   8.99   5.05   7.49   -0.53   2.48   -0.67   -1.19   -1.19   9.98   9.98   110.43  
MFLR
Mayflower Bancorp, Inc. of MA*
  8.35   2,076   17.3   10.35   6.50   8.29   0.72   0.60   -7.22   0.64   0.40   10.20   10.20   118.92  
EBSB
Meridian Fn Serv MHC MA (41.4)
  11.88   22,241   112.3   14.30   10.25   12.76   -6.90   10.31   0.76   0.66   0.49   9.87   9.25   86.50  
CASH
Meta Financial Group of IA*
  18.32   3,117   57.1   34.77   11.90   19.40   -5.57   -45.65   32.95   1.58   2.54   25.04   24.59   344.72  
MFSF
MutualFirst Fin. Inc. of IN*
  7.52   6,987   52.5   10.50   6.97   7.70   -2.34   7.74   -19.14   0.65   0.31   14.18   13.58   207.13  
NASB
NASB Fin, Inc. of Grandview MO*
  10.21   7,868   80.3   19.12   9.25   10.09   1.19   -26.28   -39.08   -2.02   -4.78   18.38   18.06   159.76  
NECB
NE Comm Bncrp MHC of NY (44.6)
  6.62   12,797   39.4   6.90   5.55   6.71   -1.34   9.78   18.21   0.22   0.32   8.40   8.26   34.71  
NHTB
NH Thrift Bancshares of NH*
  12.81   5,774   74.0   13.79   10.10   12.53   2.23   25.22   2.07   1.34   0.78   14.89   9.94   178.56  
NVSL
Naugatuck Valley Fin Crp of CT*
  7.58   7,002   53.1   9.09   4.71   7.47   1.47   12.97   12.13   0.21   0.26   11.57   11.56   84.64  
NFSB
Newport Bancorp, Inc. of RI*
  13.05   3,489   45.5   14.60   11.43   13.75   -5.09   8.75   8.75   0.56   0.54   14.58   14.58   130.10  
FFFD
North Central Bancshares of IA*
  17.25   1,355   23.4   18.75   12.11   17.41   -0.92   15.00   3.36   1.41   1.40   30.01   29.52   326.66  
NFBK
Northfield Bcp MHC of NY (43.4)
  12.15   42,371   231.8   14.42   10.51   13.35   -8.99   9.16   -8.78   0.37   0.33   9.40   9.02   54.46  
NWBI
Northwest Bancshares Inc of PA*
  11.23   103,266   1,159.7   13.36   10.24   11.73   -4.26   0.54   -4.67   0.59   0.60   11.88   10.19   78.32  
OBAF
OBA Financial Serv. Inc of MD*
  14.30   4,602   65.8   15.10   11.02   14.04   1.85   30.00   3.47   0.18   0.17   17.57   17.57   77.35  
OSHC
Ocean Shore Holding Co. of NJ*
  11.05   7,297   80.6   13.25   10.35   11.03   0.18   4.25   -3.49   0.72   0.74   14.09   14.09   117.89  
OCFC
OceanFirst Fin. Corp of NJ*
  11.25   18,846   212.0   14.69   11.24   11.81   -4.74   -1.32   -12.59   1.13   0.99   11.32   11.32   118.81  
OFED
Oconee Fed Fn Cp MHC SC (35.0)
  10.95   6,348   24.3   13.50   10.90   10.95   0.00   9.50   9.50   0.29   0.53   12.50   12.50   59.38  
OABC
OmniAmerican Bancorp Inc of TX*
  13.83   11,662   161.3   15.93   11.10   13.89   -0.43   24.26   2.07   0.19   0.12   17.26   17.26   113.88  
ONFC
Oneida Financial Corp. of NY*
  8.77   7,162   62.8   9.20   7.06   8.51   3.06   13.16   11.72   0.80   0.81   12.31   8.80   91.89  
ORIT
Oritani Financial Corp of NJ*
  12.01   55,513   666.7   13.47   9.58   12.90   -6.90   23.94   -1.88   0.51   0.52   11.63   11.63   46.61  
PSBH
PSB Hldgs Inc MHC of CT (42.9)
  5.06   6,529   14.2   5.98   2.60   5.00   1.20   23.41   21.93   0.20   0.32   7.19   6.07   73.00  
PVFC
PVF Capital Corp. of Solon OH*
  1.55   25,670   39.8   2.23   1.27   1.45   6.90   -13.41   -14.84   -0.38   -0.58   2.90   2.90   30.28  
PFED
Park Bancorp of Chicago IL*
  2.92   1,193   3.5   5.07   2.12   2.39   22.18   -31.62   -18.89   -4.55   -4.73   13.42   13.42   174.58  
PVSA
Parkvale Financial Corp of PA(8)*
  17.80   5,583   99.4   22.39   5.75   18.21   -2.25   176.83   93.90   -2.71   1.17   16.50   11.51   322.64  
PBHC
Pathfinder BC MHC of NY (36.3)
  9.10   2,486   8.2   10.25   6.03   10.08   -9.72   35.01   7.06   0.76   0.67   10.52   8.98   168.36  
PEOP
Peoples Fed Bancshrs Inc of MA*
  14.00   7,142   100.0   14.91   10.48   13.90   0.72   33.33   7.61   -0.02   0.45   16.44   16.44   75.31  
PBCT
Peoples United Financial of CT*
  11.40   355,010   4,047.1   14.49   10.50   10.98   3.83   -10.38   -18.63   0.45   0.45   14.63   9.15   71.33  
PROV
Provident Fin. Holdings of CA*
  8.25   11,419   94.2   8.74   5.30   8.08   2.10   53.06   13.95   1.16   -0.58   12.41   12.41   115.12  
PBNY
Provident NY Bncrp, Inc. of NY*
  6.03   38,006   229.2   11.09   6.01   6.33   -4.74   -27.09   -42.52   0.46   0.30   11.29   6.93   78.30  
PBIP
Prudential Bncp MHC PA (25.5)
  5.18   10,023   15.7   8.00   5.17   5.49   -5.65   -27.65   -14.38   -0.05   -0.03   5.55   5.55   49.66  
PULB
Pulaski Fin Cp of St. Louis MO*
  6.50   10,477   68.1   7.82   6.15   6.60   -1.52   1.56   -14.25   0.67   0.31   8.37   7.99   127.10  
RIVR
River Valley Bancorp of IN*
  16.10   1,514   24.4   17.13   13.49   16.20   -0.62   5.37   0.63   1.28   0.78   18.49   18.43   264.15  
RVSB
Riverview Bancorp, Inc. of WA*
  2.61   22,472   58.7   3.34   1.71   2.70   -3.33   45.00   -4.04   0.15   0.14   4.80   3.65   39.41  
RCKB
Rockville Fin New, Inc. of CT*
  9.50   29,507   280.3   10.87   6.92   9.61   -1.14   21.17   17.87   0.17   0.31   11.26   11.22   59.20  
ROMA
Roma Fin Corp MHC of NJ (26.2)
  8.19   30,321   68.2   11.25   8.19   9.09   -9.90   -22.07   -22.74   0.18   0.13   7.07   7.01   62.39  
SIFI
SI Financial Group, Inc. of CT*
  9.43   10,576   99.7   10.53   6.11   9.25   1.95   31.70   -4.07   0.26   0.22   12.29   11.90   89.75  
SPBC
SP Bancorp, Inc. of Plano, TX*
  11.35   1,725   19.6   12.50   8.71   10.82   4.90   13.50   21.00   0.58   -0.05   18.84   18.84   154.21  
SVBI
Severn Bancorp, Inc. of MD*
  3.03   10,067   30.5   5.69   2.25   3.08   -1.62   -15.36   -12.17   -0.10   -0.15   7.72   7.69   93.11  
STND
Standard Financial Corp. of PA*
  14.75   3,478   51.3   17.03   10.90   15.08   -2.19   47.50   6.50   0.67   0.93   22.25   19.52   125.85  


RP FINANCIAL, LC.
 
Financial Services Industry Consultants
 
1100 North Glebe Road, Suite 1100
 
Arlington, Virginia 222011
 
(703) 528-1700
 
 
Exhibit IV-1A (continued)
Weekly Thrift Market Line - Part One
Prices As Of September 2, 2011
                                                                                       
                                                         
Current Per Share Financials
 
     
Market Capitalization
   
Price Change Data
                     
Tangible
       
           
Shares
   
Market
   
52 Week (1)
         
% Change From
   
Trailing
   
12 Mo.
   
Book
   
Book
       
     
Price/
   
Outst-
   
Capital-
               
Last
   
Last
   
52 Wks
   
MostRcnt
   
12 Mo.
   
Core
   
Value/
   
Value/
   
Assets/
 
Financial Institution
 
Share(1)
   
anding
   
ization(9)
   
High
   
Low
   
Week
   
Week
   
Ago(2)
   
YrEnd(2)
   
EPS(3)
   
EPS(3)
   
Share
   
Share(4)
   
Share
 
   
($)
    (000)    
($Mil)
   
($)
   
($)
   
($)
   
(%)
   
(%)
   
(%)
   
($)
   
($)
   
($)
   
($)
   
($)
 
                                                                                       
NASDAQ Listed OTC Companies (continued)
                                                                                   
SIBC
State Investors Bancorp of LA*
  11.50     2,910     33.5     12.25     11.20     11.50     0.00     15.00     15.00     0.20     0.24     15.80     15.80     82.08  
THRD
TF Fin. Corp. of Newtown PA*
  21.14     2,822     59.7     22.86     19.05     21.21     -0.33     3.73     -0.42     1.06     0.79     26.73     25.12     245.06  
TFSL
TFS Fin Corp MHC of OH (26.4)
  8.35     308,442     678.0     11.07     7.76     8.60     -2.91     -13.83     -7.43     -0.03     -0.03     5.73     5.70     35.27  
TBNK
Territorial Bancorp, Inc of HI*
  19.06     11,593     221.0     21.29     16.46     19.79     -3.69     12.18     -4.27     1.08     1.04     19.62     19.62     128.38  
TSBK
Timberland Bancorp, Inc. of WA*
  5.05     7,045     35.6     6.50     3.20     4.96     1.81     29.49     39.89     0.00     -0.13     9.99     9.13     104.33  
TRST
TrustCo Bank Corp NY of NY*
  4.37     77,367     338.1     6.66     3.93     4.30     1.63     -18.62     -31.07     0.39     0.37     3.48     3.47     52.61  
UCBA
United Comm Bncp MHC IN (40.7)
  5.81     7,840     18.5     8.13     5.29     6.24     -6.89     -19.86     -19.86     -0.12     -0.16     6.81     6.35     60.71  
UCFC
United Community Fin. of OH*
  1.14     30,969     35.3     1.62     0.87     1.00     14.00     -6.56     -14.93     -0.84     -1.07     5.91     5.90     67.89  
UBNK
United Financial Bncrp of MA*
  14.17     16,099     228.1     16.76     12.95     15.13     -6.35     4.65     -7.20     0.65     0.64     14.15     13.61     99.98  
VPFG
ViewPoint Financal Group of TX*
  11.34     34,839     395.1     14.05     8.82     11.59     -2.16     25.44     -2.99     0.67     0.40     11.68     11.66     85.07  
WSB
WSB Holdings, Inc. of Bowie MD*
  2.47     7,995     19.7     3.48     2.11     2.40     2.92     2.49     7.39     -0.14     -0.06     6.62     6.62     48.81  
WSFS
WSFS Financial Corp. of DE*
  33.62     8,604     289.3     50.99     31.20     33.23     1.17     -9.28     -29.13     2.01     1.62     37.62     33.60     482.51  
WVFC
WVS Financial Corp. of PA*
  9.00     2,058     18.5     13.17     8.37     9.01     -0.11     -12.62     -0.99     0.30     0.33     13.78     13.78     120.22  
WFSL
Washington Federal, Inc. of WA*
  13.92     110,438     1,537.3     18.53     13.73     14.52     -4.13     -4.07     -17.73     0.87     0.81     16.84     14.53     120.64  
WSBF
Waterstone Fin MHC of WI (26.2)
  2.60     31,250     21.3     4.10     2.19     2.61     -0.38     -32.11     -20.00     -0.10     -1.00     5.47     5.45     55.15  
WAYN  
Wayne Savings Bancshares of OH*
  8.40     3,004     25.2     9.93     7.52     8.46     -0.71     5.66     -6.46     0.69     0.66     13.15     12.49     137.05  
WFD
Westfield Fin. Inc. of MA*
  6.90     27,871     192.3     9.45     6.63     7.64     -9.69     -10.16     -25.41     0.11     0.01     7.87     7.87     44.52  
WBKC
Wolverine Bancorp, Inc. of MI*
  14.00     2,508     35.1     15.18     11.00     14.10     -0.71     40.00     40.00     0.29     0.23     25.59     25.59     121.92  


RP FINANCIAL, LC.
 
Financial Services Industry Consultants
 
1100 North Glebe Road, Suite 1100
 
Arlington, Virginia 22201
 
(703) 528-1700
 
 
Exhibit IV-1B
Weekly Thrift Market Line - Part Two
Prices As Of September 2, 2011
                                                                                                             
   
Key Financial Ratios
   
Asset Quality Ratios
   
Pricing Ratios
   
Divident Data(6)
 
         
Tang.
                                                                     
Price/
   
Price/
   
Ind.
   
Divi-
       
   
Equity/
   
Equity/
   
Reported Earnings
   
Core Earnings
   
NPAS
   
Resvs/
   
Resvs/
   
Price/
   
Price/
   
Price/
   
Tang.
   
Core
   
Div./
   
dend
   
Payout
 
Financial Institution
 
Assets
   
Assets
   
ROA(5)
   
ROE(5)
   
ROI(5)
   
ROA(5)
   
ROE(5)
   
Assets
   
NPAS
   
Loans
   
Earning
   
Book
   
Assets
   
Book
   
Earnings
   
Share
   
Yield
   
Ratio(7)
 
   
(%)
   
(%)
   
(%)
   
(%)
   
(%)
   
(%)
   
(%)
   
(%)
   
(%)
   
(%)
   
(x)
   
(%)
   
(%)
   
(%)
   
(x)
   
($)
   
(%)
   
(%)
 
                                                                                                             
Market Averages. All Public Companies (no MHCs)
                                                                                                           
                                                                                                             
All Public Companies (117)
  11.96     11.33     0.06     0.48     3.74     -0.03     -0.44     3.70     53.30     1.82     16.62     71.78     8.78     76.57     18.97     0.21     1.91     28.63  
NYSE Traded Companies (6)
  9.44     7.39     -0.17     -0.47     7.42     -0.18     -2.63     4.91     32.30     2.11     11.11     109.58     8.84     113.25     12.30     0.43     3.43     56.48  
NASDAQ Listed OTC Companies (111)
  12.10     11.55     0.07     0.53     3.59     -0.02     -0.33     3.63     54.33     1.80     16.89     69.66     8.78     74.84     19.39     0.20     1.83     27.85  
California Companies (5)
  11.35     11.28     0.65     5.49     9.97     0.25     1.51     6.42     31.41     2.35     12.28     68.48     8.56     68.87     20.19     0.17     2.04     12.64  
Florida Companies (2)
  7.14     6.68     -0.58     3.75     2.22     0.28     12.94     7.18     24.87     3.15    
NM
    192.33     11.08     158.63     13.05     0.28     1.22     0.00  
Mid-Atlantic Companies (36)
  11.91     10.88     0.34     4.82     5.44     0.33     4.72     3.21     45.55     1.55     15.26     76.54     9.21     88.35     16.09     0.28     2.61     35.45  
Mid-West Companies (33)
  9.83     9.46     -0.41     -5.07     2.46     -0.64     -7.27     4.80     40.33     2.46     12.52     56.92     5.85     59.66     18.80     0.20     1.89     24.79  
New England Companies (17)
  14.15     13.12     0.44     3.97     4.00     0.44     3.83     1.47     85.89     1.09     21.76     86.18     12.04     96.02     22.14     0.28     2.12     35.13  
North-West Companies (5)
  12.69     11.68     -0.14     -1.38     -5.06     -0.21     -1.95     7.50     22.75     2.16     16.70     53.76     6.91     60.77     17. 91     0.05     0.34     13.79  
South-East Companies (14)
  14.42     14.31     -0.23     -5.42     2.33     -0.23     -5.50     2.95     88.36     1.59     25.80     62.57     10.02     63.24     24.88     0.08     0.80     16.25  
South-West Companies (3)
  13.70     13.69     0.47     3.78     4.13     0.19     1.41     2.84     37.82     1.08     18.25     79.15     10.94     79.21     28.35     0.07     0.59     9.95  
Western Companies (Excl CA) (2)
  15.57     15.57     0.79     5.04     5.75     0.56     3.57     0.75     42.94     0.60     17.40     87.63     13.61     87.63     18.33     0.33     2.33     40.44  
Thrift Strategy (110)
  12.20     11.60     0.08     0.41     3.86     0.01     -0.33     3.44     54.51     1.72     16.71     70.40     8.96     76.38     18.94     0.22     1.96     29.33  
Mortgage Banker Strategy (3)
  3.85     3.69     -0.57     9.76     14.06     -1.16     -4.88     11.10     33.87     4.34     7.11     149.91     3.03     66.48    
NM
    0.04     0.48     10.34  
Real Estate Strategy (1)
  9.58     9.58     -1.16     -12.10     -24.52     -1.78     -18.47     9.39     40.93     5.11    
NM
    53.45     5.12     53.45    
NM
    0.00     0.00     0.00  
Diversified Strategy (3)
  12.50     9.99     0.51     3.90     6.03     0.48     3.58     3.26     36.70     1.64     18.10     74.92     9.41     94.36     19.47     0.38     2.40     13.36  
Companies Issuing Dividends (73)
  12.27     11.44     0.41     3.59     5.37     0.34     2.96     2.65     56.62     1.54     16.22     78.53     9.80     86.77     18.54     0.35     3.12     41.80  
Companies Without Dividends (44)
  11.47     11.16     -0.50     -5.40     0.33     -0.60     -6.86     5.42     47.96     2.27     18.10     60.78     7.16     59.14     20.58     0.00     0.00     0.00  
Equity/Assets <6% (8)
  2.53     2.32     -2.10     -21.82     0.00     -2.25     -24.48     11.77     35.93     4.39    
NM
    62.59     0.77     26.89    
NM
    0.01     0.39     0.00  
Equity/Assets 6-12% (55)
  8.91     8.53     -0.04     -0.17     4.48     -0.19     -1.75     4.00     45.39     1.85     13.42     67.75     6.01     72.16     17.24     0.25     2.18     28.63  
Equity/Assets >12% (54)
  16.46     15.51     0.45     3.08     3.08     0.45     3.08     2.45     63.46     1.43     19.93     77.09     12.78     85.04     20.86     0.21     1.84     28.63  
Converted Last 3 Mths (no MHC) (4)
  16.29     16.29     0.33     2.81     2.88     0.29     3.48     1.74     51.35     1.20     27.53     70.78     11.56     70.79     26.59     0.03     0.40     14.29  
Actively Traded Companies (4)
  8.75     8.19     0.13     1.66     6.56     0.10     1.44     3.11     46.63     1.52     12.40     84.36     7.45     89.27     12.99     0.41     2.11     33.96  
Market Value Below $20 Million (17)
  7.23     7.15     -1.01     -9.11     3.23     -1.18     -10.76     7.28     31.69     2.82     22.31     44.18     3.50     44.89     25.66     0.07     0.70     19.82  
Holding Company Structure (111)
  12.07     11.43     0.03     0.11     3.53     -0.06     -0.83     3.72     53.97     1.84     16.89     71.27     8.84     75.95     19.26     0.21     1.94     28.94  
Assets Over $1 Billion (55)
  11.70     10.75     0.18     2.05     4.85     0.07     0.82     3.47     49.68     1.81     14.33     79.77     9.25     86.31     18.08     0.30     2.74     34.12  
Assets $500 Million-$1 Billion (30)
  11.50     11.03     -0.30     -2.02     0.45     -0.31     -2.25     4.63     40.67     1.81     20.27     62.50     7.80     66.73     20.73     0.11     1.02     25.62  
Assets $250-$500 Million (23)
  13.16     12.83     0.33     1.41     5.03     0.23     0.53     3.52     64.64     1.95     17.39     68.68     9.28     72.04     18.61     0.18     1.40     23.93  
Assets less than $250 Million (9)
  11.92     11.89     -0.18     -2.96     4.33     -0.33     -4.39     3.03     82.14     1.57     18.60     63.40     7.90     63.53     21.43     0.15     1.22     25.17  
Goodwill Companies (70)
  11.10     10.05     0.03     0.60     4.37     0.00     0.18     3.56     50.25     1.80     15.84     72.98     8.10     81.07     17.96     0.26     2.41     34.64  
Non-Goodwill Companies (46)
  13.40     13.40     0.13     0.63     2.82     -0.03     -1.01     3.92     58.64     1.85     17.96     71.37     9.99     71.37     21.17     0.15     1.20     20.02  
Acquirors of FSLIC Cases (1)
  13.96     12.28     0.71     5.21     6.25     0.66     4.85     5.28     23.14     1.87     16.00     82.66     11.54     95.80     17.19     0.24     1.72     27.59  

(1)
Average of high/low or bid/ask price per share.
(2)
Or since offering price if converted or first listed in the past 52 weeks. Percent change figures are actual year-to-date and are not annualized
(3)
EPS (earnings per share) is based on actual trailing twelve month data and is not shown on a pro forma basis.
(4)
Excludes intangibles (such as goodwill, value of core deposits, etc.).
(5)
ROA (return on assets) and ROE (return on equity) are indicated ratios based on trailing twelve month common earnings and average common equity and assets balances, ROI (return on investment) is current EPS divided by current price.
(6)
Annualized, based on last regular quarterly cash dividend announcement.
(7)
Indicated dividend as a percent of trailing twelve month earnings.
(8)
Excluded from averages due to actual or rumored acquisition activities or unusual operating characteristics.
   
*
Parentheses following market averages indicate the number of institutions included in the respective averages. All figures have been adjusted for stock splits, stock dividends, and secondary offerings.
 
Source:
SNL Financial, LC. and RP Financial, LC. calculations. The information provided in this table has been obtained from sources we believe are reliable, but we cannot guarantee the accuracy or completeness of such information.
 
Copyright (c) 2010 by RP Financial, LC.


RP FINANCIAL, LC.
 
Financial Services Industry Consultants
1100 North Glebe Road, Suite 1100
Arlington, Virginia 22201
(703) 528-1700
 
Exhibit IV-1B (continued)
Weekly Thrift Market Line - Part Two
Prices As Of September 2, 2011
                                                                            
   
Key Financial Ratios
 
Asset Quality Ratios
 
Pricing Ratios
 
Dividend Data(6)
 
       
Tang.
                                             
Price/
 
Price/
 
Ind.
 
Divi-
     
   
Equity/
 
Equity/
 
Reported Earnings
 
Core Earnings
 
NPAs
 
Resvs/
 
Resvs/
 
Price/
 
Price/
 
Price/
 
Tang.
 
Core
 
Div./
 
dend
 
Payout
 
Financial Institution
 
Assets
 
Assets
 
ROA(5)
 
ROE(5)
 
ROI(5)
 
ROA(5)
 
ROE(5)
 
Assets
 
NPAs
 
Loans
 
Earning
 
Book
 
Assets
 
Book
 
Earnings
 
Share
 
Yield
 
Ratio(7)
 
   
(%)
 
(%)
 
(%)
 
(%)
 
(%)
 
(%)
 
(%)
 
(%)
 
(%)
 
(%)
 
(X)
 
(%)
 
(%)
 
(%)
 
(x)
 
($)
 
(%)
 
(%)
 
                                                                           
Market Averages. MHC Institutions
                                                                         
                                                                           
All Public Companies (25)
  12.97   12.15   0.23   1.59   1.62   0.16   0.78   5.09   30.45   1.69   24.40   96.17   12.76   104.07   22.64   0.18   2.26   29.47  
NASDAQ Listed OTC Companies (25)
  12.97   12.15   0.23   1.59   1.62   0.16   0.78   5.09   30.45   1.69   24.40   96.17   12.76   104.07   22.64   0.18   2.26   29.47  
Mid-Atlantic Companies (15)
  12.02   11.46   0.18   1.18   1.36   0.19   1.26   6.29   31.59   1.88   23.43   96.08   11.68   102.10   23.98   0.16   1.93   39.30  
Mid-West Companies (6)
  14.37   12.81   0.21   1.17   0.92   -0.10   -1.99   4.69   26.72   1.50   23.86   95.24   14.51   108.55   20.45   0.22   3.01   0.00  
New England Companies (2)
  10.63   9.61   0.53   4.87   4.75   0.51   4.85   2.61   22.86   1.00   21.65   95.37   10.33   105.90   20.03   0.08   1.58   0.00  
South-East Companies (2)
  17.79   17.56   0.39   2.44   2.27   0.35   1.62   1.99   41.09   1.60   37.76   100.43   17.45   102.55   20.66   0.30   3.01   0.00  
Thrift Strategy (25)
  12.97   12.15   0.23   1.59   1.62   0.16   0.78   5.09   30.45   1.69   24.40   96.17   12.76   104.07   22.64   0.18   2.26   29.47  
Companies Issuing Dividends (17)
  13.77   12.86   0.27   1.58   1.99   0.27   1.61   5.59   30.14   1.82   26.45   95.27   13.36   103.74   22.70   0.27   3.39   47.16  
Companies Without Dividends (8)
  11.38   10.74   0.17   1.62   0.92   -0.08   -0.89   4.34   30.91   1.46   18.25   97.98   11.55   104.72   22.49   0.00   0.00   0.00  
Equity/Assets 6-12% (15)
  10.02   9.52   0.16   1.34   1.46   0.03   0.15   6.29   28.64   1.75   21.97   89.17   9.00   94.84   21.30   0.17   2.28   14.10  
Equity/Assets >12% (10)
  17.89   16.55   0.36   2.01   1.88   0.36   1.81   3.30   33.17   1.58   29.27   107.84   19.02   119.44   24.98   0.20   2.22   55.10  
Market Value Below $20 Million (1)
  8.66   8.66   -1.01   -11.78   0.00   -0.65   -7.64   24.93   17.64   6.96  
NM
  25.00   2.17   25.00  
NM
  0.04   5.06   0.00  
Holding Company Structure (23)
  13.05   12.20   0.25   1.70   1.74   0.17   0.83   5.21   30.88   1.71   24.40   96.29   12.86   104.53   22.64   0.19   2.36   29.47  
Assets Over $1 Billion (9)
  13.18   12.26   0.27   2.14   1.16   0.04   -0.24   4.12   34.51   1.61   23.93   115.62   15.47   125.27   27.94   0.10   1.04   21.62  
Assets $500 Million-$l Billion (5)
  10.55   10.11   0.15   1.11   -0.94   0.01   -0.09   5.58   33.36   1.54   23.32   100.75   10.84   105.72   15.19   0.30   2.65   54.69  
Assets $250-$500 Million (10)
  12.77   12.26   0.21   1.30   3.38   0.29   1.86   5.75   28.83   1.84   24.91   77.20   10.09   82.34   21.43   0.17   2.77   29.06  
Assets less than $250 Million (1)
  25.49   20.40   0.62   2.54   2.35   0.59   2.40   2.85   13.53   0.00  
NM
  107.44   27.39   143.44  
NM
  0.40   4.94   0.00  
Goodwill Companies (16)
  13.77   12.55   0.33   2.52   2.28   0.19   1.06   3.84   35.48   1.57   23.36   103.25   14.39   115.10   22.05   0.17   2.19   22.53  
Non-Goodwill Companies (9)
  11.37   11.37   0.03   -0.26   0.11   0.10   0.20   7.42   21.11   1.94   26.49   82.01   9.49   82.01   23.67   0.21   2.39   50.29  
MHC Institutions (25)
  12.97   12.15   0.23   1.59   1.62   0.16   0.78   5.09   30.45   1.69   24.40   96.17   12.76   104.07   22.64   0.18   2.26   29.47  

(1)
Average of high/low or bid/ask price per share.
(2)
Or since offering price if converted or first listed in the past 52 weeks. Percent change figures are actual year-to-date and are not annualized
(3)
EPS (earnings per share) is based on actual trailing twelve month data and is not shown on a pro forma basis.
(4)
Excludes intangibles (such as goodwill, value of core deposits, etc.).
(5)
ROA (return on assets) and ROE (return on equity) are indicated ratios based on trailing twelve month common earnings and average common equity and assets balances, ROI (return on investment) is current EPS divided by current price.
(6)
Annualized, based on last regular quarterly cash dividend announcement.
(7)
Indicated dividend as a percent of trailing twelve month earnings.
(8)
Excluded from averages due to actual or rumored acquisition activities or unusual operating characteristics.
   
*
Parentheses following market averages indicate the number of institutions included in the respective averages. All figures have been adjusted for stock splits, stock dividends, and secondary offerings.
 
Source:
SNL Financial, LC. and RP Financial, LC. calculations. The information provided in this table has been obtained from sources we believe are reliable, but we cannot guarantee the accuracy or completeness of such information.
 
Copyright (c) 2010 by RP Financial, LC.


RP FINANCIAL, LC.
 
Financial Services Industry Consultants
1100 North Glebe Road, Suite 1100
Arlington, Virginia 22201
(703) 528-1700
 
Exhibit IV-1B (continued)
Weekly Thrift Market Line - Part Two
Prices As Of September 2, 2011
                                                               
     
Key Financial Ratios
   
Asset Quality Ratios
 
           
Tang.
                                                 
     
Equity/
   
Equity/
   
Reported Earnings
   
Core Earnings
   
NPAs
   
Resvs/
   
Resvs/
 
Financial Institution
 
Assets
   
Assets
   
ROA(5)
   
ROE(5)
   
ROI(5)
   
ROA(5)
   
ROE(5)
   
Assets
   
NPAs
   
Loans
 
     
(%)
   
(%)
   
(%)
   
(%)
   
(%)
   
(%)
   
(%)
   
(%)
   
(%)
   
(%)
 
                                                             
NYSE Traded Companies
                                                           
AF
Astoria Financial Corp. of NY*
    7.47       6.46       0.49       7.17       9.93       0.47       6.85       2.99       35.75       1.35  
BBX
BankAtlantic Bancorp Inc of FL*
    0.67       0.30       -1.61    
NM
   
NM
      -0.99    
NM
      14.33       24.87       4.82  
BKU
BankUnited, Inc. *
    13.61       13.07       0.45       3.75       2.22       1.56       12.94       0.03    
NA
      1.48  
FBC
Flagstar Bancorp, Inc. of MI*
    7.58       7.58       -2.39       -28.50    
NM
      -3.88       -46.38       8.48       25.53       2.83  
NYB
New York Community Bcrp of NY*
    13.69       8.04       1.28       9.60       10.02       1.04       7.77       1.54       24.86       0.53  
PFS
Provident Fin. Serv. Inc of NJ*
    13.63       8.92       0.76       5.64       7.52       0.76       5.64       2.08       50.47       1.62  
                                                                                   
NASDAQ Listed OTC Companies
                                                                               
ABBC
Abington Bancorp, Inc. of PA(8)*
    18.38       18.38       0.64       3.70       4.96       0.64       3.70       4.27       8.68       0.66  
ALLB
Alliance Bancorp, Inc. of PA*
    18.40       18.40       0.47       3.36       3.84       0.48       3.45       4.59       24.69       1.81  
ABCW
Anchor BanCorp Wisconsin of WI*
    0.10       0.00       -1.07    
NM
   
NM
      -1.99    
NM
      13.94       30.71       5.45  
ANCB
Anchor Bancorp of Aberdeen, WA*
    12.18       12.18       -1.10       -10.44       -27.17       -1.15       -10.92    
NA
   
NA
      2.17  
AFCB
Athens Bancshares, Inc. of TN*
    17.73       17.61       0.60       3.37       4.80       0.60       3.37       2.71       59.33       2.20  
ACFC
Atlantic Coast Fin. Corp of GA*
    6.74       6.74       -1.45       -23.82    
NM
      -1.64       -26.82       7.65       22.31       2.30  
BCSB
BCSB Bancorp, Inc. of MD*
    8.17       8.16       0.12       1.29       1.85       0.12       1.34       2.29       26.84       1.05  
BKMU
Bank Mutual Corp of WI*
    10.55       10.52       -4.32       -37.01    
NM
      -4.62       -39.59       6.30       27.31       2.82  
BFIN
BankFinancial Corp. of IL*
    15.06       13.65       -0.28       -1.74       -2.90       -0.22       -1.41       4.76       29.02       1.75  
BFED
Beacon Federal Bancorp of NY*
    10.89       10.89       0.56       5.32       6.81       0.61       5.79       1.34       118.30       2.01  
BNCL
Beneficial Mut MHC of PA(43.7)
    13.24       10.86       -0.43       -3.34       -3.58       -0.37       -2.83       2.92       37.32       1.88  
BHLB
Berkshire Hills Bancorp of MA*
    13.79       8.32       0.40       2.94       3.64       0.58       4.20       0.63       176.65       1.30  
BOFI
Bofi Holding, Inc. Of CA*
    7.35       7.35       1.22       14.66       13.78       0.99       11.87       1.69       23.47       0.55  
BYFC
Broadway Financial Corp. of CA*
    3.23       3.23       -0.59       -8.93    
NM
      -0.60       -9.20       17.14       29.03       5.58  
BRKL
Brookline Bancorp, Inc. of MA*
    16.08       14.66       1.02       5.81       6.27       1.04       5.92       0.65       151.68       1.19  
BFSB
Brooklyn Fed MHC of NY (28.2)
    8.66       8.66       -1.01       -11.78    
NM
      -0.65       -7.64       24.93       17.64       6.96  
CITZ
CFS Bancorp, Inc of Munster IN*
    9.95       9.94       0.29       2.89       5.74       0.26       2.60       7,79       19.40       2.31  
CMSB
CMS Bancorp, Inc. of W Plains NY*
    8.91       8.91       0.12       1.38       1.98       -0.04       -0.43       3.24       14.66       0.66  
CBNJ
Cape Bancorp, Inc. of NJ*
    13.53       11.64       1.09       8.49       11.45       1.16       9.07       5.73       21.80       1.73  
CFFN
Capitol Federal Fin Inc. of KS*
    20.15       20.15       0.40       2.36       2.10       0.69       4.08       0.70       22.04       0.29  
CARV
Carver Bancorp, Inc. of NY*
    0.69       -0.01       -5.88    
NM
   
NM
      -5.88    
NM
      17.08       20.51       4.23  
CEBK
Central Bncrp of Somerville MA*
    7.53       7.11       0.12       1.30       2.06       0.01       0.14       3.49       25.46       1.06  
CFBK
Central Federal Corp. of OH*
    1.87       1.83       -1.87       -34.69    
NM
      -2.07       -38.21       3.73       77.70       4.44  
CHFN
Charter Fin Corp MHC GA (49.0)
    14.53       14.08       0.28       2.26       1.89       -0.19       -1.55       2.66       64.46       2.86  
CHEV
Cheviot Fin Cp MHC of OH (38.5)
    11. 95       10.22       0.53       3.41       3.13       0.41       2.65    
NA
   
NA
      0.34  
CBNK
Chicopee Bancorp, Inc. of MA*
    15.70       15.70       0.13       0.82       0.93       0.10       0.63       1.01       75.44       1.00  
CZWI
Citizens Comm Bncorp Inc of WI*
    9.59       9.50       -1.27       -13.90       -26.29       -1.15       -12.54       2.65       31.83       1.08  
CSBC
Citizens South Bnkg Corp of NC*
    6.64       6.50       -0.15       -1.71       -3.37       0.18       2.07       3.38       33.75       1.69  
CSBK
Clifton Svg Bp MHC of NJ(35.8)(8)
    15.96       15.96       0.74       4.69       3.37       0.74       4.69       0.40       41.92       0.44  
COBK
Colonial Financial Serv. of NJ*
    11.95       11.95       0.52       4.63       6.06       0.50       4.50       4.84       14.03       1.31  
CFFC
Community Fin. Corp. of VA*
    7.23       7.23       0.07       0.70       2.61       0.07       0.70       7.95       17.72       1.54  
DCOM
Dime Community Bancshars of NY*
    8.48       7.22       1.11       13.77       11.82       1.15       14.19       0.87       54.33       0.57  
ESBF
ESB Financial Corp. of PA*
    9.07       7.08       0.80       9.04       9.75       0.81       9.12       0.83       40.82       1.03  
ESSA
ESSA Bancorp, Inc. of PA*
    14.93       14.78       0.41       2.65       3.35       0.37       2.36       1.73       43.09       1.10  
EBMT
Eagle Bancorp Montanta of MT*
    15.85       15.85       0.72       4.51       5.83       0.28       1.78       1.24       43.69       0.95  
ESBK
Elmira Svgs Bank, FSB of NY*
    7.99       5.57       0.70       6.14       11.23       0.49       4.31       0.99       57.52       0.94  
FFDF
FFD Financial Corp of Dover OH*
    8.89       8.89       0.70       7.79       9.47       0.46       5.10       1.53       76.87       1.18  
FFCO
FedFirst Financial Corp of PA*
    17.28       16.98       0.14       0.85       1.19       0.27       1.65       0.99       87.49       1.23  
FSBI
Fidelity Bancorp, Inc. of PA*
    6.54       6.16       0.08       1.12       1.90       0.22       3.04       3.54       23.97       1.62  
FABK
First Advantage Bancorp of TN*
    19.34       19.34       0.54       2.79       3.62       0.32       1.64       0.92       121.24       1.58  
FBSI
First Bancshares, Inc. of MO*
    9.56       9.52       -1.80       -17.26    
NM
      -1.81       -17.40       4.17       30.44       2.56  
FCAP
First Capital, Inc. of IN*
    11.13       10.03       0.83       7.70       7.28       0.73       6.78       1.97       51.90       1.55  
FCLF
First Clover Leaf Fin Cp of IL*
    13.89       11.97       0.61       4.44       6.88       0.51       3.73       3.50       24.27       1.24  
FBNK
First Connecticut Bncorp of CT*
    15.30       15.30       0.20    
NM
      1.72       0.09    
NM
      1.39       70.22       1.33  
FDEF
First Defiance Fin. Corp of OH*
    11.37       8.55       0.49       3.96       7.87       0.26       2.14       2.35       84.16       2.77  
FFNM
First Fed of N. Michigan of MI*
    10.99       10.80       0.07       0.61       1.33       0.03       0.24       4.71       21.25       1.48  
FFBH
First Fed. Bancshares of AR(8)*
    13.47       13.47       -1.62       -21.14       -8.67       -1.77       -23.17       15.13       31.73       7.80  
FFNW
First Fin NW, Inc of Renton WA*
    15.56       15.56       -0.72       -4.96       -10.15       -0.83       -5.70       11.28       13.08       2.21  
FFCH
First Fin. Holdings Inc. of SC*
    6.26       6.08       -1.43       -15.39    
NM
      -1.37       -14.75       2.76       62.46       2.26  
FPTB
First PacTrust Bancorp of CA*
    18.19       18.19       0.72       4.96       4.75       0.40       2.76       4.82       19.84       1.24  
FPFC
First Place Fin. Corp. of OH*
    5.79       5.53       -1.10       -13.16    
NM
      -1.52       -18.23       4.42       32.78       1.78  
FSFG
First Savings Fin. Grp. of IN*
    11.08       9.67       0.72       6.70       10.19       0.76       7.05    
NA
   
NA
      1.25  
FFIC
Flushing Fin. Corp. of NY*
    9.37       9.01       0.94       10.28       12.06       0.97       10.60       3.56       19.08       0.91  
FXCB
Fox Chase Bancorp, Inc. of PA*
    19.28       19.28       0.36       1.97       2.30       0.26       1.41       3.04       37.66       1.91  


Pricing Ratios
   
Dividend Data(6)
 
                       
Price/
   
Price/
   
Ind.
   
Divi-
       
     
Price/
   
Price/
   
Price/
   
Tang.
   
Core
   
Div./
   
dend
   
Payout
 
Financial Institution
 
Earning
   
Book
   
Assets
   
Book
   
Earnings
   
Share
   
Yield
   
Ratio(7)
 
     
(X)
   
(%)
   
(%)
   
(%)
   
(x)
   
($)
   
(%)
   
(%)
 
                                                 
NYSE Traded Companies
                                               
AF
Astoria Financial Corp. of NY*
    10.07       70.57       5.27       82.52       10.53       0.52       5.68       57.14  
BBX
BankAtlantic Bancorp Inc of FL*
 
NM
      233.33       1.56    
NM
   
NM
      0.00       0.00    
NM
 
BKU
BankUnited, Inc. *
 
NM
      151.32       20.60       158.63       13.05       0.56       2.44    
NM
 
FBC
Flagstar Bancorp, Inc. of MI*
 
NM
      33.15       2.51       33.15    
NM
      0.00       0.00    
NM
 
NYB
New York Community Bcrp of NY*
    9.98       94.96       13.00       172.43       12.32       1.00       8.29    
NM
 
PFS
Provident Fin. Serv. Inc of NJ*
    13.30       74.14       10.11       119.54       13.30       0.48       4.20       55.81  
                                                                   
NASDAQ Listed OTC Companies
                                                               
ABBC
Abington Bancorp, Inc. of PA(8)*
    20.15       73.60       13.52       73.60       20.15       0.24       3.05       61.54  
ALLB
Alliance Bancorp, Inc. of PA*
    26.05       64.71       11.91       64.71       25.40       0.20       1.97       51.28  
ABCW
Anchor BanCorp Wisconsin of WI*
 
NM
   
NM
      0.38    
NM
   
NM
      0.00       0.00    
NM
 
ANCB
Anchor Bancorp of Aberdeen, WA*
 
NM
      32.62       3.97       32.62    
NM
      0.00       0.00    
NM
 
AFCB
Athens Bancshares, Inc. of TN*
    20.82       69.93       12.40       70.48       20.82       0.20       1.57       32.79  
ACFC
Atlantic Coast Fin. Corp of GA*
 
NM
      13.08       0.88       13.10    
NM
      0.00       0.00    
NM
 
BCSB
BCSB Bancorp, Inc. of MD*
 
NM
      76.92       6.29       77.02    
NM
      0.00       0.00       0.00  
BKMU
Bank Mutual Corp of WI*
 
NM
      50.17       5.29       50.35    
NM
      0.04       1.38    
NM
 
BFIN
BankFinancial Corp. of IL*
 
NM
      60.94       9.18       68.30    
NM
      0.28       3.87    
NM
 
BFED
Beacon Federal Bancorp of NY*
    14.67       75.67       8.24       75.67       13.50       0.20       1.48       21.74  
BNCL
Beneficial Mut MHC of PA(43.7)
 
NM
      93.92       12.44       117.67    
NM
      0.00       0.00    
NM
 
BHLB
Berkshire Hills Bancorp of MA*
    27.49       72.30       9.97       127.50       19.24       0.64       3.33    
NM
 
BOFI
Bofi Holding, Inc. Of CA*
    7.26       103.00       7.57       103.00       8.97       0.00       0.00       0.00  
BYFC
Broadway Financial Corp. of CA*
 
NM
      17.90       0.58       17.90    
NM
      0.04       2.70    
NM
 
BRKL
Brookline Bancorp, Inc. of MA*
    15.96       92.22       14.83       102.89       15.64       0.34       4.35       69.39  
BFSB
Brooklyn Fed MHC of NY (28.2)
 
NM
      25.00       2.17       25.00    
NM
      0.04       5.06    
NM
 
CITZ
CFS Bancorp, Inc of Munster IN*
    17.43       49.95       4.97       50.00       19.37       0.04       0.76       13.33  
CMSB
CMS Bancorp, Inc. of W Plains NY*
 
NM
      68.41       6.10       68.41    
NM
      0.00       0.00       0.00  
CBNJ
Cape Bancorp, Inc. of NJ*
    8.74       70.05       9.48       83.24       8.17       0.00       0.00       0.00  
CFFN
Capitol Federal Fin Inc. of KS*
 
NM
      90.74       18.28       90.74       27.58       0.30       2.86    
NM
 
CARV
Carver Bancorp, Inc. of NY*
 
NM
      36.51       0.25    
NM
   
NM
      0.00       0.00    
NM
 
CEBK
Central Bncrp of Somerville MA*
 
NM
      78.62       5.92       83.61    
NM
      0.20       1.14       55.56  
CFBK
Central Federal Corp. of OH*
 
NM
      59.52       1.11       60.98    
NM
      0.00       0.00    
NM
 
CHFN
Charter Fin Corp MHC GA (49.0)
 
NM
      113.25       16.46       117.50    
NM
      0.20       2.36    
NM
 
CHEV
Cheviot Fin Cp MHC of OH (38.5)
    31.93       107.08       12.80       127.70    
NM
      0.48       5.57    
NM
 
CBNK
Chicopee Bancorp, Inc. of MA*
 
NM
      90.21       14.16       90.21    
NM
      0.00       0.00       0.00  
CZWI
Citizens Comm Bncorp Inc of WI*
 
NM
      52.66       5.05       53.23    
NM
      0.00       0.00    
NM
 
CSBC
Citizens South Bnkg Corp of NC*
 
NM
      64.34       4.27       65.77       24.41       0.04       0.96    
NM
 
CSBK
Clifton Svg Bp MHC of NJ(35.8)(8)
    29.69       137.09       21.88       137.09       29.69       0.24       2.53    
NM
 
COBK
Colonial Financial Serv. of NJ*
    16.51       70.26       8.39       70.26       16 97       0.00       0.00       0.00  
CFFC
Community Fin. Corp. of VA*
    38.38       35.41       2.56       35.41       38.38       0.00       0.00       0.00  
DCOM
Dime Community Bancshars of NY*
    8.46       110.78       9.40       131.89       8.21       0.56       5.09       43.08  
ESBF
ESB Financial Corp. of PA*
    10.26       89.53       8.12       117.32       10.16       0.40       3.71       38.10  
ESSA
ESSA Bancorp, Inc. of PA*
    29.89       81.15       12.11       82.07       33.63       0.20       1.86       55.56  
EBMT
Eagle Bancorp Montanta of MT*
    17.15       78.12       12.38       78.12    
NM
      0.29       2.77       47.54  
ESBK
Elmira Svgs Bank, FSB of NY*
    8.90       78.04       6.24       115.02       12.68       0.80       5.05       44.94  
FFDF
FFD Financial Corp of Dover OH*
    10.56       81.08       7.21       81.08       16.13       0.68       4.53       47.89  
FFCO
FedFirst Financial Corp of PA*
 
NM
      67.48       11.66       68.97    
NM
      0.12       0.89    
NM
 
FSBI
Fidelity Bancorp, Inc. of PA*
 
NM
      66.53       4.35       70.85       19.35       0.08       0.84       44.44  
FABK
First Advantage Bancorp of TN*
    27.61       76.60       14.81       76.60    
NM
      0.20       1.57       43.48  
FBSI
First Bancshares, Inc. of MO*
 
NM
      55.25       5.28       55.51    
NM
      0.00       0.00    
NM
 
FCAP
First Capital, Inc. of IN*
    13.74       103.54       11.53       116.37       15.60       0.76       4.13       56.72  
FCLF
First Clover Leaf Fin Cp of IL*
    14.55       63.94       8.88       75.83       17.30       0.24       3.75       54.55  
FBNK
First Connecticut Bncorp of CT*
 
NM
      76.31       11.67       76.31    
NM
      0.00       0.00       0.00  
FDEF
First Defiance Fin. Corp of OH*
    12.71       54.18       6.16       74.31       23.56       0.00       0.00       0.00  
FFNM
First Fed of N. Michigan of MI*
 
NM
      44.96       4.94       45.84    
NM
      0.00       0.00       0.00  
FFBH
First Fed. Bancshares of AR(8)*
 
NM
      139.53       18.79       139.53    
NM
      0.20       3.33    
NM
 
FFNW
First Fin NW, Inc of Renton WA*
 
NM
      48.58       7.56       48.58    
NM
      0.00       0.00    
NM
 
FFCH
First Fin. Holdings Inc. of SC*
 
NM
      47.70       2.99       49.20    
NM
      0.20       3.44    
NM
 
FPTB
First PacTrust Bancorp of CA*
    21.06       81.74       14.87       81.74       37.90       0.46       4.05    
NM
 
FPFC
First Place Fin. Corp. of OH*
 
NM
      7.90       0.46       8.30    
NM
      0.00       0.00    
NM
 
FSFG
First Savings Fin. Grp. of IN*
    9.81       62.81       6.96       73.09       9.33       0.00       0.00       0.00  
FFIC
Flushing Fin. Corp. of NY*
    8.29       82.57       7.74       86.19       8.04       0.52       4.90       40.63  
FXCB
Fox Chase Bancorp, Inc. of PA*
 
NM
      84.66       16.32       84.66    
NM
      0.08       0.66       28.57  


RP FINANCIAL, LC.   
Financial Services Industry Consultants
1100 North Glebe Road, Suite 1100
Arlington, Virginia 22201
(703) 528-1700
 
Exhibit IV-1B (continued)
Weekly Thrift Market Line - Part Two
Prices As Of September 2, 2011
 
   
Key Financial Ratios
   Asset Quality Ratios    Pricing Ratios  
Dividend Data(6)
 
    Equity/    Tang.
Equity/
   
Reported Earnings
   Core Earnings   NPAs  
Resvs/
   
Resvs/
   
Price/
   
Price/
 
Price/
   Price/
Tang.
 
Price/
Core
 
Ind.
Div./
 
Divi-dend
   
Payout
 
Financial Institution
  Assets  
Assets
  ROA(5)    ROE(5)   ROI(5)   ROA(5)    ROE(5)   
Assets
   NPAs     Loans   Earning   Book    Assets    Book   Earnings   Share   Yield    Ratio (7)  
    (%)   (%)   (%)   (%)   (%)   (%)   (%)   (%)   (%)   (%)   (X)   (%)   (%)   (%)   (x)   ($)   (%)   (%)  
                                                                           
NASDAQ Listed OTC Companies (continued)
                                                                         
FRNK
 
Franklin Financial Corp. of VA*
  22.66   22.66   -0.09  
NM
  -0.63   0.26  
NM
  4.21   28.61   2.71  
NM
  63.88   14.48   63.88  
NM
  0.00   0.00  
NM
 
GCBC
 
Green Co Bcrp MHC of NY (44.1)
  8.78   8.78   1.00   11.48   6.79   0.96   11.12  
NA
 
NA
  1.66   14.72   162.41   14.27   162.41   15.19   0.70   3.72   54.69  
HFFC
 
HF Financial Corp. of SD*
  7.93   7.59   0.06   0.74   1.21   0.12   1.62   3.37   35.70   1.71  
NM
  61.08   4.84   64.01   37.59   0.45   5.44  
NM
 
HMNF
 
HMN Financial, Inc. of MN*
  5.33   5.33   -2.58   -30.52  
NM
  -2.73   -32.27  
NA
 
NA
  4.40  
NM
  20.39   1.09   20.39  
NM
  0.00   0.00  
NM
 
HBNK
 
Hampden Bancorp, Inc. of MA*
  16.15   16.15   0.33   2.03   2.23   0.28   1. 74   2.52   35.01  
NA
 
NM
  92.09   14.88   92.09  
NM
  0.12   0.95   42.86  
HARL
 
Harleysville Svgs Fin Cp of PA*
  6.59   6.59   0.65   10.35   10.64   0.73   11.59  
NA
 
NA
  0.52   9.40   93.44   6.16   93.44   8.39   0.76   5.39   50.67  
HBOS
 
Heritage Fin Group, Inc of GA*
  12.66   12.27   0.15   1. 25   1.29   0.67   5.53   1.82   37.60   1.30  
NM
  77.73   9.84   80.61   17.56   0.12   1.10  
NM
 
HIFS
 
Hingham Inst. for Sav. of MA*
  7.28   7.28   1.12   15.51   11.38   1.12   15.51   0.92   75.47   0.87   8.79   128.46   9.35   128.46   8.79   1.00   2.13   18.73  
HBCP
 
Home Bancorp Inc. Lafayette LA*
  18.93   18.73   0.66   3.52   4.11   0.76   4.01   0.30   189.49   0.90   24.33   85.52   16.18   86.62   21.38   0.00   0.00   0.00  
HFBL
 
Home Federal Bancorp Inc of LA*
  21.93   21. 93   0.91   4.19   4.81   0.23   1.05   0.08   408.74   0.63   20.78   79.17   17.36   79.17  
NM
  0.24   1.80   37.50  
HFBC
 
HopFed Bancorp, Inc. of KY*
  8.76   8.70   0.05   0.46   0.95   -0.21   -2.02   2.17   59.81   2.33  
NM
  58.41   5.12   58.82  
NM
  0.32   4.32  
NM
 
HCBK
 
Hudson City Bancorp, Inc of NJ*
  9.44   9.16   -0.38   -4.11   -7.11   -0.37   -4.01   1.81   26.95   0.86  
NM
  62.18   5.87   64.25  
NM
  0.32   5.55  
NM
 
IROQ
 
IF Bancorp, Inc. of IL*
  16.95   16.95   0.61  
NM
  5.27   0.48  
NM
  1.36   50.28   1.15   18.96   68.50   11.61   68.50   24.02   0.00   0.00   0.00  
ISBC
 
Investors Bcrp MHC of NJ(43.0)
  9.21   8.95   0.75   7.81   4.77   0.69   7.19   1.71   61.24   1.24   20.95   158.27   14.58   163.37   22.76   0.00   0.00   0.00  
JXSB
 
Jacksonville Bancorp Inc of IL*
  12.70   11.92   1.00   8.72   11.46   0.85   7.44   1.27   81.68   1.77   8.73   68.30   8.68   73.46   10.22   0.30   2.19   19.11  
JFBI
 
Jefferson Bancshares Inc of TN*
  9.66   9.34   -3.75   -38.44  
NM
  -3.97   -40.61   4.68   29.18   1.81  
NM
  33.65   3.25   34.94  
NM
  0.00   0.00  
NM
 
KFFB
 
KY Fst Fed Bp MHC of KY (39.3)
  25.49   20.40   0.62   2.54   2.35   0.59   2.40   2.85   13.53  
NA
 
NM
  107.44   27.39   143.44  
NM
  0.40   4.94  
NM
 
KFFG
 
Kaiser Federal Fin Group of CA*
  17.22   16.85   0.94   7.02   7.30   0.94   7.02   3.39   38.67   1.61   13.69   73.29   12.62   75.24   13.69   0.24   2.02   27.59  
KRNY
 
Kearny Fin Cp MHC of NJ (25.1)
  16.80   13.55   0.30   1.69   1.46   0.35   1.97  
NA
 
NA
  0.93  
NM
  114.05   19.16   146.95  
NM
  0.20   2.44  
NM
 
LSBI
 
LSB Fin. Corp. of Lafayette IN*
  10.10   10.10   0.48   5.08   8.72   0.27   2.80   5.92   33.02   2.20   11.47   56.89   5.74   56.89   20.78   0.00   0.00   0.00  
LPSB
 
LaPorte Bancrp MHC of IN(45.0)
  11.42   9.66   0.58   5.12   6.33   0.45   3.95   1. 75   41.76   1. 25   15.79   78.33   8.95   94.44   20.45   0.00   0.00   0.00  
LSBK
 
Lake Shore Bnp MHC of NY(39.4)
  12.22   12.22   0.76   6.32   6.10   0.57   4.77   0.58   43.24   0.44   16.39   100.50   12.29   100.50   21.74   0.28   2.80   45.90  
LABC
 
Louisiana Bancorp, Inc. of LA*
  18.39   18.39   0.74   3.90   4.37   0.64   3.34   0.57   94.73   0.92   22.90   93.58   17.21   93.58   26.72   0.00   0.00   0.00  
MSBF
 
MSB Fin Corp MHC of NJ (40.3)
  11. 60   11.60   0.20   1.80   2.70   0.20   1.80   8.27   11.29  
NA
  37.07   66.20   7.68   66.20   37.07   0.12   2.31  
NM
 
MGYR
 
Magyar Bancorp MHC of NJ(44.7)
  8.44   8.44   -0.02   -0.26   -0.56   -0.11   -1.31   8.66   8.09   0.96  
NM
  46.35   3.91   46.35  
NM
  0.00   0.00  
NM
 
MLVF
 
Malvern Fed Bncp MHC PA(44.6)
  9.04   9.04   -1.05   -11.34   -15.97   -1.05   -11.34   5.42   27.52   1.90  
NM
  74.65   6.75   74.65  
NM
  0.12   1.61  
NM
 
MFLR
 
Mayflower Bancorp, Inc. of MA*
  8.58   8.58   0.53   6.34   7.66   0.33   3.96  
NA
 
NA
  0.94   13.05   81.86   7.02   81.86   20.88   0.24   2.87   37.50  
EBSB
 
Meridian Fn Serv MHC MA. (41.4)
  11.41   10.77   0.80   6.85   5.56   0.59   5.08   3.03   18.63   0.89   18.00   120.36   13.73   128.43   24.24   0.00   0.00   0.00  
CASH
 
Meta Financial Group of IA*
  7.26   7.14   0.46   6.77   8.62   0.74   10.89   1. 92   23.62   1.54   11.59   73.16   5.31   74.50   7.21   0.52   2.84   32.91  
MFSF
 
MutualFirst Fin. Inc. of IN*
  6.85   6.58   0.31   3.44   8.64   0.15   1.64   2.67   41.76   1.65   11.57   53.03   3.63   55.38   24.26   0.24   3.19   36.92  
NASB
 
NASF Fin, Inc. of Grandview MO*
  11.50   11.33   -1.18   -10.09   -19.78   -2.80   -23.88   8.49   67.33   6.52  
NM
  55.55   6.39   56.53  
NM
  0.90   8.81  
NM
 
NECB
 
NE Comm Bncrp MHC of NY (44.6)
  24.20   23.89   0.59   2.61   3.32   0.86   3.79   9.31   18.37   2.02   30.09   78.81   19.07   80.15   20.69   0.12   1. 81   54.55  
NHTB
 
NH Thrift Bancshares of NH*
  8.34   5.73   0.77   8.27   10.46   0.45   4.81   0.93   105.67   1.40   9.56   86.03   7.17   128.87   16.42   0.52   4.06   38.81  
NVSL
 
Naugatuck Valley Fin Crp of CT*
  13.67   13.66   0.25   2.81   2.77   0.31   3.48   2.93   41.36   1.46   36.10   65.51   8.96   65.57   29.15   0.12   1.58   57.14  
NFSB
 
Newport Bancorp, Inc. of RI*
  11.21   11.21   0.43   3.91   4.29   0.42   3.77   0.29   282.96   1.03   23.30   89.51   10.03   89.51   24.17   0.00   0.00   0.00  
FFFD
 
North Central Bancshares of IA*
  9.19   9.05   0.42   3.85   8.17   0.42   3.82   4.52   29.33   1.82   12.23   57.48   5.28   58.43   12.32   0.04   0.23   2.84  
NFBK
 
Northfield Bcp MHC of NY(43.4)
  17.26   16.68   0.69   3.93   3.05   0.62   3.51   3.20   31.89   2.61   32.84   129.26   22.31   134.70   36.82   0.24   1. 98   64.86  
NWBI
 
Northwest Bancshares Inc of PA*
  15.17   13.30   0.75   4.72   5.25   0.76   4.80   2.45   38.37   1.37   19.03   94.53   14.34   110.21   18.72   0.44   3.92   74.58  
OBAF
 
OBA Financial Serv. Inc of MD*
  22.71   22.71   0.23   1.03   1.26   0.21   0.97   0.97   63.16  
NA
 
NM
  81.39   18.49   81.39  
NM
  0.00   0.00   0.00  
OSHC
 
Ocean Shore Holding Co. of NJ*
  11. 95   11.95   0.63   5.21   6.52   0.64   5.35   0.70   67.43   0.61   15.35   78.42   9.37   78.42   14.93   0.24   2.17   33.33  
OCFC
 
OceanFirst Fin. Corp of NJ*
  9.53   9.53   0.95   10.49   10.04   0.83   9.19   2.36   38.19   1.31   9.96   99.38   9.47   99.38   11.36   0.48   4.27   42.48  
OFED
 
Oconee Fed Fn Cp MHC SC (35.0)
  21.05   21.05   0.49   2.62   2.65   0.90   4.78   1.31   17.72   0.33   37.76   87.60   18.44   87.60   20.66   0.40   3.65  
NM
 
OABC
 
OmniAmerican Bancorp Inc of TX*
  15.16   15.16   0.18   1.11   1.37   0.12   0.70   3.54   18.37   1.29  
NM
  80.13   12.14   80.13  
NM
  0.00   0.00   0.00  
ONFC
 
Oneida Financial Corp. of NY*
  13.40   9.96   0.88   6.93   9.12   0.89   7.02   0.88   53.21   1.08   10.96   71.24   9.54   99.66   10.83   0.48   5.47   60.00  
ORIT
 
Oritani Financial Corp of NJ*
  24.95   24.95   1.12   4.39   4.25   1.14   4.48   1.40   67.75   1.56   23.55   103.27   25.77   103.27   23.10   0.40   3.33  
NM
 
PSBH
 
PSB Hldgs Inc MHC of CT (42.9)
  9.85   8.44   0.27   2.89   3.95   0.43   4.62   2.18   27.09   1.10   25.30   70.38   6.93   83.36   15.81   0.16   3.16  
NM
 
PVFC
 
PVF Capital Corp. of Solon OH*
  9.58   9.58   -1.16   -12.10   -24.52   -1.78   -18.47   9.39   40.93   5.11  
NM
  53.45   5.12   53.45  
NM
  0.00   0.00  
NM
 
PFED
 
Park Bancorp of Chicago IL*
  7.69   7.69   -2.57   -28.94  
NM
  -2.67   -30.09   8.22   34.03   4.20  
NM
  21.76   1.67   21.76  
NM
  0.00   0.00  
NM
 
PVSA
 
Parkvale Financial Corp of PA(8) *
  5.11   3.62   -0.83   -11.94   -15.22   0.36   5.16   2.04   51.69   1.87  
NM
  107.88   5.52   154.65   15.21   0.08   0.45  
NM
 
PBHC
 
Pathfinder BC MHC of NY (36.3)
  6.25   5.38   0.46   6.03   8.35   0.41   5.31   1.39   68.63   1.38   11.97   86.50   5.41   101.34   13.58   0.12   1.32   15.79  
PEOP
 
Peoples Fed Bancshrs Inc of MA*
  21.83   21.83   -0.03   -0.14   -0.14   0.59   3.11   1.17   53.49   0.83  
NM
  85.16   18.59   85.16   31.11   0.00   0.00  
NM
 
PBCT
 
Peoples United Financial of CT*
  20.51   13.90   0.67   3.03   3.95   0.67   3.03   2.82   25.18   0.99   25.33   77.92   15.98   124.59   25.33   0.63   5.53  
NM
 
PROV
 
Provident Fin. Holdings of CA*
  10.78   10.78   0.97   9.76   14.06   -0.49   -4.88   5.04   46.04   2.76   7.11   66.48   7.17   66.48  
NM
  0.12   1.45   10.34  
PBNY
 
Provident NY Bncrp, Inc. of NY*
  14.42   9.37   0.59   4.11   7.63   0.38   2.68   2.04   48.42   1.74   13.11   53.41   7.70   87.01   20.10   0.24   3.98   52.17  
PBIP
 
Prudential Bncp MHC PA (25.5)
  11.18   11.18   -0.10   -0.90   -0.97   -0.06   -0.54   2.80   22.26   1.30  
NM
  93.33   10.43   93.33  
NM
  0.00   0.00  
NM
 
PULB
 
Pulaski Fin Cp of St. Louis MO*
  6.59   6.31   0.50   5.98   10.31   0.23   2.77   5.61   34.49   2.32   9.70   77.66   5.11   81.35   20.97   0.38   5.85   56.72  
RIVR
 
River Valley Bancorp of IN*
  7.00   6.98   0.50   6.01   7.95   0.30   3.66   4.92   19.49   1.36   12.58   87.07   6.10   87.36   20.64   0.84   5.22   65.63  
RVSB
 
Riverview Bancorp, Inc. of WA*
  12.18   9.54   0.39   3.28   5.75   0.37   3.06   5.10   35.59   2.32   17.40   54.38   6.62   71.51   18.64   0.00   0.00   0.00  
RCKB
 
Rockville Fin New, Inc. of CT*
  19.02   18.97   0.29   2.16   1.79   0.53   3.93   0.74   117.82   1.06  
NM
  84.37   16.05   84.67   30.65   0.26   2.74  
NM
 
ROMA
 
Roma Fin Corp MHC of NJ (26.2)
  11.33   11.25   0.31   2.53   2.20   0.22   1.83  
NA
 
NA
  1.15  
NM
  115.84   13.13   116.83  
NM
  0.32   3.91  
NM
 
SIFI
 
SI Financial Group, Inc. of CT*
  13.69   13.32   0.30   2.73   2.76   0.25   2.31   1. 54   32.65   0.76   36.27   76.73   10.51   79.24  
NM
  0.12   1.27   46.15  
SPBC
 
SP Bancorp, Inc. of Plano, TX*
  12.22   12.22   0.41   3.80   5.11   -0.04   -0.33   4.28   16.31   0.93   19.57   60.24   7.36   60.24  
NM
  0.00   0.00   0.00  
SVBI
 
Severn Bancorp. Inc. of MD*
  8.29   8.26   -0.10   -0.95   -3.30   -0.16   -1.43   13.00   25.52   4.05  
NM
  39.25   3.25   39.40  
NM
  0.00   0.00  
NM
 
STND
 
Standard Financial Corp. of PA*
  17.68   15.85   0.55   3.67   4.54   0.76   5.10   0.85   122.45   1.54   22.01   66.29   11. 72   75.56   15.86   0.00   0.00   0.00  
SIBC
 
State Investors Bancorp of LA*
  19.25   19.25   0.24  
NM
  1.74   0.29  
NM
  1.28   43.53   0.87  
NM
  72.78   14.01   72.78  
NM
  0.00   0.00   0.00  
THRD
 
TF Fin. Corp. of Newtown PA*
  10.91   10.32   0.43   4.03   5.01   0.32   3.00  
NA
 
NA
  1.79   19.94   79.09   8.63   84.16   26.76   0.20   0.95   18.87  


RP FINANCIAL, LC.  
Financial Services Industry Consultants
1100 North Glebe Road, Suite 1100
Arlington, Virginia 22201
(703) 528-1700
 
 
Exhibit IV-1B (continued)
Weekly Thrift Market Line - Part Two
Prices As Of September 2, 2011
 
     Key Financial Ratios   Asset Quality Ratios   Pricing Ratios  
Dividend Data(6)
 
     Equity/    Tang.
Equity/
 
Reported Earnings
   Core Earnings    NPAs    Resvs/    
Resvs/
   
Price/
   
Price/
   
Price/
   Price/
Tang.
   Price/
Core
 
Ind.
 Div./
   Divi-dend  
Payout
 
Financial Institution
  Assets  
Assets
   ROA(5)    ROE(5)     ROI(5)   ROA(5)     ROE(5)   
Assets
  NPAs   Loans    Earning    Book    Assets   Book    Earnings    Share   Yield    Ratio (7)  
    (%)   (%)   (%)   (%)   (%)   (%)   (%)   (%)   (%)   (%)   (X)   (%)   (%)   (%)   (X)   ($)   (%)   (%)  
                                                                           
NASDAQ Listed OTC Companies (continued)
                                                                         
TFSL
 
TFS Fin Corp MHC of OH (26.4)
  16.25   16.18   -0.08   -0.53   -0.36   -0.08   -0.53   3.57   38.81   1.56  
NM
  145.72   23.67   146.49  
NM
  0.00   0.00  
NM
 
TBNK
 
Territorial Bancorp, Inc of HI*
  15.28   15.28   0.87   5.57   5.67   0.83   5.36   0.25   42.18   0.24   17.65   97.15   14.85   97.15   18.33   0.36   1. 89   33.33  
TSBK
 
Timberland Bancorp, Inc. of WA*
  9.58   8.82   0.00   0.00   0.00   -0.12   -1.06   8.35   19.20   2.21  
NM
  50.55   4.84   55.31  
NM
  0.00   0.00  
NM
 
TRST
 
TrustCo Bank Corp NY of NY*
  6.61   6.60   0.77   11.61   8.92   0.73   11.01   1.34   83.79   1.88   11.21   125.57   8.31   125.94   11.81   0.26   5.95   66.67  
UCBA
 
United Comm Bncp MHC IN (40.7)
  11.22   10.54   -0.20   -1.71   -2.07   -0.26   -2.28   5.02   20.32   1. 74  
NM
  85.32   9.57   91.50  
NM
  0.44   7.57  
NM
 
UCFC
 
United Community Fin. of OH*
  8.71   8.69   -1.18   -13.68  
NM
  -1.50   -17.43   10.15   21.67   2.96  
NM
  19.29   1.68   19.32  
NM
  0.00   0.00  
NM
 
UBNK
 
United Financial Bncrp of MA*
  14.15   13.69   0.66   4.67   4.59   0.65   4.60   0.96   68.36   0.96   21. 80   100.14   14.17   104.11   22.14   0.36   2.54   55.38  
VPFG
 
ViewPoint Financal Group of TX*
  13.73   13.71   0.81   6.45   5.91   0.48   3.85   0.69   78.79   1.03   16.93   97.09   13.33   97.26   28.35   0.20   1. 76   29.85  
WSB
 
WSB Holdings, Inc. of Bowie MD*
  13.56   13.56   -0.28   -2.15   -5.67   -0.12   -0.92   10.18   23.41   3.51  
NM
  37.31   5.06   37.31  
NM
  0.00   0.00  
NM
 
WSFS
 
WSFS Financial Corp. of DE*
  7.80   7.02   0.44   4.81   5.98   0.35   3.87   2.44   55.60   2.10   16.73   89.37   6.97   100.06   20.75   0.48   1.43   23.88  
WVFC
 
WVS Financial Corp. of PA*
  11.46   11.46   0.20   2.19   3.33   0.22   2.41   0.97   27.60  
NA
  30.00   65.31   7.49   65.31   27.27   0.16   1. 78   53.33  
WFSL
 
Washington Federal, Inc. of WA*
  13.96   12.28   0.71   5.21   6.25   0.66   4.85   5.28   23.14   1.87   16.00   82.66   11.54   95.80   17.19   0.24   1. 72   27.59  
WSBF
 
Waterstone Fin MHC of WI (26.2)
  9.92   9.89   -0.17   -1.81   -3.85   -1. 72   -18.15   10.28   19.19   2.62  
NM
  47.53   4.71   47.71  
NM
  0.00   0.00  
NM
 
WAYN
 
Wayne Savings Bancshares of OH*
  9.60   9.16   0.51   5.39   8.21   0.48   5.15   2.54   30.86   1.35   12.17   63.88   6.13   67.25   12.73   0.24   2.86   34.78  
WFD
 
Westfield Fin. Inc. of MA*
  17.68   17.68   0.25   1. 32   1.59   0.02   0.12   1.55   36.88   1. 30  
NM
  87.67   15.50   87.67  
NM
  0.24   3.48  
NM
 
WBKC
 
Wolverine Bancorp, Inc. of MI*
  20.99   20.99   0.23   1.37   2.07   0.19   1. 09   5.43   61.07   4.00  
NM
  54.71   11.48   54.71  
NM
  0.00   0.00   0.00  


Exhibit IV-2
Historical Stock Price Indices (1)
                         
SNL
   
SNL
 
                 
NASDAQ
   
Thrift
   
Bank
 
Year/Qtr. Ended
 
 
DJIA
   
S&P 500
   
Composite
   
Index
   
Index
 
                                 
2003:
Quarter 1
    7,992.1       848.2       1,341.2       1,096.2       401.0  
 
Quarter 2
    8,985.4       974.5       1,622.8       1,266.6       476.1  
 
Quarter 3
    9,275.1       996.0       1,786.9       1,330.9       490.9  
 
Quarter 4
    10,453.9       1,112.0       2,003.4       1,482.3       548.6  
                                           
2004:
Quarter 1
    10,357.7       1,126.2       1,994.2       1,585.3       562.2  
 
Quarter 2
    10,435.5       1,140.8       2,047.8       1,437.8       546.6  
 
Quarter 3
    10,080.3       1,114.6       1,896.8       1,495.1       556.0  
 
Quarter 4
    10,783.0       1,211.9       2,175.4       1,605.6       595.1  
                                           
2005:
Quarter 1
    10,503.8       1,180.6       1,999.2       1,516.6       551.0  
 
Quarter 2
    10,275.0       1,191.3       2,057.0       1,577.1       563.3  
 
Quarter 3
    10,568.7       1,228.8       2,151.7       1,527.2       546.3  
 
Quarter 4
    10,717.5       1,248.3       2,205.3       1,616.4       582.8  
                                           
2006:
Quarter 1
    11,109.3       1,294.8       2,339.8       1,661.1       595.5  
 
Quarter 2
    11,150.2       1,270.2       2,172.1       1,717.9       601.1  
 
Quarter 3
    11,679.1       1,335.9       2,258.4       1,727.1       634.0  
 
Quarter 4
    12,463.2       1,418.3       2,415.3       1,829.3       658.6  
                                           
2007:
Quarter 1
    12,354.4       1,420.9       2,421.6       1,703.6       634.4  
 
Quarter 2
    13,408.6       1,503.4       2,603.2       1,645.9       622.6  
 
Quarter 3
    13,895.6       1,526.8       2,701.5       1,523.3       595.8  
 
Quarter 4
    13,264.8       1,468.4       2,652.3       1,058.0       492.9  
                                           
2008:
Quarter 1
    12,262.9       1,322.7       2,279.1       1,001.5       442.5  
 
Quarter 2
    11,350.0       1,280.0       2,293.0       822.6       332.2  
 
Quarter 3
    10,850.7       1,166.4       2,082.3       760.1       414.8  
 
Quarter 4
    8,776.4       903.3       1,577.0       653.9       268.3  
                                           
2009:
Quarter 1
    7,608.9       797.9       1,528.6       542.8       170.1  
 
Quarter 2
    8,447.0       919.3       1,835.0       538.8       227.6  
 
Quarter 3
    9,712.3       1,057.1       2,122.4       561.4       282.9  
 
Quarter 4
    10,428.1       1,115.1       2,269.2       587.0       260.8  
                                           
2010:
Quarter 1
    10,856.6       1,169.4       2,398.0       626.3       301.1  
 
Quarter 2
    9,774.0       1,030.7       2,109.2       564.5       257.2  
 
Quarter 3
    10,788.1       1,141.2       2,368.6       541.0       255.0  
 
Quarter 4
    11,577.5       1,257.6       2,652.9       592.1       290.1  
                                           
2010:
Quarter 1
    12,319.7       1,325.8       2,781.1       578.1       293.1  
 
Quarter 2
    12,414.3       1,320.6       2,773.5       540.8       266.8  
 
As of Sept. 2, 2011
    11,240.3       1,174.0       2,480.3       453.2       211.4  
                                           
(1)   End of period data.
                                       
                                           
Source:  SNL Financial, LC.


Exhibit IV-3
SNL Index Values
                                           
   
Index Values
                   
   
Aug. 31,
   
July 31,
   
Dec. 31,
   
Aug. 31,
   
Price Appreciation (%)
 
   
2011
   
2011
   
2010
   
2010
   
1 Month
   
YTD
   
LTM
 
                                           
All Pub. Traded Thrifts
    478.0       518.4       592.1       522.9       -7.78 %     -19.27 %     -8.57 %
MHC Index
    2,658.4       2,740.5       2,668.9       2,515.1       -3.00 %     -0.40 %     5.70 %
                                                         
Stock Exchange Indexes
                                                       
NYSE AMEX Thrifts
 
NA
   
NA
      364.3       313.8    
NA
   
NA
   
NA
 
NYSE Thrifts
    94.0       101.3       132.2       111.3       -7.18 %     -28.91 %     -15.55 %
OTC Thrifts
    1,293.7       1,405.7       1,531.2       1,373.5       -7.97 %     -15.51 %     -5.81 %
                                                         
Geographic Indexes
                                                       
Mid-Atlantic Thrifts
    1,980.2       2,173.2       2,669.6       2,303.6       -8.88 %     -25.82 %     -14.04 %
Midwestern Thrifts
    1,401.6       1,501.8       1,636.7       1,629.6       -6.67 %     -14.36 %     -13.99 %
New England Thrifts
    1,495.4       1,588.4       1,665.6       1,455.8       -5.86 %     -10.22 %     2.72 %
Southeastern Thrifts
    191.2       204.9       217.3       204.6       -6.67 %     -12.02 %     -6.56 %
Southwestern Thrifts
    359.4       375.2       340.0       287.7       -4.22 %     5.71 %     24.91 %
Western Thrifts
    49.7       54.8       53.9       45.3       -9.42 %     -7.93 %     9.60 %
                                                         
Asset Size Indexes
                                                       
Less than $250M
    745.7       781.4       751.8       799.0       -4.57 %     -0.81 %     -6.67 %
$250M to $500M
    2,715.8       2,790.8       2,657.7       2,374.5       -2.69 %     2.19 %     14.37 %
$500M to $1B
    1,126.9       1,199.4       1,177.5       1,079.2       -6.04 %     -4.30 %     4.42 %
$1B to $5B
    1,378.5       1,457.5       1,513.3       1,299.1       -5.42 %     -8.91 %     6.11 %
Over $5B
    222.0       244.2       294.2       261.2       -9.08 %     -24.55 %     -15.01 %
                                                         
Pink Indexes
                                                       
Pink Thrifts
    142.5       145.9       142.6       143.4       -2.37 %     -0.07 %     -0.61 %
Less than $75M
    415.7       424.7       412.6       422.7       -2.13 %     0.74 %     -1.67 %
Over $75M
    143.2       146.6       143.3       144.0       -2.37 %     -0.12 %     -0.55 %
                                                         
Comparative Indexes
                                                       
Dow Jones Industrials
    11,613.5       12,143.2       11,577.5       10,014.7       -4.36 %     0.31 %     15.96 %
S&P 500
    1,218.9       1,292.3       1,257.6       1,049.3       -5.68 %     -3.08 %     16.16 %
                                                         
All SNL indexes are market-value weighted; i.e., an institution’s effect on an index is proportionate to that institution’s market capitalization.  All SNL thrift indexes, except for the SNL MHC Index, began at 100 on March 30, 1984.  The SNL MHC Index began at 201.082 on Dec. 31, 1992, the level of the SNL Thrift Index on that date.  On March 30, 1984, the S&P 500 closed at 159.2 and the Dow Jones Industrial stood at 1,164.9.
 
Mid-Atlantic: DE, DC, MD, NJ, NY, PA, PR; Midwest: IA, IL, IN, KS, KY, MI, MN, MO, ND, NE, OH, SD, WI;
New England: CT, MA, ME, NH, RI, VT; Southeast: AL, AR, FL, GA, MS, NC, SC, TN, VA, WV;
Southwest: CO, LA, NM, OK, TX, UT; West: AZ, AK, CA, HI, ID, MT, NV, OR, WA, WY
 
Source:  SNL Financial.


RP® Financial, LC.
 
Exhibit IV-4
Washington State Thrift Acquisitions 2000-Present
                                                                                                   
                       
Target Financials at Announcement
   
Deal Terms and Pricing at Announcement
 
                       
Total
                     
NPAs/
   
Rsrvs/
   
Deal
   
Value/
                           
Prem/
 
Announce
 
Complete
                 
Assets
     E/A    
ROAA
   
ROAE
   
Assets
   
NPLs
   
Value
   
Share
      P/B    
P/TB
      P/E       P/A    
Cdeps
 
Date
 
Date
 
Buyer Short Name
     
Target Name
      ($000)    
(%)
   
(%)
   
(%)
   
(%)
   
(%)
   
($M)
   
($)
   
(%)
   
(%)
   
(x)
   
(%)
   
(%)
 
                                                                                                             
07/02/2007
 
02/01/2008
 
Washington Federal Inc.
 
WA
 
First Mutual Bancshares, Inc.
 
WA
    1,056,847       6.85       1.02       15.25       0.19       493.34       189.8       27.050       250.00       250.00       17.01       17.96       21.09  
06/04/2006
 
11/30/2006
 
Sterling Financial Corp.
 
WA
 
FirstBank NW Corp.
 
WA
    846,003       9.35       1.03       11.16       0.14       689.66       169.6       27.159       207.76       272.68       19.26       20.04       23.25  
02/12/2006
 
07/05/2006
 
Sterling Financial Corp.
 
WA
 
Lynnwood Financial Group
 
WA
    435,651       10.22       2.69       26.47       0.00    
NA
      63.8    
NA
      143.35       143.35       7.41       14.65       12.51  
06/24/2004
 
10/15/2004
 
KeyCorp
 
OH
 
EverTrust Financial Group, Inc.
 
WA
    770,072       11.76       0.96       7.63       0.56       227.69       195.0       25.602       194.69       194.69       26.95       25.32       23.09  
05/19/2003
 
08/31/2003
 
Washington Federal Inc.
 
WA
 
United Savings & Loan Bank
 
WA
    311,446       13.43       1.10       8.36       0.50       131.91       65.0       1,595.090       155.39       155.39       19.36       20.87       10.98  
                                                                                                                             
               
Averages:
        684,004       10.32       1.36       13.77       0.28       385.65       136.6               190.24       203.22       18.00       19.77       18.18  
               
Medians:
        770,072       10.22       1.03       11.16       0.19       360.52       169.6               194.69       194.69       19.26       20.04       21.09  
 
Source: SNL Financial, LC.


Exhibit IV-5
1st Security Bank of Washington
Director and Senior Management Summary Resumes
 
Ted A. Leech, Chairman of the Board, is retired from Univar Corporation. From January 2003 to February 2005, Mr. Leech was Vice President of Business Development where he conducted feasibility studies and investigated potential investments in China, Hong Kong, Singapore, Australia, Malaysia, Indonesia and Brazil.  Prior to that Mr. Leech was Senior Vice President of Administration for Univar USA where he was responsible for accounting, payables/receivables, information systems, treasury, legal, human resources and internal audit. As a result of his professional experiences, Mr. Leech brings strong leadership, management, finance, accounting and human resource skills to our board.  Mr. Leech’s expertise also qualifies him as a financial expert, which was the basis of his selection as chairman of the Audit Committee.
 
Joseph C. Adams is a director and has been the Chief Executive Officer of 1st Security Bank of Washington since July 2004.  He joined 1st Security Bank of Washington in April 2003 as its Chief Financial Officer.  Mr. Adams served as Supervisory Committee Chairperson from 1993 to 1999 when the bank was Washington’s Credit Union. Mr. Adams is a lawyer having worked for Deloitte as a tax consultant, K&L Gates as a lawyer and then at Univar USA as a lawyer and Director, Regulatory Affairs. Mr. Adams received a Masters Degree equivalent from the Pacific Coast Banking School.  Mr. Adams’ legal and accounting backgrounds, as well as his duties as Chief Executive Officer of 1st Security Bank of Washington, bring a special knowledge of the financial, economic and regulatory challenges faced by the Bank which makes him as well suited to educating the Board on these matters.
 
Judith A. Cochrane, from May 2006 until her retirement in February 2011, was the Vice President, Public Finance for Seattle-Northwest Securities Corporation.  Prior to that, Ms. Cochrane was Vice President/Manager, Municipal Trading and Underwriting for BancAmerica Securities, LLC., where she was employed for 23 years  Ms. Cochrane is an arbitrator for Financial Industry Regulatory Authority (FINRA).  She also served as Managing Director for Bank of America, in charge of Northwest Capital Markets. Ms. Cochrane is now retired from Seattle Northwest as of February 2011.  Ms. Cochrane’s professional experience brings depth to the Board in the areas of finance and the capital markets.
 
Michael J. Mansfield joined the Board of Directors in September 2008.  Mr. Mansfield spent 16 years with Deloitte & Touche before joining Moss Adams in 1995 where he was a partner for more than 10 years.  During his time with Moss Adams, Mr. Mansfield served as the lead of the Business Owner Succession Services Practice in the Seattle office and he served as a member of the firm’s Tax Committee.  He provided taxation, business and financial accounting services to a variety of clients in the financial services, construction, manufacturing and distribution, and service industries.  In January 2008, Mr. Mansfield left Moss Adams to start Family Fortunes, LLC., a consulting company aimed at assisting individuals and business owners develop and execute strategic plans, with the goals of enhancing value proposition and creating a legacy vision for families and business owners.  In addition, Mr. Mansfield is a minority owner/part-time CFO for Pacific Pile & Marine, L.P., a construction company, and Columbia Pacific Finance, LLC, a financial services company.  Mr. Mansfield’s 26 years of experience as a public accountant, together with his experience running small businesses, has provided him with strong leadership, management, financial and administrative skills, which brings valuable knowledge and skills to our organization.


Exhibit IV-5 (cont.)
1st Security Bank of Washington
Director and Senior Management Summary Resumes
 
Margaret R. Piesik  was a senior manager for Microsoft Corporation in its PowerPoint Presentation Division.  Ms. Piesik worked at Microsoft for 11 years until retiring in 1998.  She served on the board of directors of the Providence Hospital Foundation from 2001 to 2003 and since 2004 has served as the President of Swedish Medical Center Service League.  She is a co-owner of White Barn Farm, a family owned organic flower and vegetable farm.  She previously served on the boards of Providence Hospital Foundation and the Kirkland Performance Center.  Ms. Piesik is also active in local organizations such as Swedish Hospital Service League and participates in the Grow A Row program for local food banks.  Ms. Piesik’s managerial experience, together with her various board experiences and active participation in the local community, brings valuable knowledge and skills to our organization.
 
Joseph P. Zavaglia, since February 2008, has been the owner and operator of Zavaglia Consulting, L.L.C., which provides retail banking and small business advisory services to community banks. He also runs the Heart of Italy, an Italian cooking school.  In addition, Mr. Zavaglia works part time for Pacific Coast Banking School, serving as the Director of Extension Programs, and for the Washington Bankers Association, overseeing their Executive Development Program.  Mr. Zavaglia started his career with Rainier Bank in 1975 in branch operations and was ultimately promoted to manager, overseeing up to 13 branches.  From 1987 until 2003, he served as a Senior Vice President and Regional Manager with Security Pacific Bank, which acquired Rainier Bank in 1987, and then with Bank of America, which acquired Security Pacific Bank in 1992.  In February 2003, Mr. Zavaglia joined First Mutual Bank as its Executive Vice President, Retail Banking Group manager.  He resigned in 2008 to begin his consulting company and cooking school.  Mr. Zavaglia has formerly held Series 6, 63, and 26 securities licenses and his state insurance license for life and disabilities. He has been a member of the administrative board of Pacific Coast Banking School for the past 9 years, and is a 1986 graduate of the program.  He was a member of the Pete Gross House Board for 14 years, is chair of the Italian Studies board at the University of Washington, is past State Board Chair for the March of Dimes where he served for 15 years, and is a former mentor in the Seattle University mentorship program and a former member of the Dean’s advisory board for the School of Business at Seattle University.  Mr. Zavaglia is a member of the athletic Hall of Fame, a Regent, and a member of the Hall of Fame selection committee at Seattle University.  Additionally, he is a member of the Advisory Board for the Dean of the College of Education at Western Washington University.  Mr. Zavaglia’s extensive banking experience, together with his numerous board experiences, educational background and active participation in the local community, brings valuable knowledge, experience and skills to our organization


Exhibit IV-5 (continued)
1st Security Bank of Washington
Director and Senior Management Summary Resumes
 
Matthew Mullet, age 32, joined 1st Security Bank of Washington in July 2011 and was appointed Chief Financial Officer in September 2011.  Mr. Mullet started his banking career in June 2000 as a financial examiner with the Washington Department of Financial Institutions, Division of Banks, where he worked until October 2004.  From October 2004 until August 2010, Mr. Mullet was employed at Golf Savings Bank, Seattle, WA, where he served in several financial capacities, including as Chief Financial Officer from May 2007 until August 2010.  In August 2010, Golf Savings Bank was merged with Sterling Savings Bank, where Mr. Mullet held the position as Senior Vice President of the Home Loan Division until resigning and commencing work at 1st Security Bank of Washington.
 
Steven L. Haynes, age 61, joined 1st Security Bank of Washington as Chief Lending Officer in November 2005, after a 23 year career at US Bank or USB. His responsibilities currently include commercial, consumer and real estate lending. Mr. Haynes held several senior lending positions at USB in commercial lending- middle-market, national and international and credit review. He left as a Senior Vice President - Commercial Lending. Prior to USB, Mr. Haynes held international and middle-market lending positions at Rainier Bank and Bank of America.  He has been involved in downtown associations and arts related boards in Seattle and Bellevue. He currently is a member of the Woodland Park Zoo Board where he is chair of the Audit Committee and member of the Executive and Finance Committees.
 
Drew B. Ness, age 46, joined 1st Security Bank of Washington as Chief Operating Officer in September 2008.  Mr. Ness has 18 years of diverse banking experience, including retail branch sales and service, branch network management, and national customer service training experience.   He served as Vice President and Manager of the Corporate Deposit Operations Department for Washington Federal Savings, Seattle Washington from February 2008 until August 2008, following its acquisition of First Mutual Bank.  Mr. Ness served as Vice-President and Administrative/Operations Manager of the Retail Banking Group at First Mutual Bank, Bellevue, Washington from June 2004 through February 2008, and as Bank Account Executive and Premier Banking Client Manager at Bank of America, Newport Beach, California from June 2002 through June 2004.


Exhibit IV-6
1st Security Bank of Washington
Pro Forma Regulatory Capital Ratios
 
         
Pro Forma at June 30, 2011
 
   
At
June 30, 2011
   
2,082,500 shares
Sold at $10.00 per
Share
(Minimum of Range)
   
2,450,000 Shares
Sold at $10.00 per
Share
(Midpoint of Range)
   
2,817,500 Shares
Sold at $10.00 per Share
(Maximum of Range)
   
3,240,125 Shares
Sold at $10.00 per Share
(Maximum of Range,
as Adjusted)
 
   
Amount
   
Percent of
Assets(1)
   
Amount
   
Percent of
Assets
   
Amount
   
Percent of
Assets
   
Amount
   
Percent of
Assets
   
Amount
   
Percent of
Assets
 
   
(Dollars in thousands)
 
Equity capital under generally accepted accounting 
principles (“GAAP”)
  $ 25,977       9.52 %   $ 33,719       11.95 %   $ 35,240       12.41 %   $ 36,761       12.86 %   $ 38,510       13.38 %
                                                                                 
Tier I leverage
  $ 25,894       9.37 %   $ 33,636       11.77 %   $ 35,157       12.23 %   $ 36,678       12.68 %   $ 38,427       13.18 %
Requirement
    11,053       4.00       11,430       4.00       11,502       4.00       11,575       4.00       11,658       4.00  
Excess
  $ 14,841       5.37 %   $ 22,206       7.77 %   $ 23,655       8.23 %   $ 25,103       8.68 %   $ 26,769       9.18 %
                                                                                 
Tier I risk based
  $ 25,894       11.31 %   $ 33,636       14.57 %   $ 35,157       15.20 %   $ 36,678       15.84 %   $ 38,427       16.56 %
Requirement
    9,160       4.00       9,235       4.00       9,250       4.00       9,264       4.00       9,281       4.00  
Excess
  $ 16,734       7.31 %   $ 24,401       10.57 %   $ 25,907       11.20 %   $ 27,414       11.84 %   $ 29,146       12.56 %
                                                                                 
Total risk based
  $ 28,781       12.57 %   $ 36,523       15.82 %   $ 38,044       16.45 %   $ 39,565       17.08 %   $ 41,314       17.81 %
Risk based requirement
    18,320       8.00       18,471       8.00       18,500       8.00       18,529       8.00       18,562       8.00  
Excess
  $ 10,461       4.57 %   $ 18,052       7.82 %   $ 19,544       8.45 %   $ 21,036       9.08 %   $ 22,752       9.81 %
                                                                                 
Reconciliation of capital infused into 1st Security Bank of Washington:
                                                                               
Net proceeds infused
                  $ 9,407             $ 11,223             $ 13,038             $ 15,125          
Common stock acquired by employee stock ownership plan
                    (1,666 )             (1,960 )             (2,254 )             (2,592 )        
Pro forma increase in GAAP and regulatory capital
                  $ 7,741             $ 9,262             $ 10,784             $ 12,533          
 

(1) Adjusted total or adjusted risk-weighted assets, as appropriate.


EXHIBIT IV-7
PRO FORMA ANALYSIS SHEET
1st Security Bank of Washington
Prices as of September 2, 2011
 
           
Subject at
   
Peer Group
   
Washington Companies
   
All Public Thrifts
 
Valuation Pricing Multiples
 
 
Symbol
   
Midpoint
   
Mean
   
Median
   
Mean
   
Median
   
Mean
   
Median
 
Price-earnings multiple
=
  P/E       14.11 x     17.08 x     17.27 x     16.70 x     16.70 x     16.62 x     15.01 x
Price-core earnings multiple
=
 
P/CE
      25.68 x     18.89 x     19.71 x     17.91 x     17.91 x     18.97 x     18.64 x
Price-book ratio
=
  P/B       53.88 %     67.44 %     69.11 %     53.76 %     50.55 %     71.78 %     73.23 %
Price-tangible book ratio
=
 
P/TB
      53.88 %     70.29 %     72.48 %     60.77 %     55.31 %     76.57 %     76.67 %
Price-assets ratio
=
  P/A       8.38 %     9.48 %     7.94 %     6.91 %     6.62 %     8.78 %     8.12 %
 
Valuation Parameters
 
                % of    
% of Offering
 
                  Offering    
+ Foundation
 
Pre-Conversion Earnings (Y)
  $
1,894,000
 
(12 Mths 6/11)
 
ESOP Stock as % of Offering (E)
   
8.0000
%  
8.0000
%
Pre-Conversion Core Earnings
  $
1,112,100
 
(12 Mths 6/11)
 
Cost of ESOP Borrowings (S)
   
0.00
%      
Pre-Conversion Book Value (B)
  $
25,977,000
 
(6/11)
 
ESOP Amortization (T)
   
10.00
   
years
 
Intangibles
  $
0
 
(6/11)
 
RRP Stock as % of Offering (M)
   
4.0000
%  
4.00%
 
Pre-Conv. Tang. Book Value (B)
  $
25,977,000
 
(6/11)
 
Stock Programs Vesting (N)
   
5.00
   
years
 
Pre-Conversion Assets (A)
  $
272,784,000
 
(6/11)
 
Fixed Expenses
  $
1,764,000
       
Reinvest. Rate: (5 Yr Treas)@6/11
   
1.760
%    
Subscr/Dir Comm Exp (Mdpnt)
  $
291,000
   
1.30%
 
Tax rate (TAX)
   
34.00
%    
Total Expenses (Midpoint)
  $
2,055,000
       
A-T Reinvestment Rate(R)
   
1.162
%    
Syndicate Expenses (Mdpnt)
  $
0
   
0.00%
 
Est. Conversion Expenses (1)(X)
   
8.39
%    
Syndicate Amount
  $
0
       
Insider Purchases
  $
735,000
     
Percent Sold (PCT)
   
100.00
%      
Price/Share
  $
10.00
     
MHC Assets
  $
0
       
Foundation Cash Contrib. (FC)
  $
0
     
Options as % of Offering (O1)
   
10.0000
%  
10.00%
 
Found. Stk Contrib (% of Total Shrs (FS)
   
0.0000
%    
Estimated Option Value (O2)
   
28.10
%      
Foundation Tax Benefit (Z)
  $
0
     
Option Vesting Period (O3)
   
5.00
   
years
 
Foundation Amount (Mdpt.)
  $
0
     
% of Options taxable (O4)
   
25.00
%      
             
Payoff of FHLB Advances (PA)
  $
0
   
@Minimum
 
             
Payoff of FHLB Advances (PA)
  $
0
   
@Mid, Max, Smax
             
Weighted Average Rate of Adv.
   
0.00
%      
 
Calculation of Pro Forma Value After Conversion
               
1.    V=
P/E * (Y)
 
V=
  $
24,500,000
 
 
1 - P/E * PCT * ((1-X-E-M-FC-FS)*R - (1-TAX)*E/T - (1-TAX)*M/N)-(1-(TAX*O4))*(O1*O2)/O3)
           
                 
1.    V=
P/E * (Y)
 
V=
  $
24,500,000
 
 
1 - P/Core E * PCT * ((1-X-E-M-FC-FS)*R - (1-TAX)*E/T - (1-TAX)*M/N)-(1-(TAX*O4))*(O1*O2)/O3)
           
                 
2.    V=
P/B  *  (B+Z)
   
V=
  $
24,500,000
 
 
1 - P/B * PCT * (1-X-E-M-FC-FS)
             
                 
2.    V=
P/TB  *  (TB+Z)
   
V=
  $
24,500,000
 
 
1 - P/TB * PCT * (1-X-E-M-FC-FS)
             
                 
3.    V=
P/A * (A+Z+PA)
   
V=
  $
24,500,000
 
 
  1 - P/A * PCT * (1-X-E-M-FC-FS)


Market Value
   
Market Value
 
     
Shares Issued
   
Shares Sold
   
Foundation
   
Total Shares
   
Price Per
   
of Stock Sold
   
of Stock Issued
 
Valuation Conclusion
   
to MHC
   
to Public
   
Shares
   
Issued
   
Share
   
in Offering
   
in Reorganization
 
Supermaximum
      0       3,240,125       0       3,240,125     $ 10.00     $ 32,401,250     $ 32,401,250  
Maximum
      0       2,817,500       0       2,817,500       10.00       28,175,000     $ 28,175,000  
Midpoint
      0       2,450,000       0       2,450,000       10.00       24,500,000     $ 24,500,000  
Minimum
      0       2,082,500       0       2,082,500       10.00       20,825,000     $ 20,825,000  
                                                           
     
Shares Issued
   
Shares Sold
   
Foundation
   
Total Shares
                         
Valuation Conclusion
   
to MHC
   
to Public
   
Shares
   
Issued
                         
Supermaximum
      0.000 %     100.000 %     0.000 %     100.000 %                        
Maximum
      0.000 %     100.000 %     0.000 %     100.000 %                        
Midpoint
      0.000 %     100.000 %     0.000 %     100.000 %                        
Minimum
      0.000 %     100.000 %     0.000 %     100.000 %                        
 
(1) Estimated offering expenses at midpoint of the offering.


Exhibit IV-8
PRO FORMA EFFECT OF CONVERSION PROCEEDS
1st Security Bank of Washington
At the Minimum of the Range
         
         
1.
Market Value of Shares Sold In Offering:
  $ 20,825,000  
 
Market Value of Shares Issued to Foundation:
    0  
 
  Total Market Value of Company:
  $ 20,825,000  
           
2.
Offering Proceeds of Shares Sold In Offering
  $ 20,825,000  
 
   Less: Estimated Offering Expenses
    2,010,000  
 
Net Conversion Proceeds
  $ 18,815,000  
           
3.
Estimated Additional Equity and Income from Offering Proceeds
       
 
Net Conversion Proceeds
  $ 18,815,000  
 
    Less: Cash Contribution to Foundation
    0  
 
    Less: Non-Cash ESOP Stock Purchases (1)
    (1,666,000 )
 
    Less: Non-Cash MRP Stock Purchases (2)
    (833,000 )
 
Net Conversion Proceeds Reinvested
  $ 16,316,000  
 
Estimated After-Tax Reinvestment Rate
    1.16 %
 
    Earnings from Reinvestment of Proceeds
  $ 189,527  
 
    Less: Estimated cost of ESOP borrowings(1)
    0  
 
    Less: Amortization of ESOP borrowings(1)
    (109,956 )
 
    Less: Stock Programs Vesting (2)
    (109,956 )
 
    Less: Option Plan Vesting (3)
    (107,088 )
 
Net Earnings Increase
  ($ 137,474 )
 
                 
Net
       
           
Before
   
Earnings
   
After
 
4.
Pro Forma Earnings
       
Conversion
   
Increase
   
Conversion


12 Months ended June 30, 2011 (reported)
    $ 1,894,000     ($ 137,474 )   $ 1,756,526  
 
12 Months ended June 30, 2011 (core)
        $ 1,112,100     ($ 137,474 )   $ 974,626  
                                 
     
Before
   
Net Equity
   
Tax Benefit
   
After
 
5.
Pro Forma Net Worth
 
Conversion
   
Proceeds
   
of Foundation
   
Conversion


June 30, 2011
  $ 25,977,000     $ 16,316,000     $ 0     $ 42,293,000  
 
June 30, 2011 (Tangible)
  $ 25,977,000     $ 16,316,000     $ 0     $ 42,293,000  
                                   
     
Before
   
Net Cash
   
Tax Benefit
   
After
 
6.
Pro Forma Assets
 
Conversion
   
Proceeds
   
of Foundation
   
Conversion


June 30, 2011
  $ 272,784,000     $ 16,316,000     $ 0     $ 289,100,000  
 
(1)
ESOP stock (8% of offering) amortized over 10 years, amortization expense is tax effected at 34%.
(2)
Stock programs (4% of offering) amortized over 5 years, amortization expense is tax effected at 34%.
(3)
Option valuation based on Black-Scholes model, 5 year vesting, and assuming 25% taxable.


Exhibit IV-8
PRO FORMA EFFECT OF CONVERSION PROCEEDS
1st Security Bank of Washington
At the Midpoint of the Range
         
1.
Market Value of Shares Sold In Offering:
  $ 24,500,000  
 
Market Value of Shares Issued to Foundation:
    0  
 
  Total Market Value of Company:
  $ 24,500,000  
           
2.
Offering Proceeds of Shares Sold In Offering
  $ 24,500,000  
 
   Less: Estimated Offering Expenses
    2,055,000  
 
 Net Conversion Proceeds
  $ 22,445,000  
           
3.
Estimated Additional Equity and Income from Offering Proceeds
       
 
Net Conversion Proceeds
  $ 22,445,000  
 
    Less: Cash Contribution to Foundation
    0  
 
    Less: Non-Cash ESOP Stock Purchases (1)
    (1,960,000 )
 
    Less: Non-Cash MRP Stock Purchases (2)
    (980,000 )
 
Net Conversion Proceeds Reinvested
  $ 19,505,000  
 
Estimated After-Tax Reinvestment Rate
    1.16 %
 
    Earnings from Reinvestment of Proceeds
  $ 226,570  
 
    Less: Estimated cost of ESOP borrowings(1)
    0  
 
    Less: Amortization of ESOP borrowings(1)
    (129,360 )
 
    Less: Stock Programs Vesting (2)
    (129,360 )
 
    Less: Option Plan Vesting (3)
    (125,986 )
 
Net Earnings Increase
  ($ 158,136 )
 
                 
Net
       
           
Before
   
Earnings
   
After
 
4.
Pro Forma Earnings
       
Conversion
   
Increase
   
Conversion


12 Months ended June 30, 2011 (reported)
    $ 1,894,000     ($ 158,136 )   $ 1,735,864  
 
12 Months ended June 30, 2011 (core)
        $ 1,112,100     ($ 158,136 )   $ 953,964  
                                 
     
Before
   
Net Capital
   
Tax Benefit
   
After
 
5.
Pro Forma Net Worth
 
Conversion
   
Proceeds
   
of Foundation
   
Conversion


June 30, 2011
  $ 25,977,000     $ 19,505,000     $ 0     $ 45,482,000  
 
June 30, 2011 (Tangible)
  $ 25,977,000     $ 19,505,000     $ 0     $ 45,482,000  
                                   
     
Before
   
Net Cash
   
Tax Benefit
   
After
 
6.
Pro Forma Assets
 
Conversion
   
Proceeds
   
of Foundation
   
Conversion


June 30, 2011
  $ 272,784,000     $ 19,505,000     $ 0     $ 292,289,000  
 
(1)
ESOP stock (8% of offering) amortized over 10 years, amortization expense is tax effected at 34%.
(2)
Stock programs (4% of offering) amortized over 5 years, amortization expense is tax effected at 34%.
(3)
Option valuation based on Black-Scholes model, 5 year vesting, and assuming 25% taxable.


Exhibit IV-8
PRO FORMA EFFECT OF CONVERSION PROCEEDS
1st Security Bank of Washington
At the Maximum of the Range
         
1.
Market Value of Shares Sold In Offering:
  $ 28,175,000  
 
Market Value of Shares Issued to Foundation:
    0  
 
    Total Market Value of Company:
  $ 28,175,000  
           
2.
Offering Proceeds of Shares Sold In Offering
  $ 28,175,000  
 
    Less: Estimated Offering Expenses
    2,100,000  
 
Net Conversion Proceeds
  $ 26,075,000  
           
3.
Estimated Additional Equity and Income from Offering Proceeds
       
 
Net Conversion Proceeds
  $ 26,075,000  
 
    Less: Cash Contribution to Foundation
    0  
 
    Less: Non-Cash ESOP Stock Purchases (1)
    (2,254,000 )
 
    Less: Non-Cash MRP Stock Purchases (2)
    (1,127,000 )
 
Net Conversion Proceeds Reinvested
  $ 22,694,000  
 
Estimated After-Tax Reinvestment Rate
    1.16 %
 
    Earnings from Reinvestment of Proceeds
  $ 263,614  
 
    Less: Estimated cost of ESOP borrowings(1)
    0  
 
    Less: Amortization of ESOP borrowings(1)
    (148,764 )
 
    Less: Stock Programs Vesting (2)
    (148,764 )
 
    Less: Option Plan Vesting (3)
    (144,884 )
 
Net Earnings Increase
  ($ 178,799 )
 
                 
Net
       
           
Before
   
Earnings
   
After
 
4.
Pro Forma Earnings
       
Conversion
   
Increase
   
Conversion


12 Months ended June 30, 2011 (reported)
    $ 1,894,000     ($ 178,799 )   $ 1,715,201  
 
12 Months ended June 30, 2011 (core)
        $ 1,112,100     ($ 178,799 )   $ 933,301  
                                 
     
Before
   
Net Capital
   
Tax Benefit
   
After
 
5.
Pro Forma Net Worth
 
Conversion
   
Proceeds
   
of Foundation
   
Conversion


June 30, 2011
  $ 25,977,000     $ 22,694,000     $ 0     $ 48,671,000  
 
June 30, 2011 (Tangible)
  $ 25,977,000     $ 22,694,000     $ 0     $ 48,671,000  
                                   
     
Before
   
Net Cash
   
Tax Benefit
   
After
 
6.
Pro Forma Assets
 
Conversion
   
Proceeds
   
of Foundation
   
Conversion


June 30, 2011
  $ 272,784,000     $ 22,694,000     $ 0     $ 295,478,000  
 
(1)
ESOP stock (8% of offering) amortized over 10 years, amortization expense is tax effected at 34%.
(2)
Stock programs (4% of offering) amortized over 5 years, amortization expense is tax effected at 34%.
(3)
Option valuation based on Black-Scholes model, 5 year vesting, and assuming 25% taxable.


Exhibit IV-8
PRO FORMA EFFECT OF CONVERSION PROCEEDS
1st Security Bank of Washington
At the Supermaximum Value
         
1.
Market Value of Shares Sold In Offering:
  $ 32,401,250  
 
Market Value of Shares Issued to Foundation:
    0  
 
  Total Market Value of Company:
  $ 32,401,250  
           
2.
Offering Proceeds of Shares Sold In Offering
  $ 32,401,250  
 
   Less: Estimated Offering Expenses
    2,152,000  
 
 Net Conversion Proceeds
  $ 30,249,250  
           
3.
Estimated Additional Equity and Income from Offering Proceeds
       
 
Net Conversion Proceeds
  $ 30,249,250  
 
    Less: Cash Contribution to Foundation
    0  
 
    Less: Non-Cash ESOP Stock Purchases (1)
    (2,592,100 )
 
    Less: Non-Cash MRP Stock Purchases (2)
    (1,296,050 )
 
Net Conversion Proceeds Reinvested
  $ 26,361,100  
 
Estimated After-Tax Reinvestment Rate
    1.16 %
 
    Earnings from Reinvestment of Proceeds
  $ 306,211  
 
    Less: Estimated cost of ESOP borrowings(1)
    0  
 
    Less: Amortization of ESOP borrowings(1)
    (171,079 )
 
    Less: Stock Programs Vesting (2)
    (171,079 )
 
    Less: Option Plan Vesting (3)
    (166,617 )
 
Net Earnings Increase
  ($ 202,564 )
 
                 
Net
       
           
Before
   
Earnings
   
After
 
4.
Pro Forma Earnings
       
Conversion
   
Increase
   
Conversion


12 Months ended June 30, 2011 (reported)
    $ 1,894,000     ($ 202,564 )   $ 1,691,436  
 
12 Months ended June 30, 2011 (core)
        $ 1,112,100     ($ 202,564 )   $ 909,536  
                                 
     
Before
   
Net Capital
   
Tax Benefit
   
After
 
5.
Pro Forma Net Worth
 
Conversion
   
Proceeds
   
of Foundation
   
Conversion


June 30, 2011
  $ 25,977,000     $ 26,361,100     $ 0     $ 52,338,100  
 
June 30, 2011 (Tangible)
  $ 25,977,000     $ 26,361,100     $ 0     $ 52,338,100  
                                   
     
Before
   
Net Cash
   
Tax Benefit
   
After
 
6.
Pro Forma Assets
 
Conversion
   
Proceeds
   
of Foundation
   
Conversion


June 30, 2011
  $ 272,784,000     $ 26,361,100     $ 0     $ 299,145,100  
 
(1)
ESOP stock (8% of offering) amortized over 10 years, amortization expense is tax effected at 34%.
(2)
Stock programs (4% of offering) amortized over 5 years, amortization expense is tax effected at 34%.
(3)
Option valuation based on Black-Scholes model, 5 year vesting, and assuming 25% taxable.


 EXHIBIT IV-9
1st Security Bank of Washington
Peer Group Core Earnings Analysis


RP® Financial, LC.
Core Earnings Analysis
Comparable Institution Analysis
For the 12 Months Ended June 30, 2011
                                               
                       
Less:
   
Estimated
             
     
Net Income
   
Less: Net
   
Tax Effect
   
Extraordinary
   
Core Income
         
Estimated
 
Comparable Group
 
 
to Common
   
Gains(Loss)
   
@ 34%
   
Items
   
to Common
   
Shares
   
Core EPS
 
      ($000)     ($000)     ($000)     ($000)     ($000)      (000)    
($)
 
                                                         
AFCB
Athens Bancshares, Inc. of TN
  $ 1,680     $ 0     $ 0     $ 0     $ 1,680       2,766     $ 0.61  
EBMT
Eagle Bancorp Montana of MT
  $ 2,410     ($ 2,206 )   $ 750     $ 0     $ 954       3,919     $ 0.24  
FFDF
FFD Financial Corp. of Dover OH (1)
  $ 1,435     ($ 742 )   $ 252     $ 0     $ 945       1,012     $ 0.93  
FABK
First Advantage Bancorp of TN
  $ 1,882     ($ 1,170 )   $ 398     $ 0     $ 1,110       4,087     $ 0.27  
FFNM
First Federal of N. Michigan of MI
  $ 141     ($ 116 )   $ 39     $ 0     $ 64       2,884     $ 0.02  
JXSB
Jacksonville Bancorp Inc. of IL
  $ 3,027     ($ 680 )   $ 231     $ 0     $ 2,578       1,931     $ 1.34  
LSBI
LSB Financial Corp. of Lafayette IN
  $ 1,810     ($ 1,235 )   $ 420     $ 0     $ 995       1,554     $ 0.64  
LABC
Louisiana Bancorp, Inc. of LA
  $ 2,406     ($ 527 )   $ 179     $ 0     $ 2,058       3,438     $ 0.60  
RVSB
Riverview Bancorp, Inc. of WA
  $ 3,264     ($ 297 )   $ 101     $ 0     $ 3,068       22,472     $ 0.14  
TSBK
Timberland Bancorp, Inc. of WA
  $ (32 )   ($ 1,364 )   $ 464     $ 0     ($ 932 )     7,045     ($ 0.13 )
 
(1)  Financial information is for the quarter ending March 31, 2011.
 
Source:
SNL Financial, LC. and RP® Financial, LC. calculations.  The information provided in this table has been obtained from sources we believe are reliable, but we cannot guarantee the accuracy or completeness of such information.
 
Copyright (c) 2011 by RP® Financial, LC.


EXHIBIT V-1
RP® Financial, LC.
Firm Qualifications Statement


RP® FINANCIAL, LC.  
Serving the Financial Services Industry Since 1988
 
 
FIRM QUALIFICATION STATEMENT
 
RP® Financial (“RP®) provides financial and management consulting, merger advisory and valuation services to the financial services industry nationwide.  We offer a broad array of services, high quality and prompt service, hands-on involvement by principals and senior staff, careful structuring of strategic initiatives and sophisticated valuation and other analyses consistent with industry practices and regulatory requirements.  Our staff maintains extensive background in financial and management consulting, valuation and investment banking.  Our clients include commercial banks, thrifts, credit unions, mortgage companies, insurance companies and other financial services companies.
 
STRATEGIC PLANNING SERVICES
 
RP®’s strategic planning services are designed to provide effective feasible plans with quantifiable results.  We analyze strategic options to enhance shareholder value, achieve regulatory approval or realize other objectives.  Such services involve conducting situation analyses; establishing mission/vision statements, developing strategic goals and objectives; and identifying strategies to enhance franchise and/or market value, capital management, earnings enhancement, operational matters and organizational issues.  Strategic recommendations typically focus on:  capital formation and management, asset/liability targets, profitability, return on equity and stock pricing.  Our proprietary financial simulation models provide the basis for evaluating the impact of various strategies and assessing their feasibility and compatibility with regulations.
 
MERGER ADVISORY SERVICES
 
RP®’s merger advisory services include targeting potential buyers and sellers, assessing acquisition merit, conducting due diligence, negotiating and structuring merger transactions, preparing merger business plans and financial simulations, rendering fairness opinions, preparing mark-to-market analyses, valuing intangible assets and supporting the implementation of post-acquisition strategies.  Our merger advisory services involve transactions of financially healthy companies and failed bank deals.  RP® is also expert in de novo charters and shelf charters.  Through financial simulations, comprehensive data bases, valuation proficiency and regulatory familiarity, RP®’s merger advisory services center on enhancing shareholder returns.
 
VALUATION SERVICES
 
RP®’s extensive valuation practice includes bank and thrift mergers, thrift mutual-to-stock conversions, goodwill impairment, insurance company demutualizations, ESOPs, subsidiary companies, merger accounting and other purposes.  We are highly experienced in performing appraisals which conform to regulatory guidelines and appraisal standards.  RP® is the nation’s leading valuation firm for thrift mutual-to-stock conversions, with appraised values ranging up to $4 billion.
 
OTHER CONSULTING SERVICES
 
RP® offers other consulting services including evaluating the impact of regulatory changes (TARP, etc.), branching and diversification strategies, feasibility studies and special research.  We assist banks/thrifts in preparing CRA plans and evaluating wealth management activities on a de novo or merger basis.  Our other consulting services are facilitated by proprietary valuation and financial simulation models.
 
KEY PERSONNEL (Years of Relevant Experience & Contact Information)
 
Ronald S. Riggins, Managing Director (30)
(703) 647-6543
rriggins@rpfinancial.com
William E. Pommerening, Managing Director (27)
(703) 647-6546
wpommerening@rpfinancial.com
Gregory E. Dunn, Director (28)
(703) 647-6548
gdunn@rpfinancial.com
James P. Hennessey, Director (25)
(703) 647-6544
jhennessey@rpfinancial.com
James J. Oren, Director (24)
(703) 647-6549
joren@rpfinancial.com
Timothy M. Biddle, Senior Vice President (21)
(703) 647-6552
tbiddle@rpfinancial.com
Janice Hollar, Senior Vice President (29)
(703) 647-6554
jhollar@rpfinancial.com
 
Washington Headquarters
 
Rosslyn Center
Telephone:  (703) 528-1700
1100 North Glebe Road, Suite 1100
Fax No.:  (703) 528-1788
Arlington, VA  22201
Toll-Free No.:  (866) 723-0594
www.rpfinancial.com
E-Mail:  mail@rpfinancial.com
 
 
EX-99.2 19 ex99-2.htm EXHIBIT 99.2 ex99-2.htm

Exhibit 99.2


graphic
SEND OVERNIGHT PACKAGES TO:
Keefe, Bruyette & Woods, Inc.
FS Bancorp, Inc. Processing Center
10 S Wacker Drive, Suite 3400
Chicago, IL 60606
(__) ____-_____
Stock Order and Certification Form
 
Deadline: The Subscription Offering ends at 12:00 noon, Pacific Time, on ______. Your original Stock Order and Certification Form, properly executed and with the correct payment, must be received (not postmarked) by the deadline or it will be considered void. Orders will be accepted at the address on the top of this form, the PO Box address on the business reply envelope provided or by hand delivery to any of our full service banking locations.  Faxes or copies of this form may not be accepted. FS Bancorp, Inc. reserves the right to accept or reject improper order forms.
 
PLEASE PRINT CLEARLY AND COMPLETE ALL APPLICABLE AREAS – READ THE ENCLOSED STOCK ORDER FORM INSTRUCTIONS AS YOU COMPLETE THIS FORM
       (1) Number of Shares   (2) Total Amount Due  
THE MINIMUM PURCHASE IS 25 SHARES ($250). Generally, no person may purchase more than 25,000 shares ($250,000), and no person together with an associate or group of persons acting in concert may purchase more than 50,000 shares ($500,000).
   
Price Per Share
x $10.00 =
    $  


(3a)Method of Payment - Check or Money Order
 
$
 
(4)
Purchaser Information
 
 
Enclosed is a personal check, bank check or money order made payable to FS Bancorp, Inc. in the amount of:
Checks will be cashed upon receipt
        Check the one box that applies, as of the earliest date, to the purchaser(s) listed in Section 8:  
       
a.   o
Eligible Account Holder - Check here if you were a depositor with aggregate account balances of at least $50 on deposit with 1st Security Bank of Washington as of the close of business on June 30, 2007. Enter information in Section 9 for all deposit accounts that you had at 1st Security Bank of Washington on this date.
 
 
(3b) Method of Payment – Certificate or Savings Account Withdrawal
The undersigned authorizes withdrawal from the 1st Security Bank of Washington deposit account(s) listed below. There will be no early withdrawal penalty applicable for funds authorized on this form. Funds designated for withdrawal must be in the account(s) listed at the time this form is received. 1st Security Bank of Washington IRA accounts or accounts with check-writing privileges may NOT be listed for direct withdrawal below.


    b.   o
Supplemental Eligible Account Holder - Check here if you were a depositor with aggregate account balances of at least $50 on deposit with 1st Security Bank of Washington as of the close of business on ______but were not an Eligible Account Holder. Enter information in Section 9 for all deposit accounts that you had at 1st Security Bank of Washington as of this date.


  1st Security Bank of Washington     Account Number(s) Withdrawal Amount(s)  
 
   
      $  


$
 
c.   o
Other Member - Check here if you were a depositor of 1st Security Bank of Washington as of ______, who were not able to subscribe for shares under the Eligible or Supplemental Eligible Account Holder categories, Enter information in Section 9 for all deposit accounts that you had at 1st Security Bank of Washington as of this date.


$
       
   Total Withdrawal Amount     
$


d.   o
Local Community – Check here if you are not an Eligible or Supplemental Eligible Account Holder, or an Other Member, and you reside in the Washington counties of King, Kitsup, Pierce, or Snohomish.


e.   o
General Public – Check here if none of the above categories apply to you.


(5) Check if you (or a household family member) are a:o Director or Officer of 1st Security Bank of Washington or FS Bancorp, Inc. o Employee of 1st Security Bank of Washington or FS Bancorp, Inc.
(6) Maximum Purchaser Identification: oCheck here if you, individually or together with others (see section 7), are subscribing for the maximum purchase allowed and are interested in purchasing more shares if the two maximum purchase limitations are increased. See Item 1 of the Stock Order Form Instructions.
(7) Associates/Acting in Concert: oCheck here if you, or any associates or persons acting in concert with you (defined on reverse side), have submitted other orders for shares. If you check this box, list below all other orders submitted by you or your associates or by persons acting in concert with you.
 Name(s) listed in Section 8 on other Order Forms
Number of Shares Ordered
 
Name(s) listed in Section 8 on other Order Forms
Number of Shares Ordered


(8)  Stock Registration: Please PRINT legibly and fill out completely: The stock certificate and all correspondence related to this stock order will be mailed to the address provided below. See Stock Order Form Instructions for further guidance.
 
o
Individual
o
Tenants in Common
o
Uniform Transfers to Minors Act
o
Partnership
o
Joint Tenants
o
Individual Retirement Account
o
Corporation
o
Trust - Under Agreement Dated _____
Name
       
SS# or Tax ID
           
Name
       
SS# or Tax ID
           
Address
       
Daytime Telephone #
           
City
State
Zip Code
County
 
Evening Telephone #
           
 
(9) Qualifying Accounts: You should list any accounts that you may have or had with 1st Security Bank of Washington in the box below. SEE THE STOCK ORDER FORM INSTRUCTIONS FOR FURTHER DETAILS. All subscription orders are subject to the provisions of the stock offering as described in the prospectus. Attach a separate page if additional space is needed. Failure to list all of your accounts may result in the loss of part or all or your subscription rights.
NAMES ON ACCOUNTS
ACCOUNT NUMBERS


(10) Acknowledgement, Certification and Signature: I understand that to be effective, this form, properly completed, together with full payment or withdrawal authorization, must be received by FS Bancorp, Inc. no later than 12:00 noon, Pacific Time, on __________, otherwise this form and all of my subscription rights will be void.  (continued on reverse side of form)
 *** ORDER NOT VALID UNLESS SIGNED ***
ONE SIGNATURE REQUIRED, UNLESS SECTION (3b) OF THIS FORM INCLUDES ACCOUNTS REQUIRING MORE THAN ONE SIGNATURE TO AUTHORIZE WITHDRAWAL
Signature
Date
 
Signature
Date
         
 
Internal Use Only: Date Rec’d ____ /_____ Check# ___________ $___________ Check#___________ $_________ Batch # ________ Order # ________ Category ______


(7) Associates/Acting In Concert (continued from front side of Stock Order Form) –
 
Associate – The term “associate” of a particular person means:
  any corporation or organization (other than 1st Security Bank of Washington, FS Bancorp or a majority-owned subsidiary of any of them) of which the person is an officer or partner or is directly or indirectly the beneficial owner of 10% or more of any class of equity securities;
  any trust or other estate in which the person has a substantial beneficial interest or as to which the person serves as trustee or in a similar fiduciary capacity;
  any relative or spouse of the person, or any relative of the spouse, who has the same home as the person or who is a director or officer of 1st Security Bank of Washington, FS Bancorp or any subsidiary of 1st Security Bank of Washington or FS Bancorp; and
  any person acting in concert with any of the persons or entities specified above.
 
Acting in Concert – The term “acting in concert” means knowing participation in a joint activity or parallel action towards a common goal whether or not pursuant to an express agreement, or a combination or pooling of voting or other interests in the securities of an issuer for a common purpose pursuant to any arrangement.  
 
A person or company which acts in concert with another person or company shall also be deemed to be acting in concert with any person or company who is also acting in concert with that other party, except that the 1st Security Bank of Washington tax-qualified employee stock benefit plans will not be deemed to be acting in concert with their trustees or a person who serves in a similar capacity solely for the purpose of determining whether stock held by the trustee and stock held by each plan will be aggregated.  The determination of whether a group is acting in concert shall be made solely by the board of directors of 1st Security Bank of Washington or officers delegated by the board of directors and may be based on any evidence upon which the board or delegates choose to rely.
 
Please see the Prospectus section entitled “The Conversion and Stock Offering – Limitations on Stock Purchases” for more information on purchase limitations and a more detailed description of “associates” and “acting in concert.”
 
(10) Acknowledgment, Certification and Signature (continued from front side of Stock Order Form)
 
I agree that after receipt by FS Bancorp, Inc., this Stock Order and Certification Form may not be modified or cancelled without FS Bancorp, Inc.’s consent, and that if withdrawal from a deposit account has been authorized, the authorized amount will not otherwise be available for withdrawal. Under penalty of perjury, I certify that (1) the Social Security or Tax ID information and all other information provided hereon are true, correct and complete, (2) I am purchasing shares solely for my own account and that there is no agreement or understanding regarding the sale of such shares, or my right to subscribe for shares, and (3) I am not subject to backup withholding tax [cross out (3) if you have been notified by the IRS that you are subject to backup withholding.]  I acknowledge that my order does not conflict with the maximum purchase limitation of $250,000 for any individual person, or the $500,000 overall purchase limitation for any person or entity together with associates of, or persons acting in concert with, such person, or entity, in all categories of the offering, combined, as set forth in the Plan of Conversion and the Prospectus dated __________.
 
Subscription rights pertain to those eligible to subscribe in the Subscription Offering. Federal regulations prohibit any person from transferring or entering into any agreement directly or indirectly to transfer the legal or beneficial ownership of subscription rights, or the underlying securities, to the account of another.
 
I ACKNOWLEDGE THAT THE SHARES OF COMMON STOCK ARE NOT A DEPOSIT OR ACCOUNT, ARE NOT FEDERALLY INSURED, AND ARE NOT GUARANTEED BY FS BANCORP, INC., 1ST SECURITY BANK OF WASHINGTON, OR BY THE FEDERAL GOVERNMENT.
 
If anyone asserts that the shares of common stock are federally insured or guaranteed, or are as safe as an insured deposit, I should call the Stock Information Center at (    ) ____-______.
 
I further certify that, before purchasing the common stock of FS Bancorp, Inc., I received the Prospectus dated _________, and that I have read the terms and conditions described in the Prospectus, including disclosure concerning the nature of the security being offered and the risks involved in the investment described in the “Risk Factors” section beginning on page __, which risks include but are not limited to the following:
 
1.
RISK FACTORS TO BE INCLUDED FROM THE PROSPECTUS WHEN FINALIZED


EXECUTION OF THIS CERTIFICATION FORM WILL NOT CONSTITUTE A WAIVER OF ANY RIGHTS THAT A PURCHASER MAY HAVE UNDER THE SECURITIES ACT OF 1933 AND THE SECURITIES EXCHANGE ACT OF 1934, BOTH AS AMENDED.


1st Security Bank of Washington
REVOCABLE PROXY
 
THIS PROXY IS SOLICITED BY THE BOARD OF DIRECTORS OF 1st SECURITY BANK OF WASHNGTON (THE “BANK”) FOR USE AT A SPECIAL MEETING OF MEMBERS TO BE HELD ON ____________, 20____ AND ANY ADJOURNMENT OF THAT MEETING, FOR THE PURPOSES SET FORTH IN THE FOREGOING NOTICE OF SPECIAL MEETING. YOUR BOARD OF DIRECTORS UNANIMOUSLY RECOMMENDS YOU VOTE “FOR” THE APPROVAL OF THE PLAN OF CONVERSION.
 
The undersigned, being a member of 1st Security Bank of Washington, hereby authorizes the Board of Directors of the Bank or any successors in their respective positions, as proxy, with full powers of substitution, to represent the undersigned at the Special Meeting of Members of the Bank to be held at ________________________________, Mountlake Terrace, Washington, on ______________, at ___ p.m., Pacific time, and at any adjournment of said meeting, to act with respect to all votes that the undersigned would be entitled to cast, if then personally present, as set forth below:
     
 
(1)
Approval of a Plan of Conversion pursuant to which the Bank would convert from a state-chartered mutual savings bank to a state-chartered stock savings bank, including the adoption of amended and restated articles of incorporation and bylaws, the concurrent sale of all of the Bank’s capital stock to FS Bancorp, Inc., a Washington-chartered corporation and the sale by FS Bancorp, Inc. of its shares of common stock, all as provided in the Plan of Conversion.
 
o     FOR          o     AGAINST
     
 
(2)
Such other business as may properly come before the Special Meeting or any adjournment thereof. At this time, the Board of Directors is not aware of any other business to come before the Special Meeting.
 
This proxy, if properly executed, will be voted in accordance with your instructions. If no instructions are given, this proxy, properly signed and dated, will be voted “FOR” adoption of the Plan of Conversion and, if necessary, for adjournment of the Special Meeting. Please date and sign this proxy on the reverse side and return it in the enclosed envelope.
 
▲   Detach the proxy voting card here   ▲
 
 
Your Board of Directors recommends
a vote “FOR” the Plan of Conversion.
 
 
Your Board of Directors believes that converting to a public
ownership structure will best support future growth and
expanded services.
 
 
Your “FOR” vote is very important!
 
 
NOT VOTING HAS THE SAME EFFECT AS VOTING
“AGAINST” THE PLAN OF CONVERSION.


A detachable Stock Order
Form is on the facing page.
 
(arrow) 


1st Security Bank of Washington
REVOCABLE PROXY
 
Any member giving a proxy may revoke it at any time before it is voted by delivering to the Secretary of 1st Security Bank of Washington either a written revocation of the proxy, or a duly executed proxy bearing a later date or by voting in person at the Special Meeting.
 
The undersigned hereby acknowledges receipt of a Notice of Special Meeting of Members to be held on the _____th day of _________________, 20___ and a Proxy Statement for the Special Meeting prior to the signing of this proxy.
           
 
Signature:
   
Date:


Signature:
   
Date:


NOTE: Please sign exactly as your name(s) appear on this Proxy. Only one signature is required in the case of a joint account. When signing in a representative capacity, please provide your title.
 
IMPORTANT: Please detach, sign and return ALL proxies from ALL packets received in the enclosed postage paid envelope.
FAILURE TO VOTE HAS THE SAME EFFECT AS A VOTE AGAINST THE PLAN OF CONVERSION.
 
Detach the proxy voting card here ▲
 
 
Your Board of Directors recommends
a vote “FOR” the Plan of Conversion.
 
 
Your Board of Directors believes that converting to a public
ownership structure will best support future growth and
expanded services.
 
 
Your “FOR” vote is very important!
 
 
NOT VOTING HAS THE SAME EFFECT AS VOTING
“AGAINST” THE PLAN OF CONVERSION.


(arrow)  
A detachable Stock Order
Form is on the facing page.


FS Bancorp, Inc.

Stock Order and Certification Form Instructions
Stock Information Center: (___)___-____
 
 
Stock Order and Certification Form Instructions – All orders are subject to the provisions of the stock offering as described in the prospectus.

Item 1 and 2 - Fill in the number of shares that you wish to purchase and the total payment due. The amount due is determined by multiplying the number of shares ordered by the subscription price of $10.00 per share. The minimum number of shares of common stock you may order is 25 shares.  The maximum number of shares of common stock that can be ordered by an individual or through a single qualifying account is 25,000 shares, and no person with an associate or group of persons acting in concert may purchase more than 50,000 shares. For additional information, see “The Conversion and Stock Offering - Limitations on Stock Purchases” in the prospectus.

Item 3a – Payment for shares may be made by check, bank draft or money order payable to FS Bancorp, Inc.  DO NOT MAIL CASH.  Funds received during the offering will be held in a segregated account at 1st Security Bank of Washington and will earn interest at a rate equal to 1st Security Bank of Washington’s passbook  (statement savings) rate, which is currently ___% per annum, until completion or termination of the offering.

Item 3b - To pay by withdrawal from a savings account or certificate of deposit at 1st Security Bank of Washington insert the account number(s) and the amount(s) you wish to withdraw from each account. If more than one signature is required for a withdrawal, all signatories must sign in the signature box on the front of the Stock Order and Certification Form. To withdraw from an account with checking privileges, please write a check. 1st Security Bank of Washington will waive any applicable penalties for early withdrawal from certificate of deposit accounts (CDs) for the purpose of purchasing stock in the offering. A hold will be placed on the account(s) for the amount(s) you indicate to be withdrawn. Payments will remain in account(s) until the Stock Offering closes and earn their respective rate of interest, but will not be available for your use until the completion of the transaction.

Item 4 - Please check the appropriate box to tell us the earliest of the three dates that apply to you, or the local community or general public boxes if you were not a qualifying customer of 1st Security Bank of Washington on any of the key dates.

Item 5 - Please check one of these boxes if you are a director, officer or employee of 1st Security Bank of Washington or FS Bancorp, Inc., or a member of such person’s household.

Item 6 - Please check the box, if applicable. If you check the box but have not subscribed for the maximum amount and did not complete Item 7, you may not be eligible to purchase more shares.

Item 7 - Check the box, if applicable, and provide the requested information. Attach a separate page, if necessary. In the Prospectus dated __________, 2011, please see the section entitled “The Conversion and Stock Offering - Limitations on Stock Purchases” for more information regarding the definition of “associate” and “acting in concert.”

Item 8 - The stock transfer industry has developed a uniform system of shareholder registrations that we will use in the issuance of FS Bancorp, Inc. common stock. Please complete this section as fully and accurately as possible, and be certain to supply your social security or Tax I.D. number(s) and your daytime and evening phone numbers. We will need to call you if we cannot execute your order as given. If you have any questions regarding the registration of your stock, please consult your legal advisor or contact the Stock Information Center at (___) ___-____. Subscription rights are not transferable. If you are an eligible or supplemental eligible account holder or other member, to protect your priority over other purchasers as described in the prospectus, you must take ownership in at least one of the account holder’s names.

Item 9 – You should list any qualifying accounts that you have or may have had with 1st Security Bank of Washington in the box located under the heading “Qualifying Accounts”. For example, if you are ordering stock in just your name, you should list all of your account numbers as of the earliest of the three dates that you were a depositor. Similarly, if you are ordering stock jointly with another depositor, you should list all account numbers under which either of you are owners, i.e. individual accounts, joint accounts, etc. If you are ordering stock in your minor child’s or grandchild’s name under the Uniform Transfers to Minors Act, the minor must have had an account number on one of the three dates and you should list only their account number(s). If you are ordering stock as a corporation, you need to list just that corporation’s account number, as your individual account number(s) do not qualify. Failure to list all of your qualifying deposit account numbers may result in the loss of part or all of your subscription rights.

Item 10 - Sign and date the form where indicated. Before you sign please read carefully and review the information which you have provided and read the acknowledgement. Only one signature is required, unless any account listed in section 3b of this form requires more than one signature to authorize a withdrawal. Please review the Prospectus dated ___________, carefully before making an investment decision.

If you have questions regarding the conversion and the stock offering, please call us, toll free, at (___) ___-____, Monday through Friday, between 7:00 a.m. and 4:00 p.m., Pacific Time. You can also stop into our Stock Information Center located at 6920 220th Street SW, Mountlake Terrace, Washington, on Monday from 12:00 noon to 5:00 p.m., Tuesday through Thursday from 8:00 a.m. to 5:00 p.m. or Friday from 8:00 a.m. to 12:00 noon, to speak with a stock center representative.  The Stock Information Center will be closed weekends and bank holidays. (See Reverse Side for Stock Ownership Guide)


FS Bancorp, Inc.

Stock Ownership Guide
Stock Information Center: (__ ) ___-____
 
 
Stock Ownership Guide

Individual - The stock is to be registered in an individual’s name only. You may not list beneficiaries for this ownership.

Joint Tenants - Joint tenants with rights of survivorship identifies two or more owners. When stock is held by joint tenants with rights of survivorship, ownership automatically passes to the surviving joint tenant(s) upon the death of any joint tenant. You may not list beneficiaries for this ownership.

Tenants in Common - Tenants in common may also identify two or more owners. When stock is to be held by tenants in common, upon the death of one co-tenant, ownership of the stock will be held by the surviving co-tenant(s) and by the heirs of the deceased co-tenant. All parties must agree to the transfer or sale of shares held by tenants in common. You may not list beneficiaries for this ownership.

Individual Retirement Account - Individual Retirement Account (“IRA”) holders may potentially make stock purchases from their existing IRA if it is a self-directed IRA or through a prearranged “trustee-to-trustee” transfer if their IRA is currently at 1st Security Bank of Washington. The stock cannot be held in your 1st Security Bank of Washington account. Please contact your broker or self-directed IRA account provider as quickly as possible to explore this option, as it may take a number of weeks to complete a trustee-to-trustee transfer and place a subscription in this manner.
 
Registration for IRA’s: On Name Line 1 - list the name of the broker or trust department followed by CUST or TRUSTEE.
  On Name Line 2 - FBO (for benefit of) YOUR NAME [IRA a/c #______].
  Address will be that of the broker / trust department to where the stock certificate will be sent.
  The Social Security / Tax I.D. number(s) will be either yours or your trustee’s, as the trustee directs.
  Please list your phone numbers, not the phone numbers of your broker / trust department.
 
Uniform Transfers To Minors Act - For residents of Washington and many states, stock may be held in the name of a custodian for the benefit of a minor under the Uniform Transfers to Minors Act. In this form of ownership, the minor is the actual owner of the stock with the adult custodian being responsible for the investment until the child reaches legal age. Only one custodian and one minor may be designated.
 
Registration for UTMA: On Name Line 1 – print the name of the custodian followed by the abbreviation “CUST”
  On Name Line 2 – FBO (for benefit of) followed by the name of the minor, followed by UTMA-IL
  (or your state’s abbreviation)
  List only the minor’s social security number on the form.
 
Corporation/Partnership – Corporations/Partnerships may purchase stock. Please provide the Corporation/Partnership’s legal name and Tax I.D. To have subscription rights, the Corporation/Partnership must have an account in its legal name and Tax I.D. Please contact the Stock Information Center to verify depositor rights and purchase limitations.

Fiduciary/Trust - Generally, fiduciary relationships (such as Trusts, Estates, Guardianships, etc.) are established under a form of trust agreement or pursuant to a court order. Without a legal document establishing a fiduciary relationship, your stock may not be registered in a fiduciary capacity.

Instructions: On the first name line, print the first name, middle initial and last name of the fiduciary if the fiduciary is an individual. If the fiduciary is a corporation, list the corporate title on the first name line. Following the name, print the fiduciary title, such as trustee, executor, personal representative, etc. On the second name line, print the name of the maker, donor or testator or the name of the beneficiary. Following the name, indicate the type of legal document establishing the fiduciary relationship (agreement, court order, etc.). In the blank after “Under Agreement Dated,” fill in the date of the document governing the relationship. The date of the document need not be provided for a trust created by a will.

If you have questions regarding the conversion and the stock offering, please call us, toll free, at (___) ___-____, Monday through Friday, between 7:00 a.m. and 4:00 p.m., Pacific Time. You can also stop into our Stock Information Center located at 6920 220th Street SW, Mountlake Terrace, Washington, on Monday from 12:00 noon to 5:00 p.m., Tuesday through Thursday from 8:00 a.m. to 5:00 p.m. or Friday from 8:00 a.m. to 12:00 noon, to speak with a stock center representative.  The Stock Information Center will be closed weekends and bank holidays.

 
(See Reverse Side for Stock Order and Certification Form Instructions)
 
EX-99.3 20 ex99-3.htm EXHIBIT 99.3 ex99-3.htm

Exhibit 99.3


(fs bancorp, inc. logo)
 
The Proposed Parent Holding Company for
 
1st Security Bank of Washington
 
 
Q&A GRAPHIC


QUESTIONS AND ANSWERS
 
ABOUT OUR CONVERSION
 
AND STOCK OFFERING


The shares of common stock being offered are not deposits or savings accounts and are not insured by the Federal
Deposit Insurance Corporation or any other governmental agency, or by 1st Security Bank of Washington or FS
Bancorp, Inc.
 
This is not an offer to sell or a solicitation of an offer to buy common stock. The offer is made only by the prospectus.


This pamphlet answers questions about the 1st Security Bank of Washington conversion and stock offering. Investing in shares of common stock involves certain risks. For a discussion of these risks and other factors, including a detailed description of the offering, investors are urged to read the accompanying prospectus, especially the discussion under the heading “Risk Factors.”
 
GENERAL – THE CONVERSION
 
Our Board of Directors has determined that the conversion is in the best interests of 1st Security Bank of Washington, our customers and the communities we serve.
 
What is the conversion?
 
Under the Plan of Conversion (the “plan”), our organization is converting from the mutual to stock form of organization.  As a result of the conversion, 1st Security Bank of Washington will be the wholly owned subsidiary of a newly formed Washington stock holding company named FS Bancorp, Inc.
 
After the conversion is completed, 100% of the common stock of FS Bancorp, Inc. will be owned by public stockholders, including certain members of 1st Security Bank of Washington who are being offered an opportunity to purchase shares subject to the subscription priorities defined in the prospectus.
 
Why is 1st Security Bank of Washington converting to the stock form of organization?
 
The primary reasons for the conversion and stock offering are to increase our capital to support future growth and provide us with greater operating flexibility and allow us to better compete with other financial institutions.
 
What effect will the conversion have on existing deposit and loan accounts and customer relationships?
 
The conversion will have no effect on existing deposit or loan accounts and customer relationships. Deposits will continue to be federally insured by the Federal Deposit Insurance Corporation to the maximum legal limit. Interest rates and existing terms and conditions on deposit accounts will remain the same upon completion of the conversion. Contractual obligations of borrowers of 1st Security Bank of Washington will not change and there will be no change in the amount, interest rate, maturity, security or any other condition relating to the respective loans of customers as a result of the conversion.
 
Will customers notice any change in 1st Security Bank of Washington’s day-to-day activities as a result of the conversion and the offering?
 
No. It will be business as usual. The conversion is an internal change in our corporate structure. There are no planned changes to our Board of Directors, management, staff or branches at this time.
 
THE PROXY VOTE
 
ALTHOUGH WE HAVE RECEIVED CONDITIONAL APPROVAL, THE PLAN IS ALSO SUBJECT TO MEMBER APPROVAL.
 
Should I vote to approve the plan of conversion?
 
Your Board of Directors recommends a vote “FOR” the Plan of Conversion. Your Board of Directors believes that converting to a public ownership structure will best support future growth and expanded services. Your “FOR” vote is very important! NOT VOTING HAS THE SAME EFFECT AS VOTING “AGAINST” THE PLAN OF CONVERSION.


Why did I get several proxy cards?
 
If you have multiple accounts with 1st Security Bank of Washington, you could receive more than one proxy card, depending on the ownership structure of your accounts. There are no duplicate cards – please vote all of the proxy cards you receive.
 
PLEASE SIGN AND RETURN ALL PROXY CARDS TODAY!
 
How many votes do i have?
 
Depositors are entitled to one vote for each $100 on deposit as of the voting record date. No member may cast more than 1,000 votes. Proxy cards are not imprinted with your number of votes; however, votes will be automatically tallied by computer when returned to the Stock Information Center.
 
May i vote in person at the special meeting?
 
Yes, but we would still like you to sign, date and mail your proxy today. If you decide to revoke your proxy, you may do so at any time before the proxy is exercised by executing and delivering a later-dated proxy or by giving notice of revocation in writing or by voting in person at the special meeting. Attendance at the special meeting will not, of itself, revoke a proxy.
 
More than one name appears on my proxy card, who must sign?
 
The names reflect the title of your accounts. Proxy cards for joint accounts require the signature of only one of the members. Proxy cards for trust or custodial accounts must be signed by the trustee or the custodian, not the listed beneficiary.
 
THE STOCK OFFERING AND PURCHASING SHARES
 
Are 1st Security Bank of Washington’s depositors required to purchase stock in the conversion?
 
No depositor or other person is required to purchase stock. However, depositors and other eligible persons will be provided the opportunity to purchase stock consistent with the established priority of subscription rights, should they so desire. The decision to purchase stock will be exclusively that of each person. Whether an individual decides to purchase stock or not will have no positive or negative impact on his or her standing as a customer of 1st Security Bank of Washington. The conversion will allow customers of 1st Security Bank of Washington an opportunity to buy common stock and become stockholders of FS Bancorp, Inc.
 
How many common shares are being offered and at what price?
 
FS Bancorp, Inc. is offering through the prospectus between 2,082,500 and 2,817,500 shares of common stock at a price of $10.00 per share.  The maximum number of shares that we may sell in the stock offering may increase by 15% to 3,240,125 shares as a result of regulatory considerations or changes in financial markets.


Who is eligible to purchase common shares in the subscription and community offerings?
 
Pursuant to the Plan, non-transferable rights to subscribe for shares of FS Bancorp, Inc. common stock in the Subscription Offering have been granted in the following descending order of priority.
 
Priority 1 -
Eligible account holders, who are depositors of 1st Security Bank of Washington with account balances of at least $50.00 as of the close of business on June 30, 2007.
Priority 2 -
1st Security Bank of Washington’s proposed employee stock ownership plan, which will purchase 8% of the shares of common stock sold in the offering.
Priority 3 -
Supplemental eligible account holders, who are depositors of 1st Security Bank of Washington with account balances of at least $50.00 as of the close of business on _________.
Priority 4 -
Other Members, who are depositors of 1st Security Bank of Washington as of the close of business on ________, other than eligible account holders or supplemental eligible account holders.
 
Shares of common stock not purchased in the subscription offering may be offered for sale to the general public who receive a prospectus in a Direct Community Offering, with a preference given to natural persons residing in King, Kitsup, Pierce, and Snohomish Counties.
 
Shares not sold in the Subscription and Direct Community Offerings may be offered for sale to selected members of the general public through a Syndicated Community Offering.
 
How many shares may i  buy?
 
The minimum number of shares of common stock you may order is 25 shares.  The maximum number of shares of common stock that can be ordered by and individual or through a single qualifying account is 25,000 shares, and no person with an associate or group of persons acting in concert may purchase more than 50,000 shares, as further discussed in the prospectus.
 
Does placing an order guarantee that i will receive all, or a portion, of the shares i ordered?
 
No.  It is possible that orders received during the stock offering will exceed the number of shares offered for sale.  In this case, referred to as an “oversubscription,” regulations require that orders be filled using a pre-determined allocation procedure.  Please refer to the section of the Prospectus titled, “The Conversion and Stock Offering” for a detailed description of allocation procedures.
 
If we are not able to fill an order (either wholly or in part), excess funds submitted for payment will be refunded by check, including interest earned at 1st Security Bank of Washington’s statement savings rate.  If payment was to be made by withdrawal from a 1st Security Bank of Washington deposit account, excess funds will remain in that account.
 
I have custodial accounts with the bank for my minor children.  May I use these to purchase stock?
 
Yes.  However, the stock must be purchased in the name of the minor child.  A custodial account does not entitle the custodian to purchase stock in his or her own name.
 
Will the common stock be insured?
 
NO. Like any common stock, the common stock of FS Bancorp, Inc. will NOT be insured.
 
How do i order the common stock?
 
You must complete and return the enclosed Stock Order and Certification Form, along with full payment. Instructions for completing your Stock Order and Certification Form are included with the order form. Your order must be received by us (not postmarked) by 12:00 noon, Pacific Time, on _________.   Delivery of an original stock order form (we reserve the right to reject copies or facsimiles) and full payment may be made by overnight courier to the address listed on the top of the stock order form, by hand-delivery to any of our full service banking locations, or by mail, using the Stock Order Reply Envelope provided. Please do not mail stock order forms to any 1st Security Bank of Washington branch office.


How may i pay for my common stock?
 
First, you may pay for common stock by check or money order made payable to FS Bancorp, Inc.  These funds will be cashed upon receipt. We cannot accept wires or third party checks. 1st Security Bank of Washington line of credit checks may not be used. Please do not mail cash!
 
Second, you may authorize us to withdraw funds from YOUR SAVINGS ACCOUNT or CERTIFICATE OF DEPOSIT at 1st Security Bank of Washington.  There is no penalty for early withdrawal from a certificate of deposit for the purposes of purchasing stock in the offering. If you authorize an account withdrawal, you will not have access to these funds from the day we receive your order until completion or termination of the conversion. You may not designate withdrawal from 1st Security Bank of Washington accounts with check-writing privileges. Please submit a check instead. Also, IRA or other retirement accounts held at 1st Security Bank of Washington may not be listed for direct withdrawal. See information on IRAs below.
 
Will i earn interest on my funds?
 
Funds received during the offering will be held in a segregated account at 1st Security Bank of Washington and will earn interest at a rate equal to 1st Security Bank of Washington’s passbook  (statement savings) rate, which is currently ___% per annum, from the day the funds are received until the completion of the offering.  At that time, you will be issued a check for interest earned on these funds. If paid by authorizing a direct withdrawal from your 1st Security Bank of Washington deposit account(s), your funds will continue earning interest within the account, at the applicable deposit account rate, until they are withdrawn.
 
Can i purchase stock using funds in my 1st Security Bank of Washington IRA?
 
Yes, but not directly.   To do so, you must first establish a self-directed IRA at an unaffiliated institution or brokerage firm and transfer the necessary funds from your IRA at 1st Security Bank of Washington.  Please contact your broker or self-directed IRA provider as soon as possible if you want to explore this option, as these transactions take time, and many brokers will not allow investment in an offering of this type by their IRA clients. Your ability to use IRA funds for this purchase may also depend on time constraints, because this type of purchase requires additional processing time.
 
If you have a self-directed IRA and wish to use those funds, contact your broker as soon as possible.  Whether you may use such funds for the purchase of shares in the stock offering may depend on limitations imposed by the brokerage firm or institution where your funds are held.
 
May i obtain a loan from 1st Security Bank to pay for the stock?
 
No.  Regulations do not allow 1st Security Bank of Washington to make loans for this purpose, nor may you use a 1st Security Bank of Washington line of credit to pay for shares.  However, you are not precluded from obtaining financing from another financial institution.


WILL DIVIDENDS BE PAID ON THE COMMON STOCK?
 
The board of directors of FS Bancorp, Inc. intends to pay cash dividends on the common stock in the future.  However, the amount and timing of any dividends has not yet been determined.  The payment of dividends will depend upon a number of factors, including capital requirements, FS Bancorp’s and 1st Security Bank of Washington’s financial condition and results of operations, tax considerations, statutory and regulatory limitations and general economic conditions.  No assurances can be given that any dividends will be paid or that, if paid, dividends will not be reduced or eliminated in future periods.
 
How will the common stock be traded?
 
After the completion of the offering, FS Bancorp, Inc’s stock is expected to trade on the Nasdaq Capital Market under the symbol “FSBW.”  We cannot predict, however, whether an active and liquid trading market for our common stock will develop.
 
Are executive officers and directors of 1st Security Bank of Washington planning to purchase stock?
 
Yes!  1st Security Bank of Washington’s senior officers and directors plan to purchase, in the aggregate, $760,000 worth of stock.
 
Must I pay a commission?
 
No. You will not be charged a commission or fee on the purchase of common stock in the conversion.  However, if you are purchasing through a brokerage account, your broker may charge fees associated with your purchase.
 
May i change my mind after i place an order to subscribe for stock?
 
No. After receipt your executed stock order form may not be modified, amended or rescinded without our consent, unless the offering is not completed by __________, in which event subscribers may be given the opportunity to increase, decrease or rescind their orders for a specified period of time.
 
If i purchase shares in the offering, when will i receive my stock certificate?
 
Our transfer agent, Registrar and Transfer Company, will send stock certificates by first class mail as soon as possible after completion of the stock offering. Although the shares of FS Bancorp, Inc. common stock will have begun trading, brokerage firms may require that you have received your stock certificate(s) prior to selling your shares. Your ability to sell the shares of common stock prior to your receipt of the stock certificate will depend on the arrangements you may make with your brokerage firm.
 
WHERE TO GET MORE INFORMATION
 
If you have questions regarding the conversion and the stock offering, please call us, toll free, at (___) ___-____, Monday through Friday, between 7:00 a.m. and 4:00 p.m., Pacific Time. You can also stop into our Stock Information Center located at 6920 220th Street SW, Mountlake Terrace, Washington, on Monday from 12:00 noon to 5:00 p.m., Tuesday through Thursday from 8:00 a.m. to 5:00 p.m. or Friday from 8:00 a.m. to 12:00 noon, to speak with a stock center representative.  The Stock Information Center will be closed weekends and bank holidays.


(KBW LOGO)
 
_________ __, 2011
 
To Members and Friends of
1st Security Bank of Washington

Keefe, Bruyette & Woods, Inc., a member of the Financial Industry Regulatory Authority (FINRA), is assisting FS Bancorp, Inc, the proposed stock holding company for 1st Security Bank of Washington, in offering shares of its common stock pursuant to a Plan of Conversion.

At the request of FS Bancorp, Inc., we are enclosing materials explaining this process and your options, including an opportunity to invest in the shares of FS Bancorp, Inc. common stock being offered to members of 1st Security Bank of Washington and various other persons until 12:00 noon, Pacific Time, on __________ __, 2011.  Please read the enclosed offering materials carefully, including the prospectus, for a complete description of the stock offering.  FS Bancorp, Inc. has asked us to forward these documents to you in view of certain requirements of the securities laws in your state.

If you have questions regarding the conversion and the stock offering, please call us, toll free, at (___) ___-____, Monday through Friday, between 7:00 a.m. and 4:00 p.m., Pacific Time. You can also stop into our Stock Information Center located at 6920 220th Street SW, Mountlake Terrace, Washington, on Monday from 12:00 noon to 5:00 p.m., Tuesday through Thursday from 8:00 a.m. to 5:00 p.m. or Friday from 8:00 a.m. to 12:00 noon, to speak with a stock center representative.  The Stock Information Center will be closed weekends and bank holidays.
 
Very truly yours,

Keefe, Bruyette & Woods, Inc.
 
The shares of common stock being offered are not deposits or accounts and are not insured or guaranteed by the Federal Deposit Insurance Corporation, or any other governmental agency, or by 1st Security Bank of Washington or FS Bancorp, Inc.

This is not an offer to sell or a solicitation of an offer to buy common stock. The offer is made only by the prospectus.


____________ __, 2011
 
Dear Friend:

We are pleased to announce that 1st Security Bank of Washington (the “Bank”) is converting to a stock holding company structure.  In connection with the conversion, FS Bancorp, Inc., a newly-formed Washington corporation that will hold all of the outstanding shares of the Bank following the conversion to stock ownership, is offering common stock in a subscription and community offering to certain members of the Bank, an employee stock ownership plan established by the Bank, and other various persons, pursuant to a Plan of Conversion.

Because we believe you may be interested in learning more about the merits of FS Bancorp, Inc.’s common stock as an investment, we are sending you the following materials which describe the offering.

 
PROSPECTUS:  This document provides detailed information about 1st Security Bank of Washington’s operations and the proposed offering of FS Bancorp, Inc.’s common stock.

 
STOCK ORDER AND CERTIFICATION FORM: This form can be used to purchase stock by returning it with your payment in the enclosed business reply envelope. Your order must be received by 12:00 Noon, Pacific Time, on ___________ __, 2011.

You will have the opportunity to buy common stock directly from FS Bancorp, Inc. in the offering without paying a commission or fee.  If you have questions regarding the conversion and the stock offering, please call us, toll free, at (___) ___-____, Monday through Friday, between 7:00 a.m. and 4:00 p.m., Pacific Time. You can also stop into our Stock Information Center located at 6920 220th Street SW, Mountlake Terrace, Washington, on Monday from 12:00 noon to 5:00 p.m., Tuesday through Thursday from 8:00 a.m. to 5:00 p.m. or Friday from 8:00 a.m. to 12:00 noon, to speak with a stock center representative.  The Stock Information Center will be closed weekends and bank holidays.

We are pleased to offer you this opportunity to become a stockholder of FS Bancorp, Inc.

Sincerely,
 
Joseph C. Adams
Chief Executive Officer
 
The shares of common stock being offered are not deposits or accounts and are not insured or guaranteed by the Federal Deposit Insurance Corporation, or any other governmental agency, or by 1st Security Bank of Washington or FS Bancorp, Inc.

This is not an offer to sell or a solicitation of an offer to buy common stock. The offer is made only by the prospectus.


__________ __, 2011

Dear Member:

We are pleased to announce that 1st Security Bank of Washington (the “Bank”) is converting to a stock holding company structure.  In connection with the conversion, FS Bancorp, Inc., a newly-formed Washington corporation that will hold all of the outstanding shares of the Bank following the conversion to stock ownership, is offering common stock in a subscription and community offering to certain members of the Bank, an employee stock ownership plan established by the Bank, and other various persons, pursuant to a Plan of Conversion.

To complete the conversion, we need your participation in an important vote. Enclosed are a proxy statement and a prospectus describing the Plan of Conversion and your voting and subscription rights. YOUR VOTE IS VERY IMPORTANT.

Enclosed, as part of the proxy materials, is your proxy card, the detachable section attached to the order form bearing your name and address. This proxy card should be voted prior to the Special Meeting of Members to be held on _____, 2011.  Please take a moment now to sign and date the enclosed proxy card and return it to us in the postage-paid envelope provided.  FAILURE TO VOTE HAS THE SAME EFFECT AS VOTING AGAINST THE PLAN OF CONVERSION.

The Board of Directors believes the conversion will offer a number of advantages.  Please remember:

Ø 
Your deposit accounts will continue to be insured up to the maximum legal limit by the Federal Deposit Insurance Corporation (“FDIC”).

Ø 
There will be no change in the balance, interest rate or maturity of any deposit account or loan because of the conversion.

I invite you to attend the Special Meeting on __________ __, 2011.  Whether or not you are able to attend, please complete the enclosed proxy card(s) and return it in the enclosed envelope.

Sincerely,
 
Joseph C. Adams
Chief Executive Officer
 
The shares of common stock being offered are not deposits or accounts and are not insured or guaranteed by the Federal Deposit Insurance Corporation, or any other governmental agency, or by 1st Security Bank of Washington or FS Bancorp Inc.

This is not an offer to sell or a solicitation of an offer to buy common stock. The offer is made only by the prospectus


__________ __, 2011
 
Dear Member:

We are pleased to announce that 1st Security Bank of Washington (the “Bank”) is converting to a stock holding company structure.  In connection with the conversion, FS Bancorp, Inc., a newly-formed Washington corporation that will hold all of the outstanding shares of the Bank following the conversion to stock ownership, is offering common stock in a subscription and community offering to certain members of the Bank, an employee stock ownership plan established by the Bank, and other various persons, pursuant to a Plan of Conversion.

Unfortunately, FS Bancorp, Inc. is unable to either offer or sell its common stock to you because the small number of eligible subscribers in your jurisdiction makes registration or qualification of the common stock under the securities laws of your jurisdiction impractical for reasons of cost or otherwise.  Accordingly, this letter and the enclosures should not be considered an offer to sell or a solicitation of an offer to buy the common stock of FS Bancorp, Inc.

However, as a member of 1st Security Bank of Washington you have the right to vote on the Plan of Conversion at the special meeting of members to be held on __________ __, 2011.  Enclosed is a proxy statement describing the Plan of Conversion, your voting rights and proxy cards.  YOUR VOTE IS VERY IMPORTANT.  Your proxy card(s) should be signed and returned to us prior to the special meeting of members on _________ __, 2011.  Please take a moment now to sign the enclosed proxy card(s) and return it to us in the postage-paid envelope provided.  FAILURE TO VOTE HAS THE SAME EFFECT AS VOTING AGAINST THE PLAN OF CONVERSION.

The Board of Directors believes the conversion will offer a number of advantages.  Please remember:

Ø 
Your deposit accounts will continue to be insured up to the maximum legal limit by the Federal Deposit Insurance Corporation (“FDIC”).

Ø 
There will be no change in the balance, interest rate or maturity of any deposit account or loan because of the conversion.

I invite you to attend the Special Meeting on __________ __, 2011.  Whether or not you are able to attend, please complete the enclosed proxy card(s) and return it in the enclosed envelope.

Sincerely,
 
Joseph C. Adams
Chief Executive Officer
 
The shares of common stock being offered are not deposits or accounts and are not insured or guaranteed by the Federal Deposit Insurance Corporation, or any other governmental agency, or by 1st Security Bank of Washington or FS Bancorp Inc.

This is not an offer to sell or a solicitation of an offer to buy common stock. The offer is made only by the prospectus


__________ __, 2011
 
Dear Prospective Investor:

We are pleased to announce that 1st Security Bank of Washington (the “Bank”) is converting to a stock holding company structure.  In connection with the conversion, FS Bancorp, Inc., a newly-formed Washington corporation that will hold all of the outstanding shares of the Bank following the conversion to stock ownership, is offering common stock in a subscription and community offering to certain members of the Bank, an employee stock ownership plan established by the Bank, and other various persons, pursuant to a Plan of Conversion.

We have enclosed the following materials that will help you learn more about the merits of FS Bancorp, Inc. common stock as an investment.  Please read the enclosed materials carefully.

 
PROSPECTUS:  This document provides detailed information about 1st Security Bank of Washington’s operations and the proposed offering of FS Bancorp, Inc.’s common stock.

 
STOCK ORDER AND CERTIFICATION FORM:  This form can be used to purchase stock by returning it with your payment in the enclosed business reply envelope.  Your order must be received by 12:00 noon, Pacific Time, on __________ __, 2011.

We invite you and other community members to become stockholders of FS Bancorp, Inc. Through this offering you have the opportunity to buy stock directly from FS Bancorp, Inc. without paying a commission or a fee.

If you have questions regarding the conversion and the stock offering, please call us, toll free, at (___) ___-____, Monday through Friday, between 7:00 a.m. and 4:00 p.m., Pacific Time. You can also stop into our Stock Information Center located at 6920 220th Street SW, Mountlake Terrace, Washington, on Monday from 12:00 noon to 5:00 p.m., Tuesday through Thursday from 8:00 a.m. to 5:00 p.m. or Friday from 8:00 a.m. to 12:00 noon, to speak with a stock center representative.  The Stock Information Center will be closed weekends and bank holidays.

Sincerely,
 
Joseph C. Adams
Chief Executive Officer
 
The shares of common stock being offered are not deposits or accounts and are not insured or guaranteed by the Federal Deposit Insurance Corporation, or any other governmental agency, or by 1st Security Bank of Washington or FS Bancorp, Inc.

This is not an offer to sell or a solicitation of an offer to buy common stock. The offer is made only by the prospectus


(1st security bank logo)
 
PROXY GRAM
 
PLEASE VOTE TODAY
 
We recently sent you a proxy statement and related materials regarding a proposal to convert 1st Security Bank of Washington into the stock holding company structure.

Your vote on the Plan of Conversion has not yet been received.

Voting for the Plan of Conversion does not obligate you to purchase stock and will not affect your accounts or FDIC Insurance.

Not Returning Your Proxy Cards has the Same Effect as Voting “Against” the Plan of Conversion.
Your Board of Directors Unanimously Recommends a Vote “FOR” the Plan of Conversion.
 
Your Vote Is Important To Us!

Please sign the enclosed proxy card and return it in the postage-paid envelope provided TODAY! If you received more than one proxy card, please be sure to sign and return all cards you received.
 
Thank you,
 
Joseph C. Adams
Chief Executive Officer
1st Security Bank of Washington


If you have already mailed your proxy card(s), please accept our thanks and disregard this notice.
For further information, call (___) ___-____.


(1st security bank logo)
 
PROXY GRAM II
PLEASE VOTE TODAY
 
We recently sent you a proxy statement and related materials regarding a proposal to convert 1st Security Bank of Washington into the stock holding company structure.
 
Your vote on the Plan of Conversion has not yet been received.
 
Voting for the Plan of Conversion does not obligate you to purchase stock and will not affect your accounts or FDIC Insurance.
 
Not Returning Your Proxy Cards has the Same Effect as Voting “Against” the Plan of Conversion.
 
Your Board of Directors Unanimously Recommends a Vote “FOR” the Plan of Conversion.
 
Our Reasons for the Corporate Change
 
As a Mutual Institution:
- There is no authority to issue capital stock and thus no access to this market source of equity capital.
- Earnings from year to year are the only source of generating capital.
 
Under a Stock Holding Company structure, we will be able to:
-Increase our capital to support future growth;
-Provide ourselves with greater operating flexibility and allow us to better compete with other financial institutions;
-Better enable us to serve our customers in our market area;
-Enable us to increase lending and support our emphasis on commercial business and commercial real estate lending and the development of new products and   services;
-Help us attract and retain qualified management through stock based compensation plans; and
- Structure our business in a form that will enable us to access the capital markets.
Your Vote Is Important To Us!
Please sign the enclosed proxy card and return it in the postage-paid envelope provided TODAY! If you received more than one proxy card, please be sure to sign and return all cards you received.
 
Thank you,
 
Joseph C. Adams
Chief Executive Officer
1st Security Bank of Washington
 
     If you have already mailed your proxy card(s), please accept our thanks and disregard this notice.
For further information, call (___) ___-____.


(1ST SECURITY BANK LOGO)
 
Proxy Gram III
 
Month, Date Year
 
Dear Valued 1st Security Bank of Washington Member:
 
We recently forwarded you a proxy statement and related materials regarding a proposal to convert 1st Security Bank of Washington into the stock holding company structure.  This conversion will allow us to operate in essentially the same manner as we currently operate, but will provide us with the flexibility to increase our capital, continue to support future lending and operational growth, and support future branching activities and/or the acquisition of financial services companies.
 
As of the date of this letter, your vote on our Plan of Conversion has not yet been received. Your Board of Directors unanimously recommends a vote “FOR” the Plan of Conversion.
 
If you have already mailed your proxy, please accept our thanks and disregard this request.  If you have not yet voted your proxy card, we would sincerely appreciate you signing the enclosed proxy card and returning it promptly in the enclosed postage-paid envelope.  Our meeting on _____, 2011 is fast approaching and we’d like to receive your vote as soon as possible.
 
Voting FOR the Plan of Conversion does not affect the terms or insurance on your accounts.  For further information please call our Stock Information Center at (___) ___-____.
 
Best regards and thank you,
 
Joseph C. Adams
Chief Executive Officer


Read This First
 
Guidance for Account Holders
 
Your financial institution is in the process of selling stock to the public in a mutual-to-stock conversion.  As an account holder at this institution, you have certain priority subscription rights to purchase stock in the offering. These priority subscription rights are non-transferable. If you subscribe for stock, you will be asked to sign a statement that the purchase is for your own account, and that you have no agreement or understanding regarding the subsequent sale or transfer of any shares you receive.
 
On occasion, unscrupulous people attempt to persuade account holders to transfer subscription rights, or to purchase shares in the offering based on the understanding that the shares will subsequently be transferred to others. Such arrangements violate federal regulations. If you participate in these schemes, you are breaking the law and may be subject to prosecution. If someone attempts to persuade you to participate in such a scheme, please contact our Stock Information Center at (___) ___-____.  FS Bancorp, Inc. is very interested in ensuring that the prohibitions on transfer of subscription rights are not violated.
 
How will you know if you are being approached illegally? Typically, a fraudulent opportunist will approach you and offer to “loan” you money to purchase a significant amount of stock in the offering. In exchange for that “loan” you most likely will be asked either to transfer control of any stock purchased with that money to an account the other person controls, or sell the stock and give the majority of the profits to the other person. You may be told, untruthfully, that there is no risk to you, that the practice is common, and even if you are caught, that your legal expenses will be covered.
 
On the back of this page is a list of some key concepts that you should keep in mind when considering whether to participate in a mutual-to-stock conversion. If you have questions, please contact the Stock Information Center at the number listed above.


What Investors Need to Know
 
Key concepts for investors to bear in mind when considering whether to participate in a conversion offering, or a stock offering by a subsidiary of a mutual holding company, include the following:
 
 
Know the Rules By law, account holders cannot sell or transfer their priority subscription rights, or the stock itself, prior to the completion of a financial institution’s conversion. Moreover, account holders cannot enter into agreements or arrangements to sell or transfer either their subscription rights or the underlying conversion stock.
 
 
“Neither a Borrower nor a Lender Be”  If someone offers to lend you money so that you can participate  or participate more fully  in a conversion, be extremely wary. Be even more wary if the source of the money is someone you do not know. The loan agreement may make you unable to certify truthfully that you are the true holder of the subscription rights and the true purchaser of the stock and that you have no agreements regarding the sale or transfer of the stock.
 
 
Watch Out for Opportunists The opportunist may tell you that he or she is a lawyer or a consultant or a professional investor or some similarly impressive tale who has experience with similar mutual conversion transactions. The opportunist may go to extreme lengths to assure you that the arrangement you are entering into is legitimate. They might tell you that they have done scores of these transactions and that this is simply how they work. Or they might downplay the warnings or restrictions in the prospectus or order form, telling you that “everyone” enters into such agreements or that the deal they are offering is legitimate. They may also tell you that you have no risk in the transaction. The cold, hard truth is that these are lies, and if you participate, you are breaking the law.
 
 
Get the Facts from the Source If you have any questions about the securities offering, contact our Stock Information Center at (  ) ___-____ for more information. If you have any doubts about a transaction proposed to you by someone else, ask us whether the proposed arrangement is proper.
 
The bottom line for investors is always to remember that if an opportunity sounds too good to be true, it probably is too good to be true.
 
 
GRAPHIC 21 img001.jpg GRAPHIC begin 644 img001.jpg M_]C_X``02D9)1@`!`0$`8`!@``#_VP!#``8$!08%!`8&!08'!P8("A`*"@D) M"A0.#PP0%Q08&!<4%A8:'24?&ALC'!86("P@(R8G*2HI&1\M,"TH,"4H*2C_ MVP!#`0<'!PH("A,*"A,H&A8:*"@H*"@H*"@H*"@H*"@H*"@H*"@H*"@H*"@H M*"@H*"@H*"@H*"@H*"@H*"@H*"@H*"C_P``1"`!1`04#`2(``A$!`Q$!_\0` M&@`!``,!`0$```````````````4&!P,$"/_$`"T0``$$`@("`0,#!0`#```` M``$``@,$!1$&$@A+1RM*M>I2Z^2O9B;+&_1!&VN!!T0#_`/0$&=6_/?C.K:FKR\HB=)"] MT;C%4L2,)!T>KVQEKA_P@D'\@J:X5Y2X=S?*RXWC&8^NNQ0FP^/Z6:+48;(8A_",;QA_P!!7GS4%.6&M7B3J&]Y M'Q-0[M]%+.]]?L7.)/[;FD#3>K2UA:"T[M2#DZS`VU M'5=-$+,C'2,B+QWOLC>=G0]:_)`4?F^+XC,VF6[E>6.\U@B%RG8EJ6/C!)^,S1.:\Q[) M/0GKO1UL`K*K&#X_C/ZBL3(]UZO)A>.6PV]1^3Q4&1NXFU.^5LF,M.MPAA`#GF&6$AVQ['69Q]:]@?^P>T62H MRPT9HKM9\5[7TCVRM+;&V%X^,[^[;&N=ZWZ!/X"]2`B(@(B(.5ML[JLS:BYH>Q`V?>@3U&]=G2JC\3F<=EY,@S&6XK3L?:=2LF,[$U9Q5.?(4_H;LL+'SU?E$OP2%H+F=QZ= MU.QL>CK:SKAG223+^5,_R0YS"`6B0P$L<=._D$`H+JB+.N37/@?%,^(M<2UIWMAV"!K\?PK*@(B("(B`B(@(B(,0 MY/>GY]YUL\'@SG(,%1P>)=;FEQ%LU9)[$CH"`XCL'1B.1NMM!#B_^-+U>.^- ML\4\]@XKCZ41XUFJKY:^5D@9]WT\TK3TT(FRO;]D8UL#;@\NT#AW"\5 MQ.UG[6,$K[.;R$F1M2S="_N\[Z`AH/QM)<6@[UV=[]KKR;'VKN:XG/6B[Q4< MF^Q8=V`Z1FG9C!]GW]\C!H;/O?X!*"J_U"9JUC/'%C&XNK]5E.13,P-.,ZZF M2P'-/8ES>OV!^CO0<6[&MKE_B2#(R8*KRC+RY7CW'V11XS#M@$,#OC:6-?:^ MYWSR=>@V.C?M=]FGN:;KE\&_)\BP.1?>ECK8E\TXJ,C;J:9\1B8]SB-@-9), M.HULO!)^W1FD'*I6@IU8:M.&*"M`QL<443`UD;&C0:T#T`````NJ*%YIBLCG M.+Y#&8;,RX2]98(V9"*+Y'PCL.W4;'LM[-!!!&]@[`0?/7D&GXVY!F\]#R+G M/D"S2H799;[&?--0QD_REC8]&!P9LN>UA&QICAV]CM:OZ9N/<=KW^=YOC]6M M'%^M38JHZ"0S1MJPAA:Z.1QS(XO<[9.RX[)V2HKAO#'\/\`&E?BN%RLK+->K+'#D9(6 MO+)I"YQE^,^B`]Y(82?0`)/LD*I@O(<'+//=[C%!L4V+P&/GD>^6N`_Z]LK( MGN8YWL!K)'Q[`;OO)_LTM*RKR*Z?FV1XIY(P\<4-Z3E-?"8#YY":MFK')(Z. M>5H:)&ET[9-C[2&:'4G[C<,G_3U>.=9F>/<^R6%R4M*&O>L5Z[@^U*UK1)*7 M,E:?W',#W!Q<2\N<7'?K5;'"*,O+,'FXKV2K18:'X:F)KS-90;^W)&'_``]? M3@R5S001H`#\#V&'V,5/X?YUFN6W7Q/MW>'S6[$[R9()\O\`/7;*&L:`\1OE MDB=^&@?*==0--EL-A*G%?+OC[O\`+7Y;R)^2RF0"Q_MY.VS7E+P7_D/E63S.3Y%\?RTHJ>/A^AW]#U>QY=V$C?DW^\-.'KY M?S]H7DR_@W.9'.MY".?V:_)!-;(OLI/?\4$[>HKPM?.?B;'VGZEIV/E]:+04 M$!SGS)R*KG;5_#8[I^F9J?C=+&-M"7]6EZRB21T0'<_&]M(M#0#^Z]G<_)]M MUY]SR]_A3"V*$]:#F/*Z56OCJT3W1N?/8;&'F(]@6=!(2'N=IIZ;))`-JQ7` M*M2_PZ[;L_5V^.TK,+93&6.L69Q&);+M._V=UE+@[MLS%Q.QLTJ7P-5N8+DF M(RN?LWJ5OHW""Q$978*-CBYL<+I'O/4@1,<&]"YL>M_@@++P/BV`\*>/+K+6 M7E_3HGF]=N6]`?(6,8[HUHV`2P=6?<[;M;<2%1:N0S'%?'&$R6"EK4LIY"Y, MVQ+),TVFT&WPYS#&-,[.8QL7IP(+@[\@C5JXSXLRC,K'-S_E?]ZXV&D*L&.R M..:(6/#@6SD%[@Z4-[M[N!>0\[=_"[=[TD6"XYB-;I<@Y!2Q%X![V.=6D<72, M:YC@1V#.A_ZUSA_.Q"5O#>7Q^1/(<1SR]5YK:8^'(Y:2A%/';C=(7Z^!Y(C( M`A8.K@T-B`#1LJ*Y5X>Y=FK53*\CYQ+RMN+>RW%@Y<;'6KW7Q$N$3@)/C:7[ M:LAK59LDVE0R?R3SQ1-BC?/3G8?A<96]G-,C?]HAK< M3AW'X=:E2O%G+ZO*L%$*7'\E@FTX6125K-0PPPR-=)$Z")V@'_&8B#U``#F@ M@.[-;=4!9KQ?DE7F'F+._ILVZG%*3L7('0%KI;-B8.E(<7?ZL^D8T?:-DO.R M`TG2E@%_P#G/[JY!F<#Y(R6$_6+LMR6&E6?'_L]SVMW7N0"1_)]#:#? MUFOA/$4:+.:Y"M/6GNY'DV1?9,;&B2#I.YC(7N!).@/D`.M";T/>S%<0\9C9(]./1CBX?<7`[<0XM0:4BJO'L/RNKR2U M?S_*ZV1QLL/2/&5L4VM'#)MOWAYD?(?37>BXC;S^-`*:X]1GQ>`QF/N79;]F MK5B@EMR[[V'M8&F1VR3MQ!)V3^?R4$@B(@(B("(B`B(@(B("(B`B(@(B("(B M`B(@(B("(B`B(@+.N*X[DF0\L GRAPHIC 22 img002.jpg GRAPHIC begin 644 img002.jpg M_]C_X``02D9)1@`!`0$`8`!@``#_VP!#``8$!08%!`8&!08'!P8("A`*"@D) M"A0.#PP0%Q08&!<4%A8:'24?&ALC'!86("P@(R8G*2HI&1\M,"TH,"4H*2C_ MVP!#`0<'!PH("A,*"A,H&A8:*"@H*"@H*"@H*"@H*"@H*"@H*"@H*"@H*"@H M*"@H*"@H*"@H*"@H*"@H*"@H*"@H*"C_P``1"`!A`D$#`2(``A$!`Q$!_\0` M'``!``,!`0$!`0````````````8'"`4$`P$"_\0`31```0,$`0("!`H'!00( M!P```0(#!``%!A$2!R$3,0@4(D$5%S(W455AD[/2%B-Q+I9K1#;0TP\E#AC-!7(-\N22G?TCONL65JSHW\QEU_A2/P4U4SF M3I@8>U5WR^8MBVTE=%*4K+72E*4"E*4"E*4"E*4"E*4"E*4"E*4"E*4"E*4" ME*4"E*4"E*4"E*4"E*4"E*4"E*4"E*4"E*4"E*4"E*4"E*4"E*4"E*4"E*4" ME*4"E*4"E*4"E*4"E*4"E*4%4.?,(Y^Z?ZFLA5KUSYA'/W3_`%-9"KQ/9YQL^RK0)&CHWQ*TXI4ZTM;PA`:ZEJL%UNK"Y$&"\N(V MK@Y*4.##1[?+=5I"/,?*(\Q4Y6K`\;(;2%7:6T"?&1^O47`D>SI7%AM/+?NE M@@GOV!5SKYU-N\V6ARUMLVQMEHLQ^`\5QA'`(_5*4-,'B-'P$M`]NW8:Y]9> MW!7[3V*UXI^G`NF*7JVM2'GH1>BQ^STF&XB2RT=ZXK<;*DI5O7LJ(/<=NXKA M5++?U`R"-*:D2Y9N+K9/%V6I1?2"-<4R$E+Z$]]\4.)!V=@@J!DLS(L,RN:] M(O-O^#Y&&B5%6TO,((5O>OUD=Q1WW<\B&WB5XHU^#9K;PG[5=2K$ MOG31UA#DJT72(_;U*XQW9;K;*9'M%.D/I4J.3V/LEU*_95[`T-P>ZVN?:)7J MUU@RH4GB%>%):4VK1\CI0!UV\ZZ4Q:WX90M2U?&'CK5G1OYC+K_"D?@IK*=: MLZ-_,9=?X4C\%-4>D_)_:UDN-=%*4K`:A2E*!2E*!2E*!2E*!2E*!2E*!2E* M!2E*!2E*!2E*!2E*!2E*!2E*!2E*!2E*!2E*!2E*!2E*!2E*!2E*!2E*!2E* M!2E*!2E*!2E*!2E*!2E*!2E*!2E*!2E*"J'/F$<_=/\`4UD*M>N?,(Y^Z?ZF MLA5N=%>7;Y9N>XH6M&FPHL%B%&ZCVEJ$T-&,BQ.I:>[`;>0&>+QTD=W`H[[^ M?>O!?8UJOTA+UWZEQY2D;#:5V^7P:!_X4(#?%"?L2`*EW1_I7C&>XJNYR7+U M#?8D&*XEN4TI*U);0HK`+6T@E?R=G6O,U76&V:UY#EG@FWW-JQ>SXSQG-I,) M&QR==>4T$%(`60.*=D@`[\^U9IM6TF=:^.Z/XY3%M(UCQ^?Z^GZ,XM_?V!_R MV7^2GZ,XM_?V!_RV7^2N?E/Z*,WQ#6,HN\FULND.O2I"$KDI!'=L!L>'Y*T5 M!1[@E(T15EY-T]PG'<$L&3S3DBV+IX')EF4PI3/BM*<[$M`*UQU[M_94[7V= M-9G?\?Q&*[6ND1N^4$_1G%O[^P/^6R_R4_1G%O[^P/\`ELO\E2C*.EEMMN$, M9K9[N]<+&HLNN1'$I:?#2U!)2'$E2?$"B$D<=`[\]:/9O'2S%T=)5YA97+U, M?5"1(3&1*:<2VHD!844M;(;)45>7R%;X^8AU]=W^YWSIX1X_2756W_YCGZ^' MVA5JMMFM$KUFT]2VH,CB4>+&AS6U<3YC:4`Z[#M7:1=(J`\A'4:S)BO#3L,8 M^OU59V#S+'@>&5[2/;X\NP&]5V^D73'#<^QHS%S+U'N4989EL(DLD!6MA:1X M>PA7?6_>%#9X[-<]/+/8\ASA-MO*ID*TNH?<#J9*$KC);0IS:U*;TH!*"#V3 MY[[:T6M+S;69UKX[H_AI:L1I$;_>?ZB\YMIF;(:CR$R6$.*2V^E)2'$@Z"@# MH@$=]'OWK4O1OYC+K_"D?@IK+ER,-4]\VQ$A$+F?!3(6%N!/NY$`#?[!6H^C M?S&77^%(_!34.DO)CY3R?F2NBE*5@-1F3TFLCRSIQ+L+F.Y==?!N8?\`$9D( M86&RWX6N)\,'OS.][_\`Y5\2UQ,1Q"?)O^033#CMJ6]<9JD>*@$`#7!`!.]< M0$DE1``)(%9X].?_`*D_^>_]/75P[,+9UMZHOQ%W`]VP%E82'I5;<\RYZX7Z\Y;>[?BTAY:[-'2U'3)?8*]MNN$MJ" M4E&@!K:MD[``*K6R:]NXS9C+^";K>&8[*W'E0RR7$)0G940MQ!42-G202='M MY;[U>6[?V5-_@K_RF@K_``KJRSF]J=N6,8EDDZ$T\8ZW-PFM.!*5$:7)!\E) M[ZUWKI-=0VT9E9<:NN.7ZU3[NEY45R4(RVE!I!6O:FGEZ(`\M;[CW'=4[Z(F M68Y8>FURBWR_VBVR5W9UQ+4R:VRM2"RR`H!2@=;!&_L-7)8LGQS-\NF1;4Y% MN8QOU>6U/C/\T!]]N0VI*2GV5:;WL[4-N:T%(H.5U"ZOV[`;C$BY#C]_0)CC MC<1YD1EHD<"D$I_7\DCVT_*"3W\O.I#^E%W_`+B9)]_;O_=51/IJ*2BY=/E+ M4$I2]+)).@!N/5UW?JK@ULM4N[ M'[+6'76%6YU#3,I#C;A0I*@MP(!!2>Q5_P#?M4;QGJVQD]RO M%OL>)9-)F6=X,3FSZFV65E2T\?;D`'NVL=M^7[*FF+QX2+6F;`AHABYD7!YM M!V/%<2DJ/T;/F=`;.R>Y)J@NAN1V/'^J?6'X>O-MMGCWH^%Z[*0SXG%^5RX\ MB-ZV-Z\MB@N1G-G$Y%:+/<\6R"V.71;C<>3($9Q@+0VIPI4MIY?$E*%:!'?1 MUV!(X-YZP0[/F,#%I^+Y&B]STA<:./4U!U)4I(/(2.(V4*\R#VJ2X]EMCR^] M7*'99,2Y,VD1W#,CN^(@.N!P\4J`T=)`V4DCVRDZT15&=9YL6W>E7@DRX26( MD1F"PIQ]]P-H0/&D=U*/8#]M!=LO,+I%BO2'<#RE3;*%.*#2X#BR`-GBA,DJ M4?H`!)\@*[V-WB-D&/VV\00M,6?&;E-)]`>X#?8>0'8=J#U5YY\8RXCC"9#\8JU^M8("TZ(/8D$>[7E7HI09 MHQ*YYA?@V`TX\R\PW&2\1[!0%$M$$\5Z.@-D=M>561F..9U9[ M"[/PS-+E/GQ-R#;[K%C/(F)3HEH*;:0M)(!`T>Y(&T[Y"G&R-=S]HJ:=2^OXU02SH7U4'4?$)AHG[P^K3$S,YV*1L2R5=_A,B1(B[A#@V0@@\S)X'LXCR/O_`&U& M_11PN%C&%2KBS=H-SN-U6V9?J,A+S4;@DE#)4DD%8#A*OM4`-@!2N=B"DH], M;/5+4$I396R23H`<(=!.VNKMB8S)K%L@@7C'[T^II,9JX1TJ1)+ATD-K96XD M]^VR0-[&]@@>CJ9U-@].HJ)E^LMY/DB.(KJXJ0K7MI# M_?M[1*.0">Y(T=?UTZSIC/+4U=+79[K%M;R5%J5,,<)<*5E!2$H=4L'8/RD@ M:'GY;E4N,Q,BO19C+3\9]"FW6G4!2'$*&BE0/8@@D$&LR89)7RXM!"G$K*CQ/DDCR&]]J]5RRR7;K`]=96)7\(80XX['0J(MY"$`$J MT'R%;&]!)*O9/;RW&[0A'4;.6\A\=N1B6/O+9M:$A2FYTT`!U-H4 M.7M!:@H=MV'=O[*F_P`%?^4T%?X5U99S>U.W+&,2R2=":>,=;FX36G`E*B-+ MD@^2D]]:[UUF<^XY9:,?NF,9!:Y5U\01GY*8RV"6VU.*!6T\O1T@]O/_`,.] M4SZ(F68Y8>FURBWR_P!HMLE=V=<2U,FMLK4@LL@*`4H'6P1O[#5S6+*,>S;+ M)<2U/1KFG'?5YC%8<4R27*M+H M9FHW";\)9*@!M4D!7="OD[\OV58L&%'@,J9ALI9:4ZX\4I\BMQ:EK5^TJ4HG M[36??1:_V^ZN?S-O\65060WU4MYL5_N#MAR)B199;,*1;7(J/6UN.J0EL-H" MR%A1<3K2NX[C>QORYCUZK`7:X3DYZ6['0X^ZAE"RO:@0TM2V_9/8%*EJ4"!O>OH&J,]-;YK+5_.FOP M'Z"=7+J@;;C*,AE85EAM"F4R/'91$>(:*>7-242"I*>/_5??J7U.A=. MF$R[]8[TY;5O)CMS8HCK;6XI)5Q"2\%CLE7?E7;P-IM_IUCK3[:'&G+ M5&0M"QM*@64@@@^8JH_36^:RU?SIK\!^@LVW9I<+C;XTV'A&2.19+27FE^-; MQR0H`I.C*V.Q'G7MPW+F,H=N["+;9MT=#C:[BR%H4&D@@IY;V"-:\Z[O3NYVO)[ M,,MM<$Q#>.ZRH^VZEI:VVU+`[(SAT7N5YL61Y#TPA7]=@%QD M\H=QG0%H>&DD?JV%<2AQYOPE`K5[(3H`J4DU;><_#/13%<=M_3*WV>3"F36[ M?ZM-CN+DR);@40ZIQ+B4J*@@`@@<=`#V=!(7I5*>DM)RK&,37E&)7ZY1O!D- M-RHP\`L-,J!3S`4CGR*RV.RC\HG7F1:V,MWQ%J;_`$GD6U^Y*TI?P='6TRCV M1M`YK45:5R]KV=C7LBOS+;#$RC&;G9+BD&+/CK84>(44$CLM(((Y).E`^X@& M@BO2R0[E72.TS#D5SD2[C&2X]<`&TO,O#V7$H!;"0$K2M(VD[`\SO=4_8LAS M&-Z0[V!Y)EUV^#2XX8CC*6$J<1P\5H+46AYH'%7$?+[#Z:Z7H;WY]JTY%AEU M\1FX6F67T,/O>VA*O8<;2V>Z0AQ&SKMR=[@$]Z]Z]7&]N]1$]1HS#)M%AO:+ M)#1(24K4]%/BJ*@/E-J<\8!05O2=$)-!L>YQ538+T=N5(AK<&@_'*0XCOO:> M0(_^H-4_THODG]$+CGN6YC,ZJ.MU:2\VE2D*YD$;(:8(20`05K[]^P6RYU"R*YQ8<_#. MG]SO%HD\E(F2IT>!XC?+27&VUJ*RE0]HNWB.?VC)+U<+&AN9;LAM MX*I5KG-!#S:=@!8*2I"TGDD@I41I23[Q4M0E*$)2A(2E(T`!H`5G?TNV9%A: MQ/.K'*]1O=MFF&AYIL9X<5*T3HDI/FD$:8B M1F(<5F+#9:8C,(2VTTT@)0VA(T$I`[`````4$2Q[J#;;CD?Z-76-+L64>%XP MML\)V\CB%%;3B"IMQ/=0[*Y>PO:1Q.O'U+ZG0NG3"9=^L=Z"QV2KN4@=O/RJMO3-B,QL1QW((H6Q>H5U0S'F-+*'&TJ;<6=$'S M"FD$'S!';6SOP^E3=_T@Z`XC>2QZN;C-AS/!YMZ%!<4K-; ME%MZYKN`Y8IE"/$*6A"<N)7/CM)=?A/M M*:>:!.CM*@`KB>Q*2H`D=^XW,JR]Z5-M?PS,\6ZD8Z@LSTOAB4L*XMN.(&VP ML)TH\T!Q"O:[H2!V[["\LSSRW8U=;=96V)%TR.Y!1AVJ'P\5:0"2M140E"/9 M/M*/N5H'BK46O/5JY8MCTBX9QA%SLCH;=5'+IC[\@RG%-Q6DI0I3:$E`)=VH`H^5H;WY"N+T@ZBVO`+G=6GYEYFV-]*2S M'3$;25.]N3B@72$$`<=))Y`@G7$"H6P<6,2^)6/6)CW>QB4FE:6Y?2I*TQU. M8TR3&*8("8DA+"PKU5??:D+!&M]M#W=_II_J)<,/OV2.76P&]0D MS)`1!5V"NQUW.M&SC;6).';2=T[_9QP]*1:-4UZAQW\AZ&LOX` MN*QBK<=+KL!<*6 MRZTPI2]EES:'D@[TE()2=#1VXH]_=&LCZLVF)T\1A^"6^=&A*85'=DW`H+G! M9)<`2"H$KY*V=C7(\0.VJYZ?Y$O%,RM5Y25^'&>'C)0D*4IH^RXD`D`DI*M; M/GJN5,O>V#>DQIOUCG^W2V-6,2MHY;^2]>F1B=+,MBXK/*7KA?9+H=DK);\) MIM2D1?9]H$N*#AUL$>(G9[5Q.MN/1<*F9)>([H$C)2EB(VV\I*V0H\Y:SL'8 M44I3V4!I]0UKL:HS?)WLASJY9"PMUA;TGQ(ZA[#C:$:#7D>R@E*>X/F*['6# M/1G]^A368S\2-&B(9##CO,!PDJ<4-:`[D)WYD(23KR$ZY>_6UO/K'^O_`'_/ MB$9Q:[$UCT\$#K5G1OYC+K_"D?@IK*=:LZ-_,9=?X4C\%->=)^3^WN2XUT4I M2L!J,J^G/_U)_P#/?^GJ;=>^C9R'>5X43;\LA#Q0F(`T9B@KERY`@I=&R0ON M3H`^XCN9QT0MN=/Q'LJRG*)ZXJ5(8!N?HZ8WC,*#H(/,>&PD)5L;V`#OOYU.Y.&3I5FEVR5FF2NL26O`4LIA!P M((*5`*$<'9!\_/ML$&@K#T*?FLNO\Z=_`8JU4VNRXKD5SOY5&@_#1APEMMLA M'C2?%="5DCNI:R^E))'D@$G6]1_"NDS.$6IVVXQEN2083KQD+;U"=VX4I23M M<8GR2GMO7:NFYT];FY!9[M?,B-$F>K".'>)2EQ2&F4;6G>TJ\TGR M]]!2_IH_VKT]_C2O\T>M'Y!9K?D-EEVF\Q6Y<"6CPW6G!L$>8(^@@@$$=P0" M.XJ"=1^D%LZA3XLG(;]?N,-2U168ZX[:&.?'D$GP>1^0GY2B>U2']%[O_?O) M/N+=_P"UH.AC\ZW-O.8Y$FMR9]GC1TRFT^;86E0;Y>X%0;)X[V`0?(@FFO1P M^=/K1_.A^/+JS\1P.-BEDND"U7B[F1<9:YK]QD+9=DEU82"=J;X?\([%)\S7 M,PCI7#PV_7.[6K(K^X_='Q(GHDF,M,I8*U;5^I"D]W%GV2GSH)9;;!#MM_NE MTA-,L+N+;*7T--)1S<0IPEQ1'RE$.`$GOI`[U075C_>XZ??]R8_&D5I2JOR/ MHW;\AS"#D]RR7(U7F`4>JO-JBH#(0LK2`D,:("E'Y6][T=B@FN8XS;LLLQM] MU90M*742&'"G:F7D':%I^@CR[>8)'D37VA9#:)K5V=C7".MBTOKC37>8#;#B M$)6M*E'M[(4.7?L=@Z(('&D8C=9$=UES/,H"'$E"BVW`0H`C7928H*3]H((] MUP^[9S;80 M6%=N.M[WVU57VOHE;K7F$G*8.5Y2U?I*G%/2B[%5SY_*!06"G7T#6AH:`T*Z M^3]-7LGMJH%XSG+W(:P4N-,.Q(X<2004K\*.GDD@GV3L?904)Z(+?@]6O?4MM%DM5^]+_`#B+?+9!N49% MI:<2U,CH>0E8;A@*`4"-Z)&_M-7?B6'V3#[$JTXQ#3;8JBI9+9*UE9_XRI?( MJ/EKEOR`\AJHG"Z11(F=NYBWE.2&_O)#;SY5$"74!*4\5(#`3KBA([`>6_/O M05C9'G_1]ZI+L\_PW,"RF25PG?'*1;UA0'M!:M`)"T)6HGVD!"M[245-?2WM M_KO1:X/\^/J,J/(U_P!K:PWK_P#)O_PJP\VP^T9KC#UBR)E4F,X`4N]DNM.` M:#J%`:2L;/NT=D$%)(/AQ+!&<=L@LCE\O%XL:8JH:8%T]7=;#:O=R2TE9`3M M(25%(2=:[#0?O1Z0S)Z480+1%;*FU!0"DM)2I.Q[PH$$>X@BN3UB=4 M](P:U14H>FS,DAO)9\0)6&6"7G7`D]R$I1W^CD/I`/,C=++]CD?U#I[G\^P6 M7Q''DP)4!FX)94M6REI3FE)0/^R2>^R2223)LW;[!]`J^J@G4[II`ZC0V85]N]W9M[3PD(BQ"PA(<"2D*Y*:4KR4KMR MU[7[-![ND+3;/2G#DLMH;2;/$60D:&U,I)/[222?M-2.[?V5-_@K_P`IKFX= MCWZ,62-:FKI/GQ(K3;$?UP,\FFT)XI2"VVC?8#NK9[>=?7*+*N_6I^`FZW"V MM/MJ:<7"\(+4E0T1M:%Z[;&QH]_IT0%+^A3\UEU_G3OX#%6O(@VK%KU>LHZUK,A"/+_A3WUY1W"NDS.$6IVVXQEN2083KQD+ M;U"=VX4I23M<8GR2GMO7:NFYT]1-R"SW6^Y'?;R;4\9$:),]63'\7B4I<4AI ME'):=[2H]TGR]^PF]9U]%K_;[JY_,V_Q95:`N<5Z9%4U'GR8#A\GHZ6RL=B/ M)Q"D^_?E[J@73[I-;\#NL^=9;_?W%W!Q+DU$MR.Z)"DE1!4?!Y#NM7DH;W^R M@L>J`]-;YK+5_.FOP'ZO^H)U.Z:0.HT-F%?;O=V;>T\)"(L0L(2'`DI"N2FE M*\E*[U^S0=OIY_L!C/\LC?A)JH/36^:RU?SIK\!^KDP_'QC%CB6IJY3IT M6(RB/'];#7)MM`XI2"VA&^VAL[/;]NX]U-Z9P>HT5J'?;S>6K),63%!#PNWRVQ):8?FQX8V5MQB_V)\])!<"`2=JXG6]*UY+5@\ZTV MN';K?F^2M0X;*([#?A0%<&T)"4C9BDG0`[DDU]\/P:+C5\O5Y-TNMVN=V\(2 M)%Q6VI20WRTE`0A`2GVO(#78:UJ@EM9B9R*-F?I"E) MY`A20D<5)4DCW[T-!%?2NP!4ZT,YW8G1#O=D"5/NI>+2ELI5M*DGR#B%'8UH MD$C9(2*]O1/+XO5F^1,BO4EB/>K%'5'C6=IX:"U)2'IVM!1"@L-A)Y!&CW)7 ML2.T=(&Y*()Z@Y)=LR5"XEF--5X<,*2?8<4R"?$6!R25+4KD%$$&N!E_HZV6 M;?&KSA%VEX?6M)4$@#02.YH+K1,CKG/0D/(,IE MM#SC0/M)0LK"5$?02VL#]TU]ZBV`87!PVW/-LR)=QN\%#1;8=D*;4V4*XD!8\ M5++RQO>U@^9!-T7#IZM_T?7L-6P7;D;7M2$R"?%G_P#QBKQ%'R5(]H[('?W" MI-F6$6W*[QB]QGC3]AG^O,D`[5I)TC8(T/$#2SV._#U[S4JH,G>B]=).8R<; ML7IGQ$E/92$KD%)!WVWVT=]KTB1+Q;K=T_SE]?A6 M1LM0I$A+:U^"$NK4YRTG7M-NJX@$D\%]NW>Z\%P:V8;-R.1;0%+O5P5/<4I" M0I`4!^JV/-"5%PI'N"R/M/8[CN""`01H M@@$$$4'N9<0\TAUE:7&EI"DK2=A0/<$'WBL]^ERZ]?XV)X-98YF7VY3_`%MM MEM8*D(0A:-K3YI2?$4>1[`-+)/8ZG*^GF3VMF)`PWJ)<;198R2AN%+MT>>6D M\B0A#JP%A"00E(45$``;T-5W\1P"TXW>KA?$N2[CD-P'&7=)S@4\ZG8(0`D) M0A(XI`"4CLE(]PH*/])C''L5RO!<[MD!Z3:+$8T:0PV0$L(8>"V@5=R`ODI/ M(C0*4^]0!TS#DL38C$J&\V_&?0EUIUI04AQ"AL*21V((((->6_6>WY!9Y5JO M41J9;Y2.#S#HV%#S'V@@@$$=P0"-$57:.F-_L41N!@&?W&Q6E*UK3"EP6+BE MKD=A#2G`%I0/H)5].][)"'^F8ZF5A>.V.*%OW>==T+C1&T%3CH2VX@\0!W/) MUL:\SR[>^N=Z5-H_1_H%B-F\?UCX.FQ(?C<.'B>'%>1RX[.MZWK9U]-7%CW3 MZW6[(ADEVE2[[E'A>"+G/*=LHX@%#+2`EMM/RCV3R_6+VH\COR=3>F4'J-'; MB7V]7EJW-NI?1#BF.A"7$I4GGR4TI>]+5V*M=_*@GM9B]*>;*S3,\6Z;XXHO M3B[ZS+2!R;94L<6RLIVI/!!<6K8[)6D]]U=TO#[I*BO1W<\RE+;R%-J+2(#: MP"-'BM,8*2?H(((\P:_<(Z=8SA3S\FR0"+E)3QDSY#JGI#Y[%14M1.N2@%$) MT">^NPH.DN\0)N3W#%I3;*WDVYJ8IIU25!]EU;K:AP/F$EL!7N_6)'OJA.O/ M0ZU6RU3LTP9Q5DN%K1ZXN+'5P:44KY%QL\AX2TC9`3V/%(2D'N;CR/IY!O>7 MLY.+E=+=>H\9J+'DP74I+:$K<4H%*TJ0L+\0;"DGY`UKON.S.EE[R-E4#/\` M/;C?;'XR'O@^-!9@)=*%;"75M@J6C[!Q[@$$$#096_Z0?4_^\W_Z$7_3I6U? MBXP?^YN-_P#*V/RTH(DY\PCG[I_J:R7;H[4J8VR_,8A-JWM]\+*$:!/<(2I7 M?R[`^?T=ZUHY\PCG[I_J:R%6WT7Y=OEFY[BA-/@^Q_7&)_X+I_IT^#[']<8G M_@NG^G4+I6CU<_E*IM^T)I\'V/ZXQ/\`P73_`$Z?!]C^N,3_`,%T_P!.H72G M5S^4FW[0FGP?8_KC$_\`!=/].GP?8_KC$_\`!=/].H72G5S^4FW[0FGP?8_K MC$_\%T_TZ?!]C^N,3_P73_3J%TIU<_E)M^T/?>HL>)-XQ)\*X]B.Y.ZT[T;^8RZ_PI'X*:RG6K.C?S&77^%(_!35+I*-,']K.3 M\R5T4I2L!J%*4H%*4H%*4H%*4H%*4H%*4H%>.[VV)>+<]`N+9>AO@)=:YJ2' M$[!*5<2-I.M%)[*!((()!]E*#Y1(S$.*S%ALM,1F$);:::0$H;0D:"4@=@`` M``*^M*4"E*4"E*4"E*4"E*4"E*4"E*4"E*4"E*4"E*4"E*4"E*4"E*4"E*4" ME*4"E*4"E*4"E*4"E*4"E*4"E*4"E*4"E*4%4.?,(Y^Z?ZFLA5LK%G;'<.FL M:SW:ZQ8P[R-FWUG"^_C?EK2R6;I@5F+>JIF M<"V+,3#)=*UI\7/3;ZSA??QORT^+GIM]9POOXWY:N]YX7*5;L5^;)=*UI\7/ M3;ZSA??QORT^+GIM]9POOXWY:=YX7*3L5^;)=*UI\7/3;ZSA??QORT^+GIM] M9POOXWY:=YX7*3L5^;)=*UI\7/3;ZSA??QORT^+GIM]9POOXWY:=YX7*3L5^ M;)=:LZ-_,9=?X4C\%->CXN>FWUG"^_C?EKOM-XSCN#WBUV:[PW$.L/*0V9+1 M5R+?'BD)U]`[:JIG,Y3'P]FKOE\O;"MK*P:4I66NE*4H%*4H%*4H%*4H%*4H M%*4H%*4H%*4H%*4H%*4H%*4H%*4H%*4H%*4H%*4H%*4H%*4H%*4H%*4H%*4H M%*4H%*4H%*4H%*4H%*4H%*4H%*4H%*4H%*4H%*4H,_TI2@4I2@4I2@4I2@4I M2@4I2@T!2E*!2E*!2E*!2E*!2E*!2E*!2E*!2E*!2E*!2E*!2E*!2E*!2E*! M2E*!2E*!2E*!2E*!2E*!2E*!2E*!2E*!2E*!2E*!2E*!2E*!2E*!2E*!2E*! +2E*!2E*!2E*#_]D_ ` end GRAPHIC 23 img003.jpg GRAPHIC begin 644 img003.jpg M_]C_X``02D9)1@`!`0```0`!``#_VP!#``8$!08%!`8&!08'!P8("A`*"@D) M"A0.#PP0%Q08&!<4%A8:'24?&ALC'!86("P@(R8G*2HI&1\M,"TH,"4H*2C_ MVP!#`0<'!PH("A,*"A,H&A8:*"@H*"@H*"@H*"@H*"@H*"@H*"@H*"@H*"@H M*"@H*"@H*"@H*"@H*"@H*"@H*"@H*"C_P``1"`"B`94#`2(``A$!`Q$!_\0` M'``!``$%`0$```````````````@5V`K5B^!7*M/1519MV+%+CU/D/5>LKVQL+G.#6MY.2N5FJ*>>>DN\H)J7T9[JCDZM)P=Q'A\>JS ME;)X7&;>\<];>2Y^YU#;!U<>'R?`^`6O=610U[C;J=C61D#OI!N+_AX@>O4_ M@E;55%Q,40)=L9DQL'VCYX\0%[T]L9]7-K*R9U,QK3)+N&,-'7KT7GMRRNIY M=-=?-8CC451$\]V[#_77HH5OVL:^_5\L MM#45-#9VOSBII:$PUCMN):B$^[SR'8YZ9'Q5;FQEQH9/J]D#YG#'>N'+ M!GP.,Y7G^.:]KWN_+0=_/#,ZKAI&/Z+2/9%"^3OZD&%C,ME9RU[O('IPM5/J*TVV$5@YSA;<]J^GPX@-KW^K81_,KV8\?)E/3CE9$A95T=QE%'M7VJZ?BR(FUU M0/`Q1;?_`)B%JZGMAI!DTUKF?@\"68,S^`*LXL[]++OTE9%`5Y[5=0U,IIVOE#>F_HX@>604SXLL)VJ MNB1$7,$1$!$1`1$0$1$!$1`1$0$1$%,I&T]PB9WE2/8J.??5L:<[\`$ M1D>9);PM)4RFLNSWP-]^IVLC:X\MP/''0*VYVV:UV.BAJ)&RU4]P=45+FD@. M\<]/+/$J]I>K(M' MZ7EN&PRU;5\C*A_<4ENA;)6U#VP4T/@YYZ`^@SD^07U/H'3=/I32U'::7GN MANED\9)7?BP?2;IW#5ETC<#('1VZ*1O,HM56BP-#;E5L9.[[%.SWYG_!@Y(]>@\2%P5PUUJBZ2NATQINJA M@=[K*FHA<7'U\&#YDJ4H:*EIW3.@IH8G3/[R4L8&E[_O.QU/'4J^9[(F.>]S M&,:"2YQP!X]5QED\ZVS*@2JT%K6\MC%S`=&P[FQU%0PL8?-K&D@=?`+`_0AM M)\VVEDRT?J290W/GG;A9VN>U2LNTTM)IJ22DM;2&^V#B6H\]N?LL\CR M3Z!1_;J>2>XT]%;X'S5M4\AD+.2\^+B?XN)^*],F=F[=?Z:QRM^DBOT!3Q%S MFW.6HA!&)(V-PX>)'/Y+;5?9G;*7V:22[R&"HD[L2&/#03]D9W>)X^:].S[1 MK;(U]9=JQQNLL;C"R%Y[J,#A[?WG9X(/R74VJ""Z6*Y4-Q$;*:0M=RXC8YW3 MD^1`(7CSYL\\&<^]CE9^%TG)EIC:*_\#]'G_O6;_=#^JH>QZC.,7:H;ZMB:#^94 MJX3"OR9?J;18>QJV2POCEN]S;N!!=#W;7?FTJ0[#::2QVJDMUOC[NEIHQ%&W M.3@>9\3X_-;!%FVY>Z;HB(H@B(@(B("(B`B(@(B("(B`A.$1`"(J'HI13.45 M%5?!!Q6MZUWUA(UN',I(00/WW'^F%V-(R&VV^.(N#8H8^7 MNX&`.23\LE5P';IK&>IF_1.T3OB:6CZSG8 M.K2.(&GP)'+CX#`\5SX<;GG6\O\`K-.+U[J@ZSU8:Z-X-HHPZ*W@9Q(W/O3$ M?O'IZ`>:]M`Z/EUQ=W-DVMT_22!M9)D[IWXSW+/E@N/@#YE8.D]-5^JKNRU6 MO]33QM!JZH1Y;`P_L@??=@@>7!Z!?3^G[/16*STUMME.(*2G8&,8/3Q)\2>I M/CE>[/DZ8]P0=$)7E84<<`E?/_ M`&RZZ??*^ITQ99L6N`F*Y3M..]?G_(M/D.-Q'7./-=-VQZ]EMS7:>L$VVYSL MW5-2W#O9(C_][AG'D!GR4)T-!)+54=FLE.9;A4NVTT+G9R`>7./D.I=\?$KT M>D=-'_`*Q_DWIQXY"^CM!Z(H-)T3A` MXU%PF`-162#WY#Y#[K!X-'YJ_L]T=2Z0LS:>+$U;-B2KJBW#I9,<_!HZ`>`] M22>K`QG`*QR.[&>.5CQL%+=J M.AJ/L5,+7RD?M/YQCRP0/Q6;J2$W&H-"^0,9M&V/H9GD.P<_=&"3\%@WILXK M=-D[7UL0,1-)`,DA\AQ@=2>!T*LN MU=<=2:A?<;AW/UE6N$3-[L0TT8R6LW>#1XD=22I7[.[SI#1U%44;ZX2U,A$L M]:()'NF?TP2UIP!X#/`^*]4QG#/$W:ZXWKCNI"T)I.CT?964%&XRR$[ZBI>` M'SR>+W?D`/``#P72+A).U'3#3EM542#]VGM*;1ME;.]IFKZHF&BIP,]Y+C(SY-'4GP'J<+3O[7K" M,?XM<3TY[MG_`%J&]:WZ?4NJJJYS%X@:T4])"3_DXNIR.FXD9./0>"ZKJII*RYUDH=)(![\\KC@!H\SP`!T&`OH/LFT$=-T)N%W;')?J MIH[P@APIF>$3#Y>9\23Z*&-$7"ELFIVWFOI'5KJ:(MI8MVP,>[ASR<'G;P,# MQ*DQG;(TDMBL63Y>U_\`Z+IRS+*=^/#CT(W1@%>>\>4GESZUO\`O#4:[G$; MW.%-"'.<[I&<8V@>1#LY]2L&JB]GN-!'22RO%)''##(X[G.SRXD^/&%J+%=- M04HJKA46"G<^JD#7SR5S,D[0-H`!^ZJV1^H(.XF%LMKOU_=0B2MDX<.W[=)X23;XI6=^Z5K&A\I+6MXPT<#/J>3\UFK#H'U;X&&MCACE\6P MO+V_B6C^"S%WGAR$1%01$0$1$!$1`1$0$1$!$1`1$0$1$!"<(AY0`K0,95RH M[HI?0M"JB+(N'1%0=%5:@(B*@B(@(BLED;%$^1[@UC`7.<3@`#Q07$X/0JQ\ M\<<;I)'M8QH)+G$``#J*L-;F"-CW,BSTRW:&,^>WXE=L>&V;I/-3?>>TK35OC>(ZMU?* MWCNJ1F_/]XX;_P`2X:]]KM=+$6V2VPT_.#+4/[PX\MK=H!]=Q^"LL79'7U#X MY;Y7P4D).704S0]^/`;C[K2/'AR[ZS=GNFK2XU'L(J)PT@R5;N\P//:?='Q` M"U_Q8_W6M8S[0W)>]5ZUWQ1S5U72@ELK*5NR$?NO+1M_VB5S=DHY[Q7MHK/` MZJJB"[9"W(#02,D]`,@C)(!QPI3O]^N7:#7RZ:T(X4]C@<8KA>6MQ&,`9BBQ M]K@D''X@D;3I&S,H+5!M;UEE>,R3.^\\^)\/A@*_),9Z\K_'\0Q1=F M&J:IQ;-0Q48^]/4,Q_P;C^2SY.R*^1T[WRU%O";0N5 MYL]>$F5](&M79@^Z0![;VRG<'EG-(Z0''[VYO/HNFH^QJV,C`JKG722?M.B# M(P?D0[^*D>HEIK>TRO:(HW.+GR!N`#YNQ_%7SUM/!1/JY)HVTS(^],A=[H:! MDG/ECE9G)G^G:OG;M6LMITW6VJU65\\UQD+IZE\TN\QP@X'``&7.)`_LE:G0 MFF)]8ZC%$R0Q6^BVRULV/M`D%L33]YV#GR`/SU5TNM3J?4%5>`SO:^[3".C@ M'VMGV8H_PY/Q)7T%HJUQ:)TY';A`Y[F,$T]06D=]4.^V2<=.@!\EZ>3E^+"2 M^UF[&]I=(Z>IV,[JQVP%H&'&F87?B1G/Q6W+8*:+.(X8HQZ`-'\EI);Q515[ M72Q[*3;@,(]]SO//E\EHZV62H8_VN0S,+^\+'\M'/0#T7SKSXV^5F.5=E7UM M/14;IYY`V/&0?O>@7(UWM$MMI9ZJ3945CA.8W?LG```'A@8SZE;&YLH.YC[R M6>H=]D!K@3CR)Z#^*\*&FGO,LTSW!C&?J\M'0?<&?S*Y\FL_$7'QYJQT9K*R MFI*)A;21O]T?=)SN<[UY.%T-NMAI26N+.ZC)$#6D^XT^>?'KRK8K:Z&Y0RP3 M=W21Q[/9P/M/S]HGT"VJZX<>O-9RR\:BC1@8541=6!$1`1$0$1$!$1`1$0$1 M$!$1`1$0$1$!%K=0WBGL-GK+G6MD-)21F68QMW%K!U./'`Y7/Z<[1;)J*\QV MRTNJ):I\)J2'1%H;&"!N))\W`?-:F-LW#3LD*P+M<6VRVU5=/&]\--&Z5XC& M7;0,DXSY`KF].]HEFU'=XK;:1435#X34$EFUK8P0-Q.?,@?-3K;-Q=.Q16M. M1E5RN:+PBHWHJE:@(J9*9*IM5%3*$H,*]W.CLUMJ+A)7SOJ_7-VUC5BAI6U5-;9W&*&@@;NFJSX*3NSC05%I2CCGE;'47N9O^,UA:-QR MU]M:GNN+TGV1U54&U&J)_9H=X>RAI'\EHZ"1^, MCU:WD?>4MV2RT%DI?9K720TL!=N+8F@9/F?$GU.2MB.%5) MTL\C8XF`N<]Y`:T`9))/0*/;FV\:^DDI:"2:TZ3?[LM8,LJ:X#JV(8]R-PXW MGDCH,'*D&IIXJF/9.P/9D$M<,@X.?X@?@O0#&5G>D:[3]EM^G[9!;K/214=# M"W#(HQ@#U]3ZGDK9*A*9/CA!5$RJ906SQMFB='(UKV.&"UPR"/51%VY5S+'I M6KM_?]Y6:@F;21Q@;=L``[P8\?V<'EV.:?=*F#X+*!%1C'NNJ'-P[& M?N,/_&IA=4W&2=U&\E\S1N601MC+Y)'8SA@'H/0>:QSXWDS\7PZ7+5 MU^-6^DJ'3,;(QQFD#B27YX'4D],>7FJ24LD4D$;097S9VAH/XE:@=INFV.DJ M)+?<=DV&ND,;7,=MS@`;STYX`4@6"YT-YMD-PMDS9Z6=N6R-&,XXP1X$$$8\ M%QO^+9-VGR5HZ"RSU)_7`P1@X.X9:.W7&EK7R543I8GPL8YA#3@C)<#GD>"U/^&"Q9 M(]CN7^[C_P"M=YQY6;D22U)**,*WMBM+:8BCH:Z2K>YL<+)&L:USW.#6Y(<< M#)Y4FL<7#G&5+C@;:'3B$.CC^*]'%=87?IJ7QI M)FH>TZSW'3]THHJ:X,EJ:66%G>,CQES'`='],E<1]'J`TW:`(7BDG4W9]IJATY=ZNEH)&3P4DTD;O:ICAP82#@N\PHT^CG--4:YBDG.9'V) M[G'IDF6%:PN/QY=3'QN/I`G'5?,'Z4774^KM35%FN5RCI(1)4QP15LC6BGB` M89`,X&XM#L?EU4M=NVHA8M$ST\,SH:ZZ'V."1IP8PX'O'^FUFXY\R%Q/9C%7 MZ6LM08-)5=P?7X>:@9:'P[`&,'N'C`SZEQ7+BQZX]J8NI["-2_6MAJ[;5U,D M];12F1LTTSI'S0R$N8[+N>#EOR'FI/JX6U%-)"YSVM>-I,;RQP^!'(/J%\MV MB>;L\UO25KZ*>AI/LKZD9()8PZ-S2QPR'#D$*\V.L MNT]4SFGR_P!E%1J+6#WT,>H+E%-2TC:ATLM5*0_+BT#&[KQU/_\`-_KK]*-" M"AK6ZBFJ9)GNC8._>_#@TN]YCCAS3@\KE>Q&T2ZCK9;;!6/H7TU(V=TS&EW> M!TA&WAPX&/'*NGIHFZ];8M:SRQ4T=2::H=')[[F.SW3\\EL;LMSCID\KOJ=] M_P!-23Q$VW*[2:@[&ZR\XDIJB>S25;3$]S#$\1%P(((.-PR/0+B_H_5M9=KQ M=IKI7W"JEAI*4Q]_5/>&[^\W<$D<[6^:DK6M+#1=FVH*6EB;#3PVBHCCC8,! MK1"0`/X*'>P>]6^P55UJ+O4LIF5%-2,B+LG<6B0NX`]0N7'YQRU&9/;OM2]G M535]J5GUA;IHRR![?:Z25VW/ZMT8DC(!]X-=RT\':LGM;UR_2%KIZ>B,'UK6 M%PB[T99#&T$NE=CKC@`>?IE;2I[3-*4\3I);M&&-!<<12$X`R>`U1C](.SR7 MBELFIX"_ZO-*ZGF(:TF23S9%MET=JK6ENCO5;7N_ M7CO*=U;,[>YIY#@UHQ&T]0`!\//QLFO;_H[4HM&II)):"&=D-7[2XO?`'GW) M62?M,P02#GH<8(PNYT3VCVB/3M+#>9A15E/$R)\8CVU=33"KWVZ=\4CAM):71NX\B'C/[RW%VU30GZ/\=QC:)?:*!E M)'&'$XJ3^KQD\G:\$G^P5U?:A8IK]V=W:W4K`ZM[GO:;CGO8R'LQ\2T#YX7S M:RX5%ST=9].T`VQU%<)Z=N"7=]+P0?0;G'XK.$F>'_E9F.W2]FUWGMO:'87W M:IEE@J&/HLS/)#)7M&QW)ZG&T?V_59G;75U-U[5[?8;%5.@JI((J*>2,=)97 MD@GG]B,;_@Y97;/IP6"ZZ4J:1KQ;8X&4&\G);-"0^`D^)(#^?-OP5_9/:OTH M[5KQJNN:T"BQ(UK1[O?RMVYYSPUC2//W@M[G_P!?R&I;N?3O.VRDCH.R6M;3 M@L=0-I_9W@\L(D8P?/!(^:C+2-H^OZ">HJ]24MM?#4.@;'52X+\`'<`7#@[L M?)2MV\8=V4WT'@%L/_.8HP[.J#35;9JJ35U:ZFJV5CFP;92S?%M9M.,'QW+' M%_TVD^ZV;.S=UZAJ8+1JJ@KYH3'(YD9+FCWL@.<''&=I6[[M[*H,>^%SM[BYH M(&W@!7/+ERQRF7XO9K=+4DMOTW::2H88Y8*2*)["02U MP8`1D=>0H:^DHZGK:RRQ458R2YT?>,FHVZZ'56J:>J[(Z M?2C;8(9*:&!G?-<"P")S3O:,9YP1SCJ]Q<"]_W1D#/C@X7GVDZBTI>=&/H:"@>^NE9^H?'"(#2RCH7.X^;6Y!&0 MH_L]7#;]0V^Y:AAFK;=10DOIVG:7$#W3M=PYHY]W('3JNVNTUK_3.6*/`&QKF@ M@8''`/@LXKR7VYOG[Z1H+M9Z8#>IHJH#X[HUBZ9GT5#IZWLU);ZRHO'=CVJ6 M-[VA\GB]`V.YW2CDEK:BF#Y7BI ME;N=D\X#L#Y+OXG%+DU-]=K--:0!GGP7/=M. MK6Z6T?*(7@7*X$TE)S]ES@BD+Z.6H8:[2TUH:&,-N?OBQUDAE)>UQ]02YI^`7+= ME-NU#IRTNJ=.V1M52W%D3F35#AQ$T$-:!N!QR3SUSE<_3S579EKREKZZC]F: M>\DFI(L8]ED>=VSD\,=@@T&86VB:'XYP>\)_,?DIE?,TU3W!ONL[DC<[H&Y/ M`R2.I7'_`$CB1>]&``GFL/`S^S&G%C<YW/>/`Z@\$,SX9 M.3TLT7H:74G9Q4W05,?UI6L>ZW;FY93M:[#6N^\26G/@`<`#G-G83JR2W7)^ MF;F!3P2RO%+&\G,%0,]Y`3Y$@EHZ9#AY+=DZY=/]K)[3U$P1MVM``^"Y7M0U M0_1>BZZ_14K:LTKHP87.V[M\C69S@\C=GY+K&DGJ,*,?I(\]CE]!\7TW_P!1 M&N&,WE(D=%V7ZIDUCI9MXEI64G>3RQMB;(7X#'EN22!R<+JY"=CMF"['&5#7 M8=J.TV#L^IZ&[5T5/5-J)WF,@Y#72.(/`\BI)LNJK3?:^IH[36QU,U,QLDH8 M'>X'9`SD=3@J\F-F5U/"WPY7LL[0*C6UPO5/-014@MI8USF2E_>.<^1N1D#` M_5]/52/X%?.G8'=:&PWK5\UUJ&4T-5,P1.?GWBR6?H^D:8;?(V"X3=VV"H,D<+K9C)-_9I*XGJXS%*^GVAY8>K1N:X8(XZ+E]+=F5LTS?(KK;J^Y&HCA=`62NB+'QG'NG$8 M/4`\$=%V%TN(H0P=T]Y?G!`]T?$^"U9OLVW`BB#L^9*S>68^&\=WTS[Y;1>+ M156Z2>:GBJ(S&^2$MWAI'.-P(YZ=%RVF>S.TZ:N]-<;767%DL,1@(=(PMDC. M/<<-O3(!XQT"VLEXJW#AS6GR:T'^:\A4U\IR)*CX`$+/SZ\1J8Y8_;`UUV<6 MS6=6R:[UER#(X'01Q0S-:Q@</0G/0`+L8FP4L,40/S*I]35KAG:T?VG+GESY7QI.N_=8FL]&Z>U5@LM/751@AA[ADKI'.E:W&![^.H'0 MJZ.R5'B^-OS*]6V$Y_[0!\&?_E:G+R6:D7K->:Y71^D=,Z0N8J[,^N#S3^S/ M$DFYKV@Y!<".N<\^I5FHM)Z6OM_FNUUIZZHJI:<4SAWNUFP>``((SGS79QZ? MB'VIWN_N@+U;8:4')?*[T)']%;ERTRRQ]N9JH:2HTH^P3.KI*1\/L[I759,S MV'J"_&22./@N=&B-.1-#8;=+L'0&JDX^'*DUMFI!^RXCR+CA7BU47'ZAO'Q5 MEYI]I,I/2+*K1&GJBEE@?;7EDK"QQ]JD)&?(9PNLIJZ2FM45O+8'PQPB#$@S MO:&[><]WO*UQ(QQ(_(^8*Y6@[/;7034))LM< M.AZX4O[?4IM"8X98^LCY/Z1Q?M+_`*1L@AN5-53102=\V,R/C;O\STR>3^*O ML&C_`*A%5]5TLT/M)!D:9R]KB.`<.: M\V\T5?2R24KG!QC$^P$CIDM/3T6H'9K1#I:W`?\`Q;_^M2GA,+6,RQFIE='R M5%E3V76VIIG1.M[X\X.YM4\D$'(ZN(Z@+IY;/722.>Z(%SNN7C^9*ZW")EAW MFLJ?+8Y#ZEK?]2P8Z$.&5BUVDS<3BXT--4`-VM=(&NM&17IH;&XQ@%K MAX*0\!4QZK5QN]]J?+8Y"GL];2T5-2P0R=Q3QB*-O??9:T8`R7$GYE>S:6Z, MQALS?A(/ZKJL*A&5CXOO9\E1M?M)TMXN+*RZT%555$49C8YTDV&@G)P`['/C MQRLVPT-18K9';K3#6T]%$3W<9:^3:""0,]!GQ7=[!E5VA:ZY7QVIWRL:UIZX`=C)\\94A[4 M#<>)3IG/623*2[TY2W5C;70045+2-CI:>,11,[QSBUH&`,G)X'FM7>K;I_45 M9#5WZTFHGAB=$QS9WX:TD$C`('S]%WSHVNZ@?@K'T\3VX>QI'J,IKDGK([>= MN4--9)-/&R24\WU8Z'N3`9G_`&.FW<';L8]5X0:2?:S*?MN`LTV:A/^AQ\''^J\C8ZMFM5%9Z$4=MIV4],UQ<(V<`$\G`\`M2[1.FWS/E- MGI.]?*9W2!GO%^0=V>N<@+9BW3,XBKIQZ'!5X@K&?9JHY/22/^8*=LOM/7JL M]G#<8PM1J73]NU+;G6^]4YJ:%SFO?%WCF!Q:EV@!MJ8`./\`+2?]2R;)HVS6.KK* MFU49IY*MC8YL2N.YK22.I./M%=$QX"I=*\N!V;/O=-N1CHND:,#"J`BC.]^Q$1!0C/ M497@^CIGG+Z:%QZ\L!60BSUB[>;(HXP!'&UH'0`85^%5%=0VHJ'X*Y#RJBQ5 M'5",(LVB[A%155EV"(BH(B("(B`B(@(B("(B`B(@(B("(B`B(@(B("(B`B(@ M(B("(B`A1$%/D@`\@JH@(B("(B`B(@(B("(B`B(@(B("%$6:+2KD1,01$6@1 M$0$1$!$1`1$0$1$%!U541`1$0$1$!$1`/16Y1$2KAT1$0$1$41$0$1$!$1`1 ..$0$1$!$1`1$0$1$'_]D_ ` end GRAPHIC 24 img004.jpg GRAPHIC begin 644 img004.jpg M_]C_X``02D9)1@`!`0```0`!``#_VP!#``8$!08%!`8&!08'!P8("A`*"@D) M"A0.#PP0%Q08&!<4%A8:'24?&ALC'!86("P@(R8G*2HI&1\M,"TH,"4H*2C_ MVP!#`0<'!PH("A,*"A,H&A8:*"@H*"@H*"@H*"@H*"@H*"@H*"@H*"@H*"@H M*"@H*"@H*"@H*"@H*"@H*"@H*"@H*"C_P``1"`!/!'X#`2(``A$!`Q$!_\0` M&P```@(#`0```````````````@,!!``%!@?_Q`!+$``!`P,#`@0"!P4$!0H' M```!`@,1``0A!1(Q05$&$R)A%'$'(S*!D;'1%4)2H<$6)&+A,T-R+-3""0ML^Y37.)0-P),4X)QTJ^''\9VND'C#4$IDHMU'_ M`&"/R-/8\97)`#MNT5'J"H?K7*=LTQ*DG*-4E(4JT=`ZPH5PZ05&9@]NU.`@=Z>AP^SRKOD^+[0+`+=P)&,33D^++ M$GU+=3\V_P#.O/TI!]?:L41NCCWI[;@>H])9\4:>H3YY$=TF/RIB/$NGD@?% MMC_:)']*\S;402(QWJ%A4C,II[;@GF]2'B"Q!GXU@_\`?`_.K#&LVST^7<,J MCLL'^M>3N)2LX,"*@92"%1TK-_J\?U9S>PLZ@AS[*PKMM-,^*($J,`\3BO%T MI*5$<9YHBXX@'RW5#N`2*S[7\K7E'LZ;N<`_AFL^,$Q)FO%47-VAA?TU[0+L1]HT?QH[UXNG7M3;;&V]?)'\1W?G5FV\2 MZNG`N)Q)W(03_P#;4]#E]#V`78(YHOC1U->1I\5:J%>IY!'8M)_H*8CQ=J8' MJ+"C_NXK/H\R/6!>@F)HOBQWKR8>,=02?4VPJ>/21_6K#7C.\X]8+I)/->'+\7IW/Q`]JP7*3,UQ M[?B;35)!^-09[I4(_E5D:W8J2"+VWSQ+B0?PK/AS_#IU`N$GK4^<#7-)U:W* M1%RP?_$%,:U1E8E#[1@]%BIX\OPZ='YHK/-%:--\E?"TGY&C38.XK4*N21R!6?$[<$YIV=-QNK-U:H7/'J''>B%P2<*'XU-,C9[JS M=6N%S/!_&I^(Q,@#W,4TQL-U9NJ@+GU`$BI-R!U%7LQ>"I-%-41 M#4VI8O36"J?Q%9\1]U)R1K*8L5E5_/' M<5/FXFJ8>:R:KE_O6><.]9NZ8L5E5_.]ZGS.LUHP^LI`=GK6>8:&'S635?S< M3-9YM9[,6)K)JOYP[UGFCO3LQ8FLFJ_G#O6><.].S%B:R:J)?$X-'YP/6G9B MQ-9-5B[CFA\W$S3R:Q:)J-U5?B*D/34\M,6=QK-U52_`/%!\13:OBN[JS=5/ MS\30JN,8J]GBO;JPKBM?\1FL-Q'-33Q7_,K/,%:Y5QGFH\\U+:>+9>8*@N"* MUWQ'O2SU9YJ:U?Q0[UAN@.M/*F-FIT1(I?Q%:URZ$8-+-QZ> M:FF-L7P:`OB>:U1N8Y,_=4&Y''7Y4Z/%MO/'>L^(^=:CSST4/QJ/B?\`$/QH M8W'GCO4%\0N==U:V1A=PTGKE8H%ZQ:(C=>6XGCZT4\>5^FNG2*N<,;4J$-/GY@?K6O2Y'3MQ_%8YK/BA_$:\^<\7.*DMVX`'\2R?RJ MLKQ7>$2VTPF?X@I4_P`ZUZ'-G9'HYN:\V5K^HK21\3]X0D?TI+FK:BI.+ MIS[C5]MR_3SCTSXHSS4?%QS7EJ]1O5`I7=OQ_MD?UI2KRXC+[A!YE9I[6_J^ M<>J_&@\*3^-0[=>6)4K:.YQ7E?FN%:9<5MYYJ6R8(.8/-:G]7]J><>F+U-@" M2\V`.25"DJUJS2)-PU'LJO/#Z>L`\Q2W!G:.N?OK7M>/ZGJ._<\16"1)N$C, MQH%F7#U%/;<9]M3F[U[Q99MB073[>6155 M?C&V_<:?43T@"/YUQJCNC$10$)&!S3T.,/-UJ_&K8,"S?)[E0'ZT+OC)6T>5 M9DD\R[_^M`YZUHS%9G^K4@D`;9^51DJS$TQH)`*N4BH<0`=PYI9^,E M+(#BCTB@7*4#/)ZTS:3R1$TM\`@)2"0#6:UBV@%+30!,!(_*L)A0`R.M3;D? M#I3R`D1/RH$IDDDQ75F?!X6>.G05&^#C[5"@E68BIQ/2:0MQ90N4Q%,VR0.X MI#9QCFFH4H+3/2M,T](&?EFA085B@4["@1P33`0%28K4NL68))G*AZJ(3F1$ MTH*))[=Z9OX'/2J@VC)C(%&F%#VFE@Y@XJ$DYZ9K6LXJ8@RI0`Z42T^O'3I09G'/M6;CD\FLVK@^E"@>E<\FA0I1)FF&!SS44@ M`IQ0%1DQ3E*YD<4B)5(FI?@GRC;"3.2::DA((@[L4)$D*[=*Q2RI)/%.*\D' MFA*ANCFI6KTCOWI))29C-9K4,W2J#4A0.*4.M8E<'`GWHU9IR/2H1F3FI=44 MDQ2]V<9/Y5F],B3S5WZ9$E6]N9-85&`D5`(X3P.U$.`:>(D=(R:8E"$[I.3R M:5,*$4:E`P",'I5P2A4(C)/O4A0/<10*DE)^R!T%2(W1.",TLUB7#/,[J,]* MA"3[0>:$QMA0@QS0A7J&3^-3(V:I`(V]NX%8TZXT2E#BTS_#@5"U>HYQ2\R= MIQ4O_!91=W*52+E]/R7'Y59&JZB$F+ZZ3'0.J_6M<24R,&*`.$G:9S3)^#:? MMK5,1?W'_FJQ^W=1+>WXQPJF9(!/Y5HEK4E7IDBFE9(3`R3%2<)^#U$'NA)_I5E'BC5`L0^DCL6T_I7/J"A&ZF;?7()^57TY^);8W[GB_4TF99 MD<^BFH\:ZB`-S5MM/=*L_P`ZY=U6Y7I$]Z;A:0"!BIZ7$VNL/C&]#9EIA7MG M]:Q'C.Y3!++6>@D5R:5#.854**CUFGI=*$B!/2*$+E/SYJ7^'@LMKT$>.+#;ZVKI*^P2DC\9H5^.+!*0=MQ$Q]E/ M_JKSMP&#L/%"J=@(^U'XUCT.#>O31XSTW:3-Q@9^K'ZUC7C+353*WA\VS7F0 M)B.9YJ4Q$H$"GH<#R>GCQCIH3/FKCW21_2B1XQTLY53U@>)]._ZVU^)_2C;\1:>XL)3>,2>ZP/SBO(DS!FL*R!C-/;<5 M>QG7+$6T?[X&O&PH\'/O3$N=L1_.GMY^CV+]KVB4R;Q M@#_>)_6I3K%FK_GC/_$3^M>+NKW+XQ4)="$>K!B!%3T)^CVC]L68,&\9!_WB M?UHQJK'";EH]O6G]:\0:=6M04LP8(S5GS8@%7JI[>?I;CVC]I-'AYD?^**PZ MFR.7T3[*!KQE:REHE"H51MN*V;BHY3WJ^WGZGD]D&IVY1'Q"/QJ%:JP.'VS\ MC7C(N(!*E&!CFGL+!7,P12?UI?L\GKG[38*MH?;FB@:\<6 MM27R0HD[H(IA62A1!(SWJ^UGZ>3V`:FPK"7VY]U`5AU%I(R\U_Q!7DC9)B.@ MH'%JD`D[2:>UGZDY:]<.IVS>%7+4GIO'ZT*M7M4_:NF!V^L&?YUY&(G"CGI3 M%**6TP3`/%/:S]7R>KJUBTR/C+>?=U(_K0?MBU"?_F[2?RKRMQ\E,[B! MR3-1YQ4$*(Q-3VW$\GJ'[?LL_P!Z:QSZJASQ#9("9NFY/N?TKS#<4D@"C6N4 MCG<.]:]KQ2\L>C_VBL)GXE$_?^E3_:.Q_P"GGY)->;-K/ERH=>E/+B0)B`.8 MI/ZO%/.N^<\36")E]7RV'%*/B>RY2MU0[[8KA%*!@CK4+5`!YS5]MQ/.N]_M M/9[>79/^&H_M1:@92^?N3^M<$J=TIX[=JDN$@]:OMN!YUVR_%EKT:?)_[OZT ME/BUL@0PY)_Q"N+0L[]O>H68B%1`BK/Z_P#'#SKL7?%D3LMED`?Q_P"5*<\7 M+R1:_BO_`"KDT*)^T)'%0^0)),1UJ^AP/.NH1XLN%\6[8G_$:)7BJY2=R&6I M[$DURK9!F59Z4:7`")-/0X?B7G70N^*[Z5`,VX^Y7_JJI_::_5)EM,Y^SQ6H M6L$R23]]*6N4^GBGH\)]+.5;AWQ!J#B8#R1'9`I'[=U#_IU3W"1^E:DK400# M%&TLE.>8J^/'\7RK;?MK4"-RKMPGI/2D?M2_)$73D?[415`N;@9$'VH4$IP1 M@]ZGCQ_$MK8G4;M8)7=/F.[A_6EO73WJ*G5K!&0I1-52N%]Q%$M6Y0`'.*U) M+])W^L9"DE2CB>V*AUP']U)/4=ZQ2EI,'BJ[SH;&\`'/%+)/I4J:2I2,)`'( MIFWT**3Z1V/%*"@$23DS!H&GH;*)R>3WHW9I@4H!(DDJY(.*-9!5`.8H`K:) M/`[57?6`2<@T3Q,#@*3-`#B1,=*2AQ)0`.:(&2$F<9-3Y43:E9S![4X*!7!( M,4E!272>0*A`ETQ&>]&E>(5CWJN^LS"<4Q/LWS83M.?>F(5Z? M5S5-"5$JW?*F;E&`>E)<:LT1RD`'K0J*1/>L^S!_E29E69J53`0KBH4([9K` M1TJ%1UQ[T&$[1B@!48J5G,'I0^8!Q1N?!I*=A[U16L+64$G'6FEPG=BD$YW5 MFT$-I(($COVIJ`,TI)"<#\.]$'.GY4&*C*CS'%)7]@;134JDQUH01!GI02D` M%-0XI*D\9CBI!A(GFD/3@IQ%!"3TXIB?LD`R323@21BH2Y!A(S4K7R)L'>I) M^S1@%/!_&@2HB2:Q9*B.E),3!*V@XH%@I!@Y)FC7$`C&:4XJ"8F*PTQ($T84%)CB* ML0\05>GBC2-_VCFEH(V#:85[TUGDA9``ZUIFI0B!1IA)R)J##8`D<4*5%4C( MBB"6!B,9J0G:J0>LT.0#@8]ZD*V)!4036I4R&@DD*/3D4:/7R*6LE(24C_.F M@JVA"F1S0'89Z"L")( M``(^=1K.CDJCI0N*^S`G-8<=HP:B3@DQTJ6ID&MX*G'%+2=R?Y41;W?9(J0@H M2-N3R165"E2IVD8HPH)5!ZU!YDE,]C0O)W(.8(ZT$J49)!P<<5$C<",`5*20 MW!(I"E*VD(R3]GM1J18F3,422..IH$%14G:D>\TTH4ER4&"KI.*L93D(3N[\ MU.X3),#\ZF#Y028((-"MOTICFM,T*%E14J,3%,21U%`!.`0*9$I`D3'(I270 M8W2.:.8)$320E4D#.<=Z8">I$U)2P2W`A20<@U@,*4>AXI8!.[`[BCSZ02*F MU>B[A22`#U-9;G=@?9J%I\Q1,\&(J2DH;(3@T43@A:H'IBA_I02H&.:!:2"0#.XS5AP! M*O1F@V$),8S)FI@%)X`DGWHSA2<2:()G:4X]S6+`"D*`W'(P:I\F+'F`$#:D MR\W!DA)'>H7*8)!D]:)3;: MT@XE7\ZR@`259&>9HPH;B%<$4"?4J)R.:4%J2]MY$P2>E7:U..KC<)C,@BH= M4=@'4<>]`$E/\,?.I5DB8,5IGQPI:B$(VB4V%#]*9`+)Q*LR*4L%;H5,`=.]-2@EN$ MD`3F:!MLB=QDSBC--2H;1M[\4P)G=/[W2@0@;29$STHO,(E(@GWH@=P28/?% M$I<*`BH`*PDF.>*G;M62HXCK0$3)(X-"H$``9-$3T3S[5.)]Q1DM*/K9!F*E MQ*3F:),)42.(X]Z!TA(2(G^*C2O=OHMT!:U`"*KMW2+IL;08'`--N6DOF"!` MX!'%8AD-)2A*0">M3>V\F)"(VD?*IW)4XE/:G!,$C!BE0%.';$Q59D9N]/JY M)B:$PE?`B*E8@@%(*DE1Q$FLV]M#L"E'/,=J)()4D$C[Z MWT`W$*E64TI9$@I$RQN/QHVFT[000<\U%+7*29@>HP.XI3JMRDE0Z1\Z-Z'%!0&T@;>:K*,"230`;4@')G\*,QU MH(9F)5T-/:`)(.:QA`D$P)[U*4DDP:W&;0N#I&1UJ)CD2>P-$H*0=PS/?BL; M3*I.*(Q224RHCF:K.%*XR?G3R029CFE&`8$5FZ1`,3M/'-$2-Q2"<<9H`#"L M9-#!\T0?5.:C8R,C<.:")4>E6'4A6U0@QV-5#(.Z3\J`TJQQ4.$$9&/:LF0, M16($[DCYT6QB\H!5GM2@."/PIBA`VSQUH`DE/0`?C-&I\`4F!CCJ*0K([#H. M]/>(!`C[Z608P0>QK(%DR((S\^E3"0042F1\ZQ`$>_-$V=YQQ$CY5``,`SCW MH@4E(,&B<3)3$">*+RB@1(CBBPEQ<#BE%9W9$"C4-P([5`02KD1[U5R!!&Y0 M.`.*%0V@0.:8Z!.(HDC<0)@>]0),`@&30D3P::X,D'D=>]3B!4M4D$C[6:A9 M!3CO6.J`5Q4$DIP`,UD/1!:;@28S[8K$G:H;>O2@MY#+<\[1^5.2`5`F9XK; M-3Z=P)YX`J]8VGQ:;UU2PU;V;8=N'"DG8"8``'VE'HDEN30#=@S>6-W<:-=.7+MDWYM MQ;NL^4YY43O0-Q"@.N16O96'F6%LN-K0["D$+$*!'>K?@EYI&K7>O[?^3;+3 M'T.K"0`2L@);`YW$@X_PU4NM4U/0OHH^CF^0\I%^AU]GSR05[=R@E`4>A``] MXJ\9;9/UFPZ,*)),<$9FI5Z5K!(P,P0?R-=6;R6G&BT M4`R`92HF"!-:,D#4-)2H\ZA;$3_ODDUT:$J=^EGQ2TWZ'&TNN@J1OV)\I$N( M3()7)`&>II;E&M((6$DIB._%2H+0D`@0K(,]*OV&Z^O/HH<4$%327<1)(G;]W2F:?W>KNC:G>'Q!]&WQCLO:AI!3=E8!4\?*DA1.3!S'>GD3BY8$^ M7N`D1C;FH:)*2Y(V=95!'W'-.O'U->"OI+L+D%%CIER#:L,MA(MQYJ_L=C`& M?<5TRV+L?VET[;<)!\.AQ%JR@BT;64G:&\^M9@DJ$??TSY88YDROD_Y5>;L7 M4^%GM9<"@VFZ3;I0!,I,`K)Z`$D<=*UND-.7;%G;L#<]<%#20.?5`)QT'6NQ MTU^SO_$&K>'4MK#-[;?!MGS`I*5,A4*"8Q))/)F!6N5R=,5R\`$3@?(U!!\P MHQ,<3_[Q[UL_#-Q'J2D$! M2AN3GD=_YBNAT2ZN;CQKK-RM@VZ+W0WGU6Z$GRW5)4@(<(/*B"H3U@UI'M2N M7_H_^C?6E7"E7*-81;JN4JR&BZI)!(Z$)`J5J<<+2DA"I"BI/,4L(4I#BTI4 M0.2!('SK?.6FIN^(OI38M[:[VO6#GDRVH)<=+/6OAGP#=:8T M]>-O6:[=Y`*E,KN%(3O#J`/49"^3`VG%9\]F-9G;1+>0TD..;_+2`5[0"0.L M"0C<2#&TY MS(,#)XF*Z[6;O]D^,M;:O+MV

)[XQ'2D_29<:F-;%LZNX39/,6CBTD$)6XE8)5/50@9]A M6\2FY3]/1^(;N`RIM2[=3B3MVBW2%;"<1,@QUK-Y;%QQ-@\YN_0[9W.J+NG5VVL%)6^%%33F.]4+I!<:Z#2G]9TMBPT]FQ M&HZ?>@.-VZV2\TH*()A7"2)/.!.:&SM&W+SZ3M'TS<]:NVB19VZ#)6?+6'`@ M=85`Q6-S5DUH6VEBXLV'FW&_B%I2/22K;(W*2G]Z!G%65V:W;_5F;!*W6-/! M=6M22E0;`!DIB9.8')B:3KME?,6GT5OJ0YYMJ^+5:AZE-N%UN$&)@PD@CV-; MO4$79\??29;6:'S=/:0EVW0VA4N'R4I!3'VC(C'7%+>O_OUN<8YII+CR'%-- MK="8)*$DP.LP.@Z4II\K6$I^TK.#,5T/A5-]_P##[PV_86+MQ?6&H.F\:3O\ MQI\E:0I:`05`!0YQ!DX%:9;*G-3?2HA5R72A41!63F(Q$]L59=+TV:+2QN]% MU]^PN;E;^E,!XJ?0E#3JH40D0203M^>4]ZU.F7%@K3=$U*]4^U:ZI>&V;4WM ME"$F%NKF?2%8_'M71^'[6^M_BK;Q%:K9\),6ZQ=HO62E*EG['EA0DG)RF1TK MBAHVI:[]$OAJQTNV=>U*RN;FP>0E.Y3:7G"4N+CA,02KB9K&[TNW/_H"$.O%*?]*EP%3*4S@%4$$]/>CU)MAEO1[JU*U6&I,J6V7,+0M/ MVD*C!CO[&MH\A.O:Y](=E;;2JZ9M5V+@^T^NW!D>XWQ$; M6R^TE^Z=:=3#C7F*5M0LP)`)_"DM-0V@SB!3D@1D@UIE=N&K(:'K6J6K3[B+"X992E:PA M3H6I(W3M.TC=Q[=*EVW7>W01I3%Q<-;$Q*"5!4>H&,&#V]ZLV>C7UU]'OB=% MO;K6YNFM%9-NW5P\AA"G"V#O"$D[(_B[58=MWA=JM@RL7"`"IO;ZD MCN1T'O6P1HES=6'CG1+8!&J7&L*O2UO']XM5E*@D&8R-T@GV/-$NWO[BR\4Z M>^HN:SMKE#^FV%V+P%4;$K2`VA4 M]1''2:T%Y::@W]%/C%IL/"[/B!UYL)7ZUI*D0H9F.?PK-YWZ6<3?*>%T[:EI M?Q#0];92=Z?W$O34+AHJ(`409CO5S6186-KX;U"W%Q<:;J?I<`4"ZER0 M"VD`?:$G'7:1BJ[MLNWO;JT>_P!/;K+3@]QV_.MAI+[37A[5K=^W#CNE.HU? M3L_ZXRF/E)!(_P`1K7*9-7C5F[TUJU^D!&BE*S:>6'U.E>?*VDER8Z%)$1]] M+\.Z8WJ^H:H4';:AMQ-DE:H6\Z`2`3UA(!/SJL_J2F/`FF+=27_$#85I/G[Y M6;R4B3UFKAN;GP\_X788M;&X>MX?4Z'@N'7#M=2%!0``02`5=IK/?P M5S5D\;FR:=6G:IP;E#B#U'XS5EURUL/"]KK%TTX^BZNEL-LI6$$(;GC[E!LI"2HKR<(4J1$Q$4R[O;TVFA7NJJ;>U^RO%+;\P M`J%N6U`!V#&[>01F>#4FVQK)\M?J]NSIGA4W[C@7=-ZBJS>;3D,;6U+V>ZL` MX[QTJY;Z9:6/BVS\.:B"+^^M0IRX;5Z;=U04I*`(]0]!$D]>!1^(;HW_`-&I M81:6J';O55H`0QM($*/F09@S`*O>IU=+>I>.]&\7(?;1I26D_&I<<"7&7&MQ M"0@D*45;@!`/!-3;A+K5>&4-7=[;6UW;73UTY=JM74VZPD,A*BDJ$I),1)F! M59P);U;5;-IT7%O;7"FVG@(W@1S[B8/N*+3K'5[TO7VEWC-D_=7"WBZ;M#18 M"EE7K!(5`G@#,5?\4W]IJ'C&[N]-1Y=LIE#:U[=OFN`JW+CH""!/6)J[V**2 M(,C`%'9A(T7Q.Z4I4Y;FQ\E9&4;W5!+DNJE(7IL>Y M\U>*M3B).U1D'-1\2EAQM;J2ML*`4`J,3&#TYI#@)0I`,;^/:F^076DLH"94 M4#U&!@C,].*WQ^2-]?Z;:+\:ZKX;;-TARWL_B&;M3B5`**084D)$)SS/2D6E MLO7O"W@B^LK)+=S?V[CKX9!`6H!,$DX$Y,$T_P`?/O?VIU!VVO$.Z?>6Z`"P MXE6XI2002,]!CBFA&W3?HZ0V[:Q87(5=)#R(9P,G/S'WURFY*LFQI;6V4_<7 M*6E#^[JVO*6H)2V9(]9.$Y'4TQ&FW2]23IOD*3?.#>AHQ+B1^\DS!'N#%.N+ MA-,O+6YM;-RZ>9*6VD>8X`94V@@P5CE(,')JOJEF_<>#?&%NE3#CRM=1>- M-^#BK-A7=)2-R(^RV4^DGWI6I6'F:HXA%Y;W%PXWYSS_F)0VI9 M,;0I1$F/Y?**/6RVKP[H.A-OMN7-O=%U]]));;D+A(5U`W@2,>FI-F!K[;+_ M`(9O;Q-DNQ7;N-HM7E.J4+J2)!!$=#D5K`E!>27D++0.0D@$CJ)@Q6TL67=* ML]<2_>-*M[VR-NQ:L/)<^NS]8=IA,",DY[4I-T+VSLK$6]I:F4)716KKM7_#*M2L+4V[C%X;);`65)=]`4%"XLG*BH M@"3WS`K9HOW4>(D7=E?M(\/*#M<=EVLU8\/63#^JVZ;XE+3C+JF$?O/%`DD=DCOU.*YE M%TX[H3NIN*+%K;LAZZN%)W):1[#E2C.$]:ZCPQJEPC6[)-XJV%M:6KJ$/N-- M[DB/2D*VSGL.:T#6H:BCP_>M[&3=W9#[K:V$+278`F".@`@#BG_K>FI(N>+E M(T;7]2:99WVUJTTO8LGUR@$S&?N$4/C)+=GXC^'L6_*MW+5AQ#0)/K65#).> M0*N_2`Z[K.L7]LW<,JM`TEIAP0$@E`W&4B3\\BJ7C;;>ZNB]TZX;>0FU8:0` MD@^8V53,@8XSVIPGQ+_JY/IM;6TMW?%6I>&F6B'V689O@M067@@+/IG:$D*X MCH1!\Q-SY?EA$? MPP)WG#?FIRFP]:24J@\)DU;UU"47FBAK:-^C6[B MX$;EY]7SJH5DM*4G[(!DGIBK6O((O-"DR/V);"??U5J_,3C]J1B9)R*VG@9- MOJ7C/]D7UFV^PNS7<'%;;P$\SIGBY6I7KJ6F M$VBV`2%**BI2".$G'IK/.7+C7'HNXW/Z3:+>TE%E=73X99(<GVC=Y<.L+8^*^#<6TZESRGOX7-I.V.L\58TA/P;FG6SKI:M6+K< MM;!4-@)(*T=08Z@"K.L>3<>&-.0@7M$O6=039N);2\JW5=CZU)26@8*MTQVJDI"V[#3KLCZJ]"U-'K"3 M!GM[5T"KBT=T6ZT%V[2AFS0VNQO-JR7E4LEUU*S< M6\D^01P`?W@?:I+2_(6]59TFT=>=TU&HK!D-+4KU`F-B0,22<$SFM[=V%M:^ M/KK3RM`L[=L.A+SNT%1;D-E1.,QGM57PNW8)N'+S4KI-N\P0;5*FE.CS/XRD M<@'@2,U7U=MHZJ!::@JZ#C9=>NG@I&]R?L@08QU(BF[2W3_$S+:-(MG&++X5 M-T\F;IN[%R@@`DMI(]()CDSQ4N,,WWA+7;K]G?!?#;$V-TT2IQQR#.^2?2(2 M23`C=VK7W#;-OX73HUM<%]^ZOQ?7+K8(;8B/2B0"K[(Z=3%7_#5PUH.JWFIN M7#=PY\,;=FW8WCS9(45**D@)'IXR>:SWF+&E:4&ULJ?E:4PI;:5;0YB(D9B< MX,XJSXCN57'@*YUBPL[>TOK/4A:-L-%6VZ1M3/),$;R9'\!I5HM2M/T_2UHM M66V_+;72RK6F:6;A?AMYG3D/^'KJR4Y>WD0IESRU%1)W2V4D!(`'<^5K(0`..-I4>@)ZUN[C4Y\2:%JNFWATNS9 MMV6KNT25DM!M1*F4`#:I*Y(DGI/6DZ)J]]:7UNBQNUV.F.ZL+I5N("4,K>*U MI,#.)GYUC.7TL4]83LU_5FFV=C#5ZXTTE(,!*<8]IFKOAFWM5Z_H2=1)-K?O MK99:0-Y>4E"E$GL@;3)ZF`*C4=3>>\1:O>K#-VEQXH9-TPEU*&4J)3M2H&.2 M>,U8\-Z]>V6N:&T[?.LZ2PZM3[8P@(\M<#:!_$1Q5RXFM5=,./ZYKS*=MLS9 MNOJ6XO"6FDK(!SSC`'4_?6SUU-I8ZYI*[5ATV"M*9N"T[*"M2U+RM23.Z`)` M-:Y_6]3&HZY>V%Z\T]?+6$*28/EI*@T,\0D\>];'Q1?NZUJ>AL/:@3I[5DR+ ME\B=C_KWJ`B2KB.F:=[+12\67S1\`JUQJV8L[^WU'X8(82=MPC9)]))RD$F? M\)KH$,VUK])%KX9=M4+T^YL_+#D'S%.^67"[N&8])$<9^ZJOB$Z*YIJ4V-R\ M\BV:*;2R\C:DK5&Y2E&9)Y)QU%6-,UQ5@TP_<7'Q=Y;LEJT;2F`U*8)4LB3' M\(GYFK\SI-$?"Y4J5+J,])>Q-4'/6@P95,XI+N_\`4Y=\JO:;:JU!;ULPM/G,,EY252"4 MCG;C)]J0TC_D32]6#B3IVIN)9MG())69$$=.#/RH]%NG+#6[*_;&6'05^[9P ML?A/\JNV>HC3E>(;1M#*])0I+^B6WEREAU!)"IYRJ59_K4Y7E+TLD^U35+,6 M.DZI?NOLJ9TQT-71:E9;42D#`$_O%F6] M84VYKS+KK+5RE,;+1<;D`CC("<]!-9WDU"6+15T[H26'FRG6@HV2Y("]HD@X MP8G'L:JFW6G]J^H%6F70LWP005.$2$ID9QU_RFXSJ#S/A&^M+-QM&IV]T+G2 MG%HW"W*@0Y'805_^>KOB'4++6O$J'@?A=,7;J??+:)<VE-A;VK^#_``HE;[3)_;%Q;%ZX<#8_?2@>YF``*J7+1M+G7&KY:;?]BK;% M\ZN2AL.`%)!&53(@`4NP;5_97PK:/.MB]L];&H7+*T^'G%M M-Z@NW3=M`D[76C()28Y!!P8.*?X=2NSUC6;53S*VWO#]S<.!E:7?+6E83M)3 M("A)X.?YU=5K-L]])6B^)-[J+1K2S9W#;@EU#FY1'!@_:,GC`K1>%PW8ZEK0 MOK@)MKRQN+-IUL$JEQ8(.TCT@`=>IQ4[L,GTIZ&Q\;I6A..W+%LK4T^79I=* MOKU)`!((&),050"3S672TV6C:IJ%XI+36F7J;&[29*V7"I(!4`/LG=,B1$&> MS%MHU'0?!+%TXRQ=Z#L8?)D^8T@HA;1`^U"#`5&3FMA97UL]XH\2W>H,)=TC M7&U%ZU=!(WHCR20.N,GHPC4-)=T>Z6AN]9LS?N`@[$L@D;BN(&1UB MJVG:6_?(M$L*3\7=VAO[:T5(==9$>L#@3.`H@FLUK4+G5/`NGV+KB%ZXXPJR MU&]4@A:[8**D)28ZRF?D:V5_?HO[+1G%7S]DXS8IL[VU1*DN!'"T0H`F2?2J M,*/:EU8IZ%J:].^BEK6]/NTM7-QK00IP`^8XG[(9(VY,XVG'OUJK>ZEL1F/;CK5E];2VOHR"7DSX=2VW>B-L`);DH[Y1$8YF@U6[;O[/6[9TI+[ M%^]J>CW*6X!\TE2V'$B".HW">09)%)+NHJZ;:KO]218VH"KEQ)ND:QJ>DM.6SVI65JF]-NAT!3K9ZI*H`_[Q3TZ9KE&]-.F^`?$7AZUNDW- MQJMRTGSO4AMNW;(*5D4G3KW1/V>"&R%AT*2 M*Q9*4Q`^^I0H!((XXBL7(1COQ6::>WM#"(R2!^5&#L("N1DT+83Y*,8" M13=H"9ZQ75*R?4,8-&AYRW=26EK0M)D*28(^5`/M8[4Q")YIFIFFO7MQ<@_$ MON/3R%J*C_,G^E2;EURW;9*U>6V06T2=J2."`9BD>5"Y3S3FVX$]:U^?X&7+ MKMRIE;CKSCK1E"UN$E![IZBCN+JXOE!5Z^\^X`0"ZX5[9YB>/NBD`';SGBI$ MIHP8JF0I*XF33@" MD20(H&^:I-NE@J4IM+A>2C=Z4N']X#HXDF M#[Q-5TH!6.],"1)W&8/2MLV?9MU:VX7WRIJ0 MVKS#*)[4D\8J>F0!1-2YW)<:67WM[:/+;5O, MH3U`(B![#[YI(2?-]N:PP%$J%,6SH;*RVI*FBIM:>"A1$HD]*%(&W<:28JP;VX+R'5/O*=0"E*RX2I*3R$GI5=M MUQA!::6XVR23Y:%E*3/<"B/J2=@E7O25(/FQ/-3(LK-L*'MD8XICCSKCVYU: MG%'$J))C[S0K!&(FL5`"5?C5.1BE*"P=RB4X3*CCY=JRX4M]06ZMQ:QP5+)C MO20OZR`,$X-$%J*2%'-$@EN./JEUQ2P.`L[HJ5..EUM9>=W(&T$K)('8=J5D M('>:8HF<_>K.I72]0N4/.!*5I:0R`/X$B`/?J: MK$`KW=!6`SD8BE[00==0E2&W7$H.-H40/PJ&W7$+"FI0K@%)@_C0J!Y'WT(7 MF8@TQMCJG`@(`)2%;]LXGO\`/WJ25(<+B5J\Y284L'U$=IJ7%%/%0?M=B:SR M[`&X=;4IM!A*\J(Q/SB)K`"04P-OL(HH@YR:E1@3WYJ'WH+ATN%,E:@G@*,Q M\NU!;N+:*DI$;\*C$^Q/6B:.]2MP$=#1E(29VG\:F?;?S#&3M^Q(`$R*S8"L MN+)*E#FI!5&P`=Z8"F,"NF=ZYWX1!2@>_P#*GMNJ;:N$-*VBX:4P[C[2#R*2 MDYIX`"-T8'-&,(4IO;M2('2L$`<5C@$)CK6**DE,`4#6SZ($"@4HI)COQ_6C MW1B.,T*AN!*>10Q!4%*D\T*EE,1SWQ/Y4L?Z3'%8I6YU*`,YJ58)1)0!@*[_ M`.5`22H]E\3S4`S@?C66L$'#O@B%1`(/3\*8PXMFX00E!"2%I"D MR-P,\4E"1O5/(HW"0X`.`**FY=A()`B?Y4R+H&TR(GBC2L)#C+9AMV/,3T41E)/N*D=Q\J`,^4ESO$BEZ M1"DE2N``D4;850M201P33R?+)`'`JS])T3<-!2(*CQ`CI3V6OJ4(3.!_.I5M M7$C$4UF4@`U,GRSY7X4TMA14%`C;P:C8%#85$JF:N.D%2I$$',4GRT[@JM?,[$K*2J)I3BU;@1D=:!8VG*UC-20I23W%0C=&3`HPLG(. M28HTI@F>]:QS+]*5"$R*KK6-Q2?M3-65$>8$GCK2B@*5D1GFI5A14=Q`HTN!2WD;3*`#)S/:F:U(:V$ MJ48'I`HE$%)%8RDD>F(`J$IA0)XHE`VWZ2`N48!.:N/I]) MP!5%!TBI<1ZC[5*#A1'-&/@C8$E0ZUC1*92KB,33$RH'=4;=^W&1Q4;AB#Q M/>!3FVPM)DP1FJ[:2#!/%-R2(/2K&*(IVJ`),\UA5(XZ\5CBB".L4M9]0(/- M;QF=F!).1@9QVH!Z("NE&"-O6:$I!.:GPGVAJ05D'$S1*6"*!1,J[$0:P(B) MZBIK;'2$GF9%(*U<<@T]0';`I22`F"G/>H&)X04@0.E)A,D`YIB6R!N'$U`` M\TE(@47:P)*%9$5(3@G&31J]1,YHD(^K/SJ8;2MIW"I6@!))-,"84GWJ%0X% M2,BJ;5>$UGRH@W"R%"A`,@@XF*F-0M:2`/:A6D*$33=FTDJ.>E04D(!/6H`C MB`)K!A>T]IFI/V5?*JV\@;8Y%!844A6#D\U"3N6359LEQ9[BC,I5GF@L%)VD M@BI.6QG(H&@!S3"W)SUS5@I`$+,]#-$`"C[S35)!,D9H74J0C@=ZSD&O?)0@ MQR#0-N;P)Q6/K5O(]J6P3B(KEK4/"@$E-%<+"4IS4`20#WFL>0%)D1SUK7_3 #'__9 ` end GRAPHIC 25 t71441001_v4.jpg GRAPHIC begin 644 t71441001_v4.jpg M_]C_X``02D9)1@`!`@``9`!D``#_[``11'5C:WD``0`$````/```_^X`#D%D M;V)E`&3``````?_;`(0`!@0$!`4$!@4%!@D&!08)"P@&!@@+#`H*"PH*#!`, M#`P,#`P0#`X/$`\.#!,3%!03$QP;&QL<'Q\?'Q\?'Q\?'P$'!P<-#`T8$!`8 M&A41%1H?'Q\?'Q\?'Q\?'Q\?'Q\?'Q\?'Q\?'Q\?'Q\?'Q\?'Q\?'Q\?'Q\? M'Q\?'Q\?'Q\?_\``$0@"G@.$`P$1``(1`0,1`?_$`,\``0`"`P$!`0`````` M```````$!0$#!@('"`$!``,!`0$!``````````````$"`P0%!@<0``(!`P(# M!00$!@L,!0H!#0$"`P`1!!(%(3$&05%A(A-Q,A0'@4(C%9&AL=%2,\%B!E28)ZEW%,+*S83IE3&%C,L;?5=E-EH#GNNOE9TWT M=TGE=3=)"3:-_P!DC^*3.CLSK'J#YA9>^8^TX. M4N!T^F=M'Q>2\9Q/7BU&:-1&WVW[7\=`3/E1DX6PXO2H4^ M*<%`I%AJ*WY4!RLG_B.ROBI=YA?:VZ=BE,0VDRS?>KQ*Y0RJ@B*%[\DU?30' MV#J^99NB=WFC/EDP)F0\C8Q$T!`^6#A?ECTN\A*@;5BEF[`!"I)-`<9+\SOF M/D;=F=8[9LF')T3@/.&BDF9W[=L3SX M@R-PRMYR@D<4P-CCQHH8N>]J`Y3X'"@+Y?F+]U8N]#9=@A&^96^':\/'20K'DY174\\KZ? M*JJ"QL.R@-I^976W3GWMM_66W8GWGB;5D;QMF1@RLT.0N,K/)"P95*,NB_B* M`SM7S&^8,>]]/2]0;1AXVP=4E8L),>9I,G&F9`Z"4%%#!K]G*@*[I+YO]7=0 M]4>E%C[6N"'=<:-21ZS)(BJ_+W5:@/LZ\J`S0"@%`*`4`H!0"@ M%`*`4`H!0"@%`*`4`H!0"@%`*`4`H!0"@%`*`4`H!0"@%`*`4`H!0"@%`*`4 M`H!0"@%`*`4`H!0"@%`*`4`H!0"@%`*`4`H!0"@%`8-`-5`9O0"]`+T`O0"] M`+T`O0"]`+T`O0"]`+T`O0"]`+T`O0"]`+T`O0"]`+T`O0"]`+T`O0"]`+T` MO0"]`+T!B]`WQ].%E^.&V1N,G-C4W].0NJK%J(XZ#0%[-T%F?UIWS=H9H MDP]RVE=LQ8`&UQLJ%03PMIH"LVWY6[A!_4^/+R()H,5O+Z87CI+!KVH"!A? M)_K3;+;'M6;M$732SF2#<)L02[K#`S:VA!*>FYU$V=FO0'U/?-LDS]@S=LB9 M5DR<:3'C9O=!="H)`[*`^?=(=/?.W9-NV?9,F;I^?9]NAAQ9BK90F>"-0ATW MC"ZM(H")/\KOF'C[=G=);7OV'%T1N,DS.\L3-N$./E.SSX\=E,;AM;`,S7%` M3\SY?=;[)O&3G=!;EA8N/N4$,.;B[FCL(G@01+/"8U>[%%%U;A0%5O'R=ZJD MW7!W&#,VWJ*=,&/"RI.H83.8Y$+%LC&4+(%9M7$&PX"@-F!\HNK=KZ6VO"Q- MSPI=YVGJ"3?(9I(VCQI8Y2X:-HT7R'3*;:18&@)F5\H]YFPMSDAW.+$WA]X& M][/E(K.D,NG0T<@8<5925-`:Y_EGUQOPWKF\B&;*)U?:"*,(0G#MMVT!Q^Y_)W MK'>]XQQO6=M61A8N6N5%U!'C>GO92,W6#6$T*.PL'O0'V4'Z*`S>@%Z`7H!> M@%Z`7H!>@%Z`7H!>@%Z`7H!>@%Z`7H!>@%Z`7H!>@%Z`7H!>@%Z`7H!>@%Z` M7H!>@%Z`7H!>@%Z`7H!>@%Z`7H!>@%Z`7H!>@%Z`7H!>@%Z`7H!>@,7H!>@. M(ROG)T5C=1'8WDR7D2<8DV='C3/A1Y)Y0ODJIB#?30'7'==M&:V!\7"<]$]1 M\3U$]4)^F4OJ"^-J`P-WVHJK#,@*NK.A$B6*)?4PX\EMQ/90%7O'7G2&T;7+ MNF9NN,,&&1(99HY%D"R2&RJ=!-B;T!OQ^J]ED7.DDR$QL;`D$]FQ9((\G/QX),KCC))*BM+?\`R8)&KZ*`FB@%`*`4`H!0"@%` M*`&@..W_`"=WDZH.!C[M)M>%!MZ93>E'"Y>22=H^)F5NQ:M6LN"M[<5)K.)O MHM?JC.%^7\FP^/\`^3K7X'ZF/Y"]!\+OG#_ZHSN/_P`-AW_!Z=/@8_(7H8^% MWW^U&@^$WS^U&;_`$;# M_BZ?CV'Y"]!\+OG]JP_(7H/A=\_M3F_T;#_BZ?CV'Y"]!\+OG M]JP_(7H/A=\_M3F_T;#_BZ?CV'Y"]!\+OG]JP_ M(7H/A=\_M3F_T;#_`(NGX]A^0O0?"[Y_:G-_HV'_`!=/Q[#\A>@^%WS^U.;_ M`$;#_BZ?CV'Y"]!\+OG]JP_(7H:I4WJ)HU/5&AM^$WW^U&=_1A7Y&YY$+:!U?FSR_Y*#$Q)6_`D9J M/A9;YT;\`]1941DDW_<<4CZDF/A$_BCJWX[]2OY"]"3\+OG]J,W^C8?\73\= MC\A>@^%WS^U.;_1L/^+I^/8?D+T'PN^?VIS?Z-A_Q=/Q[#\A>@^%WS^U.;_1 ML/\`BZ?CV'Y"]!\+OG]J@^%WS^U.;_1L/^+I^/8?D+T'PN^?VIS?Z-A_Q M=/Q[#\A>@^%WS^U.;_1L/^+I^/8?D+T,'$WP\/ZTYW]&P_XNGX]A^0O0S\+O M?]J,W^C8?\73\>P_(7H/A=\O_P`49O\`1L/^+I^.Q^0O0Q\+OG]J,W^C8?\` M%T>!C\A>AYD@WM(RYZHSK*/YMA\?_P`G46PM*2U' M#X;#YG_V=6YZ;%9U@D11;[*-7]9,]0>5\?#_`(NMZ8G8ROF53S/]]PB[]2YY M'>,;"_BZKDJZ%L>16-(RMV_M+G_T;"_BZP65,O!NQAO602%ZESP!VG&P['_\ MG6^.KN9WR*IO^#WR]SU1G?T;#_BZU_'L4_(7H:_3WD.$;JC-4L;+?&P^/C^K MI^._4C\A>A[^$WTRK#4D.K1JV<[MNV"N9B=5YOIDE75L;#U(P[&^SJW8[J MQ6XM,5K)-^Z.H?[59G]&Q/XNL?\`)TB89;XV/NCJ+^U69_1L/^+I_DZ>C'QL MT9F)ON(L32=49I6601`C&P^!:_$_9\JTQ=^MYA/0I902#L_40-OZU9G=_FV' MV?\`LZS?[.G_`$LO\;,?<_47]JLO^C8?\74?Y2G_`$O_`('QL?<_47]JLS^C M8?\`%U/^3IZ,?&Q]S]16O_6G,M_\MB?Q=/\`*4\ICXV9^Y^HK?\`%69_1L3^ M+I_E,?A,CXV/N?J+^U67_1L/^+I_DZ?]+'QLU96W]0X^+-D'J?-<0H7,:XV' MJ('8+QU;'^QI9Q#(=81[BVO?Y8TDCZKS&1U#*?AL3D?_`&=+?L:)Q#'#23T= MGZB'/JK,!'#_`#;$_BZJOV=/1_\`!;XV9&R]2'EU3F/V=3_D:_\`38KQ^I&S8MUPPAR.KLQ=?N@8N*Q] MO"*M*]SEM5_\"/J96+SX;$_BZQ_RN/T9/`Q]T=0\?_JK+X<_Y-A_Q=67[*C_JQP->5MV_XN-) MD2]4YGIQJ6(&-B7-NP?9U./]C6SB&0ZP>H=KZBEACE_K1FH)!J"MC8=P#W_9 MTM^QHG$,E4;4FS[EZDM?^M.9;_Y;$_BZK_DZ>C"I)X;:NH`P4]4YA)[L;#/_ M`/CK?'W:6IRV*/>#/W/U%>W]:C)^-F1L_45K_UJS+=_P`-B6_#Z=/\IC]&1\;(^3B[[C2P))U3 MFVR',:R?#8>E6L3YOL^VU:4_8X[%76"1]S]17M_6K,O_`/+8G\76:_:8WX9? MXV8^Z.H?[59G]&Q/XNG^4Q^C'QL?<_47]JLS^C8?\74_Y.GHQ\3'W1U%_:K, M_HV'_%T_R=/1CXV/NCJ+^U69_1L/^+I_DZ>C'QL?='47]JLS^C8?\73_`"=/ M1CXV/NCJ+^U69_1L/^+I_DZ>C'QLS]S]16_XJS/Z-B?Q=/\`)T]&5X,P-GZB M/+JK,X__``V'_%U#_:8_1D_&>9]LWR!-<_5V5$@YL^/AJ/QQU>G["MG"K8AJ M/)JV[$WW<,5/G44_84LTH9;@47275NX]2].X>^P;YN>)!FJ7BAF@P M"X4'F2L>GC7;RU*,L8MTW*61EBZEW!U3@9!C86DGN!]/C2UH4D5<@AIHHIR&DB..??D&GRO5I((T?RLZH_K67:.*.`;ME;JW4JSDY4F M/DI(J8?I'C:/U`./EL.`%`5V)\L?F&^,^!D8N/%!A[3O&W8F0F2"9Y,]IFA< M+:\8'J@&]`>]X^2F\MMF;B[=@8OI3;3M,?PC2VCES\&5WFU:KVU*P\_;0'KJ MCY5=;[G\=E8X$8DW<9\>VQY"*9(#&$*^HZM$I0C@&0T!XSOE'U=C'IR398G; M<<#'AAR,_,RXI8XPCJ3')&4U264$!HRM`?^J^JH_O@+5*)). M/N^V9#6CRXV?]&X#?2*D@F$,+$\CRH#%SWT`!OVT`N>^@%S0"Y[Z`SQH#%SW MT`N:`7OVT!!W6?'QXX)LB58569?,YL.VB*M&ENH<.1RF'#-GORO"A,8/B_(5 M5DI&2W4>1P58-OC/UK^M)]&FUOII!)X'3N-*VO/R9\Y^?VK:4^A4TTXB2QQ\ M;&QT"X\*1*/="J`?\+G4P1+-I))',@\[U)(Y#HP5/.W.!HRS8<`+M*1Y?4/!=/?:U0FK7CP:+VTGR7>0K M:"D2$PFQ#]M>ADH](1Q4:EZEE"#Z*`\2%%=M-$?$*F/R9D1A,BS'3&R7YJY'`UR4 MZZDZ;9G&ATD>3MZ^I#'/%>'C*H<:D_=]U==8JCFJW9>O:Q67:QP_O M7_)A$,[..1)(TEC8-%(H9#[:\=U=7Q9M75'OCW"G$20MW7&.W9'Q#B*,"_J' ML<<5M]-:X)5E!2\>3UM>1-D;?!-.A29E&M7%FN.%R/'G3.DK-(8W*)7T"L2Y MGCW5/$$#>37\9NN$0-P MA&3'VY.,"-/MC-S3X\=_MT(5FMS;C[YMDT@1I6A<^XLZ&-F_,OP&VIJ^0;:MPS'ON62I@4<,;'U1J3WEB2:G\BM?M'&S-C=.;*P3^3Z=!OY7 M<$]X;CQJGY63PR?C1OQ-KP,0N8(K:_>UDO8>&J_X*I;-9[LE52-+[!M)@>%8 M`@=M>M;ZU;L93S'LJ?R;21\:\&G[HW&>.V9N,@91I3X>R77O;4&\Q[:T?9QK M[:%%C?D]ITWM`0"2%I9`+&5W?4?:0P%'W+EOC7D]Q]/[3'(LJPFZ$,%+NPU# MD;$U5]FT1(6*LED.+"]B/K'N\*YJ^378^*YN3MWQW4\J9$R]7X^\:-HCCEB]_+7JXZI*K:W1D]=C=_S(ZJ&\;EC8T\+I>(*TK!9[IOO56(4D'L9R*PKCK_ M`+EY/'];NM,<18N;N$*+GIC9$FZ&$JF&D[R*5()MRC'.I^&K8DJ<+KGJF22/ M=)-UB"Y.&L6KTR($`8!\K23]7A?VU:V*B\`G3]5]7[EB9&/!FPOBX.//,VC5?Y";J24WO'9U67'R,=&L%EFB*)<]A:J/JQM9,E9'.Q8BY`(`(/$' MPKG:C(RSR"./GJ[?W*]]7 MI2UWHM"'9%?HS]R)9G?"PC[BIPE3#]/;66O$C8K'D\#,MNWW;E?Q5?\RTR]2JQI M&W(VG$R=IGVO*U9&+DQ/#+ZA#%E<6-ZR65\^1?CH?#OES\7TANN9\L-_)6:" M22?I[)8^3)Q)#?2C=Z]J]E>_CR8UZ"5?0TXH]&2>UO6>W9YS>I=*D0=]L>]8NW]-[8^:[$Y,G MH(W/S/(5&HDBP\:Y+;F;W)>W=7;3N),@BXY@VH"0*`4`H! M0"@%`*`4`H!0'([A_P`R&M;MJ0`/`^)OPH"+F;KMV)PR,F-#^C>Y^@" M]ZB1!%^^PP-NDG!Y2R_9)[;^:D@?!;]D?YWG+C(?\5BCS`?\`K#^:HU&A M'R>GMJB;'=HOB)S,GVTQ+MV^P?BJR1$EV`%Y`*.Q0`!^*A)F@%`*`4`H!0"@ M%`*`4`H!0"@,$JMV/``>9KV%AS)]GY*AD%)MW6?3>X[D,#$R2V2^KT'="L4O MIDA_2?B#IM558EU+E98G4F-UD%RMU8$DCB1<5:4$F#-%J""6,R27T)K74WL' MA228,?$0D,4D1]'`@,#9OT;=YJ+6A$<99RVY[]M>'.3GS"/5>YYA0.^W=7E6 MLW:3T*U:21HP,C$W5GR#(LL(-L:+4`&6WO%:YZJ6Y.J^D%GP``6P4"P0"R@U MJM-D9/7=EWCJ/AT1C]47KUL2]BD\V[]VAN]G*M#,B;KCSY.V96/C^F9YHFCB M69=419A8!UX77OJ&$SYXW1>_#;\A)<&"#`1\26'9I,CXB-IL>1FD>)M*&)"" M+)QKGM[3IJT]BG/1/5.1G9DF1#`D&5$\4D:RD*Y9E(.FWE%E/;6#SFZQHV[] M\O\`=9=N:+#V^?)F9H%=@!CLWJQ*!V'U$3Z*SOFY$UI#-<'0W4,,<9F2# M+SL)'>);<;\:A7@MP(6Z;1ONU[CM./D8:"+*G?&R-VBE;_M M"1V+)'E_H(VH+JK3Y'909_&EJ?3>B?A^GI=D^)PY\7.R9,GXE;%GL%0CW61?JD'QJ MJ[<6Y5400Z2G)0]([CD;=F3=/;BP5XR3B%SPL.)6Y[+>;VFNONXZY$LM=WN6 MQ8[\=$SICNFW^A+D#(1XH+F1E87!'U37G5HW9)FKQV7AR0=NP3GM'NV>WJM* M`V-`/U42?5X=K=];YL_#VU7^IBL;GW%R2;URLT,<.WE1.`0B`0H/(&M\?6Y5;;CT,[96O!HQMJ7(RGW#-:W MS*JX4V(59IR9;6^[0<42P2.T7[&K)M[$I(\T!F@%`*`4`H!0&/9Q M/=0$#?=MEW+:Y<**8XSL!:4DK1E?T_M:8&Y9&,Q$LL,,%YR@ MULVD^8'G75FL_BK#\LQQIJS_`(+M<;&#,ZPQ@MQ=@@#,>5R:YFWY9T0>RD97 MBBF_O74'B.1-5GT8:*_>^G]OWG#^#RC)%&K*Z-`1&P*<19K'AQY6JU,EJ^2L M'O;-DVK;=O@P,3&08N.OIQ(P#'0>)4W';:IMDM9[DP2UAA1=(C54`L%"@`+S MTV[JJ[V)@V`&X"BWZ(OR'=4:`\R1QR1M'(@:-Q9HVX@TI>&.,E:=@C1BT&7D MQ2#C&==U7PTVY?371^4XU2:,WC]&1XLKJ)\Z;`UXZO"JL)RIO(C#BP%^RMFL M7Q\O^"B=I@D';-T;C+NKJ.T1)I_9-8O-CW5"_"S']7\=3K3)R5R#[L^NY![[ M6Y4_+>T5@GX_J1\EMYBEAQLG)5,68Z?CXAIDU=B-STW_`$JTQ<+>Y+7T,VK+ MR38-BVZ&03/&9IQQ,L[&1OV!65^P[>(-%5(G_P!PKFF2XH!0"@.+^:7RZAZS MV-!CR?!]0;%>DFS6#)N%-KGAQJ61!TFX M])'JGH/;-IDU'$?)1\U4ZU5((6^]'/LN$,STH(<"#&PXY\5574%/'V4!W@H!0"@%`*`4` MH!0"@%`0'A0@=MN M\4),6[OW5AW"@''@+7Y\>\4*L>+)HH9>$D:R#]N M-0J((D@3=.;)*=7PHC;].'R$?2*0)/#;&RD'%W#+Q^-U1G,JV'9I:U"9'W)E M3\,W<VX37QL9(G[7MYC[2:L"63?B:`6H")G M7,V(.^8'\`-"K)0%A0E&:$B@%`*`4`H!0"@%`*`4`H!0&C/Q1E8&5BE_3&3# M)`9/T?40K?\`'4,(XS'VWK=]AAZ<7!Q\"/!Q)<==U+WUWC,.R M-W/MJZ94<.1J2")N8OB-POQ%<_9^TVPKW%3:Y(YW%[GOKSCN,\+@_2*B"62< M;!,\)D!LPY`UTTZ_)&-\O%HYOK>#=I-E3$P,)LG+S\F*!3R6--0UR,?VJ\14 M8\%E8EY4T="W2F3C/MVX8[#.SL&)8I)6-FDD'-C[*\B]^+M2ZA-[EG25H64, M/5/PTF-,,>8N61LMG96*-VA`".'MKGO\'/E4O7FRWQ,9%SX7%=>+]/@R/9 MJ#1_^P]GTI_L?9>@LC)R.DMOER;"1DTJ1P\HY5\C^TI3'F=:OVHXK9GDL[/> MVI?#ESX7MR\:X:PM?!$$'>-ZVS:,5,C.E6$32K!BJ[6]69S9$7VFM<6-W9#< M&K%]+;,=LGWNK3(^?M7@BI80RQS1K+$P:*0:D;B+@=M MN=%[^-3#$C@.'A? ML/`^RH>FX%5)%`*`<.WE0D@;UO.)LV`^=EW9%81A$%V+MR`O8?236N/%SL5; M-.'U)MDV%\7._P`"NIH_3R;`ZE[B"P8>(J]\%DX$DIMVVI6@1LN)6R0#!=O? M!X`BJ+'9O821]MZCVG<)Y<>&8+/!(\;0.0&O'P)\1PO4O!9>!)N3?-G>%YES M86CB;2[WX`DVM4?%?T$FINH-H&/+-!DID>BGJ-'&PU%;V)%[SCSK%Z[;$B@%(!B@%A0&1PH@*DB"NW:.2-H=Q M@4M-B7UQKSDA8^9?HYUT8K3[7L4NHV)N/D03PB:!P\;"X;NOV-W5C>KJX+*T MGNP/95-RZ1KR<>')@>"9=44@LW>#V&KX\O%E6B#@Y_P\@P,]].3'PCE;@)H_ MJF_+571?%S7*AFK<2S''D0?8;UR2V]323)4@VXW/+A5H)2?DQ^0VHRG+)0J&G-DY6L`.5=5X>ICC6Y,-[CO'95(-I-&1G8V.;2/=C]1!J8>T" MK\&S/Y1!FXLYTQ2JS?H\F^F]JBV&R05I-]B+@\+=E43\%]QV<./?4R(*?C_S M`_W+^S5_`DFQ0[E_2.QXQCB$4?FM&"6`\Q[3QKNI?DI/-R4XV:+06!TW^C M]FKE3)LP*L+@\"/#QH#"JJ@(@L``%`%@/`>%`>@>V@,WH!0"@%`*`4`H!0"@ M.0W'_CG*_P!C1?Z5)6F'[C+-]IM[/P5W'$SCMZFS(M^?*DRYH,1BL>V9<+:L M>.6-6+P9"`\V[[5**MFG;.K=]3$9LN"!_2C$\DI9_P#WAAZ,2*.)\K5;@0K$ M7)ZSWC<((8\&%(L]9!&&!D6-M4GI&P:S<#PXTX!V.AWCJ#/P9Y(L;&CG3!@C MGW.60D6#74K&!]:ZGG454D'CI+)S,GX_<\Z10N9DLF$@8Z!&HN%L>%S464,E M,@X/5F3#!N4LB>M##(\T;,;`*\JI'&#^Y8FIXB3Q-\P,F/.?'7$24-PQPOJ" M[>IZ8U,1H(U=JFK*A'(M(.I&-(%5B05!:[:["_=5N!"L6?5&YY<^+LT>-' ME(VX/ZTT.*0N0(U!U<21PN1543)@=2?=.W3JV/,Z8AB`&2^J9GF76RLUR/*M MZE*1R/>1U5N^+B_$9&)CHN2`^!9G%^/9VU$%DS=E<%4 MM16196=64>Z;9J41N6`!UQ2K[RD'F*\S+@9Z&/-H0LG;YLB"1;GQ MQJBP%K\?IKK9RUZN?L_:;X-;'$9>[=2Y>[;E@[#%C:-H$?K M_$E[SRR7\B%>"BPYM:O/@[CSE]>;7@[DNW9D$DZI\W M*G&25!(V/YD[;-.D)V_,@AF:,--*JZ4$Z!X;@:0PII"DJ/,.1XUTNVIS+&_)8P?,W9D1,A,/*D549\Y M%`U8:*;%INS\%<'['"KX_J;]=M,[A7#1QR0C6D@#HP_1-?,TQ+DT](/0M=Q* M/1#F,CW&Y!AQTW\*IE2DFNNY5^MO&&YQV0[@9>,.38(`>Y]/970ZTMKL9S9, MX?K#I'<-TS9IPDK[M#(!"ZH!%(I`\I/A7T'Z_P#8K#55;7$Q=',G/8>SY>[; M]!M>^:-IAQ3>1+WN3:PNWZ=J]+L=U8\+MB?/D0EK#/LN`=NCPHX\%D^#QUT( M$(955>^W=7P^:MW>6M;'55J(*:;J67'S'R9@?NN1&..MN)].XU"WZ3#AX5V5 MZE;5B=3*V2-S@.I\#=>M=RQ\C'F6/;,>!T7,R$O''F9%T0)&1<&,68-;G731 M5HN/DHK23CTSU5N44NX;ABS#=5RL,0Q>M>(0PZEDD1-6D7%C?G7(LE%;BO\` M'/DJV494;,#IJG2SL%XW.C\5;7=:@ODZ:ZNRFGBCQ\_':1T7= MYY,DE]`CN^B=KSMJPN+.T]B4=#6!84`H!0%;O^W9&X;7)BP&(2,P.C(77$ZCFK7!/'OK?!95M) M5HY_`Z%R(CBG*FBDC@GEG^#\\L,:R*55(S(";<:W?:3(@TIT!G10>BD\$JR1 MQPY#RJ2\0C=6!@X6XZ>-6_*0@WM\OV..D)R45UGR)&R54^H4FB,:B]N8O>J+ MM:B#PO0F;+/CS9,F+'\*8$6.%#Z>NZ3Y,.1##%.CK(5#%I"ZD<=0\O][4OMJ` MZR3-LZ*7`S%RL>5<:08<6.WH#2#)%:[NHX&]N)YU5]R:PU)'`O<'-ED=L7+4 M1YT8NP'NR+V,E8YL:JI6Q:MO#)GA6$K_`.;%A[:$F*`'\?90&?[N%")0H2!P M-P*$05\VVRQ2'*VYA%.3>:%N,\/%>PCV5%\+KJMA2WJ2^-R>WM_/7.MRYJR,>#(C]*>-98^P,!P]G=5UD MLG,D-)D'^KNV#W#/&>S3/(/Q7K==N_F'_H9_$@=GR(?/BY\R..0E;U$/@;W( M^BI_)7E?[!XXV8&[R8["/=(?0)X+DI=X6/T7(^FH>!/6K)3:+*_!2..KB+<; MCP-<]JM/4O*,W/YO"HC0DYKKGY>=,=;;8,+>\>\J&^)G1>3)A<<0T<@X\#QM MRK?!V;8V5=3Y1D;UUC\L6(?MD/O'VFLW M9^I:#$V'C3\)$%_TE\K?A'&K5NUNR(-'PF;!PQ%O(I MKYVWW'TE5[38>(Y?36;V+IFWJ?+WK&Z'VF38U63=&SX4Q8I7,<3.T]OM64J= M`^L+\17T>!^Q'SV=>]E1@[UG1[6F/Z\@ZFR,O(@WQI68R09(0%3"HLGIZ2-' M"UO&]:F1ZV7K;>-O38$R]SCRMM.+!\1,A62>6:4R:@\0^T/N#25\;T!K/S/W MX9F8T.3!+BSX,V9C,S*?2,61%$+QK:1!ID)(DXT!VO0^_;AN.1N.)D9D.YQ8 MAA:+<<<>0F6,.\9(X'2386[.?&@.N%KT!F@%`*`4`H!0"@%`+ M_2I*TP_<99OM-ECR]E=LG$T5$O2NQRYDF7)&Y,K&26$.WI-(18R:+VU<:FQC9GU'6#"+(0;]@JW-E3S'T=L$84+$RNKB57#MJU*_J<2 M3VOSI+#1)SNG]JS\^/.RHRT\>F]F95D"&ZZU!L=)-14F(,3].[7-M0VLHRXJ MD,A4D,I%R""#SXU)$D>7HWI^5X7D@8B&-8Q'K(5E3W=:@V8TEDL0=&[!!/ZZ MQ.9-6J.[L53[3U;*I-K:J-)+< M40CT7T_Z,,(B<+"2VH.X9RUM0B.GS$(RDI; M47$WJ-K`8:2BF_!=/"IY,AU+C"P\?#QHL7&71!"NB-!Q`%[]O&_&HEDHU3&^ M?C#]K(?R4()="PH!0"@%`*`5#8-#YV.E^.HCZH%[FLK9ZHT6)C&G>8L630/J MU-+.Q%ZJIOK4H*`4`H!0"@%`*`4`_'0D\Z(V(#@$$V-^P&JV4[DU;1\]W?J3 M.Q(-S#8Z+/@Y(@EB!)88\EM,O/EQKS\V!:P=V&TM&(NI(=O7;H9U'P.1#)*\ MZ`L5"V(N/IKDQ**J&;YZQ9FS=-[@?"W"%71LB-BF-"`;MH\Q!J]Z2MRM+P]C MSM/6T$LR^O:")H87$PN5URJ&*L?JV/?5ZZ+0ID4[G4Q=7["46\['4XAN4.G6 M>`X]Q/;7HTR34X;8VF;=\S)%V>2;%B9YCQC4^'A67:?L)P)R<=)TNF[:]QR9 M\G;LG+18R,]\QWG**VM,:ZE0Q M4H2&8%[6;E>U=F"O(PSWXE[+T1LDL3P/ZOIRB`,`UN&*@CCXC]JHKLX(Y^6L ME7LGRWV+!W'(RUFGFF$T3*7TCA#)ZR*=(')CSYU7X_)-LC)63\N]DF+^G/DX MZY!<9R1,!\3&YOZ&Z-Z7,\E3!RMKFV%][&;]UX&2JKGQ*JV,BD*43AS)-N'.EN6/ M(Z/W/PRJKIH6^V[AL&^[8\>(RRXL-L:2&13'+&P%@CJUF4VKANKULW)>$]"1 M@;-MF!M[X..B_"W/JAS<7//43QO;E3G9N?)*JH@K]MW"0=1Y6RP222P848DR M8Y19HQ)^J]-N;`V-=.77',:F=93+\68,H8,!=2.?/LKAAK4VT*G\XS96WY(E2)_2DO=&1_P!! MU/NL:IDQ-,E$J+*AD>55;2V.WIRZAI`)%["_MJ'5DB#,Q9YIX(95>7&8+D(# M/#A[;'A6N+*ZOU*NDD8Y&Z82VRHCGXX]V>$6D`_;KV_16SICR;:/T*2T!U'LQ3 M5'*\W&UHD9S?NX=M5_$O_P#&3\B']8,3^;Y1/A`_YJ/J6\Q_NB%EJ/O_`!SR MQSGVW%5\@BYN!%EJOJ$K(AO% M,O!T/M[1X5M3*Z_5%+*=MS&&V>-466`Q3W,E3[X_<]AID57JB:IDNL2YCMH0 M9O4R2>64.I5P&0\"A`(/MHK-:HAE8I.U3QH26VW(?0@/$P.W83^B:Z]+K7[C M+CQ9:_BKD-1:B8.<^8O3V+U#T1O.S9+)&N;C2+CM)P'JJI,9X\.#6KIZUG6Z M:16R4'S+Y)[\V[_+[!BGDUYNTO)@91/%KPGR_B/"OH+^IC!W=5(%1!,&/::0 M('Y*GQL$BH_[P+?_`,%_9J\^T3J6<,#+#$GQ&*2%`_S@?O:\J_2<[U_W/5K^ MQQP>O1)'Z[%Y?S@`#_R:J^G:-T37]C0[3IW&C^Y,5)?3FT7<,MG2^LFZFO7Q M5BJ4GF9;\K-E@,##]Y&CZRRW478;/#_I3";E('+/Y@?=%5KVK&CZ]32K%9,7%1))FI`H! M0"]NT#NN;?EH"+)?[TA!Y"-^/X*%62J$H?3]%"1V4`H!0&&O;N!YFID@@9$[ M9#F.(D1IQ9AVUQ9+.SA>#JI6-3U@1Q$NRKY;^4GOJV"J>Y&:UB:#V?DKH4;( MY7,ZF;BU6)D4"%[4),C4>5`8H!0"A#%!(H)';P-CW4$F@9`]4PR>5VXJOZ0' M_30$/.V#:;2BK9_4]"V7DEZHDOTAM>>6SL0L1,QD^(B<'4&%CIX5I: MC:V*?+J0)NF=MQLJ%9@QP9HXX9%/(O$`L>JW*XKBN[T<0==8M4M-OV+`R-F; M;,21(HVL!2!>^O\`%7I8+&<_8K*+8'\5> MD<2(N-Y,G*0\RPD'L(`J"2=C(&R!?E:]>?\`L\SIA<&^"G*Y8U\=9ZGJ(P>= M"0*$"@->9$LV'D0N+AXF!'@16F%NMD_1D64H^6[2\>Y=(973\6-%N&>F1ZQP M9F],N@;5>*3EZ@YCA7L=[_S5?T,:6\'I.BNJ-R5?O*!SMR-DR8F/E3`9(9\9 MTB]=XA'K(F*E>'"N6^:J>II!B3H'><)(Q%@MF[7H@?<=J&0ZG*E4`.VHDD:" M+^-%DHQ#(F/\N.N5W2'=&G*/!CQPQXHEN$)>0JS-]V]7KV*1Q*NL%7@ M;/U%M/2^=O#RRXFX8PC^#]60LF1G*2GN^(V MPR.F?!E0Y6=D!QK1K%I60L&!\QL.%<=ILO(F^]+Y2+'DM"WK$`SOC1QP- MY;<5=#1YJ^H@Z/H7IW,VC<-YDS,/TI,XQ2G*5RXF-B&7]T+5EV;JRT+([#\= M``'::LD_`D@[=U!L6Y32P;?N.-EY$)^VCAD5F4^(%3;%9*7 ML0F3ZH6%"#0,W".8<,9$?QJIZAQM7VFC]+34\'N0;^?'M//AS\:@L#00>:$& MI,W"?*?#2>-LN)1))C`W=5/)B*M\;B0;)I88H6EFD$<2`O+*>"A0+W-0E+$F M()X,B%)\>198)1JCE0W5AX5-J\7J$S8IXW'E]AJ$DM43HRJ;;]'+Y'![BIJ+=6Z+JZ)RLK`%3J4C4K#B"#6,-.&7D7-KVY4V!FJEF*%10&/Q M^%2@:LS%3*Q)<:3BDBD,WCS!'LJV*[K:61=:&C9\J3)VZ-Y?UZWAF_=IP-:= MBL7A>2,;DY'YJ_,H]'8>#A;7C#IU?D;G9"UH/G M+_*#<^I)FW3YA[]EY^[2?^ZX,IAQH/\`T:`7O;E>OD>B^G^ MD<"7`V.%HXI9/4F=VU,[`#C>I;!/9CC[D+F\64ND#NE7D*O534S;U)@-@?QF MLD:&C)FR(F'HP&53SL;&K)25=H-7WGIXRXL\?]YJJ_QOU*_(5?Q+_P!>/6^' M>WW+[EO/:_/34\'L6Y+ M"0:0Q*N0OF6_$?CK4DE_\S>EOA,C):254Q])$>D%Y%D)"-&JL;@D=MJ`W_U^ MV`9K8LGK1&,:/[*&;27,$C`FT@53<VF5=);RL#0%V.=`9H!0"@%`*`4`H!0'$]0?\`%^9_L>'_`$N2JWV)15CD M*R)(6WWCGS(1Y5CEU(AXV#_]5:9/M1E3=DMGA641-(JRL/(K.JN;=RWN:S-( M/0!/8?&W`&@2''3?ZI/`]WA0DR5/=[!_T4!@"]CR'+CRO1(EF_'S9H@`#=>Q M>?"MJ9N)C?"K$@;L>V/B>RMUVI,7U409.PUM@[$*&4R]>=43AFP6XR6KI6>FYS/"S4V>[MH@34WZ59/L.SBIHL* MJI9Q7S&AW?(W3IS"CQ4SVEGG,N`TAB1E$:E?4=`^D*>(N*.V1N$6KP@IER^L M>EV&#F[C%CS8L'Q&!AF,Y(RC(W'#67R_JQX=M7FY1\&6F+NG5&9O^Q9F9N;8 MV)/NV5BG!$&D:(0RQJ[7\VH=M3+*PC3U-NF_S]8#=]MQ,B7:>FWC@E:-BL+^ MJ07ZUZOCA3<8\A9\+G'&ZPLG&QNY%ZGD6X(\Y?6?5 MV'G3B(C&.:Z3Y&0RL\*NH-H5N!;7>H;*\4RUVWKOJ*;JR#;L^5/1RHHQ\-CQ MEA&[1ZFUN=.GB.ZL,N;0TQXM9.M#,"5!]X\;>%<`\:S3>YJZID;.ZUZNW#;ILG#F@VR#$GPHY@8RSL9I0KE7-K(1QJ[I"W'J[>]KW&;`P# M!)!AY";?!M\]VRYO(S_$%[_(@]XKKF3DDK)LC+?&E@G$D4#HPAF47> M2XY'NJ+$IG,['@;_`(VW[)CXZD+!&\>;AM9;ZV:S@_I5FTS5Q!XVK;^L<*/: M,2+'GCQ\?1\2MP8])#:K<>^U1#+:$+CA)KU,-U9' M#EI#D\9),.7%/_BS>.3]C\=;&=^TI.!FO7^\L:^/@]A MGB8GTFMQ-N7=71U*IY:RM),LGVF,<6A7C?ASK3NV3S6A%Q MK<01666KJ]2];2;_`.ZPJCK!,"J@4`H#F_F/#B9'0N\XV9N8V;'R,=H6W-B0 M(B_E!)'&Q)L:Z.KI=.)*V/BO1>W)TCUIT?#U+TWB8DV1?"V;J78\C[+,,B`* M;4<.?H9U)"_-3YJIT^_5DFX83;;B=1G9WVT8X#S0EPMS) MJX$#EPK)=?%,1[N,EI+S>_F#\P<_/ZRW#8=QPMKVOHF01?=N3$'?,95U2F5R M04!^I8&JXNMC2JG_`&')E!+N_4_47S/AZ@Z>RTV;-SND$W"9IXO6T+9)-"H2 MO-N%^ZM%C5:0]N17DRWVSYJ]<=3;=T1L^WY.-M.]=2Q94V?NTD09$7$=T(BC M)`+OZ=^=4_&K6UK%N3(V7\V_F#%L_P!WQ9&(>H,'J.+8LG33W\: MO\&%M?\`V(;9:;IUIU)%UKU3E;%@X;[M'TY@YN*TBA9&DFT75I&(#!;^5:SI MBKP2\ZOV+J38C>D1)IT/*KQ<[-JJV M3KUK:KKZDIR;/EEU/UQLG_+K;,W.Q\S8>I,&2./"2`*\!A0LI]6Y+>/"G8QT MLK-?!/=QM;LM7C/>#5`'B`.8]T'NIN05.0>7$SOLY!V+.!Y M6_OEX5UXTKT?K4S>EI+2Q'/GVCM'A7'+\FDB@%`*F0:I<;&E(,L,A6=/@-@R3` M66?)FE4_M6;@1X5T=C6R7HBN+0^.?-17V'YY=,]3[BO_`&)FXS[?#DGW8\E@ M=*GN)KTOUUDZ-&=UJ=[%,)@UN#H;2*?>![S[17=:L&:>I['+G8^-5+HT9D!F MQG5?UJ^>(_MEX_DJU7J9W7D]XN0,C'28?6'$>/;2]89:MI1ZEGBC*"0Z1(;* MW8"./&H)=CUQN3?CV_\`14-$%1_W@_[E_9J_]06.++#\+!=UN$`(U#A7@7W, M3WZL-OUB^VXL.%1Q<;!%_!T[B[_TMM^+E$&"*<9#1,H=)/2E+!6#=AM7OX?M M1JB7O/0^S[E#AXJH,7!Q7=FQL=517$BA67A;3RYBM22IV[Y8XN'BG'.3&0)( M7BDBQ8H7T0%BJ2,G%[ZN)-`2LKY?^OEYT?WG-'LNY2OD9FW(H!>:12&^V][0 M2=6GEPH"1TAT5#TZ9")89G,:P(T.-'CMZ:6TZS'[Y-KDF@.G'.@,T`H!0"@% M`*`4`H#B>H/^+\S_`&/#_I(4>!J8(-C]4]9Q[Q.-3Y.0V M(S18L<+".-Q&"K/J`!N>ZD(2C3NG4V_)'C1;9NLV3M[ZWFW.?'DC9<@:;0*% M4L5!)'*U-"46$NX=93F3)FR95]208C821601OC2N\B,>-]:K:HE`ZGHQF/2> MUB2:2>18%$DLH*R:@!<-?N-0X(9<\*(F2%G6;*P``-7JZN'&R]YK3%HF8Y-; M$J2>&(_:2(H\64?LUB[(V56C0VY;:JW,ZG]S=O\`S0:H\J198K-'A=\Q8SZB M+.P3CJ1#^R!4+L*NJ)^!D7:X]XP,B3=%/Q2Y`+2837]4H3>X8_6J^/-D3YK; MRC"W5H_.I9X/5FV92+\;$L&3$Q812KYHO%21P/B*[5W:O6#%]*R>CD]YG5VT M1N@,+9$?J`"8*3&CD'S`GZWB*BO>H]$+=.ZW990[CCO&6T^1^(*<58'B?^FM M*]M>3*W7:9%W5\7-PY<,QV@F72Q0Z&%^U67B#53)/JEGX"Y+7)/"C["2(6)MFO<-]Q]RVS3B1J[32+&H=>*N#AKV^!H<.-)/>-W;^^-^/LJVQYWJA=O2"4F7')&N/EQ++& MS`@,+BXY&U=>+/$)G+?#Z$[-P<'.A./FX\>7CDAC%,@=;\QP-=[2:.-2C,F! M@21O%+C1/%(%62,J"K!>"@C]KV55J"6VSU)#CZ%655:-"&0,`0I7W2/9V5+2 M@.T%++C;5-NAW"5(VRE70,M8CZNGNUVO7+?#9O4Z:Y%5%CAX>UF!3CP1>GQ0 MG0`=).HH>'+5QKIK5(P=VV:MRQ-G<:,G"@G<$.@DC5K,.`/'MMPK++DK5&F. MEFRJDV[;9LM\R3#@;,D7TWR#&OJ%/T2W=7FNS;D[56!/M^VSQ-'E8L,L3D&1 M)4!4Z?=O?@;=E)4;EX?H5>*8-OW1Y!EHV.?U6-""54=@TJ-*A?#G6=+Q;0AX M'$LZS#)S;97:D/0L+FYN>/`U:&5-4N+&]R%".O%) M![U_;4EGJ><25YH`7MK6Z26%O,.?"H$&C=T5\&2,@792J`]I92*Y.Y'`WZC] MY1[-,WPL`'%X#Z3CM!7@/Q5Y_7MMZG?V*S,;'4*;J.\\:]I,\B-8-.7B"=3; M@XY'O-99L*LOJ:X\SJX\'/P[GM[YC8/VIE28P-DA;PK(`28V(XJ1;GRKG74< M&K[*G0WXN?"DC/%-&X1M#@.ILU_=X'F:PJ[4?T-;5K9$K,ZDV.%3#D9"ZM`> M2,$$JK,5'XQ:O4HN53ALN+@D0;QC8NWR9TL@>##4L\J$$-&.(86]MJP[&'Y* M.K+4MQLW=,#!P)]M M(M]:_"E:6M:'N3*2T(./U=M$H19O4Q)Y)!&F-.-+EB`18^Z00>8-;/IW*K(C M9!U3L\N=\%ZNB>S:R_!5T>]QY<+U2W4O"0^1',]&;AAQ=0[WKR8HX\B5FC9G M4!B#;R\>5>E^QQMXL:UF"M+5EG<#)QR0?52Q-AYEM>UR+W[N->/P-7^"P^ M1&G)W[:,<0ZLN.^1*8(I%=2HE*D@$WX'?QX? MAJ=?0B48)L;?6M>Q[JB8<,0:-PVO"W3`GV_<,=U6B%0E-\J M^B&V%]A.)(=LESOO22,R-J.5JU:]7.U^RH_+M,^8@G@:.H/E#T%OV[ONNXXL MHRIP@S4@F>*+)]/W?B(T\LG]]2G"WI@#L9;#S#C45[5U_O)'$B;1\H>B-KCS5A@R,I\_%.!/- MF9$D\BXS"QBB=R2@]E:7[E[1/@<2PA^7O2T$FPR18[ANFD:/:/M&^S5UTL&_ M3X=]4?9OK]28.CO_`'"N?S))BWYJA:`U9>+%DX[02^XXX,.:D'@P\0:TQW=& MGX*VK)'VO*ED]7$R1_+<0A)>S6I%T<>T6J^>D>Y?:RM'X)Q\/I%80:0Q4`4` M(%$`>-QW\_\`IJTZR0U)5.6VO*3TQ?;\N18RO^2E?M'@:ZE_W*QYJ4GB6G&Q MMQ-[>RN1&EOH*B`9H!QXDBP`XW[/$U9*2&RKFFDW-OA,5M.&#_*?++;'YOZ[ZIZZ^;*;QT]TQM M.)_5G`S/AUW?()$GKPF_J1GZO$?5[*]KJ=-8U,F5G)]$V3:-S@V/;X=RR@V\ M8T"1965"/(Y06&H&U^';79\BV:,^'H3/C,F"PRH"\:\\F/BOTJ>/XJE53V(Y M-;DQ'C=%=#KC;FXX<#63JTR^Z(>W$Q-D8K>]%(SC]LLAN"*VR--IF=-'!+=$ MD0I(H=3P*GMK%-FCJF1/Y;B#TUC.5`/<(-G4=W'G6B291MK8J_C/_KCUO1DU M?<3,QLO&BRL:02 MX\RAXI5-U93R(-`;@;T`H!0"@%`*`XCJ#_B[,_V/#_ITACQ'?6^/ M!6R,;9'7ZGC*.+CQ%Y,F$IS`#!R;=R<;FL[4K769-Z-V\05XW3R-^-8U>I,QIXLN-&@99(V(\HMP)\.RM*VDS=6BZ_JS MNQ9;,A5P"7!N`?SUIP*R/ZK;H&*G0%`+:AP''CRIP!4NC([1M;4O!NT#\%1! M".>6>?/ZFR8()3'B0P!9'%N))/N'QJ6VZJJ)QPGR9:Q[5M\8X0*Y[Y//_P"= M>L?CJ7^5F]((4-XXD0_M5`_(*O50M"&V]3;J;O\``\35I(%^-^WO'.G_`.05 MXCBRMS>8QI(D">EJ(U:G[>?=5[57$IR(`:0+$7M]-,= M5QV(O9R>#M`4L^+E2XVHW],69+^`:]JYOBARF=*S>(/1Q]Y5?)FQNP'`NEO_ M`#14-9/#0YT>Z,:MW]+TY\2')1QI?0Q`(]CFDW6XBCV.'ZMZHFV;-Q<+;(VP MLQ+RR`HV0/37];JT!B"W8:Z,=E6D)&#QQ;H&'K^C]H%)(XC5;NK3 M&M816ST/3?-;$A@A?,V^6%V,:Z2=(TZBDTH#<=,:@,?"J0Y9-?M.LV7<_O3: M8-Q$7I1Y-V@!()*7X&XX<:J2R<;_`$7X&I?J*O0N,2;U(`>U>#'QKU,-DZGF MY*N3U+E0Q>\>/:*EY$A6C-$VXXX6ZW<]UJROV47I@;9Y732W6>\FV!U;)94&E&4,PX^\>(KK6JDYK*&5N29#._JF[@\^RU>3D4V>IZ. M)Q4U$V4L1P`N;]P]M4NX3+T^Y%9MV!%FP19.5KFR)_.%+L$%S8>4&U98L2N] M32^5UV.FQMIV_&C\D2+I%V(`'(7)/_37KTZU:GG9.S>S(>#U?TSGSC&Q,Y9) MS?TX@I77HX,$OP;3;LJ]LJJC/X[/R29-S<@E5%B#9B1V<*Y[=ER=%>OI))PL MF#)Q8\B&598W'ED0W4F]CRKJQN5)RWT<(QBC3E92#W25<>UN=7(&9C2SBP*Q MQ(#)+/(;*@':3[*X^WJH.CKK4K\';-MBW2/)7=\1DW!!Z$`<`R,#;4G'CW5R M8L?"TG9DM--"W1\:2-YL7(CRHH6,C7*FY/.OALM2,=RQK@7/ M"]S;D:J^Q5."WX]HDYF3I_?LZ>25&APQ('$N5"S:[P MM:NFF1;G-:L.&3\CIS3)B_=<294,:R*<7-D>5-4M@)1K)'D`->;WZ-S?_P": M&^%^"-_RYS7VN7#DRT&3-)&),Q1]HL4,1550GEYK'A7DU_85K>4O7_DZ[8&U MN7\FT[E'TS#M^-%C/D1@+D02#[*90?-QYAV'&_?7'3*G=MFG'2"A;HS?)8(E MF/B?AH)':1L831JB@2.26TE;\_976^WC\3LC/XF8?H7>D]5XY87+%M49/ M%DD`]0"_#ZHJWYU&]B%A9QFV[;DXFZ;GA)AQ9$\Y='9U)2%#,A=E8>5;`5ZV M;+6V*CG_`$,%C:LSLX^EMX0#&BR<41(TTV"^O4\VI&C2POR6,VKR;=JLS#-U MB9KP_E[NNN=\GT0CJ[IC4V<:JC)WZI:+4BN%IR28^@\['R1)B_ M#JD<2*(SJ`:2*Y77I\7-1^;1[DUQ-/<\;=T+GQ1@3QXXCA288F*P#:))+!-9 M'!](O8GC3+W:^$RRPOU.@QMK7#P<.+$S8H>;- MM>TTX0C>K[SBJ)6MN<;C@8BJ,I/+G8%35'7'=_\`3_)"Y(#^L1(F#P=_PH!X M_M=?NZJG_M;0Q%MP-NR,[3)N3%(N<6#$Q"KXNRFY/LJ/E5/LU)AVW-0RLC:Y M9,,PS94-M>"R@N22/U;MQY'OK7XUEBST?DAV==#./L<\L2Y&7DS#/:[W#^5" M>(72.!`K-]A)PEH17&WJS;ZG4<0N^/CY`7_&(S*2!W@GG1UQ;[,GG9&8=\AU MJF9#)@2/P4R^X?[_`-T5%NMY3DGY/4L58,H9&#(.3+8@_37.ZQNC3DO!GMM? MQHTP8-P+]OX*K(%^WLIH29_->F@DQ:-^YQQ!K7#?A:2MUR0P,WX MJ%BP*9$1]/(B/,,.1]AJ,U.+T%&2K_A[N9K):EC'#ES'::LDP1\[`CS#&)9' M$*>_$EP'\">=JOBR<2K1YDW'9L":+!GR\;$E9"8L=Y$C;0.9"$BHKCO>TLF4 MD?$>H.K.N_F/ON[;3T9NL>R]'[:WP>7NOIZWRI;$2B)@#P[J]KK=2J7*VYD[ M'5='=*;?TKT]B[)@LTD./J9YGX/)(QNSM;O-==B$77'AX<:2&9OQ)',\S4,( M@X0]'*R,0<%8B:!>RS]B;V_O>55:BL$I:DT M6L+]W+O%4-$+\O98BH9)3\?^8-[_`/Z%_9K2%Q(ER?1L$@8&-?MB6U?,7^XW M1O'.LWL&<]U)A',Z3AC.)D94:90D=L,K\1#HFN)8T8,)"AXZ;<:^HZW_`(T8 M6W.;P-EW_<'Q8,N'*;:GW(O/E-$V)D9$(C3CE1IHMW:A:];E31+MO4Z;?!%N M&-N.0T6)Z6S&`.6BRU?B\^BWU=-F?A:@-N)TMU/C9.5ND,,Z;]-N;%Y%++"T M9@E%[>YH:0J2UN=J`U1;7U-+C/!@P;ECEX,5=^DE$@:;-^*C,LD&KF-&KS)Y M=-`;Y^F^H,"?-DV^'.;T#"+,[CX23&2]@Q(*&4M8\[]M`,+`ZHQ^H\&9\ M3*R9'C2*9)$E$<,;:@S)*"(=(^M&RE_&@+'Y<],[ELDFR)Z.3#!-M3?>B2EB M@RU==&I6]QM);@MJ`^DB@%`*`4`H!0'%[W$TO666BD`G9X;7Y?YW)3CRT(M: M%)$^ZLO4`=(Y=M3^*_4S^=>AY;;2ACX&J_BV\,E9Z^A"W++6/%;:H7]3/ MG9?51./IQ\R21WBJWMQK&]BU*.UN6U3S%A8<37B@4-PLW/D+<";U@E)M\K>B M),4TL18QMQ/"Y%S:MJWXZ&5\A-DH).UX(P\5$(7UW\TS<[GNOX5$ZDO70EU!`J210&O(F]#'DFM?TU+ M6]E37`+4#2/,CJD;2-Q""]$FR&TB!MFW8RN^ZR0HVXYJ:9YV&KR M'G&%/(>-:9K>Z$4QI[LYW/\`E=LV7O,.8/3BP(F]4X:*RN7M8C4#ILWLN*S1 MNK$S=^C-A.WRZ$>)?3]%%#$Z5+ZUTD\19S?OJ*X[.VC#RJ-49BZ*Q4P\;%:/ M&FAQ8I(H?521F"Y"@2@L6XZQ5>-Y>I96JZEKC0;MAXT6-C+C>A`H2*%04`0< M@+DU#>1$KXS;CY_V@@R8CC3MP2_%&/ZO,S8FK2=^*R:-N9@8<*0X^X;GCX.7GJ5QH93YB3RX7JCQRC2KAR9 MVO#Q4Q2^V[CC[@-O^RRA$>*'\-:8J\6BN7W26+,LF-(J'5ZDJ-.+TAN,V=AF3;YMOV'U3(^W2Y#.WJ+`H,A8$'2T@/"JY*Q!>EO!W?R] MVN7:>D,';Y\8X-B"+5WXMC@R?<7,=QN,JVX-&I![[5H5 MDU;B8\C%W#;)U!7+A"HKG2I((NK-]6]_(UIAI+,LV1*HRX?2G93R/$$5AGHE8O2[=4;,/,](F-UO&>5CQO6O7S\7! MGFQSJ6@L1WW[N%>A,G$S3FXS30%XT)D4<#^:L3(]X=_(591`D^-]09N$8>N=HBRT3<119%'FO;NKW M;).F-^E3"LRSANE<'K;`Z@VK/S,'/]/IF#(P,2RNQD1L9Y5>QN"=7DX]M5R/ M&UIY)7(Z78NH_F?N4)ZJZM&FRW(O;@:RM3'52 M6ADF7J;YE2-U)L^/N$L4O2D9ADW'TA*V6\W&-]*@691S/(57XL:XMK[A)[Q. MK?F?'TWMV?C0YN;)/DR[1)'*J,=;NIBS`55;QHJOYO&HMAQSQG8F2NWV'J5- MUD@RHY6R[-\.ZY&TD8V0#=HF+-$X/>+\/HKHIV)TR:_P`&?"-C7+OT M^*!%G8ICS'8)`(^,4A/)E4>+$\A57U[+T)YDZ7+Q(HQ+--&D1%UD+`7'A67 MQ7F(<#D0!N>X9/\`F&$2A]S)G8*A'Z2KS(K18:5U;_V(Y3X,_X#B?P5/&8CKT*6K)IVW)F)FP\@WR<0@%SS>(^Z]7S44Z'X.>#AH,YDV_!W'==L@;1E;MBPDP(? M#AYJ[U^LNUN4YP5^9\XOF+U@SXOR\V%MNP'X-O\`NH]-=)YM$AMQ'9SKJP?K M576S*NY!3Y$]/9L#Y'4^X9N\]03G7D;KZKHP<\TB`-E3Z*[DU50D0D=ST[T_ MM?3VS8^S;7"(<+''D':S=KN>TFC8@L1_=>H`H!0&G*Q_6CN#HFC!,,@YJW=5 MJOP4C0T;0/\`L]&YR2,S3=Y=4-F*AD%/_P!X/^Y?V:T_ MJ#Z7#M.?#"D2Y:%8UTK>+_\`6K@M^MHWN6YGK[MW'LRX[_\`JO\`]:I_QF,? M(3<#%.+C+"6UE226`M?42>7TUW8\:HH11LD5H0*`4`%`*`>-`*`4`H!0"@%` M*`X7J:&.;JO-CD74AVB#ARY92="65V-R]^)U'QJV M)I-E,C;(F;U#CX'I#/QY8GF)5!&NL$@7/;W5K7!R4IF?RI:&[#WW:,P1&"<$ MS?J@PT$\;6X]MQ5;8[(E73)Q>(7U2("ILW$?364/T9:4;(YWB?3'*8Y!Q`5N M\7N14I60T]0V3-D/J>?UG-@6#`@=QL.52W:H@J(LW%W+,9HI->'@D^LQX+ZH M-N?A6RJ\=?JS.>3)C[AAI-#"T@,DX=HF!\IT6)N>SG6/&W&8-%=;&Y9HF*&U3AW,\BT-T#(T,1C_`%90%?94647U%7[3V>=1)H1MS75M M\ZCGIO\`X/&KX_N16^QOB8-!$1Q&E23WFPJ+*&R:?:>J@EH\3P1SQ&.4:E;E MW@CE8^%5O5/0FEN.I+V+-*ZMOG-\B)=<4EO?C)M?Z#PKLZ61?:]SF[>.?&--P$A5L9'NA*DBRL15;VXZH MM6LZ,C8_4^&EDSHY,&0<-4B^5OW+"M4:HY\O2M_5EF6Q\S'+1LLL=O*Z\ M1?V_EKJ?&]=#FK-'J0.JX9]RRG.63BI5K-=%YV[:X[KB MM3OHU=:$?I["7:;)@G,N+%A828WNM#"6(D?]N==4M=-:%FHT).)+,(IX M@0L:PRDL3R\A(MXWK3KY7LISE\.IOQ/F-O^=JPYLR*"#U8].\30$)`CD'2T=^V_#C49/L(II8\ M=+]3;Y!!B%MQ])LN35 ME9^-MBIAEE=H&8[B&4W>$7&@`@6JS;*<46/0&\[ONNRVW9?A\G!2)(<20%I3 M"Z76=I.%_4]ZUN%8Y:RI-<-H<%GN*@S8`/#[9N(Y>[7FY7#7\G?C\_P=%MS* M(74'S`\O"O5ZK1YF=:$3<2?BFORMPKF[/W'1U_M(_P#U@UAY-2SPLP,%B8?: MVO0PYTU#.+-@H^GF.3EPKN.5)!F)!+H0QI&"!:QM6EC- M;%!U%U3F)B9N!B2I'E))F8ZHE_6CCQEC,4I/>=9KDMAC(MHBMV':-BVZ#(?:L:.! MI5!N%556YL!P4<>('*L*.W+4MLBIV53E9>5NI#&+((3",EKK$!QTC]L:ZL^1 MU7!%**=2SR<>+(A>&91ID4HW`7`/#A7/7(ZZHNU)#VO(=0^%ED#*Q2%!N!ZD M?U7%^?#A6N;'_>NS(JX+$*W`&_#G?OK""\GFQJ`9L>5"4+'\%&2*@@4(/+*C MVU*K%#J74+V/A5J6:G40CT&-K<@>8\:HE'D08(0@J0"#P((N/P5*;7DJT0H] MBV>.3U(\1-9-_,"3?O%S6WY-XCD3P1.O^#\%922+TD'ET212CJ&5N!4\:E6: MU0A/,E9KOZ&;;19D<;_1:N6#0J\K MU,_/DV]7*84"JZU=-8I3D]WL9.7:"S1%1%55"JH"@#E823ZB\BRV[/,/QUAQM/VLF5ZGK3 MPL1P[^RIVW0WV.5^9W5.T=,=(9.[;JT@QXY(U41KK8N6N.'#NKKZ6*;Q)7)L M?)^H^I=Z^<.?@[/B;9F;3T-`XRMWS)P8VS-/%8E'Z)KU,'56)SY,^4H^@86/ MMF%?:,#"@QL*"-2(41=(')5;AQ-JZK*2B>L$T&RA0H11[J*`J_0!5.+]2PO0 MD5)$BA*%`*`#_KIYD):$+'!Q\V7%_P`7,/5A/B/>'X:TMJI,T3;WXUF:2*A@ MI_\`O!_W+^S6G]046V?-[Y@97S`DVK&DAW"!-XFV]]GCQ'1TPXQ?+N$,9"@D';=?J<`>.OT_+:@*#.^=&5G=%OONR; M=+C9$>X8&,N-DJAEEBRITC8+'JU*VE[>:W&@+)OG1BB#'5-CSWW3(W";:3M0 M$?K)DP1I*=5WTZ2DBF]Z`B97SKV^./&W9(\@;<-MSLW-VXQ(9TEPWB1HF;5P M=3+R%Q0$B?YW;=C;;N>5E[+N./E[:^.K;>T:M*Z9B%X)1Z;.`A5>-SPH#M^F M=]CWW9L?H/^+LS_8\ M/^ER56VQ**NPL/"UJRDF!0&.`]G(^RB\A(H>H]NS\K/Q)HH'FQL>.0ZHI_09 M97NH)?V5T]9PCGR4DIY^E]_DBQH&C1E@,;13J1Y5#EG\P^MQ][MK==FBW918 MGZDB+I/*&%&KPJ^2F*XD9F+:\J1AYF[]('"LGV%)?XWZGG&Z9WN+<99F)F9- M9CFU6]5"-*Q!N=@#^&K6S4918W);=+[7E;?M^0CQ>C+(Q,*'WO*MAZGCJ[>V ML MD-T1H))IHPL#LZX@<&.42<'C/@`!:JV[%8:@LL+>LD_I[IO/P=R.5EDL8URL\N:K1?%C:.FM;\_?XUR(W0U*H)8V0"['N`XU*4ALA8*^NWQ MTH/J/2I>PMX\*UR/2$9U1-K%&B(60/6W''QV_5JC3V[&*D#C^&MJ;-F= MMX)IYD]]8HN*$LP1<$'D001X&BT*LB;<3"&P7_60#[*_UHC[I_/6N5S[BE=- M":+<.X5E$&Q'R\G"AB(RYXX(Y@5!D8*#?A87J:N&F4MJC1M&1'+@PJLBN;,% MTD-<*3Q%K]E7RZN2,;T@GA7[!Q]AL"/TNZJ%TP5:W(A>RX[#W5!+-$N/DKDQ MYN*2,N(:-+#R.G,JW[!J'*:M7LC?9-N*QF&'.=564H![BDVY"G) MP/)B&:27%AT%3#;U%$?ZL:^-U"W'&JNS)@R00"+77D5Y<#V5$)[A-K8T[64V M[>!!%9,3-4D(.`69>[VK5NM?ADA[,CL5YT^I-ZD8-APXH]_*D">Q`;O^*NGO MN*I>6SGZ.K;]".`H72."J`%MW"N*J@ZK:N2#NFWY&:D(@R#CM&UVMVU+3F4X M,[UY%K*L$^/#&%5I<=;7(X$\B173EOSKINBF*GQO4U)C8+;?+C#$A$8(9TT@ M*QO?B/;16]D,AU]T^"!C=1;?%DR;9DX"';A*,:7);04#V!TE+ZM*W[JZ\%&U M'T,,]BTS=PZ?@S\3XJ6!7C#I#K%]!X`@6!TUM!AR(^Z=0;.KX\$,J2R32G&^ MS'$$`M;V<*P[%&ZZ'1@:DA[O'(,83*+MCR+(#^U!&L?@KR;*4CT<3ELMMN97 MR%=>*2+="#?F+UU].WN.3M5A0:]PR\9MP&.7`F9=2QDV-DYG\=3V'[AUTU4C M//"CQ1-(%>8VB'`ZB.=+%M.5DOD_!P_$S`%\G0"\JD=IKKPYE9G-?&ZB+;-K. MZ9&2,&`3:0KY`C`=BW>?HK?C62G)F7Z;V63=!N%@;KU=C9N8PRERY),+'97F+: M2OA>KY,3BL>"TZ'!;5UYUGDP+\%&^:V#GJ^&GIF$>G+C.TP<+<%8SYE7PM7= MGPT\[PBE;0CJH.O.K9NJ\7#@=)-O]3'C"RPF-LB.6-6EG%@=.AF(MX5R7Z]% M70M+(?S;B`ZDFW*//9,C;\)=.WOZD9(#,WJ84WM;A6O4LN/%I,K=>41 M,XYC.N(:&/J3 M[9U0'%M%K-@3J%[7KLKC;Q::F3LN1.RL+$S%$>3"LH`N+CB+\>%?AMPV_S89.5A_7Q)#>0?^K8\_8:LKUR M:/0C6I2=;['L?7G26?TY-E?#OEK:-F&F2&=.*$J;7XU?$K8;*T21S3T.#Z$Z MBW+&R?ZA]4I\)U/L\83'!X1YV*@LDT!/`D+S%>W*NI12(T1U4^+EC),^*ZI( MZZ)1(+@@&X8#LJZNMF4=#`AW<_\`O40/=Z8-.5/0<;`Q[R.4L#^U=/Y!4SC$ M7&K>EYPPR6XD*Y!/LX4XU?D3;T-V+DID`Z?)(O"2$\Q572-BZL;OR=E5)%02 M*D@A91T[EANW!`KJ#V:CR%:TUJT9WT9-^BU8HU8HR"G_`.\'_RBY"\*FV15W-^OTLV;6E92.5Z@%S]/=0`-WVMV4 M!C4VJUN%`9+<*`S?C0'$=0'_`.K\S_8\/^ER56^Q**SL%9$B@,>'>*;$U*'? MI<'[XQHMV+)M:P,Z*`WIO.205?1S\O*];X]%[3&SUU*N3/W/&Q,A]I,L>!BB M)((IDU,QE8GS`>5VA\I1;^ZO&]Q6>6F-(G$[-N4=1K]-6D M'F**6L`3>PX**Y*:N#=O1L^:I@[NL.?M\L4J1YV2F9FR@- MSDO5'(DVB;%\>V3!/,DB)&$8Z8V(!@)^K;N(JEHEEHL='TIE9V1A3MFS-*4E MTK(RZ%-K^9/K$>VN3.JIZ(WQMEW8W'"_?;\M8FC-&X1SMBO'$I+R60^"DV8_ M@J^/IH]#/+G]"]MJH"%[V[W'*&`@D=[D&U;5^U ME'K8F]GY^=8HOY%2!0$3<$<(N1$"9XS9?VRD\5/A5J,I>NLDOP\?V*AK4LGH MX8;9FVX\V0-;3*@IQAEIA[EO[I@G<&W'&*XZKMB01LXGR!? M4!%N2Y,TF= MNF9)M\V%*0`GK?9PRQ+?ZAX\.RHXH2_)(^9."XR=D:8L8,;'R8\C)^&^,'J, MB`7CTN.+7XVJ\A:'/QY/5V%@;%@XD.7BRXT4(15$A61)#8O9;J#;FK\J@,[' MI?<]TGW;=UW/)"X.R2-AID,5"SL[:UDN#S51IX5#A*1N=#B&;<=SQ9<>%_A< M?4ZS,+!V/E&F_9XUGAJ[Y%Z%[V5*SN3=TD3*W>+TC=,%6$C=A>06L/971V;* M]X]##KTXT?U'YK"LC7P#Q/AVBA![A?TYD8#@#8^RK8[19,IE4HL)L%7O+'[W M!BO817?FPJRT.598>IS.!TSM.3#N,4,T$N]2LS&>VHKJ_*!;BPJ^":O4IF:: MT(.[])[H<^*-OM(\V37N67I`15;F$OYA8VKI61&$%IM_10VS(BRYYX]&,_F) M#$`!"BM=A[W'LJMK*R:)HN+DG-S8`75KVOVCE?CWUX;I#@]:EM)(D29V%([; M=Z;1R#]3*3Y#VE2.^JTM:D\=2UHON4N^8&^YN7',(4%L>2.\3^<,VGEJX=E6 M5GO811+1E8N#U'CXT$[X.M,5I&6\GG(<'G8\+>%1;)!-*JVQ&P5RW=894R'P MVFCEE92Q4+Z=BI(X^]5?G1+PM&QL+,R\=\8HV5JADCQ83(4,1]1B"58@M=2* MT62K*6I9'T#9PT;8\;V5EC"%>?$`7`KHZ\*\&'8V(^!UQTM'OV1M+9WJ9ZY/ MI-&(I6`=OJ,X4H"MNTUT=E-T:KN9^N[.1/ MA=;>3ISXZ[HC6O;B!J\>9/*P[?HKVVT010!F`U2'Z@- M^)J&U!"1*VB?#SH#E8F0L^.[%4EB-U)7@P!\*\+]OV.-E6).[J8]VMP%:84N:G8B^ MQ3;SCS;GMLVW.Y@FGL!(.VW8?"O>R?K\:_[E7[4<'S6^UK4]XFV8VT[.!,HR MYL6(ZLEU!D8VY*QXVKQ:V;OQG1ZG;$(V=.XB8^TP?8I&SWE`50.$G'C;MIV, MC=V1C6A/^'Q_463T8_40%8WTC4H/$@'Q-9K(X@O!E\?&E9&EA25HS>)G4,5_ M4BSSMQD8\KECQK#+EM?R758-B8^-$NB&%(UO>R*!YCS;AVFJN[9:"-F M[9!D21Y,86'/QP1BY04%D!YK^Y;MK3%E:T>Q1U-F#-N+%TS8%C91?U(VNC^R M]1EI2-`FR5>L304(%`*`5(%0!0&*$HU9<'Q.+-!R$J%/PUK2T6Y%;*5`QL=H M\./&D;4RQ:'8>RW;49'+GZR0JPH-6-\%AKC[>KZ'"VA5^!:W,@\OHJ[5KS;U M"A$NW'Q[1R_!6#4:>24.R_XJ),M`J2#3D86'DB^3`DQ`L"Z@D`_HGLJU,EJ[ M$6JGJ1\6',Q)?AS>?";C%*3YD_:'OK>]JV4OI>;:;%'L=%L$VX3;#MLVY`C<)<:)\H'A:1E!>X[]5>B MWK**(G>RHEDB]!`/'Z.1JH(65]GN.),.#2ZHF;Z-0)K;'JC.VC)H%N/9>L9+ MMFG(R5@:`,.$SA+]U^^M*UDK/J;CP-4+LT9>*,J+TBYCLP96%KAARYU>EHQ^K8.O3%A5(]J(^?UE,N9%-B,Z9D M;:UG4$,+<>SOK-]AM\JFOX];UX-2F?H;'ZZ7_EQ%U+.R8\\\2Q0O*P"">1O2 MC+'E8R$$U]+AORJF?EW[#K+#GM1>&:>G?F++E[#@DPIN>_RY#X,V/ANHB:>( M!Y&60^4*J.IXUJ<9"P?FIEQ[3%DY>TS9$Z8QSL[TW1/1BUZ+:3[S>`H"TF^8 M2QNZ9.%-AY.',4R,74CZE,3RH=0X>8)]%`:5^9!GQ%>;`GV^<_"SQ1!DF:6# M*TE2-%['S@:>=`1\OYG9V3M=,^3!A-'LC8$&9# M.&3U?5E;28BAOP\:`M0U2L+>'&@)W3 M_6N%O&U[CF"!H9-LO\7"KK,MPGJ6CE3RO=>[MX4!0IU1U5#M.'U5D202;;F3 M(C[4J\4A>0H&5^V0`7/90%'!\P.NGW(/FXJXVU'XW)=XI(W<0XIB"(HX\?M> M-Z`[`_,+'3XO*;;YSLF"SPS[L"I43Q<'3TQYM(;AKY4!*Z.ZYP>I6R(XH3!/ MCJCLFM)E*2`,IUQ^6_'BO,4!5]2RI%U9FR."5&SP7T@L>.7)QL*K92B&5T3I M(B/&P9&Y,.(K&R==R:.3/Y>ZI)D7_%0F3#*KJ5959.85P&X_342Z[$0C)TF] MQ<-P92`1;NMRM27O),_0P56P&E?*;J"HL+=W=4\GN(,^6UK"WU;]E^?X:A^K M*SK"/'QF)#.J2SQQL2/([A6(OPL#5Z*&GX*6<*"3G,IR&97#(W)E-UY=]:=E M0Y&+5&G6UR-0#"VL#Q[3?E6&IH!<#AR^J`+`'PI+>K)@J>I9IXL.`+(T,$LR MQY4R\"L9%[\.7&K0"JDS,3$>`X&;+-B1Y$OJL]V7RQ:K!A[PI!$$=.I,_.EC MA>0*J9,1C>+AJC=K6:D$&(.J,W%QL&-665@%,Z27U6@ M%SS//LH#TKLON&QH#Q,@F1HY"=+^_?WAX@U-=T1=>2/M4\[X;,\K/9RJR$\7 M0_+\7Y*$FB?#Q)YX9IHEDFQB3CNW M'06X%E!H#.9)(,6;02"5-^SG0@W([JJG4PX<6!X\J!E)N^QXAV>2'$08OI%I MP5`8%G]\M>^HFYK/*I1;&M8)V%CS184,6-FSIC&-+Q^4FVD7L;<*MBR-)0+I M)DI$1`%1;*!:_:?;XU,:M^I7<]4`J0./8:BRTT#+7!R6>&ZV,R#RJ>1(Y"O3 MPW5JGGYL2W./3`W!!((,+(CV[6OQ40`&0NIF]6.%U`+(W"NAN48[.#`QNK6Q MCM\D>I` M;5$HAIG=9&`C91D!`06`7V>9)$@%F(\K'L-5QTLQDRJJ/$&T9&##JDF,PDMKU<0K#G8=QK3-B<3 M!EBR)LRHTJ40!%/U5%A[>%M_78\1[UCQ./BKP9,=B\5B;L.U2*5S*KU%L3ML<1L6P;K'U?N&YR[=E38& M\;C.Z96/D8Z0>E.+*SQL/4NO@:]/%;EJMCBRKBN/DU9_0'S'DVC<%ER6F?"R M(\3;L9)R#D[7&;DN;\)&*BKNC(5U$&_%^6W5T\*--+,DT&U92[6TF2Q]#+EG M=XU?0PU:8V4`GE4\'ZE>=2!M?RXZH:/;,O<\";*CP]RAFEVY\FY6P42SQD&_ MF(Y55II:EN2.L^7>\;1\O=@/3F_X\V#G13R9,PC#Y,7I3/=)2ZZ@B]]Z\']B MOEM-=4CJP.$;I]\Q,CK"?8/:*ZL7<:PO$UN97Q*U^1"WS*3X5\&,F3-R5TQ0J+D7(YV]T6[ZSP4 MXM7>Q:[U)\$?I8\47^315_`+5A=S9LLMC95214K4$>1F>81H."<7)KU.KAIC MP.]_[;'-DN[6A$CG7EHZ3!I`%J@&>RW#AV<:)0)%`*`5*4N`8N+>'?5N+]&0 MFF8+H!AG%O!ZBW'-CR8HMQ@CA&1=<=XVU78?5/&EL5;*:L#4= MW??B:A$F+=OXNRJD0.^_X:L2>)9X(;>M*D5^*AR%O[+U:M6U*15M(J]\ZHVG M:]MRLUY%G&)"^1+'&P:P07NQ'(5M3KV=E5HIS26A\4Z`P-WZZSL?YC=7Y!R; M/(.G=G8?8X\8/"4KR+'L->]CI7&H2,Y;/IY8FY/$DW)\:G^"QBA`H!0$7! MJ<+U(NI)8(8*PXA@"#]%4>A:KDR+=O$=U&B\$/(U8^4,RUH&41Y%NSC<-^Q6 MM=496T9,'/AQ!%Q[*S:-*[%/?_\`J!_N7]FKS[2).9ZP^6#;-D-+,OJ;7&`8 MMP/$J#]22W;7B=CI5IN?H7Z[]Y3/3B],GH5NQ=`??&4L>T0^KQ"S3LI"1!N. MIB?"L<'662T(ZNU^VI@K-M_!]WQNB-E3;-KVV6,R8FU,)8H?\7)(![SJ0;@- MY@.^OHL=.-8/SGL]BV;):]MVSQD]!['+F2YL!FPLJ5UE67%98S'(O`R1C2P! M=0%;O`JY@>,7Y==/X^"^$AG,4F-\&[,X+&/5K]ZW,F@-^9T/L65ESY^I63S6_1H"+C_++IS&QX<:!LA((H1C%!(+,BN'75Y>8*\*`ER]!=.33[ MS/)"S-OGIG-N;@-#8J8Q;R^8!CWF@)^S;'%M<$L(FERS*=4LN3H+-9=('D5% MM8=U`5F/T#LT4T'VF1)@XTPR<;:W<'$CF#%U=4MJNK&XNUJ`]2]![%(A5A*P M:/(BX.`=.6R-+V=\2VH#S)\O.G9Z:Q-DC=(9YL@OI4/.4+*B"RHNA4\H'?0%#OYMUAF6[=GA'_[T]5OL$4# MP2P.9,07!_68S<`?9W52KG0E%E^@U:V."%M(;(+_H]OA5K*EHDS::DD8S[J MN1)ND$D^0TF04DB'$&*)066UN=VX5%N+4/8E2RQZ3R]UR,O,.7)(^.$B*/+Q M\[`W"V`[JPSU2KH:XY\G1LJ,"K+K0W!4B]Q[*Y9.@\"&`(J+$H1;Z5"BPOX5 M,D&%QL93Y8D7D?*HYU,B#7-'APPF>2&.T2DW*BX\*57=$4L[!5[6;@!2)*V<$*; MY&O:F# M[;CL#?R`?@J,;FJ8R+W,EUH1`H0*`?3Q[J3X$@$KQ%[^%35V6Q6R1;X12+#D0*]#K2ZZG%GK[M#9E3M#%=4ULQTQI?F3_=QKH,C2N-DQL+@]'&Y1 MXM>J(O`(%[L`2/=X`D?34*J;U"L]D>TQ73!R)<8!3J#^F>$;D'C;N->AU%[# MB[,\RXQ)VR+*J-'.%!*=H'A6N;-7&IL]#&E&V2QB3-:X"WX\3^6O/O\`N,"6 M^IN^HV28<<1<;EI.U_#N%>-V?V-\CC9'7CZ]4<%\U^D=KS<*?=9)YT?V2R6XWJCBS==UU3/6 M/B(5$DA)OR6J=_\`9VY.E$6P=?26R45`%E%O"O!M9VPNYLH/<+\ZWPX^=H*6<(CP[)C'5+FHN5EOYI)'N0#V*H MOP45=YVK15PD56);L^3?.CA^OH[+DW)6T(Z;8L?#P]JQ\#"C,6-@(,:.,\P(O+Q_!7H76I1,GU4L*`4` MH!_<:)ZD-$+%MC94F*?U;`RXW@#[R_AN:TLI4F==X)A4&ZD74\&'@:S6AK9: M$3;"1$^/*?/`Y73^BA]VKY%)GB9,_9XU1(T/,D:2QM&_NN+&U&X#K)$CER,0 MQQ9-G@)T1Y"]Y]U2*U?NU1G,:$/C_P`P+6__`$+>_P!-9_U+%%U)\Y-SW/>) ML;:=;N-[$+`^;N^[-O$61EY MTN;M[D)-B36)"WL6%OK"M\O_`*_ARXVJU5;>J)KV+)ZGW#,ZPV?$V7'W@L^1 MBY91<9(%UR.TALJ*MQQN>^O@LN.U+NMEJCOJY4F[:^I]LW"":57.,V-)Z.3# ME6BDCDL&T,MR+V(Y&J$D\9N$S,@R(RZ`EUUJ2!WD7Y4!CX_"*/*,B(Q1\'DU MKI4]S-?A0$4=0;2VY_=PR4&4(A.%+`*R,=(*M?CQ-`3?B(!+Z'JH)@-7I:AJ MM[.=`(LK&FN894D539BA#6/=P-`;J`4`H!0"@%`*`XG?_P#B_,XVML\)_P#W MN2JWV)3*H$&W$'L`!O\`CK)RB=&8=$D0HZJP/-3RJ:Z$/4B'%GQ3JPF#1]N/ M)[M_VIJ_*=S-RC/WCZ/ES8SBL>*WNZGV$4^)>"?DC"YCQ(_B''O6X( M/:U:*I5VD)B-(WJ9^EY/J1`>1?$>-':-BO%LE`*`+6L.07A58\FB(>./A\Z; M%/N37FA_:_I_@X5=J5)1?<3:R1JQ4D"@-&?_`)G)]%`;^P>RH9#*_>R%PU=A MJ1)%9DO:X%%;6M"=D9 M47**L\8VZ)-*$(L6Y'QKS<'[)6OQ9Z>?]9PI*-[XL;.TL9].5CYG''\7;7JM M:GE5K2WT-,D-$7IJVU;]JO*UJK>NW\&=-#JPTB:@KA;\"I%_[KUR]?MVQ[+0T:DYZ M#:,+I39]RFVIGAUZIBLSF5?48EN%P+7)KJR?L[-:(4Q)O4XKJW?4Z7S1"F3D M9LVZ1"?<,5$#M%"UKR,2PO?D+5SXU=VYG1>U+IU9]'Q=VV>0PXT.5$)7B#Q8 MMP'"VOQ4_LU@ZV;DY]"-F=6=/8<,S@M2L+W)DF M-NVU*\$;9D/J9?\`FJZQ]IV>7PJJQWEZ"3Q]_;$LK1G<,?U`P1E]47#$Z0OX M118[>@D1[WMID$4F0D4K2/$L49\#(65D9E> M(V]1=)LVI;]AJ+XW522F63"ZD-;B.?C48[M63(NI1YC4K&%;GV5IV,O.[L1B MK"/1K`T8H0*`4!CG4IPY`Y#!%C!AAQRK+-/(N@,4-U"`^/.NJM?BWW,K-VT+GMX M<"3PKDKYDV\'P3<,@=;_`#XEG<&#`Z!0PQ*1IFER9/>8]Z>6O>ZF+AB_DQMJ MSNL0^EG96.QL9'$D)/;J%VTUVY7R4^3''HR9V6/,5DFXU-)U%22*`4`X]_#N MJ"31EXQE"%']*>)M4,G9<]A\*NK&=JF(%X'-@ZE=7=>I MKN4LI10:\[^N&CTS\5]R>E:_;>VO\%:Z;E..D'QK=>G-YQ=TECDC./FKQFQV M\I0G]'O%?LF#MXK8TYFOJ>;>K3U(OW)N;RH)R2S&P`N7)/E`0=IXUH^W2M6U ML0JZGZ-?I#>(_EKL>UKCRSY6%+!/-#BR>C,460.=,C%-+@>-?DW[//7+V+VK M]K9Z>.L5->W="[GDYN/+F83_`':-T.;\/GR#(R=/I1KJF9>K)&K(T"QF&296]<7(M8+:@+ MSY:[#O&SR9Z96(N)@OH&*CI$L^L,Q?4T1;6G$:68ZN\4!W=`*`4`H!0"@%`< M+U-"LW5>;&Q(!VB#BIL?\[?MJMG"#4E`(FP93)"CR8;BTJ#S,K#M%Z?=N4>A MO^\=O"!O772>P"[?X(XU7XWZ%N=?4]X^0N0&9%=5':1IU?AJMEZEN4FWA8%5"/,T:S1/%)=D<%6%^PU*9)Z4:0`.`'`?11ZN0*`4`N:`=MZB`1'QRM.:>YG$;&S%R?71O+ZY+C2.)0B($4N M;M+V,Z.L_>B9MS(V'"R$<%46'8;<:TP9/8C/+1\G)5;ILN,LD<^,S0SRS*&X M^2Y/.W8?&KWQ+)+\HKCS.CCP;4RMUP2!E*)L:]O4'$CQO7&K6H_=JCIO6F1> MWIMDBL+8IQUDF&X M^#FE-N/IM;N:O1QIVI#\G%D:5I]"'DXF1CREE7RAKH1QY>%?-9NGDQVY56B/ MINOW,>6G%O4D#>/LR?3NXKM_RZ55*U.+_#S9I/0D8VYQ2B[D1/XUU];]C3)O MH/U\F+'MY4(=P.SNKNSY5CHV<-*\K&.I?1EB7%19'W"$B3 M&9$+`,/JDGRV8<#7R"Q/(W?E&IZU+JNA4IM?S!@AB3!S(!#(#))&\8U1,S7, M8/M\,MY%+*W;\%=%M?S$W9G>3.ACBQY.`8L")(^(N`+5V._5ILGJ919 MD+=YNJ4FU=6.JI2?_B)PM6L7>#TG M!O`FFBSH&W>;*2>;.9=.48TB="O+ZQ<<`:S79\>!;$T;<#Y9[G)+BMN&-@08 M^*T,0D,1C]:0%0-9;\56OV%X*08?Y9[U&ZQP)A2QSL`^1+J$F$J9) ME'P]EY,G#VU*[*@0>E^4EL)8O2Q&R1@3XQG9/,2A;=E?45452,#Z3D8L,Z:9`1I]QU)#+[#SJ:W@JZ2:"^9AC5*PR,;M M8"TB#L)`YU?2Q$M$M&5U5E-U87U=_LK$NM3(N;<+7Y#PJ0.'8;B]KBQ^CA0" MYMXCG4`R?[O^BU$D3)!W>'UMO>RZWA(D2W$W'.U:X+ZF61)DJ"6*2%7A/V3" MXT\`3W5G>5HR4D]428X4DA)1OM$YCO%:UHG73<.S3UV-/T6-9+8O]14,%/;_ M`/J!_N2U^WG6D>T'=]7_`"^V/J>$C+#09?`+FPV$H`[+GG]->IT?V>7K:5FP%KJ`!6G:_<9\U>+<+Z>17&D=O MIKRBXTC\%2!:@!7C0#2*`:38B][T!@H"03QMRH#U0"@%`*`4`H!0'#]1ND?5 MF:SWTC9X+VX_^]R=U1;8%*N=B6!]4\K7`-A^"L7]"5'D\B7;=99"#5^ M&UZ2_4C_`$-IR\9AQEY,M^B'4G\%ZG42 MCU\3C6OZJ"W86`--1*,#*QCRE3_"%J$R;;_CH!:@,VH#'"UN%KW[ZB`0\V^/ MDQYJ\5/V:%K79M,7O"W&WX M:ZJXE;6#)W?@UX75$Y6-\7`$\TYB6:61[,9)2PLO'@!HJ+=9>&%D?D0==>H4 MMA,=`4Y174WO\M!Y=G;4/K$_*2X^I\^=RS,^?<,[ M$Q\P828*V0J%+,YXF1RW*,7XU;#1).@7J_P\F1\G%'I.N%DFC$>$Y4*C9((;@7X@(>7`=]476'S$OIG?9-U M.4I&M,>5P\Q\IXL=`0=HT]M4RX^);':2]-[VY^-8FTFG.'\BF_\` MT!E<=,B\,EO2<$2$\@*E45]&5M=K5%)L;K'E9.+$QDA4EE;L%FL/Q5Q=;VV= M3M[?]63=U)6"&7LCG1F]EZ[\.[1P98E$Q@"K*PNCCS*>59.J;@UGCL2,I]JV M"3$P)-K&5AY>-)DRY;L"!(MK1JA-^)/.M,=%786NWN4^3UYLF%C8F#NFTXZ; MG-D8T?PR2?9)#D:6274YYKJ`([ZTXILI"+W>,6/$W"6",_9#BIO<\1>WL%96 M29)"N+\K=U1H"S@GQYX/2FLJBUN/'A7?@SKBCCS87+^IZ@G))B=KJ?+'+W\. M5:MJ]8]3*J=+)^A4.K*[(>!!-_PU\?DIQLT?9X[\JIG@@'GQ[ZSWZ5MPK[/!5<%!\7F=ODM)JP=:>ICF_V3?9D]J'E6TF>Q%;J'8/^T5.= M%_V2+[HI/Z@$:@7^BJ.R>A9)K4D8L^#-MXS,5U;"FB]83KQ0Q$7U_@HJ(.SF M2)'D;9AP+N3Y"_!R+>*:WET]Y([*QIA5+27ODY*"?T[E8V49\N"590Q\Y!!T M@^ZK=Q-<'[BW_9->K74M<]L]<&?X(`Y8C+0HW`$C@3[:^:I6=_M._)]"KVW< MMU@V6"7=XK[E*X2.&,C4Q)LH;LOWU>N%7M%7_)7FX(6!@9.\9V9GY3&#;2VF M/%B8/JYV"<>/.IIDXV33(K6 M:,A]-;=D/#BR2Q018F*)HDC0'4[,;#U`>'`"N[MWKQ:7W6\F&)/='GJ3IM4! MWC:E^'S\Y;;#EI;6PM(OF=$GI.KD'N;238^VCI&I,FP MR1A])8`D7"DV)`-KV[JF"#T01S!X\A1U$@W'/A40![*@D<:D0.'?4,0#XJV!WG)B_SO;IHNPM&1*/ MP+X]^V>3_WD1$7Y*(&O*@DR,+)@BD,4LT;(DO:K,+`BK4T#/SS\G-RV[IG`W?H_? M9X=NW[:=QE&3),ZI\3ZS71U+GS>[7TOW+DC`^K<;F_&_/M%0)`\1>_`CL(/? M4:^"(D@Z9,`<+OA7N`.+1D]H\*VB44;:9KWZ3(.Q3R85VU:2Q2Y8I?S6MQJC MK!=,H:*:0#(T"TA5R` MK*1R(J8"9JR-YW/%BS6C9XLF:8LH"ZD&F%6L"][`GNI!)*7?-[>^2KA8HI,= M#CA+ZQ(2)#JM>B4%..I>8FO$R6P>!A;5+CD?5'"ZG\-7MJI91*'")RDH1;@1 MPO6=;-&EE*''M]M51*V@48*?_O!_W+^S6G]0?8JT*B@%`*`4`H!0"@%`*`4` MH!0"@%`*`X;J658NJ\UV5G`VB#RHNH\"7DKR?H/A3M`!U19# MB4,\RMZ<;194"JY%HYT`$9/9?]$FHXIZD*T:$F*7)6)`V, MQ<`7\P/9X"J-0:\I,C+D(XXT@]G&@,_&$<\:4_10&/C?_02_X)H&:LS*1\2= M7AET%&U>4]@N/R5:CU,[[#"SBV%`7BEU%%^J3PMPID4,FNQM^,7_`"4O^`:H M:'KXU+?JY?\``-20>1F1\_3DOVG0>5%J0R!FY6/N,,F&L$DF.WEFG=#I4_M. MTM[*UHU5RRC4FJ+9^G(L9,883E$;6)&#F1F(L2S7U&]%GM,D+$O)(@Q=E@1% MBPV15;6GE;F.1XGLJELMV7XU7@\#;]@$B2#$(>,!4LKC@`0MP#8V!-6>6WJ1 M\=?0]386R3+`LN.2F.-,-E8<.=C8CA19+>HX+8S++LN&D7.BM:TD62K!I;;=FR,@9F?$9LT_K);,!8$"(,9`JAAI8]Q![>VJJ]IW)=*^AAL7I]IDF]$!D4(@&KD!I!(![%)'& MBRW(^-&^%MHQV#P*L1"",%5/NCD"*FUV]RRK!O\`C\/CY^[L(M6:+&O)S,1L M>50]R5L`!VU()*7]-;\](H&><@@8\Q/(1L/I(-JI=PFR<:]Q7=-J1@.Q`!9Q M;V!0/RUS])>V7ZG3W+>Y$O-?>TEE]HY5VXON.*ZE&Z&42P1RCDZ@C MZ.%1919DU!6CADDO<(XLR\[5*NT2]R'#C[%#@G#AV?%," MN)8Q(&=[BGEFSX_6+MJ>4#R@<@%/(6'?7! M\MZ-\EH=BQ4NO;N>?ZRX9`(C;3];B/S4_+7H1^(_4L]LR\+<)1%"Y5ROE5A8 MDUU=;)3)HGJFI9PP,'AA#`M$_J2=PN"+5ZF#'Q1YV7)S9'W9%7*U*MM M8O7@?M*1D_D^A_57Y8OX(8';7F'IIEOM,VJ`H>)CKZ7]3F=\L,;#&T1;?(\+G&D2590L$<,(56B([+A>(J&F.2( M>-T;UB-G3;9D^,;U?5;,$FE#$6)7'T<@(_QWJ>+(YGE^A>IH9)OA\&;X1IVD MRXX9'O*S_J755(_5V-_;7G=ZU:J+'3A<['0X?3'6$>]X1R(F6&1!9"U^'+CSKQLF7&ZZ'5!UVZY?WINL&'C.$0ES&;V9E%UDD7]J! M=1XUE>O"KC3EN*53<^A2;[CY#[_!TWM.1+C8DH!R8U8:-)'GT\+BW,\:[.EA MKCQO/;:(7\C)EY/CY.IV+9L[:6@PHIXI=LC8!=2$36[`S`Z3^"N3JY+6S)V> MA-FN.QPV^?U^.Z;S!AODG",DGQF64;A&7'I+`@XG2.[G7T=7]#F.ZV3";_O#58&UX_4V7/0I++K@D7T\CLG<<./<<'>M%W>74/Q5/`L^O9>2PP.I]DS91#!DVD;W5==%SX7JKT*NEDM45/5FX; MJ^_;1L&'F2;9'G)--DYL05IV])2PBAU!EUFU^7*NS#1,Q;*+`^86XQ13;9B* MV\;GA23ME-FK\&\<&.@2)(Y^96^Y,>[IM6,,F9/6R<8SR M+$(,>((&47'F-VX59==$WQ?P83UWO"S^4NKKS'= M3!U9=B+6*[$^:VY86SX+Y<"YV6LKQ;GJ(6:)1D^@H9!;S<;E@+4OU$VRTG;= M)]0YN^QYF2^&N+@QRF+$8.'>2W-F'U?97)EQJNQ*9=RRQ0QF25Q'&!GT>QQ?!E+U.DZ8WO!WSIS;=UPFOBY..A6_-2%%U/BO*O4LH<&:+ M3C^&@%N/`\/'B+^-.3(XD1MO19!/BL8)^=B24;P9:LK>I1U/(RY(0(\O%"*3 M;U8P#'WW-APJ75>`K,EG0RAK*ZDZ@;*03WWMQJC4&B.63!D;485#1/\`M6[ZO>I1$L$_2.%46QJC.HU(%S0& MG-#-ASJOO&-OR5:OW(KD^UF,-PV'`5Y:$M]"BHR;A;(W54N8(O22K*R?<<>? M/&MJI09MN3WD;YM.$((Q(H6<-Z0B&H!4!U'V< M*R*4()[^BK\"UC:X'T4A@VG<-N6^K)C4@V]X<#W4@'MLK M%$@B:9$D:VE#:Y[C2`87*Q9)?3CFC:8I'R/M-TPX[>1`\A]O M$5K1Q5F5E+1-'B.7AWUBMC1;F?P?BJ21?P'XOS4`X=P_%^:@!MW#\5`8NOIT]6J=F_0F86.N/BQPKV`$GO M)Y_CK7'5521AEL[6DW@`\#R/.M9AE'L: MY!D1;)*-JWI4+8^X1K<1E>-V%^T5S9NKC3Y)<6CIQ=J]EP>Q"VKJ'?WPEC] M.#(DQXE^(RR=/JR6NS6X\Z\A_N,DN$>K7]3CT+)<^3<-O@RY$$;,2-(Y<*S[ M6=YL=;/U-^KUU@R6HO0\CNK@B3T)XD[9V83,EQ9J];]/D_[C1Y'[G'&-/T+8 MA2+,-0((*]A!KZ&#YXC1,()DQ;G2P^P)[Q]6I!CU7R)6AC8K'&;SMWGN%"42 M0O'2@M?W5%9WA5]S*I-O0GPIZ$9+OI9CYF)L!7R??[7S9(KJ>KU\:HM2OZCW M6#%VG(>.=#)8#2#J8J2-0%N];UCUZ.?=L6NYV9\_?=-LAZ^Q092N3AXJS9"> MZD<+FZ(&OQ)4B]>EUL.2_6O-6[V>FG@C+>E;))Z(ONC0 M'OXUSXL3JI:U)M;6"UBW#:A%&8LN$Q^5(SZ@(8L+HI/;<#*!X'A4X\EZ/DY9#2*G.3IW=>L((\@I+N6VPB<0>J M-*MJ.G4EN)4\1QKT5^Q:6E=2OQJ#6>L-GW'K6#:XLI9)<7&,K&(ZHRTA*A6< M'@?)RK/LY7EQ[%5I8Z3ERKR#$8T4MY@]])74W%FX^0`=E;5H^,FMNRE;B=$^=UFC+#B92Y<( M`TY".MW6P8E%^MI!YU9=9O4I?+C]#?\`&]8P8IRDRL>>,FVD6+,WZ)6PN:HL M%TX:(YX6:UZEZKQKOF111E>#8TB:7`[=(%:6ZEUJ3RP^K)R=1=59ZA=OVH0, MP_7R`%/;?A7.UZR6^.BUDJING,7-S_7W;.R=QG0@Y$.&I98])OQ>XX?1736E MG730YLF2LZ%[C)TK``(=L=V8?9.T1)D/<./&H_&NM90?8;VDE2XVX9"W.T8: MK^C(_'\2T^/$O)"RW*_<-A,\14[-%%(!=,C%E\RMV>6W$?34QB>DDOL72]3G M(9Y"_P!T];84LV*K:\*>?B\9'#6CK8A;5:]."FHQIW;DZN/HOHC+VN'&BP(9 ML&-S+$4+7+.`&+M?42UK&]8+/9DND;F_<.ANDLY0N7M<4BAC)PN@)X7#:3RX M#A3YK$<4;]SZ5Z?W/&QL7.PDF@PK?"J25]*PTC00>'"BSW7D<$1).@>C9!CH M^TPGX0%8>![6UD$W\WG\W&H_(LB8+.+%P=IV^88N.(H(@\SQH.!8"YJBF]DB M'HI(^)M\&9%'G;@JY$\JZXP;^F@/(`5ODR\)K70K13526HX*!86'!0!8"N7E MRW+PEL.'94$B@%`*`4`H!0"@*'KW*W#%Z)WS(P,4YVE]1U`BQL23:]4!CA:X((N1PL1P\14P#%`8/$:66X/-3R(HG`9$^[VC9FQLF M3'5N)C7S"_LJZRQI!G;$WLQZVXXWZZ/XE/\`*Q<&'M6K<5;;'K M*A^LC75OR55XK^&2K>I)AFBE4F-U=>W2>7AQJBK:9@M-6B&IEP;QK$TV*S,X M](!F4GBVH7K5J=RJM!-QV^(QER(E+1M<=Q!'"UJH\=O!;G4R!:XY=O&J-M;H MF2G_`.\#_P1$Q4`O'\=: MVMHBB6I+'(5D78J0*`P0#Y3P#>4^PBQJ:O4BRE$3:B1#)`>>-(4MX'BOXJOD M7DK5DPW/*LS0SPN0#:]]+'C8^-"#E<^>>;(EB25H?11XB1K`=6&OAPX M+5JW@K![Q^E)E]-Y/2-A-K2Y8`R(RKI)'83>G(LC6.DKI^PH_N)@O?E6:T+'H6)\!S%1!8Q4R0.-`.-@:`4`XFPYDU##T*O? MU1L9+.OJQL6"$^8BQ'(5R]Q)46NQT]279J"5MV6F5B+(OO(%1P>=[=U:XK\E M*,\V/BX):KJ95'UB![*W2Y,PLX1NS8C'-H)\ND:?"M,U8@KAM*9HK)FB`[A4 M`R`S'2`"W8*E2]D2X6Y:^I*B1X\8#9!'FN?='>:]7'5\=3S;I)Z%!ON\B#7M MF`6;*D.F>3F;]H_=5XO[#]AKP6Q[/0Z')?)8BXV&<;;'B(^T*.Q*]A*G@/`5 MX<:'N5KK#.1ZQZFW[;I>FMMVB5HX\W%FEG]#'CR9=419?O7#7X: M_P`GEO+9]A_P1^HOF#O6W81QL#%^)S<,XJ;EN,RJBQMDN180@D7M7/AZRLV; MY<[JM?4EX_S@.++ZR;!-+!ZH+5T=/&L>23#O6>7'!TC M_-;`65YX]OE?88)4QLO=-0^SGD1G":+W(&FQ->\\I\^L36Y6Y/S>A./'D9.S MRXB.CY&UNSACD,D_PVGGY;N?P5"R%OC(/_-S>-FR-TBW?9BKP920PXBL"(=< M"3%II4U$ZM?#A3Y!\1]=V'(ASMJQ=Q0<,R-9%`.H*&[`PO7SG[/O/(^*<(Z\ M'7XZLFY&+CY,1BGB62$\T;B#7E5RNKE:,ZK*=SY]\U,S%V38&QMLQ(XLK((5 MYD4`QQW[#V,:^G_]7P?D]Q5R.:I;'#W;?'24?%VS)WC9'8O(Y\\S>^0.PM[* M_6EUJ4AI;>%L?-O+9N6SH>B.D?ZS;5O&T1RQI/%C1Q;;!(;(JO(QF('>P/&O MS[_V[I5ZUZYJ+VVW7U/<_79G>L'7XGRIDR.J,B=XL1=H@W-LD[80='IF$(K! M+?I<:^2S=B*K?8]%+4JLSY!]338.!CX^YQ8OPV,3*L;-QS82%Q7'#W40M>JK MN8]7`=2=F_*;>,+$5]6%F>OB0IG9V2S+)B9:2++/+C`*U_5D4D\O<=TP]OP\*7;(MODAP6;[5H'=C-)J50&?U*SR]JME";(K74E)U[G MXB%_AQ-MT*M*^YDG`G7,W5-^W=TBC4 M:<3"6[OPX"P`/`\^-%ALTT1DS5JN-=?J1^N]D7=^B=_DR,4M+N06/'1E'J!& ML@`[KUUJ]:V23T1R*DZLX3!VSK-"ZV^#?=QW*%-OR]Q&W33*LN[2*4RM:JQG02,0PC#:0*AY5$? M\$<38)^MLC;,G<I5E9HTKQM5PM3O-MR3E[;CY7E+31J[ M:>(N1?E6>:L69RUTT9(=E1-4A")]9B0.!'C:J53>RU(;163[M'D:L;`C.7*P M*,P%HD%K>9C;\5=-,#KK8IS3T)>WXK8F##C:];1+9G_2)-S:LLMN3?DTHB36 M1,"@%`*`42!B@`(_Z*`U967C8D?J9+B,?5':3X#F:VQXK6<):%;.$0OOIV'J M1[=E-`.`-];$RX[+-!*/=DC?F"*UQ]FU7H3:B:/DT_R-Z\R)8,+>/F%G MS*Y]/&Q\4:6,2_6D;4/J\Z]6O>34I:&+17?+#%EVCYA]4=-[1N&1NG3&V1HL MF5E-K*YA/F5'X]O.NBEW:DQO_P#@@^JU)(J0*`4!Y9$;WE!]HI)$(T2[9M\O M$P@-S)'"]2LK]2G$UMM>.GGQBV-*#[ZL>/#M[ZMS\L<-"TV_(7$QD@),I)): M2VD$GPKIIVDC*V%^"9/CX^4@:,A7%7R8UD4HSIDO3APU_RNA).AB]+,F8V0F1"'`L>3HW`AAP(K"Z MXFM'.YN&KAW=W=[:B2)',<.([!:QO4M2(''GV#EP_(*F"=@!W<[\B?R7JK0E M%;U!E9N)M4N7AO&DD(OIF!*FY]WA?G6N&O(SNX-*[S-AI-'N3"7+@2-YF@4A M?M>*J`0.P&CIR?MV(YQN:CU?A!6D;'F6(*6AZ2S7J$'%W//T:\7#;3`O M$&0E`P#7X#BW95;84K)2;*VAXGW'>-LB&7NPCGQI%%H,>XE25O<50UM0/?4< M%9\41\AK'6FUB>2.=)(EB+))*VD@2)[R66YX'A?E3\2W@/-4T9'6V$N-%*%, M),RQR)(1[KIK4KIOQ(X5*ZS\E?G1T<4GJQK(8VCUJ"$:VH`\1>WA6#4.#96E M'NW"YY5!)&W'.7#QC(REF/E0#O-99\G"GU-<5.5]=BGQ]DR\N\N4Y@#\=:^] MIO<`53#UZ<>5M6_!;+GLGQKI!T73NU08BRKZC3(#J'J6N2>V_.O1ZV*B324' M!V,E])9Z1@N0&Y*'Y>`K)6BYI'M)NXH6C60"_>?"NOM5FLG/UG%F5U^%QRKS M_!V/[WQJ*ZV.S]?TGD]UOM.6V*$R>MER7>5B4 MN;WU'WS[6KYIVERSZ6BC8MSQ!7G<6%OT2+42T)3.5W;I_:,UL=-QQ\F;+P0Z M8ULZSA6/F(O7U'2OSQIOT/E.XG3 M*TO4T[CTCT>S8FWMA>O'#%+$(U9F98I'+L%(Y-ZOFU5V<4U)SRTROW+H7H[` MV'.RLO#GQ<(CULAOB9?B)G"B,*S7X@JH6L[X+9++'3[K?_&2LG'5G&;1\QM^ MVJ17VW)6/9\4E,/8WC54]'L76HU<.=Z]JW_IF%J+-_\`!SV_:V6R.IC^WG7P/?ZV'#V+8JVY*KW/T+]7^D^;KURWT=U,'/=4=39. M["?`RIDD&?*C1$A059."W/=WUU?I/VF/H]E97K.A/[;_`-;63K/@WRKX\'-[ MKTWU!M7JMG8,L<,8U2Y`4M$`>(;6+K8CQK]6P_NNK:LUNC\Q?4RS$:DW#^^N MEX<[+:.--V3X1\!%E5E,.2Y4R.T1:Q6U])YU\?\`LOV:_8]FF"JFCD];KX'A MQNS.@P?F]OT+#)DB@?*B0QN[%OM;VL"!^CV5U_\`_%TA)VMJVN2U75ZG135%V6]P3?MXTESN(,<>5N'=4("_A4P3!GA4 M$&.%22+]WTTD@$`\+<.ZH(@C[AMV)N&*^+E(6B?F`=)!'(BW*C>LEZOCL& M.WV[G<1.LD22(=2NH*N-VV(M:"$-RS,LE-OQF07:LJ4I!)+A9)UQ^D`3'(?>%NZNM-95O!GJCW]Y[E*+8VV.M^4D[* MJ6[R`=51\%:[V_V')G$?-'K9^C=KDR/6&=UAND1P]AVK''$,_P#C`OO:5O'$GG9PX1&GDZK] MCG:H_D#^ZXJ0/94-P&8XGEQ\*2BLF;&]K7]E-?0F4:GR\1'T-,FKV@_]55YU M]2_%^AL5E-F0AAWJ;C\53,[%8?DSPX_]?XZE#4"XY$BI5FO(:GO M5YON2UZUEQ)7@O0^O58"@%`*`4`H!0"@%`*`4`H!0"@%`*`XGJ#_`(OS/]CP M_P"ER56^Q**L&WIY:A MC([!0&+%3SYD/@QK;%V+54;F=^NK:R>$Z2VW5"V1)+D_#JJ1(Q M`&A2"!86[1>GY#\*!7`CV_2VTF1'561E9BY4+YU9RY4W'>:?D61/P5):;1@) M@38(0'%GU>I&;W.H6Y^%4>1NTLOP\$;'Z:P8Y(Y7>?*EA*-'+,Q:P2^E0!PX M7I^0]="OQHTS]/[!"\\F025R-5XC;RESJ+*!YB;CMJ],MT5XU(R[%@&)1]WR MY*@'3+(40FZZ=6FPXA3PK3FYW*NOT+6+.:&-(WQIU$:A`Q'J$A187*BL?C;> MYJKF^'<,*3@LRCO5B%;\!JCHT2KHK-YF1]TQL>9]$269CV$-Q_%:N'L_>IV. MWK*:N-RZ\I!9>*CW>-Q:NMQOX..7.I,P6MZRCBQ6X/975@MN8YE,$5%+NJCB M6_/7/P;L:MI5+/<',>+;4`>``/;[*[^QI1'%A^YP5?#Z*\ZS<';7?4LXIO1P M48"[,=*+WL37IX+10XLS]Q\RZEW[J;"WWJ`XV3FHF)D8\./DPF$8D+RHAO.K MJ7T7;CQJ,EW5-_0MCQULTCQD]6[ID2[AM\$<4V1"9'RLC(D"Q&-40GT2"+EB M3SY5\Q:G)2Y<_0^GI?BH4:$/;.L]ZVW;';(Q8IH\A\E\"4-9V,-4771I\S]`_6 M^^QS+MWP>*VZ-]HKB0_#B$P"878'WN-N=6_&7J5?8?H5T_6^[;ID;=E8&/'B M8D&9!B9CRN/6=YWT.(T^M'XVK3XE2C_@Q^;G9/Q)MZ[S]Y_K#E8N'+,(L'!A MS(!$\*+'*2=3.90686[%-9X,=6E)?+DLI@MMM^9.1E9D<4N.J[-;/T9AV*>QP?/R+'NOQ\:_05)X]GI$:F_&V9MQF+XDZKE MK83PK[P\;#OK\-_>]++3N7=TE+/V_P#2=['EZF-)ZTK!N_JJT&=`^X9:0M+( MJQ"9_34&X.J['D.VO'KALM#TIBQMMSH?#T1%T1N4&RM@ZV"NHCF5W)CXK MYB2WE[!7L_\`KN6U>[CM;2LP<_=4XVCX@!8"_8.VOVE63U/E[:>#K_E'ONV[ M=UY'BYD_HR9.+(5+&P`2Q)D/8.';7Q7_`+Q96ZRHG[N7_!Z?ZNCY2=/U_P#- MSH?(.VQ[=N@R"F8,>:3'/!&F&A=3#ZMVO>OS9=#)9=QQ$2^=]3'W0O&L;]:U5)-^Q,I'0Y7S9Z,$6'/@YL>Y1 M965\%>*11Z3VXEP?J^-37J6>Z.=V4%IL'66Q;QL.'O"Y4.)!FQB189Y4#)Q/ M`F]9WPW3B"918??^P:K_`'GB7_\`7)R[;\:IPLM4@X.4W'=,/;L>*0;C@31X MV2981'.HEM(_FO=N(TFUA79?'\J37W%<=G69.C@ZMZ5FC61-WPU$@U:6GC## MP()KE>&\Q!:4'ZNZ10V;?,!3W')B_?5'PV]"TF/ZX='6O]^X%O\`YF+]]4_# M;T(DU'KKH<&QZAVX'_YF+]]3X+OP.2']>NAO[0[=_28OWU/Q[^@YHTGYB_+\ M-I/4FW`__,1_GJ?@OZ#FC/\`S&^7O]I=O_I$?YZG\>_H1R1Y?YD_+Q%U-U+M MX'_S$?YZC\:_H.2-0^:?RT_M1MW](C_/3\;)Z#DA_P`TOEI_:C;OZ1'^>GXV M3T'-&J3YN?+",V;JC`OX3H?V:G\7)Z$\T>3\W_E=Q_\`JC;[=H]9/SU/XF3T M(YHT2?.WY51#_B?$]JN&_9JZZN1^"O*I&A^8WRJZNSX]BP-TBS-QRV&A88[R M$KQ)U6Y6YUMCZN1N+/VA7XN4=G/-L.Q0XV)FYPQTD/IXZRLH)`Y_1QXFO0_! MQP1;(V5W7G6W3W0VTQ[OODDR[>[B(S0QF6S-[MPH[:Y>Q^OG[25<^=M_XK/E M']2;.D/ABO\`FKG7ZS)Z#F:6_P#%7\NO\3A[G+WZ<=AP_!5E^LN.9C_[JN@O M]6[I_`'\U6_QF0GY#!_\5?0MOL]JW60_HB$C]BG^,R#Y"//_`.)7IG(EQ\T; M'NI@Q68^CZ7F,A'E-K=@O73B_77K1P9VNF]38?\`Q4[$>/\`5;>6?L'IC\UJ MYW^JL_)?G!K_`/NFVT__`,F[U[0@_-5E^JM&X^0\_P#W217\O0F]LO8=(_>T M_P`1;U'R&1_XG\NY:+H'>-)[38'\&FG^)OZAY$:Y_P#Q,;W)%)\-\O\`=/5T ML8S(>`8`V)&GB`:O7]0YU>A',B?)C'AWW#R>O-VG^\NJ<^:2+(FE%VPT5B!C MQJ>"X;J87]'&M-DD\>!8+V\AQ)[ZY<_8=7QK]QO@P< MERML0Y]#9#AHHXN)"A57\##4:Q>7+$LV5,4PB?C;OBNJ+(WI2D"_`Z&/> M&Y5MCSU:WU,\F%KP>\K=L''-I)-1_10:A?VBM+]BM5J94P6MX*_X[=,^1O@K MQQ)VG2./9Q-P0#K=G?\`2X?W?AJWX="C[5C3]U;AAL7P9M:\VC;@3]'+\%0\%J_:66:M MON).+O,$K"+('H9'*S<%-:4SSH]S.^"-5L36G@1@KRHK'D"P%:NR]3*'Z%1K MC_K_`*M:Z?N7WKBW/OK7DN,E8U/LE:E10"@%`*`4`H!0"@%`*`4`H!0"@%`< M3U!_Q?F?['A_TN2JWV)15CD/HK(D4`H!0"]N/=1CR:YIHX8GDD:R+S/>>P4J MI(LX(<>+E99$V8Y2,@%,>,Z5T]FL]]:O(H@RK5MEAP*VM8`>51PMVP?34U4D6<(T8<,A:3)FX3Y%B5_14240K>4\0 MPLR'C<51+4M!6;;AXQQLI&4EI7:&62YNR1\0/9QK;+=J(,\:6J8;I[;!,UN%:\G72RJ2+GQXU2/4MQ!/B;=UZ0A!KEQ<:5;20J_C;C^ M*K*[0A$*79(95`DF=R@_D\C?XKO`]OC5.Q%ZP]R<7_;O[=B)@K+@;L,5I"\4 MGNGB%XK?D:X\=72_%['=E:R4F-3H<.3T\A">7NM?D;UZ>*\,\S)6:EPL,:-Y M%"D=W.O15*[G#:SA'-=5=3[=M>9C;?-#DY&9+&V0L.+$9=,<=M3N;\!QKG[; ME0CIZU=V:\/>=IS8<:7'RXR,R/U<56.EG3M)!Y5PM:'02XMYP,54ERW*11R) M'$1Y];S$*K6%N`U6KT,3BDG#F4LJ.HNH^GL6#.?5!)'GN\&2J>99I8T]V7N- MJ\ZN;)GSUQ[5;@]NG6QXL?/^T'QTY;---+(@W?)9M,Z3H7.ADW"+:<^%,G&EU''UBY1F(9@/:5%Z^;_\`:OU% M'B>?&HLM_P"#V?TG>LLOQ/63Z.=JVUBS/BQDEFU[]M4MDLV_J37'5),];AT[L>XY*9>=A1SY*J%] M9BP?2O('20"/HI2[2%J)EEMFP[`V:^3)M\/Q6G2&&K3IMIMH!TG@;]Z.KCVN&6QV?(XC"Z`V08\:2QLK*;HBO[H` MMQ)YUVX/VG9K14L]C==2EM64$6Q]`)O&0Z;=E0R37@Q\[SI'+-%PD42:K<+] MU>5ER+-EM\FK^IW8[O#3_M^TW'Y6]+[KCB?,AFRFB.B%7E:VE>#6X]]1;KUI MJD7MV;Y/NM)X'R:^5[(TGPTT>DV9#.XMX47QQ+T,WC:<+4P/DM\LIGM#\0I[ M(UR6'Y:BCQO5$VPV2U1IWCIW8]C,V#A1.\.#C#)DFR:!HI3C38ZE9'8D64M?W17-GM M?*YR6Y%J55"%@?(G:7Q9XY-PF?+$B-"\2DHL8L6UH.);LYUPVO5:)MG1BQNV MI:)\ANF-*7SGY(;ON M9G)_+6OQ5]".*,_\D/EIV[H^.OH1Q1L'R5^68%ON@'Q]1_ST^-$ MPA_R6^6?^J!_"/\`GI\2$'H?)KY:#ELJ'Q,C_OJLL=1`_P"3?RU_U+'_`(4G M[ZGQU$'I/DY\M`;_`''&?:TG[ZGQU'$V'Y0_+4__`*!@M[7_`'U1\:(XP8_Y M0?+3_4,/^$_[ZGQH'M?E-\ME%AT_C$=YU'_\53\:)2/0^5'RX_L_BGZ&_?4X M(EHVQ_+/Y=I[O3V%X75OWU3Q16"[Z9V/I?IW>,?<]OV?%@R("5]2)"'".+-I M-SQM5;XU91`@ZOJS<4W_`.$CPY<4;>A)W.#*`2:6,6/I1.>S]("N5XWL1!JZ MJZLV7>\)=L@A$\&H&03("A*<+`-?E48[5^3A;7)]-`H^S0:%XE>!/*EDEIZF=%+;)5UYZ%[O<7\U0J^A=#6.Y?P M+^:IADZ&=;>`^@"FHT'J27L6M]`I+]!H9CE?U%\W;SHAH?%?ZW;S\N.O.I=Q M39)9NF<^6%G:,E8(V)77(O`C4W$5PY%J5?3&CH;GB.?U;GB!76;?FOPBO\`NJ/^N7P?J/H^YKZNWGWUT?#7XN,Z M&/S6YH/\`B_,_V/#_`*7) M5;[$HJQR'T5D2*`4!AV1%+R'2B\6I56]A*6Y%.[89X0DSR$V5$!N3[ M3V5987Y,W=>#,>*QD$V7:24<40>XGL'?4.\:()3N2C>_&J%Q0D4$21IL>5)3 M/C%5E;]9"?=D%:*\%&H-?QV2OOX,_P#>68?E%2L5?4A6?H`DN8X>>-XL>(AD MA?WF8=IHVEH(;KDFWL?'E0!;QJ)DD5(%`*`4`M<5`9IEP\6:199HE=QR/=5DRL&W@ M`#[H'!5%4\EC-6$B@%`*"138@K-]QD.(KX-QR9)$PL;%EQFCAE,4A:338-8'4O`UY^>WN@[L2]ISNZ]%Y4&:Z8& M-$NV3/`(,L$_$XB1QM&8XTY%6+<[U7$N5]"]]*ZF[(Z+ZE;'7%RQC1I#",>` MK*9"X&0)M3BPTG2+>%5[G:K1<6:='K6N^2\%*WR[ZB.,T0AQ6A&498<624R< M3]GDZU[5=3FMPVS-P9Y(9HRWI'2S("ZB_=:OV M'J_ML&;$KRE/J?$YNG>F3BU,'1?+O:)_C'!1,)0X5C8EG'EX5\M_[7^[I M\3P8WRL]SUOT?1M\CROP?4./;S[:_,U_$'U[%P.)Y`B]N?X:LA!QGS*WSJC8 MLO&?:SZ>S_#M/E9R0KD%'%["92R,D0[6%Z]5?KU\?)'EV_8MWXLB)\P]P@W7 M/^(P_C-BQSAH,_&-A&:_ MZ*#A4\Q\:*?4D&[X/Q+(Y3-Q,:1R8XWR0=9$5NTCOK&BK\C?_`-2^6O\`VT?0]MZ3WKX# M'U0QQ$1+KC>0*RBWO,O9[:V^925K$0RPVKI27$:7N>K7)ME5N*KG>@I6$2K>PK-8:)R:,:E,4#@$5C<`#]' MA6N1^KR] MU9VZU$Y*KL79(_KK@+DQRX^)D2*Z@94@33$SF,R@*;\]*\>%3:ME::Z_0WI: MME%C7N/5F-)EZO2680P>HD9\T9-5K:ULCY>"EN/&$;7=41G8Z5',]OT4168U-`ES9!JA14C[&DYFK04YV>P,N>OOXZO\`N&M^Q2$& M[CT)YO-/*44\HHC;\)I(X69AA)B+ZFMI,?@&5C3>VL>QUZYM]U_P7I9K[?M-6-N3HS09*%94YJ.8' MYJY*]R^/VY%_J;?&LFM=R?'+'(+Q/J_8KMIDI=2G)C:EEI8]\+&XU6XF]:%) MDYM>O=C,3S&/(3&*-)CS-&-$R(=)*68V()[;44$6>D%Q@SXRXP4SIZD8,DRW M!*7YZOIJ;M$56AXPM\VS*Q3DQY"1PJ7U%S8@1OH9O9J'#OJJ9F.OW6.CJTX M^X@;_P!,[=NNQ9>W[G*4PI8RV3(!<*J^;4/%>RK5_7JMD_)-NURDK_D/N&Y9 MG1TPRKRX6+DOC;5G,NF3)QXSY2W[FL;T5+N/)RNTGT>@%`*`7MQ[N-"37/D8 M^.H::01*QTJQN?Q4K62KM![#!E#`@AN3G+!+99%)'"P!X@^%5OCLM?!>K4F\9N(SQQB=/5 ME%XT#"Y'[%4X.-AI.YHRMYVO%QY[&.P=I8]EJFB\E;6G8 M8V-(KF:=A),_EN."*.Y146%42/IJIH/I-`*D"@-&3B0SE68LDB2&W%7.HZO`FCNA!O%5)1FA(H!0"@%`+GLN?"JMB"LEZCV MJ+-;#=G#QN(Y9M!]-7/86M6ZP-ZR4Y:EB9(P"2ZBW$W8``#WN/A67&TP3)H^ M\<+UHX5F5FE0R(RD%=(;2;GD./"KO&XDCY$9GS\*""::2=-&.+S68'2.R]N^ MHX.0\B-D MVP[*G@[$7ER-V;+)PX5FTW"\2.(K= MN$8U4LH7,CN6()U&][6U?17DWUO)Z*7&I+R8IH,=8XXC-+&K9'HVL6T\KGN% MZ]#$E5?R<%[RRDV[.S,Z`Y.9'Z4S.;]Q`\#7R.>W*S?F3ZKHM_&BSAVO M^VN*4Q4XNIQ?).)L;,W;?@YUW+;<5#CRQ@3P)P(\1WUS]_"K?]VFSW-/UV3C M.-[K8W8A^,*#&NYIZN/H#:"QE73J/U M;WMK\*ZZ]')Y.3\^BV(F]_+S8MUD5MT5WS8(O1G?&R#%(T#<=$RH;NAOR:O> MZM%6JK)X7:L[7=D>Y.B.EG3(3X(+'D-!)+&I(4G&U"+@/T=9KM=$<7-OR1_^ M7/1HFRI3ANPR@RO$TK&-!(P9_13E'J(%]-0J:06YL\[AT/TUD[OA938[KEP) M&A*2,J/%``(Q*@X/ITBUZ<$/D9[_`.7O2`33\"=%K`:S[HF:<+_".34\"KR, MY7J+HCIG*W3+>3&=9I)S.TT4C(^HJJFS#L(4<*K:J/0QN:DC;Y,+;]U#2@+A M8R0@J?T5/`?17,G.1Q_TG1D?_;1;[GA9[;]O&[X>$VZX>=$NM7DB5)54@1QP MR:]:@<-:VM63JT8M>AXV_8\J',V-9=KR((,6^1E[D9(K0/ZA?X:-5#*RAND\63NF5/$`(I)28^ZW;7728-4B*./NG@0UOI%73(93[!):2=#=9% M5=0[;*+,/PFI*4(G4O3VV;GD023(0^(PR[H;$LC`#5;LM7/EHJU=EN7I[K), MD/TELF3E[AN#*ZS;O'&LQC;RIZ=F5HQ]4BM*PU(:U:(6;T;@K&I7-RAN&1)H MGW`,?6ECD`5U?C[NE`*M2FI%K1L2!T/LZ9$;0S9$>+$XDCV]'/HB325,EB?V MU.!+1Z/3.#A8B?#:SZ$RY`,AN`5C,7(\_(QX595227#62 M5TE+Y9?7YMRJR:1!CE22#-P.? M#QYT!AE5@R/YE868\S4R+5DCI!E1E53(U1#@`RC4!W7HW)2+(D\+FH+I"A)C MLMV=U3)!IR<'&R;&9-3+[C`V8?2*I:BOI8;:HBY.,<4#(A+%5(OJ)=QWW/,B MO,R]3XGRI_J=E,JLHL,C?,2*(E[JSJ6L-)LH'O\`$\?96_\`D<;6TOT.>^+B M]/)P[=-;SDOD(WHX<.1C2P2/B.0,EI&4B0QMI6(@#ZM9/]A3T:++JM^3.;L< MV.FT[9B.6>.9UFR`/UF`QUGUW_3UJO'F:/O8W65JR?Q[(QB=,SXR9@QIH,E< MG(^(:&02LH:.;6D*-I/V3(./C6>/N9'_`$)^&K_L>GZ/SI8\O(EQX+Y43*D" M)J2!F-2_P!AQ^ZK M)_&GR=8C3.^I5.M$305)+>HBZ?-V$&N+)>^3,KT6ATUXTHZLF31Y^1C/CY$, M/4P-G%B+V\:^A41KN>5#6VQ\WZ?ZDSOEMO.%TVV3%NW2VYY9APX@R MG*PYI&'Z!.I1J[ZX,V))RB4S[9#D>I-+$4*20FS*>5B+@WK.]4DB%8VU0N*` M4!HEQC+E0RL?)#J)0\CP%31QL5=9-1P9X6+8P5FMS,FZX:G3$QG;M$8)M]/*H6)OR3S-^-E09" M$QGBG!U/`CZ*B]8)JY*S_O`Y\/N3GXWJ?!8^Q5H5%`*`4`H!0"@%`*`4`H!0 M"@%`*`4!PO4TC1]5YKJAD(V>#R+S_P`[D[Z-20W!1?'Y#*'7"ET#G=E%5^-> MI'-^ADMN\HL%BQU[R2S?BI%45AF/A=PD'V^78#BOH+;CWG53Y%X1/!^2-N&T M9)^'R\&57SL21I`^0.$FM=)Y<1;LJ:9E/NV(MCAJ"J&R=2SY!W#+,'WH7?U. M?I!64")T^MY3SO6_S57\%7C;Y965,L,:S7LD M(XDL^K5J/$7[16>;(K*"U*<=63=N(D]?(87:24@'D`B\.'TBL\CB$B:5W9,] MO+G_`'"J&B,U!(J0*`4!KGGBQX_4F.E>0`XDGN`J:UY;%6X-4>XX+H7,H0*> M(>Z'_!-B:+$RO(]8>2V1"9"F@:B$\0#SJ;*"U7)OJI87%`*`6[JJ&1WW#!C8 MH\Z*PYK<7JZI9^"OR(\+NVW:N,A`':58#\-3\%F1\E2BQ]OWG-QLK!;T1A9& M2V1E94;ZW*GW5"@FQX=M=-G6K3\HS=9-+=.;[(B^JB!L<.4B#W.06<,]^/`& MW;4_)1ZD*ECV_2^X2YT>?&D6,L8&G;XS>%M3ZOM#S\OAVU'SUB"'1R17Z4WJ M25I)(HRK@+)$2H$EI2SCR]A0V%ZM7-4AXV2'Z=WO2YQXXE.2DP](-9,;U0JF MP!XV"4^6I/&QYGZ5W.7+R"D44<4@$3.3J#+J4AE/O`V!N.5*9J;$JCB2JZEZ M?R9L/?:[+-G7I4[4N&%OU,)!O.)B[I+M M\.6V)GG%1LV'&.$RLB('0X\*QMIX>^JWKUW*9YBAHV(W6^1A8V1/-F1YF'CX MWI8YU*CNHK<3]D%]ZN;)D:T-L=$4\6\[]+FO#A9F7/N,F)-)NL8LR*R MLNIL:WU@.58'1N=5T\-YR]XVQFFW`=.QR9(Q99[I.P##0LX-FTGF-5=N*;(Y M+OBX^IU]@:=4?/YZM6I)7A] M-#)AMDY$DD4OKRA`J>@ M5)<`$<0U89,M4FT]37#A=FDUH6VWYTTSM'*!<#@14_K^];);BR>_T:XZ\D6% MK_37L'D$7')FGFG[+^G'[!S_`!T$'G7;\S*P\M3N.2! M@QK'C:5$CY".UTU=GEK/2MY^A>[]D%;B_,?+GV[H\+DBLJVT+6<-EBWS,VZ'?1C9N+*AA3T,J92&6/)"!G M4*+G3YAQK;Y-#-+6&1I/F?F1;FHR-KD3#GQ8I"R7J>Y/F0\XGBS=M;;\4"=!*[B1VDQI/3E0!2?K<+UGDR7MHMC6MJ[0:5ZR M7:MX2*79YXMQF2%(=O$J2:X\A5,4FNY`XN+BJK'P?(I\B;@D9OS2]79\A]IV MYWW+'QILF>)Y$40>D2MV-_/YE/!:Z/G4D0Y.UVS(ER=KP\F6PDR(4DDL.&IA M?A6U8:E%26B-(X1!2?M,.W9;3^OD:#%8Z1[;=M1!CDRM;$R3"V&& MS-DO)?CI6U3!57NR)ES;7Z7IXD#!NV1S^:JDUK9.2$;]A-J&\BX%"9,^-`+T M$F*$#]CE0DS?M`X]H[Z2R",VW;>TGJ-`K.#<$@6_!6?PT3Y):D\F]S&BG129Y;N5J6"!4`6, M:$`L%7@+=W"K-LON#<]IOR-0(,DL>TGNI+&IX=$>VM0]N/F`/'V4:3WU(@,\ M<4;.S"*.,%G;@JJHXL3X43@2SYQU'UJO5V2G1O1&2\^;FN4W/=(PPCQ<8>_I M;M8BXX5SY:J`H_%4MSN.*(^9"Y894'#)C''_2Y*K?8E%7^RU==4I;+!-SNH<>'8)- MXQP&`\D22@J0Y8*0P\+UG7#-^)=WA25Z]5,\)A9ER9W!/J8",Z)&H\[DW;E6 MJZVKU,UFGP;9^JMKPX$3&U-%')'$\[BT5I+%CKY:K->U5KUG9ZE^:@O<:=9X MDF565775ID&EK'D;=U8NO%P:5-E5+"@%`QQY=O=4,B2$H&1N98>:'"\JW[9& MY_@M6C?!&>[),F/!*X>2-7<<=;`7L.7*J\WZFG$V+ M.VF690_Z%[M^"I^-O0J[I'B/=,!QPFT>$HT?EI\;7@CY$&W3$/EB<3R'DD1U M?A(J5C]0[^AX,.?D\,EACP_Y*(W8^UNRI;2T(2;)"8N*BA$A0*.\`GVW-ZH\ MC+\4C852UM`L/`?LBHU?D-+T(\VW8TK!A>%_K/#Y-0_;"K5M&Q3B:@\^%]B$ M?)A;C`1S4]SGNJSK6VY#=EL>BF\=DD/Z7(_@O>U$JDS8]1YQ#Z,J(XTKED> M3<\S<;$8T2R$,!>_'4+?I'2.54_6XYN[>#3O75,:IY-FS_,-=T]288#QX*AC M%EF='4%'*Z9@!]BQ(N-5>US/)^(WXO5&Q;KAY&:<@8LF(0)O5;CI8V4GP8C@ M:SR8U8UQMU*K#W/Y?8)R\G'S2]L[7@G#K; MIH;GMVW+D^I/,Q*1WL(QH9M7W!$P0R:W!^J5'`U\OFQS=GU>#+%%)#W3J+#S,%9-IRV=(9&$K1L4*M;REK M'D3RKI_65;NT_1F/>LG73U1T&*[G$@U2-*-`(9F)O?F3K?)R:W.:C_D>4L%S\+,282?JR'FO'O[*^8EJT2?4Q M5:P7>T(YR&;L5>->O^FI[VSROW%XQ)%EE2LF/*Z\PM?1(^:3&,BKCQ*.`T@_ MX7$U(:.7D8OP#$5C-7?Z$9'[="CVOHG M89),R3)Q2F2TK-,I)#!IP3*K=I&H\*TKC32LH6AU M8+RB?B')?=LB:"-7"EA9FTVXBUKUMDY+9(Z:.C>IKZHRMS&TLD4$T+-*@R)L M8"9U@+#U&5;'DMZPODR6K''4T^.O@Y[8I-LEV[=8IXILZ;/D./$V2MI9<1>* M.Z@#05:]4Q3'&VY"B)DN\'Y<;*F=\?-MS^LT80JQ9A)J%M3\>=JZ.%8W,ZV\ MFS%^7/2F`Q9,%T=B"#*SL?(?*HN>0O4JE%L22_ZH]/:KOAAM)F.DDD7R&+R' MB>UN-7=01L7H/IS%$30Q.)X95GBR79GD#J`%6Y)\H`Y5;2"&O)$R/EIL68$B M&,V1.3(3`I*^J)#=T.FQ(-ZHZT\E?+%3]:UIY*\E4\X"2Q0`,-+N69@./`GD:MRE05K64Y-JA5XJH6_<+"J0 M7=5!Z-B+$!AW$7'X#20U.YJEQL:4`/&".P@6/XK4DK\:/:Q1JFE$"KW"DEH7 M@S87X"Q%)&IZ-[<32"3`![*`P^E%+O9%'UVX"I2(;2W-'Q@?]1`\P[6Y#Z#4 MI%'8]P3+*2H4K*O.-N8J&BRN;*@E,4)%`*`S0$;-X''D_1D`_"#5JF67=$GP M[JJS5"A(H#%"IQ7SD^\O^7>Y_`L1IT-EZ.#?#ZP'L:SRN$&=IT-@]/XO2>UR M;%B18V)D8L+JR(JR2'0+EW`O>]>;K)4ON'(^;O\`$'\U2MY(>Q"VZ\*G"?\` M71$A/VRGCPJ]E.I%63;\+WX'M[*SAEY0J$!4@4`H!0"@''LJ`4GI1?\`,#W% MT_<^K3;M_2MWUIXD2?9:T*B@%`*`4`H!0"@%`*`4`H!0"@%`*`XGJ#_B_,_V M/#_IQ!_`*@%-G=-[9DP.)Y611D#-><&Q#1@74G]$@6 M/A71CRV7VF=Z*-2IQL/I[<)%Q#D9(Q#ZCX$,RZ(1_E?2?ZPK2UKQ/^Y@E78N M)=JP8]R&:\[%Y)$*1@BRMI*JQ\`+U5YK-0D:6Q5TU(ZX&W9&!'@?$`;3M\HU ML6&J65>>JIJVG_\`:"='H3-PV?%RI4FAR/A-,1AD]`J`T#FY7VUE7+=*/4LL M5=RMPMJZ8W#&^[X9#-%"SS-`QXW8>B';Q&GA6M\UDT9UHFGJ=#!%Z&/%!K+" M)0JLW.PY"N9VERSH2A&RH`J`.?`\!VFH<^!)'R<@@C'@(;);@%')1^D36M*> M64LT>\;&$,21+YF!.I_TF[2:I?5Z%JTA2:7S$%LC'[(6-G7]P>WV5HH>Y1RMBND?[ZREB3 M5'BQ>\>1-^_]MW5YV6L(UX?RZVPY^V@9C,N)*S9J6X9:*`8U/'ZC7KDP]VE[NB.S)T\E*')?5K0VYG3F?N&4L^ M)N$<&U/DS;CC!81\0L^2K!E]2_N^;E:O*['?UA'J]?\`7*)938WRK]S=CSKC?:\P=U.M!5[9M,NWYL^&3&WJZ(Y?14QIHC.A6T MW;5(=->FLE<>-7_M8\G+:UK\?ZGT_'BCBQHXT)TH@`+<_I_;5X5W+;/>HM$C M;4(%MME_A/W3$5]-^KK.#3?4^:_:VC,M/0JY_5$K(['4#;Z+UX'8M99&F>]@ MK1T31!W=2VWSM;SQ*9(R/TEY5SO0Z'J6>T&>22)HCY60%V[".VO2_5UN[378 M\_\`:6HJ1;MM"W?NX4-<4/NI6[\]MK:S M*;D6N1>Q[14&V%-6/GVR"V7F*+\^7;>J.IW5ALV;[F+%AK$)55Y6LP8\=*C5 M^Q6M<.6)2*YL.W6U8 M5E!7&Y1X_KKU`,6+(AW99L)VGEV[):'[7*,6G3`Z_5U$FP[JXFR\P7.V[LV\ M'?A-N$6X;;BKY6,?IF')'O)$3S1>^IKH]63664:BZCMX<;5V*Q>&A<&UCPOR MJZ@2BXZ3R<;'WN-LAM"&-U5OVQY6-89JM[$,IDVK=9X9\D;9N<6#)D`2[3?[ M5BI/I9`;5YR227M;A:N5)K;`7$AC.J,GTPR"_@344HEN7ME;1TD/KG'A]:WKE%,EN6HBYK.V^ MAO35:GNJEQ0@"@-$N9C1M8L64>^R\;5,%7=(\*9]IJ#1*!0D4!BI14^??.C.RON+;NG\=O2'4&9'B9.0>"K# MJNP+=E[5EG>A#/JVW;;B[7M^+MF*+8V%$D,=N5D4"_TVO7FR"1;Z?"@@TY6, M)E!5S'+'QCE7\AJ];QH]BC1I.W"9B^;(Z$/>+=M1S]".)A)YL=TAR5 MUQ.=,63?C?LUU9I-:!-^2;VGO'!O;61=,5)(H!0"@%0P4_\`W@_[E_9K3^H/ ML5:%10"@%`*`4`H!0"@%`*`4`H!0"@%`<1U!_P`79G^QX?\`2Y*K?8%6.0^B MLB3-"1VU`(VXX9S-OR<0-H.1&R!NR["PO5JN&1>8.E=5JG$TMU]-6)LBZ=%N'[JI_(7 MA#XF:=RZ7W*,Y#X4<3X,KG^2*2ND*I5)/Q\:OCS5LY>Y5U=1C=/;NV*L*-%) M$RQ,<@N;@Q0A=.FW^4%ZK;+7EL6K1M%QT]LDFW39;RQ(KS:=$RFY9;`L#_?W MK#-EY%J8^)=#N[*Q-T*@&5XFUKGL`YT$D66229SCXQ/+[:8?4\!XUI2K6K,F MY9LQ\:"!"(EN>32'BS>)-5=G)*J;;7!`(NP(U=ES4+1ES5AXS8^*D7%K<6;L M+=IJUFBL(V@=W+N-44%DP>S]GOIH3.HI!,BI(%`*`4`H!0`7OPYT),@7/?;B M>ZD@@;ENB8L9CC\^0XLNGS`7]E6Y*Z>P5Q=M97B+Y62;LG: M%[`:]#]?U$L>IQ][.[7TV+2*+T;-E2(B)'+\%`)\T\(XW?2K>&KC;V MUYN&ZHM/N?D]7)1NVNM?0Y#&ZXR)]DFW'=,)-OAGE^"P_3D>:23()L5TZ>7" MK+'[]7)1V]D)%CC=7]-1^OAG*T28$6J8."I*H0IT\/-YF%4R8YLVMF:K(DDF M;L?K#I[(ADR$R]*XZ"5XY$9'`U:!P8#F_#A6?QO_`'+O*DI.%(F1B%992-U4>'DS16UEO)U1W,*ID?'[3U.EF=\:G+9+<_-QX^-5_8+_O-D?KY^%)D8JK*5875A9A MW@UPV.ZNY\Y?YK[[M>^Y_3^T[;C9IV2WQ2YD_H2Y(8_^[`C2S#VUZ_0M;'5. M=&>7WZURMIK8^B;EU_TMMT&)%O&4-MS=PQUF7"E#-)%Z@X"4H'5.)MS9VZ1P[A.L2QH50#TUUA=%V!X<>-0\B'QL^9;S\Y.F ML>?>)C&[G;\]<((%<%[L`TGNV"@]G.J/(=];1!9;7\PL,9N]R3RC`PMI:$)G M78-*9A=5"VU7\+4TMN7F3I,'KJ+==HW'-P-R:>+T`I8&S+,#;2$:S`M?CPK) M2*Z*N5)PY-'!KW/'ZPVJ,(F?\5%+=!J8N;6[5(%J#'16*.7: M]SS09I*]];/QY^%?HE.O2(2/G;7M=RV6/3W4>\ M;0TS8$NE(X)Y_3<7&I$)%O#OKR/WO2K;"[QJH.S]?V&[\6=8WSNBCV;;62-C MN"QPY&\/C1+\/$\S,JBQ(.H:.)`KX'+6(9[6'[]=CSG_`#2VS*QS'D)([R&< M96(L8#J,8J)'E`/NW<6K=5H7=H96Y_6NP;9&L\?Q$#'$ASH(N#++\055(M)( MXG75'CC6KU-?D34%QTYU=MF^XC2QJ^-D0R>ED8TPL8Y!V$\0:LLM=F]2JHWL M=#(,<8L>ABTKW9CV`0\[]PJ3)RV;8H8H5TQJ`#[Q`XD^-1)95-G;?M[ZC4L*DD>-`*`'B M;GG0"@%"10"@`YT((N-]I/-,_-',<8[@OYZM;8RK]Q*N>VJLU%"10&*%3F/F M9T]E]0=%9^WX4'K[B-,V`HL&$L;!O+>WFL*IDK*#+?Y8]7XG4O3..JO)]Z;6 MB8F[PS"SI/&NDW[[VKS;5AD(ZWA50+"C(@5$$FG-A$V)+&1=M)9/:!U3YJK:C6Y=63-IX<^54E$ZC^[\-!(X_P#5P'X!4));$&+<+?@X40DR MI;7Y>SC8#AQ_%1)[AL@X&D9.-6XL2D0LC>L)(2\4B2/J"Z#<'C?LYU98WY*_(CP$WC+(,@ M3'@/*-&(=@>TL>(^BI^TAJ=3F<&66?/RYW=1!'.P15RW1@L(LWV8:['R]U== MM:HQ6C9ZAZSWUVRE6''+"-),5BX"@.[(!?EJ\OUJK^.G&I*R$[8-XWG/W%IW M])L:#$5I8%N"7>_FL;JVD7[JT=%$044FY>IM^.6^$HQY9HPTLV:C?9"(1F0V[-0(TU58JK4M;(TC M?TAO.[9N+(,C'(,)L5@'Q3]N-)_Y/YZ`P,PDV]"3 M\5`/C`#;T9/P5`!S4_R4G#]K1LE%;N^>\ABP\<2+(YN5`()U<%Y>-IQY^X[J$H+QP M^+@LU]))XU\E>_+?<^NI55V, M$*`+"P[1V?CK-0O!=RST.#!KG(<+;,/'BRRTV%G?>$'(LTA MN/3L.2\>==N.^LM:'+EKIHY*X?+4/F39F1NW25M:JO M,JJ/"%<7)F=WZ7W7+W#;Q7LW+LJV'*IU\DW MQ:Q.QHZ(Z,ACV[-MOGPL>8_H[C'(D9,V+(YE5%U>X=;D76O<=JTNU?T/"RT; MJH?J=+N/2V+L&+A;ABRR9'P4LWIHPN",I45BQ'FLHC%K5R_L.NE1V1;I=RU? M:T6>+,9\:.8HT9D748VYBO`/H:MM2;XEU31@BX+`6';?V5IABUTOJ1GFM&UZ M&[<2/BG`%M(L./=75^RORS,Y/UU6L*\ZDI=\ MWG<%P]NV_=L7<50X.7D$P9.WRKS8.@NXKU>CFK]AY7^P9VW8NW[JV3-+CV./8$GT^+H0+B]>UP9XBR(U[W\J.O,[=CCPO#D[7MV5 M@383&:1%6'%*$Q%#82-Y.#/R%/C9;Y$;.H.BNL5P^IMN3!@9=RW7&WO;'U%F M8P%=4#*M[7T2+U)\O-UWV?>MU=X\'<S4H\=6Z7;NTBQAC:-C*YN7;N4UA95I?D]X M.RE^581WNQ9(W7`AD4B)('TR1*=1:0CGJ'ETGLL:M7_NZ^#>C5:L^H8<*QX< M,=N2@D^)XFNU:'C7M+9%WO!ES(4$/%XR6*]X]M0R_6R)''=1'<-IV6;.5'J5V[=)[OA3$10G*@)\DD=B2OCXU^CX/W.& MU5+AGAY.A>KT+CI/Y?YFXY!^\&?'AEC>+TQ;44=;,>/<*\G]O^TKE7"FQT]7 MJ/'[F=!U#\J.E<+!^+QYIH98H(\9H4TGXDQ,6C+$\5XL;Z:^4S5XUCR=O7N[ MY-B$G0VQ?>.Y[DRM\7O&/\-F@&RA2/,R#L+6%ZUK1(ZK*2K'RLV!H)8\G+RL MMW@BQ8YI2"8D@96BT"]O+H'MH\:97B=!LG3^%M6WG!C9LH.Y>6650&9CX#@* M/&HB"4W75&_;P$FR8[GT8WLER3;@"1[*RQ+5_0VOLI(LYT)\`RE9I)PT9(Y@ M\=5ZT[7N2,NK;C9HMB;DDGAVGLK2`8Y`\>=)(AF?Q#F":(&/V::$F;_1XTT" MDUY$AC@DDMQ120?R5**Y-CSB+HQ8UO9BH=K\R6XWHV*:(WE7%BRD!APN+?EJ M"9,6H3`M0"@%"10"@%"!?MH`>'T\J`P.=`1\3RY&2G//&\C*R*\3J[*[*0.1)!O4 M2@<3_P"'YUAVOJ+:IH].[X&YR'.F;B\JL3I=NVO-RKW$'U:PM^S5`8H2*$"@ M:(DN`NLRXS_#S<22.*L>YEJW(IP-$^1O$;PQVQS),^D>_P`AS/*M:U34F;LT MX-I7>1QU8[V^IY@?R57V>II%AZ^[<_@DMX/S/AQIQJ_)$M>"1C9"3QZM)1T. MF5#S5NZJ6J7JS;]!`JA)3_\`>!_N7]FM/Z@^Q5H5%`*`4`H!0"@%`*`4`H!0 M"@%`*`4!Q.__`/%^9_L>'_2Y*K?8E%8&-AS'+C64$D7(P_4E^(BE:#([60+9 MOW0(J];^I1U2V),*E<2TT@DR=5R0+"W94VX,B;"]S61HA0DQV5+4$$+)4Y.< MN*6988X]4VDD7+&ZCAX5JHXF;4[$J&"&%!'$H2,?E/>>^LVRR4":58$]22X' M8O:3V"B4ALT18GJ,,C*56E?]7$>*H/SU+O&Q7C)C,QX`V._I+K$JV<*MQP/* MXJ&VRT?0FV)<`D5ZA+P2CEC/,4FWC'V_#^[\>8Q79/MY`&T.^H\;J+9M;L MF.\8$3_;Z-*R"&UU%A>PU\*B^"S)KD2;9[Q.H]GR8?16`HOG1\:RLJA.+$D" MW94WPWJRJR*"'A[[COND&WX6W(V',0$<*!I1X_48MPX^;A5K8?8W(5U)T@CC M5RZJ`2`I8`"^GE>W8!P%"\G2@X^*]Y&/JR<9&/$FPO7HY^S3%]S/.Z_5OFJW5'SG:_F9F;PTK M3G#Q\&$S&;'B]1LK1$0.\J?P5Y'>[3R5XH]CH=2N-JQZ'7^"$R8DII\U=.9*V-52U1SX5:N1V;T9F;KW9HV M9K29*/I]"*")VD:\?JL'6Q]U>?"N)X;<3K^6NK]2ACS=LW3J:3#Q8Y8,2-8I M3,5L"N0VD@!AP^GD:]5+E@]VMJL\O/AJ\O&NBC_D^I2O'+IQ(VTP(@4:K&^D M<+WJF;L++95_K!;#U_A3LU-B"RNK%&!O;B>\`7L*\C@TXL>O2Z>J.!V?YNQ9 M&^X^(^!&D$V9-AJ8\B-IT]#46D>('5I(6_*N[%A5&G)QYLT$@'V?!VM;B@L;MRKI[?4Y9.;^TY.GVW7'P7W$>?YD]'8V7-B MRYKS31-I!AA=U8Z`^E;`@G2P-<.;K-/E7[3NP]J5QMN3L;Y@](PY^&K9K,V4 MB2PLJ$JHEOH]5O=4G2;`UKU*.EN31GV;1W M$:21`_K59B`--:/(F1\3+K8^H]AW';LC/VV1Y4QY3%DF5&CD$MM6DJ_F7@;B MI5A7%+ADO;MRQMP!!C&OCJ5P&-N_C4R6RXN*V/G/S7V+9]WGQ\;!@@?,="N0 M&7[-U4AD5@.T6-B*QRXE?5IGVA(\6+A+) M=@P/L)_'4HGX=-#9NO5/3>X01.N?##F*WIS84LBB2[]FDGB.%4E2TS7K+CN< MKBXVT[7O3S8@14D_6RJS.%1^+`7)"`-;E5:5K5Z(Z-G,EY'GX7'3D1BW87'Y MZFM81;D6NRDMN<#!CQO8WX$6[*E/Z&>=>QF>I\AI-]@QV\L4$)EA/8S-P/MT MVK"VN1-^">E6,;?]F5Y'`\Q?MK:34SQ-[=@XCMJ2IA38\[VXT3#>A#C)Q)I$ MDX02OK64_I'A8]U62IJ_&6^4P.IL,, M`89E#@/"Q'ZQ"2`;6\*/$/E/67U'@8VK4C,$D9)!<``(0&;CXL*?$3;+!!S. MI8S%DH8F=%8&(H/\6K!6)/[KE5JXC*^;0W/U7@*JEE>%/=DC<>8DBR:6'C57 MBU++,DM2\V[J/[RVS1H#1QDQ:7L61QQX,.?.H::)JE9RC-4-Q0D4`H!0"A`H M`+!A?W;\?9022,_#^%F5%XQR*'C8]U"E+R1QSH7(V+9\G)D_;*G^"#4MZ&=- MV2`:@TDSVV[:(!06Y"_LJ9@@^9?,&'=-W^8W3W2,FZ9&W;)NT1]48ITR%DXG M4>XUS9VT"WRO_#ST@FG[MWG<]KRP19XY[EB/K$$GG7(LEB#J.B/EYM_2&WSP MXF1+E;ADN9/;69I'U'B.![#W5#1#1%R(I(Y?C(!>1!]M'^FOY MQ5ZV7DHU!(BDCEB62-M4;BZGN[Q]%5M5HM6R94_]X'^Y?V:OX+'V*M"HH!0" M@%`*`4`H!0"@%`*`4`H!0"@.)Z@_XOS/]CP_Z7)5;[$HJQR'T5D2*@0*D0*` M'E4`UY$Z01!V'O<(U[S5J4=M3-V@U8T)C]6:8Z99CJ#VG2>W(2S23N!^K0L`$747TKPY$M57V+23\1[GZ7VZ2 M".$O(H@C,4+A@"H)O?EQO4?.Y'QZ&G^J&WV-IIU,A?UF#`%_48.>0[UM4OL6 M958B7A[!AX>7'EP.ZM&&71<6(;Z.SE46SMJ&2\<%E_=;NK%&JU0J0*`4`H!0 M`4!'&08L5;*WZ1/$D_AKT>LJUQ1Z'!V7:U_Y*G)D,F3(Q.J MY(%?+=O+SR/4^IZV/XZ)1N.JLMWN17!7)9I>"TQNB,*/IE>G9II)L*.02K*3 M=RRF]C?AI^BN?)F;M*-Z8DJPR?O.P1;@N.\,[;9E8KNV-DXBJNGU`5<6M8Z@ M:I3*]V:/&MD0<+H;:,/(CGQWE0Q@A1J'-H3"Q/#F0;GQJ+9Y3@BN"&>6Z#PL M6$YF!DR-D-"(1"Y_08O?VDFPKT<78^.M6]K'#?!SLX\;'O'W[<3TXU^# M`^)U&[.G*R@6\QM7'WNO:EN5?L>QU=3,LE>-OO6Y'ZDZZSMLG@Q8HHL9)L>; M(]??E_8MMOP=].BM%$6-VW_+G:?BD&'EF5\?)ER9 M<=`I,9DA2(+:U^'IWKOZN;Y*_&]V<'WY;PP;6V2KY#Q_KTRP1 M(MN=^/`UW+#Q4'GO/R;9HP?E!ARXD./F[G)/]WB'%V]0@7TRI-+0]&5&[I/]]8D[(2LX+AU'"R*0?RU62J4(\=/:O2GD6X)9+6Y>[5D3 M0^C;7N$>3C(53"A?#FAP?+-^ MZ8$$6[[NTB#;8F^\LK#2+^4LT'`K'*2;`ZNZN.^!*W*=3JM&Z.+'658XU(%P\ M@NEA:[74WJ5D19T/>%UIMNV9KMAYJR+BJSY!L1%I`N>!)XV[CPJU;IF=UI!T M.5\R/EYU#MF+*NYC%W%I3'BPLA,PF6UUTCZIN*SO[E*,\#>.VNQ5[EU9C['O M=[FM>1!ANO>D1B)DMG6AE+(J!29-4:ZF72./!1>IY`C[Y\P>F=OPXV M$HSI)UC9,>,7&F9BJEF[#PY56]JO0LK-;%[]VJBVQY7B5A]9]=V65IC)7V$V+8<-&^(, MLDV0^K7.Y!8ZU*7-@/JFU=_R'/7'I)Y/3FVDE?M/AB`7Q@WV;LO`,PM?A;OJ M'[YJEWT*K%J>WZ6VUT5"\H0@K(- M0.JYO?B/"H60M\56>WZ>VX8\R#5]HA!-^P,)!_Y:BK*Y6V%0>,7I[:YX$:0, M"X!:6_%65M6I;_MJAY-2:XUQDNCM.'ML,<6)D#(A:YUDC7J/$EK`\4(1NES9I<:."4:_3-UE[AV M"A' LCV,?'3%]=#IR'DLZ=XL>-"C4,U\O`]U"QR/S-ZOW'IO:<)=I2.3> M-UREQ<-91=+M8$FUN5ZRR6A20RM/RV^=&X:9=RZTCP"X#'&QH]04GC;@:Y;9 MV$RRZ+^5G4&T]9'J'J/?5WR7%QVQ]L=ELZ7M9BMZRMEG<0SOQM>.ZL9QZD[\ M6G-PP/9IX]E665KQH9VHIF=3UM\K^?&F/\HQV]X\RG8U1=>2:GK$'I^I`?*5 M;5^ZOVU0N2*`4`H#7DY*XT#S,+E1Y!WL?='X:E*65LX1XP8#!CJK>:5O-*W> MQXU;(]8(HO)OJA<4`'#CW560T0W'P4QE5;8LOZ]!R1C]<>%:[HRV(6H?U]U7 M%ON35K[+4XN"TGV.M"10"@%`*`4`H!0"@%`*`4`H!0"@%`<3U!_Q?F?['A_T MN2JWV)15\;"LB1J6W#D#Q7Q-(!HGSL3'D6.:0*Q'+CP_`.%66-LK:RV-0W;` M!TK(2/K.`2E_;4_$RJRK8R=XVP&WK@^P-Q_%3XFR?D1%DRSD9V,^)"V0L2L" M2-"AC;B2:U5(4,R=VV21CYD]OC)%6(F_H1\KCO-9\JHM#)G#@``+<-([+5E, MFRK`J0"0.)-B>`]M1QDB8(^5SQ__`%H_(:)DD@U(%0!2`*D"@%0!0"I`H!0" M@`H!8BUQ>UKCPH"TW[_M,['/M^0T,F'DWDB631&JM!(H>0=NEB*T5TJZD:O8 MYK$Z=WMMIW:#TLG`ED:$Z3+9LG)256>=+7\C`&KI2OH4Y1_)T>^;B99((86! M,42K,P_3MQ%Z\OM]UI\:GK=/IIKE8J+(1FH!IRT=\2=$74[Q M2*B]Y*FPO[:LG#15J4SC\':]WP8,B/'B;,GR<8)/,W`P2*."=MQ:O2R6K>'; MP>=BI:LI&/N/=H8,N,+DF:26.1IDL4,C.1XEAQT$4:_5`L+5R]WOJ]8KL=?3_7O'?D]R)P'$>Z.-_'LKRTM M3U+/4YC.W>+I/?-H./`9UW?);&R9&;ACPBSLZ\.PL:]?]6IM)XO[+#P7_P#( MFX/S2QWS-^&;AN<';,F.#;G@`>3)1P3ZA!*V`T]]>S;LUJ>0NK:VJ+&#YG=+ MS/#Z7KO!(D4DF6(_L85G4LGJM?@;>%6QYE9-HIDP7J]?)$S?F'!`7RL+;\O( M@ERH\:)S&`)U!",^.;^O<`863/A8T^2V-*D7N@!]9(++QOPMW4YG6R-N?7> MTO*#A^I(V,LC'5&+2("%D6/CWL+56\:/T"R1[2PVO)R\0129&.^/C9(!T/S` MY)J'8P'.K5F)955X'4X&9+BY*RQ>;4-/@VKMJTD7JK(ZK+R#!@O/)96"G][QG)C2;"='<=FM@?V*I$H[LCA)'SW8_E)M0CDR3F M2%G`N;IOE[)-B9^UMNC_`''EO)-%AJ@#1R2DM=WO=U5C[M.`-&T?+)-MS,3< M8,[3N.+-).7CC"(Y=54`K=K6"4X%'62LZAZ=R]VW#[PRLKC-$,>*+)CUJ=/, M`W\Q]MJQM1Y8NO!>MOC4$F/H;!@V['4;Y)'*(984DT<5]282%-`)LBD:;7K? MX_4JF2MF^7>%M+Q9+[D'"M._",*A.3"83I%VL/-J]M1\9,HU1_+>$XC8N#N^ MG%R5B^.0QAGD:"1I%"DL#'[W&U3\9,H[F65(8];GRH`HMS9E%A2]N-8+4K+U M(^+CDX3I("CS78GZUV_2JN"L:L9M=$96/,A4:95G1!QC*Z38"NB3%2C;#/'. MFM#?M*GF.RQJ&C5-'LN@8(7`8W.D]PYU$^I!B.:&2WINCDB]E/,420D\SS)& MA#GSL"$3F3<6L*G1$-[H8L3Q8T:.+.!Q';QX\:AD8U%8-E06%"3-"10"@%`* M`P>5Q:X(/X#0K>LHWYF5)E3^L]N046\!0K6L&BA<4`H#(!)'+MO?D.',^`H# MYYA8_P#S`^9.-F8HU=+=(.2R*GV`L2Q;M/$5S`Q0"]C[ M1SH-B+FQ2#3E1#[>$<0/KKVCZ*O0SLFM38/2R(UF3@;>1A]4]J_GJKT+K4PF M21)Z,PT2_5/U34$DCAS[J`P;<34$6V(>?]IDXF,?U;,9&]L8U"M<:]K*WW1, MN.SGQK/R66@H2*`5`,$`BQ%P>8-$"@^!Q_Z\^A9O2^Y]5K\+WK;GH5X(^U58 M"@%`*`4`H!0"@%`*`4`H!0"@%`*`X?J,2'JS-$;!7^YX;$BX_P`[DJM]B44I M3/MPFCM;@=-9$GF3X^.)Y-<9,:ER+6N1R%62EAN$1]O@SOAS,QB,F5]I*2#? MCQ"GAV5-]'H5KKJ2M&>%TCTM/Z-B!^2JRRT!1GKR$-N[C^:HED0"VX$6(C(Y M6NWYJ!*#.K/[8XC_`'S?FHM"7J->>/\`$QG^^;\U&P/4SK'5`EN\,;_CH21= MSGR!C:V@9948-%I(/G'(6OQK3'O]"ESQF9F6!B,^(RCU%,PN#86/*QK-5(EE MDKI(H:,W4\NZC4$IGJW/P-J%Q0@4`H!0"@%`*`4`H!0"@*K=$?,SL;;HA\^FPXUX:Z%M7)[_P#D*+2# M'_/N?^Q>[?P;5'^/M_U#_(5]#(^>NY/QAZ(W1E_;(PJ?\<_^HC_(U]`WSRW: MW'H?<@!QOI;GXWJ/\:WIR)_R-5X+[H[KGT>+\6HFN$D=?J* MQYD@5TV_6NU8Y:HP7[!*TQN5[_.S.Q=M^)SNA]T7'EE:.&>-=3:H^?"][4Q= M!5HZO_!CX63MNX8($DV)EH%8@^%S7!FZML?D]'! MVJY/!V"QHEP@`',H.5SV^VN9MO$7-VHPW8^DQUN`Q8<>:V/"K\F4X53Y-:JNVACE[1SJI=,S^*IB=1_)!W+IW9MY6/[S>5!$D M\,;1&UAD($8CQL.%>G^MSTQS.YYO[+KY,D);$3*^4W3\^&D.+DS12(D*QEB' M5A#JL9%8V+>?F:]7+2N2OM?N/(P9;XK19>TSM/0?3\.VS;8V1(F&#%#D1/(I M,@QAI7D385IU>JZ5AE.WV%>^GVHWQ=/]/8T\.O=LO(Q\2;UMOP;DI`5;78`< M^/?V<*Z5C./F5&\]";1D%<[$AR5<.3F2.JD.K2M-P).I?,_,55XS?%E;L5)Z M#VSU\N<9<_J90`5Q:\=N1O?[0CQJ.*.[P5.^='[+M.-)EG),6,Y9-,FF/27( M_$.%(U*NWLU.[S<%\O&>/007`87'(]G_35I4'%COQM)S._8 MDNV]*92-QFG(4\_=J$;VMSLFBFVQ&&V1>4VT\;@\:J=J1+T2"WDOJX*>5R/' M\E%4/0\"6)I)(U=7>(@2H#ZJI9:E6R! M/M[R;,<9K:R?45#[M[^[66/';XN*_L5[7N1.9(MY-5NXWJTID\3QD MS].KAIG0;F@C9C&KR7#%@+V!(UJ0.9(HF0ZDG`WS;\G)3XK(C5HRL<%SY&8@ M^]W,;<*R5'9RS977&#;F=7=/X^,<@Y2RQ)(L,SK?[-F!L7U6N.'-;U=W*+0G MINVUR0)D1922P-[LD9U"_(V`N:NAR7DP-$A7*P=!*DB1>*ANVQ%K@]U73*<7 M,HJ=[Q<_-SL=0&Q$T.GJ#S!BP%E\*SO5LFMHW(\LNXY!'P,+0*L213%1;0P- MFL>WA5(8Y)K0QD196'-)ZTDIQ5>3TIB_VC64Z#J)O4-LF"^V>263:L9Y2QE9 M?.6YD^-JO4L2ZL!QO:A)JR<@PZ0L?J2/[L=^SOJ8*6OZ'N.5)(Q(A\I_*.=1 M!96D]`\?"A)FA(H#!`H5@4),T!B@(^X[C@[9M^1N.?)Z6%AH9T6J&(8O^"I;]!`!-P;\>RA M/B")*OP;-DQ_YN3:>/N)^N.ZKUZA#(V38;IBNWN,KJO[JW&M,?V,I?2R M)G:>^LYTDNUJ*$B@%`*@%/I'_,'E_P#H7]FM/`/L5:%10"@%`*`4`H!0"@%` M*`4`H!0"@%`<7O41EZRRXP;$[/#;^ER4X&GZJ^ M)K-XVMQS4&CX'(F(.7DEU!OZ2`*O#\=3S4:#BV3;_1X"LRXY_GH!V7[.^HD& M'98UU2,$4;]-K>VU0.3(,^3E9<\F(DIC M@B`^(>Y+,6X@#Z*V2XJ3*VK)>IM"QDG0G`+<\!^>J-S_`*FJ21L?*R'559R5 M7D*7M-8*JFLGR7HXM+\^>N';@T<:*OLM7'^QTJH/0_7?<=9E==[7!NN\;6ZM M!+LD"9.;ERV$*QRBX([;CN[:X5@LTGZGHOL5Y->AHV7K"#)V;&W3%VO,:#<, MD8\32Z4D=3RG(-B$[NVK/K--J5HBJ["=4XB2YV_J39-QW#<-OP##M!J;5LHTW*4O6TZ[%@DL3N425'<#441E M9@#R)`-P#1TLE,%JV3<2>P1[1^+QXU5R61@\NZW=4Q(EF1&TH8$,57WPIM>_ M(?37;TN5LBXO1'#W758VF5>X8.)!DQA$"NH#/8FX8\P;\Z^JY-GA8,2M2&=3 MM'HR8B2K`L3_`%@%'$CD;U8X\M*JVA(S<=LG$D@#:692`;]I[ZB"<32M)P^5 M(F)D'&R!HD0$B]P++S:H@]"N1-'`_,7(V??=GQUQ))Y,/;MR?'FPCB8&4&EQ%:.[^L#'K06`U<['A5&F M42C4E;5NO6N!O.--ZF3#N\A@DA53?#;$*+ZS&WEU:M0XU>C<20]7!99F;\R, M7;-MF&9FS#,^(ER"?4+1911'_S"&-E'`DRFR/1_[73(4Z1)ZPO\)?APCO;36<9(+S7P7OR\ M$F#-ODF3!FQPY>1&^,^4K-+(@B0-F1UW3+JD^3L8(C,PRIU-S^JA M/)1XCOIB7-\K$VMQV)2FU[C@18CM(/973_!@E)P^X]#Y&7E9@QYX@_Q29"-( M'#1@H1Y63B2+\CPJCHWJR$]8/3=![J,S*FBSX(_6A,;.(R3*Y33>1"-"\>/D M%ZC@6(\'0.ZX.-DY,$V)/F2B;^3RK))#IEB6,V+@OJ\MQV4K1@\Q]!;O/BXC M)/!CZO1GD256,@DB#@H0!H*G5V\:E)K0AU(F/\N\^/-B.9DP&_I:D02.K&,$ M7*O=>([.56QX7 MKL1BZFXI-MF6K#[6*8G2+\6'T\V%3),P;\S<,4K!(CG4DJEDL0R@>\9%]Y0. M\U%\BJM61DADB(A,Z5$/V90.0.5SVUH]5(JDKP;9X()@JSQK)IXKJ%P*K$%S MVJJ`%0`)]4#]@"JDR+<2.WE]-2$:ILI4.A?-.X\J#\I\*GB9VL,?'](ZV.N8 M\23V=X7PJ)8K4UW^&G!%O1F;B/T#:_XZD;$JQ!]E0:(4)%`*$&*`S>@,7_'4 M(@X'YK[AEYB;;T-MBA]SZE?TIFY^EB@W=K=YM678M"#9]1VG:X-KVO#VN`EX M,*%,>)R;EEC4+?\`%7FQZD(E?D'"K22*(AFY3B,""&C?LMRK15HT9Q;U-)YU MC"6Q>OU'"K$F&1'5T<>1QI8=X-171R0ZRB+MKMZ3X\OZS'8QD#M7L-:9%Y*4 MC8E@\B0+\ZH:(T1K\.2.+1,Q8>%^)HMPUH:]PB:2!7B&HPN)5\0#YQ^"KXW# M*9%H2(I5GA25/<<7!]OYJHU#@E6Y*3W0L*`4`J&"G_[P?]R_LUI_4'V*M"HH M!0"@%`*`4`H!0"@%`*`4`H!0"@./W-U3K?*9B`!LT7$__-25IB:5M3+,FZZ% M9ER123EXE`%@&/:WTUEV,G+8MBIQ1HK$U%`.?LJ)!JR)U@0,5+NQTQ1CAJ)J MU44NS0F`CMZN9]O(>.DDZ%\--6=XV(K638^(HR(LB*T13RR*HL&'T4^1LE5) M'X!X#E5(@N.%`1=QB,F')8VDB(E1NYEY5;$YM!3(M)\AI%G.%,!99&U6]@-5 MLM2R)=Q:Q`(;@0>WLL:>46\,A;3'&R961J* MD"@-D$WI2![7OP([+5:N3B5O63>DVWDW,+<>=^0K=9<;UC4Q^.Z\G@9VVYNU M'<,=E6!6L9#Y=(4V-S6F:M&O;N98[M/4KVW'"]:*(2#5*C2HZFZ:%('/^^KC MXLZ^:-B3P/(\:2*TD?ZQ%-ROMHZM$JR9L_8YU620!<<.1X7J9$3HBMG6?=YTH&-MN(D,0TI&/LT',GO->S-<- M81YDO+:65K,S,6;FQN?IKS[6;0E M%75R46/$FN3]CK6L'?\`KU[F4W47RZW'JKY@=5X\>=/C)!AXT^.+?99.4BZD M62_O+P/"IPYU2E9)S8'>]H)N\=2[GU#TMTE)-BSX>Z[?O>/A[MBQAD"F*RD^ M6P]-@+U%,:K>[F="SR36J:*3=-DV/&W7Y@;<8LS`W"3,BEPYL6.64G'.EWU! M3YHRQ.JW96M&VJ^D&+K#?\DCIO.3U/-)ZNAHFC)4R,[%#=K:+#E5R]>0MCU6`"2`.9X"K5J[.$5O954LG08ZP2'UGM'"-G%D\6/<14R91)4]1;'!N>'*K62+;X<8*L;+&MRNK2%U'A7+BQ+'I.IWW^TZ3:9L=\) M8A*KO)J9DU7;S]X]E;NK>XI:&BBGQ%A=XT+2",L(EOPNPXK[+=E8=?(M4:Y\ M%IE)G2X;JF-"$D)\@`)/X1;PKHY(I2EFGH5_4W5T^%MS;1AXJY.2F/)EO(\R M1*L0*ZE4-[Q/A66;)Q:,/CUD\]/YT(VN%I%>`S@2!&XH`?=74/#G4_D>JA'3 M7'I)-OHK7E.Q2##LY`8F_T\K<+5'\D@WOV=P[ZJEI!7D`1<7[ M:NB9T(V%=O6G[9)"/:%X"I*57DWAXV++&X=D-G4&Y4^/T562YH;<,(&/3*LI ME;3%Z9!U,.8%NZHE1(DVS3QQGSF[-R0"['V#PK/)GIBULT7K2UO!#A(GW#4` M1:TGB%0:1J'9>]>9BR?+V>?]4CINN.*/)/!N/&O89R'F6""9"DJ>HG8#PTGO M!%"&I.=WG#.']LOVOE)@UM8Z1Q]-F[?"_.H>.MMS+)5G([=\S-Q2+:7W%1]Y M.2V8B@*F1B$'TVCOR(MQJ%9\25"0^22%A]?[\LPFR\$2XXB:3(",`(@,IH0]_8+6JC9/(LNL=XWS'W3;< M+93.1EXTN04QT$C$A=0U@AC:K9-";OT(6T_,)6^'BEQFS)W$?WIF1`<)9-5E M5?T1HXU'R:"JA$V'KO)?TA+MA23.L=M02J?5LP7SGZGO45RQ:=-9N?NNW9GW MFBQ9$>7-C^BI#"/TF(7S#GRJ];219:%IARM)C*7]\$HWM7_HH]"*,W4-!0"A M``I(/+O&BZG=47L9B`/PFDP0<+OG7O44_461L'1.TKOF5@J/C\IGM!&Y^KJ% MA>L+YX!8_+OHOJF/J;/ZRZR2!=[R(UQL'%@8.L$(]ZQN;'E7)DRJO&O4A69(@R(9XA)$ MQ96-KG@5([+56U8-*N3=]`]IJK(9BI@(5)85#V"W(7N[S8?XR"[V[UK:Z]J9 MA5^YHFUC)L.SE<=H\+5((\9T9!QQYD9=?LOPM4,D]8V+%C!DB9@I^JQO:YXV M%6O>64I7BC=4%A0"@%0P5-U_YA7M_P#H2U:?U!]@K0J*`4`H!0"@%`*`4`H! M0"@%`*`4`H#B.H/^+LS_`&/#_I M55XMO0O*2(LFY80ADE24.L=M2@V8W[A6BHR%9$E6#(K#DP!_#QK."QZ2-G(" M`LQX`"KJK>B*.R6INR\/&&&8<@>I,_,#APKHM6M%IN95LVR#.J#)Q!;2JGRJ M/97*=$$@&QU7L.ZHU$%?&PPIIA/?T%:MRM#.(9,26!EU1R*Z M_I`\+>RJ<675D>^`L.?=4-$R*`P6"@DD!0.)/"@;A&N1S)C2_#NKR,C!+&X# MVX#A5DX>NA$RBCQ<#J(;-!M;8T4443KZX$P/J#4Q:YT^7GXUV8\M5;,>7'GFF1F0DI"'U12:P=8)MQTFUJOFRUJ]BF%.R)7373F=MV69\HL2 M$:-"9-?J:FU%R+"L,V6MJP=..D'1V[^?8?9X5R):&LZE/U!ZI?%T$@R:EYV` M:W`V%>64#F3R`KU>MAK@I+W9Y/8 MRVRWA;$6:5Y7+.;GLKGRW=F=-:*J//$U62PM;GRH"/DSN&3'A%\B4$GN5>^K MTK&K*,]X\"8\0C3D>,CGWB:JW)9*#;^*JDCQ!L1R-`1LK+]%XX(1JRI1]DG. MP_2-4;\%E7R?+/EO&R?.+Y@AG]0J\>M_&QX5S=[2M3OZ#EV/JY`O<\#:Y(`# M$#Q\*\UV;/3JDAI2Q.E#?GY1<^/M\:EW;4$*L.19+ZK*6(MJ*C5;]U;C5>32 MW+0F]@H`X(%`/!E556X_<@6-2W-I;(6E=$4O5FW8V?LLFWRIIAR3Z4OIA4;0 MP)(6P\*M\EDTS.V.KHT2]AP<;;MCP,'$73!!CQPQ&PUE5`MJ:W&EKVR/^2<= M*XU_!:3PM"X1CRM.BO\`O(S[ MO_A9%W>>6T43-QD'J2@=NKE?\%?6>(/GNM3=GSCJ_P"8,NP;R^W)CX\@CQ!E M-)/+Z;/Q'V<=E:YXUE9P="9U/3'7>S"-LF=WQD$6*V=$1?TCFZ?1!/;UD4<-67W(IML?I["_P#8>PH]M34, MW*.4F(;?K"@6QL>\CC5E^IQ*+*ST,;_O9\AP<+*@@!M!#%IN'O: MWFY7K&.0F/M)^W]==330(V+$(9QUT\:L\F16*JRX['7])[WF;QMN1+FQQQY.+E2X,F`R:A(IN!J:]B*NVH*K1'PO>-ZZDQLWK/'V MV&8[&^X0OOFYPDF6+$<*KQQ=QMG\>*7;,IG&) M/:W)<*FBJJI6931=:=6ML\'4$J8;;6-X.V9.$B'UI5# M6#:]7"WLK&G22:M=R7>=^-"TW?K7JY(^K-QV884&T],RC'^$F35+-(#9I=6H M2SW/H&S9F"V.RX$<0PU9(1QL$;WA]-3HS-XT0I.AMC MV^,3[;#Z'HD2HC,6&H#2#<\?*#:U(12U8U'3^T;&(\C':!3'DK?S$\5]0M(H M\/4NU0T6KJBTS>E.G\YHI,C%U/"I2)HW*L$(L1<'E:EM2:I&!TIT[\1!D+AH MCXRJD6BX6PO:X[2+FG%%CW-TULTU*4$F5/HY+$\(9Q?\`))[`**"&?-MGVN;YMYF;F;I/+A](;7.^-A[?CMHER)UX&21 MAV"N++FBMAZ/VU]NV6)TBG.^JM%I-U`*`4`J&"G_`.\'_H/\`B_,_V/#_`*7)5;[$HJP.`^BLB10& MC,R?AX2PL96X0H?K/;@/94TK+*7>AC%Q3':6:[93@&5SQMVZ5I=D*NAZRLKX M<*$0R32'3%GM-S2M>2)F#2N+-.PES2+`^7%3W1^Z[ZORXZ%4I-SXF([!G MA1F7W6MR]E5YOU+\4C:3_P!558988*K#`^0PXV\MZ[,%>->3.?+;E:$0F(9>1%4U6Y* M93]3W^&Q!-K&W^O?/T"Y],"ZZK<=.JML*W(L54VY8N`_K;1BR8FWS>NP4*=$ MSI'>/TQS6[=]7K3DGR927.AHS=RWQ9Y(_5F>3T"K0JA"K)8$E@.!!#>]SK3X MZ>I6SL3)SO\`A.NU)DS_``>/&OVY6[`(IUJAORUE;5ME5;--F6)VHFB$VX=1 M8\+QS9$Q,D<6J8J5TRF+6X4K"%8@M MM9=P79SVA8S5;5QP2FY.DVN(;GO[RN+XN%Q0]A8&P/TM>O.ZM%FSROMJ=O8O M\>&/-BYW&5VG,0]Q1R[+UV]N\V@Y.M5)$0\[U@;05V_RY<&U3Y&+D#'FA&I2 M4#AB>`6Q([:OBCEJ5O/$KI.H,C:1C09\@SYI5B?(D"^D8_6LH0*NH7]M;/`K M3!G\L$"/JN>#.7*RH-4>4DRX84V9DCMI!'[8DUH\,U@I7+J6\W56+CY$L-9>>J5+#1XDWX5SUZ]F:/,>,+JA7`7K'CI)JM2#MBO--)N#J%:;RP+W1C\]95K.IK? M10?,_EG_`/\`7_F+W^M'P_PJYN_M4Z_UOD^JCPKS$>G(J0Q20*`KM[-L>&W, M2`CZ%-",FQ-VP`8V&&Y:4)_!5L7WUGU*Y9^.T>A*S'#Y,A!N`0![!6W>OSRV M:V,>C1TQ53W-4;JA9V[%-N-K7K3H/_O(KWU&%E=GZTRW4L6*=OAV"OJ6>)@^ MTY7?.C!N>ZR;C'N'.J.DFD#:?E=M\V>D&/N.1B M8++C#+QE`;U3ALK1$L2/\F.%%C,LKT.LG^5FPY.V8>UY,\TF)AS9/(@9(EC!$%S&AL3<#5SJ/B-*] MB"/M&PX^T84^W1L\J23332EP+AY2"1]%6@[5K23;MV`V)`\+R>MK-N5O)R_' MVTB-16L'/9N(NT;GZ^*JY*.MS`>&CC78LO-0S!KBR9LNSS3YAW;/4!Y?/'$. M5^0)'9:U,N;VPB<>/623MC-/NF5D$DJRFX[U;@H^BQKCDTIJW)-^[-M,$<'P ML7H0L9(HM(TJYX%E'?QIQ3+IFO&V+8\8,,?;\>(-()FTH!>5?=?VBG$1I)[. MR[094E?`A,T3-)&^@!@TGO,/%NVH=15ID9NG-E3#EQL/!@QU>03%50`&13L\E';;04O#U/6SF&`2X0B6#(C8NZ(+:@_-_::M2ZLB.'$LE:-GT:2$'[FL>P[5JW12RV)5;UV(W3W1 M&QX^1MWPRY#8VR/)+MHF<_9O+[RD?H]U8]3#:.=E[F6RV3<+8L/Z@=,_E8)1(JY)B@, M^%1`DQQN3P)[0>V]20]2!D;+ARR%T)C+<3&!=;]X'8:$-$9]EFQ_ML60M(GF M"@!&X=UB=7LH5V-F-OJ%0L\3F5>&I`!Q[B"18T"R$V#-QISH4E9!]1N!X=G" M]">VAI!Y=$=2KKJ![/'OI,%++0T:,R$71AD1CZA%F'TU9.2FM M3=%*LL8D3BK\>/9X56S+IJR-.9GPXM@UG8B^D,H"@=KLQ`6HT2U$G#]0?-S9 M##/M73T,^][YD1R0KCXJ%DB=@5N[C@+&L[Y$D).K^4/2VX=,]"XFW[C&(MPE MD?(RH^9#R&_'QKS[.6#LK"H`H!0"H8-&5C&4*8_LYX_-"Y_&I\#5EDA04:UD MSBRSR1%IH?2E0E9!' MU"06Y*OZ3GD+5:BEE6S&%!Z&*J/QHKSL#8^R@-\'_`$N2JWV)15CD M/HK(D<2;#B:$20N$^YJP]S"%F[?._$?BK5Z5,VO<3+]MS[?RUB]C4B*2V\N2 M/+#"`+\KN2*V;BB,DIM!,XUB:^!;L^DU+9$03L+")^UE'E(LHKKP8)W.;+F\ M(;C+I"P+P`XD4[=_ZH=:OD@UQG4C1,"6_[GE5ED]4(/6#EF56BE&C)C_6CEJ'814.L:H5NMF2=1O?\'9]%41=:&5=@ M0;\C?NXU*T(:1XR-QE?.5)5`60`8Q7P]X&];7L[Z[&>-<4SV&/&QO;D>W\-8 M)FA$W3-&+B,Q]Z0,B?2.)^@5GFR<:_R;8BT/!JI:33EP8\^.T>2`#F4E0S.4]/U22"J@D@+;EQ-5>=M:%OC0/3.&V5A@`?!XDAR(\]EVWYH?,*3<\Z'#:7)18FG=4U6U7MJ(K#N4M:M81V="ZK,GTK M^M_2/^N\&W9_*(OWU>ZC+]]5.-DM4P\E91+QDAG5&#))%,;+(I#+I7WBK"_*O9_5 M8=>31Y/[3.HXKR56;D+-FS2J+(6[.X<.VO<./%6*FFQ)M8$\S;CSY'Z*F&61 M*VI';/A"D`AKZB;+PXFI1GF7M.R.H@_W#G4H\Q:;B_$'^X5(E'%=5Y";?-F9 MDB'TL=/6*K:[`]Q/;[:K:RJI9Z.!S6"@V[J)LPY*2X4N#D8\,T M6XWJ#5:%-L.1CK+*AFC#3:!""ZW<@M<)QXU0K10R]T2/(6^FK0RX2_JH MHX/<$!N%Q[*3!6RE%QU''C@PM<+.5%XUY6MSJS.?`W,%*235#J.@P,/%P.EL MSJ"/`CS]QCU!4E(`TJ0+$^PURYGJ5L>,3J7&S>K8-A?:<48.7!$?B5_6"26` MRE00+<+53D5DH)=DQ=KW3+C@8MHD98B>2*3(&P)[2;\@.VIK62EK1L:%WJ.!0-RC.'DWTJGOADY:E( MOY?$U*QD/)&XRM_V^"5(4;U9'<)Y02H!%[ZN1X4X,GFF9DZ@V9(VD;("HKB, MDJURQY66UZ<&5>6JW)`RS,!\*AD)XW8%5M4<2?DG8#.C4Z9T:%O$77\(O400 MKKR;4G@=@%E1CV`$7J>)=61[#&Y_'52T#^X5`@UR8^/(2TD2.QX%F4,WX34D M-(K]PVL+"LV$CK-&>&EB>%"MJF_#W2&9524Z,@<'5N'$>)H31^I./!"QX*HU M,W8`.V]"Z:GS3J]/2W.W=4U6>=::%+];IUHW3)R9\[^;:Y1Z-R)7D,<;2P.T.K29HV(UCO: M[:@A8\!,MS&3^6I=)B!R:W/&(JY,S9TP MU#5IQP>6E?K6]M+.-"M5+DG&W;QO61L*D"@/$T0FA>$\I%*@]Q/;4JT.2+*4 M1]NG9\=8I+B:"ZR(>=AR/LJV2L/0I1SH265)``P!'9<7`K,T-_V5 MI_4'V:M"HH!0"@%`*`4`H!0"@%`*`4`H!0"@.)Z@_P"+\S_8\/\`IY0`7-6HIU*W9IP\7X=&4MJ9G9V;]*YN/P4O:6*K0] M9329GDMH7$C)%&6;DH\HKU+/C4X%5VMH4LDC2.TC.VJ262%@18@?1 MV5#)1"W$M'+B90XNLGIMXJW9X\:VI:5!E>NLDTJ0Q!/$?LUC"3@UKJM!V7J2 M2OW24'T8(U)RRP>+2."@'BQ/96N-:&65PRP)L;]W"LMWH7V4E3O"F;,P<13Y MBVIE\&.FN7-7EDI7S)U8+12UOH=3N8T8Z1KP`TK[`M>OVI54EL>1UU-FV5G# ME7%&AV>1Q-N%R>0'.JR6:(6:[3M\!"0))1>5^81!SN.\UJJI*69V1-CB.D1H M-6@!?#@+`U2'9RBW)56I.AVQR`96MWH*ZJ=6=]#FOG]#>3AXR@V%P/:;UTOC M53Y,DKV97Y&0\S$D^7L%<.7([N3MQ4XHQ%(8Y%D7BR\5'C65'%D6LI(FV0QQ M[TV*A^RR(FGT'ZK@DD_348:IY&O!;*WP3\GQ;H7H7I/J[Y@]?2]0X"YIQ&_\`#S\IV6WW7(OB)I;_`/G5/YF3U$GC_P"W M7Y4?ZOF_AI/WU/S,A,D/<_\`P\?+>+;I9X,?)5XK,;S/[O*WO5KC[>1T=O0T MPN;JK\GG;?\`P^_++*Q%E>#+UW93:=N:FU_>K-=[(3G3K:$SQOG_`(>_E_A= M/;IN&.,Q'Q,2:>+5.U@\:%EX7[Q73BS9;*=&C%9++R0-AWV3Y?;%M`@SI-ZV MO.V:?)DPF*-)BS("PMHXA6O8WKU>KEY5E%+*;)L3?-3/I_$DTQ)&965-4C<.'FO5%=E&WLR\F^< M.]XN06>'3-ML62,O$C96@FE@4L&#FY(MW&K+(S-X*V+=OG9N,!.!E;1%'O+R MQ+`J,TD'IRKJU-I):X[A4_(8VP0:=P^:`WB;`V_.V9<3;-RBB$N1D,?>E!U1 MZE("<1PUU5Y)T+8]&3!L.T[1A9BX<1@#*!*[.TC:8R+`%B>%A5E6M%*6AUM- MZ>31M68DNG!-TB-Y-1X!U;B%'C4K+-H,XTDSU#U'M^W2';Y,A,?(EC#!BP4J MANO(^SG2]DMRY\\Z0V#J39X<;=IHSN$^?C38^VJ5O\!,#>,VY$27/F\*SU(4 MK4W;.>O\#K7<<4RX./C+D;:YTSB8-Y0>T@ M=]8Y:IN647NV)^)U/$VY?%8^#AME:?2AS("S!2@TA=-RH8+PO:]*XJV4HBRX M[FAS-*[2N2[N26:W"]_#NK5;%TR/)DQ)87UL>2H"Q_`M37U(O:-"!G*J>YYFV2((((\T''1G?&AC4%]$PL*21$E0+&6&MT`!%.3*.BAQN7&]8)1XY,:,'%"!59>-[=]JEF. M#)X>Y4WORXU$'3,CMJ``2#?M[Q0$3,VO%RAAQ74\.1O7S,V3:=FQWW+==BE M7(W4Y`"X:P$\BAYE0>!KR>S91"-:U@^P[]M$F;.F5@N$RX[Z+64..P`CEI/` M=E<^/+&Y%C7T_NN5F+)#E\KI*./R-WBKJQ5 MKT/*93K*L.4OIRGW)%]Q_I[#5N*:T(5O4D^/X?"LS3^!QMP[>VA!D-;]FH8* M72/Z_P!O_P""W_'6G]0?8ZT*B@%`*`4`H!0"@%`*`4`H!0"@%`*`XGJ#_B[, M_P!CP_Z7)5;[$HJ_JUB20]L`?'7*<$SS#S2'L_<^%:Y7&B,\2E2R9]%K<.'A M640:21=S223"=8^=U9OW*F[?BK3%]QGE^TD1O&\:O'^K904/XOV*J]V76R/5 M0219ILMLI,;$D$#!3(\I%QX5I3V^XSL^6A-^*S)8@N259UX:T%M7B:OERNT0 M4IAXGBW"_;VUA$'0*$&B3_/X/W#_`)10&_P!L3^7L-0]B?4A;7^JE5Q]NDC" M9_TB3VH1K97?*R' M#9$PXE?<5>P"M,ET]BM*QN2U(N+^UAX6K.2VY7=/Q/G[W-ER<5Q@=`^FPK#H MXWDS.S\'1VKJF-)>3JLR!I80J<7N+>P\Z]K-3E70\C#:+%>NW93:N7"N/\>\ M'3\ZDBYF)N`A#0E8KDJ[D<;?M:+'Q6I//D]#S@8$2D0Q6#'C),WO-[:I3_N6 M@M;VK4LI(KHMD6/^3"F)WU>Q$.1,3J+M<]@KFMD;U-ZT2-9 MXGMM6<3NRR2\"IV+'EY%C5I'.E$!9F[@!>HF"4I//3T>N:3-F%Y\L?8#]",= MGT\ZMU%#;9'9WA M13X!Z16<^07-6QXKW95N#1O@&/LF62VJ650+?2*]'/UJ8<35ON9?JN3;M_^1DN>*.?'D@F4202!DEC/%2C"S`CV5>M[54',BNP> MB^D]OQI(<;:8((\Q63)L&>\`%V7S$V#=PKZ+]95O'-C*UOD.EFQ%P_N MZ+X2-VDB0E^#$]OFOV''&J"(C@MP4%A^Y8BI M:1Q7NW>$6". M/)P8DB1&C6%03Y'OJ!))/FO4\41L\Y/1724!2Q4V[+BBHMQ5OD<=U#*1 MM\D(;[2=M#FW&U_-6&9RU5'JXOM;]"-C[7ZVU1LCB+)!)BD\%-@#^"KY<7+^ M41CLE74HMQVK(RM\F9L[X8Y>(<#).1$'O&;DF,GE[W`U1]9MZVY%7DAZ'4XV M/+BQQ+@,LD(0*Z,>946!![S4?%;'K34W5U9:F^#.#E8I5:&4_P"*?M_A5XXU\$D%S8`DWX#MX\JU<%$CBNO-XV_-V6?:=NRX\GQY6V8)E@3<940QY+8Z@ZQCXYO[OZ7;5-2#: MN+\PL7`Q9=OARC@;ED28,1G4+-%BLZM%E3`CFJJP^FCJVB*V]"-'M74DNZY& MSE\N#;H9\R;U8+(9`$TG>Q.FA^8,V/D9.5+EKF8T.&<;'BT^E(Y9_5#C3Q;3IO4ILMH?38\ M>"*XC'!_TN/#N]E75B.*$<4,1)C14)[0*L[$JL'JPM^S>]ZB"8%"3-"1X'M[ M*21!-Q=WS,7&]".Q2]_-QJTF%L";EGG.W-LG'9?AD]?FCIY;TE%JX^.Q5#*D M5AZT#1IR]2X(O40.>I*%B+@W!Y&H-!4,#P[^'?1$HC9N#B9T6C*AU\/*UO,M MNXUHLD$-)G#=<[AND6_[#T-L,Z;(=]\V5CC&:T91W%Q8N;GE:N"]Y1)](4@$=P[3S%JS@0<[AJ^W=2 MS0SC0N8"R.?K@^Y;Z:Z[5;I)G5ZG15S&@H!0&_"%YPWZ()_`*UP_<8Y=C2YN MS'O)K.[]QK7[2/G0//@SPH=+RHR*3Q`+=M$2T4,'2V1AX,F'A2*,?)AC7*1C M>T\;+YP>?$"IE%2-E]/Y>-"\RQPL(L@2JQYD,@C;\!XU?&TV5ML>H>EMTQX5 M]%H6G;%,+2OS4L[/P]H:JN_N9*V1IDZ-W`X[*3&TOJM(AUCRJ]N/<>7=4*ZD MEG2;.9TQ!B9#B2?#M$T@Y,/TJG(HU(H]2<;=E4+B@%`:LC'&1`T9-FO=''81 MR:U31P5B=37C94K2G'R5MDJNK4/=D`X$U:RTDA6)/Y!R_+6:+BC!3_\`>#_N M7]FM/Z@^Q5H5%`*`4`H!0"@%`*`4`H!0"@%`*`4!Q'4'_%V;_L>'_2Y*K;8E M'/YS9$DR84;"..="SRGGI',+484N/)[E&Y):JL:*BBR(+"J-R:0>OIO54#S+ M*D,;2N;*H_&>0JU:RT5NX1HVV!H<)%D%FNS:>[4:MDM+(QJ"2!Q"]M[`UFU) M5(&U+&J1JR\N(NU_P5KX,UN3:S-!0"@([#^7Q_\`JV_**`D7(-Q? MAQX4V!"QA\/ES8QL1)]NI[0&-K&M+[(RKN32#?PK(V%20*`>/9WT6X(&ZLOV M42AGR"X:*("^K3Q-:8?)EDU,[B!.^/B'@\CB1T'!="-7$Y@K#FY!E+A^7)>RN!YK\I.^N*%!O^\$>/1,FKV5T?DIJ M&8OKV3E&CX@(C+$FC5];PK#Y$DX+_':5)'`YB_$64WC6P[ M36F/%RW*N\'F551M*MJ;M-3:J\%ID\W[*R_D1&Q"W%VG/P$7&22QE/8D=^-_ M&LKV\(UHHU9:;>T4$RL3H6-0%[C;@*Z^NDEJ<^>QPD'3D716)N.7LCGXOJG= MHXE;)MZ>,TNHZV[QPX5G^PP4:5C*F3P;).L9MJRLS"S]R^/;#D0LWH^E.%TD MN-.IAH+6L;UY?PIK:#0NMAZGGW3,R<3(V\X,D6*N9`WJ:P\,EM!-AP(N.%8W MQ<8C4%!MO7NZ9.)L9DQ)D?+S9(,S+>%4QY(HY"-,;ZCYB!W5W8.DKV_@I>VF MA:8WS5AGEGP\;:A)FQS10001RDQL)V=58L5%K>GQX5Z63-3%5JNYC\5F5>+\ MP\M]J9M_P-(RC/'@SQN#Z[Q.J:='U?,X[:\;,OD>YTI<6F8Z8ZUS7W'^KS[6 MR[NLY7*Q_4\L*\2SZK<;VK!X>*DZNT^>IWO`WL;@GAW&LU5[(XFH1YW64QQY M"LI%HT6/3W,3>OL,-8I5&6+W61SJCS!0+W/(]M6C4[7[4R_ZA>1,3'@$96*P M+6Y`UH1(H6D M%K]&"9M*!5\S$FQJ,SAF2V)`ZE3+Z@R,(X&)B8B1E(\J>$,#.D"3LU[W* MCU`+6^FL59@\9,#'IK"W;,@@Q<_,FTZ,9="/&?<;3^E71@LW(3\%1D8\$\1C ME4,+^4\B#X&M'C5EJ:)P5>>ZXLJ0X\DSS-R)>]NS@+7)Q\=4"R*\PLVJ6Y)/T5"ZNO]BJ<.2_&WQWU>I-QN;>IV_@J MWXZ];&JR_P#\25C[-E[ED+CQ2Y$LS#ZTGE51SOPJ+]=5_P"HJLL>*EC%T'EX MV6KQY.*D4ZZ`#*"TC@\+&W&U8UXUM(OFY*"'NW0V()1NN3BXF?/C-H;)C.MH MF'8WC>NE9$WH9)&K60;D_21Q)-:MDCBJ@D6'B*B6$Q[:G0D4(,4D"A)FA(H` M:$,QQ[.=`"`P*D:E/!@:$-21SBF(ZL:Z/_DB;JPJ4S/C!@Y&8!J;$L@]X!KV M\11HWNY<.^J`\:[L%^58.=UAECMFY0[A`981 M:2/A+$>)4VX^T-V&N3)1IF]8:)?#LXBJDCCR!L>=$#QE8F1D8K>F=":EUM^U M!XBM,*<-F=[>#W8``#A:UAW@5G.A=+04)!/E(H"'G^>3'Q6_5SN0_L0:JTQ^ M3.Y+`Y#L'`>P5DB\'F1TCB:1CY$%S^Q4UK+*MP:-NC;TFG?A)E,96'#_N7]FM/Z@^Q5H5%`*`4`H!0"@%`*`4`H!0"@%`*`4!Q._FW5^83R&S MPW_IYRH3I`)\JQ-RL*KD6AECUU)YX_EJAN>)IH84+RN( MU',MV_N:E5;*MD-%R_AQ/"L MC45)`H#0Q_[0C\(C^Q0&XLJC4QL%XM[!QJ4I(LX1$VY3()Y!P`J MUWI!2B)E4-!0"@%B>7'P_-1,AD3=%*XIR4U">#C&Z\UOSO6F)ZP4OIJ:VDBF MW'#='#J8GU&]AJ*COJ_&*?4B5R-LFYX$;:&G74#9E`)M[2`16:Q/R6=T>=US M(\7!:2^KU1H2W&Y8"-M^G;]I,["\DAN%/?[JC\%.G MBE#M7FVFQ88T4L<(65B[MYG/8">/*NB[U,::&VU4)%AW5(%03R`5F.E!=CR` MJ4F]"CLMR?DAH,*.(7!?WR.==F;VTT.>JYO4KF9(XV>1@L:C4S]WA7#R2.KC M.Q"&1FYJGX4&#&/^.<79AWHO[-9S:Q>*U_DDXV-%CPZ8R7OQD=S=B3WFKUK! M%G.Y*22-;"5+CG;NK>CU2,,FS@UY^W86Y[7)BYL(EQ,ER^@\""+:64]A'8:R M_;9+422V,<2*M>B]A6.93')-/-8_$Y4C3M=5(4$M]5;^[7C?-:35FGHCH]MC MW#-SOH*XTE".;DV4\/1G3>WY8>#&% M?/=_,U=U9U4;2(\/0O2T39)&,SC*#JZ22%T3U"&7T M[A=+;I#N^W(\A8,BO.YD8.PLVMSQ-^?&NSK)9JNK^Y;$VNWH=ETQ]XSX_K;A MI:2]XAP#%+?6`\H\+5IT>KSM+V1S9+-(LL_$]4:AQ4H4D7O4CLMVBOH%#?\` M!GCOQ9RXQ7;,E@A=6T'ROQ73[;T=3JKG33.J:6`8JQY#+*0`"`=1+>P49QZS MH>F7+4J\=EC463&`][M(U=AJ$PTR'/U1LD$;LV2IDCX-#QUAC]6UN=4MFJB] M<-K%3E]<*;-C8[#%OH.3(#?4>1"#L%<[[3G5:'97HMK`)5".!O5/C1'DF=2?,;9LS5# M-GQH-I=#)C0H^F.P["JVY&M<:50TIDCXW5NUY>X/C8K>M$N'\?'E(?(ZFVE0 M#:Q)-39J2VVIR^U_,?:#N>&V9CR)/N8R.9&F#X9F5O4-^!8K85#N5Y2='A]< M[#-CXLF5.,*?+5FB@E#75%8J#>VGC:X%ZE1T3G(=L^&R,?T\/UHX MRTH*0"2<2>JU^))C!%^^N55:6I5(W[/MLVQP;TV7-'Z&9>+!QHBI+C67]9RI M-R;^\>-7K5R2U!69?2&,,9?2>W3QM>NU5U1-G"*%MVFPIX9LC,>62: M(SM`500NO8B,#<'C6]<;#_63YW;3B8MHXNFE@T5W))O>UK\:Q5TD5U,02^E)J*AD/O1D<" M/93'E57*(NI10[ML.7A.^=LLR^B_G6`<'0\OMY5VY;U=5/DSHFMR=M6 MYQ[AC!U($ZV$R#F&\!W5PWHZ;FJ9-X=_A5$63+#$!DP70\3Q'YJ[<&M&CDS. M+H@6(-CS'Y17&U&AUU>AB@%K_EH"%D^;=,%1S4/(?\$BM:[,SMNB;V6K+P:> M2-N4#SX4D:<&`#!?TK'E5J."EUH;<>>.>/4G!A821]J'NMW4LM9+4>FILJI( MH!0"@(4OEWC&/Z<3J?\`"O6M?L91_A7&B9V7[!S/8*S2EP6=H($GI9F=CF-1+%C$F9C M8I<@V'MK9:(JU+DDY>0,>`R6NYLD0[;DV`]E9U4O4EN#U`LJH!*0TGUR.0/. MW&EOH34]2.8XFD"Z]"DZ1VGLI52RUG"(^WQ@8_KLP:3((DE(Y`]@'LJUWX,Z M+R2NVJ&@H!0&@?\`YP%^%HC?PH@]"-)EOFD8V&2B&XGG*\`H%O*3WUM2O'5F M3[%>6H'@+5UVNE]IR\7Y)I-[W[[WK!?4T8_NO4@4)%((,JQ4W!L>5Q MXTF-2(0N6[21WW[:FS;1%762!+;-R!#>V)CMJF(XZY/T:Q;Y;&Z4(G$W(XVM MP%N[L`K1*$9-SJ;X\53&TDS:$!%AWUO7$]VS!W\$J9<EEM%&S.I4MQ-SS\:^-R.S%@6L2:]&M>+E:$M)Z%SN:RXNX21Q$B/5 M=0>PVY7KBSY\N*T_U,'6LP0MMRMMS9)H4>.:8NSL+"^D6_#7H=3]A7)H9Y.O M:FO@FYE\/9=PR\%(4SH([XS2!5168@:F+<.%^VNCL-HGK(Y:+K[?S'CI'-"V M5CH!+CR)&?CIC,(SZ+QC3H2^KR5S.VAUNL$/*WS<]PZ7ZAW"/;(L_=-FE63' MDBCC5I2#]I"C1CS$#@+_`$U+:I[BUF^I-LZCV:'<\!M4<@TS1-PDAE' M!X9%[&!KLK#4HE-LQOF]3[;+AQX\>/)-F.45LJ00PJ$4L=3DKW<*SSY."DEZ M[G)8>P;1F;3D;EDPQ-D[[-+.\H56>)2&C*I(>8!;OM5Z.=7Y,VBOBZ+.#%&V M-F1SYV"8I,7*:-WB40$.%D2QO[OLJ.!/(@-\MII,D9\F?'+EY32MF6BD]+TY MN:HJ#WKWY\*A8RCMJ6V7TUDR8&;BXDJ0ID9_QN MF^G/N?(QEBR?7C2#X1;@78E@?-;P6M*XVG+,[6G0E9?R@P9L;?8?CG1]XDCD MB>US`$8,ZKV^$<:2+#9;F^-IN@^K9]/ M;3@2;OEYTSD[0NZ9F9&T4V?D,,."4J7BQ%.I$)7A[S-RK2J).O(!!OQ'X14D M&K*QTDQY(RMM2$7Y]G.J9:IT<%J:,Q@E&Q8650ME"BW[7@>-,5DZ23=:GC3_M/IK2C9CD]"-%T]LI`D^$%G3259F8#MX!CY?HJ];M%5AIY- MDFR8+Y2Y27BF`TMHMI8#ASPXFIH!K16]3TY+L;@WX'LJ M>:)BKQ1RQE@1PY`WKAAHDE9$D>/"TV0X@A3WY9"$07Y> M9K"K3H0>@1P*VLP\I[P>X]Q\*F9W$'.9^WYVV9TFY;:"\4MS-';@E^?`<=)\ M.-=-+*VEBEE!9[-NB;EC-+I$"+\;5CDHZ,E,N]OR/25!'K`W8\>ZH89HDQ)ILF#(B_Q M.OU?W)6P_'6M%*9G9ZHWW'`6X\[5GX-?(X7'A0$/<%,*_&P^66,KZEOK+>QO M5\>NC,KJ"6""`R\4/%3V<>/"J/1LNGH9_8H2*`=O[-`B%)YMXQ_VD+M;^^M6 MJ^Q_4H_N)O\`<*Q19"C)*?\`[P?]R_LUI_4'V*M"HH!0"@%`*`4`H!0"@%`* M`4`H!0"@.&ZEABFZKS8Y5UH=G@)7OMER56SA""M`L!<```<1R'RKTT(NB3'(DBK)&?*XU`_W=M5B!4B[OPP7.LKI*LR@VU=F MFKXMR+[&^#'2"!(D4H@]U3SJM_N9:FQMO])!J^!PM&CX>,*;ZAI!][G21!Y.V;;H"_"QA;W`"\CWFIDDV'$Q/5$Y@C M,J@!9-(U6'#C42")G[-CY7IF,+%-""(V`X6/'L\>ZL2RKJ^ARFY<<,;>JBBU^)J]<7U*6NS2W M!B+WMPN*HU!9,2WL'"LI;^AJE1?4GXF*L:".*T<:#46/>>9-=%,9SY,G@DK+B)$PC0F2 M_`M^6M_DK5:;F/&TSX,1AIF,V0WV26U]@X\@/&HQ)W>NQ-[JA+@5<9#-,P`D M-HP>Q3R4>)KNNZTJWZ''+LS3DY`E-DOI\:^<_8=SYH5?!TTQP:U4,X!//A7% MBIRNDRTQ):H%``'9RK[*J24+8XVY-&:7])0H)XW(%>?^R5WCBNY?%N0WA8+Z MA-M797A7Z]JUYO=^#HK44G2GS5RY.FFWW>]OCVS:LHF&"&-QDR3%19QH3B++>O1JW6T4)3U/&_P#S M1Z/VYMCW&"/%F.7=<"0*Y,<2M;4R*UAI(M=+KN4 M>T9.X*=UG*7X>022`,J-)[JNP(LIJ^=M];5>XYU]\G'X_P`Q.@TP1%)N7I9T M#/)'+'$VJZM9N*^\H^L*\FF'+C]RT.Z]Y:_Z3J(?F;TK#/BX&[9:PYF:J>F= M'J8LJ3?JRTGN`/W&O;Z?;^2D76J.2^)K6IUXT1&)1!"IQKKC@1)Y+_HAF4,\4HX%77ZK5[\*R^A;A[3NDDS8&1,< MQ7"3.Y9(S[Y4*.0/=1$TVYLLB2*STTUZ@ M3.7(!4QZ-7;Y6`'MJJQ9*:MR5^7';2(9.B,RH)('>="2&AEL'#=HO6];JQDZ M.OU,OG(@;5%(CH-3J195`[68]E(0^7Q`63-G42H4B1_.(>ZH(Y^VNF MVABJSJR2>)N?P=E1)=+0R!86H2"3V&WC2`V:)L6)_.&,4OZ2?LBK1R;:S[*AE+6=27N.W-AQX]^,D@^T[JED8\KL0ARJIO`H0*$B M@%`*`?W&H(;@U30>HPDCJWK)I!QV'\@^CL?;EA>?*^\`Q+;I!(T MZ]OQ53X5!$&O(^36Z96*VUYO5^=D["`3'AO;ITR(RC@G_`%UAEI`/KPN&%^%CR'*W;>N> M/(B4%;]=ZM>ICE6D^AJGA:"0QM]!\*SO1T9:N3DC75#0&Q4@C@ M>!'85(L:)PR(D@JTV"`C(T^&/=D7BZ#N*]U:0G)G+1*AFAFC#PNLB?I+^S5& MF:*\FSMMVU1L&&*J"SD!![Q/(5>JDAN")AJTN3-FL"H=1'"#^B.9]AJ]M%!5 M:N29PM62-!1@I_\`O!_W+^S6G]0?8JT*B@%`*`4`H!0"@%`*`4`H!0"@%`*` MX7J><0=59LI5F"[/!<*+G_.Y.RH:;V$P40W7&8`QK)+*!?T@OGM[*K\5O4CY M?H>\2&5I&R>=KWMRK/R7,4`H")F&3'$N8'01(FF1".+6[!QJU M5.I#V,;2LBX$9D&EGNX7N5C<"EGJ5IL3*J:"A`J")%"14@4`H!0"]B*B)8*9 MC\)U`IY1SCC](M_YU1O'PH\=[:[!6I737"U=_3GBVJ1F6-Y)F>3EJ-D[!X MBOGLN7+%DWI)>M48Y77M1%&MC9+R<1G_*W[+$=OFDDG9DUI/',"/39;@\-7. M]>@\"HGD6LH+(I*W;?DSNF)B8"[=NT$,^/COA3Y$T'J*8FG:;5$"WD=2UCSX M57I*^1-M0B;YDBDR.D=ZP,K)VN24OT_+G1;CFQF.^3)/!:QCFOPC;2.RMLW" M[TM[D7Y?0M.F^@$R]LPR,N)'PH,[$E0H'\V84(8GA[OIUYW:N\5W))'WKY/9 M>5%BOD[RLN!M>-C6@>*[J<);MH((X26K)=K1J(9*LT7>V_,#<,*9S,Z3;85A MG&W^F?6@AR658V6:]F-W'EMPKKP]B^-1.XOBJ]3N1(DH]16UJ_'5R)/?^#A7 ME9;/FVS-(A;G'!'COG-)\--CKK7('?V*P^M>LWH=&";.(/DO7^%N?263M_77 M3&*PEW9U7J#985)@E9@2)E0>ZQMS%>S^N[5F^+(L^-N)6[?\UY\'U,O(Z3W0 MHWF]9D/E5C[.)8UZJ[5?4K5I,H#U[G?'[IN$>R;A'!G2K.D1QM=O30+;5V`D M57YZ3JR6TR'C==YDJ/&@W67:4D=L9]!>0>[IU$`7TT?8JO)$R33\V>J(!J/R%ZBVIL'S,S7D&3!]Y1Y6X2>ENCS1Z4,;2>00W'!PG"JVNHF MKEEZ7\,Z;*3>LC;%;4OR6I-J:RMCZ+ MM<UX<;B>'.I^A# M2@KUPX5W?B;\_"NIF0H6%`#0@Q>W'G M0AGI&*N&!LZ\5(H++DM2UFW'"W&&./,9H)H^4@]TU.YS*EJ[%2PCULJ,L@4D M:E/=4&]+R.SN'=0N]S%`9H2*`4`H!0'A8@)VG)N6`%O95FY*)0>JJ2*$F1S% M`?-?G&1C9?26?AL&WK%W*-<.!3>1T<^;@.-N%<^>((9]G8DFY&DGB1W5P20: M,K"P\M%3)B64*;C5P(OW&K*[6Q#4D!NF=JLPC$L3?597`T^RX-ZNL]B'1%:^ MW;[MK2S8;M(2+++#[Q'[:+_IKIKDJ[%;J47&S;E\;C*'/\IB\LR'WB1VUSY: MM$UMIH3^TCM',5CJ2%:WF'`CE4)M.0]BS5L?+C"R$+(![QKT7:N2OU.-U=65 MK>5K`DBY`;L-<%U#@[*6E&.?.A8J-XZFP-LS(\%\?(RLJ6%LE8\:+U"L2-I9 MVXK8`T!C'R^F]TBQ,V&=$?/!.*VKTY7()4KIY"S"K-: M"5,9D-I=,DA(57MIX&W.KJZ\HK\;]3UNV]X$.#+#N$T>*[QC0S-]DRD@@AAW MVX5:F+W:,K;(^.J++;L_$SL2.?%F$L94:#WUEDI9,NKDFJHNA4,DI_\`O!_W M+^S6G]0?8JT*B@%`*`4`H!0"@%`*`4`H!0"@%`*`XGJ#_B[-_P!CP_Z7)5;[ M!%7PL#V\!?PK(M!BW"W94`S4@P_NM[#4UW1%MF1-H_\`S=![&_\`/-6R;E,> MQ,/$L!S-QQY<154X+V1"VTO&KX"UW!O<-Q!JY8J3H6_.PK,N>J$B@,<1RX]E0MR&>, M#)1LC*29=?HMIC`Y<>^M]*Q)2>6B-E[\>\DV[JQ:U+H4)%`*`4!7;UB/-`LT M0^UQ[M?MTCC^+G7-V<7)3Y1O@O#CPS;M6:W*LOP1 MGQ\;$LVM<<`/TC:P[S6S]3&)T(:@9N8LJG7@8IMQXAY._P!E955KVF-$::5H MU.I93Y,TQ\YL!PTCE73?,[?Z&%<:2-0YUE!>6"!4A:$C(15Q(-(L#Q8GF373 MDTI".:EIN1N-O&N5HZ)UDL(=$N%)!:S`:Q;G=>(KT>M=;'#G3F3S-(LD4,BB MRNO9RU#G7C_ML<64+22^)RC57E,V1BU0M"&CW&SAE56(!/&U;=?D[I5<%;;% MK<7L"!8D^L>X_/PKYK]GU/BMR6S. MC'IWNQ\6/3R98Z\F5 M^KZNL$VXJ""?:5KY:M7#;.RUSCSN>/M&_9/PZL^/(;20H">/UE6W$%/V:]A5 M78QI-Z_4KR)XZRP"XCEQIDB?RR%EX:3P/`UB_P!;D6SED\CG-YPMLBSX)-HS M)I\>(^L,%G)QHY%>X(1K6`\*Z^IU;VHU90_4LLGJ2&?JMH))H)<@8K$R%84& MD7-SI)(-K^%8VZN!??9R761+9&+]03XIR0SYT,0+!)+,`QX>9+WX5EDQ]5+[ MK%K9KU4I$C$Q-_W3%Q('RHQ*QAM!]\7.L^'EK7#DP8ZMTGF8NW)SY. MOS,:'+Q/A)''HL!Z>@KK`7DR@=@KRE>=65@QC84>/@G!BN(BK*2;$DN#JK76[:CTU*6M#. M?ZWZ1BZDZA.[/G'0/6&=G0B'=2B9 M>&YP5R5N!DI"=);B!YT(X^'&O?O92KK8[,-YJZL^@=_"Q''P\*ZE;22J]!4D MF#WT6Y$$5+?>DWC$I_'7-7_RO^#3^B)?;?M/;709"I+"@%`*$&*$"A,D;*B] M,?$0K:4,-9'UAXU8HZI:D@2PNWD<$L+VORJ()K=,R0W;V=O*D$R9`;NOXT@2 M./;403`XT(%"10DQXT(%0P@?Q40.2^:O4F9T[T1FY^#)Z6>TD>/C2=H:0VU+ MXBHR.$59NZ%^4>T8$NW]3[IF9._=0M&LZ961('2-W%[HH+"Z^VO/M=V(1]$' M$<[^-9P2#:UJ`7J`+F]P>-%HY(9S6[196%NT^X8K$>57>+F'7DY'X>(KMI=7 M6I@MR=M\T4^.,S!G=F'&6"9[DVYBQ_%6#36AHT2_O#("^JV%)'C]I/%QXZ>Z MH^.OAR1R)"R0S1:HB)(W!5N-OH/=59=67A,CX6N/*GQ%;5%&%>$-Q;S7N!X" MU6O7DI*+1DMG5%9F-E4:F;N`[?962-'8X_<>G]OZKWOXR226+$@P9,)&1C'* MLTCZUD%KW33V$U-;2$Y(3=$[X3%&\."=:01OEW97Q!CR:A)`H6UY%XGC[UZM M))JP>@-XQY,B.CLC.Q8,S,MD8\ M>:_PZ9*D-\!"CICZE/;]I1.`U)U>R;`V#LN)B2/HS,5=/JQ<`>X'O`J?D]2' M0F"/=(?.LRY2\V1E"?@(O4IU95)HWXV5'D:@G"1??C8693[*K:C197DK>']? M^W_\S6OXWJ8T+2?8JT*B@%`*`4`H!0"@%`*`4`H!0"@%`*`XGJ#_`(OS/]CP M_P"ER56^Q**L9"!&Y/`!6)^@5-=T5L]"-M((V['N/JDV\"Q-6 MON1C6A+N>WB.ZLV:20FTP[JC6T)/$0[=C.I&GZ;5K7[3&VEB;_=:LI-6*D&& M(568\E%R:>8(96P`G:),AN,N0NN0]X)X#Z*TR;P5IJ6*"T:#N`K,M!ZH2!SH M#5E3KC8LDYXA%X>)/`5:JEE;,\86.8(-+?K7)>4_MFXV^BEWJ5JO)(JI="A( MH!0"@-66&.)/IX-Z;6_`:I=^UEJ?][!`HX^6YYUR M]:524;=RSY(LL5LO=I(<>7TL2-D]6>#U%:11Q!MP'*MM4H1BO=J>"+FPL6'O"_$#OMSJI>0+]WL\?&@D&]_#OY4E$ M2;WDDT+'<&-P`A/96^2VD&5*KE)ID0QN0>'<>\5E:L&BM)$7?\+#W_$VMRQS M_A4XK\7)%ZRCUMW5?3.?AXV1#FQ08><&;&7(=(W#K(R$: M6(/%E-=79QURU^IQ5JZL]8F\[?E3Y4"2K'+B2/%(LC*"WIV+.H!OH&H7KY>V M.R>QU(VP[EM1Y5?X:/U9XU8,RIS!('8>RK]+L_%?W2RMJR<]B?-_I#+Q' MGEBR\:-H/BL='AYK,XO7T#=,M6F8_&ZG0X^5MLV+]. M*1K!+^84V3@8^%D;:KQ9V=GPX\\F,$]=HW#:E3U"JWX#MJG72ZQY5ZGZVS]T,L6&9N`;:\F9-NQ1C++\+ MCLV0QR/763TR=!-Q&6Y6[*P6?+REV&A-A^8^Y19[8#;:CKA_R:0([!S,D2N. M+631YNTUS6ZJWER1!#QNH\[?,_:5QXL;`RILV2#/,+R*XC`72;$"Y_%2V%+R M:5R-&K&QQ4??.]X M^Z/G8N5?,S$B@BCTKIAB*ZF>,'@26';7=UOU^3-7VT;CRE6(5F`[;=U<7[']?EZZG)5U3\DUS5ML5N65@ZCW!+@ M>JDL:@6)+M&MA85VT3M@J_J+'6QBT48)%]*B_P!%>-D?O9-=B=AN7C=5&EP" M>?9:]>Q^OORQVK72QCD3F3DMJ^8>V[E.F%\+)CI/+/'CY3RPNI;%+>HSHK%H MQ9#Q8"KYL,X>+U:+U4,^:=4[STY#\S=OS5RD@Z=;'E0SQAE@;+>ZD:+<'M8Z MK<>^I_7)NC5F;T?%R=BG4NR031XF1N$1:8*V*]R?41O)K&O_D;^ MA=PJ*1B]2;5/'*[S+`(6<.'()TIQ+V%^![.^MY,>2)F#N&%G8PR,.431<066 MXL1W@V(J29)%22*`4(,4`H`0#<'B#V&A#29H.#B$$!-![&3RG\56Y$<$8^[H M.UY6\#(U.17XOJ8^[H.:O(C=X=C^6G(?%]3)BS(_U70<=:V/(ZA:D%N2,A@>1!]AO40Q*-+YF.AT@^I)^@ MG'\?*I@I:_H>?C@I`FADBO\`6-BH]I%Z<0KOT)`8$!E.I3W4XFDE=U!TYLW4 M.UOMF\PG(PV.K2&*$,.1!%5M62(.*3Y9]3]//Z_1'4^3`(QK3:LTF2!@/J*2 M3SKFM@'$['HCYB1[_D/LN[8QVGJO$%LG;FX+*!SD@)]Y37->D$'9=E9@4`H( M-4^/'/&%;RLO&.3M4U:MN)2U).0TK.^/J`^VB6Z$CM.GS+]%=2R2BD M-&0.H\*))X,MX.Q+N=7H,"+6,8XC MVVJ7CTT(^I%90DBR-ND\%M?CR'*C8D\W]E MSPL.'`=]J/>"3)-[DFX/C>U"8![>7C4>2/(MR[3V&I:(;1%SH870R*ZQ9,8) M274`;CD#VV\*FE_KH0ZS]I1_>N/_`%N^.OQ^Y+?W][6J_*O&9T$6VC4^X5<" M@%`*`4`H!0"@%`*`4`H!0"@%`*`XGJ#_`(OS/]CP_P"ER56^Q**LG(PNZ7O8GQ%97K#T+ MUV/?'LJ"QAP#&ZMP##C5GN18KL8G[B!;D$LOBH/"KY?O*X]BQ7W%]@K,N9H! M0E$/<+/\-C'B)9@6'[5>?Y:TPK1MF5GK!,//C62/4CG0L'47%SP'#]@5Y_)XE#\G=5+(DUNCA]L"19Z MOC0S9.5DS3-(DJ3)EP:EXOZRVCDA%A85Z.*WLDX\RUU1N;<^M=FV7%P\?*R) ML>;'Q7GR9(@7QPT9+JMEX^:W/C5TS,TY?93DBT,Z7,BC&-'+&08R.%N5SXUMGQ164< M^.VNIKF(EQT?FT5D8\@3V?@JMXM2472XV@Y+J38NH)M]V[>]A.-)F8D,V*^+ ME%@K+-?S*RD>Z6K%+9,W;@HI_E#EC$]!YL?*E^Z'P%R&7RX^5)-)*95OV#U+ M=_"O16*$<%LBDW[W\J-ZEQ)9,;<8L?/ESVF&4NHCX*=4$T7?J;TA7F=NGQMO MP:4R3N09?E'G+U!E9&/DQC;I"[X1'O:_E-A1]#MMT.1ZG438R M8S94\DCK"%E5W6)'8F-6T]E>SAPNM==S"V:=R#E?*+JC,WW(W')SL:-"N0B3 MPJ4D:.6Y1&`M?3P!O5LE6DVV37*GH1-V^6G4FX[=@J8MMQ)L%BHP,92L,RF` M0&62_E]3MKP*YZJS^IT>#Z%T]M1VG8\':RXF.GVE7+DP(VRY4C$LK7XE0#JMRO?M%<5\KD$F38-DDS6SI, M-&R74I(]S8J1I/DOIOI[;7JKRV@&N#ICI^!4$.$D9CE]>,AF+"0^LVFVJ_45LTV?!-SGD^^,J53I9975`+ M6502`%%?NWZ_!6G7K6J\'SN:SM=MC:\S*Q=QBFQW,<\CA6L2FO5PXVM3]CUJ M9<%JW4U2DC#?C?\`D^AX[YFQ[JD^X8:N)$M`^JZLS"]_4/)NX$U^4Y.'8IQQ MOBD]3Z!;(M)-XZIE3XN'$7'Q(P&;6-+,A/'@U<%\.'&FIU+47)P7&X;Q#MD, M63Z;2K(=*!2%X,#SK?DG`NH<')X_RW,F)$CY>-'CELF>/)Q8G3*D& M8&(CG+>72FOB+5Z_9[F/AIN4KJ0]\^4\_4.$T6ZYF/#-]FD9Q(BJ*D"A8V`8 M>]Y;M7FXNXJ63-6?.,Y=RZ(RI-CZRQA)MDPQX\+J'&BUHL<#NP]5;%@3ZG97 MM8NQ7*BU;G18G1^&.GLK,P)HMTQILLJAY:07))'C6F M"[:CRB;4C8O>-:E4Q4$BI(,"Y-@#?N_8J)0''N/#G4D"A)D4`H2.=`*$&&56 M4AP&4_5/*IDK92:!@87;%?VGA3D5^)`[?AGZA'L9A^0TY#XUZ&Z.*.,6C4(O M<`+U/(TK5(]<+%3Q4\U[/II(9&;^2'U$%L?ZZ#CI\:%-M23PL+<0>(]E0]"R MVN/L(HS[*_O' MVUR0#%`*@#F6X$#M![*!D:?,CBM'%:;(>RQQ*WXW[EJU*/SH4DJ,*;9I'`FYN'ER+;<,),P=DL1T/XWOQ-2G M7PR.+1SF;'!MLLPV-FK:KG1@ES=58V/#'E2H8Y MX5"Y3221JNGN)/;4K!*>N@EF(NL#O#^AM+QH2PC8EE+J["ZJ3RN1QMSK%8*U M6Y:6QG;#U#B2QM!.S2R&TGIL]PW[8.2+>RJ9LVJ545:M>%+ZMP2FSUB=5J\K1Y4(CLB=Q!AQ.P;ZR"YT]_A62M?*_:X1 MJJTIK;6VR/R[/:J0^Z\?^NGP6IO0^YK M\A>U_P`M:?"OCXF?RVYRK54E+6@U8L,PFDR M\A-,[@(B'ZB=U6M9+1%:4UU5&%5++0DDDGF>)K"3<4`8@`D\K&A#*O&(^X0>8 M/%1^CYAY:TS?<5QEIQL+\^T5DBXJ0>7=$1GD.E%%V8]@H5=H(V.KSSC-E&D* M",9#V(?K-[:O:W'0A*=27_=QJA<4`J"05(%SRJ(92KEBK%A0"]J>`:=TPXWV MF9Y;:E0O`![P9>1JN;$GCZD$`J??N!:W<175)E!B_"W"PX*+#2+@/:)*X+1K?])@`+GQ\ M:FN.S4HKR4FMHHY2C2`&*,ARO+B.5_;6]:*OW&;M.@1IHD$2->%F'J(1P&K] M&IIDY^TI;'5:DX1%8YL9^&GSH3X5;A"LO0KREHB82ODS?9C3$OOR]Y[EK/KX MYBO M37R5F&1O1DU%`E[-8U\M;KY/D=4M).CY%!+RG:.!0.9X$]U>UW/5>Y') MEGP:5[_CO775J2DR>8\_.=&BRX%CD4V#!@;_`(*\3N_L M%#HC?'323R`>1`'?:OGZR=$GG(FAQL.3,R&$6+"I:65N2J.9-;?CVM1/ZD_;)N_JG;K3X<-KO>P.H*L22%LOU?S?17F+8&+-RM5H`TM^C4$09(_\`8(^9];=`-CF7=-M9?0D:\V,YL0Q[0WB:_1/T?_ME>"Q9D^2V/,S=!MRC MD-IVKJ+*WQL+;<"67/V[)Q1+(!JQE$I5W]1__5MPJ_[K_P!EQVQO'CG73)6*WJLJ7^H6M<5TY.LK8XM]S*U<6(_P#7[?#N&,\; M2OM4V3B21X9"OIADQ)IFQ^7Z<8-_"L/QZI0CH=9+C,^=$<6!CSPXB/-/B#+> M-SI2.1\E8-#']$!KU3\=.?Y*/$_!TG2?6J[M+N.'GMC09NVR)&SPR:X)$D19 M`4;MMKM66?'6K1;XK>3H,S#VW<\5\7*ABS,246>.0!T/LO5,>6R>AEP:9\]W M'IR;H163HO9$6@*[10-U_UEF9'P$?1N M670?:JAN@8&P4M;EXUOFSTM"F$:US)%]T=UP=]R\_;MPPUVG<]M*K)B/(&)! M`MP`%C75CNG7VN43\DG5,'4V8<^RK23$D/-/P[+EH;:"$G'Z2GMKGRU=;