Exhibit 99.1
![]()
FOR IMMEDIATE RELEASE
GLOBAL NET LEASE ANNOUNCES OPERATING RESULTS FOR FIRST QUARTER 2018
New York, May 8, 2018 – Global Net Lease, Inc. (NYSE: GNL) (“GNL” or the “Company”), a real estate investment trust focused on acquiring and managing a diversified portfolio of single tenant net lease commercial properties in the U.S. and Europe, announced today its financial and operating results for the first quarter ended March 31, 2018.
First Quarter 2018 Highlights
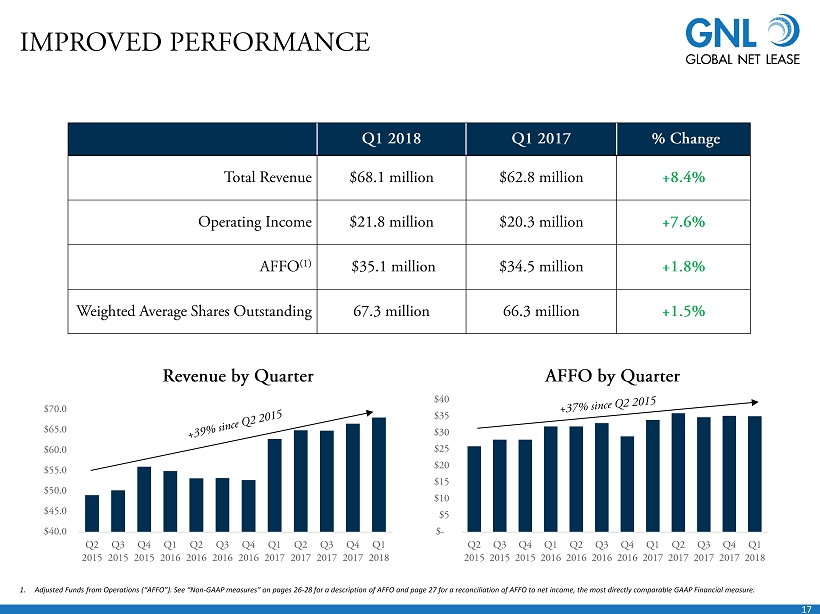
| · | Revenue increased 8.4% year over year to $68.1 million |
| · | Net income attributable to common stockholders was $2.4 million.1 |
| · | Adjusted Funds from Operations (“AFFO”) was $35.1 million as compared to $34.5 million in prior year first quarter, weighted average shares outstanding for the respective periods were 67,287,231 and 66,271,008. |
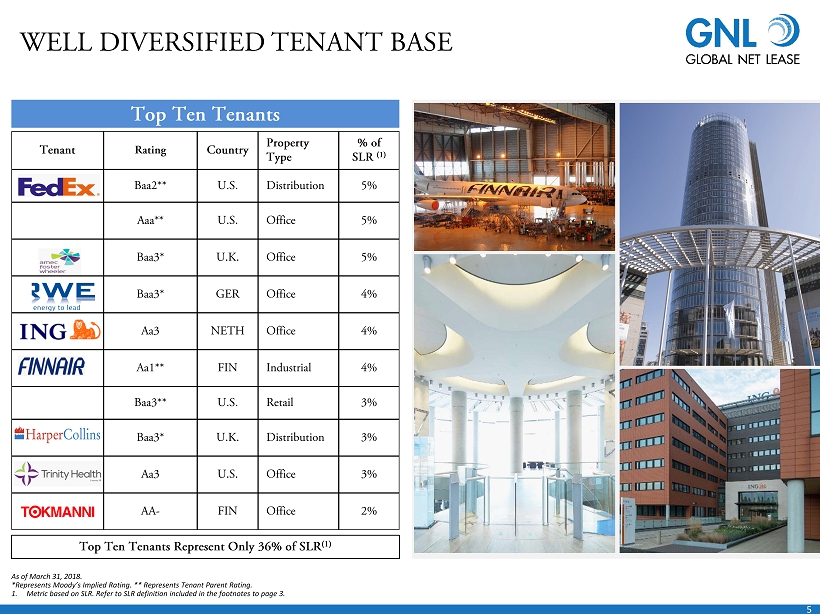
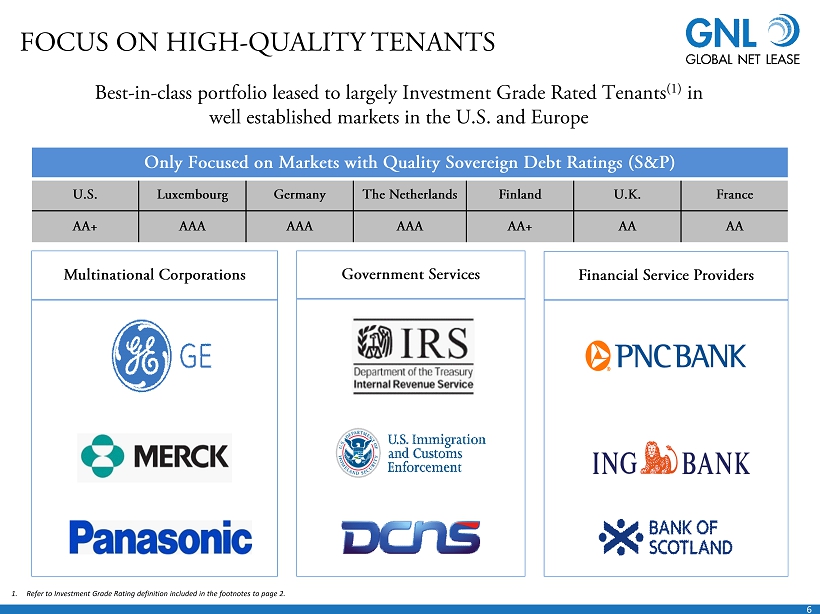
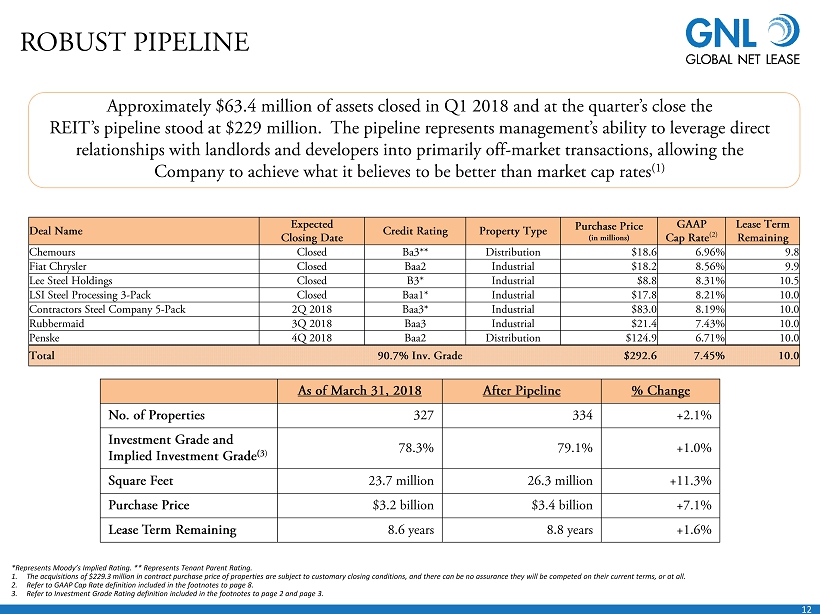
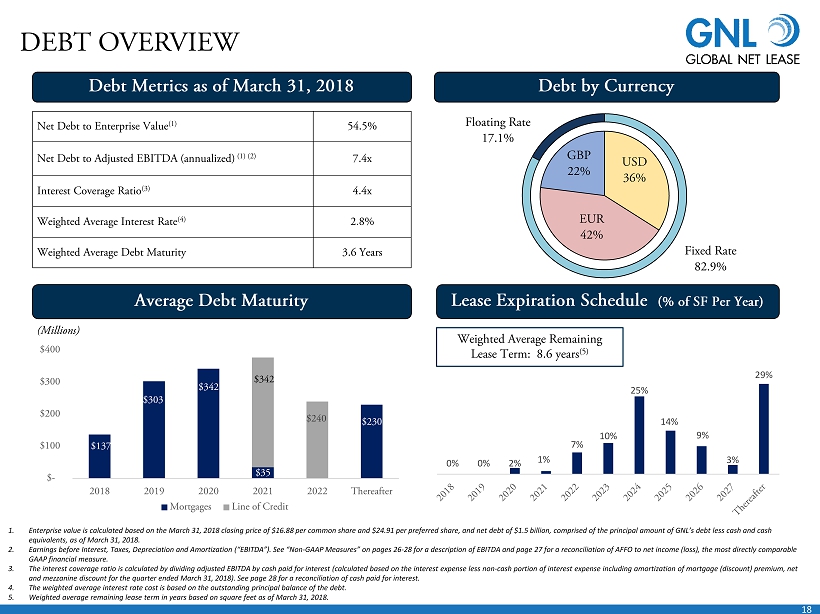
| · | Portfolio 99.5% leased with 8.6 years weighted average lease term remaining at quarter end and 78.3% of tenants rated as investment grade or implied investment grade.2 |
| · | Closed on six industrial and distribution assets totaling 759,940 square feet for $63.4 million. |
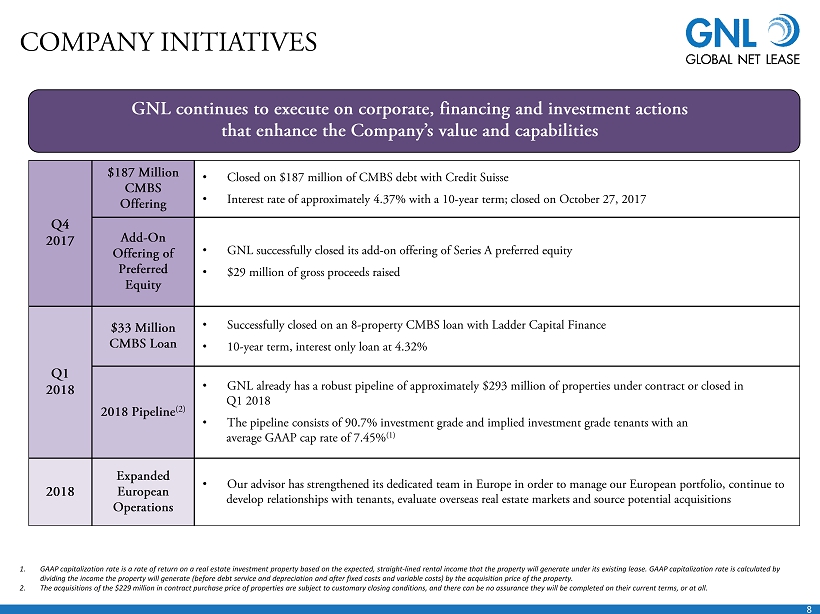
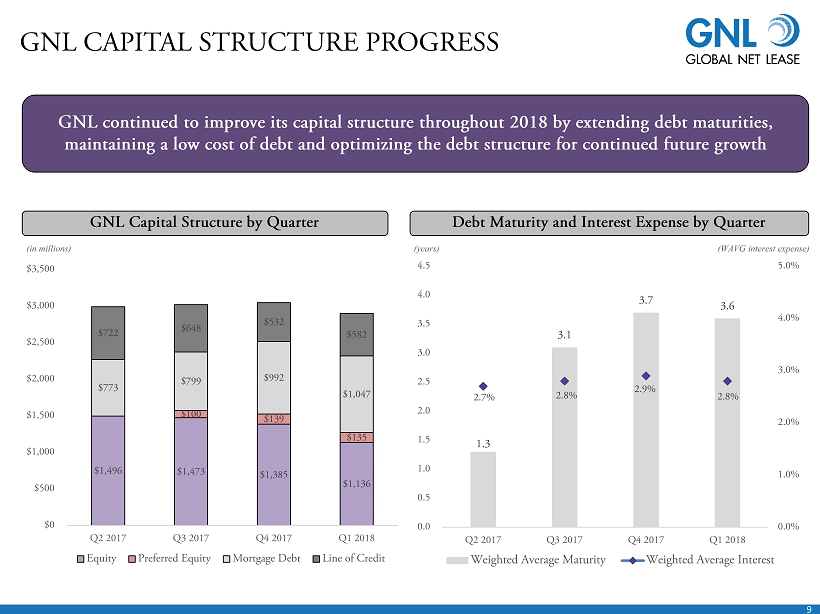
| · | Debt maturity extended to 3.6 years as compared to 1.6 years at end of the first quarter of 2017 coupled with a meaningful shift to a higher percentage of fixed rate debt from 76 % to 83% |
James Nelson, Chief Executive Officer of GNL said, “GNL’s positive first quarter results reflect the successful addition of net lease assets to the portfolio. Our year over year first quarter revenue increased 8.4% and because a number of these acquisitions occurred at the end of the quarter we expect an even greater impact to cash flow and earnings starting in the second quarter. The notable activity in our advisor’s expanded European operations serve as further evidence of GNL’s ongoing commitment to the effective execution of our strategy. During the quarter we closed on $63 million of the $293 million of industrial and distribution assets we announced in February 2018. We expect to close the majority of those acquisitions by the fall of 2018. We will remain proactive, yet disciplined, as we pursue additional acquisitions to drive shareholder value.”
| Quarter Ended | ||||||||
| March 31, | ||||||||
| 2018 | 2017 | |||||||
| (in thousands, except per share data) | ||||||||
| Revenue | $ | 68,086 | $ | 62,837 | ||||
| Net income attributable to common stockholders (1) | $ | 2,361 | $ | 7,429 | ||||
| Net income per common share | $ | 0.03 | $ | 0.11 | ||||
| NAREIT defined FFO attributable to common stockholders | $ | 31,857 | $ | 33,515 | ||||
| NAREIT defined FFO per common share | $ | 0.47 | $ | 0.51 | ||||
| Core FFO attributable to common stockholders | $ | 33,103 | $ | 34,209 | ||||
| Core FFO per common share | $ | 0.49 | $ | 0.52 | ||||
| AFFO attributable to common stockholders | $ | 35,081 | $ | 34,457 | ||||
* All per share data based on 67,287,231 weighted average shares outstanding for the three months ended March 31, 2018 and 66,271,008 for the three months ended March 31, 2017.
| 1 | Net income includes adjustments for acquisition and transaction costs and unrealized losses on derivatives of $3.9 million. |
| 2 | As used herein, “Investment Grade Rating” includes both actual investment grade ratings of the tenant or Implied Investment Grade. Implied Investment Grade includes ratings of tenant parent (regardless of whether or not the parent has guaranteed the tenant’s obligation under the lease) or lease guarantor. Implied Investment Grade ratings are determined using a proprietary Moody’s analytical tool, which compares the risk metrics of the non-rated company to those of a company with an actual rating. Ratings information is as of March 31, 2018. |
Property Portfolio
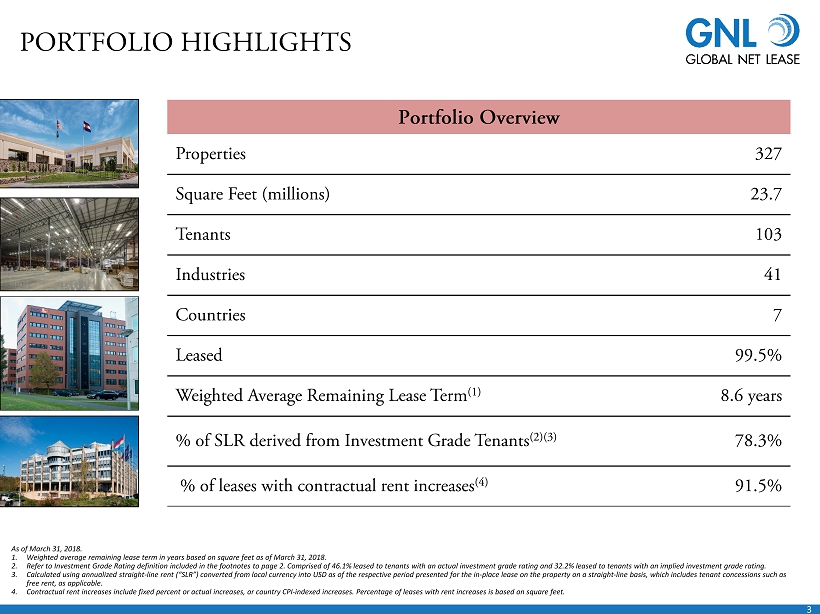
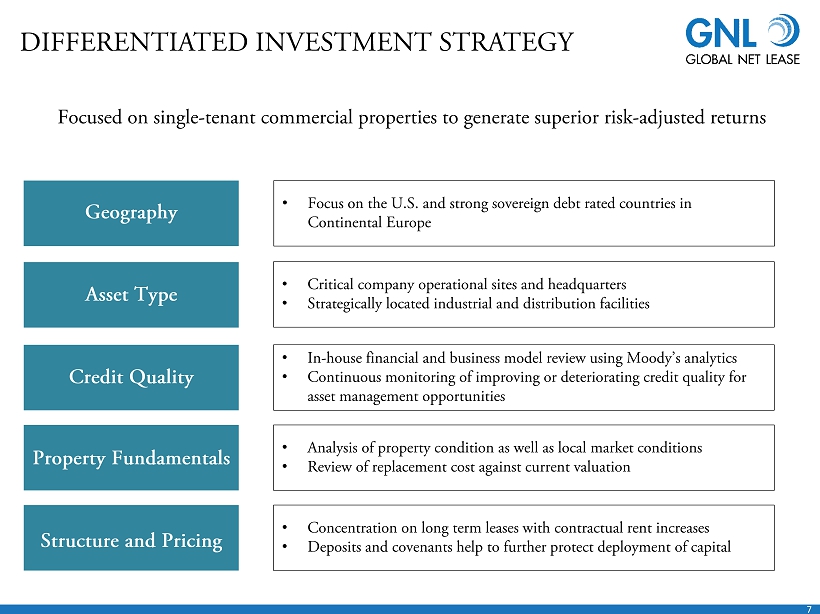
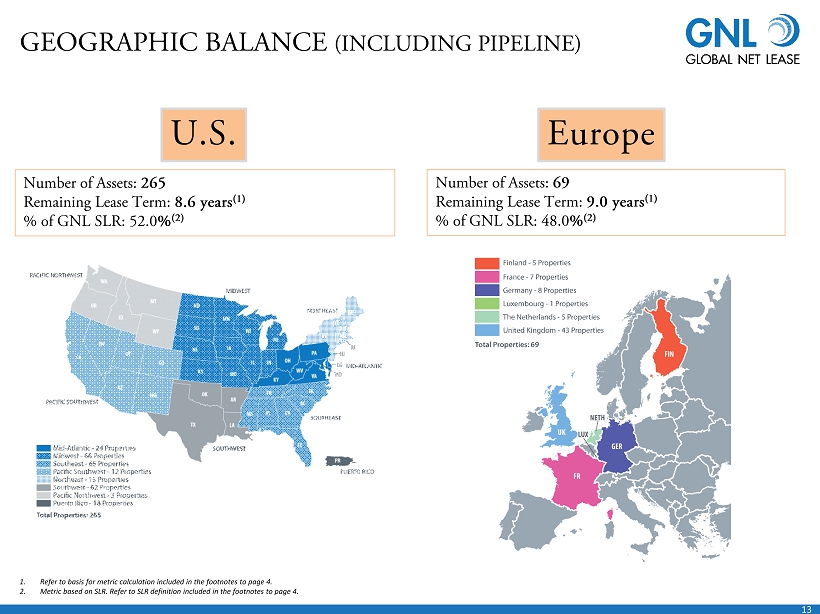
The Company’s portfolio consisted of 327 net lease properties located in seven countries and comprised 23.7 million rentable square feet leased to 103 tenants across 41 industries as of March 31, 2018. The real estate portfolio metrics include:
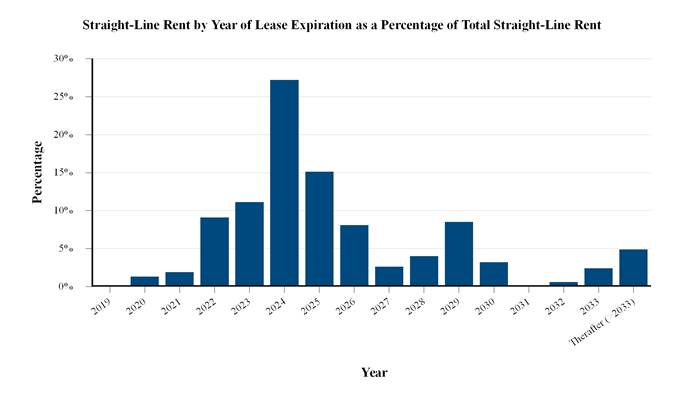
| · | 99.5 % leased with 8.6 years remaining weighted average lease term as of March 31, 2018 |
| · | 91.5% of portfolio rent with contractual rent increases based on square footage.(1) |
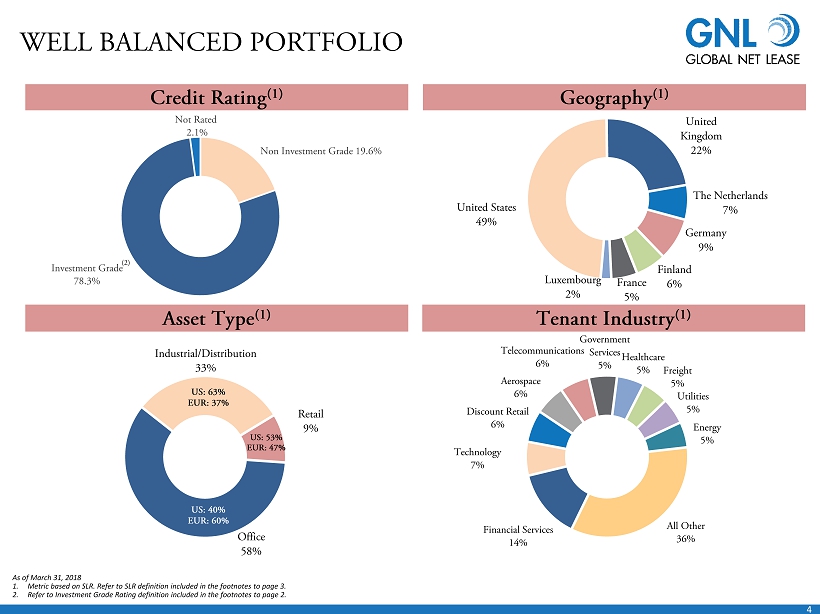
| · | 78.3% of portfolio annualized straight line rent derived from investment grade and implied investment grade rated tenants |
| · | Retail portfolio accounts for 9% of annualized straight line rent, with no retail tenants in bankruptcy, and all paying rent |
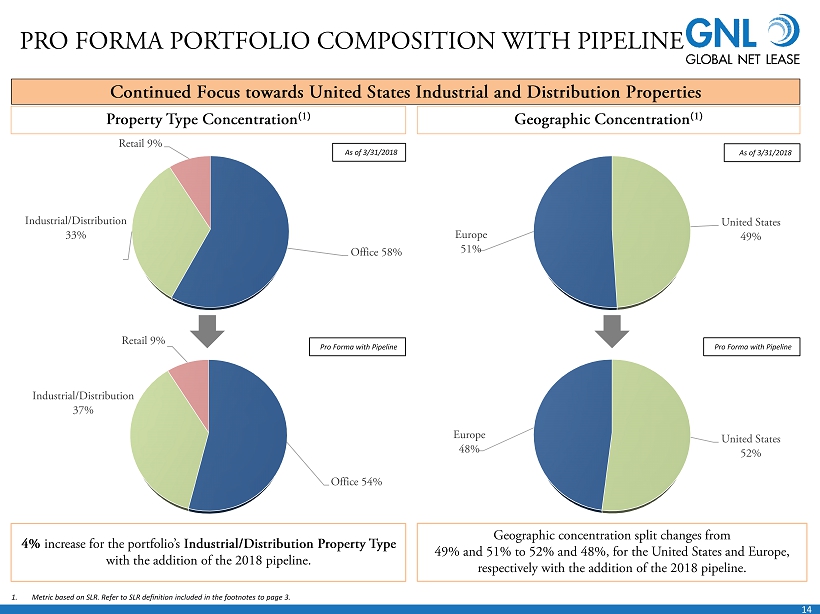
| · | 49% U.S. and 51% Europe (based on annualized straight line rent) |
| · | 58% Office, 33% Industrial / Distribution and 9% Retail (based on an annualized straight-line rent) |
Acquisition Highlights
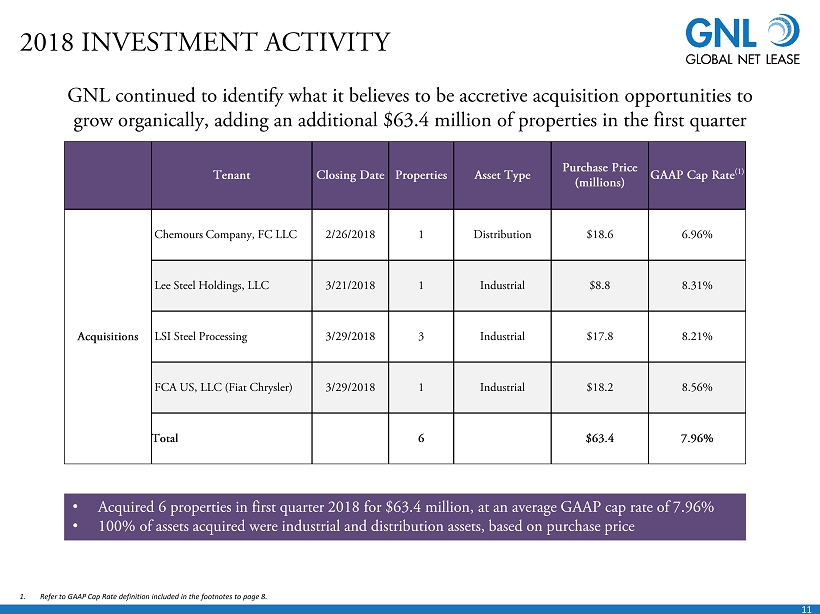
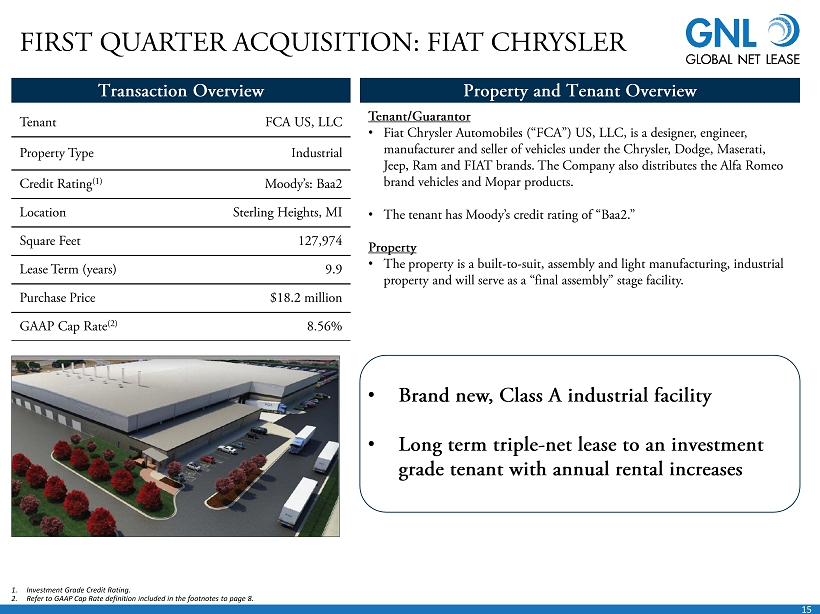
During the first quarter the Company closed on the acquisition of six industrial and distribution assets totaling 759,940 square feet for $63.4 million. The leases for these facilities, located in Mississippi, Michigan and Illinois, are with (or are guaranteed by) Fiat Chrysler, Chemours Company, Lee Steel Holdings, and LSI Steel Processing. The six assets were purchased at prices equating to a weighted-average GAAP capitalization rate of 7.96%(2) and have a weighted-average remaining lease term of 10.0 years(3).
| Tenant | Closing Date | Assets | Square Feet | Asset Type | Lease Term (yrs)(4) | Purchase Price (mm) | Location |
| Chemours Company, FC LLC | 2/26/2018 | 1 | 300,000 | Distribution | 9.8 | $18.6 | Mississippi |
| Lee Steel Holdings, LLC | 3/21/2018 | 1 | 114,042 | Industrial | 10.5 | $8.8 | Michigan |
| LSI Steel Processing | 3/29/2018 | 3 | 217,924 | Industrial | 10.0 | $17.8 | Illinois |
| FCA US, LLC (Fiat Chrysler) | 3/29/2018 | 1 | 127,974 | Industrial | 9.9 | $18.2 | Michigan |
| Total | 6 | 759,940 | $63.4 |
| (2) | GAAP capitalization rate is a rate of return on a real estate investment property based on the expected, straight-lined rental income that the property will generate under its existing lease. GAAP capitalization rate is calculated by dividing the income the property will generate (before debt service and depreciation and after fixed costs and variable costs) by the acquisition price of the property. |
| (3) | The weighted average remaining lease term in years based upon square feet as of March 31, 2018. |
| (4) | As of March 31, 2018. |
Expanded European Operations
The Company’s advisor has strengthened its European operations and has placed a team of asset and property managers dedicated exclusively to Global Net Lease’s European properties in London. The Company believes it’s advisor is now better positioned to build even stronger direct relationships with tenants by being on-the-ground in the markets where GNL owns a significant number of properties. Furthermore, by being present in the local markets this team will be able to identify additional acquisition opportunities throughout Europe.
Capital Structure and Liquidity Resources
As of March 31, 2018, the Company had $106.7 million of cash and cash equivalents. The Company’s net debt to enterprise value was 54.5% with an enterprise value of $2.8 billion based on the March 31, 2018 closing share price of $16.88 for common shares and $24.91 for the preferred shares, with net debt of $1.5 billion, including $1.0 billion of mortgage debt. The net debt to enterprise value would improve to 51.6% if the calculation was based on closing share prices from May 4th of $19.26 for common shares and $24.45 for preferred shares.
Year over year the percentage of fixed rate debt (including variable rate debt fixed with swaps) increased to 83%(5) from 76% as of March 31, 2018. The Company’s total combined debt had a weighted average interest rate cost of 2.8% resulting in an interest coverage ratio of 4.4x times. GNL did not issue common shares under the Company’s ATM Program for the three months ended March 31, 2018.
The Company successfully closed on an eight-property CMBS loan with Ladder Capital Finance. The CMBS loan is for a term of 10 years with an interest rate of 4.32%.
| (1) | 93.3% of portfolio annualized straight line rent with contractual rent increases. |
| (5) | Inclusive of floating rate debt with in place interest rate swaps allowing debt to effectively act as fixed. |
Conference Call
GNL will host a conference call on May 8, 2018 at 11:00 a.m. ET to discuss its financial and operating results.
Dial-in instructions for the conference call and the replay are outlined below. This conference call will also be broadcast live over the Internet and can be accessed by all interested parties through the GNL website, www.globalnetlease.com, in the “Investor Relations” section.
To listen to the live call, please go to GNL’s “Investor Relations” section of the website at least 15 minutes prior to the start of the call to register and download any necessary audio software. For those who are not able to listen to the live broadcast, a replay will be available shortly after the call on the GNL website at www.globalnetlease.com.
Conference Call Details
Live Call
Dial-In (Toll Free): 1-888-317-6003
International Dial-In: 1-412-317-6061
Canada Dial-In (Toll Free): 1-866-284-3684
Participant Elite Entry Number: 7191013
Conference Replay*
Domestic Dial-In (Toll Free): 1-877-344-7529
International Dial-In: 1-412-317-0088
Canada Dial-In (Toll Free): 1-855-669-9658
Conference Number: 10119587
| * | Available one hour after the end of the conference call through August 8, 2018. |
Supplemental Schedules
The Company will file supplemental information packages with the Securities and Exchange Commission (the “SEC”) to provide additional disclosure and financial information. Once posted, the supplemental package can be found under the “Presentations” tab in the Investor Relations section of GNL’s website at www.globalnetlease.com and on the SEC website at www.sec.gov.
About Global Net Lease, Inc.
Global Net Lease, Inc. (NYSE: GNL) is a publicly traded real estate investment trust listed on the NYSE focused on acquiring a diversified global portfolio of commercial properties, with an emphasis on sale-leaseback transactions involving single tenant, mission critical income producing net-leased assets across the United States, Western and Northern Europe. Additional information about GNL can be found on its website at www.globalnetlease.com.
Important Notice
The statements in this press release that are not historical facts may be forward-looking statements. These forward-looking statements involve risks and uncertainties that could cause actual results or events to be materially different. Forward-looking statements may include, but are not limited to, statements regarding stockholder liquidity and investment value and returns. The words “anticipates,” “believes,” “expects,” “estimates,” “projects,” “plans,” “intends,” “may,” “will,” “would” and similar expressions are intended to identify forward-looking statements, although not all forward-looking statements contain these identifying words. Actual results may differ materially from those contemplated by such forward-looking statements, including those set forth in the Risk Factors section of GNL’s Annual Report on Form 10-K for the year ended December 31, 2017 filed on February 28, 2018 and subsequent Quarterly Reports on Form 10-Q. Further, forward-looking statements speak only as of the date they are made, and GNL undertakes no obligation to update or revise any forward-looking statement to reflect changed assumptions, the occurrence of unanticipated events or changes to future operating results, unless required to do so by law.
Contacts:
Investors and Media:
Email: investorrelations@globalnetlease.com
Phone: (212) 415-6510
Global Net Lease, Inc.
Consolidated Balance Sheets
(In thousands, except share and per share data)
| March 31, 2018 | December 31, 2017 | |||||||
| (Unaudited) | ||||||||
| ASSETS | ||||||||
| Real estate investments, at cost: | ||||||||
| Land | $ | 418,878 | $ | 402,318 | ||||
| Buildings, fixtures and improvements | 2,218,176 | 2,138,405 | ||||||
| Construction in progress | 2,572 | 2,328 | ||||||
| Acquired intangible lease assets | 648,353 | 629,626 | ||||||
| Total real estate investments, at cost | 3,287,979 | 3,172,677 | ||||||
| Less accumulated depreciation and amortization | (375,484 | ) | (339,931 | ) | ||||
| Total real estate investments, net | 2,912,495 | 2,832,746 | ||||||
| Cash and cash equivalents | 106,733 | 102,425 | ||||||
| Restricted cash | 2,690 | 5,302 | ||||||
| Derivative assets, at fair value | 4,512 | 2,176 | ||||||
| Unbilled straight-line rent | 45,111 | 42,739 | ||||||
| Prepaid expenses and other assets | 30,817 | 22,617 | ||||||
| Due from related parties | 16 | 16 | ||||||
| Deferred tax assets | 1,057 | 1,029 | ||||||
| Goodwill and other intangible assets, net | 23,151 | 22,771 | ||||||
| Deferred financing costs, net | 6,540 | 6,774 | ||||||
| Total Assets | $ | 3,133,122 | $ | 3,038,595 | ||||
| LIABILITIES AND EQUITY | ||||||||
| Mortgage notes payable, net | $ | 1,038,894 | $ | 984,876 | ||||
| Revolving credit facilities | 342,023 | 298,909 | ||||||
| Term loan, net | 236,783 | 229,905 | ||||||
| Acquired intangible lease liabilities, net | 31,967 | 31,388 | ||||||
| Derivative liabilities, at fair value | 19,738 | 15,791 | ||||||
| Due to related parties | 770 | 829 | ||||||
| Accounts payable and accrued expenses | 27,320 | 23,227 | ||||||
| Prepaid rent | 21,489 | 18,535 | ||||||
| Deferred tax liability | 16,269 | 15,861 | ||||||
| Taxes payable | 948 | 2,475 | ||||||
| Dividends payable | 2,426 | 2,556 | ||||||
| Total Liabilities | 1,738,627 | 1,624,352 | ||||||
| Commitments and contingencies | ||||||||
| Stockholders’ Equity: | ||||||||
| 7.25% Series A cumulative redeemable preferred shares | 54 | 54 | ||||||
| Common stock | 2,003 | 2,003 | ||||||
| Additional paid-in capital | 1,859,746 | 1,860,058 | ||||||
| Accumulated other comprehensive income | 34,593 | 19,447 | ||||||
| Accumulated deficit | (502,026 | ) | (468,396 | ) | ||||
| Total Stockholders’ Equity | 1,394,370 | 1,413,166 | ||||||
| Non-controlling interest | 125 | 1,077 | ||||||
| Total Equity | 1,394,495 | 1,414,243 | ||||||
| Total Liabilities and Equity | $ | 3,133,122 | $ | 3,038,595 | ||||
Global Net Lease, Inc.
Consolidated Statements of Operations (Unaudited)
(In thousands, except share and per share data)
| Three Months Ended March 31, | ||||||||
| 2018 | 2017 | |||||||
| Revenues: | ||||||||
| Rental income | $ | 63,792 | $ | 58,492 | ||||
| Operating expense reimbursements | 4,294 | 4,345 | ||||||
| Total revenues | 68,086 | 62,837 | ||||||
| Expenses: | ||||||||
| Property operating | 7,470 | 7,236 | ||||||
| Fire recovery | (79 | ) | — | |||||
| Operating fees to related parties | 6,831 | 5,730 | ||||||
| Acquisition and transaction related | 1,325 | 696 | ||||||
| General and administrative | 2,051 | 1,770 | ||||||
| Equity-based compensation | (832 | ) | 16 | |||||
| Depreciation and amortization | 29,496 | 27,114 | ||||||
| Total expenses | 46,262 | 42,562 | ||||||
| Operating income | 21,824 | 20,275 | ||||||
| Other income (expense): | ||||||||
| Interest expense | (12,975 | ) | (11,531 | ) | ||||
| Gain on dispositions of real estate investments | — | 957 | ||||||
| Loss on derivative instruments | (2,935 | ) | (470 | ) | ||||
| Unrealized loss on undesignated foreign currency advances and other hedge ineffectiveness | (43 | ) | (882 | ) | ||||
| Other income | 11 | 7 | ||||||
| Total other expense, net | (15,942 | ) | (11,919 | ) | ||||
| Net income before income taxes | 5,882 | 8,356 | ||||||
| Income tax expense | (1,070 | ) | (906 | ) | ||||
| Net income | 4,812 | 7,450 | ||||||
| Net income attributable to non-controlling interest | — | (21 | ) | |||||
| Preferred stock dividends | (2,451 | ) | — | |||||
| Net income attributable to common stockholders | $ | 2,361 | $ | 7,429 | ||||
| Basic and Diluted Earnings Per Share: | ||||||||
| Basic and diluted net loss per share attributable to common stockholders | $ | 0.03 | $ | 0.11 | ||||
| Basic and diluted weighted average shares outstanding | 67,287 | 66,271 | ||||||
Global Net Lease, Inc.
Quarterly Reconciliation of Non-GAAP Measures (Unaudited)
(In thousands)
| Three Months Ended March 31, | ||||||||
| 2018 | 2017 | |||||||
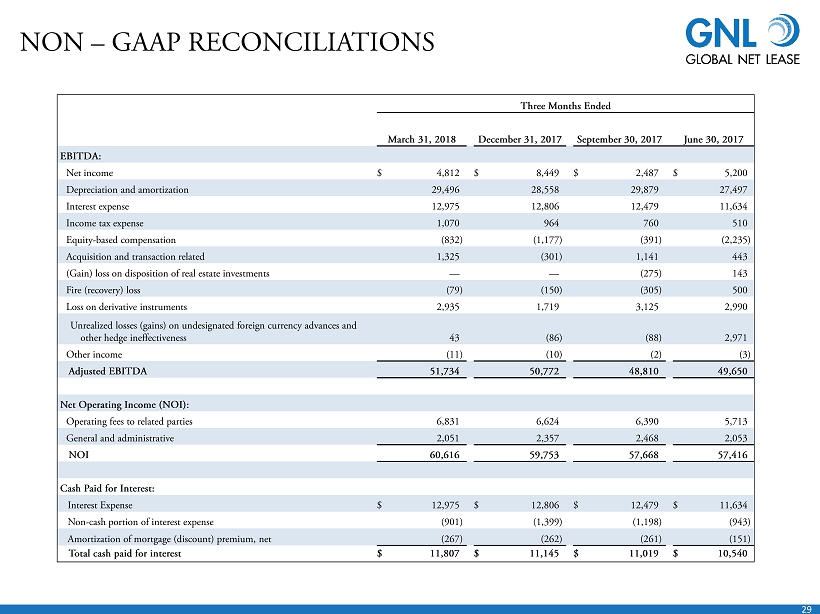
| Adjusted EBITDA | ||||||||
| Net income | $ | 4,812 | $ | 7,450 | ||||
| Depreciation and amortization | 29,496 | 27,114 | ||||||
| Interest expense | 12,975 | 11,531 | ||||||
| Income tax expense | 1,070 | 906 | ||||||
| Equity-based compensation | (832 | ) | 16 | |||||
| Acquisition and transaction related | 1,325 | 696 | ||||||
| Gain on disposition of real estate investments | — | (957 | ) | |||||
| Fire recovery | (79 | ) | — | |||||
| Loss on derivative instruments | 2,935 | 470 | ||||||
| Unrealized losses on undesignated foreign currency advances and other hedge ineffectiveness | 43 | 882 | ||||||
| Other income | (11 | ) | (8 | ) | ||||
| Adjusted EBITDA | 51,734 | 48,100 | ||||||
| Net operating income (NOI) | ||||||||
| Operating fees to related parties | 6,831 | 5,730 | ||||||
| General and administrative | 2,051 | 1,770 | ||||||
| NOI | $ | 60,616 | $ | 55,600 | ||||
Global Net Lease, Inc.
Quarterly Reconciliation of Non-GAAP Measures (Unaudited)
(In thousands)
| Three Months Ended March 31, | ||||||||
| 2018 | 2017 | |||||||
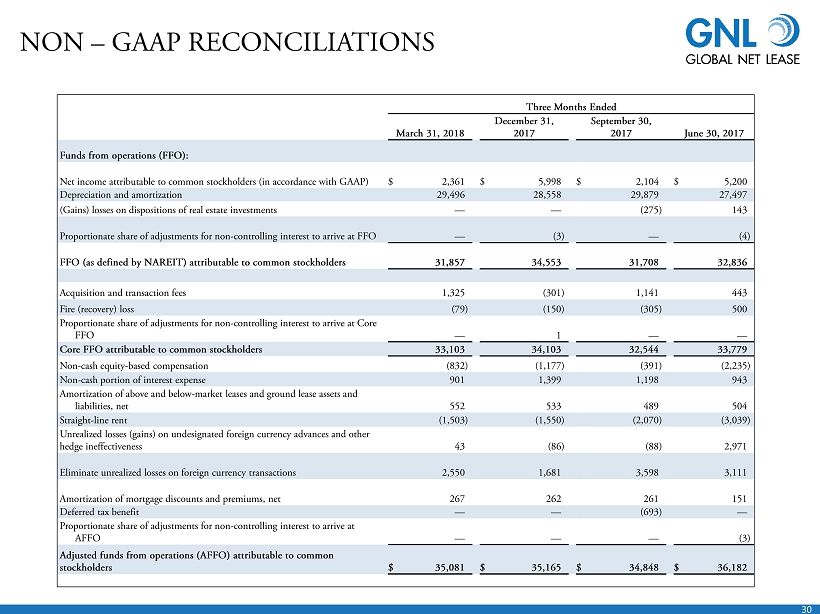
| Net income attributable to stockholders (in accordance with GAAP) | $ | 2,361 | $ | 7,429 | ||||
| Depreciation and amortization | 29,496 | 27,114 | ||||||
| Gains on dispositions of real estate investments | — | (957 | ) | |||||
| Proportionate share of adjustments for non-controlling interest to arrive at FFO | — | (71 | ) | |||||
| FFO (defined by NAREIT) | 31,857 | 33,515 | ||||||
| Acquisition and transaction fees [1] | 1,325 | 696 | ||||||
| Fire recovery [2] | (79 | ) | — | |||||
| Proportionate share of adjustments for non-controlling interest to arrive at Core FFO | — | (2 | ) | |||||
| Core FFO attributable to common stockholders | 33,103 | 34,209 | ||||||
| Non-cash equity-based compensation | (832 | ) | 16 | |||||
| Non-cash portion of interest expense | 901 | 880 | ||||||
| Amortization of above- and below-market leases and ground lease assets and liabilities, net | 552 | 404 | ||||||
| Straight-line rent | (1,503 | ) | (3,878 | ) | ||||
| Unrealized loss on undesignated foreign currency advances and other hedge ineffectiveness | 43 | 882 | ||||||
| Eliminate unrealized losses on foreign currency transactions [3] | 2,550 | 1,792 | ||||||
| Amortization of mortgage discounts and premiums net and mezzanine discount | 267 | 153 | ||||||
| Proportionate share of adjustments for non-controlling interest to arrive at AFFO | — | (1 | ) | |||||
| Adjusted funds from operations (AFFO) attributable to common stockholders | $ | 35,081 | $ | 34,457 | ||||
Footnotes:
| [1] | Includes merger related, and other costs, as applicable. |
| [2] | Recovery arising from clean-up costs related to a fire sustained at one of our office properties. |
| [3] | For AFFO purposes, we add back unrealized losses (gains). For the three months ended March 31, 2018, losses on derivative instruments were $2.9 million, which were comprised of unrealized losses of $2.6 million and realized losses of $0.3 million. For the three months ended March 31, 2017, losses on derivative instruments were $0.5 million, which were comprised of unrealized losses of $1.8 million offset by realized gains of $1.3 million. |
Funds from Operations, Core Funds from Operations and Adjusted Funds from Operations
Funds From Operations
Due to certain unique operating characteristics of real estate companies, as discussed below, the National Association of Real Estate Investment Trusts (“NAREIT”), an industry trade group, has promulgated a measure known as Funds from Operations (“FFO”), which we believe to be an appropriate supplemental measure to reflect the operating performance of a REIT. FFO is not equivalent to net income or loss as determined under GAAP.
We define FFO, a non-GAAP measure, consistent with the standards established by the White Paper on FFO approved by the Board of Governors of NAREIT, as revised in February 2004 (the “White Paper”). The White Paper defines FFO as net income or loss computed in accordance with GAAP, excluding gains or losses from sales of property but including asset impairment write-downs, plus depreciation and amortization, and after adjustments for unconsolidated partnerships and joint ventures. Adjustments for unconsolidated partnerships and joint ventures are calculated to reflect FFO. Our FFO calculation complies with NAREIT’s definition.
The historical accounting convention used for real estate assets requires straight-line depreciation of buildings and improvements, and straight-line amortization of intangibles, which implies that the value of a real estate asset diminishes predictably over time, especially if not adequately maintained or repaired and renovated as required by relevant circumstances or as requested or required by lessees for operational purposes in order to maintain the value disclosed. We believe that, because real estate values historically rise and fall with market conditions, including inflation, interest rates, unemployment and consumer spending, presentations of operating results for a REIT using historical accounting for depreciation and certain other items may be less informative. Historical accounting for real estate involves the use of GAAP. Any other method of accounting for real estate such as the fair value method cannot be construed to be any more accurate or relevant than the comparable methodologies of real estate valuation found in GAAP. Nevertheless, we believe that the use of FFO, which excludes the impact of real estate related depreciation and amortization, among other things, provides a more complete understanding of our performance to investors and to management, and when compared year over year, reflects the impact on our operations from trends in occupancy rates, rental rates, operating costs, general and administrative expenses, and interest costs, which may not be immediately apparent from net income.
Core Funds From Operations
Core funds from operations (“Core FFO”) is FFO, excluding acquisition and transaction related costs as well as certain other costs that are considered to be non-core, such as fire loss and other costs related to damages at our properties. The purchase of properties, and the corresponding expenses associated with that process, is a key operational feature of our business plan to generate operational income and cash flows in order to make dividend payments to stockholders. In evaluating investments in real estate, we differentiate the costs to acquire the investment from the operations derived from the investment. By excluding expensed acquisition and transaction related costs as well as non-core costs, we believe Core FFO provides useful supplemental information that is comparable for each type of real estate investment and is consistent with management’s analysis of the investing and operating performance of our properties.
Adjusted Funds From Operations
In calculating adjusted funds from operations (“AFFO”), we exclude certain income or expense items from AFFO that we consider more reflective of investing activities, other non-cash income and expense items and the income and expense effects of other activities that are not a fundamental attribute of our business plan. These items include early extinguishment of debt and unrealized gains and losses, which may not ultimately be realized, such as gains or losses on derivative instruments, gains and losses on foreign currency transactions, and gains and losses on investments. In addition, by excluding non-cash income and expense items such as amortization of above-market and below-market leases intangibles, amortization of deferred financing costs, straight-line rent and equity-based compensation from AFFO, we believe we provide useful information regarding income and expense items which have a direct impact on our ongoing operating performance. We also include the realized gains or losses on foreign currency exchange contracts for AFFO as such items are part of our ongoing operations and affect the current operating performance of the Company. By providing AFFO, we believe we are presenting useful information that can be used to better assess the sustainability of our ongoing operating performance without the impacts of transactions that are not related to the ongoing profitability of our portfolio of properties. We also believe that AFFO is a recognized measure of sustainable operating performance by the REIT industry. Further, we believe AFFO is useful in comparing the sustainability of our operating performance with the sustainability of the operating performance of other real estate companies.
In calculating AFFO, we exclude certain expenses which under GAAP are characterized as operating expenses in determining operating net income. All paid and accrued merger, acquisition and transaction related fees and certain other expenses negatively impact our operating performance during the period in which expenses are incurred or properties are acquired will also have negative effects on returns to investors, but are not reflective of our on-going performance. AFFO that excludes such costs and expenses would only be comparable to companies that did not have such activities. Further, under GAAP, certain contemplated non-cash fair value and other non-cash adjustments are considered operating non-cash adjustments to net income. In addition, as discussed above, we view gains and losses from fair value adjustments as items which are unrealized and may not ultimately be realized and not reflective of ongoing operations and are therefore typically adjusted for when assessing operating performance. Excluding income and expense items detailed above from our calculation of AFFO provides information consistent with management’s analysis of the operating performance of the Company. Additionally, fair value adjustments, which are based on the impact of current market fluctuations and underlying assessments of general market conditions, but can also result from operational factors such as rental and occupancy rates, may not be directly related or attributable to our current operating performance. By excluding such changes that may reflect anticipated and unrealized gains or losses, we believe AFFO provides useful supplemental information.
Caution on Use of Non-GAAP Measures
FFO, Core FFO, and AFFO should not be construed to be more relevant or accurate than the current GAAP methodology in calculating net income or in its applicability in evaluating our operating performance. The method utilized to evaluate the value and performance of real estate under GAAP should be construed as a more relevant measure of operational performance and considered more prominently than the non-GAAP FFO, Core FFO and AFFO measures and the adjustments to GAAP in calculating FFO, Core FFO and AFFO. Other REITs may not define FFO in accordance with the current NAREIT definition (as we do) or may interpret the current NAREIT definition differently than we do or calculate Core FFO or AFFO differently than we do. Consequently, our presentation of FFO, Core FFO and AFFO may not be comparable to other similarly titled measures presented by other REITs.
We consider FFO, Core FFO and AFFO useful indicators of our performance. Because FFO calculations exclude such factors as depreciation and amortization of real estate assets and gains or losses from sales of operating real estate assets (which can vary among owners of identical assets in similar conditions based on historical cost accounting and useful-life estimates), FFO facilitates comparisons of operating performance between periods and between other REITs in our peer group.
As a result, we believe that the use of FFO, Core FFO and AFFO, together with the required GAAP presentations, provide a more complete understanding of our performance including relative to our peers and a more informed and appropriate basis on which to make decisions involving operating, financing, and investing activities. However, FFO, Core FFO and AFFO are not indicative of cash available to fund ongoing cash needs, including the ability to make cash distributions. Investors are cautioned that FFO, Core FFO and AFFO should only be used to assess the sustainability of our operating performance excluding these activities, as it excludes certain costs that have a negative effect on our operating performance during the periods in which these costs are incurred.
Adjusted Earnings before Interest, Taxes, Depreciation and Amortization, and Net Operating Income
We believe that earnings before interest, taxes, depreciation and amortization adjusted for acquisition and transaction-related expenses, other non- cash items and including our pro-rata share from unconsolidated joint ventures (“Adjusted EBITDA”) is an appropriate measure of our ability to incur and service debt. Adjusted EBITDA should not be considered as an alternative to cash flows from operating activities, as a measure of our liquidity or as an alternative to net income as an indicator of our operating activities. Other REITs may calculate Adjusted EBITDA differently and our calculation should not be compared to that of other REITs. Net operating income (“NOI”) is a non-GAAP financial measure equal to net income (loss), the most directly comparable GAAP financial measure, less discontinued operations, interest, other income and income from preferred equity investments and investment securities, plus corporate general and administrative expense, acquisition and transaction-related expenses, depreciation and amortization, other non-cash expenses and interest expense. We use NOI internally as a performance measure and believe NOI provides useful information to investors regarding our financial condition and results of operations because it reflects only those income and expense items that are incurred at the property level. Therefore, we believe NOI is a useful measure for evaluating the operating performance of our real estate assets and to make decisions about resource allocations. Further, we believe NOI is useful to investors as a performance measure because, when compared across periods, NOI reflects the impact on operations from trends in occupancy rates, rental rates, operating costs and acquisition activity on an unlevered basis, providing perspective not immediately apparent from net income. NOI excludes certain components from net income in order to provide results that are more closely related to a property’s results of operations. For example, interest expense is not necessarily linked to the operating performance of a real estate asset and is often incurred at the corporate level as opposed to the property level. In addition, depreciation and amortization, because of historical cost accounting and useful life estimates, may distort operating performance at the property level. NOI presented by us may not be comparable to NOI reported by other REITs that define NOI differently. We believe that in order to facilitate a clear understanding of our operating results, NOI should be examined in conjunction with net income (loss) as presented in our consolidated financial statements. NOI should not be considered as an alternative to net income (loss) as an indication of our performance or to cash flows as a measure of our liquidity.