Exhibit 99.1

Regional Management Corp. Announces Third Quarter 2017 Results
- Net income of $5.3 million and diluted earnings per share of $0.45, including an estimated
$0.18 hurricane impact and a $0.05 benefit from bulk debt sale -
- Tenth consecutive quarter of double-digit total finance receivables growth -
Greenville, South Carolina – November 8, 2017 – Regional Management Corp. (NYSE: RM), a diversified consumer finance company, today announced results for the third quarter ended September 30, 2017.
Third Quarter 2017 Highlights and Subsequent Events
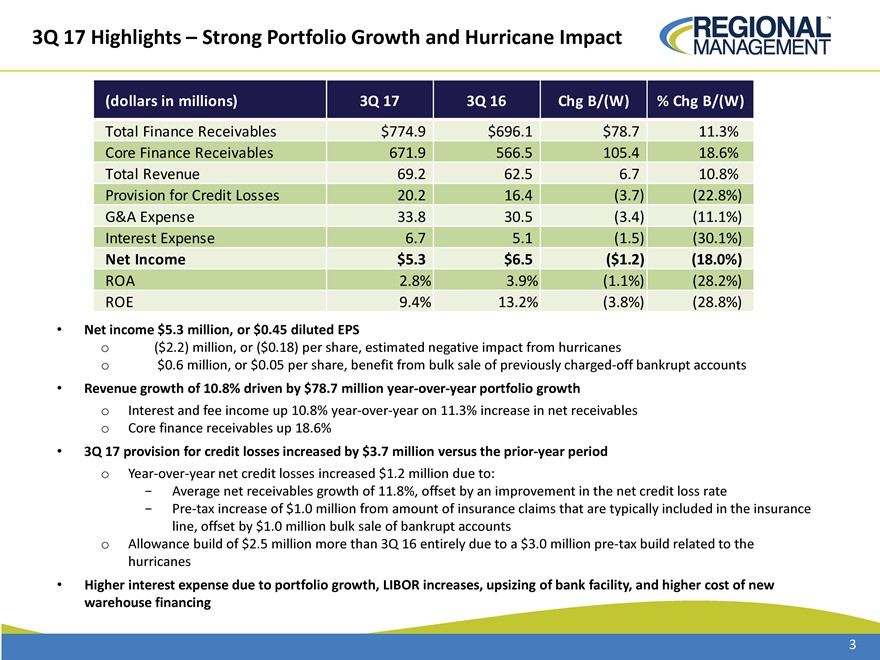
| • | Net income for the third quarter of 2017 was $5.3 million, a decrease of 18.0% from the prior-year period. Diluted earnings per share for the third quarter of 2017 was $0.45, based on a diluted share count of 11.8 million. Net income and diluted earnings per share for the third quarter of 2017 included impacts from hurricanes and a bulk sale of the Company’s previously charged-off bankrupt accounts (“bulk sale”): |
| Reported diluted earnings per share |
$ | 0.45 | ||
| Estimated impact of hurricanes |
$ | (0.18 | ) | |
| Benefit from bulk sale |
$ | 0.05 |
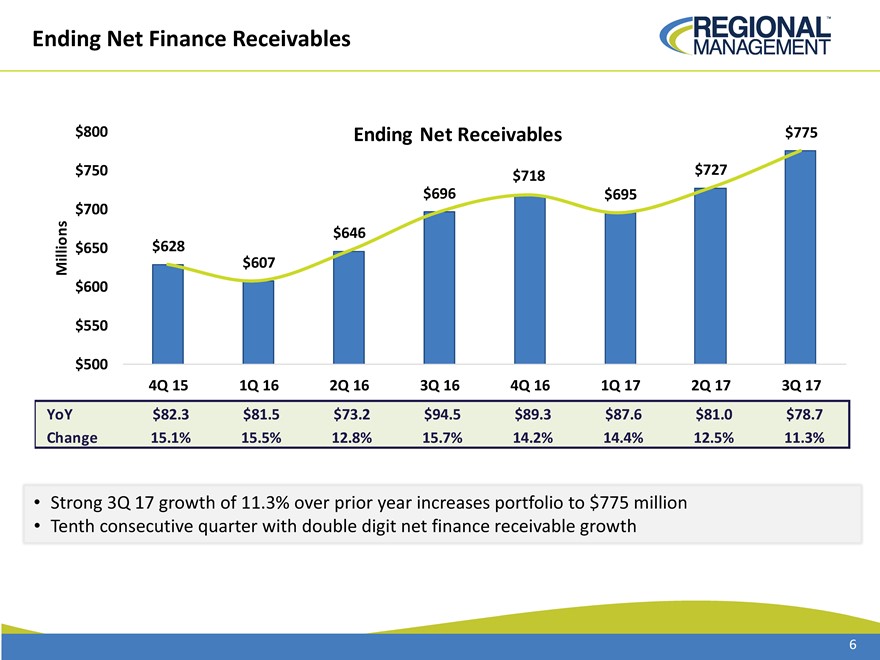
| • | Total finance receivables as of September 30, 2017 were $774.9 million, an increase of 11.3%, or $78.7 million, from the prior year, and up 6.6%, or $48.1 million, sequentially. |
| • | Tenth consecutive quarter that total finance receivables have grown at least 10% over the prior-year period. |
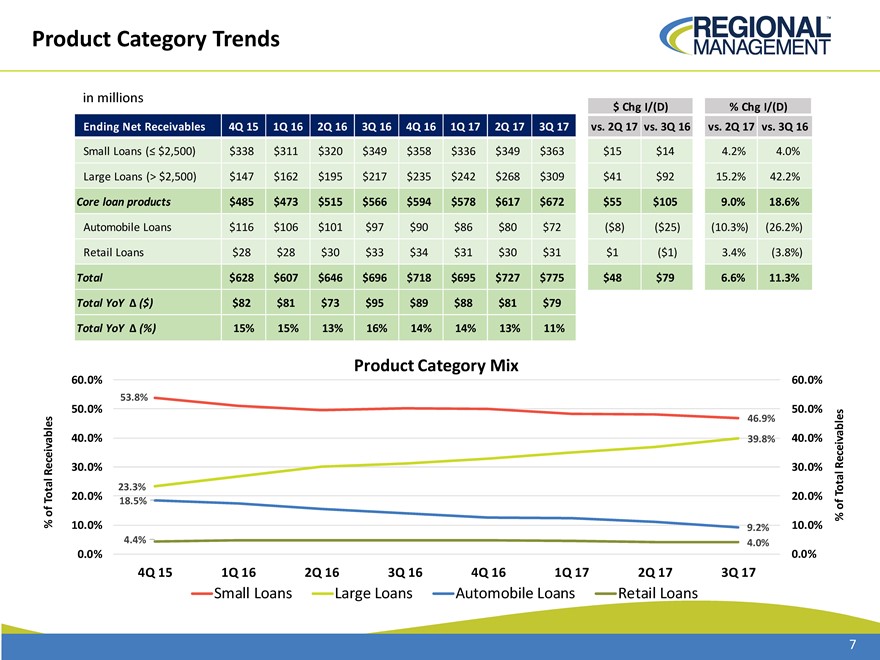
| • | Total core small and large loan receivables increased $105.4 million, or 18.6%, compared to the prior-year period, and $55.2 million, or 9.0%, sequentially. |
| • | Large loan finance receivables of $308.6 million increased $91.5 million, or 42.2%, from the prior-year period and now represent 39.8% of the total loan portfolio. Small loan finance receivables as of September 30, 2017 were $363.3 million, an increase of 4.0% over the prior-year period. |
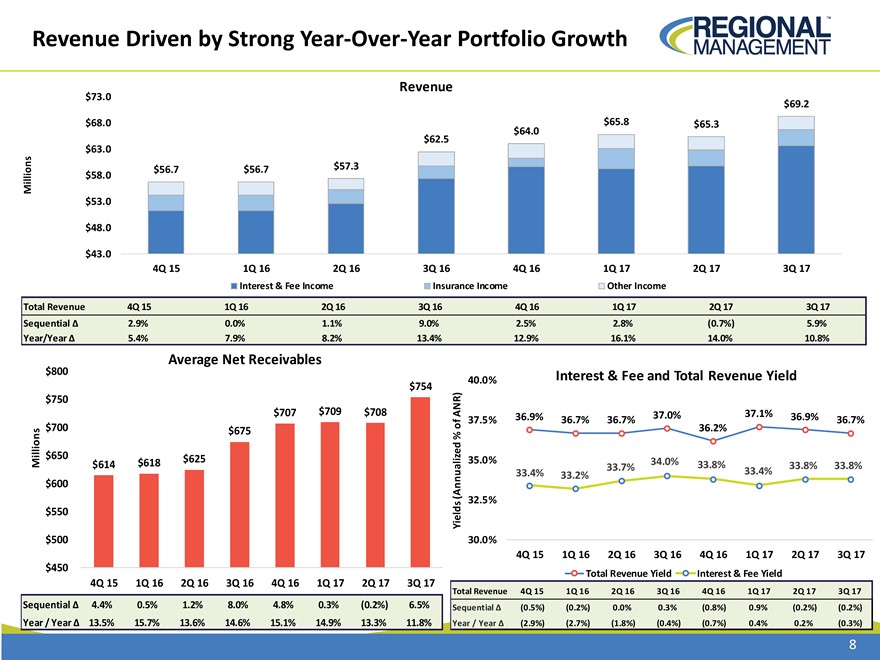
| • | Total revenue for the third quarter of 2017 was $69.2 million, a $6.7 million, or 10.8%, increase from the prior-year period. |
1
| • | Interest and fee income increase of 10.8%, driven by an 11.3% increase in receivables compared to the prior-year period. |
| • | Overall yield decrease of 30 basis points on a year-over-year basis. |
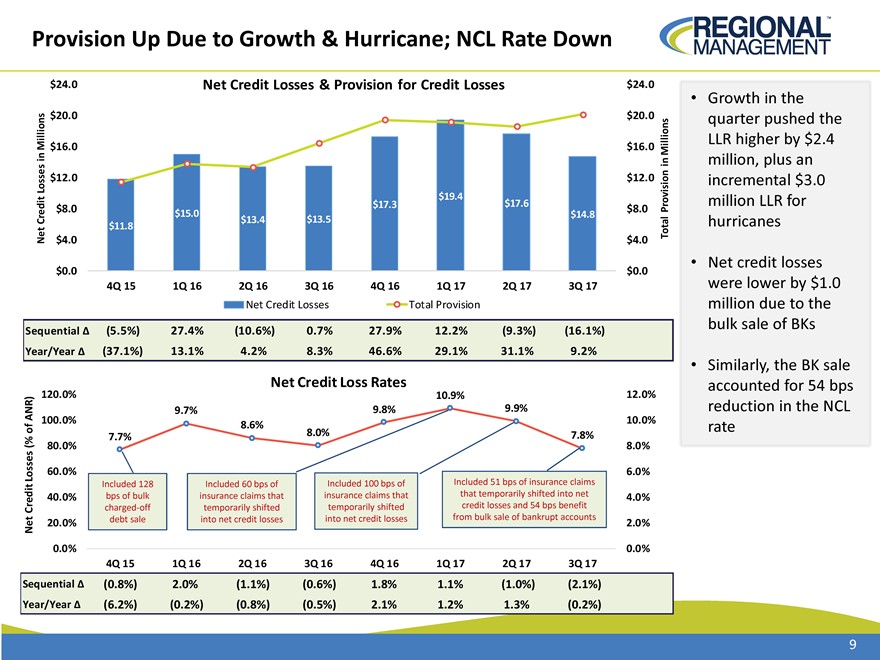
| • | Provision for credit losses for the third quarter of 2017 was $20.2 million, an increase of $3.7 million compared to the prior-year period. The provision for credit losses for the third quarter of 2017 included $3.0 million of incremental hurricane allowance, $1.2 million of higher net credit losses, and $0.6 million due to a temporary shift of insurance claims expense (which had no impact on net income), partially offset by a $1.0 million reduction resulting from the bulk sale. |
| • | Annualized net credit losses as a percentage of finance receivables were 7.8% (inclusive of 0.5% attributable to the shift in insurance claims expense noted above and a 0.5% reduction due to the bulk sale), a decrease from 8.0% in the prior-year period. |
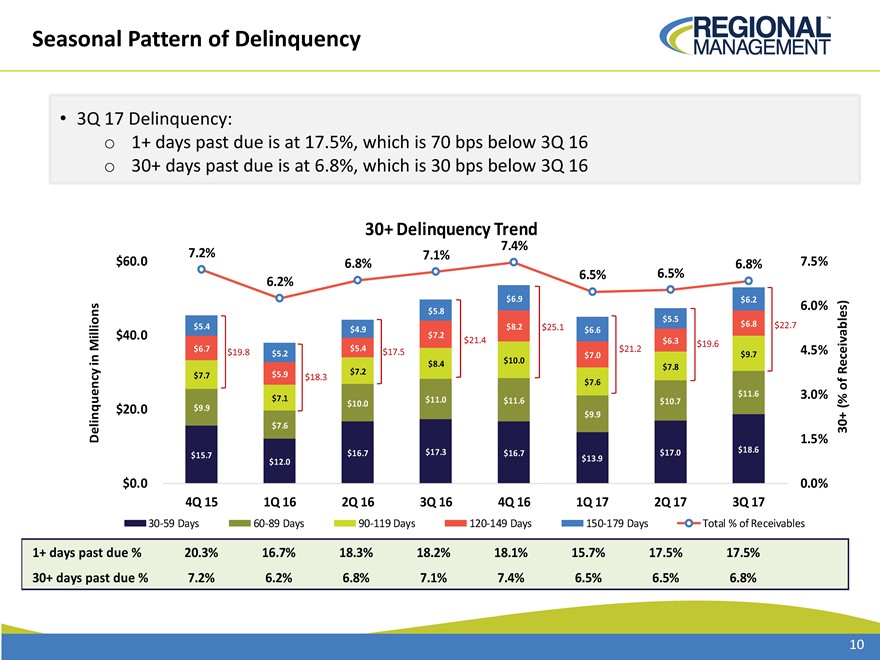
| • | Total delinquencies as a percentage of total finance receivables as of September 30, 2017 were 17.5%, an improvement from 18.2% as of September 30, 2016, and flat sequentially. |
| • | 30+ day contractual delinquencies were 6.8%, an improvement from 7.1% as of September 30, 2016 and up from 6.5% sequentially. |
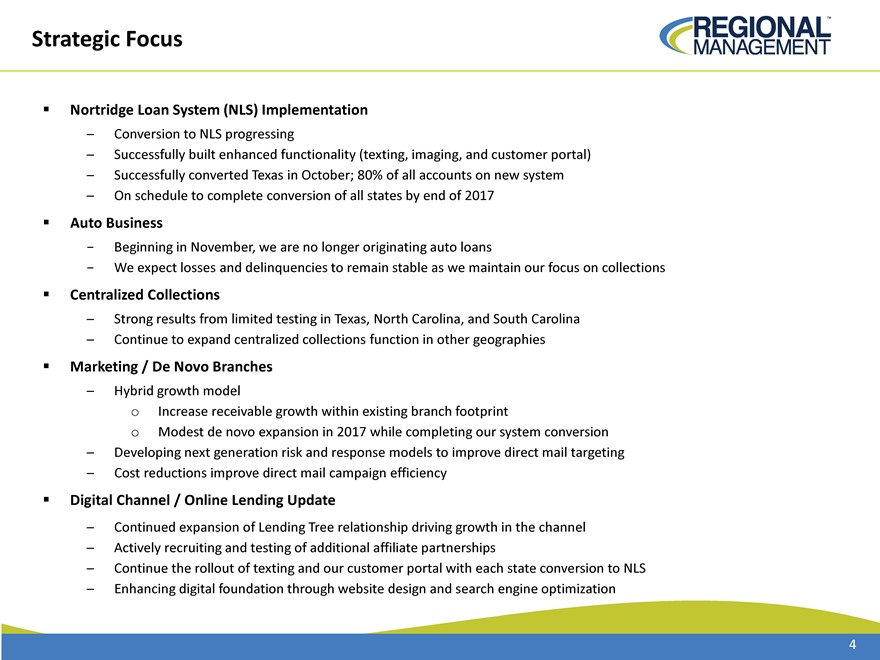
| • | Effective this month, the Company will discontinue originating auto loans, while it will continue to own and service the remaining loans in its auto portfolio. The Company expects minimal impact to net income, as reductions in revenue will be offset by expense savings and growth in the Company’s core business. |
“Despite the impact of the hurricanes, our third quarter performance drivers remained strong,” said Peter R. Knitzer, President and Chief Executive Officer of Regional Management. “We continued to generate year-over-year double-digit growth on our top line and in our finance receivables, with our credit performance, excluding the impact from the hurricanes, also improving. While our bottom line was clearly affected by the impact of the hurricanes, the additional $3.0 million allowance we took in the quarter should encompass any future net credit loss impact. Most importantly, we took great care to assist our customers in need and the hurricanes should have no impact on our overall business results and strategic plans for 2018 and beyond.”
“In addition, we announced today that we are discontinuing auto loan originations, further prioritizing our focus on the growth of our core small and large loan portfolios,” added Mr. Knitzer. “Finally, we successfully converted our branches in Texas to our new operating platform and now have 80% of our accounts on the new system. Overall, we continue to steadily progress in terms of our core loan strategy and infrastructure build, and we remain well positioned to deliver long-term shareholder value.”
2
Third Quarter 2017 Results
Finance receivables outstanding at September 30, 2017 were $774.9 million, an 11.3% increase from $696.1 million in the prior year. Finance receivables increased primarily due to an increase in both the core small and large loan portfolios.
For the third quarter ended September 30, 2017, the Company reported total revenue of $69.2 million, a 10.8% increase from $62.5 million in the prior-year period. Interest and fee income for the third quarter of 2017 was $63.6 million, a 10.8% increase from $57.4 million in the prior-year period, primarily due to an increase in the small and large loan portfolios compared to the prior-year period. Insurance income, net for the third quarter of 2017 was $3.1 million, a 31.9% increase from the prior-year period, primarily attributable to a transition in insurance carriers, causing some of the Company’s insurance claims to impact net credit losses instead of insurance income. This line swing had no impact on net income. Other income for the third quarter of 2017 was $2.5 million, an 8.3% decrease from the prior-year period, primarily the result of waiving extension and late fees for customers in hurricane-affected areas.
The provision for credit losses in the third quarter of 2017 was $20.2 million, compared to $16.4 million in the prior-year period. The increase was primarily due to an incremental $3.0 million of provision for credit losses associated with the impact of the hurricanes, higher net credit losses, and the temporary shift of $0.6 million in insurance claims expense, partially offset by proceeds of $1.0 million from the bulk sale.
Net credit losses were $14.8 million in the third quarter of 2017, an increase of $1.2 million over the prior-year period, consistent with portfolio growth. Net credit losses for the third quarter of 2017 included $1.0 million of losses attributable to the temporary shift of certain insurance claims expense into net credit losses during a transition in the Company’s insurance provider. Annualized net credit losses as a percentage of average finance receivables in the third quarter of 2017 were 7.8% (inclusive of 0.5% attributable to the shift in insurance claims expense noted above and a 0.5% reduction due to the bulk sale), an improvement from 8.0% in the prior-year period.
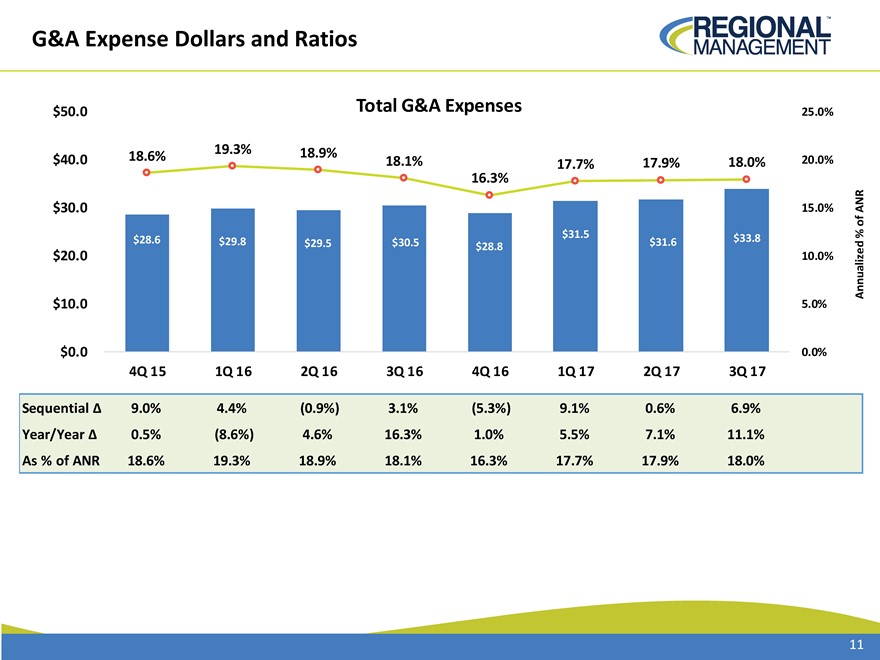
General and administrative expenses for the third quarter of 2017 were $33.8 million, an increase of 11.1%, or $3.4 million, from the prior-year period. General and administrative expenses for both the third quarters of 2017 and 2016 included $0.4 million of loan system conversion costs. Sequentially, general and administrative expenses increased $2.2 million, or 6.9%, from the second quarter of 2017, primarily from personnel cost increases due to seasonal increases in bonuses, increases in average wages, staffing related to growth, accelerated implementation of centralized collections, and a $0.5 million increase in marketing spend.
Interest expense was $6.7 million in the third quarter of 2017, compared to $5.1 million in the prior-year period. The increase in interest expense was due to higher long-term debt amounts outstanding from finance receivable growth, a federal funds rate increase, larger unused lines of credit, and incremental debt issuance costs associated with upsizing the senior revolving credit facility and entering into the new warehouse credit facility. The Company’s diversified sources of funding continue to position it for long-term growth.
3
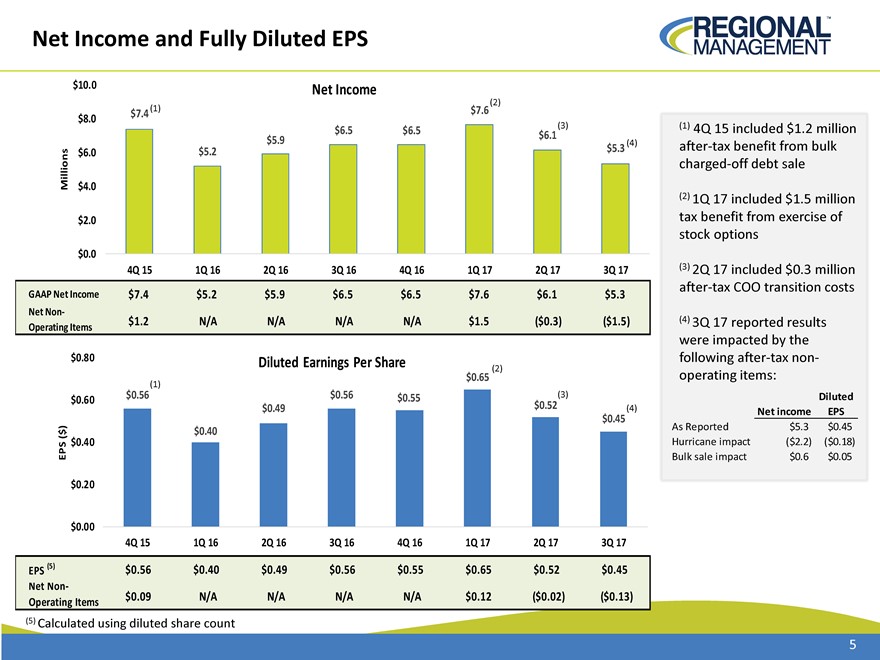
Net income for the third quarter of 2017 was $5.3 million, a decrease from $6.5 million in the prior-year period. Diluted earnings per share for the third quarter of 2017 were $0.45, a decrease from $0.56 in the prior-year period.
Nine Months 2017 Results
For the nine months ended September 30, 2017, the Company reported total revenue of $200.4 million, a 13.5% increase from $176.5 million in the prior-year period. Interest and fee income for the nine months ended September 30, 2017 was $182.7 million, a 13.2% increase from $161.3 million in the prior-year period, primarily due to an increase in the portfolios of both small and large installment loans compared to the prior-year period. Insurance income, net for the nine months ended September 30, 2017 was $10.0 million, a 26.6% increase from the prior-year period, in part attributable to the temporary shift of certain claims expense into provision for credit losses during the Company’s transition to a new insurance provider. Other income for the nine months ended September 30, 2017 was $7.7 million, a 5.6% increase from the prior-year period.
The provision for credit losses for the nine months ended September 30, 2017 was $57.9 million, compared to $43.6 million in the prior-year period. Net credit losses for the nine months ended September 30, 2017 were $51.7 million, compared to $41.9 million in the prior-year period. Net credit losses for the current-year period included $3.6 million of losses attributable to a temporary shift of certain insurance claims expense into net credit losses during a transition in the Company’s insurance provider. Annualized net credit losses as a percentage of average finance receivables for the nine months ended September 30, 2017 were 9.5% (inclusive of 0.7% attributable to the shift in insurance claims expense noted above and a 0.2% reduction due to the bulk sale), an increase from 8.7% in the prior-year period.
General and administrative expenses for the nine months ended September 30, 2017 were $96.9 million, an increase of $7.1 million, or 7.9%, from $89.8 million in the prior-year period. Included in the nine months 2017 and 2016 results were $1.2 million and $1.4 million in loan system conversion costs, respectively.
Net income for the nine months ended September 30, 2017 was $19.1 million, an 8.6% increase compared to net income of $17.6 million in the prior-year period. Diluted earnings per share for the nine months ended September 30, 2017 was $1.62 compared to $1.44 in the prior-year period.
De Novo Outlook
As of September 30, 2017, the Company’s branch network consisted of 344 locations. To improve network efficiency, Regional Management closed three branches in the third quarter of 2017 and plans to close three additional branches in the fourth quarter. The Company opened nine de novo branches as of September 30, 2017, and opened a tenth branch earlier this month, thus completing its de novo program for the year. For 2018, the Company expects to reaccelerate its de novo branch openings.
4
Liquidity and Capital Resources
As of September 30, 2017, the Company had finance receivables of $774.9 million and outstanding long-term debt of $538.4 million (consisting of $461.0 million of long-term debt on its $638.0 million senior revolving credit facility, $55.8 million of long-term debt on its $125.0 million revolving warehouse credit facility, and $21.6 million of long-term debt on its $75.7 million amortizing loan).
Conference Call Information
Regional Management Corp. will host a conference call and webcast today at 5:00 PM ET to discuss these results.
The dial-in number for the conference call is (855) 327-6837 (toll-free) or (631) 891-4304 (direct). Please dial the number 10 minutes prior to the scheduled start time.
*** A supplemental slide presentation will be made available on Regional Management’s website prior to the earnings call at www.RegionalManagement.com. ***
In addition, a live webcast of the conference call will also be available on Regional Management’s website at www.RegionalManagement.com.
A replay will be available following the end of the call through Wednesday, November 15, 2017, by telephone at (844) 512-2921 (toll-free) or (412) 317-6671 (international), passcode 10003790. A webcast replay of the call will be available at http://www.RegionalManagement.com for one year following the call.
Forward-Looking Statements
This press release may contain various “forward-looking statements” within the meaning of the Private Securities Litigation Reform Act of 1995, which represent Regional Management Corp.’s expectations or beliefs concerning future events. Words such as “may,” “will,” “should,” “likely,” “anticipates,” “expects,” “intends,” “plans,” “projects,” “believes,” “estimates,” “outlook,” and similar expressions may be used to identify these forward-looking statements. Such forward-looking statements are about matters that are inherently subject to risks and uncertainties, many of which are outside of the control of Regional Management. Factors that could cause actual results or performance to differ from the expectations expressed or implied in such forward-looking statements include, but are not limited to, the following: changes in general economic conditions, including levels of unemployment and bankruptcies; risks associated with Regional Management’s transition to a new loan origination and servicing software system; risks related to opening new branches, including the ability or inability to open new branches as planned; risks inherent in making loans, including repayment risks and value of collateral, which risks may increase in light of adverse or recessionary economic conditions; changes in interest rates; the risk that Regional Management’s existing sources of liquidity become insufficient to satisfy its needs or that its access to these sources becomes unexpectedly restricted; changes in federal, state, or local laws, regulations, or regulatory policies and practices, and risks associated with the manner in which laws and regulations are interpreted, implemented, and enforced; the timing and amount of revenues that
5
may be recognized by Regional Management; changes in current revenue and expense trends (including trends affecting delinquencies and credit losses); changes in Regional Management’s markets and general changes in the economy (particularly in the markets served by Regional Management); changes in the competitive environment in which Regional Management operates or in the demand for its products; risks related to acquisitions; changes in operating and administrative expenses; and the departure, transition, or replacement of key personnel. Such factors and others are discussed in greater detail in Regional Management’s filings with the Securities and Exchange Commission. Regional Management will not update the information contained in this press release beyond the publication date, except to the extent required by law, and is not responsible for changes made to this document by wire services or Internet services.
About Regional Management Corp.
Regional Management Corp. (NYSE: RM) is a diversified consumer finance company providing a broad array of loan products primarily to customers with limited access to consumer credit from banks, thrifts, credit card companies, and other traditional lenders. Regional Management began operations in 1987 with four branches in South Carolina and has since expanded its branch network across South Carolina, Texas, North Carolina, Tennessee, Alabama, Oklahoma, New Mexico, Georgia, and Virginia. Each of its loan products is structured on a fixed rate, fixed term basis with fully amortizing equal monthly installment payments and is repayable at any time without penalty. Regional Management’s loans are sourced through its multiple channel platform, including in its branches, through direct mail campaigns, independent and franchise automobile dealerships, online credit application networks, retailers, and its consumer website. For more information, please visit www.RegionalManagement.com.
Contact:
Investor Relations
Garrett Edson, (203) 682-8331
6
Regional Management Corp. and Subsidiaries
Consolidated Statements of Income
(Unaudited)
(in thousands, except per share amounts)
| Better (Worse) | Better (Worse) | |||||||||||||||||||||||||||||||
| 3Q 17 | 3Q 16 | $ | % | YTD 17 | YTD 16 | $ | % | |||||||||||||||||||||||||
| Revenue |
||||||||||||||||||||||||||||||||
| Interest and fee income |
$ | 63,615 | $ | 57,420 | $ | 6,195 | 10.8 | % | $ | 182,657 | $ | 161,309 | $ | 21,348 | 13.2 | % | ||||||||||||||||
| Insurance income, net |
3,095 | 2,346 | 749 | 31.9 | % | 9,985 | 7,886 | 2,099 | 26.6 | % | ||||||||||||||||||||||
| Other income |
2,484 | 2,709 | (225 | ) | (8.3 | )% | 7,710 | 7,302 | 408 | 5.6 | % | |||||||||||||||||||||
|
|
|
|
|
|
|
|
|
|
|
|
|
|
|
|
|
|||||||||||||||||
| Total revenue |
69,194 | 62,475 | 6,719 | 10.8 | % | 200,352 | 176,497 | 23,855 | 13.5 | % | ||||||||||||||||||||||
|
|
|
|
|
|
|
|
|
|
|
|
|
|
|
|
|
|||||||||||||||||
| Expenses |
||||||||||||||||||||||||||||||||
| Provision for credit losses |
20,152 | 16,410 | (3,742 | ) | (22.8 | )% | 57,875 | 43,587 | (14,288 | ) | (32.8 | )% | ||||||||||||||||||||
| Personnel |
19,534 | 18,180 | (1,354 | ) | (7.4 | )% | 56,089 | 51,981 | (4,108 | ) | (7.9 | )% | ||||||||||||||||||||
| Occupancy |
5,480 | 5,175 | (305 | ) | (5.9 | )% | 16,184 | 14,808 | (1,376 | ) | (9.3 | )% | ||||||||||||||||||||
| Marketing |
2,303 | 1,786 | (517 | ) | (28.9 | )% | 5,287 | 5,363 | 76 | 1.4 | % | |||||||||||||||||||||
| Other |
6,523 | 5,312 | (1,211 | ) | (22.8 | )% | 19,376 | 17,654 | (1,722 | ) | (9.8 | )% | ||||||||||||||||||||
|
|
|
|
|
|
|
|
|
|
|
|
|
|
|
|
|
|||||||||||||||||
| Total general and administrative |
33,840 | 30,453 | (3,387 | ) | (11.1 | )% | 96,936 | 89,806 | (7,130 | ) | (7.9 | )% | ||||||||||||||||||||
| Interest expense |
6,658 | 5,116 | (1,542 | ) | (30.1 | )% | 17,092 | 14,637 | (2,455 | ) | (16.8 | )% | ||||||||||||||||||||
|
|
|
|
|
|
|
|
|
|
|
|
|
|
|
|
|
|||||||||||||||||
| Income before income taxes |
8,544 | 10,496 | (1,952 | ) | (18.6 | )% | 28,449 | 28,467 | (18 | ) | (0.1 | )% | ||||||||||||||||||||
| Income taxes |
3,235 | 4,020 | 785 | 19.5 | % | 9,371 | 10,903 | 1,532 | 14.1 | % | ||||||||||||||||||||||
|
|
|
|
|
|
|
|
|
|
|
|
|
|
|
|
|
|||||||||||||||||
| Net income |
$ | 5,309 | $ | 6,476 | $ | (1,167 | ) | (18.0 | )% | $ | 19,078 | $ | 17,564 | $ | 1,514 | 8.6 | % | |||||||||||||||
|
|
|
|
|
|
|
|
|
|
|
|
|
|
|
|
|
|||||||||||||||||
| Net income per common share: |
||||||||||||||||||||||||||||||||
| Basic |
$ | 0.46 | $ | 0.57 | $ | (0.11 | ) | (19.3 | )% | $ | 1.65 | $ | 1.47 | $ | 0.18 | 12.2 | % | |||||||||||||||
|
|
|
|
|
|
|
|
|
|
|
|
|
|
|
|
|
|||||||||||||||||
| Diluted |
$ | 0.45 | $ | 0.56 | $ | (0.11 | ) | (19.6 | )% | $ | 1.62 | $ | 1.44 | $ | 0.18 | 12.5 | % | |||||||||||||||
|
|
|
|
|
|
|
|
|
|
|
|
|
|
|
|
|
|||||||||||||||||
| Weighted-average shares outstanding: |
||||||||||||||||||||||||||||||||
| Basic |
11,563 | 11,384 | (179 | ) | (1.6 | )% | 11,537 | 11,963 | 426 | 3.6 | % | |||||||||||||||||||||
|
|
|
|
|
|
|
|
|
|
|
|
|
|
|
|
|
|||||||||||||||||
| Diluted |
11,812 | 11,664 | (148 | ) | (1.3 | )% | 11,752 | 12,194 | 442 | 3.6 | % | |||||||||||||||||||||
|
|
|
|
|
|
|
|
|
|
|
|
|
|
|
|
|
|||||||||||||||||
| Return on average assets (annualized) |
2.8 | % | 3.9 | % | 3.5 | % | 3.7 | % | ||||||||||||||||||||||||
|
|
|
|
|
|
|
|
|
|||||||||||||||||||||||||
| Return on average equity (annualized) |
9.4 | % | 13.2 | % | 11.7 | % | 11.7 | % | ||||||||||||||||||||||||
|
|
|
|
|
|
|
|
|
|||||||||||||||||||||||||
7
Regional Management Corp. and Subsidiaries
Consolidated Balance Sheets
(Unaudited)
(in thousands, except par value amounts)
| Increase (Decrease) | ||||||||||||||||
| 3Q 17 | 3Q 16 | $ | % | |||||||||||||
| Assets |
||||||||||||||||
| Cash |
$ | 5,191 | $ | 3,959 | $ | 1,232 | 31.1 | % | ||||||||
| Gross finance receivables |
1,002,630 | 887,316 | 115,314 | 13.0 | % | |||||||||||
| Unearned finance charges and insurance premiums |
(227,774 | ) | (191,167 | ) | (36,607 | ) | (19.1 | )% | ||||||||
|
|
|
|
|
|
|
|
|
|||||||||
| Finance receivables |
774,856 | 696,149 | 78,707 | 11.3 | % | |||||||||||
| Allowance for credit losses |
(47,400 | ) | (39,100 | ) | (8,300 | ) | (21.2 | )% | ||||||||
|
|
|
|
|
|
|
|
|
|||||||||
| Net finance receivables |
727,456 | 657,049 | 70,407 | 10.7 | % | |||||||||||
| Property and equipment |
12,657 | 10,701 | 1,956 | 18.3 | % | |||||||||||
| Restricted cash |
13,849 | 7,906 | 5,943 | 75.2 | % | |||||||||||
| Intangible assets |
10,239 | 5,324 | 4,915 | 92.3 | % | |||||||||||
| Deferred tax asset |
5,121 | — | 5,121 | 100.0 | % | |||||||||||
| Other assets |
5,337 | 6,390 | (1,053 | ) | (16.5 | )% | ||||||||||
|
|
|
|
|
|
|
|
|
|||||||||
| Total assets |
$ | 779,850 | $ | 691,329 | $ | 88,521 | 12.8 | % | ||||||||
|
|
|
|
|
|
|
|
|
|||||||||
| Liabilities and Stockholders’ Equity |
||||||||||||||||
| Liabilities: |
||||||||||||||||
| Long-term debt |
$ | 538,351 | $ | 481,766 | $ | 56,585 | 11.7 | % | ||||||||
| Unamortized debt issuance costs |
(5,266 | ) | (2,403 | ) | (2,863 | ) | (119.1 | )% | ||||||||
|
|
|
|
|
|
|
|
|
|||||||||
| Net long-term debt |
533,085 | 479,363 | 53,722 | 11.2 | % | |||||||||||
| Accounts payable and accrued expenses |
18,950 | 11,436 | 7,514 | 65.7 | % | |||||||||||
| Deferred tax liability |
— | 432 | (432 | ) | (100.0 | )% | ||||||||||
|
|
|
|
|
|
|
|
|
|||||||||
| Total liabilities |
552,035 | 491,231 | 60,804 | 12.4 | % | |||||||||||
| Commitments and Contingencies |
||||||||||||||||
| Stockholders’ equity: |
||||||||||||||||
| Preferred stock ($0.10 par value, 100,000 shares authorized, no shares issued or outstanding) |
— | — | — | — | ||||||||||||
| Common stock ($0.10 par value, 1,000,000 shares authorized, 13,213 shares issued and 11,667 shares outstanding at September 30, 2017 and 12,984 shares issued and 11,438 shares outstanding at September 30, 2016) |
1,321 | 1,298 | 23 | 1.8 | % | |||||||||||
| Additional paid-in-capital |
93,673 | 91,524 | 2,149 | 2.3 | % | |||||||||||
| Retained earnings |
157,867 | 132,322 | 25,545 | 19.3 | % | |||||||||||
| Treasury stock (1,546 shares at September 30, 2017 and 2016) |
(25,046 | ) | (25,046 | ) | — | 0.0 | % | |||||||||
|
|
|
|
|
|
|
|
|
|||||||||
| Total stockholders’ equity |
227,815 | 200,098 | 27,717 | 13.9 | % | |||||||||||
|
|
|
|
|
|
|
|
|
|||||||||
| Total liabilities and stockholders’ equity |
$ | 779,850 | $ | 691,329 | $ | 88,521 | 12.8 | % | ||||||||
|
|
|
|
|
|
|
|
|
|||||||||
8
Regional Management Corp. and Subsidiaries
Selected Financial Data
(Unaudited)
(in thousands, except per share amounts)
| Averages and Yields | ||||||||||||||||||||||||
| 3Q 17 | 2Q 17 | 3Q 16 | ||||||||||||||||||||||
| Average Finance Receivables |
Average Yield (Annualized) |
Average Finance Receivables |
Average Yield (Annualized) |
Average Finance Receivables |
Average Yield (Annualized) |
|||||||||||||||||||
| Small loans |
$ | 358,380 | 42.7 | % | $ | 341,184 | 42.9 | % | $ | 337,674 | 43.3 | % | ||||||||||||
| Large loans |
288,684 | 29.0 | % | 253,049 | 29.0 | % | 206,437 | 29.0 | % | |||||||||||||||
| Automobile loans |
75,984 | 16.2 | % | 83,082 | 16.5 | % | 99,113 | 17.8 | % | |||||||||||||||
| Retail loans |
30,788 | 17.8 | % | 30,486 | 19.1 | % | 31,317 | 19.4 | % | |||||||||||||||
|
|
|
|
|
|
|
|
|
|
|
|
|
|||||||||||||
| Total interest and fee yield |
$ | 753,836 | 33.8 | % | $ | 707,801 | 33.8 | % | $ | 674,541 | 34.0 | % | ||||||||||||
|
|
|
|
|
|
|
|
|
|
|
|
|
|||||||||||||
| Total revenue yield |
$ | 753,836 | 36.7 | % | $ | 707,801 | 36.9 | % | $ | 674,541 | 37.0 | % | ||||||||||||
|
|
|
|
|
|
|
|
|
|
|
|
|
|||||||||||||
| Components of Increase in Interest and Fee Income 3Q 17 Compared to 3Q 16 Increase (Decrease) |
||||||||||||||||
| Volume | Rate | Volume & Rate | Net | |||||||||||||
| Small loans |
$ | 2,239 | $ | (466 | ) | $ | (29 | ) | $ | 1,744 | ||||||
| Large loans |
5,971 | (29 | ) | (12 | ) | 5,930 | ||||||||||
| Automobile loans |
(1,027 | ) | (393 | ) | 92 | (1,328 | ) | |||||||||
| Retail loans |
(26 | ) | (127 | ) | 2 | (151 | ) | |||||||||
| Product mix |
(407 | ) | 518 | (111 | ) | — | ||||||||||
|
|
|
|
|
|
|
|
|
|||||||||
| Total increase in interest and fee income |
$ | 6,750 | $ | (497 | ) | $ | (58 | ) | $ | 6,195 | ||||||
|
|
|
|
|
|
|
|
|
|||||||||
| Net Loans Originated (1) | ||||||||||||||||||||||||||||
| 3Q 17 | 2Q 17 | QoQ $ Inc (Dec) |
QoQ % Inc (Dec) |
3Q 16 | YoY $ Inc (Dec) |
YoY % Inc (Dec) |
||||||||||||||||||||||
| Small loans |
$ | 148,820 | $ | 160,380 | $ | (11,560 | ) | (7.2 | )% | $ | 160,642 | $ | (11,822 | ) | (7.4 | )% | ||||||||||||
| Large loans |
105,460 | 86,771 | 18,689 | 21.5 | % | 62,846 | 42,614 | 67.8 | % | |||||||||||||||||||
| Automobile loans |
3,787 | 5,828 | (2,041 | ) | (35.0 | )% | 11,099 | (7,312 | ) | (65.9 | )% | |||||||||||||||||
| Retail loans |
7,905 | 6,353 | 1,552 | 24.4 | % | 9,258 | (1,353 | ) | (14.6 | )% | ||||||||||||||||||
|
|
|
|
|
|
|
|
|
|
|
|
|
|
|
|||||||||||||||
| Total net loans originated |
$ | 265,972 | $ | 259,332 | $ | 6,640 | 2.6 | % | $ | 243,845 | $ | 22,127 | 9.1 | % | ||||||||||||||
|
|
|
|
|
|
|
|
|
|
|
|
|
|
|
|||||||||||||||
| (1) | Represents the balance of loan origination and refinancing net of unearned finance charges |
9
| Other Key Metrics | ||||||||||||
| 3Q 17 | 2Q 17 | 3Q 16 | ||||||||||
| Net credit losses |
$ | 14,752 | $ | 17,589 | $ | 13,510 | ||||||
| Percentage of average finance receivables (annualized) |
7.8 | % | 9.9 | % | 8.0 | % | ||||||
| Provision for credit losses (1) |
$ | 20,152 | $ | 18,589 | $ | 16,410 | ||||||
| Percentage of average finance receivables (annualized) |
10.7 | % | 10.5 | % | 9.7 | % | ||||||
| Percentage of total revenue |
29.1 | % | 28.5 | % | 26.3 | % | ||||||
| General and administrative expenses |
$ | 33,840 | $ | 31,642 | $ | 30,453 | ||||||
| Percentage of average finance receivables (annualized) |
18.0 | % | 17.9 | % | 18.1 | % | ||||||
| Percentage of total revenue |
48.9 | % | 48.4 | % | 48.7 | % | ||||||
| Same store results: |
||||||||||||
| Finance receivables at period-end |
$ | 768,794 | $ | 723,547 | $ | 657,764 | ||||||
| Finance receivable growth rate |
10.4 | % | 12.0 | % | 12.3 | % | ||||||
| Number of branches in calculation |
333 | 336 | 315 | |||||||||
| (1) | Includes $3,000 for incremental hurricane allowance for credit losses in 3Q 17 |
| Finance Receivables by Product | ||||||||||||||||||||||||||||
| 3Q 17 | 2Q 17 | QoQ $ Inc (Dec) |
QoQ % Inc (Dec) |
3Q 16 | YoY $ Inc (Dec) |
YoY % Inc (Dec) |
||||||||||||||||||||||
| Small loans |
$ | 363,262 | $ | 348,742 | $ | 14,520 | 4.2 | % | $ | 349,390 | $ | 13,872 | 4.0 | % | ||||||||||||||
| Large loans |
308,642 | 267,921 | 40,721 | 15.2 | % | 217,102 | 91,540 | 42.2 | % | |||||||||||||||||||
|
|
|
|
|
|
|
|
|
|
|
|
|
|
|
|||||||||||||||
| Total core loans |
671,904 | 616,663 | 55,241 | 9.0 | % | 566,492 | 105,412 | 18.6 | % | |||||||||||||||||||
| Automobile loans |
71,666 | 79,861 | (8,195 | ) | (10.3 | )% | 97,141 | (25,475 | ) | (26.2 | )% | |||||||||||||||||
| Retail loans |
31,286 | 30,243 | 1,043 | 3.4 | % | 32,516 | (1,230 | ) | (3.8 | )% | ||||||||||||||||||
|
|
|
|
|
|
|
|
|
|
|
|
|
|
|
|||||||||||||||
| Total finance receivables |
$ | 774,856 | $ | 726,767 | $ | 48,089 | 6.6 | % | $ | 696,149 | $ | 78,707 | 11.3 | % | ||||||||||||||
|
|
|
|
|
|
|
|
|
|
|
|
|
|
|
|||||||||||||||
| Number of branches at period end |
344 | 347 | (3 | ) | (0.9 | )% | 338 | 6 | 1.8 | % | ||||||||||||||||||
| Average finance receivables per branch |
$ | 2,252 | $ | 2,094 | $ | 158 | 7.5 | % | $ | 2,060 | $ | 192 | 9.3 | % | ||||||||||||||
|
|
|
|
|
|
|
|
|
|
|
|
|
|
|
|||||||||||||||
10
| Contractual Delinquency by Aging | ||||||||||||||||||||||||
| 3Q 17 | 2Q 17 | 3Q 16 | ||||||||||||||||||||||
| Allowance for credit losses (1) |
$ | 47,400 | 6.1 | % | $ | 42,000 | 5.8 | % | $ | 39,100 | 5.6 | % | ||||||||||||
| Current |
638,696 | 82.5 | % | 599,344 | 82.5 | % | 569,412 | 81.8 | % | |||||||||||||||
| 1 to 29 days past due |
83,230 | 10.7 | % | 80,064 | 11.0 | % | 77,097 | 11.1 | % | |||||||||||||||
|
|
|
|
|
|
|
|
|
|
|
|
|
|||||||||||||
| Delinquent accounts: |
||||||||||||||||||||||||
| 30 to 59 days |
18,621 | 2.4 | % | 17,018 | 2.3 | % | 17,323 | 2.4 | % | |||||||||||||||
| 60 to 89 days |
11,631 | 1.5 | % | 10,726 | 1.5 | % | 10,966 | 1.6 | % | |||||||||||||||
| 90 to 119 days |
9,653 | 1.2 | % | 7,793 | 1.0 | % | 8,363 | 1.3 | % | |||||||||||||||
| 120 to 149 days |
6,799 | 0.9 | % | 6,302 | 0.9 | % | 7,215 | 1.0 | % | |||||||||||||||
| 150 to 179 days |
6,226 | 0.8 | % | 5,520 | 0.8 | % | 5,773 | 0.8 | % | |||||||||||||||
|
|
|
|
|
|
|
|
|
|
|
|
|
|||||||||||||
| Total contractual delinquency |
$ | 52,930 | 6.8 | % | $ | 47,359 | 6.5 | % | $ | 49,640 | 7.1 | % | ||||||||||||
|
|
|
|
|
|
|
|
|
|
|
|
|
|||||||||||||
| Total finance receivables |
$ | 774,856 | 100.0 | % | $ | 726,767 | 100.0 | % | $ | 696,149 | 100.0 | % | ||||||||||||
|
|
|
|
|
|
|
|
|
|
|
|
|
|||||||||||||
| 1 day and over past due |
$ | 136,160 | 17.5 | % | $ | 127,423 | 17.5 | % | $ | 126,737 | 18.2 | % | ||||||||||||
|
|
|
|
|
|
|
|
|
|
|
|
|
|||||||||||||
| (1) | Includes $3,000 for incremental hurricane allowance for credit losses in 3Q 17 |
| Contractual Delinquency by Product | ||||||||||||||||||||||||
| 3Q 17 | 2Q 17 | 3Q 16 | ||||||||||||||||||||||
| Small loans |
$ | 30,328 | 8.3 | % | $ | 26,610 | 7.6 | % | $ | 30,169 | 8.6 | % | ||||||||||||
| Large loans |
15,578 | 5.0 | % | 13,839 | 5.2 | % | 10,142 | 4.7 | % | |||||||||||||||
| Automobile loans |
5,280 | 7.4 | % | 5,172 | 6.5 | % | 7,459 | 7.7 | % | |||||||||||||||
| Retail loans |
1,744 | 5.6 | % | 1,738 | 5.7 | % | 1,870 | 5.8 | % | |||||||||||||||
|
|
|
|
|
|
|
|
|
|
|
|
|
|||||||||||||
| Total contractual delinquency |
$ | 52,930 | 6.8 | % | $ | 47,359 | 6.5 | % | $ | 49,640 | 7.1 | % | ||||||||||||
|
|
|
|
|
|
|
|
|
|
|
|
|
|||||||||||||
11
| Quarterly Trend | ||||||||||||||||||||||||||||
| 3Q 16 | 4Q 16 | 1Q 17 | 2Q 17 | 3Q 17 | QoQ $ B(W) |
YoY $ B(W) |
||||||||||||||||||||||
| Revenue |
||||||||||||||||||||||||||||
| Interest and fee income |
$ | 57,420 | $ | 59,654 | $ | 59,255 | $ | 59,787 | $ | 63,615 | $ | 3,828 | $ | 6,195 | ||||||||||||||
| Insurance income, net |
2,346 | 1,570 | 3,805 | 3,085 | 3,095 | 10 | 749 | |||||||||||||||||||||
| Other income |
2,709 | 2,797 | 2,760 | 2,466 | 2,484 | 18 | (225 | ) | ||||||||||||||||||||
|
|
|
|
|
|
|
|
|
|
|
|
|
|
|
|||||||||||||||
| Total revenue |
62,475 | 64,021 | 65,820 | 65,338 | 69,194 | 3,856 | 6,719 | |||||||||||||||||||||
|
|
|
|
|
|
|
|
|
|
|
|
|
|
|
|||||||||||||||
| Expenses |
||||||||||||||||||||||||||||
| Provision for credit losses |
16,410 | 19,427 | 19,134 | 18,589 | 20,152 | (1,563 | ) | (3,742 | ) | |||||||||||||||||||
| Personnel |
18,180 | 16,998 | 18,168 | 18,387 | 19,534 | (1,147 | ) | (1,354 | ) | |||||||||||||||||||
| Occupancy |
5,175 | 5,251 | 5,285 | 5,419 | 5,480 | (61 | ) | (305 | ) | |||||||||||||||||||
| Marketing |
1,786 | 1,474 | 1,205 | 1,779 | 2,303 | (524 | ) | (517 | ) | |||||||||||||||||||
| Other |
5,312 | 5,103 | 6,796 | 6,057 | 6,523 | (466 | ) | (1,211 | ) | |||||||||||||||||||
|
|
|
|
|
|
|
|
|
|
|
|
|
|
|
|||||||||||||||
| Total general and administrative |
30,453 | 28,826 | 31,454 | 31,642 | 33,840 | (2,198 | ) | (3,387 | ) | |||||||||||||||||||
| Interest expense |
5,116 | 5,287 | 5,213 | 5,221 | 6,658 | (1,437 | ) | (1,542 | ) | |||||||||||||||||||
|
|
|
|
|
|
|
|
|
|
|
|
|
|
|
|||||||||||||||
| Income before income taxes |
10,496 | 10,481 | 10,019 | 9,886 | 8,544 | (1,342 | ) | (1,952 | ) | |||||||||||||||||||
| Income taxes |
4,020 | 4,014 | 2,385 | 3,751 | 3,235 | 516 | 785 | |||||||||||||||||||||
|
|
|
|
|
|
|
|
|
|
|
|
|
|
|
|||||||||||||||
| Net income |
$ | 6,476 | $ | 6,467 | $ | 7,634 | $ | 6,135 | $ | 5,309 | $ | (826 | ) | $ | (1,167 | ) | ||||||||||||
|
|
|
|
|
|
|
|
|
|
|
|
|
|
|
|||||||||||||||
| Net income per common share: |
||||||||||||||||||||||||||||
| Basic |
$ | 0.57 | $ | 0.57 | $ | 0.66 | $ | 0.53 | $ | 0.46 | $ | (0.07 | ) | $ | (0.11 | ) | ||||||||||||
|
|
|
|
|
|
|
|
|
|
|
|
|
|
|
|||||||||||||||
| Diluted |
$ | 0.56 | $ | 0.55 | $ | 0.65 | $ | 0.52 | $ | 0.45 | $ | (0.07 | ) | $ | (0.11 | ) | ||||||||||||
|
|
|
|
|
|
|
|
|
|
|
|
|
|
|
|||||||||||||||
| Weighted-average shares outstanding: |
||||||||||||||||||||||||||||
| Basic |
11,384 | 11,408 | 11,494 | 11,554 | 11,563 | (9 | ) | (179 | ) | |||||||||||||||||||
|
|
|
|
|
|
|
|
|
|
|
|
|
|
|
|||||||||||||||
| Diluted |
11,664 | 11,763 | 11,715 | 11,730 | 11,812 | (82 | ) | (148 | ) | |||||||||||||||||||
|
|
|
|
|
|
|
|
|
|
|
|
|
|
|
|||||||||||||||
| Net interest margin |
$ | 57,359 | $ | 58,734 | $ | 60,607 | $ | 60,117 | $ | 62,536 | $ | 2,419 | $ | 5,177 | ||||||||||||||
|
|
|
|
|
|
|
|
|
|
|
|
|
|
|
|||||||||||||||
| Net credit margin |
$ | 40,949 | $ | 39,307 | $ | 41,473 | $ | 41,528 | $ | 42,384 | $ | 856 | $ | 1,435 | ||||||||||||||
|
|
|
|
|
|
|
|
|
|
|
|
|
|
|
|||||||||||||||
|
|
|
|
|
|
|
|
|
|
|
|
|
|
|
|||||||||||||||
| 3Q 16 | 4Q 16 | 1Q 17 | 2Q 17 | 3Q 17 | QoQ $ Inc (Dec) |
YoY $ Inc (Dec) |
||||||||||||||||||||||
| Total assets |
$ | 691,329 | $ | 712,224 | $ | 690,432 | $ | 727,533 | $ | 779,850 | $ | 52,317 | $ | 88,521 | ||||||||||||||
|
|
|
|
|
|
|
|
|
|
|
|
|
|
|
|||||||||||||||
| Finance receivables |
$ | 696,149 | $ | 717,775 | $ | 695,004 | $ | 726,767 | $ | 774,856 | $ | 48,089 | $ | 78,707 | ||||||||||||||
|
|
|
|
|
|
|
|
|
|
|
|
|
|
|
|||||||||||||||
| Allowance for credit losses |
$ | 39,100 | $ | 41,250 | $ | 41,000 | $ | 42,000 | $ | 47,400 | $ | 5,400 | $ | 8,300 | ||||||||||||||
|
|
|
|
|
|
|
|
|
|
|
|
|
|
|
|||||||||||||||
| Long-term debt |
$ | 481,766 | $ | 491,678 | $ | 462,994 | $ | 497,049 | $ | 538,351 | $ | 41,302 | $ | 56,585 | ||||||||||||||
|
|
|
|
|
|
|
|
|
|
|
|
|
|
|
|||||||||||||||
| General & Administrative Expenses Trend | ||||||||||||||||||||||||||||
| 3Q 16 | 4Q 16 | 1Q 17 | 2Q 17 | 3Q 17 | QoQ $ B(W) |
YoY $ B(W) |
||||||||||||||||||||||
| Legacy operations expenses |
$ | 19,596 | $ | 19,238 | $ | 20,497 | $ | 19,208 | $ | 20,591 | $ | (1,383 | ) | $ | (995 | ) | ||||||||||||
| 2017 new branch expenses |
276 | 499 | 676 | (177 | ) | (676 | ) | |||||||||||||||||||||
|
|
|
|
|
|
|
|
|
|
|
|
|
|
|
|||||||||||||||
| Total operations expenses |
19,596 | 19,238 | 20,773 | 19,707 | 21,267 | (1,560 | ) | (1,671 | ) | |||||||||||||||||||
| Marketing expenses |
1,786 | 1,474 | 1,205 | 1,779 | 2,303 | (524 | ) | (517 | ) | |||||||||||||||||||
| Home office expenses |
9,071 | 8,114 | 9,476 | 10,156 | 10,270 | (114 | ) | (1,199 | ) | |||||||||||||||||||
|
|
|
|
|
|
|
|
|
|
|
|
|
|
|
|||||||||||||||
| Total G&A expenses |
$ | 30,453 | $ | 28,826 | $ | 31,454 | $ | 31,642 | $ | 33,840 | $ | (2,198 | ) | $ | (3,387 | ) | ||||||||||||
|
|
|
|
|
|
|
|
|
|
|
|
|
|
|
|||||||||||||||
12
| Averages and Yields | ||||||||||||||||
| YTD 17 | YTD 16 | |||||||||||||||
| Average Finance Receivables |
Average Yield (Annualized) |
Average Finance Receivables |
Average Yield (Annualized) |
|||||||||||||
| Small loans |
$ | 351,204 | 42.4 | % | $ | 327,626 | 42.5 | % | ||||||||
| Large loans |
261,277 | 28.8 | % | 179,508 | 28.7 | % | ||||||||||
| Automobile loans |
82,313 | 16.4 | % | 104,797 | 17.9 | % | ||||||||||
| Retail loans |
31,389 | 18.4 | % | 29,464 | 19.2 | % | ||||||||||
|
|
|
|
|
|
|
|
|
|||||||||
| Total interest and fee yield |
$ | 726,183 | 33.5 | % | $ | 641,395 | 33.5 | % | ||||||||
|
|
|
|
|
|
|
|
|
|||||||||
| Total revenue yield |
$ | 726,183 | 36.8 | % | $ | 641,395 | 36.7 | % | ||||||||
|
|
|
|
|
|
|
|
|
|||||||||
| Components of Increase in Interest and Fee Income YTD 17 Compared to YTD 16 Increase (Decrease) |
||||||||||||||||
| Volume | Rate | Volume & Rate | Net | |||||||||||||
| Small loans |
$ | 7,508 | $ | (68 | ) | $ | (4 | ) | $ | 7,436 | ||||||
| Large loans |
17,598 | 112 | 51 | 17,761 | ||||||||||||
| Automobile loans |
(3,025 | ) | (1,174 | ) | 252 | (3,947 | ) | |||||||||
| Retail loans |
277 | (168 | ) | (11 | ) | 98 | ||||||||||
| Product mix |
(1,034 | ) | 1,319 | (285 | ) | — | ||||||||||
|
|
|
|
|
|
|
|
|
|||||||||
| Total increase in interest and fee income |
$ | 21,324 | $ | 21 | $ | 3 | $ | 21,348 | ||||||||
|
|
|
|
|
|
|
|
|
|||||||||
| Net Loans Originated (1) | ||||||||||||||||
| YTD 17 | YTD 16 | YTD $ Inc (Dec) |
YTD % Inc (Dec) |
|||||||||||||
| Small loans |
$ | 424,559 | $ | 428,068 | $ | (3,509 | ) | (0.8 | )% | |||||||
| Large loans |
249,251 | 183,589 | 65,662 | 35.8 | % | |||||||||||
| Automobile loans |
18,404 | 28,939 | (10,535 | ) | (36.4 | )% | ||||||||||
| Retail loans |
20,522 | 26,586 | (6,064 | ) | (22.8 | )% | ||||||||||
|
|
|
|
|
|
|
|
|
|||||||||
| Total net loans originated |
$ | 712,736 | $ | 667,182 | $ | 45,554 | 6.8 | % | ||||||||
|
|
|
|
|
|
|
|
|
|||||||||
| (1) | Represents the balance of loan origination and refinancing net of unearned finance charges |
13
| Other Key Metrics | ||||||||
| YTD 17 | YTD 16 | |||||||
| Net credit losses |
$ | 51,725 | $ | 41,939 | ||||
| Percentage of average finance receivables (annualized) |
9.5 | % | 8.7 | % | ||||
| Provision for credit losses (1) |
$ | 57,875 | $ | 43,587 | ||||
| Percentage of average finance receivables (annualized) |
10.6 | % | 9.1 | % | ||||
| Percentage of total revenue |
28.9 | % | 24.7 | % | ||||
| General and administrative expenses |
$ | 96,936 | $ | 89,806 | ||||
| Percentage of average finance receivables (annualized) |
17.8 | % | 18.7 | % | ||||
| Percentage of total revenue |
48.4 | % | 50.9 | % | ||||
| (1) | Includes $3,000 for incremental hurricane allowance for credit losses in 3Q 17 |
14