Exhibit 99.1

Press Contact: | | Investor Contact: | ||
Trinseo | | Trinseo | ||
Dina Pokedoff | | Andy Myers | ||
Tel : +1 610-240-3307 | | Tel : +1 610-240-3221 | ||
Email: dpokedoff@trinseo.com | | Email: aemyers@trinseo.com |
Trinseo Reports Third Quarter 2021 Financial Results; Announces Planned Divestiture of Styrenics Businesses
Third Quarter 2021 and Other Highlights
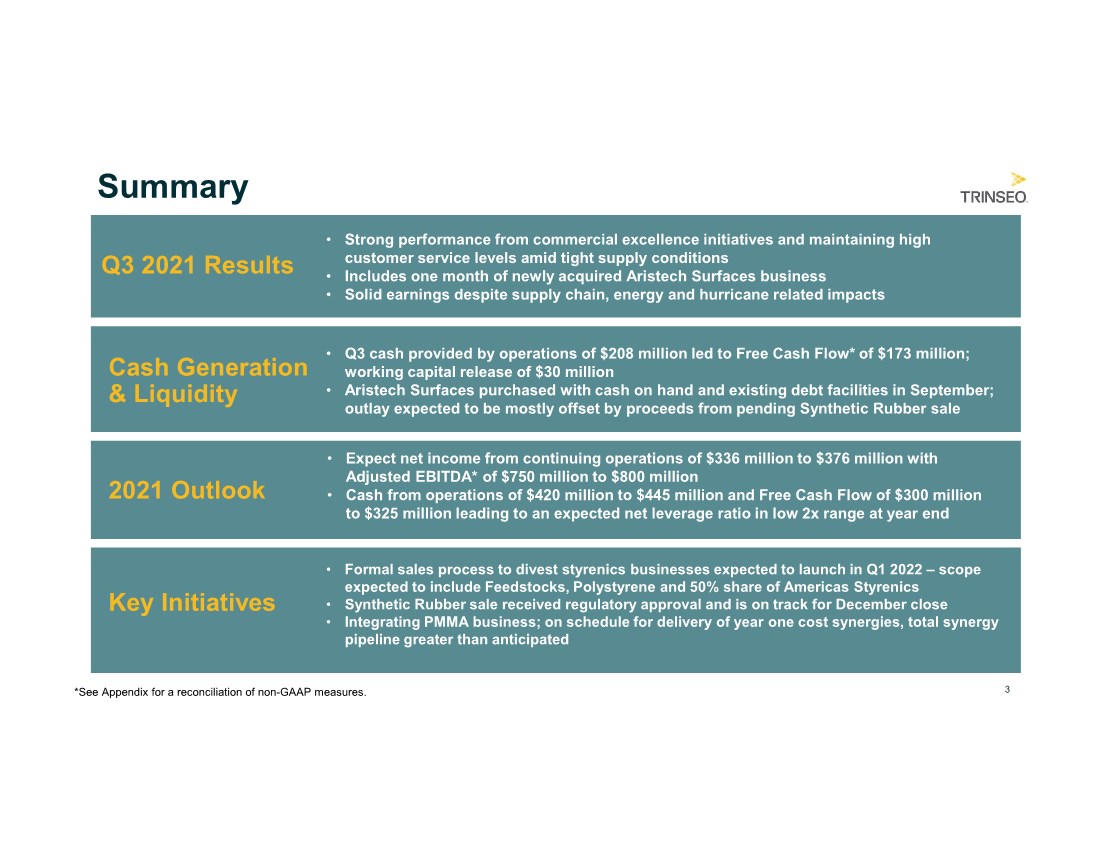
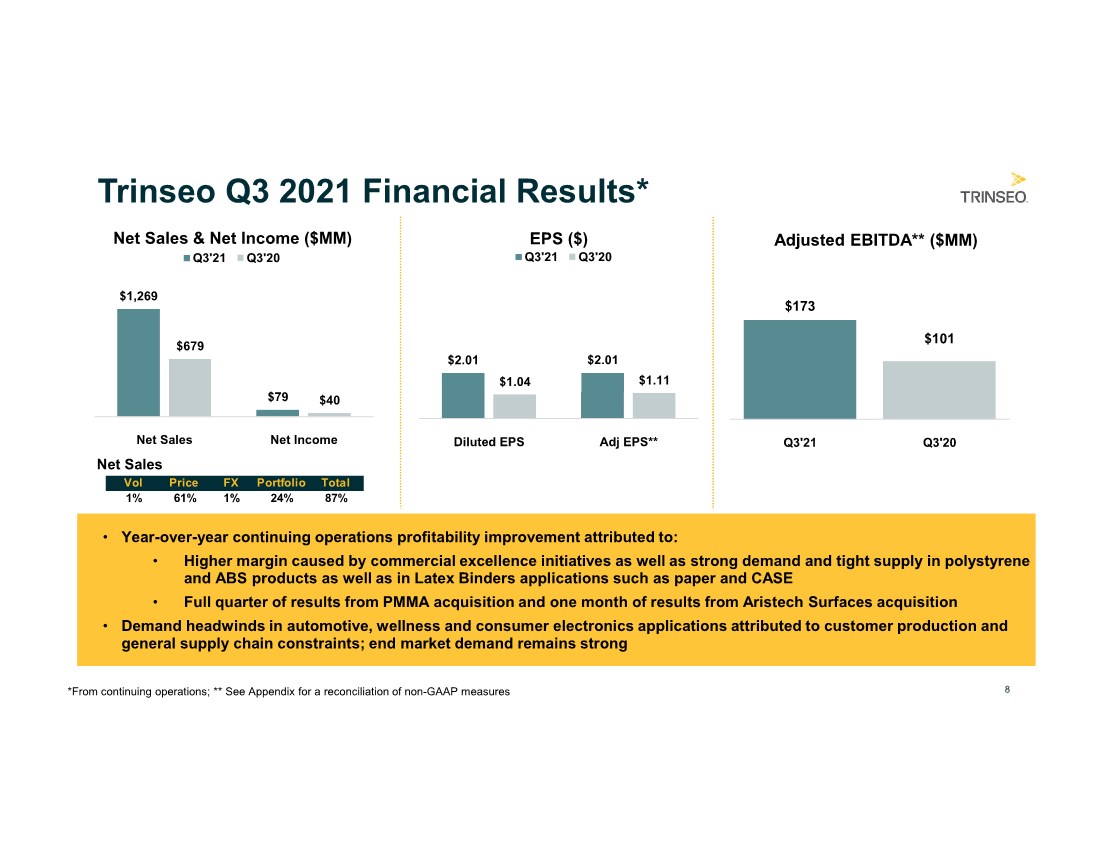
● | Strong net income from continuing operations of $79 million and diluted EPS from continuing operations of $2.01 |
● | Adjusted EBITDA* of $173 million, including a $1 million unfavorable impact from net timing, and Adjusted EPS* of $2.01 |
● | Cash from operations of $208 million and capital expenditures of $36 million resulted in Free Cash Flow* of $173 million |
| ● | Increased most recent quarterly dividend to $0.32 per share from $0.08 per share |
| ● | Completed acquisition of Aristech Surfaces on September 1, which broadens Trinseo’s PMMA product offerings in building & construction and wellness end markets |
| ● | Announces planned divestiture of its styrenics businesses with intent to launch a formal sales process in the first quarter of 2022 |
| | Three Months Ended | ||||
| | September 30, | ||||
$millions, except per share data | | 2021 |
| 2020 | ||
Net Sales |
| $ | 1,269 |
| $ | 679 |
Net Income from continuing operations | |
| 79 | |
| 40 |
EPS from continuing operations (Diluted) ($) | |
| 2.01 | |
| 1.04 |
Adjusted Net Income* | |
| 80 | |
| 43 |
Adjusted EPS ($)* | |
| 2.01 | |
| 1.11 |
EBITDA* | |
| 158 | |
| 98 |
Adjusted EBITDA* | |
| 173 | |
| 101 |
*For a reconciliation of EBITDA, Adjusted EBITDA, and Adjusted Net Income, all of which are non-GAAP measures, to Net Income, as well as a reconciliation of Free Cash Flow and Adjusted EPS, see Notes 2 and 3 to the financial statements included below. Adjusted EBITDA excludes discontinued operations contribution of $15 million and $1 million for the three months ended September 30, 2021 and 2020, respectively, and Adjusted Net Income excludes discontinued operations contribution of $14 million and $67 million for the three months ended September 30, 2021 and 2020, respectively.
BERWYN, Pa — November 5, 2021 — Trinseo (NYSE: TSE), a global materials company and manufacturer of plastics and latex binders, today reported its third quarter 2021 financial results. Net sales in the third quarter increased 87% versus prior year. Higher prices resulted in a 61% increase, mainly due to the pass through of higher raw material costs such as styrene and butadiene. The remainder of the increase was primarily from the addition of the acquired businesses within the Engineered Materials segment, including one month of results from Aristech Surfaces. Third quarter net income from continuing operations of $79 million was $39 million above prior year and third quarter Adjusted EBITDA of $173 million was $72 million above prior year. The increase in
earnings can be attributed to higher margins due to strong demand in all segments, tight supply and additional earnings from the newly acquired businesses within the Engineered Materials segment.
Cash provided by operating activities in the third quarter was $208 million and capital expenditures were $36 million, resulting in Free Cash Flow of $173 million including a working capital source of $30 million. For a reconciliation of Free Cash Flow to cash provided by operating activities, see Note 3 below.
Commenting on the Company’s third quarter performance, Frank Bozich, President and Chief Executive Officer of Trinseo, said, “We had another quarter of solid earnings despite some challenging industry operating conditions that included supply chain and energy constraints. We observed healthy demand across all of our segments and saw strong margins amid tight supply as we continued to implement commercial excellence initiatives. I want to highlight the exemplary job of our employees, whose hard work and dedication ensured product delivery to our customers with minimal interruption despite a difficult supply chain and production environment.”
Third Quarter Results and Commentary by Business Segment
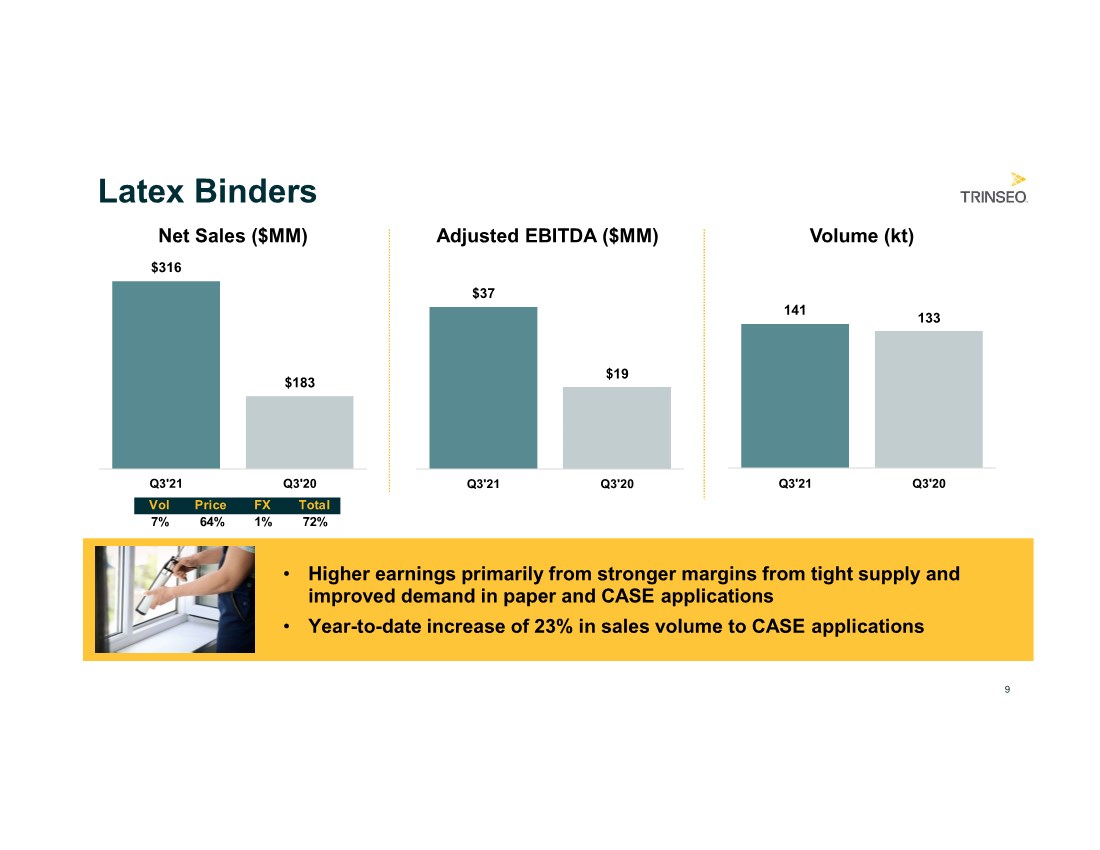
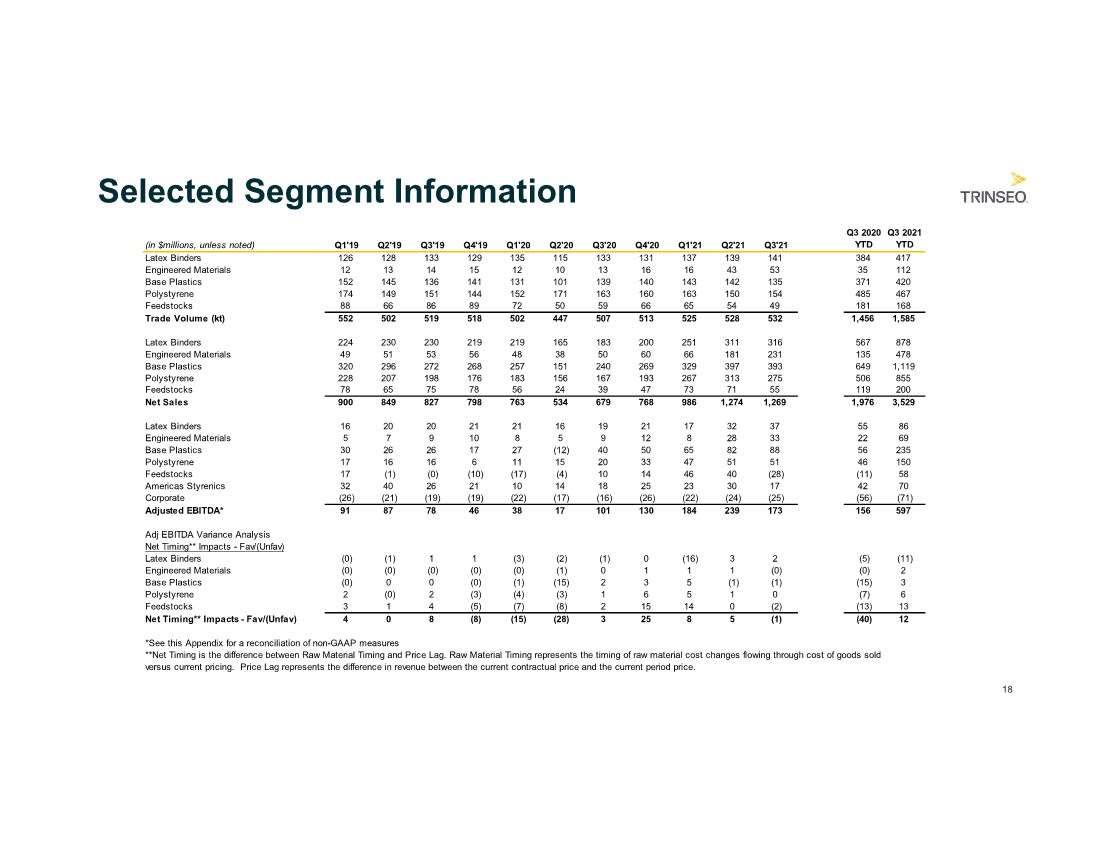
| ● | Latex Binders net sales of $316 million for the quarter increased 72% versus prior year due primarily to the passthrough of higher raw materials. Sales volume was higher than prior year due to sales increases to CASE and paper applications. Sales volume to CASE applications was up 23% on a year-to-date basis. Adjusted EBITDA of $37 million was $18 million higher than prior year attributed primarily to higher margins from tight supply and higher sales volume to CASE applications. |
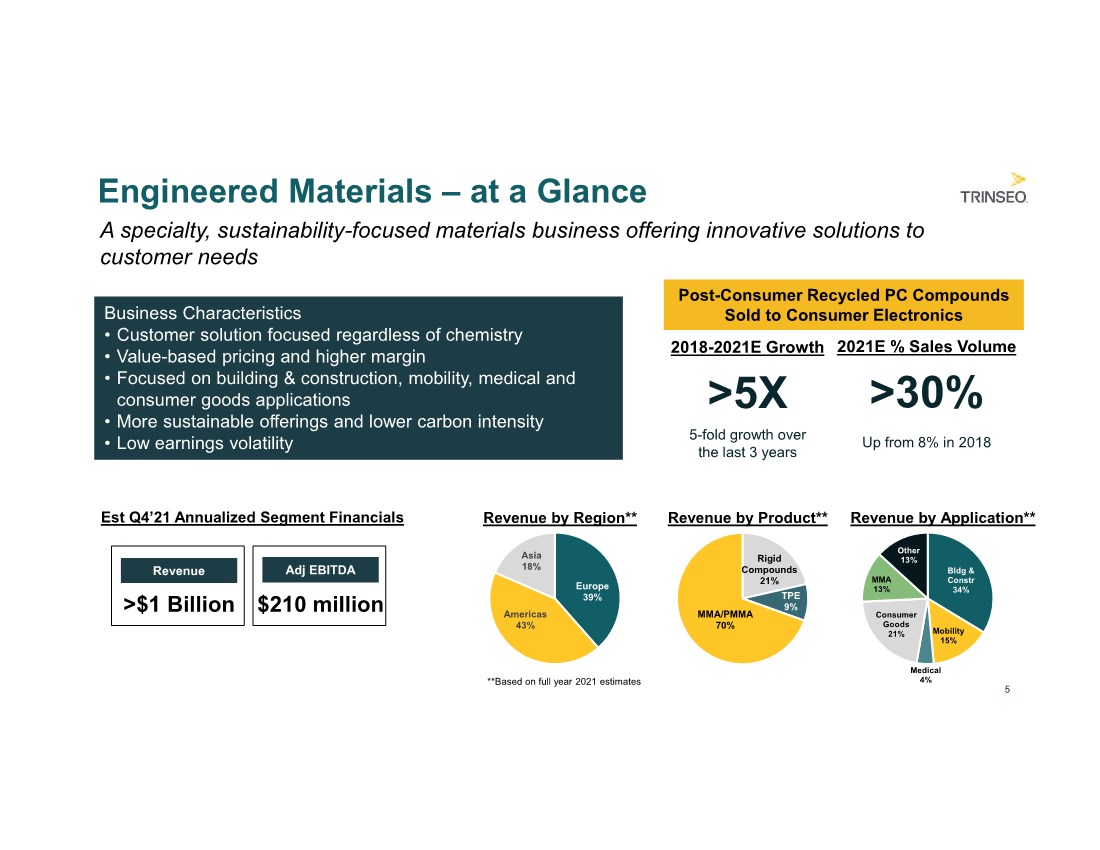
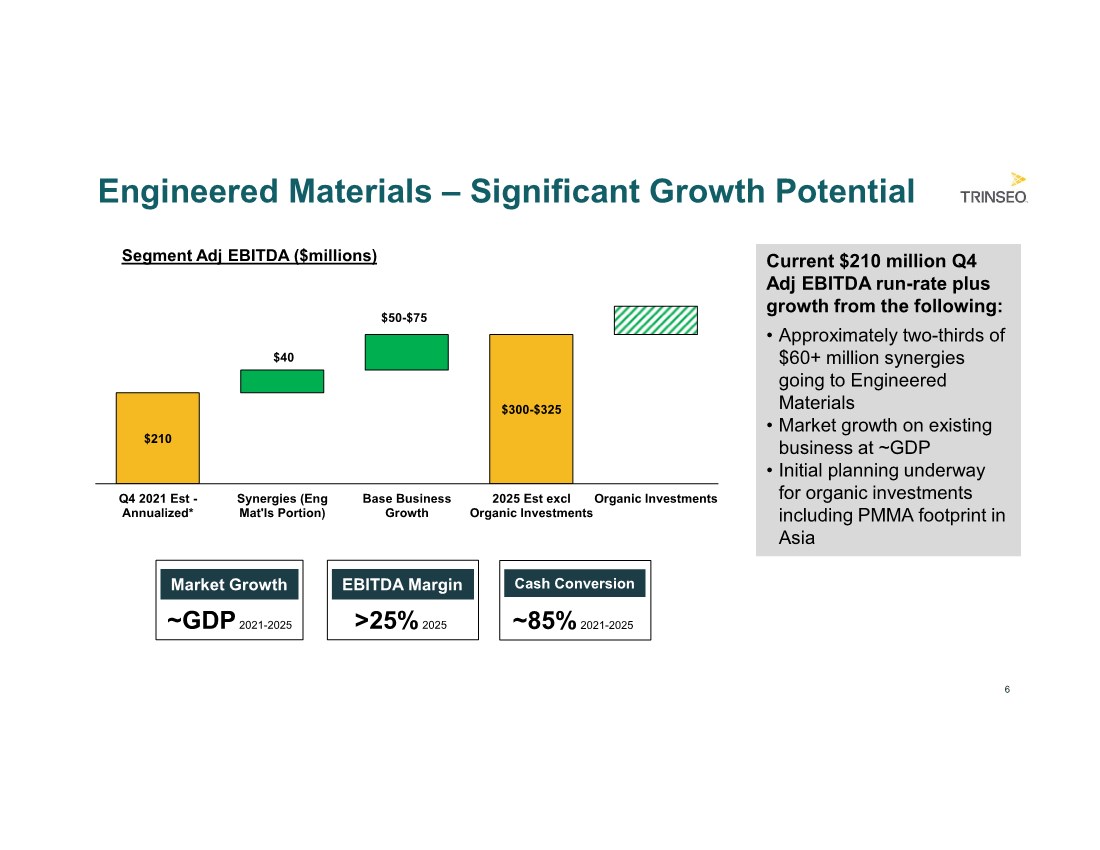
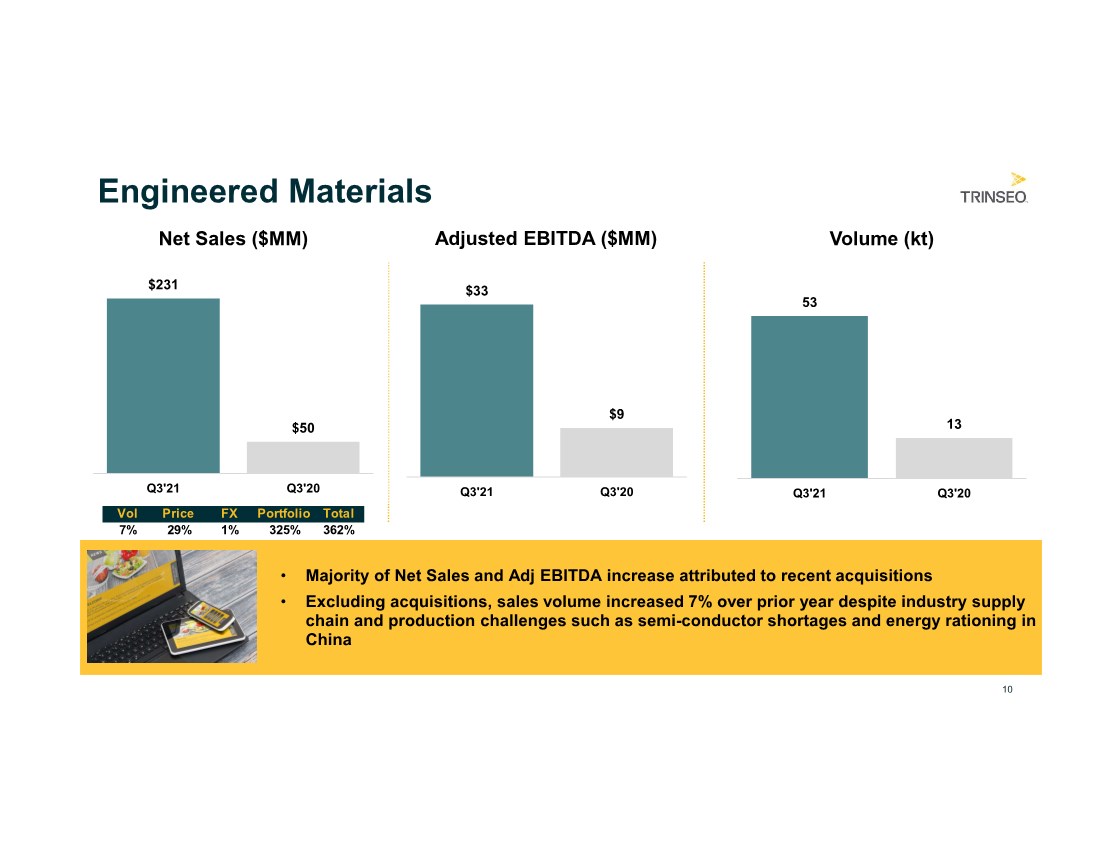
| ● | Engineered Materials net sales of $231 million for the quarter increased $181 million versus prior year and Adjusted EBITDA of $33 million increased $23 million versus prior year. These increases were mostly attributable to the addition of the acquired businesses in May and September of this year. Excluding the acquired businesses, sales volume was strong at 7% above prior year despite supply chain headwinds, such as chip shortages, impacting the consumer electronics market. The integration and synergy realization of our newly acquired businesses is on track. |
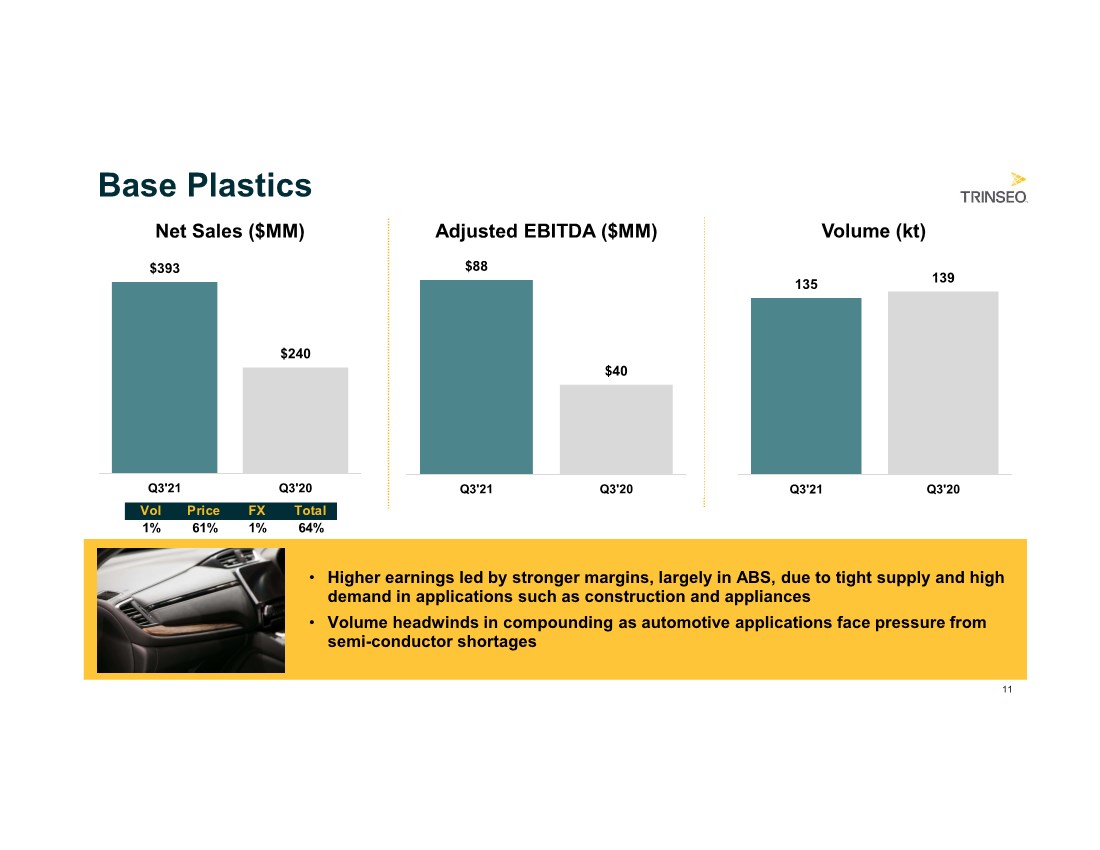
| ● | Base Plastics net sales of $393 million for the quarter were 64% higher than prior year due to higher prices from commercial excellence actions and the passthrough of higher raw materials. Sales volume was relatively flat as production issues for automotive customers offset stronger demand in other applications such as building & construction. Adjusted EBITDA of $88 million was $47 million favorable versus prior year due to margin expansion in ABS and polycarbonate products from commercial actions as well as tight supply and strong demand. |
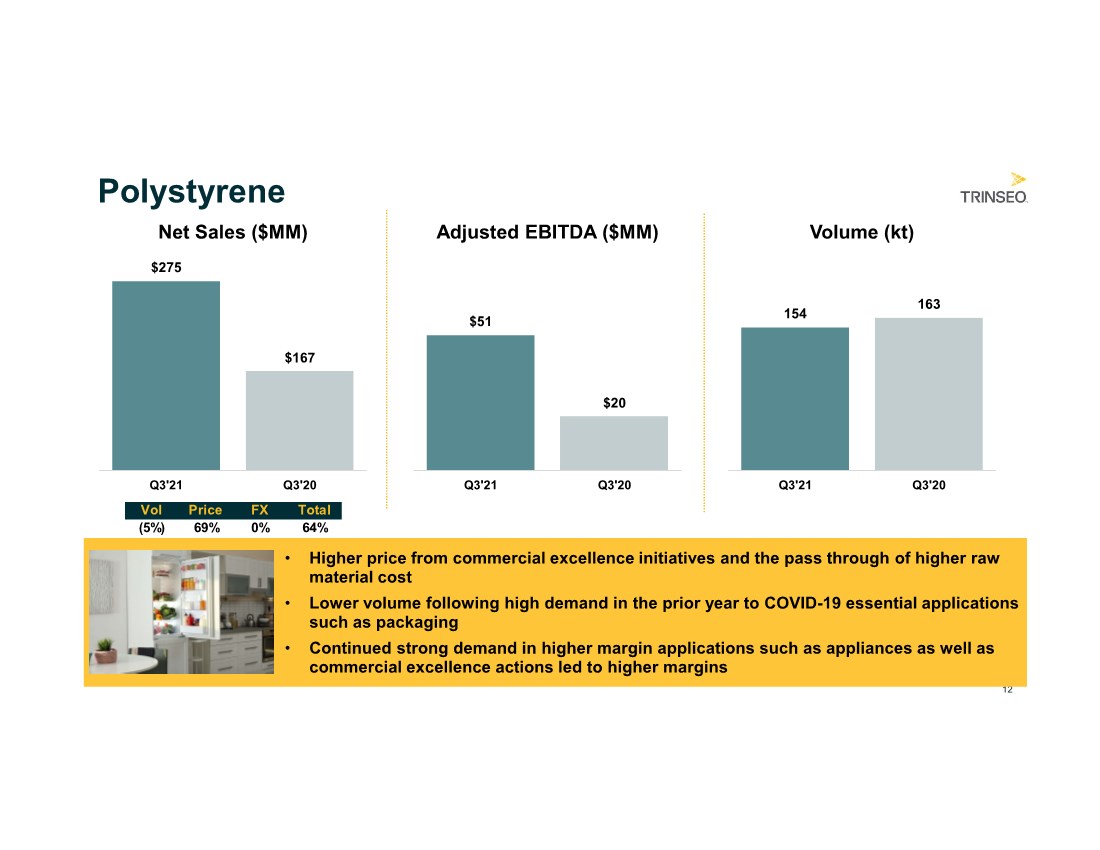
| ● | Polystyrene net sales of $275 million for the quarter were 64% above prior year mainly from the passthrough of higher styrene as well as commercial excellence actions. Sales volume decreased net sales by 5% due to higher demand in the prior year to COVID-19 essential applications such as packaging. Adjusted EBITDA of $51 million was $31 million above prior year from higher margins resulting from commercial excellence initiatives and very tight market conditions in Europe and Asia. |
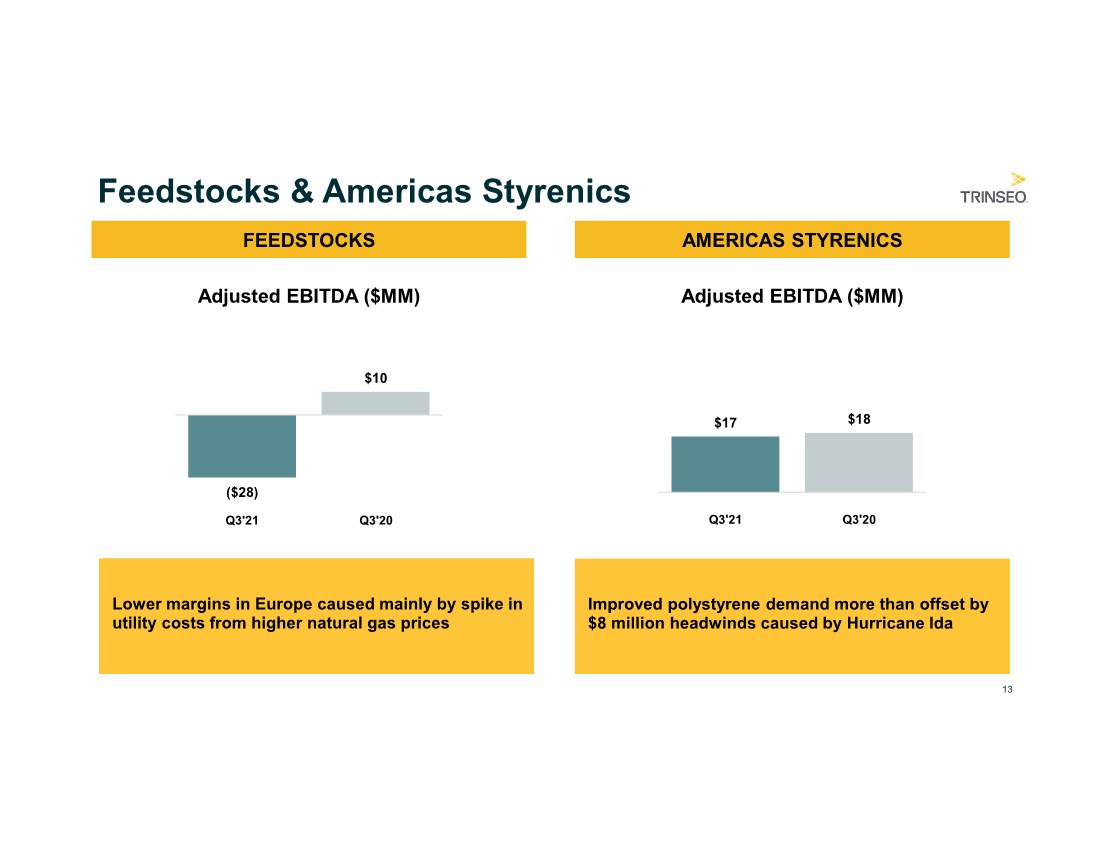
| ● | Feedstocks net sales of $55 million for the quarter were 42% above prior year due mainly to the passthrough of higher styrene. Adjusted EBITDA of negative $28 million was $38 million lower than prior year due to lower margins including higher utility costs in Europe. |
| ● | Americas Styrenics Adjusted EBITDA of $17 million for the quarter was $1 million lower than prior year as stronger polystyrene demand was more than offset by an $8 million headwind caused by production issues from Hurricane Ida as well as lower styrene margins. |
Held-For-Sale and Discontinued Operations
Beginning in the second quarter of 2021, our Synthetic Rubber business, formerly a separate reportable segment, has been classified as held-for-sale in our condensed consolidated balance sheets and treated as discontinued operations in our condensed consolidated statements of operations and statements of cash flows for all periods.
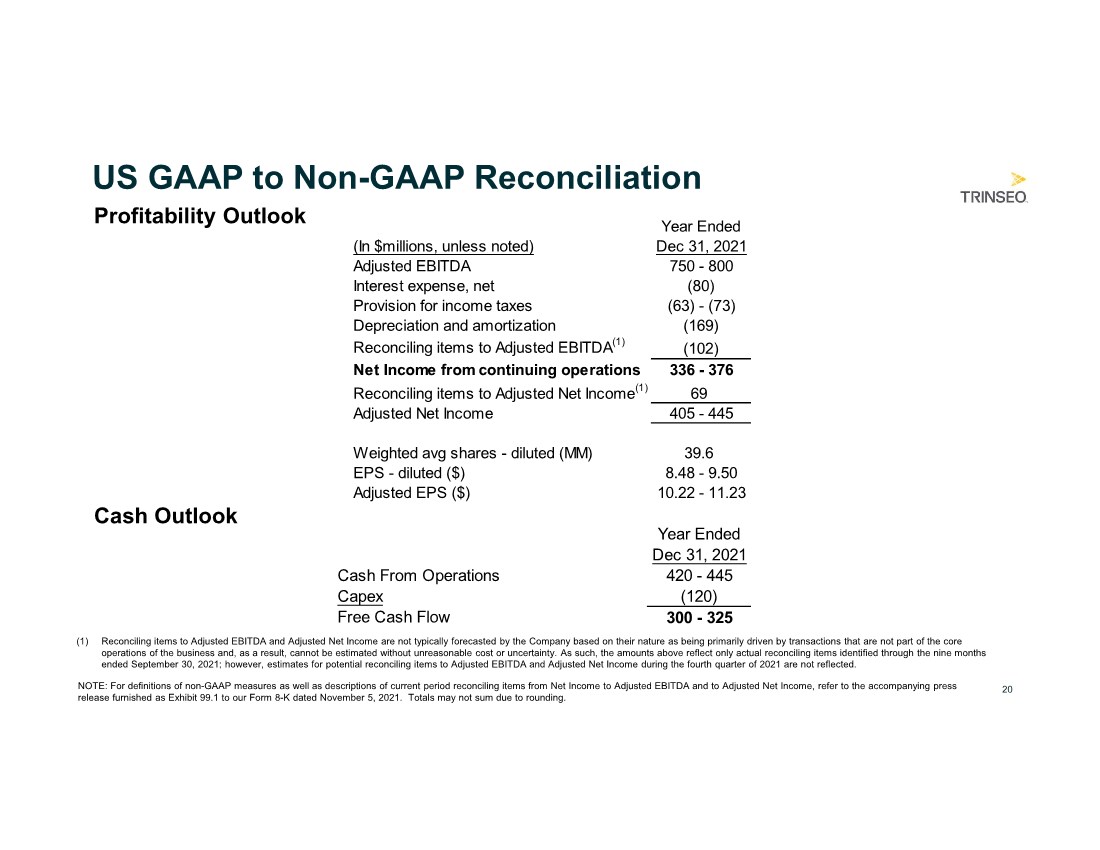
2021 Full-Year Outlook
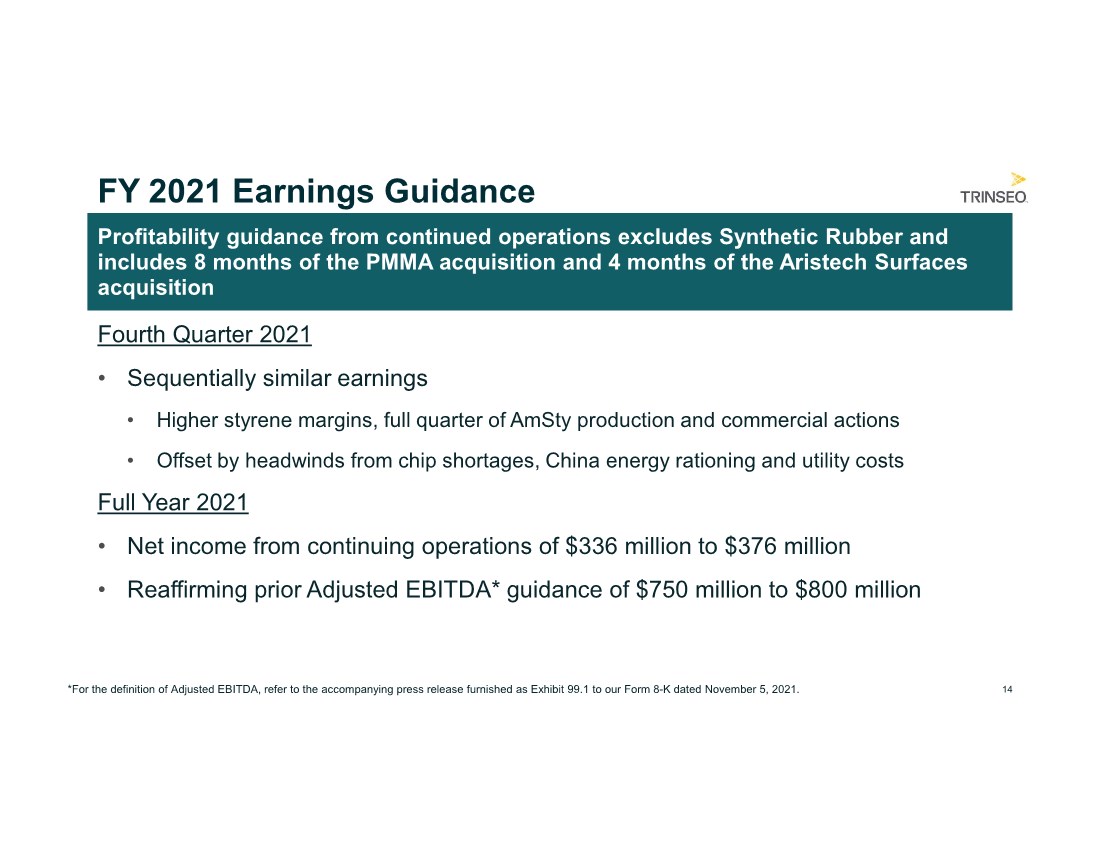
| ● | Full-year 2021 net income from continuing operations of $336 million to $376 million and Adjusted EBITDA of $750 million to $800 million; this outlook reflects eight months of the PMMA acquisition, four months of the recently acquired Aristech Surfaces and excludes Synthetic Rubber. |
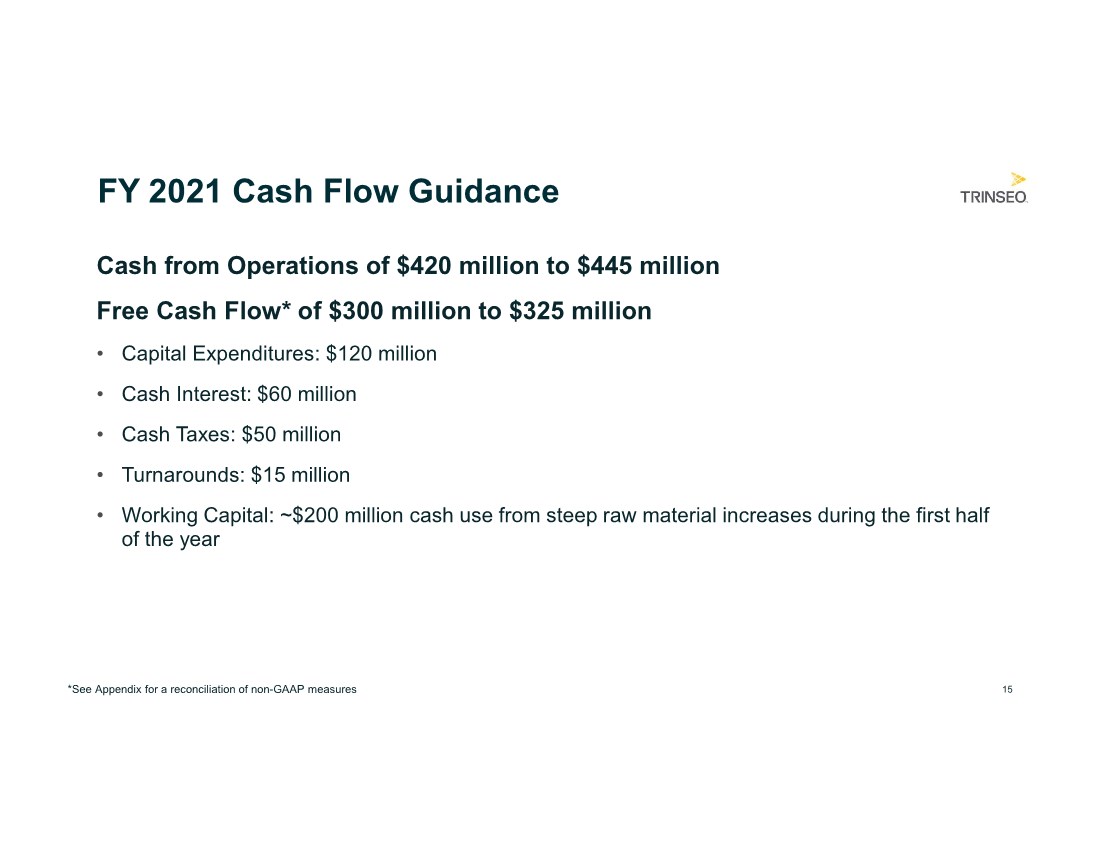
| ● | Full-year 2021 cash from operations of $420 million to $445 million and Free Cash Flow of $300 million to $325 million. |
Commenting on the outlook for the remainder of 2021, Bozich said, “We expect to finish the year with another strong quarter leading to a record year of earnings. We also expect to generate significant cash and we are reaffirming our Adjusted EBITDA guidance despite numerous industry headwinds such as high energy prices and multiple supply chain challenges.”
Planned Divestiture of Styrenics Businesses
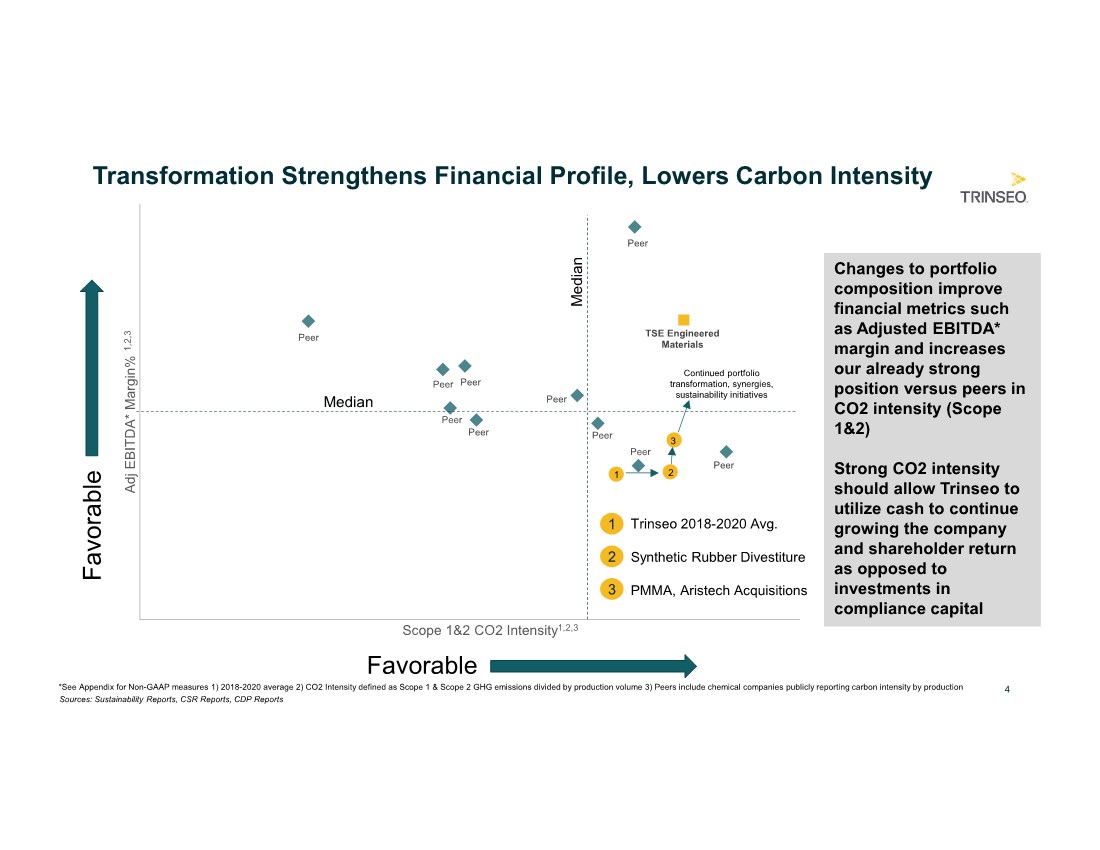
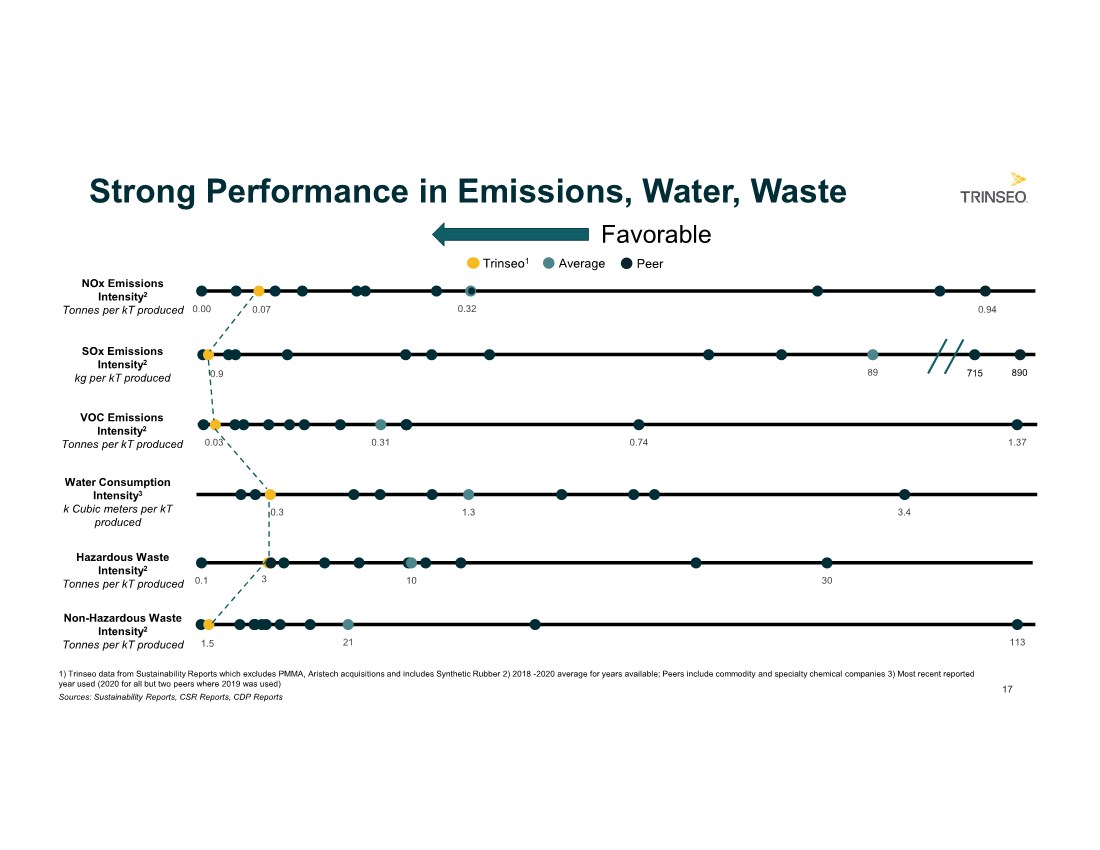
Trinseo has begun work to explore the divestiture of its styrenics businesses and plans to launch a formal sales process in the first quarter of 2022. The scope of this potential divestiture is expected to include the Feedstocks and Polystyrene reporting segments as well as the Company’s 50% ownership of Americas Styrenics. Bozich stated “The separation of the styrenics businesses would represent another key step in our transformation toward becoming a specialty materials and sustainable solutions provider. We will continue to prioritize investments in higher growth, higher margin and lower earnings volatility areas such as Engineered Materials and CASE with an ongoing focus on sustainability, including the continued decrease in our CO2 intensity through various initiatives including the transformation of our portfolio.”
Conference Call and Webcast Information
Trinseo will host a conference call to discuss its third quarter 2021 financial results on Monday, November 8, 2021 at 10 a.m. Eastern Time.
Commenting on results will be Frank Bozich, President and Chief Executive Officer, David Stasse, Executive Vice President and Chief Financial Officer, and Andy Myers, Director of Investor Relations. To register for this conference call, please use the following links:
| ● | Conference Call Registration – for those interested in asking questions during the Q&A session |
| ● | Webcast Registration – for those interested in listening only (available 20 minutes before the call) |
After registering for the conference call, you will receive a confirmation email with a meeting invitation and information for entry. Registration is open through the live call, but it is advised that you register at least one day in advance to ensure you are connected for the full call.
Trinseo has posted its third quarter 2021 financial results on the Company’s Investor Relations website. The presentation slides will also be made available in the webcast player prior to the conference call. The Company will also furnish copies of the financial results press release and presentation slides to investors by means of a Form 8-K filing with the U.S. Securities and Exchange Commission.
A replay of the conference call and transcript will be archived on the Company’s Investor Relations website shortly following the conference call. The replay will be available until November 8, 2022.
About Trinseo
Trinseo (NYSE:TSE) is a global materials solutions provider and manufacturer of plastics and latex binders with a focus on delivering innovative, sustainable, and value-creating products that are intrinsic to our daily lives. Trinseo is dedicated to making a positive impact on society by partnering with like-minded stakeholders, and supporting the sustainability goals of our customers in a wide range of end-markets including automotive, consumer electronics, appliances, medical devices, packaging, footwear, carpet, paper and board and building and construction. Trinseo had approximately $3.0 billion in net sales in 2020 and has 26 manufacturing sites around the world, and approximately 3,800 employees. For more information, please visit: www.trinseo.com.
Use of non-GAAP measures
In addition to using standard measures of performance and liquidity that are recognized in accordance with accounting principles generally accepted in the United States of America (“GAAP”), we use additional measures of income excluding certain GAAP items (“non-GAAP measures”), such as Adjusted Net Income, EBITDA, Adjusted EBITDA and Adjusted EPS and measures of liquidity excluding certain GAAP items, such as Free Cash Flow. We believe these measures are useful for investors and management in evaluating business trends and performance each period. These measures are also used to manage our business and assess current period profitability, as well as to provide an appropriate basis to evaluate the effectiveness of our pricing strategies. Such measures are not recognized in accordance with GAAP and should not be viewed as an alternative to GAAP measures of performance or liquidity, as applicable. The definitions of each of these measures, further discussion of usefulness, and reconciliations of non-GAAP measures to GAAP measures are provided in the Notes to Condensed Consolidated Financial Information presented herein.
Cautionary Note on Forward-Looking Statements
This press release may contain forward-looking statements including, without limitation, statements concerning plans, objectives, goals, projections, forecasts, strategies, future events or performance, and underlying assumptions and other statements, which are
not statements of historical facts or guarantees or assurances of future performance. Forward-looking statements may be identified by the use of words like "expect," "anticipate," "intend," "forecast," "outlook," "will," "may," "might," "see," "tend," "assume," "potential," "likely," "target," "plan," "contemplate," "seek," "attempt," "should," "could," "would" or expressions of similar meaning. Forward-looking statements reflect management’s evaluation of information currently available and are based on our current expectations and assumptions regarding our proposed sale of our Synthetic Rubber business and expected proceeds of the proposed sale, our business, the economy and other future conditions. Because forward-looking statements relate to the future, they are subject to inherent uncertainties, risks and changes in circumstances that are difficult to predict. Factors that might cause such a difference include, but are not limited to, our ability to complete the sale of our Synthetic Rubber business; our ability to successfully execute our transformation strategy and business strategy; our ability to integrate acquired businesses; global supply chain volatility, increased costs or disruption in the supply of raw materials or increased costs for transportation of our products; the nature of investment opportunities presented to the Company from time to time; and those discussed in our Annual Report on Form 10-K, under Part I, Item 1A —"Risk Factors" and elsewhere in our other reports, filings and furnishings made with the U.S. Securities and Exchange Commission from time to time. As a result of these or other factors, our actual results, performance or achievements may differ materially from those contemplated by the forward-looking statements. Therefore, we caution you against relying on any of these forward-looking statements. The forward-looking statements included in this press release are made only as of the date hereof. We undertake no obligation to publicly update or revise any forward-looking statement as a result of new information, future events or otherwise, except as otherwise required by law.
TRINSEO PLC
Condensed Consolidated Statements of Operations
(In millions, except per share data)
(Unaudited)
| | Three Months Ended | | Nine Months Ended | ||||||||
| | September 30, | | September 30, | ||||||||
|
| 2021 |
| 2020 |
| 2021 |
| 2020 | ||||
Net sales |
| $ | 1,269.3 |
| $ | 679.2 |
| $ | 3,529.0 |
| $ | 1,976.5 |
Cost of sales | |
| 1,101.0 | |
| 572.9 | |
| 2,951.7 | |
| 1,789.1 |
Gross profit | |
| 168.3 | |
| 106.3 | |
| 577.3 | |
| 187.4 |
Selling, general and administrative expenses | |
| 76.4 | |
| 46.3 | |
| 230.4 | |
| 171.8 |
Equity in earnings of unconsolidated affiliates | |
| 17.1 | |
| 18.3 | |
| 70.2 | |
| 42.5 |
Impairment charges | | | 1.2 | | | — | | | 3.0 | | | 10.3 |
Operating income | |
| 107.8 | |
| 78.3 | |
| 414.1 | |
| 47.8 |
Interest expense, net | |
| 23.0 | |
| 10.0 | |
| 56.6 | |
| 32.0 |
Acquisition purchase price hedge loss | |
| — | |
| — | |
| 22.0 | |
| — |
Other expense (income), net | | | (0.1) | | | 1.2 | | | 8.4 | | | 3.0 |
Income from continuing operations before income taxes | | | 84.9 | | | 67.1 | | | 327.1 | | | 12.8 |
Provision for income taxes | | | 5.5 | | | 26.9 | | | 48.9 | | | 16.2 |
Net income (loss) from continuing operations | | | 79.4 | | | 40.2 | | | 278.2 | | | (3.4) |
Net income (loss) from discontinued operations, net of income taxes | |
| 13.7 | |
| 65.6 | |
| 38.0 | |
| (55.4) |
Net income (loss) | | $ | 93.1 | | $ | 105.8 | | $ | 316.2 | | $ | (58.8) |
Weighted average shares- basic | | | 38.8 | | | 38.3 | | | 38.7 | | | 38.4 |
Net income (loss) per share- basic: | | | | | | | | | | | | |
Continuing operations | | $ | 2.04 | | $ | 1.05 | | $ | 7.19 | | $ | (0.09) |
Discontinued operations | | | 0.35 | | | 1.72 | | | 0.98 | | | (1.44) |
Net income (loss) per share- basic | | $ | 2.39 | | $ | 2.77 | | $ | 8.17 | | $ | (1.53) |
Weighted average shares- diluted | |
| 39.5 | |
| 38.4 | |
| 39.6 | |
| 38.4 |
Net income (loss) per share- diluted: | | | | | | | | | | | | |
Continuing operations | | $ | 2.01 | | $ | 1.04 | | $ | 7.03 | | $ | (0.09) |
Discontinued operations | | | 0.35 | | | 1.71 | | | 0.96 | | | (1.44) |
Net income (loss) per share- diluted | | $ | 2.36 | | $ | 2.75 | | $ | 7.99 | | $ | (1.53) |
TRINSEO PLC
Condensed Consolidated Balance Sheets
(In millions)
(Unaudited)
| | September 30, | | December 31, | ||
|
| 2021 | | 2020 | ||
Assets |
| | | | |
|
Cash and cash equivalents | | $ | 207.5 | | $ | 588.7 |
Accounts receivable, net | |
| 762.7 | |
| 469.5 |
Inventories | |
| 617.3 | |
| 324.1 |
Other current assets | |
| 40.0 | |
| 14.5 |
Current assets held-for-sale | | | 379.5 | | | 120.3 |
Investments in unconsolidated affiliates | |
| 250.3 | |
| 240.1 |
Property, plant, equipment, goodwill, and other intangible assets, net | |
| 2,278.1 | | | 655.8 |
Right-of-use assets - operating, net | | | 78.5 | | | 77.8 |
Other long-term assets | |
| 150.2 | |
| 126.2 |
Noncurrent assets held-for-sale | | | — | | | 228.2 |
Total assets | | $ | 4,764.1 | | $ | 2,845.2 |
Liabilities and shareholders’ equity | | | | | | |
Current liabilities | | | 923.8 | | | 491.1 |
Current liabilities held-for-sale | | | 81.3 | | | 42.2 |
Long-term debt, net | |
| 2,307.9 | |
| 1,158.1 |
Noncurrent lease liabilities - operating | | | 62.9 | | | 65.5 |
Other noncurrent obligations | |
| 466.2 | |
| 455.7 |
Noncurrent liabilities held-for-sale | | | — | | | 42.3 |
Shareholders’ equity | | | 922.0 | | | 590.3 |
Total liabilities and shareholders’ equity | | $ | 4,764.1 | | $ | 2,845.2 |
TRINSEO PLC
Condensed Consolidated Statements of Cash Flows
(In millions)
(Unaudited)
| | Nine Months Ended | ||||
| | September 30, | ||||
|
| 2021 |
| 2020 | ||
Cash flows from operating activities |
| |
|
| |
|
Cash provided by operating activities - continuing operations | | $ | 247.4 | | $ | 91.2 |
Cash provided by (used in) operating activities - discontinued operations | | | (9.2) | | | 36.5 |
Cash provided by operating activities | | | 238.2 | | | 127.7 |
| | | | | | |
Cash flows from investing activities | | | | | | |
Capital expenditures | |
| (64.7) | |
| (47.4) |
Cash received (paid) for asset or business acquisitions, net of cash acquired ($12.1 and $0.0) | | | (1,806.6) | | | 0.1 |
Proceeds from the sale of businesses and other assets | |
| 0.2 | |
| 11.9 |
Proceeds from (payments for) the settlement of hedging instruments | | | (14.7) | | | 51.6 |
Cash provided by (used in) investing activities - continuing operations | | | (1,885.8) | | | 16.2 |
Cash used in investing activities - discontinued operations | | | (3.3) | | | (13.5) |
Cash provided by (used in) investing activities | |
| (1,889.1) | |
| 2.7 |
| | | | | | |
Cash flows from financing activities | | | | | | |
Deferred financing fees | |
| (35.0) | |
| — |
Short-term borrowings, net | |
| (11.6) | |
| (8.2) |
Purchase of treasury shares | | | — | | | (25.0) |
Dividends paid | | | (9.5) | | | (46.5) |
Proceeds from exercise of option awards | | | 10.5 | | | 0.4 |
Withholding taxes paid on restricted share units | | | (0.8) | | | (0.6) |
Repayments of 2024 Term Loan B and 2028 Term Loan B | | | (7.1) | | | (5.2) |
Net proceeds from issuance of 2028 Term Loan B | | | 746.3 | | | — |
Net proceeds from issuance of 2029 Senior Notes | | | 450.0 | | | — |
Proceeds from draw on 2022 Revolving Facility | | | — | | | 100.0 |
Repayments of 2022 Revolving Facility | | | — | | | (100.0) |
Proceeds from Accounts Receivable Securitization Facility | |
| 150.0 | |
| — |
Repayments of Accounts Receivable Securitization Facility | |
| (20.0) | |
| — |
Cash provided (used in) by financing activities | |
| 1,272.8 | |
| (85.1) |
Effect of exchange rates on cash | |
| (3.1) | |
| 1.3 |
Net change in cash, cash equivalents, and restricted cash | |
| (381.2) | |
| 46.6 |
Cash, cash equivalents, and restricted cash—beginning of period | |
| 588.7 | |
| 457.4 |
Cash, cash equivalents, and restricted cash—end of period | | $ | 207.5 | | $ | 504.0 |
Less: Restricted cash | | | — | | | (0.7) |
Cash and cash equivalents—end of period | | $ | 207.5 | | $ | 503.3 |
TRINSEO PLC
Notes to Condensed Consolidated Financial Information
(Unaudited)
Note 1: Net Sales by Segment
| | Three Months Ended | | Nine Months Ended | ||||||||
| | September 30, | | September 30, | ||||||||
(In millions) | | 2021 |
| 2020 |
| 2021 |
| 2020 | ||||
Latex Binders |
| $ | 315.6 |
| $ | 183.2 |
| $ | 877.6 |
| $ | 567.3 |
Engineered Materials | |
| 230.8 | |
| 50.0 | |
| 477.5 | |
| 135.2 |
Base Plastics | | | 393.3 | | | 240.1 | | | 1,119.3 | | | 649.1 |
Polystyrene | |
| 274.8 | |
| 167.3 | |
| 855.0 | |
| 505.9 |
Feedstocks | |
| 54.8 | |
| 38.6 | |
| 199.6 | |
| 119.0 |
Americas Styrenics* | |
| — | |
| — | |
| — | |
| — |
Total Net Sales | | $ | 1,269.3 | | $ | 679.2 | | $ | 3,529.0 | | $ | 1,976.5 |
* The results of this segment are comprised entirely of earnings from Americas Styrenics, our 50%-owned equity method investment. As such, we do not separately report net sales of Americas Styrenics within our condensed consolidated statements of operations.
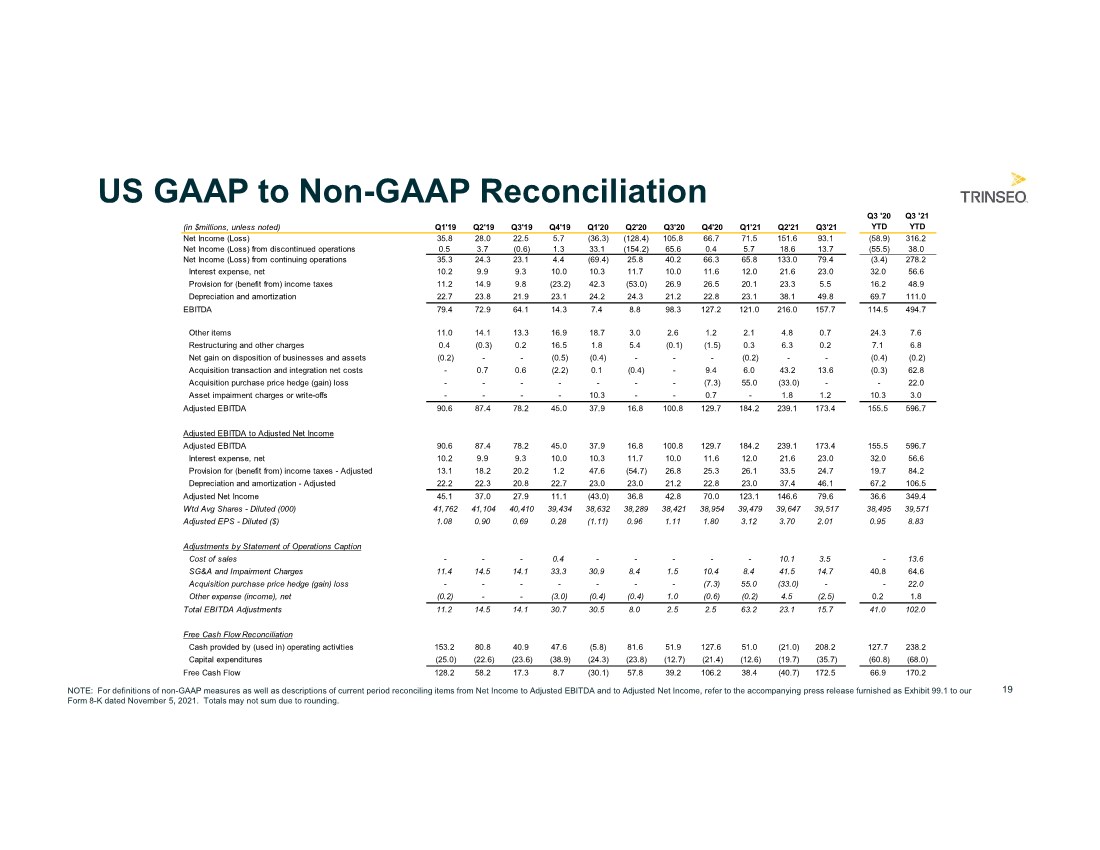
Note 2: Reconciliation of Non-GAAP Performance Measures to Net Income
EBITDA is a non-GAAP financial performance measure, which is defined as income from continuing operations before interest expense, net; income tax provision; depreciation and amortization expense. We refer to EBITDA in making operating decisions because we believe it provides our management as well as our investors with meaningful information regarding the Company’s operational performance. We believe the use of EBITDA as a metric assists our board of directors, management and investors in comparing our operating performance on a consistent basis.
We also present Adjusted EBITDA as a non-GAAP financial performance measure, which we define as income from continuing operations before interest expense, net; income tax provision; depreciation and amortization expense; loss on extinguishment of long-term debt; asset impairment charges; gains or losses on the dispositions of businesses and assets; restructuring charges; acquisition related costs and benefits, and other items. In doing so, we are providing management, investors, and credit rating agencies with an indicator of our ongoing performance and business trends, removing the impact of transactions and events that we would not consider a part of our core operations.
Lastly, we present Adjusted Net Income and Adjusted EPS as additional performance measures. Adjusted Net Income is calculated as Adjusted EBITDA (defined beginning with net income from continuing operations, above), less interest expense, less the provision for income taxes and depreciation and amortization, tax affected for various discrete items, as appropriate. Adjusted EPS is calculated as Adjusted Net Income per weighted average diluted shares outstanding for a given period. We believe that Adjusted Net Income and Adjusted EPS provide transparent and useful information to management, investors, analysts and other stakeholders in evaluating and assessing our operating results from period-to-period after removing the impact of certain transactions and activities that affect comparability and that are not considered part of our core operations.
There are limitations to using the financial performance measures noted above. These performance measures are not intended to represent net income or other measures of financial performance. As such, they should not be used as alternatives to net income as indicators of operating performance. Other companies in our industry may define these performance measures differently than we do. As a result, it may be difficult to use these or similarly-named financial measures that other companies may use, to compare the performance of those companies to our performance. We compensate for these limitations by providing reconciliations of these performance measures to our net income, which is determined in accordance with GAAP.
| | Three Months Ended | | ||||
| | September 30, | | ||||
(In millions, except per share data) |
| 2021 |
| 2020 | | ||
Net income | | $ | 93.1 |
| $ | 105.8 | |
Net income from discontinued operations | | | 13.7 | | | 65.6 | |
Net income from continuing operations | | $ | 79.4 | | $ | 40.2 | |
Interest expense, net | |
| 23.0 | |
| 10.0 | |
Provision for income taxes | |
| 5.5 | |
| 26.9 | |
Depreciation and amortization | |
| 49.8 | |
| 21.2 | |
EBITDA | | $ | 157.7 | | $ | 98.3 | |
Restructuring and other charges (a) | |
| 0.2 | |
| (0.1) | Selling, general, and administrative expenses |
Acquisition transaction and integration net costs (b) | | | 13.6 | | | — | Cost of goods sold; Selling, general, and administrative expenses |
Asset impairment charges or write-offs | | | 1.2 | | | — | Impairment charges |
Other items (c) | |
| 0.7 | |
| 2.6 | Selling, general, and administrative expenses; Other expense (income), net |
Adjusted EBITDA | | $ | 173.4 | | $ | 100.8 | |
Adjusted EBITDA to Adjusted Net Income: | | | | | | | |
Adjusted EBITDA | | | 173.4 | | | 100.8 | |
Interest expense, net | | | 23.0 | | | 10.0 | |
Provision for income taxes - Adjusted (d) | | | 24.7 | | | 26.8 | |
Depreciation and amortization - Adjusted (e) | | | 46.1 | | | 21.2 | |
Adjusted Net Income | | $ | 79.6 | | $ | 42.8 | |
Weighted average shares- diluted | | | 39.5 | | | 38.4 | |
Adjusted EPS | | $ | 2.01 | | $ | 1.11 | |
| | | | | | | |
Adjusted EBITDA by Segment: | | | | | | | |
Latex Binders | | $ | 37.1 | | $ | 18.7 | |
Engineered Materials | | | 32.7 | | | 9.4 | |
Base Plastics | | | 87.9 | | | 40.5 | |
Polystyrene | | | 51.2 | | | 20.4 | |
Feedstocks | | | (27.6) | | | 10.1 | |
Americas Styrenics | | | 17.1 | | | 18.3 | |
Corporate Unallocated | | | (25.0) | | | (16.6) | |
Adjusted EBITDA | | $ | 173.4 | | $ | 100.8 | |
| (a) | Restructuring and other charges for the three months ended September 30, 2021 and 2020 primarily relate to employee termination benefit charges as well as contract termination charges incurred in connection with the Company’s transformational restructuring program and the Company’s corporate restructuring program, respectively. |
| (b) | Acquisition transaction and integration net costs for the three months ended September 30, 2021 relate to expenses incurred for the Company’s acquisitions of the Arkema PMMA business and Aristech Surfaces. |
| (c) | Other items for the three months ended September 30, 2021 and 2020 primarily relate to fees incurred in conjunction with certain of the Company’s strategic initiatives, including our ERP upgrade project. Other items for the three months ended September 30, 2020 also includes advisory and professional fees incurred in conjunction with our initiative to transition business services from Dow, including certain administrative services such as accounts payable, logistics, and IT services, which was substantially completed in 2020. |
| (d) | Adjusted to remove the tax impact of the items noted in (a), (b), (c), and (e). The income tax expense (benefit) related to these items was determined utilizing either (1) the estimated annual effective tax rate on our ordinary income based upon our forecasted ordinary income for the full year or, (2) for items treated discretely for tax purposes we utilized the applicable rates in the taxing jurisdictions in which these adjustments occurred. |
| (e) | Amount for the three months ended September 30, 2021 excludes accelerated depreciation of $3.7 million related to the shortening of the useful life of certain IT assets related to the Company’s transition to a new ERP system. |
For the same reasons discussed above, we are providing the following reconciliation of forecasted net income to forecasted Adjusted EBITDA and Adjusted EPS for the year ended December 31, 2021. See “Note on Forward-Looking Statements” above for a discussion of the limitations of these forecasts.
| | Year Ended |
| | December 31, |
(In millions, except per share data) | | 2021 |
Adjusted EBITDA | $ | 750 - 800 |
Interest expense, net |
| (80) |
Provision for income taxes |
| (63) - (73) |
Depreciation and amortization |
| (169) |
Reconciling items to Adjusted EBITDA (f) |
| (102) |
Net Income from continuing operations |
| 336 - 376 |
Reconciling items to Adjusted Net Income (f) |
| 69 |
Adjusted Net Income | $ | 405 - 445 |
| | |
Weighted average shares - diluted (g) | | 39.6 |
EPS from continuing operations - diluted ($) | $ | 8.48 - 9.50 |
Adjusted EPS ($) | $ | 10.22 - 11.23 |
| (f) | Reconciling items to Adjusted EBITDA and Adjusted Net Income are not typically forecasted by the Company based on their nature as being primarily driven by transactions that are not part of the core operations of the business and, as a result, cannot be estimated without unreasonable cost or uncertainty. As such, the amounts above reflect only actual reconciling items identified through the nine months ended September 30, 2021; however, estimates for potential reconciling items to Adjusted EBITDA and Adjusted Net Income during the fourth quarter of 2021 are not reflected. |
| (g) | Weighted average shares calculated for the purpose of forecasting EPS and Adjusted EPS do not forecast significant future share transactions or events, such as repurchases, significant share-based compensation award grants, and changes in the Company’s share price. These are all factors which could have a significant impact on the calculation of EPS and Adjusted EPS during actual future periods. |
Note 3: Reconciliation of Non-GAAP Liquidity Measures to Cash from Operations
The Company uses certain measures, such as Free Cash Flow as non-GAAP measures, to evaluate and discuss its liquidity position and results. Free Cash Flow is defined as cash from operating activities, less capital expenditures. We believe that Free Cash Flow provides an indicator of the Company’s ongoing ability to generate cash through core operations, as it excludes the cash impacts of various financing transactions as well as cash flows from business combinations that are not considered organic in nature. We also believe that Free Cash Flow provides management and investors with useful analytical indicators of our ability to service our indebtedness, pay dividends (when declared), and meet our ongoing cash obligations.
Free Cash Flow is not intended to represent cash flows from operations as defined by GAAP, and therefore, should not be used as alternatives for that measure. Other companies in our industry may define Free Cash Flow differently than we do. As a result, it may be difficult to use this or similarly-named financial measures that other companies may use, to compare the liquidity and cash generation of those companies to our own. The Company compensates for these limitations by providing the following detail, which is determined in accordance with GAAP.
Free Cash Flow
| | Three Months Ended | | Nine Months Ended | ||||||||
| | September 30, | | September 30, | ||||||||
(In millions) | | 2021 | | 2020 | | 2021 |
| 2020 | ||||
Cash provided by operating activities |
| $ | 208.2 |
| $ | 51.9 |
| $ | 238.2 |
| $ | 127.7 |
Capital expenditures | |
| (35.7) | |
| (12.8) | |
| (68.0) | |
| (60.9) |
Free Cash Flow | | $ | 172.5 | | $ | 39.1 | | $ | 170.2 | | $ | 66.8 |
| | | | | | | | | | | | |
For the same reasons discussed above, we are providing the following reconciliation of forecasted cash provided by operations and cash used for capital expenditures to forecasted Free Cash Flow for the year ended December 31, 2021. See “Note on Forward-Looking Statements” above for a discussion of the limitations of these forecasts.
| | Year Ended | |
(In millions) | | December 31, 2021 | |
Cash provided by operating activities |
| $ | 420 - 445 |
Capital expenditures | |
| (120) |
Free Cash Flow | | $ | 300 - 325 |