UNITED STATES
SECURITIES AND EXCHANGE COMMISSION
WASHINGTON, D.C. 20549
FORM 10-K
☒ ANNUAL REPORT PURSUANT TO SECTION 13 OR 15(d) OF THE SECURITIES EXCHANGE ACT OF 1934 |
For the fiscal year ended December 29, 2017 |
OR |
☐ TRANSITION REPORT PURSUANT TO SECTION 13 OR 15(d) OF THE SECURITIES EXCHANGE ACT OF 1934 |
For the transition period from ____________ to ____________ |
Commission file number: 001-35249 |
THE CHEFS’ WAREHOUSE, INC. |
(Exact name of registrant as specified in its charter) |
Delaware | 20-3031526 | |
(State or other jurisdiction of | (I.R.S. Employer | |
incorporation or organization) | Identification No.) | |
100 East Ridge Road Ridgefield, Connecticut | 06877 | |
(Address of principal executive offices) | (Zip Code) | |
Registrant’s telephone number, including area code: (203) 894-1345 | ||
Securities registered pursuant to Section 12(b) of the Act: | ||
Title of each class | Name of each exchange on which registered | |
Common Stock, $.01 par value per share | The Nasdaq Stock Market LLC (Nasdaq Global Select Market) | |
Securities registered pursuant to Section 12(g) of the Act: None | ||
Indicate by check mark if the registrant is a well-known seasoned issuer, as defined in Rule 405 of the Securities Act. Yes ☐ No ☒
Indicate by check mark if the registrant is not required to file reports pursuant to Section 13 or Section 15(d) of the Exchange Act. Yes ☐ No ☒
Indicate by check mark whether the registrant (1) has filed all reports required to be filed by Section 13 or 15(d) of the Securities Exchange Act of 1934 during the preceding 12 months (or for such shorter period that the registrant was required to file such reports), and (2) has been subject to such filing requirements for the past 90 days. Yes ☒ No ☐
Indicate by check mark whether the registrant has submitted electronically and posted on its corporate Web site, if any, every Interactive Data File required to be submitted and posted pursuant to Rule 405 of Regulation S-T during the preceding 12 months (or for such shorter period that the registrant was required to submit and post such files). Yes ☒ No ☐
Indicate by check mark if disclosure of delinquent filers pursuant to Item 405 of Regulation S-K is not contained herein, and will not be contained, to the best of registrant’s knowledge, in definitive proxy or information statements incorporated by reference in Part III of this Form 10-K or any amendment to this Form 10-K. ☐
Indicate by check mark whether the registrant is a large accelerated filer, an accelerated filer, a non-accelerated filer, a smaller reporting company, or an emerging growth company. See the definitions of “large accelerated filer,” “accelerated filer,” “smaller reporting company,” and “emerging growth company” in Rule 12b-2 of the Exchange Act.
Large accelerated filer ☐ | Accelerated filer ☒ | Non-accelerated filer ☐ (Do not check if a smaller reporting company) |
Smaller reporting company ☐ | Emerging growth company ☐ | |
If an emerging growth company, indicate by check mark if registrant has elected not to use the extended transition period for complying with any new or revised financial accounting standards provided pursuant to Section 13(a) of the Exchange Act. ☐
Indicate by check mark whether the registrant is a shell company (as defined in Rule 12b-2 of the Exchange Act). Yes ☐ No ☒
The aggregate market value of the registrant’s common stock held by non-affiliates computed by reference to the price at which the common equity was last sold as of the last business day of the registrant’s most recently completed second quarter (June 30, 2017): $269,159,670
Indicate the number of shares outstanding of each of the registrant’s classes of common stock, as of the latest practicable date.
Class | Outstanding at March 5, 2018 | |
Common Stock, $.01 par value per share | 28,441,253 shares | |
DOCUMENTS INCORPORATED BY REFERENCE
Document | Parts Into Which Incorporated | |
Proxy Statement for the Annual Meeting of Stockholders expected to be held on May 18, 2018 (Proxy Statement) | Part III | |
Total number of pages: 84
1
THE CHEFS’ WAREHOUSE, INC.
INDEX
Description | Page Number | |||
Part I | ||||
Part II | ||||
Part III | ||||
Part IV | ||||
2
CAUTIONARY STATEMENT REGARDING FORWARD-LOOKING STATEMENTS
This Annual Report on Form 10-K of The Chefs’ Warehouse, Inc. contains forward-looking statements within the meaning of Section 27A of the Securities Act of 1933, as amended, and Section 21E of the Securities Exchange Act of 1934, as amended. Forward-looking statements provide our current expectations or forecasts of future events and are not statements of historical fact. These forward-looking statements include information about possible or assumed future events, including, among other things, discussion and analysis of our future financial condition, results of operations, our strategic plans and objectives, cost management, liquidity and ability to refinance our indebtedness as it matures, anticipated capital expenditures (and access to capital) required to complete projects, amounts of cash distributions to our stockholders in the future, if any, and other matters. Words such as “anticipates,” “expects,” “intends,” “plans,” “believes,” “seeks,” “estimates” and variations of these words and similar expressions are intended to identify forward-looking statements. These statements are not guarantees of future performance and are subject to risks, uncertainties and other factors, some of which are beyond our control, are difficult to predict and/or could cause actual results to differ materially from those expressed or forecasted in the forward-looking statements.
Forward-looking statements involve inherent uncertainty and may ultimately prove to be incorrect or false. Investors in our common stock are cautioned not to place undue reliance on forward-looking statements. Except as otherwise may be required by law, we undertake no obligation to update or revise forward-looking statements to reflect changed assumptions, the occurrence of unanticipated events or actual operating results. Our actual results could differ materially from those anticipated in these forward-looking statements as a result of various factors, including, but not limited to, the following:
• | our success depends to a significant extent upon general economic conditions, including disposable income levels and changes in consumer discretionary spending; |
• | a significant portion of our future growth is dependent upon our ability to expand our operations in our existing markets and to penetrate new markets through acquisitions; |
• | we may not achieve the benefits expected from our acquisitions, including our recent acquisitions of Fells Point Wholesale Meats, Inc. (“Fells Point”) and M.T. Food Service, Inc. (“MT Food”), which could adversely impact our business and operating results; |
• | we may have difficulty managing and facilitating our future growth; |
• | conditions beyond our control could materially affect the cost and/or availability of our specialty food products or center-of-the-plate products and/or interrupt our distribution network; |
• | our increased distribution of center-of-the-plate products, like meat, poultry and seafood, following our acquisitions of Michael’s Finer Meats, LLC (“Michael’s”), Allen Brothers, Inc. (“Allen Brothers”), Del Monte Capital Meat Co. and related entities (“Del Monte”) and Fells Point, involves increased exposure to price volatility experienced by those products; |
• | our business is a low-margin business and our profit margins may be sensitive to inflationary and deflationary pressures; |
• | group purchasing organizations may become more active in our industry and increase their efforts to add our customers as members of these organizations; |
• | because our foodservice distribution operations are concentrated in certain culinary markets, we are susceptible to economic and other developments, including adverse weather conditions, in these areas; |
• | damage to our reputation or lack of acceptance of our specialty food products, center-of-the-plate products and/or the brands we carry in existing and new markets could materially and adversely impact our business, financial condition or results of operations; |
• | our customers are generally not obligated to continue purchasing products from us; |
• | we have experienced losses due to our inability to collect accounts receivable in the past and could experience increases in such losses in the future if our customers are unable to pay their debts to us in a timely manner or at all; |
• | product liability claims could have a material adverse effect on our business, financial condition or results of operations; |
• | fuel cost volatility may have a material adverse effect on our business, financial condition or results of operations; |
• | new information or attitudes regarding diet and health or adverse opinions about the health effects of the products we distribute could result in changes in consumer eating habits, which could have a material adverse effect on our business, financial condition or results of operations; |
• | we have significant competition from a variety of sources, and we may not be able to compete successfully; |
• | our substantial indebtedness may limit our ability to invest in the ongoing needs of our business; |
• | our ability to raise capital in the future may be limited; |
• | we may be unable to obtain debt or other financing, including financing necessary to execute on our acquisition strategy, on favorable terms or at all; |
3
• | information technology system failures or breaches of our network security could interrupt our operations and adversely affect our business; |
• | our investments in information technology may not produce the benefits that we anticipate; |
• | we may not be able to adequately protect our intellectual property, which, in turn, could harm the value of our brands and adversely affect our business; |
• | our business operations and future development could be significantly disrupted if we lose key members of our management team; |
• | our insurance policies may not provide adequate levels of coverage against all claims, and fluctuating insurance requirements and costs could negatively impact our profitability. In addition, if we fail to establish proper reserves and adequately estimate future expenses, the costs associated with our self-insured group medical, workers’ compensation liability and auto liability plans may adversely affect our business, financial condition or results of operations; |
• | increases in our labor costs, including as a result of labor shortages, the unionization of some of our associates, the price or unavailability of insurance and changes in government regulation, could slow our growth or harm our business; |
• | we are subject to significant governmental regulation and failure to comply could subject us to enforcement actions, recalls or other penalties, which could have a material adverse effect on our business, financial condition or results of operations; |
• | federal, state, provincial and local tax rules in the United States and Canada may adversely impact our business, financial condition or results of operations; |
• | the price of our common stock may be volatile and our stockholders could lose all or a part of their investment; |
• | concentration of ownership among our existing executive officers, directors and their affiliates may prevent new investors from influencing significant corporate decisions; |
• | if securities analysts or industry analysts downgrade our stock, publish negative research or reports or do not publish reports about our business, our stock price and trading volume could decline; |
• | we do not intend to pay dividends for the foreseeable future and our stock may not appreciate in value; |
• | our issuance of preferred stock or debt securities could adversely affect holders of our common stock and discourage a takeover; and |
• | some provisions of our charter documents and Delaware law may have anti-takeover effects that could discourage an acquisition of us by others, even if an acquisition would be beneficial to our stockholders, and may prevent attempts by our stockholders to replace or remove our current management. |
This list of risks and uncertainties, however, is only a summary of some of the most important factors and is not intended to be exhaustive. Investors in our common stock should carefully review the risks that are set forth under the caption “Risk Factors” included in Part I, Item 1A of this Form 10-K.
Unless this Form 10-K indicates otherwise or the context otherwise requires, the terms “The Chefs’ Warehouse,” “we,” “our,” “our Company,” “the Company” or “us” as used in this Form 10-K refer to The Chefs’ Warehouse, Inc. and its subsidiaries.
4
Item 1. BUSINESS
We are a premier distributor of specialty food products in the United States and Canada. We are focused on serving the specific needs of chefs who own and/or operate some of the leading menu-driven independent restaurants, fine dining establishments, country clubs, hotels, caterers, culinary schools, bakeries, patisseries, chocolatiers, cruise lines, casinos and specialty food stores in the United States and Canada. We believe that we have a distinct competitive advantage in serving these customers as a result of our extensive selection of distinctive and hard-to-find specialty and center-of-the-plate food products, our product knowledge and our customer service.
We define specialty food products as gourmet foods and ingredients that are of the highest grade, quality or style as measured by their uniqueness, exotic origin or particular processing method. Our product portfolio includes over 48,000 stock-keeping units (“SKUs”) from more than 2,500 different suppliers and is comprised primarily of imported and domestic specialty food products, such as artisan charcuterie, specialty cheeses, unique oils and vinegars, truffles, caviar, chocolate and pastry products. We also offer an extensive line of center-of-the-plate products, including custom cut beef, seafood and hormone-free poultry, as well as broadline food products, such as cooking oils, butter, eggs, milk and flour. When marketing our products to our customers, we focus our efforts on chefs, and we believe that, by offering a wide selection of both distinctive and hard-to-find products, together with center-of-the-plate proteins and staple broadline food products, we are able to differentiate ourselves from larger, traditional broadline foodservice distributors, while simultaneously enabling our customers to utilize us as their primary foodservice distributor. Additionally, as a result of our acquisition of Allen Brothers in December 2013, we market certain of our center-of-the-plate products directly to consumers through a mail and e-commerce platform.
Since the formation of our predecessor in 1985, we have expanded our distribution network, product selection and customer base both organically and through acquisitions. From December 27, 2013 to December 29, 2017, our net revenues increased from approximately $674 million to approximately $1.3 billion. During these periods and in prior years, our sales to both new and existing customers have increased as a result of an increase in the breadth and depth of our product portfolio, our commitment to customer service, the efforts of our experienced and sophisticated sales professionals, the increased use of technology in the operations and management of our business and our ongoing consolidation of the fragmented specialty foodservice distribution industry. Since December 29, 2012, we have completed eight acquisitions which have increased our penetration in existing markets, expanded our footprint into new markets and/or enhanced our product capabilities. The up-front cash purchase prices for these eight acquisitions ranged from $0.4 million to $123.9 million, resulting in aggregate up-front cash consideration of more than $252.8 million, which we funded with borrowings under our then existing senior secured credit facilities, a portion of which we repaid with proceeds from the issuance of $125.0 million of senior secured notes in April 2013 and April 2015, and the proceeds of our common stock offering completed in September 2013.
Excluding our direct-to-consumer business, we currently serve more than 30,000 customer locations in our fifteen primary geographic markets across the United States and Canada, including New York, Washington, D.C., Los Angeles, San Francisco, Las Vegas, Miami, Portland, Seattle, Columbus, Cincinnati, Chicago, Sacramento, Vancouver, Edmonton and Toronto. By leveraging an experienced and sophisticated sales force of approximately 470 sales and customer service professionals, we maintain collaborative relationships with thousands of chefs while also acting as a critical marketing arm and route-to-market for many of our suppliers. We operate 23 distribution centers and provide service six days a week in many of our service areas, utilizing our fleet of delivery trucks to fill our customers’ orders.
Competitive Strengths
We believe that, during our over 30-year history, we have achieved, developed and/or refined the following strengths which provide us with a distinct competitive position in the foodservice distribution industry and also the opportunity to achieve superior margins relative to most large broadline foodservice distributors:
Leading Distributor of Specialty Food Products in Many of the Key Culinary Markets. Based on our management’s industry knowledge and experience, we believe we are the largest distributor of specialty food products, as measured by net sales, in the New York, Washington, D.C., San Francisco and Los Angeles metropolitan markets. We believe these markets, along with a number of other markets we serve, including Las Vegas, Miami, Philadelphia, Boston, Napa Valley, Portland, Seattle, Chicago, Cincinnati, Vancouver and Toronto, create and set the culinary trends for the rest of the United States and Canada and provide us with valuable insight into the latest culinary and menu practices. Furthermore, we believe our established relationships with many of the top chefs, culinary schools and dining establishments in these key culinary markets have benefited us when we entered into new markets where we believe that chefs at our potential customers were generally knowledgeable of our brand and commitment to quality and excellence from their experience working in other markets which we serve or through their personal relationships throughout the culinary industry.
5
Expansive Product Offering. We offer an extensive portfolio of high-quality specialty food products, ranging from basic ingredients and staples, such as milk and flour, to custom cut steaks and seafood and pastries, as well as delicacies and specialty ingredients sourced from North America, Europe, Asia and South America, which we believe helps our customers distinguish their menu items. We carry more than 48,000 SKUs and we constantly evaluate our portfolio and introduce new products to address regional trends and preferences and ensure that we are on the leading edge of broader culinary trends. Through our importing division, we provide our customers with access to a portfolio of exclusive items, including regional olive oils, truffles and charcuterie from Italy, Spain, France and other Mediterranean countries. In addition, and as evidence of our commitment to aid our customers in creating unique and innovative menu items, we regularly utilize our sourcing relationships and industry insights to procure additional products that we do not regularly carry but that our customers specifically request. We believe that the breadth and depth of our product portfolio facilitates our customers’ ability to distinguish and enhance their menu offerings and differentiates us from larger traditional broadline foodservice distributors. For example, we provide a selection of more than 200 different varieties of olive oil, while large broadline foodservice distributors only carry, on average, 5 - 10 types of olive oil.
Critical Route-to-Market for Specialty Food Suppliers. We currently distribute products from more than 2,500 different suppliers. Our suppliers are located throughout North America, Europe, Asia and South America and include numerous small, family-owned entities and artisanal food producers. We are the largest customer for many of our suppliers. As a result, our experienced and sophisticated sales professionals, customer relationships and distribution platform are important to these suppliers’ route-to-market, which enables us to offer a wide range of products on an exclusive basis.
Expanding Base of Premier Customer Relationships. Our breadth and depth of product offerings coupled with our highly regarded customer service has allowed us to develop and retain a loyal customer base that is comprised of chefs who own or work at more than 30,000 of the nation’s leading menu-driven independent restaurants, fine dining establishments, country clubs, hotels, caterers, culinary schools, bakeries, patisseries, chocolatiers, cruise lines, casinos and specialty food stores. Our focus on product selection, product knowledge and customer service has rewarded us with a number of long-term customer relationships, which often begin when chefs are introduced to us while attending the nation’s leading culinary schools, including The Culinary Institute of America and The French Culinary Institute, both of which have been customers of ours for more than nine years. Based on our management’s industry experience and our relationships and dealings with our customers, we believe we are the primary distributor of specialty food products to the majority of our customers that are not part of our direct-to-consumer center-of-the-plate business.
Collaborative Professional and Educational Relationships with our Customers. We employ a sophisticated and experienced sales force of approximately 470 sales and customer service professionals, a significant number of whom have formal culinary training, degrees in the culinary arts or prior experience working in the culinary industry. Equipped with advanced culinary and industry knowledge, our sales professionals seek to establish a rapport with our customers’ chefs, so that they can more fully understand and anticipate the needs of and offer cost-effective food product solutions to the chefs who own or operate these businesses. We believe that the specialized knowledge base of our sales professionals enables us to take a more collaborative and educational approach to selling our gourmet foods and ingredients and to further differentiate ourselves from our traditional broadline competitors.
Expertise in Logistics and Distribution. We have built a first-class, scalable inventory management and logistics platform that enables us to efficiently fill our customers’ orders and to profitably meet our customers’ needs for varying drop sizes, high service levels and timely delivery. Our average distribution service level, or the percentage of in-stock items ordered by customers that are not part of our direct-to-consumer center-of-the-plate business that were delivered by the requested date, was in excess of 97% in 2017, which we believe is among the highest rates in the foodservice distribution industry. With 23 distribution centers located throughout the United States and Canada, we are able to leverage our geographic footprint and reduce our inbound freight costs. This scale enables us to maintain a portfolio of more than 48,000 SKUs, and through the operation of our sophisticated information technology, inventory management and logistics systems, we believe we provide our customers with some of the highest levels of customer service and responsiveness in our industry.
Experienced and Proven Management Team. Our senior management team has demonstrated the ability to grow the business through various economic environments. With collective experience of more than 90 years at The Chefs’ Warehouse, its predecessor and other foodservice distribution companies, our founders and senior management are experienced operators and are passionate about our future. Our senior management team is comprised of our founders, as well as experienced professionals with expertise in the foodservice distribution industry and in a wide range of functional areas, including finance and accounting, sales and marketing, operations, information technology, legal and human resources.
6
Our Growth Strategies
We believe substantial organic growth opportunities exist in our current markets through increased penetration of our existing customers and the addition of new customers, and we have identified new markets that we believe also present opportunities for future expansion. Key elements of our growth strategy include the following:
Increase Penetration with Existing Customers. We intend to sell more products to our existing customers by increasing the breadth and depth of our product selection and increasing the efficiency of our sales professionals, while at the same time continuing to provide excellent customer service. We are a data-driven and goal-oriented organization, and our management and sales professionals are highly focused on our weekly sales and gross profit contribution from each of our non-direct-to-consumer customers and increasing the number of unique products we distribute to such customers. We believe our acquisition activity since our initial public offering reflects this focus, as we have sought to complement our existing product offerings and enhance our product capabilities through our August 2017 acquisition of Fells Point, a specialty protein manufacturer and distributor, our June 2016 acquisition of MT Food, a wholesale distributor of dairy, produce, specialty and grocer items, our April 2015 acquisition of Del Monte, a supplier of high quality, USDA inspected beef, pork, lamb, veal, poultry and seafood products, our October 2014 acquisition of Euro Gourmet Inc. (“Euro Gourmet”), a wholesale specialty distributor of imported and domestic products, our December 2013 acquisition of Allen Brothers, a leading processor and distributor of premium quality meats, and our May 2013 acquisition of Qzina Specialty Foods North America Inc. (“Qzina”), a leading supplier of gourmet chocolate, dessert and pastry products.
Expand our Customer Base Within our Existing Markets. As of December 29, 2017, we served more than 30,000 customer locations, excluding our direct-to-consumer business, in the United States and Canada. We plan to expand our market share in the fragmented specialty food distribution industry by cultivating new customer relationships within our existing markets through the continued penetration of menu-driven independent restaurants, fine dining establishments, country clubs, hotels, caterers, culinary schools, bakeries, patisseries, chocolatiers, cruise lines, casinos and specialty food stores. We believe we have the opportunity to continue to gain market share in our existing markets by offering an extensive selection of specialty food products, as well as center-of-the-plate proteins and traditional broadline staple food products through our unique, collaborative and educational sales efforts and efficient, scalable distribution solution.
Improve our Operating Margins. As we continue to grow, we believe that the investments we are making in our facilities and information technology platforms, along with improved efficiencies that we are working to achieve in our general and administrative functions, should yield both improved customer service and profitability. Utilizing our fleet of delivery trucks, we usually fill customer orders within 12-24 hours of order placement. We intend to continue to offer our customers this high level of customer service, while maintaining our focus on realizing efficiencies and economies of scale in purchasing, warehousing, distribution and general and administrative functions which, when combined with incremental fixed-cost leverage, we believe will lead to continued improvements in our operating margin over time.
Pursue Selective Acquisitions. Throughout our over 30-year history, we have successfully identified, consummated and integrated multiple strategic acquisitions, which were designed to increase our penetration in existing markets, expand our footprint into new markets and/or enhance our product capabilities. We believe that, over time, we will be able to improve the operations and overall profitability of each acquired company by leveraging our sourcing relationships to provide an expanded product portfolio, implementing our tested sales force training techniques and metrics and installing improved warehouse management and information systems. We believe we have the opportunity to capitalize on our existing infrastructure and expertise by continuing to selectively pursue opportunistic acquisitions in order to expand the breadth of our distribution network, increase our operating efficiency and add additional products and capabilities. Since our initial public offering (“IPO”), we have completed eleven acquisitions which have increased our penetration in existing markets, expanded our footprint into new markets and enhanced our product capabilities. During fiscal 2014 we implemented an “integration team” that is dedicated to onboarding new acquisitions and integrating information technology systems as quickly and efficiently as possible. The integration team helps streamline the acquisition process and enables us to achieve expected benefits and synergies more quickly. Having a team dedicated to integration helps us make sure the people, processes and products we add through acquisitions are consistent with the rest of our business and allows our management team to focus its attention on our day-to-day operations.
Our Markets and the Customers that We Serve
Excluding our direct-to-consumer business, we distribute our specialty food products to over 30,000 distinct customer locations from distribution centers located in our primary markets, which include New York, Washington, D.C., San Francisco, Los Angeles, Las Vegas, Miami, Portland, Seattle, Columbus, Cincinnati, Chicago, Vancouver, Edmonton and Toronto. We also serve customers in a number of other markets, including Philadelphia, Boston and Napa Valley. We believe that many of these
7
markets set the culinary trends for the rest of the United States and Canada and provide us with valuable insight into the latest culinary and menu trends. We have established collaborative professional and educational relationships with some of the United States’ and Canada’s most demanding chefs, which allows us to anticipate the needs of, and offer cost-effective food product solutions to, our customers while allowing our customers to locate ingredients that will enable them to create unique and differentiated menu items. Our target customers include menu-driven independent restaurants, fine dining establishments, country clubs, hotels, caterers, culinary schools, bakeries, patisseries, chocolatiers, cruise lines, casinos and specialty food stores. We have no meaningful customer concentration as our top ten customers accounted for less than 1.9% of total net sales for our 2017 fiscal year.
Additionally, as a result of our acquisition of Allen Brothers in December 2013, we have also begun to market certain of our center-of-the-plate proteins directly to consumers through a mail and e-commerce platform.
Set forth below is a breakdown of the primary geographic markets we serve and the year we entered each market:
Market Name | Geographies Served | Year Entered | ||
New York | Boston to Atlantic City | 1985 | ||
Washington, D.C. | Philadelphia to Richmond | 1999 | ||
Los Angeles | Santa Barbara to San Diego | 2005 | ||
San Francisco | Napa Valley to Monterey Bay | 2005 | ||
Las Vegas | Las Vegas | 2005 | ||
Miami | Miami | 2010 | ||
Portland | Bend, OR to Seattle, WA | 2011 | ||
Columbus | Midwest | 2012 | ||
Cincinnati | Dayton, OH to Lexington, KY | 2013 | ||
Chicago | Chicago | 2013 | ||
Vancouver | Vancouver and Western Canada | 2013 | ||
Edmonton | Edmonton and Calgary | 2013 | ||
Toronto | Toronto | 2013 | ||
Seattle | Seattle | 2013 | ||
Sacramento | Sacramento | 2015 | ||
We extend credit to virtually all of our non-direct-to-consumer customers on varying terms. Most of our customers have payment terms from 20-60 days. We complete a formal credit assessment of all significant new non-direct-to-consumer customers, and our Credit and Collections Department regularly evaluates credit terms for each such customer based upon several factors, including order frequency, average order size, the types of products purchased and the length of the relationship. We believe that we are skilled at managing customer credit.
Our Gourmet Food Products
We strive to be the primary food source solution for our customers, and, to this end, we offer our customers a comprehensive product portfolio that ranges from basic ingredients and staples, such as milk and flour, to custom-cut steaks and seafood and pastries, as well as delicacies and specialty ingredients sourced from North America, Europe, Asia and South America. We carry more than 48,000 SKUs and we are fully committed to utilizing our sourcing relationships and industry insights to procure products that we do not regularly carry but that our customers specifically request as they seek to create unique and innovative menu items.
8
The quarterly sales mix, as a percentage of net sales, of our principal product categories during fiscal years 2017 and 2016 is as follows:
Fiscal 2016 | Fiscal 2017 | |||||||||||||||||||||||
Q1 | Q2 | Q3 | Q4 | Q1 | Q2 | Q3 | Q4 | |||||||||||||||||
Center-of-the-Plate | 48.4 | % | 50.0 | % | 43.4 | % | 45.8 | % | 46.1 | % | 47.3 | % | 46.5 | % | 48.0 | % | ||||||||
Dry Goods | 17.1 | % | 16.8 | % | 18.1 | % | 17.4 | % | 17.3 | % | 17.4 | % | 17.4 | % | 16.9 | % | ||||||||
Pastries and other Bakery Products | 13.5 | % | 12.5 | % | 14.7 | % | 15.0 | % | 14.2 | % | 13.2 | % | 13.4 | % | 13.5 | % | ||||||||
Cheeses | 7.8 | % | 7.8 | % | 9.1 | % | 8.2 | % | 8.0 | % | 7.8 | % | 7.9 | % | 7.4 | % | ||||||||
Dairy Products | 5.2 | % | 5.3 | % | 8.0 | % | 7.7 | % | 6.8 | % | 6.8 | % | 7.2 | % | 7.1 | % | ||||||||
Oils and Vinegars | 6.4 | % | 5.9 | % | 4.9 | % | 4.2 | % | 5.7 | % | 5.6 | % | 5.6 | % | 5.3 | % | ||||||||
Kitchen Supplies | 1.6 | % | 1.7 | % | 1.8 | % | 1.7 | % | 1.9 | % | 1.9 | % | 2.0 | % | 1.8 | % | ||||||||
Total | 100 | % | 100 | % | 100 | % | 100 | % | 100 | % | 100 | % | 100 | % | 100 | % | ||||||||
We continuously evaluate potential additions to our product portfolio based on both existing and anticipated trends in the culinary industry. Our buyers have numerous contacts with suppliers throughout North America, Europe, Asia and South America and are always looking for new and interesting products that will aid our customers as they seek to keep up with the latest developments in the culinary industry. Our ability to successfully distribute a significant portion of the total production of smaller, regional and artisanal specialty food producers allows us the opportunity to be these producers’ primary route-to-market in our markets without, in most cases, requiring us to make contractual commitments regarding guaranteed volume. We are also able to utilize our size and successful track record of distributing products sourced from outside the United States and Canada to resist efforts from many of our foreign suppliers to push importing costs off onto us.
We seek to differentiate ourselves from our competitors by offering a more extensive depth and breadth of specialty products. We carry a wide range of high-quality specialty food products, including artisan charcuterie, specialty cheeses, unique oils and vinegars, truffles, caviar, chocolate and pastry products across each of our markets, but we also offer a number of items in each of our respective markets that are tailored to meet the unique preferences of the individual chefs in that market. We regularly rotate our inventory to identify and bring to market new products that will continue to support our value proposition.
Within our product offerings, we carry numerous gourmet brands, and at the same time, we seek to maximize product contribution through the sale of our proprietary brands, which we offer in a number of staple products, including bulk olive oil, Italian grating cheeses and butter. We believe that our ability to offer simultaneously high-quality specialty foods and ingredients, center-of-the-plate products and more traditional broadline staple food products provides our customers with foodservice distribution solutions that are efficient and cost effective.
Our Sophisticated and Experienced Sales Professionals
We employ a sophisticated and experienced sales force of approximately 470 sales and customer service professionals focused on meeting our customers’ goals and objectives, while concurrently educating them regarding our latest products and broader culinary trends. To ensure a high level of customer service, we currently maintain a ratio of approximately one sales professional for every 64 of our customers, excluding our direct-to-consumer customers. Our sales force is composed of the following three distinct groups which are all focused on providing outstanding service to our customers:
• | Outside Sales Associates: Responsible for identifying sales opportunities, educating customers and acting as our public representatives. |
• | Inside Sales Associates: Responsible for processing customer orders and arranging for delivery and payment. |
• | Product Specialists: Responsible for maintaining specialized product knowledge and educating our outside sales associates and customers regarding new products and general developments in several specific categories, including protein, seafood, pastry and cheese. |
A significant number of our sales professionals have formal culinary training, degrees in the culinary arts and/or prior experience working in the culinary industry. We strive to harness this culinary knowledge and passion for food and to concurrently promote an entrepreneurial working environment. Utilizing advanced pricing optimization software available to them on a real-time basis, our sales professionals are afforded flexibility to determine the pricing of individual items for our
9
customers within a range of pricing options. The majority of our outside sales professionals are compensated on a commission basis, and their performance is measured primarily upon their gross profit dollars obtained. We have historically experienced low turnover among our seasoned sales professionals.
Because we are highly focused on collaborating with our customers and educating them regarding our latest products and broader culinary trends, we view the ongoing education and training of our sales force as crucial to our continued success. To ensure that our sales professionals remain on the forefront of new culinary products and trends, we regularly hold “vendor shows” at our distribution centers, where our sales force is able to interact with vendors and learn more about the vendors’ latest product offerings and the performance of these products relative to competitive offerings.
Our Suppliers
We are committed to providing our customers with an unrivaled portfolio of specialty food products, as well as a comprehensive broadline product offering and center-of-the-plate products. To fulfill this commitment, we maintain strong sourcing relationships with numerous producers of high-quality artisan and regional specialty food products, as well as a wide range of broadline product suppliers and protein vendors. Our importing arm also provides us with access to exclusive items such as regional olive oils, truffles and charcuterie sourced from Italy, Spain, France and other Mediterranean countries.
We constantly seek out and evaluate new products in order to satisfy our customers’ desire to be at the forefront of the latest culinary and menu trends, and, as evidence of our commitment to aid our customers in creating unique and innovative menu items, we regularly utilize our sourcing relationships and industry insights to procure other products that we do not regularly carry but that our customers specifically request.
We currently distribute products from more than 2,500 different suppliers. We carry multiple products and utilize multiple suppliers in all of our product categories, thereby eliminating our dependence upon any single supplier. Additionally, we seek to limit commodity risk by utilizing sophisticated forecasting and inventory management systems to minimize the inventory carrying time of commodity-oriented products and by leveraging the specialized product knowledge of our product specialists to manage purchasing and inventory levels when appropriate.
Our Operations and Distribution Centers
Operating out of 23 distribution centers of varying size and providing service six days a week in many areas, we utilize our fleet of delivery trucks to fill customer orders, usually within 12-24 hours of order placement. Our average distribution service level, or the percentage of in-stock items ordered by customers that were delivered by the requested date, was in excess of 97% as of fiscal year ended December 29, 2017, which our management believes is among the highest in the foodservice distribution industry. To achieve these high service levels, we have invested significantly in sophisticated warehousing, inventory control and distribution systems, as described in more detail below.
We have implemented pick-to-voice technology in each of our distribution facilities, which enables our warehouse employees to fill orders with greater speed and accuracy.
Products are delivered to our distribution centers primarily by contract carriers, the suppliers themselves and our fleet of trucks. We lease our trucks from national leasing companies and regional firms that offer competitive services. Customer orders are assembled in our distribution centers and then sorted, placed on pallets and loaded onto trucks and trailers in delivery sequence. The majority of our trucks and delivery trailers have multiple, temperature-controlled compartments that ensure all product is delivered to the customer at its optimal temperature.
We employ advanced routing and logistics planning software, which maximizes the number of daily deliveries that each of our trucks can make, while also enabling us to typically make deliveries within each customer’s preferred 2-3 hour time window. For our direct-to-consumer business, we ship through nationally recognized couriers. We also use GPS and vehicle monitoring technology to regularly evaluate the condition of our delivery trucks and monitor the performance of our drivers, by tracking their progress relative to their delivery schedule and providing information regarding hard braking, idling and fast starts. Our use of this technology allows us to conduct proactive fleet maintenance, provide timely customer service and improve our risk management.
Our Technology Systems
We maintain an advanced information technology platform that enables us to manage our operations across our various markets, as we seek to drive our growth and profitability and ensure that the needs of our customers are met in an accurate and
10
efficient manner. We have made significant investments in distribution, sales, information and warehouse management systems over the last eight years, and are in the process of implementing a fully-integrated ERP system. Our systems improvements include the implementation of route optimization software, a warehouse management system at all specialty warehouses that integrates with pick-to-voice and directed put-away systems. We are driving increasing sales volume through our ecommerce platform and a new mobile ordering tool which we believe will enable a much more seamless online customer experience. We also leverage a reporting and analytics platform that provides our sales team and management with the information required to drive efficiency and growth. We believe that our current systems are scalable and can be leveraged together with targeted investments in new technology to provide the fuel to drive profitable growth.
Intellectual Property
Except for the Spoleto, Bel Aria, Grand Reserve, Provvista, Argonaut, Praml, Black Falls, Michael’s, Chocoa, Crescendo, Matisse, Qzina, Coccinelle, Allen Brothers, The Great Steakhouse Steaks, Del Monte, Fells Point and The Chefs’ Warehouse trademarks, we do not own or have the right to use any patent, trademark, trade name, license, franchise or concession, the loss of which would have a material adverse effect on our business, financial condition or results of operations.
Competition
The foodservice distribution industry is highly competitive. We compete with numerous smaller distributors on a local level, as well as with a limited number of national broadline foodservice distributors. Certain of these distributors have greater financial and other resources than we do. Bidding for contracts or arrangements with customers, particularly larger hotels and caterers, is highly competitive and distributors may market their services to a particular customer over a long period of time before they are invited to bid. We believe that most purchasing decisions in the foodservice distribution industry are based upon the quality and price of the product distributed and the distributor’s ability to completely and accurately fill orders and deliver them in a timely manner.
Employees
As of December 29, 2017, we had 1,994 full-time employees, 197 of whom (approximately 9.9%) currently operate under a collective bargaining agreement and are represented by unions. This collective bargaining agreement expires on August 3, 2020. We offer attractive compensation and benefit packages, and we believe our relationship with our employees is satisfactory.
Regulation
As a distributor of specialty food products and meat and seafood in the United States and Canada, we are subject to regulation by numerous international, federal, state, provincial and local regulatory agencies. For example, at the U.S. federal level, we are subject to the Federal Food, Drug and Cosmetic Act, the Bioterrorism Act and regulations promulgated by the U.S. Food and Drug Administration (“FDA”). The FDA regulates manufacturing and holding requirements for foods, specifies the standards of identity for certain foods and prescribes the format and content of certain information required to appear on food product labels, among other responsibilities. For certain product lines, we are also subject to the Federal Meat Inspection Act, the Poultry Products Inspection Act, the Perishable Agricultural Commodities Act, the Country of Origin Labeling Act and regulations promulgated thereunder by the U.S. Department of Agriculture (“USDA”). The USDA imposes standards for product quality and sanitation, including the inspection and labeling of meat and poultry products and the grading and commercial acceptance of produce shipments from vendors. In January 2011, President Obama signed into law the FDA Food Safety Modernization Act, which greatly expands the FDA’s authority over food safety, including giving the FDA power to order the recall of unsafe foods, increase inspections at food processing facilities, issue regulations regarding the sanitary transportation of food, enhance tracking and tracing requirements and order the detention of food that it has “reason to believe” is adulterated or misbranded, among other provisions. The products we distribute in Canada are also subject to regulation and inspection by Health Canada and the Canadian Food Inspection Agency. Our suppliers are also subject to similar regulatory requirements and oversight. The failure to comply with applicable regulatory requirements could result in civil or criminal fines or penalties, product recalls, closure of facilities or operations, the loss or revocation of existing licenses, permits or approvals or the failure to obtain additional licenses, permits or approvals in new jurisdictions where we intend to do business.
We are also subject to state and local regulation through such measures as the licensing of our facilities, enforcement by state and local health agencies of state and local standards for our products and facilities and regulation of our trade practices in connection with the sale of products. Our facilities are generally inspected at least annually by federal and/or state authorities. These facilities are also subject to inspections and regulations issued pursuant to the Occupational Safety and Health Act by the U.S. Department of Labor, which require us to comply with certain manufacturing, health and safety standards to protect our employees from accidents and to establish hazard communication programs to transmit information about the hazards of certain
11
chemicals present in certain products that we distribute. Our Canadian warehouse, distribution facilities, repackaging activities and other operations also are subject to regulation and inspection by the Canadian Food Inspection Agency and provincial health authorities.
Our trucking operations are regulated by the Surface Transportation Board, the Federal Highway Administration, Transport Canada and Canadian provincial transportation authorities. In addition, interstate motor carrier operations are subject to safety requirements prescribed by the U.S. Department of Transportation and other relevant federal and state agencies. Such matters as weight and dimension of equipment are also subject to federal and state regulations. We believe that we are in compliance with applicable regulatory requirements relating to our motor carrier operations. Our failure to comply with the applicable motor carrier regulations could result in substantial fines or revocation of our operating permits.
Our operations are subject to a broad range of federal, state, provincial and local environmental health and safety laws and regulations, including those governing discharges to air, soil and water, the handling and disposal of hazardous substances and the investigation and remediation of contamination resulting from releases of petroleum products and other hazardous substances.
We believe that we are in material compliance with all international, federal, state, provincial and local regulations applicable to our operations, and management is unaware of any related issues that may have a material adverse effect upon our business, financial condition or results of operations.
Litigation and Insurance
We may be subject to lawsuits, claims and assessments in the normal course of business. Our management does not believe that there are any suits, claims or unasserted claims or assessments pending which would have a material adverse effect on our operations or financial condition.
We maintain comprehensive insurance packages with respect to our facilities, equipment, product liability, directors and officers, workers’ compensation and employee matters in amounts which management believes to be prudent and customary within the foodservice distribution industry.
Seasonality
Excluding our direct-to-consumer business, we generally do not experience any material seasonality. However, our sales and operating results may vary from quarter to quarter due to factors such as changes in our operating expenses, management’s ability to execute our operating and growth strategies, personnel changes, demand for our products, supply shortages, weather patterns and general economic conditions.
Our direct-to-consumer business is subject to seasonal fluctuations, with direct-to-consumer center-of-the-plate protein sales typically higher during the holiday season in our fourth quarter; accordingly, a disproportionate amount of operating cash flows from this portion of our business is generated in the fourth quarter. Despite a significant portion of these sales occurring in the fourth quarter, there are operating expenses, principally advertising and promotional expenses, throughout the year.
Inflation
Our profitability is dependent, among other things, on our ability to anticipate and react to changes in the costs of key operating resources, including food and other raw materials, labor, energy and other supplies and services. Substantial increases in costs and expenses could impact our operating results to the extent that such increases cannot be passed along to our customers. The impact of inflation on food, labor, energy and occupancy costs can significantly affect the profitability of our operations.
Available Information
Our principal executive office is located at 100 East Ridge Road, Ridgefield, Connecticut 06877, and our telephone number is (203) 894-1345. Our annual report on Form 10-K, quarterly reports on Form 10-Q, current reports on Form 8-K, and all amendments to those reports will be made available free of charge through the Investor Relations section of our website (http://www.chefswarehouse.com) as soon as practicable after such material is electronically filed with, or furnished to, the Securities and Exchange Commission (“SEC”). Material contained on our website is not incorporated by reference into this report.
We have also adopted a Code of Business Conduct and Ethics (“Code of Ethics”) that applies to all of our employees, including our principal executive officer, principal financial officer, principal accounting officer and controller. Our Code of Ethics is
12
publicly available on the Investor Relations section of our website (http://www.chefswarehouse.com) and is available free of charge by writing to The Chefs’ Warehouse, Inc., 100 East Ridge Road, Ridgefield, Connecticut 06877, Attn: Investor Relations. If we make any substantive amendments to the Code of Ethics or grant any waiver, including any implicit waiver, from a provision of the Code of Ethics to our principal executive officer, principal financial officer, principal accounting officer or controller, or persons performing similar functions, we intend to make any legally required disclosures regarding such amendments or waivers on the Investor Relations section of our website (http://www.chefswarehouse.com).
Please note that our website address is provided as an inactive textual reference only.
The public may also read and copy any materials that we file with the SEC at the SEC’s Public Reference Room at 100 F Street, NE, Washington, D.C. 20549. The public may obtain information on the operation of the Public Reference Room by calling the SEC at 1-800-SEC-0330. The SEC also maintains an Internet website that contains reports, proxy and information statements and other information regarding issuers, including us, that file electronically with the SEC located at http://www.sec.gov.
Executive Officers
Name & Position | Age | Business Experience | ||
Christopher Pappas President, Chief Executive Officer and Chairman of the Board of Directors | 58 | Christopher Pappas is our founder and has served as our chief executive officer since 1985 and has been a director on our board and our board chairman since our IPO, and he also served as a director and the chairman of the board of our predecessor company, Chefs’ Warehouse Holdings, LLC. He has been our president since April 11, 2009 and before that was our president from our formation to January 1, 2007. Prior to founding our company, Mr. C. Pappas played basketball professionally in Europe for several years following his graduation from Adelphi University in 1981 with a Bachelor of Arts degree in Business Administration. Mr. C. Pappas currently oversees all of our business activities, with a focus on product procurement, sales, marketing, strategy development, business development and operations. | ||
John Pappas Vice Chairman and Director | 54 | John Pappas is a founder of our company and currently serves as our vice chairman, a position he has held since March 1, 2011. From our founding in 1985 to March 1, 2011, he served as our chief operating officer. Mr. J. Pappas has been a director on our board since our IPO, and he also served as a director on the board of our predecessor company, Chefs’ Warehouse Holdings, LLC. He has over 30 years of experience in logistics, facility management and global procurement and oversees our network of distribution centers nationwide. Mr. J. Pappas is also active in the development of our corporate strategy. | ||
James Leddy Chief Financial Officer | 54 | James“Jim” Leddy is our chief financial officer and assistant secretary, since his appointment as of November 11, 2017. Prior to his appointment, Mr. Leddy served as our executive vice president of finance since joining the Company in September 2017. Mr. Leddy previously served as interim chief financial officer at JetBlue Airways from November 2016 to February 2017 and served as senior vice president and treasurer from 2012 to November 2016. Prior to joining JetBlue, Mr. Leddy served as senior vice president, treasury and cash management at NBCUniversal from 2008 until 2012, and as a senior technical advisor at General Electric from 2003 until 2008. Previously, Mr. Leddy held corporate risk and treasury management positions at First Union National Bank and Dai-ichi Kangyo Bank. Mr. Leddy holds an M.B.A. in Finance and Management of Technology from the University of Connecticut and a B.A. in Economics from Fordham University. | ||
13
Alexandros Aldous General Counsel, Corporate Secretary & Chief Government Relations Officer | 37 | Alexandros Aldous is our general counsel, corporate secretary & chief government relations officer, positions he has held since joining us in March 2011, our IPO on July 27, 2011, and March 8, 2017, respectively. Mr. Aldous's prior work experience includes working as an attorney with Barclays Capital, the investment banking division of Barclays Bank PLC, in London, where he focused primarily on mergers and acquisitions and capital markets, and prior to that, working as an attorney with Shearman & Sterling LLP, in New York, where he focused primarily on mergers and acquisitions. Mr. Aldous is a member of both the General Counsel Committee and the Government Relations Leadership Committee of the International Foodservice Distributors Association, a member of the Global Alumni Advisory Board of the American College of Greece, as well as a member of the Dean's Counsel of American University's School of International Service. Mr. Aldous earned a B.A. in Classics and Government from Colby College, a Juris Doctor and M.A. from American University and an LL.M. from the London School of Economics and Political Science. Mr. Aldous is licensed to practice law in the State of New York, District of Columbia, and England and Wales. | ||
Timothy McCauley Chief Accounting Officer | 53 | Timothy McCauley is our chief accounting officer, as of February 16, 2018 and previously served as our controller since joining the Company in May 2015. Mr. McCauley has over 30 years of experience in accounting and finance roles across a variety of industries. Mr. McCauley’s prior work experience includes serving as vice president – finance at MacDermid Inc., corporate controller at Northern Tier Energy LP, director of financial reporting and investor relations at Presstek, Inc. and finance director at Eastman Kodak Company. Prior to joining Eastman Kodak Company, Mr. McCauley worked with PricewaterhouseCoopers for eleven years in their assurance and business advisory practice. Mr. McCauley holds a Bachelor of Science degree in Business - Accounting from the University of Connecticut and is a certified public accountant in the state of Connecticut. | ||
Patricia Lecouras Chief Human Resources Officer | 62 | Patricia Lecouras is our chief human resources officer, a position she has held since March 5, 2007. Ms. Lecouras joined our company from GE Capital Commercial Finance where she was vice president, human resources from 2001 to 2007. Prior to her time with GE Capital Commercial Finance, Ms. Lecouras was with Nine West Shoes (f/k/a Fischer Camuto Corporation) and Xerox. Ms. Lecouras’s professional experience is multidisciplinary and includes prior experience working in finance and tax-related functions. She also has earned a six sigma master black belt certification. Ms. Lecouras holds a Bachelor of Arts degree in Psychology and Social Work from Skidmore College. | ||
14
Item 1A. RISK FACTORS
Our business, financial condition and results of operations are subject to various risks and uncertainties, including those described below and elsewhere in this Annual Report on Form 10-K. This section discusses factors that, individually or in the aggregate, we think could cause our actual results to differ materially from our expected and historical results. Our business, financial condition or results of operations could be materially adversely affected by any of these risks. We note these factors for investors as permitted by the Private Securities Litigation Reform Act of 1995.
Our success depends to a significant extent upon general economic conditions, including disposable income levels and changes in consumer discretionary spending.
Because our target customers include menu-driven independent restaurants, fine dining establishments, country clubs, hotels, caterers, culinary schools, bakeries, patisseries, chocolatiers, cruise lines, casinos and specialty food stores, our business is exposed to reductions in consumer discretionary spending. Consumer discretionary spending may be affected by many factors outside of our control, including general economic conditions, disposable income levels, and consumer confidence levels. In uncertain economic environments, consumers may choose to spend discretionary dollars less frequently which could result in a decline in consumers’ food-away-from-home purchases, particularly in more expensive restaurants, and, consequently, adversely impact the businesses of our customers by, among other things, reducing the frequency with which our customers’ customers choose to dine out or the amount they spend on meals while dining out. If our customers’ sales decrease, our profitability could decline as we spread fixed costs across a lower volume of sales. Moreover, if a prolonged downturn or uncertain outlook in the economy were to occur, consumers might ultimately make long-lasting changes to their discretionary spending behavior, including dining out less frequently on a permanent basis. Accordingly, adverse changes to consumer preferences or consumer discretionary spending, each of which could be affected by many different factors which are out of our control, could harm our business, financial condition or results of operations. Our continued success will depend in part upon our ability to anticipate, identify and respond to changing economic and other conditions and the impact that those conditions may have on discretionary consumer spending.
A significant portion of our future growth is dependent upon our ability to expand our operations in our existing markets and to penetrate new markets either through organic growth or through acquisitions.
We intend to expand our presence in our existing markets by adding to our existing customer base through the expansion of our product portfolio and the increase in the volume and/or number of purchase orders from our existing customers. We cannot assure our investors, however, that we will be able to continue to successfully expand or acquire critical market presence in our existing markets, as we may not successfully market our specialty food and center-of-the-plate products and brands or may encounter larger and/or more well-established competitors with substantially greater financial resources. Moreover, competitive circumstances and consumer characteristics in new segments of existing markets may differ substantially from those in the segments in which we have substantial experience. If we are unable to expand in existing markets, our ability to increase our revenues and profitability may be affected in a material and adverse manner. At times, we have grown our business by expanding into new geographic markets. Efforts to expand organically may take time to produce revenues that exceed our expenses in these new markets, which can be high as we build out our infrastructure and hire associates to run our operations.
We also regularly evaluate opportunities to acquire other companies. To the extent our future growth includes acquisitions, we cannot assure investors in our common stock that we will successfully identify suitable acquisition candidates, obtain financing for such acquisitions, if necessary, consummate such potential acquisitions, effectively and efficiently integrate any acquired entities or successfully expand into new markets as a result of our acquisitions. Moreover, to the extent that we acquire companies that are principally involved in the distribution of products that we have not historically distributed, like fresh produce, there may be additional risks that we face.
We may not achieve benefits expected from our acquisitions, including our recent acquisition of Fells Point, which could adversely impact our business and operating results.
We believe that there are risks related to acquiring companies, including overpaying for acquisitions, losing key employees of acquired companies, failing to identify potential liabilities associated with the acquisition of the business prior to our acquisition and failing to achieve potential synergies. Additionally, our business could be adversely affected if we are unable to integrate the companies we acquired.
On August 25, 2017, we completed our acquisition of Fells Point. We can provide no assurance that: (1) the anticipated benefits of the Fells Point transaction, including any cost savings and operational synergies, will be fully realized in the time frame anticipated or at all, (2) the costs or difficulties related to the integration of the Fells Point business and operations into ours
15
will not be greater than expected, (3) unanticipated costs, charges and expenses, including those related to the retention of the Fells Point labor force, will not result from the transaction, and (4) the transaction will not cause disruption to our business and operations and our relationships with customers, employees and other third parties. If one or more of these or other risks are realized, it could have a material adverse impact on our business, financial condition and results of operations.
A significant portion of our past growth has been achieved through acquisitions of, or mergers with, other distributors of specialty food products and center-of-the-plate protein items. Our future acquisitions may have a material adverse effect on our results of operations, particularly in periods immediately following the consummation of those transactions while the operations of the acquired business are being integrated with our operations. Achieving the benefits of acquisitions depends on timely, efficient and successful execution of a number of post-acquisition events, including successful integration of the acquired entity. Integration requires, among other things:
• | maintaining the existing customer and supplier base and personnel; |
• | optimizing delivery routes; |
• | coordinating administrative, distribution and finance functions; and |
• | integrating management information systems and personnel. |
The integration process may temporarily redirect resources previously focused on reducing product cost, resulting in lower gross profits in relation to sales. In addition, the process of combining companies could cause the interruption of, or a loss of momentum in, the activities of the respective businesses, which could have an adverse effect on their combined operations. In an effort to streamline the acquisition and integration process and achieve expected cost savings and operational synergies more quickly, we implemented an integration team during fiscal 2014, which is dedicated to onboarding new acquisitions and integrating information technology systems as quickly and efficiently as possible. We believe that having a team dedicated to integration helps make sure the people, processes and products we add through acquisitions are consistent with our historical business and allows our management team to focus its attention on our day-to-day operations. If the integration team does not improve our integration process, the integration of acquisitions could divert the attention of management, and any difficulties or problems encountered in the integration process could have a material adverse effect on our business, financial condition or results of operations.
In connection with our acquisition of businesses in the future, if any, we may decide to consolidate the operations of any acquired business with our existing operations or make other changes with respect to the acquired business, which could result in special charges or other expenses. Our results of operations also may be adversely affected by expenses we incur in making acquisitions, by amortization of acquisition-related intangible assets with definite lives and by additional depreciation attributable to acquired assets. Any of the businesses we acquire may also have liabilities or adverse operating issues, including some that we fail to discover before the acquisition, and our indemnity for such liabilities typically has been limited and may, with respect to future acquisitions, also be limited. Additionally, our ability to make any future acquisitions may depend upon obtaining additional financing or the consents of our lenders. We may not be able to obtain this additional financing or these consents on acceptable terms or at all. Moreover, we may need to finance our acquisition activity with the issuance of equity or debt securities, which may have rights and preferences superior to those of our common stock and, in the case of common equity securities, may be issued at such prices and in such amounts as may cause significant dilution to our then-existing common stockholders. To the extent we seek to acquire other businesses in exchange for our common stock, fluctuations in our stock price could have a material adverse effect on our ability to complete acquisitions.
In addition, although we enter into acquisition agreements with each company or business we acquire that contain customary representations, warranties, covenants and indemnities, there is no guarantee that we will recover all of our losses that may result from a breach of such agreements. For example, most acquisition agreements contain baskets or deductibles and caps and limitations on damages and on periods in which we may bring a claim. In addition, there can be no guarantee that we will be successful on the merits of any claim that we bring arising out of a breach of an acquisition agreement or that if we are successful on the merits in bringing a claim that the sellers of the businesses we acquire will be able to pay us for our losses. Moreover, the costs that we incur to investigate a potential matter may not be fully recoverable. Additionally, as a result of an acquisition, we may enter into a new business or market or offer products that differ from our core business. Any such new business or market or the sale and distribution of new products may present new challenges for us, and we may not be able to overcome such challenges. Additionally, we may seek to distribute a different set of products than the business that we acquire, which may cause a loss of customers of those businesses if we can no longer carry the products they desire or charge more for those products than was charged before we acquired the business.
Our failure to realize the benefits expected from our acquisitions could result in a reduction in the price of our common stock as well as in increased costs, decreases in the amount of expected revenues and diversion of management’s time and energy and could materially and adversely impact our business, financial condition or results of operations.
16
We may have difficulty managing and facilitating our future growth.
At times since our inception, we have rapidly expanded our operations through organic growth, acquisitions or otherwise. This growth has placed and will continue to place significant demands upon our administrative, operational and financial resources. This growth, however, may not continue. To the extent that our customer base and our distribution networks continue to grow, this future growth may be limited by our inability to acquire new distribution facilities or expand our existing distribution facilities, make acquisitions, successfully integrate acquired entities, implement information systems initiatives or adequately manage our personnel.
Moreover, our future growth may be limited in part by the size and location of our distribution centers. As we near maximum utilization of a given facility, our operations may be constrained and inefficiencies may be created, which could adversely affect our results of operations unless the facility is expanded, volume is shifted to another facility or additional processing capacity is added. Conversely, as we add additional facilities or expand existing operations or facilities, excess capacity may be created. Any excess capacity may also create inefficiencies and adversely affect our results of operations. We cannot assure investors in our common stock that we will be able to successfully expand our existing distribution facilities or open new distribution facilities in new or existing markets as needed to facilitate growth.
Even if we are able to expand our distribution network, our ability to compete effectively and to manage future growth, if any, will depend on our ability to continue to implement and improve operational, financial and management information systems on a timely basis and to expand, train, motivate and manage our employees. We cannot assure investors in our common stock that our existing personnel, systems, procedures and controls will be adequate to support the future growth of our operations. Accordingly, our inability to manage our growth effectively could have a material adverse effect on our business, financial condition or results of operations.
Conditions beyond our control could materially affect the cost and/or availability of our specialty food products or center-of-the-plate products and/or interrupt our distribution network.
Our profitability and operating margins are dependent upon, among other things, our ability to anticipate and react to any interruptions in our distribution network and changes to food costs and availability. We obtain a significant portion of our specialty food products and center-of-the-plate products from local, regional, national and international third-party suppliers. We generally do not enter into long-term contracts with our suppliers, whereby they would be committed to provide products to us for any appreciable duration of time. Although our purchasing volume can provide leverage when dealing with suppliers, particularly smaller suppliers for whom we may be their largest customer, suppliers may not provide or may be unable to provide the specialty food products or center-of-the-plate products we need in the quantities and at the times and prices we request. Failure to identify an alternate source of supply for these items or comparable products that meet our customers’ expectations may result in significant cost increases. Additionally, weather, governmental regulation, water shortages, availability and seasonality may affect our food costs or cause a disruption in the quantity of our supply. For example, weather patterns in recent years have resulted in lower than normal or, conversely, higher than normal levels of rainfall and snowfall in key agricultural states such as California, impacting the price of water and the corresponding prices of food products grown in states affected by such weather. Additionally, the route-to-market for some of the products we sell, such as baking chocolate, depends upon the stability of political climates and a stable labor force in developing nations, such as the Ivory Coast. In such countries, political and social unrest may cause the prices for these products to rise to levels beyond those that our customers are willing to pay, if the product is available at all. If we are unable to obtain these products, our customers may seek a different supplier for these or other products which could negatively impact our business, financial condition or results of operations.
We do not currently use financial instruments to hedge our risk exposure to market fluctuations in the price of food products. Similarly, our suppliers may also be affected by higher costs to source or produce and transport food products, as well as by other related expenses that they pass through to their customers, which could result in higher costs for the specialty food products or center-of-the-plate products they supply to us. Our inability to anticipate and react to changing food costs through our sourcing and purchasing practices in the future could therefore negatively impact our business, financial condition or results of operations.
We may also be subject to material supply chain interruptions based upon conditions outside of our control. These interruptions could include work slowdowns, work interruptions, strikes or other adverse employment actions taken by employees of ours or our suppliers, short-term weather conditions or more prolonged climate change, crop conditions, product recalls, water shortages, transportation interruptions within our distribution channels, unavailability of fuel or increases in fuel costs, competitive demands and natural disasters or other catastrophic events, such as food-borne illnesses or bioterrorism. The efficiency and effectiveness of our distribution network is dependent upon our suppliers’ ability to consistently deliver the specialty food products and meat, poultry and seafood we need in the quantities and at the times and prices we request.
17
Accordingly, if we are unable to obtain the specialty food products or meat, poultry or seafood that comprise a significant percentage of our product portfolio in a timely manner and in the quantities and at the prices we request as a result of any of the foregoing factors or otherwise, we may be unable to fulfill our obligations to customers who may, as a result of any such failure, resort to other distributors for their food product needs or change the types of products they buy from us to products that are less profitable for us.
Our increased distribution of center-of-the-plate products, like meat, poultry and seafood, following our acquisitions of Michael’s, Allen Brothers, Del Monte and Fells Point, involves increased exposure to price volatility experienced by those products.
With our acquisitions of Michael’s, Allen Brothers, Del Monte and Fells Point, a larger percentage of our revenues is expected to come from center-of-the-plate products. With our increased distribution of center-of-the-plate products like meat, poultry and seafood, we are more susceptible to increases in the prices of those products, and we cannot assure investors in our common stock that all or part of any increased costs experienced by us from time to time can be passed along to consumers of our products, in a timely manner or at all. Conversely, rapid downward pricing for these products, including as a result of restrictions on the exporting of U.S. beef products or lower demand internationally for U.S. beef products, may result in our lowering our prices to our customers even though our inventory on hand is at a higher cost. The supply and market price of our center-of the plate products are typically more volatile than most of our core specialty products and are dependent upon a variety of factors over which we have no control, including the relative cost of feed and energy, weather, livestock diseases, government regulation and the availability of beef, chicken and seafood.
The prices of our meat and poultry products are largely dependent on the production of feed ingredients, which is affected primarily by the global level of supply inventories and demand for feed ingredients, the agricultural policies of the U.S. and foreign governments and weather patterns throughout the world. In particular, weather patterns often change agricultural conditions in an unpredictable manner. A significant change in weather patterns could affect supplies of feed ingredients, as well as the industry’s ability to obtain feed ingredients or deliver products. More recently, feed prices have been impacted by increased demand both domestically for ethanol and globally for protein production.
Additionally, our center-of-the-plate business is subject to risks relating to animal health and diseases. An outbreak of diseases affecting livestock (such as foot-and-mouth disease or bovine spongiform encephalopathy, commonly referred to as mad cow disease) could result in restrictions on sales of products, restrictions on purchases of livestock from suppliers or widespread destruction of livestock. Outbreaks of diseases, or the perception by the public that an outbreak has occurred, or other concerns regarding diseases, can lead to inadequate supply, cancellation of orders by customers and adverse publicity, any of which can have a significant negative impact on consumer demand and, as a result, on our business, financial condition or results of operations.
In addition, meat, seafood and poultry products that we distribute could be subject to recall because they are, or are alleged to be, contaminated, spoiled or inappropriately labeled. Our meat and poultry products may be subject to contamination by disease-producing organisms, or pathogens, such as Listeria monocytogenes, Salmonella and generic E.coli. These pathogens are generally found in the environment, and, as a result, there is a risk that they, as a result of food processing, could be present in the meat and poultry products that we distribute. These pathogens can also be introduced as a result of improper handling in our facilities or at the consumer level. These risks may be controlled, although not eliminated, by adherence to good manufacturing practices and finished product testing. We have little, if any, control over proper handling before we receive the product or once the product has been shipped to our customers. Illness and death may result if the pathogens are not eliminated before these products are sold to customers.
We are also susceptible to increases in the prices of our seafood products. The prices of our seafood products are largely dependent on the continuous supply of fresh seafood, which in turn could be affected by a large number of factors, including, but not limited to, environmental factors, the availability of seafood stock, weather conditions, water contamination, the policies and regulations of the governments of the relevant territories where such fishing is carried out, the ability of the fishing companies and fishermen that supply us to continue their operations and pressure from environmental or animal rights groups. The major raw material for our seafood products is fresh seafood, and any shortage in supply or upsurge in demand of fresh seafood may lead to an increase in prices, which may adversely affect our profitability, including as a result of increased production costs and lower profit margins.
Our operations are subject to extensive regulation and oversight by the United States Department of Agriculture (USDA), the United States Food and Drug Administration (FDA), and other federal, state, local and foreign authorities regarding the processing, packaging, storage, safety, distribution, advertising and labeling of its products. Recently, food safety practices and procedures in the meat processing industry have been subject to more intense scrutiny and oversight by the USDA. Failure to
18
comply with existing or new laws and regulations could result in administrative penalties and injunctive relief, civil remedies, fines, interruption of operations, recalls of products or seizures of properties, potential criminal sanctions and personal injury or other damage claims. These remedies, changes in the applicable laws and regulations or discovery of currently unknown conditions could increase costs, limit business operations and reduce profitability.
Our business is a low-margin business and our profit margins may be sensitive to inflationary and deflationary pressures.
We operate within a segment of the foodservice distribution industry, which is an industry characterized by a high volume of sales with relatively low profit margins. Although our profit margins are typically higher than more traditional broadline foodservice distributors, they are still relatively low compared to other industries’ profit margins. Volatile food costs may have a direct impact upon our profitability. Prolonged periods of product cost inflation may have a negative impact on our profit margins and results of operations to the extent we are unable to pass on all or a portion of such product cost increases to our customers. In addition, product cost inflation may negatively impact consumer discretionary spending decisions within our customers’ establishments, which could adversely impact our sales. Conversely, our profit levels may be negatively impacted during periods of product cost deflation even though our gross profit as a percentage of sales may remain relatively constant. However, some of our products, particularly certain of our protein items, are priced on a cost plus a dollar markup, which helps mitigate the negative impact of deflation. If our product mix changes, we may face increased risks of compression of our margins, as we may be unable to achieve the same level of profit margins as we are able to capture on our traditional specialty products. Our inability to effectively price our specialty food products or center-of-the-plate products, to quickly respond to inflationary and deflationary cost pressures and to reduce our expenses could have a material adverse impact on our business, financial condition or results of operations.
Group purchasing organizations may become more active in our industry and increase their efforts to add our customers as members of these organizations.
Some of our customers, including a majority of our hotel customers, purchase their products from us through group purchasing organizations. These organizations have increased their efforts to aggregate the purchasing power of smaller, independent restaurants in an effort to lower the prices paid by these customers on their foodservice orders, and we have experienced some pricing pressure from these purchasers. If these group purchasing organizations are able to add a significant number of our customers as members, we may be forced to lower the prices we charge these customers in order to retain the business, which would negatively affect our business, financial condition or results of operations. Additionally, if we were unable or unwilling to lower the prices we charge for our products to a level that was satisfactory to the group purchasing organization, we may lose the business of those of our customers that are members of these organizations, which could have a material adverse impact on our business, financial condition or results of operations.
Because our foodservice distribution operations are concentrated in certain culinary markets, we are susceptible to economic and other developments, including adverse weather conditions, in these areas.
Our financial condition and results of operations are highly dependent upon the local economies of the culinary markets in which we distribute our products. In recent years, certain of these markets have been more negatively impacted by the overall economic crisis, including experiencing higher unemployment rates and weaker housing market conditions, than other areas of the United States and Canada. Moreover, sales in our New York market, which we define as our operations on the East Coast of the United States spanning from Boston to Atlantic City, accounted for approximately 27.8% of our net sales in our 2017 fiscal year. We are therefore particularly exposed to downturns in this regional economy. Following our acquisition of Del Monte, we now have significant operations in the San Francisco Bay area and Los Angeles, California and following our acquisitions of MT Food, we now have significant operations in Chicago, Illinois. Deterioration in the economic conditions of our key markets generally, or in the local economy of the New York metropolitan area, San Francisco Bay, Los Angeles, California, or Chicago, Illinois areas, specifically, could affect our business, financial condition or results of operations in a materially adverse manner.
In addition, given our geographic concentrations, other regional occurrences such as adverse weather conditions, terrorist attacks and other catastrophic events could have a material adverse effect on our business, financial condition or results of operations. Adverse weather conditions can significantly impact the business of our customers and our ability to profitably and efficiently conduct our operations and, in severe cases, could result in our trucks being unable to make deliveries or cause the temporary closure or the destruction of one or more of our distribution centers. Our operations and/or distribution centers which are located in (i) New York City, Ohio, Washington D.C., Chicago and Canada are particularly susceptible to significant amounts of snowfall and ice, (ii) Miami are particularly susceptible to hurricanes and (iii) Los Angeles and San Francisco are particularly susceptible to earthquakes, mudslides and wildfires. In addition, our restaurant customers, many of which are independently owned with operations limited to one or two markets, may be less able to withstand the impact on their business from adverse weather conditions than national chain restaurants because they are unable to spread the risks of such events
19
across numerous locations. In some cases these customers may not be able to re-open their restaurants, and consequently make payment to us for products previously provided, if the weather event or other catastrophic event is severe, particularly if they lacked sufficient insurance or their insurance claims are not processed quickly.
Due to their prominence as, among other characteristics, densely-populated major metropolitan cities and as international hubs for intermodal transportation, a majority of our markets are known as targets for terrorist activity and other catastrophic events. If our or our customers’ operations are significantly disrupted or if any one or more of our distribution centers is temporarily closed or destroyed for any of the foregoing reasons, our business, financial condition or results of operations may be materially adversely affected. In anticipation of any such adverse weather conditions, terrorist attacks, man-made disasters or other unforeseen regional occurrences, we have implemented a disaster recovery plan. Should any of these events occur, and if we are unable to execute our disaster recovery plan, we may experience challenges in acquiring and distributing our products, failures or delays in the recovery of critical data, delayed reporting and compliance with governmental entities, inability to perform necessary corporate functions and other breakdowns in normal operating procedures that could have a material adverse effect on our business and create exposure to administrative and other legal claims against us.
Damage to our reputation or lack of acceptance of our specialty food products, center-of-the-plate products and/or the brands we carry in existing and new markets could materially and adversely impact our business, financial condition or results of operations.
We believe that we have built a strong reputation for the breadth and depth of our product portfolio and the brands we carry and that we must protect and grow their value to be successful in the future. Any incident that erodes consumer confidence in or affinity for our specialty food or center-of-the-plate products or brands, whether or not justified, could significantly reduce their respective values and damage our business. If our customers perceive or experience a reduction in the quality or selection of our products and brands or our customer service, or in any way believe that we failed to deliver a consistently positive experience, our business, financial condition or results of operations may be affected in a materially adverse manner.
A specialty foods distribution business such as ours can be adversely affected by negative publicity or news reports, whether or not accurate, regarding food quality issues, public health concerns, illness, safety, injury or government or industry findings concerning our products or others across the food distribution industry. Although we have taken steps to mitigate food quality, public health and other foodservice-related risks, these types of health concerns or negative publicity cannot be completely eliminated or mitigated and may harm our results of operations and damage the reputation of, or result in a lack of acceptance of, our products or the brands we carry.
In addition, our ability to successfully penetrate new markets may be adversely affected by a lack of awareness or acceptance of our product portfolio or our brands in these new markets. To the extent we are unable to foster name recognition and affinity for our products and brands in new markets, we may not be able to penetrate these markets as anticipated, and, consequently, our growth may be significantly delayed or impaired.
Our customers are generally not obligated to continue purchasing products from us.
Most of our customers buy from us pursuant to individual purchase orders, as we generally do not enter into long-term agreements with our customers for the purchase of our products. Because our customers are generally not obligated to continue purchasing products from us, we cannot assure our investors that the volume and/or number of our customers’ purchase orders will remain constant or increase or that we will be able to maintain or add to our existing customer base. Significant decreases in the volume and/or number of our customers’ purchase orders or our inability to retain or grow our current customer base may have a material adverse effect on our business, financial condition or results of operations.
We have experienced losses due to our inability to collect accounts receivable in the past and could experience increases in such losses in the future if our customers are unable to pay their debts to us in a timely manner or at all.
Certain of our customers have experienced bankruptcy, insolvency and/or an inability to pay their debts to us as they come due. If our customers suffer significant financial difficulties or bankruptcies, they may be unable to pay their debts to us in a timely manner or at all. It is possible that our customers may contest their obligations to pay us under bankruptcy laws or otherwise. Even if our customers do not contest their obligations to pay us, if our customers are unable to pay their debts to us in a timely manner, it could adversely impact our ability to collect accounts receivable and may require that we take larger provisions for bad debt expense. Moreover, we may have to negotiate significant discounts and/or extended financing terms with these customers in such a situation in an attempt to secure payment for outstanding debts. Accordingly, if we are unable to collect upon our accounts receivable as they come due in an efficient and timely manner, our business, financial condition or results of operations may be materially and adversely affected. During periods of economic weakness, small to medium-sized businesses,
20
like many of our independent restaurant and fine dining establishment customers, may be impacted more severely and more quickly than larger businesses. Consequently, the ability of such businesses to repay their obligations to us may deteriorate, and in some cases this deterioration may occur quickly, which could adversely impact our business, financial condition or results of operations.
Product liability claims could have a material adverse effect on our business, financial condition or results of operations.
Like any other distributor of food products, we face an inherent risk of exposure to product liability claims if the products we sell cause injury or illness. We may be subject to liability, which could be substantial, because of actual or alleged contamination in products sold by us, including products sold by companies before we acquired them. We have, and the companies we have acquired have had, liability insurance with respect to product liability claims. This insurance may not continue to be available at a reasonable cost or at all, and it may not be adequate to cover product liability claims against us or against any of the companies we have acquired. We generally seek contractual indemnification from manufacturers or suppliers of the product, but any such indemnification is limited, as a practical matter, to the creditworthiness of the indemnifying party. If we or any of our acquired companies do not have adequate insurance or contractual indemnification available, product liability claims and costs associated with product recalls, including a loss of business, could have a material adverse effect on our business, financial condition or results of operations.
Fuel cost volatility may have a material adverse effect on our business, financial condition or results of operations.
Fuel cost volatility may have a negative impact on our business, financial condition or results of operations. The cost of diesel fuel can increase the price we pay for products as well as the costs we incur to distribute products to our customers. These factors, in turn, may negatively impact our net sales, margins, operating expenses and operating results. Although we have been able to pass along a portion of increased fuel costs to our customers in the past, there is no guarantee we can do so again. If fuel costs increase in the future, we may experience difficulties in passing all or a portion of these costs along to our customers, which could have a material adverse effect on our business, financial condition or results of operations.
New information or attitudes regarding diet and health or adverse opinions about the health effects of the products we distribute could result in changes in consumer eating habits, which could have a material adverse effect on our business, financial condition or results of operations.
Consumer eating habits may impact our business as a result of changes in attitudes regarding diet and health or new information regarding the health effects of consuming the products we distribute. If consumer eating habits change significantly, we may be required to modify or discontinue sales of certain items in our product portfolio, and we may experience higher costs associated with the implementation of those changes. Additionally, changes in consumer eating habits may result in the enactment of laws and regulations that impact the ingredients and nutritional content of our products or require us to disclose the nutritional content of products. Compliance with these laws and regulations, as well as others regarding the ingredients and nutritional content of our products, may be costly and time consuming. We cannot make any assurances regarding our ability to effectively respond to changes in consumer health perceptions or resulting new laws or regulations or to adapt our menu offerings to trends in eating habits.
We have significant competition from a variety of sources, and we may not be able to compete successfully.
The foodservice distribution industry is highly fragmented and competitive, and our future success will be largely dependent upon our ability to profitably meet our customers’ needs for certain gourmet foods and ingredients, varying drop sizes, high service levels and timely delivery. We compete with numerous smaller distributors on a local level, as well as with a limited number of larger, traditional broadline foodservice distributors. We cannot assure our investors that our current or potential competitors will not provide specialty food products and ingredients, protein items or services that are comparable or superior to those provided by us at prices that are lower than the prices we charge or adapt more quickly than we do to evolving culinary trends or changing market requirements. It is also possible that alliances among competitors may develop and rapidly acquire significant market share. Accordingly, we cannot assure our investors that we will be able to compete effectively against current and future competitors, and increased competition may result in price reductions, reduced gross margins and loss of market share, any of which could have a material adverse effect on our business, financial condition or results of operations.
Our substantial indebtedness may limit our ability to invest in the ongoing needs of our business.
We have a substantial amount of indebtedness. As of December 29, 2017, we had approximately $325.8 million of total indebtedness. We had approximately $288.4 million of outstanding indebtedness under the Term Loan Facility and nothing outstanding under the ABL Facility. In addition, at December 29, 2017, we had $0.7 million outstanding under capital leases
21
and other financing agreements for computer equipment, vehicles and software. Moreover, as part of the consideration we paid in connection with our acquisition of Del Monte, we issued to entities affiliated with Del Monte $36.8 million in convertible subordinated notes with a six-year maturity bearing interest at 2.5% per annum with a conversion price of $29.70 per share.
Our indebtedness could have important consequences to you. For example our indebtedness:
• | requires us to utilize a substantial portion of our cash flows from operations to make payments on our indebtedness, reducing the availability of our cash flows to fund working capital, capital expenditures, development activity and other general corporate purposes; |
• | increases our vulnerability to adverse general economic or industry conditions; |
• | limits our flexibility in planning for, or reacting to, changes in our business or the industries in which we operate; |
• | makes us more vulnerable to increases in interest rates, as borrowings under our Term Loan Facility and ABL Facility (together the “Credit Facilities”) are at variable rates; |
• | limits our ability to obtain additional financing in the future for working capital or other purposes, including to finance acquisitions; |
• | in the case of the convertible subordinated notes, could result in the issuance of additional shares of our common stock that would result in the dilution of our then-existing stockholders; and |
• | places us at a competitive disadvantage compared to our competitors that have less indebtedness. |
If our earnings are insufficient to fund our operations, including our acquisition growth strategy, we will need to raise additional capital or issue additional debt, including longer-term, fixed-rate debt, to pay our indebtedness as it comes due or as our availability under our ABL Facility is exhausted. If we are unable to obtain funds necessary to make required payments or if we fail to comply with the various requirements of our Credit Facilities, or (subject to certain limitations on the holders ability to accelerate the obligations) our convertible subordinated notes issued in connection with the Del Monte acquisition, we would be in default, which would permit the holders of our indebtedness to accelerate the maturity of the indebtedness, or in the case of the convertible subordinated notes, convert the notes to common stock resulting in the holders of those notes and their affiliates becoming one of our largest stockholders, and could cause defaults under any indebtedness we may incur in the future. Any default under our indebtedness requiring the repayment of outstanding borrowings would have a material adverse effect on our business, financial condition and results of operations. If we are unable to refinance or repay our indebtedness as it becomes due, we may become insolvent and be unable to continue operations.
Although the agreements governing the Credit Facilities contain restrictions on the incurrence of additional indebtedness, these restrictions are subject to a number of qualifications and exceptions, and the indebtedness incurred in compliance with these restrictions could be substantial. Also, these restrictions do not prevent us from incurring obligations that do not constitute indebtedness.
The agreements governing the Credit Facilities require us to maintain fixed charge coverage ratios and leverage ratios, which become more restrictive over time. Our ability to comply with these ratios in the future may be affected by events beyond our control, and our inability to comply with the required financial ratios could result in a default under the Credit Facilities. In the event of events of default, the lenders under the Credit Facilities could elect to terminate lending commitments and declare all borrowings outstanding, together with accrued and unpaid interest and other fees, to be immediately due and payable. See Management’s Discussion and Analysis of Financial Condition and Results of Operations—Liquidity and Capital Resources.
Our ability to raise capital in the future may be limited.
Our business and operations may consume resources, including availability under our ABL Facility, faster than we currently anticipate. In the future, we may need to raise additional funds through the issuance of new equity securities, debt, including longer-term, fixed-rate debt, or a combination of both. Additional financing may not be available on favorable terms or at all. If adequate funds are not available on acceptable terms, we may be unable to fund our capital requirements or grow our business through acquisitions, or otherwise. If we issue new debt securities, the debt holders may have rights senior to those of our common stockholders to make claims on our assets, and the terms of any debt could restrict our operations, including our ability to pay dividends on our common stock. If we issue additional equity securities, existing stockholders will experience dilution, and the new equity securities could have rights senior to those of our common stock. Because our decision to issue securities in any future offering will depend upon market conditions and other factors beyond our control, we cannot predict or estimate the amount, timing or nature of our future offerings. Thus, our stockholders bear the risk of our future securities offerings reducing the market price of our common stock and diluting their interest.
22
We may be unable to obtain debt or other financing, including financing necessary to execute on our acquisition strategy, on favorable terms or at all.
There are inherent risks in our ability to borrow debt capital. Our lenders, including the lenders participating in the Credit Facilities, may have suffered losses related to their lending and other financial relationships, especially as a result of a generally weak and uncertain national economy, increased financial instability of many borrowers and the declining value of their assets. As a result, lenders may become insolvent or tighten their lending standards, which could make it more difficult for us to borrow under our ABL Facility, refinance our existing indebtedness or obtain other financing on favorable terms or at all. Our access to funds under the Credit Facilities is dependent upon the ability of our lenders to meet their funding commitments. Our financial condition and results of operations would be adversely affected in a material manner if we were unable to draw funds under the ABL Facility because of a lender default or if we had to obtain other cost-effective financing. Longer term disruptions in the capital and credit markets as a result of uncertainty, changing or increased regulation, reduced alternatives or failures of significant financial institutions could adversely affect our access to liquidity needed for our business. Any disruption could require us to take measures to conserve cash until the markets stabilize or until alternative credit arrangements or other funding for our business can be arranged. Such measures could include deferring capital expenditures (including our entry into new markets, including through acquisitions) and reducing or eliminating other discretionary uses of cash.
Information technology system failures or breaches of our network security could interrupt our operations and adversely affect our business.
We rely upon our computer systems and network infrastructure across our operations. Our business involves the storage and transmission of many types of sensitive or confidential information, including customers’ and suppliers’ personal information, private information about employees, and financial and strategic information about us and our operations. Our operations depend upon our ability to protect our computer equipment and systems against damage from physical theft, fire, power loss, telecommunications failure or other catastrophic events, as well as from internal and external security breaches, viruses, worms and other disruptive problems. Any damage or failure of our computer systems or network infrastructure that causes an interruption in our operations, or any unauthorized access to sensitive or confidential information, including as a result of hacking, could have a material adverse effect on our business, financial condition or results of operations. Although we employ both internal resources and external consultants to conduct auditing and testing for weaknesses in our systems, controls, firewalls and encryption and intend to maintain and upgrade our security technology and operational procedures to prevent such damage, breaches or other disruptive problems, there can be no assurance that these security measures will be successful.
Our investments in information technology may not produce the benefits that we anticipate.
In an attempt to reduce our operating expenses, increase our operational efficiencies, boost our operating margins and more closely track the movement of our inventory in our protein business, we have aggressively invested in the development and implementation of new information technology. We may not be able to implement these technological changes in the time frame we have planned, and any delays in implementation could negatively impact our business, financial condition or results of operations. In addition, the costs to make these changes may exceed our estimates and will likely exceed any benefits that we realize during the early stages of implementation. Even if we are able to implement the changes as planned, and within our cost estimates, we may not be able achieve the expected efficiencies, cost savings and operational enhancements from these investments which could have an adverse effect on our business, financial condition or results of operations.
We may not be able to adequately protect our intellectual property, which, in turn, could harm the value of our brands and adversely affect our business.
Our ability to implement our business plan successfully depends in part upon our ability to further build brand recognition, including for our proprietary products, using our trademarks, service marks and other proprietary intellectual property, including our names and logos. We have registered or applied to register a number of our trademarks. We cannot assure investors in our common stock that our trademark applications will be approved. Third parties may also oppose our trademark applications, or otherwise challenge our use of the trademarks. In the event that our trademarks are successfully challenged, we could be forced to rebrand our goods and services, which could result in loss of brand recognition and could require us to devote resources to advertising and marketing new brands. If our efforts to register, maintain and protect our intellectual property are inadequate, or if any third party misappropriates, dilutes or infringes upon our intellectual property, the value of our brands may be harmed, which could have a material adverse effect on our business, financial condition or results of operations and might prevent our brands from achieving or maintaining market acceptance.
We may also face the risk of claims that we have infringed third parties’ intellectual property rights. If third parties claim that we have infringed or are infringing upon their intellectual property rights, our operating profits could be affected in a materially
23
adverse manner. Any claims of intellectual property infringement, even those without merit, could be expensive and time consuming to defend, require us to rebrand our services, if feasible, divert management’s attention and resources or require us to enter into royalty or licensing agreements in order to obtain the right to use a third party’s intellectual property. Any royalty or licensing agreements, if required, may not be available to us on acceptable terms or at all. A successful claim of infringement against us could result in our being required to pay significant damages, enter into costly license or royalty agreements, or stop the sale of certain products or services, any of which could have a negative impact on our business, financial condition or results of operations and could harm our future prospects.
Our business operations and future development could be significantly disrupted if we lose key members of our management team.
The success of our business significantly depends upon the continued contributions of our founders and key employees, both individually and as a group. Our future performance will substantially depend upon our ability to motivate and retain our founders Christopher Pappas, our chairman, president and chief executive officer, John Pappas, our vice chairman, as well as certain other senior key employees. The loss of the services of either of our founders or key employees, including key employees of the businesses we have acquired, could have a material adverse effect on our business, financial condition or results of operations. We have no reason to believe that we will lose the services of these individuals in the foreseeable future; however, we currently have no effective replacement for these individuals due to their experience, reputation in the foodservice distribution industry and special role in our operations.
Our insurance policies may not provide adequate levels of coverage against all claims, and fluctuating insurance requirements and costs could negatively impact our profitability. In addition, if we fail to establish proper reserves and adequately estimate future expenses, the costs associated with our self-insured group medical, workers’ compensation liability and auto liability plans may adversely affect our business, financial condition or results of operations.
We believe that our insurance coverage is customary for businesses of our size and type. However, there are types of losses we may incur that cannot be insured against or that we believe are not commercially reasonable to insure. These losses, should they occur, could have a material and adverse effect on our business, financial condition or results of operations. In addition, the cost of workers’ compensation insurance, auto liability insurance, general liability insurance and directors’ and officers’ liability insurance fluctuates based upon our historical trends, market conditions and availability. Because our operations principally are centered in large, metropolitan areas, our insurance costs are higher than if our operations and facilities were based in more rural markets. Additionally, health insurance costs in general have risen significantly over the past few years. These increases, as well as federal legislation requiring employers to provide specified levels of health insurance to all employees, could have a negative impact upon our business, financial condition or results of operations, and there can be no assurance that we will be able to successfully offset the effect of such increases with plan modifications and cost control measures, additional operating efficiencies or the pass-through of such increased costs to our customers.
Effective October 1, 2011, we began maintaining a self-insured group medical program. We record a liability for medical claims during the period in which they occur, as well as an estimate of incurred but not reported claims. Management determines the adequacy of these accruals based on a monthly evaluation of our historical claims experience and medical cost trends. Projections of future loss expenses are inherently uncertain because of the random nature of insurance claims occurrences and could be significantly affected if future occurrences and claims differ from these assumptions and historical trends. If we suffer a substantial loss that is not covered by our self- insurance reserves, the loss and attendant expenses could harm our business and operating results. We have purchased stop loss coverage from third parties which limits our exposure above the amounts we have self-insured.
Effective August 1, 2012, we became self-insured for workers’ compensation and automobile liability to deductibles or self-insured retentions of $350 thousand for workers compensation and $250 thousand for automobile liability per occurrence. The amounts in excess of our deductibles are fully insured by third party insurers. Liabilities associated with this program are estimated in part by considering historical claims experience and cost trends. Projections of future loss expenses are inherently uncertain because of the random nature of insurance claims occurrences and could be significantly affected if future occurrences and claims differ from these assumptions and historical trends.
Increases in our labor costs, including as a result of labor shortages, the unionization of some of our associates, the price or unavailability of insurance and changes in government regulation could slow our growth or harm our business.
We are subject to a wide range of labor costs. Because our labor costs (particularly those in our center-of-the-plate businesses) are, as a percentage of revenues, higher than other industries, we may be significantly harmed by labor cost increases.
24
Our operations are dependent upon our experienced and sophisticated sales professionals, warehouse personnel and drivers, and, in our protein unit, on the experienced butchers we employ. Qualified individuals have historically been in short supply and an inability to attract and retain them may limit our ability to expand our operations in existing markets, as well as our ability to penetrate new markets. We can make no assurances that we will be able to attract and retain qualified individuals in the future. Additionally, the cost of attracting and retaining qualified individuals may be higher than we currently anticipate, and as a result, our profitability could decline. We are subject to the risk of employment-related litigation, which we believe increased as a result of our expansion in California resulting from the Del Monte acquisition and our large workforce in New York, at both the state and federal levels, including claims styled as class action lawsuits, which are more costly to defend. Also, some employment-related claims in the area of wage and hour disputes are not insurable risks.
Despite our efforts to control costs while still providing competitive healthcare benefits to our staff members, significant increases in healthcare costs continue to occur, and we can provide no assurance that our cost containment efforts in this area will be effective. Moreover, we are continuing to assess the impact of federal healthcare legislation on our healthcare benefit costs, and significant increases in such costs could adversely impact our operating results. There is no assurance that we will be able to pass through the costs of such legislation in a manner that will not adversely impact our operating results.
In addition, many of our delivery and warehouse personnel are hourly workers subject to various minimum wage requirements. Mandated increases in minimum wage levels have recently been and continue to be proposed and implemented at both federal and state government levels. Minimum wage increases may increase our labor costs.
We are also subject to the regulations of the U.S. Citizenship and Immigration Services and U.S. Customs and Immigration Enforcement. Our failure to comply with federal and state labor laws and regulations, or our employees’ failure to meet federal citizenship or residency requirements, could result in a disruption in our work force, sanctions or fines against us as well as adverse publicity and additional cost.
As of December 29, 2017, we had 1,994 full-time employees, 197 of whom (approximately 9.9%) are represented by unions and are operating under a collective bargaining agreement. We have in the past been the focus of union negotiating efforts, and it is likely that we will be the focus of similar efforts in the future.
As we increase our employee base and broaden our distribution operations to new geographic markets, including as a result of acquisitions, our increased visibility could result in increased or expanded union-organizing efforts or we may acquire businesses with unionized workforces. Three labor unions have been certified to represent bargaining units at our New York, Chicago and Maryland facilities, and we have entered into a collective bargaining agreement with our union employees in New York, Chicago and Maryland. Although we have not experienced a work stoppage to date, if we are unable to successfully negotiate union contracts, or renewals of existing contracts, if additional employees were to unionize or if we acquire additional businesses with unionized employees, we could be subject to work stoppages and increases in labor costs, either of which could have a material adverse effect on our business, financial condition or results of operations.
We are subject to significant governmental regulation, and failure to comply could subject us to enforcement actions, recalls or other penalties, which could have a material adverse effect on our business, financial condition or results of operations.
Our business is highly regulated at the federal, state and local levels, and our specialty food products, meat, poultry and seafood products and distribution operations require various licenses, permits and approvals. For example:
• | the products we distribute in the United States are subject to regulation and inspection by the FDA and the USDA, and the products we distribute in Canada are subject to regulation by Health Canada and the Canadian Food Inspection Agency; |
• | our warehouse, distribution facilities, repackaging activities and other operations also are subject to regulation and inspection, as applicable, by the FDA, the USDA, Health Canada, the Canadian Food Inspection Agency and state and provincial health authorities; and |
• | our U.S. and Canadian trucking operations are subject to regulation by, as applicable, the U.S. Department of Transportation, the U.S. Federal Highway Administration, Transport Canada, the Surface Transportation Board and provincial transportation authorities. |
Our suppliers are also subject to similar regulatory requirements and oversight. The failure to comply with applicable regulatory requirements could result in civil or criminal fines or penalties, product recalls, closure of facilities or operations, the loss or revocation of any existing licenses, permits or approvals or the failure to obtain additional licenses, permits or approvals in new jurisdictions where we intend to do business, any of which could have a material adverse effect on our business, financial condition or results of operations.
25
In addition, as a distributor and repackager of specialty food products and meat, poultry and seafood products, we are subject to increasing governmental scrutiny of and public awareness regarding food safety and the manufacture, sale, packaging, storage and marketing of natural, organic and other food products. Compliance with these laws may impose a significant burden upon our operations. If we were to distribute foods that are or are perceived to be contaminated, or otherwise not in compliance with applicable laws, any resulting product recalls could have a material adverse effect on our business, financial condition or results of operations. In January 2011, President Obama signed into law the FDA Food Safety Modernization Act, which greatly expands the FDA’s authority over food safety, including giving the FDA power to order the recall of unsafe foods, increase inspections at food processing facilities, issue regulations regarding the sanitary transportation of food, enhance tracking and tracing requirements and order the detention of food that it has reason to believe is adulterated or misbranded, among other provisions. The FDA has taken a number of steps to implement the law, including, among others, the issuance of final regulations on preventive controls, produce safety, and foreign supplier verification programs to strengthen the oversight of imported foods. These actions have resulted in increased compliance costs that are likely to continue. We cannot assure investors in our common stock that these actions will not adversely impact us or others in our industry further, including suppliers of the products we sell, many of whom are small-scale producers who may be unable or unwilling to bear the expected increases in costs of compliance and as a result cease operations or seek to pass along these costs to us.
Additionally, concern over climate change, including the impact of global warming, has led to significant U.S. and international legislative and regulatory efforts to limit greenhouse gas, or GHG, emissions. Increased regulation regarding GHG emissions, especially diesel engine emissions, could impose substantial costs upon us. These costs include an increase in the cost of the fuel and other energy we purchase and capital costs associated with updating or replacing our vehicles prematurely.
Until the timing, scope and extent of such regulation becomes known, we cannot predict its effect on our business, financial condition or results of operations. It is reasonably possible, however, that such regulation could impose material costs on us which we may be unable to pass on to our customers.
Federal, state, provincial and local tax rules in the United States and Canada may adversely impact our business, financial condition or results of operations.
We are subject to federal, state and local taxes in the United States, as well as federal, provincial and local taxes in Canada. Although we believe that our tax estimates are reasonable, if the Internal Revenue Service (“IRS”) or any other taxing authority disagrees with the positions we have taken on our tax returns, we could face additional tax liability, including interest and penalties. If material, payment of such additional amounts upon final adjudication of any disputes could have a material impact on our business, financial condition or results of operations.
Complying with new tax rules, laws or regulations could impact our business, financial condition or results of operations, and increases to federal, provincial or state statutory tax rates and other changes in tax laws, rules or regulations may increase our effective tax rate. Any increase in our effective tax rate could have a material impact on our business, financial condition or results of operations.
The price of our common stock may be volatile and our stockholders could lose all or part of their investment.
Volatility in the market price of our common stock may prevent our stockholders from being able to sell their shares at or above the price the stockholders paid for their shares. The market price of our common stock could fluctuate significantly for various reasons, which include the following:
• | our quarterly or annual earnings or those of other companies in our industry; |
• | changes in laws or regulations, or new interpretations or applications of laws and regulations, that are applicable to our business; |
• | the public’s reaction to our press releases, our other public announcements and our filings with the SEC; |
• | changes in accounting standards, policies, guidance, interpretations or principles; |
• | additions or departures of our senior management personnel; |
• | sales of common stock by our directors and executive officers; |
• | adverse market reaction to any indebtedness we may incur or securities we may issue in the future; |
• | actions by stockholders; |
• | the level and quality of research analyst coverage for our common stock, changes in financial estimates or investment recommendations by securities analysts following our business or failure to meet such estimates; |
• | the financial disclosure we may provide to the public, any changes in such disclosure or our failure to meet projections included in our public disclosure; |
26
• | various market factors or perceived market factors, including rumors, whether or not correct, involving us, our customers, our distributors or suppliers or our competitors; |
• | introductions of new products or new pricing policies by us or by our competitors; |
• | acquisitions or strategic alliances by us or our competitors; |
• | short sales, hedging and other derivative transactions in our common stock; |
• | the operating and stock price performance of other companies that investors may deem comparable to us; and |
• | other events or factors, including changes in general conditions in the United States and global economies or financial markets (including those resulting from acts of God, war, incidents of terrorism or responses to such events). |
Concentration of ownership among our existing executive officers, directors and their affiliates may prevent new investors from influencing significant corporate decisions.
As of March 5, 2018, our executive officers, directors and their affiliates beneficially owned, in the aggregate, approximately 23.5% of our outstanding shares of common stock. In particular, Christopher Pappas, our president and chief executive officer, and John Pappas, our vice chairman, beneficially owned approximately 18.7% of our outstanding shares of common stock as of March 5, 2018. Additionally, upon the closing of our acquisition of Del Monte on April 6, 2015, the shareholders of Del Monte received approximately 1.1 million shares of our common stock, or 3.9% of our outstanding common stock as of March 5, 2018, as well as $36.8 million in convertible subordinated notes, which notes may be converted into shares of our common stock by such holders at any time at a per share price of $29.70. As a result of their significant individual ownership levels, these stockholders will be able to exercise a significant level of control over all matters requiring stockholder approval, including the election of directors, amendment of our certificate of incorporation and approval of significant corporate transactions. This control could have the effect of delaying or preventing a change of control of our company or changes in management and will make the approval of certain transactions difficult or impossible without the support of these stockholders.
If securities analysts or industry analysts downgrade our stock, publish negative research or reports or do not publish reports about our business, our stock price and trading volume could decline.
The trading market for our common stock will be influenced by the research and reports that industry or securities analysts publish about us, our business and our industry. If one or more analysts adversely change their recommendation regarding our stock or our competitors’ stock, our stock price may likely decline. If one or more analysts cease coverage of us or fail to regularly publish reports on us, we could lose visibility in the financial markets, which in turn could cause our stock price or trading volume to decline.
We do not intend to pay dividends for the foreseeable future and our stock may not appreciate in value.
We currently intend to retain our future earnings, if any, to finance the operation and growth of our business and do not expect to pay any cash dividends in the foreseeable future. As a result, the success of an investment in shares of our common stock will depend upon any future appreciation in its value. There is no guarantee that shares of our common stock will appreciate in value or that the price at which our stockholders have purchased their shares will be able to be maintained.
Our issuance of preferred stock or debt securities could adversely affect holders of our common stock and discourage a takeover.
Our board of directors is authorized to issue up to 5,000,000 shares of preferred stock without any action on the part of our stockholders. Our board of directors also has the power, without stockholder approval, to set the terms of any series of preferred stock that may be issued, including voting rights, dividend rights, preferences over our common stock with respect to dividends or in the event of a dissolution, liquidation or winding up and other terms. In the event that we issue preferred stock in the future that has preference over our common stock with respect to payment of dividends or upon our liquidation, dissolution or winding up, or if we issue preferred stock with voting rights that dilute the voting power of our common stock, the rights of the holders of our common stock or the market price of our common stock could be adversely affected. In addition, the ability of our board of directors to issue shares of preferred stock without any action on the part of our stockholders may impede a takeover of us and prevent a transaction favorable to our stockholders.
Additionally, in the future, we may need to raise additional funds or pay all, or a portion, of the acquisition price for a business we acquire through the issuance of new debt, including longer-term, fixed-rate debt. If we issue new debt securities, the debt holders may have rights senior to those of our common stockholders to make claims on our assets, and the terms of any debt could restrict our operations, including our ability to pay dividends on our common stock.
27
Some provisions of our charter documents and Delaware law may have anti-takeover effects that could discourage an acquisition of us by others, even if an acquisition would be beneficial to our stockholders, and may prevent attempts by our stockholders to replace or remove our current management.
Provisions in our certificate of incorporation and bylaws as well as provisions of the Delaware General Corporation Law could make it more difficult for a third party to acquire us or increase the cost of acquiring us, even if doing so would benefit our stockholders, including transactions in which stockholders might otherwise receive a premium for their shares. These provisions include:
• | authorizing the issuance of “blank check” preferred stock, the terms of which may be established and shares of which may be issued without stockholder approval; |
• | prohibiting stockholder action by written consent, thereby requiring all stockholder actions to be taken at a meeting of our stockholders; |
• | eliminating the ability of stockholders to call a special meeting of stockholders; and |
• | establishing advance notice requirements for nominations for election to the board of directors or for proposing matters that can be acted upon at stockholder meetings. |
28
Item 1B. UNRESOLVED STAFF COMMENTS
None.
Item 2. PROPERTIES
The following table sets forth the location, purpose and approximate size of our distribution and corporate facilities as of March 5, 2018:
Name/Location | Owned/Leased | Purpose | Approximate Size (Sq. Feet) | ||||
Bronx, NY | Leased | Distribution Center | 231,100 | ||||
Chicago, IL | Leased | Distribution Center | 127,800 | ||||
Union City, CA | Leased | Distribution Center | 117,400 | ||||
City of Industry, CA | Leased | Distribution Center | 81,600 | ||||
Las Vegas, NV | Leased | Distribution Center | 74,000 | ||||
Columbus, OH | Leased | Processing Facility/Distribution Center | 60,900 | ||||
Cincinnati, OH | Owned | Distribution Center | 59,500 | ||||
Hanover, MD | Leased | Distribution Center | 55,600 | ||||
Portland, OR | Leased | Distribution Center | 55,500 | ||||
Brisbane, CA | Leased | Processing Facility/Distribution Center | 50,000 | ||||
Baltimore, MD | Leased | Distribution Center | 50,000 | ||||
Downey, CA | Subleased (1) | Distribution Center | 40,300 | ||||
Hayward, CA | Subleased (1) | Distribution Center | 40,000 | ||||
West Sacramento, CA | Leased | Processing Facility/Distribution Center | 37,900 | ||||
Hollywood, FL | Leased | Distribution Center | 27,900 | ||||
Toronto, ON | Leased | Distribution Center | 25,500 | ||||
Richmond, BC | Leased | Distribution Center | 24,900 | ||||
American Canyon, CA | Leased | Processing Facility/Distribution Center | 24,000 | ||||
San Francisco, CA | Leased | Processing Facility/Distribution Center | 23,700 | ||||
Marina, CA | Leased | Processing Facility/Distribution Center | 21,000 | ||||
Ridgefield, CT | Leased | Corporate Headquarters | 20,000 | ||||
West Sacramento, CA | Leased | Maintenance Building | 12,000 | ||||
Kent, WA | Leased | Distribution Center | 10,500 | ||||
Chicago, IL | Owned | Processing Facility | 10,000 | ||||
Edmonton, AB | Leased | Distribution Center | 9,600 | ||||
Pembroke Park, FL | Leased | Distribution Center | 6,700 | ||||
Tempe, AZ | Leased | Distribution Center | 3,500 | ||||
West Bridgewater, MA | Leased | Distribution Center | 1,400 | ||||
Total Square Feet | 1,302,300 | ||||||
(1) | These are former distribution centers that are under non-cancelable operating leases that expire in fiscal 2019. We no longer conduct any of our operations out of these sites and we have entered into third-party sublease arrangements for each of them. |
We consider our properties to be in good condition generally and believe our facilities are adequate for our operations and provide sufficient capacity to meet our anticipated requirements.
29
Item 3. LEGAL PROCEEDINGS
From time to time, we are subject to various legal proceedings that arise from the normal course of business activities. If an unfavorable ruling were to occur, there exists the possibility of a material adverse impact on our results of operations, prospects, cash flows, financial position and brand. We are not currently aware of any pending or threatened legal proceeding against us that could have a material adverse effect on our business, operating results or financial condition.
Item 4. MINE SAFETY DISCLOSURES
Not applicable.
30
PART II
Item 5. MARKET FOR REGISTRANT’S COMMON EQUITY, RELATED STOCKHOLDER MATTERS AND ISSUER PURCHASES OF EQUITY SECURITIES
The Chefs’ Warehouse, Inc. Common Stock
Our common stock is publicly traded under the symbol “CHEF” on the NASDAQ Global Select Market. The following table sets forth the high and low sale prices for our common stock for the fiscal periods indicated as reported by the Nasdaq Stock Market during the indicated quarters.
Common Stock Price | ||||||||
High | Low | |||||||
Fiscal Year Ended December 29, 2017 | ||||||||
First Quarter | $ | 16.90 | $ | 13.60 | ||||
Second Quarter | $ | 16.05 | $ | 13.00 | ||||
Third Quarter | $ | 19.80 | $ | 12.00 | ||||
Fourth Quarter | $ | 21.23 | $ | 16.60 | ||||
Fiscal Year Ended December 30, 2016 | ||||||||
First Quarter | $ | 20.23 | $ | 12.90 | ||||
Second Quarter | $ | 20.34 | $ | 14.82 | ||||
Third Quarter | $ | 16.72 | $ | 10.49 | ||||
Fourth Quarter | $ | 16.15 | $ | 10.80 | ||||
On March 8, 2018, the closing price of our common stock on the NASDAQ Global Select Market was $23.15 per share. As of March 5, 2018, there were 72 holders of record of our common stock. This does not include the number of persons whose stock is in nominee or “street” name accounts through brokers.
We have never paid a cash dividend on our common stock and do not anticipate paying any cash dividends on our common stock in the foreseeable future. Furthermore, we are prohibited from paying cash dividends under the terms of our senior secured credit facilities without the consent of the lenders thereunder.
Performance Graph
The following graph compares the cumulative total stockholder return on our common stock during the period from December 28, 2012 through December 29, 2017 with the cumulative total return on the NASDAQ Composite and the S&P Smallcap Food Distributor Index. The comparison assumes that $100 was invested on December 28, 2012 in our common stock and in each of the foregoing indices and assumes reinvestment of dividends, if any.
The following performance graph and related information shall not be deemed “soliciting material” or to be “filed” with the Securities and Exchange Commission, nor shall such information be incorporated by reference into any future filing under the Securities Act of 1933 or the Securities Exchange Act of 1934, each as amended, except to the extent that we specifically incorporate such information by reference into such filing.
31
COMPARISON OF 5 YEAR CUMULATIVE TOTAL RETURN
AMONG THE CHEFS’ WAREHOUSE, INC.
NASDAQ COMPOSITE INDEX AND THE S&P SMALLCAP FOOD DISTRIBUTOR INDEX
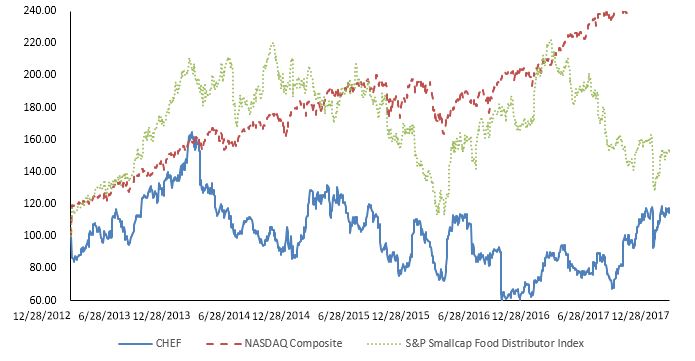
Assumes $100 invested on December 28, 2012
December 28, 2012 | December 27, 2013 | December 26, 2014 | December 25, 2015 | December 30, 2016 | December 29, 2017 | |||||||||||||||||||
The Chefs’ Warehouse, Inc. | $ | 100.00 | $ | 163.16 | $ | 123.35 | $ | 97.26 | $ | 90.43 | $ | 114.78 | ||||||||||||
NASDAQ Composite Index | $ | 100.00 | $ | 159.55 | $ | 184.51 | $ | 193.79 | $ | 208.51 | $ | 264.99 | ||||||||||||
S&P Smallcap Food Distributor Index | $ | 100.00 | $ | 207.30 | $ | 205.72 | $ | 140.35 | $ | 220.60 | $ | 151.93 | ||||||||||||
ISSUER PURCHASES OF EQUITY SECURITIES
Total Number of Shares Repurchased(1) | Average Price Paid Per Share | Total Number of Shares Purchased as Part of Publicly Announced Plans or Programs | Maximum Number (or Approximate Dollar Value) of Shares That May Yet Be Purchased Under the Plans or Programs | ||||||||||
September 30, 2017 to October 27, 2017 | 90 | $ | 20.35 | — | — | ||||||||
October 28, 2017 to November 24, 2017 | 1,109 | 18.35 | — | — | |||||||||
November 25, 2017 to December 29, 2017 | 1,092 | 20.60 | — | — | |||||||||
Total | 2,291 | $ | 19.50 | — | — | ||||||||
(1) | During the thirteen weeks ended December 29, 2017, we withheld 2,291 shares of our common stock to satisfy tax withholding requirements upon the vesting of restricted shares of our common stock awarded to certain of our officers and key employees. |
Equity Compensation Plan Information
See Part III, Item 12 for information regarding securities authorized for issuance under our equity compensation plans.
32
Item 6. SELECTED FINANCIAL DATA
The selected consolidated financial data presented below as of the end of each of the fiscal years in the five-year period ended December 29, 2017 have been derived from our or our predecessor company’s audited consolidated financial statements. The data set forth below is qualified by reference to, and should be read in conjunction with our consolidated financial statements and their notes and “Management’s Discussion and Analysis of Financial Condition and Results of Operations” included elsewhere in this Annual Report on Form 10-K. Our consolidated statement of operations for the year ended December 30, 2016 contained a 53rd week while all other years presented contained 52 weeks.
Consolidated Statement of Operations Data:
(Amounts presented in thousands, except for per share amounts)
For the Fiscal Years Ended | ||||||||||||||||||||
Statement of Operations Data: | December 29, 2017 | December 30, 2016 | December 25, 2015 | December 26, 2014 | December 27, 2013 | |||||||||||||||
Net sales | $ | 1,301,520 | $ | 1,192,866 | $ | 1,046,878 | $ | 832,709 | $ | 673,545 | ||||||||||
Cost of sales | 972,142 | 891,649 | 778,167 | 627,551 | 501,181 | |||||||||||||||
Gross profit | 329,378 | 301,217 | 268,711 | 205,158 | 172,364 | |||||||||||||||
Operating expenses (1) | 288,251 | 253,978 | 228,311 | 172,148 | 135,783 | |||||||||||||||
Operating income | 41,127 | 47,239 | 40,400 | 33,010 | 36,581 | |||||||||||||||
Interest expense, net (2) | 22,709 | 41,632 | 12,984 | 8,167 | 7,775 | |||||||||||||||
Loss (gain) on sale of assets | 10 | (69 | ) | (295 | ) | (5 | ) | 8 | ||||||||||||
Income before income taxes | 18,408 | 5,676 | 27,711 | 24,848 | 28,798 | |||||||||||||||
Provision for income taxes (3) | 4,042 | 2,653 | 11,502 | 10,633 | 11,808 | |||||||||||||||
Net income | $ | 14,366 | $ | 3,023 | $ | 16,209 | $ | 14,215 | $ | 16,990 | ||||||||||
Basic net income per share | $ | 0.55 | $ | 0.12 | $ | 0.63 | $ | 0.58 | $ | 0.78 | ||||||||||
Diluted net income per share | $ | 0.54 | $ | 0.12 | $ | 0.63 | $ | 0.57 | $ | 0.77 | ||||||||||
Weighted average common shares outstanding: | ||||||||||||||||||||
Basic | 26,118 | 25,919 | 25,532 | 24,638 | 21,767 | |||||||||||||||
Diluted | 27,425 | 26,030 | 26,509 | 24,845 | 21,995 | |||||||||||||||
Balance Sheet Data (at end of period) | ||||||||||||||||||||
Cash and cash equivalents | $ | 41,504 | $ | 32,862 | $ | 2,454 | $ | 3,328 | $ | 20,014 | ||||||||||
Working capital | $ | 188,567 | $ | 157,117 | $ | 125,371 | $ | 111,947 | $ | 117,504 | ||||||||||
Total assets | $ | 687,749 | $ | 633,538 | $ | 579,803 | $ | 374,266 | $ | 351,971 | ||||||||||
Long-term debt, net of current portion | $ | 313,995 | $ | 317,725 | $ | 267,349 | $ | 135,800 | $ | 140,847 | ||||||||||
Total liabilities | $ | 439,148 | $ | 439,778 | $ | 391,839 | $ | 227,472 | $ | 219,906 | ||||||||||
Total stockholders’ equity | $ | 248,601 | $ | 193,760 | $ | 187,964 | $ | 146,794 | $ | 132,065 | ||||||||||
(1) | Fiscal year 2016 includes income of $8,347 related to the revaluation of the Del Monte earn-out liabilities. |
(2) | Fiscal year 2016 includes the impact of our debt restructuring resulting in a loss on extinguishment of debt of $22,310. |
(3) | Fiscal year 2017 includes a tax benefit of $3,573 related to the enactment of H.R. 1, originally known as the Tax Cuts and Jobs Act, (the “Tax Act”). |
Acquisitions Affecting Comparability of Operating Results
The Company has made several acquisitions throughout the five-year period ended December 29, 2017. For acquisitions affecting the comparability of most recent three fiscal years, refer to the “Recent Acquisitions” section of “Management’s
33
Discussion and Analysis of Financial Condition and Results of Operations” included elsewhere in this Annual Report on Form 10-K. Acquisitions affecting comparability of the previous periods are described below.
On December 11, 2013, we acquired substantially all the assets of Allen Brothers (and its subsidiaries) based in Chicago, Illinois. Founded in 1893, Allen Brothers is a leading processor and distributor of premium quality meats to many of the nation’s finest restaurants, hotels, casinos and country clubs. In addition, Allen Brothers supplies many of those same high quality products to over 100,000 consumers through a direct mail and e-commerce platform. The total purchase price for the business is estimated to be approximately $30.7 million, which includes approximately $23.9 million paid at closing with cash proceeds from our September 2013 common stock offering. The remaining $6.7 million represents pension liabilities we assumed of $2.9 million and contingent earn-out consideration of $6.0 million to be paid upon the achievement of certain performance milestones over the next four years following the closing, offset by $2.1 million received as an adjustment to the purchase price. We paid a $1.5 million earn-out in fiscal 2015 and settled the remaining liability for $2.6 million in fiscal 2016.
On May 1, 2013, we acquired 100% of the equity interests of Qzina, a British Columbia, Canada corporation based in Pompano Beach, Florida. Founded in 1982, Qzina is a leading supplier of gourmet chocolate, dessert and pastry products dedicated to the pastry professional. Qzina currently supplies more than 3,000 products to some of the finest restaurants, bakeries, patisseries, chocolatiers, hotels and cruise lines throughout the U.S. and Canada. The total purchase price paid for Qzina was $31.4 million, net of $0.6 million cash and was funded with borrowings under the revolving credit facility portion of our Amended and Restated Credit Agreement. In the third quarter of 2014, the Company received a settlement of $0.5 million from the prior owners of Qzina directly related to disputes regarding the working capital adjustment.
34
Item 7. MANAGEMENT’S DISCUSSION AND ANALYSIS OF FINANCIAL CONDITION AND RESULTS OF OPERATIONS
The following discussion should be read in conjunction with information included in Item 8 of this report. Unless otherwise indicated, the terms “Company”, “Chefs’ Warehouse”, “we”, “us”, and “our” refer to The Chefs’ Warehouse, Inc. and its subsidiaries.
Overview and Recent Developments
Overview
We are a premier distributor of specialty foods in eight of the leading culinary markets in the United States. We offer more than 48,000 SKUs, ranging from high-quality specialty foods and ingredients to basic ingredients and staples and center-of-the-plate proteins. We serve more than 30,000 customer locations, primarily located in our 15 geographic markets across the United States and Canada, and the majority of our customers are independent restaurants and fine dining establishments. As a result of our acquisition of Allen Brothers, we also sell certain of our center-of-the-plate products directly to consumers.
We believe several key differentiating factors of our business model have enabled us to execute our strategy consistently and profitably across our expanding customer base. These factors consist of a portfolio of distinctive and hard-to-find specialty food products, an extensive selection of center-of-the-plate proteins, a highly trained and motivated sales force, strong sourcing capabilities, a fully integrated warehouse management system, a highly sophisticated distribution and logistics platform and a focused, seasoned management team.
In recent years, our sales to existing and new customers have increased through the continued growth in demand for specialty food products and center-of-the-plate products in general; increased market share driven by our large percentage of sophisticated and experienced sales professionals, our high-quality customer service and our extensive breadth and depth of product offerings, including, as a result of our acquisitions of Michael’s in August 2012, Allen Brothers in December 2013, Del Monte in April 2015 and Fells Point in August 2017, meat, seafood and other center-of-the-plate products, and, as a result of our acquisition of Qzina in May 2013, gourmet chocolate, pastries and dessert; the acquisition of other specialty food and center-of-the-plate distributors; the expansion of our existing distribution centers; our entry into new distribution centers, including the construction of a new distribution center in Chicago; and the import and sale of our proprietary brands. Through these efforts, we believe that we have been able to expand our customer base, enhance and diversify our product selections, broaden our geographic penetration and increase our market share. We believe that as a result of these efforts, we have increased sales from $674 million in fiscal 2013 to $1.3 billion in fiscal 2017.
Recent Acquisitions
On August 25, 2017, we acquired substantially all of the assets of Fells Point, a specialty protein manufacturer and distributor based in the metro Baltimore and Washington DC area. The aggregate purchase price for the transaction at acquisition date was approximately $33.0 million, including the impact of an initial net working capital adjustment which is subject to a post-closing working capital adjustment true up. Approximately $29.7 million was paid in cash at closing and the remaining $3.3 million consisted of 185,442 shares of the Company's common stock. We are also required to pay additional contingent consideration, if earned, in the form of an earn-out amount which could total approximately $12.0 million. The payment of the earn-out liability is subject to the successful achievement of annual Adjusted EBITDA targets for the Fells Point business over a period of four years following closing.
On June 27, 2016, we acquired substantially all of the assets of MT Food, based in Chicago, Illinois. Founded in the mid-1990's, MT Food is a wholesale distributor of dairy, produce, specialty and grocery items in the metro Chicago area. The purchase price for the transaction was $21.5 million, of which, $21.0 million was paid in cash at closing with an additional $0.5 million payable eighteen months after the closing date. The aggregate purchase was paid through cash-on-hand and the proceeds from a draw down on its delayed draw term loan facility. During the second quarter of fiscal 2017, we paid an earn-out of $0.5 million to the former owners.
On April 6, 2015, we acquired substantially all the equity interests of Del Monte for an aggregate purchase price of approximately $184.1 million. Founded in 1926, Del Monte supplies high quality, USDA inspected beef, pork, lamb, veal, poultry and seafood products to Northern California. The funding of the acquisition consisted of the following:
35
• | $123.9 million in cash, which was funded with cash-on-hand, borrowings under the revolving credit facility portion of our senior secured credit facilities and the issuance of $25.0 million of additional senior secured notes that bear interest at 5.80% per annum due on October 17, 2020; |
• | approximately 1.1 million shares of our common stock (valued at $22.17 per share); |
• | $36.8 million in convertible subordinated notes issued to certain entities affiliated with Del Monte with a six-year maturity bearing interest at 2.50% with a conversion price of $29.70 per share; and |
• | $1.3 million offset received as an adjustment to the purchase price. |
In addition, we have agreed to pay additional contingent consideration in the form of an earn-out of up to $24.5 million upon the successful achievement of Adjusted EBITDA targets for the Del Monte entities and improvements in certain operating metrics for our existing protein business and the business of any protein companies subsequently acquired by the Company over the six years following the closing. The fair value of the Del Monte earn-out liability was $0.6 million as of December 29, 2017.
Debt Restructuring and Repricing
On June 22, 2016, we refinanced our debt structure by entering into a new senior secured term loan. We used the proceeds to pay off our revolving credit facility of $96.4 million, our previous term loan of $1.7 million and our senior secured notes of $125.0 million. We were required to pay the senior note holders make-whole payments totaling $21.1 million for the early retirement of these notes. In addition, we wrote off deferred financing fees totaling $1.1 million relating to the senior secured notes, term loan, and revolving credit facility. The refinancing met the requirements of a debt extinguishment for accounting purposes and the loss on extinguishment of debt of $22.3 million, inclusive of the make-whole payments and write-off of deferred financing fees, is reflected in interest expense.
On December 13, 2017, we repriced our senior secured term loan from 475 basis points to 400 basis points over LIBOR. In connection with the repricing, we incurred debt financing costs of $0.8 million which were capitalized as deferred financing fees.
Equity Offering
On December 19, 2017, we completed a public offering of 1,900,000 shares of our common stock which resulted in net proceeds to us of approximately $34.0 million after deducting underwriters’ fees, commissions and transaction expenses. The net proceeds are currently being held as cash and cash equivalents for use in general corporate purposes including as possible consideration for future acquisitions.
Our Growth Strategies and Outlook
We continue to invest in our people, facilities and technology in an effort to achieve the following objectives and maintain our premier position within the specialty foodservice distribution market:
• | sales and service territory expansion; |
• | operational excellence and high customer service levels; |
• | expanded purchasing programs and improved buying power; |
• | product innovation and new product category introduction; |
• | operational efficiencies through system enhancements; and |
• | operating expense reduction through the centralization of general and administrative functions. |
Our growth has allowed us to improve upon our organization’s infrastructure, open new distribution facilities and pursue selective acquisitions. Over the last several years, we have increased our distribution capacity to approximately 1.3 million square feet in 23 distribution facilities at December 29, 2017. From the second half of fiscal 2013 through the end of fiscal 2017, we have invested significantly in acquisitions, infrastructure and management.
Key Factors Affecting Our Performance
Due to our focus on menu-driven independent restaurants, fine dining establishments, country clubs, hotels, caterers, culinary schools, bakeries, patisseries, chocolatiers, cruise lines, casinos and specialty food stores, our results of operations are materially impacted by the success of the food-away-from-home industry in the United States and Canada, which is materially impacted by general economic conditions, weather, discretionary spending levels and consumer confidence. When economic conditions deteriorate, our customers' businesses are negatively impacted as fewer people eat away-from-home and those who
36
do spend less money. As economic conditions begin to improve, our customers’ businesses historically have likewise improved, which contributes to improvements in our business. Similarly, the direct-to-consumer business of our Allen Brothers subsidiary is significantly dependent on consumers’ discretionary spending habits, and weakness or uncertainty in the economy could lead to consumers buying less from Allen Brothers.
Volatile food costs may have a direct impact upon our profitability. Prolonged periods of product cost inflation may have a negative impact on our profit margins and results of operations to the extent we are unable to pass on all or a portion of such product cost increases to our customers. In addition, product cost inflation may negatively impact consumer discretionary spending decisions within our customers’ establishments, which could adversely impact our sales. Conversely, our profit levels may be negatively impacted during periods of product cost deflation even though our gross profit as a percentage of sales may remain relatively constant. However, some of our products, particularly certain of our protein items, are priced on a cost plus a dollar markup, which helps mitigate the negative impact of deflation.
Given our wide selection of product categories, as well as the continuous introduction of new products, we can experience shifts in product sales mix that have an impact on net sales and gross profit margins. This mix shift is most significantly impacted by the introduction of new categories of products in markets that we have more recently entered, the shift in product mix resulting from acquisitions, as well as the continued growth in item penetration on higher velocity items such as dairy products.
The foodservice distribution industry is fragmented but consolidating, and we have supplemented our internal growth through selective strategic acquisitions. We believe that the consolidation trends in the foodservice distribution industry will continue to present acquisition opportunities for us, which may allow us to grow our business at a faster pace than we would otherwise be able to grow the business organically.
Performance Indicators
In addition to evaluating our income from operations, our management team analyzes our performance based on net sales growth, gross profit and gross profit margin.
• | Net sales growth. Our net sales growth is driven principally by changes in volume and, to a lesser degree, changes in price related to the impact of inflation in commodity prices and product mix. In particular, product cost inflation and deflation impacts our results of operations and, depending on the amount of inflation or deflation, such impact may be material. For example, inflation may increase the dollar value of our sales, and deflation may cause the dollar value of our sales to fall despite our unit sales remaining constant or growing. |
• | Gross profit and gross profit margin. Our gross profit and gross profit as a percentage of net sales, or gross profit margin, are driven principally by changes in volume and fluctuations in food and commodity prices and our ability to pass on any price increases to our customers in an inflationary environment and maintain or increase gross profit margin when our costs decline. Our gross profit margin is also a function of the product mix of our net sales in any period. Given our wide selection of product categories, as well as the continuous introduction of new products, we can experience shifts in product sales mix that have an impact on net sales and gross profit margins. This mix shift is most significantly impacted by the introduction of new categories of products in markets that we have more recently entered, impact of product mix from acquisitions, as well as the continued growth in item penetration on higher velocity items such as dairy products. |
Key Financial Definitions
• | Net sales. Net sales consist primarily of sales of specialty products, center-of-the-plate proteins and other food products to independently-owned restaurants and other high-end foodservice customers, which we report net of certain group discounts and customer sales incentives. Net sales also include sales by our Allen Brothers subsidiary that are direct-to-consumers. |
• | Cost of sales. Cost of sales include the net purchase price paid for products sold, plus the cost of transportation necessary to bring the product to our distribution facilities. Our cost of sales may not be comparable to other similar companies within our industry that include all costs related to their distribution network and protein processing costs in their costs of sales rather than as operating expenses. |
• | Operating expenses. Our operating expenses include warehousing, processing and distribution expenses (which include salaries and wages, employee benefits, facility and distribution fleet rental costs and other expenses related to warehousing, processing and delivery) and selling, general and administrative expenses (which include selling, insurance, administrative, wage and benefit expenses, share-based compensation expense and changes in the fair value of our contingent earn-out liabilities). |
37
• | Interest expense. Interest expense consists primarily of interest on our outstanding indebtedness and, as applicable, the amortization or write-off of deferred financing fees. |
Results of Operations
The following table presents, for the periods indicated, certain income and expense items expressed as a percentage of net sales:
Fiscal Year Ended | |||||||||
December 29, 2017 | December 30, 2016 | December 25, 2015 | |||||||
Net sales | 100.0 | % | 100.0 | % | 100.0 | % | |||
Cost of sales | 74.7 | % | 74.7 | % | 74.3 | % | |||
Gross profit | 25.3 | % | 25.3 | % | 25.7 | % | |||
Operating expenses | 22.1 | % | 21.3 | % | 21.8 | % | |||
Operating income | 3.2 | % | 4.0 | % | 3.9 | % | |||
Other expense | 1.7 | % | 3.5 | % | 1.2 | % | |||
Income before income taxes | 1.4 | % | 0.5 | % | 2.6 | % | |||
Provision for income taxes | 0.3 | % | 0.2 | % | 1.1 | % | |||
Net income | 1.1 | % | 0.3 | % | 1.5 | % | |||
Fiscal Year Ended December 29, 2017 compared to Fiscal Year Ended December 30, 2016
The fiscal year ended December 29, 2017 consisted of 52 weeks as compared to the fiscal year ended December 30, 2016, which consisted of 53 weeks.
Net Sales
Net sales for the fifty-two weeks ended December 29, 2017 increased approximately 9.1% to $1.30 billion from $1.19 billion for the fifty-three weeks ended December 30, 2016. Organic growth contributed $86.9 million or 7.3% to sales growth in the year. The remaining sales growth resulted from the acquisition of MT Food on June 27, 2016, $23.2 million or 1.9%, and the acquisition of Fells Point on August 25, 2017, $22.6 million or 1.9%, partially offset by the 53rd week in fiscal 2016, which contributed approximately $24.1 million, or 2.0%, to net sales in fiscal 2016. Internally calculated inflation was approximately 3.2% for the fiscal year ended December 29, 2017, compared to internally calculated deflation for fiscal 2016 of approximately 1.2%.
Gross Profit
Gross profit increased approximately 9.3% to $329.4 million for the fifty-two weeks ended December 29, 2017 from $301.2 million for the fifty-three weeks ended December 30, 2016 primarily due to the increased sales volumes discussed above. Gross profit margin increased approximately 6 basis points to 25.3% in fiscal 2017 from 25.3% in fiscal 2016. This increase in gross profit margin related to the approximately 22 basis points increase in the Company’s specialty division margin, partially offset by an approximate 41 basis points decrease in the protein division margin compared to margins in the fifty-three weeks ended December 30, 2016.
Operating Expenses
Total operating expenses increased by approximately 13.5% to $288.3 million for the fifty-two weeks ended December 29, 2017 from $254.0 million for the fifty-three weeks ended December 30, 2016. As a percentage of net sales, operating expenses increased 80 basis points to 22.1% for fiscal 2017 from 21.3% for fiscal 2016. The increase in our operating expense ratio is largely attributable to the impact of prior year gains upon the reduction of the Company’s earn-out liabilities, 80 basis points, and higher distribution costs, 19 basis points.
Operating Income
Operating income decreased approximately 12.9% to $41.1 million for the fifty-two weeks ended December 29, 2017
38
compared to $47.2 million for the fifty-three weeks ended December 30, 2016. As a percentage of net sales, operating income was 3.2% in fiscal 2017 compared to 4.0% in fiscal 2016. The decrease in operating income as a percentage of sales was driven primarily by the increase in operating expenses discussed above.
Other Expense
Total other expense decreased $18.8 million to $22.7 million for the fiscal year ended December 29, 2017, from $41.6 million for the fiscal year ended December 30, 2016. This decrease was primarily due to the prior year $22.3 million debt extinguishment loss associated with the Company's debt refinancing in June 2016. This decrease is partially offset by increased interest expense due to higher levels of debt associated with that refinancing.
Provision for Income Taxes
Our effective income tax rate was 22.0% and 46.7% for the fiscal years ended December 29, 2017 and December 30, 2016, respectively. The decrease in effective tax rate in fiscal 2017 is due primarily to the impacts of the Tax Act which created an income tax benefit of $3.6 million from the remeasurement of the Company's deferred tax assets and liabilities. The Company's effective income tax rate for fiscal 2017 exclusive of the impact of the Tax Act would have been 41.4%.
Net Income
Reflecting the factors described in more detail above, net income increased $11.3 million to $14.4 million for the fiscal year ended December 29, 2017, compared to $3.0 million for the fiscal year ended December 30, 2016.
Fiscal Year Ended December 30, 2016 compared to Fiscal Year Ended December 25, 2015
The fiscal year ended December 30, 2016 consisted of 53 weeks as compared to the fiscal year ended December 25, 2015, which consisted of 52 weeks.
Net Sales
Net sales for the fifty-three weeks ended December 30, 2016 increased approximately 13.9% to $1.19 billion from
$1.05 billion for the fifty-two weeks ended December 25, 2015. The increase in net sales was primarily the result of the Del Monte acquisition on April 6, 2015, the MT Food acquisition on June 27, 2016, the 53rd week in fiscal 2016 and organic sales growth. Del Monte contributed approximately $48.6 million, or 4.6%, MT Food contributed $31.6 million, or 3.0%, and the extra week in fiscal 2016 contributed approximately $24.1 million, or 2.3%, to net sales growth for fifty-three weeks ended December 30, 2016. Organic growth contributed the remaining approximately $41.7 million, or 4.0%, of total net sales growth. Internally calculated deflation was approximately 1.2% for the fiscal year ended December 30, 2016, driven largely by our protein division. Internally calculated inflation for fiscal 2015 was approximately 3.0%.
Gross Profit
Gross profit increased approximately 12.1% to $301.2 million for the fifty-three weeks ended December 30, 2016 from $268.7 million for the fifty-two weeks ended December 25, 2015 primarily due to the increased sales volumes discussed above. Gross profit margin decreased approximately 42 basis points to 25.3% in fiscal 2016 from 25.7% in fiscal 2015. This decrease in gross profit margin related to the higher mix of protein sales in fiscal 2016 due to the acquisition of Del Monte in the second quarter of 2015 and the relative performance of Del Monte and Allen Brothers during the period. Gross profit margins decreased approximately 34 basis points in the Company’s specialty division and 23 basis points in the protein division compared to margins in the fifty-two weeks ended December 25, 2015.
Operating Expenses
Total operating expenses increased by approximately 11.2% to $254.0 million for the fifty-three weeks ended December 30, 2016 from $228.3 million for the fifty-two weeks ended December 25, 2015. As a percentage of net sales, operating expenses decreased 52 basis points to 21.3% for fiscal 2016 from 21.8% for fiscal 2015. The increase in our operating expenses is largely attributable to the acquisitions of Del Monte and MT Food which accounted for year-on-year increases of $12.2 million and $5.2 million, respectively, higher warehousing and distribution costs of $4.6 million and $3.4 million, respectively, due to increased sales levels, the impact of the 53rd week in fiscal 2016 of approximately $4.8 million and increased amortization expense of $2.0 million, partially offset by the reduction in the fair value of earn-out obligations of $10.0 million in 2016.
39
Operating Income
Operating income increased approximately 16.9% to $47.2 million for the fifty-three weeks ended December 30, 2016 compared to $40.4 million for the fifty-two weeks ended December 25, 2015. As a percentage of net sales, operating income was 4.0% in fiscal 2016 compared to 3.9% in fiscal 2015. The increase in operating income as a percentage of sales was driven primarily from the reduction in operating expenses as a percentage of sales discussed above.
Other Expense
Total other expense increased $28.9 million to $41.6 million for the fiscal year ended December 30, 2016, from $12.7 million for the fiscal year ended December 25, 2015. This increase was primarily due to the refinancing of the Company’s debt on June 22, 2016. As part of the refinancing, the Company retired its previous revolving credit facility, term loan and senior secured notes. The Company was required to pay the senior note holders make-whole payments totaling $21.1 million for the early retirement of these notes. In addition, the Company wrote off deferred financing fees totaling $1.1 million relating to the senior secured notes, term loan, and revolving credit facility. This retirement was accounted for as a debt extinguishment and the loss on debt extinguishment of $22.3 million, inclusive of the make-whole payments and write-off of deferred financing fees is reflected in interest expense in the fifty-three weeks ended December 30, 2016. In addition, the Company had higher overall debt levels in fiscal 2016 as a result of financing the Del Monte acquisition in the second quarter of fiscal 2015.
Provision for Income Taxes
Our effective income tax rate was 46.7% and 41.5% for the fiscal years ended December 30, 2016 and December 25, 2015, respectively. The increase in effective tax rate in fiscal 2016 is due primarily to the impact of the debt extinguishment in fiscal 2016, which significantly reduced our taxable income and amplified the impacts of permanent differences on our effective tax rate. Adjusted to remove the impact of the debt extinguishment, our effective tax rate for fiscal 2016 was approximately 41.3%.
Net Income
Reflecting the factors described in more detail above, net income decreased $13.2 million to $3.0 million for the fiscal year ended December 30, 2016, compared to $16.2 million for the fiscal year ended December 25, 2015.
Liquidity and Capital Resources
We finance our day-to-day operations and growth primarily with cash flows from operations, borrowings under our senior secured credit facilities and other indebtedness, equity financing, operating leases, and trade payables.
Our New Markets Tax Credit loan (“NMTC Loan”) matured on April 26, 2017 and was repaid in full, including all accrued interest, for $11.0 million of which, $8.1 million was paid in cash and $2.9 million was paid from the associated sinking fund.
Senior Secured Term Loan Credit Facility
On June 22, 2016, Chefs’ Warehouse Parent, LLC (“CW Parent”) and Dairyland USA Corporation (“Dairyland”), as co-borrowers, and The Chefs’ Warehouse, Inc. (the “Company”) and certain other subsidiaries of the Company, as guarantors, entered into a credit agreement (the “Term Loan Credit Agreement”) with a group of lenders for which Jefferies Finance LLC (“Jefferies”) acts as administrative agent and collateral agent. The Term Loan Credit Agreement provides for a senior secured term loan B facility (the “Term Loan Facility”) in an aggregate amount of $305.0 million with a $50.0 million six-month delayed draw term loan facility (the “DDTL”; the loans outstanding under the Term Loan Facility (including the DDTL), the “Term Loans”). Additionally, the Term Loan Facility includes an accordion which permits the Company to request that the lenders extend additional Term Loans in an aggregate principal amount of up to $50.0 million (less the aggregate amount of certain indebtedness incurred to finance acquisitions) plus an unlimited amount subject to the Company’s Total Leverage Ratio not exceeding 4.90:1.00 on a pro forma basis. Borrowings under the Term Loan Facility were used to repay the Company’s senior secured notes, as well as the prior term loan and revolving credit facility. Remaining funds will be used for capital expenditures, permitted acquisitions, working capital and general corporate purposes of the Company. On June 27, 2016, the Company drew $14.0 million from the DDTL to help pay for the MT Food acquisition. On September 14, 2016, the Company entered into an amendment to the Term Loan Credit Agreement under which the remaining portion of the DDTL was terminated, the Company’s interest rate schedule was modified and the Company repaid $25.0 million of the outstanding balance of the Term Loans.
40
The final maturity of the Term Loan Facility is June 22, 2022. Subject to adjustment for prepayments, the Company is required to make quarterly amortization payments on the Term Loans in an amount equal to 0.25% of the aggregate principal amount of the Term Loans.
The interest rates per annum applicable to Term Loans, will be, at the co-borrowers’ option, equal to either a base rate or an adjusted LIBOR rate for one, two, three, six or (if consented to by the lenders) twelve-month interest periods chosen by the Company, in each case plus an applicable margin percentage.
On December 13, 2017, we repriced our senior secured term loan from 475 basis points to 400 basis points over LIBOR. In connection with the repricing, we incurred financing costs of $0.8 million which were capitalized as deferred financing fees. The interest rate on this facility at December 29, 2017 was 5.57%.
The Term Loan Facility contains customary affirmative covenants, negative covenants (including restrictions, subject to customary exceptions, on incurring debt or liens, paying dividends, repaying payment subordinated and junior lien debt, disposing assets, and making investments and acquisitions), and events of default for a term loan B facility of this type, as more particularly described in the Term Loan Credit Agreement.
As of December 29, 2017, the Company was in compliance with all debt covenants under the Term Loan Facility.
Asset Based Loan Facility
On June 22, 2016, the Company entered into a credit agreement (the “ABL Credit Agreement”) with a group of lenders for which JPMorgan Chase Bank, N.A., acts as administrative agent and collateral agent. The ABL Credit Agreement provides for an asset based loan facility (the “ABL Facility”) in the aggregate amount of up to $75.0 million. Availability under the ABL Facility will be limited to a borrowing base consisting of the difference of (a) the lesser of: (i) the aggregate amount of commitments or (ii) the sum of specified percentages of eligible receivables and eligible inventory, minus certain availability reserves minus (b) outstanding borrowings. The co-borrowers under the ABL Facility are entitled on one or more occasions, subject to the satisfaction of certain conditions, to request an increase in the commitments under the ABL Facility in an aggregate principal amount of up to $25.0 million. The ABL Facility matures on June 22, 2021.
The interest rates per annum applicable to loans, other than swingline loans, under the ABL Facility will be, at the co-borrowers’ option, equal to either a base rate or an adjusted LIBOR rate for one, two, three, six or (if consented to by the lenders) twelve-month, interest periods chosen by the Company, in each case plus an applicable margin percentage. The Company will pay certain recurring fees with respect to the ABL Facility, including fees on the unused commitments of the lenders.
The ABL Facility contains customary affirmative covenants, negative covenants and events of default as more particularly described in the ABL Credit Agreement. The ABL Facility will require compliance with a minimum consolidated fixed charge coverage ratio of 1:1 if the amount of availability under the ABL Facility falls below a specified dollar amount or percentage of the borrowing base.
There were no outstanding balances under the ABL Facility as of December 29, 2017. Borrowings under the ABL Facility will be used, and are expected to be used, for capital expenditures, permitted acquisitions, working capital and general corporate purposes of the Company. As of December 29, 2017, the Company was in compliance with all debt covenants and the Company had reserved $10.2 million of the ABL facility for the issuance of letters of credit. As of December 29, 2017, funds totaling $64.8 million were available for borrowing under the ABL facility.
Convertible Subordinated Notes
On April 6, 2015, the Company issued $36.8 million principal amount of convertible subordinated notes with a six-year maturity bearing interest at 2.5% and a conversion price of $29.70 per share (the “Convertible Subordinated Notes”) to certain of the Del Monte entities as partial consideration in the Del Monte acquisition. Interest is paid annually in cash. The holders of the Convertible Subordinated Notes may, in certain instances beginning one year after issuance, redeem the Convertible Subordinated Notes for cash or shares of the Company’s common stock. Moreover, the Company may pay the outstanding principal amount due and owing under the Convertible Subordinated Notes at maturity in either cash or shares of the Company’s common stock. The Convertible Subordinated Notes, which are subordinate to the Company’s and its subsidiaries’ senior debt, are convertible into shares of the Company’s common stock by the holders at any time at a conversion price of $29.70.
41
Liquidity
Our capital expenditures, excluding cash paid for acquisitions, were approximately $12.3 million for fiscal 2017. We believe our capital expenditures, excluding cash paid for acquisitions, for fiscal 2018 will be in the range of $14.0 million to $16.0 million. The increase in projected capital expenditures in fiscal 2018 as compared to fiscal 2017 is the result of planned expansions of several of our distribution facilities and renovations to our corporate headquarters. Recurring capital expenditures will be financed with cash generated from operations and borrowings under our ABL Facility. Our planned capital projects will provide both new and expanded facilities and improvements to our technology that we believe will produce increased efficiency and the capacity to continue to support the growth of our customer base. Future investments and acquisitions will be financed through either internally generated cash flow, borrowings under our senior secured credit facilities in place at the time of the potential investment or acquisition or through the issuance of equity or debt securities, including, but not limited to, longer-term, fixed-rate debt securities and shares of our common stock.
On December 19, 2017, we completed a public offering of 1,900,000 shares of our common stock which resulted in net proceeds to us of approximately $34.0 million after deducting underwriters’ fees, commissions and transaction expenses. The net proceeds are currently being held as cash and cash equivalents for use in general corporate purposes including as possible consideration for future acquisitions.
On August 25, 2017, the Company entered into an asset purchase agreement to acquire substantially all of the assets of Fells Point, a specialty protein manufacturer and distributor based in the metro Baltimore and Washington DC area. The aggregate purchase price for the transaction at acquisition date was approximately $33.0 million, including the impact of an initial net working capital adjustment which is subject to a post-closing working capital adjustment true up. Approximately $29.7 million was paid in cash at closing and the remaining $3.3 million consisted of 185,442 shares of the Company's common stock. The Company will also pay additional contingent consideration, if earned, in the form of an earn-out amount which could total approximately $12.0 million. The payment of the earn-out liability is subject to the successful achievement of annual Adjusted EBITDA targets for the Fells Point business over a period of four years following closing.
On June 27, 2016, we acquired substantially all of the assets of MT Food, based in Chicago, Illinois. Founded in the mid-1990's, MT Food is a wholesale distributor of dairy, produce, specialty and grocery items in the metro Chicago area. The purchase price for the transaction was $21.5 million, of which, $21.0 million was paid in cash at closing with an additional $0.5 million payable eighteen months after the closing date and an earn-out of $0.5 million paid during the second quarter of fiscal 2017. The aggregate purchase price paid by the Company was paid through cash-on-hand and the proceeds from a draw down on its delayed draw term loan facility.
On April 26, 2017, our NMTC Loan matured and was repaid in full, including all accrued interest, for $11.0 million, of which, $8.1 million was paid in cash and $2.9 million was paid from the associated sinking fund.
In July 2015, we closed on a sale-leaseback transaction of our new Las Vegas, NV distribution facility. The property was sold for $14.6 million, which approximated its cost. The related on-going lease will be accounted for as an operating lease.
On April 6, 2015, we acquired substantially all the equity interests of Del Monte for an aggregate purchase price of approximately $184.1 million. Founded in 1926, Del Monte supplies high quality, USDA inspected beef, pork, lamb, veal, poultry and seafood products to Northern California. The funding of the acquisition consisted of the following:
• | $123.9 million in cash, which was funded with cash-on-hand, borrowings under the revolving credit facility portion of our senior secured credit facilities and the issuance of $25.0 million of additional senior secured notes that bear interest at 5.80% per annum due on October 17, 2020; |
• | approximately 1.1 million shares of our common stock (valued at $22.17 per share); |
• | $36.8 million in convertible subordinated notes issued to certain entities affiliated with Del Monte with a six-year maturity bearing interest at 2.50% with a conversion price of $29.70 per share; and |
• | $1.3 million offset received as an adjustment to the purchase price. |
In addition, we have agreed to pay additional contingent consideration in the form of an earn-out of up to $24.5 million upon the successful achievement of Adjusted EBITDA targets for the Del Monte entities and improvements in certain operating metrics for our existing protein business and the business of any protein companies subsequently acquired by the Company over the six years following the closing. The fair value of the Del Monte earn-out liability was $0.6 million as of December 29, 2017.
42
Cash Flows
Net cash provided by operations was $31.5 million for fiscal 2017, a decrease of $7.4 million from the $38.9 million provided by operations for fiscal 2016. The primary reasons for the decrease in net cash provided by operations were decreased cash generated through net income from operations and increased cash used in working capital changes. During fiscal 2017 net income increased by $11.3 million. Exclusive of the impact of the fiscal year 2016 loss on extinguishment of debt of $22.3 million and $10.0 million fair-value adjustment to the Company's Allen Brothers and Del Monte earn-out liabilities, partially offset by their aggregate tax impact of $5.1 million, and the fiscal 2017 one-time income tax benefit of $3.6 million due to the Tax Act, net income from operations increased by $0.6 million. The decrease in cash provided by changes in working capital was primarily due to increases in cash used for inventory changes of $18.8 million and accounts receivable changes of $11.1 million, offset by an increase in cash provided by prepaid expenses and other current assets changes of $11.9 million (exclusive of the tax impact of the loss on debt extinguishment, a financing activity ) and an increase in cash provided by accounts payable changes of $11.3 million.
Net cash provided by operations was $38.9 million for fiscal 2016, an increase of $1.2 million from the $37.7 million provided by operations for fiscal 2015. The primary reasons for the increase in net cash provided by operations were increased cash generated through net income from operations partially offset by cash used in working capital changes. During fiscal 2016 net income decreased by $13.2 million. The primary cause for this decrease in net income was a loss on extinguishment of debt of $22.3 million, partially offset by the related tax impact on the loss of approximately $9.3 million. Exclusive of the net impact of the loss on extinguishment, which is a cash flow from financing activities, net income from operations decreased by $0.2 million. Embedded within the net income from operations decrease, non-cash charges decreased by $2.8 million, representing an overall decrease of cash provided by operations through net income of $3.0 million. The primary cause for this decrease was the $10.0 million fair-value adjustment to the Company’s Allen Brothers and Del Monte earn-out liabilities partially offset by the related tax impact of $4.2 million, organic growth as well as the cash generating impacts of the Del Monte and MT Food acquisitions. The decrease in cash provided by changes in working capital was primarily due to an increase in cash used for accounts payable changes of $16.3 million and an increase in cash used for prepaid expenses and other current assets changes of $8.5 million (exclusive of the tax impact of the loss on debt extinguishment, a financing activity), offset by increases in cash provided by inventory changes of $13.1 million and accounts receivable changes of $8.6 million.
Net cash used in investing activities was $42.4 million for fiscal 2017, an increase of $6.6 million from the net cash used in investing activities of $35.8 million for fiscal 2016. The increase in net cash used was primarily due to higher cash paid for acquisitions, resulting from the Fells Point acquisition in 2017 partially offset by the cash paid for the MT Food acquisition in 2016, and lower capital expenditures the result of completing construction of our new San Francisco, CA distribution facility.
Net cash used in investing activities was $35.8 million for fiscal 2016, a decrease of $93.5 million from the net cash used in investing activities of $129.3 million for fiscal 2015. The decrease in net cash used was primarily due to lower cash paid for acquisitions, resulting from the Del Monte acquisition in 2015 partially offset by the cash paid for the MT Food acquisition in 2016, and lower capital expenditures the result of completing construction of our Bronx, NY and Las Vegas, NV distribution facilities offset, in part, by the sale of one of our owned facilities in fiscal 2015.
Net cash provided from financing activities was $19.4 million in fiscal 2017, a decrease of $7.8 million from the $27.2 million provided from financing activities in fiscal 2016. This decrease primarily resulted from our fiscal 2016 debt restructuring and the payment of $6.7 million in contingent earn-out consideration related to the Allen Brothers and Del Monte acquisitions, partially offset by $34.0 million in net proceeds from our equity offering in December 2017.
Net cash provided from financing activities was $27.2 million in fiscal 2016, a decrease of $63.8 million from the $91.0 million provided from financing activities in fiscal 2015. This decrease primarily resulted from the debt issued in 2015 to pay for the Del Monte acquisition and payments made to pay off our revolving credit facility in fiscal 2016, the result of improved cash flow from operations and lower capital expenditures.
Seasonality
Excluding our direct-to-consumer business, we generally do not experience any material seasonality. However, our sales and operating results may vary from quarter to quarter due to factors such as changes in our operating expenses, management’s ability to execute our operating and growth strategies, personnel changes, demand for our products, supply shortages, weather patterns and general economic conditions.
Our direct-to-consumer business is subject to seasonal fluctuations, with direct-to-consumer center-of-the-plate protein sales typically higher during the holiday season in our fourth quarter; accordingly, a disproportionate amount of operating cash flows
43
from this portion of our business is generated by our direct-to-consumer business in the fourth quarter of our fiscal year. Despite a significant portion of these sales occurring in the fourth quarter, there are operating expenses, principally advertising and promotional expenses, throughout the year.
Inflation
Our profitability is dependent on, among other things, our ability to anticipate and react to changes in the costs of key operating resources, including food and other raw materials, labor, energy and other supplies and services. Substantial increases in costs and expenses could impact our operating results to the extent that such increases cannot be passed along to our customers. The impact of inflation on food, labor, energy and occupancy costs can significantly affect the profitability of our operations.
Commitments and Significant Contractual Obligations
The following table summarizes our contractual obligations and commercial commitments at December 29, 2017.
Payments Due by Period (1) | ||||||||||||||||||||
Total | Less than One Year | 1-3 Years | 4-5 Years | Thereafter | ||||||||||||||||
(In thousands) | ||||||||||||||||||||
Inventory purchase commitments | $ | 37,929 | $ | 37,929 | $ | — | $ | — | $ | — | ||||||||||
Indebtedness | $ | 325,185 | $ | 3,179 | $ | 6,358 | $ | 315,648 | $ | — | ||||||||||
Capital lease obligations and software financing | $ | 664 | $ | 647 | $ | 10 | $ | 7 | $ | — | ||||||||||
Pension exit liabilities | $ | 2,438 | $ | 130 | $ | 288 | $ | 329 | $ | 1,691 | ||||||||||
Long-term operating leases | $ | 125,118 | $ | 20,831 | $ | 35,379 | $ | 26,988 | $ | 41,920 | ||||||||||
Total | $ | 491,334 | $ | 62,716 | $ | 42,035 | $ | 342,972 | $ | 43,611 | ||||||||||
(1) | Interest on our various outstanding debt instruments is included in the above table, except for our senior secured credit facility, which has a variable interest rate. At December 29, 2017, we had borrowings of $288.4 million under our senior secured credit facility. During the fiscal year ended December 29, 2017, the weighted average interest rate on our senior secured credit facility was 6.45% and we incurred interest expense of $19.0 million. See Note 9 “Debt Obligations” to our consolidated financial statements for further information. |
Cash to be paid for income taxes is excluded from the table above.
We had outstanding letters of credit of approximately $10.2 million and $8.3 million at December 29, 2017 and December 30, 2016, respectively.
Substantially all of our assets are pledged as collateral to secure our borrowings under our Credit Facilities.
Off-Balance Sheet Arrangements
As of December 29, 2017, we did not have any off-balance sheet arrangements, as defined in Item 303(a)(4)(ii) of Regulation S-K.
Critical Accounting Policies
The preparation of our consolidated financial statements requires us to make estimates and judgments that affect the reported amounts of assets, liabilities, revenues and expenses, and related disclosure of contingent assets and liabilities. The SEC has defined critical accounting policies as those that are both most important to the portrayal of our financial condition and results and require our most difficult, complex or subjective judgments or estimates. Based on this definition, we believe our critical accounting policies include the following: (i) determining our allowance for doubtful accounts, (ii) inventory valuation, with regard to determining our reserve for excess and obsolete inventory, (iii) valuing goodwill and intangible assets, (iv) vendor rebates and other promotional incentives, (v) self-insurance reserves, and (vi) accounting for income taxes and (vii) contingent earn-out liabilities. For all financial statement periods presented, there have been no material modifications to the application of these critical accounting policies.
44
Allowance for Doubtful Accounts
We analyze customer creditworthiness, accounts receivable balances, payment history, payment terms and historical bad debt levels when evaluating the adequacy of our allowance for doubtful accounts. In instances where a reserve has been recorded for a particular customer, future sales to the customer are either conducted using cash-on-delivery terms or the account is closely monitored so that agreed-upon payments are received prior to orders being released. A failure to pay results in held or cancelled orders. We also estimate receivables that will ultimately be uncollectible based upon historical write-off experience. Our estimate could require change based on changing circumstances, including changes in the economy or in the particular circumstances of individual customers. Accordingly, we may be required to increase or decrease our allowance. Our accounts receivable balance was $142.2 million and $128.0 million, net of the allowance for doubtful accounts of $8.0 million and $6.8 million, as of December 29, 2017 and December 30, 2016, respectively.
Inventory Valuation
We maintain reserves for slow-moving and obsolete inventories. These reserves are primarily based upon inventory age plus specifically identified inventory items and overall economic conditions. A sudden and unexpected change in consumer preferences or change in overall economic conditions could result in a significant change in the reserve balance and could require a corresponding charge to earnings. We actively manage our inventory levels as we seek to minimize the risk of loss and have consistently achieved a relatively high level of inventory turnover.
Valuation of Goodwill and Intangible Assets
We are required to test goodwill for impairment at least annually and between annual tests if events occur or circumstances change that would more likely than not reduce the fair value of a reporting unit below its carrying amount. We have elected to perform our annual tests for indications of goodwill impairment during the fourth quarter of each fiscal year. We test for goodwill impairment at the reporting unit level, as we aggregate our component units into two reporting units, Protein and Specialty, based on a discounted cash flow approach. The quantitative analysis consists of a comparison of the carrying value of the our reporting units, including goodwill, to the estimated fair value of the reporting units. A goodwill impairment loss, if any, would be recognized for the amount by which the reporting unit's carrying value exceeded its fair value.
When analyzing whether to aggregate the business components into single reporting units, management considers whether each component has similar economic characteristics. We have evaluated the economic characteristics of our different geographic markets, including our recently acquired businesses, along with the similarity of the operations and margins, nature of the products, type of customer and methods of distribution of products and the regulatory environment in which we operate and concluded that the business components can be combined into two reporting units, Protein and Specialty.
As of December 29, 2017, our annual assessment indicated that no impairment of goodwill existed, as the fair value of each reporting unit exceeded their carrying value. Total goodwill as of December 29, 2017 and December 30, 2016 was $173.2 million and $163.8 million, respectively.
Intangible assets with finite lives are tested for impairment whenever events or changes in circumstances indicate that the carrying value may not be recoverable. Cash flows expected to be generated by the related assets are estimated over the assets useful lives based on updated projections. If the evaluation indicates that the carrying amount of the asset may not be recoverable, the potential impairment is measured based on a projected discounted cash flow model. There have been no events or changes in circumstances during fiscal 2017 or 2016 indicating that the carrying value of our finite-lived intangible assets are not recoverable. Total finite-lived intangible assets as of December 29, 2017 and December 30, 2016 were $140.3 million and $131.1 million, respectively.
The assessment of the recoverability of goodwill and intangible assets will be impacted if estimated future cash flows are not achieved.
Vendor Rebates and Other Promotional Incentives
We participate in various rebate and promotional incentives with our suppliers, including volume and growth rebates, annual incentives and promotional programs. In accounting for vendor rebates, we follow the guidance in ASC 605-50 (Emerging Issues Task Force, or EITF, No. 02-16, Accounting by a Customer (Including a Reseller) for Certain Consideration Received from a Vendor and EITF No. 03-10, Application of Issue No. 02-16 by Resellers to Sales Incentives Offered to Consumers by Manufacturers).
45
We generally record consideration received under these incentives as a reduction of cost of goods sold; however, in certain circumstances, we record marketing-related consideration as a reduction of marketing costs incurred. We may receive consideration in the form of cash and/or invoice deductions.
We record consideration that we receive for volume and growth rebates and annual incentives as a reduction of cost of goods sold. We systematically and rationally allocate the consideration for those incentives to each of the underlying transactions that results in progress by us toward earning the incentives. If the incentives are not probable and reasonably estimable, we record the incentives as the underlying objectives or milestones are achieved. We record annual incentives when we earn them, generally over the agreement period. We record consideration received to promote and sell the suppliers’ products as a reduction of our costs, as the consideration is typically a reimbursement of costs incurred by us. If we received consideration from the suppliers in excess of our costs, we record any excess as a reduction of cost of goods sold.
Self-Insurance Reserves
Effective October 1, 2011, we began maintaining a self-insured group medical program. The program contains individual stop loss thresholds of $175 thousand per incident and aggregate stop loss thresholds based upon the average number of employees enrolled in the program throughout the year. The amount in excess of the self-insured levels is fully insured by third party insurers. Liabilities associated with this program are estimated in part by considering historical claims experience and medical cost trends. Projections of future loss expenses are inherently uncertain because of the random nature of insurance claims occurrences and could be significantly affected if future occurrences and claims differ from these assumptions and historical trends.
Effective August 1, 2012, we became self-insured for workers’ compensation and automobile liability to deductibles or self-insured retentions of $350 thousand for workers' compensation and $250 thousand for automobile liability per occurrence. The amounts in excess of our deductibles are fully insured by third party insurers. Liabilities associated with this program are estimated in part by considering historical claims experience and cost trends. Projections of future loss expenses are inherently uncertain because of the random nature of insurance claims occurrences and could be significantly affected if future occurrences and claims differ from these assumptions and historical trends.
Income Taxes
The determination of our provision for income taxes requires significant judgment, the use of estimates and the interpretation and application of complex tax laws. Our provision for income taxes primarily reflects a combination of income earned and taxed in the various U.S. federal and state jurisdictions. Jurisdictional tax law changes, increases or decreases in permanent differences between book and tax items, accruals or adjustments of accruals for unrecognized tax benefits, and our change in the mix of earnings from these taxing jurisdictions all affect the overall effective tax rate.
Contingent Earn-out Liabilities
We account for contingent consideration relating to business combinations as a liability and an increase to goodwill at the date of the acquisition and continually remeasure the liability at each balance sheet date by recording changes in the fair value through our Consolidated Statements of Operations. We determine the fair value of contingent consideration based on future operating projections under various potential scenarios, including the use of Monte Carlo simulations, and weight the probability of these outcomes. The ultimate settlement of contingent earn-out liabilities relating to business combinations may be for amounts which are materially different from the amounts initially recorded and may cause volatility in our results of operations.
Management has discussed the development and selection of these critical accounting policies with our board of directors, and the board of directors has reviewed the above disclosure. Our consolidated financial statements contain other items that require estimation, but are not as critical as those discussed above. These other items include our calculations for bonus accruals, depreciation and amortization. Changes in estimates and assumptions used in these and other items could have an effect on our consolidated financial statements.
Recent Accounting Pronouncements
See Note 1 “Operations and Basis of Presentation” to our consolidated financial statements for a full description of recent accounting pronouncements including the respective expected dates of adoption and expected effects on our consolidated financial statements.
46
Item 7A. QUANTITATIVE AND QUALITATIVE DISCLOSURES ABOUT MARKET RISK
Interest Rate Risk
On June 22, 2016, the Borrowers and the Guarantors entered into the Term Loan Agreement with the lenders from time to time party thereto, Jefferies, as Administrative Agent, and the other parties thereto. Also on June 22, 2016, the Borrowers and Guarantors entered into the ABL Credit Agreement. Each of the Term Loan Agreement and the ABL Credit Agreement, is described in more detail above under the caption “Liquidity and Capital Resources” in “Management’s Discussion and Analysis of Financial Condition and Results of Operations.” Our primary market risks are related to fluctuations in interest rates related to borrowings under our current credit facilities.
As of December 29, 2017, we had an aggregate $288.4 million of indebtedness outstanding under the ABL Credit Facility and Term Loan Facility and $0.6 million under a software financing agreement that bore interest at variable rates. A 100 basis point increase in market interest rates would decrease our after tax earnings by approximately $2.3 million per annum, holding other variables constant.
47
Item 8. CONSOLIDATED FINANCIAL STATEMENTS AND SUPPLEMENTARY DATA
Index to the Consolidated Financial Statements | Page |
48
Report of Independent Registered Public Accounting Firm
Shareholders and Board of Directors
The Chefs’ Warehouse, Inc.
Ridgefield, CT
Opinion on the Consolidated Financial Statements
We have audited the accompanying consolidated balance sheets of The Chefs’ Warehouse Inc. (the “Company”) and subsidiaries as of December 29, 2017 and December 30, 2016, the related consolidated statements of operations and comprehensive income, stockholders’ equity, and cash flows for each of the three years in the period ended December 29, 2017, and the related notes. In our opinion, the consolidated financial statements present fairly, in all material respects, the financial position of the Company and subsidiaries at December 29, 2017 and December 30, 2016, and the results of their operations and their cash flows for each of the three years in the period ended December 29, 2017, in conformity with accounting principles generally accepted in the United States of America.
We also have audited, in accordance with the standards of the Public Company Accounting Oversight Board (United States) (“PCAOB”), the Company's internal control over financial reporting as of December 29, 2017 based on criteria established in Internal Control - Integrated Framework (2013) issued by the Committee of Sponsoring Organizations of the Treadway Commission (“COSO”) and our report dated March 9, 2018 expressed an unqualified opinion thereon.
Basis for Opinion
These consolidated financial statements are the responsibility of the Company’s management. Our responsibility is to express an opinion on the Company’s consolidated financial statements based on our audits. We are a public accounting firm registered with the Public Company Accounting Oversight Board (United States) (“PCAOB”) and are required to be independent with respect to the Company in accordance with the U.S. federal securities laws and the applicable rules and regulations of the Securities and Exchange Commission and the PCAOB.
We conducted our audits in accordance with the standards of the PCAOB. Those standards require that we plan and perform the audit to obtain reasonable assurance about whether the consolidated financial statements are free of material misstatement, whether due to error or fraud. Our audits included performing procedures to assess the risks of material misstatement of the consolidated financial statements, whether due to error or fraud, and performing procedures that respond to those risks. Such procedures included examining, on a test basis, evidence regarding the amounts and disclosures in the consolidated financial statements. Our audits also included evaluating the accounting principles used and significant estimates made by management, as well as evaluating the overall presentation of the consolidated financial statements. We believe that our audits provide a reasonable basis for our opinion.
/s/ BDO USA, LLP
We have served as the Company's auditor since 2006.
New York, NY
March 9, 2018
49
THE CHEFS’ WAREHOUSE, INC.
CONSOLIDATED BALANCE SHEETS
(Amounts in thousands, except share data)
December 29, 2017 | December 30, 2016 | ||||||
ASSETS | |||||||
Current assets: | |||||||
Cash and cash equivalents | $ | 41,504 | $ | 32,862 | |||
Accounts receivable, net of allowance of $8,026 in 2017 and $6,848 in 2016 | 142,170 | 128,030 | |||||
Inventories, net | 102,083 | 87,498 | |||||
Prepaid expenses and other current assets | 11,083 | 16,101 | |||||
Total current assets | 296,840 | 264,491 | |||||
Equipment and leasehold improvements, net | 68,378 | 62,183 | |||||
Software costs, net | 6,034 | 5,927 | |||||
Goodwill | 173,202 | 163,784 | |||||
Intangible assets, net | 140,320 | 131,131 | |||||
Other assets | 2,975 | 6,022 | |||||
Total assets | $ | 687,749 | $ | 633,538 | |||
LIABILITIES AND STOCKHOLDERS’ EQUITY | |||||||
Current liabilities: | |||||||
Accounts payable | $ | 70,019 | $ | 65,514 | |||
Accrued liabilities | 21,871 | 17,546 | |||||
Accrued compensation | 12,556 | 9,519 | |||||
Current portion of long-term debt | 3,827 | 14,795 | |||||
Total current liabilities | 108,273 | 107,374 | |||||
Long-term debt, net of current portion | 313,995 | 317,725 | |||||
Deferred taxes, net | 6,015 | 6,958 | |||||
Other liabilities and deferred credits | 10,865 | 7,721 | |||||
Total liabilities | 439,148 | 439,778 | |||||
Commitments and contingencies | |||||||
Stockholders’ equity: | |||||||
Preferred Stock - $0.01 par value, 5,000,000 shares authorized, no shares issued and outstanding at December 29, 2017 and December 30, 2016 | — | — | |||||
Common Stock - $0.01 par value, 100,000,000 shares authorized, 28,442,208 and 26,280,469 shares issued and outstanding at December 29, 2017 and December 30, 2016, respectively | 284 | 263 | |||||
Additional paid in capital | 166,997 | 127,180 | |||||
Accumulated other comprehensive loss | (1,549 | ) | (2,186 | ) | |||
Retained earnings | 82,869 | 68,503 | |||||
Total stockholders’ equity | 248,601 | 193,760 | |||||
Total liabilities and stockholders’ equity | $ | 687,749 | $ | 633,538 | |||
See accompanying notes to the consolidated financial statements.
50
THE CHEFS’ WAREHOUSE, INC.
CONSOLIDATED STATEMENTS OF OPERATIONS AND COMPREHENSIVE INCOME
(Amounts in thousands, except share and per share amounts)
Fiscal Years Ended | |||||||||||
December 29, 2017 | December 30, 2016 | December 25, 2015 | |||||||||
Net sales | $ | 1,301,520 | $ | 1,192,866 | $ | 1,046,878 | |||||
Cost of sales | 972,142 | 891,649 | 778,167 | ||||||||
Gross profit | 329,378 | 301,217 | 268,711 | ||||||||
Operating expenses | 288,251 | 253,978 | 228,311 | ||||||||
Operating income | 41,127 | 47,239 | 40,400 | ||||||||
Interest expense | 22,709 | 41,632 | 12,984 | ||||||||
Loss (gain) on sale of assets | 10 | (69 | ) | (295 | ) | ||||||
Income before income taxes | 18,408 | 5,676 | 27,711 | ||||||||
Provision for income taxes | 4,042 | 2,653 | 11,502 | ||||||||
Net income | $ | 14,366 | $ | 3,023 | $ | 16,209 | |||||
Other comprehensive income: | |||||||||||
Foreign currency translation adjustments | 637 | 763 | (2,256 | ) | |||||||
Comprehensive income | $ | 15,003 | $ | 3,786 | $ | 13,953 | |||||
Net income per share: | |||||||||||
Basic | $ | 0.55 | $ | 0.12 | $ | 0.63 | |||||
Diluted | $ | 0.54 | $ | 0.12 | $ | 0.63 | |||||
Weighted average common shares outstanding: | |||||||||||
Basic | 26,118,482 | 25,919,480 | 25,532,172 | ||||||||
Diluted | 27,424,526 | 26,029,609 | 26,508,994 | ||||||||
See accompanying notes to the consolidated financial statements.
51
THE CHEFS’ WAREHOUSE, INC.
CONSOLIDATED STATEMENTS OF CHANGES IN STOCKHOLDERS’ EQUITY
For the Fiscal Years Ended December 29, 2017, December 30, 2016, and December 25, 2015
(Amounts in thousands, except share amounts)
Common Stock | ||||||||||||||||||||||
Shares | Amount | Additional Paid in Capital | Accumulated Other Comprehensive Loss | Retained Earnings | Total | |||||||||||||||||
Balance December 26, 2014 | 25,031,267 | $ | 250 | $ | 97,966 | $ | (693 | ) | $ | 49,271 | $ | 146,794 | ||||||||||
Net income | — | — | — | — | 16,209 | 16,209 | ||||||||||||||||
Shares issued for Del Monte acquisition | 1,113,636 | 11 | 24,678 | — | — | 24,689 | ||||||||||||||||
Stock compensation | 196,950 | 2 | 3,537 | — | — | 3,539 | ||||||||||||||||
Excess tax benefits on stock compensation | — | — | 81 | — | — | 81 | ||||||||||||||||
Cumulative translation adjustment | — | — | — | (2,256 | ) | — | (2,256 | ) | ||||||||||||||
Shares surrendered to pay withholding taxes | (51,178 | ) | — | (1,092 | ) | — | — | (1,092 | ) | |||||||||||||
Balance December 25, 2015 | 26,290,675 | $ | 263 | $ | 125,170 | $ | (2,949 | ) | $ | 65,480 | $ | 187,964 | ||||||||||
Net income | — | — | — | — | 3,023 | 3,023 | ||||||||||||||||
Stock compensation | 25,895 | — | 2,579 | — | — | 2,579 | ||||||||||||||||
Cumulative translation adjustment | — | — | — | 763 | — | 763 | ||||||||||||||||
Shares surrendered to pay withholding taxes | (36,101 | ) | — | (569 | ) | — | — | (569 | ) | |||||||||||||
Balance December 30, 2016 | 26,280,469 | $ | 263 | $ | 127,180 | $ | (2,186 | ) | $ | 68,503 | $ | 193,760 | ||||||||||
Net income | — | — | — | — | 14,366 | 14,366 | ||||||||||||||||
Stock compensation | 110,331 | — | 3,018 | — | — | 3,018 | ||||||||||||||||
Public offering of common stock | 1,900,000 | 19 | 34,001 | 34,020 | ||||||||||||||||||
Shares issued for Fells Point acquisition | 185,442 | 2 | 3,298 | — | — | 3,300 | ||||||||||||||||
Cumulative translation adjustment | — | — | — | 637 | — | 637 | ||||||||||||||||
Shares surrendered to pay withholding taxes | (34,034 | ) | — | (500 | ) | — | — | (500 | ) | |||||||||||||
Balance December 29, 2017 | 28,442,208 | $ | 284 | $ | 166,997 | $ | (1,549 | ) | $ | 82,869 | $ | 248,601 | ||||||||||
See accompanying notes to the consolidated financial statements.
52
THE CHEFS’ WAREHOUSE, INC.
CONSOLIDATED STATEMENTS OF CASH FLOWS
For the Years Ended December 29, 2017, December 30, 2016, and December 25, 2015
(Amounts in thousands)
December 29, 2017 | December 30, 2016 | December 25, 2015 | |||||||||
Cash flows from operating activities: | |||||||||||
Net income | $ | 14,366 | $ | 3,023 | $ | 16,209 | |||||
Adjustments to reconcile net income to net cash provided by operating activities: | |||||||||||
Depreciation and amortization | 8,516 | 7,082 | 5,960 | ||||||||
Amortization of intangible assets | 12,033 | 11,433 | 9,453 | ||||||||
Provision for allowance for doubtful accounts | 4,061 | 3,224 | 2,909 | ||||||||
Deferred rent | 285 | 1,568 | 850 | ||||||||
Deferred taxes | (703 | ) | 2,991 | (809 | ) | ||||||
Amortization of deferred financing fees | 2,084 | 1,807 | 1,228 | ||||||||
Loss on debt extinguishment | — | 22,310 | — | ||||||||
Stock compensation | 3,018 | 2,579 | 3,539 | ||||||||
Change in fair value of earn-outs | (579 | ) | (10,031 | ) | 558 | ||||||
Gain on asset disposal | 10 | (69 | ) | (295 | ) | ||||||
Changes in assets and liabilities, net of acquisitions: | |||||||||||
Accounts receivable | (13,611 | ) | (2,503 | ) | (11,055 | ) | |||||
Inventories | (11,783 | ) | 7,038 | (6,109 | ) | ||||||
Prepaid expenses and other current assets | 4,762 | (7,168 | ) | 1,314 | |||||||
Accounts payable and accrued liabilities | 10,406 | (941 | ) | 15,351 | |||||||
Other liabilities | (1,130 | ) | (2,314 | ) | (471 | ) | |||||
Other assets | (238 | ) | (1,115 | ) | (905 | ) | |||||
Net cash provided by operating activities | 31,497 | 38,914 | 37,727 | ||||||||
Cash flows from investing activities: | |||||||||||
Capital expenditures | (12,311 | ) | (16,623 | ) | (21,656 | ) | |||||
Cash paid for acquisitions, net of cash received | (30,095 | ) | (19,742 | ) | (123,831 | ) | |||||
Proceeds from asset disposals | — | 550 | 16,187 | ||||||||
Net cash used in investing activities | (42,406 | ) | (35,815 | ) | (129,300 | ) | |||||
Cash flows from financing activities: | |||||||||||
Proceeds from the issuance of common stock, net of issuance costs | 34,020 | — | — | ||||||||
Proceeds from senior secured notes | — | 315,810 | 25,000 | ||||||||
Payment of debt and capital lease obligations | (12,830 | ) | (158,880 | ) | (23,893 | ) | |||||
Payment for debt extinguishment | — | (21,219 | ) | — | |||||||
Borrowing under revolving credit line | 24,000 | 33,200 | 209,982 | ||||||||
Payments under revolving credit line | (24,000 | ) | (126,582 | ) | (116,600 | ) | |||||
Payment of deferred financing fees | (761 | ) | (7,782 | ) | (1,012 | ) | |||||
Cash paid for contingent earn-out obligation | (500 | ) | (6,743 | ) | (1,420 | ) | |||||
Surrender of shares to pay withholding taxes | (500 | ) | (569 | ) | (1,092 | ) | |||||
Excess tax benefits on stock compensation | — | — | 81 | ||||||||
Net cash provided by financing activities | 19,429 | 27,235 | 91,046 | ||||||||
Effect of foreign currency on cash and cash equivalents | 122 | 74 | (347 | ) | |||||||
Net change in cash and cash equivalents | 8,642 | 30,408 | (874 | ) | |||||||
Cash and cash equivalents at beginning of year | 32,862 | 2,454 | 3,328 | ||||||||
Cash and cash equivalents at end of year | $ | 41,504 | $ | 32,862 | $ | 2,454 | |||||
See accompanying notes to the consolidated financial statements.
53
THE CHEFS’ WAREHOUSE, INC.
NOTES TO CONSOLIDATED FINANCIAL STATEMENTS
(Amounts in thousands, except share and per share amounts)
Note 1 - Operations and Basis of Presentation
Description of Business and Basis of Presentation
The financial statements include the consolidated accounts of The Chefs’ Warehouse, Inc. (the “Company”), and its wholly-owned subsidiaries. The Company’s quarterly periods end on the thirteenth Friday of each quarter. Every six to seven years the Company will add a fourteenth week to its fourth quarter to more closely align its year end to the calendar year. The consolidated statement of operations for the fiscal year ended December 30, 2016 contained a 53rd week while all other years presented contained 52 weeks. The Company operates in one reportable segment, food product distribution, which is concentrated on the East and West Coasts of the United States. The Company’s customer base consists primarily of menu-driven independent restaurants, fine dining establishments, country clubs, hotels, caterers, culinary schools, bakeries, patisseries, chocolatiers, cruise lines, casinos and specialty food stores.
Consolidation
The consolidated financial statements include all the accounts of the Company and its direct and indirect wholly-owned subsidiaries. All significant intercompany accounts and transactions have been eliminated.
Guidance Adopted in 2017
Subsequent Measurement of Inventory: In July 2015, the Financial Accounting Standards Board (“FASB”) issued guidance to simplify the subsequent measurement of inventory. This guidance requires that inventory be measured at the lower of cost or net realizable value. The Company adopted this guidance prospectively. Adoption of this guidance did not impact the Company's consolidated financial statements.
Improvements to Employee Share-Based Payment Accounting: In March 2016, the FASB issued guidance to simplify the accounting for employee share-based payments. The main provisions are to recognize excess tax benefits in the income statement rather than to additional paid-in capital, allow an entity to account for forfeitures as they occur, allow an entity to withhold employee shares up to the individual's maximum statutory tax rate without triggering liability classification of the award, present excess tax benefits as an operating cash flow and to present cash payments for employee tax withholding on vested stock awards as a financing cash flow. The guidance also requires that any unrecognized tax benefits that were not previously recognized be recorded through a cumulative-effect adjustment to retained earnings in the period in which the guidance is adopted. Upon adoption, the Company made an accounting policy election to account for forfeitures as they occur and began recognizing any excess tax benefits through current year earnings. There were no previously unrecognized tax benefits that required a cumulative-effect adjustment to retained earnings. Adoption of this guidance did not have a material impact on the Company's consolidated financial statements.
Restricted Cash: In November 2016, the FASB issued guidance which includes guidance to clarify how companies present and classify restricted cash or restricted cash equivalents in the statement of cash flows. The guidance requires that a statement of cash flows explain the change during the period in the total of cash, cash equivalents and amounts generally described as restricted cash or restricted cash equivalents. Adoption of this guidance did not impact the consolidated financial statements as the Company does not have restricted cash.
Simplifying the Test for Goodwill Impairment: In January 2017, the FASB issued guidance which simplifies goodwill impairment testing by removing Step 2 from the goodwill impairment test which required companies to assign the fair value of a reporting unit to its underlying assets and liabilities. Instead, an entity should recognize an impairment charge for the amount by which the carry amount of a reporting unit exceeds its fair value. Adoption of this guidance did not impact the Company's consolidated financial statements.
Scope of Modification Accounting: In May 2017, the FASB issued guidance which clarifies when to account for a change to the terms or conditions of a share-based payment award as a modification. Under the new guidance, modification accounting is required only if the fair value, the vesting conditions, or the classification of the award (as equity or liability) changes as a result of the change in terms or conditions. Adoption of this guidance did not impact the consolidated financial statements as the Company did not have any share-based payment award modifications.
54
Guidance Not Yet Adopted
Revenue from Contracts with Customers: In May 2014, the FASB issued guidance to clarify the principles for recognizing revenue. This guidance includes the required steps to achieve the core principle that an entity should recognize revenue to depict the transfer of promised goods or services to customers in an amount that reflects the consideration to which the entity expects to be entitled in exchange for those goods or services. On August 12, 2015, the FASB voted to defer the effective date by one year to December 15, 2017 for interim and annual reporting periods beginning after that date. Early adoption is permitted but not before the original effective date (annual periods beginning after December 15, 2016).
The Company has completed its analysis on the impact this guidance has on its customer contracts, sales incentive programs, gift card programs, information systems, business processes, and financial statement disclosures. The new revenue recognition model provides guidance on the identification of multiple performance obligations embedded within customer contracts. The Company's customer contracts include performance obligations which are satisfied as each product is delivered to the customer. Thus revenues will be recognized at a point in time. Under the new standard such performance obligations are satisfied at the point at which the Company transfers control to the customer. This is consistent with the Company's current practice of recognizing revenue upon delivery to the customer, with the exception of the Company's current practice of recognizing revenue at shipping point on direct-to-consumer sales. The impact of the change in revenue recognition timing of its direct-to-consumer sales is immaterial.
The new standard includes the concept of variable consideration and requires companies to include variable consideration in the transaction price to the extent it is probable that there will not be a significant reversal in the amount of cumulative revenue recognized when the uncertainty is resolved. Although the Company's sales incentive programs fall under the scope of this new guidance, it will not have a significant impact on the amount or timing of revenue recognition.
The new standard addresses current diversity in practice in regards to the derecognition of unredeemed gift card liabilities that are not subject to unclaimed property laws. The new guidance requires companies to recognize revenue on such liabilities through breakage or when the likelihood of customer redemption becomes remote. This is consistent with the Company's existing method of recognizing breakage revenue on these liabilities.
The Company expects to adopt this guidance when effective using the modified retrospective approach. Under this approach, prior financial statements would not be restated and a cumulative effect adjustment, if any, will be recorded as an adjustment to retained earnings. The cumulative effect adjustment is immaterial to our financial statements. Adoption will result in expanded disclosures on revenue recognition policies, disaggregated revenues and contract liabilities.
Leases: In February 2016, the FASB issued guidance to increase the transparency and comparability among organizations by recognizing right-of-use assets and lease liabilities on the balance sheet and disclosing key information about leasing arrangements. Current GAAP does not require lessees to recognize assets and liabilities arising from operating leases on the balance sheet. This new guidance is effective for fiscal years beginning after December 15, 2018. Early adoption is permitted. The Company expects to adopt this guidance when effective and is in the early stages of implementation. Adoption will have a material impact on the Company's consolidated financial statements, primarily to the consolidated balance sheets and related disclosures, as a result of recognizing right-of-use assets and lease liabilities arising from its operating leases.
Clarifying the Definition of a Business: In January 2017, the FASB issued guidance which clarifies whether transactions should be accounted for as acquisitions of assets or businesses. The guidance requires an entity to determine if substantially all of the fair value of the assets acquired is concentrated in a single identifiable asset or a group of similar identifiable assets. If this criterion is met, the new guidance would define this as an asset acquisition. Furthermore, the guidance requires a business to include, at a minimum, an input and substantive process that together significantly contribute to the ability to create outputs. The guidance is effective for fiscal years beginning after December 15, 2017. The Company expects to adopt this guidance when effective and adoption is not expected to have a material effect on its financial statements.
Use of Estimates
The preparation of the Company’s consolidated financial statements in conformity with generally accepted accounting principles requires it to make estimates and assumptions that affect reported amounts of assets, liabilities, revenues, expenses and disclosure of contingent assets and liabilities. Estimates are used in determining, among other items, the allowance for doubtful accounts, reserves for inventories, self-insurance reserves for group medical insurance, workers’ compensation insurance and automobile liability insurance, future cash flows associated with impairment testing for intangible assets (including goodwill) and long-lived assets, useful lives for intangible assets, stock-based compensation, contingent earn-out liabilities and tax reserves. Actual results could differ from estimates.
55
Note 2 – Summary of Significant Accounting Policies
Revenue Recognition
Revenue from the sale of a product is recognized at the point at which the product is delivered to the customer. The Company grants certain customers sales incentives, such as rebates or discounts and treats these as a reduction of sales at the time the sale is recognized. Sales tax billed to customers is not included in revenue but rather recorded as a liability owed to the respective taxing authorities at the time the sale is recognized.
Cost of Sales
The Company records cost of sales based upon the net purchase price paid for a product, including applicable freight charges incurred to deliver the product to the Company’s warehouse.
Operating Expenses
Operating expenses include the costs of facilities, product shipping and handling costs, warehousing costs, protein processing costs, selling and general administrative activities. Shipping and handling costs included in operating expenses were $70,108, $62,062 and $54,172 for fiscal 2017, 2016 and 2015, respectively. Protein processing costs included in operating expenses were $18,660, $17,320 and $14,626 for fiscal 2017, 2016 and 2015, respectively.
Cash and Cash Equivalents
The Company considers all highly liquid investments with an original maturity of less than three months to be cash equivalents. The Company periodically maintains balances at financial institutions which may exceed Federal Deposit Insurance Corporation insured limits. The Company has not experienced any losses in such accounts and believes it is not exposed to any significant risks on its cash in bank accounts.
Accounts Receivable
Accounts receivable consist of trade receivables from customers and are recorded net of an allowance for doubtful accounts. The allowance for doubtful accounts is determined based upon a number of specific criteria, such as whether a customer has filed for or been placed into bankruptcy, has had accounts referred to outside parties for collections or has had accounts significantly past due. The allowance also covers short paid invoices the Company deems to be uncollectable as well as a portion of trade accounts receivable balances projected to become uncollectable based upon historic patterns.
Inventories
Inventories consist primarily of finished goods, food and related food products held for resale and are valued at the lower of cost or market. Our different entities record inventory using a mixture of first-in, first-out and average cost, which we believe approximates first-in, first-out. The Company maintains reserves for slow-moving and obsolete inventories.
Purchase Incentives
The Company receives consideration and product purchase credits from certain vendors that the Company accounts for as a reduction of cost of sales. There are several types of cash consideration received from vendors. The purchase incentive is primarily in the form of a specified amount per pound or per case, or an amount for year-over-year growth. For the years ended December 29, 2017, December 30, 2016 and December 25, 2015, the recorded purchase incentives totaled approximately $17,265, $13,670 and $11,109, respectively.
Concentrations of Credit Risks
Financial instruments that subject the Company to concentrations of credit risk consist of cash, temporary cash investments and trade receivables. The Company’s policy is to deposit its cash and temporary cash investments with major financial institutions. The Company distributes its food and related products to a customer base that consists primarily of leading menu-driven independent restaurants, fine dining establishments, country clubs, hotels, caterers, culinary schools, bakeries, patisseries, chocolatiers, cruise lines, casinos and specialty food stores. To reduce credit risk, the Company performs ongoing credit evaluations of its customers’ financial conditions. The Company generally does not require collateral. However, the Company,
56
in certain instances, has obtained personal guarantees from certain customers. There is no significant balance with any individual customer.
Equipment and Leasehold Improvements
The Company records equipment and leasehold improvements at cost. Equipment that has been financed through capital leases is recorded at the present value of the minimum lease payments, which approximates cost. Equipment and leasehold improvements, including capital lease assets, are depreciated on a straight-line basis based upon estimated useful life.
Software Costs
The Company capitalizes certain computer software licenses and software implementation costs that are included in software costs in its consolidated balance sheets. These costs were incurred in connection with developing or obtaining computer software for internal use if it has a useful life in excess of one year, in accordance with Accounting Standards Codification (ASC) 350-40 “Internal-Use Software.” Subsequent additions, modifications or upgrades to internal-use software are capitalized only to the extent that they allow the software to perform a task that it previously did not perform. Internal use software is amortized on a straight-line basis over a three to seven year period. Capitalized costs include direct acquisitions as well as software and software development acquired under capitalized leases and internal labor where appropriate. Capitalized software purchases and related development costs, net of accumulated amortization, were $6,034 at December 29, 2017 and $5,927 at December 30, 2016.
Impairment of Long-Lived Assets
Long-lived assets, other than goodwill, are reviewed for impairment in accordance with ASC 360-10-35-15, “Impairment or Disposal of Long-Lived Assets” which only requires testing whenever events or changes in circumstances indicate that the carrying amount of the assets may not be recoverable. If any indicators are present, a recoverability test is performed by comparing the carrying amount of the asset to the net undiscounted cash flows expected to be generated from the asset. If the net undiscounted cash flows do not exceed the carrying amount (i.e., the asset is not recoverable), an additional step is performed that determines the fair value of the asset and the Company records an impairment, if any. The Company has not recorded any impairment of long-lived assets in fiscal 2017, 2016 or 2015.
Debt Issuance Costs
Certain up-front costs associated with the Company's revolving credit facilities are capitalized and included in other non-current assets in the consolidated balance sheets. The Company had $1,284 and $1,632 of such unamortized costs as of December 29, 2017 and December 30, 2016, respectively. Costs associated with the issuance of other debt instruments are capitalized and presented as a direct deduction from the carrying amount of the underlying debt liability. The Company had $8,027 and $8,979 of such unamortized costs as of December 29, 2017 and December 30, 2016, respectively. These costs are amortized over the terms of the related debt instruments by the effective interest rate method. Amortization of debt issuance costs was $2,084 for the fiscal year ended December 29, 2017, $1,807 for the fiscal year ended December 30, 2016 and $1,228 for the fiscal year ended December 25, 2015.
Intangible Assets
The intangible assets recorded by the Company consist of customer relationships, covenants not to compete and trademarks which are amortized over their useful lives on a schedule that approximates the pattern in which economic benefits of the intangible assets are consumed. Intangible assets with finite lives are tested for impairment whenever events or changes in circumstances indicate that the carrying value may not be recoverable. If any indicators are present, a recoverability test is performed by comparing the carrying amount of the asset to the net undiscounted cash flows expected to be generated from the asset. Undiscounted cash flows expected to be generated by the related assets are estimated over the assets’ useful lives based on updated projections. If the evaluation indicates that the carrying amount of the asset may not be recoverable, the potential impairment is measured based on a projected discounted cash flow model. There have been no events or changes in circumstances during fiscal 2017, 2016 or 2015 indicating that the carrying value of our finite-lived intangible assets are not recoverable.
Goodwill
Goodwill is the excess of the acquisition cost of businesses over the fair value of identifiable net assets acquired in accordance with ASC 350, “Intangibles-Goodwill and Other.” The Company has two reporting units – Protein and Specialty. For the fiscal
57
years ended December 29, 2017 and December 30, 2016, the Company tested goodwill for impairment using a quantitative analysis. The quantitative analysis consists of a comparison of the carrying value of the Company’s reporting units, including goodwill, to the estimated fair value of the reporting units that was determined using a discounted cash flow methodology. A goodwill impairment loss, if any, would be recognized for the amount by which the reporting unit's carrying value exceeded its fair value. There have been no events or changes in circumstances during fiscal 2017, 2016 or 2015 indicating that goodwill may be impaired.
The Company’s use of a discounted cash flow methodology includes estimates of future revenue based upon budget projections and growth rates which take into account estimated inflation rates. The Company also develops estimates for future levels of gross and operating profits and projected capital expenditures. This methodology also includes the use of estimated discount rates based upon industry and competitor analysis as well as other factors. The estimates that the Company uses in its discounted cash flow methodology involve many assumptions by management that are based upon future growth projections.
Employee Benefit Programs
The Company sponsors a defined contribution plan covering substantially all full-time employees (the “401(k) Plan”). The Company recognized expense related to the 401(k) Plan totaling $1,172, $1,049 and $858, respectively, for fiscal 2017, 2016 and 2015.
Income Taxes
The Company accounts for income taxes in accordance with ASC 740, “Income Taxes.” Deferred tax assets or liabilities are recorded to reflect the future tax consequences of temporary differences between the financial reporting basis of assets and liabilities and their tax basis at each year-end. These amounts are adjusted, as appropriate, to reflect enacted changes in tax rates expected to be in effect when the temporary differences reverse. The Company follows certain provisions of ASC 740, “Income Taxes” which established a single model to address accounting for uncertain tax positions and clarifies the accounting for income taxes by prescribing a minimum recognition threshold that a tax position is required to meet before being recognized in the financial statements. The Company evaluates uncertain tax positions, if any, by determining if it is more likely than not to be sustained upon examination by the tax authorities. The Company records uncertain tax positions when it is estimable and probable that such liabilities have been incurred. The Company, when required, will accrue interest and penalties related to income tax matters in income tax expense.
On December 22, 2017, the President enacted H.R. 1, originally known as the Tax Cuts and Jobs Act (the “Tax Act”). Among other changes to the U.S. Internal Revenue Code, the Tax Act reduces the U.S. federal corporate top tax rate from 35 percent to 21 percent. The Company must remeasure its net deferred tax assets and liabilities using the Federal Tax Rate that will apply when these amounts are expected to reverse. The effect of the remeasurement is reflected entirely in the interim period that includes the enactment date and is allocated directly to income tax expense from continuing operations.
Commitments and Contingencies
The Company is subject to various claims and contingencies related to lawsuits, taxes and environmental matters, as well as commitments under contractual and other commercial obligations. The Company recognizes liabilities for contingencies and commitments when a loss is probable and can be reasonably estimated.
Contingent Earn-out Liabilities
The Company accounts for contingent consideration relating to business combinations as a liability and an increase to goodwill at the date of the acquisition and continually remeasures the liability at each balance sheet date by recording changes in the fair value through the Consolidated Statements of Operations. The Company determines the fair value of contingent consideration based on future operating projections under various potential scenarios and weighs the probability of these outcomes. The ultimate settlement of contingent earn-out liabilities relating to business combinations may be for amounts which are materially different from the amounts initially recorded and may cause volatility in the Company’s results of operations.
Stock-Based Compensation
The Company measures stock-based compensation at the grant date based on the fair value of the award. Restricted stock awards and performance share units are valued based on the fair value of the stock on the grant date. The related compensation expense is recognized over the service period on a straight-line basis. Compensation expense on performance share units reflects the estimated probable outcome at the end of the performance period. The fair value of stock options with market
58
conditions is determined based on a Monte-Carlo simulation in order to simulate a range of possible future stock prices for the Company's s stock. For awards subject to graded vesting, the Company ensures that the compensation expense recognized is at least equal to the vested portion of the award.
Self-Insurance Reserves
The Company maintains a self-insured group medical program. The program contains individual stop loss thresholds of $175 per incident and aggregate stop loss thresholds based upon the average number of employees enrolled in the program throughout the year. The amount in excess of the self-insured levels is fully insured by third party insurers. Liabilities associated with this program are estimated in part by considering historical claims experience and medical cost trends. Projections of future loss expenses are inherently uncertain because of the random nature of insurance claims occurrences and could be significantly affected if future occurrences and claims differ from these assumptions and historical trends.
The Company maintains an insurance program for its automobile liability and workers' compensation insurance subject to deductibles or self-insured retentions of $350 for workers' compensation and $250 for automobile liability per occurrence. The amounts in excess of the deductibles are fully insured by third party insurers. Liabilities associated with this program are estimated in part by considering historical claims experience and cost trends. Projections of future loss expenses are inherently uncertain because of the random nature of insurance claims occurrences and could be significantly affected if future occurrences and claims differ from these assumptions and historical trends.
Assets and Liabilities Measured at Fair Value
The Company accounts for certain assets and liabilities at fair value. The Company categorizes each of its fair value measurements in one of the following three levels based on the lowest level input that is significant to the fair value measurement in its entirety:
Level 1 - Inputs to the valuation methodology are unadjusted quoted prices in active markets for identical assets.
Level 2 - Observable inputs other than quoted prices in active markets for identical assets and liabilities include the following:
a) | quoted prices for similar assets in active markets; |
b) | quoted prices for identical or similar assets in inactive markets; |
c) | inputs other than quoted prices that are observable for the asset; and |
d) | inputs that are derived principally from or corroborated by observable market data by correlation or other means. |
If the asset has a specified (contractual) term, the Level 2 input must be observable for substantially the full term of the asset.
Level 3 - Inputs to the valuation methodology are unobservable (i.e., supported by little or no market activity) and significant to the fair value measure.
Note 3 – Net Income per Share
The following table sets forth the computation of basic and diluted earnings per share:
Fiscal Year Ended | |||||||||||
December 29, 2017 | December 30, 2016 | December 25, 2015 | |||||||||
Net income per share: | |||||||||||
Basic | $ | 0.55 | $ | 0.12 | $ | 0.63 | |||||
Diluted | $ | 0.54 | $ | 0.12 | $ | 0.63 | |||||
Weighted average common shares: | |||||||||||
Basic | 26,118,482 | 25,919,480 | 25,532,172 | ||||||||
Diluted | 27,424,526 | 26,029,609 | 26,508,994 | ||||||||
59
Reconciliation of net income per common share:
Fiscal Year Ended | |||||||||||
December 29, 2017 | December 30, 2016 | December 25, 2015 | |||||||||
Numerator: | |||||||||||
Net income | $ | 14,366 | $ | 3,023 | $ | 16,209 | |||||
Add effect of dilutive securities | |||||||||||
Interest on convertible notes, net of tax | 536 | — | 403 | ||||||||
Adjusted net income | $ | 14,902 | $ | 3,023 | $ | 16,612 | |||||
Denominator: | |||||||||||
Weighted average basic common shares outstanding | 26,118,482 | 25,919,480 | 25,532,172 | ||||||||
Dilutive effect of unvested common shares | 68,670 | 110,129 | 79,385 | ||||||||
Dilutive effect of convertible notes | 1,237,374 | — | 897,437 | ||||||||
Weighted average diluted common shares outstanding | 27,424,526 | 26,029,609 | 26,508,994 | ||||||||
Potentially dilutive securities that have been excluded from the calculation of diluted net income per common share because the effect is anti-dilutive are as follows:
Fiscal Year Ended | ||||||||
December 29, 2017 | December 30, 2016 | December 25, 2015 | ||||||
Restricted Share Awards (RSAs) | 84,511 | 92,812 | 34,526 | |||||
Stock options | 201,799 | 209,071 | — | |||||
Convertible subordinated notes | — | 1,237,374 | — | |||||
Note 4 – Fair Value Measurements
Assets and Liabilities Measured at Fair Value
The Company's contingent earn-out liabilities are measured at fair value. These liabilities are reflected as accrued liabilities and other liabilities and deferred credits on the balance sheet. The fair value of contingent consideration was determined based on a probability-based approach which includes projected results, percentage probability of occurrence and the application of a discount rate to present value the payments. A significant change in projected results, discount rate, or probabilities of occurrence could result in a significantly higher or lower fair value measurement.
The following table presents the changes in Level 3 contingent earn-out liabilities:
Allen Brothers | Del Monte | MT Food | Fells Point | Total | |||||||||||||||
Balance December 25, 2015 | $ | 4,344 | $ | 13,792 | $ | — | $ | — | $ | 18,136 | |||||||||
Opening liability | — | — | 500 | — | 500 | ||||||||||||||
Gain on settlement | (1,684 | ) | — | — | — | (1,684 | ) | ||||||||||||
Payments | (2,660 | ) | (4,083 | ) | — | — | (6,743 | ) | |||||||||||
Changes in fair value | — | (8,347 | ) | — | — | (8,347 | ) | ||||||||||||
Balance December 30, 2016 | — | 1,362 | 500 | — | 1,862 | ||||||||||||||
Opening liability | — | — | — | 4,445 | 4,445 | ||||||||||||||
Payments | — | — | (500 | ) | — | (500 | ) | ||||||||||||
Changes in fair value | — | (713 | ) | — | 134 | (579 | ) | ||||||||||||
Balance December 29, 2017 | $ | — | $ | 649 | $ | — | $ | 4,579 | $ | 5,228 | |||||||||
Changes in fair value and gain on settlement are included in operating expenses within our consolidated statements of operations.
60
Fair Value of Financial Instruments
The carrying amounts reported in the Company’s consolidated balance sheets for accounts receivable and accounts payable approximate fair value, due to the immediate to short-term nature of these financial instruments. The fair values of the revolving credit facility and term loan approximated their book values as of December 29, 2017 and December 30, 2016 as these instruments had variable interest rates that reflected current market rates available to the Company. The fair value of these debt instruments were estimated using Level 3 inputs.
The following tables presents the carrying value and fair value of the Company’s convertible subordinated notes (more fully described in Note 9). In estimating the fair value of these convertible secured notes, the Company utilized Level 3 inputs including, prevailing market interest rates to estimate the debt portion of the instrument and a Black Scholes valuation model to estimate the fair value of the conversion option. The Black Scholes model utilizes the market price of the Company’s common stock, estimates of the stock’s volatility and the prevailing risk free interest rate in calculating the fair value estimate.
December 29, 2017 | December 30, 2016 | ||||||||||||||
Carrying Value | Fair Value | Carrying Value | Fair Value | ||||||||||||
Convertible Secured Notes | $ | 36,750 | $ | 38,091 | $ | 36,750 | $ | 35,557 | |||||||
Note 5 – Acquisitions
The Company accounts for acquisitions in accordance with ASC 805 “Business Combinations.” Assets acquired and liabilities assumed are recorded in the accompanying consolidated balance sheets at their estimated fair values, as of the acquisition date. Results of operations are included in the Company’s financial statements from the date of acquisition. For the acquisitions noted below, the Company used the income approach to determine the fair value of the customer relationships, the relief from royalty method to determine the fair value of trademarks and the comparison of economic income using the with/without approach to determine the fair value of non-compete agreements. The Company used Level 3 inputs to determine the fair value of all these intangible assets.
Fells Point
On August 25, 2017, the Company entered into an asset purchase agreement to acquire substantially all of the assets of Fells Point, a specialty protein manufacturer and distributor based in the metro Baltimore and Washington DC area. The aggregate purchase price for the transaction at acquisition date was approximately $33,022, including the impact of an initial net working capital adjustment which is subject to a post-closing working capital adjustment true up. Approximately $29,722 was paid in cash at closing and the remaining $3,300 consisted of 185,442 shares of the Company's common stock.
The Company will also pay additional contingent consideration, if earned, in the form of an earn-out amount which could total approximately $12,000. The payment of the earn-out liability is subject to the successful achievement of annual Adjusted EBITDA targets for the Fells Point business over a period of four years following closing. At December 29, 2017 and August 25, 2017, the Company estimated the fair value of this contingent earn-out liability to be $4,579 and $4,445, respectively. The Company is in the process of finalizing a valuation of the tangible and intangible assets of Fells Point as of the acquisition date. These assets will be valued at fair value using Level 3 inputs. Customer lists, trademarks, and non-compete agreements are expected to be amortized over 15, 20 and 6 years, respectively. Goodwill for the Fells Point acquisition will be amortized over 15 years for tax purposes. The goodwill recorded primarily reflects the value of acquiring an established meat processor to grow the Company's protein business in the Northeast and Mid Atlantic regions, as well as any intangible assets that do not qualify for separate recognition. During the fiscal year ended December 29, 2017, the Company recognized professional fees of $168 in operating expenses related to the Fells Point acquisition.
On August 25, 2017, the Company entered into a five-year lease for a warehouse facility located in Baltimore, MD that is owned by the former owners of Fells Point, some of whom are current employees. The Company paid rent of $86 during the year ended December 29, 2017. For the year ended December 29, 2017, the Company reflected net sales and income before taxes of $22,583 and $1,604, respectively, for Fells Point in its consolidated statement of operations.
The table below presents unaudited pro forma consolidated income statement information of the Company for the year ended December 29, 2017 and December 30, 2016 as if Fells Point acquisition had occurred at December 26, 2015. The pro forma results were prepared from financial information obtained from the sellers of the business, as well as information obtained during the due diligence process associated with the acquisition. The pro forma information is not necessarily
61
indicative of the Company’s results of operations had the Fells Point acquisition been completed on the above date, nor is it necessarily indicative of the Company’s future results. The pro forma information does not reflect any cost savings from operating efficiencies or synergies that could result from the Fells Point acquisition, any incremental costs for Fells Point transitioning to become a public company, and also does not reflect additional revenue opportunities following the acquisition. The pro forma information reflects amortization and depreciation of the Fells Point acquisition at their respective fair values based on available information and the estimated change in the fair value of the earn-out liability due to accretion.
Fiscal Year Ended (unaudited) | ||||||||
December 29, 2017 | December 30, 2016 | |||||||
Net sales | $ | 1,340,820 | $ | 1,252,293 | ||||
Income before income taxes | 20,130 | 9,492 | ||||||
MT Food
On June 27, 2016, the Company acquired substantially all of the assets of MT Food, based in Chicago, Illinois. Founded in the mid 1990's, MT Food is a wholesale distributor of dairy, produce, specialty and grocery items in the metro Chicago area. The purchase price for the transaction was $21,500, of which, $21,000 was paid in cash at closing with an additional $500 payable eighteen months after the closing date. The aggregate purchase price paid by the Company was paid through cash-on-hand and the proceeds from a draw down on its delayed draw term loan facility. During the second quarter of fiscal 2017, the Company paid an earn-out of $500 to the former owners.
During the second quarter of 2017, the Company obtained additional information related to the fair value of intangible assets, deferred taxes, inventories, accounts receivable acquired and liabilities owed. As a result, the Company recorded a measurement period adjustment resulting in a net increase in goodwill of $3,418 and a decrease in customer relationships of $2,700. The Company has finalized a valuation of the tangible and intangible assets of MT Food as of the acquisition date. These assets are valued at fair value using Level 3 inputs. Customer relationships are being amortized over 15 years. Goodwill for the MT Food acquisition will be amortized over 15 years for tax purposes. The goodwill recorded primarily reflects the value of acquiring an established distributor to leverage the Company’s existing products and distribution center in the markets served by MT Food, as well as any intangible assets that do not qualify for separate recognition.
The table below sets forth the purchase price allocation of the Fells Point and MT Food acquisitions:
Fells Point | MT Food | |||||||
Current assets (includes cash acquired) | $ | 6,971 | $ | 6,132 | ||||
Customer relationships | 15,100 | 7,600 | ||||||
Trademarks | 8,100 | — | ||||||
Non-compete agreement | 400 | — | ||||||
Goodwill | 5,732 | 11,976 | ||||||
Fixed assets | 2,459 | 261 | ||||||
Current liabilities | (1,295 | ) | (3,969 | ) | ||||
Earn-out liability | (4,445 | ) | (500 | ) | ||||
Total consideration | $ | 33,022 | $ | 21,500 | ||||
The Company occasionally makes small tuck-in acquisitions that are immaterial, both individually and in the aggregate. Therefore, the gross increases in goodwill and intangible assets per the above table may not agree to the gross increases of these assets as shown in Note 8 “Goodwill and Other Intangible Assets.”
Note 6 – Inventories
Inventories consist of finished product. Our different entities record inventory using a mixture of first-in, first-out and average cost, which we believe approximates first-in, first-out. Inventory is reflected net of reserves for shrinkage and obsolescence totaling $1,934 and $2,122 at December 29, 2017 and December 30, 2016, respectively.
62
Note 7 – Equipment and Leasehold Improvements
Equipment and leasehold improvements as of December 29, 2017 and December 30, 2016 consisted of the following:
Useful Lives | December 29, 2017 | December 30, 2016 | ||||||||
Land | Indefinite | $ | 1,170 | $ | 1,170 | |||||
Buildings | 20 years | 1,292 | 1,292 | |||||||
Machinery and equipment | 5-10 years | 16,183 | 13,404 | |||||||
Computers, data processing and other equipment | 3-7 years | 9,924 | 9,367 | |||||||
Leasehold improvements | 7-22 years | 53,653 | 47,971 | |||||||
Furniture and fixtures | 7 years | 3,100 | 3,011 | |||||||
Vehicles | 5-7 years | 2,570 | 2,445 | |||||||
Other | 7 years | 95 | 95 | |||||||
Construction-in-process | 15,030 | 11,359 | ||||||||
103,017 | 90,114 | |||||||||
Less: accumulated depreciation and amortization | (34,639 | ) | (27,931 | ) | ||||||
Equipment and leasehold improvements, net | $ | 68,378 | $ | 62,183 | ||||||
Construction-in-process at December 29, 2017 consists primarily of the implementation of the Company’s Enterprise Resource Planning (“ERP”) system and the build out of the Company's distribution center in Union City, CA. The build out of the Company's Union City distribution center is expected to be completed during the first quarter of fiscal 2018 and the roll-out of the ERP system is expected to continue through 2019. The Company expects the cost to complete these projects to be approximately $3,200. Construction-in-process at December 30, 2016 related primarily to the implementation of the Company’s ERP system.
The Company had $530 and $506 of equipment and vehicles financed by capital leases at December 29, 2017 and December 30, 2016, respectively. The Company recorded depreciation of $64, $71 and $96 on these assets for the fiscal years ended December 29, 2017, December 30, 2016 and December 25, 2015, respectively.
Depreciation expense, excluding capital leases, was $6,644, $5,679 and $4,536 for the fiscal years ended December 29, 2017, December 30, 2016 and December 25, 2015, respectively.
Amortization expense on software was $1,808, $1,332 and $1,328 for the fiscal years ended December 29, 2017, December 30, 2016 and December 25, 2015, respectively.
During the years ended December 29, 2017, December 30, 2016 and December 25, 2015, the Company incurred interest expense of $22,709, $41,632 and $12,984, respectively. The Company capitalized interest expense of $0, $0 and $739, respectively, during the same periods. Capitalized interest is related to the build outs of the new distribution facilities in Bronx, NY and Las Vegas, NV.
On September 26, 2016, the Company sold a parcel of land it owned in Las Vegas, for total cash consideration of $550. The Company recognized a pre-tax gain of $113 on the sale. On June 30, 2015, the Company closed on a sale-leaseback transaction of its new Las Vegas, NV distribution facility. The property was sold for $14,645, which approximated its cost. The related ongoing lease will be accounted for as an operating lease by the Company.
Note 8 – Goodwill and Other Intangible Assets
The changes in the carrying amount of goodwill are presented as follows:
Carrying amount as of December 25, 2015 | $ | 155,816 | |
Goodwill adjustments | (614 | ) | |
Business combination | 8,559 | ||
Foreign currency translation | 23 | ||
Carrying amount as of December 30, 2016 | 163,784 | ||
Goodwill adjustments | 3,418 | ||
63
Business combinations | 5,946 | ||
Foreign currency translation | 54 | ||
Carrying amount as of December 29, 2017 | $ | 173,202 | |
The goodwill adjustments during the fiscal year ended December 29, 2017 relate to the MT Food acquisition (see Note 5).
Other intangible assets consist of customer relationships being amortized over a period ranging from four to twenty years, trademarks being amortized over a period of one to forty years, and non-compete agreements being amortized over a period of two to six years. Other intangible assets as of December 29, 2017 and December 30, 2016 consisted of the following:
Weighted-Average Remaining Amortization Period | Gross Carrying Amount | Accumulated Amortization | Net Amount | |||||||||||
December 29, 2017 | ||||||||||||||
Customer relationships | 145 months | $ | 117,006 | $ | (27,704 | ) | $ | 89,302 | ||||||
Non-compete agreements | 43 months | 7,566 | (6,946 | ) | 620 | |||||||||
Trademarks | 221 months | 60,734 | (10,336 | ) | 50,398 | |||||||||
Total | $ | 185,306 | $ | (44,986 | ) | $ | 140,320 | |||||||
December 30, 2016 | ||||||||||||||
Customer relationships | 151 months | $ | 104,381 | $ | (19,981 | ) | $ | 84,400 | ||||||
Non-compete agreements | 14 months | 7,166 | (5,587 | ) | 1,579 | |||||||||
Trademarks | 231 months | 52,574 | (7,422 | ) | 45,152 | |||||||||
Total | $ | 164,121 | $ | (32,990 | ) | $ | 131,131 | |||||||
Amortization expense for other intangibles was $12,033, $11,433 and $9,453 for the fiscal years ended December 29, 2017, December 30, 2016 and December 25, 2015, respectively.
As of December 29, 2017, estimated amortization expense for other intangible assets for each of the next five fiscal years and thereafter is as follows:
2018 | $ | 11,938 | |
2019 | 11,300 | ||
2020 | 11,027 | ||
2021 | 11,027 | ||
2022 | 10,247 | ||
Thereafter | 84,781 | ||
Total | $ | 140,320 | |
Note 9 – Debt Obligations
Debt obligations as of December 29, 2017 and December 30, 2016 consisted of the following:
December 29, 2017 | December 30, 2016 | |||||||
Senior secured term loan | $ | 288,435 | $ | 291,613 | ||||
Convertible notes | 36,750 | 36,750 | ||||||
New Markets Tax Credit loan | — | 11,000 | ||||||
Capital leases and financed software | 664 | 2,136 | ||||||
Deferred finance fees and original issue discount | (8,027 | ) | (8,979 | ) | ||||
Total debt obligations | 317,822 | 332,520 | ||||||
Less: current installments | (3,827 | ) | (14,795 | ) | ||||
Total debt obligations excluding current installments | $ | 313,995 | $ | 317,725 | ||||
64
Maturities of the Company’s debt for each of the next five years and thereafter at December 29, 2017 is as follows:
2018 | $ | 3,827 | |
2019 | 3,184 | ||
2020 | 3,184 | ||
2021 | 39,934 | ||
2022 | 275,720 | ||
Thereafter | — | ||
Total | $ | 325,849 | |
Senior Secured Term Loan Credit Facility
On June 22, 2016, the Company refinanced its debt structure by entering into a credit agreement (the “Term Loan Credit Agreement”) with a group of lenders for which Jefferies Finance LLC (“Jefferies”) acts as administrative agent and collateral agent. The Company used the proceeds to pay off its revolving credit facility, its previous term loan, and its senior secured notes. The Term Loan Credit Agreement provides for a senior secured term loan B facility (the “Term Loan Facility”) in an aggregate amount of $305,000 with a $50,000 six-month delayed draw term loan facility (the “DDTL”; the loans outstanding under the Term Loan Facility (including the DDTL), the “Term Loans”). Additionally, the Term Loan Facility includes an accordion which permits the Company to request that the lenders extend additional Term Loans in an aggregate principal amount of up to $50,000 (less the aggregate amount of certain indebtedness incurred to finance acquisitions) plus an unlimited amount subject to the Company’s Total Leverage Ratio not exceeding 4.90:1.00 on a pro forma basis. Borrowings under the Term Loan Facility were used to repay the Company’s senior secured notes, as well as the prior term loan and revolving credit facility. Remaining funds will be used for capital expenditures, permitted acquisitions, working capital and general corporate purposes of the Company. On June 27, 2016, the Company drew $14,000 from the DDTL to help pay for the MT Food acquisition. On September 14, 2016, the Company entered into an amendment to the Term Loan Credit Agreement under which the remaining portion of the DDTL was terminated, the Company’s interest rate schedule was modified and the Company repaid $25,000 of the outstanding balance of the Term Loans. On December 13, 2017, the Company completed a repricing of the Term Loan Facility to reduce the Applicable Rate (as defined in the Term Loan Credit Agreement) from 475 basis points to 400 basis points over LIBOR. In connection with the repricing, the Company paid debt financing costs of $761 which were capitalized as deferred financing charges. The interest rate on this facility at December 29, 2017 was 5.57%.
The final maturity of the Term Loan Facility is June 22, 2022. Subject to adjustment for prepayments, the Company is required to make quarterly amortization payments on the Term Loans in an amount equal to 0.25% of the aggregate principal amount of the Term Loans.
The interest rates per annum applicable to Term Loans, will be, at the co-borrowers’ option, equal to either a base rate or an adjusted LIBOR rate for one, two, three, six or (if consented to by the lenders) twelve-month interest periods chosen by the Company, in each case plus an applicable margin percentage.
The Term Loan Facility contains customary affirmative covenants, negative covenants (including restrictions, subject to customary exceptions, on incurring debt or liens, paying dividends, repaying payment subordinated and junior lien debt, disposing assets, and making investments and acquisitions), and events of default for a term loan B facility of this type, as more particularly described in the Term Loan Credit Agreement.
As of December 29, 2017, the Company was in compliance with all debt covenants under the Term Loan Facility.
Asset Based Loan Facility
On June 22, 2016, the Company entered into a credit agreement (the “ABL Credit Agreement”) with a group of lenders for which JPMorgan Chase Bank, N.A., acts as administrative agent and collateral agent. The ABL Credit Agreement provides for an asset based loan facility (the “ABL Facility”) in the aggregate amount of up to $75,000. Availability under the ABL Facility will be limited to a borrowing base consisting of the difference of (a) the lesser of: (i) the aggregate amount of commitments or (ii) the sum of specified percentages of eligible receivables and eligible inventory, minus certain availability reserves minus (b) outstanding borrowings. The co-borrowers under the ABL Facility are entitled on one or more occasions, subject to the satisfaction of certain conditions, to request an increase in the commitments under the ABL Facility in an aggregate principal amount of up to $25,000. The ABL Facility matures on June 22, 2021.
The interest rates per annum applicable to loans, other than swingline loans, under the ABL Credit Facility will be, at the co-
65
borrowers’ option, equal to either a base rate or an adjusted LIBOR rate for one, two, three, six or (if consented to by the lenders) twelve-month, interest periods chosen by the Company, in each case plus an applicable margin percentage. The Company will pay certain recurring fees with respect to the ABL Facility, including fees on the unused commitments of the lenders.
The ABL Facility contains customary affirmative covenants, negative covenants and events of default as more particularly described in the ABL Credit Agreement. The ABL Facility will require compliance with a minimum consolidated fixed charge coverage ratio of 1:1 if the amount of availability under the ABL Facility falls below a specified dollar amount or percentage of the borrowing base.
There were no outstanding balances under the ABL Facility as of December 29, 2017. Borrowings under the ABL Facility will be used, and are expected to be used, for capital expenditures, permitted acquisitions, working capital and general corporate purposes of the Company. As of December 29, 2017, the Company was in compliance with all debt covenants and the Company had reserved $10,195 of the ABL facility for the issuance of letters of credit. As of December 29, 2017, funds totaling $64,805 were available for borrowing under the ABL facility.
New Markets Tax Credit Loan
On April 26, 2012, Dairyland HP LLC (“DHP”), an indirectly wholly-owned subsidiary of the Company, entered into a financing arrangement under the New Markets Tax Credit (“NMTC”) program under the Internal Revenue Code of 1986, as amended, pursuant to which a subsidiary of Chase, provided to DHP an $11,000 construction loan (the “NMTC Loan”) to help fund DHPs expansion and build-out of the Bronx, New York facility and the rail shed located at that facility, which construction is required under the facility lease agreement. Borrowings under the NMTC Loan are secured by a first priority secured lien on DHPs leasehold interest in the Bronx, New York facility, including all improvements made on the premises, as well as, among other things, a lien on all fixtures incorporated into the project improvements.
Under the NMTC Loan, DHP is obligated to pay (i) monthly interest payments on the principal balance then outstanding and (ii) the entire unpaid principal balance then due and owing on April 26, 2017. So long as DHP is not in default, interest accrues on borrowings at 1.00% per annum. The Company may prepay the NMTC Loan, in whole or in part, in $100 increments. DHP was in compliance with all debt covenants under the NMTC Loan during all periods presented.
The loan matured on April 26, 2017 and was repaid in full, including all accrued interest, for $11,009, of which, $8,070 was paid in cash and $2,939 was paid from the associated sinking fund.
Convertible Subordinated Notes
On April 6, 2015, the Company issued $36,750 principal amount of convertible subordinated notes with a six-year maturity bearing interest at 2.5% and a conversion price of $29.70 per share (the “Convertible Subordinated Notes”) to certain of the Del Monte entities as partial consideration in the Del Monte acquisition. The holders of the Convertible Subordinated Notes may, in certain instances beginning one year after issuance, redeem the Convertible Subordinated Notes for cash or shares of the Company’s common stock. Moreover, the Company may pay the outstanding principal amount due and owing under the Convertible Subordinated Notes at maturity in either cash or shares of the Company’s common stock. The Convertible Subordinated Notes, which are subordinate to the Company’s and its subsidiaries’ senior debt, are convertible into shares of the Company’s common stock by the holders at any time at a conversion price of $29.70. The Company incurred interest expense of $919 during the years ended December 29, 2017 and December 30, 2016.
Note 10 – Stockholders’ Equity
On December 19, 2017, we completed a public offering of 1,900,000 shares of our common stock which resulted in net proceeds to us of approximately $34,020 after deducting underwriters’ fees, commissions and transaction expenses.
Equity Incentive Plan
The Company has adopted the 2011 Omnibus Equity Incentive Plan (the “Equity Plan”). The purpose of the Equity Plan is to promote the interests of the Company and its stockholders by (i) attracting and retaining key officers, employees and directors; (ii) motivating such individuals by means of performance related incentives to achieve long-range performance goals; (iii) enabling such individuals to participate in the long-term growth and financial success of the Company; (iv) encouraging ownership of stock in the Company by such individuals; and (v) linking their compensation to the long-term interests of the Company and its stockholders.
66
The Equity Plan is administered by the Compensation Committee (the “Committee”) of the Board of Directors and allows for the issuance of stock options, stock appreciation rights (“SARs”), restricted share awards (“RSAs”), restricted share units, performance awards, or other stock-based awards. Stock option exercise prices are fixed by the Committee but shall not be less than the fair market value of a common share on the date of the grant of the option, except in the case of substitute awards. Similarly, the grant price of an SAR may not be less than the fair market value of a common share on the date of the grant. The Committee will determine the expiration date of each stock option and SAR, but in no case shall the stock option or SAR be exercisable after the expiration of ten years from the date of the grant. The Company plans to issue new shares upon exercise of any stock options. The Equity Plan provided 1,750,000 shares available for grant, of which no more than 1,000,000 could be for Incentive Stock Options. As of December 29, 2017, there were 553,708 shares available for grant.
Stock compensation expense was $3,018, $2,579 and $3,539 for the fiscal years ended December 29, 2017, December 30, 2016 and December 25, 2015, respectively. The related tax benefit for stock-based compensation was $1,283, $1,469 and $588 for the fiscal years ended December 29, 2017, December 30, 2016 and December 25, 2015, respectively.
The following table reflects the activity of RSAs during the fiscal years ended December 29, 2017 and December 30, 2016:
Shares | Weighted Average Grant Date Fair Value | ||||||
Unvested at December 25, 2015 | 418,604 | $ | 18.54 | ||||
Granted | 214,274 | 17.75 | |||||
Vested | (108,400 | ) | 18.00 | ||||
Forfeited | (190,425 | ) | 16.82 | ||||
Unvested at December 30, 2016 | 334,053 | $ | 18.69 | ||||
Granted | 207,871 | 14.84 | |||||
Vested | (116,442 | ) | 18.36 | ||||
Forfeited | (95,721 | ) | 17.73 | ||||
Unvested at December 29, 2017 | 329,761 | $ | 16.69 | ||||
The fair value of RSAs vested during the fiscal years ended December 29, 2017, December 30, 2016 and December 25, 2015, were $1,703, $1,779 and $3,110, respectively.
At December 29, 2017, the Company had 329,761 of unvested RSAs outstanding. At December 29, 2017, the total unrecognized compensation cost for these unvested RSAs was $3,823 to be recognized over a weighted-average period of approximately 25 months. Of this total, $2,646 related to RSAs with time-based vesting provisions and $1,177 related to RSAs with performance-based vesting provisions. At December 29, 2017, unrecognized compensation cost was to be recognized over a weighted-average period of approximately 26 months for time-based vesting RSAs and 24 months for the performance-based vesting RSAs.
The following table summarizes stock option activity during the fiscal years ended December 29, 2017 and December 30, 2016:
Shares | Weighted Average Exercise Price | Aggregate Intrinsic Value | Weighted Average Remaining Contractual Term (in years) | ||||||||||
Outstanding December 25, 2015 | — | $ | — | $ | — | 0 | |||||||
Granted | 259,577 | 20.23 | |||||||||||
Exercised | — | — | |||||||||||
Forfeited | (50,506 | ) | 20.23 | ||||||||||
Outstanding December 30, 2016 | 209,071 | $ | 20.23 | $ | — | 9.2 | |||||||
Granted | — | — | |||||||||||
Exercised | — | — | |||||||||||
Forfeited | (17,263 | ) | 20.23 | ||||||||||
Outstanding December 29, 2017 | 191,808 | $ | 20.23 | $ | 33 | 8.2 | |||||||
Exercisable at December 29, 2017 | — | — | $ | — | 0 | ||||||||
67
During March 2016, the Company granted 259,577 non-qualified stock options with market condition provisions to its employees at an exercise price of $20.23 and a weighted average grant date fair value of $9.44 using the following key assumptions:
2016 Market Stock Options | |||
Expected volatility of common stock (based on our historical stock price) | 42.8 | % | |
Risk-free interest rate (based on U.S. Treasury yields on the date of grant) | 1.91 | % | |
Expected term (median years until the simulated stock price exceeds target) | 1.38 | ||
These awards vest over a period of three years and require the Company’s stock to trade at or above $30 per share for twenty consecutive days within four years of issuance to meet the market condition threshold. The Company recognized expense of $557 and $559 on these options during fiscal year ended December 29, 2017 and December 30, 2016, respectively. At December 29, 2017, the total unrecognized compensation cost for these options was $715 to be recognized over a weighted-average period of approximately 14 months. The Company has not granted stock options prior to fiscal 2016.
No compensation expense related to the Company’s RSAs or stock options has been capitalized.
Note 11 – Leases
The Company leases various warehouse and office facilities and certain vehicles and equipment under long-term operating lease agreements that expire at various dates, with related parties and with others. See Note 15 for additional discussion of related party transactions. The Company records operating lease costs, including any determinable rent increases, on a straight-line basis over the lease term. As of December 29, 2017, the Company is obligated under non-cancelable operating lease agreements to make future minimum lease payments as follows:
Related Party Real Estate | Third Party Real Estate | Third Party Vehicles | Third Party Other | Total | ||||||||||||||||
2018 | $ | 1,230 | $ | 7,812 | $ | 10,312 | $ | 1,477 | $ | 20,831 | ||||||||||
2019 | 1,250 | 6,885 | 9,283 | 1,110 | 18,528 | |||||||||||||||
2020 | 1,270 | 7,271 | 7,843 | 467 | 16,851 | |||||||||||||||
2021 | 1,290 | 6,834 | 6,169 | 251 | 14,544 | |||||||||||||||
2022 | 1,224 | 6,504 | 4,632 | 84 | 12,444 | |||||||||||||||
Thereafter | 2,153 | 36,822 | 2,945 | — | 41,920 | |||||||||||||||
Total minimum lease payments | $ | 8,417 | $ | 72,128 | $ | 41,184 | $ | 3,389 | $ | 125,118 | ||||||||||
Total rent expense for operating leases for the fiscal years ended December 29, 2017, December 30, 2016 and December 25, 2015 was $26,678, $24,202 and $20,199, respectively.
Note 12 – Income Taxes
The provision for income taxes consists of the following for the fiscal years ended December 29, 2017, December 30, 2016 and December 25, 2015:
December 29, 2017 | December 30, 2016 | December 25, 2015 | ||||||||||
Current income tax expense (benefit): | ||||||||||||
Federal | $ | 3,342 | $ | (491 | ) | $ | 9,538 | |||||
State | 1,403 | 153 | 2,773 | |||||||||
Total current income tax expense (benefit) | 4,745 | (338 | ) | 12,311 | ||||||||
Deferred income tax expense (benefit): | ||||||||||||
Federal | (1,059 | ) | 2,441 | (725 | ) | |||||||
Foreign | 215 | 49 | 19 | |||||||||
State | 141 | 501 | (103 | ) | ||||||||
Total deferred income tax expense (benefit) | (703 | ) | 2,991 | (809 | ) | |||||||
Total income tax expense | $ | 4,042 | $ | 2,653 | $ | 11,502 | ||||||
68
Income tax expense for the fiscal years ended December 29, 2017, December 30, 2016 and December 25, 2015 differed from amounts computed using the statutory federal income tax rate due to the following reasons:
December 29, 2017 | December 30, 2016 | December 25, 2015 | ||||||||||
Statutory U.S. Federal tax | $ | 6,443 | $ | 1,987 | $ | 9,700 | ||||||
Differences due to: | ||||||||||||
State and local taxes, net of federal benefit | 1,112 | 470 | 1,728 | |||||||||
Foreign tax rate differential | (82 | ) | (168 | ) | (63 | ) | ||||||
Impact of the Tax Act | (3,573 | ) | — | — | ||||||||
Other | 142 | 364 | 137 | |||||||||
Income tax expense | $ | 4,042 | $ | 2,653 | $ | 11,502 | ||||||
Deferred tax assets and liabilities at December 29, 2017 and December 30, 2016 consist of the following:
December 29, 2017 | December 30, 2016 | |||||||
Deferred tax assets: | ||||||||
Receivables and inventory | $ | 3,969 | $ | 5,230 | ||||
Accrued expenses | 1,542 | 2,122 | ||||||
Self-insurance reserves | 2,179 | 2,515 | ||||||
Net operating loss carryforwards | 1,191 | 2,498 | ||||||
Stock compensation | 1,017 | 1,122 | ||||||
Other | 1,696 | 1,213 | ||||||
Total deferred tax assets | 11,594 | 14,700 | ||||||
Deferred tax liabilities: | ||||||||
Property & equipment | (1,701 | ) | (1,759 | ) | ||||
Intangible assets | (10,784 | ) | (12,962 | ) | ||||
Contingent earn-out liabilities | (3,646 | ) | (5,020 | ) | ||||
Prepaid expenses and other | (1,189 | ) | (1,917 | ) | ||||
Total deferred tax liabilities | (17,320 | ) | (21,658 | ) | ||||
Valuation allowance | (289 | ) | — | |||||
Total net deferred tax liability | $ | (6,015 | ) | $ | (6,958 | ) | ||
As of December 29, 2017, the Company completed its accounting for the impacts of the Tax Act and recognized an income tax benefit of $3,573 in the fiscal quarter ended December 29, 2017 due to the remeasurement of the Company's deferred tax assets and liabilities. The Company's effective income tax rate for fiscal 2017 would have been 41.4% exclusive of the impact of the Tax Act. The Company's actual effective income tax rate for fiscal 2017 was 22.0%.
The deferred tax provision results from the effects of net changes during the year in deferred tax assets and liabilities arising from temporary differences between the carrying amounts of assets and liabilities for financial reporting purposes and the amounts used for income tax purposes. The Company files income tax returns in the U.S. Federal and various state and local jurisdictions as well as the Canadian Federal and provincial districts. For Federal income tax purposes, the 2014 through 2017 tax years remain open for examination by the tax authorities under the normal three-year statute of limitations and the fact that we have not yet filed our tax return for 2017. For state tax purposes, the 2013 through 2017 tax years remain open for examination by the tax authorities under a four-year statute of limitations. The Company records interest and penalties, if any, in income tax expense.
At December 29, 2017, the Company recognized a valuation allowance of $289 which consisted of a full valuation allowance on its Canada net operating loss carryforward of $593 because it is not expected to be realizable in the future offset by a reduction in deferred tax liabilities related to finite-lived intangible assets acquired from Qzina in 2013.
For financial reporting purposes, net loss from operations before income taxes for our foreign subsidiaries was $691, $154 and $209 for the fiscal years ended December 29, 2017, December 30, 2016 and December 25, 2015, respectively. We had no foreign operations prior to fiscal 2013. It is our intention to indefinitely reinvest any earnings, therefore no U.S. taxes have been provided for these amounts. The amount of foreign accumulated earnings that have been permanently reinvested is immaterial.
69
As of December 29, 2017 and December 30, 2016, the Company did not have any uncertain tax positions.
Note 13 – Supplemental Disclosures of Cash Flow Information
December 29, 2017 | December 30, 2016 | December 25, 2015 | ||||||||||
Cash paid for income taxes, net of cash received | $ | 333 | $ | 6,368 | $ | 11,047 | ||||||
Cash paid for interest, net of loss on debt extinguishment | $ | 20,796 | $ | 17,790 | $ | 11,462 | ||||||
Non-cash financing activity: | ||||||||||||
Sinking funds used to retire debt | $ | 2,939 | $ | — | $ | — | ||||||
Non-cash investing activity: | ||||||||||||
Common stock issued for acquisitions | $ | 3,300 | $ | — | $ | 24,689 | ||||||
Convertible notes issued for acquisitions | $ | — | $ | — | $ | 36,750 | ||||||
Acquisition purchase price payable | $ | — | $ | 500 | $ | — | ||||||
Contingent earn-out liabilities for acquisitions | $ | 4,445 | $ | 500 | $ | 13,139 | ||||||
Note 14 – Employee Benefit Plans
Employee Tax-Deferred Savings Plan
The Company offers a 401(k) Plan to all full-time employees that provides for tax-deferred salary deductions for eligible employees. Employees may choose to make voluntary contributions of their annual compensation to the 401(k) Plan, limited to an annual maximum amount as set periodically by the Internal Revenue Service. Beginning in 2013, the Company provided discretionary matching contributions equal to 50 percent of the employee’s contribution amount, up to a maximum of six percent of the employee’s annual salary, capped at $2.5 per associate per year. Matching contributions begin vesting after two years and are fully vested after six. Employee contributions are fully vested when made. Under the 401(k) Plan there is no option available to the employee to receive or purchase the Company’s common stock. Matching contributions under the 401(k) Plan were $1,172 for fiscal 2017, $1,049 for fiscal 2016 and $858 for fiscal 2015.
Note 15 – Related Parties
The Company previously leased two warehouse facilities that are 100% owned by entities controlled by Christopher Pappas, the Company’s chairman, president and chief executive officer, John Pappas, the Company’s vice chairman and one of its directors, and Dean Facatselis, a former non-employee director of the Company and the brother-in-law of Messrs. Pappas, and are deemed to be affiliates of these individuals. Expense related to the above facilities was $533, $616 and $1,406 for the fiscal years ended December 29, 2017, December 30, 2016 and December 25, 2015, respectively. One of the facilities is a distribution facility leased by Chefs’ Warehouse Mid-Atlantic, LLC with a lease expiration date of September 30, 2019. The other facility is a distribution facility which one of the Company’s subsidiaries, Dairyland, sublet from TCW Leasing Co., LLC (“TCW”), an entity controlled by the Company's founders. The Company exited this facility on February 29, 2016 and is no longer required to pay rent.
Each of Christopher Pappas, John Pappas and Dean Facatselis owns 8.33% of a New York City-based restaurant customer of the Company and its subsidiaries that purchased an aggregate of approximately $121, $109 and $117 of products from the Company during fiscal 2017, fiscal 2016 and fiscal 2015, respectively. Messrs. Pappas and Facatselis have no other interest in the restaurant other than these equal interests and are not involved in the day-to-day operation or management of this restaurant.
The Company paid $137, $315 and $827 to Architexture Studios, Inc. for interior decorating and design including the purchase of furniture and leasehold improvements primarily for our Las Vegas, San Francisco and Chicago facilities during fiscal years 2017, 2016 and 2015, respectively. This entity is owned by Julie Hardridge, the sister-in-law of Christopher Pappas.
The Company purchases products from ConAgra Foods, Inc. of which Steve Goldstone, a Director of the Company, is the Chairman. Mr. Goldstone became a director of the Company on March 7, 2016. The Company purchased approximately $701 and $722 worth of products from ConAgra Foods, Inc. for the fiscal years ended December 29, 2017 and December 30, 2016.
With the acquisition of Del Monte, the Company leased two warehouse facilities that the Company leases from certain prior owners of Del Monte. Two of the owners were current employees as of December 29, 2017, one of whom, John DeBenedetti,
70
serves on the Company’s board of directors. The first property is located in American Canyon, CA and is owned by TJ Management Co. LLC, an entity owned 50% by John DeBenedetti. The Company paid rent on this facility totaling $219, $210 and $156 during fiscal years 2017, 2016 and 2015, respectively. The second property is located in West Sacramento, CA and is owned by David DeBenedetti and Victoria DeBenedetti, the parents of John DeBenedetti. The Company paid rent on this facility totaling $234, $225 and $167 during fiscal years 2017, 2016 and 2015, respectively. John DeBenedetti and Victoria DeBenedetti were employees of a subsidiary of the Company as of December 29, 2017.
John DeBenedetti, indirectly through TJ Investments, LLC, owns an 8.33% ownership interest in Old World Provisions, which supplies products to the Company following the Del Monte acquisition. The Company purchased approximately $1,713, $1,269 and $963 of products from Old World Provisions during fiscal years 2017, 2016 and 2015, respectively. Mr. J. DeBenedetti is not involved in the day-to-day management of Old World Provisions.
John Pappas’s brother-in-law, Constantine Papataros, is one of the Company’s employees. The Company paid him approximately $188, $194 and $169 in total compensation during fiscal 2017, fiscal 2016 and fiscal 2015, respectively. Christopher Pappas’s brother, John Pappas, is one of the Company’s employees and a member of the Company’s Board of Directors. The Company paid John Pappas approximately $593, $597 and $882 in total compensation for fiscal 2017, fiscal 2016 and fiscal 2015, respectively. John Pappas did not receive any compensation in fiscal 2017, fiscal 2016 or fiscal 2015 for his service on the Company’s Board of Directors. Tara Brennan, the domestic partner of John DeBennedetti, was an employee of the Company as of December 29, 2017 and was paid approximately $180 and $184 in fiscal 2017 and 2016, respectively.
An entity owned 50% by John Couri, a director of the Company, and of which Messrs. C. Pappas and S. Hanson (also directors of the Company) previously held ownership interests, owns an interest in an aircraft that the Company used for business purposes in the course of its operations. Mr. Couri paid for his ownership interest in the aircraft himself and bears his share of all operating, personnel and maintenance costs associated with the operation of this aircraft. All payments were paid directly to an entity that manages the aircraft in which Mr. Couri has a de minimis indirect ownership interest. This related party relationship ended during the fourth quarter of fiscal 2016. The Company made payments of $36 in fiscal 2017 for use of such aircraft in the fourth quarter of fiscal 2016. The Company made payments of $21 and $182 in fiscal 2016 and 2015, respectively, for use of such aircraft.
Note 16 – Commitments and Contingencies
Legal Contingencies
The Company is involved in various legal proceedings. The Company establishes reserves for specific legal proceedings when it determines that the likelihood of an unfavorable outcome is probable and the amount of loss can be reasonably estimated. Management has also identified certain other legal matters where the Company believes an unfavorable outcome is reasonably possible and/or for which no estimate of possible losses can be made. The Company does not believe that there is a reasonable possibility of material loss or loss in excess of the amount that the Company has accrued. The Company recognizes legal fees related to any ongoing legal proceeding as incurred.
Tax Audits
The Company is involved in various tax matters, with respect to some of which the outcome is uncertain. These audits may result in the assessment of additional taxes that are subsequently resolved with authorities or potentially through the courts.
Risk Management Programs
The Company’s self-insurance reserves for its medical program totaled $858 and $773 at December 29, 2017 and December 30, 2016, respectively.
The Company’s self-insurance reserves for its automobile liability program totaled $1,078 and $1,068 at December 29, 2017 and December 30, 2016, respectively. Self-insurance reserves for workers' compensation totaled $9,594 and $7,280 at December 29, 2017 and December 30, 2016, respectively.
Workforce (unaudited)
As of December 29, 2017, approximately 9.9% of the Company’s employees are represented by unions, all of whom are operating under a collective bargaining agreement which expires on August 3, 2020.
71
Note 17 – Valuation Reserves
The following tables summarize the activity in our valuation accounts during the fiscal years ended December 29, 2017, December 30, 2016 and December 25, 2015:
Balance at Beginning of Period | Additions Charged to Expense | Deductions | Balance at End of Period | |||||||||||||
Allowance for doubtful accounts | ||||||||||||||||
December 29, 2017 | $ | 6,848 | $ | 4,061 | $ | (2,883 | ) | $ | 8,026 | |||||||
December 30, 2016 | 5,803 | 3,224 | (2,179 | ) | 6,848 | |||||||||||
December 25, 2015 | 4,675 | 2,909 | (1,781 | ) | 5,803 | |||||||||||
Inventory valuation reserve | ||||||||||||||||
December 29, 2017 | $ | 2,122 | $ | 2,996 | $ | (3,184 | ) | $ | 1,934 | |||||||
December 30, 2016 | 1,956 | 3,043 | (2,877 | ) | 2,122 | |||||||||||
December 25, 2015 | 1,130 | 3,288 | (2,462 | ) | 1,956 | |||||||||||
Allowance for deferred tax assets | ||||||||||||||||
December 29, 2017 | $ | — | $ | 289 | $ | — | $ | 289 | ||||||||
December 30, 2016 | — | — | — | — | ||||||||||||
December 25, 2015 | — | — | — | — | ||||||||||||
Note 18 – Quarterly Results (unaudited)
The quarterly results of the Company for the fiscal years ended December 29, 2017 and December 30, 2016 are as follows:
Fiscal 2017 | ||||||||||||||||
Q1 | Q2 | Q3 (1) | Q4 (2) | |||||||||||||
Net sales | $ | 287,690 | $ | 331,656 | $ | 325,076 | $ | 357,098 | ||||||||
Gross profit | 73,904 | 82,596 | 80,905 | 91,973 | ||||||||||||
Operating profit | 3,121 | 12,163 | 10,494 | 15,349 | ||||||||||||
Income before income taxes | (2,812 | ) | 6,283 | 4,891 | 10,046 | |||||||||||
Net income | (1,642 | ) | 3,674 | 2,851 | 9,483 | |||||||||||
Basic net income per share | (0.06 | ) | 0.14 | 0.11 | 0.36 | |||||||||||
Diluted net income per share | (0.06 | ) | 0.14 | 0.11 | 0.35 | |||||||||||
Fiscal 2016 | ||||||||||||||||
Q1 | Q2 (3) | Q3 (4) | Q4 (5) | |||||||||||||
Net sales | $ | 260,836 | $ | 291,209 | $ | 297,917 | $ | 342,904 | ||||||||
Gross profit | 65,958 | 71,803 | 74,392 | 89,064 | ||||||||||||
Operating profit | 5,360 | 11,188 | 8,286 | 22,404 | ||||||||||||
Income before income taxes | 1,701 | (14,479 | ) | 2,299 | 16,155 | |||||||||||
Net income | 993 | (8,455 | ) | 1,343 | 9,142 | |||||||||||
Basic net income per share | 0.04 | (0.33 | ) | 0.05 | 0.35 | |||||||||||
Diluted net income per share | 0.04 | (0.33 | ) | 0.05 | 0.34 | |||||||||||
(1)Beginning in the third quarter of 2017 the Company began to reflect the results of the Fells Point acquisition.
(2)The fourth quarter of 2017 includes a tax benefit of $3,573 related to the enactment of the Tax Act.
(3) | The Company refinanced its debt structure by entering into a new senior secured term loan. Proceeds were used to pay off its revolving credit facility and previous term loan resulting in a loss on extinguishment of debt of $22,310. |
(4)Beginning in the third quarter of 2016 the Company began to reflect the results of the MT Food acquisition.
(5)The Company recorded income of $8,347 related to the revaluation of the Del Monte earn-out liabilities.
72
Item 9. CHANGES IN AND DISAGREEMENTS WITH ACCOUNTANTS ON ACCOUNTING AND FINANCIAL DISCLOSURE
Not applicable.
Item 9A. | CONTROLS AND PROCEDURES |
Disclosure Controls and Procedures.
Our management, with the participation of our chief executive officer and chief financial officer, evaluated the effectiveness of our disclosure controls and procedures pursuant to Rule 13a-15 under the Securities Exchange Act of 1934, as amended (the “Exchange Act”), as of the end of the period covered by this Annual Report on Form 10-K.
Based on that evaluation, our Chief Executive Officer and Chief Financial Officer concluded that our disclosure controls and procedures were effective, as of the end of the period covered by this report, to provide reasonable assurance that information we are required to disclose in reports that we file or submit under the Exchange Act is recorded, processed, summarized and reported within the time periods specified in SEC rules and forms, and that such information is accumulated and communicated to our management, including our Chief Executive Officer and Chief Financial Officer, as appropriate, to allow timely decisions regarding required disclosure.
Management’s Annual Report on Internal Control Over Financial Reporting.
The Company’s management is responsible for establishing and maintaining adequate internal control over financial reporting as defined in Rules 13a–15(f) and 15d–15(f) under the Exchange Act. The Company’s internal control over financial reporting is designed to provide reasonable assurance regarding the reliability of financial reporting and the preparation of financial statements for external purposes in accordance with GAAP. The Company’s internal control over financial reporting includes those policies and procedures that: (i) pertain to the maintenance of records that, in reasonable detail, accurately and fairly reflect the transactions and dispositions of the assets of the Company; (ii) provide reasonable assurance that transactions are recorded as necessary to permit preparation of financial statements in accordance with GAAP, and that receipts and expenditures of the Company are being made only in accordance with authorizations of management and directors of the Company; and (iii) provide reasonable assurance regarding prevention or timely detection of unauthorized acquisition, use or disposition of the Company’s assets that could have a material effect on the financial statements.
Because of its inherent limitations, internal control over financial reporting may not prevent or detect misstatements. Also, projections of any evaluation of effectiveness to future periods are subject to the risk that controls may become inadequate because of changes in conditions, or that the degree of compliance with the policies or procedures may deteriorate.
Under the supervision of our Chief Executive Officer and Chief Financial Officer, our management assessed the effectiveness of the Company’s internal control over financial reporting as of December 29, 2017. In making this assessment, management used the criteria set forth in Internal Control—Integrated Framework (2013) issued by the Committee of Sponsoring Organizations of the Treadway Commission (“COSO”). Based on this assessment, our Chief Executive Officer and Chief Financial Officer have concluded that the Company’s internal control over financial reporting was effective as of December 29, 2017.
The Company’s financial statements included in this Annual Report on Form 10-K have been audited by BDO USA, LLP, an independent registered public accounting firm, as indicated in the report appearing on page 49 of this Form 10-K. BDO USA, LLP has also provided an attestation report on the Company’s internal control over financial reporting.
Changes In Internal Control Over Financial Reporting.
There have been no changes in our internal control over financial reporting during the most recent fiscal quarter that have materially affected, or are reasonably likely to materially affect, our internal control over financial reporting.
73
Report of Independent Registered Public Accounting Firm
Shareholders and Board of Directors
The Chefs’ Warehouse, Inc.
Ridgefield, CT
Opinion on Internal Control over Financial Reporting
We have audited, The Chefs’ Warehouse, Inc. (the “Company’s”) internal control over financial reporting as of December 29, 2017, based on criteria established in Internal Control - Integrated Framework (2013) issued by the Committee of Sponsoring Organizations of the Treadway Commission (the “COSO criteria). In our opinion, the Company maintained, in all material respects, effective internal control over financial reporting as of December 29, 2017, based on the COSO criteria
We also have audited, in accordance with the standards of the Public Company Accounting Oversight Board (United States) (“PCAOB”), the consolidated balance sheets of the Company as of December 29, 2017 and December 30, 2016, the related consolidated statements of operations and comprehensive income, stockholders’ equity, and cash flows for each of the three years in the period ended December 29, 2017, and the related notes and our report dated March 9, 2018 expressed an unqualified opinion thereon.
Basis for Opinion
The Company’s management is responsible for maintaining effective internal control over financial reporting and for its assessment of the effectiveness of internal control over financial reporting, included in the accompanying Item 9A, Management’s Report on Internal Control over Financial Reporting. Our responsibility is to express an opinion on the Company’s internal control over financial reporting based on our audit. We are a public accounting firm registered with the PCAOB and are required to be independent with respect to the Company in accordance with U.S. federal securities laws and the applicable rules and regulations of the Securities and Exchange Commission and the PCAOB.
We conducted our audit of internal control over financial reporting in accordance with the standards of the PCAOB. Those standards require that we plan and perform the audit to obtain reasonable assurance about whether effective internal control over financial reporting was maintained in all material respects. Our audit included obtaining an understanding of internal control over financial reporting, assessing the risk that a material weakness exists, and testing and evaluating the design and operating effectiveness of internal control based on the assessed risk. Our audit also included performing such other procedures as we considered necessary in the circumstances. We believe that our audit provides a reasonable basis for our opinion.
Definition and Limitations of Internal Control over Financial Reporting
A company’s internal control over financial reporting is a process designed to provide reasonable assurance regarding the reliability of financial reporting and the preparation of financial statements for external purposes in accordance with generally accepted accounting principles. A company’s internal control over financial reporting includes those policies and procedures that (1) pertain to the maintenance of records that, in reasonable detail, accurately and fairly reflect the transactions and dispositions of the assets of the company; (2) provide reasonable assurance that transactions are recorded as necessary to permit preparation of financial statements in accordance with generally accepted accounting principles, and that receipts and expenditures of the company are being made only in accordance with authorizations of management and directors of the company; and (3) provide reasonable assurance regarding prevention or timely detection of unauthorized acquisition, use, or disposition of the company’s assets that could have a material effect on the financial statements.
Because of its inherent limitations, internal control over financial reporting may not prevent or detect misstatements. Also, projections of any evaluation of effectiveness to future periods are subject to the risk that controls may become inadequate because of changes in conditions, or that the degree of compliance with the policies or procedures may deteriorate.
/s/ BDO USA, LLP
New York, NY
March 9, 2018
74
Item 9B. | OTHER INFORMATION |
None.
PART III
Item 10. DIRECTORS, EXECUTIVE OFFICERS AND CORPORATE GOVERNANCE
The information set forth under the captions “Corporate Governance,” “Proposal 1 - Election of Directors” and “Section 16(a) Beneficial Ownership Reporting Compliance” in our definitive Proxy Statement for our 2018 Annual Meeting of Stockholders to be held on May 18, 2018, which we intend to file within 120 days after our fiscal year-end, is incorporated herein by reference. As provided in General Instruction G(3) to Form 10-K and Instruction 3 to Item 401(b) of Regulation S-K, information regarding executive officers of our Company is provided in Part I of this Annual Report on Form 10-K under the caption, “Executive Officers.”
Item 11. | EXECUTIVE COMPENSATION |
The information set forth under the caption “Executive Compensation” in our definitive Proxy Statement for our 2018 Annual Meeting of Stockholders to be held on May 18, 2018, which we intend to file within 120 days after our fiscal year-end, is incorporated herein by reference.
Item 12. | SECURITY OWNERSHIP OF CERTAIN BENEFICIAL OWNERS AND MANAGEMENT AND RELATED STOCKHOLDER MATTERS |
The information set forth under the captions “Stock Ownership of Certain Beneficial Owners and Management” in our definitive Proxy Statement for our 2018 Annual Meeting of Stockholders to be held on May 18, 2018, which we intend to file within 120 days after our fiscal year-end, is incorporated herein by reference.
The following table provides certain information with respect to equity awards under our equity compensation plans as of December 29, 2017:
Plan Category | Number of securities to be issued upon exercise of outstanding options, warrants and rights | Weighted-average exercise price of outstanding options, warrants and rights | Number of securities remaining available for future issuance under equity compensation plans (excluding securities reflected in the second column) | ||||||
Plans approved by stockholders | 191,808 | $ | 20.33 | 361,900 | |||||
Plans not approved by stockholders | — | — | — | ||||||
Total | 191,808 | $ | 20.33 | 361,900 | |||||
75
Item 13. CERTAIN RELATIONSHIPS AND RELATED TRANSACTIONS, AND DIRECTOR INDEPENDENCE
The information set forth under the captions “Corporate Governance – Director Independence” and “Corporate Governance – Certain Relationships and Related Transactions” in our definitive Proxy Statement for our 2018 Annual Meeting of Stockholders to be held on May 18, 2018, which we intend to file within 120 days after our fiscal year-end, is incorporated herein by reference.
Item 14. PRINCIPAL ACCOUNTING FEES AND SERVICES
The information set forth under the captions “Proposal 2 – Ratification of Independent Registered Public Accounting Firm – Fees Paid to BDO USA, LLP” and “Proposal 2 – Ratification of Independent Registered Public Accounting Firm – Policy on Audit Committee Pre-Approval of Audit and Permissible Non-Audit Services” in our definitive Proxy Statement for our 2018 Annual Meeting of Stockholders to be held on May 18, 2018, which we intend to file within 120 days after our fiscal year-end, is incorporated herein by reference.
PART IV
Item 15. EXHIBITS AND FINANCIAL STATEMENT SCHEDULE
The following documents are filed as part of this report:
1. | Financial Statements – See Index to the Consolidated Financial Statements at Item 8 of this Annual Report on Form 10-K. |
2. | Financial Statement Schedules - Supplemental schedules are not provided because of the absence of conditions under which they are required or because the required information is given in the financial statements or notes thereto. |
3. | Exhibits – The exhibits listed in the accompanying Index of Exhibits are filed as part of, or incorporated by reference into, this Annual Report on Form 10-K. |
Item 16. | FORM 10-K SUMMARY |
None.
76
INDEX OF EXHIBITS
Exhibit No. | Description | |
2.1 | ||
2.2 | ||
2.3 | ||
2.4 | ||
2.5 | ||
2.6 | ||
2.7 | ||
2.8 | ||
77
2.9 | ||
3.1 | ||
3.2 | ||
4.1 | ||
10.1 | ||
10.2 | ||
10.3 | ||
10.4 | ||
10.5 | ||
10.6 | ||
10.7 | ||
10.8 | ||
10.9* | ||
10.10* | ||
78
10.11* | ||
10.12* | ||
10.13* | ||
10.14* | ||
10.15* | ||
10.16 | ||
10.17* | ||
10.18* | ||
10.19* | ||
10.20* | ||
10.21† | ||
10.22* | ||
10.23* | ||
10.24(a)* | ||
10.24(b)† | ||
10.25† | ||
10.26* | ||
79
10.27(a)* | ||
10.27(b)† | ||
10.28 | ||
10.29 | ||
10.30+ | ||
10.31 | ||
10.32 | ||
10.33 | ||
10.34 | ||
10.35 | ||
10.36 | ||
80
10.37 | ||
10.38† | ||
10.39† | ||
10.40+ | ||
10.41+ | ||
10.42 | ||
10.43 | ||
81
10.44 | ||
10.45 | ||
10.46 | ||
10.47 | ||
10.48† | ||
10.49† | ||
10.50 | ||
10.51 | ||
82
10.52+ | ||
10.53 | ||
10.54 | ||
10.55 | ||
10.56* | ||
14.1 | ||
23.1† | ||
21† | ||
31.1† | ||
31.2† | ||
32.1† | ||
32.2† | ||
101.INS† | XBRL Instance Document | |
101.SCH† | XBRL Schema Document | |
101.CAL† | XBRL Calculation Linkbase Document | |
101.DEF† | XBRL Definition Linkbase Document | |
101.LAB† | XBRL Label Linkbase Document | |
101.PRE† | XBRL Presentation Linkbase Document | |
* | Management Contract or Compensatory Plan or Arrangement | |
† | Filed herewith | |
+ | Certain confidential portions of this exhibit were omitted by means of redacting a portion of the text. This exhibit has been filed separately with the Securities and Exchange Commission accompanied by a confidential treatment request pursuant to Rule 24b-2 of the Securities Exchange Act of 1934, as amended. | |
83
SIGNATURES
Pursuant to the requirements of Section 13 or 15(d) of the Securities Exchange Act of 1934, the registrant has duly caused this report to be signed on its behalf by the undersigned, thereunto duly authorized on March 9, 2018.
THE CHEFS’ WAREHOUSE, INC. | |
March 9, 2018 | /s/ Christopher Pappas |
Christopher Pappas | |
Chairman, President and Chief Executive Officer | |
Pursuant to the requirements of the Securities Exchange Act of 1934, this report has been signed below by the following persons on behalf of the registrant and in the capacities and on the dates indicated.
Signature | Capacity | Date | |||||
/s/ Christopher Pappas | Chairman, President and | March 9, 2018 | |||||
Christopher Pappas | Chief Executive Officer (Principal Executive Officer) | ||||||
/s/ James Leddy | Chief Financial Officer | March 9, 2018 | |||||
James Leddy | (Principal Financial Officer) | ||||||
/s/ Timothy McCauley | Chief Accounting Officer | March 9, 2018 | |||||
Timothy McCauley | (Principal Accounting Officer) | ||||||
/s/ John Pappas | Director and Vice Chairman | March 9, 2018 | |||||
John Pappas | |||||||
/s/ Alan Guarino | Director | March 9, 2018 | |||||
Alan Guarino | |||||||
/s/ John A. Couri | Director | March 9, 2018 | |||||
John A. Couri | |||||||
/s/ Dominick C. Cerbone | Director | March 9, 2018 | |||||
Dominick C. Cerbone | |||||||
/s/ Joseph Cugine | Director | March 9, 2018 | |||||
Joseph Cugine | |||||||
/s/ Stephen Hanson | Director | March 9, 2018 | |||||
Stephen Hanson | |||||||
/s/ John DeBenedetti | Director | March 9, 2018 | |||||
John DeBenedetti | |||||||
/s/ Katherine Oliver | Director | March 9, 2018 | |||||
Katherine Oliver | |||||||
/s/ Steven F. Goldstone | Director | March 9, 2018 | |||||
Steven F. Goldstone | |||||||
84